the effect of transformational leadership, organizational learning
TRANSCRIPT
International Journal of Economic Research27
The Effect of Transformational Leadership, Organizational Learning Capabilities and Innovation on Competitive..
Innovative Ways of Collaborative Development of Brics
Bithika Bishesh1 and Shrdha Malhotra2
1Research Scholar, School of Business Studies, Sharda University, Greater Noida (U.P.) E-mail: [email protected] Professor, School of Business Studies, Sharda University, Greater Noida (U.P.) E-mail: [email protected]
ABSTRACT
This research endeavors to postulate a platform to facilitate exchange of expertise among BRICS, after identifying them on the basis of research done by World Economic Forum through its Global Competitive Indices. The problem of ‘how to begin the collaborative techno-ethical development of BRICS’ is undertaken, in order to identify, which country’s organizations can take the lead in which trait. GCI report shows that BRICS nations have varied strengths and weaknesses under the technological, ethical and educational considerations however, the application of goal programming reveals that for each of these considerations, BRICS can form a team of two nations and act as leaders wherein the left out countries can replicate the strategies of the leaders. Goal Programming tries to find a solution within the framework of factorial constraints. It is neither intended to put a question mark on development of the GCI Index nor any modification in Index is suggested in this paper, but an approach has been developed for team-collaboration with implied improvement in their rankings.
JEL Classification: F15 F55 F63.
Keywords: BRICS, Ethics, Technology, Education, GCI Ranking, Goal Programming.
1. INTRODUCTION
BRICS is an association of the five fastest emerging nations of the world, namely, Brazil, Russia, India, China and South Africa. The acronym BRIC was first used in 2001 by Goldman Sachs in their Global Economics Paper, “Building Better Economic BRICs” on the basis of econometric analyses projecting that the economies of Brazil, Russia, India and China would individually and collectively occupy far greater economic space and would be amongst the world’s largest economies in the next fifty years or so. After the
International Journal of Economic Research
ISSN : 0972-9380
available at http: www.serialsjournals.com
„ Serials Publications Pvt. Ltd.
Volume 14 • Number 15 (Part 3) • 2017
Bithika Bishesh and Shrdha Malhotra
International Journal of Economic Research 28
induction of South Africa at the BRIC Foreign Ministers’ meeting in New York in September 2010, the group was renamed as BRICS. BRICS brings together five major emerging economies, comprising 43% of the world population, having 30% of the world GDP and 17% share in the world trade (BRICS India 2016 Report). These five countries are not an obvious set. There are neither the same strengths nor similar development challenges across the group. Though all these countries possess modern industrial sectors with ever deepening links to the global capitalist economy, their internal policies and economics are dissimilar and they face looming challenges that could choke their economic progress. Policymakers, businesses, and citizens increasingly recognize the need for economic growth. When a nation develops, wages tend to increase, and that in order to sustain this higher income, labor productivity must improve for the nation to be competitive. Once the labor productivity increases, there arise need to maintain this growth with efforts in the field of research and development and like. The relationship between productivity, social development, and environmental stewardship is complex. To facilitate research in this area of micro- and macro- economics, KOF index, Global Competitive Index and A.T. Kearney Index have been used to measure the role of various factors. In this paper use of Global Competitive Index (GCI) developed by World Economic Forum has been used. World Economic Forum was formed with Headquarter at Cologny, Switzerland. It aims to analyze how country competitiveness can be assessed once issues of social and environmental sustainability are taken into account. Once strength and weakness of nations are identified and ranked judiciously, it can pave the way for mutual collaboration for strengthening their economies. The Global Competitiveness Index, being updated every year, integrates the macroeconomic and the micro/business aspects of competitiveness into a single index. Rankings of Nations provided by this Index have been developed based on various social, technical, ethical, political and other factors being accepted over the entire world. This measures the set of institutions, policies, and factors that set the sustainable current and medium-term levels of economic prosperity. Thus this Index, developed as an Innovative tool by World Economic Forum, has been used as a Collaborative tool for Nations in this paper. A study of BRICS group of economies on the basis of 2014-2015 Global Competitive Index reveals that these five countries have varied strength and weaknesses which lead to lack of stability and lack of future prediction which gives way to lower investment and Consumer confidence. However, the findings of this paper reveal that BRICS have the potential to be leaders in their own specialized fields, based on the 114 factors taken in Global Competitive Index. Technological, ethical and educational considerations have varying impact within BRICS. Prosperity can be obtained by having mutual co-operation / collaboration between two or more nations. Every nation has a different ranking in different fields of economic activities (variables). So, accepting the Rankings as Constraints, it is desired to suggest a combination of nations for mutual collaboration/co-operation. Goal Programming is one such Mathematical / Quantitative technique which tries to find a solution within the framework of factorial constraints. It is neither intended to put a question mark on development of this Index nor any modification in Index is suggested in this paper, but an approach has been developed for team-collaboration to have an improved performance of collaborating economies with implied improvement in their rankings. The absolute importance of Ranking is that it provides a platform on which a country stands. This ranking makes the environment competitive for a nation and the nation tries hard to maintain a Top position or vie for a Top position. In case the nation stands in an in-between position, the Goal programming model suggests a collaborative nation to improve its ranking.
Innovative Ways of Collaborative Development of Brics
International Journal of Economic Research29
2. LITERATURE SURVEY
In economics, BRICS is a grouping acronym that refers to the countries of Brazil, Russia, India, China and South Africa which are all deemed to be at a similar stage of newly advanced economic development. According to BRICS Economic Cooperation Strategy drafted by Ministry of Economic development of the Russian Federation, to strengthen the positions of BRICS countries in the global economy and resolving domestic economic and social problems, industrial, technical and scientific cooperation should be deepened within BRICS which will create a synergic effect of growth and make it possible to tap into opportunities brought in by the complementarities of the BRICS countries.
Economies of BRICS nations, either individually or in comparison, have been vividly studied by various authors. China and India are the fastest growing economies and if they maintain their rate of growth in innovation they can catch up with the most advanced economies (Kumar & Singh, 2015). These two countries have shown robust rise in GDP every year and this has been attributed to the increasing patenting activities in these nations. For the period under study, 2001-2013, the number of patent applications filed by China was more than the combined total patent applications of Brazil, Russia, India and South Africa. India has also shown a robust growth in the field of research and innovation since its number of patent applications increased by six times from 2001 to 2013. Bagchi (2011) has found out that China and India continue to increase their spending on education without any indication of a dip brought about by the events of the financial crisis, but the other three countries that were having very high values in this indicator pre financial crisis have show dips. India and China are also not showing any sign of getting affected by the financial crisis, whereas, some dip is noticeable in the case of Brazil, Russia and South Africa. India’s overall economic growth was even slightly higher in 2009 than in the year before (Schrooten, 2011). Sunny and Unnikrishnan (2015) have inextricably related capital inflows to economic growth in BRICS. In China, higher Gross Capital Formation has led to higher capital inflows and thus it is regarded as the most economically stable BRICS economy. Bremer (2016) has advocated that India is the only BRICS nation which is not imploding as it is benefitting from some important current trends. India’s vulnerability to slowing economies elsewhere is limited as its growth depends little on exports and more on import of energy and other commodities. India has greatly benefitted from the sharply lower prices of the last few years. China’s chief-export model of growth and Russia’s dependency on export of natural resources like energy is found to be unsustainable in the long run. Mielniczuk (2013) suggests that India and China have converging interests of self-depiction and description of international relations. Hence they followed the same developmental-multipolar model and transitioned from bipolarity to multipolarity. Brazil, Russia and South Africa wanted to promote their economies by becoming a part of liberalization but became frustrated with the non-accomplishment of the promises of globalization. Therefore, they aligned with China and India by replicating their strategy and transitioning from a liberal-unilateral model to a developmental-multipolar model.
BRICS is emerging as a global power but with the increase in this power, social and ethical considerations will arise. With the advancement in technology, society has to deal with social and Ethical Crisis (Luppicini, 2009). Masrom, Ismail, Hussein and Mohamed (2010) have tried to explain ethical issues using scenarios which are descriptions of situations and their resulting actions. Similar to this concept, the Global Competitive Index enlists several factors which act as scenario with each BRICS nation in a different situation and with the help of that data we have tried to recommend the resulting actions.
Bithika Bishesh and Shrdha Malhotra
International Journal of Economic Research 30
Moor (2005) hypothesized that “as technological revolutions increase their social impact, ethical problems increase” (p. 117). He identified three different stages of technological revolution namely Introduction, permeation and power to show how ethical issues vary in each stage. Considering BRICS nations to be in different such stages, it is necessary to create synergy amongst them so that they can indulge in transfer of expertise without having to compromise with ethical issues. Education variables are crucial for our study because to ensure optimal use of technology, it is important to evaluate its advantages and drawbacks from the viewpoint of the concerned users (Magnusson & Hanson, 2003). Since, while technology empowers some individuals it also reinforces traditional barriers to others (Lin, 2007). With education becoming increasingly digital, it is necessary to identify coping strategies to mitigate the ethical obligations in the area of educational technology. Schomberg ( 2011) has highlighted the concept of responsible innovation. In the absence of synergy amongst BRICS, there will be winners and losers. Therefore, to have a win-win scenario, a holistic framework is required wherein responsibilities are interlinked.
3. RESEARCH METHODOLOGY AND PROBLEM DEFINITION
To be able to realize the full potential of an economic integration, it is necessary for the member countries to collaborate and co-operate to enhance their position on the international platform. GCI report shows that BRICS nations have varied strengths and weaknesses under the technological, ethical and educational considerations. A BRICS country having technical expertise might not be performing well on the educational front or the ethical front. Hence, in this paper, an effort has been made to intertwine technological, ethical and educational considerations to study their impact within BRICS. Thus the research question is to find out which of the BRICS nations are the leaders in the respective fields of education, technology and ethics so that they can form a team. Hence, collaborative strategies amongst BRICS members are being suggested. The factors responsible for such considerations are derived from the Global Competitive Index published by World Economic Forum. The World Economic Forum has continued its research into how sustainability relates to competitiveness and economic performance. It aims to analyze how country competitiveness can be assessed once issues of social and environmental sustainability are taken into account. It annually publishes its report whereby relative competitiveness of nations are measured and ranked on a Global Competitive Index (GCI). It benchmarks where a country stands to provide high levels of prosperity to their citizens. The report stands on the philosophy that as a nation develops, wages tend to increase, and that in order to sustain this higher income, labor productivity must improve for the nation to be competitive. In addition, what creates productivity in China is necessarily different from what drives it in Brazil. Thus, the GCI separates countries into three specific stages of economies: factor-driven (Stage-I), efficiency-driven (Stage-II), and innovation-driven (Stage-III), each implying a growing degree of complexity in the operation of the economy. The aim of economy is to move from Stage-I to Stage-II followed by Stage-III. After Stage-III, when saturation occurs further advancement need happen. Keys for these economies are also called Pillars of competitiveness and are as stated below.
1. Factor-driven economy (Stage-I): In the factor-driven stage countries compete based on their factor endowments, primarily unskilled labor and natural resources. Companies compete on the basis of prices and sell basic products or commodities, with their low productivity reflected in low wages. To maintain competitiveness at this stage of development, competitiveness depends on well-functioning public and private institutions (pillar 1), appropriate infrastructure (pillar 2), a stable macroeconomic framework (pillar 3), and good health and primary education (pillar 4).
Innovative Ways of Collaborative Development of Brics
International Journal of Economic Research31
2. Efficiency-driven economy (Stage-II): As countries advance they move into the second stage of efficiency driven. At this stage they have to focus on developing more efficient production processes and improving the quality of the products, since the wages have risen but the price cannot be increased. In this stage, competitiveness is driven by the following six pillars: Higher Education and Training (pillar 5), Goods Market Efficiency (pillar 6), Labor Market Efficiency (pillar 7), Financial Market Development (pillar 8), Technological Readiness (pillar 9) and, Market Size both domestic and international (pillar 10).
3. Innovation-driven economy (Stage-III): Finally, as countries move into the innovation-driven stage, they are only able to sustain higher wages and a higher standard of living if their businesses are able to compete by providing new or unique products. At this stage economies are able to sustain higher wages and higher standard of living if they are able to compete by producing new and unique goods using the two pillars of Business Sophistication (pillar 11) and Innovation (pillar 12).
The 12 Pillars (Keys of Economies) of GCI are further expanded into 114 variables and form a basis for developing a Global Competitive Index (GCI). This GCI developed by World Economic Forum is published in a Report every year. While all of these factors are likely to be important for competitiveness and growth, they are not mutually exclusive—two or more of them can be significant at the same time. Although the 12 pillars of competitiveness have been identified separately, it is important to keep in mind that they are not independent: they tend to reinforce each other, and a weakness in one area often has a negative impact in others. For example, a strong innovation capacity (pillar 12) will be very difficult to achieve without a healthy, well-educated and trained workforce (pillars 4 and 5) that is adept at absorbing new technologies (pillar 9), and without sufficient financing (pillar 8) for R&D or an efficient goods market that makes it possible to take new innovations to market (pillar 6). Nations, and so BRICS nations, have the potential to be leaders in their own specialized fields. Technological, ethical and educational considerations have varying impact within BRICS. So when treating BRICS economy as a whole, every nation is in different stage of economy development. Prosperity can be obtained by having mutual co-operation / collaboration between two or more nations. Every nation has a different ranking in different fields of economic activities (variables). So, accepting the Rankings as Constraints, it is desired to suggest a combination of nations for mutual collaboration/co-operation. Goal Programming is one such Mathematical / Quantitative technique which tries to find a solution within the framework of constraints (Pillars). It does not try to disturb or reform the existence of various Pillars.
In general the principle idea of goal programming is to convert original multiple objective into a single goal. Real world problems are mainly based on multiple objectives rather than single objective. It is obvious that one of the ways is to apply mathematical programming model for the management systems. Economical plans are a key in management, applying fundamental programming methods is inevitable. Application of a multi-objective programming model like goal programming model is an important tool for studying various aspects of management systems. One of the technical advantages of multiple goal programming is that there is always a solution to the problem, even if some goals are conflicting.
4. STATEMENT OF PROBLEM
In our Problem, we have the following conditions:
There are 5 (i = 1,2,3,4, and 5) BRICS nations xi (where xi stands for Nations 1,2,3,4 and 5 respectively.
Bithika Bishesh and Shrdha Malhotra
International Journal of Economic Research 32
There are 3 Specific Areas of Ethics, Technology and Education which are being studied in this paper. In every specific area 8 factors (where j stands for No. of factors 1,2,3,4,5,6,7 and 8 respectively) have been identified for which World Rankings of BRICS nations are available. These factors are ranked in such a way (as per GCI) that they are conflicting in nature meaning any nation holds different rankings in different attributes and they do not follow any pattern.
The problem is to select overall best 2 Nations (variable xi ), in every Specific Areas to form a Team for collaboration so that a lower Ranked nation may be complimented by a higher Ranked nation and vice versa.
4.1. The Goal Programming Technique
Goal programming is used to manage a set of conflicting objectives by minimizing the deviations between the target values and the realized results (Rifai 1994). The original objectives are re-formulated as a set of constraints with target values and two auxiliary variables. Two auxiliary variables are called positive deviation d+ and negative deviation d−, which represent the distance from this target value. The objective of goal programming is to minimize the achievement of each actual goal level, i.e. since simultaneous occurrence of both over achievement or underachievement is not possible, it will be written as:
Minimize under or overachievement of target (Minimize d – or d + as the case may be)
To understand it more clearly,
Say, x 1 = 1,
x 2 = 1
Then obviously, x1 + x 2 = 2
However, if the Goal is to make x 1 + x 2 = 1, we add a negative quantity d– (called deviation variable d–), with a value of –1, and re-write the equation as, x1 + x2 + d– = 1 then the equation is satisfied. Now suppose x1, x2 and x3 are three nations holding 1st, 2nd and 3rd rank respectively in one of the fields, AREA-1. Then it is easy to select x1 as the top most nation. But, say, if these nations x1, x2 and x3 hold 3rd, 1st and 2nd rank in another field AREA-2, then it will be difficult to judge the overall 1st (Best) nation. Fortunately, application of principle of Goal Programming can show us a path ahead as has been tried in this paper.
5. BRICS RANKINGS UNDER DIFFERENT PILLARS OF GLOBAL COMPETITIVE INDEX
The 12 pillars of GCI are given different weights on the basis of the per capita income of a country as well as country’s share of exports of mineral goods in total exports. Although these 12 pillars are important to some extent for every nation, the relative importance of these pillars depends on the nation’s stage of development. For our convenience, we have limited our study to eight pillars, in respect of BRICS and their respective factors which we have assumed to be critical in deciding the techno-ethical issues of a nation.
5.1. Institutional Pillar
The ways in which individuals, firms and governments interact to generate wealth has a strong impact on the competitiveness of a nation. The quality of institutions has a strong bearing on competitiveness and growth. It influences investment decisions and the organization of production and plays a key role
Innovative Ways of Collaborative Development of Brics
International Journal of Economic Research33
in the ways in which societies distribute the benefits and bear the costs of development strategies and policies. Valeriani and Peluso (2011) have tested the impact of institutional quality on economic growth at different stages of development and represented it as an analytical instrument for the interpretation of different economic realities. South Africa boasts a strong judicial independence, and hence it is not only the top most institutionally competitive BRICS nation but is also amongst the world’s top 25 in factors of institutional competitiveness like property rights, intellectual property protection and, efficiency of legal framework in settling disputes. The role of institutions goes beyond the legal framework. Government’s attitudes toward markets and freedoms and the efficiency of its operations are also very important. Excessive bureaucracy and red tape, overregulation, corruption, dishonesty in dealing with public contracts, lack of transparency and trustworthiness, inability to provide appropriate services for the business sector and political dependence of the judicial system impose significant economic costs to businesses and slow the process of economic development. Although South Africa has sound judicial independence and shows efficiency in legal framework, but it faces a major challenge in the payment and bribes factor where it is ranked 48th in the world. Even the transparency of government policymaking is better in China as compared to South Africa; hence China is the second most institutionally competitive BRICS nation. China also tops in factors like public trust in politicians and reliability of police services. China is competing well with South Africa in factors like property rights, intellectual property protection, efficiency of legal framework in settling disputes and efficiency of legal framework in challenging regulations but proper management of public finances is also critical for ensuring trust in the national business environment. China falls short of South Africa because it faces key challenges in areas of corruption in diversion of public funds, favoritism in decisions of government officials, wastefulness of government spending, burden of government regulation, organized crime and business costs of terrorism.
India is ranked 3rd amongst BRICS because although it is competitive with South Africa and China in terms of government efficiencies like efficiency of legal framework in settling disputes and challenging regulations, judicial independence and public trust in politicians, but India suffers a major setback in terms of security where it has the highest business cost of terrorism amongst BRICS. Similar to China, India is also struggling with corruption in diversion of public funds, favoritism in decisions of government officials, and wastefulness of government spending. Brazil and Russia occupy the 4th and last rank respectively as they are weak on almost every factor like corruption, undue influence, government efficiency and security. Although the focus is mainly on public institutions, private institutions are also an important element in the process of creating wealth. An economy is well served by businesses that are run honestly, where managers abide by strong ethical practices in their dealings with the government, other firms, and the public at large. Private-sector transparency is indispensable to business; it can be brought about through the use of standards as well as auditing and accounting practices that ensure access to information in a timely manner. Improved information enhances public understanding leading to stronger support for important fiscal reforms which can in turn reduce the public debt and eliminate fiscal vulnerabilities (Parry, 2007). South Africa is ranked 1st in world in strength of auditing and reporting standards, 2nd in protection of minority shareholders’ interests, 3rd in efficacy of corporate boards and 10th in strength of investor protection. China is next to South Africa in terms of corporate Ethics and accountability. Although Brazil comes under world’s top 50 in terms of accountability, but it has the worst ranking in the ethical behavior of firms. India is competitive in maintaining investor and consumer confidence with a good score in strength of investor protection, but apart from that India as well as Russia face a serious challenge in the functioning of their private Institutions.
Bithika Bishesh and Shrdha Malhotra
International Journal of Economic Research 34
5.2. Infrastructure Pillar
Well-developed infrastructure and the quality of infrastructure have a strong impact on nations’ economic growth. Effective modes of transport (rail, roads, ports and air transports) ensure timely delivery of goods and services. Sahoo, Dash and Nataraj (2010) have suggested the necessity of designing an economic policy that improves the formation of physical infrastructure for sustainable economic growth in developing countries. Banerjee, Duflo and Qian (2012) have used country level data from China to show that “regions closer to historical transportation networks have higher levels of GDP per capita, higher income inequality, a higher number of firms and higher average firm profit.” (p. 32). The world class infrastructure of Russia makes it the most competitive BRICS nation under this pillar with a rank of 59, followed by China, South Africa, Brazil and India. Out of the nine factors that determine the competitiveness of a nation’s infrastructure, Russia’s three factors are amongst world’s top 25. Russia boasts high Quality of railroad Infrastructure, although the quality of roads and port infrastructure are better in China, South Africa and India. Russia has also a competitive edge over other BRICS nations in factors of electricity and telephone infrastructure. Brazil has the poorest transport infrastructure, whereas India has the worst electricity and telephone Infrastructure. South Africa can beat China and Russia and secure the top position if it focuses on improving the Quality of Electricity supply and railroad Infrastructure.
5.3. Health and primary education Pillar
Aghion, Boustan, Hoxby and Vandenbussche (2009) have stated that “the Asian miracle (high productivity growth in Asian countries like South Korea) is associated more with investments in primary and secondary education than with investments in higher education” (p. 3).
Education at secondary level affect Real GDP per capita in long run (Khattak & Khan, 2012) and a healthy workforce reduces absenteeism as well as low levels of efficiency. Well-qualified workforces are more likely to adapt to advanced techniques and thus help the firms in moving up the value chain. Worker productivity is affected by health and human capital and in many developing countries even modest income gains from health have generated very high rates of return (Bloom & Canning, 2008).
China’s health and primary education is best amongst the BRICS nation, owing to its good quality of primary Education, and low incidences of diseases like malaria, tuberculosis and HIV. China is also ranked fourth in primary education enrollment. Russia is next to China in terms of Health and Primary Education, although it is two ranks ahead of China in terms of quality of primary education. Brazil stands at third position where it is worth noting that not only the health condition of Brazil is far better than Russia with lower prevalence of diseases but the enrollment in primary education is also high as compared to Russia. The problem with Brazil lies in its poor quality of primary education. South Africa and India stands at fourth and fifth position respectively as both of these nations struggle with poor health management and poor quality of primary education.
5.4. Higher Education and Training Pillar
Proper quality of higher education and vocational as well as on-the-job training ensures that workers are able to perform complex tasks well. Higher education benefits the society both on micro and macro level where the benefits gained by individuals because of higher education leads to both the individuals and society gaining economic benefits (Bashir, Herath & Gebremedhin, 2012).
Innovative Ways of Collaborative Development of Brics
International Journal of Economic Research35
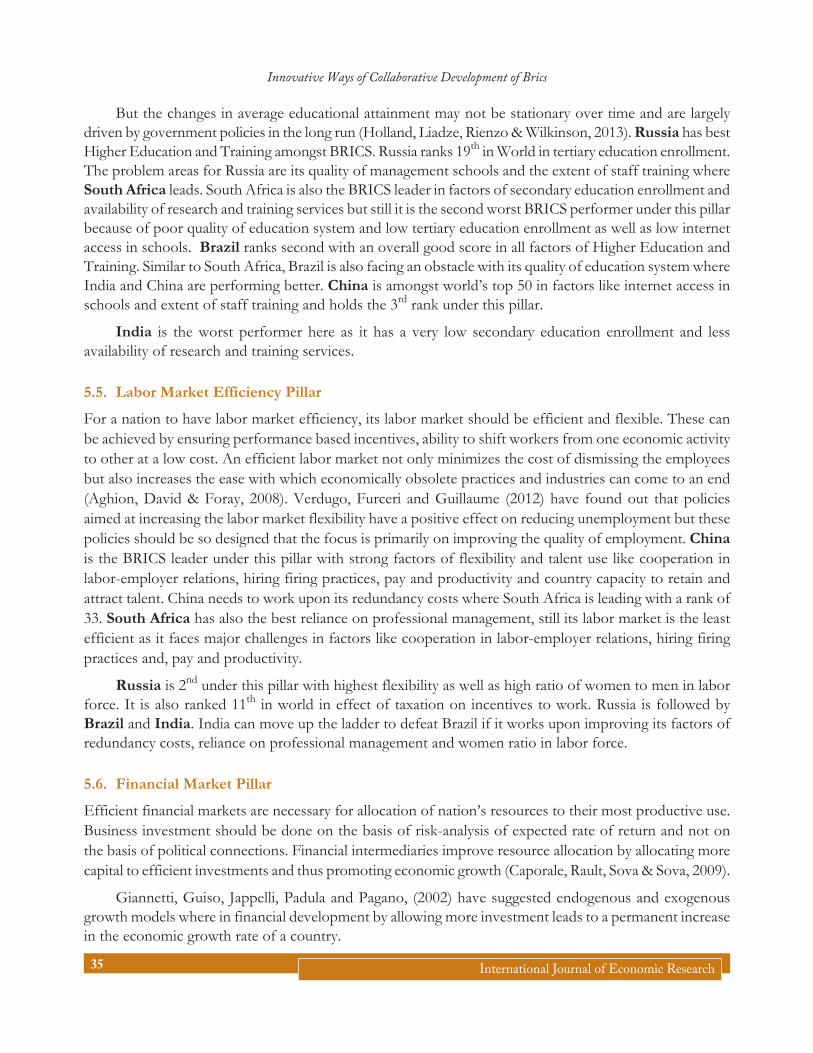
But the changes in average educational attainment may not be stationary over time and are largely driven by government policies in the long run (Holland, Liadze, Rienzo & Wilkinson, 2013). Russia has best Higher Education and Training amongst BRICS. Russia ranks 19th in World in tertiary education enrollment. The problem areas for Russia are its quality of management schools and the extent of staff training where South Africa leads. South Africa is also the BRICS leader in factors of secondary education enrollment and availability of research and training services but still it is the second worst BRICS performer under this pillar because of poor quality of education system and low tertiary education enrollment as well as low internet access in schools. Brazil ranks second with an overall good score in all factors of Higher Education and Training. Similar to South Africa, Brazil is also facing an obstacle with its quality of education system where India and China are performing better. China is amongst world’s top 50 in factors like internet access in schools and extent of staff training and holds the 3rd rank under this pillar.
India is the worst performer here as it has a very low secondary education enrollment and less availability of research and training services.
5.5. Labor Market Efficiency Pillar
For a nation to have labor market efficiency, its labor market should be efficient and flexible. These can be achieved by ensuring performance based incentives, ability to shift workers from one economic activity to other at a low cost. An efficient labor market not only minimizes the cost of dismissing the employees but also increases the ease with which economically obsolete practices and industries can come to an end (Aghion, David & Foray, 2008). Verdugo, Furceri and Guillaume (2012) have found out that policies aimed at increasing the labor market flexibility have a positive effect on reducing unemployment but these policies should be so designed that the focus is primarily on improving the quality of employment. China is the BRICS leader under this pillar with strong factors of flexibility and talent use like cooperation in labor-employer relations, hiring firing practices, pay and productivity and country capacity to retain and attract talent. China needs to work upon its redundancy costs where South Africa is leading with a rank of 33. South Africa has also the best reliance on professional management, still its labor market is the least efficient as it faces major challenges in factors like cooperation in labor-employer relations, hiring firing practices and, pay and productivity.
Russia is 2nd under this pillar with highest flexibility as well as high ratio of women to men in labor force. It is also ranked 11th in world in effect of taxation on incentives to work. Russia is followed by Brazil and India. India can move up the ladder to defeat Brazil if it works upon improving its factors of redundancy costs, reliance on professional management and women ratio in labor force.
5.6. Financial Market Pillar
Efficient financial markets are necessary for allocation of nation’s resources to their most productive use. Business investment should be done on the basis of risk-analysis of expected rate of return and not on the basis of political connections. Financial intermediaries improve resource allocation by allocating more capital to efficient investments and thus promoting economic growth (Caporale, Rault, Sova & Sova, 2009).
Giannetti, Guiso, Jappelli, Padula and Pagano, (2002) have suggested endogenous and exogenous growth models where in financial development by allowing more investment leads to a permanent increase in the economic growth rate of a country.
Bithika Bishesh and Shrdha Malhotra
International Journal of Economic Research 36
South Africa has the most efficient Financial Market as it is amongst world’s top 10 in factors like availability of financial services, financing through local equity market, soundness of banks and regulation of securities exchanges. Russia has the worst performing financial market because of its hurdles in factors of trustworthiness and confidence where it ranks the lowest in each factor. India ranks 2nd with its strengths lying in financing through local equity market, ease of access to loans, Venture capital availability and legal rights index. To have a better functioning financial market, India should improve its availability and affordability of financial services. India is followed by Brazil and China. Although China is the leader in factors of ease of access to loans, and venture capital availability where Brazil is performing the worst, still Brazil has secured a better position than China because of its strong factors of trustworthiness and confidence.
5.7. Technological Readiness Pillar
Countries should have access to latest and developed technologies irrespective of the fact whether it is developed within the nation or not. They should also have the ability to adapt to new technologies. Technological advancement popularizes new technique in the market and improves labor quality as well as capital efficiency; hence it is the most important influencing factor of economic growth in the long run (Weng, Song & Sheng, 2012). ICT leads to innovation by improving the transparency of information flow and enabling new ways of working within value network (Bubanja & Bubanja, 2015).
Brazil has the best Technological Readiness and India has the worst. India is lagging behind in almost all factors of Technological Adoption and ICT use.
Russia ranks 2nd because although it has better factors of ICT use as compared to brazil but it faces problems in factors of technological adoption with the worst FDI and technology transfer. South Africa ranks 4th with the highest availability of latest technologies and firm-level technology absorption. Similar to India, China’s factors of technological adoption are poor. Still China is one rank ahead of India as it has better factors of ICT use as compared to India.
5.8. Innovation Pillar
Radical and incremental innovations foster the economic growth of a country by opening up new opportunities and improving the existing practices of technologies (Singh, 2006).
Thompson (2015) found that “a higher innovation’s depreciation rate increases the innovation activities and output, leading to higher economic growth” (p. 19). An economy can grow in the short run by accumulating factor but a permanent growth is possible only through technological innovation (Nicholas, 2014). Out of all the seven factors determining a nation’s Innovative competitiveness, China is amongst World’s top fifty in all the factors and hence is at the top most position in BRICS under this pillar. South Africa beats China in factors of capacity for innovation, quality of scientific research institutions and universities but the key challenge for South Africa is Government’s procurement of advanced technology products which is the worst in BRICS and hence it ranks below China. Also, similar to Brazil South Africa faces the problem of availability of scientists and engineers. India is at third position as it is performing well with four of its factors amongst world’s top 50. In fact India’s company spending on research and development, Government’s procurement of advanced technology products and availability of scientists
Innovative Ways of Collaborative Development of Brics
International Journal of Economic Research37
and engineers is better than South Africa but the PCT patents application in India is the lowest. India is followed by Brazil and Russia. Brazil is giving India a tough Competition in most of the seven factors. Russia is amongst the world’s top 50 only in PCT patents applications and performs poorly in almost all other factors of Innovation.
6. DATA ANALYSIS
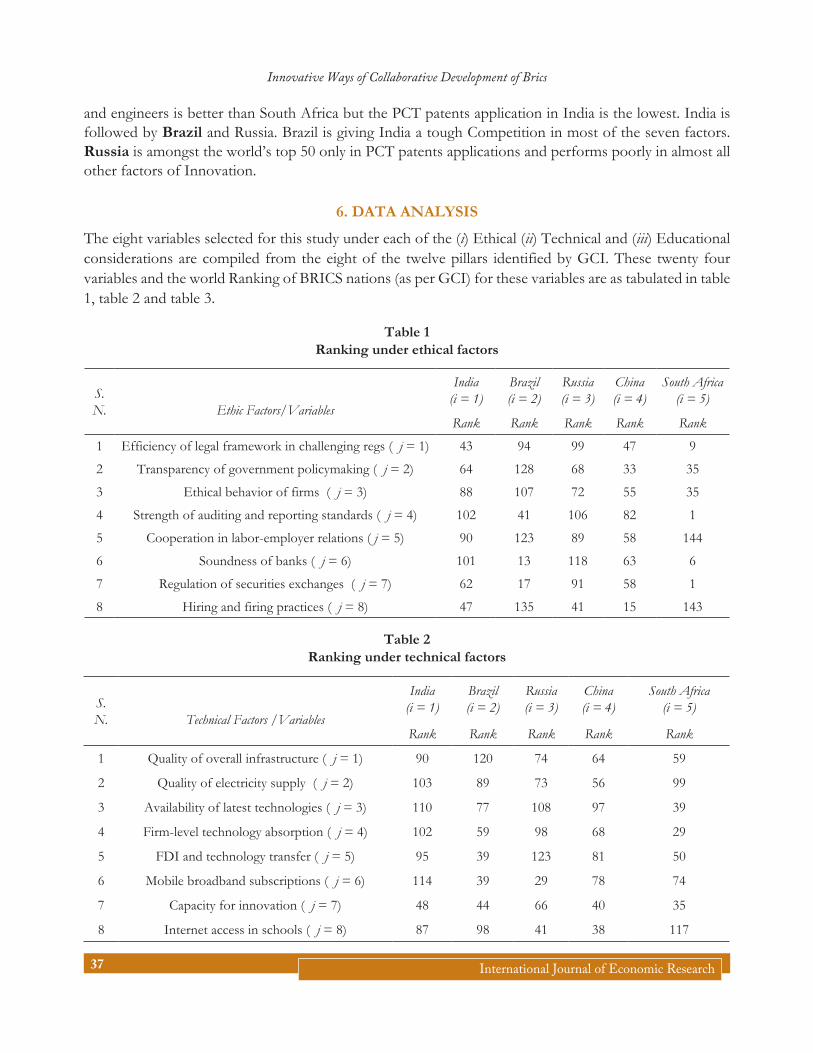
The eight variables selected for this study under each of the (i) Ethical (ii) Technical and (iii) Educational considerations are compiled from the eight of the twelve pillars identified by GCI. These twenty four variables and the world Ranking of BRICS nations (as per GCI) for these variables are as tabulated in table 1, table 2 and table 3.
Table 1 Ranking under ethical factors
S. N. Ethic Factors/Variables
India(i = 1)
Brazil(i = 2)
Russia(i = 3)
China(i = 4)
South Africa(i = 5)
Rank Rank Rank Rank Rank
1 Efficiency of legal framework in challenging regs ( j = 1) 43 94 99 47 9
2 Transparency of government policymaking ( j = 2) 64 128 68 33 35
3 Ethical behavior of firms ( j = 3) 88 107 72 55 35
4 Strength of auditing and reporting standards ( j = 4) 102 41 106 82 1
5 Cooperation in labor-employer relations ( j = 5) 90 123 89 58 144
6 Soundness of banks ( j = 6) 101 13 118 63 6
7 Regulation of securities exchanges ( j = 7) 62 17 91 58 1
8 Hiring and firing practices ( j = 8) 47 135 41 15 143
Table 2 Ranking under technical factors
S. N. Technical Factors /Variables
India(i = 1)
Brazil(i = 2)
Russia(i = 3)
China(i = 4)
South Africa(i = 5)
Rank Rank Rank Rank Rank
1 Quality of overall infrastructure ( j = 1) 90 120 74 64 59
2 Quality of electricity supply ( j = 2) 103 89 73 56 99
3 Availability of latest technologies ( j = 3) 110 77 108 97 39
4 Firm-level technology absorption ( j = 4) 102 59 98 68 29
5 FDI and technology transfer ( j = 5) 95 39 123 81 50
6 Mobile broadband subscriptions ( j = 6) 114 39 29 78 74
7 Capacity for innovation ( j = 7) 48 44 66 40 35
8 Internet access in schools ( j = 8) 87 98 41 38 117
Bithika Bishesh and Shrdha Malhotra
International Journal of Economic Research 38
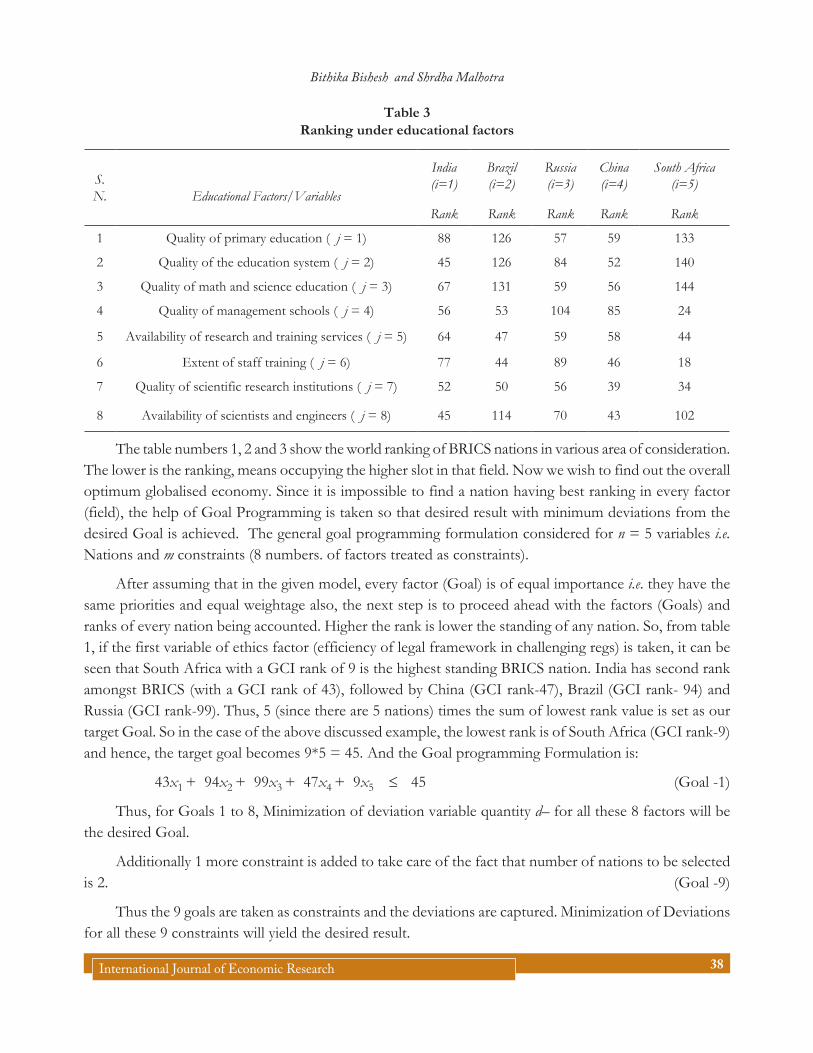
Table 3 Ranking under educational factors
S. N. Educational Factors/Variables
India(i=1)
Brazil(i=2)
Russia(i=3)
China(i=4)
South Africa(i=5)
Rank Rank Rank Rank Rank
1 Quality of primary education ( j = 1) 88 126 57 59 133
2 Quality of the education system ( j = 2) 45 126 84 52 140
3 Quality of math and science education ( j = 3) 67 131 59 56 144
4 Quality of management schools ( j = 4) 56 53 104 85 24
5 Availability of research and training services ( j = 5) 64 47 59 58 44
6 Extent of staff training ( j = 6) 77 44 89 46 18
7 Quality of scientific research institutions ( j = 7) 52 50 56 39 34
8 Availability of scientists and engineers ( j = 8) 45 114 70 43 102
The table numbers 1, 2 and 3 show the world ranking of BRICS nations in various area of consideration. The lower is the ranking, means occupying the higher slot in that field. Now we wish to find out the overall optimum globalised economy. Since it is impossible to find a nation having best ranking in every factor (field), the help of Goal Programming is taken so that desired result with minimum deviations from the desired Goal is achieved. The general goal programming formulation considered for n = 5 variables i.e. Nations and m constraints (8 numbers. of factors treated as constraints).
After assuming that in the given model, every factor (Goal) is of equal importance i.e. they have the same priorities and equal weightage also, the next step is to proceed ahead with the factors (Goals) and ranks of every nation being accounted. Higher the rank is lower the standing of any nation. So, from table 1, if the first variable of ethics factor (efficiency of legal framework in challenging regs) is taken, it can be seen that South Africa with a GCI rank of 9 is the highest standing BRICS nation. India has second rank amongst BRICS (with a GCI rank of 43), followed by China (GCI rank-47), Brazil (GCI rank- 94) and Russia (GCI rank-99). Thus, 5 (since there are 5 nations) times the sum of lowest rank value is set as our target Goal. So in the case of the above discussed example, the lowest rank is of South Africa (GCI rank-9) and hence, the target goal becomes 9*5 = 45. And the Goal programming Formulation is:
43x1 + 94x2 + 99x3 + 47x4 + 9x5 ≤ 45 (Goal -1)
Thus, for Goals 1 to 8, Minimization of deviation variable quantity d– for all these 8 factors will be the desired Goal.
Additionally 1 more constraint is added to take care of the fact that number of nations to be selected is 2. (Goal -9)
Thus the 9 goals are taken as constraints and the deviations are captured. Minimization of Deviations for all these 9 constraints will yield the desired result.
Innovative Ways of Collaborative Development of Brics
International Journal of Economic Research39
The Goal programming Solution Model proceeds to find the optimum solution in certain number of iterations, alternatively called trial and error solution. If the final solution is optimum then it will be called as the feasible solution and the best option is readily determined. However, in case of infeasible solution obtained in the selected number of iterations, fractional values for all or some variables will be achieved, thus calling for judicious decision based upon the proximity to the integer value 1.
Excel Solver is used to solve the Model. The Solution Models are shown in Tabular presentation in Figure 1, Figure 2 and Figure 3.
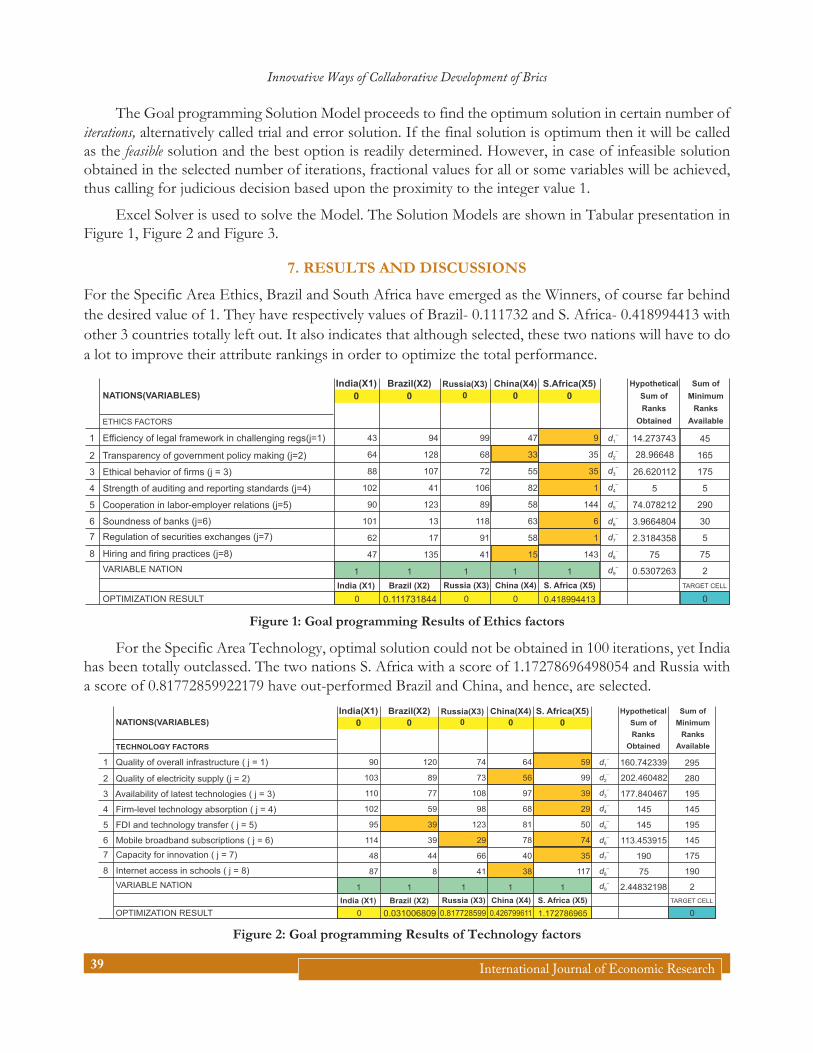
7. RESULTS AND DISCUSSIONS
For the Specific Area Ethics, Brazil and South Africa have emerged as the Winners, of course far behind the desired value of 1. They have respectively values of Brazil- 0.111732 and S. Africa- 0.418994413 with other 3 countries totally left out. It also indicates that although selected, these two nations will have to do a lot to improve their attribute rankings in order to optimize the total performance.
NATIONS(VARIABLES)
ETHICS FACTORS
1 Efficiency of legal framework in challenging regs(j=1)
2 Transparency of government policy making (j=2)
3 Ethical behavior of firms (j = 3)
4 Strength of auditing and reporting standards (j=4)
5 Cooperation in labor-employer relations (j=5)
6 Soundness of banks (j=6)
7 Regulation of securities exchanges (j=7)
8 Hiring and firing practices (j=8)
VARIABLE NATION
OPTIMIZATION RESULT
India(X1)
0
Brazil(X2)
0
Russia(X3)
0
China(X4)
0
S.Africa(X5)
0
Hypothetical
Sum of
Ranks
Obtained
Sum of
Minimum
Ranks
Available
43
64
88
102
90
101
62
47
1
0 0 0
India (X1) Brazil (X2) Russia (X3) China (X4) S. Africa (X5)
1
0.111731844
1 1 1
0.418994413
94
128
107
41
123
13
17
135
99
68
72
106
89
118
91
41
47
33
55
82
58
63
58
15
9
35
35
1
144
6
1
143
d1
–
d2
–
d3
–
d4
–
d5
–
d6
–
d7
–
d8
–
d9
–
14.273743 45
165
175
5
290
30
5
75
2
0
TARGET CELL
28.96648
26.620112
5
74.078212
3.9664804
2.3184358
75
0.5307263
Figure 1: Goal programming Results of Ethics factors
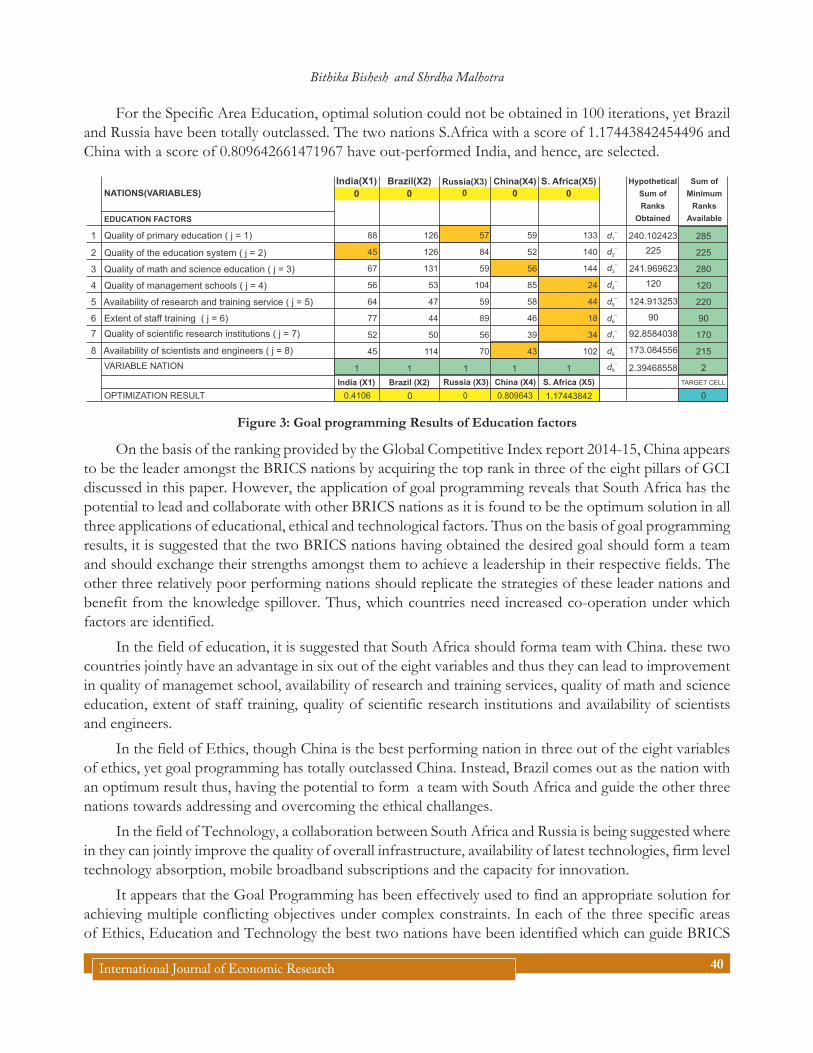
For the Specific Area Technology, optimal solution could not be obtained in 100 iterations, yet India has been totally outclassed. The two nations S. Africa with a score of 1.17278696498054 and Russia with a score of 0.81772859922179 have out-performed Brazil and China, and hence, are selected.
NATIONS(VARIABLES)
TECHNOLOGY FACTORS
1 Quality of overall infrastructure ( j = 1)
2 Quality of electricity supply (j = 2)
3 Availability of latest technologies ( j = 3)
4 Firm-level technology absorption ( j = 4)
5 FDI and technology transfer ( j = 5)
6 Mobile broadband subscriptions ( j = 6)
7 Capacity for innovation ( j = 7)
8 Internet access in schools ( j = 8)
VARIABLE NATION
OPTIMIZATION RESULT
India(X1)
0
Brazil(X2)
0
Russia(X3)
0
China(X4)
0
S. Africa(X5)
0
Hypothetical
Sum of
Ranks
Obtained
Sum of
Minimum
Ranks
Available
90
103
110
102
95
114
48
87
1
0 0.817728599 0.426799611
India (X1) Brazil (X2) Russia (X3) China (X4) S. Africa (X5)
1
0.031006809
1 1 1
1.172786965
120
89
77
59
39
39
44
8
74
73
108
98
123
29
66
41
64
56
97
68
81
78
40
38
59
99
39
29
50
74
35
117
d1
–
d2
–
d3
–
d4
–
d5
–
d6
–
d7
–
d8
–
d9
–
160.742339 295
280
195
145
195
145
175
190
2
0
TARGET CELL
202.460482
177.840467
145
145
113.453915
190
75
2.44832198
Figure 2: Goal programming Results of Technology factors
Bithika Bishesh and Shrdha Malhotra
International Journal of Economic Research 40
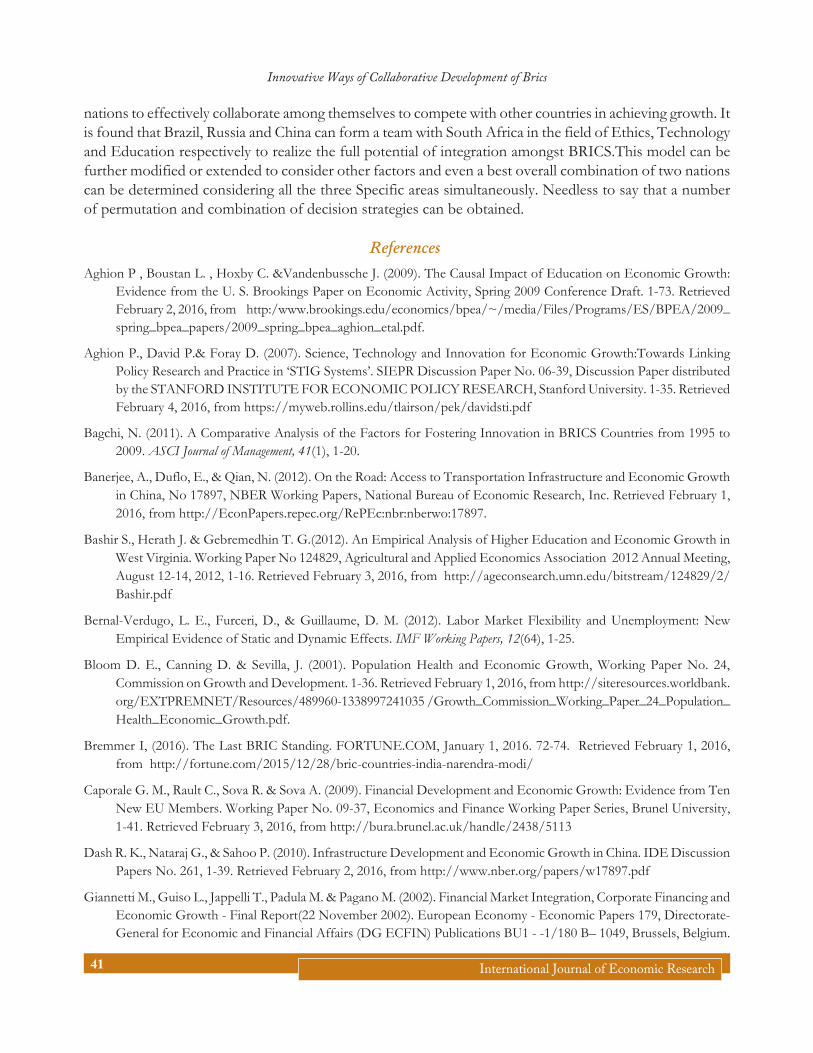
For the Specific Area Education, optimal solution could not be obtained in 100 iterations, yet Brazil and Russia have been totally outclassed. The two nations S.Africa with a score of 1.17443842454496 and China with a score of 0.809642661471967 have out-performed India, and hence, are selected.
NATIONS(VARIABLES)
EDUCATION FACTORS
1 Quality of primary education ( j = 1)
2 Quality of the education system ( j = 2)
3 Quality of math and science education ( j = 3)
4 Quality of management schools ( j = 4)
5 Availability of research and training service ( j = 5)
6 Extent of staff training ( j = 6)
7 Quality of scientific research institutions ( j = 7)
8 Availability of scientists and engineers ( j = 8)
VARIABLE NATION
OPTIMIZATION RESULT
India(X1)
0
Brazil(X2)
0
Russia(X3)
0
China(X4)
0
S. Africa(X5)
0
Hypothetical
Sum of
Ranks
Obtained
Sum of
Minimum
Ranks
Available
88
45
67
56
64
77
52
45
1
0.4106 0 0.809643
India (X1) Brazil (X2) Russia (X3) China (X4) S. Africa (X5)
1
0
1 1 1
1.17443842
126
126
131
53
47
44
50
114
57
84
59
104
59
89
56
70
59
52
56
85
58
46
39
43
133
140
144
24
44
18
34
102
d1
–
d2
–
d3
–
d4
–
d5
–
d6
–
d7
–
d8
–
d9
–
240.102423 285
225
280
120
220
90
170
215
2
0
TARGET CELL
241.969623
120
225
124.913253
90
92.8584038
173.084556
2.39468558
Figure 3: Goal programming Results of Education factors
On the basis of the ranking provided by the Global Competitive Index report 2014-15, China appears to be the leader amongst the BRICS nations by acquiring the top rank in three of the eight pillars of GCI discussed in this paper. However, the application of goal programming reveals that South Africa has the potential to lead and collaborate with other BRICS nations as it is found to be the optimum solution in all three applications of educational, ethical and technological factors. Thus on the basis of goal programming results, it is suggested that the two BRICS nations having obtained the desired goal should form a team and should exchange their strengths amongst them to achieve a leadership in their respective fields. The other three relatively poor performing nations should replicate the strategies of these leader nations and benefit from the knowledge spillover. Thus, which countries need increased co-operation under which factors are identified.
In the field of education, it is suggested that South Africa should forma team with China. these two countries jointly have an advantage in six out of the eight variables and thus they can lead to improvement in quality of managemet school, availability of research and training services, quality of math and science education, extent of staff training, quality of scientific research institutions and availability of scientists and engineers.
In the field of Ethics, though China is the best performing nation in three out of the eight variables of ethics, yet goal programming has totally outclassed China. Instead, Brazil comes out as the nation with an optimum result thus, having the potential to form a team with South Africa and guide the other three nations towards addressing and overcoming the ethical challanges.
In the field of Technology, a collaboration between South Africa and Russia is being suggested where in they can jointly improve the quality of overall infrastructure, availability of latest technologies, firm level technology absorption, mobile broadband subscriptions and the capacity for innovation.
It appears that the Goal Programming has been effectively used to find an appropriate solution for achieving multiple conflicting objectives under complex constraints. In each of the three specific areas of Ethics, Education and Technology the best two nations have been identified which can guide BRICS
Innovative Ways of Collaborative Development of Brics
International Journal of Economic Research41
nations to effectively collaborate among themselves to compete with other countries in achieving growth. It is found that Brazil, Russia and China can form a team with South Africa in the field of Ethics, Technology and Education respectively to realize the full potential of integration amongst BRICS.This model can be further modified or extended to consider other factors and even a best overall combination of two nations can be determined considering all the three Specific areas simultaneously. Needless to say that a number of permutation and combination of decision strategies can be obtained.
ReferencesAghion P , Boustan L. , Hoxby C. &Vandenbussche J. (2009). The Causal Impact of Education on Economic Growth:
Evidence from the U. S. Brookings Paper on Economic Activity, Spring 2009 Conference Draft. 1-73. Retrieved February 2, 2016, from http:/www.brookings.edu/economics/bpea/~/media/Files/Programs/ES/BPEA/2009_ spring_bpea_papers/2009_spring_bpea_aghion_etal.pdf.
Aghion P., David P.& Foray D. (2007). Science, Technology and Innovation for Economic Growth:Towards Linking Policy Research and Practice in ‘STIG Systems’. SIEPR Discussion Paper No. 06-39, Discussion Paper distributed by the STANFORD INSTITUTE FOR ECONOMIC POLICY RESEARCH, Stanford University. 1-35. Retrieved February 4, 2016, from https://myweb.rollins.edu/tlairson/pek/davidsti.pdf
Bagchi, N. (2011). A Comparative Analysis of the Factors for Fostering Innovation in BRICS Countries from 1995 to 2009. ASCI Journal of Management, 41(1), 1-20.
Banerjee, A., Duflo, E., & Qian, N. (2012). On the Road: Access to Transportation Infrastructure and Economic Growth in China, No 17897, NBER Working Papers, National Bureau of Economic Research, Inc. Retrieved February 1, 2016, from http://EconPapers.repec.org/RePEc:nbr:nberwo:17897.
Bashir S., Herath J. & Gebremedhin T. G.(2012). An Empirical Analysis of Higher Education and Economic Growth in West Virginia. Working Paper No 124829, Agricultural and Applied Economics Association 2012 Annual Meeting, August 12-14, 2012, 1-16. Retrieved February 3, 2016, from http://ageconsearch.umn.edu/bitstream/124829/2/Bashir.pdf
Bernal-Verdugo, L. E., Furceri, D., & Guillaume, D. M. (2012). Labor Market Flexibility and Unemployment: New Empirical Evidence of Static and Dynamic Effects. IMF Working Papers, 12(64), 1-25.
Bloom D. E., Canning D. & Sevilla, J. (2001). Population Health and Economic Growth, Working Paper No. 24, Commission on Growth and Development. 1-36. Retrieved February 1, 2016, from http://siteresources.worldbank.org/EXTPREMNET/Resources/489960-1338997241035 /Growth_Commission_Working_Paper_24_Population_Health_Economic_Growth.pdf.
Bremmer I, (2016). The Last BRIC Standing. FORTUNE.COM, January 1, 2016. 72-74. Retrieved February 1, 2016, from http://fortune.com/2015/12/28/bric-countries-india-narendra-modi/
Caporale G. M., Rault C., Sova R. & Sova A. (2009). Financial Development and Economic Growth: Evidence from Ten New EU Members. Working Paper No. 09-37, Economics and Finance Working Paper Series, Brunel University, 1-41. Retrieved February 3, 2016, from http://bura.brunel.ac.uk/handle/2438/5113
Dash R. K., Nataraj G., & Sahoo P. (2010). Infrastructure Development and Economic Growth in China. IDE Discussion Papers No. 261, 1-39. Retrieved February 2, 2016, from http://www.nber.org/papers/w17897.pdf
Giannetti M., Guiso L., Jappelli T., Padula M. & Pagano M. (2002). Financial Market Integration, Corporate Financing and Economic Growth - Final Report(22 November 2002). European Economy - Economic Papers 179, Directorate-General for Economic and Financial Affairs (DG ECFIN) Publications BU1 - -1/180 B– 1049, Brussels, Belgium.
Bithika Bishesh and Shrdha Malhotra
International Journal of Economic Research 42
1-82. Retrieved February 6, 2016, from http://ec.europa.eu/economy_finance/publications/publication1660_en.pdf
Holland D., Liadze I., Rienzo C. & Wilkinson D. (2013). The relationship between graduates and economic growth across countries. BIS RESEARCH PAPER NO. 110, Department of Business Innovation and Skill, Government of United Kingdom, 1-72. Retrieved February 5, 2016, from https://www.gov.uk/government/uploads/system/uploads/attachment_data/file/229492/bis-13-858-relationship-between-graduates-and-economic-growth-across-countries.pdf
Khattak, N. U., & Khan, J. (2012). Contribution of Education to Economic Growth: Evidence from Pakistan. International Journal of Business and Social Science, 3(4), 145-151.
Kumar, D., & Singh, N. (2015). Patenting Trends among BRICS and Effect on GDP. Economic Affairs Econ. Affa., 60(3), 473-476.
Lin, H. (2007). The ethics of instructional technology: Issues and coping strategies experienced by professional technologists in design and training situations in higher education. Education Tech Research Dev Educational Technology Research and Development, 55(5), 411-437.
Magnusson, L., & Hanson, E. J. (2003). Ethical issues arising from a research, technology and development project to support frail older people and their family carers at home. Health Soc Care Community Health and Social Care in the Community, 11(5), 431-439.
Masrom, M., Ismail, Z., Hussein, R., & Mohamed, N. (2010). An Ethical Assessment of Computer Ethics Using Scenario Approach. International Journal of Electronic Commerce Studies, 1(1), 25-36.
Mielniczuk, F. (2013). Brics in the Contemporary World: Changing identities, converging interests. Third World Quarterly, 34(6), 1075-1090.
Moor, J. H. (2005). Why We Need Better Ethics for Emerging Technologies. Ethics and Information Technology Ethics Inf Technology, 7(3), 111-119.
Neill, J. O. (2001). Building Better Economic BRICs. Goldman Sachs, Global Economics Paper No: 66.
Nicholas, T. (2012). Technology, Innovation and Economic Growth in Britain Since 1870. Chap, 7, 181-204.
Parry, T. (2007). The Role of Fiscal Transparency in Sustaining Stability and Growth in Latin America. IMF Working Papers, 07(220), 3-39.
Rocci, L. (2009). The Nature and Areas of Technoethical Inquiry. Ethical Issues in Technological Design, Research, Development, and Innovation Technoethics and the Evolving Knowledge Society, 86-107.
Schomberg, R. V. (2011). Towards Responsible Research and Innovation in the Information and Communication Technologies and Security Technologies Fields. SSRN Electronic Journal SSRN Journal.
Schrooten M. (2011). Brazil, Russia, India, China and South Africa: Strong Economic Growth -- Major Challenges. DIW Economic Bulletin;2011, Vol. 1 Issue 4. 18-23.
Singh, L. (2006). Innovations and Economic Growth in a Fast Changing Global Economy:Comparative Experience of South East Asian Countries. Paper presented at the conference on “Korea and the World Economy V”, July7-8, 2006, Korea University, Seoul, South Korea. 1-22. Retrieved February 6, 2016, from http://faculty.washington.edu/karyiu/confer/seoul06/papers/singh.pdf
Sunny, D., & Unnikrishnan, A. (2015). Pattern of capital inflows in BRICS: Aspects to ponder for policy implementation. The Journal of Developing Areas, 49(6), 219-234.
Innovative Ways of Collaborative Development of Brics
International Journal of Economic Research43
Thompson M. (2015). Social Capital, Innovation and Economic Growth. Documentos de Trabalho Working Paper Series NIPE WP 03// 2015, Universidade do Minho. 1-27. Retrieved February 5, 2016, from http://apdr.pt/data/documents/Proceedings_19_congress_1.pdf
Valeriani E, & Peluso S. (2011). The Impact Of Institutional Quality On Economic Growth And Development: An Empirical Study. Journal of Knowledge Management, Economics and Information Technology, 1 (6), р. 274-299.
Vidas-Bubanja, M., & Bubanja, I. (2015). ICT as prerequisite for economic growth and competitiveness: Case study print media industry. JEMC Journal of Engineering Management and Competitiveness, 5(1), 21-28.
Weng, L., Song, W., & Sheng, S. (2012). Empirical Research on Scientific and Technical Innovation and Economic Growth in Shanghai. American Journal of Operations Research AJOR, 02(01), 82-90.
