the effect of test anxiety in iq test performance
TRANSCRIPT
Univers
ity of
Cap
e Tow
n
THE EFFECT OF TEST ANXIETY ON IQ TEST PERFORMANCE,
ACHIEVEMENT, AND SELF-CONCEPT IN ELEMENTARY SCHOOLCHILDREN
by
Gillian Mary Baddeley
Thesis submitted in fulfilment of the requirements
for the Degree of Master of Arts
in Psychology
Department of Psychology Faculty of Social Science and Humanities
UNIVERSITY OF CAPE TOWN
1984 . he Ln \v·~ , •• ~ C'c."'c Tn•· l"l'l been n;ven the rigf t tO I , r~• • '- • ;5 •' C i3 i'1 \~hnfe • or in p~rt. Cu1 1 ~J·~: ;~ • : l 1)'J t'ie author.
The copyright of this thesis vests in the author. No quotation from it or information derived from it is to be published without full acknowledgement of the source. The thesis is to be used for private study or non-commercial research purposes only.
Published by the University of Cape Town (UCT) in terms of the non-exclusive license granted to UCT by the author.
Univers
ity of
Cap
e Tow
n
CONTENTS
Acknowledgements
List of Tables
List of Figures
Abstract
Preface
CHAPTER 1 INTRAPERSONAL AND FAMILIAL FACTORS
IN TEST ANXIETY
1.1
1.2
1.3
1.4
1.5
1.6
Contributions of Cognitive-attentional Theory
Contributions of Motivational/ Attribution Analyses
Learned Helplessness in Children
Self-Efficacy
Aetiology of Test Anxiety/Familial Factors
Developmental Trends in the Stability of Test Anxiety
CHAPTER 2 SCHOOL FACTORS
2 .1 Characteristics of School Life
2. 2 Teacher Attributions and Expectations
CHAPTER 3 INTELLIGENCE TESTING IN EDUCATION
3 .1 Historical Perspectives
3. 2 Use of IQ Scores in Schools
3.3 Stability and Instability of the IQ
3. 4 Implications for the High Test Anxious Child
Page
i
ii
iv
v
viii
1
1
10
13
15
16
20
22
24
29
41
41
51
54
56

CHAPTER 4 RATIONALE
4.1 Model of the Development of Test Anxiety in the Elementary Schoolchild
4. 2 Aims and Hypotheses of the Study
CHAPTER 5 METHOD
5 .1 Subjects
5. 2 Instrumentation
5.3 Design of the Study
5 . 4 Procedure
CHAPTER 6 RESULTS AND INTERPRETATIONS
6 .1 Main Study
6. 2 Subsidiary Study I
6. 3 Subsidiary Study II
6. 4 Relationship of Variables
CHAPTER 7 DISCUSSION AND CONCLUSIONS
REFERENCES
APPENDICES
A Test Anxiety Scale for Children (Copy)
B Defensiveness Scale for Children (Copy)
C Piers-Harris Children's Self Concept Scale (Copy)
D Raw Data: 8 Variables
E Raw Data: WISC-R subtests
F Means and Standard Deviations for Boys and Girls
Separately and Combined (IQ Data)
58
58
63
70
70
72
87
89
92
92
110
112
114
119
142
i
ACKNOWLEDGEMENTS
My sincere appreciation is expressed for the contributions of
the following.:
Richard Oxtoby and Andy Dawes (Supervisors)
Patrick Normand
The Principals, Staff and Children of the schools in which this
study was conducted
Junior Research Fellows of the Psychology Department, UCT:
Sandy Lazarus, Desiree Hanssen, and Mark Forshaw
The "Social" Masters Group
My family, especially Felix and Jane
The Postgraduate Scholarship Committee, UCT, for financial
assistance

LIST OF TABLES
(CHAPTER SIX)
1 Means and Standard Divisions : Main Study
2 ANOVA Summary Table : Main Study
3 Means and Standard Deviations : High IQ Level
4 Vector of Mean Differences and Standard Errors
5 Correlation Matrix HA HIQ Group
6 Correlation Matrix LA HIQ Group
7 Correlation Matrix Both Groups Combined
8 Means and Standard Deviations WISC-R Subtests HIQ Level
9 Vector of Mean Differences and Standard Errors
10 Means and Standard Deviations : Medium IQ Level
11 Vector of Mean Differences and Standard Errors
12 Correlation Matrix HA MIQ Group
13 Correlation Matrix LA MIQ Group
14 Correlation Matrix Both Groups Combined
15 Means and Standard Deviations WISC-R

LIST OF TABLES (Ctd)
16 Vector of Mean Differences and Standard Errors
17 Means and Standard Deviations : Substudy 1
18 ANOVA Summary Table : Substudy 1
19 Scheffe's Multiple Comparisons for Unequal N Substudy 1
20 Means and Standard Deviations : Substudy 2
21 ANOVA Summary Table : Substudy 2
22 Simple Correlation : Means and Standard Deviations
23 Simple Correlation Matrix
lV
LIST OF FIGURES
(CHAPTER SIX)
1 Graph of Cell Mean Profiles Main St udy (A at B)
2 Graph of Cell Mean Profiles Main Study (B at A)
3 Graph of Cell Mean Profiles Substudy 1
4 Graph of Cell Mean Profiles Substudy 2
ABSTRACT
IQ test performance of elementary schoolchildren was investigated as a
function of two levels of test anxiety and two types of IQ measure. IQ
measures used, the New South African Group Test (NSAGT) and the
Wechsler Intelligence Scale for Children - Revised (WISC-R) were
assumed to vary · in anxiety-provoking cues on cognitive-attentional
theoretical grounds. The hypothesis tested was that high test anxiety
would lower performance on the NSAGT, but not the WISC-R. The
performance of children varying in test anxiety but equivalent in
intelligence was then compared at different IQ levels with the
hypothesis that high-test anxious children would perform less well at
each level.
Academic achievement and self-concept of these children were also
investigated, with the hypotheses that high-test-anxious children would
be lower in both than low-test-anxious children of equivalent
intelligence.
The Test Anxiety Scale for Children, the Defensiveness Scale for
Children and the Piers-Harris Children's Self-Concept Scale were
administered to all Standard 4 pupils at two white, English-language,
co-educational schools in middle-class suburbs. Highly defensive
v
V1
children were eliminated; the top and bottom 20% of the test anxiety
distribution formed the experimental groups, high-test-anxious
(HA;n=28) and low-test-anxious (LA;n=27) who were tested blind, in
random order, on the WISC-R. NSAGT and achievement data were
obtained from school records and subjects assigned to High, Medium and
Low IQ levels based on NSAGT scores.
Analysis of variance indicated that HA children obtained significantly
lower IQ scores independent of type of IQ measure. Hotelling's T2
tests at High and Medium IQ levels (there were insufficient Low IQ
subjects) yielded significant overall differences between HA and LA
children when compared on subscales and Totals of the NSAGT and
WISC-R, HA children scoring less, although different patterns of
impaired performance were apparent at the two levels of intelligence.
These results were interpreted as supporting a cognitive-attentional
theory of test anxiety, and that the equally impaired performance on
both IQ measures indicated that HA children are not easily deceived by
manipulations of the evaluative-stress dimension, probably as a result of
the development of extreme sensitivity to social-evaluative cues over the
early years at school. Previously contradictory research findings were
reinterpreted to support this conclusion.
The subsidiary studies indicated that HA children achieved less well
and had poorer self-concepts than LA children which was taken as
inoicative of generally unsatisfactory school adjustment o
In view of the use of I Q data in education to determine
ability-motivation discrepancy, it was suggested that IQ results of HA
children would be better interpreted together with a measure of test
anxiety o
vii
The findings of this study appear to support an interactive model of
the development of test anxiety in white, middle-class, elementary
schoolchildren which stresses the importance of hard test data in the
formulation of teacher and pupil attributions and expectations o
viii
PREFACE
CONTEXT AND AIMS OF THE PRESENT STUDY
Test anxiety is an unpleasant, consciously experienced emotional state
that has cognitive, physiological and behavioural concomitants o High
test anxious children typically perform more poorly than low test
anxious children in stressful evaluative situations, responding with a
variety of cognitive and attentional processes that interfere with
effective and successful task performance (Hill, 1972; I. Sarason,
1972a, 1978; Wine, 1971, 1981)0
The first systematic study of test anxiety in children was a five-year
longitudinal study by Seymour Sarason and colleagues at Yale
University (Hill & Sarason, 1966; S 0 Sarason, Davidson, Lighthall,
Waite & Ruebush, 1960; So Sarason, Hill & Zimbardo, 1964)0 This
followed earlier studies of test anxiety in college students (Mandler &
Sarason, 1952; I. Sarason, 1958; So Sarason, Mandler & Craighill,
1952) o The decision to focus on a relatively specific anxiety was
initially made in the hope that it would shed some light on the origin
and effects of anxiety in other situations, eventually enabling
•
•
statements to be made on the general significance of anxiety. Test
anxiety was selected as the initial focus because test situations were
considered to be near-universal experiences for people in our culture.
Such situations were perceived as having an important evaluative
function and test performance frequently has important effects on the
lives of individuals.
Sarason and his colleagues found that test anxiety bore a negative
relationship to IQ and Achievement test performance, a finding that was
generally confirmed by studies in older children and adults (reviewed
by Rue bush, 1963). This led to the undertaking of numerous studies ~JJ
to investigate the cognitive and motivationa1 aspects of debilitating test
anxiety in both children and adults. Interest in test anxiety as a valid
research subject in its own right has not only, persisted over the past
20 years but actually intensified (1. Sarason, 1980). The reasons that
led to its original choice: its universality and its potential for
disruptive effects, make it of on-going concern to clinicians, educators
and researchers.
The Sarason longitudinal study revealed that when children first started
school, test anxiety was not significantly related to measures of IQ.
However, by the middle of the elementary school years there was a
significant low negative correlation of approximately -:, 2 which increased
to -. 3 to -, 4 by the fifth and sixth grades (Hill & Sarason, 1966) .
X
Furthermore, reductions in test anxiety were related to increased
performance on measures of IQ. A slightly stronger but similar
developmental pattern held for measures of academic achievement. The
researchers surveyed the relevant literature and argued that test
anxiety was the aetiologically significant variable on two main grounds.
Firstly, that the negative correlation increases as the measure of
intellectual performance becomes more "test-like" and decreases as the
measure becomes more "game-like" (Lighthall, Ruebush, Sarason &
Zwibelson, 1959; S. Sarason et al, 1960; Zwibelson, 1956). Secondly,
that the negative relationship between test anxiety and IQ or
Achievement is of equ~ strength across intelligence levels (Hill &
Sarason, 1966) . Even in a superior ability group of college students a
negative relationship of -, 2 between test anxiety and a test of mental
ability was obtained (Mandler & Sarason, 1952).
This argument has not gone unchallenged. An alternative viewpoint
that doing poorly on tests causes less intelligent children to become
more anxious is supported by a study by Feldhusen & Klausmeier
( 1962), which found anxiety to be significantly negatively correlated
with IQ only in the middle IQ group and with achievement measures
only in the middle and low IQ groups. Their use of a general anxiety
measure may, however, account for these findings as test anxiety scales
have been found to predict intellectual performance more accurately
(Albert & Haber, 1960). French (1962) came to the conclusion that the
effects of both test and general anxiety on college entrance examination
xi
performance were negligible on finding little difference under conditions
labelled "pressure" and "relaxed" respectively. In more recent years,
Milgram & Milgram (1976) reported a marked difference in levels of test
anxiety in children of different intelligence, with "gifted" children
having mean test anxiety scores only half as high as "average"
children. The same researchers followed this- up the following year by
administering a humour comprehension IQ test to 177 children in grades
4 to 6 and found it bore the same negative relationship to test anxiety
as did conventional IQ measures. They concluded a more complete
explanation of the IQ-test anxiety relationship must take into account
both native intelligence and anxiety level (Milgram & Milgram, 1977) .
Hill (1972) had already argued that the complex relationship between
the two variables was probably the result of reciprocal influences:
increasing levels of test anxiety may hinder performance at the same
time that increasingly poor levels of performance enhance test anxiety.
Similarly, the experience of success in evaluative situations may lead to
lowered text anxiety.
Few would deny that reciprocal influences may operate, but more detail
is needed as to their nature and how they operate in order to propose
an overarching theory which would account for these contradictory
imdings. The present study has a two-fold purpose: firstly, to
conduct a literature review to highlight intrapersonal, familial and
school factors that appear to elicit, reinforce or change the test anxious

xii
response in strength and frequency in the elementary schoolchild.
These factors are listed below:
FAMILIAL INTRAPERSONAL SCHOOL
Parental Cognitions Characteristics
expectations of school life
Attention
Parent-child Achievement- Teacher
interactions motivation expectations
Self-efficacy I
Helplessness IQ testing in
education Self concept
By synthesis of research findings it is hoped to construct a model of
the development of test anxiety in the elementary schoolchild.
The second purpose is to focus on the test anxiety - intelligence
relationship with the aim of seeking some clarification of the role played
by test anxiety in that relationship. An empirical study will be
conducted, comparing the performance of elementary schoolchildren who
are high and low in test anxiety, on both a group, and an individual,
measure of intelligence.
Throughout this study, the terms high anxious (HA) and low anxious
(LA) refer to children who score at the extremes of the Test Anxiety
xiii
Scale for Children (TASC) (S. Sarason et al, 1960), a measure of
debilitating test anxiety, or in the case of adults, an equivalent
measure such as the Test Anxiety Questionnaire (TAQ) (Mandler &
Sarason, 1952), or the Test Anxiety Scale (TAS) (1. Sarason, 1958).
It should be noted that a broad definition of test anxiety is being
employed. Persons high in one form of test anxiety, such as
mathematics anxiety, may be free of anxiety in other evaluative
situations since the cues which elicit anxiety depend on the individual's
learning history; but on the whole it is considered that children who
score high on the TASC are prone to experiencing test anxiety in a
wide range of evaluative situations. The TASC measures broader
concerns about school as well as concerns and worries about testing .
Typically, HA persons tend to interpret a wide range of situations as
evaluative (Wine, 1980).
It should also be noted that the elementary schoolchildren with whom
this study is concerned are white, suburban, middleclass,
English-speaking, South Africans. It is essential to thus contextualize
the survey of the literature, the proposed model of the development of
test anxiety in the elementary schoolchild, and the study itself,
including discussion and conclusions. To do otherwise, and seek to
generalize further, would be to ignore crucial limitations.
1
C H A P T E- R 0 N E
1 INTRAPERSONAL AND FAMILIAL FACTORS IN TEST ANXIETY
1.1 Contributions of Cognitive-Attentional Theory of Test Anxiety
Correlational studies over the years have reported a negative
relationship between test anxiety and various types of ability tests
in both children and adults. As such studies cannot indicate the
direction of cause and effect, experimental evidence has been
sought to confirm the hypothesis that high- test-anxious persons
are not less intelligent, but are detrimentally affected by their
level of anxiety.
investigated the
Consequently, much of the early research
effects of test anxiety on cognitive task
performance as a function of situational conditions varying in
degree of evaluative stress. It was found that ego-involving
instructions, task difficulty, evaluative feedback and the presence
of an audience resulted in worse performance by HA subjects
compared to LA subjects, although performance was comparable
under non-stressful conditions (for reviews see Hill, 1972;
Rue bush, 1963; I. Sarason, 1960; S. Sarason et al, 1960; Wine
1971).
2
Early investigators seemed to assume, often implicitly, that test
anxiety level was equivalent to emotional arousal level, an
assumption that reflected the mechanistic nature of the Hullian
Drive theory on which it was based (Mandler & Sarason, 1952; S.
Sarason, Mandler & Craighill, 1952). From the beginning,
however, these theorists identified a class of task-interfering
r esponses elicited by evaluative conditions which the Test Anxiety
Questionnaire was designed to measure. These responses were
described as being self rather than task centred, involving
feelings of inadequacy and helplessness. I. Sarason (1958)
restated the interfering response hypothesis, emphasizing that it is
a habit interpretation of anxiety: while LA subjects habitually
respond to evaluative threat with increased effort and attention,
HA subjects respond with self-oriented personalized responses.
In 1966 S. Sarason recognised the overriding importance of
cognitive factors in self-reported test anxiety. He viewed painful
emotional reactivity as playing an indispensible part in its origins,
but felt it was the cognitive consequences of anxiety in children
that affected personality development.
"It is these cognitive consequences - involving attitude formation , social perceptions, fantasy, judgemental processes and the like - which take on a kind of pattern of organization that will itself affect the nature of subsequent experience at the same time that it will be changed by it." (S. Sarason, 1966:78)
l.l.a
3
In 1971 Jeri Wine proposed the Direction-of-Attention Hypothesis
which stated that the explanation for performance deficits of HA
individuals on cognitive tasks under evaluatively stressful
conditions lay in the different attentional focus of HA and LA
persons in such conditions, with HA individuals dividing attention
between self-preoccupied worry and task cues, while LA
individuals focused more fully on task cues. Wine ( 1971) reviewed
the test anxiety literature in light of this hypothesis with
additional evidence being presented by I. Sarason (1976) and Wine
herself (1980, 1981). Her conclusions are here summarised
together with a brief account of relevant research findings.
Test Anxiety and Self-Focussing
Test anxious persons are generally more preoccupied than
less anxious persons; furthermore, these self-focused and
task-irrelevant cognitions are specifically elicited by stress
ful evaluative conditions.
Evidence:
HA persons tend to describe themselves in devaluing terms on
other paper ~d pencil measures (I. Sarason, 1960, 1975b).
Many and Many (1975) found a significant negative
relationship between test anxiety and self-reported self-esteem
in a large-scale survey of children. HA elementary
l.l.b
4
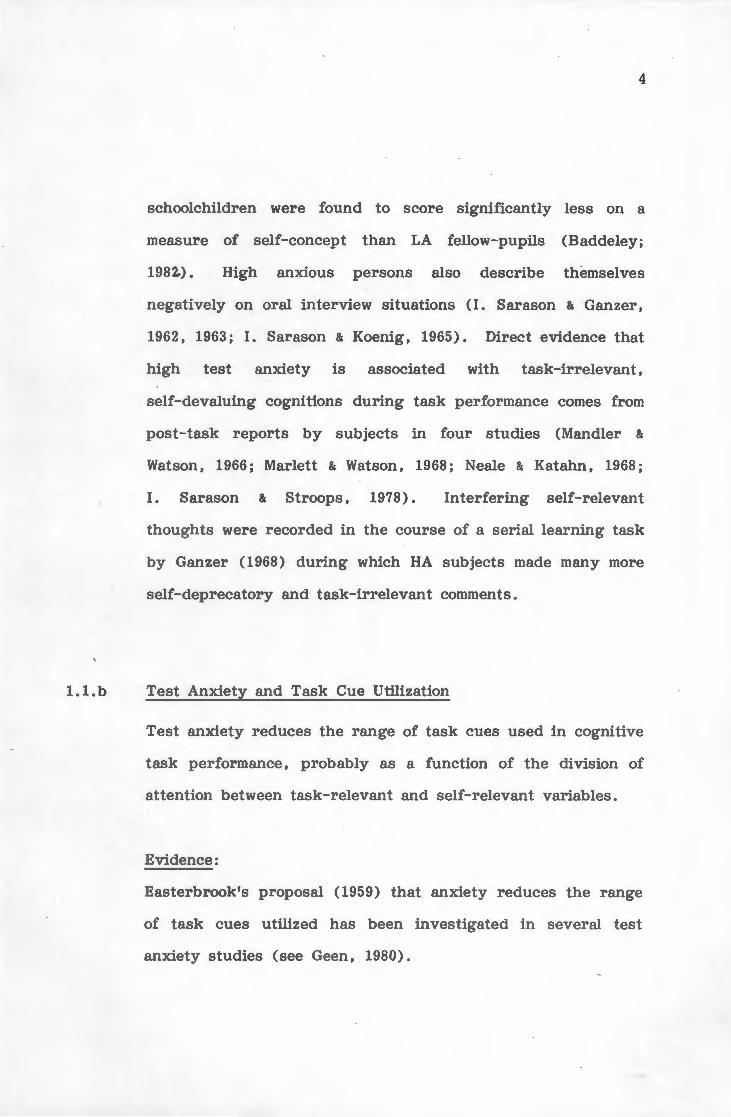
schoolchildren were found to score significantly less on a
measure of self-concept than LA fellow-pupils (Baddeley;
1982.). High anxious persons also describe themselves
negatively on oral interview situations (I. Sarason & Ganzer,
1962, 19£3; I. Sarason & Koenig, 1965) • Direct evidence that
high test anxiety is associated with task-irrelevant,
self-devaluing cognitions during task performance comes from
post-task reports by subjects in four studies (Mandler &
Watson, 1966; Marlett & Watson, 1968; Neale & Katahn, 1968;
I. Sarason & Stroops, 1978). Interfering self-relevant
thoughts were recorded in the course of a serial learning task
by Ganzer (1968) during which HA subjects made many more
self-deprecatory and· task-irrelevant comments.
Test Anxiety and Task Cue Utilization
Test anxiety reduces the range of task cues used in cognitive
task performance, probably as a function of the division of
attention between task-relevant and self-relevant variables.
Evidence:
Easterbrook's proposal (1959) that anxiety reduces the range
of task cues utilized has been investigated in several test
anxiety studies (see Geen, 1980).
l.l.c
5
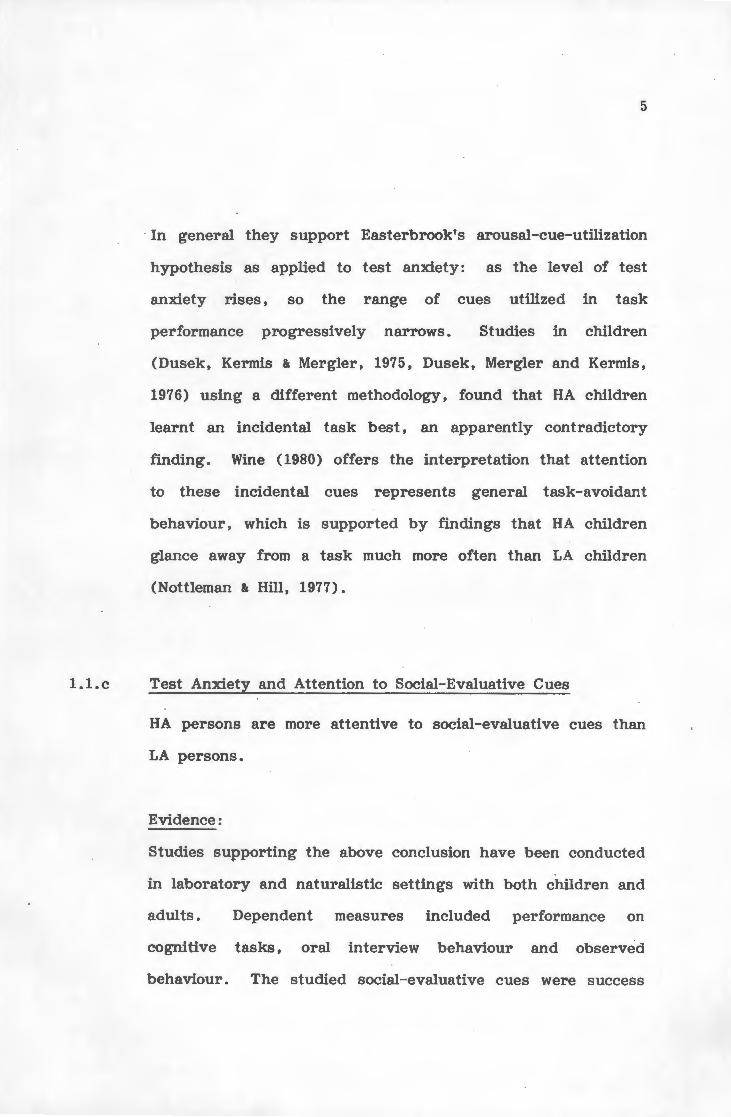
In general they support Easterbrook's arousal-cue-utilization
hypothesis as applied to test anxiety: as the level of test
anxiety rises, so the range of cues utilized in task
performance progressively narrows. Studies in children
(Dusek, Kermis & Mergler, 1975, Dusek, Mergler and Kermis,
1976) using a different methodology, found that HA children
learnt an incidental task best, an apparently contradictory
imding. Wine ( 1980) offers the interpretation that attention
to these incidental cues represents general task-avoidant
behaviour, which is supported by findings that HA children
glance away from a task much more often than LA children
(Nottleman & Hill, 1977).
Test Anxiety and Attention to Social-Evaluative Cues
HA persons are more attentive to social-evaluative cues than
LA persons.
Evidence:
Studies supporting the above conclusion have been conducted
in laboratory and naturalistic settings with both children and
adults. Dependent measures included performance on
cognitive tasks, oral interview behaviour and observed
behaviour. The studied social-evaluative cues were success

l.l.d
6
and failure feedback, verbal reinforcement, cues presented
via models, and presence of observers.
Results indicated that both success and failure feedback had
a greater effect on subsequent performance in HA than LA
subjects (Weiner, 1966; Weimer & Schneider, 1971). HA
subjects were found to be very responsive to verbal
reinforcement of specific response classes in oral interview
situations (I. Sarason & Ganzer, 1962, 1963). Modeling had
powerful effects on HA observers' subsequent performance
and the nature of these depended on the characteristics of
the model (I. Sarason, 1968, 1972b, 1973, 1975a; I. Sarason,
Pederson & Nyman, 1968). The performance of HA subjects
was adversely affected by the presence of observers (Cox,
1966, 1968; Ganzer, 1968; Geen, 1976), but facilitated if the
observer's presence was defined as non-evaluative and helpful
( Geeri, 1977) . HA children glanced more frequently at the
experimenter than LA children (Nottleman & Hill, 1977).
Finally, HA subjects conformed more to the opinion of others
in making perceptual judgements (Meuniere & Rule, 1967).
Cognitive and Physiological Components of Test Anxiety
While test anxiety is
physiological components,
composed
it is
of
the
both cognitive and
cognitive component,

7
consisting of self-preoccupied worry, that interferes most
directly with cognitive performance, is the more stable
component, and serves as a trigger for heightened
physiological reactivity.
Evidence:
Liebert and Morris (1967) analyzed test anxiety into the two
components of Worry, defined as cognitive concern over
performance, and Emotionality, or the autonomic arousal
aspect of anxiety. They constructed a self-report situational
measure which required subjects to report worry and
emotionality in specific testing situations, as well as a more
general measure (Morris & Liebert, 1969).
In a series of studies using the worry-emotionality distinction
(Doctor & Altman, 1969; Liebert & Morris, 1976; Morris &
Fulmer, 1976; Morris and Liebert, 1969, 1970; Morris & Perez,
1972; Spiegler, Morris & Liebert, J968) it was found that in
specific testing situations worry scores remained fairly
constant over time, whereas emotionality scores peaked just
before the testing situation and fell off rapidly thereafter.
Performance feedback, a cognitive informational variable,
reduced worry scores, but not emotionality scores. Most
importantly, worry scores were negatively related to both
performance expectancies and actual performance, while
l.l.e
8
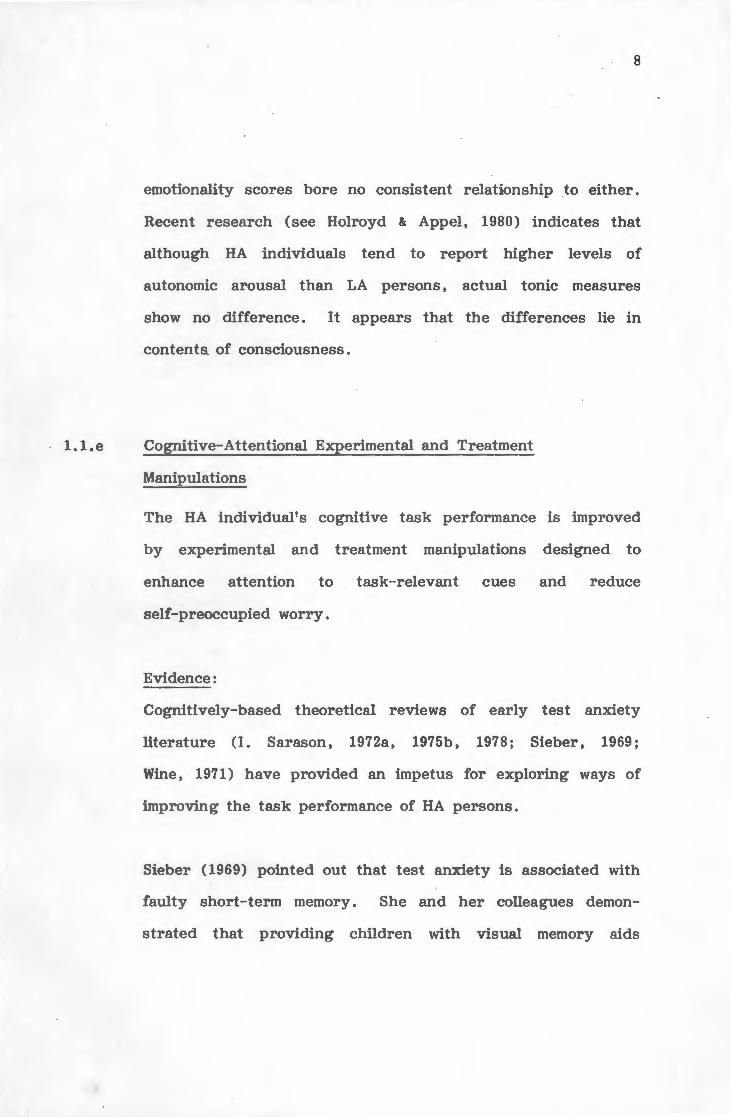
emotionality scores bore no consistent relationship to either.
Recent research (see Holroyd & Appel, 1980) indicates that
although HA individuals tend to report higher levels of
autonomic arousal than LA persons, actual tonic measures
show no difference. It appears that the differences lie in
contents. of consciousness.
Cognitive-Attentional Experimental and Treatment
Manipulations
The HA individual's cognitive task performance is improved
by experimental and treatment manipulations designed to
enhance attention to task-relevant cues and reduce
self-preoccupied worry.
Evidence:
Cognitively-based theoretical reviews of early test anxiety
literature (1. Sarason, 1972a, 1975b, 1978; Sieber, 1969;
Wine, 1971) have provided an impetus for exploring ways of
improving the task performance of HA persons.
Sieber (1969) pointed out that test anxiety is associated with
faulty short-term memory. She and her colleagues demon
strated that providing children with visual memory aids
9
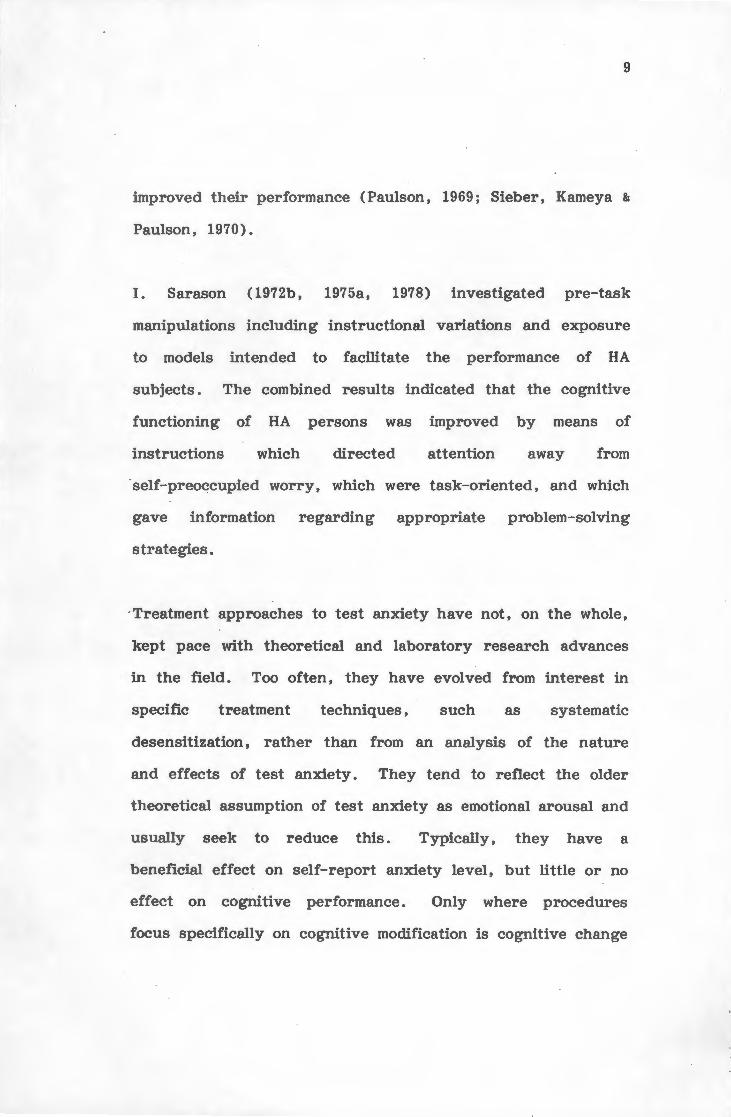
improved their performance (Paulson, 1969; Sieber, Kameya &
Paulson, 1970).
I. Sarason (1972b, 1975a, 1978) investigated pre-task
manipulations including instructional variations and exposure
to models intended to facilitate the performance of HA
subjects. The combined results indicated that the cognitive
functioning of HA persons was improved by means of
instructions which directed attention away from
·self-preoccupied worry, which were task-oriented, and which
gave information regarding appropriate problem-solving
strategies.
·Treatment approaches to test anxiety have not, on the whole,
kept pace with theoretical and laboratory research advances
in the field. Too often, they have evolved from interest in
specific treatment techniques, such as systematic
desensitization, rather than from an analysis of the nature
and effects of test anxiety. They tend to reflect the older
theoretical assumption of test anxiety as emotional arousal and
usually seek to reduce this. Typically, they have a
beneficial effect on self-report anxiety level, but little or no
effect on cognitive performance. Only where procedures
focus specifically on cognitive modification is cognitive change

10
reliably elicited (for reviews see Denny, 1980; Spielberger,
Anton & Bedell, 1976).
1. 2 Contributions of Motivational/ Attribution Analyses
Attributional analyses of test anxiety, and reactions to success and
failure, accord well with a cognitive theoretical approach. The
first study to examine the attribution of causality made by subjects
varying in levels of test anxiety was conducted by Doris and
Sarason ( 1955), who found that HA subjects blamed themselves for
failure more than . did LA subjects. Since then, test anxiety
theorists have not concerned themselves directly with attributional
analyses but are now finding the work of theorists in the area of
achievement motivation who have adopted an attribution approach
to be of considerable interest and relevance since a high level of
achievement motivation may be regarded as roughly equivalent to a
low level of test anxiety.
Weiner (1966) investigated the interaction of anxiety, task
difficulty and success and failure experiences. His results
indicated that among subjects learning a difficult task with success
feedback, HA subjects outperformed LA subjects. However,
subjects outperformed LA subjects. However, subjects working on
an easy task with failure feedback showed an opposite pattern of
results. Initially, Weiner discussed these data in terms of a

11
theory of inertial motivation (Atkinson, 1964; Weiner, 1970), but
since then Weiner and colleagues have reanalyzed the basis of
achievement behaviour, proposing that achievement motivation
differences may be related to differences in subjects' causal
attributions (Weiner, Frieze, Kukla, Reed, Rest and Rosenbaum,
1971, Weiner, 197 4) . According to their classification system,
success and failure may be attributed to four causal elements:
ability, effort, task difficulty and luck. Ability and effort are
defined as internal attributions or properties of the person. Task
difficulty and luck are defined as external attributions or
properties of the environment or situation. Weiner and colleagues
also argued that ability and task difficulty are fixed and relatively
stable over time, whereas effort and luck are subject to change.
In terms of this analysis, individual differences in causal
attributions for success and failure mediate differences in
achievement motivation, (and by implication, test anxiety) affecting
achievement behaviour. Persons high in achievement motivation,
or LA, attribute failure to lack of effort (an unstable internal
factor), and subsequently direct more effort and attention to the
task on hand. Persons low in achievement motivation, or HA,
attribute their failure to a stable internal attribution, lack of
ability, and give up on the task. The different responses made to
success by individuals differing in levels of achievement
motivation/test anxiety have proved less easy to explain. Why

12
success attributed to ability, a stable internal factor, should cause
LA persons to expend less effort, while HA persons respond to
success by tryi~g harder even though they attribute it to the
external factors of luck or task ease, has led Wine (1980) to offer
an explanation combining responsibility attributions with task- self-
and social -evaluative-cue analyses. She suggests that LA persons
typically interpret success and failure feedback as task-relevant
information: failure calls for the expenditure of more effort white
success informs him he has proved himself and can relax. In
contrast, the HA person is likely to interpret success and failure
as social-evaluative cues which he interprets in terms of his
generally negative self-concept. He will be pre-occupied with how
he is being evaluated, not with the task itself. Failure confirms
lack of ability and the hopelessness of additional effort, while
success leads to greater effort in order not to disappoint the
evaluator.
An additional theoretical construct from attribution theory that
Wine (1980) considers to be useful to an understanding of the
cognitive differences between LA and HA individuals is the
actor-observer distinction advanced by Jones and Nidbett (1972).
She suggests:
"Highly test-anxious persons are self-observers in evaluative situations, attributing their typically inadequate performance to stable negative dispositions, whereas low-test-anxious persons may be described as actors matching their behaviour to shifting situational demands." (Wine, 1980:362)
13
1. 3 Learned Helplessness in Children
A further area of research which has considerable relevance to
test anxiety is learned helplessness in children. The original
model of learned helplessness proposed that exposure to
uncontrollable aversive outcomes results in "learned helplessness"
which is characterised by a reduced incentive for responding,
interference with the learning of new response-relief contingencies,
passivity and depression. Subsequently, researchers became
convinced that objective non-contingency might be less important
than how this is experienced by the subject. Factors such as the
subject's initial expectancies of control, the importance of outcome,
and attributions of causality for outcome, received increased
attention (Abramson, Seligman & Teasdale, 1978; Wortman &
Brehm, 1975).
The relationship between attributions of causality and subsequent
performance in children has been extensively investigated by
Dweck and her colleagues (Diener & Dweck & Repucci, 1973).
Their findings indicate that when attributions for failure are
assessed, they rather reliably predict response to failure despite
equivalent performance before failure. This points to the
importance of cognitions about the causes and controllability of
failure, rather than the failure experience itself, in determining
whether or not performance decrements will follow. "Mastery"
children (those who persisted following failure) placed far greater

14
emphasis on motivational factors which can be surmounted by one's
own efforts. "Helpless" children (those who gave up following
failure) placed relatively more blame for their failures on factors
they could not control, such as lack of ability. Verbalization of
thoughts during tasks following failure reflected these differences,
helpless children manifesting negative and task-irrelevant
cognitions while mastery children verbalized self-instructions and
made self-monitoring comments aimed at successful task-completion.
When helpless children were taught to change their attributions of
failure to lack of effort instead of lack of ability, they showed an
improvement in performance (Dweck, 1975) .
Attributions for success made · by helpless and mastery children
also differed. Helpless children viewed success as irrelevant to
their competence and unreplicable. Mastery children, however,
took success as a sign of intelligence, believed it would continue,
and did not change this view in the face of obstacles (Diener &
Dweck, 1980).
Dweck and Wortman (1982) point to the parallels · between the
f"mdings of the three research areas of achievement motivation,
test anxiety and learned helplessness, from which a fairly
consistent picture emerges of the maladaptive responder in the
performance setting, characterised by high fear of failure, high
test anxiety and helplessness.
15
1. 4 Self-Efficacy
Bandura's theory of self- efficacy (1977) is a closely-related
conceptual system. He, too, stresses the importance of cognitive
factors, and his "expectations of self-efficacy" are essentially the
same as self-attributions and expectations. In his system, efficacy
expectations are differentiated from outcome response expectancies.
An outcome response expectancy is defined as a person's estimate
that a given behaviour will lead to certain outcomes, which is not
the same as an efficacy expectation which is a person's conviction
that he is able to successfully perform the behaviour required to ~
bring about the outcomes. For example, two students may have
identical beliefs in good grades resulting from scholastic skills
(internal locus of control) but while Student A believes she has
the requisite skills and so is high is self-efficacy, Student B . may
believe she lacks those skills and so be low in self-efficacy.
Bandura (1977) specifically suggested that theorists of learned
helplessness could profit from a consideration of this conceptual
distinction. Abramson, Seligman and Teasdale did so, with the
result that their reformulated model adopted an attributional
approach (1978).
It would appear that lack of self-efficacy beliefs characterises the
HA child; and effective therapy would need to address itself to
this.
16
1.5 Aetiology of Test Anxiety/Familial Factors
S. Sarason et al (1960), working within a psychoanalytic
framework, held that test anxiety, a personality characteristic,
develops during the pre-school years and slowly stabilizes during
the school years. They hypothesized that when parental standards
are so unrealistically high that a child is unable to meet them,
negative judgements ensue. These are internalized by the child
who then feels hostile towards the rejecting parents. These
hostile feelings make the child feel guilty, resulting in
self-derogation and repression of hostility. In addition, the
child's hostility ·towards overdemanding parents produces
unconscious fantasies of parental retaliation and rejection as a
consequence for the hostility. These fantasies represent a threat
to the child's dependenc~ needs and lead to both repression of the
hostility and engagement of behaviours intended to obtain parental
approval and satisfy their expectations. In so doing, the child
risks losing his ability to function independently in
problem-solving situations and seeks direction and support first
from parents and subsequently from teachers and other adults.
Hill (1972) also assumed that test anxiety begins in early
parent-child interactions, with parental criticism leading to a
growing sensitivity to evaluation on the part of the child. As
children grow older, Hill saw a shift in the primary locus of
evaluative feedback to teachers and eventually to peers. He
17
suggested that LA children have generally enjoyed a history of
success in evaluative situations, with generally positive
interactions with adults, so developing a relatively higher motive
to approach success than to avoid failure. HA children, on the
contrary, are thought to have had a generally poorer history of
success and somewhat more punitive interactions with important
adults, developing in consequence a relatively higher motive to
avoid failure and criticism than to approach success. Hill believed
his position to be consistent with the S. Sarason et al (1962)
position in emphasizing that evaluative reactions from adults
underlie and enhance the effects of test anxiety, but differed from
it in emphasizing social interaction and achievement histories
without positing internal reactions such as guilt or hostility.
There is a long line of theorizing that holds a person's
self-concept is largely an internalization of how he thinks others
see him (see e.g. Gergen, 1971). As Mead wrote,
"We are in possession of selves just in so far as we can and do take the attitudes of others towards ourselves and respond to these attitudes," (Mead, 1925:273)
Thus the generally negative self-concept held by HA children
(Many & Many, 1975; I. Sarason, 1969) may be seen as suggestive
of negative early parent-child interactions.
18
Actual evidence relating to the aetiology of test anxiety is sparse.
S. Sarason et al (1960) reported as supporting their suppositions a
study conducted by Davidson, Sarason, Lighthall, Waite and
Sarnoff, in 1958. All the mothers, and 21 fathers, of 32 pairs of
LA and HA children matched for grade level, sex and IQ were
interviewed and required in addition to complete a rating scale of
their children's personalities. Results indicated that fathers, but
not mothers, differentiated between HA and LA children, rating LA
children as more mature, responsible and optimistic but less
generous and affectionate than HA children. S. Sarason et al
(1960) suggested that. fathers may be less defensive and/or more I
objective than mothers. Alternatively, perhaps fathers interact
differently with their children in qualitatively different situations
and so reach different judgements. It is also possible, perhaps,
that the judgements of fathers of HA children were displaying that
very tendency to excessively high standards they were hypothe-
sized to hold.
Another study investigating parent-child relations supports the
hypothesis that parents of HA children tend to be aversive to
their children in problem-solving situations (Hermans, ter Laak &
Maes, 1972).
While parents of LA children in the study offered effective
problem-solving strategies without taking over, parents of HA
19
children ignored their children's bids for security, failed to offer
task-relevant strategies, and tended if anything to teach them to
engage in task-irrelevant or inappropriate behaviour. Since
confidence and self-reliance need a secure early attachment in
order to develop according to Bowlby (1969), HA children whose
parents behaved in the above manner would appear to lack ideal
conditions to develop self-efficacy.
The test anxiety literature has ignored later parent-child
interactions in eliciting, reinforcing or changing the test anxiety
response, yet it seems highly probable that familial factors
continue to play an important part. Once again, the field of
achievement motivation may supply findings that are applicable,
since the HA child is often a poor achiever.
Supportive family relations appear to foster academic achievement.
Christopher (1967) argued that academic achievement is
functionally related to the perceived strength of the parent-child
relationship and . perceived parental attitudes toward achievement.
Poor achievement appears to result from over-restrictive and
domineering parenting (Kimball, 1953) with both babying and
excessive punishment proving harmful. Parents of high achievers
give their children more praise and approval, and foster a feeling
of closeness between family members (Morrow & Wilson, 1961), and
encourage participation in adult discussions (Christopher, 1967).
20
More direct study of parent-child interactions of school-going
children who vary in their level of test anxiety is sorely needed.
1. 6 Developmental Trends in the Stability of Test Anxiety
Once children have started school, test anxiety scores slowly
stabilize in the later elementary school years. Children's first
grade scores do not allow accurate prediction of fifth grade test
anxiety level, but somewhat higher test-retest correlations are
obtained over two-year testing intervals, averaging about 0, 4
during the early school grades and 0, 5 later (Hill & Sarason,
1966). There is an indication that T ASC scores stabilize further
in middle- and high-school years (Manley & Rosemeir, 1972).
There are indications that boys and girls differ in level of test
anxiety and defensiveness as measured by the Defensiveness Scale
for Children (S. Sarason, Hill & Zimbardo, 1964) in the later
elementary school years although initially there are no differences.
In general, girls admit to more test anxiety and are less defensive
than boys by the fifth and sixth grades, although there is a
decrease in defensiveness in both sexes over this period. (Hill &
Sarason, 1966; Manley & Rosemeir, 1972). Interpretation of these
trends is complicated; it may be that older children admit to more
anxiety because they genuinely experience more anxiety, or they
have become truly less defensive, or the extreme questions of the
21
defensiveness scale may strike them as unrealistic. Hill & Sarason
( 1966) offered the interpretation that sex-role socialisation may
account for older boys admitting less anxiety than girls, for whom
it is more socially acceptable. They proposed that girls may cope
with anxiety by admitting it, while boys cope by denial. This
hypothesis receives support from the emergence of a negative
correlation between defensiveness and IQ and Achievement test
scores in boys only, in the later elementary school years.
High-test-anxious girls manifest higher need achievement in the
classroom than boys · which may mean that the TASC measures a
combination of drive and anxiety-related interfering responses in
girls but only of the anxiety-related responses in boys (Davidson,
1959). On the whole, the general pattern of findings for boys is
much clearer and more consistent than for girls (Ruebush, 1963).
22
CHAPTER T W 0
2 SCHOOL FACTORS
It has always been assumed that the school setting is of major
importance (together with intrapersonal and familial factors) in
eliciting, reinforcing, or changing the test anxious response ·in
strength and frequency. On completion of their longitudinal
study, Hill and Sarason (1966) wrote,
"It is obvious but important to state that the longitudinal~ findings are compelling evidence that 'something is going on' and that the school culture is part of that something . . . The school is not merely an arena in which familial and intrapersonal characteristics are given an opportunity to become manifest. It is assumed that the behaviour of the child in school is actively and heavily influenced by the nature of his school experiences as well as by non-school factors." (Hill & Sarason, 1966:69)
In 1980, Phillips, Pitcher, Worsham and Miller were appealing for a
school ecological perspective in test anxiety research, an indication
that little had been done in the intervening 14 years to delineate
which aspects of the school culture might be contributing to
increasing levels of test anxiety.

23
The elementary school years embrace the time when children are
acquiring skills vital to their society (Gardner, 1978), which in
Western-style society are largely cognitive. Theories of
instruction tend to focus on the cognitive skills of the individual
child, how they develop, and how they should be fostered (e . g .
Bruner, 1966). This overlooks the fact that schooling is a
socialization process (Bronfenbrenner, 1970; Leff, 1978), and that
the school itself is a complex social organization (Bidwell, 1965).
Within the classroom, teachers instruct a group of children, and
even when the focus is on one individual child, this takes place in
context of the group and a set of relationships.
Much educational research has been carried out in college
classrooms or in microteaching or other special situations, but the
ordinary elementary classroom situation is quite different. Even
those studies which do involve ordinary classrooms have often been
conducted in connection with special experimental programmes, or
with teachers in training .. (Brophy & Good, 1974). In order to
find out what children experience _ in the ordinary everyday '
classroom situation, this type of research is unhelpful. Nor is it
feasible to obtain such information from teachers themselves. John
Holt, a teacher, concluded after observing in a colleague's
classroom that what really goes on in classrooms is not what
teachers think:
"A teacher is like a man with a powerful flashlight in his hand. Wherever he turns his light, the creatures on whom it shines are aware of it, and do not behave as they do in the dark." (Holt, 1964:21)
24
It would seem that the best way to find out the real characteristics
of school life would be for an observer to remain in a classroom
long enough to allow pupils and teacher to revert to their normal
behaviour. This was the procedure followed by Dr Philip Jackson
of the University of Chicago, whose book "Life in Classrooms"
(1968) was written about his observations made during two years
spent in four elementary classrooms.
2 .1 Characteristics of School Life
Jackson (1968) noted that teachers, students and parents typically
focus on the highlights of school experience, yet its true
significance should be sought in the thousands of fleeting events
that combine to form everyday humdrum routine. By the time a
child is ready to move on to high school, he will have been
exposed to such routine for about 7, 000 hours, the equivalent to
spending an hour in church on Sundays for 150 years. This
environment is highly predictable, with little change over time
occurring in physical objects, social relations and major activities.
In addition, the child's attendance is involuntary.
25
Jackson (1968) believes that three fundamental, but less obvious,
characteristics of school . life form a 'hidden curriculum' which must
be mastered by each student if he is to progress satisfactorily
through school. They ar.!L.!,!le crowded nature of the classroom,
the continued and pervasive spirit of evaluation within it, and the
unequal division of power. Since failure to master this 'hidden
curriculum' may underlie increases in test anxiety in the
eleme.qtary schoolchild, it is JYQ!:th looking at in greater detail.
Crowds
It has already been stated that the teacher is not teaching an
individual but a class of children. In order to keep the class
running smoothly she must carry out several functions. She will --~ -
talk. deci.ruLw.ho else ml!y_ ,!&k,_ allocate classr09m resources, _grant
privileges, and keep time. This makes the classroom a busy , .......... ,_,_ - - - ..
place; - Jackson (1965) found that an elementar¥. schoolteacher Il!ay
engage in as many as 1 000 personal exchang:es ~aily. For pupils,
the experience of being part of a crowd means experiencing
considerable delay: they will have to wait their turn at the
teacher's desk or to use equipment; they will also have to wait for
others to finish assignments. Another consequence is the
continual occurrence of distractions and interruptions, which
pupils are expected to ignore; they are expected to act as if alone
when surrounded by other they know well.

26
In addition, the work to which they are expected to devote their
attention is not of their own choosing. Jackson (1968) concluded
that children in class are supposed to disengage feelings from
actions some of the time, yet still be capable of enthusiastic
participation where appropriate, such as in group activities. Both
impulsive action and apathetic withdrawal are regarded by the
teacher as undesirable.
Evaluation
The experience of success and failure is not new to the child just
starting school. Up until this time, however, formal evaluation of
his abilities and achievements rarely occurs. Once in school, he
will accumulate a semi-public record on which such evaluations will
be documented over his entire school career.
Tests are the classic form of educational evaluation, and are
encountered more frequently in the school environment than
elsewhere. In addition to relatively informal class tests,
examinations are written at various times in the school year. The
culmination of these is an external examination at the end of the
final year of school, the passing of which is crucial to career
choice and admission to universities. Group intelligence testing is
another classic form of educational evaluation which has important
consequences for test anxiety. IQ testing will be considered in
detail in Chapter 3.
27
Tests and examinations are not the only form of school evaluation
as may be seen from the fact that evaluation also occurs in the
lower standards where formal tests are almost non-existent.
Jackson (1968) suggested that the complexity of the school
evaluative process is better understood if it is broken down into
various features. For example, evaluations may be seen as
deriving from more than one source, the conditions of their
communication may vary, they may have one or more referents,
and they may range in quality on a continuum from intensely
positive to intensely negative.
The chief source of classroom evaluation is the teacher, who is
continuously involved in passing judgements on the work and
behaviour of pupils. Peers sometimes participate in this process,
and self-evaluation is a further source. Such evaluations may, or
may not, be accurate.
Conditions of communication of evaluation vary. Some of the more
important judgements, such as IQ test results, are kept solely for
school personnel; others are shared only with parents. Those of
which pupils are openly apprised are made with varying degrees of
privacy. Particularly in the elementary school, many judgements
are made publicly, and even where private communication is the
aim, the crowded nature of the classroom makes this difficult to
achieve.
28
While the chief referent of classroom evaluation is educational
achievement, Jackson (1968) .observed that evaluation is not
confined to this, but also refers to children's adjustment to
institutional expectations and possession of specific character
traits.
Evaluations connote value, and most pupils experience judgements
from both ends of a continuum from positive to negative. There is
perhaps some effort made to modify harsh academic judgements but
there are still many opportunities for negative evaluation such as
disapproval of behaviour, accusations of lack of effort, or
impatience when answers are not forthcoming. The present system
of evaluation in education makes comparison ubiquitous: grading,
streaming, and testing are all comparative, and teachers' comments
frequently involve either explicit or implicit comparisons (Leff,
1978). In this milieu competition flourishes, and leads to some
children· - believing themselves to be failures.
"Perhaps they are thrown too early, and too much, into a crowded society of other children, where they have to think, not about the world, but about their position in it." (Holt, 1964: 421 )
Power
School is a place where the division between the weak and
powerful is very clearly drawn (Henry 1963; Jackson, 1968;
S. Sarason, 1971).

29
Jackson (1968) claimed that the difference in authority between
teacher and pupils is the most salient feature in the social
structure of the classroom, and its consequences relate to the
broader conditions of freedom, privilege and responsibility as
manifest in classroom affairs. In the same vein, S. Sarason (1971)
recorded that "constitutional issues" in the classroom were always
decided by teachers without reference to the opinions and feelings
of pupils, and that teachers held complete power. He concluded
that "authoritarian" and "democratic" teachers differed little in this
respect, a conclusion shared by Jules Henry (1963), an
anthropologist who directly studied the classroom. The
consequence of the power structure in classrooms is that children
develop strategies to meet or dodge the demands made of them.
Such strategies are numerous, varied, and range from adaptive to
restrictive and self-defeating (Holt, 1964; Jackson, 1968). They
may persist into adulthood and the job situation to the detriment of
the individual.
2. 2 Teacher Attributions and Expectations
In the classroom, teacher and pupils act and interact within the
demands of the school organization. A useful theoretical
framework within which to view the process is attribution theory,
which proposes that in our relationships with others our behaviour
depends to a large extent on the impressions we form of them, our

30
interpretations of their past and present behaviour, and our
predictions of what they will do in the future. Inferences about
their internal states, such as motives, intentions, abilities and
dispositions are made on the basis of overt behaviour. Such
inferences are called attributions (Eiser, 197 8). When we make
attributions, we are thus categorizing behaviour in terms of why
we suppose it happened in terms of our assumptions of the other
person's wishes, motives, abilities, intentions, his awareness of
what he is doing and his ability to do it, and the situational
restraints that are operating. In so doing, we attempt to render
the social environment more predictable and intelligible.
A key issue in attribution theory is whether people attribute a
given act or event to personal causes (internal motivation) or to
impersonal causes (situational restraints), which Kelley (1967)
proposed they did on the basis of four criteria: distinctiveness,
consensus, consistency over time and consistency over modality.
This offers a useful set of principles to account for the process by
which teachers assess ability of their pupils. A teacher might
judge as follows: if a child's academic performance is usually poor
(low distinctiveness), but the majority of the class copes
reasonably well (low consensus) , in the past the child has usually
done poorly, and this is consistent with his performance in all
other intellectual tasks, especially IQ tests (high consistency),
31
then the teacher will almost certainly attribute this child's
performance to lack of ability, a stable internal attribute which is
likely to be regarded as unchangeable.
There is evidence that other factors also influence teachers'
attributions. These include sex, physical appearance,
socio-economjc status, · ethnic background and previous
acquaintance with siblings, all of which may serve as sources of
bias (see e.g. Braun, 1976; Brophy & Good, 1974 for reviews of
research relating to sources of input to teacher expectancies).
Willis (1972) found that predictions regarding ability were being
made with a considerable degree of confidence as early as the
third day of the school year by first-grade teachers. They had
had no prior contact with the children, who had not been to
kindergarten .nor taken tests. In some cases teachers had prior
knowledge of family or siblings. Teachers commented in terms of
manners, behaviour, and family problems. Mackler (1969) found
that streaming, or tracking, began informally in kindergarten on
the basis of such valued traits as politeness, passivity, listening
and following instructions. Such early judgements are likely to
remain relatively stable over time, partly due to primacy effects
(Asch, 1946; Jones & Goethals, 1971; and with specific reference
to education, Feldman & Allen, 1972, 1973; Murray, Herling &
Staebler, 1972).
32
Decisions about the behaviour or performance of others in terms of
internal or situational factors has important consequences, since we
come to expect certain behaviour from them and act accordingly.
This may in turn constrain their behaviour since their role in the
interaction is determined. If such constraint is sufficiently strong
or sustained, it may force others into behaving in ways that
confirm our expectations. Attribution to stable internal
characteristics of the other is much more likely to give rise to
expectations and constraining behaviour on our part. Expectancies
of this sort may thus act as self-fulitlling prophecies.
The incentive for much of the work on expectation effects came
from laboratory animal studies by Robert Rosenthal (1966). He
showed that in the absence of stringent precautions, an
experimenter's expectations tended to bring about their own
confirmation; this experimenter bias has since been accepted as a
confounding variable to be controlled in research as far as
possible. Rosenthal hypothesized that expectations in the
" classroom could produce a similar effect to that in the laboratory,
and manipulated teachers' expectancies by identifying (at random)
some of their pupils as academic 'spurters' on the strength of a
'special' test which was nothing more than an IQ test (Rosenthal &
Jacobson, 1968). The researchers claimed that the children so
identified made IQ gains the following year. Braun (1976)
describes the study's impact:

"The Rosenthal and Jacobson study stimulated an immediate flurry of interest in both lay and academic circles. Reaction to the study ranges from unquestioning acceptance of the phenomenon as akin to ESP to scathing scepticism." (Braun, 1976:187)
33
The controversy still continues. A number of serious method-
ological flaws were pointed out by fellow psychologists (Elashoff &
Snow, 1971), and replication studies have failed to yield similar
results. However, in a thoughtful review of the Pygmalion study,
as it was known, and subsequent research, Brophy and Good
(1974) conclude that it would be inappropriate to dismiss the study
on this basis, since most replication studies have involved weaker
treatments than the original. Moreover, some or all of the
teachers involved in them failed to acquire the desired
expectations, and many were aware of the nature of the experiment
due to the widespread publicity received by the original study.
In addition, Brophy and Good are of the opinion that since
subsequent research has revealed that the presence of expectancy
effects appears to depend on teacher and student variables, no
findings in this field should be evaluated on the basis of group
data. For example, the negative findings in the Pygmalion study
for teachers in grades three to six should not be used to
invalidate the positive findings for grades one and two.
34
Of the many studies of teacher expectancy effects undertaken
since 1968, some have utilized experimentally-induced expectancies
(e.g. Beez, 1968; Cornbleth, Davis & Button, 1972; Jeter & Davis,
1973) ; others have utilized expectancies formed naturalistically in
the classroom situation (e.g. Brophy & Good, 1970; Brophy,
Evertson, Harris & Good, 1973; Douglas, 1964; Mackler, 1969).
The naturalistic . studies have been more successful in showing
evidence of teacher expectancy effects than the experimental
studies, on the whole. The latter have shown mixed, mostly
negative results, while the former have shown mostly positive
results. Teachers appear to reject test scores that are too
discordant with their own experience of children (Brophy & Good,
1974; Wilkins & Glock, 1973), and their behaviour relates to their
self-generated expectancies (Dusek & O'Connell, 1973). They also
vary in their susceptibility to input factors. Braun (1976)
reviewed relevant studies and ·concluded that teacher information
and personality were prime factors controlling the influence of
expectancy cues. He suggested that suggestibility, positive
attitudes to test data, sex of teacher, and the ways they reduce
dissonance were important variables. Added advantages of
naturalistically-formed expectations are greater generalizability to
other classrooms, and the opportunity to study low expectations
which could not be experimentally induced without raising serious
ethical implications.
35
The most common type of study utilizing naturalistically-formed
teacher expectations has involved the effects of streaming or
tracking in schools. Mackler (1969), already mentioned in
connection with teacher attributions, found that teachers assigned
children to streams very early on in the first grade on very little
objective evidence, and that there was little mobility between the
streams on the basis of subsequent performance. At the end of
the first grade the difference in achievement between the highest
and lowest streams was seven months. By third grade, the gap
had increased to twenty months. Thus, where pupils had been
streamed inappropriately, the rigid streaming system served to
deime and - it may be argued - limit the pupils' potential. Similar
results have been reported by other researchers (e.g. Barker
Lunn, 1970; Husen & Svensson, 1960; Pidgeon, 1970).
One of the most striking studies of streaming was conducted in
Britain by Douglas (1964). He found that many eight-year-olds
had been placed in higher or lower streams than their measured
ability would indicate, stream placement being influenced by such
factors as socio-economic-status, personality traits and behaviour.
Three years later, on re-testing, children's test scores showed
that those placed in upper streams had improved, while those
placed in lower streams had deteriorated. In upper streams, those
children whose ability was relatively low had shown most improve
ment, while in the lower streams it was the brighter children who
36
showed greater~ than-average deterioration. Douglas noted that
transfers between streams were rare, and concluded:
"Once allocated, the children tend to take on the characteristics expected of them and the forecasts of ability made at the point of streaming are to this extent self-fuliilling." (Douglas, 1964:115)
Allocation to a . particular stream may determine the subsequent
level of achievement by restricting learning opportunities. Even in
schools with no official streaming policy, children are usually
allocated to learning groups within classes which may have
considerable consequences. Rist (1970) found that kindergarten
children were grouped according to teacher estimates of ability,
and allocated to one of three tables in the classroom. The bottom
group was placed at the table furthest away from the teacher,
received less attention and had difficulty in hearing. This differ-
entia! treatment was perpetuated as the children progressed to
first and second grade. Group placement also assigns status
within the classroom social microcosm. Rist (1970) described the
development of a caste system in which top group, high status
children learned to convey disrespect for low status, bottom group
children. In another study, children and teachers showed
preference for children who belonged to the top reading group,
with five out of the six teachers in the study expressing negative
feelings towards those in the lower reading groups (McGinley &
McGinley, 1970).

37
Brophy and Good (1974) reviewed several studies that
demonstrated differential teacher-pupil interaction, some teachers
showing a pattern of favouritism of high-expectancy pupils and
inappropriate teaching of low-expectancy pupils. Low-expectancy
pupils were more
teachers , (Willis,
likely to receive less verbal response from
1970), more criticism and less praise in
equivalent situations than high-expectancy pupils, (Brophy &
Good, 1970), and were called upon less often in class (Good &
Denbo, 1973). In the early grades, differences between high and
low expectancy student-teacher interaction tended to be
qualitative, but in later grades became quantitative (Brophy,
Evertson, Harris & Good, 1977).
These patterns of differential behaviour were not universal among
teachers and app~ared to reflect rigid and inappropriate
attributions and expectations ·which in turn appeared to reflect
more general teacher expectancies such as belief in the
unchangeability of students' abilities, and their potential to benefit
from teaching. Brophy and Good (197 4) concluded that
expectations in the classroom are normal, ubiquitous, and in
themselves neither bad nor good. What is crucial is their degree
of accuracy and flexibility which depends on the attributions on
which they are based. Attributions are typically logical inferences
based on observations and should incorporate all available
information, but this is by no means always the case. Teachers
38
differ in the general accuracy of their interpersonal attributions
and susceptibility to bias, and in their readiness to be open to
correction when contradictory evidence presents itself. In the
classroom, teachers rapidly make attributions and form expectations
from available records and their own observations. This is
unavoidable. If they are accurate and continually updated to keep
pace with student development they can be beneficial. If,
however, they are inflexible and inappropriate they may act as
self-fulfilling prophecies by being translated into teacher behaviour
that limits learning opportunities and conveys to children certain
messages that serve to lower their self-attributions and
expectations.
Children may be seen as varying in degree of vulnerability to
expectancy cues from teachers. Because a teacher's credibility is
likely to be high with pupils, especially those in early grades, the
expectancy cues she emits via her behaviour are very probably
read and internalized to some degree. But their potency to affect
self-concept and general motivation to the necessary degree to act
as self-fulfilling prophecies is hypothesized by Braun (1976) to be
a function of the already existing self-image of the child. If he
already perceives himself as competent in learning situations, he
will require many cues from highly credible sources to alter this
image. Similarly, if he has come to hold a negative view of his
capabilities, he will be highly resistant to change (Gilham, 1967;
39
Glock, 1972). The age of the child is also a relevant factor, with
expectancy effects showing up most readily in the first grade
(Brophy & Good, 1970; Rosenthal & Jacobson, 1968). It may be
hypothesized that the child who starts school does not, as yet,
possess a view of his academic abilities, and this may be gradually
formed on the basis of data received from teachers. The already
existing self-concept, formed on the basis of parent-child
interactions, will influence how school data are processed. It
appears probable that it will be either confirmed or revised on the
basis of this new information. Each successive year at school
would tend to reinforce the academic aspect of the self-concept;
there is good evidence that global self-concept and academic
achievement bear a positive relationship in schoolchildren (Purkey,
1970; Wylie, 1974).
This chapter has reviewed research relating to certain
characteristics of the school environment: its crowded, evaluative
nature, the inequality of power that exists within it, and teacher
expectancy effects that sometimes operate in classrooms. All of
these may be hypothesized to interact with the intrapersonal and ·
familial factors already considered in relation to test anxiety.
It is highly probably that the HA child is handicapped in
mastering the "hidden curriculum" of the classroom as delineated
by Jackson (1968). It may well serve to trigger off increased
40
levels of test anxiety, attended by cognitive and attentional
deficits which depress performance on intellectual tasks, leading to
lowered expectations on the part of the teacher. If a teacher is
prone to rigid and inflexible expectations, a self-fulfilling
prophecy may be set in motion, since the HA child is highly
susceptible to social-evaluative cues and his already fragile
self-concept will readily accept that others may evaluate him
negatively.

CHAPTER THREE
3 INTELLIGENCE TESTING IN EDUCATION
"The major impact of the (IQ) tester's success was probably on the · educational system; but we do not even know the dimensions of this effect, to say nothing of its consequences." (Samelson, 1977:280)
41
The major focus of this study . is the test anxiety-intelligence
relationship in elementary schoolchildren. As the above quote
implies, no consideration of the school environment would be
complete without a consideration of IQ testing in education, its
history and current status, and the implications for test anxiety.
3 .1 Historical Perspective
The origins of IQ testing may be traced to the interest in, and
scientific study of, individual differences which took place in
university laboratories towards the close of the nineteenth century
(Freeman, 1939). Although these early experiments with college
students had little practical application to educational problems,
they laid the necessary foundation.

42
The year 1905 saw the beginning of educational interest in mental
tests with the success of Binet and his co-workers in developing
an individual scale · for the measurement of intelligence in children
on an empirical basis (Binet & Simon, 1905). This first test of
intelligence was not constructed along theoretical lines, but with
the practical view of developing a fairly objective standard
procedure for screenin g out from the Parisian regular school
system those children who were unable to benefit from it. By this
pragmatic criterion, his results were very successful. His scale,
revised in 1908 and 1911, included a wide variety of tasks
designed to tap his common- sen se definition of intelligence as
"Judgement, otherwise good sense, initiative, practical sense, the
faculty ' of adapting oneself to circumstances" (Binet, 1905). It
yielded a total score expressed as a mental level corresponding to
the age of normal children whose performance the score equalled.
Thus a child whose chronological age was eight might have a
mental level of only six. In subsequent translations and
adaptations, the term Mental Age came to be substituted for
Binet's more neutral term of mental level.
The Binet-Simon scale attracted world-wide attention, and
translations and adaptations appeared in many languages. In
America, the most famous revision was developed at Stanford
University under the direction of L.M. Terman in 1916 and became
known as the Stanford-Binet. This was the first test to make use
43
of the Intelligence Quotient (IQ), the ratio between the mental and
chronological age, first proposed by Stern (1912). This took into
account the fact that an absolute difference of one year means
something different at different ages, with the greatest absolute
change usually occurring in the early years. Terman's use of the
IQ index firmly established its use in all future intelligence tests
until it, in turn, was replaced by the deviation IQ used by
Weschler (1939) in the construction of his test of adult
intelligence. Here the strategy of age-grading was abandoned in
favour of a score giving the relative position of an individual
compared with his peers in terms of the properties of the normal
curve (Maloney & Ward, 1976).
The Binet test and its adaptations were individual scales requiring
highly trained examiners; moreover, since they necessitated oral
responses from the subject and manipulations of material, they
could not be · adapted to group administration in schools. With
World War 1, · however, came a development that was to have
profound consequences for testing in education. In 1917, when
America entered the war, the National Research Council composed
of a group of the leading psychologists of the day, devised two
group intelligence tests known as Army Alpha for routine general
testing, and Army Beta, a non-language scale for illiterates and
foreign-born recruits.
44
The express purpose of these tests (which permeated later
educational thinking) was:
a To aid in segregating and eliminating the mentally
incompetent.
b To classify men according to their mental ability.
c To assist in selecting competent men for responsible
positions.
(Yerkes in Samelson, 1977: 276)
As Samelson (1977) points out, these IQ tests were assumed to
measure native ability rather than the results of school training,
and the high correlation of IQ and achievement was taken to
indicate that achievement is the result of high intelligence and not
vice versa.
The army tests enabled nearly 2 million men to be classified with
considerable success. At the end of the war, the tests were
released for civilian use, serving as models for a proliferation of
· group intelligence tests devised for all ages and types of persons
(Anastasi, 1976) • School systems and colleges, especially, took up
group testing as a basis for pupil classification, guidance and
college admissions (Cronbach, 1975). Terman, whose individual
adaptation of the Binet-Simon test was already widely used and
who was a member of the National Research Institute which
45
developed the army tests, was explicit on the application of testing
in education,
"Teachers must learn to use tests, otherwise the universal grading of children according to mental ability must remain a Utopian dream."
(Terman, 1919:291)
The National Research Council was given a grant of 25 000 dollars
of Rockerfeller money from the General Education Fund to develop
a group test for children. The resultant National Intelligence Test
was eventually given to some 7 million children during the 1920s
(Samelson, 1977).
"The test technology became an accepted and increasingly influential feature of American life. The momentum of tests overrode all criticism."
(Cronbach, 1975:1)
In Britain, mass intelligence testing in the schools became an
accepted part of life, especially in the years 1930-1950. In South
Africa, government schools followed suit in 1932 with the
introduction of the South African Group Test for white children
between the ages of ten and eighteen. This test was updated in
1965 to become the New South African Group Test, also for whites.
A new update is scheduled for 1985.
As Cronbach (1975) states, virtually everyone favoured testing in
schools; it promised to aid the bright child who was being held
46
back, as well as helping the slow child who was struggling to keep
up. It was also seen as appropriate to a period when ~
resources available for the development and nurturance of uman
potential were quite scarce (Gordon & Terrell, 1981).
Interestingly, the army itself was more cautious, and after World
War I it dropped its IQ testing programme despite its apparent
success. According to Kevles (quoted in Samelson, 1977), the War
Plans Division, in an early concern over labelling effects, did not
want men of low mentality to be officially identified since such a
practice could result in their becoming objects of public ridicule
and the butt of practical jokes. This, it was felt, would not be
conducive toward military efficiency. When the Army General
Classification Tests were produced for World War II, one of the
first decisions of army psychologists was to not call them
intelligence tests. This might explain why intelligence testing in
World War II received much less attention than in World War I.
Early test construction was not guided by an explicit theoretical
base. There was, however, a latent implicit theory on which there
was a fairly general agreement. Its basic assumptions included:
1 Intelligence is a recognizable attribute which is
responsible for differences among children and adults in
their learning, reasoning, and other cognitive capacities
and is essentially stable over time.
47
2 Although not measurable in the same sense as physical
attributes, the practice of sampling appropriate mental
tasks, and standardizing scores against the distribution
in the general population will yield IQ's which can be
accepted as quantitative measures of level of intelligence.
3 Intelligence is essentially innate, being determined by
the genes that a child inherits from his parents. It
matures with age, irrespective of environmental
influences, reaching its maximum around 15 years and
then stays constant until senility sets in. An IQ
obtained from a reliable test in childhood may thus be
taken to indicate the individual's educational and
vocational level in later years.
(Vernon, 1979)
The last assumption was contrary to the notions of Binet himself,
who labelled as "brutal pessimism" the idea that the intelligence of
an individual is a fixed quantity which cannot be augmented.
The idea that intelligence tests provided a fixed measure of innate
intelligence was arrived at by the major translators and adaptors
of his test in America: Lewis Terman of Stanford, Henry Goddard

48
at the Vineland Training School in New Jersey, and Robert Yerkes
at Harvard.
These three pioneers of the testing movement were members of
various eugenic societies and organizations, holding that IQ testing
could be used to detect the genetically inferior. Kamin (1974)
quotes from a number of their early writings to illustrate their
socio-political views. One such example is as follows:
"Children · of this group (IQ's in the 70-80 range) should be segregated in special classes . . . they cannot master abstractions, but they can often be made efficient workers . . . There is no possibility at present of convincing society that they should not be allowed to reproduce, although from a eugenic point of view they constitute a grave problem because of their unusually prolific breeding."
(Terman, 1916, quoted in Kamin, 1974:6)
The idea of a fixed mental level "that could be measured with
accuracy and ease" (Burt, 1933) combined with notions of
heritability of intelligence went relatively unchallenged until the
1960s. Some voices of criticism were raised before this, however.
When the army data from testing in World War I were made public,
they provided amunition for both the eugenics movement and
racism directed against immigrants. Lippmann (1923) spoke up
against the sweeping assumptions that were being made, objecting
in particular to the claim that tests measured innate ability, and
thus could predict who would benefit from education. He also
49
objected to the comparison of ethnic groups, arguing that early
exp~rience in the home might account for much of the correlation
of IQ with ·social class - a surprisingly modern view. Bagely
( 1925) objected to the determinism that arose from the practice of
sorting children into academic streams on the basis of test results.
From 1945 to 1953, Davis, a sociologist, contended that existing
tests underestimated the abilities of children of the working class
( Cronbach, 1975).
These challenges received little attention at the time they were
issued although they anticipate later concerns such as the
nature-nurture debate and the effects of class bias, classification,
and labelling. Cronbach (1975) argues that the then zeitgeist
favoured testers. This is no longer the case: virtually all the
major assumptions concerning IQ testing generally agreed upon
fifty years ago are today hotly contested by psychologists, and
the · testing movement itself is widely criticised and distrusted
(Vernon, 1978). In Britain, there has been a decline in group
. testing with the virtual demise of the 11 + examinations. In
America, anti-testing sentiment has gathered enough support to
affect policy regarding testing in some instances, leading some
states to ban the use of IQ tests for the purpose of tracking
minority students in state-supported schools (Gordon & Terrell,
1981). . Civil · rights leaders, especially, have become more and
more vocal concerning political and economic abuse of standardized

50
testing. Parents have successfully challenged in the courts the
allocation of their children to special classes or schools oh the
basis of low IQ test results.
Cronbach (1975) traces this change in attitude to three major
factors: post World War II concern for the part played by test
scores in determining life chances, especially in regard to gaining
access to prestigious colleges or evading the draft; challenges to
traditional concepts in child psychology in the 1960s with growing
emphasis on the - role played by environmental factors in the
development of the in,tellect; finally to increasing national concern
with the conditions of blacks during the same period. Gordon and
Terrell (1981) also discuss the changed social context of testing,
pointing out that in the past three decades ~ a commitment to
democratic access to human developmental resources has been
repeatedly voiced, rendering inappropriate the meritocratic
approach with its emphasis on the identification of talent, an
approach which had influenced the development and use of IQ
tests.
It would _ be exceedingly naive, however, to believe that
psychological testing will therefore be abolished or even much
changed. There is good reason to believe, on the contrary, that
it is firmly entrenched in the very fabric of society, and the field
of education in particular. Vernon (1979) clearly expects

51
intelligence testing to continue in schools although he concedes it
should be called something else:
"Lastly, let us ask, what of the future? I shall be neither surprised not sorry if group
-tests of children's intelligence disappear, particularly within elementary or primary schools. There is likely to be much less criticism by educationalists and parents of instruments called Verbal or Non-verbal reasoning tests - that is the name adopted for the Moray House series many years ago."
Vernon, 1979:11)
As a matter of interest, the Moray House series was in its hey-day
at the height of IQ testing in Britain.
Reschly (1981) believes that abandoning the term IQ in favour of a
more accurate descriptor such as school ability or academic
aptitude, would help to dispel such myths as intelligence being
unitary, fixed and predetermined, that are bound to the term I Q.
He believes a name change would not be merely cosmetic, but
would reduce damaging misconceptions and imply that environment
also played an important part in intellectual development, thus
removing some of the polemics from the nature-nurture debate.
3.2 Use of IQ Scores in Schools
As yet, the term IQ is the one most commonly used in schools, and
52
while psychologists may be hotly contesting the old IQ myths,
there is no guarantee that teachers, who are seldom trained in the
interpretation of IQ scores, are doing the same.
Vernon (1979) is of the opinion that the belief that IQ tests
measure innate ability and educational tests measure acquired
knowledge is still far too commonly held by many teachers, and
even by some educational psychologists.
Goslin (1967) found that 47% of a national sample of American
elementary schoolteachers considered intelligence and scholastic
aptitude test scores to be the most accurate measure of a student's
intellectual ability. He regarded as striking the general
acceptance of IQ tests as accurate measures of intellectual potential
by both secondary and elementary schoolteachers.
Fifteen years later, Fields and Kumar (1982) found little change in
attitude, with 42% of the teachers in two school districts in Ohio
holding the opinion that group IQ scores were helpful "in knowing
a student's potential and/or determining ability-motivation
discrepancy" (pg 38) . These teachers also found test results
useful in assignment of students to groups, in planning teaching,
and in talking to parents.

53
'
Attitudes of South African teachers to IQ data must remain largely
a matter for speculation since research does not seem to have
addressed itself to this precise question. It seems probable that
teachers in this country utilize IQ scores in much the same way as
do American teachers.
The prevailing system of entering pupils' achievement and IQ
scores, together with their ranking on each, on the class
schedules, lends itself to the practice of looking for
ability-motivation discrepancies. If such discrepancies exist, the
labels 'underachiever' and 'overachiever' are applied, using the IQ
score as the ultimate gauge of achievement. The use of these
labels is unquestioned although their farcical nature is clearly
evident in that 'overachiever' essentially asserts that some children
achieve more than they are capable of (Zigler & Trickett, 1978).
Group IQ tests in South Africa are administered and scored by
educational psychologists in provincial government employ, unlike
the position in the Fields and Kumar study where 80% of the
teachers had administered and scored the tests themselves. While
there are undoubted advantages to a test being administered and
scored by a psychologist, the resultant score may carry additional
weight, since it has the flavour of an independent, expert,
objective assessment.
Lastly, government schools are racially segregated and in general
each serves its local community. Each has therefore a relatively
54
homogenous group of children, in terms of socio-economic status
and cultural background. Differences between children in terms of
IQ scores within such a school may be less likely to be attributed
to environmental factors, and it may be speculated that a tendency
might exist to perceive them as reflecting individual differences in
innate ability.
3.3 Stability and Instability of the IQ
The use of IQ scores as the ultimate gauge of achievement implies
that what the IQ test measures is stable, and immune to the
environmental, emotional and motivational factors that are readily
acknowledged to have an effect on achievement. That this is not
so is attested to by a considerably body of- research, ably
reviewed by Anastasi (1976). In examining typical findings of
longitudinal studies of intelligence, Anastasi inquired into the
conditions making for both the stability and the instability of the
IQ.
Correlational studies show that in an actuarial (applicable to group
prediction) sense, IQ's tend to be quite stable. One explanation
offered for this is the overlap hypothesis (Anderson, 1940) which
maintains that "since the growing individual does not lose what he
already has, the constancy of the IQ is in large measure a matter
of the part-whole or overlap relation" (pg 394). Anastasi (1976)
offers two additional explanations, the environmental stability

55
which characterizes the developmental years of most individuals,
and the role of prerequisite learning skills on subsequent learning.
Individual studies, as opposed to correlational studies, reveal large
upward or downward shifts in IQ. Anastasi (1976) cites research
showing that some of these sharp rises or drops in IQ have
occurred in response to major environmental changes in a child's
life, such as drastic changes in family structure or home
conditions, fostering, serious or lengthy illness, and therapeutic
or remedial programmes. She further points out that even
children whose environment does not change may show large
increases or decreases on re-testing, indicating that they are
developing at a faster or slower rate than the standardization
sample of that test.
In general, culturally disadvantaged environments lead to IQ losses
and superior environments to IQ gains. IQ changes are seldom
random or erratic, but follow consistent upward or downward
trends · over several consecutive years. Parental concern with
educational achievement, and parental socio-economic-status, were
significantly related to changes in IQ, as was the amount of formal
schooling the individual himself had completed between test and
re-test (Anastasi, 1976).

56
Personality characteristics have also been associated with
acceleration and deceleration, as have child-rearing practices.
During the school years, IQ gains were associated with high
achievement drive, competitive striving, and curiosity about nature
(Kagan, Sontag, Baker & Nelson, 1958). Comparison of
child-rearing practices within the same sample revealed that
parents of children with rising IQ's typically presented "an
encouraging and rewarding atmosphere, but one with some
structure and enforcement of policies" (McCall, Applebaum &
Hogarty, 1973). The extent to which the parents deliberately
trained the child in various mental or motor skills which were not
yet essential was also associated with rising IQ's in the same
study.
Another study compared accelerators and decelerators in terms of
coping or defence mechanisms in dealing with problems or
frustrations (Haan, 1963). . Accelerators made significantly more
use of coping mechanisms representing an objective, constructive,
realistic approach, which decelerators utilized defence mechanisms
characterized by withdrawal, denial, rationalization and distortion.
3. 4 Implications for the HA Child
These findings lend considerable support to the argument advanced
by S Sarason et al (1960) that a high level of test anxiety leads to
57
a decline in IQ. Tpe emotional and motivational characteristics of
the HA child, and his motive to avoid failure (Hill, 1972), his
helpless response to problems (Dweck & Wortman, 1982) , his
negative self-concept (Wine, 1980), and his parents' style of
child-rearing (S Sarason et al, 1960), would appear to characterize
the decelerator.
If the HA child does score below his true potential on an IQ test,
then the use teachers make of IQ scores in detecting
motivation/ ability discrepancies could prove to be a considerable
disadvantage to him, leading to an explanation of poor achievement
in terms of low ability (Fields & Kumar, 1982). Such a stable,
internal attribution is more likely to set in motion a self-fulfilling
prophecy (Brophy & Good, 1974; Eiser, 1978) to which the HA
child may be particularly vulnerable because of his susceptibility
to social -evaluative cues and negative self-image (Wine, 1982).
Anastasi (1976) believes that prediction of subsequent intellectual
status could be improved if measures of the individual's emotional
and motivational characteristics, and of his environment, were
combined with initial test scores. This could be particularly
helpful in testing in education.
58
CHAPTER FOUR
4 RATIONALE
In this chapter the rationale for the study will be discussed,
leading to the formulation of specific hypotheses to be tested. It
is considered that the reviewed research has yielded a clearer
picture of the complex interaction of factors that leads to the
development and maintenance of test anxiety and, by synthesis of
findmgs, makes it possible to propose a model of the development
of test anxiety in the elementary schoolchild. It is a contextual
model, recognising the child as a social being, acting and
interacting in the social groups of home and school; also, it
deimes the role played ·by hard test data, especially IQ scores.
4.1 Model of the Development of Test Anxiety in the Elementary
SchoolchUd
Pre-school: Early parent-child interactions appear to predispose a
child to the development of test anxiety (Hill, 1972; S Sarason et
al, 1960). Cues indicating negative parental evaluations resulting
59
from unrealistically high expectations are read and internalized by
the child, while lack of support and constructive help in
problem-solving give the child little chance to develop a sense of
self-efficacy or to outgrow dependency (Hermans, ter Laak &
Maes, 1972).
School Entry and Junior Primary (ages 6 to 9)
HA children have been perceived as less mature and responsible
than LA children (Davidson et al, 1958); their parents may fail to
teach effectual problem-solving or gratify their dependency needs
(Hermans, ter Laak & Maes, 1972), so that a HA child may enter
school with the characteristics of immaturity, irresponsibility,
attention-seeking, and ineffectual problem-solving skills. Such a
child is not likely to make a good initial impression on the teacher,
and these primacy effects are likely to be persistent (Asch, 1946) .
His group placement will probably reflect this negative impression,
regardless of his actual ability, and mere placement in a group will
convey to him a considerable amount about himself and determine
his classroom status and peer interaction (McGinley & McGinley,
1970). The teacher may behave in such a way as to convey low
expectations and limit his learning opportunities (Brophy & Good,
1970). Formal assessment in the form of grades or symbols on
report cards provides additional feedback to the child and his
parents. All these data will be incorporated into the child's
already existing cognitive structures which determine the meaning
60
to him of evaluative situations (Meichenbaum & Butler, 1980).
Since they will tend to confirm his early experiences, the negative
valence and intensity of evaluative situations is likely to increase,
leading to greater anxiety and a poor self-concept. Task
interfering responses, consisting of an habitual replay of negative
cognitions arise in response to evaluative cues (Wine, 1971, 1980,
1982) and increase in strength and frequency.
The characteristics of the school, its crowded nature, ubiquitous
evaluation, and the power invested in the teacher (Jackson, 1968)
contribute to an environment which may be inimical to the HA
child.
Senior Primary (ages 10 to 12)
Hard test data become available to teachers, parents and pupils ·
with the introduction of formal examinations in Standard 2. In
government schools additional hard test data become available to
teachers with the administration of Junior Level of the New South
African Group Test in Standard 3. Such hard test data are
important bases of teacher expectancies, especially when they
confirm impressions based on classroom behaviour (Dusek, 1980;
Dusek & O'Connell, 1973). It is suggested that the HA child's
performance, by this time, may be depressed on both measures
due to the debilitating effects of test anxiety (S Sarason et al,
1960), leading to an explanation of his poor achievement in terms

61
of low ability. Even in a superior ability child, cognitive and
attentional deficits may result in an IQ score in line with
unremarkable achievement so that his true potential goes
unrecognised. There is some evidence that teachers reject scores
that are too discordant with their classroom experience (Brophy &
Good, 197 4; Wilkins & Glock, 1973) , but the low salience of the HA
child, who by this time seeks to avoid failure (Hill, 1972) provides
the teacher with little reason to disbelieve test scores.
In this · model, IQ scores play an important role, leading teachers
to attribute causality of performance to native ability, a stable
internal characteristic (Kelley , 1967). It is suggested that teacher
expectations formed on this basis are more likely to be fixed and
rigid and, in the case of the HA child, inappropriate, than if
attributions to emotional, motivational or situational factors had
been made, which could be regarded as potentially amenable to
intervention.
When teacher expectations are rigid, inappropriate and acted out
in behaviour, they may operate as self-fulfilling prophecies
(Brophy & Good, 1974). Most children will encounter at least one
teacher in their primary school career who is prone to arriving at
fixed and rigid expectancies and who teaches inappropriately as a
result. With each such experience, the HA child is at risk of
62
experiencing a further eroding of self- confidence, motivation and
level of aspiration, as well as a greater degree of test anxiety.
By Standard 5, when another group IQ test is administered, there
may well be a further decline in the score of the HA child,
providing additional confirmation of teacher expectancies. By this
time, the HA child has probably become 'helpless', defeated by
failure (Dweck, 1975). If he succeeds, he attributes this to
external factors, not his own efforts or ability (Diener & Dweck,
1980). Teachers may reinforce this kind of attribution by
responding to his success with surprise or even doubt (Brophy &
Good, 1974).
The parents of HA schoolchild are probably also anxious about his
lack of achievement; however, it is suggested that they continu~
to act aversively, failing to teach constructive study habits or
task-related skills. One may surmise that they hold unrealistically
high expectations, but tend to accompany them with the underlying
message, "You can't measure up". There may be over-rigid
discipline, or too few set limits (Kimball, 1953), but either way
there is probably little discussion or sharing within the family.
Overall, it may be hypothesized that the HA child lacks emotional
security at both home and school, and is dominated by fear of
failure and criticism as a result .
63
4. 2 Aims and Hypotheses of the Study
The foregoing model argues that hard test data in the schools,
including group IQ scores, are affected by the cognitive and
attentional deficits that attend high levels of test anxiety. It
further argues that this has important consequences in terms of
teacher-child interactions.
Specific interest in the effects of test anxiety on measures of
intelligence stems from an earlier study of test anxiety in
elementary schoolchildren (Baddeley, 1982).
Results of this study indicated a significant difference between
high and low anxious children on the variables of achievement,
intelligence and self-concept, with HA children scoring less on all
three. No significant difference was evident, however, between
the two groups in achievement when the variance due to IQ was
removed. A possible explanation was offered, that the New South
African Group Test for intelligence - the IQ measure utilised - is
highly "test-like" and in terms of the Sarason et al (1960)
hypothesis is very likely to arouse test anxiety in susceptible
children. Their IQ scores may therefore have reflected the
debilitating effects of test anxiety in the same way as their
achievement scores.
64
Studies investigating the effects of test anxiety in the classroom
situation have failed to consider possibility that IQ measures and
the conditions of their administration may themselves elicit test
anxiety. For example, Boor (1972) sought to explain the negative
correlation he obtained between test anxiety and classroom
performance in terms of the "confounding variable" of intelligence
as the correlation dropped to zero when he partialled out the
factor of intelligence. Unlike Boor, Daniels and Hewitt (1978)
found that a strong negative correlation between test anxiety and
classroom performance remained even after IQ was partialled out,
but in their study, too, there was an implicit assumption that
measures of IQ escape from the effects of test anxiety.
The present study has been undertaken to look more closely at the
effect of . test anxiety on IQ test performance in elementary
schoolchildren. Two IQ tests will be used: a group test, the New
South African Group Test, Junior Level (1965) and an individual
measure, the . Wechsler Intelligence Scale for Children - Revised
(1974). If. test anxiety c'an be shown to have different effects on
these tests, then this would support the S Sarason et al ( 1960)
argument that test anxiety is the more important variable in the
negative test anxiety-intelligence relationship. Both measures are
administered under standardised conditions, and it is considered
that these instruments will be acceptable as typical of the types of
IQ measures schoolchildren are likely to encounter.
65
The Wechsler Intelligence Scale for Children - Revised was chosen
in preference to the New South African Individual Scale because
the latter instrument is used in the school clinics and it was felt
that it would be preferable to avoid giving children practice on it
in case they subsequently needed clinic assessment.
A problem researchers and clinicians encounter in use of the WISC
or the WISC-R is that of lack of standardisation on South African
children. Since it cannot be assumed that norms for children in
this country would be the same as for American children, IQ
scores yielded by the WISC or WISC-R cannot be regarded as
meaningful in terms of overall intelligence. However, they do
provide an opportunity to test performance on a variety of
intellectual tasks. It is considered that lack of standardisation is
not a problem that affects this study, since the aspect of the
WISC-R that is of interest is the comparative performance on this
measure of HA and LA children who will participate in the study.
The surveyed research literature suggests that HA children are
likely to perform below their true capability on the New South
African Group Test (NSAGT) fer the following reasons: it is
administered under strict examination-like conditions by a school
psychologist who is usually a total stranger and who maintains an
impersonal, evaluative, relationship with the children (Geen,
1980); the subtests are strictly timed, and since they are both
66
speed and power tests they contain more items than the children
can hope to finish as well as items beyond their present ability.
This could give rise to mounting levels of frustration and anxiety
(Anastasi, 1976). The individual works alone and unaided in the
group situation with the questions mediated by the printed symbol
or word once the practice examples have been dealt with, and no
provision is made for gratification of dependency needs.
Furthermore, the group situation could prove distracting, ·
especially if others are perceived as working more swiftly. It is
hypothesized that HA working under these conditions will suffer
from lack of task-focused attention and manifest progressively
disintegrating coping strategies to the detriment of their
performance (Dweck & Wortman, 1982; Wine, 1980).
The chosen individual measure, the Wechsler Intelligence Scale for
Children Revised (WISC-R) is hypothesized to yield a
performance score less affected by test anxiety although it is
clearly a test and not a "game". In this respect it may be seen as
a weaker treatment condition than that employed in the Zwibelson
(1956) study, which utilized the Davis-Eels games. However,
performance on an individual IQ measure has not yet been
compared with that on a group measure in terms of their
anxiety-provoking properties. It would seem that there are
theoretical reasons for expecting facilitated performance on the
individual measure by HA children. The one-to-one testing
·'
67
situation with an examiner who seeks to establish rapport should
help to gratify dependency needs (Hill, 1972); it should also help
to cut down on distractions and so focus attention which is often
diverted from the task on hand in the HA child (Wine, 1980).
Items are given within a difficulty range which is appropriate to
the testee's ability level (Anastasi, 1976). Timing does not occur
on every subtest and in the hands of a trained examiner need not
be obtrusive.
In this study, the WISC-R will be administered to all subjects by
the same examiner, who is trained in its administration. She will
be blind as to the level of test anxiety and intelligence level of the
subjects and order and practice effects will likewise be controlled.
Subjects will be told that results will not be made available to
school personnel but are for research purposes only.
Furthermore, she will be familiar to the children, having
previously administered anxiety, defensiveness, and self-concept
questionnaires in their classrooms.
The main part of the study will be a comparison of the
performance on the NSAGT and on the WISC-R in two groups of
elementary schoolchildren, those falling at the upper and lower
extremes of the test anxiety distribution. As it has 'Qeen
suggested in the literature that performance in high intelligence,
HA children is not affected (Feldhusen & Klausmeier, 1962),
68
further analysis of the main study data will be undertaken with children
allocated to three levels of intelligence, High (120-145); Medium
(100-119); Low (84-99) on the basis of their NSAGT scores. Each level
will be analysed separately to determine what, if any, differences are to
be found between HA and LA children on the Verbal, Non-Verbal and
Total Scales of the two IQ tests; and the subtests of the WISC-R if
differences become apparent on that measure.
Exp~rimental Hypotheses of the Main Study:
1 The scores of HA children will be lower than the scores of LA
children on the NSAGT.
2 The scores of HA children will be equal to the scores of LA
children on the WISC-R.
This hypothesizes that there will be an interaction between level of test
anxiety and type of I Q measure.
Further Main Study Hypothesis:
3 At each level of intelligence, there will be a significant difference
between HA and LA children, with HA children obtaining lower
scores on the Sub-scales and Totals of the NSAGT but not the
WISC-R.
69
Two subsidiary studies will be conducted:
Subsidiary Study A will investigate the effects of level of test
anxiety and level of intelligence on academic achievement. It is
expected that findings will confirm those of Hill and Sarason (1966)
that achievement is lower in HA than LA children matched for
intelligence level, rather than the Feldhusen and Klausmeier (1962)
findings that high IQ, HA children's achievement was equivalent to
that of high IQ, LA children.
Experimental Hypothesis:
HA children wUl show lower academic achievement scores tban
LA children at equivalent levels of intelligence.
This hypothesizes a test anxiety main effect, not an interaction
between test anxiety and intelligence level.
Subsidiary Study B will investigate the effects of level · of test
anxiety and intelligence on self-concept. Since a neg~tive view of .
the self appears to accompany raised levels of test anxiety (Wine,
1980). it is expected t)lat HA children will obtain a lower score on
a measure of self-concept at equivalent levels of intelligence.
Experimental Hypothesis
HA children will score less on a self-concept scale than LA
children at equivalent levels of intelligence.
This hypothesizes a main effect of test anxiety, not an interaction
between test anxiety level and intelligence level.
70
CHAPTER FIVE
5 METHOD
5.1 Subjects
The subjects in this study were drawn from a population of 175
white, English-speaking Standard 4 pupils at two elementary
schools in middle-class suburbs of Cape Town. The average age
was 11 years 3 months with a range from 10 years 3 months to 12
years 9 months; no child was excluded on the basis of age or · of
having failed a standard since it was of interest to investigate
whether HA children differed from LA children in these respects.
No attempt was made to control for · variables in their home
situations other than to exclude those for whom English was not
their home language. In order to be eligible for inclusion in the
study, children had to be present for the administration of test
anxiety, defensiveness and self-concept questionnaires in the
classroom (that is, no late administration of questionnaires was
undertaken to those who were absent for some reason) , and a
group IQ test score had to be available for them. This reduced
the numbers to 162. A further six children were eliminated as
71
their defensiveness scores were more than two standard deviations
above the mean, and whose scores on self-report instruments could
therefore be regarded as suspect (Dusek, 1980). One child was
'elimiriated as his test anxiety questionnaire was invalidated by his
method of answering contrary to instructions; another child did
not answer the test in a serious manner, so was also eliminate<;!.
The . remaining pool from which subjects were drawn was 154
children, 76 girls, 78 boys.
Experimental groups in test anxiety research are commonly the top
and', -bottom quartiles of the test anxiety distribution. As this
study involved individual IQ testing during school hours, it was
decided to reduce this percentage to 20%, the contribution from
each school . to be · on a pro rata basis. Initially the top ten . . "•
scorers on the TASC at School A and the top twenty scorers at
School B made up the HA group, while the bottom ten scorers on
the TASC at School A and bottom twenty at School B made up the
LA group. · In · the course of the study these numbers were
reduced to 28 for the HA group and 27 for the LA group as a
result of children leaving the schools. Boys and girls had an
equal chance of inclusion. The literature has shown a consistent
tenden~ for girls to be more high anxious than boys which may
be due to · the fact that it is more socially acceptable for girls to
admit to anxiety than for boys (S Sarason et al, 1960). It was
therefore not unexpected to find that the final grouping consisted
72
of HA n = 28, 17 girls and 11 boys; LA n = 27, 12 girls, 15 boys.
Since HA girls have shown a somewhat less predictable interfering
effect of test anxiety than have boys, (Rue bush, 1963), it was
considered that the effect of having more girls than boys in the
HA group might be to obscure the effect of test anxiety.
Unfortunately, the difficulty of obtaining sufficient subjects of
both sexes at each IQ level precluded the inclusion of sex as a
variable. Its possible confounding effects were, however, not
ignored, and will be considered in the Discussion section (also see
Appendix F).
5. 2 Instrumentation
5. 2 .1 Test Anxiety Scale for Children ( T AS C) ( S Sarason et al, 1960)
Appendix A
The TASC is a group-administered paper and pencil test
consisting of 30 items to which a child responds by circling the
appropriate answer on an answer sheet as the experimenter
reads the questions.
with Freud's (1949)
The items were selected to be consistent
definition of anxiety as a conscious,
unpleasant experience, but are limited to reactions to evaluative
and test-like situations. Twelve of the items specifically
mention the word "test"; others ask about "worry" over
classroom performance. The anxiety score is the number of
"yes" responses.
l /

73
The TASC is internally consistent, and has a test retest
reliability after 4 months of . 55 to , 78 with an average of . 67.
The variances of the two administrations showed no difference,
and the second administration of the scale displayed comparable
correlations with IQ and a general anxiety scale as did the first
administration (S Sarason et al, 1960). The reliability
coefficients drop after a two-year interval, averaging about . 40
during the early grades and . 50 during the later ones (Hill,
1972). These changes are thought to reflect a meaningful
change in anxiety status (Hill & Sarason, 1966). Normative
data means and variances are available for American, English,
Australian and Norwegian elementary schoolchildren. Test
anxiety scores increase linearly with grade and girls obtain
significantly higher scores than boys (Ruebush, 1963).
S Sarason et al (1960) reported a modest positive correlation
between social class as reflected by fathers' occupational level,
and test anxiety ( + , 12, p < 001) ~ but subsequently found no
significant difference in fathers' occupations of HA and LA
subjects, or found that the fathers of LA boys completed
significantly more grades of school than fathers of HA boys.
They concluded that, overall, there is little evidence to suggest
that test anxiety is related to social class.
Ruebush (1963) and Hill (1972) review validity studies of the
TASC. There are several types of direct evidence concerning
74
the validity of T ASC as a specific measure of anxiety in
test-like situations. A small but systematic positive relationship
obtains between TASC scores and teacher ratings of anxiety
( r = . 2, p < 0, 001) ; that this relationship is small probably
reflects lack of reliability in teacher ratings as revealed by the
amount of variability of teacher ratings within and between
classrooms (S Sarason et al, 1960).
Test anxiety level rises with grade, a relevant finding in terms
of the increased exposure to test situations experienced by
children as they advance in school (S Sarason et al, 1960).
TASC scores were higher in British children than in American
children when the 11 + examinations were crucial determinants of
British children's educational futures, although general anxiety
scores were similar (Sarnoff, Lighthall, Waite, Davidson &
Sarason, 1958) • High test-anxious children show more negative
affect in the test-like condition of a recorded interview
(Barnard, Zimbardo & Sarason, 1961), rate school concepts
more negatively in a semantic differential task (Barnard, 1963
in Ruebush, 1963)\ and show a decrease ·in reaction time to
emotional but not to neutral words in a word association test
(Doris, Sarason & Berkowitz, 1963). Moderate but consistent
positive correlations of . 45 to . 77 obtain between the TASC and
the General Anxiety Scale for Children (GASC) (S Sarason et
al, 1960).
75
Early investigations of TASC construct validity were concerned
with the relationship between TASC scores and various group
administered tests. Moderate and consistently significant
negative correlations of -.4 between TASC scores and IQ
scores, and -.5 between TASC and Achievement scores have
developed by the end of the elementary school years, and TASC
scores predict intelligence and achievement scores significantly
better than do GASC scores (Hill & Sarason, 1966).
There is considerable evidence that the T AS C is a
multidimensional instrument. The initial factor analytic studies
were conducted on 633 children in grades four, five and six.
Four factors emerged , Test Anxiety, Generalized School
Anxiety, Recitation Anxiety and Physiological Arousal (Dunn,
1964). A subsequent study in 866 children from grades four,
five, seven and nine revealed a Test Anxiety factor and a
Manifest Dream Anxiety factor that were consistent for sex and
grade level (Dunn, 1965) . Dunn ( 1964, 1965) concluded that,
in general, the T ASC measures different sets of concerns
concerning tests and broader · school concerns, yielding overall a
measure of school anxiety. Consistent with this conclusion is a
correlation of .82 (corrected r = .61, Phillips, 1978) between
the TASC and a test of school anxiety for elementary
schoolchildren (Phillips, 1966).
76
Feld and Lewis (1969) factor analyzed TASC data from 7551
second-grade children; their findings support the view that the
TASC is multidimensional, measuring four major factors with
wide individual differences among anxious children with regard
to which factor(s) detected their anxiety. The most prominent,
labelled The Test Anxiety factor measured children's reactions
and feelings about school tests, and included most of the items
that referred to "tests" specifically. The Somatic Signs of
Anxiety factor involved items dealing with physiological
reactions, while the Poor Self-Evaluation component concerned
those items dealing primarily with children's derogation of the
themselves relative to other children. Least important was a
fourth factor labelled Remote School Concern which assessed
children's worries about school while at home. Comparison of
these four factors with those reported by Dunn revealed a high
degree of similarity (Feld & Lewis, 1969). In both studies, the
Test Anxiety Factor accounted for most variance. Dusek (1980)
concludes that there appears to be some stability to the factor
structure of the T AS C across grade and sex.
Feld and Lewis ( 1969) found moderate positive correlations
between scores on the four factors, and they suggested that
they reflect individual differences in the way children express
anxiety, and the types of school situations that elicit it.
77
The above-mentioned studies involved middle-class children. A
study of 287 boys and 266 girls in grade three from the lower
class compared factor structure with that reported by Feld and
Lewis (1967) (Rhine and Spaner, 1973). The same four factors
emerged, which would appear to support the S Sarason et al
(1960) conclusion that test anxiety did not appear to be related
to social class. However, measures of factor structure
similarity revealed a sex-social class interaction: while
comparisons across social class revealed very similar factor
structures between middle-class boys and girls and lower class
girls, and between middle-class boys and lower-class boys, the
factor similarity for lower- class boys and middle-class girls was
only moderate except for the Test Anxiety factor. Rhine and
Spaner (1973) suggested that lower-class boys may have more
negative views of school due to qualitatively poorer interactions
with teachers, which could alter the meaning of the TASC items ·
for them relative to their peers.
In common with most studies of test anxiety in children this
study has not attempted to identify sub-groups of children in
terms of these factors. High-test-anxious children were
identified by their responses to the entire 30-item instrument.
78
5. 2. 2 The Defensiveness Scale for Children (DSC) ( S Sarason et al,
1964) Appendix B
This was developed in order to deal with the problem of
defensiveness against admitting anxiety. It is composed of 11
Lie Scale items to which ·nearly every child reasonably answers
"yes" (e.g. "Do you every worry?") plus three items designed
to pick up negative response set, plus 24 items that measure a
child's willingness to admit to a wide range of feelings and
emotions that, it is assumed, nearly every child has
experienced. It is administered in exactly the same way as the
TASC, and the dhild's defensiveness score is the sum of the
"no" responses. The split-half reliability of the scale is . 82
(Ruebush • Waite, 1961).
The correlation between the TASC and total defensiveness score
is .about -, 5 (Hill & Sarason, 1966). Highly defensive children
tend to admit less anxiety. The validity of the self-report of
anxiety of highly defensive children is therefore suspect, and
the DSC is usually administered with the TASC for research
purposes, with children who score more than two standard
deviations above the mean being eliminated. This gives the
researcher a measure of control, albeit imperfect, over the
v81idity of the scores of the low-anxious subjects included in
the research (Dusek, 1980). The DSC was utilized in the
above way in this study.
5.2.3
79
The Piers-Harris Children's Self-Concept Scale (Piers & Harris,
1969) Appendix C
This is a self-report instrument, administered in a group
setting with pencil and paper. It was designed for research
into the development of children's self-attitudes and correlates
of these attitudes. The "self-concept" as assessed by this
instrument is in accord with the phenomenological approach and
is assumed to refer to a set of relatively stable self-attitudes
(Piers, 1977). It consists of 80 declarative sentences worded at
the Standard 3 reading level. Examples include "I am dumb at
most things" and "I can be trusted", and are both descriptive
and evaluative. The child answers "yes" or "no" according to
how he generally feels. Items are scored in a positive or
negative direction according to a favourable self-assessment.
Thus a high score indicates a favourable self-concept. In the
normative sample of 1138 children the mean was 51.84 with a
standard deviation of 13.87.
Test-retest reliability of , 77 is considered by Wylie (1974) to be
satisfactory for research purposes, and a correlation of , 43 has
been reported between self-rating on the Scale and teacher and
peer ratings of socially effective behaviour (Piers & Harris,
1969)
80
5.2.4 New South African Group Test (National Bureau for Educational
and Social Research, 1969)
This is a group intelligence test designed for screening use in
white pupils, with three levels:
Junior (ages 8 - 11 years) 2 forms
Intermediate (ages 10 - 14 years 11 months) 1 form
Senior (ages 13 - 17 years 11 months) 2 forms
The Junior level of this test had been given to the children in
this study in 1982, their Standard 3 year at school, by the
school. psychologists in their areas.
Each series of NSAGT consists of Nonverbal and Verbal tests as
follows:
Nonverbal
' Test 1 Number series
Test 3 Figure Analogies
Test 5 Pattern Completion
Verbal
Test 2 Classification of
pairs of words
Test 4 Verbal Reasoning
Test 6 Analogies of Words
There are 30 items in each test, the first five of which serve
as practice examples. Each item is of the multiple choice type
with a set of 5 possible answers. Verbal, Nonverbal and total
IQ scores for each child in the study were obtained from school
records.

81
The test was standardised in 1964 on a sample representing all
white pupils in South Africa. At the Junior level, the sample
was constituted of 2923 Afrikaans-speaking and 1525
English-speaking children. The following controls were applied:
1 A control for the ratio of Afrikaans to English speaking
pupils (2: 1).
2 Geographical location: taking account of the size of school
populations, pupils in White schools (provincial, private and
provincial-aided) in all four provinces and South West Africa
were used in the sample.
3 Urban-rural distribution was controlled.
4 Physically and mentally handicapped children were omitted.
5 Random sampling of ten pupils for each age group in the
school was instituted.
Norms were calculated independently for the two language
groups. The test has a mean of 100 and a standard deviation
of 15. The standard error of measurement is reported to be
2,5 IQ points for the Junior series and 3. 0 IQ points for the
Intermediate series.
The reliability of the test calculated by means of the K-R21
formula for verbal, non-verbal and total scores ranges from . 89
to . 96 for both groups in the Junior series. Validity in
predicting school success is shown by a correlation of , 86 and
82
• 81 respectively for the Junior verbal and non-verbal scores
with a Silent Reading Test. Reliability and validity for the
other levels of the NSAGT are equally satisfactory. The
requirement of the NSAGT that the child be able to read, may
result in the confounding of reading ability and intelligence.
5. 2. 5 Wechsler Intelligence Scale for Children - Revised.
(Wechsler 1974)
This is an individual intelligence test which aims to probe
intelligence in as many ways as possible, and thus consists of
12 tests, 6 on a Verbal Scale and 6 on a Non-Verbal Scale. All
12 tests were administered to the standardization sample but
only 10 of the WISC-R tests are considered mandatory. The
IQ's are calculated on the basis of 5 Verbal and 5 Non-Verbal
tests as follows:
Verbal Non-Verbal
1 Information 2 Picture Completion
3 Similarities 4 Picture Arrangement
5 Arithmetic 6 Block Design
7 Vocabulary 8 Object Assembly
9 Comprehension 10 Coding
(The tests are administered in the order indicated by the
numbers)
83
Digit Span (Verbal) and Mazes (Non-Verbal) were not used in
establishing the IQ tables, but have been retained as
alternatives should one of the above tests be invalidated or
cannot be given. It is not permissible to make such a
substitution because of poor performance on one of the other
tests. It is, however, permissible to give all 12 tests to gain
additional qualitative information. They must not be included in
calculating the child's IQ.
Raw scores on each subtest are first transmuted into normalized
standard scores within the child's own age group. Tables of
such scaled scores are provided for every 4 month interval
between the ages of 6. 0 and 16.11 years. Subtest scores are
added and converted into a deviation IQ with a mean of 100 and
a standard deviation of 15. Verbal, Non-Verbal and Full Scale
IQ's can be computed.
The test was standardised for American children by means of a
stratified sampling plan, based on 1970 U S census, which
ensured that the normative sample included representative
proportions of children with respect to geographic region,
urban-rural residence, o~cupation of head of household and
race (white-non white). The total sample consisted of 2200
children, 200 in each of 11 age groups, half male and half
female. Bilinguals were included if they could speak and
understand English.
84
Institutionalized mental retardates and severely emotionally
disturbed children were excluded. As has already been stated,
the WISC-R has not been standardised for South African
children thus it is not possible to designate a South African
child's position with regard to his own age group. However,
the test does permit a measure of intellectual performance under
standardised conditions which is sufficien t for the purposes of
this study. Slight changes were made to the content of the
Information Subtest to bring it more closely in accord with the
general knowledge of S A children.
Anastasi (1976) reports that reliability is satisfactory. Average
split-half reliabilities for Verbal, Non- Verbal and Full Scale IQ's
are , 94 , 90 and , 96 with corresponding re- test coefficients of
, 93 , 90 and , 95 ~· Some practice effect was observed on re-test,
with mean gains of 3i IQ points on the Verbal Scale, 9i on the
Non-Verbal Scale and 7 on the Full Scale. Subtest reliabilites
are generally satisfactory. The Standard Error of the Full
Scale IQ is approximately 3 points.
The WISC-R manual does not include a discussion of validity
and fails to evaluate the normative tables of standard score
equivalents in terms of the criterion of age differentiation
(Anastasi, 1976). Earlier investigators found the concurrent
validity coefficients of the WISC and achievement tests of
85
other academic criteria of intelligence to be around , 5 and , 6
(Littell, 1960; Zimmerman & Woo-Sam, 1972) with the Verbal
Scale showing a higher correlation than the Non-Verbal Scale.
The WISC-R manual reports correlations with the 1972
Stanford-Binet IQ's within homogenous age-groups. The mean
correlation of Full Scale IQ S is , 73 and again Verbal Scales
show higher correlation than Non-Verbal Scales at , 71 versus
,60.
The WISC-R manual includes various intercorrelations of
subtests and composite scores. Correlations between Verbal
and Non-Verbal . Scales range from ,60 to , 73 indicating that
while the two parts have much in common there is still cause to
retain both.
A factorial analysis of the WISC-R scores of the standardisation -
sample at 11 age levels yielded evidence of 3 major factors at
each age level (Kaufman, 1975). These factors correspond to
Verbal Comprehension (5 verbal _tests), Perceptual Organization
(Block Design and Object Assembly), and Memory (or Freedom
from Distraction) .
86
5. 2 . 6 Academic Achievement
Academic achievement was calculated as a single score for each
child from the 1982 Class Schedules by summing marks obtained
in the December class examinations for English, Mathematics and
Content Subjects (History, Geography, General Science and
Health Education) . The total marks obtained were expressed as
a percentage.
lr-"
5.2. 7 Age
The age of each subject was expressed as a deviation score in
months from the median age for Standard 3 in the Cape
Province as of December 1 1981 (lly 01m). These deviation
scores were then numbered from 1 ( -8) to 23 (+14). At the
time of the study, the range of subjects' ages was from ten
years, seven months to twelve years, six months.
5.3 DESIGN OF THE STUDY
5.3 .1 Main Study
This was a blind study with the administrator of the WISC-R
unaware of intelligence or anxiety levels of the children she
tested.
87
A 2 x 2 factorial design with repeated measures on factor B
was used. The variables were as follows:
Factor A Level of Test Anxiety based on T ASC scores
Level 1 score on TASC 21 - 30 (HA)
Level 2 score on TASC 0 - 10 (LA)
Factor B Type of IQ Measure
Level 1 New South African Group Test (NSAGT)
Level 2 Wechsler Intelligence Scale for
Children - Revised (WISC-R)
Dependent Variable: IQ scores on both IQ measures.
5.3.2 Subsidiary Studies I and II
A 2 x 2 factorial design was used for both subsidiary studies.
The variables were:
Factor A Level of Intelligence based on NSAGT scores
Level 1 IQ range 120 - 145 High (HIQ)
Level 2 IQ range 100 - 119
Level 3 IQ range 84 - 99
Medium (MIQ)
Low (LIQ)
It should be noted that these IQ levels do not correspond to
the usual High, Medium and Low classifications of I Q tests.
They were determined with reference to the sample of children
88
who participated in the study (mean 113.34, SD 14.51) because
they fell into either the HA or LA groups on the basis of their
TASC scores. Their NSAGT scores were unknown until after
they were tested on the WISC-R; thus, determination of IQ
levels above was based on practical considerations.
Factor B Level of Test Anxiety, two levels, as in Main Study.
The Dependent Variable for Subsidiary Study I was Achievement
scores based on 1982 December Examination results as detailed
under 5 . 2 . 6 .
The Dependent Variable for Subsidiary Study II was scores on
the Piers-Harris Children's Self-Concept Scale (see 5. 2. 3) .
5.4 PROCEDURE
5.4.1 . Stage 1:
Administration of the Test Anxiety Scale for Children,
Defensiveness Scale for Children, and Piers-Harris Children's
Self-Concept · Scale. This stage was timed for the fifth week of
the school year when it was estimated that the children would
have settled into their n~w classes reasonably well. The scales
were administered by the Experimenter to the children in their
classrooms during the morning of a normal school day.
Teachers were not present. Children were told that the
5.4.2
89
purpose of the questionnaires was to find out how they thought
and felt, and that there were no right or wrong answers.
They were assured that their answers would be held in
confidence. Appendix A gives actual instructions on the TASC.
Testing took place in two sessions. In the first, lasting some
35 minutes, the DSC was administered first, followed
immediately by the T ASC; in the second session two days later,
lasting 20 minutes, the Piers-Harris Self-Concept Scale was
administered. Classes were tested separately, with no
opportunity for children from one class to discuss the
questionnaires with children from other classes before hand.
Testing at School A was completed within a week, and testing
at School B was completed the following week.
As this was a blind study in order to control for expectation
effects on the part of the Experimenter, all Stage I completed
questionnaires were delivered to an assistant for scoring,
ranking, and selection of subjects.
Stage 2:
Grouping of subjects.
The assistant eliminated children who scored more than two
standard deviations above the mean on the DSC, those for whom
5.4.3
90
no NSAGT scores were available (names supplied . by teachers),
and the two children whose answer sheets were invalidated.
Two groups were then formed on the basis of T ASC scores:
the top 20% formed the HA group, and the bottom 20% formed
the LA group. In forming these groups it was necessary to
randomly select subjects from a larger number of children who
obtained the same cut-off score. For example, the cut-off
score for the HA group was 21 out of 30; four children
. ·obtained this score and only one was needed to complete the group.
Similarly, seven children scored 10 out of 30, the LA group cut-off
point, · and only two of them were needed.
The assistant compiled two lists, one for each school, of HA
and LA children in random order to control for practice effects
on the part of the WISC-R administrator who could be expected
to become progressively more practiced as she administered the
test to 55 children.
Stage 3:
The Experimenter administered the WISC-R to the children as
listed~ spending alternate days at each school. In both she
was provided with a small room offering privacy and reasonable
freedom from noise. In order to control for fatigue effects,
and to ensure that testing did not continue into break-time, two
5.4.4
91
children only were tested each morning, the first from 8.30 to
10.00 a.m. and the second from 10.30 till noon. The children
received no advance notice of testing, being summoned by the
Experimenter from their classrooms. Immediately after testing,
they returned to their classrooms and normal activities.
Protocols were scored immediately and on completion of the
study each was re-checked to ensure that there was no
difference in scoring between those which fell early or late in
the study. At all times standardised conditions of administration and
scoring as laid down in the WISC-R handbook were adhered to.
Stage 4:
NSAGT scores and achievement scores were obtained from school
records, and subjects assigned to intelligence levels on the
basis of their NSAGT scores.
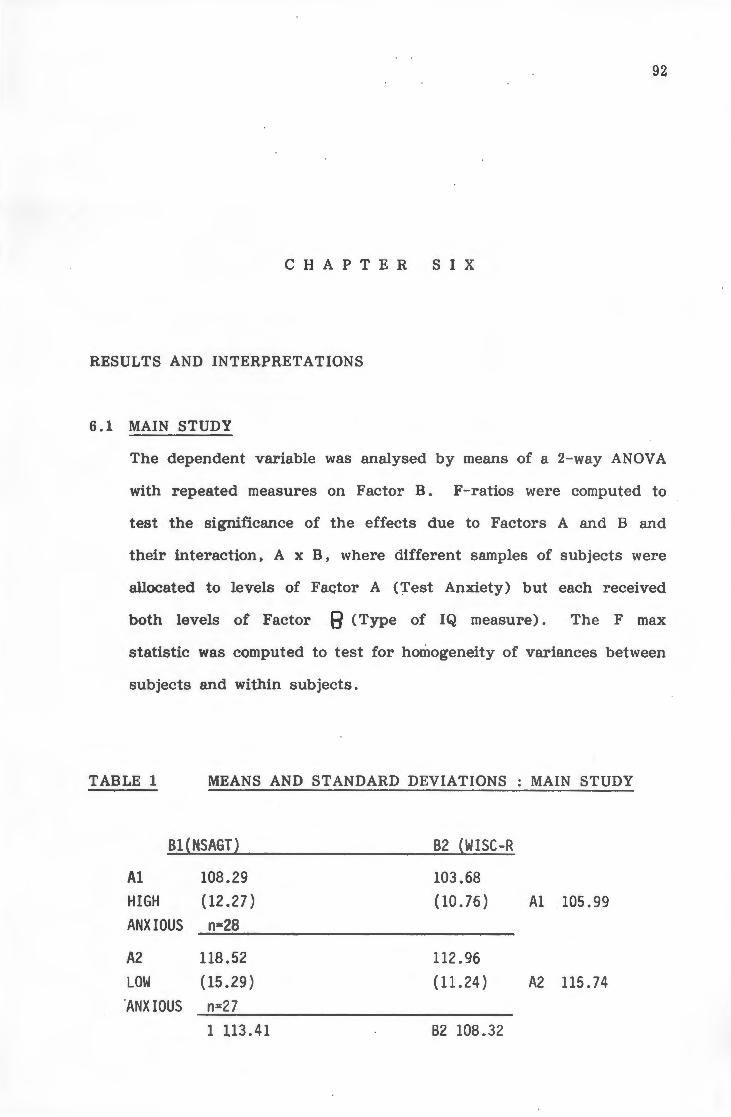
92
CHAPTER SIX
RESULTS AND INTERPRETATIONS
6.1 MAIN STUDY
The dependent variable was analysed by means of a 2-way ANOV A
with repeated measures on Factor B. F-ratios were computed to
test the significance of the effects due to Factors A and B and
their interaction, A x B, where different samples of subjects were
allocated to levels of FaGtor A (Test Anxiety) but each received
both levels of Factor 9 (Type of IQ measure). The F max
statistic was computed to test for homogeneity of variances between
subjects and within subjects.
TABLE 1 MEANS AND STANDARD DEVIATIONS MAIN STUDY
B1{NSAGT} B2 (WISC-R
A1 108.29 103.68 HIGH (12.27) (10.76) A1 105.99 ANXIOUS n=28
A2 118.52 112.96 LOW (15 .29) (11.24) A2 115.74 ANXIOUS n=27
1 113.41 B2 108.32
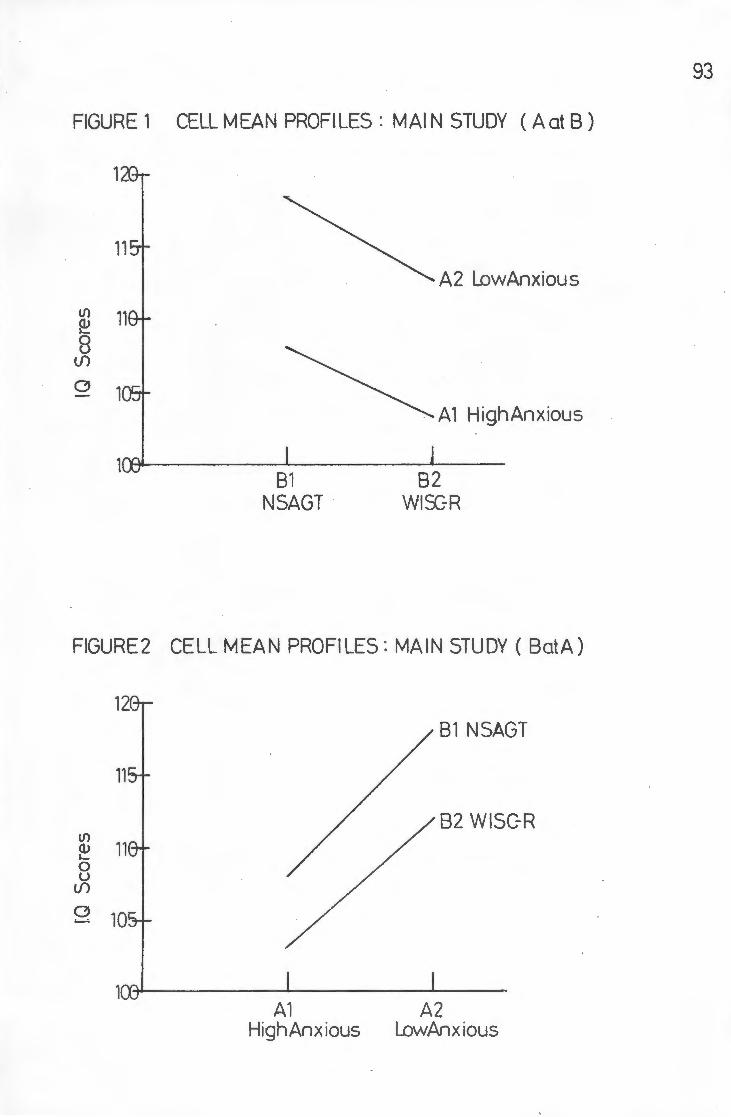
FIGURE 1 CELL MEAN PROFILES : MAl N STUDY (A at 8)
lf)
~ 8
(j)
1
G 1
81 NSAGT
A2 LowAnxious
A1 HighAnxious
82 WI~R
FIGURE2 CELL MEAN PROFILES : MAIN STUDY (BetA)
lf) OJ 1-
0 u
{j)
G ...._..
81 NSAGT
82 WISC-R
A1 A2 HighAnxious LowAnx ious
93
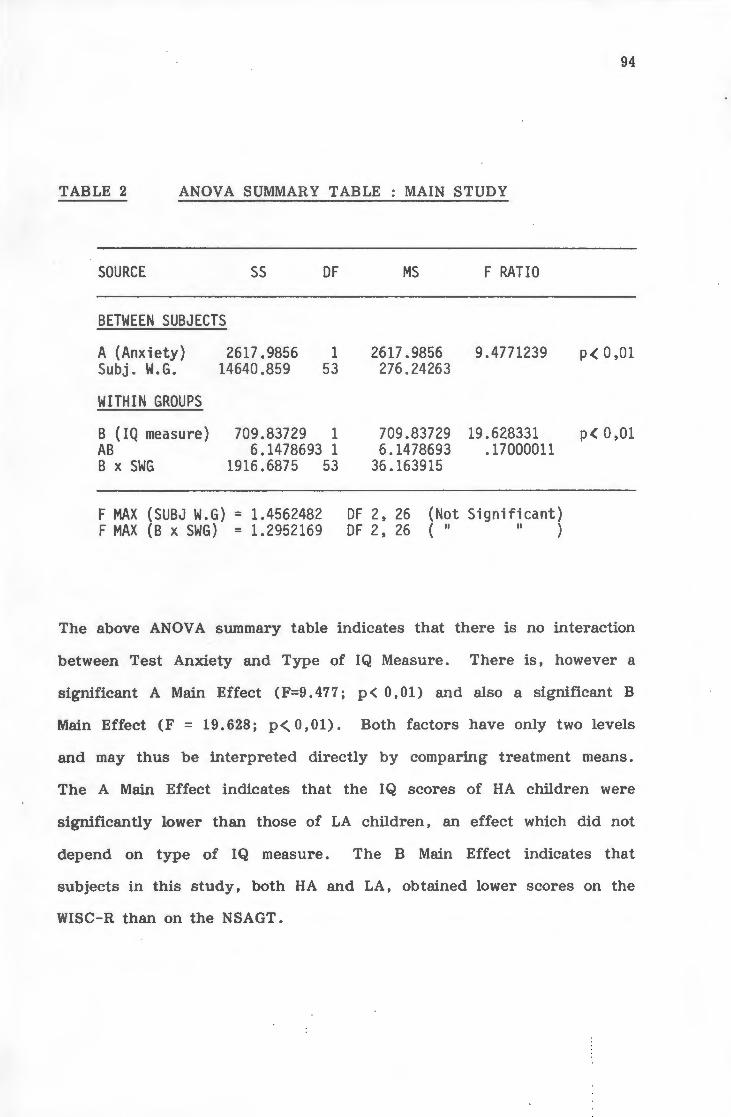
94
TABLE 2 ANOVA SUMMARY TABLE MAIN STUDY
SOURCE ss OF MS F RATIO
BETWEEN SUBJECTS
A (Anxiety) 2617.9856 1 2617.9856 9.4771239 p < 0,01 Subj. W.G. 14640.859 53 276.24263
WITHIN GROUPS
B {IQ measure) 709.83729 1 709.83729 19.628331 p< 0,01 AB 6.1478693 1 6.1478693 .17000011 B x SWG 1916.6875 53 36.163915
F MAX (SUBJ W.G) = 1.4562482 OF 2, 26 (Not Significant) F MAX (B x SWG) = 1.2952169 OF 2, 26 ( II II )
The above ANOVA summary table indicates that there is no interaction
between Test Anxiety and Type of IQ Measure. There is, however a
significant A Main Effect (F=9.477; p< 0,01) and also a significant B
Main Effect (F = 19.628; p<.0,01). Both factors have only two levels
and may thus be interpreted directly by comparing treatment means.
The A Main Effect indicates that the I Q scores of HA children were
significantly lower than those of LA children, an effect which did not
depend on type of IQ measure. The B Main Effect indicates that
subjects in this study, both HA and LA, obtained lower scores on the
WISC-R than on the NSAGT.

95
6.1.2 Hotelling's T 2 Tests
Further data analysis was conducted by means of Hotelling's T 2
tests comparing 6 variables: Verbal, Non-Verbal and Total
scores on the WISC-R and Verbal, Non-Verbal and Total scores
on the NSAGT, in the two groups, HA and LA at the High IQ
level and the Medium IQ level. It was not possible to perform
this test at the Low IQ level since in order to obtain valid
results the number of variables must not exceed the number of
subjects. Raw data of low IQ subjects may be found in
Appendices D and E.
TABLE 8: Means and Standard Deviations High IQ Level
WISC-R NSAGT Verba 1 Non-V Total Verba 1 Non-V Total
HIGH ANXIOUS 112.86 114.43 115.29 123.14 124.29 125.29 (4.78) (11.77) (8.56) (4.6) (9.84) (4.68)
LOW ANXIOUS 123.75 114 121.58 128.67 133.58 132.5 (8.31) {11.5) (9.26) (8.68) (7.05) (6.69)
TABLE 9: Vector of Mean Differences and Standard Errors
Mean -10.89 0.43 -6.3 -5.5 -9.3 -7.21 . ' Standard Error 1.67 2.66 2.07 1.72 1.87 1.49
t -6.52 0.16 -3.04 -4.33 -4.97 -4.84 t2 42.51* 0.026 9.26 18.76 24.73 23.42
T2 27.64 * F ratio 3.25* df 6 '17 T2crit 0,05 = 25.467 (*)
There was a significant difference between HA, HIQ and LA,
HIQ children overall, as indicated by t he T2 of 27.64
(p < 0, 05) . Inspection of the t 2 of each variable reveals that
only the WISC-R Verbal Scale is significant (p~ 0,05), while the
Non-Verbal Scale and Total Scale of the NSAGT almost reach
significance. In each case, HA, HIQ children score less than
LA,HIQ children. On the variable of the Non-Ver bal Scale of
the WISC-R, their performance is almost identical in respect of
means and standard deviations. The larges t standard
deviations are to be found in this variable, indicating that
there was considerable variation in performance on this Scale in
both HA and LA children of high intelligence . Of interest is
the fact that the difference between the groups is considerably
less on the WISC-R Total, being well below significance level
(t 2 9 . 26) , whereas on the NSAGT Total the difference is close
to the 5% significance level (t 2 = 23.42) .
96
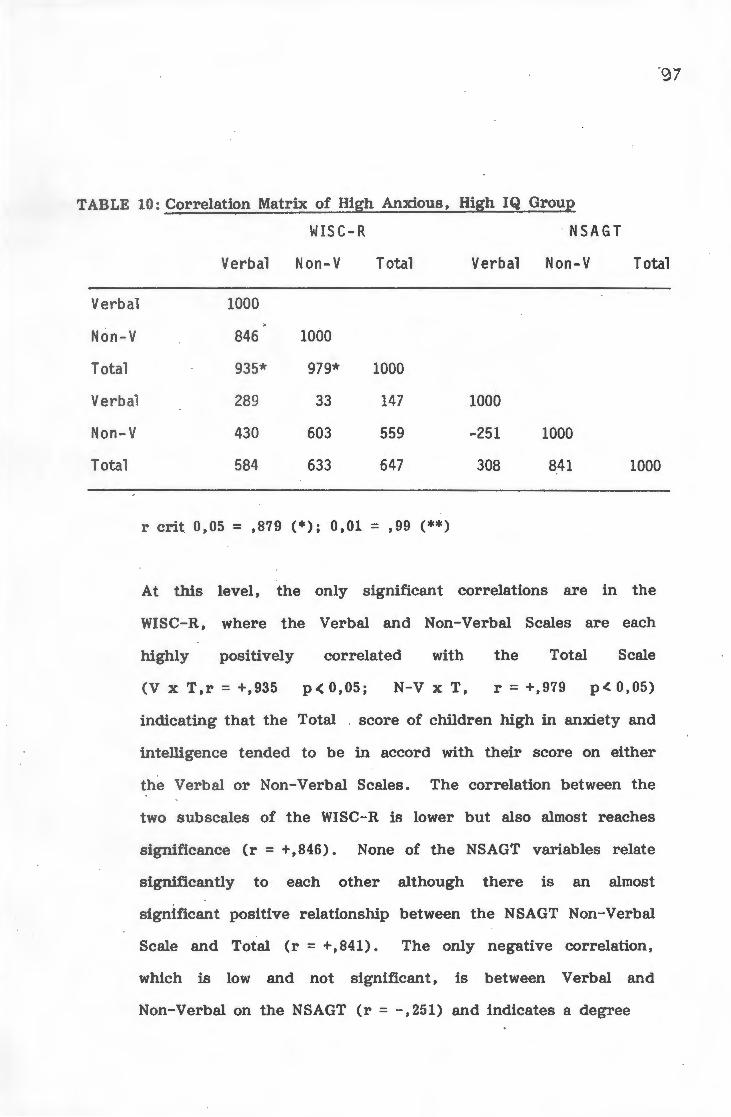
97
TABLE 10: Correlat ion Matrix of High Anxious, High IQ Grou12
Ver bal
Non-V
Tot al
Verbal
Non-V
Total
WIS C- R · NSAGT
Verbal Non-V Total Verbal Non-V Total
1000
846 1000
935* 979* 1000
289 33 147 1000
430 603 559 -251 1000
584 633 647 308 841 1000
r crit 0,05 = ,879 (*); 0,01 = ,99 (**)
At this level, the only significant correlations are in the
WISC-R, where the Verbal and Non-Verbal Scales are each
highly positively correlated with the Total Scale
(V x T,r = +,935 p< 0,05; N-V x T, r = +,979 p<.0,05)
indicating that the Total . score of children high in anxiety and
intelligence tended to be in accord with their score on either
the Verbal or Non-Verbal Scales. The correlation between the
two subscales of the WISC-R is lower but also almost reaches
significance (r = +,846). None of the NSAGT variables relate
significantly to each other although there is an almost
significant positive relationship between the NSAGT Non-Verbal
Scale and Total (r = +,841). The only negative correlation,
which is low and not significant, is between Verbal and
Non-Verbal on the NSAGT (r = -, 251) and indicates a degree

of discrepancy between performance on the two scales. The
Verbal Scale on the NSAGT bears the least degree of
relationship to the other Scales, which suggests that
performance on this scale by high anxious, high IQ children
bore little relationship to their performance on other scales.
Taken together, these correlations appear to indicate greater
consistency of performance on the WISC-R than the NSAGT by
such children.
TABLE 11: Correlation Matrix of Low Anxious, High IQ Group
W IS C- R ~ NSA G
Verbal Non-V Total Verbal Non-V Total
Verbal 1000 Non-V 343 1000 Total 763* e69** 1000 Verbal 326 483 507 1000 Non-V 432 870** 833** 4 ~. 6 100')
Total 414 786** 765* 853** 821** 1000 .
r crit, o,o5 = • 631 (*); 0,01 = ,765 (**)
Many more significant positive relationsh"ps are to be found
among the variables in the low anxious, high IQ group which
suggests more consistent performance. These children's Total
·performance on the WISC-R relates positively very significantly
to their performance on the Non-Verbal Scale (r = +,869**)

99
and significantly to that on the Verbal Scale of the test
(r = +, 763*). The same is true of their performance on the
NSAGT, with both subscales relating positively very
significantly to the Total (V x T, r = +,853**; N-V x T,
r = +,821**). Furthermore, their performance on both
Non-Verbal Scales is positively related very significantly
(r = +,870**) while the two Totals are also positively related
(r = +, 765). The lowest correlation in the matrix is to be
found between the two Verbal Scales (r = +,326) which suggests
that in LA, HIQ children these scales are not measuring the
same ability. The Verbal Scales also relate only moderately and
non-significantly to the Non-Verbal Scales of both tests
(WISC-R V x NSAGT N-V, r = +,432; NSAGT V x WISC-R N-V,
r = +,483). _
TABLE 12: Correlation Matrix Both Groups Combined
WIS C- R NSAGT
Verbal Non-V Total Verbal Non-V Total
Verbal 1000 Non-V 451 1000 Total 786** 905** 1000 Verbal 321 366 420 1000 Non-V 398 744** 705** 204 1000 Total 443 732** 729** 757** 785** 1000
r crit 0,05 = ,482 (•); 0,01 = ,606 (**)
In the two groups combined, the significant positive correlations
found in the Low Anxious group are again found, all reaching
the 1% level of significance. High IQ children who attained a
certain level of performance on the WISC-R Non-Verbal Scale
were most likely to attain the same level in the Total of that
test (r = +,905**), and their Verbal Performance was also
related to the Total although less strongly (r = +, 796**).
Positive correlations of similar strength are to be found between
the NSAGT Verbal and Total (r = +, 757**), Non-Verbal and
Total (r = +,785**) and between the two Totals (r = +,729**)
and two Non-Verbals (r = +, 744**) and WISC-R Total and
NSAGT Non-Verbal (r = +,70S**). These results indicate a
tendency on the part of high IQ children to perform with
reasonable consistency on both intelligence tests. No
correlation is lower than that between Non-Verbal and Verbal on
the NSAGT (r = +, 204).
100

A further comparison of the performance of HA and LA, HIQ
children was undertaken by analysis of the subtests of the
WISC-R.
TABLE 13: Means and Standard Deviations WISC-R Subtests
High IQ Level IQ
Verbal Non-Verbal
s A v c PC PA BD OA
High 11 12.86 11 11 15 10.57 10.29 14.14 14.29
Anxious (1) (1.57) (2.08) (.58) (2.38) (3.05) (2.21) (2.61) (2.69)
Low 13.33 15.67 13 12.42 14.92 11.83
Anx. (1.23) (1.97) (2.04) (2.61) (1.93) (1.9)
10.92
(3.2)
13.58 12.83
(2.23) (2.95)
TABLE 14: Vector of Mean Differences and Standard Errors
Mean - 2.33 - 2.81
Standard Error .26
**
.42
**
- 2 -1.42 .08 - 1.26 - .63
.47 .49 .48 .54 .66
** ** t - 8.96 - 5.98 -4.26 -2.9 0.17 - 2.33 - 0.955
** p<0,01 KEY
Verbal Scale Non-Verbal Scale
Information PC Picture Completion
s Similarities PA Picture Arrangement
A Arithmetic BD Block Design
v Vocabulary OA Object Arrangement
c Comprehension Cod Coding
.5 1.45
.54 .66
0.93 2.2
101
Cod
11.14
(3.02)
11.08
(2.61)
.06
.63
0.09
Only the t-scores of the above WISC-R subtests are of
relevance since there were too few subjects to permit a
meaningful Hotelling's T 2 test to he performed with 10
variables. Results indicate that HA children scored
significantly less on the subtests Information, Similarities, and
Vocabulary. (p < 0, 01) • The Non-Verbal Scale does not
differentiate between HA and LA HIQ children according to the
earlier Hotelling's T 2 test, therefore the t-scores on these
sub tests were not considered.
10.7.
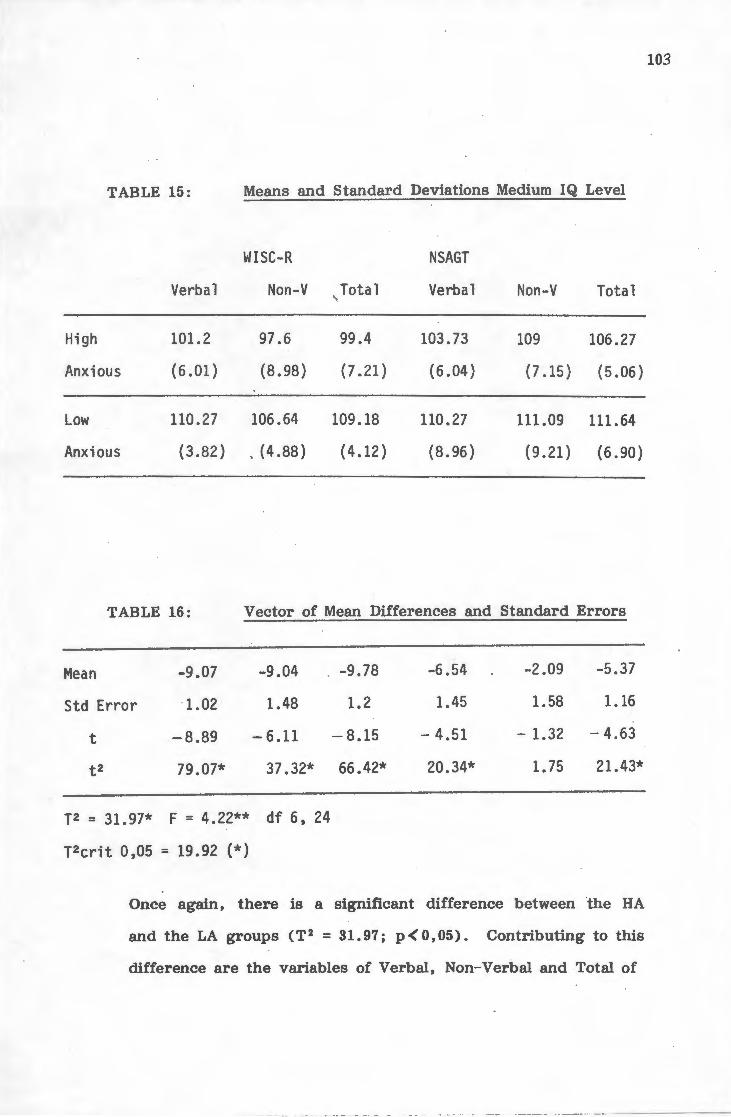
TABLE 15: Means and Standard Deviations Medium IQ Level
WISC-R NSAGT
Verbal Non-V , Total Verbal Non-V Total
High 101.2 97.6 99.4 103.73 109 106.27
Anxious (6.01) (8.98) (7.21) (6.04) ( 7 .15) (5.06)
Low 110.27 106.64 109.18 110.27 111.09 111.64
Anxious (3.82) ' ( 4.88) (4.12) (8.96) (9.21) (6.90)
TABLE 16: Vector of Mean Differences and Standard Errors
Mean -9.07 -9.04 -9.78 -6.54 -2.09 -5.37
Std Error 1.02 1.48 1.2 1.45 1.58 1.16
t -8.89 -6.11 -8.15 - 4.51 - 1.32 -4.63
t2 79.07* 37.32* 66.42* 20.34* 1. 75 21.43*
T2 = 31.97* F = 4.22** df 6, 24
T2crit 0,05 = 19.92 (*)
Once again, there is a significant difference between the HA
and the LA groups (T 2 = 31.97; p<0,05). Contributing to this
difference are the variables of Verbal, Non-Verbal and Total of
103

the WISC-R and Verbal and Total of the NSAGT. In each case,
HA,MIQ children performed significantly less well than their LA
counterparts. Only in the Non-Verbal Scale of the NSAGT did the
two groups perform in an equivalent manner (t2 = 1, 75). The t2
of the WISC-R variables (V = 79.07*; N-V = 37 .32*; T = 66.42*)
are considerably higher than those of the NSAGT Verbal (20. 34*)
and Total (21.43*) which indicates that HA, MIQ children
performed less well on the WISC-:R than the NSAGT, compared to
LA,MIQ children.
TABLE 17: Correlation Matrix High Anxious, Medium IQ Group
WISC-R
Verbal Non-V
Verbal 1000
Non-V 544 1000
Total 858** 894**
Verbal 481 265
Non-V 359 359
Total 596* 409
Total
1000
398
417
560*
Verbal
1000
NSAGT
Non-V
43 1000
754** 679*
Total
r crit 0.05 = 0.553 (*)
0.01 = 0.684 (**)
Correlations ·among the variables in the HA,MIQ group between the Verbal
and Non-Verbal Scales of the WISC-R and its Total are high, positive and
significant at the 1% level
(WISC-R V x T, r = +,858**; N-V x T, r = +,894**).
104
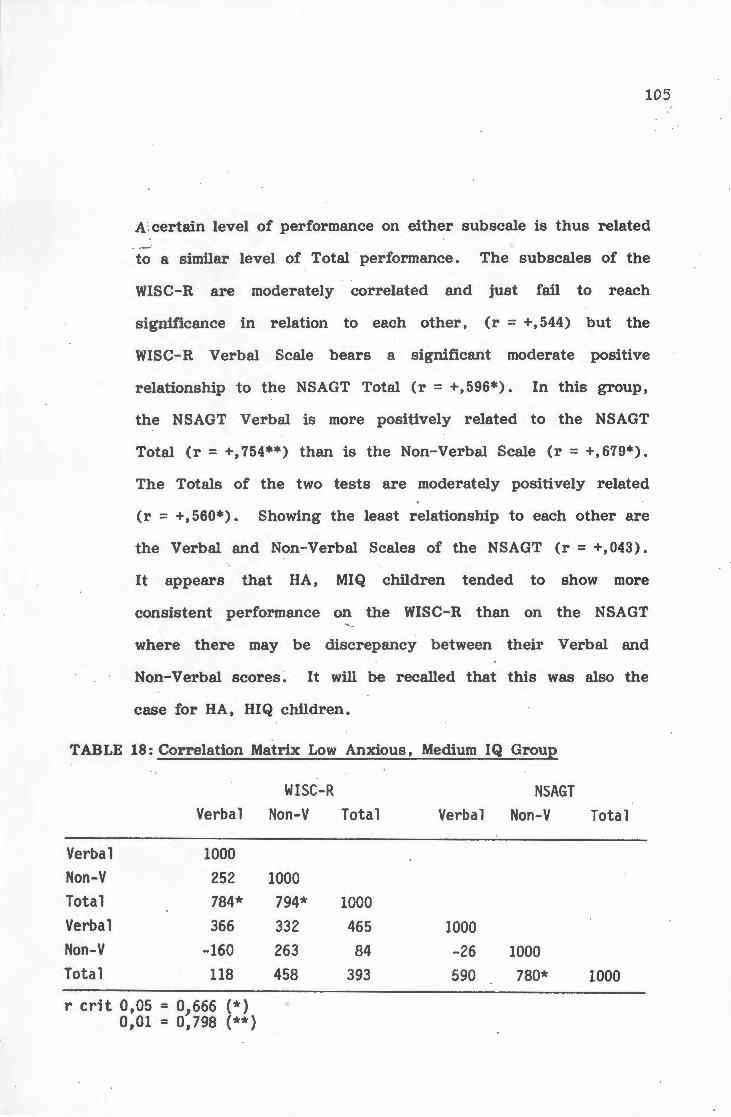
105
A . certain level of performance on either sub scale is thus related
to a similar level of Total performance. The sub scales of the
WISC-R are moderately correlated and just fail to reach
significance in relation to each other, (r = +,544) but the
WISC-R Verbal Scale bears a significant moderate positive
relationship to the NSAGT Total (r = +,596*). In this group,
the NSAGT Verbal is more positively related to the NSAGT
Total (r = +, 754**) than is the Non-Verbal Scale (r = +, 679*).
The Totals of the two tests are moderately positively related
(r = +,560*). Showing the least relationship to each other are
the Verbal and Non-Verbal Scales of the NSAGT (r = +,043).
It appears that HA, MIQ children tended to show more
consistent performance on the WISC-R than on the NSAGT
where there may be discrepancy between their Verbal and
Non-Verbal scores. It will be recalled that this was also the
case for HA, HIQ children.
TABLE 18: Correlation Matrix Low Anxious, Medium IQ Group
Verbal Non-V Total Verbal Non-V Total
WISC-R Verbal Non-V
1000 252 1000 784* 794* 366 332
-160 118
263
458
r crit 0,05 = 01 666 (*) 0,01 = 0,798 (**)
Total
1000 465
84 393
Verbal
1000 -26
590
NSAGT Non-V
1000 780*
Total
1000
106
There are few significant relationships between performance on
the various subscales and Totals among LA, MIQ children.
Again, there is an indication that performance on the WISC-R
showed greater consistency, with significant positive
relationships obtaining between Verbal and Total (r = +, 784*)
and Non-Verbal and Total (r = +794*). The Non-Verbal Scale
of the NSAGT relates significantly in a positive direction with
the NSAGT Total (r = +, 780), but correlates non-significantly
in a negative direction with both the NSAGT Verbal (r = -,26)
and the WISC-R Verbal (r = -,160) Subscales. The way a LA,
MIQ child performed on the Non- Verbal Scale of the NSAGT
obviously gave no indication of his or her performance on the
Verbal Scales. Low correlations between this subscale are also
found between it and WISC-R Non-Verbal (r = +,263) and
WISC-R Total (r = +,084) which, although in a positive
direction, again indicate little or no relationship between
performances.
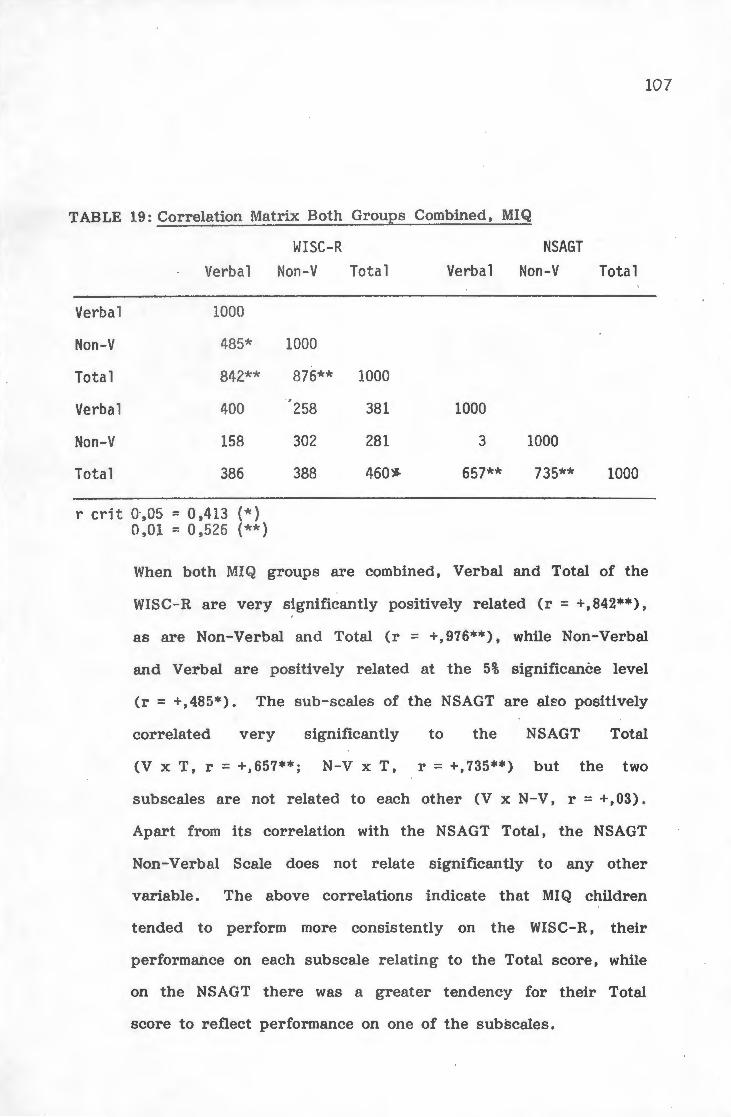
107
TABLE 19: Correlation Matrix Both GrOUJ2S Combined, Ml Q
WISC-R NSAGT Verbal Non-V Total Verbal Non-V Total
Verba l 1000
Non-V 485* 1000
Total 842** 876** 1000
' Verbal 40 258 381 1000
Non-V 158 302 281 3 1000
Total 386 388 460}'S. 657** 735** 1000
r crit 0·,05 = 0,413 (*) 0,01 ::: 0,526 ( *i<)
When both MIQ groups are combined, Verbal and Total of the
WISC-R are very significantly positively related (r = +, 842**),
as are Non-Verbal and Total (r = +, 976**), while Non-Verbal
and Verbal are positively related at the 5% significance level
(r = +,485*). The sub-scales of the NSAGT are aleo positively
correlated very significantly to the NSAGT Total
(V x T, r = +,657**; N-V x T, r = +,735**) but the two
subscales are not related to each other (V x N-V, r = +,03).
Apart from its correlation with the NSAGT Total, the NSAGT
Non-Verbal Scale does not relate significantly to any other
variable. The above correlations indicate that MI Q children
tended to perform more consistently on the WISC-R, their
performance on each sub scale relating to the Total score, while
on the NSAGT there was a greater tendency for their Total
score to reflect performance on one of the sub scales.

TABLE 20: Means and Standard Deviations WISC-R Subtest
Medium IQ Level
Verbal Non-Verbal
s A v c PC PA
High 9.6 11.13 9.33 10.4 10.87 18.93 9.47
Anx. (1.64) (2.07) ( 1 • 95) (1.59) ( 1 • 6) (2.74) (2.33)
Low 12 11.45 11.45 11 12.82 10.45 9.73
Anx. (1.41) (2.02) (2.34) (1) ( 1. 99) ( 1. 75) ( 2.1)
TABLE 21: Vector of Mean Differences and Standard Errors
Mean -2.40
Standard Error .304
**
-.321
.397
-2.12 -.6
.416 .27
** *
-1.95 -1.52 -.26
.348 .466 .438
** **
109
BD OA Cod
10 10.93 9.53
(3.44) 2.79) (2.26)
13.36 12 9.73
( 2. 01 ) (2.05) (2.61)
-3.36 -1.07 -.194
.575 .492 .474
** * t -7.899 -.809 -5.098 -2.22 -5.616 -3.26 -.595 - 5.85 -2.169 - .41
* p< 0,05 ** p < 0,01
KEY
Verbal Scale
Information
s Similarities
A Arithmetic
v Vocabulary
c Comprehension
Non-Verbal Scale
PC Picture Completion
PA Picture Arrangement
BD Block Design
OA Object Arrangement
Cod Coding
Previous analysis indicated that both Verbal and Non-Verbal
Scales of the WISC-R revealed a significant difference between
HA and LA medium IQ children. Inspection of the t-scores of
the WISC-R subtests, above, shows that there were differences
on the Information, Arithmetic and Comprehension at the 1%
level of significance and Vocabulary at the 5% level on the
Verbal Scale, while on th~ Non-Verbal Scale, Picture
Completion and Block Design showed differences which were
significant at the 1% level and Object Assembly at the 5% level.
In all these sub tests, HA children scored less than LA children
of medium IQ.
109
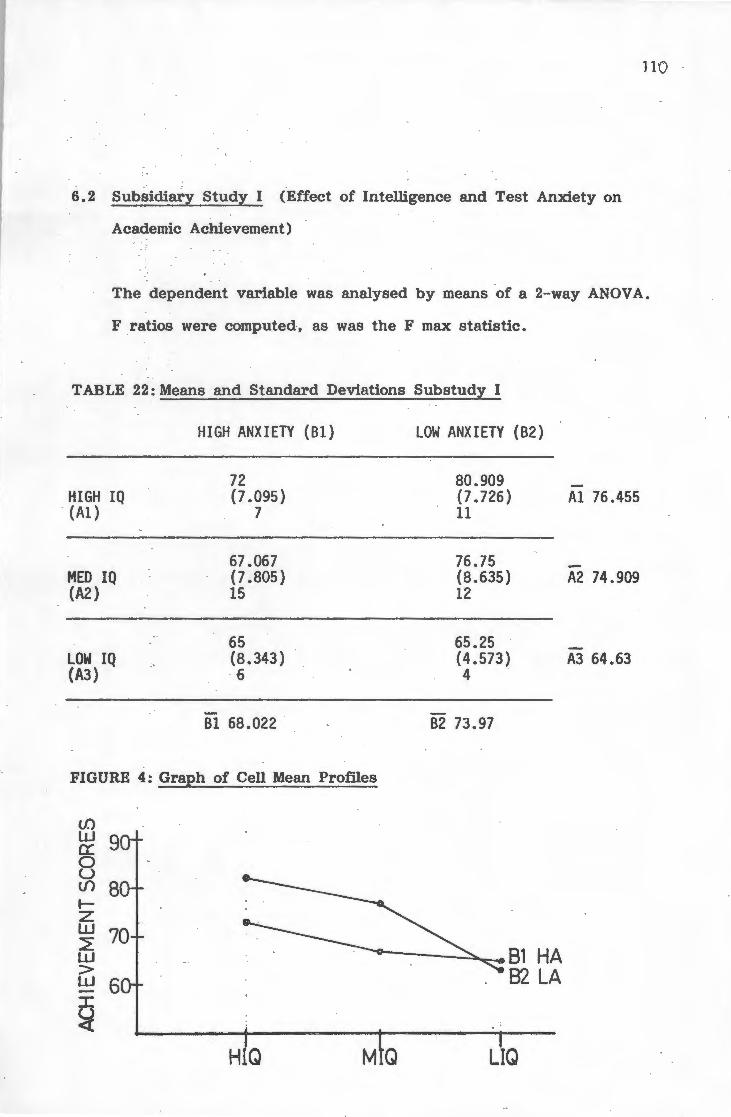
6. 2 Subsidiary Study I (Effect of Intelligence and Test Anxiety on
Academic Achievement)
110
The dependent variable was analysed by means of a 2-way ANOVA.
F ratios were computed, as was the F max statistic.
TABLE 22: Means and Standard Deviations Substudy I
HIGH ANXIETY (81) LOW ANXIETY (82)
72 80.909 HIGH IQ (7.095) (7.726) A1 76.455 (A1) 7 11
67.067 76.75 MED IQ (7.805} (8.635) A2 74.909 (A2) 15 12
65 65.25 LOW IQ (8.343} {4.573) A3 64.63 (A3) 6 4
81 68.022 82 73.97
FIGURE 4: Graph of Cell Mean Profiles
(.[) w 9 a: 0 u (/)
1-z w ~
81 HA w > 82 LA w 6 -I
~ HIQ MQ LIQ
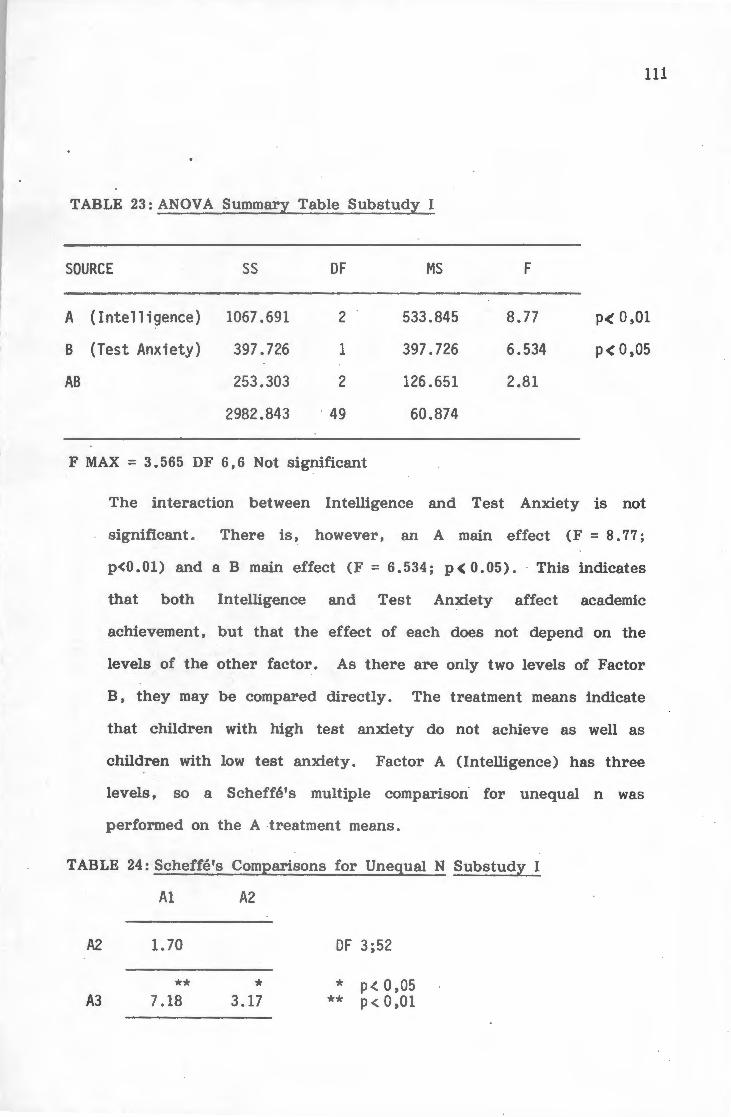
111
TABLE 23: ANOVA Summary Table Substudy I
SOURCE ss DF MS F
A (Intelligence) 1067.691 2
1
2
533.845
397.726
126.651
8.77
6.534
2.81
P< 0,01
p< 0,05 B (Test Anxiety) 397.726
253.303
2982.843
AB
' 49 60.874
F MAX = 3. 565 DF 6, 6 Not significant
The interaction between Intelligence and Test Anxiety is not
significant. There is, however, an A main effect (F = 8. 77;
p<O. 01) and a B main effect (F = 6. 534; p < 0. 05). This indicates
that both Intelligence and Test Anxiety affect academic
achievement, but that the effect of each does not depend on the
levels of the other factor. As there are only two levels of Factor
B, they may be compared directly. The treatment means indicate
that children with high test anxiety do not achieve as well as
children with low test anxiety. Factor A (Intelligence) has three
levels, so a Scheffe's multiple comparison for unequal n was
performed on the A treatment means.
TABLE 24: Scheffe's Comparisons for Unequal N Substudy I
A1 A2
A2 1.70
** * A3 7.18 3.17
DF 3;52
* p<0,05 ** P< 0,01

ll2.
Scheffe's ' comparisons indicate that there is no significant
difference in achievement between children of high and medium IQ
levels. (Scheffe's: 1. 70) There is a significant difference
between medium and low I Q children ( Scheffe 's: 3 .17) and a highly
significant difference between high and low IQ children in terms of
their scholastic achievement (Scheffe's: 7 .18**).
6.3 Subsidiary Study II Effect of Intelligence and Test Anxiety on
Self-Concept.
Again, the dependent variable was analysed by means of a 2-way
AN OVA. F ratios and the F max statistic were computed.
TABLE 25: Means and Standard Deviations Substudy II
HIGH ANXIETY (B1) LOW ANXIETY (B2)
HIGH IQ 54.57 63.67 A(l) (12.75) (6.96) A1 59.12
7 11
48 61.27 MED IQ (12.19) (13 .62) A2 54.64
(A2) 15 12
48 53.25 LOW IQ (10.73) (15.65) A3 50.63
(A3) 6 4
·-81 50.19 82 59.4
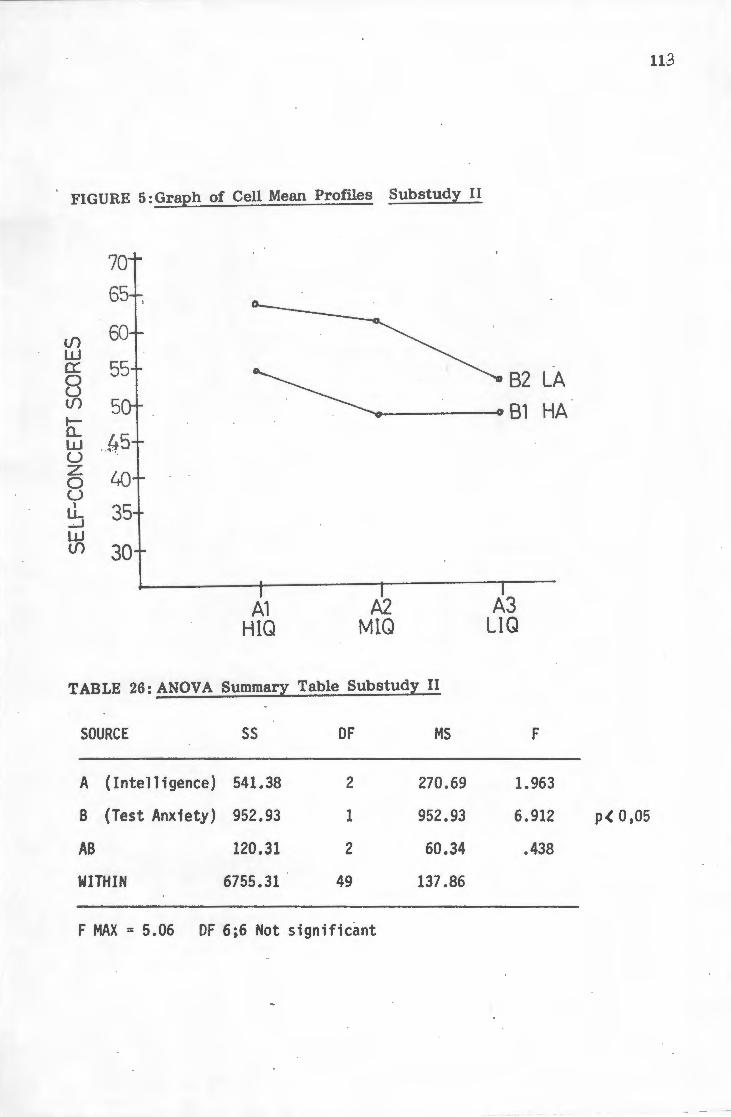
FIGURE 5: Graph of Cell Mean Profiles Sub study II
<f) w 0:::
8 <f)
tL w u z 0 u t.L _J
w <f)
A1 HIQ
A2 MlQ
TABLE 26: ANOV A Summary Table Substudy II
SOURCE ss OF MS
A (I nte 11 i gence) 541.38 2 270.69
B (Test Anxiety) 952.93 1 952.93
AB 120.31 2 60.34
WITHIN 6755.31 49 137.86
F MAX = 5.06 OF 6;6 Not significant
82 LA
81 HA
A3 LIQ
F
1.963
6.912
.438
113
p< 0,05
114
The AB interaction is not significant, indicating that Intelligence
and Test Anxiety do not interact in their effect on self-concept.
Intelligence has no effect on self-concept but Test Anxiety does
have a significant effect (F = 6. 912; p( 0 ,05). HA children thus
have a poorer self-concept than LA children regardless of
intelligence level.
6. 4 Relationship of Variables
In order to obtain an overall view of the relationships between
relevant variables in the two groups of subjects when combined, a
simple correlation matrix was undertaken with the following six
variables:
The NSAGT, the WISC-R, the TASC, the Piers-Harris Self-Concept
Scale, the DSC, Academic Achievement, Age and Sex.
~-

U5
TABLE 27: Simple Correlation : Means and Standard Deviations
VAR NO MEAN SDEV
1 NSAGT . 113.33928 14.51308
2 iHSC-R 108.17857 11.762976
3 TASC 15.33928 9.491195
4 S-C 54.857142 12.924154
5 DSC 9.464285 4.06745
6 ACH 72.196428 9.56588
7 AGE 8.214285 5.0153
8 SEX 1.535714 .50323
VARIABLE 1 = New South African Group Test (NSAGT)
VARIABLE 2 = Wechsler Intelligence Scale for Children (WISC-R)
VARIABLE 3 = Test Anxiety Scale for Children (TASC)
VARIABLE 4 = Piers-Harris Self-Concept Scale for Children (S-C)
VARIABLE 5 = Defensiveness Scale for Children (DSC)
VARIABLE 6 = Academic Achievement (ACH)
VARIABLE 7 = Age as deviation score (see 5.2.6)
VARIABLE 8 = Sex (Girls scored 2, boys scored 1)
Inspection of the means and standard deviations of these variables
indicates that this combined group of HA and LA children displays
bright-average intelligence on the NSAGT (Mean = 113.34, SD
14.51), and a somewhat lower mean score on the WISC-R, with less
variation (Mean 108 .18, SD 11.76). The T ASC mean and standard
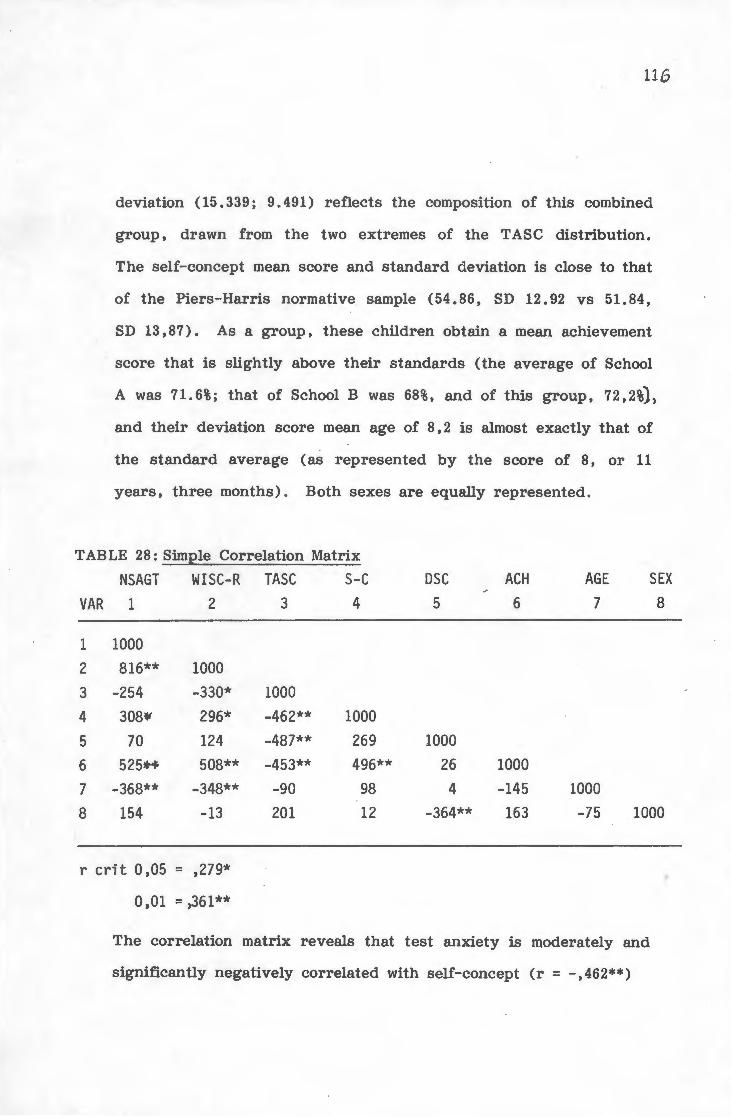
116
deviation (15. 339; 9. 491) reflects the composition of this combined
group, drawn from the two extremes of the TASC distribution.
The self-concept mean score and standard deviation is close to that
of the Piers-Harris normative sample (54. 86, SD 12.92 vs 51.84,
SD 13,87). As a group, these children obtain a mean achievement
score that is slightly above their standards (the average of School
A was 71.6%; that of School B was 68%, and of this group, 72,2%),
and their deviation score mean age of 8, 2 is almost exactly that of
the standard average (as represented by the score of 8, or 11
years, three months). Both sexes are equally represented.
TABLE 28: SimJ2le Correlation Matrix
NSAGT WISC-R TASC S-C DSC ACH AGE SEX VAR 1 2 3 4 5 6 7 8
1 1000
2 816** 1000
3 -254 -330* 1000
4 308¥ 296* -462** 1000
5 70 124 -487** 269 1000
6 525*-'f 508** -453** 496** 26 1000
7 -368** -348** -90 98 4 -145 1000
8 154 -13 201 12 -364** 163 -75 1000
r crit 0,05 = ,279*
0,01 = ,361**
The correlation matrix reveals that test anxiety is moderately and
significantly negatively correlated with self-concept (r = -, 462**)
ll7
and academic achievement ( r = -, 453 **) , which is as expected.
Test anxiety bears a low negative correlation to both IQ measures
(NSAGT x TASC, r = -,254; WISC-R x TASC, r = -,330*).
Contrary to expectations, the negative relationship between test
anxiety and the individual IQ measure is thus somewhat the
stronger, and reaches the 5% level of significance. These
relationships indicate that the HA child tends to have a lower
self-concept, achieves less well, and ·scores
an I Q test, than the LA child.
somewhat less on
The IQ measures are very significantly and strongly positively
re1.ated to each other (r = +,816**) and very significantly
moderately positively correlated to academic achievement (NSAGT x
ACH, r = +,525**; WISC-R x ACH, r = +,508**). There is
t herefore a strong tendency in this group for children to perform
very similarly on the two IQ measures in terms of rank order, but
their academic achievement is somewhat less consistent with their
IQ performance although there is a tendency for high achievers to
score high on IQ measures and vice versa.
Low positive significant correlation between self-concept and the IQ
measures (NSAGT x s-c, r = +,308*; WISC-R x s-c, r = +,296*)
and a higher positive significant correlation between self-concept
and academic achievement (r = +,496**) indicates that, not
unexpectedly, there is a trend for children's views of themselves

11'3
to be more closely related to classroom performance for which they
receive feedback than to IQ measures for which they receive no
indication how they have performed.
There is a low positive, but non-significant, ' correlation between
sex and test anxiety (r = +, 201) which as girls were scored 2 and
boys 1 indicates that girls have slightly higher levels of test
anxiety than boys, which is in accordance with previous research
findings. Also in accordance with previous findings is that a
significant number of boys are more defensive than girls (Sex x
DSC, r = -, 364++). Sex has a very low positive correlation with
achievement (r = +).63) and the NSAGT (r = +,1.54) indicating a
very slight tendency for girls to achieve better than boys and
score more on the group IQ test. Sex is not related to the
WISC-R, s~lf-concept nor age as shown by correlations below
approximately ,10. Age is very significantly and moderately
related to IQ scores, with younger children tending to score high
(NSAGT x Sex, r = -,368; WISC-R x Sex, r -,348), but is not
related to test anxiety, self-concept or defensiveness.
The moderate, highly significant negative relationship between test
anxiety and defensiveness (r = -487++) is the same as that usually
found tn research of this nature (Dusek, 1980) indicating that the
highly defensive chUd tends to admit to less test anxiety.
Means and Standard Deviations of IQ data for boys and girls
separately are given in Appendix F and will be discussed in
Chapter 7.
H9
CHAPTER SEVEN
7 DISCUSSIONS AND CONCLUSIONS
It was predicted in the main study that HA children at three levels
of intelligence. would perform less well than LA children on the
NSAGT, a group measure of intelligence, but show comparable
performance on an individual IQ measure, the WISC-R. It was
suggested that such results would support the Sarason et al (1960)
(Hill & Sarason, 1966) argument that test anxiety is the
aetiologically significant factor in the negative relationship
commonly found between test anxiety and intelligence in children.
Since the results will be discussed in reference to this argument,
it is useful to recap it here. The Sarason argument rests on two
main grounds: firstly, intelligence tests correlate differently with
the TASC, the more "test-like" te~ts showing stronger negative
correlations with test anxiety; secondly, children matched for
intelligence level but varying in level of test anxiety perform
differently on intellectual tasks, the HA children performing less
well than LA children, even in intellectually superior groups.
120
The evidence failed to provide unequivocal support for the above
argument. In the 2-way ANOV A there was no interaction between l~vel
of anxiety and type of IQ measure. Instead, test anxiety showed a
main effect in lowering IQ test scores of HA children, an effect which
did not depend on type of IQ measure. Contrary to the hypothesis
that the WISC-R would show a weaker negative relationship, or no
relationship, to test anxiety, the simple correlation matrix revealed that
the WISC-R was significantly negatively related to test anxiety to a
greater degree than the NSAGT. However, this study supported the
premise that children matched for intelligence level but differing in
level of test anxiety perform differently on intellectual tasks: HA
subjects obtained lower scores than LA subjects, at the High and
Medium IQ levels, as shown by the Hotellings T 2 tests.
The most probable explanation for these results is that the two
intelligence tests did not differ in their capacity to arouse test
anxiety. It appears that the WISC-R, given under standardised
conditions, was as anxiety-provoking as the NSAGT to HA children
in spite of the advantages of the one-to-one testing situation and •
efforts to establish rapport between tester and testee, with the
result that the performance of such children was impaired. In the
light of the known susceptibility of HA children to social-evaluative
cues (Wine, 1980), this is, perhaps, not surprising. Indeed, it
may have been naive to assume that a well-established pattern of
1.2i
cognitive and attentional responses would not come into operation in HA
children in what was clearly an evaluative situation.
An alternative explanation, that less able children have become test
anxious as a result of poor performance, is not very credible in this
group of HA children whose mean NSAGT score is 108.27 (SD 12.27).
Of these, 7 fall in the High IQ level, 15 in the Medium IQ level and
only 6 obtained less than 100. Thus there is no overrepresentation of
low IQ children to account for the difference. At the same time it
should be noted that it was never disputed by Sarason et al (1960),
and is not disputed here, that some HA children have become so as a
result of their inability to perform successfully at intellectual tasks of
various kinds especially at lower intelligence levels. The contention is
that in the majority of HA children, the direction of cause and effect is
the opposite, with test anxiety as the major aetiological factor.
Manipulation of the evaluative-stress dimension of IQ tests has in
the past been confined to group tests (e.g. Lighthall, Ruebush,
Sarason and Zwibelson, 1959; Milgram and Milgram, 1977; Sarason
et al, 1960; Zwibelson, 1956). The Zwibelson (19!>6) study, for
example, compared the relation of the TASC to the Davis-Eels
Games and the Otis tests, the former being much less "test-like"
than the latter, having no time limits nor reading requirements,
and having substantial provision for praise and reassurance. Yet
122
even in this study the difference between Test Anxiety vs
Otis-Beta r of -. 24 and the Test Anxiety vs Davis-Eels r of -.14
was only significant at the 10% level, although there was a
difference which was significant at the 5% level between Test
Anxiety vs Otis-Alpha r of -. 28 and the Test Anxiety vs
Davis-Eels r of -.14 . Lighthall et al (1959) found that LA
children gained more over time on the Otis Beta than HA children,
but HA children gained significantly more over time on the
Davis-Eels than the LA children, indicating that the performance
of HA children appears to have been facilitated on the latter test.
Quite possibly, the performance of LA children was lowered by the
very qualities of the Davis-Eels Games that facilitated HA
children's performance: there is considerable evidence to show
that manipulations designed to eliminate evaluative stress have a
detrimental impact on the performance of LA individuals
(I Sarason, 1972). Such a situation could make the Davis-Eels
Games as unsatisfactory for educational testing purposes as a test
that arouses high levels of . test anxiety in susceptible children.
On balance, it would appear that the attempt to minimise evaluative
stress by using the Davis-Eels Games is not particularly effective
in facilitating performance in HA children and may be detrimental
to the-performance of LA children.
Another attempt to determine the effect of evaluative stress on test
performance was French's (1962) study comparing performance of
123
high school students on the Scholastic Aptitude Tests under
"regular" and "relaxed" conditions. When he found no difference
between the two, he concluded that test anxiety did not affect
performance. However, an alternative explanation might be that
his treatment condition was too weak to alleviate anxiety. This is
very probable, since his "relaxed" condition consisted of informing
students that results would not be sent to colleges, but would be
sent to their schools - not a particularly reassuring condition.
Although French was looking at performance on a general
achievement battery, not an IQ test, the SAT falls between
course-oriented achievement tests and IQ tests proper, and
therefore his findings may reasonably be included in this
discussion .
Milgram and Milgram (1977) investigated the effects of test content
and context on the anxiety /intelligence relationship by
administering a group intelligence measure, comprehension of
cartoons, presumed to be free of anxiety-provoking cues, to 177
elementary schoolchildren in Tel Aviv, together with two widely
used conventional group intelligence tests. The "anxiety-free"
test correlated with the conventional tests at around . 50, as highly
as the latter did with each other. Results showed that a negative
relationship obtained between test anxiety and the Humour
Comprehension Test of the same magnitude as between test anxiety
and the other group IQ measures (-. 22 for boys and ~. 24 for
124
girls). There appeared to be evidence that the children did not
find the Humour Comprehension test anxiety-provoking: they
reported high funniness ratings and appeared to enjoy taking the
test.
Milgram and Milgram concluded that their results supported the
less widely-held view that less intelligent children are more test
anxious than more intelligent children regardless of the test stimuli
used in measuring intelligence. They cited as additional support
their earlier findings that mean anxiety scores for average children
were twice as high as for children with IQ's of 140 (Milgram &
Milgram, 1976). They did, however, suggest that intelligence
level and anxiety level were aetiological variables in dynamic ·
interaction. They left open the question why test context did not
affect the magnitude of the anxiety-intelligence relationship and
recommended further research.
Reinterpretation of the above results is, however, possible. They
may indicate that the high anxious children were not deceived as
to the true purpose of the Humour Comprehension Test which was
to evaluate them, and responded with the pattern of cognitive and
attentional deficits which accompany .raised levels of test anxiety.
Such deficits may have a considerable effect on humour
comprehension, which depends partly on appreciation of visual
cues. Research on cue utilization, reviewed earlier, indicates that

1Z5
HA children display reduced or altered cue utilization, which could
appreciably lower their scores on such a measure. It is thus
possible to reinterpret the findings of the Milgram and Milgram
(1977) study as · indicating an ineffectual treatment condition.
Moreover, these researchers' comparison of mean test anxiety
scores in average and gifted children (1976) is misleading. Such
mean scores do not indicate the scores of individual high IQ
children, some of whom might have suffered debilitating levels of
test anxiety. Indeed, the fact that such a gifted group was test
anxious at all is an unexpected finding if intelligence is the major
aetiological variable.
There appears to have been a tendency on the part of researchers
to interpret findings bearing on the test anxiety-intelligence
relationship as supporting the major role of either one or the other
variable. It is suggested that it is possible to reinterpret all
these findings as supporting a cognitive-attentional theory of
debilitating test anxiety, which is more reliably elicited in
evaluative situations than anticipated.
This leads to the conclusion that by mid-childhood it may be
impos~ible to test a HA child's intellectual abilities in a way that
does not arouse levels of test anxiety high enough to impair
performance. S Sarason and colleagues found that intelligence and
test anxiety were not related in first grade, but that a significant

126
low negative correlation developed by the middle of the elementary
school years, increasing to -. 3 to -. 4 by the fifth to sixth grade
(Hill and Sarason, 1966). Thus, while the effects of test anxiety
appear not to impair IQ test performance in the child who has just
started school, this may be because test anxiety is not yet reliably
elicited in the IQ testing situation, which such a young child may
not perceive as evaluative. Children rapidly learn the significance
of various kinds of formal tests, however, and as hypothesized in
the proposed model of the development of test anxiety (Chapter
4: 1), an interactive process may lead to increasing levels of test
anxiety and progressive impairment of performance.
It would appear that any attempt to vary educational IQ testing
with the aim of reducing evaluative stress would be unsuccessful,
especially since IQ tests are required to be administered under
standardized conditions. If accurate assessment of IQ in HA
schoolchildren is not possible, it becomes very important to obtain
some measure of test anxiety to be read in conjunction with I Q
data. The Test Anxiety Scale for Children, which is simple,
quick, and economical to administer in the classroom situation,
appears to be an ideal adjunct to educational testing as currently
conducted in our schools, and deserves serious consideration.
While the ANOV A revealed only that the effect of test anxiety was
to lower performance on both the NSAGT and the WISC-R, further
127
statistical analyses showed that the differences between HA and LA
children were not the same on the two tests, nor were they the
same at different levels of intelligence. As there were too few
children in the low IQ level to furnish ·valid results, discussion
will be confined to high and medium IQ levels.
At the high IQ level, the variable which contributed the most to
the significant overall difference between HA and LA children was
the Verbal Scale of the WISC-R. HA children performed much less
well than LA children on this scale with significantly lower scores
on the subtests Information, Similarities, Arithmetic and
Vocabulary. The Information subtest is the "icebreaker" and so
may be particularly prone to the effect of anxiety; moreover, the
questions on this subtest are similar to testing of school subject
material so it may cue evaluation anxiety in children with a record
of poor school performance. The Similarities sub test measures the
ability to abstract and questions are scored 0, 1 or 2 according to
the level of abstraction achieved. Accordingly, a score might
consist of mostly 1 's which would indicate fairly mediocre calibre,
or it might be made up of an unpredictable proportion of credits
which would indicate more potentialities and possibilities. As might
be expected, high anxious, high I Q children displayed the latter
pattern, a possible consequence of their anxiety. The Arithmetic
subtest is thought to be affected by poor attention and
distractibility caused by the invasion of anxiety into the thinking
12.8
process (Glasser & Zimmerman, 1967). The Vocabulary subtest,
related as it is to learning ability and educational achievement and
opportunity, is a good indicator of scholastic performance. The
results of Substudy A indicated clearly that high anxious high IQ
children achieved less well than low anxious high I Q children, so
that lower performance on Vocabulary seems not unexpected.
The Non-Verbal Scale of the WISC-R did not differentiate between
HA and LA high IQ children; the mean score of both groups was
virtually identical and both showed the greatest degree of variation
on it. On the NSAGT there was a difference that almost reached
significance on the Non-Verbal Scale, with HA children scoring
less. A slightly lower but similar difference existed on the Verbal
Scale. Interestingly, there was considerably less difference
between the Total scores of HA and LA high IQ children on the
WISC-R th,an on the NSAGT, a finding that is in line with the
original hypothesis that HA children would perform better on the
individual IQ measure. On the whole, HA high IQ children
performed somewhat more consistently on the WISC-R than on the
NSAGT, but much less consistently than their low anxious
counterparts.
The medium IQ level displayed · a different pattern. Here, HA
children performed significantly less well than LA children on the
Verbal, Non-Verbal and Total of the WISC-R, and the Verbal and
12.9
Total of the NSAGT. Only on the Non-Verbal of the NSAGT did
they achieve comparable results. Scrutiny of the subtests of the
WISC-R revealed that on the Verbal Scale HA medium IQ children
scored less on Information, Arithmetic, Comprehension and
Vocabulary, while on the Non-Verbal Scale they did less well on
Picture Completion, Block Design and Object Assembly.
Information, Arithmetic and Vocabulary subtests have already been
considered in relation to HA high IQ children. The Comprehension
subtest is thought to give some knowledge of a child's coping
ability as well as his interest in coping. While low scores may
have a number of meanings, perhaps the one which is most
relevant to this discussion is over-dependency, a trait thought to \
be characteristic of HA children, the evidence for which has been
reviewed. Picture Completion calls for visual indentification of
familiar items, and the further capacity to identify and isolate
essential from non-essential details. Attention and concentration
are therefore important elements in the test. High levels of test
anxiety appear to impair both as well as leading to changes in cue
utilization which could also affect performance on this test. Low
performance on Block Design could be attributable to problems with
perception , abstraction, visual-motor reproduction or spatial
orientation. However, anxiety could lead to excessive activity or
failure to become aware of errors. Object Assembly calls for the
ability to see spatial relationships , as does Block Design, but on
this subtest the child does not match a pattern but
130
has to work out in advance what he is constructing. Anxiety
could result in lack of flexibility or readiness to give up and
aimless behaviour to offset feelings of helplessness.
Overall, differences between HA and LA medium IQ children
increased on the WISC-R compared to the NSAGT, with somewhat
more consistent performance being evidenced on the · WISC-R by
both.
It is necessary to consider what the effect of sex as a variable
might have been had there been sufficient subjects to permit its
inclusion. The means and standard deviations of IQ data of boys a.vul.. ho ~ 'i e. ¥e<.. Co~~~· n <2.J )
and girls separate!~ have been included in Appendix F. From
these certain trends may be discerned.
Firstly, all the HA, HI Q subjects were girls (n = 7) , while half of
the LA, HIQ subjects were girls (n = 6). It appears that while
there was a difference between them on the NSAGT, with the HA
girls scoring less, this difference disappeared on the WISC-R
although there was more variation in performance on the part of
131
the HA girls. This appears to support the original hypothesis
that performance of HA children would be facilitated on an
individual IQ measure. Since there were no HA, HIQ boys, it is
impossible to speculate what their performance would have been,
but LA,HIQ boys maintained high performance on the WISC-R,
dropping much less than LA,HIQ girls. It appears that the
inclusion of sex as a variable at the high intelligence level might
have led to somewhat different results, interpretations and
conclusions .
A possible explanation for the different anxiety and performance
pattern of high intelligence boys and girls might lie in a study
which · analyzed the contingencies of evaluative feedback in the
classroom (Dweck, Davidson, Nelson & Enna, 1978). It was found
that negative feedback for boys centred around conduct and
nonintellectual aspects of work, which together with teachers'
motivational attributions for boys'
indicative of nonintellectual factors.
however, was very specifically
failure, made failure more
Negative feedback for girls,
addressed to intellectual
inadequacies on their academic work, and their motivation was not
called into question. Failure feedback thus appeared to be an
objecti,ve assessment of their ability. Essentially the opposite
pattern occurred with positive feedback, being interpreted as an
assessment of ability by boys. Over time this could lead to
impaired self-confidence, raised levels of anxiety and lower
132-
performance even· in high ability girls. Dweck and Wortman (1982)
suggest that this may be why girls lose their earlier edge over
boys and fall progressively behind them in achievement over the
school years.
While sex may be seen as a confounding variable in this study at
the high IQ level, this does not appear to be the case at the
middle and low IQ levels. Comparison of the means and standard
deviations for boys and girls separately, given in Appendix F , -pa.c:ae. I ,
with those given for both sexes together in Append he F)
pQC;j€.- 2 > show virtually no differences. It may therefore be
concluded that at these IQ levels sex does not appear to confound
the results and its inclusion as a variable would not have altered
the interpretations and conclusions as offered.
Before leaving the main study to consider the subsidiary studies,
there is one further point of interest that emerged .in adminis
tration of the WISC-R. As this test is not standardised for South
African children, it cannot be compared directly with the NSAGT
in regard to IQ scores although both have a mean of 100 and a
standard deViation of 15. However, it is worth noting that results
of tnis study indicate a narrower range of scores on the WISC-R,
with the means of the low and high IQ groups being 99.17 and
118.43 respectively on the WISC-R, whereas the comparable figures
for the NSAGT were 94.5 and 128.6. In general, it appears to be
133
more difficult to obtain a high score on the WISC-R, especially one
over 130, while more children obtained such a score on the
NSAGT. The administrator of the WISC-R observed that there
were three children who were clearly outstanding in performance
· on the test. They were also remarkable for their general poise
and maturity. The WISC-R thus appears to differentiate among
high IQ children in a way that the NSAGT does not do.
Turning now to the subsidiary studies, it may be said that both
yielded clear-cut results in the expected direction. Academic
achievement was affected by both intelligence level and level of
test anxiety although the effect of each did not depend on the
levels of the other. HA children did not achieve as well as LA
children, a finding which supports the body of test anxiety
literature. However, there was an indication that HA, low IQ
children achieved slightly better than their LA counterparts, which
could indicate that their actual level of ability was higher. This
was not significant, probably as a result of the few children in the
low IQ level, but could be cautiously interpreted as a trend. The
effect of intelligence on achievement was that there was no
significant difference between children of high and medium IQ.
There was, however. a highly significant difference between high
and low IQ children, and a significant difference between medium
and low I Q children. The findings suggest that above a certain
level IQ may not be as important as other factors, such as freedom
1 '~4 .. . .-.4 .
from anxiety and diligence in obtaining a good level of achievement
in the elementary school. The correlation matrix, which yielded a
positive ·and highly significant but only moderate correlation of the
NSAGT with achievement would appear to lend support to this
conclusion.
The effect of level of intelligence and test anxiety on self-concept
was included in this study because it was considered to be an
indication of the self-attributions and expectations of the HA child.
Results were as expected: intelligence did not have an effect on
self-concept scores, but test anxiety had an overall effect, HA
children having poorer self-concepts than LA children. The
findings lend some support to the hypothesis that views of the self
are based on feedback received from others, and therefore relate
more closely to academic achievement (as shown in the correlation
matrix), which is direct feedback. IQ scores are not divulged to
the children and it seems their effect may be more subtle,
operating through the medium of teacher attributions and
expectations. The effect of anxiety on self-concept might be
conceptualised as follows: anxiety lowers achievement, achievement
lowers self-concept, which in turn increases anxiety and so on in
a self-defeating · circle. At the same time, anxiety lowers I Q
scores, which results in lower teacher expectations which are
communicated in various ways and serve to further lower
self-esteem. The moderate, positive and very significant
13.5
relationship between self-concept and achievement shown in the
simple correlation matrix (Table 28) indicated that the way children
performed scholastically , played an important part in the way they
felt about themselves, although the Piers-Harris Self-Concept scale
includes questions about children's feelings on much wider aspects
of themselves. This moderate, positive and significant relationship
has been found in several correlational studies of children's
self-concepts and academic achievement (e.g. Bledsoe, 1967);
Brookover, Thomas & Paterson, 1964; Epps, 1969; Rosenberg &
Simmons, 1973).
Before reaching final conclusions based on the findings of this
study, it is important to evaluate it and suggest ways it could
have been improved. The major defect was that there were too
few subjects to permit equal allocation to the various levels of
intelligence .and anxiety. This insufficiency was most marked at
the low IQ level for both HA and LA groups, and also the HA,
high IQ group, where, in addition, the 7 subjects were all girls.
This had various consequences. One of the assumptions of the
ANOVA, the homogeneity of variance, may be violated where there
are unequal cell sizes, ~vc.h · Q."'5 e-~L~ted \...-, tine. -suboi,d ia.ry
stuclies. While Young and Veldman (1963) have shown that
even considerable departures from homogeneity of variance have
relatively Uttle influence on the ANOV A, it was decided to compute
the F max statistic as a check. It was not significant in any of the
statistical analyses, therefore it may be concluded that homogene~ty of
variance was not violated, and that the computed F ratios may be
accepted as valid. A major consequence of insufficiency of subjects was
that IQ data at the low IQ level could not be analysed by means of a
Hotelling's T 2 test, although showing a slight trend towards improved
performance on the WISC-R by HA subjects. Yet another consequence
was the confounding effect of sex at the HA, high IQ level. An
increase of subjects would have permitted inclusion of sex as a
variable.
In this study, allocation of subjects to IQ level did not occur until
Stage 4, after completion of testing on the WISC-R. This made it
impossible to include additional subjects in those cells where there
were very few. It would have been preferable for the assistant to
allocate subjects to IQ level at the same time that selection was
performed on the basis of the TASC, maintaining precautions to
preserve the blind nature of the study. It would appear,
however, that this would have made little difference in this study,
as the opportunity to obtain further subjects was limited due to
the size of the population they were drawn from (the Standard 4
classes). It was not possible to increase the population by
including other grades because of developmental trends in test
anxiety. The only solution would have been to include the
Standard 4 classes of other schools, matched for social class, who
would have been prepared to participate. For various reasons,
this was not feasible at the time this study was undertaken but
would have been an undoubted improvement.
It is con~idered that the variable of social class may be relevant to
the study of test anxiety, and for this reason matching of schools
on this variable was done, as a cross sectional study involving
class would have been beyond the scope of the present study.
However, the choice of middle-class schools led to a problem
concerning levels of IQ. As the mean IQ of these middle-class
subjects was NSAGT 113.34, with a standard deviation of 14.51, it
is apparent that they are, on the whole, of above-average
intelligence. This leads to a problem in obtaining sufficient low IQ
subjects. Even adjusting the levels of IQ to allow for the higher
mean IQ did not solve the problem (there were 18 "high" IQ's; 27
"medium" IQ's and only 10 "low" IQ's).
137
It becomes apparent that a large population of Standard 4 children from
white, English-language, middle-class, suburban schools would be
needed in order to obtain eight subjects in each cell at three levels of
IQ, two levels of test anxiety, and two levels of sex, in the subsidiary
studies; or 24 in each cell in a test anxiety x type of I Q measure x sex
design, which would have improved the Main Study.
139
This would involve 48 boys and 48
girls. It is possible that five schools would yield this number of
subjects, and testing on the WISC-R could then take place on one
day per week at each school, lasting some 10 weeks.
A more general problem that merits discussion is that any research
conducted in the schools is an intrusion into a highly structured
system. Even this study, which involved little time in actual
classrooms, was disruptive in that children were called out of
class, a room had to be provided, and an "outsider" was present.
This was tolerated by school personnel with unfailing co-operation
and courtesy, but led to a tendency on the part of the researcher
to make decisions that caused as little disruption as possible,
sometimes to the detriment of the study. For example, it was
decided to limit the HA and LA groups to the top and bottom 20%
of the test anxiety distribution, instead of the more usual 25% so
that fewer children would have to be called from class. This was
a mistake, as inclusion of another 16 children would have had little
more potential for disruption of classes, yet would have helped the
study. It appears that researchers need to strike a balance
between the needs of the school and the needs of the study, being
aware that while it is a serious mistake to be over-intrusive, so,
too, is it an error to be over-diffident.
The shortcomings of the present study do not appear to invalidate
the main conclusion reached, which is that HA children show
impaired performance on measures of intellectual functioning as well
as poorer achievement and self-concept. This lends support to the
proposed model of the development of test anxiety which posits the
interaction of intrapersonal, familial and school factors. Hard test
data are seen to be important as bases for teacher and pupil
expectancies and the effect of test anxiety in lowering such data
thus has far-reaching consequences.
The conclusion has also been reached that HA children are so
susceptible to social- evaluative cues by the later elementary school
years that they are not deceived by manipulations of the
evaluative-stress dimension. Thus there would appear to be httle
usefulness in attempts to change the system of formal evaluation in
education. If marks were accumulated for this purpose on daily
classroom assignments as is often recommended, HA children would
probably rapidly shift their focus of anxiety to these activities,
thus increasing the number of stressful situations, with resultant
distress.
It ha~ been suggested that inclusion of the TASC in the battery of
educational tests would furnish teachers with useful information to
be read in conjunction with IQ and achievement measures and lead
to less rigid expectancies. In addition to this, it would seem to
• .
140
be useful to engage in constructive dialogue with teachers to
enable tnem to perceive the role they may be playing in the
development and maintenance of test anxiety. This, naturally,
would be in addition to a remediation programme aimed at cognitive
restructuring in HA children themselves, and intervention to
improve parent-child relationships.
. .
14 l
REFERENCES
Abramson, L. Y. , Seligman, M. E. P. & Teasdale, J.D. Learned helpless
ness in humans: Critique and reformulation.
Journal of Abnormal Psychology, 1978, 87, 49-7 4
Alpert, R & Haber, R.N. Anxiety in academic achievement situations.
Anastasi, A.
Anderson, J. E.
Asch, S
Atkinson, J. W.
Journal or Abnormal and Social Psychology, 1960
61, 207-215
Psychological Testing (4th edition) NY: Macmillan
Publishing Company, 1976
The prediction of terminal intelligence from infant
and pre-school tests. Thirty-ninth Yearbook,
National Society for the Study of Education,
Part 1, 385- 403
Forming impressions of personality. Journal of
Abnormal and Social Psychology, 1946, 41, 258-290
An introduction to motivation NY: Van Nostrand,
1964
Baddeley, G.M.
Bagley, W C
Bandura, A.
Barker, Lunn, J
Barnard, J. W.
The Relationship of test anxiety, self-concept,
intelligence and achievement. Honours Project,
Department of Psychology, University of Cape
Town 1982
142
Determinism in education. Baltimore: Warwick &
York, 1925
Self-efficacy: Towards a unifying theory of
behavioural change. Psychological Review, 1977
2, 191-215
Streaming in the primary school. Slough, Great
Britain, NFER, 1970
The effects of anxiety on connotative meaning in
elementary schooldchildren. Unpublished doctoral
dissertation, Yale University, 1963
Barnard, J.W., Zimbardo, D.G., & Sarason, S.B. Anxiety and Verbal
behaviour in children. Child Development, 1961,
32, 379-392
Beez, W.
Bidwell, C.E.
143
Influence of biased psychological reports on teacher
behaviour and pupil performance. Proceedings of the
76th Annual Convention of the American Psychological
Association, 1968, 3, 605-606
The school as a formal organization. In J. G.
March (Ed) Handbook of Organizations, Chicago:
Rand McNally, 1965
Binet, A. & Simon, Th, Methodes nouvelles pour le diagnostic du niveau
intellectuel des anormaux. Anee psychologique,
1905, 11, 191-244
Boor, M.
Bowlby, J.
Braun, C.
Bronfenbrenner, V
Relationship of test anxiety and academic performance
when controlled for intelligence. Journal of
Clinical Psychology, 1978, 28, 171-172
Attachment and loss (Vol 2, Attachment) N Y:
Basic Books, 1969
Teacher expectation: Sociopsychological Dynamics.
Review of Educational Research, 1976, 46 (2), 185-213
Two worlds of childhood, U.S. and U.S.S.R.
NY: Basic Books, 1970

144-
Brophy, J. , Evertson, C. , Harris, T. & Good, T. Communication of
teacher expectations : Fifth grade. Report No 93,
Research and Development Centre for Teacher
Education, The University of Texas at Austin, 1973
Brophy, J. E. & Good, T. L. Teacher-student relationships: causes and
consequences. . NY: Holt Rinehart and Winston, 197 4
Bruner, J. S .•
Christopher, S. A.
Towards a theory of instruction. Cambridge, Mass:
Harvard University Press, 1966
Parental relations and value orientation as factors
in academic achievement. Personnel and Guidance
Journal, 1967, 45,(9), 921-925
Cornbleth, C., Davis, 0. & Button, C. Teacher-pupil interaction and teacher
expectations for pupil achievement in secondary social
studies classes. Paper presented at the annual
Cox, F .N.
meeting of the American Education Research
Association, 1972
Some effects of test anxiety and the presence or
absence of other persons on boys' performance on
a repetitive motor task. Journal of Experimental
Child Psychology, 1966, 3, 100-112
145
Cox, F .N. Some relationships between test anxiety, presence
or absence of male persons, and boys performance
on a repetitive motor task. Journal of Experimental
Child Psychology, 1968, 6, 1-12
Cronbach, L.J. Five decades of public controversy over mental testing.
American Psychologist, Jan 1975, 1-14
Daniels, B & Hewitt, J. Anxiety and classroom examination performance.
Journal of Clinical Psychology, 1978, 34 (2), 340-345
Davidson, K., Sarason, S., Lighthall, F., Waite, R. & Sarnoff, I.
Differences between mothers' and fathers' ratings
of low anxious and high anxious children. Child
Development, 1958, 29, 155-160
Denny, J.P. Effects of anxiety and intelligence on concept
formation. Journal of Experimental Psychology
1966, 72, 596-602
Diener, C.I. & Dweck, C.S. An analysis of learned helplessness: Con-
tinuous changes in performance strategy and
achievement cognitions following failure. · Journal of
Personality and Social Psychology, 1978, 36, 451-462
146
Doctor R.M. & Altman, F. Worry and emotionality as components of test
anxiety: Replication and further data. Psychological
Reports, 1969, 24, 563-568
Doris, J. , & Sarason, S. B. Test anxiety and blame assignment in a
failure situation. Journal of Abnormal and
Social Psychology, 1955, 50, 335-338
Douglas, J. The home and school. London: MacGibbon & Kee, 1964
Doyle, W. , Hancock, G. , & Kifer, E. Teachers 1 perceptions: do they make a
difference? Journal of the Association for the study
of perception, 1972, 7, 21-30
Dunn, J .A.
Dunn, J.A.
Dusek, J.B.
Factor structure of the test anxiety scale for children.
Journal of Consulting Psychology, 1964, 28, 92
Stability of the factor structure of the test
anxiety scale for children across age and sex groups.
Journal of Consulting Psychology, 1965, 29, 1897
Do teachers bias children 1 s learning? Review
of Educational Research, 1975, 45, 661-684

147
Dweck, C.S., Davidson, W., Nelson, S & Enna, B. Sex differences in
learned helplessness, 2. The contingencies of
evaluative feedback in the classroom. Developmental
Psychology, 1978, 14, 268-276
Dweck, C.S., & Repucci, N.D. Learned helplessness and reinforcement
responsibility in children. Journal of Personality
and Social Psychology, 1973, 25, 109-116
Dweck, C. S. lk Wortman, C. B. Learned helplessness, anxiety and achieve
ment motivation: Neglected parallels in cognitive,
affective and coping responses. In H. W. Krohn~ &
L.C. Laux (Eds) Achievement, stress and anxiety,
Washington, D.C.: Hemisphere, 1982
Easterbrook, J. A. The effect of emotion on cue utilization and the
organization of behaviour. Psychological Review, 1959
66, 183-201
Eiser, J .R. Interpersonal attributions. In H. Tajfel & C. Fraser
(Eds), Introducing Social Psychology, Penguin, 1978
Elashoff, J & Snow, R. Pygmalion reconsidered. Worthington, Ohio:
Charles A. Jones, 1971
14$
Erikson, E • H . Childhood and Society. NY: Norton, 1950
Evertson, C., Brophy, J. & Good, T. Communication of teacher
expectations: second grade. Report No. 92,
Research and Development Centre for Teacher
Education. The University of Texas at Austin, 1973
Feld, S. & Lewis, J. Further evidence on the stability of the factor
structure of the test anxiety scale for children.
Journal of Consulting Psychology, 1967, 31, 434
Feld, S . & Lewis, J. The assessment of achievement anxieties in children.
In C. P. Smith (Ed) Achievement-related motives in
children. NY: Russell- Sage, 1969
Feldman, R & Allen, V. Effect of tutee's performance on tutor's attitudes
and attributions. Proveedings of the 80th Annual
Convention of the American Psychological Association,
1972, 519-520
Feldman, R. • Allen, V. Effects of temporal factors on ability attributions
in a tutoring situation. Paper presented at the
annual meeting of the American Educational Research
Association, 1973
149
Feldhusen, J. F. & Klausmeier, H. J. Anxiety, intelligence and achieve
ment in children of low, average and high
intelligence. Child Development, 33, 403-409,
1962
Fields, J.P. & Kumar, V. K. How teachers use the group I Q scores.
Freeman, F .G.
French, J. W.
Journal of School Psychology, 20 (1), 32-39, 1982
Mental tests. NY: Houghton Mifflin C. 1939
Effect of anxiety on verbal and mathematical
examination scores. Educational and Psychological
measurement, 1962, 22, 553-564
Ganzer, V. J. Effects of audience presence and test anxiety on learning
and retention in a serial learning situation.
Gardner, H.
Journal of Personality and Social Psychology, 1968,
~. 194-199
Developmental Psychology: An introduction. Boston
Toronto: Little Brown and Co., 1978
Gaudry, E. & Spielberger, C.D. Anxiety and Educational achievement.
NY: Wiley, 1974
Geen, R.G.
Gergen, K.J.
Gilham, I.
Glock, M.D.
150
Test anxiety and cue utilization. In Test anxiety:
theory, research and applications. I. G. Sarason ( ed)
NJ: Lawrence Erlbaum Associates, 1980
The concept of self. NY: Holt, Rinehart & Winston,
1971
Self-concept and reading. The Reading Teacher,
1967, 21, 270-273
Is there a Pygmalion in the classroom? The Reading
Teacher, 1972, 25, 405-408
Good, T & Denbo, M. Teacher expectations: self-report data. School Review,
1973, 81, 247-253
Good, T. , Sikes, J. & Brophy, J. Effects of teacher sex, student sex,
and student achievement on classroom interaction.
Technical Report 61, Centre for Research in Social
Behaviour. University of Missouri at Columbia, 1972
Gordon, E. W. & Terrell, M.D. The changed social context of testing.
American Psychologist, 1981, 36 (10), 1167-1171
Goslin, D.A . Teachers and testing. NY: Russel Sage, 1967
. ...,_ -.. .. .. .

Haan, N.
Henry, J.
. 151
Proposed model of ego functioning: Coping and defense
mechanisms in relation to IQ change. Psychological
Monographs, 1963, 77, (8 Whole No. 571)
Culture against man. NY: Random House, Inc. 1963
Hermans, H. J. M. , ter Laak, J. J. F. , & Maes, P. C. J. M. Achievement motivation
and fear of failure in family and school. Developmental
Psychology,_. 6,520-528 1972
Hill, K. T. Anxiety in the evaluative context. In W. Hartup (Ed),
The young child (Vol 2) Washington D.C. National
Association for the Education of Young Children, 1972
Hill, K. T. & Sarason, S. B. The relationship of test anxiety and defensive
ness to test and school performance over the elementary
school years : A further longitudinal study. Mono
graphs of the Society for Research in Child Development.
31, (2, Serial No.104), 1966
Holt, J. How children fail. NY: Pitman Publishing Corp.
1964
Husen, T & Svennson, N. Pedagogic milieu and development of intellectual
skills. School Review, 1960, 68, 36-51
.. Jackson, P. W.
152
Life in Classrooms. NY: Holt, Rinehart & Winston,
1968
Jenkins, B. Teachers' views of particular students and their
behaviour in the classroom. Unpublished doctoral
dissertation, The University of Chicago, 1972
Jeter, J & Davis, 0. Elementary schoolteachers' differential classroom
interaction with children as a function of different
·expectations of pupil achievement. Paper presented
at the annual meeting of the American Educational
Research Association, 1973 -
· Jones, E. E. & Goethals, G. R. Order effects in impression formation:
attribution context and the nature of the entity
in Jones et al (eds) Attribution: Perceiving the
causes of behaviour. Morristown, General Learning
Press. 1971
Jones, E.E. & Nisbett, R.E. The actor and the observer: Divergent
perceptions of the causes of behaviour. In
E.E. Jones, D.E. Kanouse, H.H. Kelley, R.W. Nisbett,
S. Valins & B. Weiner (Eds) Attribution: perceiving
the causes of behaviour. Morristown, NJ: Learning
Press, 1972
153
Kagan, J., Sontag, L., Baker, C. & Nelson, V. Personality and IQ
change. Journal of Abnormal and Social Psychology,
Kamin, L.J.
Kelley, H.H.
Kimball, B
Leff, H.
1958, 56, 261-266
The Science and Politics of IQ. Potomac, Md:
Erlbaum, 197 4
Attribution theory in Social psychology. In D.
Levine (Ed) Nebraska Symposium on Motivation,
15, 192-238
Case studies in educational failure during adolescence.
American Journal of Orthopsychiatry, 1953, 23,
406-415
Experience, environment and human potentials.
NY: Oxford University Press, 1978
Liebert, R .M. & Morris, L. W. Cognitive and emotional components of
test anxiety: A distinction and some initial data.
Psychological Reports, 1967, 20, 975-978
Lighthall, F., Ruebush, B. & Sarason, S. Change in mental ability as
a function of test anxiety and the type of mental
test. Journal of Consulting Psychology, 23, 34-38
. ...
Lippman, W.
15+
Mr. Burt and the intelligence tests. New Republic,
1923, 34, 263-264
McCall, R. , Applebaum. M. , & Hogarty, P. Developmental changes in
mental performance. Monographs of the Society
for Research in Child Development, 1973, 38,
(3, Serial No.150)
McGinley, P. & McGinley, H. Reading groups as psychological groups.
Mackler, B.
Journal of Experimental Education, 1970, 39,
36-42
Grouping in the ghetto. Education and urban society
1969, 2, 80-96
Maloney, M.P. & Ward, M.P. Psychological assessment, NY: Oxford
University Press, 1976
Mandler, G & Sarason, S. A study of anxiety and learning. Journal of
Abnormal and Social Psychology, 1952, 47, 166-173
Mandler, G. & Watson, D.L. Anxiety and the interruption of behaviour.
In C.D. Spielberger (ed) Anxiety and Behaviour.
NY: Academic Press, 1966

155
Manley, M. and Rosemeir, R. Developmental trends in general and test
anxiety, among junior and senior high school
students. Journal of Genetic Psychology, 1972,
120 (2), 219-226
Many, M.A . & Many, W. A. The relationship between self-esteem and
anxiety in grades four through eight. Educational
and Psychological Measurement, 1975, 35, 1017-1021
Marlett, N.J. & Watson, D. Test anxiety and immediate or delayed feedback
in a test- like avoidance task. Journal of Personality
and Social Psychology, 1968, 8, 200-203
Mead, G. The genesis of self and social control. International
Journal of Ethics, 35, 251-273
156
Meichenbaum, D. & Butler, L. Towards a conceptual model for the treat-
ment of test anxiety: Implications for research
and treatment. In I. G. Sarason (Ed) Test Anxiety:
theory, research and applications. Hillsdale,
NJ: Lawrence Erlbaum Associates, 1980
Meuniere, C. & Rule, B. G. Anxiety, confidence and conformity. Journal
of Personality, 1967, 35, 498-504
Milgram, R. M. & Milgram, N. A. The effect of test context on the
anxiety-intelligence relationship. Journal of Genetic
Psychology, 130, 121-127, 1977
Milgram, R. M. & Milgram, N. A. Personality characteristics of gifted
' Israeli children. Journal of Genetic Psychology,
129, 185-194, 1976
Morris, L. & Liebert, R. Effects of anxiety on timed and untimed
intelligence tests. Journal of Consulting and
Clinical Psychology, 1969, 33, 240-244
\ .. _
157
Milgram, R .M. & Milgram, N. A. The effect of test context on the
anxiety-intelligence relationship. Journal of Genetic
Psychology, 130, 121-127, 1977
Milgram, R. M. & Milgram, N. A. Personality characteristics of gifted
Israeli children. Journal of Genetic Psychology,
129, 185-194, 1976
Morris, L. & Liebert, R. Effects of anxiety on timed and untimed
intelligence tests. Journal of Consulting and
Clinical Psychology, 1969, 33, 240-244
Morris, L & Fulmer, R. Test anxiety (worry and motionality) changes
during academic testing as a function of feedback
and test importance. Journal of Educational
Psychology, 1976, 68, 817-824
Morris, L. , & Perez, T. Effects of test interruption on emotional arousal
and performance. Psychological Reports, 1972,
31, 559-564
Murray, H. , Herling, G. & Staebler, B. The effects of locus of control
and pattern of performance on teacher's evaluation
of a student. Paper presented at the Annual con
vention of the American Psychological Association,
1972
158
Neale, J .M. & Katahn, M. Anxiety choice and stimulus uncertainty.
Journal of Personality, 1968, 36, 235-245
New South African Group Test Junior & Intermediate series - manual.
Pretoria: National Bureau for Educational & Social
Research, 1965
Nottleman, E.D. & Hill, K. T. Test anxiety and off-task behaviour in
evaluative situations. Child Development, 48,
225-231, 1977
Phillips, B . N.
Phillips, B. N.
Phillips, B.N.,
Pidgeon, D.A.
An analysis of causes of anxiety among children in
in school. Final Report submitted to USOE
(Contract No.OE 5-10-012), 1966
School stress and anxiety: theory, research and
intervention. NY: Human Sciences Press, 1978
Pitcher, G. , Worsham, M. & Miller, S. Test Anxiety
and the school environment. In I. G. Sarason (Ed)
Test anxiety: theory, research and applications,
Hillsdale, NJ: Lawrence Erlbaum Assoc, 1980
Expectation and pupil performance. London:
National Foundation for Education Research, 1970
Piers, E. V. The Piers-Harris Children's Self-Concept Scale Research
monograph 1. Nashville: Counsellor Recordings and
Tests, 1977
Piers, E. V. & Harris, D. B. Manual for the Piers-Harris Children's
Self- Concept Scale. Nashville: Counsellor
Recordings and Tests. 1969
Purkey, W. W.
Reschly, D.J.
Self- concept and school achievement. Engle~ wood
Cliffs, NJ: Prentice-Hall, 1970
Psychological testing in educational classification
and placement. American Psychologist, 36 (10)
1094- 1102
Rhine, W. R. & Spaner, S.D. A comparison of the factor structure of the
test anxiety scale for children among lower and
middle-class children. Develop men tal Psychology,
1973, !· 421-423
Rist, R. Student social class and teacher expectations:
the self-fulfilling prophecy in ghetto education.
·Harvard Education Review, 1970, 40, 411-451

160
Rosenthal, R. & Jacobson, L. Pygmalion in the clJissroom: Teacher
expectation and pupils' intellectual development.
NY: Holt, Rinehart & Winston, 1968
Rotter, J .B.
Ruebush, B.K.
Samelson F.
Sarason, I.G.
Sarason, I.G.
Generalized expectancies for external versus internal
control of reinforcement. Psychological Monographs,
1966, 80 (1, Whole No. 609)
Anxiety. In Child Psychology. Sixty. second
Yearbook of the National Soceity for the Study of
Education. Part 1. 1963
World War 1 Intelligence testing and the development
of psychology. Journal of the History of the
Behavioural Sciences, 1977, 13, (3), 274-282
The effects of anxiety, reassurance, and meaning
fulness of material to be learned in verbal learning.
Journal of Experimental Psychology, 1958, 56, 472-477
Empirical findings and theoretical problems in the use
of anxiety scales. Psychological Bulletin, 1960,
57, 403-415
Sarason, I.G.
Sarason, I.G.
Sarason, I.G.
Sarason, I.G.
Sarason, I.G.
Sarason, I.G.
.J
-161
Experimental approaches to test anxiety: attention
and the uses of information. In C. D. Spielberger ·
(ed) Anxiety: current trends in theory and research
(vol. 2) NY: Academic Press, 1972(a)
Test anxiety and the model who fails. Journal of
Personality and Social Psychology, 1972, 22, 410-413(b)
Test anxiety and the self-disclosing coping model.
Journal of Consulting and Clinincal Psychology,
1975, 43, 148-153 (a)
Test anxiety, attention and the general problem of
anxiety. In C. D. Spielberger & I. G. Sarason (Eds)
Stress and anxiety (Vol1), Washington D.C.: Hemi
sphere, 1975 (b)
The Test Anxiety Scale: Concept and research. In
C.D. Spielberger & I.G. Sarason (Eds) Stress &
Anxiety Vol 5), Washington D.C.; Hemisphere, 1978
Introduction to the study of test anxiety. In I. G.
Sarason (Ed), Test anxiety: theory, research
and applications. Hillsdale, NJ: Lawrence Erlbaum
Associates, 1980
..f._
162.
Sarason, I. G. & Ganzer, V. J. Anxiety, reinforcement ~d experimental
instructions in a free verbalization situation.
Journal of Abnormal and Social Psychology, 1962,
65, 300-307
Sarason, I. G. & Ganzer, V . J. Effects of test anxiety and reinforcement
history on verbal behaviour. Journal of Abnormal
and Social Psychology, 1963, 67, 513-524
Sarason, I. G. & Koenig, K. P. The relationship of test anxiety to descrip
tion of self and parents. Journal of Personality
Sarason, I. G . ,
and Social Psychology, 1965, 2, 617-621
Pederson, A.M. & Nyman, B. Test anxiety and the
observation of models. Journal of Personality,
1968, 36, 493-511
Sarason, I.G. & Stoops, R Test anxiety and the passage of time.
Journal of Consulting and Clinical Psychology, 1978,
46, 102-109
Sarason, S.B., Davidson, K. S., Lighthall, F .F. Waite, R.R. & Ruebush, B .K.
Anxiety in elementary schoolchildren. NY: Wiley,
1960
163
Sarason, S. B. , Hill, K. T. & Zimbardo, P. G. A longitudinal study of the
relation of test anxiety to performance on intel
ligence and achievement tests. Monographs of t he
Society for Research in Child Development, 1964, 29
(7, Serial No. 98)
Sarason, S. B. , Mandler, G & Craig hill, P. G. The effect of differential
instructions on anxiety and learning. Journal of
Abnormal and Social Psychology, 1952, 47, 561-565
Sarnoff, I. , Lighthall, F. F. , Waite, R. R. , Davidson, K. S. , and Sarason, S. B.
Schachter, S.
Sieber, J .E .
A cross-cultural study of anxiety amongst American
and English children. Journal of Educational
Psychology, 1958, 49, 129-137
The interaction of cognitive and physiological deter
minants of emotional states. In P. H. Liederman &
D. Shapirc (Eds), Psychobiological approaches to
social behaviour. Stanford: Stanford University Press,
1964
A paradigm for experimental modification of the effects
of test anxiety on cognitive processes. American
Educational Research Journal, 1969, 6, 46-61
/
164
Sieber J.E., Kameya, L.I. & Paulson, F.L. Effects of memory support
on the problem-solving abilities of test anxious
children. Journal of Educational Psychology,
1970, 61, 159-168
Siegman, A. W. The effect of manifest anxiety on a concept formation
task, a non-directed learning task and on timed and
untimed IQ tests. Journal of Consulting Psychology,
1956, 20, 176-178
Spiegler, M.D. , Morris, L. W. & Liebert, R. M. Cognitive and emotional
components of test anxiety: Temporal factors.
Psychological Reports, 1968, 22, 451-456
Spielberger, C. D. , Anton, W. D. , & Bedell, J. The na)il;ure and treatment
of test anxiety. In M. Zuckerman & C.D. Spiel
berger (Eds), Emotions and Anxiety: New Concepts,
methods and applications. Hillsdale NJ Lawrence
Erlbaum Associates, 1976
Stern, W .L. (1912) The psychological methods of testing intelligence.
English translation by: G. M. Whipple, Educational
Psychology Monograph No .13. Baltimore: Warwick
& York, 1914

Terman, L.M.
Vernon, P .E.
The intelligence of schoolchildren. Boston: Houghton
Mifflin, 1919
The intelligence testing and the nature/ nurture
debate. British Journal of Educational Psychology,
1979, 49, 17"14
Waite, R.R. Sarason, S.B., Lighthall, F.F. & Davidson, K.S. A study of
anxiety and learning in children. Journal of
abnormal and social psychology, 1958, 57, 267-270
Wechsler, D .
Wechsler, D.
Weiner, B.
Weiner, B.
The measurement of adult intelligence (1st ed).
Baltimore: William & Wilkins, 1939
Manual, Wechsler Intelligence Scale for Children
Revised. NY: Psychological Corporation, 197 4
The role of success and failure in the learning of
easy and complex tasks. Journal of Personality
and Social Psychology, 1966, !• 339-334
New conceptions in the study of achievement motiv
ation. In B. Maher (Ed) Progress in Experimental
_eersonality research. (Vol 5) NY: Academic Press,
1970
Weiner, B. (Ed) Achievement motivation and attribution theory.
Morristown NJ, General Learning Press, 1974
166
Weiner, B., Frieze, L., Kukla, A., Rest, S. & Rosenbaum, R.M. Perceiving
the causes of success and failure. Morristown NJ:
General Learning Press, 1971
Weiner, B. & Schneider, K. Drive versus cognitive theory: a reply to
Boor and Hamon. Journal of Personality and Social
Psychology, 1971, 18, 258-262
Wilkins, E. W. & Glock, M.D. Teacher expectations and student achieve
m~nt: a replication and extension. Ithaca, NY :
Willis, J.
Willis, S.
Wine, J.D.
Cornell University, 1973 (ERIC document Reproduc
tion Service No. 080-567)
Group versus individual I Q tests in a sample of
emotionally disturbed children. Psychological reports,
1970 , '!_, 45- 59
. Formation of teacher expectations of students' academic
performance. Unpublished doctoral dissertation.
The University of Texas at Austin, 1972
Test anxiety and t he direction of attention.
Psychological Bulletin, 1976, 76, 92-104
Wine, J.D.
Wine, J.D.
16 7
Cognitive-attentional theory of test anxiety. In
I.G. Sarason (Ed) Test Anxiety: th_eory, research
and applications. Hillsdale NJ: Lawrence Erlbaum
Associates, 1980
Evaluation anxiety: a cognitive-attentional construct.
In H.W. Krohne & L. C. Laux (Eds) Achievement, Stress
& Anxiety. Washington, DC: Hemisphere, 1982
Wortman, C. B. & Brehm, J. W. Responses to uncontrollable outcomes:
Wylie; R. C.
Yerkes, R.M. (Ed)
An integration of reactance theory and the learned
helplessness model. In L.Berkowitz (Ed), Advances
in experimental social psychology, (Vol 8). NY:
Academic Press, 1975
The self concept. Lincoln: University of Nebraska
Press, 1974
Psychological examining in the United States Army.
Memoirs of the National Academy of Sciences, 1921,
15 Quoted in F. Samelson, World War I Intelligence
testing and the development of psychology. Journal
of the History of the Behavioural Sciences, 1977,
13 (3) , 274- 282
1G8
Zigler, E & Trikett, P. K. IQ, social competence and evaluations of early
childhood intervention programmes Amercian Psycholo
~. Sept 1978, 789-798
Zwibelson, I. Test anxiety and intelligence test performance.
Journal of Consulting Psychology, 1956, 20, 479-481
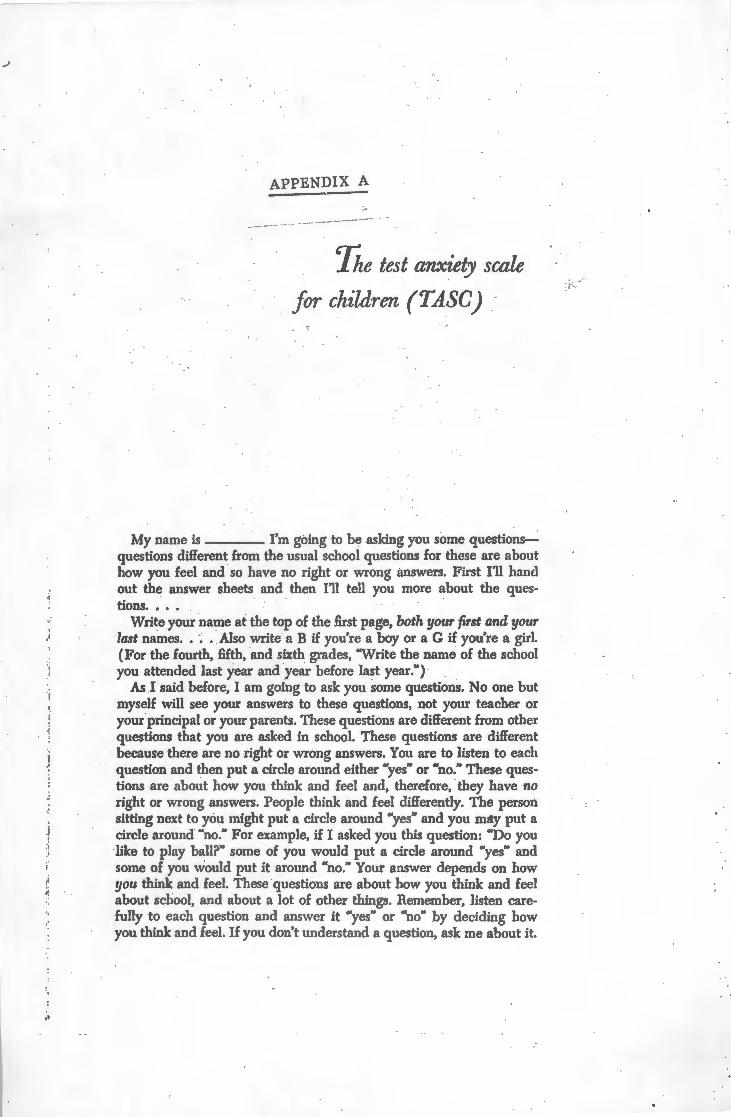
;i
•!
,,
APPENDIX A
The test anxiety scale
for children (TASC)
My name is I'm going to be asking you some questions-questions different from the usual school questions for these are about how you feel and so have no right or wrong answers. First I'll hand out the answer sheets and then I'll tell you more about the questions .•••
Write your name at the top of the first page, both your first and your last names .. · •• Also write a B if you're a boy or a G if you're a girl. (For the fourth, fifth, and sixth grades, 'Write the name of the school you attended last year and year before last year.")
As I said before, I am going to ask you some questions. No one but myself will see your answers to these questions, not your teacher or your principal or your parents. These questions are different from other questions that you are asked in school. These questions are different because there are no right or wrong answers. You are to listen to each question and then put a circle around either "yes" or "no." These questions are about how you think and feel and, therefore, ·they have no right or wrong answers. People think and feel differently. The person sitting next to you might put a circle around "yes" and you m4y put a circle around "no." For example, if I asked you this question: "Do you like to play ball?" some of you would put a circle around "yes" and some of you would put it around "no." Your answer depends on how you think and feel. These questions are about how you think and feel about school, and about a lot of other things. Remember, listen carefully to each question and answer it "yes" or "no" by deciding how you think and feel. If you don't understand a question, ask me about it.
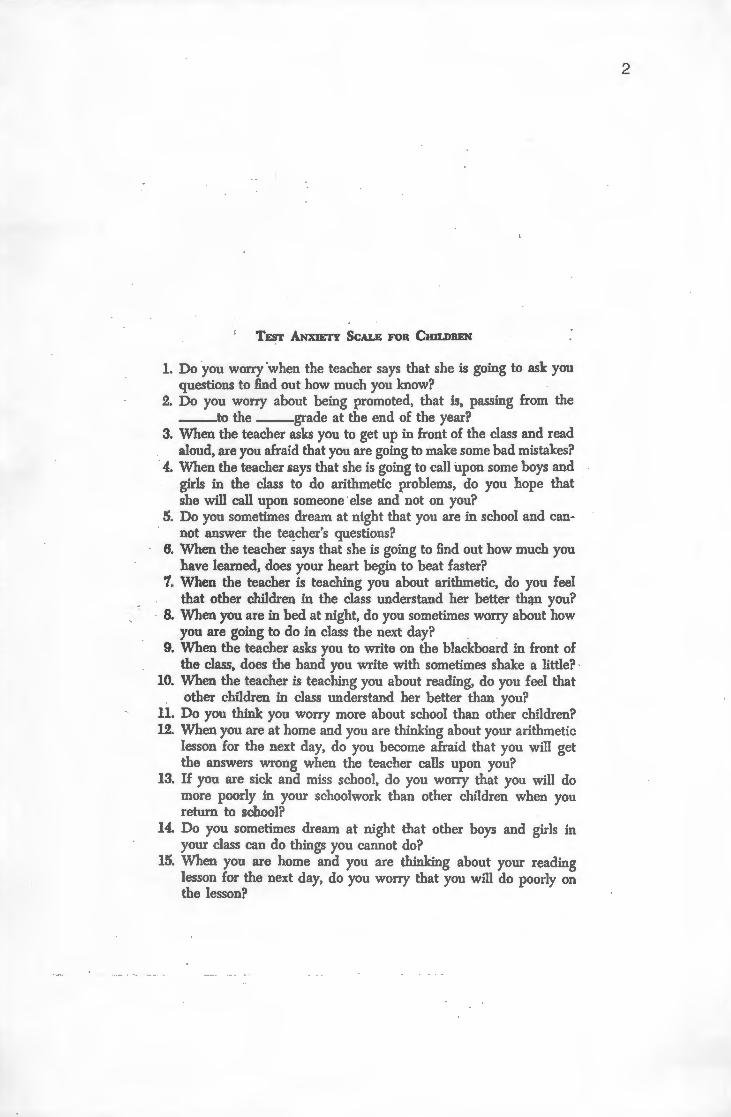
TEsT ANXIETY ScALE FOR CHILDREN
1. Do you worry 'when the teacher says that she is going to ask you questions to find out how much you know? ·
2. Do you worry about being promoted, that is, passing from the __ to the --grade at the end of the year?
3. When the teacher asks you to get up in front of the class and read aloud, are you afraid that you are going to make some bad mistakes?
4. When the teacher says that she is going to call upon some boys and girls in the class to do arithmetic problems, do you hope that she will call upon someone else and not on you?
5. Do you sometimes dream at night that you are in school and cannot answer the te~cher's questions?
6. When the teacher says that she is going to find out how much you have learned, does your heart begin to beat faster?
7. When the teacher is teaching you about arithmetic, do you feel that other children in the class understand her better th~n you?
8. When you are in bed at night, do you sometimes worry about how you are going to do in class the next day?
9. When the teacher asks you to write on the blackboard in front of the class, does the hand you write with sometimes shake a little? ·
10. When the teacher is teaching you about reading, do you feel that other children in class understand her better than you?
11. Do you think you worry more about school than other children? 12. When you are at home and you are thinking about your arithmetic
lesson for the next day, do you become afraid that you will get the answers wrong when the teacher calls upon you?
13. H you are sick and miss school, do you worry that you will do more poorly in your schoolwork than other children when you return to school?
14. Do you sometimes dream at night that other boys and girls in your class can do things you cannot do?
15. When you are home and you are thinking about your reading lesson for the next day, do you worry that you will do poorly on the lesson?
2
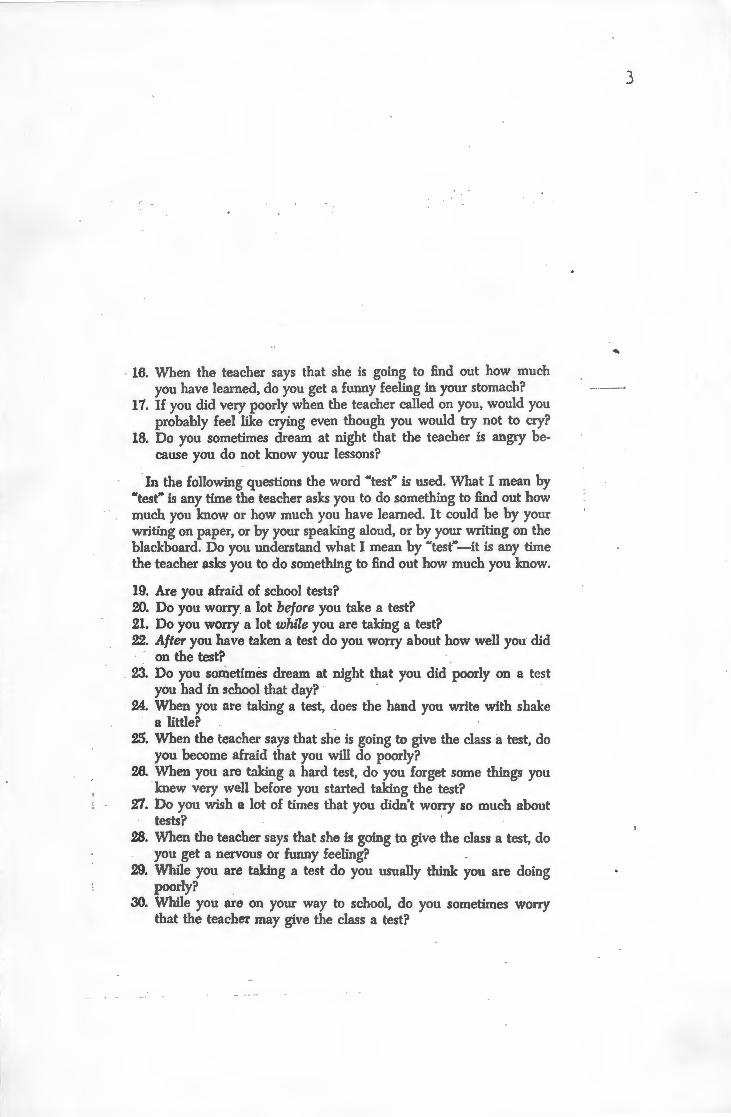
16. When the teacher says that she is going to find out how much you have learned, do you get a funny feeling in your stomach?
17. If you did very poorly when the teacher called on you, would you probably feel like crying even though you would try not to cry?
18. Do you sometimes dream at night that the teacher is angry because you do not know your lessons?
In the following questions the word "test" is used. What I mean by "test" is any time the teacher asks you to do something to find out how much you know or how much you have learned. It could be by your writing on paper, or by your speaking aloud, or by your writing on the blackboard. Do you understand what I mean by "test"-it is any time the teacher asks you to do something to find out how much you know.
19. Are you afraid of school tests? 20. Do you worry. a lot before you take a test? 21. Do you worry a lot while you are taking a test? 22. After you have taken a test do you worry about how well you did
on the test? 23. Do you sometimes dream at night that you did poorly on a test
you had in school that day? · 24. When you nre taking a test, does the hand you write with shake
a little? .25. When the teacher says that she is going to give the class a test, do
you become afraid that you will do poorly? 26. When you are taking a hard test, do you forget some things you
knew very well before you started taking the test? 27. Do you wish a lot of times that you didn't worry so much about
tests? 28. When the teacher says that she is going to give the class a test. do
you get a nervous or funny feeling? 29. While you are taking a test do you usually think you are doing
poorly? 30. While you are on your way to school, do you sometimes worry
that the teacher may give the class a test?
3
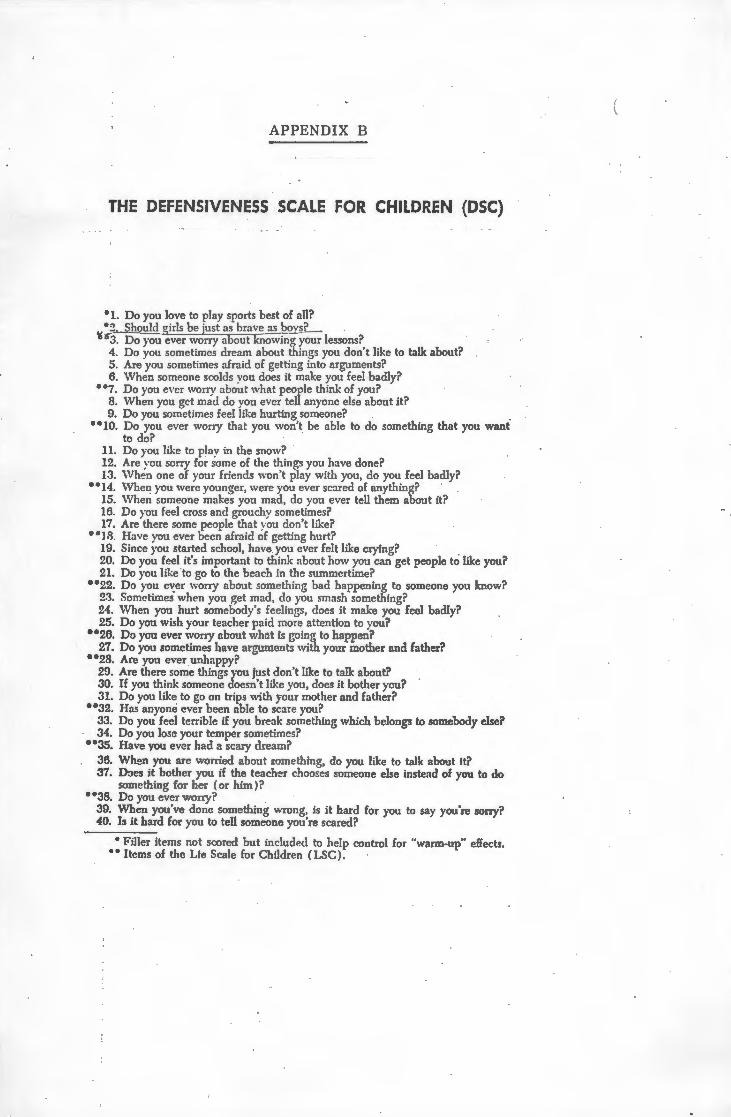
APPENDIX B
THE DEFENSIVENESS SCALE FOR CHILDREN (DSC)
0 1. Do you love to play sports best of all? 0 2....__S_hould airls be ·ust as brave as bovs
""3. Do you ever worry a out · owing your lessons? 4. Do you sometimes dream about things you don't like to talk about? 5. Are you sometimes afraid of getting into arguments? 6. When someone scolds you does it make yon feel badly?
007. Do you ever worry about what people think of you? 8. When you get mad do you ever tell anyone else about it? 9. Do you s.omctimes feel like hurting someone? .
0 "10. Do you ever worry that you won't be able to do something that you want to do?
11. Do you like to play in the snow? 12. Are you sorry for some of the things you have done? 13. When one of your friends \von't play with you, do you feel baclly?
""14. 'When you were younger, were you ever scared of anything? 15. When someone makes you mad, do you ever tell them about it? 16. Do you feel cross and grouchy sometimes? 17. Are there some people that you don't like?
• "18. Have you ever been afraid of getting hurt? 19. Since you started school, have you ever felt like crying? . 20. Do you feel it's important to think about how you can get people to like you? 21. Do you like ·to go to the beach in the summertime?
• 0 22. Do you e~er worry nbout something bad happening to someone you know? 2.'3. Sometimes when you get mad, do you smash something? 24. When you hurt somebody's feelings, does it make you feel baclly? 25. Do you wish your teacher paid more attention to you?
.. 26. Do you ever worry about what is eoing to happen? 27. Do you sometimes have argunents with your mother and father?
.. 28. Are you ever unhappy? 29. Are there some things you just don't like to tallc about? 30. If you think someone doesn't like you, does it bother you? 31. Do you like to go on trips with your mother and father?
""32. Has anyone ever been able to scare you? 33. Do you feel terrible if you break something which belongs to somebody else? 34. Do you lose your temper sometimes?
• "35. Have you ever had a scary dream? 35. When you are worried about something, do you like to talk about it? 37. Does it bother you if the teacher choo~es someone else instead of you to do
something for her (or him)? .. 38. Do you ever worry? .
39. When you've done something wrong; is it hard for you to say you're sorry? 40. Is it hard for you to tell someone you're scared?
• Filler items not scored but included to help control for "warm-up" eHects. • • Items of the Lie Scale for Children ( LSC). ·
APPENDIX C
-------THE PIERS - HARRIS
CHILDREN'S SELF CONCEPT SCALE .
THE WAY I FEEL ABOUT MYSELF
}{~ .•....•......••..................................•.
AGE ••••••.•••• · ••••••••••••• GIRL OR BOY ••••••••••••••••••
ST.AN'D.(LR.D • ••••••••••••••••• SCHOOL • ••• • ••••••••••••••• e • o
DATE ••••••••••••••••••••••
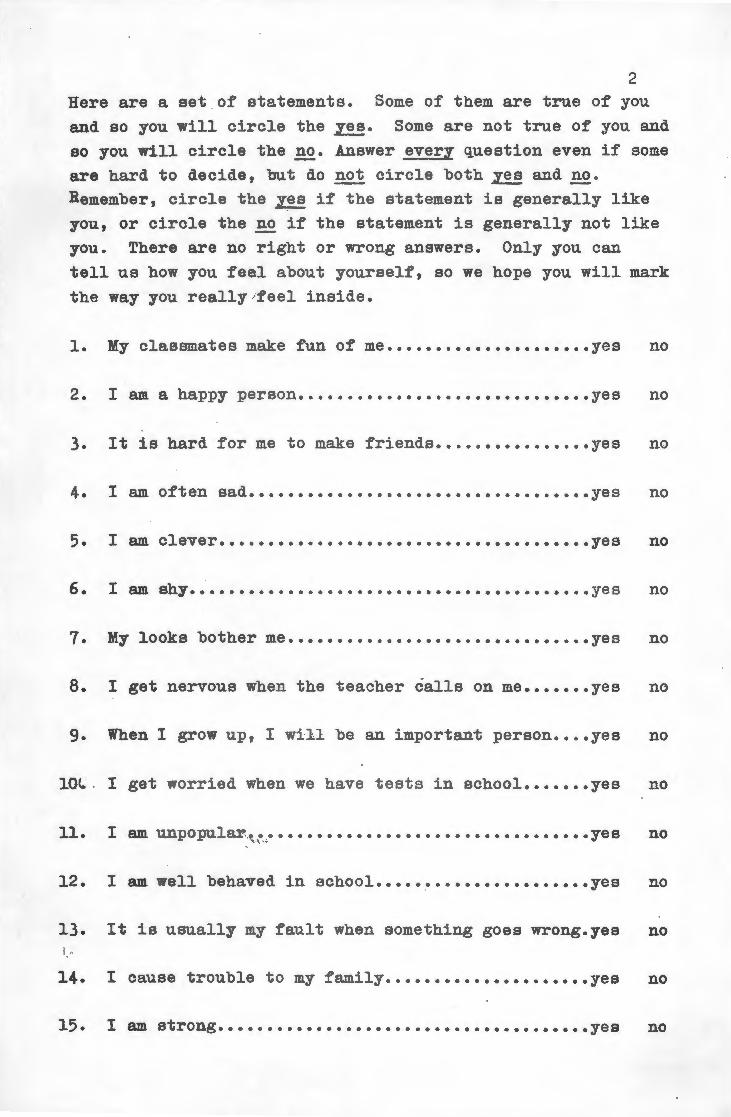
2
Here are a set of statements. Some of them are true of you and so you will circle the .Z!!. Some are not true of you and so you will circle the ~· Answer every question even if some are hard to decide, but do not circle both~ and~· Remember, circle the y~s if the statement is generally like you, or circle the no if the statement is generally not like you. There are no right or wrong answers. Only you can tell us how you feel about yourself, so we hope you will mark the way you really -feel inside.
1. My classmates make fun of me ••••••••••••••••••••• yes no
2. I am a happy person •••••••••••••••••••••••••••••• yes no
3. It is hard for me to make friends •••••••••••••••• yes no
4. I am often sad ••••••••••••••••••••••••••••••••••• yes no
5. I am clever •••••••••••••••••••••••••.•••••••••••• yes no
6 • I am. shy . .•............ ...• ............•......... yes no
1. My looks bother me ••••••••••••••••••••••••••••••• yes no
8. I get nervous when the teacher calls on me ••••••• yes no
9. When I grow up, I will be an important person •••• yes no
10~ . I get worried when we have tests in school ••••••• yes no
11. I am unpopular..!!_,•.,• •••••••••••••••••••••••••••••••• yes no
12. I am well behaved in school ••••• _ ••••••••••••••••• yes no
13. It is usually my fault when something goes wrong.yes no i'
14. I cause trouble to my family ••••••••••••••••••••• yes no
15. I am strong ••••••••••••••••• ••••••••• •••••••••••• yes no
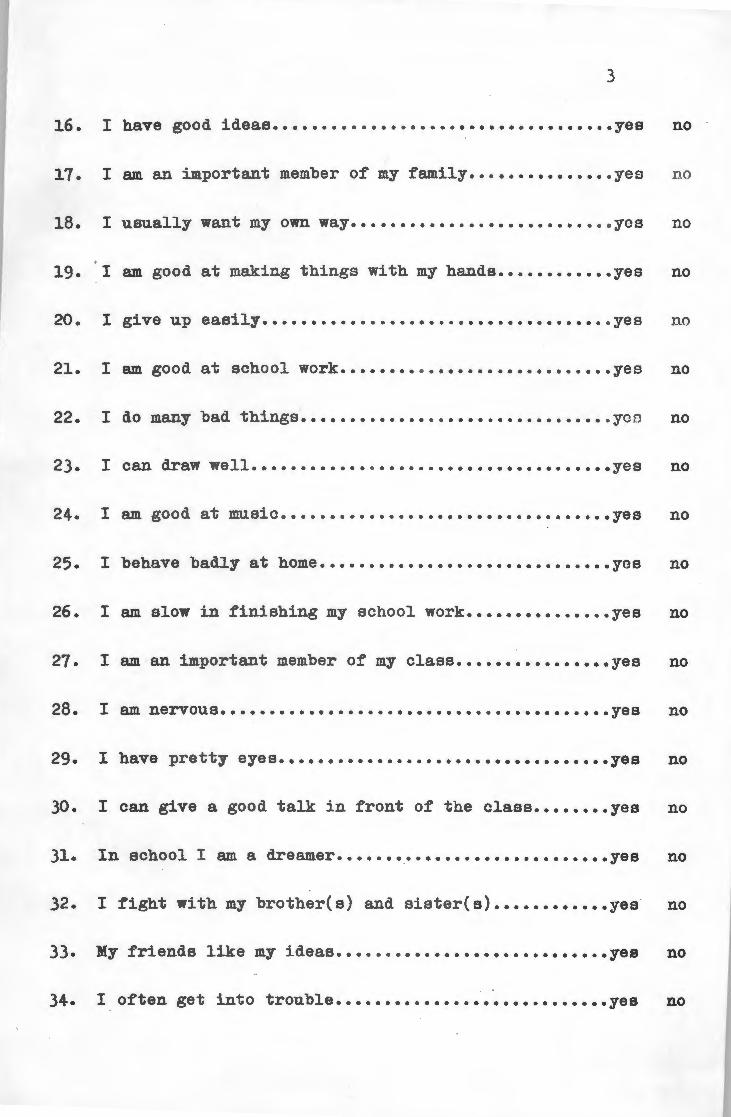
3
16. I have good ideas ••• • •••• •• ••••• • •• • •••••••••••••••• yes no
17. I am an important member of my family •• • • • •••••• • •• • yes no
18. I usually want my own way ••••••••••• • •••• • ••••••• &oo yoa no
19. I am good at maki ng things with my hands •••••••••••• yes no
20. I give up easily ••••••••• •• • • ••••••••••••••••••••• &. yes no
21. I am good at school work •••••••• •• •••••••••••••••••• yes no
22. I do many bad things ••••••••••••• &• •••••••••••••••• oYC D no
23. I can. draw well•••••••••••• o ••••••••••••••••••••••••Yes no
I am good at musi c •••••• ••• • •••••••••••••••••••••••• yes no
25. I behave badly at home •••••••••••••••••••••••••••••• yos no
26. I am slow in finishing my school work ••••••••••••••• yes no
27. I am an important member of my class •••••••••••••••• yes no
28. I am nervous •••••••••••••••••••••••••••••••••••••••• yes no
29. I have pretty eyes •••••••••••••••••••••••••••••••••• yes no
30. I can give a good talk in front of the class •••••••• yes no
31. In school I am a dreamer •••••••••••••••••••••••••••• yes no
32. I fight with my brother(s) and sister(s) •••••••••••• yes no
33. My friends like my ideas •••• ••• ••••••••••••••••••••• yes no
34. I often get into trouble •••••••••••••••••••••••••••• yes no
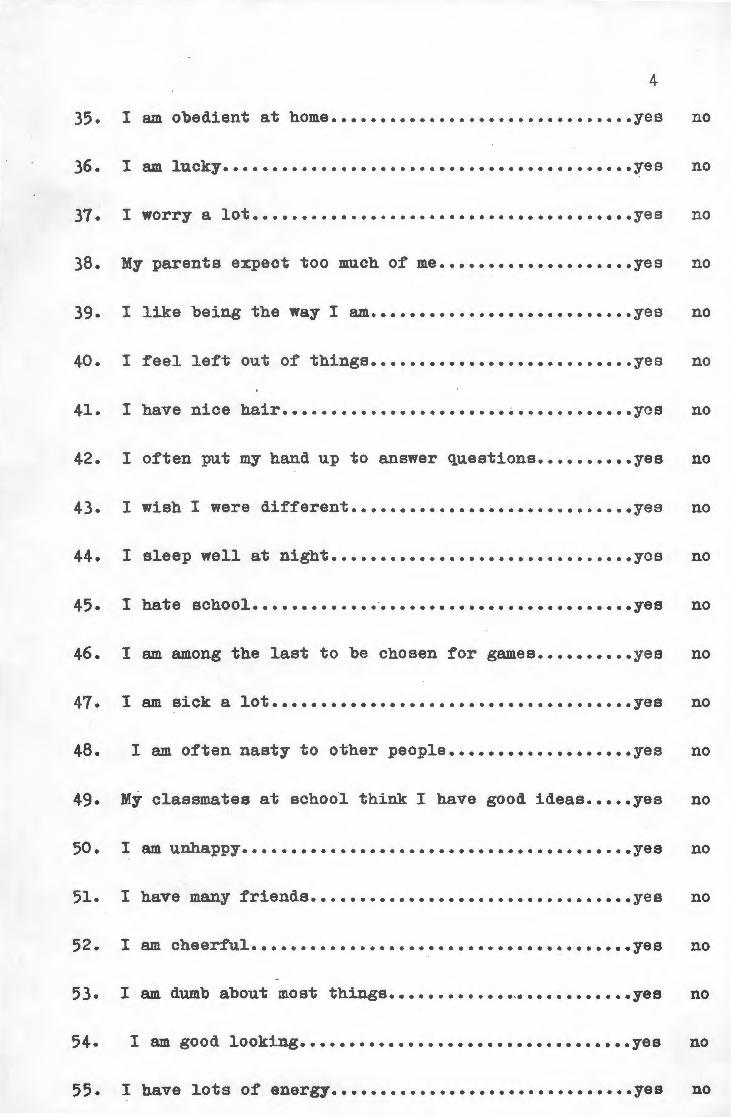
4
35. I am obedient at home ••••••••••••••••••••••••••••••• yes no
36. I am. lucky . ........•.•..............•...•........... yes no
37. I worry a lot ••••••..••.••..•••••••••••••••••••••••• yes no
38. My parents expect too much of me •••••••••••••••••••• yes no
39. I like being the way I am ••••••••••••••••••••••••••• yes no
40. I feel left out of things ••••••••••••••••••••••••••• yes no
41. I have nice hair •••••••••••••••••••••••••••••••••••• ycs no
42. I often put my hand up to answer questions •••••••••• yes no
43. I wish I were different ••••••••••••••••••••••••••••• yes no
44. I sleep well at night ••••••••••••••••••••••••••••••• yos no
45. I hate school ••••••••••••••••••••••••••••••••••••••• yes no
46. I am among the last to be chosen for games •••••••••• yes no
47. I am sick a lot ••••••••••••••••••••••••••••••••••••• yea no
48. I am often nasty to other people ••••••••••••••••••• yes no
My classmates at school think I have good ideas ••••• yea no
50. I am. unhappy •• •••••••••••••••••••••••••••••••••••••• yes no
51. I have many friends ••••••••••••••••••••••••••••••••• yea no
52. I am cheerful ••••••••••••••••••••••••••••••••••••••• yes no
53. I am dumb about most things •••••••••••••.•••••••••••• yes no
54. I am good looking •••••••••••••••••••••••••••••••••• yea no
55. I have lots of energy ••••••••••••••••••••••••••••••• yes no
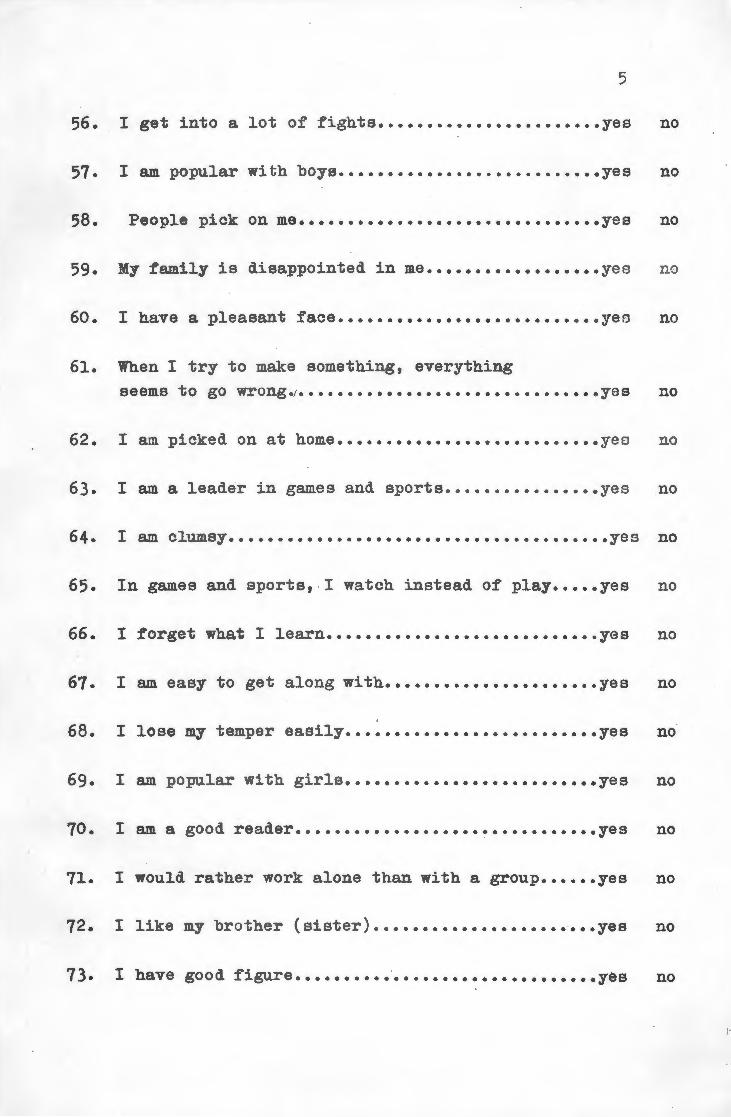
5
56. I get into a lot of fights ••••••••••••••••••••••• yes no
57. I am popular with boys ••••••••••••••••••••••.•••• yes no
58. People pick on me ••••••••••••••••••••••••••••••• yes no
59. My family is disappointed in me •••••••••••••••••• yes no
60. I have a pleasant face ••••••••••••••••••••••••••• yeo no
61. When I try to make something, everything
seems to go wrong.t••••••••••••••••••••••••••••••eyes no
62. I am picked on at home ••••••••••••••••••••••••••• yeo no
63. I am a leader in games and sports •••••••••• •••••• yes no
64. I am clumsy ••••••••••••••••••••••..••.••..•.••..•• yes no
65. In games and sports, I watch instead of play ••••• yes no
66. I forget what I learn •••••••••••••••••••••••••••• yes no
67. I am easy to get along with •••••••••••••••••••••• yes no
68. I lose my temper easily •••••••••••••••••••••••••• yes no
69. I am popular with girls •••••••••••••••••••••••••• yes no
70. I am a good reader ••••••••••••••••••••••••••••••• yes no
71. I would rather work alone than with a group •••••• yes no
72. I like my brother (sister) ••••• •••••••••••••••••• yes no
73. I have good figure •••••••••• · ••••••••••••••••••••• yes no
:·
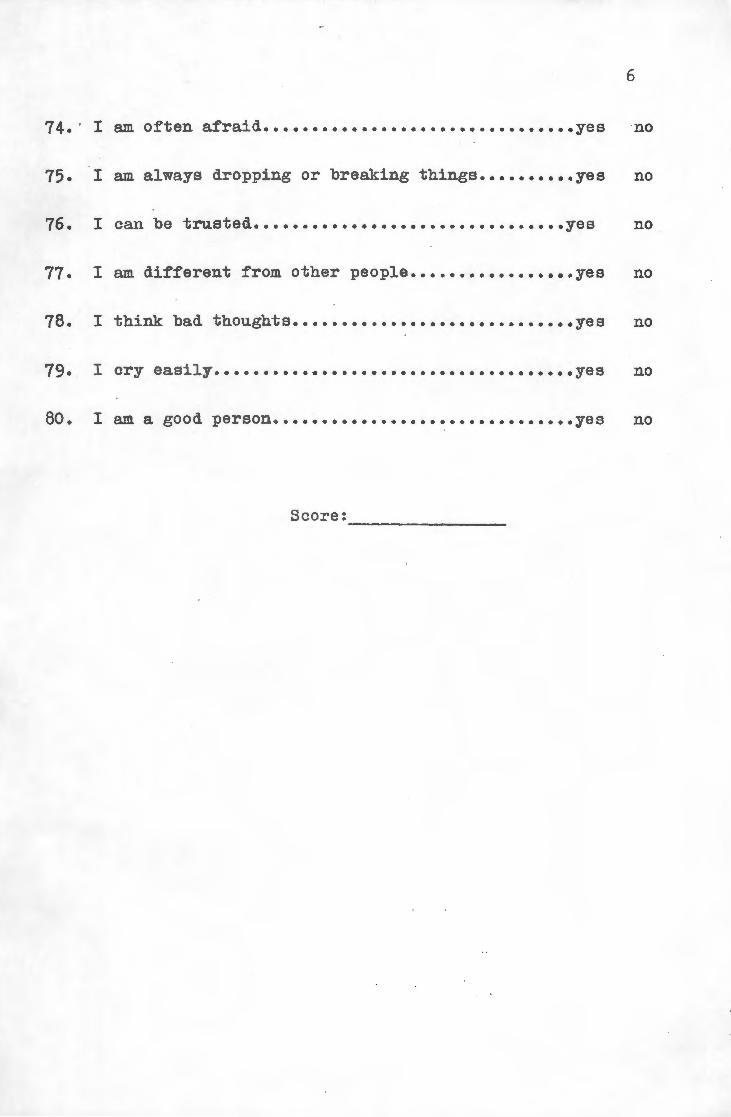
6
74. · I am often afraid •••••••••••••••••••••••••••••••• yes no
75. I am always dropping or breaking things •••••••••• yes no
76. I can be trusted •••••••••••••••••••••••••••••••• yes no
77. I am different from other people ••••••••••••••••• yes no
78. I think bad thoughts ••••••••••••••••••••••••••••• yes no
79. I cry easily .•••••••••••••.•••••••••...•.•••••.•• yes no
80. I am a good person ••••••••••••••••••••••••••••••• yes no
Score: --------------------

APPENDIX D RAW :OATA
HIGH ANXIOUS, HIGH IQ
NSAGT WISC-R
Subj v NV ' T ·v NV T TASC S-C DSC ACH AGE SEX
1 123 139 132 119 124 124 24 62 4 76 1 2 2 118 118 120 108 108 109 22 51 10 70 12 2 3 131 120 128 114 118 118 30 44 5 66 5 2 4 119 121 121 112 112 113 27 61 14 61 1 2 5 125 ' 118 123 106 92 100 24 50 4 77 1 2 6 120 138 130 113 126 121 27 76 0 82 10 2 7 126 116 123 118 121 122 24 38 11 72 4 2
LOW ANXIOUS HIGH IQ
8 131 133 134 114 112 115 6 72 15 94 10 2 9 121 139 131 137 121 133 9 55 7 87 11 1
10 142 144 144 131 138 139 10 58 16 88 3 1 11 123 139 132 119 121 123 9 69 16 78 12 2 12 138 129 134 137 106 125 5 75 8 90 10 1 13 135 145 143 127 131 133 6 63 7 73 2 1 14 128 133 132 128 108 121 6 67 11 71 3 1 15 123 133 129 122 104 115 8 64 12 75 5 2 16 120 127 125 112 106 110 9 54 10 81 17 2 17 126 130 130 122 102 114 8 68 14 74 7 2 18 141 130 136 118 114 118 4 64 6 79 8 2 19 116 121 120 118 105 113 5 55 15 70 8 1
HIGH ANXIOUS, MEDIUM IQ
20 105 112 108 102 115 109 25 20 10 61 5 1 21 105 103 104 101 105 102 23 45 11 83 7 1 22 100 119 108 100 105 102 25 40 4 65 7 2 23 105 103 104 96 91 92 25 42 6 69 6 1 24 102 99 101 95 78 86 22 57 5 78 10 2 25 101 101 101 103 101 102 22 51 10 55 4 1 26 94 109 101 103 95 100 23 58 6 61 8 1
KEY Continued
NSAGT = New South African Group Test WISC-R = Wechsler Intelligence Scale for Children - Revised
TASC = Test Anxiety Scale for Children
s-c = Piers-Harris Self Concept Scale for Children
DSC = Defensiveness Scale for Children
ACH = Achievement ------·- - --- - -- ·-
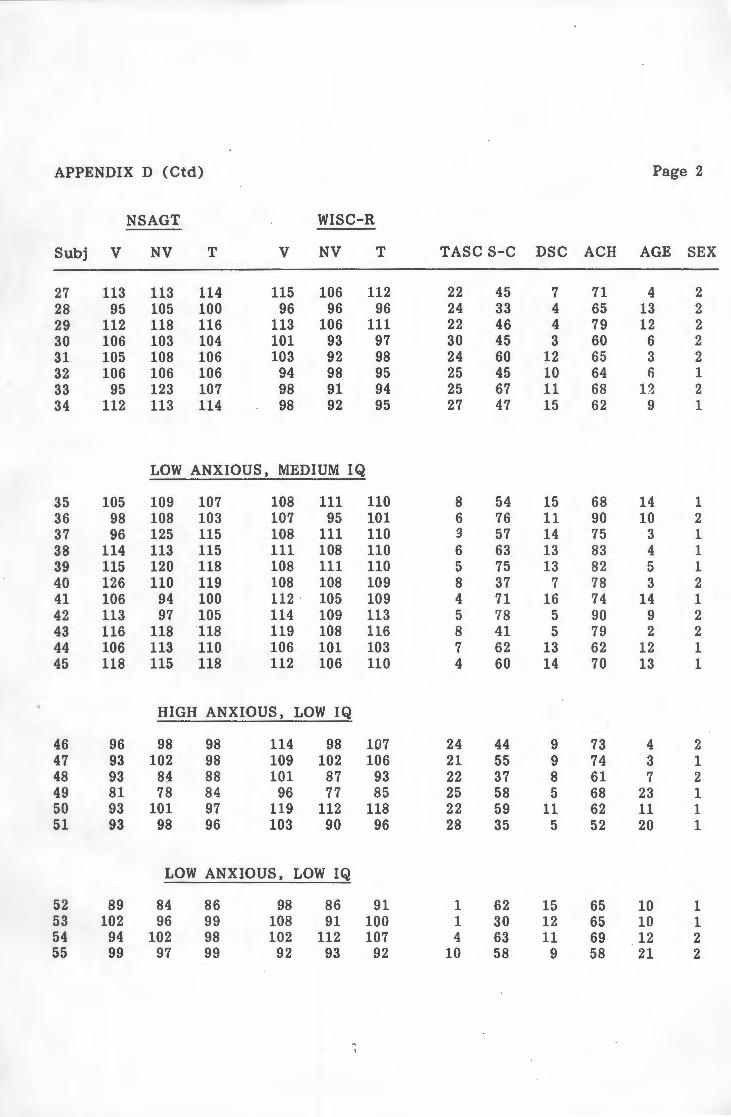
APPENDIX D (Ctd) Page 2
NSAGT WISC-R
Subj v NV T v NV T TASC S-C DSC ACH AGE SEX
27 113 113 114 115 106 112 22 45 7 71 4 2 28 95 105 100 96 96 96 24 33 4 65 13 2 29 112 118 116 113 106 111 22 46 4 79 12 2 30 106 103 104 101 93 97 30 45 3 60 6 2 31 105 108 106 103 92 98 24 60 12 65 3 2 32 106 106 106 94 98 95 25 45 10 64 6 1 33 95 123 107 98 91 94 25 67 11 68 1?. 2 34 112 113 114 98 92 95 27 47 15 62 9 1
LOW ANXIOUS, MEDIUM IQ
35 105 109 107 108 111 110 8 54 15 68 14 1 36 98 108 103 107 95 101 6 76 11 90 10 2 37 96 125 115 108 111 110 g 57 14 75 3 1 38 114 113 115 111 108 110 6 63 13 83 4 1 39 115 120 118 108 111 110 5 75 13 82 5 1 40 126 110 119 108 108 109 8 37 7 78 3 2 41 106 94 100 112 105 109 4 71 16 74 14 1 42 113 97 105 114 109 113 5 78 5 90 9 2 43 116 118 ·us 119 108 116 8 41 5 79 2 2 44 106 113 110 106 101 103 7 62 13 62 12 1 45 118 115 118 112 106 110 4 60 14 70 13 1
HIGH ANXIOUS, LOW IQ
46 96 98 98 114 98 107 24 44 9 73 4 2 47 93 102 98 109 102 106 21 55 9 74 3 1 48 93 84 88 101 87 93 22 37 8 61 7 2 49 81 78 84 96 77 85 25 58 5 68 23 1 50 93 101 97 119 112 118 22 59 11 62 11 1 51 93 98 96 103 90 96 28 35 5 52 20 1
LOW ANXIOUS, LOW IQ
52 89 84 86 98 86 91 1 62 15 65 10 1 53 102 96 99 108 91 100 1 30 12 65 10 1 54 94 102 98 102 112 107 4 63 11 69 12 2 55 99 97 99 92 93 92 10 58 9 58 21 2
-'

APPENDIX E : RAW DATA
WISC-R Subtests
- - -
HIGH ANXIOUS, HIGH IQ
Subj I s A v c PC PA BD OA Cod
1 11 14 11 11 19 12 11 9 16 18 2 10 12 9 11 15 12 9 14 15 13 3 11 14 11 12 14 11 11 13 17 11 4 11 14 11 11 13 9 11 11 14 13 5 10 14 8 11 12 10 5 7 9 11 6 11 10 13 10 17 12 12 9 17 16 7 13 12 14 11 15 15 11 15 12 12
LOW ANXIOUS, HIGH IQ
8 13 13 11 10 15 19 12 10 14 10 9 13 17 16 14 19 12 9 15 17 12
10 14 18 15 13 15 14 14 16 18 15 11 11 17 16 9 13 10 14 14 16 11 12 15 14 15 19 16 13 10 13 12 7 13 15 15 12 14 16 15 14 15 15 13 14 14 19 11. 13 16 12 14 10 11 9 15 14 15 12 12 15 11 10 11 10 11 16 13 13 12 10 12 10 6 13 13 13 17 12 17 13 11 15 13 5 12 10 12 18 12 16 10 12 15 8 11 18 12 11 19 14 14 13 12 12 12 14 12 10 6
HIGH ANXIOUS, MEDIUM IQ
20 10 14 7 10 11 13 10 14 18 6 21 10 8 9 10 14 11 12 13 8 10 22 10 10 9 10 11 7 11 12 14 10 23 7 11 8 11 10 5 10 10 9 10 24 9 10 10 8 9 5 4 8 8 10 25 11 11 11 9 11 4 10 15 12 10 26 10 10 9 12 12 9 10 11 10 7 KEY
Verbal Scale Non-Verbal Scale Continued • • •
I Information PC Picture Completion
S Similarities PA Picture Arrangement
A Arithmetic BD Block Design
V Vocabulary OA Object Arrangement
C Comprehension Cod Coding
----- -·-·- ·--- - ·---~-- -,..-··· ·- -

APPENDIX E (Ctd) Page 2
Verbal Non-Verbal
Subj I s A v c PC PA BD OA Cod
27 11 15 12 13 12 11 8 12 10 14 28 7 12 6 12 10 13 8 11 8 8 29 11 14 10 13 13 9 13 10 10 13 30 9 10 11 9 12 8 10 11 10 7 31 10 10 12 10 11 10 8 3 12 12 32 8 10 6 11 10 10 11 6 14 8 33 8 13 9 10 9 10 11 4 9 10 34 13 9 11 8 8 9 6 10 12 8
LOW ANXIOUS, MEDIUM IQ
35 12 10 9 11 15 8 13 13 15 9 36 13 12 8 10 13 8 6 12 12 9 37 13 12 12 10 10 11 11 13 10 13 38 12 12 13 11 11 12 9 13 13 9 39 10 10 12 12 13 9 11 15 13 10 40 12 11 11 12 11 10 10 13 15 8 41 15 9 9 12 15 13 10 14 12 5 42 12 16 10 12 12 11 10 9 12 15 43 11 12 16 11 16 12 6 17 12 9 44 10 9 13 9 14 9 11 13 9 9 45 12 13 13 11 11 10 10 15 9 11
HIGH ANXIOUS, LOW IQ
46 13 14 11 10 14 11 6 12 12 8 47 12 12 12 12 10 10 10 12 12 8 48 10 8 9 11 13 8 7 9 9 8 49 9 9 8 8 13 8 5 10 8 2 50 10 15 15 11 15 10 15 11 12 11 51 8 10 11 12 12 9 10 10 7 7
LOW ANXIOUS, LOW IQ
52 7 9 10 11 12 9 5 7 8 11 53 10 14 9 10 14 8 11 10 9 6 54 10 13 9 9 11 9 12 14 12 12 55 6 12 6 8 12 9 7 11 12 7

APPENDIX F
MEANS AND STANDARD DEVIATIONS FOR GIRLS
HIGH ANXIOUS
NASGT
HIGH IQ 125.29
(n=7)
MED IQ
(n=8)
LOW IQ
(n=2)
(4.68)
107
(5.68)
93
(7.=7)
WISC-R
115.29
(8.86)
99.5
(8.68)
100
9.899)
(n=6)
(n=4)
(n=2)
NSAGT
131
(3.9)
111.25
(8.42)
98.5
(0.71)
LOW ANXIOUS
WISC-R
115.833
(4.36)
109.75
(6.5)
99.5
(10. 61)
MEANS AND STANDARD DEVIATIONS FOR BOYS
HIGH ANXIOUS
HIGH IQ
(n=O)
NSAGT
MED IQ 105.43
(n=7) (4.54)
LOW IQ 93.75
(n=2) (6.55)
WISC-R
99.29
(5.77)
101.25
(14.88)
LOW ANXIOUS
NSAGT WISC-R
134 127.33
(n=6) (8.83) (9.5)
111.86 108.86
(n=7) (6.62) (2.61)
92.5 95.5
(n=2) (9.19) (6.36)
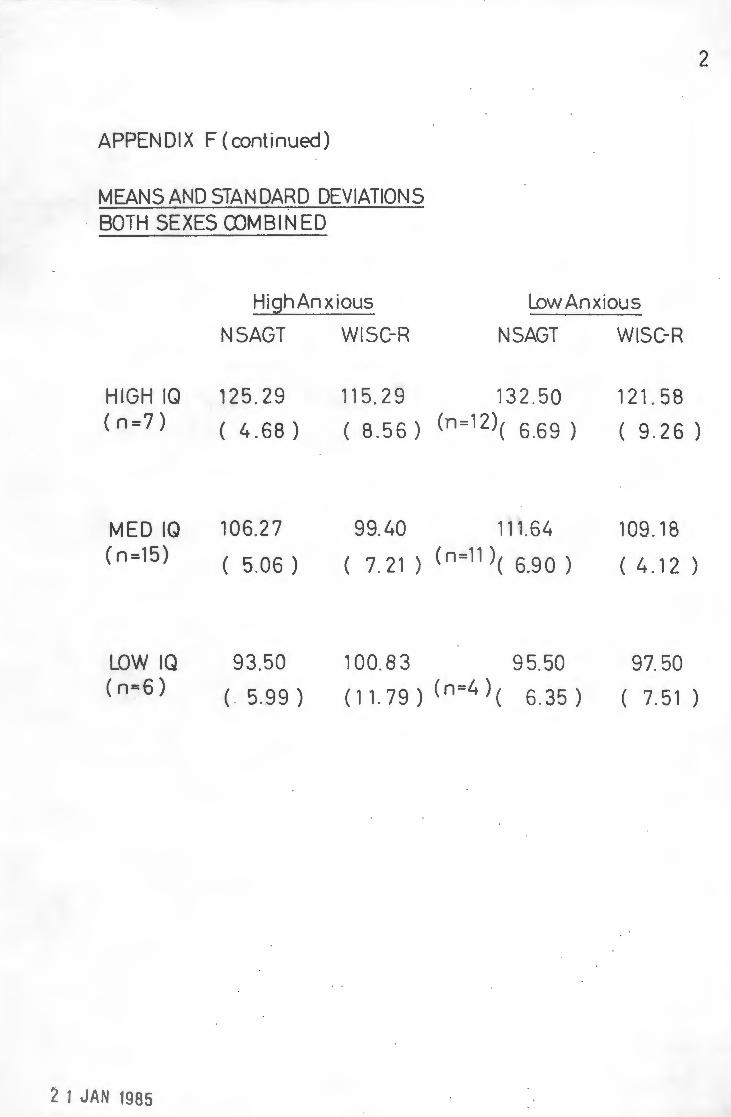
APPENDIX F (continued)
MEANS AND STANDARD DEVIATIONS BOTH SEXES COMBINED
High Anxious
NSAGT WISC-R
Low Anxious
NSAGT WISC-R
125.29 115.29 132 .50 121.58
2
HIGH IQ ( n =7) ( 4. 68 ) ( 8.56) (n=12)( 6.69) ( 9 .26)
MED IQ (n=15)
LOW IQ (n=6)
2 1 JAN 1985
106.27
( 5.06 )
93.50
( . 5.99)
99.40 111.64 109. 18
( 7. 21 ) (n=l 1 )( 6.90) ( 4.12)
100.83 95.50 97.50
(11.79) (n=4 )( 6.35) ( 7.51 )