the effect of english movies on college english listening
TRANSCRIPT
The Effect of English Movies on College English
Listening Teaching
Jiaosheng Qiu Taishan University, China
Abstract—It is commonly acknowledged that listening plays an important role in language learning.
Researchers at home and abroad have been diligently pursuing various approaches on teaching listening to
improve students’ listening proficiency. Among them, teaching English listening through movies is regarded as
one of the effective ways to fulfill the need. However, most of the studies on teaching listening through English
movies are theory recounting. What's more, researchers just consider the change of listening achievement in
their experimental studies, almost pay no attention to anxiety and motivation, which are believed to be two
important determinants of second language learning achievement. The present study explored the effects of
utilizing English movies on teaching college English listening with considering anxiety, motivation and
achievement.
Index Terms—college English listening, English movies, listening anxiety, motivation
I. INTRODUCTION
Listening is an important skill which requires active engagement in language teaching. Researchers conducted many
studies to explore ways of College English listening teaching to correspond its importance. Wang and Miao (2003)
believe that video materials can benefit students with different learning styles in teaching listening. Studies on the effect
of movies in listening teaching were conducted later both theoretically and experimentally. Long (2003) discussed the
prospects of using films in teaching college listening refer to the advantages, feasibility, film selection, problems and
possible solutions. Jiang (2006) analyzed the status of college English listening and the role of English films in listening teaching. Shen (2011) carried out an empirical study in Lanzhou Jiao Tong University to prove that English movies had
a positive effect on both learner’s motivation and achievement.
Researchers and teachers both at home and abroad come to realize the importance of listening and they have made
large quantities of studies on listening, many of which related to teaching listening through movies. However, few
studies about the teaching listening through movies mentioned the effect on the listeners' motivation and anxiety of this
teaching method. In this study, the author conducts a study about the effect on the listeners' motivation and anxiety of
teaching listening through movies, concerning variables of participants’ listening anxiety, motivation and listening
achievement, in the hope of offering meaningful implications for the teaching and learning of listening.
The study tries to identify the effects of English movies on teaching college English listening. To be more specific,
this study is trying to answer the following research questions:
1. Can teaching college English listening through movies reduce anxiety compared with traditional ways of
teaching listening?
2. Can teaching college English listening through movies promote motivation compared with traditional ways
of teaching listening?
3. Can teaching college English listening through movies improve students’ achievement compared with
traditional ways of teaching listening?
The study aims at investigating the effect of teaching listening through movies in improving students’ listening
achievement and in its capacity to promote their motivation and reduce anxiety, the findings of the study will
surely contribute to college English listening teaching in China as an empirical study of the effect of English
movies on college English listening teaching,
II. RESEARCH METHODOLOGY
A. Subjects
Ninety students participated in the study from September, 2011 to January, 2012. All of the subjects were sophomores
and most of them have been exposed to listening comprehension activities ever since they were in junior middle schools,
and some even in primary schools; therefore, each of them has had the experience of learning English for at least 7
years. Among these ninety students, forty of them majored in accounting were assigned to the experimental group while
the other forty majored in marketing management were assigned to the control group.
B. Instruments
ISSN 1799-2591Theory and Practice in Language Studies, Vol. 7, No. 11, pp. 1011-1024, November 2017DOI: http://dx.doi.org/10.17507/tpls.0711.10
© 2017 ACADEMY PUBLICATION
To find out how students feel about English listening and how they are motivated to improve their listening ability,
the author adopted two questionnaires in his study: Foreign Language Listening Anxiety Scale (FLLAS) and Motivation
for English Listening Questionnaire (MELQ). Two tests were conducted to measure the subjects’ listening skill before
and after the experiments were conducted.
C. Teaching Process
The current study had been conducted from September, 2011 to 2012, January, students in control group got the
traditional ways of teaching English listening with the second edition of New Horizon College English (Listening and
Speaking Course, Book 3), while students in experimental group took English movies as their main content of English
listening. The teaching process of experimental group were carried out with three movies: The Lion King , Sleepless in
Seattle and Forrest Gump.
1. Background Introduction
Before watching The Lion King, a brief introduction including the background, main characters and rewards of the
movie was given to students. The following questions were listed:
1) Have you watched the Lion King?
2) Do you know the characters in this film? Who are they?
3) Do you know Simba in the movie? Try to describe it using one word. Then the students will have a discussion and give their answers. Additional contents can be filled up by the teacher as
the students didn't have enough knowledge about the movie.
2. While-watching
For the playing of the movie, the teacher can decide whether the students should watch the whole movie or segment
it into several parts to play according to different teaching aims and the difficulty levels of videos.
2.1 Watching the Movie With No Interruption
A movie can be played with no interruption if it is within or a little beyond students’ linguistic and contextual
competence. Through classroom observation, the author noticed that most students are reluctant to be interrupted while
watching the movie, and they just want to have an overall impression about the movie and needn’t to pay much
attention to details. After watching, several questions were listed for them.The students are required to answer these
questions with one or two sentences, even several words are OK. Then they are asked to have a discussion about these
questions to have a better understanding of the movie.
2.2 Scanning Certain Part for Certain Activity
If a movie is much beyond students’ linguistic and contextual competence, it should be played by segmenting it into
several parts, it can be divided by its scenes or time. In this part, the students need to finish some assignments after
scanning several segments of the movie.
2.3 Dubbing
Dubbing means showing students only pictures on the screen without any sound, and the students are required to add
the sound. If they want to do this part well, they should be accurate performers. First, they need listen to the actors and
actresses carefully and remember the exact words. To have a better job, they also have to imitate the pronunciation and
intonation. This part seems to be the students' favorite, that’s because they can learn a lot in the form of entertainment.
So we can say dubbing is one of these ways to stimulate students’ interest to learn English.
2.4 Role Play Students were required to work in groups to carry out role play. Role play should be based on a short scene which can
be situational dialogues in the movie. It appeared to be that some shy students are more active in this part.
D. Data Collection and Treatment
The listening proficiency pretest was held in September, 2011while the post test was held in January, 2012. The
collected data of the questionnaire were analyzed by the software SPSS 17.0. Quantitative data analysis was carried out
in the study. The descriptive statistics was employed to find sums and means of tests and questionnaires. Independent samples t-tests were performed to find out the differences between same variables of the two classes, and the purpose of
paired-samples t-tests was to discover the changes of each variable in the pretest and post test for both classes.
III. RESULTS AND ANALYSIS
A. Results and Analysis about Anxiety
1.1 The Anxiety Comparison Between Control Class and Experimental Class in the Pretest
The 33 items in FLLAS were scored on a five-point scale. A higher score may indicate a relatively higher level of listening anxiety. Table 3-1 tells us that before the experiment, the students from the two groups share a roughly equal
level of listening anxiety (average value: 3.1245 to 3.1786; sum: 103.1081 to 104.8947), and it’s also true for these four
categories of anxiety items. Besides, Table 3-2 shows a result of p>.05 for each item of listening anxiety, which
indicates that the anxiety differences between the control and experimental classes are not significant.
1012 THEORY AND PRACTICE IN LANGUAGE STUDIES
© 2017 ACADEMY PUBLICATION
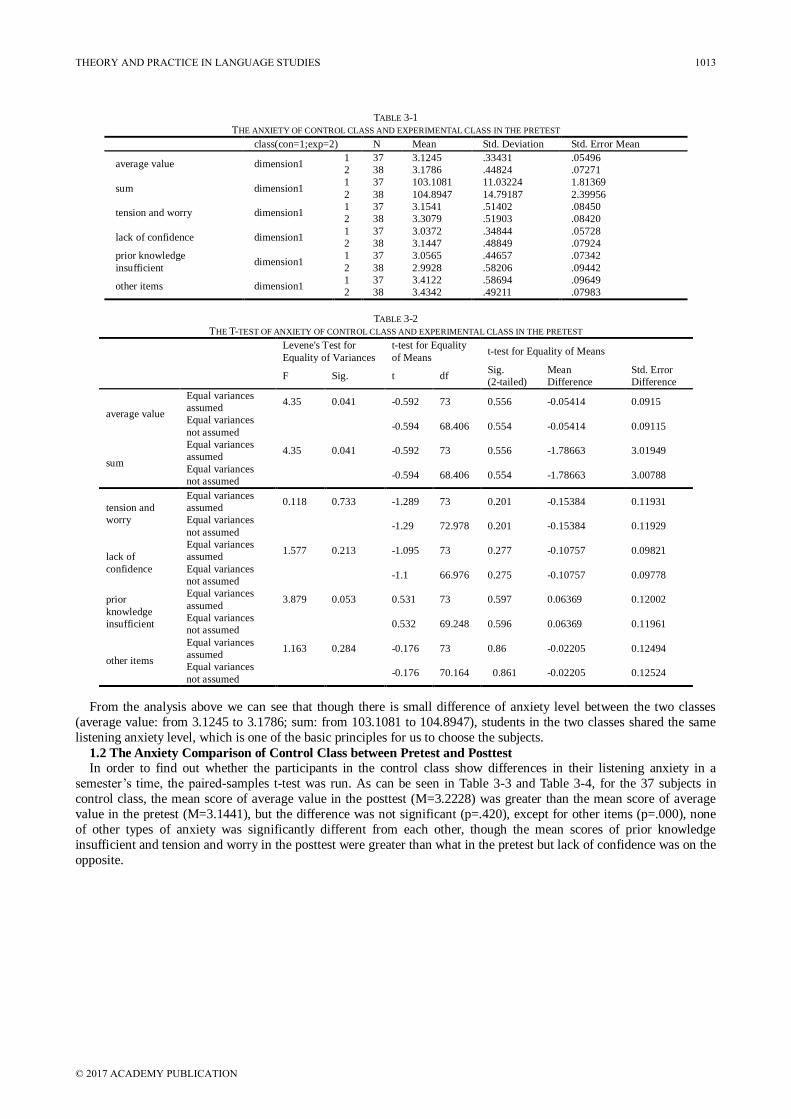
TABLE 3-1
THE ANXIETY OF CONTROL CLASS AND EXPERIMENTAL CLASS IN THE PRETEST
class(con=1;exp=2) N Mean Std. Deviation Std. Error Mean
average value dimension1 1 37 3.1245 .33431 .05496
2 38 3.1786 .44824 .07271
sum dimension1 1 37 103.1081 11.03224 1.81369
2 38 104.8947 14.79187 2.39956
tension and worry dimension1 1 37 3.1541 .51402 .08450
2 38 3.3079 .51903 .08420
lack of confidence dimension1 1 37 3.0372 .34844 .05728
2 38 3.1447 .48849 .07924
prior knowledge
insufficient dimension1
1 37 3.0565 .44657 .07342
2 38 2.9928 .58206 .09442
other items dimension1 1 37 3.4122 .58694 .09649
2 38 3.4342 .49211 .07983
TABLE 3-2
THE T-TEST OF ANXIETY OF CONTROL CLASS AND EXPERIMENTAL CLASS IN THE PRETEST
Levene's Test for
Equality of Variances
t-test for Equality
of Means t-test for Equality of Means
F Sig. t df Sig.
(2-tailed)
Mean
Difference
Std. Error
Difference
average value
Equal variances
assumed 4.35 0.041 -0.592 73 0.556 -0.05414 0.0915
Equal variances
not assumed -0.594 68.406 0.554 -0.05414 0.09115
sum
Equal variances
assumed 4.35 0.041 -0.592 73 0.556 -1.78663 3.01949
Equal variances
not assumed -0.594 68.406 0.554 -1.78663 3.00788
tension and
worry
Equal variances
assumed 0.118 0.733 -1.289 73 0.201 -0.15384 0.11931
Equal variances
not assumed -1.29 72.978 0.201 -0.15384 0.11929
lack of
confidence
Equal variances
assumed 1.577 0.213 -1.095 73 0.277 -0.10757 0.09821
Equal variances
not assumed -1.1 66.976 0.275 -0.10757 0.09778
prior
knowledge
insufficient
Equal variances
assumed 3.879 0.053 0.531 73 0.597 0.06369 0.12002
Equal variances
not assumed 0.532 69.248 0.596 0.06369 0.11961
other items
Equal variances
assumed 1.163 0.284 -0.176 73 0.86 -0.02205 0.12494
Equal variances
not assumed -0.176 70.164 0.861 -0.02205 0.12524
From the analysis above we can see that though there is small difference of anxiety level between the two classes
(average value: from 3.1245 to 3.1786; sum: from 103.1081 to 104.8947), students in the two classes shared the same
listening anxiety level, which is one of the basic principles for us to choose the subjects.
1.2 The Anxiety Comparison of Control Class between Pretest and Posttest
In order to find out whether the participants in the control class show differences in their listening anxiety in a
semester’s time, the paired-samples t-test was run. As can be seen in Table 3-3 and Table 3-4, for the 37 subjects in
control class, the mean score of average value in the posttest (M=3.2228) was greater than the mean score of average
value in the pretest (M=3.1441), but the difference was not significant (p=.420), except for other items (p=.000), none
of other types of anxiety was significantly different from each other, though the mean scores of prior knowledge
insufficient and tension and worry in the posttest were greater than what in the pretest but lack of confidence was on the
opposite.
THEORY AND PRACTICE IN LANGUAGE STUDIES 1013
© 2017 ACADEMY PUBLICATION
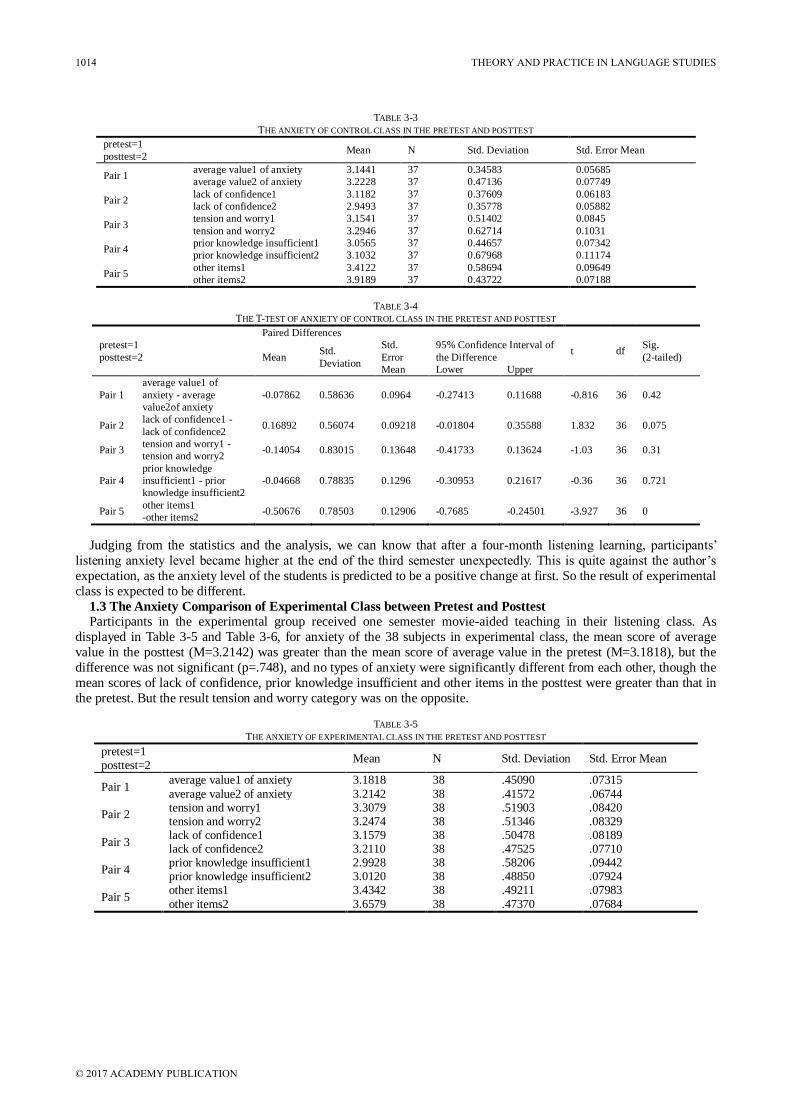
TABLE 3-3
THE ANXIETY OF CONTROL CLASS IN THE PRETEST AND POSTTEST
pretest=1 Mean N Std. Deviation Std. Error Mean
posttest=2
Pair 1 average value1 of anxiety 3.1441 37 0.34583 0.05685
average value2 of anxiety 3.2228 37 0.47136 0.07749
Pair 2 lack of confidence1 3.1182 37 0.37609 0.06183
lack of confidence2 2.9493 37 0.35778 0.05882
Pair 3 tension and worry1 3.1541 37 0.51402 0.0845
tension and worry2 3.2946 37 0.62714 0.1031
Pair 4 prior knowledge insufficient1 3.0565 37 0.44657 0.07342
prior knowledge insufficient2 3.1032 37 0.67968 0.11174
Pair 5 other items1 3.4122 37 0.58694 0.09649
other items2 3.9189 37 0.43722 0.07188
TABLE 3-4
THE T-TEST OF ANXIETY OF CONTROL CLASS IN THE PRETEST AND POSTTEST
pretest=1
posttest=2
Paired Differences
t df Sig.
(2-tailed) Mean Std.
Deviation
Std.
Error
Mean
95% Confidence Interval of
the Difference
Lower Upper
Pair 1
average value1 of
anxiety - average
value2of anxiety
-0.07862 0.58636 0.0964 -0.27413 0.11688 -0.816 36 0.42
Pair 2 lack of confidence1 -
lack of confidence2 0.16892 0.56074 0.09218 -0.01804 0.35588 1.832 36 0.075
Pair 3 tension and worry1 -
tension and worry2 -0.14054 0.83015 0.13648 -0.41733 0.13624 -1.03 36 0.31
Pair 4
prior knowledge
insufficient1 - prior
knowledge insufficient2
-0.04668 0.78835 0.1296 -0.30953 0.21617 -0.36 36 0.721
Pair 5 other items1
-other items2 -0.50676 0.78503 0.12906 -0.7685 -0.24501 -3.927 36 0
Judging from the statistics and the analysis, we can know that after a four-month listening learning, participants’
listening anxiety level became higher at the end of the third semester unexpectedly. This is quite against the author’s
expectation, as the anxiety level of the students is predicted to be a positive change at first. So the result of experimental
class is expected to be different.
1.3 The Anxiety Comparison of Experimental Class between Pretest and Posttest
Participants in the experimental group received one semester movie-aided teaching in their listening class. As
displayed in Table 3-5 and Table 3-6, for anxiety of the 38 subjects in experimental class, the mean score of average
value in the posttest (M=3.2142) was greater than the mean score of average value in the pretest (M=3.1818), but the
difference was not significant (p=.748), and no types of anxiety were significantly different from each other, though the
mean scores of lack of confidence, prior knowledge insufficient and other items in the posttest were greater than that in
the pretest. But the result tension and worry category was on the opposite.
TABLE 3-5
THE ANXIETY OF EXPERIMENTAL CLASS IN THE PRETEST AND POSTTEST
pretest=1 posttest=2
Mean N Std. Deviation Std. Error Mean
Pair 1 average value1 of anxiety 3.1818 38 .45090 .07315
average value2 of anxiety 3.2142 38 .41572 .06744
Pair 2 tension and worry1 3.3079 38 .51903 .08420 tension and worry2 3.2474 38 .51346 .08329
Pair 3 lack of confidence1 3.1579 38 .50478 .08189 lack of confidence2 3.2110 38 .47525 .07710
Pair 4 prior knowledge insufficient1 2.9928 38 .58206 .09442 prior knowledge insufficient2 3.0120 38 .48850 .07924
Pair 5 other items1 3.4342 38 .49211 .07983
other items2 3.6579 38 .47370 .07684
1014 THEORY AND PRACTICE IN LANGUAGE STUDIES
© 2017 ACADEMY PUBLICATION
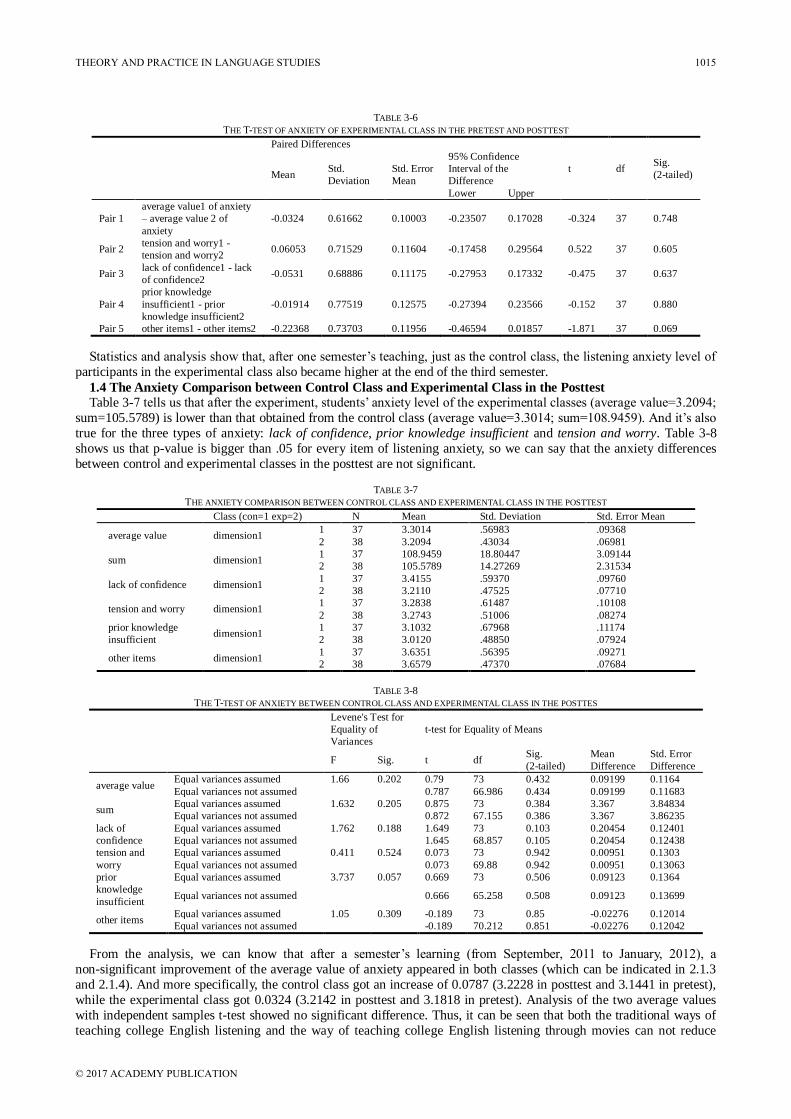
TABLE 3-6
THE T-TEST OF ANXIETY OF EXPERIMENTAL CLASS IN THE PRETEST AND POSTTEST
Paired Differences
t df Sig.
(2-tailed) Mean Std.
Deviation
Std. Error
Mean
95% Confidence
Interval of the
Difference
Lower Upper
Pair 1
average value1 of anxiety
– average value 2 of
anxiety
-0.0324 0.61662 0.10003 -0.23507 0.17028 -0.324 37 0.748
Pair 2 tension and worry1 -
tension and worry2 0.06053 0.71529 0.11604 -0.17458 0.29564 0.522 37 0.605
Pair 3 lack of confidence1 - lack
of confidence2 -0.0531 0.68886 0.11175 -0.27953 0.17332 -0.475 37 0.637
Pair 4
prior knowledge
insufficient1 - prior
knowledge insufficient2
-0.01914 0.77519 0.12575 -0.27394 0.23566 -0.152 37 0.880
Pair 5 other items1 - other items2 -0.22368 0.73703 0.11956 -0.46594 0.01857 -1.871 37 0.069
Statistics and analysis show that, after one semester’s teaching, just as the control class, the listening anxiety level of
participants in the experimental class also became higher at the end of the third semester.
1.4 The Anxiety Comparison between Control Class and Experimental Class in the Posttest
Table 3-7 tells us that after the experiment, students’ anxiety level of the experimental classes (average value=3.2094;
sum=105.5789) is lower than that obtained from the control class (average value=3.3014; sum=108.9459). And it’s also
true for the three types of anxiety: lack of confidence, prior knowledge insufficient and tension and worry. Table 3-8
shows us that p-value is bigger than .05 for every item of listening anxiety, so we can say that the anxiety differences
between control and experimental classes in the posttest are not significant.
TABLE 3-7
THE ANXIETY COMPARISON BETWEEN CONTROL CLASS AND EXPERIMENTAL CLASS IN THE POSTTEST
Class (con=1 exp=2) N Mean Std. Deviation Std. Error Mean
average value dimension1 1 37 3.3014 .56983 .09368
2 38 3.2094 .43034 .06981
sum dimension1 1 37 108.9459 18.80447 3.09144
2 38 105.5789 14.27269 2.31534
lack of confidence dimension1 1 37 3.4155 .59370 .09760
2 38 3.2110 .47525 .07710
tension and worry dimension1 1 37 3.2838 .61487 .10108
2 38 3.2743 .51006 .08274
prior knowledge
insufficient dimension1
1 37 3.1032 .67968 .11174
2 38 3.0120 .48850 .07924
other items dimension1 1 37 3.6351 .56395 .09271
2 38 3.6579 .47370 .07684
TABLE 3-8
THE T-TEST OF ANXIETY BETWEEN CONTROL CLASS AND EXPERIMENTAL CLASS IN THE POSTTES
Levene's Test for
Equality of
Variances
t-test for Equality of Means
F Sig. t df Sig.
(2-tailed)
Mean
Difference
Std. Error
Difference
average value Equal variances assumed 1.66 0.202 0.79 73 0.432 0.09199 0.1164
Equal variances not assumed 0.787 66.986 0.434 0.09199 0.11683
sum Equal variances assumed 1.632 0.205 0.875 73 0.384 3.367 3.84834
Equal variances not assumed 0.872 67.155 0.386 3.367 3.86235
lack of
confidence
Equal variances assumed 1.762 0.188 1.649 73 0.103 0.20454 0.12401
Equal variances not assumed 1.645 68.857 0.105 0.20454 0.12438
tension and
worry
Equal variances assumed 0.411 0.524 0.073 73 0.942 0.00951 0.1303
Equal variances not assumed 0.073 69.88 0.942 0.00951 0.13063
prior
knowledge
insufficient
Equal variances assumed 3.737 0.057 0.669 73 0.506 0.09123 0.1364
Equal variances not assumed 0.666 65.258 0.508 0.09123 0.13699
other items Equal variances assumed 1.05 0.309 -0.189 73 0.85 -0.02276 0.12014
Equal variances not assumed -0.189 70.212 0.851 -0.02276 0.12042
From the analysis, we can know that after a semester’s learning (from September, 2011 to January, 2012), a
non-significant improvement of the average value of anxiety appeared in both classes (which can be indicated in 2.1.3
and 2.1.4). And more specifically, the control class got an increase of 0.0787 (3.2228 in posttest and 3.1441 in pretest),
while the experimental class got 0.0324 (3.2142 in posttest and 3.1818 in pretest). Analysis of the two average values
with independent samples t-test showed no significant difference. Thus, it can be seen that both the traditional ways of
teaching college English listening and the way of teaching college English listening through movies can not reduce
THEORY AND PRACTICE IN LANGUAGE STUDIES 1015
© 2017 ACADEMY PUBLICATION
students’ listening anxiety, which just denied the first experimental hypothesis totally and answered the first research
question.
Actually, the researcher was really confused about the changes of anxiety level of the two classes, for the researcher
had expected the participants’ anxiety level would be a positive change after a semester’s learning, but the result was on
the opposite. Anyway, the following research was carried on all the same and an increase of motivation was expected by
the author.
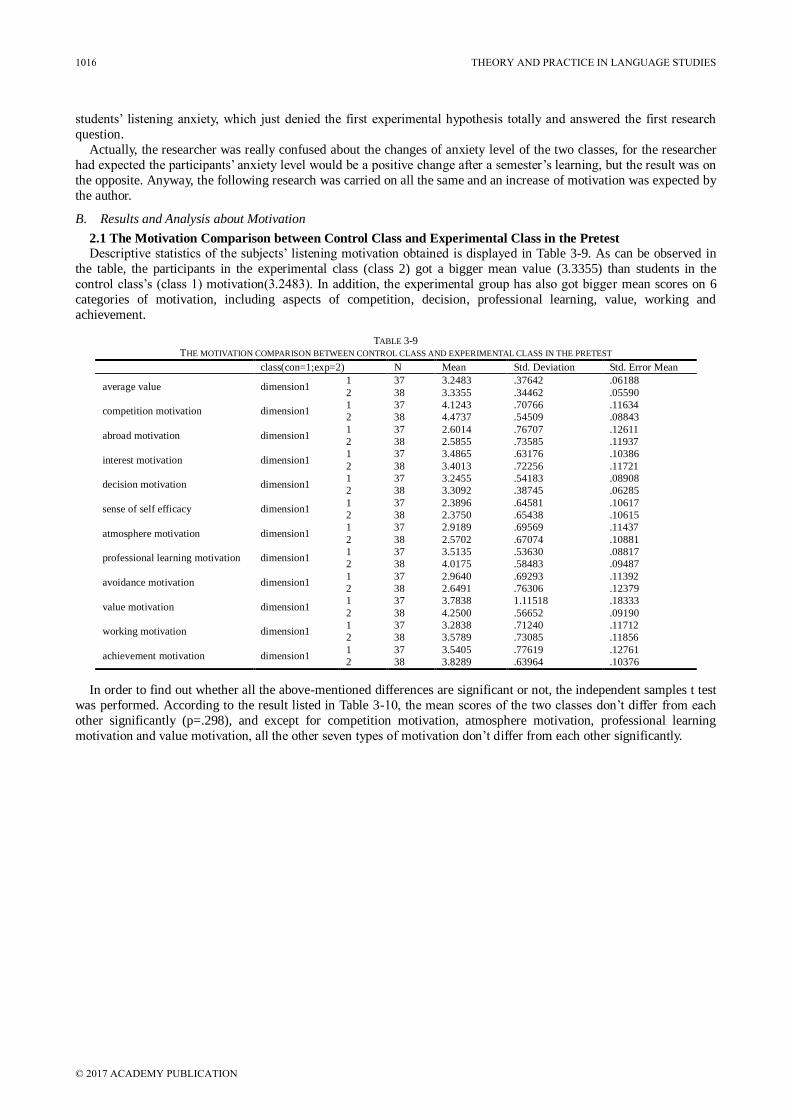
B. Results and Analysis about Motivation
2.1 The Motivation Comparison between Control Class and Experimental Class in the Pretest
Descriptive statistics of the subjects’ listening motivation obtained is displayed in Table 3-9. As can be observed in
the table, the participants in the experimental class (class 2) got a bigger mean value (3.3355) than students in the
control class’s (class 1) motivation(3.2483). In addition, the experimental group has also got bigger mean scores on 6
categories of motivation, including aspects of competition, decision, professional learning, value, working and
achievement.
TABLE 3-9
THE MOTIVATION COMPARISON BETWEEN CONTROL CLASS AND EXPERIMENTAL CLASS IN THE PRETEST
class(con=1;exp=2) N Mean Std. Deviation Std. Error Mean
average value dimension1 1 37 3.2483 .37642 .06188
2 38 3.3355 .34462 .05590
competition motivation dimension1 1 37 4.1243 .70766 .11634
2 38 4.4737 .54509 .08843
abroad motivation dimension1 1 37 2.6014 .76707 .12611
2 38 2.5855 .73585 .11937
interest motivation dimension1 1 37 3.4865 .63176 .10386
2 38 3.4013 .72256 .11721
decision motivation dimension1 1 37 3.2455 .54183 .08908
2 38 3.3092 .38745 .06285
sense of self efficacy dimension1 1 37 2.3896 .64581 .10617
2 38 2.3750 .65438 .10615
atmosphere motivation dimension1 1 37 2.9189 .69569 .11437
2 38 2.5702 .67074 .10881
professional learning motivation dimension1 1 37 3.5135 .53630 .08817
2 38 4.0175 .58483 .09487
avoidance motivation dimension1 1 37 2.9640 .69293 .11392
2 38 2.6491 .76306 .12379
value motivation dimension1 1 37 3.7838 1.11518 .18333
2 38 4.2500 .56652 .09190
working motivation dimension1 1 37 3.2838 .71240 .11712
2 38 3.5789 .73085 .11856
achievement motivation dimension1 1 37 3.5405 .77619 .12761
2 38 3.8289 .63964 .10376
In order to find out whether all the above-mentioned differences are significant or not, the independent samples t test
was performed. According to the result listed in Table 3-10, the mean scores of the two classes don’t differ from each
other significantly (p=.298), and except for competition motivation, atmosphere motivation, professional learning
motivation and value motivation, all the other seven types of motivation don’t differ from each other significantly.
1016 THEORY AND PRACTICE IN LANGUAGE STUDIES
© 2017 ACADEMY PUBLICATION
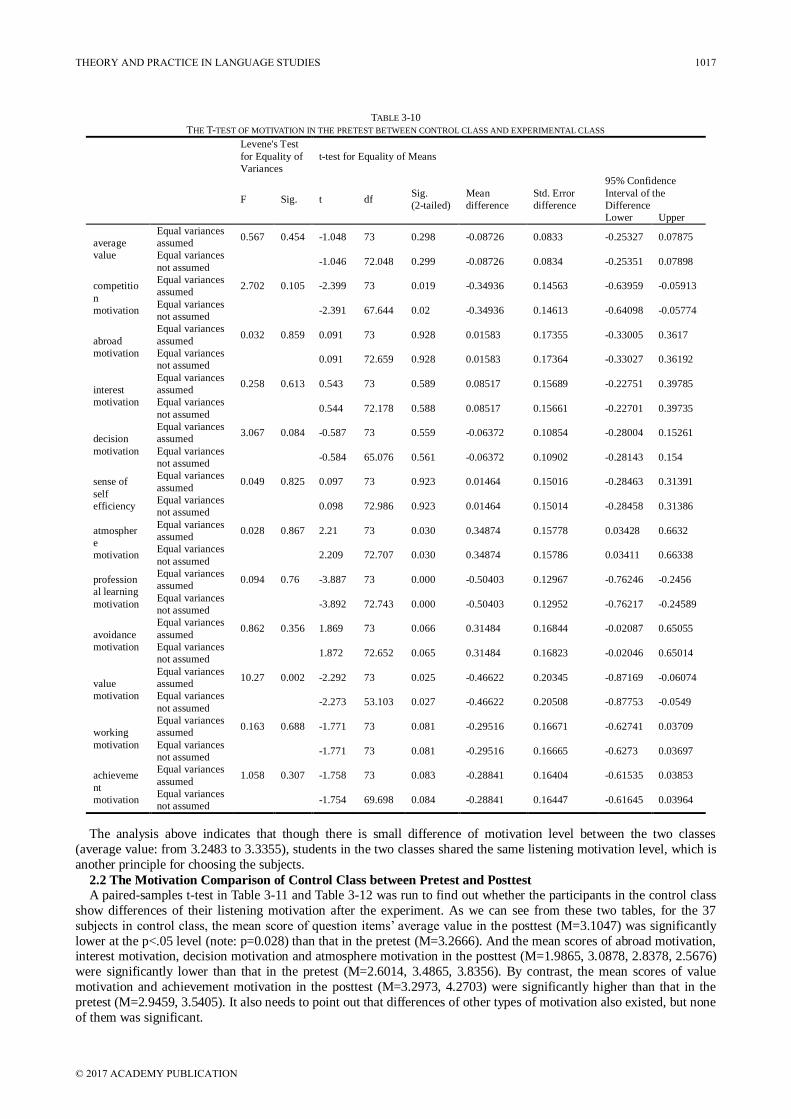
TABLE 3-10
THE T-TEST OF MOTIVATION IN THE PRETEST BETWEEN CONTROL CLASS AND EXPERIMENTAL CLASS
Levene's Test
for Equality of
Variances
t-test for Equality of Means
F Sig. t df Sig.
(2-tailed)
Mean
difference
Std. Error
difference
95% Confidence
Interval of the
Difference
Lower Upper
average
value
Equal variances
assumed 0.567 0.454 -1.048 73 0.298 -0.08726 0.0833 -0.25327 0.07875
Equal variances
not assumed -1.046 72.048 0.299 -0.08726 0.0834 -0.25351 0.07898
competitio
n
motivation
Equal variances
assumed 2.702 0.105 -2.399 73 0.019 -0.34936 0.14563 -0.63959 -0.05913
Equal variances
not assumed -2.391 67.644 0.02 -0.34936 0.14613 -0.64098 -0.05774
abroad
motivation
Equal variances
assumed 0.032 0.859 0.091 73 0.928 0.01583 0.17355 -0.33005 0.3617
Equal variances
not assumed 0.091 72.659 0.928 0.01583 0.17364 -0.33027 0.36192
interest
motivation
Equal variances
assumed 0.258 0.613 0.543 73 0.589 0.08517 0.15689 -0.22751 0.39785
Equal variances
not assumed 0.544 72.178 0.588 0.08517 0.15661 -0.22701 0.39735
decision
motivation
Equal variances
assumed 3.067 0.084 -0.587 73 0.559 -0.06372 0.10854 -0.28004 0.15261
Equal variances
not assumed -0.584 65.076 0.561 -0.06372 0.10902 -0.28143 0.154
sense of
self
efficiency
Equal variances
assumed 0.049 0.825 0.097 73 0.923 0.01464 0.15016 -0.28463 0.31391
Equal variances
not assumed 0.098 72.986 0.923 0.01464 0.15014 -0.28458 0.31386
atmospher
e
motivation
Equal variances
assumed 0.028 0.867 2.21 73 0.030 0.34874 0.15778 0.03428 0.6632
Equal variances
not assumed 2.209 72.707 0.030 0.34874 0.15786 0.03411 0.66338
profession
al learning
motivation
Equal variances
assumed 0.094 0.76 -3.887 73 0.000 -0.50403 0.12967 -0.76246 -0.2456
Equal variances
not assumed -3.892 72.743 0.000 -0.50403 0.12952 -0.76217 -0.24589
avoidance
motivation
Equal variances
assumed 0.862 0.356 1.869 73 0.066 0.31484 0.16844 -0.02087 0.65055
Equal variances
not assumed 1.872 72.652 0.065 0.31484 0.16823 -0.02046 0.65014
value
motivation
Equal variances
assumed 10.27 0.002 -2.292 73 0.025 -0.46622 0.20345 -0.87169 -0.06074
Equal variances
not assumed -2.273 53.103 0.027 -0.46622 0.20508 -0.87753 -0.0549
working
motivation
Equal variances
assumed 0.163 0.688 -1.771 73 0.081 -0.29516 0.16671 -0.62741 0.03709
Equal variances
not assumed -1.771 73 0.081 -0.29516 0.16665 -0.6273 0.03697
achieveme
nt
motivation
Equal variances
assumed 1.058 0.307 -1.758 73 0.083 -0.28841 0.16404 -0.61535 0.03853
Equal variances
not assumed -1.754 69.698 0.084 -0.28841 0.16447 -0.61645 0.03964
The analysis above indicates that though there is small difference of motivation level between the two classes
(average value: from 3.2483 to 3.3355), students in the two classes shared the same listening motivation level, which is
another principle for choosing the subjects.
2.2 The Motivation Comparison of Control Class between Pretest and Posttest
A paired-samples t-test in Table 3-11 and Table 3-12 was run to find out whether the participants in the control class
show differences of their listening motivation after the experiment. As we can see from these two tables, for the 37
subjects in control class, the mean score of question items’ average value in the posttest (M=3.1047) was significantly
lower at the p<.05 level (note: p=0.028) than that in the pretest (M=3.2666). And the mean scores of abroad motivation, interest motivation, decision motivation and atmosphere motivation in the posttest (M=1.9865, 3.0878, 2.8378, 2.5676)
were significantly lower than that in the pretest (M=2.6014, 3.4865, 3.8356). By contrast, the mean scores of value
motivation and achievement motivation in the posttest (M=3.2973, 4.2703) were significantly higher than that in the
pretest (M=2.9459, 3.5405). It also needs to point out that differences of other types of motivation also existed, but none
of them was significant.
THEORY AND PRACTICE IN LANGUAGE STUDIES 1017
© 2017 ACADEMY PUBLICATION
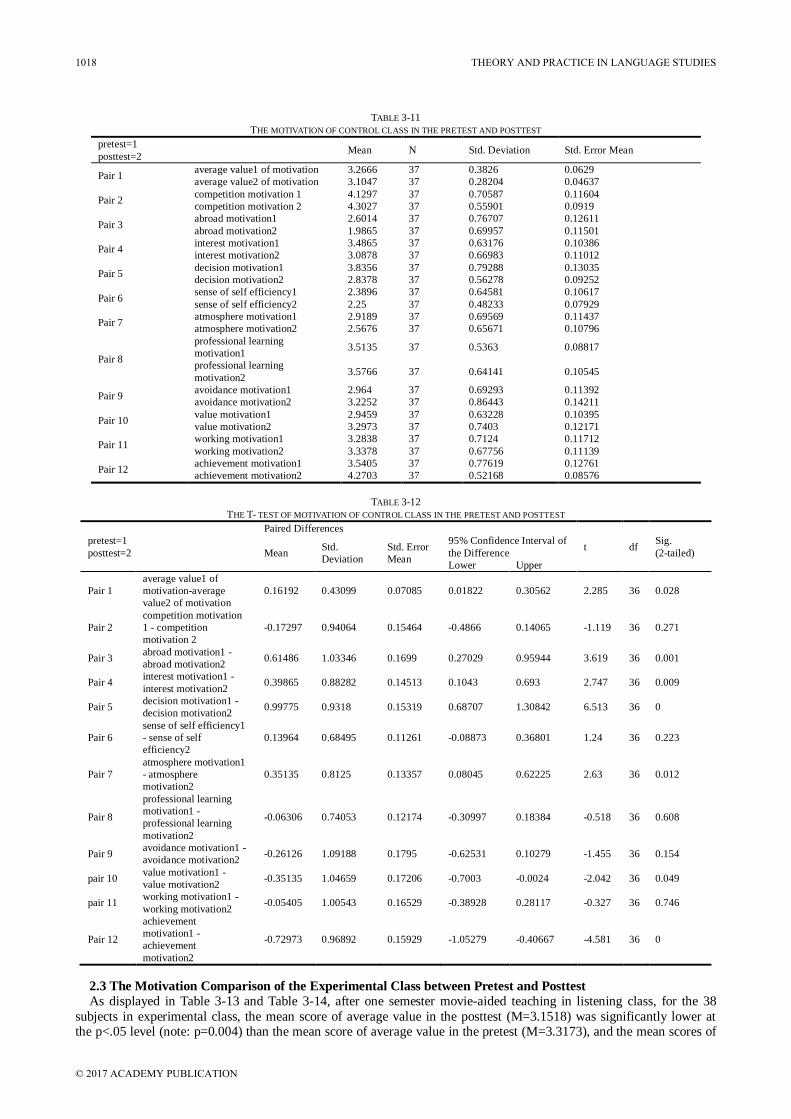
TABLE 3-11
THE MOTIVATION OF CONTROL CLASS IN THE PRETEST AND POSTTEST
pretest=1 Mean N Std. Deviation Std. Error Mean
posttest=2
Pair 1 average value1 of motivation 3.2666 37 0.3826 0.0629
average value2 of motivation 3.1047 37 0.28204 0.04637
Pair 2 competition motivation 1 4.1297 37 0.70587 0.11604
competition motivation 2 4.3027 37 0.55901 0.0919
Pair 3 abroad motivation1 2.6014 37 0.76707 0.12611
abroad motivation2 1.9865 37 0.69957 0.11501
Pair 4 interest motivation1 3.4865 37 0.63176 0.10386
interest motivation2 3.0878 37 0.66983 0.11012
Pair 5 decision motivation1 3.8356 37 0.79288 0.13035
decision motivation2 2.8378 37 0.56278 0.09252
Pair 6 sense of self efficiency1 2.3896 37 0.64581 0.10617
sense of self efficiency2 2.25 37 0.48233 0.07929
Pair 7 atmosphere motivation1 2.9189 37 0.69569 0.11437
atmosphere motivation2 2.5676 37 0.65671 0.10796
Pair 8
professional learning
motivation1 3.5135 37 0.5363 0.08817
professional learning
motivation2 3.5766 37 0.64141 0.10545
Pair 9 avoidance motivation1 2.964 37 0.69293 0.11392
avoidance motivation2 3.2252 37 0.86443 0.14211
Pair 10 value motivation1 2.9459 37 0.63228 0.10395
value motivation2 3.2973 37 0.7403 0.12171
Pair 11 working motivation1 3.2838 37 0.7124 0.11712
working motivation2 3.3378 37 0.67756 0.11139
Pair 12 achievement motivation1 3.5405 37 0.77619 0.12761
achievement motivation2 4.2703 37 0.52168 0.08576
TABLE 3-12
THE T- TEST OF MOTIVATION OF CONTROL CLASS IN THE PRETEST AND POSTTEST
pretest=1
posttest=2
Paired Differences
t df Sig.
(2-tailed) Mean Std.
Deviation
Std. Error
Mean
95% Confidence Interval of
the Difference
Lower Upper
Pair 1
average value1 of
motivation-average
value2 of motivation
0.16192 0.43099 0.07085 0.01822 0.30562 2.285 36 0.028
Pair 2
competition motivation
1 - competition
motivation 2
-0.17297 0.94064 0.15464 -0.4866 0.14065 -1.119 36 0.271
Pair 3 abroad motivation1 -
abroad motivation2 0.61486 1.03346 0.1699 0.27029 0.95944 3.619 36 0.001
Pair 4 interest motivation1 -
interest motivation2 0.39865 0.88282 0.14513 0.1043 0.693 2.747 36 0.009
Pair 5 decision motivation1 -
decision motivation2 0.99775 0.9318 0.15319 0.68707 1.30842 6.513 36 0
Pair 6
sense of self efficiency1
- sense of self
efficiency2
0.13964 0.68495 0.11261 -0.08873 0.36801 1.24 36 0.223
Pair 7
atmosphere motivation1
- atmosphere
motivation2
0.35135 0.8125 0.13357 0.08045 0.62225 2.63 36 0.012
Pair 8
professional learning
motivation1 -
professional learning
motivation2
-0.06306 0.74053 0.12174 -0.30997 0.18384 -0.518 36 0.608
Pair 9 avoidance motivation1 -
avoidance motivation2 -0.26126 1.09188 0.1795 -0.62531 0.10279 -1.455 36 0.154
pair 10 value motivation1 -
value motivation2 -0.35135 1.04659 0.17206 -0.7003 -0.0024 -2.042 36 0.049
pair 11 working motivation1 -
working motivation2 -0.05405 1.00543 0.16529 -0.38928 0.28117 -0.327 36 0.746
Pair 12
achievement
motivation1 -
achievement
motivation2
-0.72973 0.96892 0.15929 -1.05279 -0.40667 -4.581 36 0
2.3 The Motivation Comparison of the Experimental Class between Pretest and Posttest
As displayed in Table 3-13 and Table 3-14, after one semester movie-aided teaching in listening class, for the 38
subjects in experimental class, the mean score of average value in the posttest (M=3.1518) was significantly lower at the p<.05 level (note: p=0.004) than the mean score of average value in the pretest (M=3.3173), and the mean scores of
1018 THEORY AND PRACTICE IN LANGUAGE STUDIES
© 2017 ACADEMY PUBLICATION
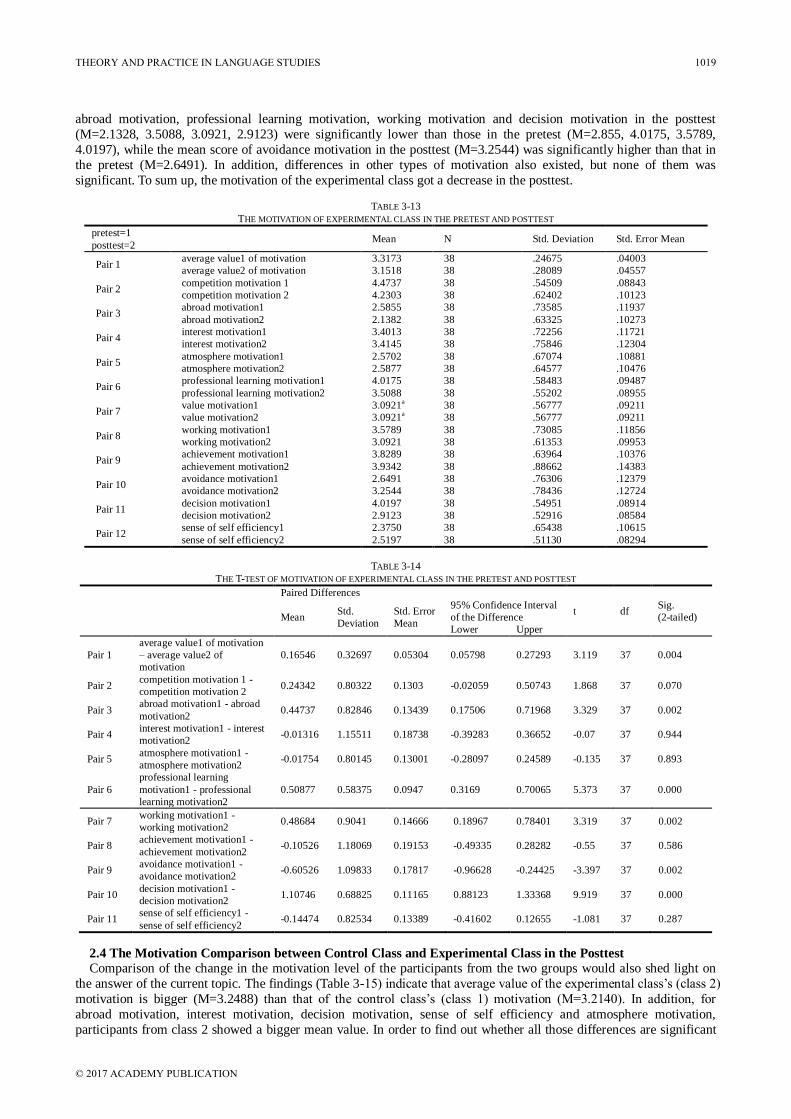
abroad motivation, professional learning motivation, working motivation and decision motivation in the posttest
(M=2.1328, 3.5088, 3.0921, 2.9123) were significantly lower than those in the pretest (M=2.855, 4.0175, 3.5789,
4.0197), while the mean score of avoidance motivation in the posttest (M=3.2544) was significantly higher than that in
the pretest (M=2.6491). In addition, differences in other types of motivation also existed, but none of them was
significant. To sum up, the motivation of the experimental class got a decrease in the posttest.
TABLE 3-13
THE MOTIVATION OF EXPERIMENTAL CLASS IN THE PRETEST AND POSTTEST
pretest=1
posttest=2 Mean N Std. Deviation Std. Error Mean
Pair 1 average value1 of motivation 3.3173 38 .24675 .04003
average value2 of motivation 3.1518 38 .28089 .04557
Pair 2 competition motivation 1 4.4737 38 .54509 .08843
competition motivation 2 4.2303 38 .62402 .10123
Pair 3 abroad motivation1 2.5855 38 .73585 .11937
abroad motivation2 2.1382 38 .63325 .10273
Pair 4 interest motivation1 3.4013 38 .72256 .11721
interest motivation2 3.4145 38 .75846 .12304
Pair 5 atmosphere motivation1 2.5702 38 .67074 .10881
atmosphere motivation2 2.5877 38 .64577 .10476
Pair 6 professional learning motivation1 4.0175 38 .58483 .09487
professional learning motivation2 3.5088 38 .55202 .08955
Pair 7 value motivation1 3.0921
a 38 .56777 .09211
value motivation2 3.0921a 38 .56777 .09211
Pair 8 working motivation1 3.5789 38 .73085 .11856
working motivation2 3.0921 38 .61353 .09953
Pair 9 achievement motivation1 3.8289 38 .63964 .10376
achievement motivation2 3.9342 38 .88662 .14383
Pair 10 avoidance motivation1 2.6491 38 .76306 .12379
avoidance motivation2 3.2544 38 .78436 .12724
Pair 11 decision motivation1 4.0197 38 .54951 .08914
decision motivation2 2.9123 38 .52916 .08584
Pair 12 sense of self efficiency1 2.3750 38 .65438 .10615
sense of self efficiency2 2.5197 38 .51130 .08294
TABLE 3-14
THE T-TEST OF MOTIVATION OF EXPERIMENTAL CLASS IN THE PRETEST AND POSTTEST
Paired Differences
t df Sig.
(2-tailed) Mean Std.
Deviation
Std. Error
Mean
95% Confidence Interval
of the Difference
Lower Upper
Pair 1
average value1 of motivation
– average value2 of
motivation
0.16546 0.32697 0.05304 0.05798 0.27293 3.119 37 0.004
Pair 2 competition motivation 1 -
competition motivation 2 0.24342 0.80322 0.1303 -0.02059 0.50743 1.868 37 0.070
Pair 3 abroad motivation1 - abroad
motivation2 0.44737 0.82846 0.13439 0.17506 0.71968 3.329 37 0.002
Pair 4 interest motivation1 - interest
motivation2 -0.01316 1.15511 0.18738 -0.39283 0.36652 -0.07 37 0.944
Pair 5 atmosphere motivation1 -
atmosphere motivation2 -0.01754 0.80145 0.13001 -0.28097 0.24589 -0.135 37 0.893
Pair 6
professional learning
motivation1 - professional
learning motivation2
0.50877 0.58375 0.0947 0.3169 0.70065 5.373 37 0.000
Pair 7 working motivation1 -
working motivation2 0.48684 0.9041 0.14666 0.18967 0.78401 3.319 37 0.002
Pair 8 achievement motivation1 -
achievement motivation2 -0.10526 1.18069 0.19153 -0.49335 0.28282 -0.55 37 0.586
Pair 9 avoidance motivation1 -
avoidance motivation2 -0.60526 1.09833 0.17817 -0.96628 -0.24425 -3.397 37 0.002
Pair 10 decision motivation1 -
decision motivation2 1.10746 0.68825 0.11165 0.88123 1.33368 9.919 37 0.000
Pair 11 sense of self efficiency1 -
sense of self efficiency2 -0.14474 0.82534 0.13389 -0.41602 0.12655 -1.081 37 0.287
2.4 The Motivation Comparison between Control Class and Experimental Class in the Posttest
Comparison of the change in the motivation level of the participants from the two groups would also shed light on
the answer of the current topic. The findings (Table 3-15) indicate that average value of the experimental class’s (class 2)
motivation is bigger (M=3.2488) than that of the control class’s (class 1) motivation (M=3.2140). In addition, for
abroad motivation, interest motivation, decision motivation, sense of self efficiency and atmosphere motivation,
participants from class 2 showed a bigger mean value. In order to find out whether all those differences are significant
THEORY AND PRACTICE IN LANGUAGE STUDIES 1019
© 2017 ACADEMY PUBLICATION
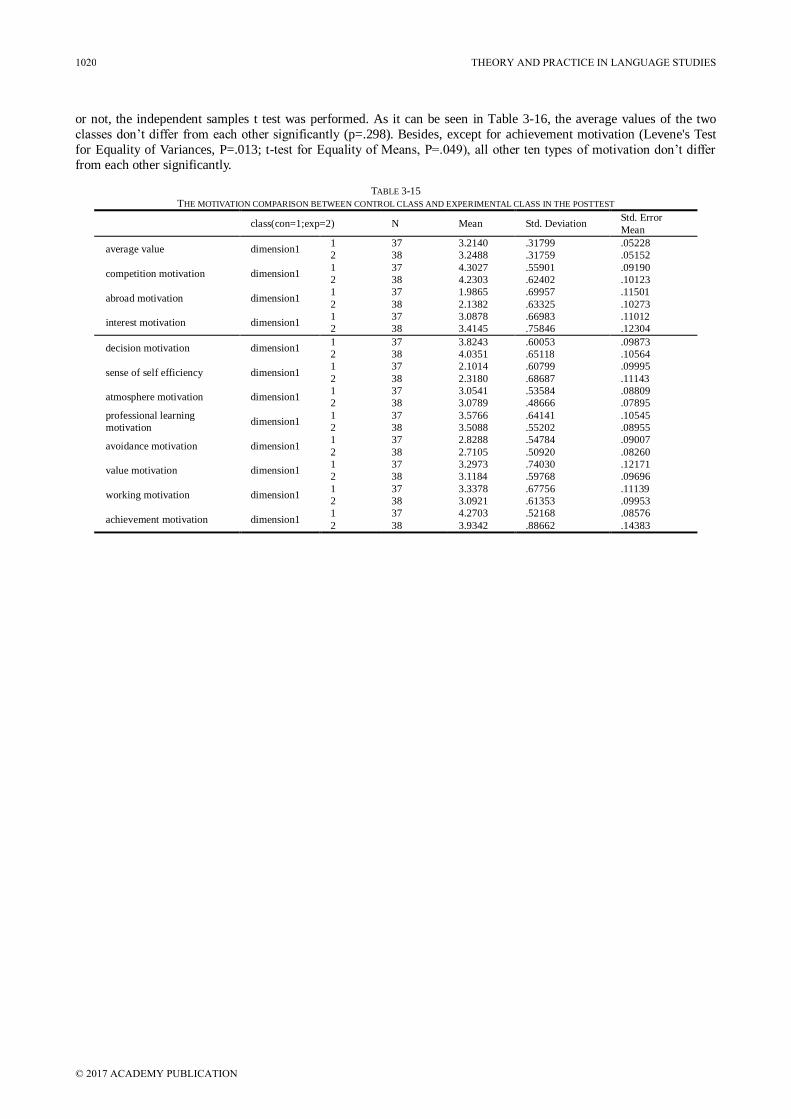
or not, the independent samples t test was performed. As it can be seen in Table 3-16, the average values of the two
classes don’t differ from each other significantly (p=.298). Besides, except for achievement motivation (Levene's Test
for Equality of Variances, P=.013; t-test for Equality of Means, P=.049), all other ten types of motivation don’t differ
from each other significantly.
TABLE 3-15
THE MOTIVATION COMPARISON BETWEEN CONTROL CLASS AND EXPERIMENTAL CLASS IN THE POSTTEST
class(con=1;exp=2) N Mean Std. Deviation Std. Error
Mean
average value dimension1 1 37 3.2140 .31799 .05228
2 38 3.2488 .31759 .05152
competition motivation dimension1 1 37 4.3027 .55901 .09190
2 38 4.2303 .62402 .10123
abroad motivation dimension1 1 37 1.9865 .69957 .11501
2 38 2.1382 .63325 .10273
interest motivation dimension1 1 37 3.0878 .66983 .11012
2 38 3.4145 .75846 .12304
decision motivation dimension1 1 37 3.8243 .60053 .09873
2 38 4.0351 .65118 .10564
sense of self efficiency dimension1 1 37 2.1014 .60799 .09995
2 38 2.3180 .68687 .11143
atmosphere motivation dimension1 1 37 3.0541 .53584 .08809
2 38 3.0789 .48666 .07895
professional learning
motivation dimension1
1 37 3.5766 .64141 .10545
2 38 3.5088 .55202 .08955
avoidance motivation dimension1 1 37 2.8288 .54784 .09007
2 38 2.7105 .50920 .08260
value motivation dimension1 1 37 3.2973 .74030 .12171
2 38 3.1184 .59768 .09696
working motivation dimension1 1 37 3.3378 .67756 .11139
2 38 3.0921 .61353 .09953
achievement motivation dimension1 1 37 4.2703 .52168 .08576
2 38 3.9342 .88662 .14383
1020 THEORY AND PRACTICE IN LANGUAGE STUDIES
© 2017 ACADEMY PUBLICATION
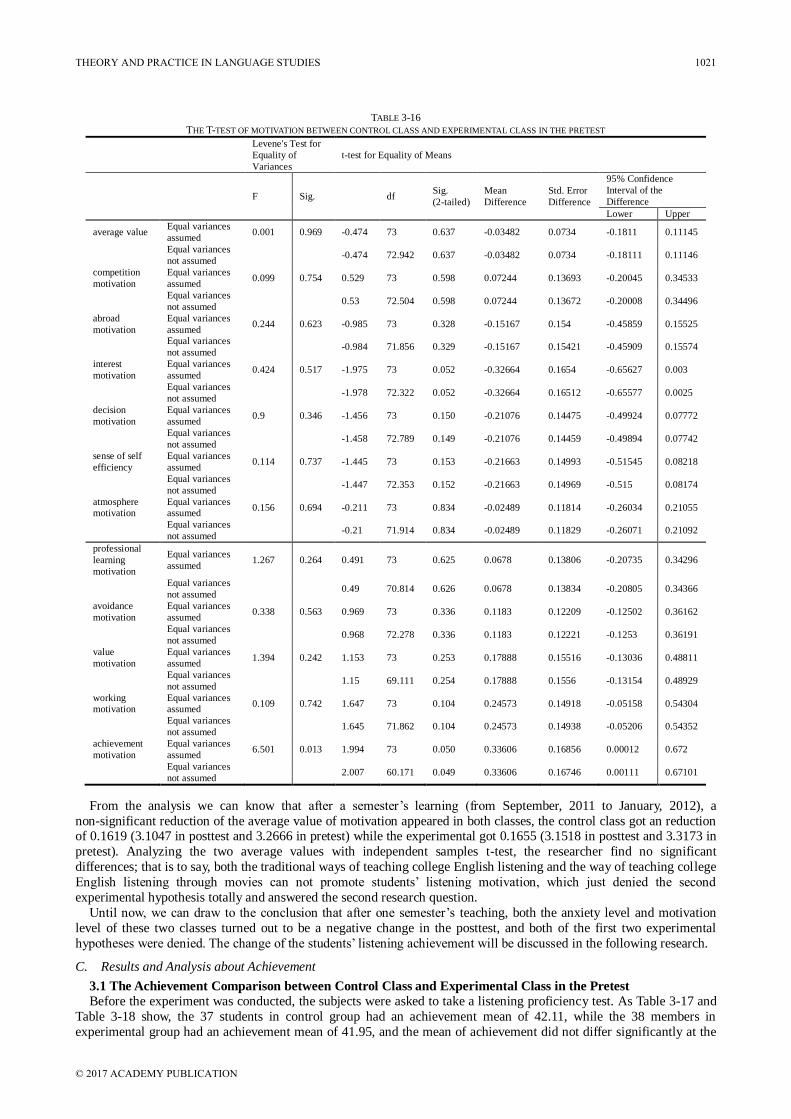
TABLE 3-16
THE T-TEST OF MOTIVATION BETWEEN CONTROL CLASS AND EXPERIMENTAL CLASS IN THE PRETEST
Levene's Test for
Equality of
Variances
t-test for Equality of Means
F Sig. df Sig.
(2-tailed)
Mean
Difference
Std. Error
Difference
95% Confidence
Interval of the
Difference
Lower Upper
average value Equal variances
assumed 0.001 0.969 -0.474 73 0.637 -0.03482 0.0734 -0.1811 0.11145
Equal variances
not assumed -0.474 72.942 0.637 -0.03482 0.0734 -0.18111 0.11146
competition
motivation
Equal variances
assumed 0.099 0.754 0.529 73 0.598 0.07244 0.13693 -0.20045 0.34533
Equal variances
not assumed 0.53 72.504 0.598 0.07244 0.13672 -0.20008 0.34496
abroad
motivation
Equal variances
assumed 0.244 0.623 -0.985 73 0.328 -0.15167 0.154 -0.45859 0.15525
Equal variances
not assumed -0.984 71.856 0.329 -0.15167 0.15421 -0.45909 0.15574
interest
motivation
Equal variances
assumed 0.424 0.517 -1.975 73 0.052 -0.32664 0.1654 -0.65627 0.003
Equal variances
not assumed -1.978 72.322 0.052 -0.32664 0.16512 -0.65577 0.0025
decision
motivation
Equal variances
assumed 0.9 0.346 -1.456 73 0.150 -0.21076 0.14475 -0.49924 0.07772
Equal variances
not assumed -1.458 72.789 0.149 -0.21076 0.14459 -0.49894 0.07742
sense of self
efficiency
Equal variances
assumed 0.114 0.737 -1.445 73 0.153 -0.21663 0.14993 -0.51545 0.08218
Equal variances
not assumed -1.447 72.353 0.152 -0.21663 0.14969 -0.515 0.08174
atmosphere motivation
Equal variances assumed
0.156 0.694 -0.211 73 0.834 -0.02489 0.11814 -0.26034 0.21055
Equal variances
not assumed -0.21 71.914 0.834 -0.02489 0.11829 -0.26071 0.21092
professional
learning
motivation
Equal variances
assumed 1.267 0.264 0.491 73 0.625 0.0678 0.13806 -0.20735 0.34296
Equal variances
not assumed 0.49 70.814 0.626 0.0678 0.13834 -0.20805 0.34366
avoidance
motivation
Equal variances
assumed 0.338 0.563 0.969 73 0.336 0.1183 0.12209 -0.12502 0.36162
Equal variances
not assumed 0.968 72.278 0.336 0.1183 0.12221 -0.1253 0.36191
value
motivation
Equal variances
assumed 1.394 0.242 1.153 73 0.253 0.17888 0.15516 -0.13036 0.48811
Equal variances
not assumed 1.15 69.111 0.254 0.17888 0.1556 -0.13154 0.48929
working motivation
Equal variances assumed
0.109 0.742 1.647 73 0.104 0.24573 0.14918 -0.05158 0.54304
Equal variances
not assumed 1.645 71.862 0.104 0.24573 0.14938 -0.05206 0.54352
achievement
motivation
Equal variances
assumed 6.501 0.013 1.994 73 0.050 0.33606 0.16856 0.00012 0.672
Equal variances
not assumed 2.007 60.171 0.049 0.33606 0.16746 0.00111 0.67101
From the analysis we can know that after a semester’s learning (from September, 2011 to January, 2012), a
non-significant reduction of the average value of motivation appeared in both classes, the control class got an reduction of 0.1619 (3.1047 in posttest and 3.2666 in pretest) while the experimental got 0.1655 (3.1518 in posttest and 3.3173 in
pretest). Analyzing the two average values with independent samples t-test, the researcher find no significant
differences; that is to say, both the traditional ways of teaching college English listening and the way of teaching college
English listening through movies can not promote students’ listening motivation, which just denied the second
experimental hypothesis totally and answered the second research question.
Until now, we can draw to the conclusion that after one semester’s teaching, both the anxiety level and motivation
level of these two classes turned out to be a negative change in the posttest, and both of the first two experimental
hypotheses were denied. The change of the students’ listening achievement will be discussed in the following research.
C. Results and Analysis about Achievement
3.1 The Achievement Comparison between Control Class and Experimental Class in the Pretest
Before the experiment was conducted, the subjects were asked to take a listening proficiency test. As Table 3-17 and
Table 3-18 show, the 37 students in control group had an achievement mean of 42.11, while the 38 members in
experimental group had an achievement mean of 41.95, and the mean of achievement did not differ significantly at the
THEORY AND PRACTICE IN LANGUAGE STUDIES 1021
© 2017 ACADEMY PUBLICATION
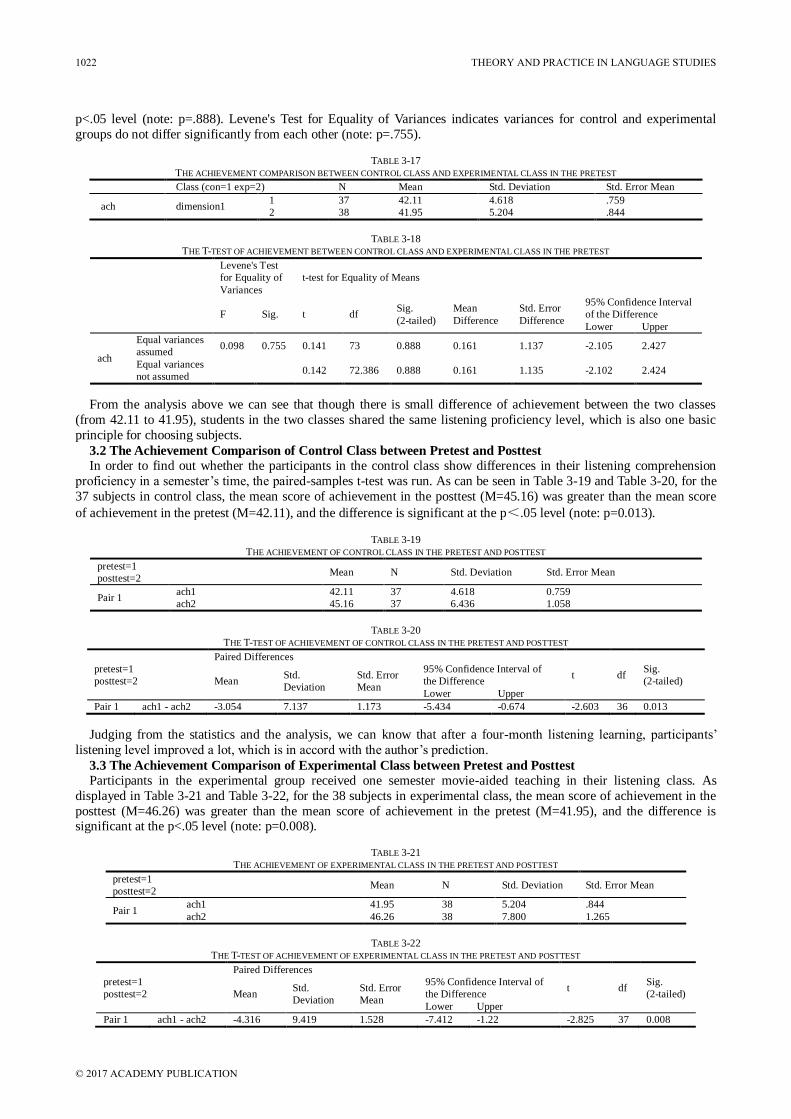
p<.05 level (note: p=.888). Levene's Test for Equality of Variances indicates variances for control and experimental
groups do not differ significantly from each other (note: p=.755).
TABLE 3-17
THE ACHIEVEMENT COMPARISON BETWEEN CONTROL CLASS AND EXPERIMENTAL CLASS IN THE PRETEST
Class (con=1 exp=2) N Mean Std. Deviation Std. Error Mean
ach dimension1 1 37 42.11 4.618 .759
2 38 41.95 5.204 .844
TABLE 3-18
THE T-TEST OF ACHIEVEMENT BETWEEN CONTROL CLASS AND EXPERIMENTAL CLASS IN THE PRETEST
Levene's Test
for Equality of
Variances
t-test for Equality of Means
F Sig. t df Sig.
(2-tailed)
Mean
Difference
Std. Error
Difference
95% Confidence Interval
of the Difference
Lower Upper
ach
Equal variances
assumed 0.098 0.755 0.141 73 0.888 0.161 1.137 -2.105 2.427
Equal variances
not assumed 0.142 72.386 0.888 0.161 1.135 -2.102 2.424
From the analysis above we can see that though there is small difference of achievement between the two classes
(from 42.11 to 41.95), students in the two classes shared the same listening proficiency level, which is also one basic
principle for choosing subjects.
3.2 The Achievement Comparison of Control Class between Pretest and Posttest
In order to find out whether the participants in the control class show differences in their listening comprehension
proficiency in a semester’s time, the paired-samples t-test was run. As can be seen in Table 3-19 and Table 3-20, for the
37 subjects in control class, the mean score of achievement in the posttest (M=45.16) was greater than the mean score
of achievement in the pretest (M=42.11), and the difference is significant at the p<.05 level (note: p=0.013).
TABLE 3-19
THE ACHIEVEMENT OF CONTROL CLASS IN THE PRETEST AND POSTTEST
pretest=1
posttest=2 Mean N Std. Deviation Std. Error Mean
Pair 1 ach1 42.11 37 4.618 0.759
ach2 45.16 37 6.436 1.058
TABLE 3-20
THE T-TEST OF ACHIEVEMENT OF CONTROL CLASS IN THE PRETEST AND POSTTEST
pretest=1
posttest=2
Paired Differences
t df Sig.
(2-tailed) Mean Std.
Deviation
Std. Error
Mean
95% Confidence Interval of
the Difference
Lower Upper
Pair 1 ach1 - ach2 -3.054 7.137 1.173 -5.434 -0.674 -2.603 36 0.013
Judging from the statistics and the analysis, we can know that after a four-month listening learning, participants’
listening level improved a lot, which is in accord with the author’s prediction.
3.3 The Achievement Comparison of Experimental Class between Pretest and Posttest
Participants in the experimental group received one semester movie-aided teaching in their listening class. As
displayed in Table 3-21 and Table 3-22, for the 38 subjects in experimental class, the mean score of achievement in the
posttest (M=46.26) was greater than the mean score of achievement in the pretest (M=41.95), and the difference is significant at the p<.05 level (note: p=0.008).
TABLE 3-21
THE ACHIEVEMENT OF EXPERIMENTAL CLASS IN THE PRETEST AND POSTTEST
pretest=1
posttest=2 Mean N Std. Deviation Std. Error Mean
Pair 1 ach1 41.95 38 5.204 .844
ach2 46.26 38 7.800 1.265
TABLE 3-22
THE T-TEST OF ACHIEVEMENT OF EXPERIMENTAL CLASS IN THE PRETEST AND POSTTEST
pretest=1
posttest=2
Paired Differences
t df Sig.
(2-tailed) Mean Std.
Deviation
Std. Error
Mean
95% Confidence Interval of
the Difference
Lower Upper
Pair 1 ach1 - ach2 -4.316 9.419 1.528 -7.412 -1.22 -2.825 37 0.008
1022 THEORY AND PRACTICE IN LANGUAGE STUDIES
© 2017 ACADEMY PUBLICATION
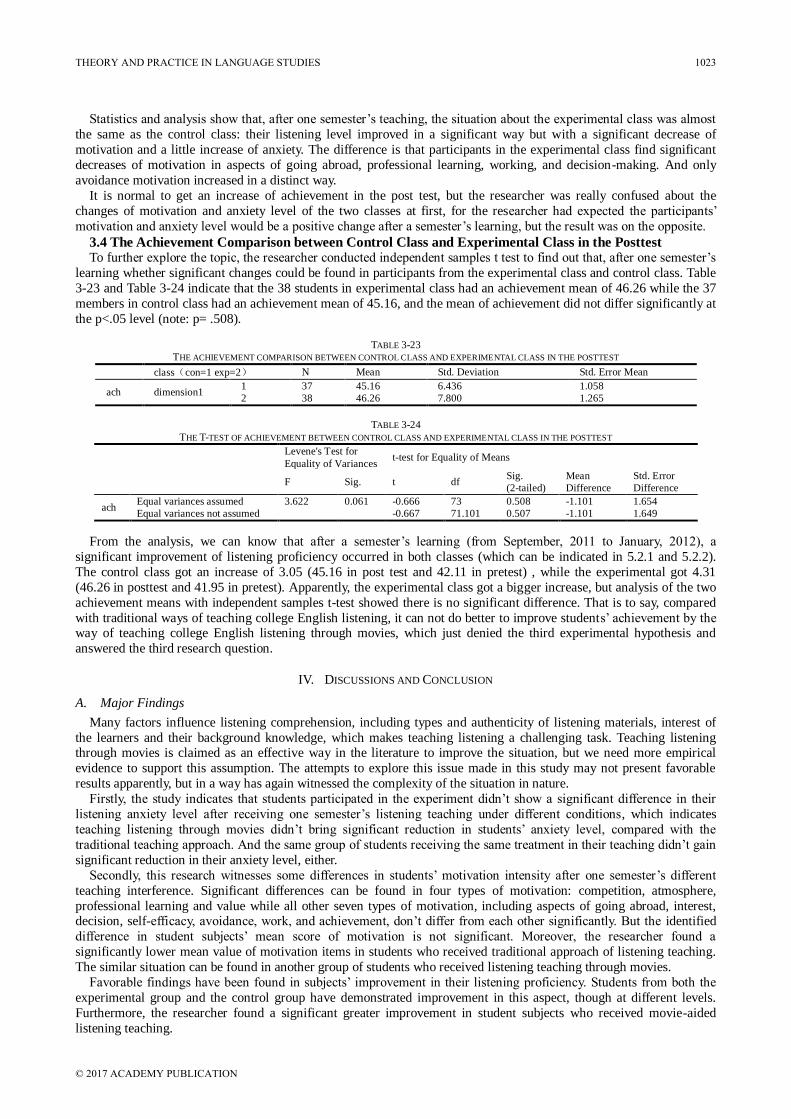
Statistics and analysis show that, after one semester’s teaching, the situation about the experimental class was almost
the same as the control class: their listening level improved in a significant way but with a significant decrease of
motivation and a little increase of anxiety. The difference is that participants in the experimental class find significant
decreases of motivation in aspects of going abroad, professional learning, working, and decision-making. And only
avoidance motivation increased in a distinct way.
It is normal to get an increase of achievement in the post test, but the researcher was really confused about the
changes of motivation and anxiety level of the two classes at first, for the researcher had expected the participants’
motivation and anxiety level would be a positive change after a semester’s learning, but the result was on the opposite.
3.4 The Achievement Comparison between Control Class and Experimental Class in the Posttest To further explore the topic, the researcher conducted independent samples t test to find out that, after one semester’s
learning whether significant changes could be found in participants from the experimental class and control class. Table
3-23 and Table 3-24 indicate that the 38 students in experimental class had an achievement mean of 46.26 while the 37
members in control class had an achievement mean of 45.16, and the mean of achievement did not differ significantly at
the p<.05 level (note: p= .508).
TABLE 3-23
THE ACHIEVEMENT COMPARISON BETWEEN CONTROL CLASS AND EXPERIMENTAL CLASS IN THE POSTTEST
class(con=1 exp=2) N Mean Std. Deviation Std. Error Mean
ach dimension1 1 37 45.16 6.436 1.058
2 38 46.26 7.800 1.265
TABLE 3-24
THE T-TEST OF ACHIEVEMENT BETWEEN CONTROL CLASS AND EXPERIMENTAL CLASS IN THE POSTTEST
Levene's Test for
Equality of Variances t-test for Equality of Means
F Sig. t df Sig.
(2-tailed)
Mean
Difference
Std. Error
Difference
ach Equal variances assumed 3.622 0.061 -0.666 73 0.508 -1.101 1.654
Equal variances not assumed -0.667 71.101 0.507 -1.101 1.649
From the analysis, we can know that after a semester’s learning (from September, 2011 to January, 2012), a
significant improvement of listening proficiency occurred in both classes (which can be indicated in 5.2.1 and 5.2.2).
The control class got an increase of 3.05 (45.16 in post test and 42.11 in pretest) , while the experimental got 4.31
(46.26 in posttest and 41.95 in pretest). Apparently, the experimental class got a bigger increase, but analysis of the two
achievement means with independent samples t-test showed there is no significant difference. That is to say, compared
with traditional ways of teaching college English listening, it can not do better to improve students’ achievement by the way of teaching college English listening through movies, which just denied the third experimental hypothesis and
answered the third research question.
IV. DISCUSSIONS AND CONCLUSION
A. Major Findings
Many factors influence listening comprehension, including types and authenticity of listening materials, interest of
the learners and their background knowledge, which makes teaching listening a challenging task. Teaching listening through movies is claimed as an effective way in the literature to improve the situation, but we need more empirical
evidence to support this assumption. The attempts to explore this issue made in this study may not present favorable
results apparently, but in a way has again witnessed the complexity of the situation in nature.
Firstly, the study indicates that students participated in the experiment didn’t show a significant difference in their
listening anxiety level after receiving one semester’s listening teaching under different conditions, which indicates
teaching listening through movies didn’t bring significant reduction in students’ anxiety level, compared with the
traditional teaching approach. And the same group of students receiving the same treatment in their teaching didn’t gain
significant reduction in their anxiety level, either.
Secondly, this research witnesses some differences in students’ motivation intensity after one semester’s different
teaching interference. Significant differences can be found in four types of motivation: competition, atmosphere,
professional learning and value while all other seven types of motivation, including aspects of going abroad, interest, decision, self-efficacy, avoidance, work, and achievement, don’t differ from each other significantly. But the identified
difference in student subjects’ mean score of motivation is not significant. Moreover, the researcher found a
significantly lower mean value of motivation items in students who received traditional approach of listening teaching.
The similar situation can be found in another group of students who received listening teaching through movies.
Favorable findings have been found in subjects’ improvement in their listening proficiency. Students from both the
experimental group and the control group have demonstrated improvement in this aspect, though at different levels.
Furthermore, the researcher found a significant greater improvement in student subjects who received movie-aided
listening teaching.
THEORY AND PRACTICE IN LANGUAGE STUDIES 1023
© 2017 ACADEMY PUBLICATION
B. Implications for Teaching and Learning College English Listening
According to the literature review and the findings, some meaningful and significant implications are provided for
teaching and learning college English listening respectively.
Though there are an increasing number of experts and teachers at home and aboard have come to realize the value of
teaching listening through movies in ELT with the development of psycholinguistics and teaching methodology, teachers should realize the challenge in teaching listening through movies to non-English majors. Factors like selection
criteria of the movie, instructional activities during the class, the student’s level of English proficiency and the interests
of learners will all affect the result of teaching listening through movies. So the teachers should take all of them into
account to make sure that students can get a significant increase of listening proficiency.
As for the students, the following suggestions may be helpful for their English listening learning: First, students
should try every means to ccultivate interest in learning, that’s the basement of language learning. Then, proper learning
goals are also important for learners, the goals should be challenging and within the reach of learners’ effort. Last but
not least, the building of self-confidence is essential for students in language learning. So learners should try their best
to keep self-confidence in language learning.
C. Limitations of the Study
Several limitations of this study need to be recognized in interpreting the results. First of all, the number of the
subjects is apparently small, compared with the great number of all the non-English majors in the university.
Second, the experiment was performed in a limited time, actually the author needs to spend many extra hours to
prepare and negotiate with students about the contents and activities of the class. If it could last longer, more teaching
strategies would be adopted, and more work would be conducted and the result would be different.
Though both the control group and experimental group were taught by the author in the study, it seems there is no
variation in terms of the teacher's factor, but in fact we can hardly say that the author executed the two ways of teaching equally well in the study.
Due to all the limitations above, probably the reliability of the data and the validity of the research could be
compromised, so as the findings.
D. Suggestions for Further Study
All limitations exist in this study should be avoided in future research. For instance, since the sample of the subjects
is quite small in size which makes the results are not very convincing, future research can carry out the study with a larger sample of learners to obtain more accurate and complete information. We should carry out the study in a longer
period and try every means to make sure the consistency of same variables in different groups.
In spite of all these limitations above, empirically, there are still some possibilities of using movies to teach English
listening for non-English majors. Student subjects in this study are influenced by the university culture. The relatively
lower level of English and the longing for further studies give them impetus to make efforts to gain a better result in
performance, which may influence their anxiety level and motivation intensity. In this sense, teachers and researchers
could further explore strategies to carry out anxiety interference with a focus on positive and task-based guidance,
which can help students gain sense of achievements. Meanwhile, efforts could also be made to provide students with
positive emotional, professional and cognitive support, meaningful teaching materials and guidance on the development
of autonomy and creativity. What’s more, whether their speaking is also improved in the study is not mentioned, which
suggests that there is much potential for future research using English movies in the language classroom.
REFERENCES
[1] Jiang Yuxiu. (2006). Study on English film listening teaching. Journal of Urumqi Adult Education Institute, 2, 40-43.
[2] Long Qianhong. (2003). English movies and the teaching of listening and speaking. Media in Foreign Language Instruction, 3, 48-51.
[3] Shen Weiju. (2011). An empirical study of the effect of English film on listening teaching. E-Education Research, 3. 106-112. [4] Wang Shouyuan & Miao Xingwei. (2003). The theory and methods of English listening teaching. Media in Foreign Language
Instruction, 4, 1-5. Jiaosheng Qiu was born in Tengzhou, China in 1983. He received his master’s degree in foreign linguistics and applied linguistics
from Shandong Agricultural University, China in 2012. He is currently a lecturer in the Department of College Foreign Languages Teaching, Taishan University, Tai’an, China. His
research interests include Second Language Acquisition and College English Teaching.
1024 THEORY AND PRACTICE IN LANGUAGE STUDIES
© 2017 ACADEMY PUBLICATION