the dose-response relationship between cumulative lifting load and lumbar disk degeneration based on...
TRANSCRIPT

doi: 10.2522/ptj.20130095Originally published online June 26, 2014
2014; 94:1582-1593.PHYS THER. Liou, Ing-Kang Ho and Yue L. GuoHwang, Li-Ping Ma, Wen-Chuan Huang, Saou-Hsing Yu-Ju Hung, Tiffany T-F. Shih, Bang-Bin Chen, Yaw-HueiImaging FindingsDegeneration Based on Magnetic ResonanceCumulative Lifting Load and Lumbar Disk The Dose-Response Relationship Between
http://ptjournal.apta.org/content/94/11/1582found online at: The online version of this article, along with updated information and services, can be
Online-Only Material 30095.DC1.html
http://ptjournal.apta.org/content/suppl/2014/10/24/ptj.201
Collections
Injuries and Conditions: Spine Injuries and Conditions: Low Back
Anatomy and Physiology: Musculoskeletal System in the following collection(s): This article, along with others on similar topics, appears
e-Letters
"Responses" in the online version of this article. "Submit a response" in the right-hand menu under
or click onhere To submit an e-Letter on this article, click
E-mail alerts to receive free e-mail alerts hereSign up
by Eileen Chang on November 8, 2014http://ptjournal.apta.org/Downloaded from by Eileen Chang on November 8, 2014http://ptjournal.apta.org/Downloaded from
The Dose-Response RelationshipBetween Cumulative Lifting Loadand Lumbar Disk DegenerationBased on Magnetic ResonanceImaging FindingsYu-Ju Hung, Tiffany T-F. Shih, Bang-Bin Chen, Yaw-Huei Hwang, Li-Ping Ma,Wen-Chuan Huang, Saou-Hsing Liou, Ing-Kang Ho, Yue L. Guo
Background. Lumbar disk degeneration (LDD) has been related to heavy physicalloading. However, the quantification of the exposure has been controversial, and thedose-response relationship with the LDD has not been established.
Objective. The purpose of this study was to investigate the dose-response rela-tionship between lifetime cumulative lifting load and LDD.
Design. This was a cross-sectional study.
Methods. Every participant received assessments with a questionnaire, magneticresonance imaging (MRI) of the lumbar spine, and estimation of lumbar disk com-pression load. The MRI assessments included assessment of disk dehydration, annulustear, disk height narrowing, bulging, protrusion, extrusion, sequestration, degener-ative and spondylolytic spondylolisthesis, foramina narrowing, and nerve root com-pression on each lumbar disk level. The compression load was predicted using abiomechanical software system.
Results. A total of 553 participants were recruited in this study and categorizedinto tertiles by cumulative lifting load (ie, �4.0 � 105, 4.0 � 105 to 8.9 � 106, and�8.9 � 106 Nh). The risk of LDD increased with cumulative lifting load. The bestdose-response relationships were found at the L5–S1 disk level, in which highcumulative lifting load was associated with elevated odds ratios of 2.5 (95% confi-dence interval [95% CI]�1.5, 4.1) for dehydration and 4.1 (95% CI�1.9, 10.1) for diskheight narrowing compared with low lifting load. Participants exposed to interme-diate lifting load had an increased odds ratio of 2.1 (95% CI�1.3, 3.3) for bulgingcompared with low lifting load. The tests for trend were significant.
Limitations. There is no “gold standard” assessment tool for measuring thelumbar compression load.
Conclusions. The results suggest a dose-response relationship between cumula-tive lifting load and LDD.
Y-J. Hung, MS, Institute of Occu-pational Medicine and IndustrialHygiene, National Taiwan Univer-sity (NTU), College of PublicHealth, Taipei, Taiwan, andDepartment of Biological Scienceand Technology, Chung Hwa Uni-versity of Medical Technology,Tainan, Taiwan.
T.T-F. Shih, MD, Department ofMedical Imaging and Radiology,NTU Hospital and NTU College ofMedicine.
B-B. Chen, MD, Department ofMedical Imaging and Radiology,NTU Hospital and NTU College ofMedicine.
Y-H. Hwang, PhD, Institute ofOccupational Medicine andIndustrial Hygiene, NTU Collegeof Public Health.
L-P. Ma, BS, Department of Envi-ronmental & Occupational Medi-cine, NTU Hospital and NTU Col-lege of Medicine.
W-C. Huang, MS, Department ofEnvironmental & OccupationalMedicine, NTU Hospital and NTUCollege of Medicine.
S-H. Liou, PhD, MD, Departmentof Public Health, National DefenseMedical Center, Taipei, Taiwan,and Division of EnvironmentalHealth and Occupational Medi-cine, National Health ResearchInstitute, Taipei, Taiwan.
I-K. Ho, PhD, Center for DrugAbuse and Addiction, China Med-ical University Hospital, Taichung,Taiwan; Graduate Institute of Clin-ical Medical Science, China Medi-cal University, Taichung, Taiwan;and Neuropsychiatric ResearchCenter, National Health ResearchInstitute, Zhunan, Miaoli County,Taiwan.
Author information continues onnext page.
Research Report
Post a Rapid Response tothis article at:ptjournal.apta.org
1582 f Physical Therapy Volume 94 Number 11 November 2014 by Eileen Chang on November 8, 2014http://ptjournal.apta.org/Downloaded from
Lumbar disk degeneration (LDD)is associated with heavy physicalloading.1–9 Some individuals
who experience degenerativechanges in the disks may have symp-toms of low back pain (LBP).6,10,11 InUS industries, LBP is the most prev-alent and costly musculoskeletal dis-order; moreover, because it is amajor cause of work absenteeism, itaccounts for a large proportion ofoccupational disability costs.12
According to the US Bureau of LaborStatistics, 11 to 13 million peopledeveloped LBP in 2000, and approx-imately $100 billion was spent ontreating this symptom.13 The sub-stantial economic burden and pro-ductivity loss caused by LBP havebecome considerable societal prob-lems. In 2001, 65% of all reportedcases of low back injuries werecaused by overexertion, whereas60% occurred during lifting.13 There-fore, understanding the dose-response relationship between phys-ical loading and LDD can providevaluable information regarding safelifting load for designing work taskswith relatively low risks of low backinjury. However, few studies haveanalyzed the dose-response relation-ship between physical loading andLDD. Establishing such a dose-response relationship is difficultbecause of suboptimal exposureassessments and a relative lack ofdefinitive imaging findings regardingLDD. Regarding exposure assess-ment, the suspected major risk fac-tors for LDD are physical loading orbiomechanical forces on the disks,and the most relevant risk factor isthe lifetime cumulative dose.14
Regarding outcome measurement,the results are typically based on 2 or3 degenerative disk–related condi-tions or on self-reported LBP.
In recent decades, magnetic reso-nance imaging (MRI) has been con-sidered the most sensitive techniquefor detecting disk degeneration4 andis an ethically acceptable method for
large population samples. Lumbardisk degeneration can be mostclearly described using MRI, thusclarifying the dose-response relation-ship between physical loading andLDD. Determining the prevalencerate of specific disk degeneration byusing MRI and assessing the relation-ships between lumbar spine levelsand various findings can provideinsights into the etiopathogenesis ofdisk degeneration.15,16 Comprehen-sive investigations of the lifetimecumulative load on lumbar disks thatresult in various LDDs on each disklevel are rarely conducted. There-fore, the purpose of this study was toexamine the dose-response relation-ship between various LDDs and thelifetime cumulative load on eachlumbar disk level caused by manuallifting.
MethodParticipantsWe conducted a cross-sectionalstudy. To analyze workers from abroad spectrum of lifting exposures,the participants in this study wererecruited from 2 populations: (1)workers who carry heavy loads and(2) walk-in clinic patients. The groupthat carried heavy loads comprisedmembers of the San Chung Fruit andVegetable Wholesale Market in Tai-wan. Most of these workers load andunload fruit boxes almost every day;thus, lifting is a common task at theirworkplace. Patients who soughttreatment in the Internal MedicineClinic of the National Taiwan Univer-sity Hospital and were diagnosedwith upper respiratory infections(URIs), mostly the common cold,were recruited as the backgroundpopulation. During recruitment, thewholesale market workers and thewalk-in clinic patients were notinformed of the hypothesis of thestudy. They were invited to partici-pate in a survey regarding spine andbone disorders. The inclusion crite-ria for the study were an agebetween 20 and 65 years and at least
Y.L. Guo, PhD, MD, Department of Environ-mental & Occupational Medicine, NTU Col-lege of Medicine and NTU Hospital, Taipei,Taiwan, and Institute of Occupational Med-icine and Industrial Hygiene, NTU College ofPublic Health, Room 339, No. 17, XuzhouRd, Taipei, Taiwan. Address all correspon-dence to Dr Guo at: [email protected].
[Hung Y-J, Shih TT-F, Chen B-B, et al. Thedose-response relationship between cumula-tive lifting load and lumbar disk degenera-tion based on magnetic resonance imagingfindings. Phys Ther. 2014;94:1582–1593.]
© 2014 American Physical Therapy Association
Published Ahead of Print: June 26, 2014Accepted: June 15, 2014Submitted: March 10, 2013
Available WithThis Article atptjournal.apta.org
• eTable 1: Percentage ofAgreement for IntrareaderReliability of All MagneticResonance Imaging Variables
• eTable 2: Kappa Values forIntrareader Reliability of AllMagnetic Resonance ImagingVariables
Relationship Between Cumulative Lifting Load and Lumbar Disk Degeneration
November 2014 Volume 94 Number 11 Physical Therapy f 1583 by Eileen Chang on November 8, 2014http://ptjournal.apta.org/Downloaded from
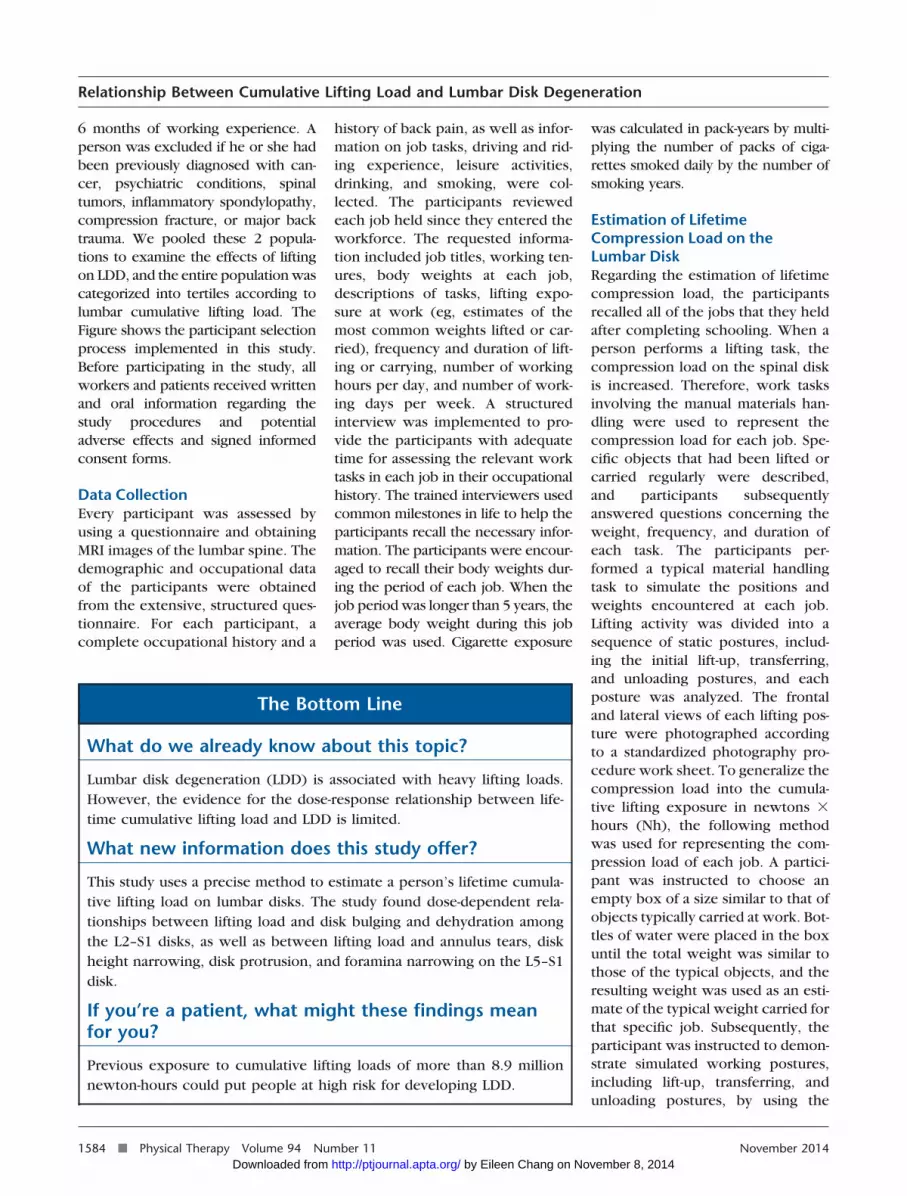
6 months of working experience. Aperson was excluded if he or she hadbeen previously diagnosed with can-cer, psychiatric conditions, spinaltumors, inflammatory spondylopathy,compression fracture, or major backtrauma. We pooled these 2 popula-tions to examine the effects of liftingon LDD, and the entire population wascategorized into tertiles according tolumbar cumulative lifting load. TheFigure shows the participant selectionprocess implemented in this study.Before participating in the study, allworkers and patients received writtenand oral information regarding thestudy procedures and potentialadverse effects and signed informedconsent forms.
Data CollectionEvery participant was assessed byusing a questionnaire and obtainingMRI images of the lumbar spine. Thedemographic and occupational dataof the participants were obtainedfrom the extensive, structured ques-tionnaire. For each participant, acomplete occupational history and a
history of back pain, as well as infor-mation on job tasks, driving and rid-ing experience, leisure activities,drinking, and smoking, were col-lected. The participants reviewedeach job held since they entered theworkforce. The requested informa-tion included job titles, working ten-ures, body weights at each job,descriptions of tasks, lifting expo-sure at work (eg, estimates of themost common weights lifted or car-ried), frequency and duration of lift-ing or carrying, number of workinghours per day, and number of work-ing days per week. A structuredinterview was implemented to pro-vide the participants with adequatetime for assessing the relevant worktasks in each job in their occupationalhistory. The trained interviewers usedcommon milestones in life to help theparticipants recall the necessary infor-mation. The participants were encour-aged to recall their body weights dur-ing the period of each job. When thejob period was longer than 5 years, theaverage body weight during this jobperiod was used. Cigarette exposure
was calculated in pack-years by multi-plying the number of packs of ciga-rettes smoked daily by the number ofsmoking years.
Estimation of LifetimeCompression Load on theLumbar DiskRegarding the estimation of lifetimecompression load, the participantsrecalled all of the jobs that they heldafter completing schooling. When aperson performs a lifting task, thecompression load on the spinal diskis increased. Therefore, work tasksinvolving the manual materials han-dling were used to represent thecompression load for each job. Spe-cific objects that had been lifted orcarried regularly were described,and participants subsequentlyanswered questions concerning theweight, frequency, and duration ofeach task. The participants per-formed a typical material handlingtask to simulate the positions andweights encountered at each job.Lifting activity was divided into asequence of static postures, includ-ing the initial lift-up, transferring,and unloading postures, and eachposture was analyzed. The frontaland lateral views of each lifting pos-ture were photographed accordingto a standardized photography pro-cedure work sheet. To generalize thecompression load into the cumula-tive lifting exposure in newtons �hours (Nh), the following methodwas used for representing the com-pression load of each job. A partici-pant was instructed to choose anempty box of a size similar to that ofobjects typically carried at work. Bot-tles of water were placed in the boxuntil the total weight was similar tothose of the typical objects, and theresulting weight was used as an esti-mate of the typical weight carried forthat specific job. Subsequently, theparticipant was instructed to demon-strate simulated working postures,including lift-up, transferring, andunloading postures, by using the
The Bottom Line
What do we already know about this topic?
Lumbar disk degeneration (LDD) is associated with heavy lifting loads.However, the evidence for the dose-response relationship between life-time cumulative lifting load and LDD is limited.
What new information does this study offer?
This study uses a precise method to estimate a person’s lifetime cumula-tive lifting load on lumbar disks. The study found dose-dependent rela-tionships between lifting load and disk bulging and dehydration amongthe L2–S1 disks, as well as between lifting load and annulus tears, diskheight narrowing, disk protrusion, and foramina narrowing on the L5–S1disk.
If you’re a patient, what might these findings meanfor you?
Previous exposure to cumulative lifting loads of more than 8.9 millionnewton-hours could put people at high risk for developing LDD.
Relationship Between Cumulative Lifting Load and Lumbar Disk Degeneration
1584 f Physical Therapy Volume 94 Number 11 November 2014 by Eileen Chang on November 8, 2014http://ptjournal.apta.org/Downloaded from
empty box, and photographs ofthese postures were captured. Theinitial position of the weight liftingtask was defined as the lift-up pos-ture, the final position was defined asthe unloading posture, and theaction of transferring material whilewalking was defined as the transfer-ring posture.
Although the initial and final liftingpositions may have varied during atypical day of materials handling onthe job, the selected typical tasks,including the simulated positionsand weights, were used to calculatethe compression load to representthe job. The compression load onthe lumbar disk during lifting wasestimated using the 3D StaticStrength Prediction Program(3DSSPP, Center for Ergonomics,University of Michigan, Ann Arbor,Michigan) software system.17,18 The3DSSPP was used to predict thestatic strength requirements for taskssuch as lifts, pushes, and pulls duringeach work period. Anthropometricdata such as sex, height, bodyweight, carried load, and workingposture photograph of each partici-pant were input into the 3DSSPP sys-tem to predict the compression loadon the lumbar disk. In addition, theangle of the body can be adjustedautomatically by using the system.To evaluate the intrarater and inter-rater reliability of lumbar load esti-mation by using the 3DSSPP, photo-graphs of the simulated workconditions of the 60 study partici-pants were repeatedly evaluated in 2rounds, with the second round ofevaluation conducted 4 weeks afterthe first round.
To investigate the actual cumulativelifting exposure, the participantsrecalled details regarding lift-uptime (tlift-up), transporting time(ttransporting), and unloading time(tunload) of each lifting task at theirjobs. Hence, in this study, the liftingexposure of each task was defined as
the sum of the products of the lift-upforce (Flift-up) and lift-up time, trans-porting force (Ftransporting) and trans-porting time, and unloading force(Funload) and unloading time. Thecumulative compression load calcu-lation method used in this study wasmodified from that used by Seidlerand colleagues.1–3 However, unlike
Seidler and colleagues, we used the3DSSPP to estimate the lumbar com-pression load. For each jobdescribed, the load on the lumbardisk was calculated as the product ofthe compression load and the dura-tion of lifting in hours. The lifetimecumulative load (Nh) for each partic-ipant was then estimated by sum-
QuestionnaireMaterial
handling tasksimulation
MRIassessment
Cancer n=84
Psychiatric condition n=16
Spinal tumor n=13
Inflammatory spondylopathy n=4
Major back trauma n=27
Compression fracture n=18
Participantsn=553
Lifting load estimation by3DSSPP
Low lifting load group
n=185
Intermediatelifting load group
n=184
High lifting load group
n=184
Fruit market workersn=452
Walk-in clinic patients with URIn=263
Eligible participantsn=715
Figure.Flow diagram of the participants’ selection process in the study. URI�upper respiratoryinfection, MRI�magnetic resonance imaging.
Relationship Between Cumulative Lifting Load and Lumbar Disk Degeneration
November 2014 Volume 94 Number 11 Physical Therapy f 1585 by Eileen Chang on November 8, 2014http://ptjournal.apta.org/Downloaded from
ming the loads on the lumbar diskfrom all jobs. The calculation can beexpressed as the following equation:
Cumulative lifting load
�¥[(Flift-up � tlift-up
�Ftransporting � ttransporting
�Funload � tunload)/3,600
� frequency of lifting/day
� working days/year
� working year],
where F represents the compressionload on the lumbar disk and t repre-sents time (seconds).
According to the findings of Siedleret al,3 all workloads from the pastcontribute to LDD. Therefore, thelifetime cumulative load for each par-ticipant was estimated by summingeach load on the lumbar disk from alljobs. In previous studies, the lifetimeexposure was typically estimatedusing the number of working hoursper day.1–3 However, in practicalworking environments, workers donot lift for 8 hours daily; therefore,the results might have been overes-timated in previous studies. By con-trast, the detailed investigation andcalculation methods used in thisstudy were implemented for calcu-lating precise cumulative liftingexposure values.
We visited the fruit market to obtaina video recording of the workingconditions and lifting processes andobserved that the weight lifted perunit of fruit was rather regular, thussimplifying the calculation process.The video recording was rated sepa-rately using the 3DSSPP, whichyielded results consistent with thosefrom the recollections of the fruitmarket workers. The reproducibilityof the lifting measurements wastested 6 months after the initial inter-view with the help of 25 partici-
pants. The lifting measurements oftheir current jobs were used for reli-ability testing. These measurementsincluded the weight lifted, lift-uptime, frequency of lifting per day,and tenure at the job. We observedthat most of the participants’ lift-uptime was almost equal to theirunloading time and that the trans-porting time was zero. Therefore,the reliability of the transportingtime and unloading time was notexamined. After observing andrecording the fruit workers’ prac-tices, we determined that pushing orpulling is not a common task for themajority of fruit market workersbecause they typically drive an elec-tric pedicab to transfer fruit boxes.Therefore, the lumbar compressionload of pushing and pulling was notassessed.
Magnetic Resonance ImagingEquipment and ProtocolThe LDD was assessed using MRI. AllMRI examinations were conductedat National Taiwan University Hospi-tal using a GE 1.5-T unit (GeneralElectric Medical Systems, Milwau-kee, Wisconsin) and a spine arraycoil (12.7 � 27.9 cm [5 � 11 in]).The study involved 4 spin-echosequences: an axial localizer (spoiledgradient), sagittal views with a repe-tition time and echo time (TR/TE) of500/minimum milliseconds and3,350/110 milliseconds, and an axialview with a TR/TE of 5,325/110 mil-liseconds. The slice thickness was 4mm for sagittal and axial sequences,and the field of view was 28 and 20cm for the sagittal and axial images,respectively. The T1-weighted axialsequences were stacked slicesextending from the inferior aspect ofT12 through the inferior aspect ofS1. The T1-weighted axial and sagit-tal images exhibited 2 excitations,and the T2-weighted sagittal imagesexhibited one excitation.
Definition of the DegenerativeDisk–Related MRI FindingsEach intervertebral disk from L1–L2to L5–S1 was evaluated for disk dehy-dration, annulus tear, disk height nar-rowing, disk bulging, protrusion,extrusion, sequestration, degenera-tive and spondylolytic spondylolis-thesis, foramina narrowing, andnerve root compression. An experi-enced radiologist performed theevaluation based on standard imagesand according to written instruc-tions. The radiologist was blinded tothe participants’ medical historiesand occupational exposure statuses.
Disk dehydration was defined asT2-weighted signal intensity lossfrom the intervertebral disk.19 Annu-lar tears are separations betweenannular fibers, the avulsion of fibersfrom their vertebral body insertions,or breaks through fibers that extendradially, transversely, or concentri-cally, involving one or more layers ofthe annular lamellae.20 According tothe Farfan method,21 disk height canbe measured as the mean of the ven-tral and dorsal distances between thecontours of the adjacent vertebralbodies. Reduction of disk height wasdefined as disk height that is lessthan that of the disk height of thedisk above.16 Disk bulging wasdefined as the presence of disk tissuethat is circumferentially (50%–100%)beyond the edges of the ring apoph-yses. Protrusion was present if thegreatest distance, in any plane,between the edges of the disk mate-rial beyond the disk space was morethan the distance between the edgesof the base in the same plane. Extru-sion was present when, in at leastone plane, any one distance betweenthe edges of the disk materialbeyond the disk space was greaterthan the distance between the edgesof the base or when no continuityexisted between the disk materialbeyond the disk space and thatwithin the disk space. Extrusion maybe further specified as sequestration
Relationship Between Cumulative Lifting Load and Lumbar Disk Degeneration
1586 f Physical Therapy Volume 94 Number 11 November 2014 by Eileen Chang on November 8, 2014http://ptjournal.apta.org/Downloaded from
if the displaced disk material hascompletely lost continuity with theparent disk.20 Spondylolytic spondy-lolisthesis was identified in a lateralprojection as an anterior displace-ment with a break of the pars inter-articularis. Degenerative spondylolis-thesis was defined as displacementof one vertebral body relative to thenext inferior vertebral body with anintact pars interarticularis, and spon-dylolytic spondylolisthesis involvesthe separation of the posterioraspect of the vertebral body from theanterior body.19 The intrareader reli-ability regarding the presence orabsence of each MRI variable wasdetermined as the average reliabilityof 5 lumbar disks of the 60 partici-pants evaluated on 2 occasionswithin 3 months.
Data AnalysisAll statistical analyses were con-ducted using JMP 5.0 (SAS InstituteInc, Cary, North Carolina). For theevaluation of the occurrence of LDDamong the lifting group, a logisticregression was conducted, adjustingfor potential risk factors, includingage, sex, body mass index (BMI), andsmoking. To calculate tests for trend,the lifting exposure was included asan interval-scaled variable in thelogistic regression model. For powercalculation in this study with analpha error of .05, twice the riskcompared with the reference group,a prevalence �3.5% in degenerativedisk–related MRI findings in each lift-ing load group (data not shown)could not achieve statistical powerof 80%. Therefore, we did not fur-ther examine the relationshipbetween the lifting exposure andthese MRI variables (prevalence�3.5%). A Bonferroni correction formultiple comparisons was per-formed, and P values �.0042 and�.0083 indicated significance for theupper and lower lumbar regions,respectively. The reproducibility ofthe modified calculation of the com-pression load and lifting measure-
ments was analyzed using SPSS ver-sion 16.0 for Windows (SPSS Inc,Chicago, Illinois) to compute intra-class correlation coefficients (ICCs).Percentage of agreement was used toassess the intrareader reliability ofthe MRI variables.
Role of the Funding SourceThis study was supported by a grantfrom the Taiwan National HealthResearch Institute (NHRI-98�100A1-PDCO-0108111).
ResultsOf the 715 eligible people, 162 wereexcluded from this study for the fol-lowing reasons: 84 people had can-cer, 16 people had psychiatric con-ditions, 13 people had spinal tumors,4 people had inflammatory spondy-lopathy, 18 people had compressionfractures, and 27 people experi-enced major back trauma (Figure). Atotal of 393 fruit market workers(mean age�51.2 years, SD�10.0)and 160 walk-in clinic patients(mean age�49.3 years, SD�11.6)with URIs were included in the anal-ysis in the study; 252 participantswere men, and 301 participantswere women. The demographiccharacteristics of the participants areshown in Table 1. The BMI was cal-culated as weight in kilogramsdivided by length in meters squared(kg/m2). The fruit market workers(25.3�3.5 kg/m2) exhibited higherBMI values compared with thewalk-in clinic patients (25.3 kg/m2,SD�3.5, and 23.6 kg/m2, SD�3.4,respectively), and most participants(75.6%) had more than 15 years ofwork experience.
The cumulative lifting load was cat-egorized into tertiles (ie,�4.0 � 105, 4.0 � 105�8.9 � 106,and �8.9 � 106 Nh). There were185, 184, and 184 participants in thelow, intermediate, and high liftingload groups, respectively. The fruitmarket workers were exposed tohigher lifting loads than the walk-in
clinic patients. Low back pain duringthe previous 6 months was reportedby approximately 83.6% of the par-ticipants. The prevalence rate of LBPamong the fruit market workers(86.3%) was higher than that amongthe walk-in clinic patients (76.7%).The ICCs for intrarater and interraterreliability of a modified calculation ofthe compression load, excludingtransporting and unloading time,were .998 and .992, respectively.The reproducibility of lifting mea-surements was high for liftingweights (ICC�.945), frequency oflifting per day (ICC�.914), andworking tenure (ICC�.943) andmoderate for lifting time(ICC�.743). The percentage agree-ment of intrareader reliability for theMRI variables ranged from .833 to1.000, as shown in eTable 1 (avail-able at ptjournal.apta.org). Thekappa values of intrareader reliabilityfor the MRI variables are shown ineTable 2 (available at ptjournal.apta.org).
The prevalence rates of LDD areshown in Table 2. The most preva-lent conditions were dehydrationand the bulging of disks. Dehydra-tion was most common at levelL4–L5 (69.1%), followed by L5–S1(63.7%), L3–L4 (54.4%), L2–L3(38.5%), and L1–L2 (20.2%). Diskbulging was most common at levelL4–L5 (61.8%), followed by L3–L4(46.1%), L5–S1 (45.4%), L2–L3(26.4%), and L1–L2 (7.8%). Amongthe conditions, the most prevalentsite of disk height narrowing, spon-dylolytic spondylolisthesis, andnerve root compression was theL5–S1 level. The other disk condi-tions, including disk dehydration,annulus tears, disk bulging, protru-sion, extrusion, degenerative spon-dylolisthesis, and foramina narrow-ing, were most frequently observedat the L4–L5 level. No disk seques-tration was observed in this study.
Relationship Between Cumulative Lifting Load and Lumbar Disk Degeneration
November 2014 Volume 94 Number 11 Physical Therapy f 1587 by Eileen Chang on November 8, 2014http://ptjournal.apta.org/Downloaded from
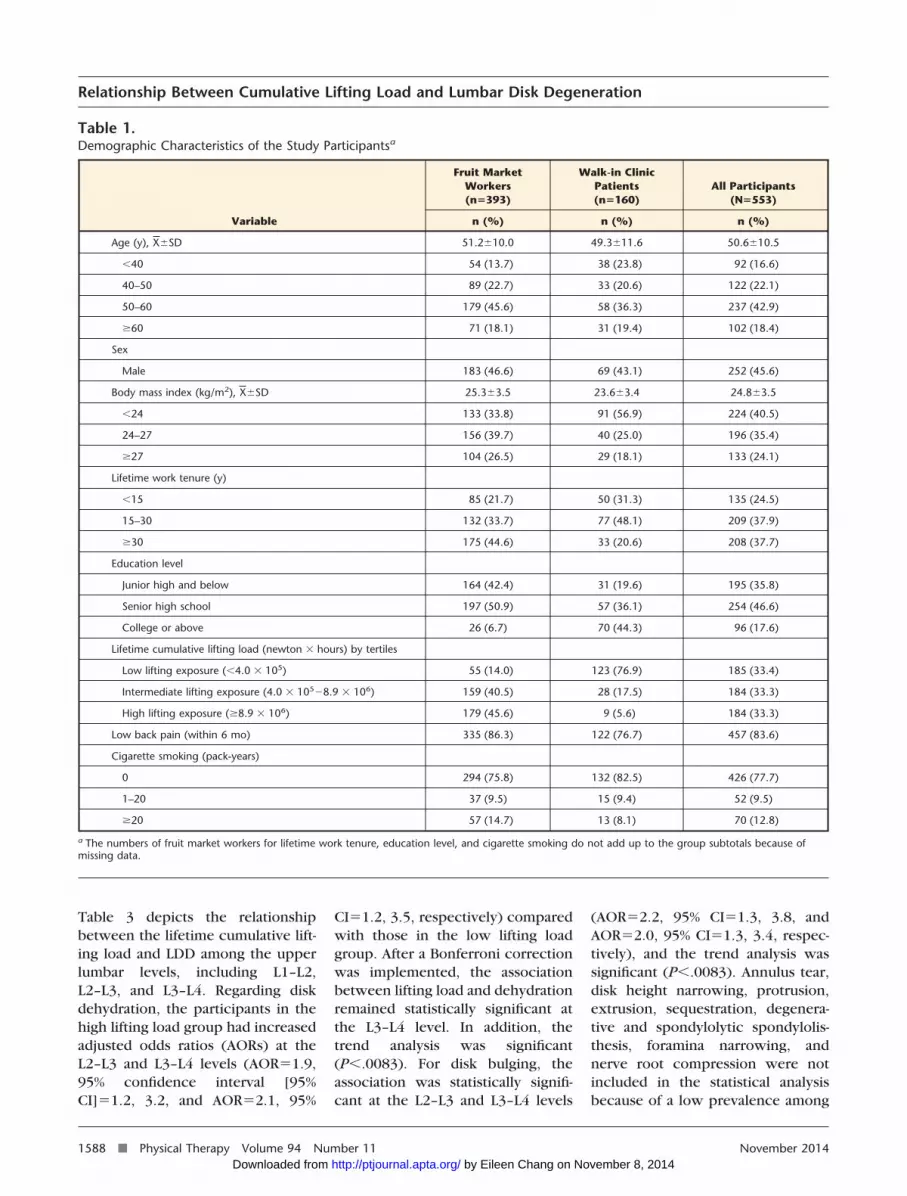
Table 3 depicts the relationshipbetween the lifetime cumulative lift-ing load and LDD among the upperlumbar levels, including L1–L2,L2–L3, and L3–L4. Regarding diskdehydration, the participants in thehigh lifting load group had increasedadjusted odds ratios (AORs) at theL2–L3 and L3–L4 levels (AOR�1.9,95% confidence interval [95%CI]�1.2, 3.2, and AOR�2.1, 95%
CI�1.2, 3.5, respectively) comparedwith those in the low lifting loadgroup. After a Bonferroni correctionwas implemented, the associationbetween lifting load and dehydrationremained statistically significant atthe L3–L4 level. In addition, thetrend analysis was significant(P�.0083). For disk bulging, theassociation was statistically signifi-cant at the L2–L3 and L3–L4 levels
(AOR�2.2, 95% CI�1.3, 3.8, andAOR�2.0, 95% CI�1.3, 3.4, respec-tively), and the trend analysis wassignificant (P�.0083). Annulus tear,disk height narrowing, protrusion,extrusion, sequestration, degenera-tive and spondylolytic spondylolis-thesis, foramina narrowing, andnerve root compression were notincluded in the statistical analysisbecause of a low prevalence among
Table 1.Demographic Characteristics of the Study Participantsa
Variable
Fruit MarketWorkers(n�393)
Walk-in ClinicPatients(n�160)
All Participants(N�553)
n (%) n (%) n (%)
Age (y), X�SD 51.2�10.0 49.3�11.6 50.6�10.5
�40 54 (13.7) 38 (23.8) 92 (16.6)
40–50 89 (22.7) 33 (20.6) 122 (22.1)
50–60 179 (45.6) 58 (36.3) 237 (42.9)
�60 71 (18.1) 31 (19.4) 102 (18.4)
Sex
Male 183 (46.6) 69 (43.1) 252 (45.6)
Body mass index (kg/m2), X�SD 25.3�3.5 23.6�3.4 24.8�3.5
�24 133 (33.8) 91 (56.9) 224 (40.5)
24–27 156 (39.7) 40 (25.0) 196 (35.4)
�27 104 (26.5) 29 (18.1) 133 (24.1)
Lifetime work tenure (y)
�15 85 (21.7) 50 (31.3) 135 (24.5)
15–30 132 (33.7) 77 (48.1) 209 (37.9)
�30 175 (44.6) 33 (20.6) 208 (37.7)
Education level
Junior high and below 164 (42.4) 31 (19.6) 195 (35.8)
Senior high school 197 (50.9) 57 (36.1) 254 (46.6)
College or above 26 (6.7) 70 (44.3) 96 (17.6)
Lifetime cumulative lifting load (newton � hours) by tertiles
Low lifting exposure (�4.0 � 105) 55 (14.0) 123 (76.9) 185 (33.4)
Intermediate lifting exposure (4.0 � 105�8.9 � 106) 159 (40.5) 28 (17.5) 184 (33.3)
High lifting exposure (�8.9 � 106) 179 (45.6) 9 (5.6) 184 (33.3)
Low back pain (within 6 mo) 335 (86.3) 122 (76.7) 457 (83.6)
Cigarette smoking (pack-years)
0 294 (75.8) 132 (82.5) 426 (77.7)
1–20 37 (9.5) 15 (9.4) 52 (9.5)
�20 57 (14.7) 13 (8.1) 70 (12.8)
a The numbers of fruit market workers for lifetime work tenure, education level, and cigarette smoking do not add up to the group subtotals because ofmissing data.
Relationship Between Cumulative Lifting Load and Lumbar Disk Degeneration
1588 f Physical Therapy Volume 94 Number 11 November 2014 by Eileen Chang on November 8, 2014http://ptjournal.apta.org/Downloaded from

the MRI findings (�3.5%), whichlimited the analytical power fordetecting statistical differences.
Table 4 shows the data regarding theassociation between lifetime cumu-lative lifting load and LDD among thelower lumbar levels, includingL4–L5 and L5–S1. After Bonferronicorrection, the high lifting loadgroup was associated with disk dehy-dration at the L4–L5 and L5–S1 levels
(AOR�3.1, 95% CI�1.8, 5.5, andAOR�2.5, 95% CI�1.5, 4.1, respec-tively), and the trend analysis wassignificant (P�.0042). After Bonfer-roni correction, the associationbetween disk height narrowing atthe L5–S1 level and both the inter-mediate and high lifting load groupswas significant compared with thelow lifting load group (AOR�3.7,95% CI�1.7, 9.0, and AOR�4.1, 95%CI�1.9, 10.1, respectively), and the
trend analysis was significant(P�.0042). Regarding disk bulging,the associations with the intermedi-ate lifting load group were signifi-cant at both the L4–L5 and L5–S1levels compared with the low liftingload group (AOR�2.0, 95% CI�1.3,3.2, and AOR�2.1, 95% CI�1.3, 3.3,respectively). After a Bonferroni cor-rection was performed, no associa-tion between the lifting load andannulus tears, protrusion, or foram-
Table 2.Prevalence of Disk-Related Degenerative Findings on Magnetic Resonance Imaging Scans of the Lumbar Spine in the Study
Degeneration Sign
Intervertebral Disk Level
L1–L2 L2–L3 L3–L4 L4–L5 L5–S1
n (%) n (%) n (%) n (%) n (%)
Dehydration 112 (20.2) 213 (38.5) 301 (54.4) 382 (69.1) 352 (63.7)
Annulus tear 1 (0.2) 10 (1.8) 30 (5.4) 113 (20.4) 91 (17.9)
Disk height narrowing 16 (2.9) 23 (4.2) 26 (4.7) 31 (5.6) 74 (13.4)
Bulging 43 (7.8) 146 (26.4) 255 (46.1) 342 (61.8) 251 (45.4)
Protrusion 14 (2.5) 14 (2.5) 19 (3.4) 99 (17.9) 92 (16.6)
Extrusion 0 (0.0) 0 (0.0) 0 (0.0) 3 (0.5) 1 (0.2)
Sequestration 0 (0.0) 0 (0.0) 0 (0.0) 0 (0.0) 0 (0.0)
Degenerative spondylolisthesis 0 (0.0) 1 (0.3) 14 (2.5) 61 (11.0) 11 (2.0)
Spondylolytic spondylolisthesis 0 (0.0) 0 (0.0) 0 (0.0) 3 (0.5) 15 (2.7)
Foramina narrowing 0 (0.0) 6 (1.1) 21 (3.8) 74 (13.4) 65 (11.8)
Nerve root compression 0 (0.0) 0 (0.0) 5 (0.9) 16 (2.9) 22 (4.0)
Table 3.Association Between Disk Degeneration and Life-Time Lifting Exposure (Newtons � Hours [Nh]) Among Upper Lumbar Levela
Variable
Intervertebral Disk Level
L1–L2 L2–L3 L3–L4
% OR (95% CI) AOR (95% CI) % OR (95% CI) AOR (95% CI) % OR (95% CI) AOR (95% CI)
Dehydration
�4.0 � 105 Nh 14.6 1 1 26.0 1 1 38.9 1 1
4.0 � 105–8.9 � 106 Nh 17.4 1.2 (0.7, 2.2) 1.0 (0.5, 1.8) 36.4 1.6b (1.1, 2.6) 1.2 (0.7, 2.1) 54.4 1.9b,c (1.2, 2.8) 1.3 (0.8, 2.2)
�8.9 � 106 Nh 28.8 2.4b,c (1.4, 4.0) 1.3 (0.7, 2.4) 53.3 3.3b,c (2.1, 5.1) 1.9b (1.2, 3.2) 70.1 3.7b,c (2.4, 5.7) 2.1b,c (1.2, 3.5)
P value for trend b,c b,c b b,c b,c
Bulging
�4.0 � 105 Nh 4.3 1 1 14.1 1 1 31.9 1 1
4.0 � 105– 8.9 � 106 Nh 10.3 2.5b (1.1, 6.3) 2.1 (0.9, 5.4) 27.2 2.3b,c (1.4, 3.9) 1.7 (1.0, 3.0) 43.5 1.6 b (1.1, 2.5) 1.2 (0.8, 2)
�8.9 � 106 Nh 8.7 2.1 (0.9, 5.3) 1.1 (0.5, 3) 38.0 3.8b,c (2.3, 6.3) 2.2b,c (1.3, 3.8) 63.0 3.6 b,c (2.4, 5.6) 2.0 b,c (1.3, 3.4)
P value for trend b,c b,c b,c b,c
a Adjusted for age, sex, body mass index, and smoking (pack-years). OR�odds ratio, AOR�adjusted odds ratio, 95% CI�95% confidence interval.b Statistically significant, P�.05.c Statistically significant after Bonferroni correction, P�.0083.
Relationship Between Cumulative Lifting Load and Lumbar Disk Degeneration
November 2014 Volume 94 Number 11 Physical Therapy f 1589 by Eileen Chang on November 8, 2014http://ptjournal.apta.org/Downloaded from

ina narrowing was observed. Diskextrusion, sequestration, degenera-tive and spondylolytic spondylolis-thesis, and nerve root compressionwere not analyzed because of theirlow prevalence among the MRI find-ings (�3.5%). In summary, the opti-mal dose-response relationshipsbetween the cumulative lifting load
and LDD were observed at the L5–S1level.
DiscussionThis was a cross-sectional study con-ducted to examine whether the life-time cumulative lifting load causesdose-dependent LDD. The effects oflifetime cumulative lifting load
include disk dehydration, disk heightnarrowing, and disk bulging. Theseeffects have been observed amongpeople exposed to cumulative liftingloads of 4.0 � 105 to 8.9 � 106 Nh aspresentations of disk bulging at theL4–L5 and L5–S1 levels and diskheight narrowing at the L5–S1 level.When the cumulative lifting load
Table 4.Association Between Disk Degeneration and Life-Time Lifting Exposure (Newtons � Hours [Nh]) Among Lower Lumbar Levelsa
Variable
Intervertebral Disk Level
L4–L5 L5–S1
% OR (95% CI) AOR (95% CI) % OR (95% CI) AOR (95% CI)
Dehydration
�4.0 � 105 Nh 1.4 1 1 47.6 1 1
4.0 � 105–8.9 � 106 Nh 72.3 2.5b,c (1.6, 3.8) 2.0b (1.2, 3.4) 66.9 2.2b,c (1.5, 3.4) 1.9b (1.2, 3.1)
�8.9 � 106 Nh 83.7 4.9b,c (3.0, 8.0) 3.1b,c (1.8, 5.5) 76.6 3.6b,c (2.3, 5.7) 2.5b,c (1.5, 4.1)
P value for trend b,c b,c b,c b,c
Annulus tear
�4.0 � 105 Nh 20.0 1 1 12.4 1 1
4.0 � 105–8.9 � 106 Nh 19.6 1 (0.6, 1.6) 0.9 (0.6, 1.6) 20.1 1.8b (1, 3.2) 2.0b (1.1, 3.7)
�8.9 � 106 Nh 21.7 1.1 (0.7, 1.8) 1.0 (0.6, 1.8) 21.2 1.9b (1.1, 3.4) 2.2b (1.2, 4.2)
P value for trend b b
Disk height narrowing
�4.0 � 105 Nh 3.2 1 1 4.3 1 1
4.0 � 105–8.9 � 106 Nh 5.4 1.7 (0.6, 5.1) 1.4 (0.5, 4.4) 15.2 4.0b,c (1.8, 9.6) 3.7b,c (1.7, 9.0)
�8.9 � 106 Nh 8.2 2.6b (1, 7.6) 1.4 (0.5, 4.3) 20.7 5.8b,c (2.7, 13.6) 4.1b,c (1.9, 10.1)
P value for trend b b,c b,c
Bulging
�4.0 � 105 Nh 45.4 1 1 30.8 1 1
4.0 � 105–8.9 � 106 Nh 67.9 2.5b,c (1.7, 3.9) 2.0b,c (1.3, 3.2) 51.6 2.4b,c (1.6, 3.7) 2.1b,c (1.3, 3.3)
�8.9 � 106 Nh 72.3 3.1b,c (2, 4.9) 1.7b (1.1, 2.8) 53.8 2.6b,c (1.7, 4) 1.9b (1.2, 3.1)
P value for trend b,c b b,c b
Protrusion
�4.0 � 105 Nh 12.4 1 1 11.4 1 1
4.0 � 105–8.9 � 106 Nh 22.3 2.0b (1.2, 3.6) 1.8b (1, 3.3) 17.4 1.6 (0.9, 3) 1.7 (0.9, 3.1)
�8.9 � 106 Nh 19.0 1.7 (0.9, 3) 1.3 (0.7, 2.4) 21.2 2.1b (1.2, 3.8) 2.2b (1.2, 4.1)
P value for trend b b
Foramina narrowing
�4.0 � 105 Nh 8.1 1 1 4.9 1 1
4.0 � 105–8.9 � 106 Nh 13.6 1.8 (0.9, 3.6) 1.6 (0.8, 3.4) 12.5 2.8b (1.3, 6.5) 2.4b (1.1, 5.8)
�8.9 � 106 Nh 18.5 2.6b (1.4, 5.0) 1.7 (0.8, 3.4) 17.9 4.3b,c (2.1, 9.8) 2.5b (1.2, 6.1)
P value for trend b,c b,c b
a Adjusted for age, sex, body mass index, and smoking (pack-years). OR�odds ratio, AOR�adjusted odds ratio, 95% CI�95% confidence interval.b Statistically significant, P�.05.c Statistically significant after Bonferroni correction, P�.0042.
Relationship Between Cumulative Lifting Load and Lumbar Disk Degeneration
1590 f Physical Therapy Volume 94 Number 11 November 2014 by Eileen Chang on November 8, 2014http://ptjournal.apta.org/Downloaded from
exceeds 8.9 � 106 Nh, disk dehydra-tion has been observed at the L3–L4,L4–L5, and L5–S1 levels. Theseresults suggest that a dose-responserelationship exists between the life-time cumulative lifting load andLDD.
Based on our research, only a fewstudies have described a dose-response relationship between phys-ical loading and LDD.1–3,7 Kelsey etal7 indicated that people who liftedobjects heavier than 11.3 kg (25 lb)more than 25 times per day exhib-ited more than 3 times the risk fordeveloping acute prolapsed lumbarintervertebral disks than did peoplewho did not. Seilder and col-leagues1–3 showed that a positivedose-response relationship existsbetween lumbar disk herniation andthe cumulative lumbar load throughmanual material handling. The oddsratio (OR) was 1.7 for men in themiddle exposure group (5–21.51 �106 Nh), whereas the OR was 2.4 forwomen in the second-highest expo-sure group (4.04–14.47 � 106 Nh).3
In our study, the workers exposed tointermediate lifting loads (4.0 � 105–8.9 � 106 Nh) were 2.1 times morelikely to have disk bulging at L5–S1compared with those exposed tolow lifting load (�4 � 105 Nh). Wedetermined that workers exposed tointermediate lifting loads exhibited a3.7-fold likelihood of experiencingdisk height narrowing at L5–S1,which is consistent with the findingsof Seilder et al.3 In our study, observ-able health effects exerted on theintervertebral disks were observedamong the lower lumbar levels.
Direct measurement of lumbar spineload when conducting in vivo stud-ies requires implanting a transduceror sensor into the disk. This type ofstudy is rarely attempted because ofthe ethical considerations regardingsuch an invasive procedure. Numer-ous methods have been developedfor estimating the disk compression
load. Among these methods, com-puterized biomechanical modeling isconsidered the most precise methodfor estimating the disk compressionload. The 3DSSPP was establishedbased on several biomechanical stud-ies,16,22–27 and anthropometric datafrom a US industrial database wereapplied in estimating the lumbar diskcompression load28; this method hasbeen used in field investiga-tions.17,18,29,30 The advantage of thiscomputerized biomechanical modelis its capability for estimating thedisk compression load within a sin-gle exertion. This model was vali-dated by comparing it with 4 optimi-zation models, and high correlationrates were obtained (r.8).22 More-over, the model has been used as thestandard model for estimating thedisk compression load.18 The limita-tion of 3DSSPP is that it cannot beused for simulating dynamic exer-tions. Therefore, in this study, thework tasks were divided intosequences of static postures, andeach posture was analyzed.
Compared with previous studies thatfocused on only 1 or 2 disk degener-ations1,2,7 at specific lumbar levels,this study evaluated various LDD andexamined each lumbar level. Theresults indicated that varying liftingloads appear to exert differenteffects for various LDDs and at dif-ferent lumbar levels. For example,disk bulging caused by carryingintermediate loads was observed atthe L2–L3 and L3–L4 levels, and bulg-ing caused by carrying high liftingloads was detected at the L4–L5 andL5–S1 levels. However, dehydrationwas observed only in the group thatcarried high lifting loads. Disk heightnarrowing was detected in bothgroups that carried intermediate andhigh lifting loads, but only at theL5–S1 level. Regarding the mostprevalent sites, the study results indi-cated that disk height narrowing,spondylolytic spondylolisthesis, andnerve root compression were mostly
detected at the L5–S1 level and thatthe other LDDs were common at theL4–L5 level. These results are consis-tent with those of previous stud-ies.5,6,16,31 Generally, most studies onLDD have observed that the effectsoccur more frequently and severelyat lower levels than at upper lev-els.5,6,16,31 Systemic factors such asage, smoking habits, and genetics areexpected to have similar effects at alllumbar levels.
The observation that severe degener-ation frequently occurred at theL4–L5 and L5–S1 levels supportedthe hypothesis that mechanical load-ing may play a crucial role in diskpathogenesis.16 Although many ofthe ORs were statistically significant,they were minor (�3.0), suggestingthat the associations between thelifting load and degenerative disk–related MRI findings were notstrong. Based on the literature, sev-eral critical risk factors, such ashereditary factors and age, may leadto the development of degenerativedisks.9,32,33 Nevertheless, the signifi-cant ORs identified in this study sug-gested that lifting exposure contrib-utes to the development ofdegenerative disks and should not beignored.
The walk-in clinic patients with URIwere recruited to incorporate abackground population that wasminimally exposed to lifting load.The ideal study participants wouldhave been from one industry thatinvolved a broad spectrum of liftingexposure. However, most fruit mar-ket workers were exposed to heavylifting, except for a small percentageof administrative workers. Thus,recruiting a group of participantswith low lifting exposure as a com-parison group enhanced this study.Because these walk-in patients wereemployed in various occupations,they were predominantly groupedinto the low lifting exposure tertile.In addition, URIs are among the most
Relationship Between Cumulative Lifting Load and Lumbar Disk Degeneration
November 2014 Volume 94 Number 11 Physical Therapy f 1591 by Eileen Chang on November 8, 2014http://ptjournal.apta.org/Downloaded from
common conditions in the generalpopulation. Therefore, these walk-inpatients with URI were regarded asrepresentative of the generalpopulation.
LimitationsThis study had several limitations.Because this was a cross-sectionalstudy, it was subject to the healthyworker survivor effect. For example,disk bulging at the L4–L5 and L5–S1levels was observed more frequentlyamong the participants who liftedintermediate loads than among thosewho lifted high lifting loads. More-over, disk sequestration was notobserved in this study. In addition,the prevalence of disk extrusion andspondylolytic spondylolisthesis waslower compared with that reportedin previous studies.31,34 This lowerprevalence might have occurredbecause severely affected workershad left their jobs. Consequently,based on the MRI findings, severaldegenerative disk–related conditionswere not analyzed because of lowprevalence.
Another limitation was the relianceon the participants’ memoriesregarding their occupational historyand relevant work tasks from severaldecades previously. Although therepeatability of self-reported and spe-cific current job tasks was examinedand determined to be satisfactory,the reliability of the information per-taining to previous jobs was difficultto determine. To enhance reliability,a structured interview was adminis-tered to provide the participantswith adequate time for examiningthe work details of their previousjobs. The trained interviewers usedcommon milestones in life to helpthe participants recall the necessarydetails. The trained interviewers cap-tured the working simulation photosby following a standard procedure.Several studies have indicated that,compared with direct measure-ments, the validity of self-reported
data is lacking.35–37 By contrast, Popeet al38 demonstrated the accuracy ofself-reported manual material han-dling activities and presented satis-factorily accurate results regardingfrequency, duration, and amplitude.Direct measurements obtained usingwork or laboratory simulations yieldthe most accurate information; how-ever, using such methods in retro-spective studies involving relativelylarge sample sizes is impractical.
Another limitation was not includingpushing and pulling tasks in loaddetermination. We observed that thefruit market workers did not typi-cally practice pushing and pulling,potentially causing the lifetimecumulative load to be underesti-mated among the other participantswho performed pushing or pullingtasks in their jobs. These factorswere not considered to have gener-ated bias in our findings becausepushing and pulling involve exertingmuch smaller compression loads onthe lumbar disks compared with lift-ing. Similarly, if the participants ofthe low lifting load group wereexposed to higher lifting loads thanrecorded, these higher lifting loadspotentially caused random errorsand several values regarding the rela-tionship between lifting exposureand LDD to be underestimated.Another limitation was that expo-sure to lifting during leisure andhome activities was not considered,potentially causing misclassificationand error in the cumulative liftingload estimates.
Moreover, the differences betweenthe study groups may have con-founded the association betweencumulative lifting load and LDD. Thesex and age distributions of the par-ticipants from the 2 groups weresimilar. The fruit market workerslifted heavier loads and exhibitedhigher BMIs and smoking durationsand lower education levels com-pared with the walk-in clinic
patients. The lifting exposure pat-terns among the fruit market work-ers were more consistent comparedwith those of the walk-in clinicpatients. When we grouped the par-ticipants into tertiles, the possibilityof misclassification was consideredacceptable. In addition, from a statis-tical point of view, such misclassifi-cation is unlikely to cause an over-estimation of the ORs, and an under-estimation of the actual results ismore likely to occur. The BMI wasassociated with our findings regard-ing disk dehydration and bulging.Age is strongly associated withLDD,5,33 and degenerative changesin the lumbar spine are observedapproximately 10 years earlier inmen than in women.32 Smoking hasbeen associated with LDD39; how-ever, findings regarding smokinghave not been consistent. Educationlevel has probably no effect on LDD.People with lower education levelsare more likely to choose physicallydemanding work than people withhigher education levels, therebyexposing themselves to high levelsof lifting. Therefore, we adjustedage, sex, BMI, and smoking habits tominimize the possible confoundingthat might occur. After the adjust-ment, the ORs were decreased com-pared with the crude ORs, suggest-ing that these adjusted factorsinfluence the outcome; therefore,the effects of lifting can be detected.
In conclusion, the results suggest adose-response relationship betweencumulative lifting load and LDD. Basedon the MRI findings, the effectsinclude disk dehydration, disk heightnarrowing, and disk bulging, espe-cially at the lower lumbar levels. Thelifting load apparently exerts differenteffects on various LDDs, as well as ondifferent disk levels.
Ms Hung, Dr Shih, Dr Liou, and Dr Guoprovided concept/idea/research design. MsHung and Dr Guo provided writing. MsHung, Dr Chen, Ms Ma, Ms Huang, and Dr
Relationship Between Cumulative Lifting Load and Lumbar Disk Degeneration
1592 f Physical Therapy Volume 94 Number 11 November 2014 by Eileen Chang on November 8, 2014http://ptjournal.apta.org/Downloaded from
Guo provided data collection. Ms Hung, DrChen, Ms Ma, and Ms Huang provided dataanalysis. Ms Hung, Dr Shih, Ms Ma, and DrGuo provided project management. Dr Guoprovided fund procurement. Dr Shih and DrGuo provided facilities/equipment. Dr Hoprovided institutional liaisons. Dr Shih, DrHwang, and Dr Guo provided consultation(including review of manuscript before sub-mission). The authors thank Dr DickensChen for his valuable contributions to therecruitment of participants from the fruitmarket.
The Institutional Review Board of theNational Taiwan University Medical Centerapproved the study.
This study was supported by a grant fromthe Taiwan National Health Research Insti-tute (NHRI-98�100A1-PDCO-0108111).
DOI: 10.2522/ptj.20130095
References1 Seidler A, Bolm-Audorff U, Siol T, et al.
Occupational risk factors for symptomaticlumbar disc herniation; a case-controlstudy. Occup Environ Med. 2003;60:821–830.
2 Seidler A, Bolm-Audorff U, Heiskel H, et al.The role of cumulative physical work loadin lumbar spine disease: risk factors forlumbar osteochondrosis and spondylosisassociated with chronic complaints.Occup Environ Med. 2001;58:735–746.
3 Seidler A, Bergmann A, Jager M, et al.Cumulative occupational lumbar load andlumbar disc disease: results of a Germanmulti-center case-control study (EPILIFT).BMC Musculoskelet Disord. 2009;10:48.
4 Modic MT, Masaryk TJ, Ross JS, Carter JR.Imaging of degenerative disk disease.Radiology. 1988;168:177–186.
5 Battie MC, Videman T, Parent E. Lumbardisc degeneration: epidemiology andgenetic influences. Spine (Phila Pa 1976).2004;29:2679–2690.
6 Battie MC, Videman T, Gibbons LE, et al.1995 Volvo Award in Clinical Sciences.Determinants of lumbar disc degenera-tion: a study relating lifetime exposuresand magnetic resonance imaging findingsin identical twins. Spine. 1995;20:2601–2612.
7 Kelsey JL, Githens PB, White AA III, et al.An epidemiologic study of lifting andtwisting on the job and risk for acute pro-lapsed lumbar intervertebral disc.J Orthop Res. 1984;2:61–66.
8 Jorgensen S, Hein HO, Gyntelberg F.Heavy lifting at work and risk of genitalprolapse and herniated lumbar disc inassistant nurses. Occup Med (Lond). 1994;44:47–49.
9 Sambrook PN, MacGregor AJ, Spector TD.Genetic influences on cervical and lumbardisc degeneration: a magnetic resonanceimaging study in twins. Arthritis Rheum.1999;42:366–372.
10 Lawrence RC, Helmick CG, Arnett FC,et al. Estimates of the prevalence of arthri-tis and selected musculoskeletal disordersin the United States. Arthritis Rheum.1998;41:778–799.
11 Endean A, Palmer KT, Coggon D. Potentialof magnetic resonance imaging findings torefine case definition for mechanical lowback pain in epidemiological studies: a sys-tematic review. Spine (Phila Pa 1976).2011;36:160–169.
12 Poitras S, Blais R, Swaine B, et al. Manage-ment of work-related low back pain: apopulation-based survey of physical thera-pists. Phys Ther. 2005;85:1168–1181.
13 Craig BN, Congleton JJ, Kerk CJ, et al. Aprospective field study of the relationshipof potential occupational risk factors withoccupational injury/illness. Am Ind HygAssoc J. 2003;64:376–387.
14 Videman T, Gibbons LE, Kaprio J, et al.Challenging the cumulative injury model:positive effects of greater body mass ondisc degeneration. Spine J. 2010;10:26–31.
15 Lyons G, Eisenstein SM, Sweet MB. Bio-chemical changes in intervertebral discdegeneration. Biochim Biophys Acta.1981;673:443–453.
16 Videman T, Battie MC, Gill K, et al. Mag-netic resonance imaging findings and theirrelationships in the thoracic and lumbarspine: insights into the etiopathogenesisof spinal degeneration. Spine (Phila Pa1976). 1995;20:928–935.
17 Jang R, Karwowski W, Quesada PM, et al.Biomechanical evaluation of nursing tasksin a hospital setting. Ergonomics. 2007;50:1835–1855.
18 Merryweather AS, Loertscher MC, Blos-wick DS. A revised back compressiveforce estimation model for ergonomicevaluation of lifting tasks. Work. 2009;34:263–272.
19 Modic MT, Ross JS. Lumbar degenerativedisk disease. Radiology. 2007;245:43–61.
20 Fardon DF, Milette PC; for the CombinedTask Forces of the North American SpineSociety, American Society of Spine Radiol-ogy, and American Society of Neuroradiol-ogy. Nomenclature and classification oflumbar disc pathology: recommendationsof the Combined Task Forces of the NorthAmerican Spine Society, American Societyof Spine Radiology, and American Societyof Neuroradiology. Spine (Phila Pa 1976).2001;26:E93–E113.
21 Farfan HF. Mechanical Disorders of theLow Back. Hagerstown, MD: Lea &Febiger; 1973.
22 Hughes RE, Chaffin DB, Lavender SA, et al.Evaluation of muscle force predictionmodels of the lumbar trunk using surfaceelectromyography. J Orthop Res. 1994;12:689–698.
23 Hansson TH, Keller TS, Spengler DM.Mechanical behavior of the human lumbarspine, II: fatigue strength during dynamiccompressive loading. J Orthop Res. 1987;5:479–487.
24 Adams MA, Hutton WC. Gradual disc pro-lapse. Spine (Phila Pa 1976). 1985;10:524–531.
25 Hughes RE, Bean JC, Chaffin DB. Evaluat-ing the effect of co-contraction in optimi-zation models. J Biomech. 1995;28:875–878.
26 Norman R, Wells R, Neumann P, et al. Acomparison of peak vs cumulative physi-cal work exposure risk factors for thereporting of low back pain in the automo-tive industry. Clin Biomech (Bristol,Avon). 1998;13:561–573.
27 Nussbaum MA, Chaffin DB. Developmentand evaluation of a scalable and deform-able geometric model of the human torso.Clin Biomech (Bristol, Avon). 1996;11:25–34.
28 Chaffin DB, Andersson GB. OccupationalBiomechanics. 4th ed. New York, NY:John Wiley & Sons Inc; 2006.
29 Jones T, Strickfaden M, Kumar S. Physicaldemands analysis of occupational tasks inneighborhood pubs. Appl Ergon. 2005;36:535–545.
30 Gordon SJ, Yang KH, Mayer PJ, et al.Mechanism of disc rupture: a preliminaryreport. Spine (Phila Pa 1976). 1991;16:450–456.
31 Jensen MC, Brant-Zawadzki MN, Obu-chowski N, et al. Magnetic resonanceimaging of the lumbar spine in peoplewithout back pain. N Engl J Med. 1994;331:69–73.
32 Battie MC, Videman T. Lumbar disc degen-eration: epidemiology and genetics.J Bone Joint Surg Am. 2006;88(suppl2):3–9.
33 de Schepper EI, Damen J, van Meurs JB,et al. The association between lumbar discdegeneration and low back pain: the influ-ence of age, gender, and individual radio-graphic features. Spine (Phila Pa 1976).2010;35:531–536.
34 Kalichman L, Kim DH, Li L, et al. Spondy-lolysis and spondylolisthesis: prevalenceand association with low back pain in theadult community-based population. Spine(Phila Pa 1976). 2009;34:199–205.
35 van der Beek AJ, Frings-Dresen MH. Assess-ment of mechanical exposure in ergo-nomic epidemiology. Occup EnvironMed. 1998;55:291–299.
36 Burdorf A, Laan J. Comparison of methodsfor the assessment of postural load on theback. Scand J Work Environ Health.1991;17:425–429.
37 Wiktorin C, Selin K, Ekenvall L, et al. Eval-uation of perceived and self-reported man-ual forces exerted in occupational materi-als handling. Appl Ergon. 1996;27:231–239.
38 Pope DP, Silman AJ, Cherry NM, et al.Validity of a self-completed questionnairemeasuring the physical demands of work.Scand J Work Environ Health. 1998;24:376–385.
39 Battie MC, Videman T, Gill K, et al. 1991Volvo Award in Clinical Sciences. Smokingand lumbar intervertebral disc degenera-tion: an MRI study of identical twins. Spine(Phila Pa 1976). 1991;16:1015–1021.
Relationship Between Cumulative Lifting Load and Lumbar Disk Degeneration
November 2014 Volume 94 Number 11 Physical Therapy f 1593 by Eileen Chang on November 8, 2014http://ptjournal.apta.org/Downloaded from
doi: 10.2522/ptj.20130095Originally published online June 26, 2014
2014; 94:1582-1593.PHYS THER. Liou, Ing-Kang Ho and Yue L. GuoHwang, Li-Ping Ma, Wen-Chuan Huang, Saou-Hsing Yu-Ju Hung, Tiffany T-F. Shih, Bang-Bin Chen, Yaw-HueiImaging FindingsDegeneration Based on Magnetic ResonanceCumulative Lifting Load and Lumbar Disk The Dose-Response Relationship Between
References
http://ptjournal.apta.org/content/94/11/1582#BIBLfor free at: This article cites 37 articles, 6 of which you can access
Information Subscription http://ptjournal.apta.org/subscriptions/
Permissions and Reprints http://ptjournal.apta.org/site/misc/terms.xhtml
Information for Authors http://ptjournal.apta.org/site/misc/ifora.xhtml
by Eileen Chang on November 8, 2014http://ptjournal.apta.org/Downloaded from