the costs of bankruptcy chapter 7 cash auctions vs. chapter 11 bargaining
TRANSCRIPT
The Costs of Bankruptcy:
Chapter 7 Liquidation vs. Chapter 11 Reorganization
Arturo Bris, Ivo Welch, and Ning Zhu∗
August 24, 2005
∗Arturo Bris is at the Yale School of Management and ECGI. Ivo Welch is at Brown University Department ofEconomics and the National Bureau of Economics Research (NBER). Ning Zhu is at the University of Californiaat Davis. We wish to thank our team of research assistants: Stephanie Mastrobuono, Carolina Velosa,Theresa Kwon, Vanessa Janowski, and Jennifer Gao. We also thank Ed Altman, Douglas Baird, Judge SamuelBufford, Espen Eckbo, Hulya Eraslan, Rick Green, Edith Hotchkiss Steven Kaplan, Edward Morrison, DinaNaples-Layish, David Scharfstein (our discussant at the American Finance Association meetings), and AlanSchwartz for their individual comments. We thank seminar audiences at the American Finance Association,the University of Southern California, New York University, Columbia University, the European FinanceAssociation, Insead University, and the NBER. Finally, we thank both a terrific anonymous referee and oureditor Rick Green, who were willing to bear with us through mediocre earlier drafts.
1
Abstract
Our paper explores a comprehensive sample of small and large corporate bankruptcies
in Arizona and New York from 1995 to 2001. bankruptcy costs are very heterogeneous
and sensitive to the measurement method used. We find that Chapter 7 liquidations
appear to be no faster or cheaper (in terms of direct expense) than Chapter 11 reor-
ganizations. However, Chapter 11 seems to preserve assets better, thereby allowing
creditors to recover relatively more. Our paper also provides a large number of further
empirical regularities.
Our paper analyzes the largest sample of corporate bankruptcies to date. We research
approximately 300 cases from the Arizona and New York federal bankruptcy courts from
1995 to 2001. These cases consist of (1) both publicly traded and privately held corpora-
tions, and (2) both Chapter 7 liquidations and Chapter 11 reorganizations. This sample is
practically the entire population of unique corporate bankruptcies in these courts.
Our paper’s primary objective is to measure how the two available bankruptcy proce-
dures differ, especially but not only in terms of cost. We explore four variables, namely, the
change in the estate’s value during bankruptcy (a measure of indirect costs), the time spent
in bankruptcy (another and more common measure of indirect costs), the expenses submit-
ted to and approved by the bankruptcy court (a measure of direct costs), and the recovery
rates for creditors and APR violations. Our most important findings are that Chapter 7
liquidations are not cheaper than Chapter 11 reorganizations, particularly after we control
for endogenous self-selection of firms into bankruptcy procedure. Bankruptcy profession-
als (attorneys, accountants, trustees) regularly end up with most of the post-bankruptcy
firm’s value in Chapter 7.
Our paper challenges the conclusions of earlier literature that suggest that bankruptcy
costs are “modest.” Instead, we interpret the data as telling us that bankruptcy costs are
very heterogeneous. Moreover, bankruptcy costs are measurement sensitive. For exam-
ple, the conclusions one draws depend on whether uses at-bankruptcy declared values or
end-of-bankruptcy declared values, whether one believes the value declarations filed by
management, and whether one reports means or medians. At the onset of bankruptcy, the
eventual costs are quite predictable and different across cases. The regression suggests
fitted values that range between 0% and 20% of assets.
Given that our study is the first to our knowledge that has access to a complete sample
of ordinary corporate bankruptcies, we indulge in an exploration of bankruptcy-related
1
variables. We uncover a number of interesting regularities—too numerous to list compre-
hensively here. For example, bankruptcy courts approve almost all requested expenses;
the three phases of Chapter 11 bankruptcies take about equally long; firm scale is strongly
related to the presence of a creditors’ committee, to the choice of Chapter, and to total
and debtor bankruptcy expenses; firm scale is fairly unrelated to percent value changes
in bankruptcy, time needed to emerge from bankruptcy, and creditor recovery rates; the
larger the management’s ownership, the longer is the delay in filing a reorganization plan;
the particular bankruptcy judge matters for APR violations and length of time in bank-
ruptcy, but not recovery rates or legal expenses; and, creditor organization (bank presence,
creditors’ committee, number of creditors) and indebtedness often matters (but not in all
regressions).
We review the literature in Section I. and describe the data in Section II.. We examine
asset values changes in bankruptcy in Section III., bankruptcy duration in Section IV., legal
and administrative court-reported fees and creditor recovery in Section V., and APR viola-
tions in Section VI.. We take a brief look at the role of courts and judges in Section VII.,
before we conclude in Section VIII..
2
I. Related Literature
Our paper is related to the literature that focuses on estimating the costs of two bank-
ruptcy procedures: Cash auction procedures (i.e., Chapter 7s) and negotiation procedures
(i.e., Chapter 11s).
With respect to Chapter 11 reorganizations, the literature offers mixed conclusions, per-
haps due to variation in sample sizes and sample periods. Previous results mostly draw
conclusions from the relatively small numbers of public corporations. Warner (1977) finds
that the direct costs of Chapter 11 bankruptcy—compensation provided to lawyers, ac-
countants, consultants, and expert witnesses—for 11 railroads are about 4% of the market
value of the firm one year prior to default. Altman (1984) calculates these costs to be about
7.5% of firm value using a broader sample of 19 bankrupt companies from 1974 to 1978.
Using 105 Chapter 11 cases from the Western District of Oklahoma, Ang, Chua, and Mc-
Connell (1982) report that administrative fees are about 7.5% of the total liquidating value
of the bankrupt corporation’s assets. Weiss (1990), Betker (1995), and Tashjian, Lease, and
McConnell (1996) provide similar estimates, relying on samples of 31 public Chapter 11
firms, 75 public and private Chapter 11 firms, and 49 pre-packed Chapter 11 firms, respec-
tively. Lubben (2000) calculates in his sample of 22 firms from 1994 that the cost of legal
counsel in Chapter 11 bankruptcy represents about 1.8% of the distressed firm’s total as-
sets, though it can be as high as 5% in some cases—in the average case, the debtor spends
$500,000 on lawyers, and creditors spend $230,000. LoPucki and Doherty (2004) examine
professional fees in a sample of 48 cases from 1998 to 2002, mostly from Delaware and
New York. They report that professional fees are 1.4% of the debtor’s total assets at the
beginning of the bankruptcy case. Our view from reading the literature is that it is divided.
For example, Altman (1984), Hotchkiss (1995), and Weiss and Wruck (1998), among others,
consider Chapter 11 costs to be high, whereas Alderson and Betker (1995), Gilson (1997),
3
and Maksimovic and Phillips (1998) consider costs to be low.
There is less evidence regarding bankruptcy-related cash auction systems. Pulvino (1998)
examines commercial aircraft sales, and finds that asset fire sales can depress asset val-
ues. Stromberg (2000) also finds that asset fire sales and resales to management can lead
to striking inefficiencies in the cash auction system. Lawless et al. (1994) and White (1984)
find that bankruptcy costs consumed a large fraction of pre-bankruptcy assets in small
Chapter 7 cases before the 1994 Bankruptcy Reform Act.
The controversy is even more lively when it comes to APR violations and recovery rates.
Franks and Torous (1989) find that APR violations are frequent in a sample of 30 firms.
Eberhart, Moore, and Roenfeldt (1990) and Betker (1995) confirm regular APR violations
under Chapter 11, arguing that this may undermine the efficiency of ex ante contracts. Such
Chapter 11 violations—we document that on occasion judges have deliberately used them
to punish parties—are in contrast to a strict APR adherence in Chapter 7 procedure. When it
comes to recovery rates, Pulvino (1999) exploits a large sample of Chapter 7 and Chapter 11
filings by nine U.S. airlines (43 subsidiary or individual airplane sales in Chapter 7 and 107
in Chapter 11) and finds that prices obtained in asset sales by firms reorganized under
Chapter 11 are not greater than those obtained by Chapter 7 firms. However, Pulvino does
not report information on bankruptcy costs, and his sample is not representative of the
typical bankruptcy. Our study offers the most comprehensive data for both Chapter 7 and
Chapter 11 within the U.S. Moreover, we examine various measures of bankruptcy costs
with the same sample.
Some recent studies turn their attention to bankruptcy procedures outside the U.S. Us-
ing a rich data set from Swedish bankruptcy courts, Stromberg (2000) cautions that the
efficiency of the cash auction procedure may be severely impaired by how the assets are
auctioned. Eckbo and Thorburn (2002, 2003) show that both the outcome of the auction
4
procedure and the resulting management turnover can vary dramatically, depending on
CEO private benefits and the strategic role played by major creditors. Ravid and Sund-
gren (1998) find that the U.S. bankruptcy system is more efficient than the Finnish code,
which is essentially an auction procedure. In contrast, Thorburn (2000) argues that the
Swedish auction system is much faster and much cheaper than the U.S. Chapter 11 pro-
cess.
Our conclusion that Chapter 7 liquidation has very little to offer unsecured creditors
differs so markedly from Thorburn (2000) that elaboration is in order. Both studies explore
bankruptcy procedures that are essentially cash auctions. Thorburn (2000) shows that the
Swedish procedure has slightly higher direct costs than either Chapter 7 or Chapter 11
in the U.S., but Swedish bankruptcy takes only 2.4 months to complete, versus the 23
months we document for the U.S. Chapter 7 procedure. We find that unsecured creditors
in Chapter 7 rarely receive anything, although unsecured creditors in Chapter 11 do recover
about one-third to one-half of their claims. This is not attributable to differing degrees of
indebtedness or firm size.
There are at least four possible explanations for the discrepancy between studies. First,
the majority of the Swedish bankrupt firms (74% of sample firms in Thorburn (2000)) are
sold as “going concerns,” whereby the appointed trustees have to run the business until
the case is closed. In this case, being time-constrained and running multiple bankruptcies
at the same time may motivate the trustees to sell the bankrupt firm sooner rather than
later. In contrast, U.S. firms in Chapter 7 cases usually cease as going concerns immediately
after the trustee takes over—the trustee’s major responsibility is to oversee and liquidate
the remaining assets rather than manage the bankrupt firm. Second, the speed with which
the Swedish trustees handle cases directly influences their reputations and future em-
ployment opportunities (Stromberg (2000, p.2647)). In contrast, U.S. trustees are neither
judged nor compensated by the speed with which they handle cases (U.S. Bankruptcy Code
5
§326(a)). Third, Swedish Bankruptcy Law forbids running the firm’s operations for more
than one year, except under extraordinary circumstances and only if the court approves
such (Stromberg (2000)). In contrast, the U.S. Code puts no limit on the length of the pro-
ceedings. Fourth, a myriad of other economic and noneconomic differences between the
two countries, ranging from judicial to cultural differences, influence the way in which
bankruptcy happens.
II. Bankrupt Firm Characteristics
A. The Sample
Our sample consists of all corporate bankruptcies filed under Chapter 7 and Chapter 11
between 1995 and 2001 in the Federal Bankruptcy Courts of Arizona (AZ) and Southern
New York (NY) with sufficient data. Only these two courts have made their past cases
available on the Pacer (Public Access to Court Electronic Records) service, which provides
the full-text source for bankruptcy documents. From 1995 to 2001, each court handled
about 5,200 business bankruptcies, which places both of them around rank 15 among the
94 U.S. bankruptcy courts. About half of all bankruptcy cases are routinely dismissed or
transferred to other courts shortly after filing—we omit such cases. Further, we delete
about 2,000 cases that are subsidiaries of one company, rather than individual bankruptcy
cases. We also exclude bankruptcies designated as “pre-packs,” which can take as little as
two weeks to resolve. After eliminating and consolidating such cases, there are “only”
225 unique corporate Chapter 11 cases and “only” 61 unique corporate Chapter 7 cases.
We believe this is the largest and most comprehensive sample of corporate bankruptcies
assembled for an academic paper. We note, however, that the the sample period unfortu-
6
nately does not include a recession.
Our Chapter 11 sample is roughly equally split across NY (117 cases) and AZ (108
cases), but there are more Chapter 7 cases in NY (50 cases) than in AZ (11 cases). As of late
2004, eleven Chapter 11 cases in AZ had not yet closed. When required, we estimate the
remaining duration from bankruptcy cases that had taken at least as long, but had already
closed. Our results reported below—especially the inference about time in bankruptcy—
do not change if we simply winsorize these cases as if they were closed at the end of our
sample or if we omit them.
All data are handcoded from the full bankruptcy documents. Although the forms are
standardized, each firm reported its information in a different format. Some firms did not
even report basic data, such as assets, despite a legal requirement to do so. In some cases,
we have no choice but to discard the entire observation. In other cases, we can use an
observation in some tests, but not in others.
To summarize, our database is quite comprehensive and tracks firm history from bank-
ruptcy filing through September 2004. This database provides information on firm char-
acteristics, creditor characteristics, judge characteristics and behavior, expenses, duration
of proceedings, recovery rates, frequency of APR violations, and case outcome. Because we
cannot possibly hope to describe here all interesting correlations in our data, we make our
database publicly available to researchers, so that any interested reader can recompute the
relevant statistics.
7
B. Pre-Bankruptcy Firm Characteristics
Table I describes the characteristics of our firms as they entered bankruptcy. The me-
dian Chapter 11 bankruptcy is about ten times as large as the median Chapter 7 bankruptcy—
the mean difference is greater, because the sample contains some extremely large Chap-
ter 11 cases. (Subsequent results are equally-weighted to not place too much weight on
such firms.) Differences in indebtedness are surprisingly modest—the typical Chapter 7
case is no more underwater than the typical Chapter 11 case. Chapter 11 firms seem to
have more secured debt, but the median fraction of secured creditors is the same. (Two
Chapter 7 and two Chapter 11 cases had exclusively secured debt; 44 Chapter 11 cases and
20 Chapter 7 cases had exclusively unsecured debt.) The median Chapter 11 firm—much
larger in terms of assets—has about twice as many creditors as the median Chapter 7 firm.
In our Chapter 7 cases, at least one bank is among secured creditors in 31% of our cases
and among unsecured creditors in 37% of our cases. In our Chapter 11 cases, a bank is
among secured creditors in 37% of our cases, and among unsecured creditors in 18% of
our cases.1 Finally, managers tend to own more equity in Chapter 11 cases than in Chap-
ter 7 cases. Though not reported here, AZ and NY cases tend to be similar in terms of the
variables reported in Table I. Table I
8
C. Determinants of Choice of Procedure
Table II investigates whether firms systematically begin their bankruptcies differently
in terms of three binary choices: Whether they work with an unsecured creditors’ com-
mittee, whether they file voluntarily, and whether they file for Chapter 7 (vs. Chapter 11).
These choices are endogenous, and self-selection could contaminate our later attempts to
determine the influence of other variables on procedural costs and outcome. Thus, in later
regressions, we control for the self-selection into bankruptcy chapter (Chapter 7 or Chap-
ter 11). We also experiment with endogeneity control for the other two choices (committee
and who filed), but this ultimately matters little, so we do not report the related results. Table II
Creditors’ Committee. The court appointed a committee to represent unsecured cred-
itors in 45 out of our 225 Chapter 11 cases. The left probit investigates the formation of
a creditors’ committee, which represents unsecured creditors. Under §1102 and §1103 of
the Code, the trustee shall appoint a committee of creditors consisting of the persons that
had the seven largest claims against the debtor. The committee has the right to employ
attorneys, accountants, and other experts, and to request reimbursement from the court.
Table II shows that the formation of a committee is reasonably predictable, with an R2 of
37%. Firms with large scale (assets), firms in NY, firms without a bank among the unsecured
debt (which could conceivably represent the unsecured creditors to the court), and very
underwater firms tend to form creditors committees.
Petition Source. Under §301(a) of the Code, creditors can force bankruptcy if at least
three secured creditors are out of the money. Their claims must aggregate to at least
$10,000 more than the value of any lien on property of the debtor securing such claims
in order for an involuntary petition to be eligible for filing by these creditors. If there
are fewer than 12 secured creditors, the petition can be filed by one or more of such
holders who holds in the aggregate at least $10,000 of such claims. Therefore, under the
9
bankruptcy code, forced filings are only possible when secured creditors are sufficiently
concentrated. In our sample, 161 out of 166 of our bankruptcies were filed “voluntarily” by
the firm (presumably under creditor threat), rather than forced by creditors. Our middle
probit predicts whether some variables change this propensity. Only two variables stand
out: Our five forced firms were relatively smaller ($1.5 million on average) and had fewer
secured creditors.
Bankruptcy Chapter. The focus of our paper is the most important choice of a bankrupt
firm—whether to file for Chapter 7 or Chapter 11. If firms identifiably self-select, then it
could be misleading to compare the cost of procedures, without controlling for endogeneity
of chapter choice. The right probit shows that the choice of procedure is indeed correlated
with a number of identifiable firm characteristics.
In the text, we often report the standardized beta coefficient for regression variables,
and use this to gauge the relative importance of different variables (provided we have
statistical significance). We multiply the estimated coefficient by the standard deviation of
the independent variable, and divide it by the standard deviation of the dependent variable.
The resulting number measures what fraction of the range of the dependent variable is
implied to be explained by the range of the independent variable. The standardized beta
is one among a number of reasonable measures of economic significance.
Listing the variables that help predict the choice of procedure, in rough order of im-
portance:
• Firms are more likely to file for Chapter 11 when they are not tiny. For assets above
$100,000, estimated coefficients need to be added to ascertain size. The propensity
to reorganize is thus strongest in the $100,000 to $1 million category, and is still
positive but diminishing when assets are above $1 million. (Reducing the number
and type of asset controls makes no difference in later results.)
10
Although Chapter 11 cases are larger, there is considerable overlap—from the per-
spective of asset scale, a good number of firms could have chosen either procedure.
This is even easier to see in Figure 1 below.
• Firms that have a large number of secured creditors are more likely to file for Chap-
ter 11 reorganization than Chapter 7 liquidation (standardized beta, 240%). This
could point to coordination problems among creditors, with debtors recognizing that
Chapter 11 could overcome this type of obstacle and result in a viable reorganized
firm after bankruptcy.
• Firms in which a bank is a creditor—especially an unsecured creditor—are more likely
to choose liquidation over reorganization (standardized beta, 130%). This is consis-
tent with the view that pre-bankruptcy negotiations are more likely to occurr when
the main creditor is a bank, and this bank has already shown itself unwilling to com-
promise.
• Firms that are more underwater tend to prefer Chapter 11 reorganization over Chap-
ter 7 liquidation (standardized beta, 80%). This could imply that firms not underwater
that filed for Chapter 7 did so under economic, rather than financial, distress.
We use this probit regression as a first-stage control for endogenous self-selection in
subsequent “treatment” and “Heckman (1979)” second-stage regressions. We also experi-
ment with first-stage probits that rely on fewer, more carefully chosen variables, and with
probits that focus only on observations used in a particular second-stage regression. Such
first-stage variations make little or no difference in the second-stage regression results
reported below. (In retrospect, this is not surprising. Regressions are fairly robust to
endogeneity in terms of coefficient estimates other than the coefficient estimate of the
specific first-stage procedural choice variable itself. This is the case in Heckman (1979),
and such is the case here.)
11
III. Indirect Bankruptcy Cost: Reported Asset Value Changes
during Bankruptcy
A. Descriptive Statistics
Upon entering bankruptcy, firms must fill out a standard form with declarations of their
business outlook and financial situations, specifically their assets. (Debtors later collect
more information, including more detailed financial statements.) Many firms exercise dis-
cretion in filling out the form. For instance, some firms report values excluding intangible
assets, while other firms include them. Moreover, the reported numbers are not necessar-
ily market values—especially for intangible assets, this could itself depend on whether the
firm continues, is parceled up, or liquidated. (Unfortunately, we do not have data to distin-
guish between tangible and intangible assets.) Yet, these are the most accurate valuations
available to academic research, so the reader must remain cognizant of their limitations.
At the end of bankruptcy, we again obtain information on firms’ values through the
declaration of the distributions. Our exit valuations are the sum of interim and final expert
fees and creditor recovery—some of these were explicitly reported to be zero. (We never
impute zero for missing or dubious values!) However, there is one important complication.
In Chapter 11, when assets are sold, regardless of whether they are collateral, the cash
returns to the estate and is thus recorded in the case. In Chapter 7, however, secured
creditors can lay claim on their security, because continuation is not an argument that
the firm can muster to resist seizure.2 For such direct asset seizures, both assets and
claims should not appear in the final Chapter 7 bankruptcy declaration. Moreover, we
cannot track the seizures, because such claims are only recorded in the local courthouse
that corresponds to where the assets are located. Because there is not even a central
directory of where assets might be located, we cannot possibly trace them. Hence, we
12
must consider the recorded Chapter 7 distributed assets to secured creditors (and the
post-Chapter 7 assets) as a lower bound. For measuring at-exit values, our paper thus
entertains two versions for secured creditor recovery. The lower, pessimistic bound uses
only the recorded distributions in bankruptcy. For an upper, very optimistic bound, we
double the highest observed total distribution to secured creditors in Chapter 7 (1.3 times
the pre-bankruptcy assets). We therefore assume here that up to 1.3·2 = 2.6 times reported
pre-bankruptcy assets were available to satisfy (up to 100% of) the secured claims.3 In most
but not all cases, this de facto assumes full satisfaction of secured claims. In contrast, the
post-bankruptcy asset values and therefore recovery statistics for unsecured creditors are
at least as trustworthy for Chapter 7 cases as they are for Chapter 11 cases.
The change in firm value during bankruptcy is interesting for two reasons. First, it can
be considered a noisy measure of the indirect cost of bankruptcy. Second, earlier research
typically measures legal fees as a fraction of reported assets upon entry into bankruptcy.
However, such fees may appear relatively small either if at-entry bankruptcy assets are
overstated, or if the bankruptcy itself dissipates assets rapidly—in which case, not much
may be left to distribute in fees.
The left columns in Table III show that the median Chapter 11 case enters bankruptcy
about 10 times larger than the typical Chapter 7 case. (The mean assets are 40 times
larger.) The 75th percentile of Chapter 7 cases is about the same size as the 25th percentile
of Chapter 11 cases. The middle columns show that total assets at the conclusion of
bankruptcy, available to satisfy both experts and creditors, are considerably smaller than
assets upon entry into bankruptcy for Chapter 7 cases. The right columns show that even
assuming our overly optimistic secured recovery rate, Chapter 7 assets drop by at least
20% in mean and 62% in median. Assuming our overly pessimistic reported-only creditor
recovery, the median Chapter 7 dissipates substantially all its assets, even before any fees
are paid. In contrast, our Chapter 11 cases report that they exited bankruptcy with assets
13
that were pretty similar to those reported upon entry into bankruptcy. The median value
change is −13%; the mean value change is +7%. (Not reported, there is no obvious scale
difference between cases filed in NY and AZ.) Table III
Of course, firms, lawyers, unsecured creditors, and managers—though not the secured
creditors—have incentives to overstate assets at Chapter 11 exit. Because it is not clear
how accurate Chapter 11 post-bankruptcy values are, and because we suspect some value
padding at bankruptcy exit, we try to track the firms. For our 225 Chapter 11 cases, we
cannot locate 64 firms after bankruptcy. Of the remaining 161 firms, 11 still remained
in the original bankruptcy process. Thus, we can determine the eventual fate of about
150 Chapter 11s: 15 firms emerged and later filed for Chapter 7, 53 were later liquidated,
78 continued as independent companies, three merged, and one refiled for Chapter 11.
Thus, despite gaining value in Chapter 11, only about half of our Chapter 11 firms seem
to ultimately survive healthy. We consider this to be a mild indication that the Chapter 11
exit values are optimistic.4 Figure 1
Figure 1 plots Chapter 7 and Chapter 11 assets before and after bankruptcy. The fig-
ure shows that the pessimistic lower bound for Chapter 7 cases is uniformly such that
post-bankruptcy values are less than pre-bankruptcy, with one exception for the highest
valued Chapter 7 case.5 Even if we use the upper bound—our optimistic secured recovery,
in which we gross up some observations to twice the pre-bankruptcy asset values—the
Chapter 7 value decline seems worse than the Chapter 11 value decline. Equally remark-
able to us, Chapter 11 cases asset changes are very heterogeneous. However, a one-to-one
correspondence on average between pre- and post-bankruptcy recorded assets is not an
unreasonable assumption, especially for larger bankruptcies—even though in one outly-
ing Chapter 11 case, post-bankruptcy assets were over ten times pre-bankruptcy assets.6
There is also some regression to the mean—the lowest pre-bankruptcy asset Chapter 11
cases tend to end up with relatively more assets post-bankruptcy.
14
Our first conclusion is that this evidence does not suggest that Chapter 7 cases are
better at retaining value throughout the bankruptcy process than Chapter 11 cases. There
are a number of possible explanations. First, Chapter 7 liquidations could be fire sales
at the wrong time (as in Shleifer and Vishny (1992)). However, this is not consistent with
the fact that the typical Chapter 7 case takes two years to unwind. Second, it could be
that Chapter 11 firms are more pessimistic in estimating firm value at bankruptcy entry—
although there is no ex ante reason to believe this. Third, Chapter 11 firms could be
more optimistic in estimating firm value at bankruptcy exit, which is in the interest of
some, but not all parties, and for which we provide some anecdotal evidence (poor ultimate
corporate survivorship) above. Fourth, a combination of the preceding factors could be at
work. Without an independent and unbiased value assessment, these causes cannot be
disentangled.
Our second conclusion will be that the measurement of the estate value in bankruptcy—
and therefore the measurement of fees as a fraction of the estate value, as we show below—
is sensitive to specification and sample.
B. Determinants
In this section, we try to answer the following questions: How well do firms hold their
value during the bankruptcy process before we subtract the direct bankruptcy costs? Is the
poor performance of Chapter 7 cases due to differences in firm type or due to measurable
factors? Or is the performance just equally bad in all bankruptcies?
Table IV introduces our reporting format for second-stage regressions. We attempt to
entertain the same set of regressors in all regressions. As independent variables, we usually
include: Multiple nonlinear controls for assets; the degree to which the firm is underwater;
the fraction of debt that is secured; the number of creditors, both secured and unsecured;
15
the presence of a bank among creditors, secured or unsecured; the presence of a creditors’
committee;7 whether the firm or creditors initiate bankruptcy; the ownership proportion
of management; and, the jurisdiction. In the right-most Heckman regressions, we also
control for fixed effects caused by differences in judges.
Our most interesting variables relate to the observed choice of procedure. The left-most
regression is simple ordinary least squares (OLS), which ignores self-selection but does in-
clude the actual choice of chapter as a dummy. The coefficient measures both the influence
of the procedure itself, and the differences between firms that choose Chapter 7 and firms
that choose Chapter 11—the self-sorting effect. The remaining three regressions seek to
disentangle these two effects by relying on the predictions from the procedural choice
probit regressions from Table II. The “treatment effects regression” uses both Chapter 11
and Chapter 7 cases, and therefore requires variables to have data in both cases. The two
Heckman regressions are run only among Chapter 11 firms, thereby allowing inclusion
of variables that are available only in Chapter 11 cases (such as a breakout of debtor ex-
penses). The two regressions differ in that the latter tests whether the identity of the judge
matters. Because judges are unique to a district, including the full set of judge dummies
subsumes the dummy that distinguishes between AZ and NY.
In both treatment and Heckman regressions, the Inverse Mills Ratio controls for the
effect that is due to intrinsic firm differences (self-selection). Unfortunately, its sign is
meaningless (see, e.g., Maddala (1983, p.261), Kenny et al. (1979)). (The coefficient is the
correlation between the errors in the selection and model equations, and the standard error
in the model equation. Because the latter is always positive, the sign of the coefficient of
the Inverse Mills Ratio tells us the sign of the correlation between two residuals.) In the
treatment regressions, the coefficient on the Chapter 11 dummy measures the effect that
is due to the pure direct procedural difference itself.
16
While the four regression specifications do have different economic meanings, a variable
that matters in all of them is easiest to interpret. Thus, next to the variable name, we
visually indicate whether a variable is statistically significant with a ‘+’ or ‘−’ for each
regression, and we box those variables that are universally significant. These visuals ensure
that in-text interpretations remain reasonably consistent. We also try various stepwise
regressions, and note in the text instances in which variables seem not particularly robust.
Table IV explains percent changes in assets during bankruptcy, using the pessimistic
“reported-only” scenario on secured recovery. We shall note where this matters. Table IV
Ceteris paribus, the average Chapter 11 case retains value 78% better than the aver-
age Chapter 7 case (standardized beta, 30%). Controlling for self-selection (the effect of
which differs by specification) increases this number to 137% (standardized beta, 50%).
Unreported, under the pessimistic scenario, the average Chapter 11 case does “only” 35%
better in the OLS regression, and 75% better after controlling for self-selection (both with
t-statistics of 1.5).
Therefore, our evidence suggests that it is the Chapter 11 procedure itself, and not the
self-selection, that results in better reported asset retention in bankruptcy—regardless of
the type of firm that chooses Chapter 11. This could also be because Chapter 11 over-
states the remaining assets. We conclude that Chapter 11 as a procedure is no worse for
asset retention than Chapter 7: Depending on the assumption about secured creditor re-
covery, Chapter 7 asset retention is somewhere between “statistically significantly worse”
and “considerably but not statistically significantly worse.” The self-selection component
partially, but never fully, obscures this relationship.
A number of other variables have interesting correlations here, too. Debtor expenses
or total bankruptcy expenses are not associated with less asset retention. Both variables
not only come in statistically significantly positive but are also the most economically
17
significant variables (standardized coefficients of around 80% and 60%, respectively.) The
regressions suggest that some other variables may play less economically or statistically
important roles. Firms that are very underwater seem to retain value significantly better—
almost 50% better (standardized beta, 20% to 25%). In some stepwise regressions, this
variable loses its economic importance however. Next, the fraction of secured debt among
total debt matters, if not controlled for judge (standardized beta of around 10% to 20%).
The other statistically significant variables (such as the AZ dummy and the forced petition)
have less than 10% standardized beta. Finally, the identity of the judge matters.
Surprisingly, the scale of the estate does not seem to matter strongly for asset retention.
As a set, the four asset variables are statistically insignificant. To assess the effect of, say,
a $5 million firm, one needs to add the coefficient estimates. When both Chapter 7 and
Chapter 11 cases are included, the (summed) coefficient is always nonnegative. There is
no clear monotonicity—larger cases may have had worse asset retention. This can be seen
in a simple classification of mean percent asset changes (the medians are similar):
Scale
-$100k $100k-$1m $1m-$10m $10m-
Mean Asset Change, Ch7 −64% −84% −66% n/a
Mean Asset Change, Ch11 +195% +17% −31% +15% .
18
IV. Indirect Bankruptcy Cost: Time in Bankruptcy
A. Overall Duration
The time in bankruptcy is interesting because previous studies (Franks and Torous (1989),
Thorburn (2000)) argue that it is a (very noisy) proxy for indirect bankruptcy costs. The
rationale is that indirect bankruptcy costs such as bankruptcy’s adverse impact on product
and capital markets increase with the time that firms spend in bankruptcy. A bankruptcy
that takes five years to resolve is likely to incur more indirect costs than a bankruptcy
that takes three months to resolve. As noted, the retention of asset value, as measured
in our previous section, could be considered an alternative (inverse) measure of indirect
bankruptcy costs, though it, too, is very noisy.
Table V shows that the average Chapter 7 and Chapter 11 bankruptcies take about two
years to resolve. This is shorter than the 3.7 years that Franks and Torous (1989) report for
Chapter 11 cases. It surprises us how long Chapter 7 cases take: It appears that ordinary
managerial agency problems are not responsible for the bankruptcy process lengthiness,
because Chapter 7 cases are conducted by elected trustees, whose interest should be to
wind down the case, and no longer in the interest of the firm but only of the creditors.
The fact that our Chapter 7 cases take so long also contrasts with Thorburn (2000), which
finds that the Swedish cash auction system takes only two months. While the Swedish
cash auction system seems to be more efficient in terms of time, this seems peculiar to the
Swedish system—it does not apply to U.S.-style liquidation of assets. Table V
Conversions: We can classify cases that start out as Chapter 11 but then convert
into Chapter 7 as Chapter 7 cases. Such conversions from Chapter 11 to Chapter 7 are
governed by §1019 of the U.S. Bankruptcy Code, which states that, upon the conversion, a
new period for filing claims starts. The debtor-in-possession or trustee previously acting
19
in the Chapter 11 must turn over to the Chapter 7 trustee all records and property of the
estate under its control. Under §1112(a), the debtor can convert a case to Chapter 7, except
when (a) the debtor is not a debtor-in-possession, or (b) the case originally commenced as
an involuntary case or converted into a Chapter 11 as an involuntary case.
Table V also shows how the conversions differ. Fourty-two cases with data converted,
with these liquidations taking a total of 672 days on average (196 days in Chapter 11,
and 476 in Chapter 7). This is shorter than either pure procedure, but not statistically
significantly different from the total length of pure Chapter 7 of 709 days. The same
inference obtains for the median, where the total length of Chapter 11 conversions to
Chapter 7 is 655. This is not significantly different from the median length of a pure
Chapter 7 case, which is 672 days. However, in the regressions in Table VI, we find that,
controlling for other characteristics, our 42 Chapter 7 to Chapter 11 conversions take about
one year longer.
Table VI explains the log of the time in bankruptcy. Our OLS regression indicates that
firms in Chapter 11 took longer than firms in Chapter 7. The estimated coefficient of 0.41
(standardized beta, 24%) suggests that the dummy can explain about two-thirds of the
observed heterogeneity in bankruptcy duration (0.61). Our remaining regressions disen-
tangle this effect into a self-selection-induced effect and a procedure-induced effect. We
find that the estimated coefficient for the latter not only becomes insignificant, but even
reverses in sign when we cntrol for the former. It therefore appears that Chapter 11 takes
longer only because the types of firms that choose Chapter 11 intrinsically need more time.
Our evidence therefore suggests that the procedure itself does not increase indirect costs
when measured by duration.
20
Table VI
With regards to our other variables, there are only four variables that matter. First, con-
versions from Chapter 11 to Chapter 7 take longer (economic significance, 21%). Second,
firms with more secured creditors tend to spend more time in bankruptcy. However, the
standardized beta is only a modest 5% to 7% percent, and the significance disappears in
some stepwise regressions. Third, the judge-fixed effects come in highly significant—the
particular judge drawn to handle the case appears to play a role in how long a case takes,
holding constant our other characteristics. Fourth, remarkably, the four variables control-
ling for size are not jointly statistically significant in the regressions. Again, the coefficient
should be added for larger firms, and to the extent that there is any scale effect, it is very
mild. (Table VII will show that this time saving occurs primarily in the middle and later
stages—after the firm has filed its plan. Our court system therefore seems to be geared
towards preferentially dealing with larger cases.) In a simple classification, we have:
Scale
-$100k $100k-$1m $1m-$10m $10m-
Mean Time, Ch 7 666 674 738
Mean Time, Ch 11 694 750 835 958 .
Though monotonic, these are mild differences in light of the typical standard deviation of
388 days. Unreported graphical inspection indicates the relationship between asset size
and bankruptcy duration is indeed weak or nonexistent. Larger bankruptcies take longer
to resolve, but the relative increase is small relative to the idiosyncratic variation. Even
the largest bankruptcies seem to only require a couple of months longer than the smallest
bankruptcies—except for the very largest Chapter 11s. Even a corporate bankruptcy worth
only a couple of thousand dollars regularly takes two years to wind down.
21
B. Chapter 11 Phases
Chapter 11 has three distinct identifiable phases: From filing to plan, from plan to
confirmation, and from confirmation to closure.
Filing to Submission: The first phase is mostly under the control of the corporation,
although the Code (§1121) prescribes a deadline of 120 days. After the original financials
have been filed, the debtor must file a reorganization plan to determine the new financial
structure of the firm within 120 days of the bankruptcy filing. This period can be and
usually is extended upon the debtor’s requests. The debtor usually has the exclusive right
to file the plan during these first 120 days. (Although creditors can motion to file the plan
themselves, they are usually hampered by insufficient access to the financials and to the
business.) The activities in the first phase reflect how complicated the cases are and how
cooperative the debtor-in-possession is in facilitating the bankruptcy procedure.
Submission to Confirmation: The second phase is almost entirely under the control of
the security holders and the court. In reorganizing the firm, all claimants are classified
into different classes, such as secured creditors, priority unsecured creditors, non-priority
unsecured creditors, and equity holders. When a class is not fully satisfied, it is regarded
as impaired and allowed to vote on the plan. Majority has to be reached in both the number
of the creditors and the amount owed to all creditors before the court can confirm a plan.8
The length of the second phase can be considered a proxy for the degree of difficulty
in the bargaining process. Because the plan has to be confirmed by all impaired classes
with majority rule, the length of this phase in part reflects how difficult it is to satisfy the
conditions of all parties. Although the court can use “cram down” to pass the plan and
save time, no court used this in our sample.
22
Confirmation to Closure: The third phase is often dedicated to the implementation of
the plan and the final disbursement of fees to professional experts (lawyers, auditors, etc.).
It is thus under the control of management and the court. The management of the debtor
then sets out to implement the confirmed plan. The length of the third phase should be
influenced less by stakeholder gaming and more by the scale of the case, rather than by
the manager’s incentive. Large cases usually involve more claimants and complex financial
structure, which can prolong the process of distributing the assets. There could also be
potentially greater opposition during the process of plan implementation if there are more
stakeholders or complicated financial structures. Although debtor management may still
have some incentive to delay the process, they should be more cooperative with the new
creditors and equity holders than in the previous two phases in order to retain their jobs.
Therefore, the length of the third phase should mostly reflect how complicated the cases
are instead of how efficient the procedure is.
Table VII shows that the three phases take about equally long on average. Only 22% of
our firms meet the 120-day legal deadline to file a plan. Table VII
Not reported, debtors in AZ take only 165 days on average to propose a plan, while
debtors in NY take 296 days—almost twice as long. However, the plan takes as long to
confirm in AZ as in NY (200 days in both). Implementation is again faster in AZ (207 days)
than in NY (257). The differences in the first and third phases are statistically significant.
Table VIII explains the lengths of the three individual Chapter 11 phases: From filing to
plan (Panel A), from plan to approval (Panel B), and from approval to emergence (Panel C). Table VIII
We cannot explore the effect of procedural choice, because these three phases apply
only to Chapter 11. However, the Inverse Mills Ratio tells us that self-selection seems not
to have mattered. As to other variables,
23
Filing to Submission: There are two important variables that explain how long management
takes to file a plan. First, firms with more secured creditors tend to file faster. Al-
though this effect also appears in the overall time required regression (Table VI), it
is even stronger here because the creditors do not appear necessarily as eager to
approve the plan (Phase 2) when there are more of them. Second, and more inter-
estingly, when management owns more of the firm, the first phase tends to drag on
(standardized beta, 20% to 30%). This may indicate that managers with more of their
own money at stake “play the option” of keeping the firm alive, and are reluctant to
resolve the bankruptcy. (In 17% of our Chapter 7 cases and 37% of our Chapter 11
cases, entrepreneurs own a majority of shares in the firm.)
Submission to Acceptance: There are two important variables that explain how long it takes
to confirm the plan. First, firms with more unsecured creditors take longer to confirm
(standardized beta, approximately 30%). Second, an unsecured creditors’ committee
substantially reduces this time (standardized beta, again about 30%). This is evidence
of coordination problems, which are remedied by the presence of a coordinating
organ. There is also mild evidence that coordination problems also play a role in how
long secured creditors require, but this is subsumed by the judge effects.
Acceptance to Emergence: There are no variables that explain how long it takes for a firm
with a confirmed plan to depart bankruptcy.
The identity of the judge matters for all three phases. Firm scale may or may not play a
role, depending on specification. In a simple classification:
Scale
-$100k $100k-$1m $1m-$10m $10m-
Mean Number of Days, First Phase 285 231 343 144
Mean Number of Days, Second Phase 133 190 139 252
Mean Number of Days, Third Phase 112 210 224 339 .
24
Only the third phase shows monotonicity. Not reported, the lengths of the first phase (plan
filing) of a Chapter 11 has a modest +0.10 correlation with the length of the second phase
and a modest +0.25 correlation with the length of the third phase; the latter two have a
−0.15 correlation, each seemingly able to substitute for the other.
V. Direct Bankruptcy Costs: Court-Declared Expenses
A. Descriptive Statistics
We now turn our attention towards direct expenses and their components. Chapter 7
expenses have three major cost components, namely, the trustee expenses,9 accountant
expenses, and debtor attorney expenses. Chapter 11 reorganizations have two identifiable
reimbursable cost components, namely, debtor expenses and unsecured creditors’ com-
mittee expenses. In both cases, direct costs exclude bankruptcy filing fees, and the salary
collected by the debtor’s management is not really a bankruptcy cost, because managers
have to be paid for running the firm in any event.
Direct expenses are not only relatively easier to measure than indirect expenses, but
they have also already attracted much attention in previous work. LoPucki and Doherty (2004)
report direct bankruptcy costs of 1.4%. Warner (1977) reports 4%. Ang, Chua, and Mc-
Connell (1982), Weiss (1990), and Betker (1995) report direct expenses of about 7.5%. In
Sweden, Thorburn (2000) reports 13.2%. All of these are relative to asset value at entry into
bankruptcy. The studied samples are typically small, but their value estimates are more
reliable than our own because they restrict themselves to publicly traded companies, for
which market value estimates can be readily obtained. It is not immediately clear why es-
timates differ across studies. Although much of the discrepancies may be sample-specific,
25
our findings below indicate that differences induced by measurement could easily have
played a role.
The left columns in Table IX measure fees as a fraction of pre-bankruptcy assets. Our
57 Chapter 7 cases have a mean expense ratio of about 8.1%, which is lower than the 16.9%
reported in Chapter 11 (driven by four large outliers). The median expense ratio in Chap-
ter 7 is a slightly higher 2.5% than the 1.9% in Chapter 11. With only 57 observations in
Chapter 7, the difference is not statistically significant so one should not overread this dif-
ference. The evidence suggests that the typical pre-bankruptcy expense ratios are roughly
similar across procedures. Table IX
The extremes here may be as interesting as the central statistics. Reported reimbursed
expenses are less than 1% of firm value in about 40% to 45% of our cases—and exactly zero
in about 35% of all Chapter 7 cases and 20% of all Chapter 11 cases. (These are not cases
for which we cannot locate data [either fees or assets], so this is a real effect. In a number
of Chapter 11 cases, there are no unsecured creditors’ committees and/or the unsecured
creditors do not receive reimbursement. If the debtor does not ask for reimbursement
either, the court-recorded Chapter 11 expenses are $0.)
The middle columns use post-bankruptcy assets as the denominator—Table III shows
that assets can be very different at exit than at entry. Because at-exit values are the sum
of fees and creditor recovery, it now matters whether we choose pessimistic or optimistic
secured recovery rates in Chapter 7; this middle category also has the fewest observations
due to data availability. Table IX shows that 68% of our Chapter 7 cases use up all assets
to pay for expenses under the pessimistic reported-only secured recovery scenario. In the
optimistic 2.6-times-grossed-up scenario (in this case, we gain 17 cases for which we have
no reported secured recovery, but can impute a recovery), we find that this number drops
to 29%, and the bankruptcy expense still remains around 38% of assets on average, with a
26
median of 10%.
The right columns introduce a different denominator, total liabilities, which suffers
from less declaration uncertainty—and offers more observations. However, this normal-
ization masks the degree to which the firm is underwater. (We can control for some of this
in the regressions.) In Chapter 11, average fees as a fraction of liabilities amount to around
1.4% in medians, and a hefty 11.5% in means, due to four outliers with fees-to-liability ra-
tios of 140%, 290%, 520%, and 555%.10 Chapter 7 seems to be cheaper, with expenses per
dollar liability are only 2.9% in means and 0.4% in medians.
Table X shows that Chapter 7 cases consumed a median of $806 and a mean of $21,417
in identifiable fees. The debtor’s attorney consumes 50% more than the trustee. Accountant
and other expenses together consume about as much as the trustee. In the median case, the
debtor attorney is the only charging entity. Chapter 11 cases occur in larger companies, so
it is no surprise that the median consumption is $21,403 ($166,627 in mean). The debtor
creates about 80% of the expenses in means (100% in median). The balance obviously goes
to the creditors’ committee. However, conditional on creditors’ committee presence (which
is the case in 20% of our Chapter 11 cases), the two parties seem to spend roughly equal
amounts in means. Even in medians, the corporation spends only about three times what
the creditor committee spends. Table X
Table IX also splits the sample into cases from AZ and NY, and, though not reported
in the tables, we can describe how the components differ across jurisdictions. Chapter 7
expenses are fairly similar in both jurisdictions. Debtors’ attorney fees are similar in AZ
and NY, around $10,000 per case, with total fees higher in NY than AZ, and attorneys’
costs relatively higher in AZ (8% vs. 3%). While NY accountants charged $1,500 per case,
AZ accountants charge only $200 per case, but these expense categories are relatively
minor. The “big” differences are due to Trustee expenses ($6,000 per case, or 2%, in NY,
27
and $1,000 per case, or 1%, in AZ) and other expenses ($5,000 per case, or 1.5%, in NY
and $700 per case, or 0.5%, in AZ). Chapter 11 expenses, on the other hand, are at least
twice as high in NY, both in terms of means and medians, as they are in AZ: The mean
(median) AZ debtor expense is $30,447 ($4,368), while the NY debtor expense is about ten
times this amount, $256,430 ($62,250). In percentages, this is 4.5% (0.8%) vs. 29% (3.9%) of
assets. The unsecured creditors’ committee spends $8,506 on average, or 1.25% of assets,
in AZ, and $64,693, or 7.2%, in NY. This is consistent with the view that the climate is
more adversarial in Chapter 11 cases in NY, where substantial amounts of money can be
involved, but Chapter 7 stakes are just “too small to bother.”
B. Determinants
Table XI explores the determinants of asset-normalized court-declared expenses. (The
fraction of the firm captured by creditors is one minus this number.) Table XI
In the OLS regression, the procedure choice variable is positive and statistically signifi-
cant: Chapter 11 cases have higher expense ratios (standardized beta, 17%). However, when
we control for endogeneity, we find that Chapter 11 cases consume more fees proportion-
ally, not because Chapter 11 is intrinsically the more expensive procedure, but rather only
because self-selecting Chapter 11 firms intrinsically require more expenses. The Inverse
Mills Ratio is highly statistically significant. The coefficient estimate for the “Instrumented
Chapter 11 Procedure” in the Treatment Effects regression is not statistically significant,
but it is negative, and its standardized coefficient of 60% is considerably higher than that
of the OLS standardized coefficient of 17%.
Most of our other variables offer no explanatory power. The presiding judge’s identity,
which does robustly matter for duration, does not matter in terms of expenses. AZ cases
are cheaper, but primarily so if both Chapter 7 and Chapter 11 cases are included. The
28
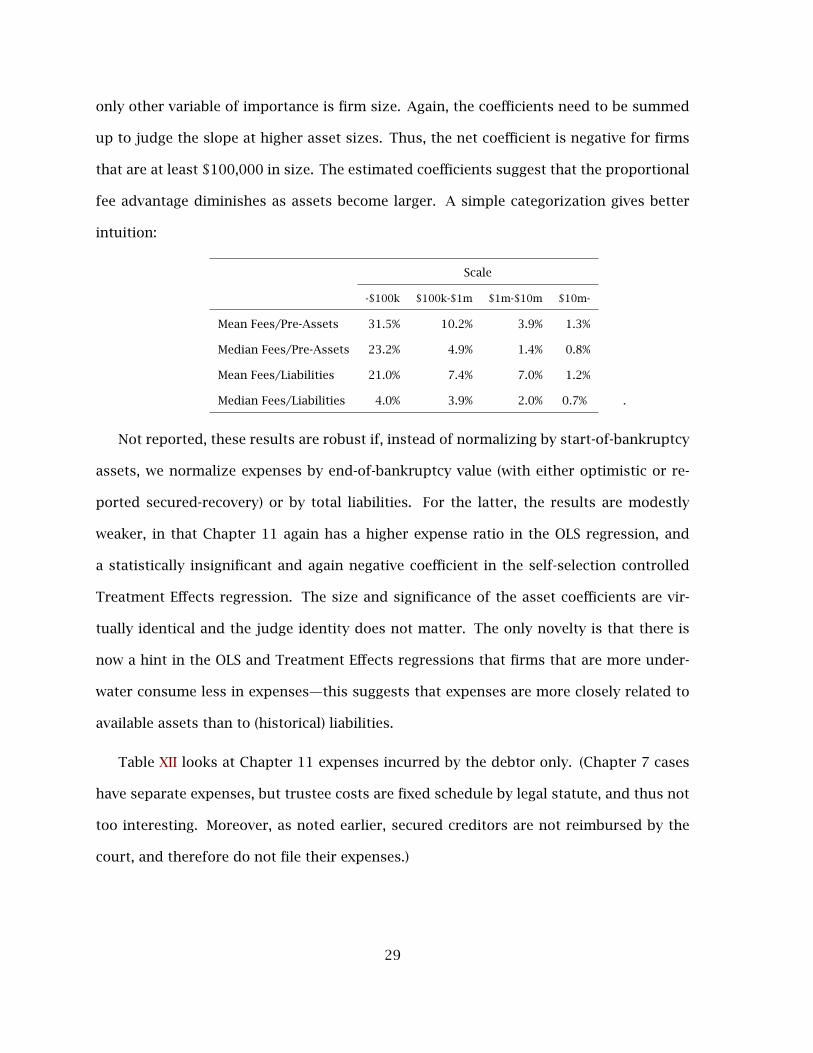
only other variable of importance is firm size. Again, the coefficients need to be summed
up to judge the slope at higher asset sizes. Thus, the net coefficient is negative for firms
that are at least $100,000 in size. The estimated coefficients suggest that the proportional
fee advantage diminishes as assets become larger. A simple categorization gives better
intuition:
Scale
-$100k $100k-$1m $1m-$10m $10m-
Mean Fees/Pre-Assets 31.5% 10.2% 3.9% 1.3%
Median Fees/Pre-Assets 23.2% 4.9% 1.4% 0.8%
Mean Fees/Liabilities 21.0% 7.4% 7.0% 1.2%
Median Fees/Liabilities 4.0% 3.9% 2.0% 0.7% .
Not reported, these results are robust if, instead of normalizing by start-of-bankruptcy
assets, we normalize expenses by end-of-bankruptcy value (with either optimistic or re-
ported secured-recovery) or by total liabilities. For the latter, the results are modestly
weaker, in that Chapter 11 again has a higher expense ratio in the OLS regression, and
a statistically insignificant and again negative coefficient in the self-selection controlled
Treatment Effects regression. The size and significance of the asset coefficients are vir-
tually identical and the judge identity does not matter. The only novelty is that there is
now a hint in the OLS and Treatment Effects regressions that firms that are more under-
water consume less in expenses—this suggests that expenses are more closely related to
available assets than to (historical) liabilities.
Table XII looks at Chapter 11 expenses incurred by the debtor only. (Chapter 7 cases
have separate expenses, but trustee costs are fixed schedule by legal statute, and thus not
too interesting. Moreover, as noted earlier, secured creditors are not reimbursed by the
court, and therefore do not file their expenses.)
29
Table XII
The effect of procedure choice and self-selection now drops below statistical signifi-
cance, but the signs and interpretations are the same as in Table XI—firms with intrin-
sically higher debtor expense ratios disproportionately select into Chapter 11, but these
higher expenses are not intrinsically due to the procedure itself. So, although Chapter 11
cases suffer proportionally higher debtor fees in the OLS regression, this is attributable to
self-selection, not to the effect of the procedure itself.
As in Table XI, the AZ effect remains present. Judicial identity is irrelevant once other
factors are taken into account. While asset size may or may not matter in the multivariate
framework, it clearly matters in a simple classification of means or medians—larger cases
have lower debtor expense ratios, which is almost the same pattern reported above for all
expenses.
Our most interesting finding in Table XII is that expenses by debtor and unsecured
creditors are strategic complements. When one spends more, so does the other, though
the standardized beta is only 0.1. This is consistent, either with negative externalities
created by conflict, or with an optimal division of labor among multiple parties.
We omit the equivalent tables that explains unsecured creditor expenses because it
contains only one interesting finding: An unsecured creditors’ committee translates into
a mildly higher expense ratio (t-statistics are only between 1.6 and 1.8). In Table XII, the
unsecured creditors’ committee translates into a lower debtor expense ratio. Thus, the
debtor seems to substitute for some of the tasks carried out by unsecured creditors if no
creditors’ committee is formed. Unfortunately, there are only 22 Chapter 7 observations
available—too few to give us much confidence in disentangling the determinants. The
significant findings are that trustees seem to spend more when there are more secured
and unsecured creditors, when managers own more of the equity, and when the case is
30
in AZ instead of NY. Both accountants and trustees spend less when the firm is more
underwater.
C. Interpreting Direct Bankruptcy Cost Estimates
Empirical bankruptcy expense estimates are often used as proxies for future financial
distress costs, for example in the calibration of theories of capital structure. Thus, the
estimated distress cost magnitude has broad significance. In contrast to earlier work, we
come away from our cost estimates with a new appreciation for their sensitivity. We are
therefore reluctant to recommend a particular “take-away” expense ratio, and we also ad-
vise caution in interpreting other frequently cited expense estimates. Whether bankruptcy
costs are modest or extreme can depend significantly on which statistic (mean or median)
and which asset valuation (pre- or post-bankruptcy) is reported. Our simple descriptive
statistics show that a theorist can muster expense claims as low as 2% (median Chapter 11
costs, measured against at-bankruptcy entry asset values) or as as high as 100% (median
Chapter 7 costs, measured against post-bankruptcy asset values). Moreover, there is large
heterogeneity in bankruptcy costs: the estimated standard deviations and interquartile
ranges of bankruptcy costs, even measured in terms of pre-bankruptcy assets, are much
larger than the means.
Perhaps most important is that the variation is predictable on a firm-by-firm basis, at
least as early as at the onset of bankruptcy. To calibrate a model, a theorist could interpret
fitted expected bankruptcy costs calculated on a firm-by-firm basis as a substitute for
priors. For example, if we consider the fitted values from our regressions that predict the
ratio of fees over assets from Table XI, we find that they have a mean of 10% and a standard
deviation of 11% to 12%.11 This translates into a range for prior expected bankruptcy costs
of 0% to 20%. Similarly, when expenses are measured as a fraction of liabilities, prior
31
expected bankruptcy costs have a heterogeneity of about 10%. Again, this suggests that
theorists should adopt a more balanced approach. Specifically, bankruptcy costs should
be recognized to be high in some firms, and modest in other firms.
VI. Creditor Recovery Rates and APR Violations
The previous sections relate fees to assets left in the estate. This section relates dis-
bursed assets to what creditors are owed. Looking at recovery rates also allows us to
consider APR violations. In Weiss (1990), APR is violated in 29 out of 37 cases. In Franks
and Torous (1989), 21 out of 27 cases violate APR, 18 of which are in favor of equity holders,
and three of which (11%) are in favor of unsecured creditors.
A. Descriptive Statistics
Table XIII shows that secured creditors in Chapter 7 do not fare well, regardless of the
recovery assumption. In about half of our 30 Chapter 7 liquidations, secured creditors
receive nothing. Under the pessimistic reported-only secured-recovery scenario, we find
that the mean recovery is 32%; under the optimistic 2.6-times secured-recovery scenario,
the mean recovery is 51%. In contrast, secured creditors are deemed fully satisfied in 74%
of our Chapter 11 reorganizations, and the unconditional mean satisfaction is around 90%.
There was only one reorganization in which secured creditors do not receive anything.12 Table XIII
Fortunately, unlike secured recovery rates, our unsecured recovery rates are, if any-
thing, more reliable in Chapter 7 liquidations than in Chapter 11 reorganizations. We find
that unsecured creditors receive nothing in 95% of our Chapter 7 cases. The mean recovery
rate is 1%, all driven by one case.13 Unsecured creditors in Chapter 11 are more fortunate.
32
Their mean (median) recovery rate was 52% (40%).14
Putting secured and unsecured recovery together shows that creditors in Chapter 11 re-
organizations fare significantly better (mean 69%, median 79%) than creditors in Chapter 7
liquidations. Even in the optimistic 2.6-times secured-recovery scenario, the mean is 27%
and the median is 6%. In the pessimistic scenario, this drops to 5.4% and 0%, respectively.
In Chapter 7, APR is always followed. Therefore, Table XIII reports only on APR viola-
tions in Chapter 11 reorganizations. In 88% of these cases, APR is strictly followed, and
in 12% it is modified. The final column computes an APR index: For a case that follows
proportional allocation (i.e., ignores APR), the index is zero. For a firm that follows abso-
lute priority, the index is one. The average index is 91%, though even the 25th percentile
is 100%. There is one outlier that yields an APR adherence index of –40.5%.15 Compared
to earlier studies, we find fewer APR violations in our sample. Although violations in fa-
vor of equity are not comparable with violations in favor of unsecured creditors, there are
no public equity holders in most of our cases. (Private equity does not seem to receive
anything in our cases, but many entrepreneurs are both an unsecured lender and equity
holder.)
Conversions: Not reported, recovery rates for Chapter 7 conversions from Chapter 11
do not differ statistically from pure Chapter 7 cases. The mean recovery rate for secured
creditors is 12.75% (median 0%), and the mean recovery rate for unsecured creditors is
2.20% (median is 0%). In total, creditors recover 4.3% of their total claims (median 0%), and
28.32% (median 4.78%) if we assume the maximum recovery by secured creditors of 2.6
times pre-bankruptcy assets. Relative to the post-bankruptcy value of the assets, creditors
receive 11.74% (median 0%). The remaining assets go to pay fees.
33
B. Determinants of Recovery Rates
Table XIV explores the total creditor recovery rate. Recall that we have solid data on
recovery rates of unsecured creditors in both chapters, solid data on secured recovery in
Chapter 11, and no good estimates of secured recovery in Chapter 7. Therefore, the left
two regressions in Table XIV are not altogether trustworthy. The dependent variable in
Chapter 7 here is based on our assumption of pessimistic secured creditor recovery in
Chapter 7, but none of the significant correlations change when we use optimistic senior
recovery instead.16 Table XIV
Chapter 11 unequivocally seems better for creditors from the perspective of total recov-
ery rate, regardless of controls for self-selection (which matters little). The standardized
beta is a strong 50%, and procedural choice is our single-most important variable. It is
the procedure itself that indicates higher recovery rates, either through more optimistic
valuations or through better asset retention.
As to our other variables, not surprisingly, creditors in firms that are more underwater
recover less (standardized beta, 30% to 40%). The fraction of secured debt in total debt
matters (standardized beta, 25% to 35%). That is, in firms with relatively more secured
debt, creditors end up with more assets even in aggregate. Dispersion matters in the
opposite fashion. When there are fewer secured creditors, creditors end up with less, but
the standardized beta is a weak 5%. In the few firms that are forced into bankruptcy by
creditors, recovery is less. In specifications that include Chapter 7 cases, creditors in AZ
recover less than those in NY, again with only modest statistical and economic significance.
Surprisingly, debtor expenses do not associate with lower recovery rates, but rather with
higher recovery rates (standardized beta, 17%).
Also surprisingly, the identity of the judge does not matter. It is also a surprise to us
how relatively weak the influence of firm scale can be—creditors in firms that are very large
34
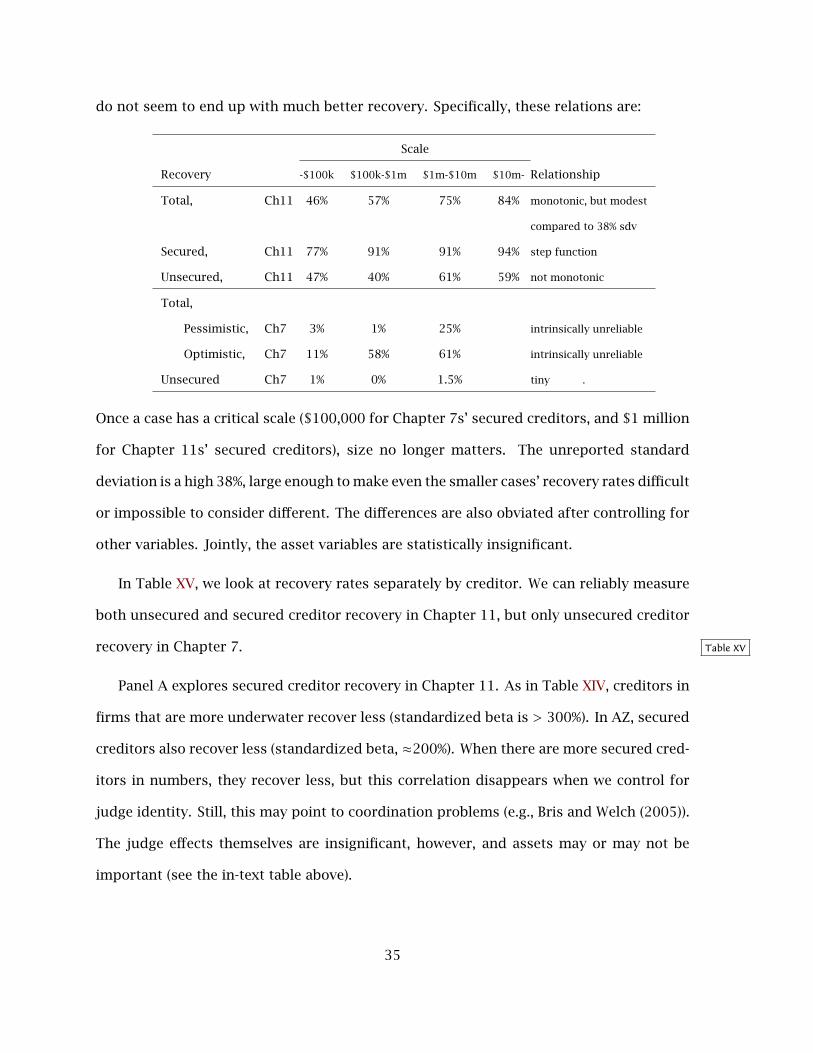
do not seem to end up with much better recovery. Specifically, these relations are:
Scale
Recovery -$100k $100k-$1m $1m-$10m $10m- Relationship
Total, Ch11 46% 57% 75% 84% monotonic, but modest
compared to 38% sdv
Secured, Ch11 77% 91% 91% 94% step function
Unsecured, Ch11 47% 40% 61% 59% not monotonic
Total,
Pessimistic, Ch7 3% 1% 25% intrinsically unreliable
Optimistic, Ch7 11% 58% 61% intrinsically unreliable
Unsecured Ch7 1% 0% 1.5% tiny .
Once a case has a critical scale ($100,000 for Chapter 7s’ secured creditors, and $1 million
for Chapter 11s’ secured creditors), size no longer matters. The unreported standard
deviation is a high 38%, large enough to make even the smaller cases’ recovery rates difficult
or impossible to consider different. The differences are also obviated after controlling for
other variables. Jointly, the asset variables are statistically insignificant.
In Table XV, we look at recovery rates separately by creditor. We can reliably measure
both unsecured and secured creditor recovery in Chapter 11, but only unsecured creditor
recovery in Chapter 7. Table XV
Panel A explores secured creditor recovery in Chapter 11. As in Table XIV, creditors in
firms that are more underwater recover less (standardized beta is > 300%). In AZ, secured
creditors also recover less (standardized beta, ≈200%). When there are more secured cred-
itors in numbers, they recover less, but this correlation disappears when we control for
judge identity. Still, this may point to coordination problems (e.g., Bris and Welch (2005)).
The judge effects themselves are insignificant, however, and assets may or may not be
important (see the in-text table above).
35
Panel B explores unsecured recovery, this time reliably for both Chapters 7 and 11.
Again, whether or not we control for self-selection, Chapter 11 cases offer much higher
recovery rates for secured creditors. The coefficient estimate translates into a standardized
beta of 50%. Thus, it essentially does not matter whether we control for self-selection or
not.
As to our other variables, creditors in firms that are more underwater again recover
less. Second, the number of secured creditors again matters and again negatively: There
is less unsecured recovery when there are many secured creditors. We cannot think of a
good explanation for this finding. Third, unsecured creditors recover relatively more when
there is a bank among them, but this disappears when judge identity is taken into account.
Fourth, when the debtor firm spends more on bankruptcy expenses, unsecured creditors
recover more. Fifth, the identity of the judge matters here, that is, whether unsecured
creditors recover more or less seems to relate to which judge is drawn. Assets do not
matter.
C. Determinants of APR violations
Table XVI explores APR violations in Chapter 11, either a dummy, which equals one if
both secured creditors do not receive 100% and unsecured creditors receive something, or
a continuous APR adherence index, which equals one under APR and zero under purely pro-
portional allocation (i.e., perfect APR violation). APR violations are specific to Chapter 11
cases. There are no APR violations in Chapter 7. Table XVI
Our findings are (in rough order of importance):
• APR tends to be violated when there are fewer secured creditors (in number, stan-
dardized beta ≈ 10%), and
36
• when secured creditors own a large fraction of the total debt (standardized beta, 11%
to 27%).
• APR tends to be violated when the firm is more underwater (standardized beta of 21%
to 27%).
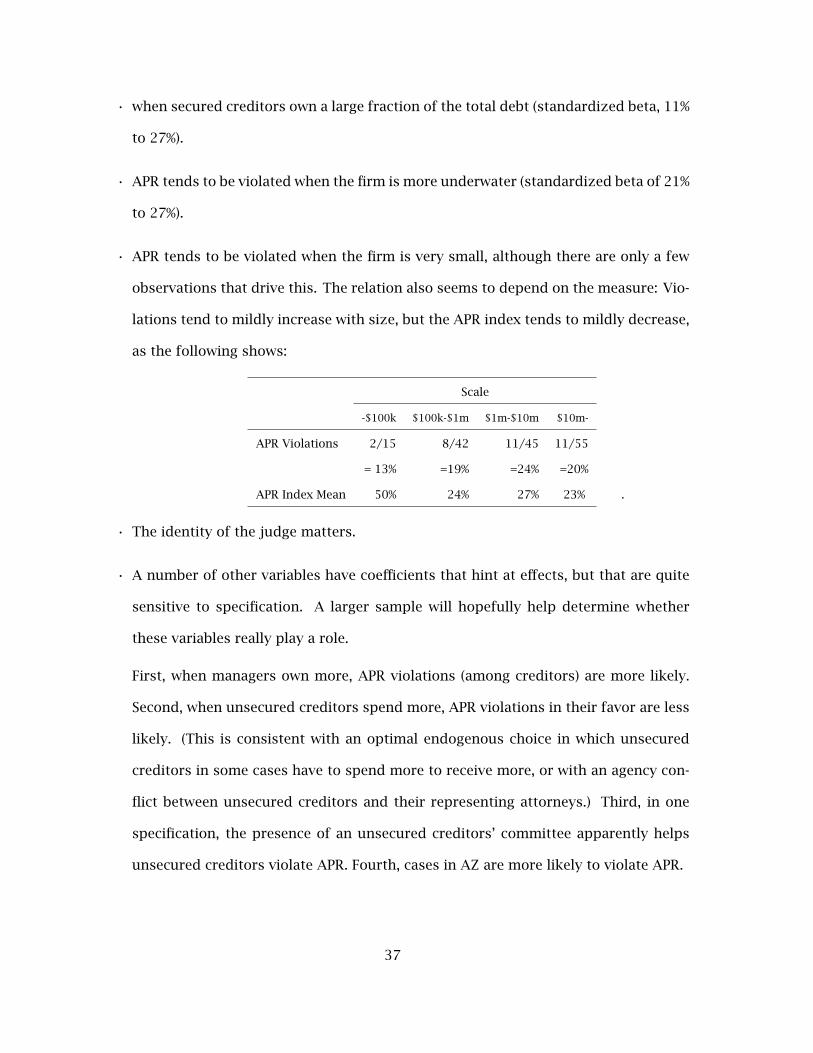
• APR tends to be violated when the firm is very small, although there are only a few
observations that drive this. The relation also seems to depend on the measure: Vio-
lations tend to mildly increase with size, but the APR index tends to mildly decrease,
as the following shows:
Scale
-$100k $100k-$1m $1m-$10m $10m-
APR Violations 2/15 8/42 11/45 11/55
= 13% =19% =24% =20%
APR Index Mean 50% 24% 27% 23% .
• The identity of the judge matters.
• A number of other variables have coefficients that hint at effects, but that are quite
sensitive to specification. A larger sample will hopefully help determine whether
these variables really play a role.
First, when managers own more, APR violations (among creditors) are more likely.
Second, when unsecured creditors spend more, APR violations in their favor are less
likely. (This is consistent with an optimal endogenous choice in which unsecured
creditors in some cases have to spend more to receive more, or with an agency con-
flict between unsecured creditors and their representing attorneys.) Third, in one
specification, the presence of an unsecured creditors’ committee apparently helps
unsecured creditors violate APR. Fourth, cases in AZ are more likely to violate APR.
37
VII. The Role of Courts
A. Court Oversight of Fees
Legal expenses have to be approved by the court, and we know of no prior evidence re-
garding whether courts tend to approve or knock down expense requests. Thus, Table XVII
explores whether the courts appear to act as a binding constraint on legal expenses in equi-
librium. The answer is negative: Requests by either the debtor or unsecured creditor for
reimbursement are almost always fully granted. The median reimbursement is 100%; the
mean reimbursement is 99% for debtors, 97.5% for creditors. In equilibrium, courts mostly
rubberstamp legal expense requests. Table XVII
B. Behavioral Differences Among Judges
Table XVIII offers some Chapter 11 statistics by judge, which are explored as fixed ef-
fects in previous tables. Many differences among judges are probably idiosyncratic case
noise, but some differences are remarkably stark. For example, during our sample period,
AZ Judge Baum handled typical cases (mean $7.5 million), but allowed much higher ex-
penses than, say, AZ Judge Curley ($5.9 million): 12% vs. 4%. AZ Judge Nielsen handled
the largest cases ($69.9 million). Remarkably, he did so much faster than any other judges
(581 days vs. an average of 764 days in AZ), but he violated APR in four out of his seven
cases and creditors received less (93%) than they did on average (96%). In NY, Judge Garrity
handled large cases ($38.4 million), adhered strongly to APR, but also allowed very high
expense ratios (above 100%!). NY Judge Burton Lifland, notorious for his creditor violations
in earlier bankruptcies (such as that of Eastern Airlines), both stuck to APR in our sample
and managed to keep expenses relatively modest.
38
Table XVIII
A more rigorous analysis shows that judges differ statistically in terms of the fraction
that they pay out to creditors, how they adhere to APR, and how many days the proceedings
take. AZ judges systematically violate APR, while NY judges do so only on occasion. In
terms of identifiable judge differences, the quality of the alma mater of the judge does
not matter. However, judges who have graduated after 1975 (the mean graduation year
in our sample) have seen creditors recover a higher fraction of the firm in total but are
less likely to follow APR. We have few observations to obtain statistical significance on
gender, but there is an intriguing correlation worth mentioning—female judges tend to
pay considerably more to creditors, reigning in fees.
VIII. Conclusion
Our paper not only examines the most comprehensive sample of bankruptcy cases to
date, but also explores the alternative between Chapter 11 reorganizations and Chapter 7
liquidations. We find that Chapter 7 cases are systematically different from Chapter 11
cases along a number of dimensions such as firm size. After controlling for self-selection
(which is important and effective), Chapter 7 seems to offer few advantages: It takes almost
as long to resolve, requires similar fees, and in the end provides creditors with lower
recovery rates—often zero—than a comparable Chapter 11 procedure.
We advise caution when interpreting figures that measure the cost of bankruptcy. These
costs are sensitive to the procedure, to the denominator (how assets are measured), and
to the central statistic used. More importantly, they vary widely and predictably from
firm to firm. A range of estimates from 2% to 20% can not only be defended, but can
even be predicted by our regressions at bankruptcy onset. Thus, theorists would be well
39
advised not to claim either uniformly low or uniformly high bankruptcy costs, but rather
to recognize that bankruptcy costs are modest in some firms, and large in other firms.
Our paper uses a rich data source that also allows us to examine a variety of factors,
such as: jurisdiction (AZ and NY), the identity of the judge, the role of scale (asset size),
managerial equity holdings in the firm, the degree of firm indebtedness, the presence of a
debtor’s committee, the number of secured and unsecured creditors as well as their respec-
tive claims, the division of the Chapter 11 procedure into its three phases, and the legal
fees requested and granted by the court to individual claimants. These variables provide
many interesting associations—again, too many to summarize here in our conclusion, or
even to comprehensively cover in our paper. Therefore, we invite interested readers to
further explore our data, which we make available on our websites.
40
References
Alderson, Michael J., and Brian L. Betker, 1995, Liquidation costs and capital structure,
Journal of Financial Economics 39, 45-69.
Altman, Edward I., 1984, A further empirical investigation of the bankruptcy cost ques-
tion, Journal of Finance 39, 1067-1089.
Altman, Edward I., and Scott A. Nammacher, 1984, The default rate experience of high
yield debt, Financial Analyst Journal 41, 25-41.
Ang, James S., Jess H. Chua, and John J. McConnell, 1982, The administrative costs of
corporate bankruptcy: A note, Journal of Finance 37, 219-226.
Baird, Douglas G., and Edward R. Morrison, 2001, Bankruptcy decision-making, Journal
of Law and Economics and Organizations 17, 356-372.
Betker, Brian L., 1995, Management’s incentive, equity’s bargaining power and deviations
from absolute priority in Chapter 11 bankruptcies, Journal of Business 68, 161-184.
Bolton, Patrick, and David S. Scharfstein, 1996, Optimal debt structure and the number
of creditors, Journal of Political Economy 104, 1-25.
Bris, Arturo, and Ivo Welch, 2005, The optimal concentration of creditors, Journal of
Finance, in press.
Cleveland, William S., 1981, LOWESS: A program for smoothing scatterplots by robust
locally weighted regression. American Statistician 35, 54.
Eberhart, Allan C., William T. Moore, and Rodney L. Roenfeldt, 1990, Security pricing and
deviations from absolute priority rule in bankruptcy proceedings, Journal of Finance
45, 1457-1469.
41
Eckbo, B. Espen, and Karin S. Thorburn, 2002, Overbidding vs. fire-sales in bankruptcy
auctions, Working paper (Series #02-04), Tuck School of Business, Dartmouth.
Eckbo, B. Espen, and Karin S. Thorburn, 2003, Control benefits and CEO discipline in
automatic bankruptcy auctions, Journal of Financial Economics 69, 227-258.
Franks, Julian R, and Walter N. Torous, 1989, An empirical investigation of U.S. firms in
reorganization, Journal of Finance 44, 747-769.
Gilson, Stuart C., 1997, Transaction costs and capital structure choice: Evidence from
financially distressed firms, Journal of Finance 52, 161-196.
Heckman, James J., 1979, Sample selection bias as a specification error, Econometrica
47, 153-161.
Hotchkiss, Edith Shwalb, 1995, Post-Bankruptcy performance and management turnover,
Journal of Finance 50, 3-21.
Kahl, Matthias, 2002, Financial distress as a selection mechanism: Evidence from the
United States, Working paper, Anderson School.
Kenny, Lawrence W., Lung-Fei Lee, G.S. Maddala, and Robert P. Trost, 1979, Returns to
college education: An investigation of self-selection bias based on the project talent
data, International Economic Review 20, 775-789.
Lawless, Robert M., Stephen P. Ferris, Narayanan Jayaraman, and Anil K. Makhija, 1994,
A glimpse at professional fees and other direct costs in small firms bankruptcies,
University of Illinois Law Review 4, 847-888.
LoPucki Lynn M., and Joseph W. Doherty, 2004, The determinants of professional fees in
large bankruptcy reorganization cases, Journal of Empirical Legal Studies 1, 111-141.
42
Lubben, Stephen J., 2000, The direct costs of corporate reorganization: An empirical
examination of professional fees in large Chapter 11 cases, American Bankruptcy
Law Journal 509, 508-552.
Maddala, G.S., 1983, Limited-Dependent and Qualitative Variables in Econometrics (Cam-
bridge University Press, Cambridge).
Maksimovic, Vojislav, and Gordon Phillips, 1998, Asset efficiency and reallocation deci-
sions of bankrupt firms, Journal of Finance 53, 1495-1532.
Pulvino, Todd C., 1998, Do asset fire sales exist? An empirical investigation of commer-
cial aircraft transactions, Journal of Finance 53, 939-978.
Pulvino, Todd C., 1999, Effects of bankruptcy court protection on asset sales, Journal of
Financial Economics 52, 151-186.
Ravid, S. Abraham, and Stefan Sundgren, 1998, The comparative efficiency of small-firm
bankruptcies: A study of the U.S. and Finnish bankruptcy codes, Financial Manage-
ment 27, 28-40.
Shleifer, Andrei, and Robert W. Vishny, 1992, Liquidation values and debt capacity: A
market equilibrium approach, Journal of Finance 47, 1343-1366.
Stromberg, Per, 2000, Conflicts of interest and market illiquidity in bankruptcy auctions:
Theory and tests, Journal of Finance 55, 2641-2691.
Tashjian Elizabeth, Ronald C. Lease, and John J. McConnell, 1996, Prepacks: An empirical
analysis of prepacked bankruptcies, Journal of Financial Economics 40, 135-162.
Thorburn, Karin S., 2000, Bankruptcy auctions: Costs, debt recovery and firm survival,
Journal of Financial Economics 58, 337-368.
Warner, Jerold B., 1977, Bankruptcy cost: Some evidence, Journal of Finance 32, 337-347.
43
Weiss, Lawrence A., 1990, Bankruptcy resolution, Journal of Financial Economics 27, 285-
314.
Weiss, Lawrence A, and Karen H. Wruck, 1998, Information problems, conflicts of inter-
est, and asset stripping: Chapter 11’s failure in the case of Eastern Airlines, Journal
of Financial Economics 48, 55-97.
Welch, Ivo, 1997, Why is bank debt senior? A theory of asymmetry and claim priority
based on influence costs, Review of Financial Studies 10, 1203-1236.
White, Michelle J., 1984, Bankruptcy, liquidation, and reorganization, in D. Logue, ed.:
Handbook of Modern Finance (Boston, MA, Warren, Gorham & Lamont), 1-49.
44
Notes
1This masks the fact that banks are usually the secured and senior creditor (see Welch (1997)).
In Chapter 11 (Chapter 7), of 176 (24) sample cases with both secured and unsecured credit,
39 (2) had a bank among the secured creditors, and 7 (5) had a bank among unsecured cred-
itors. To complete the picture, 75 (9) had both secured and unsecured creditors but no
banks; 55 (8) had both secured and unsecured creditors both including a bank.
2When a firm enters bankruptcy, there is an automatic stay of all collection efforts,
including foreclosure of liens. A creditor can move to vacate the stay. The two principal
criteria for vacation of a stay of secured creditor collection are: (a) The debtor has no equity
in the collateral; and (b) the collateral is not necessary for an effective reorganization. A
debtor in Chapter 7 has no chance to survive, and thus criterion (b) is always satisfied for
Chapter 7. Regarding (a), if there is equity above the value of the secured creditor’s lien,
the trustee will sell the collateral and remit the average to general creditors. If there is
no equity, criterion (a) is satisfied and the creditor forecloses. Because Chapter 7 debtors
usually have no equity in the collateral (Table I shows that the median equity holdings of
management ownership in Chapter 11 cases is zero; equity holdings of management is
the only equity information for which we have reliable information), there usually is no
secured property to be listed in an asset schedule. In contrast, in Chapter 11, for obvious
reasons, the stay is commonly not vacated. And if the firm emerges, the secured creditor’s
lien continues (or it is given new debt), but the property usually stays.
3If one assumes 100% recovery for secured creditors, our results are robust—after elim-
inating one case, in which secured creditors were owed $169 million and the firm recorded
$7.9 million in pre-bankruptcy assets and $7.3 million in secured payout, i.e., where 100%
assumed recovery would come to 90 times the assets, Not reported: Our results also hold
up if we winsorize dependent and independent variables at reasonable levels.
45
4Kahl (2002) shows that in about one-third of the 102 firms in his sample of Chapter 11
cases, the firm survives as an independent company.
5ES&US Corporation (Case NY-99-10280) is our largest Chapter 7 case, a real estate hold-
ing company with one asset, a building at 34–36 West 32nd Street in New York. Its bank-
ruptcy started out as a Chapter 11, but the secured creditors managed to convince Judge
Gallet that the company had no good reorganization plan. It was therefore converted into
a Chapter 7 bankruptcy, in which the secured creditors received the building, and were
therefore fully satisfied. It is the only Chapter 7 case for which we find post-bankruptcy
assets equal to pre-bankruptcy assets.
6Quick Interiors (Case NY-97-45020) had declared assets of $76,484 at bankruptcy en-
try. Oddly, secured creditors were owed $129,064 and were paid in full. Further, fees of
$677,105 were paid, mostly to the creditors’ committee. This again makes it clear how
important it is to check robustness of results, winsorize, etc.
7These are creditor coordination measures. The number of unsecured creditors matters
less than the number of secured creditors, because unsecured creditors are often syndi-
cated in a creditors’ committee and therefore can behave as a single creditor.
8Ordinarily, confirmation of the plan requires the approval of each impaired class of
creditors. Within each class of impaired creditors, a majority vote requires that more than
half of the creditors approve the plan, and that at least two-thirds of the claims vote to
approve.
9Bankruptcy trustees in Chapter 7 and Chapter 11 are compensated according to mech-
anistic stipulations, usually a fixed amount plus some additional amount depending on
the asset size of the case. Trustee compensation is governed by §330 of the Code, subject
to the limits imposed in §326(a). The trustee’s compensation cannot “exceed 25% on the
first $5,000 or less, 10% on any amount in excess of $5,000 but not in excess of $50,000,
5% on any amount in excess of $50,000 but not in excess of $1,000,000, and reasonable
46
compensation not to exceed 3% of such moneys in excess of $1,000,000, upon all moneys
[sic] disbursed or turned over in the case by the trustee to parties in interest, excluding
the debtor, but including holders of secured claims.” This compensation scheme makes
trustee costs a larger fraction of direct bankruptcy costs in smaller cases with less asset
value to be distributed.
10American Business Fundings, case AZ-00-01782, owed $50,201 and suffered fees of
$278,831. Quick Interiors, Inc., NY-97-45020, owed $129,066 and suffered fees of $677,105.
George Goldring, NY-96-44577 owed $46,277 and suffered fees of $133,745. Jenny Fash-
ions, Inc., owed $277,468, and suffered fees of $394,535.
11The regressions have two variables—length and creditor committee formation—not
known at the onset of bankruptcy. If we exclude these, the standard deviation is “only”
10.3%.
12Case NY-96-41643: Angelika Films 57th, a movie theater, had $80,000 in assets, but
owed $711,000 to a secured creditor (Angelika Film Center). Before bankruptcy, the cred-
itor had sought “replevin,” an old-fashioned legal remedy in which specific assets are re-
turned at the outset of the case. When a NY court granted replevin, the company filed
Chapter 11. Bankruptcy Judge Gonzalez allocated $0 to the secured creditor, $19,000
to the unsecured creditors, and $140,000 to the I.R.S. The remaining $900,000 went to
expenses and fees.
13In NY-98-22754, World Wide Auto Parts, secured creditors received $122,586 (100%)
and unsecured creditors received $38,914 (87.5%).
14Tax agencies were also unsecured claimants (generally with priority over other unse-
cured claimants) in many cases, and are counted as such in our paper. (A tax payment
counts as a recovery.) The average Chapter 11 tax claim was 25% of assets in NY and 9%
of assets in AZ, 14% of liabilities in NY and 3% in AZ. The median tax claim, however, was
always $0. Although we do not have data on tax collections in Chapter 7, from reading the
47
filings, it is our impression that in many Chapter 7 liquidations, taxes receive most or all
unsecured assets.
15In case AZ-98-0466, Marlaine Associates, NV, Inc., secured creditors were owed $75,000
(23% under proportional allocation), unsecured creditors were owed $250,000 (77%). Judge
Baum awarded secured creditors 50% of what they were owed ($37,500/$75,000), and unse-
cured creditors 68.75% of what they were owed ($171,875 / $250,000). Under proportional
allocation, secured creditors would have received 23% · $209,375 ≈ $63,812. The actual
recovery of $37,500 yields an APR adherence index of –40.5.
16The Chapter 11 coefficients become much smaller, but continue to be significantly pos-
itive. Length of proceedings and the AZ dummy become negatively statistically significant
in the first two specifications, but remain insignificant in the latter two.
48
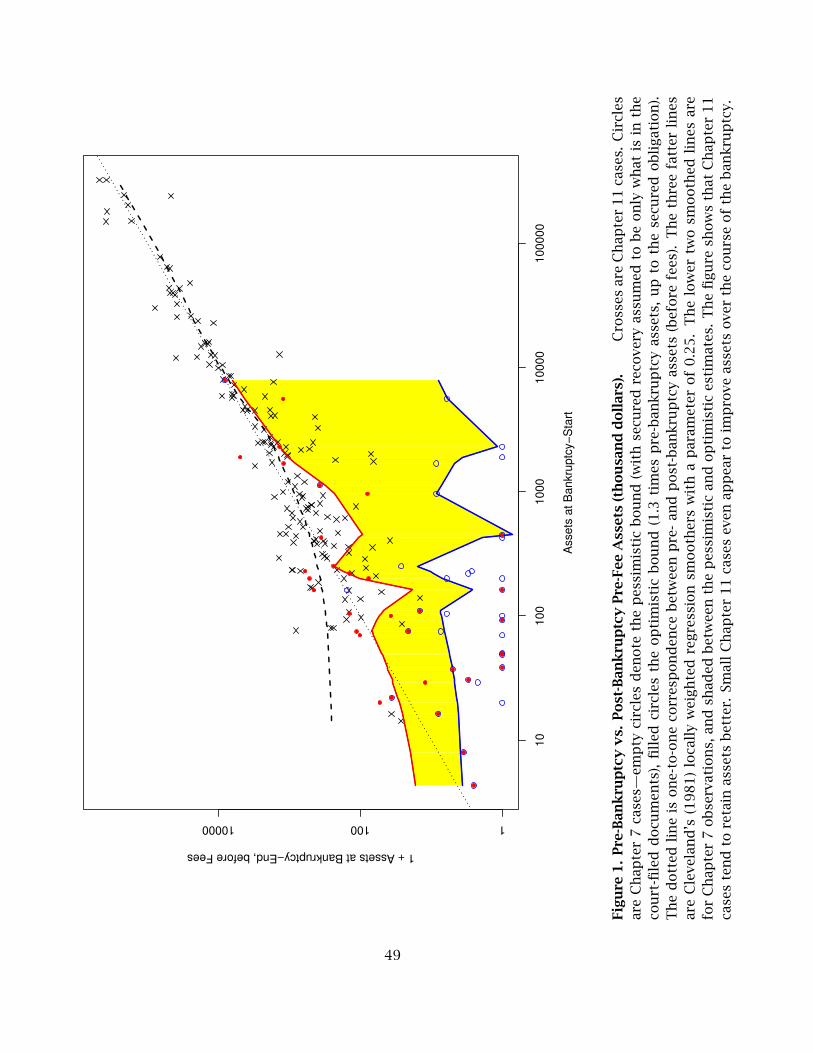
1010
010
0010
000
1000
00
110010000
Ass
ets
at B
ankr
uptc
y−S
tart
1 + Assets at Bankruptcy−End, before Fees
Fig
ure
1.
Pre
-Ban
kru
ptc
yv
s.Post
-Ban
kru
ptc
yPre
-Fee
Ass
ets
(th
ou
san
dd
oll
ars)
.C
ross
esar
eC
hap
ter
11
case
s.C
ircl
esar
eC
hap
ter
7ca
ses—
emp
tyci
rcle
sd
enote
the
pes
sim
isti
cb
ou
nd
(wit
hse
cure
dre
cove
ryas
sum
edto
be
on
lyw
hat
isin
the
cou
rt-fi
led
docu
men
ts),
fill
edci
rcle
sth
eop
tim
isti
cb
ou
nd
(1.3
tim
esp
re-b
ankru
ptc
yas
sets
,u
pto
the
secu
red
ob
ligat
ion
).T
he
dott
edli
ne
ison
e-to
-on
eco
rres
pon
den
ceb
etw
een
pre
-an
dp
ost
-ban
kru
ptc
yas
sets
(bef
ore
fees
).T
he
thre
efa
tter
lin
esar
eC
leve
lan
d’s
(1981)
loca
lly
wei
gh
ted
regre
ssio
nsm
ooth
ers
wit
ha
par
amet
erof
0.2
5.
Th
elo
wer
two
smooth
edli
nes
are
for
Ch
apte
r7
ob
serv
atio
ns,
and
shad
edb
etw
een
the
pes
sim
isti
can
dop
tim
isti
ces
tim
ates
.T
he
figu
resh
ow
sth
atC
hap
ter
11
case
ste
nd
tore
tain
asse
tsb
ette
r.Sm
all
Ch
apte
r11
case
sev
enap
pea
rto
imp
rove
asse
tsove
rth
eco
urs
eof
the
ban
kru
ptc
y.
49
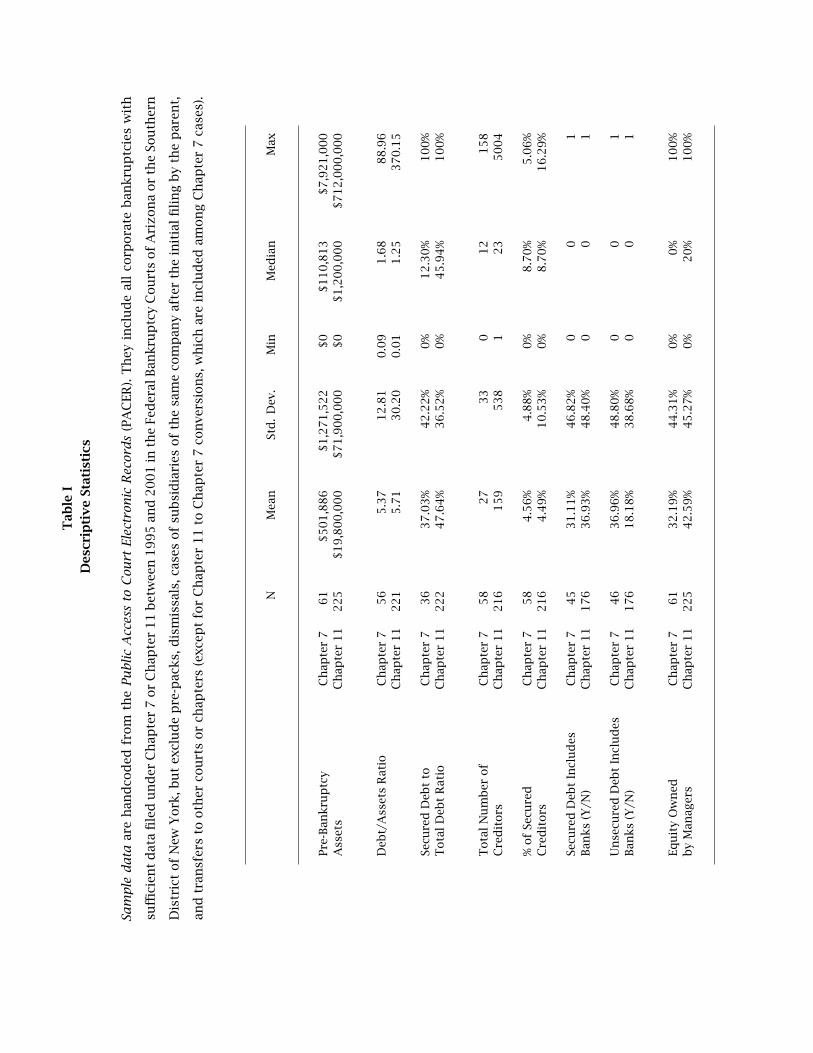
Tab
leI
Des
crip
tiv
eSt
atis
tics
Sam
ple
da
taar
eh
and
cod
edfr
om
the
Pu
blic
Acc
ess
toC
ourt
Elec
tron
icR
ecor
ds
(PA
CER
).T
hey
incl
ud
eal
lco
rpora
teb
ankru
ptc
ies
wit
h
suffi
cien
td
ata
file
du
nd
erC
hap
ter
7or
Ch
apte
r1
1b
etw
een
19
95
and
20
01
inth
eFe
der
alB
ankru
ptc
yC
ou
rts
of
Ari
zon
aor
the
Sou
ther
n
Dis
tric
tof
New
York
,bu
tex
clu
de
pre
-pac
ks,
dis
mis
sals
,cas
esof
sub
sid
iari
esof
the
sam
eco
mp
any
afte
rth
ein
itia
lfi
lin
gb
yth
ep
aren
t,
and
tran
sfer
sto
oth
erco
urt
sor
chap
ters
(exc
ept
for
Ch
apte
r1
1to
Ch
apte
r7
con
vers
ion
s,w
hic
har
ein
clu
ded
amon
gC
hap
ter
7ca
ses)
.
NM
ean
Std
.D
ev.
Min
Med
ian
Max
Pre
-Ban
kru
ptc
yC
hap
ter
761
$501,8
86
$1,2
71,5
22
$0
$110,8
13
$7,9
21,0
00
Ass
ets
Ch
apte
r11
225
$19,8
00,0
00
$71,9
00,0
00
$0
$1,2
00,0
00
$712,0
00,0
00
Deb
t/A
sset
sR
atio
Ch
apte
r7
56
5.3
712.8
10.0
91.6
888.9
6C
hap
ter
11
221
5.7
130.2
00.0
11.2
5370.1
5
Secu
red
Deb
tto
Ch
apte
r7
36
37.0
3%
42.2
2%
0%
12.3
0%
100%
Tota
lD
ebt
Rat
ioC
hap
ter
11
222
47.6
4%
36.5
2%
0%
45.9
4%
100%
Tota
lN
um
ber
of
Ch
apte
r7
58
27
33
012
158
Cre
dit
ors
Ch
apte
r11
216
159
538
123
5004
%of
Secu
red
Ch
apte
r7
58
4.5
6%
4.8
8%
0%
8.7
0%
5.0
6%
Cre
dit
ors
Ch
apte
r11
216
4.4
9%
10.5
3%
0%
8.7
0%
16.2
9%
Secu
red
Deb
tIn
clu
des
Ch
apte
r7
45
31.1
1%
46.8
2%
00
1B
anks
(Y/N
)C
hap
ter
11
176
36.9
3%
48.4
0%
00
1
Un
secu
red
Deb
tIn
clu
des
Ch
apte
r7
46
36.9
6%
48.8
0%
00
1B
anks
(Y/N
)C
hap
ter
11
176
18.1
8%
38.6
8%
00
1
Equ
ity
Ow
ned
Ch
apte
r7
61
32.1
9%
44.3
1%
0%
0%
100%
by
Man
ager
sC
hap
ter
11
225
42.5
9%
45.2
7%
0%
20%
100%
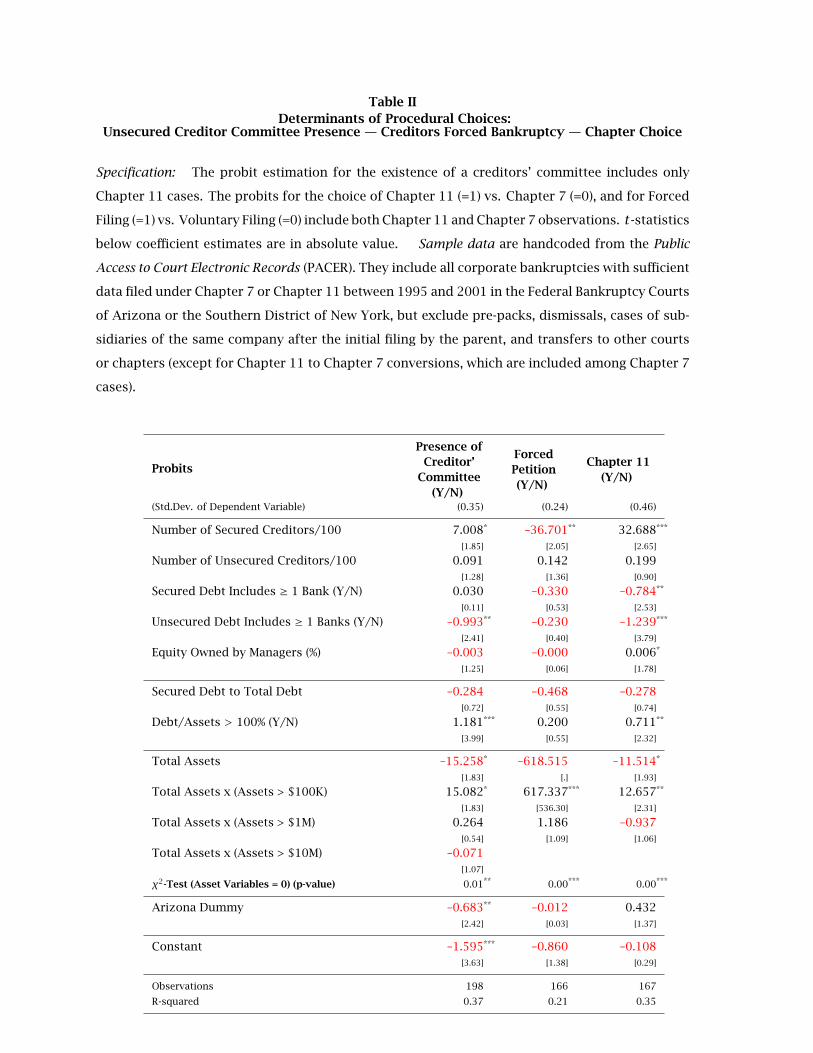
Table IIDeterminants of Procedural Choices:
Unsecured Creditor Committee Presence — Creditors Forced Bankruptcy — Chapter Choice
Specification: The probit estimation for the existence of a creditors’ committee includes only
Chapter 11 cases. The probits for the choice of Chapter 11 (=1) vs. Chapter 7 (=0), and for Forced
Filing (=1) vs. Voluntary Filing (=0) include both Chapter 11 and Chapter 7 observations. t-statistics
below coefficient estimates are in absolute value. Sample data are handcoded from the Public
Access to Court Electronic Records (PACER). They include all corporate bankruptcies with sufficient
data filed under Chapter 7 or Chapter 11 between 1995 and 2001 in the Federal Bankruptcy Courts
of Arizona or the Southern District of New York, but exclude pre-packs, dismissals, cases of sub-
sidiaries of the same company after the initial filing by the parent, and transfers to other courts
or chapters (except for Chapter 11 to Chapter 7 conversions, which are included among Chapter 7
cases).
Probits
Presence ofCreditor’
Committee(Y/N)
ForcedPetition(Y/N)
Chapter 11(Y/N)
(Std.Dev. of Dependent Variable) (0.35) (0.24) (0.46)
Number of Secured Creditors/100 7.008* –36.701** 32.688***
[1.85] [2.05] [2.65]
Number of Unsecured Creditors/100 0.091 0.142 0.199[1.28] [1.36] [0.90]
Secured Debt Includes ≥ 1 Bank (Y/N) 0.030 –0.330 –0.784**
[0.11] [0.53] [2.53]
Unsecured Debt Includes ≥ 1 Banks (Y/N) –0.993** –0.230 –1.239***
[2.41] [0.40] [3.79]
Equity Owned by Managers (%) –0.003 –0.000 0.006*
[1.25] [0.06] [1.78]
Secured Debt to Total Debt –0.284 –0.468 –0.278[0.72] [0.55] [0.74]
Debt/Assets > 100% (Y/N) 1.181*** 0.200 0.711**
[3.99] [0.55] [2.32]
Total Assets –15.258* –618.515 –11.514*
[1.83] [.] [1.93]
Total Assets x (Assets > $100K) 15.082* 617.337*** 12.657**
[1.83] [536.30] [2.31]
Total Assets x (Assets > $1M) 0.264 1.186 –0.937[0.54] [1.09] [1.06]
Total Assets x (Assets > $10M) –0.071[1.07]
χ2-Test (Asset Variables = 0) (p-value) 0.01** 0.00*** 0.00***
Arizona Dummy –0.683** –0.012 0.432[2.42] [0.03] [1.37]
Constant –1.595*** –0.860 –0.108[3.63] [1.38] [0.29]
Observations 198 166 167
R-squared 0.37 0.21 0.35
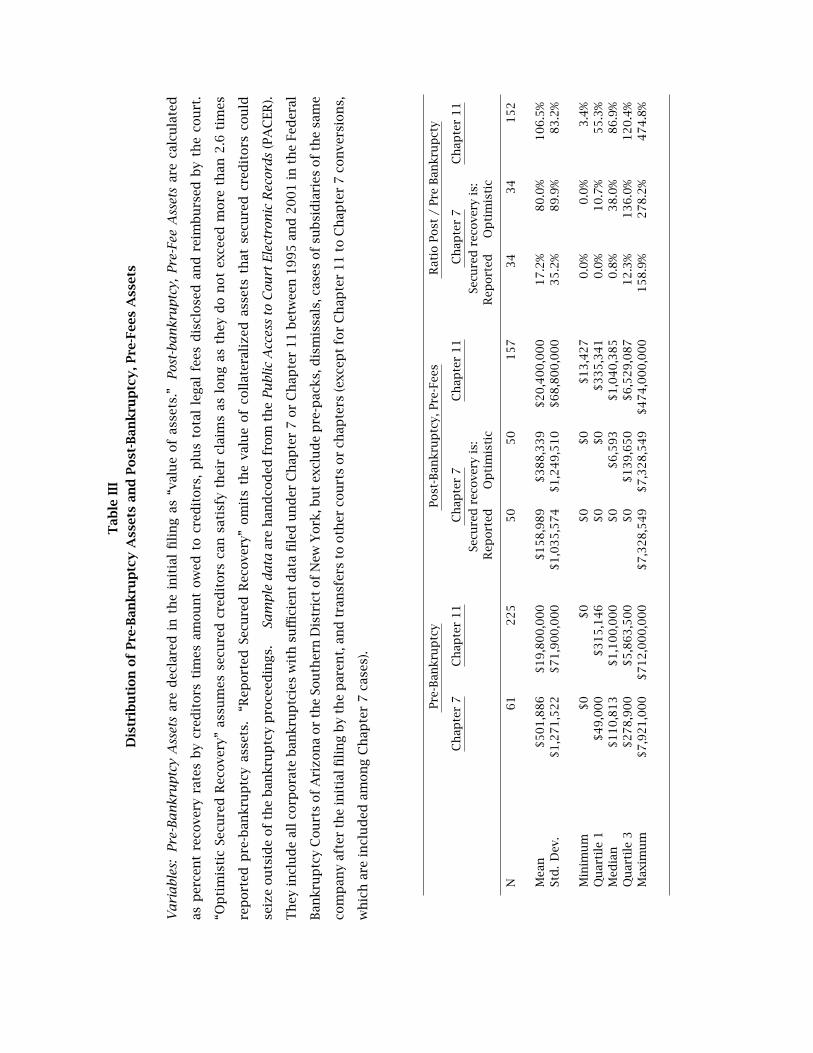
Tab
leII
I
Dis
trib
uti
on
of
Pre
-Ban
kru
ptc
yA
sset
san
dPost
-Ban
kru
ptc
y,Pre
-Fee
sA
sset
s
Va
ria
ble
s:Pre
-Ba
nkr
up
tcy
Ass
ets
are
dec
lare
din
the
init
ial
fili
ng
as“v
alu
eof
asse
ts.”
Pos
t-ba
nkr
up
tcy,
Pre
-Fee
Ass
ets
are
calc
ula
ted
asp
erce
nt
reco
very
rate
sb
ycr
edit
ors
tim
esam
ou
nt
ow
edto
cred
itors
,p
lus
tota
lle
gal
fees
dis
close
dan
dre
imb
urs
edb
yth
eco
urt
.
“Op
tim
isti
cSe
cure
dR
ecove
ry”
assu
mes
secu
red
cred
itors
can
sati
sfy
thei
rcl
aim
sas
lon
gas
they
do
not
exce
edm
ore
than
2.6
tim
es
rep
ort
edp
re-b
ankru
ptc
yas
sets
.“R
eport
edSe
cure
dR
ecove
ry”
om
its
the
valu
eof
coll
ater
aliz
edas
sets
that
secu
red
cred
itors
cou
ld
seiz
eou
tsid
eof
the
ban
kru
ptc
yp
roce
edin
gs.
Sam
ple
da
taar
eh
and
cod
edfr
om
the
Pu
blic
Acc
ess
toC
ourt
Elec
tron
icR
ecor
ds
(PA
CER
).
Th
eyin
clu
de
allco
rpora
teb
ankru
ptc
ies
wit
hsu
ffici
ent
dat
afi
led
un
der
Ch
apte
r7
or
Ch
apte
r1
1b
etw
een
19
95
and
20
01
inth
eFe
der
al
Ban
kru
ptc
yC
ou
rts
of
Ari
zon
aor
the
Sou
ther
nD
istr
ict
of
New
York
,bu
tex
clu
de
pre
-pac
ks,
dis
mis
sals
,cas
esof
sub
sid
iari
esof
the
sam
e
com
pan
yaf
ter
the
init
ialfi
lin
gb
yth
ep
aren
t,an
dtr
ansf
ers
tooth
erco
urt
sor
chap
ters
(exc
ept
for
Ch
apte
r1
1to
Ch
apte
r7
con
vers
ion
s,
wh
ich
are
incl
ud
edam
on
gC
hap
ter
7ca
ses)
.
Pre
-Ban
kru
ptc
yPost
-Ban
kru
ptc
y,Pre
-Fee
sR
atio
Post
/Pre
Ban
kru
pct
y
Ch
apte
r7
Ch
apte
r11
Ch
apte
r7
Ch
apte
r11
Ch
apte
r7
Ch
apte
r11
Secu
red
reco
very
is:
Secu
red
reco
very
is:
Rep
ort
edO
pti
mis
tic
Rep
ort
edO
pti
mis
tic
N61
225
50
50
157
34
34
152
Mea
n$501,8
86
$19,8
00,0
00
$158,9
89
$388,3
39
$20,4
00,0
00
17.2
%80.0
%106.5
%St
d.
Dev
.$1,2
71,5
22
$71,9
00,0
00
$1,0
35,5
74
$1,2
49,5
10
$68,8
00,0
00
35.2
%89.9
%83.2
%
Min
imu
m$0
$0
$0
$0
$13,4
27
0.0
%0.0
%3.4
%Q
uar
tile
1$49,0
00
$315,1
46
$0
$0
$335,3
41
0.0
%10.7
%55.3
%M
edia
n$110,8
13
$1,1
00,0
00
$0
$6,5
93
$1,0
40,3
85
0.8
%38.0
%86.9
%Q
uar
tile
3$278,9
00
$5,8
63,5
00
$0
$139,6
50
$6,5
29,0
87
12.3
%136.0
%120.4
%M
axim
um
$7,9
21,0
00
$712,0
00,0
00
$7,3
28,5
49
$7,3
28,5
49
$474,0
00,0
00
158.9
%278.2
%474.8
%
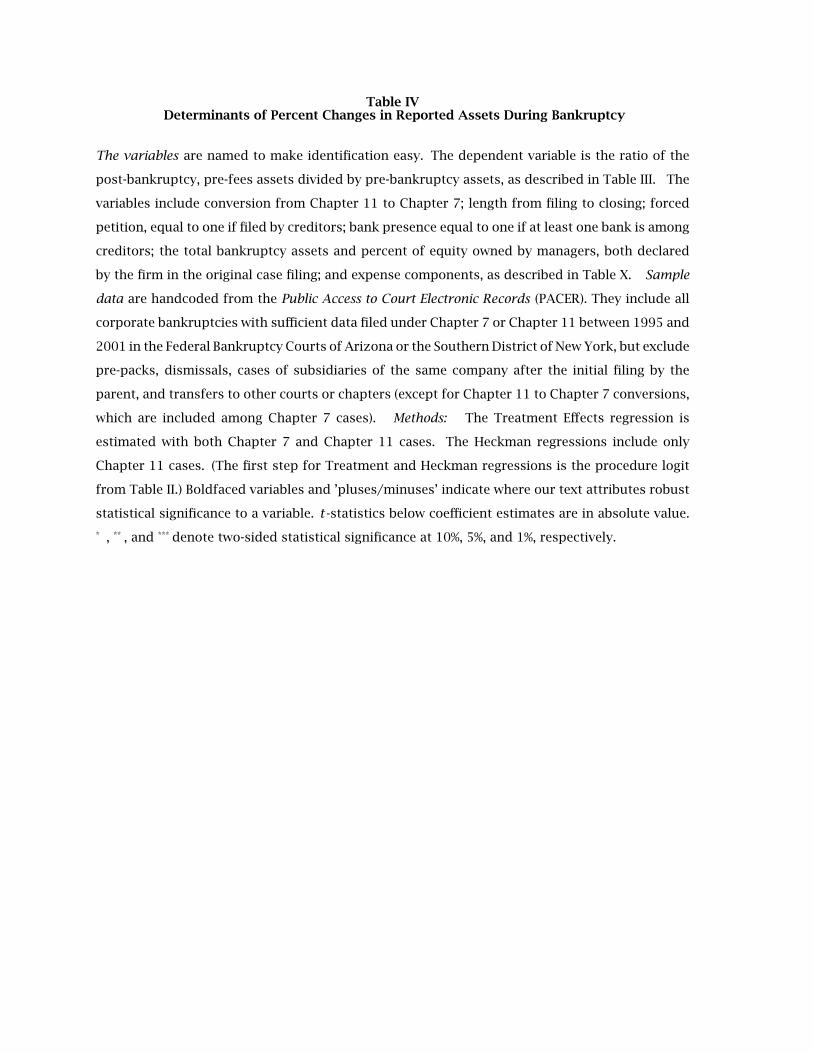
Table IVDeterminants of Percent Changes in Reported Assets During Bankruptcy
The variables are named to make identification easy. The dependent variable is the ratio of the
post-bankruptcy, pre-fees assets divided by pre-bankruptcy assets, as described in Table III. The
variables include conversion from Chapter 11 to Chapter 7; length from filing to closing; forced
petition, equal to one if filed by creditors; bank presence equal to one if at least one bank is among
creditors; the total bankruptcy assets and percent of equity owned by managers, both declared
by the firm in the original case filing; and expense components, as described in Table X. Sample
data are handcoded from the Public Access to Court Electronic Records (PACER). They include all
corporate bankruptcies with sufficient data filed under Chapter 7 or Chapter 11 between 1995 and
2001 in the Federal Bankruptcy Courts of Arizona or the Southern District of New York, but exclude
pre-packs, dismissals, cases of subsidiaries of the same company after the initial filing by the
parent, and transfers to other courts or chapters (except for Chapter 11 to Chapter 7 conversions,
which are included among Chapter 7 cases). Methods: The Treatment Effects regression is
estimated with both Chapter 7 and Chapter 11 cases. The Heckman regressions include only
Chapter 11 cases. (The first step for Treatment and Heckman regressions is the procedure logit
from Table II.) Boldfaced variables and ’pluses/minuses’ indicate where our text attributes robust
statistical significance to a variable. t-statistics below coefficient estimates are in absolute value.
* , ** , and *** denote two-sided statistical significance at 10%, 5%, and 1%, respectively.
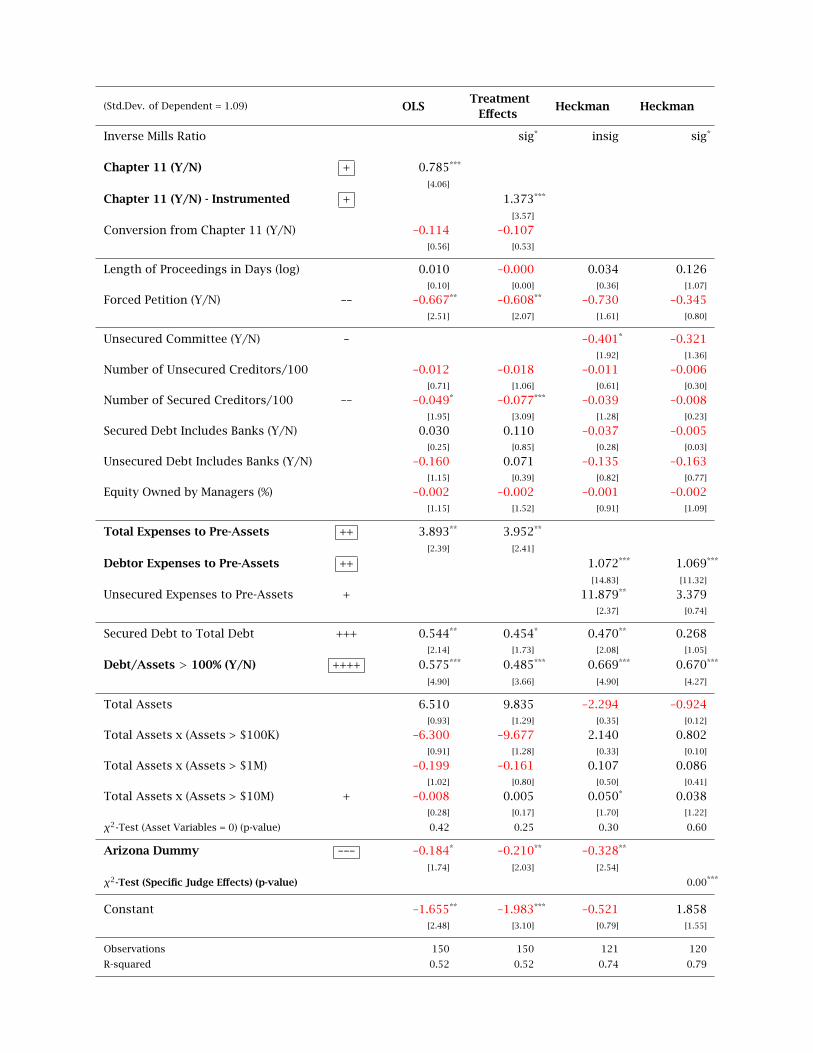
(Std.Dev. of Dependent = 1.09) OLSTreatment
EffectsHeckman Heckman
Inverse Mills Ratio sig* insig sig*
Chapter 11 (Y/N) + 0.785***
[4.06]
Chapter 11 (Y/N) - Instrumented + 1.373***
[3.57]
Conversion from Chapter 11 (Y/N) –0.114 –0.107[0.56] [0.53]
Length of Proceedings in Days (log) 0.010 –0.000 0.034 0.126[0.10] [0.00] [0.36] [1.07]
Forced Petition (Y/N) –– –0.667** –0.608** –0.730 –0.345[2.51] [2.07] [1.61] [0.80]
Unsecured Committee (Y/N) – –0.401* –0.321[1.92] [1.36]
Number of Unsecured Creditors/100 –0.012 –0.018 –0.011 –0.006[0.71] [1.06] [0.61] [0.30]
Number of Secured Creditors/100 –– –0.049* –0.077*** –0.039 –0.008[1.95] [3.09] [1.28] [0.23]
Secured Debt Includes Banks (Y/N) 0.030 0.110 –0.037 –0.005[0.25] [0.85] [0.28] [0.03]
Unsecured Debt Includes Banks (Y/N) –0.160 0.071 –0.135 –0.163[1.15] [0.39] [0.82] [0.77]
Equity Owned by Managers (%) –0.002 –0.002 –0.001 –0.002[1.15] [1.52] [0.91] [1.09]
Total Expenses to Pre-Assets ++ 3.893** 3.952**
[2.39] [2.41]
Debtor Expenses to Pre-Assets ++ 1.072*** 1.069***
[14.83] [11.32]
Unsecured Expenses to Pre-Assets + 11.879** 3.379[2.37] [0.74]
Secured Debt to Total Debt +++ 0.544** 0.454* 0.470** 0.268[2.14] [1.73] [2.08] [1.05]
Debt/Assets > 100% (Y/N) ++++ 0.575*** 0.485*** 0.669*** 0.670***
[4.90] [3.66] [4.90] [4.27]
Total Assets 6.510 9.835 –2.294 –0.924[0.93] [1.29] [0.35] [0.12]
Total Assets x (Assets > $100K) –6.300 –9.677 2.140 0.802[0.91] [1.28] [0.33] [0.10]
Total Assets x (Assets > $1M) –0.199 –0.161 0.107 0.086[1.02] [0.80] [0.50] [0.41]
Total Assets x (Assets > $10M) + –0.008 0.005 0.050* 0.038[0.28] [0.17] [1.70] [1.22]
χ2-Test (Asset Variables = 0) (p-value) 0.42 0.25 0.30 0.60
Arizona Dummy ––– –0.184* –0.210** –0.328**
[1.74] [2.03] [2.54]
χ2-Test (Specific Judge Effects) (p-value) 0.00***
Constant –1.655** –1.983*** –0.521 1.858[2.48] [3.10] [0.79] [1.55]
Observations 150 150 121 120
R-squared 0.52 0.52 0.74 0.79
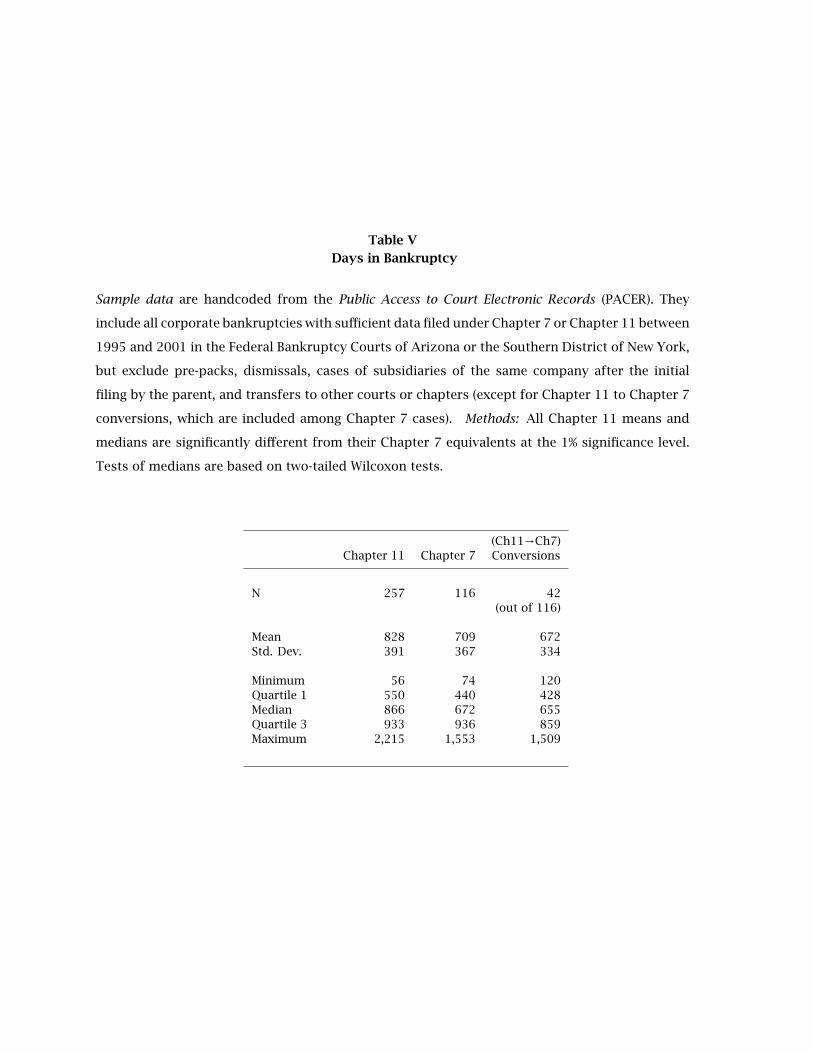
Table V
Days in Bankruptcy
Sample data are handcoded from the Public Access to Court Electronic Records (PACER). They
include all corporate bankruptcies with sufficient data filed under Chapter 7 or Chapter 11 between
1995 and 2001 in the Federal Bankruptcy Courts of Arizona or the Southern District of New York,
but exclude pre-packs, dismissals, cases of subsidiaries of the same company after the initial
filing by the parent, and transfers to other courts or chapters (except for Chapter 11 to Chapter 7
conversions, which are included among Chapter 7 cases). Methods: All Chapter 11 means and
medians are significantly different from their Chapter 7 equivalents at the 1% significance level.
Tests of medians are based on two-tailed Wilcoxon tests.
(Ch11→Ch7)Chapter 11 Chapter 7 Conversions
N 257 116 42(out of 116)
Mean 828 709 672Std. Dev. 391 367 334
Minimum 56 74 120Quartile 1 550 440 428Median 866 672 655Quartile 3 933 936 859Maximum 2,215 1,553 1,509
Table VIDeterminants of Overall Time in Bankruptcy (in log-days)
The variables are named to make identification easy. The variables include conversion from
Chapter 11 to Chapter 7; length from filing to closing; forced petition, equal to one if filed by
creditors; bank presence equal to one if at least one bank is among creditors; the total bankruptcy
assets and percent of equity owned by managers, both declared by the firm in the original case
filing; and expense components, as described in Table X. Sample data are handcoded from the
Public Access to Court Electronic Records (PACER). They include all corporate bankruptcies with suf-
ficient data filed under Chapter 7 or Chapter 11 between 1995 and 2001 in the Federal Bankruptcy
Courts of Arizona or the Southern District of New York, but exclude pre-packs, dismissals, cases
of subsidiaries of the same company after the initial filing by the parent, and transfers to other
courts or chapters (except for Chapter 11 to Chapter 7 conversions, which are included among
Chapter 7 cases). Methods: Both Chapter 11 and Chapter 7 cases are included in this table. The
Treatment Effects regression is estimated with both Chapter 7 and Chapter 11 cases. The Heckman
regressions include only Chapter 11 cases. (The first step for Treatment and Heckman regressions
is the procedure logit from Table II.) Boldfaced variables and ’pluses/minuses’ indicate where our
text attributes robust statistical significance to a variable. t-statistics below coefficient estimates
are in absolute value. * , ** , and *** denote two-sided statistical significance at 10%, 5%, and 1%,
respectively.
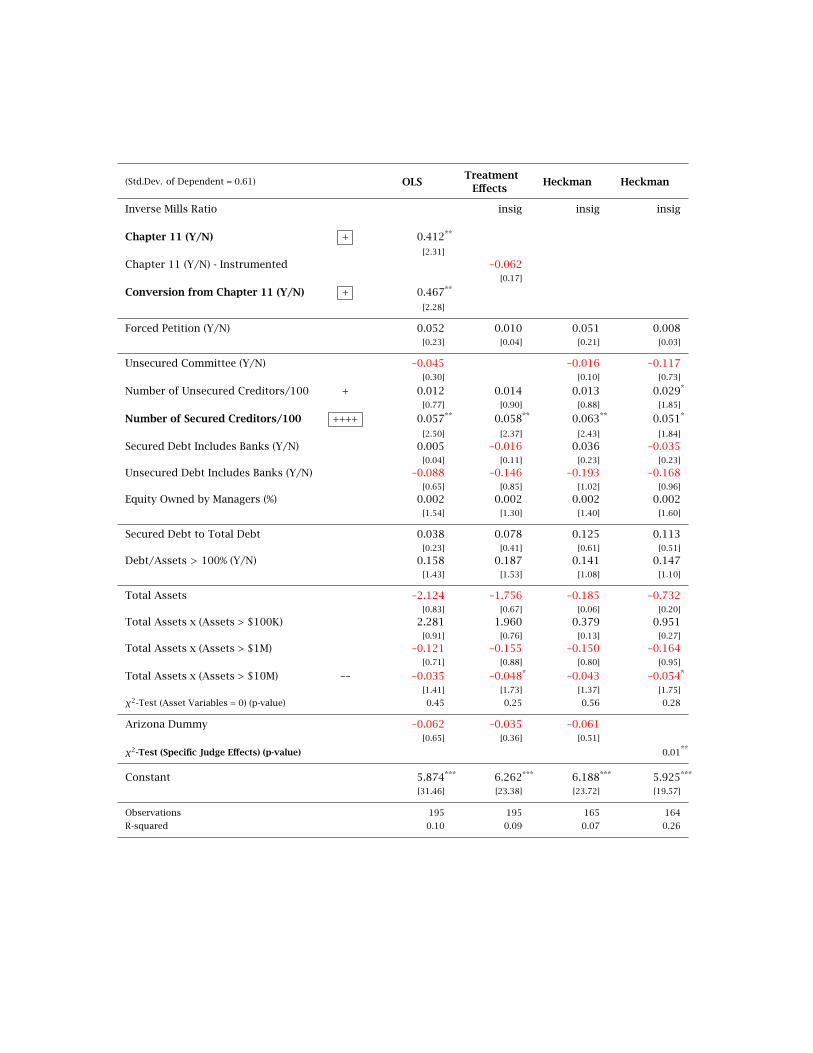
(Std.Dev. of Dependent = 0.61) OLSTreatment
EffectsHeckman Heckman
Inverse Mills Ratio insig insig insig
Chapter 11 (Y/N) + 0.412**
[2.31]
Chapter 11 (Y/N) - Instrumented –0.062[0.17]
Conversion from Chapter 11 (Y/N) + 0.467**
[2.28]
Forced Petition (Y/N) 0.052 0.010 0.051 0.008[0.23] [0.04] [0.21] [0.03]
Unsecured Committee (Y/N) –0.045 –0.016 –0.117[0.30] [0.10] [0.73]
Number of Unsecured Creditors/100 + 0.012 0.014 0.013 0.029*
[0.77] [0.90] [0.88] [1.85]
Number of Secured Creditors/100 ++++ 0.057** 0.058** 0.063** 0.051*
[2.50] [2.37] [2.43] [1.84]
Secured Debt Includes Banks (Y/N) 0.005 –0.016 0.036 –0.035[0.04] [0.11] [0.23] [0.23]
Unsecured Debt Includes Banks (Y/N) –0.088 –0.146 –0.193 –0.168[0.65] [0.85] [1.02] [0.96]
Equity Owned by Managers (%) 0.002 0.002 0.002 0.002[1.54] [1.30] [1.40] [1.60]
Secured Debt to Total Debt 0.038 0.078 0.125 0.113[0.23] [0.41] [0.61] [0.51]
Debt/Assets > 100% (Y/N) 0.158 0.187 0.141 0.147[1.43] [1.53] [1.08] [1.10]
Total Assets –2.124 –1.756 –0.185 –0.732[0.83] [0.67] [0.06] [0.20]
Total Assets x (Assets > $100K) 2.281 1.960 0.379 0.951[0.91] [0.76] [0.13] [0.27]
Total Assets x (Assets > $1M) –0.121 –0.155 –0.150 –0.164[0.71] [0.88] [0.80] [0.95]
Total Assets x (Assets > $10M) –– –0.035 –0.048* –0.043 –0.054*
[1.41] [1.73] [1.37] [1.75]
χ2-Test (Asset Variables = 0) (p-value) 0.45 0.25 0.56 0.28
Arizona Dummy –0.062 –0.035 –0.061[0.65] [0.36] [0.51]
χ2-Test (Specific Judge Effects) (p-value) 0.01**
Constant 5.874*** 6.262*** 6.188*** 5.925***
[31.46] [23.38] [23.72] [19.57]
Observations 195 195 165 164
R-squared 0.10 0.09 0.07 0.26
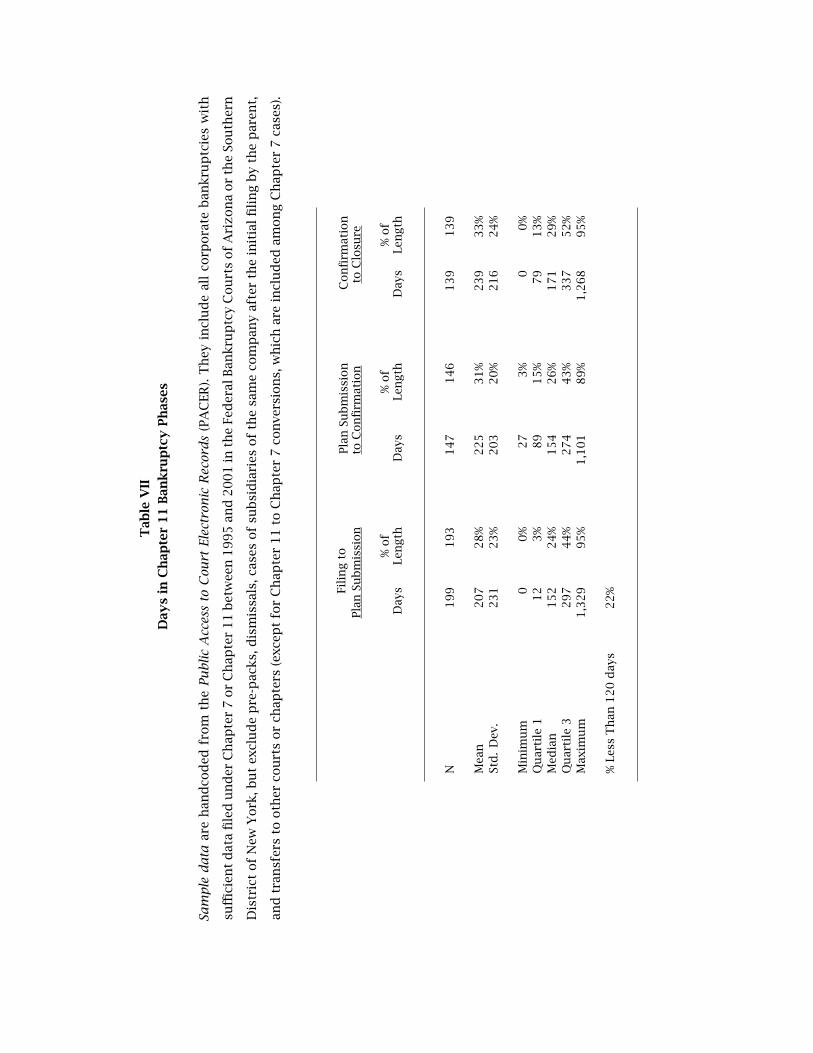
Tab
leV
II
Day
sin
Ch
apte
r11
Ban
kru
ptc
yPh
ases
Sam
ple
da
taar
eh
and
cod
edfr
om
the
Pu
blic
Acc
ess
toC
ourt
Elec
tron
icR
ecor
ds
(PA
CER
).T
hey
incl
ud
eal
lco
rpora
teb
ankru
ptc
ies
wit
h
suffi
cien
td
ata
file
du
nd
erC
hap
ter
7or
Ch
apte
r1
1b
etw
een
19
95
and
20
01
inth
eFe
der
alB
ankru
ptc
yC
ou
rts
of
Ari
zon
aor
the
Sou
ther
n
Dis
tric
tof
New
York
,bu
tex
clu
de
pre
-pac
ks,
dis
mis
sals
,cas
esof
sub
sid
iari
esof
the
sam
eco
mp
any
afte
rth
ein
itia
lfi
lin
gb
yth
ep
aren
t,
and
tran
sfer
sto
oth
erco
urt
sor
chap
ters
(exc
ept
for
Ch
apte
r1
1to
Ch
apte
r7
con
vers
ion
s,w
hic
har
ein
clu
ded
amon
gC
hap
ter
7ca
ses)
.
Fili
ng
toPla
nSu
bm
issi
on
Pla
nSu
bm
issi
on
toC
on
firm
atio
nC
on
firm
atio
nto
Clo
sure
Day
s%
of
Len
gth
Day
s%
of
Len
gth
Day
s%
of
Len
gth
N199
193
147
146
139
139
Mea
n207
28%
225
31%
239
33%
Std
.D
ev.
231
23%
203
20%
216
24%
Min
imu
m0
0%
27
3%
00%
Qu
arti
le1
12
3%
89
15%
79
13%
Med
ian
152
24%
154
26%
171
29%
Qu
arti
le3
297
44%
274
43%
337
52%
Max
imu
m1,3
29
95%
1,1
01
89%
1,2
68
95%
%Le
ssT
han
120
day
s22%
Tab
leV
III
Det
erm
inan
tsof
Tim
ein
Ch
apte
r11
Ph
ases
Th
eva
ria
ble
sar
en
amed
tom
ake
iden
tifi
cati
on
easy
.T
he
vari
able
sin
clu
de
con
vers
ion
from
Ch
apte
r1
1to
Ch
apte
r7
;le
ngth
from
fili
ng
tocl
osi
ng;
forc
edp
etit
ion
,eq
ual
toon
eif
file
db
ycr
edit
ors
;b
ank
pre
sen
ceeq
ual
toon
eif
atle
ast
on
eb
ank
isam
on
gcr
edit
ors
;
the
tota
lb
ankru
ptc
yas
sets
and
per
cen
tof
equ
ity
ow
ned
by
man
ager
s,b
oth
dec
lare
db
yth
efi
rmin
the
ori
gin
alca
sefi
lin
g;a
nd
exp
ense
com
pon
ents
,as
des
crib
edin
Tab
leX
.Sa
mp
led
ata
are
han
dco
ded
from
the
Pu
blic
Acc
ess
toC
ourt
Elec
tron
icR
ecor
ds
(PA
CER
).T
hey
incl
ud
eal
lco
rpora
teb
ankru
ptc
ies
wit
hsu
ffici
ent
dat
afi
led
un
der
Ch
apte
r7
or
Ch
apte
r1
1b
etw
een
19
95
and
20
01
inth
eFe
der
al
Ban
kru
ptc
yC
ou
rts
of
Ari
zon
aor
the
Sou
ther
nD
istr
ict
of
New
York
,bu
tex
clu
de
pre
-pac
ks,
dis
mis
sals
,cas
esof
sub
sid
iari
esof
the
sam
e
com
pan
yaf
ter
the
init
ialfi
lin
gb
yth
ep
aren
t,an
dtr
ansf
ers
tooth
erco
urt
sor
chap
ters
(exc
ept
for
Ch
apte
r1
1to
Ch
apte
r7
con
vers
ion
s,
wh
ich
are
incl
ud
edam
on
gC
hap
ter
7ca
ses)
.M
eth
ods:
On
lyC
hap
ter
11
case
sca
nb
ein
clu
ded
inth
isT
able
.T
he
Hec
km
anre
gre
ssio
ns
incl
ud
eon
lyC
hap
ter
11
case
s.(T
he
firs
tst
epfo
rH
eckm
anre
gre
ssio
ns
isth
ep
roce
du
relo
git
from
Tab
leII
.)B
old
face
dva
riab
les
and
’plu
ses/
min
use
s’in
dic
ate
wh
ere
ou
rte
xtat
trib
ute
sro
bu
stst
atis
tica
lsi
gn
ifica
nce
toa
vari
able
.t-
stat
isti
csb
elow
coeffi
cien
tes
tim
ates
are
inab
solu
teva
lue.
*,*
*,a
nd
***d
enote
two-s
ided
stat
isti
cal
sign
ifica
nce
at1
0%
,5%
,an
d1
%,r
esp
ecti
vely
.
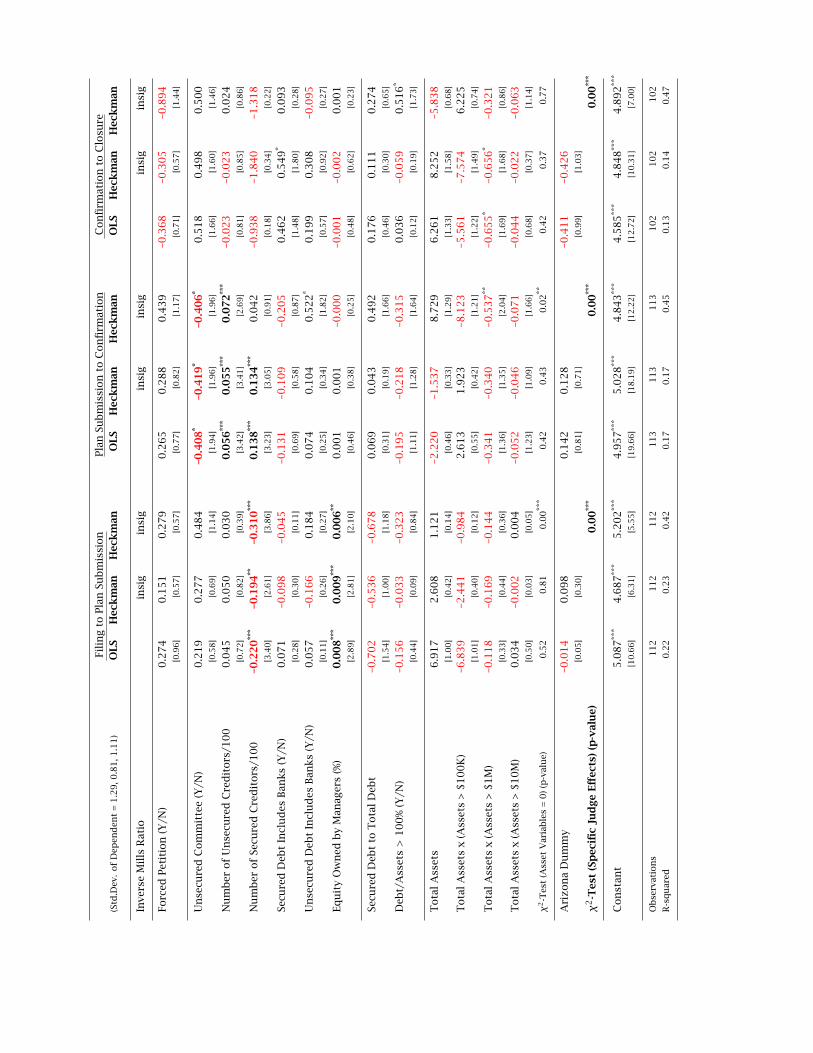
Fili
ng
toPla
nSu
bm
issi
on
Pla
nSu
bm
issi
on
toC
on
firm
atio
nC
on
firm
atio
nto
Clo
sure
(Std
.Dev
.of
Dep
end
ent
=1.2
9,0
.81,1
.11)
OLS
Hec
km
anH
eck
man
OLS
Hec
km
anH
eck
man
OLS
Hec
km
anH
eck
man
Inve
rse
Mil
lsR
atio
insi
gin
sig
insi
gin
sig
insi
gin
sig
Forc
edPet
itio
n(Y
/N)
0.2
74
0.1
51
0.2
79
0.2
65
0.2
88
0.4
39
–0.3
68
–0.3
05
–0.8
94
[0.9
6]
[0.5
7]
[0.5
7]
[0.7
7]
[0.8
2]
[1.1
7]
[0.7
1]
[0.5
7]
[1.4
4]
Un
secu
red
Com
mit
tee
(Y/N
)0
.21
90
.27
70
.48
4–0
.408
*–0
.419
*–0
.406
*0
.51
80
.49
80
.50
0[0
.58
][0
.69
][1
.14
][1
.94
][1
.96
][1
.96
][1
.66
][1
.60
][1
.46]
Nu
mb
erof
Un
secu
red
Cre
dit
ors
/10
00
.04
50
.05
00
.03
00.0
56
***
0.0
55
***
0.0
72
***
–0.0
23
–0.0
23
0.0
24
[0.7
2]
[0.8
2]
[0.3
9]
[3.4
2]
[3.4
1]
[2.6
9]
[0.8
1]
[0.8
5]
[0.8
6]
Nu
mb
erof
Secu
red
Cre
dit
ors
/10
0–0
.220
***
–0.1
94
**–0
.310
***
0.1
38
***
0.1
34
***
0.0
42
–0.9
38
–1.8
40
–1.3
18
[3.4
0]
[2.6
1]
[3.8
6]
[3.2
3]
[3.0
5]
[0.9
1]
[0.1
8]
[0.3
4]
[0.2
2]
Secu
red
Deb
tIn
clu
des
Ban
ks
(Y/N
)0
.07
1–0
.09
8–0
.04
5–0
.13
1–0
.10
9–0
.20
50
.46
20
.54
9*
0.0
93
[0.2
8]
[0.3
0]
[0.1
1]
[0.6
9]
[0.5
8]
[0.8
7]
[1.4
8]
[1.8
0]
[0.2
8]
Un
secu
red
Deb
tIn
clu
des
Ban
ks
(Y/N
)0
.05
7–0
.16
60
.18
40
.07
40
.10
40
.52
2*
0.1
99
0.3
08
–0.0
95
[0.1
1]
[0.2
6]
[0.2
7]
[0.2
5]
[0.3
4]
[1.8
2]
[0.5
7]
[0.9
2]
[0.2
7]
Equ
ity
Ow
ned
by
Man
ager
s(%
)0.0
08
***
0.0
09
***
0.0
06
**0
.00
10
.00
1–0
.00
0–0
.00
1–0
.00
20
.00
1[2
.89
][2
.81
][2
.10
][0
.46
][0
.38
][0
.25
][0
.48
][0
.62
][0
.23
]
Secu
red
Deb
tto
Tota
lD
ebt
–0.7
02
–0.5
36
–0.6
78
0.0
69
0.0
43
0.4
92
0.1
76
0.1
11
0.2
74
[1.5
4]
[1.0
0]
[1.1
8]
[0.3
1]
[0.1
9]
[1.6
6]
[0.4
6]
[0.3
0]
[0.6
5]
Deb
t/A
sset
s>
10
0%
(Y/N
)–0
.15
6–0
.03
3–0
.32
3–0
.19
5–0
.21
8–0
.31
50
.03
6–0
.05
90
.51
6*
[0.4
4]
[0.0
9]
[0.8
4]
[1.1
1]
[1.2
8]
[1.6
4]
[0.1
2]
[0.1
9]
[1.7
3]
Tota
lA
sset
s6
.91
72
.60
81
.12
1–2
.22
0–1
.53
78
.72
96
.26
18
.25
2–5
.83
8[1
.00
][0
.42
][0
.14
][0
.46
][0
.33
][1
.29
][1
.33
][1
.58
][0
.68
]
Tota
lA
sset
sx
(Ass
ets
>$
10
0K
)–6
.83
9–2
.44
1–0
.98
42
.61
31
.92
3–8
.12
3–5
.56
1–7
.57
46
.22
5[1
.01
][0
.40
][0
.12
][0
.55
][0
.42
][1
.21
][1
.22
][1
.49
][0
.74
]
Tota
lA
sset
sx
(Ass
ets
>$
1M
)–0
.11
8–0
.16
9–0
.14
4–0
.34
1–0
.34
0–0
.53
7**
–0.6
55
*–0
.65
6*
–0.3
21
[0.3
3]
[0.4
4]
[0.3
6]
[1.3
6]
[1.3
5]
[2.0
4]
[1.6
9]
[1.6
8]
[0.8
6]
Tota
lA
sset
sx
(Ass
ets
>$
10
M)
0.0
34
–0.0
02
0.0
04
–0.0
52
–0.0
46
–0.0
71
–0.0
44
–0.0
22
–0.0
63
[0.5
0]
[0.0
3]
[0.0
5]
[1.2
3]
[1.0
9]
[1.6
6]
[0.6
8]
[0.3
7]
[1.1
4]
χ2-T
est
(Ass
etV
aria
ble
s=
0)
(p-v
alu
e)0.5
20.8
10.0
0**
*0.4
20.4
30.0
2**
0.4
20.3
70.7
7
Ari
zon
aD
um
my
–0.0
14
0.0
98
0.1
42
0.1
28
–0.4
11
–0.4
26
[0.0
5]
[0.3
0]
[0.8
1]
[0.7
1]
[0.9
9]
[1.0
3]
χ2-T
est
(Sp
ecifi
cJu
dge
Eff
ects
)(p
-val
ue)
0.0
0**
*0.0
0**
*0.0
0**
*
Con
stan
t5
.08
7**
*4
.68
7**
*5
.20
2**
*4
.95
7**
*5
.02
8**
*4
.84
3**
*4
.58
5**
*4
.84
8**
*4
.89
2**
*
[10
.66
][6
.31
][5
.55
][1
9.6
6]
[18
.19
][1
2.2
2]
[12
.72
][1
0.3
1]
[7.0
0]
Ob
serv
atio
ns
112
112
112
113
113
113
102
102
102
R-s
qu
ared
0.2
20.2
30.4
20.1
70.1
70.4
50.1
30.1
40.4
7
Tab
leIX
Ran
ge
of
Exp
ense
sas
aFra
ctio
nof
Fir
m
Va
ria
ble
s:Pre
-Ba
nkr
up
tcy
Ass
ets
are
dec
lare
din
the
init
ial
fili
ng
as“v
alu
eof
asse
ts.”
Pos
t-ba
nkr
up
tcy,
Pre
-Fee
Ass
ets
are
calc
ula
ted
asp
erce
nt
reco
very
rate
sb
ycr
edit
ors
tim
esam
ou
nt
ow
edto
cred
itors
,p
lus
tota
lle
gal
fees
dis
close
dan
dre
imb
urs
edb
yth
eco
urt
.
“Op
tim
isti
cSe
cure
dR
ecove
ry”
assu
mes
secu
red
cred
itors
can
sati
sfy
thei
rcl
aim
sas
lon
gas
they
do
not
exce
edm
ore
than
2.6
tim
es
rep
ort
edp
re-b
ankru
ptc
yas
sets
.“R
eport
edSe
cure
dR
ecove
ry”
om
its
the
valu
eof
coll
ater
aliz
edas
sets
that
secu
red
cred
itors
cou
ldse
ize
ou
tsid
eof
the
ban
kru
ptc
yp
roce
edin
gs.
Exp
ense
cate
gori
esar
est
and
ard
ized
inth
eco
urt
fili
ng
form
s.C
hap
ter
7ex
pen
ses
incl
ud
e
deb
tor’
sat
torn
ey,
acco
un
tan
t,tr
ust
ee,
and
oth
erex
pen
ses
pai
dfo
rb
yth
eco
mp
any.
Ch
apte
r1
1ex
pen
ses
incl
ud
ere
imb
urs
emen
t
req
ues
tsb
yb
oth
the
un
secu
red
cred
itors
com
mit
tee
and
the
deb
tor-
in-p
oss
essi
on
.Sa
mp
led
ata
are
han
dco
ded
from
the
Pu
blic
Acc
ess
toC
ourt
Elec
tron
icR
ecor
ds
(PA
CER
).T
hey
incl
ud
eal
lco
rpora
teb
ankru
ptc
ies
wit
hsu
ffici
ent
dat
afi
led
un
der
Ch
apte
r7
or
Ch
apte
r1
1
bet
wee
n1
99
5an
d2
00
1in
the
Fed
eral
Ban
kru
ptc
yC
ou
rts
of
Ari
zon
aor
the
Sou
ther
nD
istr
ict
of
New
York
,b
ut
excl
ud
ep
re-p
acks,
dis
mis
sals
,ca
ses
of
sub
sid
iari
esof
the
sam
eco
mp
any
afte
rth
ein
itia
lfi
lin
gb
yth
ep
aren
t,an
dtr
ansf
ers
tooth
erco
urt
sor
chap
ters
(exc
ept
for
Ch
apte
r1
1to
Ch
apte
r7
con
vers
ion
s,w
hic
har
ein
clu
ded
amon
gC
hap
ter
7ca
ses)
.
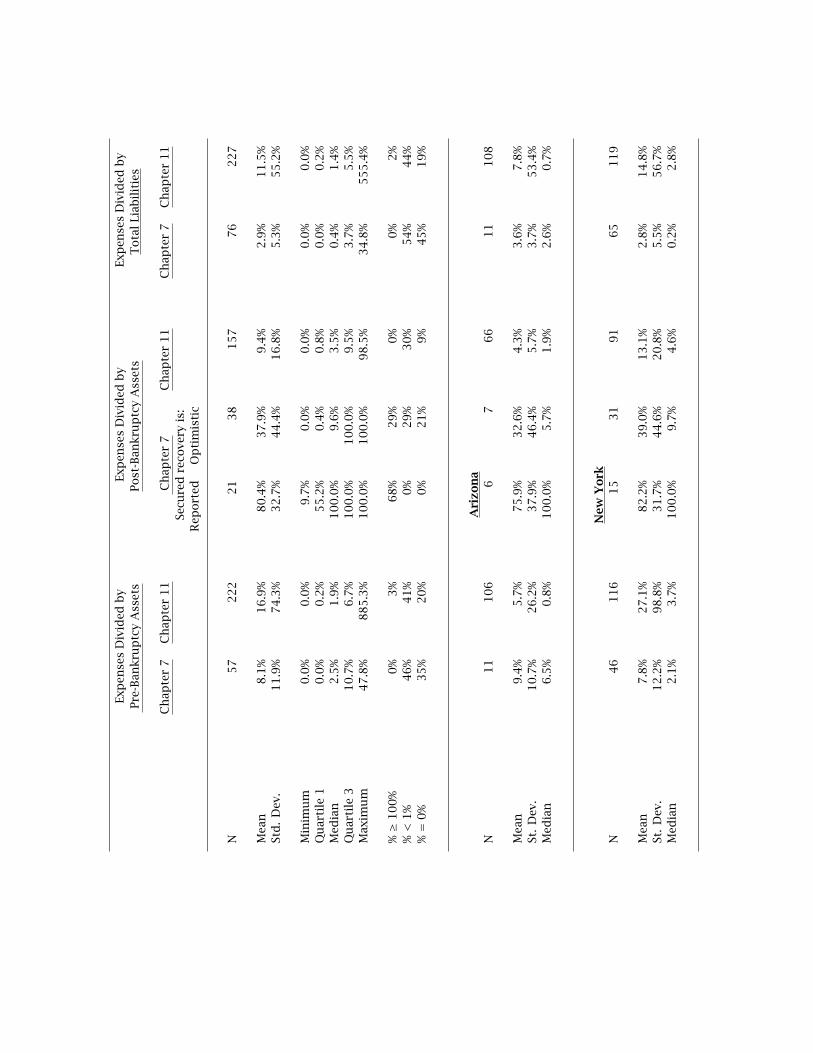
Exp
ense
sD
ivid
edb
yPre
-Ban
kru
ptc
yA
sset
sEx
pen
ses
Div
ided
by
Post
-Ban
kru
ptc
yA
sset
sEx
pen
ses
Div
ided
by
Tota
lLi
abil
itie
s
Ch
apte
r7
Ch
apte
r11
Ch
apte
r7
Ch
apte
r11
Ch
apte
r7
Ch
apte
r11
Secu
red
reco
very
is:
Rep
ort
edO
pti
mis
tic
N57
222
21
38
157
76
227
Mea
n8.1
%16.9
%80.4
%37.9
%9.4
%2.9
%11.5
%St
d.
Dev
.11.9
%74.3
%32.7
%44.4
%16.8
%5.3
%55.2
%
Min
imu
m0.0
%0.0
%9.7
%0.0
%0.0
%0.0
%0.0
%Q
uar
tile
10.0
%0.2
%55.2
%0.4
%0.8
%0.0
%0.2
%M
edia
n2.5
%1.9
%100.0
%9.6
%3.5
%0.4
%1.4
%Q
uar
tile
310.7
%6.7
%100.0
%100.0
%9.5
%3.7
%5.5
%M
axim
um
47.8
%885.3
%100.0
%100.0
%98.5
%34.8
%555.4
%
%≥
100%
0%
3%
68%
29%
0%
0%
2%
%<
1%
46%
41%
0%
29%
30%
54%
44%
%=
0%
35%
20%
0%
21%
9%
45%
19%
Ari
zon
aN
11
106
67
66
11
108
Mea
n9.4
%5.7
%75.9
%32.6
%4.3
%3.6
%7.8
%St
.D
ev.
10.7
%26.2
%37.9
%46.4
%5.7
%3.7
%53.4
%M
edia
n6.5
%0.8
%100.0
%5.7
%1.9
%2.6
%0.7
%
New
York
N46
116
15
31
91
65
119
Mea
n7.8
%27.1
%82.2
%39.0
%13.1
%2.8
%14.8
%St
.D
ev.
12.2
%98.8
%31.7
%44.6
%20.8
%5.5
%56.7
%M
edia
n2.1
%3.7
%100.0
%9.7
%4.6
%0.2
%2.8
%
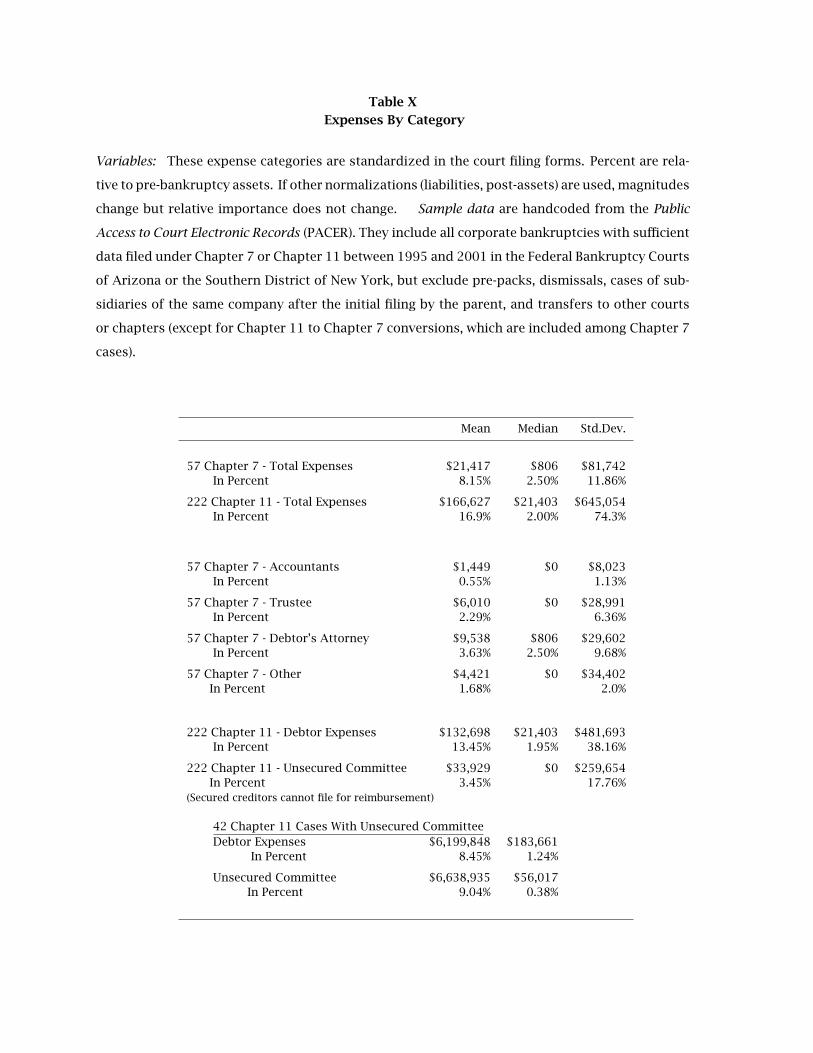
Table X
Expenses By Category
Variables: These expense categories are standardized in the court filing forms. Percent are rela-
tive to pre-bankruptcy assets. If other normalizations (liabilities, post-assets) are used, magnitudes
change but relative importance does not change. Sample data are handcoded from the Public
Access to Court Electronic Records (PACER). They include all corporate bankruptcies with sufficient
data filed under Chapter 7 or Chapter 11 between 1995 and 2001 in the Federal Bankruptcy Courts
of Arizona or the Southern District of New York, but exclude pre-packs, dismissals, cases of sub-
sidiaries of the same company after the initial filing by the parent, and transfers to other courts
or chapters (except for Chapter 11 to Chapter 7 conversions, which are included among Chapter 7
cases).
Mean Median Std.Dev.
57 Chapter 7 - Total Expenses $21,417 $806 $81,742In Percent 8.15% 2.50% 11.86%
222 Chapter 11 - Total Expenses $166,627 $21,403 $645,054In Percent 16.9% 2.00% 74.3%
57 Chapter 7 - Accountants $1,449 $0 $8,023In Percent 0.55% 1.13%
57 Chapter 7 - Trustee $6,010 $0 $28,991In Percent 2.29% 6.36%
57 Chapter 7 - Debtor’s Attorney $9,538 $806 $29,602In Percent 3.63% 2.50% 9.68%
57 Chapter 7 - Other $4,421 $0 $34,402In Percent 1.68% 2.0%
222 Chapter 11 - Debtor Expenses $132,698 $21,403 $481,693In Percent 13.45% 1.95% 38.16%
222 Chapter 11 - Unsecured Committee $33,929 $0 $259,654In Percent 3.45% 17.76%
(Secured creditors cannot file for reimbursement)
42 Chapter 11 Cases With Unsecured CommitteeDebtor Expenses $6,199,848 $183,661
In Percent 8.45% 1.24%
Unsecured Committee $6,638,935 $56,017In Percent 9.04% 0.38%
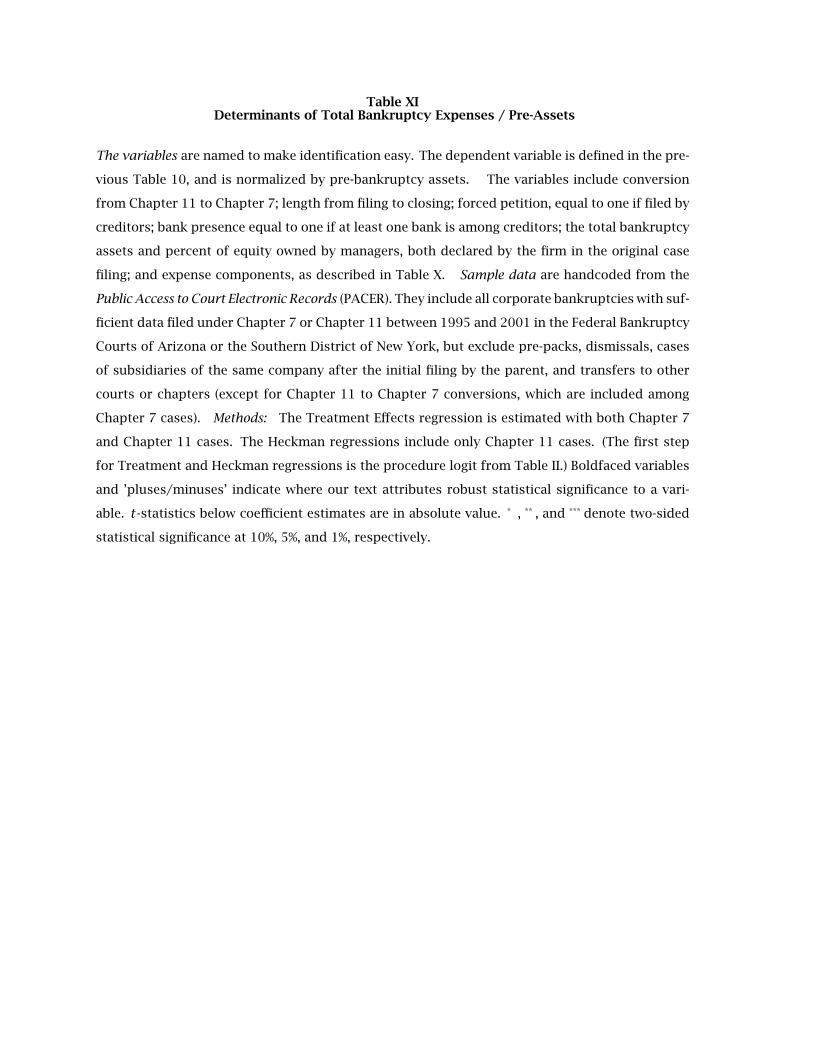
Table XIDeterminants of Total Bankruptcy Expenses / Pre-Assets
The variables are named to make identification easy. The dependent variable is defined in the pre-
vious Table 10, and is normalized by pre-bankruptcy assets. The variables include conversion
from Chapter 11 to Chapter 7; length from filing to closing; forced petition, equal to one if filed by
creditors; bank presence equal to one if at least one bank is among creditors; the total bankruptcy
assets and percent of equity owned by managers, both declared by the firm in the original case
filing; and expense components, as described in Table X. Sample data are handcoded from the
Public Access to Court Electronic Records (PACER). They include all corporate bankruptcies with suf-
ficient data filed under Chapter 7 or Chapter 11 between 1995 and 2001 in the Federal Bankruptcy
Courts of Arizona or the Southern District of New York, but exclude pre-packs, dismissals, cases
of subsidiaries of the same company after the initial filing by the parent, and transfers to other
courts or chapters (except for Chapter 11 to Chapter 7 conversions, which are included among
Chapter 7 cases). Methods: The Treatment Effects regression is estimated with both Chapter 7
and Chapter 11 cases. The Heckman regressions include only Chapter 11 cases. (The first step
for Treatment and Heckman regressions is the procedure logit from Table II.) Boldfaced variables
and ’pluses/minuses’ indicate where our text attributes robust statistical significance to a vari-
able. t-statistics below coefficient estimates are in absolute value. * , ** , and *** denote two-sided
statistical significance at 10%, 5%, and 1%, respectively.
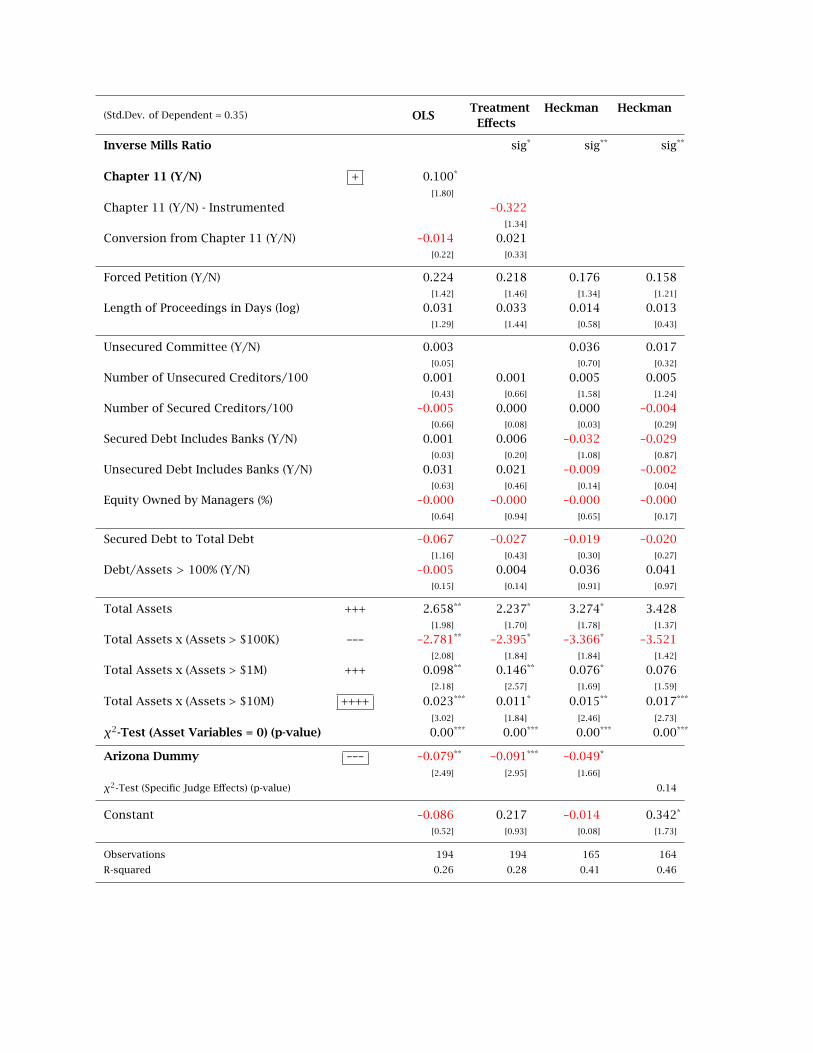
(Std.Dev. of Dependent = 0.35) OLSTreatment
EffectsHeckman Heckman
Inverse Mills Ratio sig* sig** sig**
Chapter 11 (Y/N) + 0.100*
[1.80]
Chapter 11 (Y/N) - Instrumented –0.322[1.34]
Conversion from Chapter 11 (Y/N) –0.014 0.021[0.22] [0.33]
Forced Petition (Y/N) 0.224 0.218 0.176 0.158[1.42] [1.46] [1.34] [1.21]
Length of Proceedings in Days (log) 0.031 0.033 0.014 0.013[1.29] [1.44] [0.58] [0.43]
Unsecured Committee (Y/N) 0.003 0.036 0.017[0.05] [0.70] [0.32]
Number of Unsecured Creditors/100 0.001 0.001 0.005 0.005[0.43] [0.66] [1.58] [1.24]
Number of Secured Creditors/100 –0.005 0.000 0.000 –0.004[0.66] [0.08] [0.03] [0.29]
Secured Debt Includes Banks (Y/N) 0.001 0.006 –0.032 –0.029[0.03] [0.20] [1.08] [0.87]
Unsecured Debt Includes Banks (Y/N) 0.031 0.021 –0.009 –0.002[0.63] [0.46] [0.14] [0.04]
Equity Owned by Managers (%) –0.000 –0.000 –0.000 –0.000[0.64] [0.94] [0.65] [0.17]
Secured Debt to Total Debt –0.067 –0.027 –0.019 –0.020[1.16] [0.43] [0.30] [0.27]
Debt/Assets > 100% (Y/N) –0.005 0.004 0.036 0.041[0.15] [0.14] [0.91] [0.97]
Total Assets +++ 2.658** 2.237* 3.274* 3.428[1.98] [1.70] [1.78] [1.37]
Total Assets x (Assets > $100K) ––– –2.781** –2.395* –3.366* –3.521[2.08] [1.84] [1.84] [1.42]
Total Assets x (Assets > $1M) +++ 0.098** 0.146** 0.076* 0.076[2.18] [2.57] [1.69] [1.59]
Total Assets x (Assets > $10M) ++++ 0.023*** 0.011* 0.015** 0.017***
[3.02] [1.84] [2.46] [2.73]
χ2-Test (Asset Variables = 0) (p-value) 0.00*** 0.00*** 0.00*** 0.00***
Arizona Dummy ––– –0.079** –0.091*** –0.049*
[2.49] [2.95] [1.66]
χ2-Test (Specific Judge Effects) (p-value) 0.14
Constant –0.086 0.217 –0.014 0.342*
[0.52] [0.93] [0.08] [1.73]
Observations 194 194 165 164
R-squared 0.26 0.28 0.41 0.46
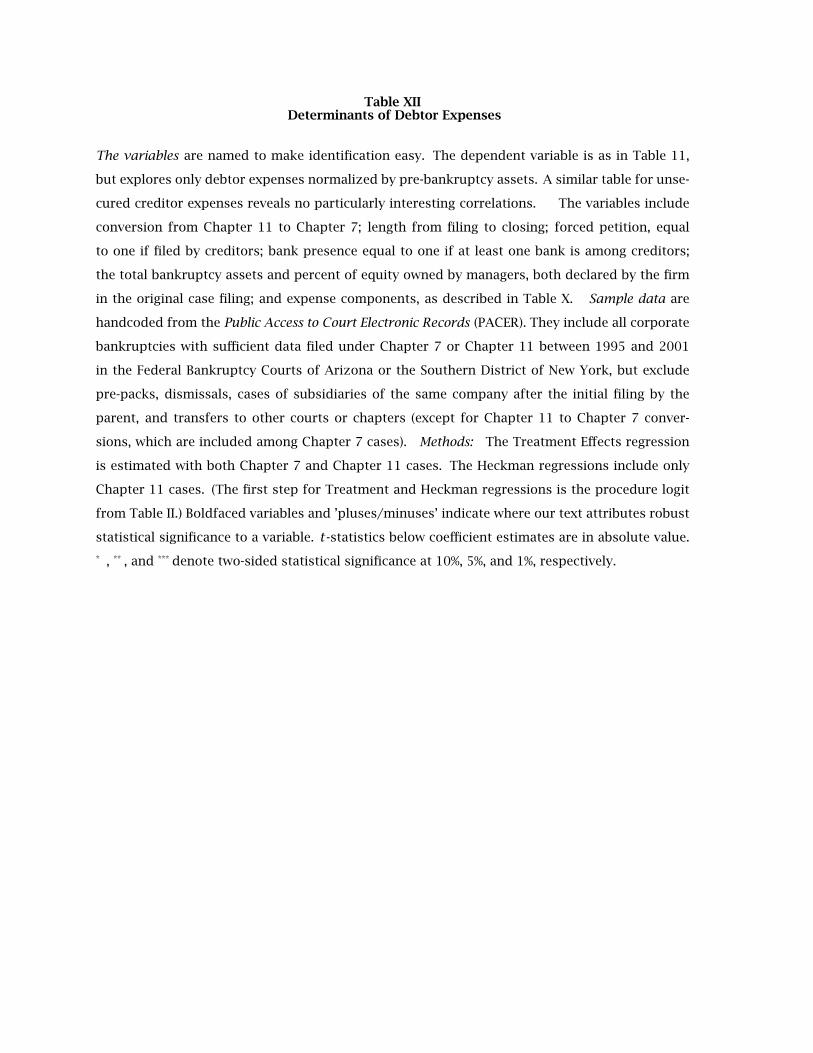
Table XIIDeterminants of Debtor Expenses
The variables are named to make identification easy. The dependent variable is as in Table 11,
but explores only debtor expenses normalized by pre-bankruptcy assets. A similar table for unse-
cured creditor expenses reveals no particularly interesting correlations. The variables include
conversion from Chapter 11 to Chapter 7; length from filing to closing; forced petition, equal
to one if filed by creditors; bank presence equal to one if at least one bank is among creditors;
the total bankruptcy assets and percent of equity owned by managers, both declared by the firm
in the original case filing; and expense components, as described in Table X. Sample data are
handcoded from the Public Access to Court Electronic Records (PACER). They include all corporate
bankruptcies with sufficient data filed under Chapter 7 or Chapter 11 between 1995 and 2001
in the Federal Bankruptcy Courts of Arizona or the Southern District of New York, but exclude
pre-packs, dismissals, cases of subsidiaries of the same company after the initial filing by the
parent, and transfers to other courts or chapters (except for Chapter 11 to Chapter 7 conver-
sions, which are included among Chapter 7 cases). Methods: The Treatment Effects regression
is estimated with both Chapter 7 and Chapter 11 cases. The Heckman regressions include only
Chapter 11 cases. (The first step for Treatment and Heckman regressions is the procedure logit
from Table II.) Boldfaced variables and ’pluses/minuses’ indicate where our text attributes robust
statistical significance to a variable. t-statistics below coefficient estimates are in absolute value.
* , ** , and *** denote two-sided statistical significance at 10%, 5%, and 1%, respectively.
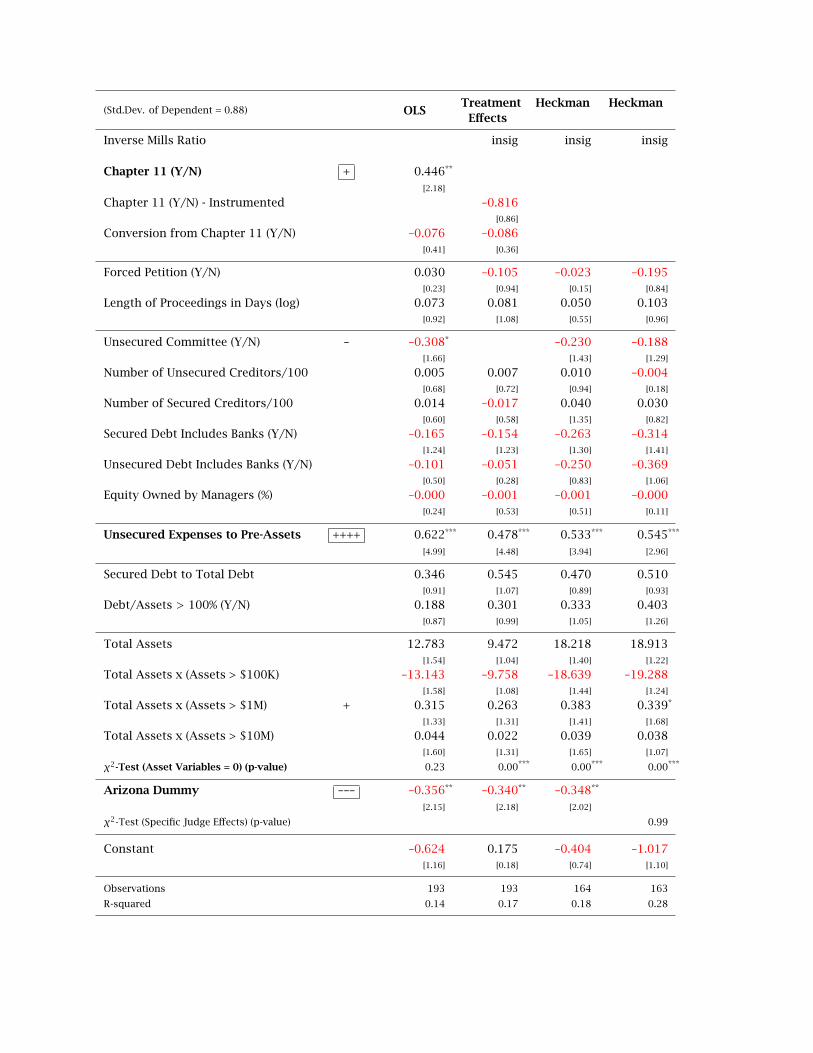
(Std.Dev. of Dependent = 0.88) OLSTreatment
EffectsHeckman Heckman
Inverse Mills Ratio insig insig insig
Chapter 11 (Y/N) + 0.446**
[2.18]
Chapter 11 (Y/N) - Instrumented –0.816[0.86]
Conversion from Chapter 11 (Y/N) –0.076 –0.086[0.41] [0.36]
Forced Petition (Y/N) 0.030 –0.105 –0.023 –0.195[0.23] [0.94] [0.15] [0.84]
Length of Proceedings in Days (log) 0.073 0.081 0.050 0.103[0.92] [1.08] [0.55] [0.96]
Unsecured Committee (Y/N) – –0.308* –0.230 –0.188[1.66] [1.43] [1.29]
Number of Unsecured Creditors/100 0.005 0.007 0.010 –0.004[0.68] [0.72] [0.94] [0.18]
Number of Secured Creditors/100 0.014 –0.017 0.040 0.030[0.60] [0.58] [1.35] [0.82]
Secured Debt Includes Banks (Y/N) –0.165 –0.154 –0.263 –0.314[1.24] [1.23] [1.30] [1.41]
Unsecured Debt Includes Banks (Y/N) –0.101 –0.051 –0.250 –0.369[0.50] [0.28] [0.83] [1.06]
Equity Owned by Managers (%) –0.000 –0.001 –0.001 –0.000[0.24] [0.53] [0.51] [0.11]
Unsecured Expenses to Pre-Assets ++++ 0.622*** 0.478*** 0.533*** 0.545***
[4.99] [4.48] [3.94] [2.96]
Secured Debt to Total Debt 0.346 0.545 0.470 0.510[0.91] [1.07] [0.89] [0.93]
Debt/Assets > 100% (Y/N) 0.188 0.301 0.333 0.403[0.87] [0.99] [1.05] [1.26]
Total Assets 12.783 9.472 18.218 18.913[1.54] [1.04] [1.40] [1.22]
Total Assets x (Assets > $100K) –13.143 –9.758 –18.639 –19.288[1.58] [1.08] [1.44] [1.24]
Total Assets x (Assets > $1M) + 0.315 0.263 0.383 0.339*
[1.33] [1.31] [1.41] [1.68]
Total Assets x (Assets > $10M) 0.044 0.022 0.039 0.038[1.60] [1.31] [1.65] [1.07]
χ2-Test (Asset Variables = 0) (p-value) 0.23 0.00*** 0.00*** 0.00***
Arizona Dummy ––– –0.356** –0.340** –0.348**
[2.15] [2.18] [2.02]
χ2-Test (Specific Judge Effects) (p-value) 0.99
Constant –0.624 0.175 –0.404 –1.017[1.16] [0.18] [0.74] [1.10]
Observations 193 193 164 163
R-squared 0.14 0.17 0.18 0.28
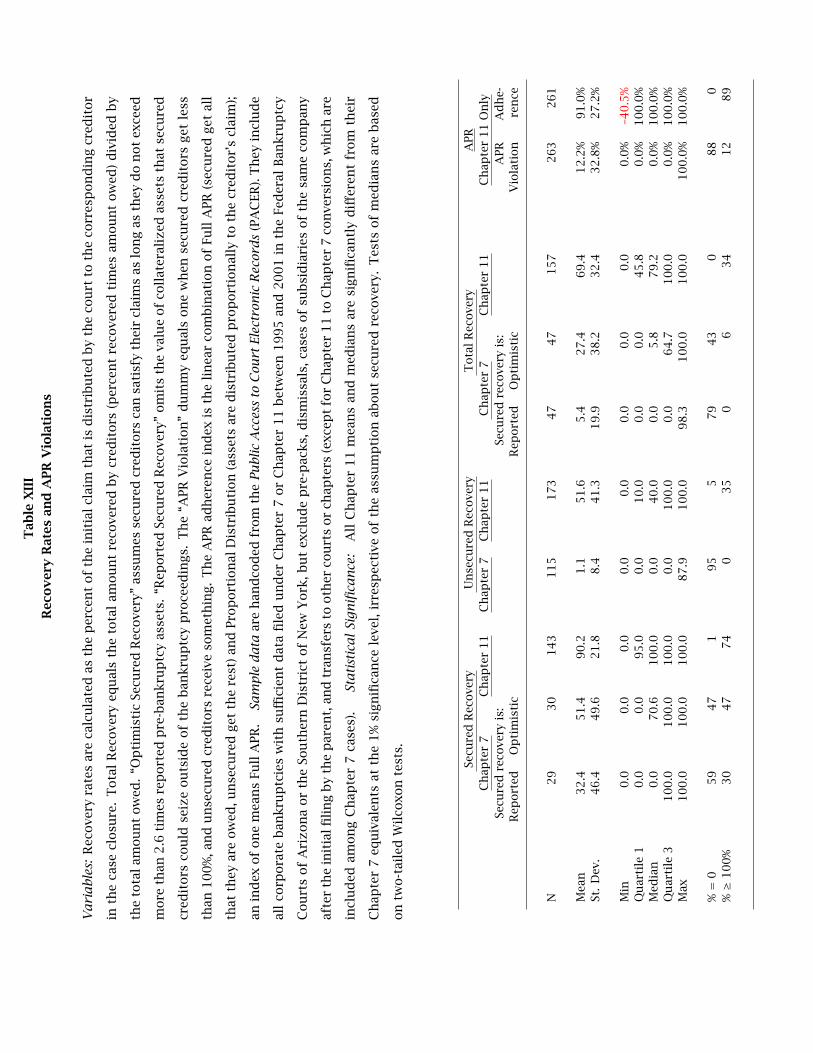
Tab
leX
III
Rec
ov
ery
Rat
esan
dA
PR
Vio
lati
on
s
Va
ria
ble
s:R
ecove
ryra
tes
are
calc
ula
ted
asth
ep
erce
nt
of
the
init
ialcl
aim
that
isd
istr
ibu
ted
by
the
cou
rtto
the
corr
esp
on
din
gcr
edit
or
inth
eca
secl
osu
re.
Tota
lR
ecove
ryeq
ual
sth
eto
tal
amou
nt
reco
vere
db
ycr
edit
ors
(per
cen
tre
cove
red
tim
esam
ou
nt
ow
ed)
div
ided
by
the
tota
lam
ou
nt
ow
ed.
“Op
tim
isti
cSe
cure
dR
ecove
ry”
assu
mes
secu
red
cred
itors
can
sati
sfy
thei
rcl
aim
sas
lon
gas
they
do
not
exce
ed
more
than
2.6
tim
esre
port
edp
re-b
ankru
ptc
yas
sets
.“R
eport
edSe
cure
dR
ecove
ry”
om
its
the
valu
eof
coll
ater
aliz
edas
sets
that
secu
red
cred
itors
cou
ldse
ize
ou
tsid
eof
the
ban
kru
ptc
yp
roce
edin
gs.
Th
e“A
PR
Vio
lati
on
”d
um
my
equ
als
on
ew
hen
secu
red
cred
itors
get
less
than
10
0%
,an
du
nse
cure
dcr
edit
ors
rece
ive
som
eth
ing.
Th
eA
PR
adh
eren
cein
dex
isth
eli
nea
rco
mb
inat
ion
of
Full
APR
(sec
ure
dget
all
that
they
are
ow
ed,u
nse
cure
dget
the
rest
)an
dPro
port
ion
alD
istr
ibu
tion
(ass
ets
are
dis
trib
ute
dp
rop
ort
ion
ally
toth
ecr
edit
or’
scl
aim
);
anin
dex
of
on
em
ean
sFu
llA
PR
.Sa
mp
led
ata
are
han
dco
ded
from
the
Pu
blic
Acc
ess
toC
ourt
Elec
tron
icR
ecor
ds
(PA
CER
).T
hey
incl
ud
e
all
corp
ora
teb
ankru
ptc
ies
wit
hsu
ffici
ent
dat
afi
led
un
der
Ch
apte
r7
or
Ch
apte
r1
1b
etw
een
19
95
and
20
01
inth
eFe
der
alB
ankru
ptc
y
Cou
rts
of
Ari
zon
aor
the
Sou
ther
nD
istr
ict
of
New
York
,b
ut
excl
ud
ep
re-p
acks,
dis
mis
sals
,ca
ses
of
sub
sid
iari
esof
the
sam
eco
mp
any
afte
rth
ein
itia
lfi
lin
gb
yth
ep
aren
t,an
dtr
ansf
ers
tooth
erco
urt
sor
chap
ters
(exc
ept
for
Ch
apte
r1
1to
Ch
apte
r7
con
vers
ion
s,w
hic
har
e
incl
ud
edam
on
gC
hap
ter
7ca
ses)
.St
ati
stic
al
Sign
ifica
nce
:A
llC
hap
ter
11
mea
ns
and
med
ian
sar
esi
gn
ifica
ntl
yd
iffer
ent
from
thei
r
Ch
apte
r7
equ
ival
ents
atth
e1
%si
gn
ifica
nce
leve
l,ir
resp
ecti
veof
the
assu
mp
tion
abou
tse
cure
dre
cove
ry.
Tes
tsof
med
ian
sar
eb
ased
on
two-t
aile
dW
ilco
xon
test
s.
Secu
red
Rec
ove
ryU
nse
cure
dR
ecove
ryT
ota
lR
ecove
ryA
PR
Ch
apte
r7
Ch
apte
r11
Ch
apte
r7
Ch
apte
r11
Ch
apte
r7
Ch
apte
r11
Ch
apte
r11
On
lySe
cure
dre
cove
ryis
:Se
cure
dre
cove
ryis
:A
PR
Ad
he-
Rep
ort
edO
pti
mis
tic
Rep
ort
edO
pti
mis
tic
Vio
lati
on
ren
ce
N29
30
143
115
173
47
47
157
263
261
Mea
n32.4
51.4
90.2
1.1
51.6
5.4
27.4
69.4
12.2
%91.0
%St
.D
ev.
46.4
49.6
21.8
8.4
41.3
19.9
38.2
32.4
32.8
%27.2
%
Min
0.0
0.0
0.0
0.0
0.0
0.0
0.0
0.0
0.0
%–4
0.5
%Q
uar
tile
10.0
0.0
95.0
0.0
10.0
0.0
0.0
45.8
0.0
%100.0
%M
edia
n0.0
70.6
100.0
0.0
40.0
0.0
5.8
79.2
0.0
%100.0
%Q
uar
tile
3100.0
100.0
100.0
0.0
100.0
0.0
64.7
100.0
0.0
%100.0
%M
ax100.0
100.0
100.0
87.9
100.0
98.3
100.0
100.0
100.0
%100.0
%
%=
059
47
195
579
43
088
0%≥
100%
30
47
74
035
06
34
12
89
Table XIVDeterminants of Total Recovery Rate
— Assuming Pessimistic Secured Recovery in Chapter 7
The variables are named to make identification easy. The dependent variable is described in Ta-
ble XIII. Total Proportional Recovery is the total amount recovered by creditors (percent recovered
times amount owed) divided by the total amount owed. (A component, secured recovery in Chap-
ter 7, is the “as reported” figure, but all significant/insignificant correlations remain if we use the
optimistic recovery assumption instead.) The variables include conversion from Chapter 11 to
Chapter 7; length from filing to closing; forced petition, equal to one if filed by creditors; bank
presence equal to one if at least one bank is among creditors; the total bankruptcy assets and
percent of equity owned by managers, both declared by the firm in the original case filing; and
expense components, as described in Table X. Sample data are handcoded from the Public Access
to Court Electronic Records (PACER). They include all corporate bankruptcies with sufficient data
filed under Chapter 7 or Chapter 11 between 1995 and 2001 in the Federal Bankruptcy Courts
of Arizona or the Southern District of New York, but exclude pre-packs, dismissals, cases of sub-
sidiaries of the same company after the initial filing by the parent, and transfers to other courts
or chapters (except for Chapter 11 to Chapter 7 conversions, which are included among Chap-
ter 7 cases). Methods: The Treatment Effects regression is estimated with both Chapter 7 and
Chapter 11 cases. The Heckman regressions include only Chapter 11 cases. (The first step for
Treatment and Heckman regressions is the procedure logit from Table II.) Boldfaced variables
and ’pluses/minuses’ indicate where our text attributes robust statistical significance to a vari-
able. t-statistics below coefficient estimates are in absolute value. * , ** , and *** denote two-sided
statistical significance at 10%, 5%, and 1%, respectively.
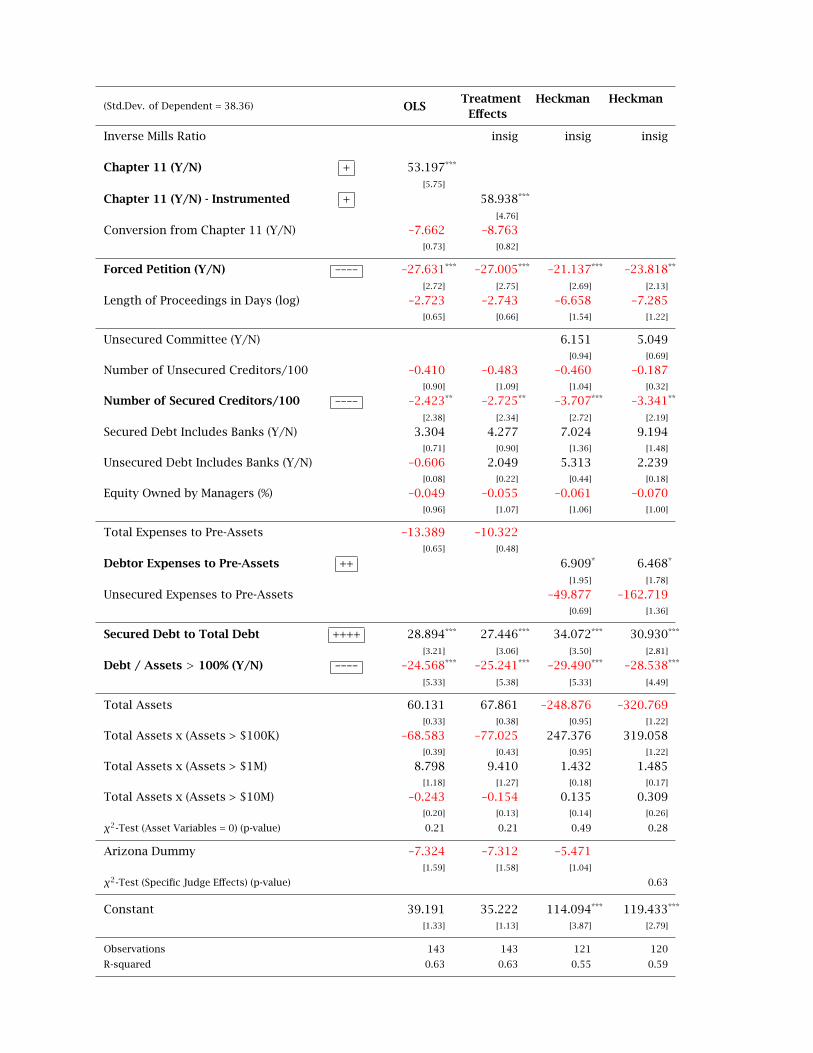
(Std.Dev. of Dependent = 38.36) OLSTreatment
EffectsHeckman Heckman
Inverse Mills Ratio insig insig insig
Chapter 11 (Y/N) + 53.197***
[5.75]
Chapter 11 (Y/N) - Instrumented + 58.938***
[4.76]
Conversion from Chapter 11 (Y/N) –7.662 –8.763[0.73] [0.82]
Forced Petition (Y/N) –––– –27.631*** –27.005*** –21.137*** –23.818**
[2.72] [2.75] [2.69] [2.13]
Length of Proceedings in Days (log) –2.723 –2.743 –6.658 –7.285[0.65] [0.66] [1.54] [1.22]
Unsecured Committee (Y/N) 6.151 5.049[0.94] [0.69]
Number of Unsecured Creditors/100 –0.410 –0.483 –0.460 –0.187[0.90] [1.09] [1.04] [0.32]
Number of Secured Creditors/100 –––– –2.423** –2.725** –3.707*** –3.341**
[2.38] [2.34] [2.72] [2.19]
Secured Debt Includes Banks (Y/N) 3.304 4.277 7.024 9.194[0.71] [0.90] [1.36] [1.48]
Unsecured Debt Includes Banks (Y/N) –0.606 2.049 5.313 2.239[0.08] [0.22] [0.44] [0.18]
Equity Owned by Managers (%) –0.049 –0.055 –0.061 –0.070[0.96] [1.07] [1.06] [1.00]
Total Expenses to Pre-Assets –13.389 –10.322[0.65] [0.48]
Debtor Expenses to Pre-Assets ++ 6.909* 6.468*
[1.95] [1.78]
Unsecured Expenses to Pre-Assets –49.877 –162.719[0.69] [1.36]
Secured Debt to Total Debt ++++ 28.894*** 27.446*** 34.072*** 30.930***
[3.21] [3.06] [3.50] [2.81]
Debt / Assets > 100% (Y/N) –––– –24.568*** –25.241*** –29.490*** –28.538***
[5.33] [5.38] [5.33] [4.49]
Total Assets 60.131 67.861 –248.876 –320.769[0.33] [0.38] [0.95] [1.22]
Total Assets x (Assets > $100K) –68.583 –77.025 247.376 319.058[0.39] [0.43] [0.95] [1.22]
Total Assets x (Assets > $1M) 8.798 9.410 1.432 1.485[1.18] [1.27] [0.18] [0.17]
Total Assets x (Assets > $10M) –0.243 –0.154 0.135 0.309[0.20] [0.13] [0.14] [0.26]
χ2-Test (Asset Variables = 0) (p-value) 0.21 0.21 0.49 0.28
Arizona Dummy –7.324 –7.312 –5.471[1.59] [1.58] [1.04]
χ2-Test (Specific Judge Effects) (p-value) 0.63
Constant 39.191 35.222 114.094*** 119.433***
[1.33] [1.13] [3.87] [2.79]
Observations 143 143 121 120
R-squared 0.63 0.63 0.55 0.59
Table XVDeterminants of Creditors’ Recovery Rates in Chapter 11
The variables are named to make identification easy. The dependent variables are described in
Table 13. The recovery rates are calculated as the percent of the initial claim that is distributed by
the court to the corresponding creditor in the case closure. Panel A focuses on secured creditors,
of course in Chapter 11 only due to measurement difficulties for secured creditors in Chapter 7.
Panel B explores both Chapter 7 and Chapter 11 cases. The variables include conversion from
Chapter 11 to Chapter 7; length from filing to closing; forced petition, equal to one if filed by
creditors; bank presence equal to one if at least one bank is among creditors; the total bankruptcy
assets and percent of equity owned by managers, both declared by the firm in the original case
filing; and expense components, as described in Table X. Sample data are handcoded from the
Public Access to Court Electronic Records (PACER). They include all corporate bankruptcies with suf-
ficient data filed under Chapter 7 or Chapter 11 between 1995 and 2001 in the Federal Bankruptcy
Courts of Arizona or the Southern District of New York, but exclude pre-packs, dismissals, cases
of subsidiaries of the same company after the initial filing by the parent, and transfers to other
courts or chapters (except for Chapter 11 to Chapter 7 conversions, which are included among
Chapter 7 cases). Methods: The Treatment Effects regression is estimated with both Chapter 7
and Chapter 11 cases. The Heckman regressions include only Chapter 11 cases. (The first step
for Treatment and Heckman regressions is the procedure logit from Table II.) Boldfaced variables
and ’pluses/minuses’ indicate where our text attributes robust statistical significance to a vari-
able. t-statistics below coefficient estimates are in absolute value. * , ** , and *** denote two-sided
statistical significance at 10%, 5%, and 1%, respectively.
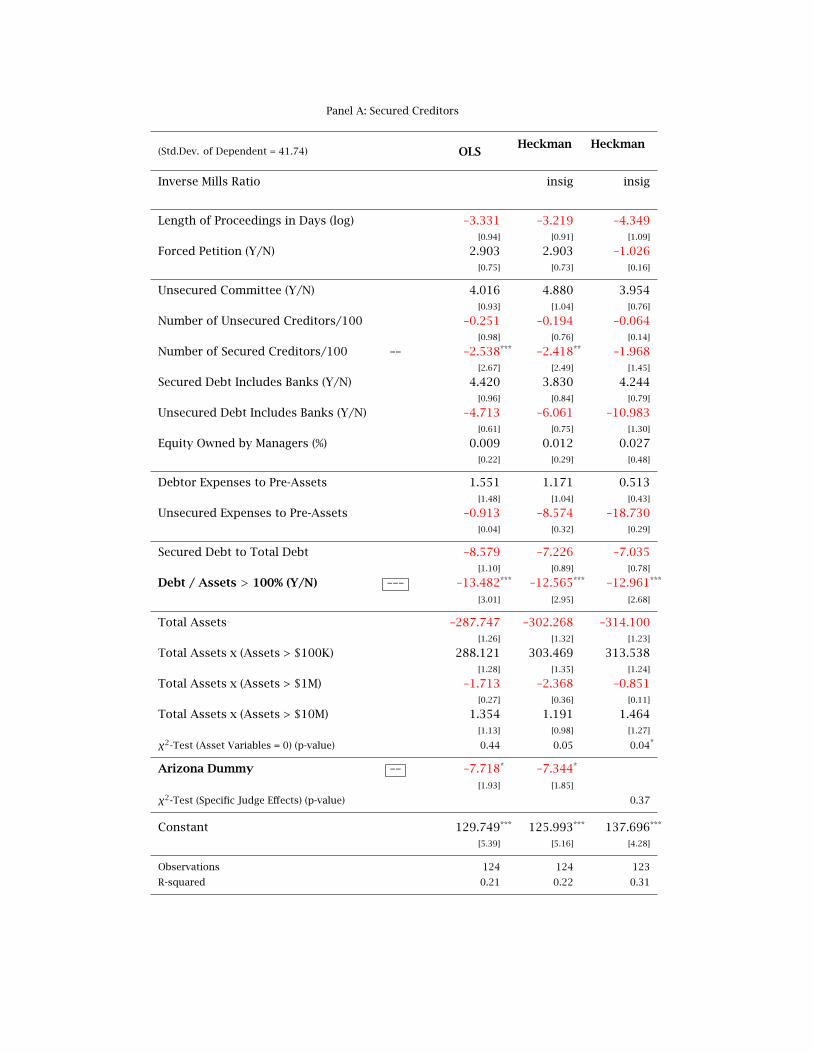
Panel A: Secured Creditors
(Std.Dev. of Dependent = 41.74) OLSHeckman Heckman
Inverse Mills Ratio insig insig
Length of Proceedings in Days (log) –3.331 –3.219 –4.349[0.94] [0.91] [1.09]
Forced Petition (Y/N) 2.903 2.903 –1.026[0.75] [0.73] [0.16]
Unsecured Committee (Y/N) 4.016 4.880 3.954[0.93] [1.04] [0.76]
Number of Unsecured Creditors/100 –0.251 –0.194 –0.064[0.98] [0.76] [0.14]
Number of Secured Creditors/100 –– –2.538*** –2.418** –1.968[2.67] [2.49] [1.45]
Secured Debt Includes Banks (Y/N) 4.420 3.830 4.244[0.96] [0.84] [0.79]
Unsecured Debt Includes Banks (Y/N) –4.713 –6.061 –10.983[0.61] [0.75] [1.30]
Equity Owned by Managers (%) 0.009 0.012 0.027[0.22] [0.29] [0.48]
Debtor Expenses to Pre-Assets 1.551 1.171 0.513[1.48] [1.04] [0.43]
Unsecured Expenses to Pre-Assets –0.913 –8.574 –18.730[0.04] [0.32] [0.29]
Secured Debt to Total Debt –8.579 –7.226 –7.035[1.10] [0.89] [0.78]
Debt / Assets > 100% (Y/N) ––– –13.482*** –12.565*** –12.961***
[3.01] [2.95] [2.68]
Total Assets –287.747 –302.268 –314.100[1.26] [1.32] [1.23]
Total Assets x (Assets > $100K) 288.121 303.469 313.538[1.28] [1.35] [1.24]
Total Assets x (Assets > $1M) –1.713 –2.368 –0.851[0.27] [0.36] [0.11]
Total Assets x (Assets > $10M) 1.354 1.191 1.464[1.13] [0.98] [1.27]
χ2-Test (Asset Variables = 0) (p-value) 0.44 0.05 0.04*
Arizona Dummy –– –7.718* –7.344*
[1.93] [1.85]
χ2-Test (Specific Judge Effects) (p-value) 0.37
Constant 129.749*** 125.993*** 137.696***
[5.39] [5.16] [4.28]
Observations 124 124 123
R-squared 0.21 0.22 0.31
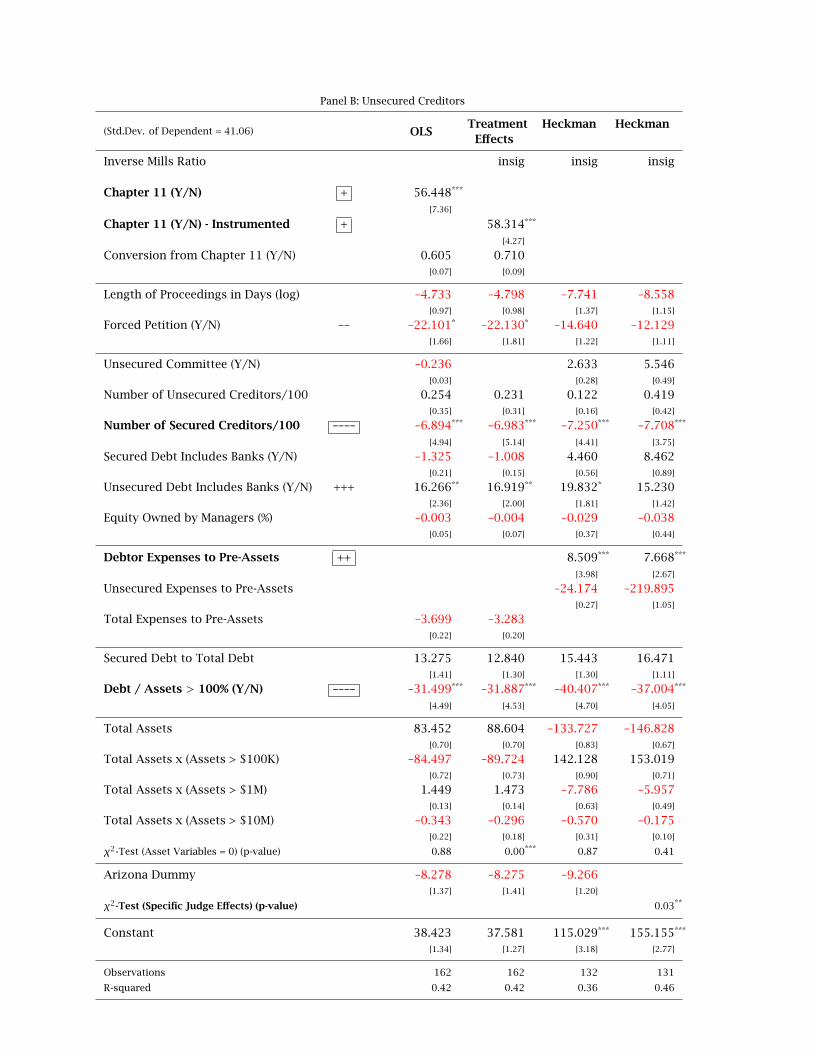
Panel B: Unsecured Creditors
(Std.Dev. of Dependent = 41.06) OLSTreatment
EffectsHeckman Heckman
Inverse Mills Ratio insig insig insig
Chapter 11 (Y/N) + 56.448***
[7.36]
Chapter 11 (Y/N) - Instrumented + 58.314***
[4.27]
Conversion from Chapter 11 (Y/N) 0.605 0.710[0.07] [0.09]
Length of Proceedings in Days (log) –4.733 –4.798 –7.741 –8.558[0.97] [0.98] [1.37] [1.15]
Forced Petition (Y/N) –– –22.101* –22.130* –14.640 –12.129[1.66] [1.81] [1.22] [1.11]
Unsecured Committee (Y/N) –0.236 2.633 5.546[0.03] [0.28] [0.49]
Number of Unsecured Creditors/100 0.254 0.231 0.122 0.419[0.35] [0.31] [0.16] [0.42]
Number of Secured Creditors/100 –––– –6.894*** –6.983*** –7.250*** –7.708***
[4.94] [5.14] [4.41] [3.75]
Secured Debt Includes Banks (Y/N) –1.325 –1.008 4.460 8.462[0.21] [0.15] [0.56] [0.89]
Unsecured Debt Includes Banks (Y/N) +++ 16.266** 16.919** 19.832* 15.230[2.36] [2.00] [1.81] [1.42]
Equity Owned by Managers (%) –0.003 –0.004 –0.029 –0.038[0.05] [0.07] [0.37] [0.44]
Debtor Expenses to Pre-Assets ++ 8.509*** 7.668***
[3.98] [2.67]
Unsecured Expenses to Pre-Assets –24.174 –219.895[0.27] [1.05]
Total Expenses to Pre-Assets –3.699 –3.283[0.22] [0.20]
Secured Debt to Total Debt 13.275 12.840 15.443 16.471[1.41] [1.30] [1.30] [1.11]
Debt / Assets > 100% (Y/N) –––– –31.499*** –31.887*** –40.407*** –37.004***
[4.49] [4.53] [4.70] [4.05]
Total Assets 83.452 88.604 –133.727 –146.828[0.70] [0.70] [0.83] [0.67]
Total Assets x (Assets > $100K) –84.497 –89.724 142.128 153.019[0.72] [0.73] [0.90] [0.71]
Total Assets x (Assets > $1M) 1.449 1.473 –7.786 –5.957[0.13] [0.14] [0.63] [0.49]
Total Assets x (Assets > $10M) –0.343 –0.296 –0.570 –0.175[0.22] [0.18] [0.31] [0.10]
χ2-Test (Asset Variables = 0) (p-value) 0.88 0.00*** 0.87 0.41
Arizona Dummy –8.278 –8.275 –9.266[1.37] [1.41] [1.20]
χ2-Test (Specific Judge Effects) (p-value) 0.03**
Constant 38.423 37.581 115.029*** 155.155***
[1.34] [1.27] [3.18] [2.77]
Observations 162 162 132 131
R-squared 0.42 0.42 0.36 0.46
Tab
leX
VI
APR
Vio
lati
on
san
dA
PR
Vio
lati
on
Ind
ex
Th
eva
ria
ble
sar
en
amed
tom
ake
iden
tifi
cati
on
easy
.T
he
ind
epen
den
tva
riab
les
are
des
crib
edin
Tab
leX
III.
Aca
seis
con
sid
ered
in
viola
tion
of
APR
wh
enth
ere
are
both
secu
red
and
un
secu
red
cred
itors
,an
du
nse
cure
dcr
edit
ors
rece
ive
more
than
zer
ow
hen
secu
red
cred
itors
rece
ive
less
than
10
0%
.T
he
APR
adh
eren
cein
dex
isca
lcu
late
d,f
or
each
case
,as
the
con
vex
com
bin
atio
nof
full
APR
viola
tion
(pro
port
ion
ald
istr
ibu
tion
,eq
ual
tozer
o),
and
full
APR
adh
eren
ce(a
llto
secu
red
,noth
ing
or
wh
atev
eris
left
tou
nse
cure
d,e
qu
alto
on
e).
Th
eva
riab
les
incl
ud
eco
nve
rsio
nfr
om
Ch
apte
r1
1to
Ch
apte
r7
;le
ngth
from
fili
ng
tocl
osi
ng;
forc
edp
etit
ion
,eq
ual
toon
eif
file
db
y
cred
itors
;b
ank
pre
sen
ceeq
ual
toon
eif
atle
ast
on
eb
ank
isam
on
gcr
edit
ors
;th
eto
tal
ban
kru
ptc
yas
sets
and
per
cen
tof
equ
ity
ow
ned
by
man
ager
s,b
oth
dec
lare
db
yth
efi
rmin
the
ori
gin
alca
sefi
lin
g;an
dex
pen
seco
mp
on
ents
,as
des
crib
edin
Tab
leX
.Sa
mp
led
ata
are
han
dco
ded
from
the
Pu
blic
Acc
ess
toC
ourt
Elec
tron
icR
ecor
ds
(PA
CER
).T
hey
incl
ud
eal
lco
rpora
teb
ankru
ptc
ies
wit
hsu
ffici
ent
dat
afi
led
un
der
Ch
apte
r7
or
Ch
apte
r1
1b
etw
een
19
95
and
20
01
inth
eFe
der
alB
ankru
ptc
yC
ou
rts
of
Ari
zon
aor
the
Sou
ther
nD
istr
ict
of
New
York
,b
ut
excl
ud
ep
re-p
acks,
dis
mis
sals
,ca
ses
of
sub
sid
iari
esof
the
sam
eco
mp
any
afte
rth
ein
itia
lfi
lin
gb
yth
ep
aren
t,an
dtr
ansf
ers
tooth
erco
urt
sor
chap
ters
(exc
ept
for
Ch
apte
r1
1to
Ch
apte
r7
con
vers
ion
s,w
hic
har
ein
clu
ded
amon
gC
hap
ter
7ca
ses)
.M
eth
ods:
Th
eT
reat
men
tEff
ects
regre
ssio
nis
esti
mat
edw
ith
both
Ch
apte
r7
and
Ch
apte
r1
1ca
ses.
Th
eH
eckm
anre
gre
ssio
ns
incl
ud
eon
ly
Ch
apte
r1
1ca
ses.
(Th
efi
rst
step
for
Tre
atm
ent
and
Hec
km
anre
gre
ssio
ns
isth
ep
roce
du
relo
git
from
Tab
leII
.)B
old
face
dva
riab
les
and
’plu
ses/
min
use
s’in
dic
ate
wh
ere
ou
rte
xtat
trib
ute
sro
bu
stst
atis
tica
lsi
gn
ifica
nce
toa
vari
able
.t-
stat
isti
csb
elow
coeffi
cien
tes
tim
ates
are
inab
solu
teva
lue.
*,*
*,a
nd
***d
enote
two-s
ided
stat
isti
cal
sign
ifica
nce
at1
0%
,5%
,an
d1
%,r
esp
ecti
vely
.T
he
+/-
des
ign
atio
nin
the
seco
nd
colu
mn
for
the
APR
adh
eren
cein
dex
has
bee
nre
vers
edto
be
sign
-con
sist
ent
wit
hth
ep
rob
abil
ity
of
APR
viola
tion
.
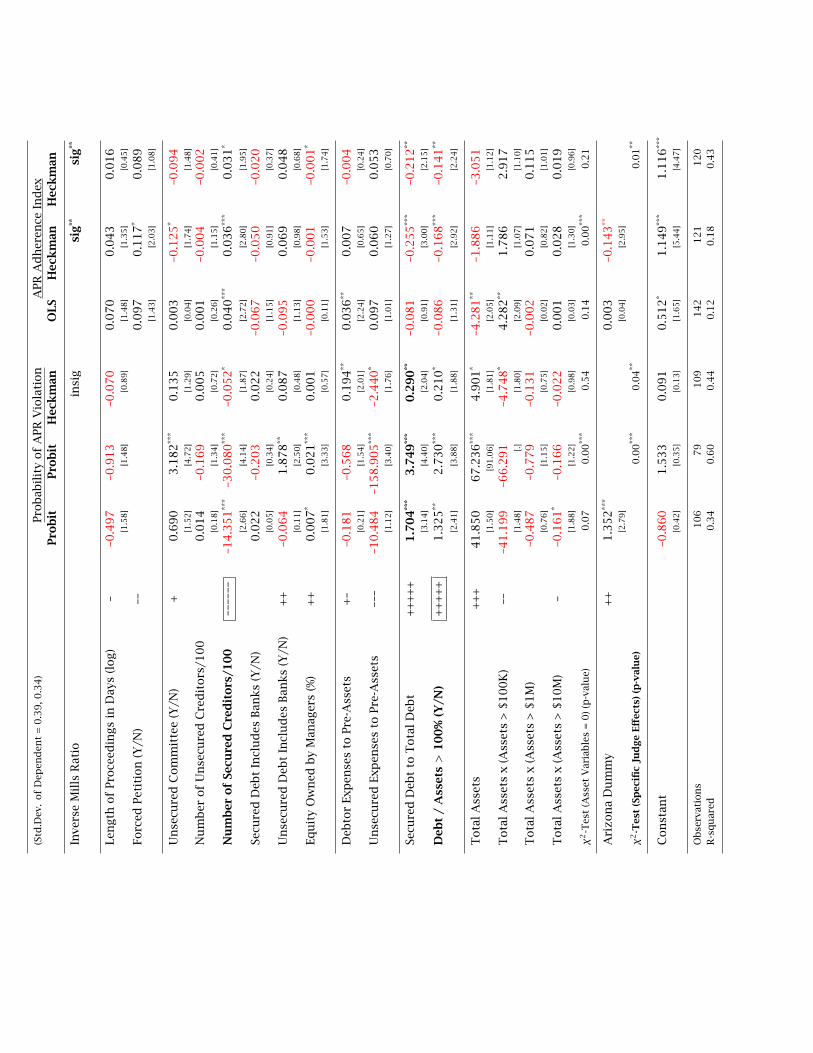
(Std
.Dev
.of
Dep
end
ent
=0.3
9,0
.34)
Pro
bab
ilit
yof
APR
Vio
lati
on
APR
Ad
her
ence
Ind
exPro
bit
Pro
bit
Hec
km
anO
LS
Hec
km
anH
eck
man
Inve
rse
Mil
lsR
atio
insi
gsi
g**
sig
**
Len
gth
of
Pro
ceed
ings
inD
ays
(log)
––0
.497
–0.9
13
–0.0
70
0.0
70
0.0
43
0.0
16
[1.5
8]
[1.4
8]
[0.8
9]
[1.4
8]
[1.3
5]
[0.4
5]
Forc
edPet
itio
n(Y
/N)
––0.0
97
0.1
17
*0.0
89
[1.4
3]
[2.0
3]
[1.0
8]
Un
secu
red
Com
mit
tee
(Y/N
)+
0.6
90
3.1
82
***
0.1
35
0.0
03
–0.1
25
*–0
.094
[1.5
2]
[4.7
2]
[1.2
9]
[0.0
4]
[1.7
4]
[1.4
8]
Nu
mb
erof
Un
secu
red
Cre
dit
ors
/100
0.0
14
–0.1
69
0.0
05
0.0
01
–0.0
04
–0.0
02
[0.1
8]
[1.3
4]
[0.7
2]
[0.2
6]
[1.1
5]
[0.4
1]
Nu
mb
erof
Secu
red
Cre
dit
ors
/100
––––
–––1
4.3
51
***
–30.0
80
***
–0.0
52
*0.0
40
***
0.0
36
***
0.0
31
*
[2.6
6]
[4.1
4]
[1.8
7]
[2.7
2]
[2.8
0]
[1.9
5]
Secu
red
Deb
tIn
clu
des
Ban
ks
(Y/N
)0.0
22
–0.2
03
0.0
22
–0.0
67
–0.0
50
–0.0
20
[0.0
5]
[0.3
4]
[0.2
4]
[1.1
5]
[0.9
1]
[0.3
7]
Un
secu
red
Deb
tIn
clu
des
Ban
ks
(Y/N
)++
–0.0
64
1.8
78
**0.0
87
–0.0
95
0.0
69
0.0
48
[0.1
1]
[2.5
0]
[0.4
8]
[1.1
3]
[0.9
8]
[0.6
8]
Equ
ity
Ow
ned
by
Man
ager
s(%
)++
0.0
07
*0.0
21
***
0.0
01
–0.0
00
–0.0
01
–0.0
01
*
[1.8
1]
[3.3
3]
[0.5
7]
[0.1
1]
[1.5
3]
[1.7
4]
Deb
tor
Exp
ense
sto
Pre
-Ass
ets
+–
–0.1
81
–0.5
68
0.1
94
**0.0
36
**0.0
07
–0.0
04
[0.2
1]
[1.5
4]
[2.0
1]
[2.2
4]
[0.6
5]
[0.2
4]
Un
secu
red
Exp
ense
sto
Pre
-Ass
ets
–––
–10.4
84
–158.9
05
***
–2.4
40
*0.0
97
0.0
60
0.0
53
[1.1
2]
[3.4
0]
[1.7
6]
[1.0
1]
[1.2
7]
[0.7
0]
Secu
red
Deb
tto
Tota
lD
ebt
+++++
1.7
04
***
3.7
49
***
0.2
90
**–0
.081
–0.2
55
***
–0.2
12
**
[3.1
4]
[4.4
0]
[2.0
4]
[0.9
1]
[3.0
0]
[2.1
5]
Deb
t/
Ass
ets>
100%
(Y/N
)+++++
1.3
25
**2.7
30
***
0.2
10
*–0
.086
–0.1
68
***
–0.1
41
**
[2.4
1]
[3.8
8]
[1.8
8]
[1.3
1]
[2.9
2]
[2.2
4]
Tota
lA
sset
s+++
41.8
50
67.2
36
***
4.9
01
*–4
.281
**–1
.886
–3.0
51
[1.5
0]
[91
.06
][1
.81
][2
.05
][1
.11
][1
.12
]
Tota
lA
sset
sx
(Ass
ets
>$100K
)––
–41.1
99
–66.2
91
–4.7
48
*4.2
82
**1.7
86
2.9
17
[1.4
8]
[.]
[1.8
0]
[2.0
9]
[1.0
7]
[1.1
0]
Tota
lA
sset
sx
(Ass
ets
>$1M
)–0
.487
–0.7
79
–0.1
31
–0.0
02
0.0
71
0.1
15
[0.7
6]
[1.1
5]
[0.7
5]
[0.0
2]
[0.8
2]
[1.0
1]
Tota
lA
sset
sx
(Ass
ets
>$10M
)–
–0.1
61
*–0
.166
–0.0
22
0.0
01
0.0
28
0.0
19
[1.8
8]
[1.2
2]
[0.9
8]
[0.0
3]
[1.3
0]
[0.9
6]
χ2-T
est
(Ass
etV
aria
ble
s=
0)
(p-v
alu
e)0.0
70.0
0**
*0.5
40.1
40.0
0**
*0.2
1
Ari
zon
aD
um
my
++
1.3
52
***
0.0
03
–0.1
43
**
[2.7
9]
[0.0
4]
[2.9
5]
χ2-T
est
(Sp
ecifi
cJu
dge
Eff
ects
)(p
-val
ue)
0.0
0**
*0.0
4**
0.0
1**
Con
stan
t–0
.860
1.5
33
0.0
91
0.5
12
*1.1
49
***
1.1
16
***
[0.4
2]
[0.3
5]
[0.1
3]
[1.6
5]
[5.4
4]
[4.4
7]
Ob
serv
atio
ns
106
79
109
142
121
120
R-s
qu
ared
0.3
40.6
00.4
40.1
20.1
80.4
3
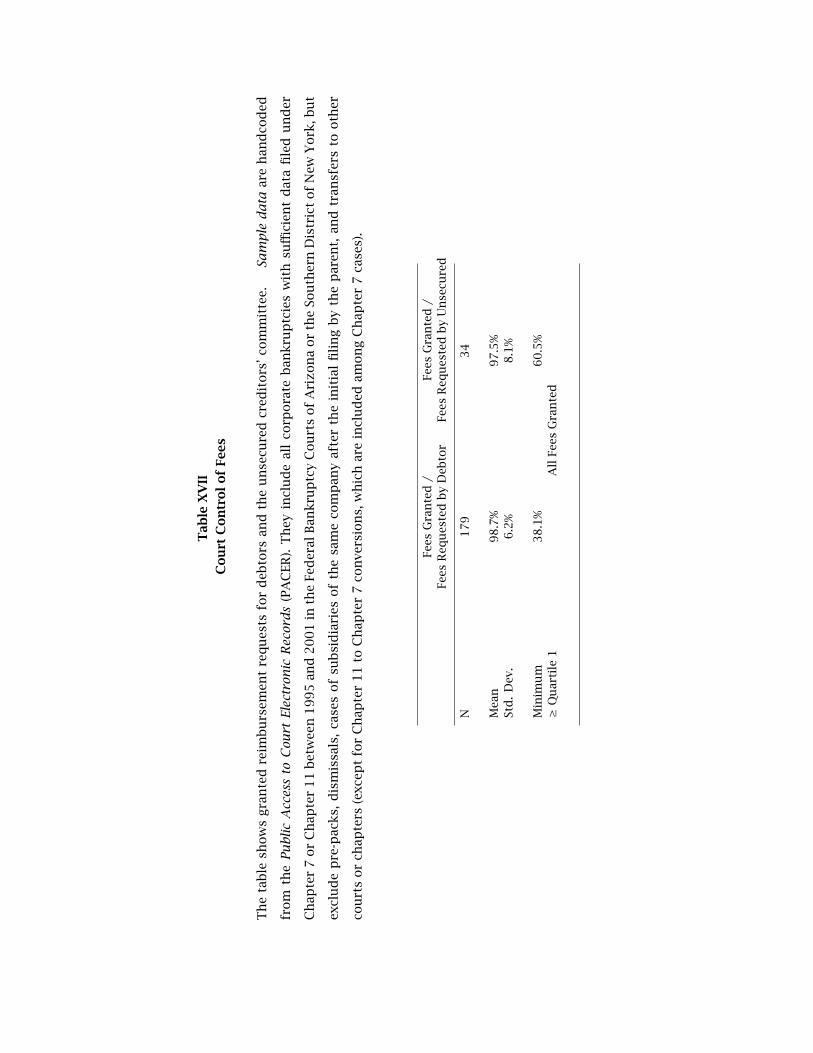
Tab
leX
VII
Cou
rtC
on
trol
of
Fee
s
Th
eta
ble
show
sgra
nte
dre
imb
urs
emen
tre
qu
ests
for
deb
tors
and
the
un
secu
red
cred
itors
’co
mm
itte
e.Sa
mp
led
ata
are
han
dco
ded
from
the
Pu
blic
Acc
ess
toC
ourt
Elec
tron
icR
ecor
ds
(PA
CER
).T
hey
incl
ud
eal
lco
rpora
teb
ankru
ptc
ies
wit
hsu
ffici
ent
dat
afi
led
un
der
Ch
apte
r7
or
Ch
apte
r1
1b
etw
een
19
95
and
20
01
inth
eFe
der
alB
ankru
ptc
yC
ou
rts
of
Ari
zon
aor
the
Sou
ther
nD
istr
ict
of
New
York
,bu
t
excl
ud
ep
re-p
acks,
dis
mis
sals
,ca
ses
of
sub
sid
iari
esof
the
sam
eco
mp
any
afte
rth
ein
itia
lfi
lin
gb
yth
ep
aren
t,an
dtr
ansf
ers
tooth
er
cou
rts
or
chap
ters
(exc
ept
for
Ch
apte
r1
1to
Ch
apte
r7
con
vers
ion
s,w
hic
har
ein
clu
ded
amon
gC
hap
ter
7ca
ses)
.
Fees
Gra
nte
d/
Fees
Req
ues
ted
by
Deb
tor
Fees
Gra
nte
d/
Fees
Req
ues
ted
by
Un
secu
red
N179
34
Mea
n98.7
%97.5
%St
d.
Dev
.6.2
%8.1
%
Min
imu
m38.1
%60.5
%≥
Qu
arti
le1
All
Fees
Gra
nte
d
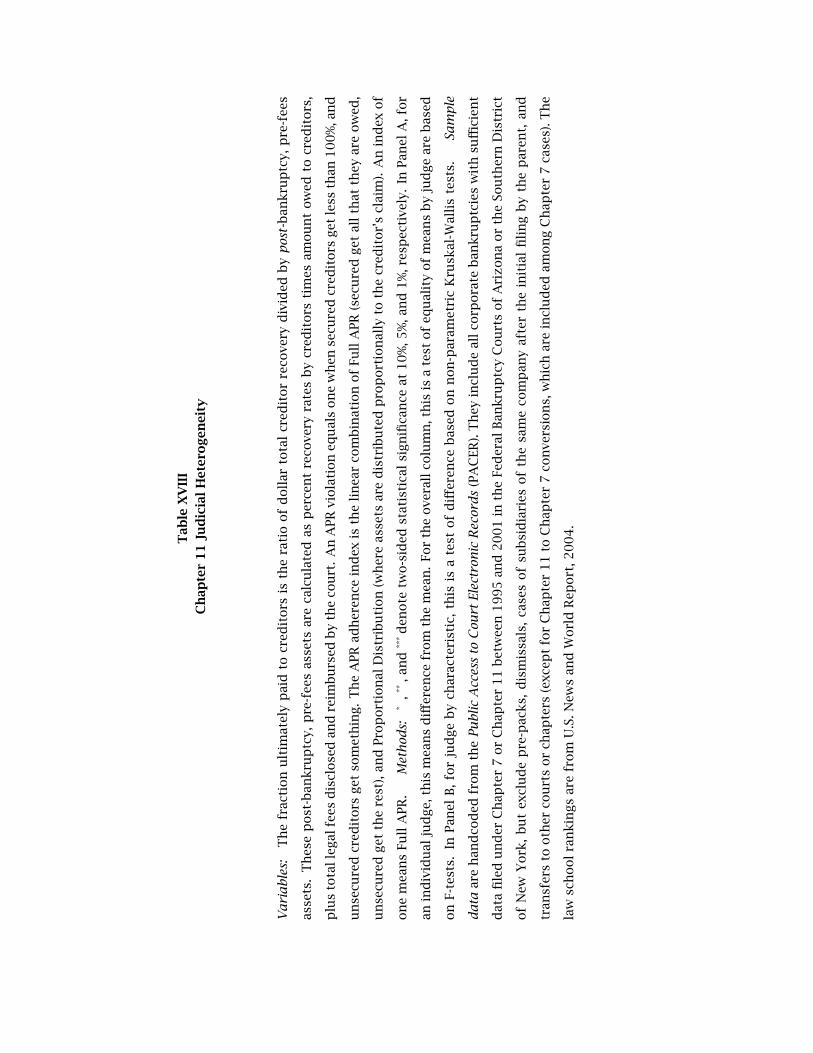
Tab
leX
VII
I
Ch
apte
r11
Jud
icia
lH
eter
ogen
eity
Va
ria
ble
s:T
he
frac
tion
ult
imat
ely
pai
dto
cred
itors
isth
era
tio
of
doll
arto
tal
cred
itor
reco
very
div
ided
by
pos
t-b
ankru
ptc
y,p
re-f
ees
asse
ts.
Th
ese
post
-ban
kru
ptc
y,p
re-f
ees
asse
tsar
eca
lcu
late
das
per
cen
tre
cove
ryra
tes
by
cred
itors
tim
esam
ou
nt
ow
edto
cred
itors
,
plu
sto
talle
gal
fees
dis
close
dan
dre
imb
urs
edb
yth
eco
urt
.A
nA
PR
viola
tion
equ
als
on
ew
hen
secu
red
cred
itors
get
less
than
10
0%
,an
d
un
secu
red
cred
itors
get
som
eth
ing.
Th
eA
PR
adh
eren
cein
dex
isth
eli
nea
rco
mb
inat
ion
of
Full
APR
(sec
ure
dget
all
that
they
are
ow
ed,
un
secu
red
get
the
rest
),an
dPro
port
ion
alD
istr
ibu
tion
(wh
ere
asse
tsar
ed
istr
ibu
ted
pro
port
ion
ally
toth
ecr
edit
or’
scl
aim
).A
nin
dex
of
on
em
ean
sFu
llA
PR
.M
eth
ods:
*,*
*,a
nd
***d
enote
two-s
ided
stat
isti
cal
sign
ifica
nce
at1
0%
,5
%,an
d1
%,re
spec
tive
ly.
InPan
elA
,fo
r
anin
div
idu
alju
dge,
this
mea
ns
diff
eren
cefr
om
the
mea
n.
For
the
ove
rall
colu
mn
,th
isis
ate
stof
equ
alit
yof
mea
ns
by
jud
ge
are
bas
ed
on
F-te
sts.
InPan
elB
,fo
rju
dge
by
char
acte
rist
ic,
this
isa
test
of
diff
eren
ceb
ased
on
non
-par
amet
ric
Kru
skal
-Wal
lis
test
s.Sa
mp
le
da
taar
eh
and
cod
edfr
om
the
Pu
blic
Acc
ess
toC
ourt
Elec
tron
icR
ecor
ds
(PA
CER
).T
hey
incl
ud
eal
lco
rpora
teb
ankru
ptc
ies
wit
hsu
ffici
ent
dat
afi
led
un
der
Ch
apte
r7
or
Ch
apte
r1
1b
etw
een
19
95
and
20
01
inth
eFe
der
alB
ankru
ptc
yC
ou
rts
of
Ari
zon
aor
the
Sou
ther
nD
istr
ict
of
New
York
,b
ut
excl
ud
ep
re-p
acks,
dis
mis
sals
,ca
ses
of
sub
sid
iari
esof
the
sam
eco
mp
any
afte
rth
ein
itia
lfi
lin
gb
yth
ep
aren
t,an
d
tran
sfer
sto
oth
erco
urt
sor
chap
ters
(exc
ept
for
Ch
apte
r1
1to
Ch
apte
r7
con
vers
ion
s,w
hic
har
ein
clu
ded
amon
gC
hap
ter
7ca
ses)
.Th
e
law
sch
ool
ran
kin
gs
are
from
U.S
.New
san
dW
orl
dR
eport
,20
04
.
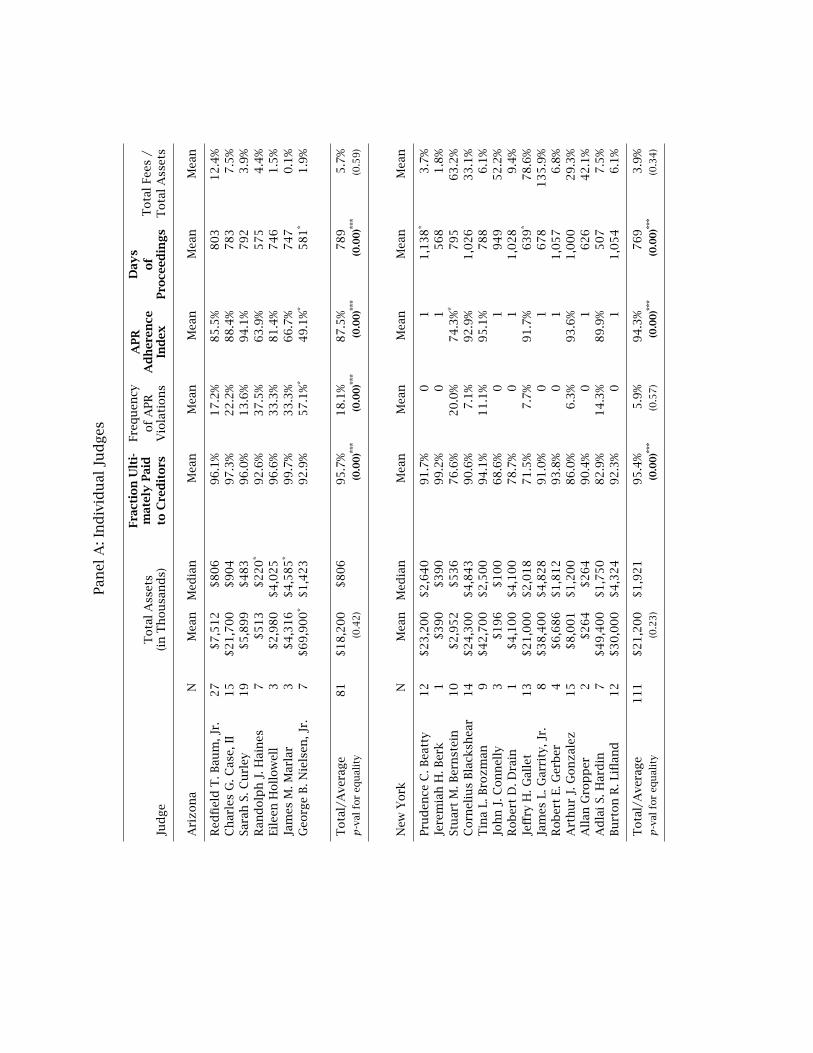
Pan
elA
:In
div
idu
alJu
dges
Jud
ge
Tota
lA
sset
s(i
nT
hou
san
ds)
Fra
ctio
nU
lti-
mat
ely
Pai
dto
Cre
dit
ors
Freq
uen
cyof
APR
Vio
lati
on
s
APR
Ad
her
ence
Ind
ex
Day
sof
Pro
ceed
ings
Tota
lFe
es/
Tota
lA
sset
s
Ari
zon
aN
Mea
nM
edia
nM
ean
Mea
nM
ean
Mea
nM
ean
Red
fiel
dT
.Bau
m,J
r.27
$7,5
12
$806
96.1
%17.2
%85.5
%803
12.4
%C
har
les
G.C
ase,
II15
$21,7
00
$904
97.3
%22.2
%88.4
%783
7.5
%Sa
rah
S.C
url
ey19
$5,8
99
$483
96.0
%13.6
%94.1
%792
3.9
%R
and
olp
hJ.
Hai
nes
7$513
$220
*92.6
%37.5
%63.9
%575
4.4
%Ei
leen
Holl
ow
ell
3$2,9
80
$4,0
25
96.6
%33.3
%81.4
%746
1.5
%Ja
mes
M.M
arla
r3
$4,3
16
$4,5
85
*99.7
%33.3
%66.7
%747
0.1
%G
eorg
eB
.Nie
lsen
,Jr.
7$69,9
00
*$1,4
23
92.9
%57.1
%*
49.1
%*
581
*1.9
%
Tota
l/A
vera
ge
81
$18,2
00
$806
95.7
%18.1
%87.5
%789
5.7
%p
-val
for
equ
alit
y(0
.42)
(0.0
0)**
*(0
.00)**
*(0
.00)**
*(0
.00)**
*(0
.59)
New
York
NM
ean
Med
ian
Mea
nM
ean
Mea
nM
ean
Mea
n
Pru
den
ceC
.Bea
tty
12
$23,2
00
$2,6
40
91.7
%0
11,1
38
*3.7
%Je
rem
iah
H.B
erk
1$390
$390
99.2
%0
1568
1.8
%St
uar
tM
.Ber
nst
ein
10
$2,9
52
$536
76.6
%20.0
%74.3
%*
795
63.2
%C
orn
eliu
sB
lack
shea
r14
$24,3
00
$4,8
43
90.6
%7.1
%92.9
%1,0
26
33.1
%T
ina
L.B
rozm
an9
$42,7
00
$2,5
00
94.1
%11.1
%95.1
%788
6.1
%Jo
hn
J.C
on
nel
ly3
$196
$100
68.6
%0
1949
52.2
%R
ob
ert
D.D
rain
1$4,1
00
$4,1
00
78.7
%0
11,0
28
9.4
%Je
ffry
H.G
alle
t13
$21,0
00
$2,0
18
71.5
%7.7
%91.7
%639
*78.6
%Ja
mes
L.G
arri
ty,J
r.8
$38,4
00
$4,8
28
91.0
%0
1678
135.9
%R
ob
ert
E.G
erb
er4
$6,6
86
$1,8
12
93.8
%0
11,0
57
6.8
%A
rth
ur
J.G
on
zal
ez15
$8,0
01
$1,2
00
86.0
%6.3
%93.6
%1,0
00
29.3
%A
llan
Gro
pp
er2
$264
$264
90.4
%0
1626
42.1
%A
dla
iS.
Har
din
7$49,4
00
$1,7
50
82.9
%14.3
%89.9
%507
7.5
%B
urt
on
R.L
iflan
d12
$30,0
00
$4,3
24
92.3
%0
11,0
54
6.1
%
Tota
l/A
vera
ge
111
$21,2
00
$1,9
21
95.4
%5.9
%94.3
%769
3.9
%p
-val
for
equ
alit
y(0
.23)
(0.0
0)**
*(0
.57)
(0.0
0)**
*(0
.00)**
*(0
.34)
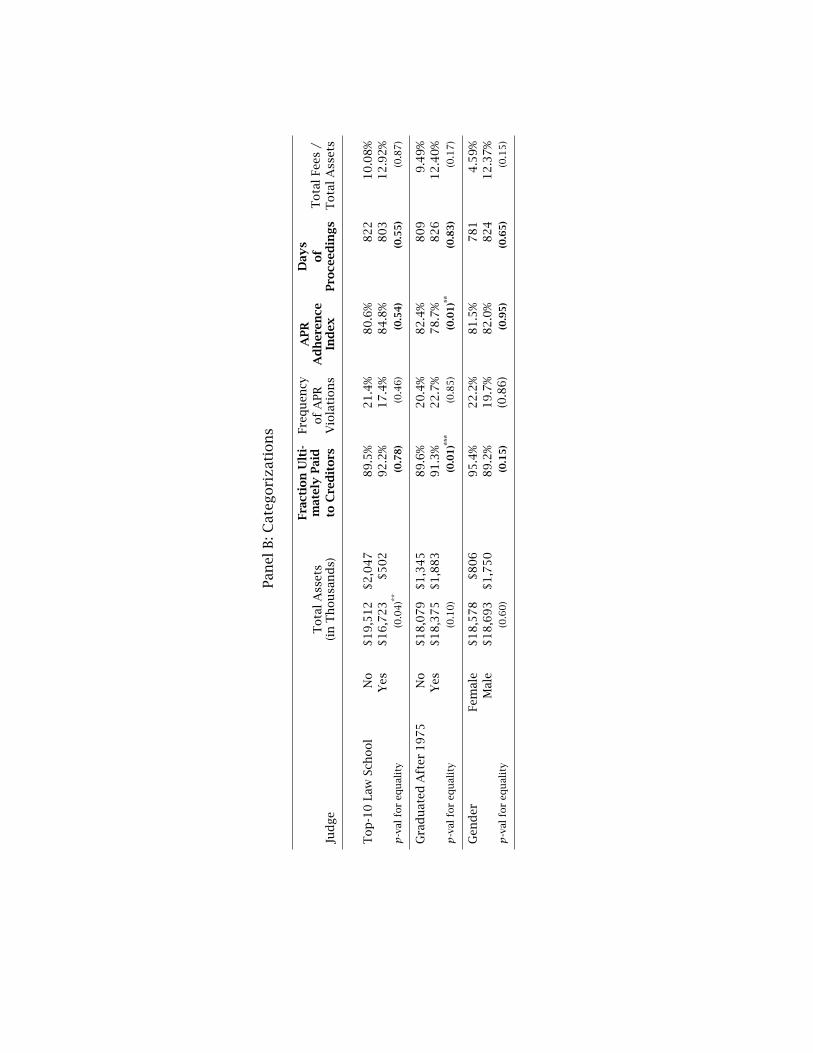
Pan
elB
:Cat
egori
zat
ion
s
Jud
ge
Tota
lA
sset
s(i
nT
hou
san
ds)
Fra
ctio
nU
lti-
mat
ely
Pai
dto
Cre
dit
ors
Freq
uen
cyof
APR
Vio
lati
on
s
APR
Ad
her
ence
Ind
ex
Day
sof
Pro
ceed
ings
Tota
lFe
es/
Tota
lA
sset
s
Top
-10
Law
Sch
ool
No
$19,5
12
$2,0
47
89.5
%21.4
%80.6
%822
10.0
8%
Yes
$16,7
23
$502
92.2
%17.4
%84.8
%803
12.9
2%
p-v
alfo
req
ual
ity
(0.0
4)**
(0.7
8)
(0.4
6)
(0.5
4)
(0.5
5)
(0.8
7)
Gra
du
ated
Aft
er1975
No
$18,0
79
$1,3
45
89.6
%20.4
%82.4
%809
9.4
9%
Yes
$18,3
75
$1,8
83
91.3
%22.7
%78.7
%826
12.4
0%
p-v
alfo
req
ual
ity
(0.1
0)
(0.0
1)**
*(0
.85)
(0.0
1)**
(0.8
3)
(0.1
7)
Gen
der
Fem
ale
$18,5
78
$806
95.4
%22.2
%81.5
%781
4.5
9%
Mal
e$18,6
93
$1,7
50
89.2
%19.7
%82.0
%824
12.3
7%
p-v
alfo
req
ual
ity
(0.6
0)
(0.1
5)
(0.8
6)
(0.9
5)
(0.6
5)
(0.1
5)