the cambrian basal sandstone unit in central alberta — an investigation of temperature...
TRANSCRIPT

1
The Cambrian Basal Sandstone Unit in central Alberta – an investigation of 1
temperature distribution, petrography and hydraulic and geomechanical 2
properties of a deep saline aquifer 3
Authors: Simon Weides*, Inga Moeck, Jacek Majorowicz, Matthias Grobe 4
5
* Corresponding author: Simon Weides at Helmholtz Centre Potsdam GFZ German Research 6
Centre for Geosciences, Telegrafenberg, 14473 Potsdam, Germany. 7
Phone: +49 (0)331 288 28689, fax: +49 (0)331 288 1570, email: [email protected] 8
9
Inga Moeck at Department of Earth and Atmospheric Sciences, University of Alberta, 1- 26 10
Earth Science Building, Edmonton, AB, Canada. 11
Phone: +1 780 492 3265, fax: +1 780 492 2030, mail: [email protected] 12
13
Jacek Majorowicz at Department of Physics, University of Alberta, 11322-89 Ave., 14
Edmonton, AB, Canada. 15
Phone: +1 780 20492 5007, fax: +1 780 492 0714, email: [email protected] 16
17
Matthias Grobe at Alberta Geological Survey, Alberta Energy Regulator, 402, Twin Atria 18
Building, 4999 - 98 Ave., Edmonton, AB, Canada. 19
Phone: +1 780 427 2843, fax:+1780 422 1459, email: [email protected] 20
21
22
23
24

2
The Cambrian Basal Sandstone Unit in central Alberta – an investigation of temperature 1
distribution, petrography and hydraulic and geomechanical properties of a deep saline aquifer 2
Authors: Simon Weides*, Inga Moeck, Jacek Majorowicz, Matthias Grobe 3
4
Abstract 5
Recent geothermal exploration indicated that the Cambrian Basal Sandstone Unit (BSU) in 6
central Alberta could be a potential target formation for geothermal heat production, due to its 7
depth and extent. Although several studies showed that the BSU in the shallower Western 8
Canada Sedimentary Basin (WCSB) has good reservoir properties, almost no information 9
exists from the deeper WCSB. This study investigated the petrography of the BSU in central 10
Alberta with help of drill cores and thin sections from six wells. Porosity and permeability as 11
important reservoir parameters for geothermal utilization were determined by core testing. 12
The average porosity and permeability of the BSU is 10 % and less than 1 × 10-14 m2, 13
respectively. A zone of high porosity and permeability was identified in a well located in the 14
northern part of the study area. This study presents the first published geomechanical tests of 15
the BSU, which were obtained as input parameters for the simulation of hydraulic stimulation 16
treatments. The BSU has a relatively high unconfined compressive strength (up to 97.7 MPa), 17
high cohesion (up to 69.8 MPa) and a remarkably high friction coefficient (up to 1.22), 18
despite a rather low tensile strength (less than 5 MPa). An average geothermal gradient of 19
35.6 °C/km was calculated from about 2000 temperature values. The temperature in the BSU 20
ranges from 65 °C to 120 °C. Results of this study confirm that the BSU is a potential 21
geothermal target formation, though hydraulic stimulation treatments are required to increase 22
the permeability of the reservoir. 23
24
Key Words: Alberta Basin – geothermal – reservoir characterization – geomechanics - 25
petrography 26

3
Introduction 1
The Cambrian Basal Sandstone Unit (BSU) is distributed in the eastern and central part of the 2
Western Canada Sedimentary Basin (WCSB) and unconformably overlies the Precambrian 3
basement (Fig.1). Due to the lack of hydrocarbon resources in the BSU and its position at the 4
base of the sedimentary succession, information and knowledge about the BSU in the deeper 5
WCSB is scarce. New interest in the BSU in central Alberta has arisen because it is being 6
considered as a target reservoir for underground storage of CO2 (Shell 2010, 2011) and as a 7
potential target formation for geothermal heat production (Weides et al. 2013; Hofmann et al. 8
2014). 9
The aim of this study was to improve the understanding of the temperature regime in central 10
Alberta and the reservoir characteristics of the BSU (i.e. petrography, porosity, permeability, 11
geomechanical properties) to assess its suitability for geothermal heat production. In the 12
portion of central Alberta, described in this study (Fig. 2), two general requirements for siting 13
a geothermal project are fulfilled: (1) a high heat demand (in the Edmonton metropolitan area) 14
and (2), the temperatures in the BSU are high enough (60-120 °C) to be used for applications 15
such as warm water provision or district heating and meet this heat demand (Weides et al. 16
2013). Besides temperature, the porosity, permeability and thickness of the reservoir rock are 17
important parameters because they control the flow rate of a geothermal well. In areas of 18
moderate heat flow like central Alberta, the critical point in geothermal project development 19
is to achieve suifficiently high flow rates to transport enough heat from the subsurface. 20
Furthermore knowledge of the geomechanical properties of the reservoir rock is required to 21
predict the behavior of the reservoir during extraction and injection of fluids (in geothermal 22
production or CO2 sequestration), or during stimulation treatments which might be conducted 23
to increase the reservoir permeability (see Hofmann et al. 2014). Injection (or extraction) of 24

4
fluids changes the in situ stress state of the reservoir, which could induce tensile or shear 1
fractures in the rock, or lead to movement on fault planes and related seismicity. 2
With regard to heat transfer, the central Alberta part of the WCSB belongs to the conduction 3
dominated geothermal systems (applying the ‘geothermal play type’ catalog from Moeck and 4
Beardsmore 2014). Within this category it can be classified as ‘foreland basin’ type, whose 5
typical geothermal reservoirs are characterized by high porosity and preferably high 6
permeability (Moeck and Beardsmore 2014). Geothermal conditions similar to the central 7
WCSB exist, for example, in the German Molasse Basin, where geothermal wells produce 8
heat at temperatures of 100-140 °C from carbonate reservoirs at depths of 3-4 km 9
(Geothermie Unterhaching 2014). Siliciclastic reservoir rocks similar to the BSU which are 10
used as geothermal reservoirs are, for example, the Triassic sandstones (Buntsandstein) at the 11
geothermal site of Landau (Upper Rhine graben, Germany) (Geox 2014) and the Permian 12
sandstone (Rotliegend) at the geothermal site of Gross Schönebeck in the Northeast German 13
Basin (Moeck et al. 2009). 14
Previous studies 15
Cambrian strata in the Alberta Basin were first recognized in a few deep hydrocarbon 16
exploration wells drilled in the early 1950s. The lithological term Basal Sandstone Unit was 17
introduced by Aitken (1968) for medium- and coarse-grained Cambrian sandstones with 18
excellent (20–25% according to the classification after Levorsen, 1967) porosity in some 19
wells. The thickness of the BSU in the wells studied by Aitken (1968) ranges between 27 m 20
and 45 m. Pugh (1971, 1973) described the BSU in Alberta as a deposit of mainly coarse-21
grained sandstones, composed of rounded and poorly to very poorly sorted quartz grains, with 22
good (15–20 %) to excellent (20–25 %) porosity. As an exception he describes a band south 23
and southeast of Edmonton where the sandstone is cemented with kaolin and porosity is poor 24
(5–10 %; Pugh, 1971). In the wells studied by Pugh (1971, 1973) the thickness of the BSU 25

5
ranges from 17 m in the southeast and northwest to 115 m at the eastern border to 1
Saskatchewan in the Lloydminster area. Slind et al. (1994) presented a synthesis of Cambrian 2
stratigraphy and palaeography that included cross-sections and a brief descriptive text on the 3
BSU. Coskun et al. (1995) analyzed porosity and permeability of the BSU in the shallower 4
basin (1000-1500 m) of east-central Alberta from 143 core samples (from 4 wells), resulting 5
in an average porosity value of 17 % and an average permeability value of more than 6
1 × 10-13 m2. 7
The first detailed sedimentological study of the BSU was presented by Dixon (2008) for the 8
eastern, shallower part of the WCSB in Saskatchewan, where the BSU is up to 290 m thick. 9
According to Dixon (2008), the BSU and the overlying shales of the Early Formation 10
represent the first of two major transgressive-regressive sequences between the Middle 11
Cambrian and the earliest Ordovician (Fig. 1). 12
The feasibility of large scale CO2 storage in the BSU is being investigated in the Shell Quest 13
project located northeast of Edmonton (Shell 2010, 2011). Further work focusing on the CO2 14
storage potential of the BSU has been conducted by Alberta Innovates and partners 15
(Government of Canada 2010; Hauck et al. 2012; Huang et al. 2012; Rebscher et al. 2012). 16
The geochemical effects of storing CO2 in the BSU were investigated by Talman et al. (2013). 17
Weides et al. (2013) identified the BSU as the most suitable horizon for geothermal 18
applications in in central Alberta. Hofmann et al. (2014) performed thermo-hydraulic 19
reservoir simulations and simulated hydraulic fracture stimulations for geothermal heat 20
production from the BSU using the results of this present study as input parameters. 21
The geothermal potential of the basal clastics in Saskatchewan (which is an Upper Cambrian 22
siliciclastic unit similar to the BSU) was studied by Vigrass 1979, Jessop and Vigrass (1989), 23
Vigrass (2007) and Ferguson and Grasby (2014). The authors concluded that direct 24
geothermal use of the basal clastics could be quite successful, mainly due to the good 25

6
hydraulic properties which should provide flow rates necessary for geothermal production 1
with minimal or no stimulation (Ferguson and Grasby 2014). 2
Several studies investigated the heat flow, geothermal regime and radiogenic heat production 3
of the WCSB during the last decades (Garland and Lennox 1962; Majorowicz and Jessop 4
1981; Jessop et al. 1984; Majorowicz et al. 1985; Burwash and Burwash 1989; Bachu 1993; 5
Bachu and Burwash 1994; Jessop et al. 2005; Majorowicz 1996; Majorowicz et al. 1999; 6
Grasby et al. 2009; Majorowicz and Grasby 2010, Majorowicz et al. 2014; Weides and 7
Majorowicz 2014). The heat flow of the WCSB ranges from 30-100 mW/m2 (average of 8
60.4 mW/m2), and the geothermal gradient is between 20 °C/km and more than 55 °C/km 9
(average of 33.2 °C/km; Weides and Majorowicz 2014). 10
Only little knowledge on the nature of the granitic Precambrian basement underneath the BSU 11
exists. Dietrich (1999) speculated that amplitude changes of the top-basement reflection in the 12
Lithoprobe seismic profile of central Alberta could be an evidence for fracturing or 13
weathering of the basement. Seismic surveys and FMI logs run northeast of Edmonton (for 14
Shell`s CO2 sequestration project) indicate the presence of fractures in the basement that 15
presumably were driven by the accretion of Archean province and Paleo-Proterozoic terranes 16
more than 2 billion years ago (ERCB 2012). According to Shell no substantial porosity or 17
permeability is expected in the Precambrian interval (ERCB 2012). 18
Methods 19
A variety of different methods was used to investigate the petrography of the BSU and the 20
parameters that are relevant in geothermal exploration which are porosity, permeability and 21
geomechanical properties, as well as depth, thickness and temperature distribution. For this 22
study about 50 m of BSU core material from six wells was available for analysis, with four of 23
these wells located within the study area (wells 5-29-62-1W5, 1-27-60-26W4, 8-17-50-26W4, 24
16-17-48-20W4), and two wells (15-34-43-10W4, 6-7-65-4W4) located approximately 50 km 25

7
southeast and 75 km northeast of the study area, respectively (Fig.2). The depth of the BSU in 1
wells 5-29-62-1W5, 1-27-60-26W4, 8-17-50-26W4, 16-17-48-20W4 and 15-34-43-10W4 2
ranges from 2108 m (15-34-43-10W4) to 2730 m (8-17-50-26W4) (see Fig. 2), while well 3
6-7-65-4W4 is located in the shallower basin and penetrates the BSU at a depth of 1320 m. 4
Petrographic analysis of core material 5
For the petrographic description of the BSU the core material was visually analyzed (Figs.3, 6
4, 5, 6). The mineral composition of the BSU was investigated by conducting a modal 7
analysis (area percentage) on thin sections from 32 rock samples (from wells 5-29-62-1W5, 8
1-27-60-26W4, 8-17-50-26W4, 16-17-48-20W4 and 15-34-43-10W4; Fig. 1) using an optical 9
microscope (Fig. 7). The grain size of 10 of these samples was analyzed using the image 10
analysis software JMicroVision developed by Roduit (2008). Grain roundness was studied on 11
10 samples using visual comparators developed after Pettijohn et al. (1987). The degree of 12
grain sorting was analyzed by applying the Folk and Ward (1957) formula on the graphic 13
representation of the grain size data, and by using visual comparators as they were developed 14
by Jerram (2001). 15
16
Helium pycnometry 17
Porosity was calculated from grain volumes and bulk volumes of 10 plug samples (from wells 18
5-29-62-1W5, 1-27-60-26W4, 8-17-50-26W4 and 15-34-43-10W4; Figs. 2, 8; Table 1). The 19
bulk volumes were determined with a caliper gauge, assuming a perfect cylindrical shape of 20
the plug samples. Grain volume and density of the samples were measured using a 21
MicroMeritics AccuPyc 1330 helium pycnometer. The pycnometer operates on Archimedes’ 22
principle of gas displacement. Density and volume of the sample are determined by 23
measuring the pressure change of helium in a calibrated volume. A detailed description of the 24
method can be found in Chang (1988). 25

8
Probe permeametry 1
Permeability was measured directly on cores using a Temco MP-401 Mini–Permeameter. 2
With probe-permeametry the permeability of rock can be determined by measuring the flow-3
rate and pressure of nitrogen gas as it follows an unconfined flow path through the rock. Mini-4
permeametry is a rapid, inexpensive, nondestructive method to determine permeability of a 5
rock sample (Halvorsen and Hurst 1990). The estimates of permeability obtained from probe 6
permeametry are at least as accurate as Hassler–sleeve estimates (Halvorsen and Hurst 1990). 7
However, it should be noted that with this method only matrix permeability of very small rock 8
volumes of up to 1 cm3 is measured. The probe tip used in this study had an inner diameter of 9
0.125 in. 96 measurements were conducted on cores from wells 5-29-62-1W5, 10
1-27-60-26W4, 8-17-50-26W4, 16-17-48-20W4 and 15-34-43-10W4 (Tables 1 and 2; Fig. 9). 11
All measurements were performed perpendicular to the direction of drilling, hence subparallel 12
to bedding. For comparison with the porosity values which were measured on plug samples, 9 13
of these 96 measurements were taken at the location from which core plugs were taken. 14
Geomechanical testing 15
The geomechanical properties of the BSU were determined in uniaxial, triaxial, and diametral 16
compression tests (Table 3). In total, 10 tests were conducted on core plugs which were all 17
taken in the direction of drilling, hence subvertical to bedding. The tests were conducted using 18
a servo controlled MTS 4,600 kN high stiffness loading frame, a 1,000 kN load cell (class 1) 19
and servo controlled oil driven confining pressure system with a total capacity of 200 MPa. 20
For diametral compression testing (Brazilian disk) a loading device was used that introduces 21
the load on the required diametral sectors. The axial loading rate on the specimen was 22
0.1-0.2 mm/min. All geomechanical tests were conducted at room temperature. 23
Three samples (from wells 1-27-60-26W4 and 8-17-50-26W4) were tested under unconfined 24
compression. The uniaxial compression test is conducted on cylindrical test specimens with a 25
length to diameter ratio of 2:1. The specimens used had a long axis parallel to the axis of the 26

9
drill core, a length of 5 cm, and a diameter of 2.5 cm. The ends of each test specimen were 1
lapped so that they were perpendicular to the long axis. The specimens were axially loaded, 2
and the load was increased in displacement mode until the peak load was reached. The 3
unconfined compressive strength (UCS) was calculated from peak load. The Young's modulus 4
is calculated from the linear part of the stress-strain diagram at 50 % of the strength (Tobias 5
Backers, personal communication). 6
Six samples (from wells 5-29-62-1W5, 1-27-60-26W4, 8-17-50-26W4, and 15-34-43-10W4) 7
were subjected to a multiple failure state test in a standard triaxial testing cell. In a triaxial test 8
configuration, the rock specimen is subjected to a homogeneous state of stress in which two 9
of the principal stresses are of equal magnitude (Jaeger et al. 2007). All stresses are 10
compressive, with the unequal stress more compressive than the two equal stresses, so that 11
σ1> σ2 = σ3 > 0. The triaxial stress state is achieved by subjecting the cylindrical rock 12
specimen to uniaxial compression in the presence of hydrostatic compression applied by a 13
pressurized fluid (Jaeger et al. 2007). The confining stress and the axial stress (or differential 14
stress) are measured during the test. The initial confining pressure is isostatically applied to 15
the specimen. Then the axial load on the specimen is increased at a constant displacement 16
rate. At the onset of failure, i.e., at zero inclination of the load-displacement diagram, the axial 17
loading is stopped. The confining pressure is subsequently increased to a higher level. The 18
axial stress is then increased further until failure occurs, and in this way the test continues at a 19
multiple of confining stress levels (Fjar et al. 2008). With this test the parameters of a Mohr 20
failure envelope can be derived from just one sample. 21
The tensile strength of two rock specimens (from wells 5-29-62-1W5 and 1-27-60-26W4) was 22
determined by the Brazilian test. In this test, a thin circular disk is diametrically compressed 23
to failure. The compression induces tensile stresses normal to the vertical diameter, which are 24
essentially constant over a region around the center (Li and Wong 2013). The indirect tensile 25
strength is typically calculated based on the assumption that failure occurs at the point of 26

10
maximum tensile stress, i.e. at the center of the disc. At peak load a fracture is introduced 1
from the center of the specimens and propagates outwards. If the fracture is initiated at the 2
mantle surface the test is not valid. From the geometrical measures and the peak load the 3
indirect tensile strength is determined. 4
Mapping of depth, thickness, thermal gradient and temperature 5
The depth to the top of the Precambrian (which is equal to the base of the BSU) and the 6
thickness of the BSU were mapped with Inverse Distance Weighting (IDW) using data from 7
15 wells (from IHS 2012) (Fig. 10a, b). 8
The geothermal gradient was calculated from 2005 temperature values from 615 wells. The 9
temperature data were derived from bottom hole temperature measurements (BHTs), 10
temperature measurements from drill stem tests (DSTs) and annual pressure and temperature 11
tests in shut in wells. This data set was compiled from data published in Majorowicz and 12
Moore (2008), Majorowicz and Grasby (2010), Gray et al. (2012), Majorowicz et al. (2012) 13
and Weides and Majorowicz (2014). Where information about circulation times was 14
available, the data from BHTs were corrected using the Horner method (Lachenbruch and 15
Brewer 1959). The rest were corrected using the standard AAPG Harrison correction 16
(Harrison et al. 1983). The distribution of the thermal gradient in the sedimentary succession 17
was mapped using the simple kriging method (Fig. 10c). With kriging, unbiased estimates of 18
regionalized variables at unsampled locations are made using the structural properties of the 19
semivariogram and the initial set of data values (David 1977). The raster of the thermal 20
gradient map was then multiplied with the raster of a Precambrian depth map (Fig. 10a), 21
resulting in a temperature map for the top of the Precambrian (i.e., the base of the BSU) 22
(Fig. 10d). 23

11
Results 1
Sedimentology and petrography 2
The succession of the BSU consists mainly of thin to thick beds of fine- to coarse-grained 3
sandstone with minor amounts of interbedded mudstone. The BSU can be described as mainly 4
quartz arenite. White, grey, brown, and red are the predominant colours. In well 6-7-65-4W4 5
some core intervals show greenish colours. Overall the BSU can be subdivided into a lower 6
lithic/pebbly zone, a middle zone characterized by cross-bedded sandstones and an upper zone 7
containing bioturbated sandstones (see Figs. 3–6). 8
In the basal zone (1 - 5 m) the Precambrian basement is typically overlain by a 20–40 cm 9
thick pebbly sandstone containing granitic and metamorphic basement rock fragments and 10
feldspar grains (Fig. 4a-c). The average grain size of the pebbly sandstone ranges from less 11
than 1 mm to 2 mm. The size of most pebbles is less than 30 mm, though larger pebbles are 12
found. The pebbly sandstone beds are generally followed by a sequence of poorly sorted finer 13
grained sandstone beds that can still contain basement rock fragments (smaller than 30 mm). 14
Above this section the sandstone beds exhibit a better sorting, and basement fragments are 15
only found sporadically (Fig. 4c). Thin mudstone beds (1–10 cn) can be intercalated in the 16
sandstone beds of the lower zone. 17
The overlying middle zone consists predominantly of cross-bedded sandstone beds (Fig. 18
5a-c). Low angle cross laminae and ripple cross-laminae are also present. The bed thickness is 19
typically less than 5 cm, although thicker beds of 10 cm or more are present locally. Grain 20
size in the sandstone beds is mostly fine sand to medium sand, with minor amounts of coarse 21
sand (Fig. 5c). Some examples of thin graded beds (fining upwards) exist (Fig. 5a). Convolute 22
bedding structures and ripple bedding were observed in well 6-7-65-4W4. Very thin (less than 23
1 mm) to thick (up to 10 mm) laminae of clay are intercalated between the sandstone beds 24
(Fig. 5b). The sandstone mostly occurs in cosets of planar- or cross-bedded strata which are 25

12
between 1 m and 5 m thick. These cosets are separated by thin mudstone beds that are 1
between 1 cm and 25cm thick. 2
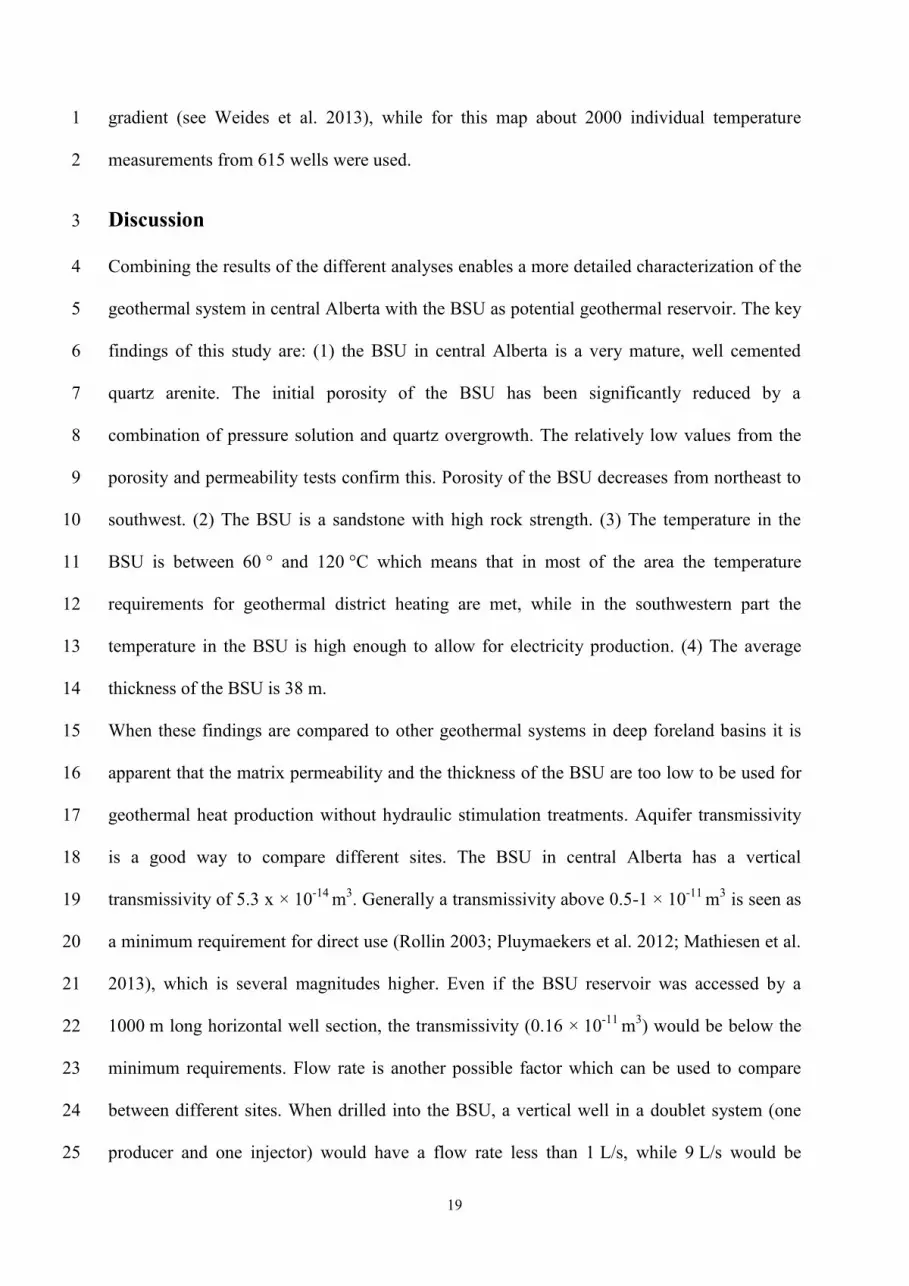
The upper zone consists mainly of bioturbated sandstones with intercalated clay laminae and 3
thin (1–25 cm) mudstone beds. Horizontal and vertical burrows are very common (Fig. 6a-c). 4
In some cases the primary sedimentary structures were almost completely destroyed by 5
bioturbation (Fig. 6a).This upper zone of the BSU has a minimum thickness of about 4-10 m 6
(in wells 1-27-60-26W4 and 5-29-62-1W5). 7
The middle quartz arenite zone makes up most of the BSU. Based on the available core 8
material, the relative shares of the lower lithic/pebbly sandstone zone and the upper 9
bioturbated sandstone zone are 5-10 % and 10-25 %, respectively. 10
No consistent lateral facies trend could be identified from the core material. A vertical 11
coarsening-upward trend exists for the basal part of the BSU, where the pebbly sandstone 12
with feldspar and granitic grains gradually develop into quartz arenite. 13
Modal analysis of the samples (which where all taken from cores sections above the basal 14
pebbly sandstone) indicates that the BSU has a quartz content of at least 95 % and thus can be 15
classified as a quartz arenite (Fig. 7a-f). Monocrystalline quartz grains dominate, the amount 16
of polycrystalline and undulatory quartz grains is less than a few percent. Microcline, 17
plagioclase, chlorite, muscovite, biotite, amphibole, pyroxene, zircon, and tourmaline are 18
found as accessory detrital minerals. One sample from the upper zone of the BSU (well 19
5-29-62-1W5) contained 5-10 % glauconite (Fig. 7 c). In samples from wells 5-29-62-1W5, 20
1-27-60-26W4, 8-17-50-26W4 and 16-17-48-20W4, the cement is composed of silica which 21
occurs as quartz overgrowths around and in optical continuity with the original detrital quartz 22
grains (Fig. 7a, d, f). In some cases the original grain shape can be identified from iron 23
mineral coatings, which mark the grain boundaries (Fig. 7a, d, f). In other cases the boundary 24
between grain and overgrowth cannot be discerned with the petrographic microscope; in these 25
cases the rock structure appears as a tight mosaic of interlocking crystals. Structures resulting 26

13
from pressure dissolution are frequently found in the BSU thin sections. Fig. 7 (b, e) shows 1
sutured contacts between quartz grains in a sample from well 5-29-62-1W5. Iron minerals are 2
present at the original grain boundaries, and often also in the pore space (Fig. 7a, e). The type 3
of iron mineral could not be identified with the petrographic microscope. Thin clay lamina, 4
and less often hydrocarbons and flakes of mica, are present between the quartz grains. 5
The BSU in well 15-34-43-10W4, located approximately 50 km southeast of the study area is 6
cemented with clay and carbonate. Some quartz grains exhibit evidence of earlier quartz 7
overgrowth. 8
The grain size analysis showed that on average the BSU is composed of fine (57 %) to 9
medium sand (30 %), with minor amounts of coarse sand (7 %) and silt (6 %). The majority 10
of BSU samples can be classified as moderately well sorted with most of the grains being 11
sub–rounded to rounded. 12
Interpretation and discussion of sedimentological and petrographic analyses 13
The basal part of the BSU contains basement lithic fragments, which were weathered under 14
subaerial exposure (Dixon 2008) and were presumably fluvially transported prior to 15
deposition. Another possible option is that the fragments are remnants of an in-situ weathered 16
basement. Paleographic reconstruction of the North American continent indicates a 17
continental depositional environment for Alberta during the time from the Late Precambrian 18
until the deposition of the BSU in the Middle Cambrian (Blakey 2008), and weathering of the 19
basement would explain amplitude changes in the top-basement reflection in central Alberta 20
(Dietrich 1999). 21
Overlying planar- and cross-stratified sandstones were deposited in a marine shoreface 22
environment at a depth where sedimentation was influenced by current and wave action. 23
The bioturbated sandstone and intercalated mudstone beds in the upper zone of the BSU 24
indicate a deposition in the deeper offshore transition zone. The presence of glauconite in 25

14
samples from this section (found in well 5-29-62-1W5) supports this interpretation. 1
Glauconite is an important indicator of a marine depositional environment at depths of a few 2
tens to hundreds of meters (Tucker 2009). 3
The succession of the BSU represents first progressive onlap of strata on the Precambrian 4
shield and is the basal part of the Sauk sequence (Sloss 1963), the first transgressive phase of 5
the Phanerozoic. The BSU beds record an overall transition from (presumably) fluvial 6
conditions in the basal pebbly zone to shoreface sandstones (middle zone), which are in turn 7
overlain by offshore transition deposits (bioturbated sandstones of the upper zone). 8
Thin-section analysis showed that the BSU is a very mature quartz arenite, with rounded and 9
moderately well sorted grains, typical of sediments deposited in a shoreline depositional 10
environment (Tucker 2009). 11
Previous studies came to a similar interpretation of the BSU depositional setting. Dixon 12
(2008) interpreted a “marine depositional environment… within water depths where wave and 13
current action were prevalent”. The authors of the Shell Quest report suggested that the BSU 14
was “deposited in a tide-dominated bay margin…in which sand, originally deposited by 15
rivers, was reworked into tidal dunes…” (Shell 2010). 16
Silica cementation appears to have significantly reduced the initial porosity of the sandstone 17
in parts of the BSU (Fig. 7d). The origin of the silica for quartz overgrowth cementation 18
frequently has been attributed to pressure dissolution (Tucker 2009). In this process 19
dissolution of feldspars, amphiboles and pyroxenes (which all occur in the granite of the 20
underlying basement) would provide silica, as would the mineral transformation from feldspar 21
to kaolinite (Tucker 2009). Pore solutions become enriched in silica, which is then 22
reprecipitated as overgrowth when supersaturation is achieved (Tucker 2009). Fig. 7 (b,e) 23
shows sutured contacts between quartz grains in a sample from well 5-29-62-1W5, as they 24
form in the early stage of pressure solution. 25
26

15
Porosity and permeability 1
Porosity of the 10 core plug samples ranges from 5.3 % to 19.6 %, with a geometric average 2
of 9.9 % (Table 1). In the classification of Levorsen (1967) the porosity of the BSU samples 3
can be described as poor to good. The small number of samples and the relatively large spread 4
of test results do not allow us to clearly identify a well which has the highest porosity 5
(Table 1). The majority of the 96 horizontal permeability measurements have results between 6
1 × 10-16 m2 and 1 × 10-14 m2 and can be classified as fair (after Levorsen 1967) (Fig. 9). 7
However, three measurements which were conducted in a 50 cm thick interval of well 8
1-27-60-26W4 showed comparatively high permeability values larger than 1 × 10-13 m2 (very 9
good), with a maximum at 1.1 × 10⁻¹² m2 (Fig. 9). For comparison with the porosity 10
measurements, nine out of these 96 permeability tests were conducted at the location from 11
where the core plug samples were taken. These samples have a permeability of 7 × 10-16 m2 to 12
1.5 × 10⁻¹⁵ m2 (Table 1). For comparison between the different wells average values were 13
calculated (Table 2). Geometric averages of horizontal permeability range from 5 × 10-16 m2 14
(wells 8-17-50-26W4 and 15-34-43-10W4) to 3.4 × 10⁻¹⁵ m2 (5-29-62-1W5). The box plot and 15
the histogram shown in Fig. 9 give a good pictorial representation of the variability of the 16
BSU permeability data. 17
18
Interpretation and discussion of porosity and permeability results 19
The average porosity of the BSU in central Alberta is lower than earlier studies from the 20
shallower WCSB of eastern Alberta and Saskatchewan have reported, and consistent with the 21
band of lower porosity south and southeast of Edmonton which had been suggested by Pugh 22
(1971). When comparing porosity data from the BSU, a general trend of decreasing porosity 23
with depth can be identified. Fig. 8 shows the porosity of the BSU in the study area, based on 24
the new core test results presented in this study and on porosity values from well log 25
interpretation from Shell (2010). The two wells located northeast of the study area 26

16
(14-5-66-5W4 and 5-8-66-5W4) confirm the trend of decreasing porosity with depth, having 1
average porosities above 20 % (core analysis results; IHS 2012). One reason for the lower 2
porosity in the deeper basin of central Alberta could be higher compaction of the sediments. 3
Secondly, it is observed in this study that quartz overgrowth and pressure solution have 4
reduced the porosity of the samples. In well 15-34-43-10W4 the BSU is cemented with clay, 5
which additionally decreases porosity. Determination of the factors causing the lower porosity 6
of the BSU in central Alberta compared to the shallower basin was beyond the scope of this 7
study, but could be achieved through a detailed investigation of grain size distribution, sorting 8
of grains, cementation, and porosity of the BSU in both the deeper and the shallower parts of 9
the basin. 10
While the permeability in most samples is generally less than 1 × 10-14 m2, three 11
measurements conducted in a 50 cm thick part of well 1-27-60-26W4 showed permeability 12
larger than 1 × 10-13 m2. Semi-quantitative thin section analysis of a sample from this interval 13
showed that the porosity is more than 30 %. Sutured grain boundaries resulting from pressure 14
solution are present. This exceptionally high permeability may have been caused by 15
dissolution and/or alteration of an early-formed non-silica cement (carbonate?) or unstable 16
minerals (such as feldspar). 17
18
Geomechanical properties 19
The unconfined compressive strength (UCS) of the tested BSU specimens ranges from 20
22.9 MPa to 97.7 MPa (Table 3). Young´s moduli of the three BSU specimens range from 21
3.9 GPa to 21.6 GPa (Table 3). The friction coefficients of the six BSU specimens tested 22
range from 0.6 – 1.22, with an average value of 0.96 (friction angle 31° to 50.7°) (Table 3). 23
The cohesion of the BSU specimens varies from 9.4 MPa to 69.8 MPa, with an average value 24

17
of 31.9 MPa. The values for tensile strength of the two test specimen are 2.1 MPa and 1
4.9 MPa (Table 3). 2
3
Interpretation and discussion of geomechanical test results 4
According to the UCS classification of Anon (1977) the BSU samples can be classified as 5
moderately strong (12.5–50 MPa) to strong (50–100 MPa). Generally the UCS of sandstone 6
has a wide spread and can range from 10 MPa to more than 200 MPa (Johnson and DeGraff 7
1988). Young´s moduli of the BSU samples (3.9-21.6 GPa) are within the typical sandstone 8
range of 0.1 GPa to 30 GPa (Fjar et al. 2008). The friction coefficients of the BSU samples 9
(0.6-1.22) are remarkably high in comparison to other sandstones, which typically range from 10
0.51 to 0.68 (Jaeger et al. 2007). The BSU samples also show a very high cohesion 11
(9.4-69.8 MPa) compared to other sandstones which commonly have values between 8.0 MPa 12
and 37 MPa (Zang and Stephansson 2008; Schön 2011). The tensile strength of the BSU 13
samples (2.1-4.9 MPa) is rather low. Commonly the tensile strength of sandstones is between 14
2.8 MPa and 8.7 MPa (Siegesmund and Snethlage 2011). 15
Thickness and depth 16
The depth of the BSU ranges from about 1900 m in the northeast to more than 3400 m in the 17
southwest (Fig. 10a). The thickness ranges from 28-47 m with an average of 38 m (Fig. 10b). 18
A trend of decreasing thickness with depth towards the southwest can be recognized. 19
Thermal gradient and temperature distribution 20
The average geothermal gradient in the study area is 35.6 °C/km (calculated from the kriging 21
map Fig. 10c). A high-gradient zone exists in the southwestern portion of the study area, 22
where the gradient exceeds 40 °C/km (Fig. 10c). A second zone of higher gradient exists in 23
the northwestern corner of the area (Fig. 10c). In a band striking from the northern to the 24
western part of the study area, the gradient is relatively low, with values smaller than 25

18
30 °C/km (Fig. 10c). Apart from this lateral variation of the geothermal gradient, the 1
temperature distribution in the BSU is mainly controlled by depth (Fig. 10a, d). Following the 2
general southwestward dip direction of the sedimentary strata in central Alberta the 3
temperature in the BSU increases from about 65 °C in the shallow northeast to more than 4
120 °C in the deepest southwestern part (Fig. 10d). 5
6
Interpretation and discussion of the thermal data 7
The observed variations in the geothermal gradient (dT/dz) in the study area (Fig. 10c) can 8
be inferred to be differences in heat flow (Q), controlled by changes in the thermal 9
conductivity (k) of the rock units. Heat conduction is estimated to be the main force of heat 10
transfer in this system, which is not affected by convective heat transfer due to the low Darcy 11
flow velocities in the basin (Majorowicz et al. 1999). The variations in heat flow (Q), which 12
control the variations of the geothermal gradient (dT/dz=Q/k), depend also on variations in 13
heat contribution from heat production in the crust and from the mantle heat flow. As the 14
variability in mantle heat flow in northern Alberta is low (15 mW/m2; S.D. 5 mW/m2) 15
according to the recent study by Majorowicz et al. (2014), we assume that the heat flow-heat 16
generation relationship for the large upper crustal Precambrian domains is the major control 17
on the heat flow (Majorowicz et al. 2014). 18
Variations in the BSU temperature (Fig. 10d) depend on the geothermal gradient and the 19
depth to the Precambrian surface. For calculation of the BSU temperature a ground surface 20
temperature of 0 °C was assumed to be in thermal equilibrium with the temperature at depth 21
(Majorowicz et al. 2012). 22
From the newly established maps of the geothermal gradient and the temperature distribution 23
in the BSU (Fig. 10c, d) regional variations can be identified. This is an improvement in 24
comparison to earlier temperature maps which were only based on one regional geothermal 25
19
gradient (see Weides et al. 2013), while for this map about 2000 individual temperature 1
measurements from 615 wells were used. 2
Discussion 3
Combining the results of the different analyses enables a more detailed characterization of the 4
geothermal system in central Alberta with the BSU as potential geothermal reservoir. The key 5
findings of this study are: (1) the BSU in central Alberta is a very mature, well cemented 6
quartz arenite. The initial porosity of the BSU has been significantly reduced by a 7
combination of pressure solution and quartz overgrowth. The relatively low values from the 8
porosity and permeability tests confirm this. Porosity of the BSU decreases from northeast to 9
southwest. (2) The BSU is a sandstone with high rock strength. (3) The temperature in the 10
BSU is between 60 ° and 120 °C which means that in most of the area the temperature 11
requirements for geothermal district heating are met, while in the southwestern part the 12
temperature in the BSU is high enough to allow for electricity production. (4) The average 13
thickness of the BSU is 38 m. 14
When these findings are compared to other geothermal systems in deep foreland basins it is 15
apparent that the matrix permeability and the thickness of the BSU are too low to be used for 16
geothermal heat production without hydraulic stimulation treatments. Aquifer transmissivity 17
is a good way to compare different sites. The BSU in central Alberta has a vertical 18
transmissivity of 5.3 x × 10-14 m3. Generally a transmissivity above 0.5-1 × 10-11 m3 is seen as 19
a minimum requirement for direct use (Rollin 2003; Pluymaekers et al. 2012; Mathiesen et al. 20
2013), which is several magnitudes higher. Even if the BSU reservoir was accessed by a 21
1000 m long horizontal well section, the transmissivity (0.16 × 10⁻¹¹ m3) would be below the 22
minimum requirements. Flow rate is another possible factor which can be used to compare 23
between different sites. When drilled into the BSU, a vertical well in a doublet system (one 24
producer and one injector) would have a flow rate less than 1 L/s, while 9 L/s would be 25

20
possible with a system of three horizontal wells with a 1000 m long open hole section in the 1
BSU (two producers and one injector) (see Hofmann et al. 2014). In the Dogger aquifer of 2
France, which has been exploited for direct use of geothermal heat for more than 40 years, 3
production rates typically range from 14-167 L/s (Lopez et al. 2010). The geothermal sites of 4
Landau and Unterhaching in Germany have flow rates of 50-70 L/s and 100-150 L/s 5
respectively (Geox 2014, Geothermie Unterhaching 2014). Brine disposal wells injecting into 6
the basal clastics in Saskatchewan (which are considered as a geothermal reservoir) have flow 7
rates between 30-40 L/s (Ferguson and Grasby 2014). Therefore the permeability of the BSU 8
reservoirs would need to be increased by hydraulic stimulation treatments. Results from 9
Hofmann et al. (2014) show that the average production of more than 25 L/s per well can be 10
obtained, when the reservoir is accessed with horizontal wells that are connected by vertical 11
hydraulic fractures. 12
If natural fractures exist in the Precambrian basement, as earlier studies have indicated 13
(Dietrich 2009, ERCB 2012), they theoretically might be zones of fluid flow if they are open 14
and connected to the overlying BSU. If this is the case, co-production of fluids from the BSU 15
and the Precambrian fractures might theoretically be a scenario for a geothermal project. 16
17
Conclusions 18
Due to its depth and related high temperature and its extension throughout central Alberta the 19
BSU is a potential geothermal target formation. The BSU in central Alberta has relatively low 20
thickness of 38 m and a relatively low matrix porosity and matrix permeability, which makes 21
horizontal drilling and hydraulic stimulation treatments necessary for geothermal heat 22
production. 23
For most of the study area the temperature is higher than 70 °C, which is sufficient for direct 24
use of geothermal heat for district heating (Líndal 1973). The temperature in the BSU 25
increases towards the southwest, where up to 120 °C is reached. 26

21
The geomechanical tests showed that the BSU has relatively high unconfined compressive 1
strength (up to 97.7 MPa), high cohesion (up to 69.8 MPa) and remarkably high values for the 2
friction coefficient (up to 1.22), while the tensile strength is rather low (less than 5 MPa). 3
4
Acknowledgements 5
The probe permeameter, access to core material and well data was provided by the Alberta 6
Geological Survey (AGS). Special thanks to Gordon Jean (AGS) for supervision of the probe 7
permeameter measurements. 8
The geomechanical tests were conducted at the GFZ Potsdam by Tobias Backers and Tobias 9
Meier from Geomecon GmbH, Potsdam. 10
Thanks to my colleagues Fiorenza Deon and Stefan Klapperer from GFZ Potsdam and to 11
Torsten Steiger from GeoTec Consult for fruitful discussions on the thin sections. 12
The maps were created using ArcGIS® software by Esri Inc. 13
This study is part of the Helmholtz – Alberta Initiative (HAI), a research collaboration 14
between the Helmholtz Association of German Research Centres and the University of 15
Alberta. 16
The authors would like to acknowledge the helpful reviews by Dr. Stephen Grasby and an 17
anonymous reviewer, and the useful comments and suggestions by the Editor Dr. Ali Polat 18
and Associate Editor Dr. Michael Rygel. 19

22
References 1
Aitken, J.D. 1968. Cambrian sections in the easternmost southern Rocky Mountains and the 2
adjacent subsurface, Alberta. Geological Survey of Canada, Dept. of Energy, Mines and 3
Resources, Ottawa. 4
Anon, Q. 1977. The description of rock masses for engineering purposes. QJ Eng Geol 10: 5
355-388. 6
Bachu, S. 1993. Basement heat flow in the Western Canada sedimentary basin. 7
Tectonophysics 222 (1):119-133. 8
Bachu S., and Burwash, R. 1994. Geothermal regime in the Western Canada sedimentary 9
basin. In Geological Atlas of the Western Canada Sedimentary Basin. Edited by G. Mossop 10
and I. Shetsen. Canadian Society of Petroleum Geologists and Alberta Research Council, 11
Special Report 4: 447-454. 12
Blakey, R. 2008. Paleogeography and Geologic Evolution of North America. Available from 13
http://jan.ucc.nau.edu/∼rcb7/nam.html [accessed 21 May 2014]. 14
Burwash R.,and Burwash, R. 1989. A radioactive heat generation map for the subsurface 15
Precambrian of Alberta. Geological Survey of Canada, Paper 89:363-368. 16
Chang, C. 1988. Measuring density and porosity of grain kernels using a gas pycnometer. 17
Cereal Chem 65(1): 13-15. 18
Coskun, S.B., Addison, G.D., and Hein, F.J. 1995. Thin Section Image Analyis of the 19
Cambrian Basal Sandstone, East Central Alberta. In LITHOPROBE Alberta Basement 20
Transects #47 Report Transect Workshop April 10-11, 1995. pp. 113-164. 21

23
David, M. 1977. Geostatistical ore reserve estimation, Elsevier Scientific Publishing 1
Company, New York. 2
Dietrich, J.R. 1999. Seismic stratigraphy and structure of the Lower Paleozoic, central Alberta 3
Lithoprobe transect. Bulletin of Canadian Petroleum Geology, 47(4), 362-374. 4
Dixon, J. 2008. Stratigraphy and facies of Cambrian to Lower Ordovician strata in 5
Saskatchewan. Bulletin of canadian petroleum geology 56(2): 93-117. 6
Energy Resources Conservation Board (ERCB) 2012. Decision 2012 AB ERCB 008: Shell 7
Canada Limited, Application for the Quest Carbon Capture and Storage Project, Radway 8
Field; ERCB, Calgary, Canada. 67 p. 9
Ferguson, G., and Grasby, S.E. 2014. The geothermal potential of the basal clastics of 10
Saskatchewan, Canada. Hydrogeol. J., 22, 143–150. 11
Fjar, E., Holt, R.M., Raaen, A., Risnes, R., and Horsrud, P. 2008. Petroleum related rock 12
mechanics. Elsevier, Amsterdam. 13
Folk, R.L., and Ward, W.C. 1957. Brazos River bar; a study in the significance of grain size 14
parameters. J Sediment Res 27:3–26. 15
Garland, G., and Lennox, D. 1962. Heat flow in western Canada. Geophys. J. Int. 6, 245–16
262. 17
Geothermie Unterhaching. 2014. Geothermieprojekt Unterhaching [online]. Available from 18
https://www.geothermie-unterhaching.de/cms/geothermie/web.nsf/id/pa_daten_fakten.html. 19
[cited 17 April 2014]. 20

24
Geox GmbH. 2014. Geothermische Stromerzeugung in Landau [online]. Available from: 1
http://www.geox-gmbh.de/media/Downloadbereich/projekt_1407internet-x.pdf [cited 17 2
April 2014]. 3
Government of Canada. 2010. Basal Cambrian saline formation CO2 storage project [online]. 4
Available from http://www.climatechange.gc.ca/dialogue/default.asp?lang=En&n=774E76B0 5
-1&offset=1&toc=show [cited 10 April 2014]. 6
Grasby, S., Majorowicz, J., and Ko, M. 2009. Geothermal maps of Canada. Geological 7
Survey of Canada, Open File 6167:35. 8
Gray, D.A., Majorowicz, J., and Unsworth, M. 2012. Investigation of the geothermal state of 9
sedimentary basins using oil industry thermal data: case study from Northern Alberta 10
exhibiting the need to systematically remove biased data. Journal of Geophysics and 11
Engineering 9(5): 534-548. doi: 10.1088/1742-2132/9/5/534. 12
Halvorsen, C., and Hurst, A. 1990. Principles, practice and applications of laboratory 13
minipermeametry. In Advances in Core Evaluation: Accuracy and Precision in Reserves 14
Estimation. Edited by P. F. Worthington: Gordon and Breach, London, pp. 521-549. 15
Harrison, W., Luza, K., Prater, M., and Chueng, P. 1983. Geothermal resource assessment of 16
Oklahoma, Oklahoma Geological Survey Special Publication SP 83-1, Oklahoma. 17
Hauck, T., Peterson, J., Melnik, A., and Bachu, S. 2012. Geology and Hydrogeology of the 18
Basal Aquifer in the Prairie Region of Canada: Characterization for CO2 Storage. In 2012 19
CSPG CSEG CWLS Conference GeoConvention 2012: Vision, Calgary, Canada. 20

25
Hofmann, H., Weides, S., Babadagli, T., Zimmermann, G., Moeck, I., Majorowicz, J., and 1
Unsworth, M., 2014. Potential for Enhanced Geothermal Systems in Alberta, Canada. Energy. 2
First published online. Available from http://dx.doi.org/10.1016/j.energy.2014.03.053 3
[accessed 24 April 2014]. 4
Huang, X., Bandilla, K., Celia, M., Bachu, S., Rebscher, D., Zhou, Q., and Birkholzer, J. 5
2012. Modeling carbon dioxide storage in the Basal Aquifer of Canada. In AGU fall meeting, 6
San Francisco, USA, H23A-1322. 7
IHS Energy 2012. IHS Accumap. Commercial database IHS Energy, Englewood, CO. 8
Jaeger, J., Cook, N., and Zimmerman, R. 2007. Fundamentals of Rock Mechanics. Wiley-9
Blackwell, Oxford. 10
Jerram, D.A. 2001. Visual comparators for degree of grain-size sorting in two and three-11
dimensions. Computers & geosciences 27(4): 485-492. doi: 10.1016/S0098-3004(00)00077-7. 12
Jessop, A.M., Vigrass, L.W. 1989. Geothermal measurements in a deep well at Regina, 13
Saskatchewan. J. Volcanol. Geotherm. Res. 37, 151–166. 14
Jessop A., Lewis T., Judge A., Taylor A., and Drury M. 1984. Terrestrial heat flow in Canada. 15
Tectonophysics 103 (1):239-261. 16
Jessop, A.M., Allen, V., Bentkowski, W., Burgess, M., Drury, M., Judge, A.S., Lewis, T., 17
Majorowicz, J., Mareschal, J., and Taylor, A. 2005. The Canadian geothermal data 18
compilation. Geological Survey of Canada, Open File 4887. 19
Johnson, R.B., and DeGraff, J.V. 1988. Principles of engineering geology. Wiley, New York. 20
Lachenbruch, A.H., and Brewer, M.C. 1959. Dissipation of the temperature effect of drilling a 21
well in Arctic Alaska. US Geol. Surv. Bull 1083: 73-109. 22

26
Levorsen, A. 1967. Geology of petroleum. WH Freeman, New York. 1
Li, D.Y., and Wong, L.N.Y. 2013. The Brazilian Disc Test for Rock Mechanics Applications: 2
Review and New Insights. Rock Mechanics and Rock Engineering 46(2): 269-287. 3
doi: 10.1007/s00603-012-0257-7. 4
Líndal, B. 1973. Industrial and other applications of geothermal energy:(except power 5
production and district heating). In Geothermal Energy: Review of Research and 6
Development, Paris, UNESCO, LC No. 72-97138, pp135-148. 7
Lopez, S., Hamm, V., Le, M. et al. 2010. 40 years of Dogger aquifer managment in Ile-de-8
France, Paris Basin, France. Geothermics 39 (4):339-356. 9
Majorowicz, J.A. 1996. Anomalous heat flow regime in the western margin of the North 10
American craton, Canada. Journal of geodynamics 21 (2):123-140. 11
Majorowicz, J., and Grasby, S.E. 2010. Heat flow, depth–temperature variations and stored 12
thermal energy for enhanced geothermal systems in Canada. Journal of Geophysics and 13
Engineering 7(3): 232-241. 14
Majorowicz, J., and Jessop, A. 1981. Regional heat flow patterns in the western Canadian 15
sedimentary basin. Tectonophysics 74, 209–238. 16
Majorowicz, J., and Moore, M.C. 2008. Enhanced Geothermal Systems (EGS) Potential in the 17
Alberta Basin. University of Calgary, Institute for Sustainability, Energy, Environment and 18
Economy, Calgary, Alberta. 19
Majorowicz J., Jones F., Lam H., and Jessop, A. 1985. Terrestrial heat flow and geothermal 20
gradients in relation to hydrodynamics in the Alberta Basin, Canada. Journal of geodynamics 21
4 (1):265-283. 22

27
Majorowicz, J. A., Garven, G., Jessop, A. and Jessop, C. 1999. Present heat flow along a 1
profile across the Western Canada Sedimentary Basin: the extent of hydrodynamic influence. 2
In Geothermics in Basin Analysis. Edited by A. Foerster and D. F. Merriam. Kluwer Acad., 3
Norwell, Mass. pp. 61-80. 4
Majorowicz, J., Gosnold, W., Gray, A., Safanda, J., Klenner, R., and Unsworth, M. 2012. 5
Implications of Post-Glacial Warming for Northern Alberta heat flow- correcting for the 6
underestimate of the geothermal potential. In GRC Transactions 36: 693-698. 7
Majorowicz, J., Chan, J., Crowell, J., Gosnold, W., Heaman, L. M., Kück, J., Nieuwenhuis, 8
G., Schmitt, D. R., Unsworth, M., Walsh, N. and Weides, S. 2014. The first deep heat flow 9
determination in crystalline basement rocks beneath the Western Canadian Sedimentary 10
Basin, Geophysical Journal International 197 (2): 731-749. doi: 10.1093/gji/ggu065. 11
Mathiesen, A., Kristensen, L., Nielsen, C., Weibel, R., Hjuler, M., Rogen, B., Mahler, A., 12
Nielsen, L. 2013. Assessment of sedimentary geothermal aquifer parameters in Denmark with 13
focus on transmissivity. In European Geothermal Congress 3-7 June 2013. Pisa, Italy, pp 1-9. 14
Moeck, I., and Beardsmore, G. 2014. A new ‘geothermal play type’ catalog: Streamlining 15
exploration decision making. In Proceedings of the Thirty-Ninth Workshop on Geothermal 16
Reservoir Engineering, Stanford University, Stanford, California, February 24-26, 2014, SGP-17
TR-202. 18
Moeck I, Schandelmeier H., and Holl, H. 2009. The stress regime in a Rotliegend reservoir of 19
the Northeast German Basin. International Journal of Earth Sciences 98 (7):1643-1654. 20
Nowlan, G.S., and Palmer, B.R. 1998. Introduction. In: The Lower Paleozoic: A New Frontier 21
in the Western Canada Basin. Compiled by G.S. Nowlan and B.R. Palmer. Geological Survey 22
of Canada, open file 3416, Ottawa, Canada. 23

28
Pettijohn, F.F.J. 1987. Sand and sandstone. Springer, Heidelberg. 1
Pluymaekers, M., Kramers, L., van Wees, J., Kronimus, A., Nelskamp, S., Boxem, T., and 2
Bonté, D. 2012. Reservoir characterisation of aquifers for direct heat production: 3
Methodology and screening of the potential reservoirs for the Netherlands. Netherlands 4
Journal of Geosciences-Geologie en Mijnbouw 91 (4):621-636. 5
Pugh, D.C. 1971. Subsurface Cambrian stratigraphy in southern and central Alberta. 6
Geological Survey of Canada, Dept. of Energy, Mines and Resources, Ottawa. 7
Pugh, D.C. 1973. Subsurface lower Paleozoic stratigraphy in northern and central Alberta. 8
Geological Survey of Canada, Dept. of Energy, Mines and Resources, Ottawa. 9
Rebscher, D., Zhou, Q., and Birkholzer, J.T. 2012. Simulation of CO2 storage in the Basal 10
Aquifer in the Northern Plains - Prairie region of North America. In TOUGH2 Symposium 11
2012, Lawrence Berkeley National Laboratory, Berkeley, California, September 17-19, 2012. 12
Roduit, N. 2008. JMicroVision: Image analysis toolbox for measuring and quantifying 13
components of high-definition images. Version 1.2.7. Available from 14
http://www.jmicrovision.com [cited 22 October 2013]. 15
Rollin, K. 2003. Low-temperature geothermal energy. Earthwise Issue 19: Energy and 16
mineral resources, British Geological Survey BGS, 24-25. 17
Schön, J. 2011. Physical Properties of Rocks: A Workbook. Elsevier, Amsterdam. 18
Shell. 2010. Quest Carbon Capture and Storage Project; Directive 65: Application for a CO2 19
acid gas storage scheme. Available from http://s05.static-shell.com/content/dam/shell-20
new/local/country/can/downloads/pdf/aboutshell/our-business/oil-sands/quest/d65-main-21
report-appai.pdf [accessed 6 January 2014]. 22

29
Shell. 2011. Quest Carbon Capture and Storage Project; update to directive 65: Application 1
for a CO2 acid gas storage scheme. Available from http://s08.static-2
shell.com/content/dam/shell-new/local/country/can/downloads/pdf/aboutshell/our-3
business/oil-sands/quest/quest-d65-updatejune2011.pdf [accessed 6 January 2014]. 4
Siegesmund, S., and Snethlage, R. 2011. Stone in architecture: properties, durability. 5
Springer, Heidelberg. 6
Slind, O., Andrews, G., Murray, D., Norford, B., Paterson, D., Salas, C., and Tawadros, E. 7
1994. Middle Cambrian to Lower Ordovician strata of the Western Canada Sedimentary 8
Basin. In Geological Atlas of the Western Canada Sedimentary Basin. Edited by G. Mossop 9
and I. Shetsen. Canadian Society of Petroleum Geologists and Alberta Research Council, 10
Special Report 4: 87-108. 11
Sloss L.L. 1963. Sequences in the Cratonic Interior of North America. Geological Society of 12
America Bulletin 74(2): 93-114. 13
Talman, S., Perkins, E., Wigston, A., Ryan, D., and Bachu, S. 2013. Geochemical Effects of 14
Storing CO2 in the Basal Aquifer that Underlies the Prairie Region in Canada. Energy 15
Procedia 37: 5570-5579. 16
Tucker, M.E. 2009. Sedimentary petrology: an introduction to the origin of sedimentary 17
rocks. Wiley-Blackwell, Oxford. 18
Vigrass, L. 1979. Final well report, U or R Regina 3-8-17-19 (W.2nd.Mer.) Saskatchewan. 19
Earth Physics Branch Open File, vol 79-9. Regina, Saskatchewan, Canada. 20
Vigrass, L.W., Jessop, A.M., and Brunskill, B. 2007. Regina geothermal project. In Summary 21
of investigations. Saskatchewan Geological Survey, Regina, SK, p A–2. Regina, 22
Saskatchewan, Canada. 23

30
Weides, S. and Majorowicz, J. 2014. Implications of spatial variability in heat flow for 1
geothermal resource evaluation in large foreland basins: the case of the Western Canada 2
Sedimentary Basin. Energies 7(4): 2573-2594. doi:10.3390/en7042573. 3
Weides, S., Moeck, I., Majorowicz, J., Palombi, D., and Grobe, M. 2013. Geothermal 4
exploration of Paleozoic formations in Central Alberta. Canadian Journal of Earth Sciences 5
50(5): 519-534. doi: 10.1139/cjes-2012-0137. 6
Zang, A.H., and Stephansson, O.J. 2010. Stress field of the Earth’s crust. Springer, 7
Heidelberg. 8

31
Table captions 1
Table 1: Hydraulic properties of the BSU; porosity was measured on core plugs using helium 2
pycnometry; horizontal permeability Khor was measured using a probe permeameter; the 3
permeability measurements were conducted on the core section at the same location where the 4
plugs were sampled. 5
6
Table 2: Horizontal permeability of BSU obtained from probe permeametry measurements. 7
8
Table 3: Geomechanical properties of the BSU samples. 9

32
Table 1 1
Sample ID UWI Depth [m]
Density [kg/m3]
Porosity [%] Khor [x 10 -15 m2]
A6 5-29-62-1W5 2262.9 2.69 10.02 1.66
A7 5-29-62-1W5 2264.8 2.70 19.28 6.45
B7 1-27-60-26W4 2254.2 2.62 7.97 14.94
B8 1-27-60-26W4 2252.9 2.69 11.08 2.38
B9 1-27-60-26W4 2261.3 2.68 13.00 1.32
B10 1-27-60-26W4 2263.2 2.70 5.41 0.65
C8 8-17-50-26W4 2731.6 2.67 7.38 0.66
C9 8-17-50-26W4 2733.3 2.67 19.57 1.80
C10 8-17-50-26W4 2730.4 2.66 5.25 2.36
E4 15-34-43-10W4 2111.1 2.67 9.51 -
2

33
Table 2 1
horizontal permeability [x 10 -15 m2]
UWI # Samples Minimum Maximum arithm. Average geomtr. Average 5-29-62-1W5 15 0.1 42.5 8.8 3.4
1-27-60-26W4 37 0.1 1148.1 45.8 1.6
8-17-50-26W4 27 0.1 25.6 1.9 0.5
16-17-48-20W4 4 0.6 1.9 1 0.9
15-34-43-10W4 13 0.2 1 0.6 0.5
2

34
Table 3 1
Sample ID UWI
Sample depth [m]
Unconfined compressive strength [MPa]
Young`s modulus [GPa]
Tensile strength [MPa]
Cohesion [MPa]
Friction angle [°]
Friction coefficient
A6 5-29-62-1W5 2262.9 - - - 27.1 31 0.6
A7 5-29-62-1W5 2264.75 - - 2.1 - - -
B7 1-27-60-26W4 2254.15 - - - 9.4 50.4 1.21
B8 1-27-60-26W4 2252.9 - - 4.9 25.7 42.9 0.93
B9 1-27-60-26W4 2261.25 51.5 9.9 - - - -
B10 1-27-60-26W4 2263.8 97.7 21.6 - - - -
C8 8-17-50-26W4 2731.55 - - - 30.9 50.7 1.22
C9 8-17-50-26W4 2733.3 22.9 3.9 - - - -
C10 8-17-50-26W4 2730.4 - - - 69.8 45 1
E4 15-34-43-10W4 2111.1 - - - 28.7 38.7 0.8 2

35
Figure Captions 1
2
Fig. 1: Cambrian stratigraphy for central Alberta (modified from Nowlan and Palmer, 1998). 3
Shaded intervals are carbonate units. 4
5
Fig. 2: Location of the study area and of the 6 wells with Basal Sandstone Unit (BSU) core 6
material analyzed in this study. Contours show the depth of the top of the Precambrian 7
basement in this region. 8
9
Fig. 3: Graphic representation of 2 cores from the BSU. Cores from well 8-17-50-26W4 show 10
the bottom section, and cores from well (1-27-60-26W4) show the top section of the BSU; in 11
well 8-17-50-26W4 the contact to the Precambrian is located at a depth of 2737.2 m, and the 12
total thickness of the BSU is 33.3 m; in well 1-27-60-26W4 the contact to the Precambrian is 13
located at a depth of 2288.4 m, and the total thickness of the BSU is 34.9 m. 14
15
Fig. 4: Photographs of core segments representative of the basal zone of the BSU. a: contact 16
between granitic basement and the basal pebbly sandstone bed of the BSU (6-7-65-4W4); b: 17
feldspathic arenite containing basement rock fragments of various grain sizes (16-17-48-18
20W4); c: basal lithic arenite(15-34-43-10W4). 19
20

36
Fig. 5: Photographs of core segments representative for the middle cross-bedded sandstone 1
zone of the BSU(arrows indicate the way down) . a: low–angle laminae in the planar-bedded 2
sandstone in the lower beds; upper beds consisting of cross–bedded sandstone; grain size fines 3
upward within the middle and upper beds (1-27-60-26W4); b: cross-bedded sandstone; thin 4
laminae of clay intercalated in the upper bed (1-27-60-26W4); c: fine-grained sandstone bed, 5
cut off by a fine- to coarse-grained sandstone with white to brownish quartz granules 6
(8-17-50-26W4). 7
8
Fig. 6: Photographs of core segments representative of upper bioturbated zone of the BSU. 9
a: intensely bioturbated muddy sandstone (5-29-62-1W5); b: planar-bedded sandstone with 10
clay laminae and vertical burrow (5-29-62-1W5); c: planar-bedded sandstone with horizontal 11
and vertical burrows (1-27-60-26W4). 12
13
Fig. 7: Photographs of thin sections from the BSU. a: quartz arenite with well-developed 14
overgrowth on rounded quartz grains; iron mineral coating around grains marks the original 15
grain boundaries; rock impregnated with blue resin to show porosity (16-17-48-20W4); 16
b: interpenetrating quartz grains as a result of pressure solution (5-29-62-1W5); c: glauconite 17
grains in a tightly interlocked texture dominated by quartz; porosity is reduced by cementation 18
and pressure solution (5-29-62-1W5); d: rounded quartz grains tightly interlocked by silica 19
cementation; quartz overgrowth has eliminated initial porosity (8-17-50-26W4); e: porosity is 20
reduced by pressure solution; iron minerals are abundant on grain contacts (8-17-50-26W4); 21
f: sample showing quartz overgrowth, pressure solution and fracturing (8-17-50-26W4). 22
23
24
25
26

37
Fig. 8: Porosity map for the BSU in the study area. Inverse Distance Weighting was used for 1
interpolation. Porosity data includes core analysis results presented in this study (black 2
rectangles) and porosity values from well log interpretation from Shell (2010) (black 3
triangles). Core analysis data from wells 14-5-66-5W4 and 5-8-66-5W4 is from the IHS 4
Accumap (IHS 2012). 5
6
Fig. 9: left: box plot of horizontal permeability of BSU from 96 probe permeametry samples; 7
right: lognormal histogram of probe permeametry data. 8
9
Fig. 10: a: Map showing the depth from ground surface to the top of the Precambrian 10
basement (i.e., the base of the BSU), based on 15 wells; inverse distance weighting method 11
(IDW) was used for interpolation; b: Thickness map of the BSU, based on 15 wells, 12
calculated with IDW; c: Geothermal gradient map of the Phanerozoic succession, based on 13
approximately 2000 temperature values from 615 wells; map was calculated using the simple 14
kriging method; d: Map of the temperature distribution at the base of the BSU; map was 15
calculated by multiplication of raster maps a and b, assuming a surface temperature of 0oC to 16
be in equilibrium with the deeper Basin (see Majorowicz et al. 2012). 17
18

Figure 1

Figure 2:

Figure 3

Figure 4

Figure 5
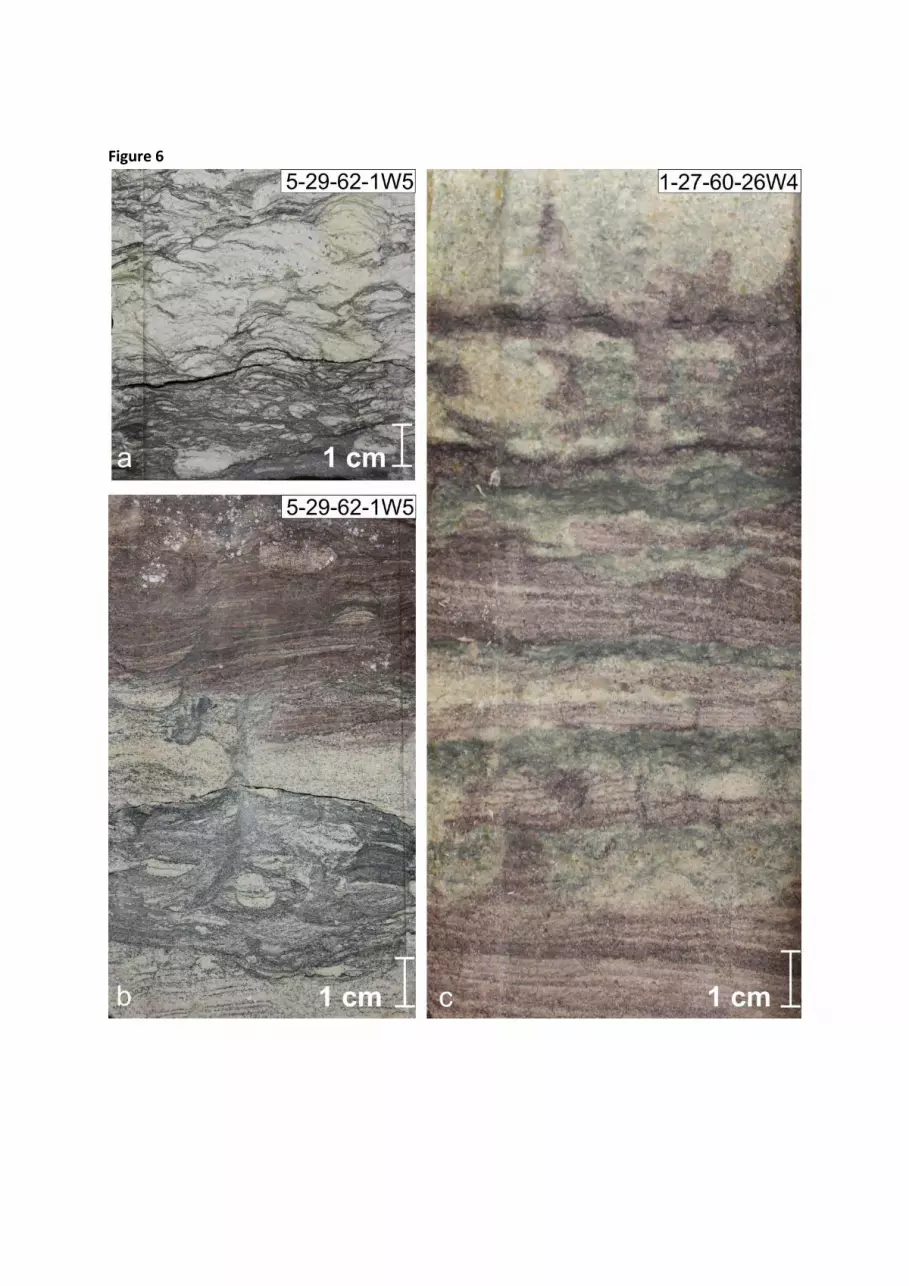
Figure 6

Figure 7

Figure 8

Figure 9

Figure 10