the cairo real estate market - jll
TRANSCRIPT

Q2 2019
JLL Research Report
Cairo
The Cairo Real Estate Market
The Cairo Real Estate Market Q2 2019The Cairo Real Estate Market Q2 2019 0302
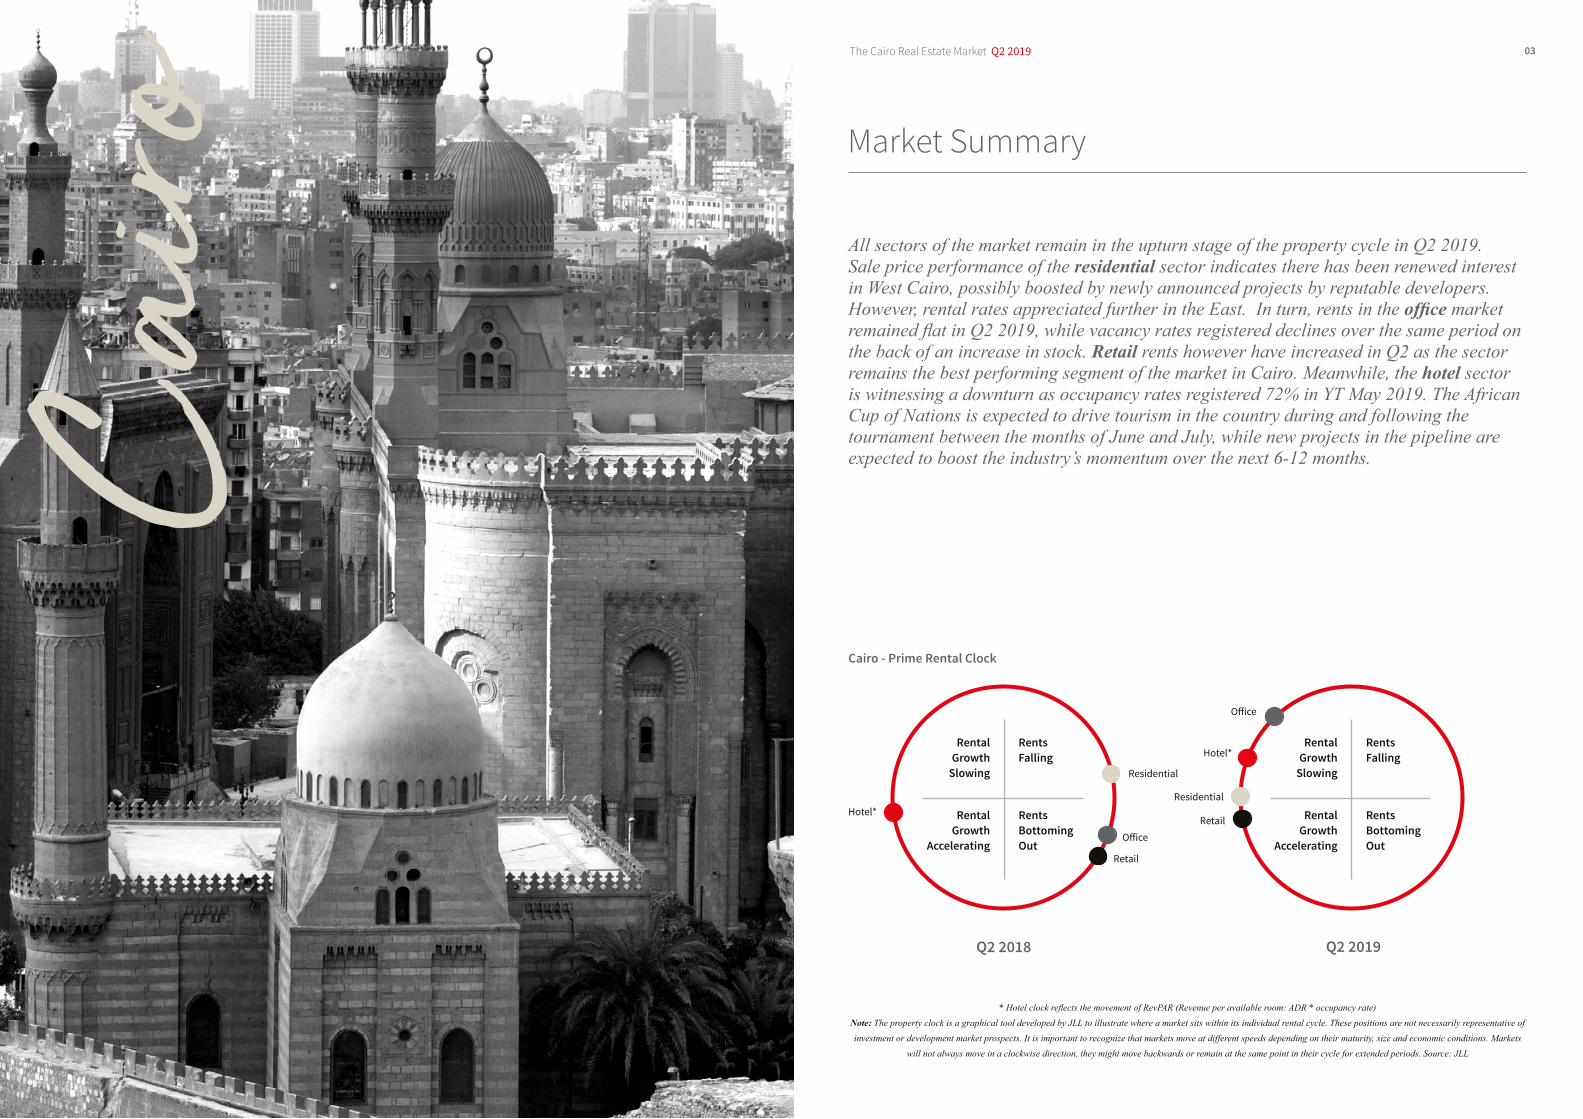
Cairo
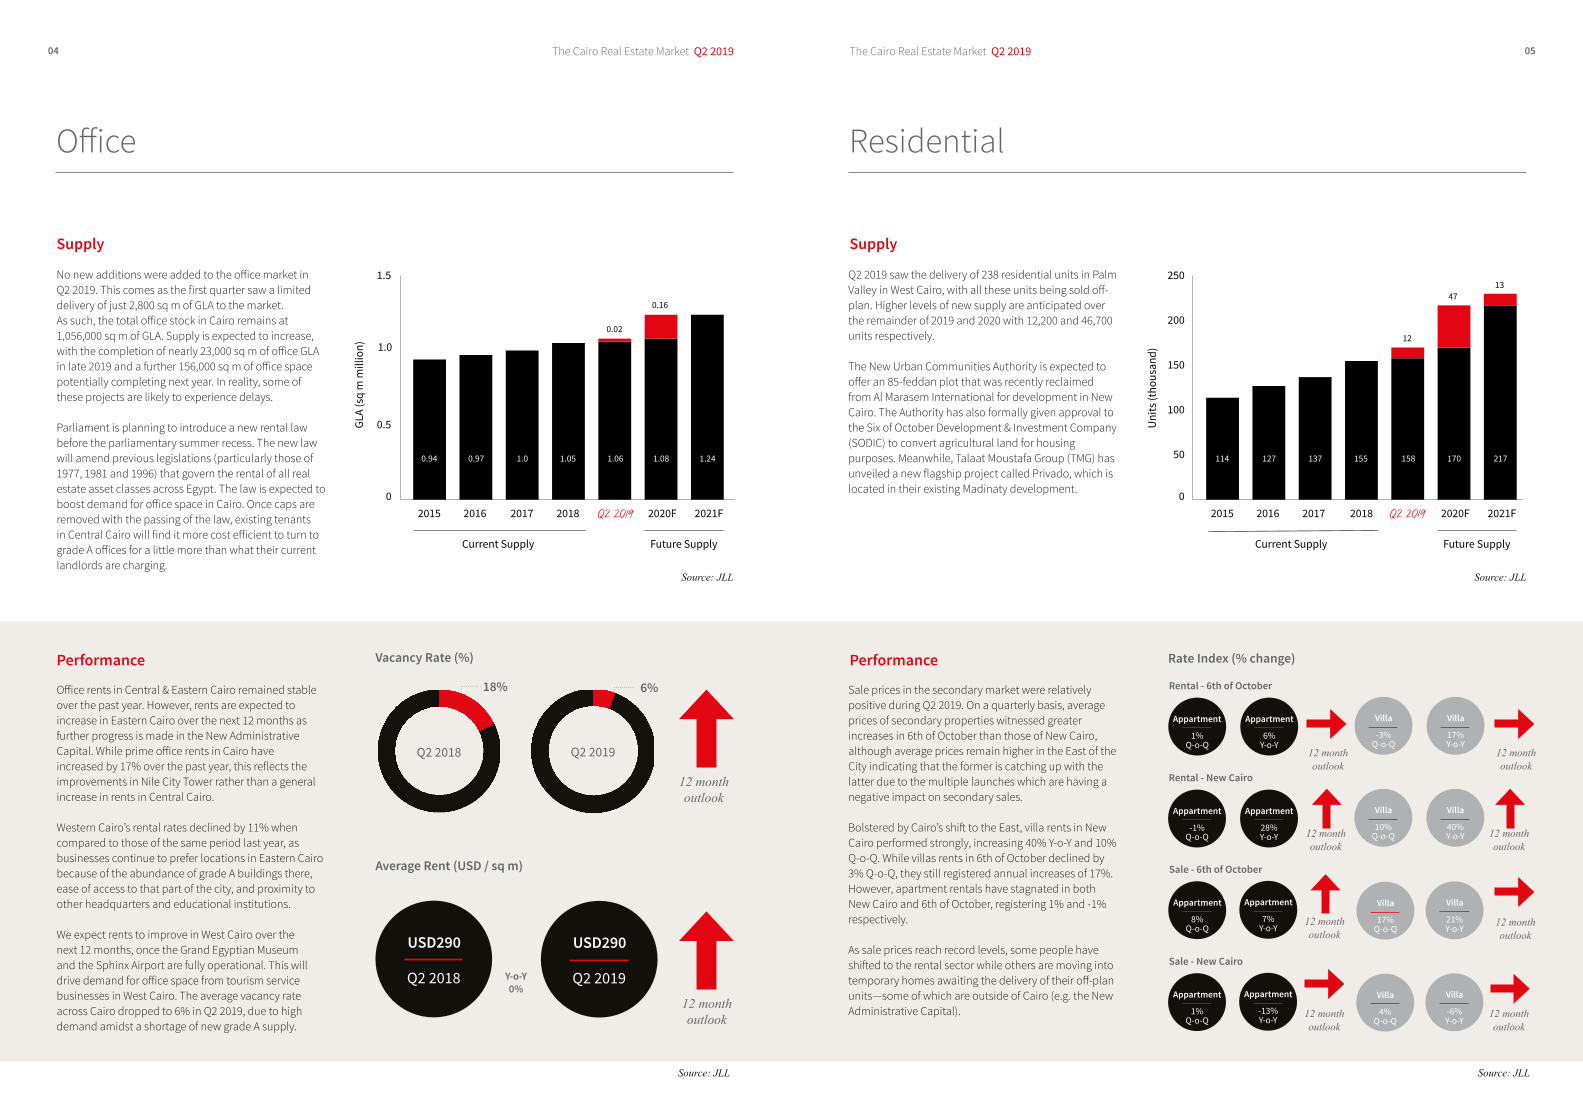
* Hotel clock reflects the movement of RevPAR (Revenue per available room: ADR * occupancy rate) Note: The property clock is a graphical tool developed by JLL to illustrate where a market sits within its individual rental cycle. These positions are not necessarily representative of investment or development market prospects. It is important to recognize that markets move at different speeds depending on their maturity, size and economic conditions. Markets
will not always move in a clockwise direction, they might move backwards or remain at the same point in their cycle for extended periods. Source: JLL
Cairo - Prime Rental Clock
Q2 2018 Q2 2019
Hotel*
Residential
Retail
Office
RentalGrowth
Slowing
Rental Growth
Accelerating
RentsFalling
Rents BottomingOut
RentalGrowth
Slowing
Rental Growth
Accelerating
RentsFalling
Rents BottomingOut
Hotel*
Residential
Retail
Office
Market Summary
All sectors of the market remain in the upturn stage of the property cycle in Q2 2019. Sale price performance of the residential sector indicates there has been renewed interest in West Cairo, possibly boosted by newly announced projects by reputable developers. However, rental rates appreciated further in the East. In turn, rents in the office market remained flat in Q2 2019, while vacancy rates registered declines over the same period on the back of an increase in stock. Retail rents however have increased in Q2 as the sector remains the best performing segment of the market in Cairo. Meanwhile, the hotel sector is witnessing a downturn as occupancy rates registered 72% in YT May 2019. The African Cup of Nations is expected to drive tourism in the country during and following the tournament between the months of June and July, while new projects in the pipeline are expected to boost the industry’s momentum over the next 6-12 months.
The Cairo Real Estate Market Q2 2019The Cairo Real Estate Market Q2 2019 0504
Office
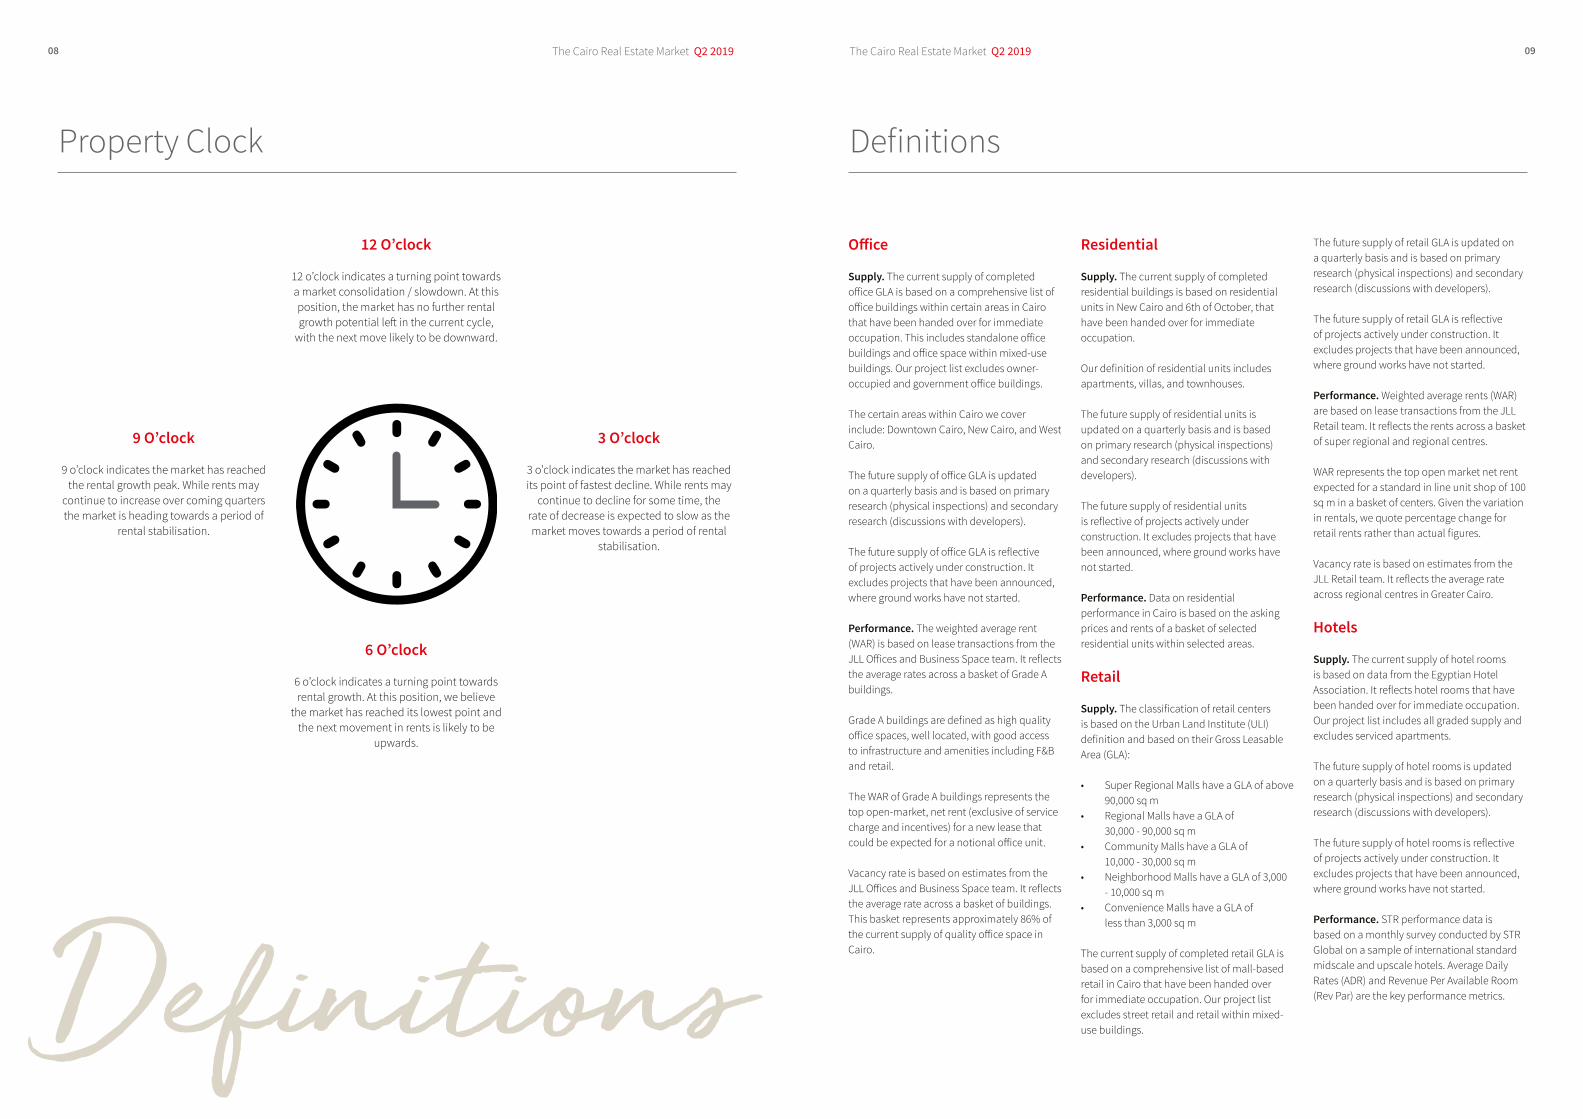
No new additions were added to the office market in Q2 2019. This comes as the first quarter saw a limited delivery of just 2,800 sq m of GLA to the market. As such, the total office stock in Cairo remains at 1,056,000 sq m of GLA. Supply is expected to increase, with the completion of nearly 23,000 sq m of office GLA in late 2019 and a further 156,000 sq m of office space potentially completing next year. In reality, some of these projects are likely to experience delays.
Parliament is planning to introduce a new rental law before the parliamentary summer recess. The new law will amend previous legislations (particularly those of 1977, 1981 and 1996) that govern the rental of all real estate asset classes across Egypt. The law is expected to boost demand for office space in Cairo. Once caps are removed with the passing of the law, existing tenants in Central Cairo will find it more cost efficient to turn to grade A offices for a little more than what their current landlords are charging.
Supply
Office rents in Central & Eastern Cairo remained stable over the past year. However, rents are expected to increase in Eastern Cairo over the next 12 months as further progress is made in the New Administrative Capital. While prime office rents in Cairo have increased by 17% over the past year, this reflects the improvements in Nile City Tower rather than a general increase in rents in Central Cairo.
Western Cairo’s rental rates declined by 11% when compared to those of the same period last year, as businesses continue to prefer locations in Eastern Cairo because of the abundance of grade A buildings there, ease of access to that part of the city, and proximity to other headquarters and educational institutions.
We expect rents to improve in West Cairo over the next 12 months, once the Grand Egyptian Museum and the Sphinx Airport are fully operational. This will drive demand for office space from tourism service businesses in West Cairo. The average vacancy rate across Cairo dropped to 6% in Q2 2019, due to high demand amidst a shortage of new grade A supply.
Performance
Source: JLL
0
0.5
1.0
1.5
2015 2017 2020F 2021F2016
0.94 0.97 1.0 1.05 1.06 1.241.08
0.16
0.02
2018
Current Supply
Q2 2019
GLA
(sq
m m
illio
n)
Future Supply
Source: JLL
Residential
Q2 2019 saw the delivery of 238 residential units in Palm Valley in West Cairo, with all these units being sold off-plan. Higher levels of new supply are anticipated over the remainder of 2019 and 2020 with 12,200 and 46,700 units respectively.
The New Urban Communities Authority is expected to offer an 85-feddan plot that was recently reclaimed from Al Marasem International for development in New Cairo. The Authority has also formally given approval to the Six of October Development & Investment Company (SODIC) to convert agricultural land for housing purposes. Meanwhile, Talaat Moustafa Group (TMG) has unveiled a new flagship project called Privado, which is located in their existing Madinaty development.
Supply
Sale prices in the secondary market were relatively positive during Q2 2019. On a quarterly basis, average prices of secondary properties witnessed greater increases in 6th of October than those of New Cairo, although average prices remain higher in the East of the City indicating that the former is catching up with the latter due to the multiple launches which are having a negative impact on secondary sales.
Bolstered by Cairo’s shift to the East, villa rents in New Cairo performed strongly, increasing 40% Y-o-Y and 10% Q-o-Q. While villas rents in 6th of October declined by 3% Q-o-Q, they still registered annual increases of 17%. However, apartment rentals have stagnated in both New Cairo and 6th of October, registering 1% and -1% respectively.
As sale prices reach record levels, some people have shifted to the rental sector while others are moving into temporary homes awaiting the delivery of their off-plan units—some of which are outside of Cairo (e.g. the New Administrative Capital).
Performance
Source: JLL
0
50
100
150
200
250
2015 2017 2018 2020F 2021F2016
114 127 137 155 158 217170
1347
12
Current Supply
Q2 2019
Uni
ts (t
hous
and)
Future Supply
Source: JLL
Vacancy Rate (%)
6%
Q2 2019
12 month outlook
18%
Q2 2018
Rate Index (% change)
Appartment
1%Q-o-Q
Appartment
6%Y-o-Y
Rental - 6th of October
Appartment
-1%Q-o-Q
Appartment
28%Y-o-Y
Rental - New Cairo
Appartment
8%Q-o-Q
Appartment
7%Y-o-Y
Sale - 6th of October
Appartment
1%Q-o-Q
Appartment
-13%Y-o-Y
Sale - New Cairo
12 month outlook
Villa
-3%Q-o-Q
Villa
17%Y-o-Y
Villa
10%Q-o-Q
Villa
40%Y-o-Y
Villa
17%Q-o-Q
Villa
21%Y-o-Y
Villa
4%Q-o-Q
Villa
-6%Y-o-Y
12 month outlook
12 month outlook
12 month outlook
12 month outlook
12 month outlook
12 month outlook
12 month outlook
Average Rent (USD / sq m)
USD290
Q2 201812 month outlook
USD290
Q2 2019Y-o-Y0%

The Cairo Real Estate Market Q2 2019The Cairo Real Estate Market Q2 2019 0706
Retail
Retail supply in Cairo witnessed one new addition in Q2, with the completion of The Yard (15,000 sq m of GLA) in Rehab City. Some 216,000 sq m of retail space is expected to enter the market in 2019, including the Open-Air Mall of Madinaty (which is already partially open) and Almaza City Centre. Most of the future supply is in New Cairo, with very few announcements in West Cairo.
At a time when Sheikh Zayed City’s current retail centers are witnessing expansions, especially on the 26th of July Corridor, New Cairo will still remain a prime location for retail. As such, more developments are expected to shift towards the East as confidence in the New Administrative Capital’s success grows sturdier.
That convergence in the East has in turn provided stimulus and competition for retailers as well as for developers and has been complemented by appreciating retail performance and increased consumer appetite in Cairo.
Supply
Q2 2019 saw retail rents increase significantly by 7% versus Q2 2018. This increase is partially caused by increased interest in newer retail centers and strips in more prime locations, especially in East Cairo. Meanwhile, retail vacancy rates increased on an annual basis to 15% but remained stable when compared to Q1 2018.
Looking ahead, vacancy rates are expected to increase with the delivery of new supply over the remainder of the year. This new stock will be matched with higher rental rates because those new market entrants will offer more luxurious, innovative and superior quality space in underserved locations and will be quasi monopolistic in those areas. The focus among both existing and new malls remains on enhancing the retail experience, with developers and mall owners continuing to innovate by offering interactive concepts (such as pop-up events and activities).
Performance
Source: JLL
0
0.5
1.0
1.5
2.0
2.5
2015 2016 2017 2020F 2021F
1.48 1.62 1.90 2.10 2.352.34
0.01
2.13
2018
0.21
Current Supply
Q2 2019
GLA
(sq
m m
illio
n)
Future Supply
Source: JLL
Hotel
Hotel supply in Cairo currently stands at 23,438 rooms. The latest addition, Steigenberger Pyramids Cairo hotel with 138 rooms was handed over in June 2019. Two projects of a total of 600 rooms previously announced to be completed in 2019 have been put on hold.
There are currently no further hotels scheduled to open in Cairo in 2020 or 2021, although some have witnessed construction delays and will likely be handed over in those years.
However, as the government targets around 40,000 hotel rooms in the first phase of the New Administrative Capital (NAC), hospitality developers are expected to focus on establishing themselves there while competition remains low and opportunities are wide (only one hotel is currently operating there, Al Masa Royal Palace – New Capital).
Supply
Occupancy rates increased by 100 basis points to register 72% in the YT May 2019 compared to 71% in the YT May 2018. Average daily room rates (ADR’s) registered USD 100 in the YT May 2019, which was 9% higher than that of the same period in 2018 (USD 92). As a result, revenue per available room (RevPAR’s) increased 10% over the same period. On the back of healthy performance metrics, we remain positive in our outlook for the sector.
As Egypt will be hosting the African Cup of Nations this year, sports tourism is expected to drive strong performance in the hotel sector in Q3 2019. Plans for Egypt to become a destination for religious tourism are gaining momentum. Arrangements to develop the Trail of the Holy Family are under development and this could possibility attract thousands of Christian pilgrims to visit dozens of important Christian sites across Egypt. Traditional tourism is also expected to pick up throughout 2020 with the simultaneous openings of the Grand Egyptian Museum and the nearby Sphinx Airport.
Performance
Source: STR Global
0
5
10
15
20
25
2015 2016 2017 2020F 2021F
21.3 21.4 23.0 23.3 23.623.623.5
2018
0.14
Current Supply
Q2 2019
Keys
(tho
usan
d)
Future Supply
Source: JLL
Vacancy Rate (%)
Average Rent (% change)
Q2 2018
15%
Q2 2019
12 month outlook
7%
Q-o-Q
12%
12 month outlook
7%
Y-o-Y
Occupancy
ADR (USD)
YT May 2018
72%
YT May 2019
12 month outlook
71%
12 month outlook
USD92
YT May 2018
USD100
YT May 2019
Y-o-Y100bp
Y-o-Y9%
The Cairo Real Estate Market Q2 2019The Cairo Real Estate Market Q2 2019 0908
Definitions
Definitions
12 O’clock
12 o’clock indicates a turning point towards a market consolidation / slowdown. At this position, the market has no further rental growth potential left in the current cycle,
with the next move likely to be downward.
9 O’clock
9 o’clock indicates the market has reached the rental growth peak. While rents may
continue to increase over coming quarters the market is heading towards a period of
rental stabilisation.
3 O’clock
3 o’clock indicates the market has reached its point of fastest decline. While rents may
continue to decline for some time, the rate of decrease is expected to slow as the market moves towards a period of rental
stabilisation.
6 O’clock
6 o’clock indicates a turning point towards rental growth. At this position, we believe
the market has reached its lowest point and the next movement in rents is likely to be
upwards.
Property Clock
Office
Supply. The current supply of completed office GLA is based on a comprehensive list of office buildings within certain areas in Cairo that have been handed over for immediate occupation. This includes standalone office buildings and office space within mixed-use buildings. Our project list excludes owner-occupied and government office buildings.
The certain areas within Cairo we cover include: Downtown Cairo, New Cairo, and West Cairo.
The future supply of office GLA is updated on a quarterly basis and is based on primary research (physical inspections) and secondary research (discussions with developers).
The future supply of office GLA is reflective of projects actively under construction. It excludes projects that have been announced, where ground works have not started.
Performance. The weighted average rent (WAR) is based on lease transactions from the JLL Offices and Business Space team. It reflects the average rates across a basket of Grade A buildings.
Grade A buildings are defined as high quality office spaces, well located, with good access to infrastructure and amenities including F&B and retail.
The WAR of Grade A buildings represents the top open-market, net rent (exclusive of service charge and incentives) for a new lease that could be expected for a notional office unit.
Vacancy rate is based on estimates from the JLL Offices and Business Space team. It reflects the average rate across a basket of buildings. This basket represents approximately 86% of the current supply of quality office space in Cairo.
Residential
Supply. The current supply of completed residential buildings is based on residential units in New Cairo and 6th of October, that have been handed over for immediate occupation.
Our definition of residential units includes apartments, villas, and townhouses.
The future supply of residential units is updated on a quarterly basis and is based on primary research (physical inspections) and secondary research (discussions with developers).
The future supply of residential units is reflective of projects actively under construction. It excludes projects that have been announced, where ground works have not started.
Performance. Data on residential performance in Cairo is based on the asking prices and rents of a basket of selected residential units within selected areas.
Retail
Supply. The classification of retail centers is based on the Urban Land Institute (ULI) definition and based on their Gross Leasable Area (GLA):
• Super Regional Malls have a GLA of above 90,000 sq m
• Regional Malls have a GLA of 30,000 - 90,000 sq m
• Community Malls have a GLA of 10,000 - 30,000 sq m
• Neighborhood Malls have a GLA of 3,000 - 10,000 sq m
• Convenience Malls have a GLA of less than 3,000 sq m
The current supply of completed retail GLA is based on a comprehensive list of mall-based retail in Cairo that have been handed over for immediate occupation. Our project list excludes street retail and retail within mixed-use buildings.
The future supply of retail GLA is updated on a quarterly basis and is based on primary research (physical inspections) and secondary research (discussions with developers).
The future supply of retail GLA is reflective of projects actively under construction. It excludes projects that have been announced, where ground works have not started.
Performance. Weighted average rents (WAR) are based on lease transactions from the JLL Retail team. It reflects the rents across a basket of super regional and regional centres.
WAR represents the top open market net rent expected for a standard in line unit shop of 100 sq m in a basket of centers. Given the variation in rentals, we quote percentage change for retail rents rather than actual figures.
Vacancy rate is based on estimates from the JLL Retail team. It reflects the average rate across regional centres in Greater Cairo.
Hotels
Supply. The current supply of hotel rooms is based on data from the Egyptian Hotel Association. It reflects hotel rooms that have been handed over for immediate occupation. Our project list includes all graded supply and excludes serviced apartments.
The future supply of hotel rooms is updated on a quarterly basis and is based on primary research (physical inspections) and secondary research (discussions with developers).
The future supply of hotel rooms is reflective of projects actively under construction. It excludes projects that have been announced, where ground works have not started.
Performance. STR performance data is based on a monthly survey conducted by STR Global on a sample of international standard midscale and upscale hotels. Average Daily Rates (ADR) and Revenue Per Available Room (Rev Par) are the key performance metrics.
Dubai, Abu Dhabi, Riyadh, Jeddah, Al Khobar, Johannesburg and Casablanca
With MEA offices in:
COPYRIGHT © JONES LANG LASALLE IP, INC. 2019. This report has been prepared solely for information purposes and does not necessarily purport to be a complete analysis of the topics discussed, which are inherently unpredictable. It has been based on sources we believe to be reliable, but we have not independently verified those sources and we do not guarantee that the information in the report is accurate or complete. Any views expressed in the report reflect our judgment at this date and are subject to change without notice. Statements that are forward-looking involve known and unknown risks and uncertainties that may cause future realities to be materially different from those implied by such forward-looking statements. Advice we give to clients in particular situations may differ from the views expressed in this report. No investment or other business decisions should be made based solely on the views expressed in this report.
For questions and inquiries about the Cairo real estate market, please contact:
Craig PlumbHead of Research, [email protected]
Dana SalbakResearch Associate, [email protected]
Cairo
Office 141, 14th Floor, Star Capital2, Aly Rashed Street HeliopolisCairo, EgyptTel: +20 2 2480 1946Fax: +20 2 2480 1950
Mahmoud Elleissy NassefResearch Analyst, [email protected]