the biology of the cod in greenland waters - ices
TRANSCRIPT
CONSEIL P E R M A N E N T I N T E R N A T I O N A L POUR
L’E X P L O R A T I O N DE LA MER
C H A R L O T T E N L U N D SLOT — D A N E M A R K
RAPPORTSET
PROCÈS-VERBAUX DES RÉUNIONSV O L U M E c x x r n
STU D IES ON
T HE BIOLOGY OF T HE COD IN G R E E N L A N D WATERS
BY
PAUL M. HANSEN
EN COMMISSION CHEZ
A N D R . F R E D . H Ø S T & F I L S
COPENHAGUE

CONSEIL P E R M A N E N T I N T E R N A T I O N A L POUR
L’E X P L O R A T I O N DE LA MER
C H A R L O T T E N L U N D SLOT — D A N E M A R K
RAPPORTSET
PROCÈS-VERBAUX DES RÉUNIONSV O L U M E C X X I I I
STU D IES ON
TH E BIOLOGY OF THE COD IN G R E E N L A N D WATERS
BY
PAUL M. HANSEN
EN COMMISSION CHEZ
A N D R . F R E D . H Ø S T & F I L S
COPENHAGUE
P rix: Kr. 8.00.
Mars 1949.
C O N T E N T S
Page
F orew ord .............................................................................................................................................................................. 5
I. Introduction............................................................................................................................................................ 5A. Previous Investigations................................................................................................................................... 5B. The Occurrence of the Cod a t Greenland................................................................................................. 6
II. E nv ironm en t.......................................................................................................................................................... 8A. Hydrographical Conditions in Greenland W aters...................................................................................... 8B. Hydrographical Conditions and Spawning in other North Atlantic Regions compared with
G reenland........................................................................................................................................................... 12C. Changes in the Marine Fauna a t Greenland in Recent T im es........................................................... 14
III. Spawning and Development,..................................................................................................................................... 16A. Distribution of the Cod Fry in West Greenland W aters...................................................................... 16B. Investigations on the Spawning of the Cod in Ikertok Fjord and Godthaab F jo rd ....................... 22C. Age of Cod a t First-Maturity in the Coastal A rea................................................................................. 27D. Distribution of the youngest Age-Groups of Cod a t Greenland.......................................................... 28
IV. Growth and F o o d ..................................................................................................................................................... 31A. Growth of the Cod a t Greenland ................................................................................................................ 31B. Food of the Cod at West G reenland.......................................................................................................... 39
V. R aces ........................................................................................................................................................................ 43
VI. Migrations and Fluctuations............................................................................................................................... 49A. Migrations ......................................................................................................................................................... 49B. Fluctuations in the Stock of Greenland C o d ........................................................................................... 61
VII. The relative Importance of the various Year-Classes in the Greenland Fisheries................................ 70
VIII. Concluding Remarks and Future W ork .......................................................................................................... 72
S um m ary .............................................................................................................................................................................. 73
L itera tu re ................................................................................................................................................................................ 75
PRINTED BY BIANCO LÜNO COPENHAGEN
S T UD IE S ON
THE BIOLOGY OF TH E COD IN G R E E N L A N D WATERS
BY
PAUL M. HANSEN
\
r n s<*/ 0Js nsTK /R a i r NyijgS,
pâ>$^rs^ '
i^^ els'ortot '
iSaUstf" 's**«s
« v ' 4 v
c f t ü
f = § 8
'Çnffenfüdl. Islarut
4-0° W. f Greenw.
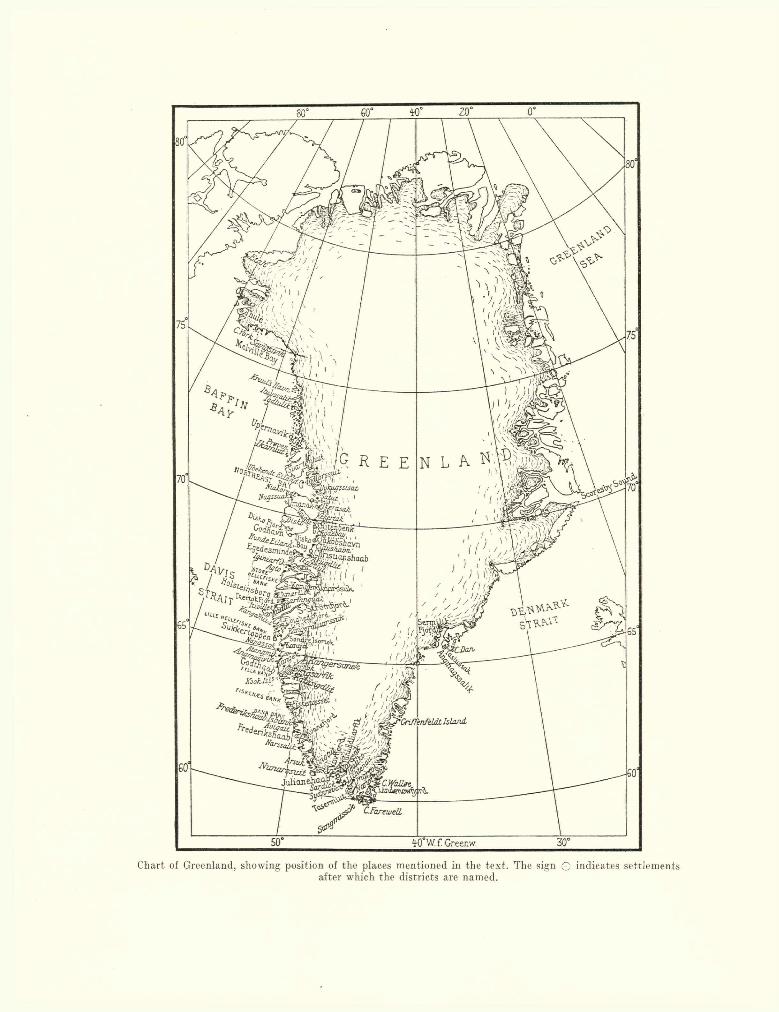
Chart of Greenland, showing position of the places mentioned in the text. The sign Q indicates settlementsafter which the districts are named.
— 5 —
Foreword.
m H is work, a summary of what we know a t presentX regarding the biology of the Cod in Greenland
waters, is based on continuous investigations over several years undertaken by the Greenland Administration; the marking experiments in collaboration with “Kommissionen for Danmarks Fiskeri- og Havundersøgelser” .
For the assistance and interest received during this work from the Greenland Administration I am greatly indebted to the late Director J e n s D a u g a a r d J e n s e n and the former Director K n u d O l d e n d o w .
Next, I beg to tender my thanks to the present Director E s k e B r u n ; during the war years, when all communication between Greenland and Denmark was severed, he ordered measurement data and otoliths to be collected every year as usually, and thus the war years did not interrupt the investigations on the stock of cod and their composition in year-classes.
Valuable help and support have been accorded me in various ways by the officials of the Greenland Administration, both at home and in Greenland, as
well as by other Danes and Greenlanders, especially in the collection of material1). To mention any special names would be impossible; I must be content with expressing my sincere thanks to all.
I am grateful to the Director of the Marine Biological Laboratory, Dr. phil. Å. V e d e l T å n i n g , for his excellent cooperation, especially in the cod marking experiments ; further, he has most kindly handed over to me a considerable material of cod otoliths, which on his initiative was collected by Faroese fishermen during several years from the fishing banks in Davis Strait.
Most thanks are due to Professor Dr. phil. A d . S. J e n s e n , for many years the fisheries adviser of the Greenland Administration; he it was who started me on these investigations and he has always been at hand with advice and directions during the progress of the work.
And finally I have to accord my appreciation of the kindness of Dr. H a r r y M. K y l e for translating this paper from the Danish.
I. Introduction.
A. Previous Investigations.
At the time when A d . S. J e n s e n undertook the first practical-scientific fisheries investigations with the brig “Tjalfe” in 1908—09, the cod was a rare and but locally occurring fish at Greenland. All the same, a t the investigation of A d . S. J e n s e n , a cod fishery was started and a couple of Greenland fishery stations set up ; this was the first beginning of a fishery which has proved of great importance to the Greenlanders; it was successful and gradually, as the cod increased in numbers due to more favourable hydrographical conditions in the Greenland waters, extended northwards along the coast of West Greenland. Until the investigations of the twenties were undertaken,
1) For practical reasons the original figures regarding the catch of fry and the age analyses of the catches from the various years are not included in the present report, but they may be had on application to the University Library in Copenhagen.
nothing was known about the biological conditions of the stock of cod in Greenland waters. Thus it was not known how far the species spawned in Greenland waters and whether the young cod grew up there. Nor was it known to what extent the Greenland cod was connected with the American or the Iceland stocks. Neither the growth nor the age-composition of the stock was known and there were many problems therefore to solve and many of them could only be solved by continuous investigations over several years.
The investigations which have now been carried on for a number of years have thrown light on many of these conditions. In 1924 T å n in g with "Islands Falk” of the Danish Marine undertook the first investigations into the occurrence of the cod fry; at the same time he began marking experiments and collected a large material of cod otoliths for the determination of the age, growth and composition of the stock. I t was on this occasion that for the first
— 6 -
time cod fry were proved to occur in Greenland waters. In 1925 investigations over the off-shore banks were undertaken under the direction of A d . S. J e n s e n and in 1926 and 1927 the cod investigations were continued in the coastal and fjord waters from Frederikshaab to Holsteinsborg district, by means of various motor boats and from the fishery stations ; these investigations were carried out by the present author. In 1928 the S.S. “Godthaab” continued the investigations over the banks and a t several places along the coast. As the principal working area of the Godthaab Expedition lay chiefly in the northern part of Baffin Bay and Melville Bay, only scattered observations on the biology of the cod could be made.
The coast and fjord investigations were continued in 1929 from motor boat on the initiative of Ad. S. J e n s e n and were carried out each summer by the author till the summer of 1939. The war stopped the work, but a large material of cod otoliths and measurements was collected in the war years by the Greenland fishery officials a t the various stations. After the war the investigations were renewed in 1946 from the new research vessel M/K ' “Adolf Jensen” by the Greenland Administration.
In the course of the years various papers have been published dealing with the biology of the Greenland cod. In his reports from the “Tjalfe” Expedition A d . S. J e n s e n has dealt with its occurrence a t Greenland in the beginning of the century ( J e n s e n 1909) and in “ The Fishery of the Greenlanders” (1925) he refers further to the cod fishery of the Greenlanders and also to the first fisheries investigations at Greenland in 1924. The investigations of the S.S. “Dana” are discussed by J e n s e n (1925 and 1926). A complete account of the results of the investigations in the twenties is given by H a n s e n and J e n s e n (1930 and 1931). The change in the natural conditions of the sea, which has influenced the mass occurrence of the cod in Greenland waters, is described in detail by J e n s e n (1939 and 1944), who a t the same time discusses various conditions affecting the biology of the cod a t Greenland.
In his work on the Atlantic races of the cod S c h m id t (1931) also deals with the cod a t Greenland and here we find also the first records of marked Greenland cod recovered from Icelandic waters. The extensive marking experiments are dealt with by H a n s e n , J e n s e n and T å n i n g (1935), who give the results of the experiments from the years 1924—1933. Further, T å n in g (1934 and 1937) has discussed various conditions affecting the migrations of the Greenland cod with special reference to the migrations to Iceland. The present author (1934) has discussed the year-class composition of the cod stock in different Greenland areas. A further survey of the same kind carries on the investigations to 1938 ( H a n s e n 1939). The present author has given reports ( H a n s e n 1931—46) concerning the investigations which were carried out yearly in Greenland waters from 1931—1939 and in 1946, with special regard for the biology of the cod. Quite brief summaries are given in 1930 ( H a n s e n )
and in 1942 in connection with the statistical reports on Greenland. In the Annales Biologiques for 1943 the present author gave a review of the age-group composition of the cod stock in the years 1924— 1939, the average lengths of the cod in the different age-groups and the average size of individual year- classes.
B. T h e Occurrence of the Cod at Greenland.
In an earlier publication ( H a n s e n and J e n s e n 1930) the section which deals with the history of the Greenland cod fisheries describes the occurrence of the cod a t Greenland in earlier years up to 1929 and in his paper on the climatic changes (1939) A d . S. J e n s e n refers to the distribution of the cod at Greenland both in earlier and recent times.
I t will be sufficient, therefore, to give only a brief outline here of the information recorded in these two works.
The occurrence of the cod at West Greenland has been of a periodic character. According to R i n k the eighteen twenties and end of the forties have been periods of many cod. In the forties, the period we know best, a large cod fishery was carried on by foreign vessels in the Davis Strait, whilst the Danes and Greenlanders also took part in the fishery. In 1850 the cod fishery gave only a meagre result and in 1851 practically no cod were found. In both periods the cod were caught along the whole coast up to Disko Bay. For the remainder of the nineteenth century we have no notices of large occurrences of cod.
From experience we know th a t there have always been cod in a few of the South Greenland fjords; for example, in some fjords of the Sukkertoppen district (Kangia, Angmasivik). Cod have also been present in the Amerdlok fjord a t Holsteinsborg. I t was well known a t Fiskenæsset in the Godthaab district, tha t the cod appeared as a rule every summer (August- September), and a fishery was then carried on, the dried cod being used for distribution to the poor in times of scarcity. The liver also was used in the making of oil.
In 1906 an experimental fishery for cod was undertaken by two Faroese cutters under the direction of N a p o l e o n A n d r e a s e n , a company manager. The trials, which were carried out for the Greenland Trading Company, gave almost negative results so far as the cod was concerned. Ju st as little fortune came to two Faroese cutters, which made a trial fishery in 1914 from about July 19. to August 20. mainly off Sukkertop and Kangamiut. They got no cod but about 900 halibut, none of which was under 50 kg. in weight. In addition they caught large quantities of the catfish (Anarhichas minor) on long-lines.
When the “Tjalfe” Expedition of 1908—09 carried out its investigations, cod were only found in some quantities a t Fiskenæs and in the sounds a t Cape Farewell. The cod fishery, which was begun in 19ll a t Fiskenæs and Sarfanguak in Amerdlok Fjord, on the initiative of A d . S. J e n s e n , the leader of the Expedition, yielded only meagre results in the first six
years. In 1917 there was a marked upward tendency in the fishery, the cod appearing in tha t year in greater numbers and over larger areas than before. I t came first into the Julianehaab district and a little
1000 TONS
15
12
10
9
8
7
6
5
5
2
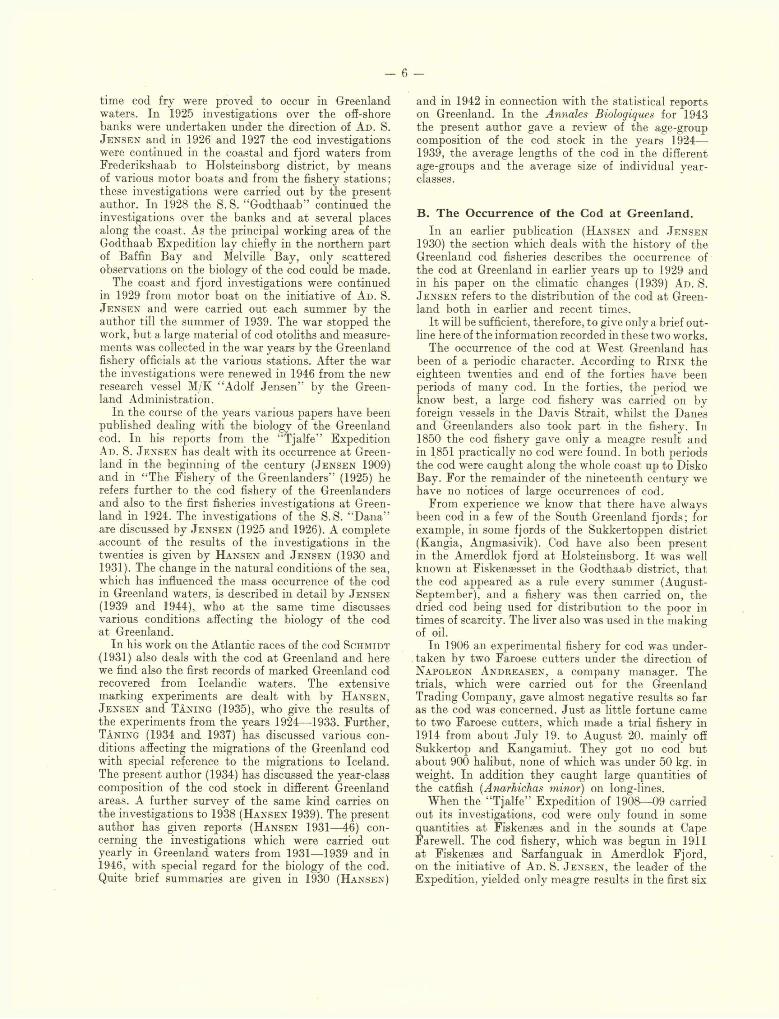
Fig. 1. Product of the Greenlanders’ Cod Fishery in the years 1925—1946, in tons.
later into the Frederikshaab district, since 1919 in the area of the Godthaab Fjord, after 1922 in the Sukkertoppen district and in 1927 in the Holsteinsborg district. In 1928 the cod went right up to Hunde Eiland in the Egedesminde district. In 1931 there were cod as far up as Disko Bay and in the Umanak district. In the following years the cod has appeared each year up in these northern districts. For example, in the Umanak district in 1932 over 36 tons of cod were obtained at the outposts Nugssuak and Niakor- nat. From the end of the thirties a few cod have been taken even a t Upernavik ( J e n s e n 1939, p. 5).
W ith regard to East Greenland, J o h s . S c h m id t (1931) noted the occurrence of the cod a t Angmags- salik, and A d . S. J e n s e n in 1939 gave information regarding the occurrence of the cod in this district in the later years. According to this the cod had been unknown there until 1912, when some few specimens were taken. From about 1920 it began to occur in small shoals, from 1923 it was fairly common and from about 1930 it was found almost everywhere in the district, especially in the inner parts of the fjords. In the winter of 1930— 31 it was abundant in most of the district. Since then the cod has occurred regularly each year in the summer and autumn at Angmagssalik and was caught by the Greenlanders for their own use, no salting of the cod being undertaken in this district.
The quantities of cod taken by the Greenlanders and turned into saltfish are indicated in the accompanying graph, Fig. 1, which shows the yield of cod in unprepared condition for the whole of Greenland in the years 1925— 46.
I t will be seen how the fishery from a small beginning suddenly rose in the middle twenties and reached a peak provisionally in 1930 with a yield of over eight thousand tons. In the following years the yield was somewhat variable. I t was very low especially in 1938 which was an unusually cold year with stormy weather, thus greatly interfering with the fishery. In 1939 the yield was again up to normal.
In the war years the product of the cod fishery by the Greenlanders was very large. In 1942 it exceeded ten thousand tons and in 1946 it reached the record of thirteen thousand tons.
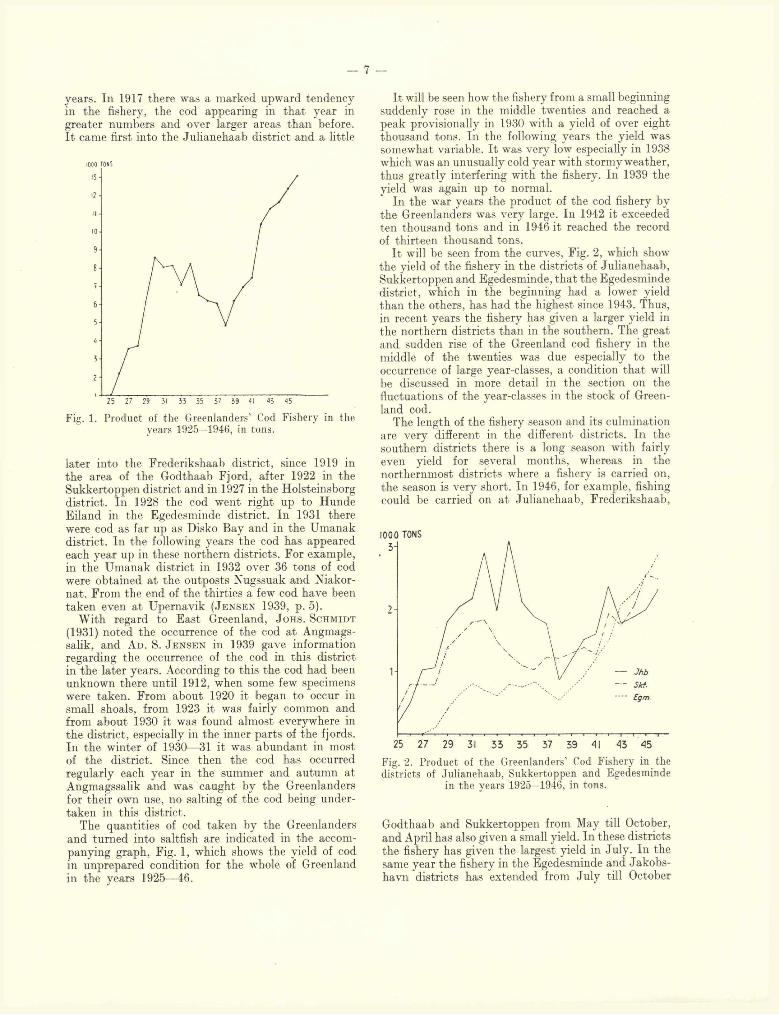
I t will be seen from the curves, Fig. 2, which show the yield of the fishery in the districts of Julianehaab, Sukkertoppen and Egedesminde, tha t the Egedesminde district, which in the beginning had a lower yield than the others, has had the highest since 1943. Thus, in recent years the fishery has given a larger yield in the northern districts than in the southern. The great and sudden rise of the Greenland cod fishery in the middle of the twenties was due especially to the occurrence of large year-classes, a condition th a t will be discussed in more detail in the section on the fluctuations of the year-classes in the stock of Greenland cod.
The length of the fishery season and its culmination are very different in the different districts. In the southern districts there is a long season with fairly even yield for several months, whereas in the northernmost districts where a fishery is carried on, the season is very short. In 1946, for example, fishing could be carried on at Julianehaab, Frederikshaab,
1000 TONS
25 27 29 31 33 35 37 39 41 43 45
Fig. 2. Product of the Greenlanders’ Cod Fishery in the districts of Julianehaab, Sukkertoppen and Egedesminde
in the years 1925—1946, in tons.
Godthaab and Sukkertoppen from May till October, and April has also given a small yield. In these districts the fishery has given the largest yield in July. In the same year the fishery in the Egedesminde and Jakobs- havn districts has extended from July till October
with a minimum yield in June. August has given here by far the largest yield.
In the winters of 1946—47 and 1947—48 the cod have been found in all the South Greenland districts from Julianehaab up to and including the Sukkertoppen district. Some quantities have been dried in these winters, but no cod were salted owing to the frost.
The very great occurrence of the cod in Greenland waters must be viewed from the background of the considerable change in the natural conditions, tem perature and marine currents, which has taken place there from the beginning of the twenties. Several papers have dealt with this condition ( H a n s e n , J e n s e n , T å n i n g 1935), ( J e n s e n 1939 and 1944) to which reference may be made. The warmer conditions in the sea have led to several marine forms, previously with a southern distribution, extending their area northwards in the Greenland waters, whilst more arctic forms have retreated farther north. This change in the occurrence applies to the invertebrates as well as to fish and marine mammals (see pp. 14— 15). The warm period has now lasted over twenty-five years and there is still no sign th a t it is about to end.
As the cod fishery gradually developed the Greenland Administration set up more and more stations for the salting of cod. In the report of the Greenland Administration No. 1,1944, summary of the statistical information regarding Greenland III , p. 659, an account is given of the fish-houses erected in West Greenland. From this we have the following:
T able 1. F ish -H o u ses in W est Greenland.
Yoar 1910 1915 1920 1925 1930 1935 T , ,......................... —14 —19 —24 —29 —34 —39 10tiU
No. of houseserected. . . . 11 3 24 21 52 14 125
m.* floor area 725 129 1506 1077 3134 1104 7675
Among these are reckoned fish-houses for the Greenland halibut, but this means only a few houses, as the fishery and treatm ent of the Greenland halibut are restricted to Jakobshavn and the Julianehaab district. Some of the houses are also used for the salting of sharks’ skins and a few of them have changed to other uses, whilst several have been extended. In 1939 there were in all 115 fish-houses, 75 in South Greenland and 40 in North Greenland. During the war and since more new and spacious fish-houses have been built and several of the old have been greatly extended.
Just as along the coast large quantities of cod appeared on the off-shore banks in the Davis Strait and at the same time, though in earlier periods scarcely any cod had been found there. Fishing vessels belonging to many different nations have been fishing on the banks each summer since the middle of the twenties. The Norwegians began this fishery in 1924 after the Norwegian Arctic skipper J o h a n O l s e n had discovered large quantities of cod on the banks in Davis Strait in the summer of 1923 (D e v o l d 1947). According to information received from the International Council the yield of this fishery has been as follows :
T able 2. Yield of the F ish ery on the off-shore B anks in the D avis Strait.
Tons Tons Tons1925... 352 1930. .. 43,060 1935 .. 38,2321926... 2,502 1931. .. 51,053 1936 .. 61,5531927... 3,114 1932. .. 36,603 1937 .. 48,4591928... 1,808 1933. .. 18,038 1938 .. 47,0691929... 14,312 1934. .. 45,713
During the w ar there was practicallv no fishingby foreign countries in Greenland waters, w ith theexception of some Portuguese vessels.
II. Environment.
A. H ydrographica l C onditions in Greenland W aters.
The hydrography of the Greenland waters has been the object of investigations by several expeditions; of these special mention may be made: “ Ingolf” 1896, “Tjalfe” 1908—09, “Dana” 1925, “Godthaab” 1928 and the American expeditions “Marion” and “General Green” in 1928, 1931, 1933, 1934 and 1935. In addition, hydrographical observations have occasionally been made by the Danish inspection vessels, whilst the small research vessels of the Greenland Administration have made observations especially in the coastal and fjord areas. The available observations are unfortunately somewhat scattered and we lack especially continuous observations throughout the year over a long period.
I t has been possible nevertheless to obtain a view
over the main tendencies of the hydrographical conditions. A survey has been given by K i i l e r i c h (1943) and this has been followed in the main here. During the war D tjnbab made some hydrographical observations especially a t Godthaab (D u n b a e 1946). S m e d has noted the variations of the surface temperature in Greenland waters over the period 1876—1939 (S m e d 1947).
The Greenland waters come under the influence of the cold East Greenland Polar Current on the one side and of the warm Atlantic Irminger Current on the other. The Polar is a surface current coming from the Greenland Sea and the Arctic Sea; it runs close to the East Greenland coast. After rounding Cape Farewell it turns northwards along the coast of West Greenland. At Cape Farewell the temperature early in the summer is negative across almost the whole
- 9 —
breadth of the current; later, it may rise right up to 2°—4°; the salinity is 32— 34 °/00. The Irminger Current is a branch of the North Atlantic Current. I t washes the coast of West Iceland, then turns west and follows the Polar Current outside the shelf. At a depth of 200— 400 m. the nucleus of this current has a temperature of 4°— 5° and a salinity of 34-75— 35-00 °/00. Later in the summer the temperature rises one or two degrees, whilst the salinity falls slightly. The two streams gradually mix with each other east of Cape Farewell and with subarctic water which flows out from the western part of the Davis Strait. The water masses occurring a t the southernmost part of East Greenland and along West Greenland are in great part mixed water. On the west coast the Polar Current is strongest a t Cape Farewell and is only present on the southern banks, where in certain years it can be detected on the slope of the banks a t a depth of about 100 m. I t increases in volume about midsummer and may sometimes overflow the banks. In other summers with small volume it can hardly be detected, and in specially warm years the Polar Current may itself be warm and the temperature may rise evenly over the banks in the south up to 4°— 5° C. The Polar Current spreads along the southern side of Lille Helleflske Bank and thus has no influence on the hydrographical conditions of the northern banks. I t continues towards the west where it mixes with the cold, south-going Canadian Polar Current from Baffin Bay, farther south called the Labrador Current. From experiments with drift bottles it has been shown ( H e r m a n n and T h o m s e n 1946), th a t their rate of drift was strongest near Cape Farewell, decreasing considerably northwards. For example, a t the southernmost part of West Greenland an average drift of 11 sea-miles in 24 hours was observed, whereas to the north around 68° the drift was less than 1 mile.
The Polar Current is strongest as a rule in the first part of the summer, slacking off generally before the middle of August. While the southern banks are under the influence of the Polar Current, this current is not felt over the Store Hellefiske Bank. According to K i i l e r i c h the weak north-going current over these banks consists mainly of local mixed water. The warm Irminger Current appearing as an undercurrent reaches a maximum in the autumn or later in the winter. I t then penetrates into all the deep fjords, even where there is a threshold at the mouth, and perhaps over the banks.
In May—June before the currents make their appearance, the temperature over the southern banks may amount to 0—1° and the salinity to 33-50—34-00 °/00; in warm years the temperature may rise to 2°. Over the northern banks a t this time there may oftenbe cold, winter-cooled water (temperature 0------ 1°,salinity ca. 34-00 °/oo)> which however soon becomes warmer when the winter ice and west ice disappear. At greater depths, 400—700 m., to the north we often find a warm water layer with a temperature of 1—5°, originating from the warm current of the previous year. In warm summers the surface water down to
50 m. over the northern banks may have a temperature of 4—6°, when the temperature a t ca. 100 m. is about 1—2° as a rule. The cold south-going Canadian Current on the west side of the Strait may sometimes extend as far to the east as to the edge of the Store Hellefiske Bank at a depth of 100—200 m. and thus may prevent the inflow of warm water.
The temperatures over the banks are thus dependent on which of the two main currents, Polar and Irminger, is the strongest. Great variations are apparent in the hydrographical conditions. Warm and cold periods have succeeded each other. I t would appear th a t the eighties of last century had a warm period, replaced however by a cold a t the beginning of this century. In the twenties again a markedly warm period sets in which still continues. I t reached its peak in 1934, a very warm year. 1938 again was unusually cold. In tha t year large quantities of dead fish of various species, e.g., cod, catfish and Norway haddock, were stranded at Sukkertop ; in the spring a t Holsteinsborg the prawn fishery with trawl brought up large quantities of dead cod ( H a n s e n 1939) (A d . S. J e n s e n 1939, pp. 73, 74). 1939 was again a year with higher temperatures in the sea.
S m e d (1947) from a study of the surface temperature over the period 1876—1939 has shown, th a t the records indicate a considerable increase in the beginning of the twenties, and the high temperatures continued till 1939 with exception of the year 1938, when they were very low. In agreement with the increase in temperature is the fact tha t the air tem perature increased greatly. According to S c h e r h a g
(1937) the temperature increase was due to an increased atmospheric circulation in recent years. In the war years D u n b a r (1946) made hydrographical observations especially a t the mouth of Godthaab Fjord and came to the conclusion, tha t the warm period was about to end ; this was based on the lower temperatures found in the period 1942—44 in conjunction with much winter-ice in the winters of 1943—44 and 1944—45 as well as the occurrence of “Storis” at Godthaab in August 1945. On the other hand, observations from the research vessel “Adolf Jensen” have not indicated any decrease in the sea temperatures in 1946—47.
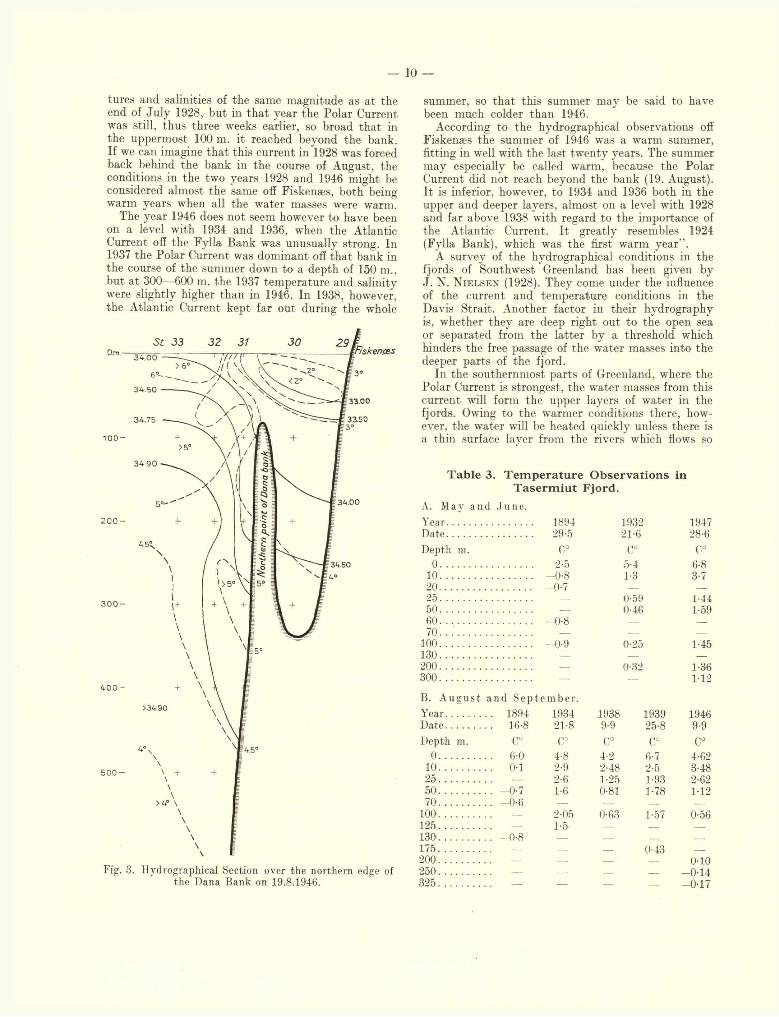
I t is evident tha t the increase in the sea temperatures, which has takpn place in Greenland waters in recent years, has produced better conditions for the cod, to the extent th a t it has been able to spawn there. On 10. August 1946 a hydrographical section was taken from Fiskenæs towards the SW. out over the north point of the Dana Bank. The observations were made by Cand. mag. F r e d e H e r m a n n and the results are shown in Fig. 3. At the request of the present author the material was worked up by Mag. scient. A l f K i i l e b i c h and his conclusions read as follows. “The Polar Current along the outer side of the Dana Bank has obviously been weak and by this time, 19. August, cannot be detected. The Atlantic Current extends outside the bank on the surface throughout the whole section and at some depth shows tempera-
— 10 —
tures and salinities of the same magnitude as a t the end of Ju ly 1928, but in tha t year the Polar Current was still, thus three weeks earlier, so broad tha t in the uppermost 100 m. it reached beyond the bank. If we can imagine tha t this current in 1928 was forced back behind the bank in the course of August, the conditions in the two years 1928 and 1946 might be considered almost the same off Fiskenæs, both being warm years when all the water masses were warm.
The year 1946 does not seem however to have been on a level with 1934 and 1936, when the Atlantic Current off the Fylla Bank was unusually strong. In1937 the Polar Current was dominant off tha t bank in the course of the summer down to a depth of 150 m., but a t 300—600 m. the 1937 temperature and salinity were slightly higher than in 1946. In 1938, however, the Atlantic Current kept far out during the whole
30St 33 32O.m.
3 4 ,0 0
3 4 5 0
33.00
[ 33.50 3°
34.75
1 0 0 -
3 4 9 0
2 0 0 -
3 0 0 -
4 0 0
>34.90
4.5‘
5 0 0 -
summer, so tha t this summer may be said to have been much colder than 1946.
According to the hydrographical observations off Fiskenæs the summer of 1946 was a warm summer, fitting in well with the last twenty years. The summer may especially be called warm, because the Polar Current did not reach beyond the bank (19. August). I t is inferior, however, to 1934 and 1936 both in the upper and deeper layers, almost on a level with 1928 and far above 1938 with regard to the importance of the Atlantic Current. I t greatly resembles 1924 (Fylla Bank), which was the first warm year” .
A survey of the hydrographical conditions in the fjords of Southwest Greenland has been given by J . N . N i e l s e n (1928). They come under the influence of the current and temperature conditions in the Davis Strait. Another factor in their hydrography is, whether they are deep right out to the open sea or separated from the latter by a threshold which hinders the free passage of the water masses into the deeper parts of the fjord.
In the southernmost parts of Greenland, where the Polar Current is strongest, the water masses from this current will form the upper layers of water in the fjords. Owing to the warmer conditions there, however, the water will be heated quickly unless there is a thin surface layer from the rivers which flows so
Table 3. T em p eratu re O b servations in T a serm iu t Fjord.
A. May an d Ju n e .
Fig. 3. Hydrographical Section over the northern edge of the Dana Bank on 19.8.1946.
Y ear.. 1894 1932 1947D ate .. 29-5 21-6 28-6Depth
0. ..m. 0°
2-5C°
5-4C°
6-810. .. -0-8 1-3 3-720 ... -0-7 — —25. .. — 0-59 1-4450. . . — 0-46 1-5960. . . -0-8 — —70
100.. . -0-9 0-25 1-45130 ... — — —200 ... — 0-32 1-36300. .. — — 112
B. Au
Year. .gu s t and S ep tem ber. ............ 1894 1934 1938 1939 1946
Date.. .. 16-8 21-8 9-9 25-8 9-9Depth m. C° C° C° C° C°
0. .. .. 6-0 4-8 4-2 6-7 4-621 0 . . . .. 0-1 2-9 2-48 2-5 3-4825. .. — 2-6 .1-25 1-93 2-6250. .. .. —0-7 1-6 0-81 1-78 M 270. .. .. —0-6 — — — .—
100 ... — 2-05 0-63 1-57 0-56125 ... — 1-5 — .— —.130 ... .. —0-8 — — — .—175. . . — — .— 0-43 —200. . . — — — — 0-10250. . . — — _ _ -0-14325. .. — — — — -0-17
- 11 —
rapidly out of the fjord, tha t it is not able to heat the layers below. In fjords with a threshold only the water of the Polar Current can penetrate early in the summer, whereas the deep fjords without threshold allow the warm, deeper lying Atlantic Current to enter towards the autumn when the warm current is a t its strongest. In the years when the Polar Current has been warm, the temperatures in these fjords have been relatively high. Temperature measurements in the two fjords Tasermiut and Lichtenau are given in Table 3, to exemplify these conditions.
In Tasermiut M o l t k e (1896, p. 110) gives the measurements taken in May and August. The present author has made the temperature observations in this fjord in recent years.
I t will be seen that, whilst in 1894 there was a very thick layer of negative water which in May reached almost right up to the surface and in August to ca. 50 m., no negative temperatures have been found in recent years except in 1946, when the bottom water was negative. A marked increase of the temperature has thus taken place and this may be ascribed to the higher temperatures of the water which has penetrated into the fjord from outside.
In Tunugdliarfik, a t the beginning of August 1909, N i e l s e n found a surface temperature of 8°, but the surface layer was quite thin. Under this came a water layer almost 100 m. thick with a temperature of ca.0-3°. The bottom temperature was however about 2°.
In recent years the following temperatures have been measured:—
T able 4. T em p erature O bservations inTunugdliarfik .
Year.............. . . . 1932 1946 1947D ate.............. . . . 4-6 19-9 10-7
Depth m. C° C° C°0 .............. . .. 4-25 2-68 9-5
1 0 ................... . .. 0-59 0-23 8-472 5 ................... . . . 0-33 0-09 2-325 0 ................... . . . 0-08 0-58 1-92
100................ . . . -0-13 0-16 1-90170................... — 1-84 —2 0 0 ................... . . . 1-70 — 2-353 5 0 ................ — — 2-62
The temperatures in this fjord are extremely variable. The measurements for 1932 and 1946 differ little from N i e l s e n ’s recordings in 1909, but in 1947 the temperatures are considerably higher.
From the Lichtenau Fjord we have temperature measurements for several years, many taken at the same time of year. The temperatures for 1909 were taken by the “Tjalfe” Expedition, in 1946 by F r e d e H e r m a n n and in the other years by the present author.
The temperatures in this fjord have also been extremely variable, yet it is evident from the observations, which were made in the month of August, tha t
T able 5. T em p erature O bservations in Lichtenau Fjord.
Year 1909 1932 1938 1939 1946 1932 1947Date 22-8 15*8 12-8 18-8 4-9 22-6 25-6
Depth m. C° C° C° C° G° C° C°0 3-85 9-35 9-5 7-6 8-01 5-35 10-2
10.............. 1-45 3-85 1-56 3-85 3-13 1-36 7-5425.............. 0-52 2-49 0-87 2-87 2-52 0-61 1-8750.............. 0-62 1-35 0-63 1-38 -0-62 0-06 1-52
100.............. 0-07 1-53 -0-13 0-72 0-50 0-35 1-75175............... — — — 0-93200.............. 0-61 1-14 0-18 - 1-54 1-20 1-70300.............. 0-59 — — — — — 2-08390.............. 0-58 — — — — — —400............... — — — — 2-66 — —
all years except 1938 show higher values than 1909. Except in 1909 the surface layer is fairly warm and the salinity low ; this comes from the addition of river water. The upper layer down to ca. 100 m. must come from the Polar Current, more, or less mixed with Atlantic water. The uppermost layer has been heated by the air. The warming process has not penetrated to 50—100 m. The lowermost layer is fairly warm and in recent years considerably warmer than in 1909. This has been caused presumably by the penetration of Atlantic water in the preceding autumn. The years 1938 and 1946 are the only ones to show negative temperatures in the water. In 1938 this occurred a t a depth of 100 m., in 1946 a t 50 m. In1938 the bottom water was cold, 0-18° at 200 m., but it was comparatively warm in 1946, which points to a stronger inflow of polar water in 1938 than in 1946. Its fairly high salinity in 1946, 33-98 °/00 a t a depth of 400 m., indicates a preponderance of Atlantic bottom water in th a t year.
Turning now to the Godthaab Fjord we find tha t the conditions during the present warm period have changed even more than in the southern fjords, especially in the inner parts of the fjord.
Some of the temperatures observed in this fjord are given in Table 6. The observations in 1908 were made by J. N . N i e l s e n , those of 1946 by F r e d e H e r m a n n , in 1943 by D u n b a r , the remainder by the present author.
In 1908 the temperatures at the mouth of the fjord lay below 1° in all layers of water, whereas in the later years no temperatures below 1° were found. The temperatures are thus far higher in recent years than in 1908. Turning to the observations inside the fjord we find an even more marked difference between 1908 and the later years. On station 27 of the “ Tjalfe” Expedition in the sound off Kornok negative temperatures were found from 75 m. to 250 m.; in the later years negative temperatures have not been found anywhere in the fjord area.
Comparing the observations for the years 1946 and 1947 with those from the thirties in the same months we do not find any great differences. There seems nothing to indicate, tha t the warm period is about
- 12 -
T able 6. T em p erature M easu rem en ts at G odthaab Fjord.
A. At th e m o u th of the F jo rd .
Year 1908 1947 1935 1934 1946 1947 1943Date 20-6 31-5 11-6 5-7 15-7 1-8 28-10Depth m. C° C° C° C° C° C° C°
0 ............ 0-75 3-95 4-35 5-0 7-81 8-0 0-9610............... — 3-80 3-62 3-65 6-09 4-27 1-0625............. 0-60 2-81 2-65 3-67 3-71 3-72 —50............. 0-62 1-89 2-0 3-27 2-61 4-70 2-45
100............. 0-58 1-77 1-31 2-82 2-11 3-05 2-75200............ 0-61 1-80 1-14 2-52 1-45 2-55 —300............ — 1-70 1-10 2-49 1-35 2-28 3-25350............38.5............ 0-54 _ _ _ _ _ _400............ — 1-94 — — 1-32 2-47 —
B. In s ide th e F jo rd .
Year 1933 1936 1939 1947 1926 1938 1946Date 25-5 24-5 15-6 2-6 7-7 9-7 27-7Depth m. C° C° C° 0° C° C° C°
0 ............ 3-9 2-8 6-2 7-1 8-59 8-3 4-7310............ 1-05 2-16 5-38 6-48 8-93 4-74 1-4525............ 1-02 2-00 2-48 4-3 2-25 1-17 2-4450............ 1-40 1-92 1-13 2-08 2-60 1-67 2-62
100.............. 0-86 1-92 0-94 2-43 2-30 1-28 2-00200.............. 0-67 1-38 0-79 2-14 1-73 1-20 1-40250............ — — — 2-08 — — —300............ — — — — 1-21 1-47 1-35400............ _ _ _ _ _ 9-42 1-94
to end. I t looks rather as if the temperatures, especially in the deeper layers, are on the whole a little higher than the earlier years’ observations show.
During the investigations of the “Tjalfe” in 1908 practically no cod were taken in Godthaab Fjord, which is not surprising when we consider the hydro- graphical conditions. In the warm period, on the other hand, large quantities of cod were present everywhere in the fjord.
B. H ydrographical C onditions and S p aw n in g of the Cod in other N orth A tlantic R eg ion s com p ared w ith G reenland.
We may now consider quite briefly the hydrographical conditions in various other regions where the cod occurs. A short summary of the hydrographical conditions at Newfoundland is given by T h o m p s o n (1943, pp. 94—96). The region is under the influence of the cold, south-going Labrador Current coming from Baffins Bay. I t flows along the east coast of Newfoundland in February and sends a branch into the strait a t Belle Isle. I t has a breadth of 10—20 miles and reaches down to ca. 450 m. ; its rate of flow is from 12—14 miles per day and its temperature is from 0—3° C. To the south of Newfoundland it mixes with warm oceanic water. The cold stream shows great variations in different years; strong in 1932, 1933 and 1935, whilst 1930 and 1934 were very warm years. The region is characterised by greatly varying temperatures.
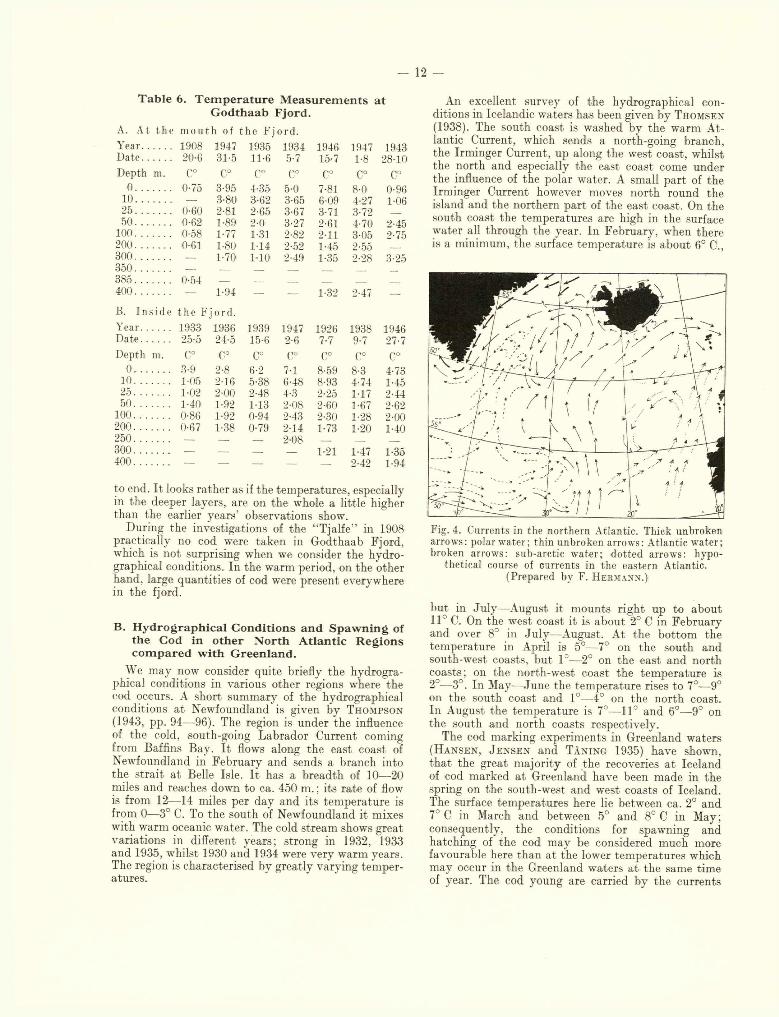
An excellent survey of the hydrographical conditions in Icelandic waters has been given by T h o m s e n
(1938). The south coast is washed by the warm Atlantic Current, which sends a north-going branch, the Irminger Current, up along the west coast, whilst the north and especially the east coast come under the influence of the polar water. A small part of the Irminger Current however moves north round the island and the northern part of the east coast. On the south coast the temperatures are high in the surface water all through the year. In February, when there is a minimum, the surface temperature is about 6° C.,
Fig. 4. Currents in the northern Atlantic. Thick unbroken arrows: polar water; thin unbroken arrows: Atlantic water; broken arrows: sub-arctic water; dotted arrows: hypo
thetical course of currents in the eastern Atlantic.(Prepared by F. H e r m a n n .)
but in July—August it mounts right up to about 11° C. On the west coast it is about 2° C in February and over 8° in July-—August. At the bottom the temperature in April is 5°—7° on the south and south-west coasts, but 1°—2° on the east and north coasts; on the north-west coast the temperature is 2°—3°. In May—June the temperature rises to 7°—9° on the south coast and 1°—4° on the north coast. In August the temperature is 7°—11° and 6°—9° on the south and north coasts respectively.
The cod marking experiments in Greenland waters (H a n s e n , J e n s e n and T å n i n g 1935) have shown, th a t the great majority of the recoveries a t Iceland of cod marked at Greenland have been made in the spring on the south-west and west coasts of Iceland. The surface temperatures here lie between ca. 2° and 7° C in March and between 5° and 8° C in May; consequently, the conditions for spawning and hatching of the cod may be considered much more favourable here than a t the lower temperatures which may occur in the Greenland waters a t the same time of year. The cod young are carried by the currents
- 13 -
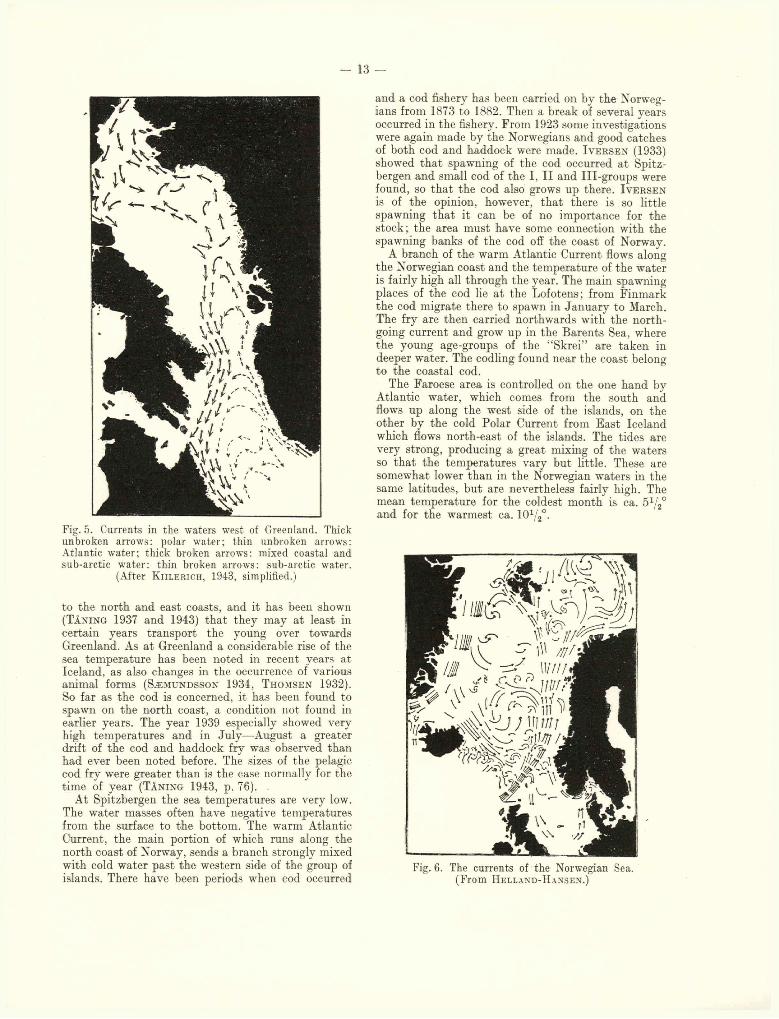
Fig. 5. Currents in the waters west of Greenland. Thick unbroken arrows: polar water; thin unbroken arrows: Atlantic water; thick broken arrows: mixed coastal and sub-arctic water: thin broken arrows: sub-arctic water.
(After K i i l e r i c h , 1943, simplified.)
to the north and east coasts, and it has been shown (T å n in g 1937 and 1943) tha t they may at least in certain years transport the young over towards Greenland. As at Greenland a considerable rise of the sea temperature has been noted in recent years at Iceland, as also changes in the occurrence of various animal forms (Sæ m u n d s s o n 1934, T h o m s e n 1932). So far as the cod is concerned, it has been found to spawn on the north coast, a condition not found in earlier years. The year 1939 especially showed very high temperatures and in July—August a greater drift of the cod and haddock fry was observed than had ever been noted before. The sizes of the pelagic cod fry were greater than is the case normally for the time of year (T å n i n g 1943, p. 76). .
At Spitzbergen the sea temperatures are very low. The water masses often have negative temperatures from the surface to the bottom. The warm Atlantic Current, the main portion of which runs along the north coast of Norway, sends a branch strongly mixed with cold water past the western side of the group of islands. There have been periods when cod occurred
and a cod fishery has been carried on by the Norwegians from 1873 to 1882. Then a break of several years occurred in the fishery. From 1923 some investigations were again made by the Norwegians and good catches of both cod and haddock were made. I v e r s e n (1933) showed th a t spawning of the cod occurred a t Spitzbergen and small cod of the I , I I and III-groups were found, so th a t the cod also grows up there. I v e k s e n is of the opinion, however, th a t there is so little spawning tha t it can be of no importance for the stock; the area must have some connection with the spawning banks of the cod off the coast of Norway.
A branch of the warm Atlantic Current flows along the Norwegian coast and the temperature of the water is fairly high all through the year. The main spawning places of the cod lie a t the Lofotens; from Finmark the cod migrate there to spawn in January to March. The fry are then carried northwards with the north- going current and grow up in the Barents Sea, where the young age-groups of the “Skrei” are taken in deeper water. The codling found near the coast belong to the coastal cod.
The Faroese area is controlled on the one hand by Atlantic water, which comes from the south and flows up along the west side of the islands, on the other by the cold Polar Current from East Iceland which flows north-east of the islands. The tides are very strong, producing a great mixing of the waters so th a t the temperatures vary but little. These are somewhat lower than in the Norwegian waters in the same latitudes, but are nevertheless fairly high. The mean temperature for the coldest month is ca. ö1/ / and for the warmest ca. IO1/ / -
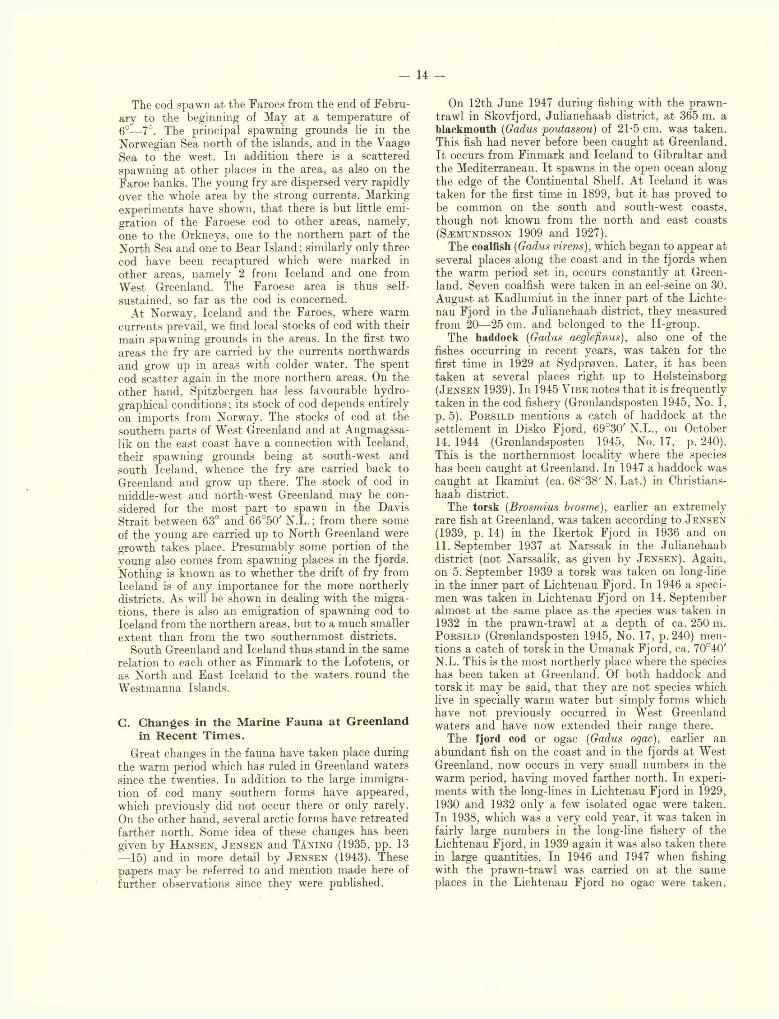
Fig. 6. The currents of the Norwegian Sea. (From H e l l a n d - H a n s e n .)
— 14 -
The cod spawn a t the Faroes from the end of February to the beginning of May a t a temperature of go—7°. rpkg prineipal spawning grounds lie in the Norwegian Sea north of the islands, and in the Vaagø Sea to the west. In addition there is a scattered spawning a t other places in the area, as also on the Faroe banks. The young fry are dispersed very rapidly over the whole area by the strong currents. Marking experiments have shown, th a t there is but little emigration of the Faroese cod to other areas, namely, one to the Orkneys, one to the northern part of the North Sea and one to Bear Island; similarly only three cod have been recaptured which were marked in other areas, namely 2 from Iceland and one from West Greenland. The Faroese area is thus selfsustained, so far as the cod is concerned.
At Norway, Iceland and the Faroes, where warm currents prevail, we find local stocks of cod with their main spawning grounds in the areas. In the first two areas the fry are carried by the currents northwards and grow up in areas with colder water. The spent cod scatter again in the more northern areas. On the other hand, Spitzbergen has less favourable hydro- graphical conditions ; its stock of cod depends entirely on imports from Norway. The stocks of cod a t the southern parts of West Greenland and a t Angmagssa- lik on the east coast have a connection with Iceland, their spawning grounds being a t south-west and south Iceland, whence the fry are carried back to Greenland and grow up there. The stock of cod in middle-west and north-west Greenland may be considered for the most part to spawn in the Davis Strait between 63° and 66°50' N.L. ; from there some of the young are carried up to North Greenland were growth takes place. Presumably some portion of the young also comes from spawning places in the fjords. Nothing is known as to whether the drift of fry from Iceland is of any importance for the more northerly districts. As will be shown in dealing with the migrations, there is also an emigration of spawning cod to Iceland from the northern areas, but to a much smaller extent than from the two southernmost districts.
South Greenland and Iceland thus stand in the same relation to each other as Finmark to the Lofotens, or as North and East Iceland to the waters round the Westmanna Islands.
C. C hanges in the M arine Fauna at G reenland in R ecen t T im e s .
Great changes in the fauna have taken place during the warm period which has ruled in Greenland waters since the twenties. In addition to the large immigration of cod many southern forms have appeared, which previously did not occur there or only rarely. On the other hand, several arctic forms have retreated farther north. Some idea of these changes has been given by H a n s e n , J e n s e n and T å n in g (1935, pp. 13 —15) and in more detail by J e n s e n (1943). These papers may be referred to and mention made here of further observations since they were published.
On 12th June 1947 during fishing with the prawn- trawl in Skovfjord, Julianehaab district, a t 365 m. a blackmouth (Gadus poutassou) of 21-5 cm. was taken. This fish had never before been caught a t Greenland. I t occurs from Finmark and Iceland to Gibraltar and the Mediterranean. I t spawns in the open ocean along the edge of the Continental Shelf. At Iceland it was taken for the first time in 1899, but it has proved to be common on the south and south-west coasts, though not known from the north and east coasts (Sæ m u n d s s o n 1909 and 1927).
The coalllsh (Gadus virens), which began to appear at several places along the coast and in the fjords when the warm period set in, occurs constantly a t Greenland. Seven coalfish were taken in an eel-seine on 30. August a t Kadlumiut in the inner part of the Lichtenau Fjord in the Julianehaab district, they measured from 20—25 cm. and belonged to the Il-group.
The haddock (Gadus aeglefinus), also one of the fishes occurring in recent years, was taken for the first time in 1929 a t Sydprøven. Later, it has been taken a t several places right up to Holsteinsborg ( J e n s e n 1939). In 1945 V ib e notes th a t it is frequently taken in the cod fishery (Grønlandsposten 1945, No. 1, p. 5). P o r s i l d mentions a catch of haddock a t the settlement in Disko Fjord, 69°30' N.L., on October 14.1944 (Grønlandsposten 1945, No. 17, p. 240). This is the northernmost locality where the species has been caught a t Greenland. In 1947 a haddock was caught a t Ikam iut (ca. 68°38' N. Lat.) in Christians- haab district.
The torsk (Brosmius brosme), earlier an extremely rare fish a t Greenland, was taken according to J e n s e n (1939, p. 14) in the Ikertok Fjord in 1936 and on11. September 1937 a t Narssak in the Julianehaab district (not Narssalik, as given by J e n s e n ). Again, on 5. September 1939 a torsk was taken on long-line in the inner part of Lichtenau Fjord. In 1946 a specimen was taken in Lichtenau Fjord on 14. September almost a t the same place as the species was taken in 1932 in the prawn-trawl at a depth of ca. 250 m. P o r s il d (Grønlandsposten 1945, No. 17, p. 240) mentions a catch of torsk in the Umanak Fjord, ca. 70°40' N.L. This is the most northerly place where the species has been taken a t Greenland. Of both haddock and torsk it may be said, th a t they are not species which live in specially warm water but simply forms which have not previously occurred in West Greenland waters and have now extended their range there.
The fjord cod or ogac (Gadus ogac), earlier an abundant fish on the coast and in the fjords at West Greenland, now occurs in very small numbers in the warm period, having moved farther north. In experiments with the long-lines in Lichtenau Fjord in 1929,1930 and 1932 only a few isolated ogac were taken. In 1938, which was a very cold year, it was taken in fairly large numbers in the long-line fishery of the Lichtenau Fjord, in 1939 again it was also taken there in large quantities. In 1946 and 1947 when fishing with the prawn-trawl was carried on a t the same places in the Lichtenau Fjord no ogac were taken.
— 15 —
Thus it seems to have disappeared again from this fjord.
The witch (Pleuronectes cynoglossus L. ) had previously been taken by the “Dana” in 1925, only two specimens with the otter-trawl on the edge of the Lille Helle- fiske Banke. With the prawn-trawl it was taken both in 1946 and 1947, in the Lichtenau Fjord on 14. September at 250 m. and in Skovfjord on 15. June at ca. 350 m. The first specimen was a full-grown female of 34 cm., the second a young fish of 95 mm. The distribution of this species extends from the Murman Coast and Iceland to the Bay of Biscay, in America it occurs down to Cape Cod. At Iceland ,t was previously not known from the north coasi. Its northern limit was Djupall off Isafjord Deep. I t was taken for the first time at North Iceland in May 1926 on the outermost edge of Stranda ground (240—250 m.) and in May 1931 other three specimens were taken on the Skaga ground farther east. Sæ m u n d s s o n (1934) is of the opinion tha t its occurrence there was due to a rise in temperature of the sea.
The halibut {Hippoglossus vulgaris) spread right up to Upernavik towards the end of the thirties, according to L u n d -D k o sv a d it has constantly been taken in this district during the forties.
The young of the Norway haddock (redfish — Sebastes marinus) were not found in the Davis Strait by the “ Tjalfe” in 1908 and 1909, but it was common in the Denmark Strait. Ad. J e n s e n (1922) concluded from this, th a t the large pelagic young found a t West Greenland came from fry carried over by the current from the Denmark Strait. On the other hand, both the “Dana” in 1925 and the “Godthaab” in 1928 obtained large numbers of the tiny fry of the Norway haddock in the Davis Strait as far up as the submarine ridge, which extends from about the latitude of Holsteinsborg right across the Strait to Cumberland. In the Greenland fjords only two small fry of the Norway haddock had earlier been taken with the 1 m. ring-net, namely in Tunugdliarfik a t the beginning of June 1933. In 1947 several specimens of the young Norway haddock were taken by the ring-net in Tunugdliarfik about the middle of June, a t the end of May in the same year the fry of the Norway haddock were taken in Godthaab Fjord.
On 2. June 1947 two Norway haddock were caught in Pisigsarfik in the Godthaab Fjord, they were caught in the prawn-trawl a t 260 m. and both measured 44 cm., both were in full spawning. The Norway haddock has thus begun to spawn in the Davis Strait and recently also in the fjords of south-west Greenland.
The herring (Clupea harengus) has always been present along the coast, especially in the districts of Julianehaab, Frederikshaab and Sukkertoppen. During the whole war years the herring were fished for salting at Kangerdluarssuk in the Sukkertoppen district. The catches have been so good, tha t they were in part able to satisfy the demands of the inhabitants.
In 1947 there were reports of larger shoals than in previous years from various parts of the Julianehaab
district. Some herring were taken in nets and several barrels salted. From earlier investigations ( H a n s e n 1934) it appeared that the Greenland herring were probably the same as the summer-spawning herring a t Iceland.
The spotted catfish (Anarhichas minor) has spread far to the north in recent years. The outpost-manager L u n d -D r o s v a d reported in “Grønlandsposten” 1946 No. 5, p. 115): “The catfish has now reached far to the north and is very abundant in the Upernavik district. In 1943 it was taken for the first time right up to the north of Melville Bay a t Savigsivik, on long lines laid out for halibut. At Prøven it had not been known 10 years ago, but it is now so numerous tha t last year 8,000 kg. could be traded apart from what the inhabitants themselves used.”
The capelan or lodde (Mallotus villosus) had spread right up into the Upernavik district by the middle of the thirties and according to L u n d -D r o s v a d (1946) had become even more common in this district by the middle of the forties. At Ikam iut it was so abundant tha t it could be caught in buckets—-something tha t could not be done earlier.
The piked dogfish (Squalus acanthias) was earlier a great rarety a t Greenland, but in the thirties some were caught a t several places in the Sukkertoppen district right up to Umanak, though single specimens only. In the autumn of 1947 several were caught round about the Sukkertoppen district according to a letter from the colony-manager B r a n d t in Sukkertoppen.
With regard to the arctic mammals L u n d -D r o s v a d (1946) has noted, th a t the migrations take place later than in earlier years. I t was reckoned previously in Upernavik, tha t the white whale (Delphinapterus leucas) arrived about the 10. September. In 1945 it did not appear till the 20. of October, but remained on the other hand the whole of January in to February. The narwhal (Monodon monoceros) also migrates much later than in earlier years. In 1947 the Sei-whale (Balaenoptera borealis) was observed for the first time in Greenland waters, i. e., seven animals in the Davis Strait off Holsteinsborg district; two of them were captured.
In the case of invertebrates we have the discovery of Mytilus edulis by mag. scient. Ch r . V i b e a t Thule in 1939. This mussel had not been known previously so far north. I t was not found in this district when the “Godthaab” was working there in 1928. Further, V i b e on the 11. of December 1939 caught two Crustacea with the bottom-sampler a t 54 m., namely the prawn Synalpheus fritsmulleri Coutiere and the isopod Nerocila acuminata Sch. and Mein. Previously these two species had only been known about 40 degrees farther to the south, namely on the east coast of North America from 35°— 40° N. to the Gulf of Mexico or more to the south (Brazil) and the West Indies (St e p h e n s e n 1947). Their occurrence a t Thule is a mystery, it cannot be said whether these forms have reached here in recent years, or whether they have always lived at the place where they were found.
— 16 —
Possibly it is a question of animals which have a much wider distribution than we were previously aware of.
On 30. June 1948 two big specimens of the common starfish (Asterias rubens) which, since the middle
of the twenties, has been found at various localities from Julianehaab to Holsteinsborg, were caught in the innermost part of the Kangersunek Fjord, near Akugdlît, a t ca. 68°50' N .Lat., which is the northernmost locality where this species has been found.
III. Spawning and Development.
A. D istr ibution of the Cod Fry in W est G reen land W aters.
1. Methods and Gear for the Capture of Cod Fry.The eggs and postlarvae of the cod are obtained by
means of conical canvas nets of various sizes.The “Dana” , “Godthaab” and “Islands Falk” used
canvas nets with the opening attached to rings of 2 m. and l x/2 m. in diameter. Rings of 2 m. in diameter were most frequently used. From motor boats the ring was usually 1 m. in diameter; in a few cases a ring of x/2 m. was used. The nets of % m. and 1 m. in diameter were provided with a sieve a t the end, closed by a piece of fine gauze kept in place by means of a galvanized ring with a wing-screw. The hauls were made horizontally at slow speed. The duration of the haul has usually been half an hour and the nets have been towed by varying lengths of wire. The “Dana” has made many hauls with much greater wire-lengths and the “Godthaab” has also used greater lengths several times; otherwise the length of wire out was in most cases 100 m. or 50 m., corresponding to an actual depth of approximately 30 m. and about 15 m., respectively. The larger vessels have often used several nets on the wire a t one time, thus fishing at different depths. This could not be done from motor boats.
Vertical nets for the purpose of a quantitative estimate of the numbers of fry have not been used. In the Greenland waters the cod fry are so few and scattered, th a t in most cases practically no cod fry would be captured.
Horizontal hauls with the canvas net can only give an imperfect idea of the quantitative occurrence of the cod fry. I t is not certain, th a t the net has been towed a t the same rate in all the hauls, thus fished a t the same depth ; nor is it certain th a t the same amount of water has filtered through the net in the same time. Sometimes large quantities of diatoms are entangled in the net, resulting in imperfect filtration. Hence no reliable, quantitative investigation could be made with this apparatus. Under the conditions prevailing however, the canvas net has been the only apparatus th a t could be used, and on collating the results from the different stations it would seem, th a t the available material nevertheless permits of a rough comparison.
The number of stations where pelagic hauls were made varied greatly in the different years. Over the banks and the deep parts of the Davis Strait most hauls were made in 1925 when the “Dana” carried
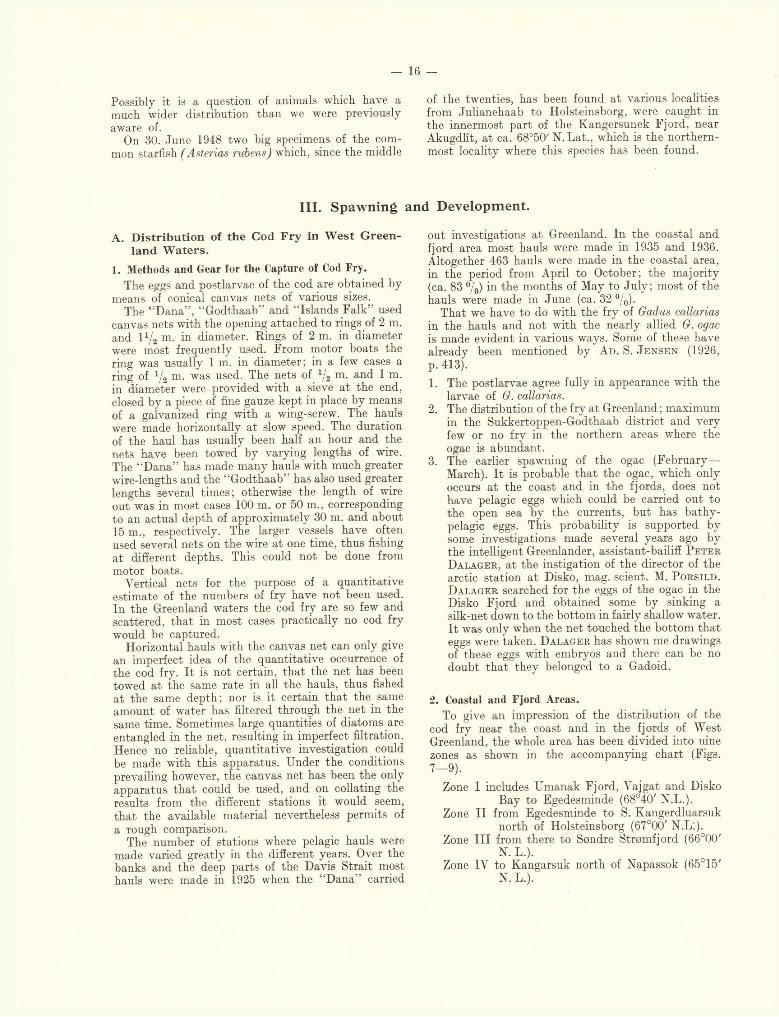
out investigations a t Greenland. In the coastal and fjord area most hauls were made in 1935 and 1936. Altogether 463 hauls were made in the coastal area, in the period from April to October; the majority (ca. 83 % ) in the months of May to July; most of the hauls were made in June (ca. 32 °/0).
That we have to do with the fry of Gadus callarias in the hauls and not with the nearly allied G. ogac is made evident in various ways. Some of these have already been mentioned by A d . S. J e n s e n (1926, p. 413).
1. The postlarvae agree fully in appearance with the larvae of G. callarias.
2. The distribution of the fry a t Greenland ; maximum in the Sukkertoppen-Godthaab district and very few or no fry in the northern areas where the ogac is abundant.
3. The earlier spawning of the ogac (February— March). I t is probable th a t the ogac, which only occurs a t the coast and in the fjords, does not have pelagic eggs which could be carried out to the open sea by the currents, but has bathy- pelagic eggs. This probability is supported by some investigations made several years ago by the intelligent Greenlander, assistant-bailiff P e t e r D a l a g e r , a t the instigation of the director of the arctic station a t Disko, mag. scient. M. P o r s il d . D a l a g e r searched for the eggs of the ogac in the Disko Fjord and obtained some by sinking a silk-net down to the bottom in fairly shallow water. I t was only when the net touched the bottom that eggs were taken. D a l a g e r has shown me drawings of these eggs with embryos and there can be no doubt th a t they belonged to a Gadoid.
*2. Coastal and Fjord Areas.To give an impression of the distribution of the
cod fry near the coast and in the fjords of West Greenland, the whole area has been divided into nine zones as shown in the accompanying chart (Figs. 7—9).
Zone I includes Umanak Fjord, Vajgat and Disko Bay to Egedesminde (68°40' N.L.).
Zone I I from Egedesminde to S. Kangerdluarsuk north of Holsteinsborg (67°00' N.L:).
Zone I I I from there to Søndre Strømfjord (66°00' N. L.).
Zone IV to Kangarsuk north of Napassok (65°15' N. L.).
- 17 —
NU C S U A K E
EA.LVÖ
D I S K O
2 Haws
O Larva*
-6-Hcm2EggsOLarv
I 35 Hal Is !JJf. mQEggS y , Â
____ d l Q T Y W O'
19 Hai//sy ¥'11270 Eggi \
3 7 L arvaé \\.
2 ? Hauls' '12 Eggs 3 Larvae
- i l . 9 Hadis Wt 134 Eggs
- ' 0 larvae
O Larvae
Fig. 7. Number of Cod Eggs and Fry in 10 hauls of half an hour each with the 1 m. ring-net,at West Greenland in May.
2
- 18 -
NUCSUAKS
tt AL V Ö
DI SKO
2 Hauls L 15 Eg g s
Olnrvae
—£Hau4s uEggs
30 Larvae
_ 22Hauls M: w frøj J&Lgrvae
^ 37Haah ] y .1061E!ggs \
ItOLarvaf
26Hauls y S02Eggs _ 1SHau/s
v\ y± 1509Eggs j; __71Jarvae
16 Hauls VTf 29Eggs
1 Hauls OEggs 0 Larva >
21 HaulsIK ^Eggs -
Fig. 8. Number of Cod Eggs and Fry as above, at West Greenland in June.
- 19 -
w A’ 50- IS*
F
i! (1
i
iil ........ 10ÅGur. ...... Somttr'1 ______ ______ toe Xitcr
/ --------------------*” -L. V _____________ jooo —! —
¥ ■ ■
•:•
70‘
r
1 rV
O 'N
31 Hauls J ; OEggs
1 Larvae
\
DISKO
1 X' ^ ' H i
11 '
ti ï lf
65'
\
\ ii j J P S é_ - < * a j9 î</
|\ .If\ /
! VS h \ \
L
\ S Ê - ° f s g si f arvae
' ) ) Å \_ ___L ~ G i t i
IX )
É n L A N D, ' f N
—- - ^ 7 p a u ls U l\ OEggs
■_36 Larvae 17
• Æ \ "i \ ?■
kLÿ Q LufitUi à 16 H auls 5Eggs
1 37Larvae
\ T
,v <a.W V-?< iwJ il j l
J
L V ' 1S ; - - ' \ l m N k
Ä-silY _ 16H au/sjlÏc Æ :
5© ^ 79 Larvae» wL , W u
/
r • 'i
y^ ' ' 1 7 H auls
y w f & P/ $9Larvai / i 1; i
\ \ \ \ '%v . ,
« ; % " - ' ' Î at
' ' v ' V ^ ______\ \ \ ^
%,( 3 - ;:- .
i f» ,
6ÿ
\ \ \ ( ’
u'
\ \ 14H au ls Y È - OEggs
1 Larvae
7H au/s
\ ' \ \' \ \ \
\ \ s \ \
\ \
\
>Ù. (.3 ’ Si s
r
a ' a t A .
• HHUAjntAS t
* . ■ ■
OLarvaeV SN- - - ___/ ” V s
" ”*\vs
59
vflto ss* S0‘ «•
Fig. 9. Number of Cod Eggs and Fry as above, at West Greenland in July.
2 *
- 20 -
Zone V to Kangek (64°10' N. L.).Zone VI the area of Godthaab Fjord.Zone VII from 64°10' N. L. to the glacier (Isblink)
of Frederikshaab (62°30' N.L.).Zone V III extends to Nunarssuit (60°40' N.L.).Zone IX embraces southernmost Greenland includ
ing Lindenow Fjord (60°30' N.L.).
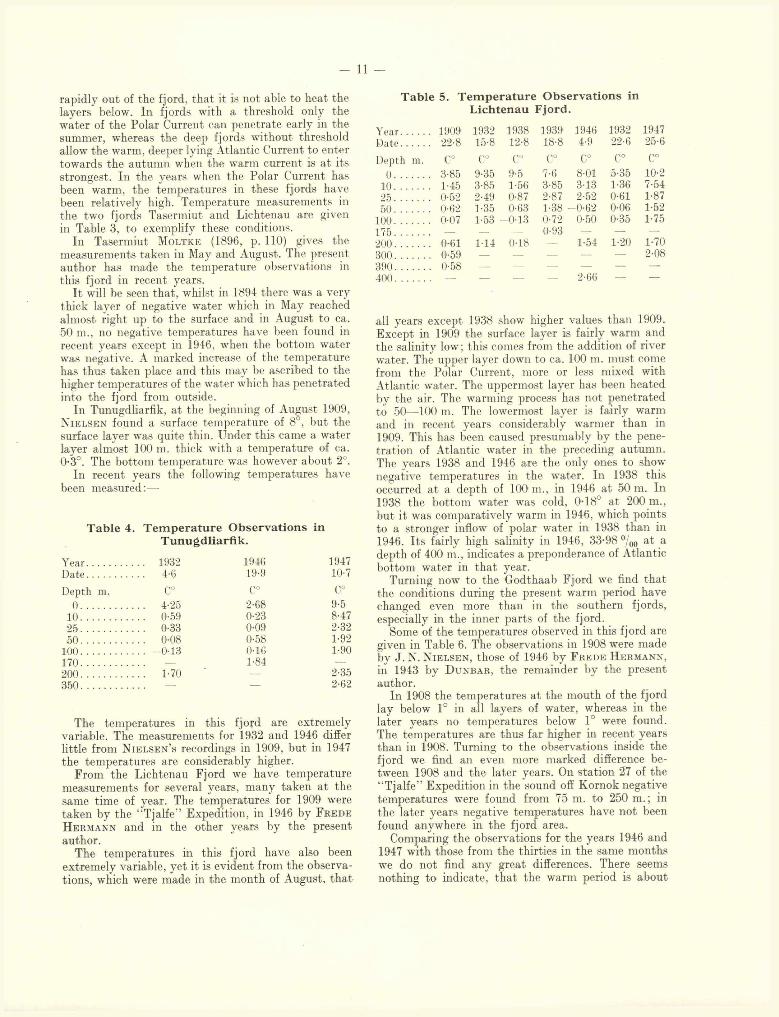
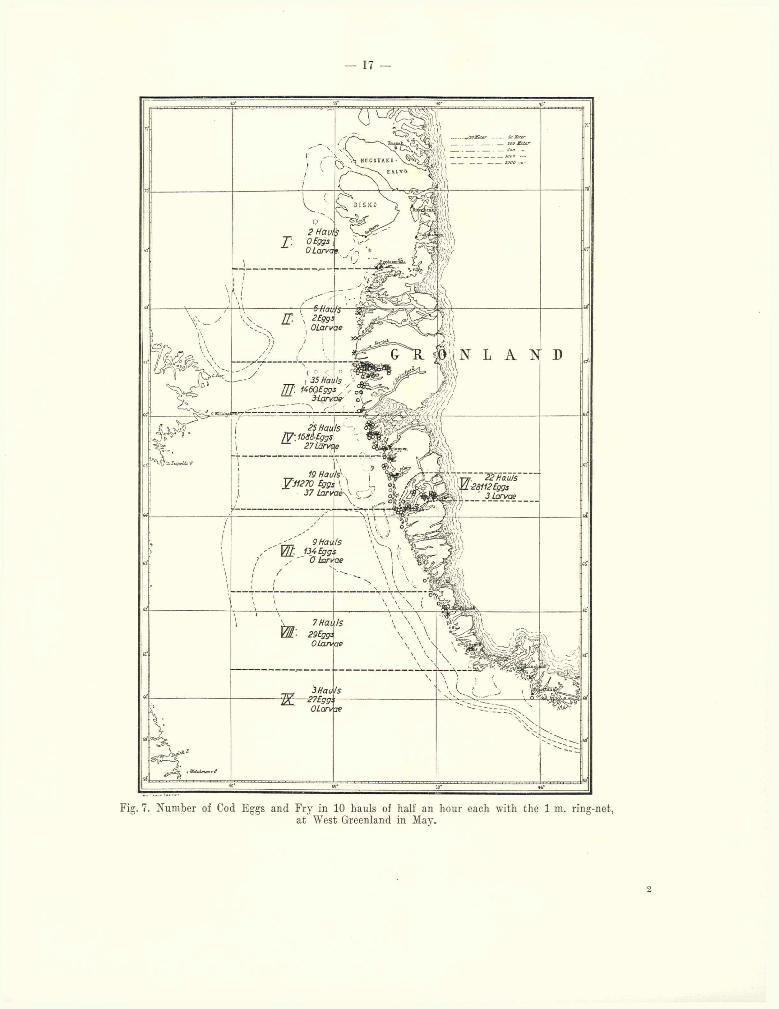
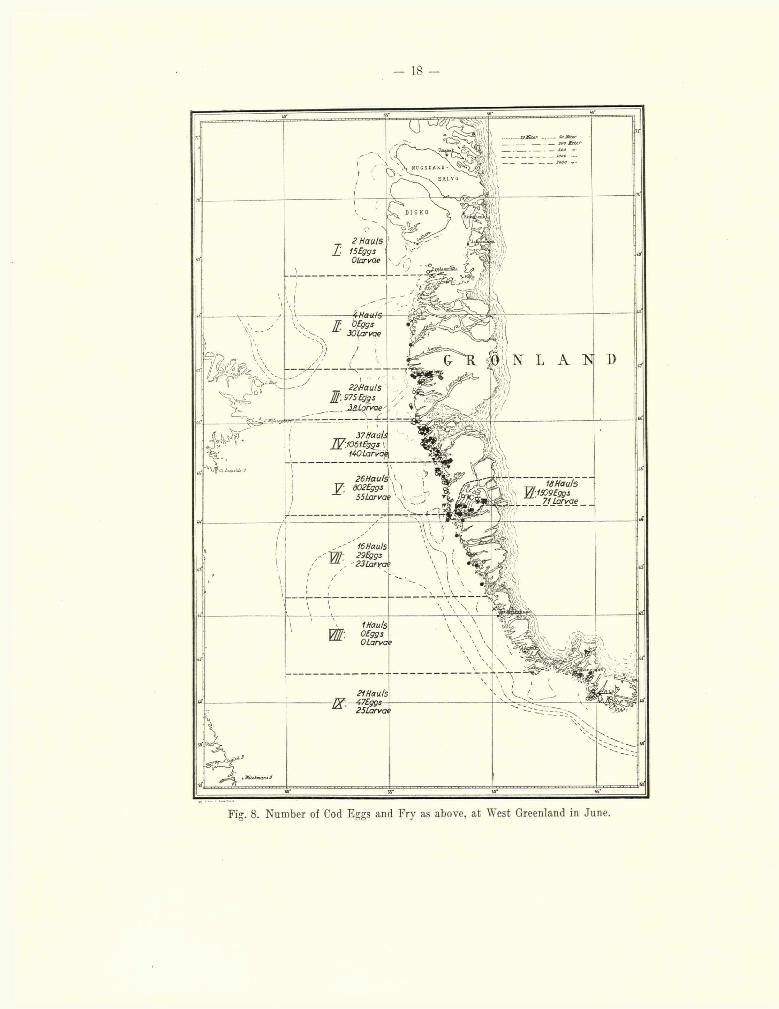
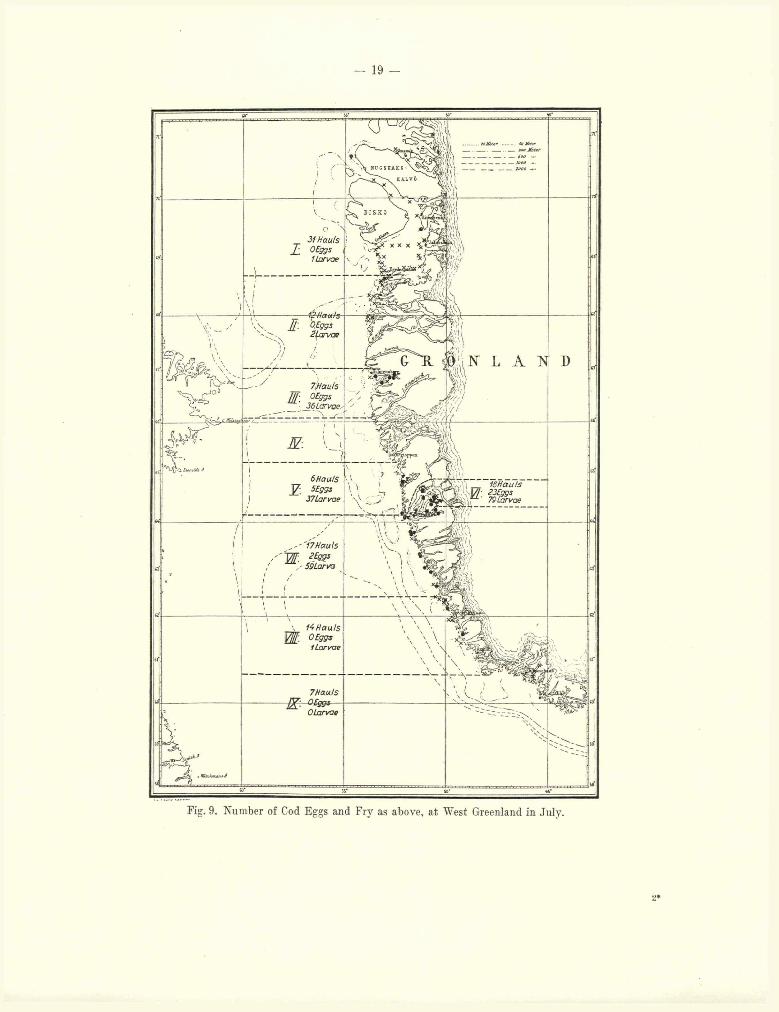
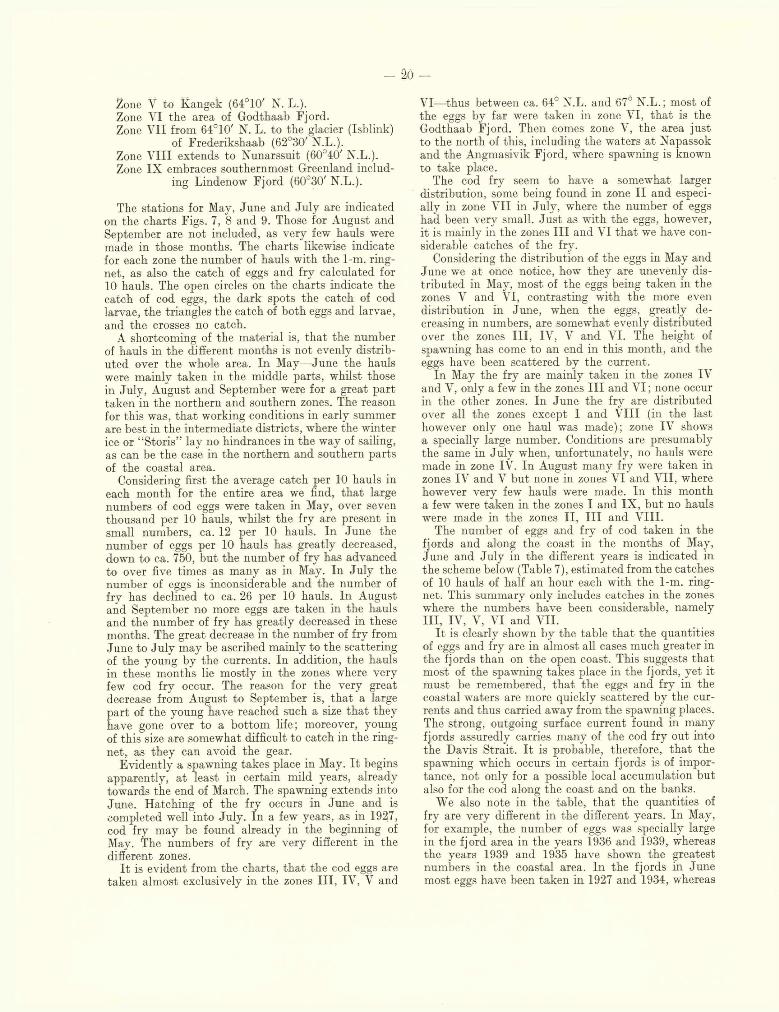
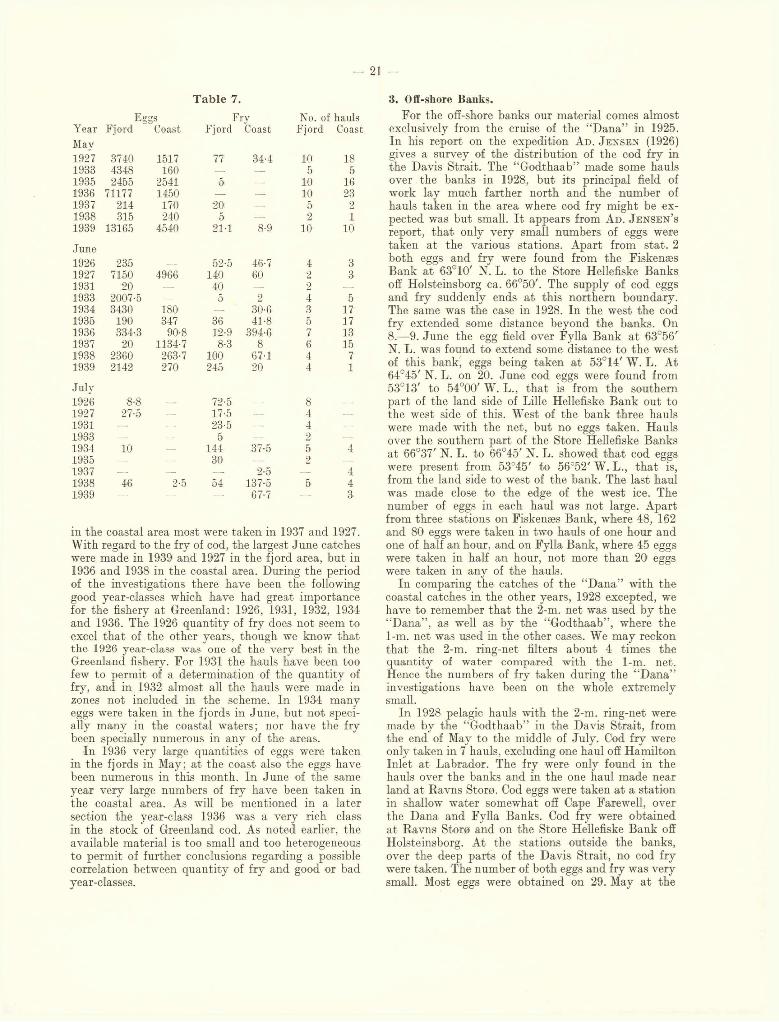
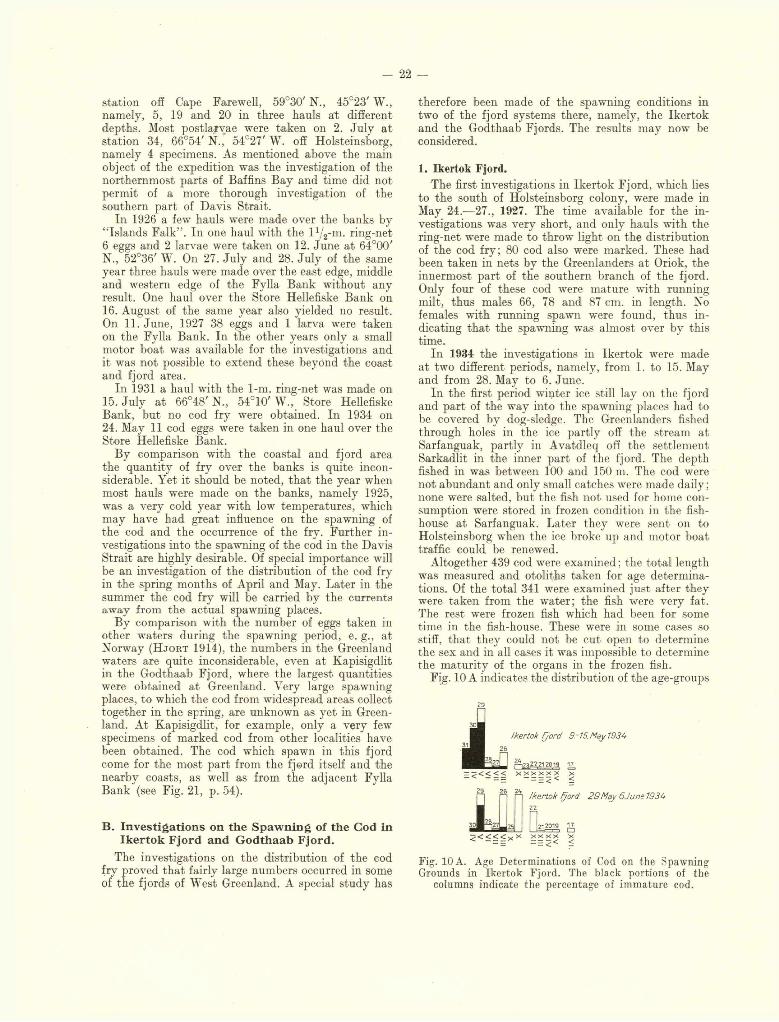
The stations for May, June and Ju ly are indicated on the charts Figs. 7, 8 and 9. Those for August and September are not included, as very few hauls were made in those months. The charts likewise indicate for each zone the number of hauls with the 1-m. ring- net, as also the catch of eggs and fry calculated for10 hauls. The open circles on the charts indicate the catch of cod eggs, the dark spots the catch of cod larvae, the triangles the catch of both eggs and larvae, and the crosses no catch.
A shortcoming of the material is, th a t the number of hauls in the different months is not evenly distributed over the whole area. In May—June the hauls were mainly taken in the middle parts, whilst those in July, August and September were for a great part taken in the northern and southern zones. The reason for this was, tha t working conditions in early summer are best in the intermediate districts, where the winter ice or “Storis” lay no hindrances in the way of sailing, as can be the case in the northern and southern parts of the coastal area.
Considering first the average catch per 10 hauls in each month for the entire area we find, th a t large numbers of cod eggs were taken in May, over seven thousand per 10 hauls, whilst the fry are present in small numbers, ca. 12 per 10 hauls. In June the number of eggs per 10 hauls has greatly decreased, down to ca. 750, but the number of fry has advanced to over five times as many as in May. In July the number of eggs is inconsiderable and the number of fry has declined to ca. 26 per 10 hauls. In August and September no more eggs are taken in the hauls and the number of fry has greatly decreased in these months. The great decrease in the number of fry from June to July may be ascribed mainly to the scattering of the young by the currents. In addition, the hauls in these months lie mostly in the zones where very few cod fry occur. The reason for the very great decrease from August to September is, th a t a large part of the young have reached such a size th a t they have gone over to a bottom life; moreover, young of this size are somewhat difficult to catch in the ring- net, as they can avoid the gear.
Evidently a spawning takes place in May. I t begins apparently, a t least in certain mild years, already towards the end of March. The spawning extends into June. Hatching of the fry occurs in June and is completed well into July. In a few years, as in 1927, cod fry may be found already in the beginning of May. The numbers of fry are very different in the different zones.
I t is evident from the charts, tha t the cod eggs are taken almost exclusively in the zones II I , IV, V and
VI—thus between ca. 64° N.L. and 67ô N.L. ; most of the eggs by far were taken in zone VI, th a t is the Godthaab Fjord. Then comes zone V, the area just to the north of this, including the waters a t Napassok and the Angmasivik Fjord, where spawning is known to take place.
The cod fry seem to have a somewhat larger distribution, some being found in zone I I and especially in zone VII in July, where the number of eggs had been very small. Ju st as with the eggs, however, it is mainly in the zones I I I and VI th a t we have considerable catches of the fry.
Considering the distribution of the eggs in May and June we at once notice, how they are unevenly distributed in May, most of the eggs being taken in the zones V and VI, contrasting with the more even distribution in June, when the eggs, greatly decreasing in numbers, are somewhat evenly distributed over the zones III , IV, V and VI. The height of spawning has come to an end in this month, and the eggs have been scattered by the current.
In May the fry are mainly taken in the zones IV and V, only a few in the zones I I I and VI ; none occur in the other zones. In June the fry are distributed over all the zones except I and V III (in the last however only one haul was made); zone IV shows a specially large number. Conditions are presumably the same in July when, unfortunately, no hauls were made in zone IV. In August many fry were taken in zones IV and V but none in zones VI and VII, where however very few hauls were made. In this month a few were taken in the zones I and IX , but no hauls were made in the zones II, I I I and VIII.
The number of eggs and fry of cod taken in the fjords and along the coast in the months of May, June and July in the different years is indicated in the scheme below (Table 7), estimated from the catches of 10 hauls of half an hour each with the 1-m. ring- net. This summary only includes catches in the zones where the numbers have been considerable, namelyIII, IV, V, VI and VII.
I t is clearly shown by the table th a t the quantities of eggs and fry are in almost all cases much greater in the fjords than on the open coast. This suggests tha t most of the spawning takes place in the fjords, yet it must be remembered, th a t the eggs and fry in the coastal waters are more quickly scattered by the currents and thus carried away from the spawning places. The strong, outgoing surface current found in many fjords assuredly carries many of the cod fry out into the Davis Strait. I t is probable, therefore, th a t the spawning which occurs in certain fjords is of importance, not only for a possible local accumulation but also for the cod along the coast and on the banks.
We also note in the table, th a t the quantities of fry are very different in the different years. In May, for example, the number of eggs was specially large in the fjord area in the years 1936 and 1939, whereas the years 1939 and 1935 have shown the greatest numbers in the coastal area. In the fjords in June most eggs have been taken in 1927 and 1934, whereas
— 21 -
Eges
Table 7.
Fry No. of haulsYear Fjord Coast Fjord Coast Fjord CoastMay1927 3740 1517 77 34-4 10 181933 4348 160 5 51935 2455 2541 5 — 10 161936 71177 1450 — — 10 231937 214 170 20 — 5 21938 315 240 5 — 2 11939 13165 4540 21-1 8-9 10 10
June1926 235 — 52-5 46-7 4 31927 7150 4966 140 60 2 31931 20 40 — . 21933 2007-5 — 5 2 4 51934 3430 180 — 30-6 3 171935 190 347 36 41-8 5 171936 334-3 90-8 12-9 394-6 7 131937 20 1134-7 8-3 8 6 151938 2360 263-7 100 67-1 4 71939 2142 270 245 20 4 1
July1926 8-8 — 72-5 8 —
1927 27-5 — 17-5 41931 — — 23-5 4 —
1933 — _ 5 2 —
1934 10 144 37-5 5 41935 30 21937 — — 2-5 — 41938 46 2-5 54 137-5 5 41939 — — — 67-7 — 3
in the coastal area most were taken in 1937 and 1927. With regard to the fry of cod, the largest June catches were made in 1939 and 1927 in the fjord area, but in 1936 and 1938 in the coastal area. During the period of the investigations there have been the following good year-classes which have had great importance for the fishery a t Greenland: 1926, 1931, 1932, 1934 and 1936. The 1926 quantity of fry does not seem to excel th a t of the other years, though we know that the 1926 year-class was one of the very best in the Greenland fishery. For 1931 the hauls have been too few to permit of a determination of the quantity of fry, and in 1932 almost all the hauls were made in zones not included in the scheme. In 1934 many eggs were taken in the fjords in June, but not specially many in the coastal waters; nor have the fry been specially numerous in any of the areas.
In 1936 very large quantities of eggs were taken in the fjords in May; a t the coast also the eggs have been numerous in this month. In June of the same year very large numbers of fry have been taken in the coastal area. As will be mentioned in a later section the year-class 1936 was a very rich class in the stock of Greenland cod. As noted earlier, the available material is too small and too heterogeneous to permit of further conclusions regarding a possible correlation between quantity of fry and good or bad year-classes.
3. Off-shore Banks.For the off-shore banks our material comes almost
exclusively from the cruise of the “Dana” in 1925. In his report on the expedition A d . J e n s e n (1926) gives a survey of the distribution of the cod fry in the Davis Strait. The “Godthaab” made some hauls over the banks in 1928, but its principal field of work lay much farther north and the number of hauls taken in the area where cod fry might be expected was but small. I t appears from A d . J e n s e n ’s report, th a t only very small numbers of eggs were taken a t the various stations. Apart from stat. 2 both eggs and fry were found from the Fiskenæs Bank a t 63°10' N. L. to the Store Hellefiske Banks off Holsteinsborg ca. 66°50'. The supply of cod eggs and fry suddenly ends a t this northern boundary. The same was the case in 1928. In the west the cod fry extended some distance beyond the banks. On 8.—9. June the egg field over Fylla Bank a t 63°56' N. L. was found to extend some distance to the west of this bank, eggs being taken a t 53°14' W. L. A t 64°45' N. L. on 20. June cod eggs were found from 53°13' to 54°00' W. L., th a t is from the southern part of the land side of Lille Hellefiske Bank out to the west side of this. West of the bank three hauls were made with the net, but no eggs taken. Hauls over the southern part of the Store Hellefiske Banks a t 66°37' N. L. to 66°45' N. L. showed th a t cod eggs were present from 53°45' to 56°52' W. L., th a t is, from the land side to west of the bank. The last haul was made close to the edge of the west ice. The number of eggs in each haul was not large. Apart from three stations on Fiskenæs Bank, where 48, 162 and 80 eggs were taken in two hauls of one hour and one of half an hour, and on Fylla Bank, where 45 eggs were taken in half an hour, not more than 20 eggs were taken in any of the hauls.
In comparing the catches of the “Dana” with the coastal catches in the other years, 1928 excepted, we have to remember th a t the 2-m. net was used by the “Dana” , as well as by the “Godthaab” , where the1-m. net was used in the other cases. We may reckon th a t the 2-m. ring-net filters about 4 times the quantity of water compared with the 1-m. net. Hence the numbers of fry taken during the “Dana” investigations have been on the whole extremely small.
In 1928 pelagic hauls with the 2-m. ring-net were made by the “Godthaab” in the Davis Strait, from the end of May to the middle of July. Cod fry were only taken in 7 hauls, excluding one haul off Hamilton Inlet at Labrador. The fry were only found in the hauls over the banks and in the one haul made near land at Ravns Storø. Cod eggs were taken a t a station in shallow water somewhat off Cape Farewell, over the Dana and Fylla Banks. Cod fry were obtained at- Ravns Storø and on the Store Hellefiske Bank off Holsteinsborg. At the stations outside the banks, over the deep parts of the Davis Strait, no cod fry were taken. The number of both eggs and fry was very small. Most eggs were obtained on 29. May a t the
- 22 -
station off Cape Farewell, 59°30' N., 45°23' W., namely, 5, 19 and 20 in three hauls a t different depths. Most postlarvae were taken on 2. July a t station 34, 66°54' N., 54°27' W. off Holsteinsborg, namely 4 specimens. As mentioned above the main object of the expedition was the investigation of the northernmost parts of Baffins Bay and time did not permit of a more thorough investigation of the southern part of Davis Strait.
In 1926 a few hauls were made over the banks by “Islands Falk” . In one haul with the l a/2-m. ring-net 6 eggs and 2 larvae were taken on 12. June at 64°00' N., 52°36' W. On 27. July and 28. July of the same year three hauls were made over the east edge, middle and western edge of the Fylla Bank without any result. One haul over the Store Hellefiske Bank on 16. August of the same year also yielded no result. On 11. June, 1927 38 eggs and 1 larva were taken on the Fylla Bank. In the other years only a small motor boat was available for the investigations and it was not possible to extend these beyond the coast and fjord area.
In 1931 a haul with the 1-m. ring-net was made oil 15. July at 66°48' N.., 54°10'W „ Store Hellefiske Bank, but no cod fry were obtained. In 1934 on24. May 11 cod eggs were taken in one haul over the Store Hellefiske Bank.
By comparison with the coastal and fjord area the quantity of fry over the banks is quite inconsiderable. Yet it should be noted, th a t the year when most hauls were made on the banks, namely 1925, was a very cold year with low temperatures, which may have had great influence on the spawning of the cod and the occurrence of the fry. Further investigations into the spawning of the cod in the Davis Strait are highly desirable. Of special importance will be an investigation of the distribution of the cod fry in the spring months of April and May. Later in the summer the cod fry will be carried by the currents a w a y from the actual spawning places.
By comparison with the number of eggs taken in other waters during the spawning period, e. g., a t Norway ( H j o r t 1914), the numbers in the Greenland waters are quite inconsiderable, even a t Kapisigdlit in the Godthaab Fjord, where the largest quantities were obtained a t Greenland. Very large spawning places, to which the cod from widespread areas collect together in the spring, are unknown as yet in Greenland. At Kapisigdlit, for example, only a very few specimens of marked cod from other localities have been obtained. The cod which spawn in this fjord come for the most part from the fjord itself and the nearby coasts, as well as from the adjacent Fylla Bank (see Fig. 21, p. 54).
B. In vestigation s on the S p aw n in g of the Cod in Ikertok Fjord and G odthaab Fjord.
The investigations on the distribution of the cod fry proved tha t fairly large numbers occurred in some of the fjords of West Greenland. A special study has
therefore been made of the spawning conditions in two of the fjord systems there, namely, the Ikertok and the Godthaab Fjords. The results may now be considered.
1. Ikertok Fjord.The first investigations in Ikertok Fjord, which lies
to the south of Holsteinsborg colony, were made in May 24.—27., 1927. The time available for the investigations was very short, and only hauls with the ring-net were made to throw light on the distribution of the cod fry; 80 cod also were marked. These had been taken in nets by the Greenlanders a t Oriok, the innermost part of the southern branch of the fjord. Only four of these cod were mature with running milt, thus males 66, 78 and 87 cm. in length. No females with running spawn were found, thus indicating th a t the spawning was almost over by this time.
In 1934 the investigations in Ikertok were made a t two different periods, namely, from 1. to 15. May and from 28. May to 6. June.
In the first period winter ice still lay on the fjord and part of the way into the spawning places had to be covered by dog-sledge. The Greenlanders fished through holes in the ice partly off the stream at Sarfanguak, partly in Avatdleq off the settlement Sarkadlit in the inner part of the fjord. The depth fished in was between 100 and 150 m. The cod were not abundant and only small catches were made daily ; none were salted, but the fish not used for home consumption were stored in frozen condition in the fish- house a t Sarfanguak. Later they were sent on to Holsteinsborg when the ice broke up and motor boat traffic could be renewed.
Altogether 439 cod were examined ; the total length was measured and otoliths taken for age determinations. Of the total 341 were examined just after they were taken from the water; the fish were very fat. The rest were frozen fish which had been for some time in the fish-house. These were in some cases so stiff, tha t they could not be cut open to determine the sex and in all cases it was impossible to determine the m aturity of the organs in the frozen fish.
Fig. 10 A indicates the distribution of the age-groups
Ikertok Fjord 9~15.MayT934
29 May GJune 193U
Fig. 10 A. Age Determinations of Cod on the Spawning Grounds in Ikertok Fjord. The black portions of the
columns indicate the percentage of immature cod.
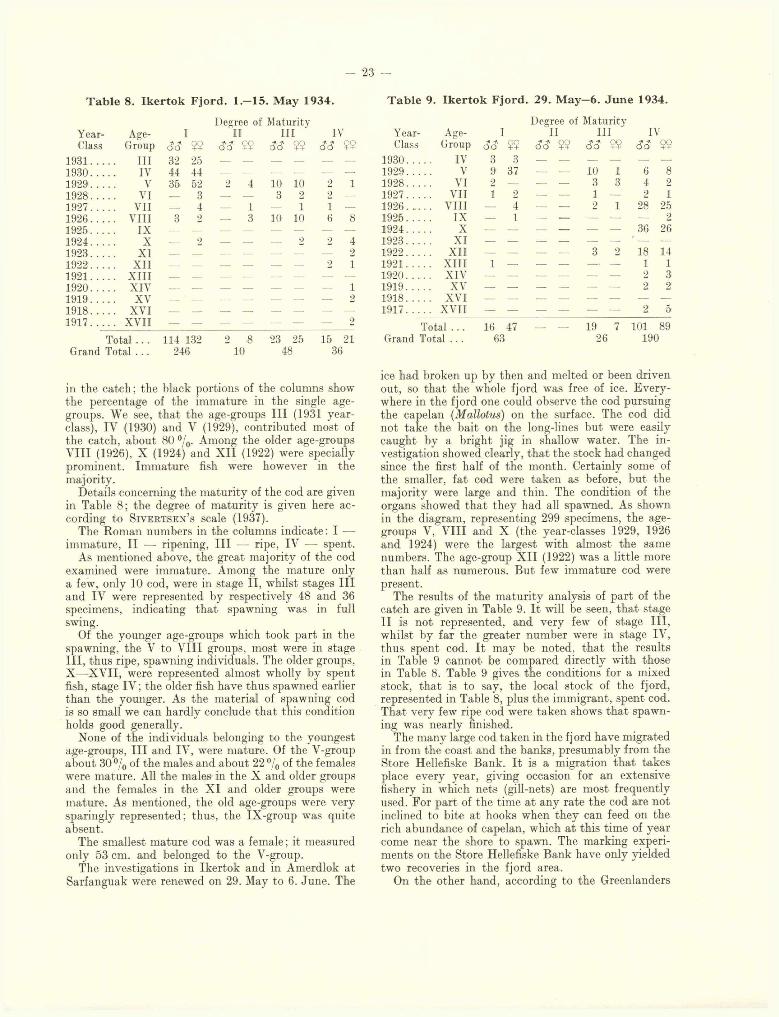
- -23 -
T able 8. Ikertok Fjord. 1.—15. M ay 1934.
Degree of MaturityYear- Age- I II III IVClass Group 3 3 ?? 3 3 ?? 33 S9 3 3 ?S
1931... III 32 251930. .. IV 44 44 — — ■— -— — —1929. .. V 35 52 2 4 10 10 2 11928. .. VI — 3 — — 3 2 2 _1927. ... . . VII — 4 1 1 1 —1926. .. .. VIII 3 2 — 3 10 10 6 81925. .. IX — — — — — — —
1924. .. X — 2 — — — 2 2 41923. .. XI — . — — — — _ 21922. . . .. XII — . .— — — — 2 11921. . . . . XIII — —1920... . . XIV — 11919. . . . . XV — ' — — — — — _ 21918. .. .. XVI — — — _ — — — —1917. ... . . XVII 0
Total . . . 114 132 2 8 23 25 15 21Grand Total . . . 246 10 48 36
in the catch; the black portions of the columns show the percentage of the immature in the single age- groups. We see, tha t the age-groups I I I (1931 year- class), IV (1930) and V (1929), contributed most of the catch, about 80 °/0. Among the older age-groups V III (1926), X (1924) and X II (1922) were specially prominent. Immature fish were however in the majority.
Details concerning the m aturity of the cod are given in Table 8; the degree of maturity is given here according to S i v e r t s e n ’s scale (1937).
The Roman numbers in the columns indicate: I — immature, II — ripening, I I I — ripe, IV — spent.
As mentioned above, the great majority of the cod examined were immature. Among the mature only a few, only 10 cod, were in stage II, whilst stages I I I and IV were represented by respectively 48 and 36 specimens, indicating th a t spawning was in full swing.
Of the younger age-groups which took part in the spawning, the V to V III groups, most were in stageIII , thus ripe, spawning individuals. The older groups,X—XVII, were represented almost wholly by spent fish, stage IV ; the older fish have thus spawned earlier than the younger. As the material of spawning cod is so small we can hardly conclude tha t this condition holds good generally.
None of the individuals belonging to the youngest age-groups, I I I and IV, were mature. Of the V-group about 30 °/0 of the males and about 22 °/0 of the females were mature. All the males in the X and older groups and the females in the X I and older groups were mature. As mentioned, the old age-groups were very sparingly represented; thus, the IX-group was quite absent.
The smallest mature cod was a female ; it measured only 53 cm. and belonged to the V-group.
The investigations in Ikertok and in Amerdlok at Sarfanguak were renewed on 29. May to 6. June. The
T able 9. Ikertok Fjord. 29. M ay—6. Ju ne 1934.
Degree of MaturityYear- Age- I 11 III I \ :Class Group 33 9? 33 5$ 33 ?? 33 ¥?
1 9 3 0 . . IV 3 31 9 2 9 .. V 9 37 — — 10 1 6 81 9 2 8 . . VI 2 — — — 3 3 4 21 9 2 7 . . . . . VII 1 2 — — 1 — 2 11926. . . . . VIII — 4 — — 2 1 28 251925. . IX — 1 — — — — — 21924. . X — — — — — — 36 261923. . XI1922. . . . . XII — — — — 3 2 18 141921. . . . . XIII 1 — — — — — 1 11920. . . . . XIV 2 31919. .. . . XV 2 21918. ... . . XVI — — .— — — — — —1917. ... . . XVII — — — — — — 2 5
Total .. . 16 47 __. _ 19 7 101 89Grand Total . . . 63 26 190
ice had broken up by then and melted or been driven out, so tha t the whole fjord was free of ice. Everywhere in the fjord one could observe the cod pursuing the capelan (Mallotus) on the surface. The cod did not take the bait on the long-lines but were easily caught by a bright jig in shallow water. The investigation showed clearly, tha t the stock had changed since the first half of the month. Certainly some of the smaller, fat cod were taken as before, but the majority were large and thin. The condition of the organs showed th a t they had all spawned. As shown in the diagram, representing 299 specimens, the age- groups V, V III and X (the year-classes 1929, 1926 and 1924) were the largest with almost the same numbers. The age-group X II (1922) was a little more than half as numerous. But few immature cod were present.
The results of the m aturity analysis of part of the catch are given in Table 9. I t will be seen, th a t stageII is not represented, and very few of stage III, whilst by far the greater number were in stage IV, thus spent cod. I t may be noted, th a t the results in Table 9 cannot be compared directly with those in Table 8. Table 9 gives the conditions for a mixed stock, th a t is to say, the local stock of the fjord, represented in Table 8, plus the immigrant, spent cod. That very few ripe cod were taken shows th a t spawning was nearly finished.
The many large cod taken in the fjord have migrated in from the coast and the banks, presumably from the Store Hellefiske Bank. I t is a migration th a t takes place every year, giving occasion for an extensive fishery in which nets (gill-nets) are most frequently used. For part of the time a t any rate the cod are not inclined to bite a t hooks when they can feed on the rich abundance of capelan, which a t this time of year come near the shore to spawn. The marking experiments on the Store Hellefiske Bank have only yielded two recoveries in the fjord area.
On the other hand, according to the Greenlanders
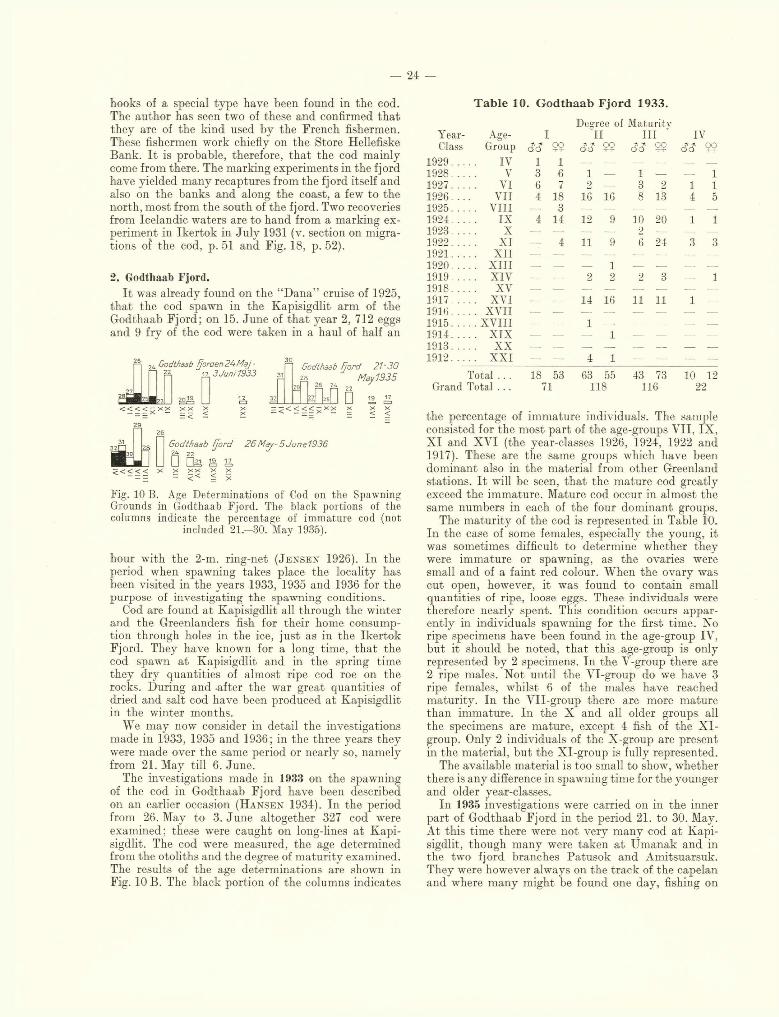
— 24 —
hooks of a special type have been found in the cod. The author has seen two of these and confirmed tha t they are of the kind used by the French fishermen. These fishermen work chiefly on the Store Hellefiske Bank. I t is probable, therefore, th a t the cod mainly come from there. The marking experiments in the fjord have yielded many recaptures from the fjord itself and also on the banks and along the coast, a few to the north, most from the south of the fjord. Two recoveries from Icelandic waters are to hand from a marking experiment in Ikertok in July 1931 (v. section on migrations oî the cod, p. 51 and Fig. 18, p. 52).
2. Godtliaab Fjord.I t was already found on the “D ana” cruise of 1925,
tha t the cod spawn in the Kapisigdlit arm of the Godthaab Fjord; on 15. June of th a t year 2, 712 eggs and 9 fry of the cod were taken in a haul of half an
< < < < x x x x x x x = < < < < < 5 * 2 2 < <
2926
< < < < < X * * * * *- = = - < < S x
Fig. 10 B. Age Determinations of Cod on the Spawning Grounds in Godthaab Fjord. The black portions of the columns indicate the percentage of immature cod (not
included 21.-30. May 1935).
hour with the 2-m. ring-net ( J e n s e n 1926). In the period when spawning takes place the locality has been visited in the years 1933, 1935 and 1936 for the purpose of investigating the spawning conditions.
Cod are found a t Kapisigdlit all through the winter and the Greenlanders fish for their home consumption through holes in the ice, just as in the IkertokFjord. They have known for a long time, th a t thecod spawn at Kapisigdlit and in the spring time they dry quantities of almost ripe cod roe on the rocks. During and -after the war great quantities of dried and salt cod have been produced a t Kapisigdlit in the winter months.
We may now consider in detail the investigations made in 1933, 1935 and 1936; in the three years they were made over the same period or nearly so, namely from 21. May till 6. June.
The investigations made in 1938 on the spawning of the cod in Godthaab Fjord have been described on an earlier occasion ( H a n s e n 1934). In the period from 26. May to 3. June altogether 327 cod were examined; these were caught on long-lines a t Kapisigdlit. The cod were measured, the age determined from the otoliths and the degree of m aturity examined. The results of the age determinations are shown in Fig. 10 B. The black portion of the columns indicates
Table 10. G odthaab Fjord 1933.
Degree of MaturityYear- Age- I II III IVClass Group <?<? $ ? 9 ? S?
1929 IV 1 1 —. — — —.1928 V 3 6 1 — . 1 — — 11927 VI 6 7 2 — 3 2 l 11 9 2 6 . . . VII 4 18 16 16 8 13 4 51925 VIII — 3 — — — — —1924 IX 4 14 12 9 10 20 1 11923 X — — — —. 2 — — —1922. . . XI 4 11 9 6 24 3 31921 XII — — —. — —. _1920 XIII —. 1 •— — —1919 XIV 2 2 2 3 — 11918 XV — — — —. —1917 . . .. XVI 14 16 11 11 1 —1916 XVII .— — —. — — .1915 XVIII _ 1 — .— __ .— —1914 XIX — — — 1 — — — —1913 XX — — — —. — —1912 . . XXI — — 4 1 — — — —
Total . . . 18 53 63 55 43 73 10 12Grand Total . . . 71 118 116 22
the percentage of immature individuals. The sample consisted for the most part of the age-groups VII, IX,X I and XVI (the year-classes 1926, 1924, 1922 and 1917). These are the same groups which have been dominant also in the material from other Greenland stations. I t will be seen, th a t the mature cod greatly exceed the immature. Mature cod occur in almost the same numbers in each of the four dominant groups.
The m aturity of the cod is represented in Table 10. In the case of some females, especially the young, it was sometimes difficult to determine whether they were immature or spawning, as the ovaries were small and of a faint red colour. When the ovary was cut open, however, it was found to contain small quantities of ripe, loose eggs. These individuals were therefore nearly spent. This condition occurs apparently in individuals spawning for the first time. No ripe specimens have been found in the age-group IV, bu t it should be noted, th a t th is . age-group is only represented by 2 specimens. In the V-group there are2 ripe males. Not until the VI-group do we have 3 ripe females, whilst 6 of the males have reached maturity. In the VII-group there are more mature than immature. In the X and all older groups all the specimens are mature, except 4 fish of the XI- group. Only 2 individuals of the X-group are present in the material, but the XI-group is fully represented.
The available material is too small to show, whether there is any difference in spawning time for the younger and older year-classes.
In 1935 investigations were carried on in the inner part of Godthaab Fjord in the period 21. to 30. May. At this time there were not very many cod at Kapisigdlit, though many were taken a t Umanak and in the two fjord branches Patusok and Amitsuarsuk. They were however always on the track of the capelan and where many might be found one day, fishing on
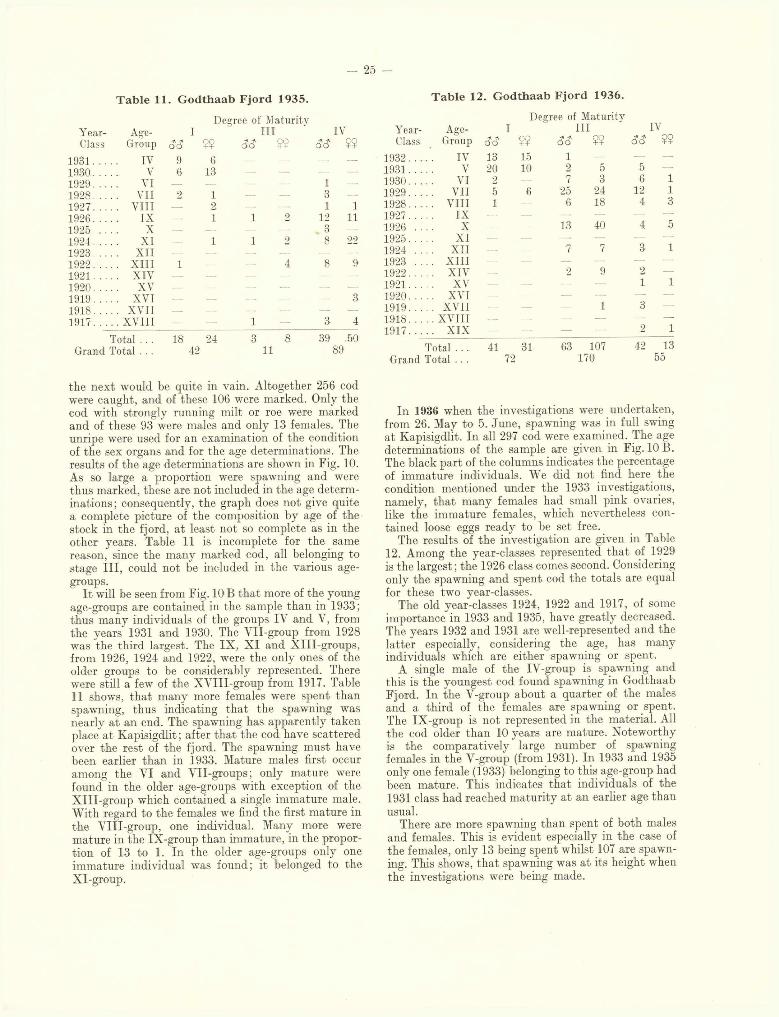
— 25 —
Table 11. Godthaab Fjord 1935.
Degree of MaturityYear- Age- I III IVClass Group 99 99 <5c? 99
1931 IV 9 6 — —
1930 V 6 131929 VI — — 1 —
1928 VII 2 1 — — 3 —
1927 VIII 2 1 11926 IX — 1 1 2 12 111925 .. X — 31924 XI 1 1 2 8 221923 XII1922 XIII 1 — 4 8 91921 XIV — —
1920 XV — —
1919 XVI — 31918 XVII — — — —
1917... .. XVIII — — 1 3 4
Total . . . 18 24 3 8 39 .50Grand Total .. . 45» 11 89
the next would be quite in vain. Altogether 256 cod were caught, and of these 106 were marked. Only the cod with strongly running milt or roe were marked and of these 93 were males and only 13 females. The unripe were used for an examination of the condition of the sex organs and for the age determinations. The results of the age determinations are shown in Fig. 10. As so large a proportion were spawning and were thus marked, these are not included in the age determinations ; consequently, the graph does not give quite a complete picture of the composition by age of the stock in the fjord, a t least not so complete as in the other years. Table 11 is incomplete for the same reason, since the many marked cod, all belonging to stage III, could not be included in the various age- groups.
I t will be seen from Fig. 10 B th a t more of the young age-groups are contained in the sample than in 1933; thus many individuals of the groups IV and V, from the years 1931 and 1930. The VII-group from 1928 was the third largest. The IX , X I and Xlll-groups, from 1926, 1924 and 1922, were the only ones of the older groups to be considerably represented. There were still a few of the XVIII-group from 1917. Table11 shows, tha t many more females were spent than spawning, thus indicating th a t the spawning was nearly a t an end. The spawning has apparently taken place a t Kapisigdlit; after tha t the cod have scattered over the rest of the fjord. The spawning must have been earlier than in 1933. Mature males first occur among the VI and VII-groups; only mature were found in the older age-groups with exception of the XHI-group which contained a single immature male. W ith regard to the females we find the first mature in the VHI-group, one individual. Many more were mature in the IX-group than immature, in the proportion of 13 to 1. In the older age-groups only one immature individual was found; it belonged to theXI-group.
T able 12. G odthaab Fjord 1936.
Degree of MaturityYear- Age- I III IVClass Group 99 <?<? 99 <?<? 99
1932 IV 13 15 1 — — —1931 V 20 10 2 5 5 —1930 VI 2 — 7 3 6 l1999 VII 5 6 25 24 12 l1928 VIII 1 — 6 18 4 3
1927 IX — — — —1926 . . X 13 40 4 5
1925. . . XI — — — -—1924 . . .. XII 7 7 3 1
1923 .. .. XIII — — — —1922 XIV 2 9 2 —1921 XV — 1 1
1920 XVI — —• —•1919 XVII 1 3 •—1918 XVIII —• — — —1917 XIX — — - — 2 1
Total . . . Grand Total . . .
41 3172
63 107170
42 1355
In 1936 when the investigations were undertaken, from 26. May to 5. June, spawning was in full swing a t Kapisigdlit. In all 297 cod were examined. The age determinations of the sample are given in Fig. 10 B. The black part of the columns indicates the percentage of immature individuals. We did not find here the condition mentioned under the 1933 investigations, namely, tha t many females had small pink ovaries, like the immature females, which nevertheless contained loose eggs ready to be set free.
The results of the investigation are given in Table12. Among the year-classes represented th a t of 1929 is the largest; the 1926 class comes second. Considering only the spawning and spent cod the totals are equal for these two year-classes.
The old year-classes 1924, 1922 and 1917, of some importance in 1933 and 1935, have greatly decreased. The years 1932 and 1931 are well-represented and the latter especially, considering the age, has many individuals which are either spawning or spent.
A single male of the IV-group is spawning and this is the youngest cod found spawning in Godthaab Fjord. In the V-group about a quarter of the males and a third of the females are spawning or spent. The IX-group is not represented in the material. All the cod older than 10 years are mature. Noteworthy is the comparatively large number of spawning females in the V-group (from 1931). In 1933 and 1935 only one female (1933) belonging to this age-group had been mature. This indicates th a t individuals of the1931 class had reached m aturity a t an earlier age than usual.
There are more spawning than spent of both males and females. This is evident especially in the case of the females, only 13 being spent whilst 107 are spawning. This shows, th a t spawning was a t its height when the investigations were being made.
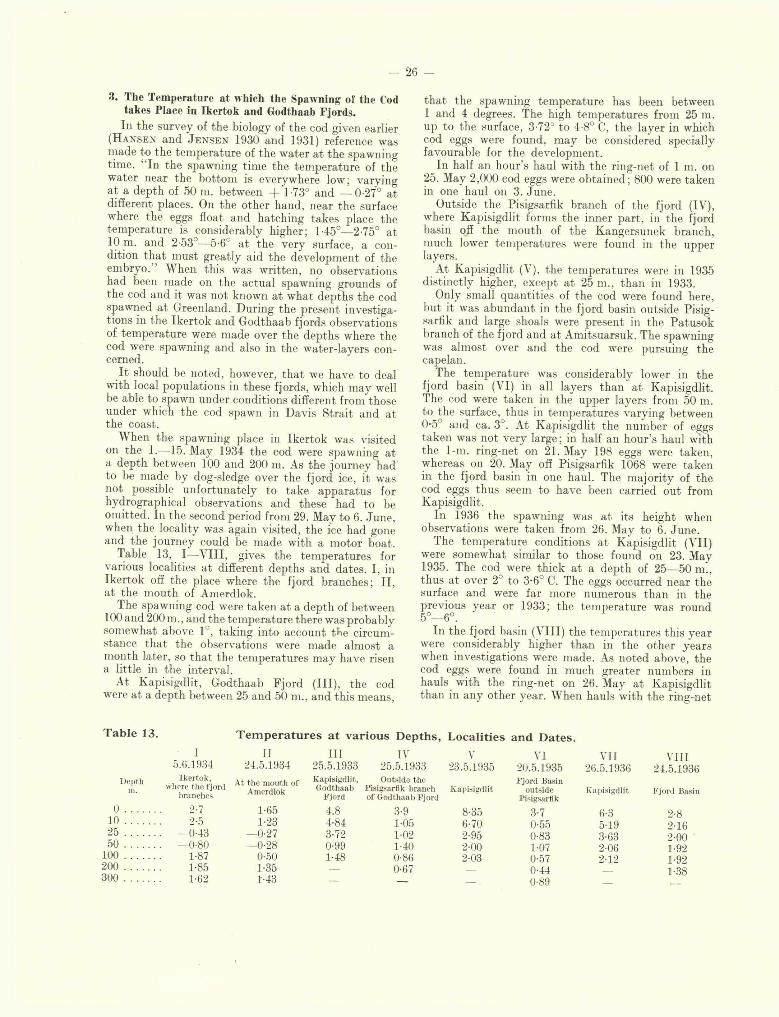
— 26 -
3. The Temperature at which the Spawning oï the (’od takes Place in Ikertok and Godthaab Fjords.
In the survey of the biology of the cod given earlier ( H a n s e n and J e n s e n 1930 and 1931) reference was made to the temperature of the water a t the spawning time. “ In the spawning time the temperature of the water near the bottom is everywhere low; varying at a depth of 50 m. between - f 1-73° and -0 -2 7 ° at different places. On the other hand, near the surface where the eggs float and hatching takes place the temperature is considerably higher; 145°—2-75° at10 m. and 2-53°—5-6° a t the very surface, a condition th a t must greatly aid the development of the embryo.” When this was written, no observations had been made oil the actual spawning grounds of the cod and it was not known a t what depths the cod spawned a t Greenland. During the present investigations in the Ikertok and Godthaab fjords observations of temperature were made over the depths where the cod were spawning and also in the water-layers concerned.
I t should be noted, however, tha t we have to deal with local populations in these fjords, which may well be able to spawn under conditions different from those under which the cod spawn in Davis Strait and at the coast.
When the spawning place in Ikertok was visited on the 1.—15. May 1934 the cod were spawning at a depth between 100 and 200 m. As the journey had to be made by dog-sledge over the fjord ice, it was not possible unfortunately to take apparatus for hydrographical observations and these had to be omitted. In the second period from 29. May to 6. June, when the locality was again visited, the ice had gone and the journey could be made with a motor boat.
Table 13, I—V III, gives the temperatures for various localities a t different depths and dates. I, in Ikertok off the place where the fjord branches; II, at the mouth of Amerdlok.
The spawning cod were taken at a depth of between 100 and 200 in., and the temperature there was probably somewhat above 1°, taking into account the circumstance tha t the observations were made almost a month later, so th a t the temperatures may have risen a little in the interval.
At Kapisigdlit, Godthaab Fjord (III), the cod were at a depth between 25 and 50 m., and this means,
th a t the spawning temperature has been between1 and 4 degrees. The high temperatures from 25 m. up to the surface, 3-72° to 4-8° C, the layer in which cod eggs were found, may be considered specially favourable for the development.
In half an hour’s haul with the ring-net of 1 m. on25. May 2,000 cod eggs were obtained; 800 were taken in one haul on 3. June.
Outside the Pisigsarfik branch of the fjord (IV), where Kapisigdlit forms the inner part, in the fjord basin off the mouth of the Kangersunek branch, much lower temperatures were found in the upper layers.
At Kapisigdlit (V), the temperatures were in 1935 distinctly higher, except a t 25 m., than in 1933.
Only small quantities of the cod were found here, but it was abundant, in the fjord basin outside Pisigsarfik and large shoals were present in the Patusok branch of the fjord and a t Amitsuarsuk. The spawning was almost over and the cod were pursuing the capelan.
The temperature was considerably lower in the fjord basin (VI) in all layers than a t Kapisigdlit. The cod were taken in the upper layers from 50 m. to the surface, thus in temperatures varying between0-5° and ca. 3°. At Kapisigdlit the number of eggs taken was not very large; in half an hour’s haul with the 1-m. ring-net on 21. May 198 eggs were taken, whereas on 20. May off Pisigsarfik 1068 were taken in the fjord basin in one haul. The majority of the cod eggs thus seem to have been carried out from Kapisigdlit.
In 1936 the spawning was a t its height when observations were taken from 26. May to 6. June.
The temperature conditions a t Kapisigdlit (VII) were somewhat similar to those found on 23. May1935. The cod were thick a t a depth of 25—50 m., thus a t over 2° to 3-6° C. The eggs occurred near the surface and were far more numerous than in the previous year or 1933; the temperature was round 5°—6°.
In the fjord basin (VIII) the temperatures this year were considerably higher than in the other years when investigations were made. As noted above, the cod eggs were found in much greater numbers in hauls with the ring-net on 26. May a t Kapisigdlit than in any other year. When hauls with the ring-net
T able 13. T em p eratu res at various D epths, Localities and D ates.1 11 III IV V VI VII VIII
5.6.1934 24.5.1934 25.5.1933 25.5.1933 23.5.1935 20.5.1935 26.5.1936 24.5.1936Depth Ikertok,
At the mouth of Kapisigdlit, Outside the Fjord Basinm. where the fjord
Amerdlok Godthaab Pisigsarfik branch Kapisigdlit outside Kapisigdlit Fjord Basinbranches Fjord of Godthaab Fjord Pisigsarfiko ........... 2-7 1-65 4.8 3-9 8-35 3-7 6-3 2-81 0 ............. 2-5 1-23 4-84 1-05 6-70 0-55 5-19 2-16
2 5 ............. -0 -43 -0-27 3-72 1-02 2-95 0-83 3-63 2-005 0 ............. -0 -80 —0-28 0-99 1-40 2-00 1-07 2-06 1-92
1 0 0 ............. 1-87 0-50 1-48 0-86 2-03 0-57 212 1-92200 ............. 1-85 1-35 — 0-67 ___ 0-44 1-38300 ............. 1-62 1-43 — — — . 0-89 —
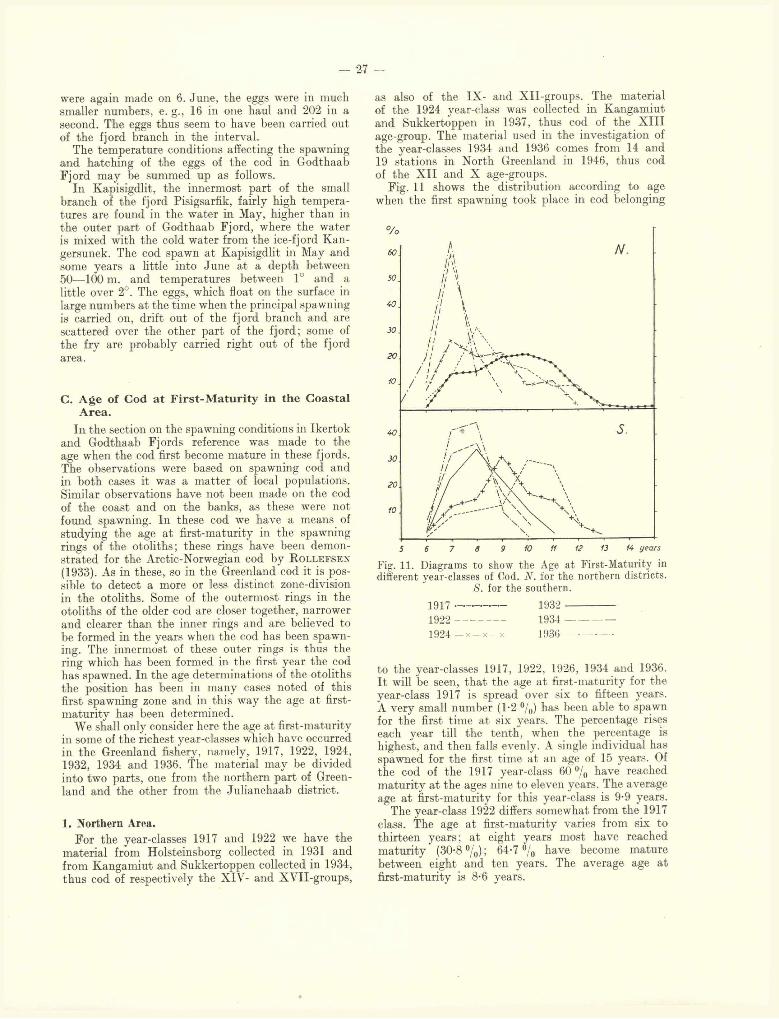
— 27 —
were again made on 6. June, the eggs were in much smaller numbers, e. g., 16 in one haul and 202 in a second. The eggs thus seem to have been carried out of the fjord branch in the interval.
The temperature conditions affecting the spawning and hatching of the eggs of the cod in Godthaab Fjord may be summed up as follows.
In Kapisigdlit, the innermost part of the small branch of the fjord Pisigsarfik, fairly high temperatures are found in the water in May, higher than in the outer part of Godthaab Fjord, where the water is mixed with the cold water from the ice-fjord Kan- gersunek. The cod spawn a t Kapisigdlit in May and some years a little into June a t a depth between50—100 m. and temperatures between 1° and a little over 2°. The eggs, which float on the surface in large numbers a t the time when the principal spawning is carried on, drift out of the fjord branch and are scattered over the other part of the fjord; some of the fry are probably carried right out of the fjord area.
C. A ge of Cod at F irst-M atu rity in the Coastal Area.
In the section on the spawning conditions in Ikertok and Godthaab Fjords reference was made to the age when the cod first become mature in these fjords. The observations were based on spawning cod and in both cases it was a m atter of local populations. Similar observations have not been made on the cod of the coast and on the banks, as these were not found spawning. In these cod we have a means of studying the age at first-maturity in the spawning rings of the otoliths; these rings have been demonstrated for the Arctic-Norwegian cod by R o l l e f s e n
(1933). As in these, so in the Greenland cod it is possible to detect a more or less distinct zone-division in the otoliths. Some of the outermost rings in the otoliths of the older cod are closer together, narrower and clearer than the inner rings and are believed to be formed in the years when the cod has been spawning. The innermost of these outer rings is thus the ring which has been formed in the first year the cod has spawned. In the age determinations of the otoliths the position has been in many cases noted of this first spawning zone and in this way the age a t first- maturity has been determined.
We shall only consider here the age at first-maturity in some of the richest year-classes which have occurred in the Greenland fishery, namely, 1917, 1922, 1924, 1932, 1934 and 1936. The material may be divided into two parts, one from the northern part of Greenland and the other from the Julianehaab district.
1. Northern Area.For the year-classes 1917 and 1922 we have the
material from Holsteinsborg collected in 1931 and from Kangamiut and Sukkertoppen collected in 1934, thus cod of respectively the XIV- and XVII-groups,
as also of the IX- and XII-groups. The material of the 1924 year-class was collected in Kangamiut and Sukkertoppen in 1937, thus cod of the X III age-group. The material used in the investigation of the year-classes 1934 and 1936 comes from 14 and19 stations in North Greenland in 1946, thus cod of the X II and X age-groups.
Fig. 11 shows the distribution according to age when the first spawning took placc in cod belonging
%
w
x>
40
30
20
14 years11 1310 1295 7 86
Fig. 11. Diagrams to show the Age at First-Maturity in different year-classes of Cod. N. for the northern districts.
8. for the southern.
1917 -------------- 1932 -------------1922 ------------- 1934 -------------1924 - x - x x 193(i - ■
to the year-classes 1917, 1922, 1926, 1934 and 1936. I t will be seen, th a t the age a t first-maturity for the year-class 1917 is spread over six to fifteen years. A very small number (1*2 %) has been able to spawn for the first time a t six years. The percentage rises each year till the tenth, when the percentage is highest, and then falls evenly. A single individual has spawned for the first time a t an age of 15 years. Of the cod of the 1917 year-class 60 °/0 have reached m aturity a t the ages nine to eleven years. The average age a t first-maturity for this year-class is 9-9 years.
The year-class 1922 differs somewhat from the 1917 class. The age a t first-maturity varies from six to thirteen years; at eight years most have reached m aturity (30-8%); 64-7 °/0 have become mature between eight and ten years. The average age at first-maturity is 8-6 years.
— 28 —
For the year-class 1924 the average age a t first- m aturity is 8-4 years.
For the year-classes 1934 and 1936 the ages are quite different from those of the 1917 and 1922 year- classes. Most of the individuals by far, respectively 60-6 °/0 and 64-6 °/0, have reached m aturity a t an age of seven years, and no individuals of these year- classes have become mature later than nine years. Of the year-class 1936 five individuals (1-2 °/0) were already mature in their fifth year. The average age a t first-maturity was 7-8 for the year-class 1934 and 6-9 for the 1936 class.
I t is evident, therefore, tha t m aturity has been reached by these two year-classes a t a much earlier age than has been'the case in the older classes.
2. Southern Area.
The samples examined in this area came from the year-classes 1922, 1924, 1932, 1934 and 1936. The material of the year-class 1922, consisting of 147 otoliths, comes from stations in the Julianehaab district and were collected in 1934 (92 specimens) and1935 (52 specimens). These cod therefore belonged to the X II and X III age-groups. The material of the year-class 1932 was collected in 1946; it consists of 46 otoliths of cod belonging to the XIV age-group. The material of the year-classes 1934 and 1936 was collected in 1947, belonging therefore to the X III and X I age-groups respectively; the number of specimens in the samples was 88 and 39. The material is thus not large, due to the fact th a t the old year- classes had to be taken for the sake of comparison, and old cod as a rule are only present in the Julianehaab district in small numbers.
Fig. 11 shows very clearly, th a t a change has also taken place in the southern area with regard to the age of the cod at first-maturity. In the year-class 1922 most of the first-time spawners, 57-1 °/0, were10 and 11 years, old and their average age was 9-3 years. The year-classes 1932, 1934 and 1936 had most first-time spawners a t the age of 7 and 8 years. Only a few have spawned for the first time a t the age of10 and 11. For these three year-classes the average age a t first-maturity has been 8-1, 7-8 and 7-6.
Thus in both the northern and the southern area there has been a change in the age a t first-maturity from higher to lower years. This change has possibly been connected with changes in the hydrographical conditions. At higher temperatures in the sea m aturity may be hastened and attained earlier. According to D u n b a r (1946) the warm period reached its peak in the middle of the thirties and it is natural, therefore, tha t the younger year-classes, influenced by the higher temperatures, have reached m aturity a t an early age, whereas the older classes of 1922 and especially of 1917, developing before the warm period had fully arrived, had become mature a t a later age.
In Newfoundland H a r o l d T h o m p s o n has found, th a t the majority of the cod spawn for the first time a t an age between 6 and 9 years and a t a length
between 60 and 80 cm. Practically all cod of 9 years of age or over are adults. This is to some extent in agreement with the results obtained for the cod of West Greenland.
For the cod a t Iceland S æ m u n d s s o n (1927 p. 25) states, th a t the males reach m aturity a t an age of4 to 7 years and a t lengths between 60 and 70 cm. ; for the females the age and lengths are respectively5 to 9 years and 70—80 cm. At south and west Iceland m aturity is reached a t an earlier age and smaller length than on the north and east coasts.
At the south coast of Norway near Arendal D a n n e -
v i g (1933) reports, th a t the cod reach m aturity and spawn from the third to the twelfth year (mostly from the fourth to the sixth). R o l l e f s e n (1935, 1938) has found from his studies on the otoliths of the Lofoten cod, th a t the age a t first-maturity extends from 6 to 16 years (mainly 8, 9 and 10 years).
D. D istr ib u tion of the yo u n g est A ge-G rou p s of Cod at Greenland.
An earlier section has described the distribution of the eggs and fry of the cod ; here we may consider the distribution of the youngest age-groups, namely I,I I and III , and their connection with the places where the fry occur. I t is of interest naturally to learn, where these young cod grow up and in which year they occur in abundance, since a t some time, when they are large enough, they come to be of importance for the commercial fishery. The quantitative occurrence of the various year-classes of small cod will be discussed however in a later section ; here we are considering only the localities where catches of the small cod have be,en made.
These young cod have been sought after with eel- nets in coves and bays along the coast and in the fjords. I t is only places where the bottom is smooth and even, th a t this apparatus could be used without difficulty. Often it is impossible to work such a net owing to the large stones and rocks or thick clay at some river mouths, where the net digs itself into” the clay. In some of the quiet inlets the accumulations of rotten vegetation, including large Laminaria, may be so great th a t it is impossible to use the net. In some localities where stones occur, fishing may well be carried on but only when the net is lifted over the stones, which means part of the catch being lost under the net. At a few localities where the bottom was very bad, good results have nevertheless been obtained when the cod were close in on the beach, by enclosing some cod in the one arm of the net.
I t will be understood from all this, th a t the hauls with the eel-net can only approximately give any quantitative determination of the numbers of the youngest year-classes a t the different localities; any comparison between these localities and between the numbers of small cod in the different years cannot be other than imperfect. Such a comparison could better be made for the tiny fry taken with the pelagic nets.
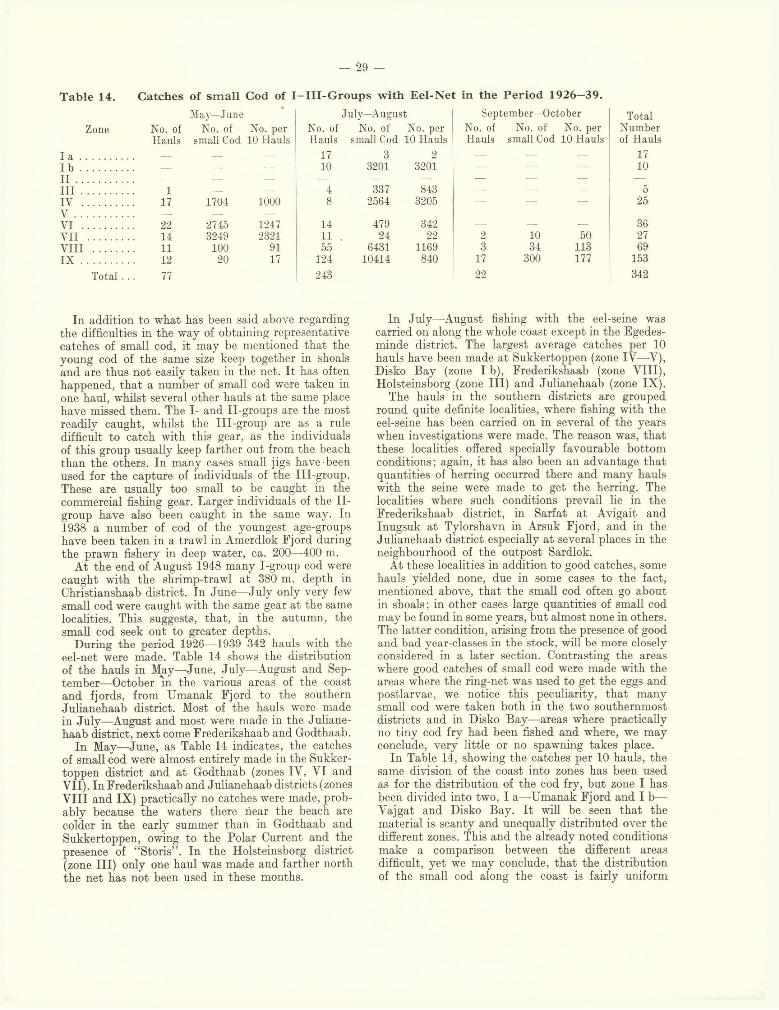
— 29 -
T able 14. Catches of sm a ll Cod of I - I I I -G r o u p s w ith E e l-N et in the P er iod 1926—39.
May—June July—August September—October TotalZone No. of No. of No. per No. of No. of No. per No. of No. of No. per Number
Hauls small Cod 10 Hauls Hauls small Cod 10 Hauls Hauls small Cod 10 Hauls of Hauls
l a ................. __ — 17 3 2 _ ■— 17I b ................. — 10 3201 3201 — — 10I I .................. — —• — — — •— •— —I l l ................. 1 — 4 337 843 — — — 5IV ................TT
17 1704 1000 8 2564 3205 — — — 25V ...................VI ................ 22 2745 1247 14 479 342 — 36VII .............. 14 3249 2321 11 24 22 2 10 50 27VIII ............ 11 100 91 55 6431 1169 3 34 113 69I X ................. 12 20 17 124 10414 840 17 300 177 153
Total . . 77 243 22 342
In addition to what has been said above regarding the difficulties in the way of obtaining representative catches of small cod, it may be mentioned tha t the young cod of the same size keep together in shoals and are thus not easily taken in the net. I t has often happened, th a t a number of small cod were taken in one haul, whilst several other hauls a t the same place have missed them. The I- and II-groups are the most readily caught, whilst the III-group are as a rule difficult to catch with this gear, as the individuals of this group usually keep farther out from the beach than the others. In many cases small jigs have been used for the capture of individuals of the III-group. These are usually too small to be caught in the commercial fishing gear. Larger individuals of the II- group have also been caught in the same way. In 1938 a number of cod of the youngest age-groups have been taken in a trawl in Amerdlok Fjord during the prawn fishery in deep water, ca. 200—400 m.
At the end of August 1948 many I-group cod were caught with the shrimp-trawl a t 380 m. depth in Christianshaab district. In June—July only very few small cod were caught with the same gear a t the same localities. This suggests, that, in the autumn, the small cod seek out to greater depths.
During the period 1926—1939 342 hauls with the eel-net were made. Table 14 shows the distribution of the hauls in May—June, July—August and September—October in the various areas of the coast and fjords, from Umanak Fjord to the southern Julianehaab district. Most of the hauls were made in July—August and most were made in the Julianehaab district, next come Frederikshaab and Godthaab.
In May—June, as Table 14 indicates, the catches of small cod were almost entirely made in the Sukkertoppen district and a t Godthaab (zones IV, VI and V II). In Frederikshaab and Julianehaab districts (zonesV III and IX) practically no catches were made, probably because the waters there near the beach are colder in the early summer than in Godthaab and Sukkertoppen, owing to the Polar Current and the presence of “Storis” . In the Holsteinsborg district (zone III) only one haul was made and farther north the net has not been used in these months.
In July—August fishing with the eel-seine was carried on along the whole coast except in the Egedesminde district. The largest average catches per 10 hauls have been made a t Sukkertoppen (zone IV—-V), Disko Bay (zone I b), Frederikshaab (zone VIII), Holsteinsborg (zone III) and Julianehaab (zone IX).
The hauls in the southern districts are grouped round quite definite localities, where fishing with the eel-seine has been carried on in several of the years when investigations were made. The reason was, tha t these localities offered specially favourable bottom conditions; again, it has also been an advantage tha t quantities of herring occurred there and many hauls with the seine were made to get the herring. The localities where such conditions prevail lie in the Frederikshaab district, in Sarfat a t Avigait and Inugsuk a t Tylorshavn in Arsuk Fjord, and in the Julianehaab district especially at several places in the neighbourhood of the outpost Sardlok.
At these localities in addition to good catches, some hauls yielded none, due in some cases to the fact, mentioned above, th a t the small cod often go about in shoals; in other cases large quantities of small cod may be found in some years, but almost none in others. The latter condition, arising from the presence of good and bad year-classes in the stock, will be more closely considered in a later section. Contrasting the areas where good catches of small cod were made with the areas where the ring-net was used to get the eggs and postlarvae, we notice this peculiarity, th a t many small cod were taken both in the two southernmost districts and in Disko Bay—areas where practically no tiny cod fry had been fished and where, we may conclude, very little or 110 spawning takes place.
In Table 14, showing the catches per 10 hauls, the same division of the coast into zones has been used as for the distribution of the cod fry, but zone I has been divided into two, I a—Umanak Fjord and I b— Vajgat and Disko Bay. I t will be seen th a t the material is scanty and unequally distributed over the different zones. This and the already noted conditions make a comparison between the different areas difficult, yet we may conclude, th a t the distribution of the small cod along the coast is fairly uniform
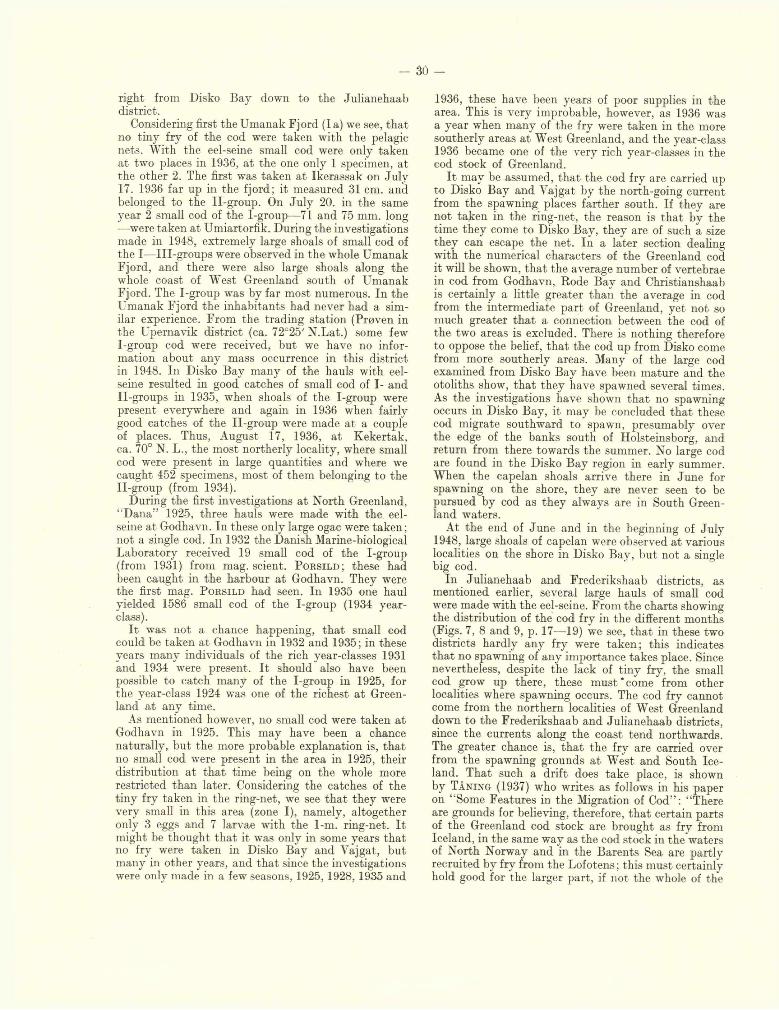
- 30 -
right from Disko Bay down to the Julianehaab district.
Considering first the Umanak Fjord (la) we see, tha t no tiny fry of the cod were taken with the pelagic nets. With the eel-seine small cod were only taken a t two places in 1936, a t the one only 1 specimen, at the other 2. The first was taken a t Ikerassak on July17. 1936 far up in the fjord; it measured 31 cm. and belonged to the II-group. On July 20. in the same year 2 small cod of the I-group—71 and 75 mm. long •—were taken at Umiartorfik. During the investigations made in 1948, extremely large shoals of small cod of the I—III-groups were observed in the whole Umanak Fjord, and there were also large shoals along the whole coast of West Greenland south of Umanak Fjord. The I-group was by far most numerous. In the Umanak Fjord the inhabitants had never had a similar experience. From the trading station (Prøven in the Upernavik district (ca. 72°25' N.Lat.) some fewI-group cod were received, but we have no information about any mass occurrence in this district in 1948. In Disko Bay many of the hauls with eel- seine resulted in good catches of small cod of I- andII-groups in 1935, when shoals of the I-group were present everywhere and again in 1936 when fairly good catches of the II-group were made a t a couple of places. Thus, August 17, 1936, a t Kekertak, ca. 70° N. L., the most northerly locality, where small cod were present in large quantities and where we caught 452 specimens, most of them belonging to theII-group (from 1934).
During the first investigations at North Greenland, “Dana” 1925, three hauls were made with the eel- seine a t Godhavn. In these only large ogac were taken ; not a single cod. In 1932 the Danish Marine-biological Laboratory received 19 small cod of the I-group (from 1931) from mag. scient. P o r s i l d ; these had been caught in the harbour a t Godhavn. They were the first mag. P o r s i l d had seen. In 1935 one haul yielded 1586 small cod of the I-group (1934 year- class).
I t was not a chance happening, th a t small cod could be taken a t Godhavn in 1932 and 1935; in these years many individuals of the rich year-classes 1931 and 1934 were present. I t should also have been possible to catch many of the I-group in 1925, for the year-class 1924 was one of the richest a t Greenland a t any time.
As mentioned however, no small cod were taken at Godhavn in 1925. This may have been a chance naturally, but the more probable explanation is, th a t no small cod were present in the area in 1925, their distribution a t th a t time being on the whole more restricted than later. Considering the catches of the tiny fry taken in the ring-net, we see tha t they were very small in this area (zone I), namely, altogether only 3 eggs and 7 larvae with the 1-m. ring-net. I t might be thought th a t it was only in some years tha t no fry were taken in Disko Bay and Vajgat, but many in other years, and th a t since the investigations were only made in a few seasons, 1925, 1928, 1935 and
1936, these have been years of poor supplies in the area. This is very improbable, however, as 1936 was a year when many of the fry were taken in the more southerly areas a t West Greenland, and the year-class 1936 became one of the very rich year-classes in the cod stock of Greenland.
I t may be assumed, th a t the cod fry are carried up to Disko Bay and Vajgat by the north-going current from the spawning places farther south. If they are not taken in the ring-net, the reason is th a t by the time they come to Disko Bay, they are of such a size they can escape the net. In a later section dealing with the numerical characters of the Greenland cod it will be shown, th a t the average number of vertebrae in cod from Godhavn, Rode Bay and Christianshaab is certainly a little greater than the average in cod from the intermediate part of Greenland, yet not so much greater th a t a connection between the cod of the two areas is excluded. There is nothing therefore to oppose the belief, th a t the cod up from Disko come from more southerly areas. Many of the large cod examined from Disko Bay have been mature and the otoliths show, th a t they have spawned several times. As the investigations have shown th a t no spawning occurs in Disko Bay, it may be concluded th a t these cod migrate southward to spawn, presumably over the edge of the banks south of Holsteinsborg, and return from there towards the summer. No large cod are found in the Disko Bay region in early summer. When the capelan shoals arrive there in June for spawning on the shore, they are never seen to be pursued by cod as they always are in South Greenland waters.
At the end of June and in the beginning of July 1948, large shoals of capelan were observed a t various localities on the shore in Disko Bay, but not a single big cod.
In Julianehaab and Frederikshaab districts, as mentioned earlier, several large hauls of small cod were made with the eel-seine. From the charts showing the distribution of the cod fry in the different months (Figs. 7, 8 and 9, p. 17—19) we see, th a t in these two districts hardly any fry were taken; this indicates th a t no spawning of any importance takes place. Since nevertheless, despite the lack of tiny fry, the small cod grow up there, these m u s t‘ come from other localities where spawning occurs. The cod fry cannot come from the northern localities of West Greenland down to the Frederikshaab and Julianehaab districts, since the currents along the coast tend northwards. The greater chance is, th a t the fry are carried over from the spawning grounds a t West and South Iceland. That such a drift does take place, is shown by T å n i n g (1937) who writes as follows in his paper on “Some Features in the Migration of Cod” : “There are grounds for believing, therefore, th a t certain parts of the Greenland cod stock are brought as fry from Iceland, in the same way as the cod stock in the waters of North Norway and in the Barents Sea are partly recruited by fry from the Lofotens; this must certainly hold good for the larger part, if not the whole of the
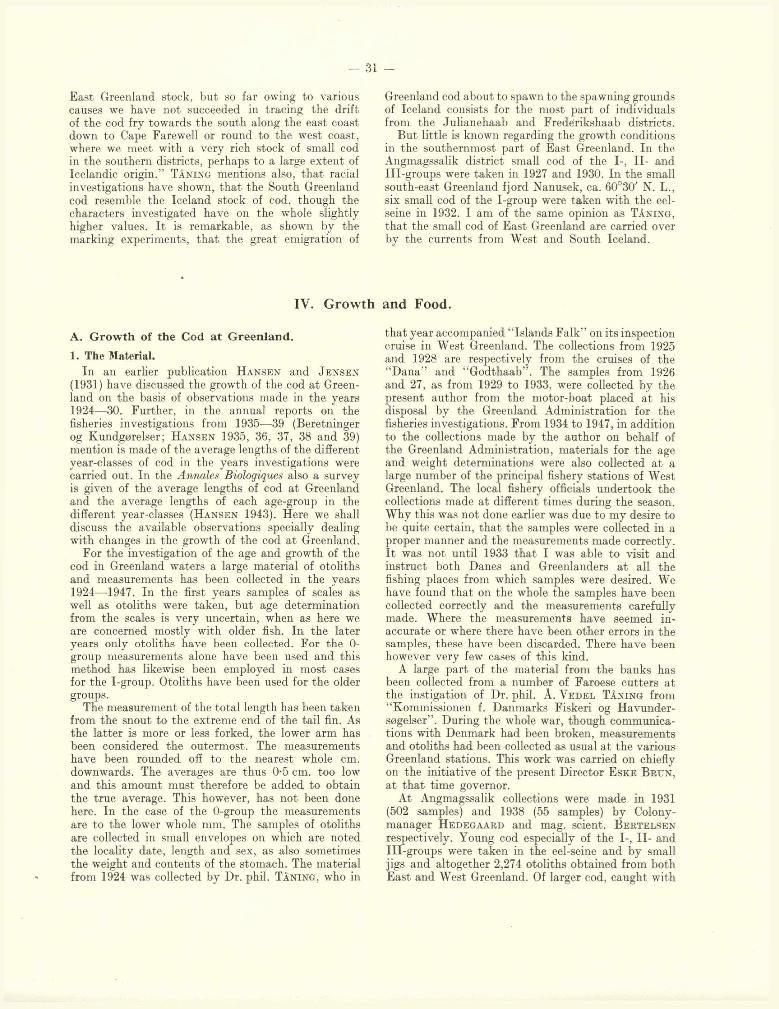
- 31 -
East Greenland stock, but so far owing to various causes we have not succeeded in tracing the drift of the cod fry towards the south along the east coast down to Cape Farewell or round to the west coast, where we meet with a very rich stock of small cod in the southern districts, perhaps to a large extent of Icelandic origin.” T å n i n g mentions also, th a t racial investigations have shown, th a t the South Greenland cod resemble the Iceland stock of cod, though the characters investigated have on the whole slightly higher values. I t is remarkable, as shown by the marking experiments, tha t the great emigration of
Greenland cod about to spawn to the spawning grounds of Iceland consists for the most part of individuals from the Julianehaab and Frederikshaab districts.
But little is known regarding the growth conditions in the southernmost part of East Greenland. In the Angmagssalik district small cod of the I-, II- and III-groups were taken in 1927 and 1930. In the small south-east Greenland fjord Nanusek, ca. 60°30' N. L., six small cod of the I-group were taken with the eel- seine in 1932. I am of the same opinion as T å n i n g ,
tha t the small cod of East Greenland are carried over by the currents from West and South Iceland.
IV. Growth and Food.
A. G row th of the Cod at G reenland.
1. The Material.In an earlier publication H a n s e n and J e n s e n
(1931) have discussed the growth of the cod at Greenland on the basis of observations made in the years 1924—30. Further, in the annual reports on the fisheries investigations from 1935—39 (Beretninger og Kundgørelser; H a n s e n 1935, 36, 37, 38 and 39) mention is made of the average lengths of the different year-classes of cod in the years investigations were carried out. In the Annales Biologiques also a survey is given of the average lengths of cod a t Greenland and the average lengths of each age-group in the different year-classes ( H a n s e n 1943). Here we shall discuss the available observations specially dealing with changes in the growth of the cod a t Greenland.
For the investigation of the age and growth of the cod in Greenland waters a large material of otoliths and measurements has been collected in the years 1924—1947. In the first years samples of scales as well as otoliths were taken, but age determination from the scales is very uncertain, when as here we are concerned mostly with older fish. In the later years only otoliths have been collected. For the 0- group measurements alone have been used and this method has likewise been employed in most cases for the I-group. Otoliths have been used for the older groups.
The measurement of the total length has been taken from the snout to the extreme end of the tail fin. As the latter is more or less forked, the lower arm has been considered the outermost. The measurements have been rounded off to the nearest whole cm. downwards. The averages are thus 0-5 cm. too low and this amount must therefore be added to obtain the true average. This however, has not been done here. In the case of the 0-group the measurements are to the lower whole mm. The samples of otoliths are collected in small envelopes on which are noted the locality date, length and sex, as also sometimes the weight and contents of the stomach. The material from 1924 was collected by Dr. phil. T â n i n g , who in
that year accompanied “Islands Falk” on its inspection cruise in West Greenland. The collections from 1925 and 1928 are respectively from the cruises of the “D ana” and “Godthaab” . The samples from 1926 and 27, as from 1929 to 1933, were collected by the present author from the motor-boat placed a t his disposal by the Greenland Administration for the fisheries investigations. From 1934 to 1947, in addition to the collections made by the author on behalf of the Greenland Administration, materials for the age and weight determinations were also collected a t a large number of the principal fishery stations of West Greenland. The local fishery officials undertook the collections made at different times during the season. Why this was not done earlier was due to my desire to be quite certain, th a t the samples were collected in a proper manner and the measurements made correctly. I t was not until 1933 that I was able to visit and instruct both Danes and Greenlanders a t all the fishing places from which samples were desired. We have found th a t on the whole the samples have been collected correctly and the measurements carefully made. Where the measurements have seemed inaccurate or where there have been other errors in the samples, these have been discarded. There have been however very few cases of this kind.
A large part of the material from the banks has been collected from a number of Faroese cutters at the instigation of Dr. phil. A. V e d e l T å n i n g from “Kommissionen f. Danmarks Fiskeri og Havundersøgelser” . During the whole war, though communications with Denmark had been broken, measurements and otoliths had been collected as usual a t the various Greenland stations. This work was carried on chiefly on the initiative of the present Director E s k e B r u n ,
a t th a t time governor.At Angmagssalik collections were made in 1931
(502 samples) and 1938 (55 samples) by Colony - manager H e d e g a a r d and mag. scient. B e r t e l s e n
respectively. Young cod especially of the I-, II- andIII-groups were taken in the eel-seine and by small jigs and altogether 2,274 otoliths obtained from both East and West Greenland. Of larger cod, caught with
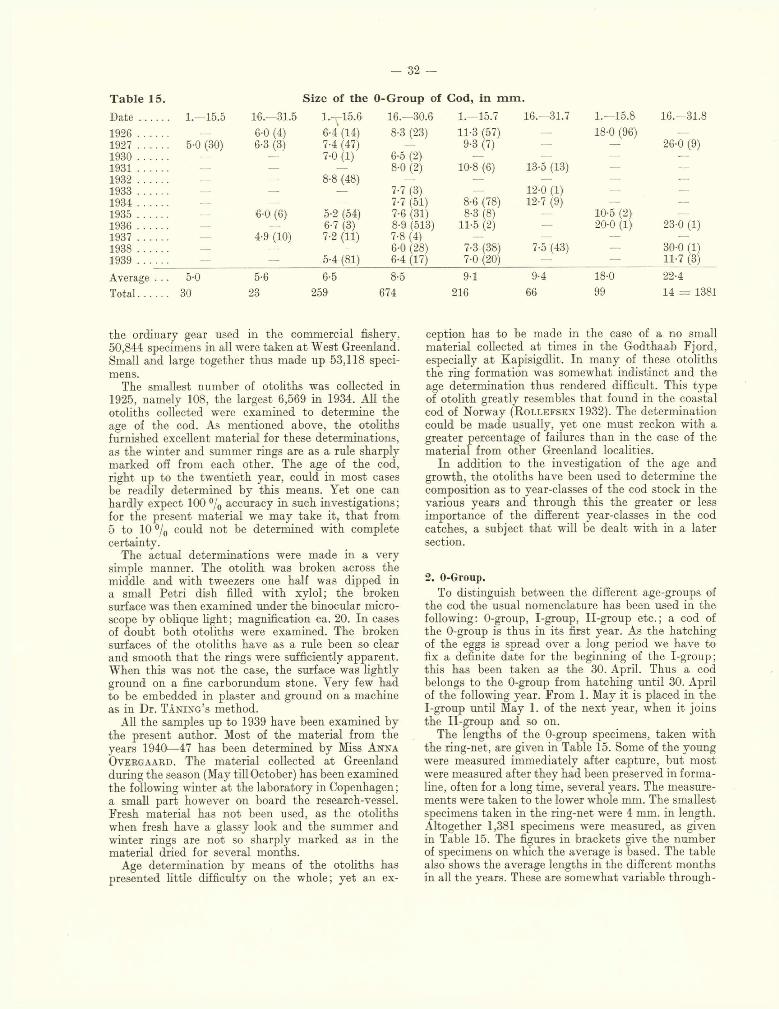
- 32 —
T a b le 15. Size of th e 0-G roup of Cod, in m m .
D a te .......... 1.—15.5 16.-31.5 l .T 15.6 16.—30.6 1.—15.7 16.—31.7 1.—15.8 16.—31.8
1926 ........... — 6-0 (4) 6-4 (14) 8-3 (23) 11-3 (57) — 18-0 (96) —1927 ........... 5-0 (30) 6-3 (3) 7-4 (47) — 9-3 (7) — — 26-0 (9)1930 ........... — — 7-0 (1) 6-5 (2) •— — — —1931 ........... •— 8-0 (2) 10-8 (6) 13-5 (13) •— —
1932 ........... — 8-8 (48) — — — — —1933 ........... — —- — 7-7 (3) — 12-0 (1) — —1934 .......... -— — — 7-7 (51) 8-6 (78) 12-7 (9) — —1935 ........... —■ 6-0 (6) 5-2 (54) 7-6 (31) 8-3 (8) — 10-5 (2) —1936 ........... — — 6-7 (3) 8-9 (513) 11-5 (2) — 20-0 (1) 23-0 (1)1937 .......... —. 4-9 (10) 7-2 (11) 7-8 (4) — — — —1938 ........... —. — — 6-0 (28) 7-3 (38) 7-5 (43) — 30-0 (1)1939 .......... — — 5-4 (81) 6-4 (17) 7-0 (20) — — 11-7 (3)
Average . .. 5-0 5-6 6-5 8-5 9-1 9-4 18-0 22-4
Total.......... 30 23 259 674 216 66 99 14 = 138
the ordinary gear used in the commercial fishery, 50,844 specimens in all were taken a t West Greenland. Small and large together thus made up 53,118 specimens.
The smallest number of otoliths was collected in 1925, namely 108, the largest 6,569 in 1934. All the otoliths collected were examined to determine the age of the cod. As mentioned above, the otoliths furnished excellent material for these determinations, as the winter and summer rings are as a rule sharply marked off from each other. The age of the cod, right up to the twentieth year, could in most cases be readily determined by this means. Yet one can hardly expect 100 °/o accuracy in such investigations ; for the present material we may take it, th a t from 5 to 10 % could not be determined with complete certainty.
The actual determinations were made in a very simple manner. The otolith was broken across the middle and with tweezers one half was dipped in a small Petri dish filled with xylol; the broken surface was then examined under the binocular microscope by oblique light; magnification ca. 20. In cases of doubt both otoliths were examined. The broken surfaces of the otoliths have as a rule been so clear and smooth that the rings were sufficiently apparent. When this was not the case, the surface was lightly ground on a fine carborundum stone. Very few had to be embedded in plaster and ground on a machine as in Dr. T å n i n g ’s method.
All the samples up to 1939 have been examined by the present author. Most of the material from the years 1940—47 has been determined by Miss A n n a
O v e r g a a r d . The material collected a t Greenland during the season (May till October) has been examined the following winter a t the laboratory in Copenhagen ; a small part however on board the research-vessel. Fresh material has not been used, as the otoliths when fresh have a glassy look and the summer and winter rings are not so sharply marked as in the material dried for several months.
Age determination by means of the otoliths has presented little difficulty on the whole; yet an ex
ception has to be made in the case of a no small material collected a t times in the Godthaab Fjord, especially a t Kapisigdlit. In many of these otoliths the ring formation was somewhat indistinct and the age determination thus rendered difficult. This type of otolith greatly resembles th a t found in the coastal cod of Norway ( R o l l e f s e n 1932). The determination could be made usually, yet one must reckon with a greater percentage of failures than in the case of the material from other Greenland localities.
In addition to the investigation of the age and growth, the otoliths have been used to determine the composition as to year-classes of the cod stock in the various years and through this the greater or less importance of the different year-classes in the cod catches, a subject th a t will be dealt with in a later section.
2. 0-Group.To distinguish between the different age-groups of
the cod the usual nomenclature has been used in the following: 0-group, I-group, II-group etc.; a cod of the 0-group is thus in its first year. As the hatching of the eggs is spread over a long period we have to fix a definite date for the beginning of the I-group; this has been taken as the 30. April. Thus a cod belongs to the 0-group from hatching until 30. April of the following year. From 1. May it is placed in the I-group until May 1. of the next year, when it joins the II-group and so on.
The lengths of the 0-group specimens, taken with the ring-net, are given in Table 15. Some of the young were measured immediately after capture, but most were measured after they had been preserved in formaline, often for a long time, several years. The measurements were taken to the lower whole mm. The smallest specimens taken in the ring-net were 4 mm. in length. Altogether 1,381 specimens were measured, as given in Table 15. The figures in brackets give the number of specimens on which the average is based. The table also shows the average lengths in the different months in all the years. These are somewhat variable through
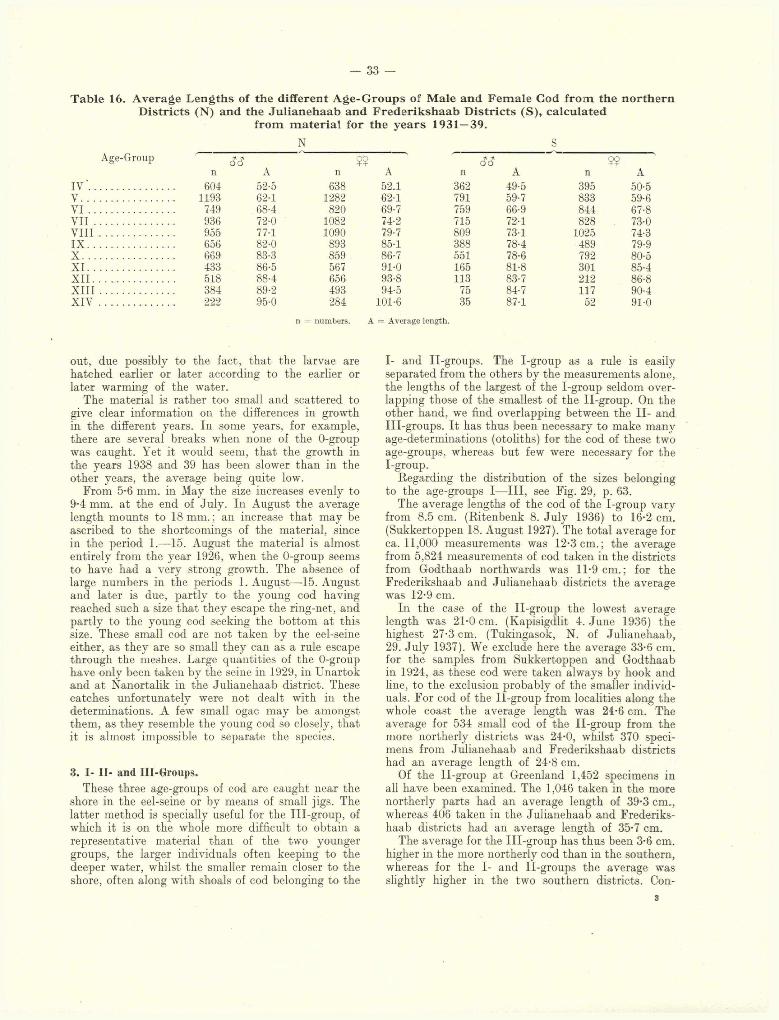
- 33 —
Table 16. A verage L engths of the different A ge-G roup s of M ale and F em ale Cod from the northernD istr ic ts (N) and the Ju lianehaab and Frederikshaab D istr ic ts (S), calcu lated
from m ateria l for the years
N
1 9 3 1 -3 9 .
SAge-Group S 3 ?? c?<? $2
n A n A n A n AI V .............................. 604 52-5 638 52.1 362 49-5 395 50-5V ................................. 1193 62-1 1282 62-1 791 59-7 833 59-6V I .............................. 749 68-4 820 69-7 759 66-9 844 67-8V I I ............................ 936 72-0 1082 74-2 715 72-1 828 73-0V I I I .......................... 955 77-1 1090 79-7 809 73-1 1025 74-3I X ............................... 656 82-0 893 85-1 388 78-4 489 79-9X ................................. 669 83-3 859 86-7 551 78-6 792 80-5X I ............................... 433 86-5 567 91-0 165 81-8 301 85-4X I I ............................. 518 88-4 656 93-8 113 83-7 212 86-8X I I I .......................... 384 89-2 493 94-5 75 84-7 117 90-4X I V ........................... 222 95-0 284 101-6 35 87-1 52 91-0
n = numbers. A = Average length.
out, due possibly to the fact, that the larvae are hatched earlier or later according to the earlier or later warming of the water.
The material is rather too small and scattered to give clear information on the differences in growth in the different years. In some years, for example, there are several breaks when none of the 0-group was caught. Yet it would seem, that the growth in the years 1938 and 39 has been slower than in the other years, the average being quite low.
From 5-6 mm. in May the size increases evenly to 9-4 mm. a t the end of July. In August the average length mounts to 18 mm. ; an increase that may be ascribed to the shortcomings of the material, since in the period 1.—15. August the material is almost entirely from the year 1926, when the 0-group seems to have had a very strong growth. The absence of large numbers in the periods 1. August—15. August and later is due, partly to the young cod having reached such a size tha t they escape the ring-net, and partly to the young cod seeking the bottom at this size. These small cod are not taken by the eel-seine either, as they are so small they can as a rule escape through the meshes. Large quantities of the 0-group have only been taken by the seine in 1929, in Unartok and a t Nanortalik in the Julianehaab district. These catches unfortunately were not dealt with in the determinations. A few small ogac may be amongst them, as they resemble the young cod so closely, that it is almost impossible to separate the species.
3. I- II- and III-Groups.These three age-groups of cod are caught near the
shore in the eel-seine or by means of small jigs. The latter method is specially useful for the III-group, of which it is on the whole more difficult to obtain a representative material than of the two younger groups, the larger individuals often keeping to the deeper water, whilst the smaller remain closer to the shore, often along with shoals of cod belonging to the
I- and II-groups. The I-group as a rule is easily separated from the others by the measurements alone, the lengths of the largest of the I-group seldom overlapping those of the smallest of the II-group. On the other hand, we find overlapping between the II- andIII-groups. I t has thus been necessary to make many age-determinations (otoliths) for the cod of these two age-groups, whereas but few were necessary for theI-group.
Regarding the distribution of the sizes belonging to the age-groups I—III, see Fig. 29, p. 63.
The average lengths of the cod of the I-group vary from 8.5 cm. (Ritenbenk 8. July 1936) to 16-2 cm. (Sukkertoppen 18. August 1927). The total average for ca. 11,000 measurements was 12-3 cm.; the average from 5,824 measurements of cod taken in the districts from Godthaab northwards was 11-9 cm.; for the Frederikshaab and Julianehaab districts the average was 12-9 cm.
In the case of the II-group the lowest average length was 21-0 cm. (Kapisigdlit 4. June 1936) the highest 27-3 cm. (Tukingasok, N. of Julianehaab, 29. July 1937). We exclude here the average 33-6 cm. for the samples from Sukkertoppen and Godthaab in 1924, as these cod were taken always by hook and line, to the exclusion probably of the smaller individuals. For cod of the II-group from localities along the whole coast the average length was 24-6 cm. The average for 534 small cod of the II-group from the more northerly districts was 24-0, whilst 370 specimens from Julianehaab and Frederikshaab districts had an average length of 24-8 cm.
Of the II-group at Greenland 1,452 specimens in all have been examined. The 1,046 taken in the more northerly parts had an average length of 39-3 cm., whereas 406 taken in the Julianehaab and Frederikshaab districts had an average length of 35-7 cm.
The average for the III-group has thus been 3-6 cm. higher in the more northerly cod than in the southern, whereas for the I- and II-groups the average was slightly higher in the two southern districts. Con-
3
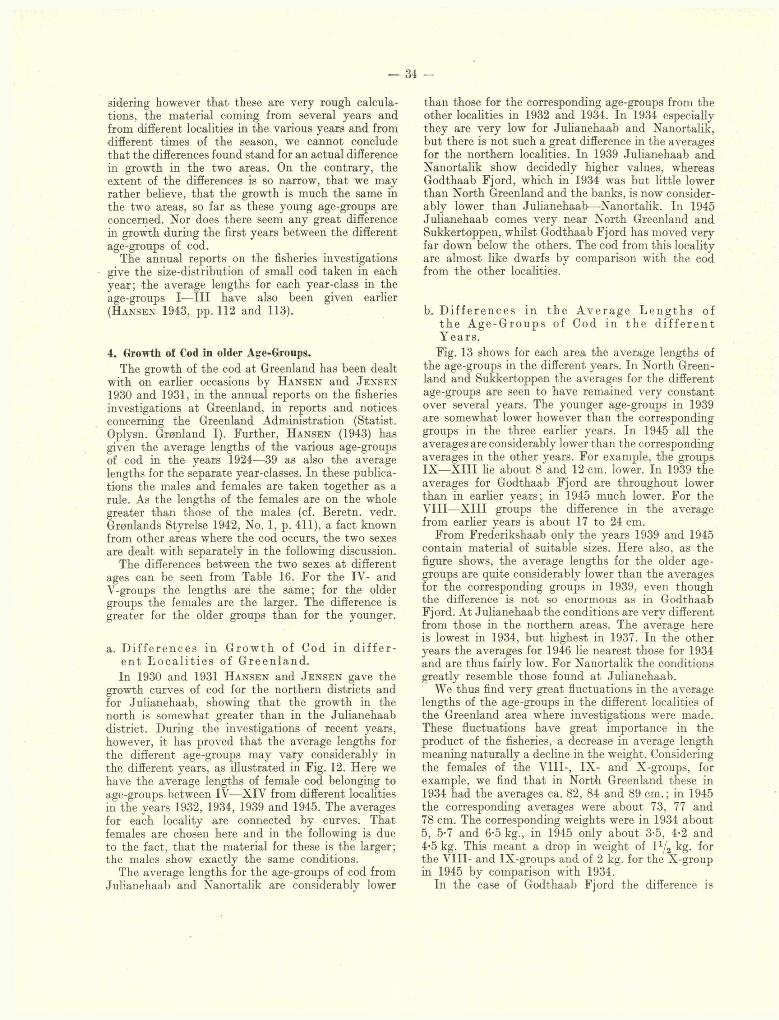
— 34 -
sidering however th a t these are very rough calculations, the material coming from several years and from different localities in the various years and from different times of the season, we cannot conclude tha t the differences found stand for an actual difference in growth in the two areas. On the contrary, the extent of the differences is so narrow, th a t we may rather believe, th a t the growth is much the same in the two areas, so far as these young age-groups are concerned. Nor does there seem any great difference in growth during the first years between the different age-groups of cod.
The annual reports on the fisheries investigations give the size-distribution of small cod taken in each year; the average lengths for each year-class in the age-groups I—II I have also been given earlier (Hansen 1943, pp. 112 and 113).
4. Growth of Cod in older Age-Groups.The growth of the cod a t Greenland has been dealt
with on earlier occasions by H a n s e n and J e n s e n
1930 and 1931, in the annual reports on the fisheries investigations a t Greenland, in reports and notices concerning the Greenland Administration (Statist. Oplysn. Grønland I). Further, H a n s e n (1943) has given the average lengths of the various age-groups of cod in the years 1924—39 as also the average lengths for the separate year-classes. In these publications the males and females are taken together as a rule. As the lengths of the females are on the whole greater than those of the males (cf. Beretn. vedr. Grønlands Styrelse 1942, No. 1, p. 411), a fact known from other areas where the cod occurs, the two sexes are dealt with separately in the following discussion.
The differences between the two sexes a t different ages can be seen from Table 16. For the IV- and V-groups the lengths are the same; for the older groups the females are the larger. The difference is greater for the older groups than for the younger.
a. D if fe re n c e s in G ro w th of Cod in d i f f e r e n t l o c a l i t i e s o f G re e n la n d .In 1930 and 1931 H a n s e n and J e n s e n gave the
growth curves of cod for the northern districts and for Julianehaab, showing th a t the growth in the north is somewhat greater than in the Julianehaab district. During the investigations of recent years, however, it has proved th a t the average lengths for the different age-groups may vary considerably in the different years, as illustrated in Fig. 12. Here we have the average lengths of female cod belonging to age-groups between iV—XIV from different localities in the years 1932, 1934, 1939 and 1945. The averages for each locality are connected by curves. That females are chosen here and in the following is due to the fact, th a t the material for these is the larger; the males show exactly the same conditions.
The average lengths for the age-groups of cod from Julianehaab and Nanortalik are considerably lower
than those for the corresponding age-groups from the other localities in 1932 and 1934. In 1934 especially they are very low for Julianehaab and Nanortalik, but there is not such a great difference in the averages for the northern localities. In 1939 Julianehaab and Nanortalik show decidedly higher values, whereas Godthaab Fjord, which in 1934 was but little lower than North Greenland and the banks, is now considerably lower than Julianehaab—Nanortalik. In 1945 Julianehaab comes very near North Greenland and Sukkertoppen, whilst Godthaab Fjord has moved very far down below the others. The cod from this locality are almost like dwarfs by comparison with the cod from the other localities.
b. D if f e r e n c e s in th e A v e ra g e L e n g th s of th e A g e -G ro u p s of C od in th e d i f f e r e n t Y ea rs .
Fig. 13 shows for each area the average lengths of the age-groups in the different years. In North Greenland and Sukkertoppen the averages for the different age-groups are seen to have remained very constant over several years. The younger age-groups in 1939 are somewhat lower however than the corresponding groups in the three earlier years. In 1945 all the averages are considerably lower than the corresponding averages in the other years. For example, the groups IX —X III he about 8 and 12 cm. lower. In 1939 the averages for Godthaab Fjord are throughout lower than in earlier years; in 1945 much lower. For the V III—X III groups the difference in the average from earlier years is about 17 to 24 cm.
From Frederikshaab only the years 1939 and 1945 contain material of suitable sizes. Here also, as the figure shows, the average lengths for the older age- groups are quite considerably lower than the averages for the corresponding groups in 1939, even though the difference is not so enormous as in Godthaab Fjord. At Julianehaab the conditions are very different from those in the northern areas. The average here is lowest in 1934, but highest in 1937. In the other years the averages for 1946 lie nearest those for 1934 and are thus fairly low. For Nanortalik the conditions greatly resemble those found a t Julianehaab.
We thus find very great fluctuations in the average lengths of the age-groups in the different localities of the Greenland area where investigations were made. These fluctuations have great importance in the product of the fisheries, a decrease in average length meaning naturally a decline in the weight. Considering the females of the VIII-, IX - and X-groups, for example, we find th a t in North Greenland these in1934 had the averages ca. 82, 84 and 89 cm. ; in 1945 the corresponding averages were about 73, 77 and 78 cm. The corresponding weights were in 1934 about 5, 5-7 and 6-5 kg., in 1945 only about 3-5, 4-2 and 4-5 kg. This meant a drop in weight of l x/g kg. for the V III- and IX-groups and of 2 kg. for the X-group in 1945 by comparison with 1934.
In the case of Godthaab Fjord the difference is
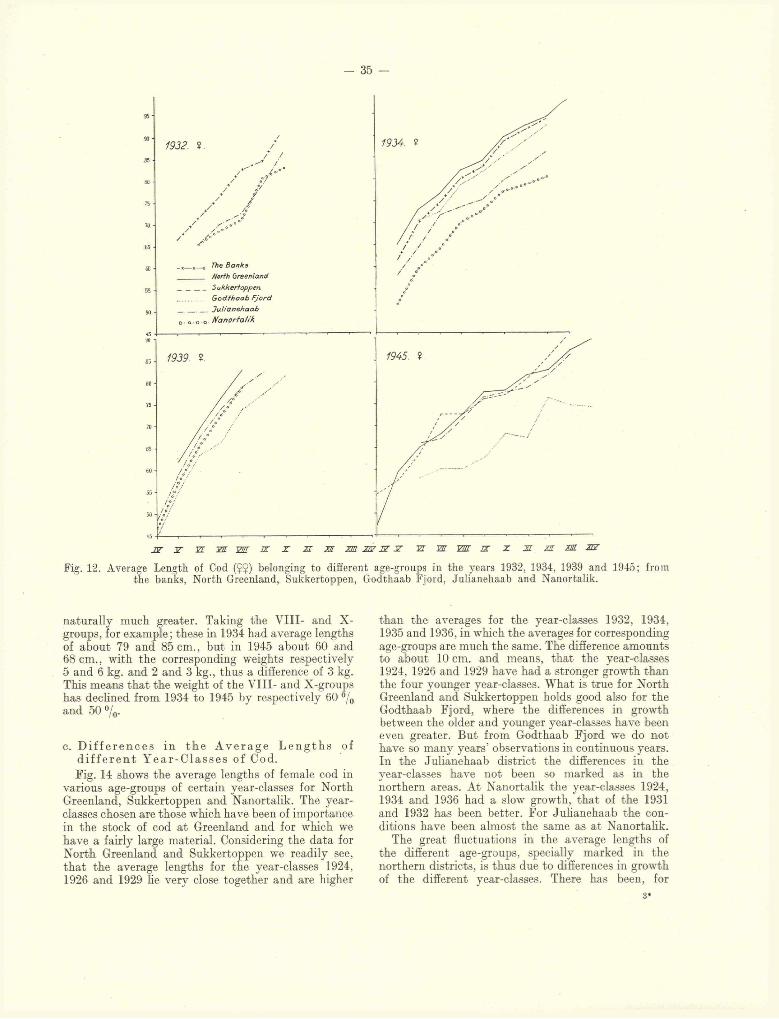
- 35
95
90
1932. ?.85
ao
75
70
65
{ x K The B anks
North Greenland
Sukkertoppen.G o d th a a b F jo rd
______ J u lia n e h a a b
. e-o-o- N anorfalik
60
55
50
1939. ?.£5
75
70
65
60
55
50
45J V JET YL YE wr TZ X 21 M UR 227
Fig. 12. Average Length of Cod ($$) belonging to different the banks, North Greenland, Sukkertoppen, G
naturally much greater. Taking the VIII- and X- groups, for example; these in 1934 had average lengths of about 79 and 85 cm., but in 1945 about 60 and 68 cm., with the corresponding weights respectively5 and 6 kg. and 2 and 3 kg., thus a difference of 3 kg. This means th a t the weight of the V III- and X-groups has declined from 1934 to 1945 by respectively 60 °/0 and 50 °/0.
c. D if f e r e n c e s in th e A v e ra g e L e n g th s of d i f f e r e n t Y e a r -C la s s e s o f Cod.Fig. 14 shows the average lengths of female cod in
various age-groups of certain year-classes for North Greenland, Sukkertoppen and Nanortalik. The year- classes chosen are those which have been of importance in the stock of cod a t Greenland and for which we have a fairly large material. Considering the data for North Greenland and Sukkertoppen we readily see, th a t the average lengths for the year-classes 1924, 1926 and 1929 lie very close together and are higher
1934. ?
1945. Î
m jr yr w vnr n: x i a a t ü f
Lge-groups in the years 1932, 1934, 1939 and 1945; from dthaab Fjord, Julianehaab and Nanortalik.
than the averages for the year-classes 1932, 1934,1935 and 1936, in which the averages for corresponding age-groups are much the same. The difference amounts to about 10 cm. and means, tha t the year-classes 1924, 1926 and 1929 have had a stronger growth than the four younger year-classes. W hat is true for North Greenland and Sukkertoppen holds good also for the Godthaab Fjord, where the differences in growth between the older and younger year-classes have been even greater. But from Godthaab Fjord we do not have so many years’ observations in continuous years. In the Julianehaab district the differences in the year-classes have not been so marked as in the northern areas. At Nanortalik the year-classes 1924, 1934 and 1936 had a slow growth, th a t of the 1931 and 1932 has been better. For Julianehaab the conditions have been almost the same as at Nanortalik.
The great- fluctuations in the average lengths of the different age-groups, specially marked in the northern districts, is thus due to differences in growth of the different year-classes. There has been, for
3 *
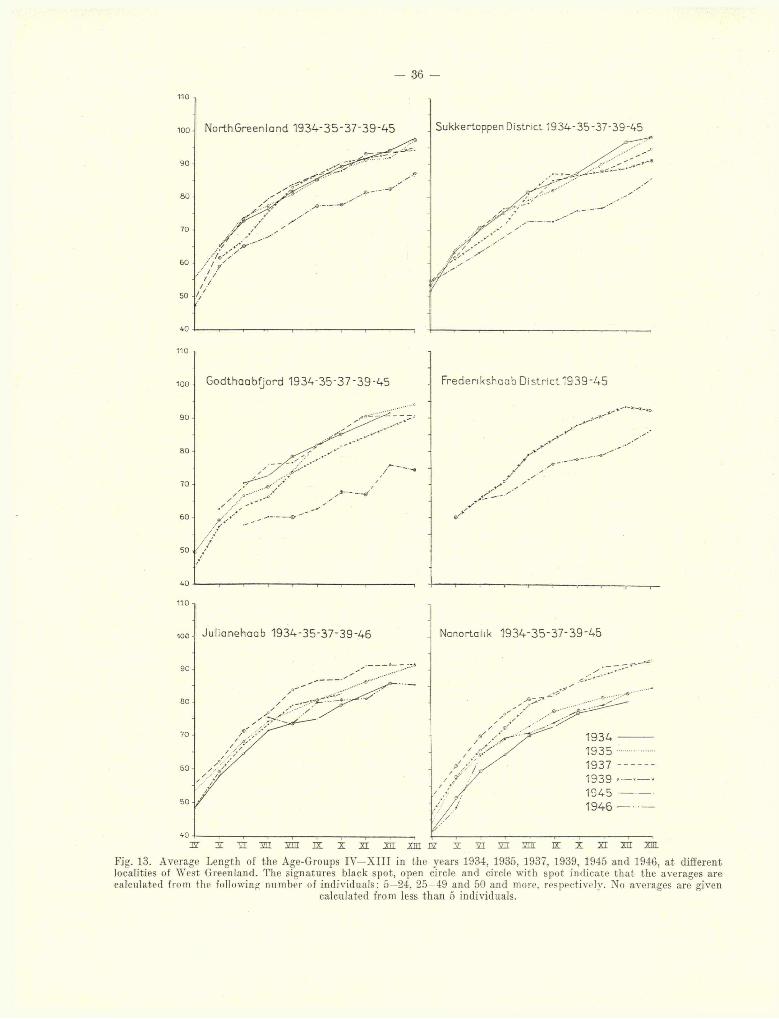
- 36 -
110
Sukkertoppen District 1934-35-37-39-45North Green I and 1934-35-37-39-45100
90
80
70
60
50
40
110
Frederikshaab District 1939'45Godthaabfjord 1934-35-37-39-45100
90 -
80
70
60-
50
110
Nanortaiik 1934-3 5 _37- 39"46Julianehaab 1934-35-37-39-46100 -
:690-
80-
70
60-
50
w î H m n i i i y r M XTTT i7 i i m m K x x i m m
Fig. 13. Average Length of the Age-Groups IV—X III in the years 1934, 1935, 1937, 1939, 1945 and 1946, at different localities of West Greenland. The signatures black spot, open circle and circle with spot indicate that the averages are calculated from the following number of individuals: 5—24, 25 49 and 50 and more, respectively. No averages are given
calculated from less than 5 individuals.
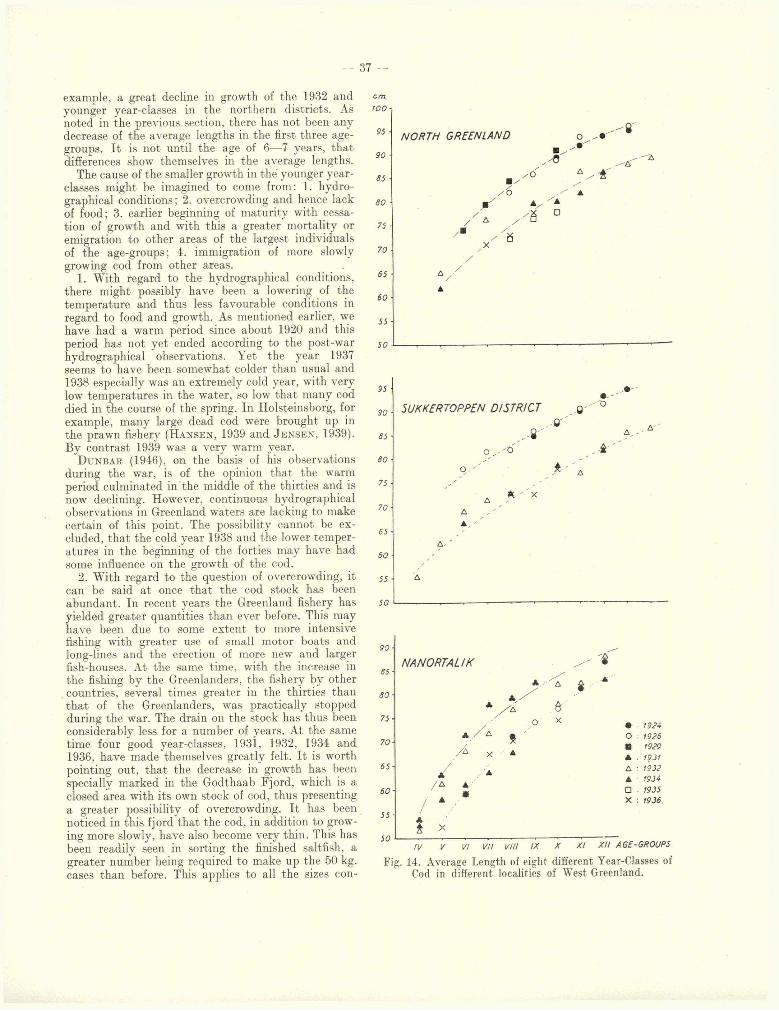
- 37 —
example, a great decline in growth of the 1932 and younger year-classes in the northern districts. As noted in the previous section, there has not been any decrease of the average lengths in the first three age- groups. I t is not until the age of 6—7 years, tha t differences show themselves in the average lengths.
The cause of the smaller growth in the younger year- classes might be imagined to come from: 1. hydro- graphical conditions; 2. overcrowding and hence lack of food; 3. earlier beginning of m aturity with cessation of growth and with this a greater mortality or emigration to other areas of the largest individuals of the age-groups; 4. immigration of more slowly growing cod from other areas.
1. With regard to the hydrographical conditions, there might possibly have been a lowering of the temperature and thus less favourable conditions in regard to food and growth. As mentioned earlier, we have had a warm period since about 1920 and this period has not yet ended according to the post-war hydrographical observations. Yet the year 1937 seems to have been somewhat colder than usual and 1938 especially was an extremely cold year, with very low temperatures in the water, so low th a t many cod died in the course of the spring. In Holsteinsborg, for example, many large dead cod were brought up in the prawn fishery ( H a n s e n , 1939 and J e n s e n , 1939). By contrast 1939 was a very warm year.
D u n b a r (1946), on the basis of his observations during the war, is of the opinion tha t the warm period culminated in the middle of the thirties and is now declining. However, continuous hydrographical observations in Greenland waters are lacking to make certain of this point. The possibility cannot be excluded, th a t the cold year 1938 and the lower temperatures in the beginning of the forties may have had some influence on the growth of the cod.
2. With regard to the question of overcrowding, it can be said at once tha t the cod stock has been abundant. In recent years the Greenland fishery has yielded greater quantities than ever before. This may have been due to some extent to more intensive fishing with greater use of small motor boats and long-lines and the erection of more new and larger fish-houses. At the same time, with the increase in the fishing by the Greenlanders, the fishery by other countries, several times greater in the thirties than tha t of the Greenlanders, was practically stopped during the war. The drain on the stock has thus been considerably less for a number of years. At the same time four good year-classes, 1931, 1932, 1934 and 1936, have made themselves greatly felt. I t is worth pointing out, th a t the decrease in growth has been specially marked in the Godthaab Fjord, which is a closed area with its own stock of cod, thus presenting a greater possibility of overcrowding. I t has been noticed in this fjord tha t the cod, in addition to growing more slowly, have also become very thin. This has been readily seen in sorting the finished saltfish, a greater number being required to make up the 50 kg. cases than before. This applies to all the sizes con-
cm.
t o o
95
90
85
8 0
75
70
65
60
55
50
95 •
90 ■
85 •
8 0 -
75 •
7 0 -
65 ■
60
55
5 0
90
85
80
75
70
65
60
55
50
Fi,
NORTH GREENLAND o
y om ' * 'A
/a 'ft D/ A / □
//
/
SUKKER TOPPEN DISTRICT o ’ °
■ 0'''
, 8 ' * -
P ' ' * A
* ' X
NANORTALIK
A/ A
X
▲
A/L
*A
▲m
19241926192919311932 1934
□ . 1935 X : 1936.
tI]/ V VI VU vrn IX X X I XII AGE-GROUPS
14. Average Length of eight different Year-Classes of Cod in different localities of West Greenland.
— 38 -
cerned. The food tha t means most for the nourishment and growth of the cod is certainly the capelan (Mallotus villosus). I t is possible th a t a reduced occurrence of this small fish may have greatly influenced the decline in weight of the cod. According to several Danes and the Greenlanders there have been for years far fewer capelan than earlier in the more northerly districts, whilst it has shown normal occurrence in most years in the Julianehaab district. These statements are so uncertain, however, it is not possible to come to any definite conclusion.
3. I t cannot be excluded tha t an earlier beginning of m aturity and therewith stoppage of growth has influenced the slow growth of the younger year- classes. In an earlier section (p. 27) it has been noted, tha t examination of so-called spawning zones in the otoliths has proved, th a t an actual change has occurred in the age when m aturity begins. Whereas the year-class 1917 in the northern districts had 60°/0 of first-time spawners in the ages 9 to 11, and the year-class 1922 64-7 °/0 in the ages 8 to 10 years, the year-classes 1934 and 1936 had 60-6 and 64-6 % first-time spawners a t an age of 7 years. I t is well- known, tha t the growth becomes slower when maturity sets in. When this occurs earlier for the younger than for the older year-classes, it may perhaps account for the slower growth of the younger year-classes.
In order to show the influence which an early beginning of m aturity may have upon the stagnation of growth, calculations are given in Table 17 of the average lengths of cod of the year-classes 1934 and 1936 (age-groups X III and XI) which have spawned for the first time as 6, 7, 8, 9, and 10-year-old fish.
T ab le 17. A verage L ength s of Cod at F irst-M atu rity .
N o r th e r n D is t r i c t sAge at First-Maturity
! Year-Class 6 7 8 9 10(Age-Group) A n A n A n A n A n
1934 S3 81-7(20) 81-6(143) 81-8(84) 82-6(45) —(XIII) ÇÇ 83-4(19) 84-5(239) 85.1(146) 85-4(77) 86-0(22)
1936 S3 76-3(18) 76-9(96) 77-1(82) 77-1(11) —(XI) $$ 79-9(18) 79-6(130) 79-9(102) 82-5(19) —
S o u th e r n D is t r i c t sAge at First-Maturity
Year-Class 6 7 8 9 10(Age-Group) A n A n A n A n A n
1934 S3 82-2(13) 80-8(49) 80-3(45) 80-5(34) 81-9(8)(XIII) ÇÇ 81-5(12) 83-9(107) 84-1(101) 86-5(52) 89-2(12)
1936 S 3 76-3(6) 77-3(39) 78-7(37) 81-2(11) —(XI) o$ 78-3(6) 79-2(80) 79-6(77) 81-3(22) 82-8(5)
I t will be seen th a t the average lengths of cod tha t have spawned a t an. early age, are generally somewhat smaller than those of cod tha t have spawned at a higher age. The differences are, however, generally quite small compared with the great differences in growth observed in the various year-classes. This
would indicate th a t the early beginning of m aturity in the younger age-classes is not the only cause of their stagnation of growth.
4. That there may be an immigration of cod from Iceland over to Greenland, a t least in certain years, has been proved by the marking experiments (p. 59). Presumably however, it is a question of cod which have grown up a t Greenland and have returned there after spawning a t Iceland. The investigations have shown ( H a n s e n , J e n s e n and T å n i n g 1935, pp. 84— 86), th a t the cod which are approaching first-maturity and migrate to Iceland, have a slower rate of growth than the cod which remain a t Greenland. I t is conceivable, therefore, th a t the decrease in growth for some year-classes results from the migration of large numbers of these year-classes to Iceland, spawning there and returning to the Greenland waters. These cod would then affect the average lengths of the age- groups to which they belong, bringing them lower.
I am inclined to believe, tha t the cause of the slower growth of the cod in recent years is to be found in a combination of the above-mentioned factors. I t seems most probable, th a t shortage of food, whether from overcrowding or from a scarcity of the principal food-species, has been of great importance. In support of this we have the investigations in Godthaab Fjord, where the cod in recent years have not only grown more slowly but have become much thinner a t the same time. The earlier inception of m aturity has also had some influence on the rate of growth.
No decline in the rate of growth has been noticed in the case of the three youngest age-groups. Their average lengths have been almost the same in the different year-classes. This can be explained, whether we take lack of food or earlier beginning of m aturity as the cause of the great decline in the rate of growth. The youngest age-groups live mainly on other organisms than the older cod. Bottom-animals like worms, molluscs and small crustaceans play a great part in the food of the young, whilst the principal food of the older cod is fish (capelan and sand-eels). But where the organisms the young feed on, may be considered to occur in uniform quantities in the various years, there is a greater probability for variations in the principal food sources of the older cod. These consequently are more subject to lack of food and thus decline in growth more than the younger.
With regard to limitation of growth when m aturity sets in, it is evident, th a t this can only show itself when the individuals have reached an age near the beginning of maturity. Consequently it does not affect the younger age-groups.
R o l l e f s e n (1947) has given a curve showing the variations in length of the age-groups V III—X III in the years 1932'—45 for the Norwegian spawning cod a t the Lofotens (‘"Skrei” ). I t appears tha t the average lengths were low in 1932, about 84 cm., and thereafter rose to about 92-5 cm. in 1936. Then they fell steeply till 1945, to about 85 cm.; R o l l e f s e n ascribes these variations in the growth to varying conditions of food on the feeding grounds of the cod.
— 39 -
5. Growth Conditions in different Fjord Populations.In a later section it will be mentioned, th a t local
populations occur in certain fjords and tha t these differ from the cod in the coastal regions, among other things in number of vertebrae and rays in D?. Such local stocks are found in the Ikertok Fjord in Holsteinsborg district and in Kangia Fjord in the Sukkertoppen district. The growth in these fjord populations differs from what we find in the cod of adjacent localities in the coastal region.
When discussing the spawning conditions in Ikertok Fjord it was mentioned, th a t a local stock was found there in the spring, spawning a t a great depth below the ice, whilst later other cod migrated into the fjord from outside. In 1934 material was collected of otoliths and measurements for age and growth determinations in two periods, 1.-—15. May and 29. May—6. June. In the first period only cod belonging .to the local stock were found, whilst in the second a large immigration of cod from outside had taken place. The average lengths of the cod belonging to different age-groups in the two periods were as follows.
T able 18 A. A verage L ength s in tw o P eriod s in Ikertok Fjord.
vAv. L. No.
V III Av. I.. No.
X Av. L. No.
X II Av. L. No.
1.—15.5$ ........... 56-7 49 74-8 19 81-5 4 86-0 39 ........ 60-4 67 76-4 23 96-7 6 91-0 229.5-6.6<J ........... 63-9 25 78-3 40 87-6 31 91-8 22? ........ 64-6 46 85-0 30 90-7 41 98-4 17
I t will be seen, th a t the average lengths for corresponding age-groups are lower in the first period than in the second. The local population has thus a slower growth.
Comparing now the average lengths of cod from the Kangia Fjord in 1934 with those from the other part of Sukkertoppen district in the same year, we find th a t the Kangia cod have the lowest average lengths.
Table 18 B. A verage Lengths at Sukkertoppen and Kangia.
Av! L. No-V I AT
Av.L. No-V III
Av. L. No.X
Av.L. No.
1934, Sukkertoppen District A 62-9 38 69-5 18 78-8 68 83-4 500 63-5 50 70-0 28 81-7 70 87-2 53
1934, Kan"ia<J 60-1 22 66-7 44 71-3 76 83-1 8$ 58-1 10 67-7 27 76-0 50 85-9 11
The local fjord populations in Ikertok and Kangia are thus distinguished from the cod in the coastal area by a slower growth.
Similar investigations a t Atangmik in Angmasivik Fjord in the Sukkertoppen district showed, th a t the
cod in this fjord were not different from the coastal cod in the m atter of rate of growth. We shall see also in a later section, th a t the number of vertebrae shows no difference between cod in Angmasivik and in the coastal areas. A separate population does not seem to occur in this fjord; if it does, it becomes mixed to a very great extent with cod from outside.
The growth of the cod in Godthaab Fjord has been discussed in the previous section. I t has been shown for these cod, tha t the growth is considerably slower in the younger year-classes than in the older, with the result, th a t the average lengths for the different age-groups have greatly decreased since the middle of the thirties. The cod in Godthaab Fjord are now much smaller than cod of the same age a t the coast.
B. Food of the Cod at W est Greenland.
The food of the cod a t Greenland has been dealt with in an earlier paper ( H a n s e n and J e n s e n 1930). Since th a t work appeared, further investigations into this m atter have been made a t several localities in West Greenland.
'Many of the cod used in the measurements and age determinations from the otoliths, have also been cut open and the contents of the stomach examined. In most cases no counting has been undertaken of the number of individuals in the various kinds of food, nor has any measurement been made of their amount or weight.
Table 19 only shows, therefore, how many cod stomachs have contained the food-stuffs mentioned. As the 1930 publication did not give any tables for the food investigations carried out in the years 1925 to 1929, these have been included in Table 19 along with the results for later years.
The cod examined have been caught partly on hand-line and hook, partly by long-lines. The catches include both pelagic cod, i. e., taken near the surface and those caught a t the bottom. The results given in the table are from cod of from ca. 50 cm. to over 1 m. in length. An exception is the sample from Sukkertoppen on 19.—26. August 1927, which consists mainly of smaller cod. The localities where investigations were made, include fjords, coastal waters and the banks. In addition to the places noted in the table there have been others, where the stomach contents have been examined in part of the catches. As a rule only some of the individuals in the catches have been examined as samples and it has thus not been possible to include them in the table. This procedure has been especially adopted in the cases where the food has been mainly of one certain kind, far exceeding the rest. This has often happened in the early summer, for example, when the capelan is practically the only food of the cod, especially in the fjords. In consequence of this the capelan is not at all well represented in the table.
The investigations show th a t the cod a t Greenland, as a t all other places, is practically omnivorous, such a number of different kinds of animals make up their
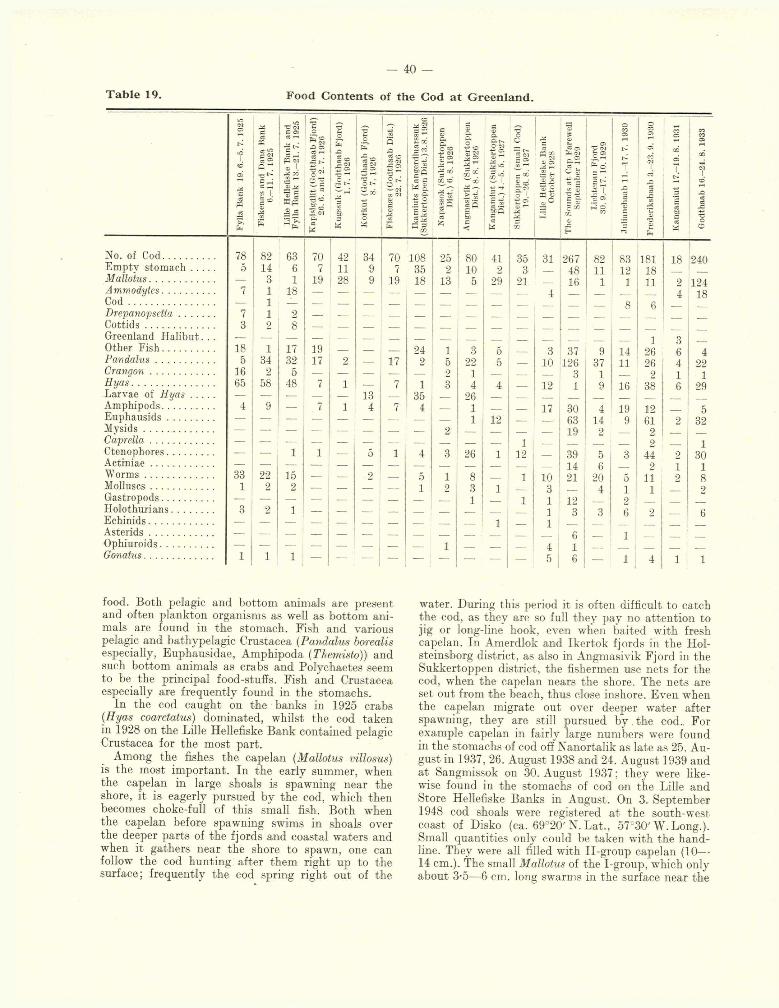
T ab le 19.
- 40 —
Food C ontents of the Cod at G reenland.
Fylla
B
ank
19.
6.-5
. 7.
1925
1 Fi
sken
æs
and
Dan
a B
ank
0.-
11
.7.
1925
Lille
H
elle
flsk
e B
ank
and
Fylla
B
ank
13.-
21.
7. 19
25
Kap
isig
dlit
(G
odth
aab
Fjo
rd)
26.
6. a
nd
2. 7
. 19
26
Kug
ssuk
(G
odth
aab
Fjo
rd)
1.7.
19
26
Kor
kut
(God
thaa
b F
jord
) 8.
7.
1926
Fisk
enæ
s (G
odth
aab
Dis
t.)
22.
7. 19
26
Ikam
iuts
K
ang
erd
luar
ssu
k
(Suk
kert
oppe
n D
ist.)
3.8
.19
26
Nap
asso
k (S
uk
ker
top
pen
D
ist.)
6.
8.1
92
6
eao*3 CDo3 >M
.GO ® '—' 00 >| sSo< K
anga
miu
t (S
uk
ker
top
pen
D
ist.)
4.
-5.
5. 19
27
Suk
kert
oppe
n (s
mal
l C
od)
19.-
26.
8.
1927 CQ 00
O Ci.a: .-i« t£-5— Üo ®
<U£ascS afs*
7! *
1 1 •c 2 §■ C 5Q<DH
Lic
hten
au
Fjo
rd
30.
9.-1
7.
10.
1929
Juli
aneh
aab
11.-
17.
7. 19
30
Fre
deri
ksha
ab
3.-2
3. 9
. 19
30
Kan
gam
iut
17.-
19.
8.
1931
God
thaa
b 16
.-24
. 8.
19
33
!
No. of Cod.................. 78 2 63 70 42 34 70 108 25 80 41 35 31 267 82 83 181 18 940Empty stom ach........ 5 14 6 7 11 9 7 35 2 10 2 3 _ 48 11 19 18M a llo tu s ..................... — 3 1 19 28 9 19 18 13 5 29 21 __ 1 fi 1 1 11 2 194A m m o d y te s ................. 7 1 18 — — — — — — _ _ _ 4 4 18C o d .............................. — 1 8 6D r e p a n o p se t ta ........... 7 1 2C ottids........................Greenland H alibut. ..
3 2 8i 3
—
Other F ish .................. 18 1 17 19 — — — 24 1 3 5 _ 3 37 9 14 26 6 4P a n d a l u s .................. 5 34 32 17 2 — 17 2 5 22 5 _ 10 136 37 11 26 4 9?C r a n g o n .................... 16 •) 5 — — — — — 2 1 _ _ 3 1 2 1 1I i y a s .......................... 65 58 48 7 1 — 7 1 3 4 4 _ 12 1 9 16 38 6 29Larvae of H y a s ....... — — — — 13 — 35 _ 26 _ _ _Amphipods.................. 4 9 — 7 1 4 7 4 _ 1 _ _ 17 30 4 19 19 5Euphausids................. — — — — — — — — 1 12 _ 63 14 9 61 3 39M ysids......................... •— — — — — — _ 2 _ _ _ _ 19 ? 2C a p r e l l a .................... — .— — — — — _ _ _ _ 1 _ 9 1Otenophores................ - - 1 1 — 5 1 4 3 26 1 12 _ 39 5 3 44 9 30A ctiniae....... — — — — — — — _ _ _ _ _ 14 6 2 1 1W orm s........ as 22 15 — — 2 — 5 1 8 _ 1 10 31 90 5
111 2 8
Molluscs...................... i 2 2 — — — — 1 9 3 1 _ 3 4 1 9Gastropods.................. — — — — — — _ _ 1 1 1 19 2 _Holothurians............... 3 2 1 — — _ _ _ _ _ 1 3 3 6 2 fiEchinids....................... — — — — _ _ _ _ _ 1 1A sterids....................... — — — — _ _ _ _ _ 6 1Ophiuroids................... — — — — — _ _ 1 _ _ 4 1G on atu s ...................... 1 1 1 5 6 1 4 1 1
food. Both pelagic and bottom animals are present and often plankton organisms as well as bottom animals are found in the stomach. Fish and various pelagic and bathypelagic Crustacea (Pandalus borealis especially, Eluphausidae, Amphipoda (Themisto)) and such bottom animals as crabs and Polychaetes seem to be the principal food-stuffs. Fish and Crustacea especially are frequently found in the stomachs.
In the cod caught on the banks in 1925 crabs (.Ryas coarctatus) dominated, whilst the cod taken in 1928 on the Lille Hellefiske Bank contained pelagic Crustacea for the most part.
Among the fishes the capelan (Mallotus villosus) is the most important. In the early summer, when the capelan in large shoals is spawning near the shore, it is eagerly pursued by the cod, which then becomes choke-full of this small fish. Both when the capelan before spawning swims in shoals over the deeper parts of the fjords and coastal waters and when it gathers near the shore to spawn, one can follow the cod hunting after them right up to the surface; frequently the cod spring right out of the
water. During this period it is often difficult to catch the cod, as they are so full they pay no attention to jig or long-line hook, even when baited with fresh capelan. In Amerdlok and Ikertok fjords in the Holsteinsborg district, as also in Angmasivik Fjord in the Sukkertoppen district, the fishermen use nets for the cod, when the capelan nears the shore. The nets are set out from the beach, thus close inshore. Even when the capelan migrate out over deeper water after spawning, they are still pursued b y . the cod.. For example capelan in fairly large numbers were found in the stomachs of cod off Nanortalik as late as 25. August in 1937, 26. August 1938 and 24. August 1939 and at Sangmissok on 30. August 1937 ; they were likewise found in the stomachs of cod on the Lille and Store Hellefiske Banks in August. On 3. September 1948 cod shoals were registered a t the south-west coast of Disko (ca. 69°20'N. Lat., 57°30'W. Long.). Small quantities only could be taken with the hand- line. They were all filled with II-group capelan (10— 14 cm.). The small Mallotus of the I-group, which only about 3-5—6 cm. long swarms in the surface near the
- 41 —
coast and in the fjords, is pursued by the smaller cod, which are often found quite full of these small, glass- clear fish.
In the Amerdlok and Ikertok fjords in the Holsteinsborg district the arrival of the capelan at the spawning grounds in the early summer gives rise to an extensive migration into the fjord of the cod which have just spawned outside. This leads to a very important fishery for the Greenlanders.
After the capelan the lance (Ammodytes lancea) is the most important food of the cod, especially later in the summer and mainly over the banks and in the coastal waters. Examination of cod stomachs, especially in Godthaab, Sukkertoppen and Egedesminde districts, gave in August large quantities of Ammodytes, both large and small specimens. In the Sukkertoppen district they were almost all large, whereas in Egedesminde the small seemed to be in the majority. In the middle of August large shoals of cod going northwards after the lance have been observed in several years over the Lille Hellefiske Bank. In 1931 the present author had the opportunity of observing directly this north-going migration, off Sukkertoppen on 5.—9. August and off Kangamiut on the 14. and15. August. At the latter place especially the movement was clearly seen; the weather being calm and the water like a mirror. The migration was going on right a t the surface with the dorsal fins of the cod in many cases showing above the water. Everywhere as far as one could see, the dorsal fins projected from the water and one could observe distinctly, th a t the shoals were moving northwards. Small and large flocks of Rissa tridactyla followed the shoals. Now a-nd then when the gulls dived, one could see that they were after the lance. Two French boats and six Faroese cutters were fishing on the bank and through the telescope one could watch the fishermen continuously hauling in the cod over the side.
On 14. August the research-vessel marked 240 cod which had been taken by 2 men in 3 hours. They were so full of Ammodytes tha t these often sprung out of the mouth of the cod when brought on deck. On 17. August 150 cod were taken a t the same place. The weather was then bad, with south-west gale and rain, and no cod were seen on the surface. Those caught were taken near the bottom and none had lance in the stomach. Fishmaster N . L. N ie l s e n at Sukkertoppen has reported, tha t he has observed in several years this mass-migration northwards of the cod after lance. The lance thus seems to play a very important role in the migration of the cod, at any rate over the marine banks of West Greenland.
The 1931 marking experiments showed, th a t in th a t year extensive migrations took place in a northerly direction. 1931 was likewise the year when the largest number of marked Iceland cod were recaptured on the West Greenland banks. As will be noted later, most of these recoveries were made far to the north on the Store and Lille Hellefiske Banks. Whether any great migration of lance a t West Greenland can give rise to a migration on a large scale of cod from Ice
land to West Greenland, is a m atter naturally tha t cannot be decided on from the one year’s observations.
In addition to Mallotus and Ammodytes various other fishes have been found in the stomachs of cod. Small specimens of cod and Oadus ogac are often taken in large cod; this applies also to small Drepanopsetta (long-rough dab) and various cottids. Lum- penus-species, Centronotus fasciatus and Stichaeus punctatus also are found now and then. None of these however has anything like the great importance of Mallotus and Ammodytes.
Greenland halibut about to change over to the bottom-stage may often be found in fairly large numbers in cod stomachs in August and September. This has been observed for several years a t Sukkertoppen and in the sounds a t Cape Farewell, for example by Ad. J e n s e n at the end of September 1909 (J e n s e n 1909). •
The herring, which only occurred sparingly and locally in earlier years, became more abundant at Greenland in the thirties with a wider distribution. For example, it occurs in large numbers a t several places in the Sukkertoppen, Frederikshaab and Julianehaab districts. Nevertheless, in contrast to the conditions at Newfoundland, Iceland and the Barents Sea, the herring plays no part in the food of cod at Greenland. In very few cases have small herring been found in cod stomachs; most cases occurred in Ika- miuts Kangerdluarssuk in the Sukkertoppen district in 1930 and in Neria, Frederikshaab district, in 1933.
Among the Crustacea Pandalus borealis is of great importance as food, especially for large cod living in deeper water. In the deeper part of Amerdlok Fjord the cod as a rule are filled with Pandalus. The same condition was found also a t Jakobshavn in1936 and in the Lichtenau Fjord in August in the years 1929, 1936 and 1938. In addition to Pandalus several species of Spirontocaris are usually present in smaller quantities. The same is the case with the species of Sclerocrangon and Nectocrangon. The Am- phipoda are fairly evenly distributed in the cod stomachs in most localities ; they seem mainly to be of some importance for the smaller fish. The species Themisto libellula is the one which is often taken in large numbers in the plankton nets. Euphausids, often found in swarms in the plankton, have only been seen in cod stomachs in less than half the localities; only in cod from the sounds a t Cape Farewell in 1929 and off Frederikshaab in 1930 have they occurred frequently in the stomachs of cod.
Sometimes the larvae of crabs, both in the Zoëa and Megalops stage, have been found in the stomachs, especially of the smaller cod. Three stations are noted in the table, all from fjords, namely Korkut, Ikamiuts Kangerdluarssuk and Angmasivik, where crab larvae have been present in most of the cod stomachs. The small crab larvae are certainly an indifferent kind of nutriment, only taken when no other food was available.
Crabs, Hyas coarctatus and H. araneus, occurred
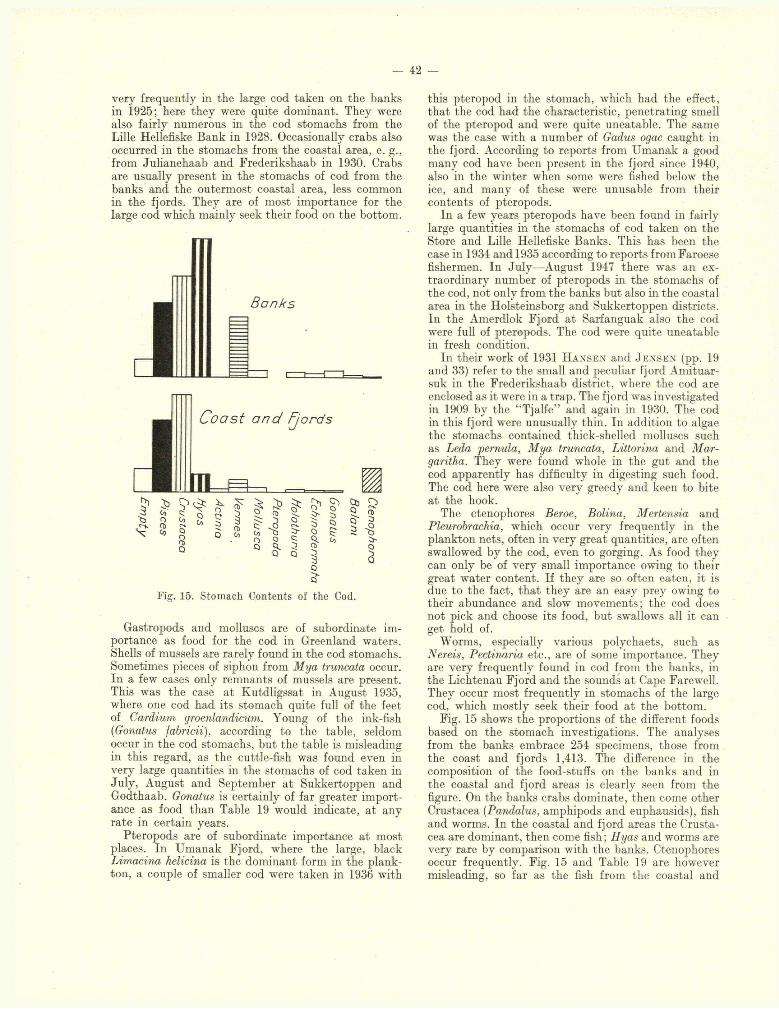
— 42 —
very frequently in the large cod taken on the banks in 1925; here they were quite dominant. They were also fairly numerous in the cod stomachs from the Lille Hellefiske Bank in 1928. Occasionally crabs also occurred in the stomachs from the coastal area, e. g., from Julianehaab and Frederikshaab in 1930. Crabs are usually present in the stomachs of cod from the banks and the outermost coastal area, less common in the fjords. They are of most importance for the large cod which mainly seek their food on the bottom.
JI
Banks
Coast and Fjords
/A
ä 8QOn>Q
cf J3Co aO o Q a
c:
Q
1 * i-o3
Fig. 15. Stomach Contents of the Cod.
Gastropods and molluscs are of subordinate importance as food for the cod in Greenland waters. Shells of mussels are rarely found in the cod stomachs. Sometimes pieces of siphon from M ya truncata occur. In a few cases only remnants of mussels are present. This was the case a t Kutdligssat in August 1935, where one cod had its stomach quite full of the feet of Cardium groenlandicum. Young of the ink-fish (Gonatus fabricii), according to the table, seldom occur in the cod stomachs, but the table is misleading in this regard, as the cuttle-fish was found even in very large quantities in the stomachs of cod taken in July, August and September a t Sukkertoppen and Godthaab. Gonatus is certainly of far greater importance as food than Table 19 would indicate, a t any rate in certain years.
Pteropods are of subordinate importance a t most places. In Umanak Fjord, where the large, black Limacina helicina is the dominant form in the plankton, a couple of smaller cod were taken in 1936 with
this pteropod in the stomach, which had the effect, tha t the cod had the characteristic, penetrating smell of the pteropod and were quite uneatable. The same was the case with a number of Gadus ogac caught in the fjord. According to reports from Umanak a good many cod have been present in the fjord since 1940, also in the winter when some were fished below the ice, and many of these were unusable from their contents of pteropods.
In a few years pteropods have been found in fairly large quantities in the stomachs of cod taken on the Store and Lille Hellefiske Banks. This has been the case in 1934 and 1935 according to reports fromFaroese fishermen. In July—August 1947 there was an extraordinary number of pteropods in the stomachs of the cod, not only from the banks bu t also in the coastal area in the Holsteinsborg and Sukkertoppen districts. In the Amerdlok Fjord a t Sarfanguak also the cod were full of pteropods. The cod were quite uneatable in fresh condition.
In their work of 1931 H a n s e n and J e n s e n (pp. 19 and 33) refer to the small and peculiar fjord Amituar- suk in the Frederikshaab district, where the cod are enclosed as it were in a trap. The fjord was investigated in 1909 by the “Tjalfe” and again in 1930. The cod in this fjord were unusually thin. In addition to algae the stomachs contained thick-shelled molluscs such as Leda pernula, M ya truncata, Littorina and Mar- garitha. They were found whole in the gut and the cod apparently has difficulty in digesting such food. The cod here were also very greedy and keen to bite a t the hook.
The ctenophores Beroe, Bolina, Mertensia and Pleurobrachia, which occur very frequently in the plankton nets, often in very great quantities, are often swallowed by the cod, even to gorging. As food they can only be of very small importance owing to their great water content. If they are so often eaten, it is due to the fact, th a t they are an easy prey owing to their abundance and slow movements; the cod does not pick and choose its food, but swallows all it can get hold of.
Worms, especially various polychaets, such as Nereis, Pectin-aria etc., are of some importance. They are very frequently found in cod from the banks, in the Lichtenau Fjord and the sounds a t Cape Farewell. They occur most frequently in stomachs of the large cod, which mostly seek their food a t the bottom.
Fig. 15 shows the proportions of the different foods based on the stomach investigations. The analyses from the banks embrace 254 specimens, those from the coast and fjords 1,413. The difference in the composition of the food-stufis on the banks and in the coastal and fjord areas is clearly seen from the figure. On the banks crabs dominate, then come other Crustacea (Pandalus, amphipods and euphausids), fish and worms. In the coastal and fjord areas the Crustacea are dominant, then come fish; Hyas and worms are very rare by comparison with the banks. Ctenophores occur frequently. Fig. 15 and Table 19 are however misleading, so far as the fish from the coastal and
- 43 —
fjord areas are concerned, as the samples containing the capelan exclusively, are not included. As a m atter of fact, fish (i. e. capelan and lance) constitute the most important of the food-stuffs in this area, even if they are to some degree seasonal.
The food of the cod in the Newfoundland area has been noted by H a r o l d T h o m p s o n (1943). The conditions there are much the same as in Greenland. Fish contribute the main part of the food, especially capelan, lance and herring. The capelan is of extreme importance, particularly for the cod in the coastal area and quite specially in the northern part of the area. In Labrador it can be found in the stomachs as late as in September. T h o m p s o n writes: “There is no doubt tha t cod in the region mentioned depend upon caplin for the period of gross feeding and recuperation which succeeds the spawning season” . .
On the banks the cod also take a quantity of capelan but here the lance, as a t Greenland, is the principal food especially near the outer slopes of the banks. In the south-western region especially herring form an important constituent in the diet of the cod; but on the banks and in the south-east region they are seldom seen in the stomachs. Crustaceans, next to fish, are the most common components of the cod’s food. Shrimps and prawns are taken throughout the Newfoundland area, but particularly in the more northerly portion.
“ In fact one might say tha t here, just as caplin (inshore) and lance (on the banks) provide for periods of high-feeding, shrimps provide throughout the year the chief subsistence diet.” At Newfoundland as on
the West Greenland banks Hyas is an important component of the cod’s food.
As a t Greenland molluscs are somewhat less in importance than the above-mentioned foods.
Ctenophores and tunicates are also found in the stomachs of the Newfoundland cod just as in Greenland waters.
M e s c h k a t (1936) has investigated the food of the cod a t the Westmanna Isles. The proportions of the different components are much the same as a t Greenland. Crustacea are the most important, next come fish (capelan and lance). All other forms are of much less importance.
I d e l s o n (1930) has examined the food of cod in the Barents Sea. Here also the conditions are much the same as a t Greenland apart from the herring, which is but rarely taken in the Greenland cod. I d e l s o n writes: “The principal food of the cod in the Barents Sea consists of fish (herring, capelan (Mallotus) and others) and Decapoda Macrura (principally Pandalus). Besides this staple food, typical benthos organisms are also frequently found in the stomachs of cod, such as Vermes, Echinodermata, Mollusca, which, however, are quantitatively of very small importance. Moreover, indications exist (see Sc h v e in z e w (1, 2) and the reports of the Murman Expedition), th a t the stomachs of the cod contain sometimes Beroe (Cteno- phora) in great quantity.”
In most parts of the Barents Sea almost the same food components are found as in the Greenland coastal and fjord areas. On the banks a t Cape Kanin, as on the Greenland coastal banks, it is Hyas which is the principal food.
V. Races.
Can N u m erica l C haracters be used for the C haracterisation of R aces of the Cod
at G reenland?
In 1930 in his important work on the races of the Atlantic cod S c h m id t has shown, on the basis of a very large material of number of vertebrae and rays in D2, tha t there is a considerable geographical variation in these characters. The lowest values are found in the eastern Atlantic, the highest in the western Atlantic along the American coast. In both regions the number of vertebrae increases from south to north. The number may vary in different years, but not to such an extent as to obscure the geographical differences. Sc h m id t points’ out, tha t populations of cod in separate seas and fjords have as a rule a lower number of vertebrae than populations in the coastal and banks areas. In regard to Greenland it appears, th a t there is a fairly large difference between the populations of this region and those of the American region, the latter having a much higher number of vertebrae on the whole. From which it follows, that there is apparently but little if any connection between these two regions. On the other hand, the cod of Greenland and the cod of Iceland are much more
closely related in number of vertebrae. S c h m id t also refers to the migration of cod from Greenland to Iceland, first observed in 1930.
T h o m p s o n (1943, pp. 63—69) has supplemented S c h m id t ’s investigations and given several enumerations of the number of vertebrae in the cod from different localities a t Newfoundland.
At Greenland investigations have continued on the number of vertebrae and rays in D2 of cod from different localities. Some of these recent enumerations have been dealt with by T å n in g (1938). Still more have been made since then. Enumerations of vertebrae and D2 rays in cod from localities a t Greenland are given in the chart, Fig. 16, and in Table 20. On the chart the figures in brackets indicate the year when the sample was taken. Two samples are omitted however; the one because the material was too small (18 specimens from Godhavn 1932), the other because the material was a mixture of specimens from two localities remote from each other (Lille Hellefiske Bank and Fiskenæs Bank 1930).
For the sake of comparison the table likewise contains some enumerations from American localities, from T h o m p s o n and Sc h m id t , and from Iceland,
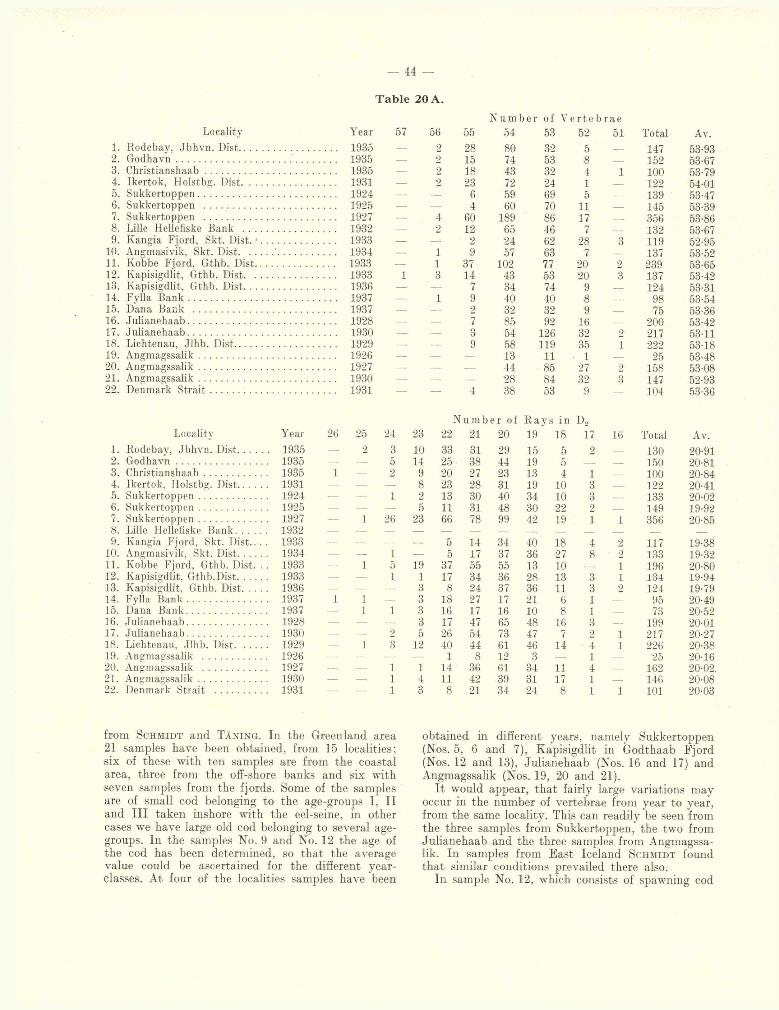
Tab le 20 A.
Locality Year 571. Rodebay, Jbhvn. Dist................................... 19352. Godhavn.......................................... 1935 —3. Christianshaab............................................... 19354. Ikertok, Holstbg. Dist.................................. 19315. Sukkertoppen................................................. 19246. Sukkertoppen ............................................... 19257. Sukkertoppen ............................................... 1927 —8. Lille Hellefiske Bank ................................. 19329. Kangia Fjord, Skt. D ist.1.......................... 1933 —
10. Angmasivik, Skt. Dist ' ..................... 1934 —11. Kobbe Fjord, Gthb. Dist............................ 193312. Kapisigdlit, Gthb. Dist................................. 1933 113. Kapisigdlit, Gthb. Dist................................. 193614. Fylla B ank ..................................................... 1937 —15. Dana Bank ................................................... 193716. Julianehaab..................................................... 1928 —17. Julianehaab..................................................... 193018. Lichtenau, Jlhb. Dist.................................... 1929 —19. Angmagssalik................................................. 192620. Angmagssalik................................................. 192721. Angmagssalik................................................. 193022. Denmark S tra it ............................................. 1931 —
Locality Year 26 25 241. Rodebav, Jbhvn. Dist......... . 1935 _ ■) 30 Godhavn .............................. . 1935 — —. 53. Christianshaah.................... . 1935 1 24. Ikertok, Holstbg. Dist........ . 1931 —- — —.5. Sukkertoppen...................... . 1924 — — 16. Sukkertoppen...................... . 1925 — — —■7. Sukkertoppen...................... . 1927 1 268. Lille Hellefiske liank......... . 1932 — —9. Kangia Fjord, Skt. Dist... . 1933 _
10. Angmasivik, Skt. Dist........ . 1934 — - 111. Kobbe Fiord, Gthb. Dist. . . 1933 1 512. Kapisigdlit, Gthb.Dist........ . 1933 .— _ 113. Kapisigdlit, Gthb. Dist. . . . . 1936 — — —14. Fylla Bank.......................... . 1937 1 1 —15. Dana Bank.......................... . 1937 1 116. Julianehaab........................... . 1928 —.17. Julianehaab.......................... . 1930 — — 018. Lichtenau, Jlhb. Dist.......... . 1929 1 319. Angmagssalik ..................... . 1926 —20. Angmagssalik ..................... . 1927 — — 121. Angmagssalik...................... . 1930 —. _ 122. Denmark Strait ................ 1931 -- 1
from S ch m id t and Tå n i n g . In the Greenland area21 samples have been obtained, from 15 localities; six of these with ten samples are from the coastal area, three from the off-shore banks and six with seven samples from the fjords. Some of the samples are of small cod belonging to the age-groups I, II and I I I taken inshore with the eel-seine, in other eases we have large old cod belonging to several age- groups. In the samples No. 9 and No. 12 the age of the cod has been determined, so that- the average value could be ascertained for the different year- classes. At four of the localities samples have been
N u m b e r of V e r te b r a e56 55 54 53 52 51 Total Av.
2 28 80 32 5 _ _ 147 53-932 15 74 53 8 — 152 53-672 18 43 32 4 1 100 53-792 23 72 24 1 — 122 54-01
— 6 59 69 5 — 139 53-47— 4 60 70 11 — . 145 53-394 60 189 86 17 — 356 53-862 12 65 46 7 — 132 53-67
— 2 24 62 28 3 119 52-951 9 57 63 7 — 137 53-521 37 102 77 20 2 239 53-653 14 43 53 20 3 137 53-42
— 7 34 74 9 — 124 53-311 9 40 40 8 — 98 53-54
— 2 32 32 9 75 53-36— 7 85- 92 16 — 200 53-42— 3 54 126 32 2 217 5311— 9 58 119 35 1 222 53-18— — 13 11 1 — 25 53-48— — 44 85 27 2 158 53-08— — 28 84 32 3 147 52-93— 4 38 53 9 104 53-36
N u m b e r of R a y s in I)«23 22 21 20 19 18 17 16 Total Av.10 33 31 29 15 5 2 130 20-9114 25 38 44 19 5 — — 150 20-819 20 27 23 13 4 1 100 20-848 23 28 31 19 10 3 122 20-412 13 30 40 34 10 3 — 133 20-025 11 31 48 30 22 2 — 149 19-92
23 66 78 99 42 19 1 1 356 20-85
____ 5 14 34 40 18 4 2 117 19-38— 5 17 37 36 27 8 2 133 19-3219 37 55 55 13 10 — 1 196 20-80
1 17 34 36 28 13 3 I 134 19-943 8 24 37 36 11 3 2 124 19-793 18 27 17 21 6 1 — . 95 20-493 16 17 16 10 8 1 — 73 20-523 17 47 65 48 16 3 — 199 20-015 26 54 73 47 7 2 1 217 20-27
12 40 44 61 46 14 4 1 226 20-38— 1 8 12 3 .— 1 — 25 20-16
1 14 36 61 34 11 4 _ _ 162 20-02.4 11 42 39 31 17 1 — 146 20-083 8 21 34 24 8 1 1 101 20-03
obtained in different years, namely Sukkertoppen (Nos. 5, 6 and 7), Kapisigdlit in Godthaab Fjord (Nos. 12 and 13), Julianehaab (Nos. 16 and 17) and Angmagssalik (Nos. 19, 20 and 21).
I t would appear, th a t fairly large variations may occur in the number of vertebrae from year to year, from the same locality. This can readily be seen from the three samples from Sukkertoppen, the two from Julianehaab and the three samples from Angmagssalik. In samples from East Iceland S chm idt found th a t similar conditions prevailed there also.
In sample No. 12, which consists of spawning cod
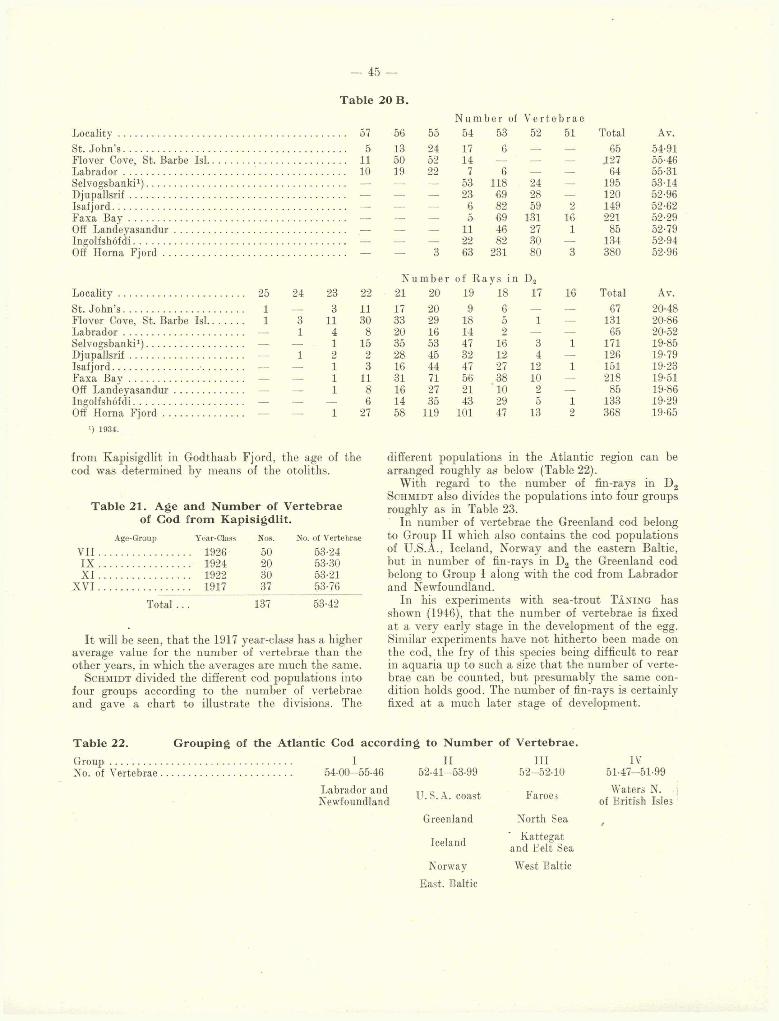
— 45 —
Table 20 B.
N u m b e r of V e r to b ra eLocality ........................................ 57 56 55 54 53 52 51 Total Av.
St. John’s ....................................... 5 13 24 17 6 — ___ 65 54-91Flover Cove, St. Barbe Isl........ 11 50 52 14 — — — 127 55-46L abrador....................................... 10 19 22 7 6 — — 64 55-31Selvogsbanki1) .............................. — — — 53 118 24 — 195 53-14Djupallsrif.................................... — — — 23 69 28 — 120 52-96Tsafjord.......................................... — — — 6 82 59 2 149 52-62Faxa Bay ..................................... — — — 5 69 131 16 221 52-29Off Landevasandur .................... — .— . — 11 46 27 1 85 52-79Ingolfshofdi................................... — — — 22 82 30 — 134 52-94Off Ilorna F jo rd ........................ 3
N u m b e r
63
of R
231
ays in
80
Da
3 380 52-96
Locality ........................................ . . . 25 24 23 22 21 20 19 18 17 16 Total Av.
St. John’s ....................................... 1 ___ 3 11 17 20 9 6 — — 67 20-48Flover Cove, St. Barbe Isl........ 1 3 11 30 33 29 18 5 1 — 131 20-86L abrador....................................... — 1 4 8 20 16 14 9 — — 65 20-52Selvogsbanki1) .............................. — — 1 15 35 53 47 16 3 1 171 19-85Djupallsrif.................................... .. — 1 2 2 28 45 32 12 4 — 126 19-79Isafjord.............................. ............ — — 1 3 16 44 47 27 12 1 151 19-23Faxa Bay ..................................... — — 1 11 31 71 56 38 10 — 218 19-51Off Landevasandur.................... — — 1 8 16 27 21 10 2 — 85 19-86Ingolfshofdi................................... — — — 6 14 35 43 29 5 1 133 19-29Off Homa F jo rd ........................
') 1934.
— 1 27 58 119 101 47 13 2 368 19-65
from Kapisigdlit in Godthaab Fjord, the age of the cod was determined by means of the otoliths.
T ab le 21. A ge and N u m b er of Vertebrae of Cod from K ap isigd lit .
Age-Group Year-Class Nos. No. of Vertebrae
V I I ................................... 1926 50 53-24I X 1924 20 53-30X I ................................... 1922 30 53-21
X V I................................... 1917 37_______53-76
T ota l. . . 137 53-42
I t will be seen, tha t the 1917 year-class has a higher average value for the number of vertebrae than the other years, in which the averages are much the same.
Sch m id t divided the different cod populations into four groups according to the number of vertebrae and gave a chart to illustrate the divisions. The
different populations in the Atlantic region can be arranged roughly as below (Table 22).
With regard to the number of fin-rays in D2 S chm idt also divides the populations into four groups roughly as in Table 23.
In number of vertebrae the Greenland cod belong to Group II which also contains the cod populations of U.S.A., Iceland, Norway and the eastern Baltic, but in number of iin-rays in D2 the Greenland cod belong to Group I along with the cod from Labrador and Newfoundland.
In his experiments with sea-trout Tåning has shown (1946), tha t the number of vertebrae is fixed at a very early stage in the development of the egg. Similar experiments have not hitherto been made on the cod, the fry of this species being difficult to rear in aquaria up to such a size tha t the number of vertebrae can be counted, but presumably the same condition holds good. The number of fin-rays is certainly fixed a t a much later stage of development.
T ab le 22.
G roup ..................No. of Vertebrae .
G rouping of the A tlantic Cod accord in g to N u m b er of Vertebrae.
I54-00-55-46
Labrador and Newfoundland
II62-41-53-99
U.S.A. coast
Greenland
Iceland
Norway
East. Baltic
III52-52-10
Faroej
North Sea
Kattegat and Eelt Sea
West Baltic
IV51-47-51-99
Waters N. of British Islej
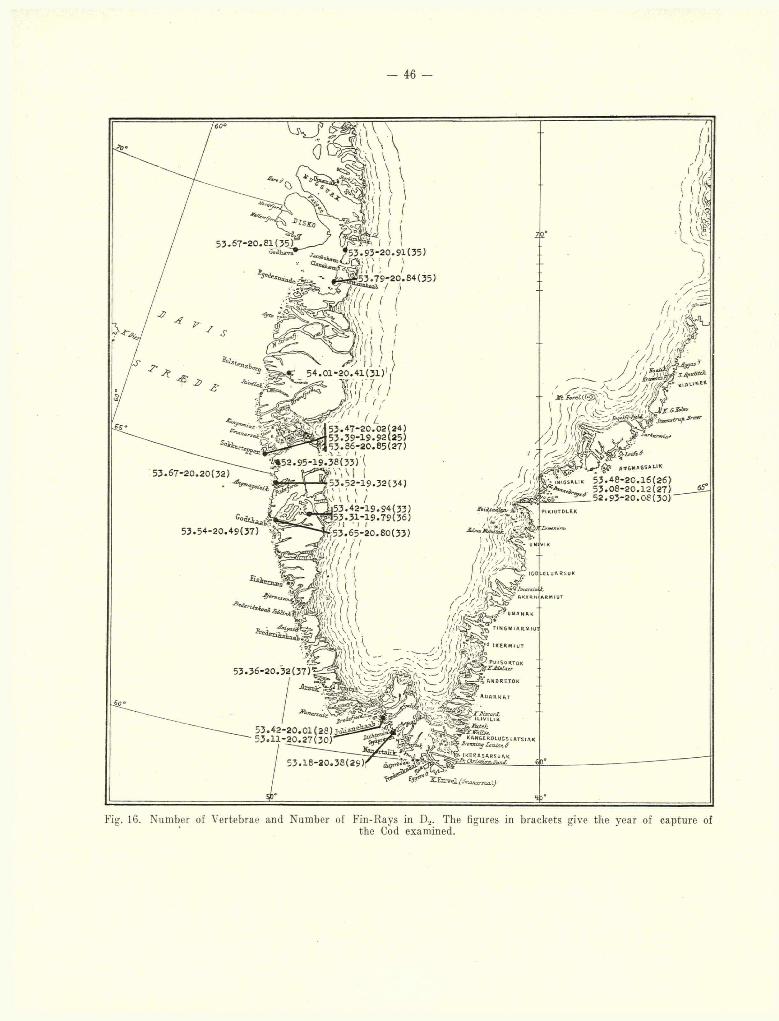
- 46 —
53 .6 7 -2 0 .8 1 (3 5 ) 'GoÜlscto?
I / (
53 .93 -2 0 .9 1 (3 5 )
I P : ' /® 5 3 . 79-20 .84(35)
KlRUNÎ*
( ‘A 53 • 47 -20 . 02 ( 24 ) 39-19 .92(25)
53 . 86-20 . 85 ( 27 )V \ f • .»
9 5 - 1 9 .3 8 (3 3 ) l(
r 4 ^ 5 3 .5 2 -1 9 .3 2 ( 3 4 ); J ' 1 ' \ '% kC V V V ' / S J Q | 5 3 . 42 -19 .94(33) ^ W 1 5 3 . 31-19 .79 (36 )
“^ 1 ^ 5 3 . 6 5 - 2 0 . 8 0 ( 3 3 )
Æ S f ' l lT i t ( ( ,
%Le& 0Aff&MACS*»-1*
5 3 .4 8 -2 0 .1 6 (2 6 )5 3 .0 8 -2 0 .1 2 (2 7 )5 2 .9 3 -2 0 .0 8 (3 0 )
5 3 .67 -20 .20 (32) t VIMI6SALIK
53 . 54-20 . 4 9 (37)
5 3 .3 6 - 2 0 .3 2 ( 3 7 ) ^
/ «4suANORETOK
.Discord,ILIVILIK
&KAN6EK0LUGSUATSIAK
JroT txu ij £ouis». Ö
• IKERASARSUAKaruftn .fa /______ (
/ jre&j*5 3 .4 2 - 2 0 .0 1 ( 2 8 ) j ^ S Î5 3 .1 1 -2 0 .2 7 (3 0 ) '
5 3 .1 8 -2 0 .38(29)f
Fig. 16. Number of Vertebrae and Number of Fin-Rays in D2. The figures in brackets give the year of capture ofthe Cod examined.
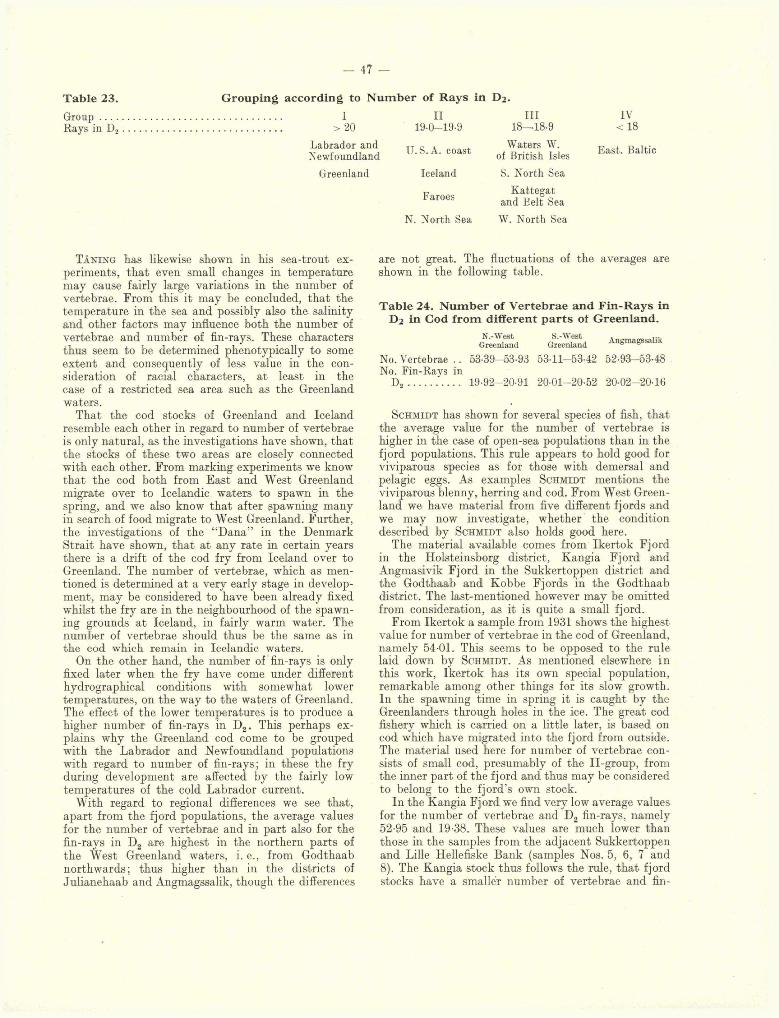
- 47 —
T able 23. G rouping accord in g to N u m b er of R ays in D 2 .
G roup ........Rays in D2 .
I> 20
Labrador and Newfoundland
Greenland
II19-0—19-9
U. S. A. coast
Iceland
Faroes
N. North Sea
III18-18-9
Waters W. of British Isles
S. North Sea
Kattegat and Belt Sea
W. North Sea
IV< 18
East. Baltic
Tå n in g has likewise shown in his sea-trout experiments, th a t even small changes in temperature may cause fairly large variations in the number of vertebrae. From this it may be concluded, th a t the temperature in the sea and possibly also the salinity and other factors may influence both the number of vertebrae and number of fin-rays. These characters thus seem to be determined phenotypically to some extent and consequently of less value in the consideration of racial characters, a t least in the case of a restricted sea area such as the Greenland waters.
That the cod stocks of Greenland and Iceland resemble each other in regard to number of vertebrae is only natural, as the investigations have shown, tha t the stocks of these two areas are closely connected with each other. From marking experiments we know th a t the cod both from East and West Greenland migrate over to Icelandic waters to spawn in the spring, and we also know th a t after spawning many in search of food migrate to West Greenland. Further, the investigations of the “Dana” in the Denmark Strait have shown, tha t a t any rate in certain years there is a drift of the cod fry from Iceland over to Greenland. The number of vertebrae, which as mentioned is determined a t a very early stage in development, may be considered to have been already fixed whilst the fry are in the neighbourhood of the spawning grounds a t Iceland, in fairly warm water. The number of vertebrae should thus be the same as in the cod which remain in Icelandic waters.
On the other hand, the number of fin-rays is only fixed later when the fry have come under different hydrographical conditions with somewhat lower temperatures, on the way to the waters of Greenland. The effect of the lower temperatures is to produce a higher number of fin-rays in D2. This perhaps explains why the Greenland cod come to be grouped with the Labrador and Newfoundland populations with regard to number of fin-rays; in these the fry during development are affected by the fairly low temperatures of the cold Labrador current.
With regard to regional differences we see that, apart from the fjord populations, the average values for the number of vertebrae and in part also for the fin-rays in D2 are highest in the northern parts of the West Greenland waters, i. e., from Godthaab northwards; thus higher than in the districts of Julianehaab and Angmagssalik, though the differences
are not great. The fluctuations of the averages are shown in the following table.
T ab le 24. N u m b er of Vertebrae and F in -R ays in D 2 in Cod from different p arts of G reenland.
N.-WestGreenland
S.-WestGreenland Angmagssalik
No. Vertebrae . . 53-39-53-93 53-11-53-42 52-93-53-48 No. Fin-Rays in
D , 19-92-20-91 20-01-20-52 20-02-20-16
S chm idt has shown for several species of fish, th a t the average value for the number of vertebrae is higher in the case of open-sea populations than in the fjord populations. This rule appears to hold good for viviparous species as for those with demersal and pelagic eggs. As examples Schm idt mentions the viviparous blenny, herring and cod. From West Greenland we have material from five different fjords and we may now investigate, whether the condition described by Sc h m id t also holds good here.
The material available comes from Ikertok Fjord in the Holsteinsborg district, Kangia Fjord and Angmasivik Fjord in the Sukkertoppen district and the Godthaab and Kobbe Fjords in the Godthaab district. The last-mentioned however may be omitted from consideration, as it is quite a small fjord.
From Ikertok a sample from 1931 shows the highest value for number of vertebrae in the cod of Greenland, namely 54-01. This seems to be opposed to the rule laid down by S c h m id t . A s mentioned elsewhere in this work, Ikertok has its own special population, remarkable among other things for its slow growth. In the spawning time in spring it is caught by the Greenlanders through holes in the ice. The great cod fishery which is carried on a little later, is based 011 cod which have migrated into the fjord from outside. The material used here for number of vertebrae consists of small cod, presumably of the II-group, from the inner part of the f j ord and thus may be considered to belong to the fjord’s own stock.
In the Kangia Fjord we find very low average values for the number of vertebrae and D2 fin-rays, namely52-95 and 19-38. These values are much lower than those in the samples from the adjacent Sukkertoppen and Lille Hellefiske Bank (samples Nos. 5, 6, 7 and 8). The Kangia stock thus follows the rule, th a t fjord stocks have a smaller number of vertebrae and fin-
— 48 —
rays than the open-sea populations. The cod in Kangia Fjord are markedly different in appearance from the cod met with out on the coast and banks, being plumper with the colour of the belly darker. They remind one constantly of Gadus ogac.
In the Angmasivik Fj ord in the Sukkertoppen district53-52 was found for the number of vertebrae in 1932, thus a fairly high average not below what is found in the cod of the coastal region and banks. On the other hand, the number of fin-rays in D2 was low as in Kangia Fjord, namely 19-32, the lowest for cod at Greenland. There are no outer characters as in Kangia to distinguish the Angmasivik cod from the coastal and banks cod.
From the Godthaab Fjord we have enumerations of vertebrae and fin-rays from 1933 and 1936. The 1933 sample consists of spawning cod and contains four year- classes (see Table 21, p. 45), whilst the 1936 sample is made up of the I-group, year-class 1935. As mentioned previously, the year-class 1917 is represented by 37 specimens in the 1933 sample, and this year- class had a higher average for number of vertebrae than the other three year-classes, in which the average was much the same. Excluding the 1917 class the average of the sample is 53-42, which is very close to the average 53-31 found in 1936. Compared with the values found in adjacent localities outside the fjord (samples Nos. 11 and 14) the averages are certainly somewhat lower in the fjord, but the difference is not striking. The average for the number of fin-rays in D2 is also lower, below 20 in both samples, than what is found in the near-by coastal waters and on the banks.
Thus, the cod population of the Godthaab Fjord follows the rule laid down by Sc h m id t , but the differences between the populations inside and outside the fjord are but faint by comparison with the population in Kangia. That the Godthaab Fjord has its own population is seen more clearly from an investigation of the otoliths. In by far the most cases these differ completely from what is found in the cod of the coast and banks. A cross-section of the otolith in cod from the Godthaab Fjord has almost the same appearance as the otolith of the Norwegian coastal cod (R o l l e f s e n 1932). The winter-rings are not prominent and many secondary rings are present.
The differences in the numerical characters mentioned are on the whole very small in samples of cod from various places a t Greenland, with the one exception of the isolated Kangia population. The differences observed in the number of vertebrae in the various year-classes are sometimes just as great or greater than those found between samples from localities remote from each other. The uniformity in the average values presumably comes from the fact, th a t the cod fry may be carried for long distances by the currents and the stock becomes a mixed population from different spawning places. From the spawning grounds on the banks and a t the coast the fry
are carried northwards by the north-going current, and some of the fry from spawning grounds in the fjords are carried into the coastal area by the strong outgoing current. In this way a great mixing of the populations takes place. In addition, the larger cod migrate to some extent from one locality to another. This migration affects mostly the cod. of the banks, in lesser degree the fjord cod. Marking experiments in the northern and middlemost parts of the West Greenland waters (zones I—VII) have shown, tha t among the recaptures of cod marked on the banks, coast and in the fjords respectively ca. 75, 63 and 24 per cent, have migrated to other zones or to Iceland. I t is evident th a t such a mixing partly of fry and partly of larger cod must lead to uniformity in such characters as those discussed here. Only in the case of a fjord population which is isolated and without connection with other areas, can we expect to find racial characters differing from those a t other localities. The only locality of this kind so far discovered is Kangia, a small fjord with a number of islands off its mouth, which to a certain extent cut it off from the outer area. I t is possible nevertheless, th a t one may also find other places with similar isolated populations and possessing distinct racial characters.
The marking experiments offer a considerably better means than the numerical characters for the investigation of the mutual relationships between the cod populations and possible occurrence of local groups. These have shown with much clearer evidence (see pp. 49—61), th a t the Greenland stock of cod is closely connected with the Icelandic, but not with the populations at Newfoundland. In the case of the fjords the marking experiments in Kangia have shown this to contain a special population. Of 77 cod marked in Kangia in 1933 seven (ca. 9-1 °/o) have been recovered; three were retaken in Kangia, two in the neighbourhood a t Napassok and two a t Atangmik only about 30—35 miles from the place of marking.
The results of the marking experiments in Ikertok and the Godthaab Fjord are shown in Table 27 and on the charts, Figs. 18 and 21, in the section on migrations. In Ikertok 442 cod were marked and in Godthaab Fjord 1080. A very large number of the recaptures in these experiments came from the neighbourhood of the marking places, namely 61 in Ikertok and 106 in Godthaab Fjord (75-3 °/0 and 76-3% respectively of the recaptures). But few cod from these experiments were recaptured a t Iceland, namely 2 and 9 respectively (2-5 % and 6-5 % of the recaptures).
The many recaptures near the place of marking in these fjords show, th a t the cod here are more or less stationary and th a t each fjord has its own population. This conclusion is further strengthened by the fact, th a t spawning takes place in the fjords and also by the fact, th a t the rate of growth is less than in the cod of the coastal area and on the banks.
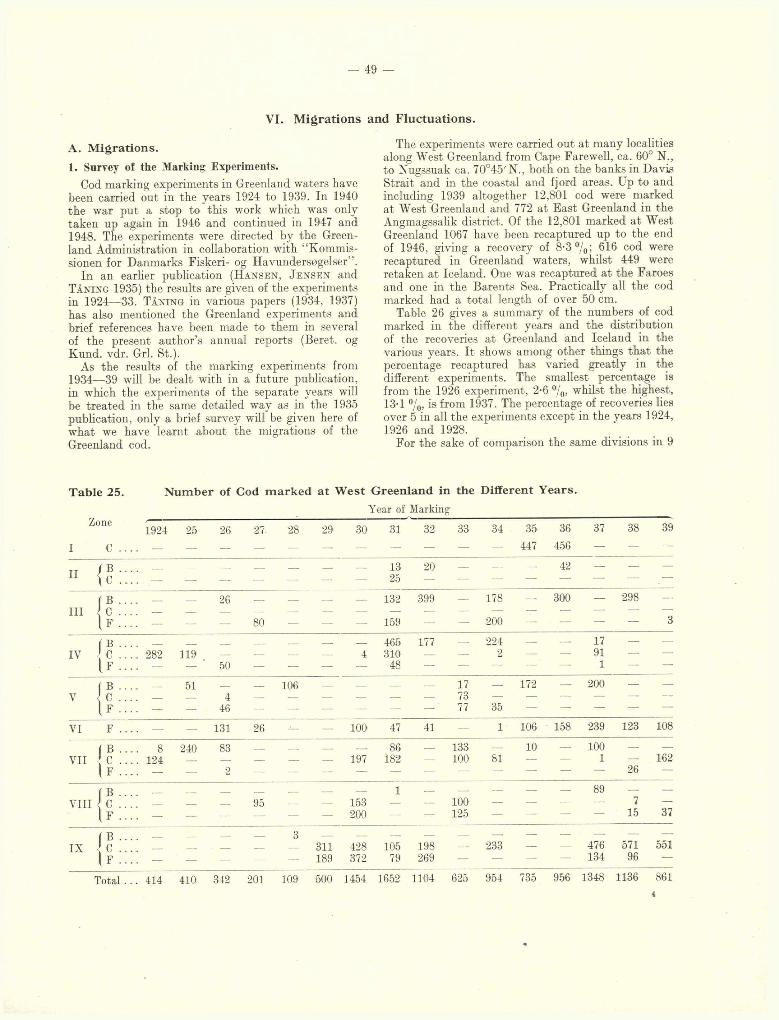
— 49 —
VI. Migrations and Fluctuations.
A. M igration s.
1. Survey of the Marking Experiments.
Cod marking experiments in Greenland waters have been carried out in the years 1924 to 1939. In 1940 the war pu t a stop to this work which was only taken up again in 1946 and continued in 1947 and 1948. The experiments were directed by the Greenland Administration in collaboration with “Kommissionen for Danmarks Fiskeri- og Havundersøgelser” .
In an earlier publication (H a n s e n , J e n s e n and T å n in g 1935) the results are given of the experiments in 1924—33. T I n in g in various papers (1934, 1937) has also mentioned the Greenland experiments and brief references have been made to them in several of the present author’s annual reports (Beret, og Kund. vdr. Grl. St.).
As the results of the marking experiments from 1934—39 will be dealt with in a future publication, in which the experiments of the separate years will be treated in the same detailed way as in the 1935 publication, only a brief survey will be given here of what we have learnt about the migrations of the Greenland cod.
The experiments were carried out a t many localities along West Greenland from Cape Farewell, ca. 60° N., to Nugssuak ca. 70°45'N., both on the banks in Davis Strait and in the coastal and fjord areas. Up to and including 1939 altogether 12,801 cod were marked a t West Greenland and 772 a t East Greenland in the Angmagssalik district. Of the 12,801 marked at West Greenland 1067 have been recaptured up to the end of 1946, giving a recovery of 8-3 °/0; 616 cod were recaptured in Greenland waters, whilst 449 were retaken a t Iceland. One was recaptured a t the Faroes and one in the Barents Sea. Practically all the cod marked had a total length of over 50 cm.
Table 26 gives a summary of the numbers of cod marked in the different years and the distribution of the recoveries a t Greenland and Iceland in the various years. I t shows among other things th a t the percentage recaptured has varied greatly in the different experiments. The smallest percentage is from the 1926 experiment, 2-6 % , whilst the highest, 13-1 %> is from 1937. The percentage of recoveries lies over 5 in all the experiments except in the years 1924, 1926 and 1928.
For the sake of comparison the same divisions in 9
T ab le 25. N u m b er of Cod m ark ed at W est G reenland in the Different Y ears.
Year of MarkingZone
I C . . .
1924 25 26 27- 28 29 30 31 32 33 34 35
447
36
456
37 38 39
II / B . . . |C . . . _ _ .— — — — —
1325
20 — — — 42 — — —
(B . . . ___ ___ 26 _ — — .— 132 399 178 — 300 — 298 —ITT ] C . . . ___ ___ _ —. _ —. — — — — — — — — — —
I f . . . . — — — 80 — — — 159 — — 200 — — — — 3
IB .. . _ ___ ___ ___ _ 465 177 — 224 — - 17 — —TV J o . . . . 282 119 — — —• — 4 310 — — 2 — — 91 — —
( f . . . . — — 50 — — — — 48 — — — — — 1 — —
I B . . . ___ 51 ___ — 106 — _ —. — 17 — 172 — 200 — —V J o . . . _ _ 4 — .—. _ _ — — 73 — — — — — —
I f . . . . — — 46 — — — — — — 77 35 — — — — —
VI F . . . . — — 131 26 — — 100 47 41 — 1 106 158 239 123 108
( B . . . . 8 240 83 ___ ___ ___ ___ 86 — 133 .— 10 — 100 — —VII C . . . . 124 ___ — — — — 197 182 — 100 81 — — 1 — 162
I f . . . . — — 2 — — — — — — — — — — — 26 —
IB . ..____ ___ ___ 1 ___ — — — — 89 — —
VTTT 0 ___ ___ ___ 95 — — 153 — — 100 — — — — 7 —I f . . . . — — — — — — 200 — — 125 — — — — 15 37
f B . . . 3 _ ___. ___ — _ — — — — —TX n 311 428 105 198 — 233 — — 476 571 551
I f ... 189 372 79 269 — — — — 134 96 —
Total .. . 414 410 342 201 109 500 1454 1652 1104 625 954 735 956 1348 1136 8614
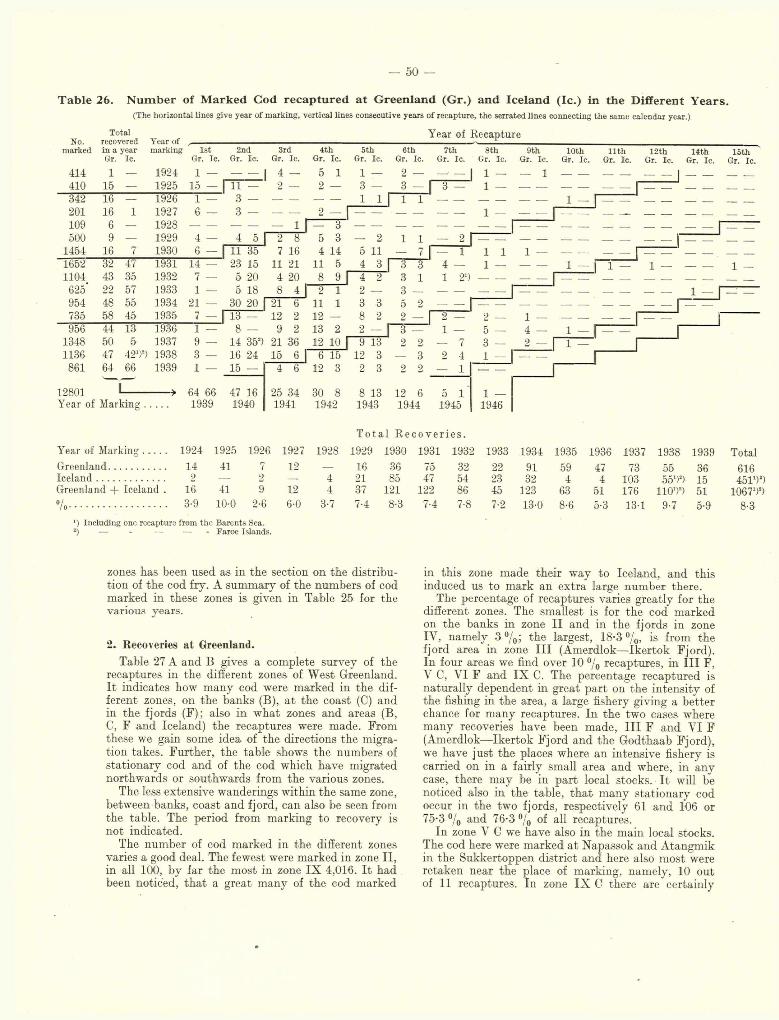
— 50 —
T ab le 26. N u m b er of M arked Cod recaptured a t G reenland (Gr.) and Iceland (Ic.) in the D ifferent Y ears.(The horizontal lines give year of marking, vertical lines consecutive years of recapture, the serrated lines connecting the same calendar year.)
Year of Recapture»ar nf ATotal
marked in a year marking 1st 2nd 3rd 4th 5th 6th 7th 8th 9th 10th l l t h 12th 14th 15thGr. Ic. Gr. Ic. Gr. Ic. Gr. Ic. Gr. ic. Gr. le. Gr. Ic. Gr. Ic. Gr. Ic. Gr. Ic. Gr. Ic. Gr. Ic. Gr. Ic. Gr. Ic. Gr. Ic.
414 1 — 1924 1 — — — 4 - 5 1 1 — 2 — - 1 - — -------410 15 — 1925 15 - 1 1 - 2 _ 2 — 3 — 3 - I 3 1 - ------- ------- - - _ ._342 16 — 1926 1 — 3 — ------ — — 1 1 1 1 i201 16 1 1927 6 - 3 — 1 -------109 6 — 1928 1 1 ---------- -------500 9 — 1929 4 — 4 5 2 8 5 3 — 2 1 1 — 2 r
1454 16 7 1930 6 - 11 35 7 16 4 14 5 11 — 7 1 — i 1 1 1 — - -1652 32 47 1931 14 — 23 15 11 21 11 5 4 3 3 3 4 — 1 — — . — i - 1 - i — _ __ 1 —1104 43 35 1932 7 — 5 20 4 20 8 9 1 4 2 3 1 1 21) -625 22 57 1933 1 — 5 18 8 4 I 2 1 2 -— 3 ___ ---------- i -954 48 55 1934 21 — 30 20 I 21 6 11 1 3 3 5 2 ---------- -------1735 58 45 1935 7 - lä - 12 2 12 — 8 2 2 - 1 2 2 — 1 — -------956 44 13 1936 1 — 8 — 9 2 13 2 2 3 1 — 5 — 4 — 1 -
1348 50 5 1937 9 — 14 35!) 21 36 12 10 f 9 ià 2 2 — 7 3 — 2 - i —1136 47 42‘)!) 1938 3 — 16 24 15 6 1 6 15 12 3 — 3 2 4 1 - - -861 64 66 1939 1 — 15 - 4 6 12 3 2 3 2 2 — 1 ---------
12801 ------» 64 66 47 16 25 34 30 8 8 13 12 6 5 1 1 —Year of Marking . 1939 1940 1941 1942 1943 1944 1945 1946
T o ta l Re
Year of Marking........ 1924 1925 1926 1927 1928 1929 1930Greenland.................... 14 41 7 12 — 16 36Iceland........................ 2 — 2 — 4 21 85Greenland + Iceland . 16 41 9 12 4 37 121•/0.................................. 3-9 10-0 2-6 6-0 3-7 7-4 8-3
*) Including one recapture from the Barents Sea.2) — - — — - Faroe Islands.
co v e r ie s .
1931 1932 1933 1934 1935 1936 1937 1938 1939 Total75 32 22 91 59 47 73 55 36 61647 54 23 32 4 4 103 55')') 15 45D’)
122 86 45 123 63 51 176 n o 1)*) 51 1067')’)7-4 7-8 7-2 13-0 8-6 5-3 131 9-7 5-9 8-3
zones has been used as in the section on the distribution of the cod fry. A summary of the numbers of cod marked in these zones is given in Table 25 for the various years.
2. Recoveries at Greenland.
Table 27 A and B gives a complete survey of the recaptures in the different zones of West Greenland. I t indicates how many cod were marked in the different zones, on the banks (B), a t the coast (C) and in the fjords (F); also in what zones and areas (B,C, F and Iceland) the recaptures were made. From these we gain some idea of the directions the migration takes. Further, the table shows the numbers of stationary cod and of the cod which have migrated northwards or southwards from the various zones.
The less extensive wanderings within the same zone, between banks, coast and fjord, can also be seen from the table. The period from marking to recovery is not indicated.
The number of cod marked in the different zones varies a good deal. The fewest were marked in zone II, in all 100, by far the most in zone IX 4,016. I t had been noticed, th a t a great many of the cod marked
in this zone made their way to Iceland, and this induced us to mark an extra large number there.
The percentage of recaptures varies greatly for the different zones. The smallest is for the cod marked on the banks in zone I I and in the fjords in zone IV, namely 3 % ; the largest, 18-3 % , is from the fjord area in zone I I I (Amerdlok—Ikertok Fjord). In four areas we find over 10 % recaptures, in I I I F, V C, VI F and IX C. The percentage recaptured is naturally dependent in great part on the intensity of the fishing in the area, a large fishery giving a better chance for many recaptures. In the two cases where many recoveries have been made, I I I F and VI F (Amerdlok—Ikertok Fjord and the Godthaab Fjord), we have just the places where an intensive fishery is carried on in a fairly small area and where, in any case, there may be in part local stocks. I t will be noticed also in the table, th a t many stationary cod occur in the two fjords, respectively 61 and 106 or 75-3 °/0 and 76-3 °/0 of all recaptures.
In zone V C we have also in the main local stocks. The cod here were marked a t Napassok and Atangmik in the Sukkertoppen district and here also most were retaken near the place of marking, namely, 10 out of 11 recaptures. In zone IX C there are certainly
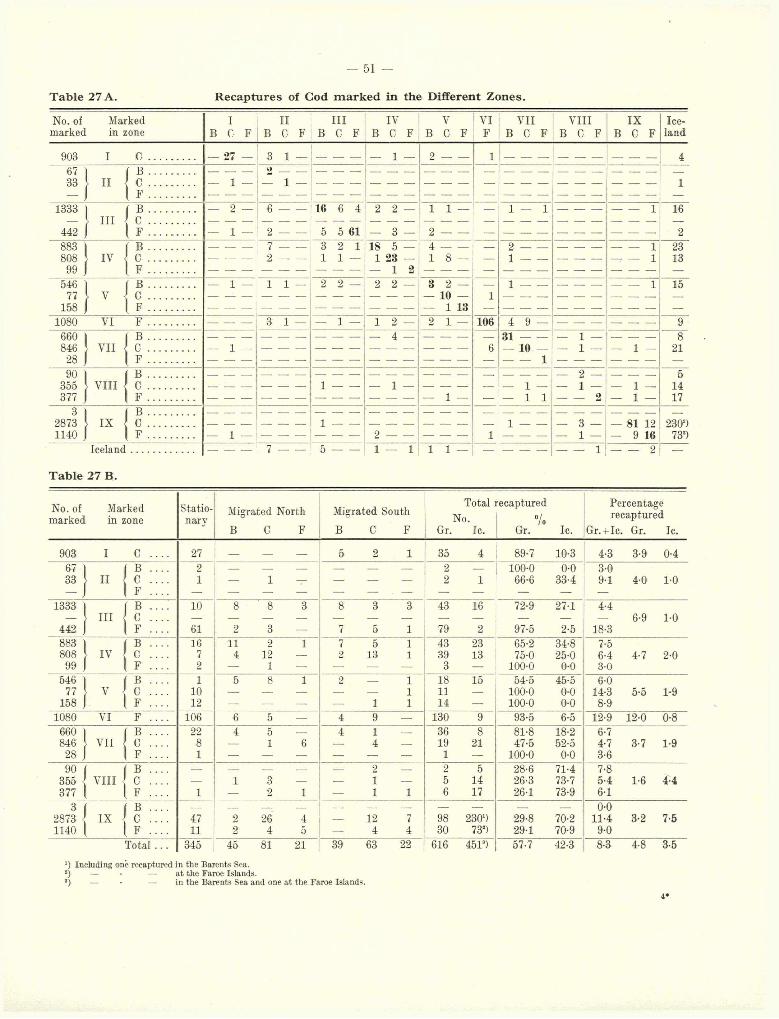
— 51 —
R ecaptures of Cod m ark ed in the Different Zones.T ab le 27 A.
Marked in zone
III VINo. of marked
VII VIII IX Iceland
903 — 27 — 1 —
1333 I - I l l
442 J
2 — 6 ---------
1 — 3 — 2 ---883 4 -------
2 --- 1 23 —
546 1 —
— 10 —
— 1 131581080 VI 1 — 106
660 I846 VII
4 — 1 — 1 —— 10 —1 — 1 —
355 } VIII 377 I
1 — 1 - 1 — 1 — 1 —1 —
2873 } IX 1140
3 — 1 —
1 — 81 12 9 16
230’)73*)2 ---
Iceland 1 —
T ab le 27 B.
No. of Marked marked in zone
Stationary
Migrated North
B C F
Migrated South
B C F
TotalNo.
Gr. Ic.
recaptured
°/oGr. Ic.
Percentagerecaptured
Gr.+Ic. Gr. Ic.
903 I C . . . . 27 — — — 5 2 1 35 4 89-7 10-3 4-3 3-9 0-46733 Mis
21 1 — — — —
2 _2 1
100-0 0-0 66-6 33-4
3-09-1 4-0 1-0
1333
442
( B . . . . I l l C . . . .
1 F . . . .
10
61
8 8 3
2 3 —
8 3 3
7 5 1
43 16
79 2
72-9 27-1
97-5 2-5
4-4— 6-9 1-0
18-388380899 Ml:::: 16
72
11 2 1 4 12 —
1 —
7 5 1 2 IB 1
43 23 39 13
3 —
65-2 34-8 75-0 25-0
100-0 0-0
7-56-4 4-7 2-0 3-0
54677
158
( B . . . . V C . . . .
I f . . . .
11012
5 8 1 2 — 11
1 1
18 15 11 — 14 —
54-5 45-5 100-0 0-0 100-0 0-0
6-014-3 5-5 1-9 8-9
1080 VI F . . . . 106 6 5 4 9 — 130 9 93-5 6-5 12-9 12-0 0-8660846
28
( B . . . . VII { c ....
1 F . . . .
2281
4 5 — 1 6
4 1 — 4 —
36 8 19 21
1 —
81-8 18-2 47-5 52-5
100-0 0-0
6-74-7 3-7 1-9 3-6
90355377
( B . . . . VIII c ....
1 F . . . . 11 3 —
2 1
21 — 1 1
2 55 146 17
28-6 71-4 26-3 73-7 26-1 73-9
7-85-4 1-6 4-46-1
32873 • 1140
f B . . . . IX C . . . .
{ ¥ . . . .4711
2 26 4 2 4 5
— 12 7 4 4
98 2301) 30 73’)
29-8 70-2 29-1 70-9
0-011-4 3-2 7-5 9-0
T o ta l. . . 345 45 81 21 39 63 22 616 45D 57-7 42-3 8-3 4-8 3-5
') Including one recaptured in the Barents Sea.!) — - — a t the Faroe Islands.3) — - — in the Barents Sea and one a t the Faroe Islands.
4 *
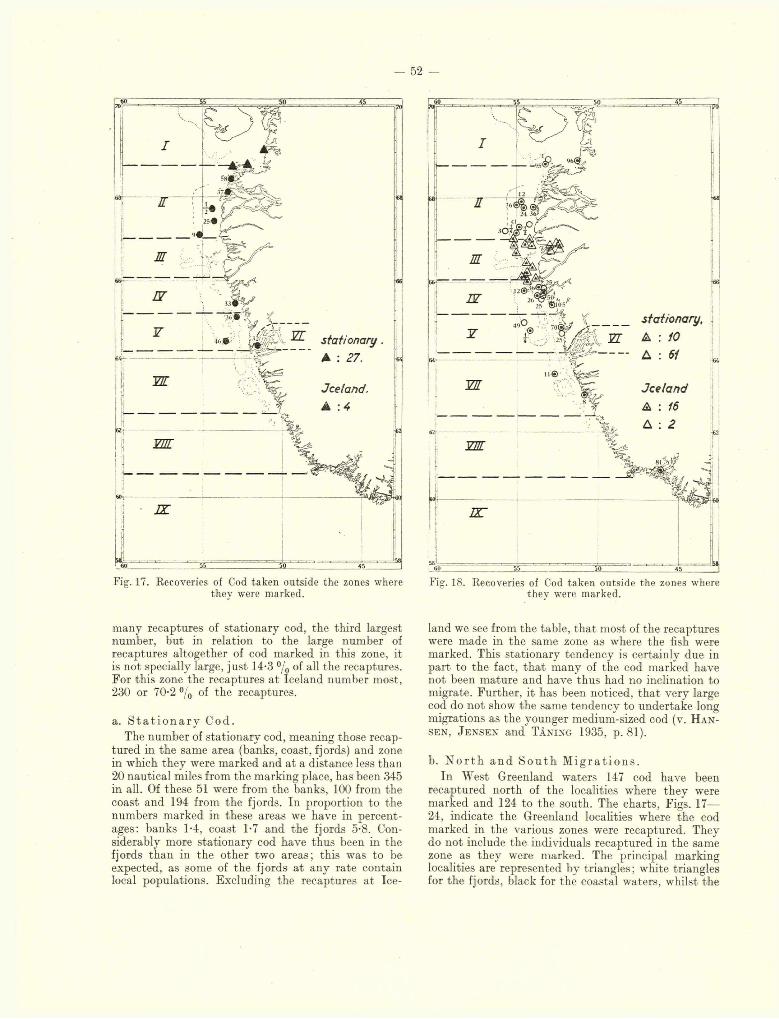
— 52 -
DT
stationary. A : 27.
vnT
Fig. 17. Recoveries of Cod taken outside the zones where they were marked.
many recaptures of stationary cod, the third largest number, but in relation to the large number of recaptures altogether of cod marked in this zone, it is not specially large, just 14-3 °/0 of all the recaptures. For this zone the recaptures a t Iceland number most, 230 or 70-2 °/0 of the recaptures.
a. S t a t i o n a r y Cod.The number of stationary cod, meaning those recap
tured in the same area (banks, coast, fjords) and zone in which they were marked and at a distance less than20 nautical miles from the marking place, has been 345 in all. Of these 51 were from the banks, 100 from the coast and 194 from the fjords. In proportion to the numbers marked in these areas we have in percentages: banks 1-4, coast 1-7 and the fjords 5-8. Considerably more stationary cod have thus been in the fjords than in the other two areas; this was to be expected, as some of the fjords a t any rate contain local populations. Excluding the recaptures a t Ice
------
2+J6<
nrstationary,
Jceland
VTTT
zzr
Fig. 18. Recoveries of Cod taken outside the zones where they were marked.
land we see from the table, th a t most of the recaptures were made in the same zone as where the fish were marked. This stationary tendency is certainly due in part to the fact, th a t many of the cod marked have not been mature and have thus had no inclination to migrate. Further, it has been noticed, th a t very large cod do not show the same tendency to undertake long migrations as the younger medium-sized cod (v. H a n s e n , J e n s e n and Tå n in g 1935, p. 81).
b. N o r t h a n d S o u t h M i g r a t i o n s .In West Greenland waters 147 cod have been
recaptured north of the localities where they were marked and 124 to the south. The charts, Figs. 17— 24, indicate the Greenland localities where the cod marked in the various zones were recaptured. They do not include the individuals recaptured in the same zone as they were marked. The principal marking localities are represented by triangles ; white triangles for the fjords, black for the coastal waters, whilst the
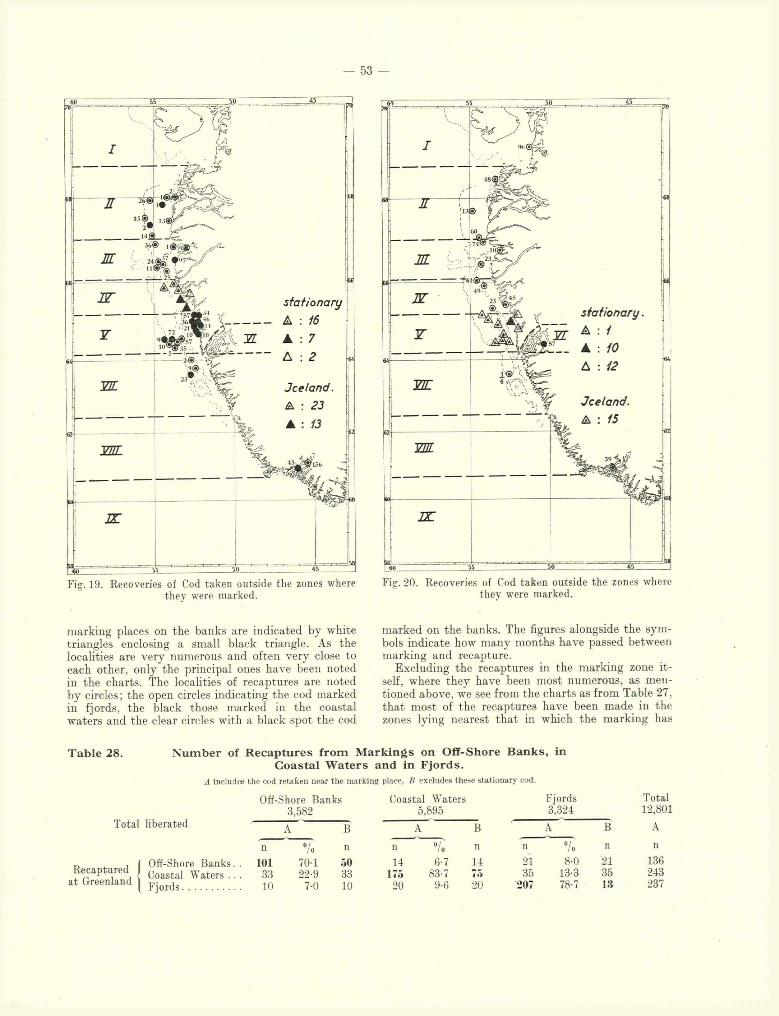
— 53 —
stationary
Jceland
IK
mJceland.
vrn
m
Fig. 19. Recoveries of Cod taken outside the zones where they were marked.
Fig. 20. Recoveries of Cod taken outside the zones where they were marked.
marking places on the banks are indicated by white triangles enclosing a small black triangle. As the localities are very numerous and often very close to each other, only the principal ones have been noted in the charts. The localities of recaptures are noted by circles; the open circles indicating the cod marked in fjords, the black those marked in the coastal waters and the clear circles with a black spot the cod
marked on the banks. The figures alongside the symbols indicate how many months have passed between marking and recapture.
Excluding the recaptures in the marking zone i t self, where they have been most numerous, as mentioned above, we see from the charts as from Table 27, tha t most of the recaptures have been made in the zones lying nearest th a t in which the marking has
T able 28. N u m b er of R ecaptures from M ark in gs on O ff-Shore B an k s , inC oastal W aters and in F jords.
A includes the cod retaken near the marking place, B excludes these stationary cod.
Total liberated
n , ( Off-Shore Banks.Recaptured Jat Greenland Coastal Waters
Fjords..............
Off-Shore Banks 3,582
Coastal Waters 5,895
Fjords3,324
Total12,801
A B A B A B A
n °/o n n % n n 01 10 n n
101 70-1 50 14 f>-7 14 21 8-0 21 13633 22-9 33 175 83-7 75 35 13-3 35 24310 7-0 10 20 9-6 20 ‘>07 78-7 13 237
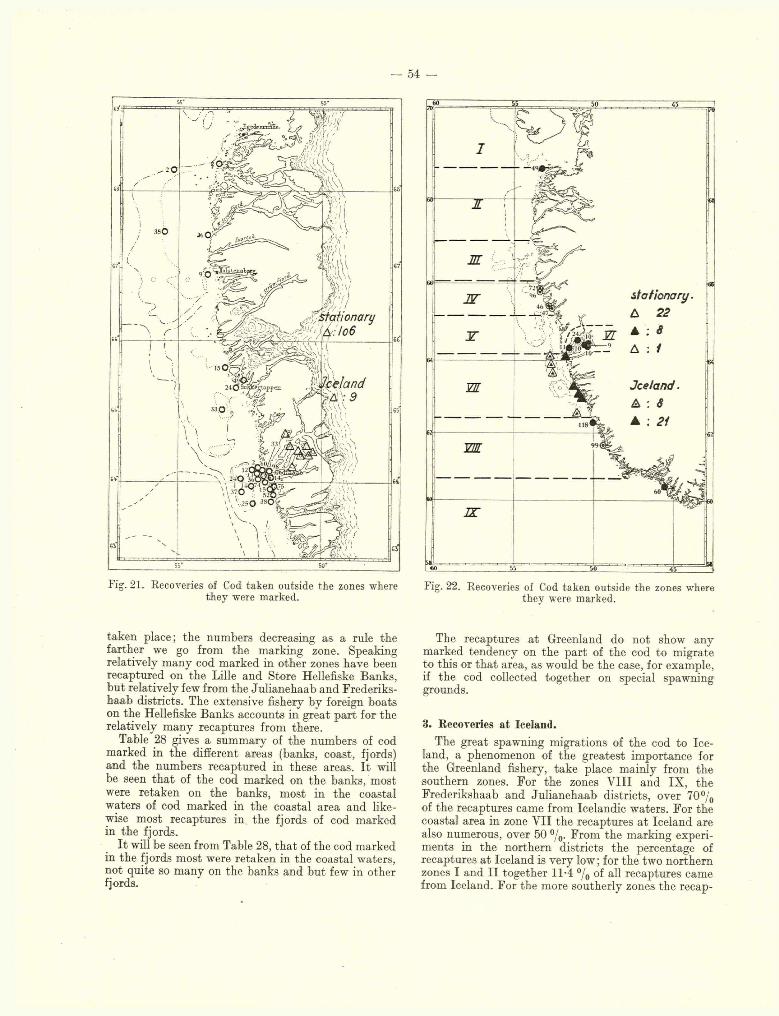
— 54
J l S T U T ion
106
Fig. 21. Recoveries of Cod taken outside the zones where they were marked.
taken place; the numbers decreasing as a rule the farther we go from the marking zone. Speaking relatively many cod marked in other zones have been recaptured on the Lille and Store Hellefiske Banks, but relatively few from the Julianehaab and Frederiks- haab districts. The extensive fishery by foreign boats on the Hellefiske Banks accounts in great part for the relatively many recaptures from there.
Table 28 gives a summary of the numbers of cod marked in the different areas (banks, coast, fjords) and the numbers recaptured in these areas. I t will be seen th a t of the cod marked on the banks, most were retaken on the banks, most in the coastal waters of cod marked in the coastal area and likewise most recaptures in. the fjords of cod marked in the fjords.
I t will be seen from Table 28, th a t of the cod marked in the fjords most were retaken in the coastal waters, not quite so many on the banks and but few in other fjords.
M
stationary.
Jceland ■YE
991VÏÏT
45Fig. 22. Recoveries of Cod taken outside the zones where
they were marked.
The recaptures a t Greenland do not show any marked tendency on the part of the cod to migrate to this or th a t area, as would be the case, for example, if the cod collected together on special spawning grounds.
8. Recoveries at Iceland.
The great spawning migrations of the cod to Iceland, a phenomenon of the greatest importance for the Greenland fishery, take place mainly from the southern zones. For the zones V III and IX , the Frederikshaab and Julianehaab districts, over 70°/0 of the recaptures came from Icelandic waters. For the coastal area in zone VII the recaptures a t Iceland are also numerous, over 50 °/0. From the marking experiments in the northern districts the percentage of recaptures a t Iceland is very low; for the two northern zones I and I I together 11-4 °/0 of all recaptures came from Iceland. For the more southerly zones the recap-
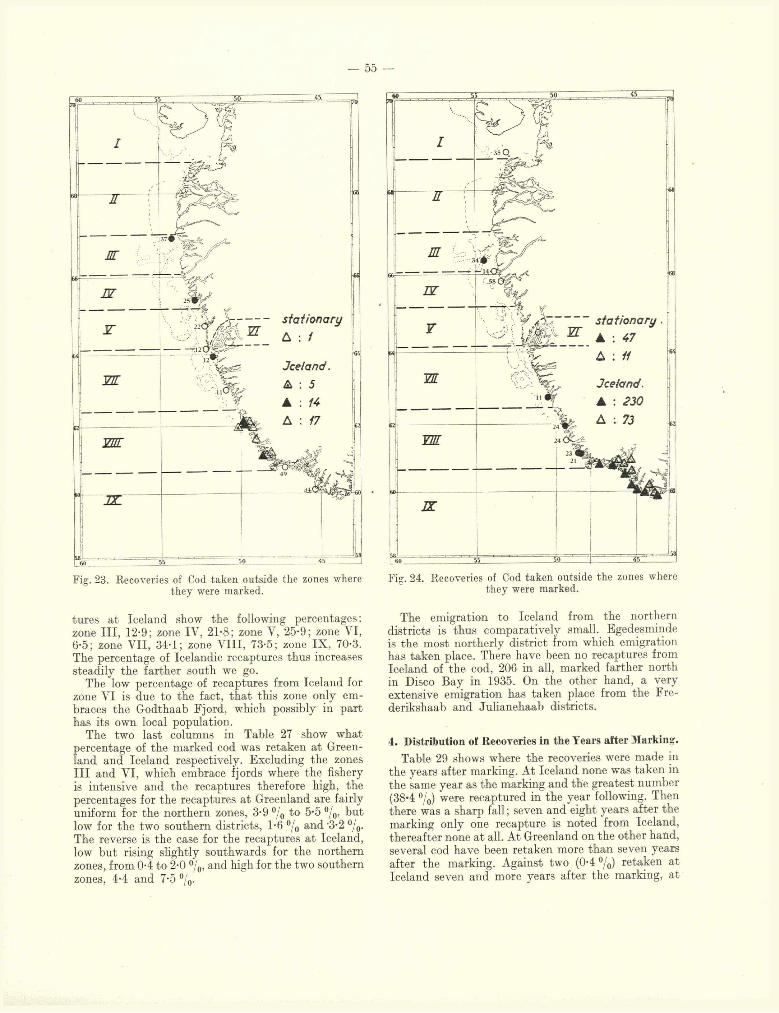
— 55
M
stationary\ W
Jcelandm
vnr
JZ .
Fig. 23. Recoveries of Cod taken outside the zones where they were marked.
tures a t Iceland show the following percentages: zone III , 12-9; zone IV, 21-8; zone Y, 25-9; zone VI, 6'5; zone VII, 34-1; zone V III, 73-5; zone IX , 70-3. The percentage of Icelandic recaptures thus increases steadily the farther south we go.
The low percentage of recaptures from Iceland for zone VI is due to the fact, th a t this zone only embraces the Godthaab Fjord, which possibly in part has its own local population.
The two last columns in Table 27 show what percentage of the marked cod was retaken a t Greenland and Iceland respectively. Excluding the zones I I I and VI, which embrace fjords where the fishery is intensive and the recaptures therefore high, the percentages for the recaptures a t Greenland are fairly uniform for the northern zones, 3-9 °/0 to 5-5 %, but low for the two southern districts, 1-6 °/0 and ’3-2 °/0. The reverse is the case for the recaptures a t Iceland, low but rising slightly southwards for the northern zones, from 0 4 to 2-0 °/0, and high for the two southern zones, 4-4 and 7-5 %•
Fig. 24. Recoveries of Cod taken outside the zones where they were marked.
The emigration to Iceland from the northern districts is thus comparatively small. Egedesminde is the most northerly district from which emigration has taken place. There have been no recaptures from Iceland of the cod, 206 in all, marked farther north in Disco Bay in 1935. On the other hand, a very extensive emigration has taken place from the Fre- derikshaab and Julianehaab districts.
4. Distribution of Recoveries in the Years after Marking.
Table 29 shows where the recoveries were made in the years after marking. At Iceland none was taken in the same year as the marking and the greatest number (38*4 %) were recaptured in the year following. Then there was a sharp fall ; seven and eight years after the marking only one recapture is noted from Iceland, thereafter none a t all. At Greenland on the other hand, several cod have been retaken more than seven years after the marking. Against two (0-4 °/0) retaken at Iceland seven and more years after the marking, at
I Jstationary .A : 47L : 11 ?
Jceland.A : 230 A : 73 i.G2
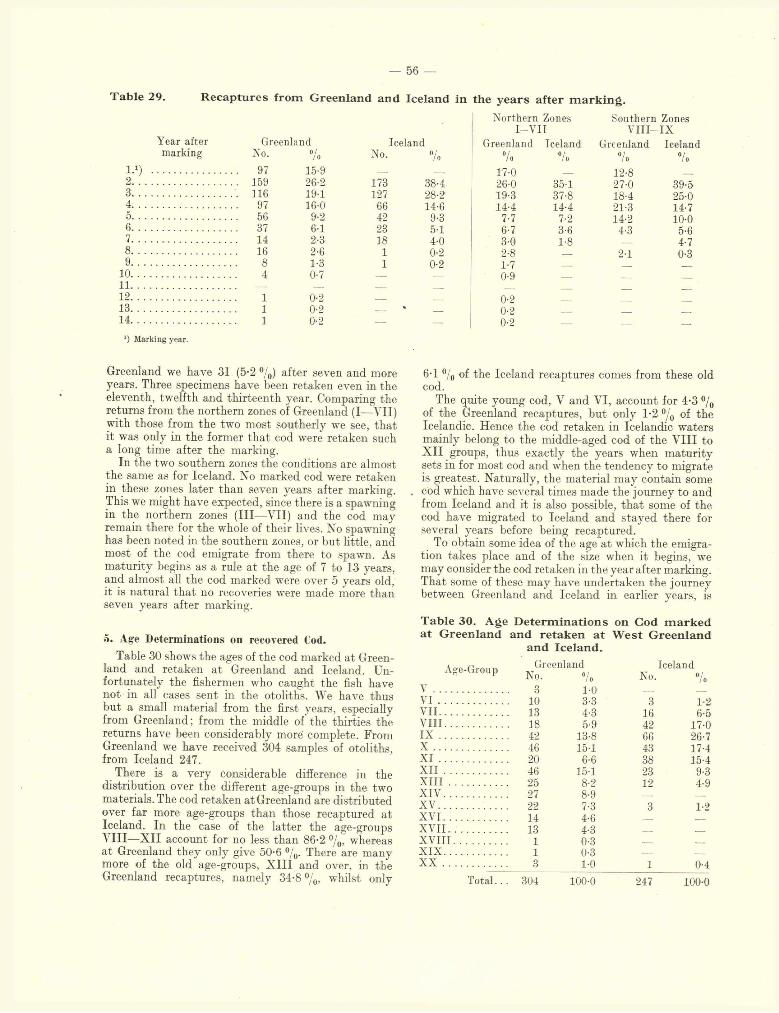
— 56 —
T able 29. R ecaptures from G reenland and Iceland in the yea rs after m a rk in g .
Year after marking
I - 1)2.3.4. . .5. . .6. . .7. . .8. . . 9. . .
10. . . 11. . . 12. . .13. . .14. . .
Greenland
Northern Zones I -V I I
Southern Zones V II I - IX
Iceland Greenland Iceland Greenland IcelandNo. 7 0 No. Vo % »/10 7 . 7#97 15-9 — — 17-0 _ 12-8 _
159 26-2 173 38-4 26-0 35-1 27-0 39-5116 19-1 127 28-2 19-3 37-8 18-4 25-097 16-0 66 14-6 14-4 14-4 21-3 14-756 9-2 42 9-3 7-7 7-2 14-2 10-037 6-1 23 5-1 6-7 3-6 4-3 5-614 2-3 18 4-0 3-0 1-8 .—. 4-716 2-6 1 0-2 2-8 — 2-1 0-38 1-3 1 0-2 1-7 _ _ _4 0-7 — — 0-9 — — —
1 0-2 __ z 0-21 0-2 _ % _ 0-2 _ _ _1 0-2 --- - 0-2 —. _ _
L) Marking year.
Greenland we have 31 (5-2 %) after seven and more years. Three specimens have been retaken even in the eleventh, twelfth and thirteenth year. Comparing the returns from the northern zones of Greenland (I—VII) with those from the two most southerly we see, tha t it was only in the former th a t cod were retaken such a long time after the marking.
In the two southern zones the conditions are almost the same as for Iceland. No marked cod were retaken in these zones later than seven years after marking. This we might have expected, since there is a spawning in the northern zones (III—VII) and the cod may remain there for the whole of their lives. No spawning has been noted in the southern zones, or but little, and most of the cod emigrate from there to spawn. As maturity begins as a rule a t the age of 7 to 13 years, and almost all the cod marked were over 5 years old, it is natural th a t no recoveries were made more than seven years after marking.
5. Age Determinations on recovered Cod.
Table 30 shows the ages of the cod marked a t Greenland and retaken a t Greenland and Iceland. Unfortunately the fishermen who caught the fish have not in all cases sent in the otoliths. We have thus but a small material from the first years, especially from Greenland; from the middle of the thirties the returns have been considerably more complete. From Greenland we have received 304 samples of otoliths, from Iceland 247.
There is a very considerable difference in the distribution over the different age-groups in the two materials. The cod retaken at Greenland are distributed over far more age-groups than those recaptured a t Iceland. In the case of the latter the age-groups V III—X II account for no less than 86-2 % , whereas a t Greenland they only give 50-6 °/0. There are many more of the old age-groups, X III and over, in the Greenland recaptures, namely 34-8%, whilst only
6-1 °/o the Iceland recaptures comes from these old cod.
The quite young cod, V and VI, account for 4-3 °/0 of the Greenland recaptures, but only 1-2 °/0 of the Icelandic. Hence the cod retaken in Icelandic waters mainly belong to the middle-aged cod of the V III to X II groups, thus exactly the years when m aturity sets in for most cod and when the tendency to migrate is greatest. Naturally, the material may contain some cod which have several times made the journey to and from Iceland and it is also possible, th a t some of the cod have migrated to Iceland and stayed there for several years before being recaptured.
To obtain some idea of the age a t which the emigration takes place and of the size when it begins, we may consider the cod retaken in the year after marking. That some of these may have undertaken the journey between Greenland and Iceland in earlier years, is
T able 30. A ge D eterm in ation s on Cod m ark ed at G reenland and retaken a t W est G reenland
and Iceland.
A™ Greenland IcelandAge-Group No_ 0/o No_ 0/o
V......................... 3 10 —V I ....................... 10 3-3 3 1-2VI I ....................... 13 4-3 16 6-5VII I ..................... 18 5-9 42 17-0I X ....................... 42 13-8 66 26-7 X ......................... 46 15-1 43 17-4X I ....................... 20 6-6 38 15-4X I I ..................... 46 15 1 23 9-3X II I ................... 25 8-2 12 4-9X I V ..................... 27 8-9 —X V ....................... 22 7-3 3 1-2XV I ..................... 14 4-6 — —XVI I ................... 13 4-3 — —XVII I .................. 1 0-3 —XI X ..................... 1 0-3 — —X X ............... 3________M)________ 1______ 0-4
T ota l.. . 304 100-0 247 100-0
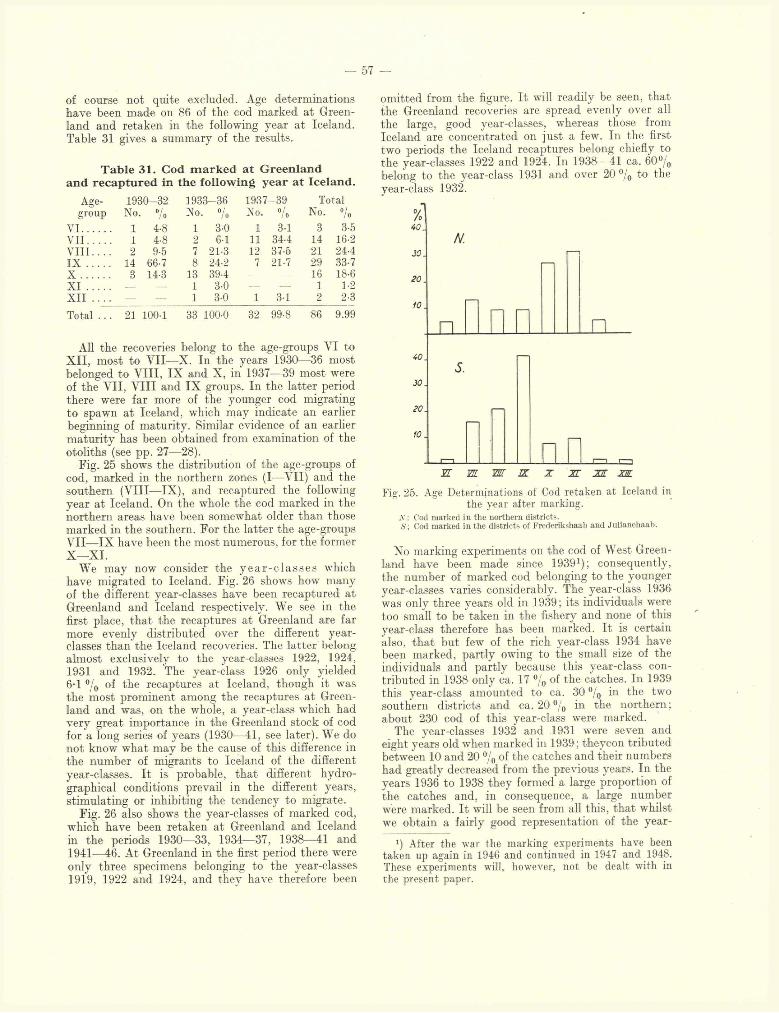
— 57 —
of course not quite excluded. Age determinations have been made on 86 of the cod marked at Greenland and retaken in the following year at Iceland. Table 31 gives a summary of the results.
T able 31. Cod m ark ed at G reenland and recaptured in the fo llow ing year at Iceland.
Age- 1930-32 1933-36 1937-39 Totalgroup No. »/„ No. °/0 No. °/0 No. %
V I 1 4-8 1 3-0 1 3-1 3 3-5VI I 1 4-8 2 6-1 11 34-4 14 16-2V I I I . . . . 2 9-5 7 21-3 12 37-5 21 244I X 14 66-7 8 24-2 7 21-7 29 33-7 X 3 14-3 13 39-4 16 18-6X I — — 1 3-0 — 1 1-2XII . — — 1 30 1 3-1 2 2-3
Total . . . 21 100-1 33 100-0 32 99-8 86 9.99
All the recoveries belong to the age-groups VI to X II, most to VII—X. In the years 1930—36 most belonged to V III, IX and X, in 1937—39 most were of the VII, V III and IX groups. In the latter period there were far more of the younger cod migrating to spawn a t Iceland, which may indicate an earlier beginning of maturity. Similar evidence of an earlier m aturity has been obtained from examination of the otoliths (see pp. 27—28).
Fig. 25 shows the distribution of the age-groups of cod, marked in the northern zones (I—VII) and the southern (VIII—IX), and recaptured the following year a t Iceland. On the whole the cod marked in the northern areas have been somewhat older than those marked in the southern. For the latter the age-groups V II—IX have been the most numerous, for the formerX —XI.
We may now consider the y e a r -c la s s e s which have migrated to Iceland. Fig. 26 shows how many of the different year-classes have been recaptured at Greenland and Iceland respectively. We see in the first place, th a t the recaptures at Greenland are far more evenly distributed over the different year- classes than the Iceland recoveries. The latter belong almost exclusively to the year-classes 1922, 1924,1931 and 1932. The year-class 1926 only yielded 6-1 % of the recaptures at Iceland, though it was the most prominent among the recaptures at Greenland and was, on the whole, a year-class which had very great importance in the Greenland stock of cod for a long series of years (1930—41, see later). We do not know what may be the cause of this difference in the number of migrants to Iceland of the different year-classes. I t is probable, th a t different hydro- graphical conditions prevail in the different years, stimulating or inhibiting the tendency to migrate.
Fig. 26 also shows the year-classes of marked cod, which have been retaken at Greenland and Iceland in the periods 1930—33, 1934—37, 1938—41 and 1941—46. At Greenland in the first period there were only three specimens belonging to the year-classes 1919, 1922 and 1924, and they have therefore been
omitted from the figure. I t will readily be seen, tha t the Greenland recoveries are spread evenly over all the large, good year-classes, whereas those from Iceland are concentrated on just a few. In the first two periods the Iceland recaptures belong chiefly to the year-classes 1922 and 1924. In 1938—41 ca. 60% belong to the year-class 1931 and over 20 °/0 to the year-class 1932.
ye m
Fig. 25. Age Determinations of Cod retaken at Iceland in the year after marking.
N : Cod marked in the northern districts.Cod marked in the districts of Frederikshaab and Julianehaab.
No marking experiments on the cod of West Greenland have been made since 19391) ; consequently, the number of marked cod belonging to the younger year-classes varies considerably. The year-class 1936 was only three years old in 1939; its individuals were too small to be taken in the fishery and none of this year-class therefore has been marked. I t is certain also, tha t but few of the rich year-class 1934 have been marked, partly owing to the small size of the individuals and partly because this year-class contributed in 1938 only ca. 17 % the catches. In 1939 this year-class amounted to ca. 30 °/0 in the two southern districts and ca. 20 °/0 in the northern ; about 230 cod of this year-class were marked.
The year-classes 1932 and .1931 were seven and eight years old when marked in 1939 ; theycon tributed between 10 and 20 % of the catches and their numbers had greatly decreased from the previous years. In the years 1936 to 1938 they formed a large proportion of the catches and, in consequence, a large number were marked. I t will be seen from all this, tha t whilst we obtain a fairly good representation of the year-
') After the war the marking experiments have been taken up again in 1946 and continued in 1947 and 1948. These experiments will, however, not be dealt with in the present paper.
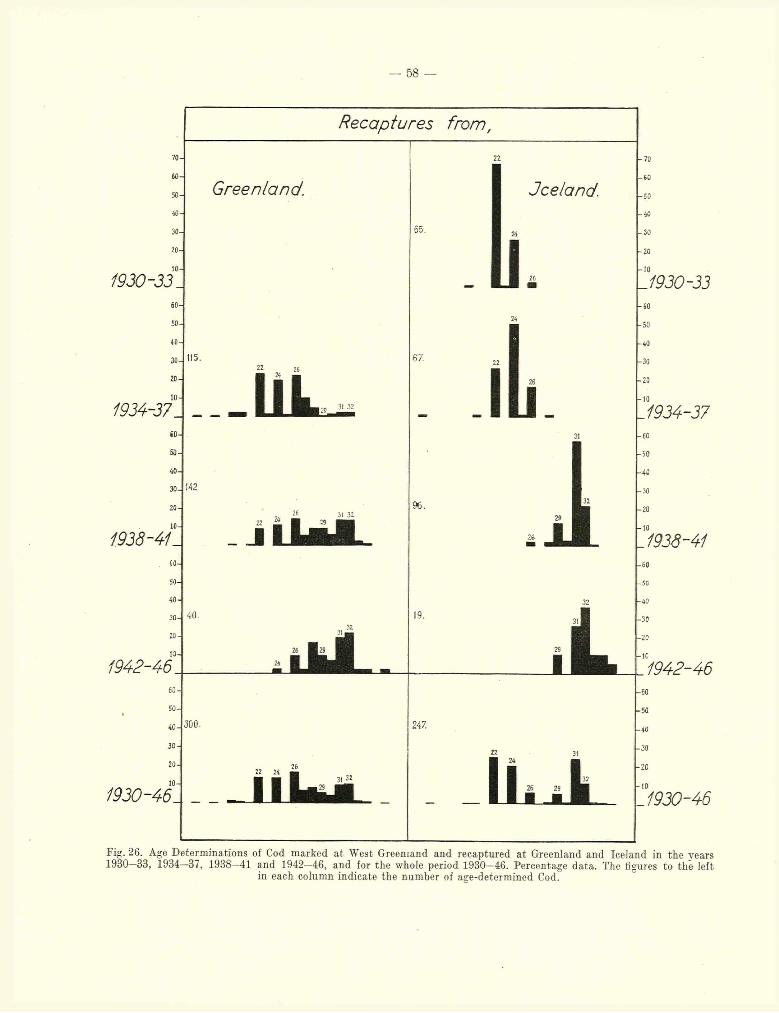
-33.6 0
50
4 0
30
20
10
-37.60
50-
40.
30.
2 0 -
1 0 -
-4L. 60-
5 0 -
40-
3 0 -
2 0 -
1 0 -
46.60-
50-
40-
30-
2 0 -
1 0 -
■46_
Age B
— 58 —
Recaptures from,
Greenland. Jceland.
terminations of Cod marked at West Greenland and recaptured at Greenland and Ici -37, 1938—41 and 1942—46, and for the whole period 1930—46. Percentage data. The
in each column indicate the number of age-determined Cod.
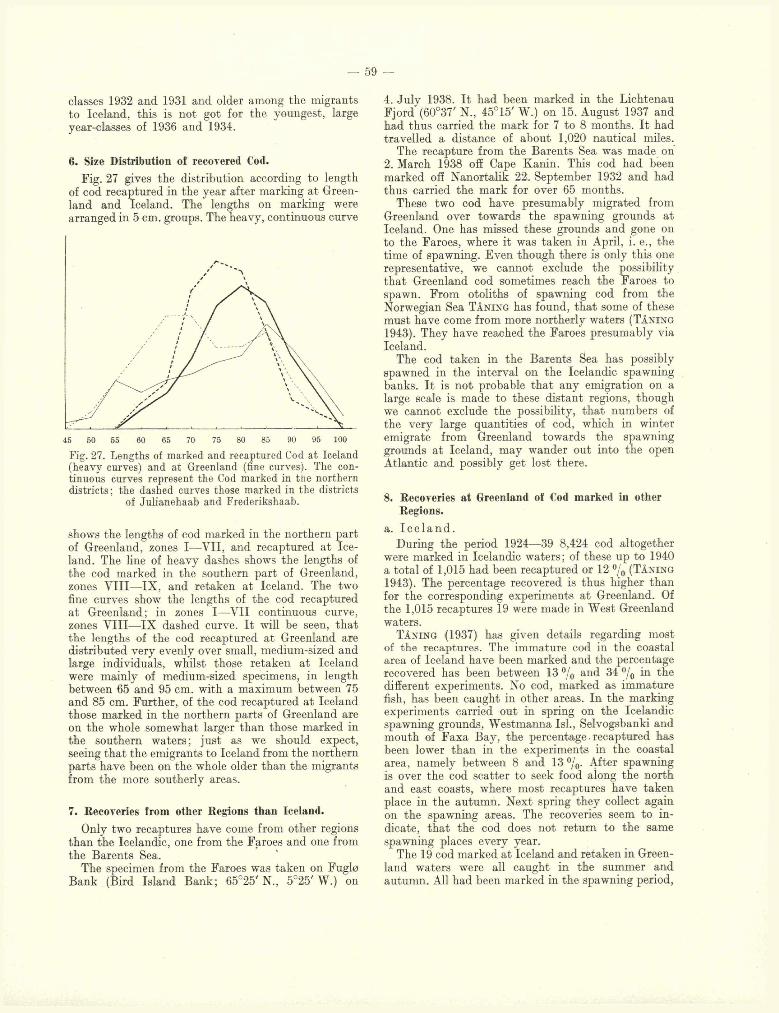
— 59 —
classes 1932 and 1931 and older among the migrants to Iceland, this is not got for the youngest, large year-classes of 1936 and 1934.
6. Size Distribution of recovered Cod.
Fig. 27 gives the distribution according to length of cod recaptured in the year after marking a t Greenland and Iceland. The lengths on marking were arranged in 5 cm. groups. The heavy, continuous curve
90 95 10065 70 75 80 8545 50 55 60
Fig. 27. Lengths of marked and recaptured Cod at Iceland (heavy curves) and at Greenland (fine curves). The continuous curves represent the Cod marked in the northern districts ; the dashed curves those marked in the districts
of Julianehaab and Frederikshaab.
shows the lengths of cod marked in the northern part of Greenland, zones I—VII, and recaptured a t Iceland. The line of heavy dashes shows the lengths of the cod marked in the southern part of Greenland, zones V III—IX, and retaken a t Iceland. The two fine curves show the lengths of the cod recaptured a t Greenland ; in zones I—V II continuous curve, zones V III—IX dashed curve. I t will be seen, th a t the lengths of the cod recaptured a t Greenland are distributed very evenly over small, medium-sized and large individuals, whilst those retaken at Iceland were mainly of medium-sized specimens, in length between 65 and 95 cm. with a maximum between 75 and 85 cm. Further, of the cod recaptured a t Iceland those marked in the northern parts of Greenland are on the whole somewhat larger than those marked in the southern waters; just as we should expect, seeing that the emigrants to Iceland from the northern parts have been on the whole older than the migrants from the more southerly areas.
7. Recoveries from other Regions than Iceland.
Only two recaptures have come from other regions than the Icelandic, one from the Faroes and one from the Barents Sea.
The specimen from the Faroes was taken on Fuglø Bank (Bird Island Bank; 65°25'N„ 5°25'W .) on
4. July 1938. I t had been marked in the Lichtenau Fjord (60°37' N., 45°15' W.) on 15. August 1937 and had thus carried the mark for 7 to 8 months. I t had travelled a distance of about 1,020 nautical miles.
The recapture from the Barents Sea was made on 2. March 1938 off Cape Kanin. This cod had been marked off Nanortalik 22. September 1932 and had thus carried the mark for over 65 months.
These two cod have presumably migrated from Greenland over towards the spawning grounds at Iceland. One has missed these grounds and gone on to the Faroes, where it was taken in April, i. e., the time of spawning. Even though there is only this one representative, we cannot exclude the possibility th a t Greenland cod sometimes reach the Faroes to spawn. From otoliths of spawning cod from the Norwegian Sea Tå n i n g has found, th a t some of these must have come from more northerly waters (Tå n in g 1943). They have reached the Faroes presumably via Iceland.
The cod taken in the Barents Sea has possibly spawned in the interval on the Icelandic spawning banks. I t is not probable tha t any emigration on a large scale is made to these distant regions, though we cannot exclude the possibility, th a t numbers of the very large quantities of cod, which in winter emigrate from Greenland towards the spawning grounds a t Iceland, may wander out into the open Atlantic and possibly get lost there.
8. Recoveries at Greenland of Cod marked in otherRegions.
a. I c e l a n d .During the period 1924—39 8,424 cod altogether
were marked in Icelandic waters ; of these up to 1940 a total of 1,015 had been recaptured or 12 °/0 (Tå n i n g 1943). The percentage recovered is thus higher than for the corresponding experiments a t Greenland. Of the 1,015 recaptures 19 were made in West Greenland waters.
Tå n in g (1937) has given details regarding most of the recaptures. The immature cod in the coastal area of Iceland have been marked and the percentage recovered has been between 13 °/0 and 34 % in the different experiments. No cod, marked as immature fish, has been caught in other areas. In the marking experiments carried out in spring on the Icelandic spawning grounds, Westmanna Isl., Selvogsbanki and mouth of Faxa Bay, the percentage. recaptured has been lower than in the experiments in the coastal area, namely between 8 and 13 %• After spawning is over the cod scatter to seek food along the north and east coasts, where most recaptures have taken place in the autumn. Next spring they collect again on the spawning areas. The recoveries seem to indicate, th a t the cod does not return to the same spawning places every year.
The 19 cod marked a t Iceland and retaken in Greenland waters were all caught in the summer and autumn. All had been marked in the spawning period,
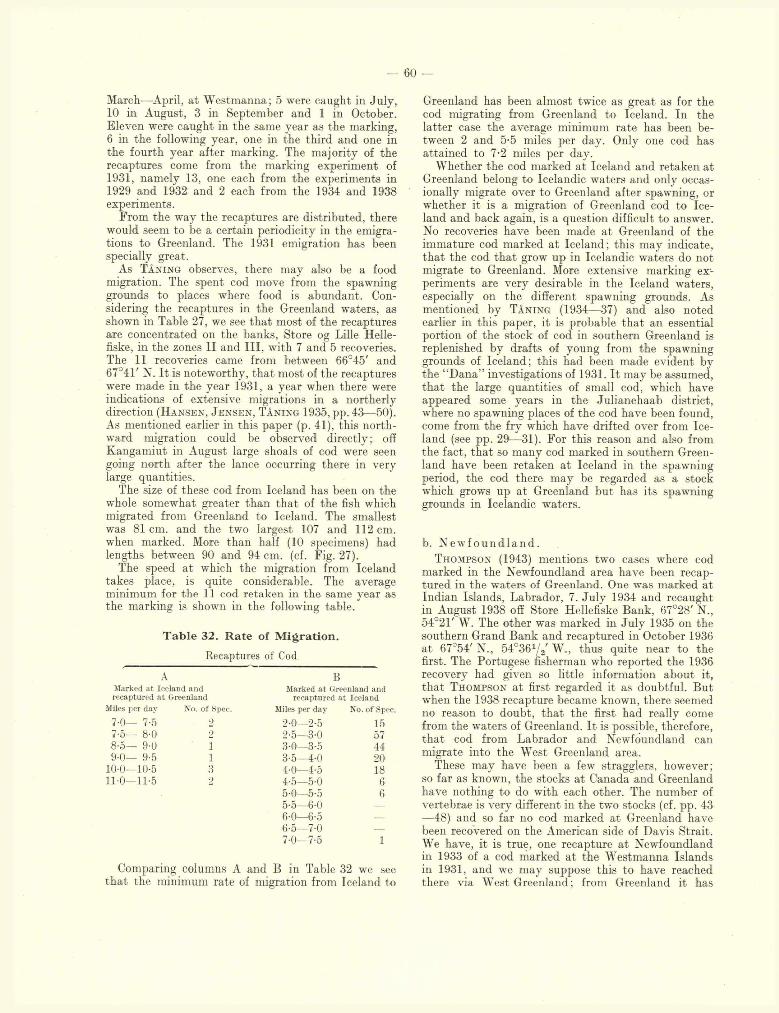
— 6 0 —
March—April, a t Westmanna; 5 were caught in July, 10 in August, 3 in September and 1 in October. Eleven were caught in the same year as the marking, 6 in the following year, one in the third and one in the fourth year after marking. The majority of the recaptures come from the marking experiment of 1931, namely 13, one each from the experiments in1929 and 1932 and 2 each from the 1934 and 1938 experiments.
From the way the recaptures are distributed, there would seem to be a certain periodicity in the emigrations to Greenland. The 1931 emigration has been specially great.
As Tå n i n g observes, there may also be a food migration. The spent cod move from the spawning grounds to places where food is abundant. Considering the recaptures in the Greenland waters, as shown in Table 27, we see th a t most of the recaptures are concentrated on tbe banks, Store og Lille Helle- fiske, in the zones I I and III, with 7 and 5 recoveries. The 11 recoveries came from between 66°45' and 67°41' N. I t is noteworthy, th a t most of the recaptures were made in the year 1931, a year when there were indications of extensive migrations in a northerly direction (H a n s e n , J e n s e n , Tå n i n g 1935, pp. 43—50). As mentioned earlier in this paper (p. 41), this northward migration could be observed directly; off Kangamiut in August large shoals of cod were seen going north after the lance occurring there in very large quantities.
The size of these cod from Iceland has been on the whole somewhat greater than th a t of the fish which migrated from Greenland to Iceland. The smallest was 81cm. and the two largest 107 and 112 cm. when marked. More than half (10 specimens) had lengths between 90 and 94 cm. (cf. Fig. 27).
The speed a t which the migration from Iceland takes place, is quite considerable. The average minimum for the 11 cod retaken in the same year as the marking is shown in the following table.
T ab le 32. R ate of M igration .
Recaptures of Cod
A BMarked a t Iceland and Marked a t Greenland andrecaptured a t Greenland recaptured a t Iceland
Miles per day No. of Spec. Miles per day No. of Spe
7-0— 7-5 2 2-0—2-5 157-5— 8-0 2 2-5— 3-0 578-5— 9-0 1 3-0—3-5 449-0— 9-5 1 3-5— 4-0 20
10-0—10-5 3 4-0—4-5 1811-0—11-5 2 4-5—5-0 6
5-0—5-5 65-5—6-0 —
6-0—6-5 —
6-5—7-0 _
7-0—7-5 1
Comparing columns A and B in Table 32 we see th a t the minimum rate of migration from Iceland to
Greenland has been almost twice as great as for the cod migrating from Greenland to Iceland. In the latter case the average minimum rate has been between 2 and 5-5 miles per day. Only one cod has attained to 7-2 miles per day.
Whether the cod marked a t Iceland and retaken at Greenland belong to Icelandic waters and only occasionally migrate over to Greenland after spawning, or whether it is a migration of Greenland cod to Iceland and back again, is a question difficult to answer. No recoveries have been made a t Greenland of the immature cod marked a t Iceland; this may indicate, tha t the cod th a t grow up in Icelandic waters do not migrate to Greenland. More extensive marking experiments are very desirable in the Iceland waters, especially on the different spawning grounds. As mentioned by Tå n i n g (1934—37) and also noted earlier in this paper, it is probable th a t an essential portion of the stock of cod in southern Greenland is replenished by drafts of young from the spawning grounds of Iceland; this had been made evident by the “D ana” investigations of 1931. I t may be assumed, th a t the large quantities of small cod, which have appeared some years in the Julianehaab district, where no spawning places of the cod have been found, come from the fry which have drifted over from Iceland (see pp. 29—31). For this reason and also from the fact, th a t so many cod marked in southern Greenland have been retaken a t Iceland in the spawning period, the cod there may be regarded as a stock which grows up a t Greenland but has its spawning grounds in Icelandic waters.
b. N e w f o u n d l a n d .T h o m pso n (1943) mentions two cases where cod
marked in the Newfoundland area have been recaptured in the waters of Greenland. One was marked at Indian Islands, Labrador, 7. Ju ly 1934 and recaught in August 1938 off Store Hellefiske Bank, 67°28' N., 54°21' W. The other was marked in July 1935 on the southern Grand Bank and recaptured in October 1936 a t 67°54' N., 54°361/2' W., thus quite near to the first. The Portugese fisherman who reported tbe 1936 recovery had given so little information about it, th a t T h o m pson at first regarded it as doubtful. But when the 1938 recapture became known, there seemed no reason to doubt, th a t the first had really come from the waters of Greenland. I t is possible, therefore, th a t cod from Labrador and Newfoundland can migrate into the West Greenland area.
These may have been a few stragglers, however; so far as known, the stocks at Canada and Greenland have nothing to do with each other. The number of vertebrae is very different in the two stocks (cf. pp. 43 —48) and so far no cod marked a t Greenland have been recovered on the American side of Davis Strait. We have, it is true, one recapture a t Newfoundland in 1933 of a cod marked a t the Westmanna Islands in 1931, and we may suppose this to have reached there via West Greenland; from Greenland it has
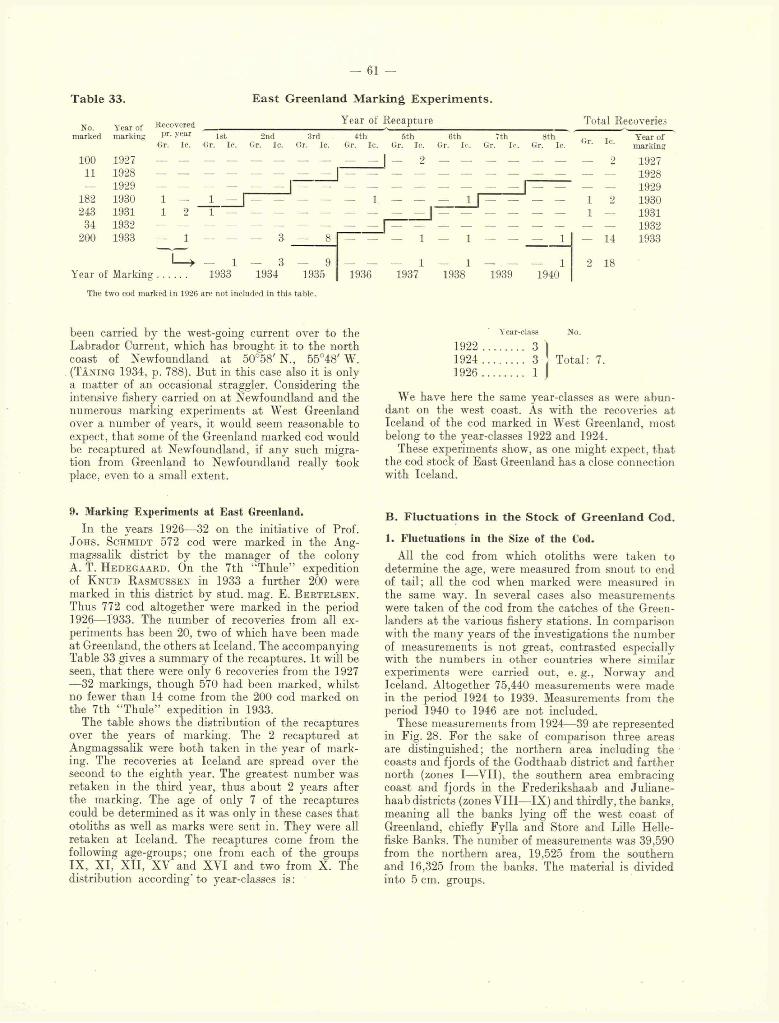
— 61 —
Table 33.
No. Tear of Recovered marked marking Pr - ^ear
E ast Greenland M arking E xp er im en ts .
Year of Recapture1st 2nd
Ic. Gr. Ic. Gr. Ic.3rd
Gr. Ic.4th
Gr. Ic.5th 6th
Gr. Ic. Gr. Ic.7th
Gr. Ic.8th
Gr. Ic.
Total Recoveries
Or. Ic.
100 .192711 1928
1929 182 1930243 193134 1932
200 1933
Year of Markin: 1933 1934 1935 19371936 1938 1939 1940
The two cod marked in 1926 are not included in this table.
Year of marking
1927192819291930193119321933
been carried by tbe west-going current over to tbe Labrador Current, whicb has brought it to the north coast of Newfoundland a t 50°58' N., 55°48' W. (Tå n in g 1934, p. 788). But in this case also it is only a m atter of an occasional straggler. Considering the intensive fishery carried on a t Newfoundland and the numerous marking experiments at West Greenland over a number of years, it would seem reasonable to expect, tha t some of the Greenland marked cod would be recaptured a t Newfoundland, if any such migration from Greenland to Newfoundland really took place, even to a small extent.
Year-class No.
1922 ............... 3 I1924 ............... 3 Total: 7.1926 ............... 1 I
We have here the same year-classes as were abundant on the west coast. As with the recoveries at Iceland of the cod marked in West Greenland, most belong to the year-classes 1922 and 1924.
These experiments show, as one might expect, th a t the cod stock of East Greenland has a close connection with Iceland.
9. Marking Experiments at East Greenland.
In the years 1926—32 on the initiative of Prof. J o h s . S chm idt 572 cod were marked in the Ang- magssalik district by the manager of the colonyA. T. H e d e g a a r d . On the 7th “Thule” expedition of K n u d R a sm u s s e n in 1933 a further 200 were marked in this district by stud. mag. E. B e r t e l s e n . Thus 772 cod altogether were marked in the period 1926—1933. The number of recoveries from all experiments has been 20, two of which have been made a t Greenland, the others a t Iceland. The accompanying Table 33 gives a summary of the recaptures. I t will be seen, th a t there were only 6 recoveries from the 1927 —32 markings, though 570 had been marked, whilst no fewer than 14 come from the 200 cod marked on the 7th “Thule” expedition in 1933.
The table shows the distribution of the recaptures over the years of marking. The 2 recaptured a t Angmagssalik were both taken in the year of marking. The recoveries a t Iceland are spread over the second to the eighth year. The greatest number was retaken in the third year, thus about 2 years after the marking. The age of only 7 of the recaptures could be determined as it was only in these cases that otoliths as well as marks were sent in. They were all retaken a t Iceland. The recaptures come from the following age-groups; one from each of the groupsIX, XI, X II, XV and XVI and two from X. The distribution according' to year-classes is :
B. F lu ctuation s in the Stock of G reenland Cod.
1. Fluctuations in the Size of the Cod.
All the cod from which otoliths were taken to determine the age, were measured from snout to end of tail; all the cod when marked were measured in the same way. In several cases also measurements were taken of the cod from the catches of the Greenlanders a t the various fishery stations. In comparison with the many years of the investigations the number of measurements is not great, contrasted especially with the numbers in other countries where similar experiments were carried out, e. g., Norway and Iceland. Altogether 75,440 measurements were made in the period 1924 to 1939. Measurements from the period 1940 to 1946 are not included.
These measurements from 1924—39 ate represented in Fig. 28. For the sake of comparison three areas are distinguished; the northern area including the coasts and f j ords of the Godthaab district and farther north (zones I—VII), the southern area embracing coast and fjords in the Frederikshaab and Julianehaab districts (zones V III—IX) and thirdly, the banks, meaning all the banks lying off the west coast of Greenland, chiefly Fylla and Store and Lille Helle- fiske Banks. The number of measurements was 39,590 from the northern area, 19,525 from the southern and 16,325 from the banks. The material is divided into 5 cm. groups.
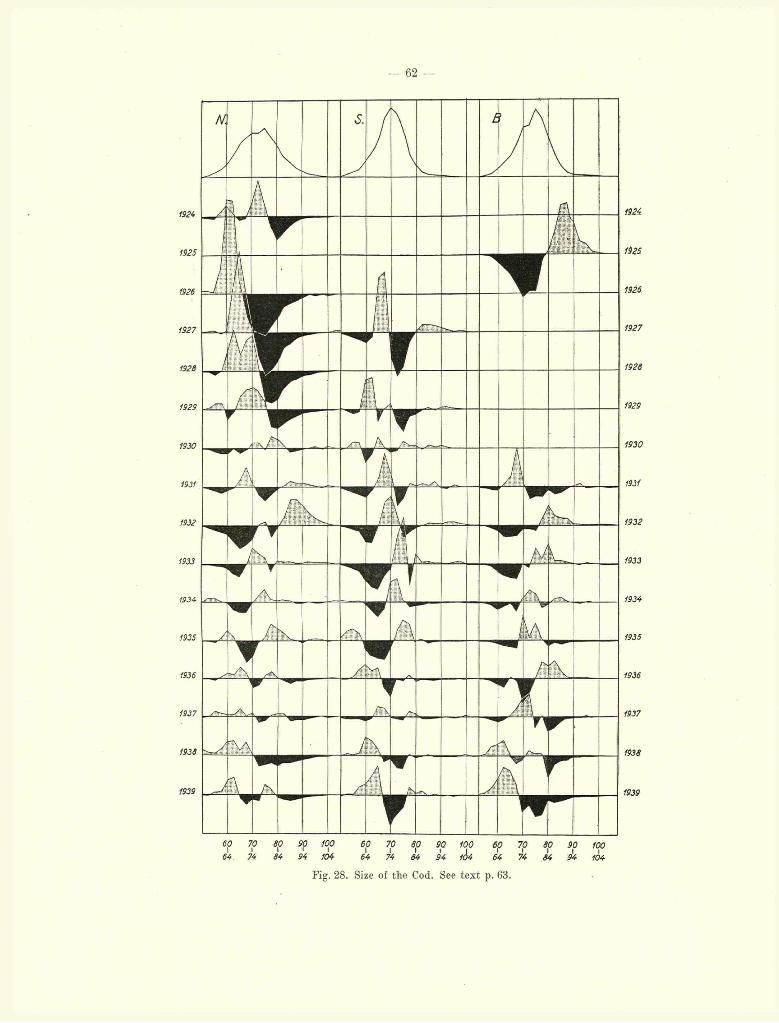
- 62 —
60 70 dp 90 100 60 70 6p 90 100 6p 70 åp 90 10064 74 84 94 104 64 74 64 94 104 64 74 64 94 104
Fig. 28. Size of the Cod. See text p. 63.
1924.
1925
1926
1927
1926
1929
1930
1931
1932
1933
1934
1935
1936
1937
ma
1S39
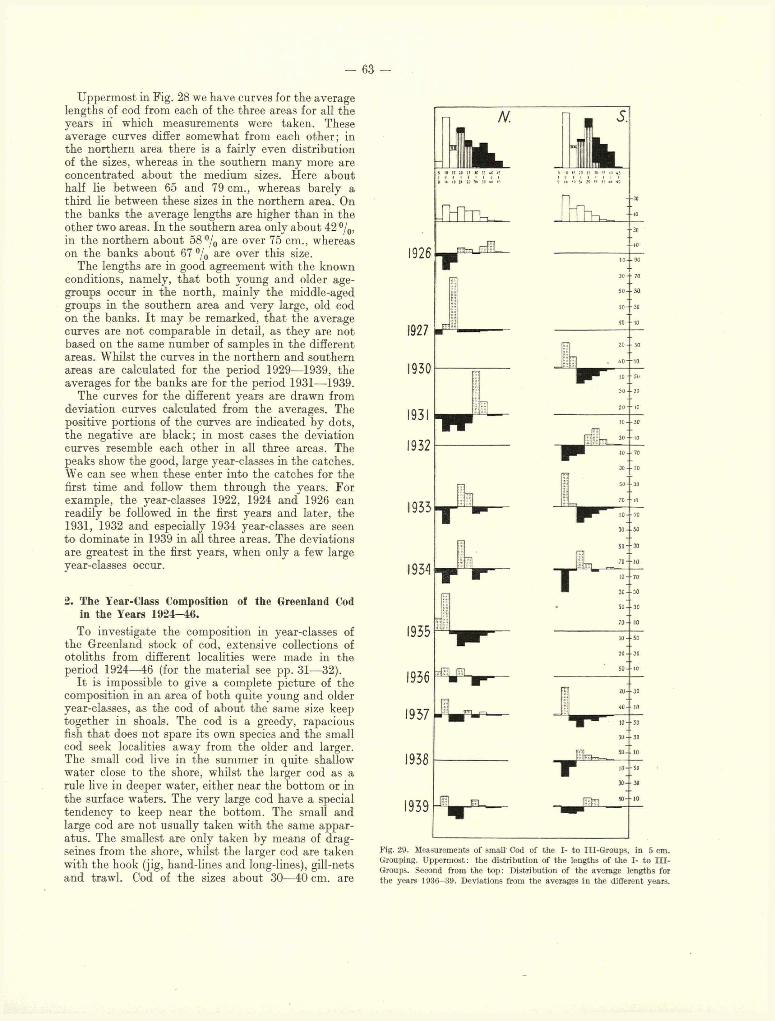
— 63 -
Uppermost in Fig. 28 we have curves for the average lengths of cod from each of the three areas for all the years iri which measurements were taken. These average curves differ somewhat from each other; in the northern area there is a fairly even distribution of the sizes, whereas in the southern many more are concentrated about the medium sizes. Here about half lie between 65 and 79 cm., whereas barely a third he between these sizes in the northern area. On the banks the average lengths are higher than in the other two areas. In the southern area only about 42 % , in the northern about 5 8 % are over 75 cm., whereas on the banks about 67 % are over this size.
The lengths are in good agreement with the known conditions, namely, tha t both young and older age- groups occur in the north, mainly the middle-aged groups in the southern area and very large, old cod on the banks. I t may be remarked, th a t the average curves are not comparable in detail, as they are not based on the same number of samples in the different areas. Whilst the curves in the northern and southern areas are calculated for the period 1929—1939, the averages for the banks are for the period 1931—-1939.
The curves for the different years are drawn from deviation curves calculated from the averages. The positive portions of the curves are indicated by dots, the negative are black; in most cases the deviation curves resemble each other in all three areas. The peaks show the good, large year-classes in the catches.We can see when these enter into the catches for the first time and follow them through the years. For example, the year-classes 1922, 1924 and 1926 can readily be followed in the first years and later, the 1931, 1932 and especially 1934 year-classes are seen to dominate in 1939 in all three areas. The deviations are greatest in the first years, when only a few large year-classes occur.
2. The Year-Class Composition o! the Greenland Codin the Years 1924-46.
To investigate the composition in year-classes of the Greenland stock of cod, extensive collections of otobths from different localities were made in the period 1924—46 (for the material see pp. 31—32).
I t is impossible to give a complete picture of the composition in an area of both quite young and older year-classes, as the cod of about the same size keep together in shoals. The cod is a greedy, rapacious fish th a t does not spare its own species and the small cod seek localities away from the older and larger.The small cod live in the summer in quite shallow water close to the shore, whilst the larger cod as a rule live in deeper water, either near the bottom or in the surface waters. The very large cod have a special tendency to keep near the bottom. The small and large cod are not usually taken with the same apparatus. The smallest are only taken by means of drag- seines from the shore, whilst the larger cod are taken r i 8- 29- Measurements of small Cod of the I- to III-Groups, in 5 cm.
with the hook (jig, hand-lines and long-lines), gill-nets  2 T 0,t:(ktk (î It t T « theflc"gth5 of the,j 1 n J £ ±1. ‘ i 4. o n / a Groups. Second from the top: Distribution of the average lengths forand trawl. Cod. OI tile sizes about 30 40 cm. are the years 1936—39. Deviations from the averages in the different years.
1926
1927
1930
1931
1932
1933
1934
1935
1936
1937
1938
1939
i t M lS 19 15 20 25 JO IS «0 *5I I I I I I I II H I« i t » S> »
5 10 15 20 25 » H *0 45 0 2« 29 M It« I
TCL-
■SO
-30
-10
— 64 —
difficult to catch, whether with the seine or the commercial gear; they are most readily taken as a rule with the small, shining jigs. I t will be understood from this, th a t one is obliged to keep the small and larger cod separate when investigating the year-class composition of the cod stock.
a. I n v e s t i g a t i o n s on t h e e a r l i e s t Age- G r o u p s of t h e Cod.
The material of the small cod has been almost entirely collected by means of the eel-seine, a small portion however by the jig. The specimens taken by seine are counted immediately on capture and the total length measured from snout to tip of tail, either in mm. or, as a rule, in cm. down to the nearest whole cm. In small catches all the specimens have been measured ; otherwise a suitable number has been selected by chance and then measured. As control of the determinations, samples of otoliths have been taken for many of the catches, in all 2,274. This has only been done in a few cases for the I-group, as this group is fairly easily separated from the measurements alone ; the overlapping of the largest I-group with the smallest of the II-group is very slight. More considerable is the overlapping between the II- and III-groups (see uppermost figure, Fig. 29). In most cases nevertheless the measurements alone give a fairly good representation of the age-groups in the catches. When we have age-analyses from otoliths as well as the measurements, the material is well-suited to display the occurrence of the youngest age-groups.
Fig. 29 gives the measurements from the different years as deviation curves from an average for each of the two areas (zones I—VII and V III—IX). The measurements are arranged in 5 cm. groups and the figures indicate percentages. In the second figure from above the average curves represent the measurements of the cod taken in seines in each of the two areas. In both the measurements are distributed much in the same way, with most of them grouped between 10 and 40 cm. Comparing these curves with the curves for age analyses (cf. Fig. 29 top) we see, th a t the I- and II-groups are present in the catches in almost the same quantities, whereas specimens of the III-group occur more rarely. In the samples from the southern areas the I-group occurs more frequently than in the samples from the northern areas, but the reverse has been the case with group III. This may not be taken as a general rule, however, as the samples from the two areas have been caught in different years and we have thus to take into account the fluctuations in the quantities of the different age-groups. I t was only in the years 1933, 34, 37 and 39, th a t samples were taken in both areas.
In a later section dealing with the fluctuations in the age-group composition of the commercial catches, the importance of the separate age-groups will be discussed in more detail. I t need only be remarked here, th a t the age-groups prominent in the eel-seine catches have also appeared as rich age-groups in the stock of older and larger cod taken by the commercial
catches in the years under review. According to the regulations governing the preparation of saltfish for export, only fish larger than ca. 60 cm. are used. This size is reached by most cod only in their sixth year, thus of the V-group. We should thus as a rule be able to forecast, from an examination of the quantities in the I- and II-groups taken by the eel-seine, whether a rich age-group will make its appearance in the commercial catches four to three years later.
In each of the years the fishery investigations have been carried on, the annual report has referred to the age-groups which are growing up and will be of importance in the commercial catches in the years to come. These estimates have proved to be correct in by far the most cases, as can be seen from the summary below. This has been worked out from the author’s annual reports, in which on the basis of the eel-seine catches of the I-, II- and III-groups forecasts were made as to what groups would become of importance in the practical fishery of the Greenlanders. The symbols used indicate: excellent + + + , good -|—|-, fairly good + , poor — and b a d .
T able 34. F o re ca sts on the B a s is of the you ng A ge-G roups.
V ear-Class Age-Group Importance' j j j j j j in the Fishery
1922 .............................. + + + + + + + + +1923 .............................. ....... ...............1924 ..................... + + + + + + + + + + + +1925 ..................... ...........................1926 ..................... + + + + + + + + + +1927 .............................. ....... ■ ---------1928 ............. + + ----------- -----------1929 ..................... + + + + + +1930 .................................193 1 .................... . . . . .■ + ■. + -f-1932 ..................... + + + + + + + +1QQQ _ __ _____ __1934!..'.'.’ ...'.'.’ .’ ! + + + + + + .. + + +1935 ................................. .. + +1936 ..................... + + + + + + 4- H—r •I- H- -f-1937 ................................................1938 ............................... .. . . —
In the 1946 and 1947 investigations the seine catches yielded good quantities of cod belonging to the I- and II-groups, thus indicating th a t the 1945 year- class was abundant; in 1950 it should be prominent in the commercial catches in the Greenland waters. In 1948 much greater quantities of I-group cod were found along the whole coast from Julianehaab district up to Umanak Fjord than in any earlier year. Thus year-class 1947 seems to be very rich and will certainly prove to be of very great importance in the future from 1952 on.
b. T h e Y e a r - C l a s s e s of Cod in t h e C o m m e r c i a l C a t c h e s .
• A very important branch of the investigations on the biology of the food-fishes has been concerned with the composition of the stock year by year and
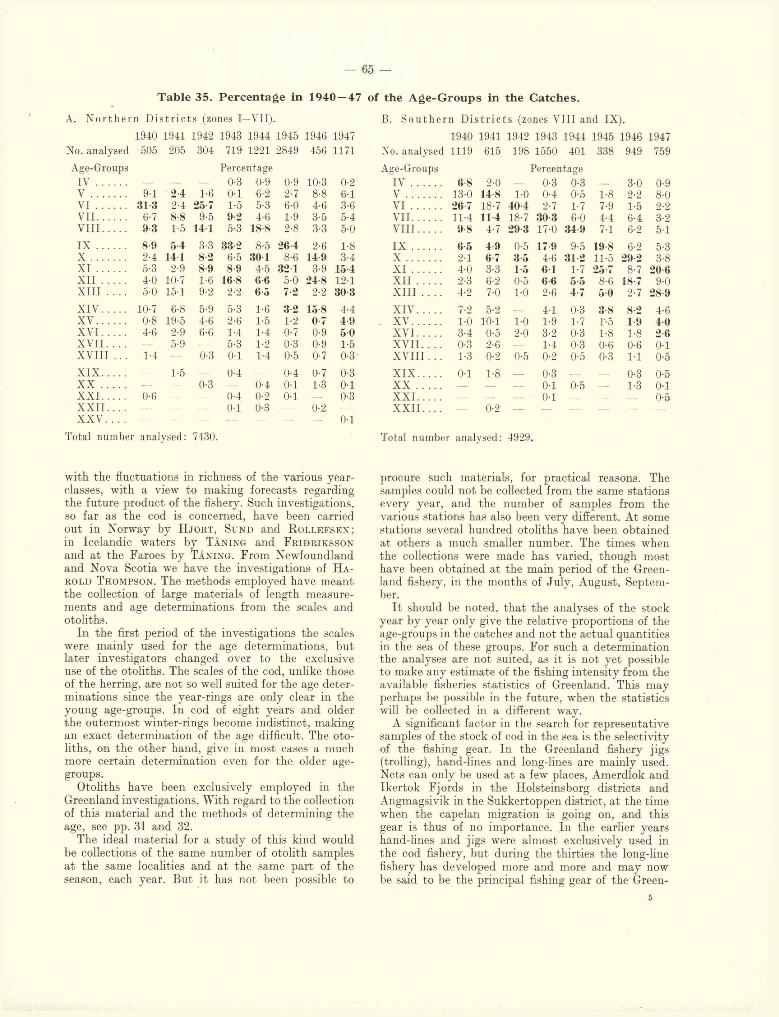
— 65 —
T able 35. P ercentage in 1940 — 47 of the A ge-G rou p s in the C atches.
A. N o r th e rn D is tr ic ts (zones I—VII).
1940 1941 1942 1943 1944 1945 1946 1947 No. analysed 505 205 304 719 1221 2849 456 1171
Age-Groups PercentageI V — — — 0-3 0-9 0-9 10-3 0-2 V 9-1 2-4 1-6 0-1 6-2 2-7 8-8 6-1V I 31-3 2-4 25-7 1-5 5-3 6-0 4-6 3-6VI I 6-7 8-8 9-5 9-2 4-6 1-9 3-5 5-4VII I 9 3 1-5 14 1 5-3 18-8 2-8 3-3 5-0
I X 8-9 5-4 3-3 33-2 8-5 26-4 2-6 1-8 X 2-4 14 1 8-2 6-5 30 1 8-6 14 9 3-4X I 5-3 2-9 8-9 8-9 4-5 32 1 3-9 15-4X I I 4-0 10-7 1-6 16-8 <»-6 5-0 24-8 12-1X II I 5-0 15-1 9-2 2-2 6-5 7-2 2-2 30-3
XI V 10-7 6-8 5-9 5-3 1-6 3-2 15-8 4-4X V 0-8 19-5 4-6 2-6 1-5 1-2 0-7 4-9XV I 4-6 2-9 6'6 1-4 1-4 0-7 0-9 5-0XVII. . . . — 5-9 5-3 1-2 0-3 0-9 1-5X V I I I . . . 1-4 — 0-3 0-1 1-4 0-5 0-7 0-3
X I X 1-5 0-4 0-4 0-7 0-3X X 0-3 0-4 0-1 1-3 0-1X X I 0-6 - 0-4 0-2 0-1 - 0-3X X I I . . . . 0-1 0-3 — 0-2X X V . . . . 01
Total number analysed: 7430.
w ith the fluctuations in richness of the various year- classes, w ith a view to making forecasts regarding the fu ture product of the fishery. Such investigations, so far as the cod is concerned, have been carried out in Norway by H jo r t , Sund and R o llefsen ; in Icelandic waters by Tåning and F ridriksson and a t the Faroes by Tåning . From Newfoundland and Nova Scotia we have the investigations of H arold T hompson. The methods employed have m eant the collection of large materials of length measurem ents and age determ inations from the scales and otoliths.
In the first period of the investigations the scales were mainly used for the age determinations, but later investigators changed over to the exclusive use of the otobths. The scales of the cod, unlike those of the herring, are not so well suited for the age determinations since the year-rings are only clear in the young age-groups. In cod of eight years and older the outermost winter-rings become indistinct, making an exact determination of the age difficult. The otoliths, on the other hand, give in most cases a much more certain determination even for the older age- groups.
Otoliths have been exclusively employed in the Greenland investigations. W ith regard to the collection of this material and the methods of determining the age, see pp. 31 and 32.
The ideal material for a study of this kind would be collections of the same number of otolith samples a t the same localities and at the same part of the season, each year. But it has not been possible to
B. S o u th e rn D is tr ic ts (zones VIII and IX).
1940 1941 1942 1943 1944 1945 1946 1947io. analysed 1119 615 198 1550 401 338 949 759
.ge-Groups PercentageIV 6-8 2-0 — 0-3 0-3 — 3-0 0-9V ............ 13-0 148 1-0 0-4 0-5 1-8 2-2 8-0V I ........... 26 7 18-7 404 2-7 1-7 7-9 1-5 2-2VII 11-4 114 18-7 303 6-0 4-4 6-4 3-2VIII 9-8 4-7 293 17-0 349 7-1 6-2 5-1JX 6 5 4-9 0-5 17 9 9-5 198 6-2 5-3X ............ 2-1 6 7 3-5 4-6 312 11-5 29 2 3-8XI 4-0 3-3 1-5 61 1-7 257 8-7 206X I I ........ 2-3 6-2 0-5 6 6 5-5 8-6 18-7 9-0X I I I ___ 4-2 7-0 1-0 2-6 4-7 5 0 2-7 28-9
X IV ........ 7-2 5-2 ___ 4-1 0-3 3-8 8-2 4-6XV 1-0 10-1 1-0 1-9 1-7 1-5 19 4 0XVI 3-4 0-5 2-0 3-2 0-3 1-8 1-8 2 6XVII. . .. 0-3 2-6 — 1-4 0-3 0-6 0-6 0-1X V I I I . . . 1-3 0-2 0-5 0-2 0-5 0-3 1-1 0-5XIX 0-1 1-8 ___ 0-3 — 0-3 0-5XX — — • — 0-1 <i-r> — . 1-3 0-1XXI — — — 0-1 .— — — 0-5X X II . . . . 0-2 — — — — — — .
Total number analysed: 4929.
procure such materials, for practical reasons. The samples could not be collected from the same stations every year, and the number of samples from the various stations has also been very different. At some stations several hundred otoliths have been obtained a t others a much smaller number. The times when the collections were made has varied, though most have been obtained at the main period of the Greenland fishery, in the months of July, August, September.
I t should be noted, th a t the analyses of the stock year by year only give the relative proportions of the age-groups in the catches and not the actual quantities in the sea of these groups. For such a determination the analyses are not suited, as it is not yet possible to make any estimate of the fishing intensity from the available fisheries statistics of Greenland. This may perhaps be possible in the future, when the statistics will be collected in a diSerent way.
A significant factor in the search for representative samples of the stock of cod in the sea is the selectivity of the fishing gear. In the Greenland fishery jigs (trolling), hand-lines and long-lines are mainly used. Nets can only be used at a few places, Amerdlok and Ikertok Fjords in the Holsteinsborg districts and Angmagsivik in the Sukkertoppen district, at the time when the capelan migration is going on, and this gear is thus of no importance. In the earlier years hand-lines and jigs were almost exclusively used in the cod fishery, but during the thirties the long-line fishery has developed more and more and may now be said to be the principal fishing gear of the Green-
5
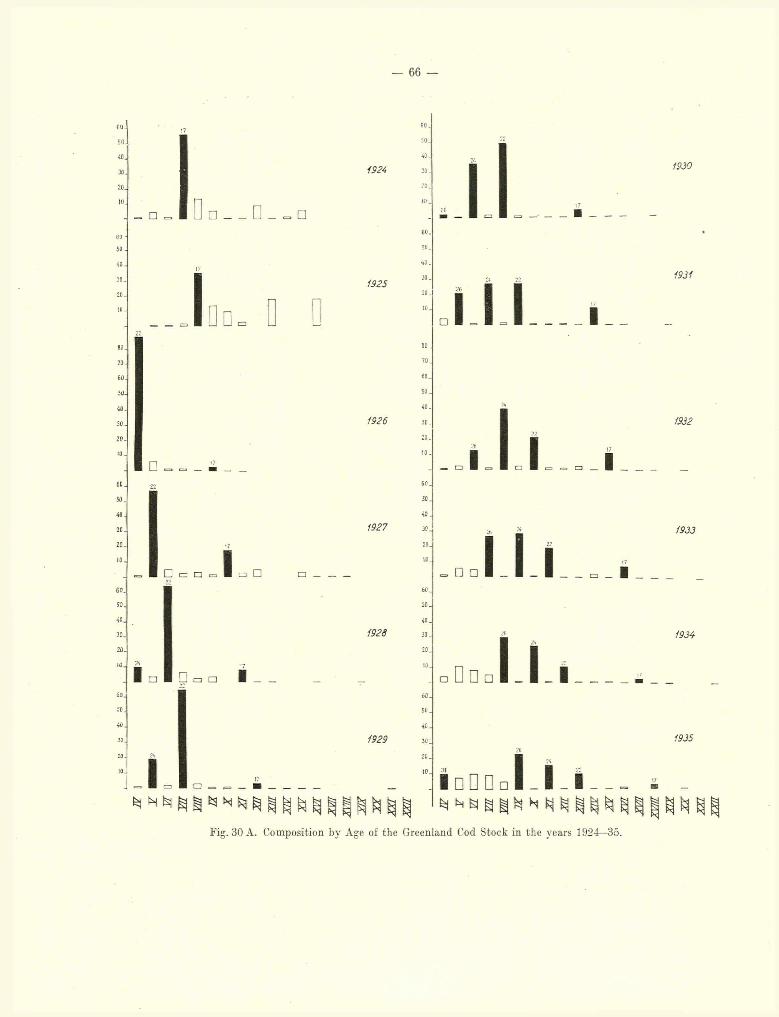
6 0
50
40.
30
20
10
60
SO
40 .
30 .
2 0 .
10.
807060
50.
4 0
30
2 0 .
10.
6 0 .
SO.
4 0 .
30 .
2 0 .
10.
60 .
JO .
40.
30.
2 0 .
10.
CO.
50.
4 0 .
30.
2010
— 66 —
1924
□ □
17
I
1925
□ □ □ L J
1926
□22
1927
□ a n
17
I □
1928
1929
24
I
50 _
40 .
30
20.
10..
60 _
50 .
40
30
20
60 .
50
40
30 _
20
10
I
24 22
I I I
1930
1931
I
1932
I i I
■
I
1933
□ □ J I I
1934
1935
I'
_l _iN N ^ i j N N f c | ^ £ ^
Fig. 30 A. Composition by Age of the Greenland Cod Stock in the years 1924—35.
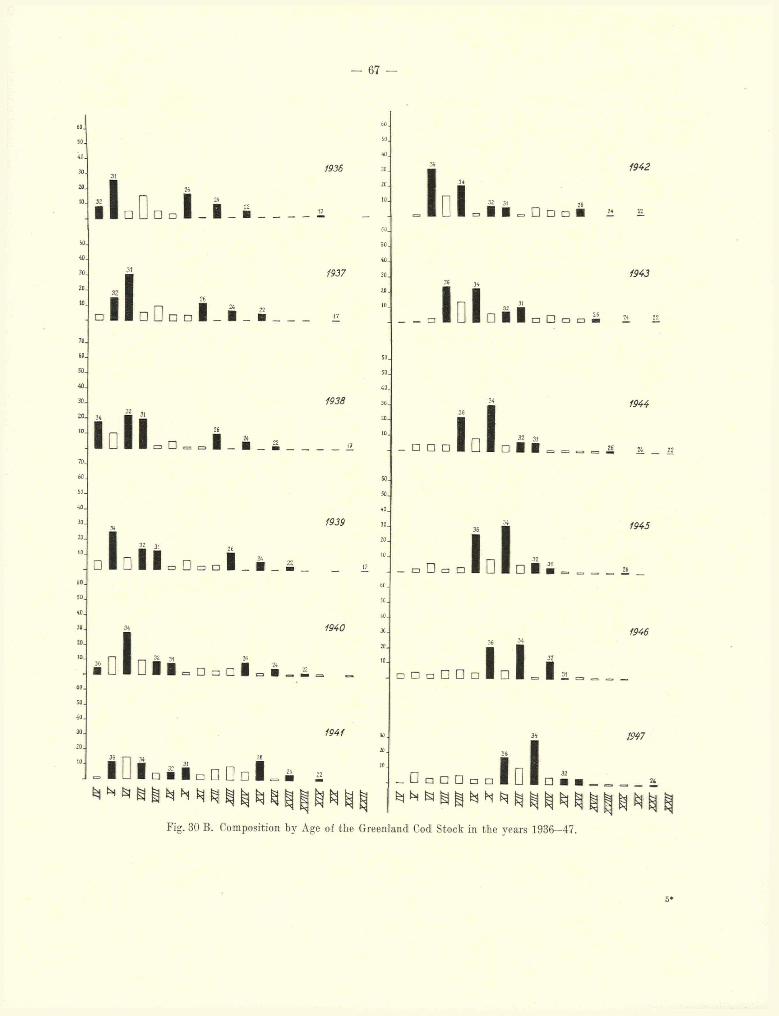
— 67 —
30.
20.
■ I li.1936
D
■UL
I I n D n n l - i - B
193736 34
l l . 1 □ P
1938a ,,
I II □
34
I1939
□ I □ Ï Ï CD 0 O □ i
■ □ l [ ] i i = n a D i = å _ s
1940
1941
■ PI 34 31 ■
= I U I p i É n D D n l =aå £
□ □ □
□ □ □
I
l l
36 ■
loi
32 31
□
□ □ □ □ D □
36 _
l o i
_ D □ o o □ □
Fig. 30 B. Composition by Age of the Greenland Cod Stock in the years 1936-47.
1942
24 22
1943
1944
=s — J i 22
1945
2b
1946
1941
u
5 ‘
— 68 —
landers. The collections of otoliths from the later years practically all come from the cod taken by long-lines.
My impression is, tha t the selectivity of the gear used in the investigation of the cod stock in Greenland waters has been of less importance than in other waters, e. g., Iceland where nets are used to a great extent. One cannot ignore the possibility, however, th a t in the first years of the investigations, when the fishery was mainly carried on by jigs, some age-groups have been too strongly represented in the catches by comparison with their actual quantities in the sea. This applies especially to the 1922 year-class.
In the Annales Biologiques 1943, pp. 108—109, the present author has discussed the age-group composition of the catches made by the Greenlanders in the years 1924—39.
Table 35 shows the age analyses of the catches in the different years' from the two areas, northern districts (zones I—VII) A and southern districts (zones V III—IX) B for the period 1940—47. A graphic representation of the results of the age analyses in 1924—47 is given for both areas and the banks in Fig. 30. The number of the determinations has varied somewhat in the different years ; the greatest number is from the northern area, 28,438, from the southern we have 18,483 and from the banks 3,362.
The III-group is omitted from these summaries; owing to the small size of the individuals it is not well represented in the catches. The IV-group also is possibly not well represented in all the catches, as the size lies below the limit, ca. 60 cm., set by the Greenland Administration as the minimum for the cod to be landed and prepared for export. I t is possible namely, th a t these undersized fish are not always brought to land but thrown overboard after capture. And it is also possible, th a t the smallest specimens of this age-group are too small to be taken by the fishing gear ordinarily used. The same is the case with a number of the V-group. I t is only in the catches of the Greenlanders when fishing for themselves, that the IV-group may not be fully represented. Instructions have always been given to the fishermen to bring in the whole catch, including the small, on the days when samples for analysis were wanted.
From the table and Fig. 30 we see th a t very great fluctuations occur in the size of the year-classes. Large, good classes alternate with small. Eight good years occur in the years of the investigations: 1917, 1922, 1924, 1926, 1931, 1932, 1934 and 1936. From an earlier period there are signs of some good years which may have played a great part in the stock of tha t time: 1912 and 1909. The 1919 year-class, which is known to have been abundant both a t Iceland and Norway, has not been so numerous when young in the Greenland stock, yet seems as older fish to be the class which, after the 1917 year-class, has been the most abundant among the year-classes older than 1922.
The 1922 year-class has been the most abundant of
all year-classes th a t have occurred a t Greenland up to 1939. From the time when it first entered the catches, as IV-group, in 1926 and till 1929 it contributed over 60 °/0 of the cod taken by the Greenlanders. In 1926 it amounted to as much as 87-9 °/0 of the cod taken in the northern districts. Even if it has played such a large part in the catches, i t has certainly not amounted to such a large percentage in the actual stock. Its large proportions in the catches may have come from its living in shallower water with a greater tendency to take the bait than the large, older cod. In these years the cod of this group literally swarmed everywhere in the coastal waters and in the fjords, both right inshore and farther out. The fish were often in such dense shoals, th a t the hand-line could not be sunk to the bottom, so keen were they to snap a t the bait ; consequently, it was difficult to get a t the larger and older cod which as a rule keep down below and do not take the hook so readily. Several times in calm weather the author has stood on the rocks and watched enormous numbers of these smaller cod so densely packed th a t one could hardly see the bottom even in the shallow water. All about, small children as well as old folk, took part in the fishing a t this time and it proved of immense importance to the population. The cod fishing became the staple industry in South Greenland. As XHI-group the 1922 year-class still yielded about 10 °/0 of the cod taken; a t this age it had an average weight of about 7-5 kg. and was thus obviously of great importance in the fishery. As XIV-group in 1936 it contributed only a little over 5 °/0 and decreased still further in the following years. The last individuals of the 1922 class were found in 1944. In the more northerly districts (zones I—VII) it was represented by about 0-3 °/o in the catches.
The marking experiments have shown, th a t the cod of this year-class (1922) migrated in large numbers to Iceland; more of this class have been retaken at Iceland than of any other one. The 1924 class has also been abundant but its importance for the fishery has not been so great; in 1930—35 as VI- to Xl-group it seems to have been specially abundant in the two southern districts. In 1936 it shows a sudden drop with the appearance of the 1931 and 1932 classes, right down to 5-6 °/0 and to slightly over 3 % in1938 and 1939.
The marking experiments have also shown a great emigration to Iceland of the 1924 class. In the southern districts it was detected for the last time in 1944, when as XX-group it composed 0-5 °/0 of the catches ; in the northern districts it yielded 0-2 °/o of the catches in 1946.
The 1926 class stands No. 3 in the series of year- classes which have been of importance in the Greenland stock of cod during the years of investigation. I t seems to have occurred in greatest numbers in the northern area, in contrast to the 1924 class which was most abundant in the southern parts. I t maintains itself fairly uniformly until 1942 when as XVI- group it falls right down to 6-6 °/0 from 19-5 °/„ in the
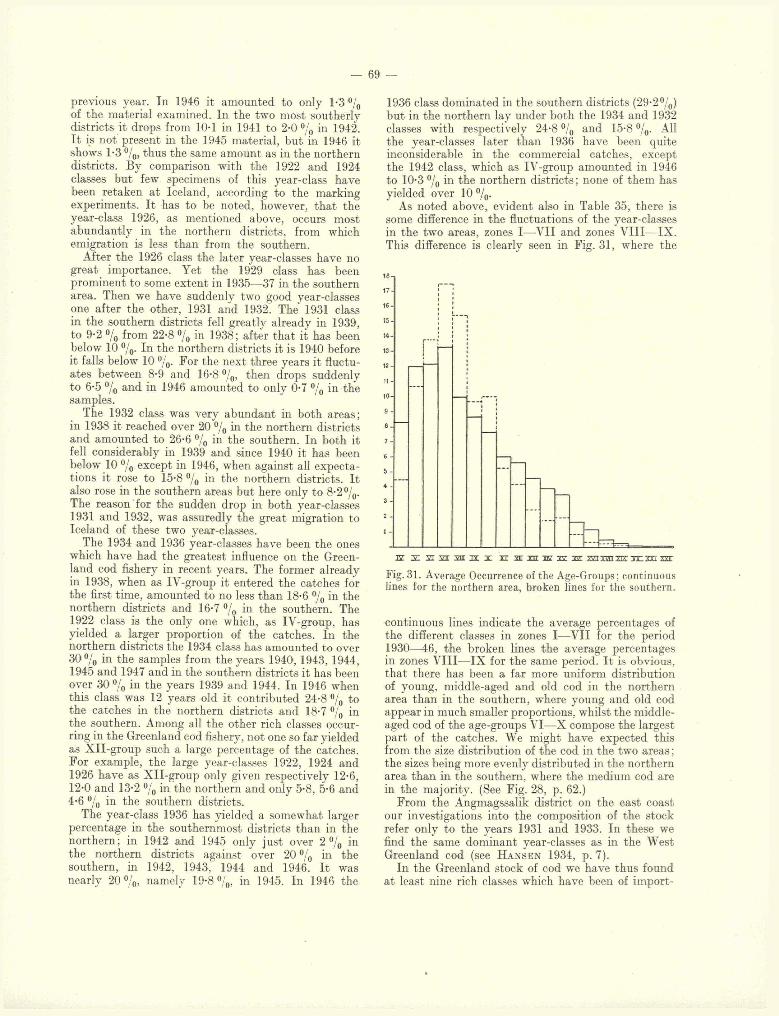
— 69 —
previous year. In 1946 it amounted to only 1-3 % of the material examined. In the two most southerly districts it drops from 10-1 in 1941 to 2-0 % in 1942. I t is not present in the 1945 material, but in 1946 it shows 1-3 °/0, thus the same amount as in the northern districts. By comparison with the 1922 and 1924 classes but few specimens of this year-class have been retaken a t Iceland, according to the marking experiments. I t has to be noted, however, th a t the year-class 1926, as mentioned above, occurs most abundantly in the northern districts, from which emigration is less than from the southern.
After the 1926 class the later year-classes have no great importance. Yet the 1929 class has been prominent to some extent in 1935—37 in the southern area. Then we have suddenly two good year-classes one after the other, 1931 and 1932. The 1931 class in the southern districts fell greatly already in 1939, to 9-2 % from 22-8 % in 1938; after tha t it has been below 10 % . In the northern districts it is 1940 before it falls below 10 % . For the next three years it fluctuates between 8-9 and 16-8 % , then drops suddenly to 6-5 °/0 and in 1946 amounted to only 0-7 % in the samples.
The 1932 class was very abundant in both areas; in 1938 it reached over 20 % hi the northern districts and amounted to 26-6 % the southern. In both it fell considerably in 1939 and since 1940 it has been below 10 % except in 1946, when against all expectations it rose to 15-8 % in the northern districts. I t also rose in the southern areas but here only to 8-2%. The reason for the sudden drop in both year-classes1931 and 1932, was assuredly the great migration to Iceland of these two year-classes.
The 1934 and 1936 year-classes have been the ones which have had the greatest influence on the Greenland cod fishery in recent years. The former already in 1938, when as IV-group it entered the catches for the first time, amounted to no less than 18-6 % in the northern districts and 16-7 % in the southern. The 1922 class is the only one which, as IV-group, has yielded a larger proportion of the catches. In the northern districts the 1934 class has amounted to over 30 % in the samples from the years 1940, 1943, 1944, 1945 and 1947 and in the southern districts it has been over 3 0 % in the years 1939 and 1944. In 1946 when this class was 12 years old it contributed 24-8 % to the catches in the northern districts and 18-7 % in the southern. Among all the other rich classes occurring in the Greenland cod fishery, not one so far yielded as XII-group such a large percentage of the catches. For example, the large year-classes 1922, 1924 and 1926 have as XII-group only given respectively 12-6, 12-0 and 13-2 % in the northern and only 5-8, 5-6 and 4-6 % in the southern districts.
The year-class 1936 has yielded a somewhat larger percentage in the southernmost districts than in the northern; in 1942 and 1945 only just over 2 % in the northern districts against over 20 % in the southern, in 1942, 1943, 1944 and 1946. I t was nearly 20 % , namely 19-8 % , in 1945. In 1946 the
1936 class dominated in the southern districts (29-2%) but in the northern lay under both the 1934 and 1932 classes with respectively 24-8 % and 15-8 % . All the year-classes later than 1936 have been quite inconsiderable in the commercial catches, except the 1942 class, which as IV-group amounted in 1946 to 10-3 % in the northern districts ; none of them has yielded over 10 %.
As noted above, evident also in Table 35, there is some difference in the fluctuations of the year-classes in the two areas, zones I—V II and zones V III—IX. This difference is clearly seen in Fig. 31, where the
1 6 - ,
I Z X 2 1 3 Z II 2 1 H I X E H E 2 H E 2 H !E Z 2 2 T X H T X M S X 3 X 1 X X E X X T
Fig. 31. Average Occurrence of the Age-Groups; continuous lines for the northern area, broken lines for the southern.
continuous lines indicate the average percentages of the different classes in zones I—V ll for the period 1930— 46, the broken lines the average percentages in zones V III—IX for the same period. I t is obvious, tha t there has been a far more uniform distribution of young, middle-aged and old cod in the northern area than in the southern, where young and old cod appear in much smaller proportions, whilst the middle- aged cod of the age-groups VI—X compose the largest part of the catches. We might have expected this from the size distribution of the cod in the two areas; the sizes being more evenly distributed in the northern area than in the southern, where the medium cod are in the majority. (See Fig. 28 , p. 62.)
From the Angmagssalik district on the east coast our investigations into the composition of the stock refer only to the years 1931 and 1933. In these we find the same dominant year-classes as in the West Greenland cod (see H a n s e n 1934, p . 7).
In the Greenland stock of cod we have thus found at least nine rich classes which have been of import
— 70 —
ance in the practical fishery. These were 1912, 1917, 1922, 1924, 1926, 1931, 1932, 1934 and 1936. For Iceland similar investigations on the fluctuations of the year-classes in the stock have been published by Tåning (1931) and by F ribriksson (1934 and 1943). S und (1936) made a comparison of the fluctuations in European waters and in the north-western area. For Newfoundland Thom pson (1943) has given some information regarding the fluctuations there. The same author has made a summary of the fluctuations in Norwegian, Icelandic, Greenland and American waters. At Iceland the year-classes 1912, 1917, 1922 and 1924 have been rich year-classes as a t Greenland. On the other hand, the rich years 1913, 1915 and 1919 a t Iceland have not shown themselves in any large quantities in the Greenland waters. The year- class 1926 was very rich a t Greenland but does not seem to have been very important a t Iceland. We may note here, th a t this year-class was only slightly represented in the recaptures of marked Greenland cod a t Iceland.
Regarding the year-class 1931 F rid r i ic s so n (1943) states, th a t it was present in 1939 on the Icelandic spawning grounds, where with the year-class 1930 it made up more than half of the stock. As the 1931 class had not been found abundantly in the immature stages a t Iceland, F r ib r ik s s o n is of the opinion tha t it has grown up a t Greenland and later migrated to Iceland to spawn. After the spawning of 1939 was over, the 1930 and 1931 classes were not found in any great quantities in the colder parts of Iceland (N. and E. coasts), from which F r ib r ik s s o n concludes, tha t it has migrated back again to Greenland. As we have seen, the 1931 class has been of some importance in some years in the Greenland waters. Its sudden decline in 1939 as well as the recovery of many marked Greenland cod of this class a t Iceland makes it probable, th a t this year-class has gone to supplement the spawning stock a t Iceland. But th a t it may have returned to Greenland after spawning, is not evident in the percentages for the Greenland catches.
The 1930 class has not been of any importance at Greenland whereas it has been richly represented at Iceland. The 1932 class, a rich year a t Greenland, does not seem to have amounted to much a t Iceland, whereas the 1934 class has been good in both Greenland and Iceland. The 1936 class, a very rich year a t Greenland, occurred in fairly large quantities on
T able 36. Cod F lu ctuation s.
Year-Class Norway Iceland Greenland191 2 ................... + + +191 3 ................... — +1915................... + +1917................... + + +1919................... + + +?1922................... + + +1924................... + + .+1926................... — — +192 9 ................... + — —?193 0 ................... + + —193 1................... — — +193 2 ................... — — +1934 + + +193 6 ................... — + ? +193 7................... + — —
the north-west and north coasts of Iceland in 1939 and has probably been a good year-class also in Icelandic waters.
The fluctuations in Greenland and Iceland thus only resemble each other to a certain extent. Most of the dominant classes in the Greenland stock have also been well-represented a t Iceland, e. g., the year- classes 1912, 1917, 1922, 1924, 1934 and perhaps 1936. Some of the year-classes have been dominant in the one area, and not in the other, e. g., 1926, 1931 and 1932, rich a t Greenland but not a t Iceland; and the classes 1913, 1915, 1919 and 1930 which have been of importance a t Iceland, but not a t Greenland.
The fluctuations in Norwegian waters have been discussed in recent years by T å n in g (1931), S und (1936) and R o l l e f s e n (1947). I t appears tha t the classes 1912, 1917, 1922, 1924 and 1934 have been prominent years a t Norway as a t Greenland; besides these the year-classes 1915, 1919, 1929, 1930, and1937 dominated a t Norway, bu t were of less importance a t Greenland. The rich Greenland classes 1926, 1931,1932 and 1936 do not seem to have had any great importance in Norwegian waters.
For Newfoundland and Labrador the information given by Thom pson is not so exact as to permit of a comparison between the different areas. I t is stated for Labrador, th a t the classes 1924, 1925 and1926 have been good.
The accompanying Table 36 indicates the year- classes of importance in the Norwegian, Icelandic and Greenland stocks of cod. + means a rich year-class,— a class of little importance.
VII. The relative Importance of the various Year-Classes in the Greenland Fisheries.
In the preceding section we have only dealt with the percentage quantities of the various year-classes of cod in the catches of the Greenlanders. We have now to consider, what the various year-classes have yielded both in number and weight in the years 1926 to 1946. By means of the total catches in the separate vears, the percentages of the year-classes in the
samples collected and the average lengths and weights of cod belonging to the different age-groups, we are able to calculate the number and weight of each year- class taken in the separate years.
Fig. 32 shows the number (columns) and weight (dotted lines) of the year-classes for the period 1926—1946. I t gives some idea of the dominating
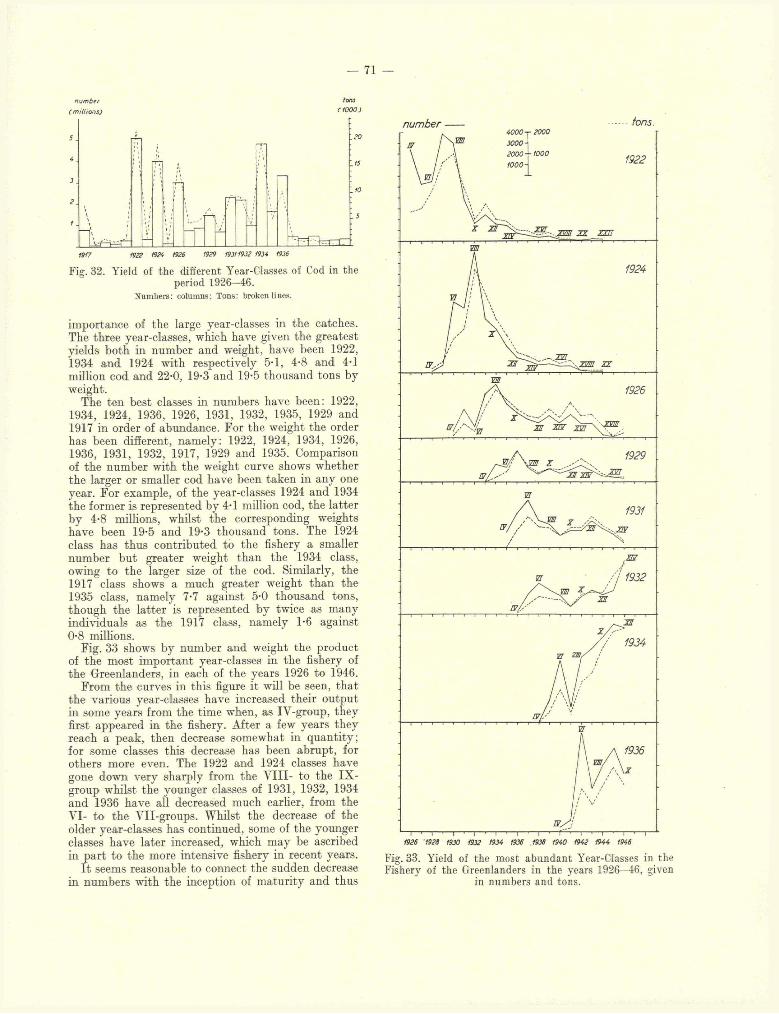
— 71 —
tons C1000)
number(millions)
1917 1922 1924 1926 1929 19311932 1934 1936
Fig. 32. Yield of the different Year-Classes of Cod in the period 1926—46.
Numbers: columns; Tons: broken lines.
importance of the large year-classes in the catches. The three year-classes, which have given the greatest yields both in number and weight, have been 1922,1934 and 1924 with respectively 5*1, 4-8 and 4-1 million cod and 22-0, 19-3 and 19-5 thousand tons by weight.
The ten best classes in numbers have been: 1922,1934, 1924, 1936, 1926, 1931, 1932, 1935, 1929 and 1917 in order of abundance. For the weight the order has been different, namely: 1922, 1924, 1934, 1926, 1936, 1931, 1932, 1917, 1929 and 1935. Comparison of the number with the weight curve shows whether the larger or smaller cod have been taken in any one year. For example, of the year-classes 1924 and 1934 the former is represented by 4-1 million cod, the latter by 4*8 millions, whilst the corresponding weights have been 19-5 and 19*3 thousand tons. The 1924 class has thus contributed to the fishery a smaller number but greater weight than the 1934 class, owing to the larger size of the cod. Similarly, the1917 class shows a much greater weight than the1935 class, namely 7-7 against 5-0 thousand tons, though the latter is represented by twice as many individuals as the 1917 class, namely 1*6 against 0-8 miUions.
Fig. 33 shows by number and weight tbe product of the most important year-classes in the fishery of the Greenlanders, in each of the years 1926 to 1946.
From the curves in this figure it will be seen, that the various year-classes have increased their output in some years from the time when, as IV-group, they first appeared in the fishery. After a few years they reach a peak, then decrease somewhat in quantity; for some classes this decrease has been abrupt, for others more even. The 1922 and 1924 classes have gone down very sharply from the V III- to the IX- group whilst the younger classes of 1931, 1932, 1934 and 1936 have all decreased much earlier, from the VI- to the VH-groups. Whilst the decrease of the older year-classes has continued, some of the younger classes have later increased, which may be ascribed in part to the more intensive fishery in recent years.
I t seems reasonable to connect the sudden decrease in numbers with the inception of m aturity and thus
number tons.
1922
1924
YVJ _
1926
m znr
1929
1931
1932
1936
1926 19IS 1930 1932 1934 1936 .1936 1940 1942 1944 1946
Fig. 33. Yield of the most abundant Year-Classes in the Fishery of the Greenlanders in the years 1926—46, given
in numbers and tons.
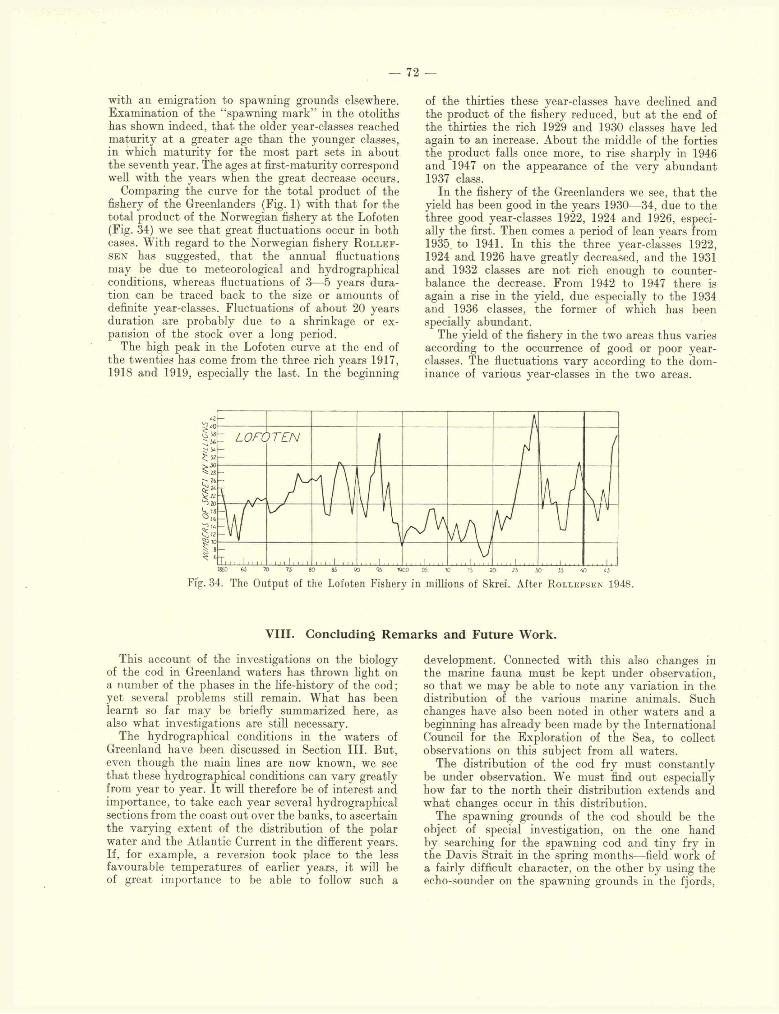
— 72 —
with an emigration to spawning grounds elsewhere. Examination of the “spawning m ark” in the otoliths has shown indeed, tha t the older year-classes reached m aturity a t a greater age than the younger classes, in which m aturity for the most part sets in about the seventh year. The ages a t first-maturity correspond well with the years when the great decrease occurs.
Comparing the curve for the total product of the fishery of the Greenlanders (Fig. 1) with th a t for the total product of the Norwegian fishery at the Lofoten (Fig. 34) we see th a t great fluctuations occur in both cases. With regard to the Norwegian fishery R o l l e f - se n has suggested, th a t the annual fluctuations may be due to meteorological and hydrographical conditions, whereas fluctuations of 3—5 years duration can be traced back to the size or amounts of definite year-classes. Fluctuations of about 20 years duration are probably due to a shrinkage or expansion of the stock over a long period.
The high peak in the Lofoten curve a t the end of the twenties has come from the three rich years 1917,1918 and 1919, especially the last. In the beginning
of the thirties these year-classes have declined and the product of the fishery reduced, but a t the end of the thirties the rich 1929 and 1930 classes have led again to an increase. About the middle of the forties the product falls once more, to rise sharply in 1946 and 1947 on the appearance of the very abundant1937 class.
In the fishery of the Greenlanders we see, tha t the yield has been good in the years 1930—34, due to the three good year-classes 1922, 1924 and 1926, especially the first. Then comes a period of lean years from1935. to 1941. In this the three year-classes 1922,1924 and 1926 have greatly decreased, and the 1931 and 1932 classes are not rich enough to counterbalance the decrease. From 1942 to 1947 there is again a rise in the yield, due especially to the 1934 and 1936 classes, the former of which has been specially abundant.
The yield of the fishery in the two areas thus varies according to the occurrence of good or poor year- classes. The fluctuations vary according to the dominance of various year-classes in the two areas.
L O F O T E N
Fig. 34. The Output of the Lofoten Fishery in millions of Skrei. After R o l l e f s e n 1948.
VIII. Concluding Remarks and Future Work.
This account of the investigations on the biology of the cod in Greenland waters has thrown light on a number of the phases in the life-history of the cod ; yet several problems still remain. W hat has been learnt so far may be briefly summarized here, as also what investigations are still necessary.
The hydrographical conditions in the waters of Greenland have been discussed in Section III . But, even though the main lines are now known, we see th a t these hydrographical conditions can vary greatly from year to year. I t will therefore be of interest and importance, to take each year several hydrographical sections from the coast out over the banks, to ascertain the varying extent of the distribution of the polar water and the Atlantic Current in the different years. If, for example, a reversion took place to the less favourable temperatures of earlier years, it will be of great importance to be able to follow such a
development. Connected with this also changes in the marine fauna must be kept under observation, so th a t we may be able to note any variation in the distribution of the various marine animals. Such changes have also been noted in other waters and a beginning has already been made by the International Council for the Exploration of the Sea, to collect observations on this subject from all waters.
The distribution of the cod fry must constantly be under observation. We must find out especially how far to the north their distribution extends and what changes occur in this distribution.
The spawning grounds of the cod should be the object of special investigation, on the one hand by searching for the spawning cod and tiny fry in the Davis Strait in the spring months—field work of a fairly difficult character, on the other by using the echo-sounder on the spawning grounds in the fjords,
— 73 —
e. g. Godthaab Fjord, to determine the depths and the temperature a t which spawning takes place. Preparations have already been made to carry out such investigations, as it has been arranged th a t the research vessel M/K “Adolf Jensen” , so far as the conditions permit, will work on the Fylla Bank and in Godthaab Fjord in the early spring of 1948.
The age of the cod a t first-maturity has constantly to be investigated, the samples of otoliths collected every year being examined not only for analysis of the age but also for the number of spawning zones. These investigations have shown, namely, tha t great differences may occur in the age a t first-maturity for the different year-classes.
With regard to the growth of the cod, great differences have also been found in this respect in the different year-classes. The otolith samples and length measurements collected yearly at the different fishing stations and by the research vessels will provide excellent material for such investigations.
So far as the food of the cod is concerned, the investigations have so far been mainly superficial. I t is desirable to have investigations of a more quantitative character. So far it has been difficult to make such investigations from the small vessels available. I t would be better to undertake them from a station on land. They should also be carried on throughout a whole season, to determine variations in the quantity of food a t different times. More complete information regarding the occurrence and changes in quantity of the principal food-animals, such as capelan and lance should be sought and also, the amount of food in the cod stomachs. Both old and young cod should be examined.
The numerical characters, number of vertebrae and rays in D 2, are hardly worth investigating, the variations within the restricted area of the Greenland waters being insignificant. The results obtainable are out of all proportion to the immense, time-wasting labour involved in such investigations.
W ith regard to the migrations of the cod, the marking experiments have yielded such interesting results, th a t they should be continued every year. Special importance attaches to the marking of cod in the Julianehaab district, from which it is known th a t the greatest migration to Iceland takes place, but similar experiments in the northern districts should not be neglected. I t would be of importance to have marking experiments in some years from
localities evenly distributed over fjords, coastal areas and the off-shore banks within the whole field of distribution of the cod a t West Greenland.
I t is desirable likewise, th a t continuous marking experiments should be made a t Iceland, especially on the cod spawning grounds there, in order to ascertain whether a return migration of spent cod to Greenland occurs regularly.
In the investigations on the Greenland cod most weight has been laid on determining the fluctuations in the quantities of the different year-classes in the stock. The practical importance of such investigations for determining the prospects of the future fishery is obvious. I t has proved, th a t investigations of this kind on the quantities of cod in the earliest age-groups can in most cases yield an estimate of the probable product of the fishery some four to five years ahead. Observations on the occurrence of the three youngest age-groups are thus of great importance and the search for these groups with eel-seine a t suitable localities will be continued. Collection of otoliths to determine the importance of the different year-classes in the catches will likewise continue, as it is of interest to determine how long any dominant year-class continues prominent in the catches. Investigation has shown, th a t the different year-classes vary greatly in this respect. For example, the year-class 1934 has remained much longer prominent in the catches than the previously known rich year-classes.
Finally, the wish may be expressed, th a t in other areas where cod investigations are carried on, similar yearly analyses of the stock should be made to determine the good and bad years. Such investigations are being made in Norway, the Faroes and Iceland, but are lacking in the whole American region, from Labrador, Newfoundland and the U.S.A., where an intensive cod fishery is carried on. I t would be extremely desirable to have these areas included in these investigations, so as to obtain a complete picture of the composition of the stock in the whole region of distribution. Comparisons between the areas with regard to the composition of the stocks in good or bad year-classes together with observations on tbe hydrographical and possibly other factors affecting the composition would lead to a fuller comprehension of the changes and fluctuations which are of such importance for the commercial fishery.
S u m m a r y .
The occurrence of the cod in Greenland waters has been periodic. The present period, the longest known, began in the twenties and has arisen from a favourable change in the hydrographical conditions. This warm period has been marked by changes in the distribution of several species in the Greenland waters.
The stock of cod a t West Greenland may be divided
roughly into a northern part, living in the waters north of the Frederikshaab district as far as the most northerly occurrence of the species up towards Uperni- vik and including the off-shore banks in the Davis Strait, and a southern part living in the Julianehaab and the Frederikshaab districts. There is no sharp delimitation between the two, and the conditions
74
cannot yet be said to be wholly elucidated. In addition, local populations are to be found in certain fjords.
At East Greenland the cod occurs in the Angmags- salik district, but very little is as yet known about its occurrence a t the southern part of the east coast. The spawning grounds of the northern stock have not yet been precisely determined, but it may be assumed th a t the cod spawns in the Davis Strait, possibly in the warm Atlantic water on the slope of the marine banks, and sporadically in the coastal area between ca. 63° and 67° N. L. From there the fry are carried northwards with the current. Some of the cod spawn in Icelandic waters, but this emigration is of far less extent than from the southern area of Julianehaab and Frederikshaab. The small cod of the age-groups I and II have been found growing up in Disko Bay and the northern Yajgat, and in small numbers in Umanak Fjord.
The cod in the districts of Julianehaab and Frederikshaab have a close connection with Iceland, having their spawning places on the south and west coasts of th a t island, whence the fry are carried with the current over to Greenland, where on the southwest coast large numbers of the I- and Il-groups have been discovered. The East Greenland stock a t Ang- magssalik has also a close connection with Iceland.
The local populations occurring in Ikertok, Kangia and the Godthaab Fjord spawn within the fjord. Fairly large numbers of the fry are apparently carried out of Godthaab Fjord and spread along the coastal area. An important spawning ground of the cod has been found in one of the innermost arms of the Godthaab Fjord, a t 'Kapisigdlit.
In numerical characters, number of vertebrae and number of rays in D 2, the northern group is distinguished from the southern in having a higher number of vertebrae. The number of vertebrae in the southern group and the population on the east coast is very close to what has been found for the cod a t Iceland. There is no agreement between the Greenland and Newfoundland cod in regard to number of vertebrae. Whilst the cod of Godthaab Fjord are distinguished from the cod bl the coast and banks chiefly by the structure of the otoliths and less by the numerical characters, the stocks in Ikertok and Kangia have respectively higher and lower values for the number of vertebrae than the cod in other localities. These two stocks may be regarded as old accumulations in contrast to the cod in Godthaab Fjord which are possibly a mixture of an old stock with cod from outside.
I t has been shown, th a t maturity begins a t an earlier stage in the younger than in the older year- classes of cod; this holds good for both the northern and southern groups of cod. The curves for the age a t first-maturity have however a somewhat different character in the two areas (Fig. 11).
The growth shows certain differences in the different groups. For a long period the average lengths of the various year-classes have been greater in the northern than in the southern cod. This has now changed and
the lengths of the year-classes occurring in the Ju lianehaab district do not show any essential difference from the corresponding lengths in the northern group. This has been caused by the slower growth of the later year-classes (1931, 1932,1934 and 1936) by comparison with the older (1922, 1924 and 1926). This decrease in growth has been greater in the northern districts than in Julianehaab. With regard to the fjord population, we have only material from the Godthaab Fjord for any number of years, and this shows an even greater decline in the average lengths than is apparent in other Greenland localities. The fjord populations in Ikertok and Kangia seem to have a slower growth than the cod in the coastal area. The capelan and lance play a great part in the food of the cod and give rise to more or less extensive migrations.
Marking experiments over a number of years have shown that the cod migrate to Iceland from most of the West Greenland localities right up to Egedesminde. From the northern districts there is but little emigration, but it is very considerable from the Frederikshaab and Julianehaab districts. This is a spawning migration, taking place in the late autumn and winter to spawning places a t Iceland. There is a migration in the opposite direction, which seems to have a still more periodic character than the spawning migration. We cannot say whether it is a general rule, th a t the Greenland cod after spawning a t Iceland return to Greenland waters. The greatest number of marked cod, which have migrated from Iceland, have been retaken on the northern banks. I t may be mentioned, th a t in the year 1931 when most of these recaptures were made, a great many cod were caught north of the marking localities a t Greenland. Special spawning places for the cod a t Greenland have not been disclosed by the marking experiments. One exception however is Kapisigdlit in the Godthaab Fjord, but this is only a spawning ground for the local fjord population and some few cod from the adjacent coastal and bank areas, Fylla Bank. Marking experiments on the cod in Ikertok, Kangia and Godthaab Fjord have yielded a very large number of recaptures from the place of marking and its neighbourhood. From these marking experiments there have been but few returns from Iceland.
Recaptures of marked Greenland cod a t Iceland continue in the first seven years after marking, but most are retaken in the year after marking. Whilst recaptures in the northern part of Greenland continue for a long series of years (up to 10—13 years), no cod in the Frederikshaab and Julianehaab districts have been retaken later than seven years after marking. The ages of the cod recaptured at Iceland are different for those marked in the northern districts and those marked in the Frederikshaab—Julianehaab district. In the former the cod mainly belong to the X- andXI-groups, in the latter to the age-groups VII—IX. Of the cod retaken a t Iceland those marked in the northern part of Greenland have been larger than those marked in the Julianehaab district.
W ith regard to the size of the cod caught by the
— 75 —
Greenlanders it has been found, th a t the lengths in the northern area represent a fairly even mixture of small, medium and large cod, whereas the cod in the southern districts are mainly of the medium size. In agreement with this we find from the distribution of the age-classes in the catches, th a t there is a much more equal distribution in the northern area than in the southern, where cod of the middle ages dominate.
The different year-classes persist longer in the northern than in the southern area. Fluctuations of the year-classes are more marked in the Greenland stock of cod than in other regions where cod occur. During the period 1926—1946 there have been eight rich year-classes, which have been dominant in the catches. These were from the years 1917, 1922, 1924, 1926, 1931, 1932, 1934 and 1936. Several of these year-classes have been identified already as I- and II-groups in the eel-seine catches at the coast.
Differences have been found in the occurrence of the year-classes in the northern and southern areas;
for example, the 1924 class has been more prominent in the southern than in the northern. On the other hand, the 1926 class has been more numerous in the northern stock. This may account for the fact, tha t this 1926 class has been poorly represented in the recaptures of Greenland cod at Iceland, since the most extensive emigration takes place from the southernmost districts.
Comparison of the results from Greenland, Norway and Iceland with regard to the fluctuations of the different year-classes, has revealed fairly large differences between them (Table 36).
The importance of the different year-classes for the fishery of the Greenlanders has been indicated by numbers and weight in Fig. 33. The 1922 class has had the greatest importance hitherto, but in a few years it will probably be superseded by the 1934 class, which has been unusually abundant. For nearly the whole war period the 1934 and 1936 classes have been quite dominant in the catches of the Greenlanders.
L iterature.
Annales Biologiques. 1943: Vol. I, 1939—41. North-Western Area. Contributors: Å r n i F k i d r i k s s o n , P a u l M. H a n s e n , A d o l f K o t t h a u s , Å . V e d e l T å n i n g . Cons. Internat. Explor. Mer., Copenhague.
— 1947 : Vol. II, 1942—1945. North-Eastern Area Report. G u n n a r R o l l e f s e n : Cod (Skrei). North-Western Area Report. Cons. Internat. Explor. Mer, Copenhague.
B r a a r u d , T. & R u u d , J o h . T. 1932: The “ 0 s t”-Expedition to the Denmark Strait. 1929. I. Hydrography. Hval- rådets Skrifter Nr. 4, Oslo.
Bulletin Statistique des Pêches Maritimes. 1925—1938: Vol. XV—XXVIII. Cons. Internat. Explor. Mer, Copenhague.
D e v o l d , F. 1947: Fiskeriene ved Vestgrønland. Fiskets Gang 33. Aarg. Nr. 44, pp. 522—525. Nr. 45, pp. 535— 537. Bergen.
D u n b a r , M. J. 1946: The State of the West Greenland Current up to 1944. Journal of the Fisheries Research Board of Canada, Vol. VI, No. 7. Toronto.
Fiskeriberetninger. Beretninger og Kundgørelser vedr. Styrelsen af Grønland. Aarene 1911—1947. København.
F r i d r i k s s o n , Å. 1929: Age-Composition of the Stock of Cod in East Iceland Fjords during the Years 1925—27. Rapp, et Proc.-Verb. Vol. LVII, Copenhague.
F r i d r i k s s o n , A., H a n s e n P. M., B r u u n , A. F . & V e d e l T å n i n g , Â. 1934: Report concerning the Analysis of Cod Otoliths from Iceland. Rapp. et. Proc.-Verb. Vol. LXXXVI, Copenhague.
F r i d r i k s s o n , Å . 1940: Investigations carried out b y the Fisheries Department of the University Research Institute Reykjavik in the Years 1937—1939. Atvin- nudeild Haskolans. Rit Fiskideildar 1940, Nr. 1. Reykjavik.
G r a h a m , M i c h a e l . 1934: Report on the North Sea Cod. Min. Agric. and Fish., Fish. Invest., Ser. II, Vol. XIII, No. 4. 1933.
H a n s e n , P a u l M. 1931: Undersøgelser over den grønlandske Torsk. Beretninger og Kundgørelser vedr. Styrelsen af Grønland. No. 4, p. 705—711. København.
H a n s e n , P a u l M. 1934: Synopsis of investigations into Fluctuations in the Stock of Cod at Greenland during the years 1930—1933. Rapp, et Proc.-Verb. Vol. LXXXVI. Copenhague.
H a n s e n , P a u l M., J e n s e n , Ad. S. & V e d e l T å n i n g , A. 1935: Cod Marking Experiments in the Waters of Greenland 1924—1933. København.
H a n s e n , P a u l M. 1939: The Age-Composition of the Stock of Cod in West Greenland Waters in the Years 1924 to 1938. Rapp, et Proc.-Verb. Vol. CIX. Copenhague.
— Fiskeriundersøgelser ved Vestgrønland. Beretninger og Kundgørelser vedr. Styrelsen af Grønland. Aarene 1932—1940 & 1947. København.
H e r m a n n , F. & T h o m s e n , H. 1946: Drift-Bottle Experiments in the northern Atlantic. Medd. Komm. Danmarks Fiskeri- og Havunders., Ser. Hydrografi. Bd. III, No. 4. København.
H j o r t , J o h a n . 1909: Rapport sur les travaux de la Commission A, 1902—07 (On Gadidae). Rapp, et Proc.- Verb. X. Copenhague.
— 1914: Fluctuations in the great Fisheries of Northern Europe. Rapp, et Proc.-Verb. XX. Copenhague. 1926: Fluctuations in the Year-Classes of important foodfishes. Journ. du Conseil. Vol. I, 1. Copenhague.
H j o r t , J o h a n & R u u d , J o i i . T . 1929: Whaling and Fishing in the North Atlantic. Rapp, et Proc.-Verb. LVI, 1. Copenhague.
I d e l s o n , M. 1930: On the Nourishment of the Food Fishes in the Barents Sea. Ilydrobiologische Zeitschrift herausgegeben von der Biologischen Wolga-Station. Band VIII, No. 10—12. Saratov.
— 1931: Fish Marking in the Barents Sea. Journ. du Conseil. Vol. VI, 3. Copenhague.
I v e r s e n , T h o r . 1933: Nogen Iakttagelser over fiskeyngel i trålfangster i Barentshavet. Rep. Norw. Fish, and Mar. Invest. Vol. IV, No. 5. Bergen. English version see: Some Observations on Fry in Trawl Catches in the Barents Sea. Rapp, et Proc.-Verb. Vol. LXXXV, pt. 3, 1. Copenhague.
— 1933: Some Observations on Cod in Northern Waters. Rep. Norw. Fish and Mar.Invest.VoI. IV, No. 8. Bergen.
— 76 —
I v e r s e n , T h o r . 1936: Sydøstgrønland Jan Mayen. Fiskeri- undersøkelser. Fiskeridirektoratets Skrifter, Ser. Havundersøgelser. Vol. V, No. 1. Bergen.
J e n s e n , A a g e J . C. 1939: On the Laws of Decrease in Fish Stocks. Rapp, et Proc.-Verb. Vol. CX. Copenhague.
J e n s e n , A d . S. 1909: Indberetninger o m Fiskeriundersøgelserne i 1908. Beretninger og Kundgørelser vedr. Kolonierne i Grønland. Nr. 2, pp. 11—32. København.
— 1909: Beretning om Fiskeriundersøgelserne ved Grønland. Beretninger og Kundgørelser vedr. Kolonierne i Grønland. Nr. 5, p. 73—106. København.
•— 1922: S ela stes m arinus. Vidensk. Meddel, fra Dansk naturhist. Foren., Bd. 74, p. 90. København.
— 1925: On the Fishery of the Greenlanders. Medd.. Komm. Havunders., Ser. Fiskeri. VII, 7. København.
— 1926: Investigations of the “ Dana” in West-Green- land Waters, 1925. Rapp, et Proc.-Verb. Vol. XXXIX, p. 97. Copenhague.
J e n s e n , A d . S. & H a n s e n , P. M. 1931: Investigations on the Greenland Cod (Gadus callarias L.). With an Introduction on the History of the Greenland Cod Fisheries. Rapp, et Proc.-Verb. LXXII. (I). Copenhague.
J e n s e n , A d . S. 1939: Concerning a Change of Climate during recent Decades in the Arctic and Subarctic Regions, from Greenland in the West to Eurasia in the East, and contemporary biological and geophysical Changes. Det Kgl. Danske Videnskabernes Selskab. Biolog. Medd. XIV, 8. København.
— 1944: Klimasvingninger over Arktis og deres Følgevirkninger med særligt Henblik paa Grønland. Det Grønlandske Selskabs Aarsskrift. Pag. 7—19. København.
K i i l e r i c h , A. 1943: The Hydrography of the West Greenland Fishing Banks. Medd. Komm. Danmarks Fiskeri- og Havunders., Ser. Hydrografi. Bd. 3, Nr. 3. København.
— 1945: On the Hydrography of the Greenland Sea. Medd. om Grønland. Bd. 144, Nr. 2. København.
L ø v e r s e n , R. 1946: Torskens vekst og vandringer på Sørlandet. Rep. Norw. Fish, and Mar. Invest. Vol. VIII, Nr. 6.
M c K e n z i e , R. A. 1934: Cod Movements on the Canadian Atlantic Coast. Contrib. Canad. Biol, and Fish., N. S. Vol. VIII, No. 31. Toronto.
— 1934: Cod tagging along outer Coast of Nova Scotia. Ann. Rep. Biol. Board of Canada 1933. Ottawa.
M e s c h k a t , A. 1936: Untersuchungen über den Aufbau der Kabeljaunahrung im Bereich der Vestmannainseln. Rapp, et Proc.-Verb. Vol. XCIX. Copenhague.
M e s s i a t z e v a , E. 1932 : Chief Results of the Fishery Research in the Barents Sea in 1930 by the Goin (State .Oceanographical Institute of U.S.S.R.). Rapp, et Proc.-Verb., Vol. LXXXI. Copenhague.
M o l t k e , C. 1896: Temperatur og Saltholdighedsmaalinger af Fjordvand. Medd. om Grønland. Bd. 16, p. 108— 122. København.
N i e l s e n , J. N . 1928: The Waters Round Greenland. Greenland Vol. I, pp. 185—230. Copenhagen.
O l d e n d o w , K n u d : Tilstandene i Grønland 1946. København.
P o r s i l d , M. P . 1945: Sjældne grønlandske Fisk. Grønlandsposten 4. Aarg. Nr. 17, pag. 240—241. Godthaab.
P o u l s e n , E r i k M. 1931 : Biological investigations upon the Cod in Danish Waters. Medd. Komm. Danmarks Fiskeri- og Havunders., Ser. Fiskeri, Vol. IX, No. 1. København.
R o l l e f s e n , G. 1933: The Otoliths of the Cod. Rep. Norw. Fish, and Mar. Invest. Vol. IV, No. 3. Bergen.
R o l l e f s e n , G. 1934: The Cod Otoliths as a Guide to Race, Sexual Development and Mortality. Rapp, et Proc.-Verb. Vol. LXXXVIII. Copenhague.
— 1938: Changes in Mean Age and Growth-Rate of the Year Classes in the Arcto-Norwegian Stock of Cod. Rapp, et Proc.-Verb. Vol. CVIII, I. Copenhague.
— 1942: Litt om skreiens dødelighet. The Fish and the Sea. Rep. Norw. Fish, and Mar. Invest. Vol. VII, No. 6. Bergen.
— 1947: The Cod (Skrei). (North-Eastern Area Report) Ann. Biolog. Vol. II, 1942—1945. Copenhague.
— 1948: The Arcto-Norwegian Stock of Cod. Rapp, et Proc.-Verb. Vol. No. 122, No. 1. Copenhague.
S c h m i d t , J o h s . 1905: The pelagic Postlarval Stages of the Atlantic species of Gadus. Part 1. Medd. Komm. Havunders., Ser. Fiskeri. Bd. 1, Nr. 4. København.
— 1907: Marking experiments on Plaice and Cod in Icelandic Waters. Medd. Komm. Danmarks Fisk.- og Havunders., Ser. Fiskeri Bd. II, Nr. 6. København.
— 1926: The Frequency of young Cod etc. on the North- and East Coasts of Iceland during a period of years. With a Survey of the Life-History of the Icelandic Cod. Rapp, et Proc.-Verb. Vol. XXXIX. Copenhague.
— 1930: Racial Investigations. X. The Atlantic Cod {Gadus callarius L.) and local races of the same. Comptes-Rendus des Trav. du Laboratoire CarlsbergXVIII, Nr. 6. Copenhague.
— 1931: Summary of the Danish Marking experiments on Cod 1904—1929, at the Faroes, Iceland and Greenland. Rapp, et Proc.-Verb. LXXII (III). Copenhague.
S c h r o e d e r , W. C. 1930: Migrations and other Phases in the Life History of the Cod off Southern New England. U. S. Dept, of Commerce, Bull. Bur. Fish. Vol. XLVI. Washington.
S i v e r t s e n , E. 1935: Torskens Gytning. Rep. Norw. Fish, and Mar. Invest. Vol. IV, No. 10. Bergen.
— 1937: Torskens Gytning. Undersøgelser 1934—35. Rep. Norw. Fish, and Mar. Invest. Vol. V, No. 3. Bergen.
S m e d , J e n s . 1947: Monthly Anomalies of the Surface Temperature in the Sea round South Greenland during the Years 1876—1939. Ann. Biol. Vol. II. Copenhague.
Statistiske Oplysninger om Grønland. I. Beretn. vedr.Grønlands Styrelse. Nr. 1. 1942. København.
S t e p h e n s e n , K. 1947: Mærkeligt Fund af to tropiske (subtropiske) Krebsdyr ved Thule. Naturhist. Tidende. 11. Aarg., No. 2. København.
S t r u b b e r g , A. C. 1916: Marking experiments with Cod at the Faroes. Medd. Komm. Havunders. Ser. Fiskeri V, No. 2. København.
— 1933: Marking Experiments with Cod at the Faroes.II. Second Report Experiments in 1923—27. Medd. Komm. Havunders., Ser. Fiskeri IX, No. 7. København.
S u n d , O s c a r . 1929: Torskemerkningen 1928. Arsber. Norges Fiskerier, 1928, Hefte 1. Bergen.
- 1930: The Renewal of a Fish Population studied by Means of Measurement of Commercial Catches. Example: the Arcto-Norwegian Cod Stock. Rapp, et Proc.-Verb. Vol. LXV. Copenhague.
— 1932: Merkning af Torsk. Beretning om Lofotfisket 1931. Bergen.
— 1932: On the German and Norwegian Observations on Cod in 1931. Rapp, et Proc.-Verb. Vol. LXXXI. Copenhague.
— 1934: Cod-Measurements during 21 Years on the Western and Northern Coasts of Norway. Methods and
— 77 —
Results. Rapp, et Proc.-Verb. Vol. LXXXVIII. Copenhague.
S æ m u n d s s o n , B. 1909: Oversigt over Islands Fiske. Skrifter udgivne af Komm. for Havunders. No. 5. København.
— 1913: Continued marking experiments on Plaice and Cod in Iceland Waters. Medd. Komm. Havunders., Ser. Fiskeri. IV. No. 6. København.
— 1923: On the Age and Growth of the Cod (Gadus callarias L.) in Icelandic Waters. Medd. Komm, Havunders., Ser. Fiskeri VII, 3. København.
— 1926: Fiskarnir. Islensk Dyr. I. Reykjavik.— 1927 a: Zoologiske Meddelelser fra Island XV. Vi
densk. Medd. fra Dansk naturh. Foren. Bd. 84. Kobenhavn. .
— 1927 b: Synopsis of the Fishes of Iceland. Rit Visinda- félags Islendinga II. Reykjavik.
— 1934: Probable influence of Changes in Temperature on the Marine Fauna of Iceland. Rapp, et Proc.-Verb. Vol. LXXXVI. Copenhague.
T å n i n g , å . V e d e l . 1929: Plaice investigations in Icelandic Waters. Rapp, et Proc.-Verb. Vol. LVII. Copenhague.
— 1931: Fluctuations in the Stock of Cod in Icelandic Waters. Medd. Komm. Havunders., Ser. Fiskeri IX, No. 3. København.
T å n i n g , å . V e d e l . 1933: A Method for Marking Cod. Capt. Hansen’s Marking Needle. Journ. du Conseil. Vol. VIII, 3. Copenhague.
- 1934: Survey of Long Distance Migrations of Cod in the North Western Atlantic according to Marking Experiments. Rapp, et Proc.-Verb. Vol. LXXXIX,III, 2. Copenhague.
- 1937 : Some Features in the Migrations of Cod. Journ. du Conseil. Vol. XII, No. 1. Copenhague.
- 1940: Migrations of Cod marked on the spawning places off the Faroes. Medd. Komm. Danmarks Fiskeri- og Havunders., Ser. Fiskeri. Bd. X, No. 7. København.
— 1943: Fiskeri og Havundersøgelser ved Færøerne. Skrifter udgivet af Komm. f. Danmarks Fiskeri- og Havunders. København.
- 1944: Experiments on Meristic and other Characters in Fishes I. Medd. Komm. Danmarks Fiskeri- og Havunders., Ser. Fiskeri. Bd. XI. København.
T h o m p s o n , H a r o l d . 1943: A biological and economic study of Cod (Gadus callarias, L.) in the Newfoundland area. Newfoundland Government. Research Bulletin No. 14. St. Johns.
V i b e , Chr. 1945: Ny Fisk til Grønlands Kyster. Grønlandsposten 4. Aarg. Nr. 1, p. 5. Godthaab.

NB. Une LISTE DES PUBLICATIONS du Conseil
Permanent International pour l’Exploration de la Mer est envoyée
franco, sur demande adressée à MM. Andr. Fred. Høst et fils,
libraires à Copenhague.
Série A: Rapports et Procès-Verbaux des Réunions
— B 1 : Bulletin Hydrographique
— C l: Journal du Conseil
— D: Bulletin Statistique
— F : Annales Biologiques
Les séries suivantes ont cessé de paraître
Série B: Bulletin (trimestriel) des résultats acquis pendant les
croisières périodiques etc.
a. Bulletin Planktonique
b. Résumé des Observations sur le Plankton
— C: Publications de Circonstance
— E: Fiches Faunistiques.
IM PRIM ERIE BIANCO LUNO COPENHAGUE