the accuracy and use of item difficulty calibrations estimated
TRANSCRIPT
DOCUMENT RESUME
ED 399 282 TM 025 507
AUTHOR Taube, Kurt T.; Newman, Larry S.TITLE The Accuracy and Use of Item Difficulty Calibrations
Estimated from Judges' Ratings of Item Difficulty.PUB DATE 12 Apr 96NOTE 21p.; Paper presented at the Annual Meeting of the
American Educational Research Association (New York,NY, April 8-12, 1996).
PUB TYPE Reports Research/Technical (143)Speeches /Conference Papers (150)
EDRS PRICE MFO1 /PCO1 Plus Postage.DESCRIPTORS Correlation; Cutting Scores; *Difficulty Level;
*Estimation (Mathematics); *Interrater Reliability;Item Response Theory; *Judges; Social Workers; *TestItems
IDENTIFIERS *Accuracy; *Calibration; Rasch Model
ABSTRACTA method of estimating Rasch-model difficulty
calibrations from judges' ratings of item difficulty is described.The ability of judges to estimate item difficulty was assessed bycorrelating estimated and empirical calibrations on each of fourexaminations offered by the American Association of State Social WorkBoards. Thirteen members of the association's examination committeeserved as expert judges, and seven of these judges rated all fourexaminations. The correlations were highly significant for all fourexaminations, so judges seem to be able to distinguish among items ofvarying difficulty. This method can be used to adjust passing scoresthat yield unacceptably high or low pass rates. (Contains 3 tablesand 26 references.) (Author/SLD)
***********************************************************************
Reproductions supplied by EDRS are the best that can be madefrom the original document.
***********************************************************************
U.S EPARTMENT OF EDUCATIONOffic of Educational Research and Improvement
ED ATIONAL RESOURCES INFORMATIONCENTER (ERIC)
This document has been reproduced asreceived from the person or organizationoriginating it.
Minor changes have been made toimprove reproduction quality.
Points of view or opinions stated in thisdocument do not necessarily representofficial OERI position or policy.
(PERMISSION TO REPRODUCE AND
DISSEMINATE THIS MATERIALHAS BEEN GRANTED BY
/190.616--
TO THE EDUCATIONAL RESOURCESINFORMATION CENTER (ERIC)
THE ACCURACY AND USE OF ITEM DIFFICULTY CALIBRATIONS
ESTIMATED FROM JUDGES' RATINGS OF ITEM DIFFICULTY
Kurt T. Taube
American Association of State Social Work Boards
Larry S. Newman
Assessment Systems, Inc.
ABSTRACT
A method of estimating Rasch-model item difficulty calibrations from judges' ratings of item
difficulty was described. The ability of judges to estimate item difficulty was assessed by
correlating estimated and empirical calibrations on each of four examinations. The correlations
were highly significant for all four examinations, so judges seem to be able to distinguish among
items of varying difficulty. This method can be used to adjust passing scores which yield
unacceptably high or low pass rates.
Presented at the American Educational Research Association annual meeting, New York City,
April 12, 1996.
BEST COPY AVAILABLE
2
Variations of the Angoff procedure are frequently used to set passing scores for
examinations used in licensure and certification. Angoff (1984) described the procedure as
follows:
Ask each judge to state the probability that the 'minimally acceptable person'
would answer each item correctly. In effect, the judges would think of a number
of minimally acceptable persons, instead of only one such person, and would
estimate the proportion of minimally acceptable persons who would answer each
item correctly. The sum of these probabilities, or proportions, would then
represent the minimally acceptable score. (p. 10)
Bowers and Shindoll (1989, p. 1) stated that "the purpose of (a) passing score study (is) to
determine the performance of the 'borderline' test taker, i.e., the performance of an individual who
is just above the borderline that separates competent from incompetent performance." These
individuals are, by definition, neither clearly qualified nor clearly unqualified.
The process of estimating the proportion of minimally competent examinees who will
answer a given item correctly is analogous to item response theory (IRT). Harris (1989, p. 35)
defined IRT as an attempt to "model the relationship between an unobserved variable, usually
conceptualized as an examinee's ability, and the probability of the examinee correctly responding
to any particular test item." Kane (1987) suggested that an item's minimum pass level (MPL), or
Angoff rating, is an estimate of the true score for minimally competent examinees on that item:
If we assume that there is some value, 0*, on the 9 scale that characterizes minimal
competence, then Pi(0*), the value for 9* of the item characteristic curve for Item
i, would indicate the expected observed score on the item for minimally competent
examinees. Therefore...the expected MPL over the population of raters for each
item should equal Pi(0*) for the item for some fixed value of 0*. (pp. 334-335)
The process of determining an item's Angoff rating has been described by Harker and Cope
(1988):
1 3
The judges' task seems appropriately modeled by item response theory....The
Angoff method requires them to fix the minimum competence level 9* of 9, the
trait in question. Then they are required to estimate the probability...that an
examinee at level 0* will answer a given item g correctly. P(0*) is not a p-value in
the conventional sense. Yet...we suggest that we want them to supply a p-value
when in fact we are asking for something else. To judges conversant with item
response theory we could more accurately instruct them as follows: "Decide the
9* that represents the level of minimum competence, then look at the items and
estimate their P(0*). You may first want to try estimating b, the difficulty
parameter. But you will also need to consider the item discrimination, a. And
because the item is multiple choice, you will also want to estimate c, the pseudo-
guessing parameter, unless of course you are of the Rasch persuasion, in which
case you can take one 'a' for this and all the other items and forget about 'c'." In
practice, few if any judges know MT. Yet this seems to be the sort of thought
process expected of them. Their task, so explicated, is difficult. (p. 14)
Given the nature of the process, Haladyna (1994, p. 252) questioned the "underlying
assumption...that content experts can look at any item and determine the relative performance of
borderline competent professionals." Glass (1978) also questioned whether judges can estimate
the performance of minimally competent examinees with any degree of accuracy. Mills and
Melican (cited in Wheeler, 1991, p. 1) stated that "one problem associated with the use of item
judgment methods has been the low to modest relationship of raters' perception of item difficulty
to the actual item difficulty." Shepard (1980, p. 453) wrote that judges "have the sense that they
are pulling the probabilities from thin air." Shepard believes that the simplicity of the Angoff
procedure is an advantage, because the basic subjectivity of the process is not obscured.
Positive correlations between p-values (the proportion of examinees who answered the
item correctly) and mean Angoff ratings of items on national certification examinations have been
reported (Norcini, Shea, & Kanya, 1988; Bowers & Shindoll, 1989). Smith and Smith (1988)
2 4
transformed p-values and mean Angoff ratings of items from a statewide high school graduation
test to log odds and obtained a positive correlation between these variables. Poggio, Glasnapp,
and Eros (cited in Ward & Marshall, 1982) reported that student performance on items from
competency tests correlated positively with teacher estimates of student performance.
Sometimes judges are asked to choose one of a number of previously defined difficulty
values rather than supply one. This is usually referred to as a "modified" Angoff procedure.
Some researchers (Ward & Marshall, 1982; Thorndike, cited in Melican, Mills, & Plake, 1989;
Wheeler, 1991) have obtained positive correlations between p-values and mean judges' ratings
using this procedure. The Angoff and modified Angoff procedures generally yield similar results.
Harker and Cope (1988) used both procedures and obtained significantly different passing scores
only once in eight trials. Garrido and Payne (1991) noted positive correlations between mean
judges' ratings and p-values using both procedures. The difference between the two correlations
was not significant.
Klein (1984) believes that judges base their performance estimates on average or above
average examinees rather than the minimally competent, thus these estimates will tend to be
unrealistically high. Klein (1984) and Norcini (1994) suggested providing judges with
performance data to ensure that the resulting standards are reasonable. However, as Klein
pointed out, "it is one thing to provide item statistics to content experts, but it is quite another to
have the content experts use them appropriately" (p. 5). A number of researchers have observed
that the availability of item difficulty data leads judges to conform to the data when making their
Angoff ratings. Correlations of item difficulty and judges' ratings with data provided are
significantly higher than correlations of item difficulty and ratings made without access to data
(Cope, 1987; Harker & Cope, 1988; Norcini et al., 1988; Bowers & Shindoll, 1989; Garrido &
Payne, 1991). Indeed, the correlations of item difficulty and judges' ratings with data provided
approached unity in two of these studies (Bowers & Shindoll, 1989; Garrido & Payne, 1991).
Judges' reliance on the data is also reflected in the variability of the ratings. When data are
provided, ratings conform closely to reported p-values. Difficult items tend to receive lower
3
5
ratings, and easier items tend to receive higher ratings, thus, ratings made with data provided are
more variable than ratings made without access to data. Bowers and Shindoll (1989) noted that
the standard deviation of Angoff ratings made with data provided was 98 percent as large as the
standard deviation of the reported p-values, while the standard deviation of ratings made without
data was only 52 percent as large. Other researchers (Harker & Cope, 1988; Norcini et al., 1988)
have reported similar effects of lesser magnitude. Thus, providing performance data as a "reality
check" (Harker & Cope, 1988, p. 13; Norcini, 1994, p. 169) is a questionable practice because it
may lead judges to disregard their own judgment (Cope, 1987; Garrido & Payne, 1991; Wheeler,
1991). Performance data were not provided to judges in the present study. For this reason,
studies in which data were provided were not included in the literature review.
The present study
Most of the research on the relationship between empirical and estimated item difficulty is
based on the correlation of p-values obtained from the entire group of examinees with judges'
estimates of the performance of a minimally competent subgroup of these examinees. It would be
more appropriate to compare empirical and estimated item difficulty for equivalent groups of
examinees.
One possible approach is to correlate Angoff ratings with p-values from groups of
examinees identified as minimally competent. Some researchers (Ward & Marshall, 1982; Cope,
1987; Harker & Cope, 1988; Melican et al., 1989) have identified borderline groups of examinees
based on performance on the entire examination or other criteria (e.g., course grade). Cope
reported positive correlations between mean Angoff ratings and borderline group p-values on a
professional certification test. Others (Ward & Marshall, 1982; Harker & Cope, 1988; Melican et
al., 1989) have obtained nearly identical correlations between judges' ratings and p-values for the
total group and the borderline group. Melican et al. used the Nedelslcy procedure, which, like the
modified Angoff procedure, allows only a limited number of possible ratings.
Another strategy is to estimate the performance of the entire group of examinees from
judges' estimates of the performance of minimally competent examinees. The present study
describes a method of estimating Rasch-model item difficulty calibrations from Angoff ratings.
These estimated calibrations were then correlated with empirical calibrations derived from the
performance of the entire group of examinees. The use of empirical and estimated calibrations
rather than p-values and Angoff ratings eliminates one possible source of distortion, because the
range of calibrations is not bounded, while proportions can only fall between .00 and 1.00.
METHOD
The examination program
The American Association of State Social Work Boards' (AASSWB) examinations are a
criterion of licensure for social workers in 49 states, the District of Columbia, and the Virgin
Islands. AASSWB offers four examinations designed to test entry-level competence at four
different levels of social work practice. These examinations are denoted Basic, Intermediate,
Advanced, and Clinical. Each examination form consists of 170 four-option multiple-choice
items, of which 150 count toward an examinee's score and 20 are pretest items which do not
count toward an examinee's score.
Standard-setting procedure
Thirteen members of the AASSWB Examination Committee served as expert judges, of
whom seven rated all four examinations. A modified Angoff procedure was employed in which
ratings were limited to 5 percent increments. Item difficulty data were not provided, and items
were not discussed unless the difference between the highest and lowest ratings was at least 20
percent. The raw passing score recommended for each examination was the sum of the mean
ratings of all rated items. The recommended passing scores yielded significantly lower pass rates
than had been obtained in the past, so the passing scores ultimately applied to each examination
were 1 to 3 standard errors of measurement lower than those recommended by the committee.
Such adjustments are common in setting passing scores on licensure examinations (Biddle, 1993;
Cizek, 1996).
Estimation of calibrations from Angoff ratings
The Rasch model estimates the probability of answering a specific item correctly given a
certain level of ability, or p(cl 9), according to the equation:
p(c10) = 1 / (1 + exp (b-0))
9 represents the examinee's ability, and b represents the difficulty index, or calibration, of the item.
Both 9 and b are expressed in log-odds units, or logits. When item calibration and examinee
ability are equal, the probability of a correct answer is .50.
An Angoff rating can be understood as an estimate ofp(cl 9) at the level of minimal
competence, or p(ci 9*). This is not a p-value in the usual sense. It is a conditional p-value; an
estimate of the proportion of minimally competent examinees who will answer that item correctly.
The previous equation can be algebraically rearranged to solve for (b*-0*), the expected
difference between item difficulty and minimal competence:
(b*-0*) =1n ((1 / p(c10*)) -1)
For example, if an item's Angoff rating is .69:
(b*-0*) = In ((1/.69) -1) = In (.4493) = -.80
This item's estimated calibration is .80 logits below the level of minimal competence. Note that
(b * -9 *) cannot be estimated if an item's Angoff rating is .00 or 1.00.
In this procedure, 9* corresponds to the ability of examinees defined as minimally
competent, thus it represents the hypothetical passing score. Therefore, the calibration of each
item was estimated by adding the logit corresponding to the recommended raw passing score for
that examination to (b *-9*) as estimated above. Expressed mathematically, (b * -9 *) + 9* = b*.
6
Data analysis
Items were calibrated according to the Rasch model using the BIGSCALE software
program (Wright, Linacre, & Schulz, 1990).1 Each examination was calibrated separately. The
relationship between p-value and calibration is inverse, thus easier items have negative calibrations
and more difficult items have positive calibrations. Only items which were both rated and
calibrated were considered in the present study. Items which were added to the examinations
after the standard setting procedure was conducted, or were not calibrated (e.g., more than one
answer was later judged to be defensibly correct), were not included.
The ability of the judges to estimate item difficulty was assessed by correlating the
estimated (b *) and empirical (b) calibrations for each of the four examinations. To the extent that
judges' estimates of item difficulty were accurate, these correlations were expected to be
significant and positive.
RESULTS
ti
The p-values, Angoff ratings, and empirical and estimated calibrations obtained for each
examination are summarized in Table 1. The standard deviations of the calibrations estimated
from mean judges' ratings were only 16-35 percent as large as the standard deviations of the
empirical calibrations. This is consistent with results obtained by other researchers (Ward &
Marshall, 1982; Harker & Cope, 1988; Bowers & Shindoll, 1989). One reason for this may be
the judges' reluctance to rate items as extremely easy or difficult, but the averaging of judges'
ratings also accounts for part of this phenomenon. The standard deviation of the calibrations
estimated from an individual judge's ratings was larger than the standard deviation of the
calibrations estimated from the mean judges' ratings for that examination in 39 of 40 cases.2
Others (Ward & Marshall, 1982; Bowers & Shindoll, 1989) have noted similar results. Note that
the mean Angoff rating was higher than the mean p-value for the Intermediate and Advanced
examinations. This suggests that the judges' initial estimates of the performance of minimally
7
9
competent examinees on these two examinations may have been inconsistent with the actual
performance of these examinees.
Insert Table 1 about here
The correlations between empirical calibrations and calibrations estimated from mean
judges' ratings are presented in Table 2. All were highly significant (p < .001). The correlations
between empirical calibrations and calibrations estimated from individual judges' ratings are also
presented in Table 2. These correlations were significant (p < .05) for all judges on the Basic
examination and for all but one judge on each of the other three examinations (37 of 40 in all), but
the judges varied greatly in their ability to estimate item difficulty. Other researchers (Ward &
Marshall, 1982; Kleinke, cited in Ward & Marshall, 1982; Cross, Impara, Frary, & Jaeger, 1984;
Smith & Smith, 1988; Bowers & Shindoll, 1989) have reported similar results. The highest
correlations obtained for individual judges on each examination were similar to the correlations
between empirical calibrations and calibrations estimated from mean judges' ratings for that
examination. Only once did a correlation based on an individual judge's ratings exceed the
correlation based on mean judges' ratings for that examination.
Insert Table 2 about here
DISCUSSION
The correlations between estimated and empirical calibrations were highly significant for
all four examinations. Therefore, judges seem to be able to distinguish among items of varying
difficulty to a great extent. These results contradict the fears of researchers such as Glass (1978),
Shepard (1980), Mills and Melican (cited in Wheeler, 1991), and Haladyna (1994), and provide a
8_0
measure of support for the validity of the Angoff procedure. However, there is much room for
improvement. Mean judges' ratings accounted for only 16-39 percent of the variance of the
calibrations.
One possible explanation for differences in judges' ability to estimate item difficulty is
differences in the expertise of the judges themselves. Chang, Dziuban, Hynes, and Olson (1994)
noted that judges tended to set higher standards for items they answered correctly and lower
standards for items they answered incorrectly. However, other researchers (Norcini et al., 1988;
Plake, Impara, & Potenza, 1994) have failed to obtain this effect.
The accuracy of individual judges, as measured by the correlation between empirical
calibrations and calibrations estimated from individual judges' ratings, was not significantly
correlated with the mean (r = -.10) or standard deviation (r = -.08) of the individual's ratings or
the mean (r = .12) or standard deviation (r = -.12) of the calibrations estimated from the
individual's ratings.2,3 Inspection and analysis of scatterplots revealed no nonlinear relationships
with individual accuracy. Therefore, suggesting that judges alter their ratings to be more
stringent, more lenient, or more variable should have little effect on accuracy. However, the
relative lack of variability among Angoff ratings produced a systematic pattern of overestimation
on difficult items and underestimation on easy items. For example, according to the Rasch model,
it was expected that 98-99 percent of minimally competent examinees would respond correctly to
the easiest item on each examination. The highest observed Angoff rating was .90, so judges
underestimated the performance of minimally competent examinees on the easiest items. In
contrast, it was expected that only 9-32 percent of minimally competent examinees would respond
correctly to the most difficult item on each examination. All Angoff ratings exceeded .50, so
judges substantially overestimated the performance of minimally competent examinees on the
most difficult items. The degree of overestimation is partially a result of the Rasch model's lack
of a nonzero lower asymptote, but even so, the lowest Angoff ratings were well above chance
level. If judges overestimate the performance of minimally competent examinees (Klein, 1984),
they do so primarily on difficult items.
191
Cizek (1996, p. 16) stated that "one particularly vexing issue in standard setting is the
issue of adjustments to the data that result from carefully implemented procedures." The Angoff
procedure may yield pass rates which are unacceptably high or low. One possible reason for this
is that the judges' estimates of the performance of minimally competent examinees are unrealistic.
Whatever the cause, the remedy typically involves raising or lowering the passing score by some
arbitrary number of standard errors of measurement until an acceptable pass rate is achieved
(Biddle, 1993; Cizek, 1996). A more rational method of adjusting the passing score of an
examination would be to subtract the difference between the mean estimated and empirical
calibrations from the logit equivalent of the unadjusted Angoff passing score. This adjustment is
summarized in Table 3. For example, the mean estimated calibration for the Basic examination
was .23 logits higher than the mean empirical calibration for that examination. The logit
equivalent of the Angoff passing score was 1.13. Therefore, the adjusted passing score (0") for
this examination can be set at the raw score closest to .90 logits (1.13 - .23). The adjusted raw
passing score would be six items lower than that obtained through the Angoff procedure, resulting
in a 12 percent increase in the pass rate. Note that the pass rates for the Intermediate and
Advanced examinations would still be rather low even after the passing scores are adjusted, so the
organization may elect to lower the passing scores for these two examinations by an additional
amount. Note also that this adjustment incorporates examinee performance data without
contaminating expert judgment.
Insert Table 3 about here
Because (b*-9*) is equal to (b-9**), identical results are obtained by estimating the ability
level corresponding to minimal competence for each item given the item's empirical calibration
and Angoff rating, thus bypassing estimated calibrations altogether:
0** = b - In ((1 / p(c10*)) -1)
1210
The mean of these estimates is the passing score of the examination expressed in logits. This
method deviates from the Angoff procedure in that the standard is defined in terms of the level of
minimal competence estimated for each item rather than the ability level corresponding to the sum
of the estimated probabilities of correct responses across all items for minimally competent
examinees. Note that the test characteristic curve (the expected proportion of correct responses
across all items on the examination) is "elongated" in comparison to the Rasch-model item
characteristic curve due to variation in item calibrations, so this method will usually result in a
lower passing score than that obtained from the Angoff procedure.
This procedure can also be applied to logistic models with more than one parameter. For
example, given a three-parameter item for which a = 1.15, b = .59, c = .22, and Angoff rating
(p(c19*)) = .71: .
p(cle) = c + (1-c) / (1 + exp (-1.70240-b)))
0** = b + In ((1-c) / (p(c10*) -c) -1) / -1.702a
0** = .59 + In ((.78/.49) -1) / -1.9573 = .86
The estimated ability level corresponding to minimal competence for this item is .86 logits. Cizek
(1996) reported that this procedure was used to measure intrajudge consistency in setting
achievement levels on the National Assessment of Educational Progress (NAEP). The ability
levels corresponding to each of three levels of performance on each item were estimated for each
judge. The standard deviation of each judge's estimates at each level provided a measure of
intrajudge consistency. In the present study, the correlations between consistency and accuracy,
as measured by the correlation between empirical calibrations and calibrations estimated from
individual judges' ratings, were highly significant (r < -.82; p < .01) for all four examinations. It is
not surprising that judges who hold a more stable conception of minimal competence tend to
estimate the performance of minimally competent examinees with greater accuracy.
The Angoff procedure can be quite tedious if large numbers of items must be rated
(Grosse & Wright, 1986; Norcini, 1994). Grosse and Wright stated that "approaches to standard
setting that require review of a large number of items can result in a cursory review" (p. 280).
Grosse and Wright went on to suggest that a passing score can be set based on a detailed review
of a subset of "criterion" items, thus eliminating the need to rate every item on an examination.
One such method is the "item mapping" procedure described by McKinley, Newman, and Wiser
(1996). Items are placed on a horizontal axis according to their Rasch-model difficulty
calibrations. Judges estimate the ability level at which the probability ofa correct response for a
minimally competent examinee is .50 after reviewing a subset of items in detail. This ability level
is the passing score expressed in logits.
As Van der Linden (1982, p. 298) pointed out, "All latent trait models are approximations
of the actual characteristic function of the items under consideration. If a model fits this function
satisfactorily, it can be used for analyzing the item responses." The use of items in standard
setting which do not fit the IRT model being used is a questionable practice, and the
consequences of using such items should be investigated further. However, the standard setting
procedure described in the present study was conducted before IRT methodology was introduced.
Therefore, items which were subsequently determined to fit the Rasch model poorly were
included in the standard setting procedure and were later calibrated.4 The mean 0** was
recalculated for each examination after these items were deleted from the data set.
The relationship between calibration (b) and 0** was essentially linear (rs ranged from .93
to .99), which was expected because b is used to calculate 0". In this data set, the items which
were deleted due to poor fit tended to be more difficult than those which were retained.
Therefore, the mean calibrations of the retained items were lower than those of the entire set of
items. This resulted in lower mean 0** values, which would have resulted in higher passing rates
had the resulting standards been applied. The opposite effect would have occurred if the deleted
items were relatively easy. This effect must be taken into account in setting and adjusting passing
scores if the entire set of items is not rated. One possible strategy would be to determine the
linear regression equation for predicting 0** from item calibration for the rated items, and
estimate the value of 0** corresponding to the mean calibration of the entire set of items. The set
1412
of rated items should be relatively large and representative of the content and difficulty
distribution of the examination to ensure accurate estimation of the passing score.
The present study was based on four examinations in one examination program, using
certain judges and statistical assumptions. Replication would be desirable to confirm that the
results obtained in this study occur in other situations.
NOTES
1. All empirical calibrations, estimated calibrations, and logit passing scores reported in this paper
reflect the "bank" scale rather than the "local," or single-administration, scale. The mean local
calibration for any single administration of an examination is .00.
2. One judge assigned ratings of 1.00 to two items on the Intermediate examination. Following
Smith and Smith's (1988) procedure, these ratings were changed to .995 before calibrations were
estimated.
3. Estimated calibrations were expressed in (b*-9*) form because each examination had a
different logit passing score.
4. Items were considered to fit poorly if either Infit or Outfit (Wright et al., 1990) was
unacceptable (p < .01). Eighteen items met this criterion on the Basic examination, eleven on
Intermediate, seven on Advanced, and fourteen on Clinical.
REFERENCES
Angoff, W.H. (1984). Scales, norms, and equivalent scores. Princeton, NJ: Educational TestingService.
Biddle, R.E. (1993). How to set cutoff scores for knowledge tests used in promotion, training,certification, and licensing. Public Personnel Management, 22, 63-79.
Bowers, J.J. & Shindoll, R.R. (1989). A comparison of the Angoff Beuk, and Hofstee methodsfor setting a passing score. Iowa City, IA: ACT Research Report Series, 89-2.
Chang, L.; Dziuban, C.; Hynes, M.; & Olson, A. (1994). Does a standard reflect minimalcompetency of examinees or judge competency? Paper presented at the American EducationalResearch Association annual meeting, New Orleans, LA. ERIC Document Reproduction ServiceNo. ED 371 001.
Cizek, G.J. (1996). Standard-setting guidelines. Educational Measurement: Issues andPractice, 15 (1), 12-21.
Cope, R.T. (1987). A generalizability study of the Angoff method applied to setting cutoff scoresof professional certification tests. Paper presented at the American Educational ResearchAssociation annual meeting, Washington, DC. ERIC Document Reproduction Service No. ED282 921.
Cross, L.H.; Impara, J.C.; Frary, R.B.; & Jaeger, R.M. (1984). A comparison of three methodsfor establishing minimum standards on the National Teacher Examinations. Journal ofEducational Measurement, 21, 113-129.
Garrido, M. & Payne, D. (1991). The effect of judges' knowledge of item data on two forms ofthe Angoff standard setting method. Georgia Educational Researcher, 8 (2), 7-36.
Glass, G.V. (1978). Standards and criteria. Journal of Educational Measurement, 15, 237-261.
Grosse, M.E. & Wright, B.D. (1986). Setting, evaluating, and maintaining certification standardswith the Rasch model. Evaluation and the Health Professions, 9, 267-285.
Haladyna, T.M. (1994). A research agenda for licensing and certification testing validationstudies. Evaluation and the Health Professions, 17, 242-256.
Harker, J.K. & Cope, R.T. (1988). The effect of several variables on judgmentally-obtained cutscores. Paper presented at the American Educational Research Association annual meeting, NewOrleans, LA.
1614
Harris, D. (1989). An NCME instructional module on comparison of 1-, 2-, and 3-parameter IRTmodels. Educational Measurement: Issues and Practice, 8 (1), 35-41.
Kane, M.T. (1987). On the use of IRT models with judgmental standard setting procedures.Journal of Educational Measurement, 24, 333-345.
Klein, L.W. (1984). Practical considerations in the design of standard setting studies in healthoccupations. Paper presented at the American Educational Research Association annual meeting,New Orleans, LA.
McKinley, D.W.; Newman, L.S.; & Wiser, R.F. (1996). Using the Rasch model in the standardsetting process. Paper presented at the National Council on Measurement in Education annualmeeting, New York, NY.
Melican, G.J.; Mills, C.N.; & Plake, B.S. (1989). Accuracy of item performance predictionsbased on the Nedelsky standard setting method. Educational and Psychological Measurement,49, 467-478.
Norcini, J.J. (1994). Research on standards for professional licensure and certificationexaminations. Evaluation and the Health Professions, 17, 160-177.
Norcini, J.J.; Shea, J.A.; & Kanya, D.T. (1988). The effect of various factors on standard setting.Journal of Educational Measurement, 25, 57-65.
Plake, B.S.; Impara, J.C.; & Potenza, M.T. (1994). Content specificity of expert judgments in astandard-setting study. Journal of Educational Measurement, 31, 339-347.
Shepard, L. (1980). Standard setting issues and methods. Applied Psychological Measurement,4, 447-467.
Smith, R.L. & Smith, J.K. (1988). Differential use of item information by judges using Angoffand Nedelsky procedures. Journal of Educational Measurement, 25, 259-274.
Van der Linden, W.J. (1982). A latent trait method for determining intrajudge consistency in theAngoff and Nedelsky techniques of standard setting. Journal of Educational Measurement, 19,295-308.
Ward, W.H. & Marshall, D.M. (1982). The ability of judges to subjectively estimate itemdifficulty. Paper presented at the National Council on Measurement in Education annual meeting,New York, NY.
Wheeler, P. (1991). The relationship between modified Angoff knowledge estimation judgmentsand item difficulty values for seven NTE specialty area tests. Paper presented at the CaliforniaEducational Research Association annual meeting, San Diego, CA. ERIC DocumentReproduction Service No. ED 340 745.
1715
Wright, B.D.; Linacre, J.M.; & Schulz, M. (1990). A user's guide to BIGSCALE, Version 1.7.Chicago, IL: MESA Press.
18
16
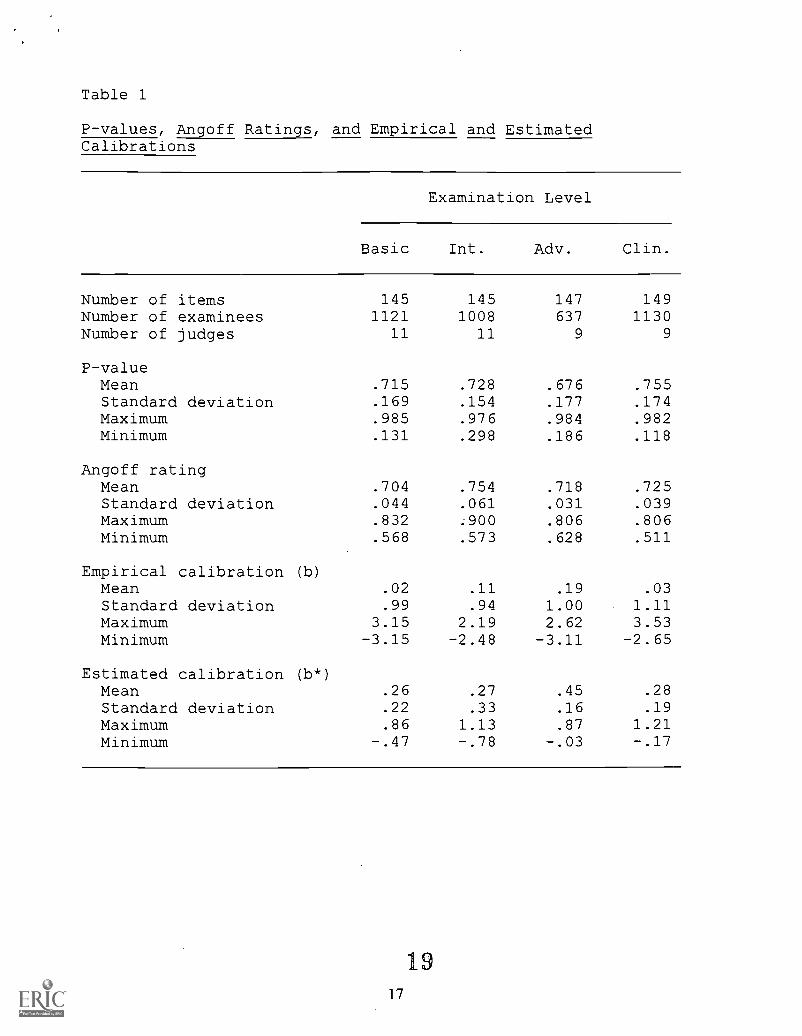
Table 1
P-values, Angoff Ratings, and Empirical and EstimatedCalibrations
Examination Level
Basic Int. Adv. Clin.
Number of items 145 145 147 149Number of examinees 1121 1008 637 1130Number of judges 11 11 9 9
P-valueMean .715 .728 .676 .755Standard deviation .169 .154 .177 .174Maximum .985 .976 .984 .982Minimum .131 .298 .186 .118
Angoff ratingMean .704 .754 .718 .725Standard deviation .044 .061 .031 .039Maximum .832 .900 .806 .806Minimum .568 .573 .628 .511
Empirical calibration (b)
Mean .02 .11 .19 .03Standard deviation .99 .94 1.00 1.11Maximum 3.15 2.19 2.62 3.53Minimum -3.15 -2.48 -3.11 -2.65
Estimated calibration (b*)
Mean .26 .27 .45 .28Standard deviation .22 .33 .16 .19Maximum .86 1.13 .87 1.21Minimum -.47 -.78 -.03 -.17
1917
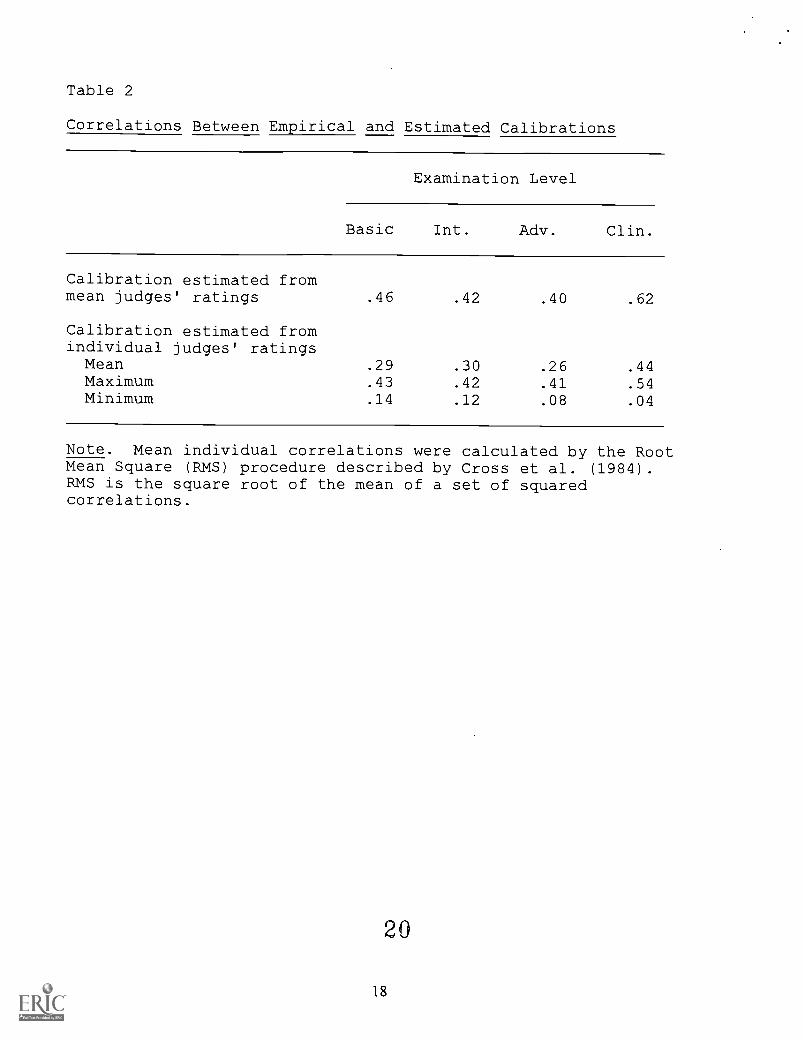
Table 2
Correlations Between Empirical and Estimated Calibrations
Examination Level
Basic Int. Adv. Clin.
Calibration estimated frommean judges' ratings .46 .42 .40 .62
Calibration estimated fromindividual judges' ratingsMean .29 .30 .26 .44Maximum .43 .42 .41 .54Minimum .14 .12 .08 .04
Note. Mean individual correlations were calculated by the RootMean Square (RMS) procedure described by Cross et al. (1984).RMS is the square root of the mean of a set of squaredcorrelations.
20
18
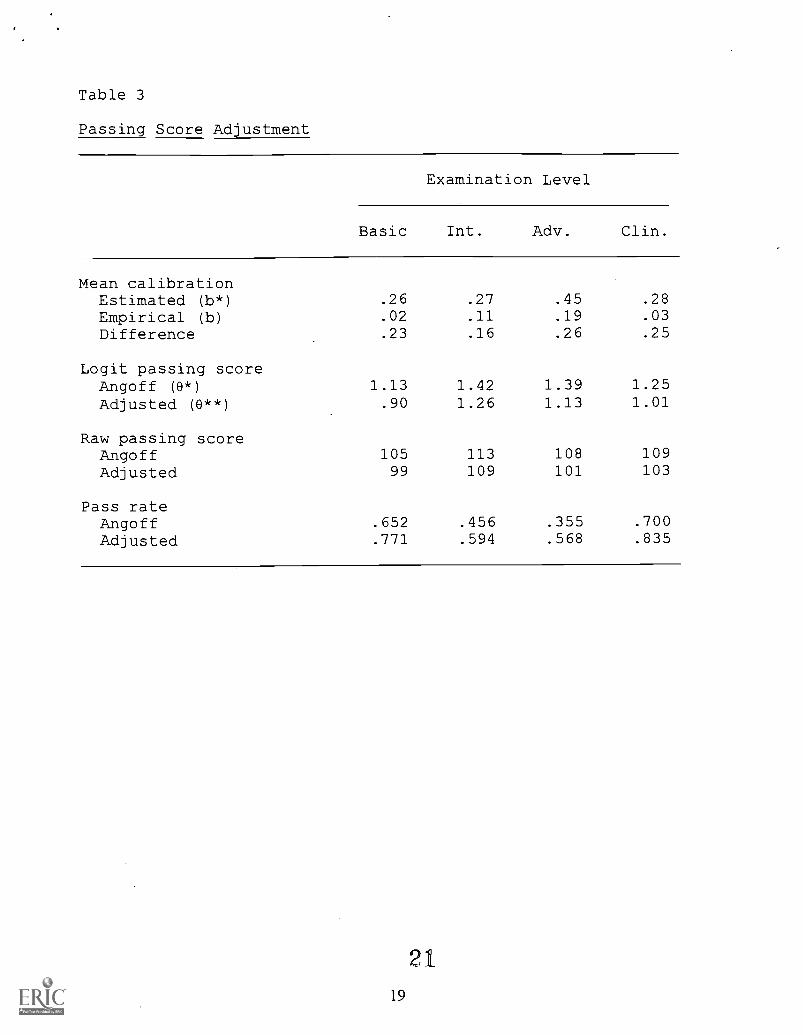
Table 3
Passing Score Adjustment
Examination Level
Basic Int. Adv. Clin.
Mean calibrationEstimated (b*) .26 .27 .45 .28
Empirical (b) .02 .11 .19 .03
Difference .23 .16 .26 .25
Logit passing scoreAngoff (9 *) 1.13 1.42 1.39 1.25
Adjusted (0**) .90 1.26 1.13 1.01
Raw passing scoreAngoff 105 113 108 109
Adjusted 99 109 101 103
Pass rateAngoff .652 .456 .355 .700
Adjusted .771 .594 .568 .835
2119
AERA April 8-12, 1996
U.S. DEPARTMENT OF EDUCATIONOffice of Educational Research and Improvement (OERI)
Educational Resources Information Center (ERIC)
REPRODUCTION RELEASE(Specific Document)
I. DOCUMENT IDENTIFICATION:
ERIC
Title:C1.44-iit-Cz2 61-4A-X- 141-tet di II/ C e-r 1-1-7 Cot 14 Li-A-41-11_3
6S- kriAl-c-J( r -5 I 1-4-1" °IV r? et, N-7Author(s):
0.1Corporate Source:44 .c.10 Publication Date:
4/9(,,II. REPRODUCTION RELEASE:
In order to disseminate as widely as possible timely and significant materials of interest to the educational community, documentsannounced in the monthly abstract journal of the ERIC system, Resources in Education (RIE), are usually made available to usersin microfiche, reproduced paper copy, and electronic/optical media, and sold through the ERIC Document Reproduction Service(EDRS) or other ERIC vendors. Credit is given to the source of each document, and, if reproduction release is granted, one ofthe following notices is affixed to the document.
If permission is granted to reproduce the identified document, please CHECK ONE of the following options and sign the releasebelow.
FA/0 Sample sticker to be affixed to document
Check herePermittingmicrofiche(4"x 6" film),paper copy,electronic,and optical mediareproduction
"PERMISSION TO REPRODUCE THISMATERIAL HAS BEEN GRANTED BY
TO THE EDUCATIONAL RESOURCESINFORMATION CENTER (ERIC):'
Level 1
Sign Here, Please
Sample sticker to be affixed to document [ior here"PERMISSION TO REPRODUCE THIS
MATERIAL IN OTHER THAN PAPERCOPY HAS BEEN GRANTED BY
$60TO THE EDUCATIONAL RESOURCES
INFORMATION CENTER (ERIC)."
Level 2
Permittingreproductionin other thanpaper copy.
Documents will be processed as indicated provided reproduction quality permits. If permission to reproduce is granted, butneither box is checked, documents will be processed at Level 1.
"I hereby grant to the Educational Resources Information Center (ERIC) nonexclusive permission to reproduce this document asindicated above. Reproduction from the ERIC microfiche or electronic/optical media by persons other than ERIC employees and itssystem contractors requires permission from the copyright holder. Exception is made for non-profit reproduction by libraries and otherservice agencies to satisfy information needs of educators in response to discrete inquiries."
Signature: ki iLit/t/ i /a ad/ Position: .
PS yej4074-1 -1-.4e ;e2-4_
Printed Name: Organization A pn4.,-jc4., 4 S ..I., c)c4.4-3Vm . 4)3 -17S-e_ Ss. cia I w 0,-L 13 0 ez_r45,Kl . f r7.- T ---tet-u_42.4_.
Address: ifro ozg, Z ;Ware_ Per-r-k-ca ,
S 1,44e "Bei, Itt l)3 VA Z2-70 I
Telephone Number:( 0) Pzs -62ka
Date: 4 / 0 q,6
C UA
THE CATHOLIC UNIVERSITY OF AMERICADepartment of Education, O'Boyle Hall
Washington, DC 20064202 319-5120
February 27, 1996
Dear AERA Presenter,
Congratulations on being a presenter at AERA'. The ERIC Clearinghouse on Assessment andEvaluation invites you to contribute to the ERIC database by providing us with a written copy ofyour presentation.
Abstracts of papers accepted by ERIC appear in Resources in Education (RIE) and are announcedto over 5,000 organizations. The inclusion of your work makes it readily available to otherresearchers, provides a permanent archive, and enhances the quality of RIE. Abstracts ofyourcontribution will be accessible through the printed and electronic versions of ME. The paper willbe available through the microfiche collections that are housed at libraries around the world andthrough the ERIC Document Reproduction Service.
We are gathering all the papers from the AERA Conference. We will route your paper to theappropi late clearinghouse. You will be notified if your paper meets ERIC's criteria for inclusionin ME: contribution to education, timeliness, relevance, methodology, effectiveness ofpresentation, and reproduction quality.
Please sign the Reproduction Release Form on the back of this letter and include it with two copiesof your paper. The Release Form gives ERIC permission to make and distribute copies of yourpaper. It does not preclude you from publishing your work. You can drop off the copies of yourpaper and Reproduction Release Form at the E C boot 3j or mail to our attention at theaddress below. Please feel free to copy the form for future or additional submissions.
Mail to: AERA 1996/ERIC AcquisitionsThe Catholic University of AmericaO'Boyle Hall, Room 210Washington, DC 20064
This year ERIC/AE is making a Searchable Conference Program available on the AERA webpage (http://tikkun.ed.asu.edu/aera/). Check it out!
Sincerely,
Ph.D.awre dice M. udDirector, ERIC/AE
'If you are an AERA chair or discussant, please save this form for future use.
ERIC Clearinghouse on Assessment and Evaluation