the abolition of user fees in the jamaican public
TRANSCRIPT
THE ABOLITION OF USER FEES IN THE JAMAICAN PUBLIC HEALTH SYSTEM:
IMPACT ON ACCESS, CARE PROVIDED AND THE WORK OF THE
PROFESSIONAL NURSE
BY
ADELLA CAMPBELL
A thesis
submitted to the Victoria University of Wellington
in fulfilment of the requirements for the degree of
Doctor of Philosophy in Nursing
Victoria University of Wellington
2013
ii
Abstract
The negative impact of user fees on the utilisation of the health services by the poor in
developing countries such as Uganda and Jamaica is well documented. Therefore, various
governments have been engaged in reforming public health systems to increase access by
underserved populations. One such reform is the introduction of free health services. In
Jamaica, user fees were abolished in the public health sector in 2007 for children under 18
years and in 2008 free health care was introduced for all users of the public health system.
This study evaluated the impact of the 2008 reform on the Jamaican public health system
at 1) the national level, 2) the provider level, and 3) the user level. Perspectives were
sought on access to care, the care provided, and the work of the professional nurse.
Participants were selected from the Ministry of Health (MOH), the four Regional Health
Authorities (RHAs), and urban and rural health facilities.
Data collection was done during March – August 2010, using a multi-layered
mixed methods evaluation approach, incorporating both qualitative and quantitative
methods. Methods included individual interviews with key policymakers (eight) at the
MOH and the four RHAs, as well as a senior medical officer of health (one) and
pharmacists (three); focus groups with representatives of the main practitioners in the
health system including nurses (six groups), pharmacists (one group) and doctors (two
groups); document reviews of the MOH and RHAs‘ annual reports, and a survey of
patients (200). Views on the impact of the abolition of user charges differed across the
three levels and among the health authorities, facilities, and perspectives (policymakers,
practitioners and users). Patient utilisation of the public health system increased
exponentially immediately following the abolition of user fees, then declined, but
remained above the pre-policy level. The work of health care providers, especially the
professional nurse, was affected in that they had to provide the expected and required
services to the patients despite an increase in workload and constraints such as inadequate
resources.
The research found that, while policymakers were optimistic about the policy,
providers had concerns but patients were satisfied with the increased access and the quality
care they were now receiving. Users also encountered challenges that constituted barriers
to access. In addition to providing further evidence about the abolition of user fees in the
public health system, this research provides important new insights into the impact of the
iii
nationwide abolition of user fees, as well as the impact of the policy change on the work of
the professional nurse. Equally, the findings highlighted the potential benefits, gaps, and
failures of the abolition of user fees‘ policy, and will serve as a catalyst to improve the
policy process regarding access to health services and the work of the professional nurse.
The findings of this research will be valuable in the planning of health-related programmes
for the consumers of health care in developing countries. Despite the need for further
research in this area, this research has contributed to the body of knowledge regarding user
fees and access to health care in developing countries.
iv
Acknowledgements
I must acknowledge divine guidance, without which this journey would have been
futile. Profound thanks to my supervisors Dr. Katherine Nelson and Associate Professor
Jackie Cumming for the tremendous support and guidance given to me. Their constructive
feedback and propensity for detail were catalysts to improve my work and ensured
completion of this study.
Thanks to the Commonwealth Scholarship Fund for giving me the opportunity to
study at Victoria University of Wellington, an opportunity that has empowered me to make
meaningful contributions to my country‘s development. Special thanks to the NZAid
Team that supported me throughout my journey here in New Zealand.
Special thanks to the faculty and staff at the Graduate School of Nursing,
Midwifery and Health, as well as Victoria University of Wellington for the support I
received and opportunities I was given during my time as student. I am also grateful to my
colleagues and Student Learning Support Services who took time out of their busy
schedule to proofread portions or all of my scripts. I must also acknowledge the valuable
contribution of the personnel from the Ministry of Health, Jamaica who provided well
needed data by email throughout the course of my study and I am eternally grateful to all
the participants without whose contribution this project would have been futile.
Finally, I would also like to acknowledge my family, students and friends who
were always there to assist and provide support at some stage of my work. Thanks
especially to my son Romaine who endured my absence from home for the entire period of
study.
v
Table of Contents
Abstract ........................................................................................................................... ii
Acknowledgements ........................................................................................................ iv Table of Contents ............................................................................................................ v
List of Tables ................................................................................................................ viii List of Figures ................................................................................................................. x
List of Abbreviations ..................................................................................................... xi
Chapter 1: Introduction.................................................................................................. 1 1.1. Profile of Jamaica ................................................................................................... 2
1.2. Overview of health care in Jamaica ........................................................................ 6 1.3. Problem statement, aim and research questions..................................................... 10
1.4. Significance and relevance of the research ............................................................ 11 1.5. Thesis chapter outline ........................................................................................... 11
Chapter 2: The Jamaican health system ...................................................................... 14 2.1. Introduction .......................................................................................................... 14 2.2. Jamaica ................................................................................................................ 14
2.3. Development and reform of the Jamaican health system (17th – 21
st Centuries)..... 15
2.4. Summary .............................................................................................................. 31
2.5. Financing the public health system (17th
– 21st Centuries) ..................................... 32
2.6. Health service delivery and utilisation of the health care system ........................... 36
2.7. Patient‘s journey................................................................................................... 47 2.8. Conclusion ........................................................................................................... 50
Chapter 3: Literature review........................................................................................ 51 3.1. Introduction .......................................................................................................... 51 3.2. Search strategy ..................................................................................................... 51
3.3. Key limitations of literature review ...................................................................... 52 3.4. Impact of user fees ............................................................................................... 52
3.5. Jamaica and other Caribbean countries‘ experience with user fees ........................ 58 3.6. The impact of the abolition of user fees ................................................................ 59
3.7. Jamaican experience with the abolition of user fees .............................................. 67 3.8. The impact of the abolition of user fees on health workers .................................... 70
3.9. Impact of the abolition of user fees on the work of the professional nurse ............. 73 3.10. Conclusion ......................................................................................................... 74
Chapter 4: Theoretical framing.................................................................................... 76 4.1. Introduction .......................................................................................................... 76 4.2. Access defined ..................................................................................................... 76
4.3. Policymakers and access to health care ................................................................. 82 4.4. Providers and access ............................................................................................. 82
4.5. Consumers and access to health care .................................................................... 84 4.6. Nursing and access ............................................................................................... 89
4.7. Conclusion ........................................................................................................... 92
Chapter 5: Methodology and research design ............................................................. 93
5.1. Evaluation ............................................................................................................ 93
5.2. Mixed methods ..................................................................................................... 95
vi
5.3. Philosophical underpinning .................................................................................. 96 5.4. Design .................................................................................................................. 98
5.5. Data analysis ...................................................................................................... 104 5.6. Triangulation ...................................................................................................... 107
5.7. Ethical considerations ......................................................................................... 107 5.8. Rigour/validity ................................................................................................... 109
5.9. Conclusion ......................................................................................................... 110
Chapter 6: Results – National and user perspectives ................................................ 111 6.1. Introduction ........................................................................................................ 111
6.2. Policymakers ...................................................................................................... 111 6.3. Official statistics from Document Review .......................................................... 125
6.4. User results ........................................................................................................ 131 6.5. Conclusion ......................................................................................................... 151
Chapter 7: Impact of the abolition of user fees on the work of main health
practitioners and the professional nurse .................................................................... 152 7.1. Introduction ........................................................................................................ 152
7.2. Practitioners‘ and professional nurses‘ involvement in the policy process ........... 153 7.3. Changes in the work of the practitioners since the policy change ........................ 155
7.4. Practitioners‘ perspectives on funding and resources in the public health system 161 7.5. Quality and effectiveness of care ........................................................................ 166
7.6. Contribution to improving access to health services ............................................ 168 7.7. Practitioners‘ satisfaction with their work environment since the policy change.. 173
7.8. Practitioners‘ overall impression of the abolition of user fees policy ................... 178 7.9. Conclusion ......................................................................................................... 181
Chapter 8: Discussion ................................................................................................. 182 8.1. Introduction ........................................................................................................ 182 8.2. Overview of findings .......................................................................................... 182
8.3. Overall impression of the policy change ............................................................. 185 8.4. Impact of the abolition of user fees on access to health services .......................... 188
8.5. Impact on the work of main health practitioners and the professional nurse ........ 200 8.6. Conclusion ......................................................................................................... 215
Chapter 9: Conclusion ................................................................................................ 217 9.1. Introduction ........................................................................................................ 217 9.2. Strengths and limitations of the study ................................................................. 221
9.3. Lessons learned .................................................................................................. 223 9.4. Recommendations .............................................................................................. 227
Appendices .................................................................................................................. 230 Appendix 1. Ten leading causes of death among males and females in Jamaica: 2006-
2008 .......................................................................................................................... 230
Appendix 2. Policymakers‘ letter of invitation........................................................... 231 Appendix 3. Information sheet .................................................................................. 233
Appendix 4. Policymakers‘ and providers‘ consent form ........................................... 236 Appendix 5. Policymakers‘ interview schedule ......................................................... 237
Appendix 6. Checklist – document review................................................................. 238 Appendix 7. Providers‘ letter of invitation ................................................................. 239
vii
Appendix 8. Providers‘ interview schedule................................................................ 240 Appendix 9. Patients‘ consent form ........................................................................... 241
Appendix 10. Patients‘ questionnaire ........................................................................ 242 Appendix 11. Victoria University of Wellington ethical approval .............................. 250
Appendix 12. Ministry of Health, Jamaica ethical approval ....................................... 251 Appendix 13. Confidentiality agreement for nursing students .................................... 252
Appendix 14. Supplementary data for user survey .................................................... 253
References ................................................................................................................... 265
viii
List of Tables
Table 1. Social indicators of Jamaica 2006-2010…………………………………………..4
Table 2. Economic indicators of Jamaica 2006-2010………………………………………5
Table 3. Health financing indicators in the Jamaican public health sector 2006-2010…….7
Table 4. Ticket payment system for outpatients…………………………………………..32
Table 5. Network of service delivery facilities 2010……………………………………...38
Table 6. Classification of hospital………………………………………………………...38
Table 7. Total health centre and curative visits 2003-2007……………………………….46
Table 8. Attendance and source of referral to public Casualty Department 2003-2007…..46
Table 9. Health indicators 2003-2007 ……………………………………………………..47
Table 10. Summary of the actual design of the study……………………………………..99
Table 11. National and regional policymaker interviewees……………………………...112
Table 12. Utilisation patterns of the health system………………………………………126
Table 13. Types of cases seen at health facilities during 2009…………………………..128
Table 14. Modes of referral to Casualty in 2006 & 2009………………………………..129
Table 15. Health indicators for 2006 & 2009……………………………………………130
Table 16. Facilities used for patient survey……………………………………………...132
Table 17. Biographic data for respondents who completed the survey by RHA………...133
Table 18. Household composition and standard of living of respondents by RHA……..134
Table 19. Nationality, income and employment of respondents by RHA……………….136
Table 20. Current health status of respondents…………………………………………..137
Table 21. Diagnosed health conditions of respondents………………………………….138
Table 22. Respondents‘ utilisation of the health facilities by RHA……………………..139
Table 23. Respondents‘ perceptions of the service they received from the public health
system……………………………………………………………………………………142
Table 24. Respondents‘ knowledge of free services…………………………………….145
ix
Table 25. Respondents who received a prescription and use of alternative medicine…...147
Table 26. Respondents who were referred and hospitalised……………………………..148
Table 27. Respondents‘ perceptions regarding cost-related problems and access to health
insurance…………………………………………………………………………………150
Table 28. Practitioners focus groups and individual interviews…………………………153
x
List of Figures
Figure 1. Map of Jamaica…………………………………………………………………...2
Figure 2. Hospitals and population by parish in the health regions……………………….27
Figure 3. Structure and function of the public health sector………………………………29
Figure 4. Structure of the Regional Health Authorities, Jamaica…………………………30
Figure 5. Typical structure of a hospital…………………………………………………..41
Figure 6. Typical structure of a health centre……………………………………………..42
Figure 7. Nursing structure………………………………………………………………..43
Figure 8. Patient‘s journey to accessing health care………………………………………48
Figure 9. The multi-layered approach to the research…………………………………….95
Figure 10. Diagrammatic representation of the mixed methods procedure used in the
study……………………………………………………………………………………….97
Figure 11. Age of respondents…………………………………………………………...133
Figure 12. Problems encountered by respondents while accessing care…………………146
xi
List of Abbreviations
A&E Accident and Emergency Department
AIDS Acquired Immune Deficiency Syndrome
ANOVA Analysis of Variance
ART Antiretroviral Therapy
CAT/CT Computerised Axial Tomography
CARICOM Caribbean Community
CHA Community Health Aide
CHASE Culture, Health, Arts, Sports and Education
CINAHL Cumulative Index to Nursing and Allied Health Literature
CEO Chief Executive Officer
CMO Chief Medical Officer
CNO Chief Nursing Officer
DR Doctor
ECOSOC Economic and Social Council
ESIF Elective Services Initiatives
NP Nurse Practitioner
GEASO Government Employees Administrative Services Only
GDP Gross Domestic Product
GOJ Government of Jamaica
GNI Gross National Income
HIV Human Immuno-deficiency Virus
IDB Inter-American Development Bank
ICN International Council of Nurses
JADEP Jamaica Drug for the Elderly Programme
JAMPRO Jamaica Promotions Corporation
JIS Jamaica Information Service
JSIF Jamaica Social Investment Fund
JSLC Jamaica Survey of Living Conditions
KES Kenya Shilling
KFC Kentucky Fried Chicken
KPH Kingston Public Hospital
MDG Millennium Development Goals
xii
MOF Ministry of Finance
MOH Ministry of Health
MoU Memorandum of Understanding
MRI Magnetic Resonance Imaging
NERHA Northern Regional Health Authority
NGO Non-Governmental Organisation
NHF National Health Fund
NHS National Health Services
NIS National Insurance Scheme
ODA Official Development Assistance
OECD Organization for Economic Cooperation and Development
PAHO Pan American Health Organisation
PATH Programme of Advancement through Health and Education
PHC Primary Health Care
PHI Public Health Inspectors
PHN Public Health Nurse
PIOJ Planning Institute of Jamaica
RHA Regional Health Authority
RN Registered Nurse
SERHA South East Regional Health Authority
SRHA Southern Regional Health Authority
STATIN Statistical Institute of Jamaica
STI Sexually Transmitted Infections
SPSS Statistical Package for the Social Sciences
TB Tuberculosis
UK United Kingdom
UNICEF United Nations International Children's Emergency Fund
USA United States of America
USAID United States Agency for International Development
UTI Urinary Tract Infection
VEN Vital Essential and Necessary
VJH Victoria Jubilee Hospital
WHO World Health Organisation
WRHA Western Regional Health Authority
1
Chapter 1: Introduction
People have ‗good access‘ to health services when they receive ―the right service,
at the right time, in the right place‖ (Chapman, Zechel, Carter, & Abbott, 2004, p. 374).
For many people, however, poor access to health services is a reality. Furthermore, such
poor access appears to be a global issue, regardless of the type of health care system that
exists in any one particular country. Diverse factors such as one‘s socioeconomic status,
ethnicity and gender contribute to the inability to access health care. In addition, charges
for health care (user fees) are major barriers to people‘s ability to access health services
when required (Flores, Abreu, Olivar, & Kastner, 1998; Hussey et al., 2007; Kiwanuka et
al., 2008; Yamada, Chen, Yamada, Chiu, & Smith, 2009).
One solution adopted by some policymakers for the problem of poor access, as
well as to ensure universal coverage, is the abolition of user fees (Bitran & Giedeon, 2002;
Ridde & Diarra, 2009). Removal of user fees has been shown in many countries to be
effective in achieving improved access to health services (Abdu, Mohammed, Bashier, &
Eriksson, 2004; James, Morris, Keith, & Taylor, 2005; Ridde & Diarra, 2009; McPake,
Schmidt, Araujo, & Tashobya, 2008). Based on the findings of the Jamaica Survey of
Living Conditions 2007 (Planning Institute of Jamaica [PIOJ] & the Statistical Institute of
Jamaica [STATIN], 2008), it was apparent that patients encountered barriers in accessing
health care in Jamaica. Inability to pay was identified as one such barrier to individuals of
low socioeconomic status. Therefore, in 2007 and 2008 the government embarked on far-
reaching policy changes regarding user fees in the public health sector as a means to
improve access to health services by the underserved population. User fees had previously
been charged to raise revenue in order to foster improvement and efficiency in the health
sector. However, user fees were found to be regressive and resulted in unnecessary
morbidity and mortality among the poor who could not afford the services (PIOJ &
STATIN). This thesis reports on a study that examined the impact of the abolition of user
fees on access to health care in Jamaica.
To better understand the Jamaican context, this chapter provides an overview of the
profile of Jamaica and issues regarding access to health care within the country generally.
It further sets out the aim; the research questions; the significance and relevance of the
study; and presents the thesis outline.
2
1.1. Profile of Jamaica
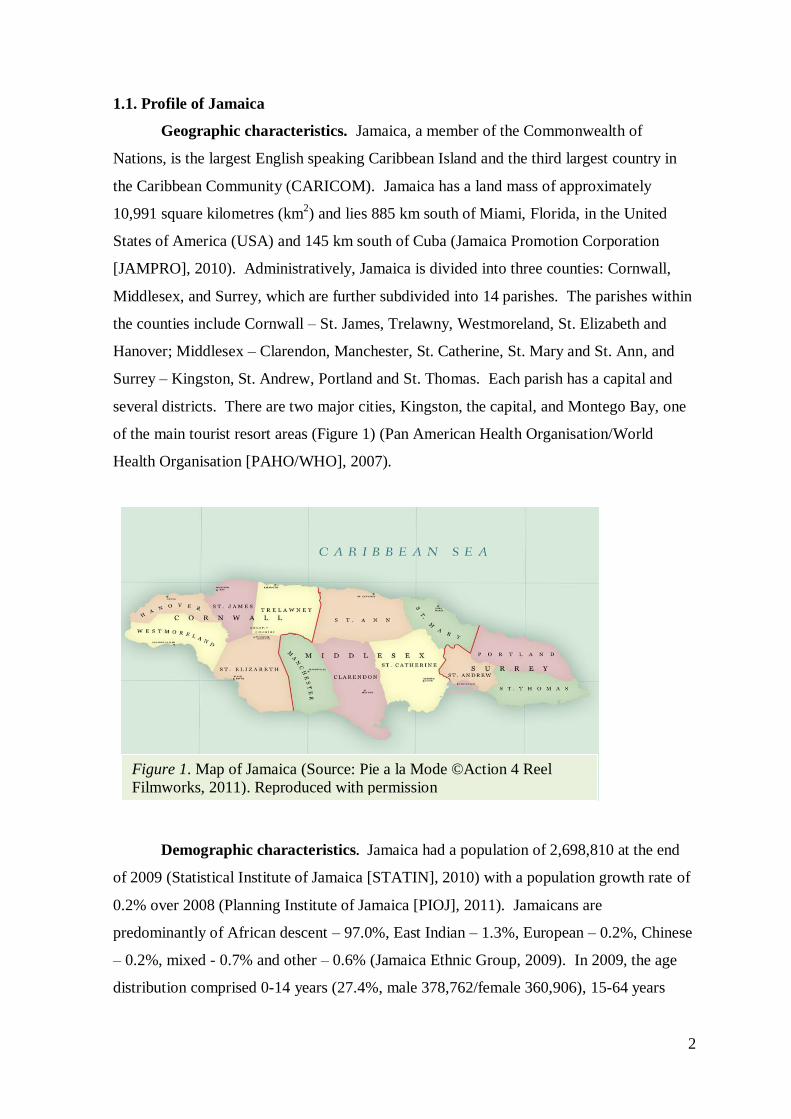
Geographic characteristics. Jamaica, a member of the Commonwealth of
Nations, is the largest English speaking Caribbean Island and the third largest country in
the Caribbean Community (CARICOM). Jamaica has a land mass of approximately
10,991 square kilometres (km2) and lies 885 km south of Miami, Florida, in the United
States of America (USA) and 145 km south of Cuba (Jamaica Promotion Corporation
[JAMPRO], 2010). Administratively, Jamaica is divided into three counties: Cornwall,
Middlesex, and Surrey, which are further subdivided into 14 parishes. The parishes within
the counties include Cornwall – St. James, Trelawny, Westmoreland, St. Elizabeth and
Hanover; Middlesex – Clarendon, Manchester, St. Catherine, St. Mary and St. Ann, and
Surrey – Kingston, St. Andrew, Portland and St. Thomas. Each parish has a capital and
several districts. There are two major cities, Kingston, the capital, and Montego Bay, one
of the main tourist resort areas (Figure 1) (Pan American Health Organisation/World
Health Organisation [PAHO/WHO], 2007).
Demographic characteristics. Jamaica had a population of 2,698,810 at the end
of 2009 (Statistical Institute of Jamaica [STATIN], 2010) with a population growth rate of
0.2% over 2008 (Planning Institute of Jamaica [PIOJ], 2011). Jamaicans are
predominantly of African descent – 97.0%, East Indian – 1.3%, European – 0.2%, Chinese
– 0.2%, mixed - 0.7% and other – 0.6% (Jamaica Ethnic Group, 2009). In 2009, the age
distribution comprised 0-14 years (27.4%, male 378,762/female 360,906), 15-64 years
Figure 1. Map of Jamaica (Source: Pie a la Mode ©Action 4 Reel
Filmworks, 2011). Reproduced with permission
3
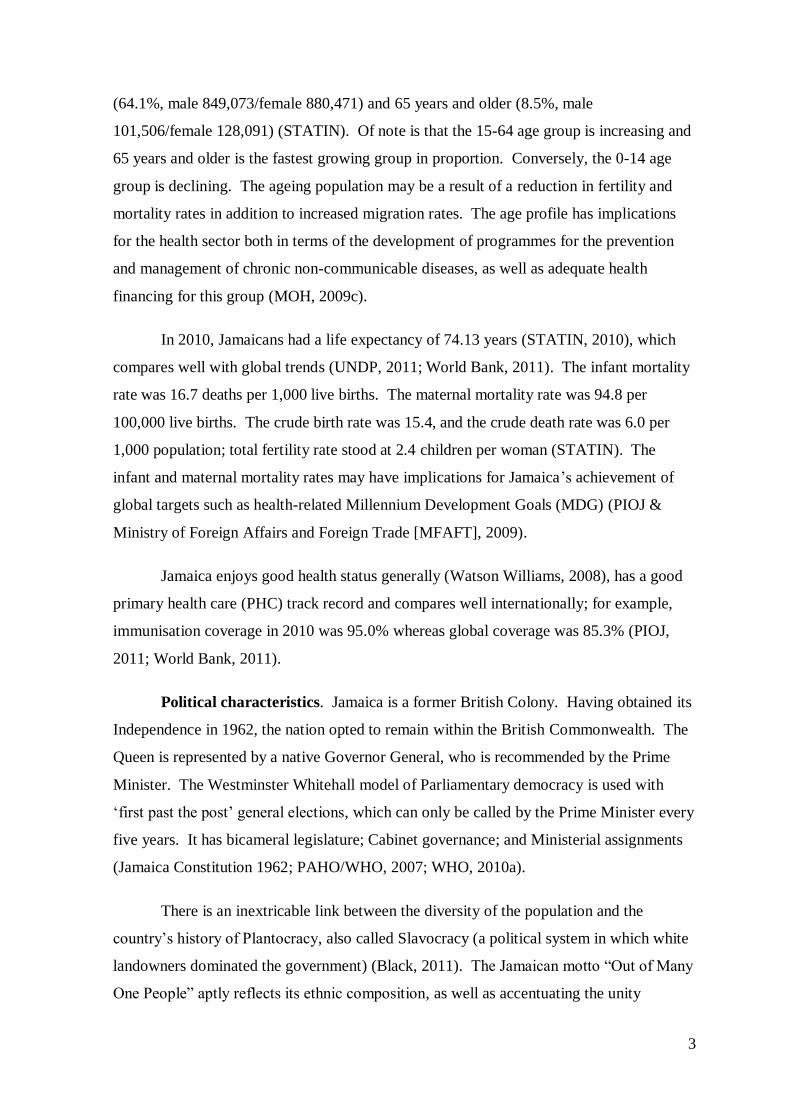
(64.1%, male 849,073/female 880,471) and 65 years and older (8.5%, male
101,506/female 128,091) (STATIN). Of note is that the 15-64 age group is increasing and
65 years and older is the fastest growing group in proportion. Conversely, the 0-14 age
group is declining. The ageing population may be a result of a reduction in fertility and
mortality rates in addition to increased migration rates. The age profile has implications
for the health sector both in terms of the development of programmes for the prevention
and management of chronic non-communicable diseases, as well as adequate health
financing for this group (MOH, 2009c).
In 2010, Jamaicans had a life expectancy of 74.13 years (STATIN, 2010), which
compares well with global trends (UNDP, 2011; World Bank, 2011). The infant mortality
rate was 16.7 deaths per 1,000 live births. The maternal mortality rate was 94.8 per
100,000 live births. The crude birth rate was 15.4, and the crude death rate was 6.0 per
1,000 population; total fertility rate stood at 2.4 children per woman (STATIN). The
infant and maternal mortality rates may have implications for Jamaica‘s achievement of
global targets such as health-related Millennium Development Goals (MDG) (PIOJ &
Ministry of Foreign Affairs and Foreign Trade [MFAFT], 2009).
Jamaica enjoys good health status generally (Watson Williams, 2008), has a good
primary health care (PHC) track record and compares well internationally; for example,
immunisation coverage in 2010 was 95.0% whereas global coverage was 85.3% (PIOJ,
2011; World Bank, 2011).
Political characteristics. Jamaica is a former British Colony. Having obtained its
Independence in 1962, the nation opted to remain within the British Commonwealth. The
Queen is represented by a native Governor General, who is recommended by the Prime
Minister. The Westminster Whitehall model of Parliamentary democracy is used with
‗first past the post‘ general elections, which can only be called by the Prime Minister every
five years. It has bicameral legislature; Cabinet governance; and Ministerial assignments
(Jamaica Constitution 1962; PAHO/WHO, 2007; WHO, 2010a).
There is an inextricable link between the diversity of the population and the
country‘s history of Plantocracy, also called Slavocracy (a political system in which white
landowners dominated the government) (Black, 2011). The Jamaican motto ―Out of Many
One People‖ aptly reflects its ethnic composition, as well as accentuating the unity
4
embraced by the Jamaican people as they contribute to nation building (Jamaica
Information Service [JIS], 2007). Consistent with international trends there is increased
urbanisation in Jamaica. Half of the population reside in urban areas, especially in the
Kingston Metropolitan Area. This essentially is a result of industrialisation (PAHO/WHO,
2007), which has encouraged people to move to urban areas in search of jobs and better
quality of life.
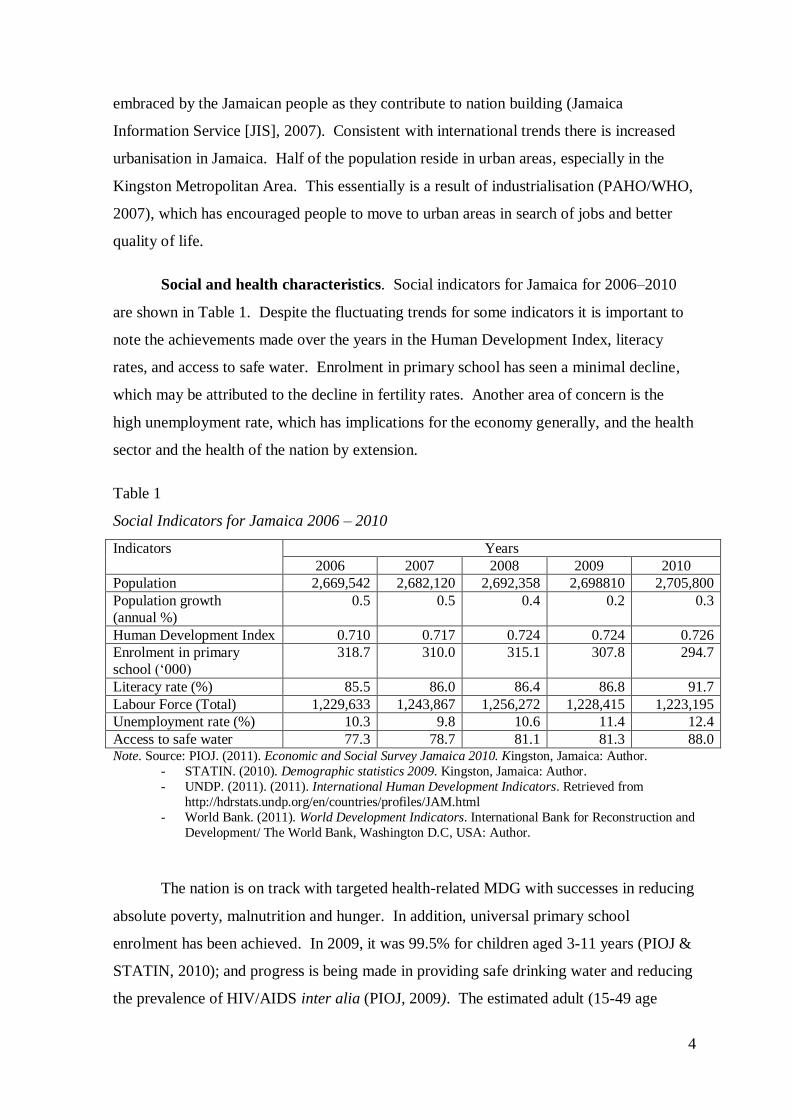
Social and health characteristics. Social indicators for Jamaica for 2006–2010
are shown in Table 1. Despite the fluctuating trends for some indicators it is important to
note the achievements made over the years in the Human Development Index, literacy
rates, and access to safe water. Enrolment in primary school has seen a minimal decline,
which may be attributed to the decline in fertility rates. Another area of concern is the
high unemployment rate, which has implications for the economy generally, and the health
sector and the health of the nation by extension.
Table 1
Social Indicators for Jamaica 2006 – 2010
Indicators Years
2006 2007 2008 2009 2010
Population 2,669,542 2,682,120 2,692,358 2,698810 2,705,800
Population growth
(annual %)
0.5 0.5 0.4 0.2 0.3
Human Development Index 0.710 0.717 0.724 0.724 0.726
Enrolment in primary
school (‗000)
318.7 310.0 315.1 307.8 294.7
Literacy rate (%) 85.5 86.0 86.4 86.8 91.7
Labour Force (Total) 1,229,633 1,243,867 1,256,272 1,228,415 1,223,195
Unemployment rate (%) 10.3 9.8 10.6 11.4 12.4
Access to safe water 77.3 78.7 81.1 81.3 88.0 Note. Source: PIOJ. (2011). Economic and Social Survey Jamaica 2010. Kingston, Jamaica: Author.
- STATIN. (2010). Demographic statistics 2009. Kingston, Jamaica: Author.
- UNDP. (2011). (2011). International Human Development Indicators. Retrieved from
http://hdrstats.undp.org/en/countries/profiles/JAM.html
- World Bank. (2011). World Development Indicators. International Bank for Reconstruction and
Development/ The World Bank, Washington D.C, USA: Author.
The nation is on track with targeted health-related MDG with successes in reducing
absolute poverty, malnutrition and hunger. In addition, universal primary school
enrolment has been achieved. In 2009, it was 99.5% for children aged 3-11 years (PIOJ &
STATIN, 2010); and progress is being made in providing safe drinking water and reducing
the prevalence of HIV/AIDS inter alia (PIOJ, 2009). The estimated adult (15-49 age
5
group) HIV prevalence rate was 1.7% in 2009, with approximately 21,000 Jamaicans of all
ages living with the disease (United Nations International Children's Emergency Fund
[UNICEF], 2010).
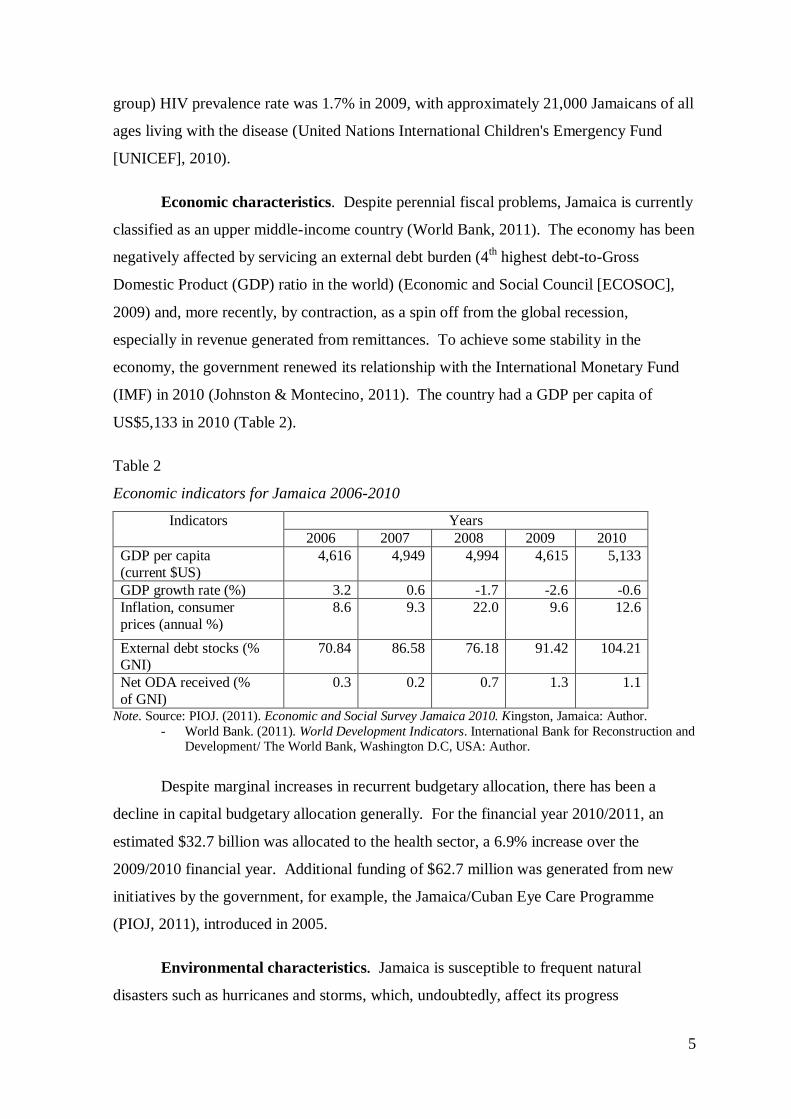
Economic characteristics. Despite perennial fiscal problems, Jamaica is currently
classified as an upper middle-income country (World Bank, 2011). The economy has been
negatively affected by servicing an external debt burden (4th highest debt-to-Gross
Domestic Product (GDP) ratio in the world) (Economic and Social Council [ECOSOC],
2009) and, more recently, by contraction, as a spin off from the global recession,
especially in revenue generated from remittances. To achieve some stability in the
economy, the government renewed its relationship with the International Monetary Fund
(IMF) in 2010 (Johnston & Montecino, 2011). The country had a GDP per capita of
US$5,133 in 2010 (Table 2).
Table 2
Economic indicators for Jamaica 2006-2010
Indicators Years
2006 2007 2008 2009 2010
GDP per capita
(current $US)
4,616 4,949 4,994 4,615 5,133
GDP growth rate (%) 3.2 0.6 -1.7 -2.6 -0.6
Inflation, consumer
prices (annual %)
8.6 9.3 22.0 9.6 12.6
External debt stocks (% GNI)
70.84 86.58 76.18 91.42 104.21
Net ODA received (%
of GNI)
0.3 0.2 0.7 1.3 1.1
Note. Source: PIOJ. (2011). Economic and Social Survey Jamaica 2010. Kingston, Jamaica: Author.
- World Bank. (2011). World Development Indicators. International Bank for Reconstruction and Development/ The World Bank, Washington D.C, USA: Author.
Despite marginal increases in recurrent budgetary allocation, there has been a
decline in capital budgetary allocation generally. For the financial year 2010/2011, an
estimated $32.7 billion was allocated to the health sector, a 6.9% increase over the
2009/2010 financial year. Additional funding of $62.7 million was generated from new
initiatives by the government, for example, the Jamaica/Cuban Eye Care Programme
(PIOJ, 2011), introduced in 2005.
Environmental characteristics. Jamaica is susceptible to frequent natural
disasters such as hurricanes and storms, which, undoubtedly, affect its progress
6
economically. Disruption in the agricultural sector from these phenomena over the years
has resulted in a decline in exports of produce such as sugar, banana and coffee. However,
through governmental assistance to improve the robustness in the sector, there was some
growth in 2010. The growth was realised despite damage caused by Tropical Storm
Nicole to crops and livestock amounting to $576.5 million (PIOJ, 2011). The environment
portfolio falls within the ambit of the MOH and, as such, has implications for funding of
the health sector.
1.2. Overview of health care in Jamaica
Recent efforts by the Jamaican government to enhance access to health care were
fast-tracked by data from the Jamaica Survey of Living Conditions 2007. The data
revealed that approximately 50.3% of Jamaicans in the lower socioeconomic group were
not accessing health care despite their illnesses (PIOJ & STATIN, 2008). The evidence
indicated that the cost of services and socioeconomic status were determinants in
individuals‘ ability to access health services.
Jamaica has a two-tiered health sector, which comprises both a public and private
sector. This research focuses primarily on the public sector; however, a brief description
of the private health sector will also be given in this chapter. Both systems will be
discussed further in Chapter 2. Despite the dearth of literature on the private health sector,
the available information suggests that it is utilised by individuals as an alternative to the
public sector. The private sector is largely unregulated, and therefore has minimal
obligatory responsibilities to the MOH (Health Sector Task Force, 2009).
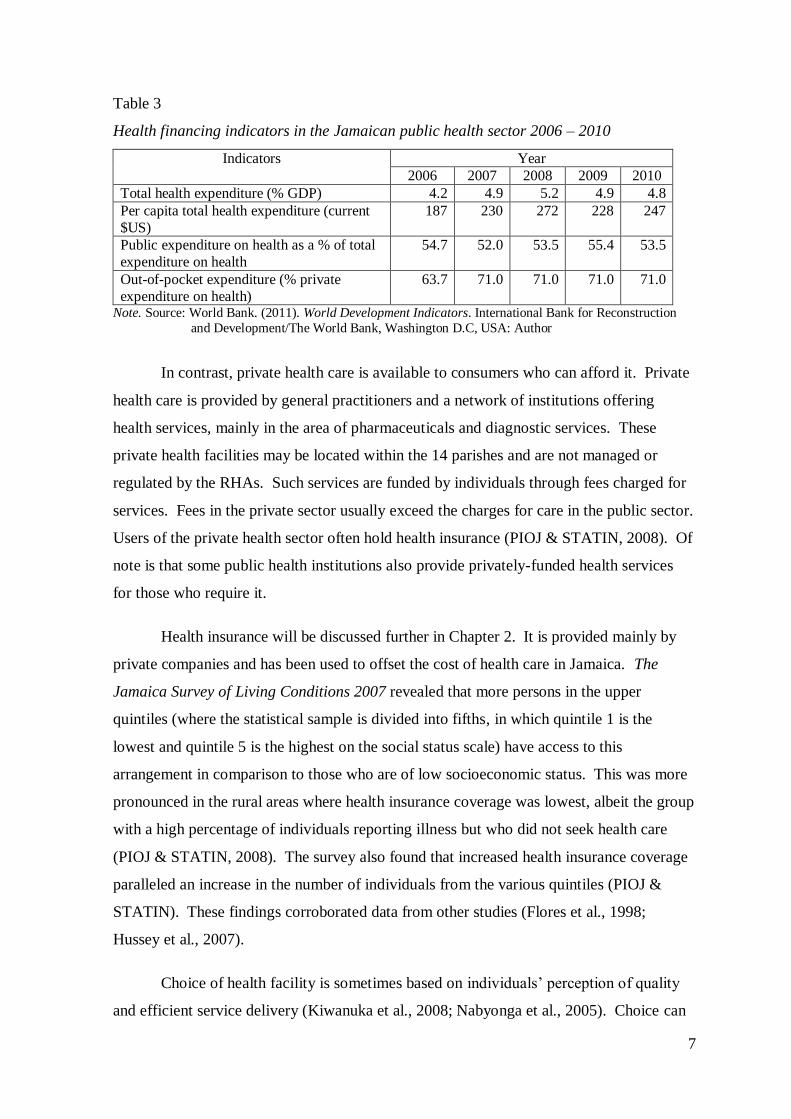
Delivery of public health care is provided by four Regional Health Authorities
(RHAs) through a network of primary, secondary and tertiary health care facilities. The
public health services are funded by an annual national budgetary allocation from the
government, revenues collected from user fees, funds donated by international bilateral
and multilateral development agencies (MOH, 2008a), and gifts. Table 3 shows the
expenditure on health for the period 2006-2010. While the figures portray some volatility
in funding over time, they also highlight the significant role played by out-of-pocket
expenditures. For some users of the public health sector, health insurance is not a reality
and, as such, many experience difficulty obtaining care when required, especially from
private providers.
7
Table 3
Health financing indicators in the Jamaican public health sector 2006 – 2010
Indicators Year
2006 2007 2008 2009 2010
Total health expenditure (% GDP) 4.2 4.9 5.2 4.9 4.8
Per capita total health expenditure (current
$US)
187 230 272 228 247
Public expenditure on health as a % of total
expenditure on health
54.7 52.0 53.5 55.4 53.5
Out-of-pocket expenditure (% private
expenditure on health)
63.7 71.0 71.0 71.0 71.0
Note. Source: World Bank. (2011). World Development Indicators. International Bank for Reconstruction
and Development/The World Bank, Washington D.C, USA: Author
In contrast, private health care is available to consumers who can afford it. Private
health care is provided by general practitioners and a network of institutions offering
health services, mainly in the area of pharmaceuticals and diagnostic services. These
private health facilities may be located within the 14 parishes and are not managed or
regulated by the RHAs. Such services are funded by individuals through fees charged for
services. Fees in the private sector usually exceed the charges for care in the public sector.
Users of the private health sector often hold health insurance (PIOJ & STATIN, 2008). Of
note is that some public health institutions also provide privately-funded health services
for those who require it.
Health insurance will be discussed further in Chapter 2. It is provided mainly by
private companies and has been used to offset the cost of health care in Jamaica. The
Jamaica Survey of Living Conditions 2007 revealed that more persons in the upper
quintiles (where the statistical sample is divided into fifths, in which quintile 1 is the
lowest and quintile 5 is the highest on the social status scale) have access to this
arrangement in comparison to those who are of low socioeconomic status. This was more
pronounced in the rural areas where health insurance coverage was lowest, albeit the group
with a high percentage of individuals reporting illness but who did not seek health care
(PIOJ & STATIN, 2008). The survey also found that increased health insurance coverage
paralleled an increase in the number of individuals from the various quintiles (PIOJ &
STATIN). These findings corroborated data from other studies (Flores et al., 1998;
Hussey et al., 2007).
Choice of health facility is sometimes based on individuals‘ perception of quality
and efficient service delivery (Kiwanuka et al., 2008; Nabyonga et al., 2005). Choice can
8
also be influenced by distance from facility, transportation, diversity of the service, how
technologically advanced the service is, operating hours, cost of the service, access to
health insurance, preference, and severity of illness (MOH, 2008a).
Although consumers of health care in Jamaica have access to both public and
private health care, data from The Jamaica Survey of Living Conditions 2007 highlighted
that, over time, there was an increase in the number of persons reporting illness and injury
in all quintiles. Significantly, the findings showed that those in quintile 1 had a lower
utilisation rate of the health system than those in the higher quintiles (PIOJ & STATIN,
2008). Despite the ability to choose, some consumers were challenged by issues relating
to affordability and accessibility of care.
For this reason, policymakers are constantly monitoring the progress of health care
and the quality of life of the nation‘s people through health indicators such as mortality
rates and life expectancy (MOH, 2008a). In recent years, initiatives such as the Jamaica
Drug for the Elderly Programme (JADEP), Programme of Advancement through Health
and Education (PATH), the Culture, Health, Arts, Sports and Education (CHASE) Fund
and the National Health Fund (NHF) have been implemented to improve access to health
services, especially pharmaceuticals. These initiatives will be discussed in more detail in
Chapter 2.
Accessing health care, whether public or private, from both hospitals and health
centres involves a journey and patients can be either hindered or facilitated at varying
stages. Persons facilitating the process include nurses, pharmacists, doctors and other
health care providers. Noteworthy is that several categories of nurse facilitate the process
at different stages of a patient‘s journey. Professional nurses in the secondary care settings
include registered nurses (RNs) or staff nurses, ward managers and directors of nursing
services, and in the PHC settings there are nurse/midwives, public health nurses (PHNs)
and nurse practitioners (NPs). NPs attend to patients who are similar to the patients seen
by doctors in both the secondary and PHC settings, while the PHNs focus on maternal and
child health services. Nurses‘ roles are discussed further in Chapter 2.
Nurses as members of the health workforce in modern Jamaica are fundamental to
achieving access to health care especially among the vulnerable. They have adopted new
roles, expanded the scope of their practice, relocated where services are delivered and have
9
consistently targeted at risk groups to improve access. Despite their innovative efforts
however, very little is documented about nursing contribution to improving access as well
as the impact of health policies on the work of the professional nurse. Therefore, this
study also examined the impact of user fees policies on the work of the professional nurse.
Nominal fees used to be charged for health services, especially in the PHC setting.
These, however, were found to be one of the barriers to accessing services in the public
health sector. Geographic location was also identified as a barrier, especially for people
living in the rural areas (PIOJ & STATIN, 2008). To meet the demand of this segment of
the population, policymakers resorted to establishing new categories of health workers
such as the NPs from as early as 1977 and expanding the role of others such as midwives
in the 1970s (McCaw-Binns, Moody, & Standard, 1998).
The debate on user fees in the Jamaica public health system has been on-going. As
a result, on May 28, 2007 user fees were abolished for children under 18 years and an
election promise was made by the incumbent government to abolish user fees in 2008 for
all users of the public health system. The Minister of Health, in a statement validating the
government‘s position on the abolition of user fees, mentioned the relationship between
well-being and development (JIS, 2008), further reiterating the inextricable link between
the growth of a nation and the health of its people. Subsequently, fees were removed for
all users of public health facilities (hospitals, health centres, laboratories, diagnostic
facilities, pharmacies) on April 1, 2008 (MOH, 2008b, 2008c).
This move was intended to indirectly improve access to health services for the
poor. The MOH in outlining the policy context noted that:
The imperatives that informed the abolition of user fees policy are not unique to
Jamaica and are as follows: (a) user fees policy has been shown to be regressive
and a major impediment to access to health. The Jamaica Survey of Living
Conditions 2007 show that 50.8% of the poorest quintile who reported an illness
did not seek health care because they could not afford so to do; (b) user fees have
increased poverty because they reduce the disposable incomes of the poor and
deplete their asset base; (c) user fees policy impacts negatively on utilisation
resulting in deteriorating health outcomes, increasing morbidity and reduced life
expectancy. (MOH, 2008b, p. 1)
10
The aims of the policy included eliminating impediments to access, creating an equitable
health sector, reorienting PHC, relieving health staff of administrative tasks such as
assessment of patients and collection of fees, and identifying suitable alternative financing
and modes of service delivery (MOH, 2008b). Reports have indicated that utilisation of
the health facilities increased rapidly in the days following the removal of user fees. There
was a 125.0% increase in utilisation for some institutions within days of the policy change
(MOH, 2008d, 2009a).
1.3. Problem statement, aim and research questions
While initial government publications indicated increased utilisation of the
Jamaican public health system one year after the policy change and poor Jamaicans having
saved billions of dollars since the removal of user fees policy (MOH, 2009a; 2009b), it
was unclear which segments of society were receiving the benefits. Additionally, there
were limited discussions regarding other barriers to accessing health services, as well as
the impact of the policy change on the work of the health workforce, especially the
professional nurse. Due to limited work in this area and the paucity of information, this
study examines the impact of the policy change on access, the care provided, and the work
of the professional nurse.
Aim. The aim of this research was to examine access to health services, the care
provided, and the work of the professional nurse after the abolition of user fees. The
analyses focused on three perspectives: 1) the national level, which included national and
regional policymakers sharing their roles in and experiences of the policy change, 2) the
provider level, which included the perceptions of main health practitioners such as doctors,
nurses and pharmacists in rural and urban settings, and 3) the user level, where patients
using the public health system in rural and urban settings shared their perceptions.
Research questions. Four research questions were identified for this study:
1. What is the impact of the abolition of user fees on users‘ access to health services?
2. What is the impact of the abolition of user fees on the utilisation of health services and
nursing services in particular in the public health sector?
3. What is the impact of the policy change on the work of the professional nurse?
4. What are the lessons learned from the policy change for Jamaica and other developing
countries?
11
1.4. Significance and relevance of the research
It is apparent from the MOH Jamaica reports that the current policy focus is on
determining the effects of the user fees policy change on utilisation patterns, savings for
the patient, use of pharmaceuticals, waiting time and patient satisfaction (JIS, 2009; MOH,
2009a). This is amidst disparaging remarks by critics, aimed at discrediting the free health
care policy change. Critics frequently felt that the policy change was unrealistic and
unable to be sustained in the present local and global economic situation (Luton, 2009).
While the policy change has its merits as an agenda to improve access by the poor
to health services, little has been published about its success: in reaching target
populations, health outcomes, or benefits to the nation from policymakers‘, providers‘, and
users‘ perspectives. Most of the available literature has noted the impact of the removal of
fees policy on health workers in African countries generally (Burnham, Pariyo,
Galiwango, & Wabwire-Mangen, 2004; Wilkinson, Gouws, Sach, & Abdool Karim,
2001). However, very little has been documented about the impact on the work of the
professional nurse. One study revealed nurses were indecisive about the impact on their
work (Walker & Gilson, 2004). It has also been reported that nurses received bonuses,
which contributed to quality of care and effectiveness of the policy change (Ridde &
Diarra, 2009). Nurses also associated the removal of user fees with a ―sense of being
exploited, overworked and de-motivated to the point of considering resignation‖ (Ridde &
Morestin, 2011, p. 8).
Therefore, this project evaluated the effects of the policy change at three levels.
Triangulation was used to gather dissimilar but corresponding data that could be used to
determine the impact of the no user fees policy. The findings from this multi-layered
mixed methods evaluation generated three tiers of data on the impact of the removal of
user fees and added to our knowledge of the effects of such policies. Findings also provide
insights into how the removal of user fees affected the work of the professional nurse.
These findings should be useful in influencing the policy process regarding access to and
the delivery of health services.
1.5. Thesis chapter outline
Chapter 1 has provided an introduction to the study, highlighting health care access
issues in the Jamaican context. To position the research, it presented the study‘s statement
of problem, the aim, the research questions, and the significance of the study.
12
Chapter 2 introduces Jamaica historically, as well as providing a detailed
description of the Jamaican health service from a policy and organisational perspectives.
The purpose of the chapter is to highlight the development and reform of the public health
system from the 17th–21
st centuries. Additionally, it provides information on the private
health system, funding of the health system including health insurance, Jamaican folk
medicine, work of the professional nurse, patient‘s journey to accessing health services,
and measures to improve access to care in the Jamaican context.
Chapter 3 provides information on the search strategy for this research, as well as
literature about user fees in various health systems including Jamaica, and the impact of
the abolition of user fees on health service delivery. It also provides information on the
settings of available studies. Most of the studies were conducted in developing countries
in Africa; however, some studies have been done in Jamaica. This chapter also highlights
the research designs adopted by the researchers, which included qualitative, quantitative
and mixed methods designs. The findings regarding the positive and negative effects of
user fees and the abolition of user fees are presented. Additionally, it underscores the gaps
in the literature, such as the limited work on the impact of the removal of user fees on the
work of the professional nurse. The chapter concludes with a restatement of the objectives
of the study.
Chapter 4 provides the theoretical framework for the study. It provides detailed
discussion on access to health care, clarifying concepts such as access, need, and
availability. In addition, it presents information on consumers and access, gender and
access, health care affordability and availability, policymakers and access, providers and
access, and access to health care within the Jamaican context. The chapter also describes
nursing‘s contribution to improving access.
Chapter 5 describes the methodology for the study. It commences with an
overview of the mixed method evaluation multi-layered approach. It highlights the
strengths and weaknesses of the design, as well as providing information regarding ethical
considerations; population and sampling; materials and methods, instrumentation and
timeframe; analysis strategies, measures to ensure validity and reliability; and some of the
limitations of the processes involved.
13
Chapter 6 presents the results for the national, provider and user levels of the study.
It commences with the presentation of the policymakers‘ findings. In addition, it
highlights the official statistics regarding utilisation patterns and key health indicators one
year before and one year after the abolition of user fees, and the users‘ findings.
Chapter 7 presents findings on the impact of the abolition of user fees policy on the
work of main health practitioners with a focus on the professional nurse. The chapter
commences with the practitioners‘ and nurses‘ perspectives on their involvement in the
policy process, impact of the policy change on their work, funding, their contribution to
improving access, satisfaction with their work environment, and their general impression
of the policy change.
Chapter 8 discusses the significance of the key findings of the study from the
national, provider, and user perspectives. It discusses the impact of the policy change on
service delivery in terms of access and utilisation of the services, and on the health of the
workforce including nurses. The chapter commences with an overview of the key
findings. It further provides justification for the interpretation using relevant research
findings and explanations to support findings where appropriate. The discussion integrates
all three levels of results.
Chapter 9 provides a conclusion to the study and presents the lessons learnt from
the Jamaican experience of the removal of user fees for health services. In addition, it
highlights the strengths and limitations of the study; implications for policy, practice and
research; and concludes with recommendations for future policy implementation.
The terms users and patients and providers and practitioners will be used
interchangeably throughout this study. In addition the ‗abolition of user fees policy‘ will
hereafter be referred to as the ‗the user fee policy‘.
14
Chapter 2: The Jamaican health system
2.1. Introduction
This chapter provides an introduction to Jamaica and its health system from a
policy and structural perspective. It is intended to assist the readers to understand the
historical and cultural climate within which the system operates, as well as highlighting
significant developments and the current structure. The chapter includes a brief
description of Jamaica as a country; the development and reform of the public health
system from the 17th-21
st centuries; health system funding from the 17
th-21
st centuries; and
the delivery and utilisation of health services.
2.2. Jamaica
Indigenous people and the Spaniards. Historically, the first inhabitants of
Jamaica were the Arawak Indians (also called Tainos) from South America. Very little is
documented about these natives because they were exterminated seemingly by the 18th
century due to the exploitation of the Spaniards and Europeans. Subsequent to the
incursion of Christopher Columbus and Spanish convoys in 1494, mortality rates among
natives increased exponentially. As a consequence of the high mortality rate among the
natives there were fewer labourers to work on the plantations that were established by the
Spaniards. Therefore, they resorted to African slave workers in 1517 (Black, 2011;
Warner-Lewis, 2002). Mortality rates among the Arawaks were so concerning that ―In
1598 the Governor of Jamaica Fernando Melgarejo was alarmed at the speed [with] which
the Indian population was dwindling‖ (Black, p. 27). While many Indians died of the
harsh treatment meted out to them by the Spaniards, others committed suicide or
infanticide in order to escape the realities of slavery. Additionally, other Indians died as a
result of infectious diseases brought into the country by the Europeans. Indians‘ farms
were also destroyed by the Europeans‘ animals such as cattle and goats, leaving very little
cultivated land for their survival. The decimation of the natives continued throughout the
reign of the British, who conquered the Spaniards and occupied the country in 1655
(Robertson, 2002).
British and Slavocracy. Between the period 1655 and 1838 Jamaica was known
for its Plantation System, mainly sugar plantations, which were first introduced by the
Spaniards. Sugar production was an economically viable commodity at the time and
Jamaica, a leading producer, had a reputation for producing quality sugar (Higman, 2005).
15
To maintain this status, British estate owners expanded the slave trade and brought slaves
in large numbers from Africa to sustain their plantations, which were villages equipped
with all the facilities for the production and manufacturing of sugar. This essentially was
the precursor to the widely-known slave trade to Jamaica (Black, 2011). After much
resistance by estate owners, Jamaica achieved full emancipation in 1838 (Campbell, 2002),
a process that commenced with the Abolition Act of 1833. This process was further
strengthened by pockets of sustained activism against the inhumane treatment of slaves on
the plantations. Notable activists included Granville Sharp, William Wilberforce and
William Knibb. Of note however, is that estate owners were averse to ending slavery
because ―sugar was the crop that produced the greatest wealth and the best opportunities
for long term financial success‖ (Higman, p. 18). This resulted in the introduction of the
Apprenticeship system. Under this arrangement, ex-slaves were employed to work 40½
hours per week for the estate owners without compensation (Black). The Apprenticeship
system was transitory because reports of the brutal treatment of apprentices resulted in the
passing of a resolution in England that signalled its end in 1838. Absentee estate owners
had to seek labourers elsewhere (Black). For this reason, persons from India and China
were brought to Jamaica as indentured or contract labourers to work on the plantations
(Campbell, 2002).
2.3. Development and reform of the Jamaican health system (17th
– 21st Centuries)
In the absence of easily accessible archival material, a document prepared by the
MOH Health Sector Task Force in 2007 was used to provide background on the history of
the public health sector in this chapter. The Jamaican health system evolved over time and
has its history embedded in the Plantation System. While there is limited documented
evidence on the health services for the native people prior to the arrival of the Africans,
reports implied that ‗medicine men‘ treated sick Arawaks and that folk medicine was often
adopted for ailments (Hay Ho Sang, 1985). The following discussion highlights the health
service delivery system in existence during the colonial period. The historical
underpinning of the health system is one of oppression, inequity and mistrust. This has
influenced political and social reforms, as well as the policy directives of the nation and
the manner in which people respond to the processes over the years.
Plantation System (1658 – 1838). During this period, Jamaican society was
pluralistic and greatly influenced by Plantocracy (Black, 2011). The health system, which
16
dates back approximately two and a half centuries, was hierarchical (Health Sector Task
Force, 2007), providing quality services for the whites and substandard services for the
blacks. A glance at the Plantation System reveals a health system in which health care for
slaves was not a priority and inhumane treatment of slaves a daily occurrence. Epidemics
among the slaves were widespread, mainly because the attention estate owners gave to the
health of slaves was negligible. Diseases affecting the slaves included yaws, dysentery,
yellow fever, small pox, tuberculosis, and worm infestations. In addition to the epidemics,
there were reports of high incidences of infant mortality rates, maltreatment, overwork and
starvation among the slaves (Health Sector Task Force; McCaw-Binns & Moody, 2001).
A possible explanation for the neglect of the slaves‘ health was their position in society;
they were treated as property. Furthermore, the death of a slave was not a challenge for
estate owners, because a replacement could be obtained through the lucrative slave trade
without much difficulty.
Despite lacking an organised structure, by 1774 the health system had military
hospitals and a naval hospital in the main cities at which medical officers administered
health services on a capitation basis (Golding as cited in McCaw-Binns & Moody, 2001).
In 1776, the first public hospital, the Kingston Public Hospital (KPH), was established and
served as a hospital, alms-house and asylum (Swaby, 2005). It provided health care
exclusively for whites. Categories of health workers included medical officers, who had
responsibility for demographics such as births and deaths, management of infectious
diseases, and hygiene on the properties generally. They also delivered health care to the
plantation owners, their families, and the house slaves. Although limited attention was
given to the health needs of slaves, records indicated they were treated by doctors in
hospitals known as ―plantation hospitals‖ or ―hot houses‖ (Black, 2011, p. 137). In
contrast to the military hospitals, these facilities were sometimes managed by veterinarians
(Health Sector Task Force, 2007). There were also nursing homes for those who could pay
for the services (Hay Ho Sang, 1985). In addition to medical officers, records make
reference to other categories of health workers, namely ―grandees‖, ―wet nurses‖ and
‗doctresses‘, who assisted with the care of the sick, and the pregnant and dying slaves
(Swaby, p. 16). Nanas (untrained midwives) and nurses also delivered care to the sick
(Hay Ho Sang). Golding, in identifying the category of staff in hospitals during this era,
asserted that the staff included ―one part-time physician, two apothecaries, a matron and
17
five slaves‖ (as cited in McCaw-Binns & Moody, p. 7). They provided care to individuals
who could not afford to pay for services.
Given the high mortality among slaves, poor health services and intolerable
treatment meted out to them, anti-slavery movements raised consciousness regarding the
evils of the system and, in 1792, the Consolidated Slave Act was enacted in Britain, giving
slaves the right to improved health services (Health Sector Task Force, 2007). One of the
articles of this Act dealt with the mandatory submission of reports by medical officers,
regarding the number of deaths among slaves, as well as causes of death. These data had
not been previously reported (Health Sector Task Force). Despite these arrangements, the
inhumane treatment of slaves persisted. Poor living conditions, unacceptable health care
and maltreatment of slaves were often a reality on the plantations for many more years.
Early Emancipation (1839 – 1846). After the abolition of slavery in 1838,
extensive changes took place in the social system, which served as catalysts for change in
the health system. Notable changes in the social system included movement of slaves
away from the plantations, with only a few loyal slaves remaining, which led to the
collapse of operations on the plantations (Health Sector Task Force, 2007). In 1846, the
Sugar Equalisation Act was passed, further dismantling the plantation system. As a result,
medical officers‘ incomes declined; therefore, they migrated to other countries such as
England in search of employment (Health Sector Task Force; McCaw-Binns & Moody,
2001). These changes contributed to the deteriorating social and health conditions of the
nation. The deteriorating conditions occurred because earnings from the plantations were
non-existent and inadequate provision for ex-slaves inevitably resulted in anarchy.
Furthermore, the absence of medical officers in a poorly organised and ailing health
system created an environment that was conducive to epidemics.
Colonial Post Emancipation (Crown Colony Period) (1847 – 1900). The demise
of the Plantation system impacted negatively on the health and social systems of the nation
in several ways and, as such, crises were inevitable. There were hardships, empty
hospitals, migration of doctors, deteriorating health conditions and widespread
epidemiological crises (McCaw-Binns & Moody, 2001). Epidemics affecting the country
included typhoid fever (1853), cholera (1850, 1852) and smallpox (1852). For these
reasons, mortality and morbidity rates were high and all the parishes were affected. The
death rate from cholera was ―1 in every 13 of the population‖ (Black, 2011, p. 118). Of
18
note is that Mary Seacole, one of Jamaica‘s first nurses, began her nursing career in 1850
during the cholera outbreak (Black; Swaby, 2005). There is a dearth of information on
nurses training during this period of time. However, some training commenced as early as
1856 at the Lady Barkly Training Institution (Hay Ho Sang, 1985; Swaby). It was
apparent that a link existed between the post-emancipation reduction in the number of
medical officers and the increasing epidemiological crises (McCaw-Binns & Moody). A
possible explanation is that no alternative provision was made for the health care of the
free slaves generally (Black). Even though there was a lack of alternative health care and
shortage of medical officers, the care of individuals affected with yellow fever and cholera
was effectively administered by nurses, some of whom were known as ―doctresses‖ at the
time (Swaby, p. 16).
British governors continued to rule the country post-emancipation and in 1866 the
reigning Governor, Edward John Eyre, replaced the constitution with a Crown Colony
government. Under the Crown Colony, the governor formed the government and had
sufficient power to make far-reaching changes to the social welfare of the nation (Black,
2011). Eyre became unpopular, and was later dismissed and recalled to England following
a Royal Commission into the Morant Bay Rebellion of 1865. The rebellion which took
place in Morant Bay, St. Thomas, was the result of deteriorating social conditions in the
nation. The commission revealed that Eyre‘s authority was a contributing factor to the
rebellion. Eyre‘s successor, Governor Sir John Grant, was appointed the same year.
Grant‘s work heralded in the new Jamaica, resulting in the development of organised
social and health systems (Black).
Public Health Act and Boards of Health. As the years progressed, the
improvements made by Grant reflected advancements in the health system. For example,
in 1867, the Public Health Law was enacted resulting in the establishment of the Island
Medical Services or Central Board of Health (Health Sector Task Force, 2007; McCaw-
Binns & Moody, 2001; Public Health Act, 1985). Parochial Boards of Health were
subsequently instituted in all 14 parishes, through which the agenda of the Central Board
of Health was implemented. The Parochial Boards had the task to create a link between
health and the country‘s development, to quarantine and treat diseases, and to provide
public health care, including safe water supplies, proper roads and communications (Black,
19
2011; Health Sector Task Force). The intention of this system was essentially to provide
services to free slaves and indentured labourers regardless of their income.
In addition to the establishment of the health boards, there was a proliferation of
dispensaries (modern day health centres) in all 14 parishes. These facilities were hospital-
outstations, offering health services in Kingston from as early as 1870 (Cover, 1995;
McCaw-Binns & Moody, 2001). Information on the exact number and location of these
facilities is not available. Some plantation hospitals were reopened with the aim of making
health services more accessible to the greater populace. Additionally, 40 medical districts
were established among the 14 parishes in 1874, to which District Medical Officers were
deployed (Cover; Health Sector Task Force, 2007), and in 1887 the first Lying-In facility,
the Victoria Jubilee hospital (VJH) was established in response to a maternal mortality rate
in excess of 600/100,000 births. It was so named because construction occurred in the
year that Queen Victoria celebrated her Golden Jubilee (McCaw-Binns, 2008).
The National Health Services System (1901 – 1938). By the turn of the century,
there was a myriad of noticeable developments in the health system. Firstly, there was
rationing of hospital services as a result of overcrowding. This was evident in the
revocation of funding allocated for health services to the poor in 1904. Subsequently,
funding of health services was replaced with a ticket system in 1933-1934 in an attempt to
ensure accessibility (Cover, 1995). Secondly, more hospitals were built across the country
between 1916 and 1926, which ultimately resulted in the ‗hospitalisation‘ of the health
system. Despite the colossal improvement in public health, there was still discrepancy
between the support for community-based and hospital-based health services. Support for
hospital-based services was evident in the increased workforce assigned to hospitals versus
the limited number of District Medical Officers (DMOs) assigned to community health
services. Moreover, the budgetary support for community health services was inadequate.
This created a need to forge greater links between the two levels of health services in order
to provide a more equitable and accessible health service delivery system. Thirdly, the
number of DMOs, private practitioners and other health practitioners increased during this
era (Health Sector Task Force, 2007).
Appointment of commissions. An equally significant feature of this period was the
appointment of landmark commissions to investigate the health and social conditions of
the nation. Widespread riots against ineffective governance and deteriorating social
20
conditions were often catalysts for the appointment of commissions of inquiry (Health
Sector Task Force, 2007). Essentially, riots were mechanisms adopted by ex-slaves to
attract the attention of the Colonial Government to their situation and have it act in line
with the interests of the masses. Key commissions during this period included the
Rockefeller Foundation Commission and the Moyne Commission (McCaw-Binns &
Moody, 2001).
At the end of World War I, the Rockefeller Foundation Commission (1918-1932)
was appointed to investigate the deteriorating public health conditions of the nation. The
work of the Commission was significant and involved the investigation of epidemics such
as hookworm (1918), tuberculosis (1927), malaria (1928) and yaws (1932) (McCaw-Binns
& Moody, 2001). As a result of the recommendations contained in the Rockefeller
Commission‘s report, the Bureau of Health Education was established in 1927 and a new
cadre of staff, PHNs and public health inspectors (PHIs) (sanitary inspectors), was
introduced. The roles of the new health personnel included management of communicable
diseases. Nurses were involved in delivering social services, while PHIs managed the
home and community environments (McCaw-Binns & Moody). Sensitising the population
about preventive measures was an equally important role for both nurses and PHIs.
Further support from the Rockefeller Commission resulted in the provision of
fellowships and grants for the training of additional health personnel and the establishment
of health facilities. Facilities established under the support of the Commission included a
tuberculosis clinic and tuberculosis sanatorium. Consequently, through the
implementation of the recommendations of the Rockefeller Commission there was
noticeable improvement in the control of communicable diseases and importantly the
eradication of some diseases such as malaria by 1961 (McCaw-Binns & Moody, 2001).
Concerns were again raised in 1938, when there were widespread riots, and
infectious diseases were among the five leading causes of death (McCaw-Binns & Moody,
2001; Watson Williams, 2008). These conditions were drivers for the appointment of the
Moyne Commission (1938-1939) to investigate conditions in the nation and the West
Indies generally. Through the Commission‘s recommendations epidemiological, social
and political strategies were implemented, which resulted in a reduction in mortality and
morbidity rates, as well as improved quality of life for the nation‘s people. Training
facilities for health personnel were also established and included the Training Station for
21
Sanitary Inspectors and Health Visitors (renamed as the West Indies School of Public
Health (1957), now known as the University of Technology, Jamaica, School of Public
Health. The School enrolled its first entrants in 1944 (McCaw-Binns & Moody). Further
recommendations by the Moyne Commission included reorganisation of the health
services and allocation of a minimum 10.0% of the national budget to health services
(West India Royal Commission, 1945). The Commission also highlighted the
―relationship between health and poverty, housing, public health...community development
and adequate funding of community health services‖ (Health Task Force, 2007, pp. 29-30).
Impact of natural disaster. While the deteriorating social conditions could not be
attributed to any one factor, one possible reason for the minimal improvement in social and
health services during the early 20th
century was the impact of natural disasters on the
island. Such catastrophes shift the interest of authorities from social and health needs to
restoring the affected areas (McCaw-Binns & Moody, 2001). One notable event was the
earthquake of 1907 in which the country was devastated (Black, 2011). It is not
uncommon for disasters to erase the gains made in the health and social system, further
plunging the country into a state that requires the government to seek external assistance.
The impact of the aforementioned earthquake overwhelmed hospitals and the number of
death was high. External assistance in the form of medical supplies and health personnel
was obtained from the USA (Black). In the face of the on-going situations, health services
continued to deteriorate, with the greatest impact on the poor and vulnerable.
Pre-Independence – Self Government Period (1939 – 1962). Social and
economic development continued throughout this period; however, due to the effects of
World War II there was delay in timely implementation of the recommendations of the
Moyne Commission. Despite the delay, health services continued to expand and
additional commissions of inquiry were appointed including the Irvine Committee in 1944.
The Irvine Committee. This Committee was appointed to investigate the
contentious health conditions as part of a larger investigation being undertaken in the
British colonies at the time. The recommendations of the Committee were catalysts for the
establishment of the University College Hospital of the West Indies (now the University
Hospital of the West Indies) and the training of medical doctors, which was initiated in
1948. The training of doctors took precedence because there was sufficient evidence to
22
suggest health conditions in the nation were deteriorating (McCaw-Binns & Moody,
2001).
Crown colony and independence. Amidst the challenges to social and health
conditions in the country, the political change process continued. One such change
involved embracing self-government in exchange for Crown Colony status. This was
achieved under the provision of a new constitution in 1944. Jamaica now had a legislature
that included a House of Representatives and Legislative Council. Additionally, the new
constitution empowered Jamaicans with additional rights under Adult Suffrage. Jamaicans
21 years and over became eligible to vote during elections (Black, 2011; Health Sector
Task Force, 2007). Undoubtedly, this gave voice to the poor in matters of national
importance such as issues surrounding health and social conditions.
Additional changes in the health system during this era included the amalgamation
of the Medical Department into the MOH in 1955. Accordingly, a leadership structure
emerged which included a Minister of Health, a Permanent Secretary, a Chief Medical
Officer (CMO), Principal Nursing Officers and Assistant Nursing Officers for secondary
and primary services (Health Sector Task Force, 2007).
Another significant milestone achieved by Jamaica in 1962 was independence from
British rule. This signalled not only a change in the political structure but also in the
health system. The country was now fully self-governing and the Ministry of Health‘s
focus was on hospital services. The hospital-based services offered were influenced by
international standards and, as such, were similar to the American hospital-centred model
of health system (Health Sector Task Force, 2007). This ultimately resulted in the
‗hospitalisation‘ of the health system to the detriment of PHC.
The Post-Independence Period (1963 – 1971)
Expansion in health infrastructure and services. In the Post-Independence
period, additional hospitals were built with the assistance of funding from the World Bank.
One such institution was the Cornwall Regional Hospital, a Type A Regional hospital in
St. James. This institution was fraught with design faults, which resulted in some
departments being abandoned. Possible reasons for the faults included cultural
differences, in that the facility was fitted with an infrastructure similar to European
hospital design. The design provided for warmth in the winter season, whereas Jamaica is
23
a tropical country. The lack of consultation with main stakeholders such as nurses was
also problematic.
Notwithstanding setbacks, advancement in the social conditions continued and
there were observable demographic changes such as population explosion. According to
the Health Sector Task Force (2007),
Jamaica entered the stage of a demographic transition. Improvement in health
status of the population resulted in lower death rates and greater birth rates with
high dependency ratios and demonstrated the inability of the economy to sustain
the rapid rate of population increase. (p. 35)
As a result of the increase in birth rates, a Family Planning Service was established in 1967
under the umbrella of the National Family Planning Board, which was supported by the
World Bank. In addition to the development in family planning, there were attempts to
privatise the system. For example, private beds were introduced into the public health
system as a means of encouraging privatisation.
Reform in the governance of the health system. Occurring in the post-
emancipation period was a greater separation between Central and Local Boards of Health,
whereby the Ministry of Finance now had responsibility for MOH supplies, while the
Ministry of Works had responsibility for maintenance, even though artisans were assigned
to hospitals (Health Sector Task Force, 2007).
Fundamental changes occurring at this time included special arrangements
instituted, by way of a means test, for people who could not afford to pay for health care.
Moreover, little or no budgetary assistance was allocated to health centres that functioned
in an unplanned manner. A possible explanation for this practice was the strong focus
given to hospital-based services.
Development in the health workforce. There was also inaugural training of
community health aides (CHAs) in 1967. Their role as members of the health team
included working in the community in areas such as maternal and child health, health
education and promotion, and disease prevention (McCaw-Binns & Moody, 2001).
Additionally, there was the introduction of dental nurses and dental assistants in 1970
(McCaw-Binns & Moody). They functioned primarily in the PHC settings and were
instrumental in offering school dental services.
24
Despite the training of new cadre of health personnel, one should not be oblivious
to the effects of the Cold War political tensions of 1962 on Jamaica, which resulted in
mass migration of health personnel, similar to the exodus in 1838. As a consequence, a
bilateral accord was forged in the 1970s between Jamaica and Cuba for the supply of
health workers, among other arrangements, in order to maintain a stable health system
(Health Sector Task Force, 2007).
Modernisation of the health system (1972 – 1989). Throughout the 20th century,
robust policy initiations further impacted on the development of the health sector. For
example, in 1972 the Environment Control Portfolio was placed under the MOH. This
move by the government was lauded by some stakeholders, who felt this would impact
positively on the development of the nation (Health Sector Task Force, 2007).
New nomenclature, management and fees system in hospitals. A national policy
initiative implemented at the local level included new nomenclature for hospitals. The
categories were determined by virtue of the services offered and comprised Types A, B, C
and D. These categories will be discussed in more detail later. Additionally, hospital
boards were established in 1972 and, as such, hospitals were now governed by a Board of
Management (Health Sector Task Force, 2007). Subsequent to the establishment of
hospital boards, user fees were removed for public health services. This policy change
formed part of the on-going reform and hinged on the premise that the revenue generated
from user fees was inadequate for an equitable and sustainable health system (Health
Sector Task Force).
Green Paper 1974. In 1974 a Green Paper ―The Health of the Nation‖ was ratified
in parliament. This was a significant event in that the implementation of the Green Paper‘s
recommendations vastly influenced the public health system. Some of the
recommendations included introducing charges for drugs, establishing a Central Planning
and Evaluation unit to oversee the amalgamation of secondary and PHC services, offering
PHC services in health centres, locating health centres to meet the needs of the population
within their boundaries, managing pharmaceutical services by engaging advanced
techniques and expertise, and retaining staff by adopting measures such as better working
conditions, remuneration commensurate to work done and making postgraduate training
facilities available for health workers, inter alia (Health Sector Task Force, 2007).
25
New roles and categories of staff. In order to achieve acceptable coverage for
maternal and child health services, the role of the midwife was expanded in the 1970s.
This move was to provide quality maternal and child health services to the underserved
population in the rural areas, as well as to relieve the PHNs of some tasks. PHNs were
now able to focus on specialty-oriented tasks. This initiative resulted in increased
antenatal visits island-wide (McCaw-Binns & Moody, 2001).
Training of health workers continued in this era. Another category, NPs,
commenced training and joined the workforce in 1977. They were deployed to the health
system on completion of extensive training. NPs function mainly in the PHC setting with
a focus on curative services (McCaw-Binns & Moody, 2001) and deliver specialist health
services in various settings. They work in parallel with the medical officer in health
centres. NPs‘ roles were expanded in order to be responsive to the needs of people,
especially in certain geographic areas, for example, rural and poorer communities (Safriet,
1992). In addition to providing services in some urban facilities, NPs in Jamaica offer
services to individuals living in rural communities. The elderly and the poor benefit the
most.
Other important events in the era. Five events occurred during this period. The
first main event occurred between 1976 and 1977 and involved some level of
organisational reform in the public health system, including the integration of Central and
Local Boards of Health. The aim was to reduce the fragmentation in delivery of health
services, which had contributed to the lack of proper mechanisms to manage and monitor
the transformation taking place. One factor that may have been responsible for this
situation was the notion of shared management responsibilities in which the MOH had
responsibility for hospital services, while Local Government had responsibility for Parish
Health Services (Health Sector Task Force, 2007). Secondly, a National Formulary was
established between 1977 and 1980 to strengthen the management and delivery of
pharmaceutical services in the country (Health Sector Task Force).
Thirdly, PHC research commenced and was conducted through PHC units. This
served as the launching pad for ‗The Primary Health Care: Jamaican Perspective‘ policy
that was formulated in 1978. The success of this work influenced the appointment of
Jamaicans to serve on the Drafting Committee of the Alma Ata Declaration of 1978
(Health Sector Task Force, 2007). The fourth event was the introduction of compulsory
26
immunisation in 1978 for all Jamaican children in order to prevent childhood immunisable
diseases such as tuberculosis, poliomyelitis, diphtheria, tetanus and pertussis. To enforce
this law, proof of immunisation became mandatory prior to entry into school and parents
had a legal obligation to ensure their children were immunised. As a result of this policy,
the rate of immunisable diseases significantly reduced (Health Sector Task Force).
The fifth event was reforms in the hospital system. The aims of these reforms were
to achieve a greater level of efficiency in service delivery, as well as to modernise the
secondary and tertiary level services. Some hospitals involved in the reform process
included the Bellevue Hospital, a psychiatric institution, which changed to a ―decentralised
therapeutic hospital‖ with over 1000 beds (Health Sector Task Force, 2007, p. 59) and the
May Pen Hospital, where a new hospital was constructed. Construction of the facility was
achieved with the assistance of the Inter-American Development Bank (IDB).
The impact of structural adjustment on the health system. The effects of the
country‘s involvement with the IMF must not be ignored, since some reform processes
were a direct result of Structural Adjustment in 1979 under the IMF. This resulted in
austerity measures, which impacted on the delivery of health services. There was drastic
budgetary adjustment (one third reduction) between 1982 and 1987 (Watson Williams,
2008). As an outcome there was a mass migration of health workers and a reduction in the
training of some groups such as CHAs and nurses. Additionally, the rationing of the
health services resulted in the closure of some training institutions and health facilities.
Institutions affected included the Cornwall School of Nursing, The West Indies School of
Public Health, and Type D hospitals, as well as some health centres (Health Sector Task
Force, 2007). In addition to creating a gap in the health sector‘s human resources, the
quality of services declined and shortages of equipment and supplies was a daily problem
(Watson Williams). These issues increased the country‘s level of susceptibility to health
conditions that had either been under control or successfully eradicated. The robustness of
the PHC services declined and immunisation rates plummeted in the aftermath of the IMF
interventions. Epidemics such as poliomyelitis re-emerged in the 1980s, which had
serious implications for the tourist industry, one of the country‘s main sources of income
(Health Sector Task Force).
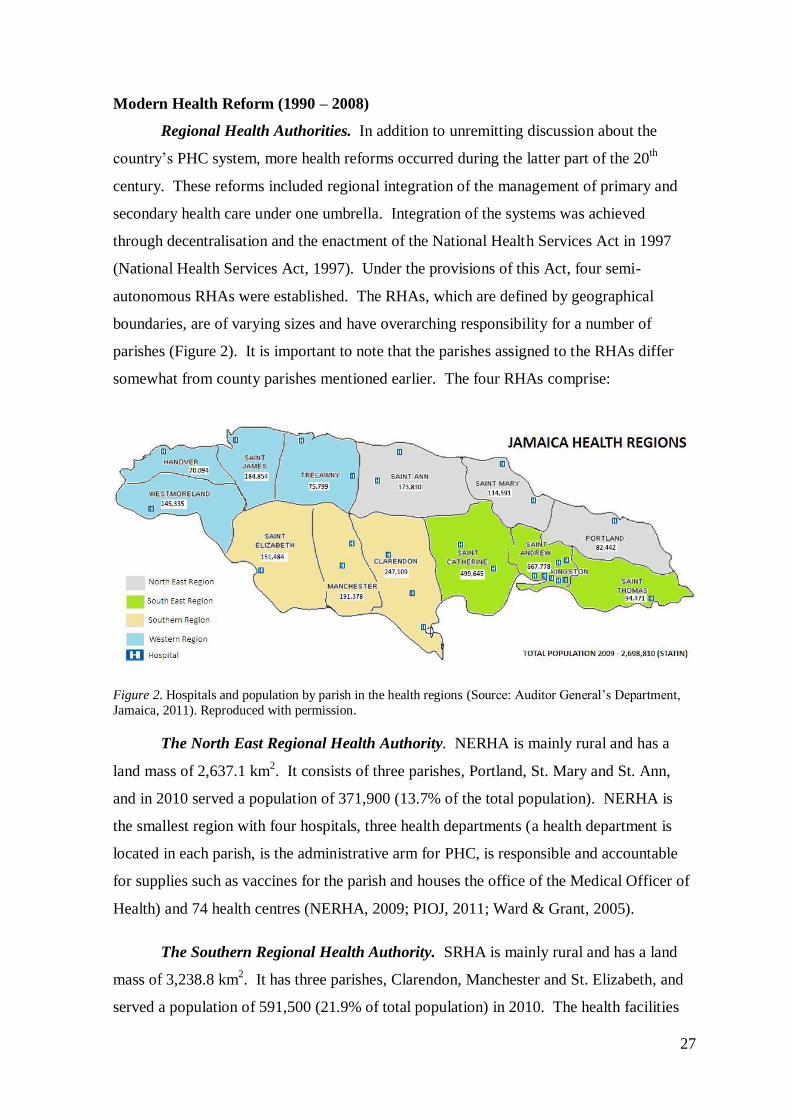
27
Modern Health Reform (1990 – 2008)
Regional Health Authorities. In addition to unremitting discussion about the
country‘s PHC system, more health reforms occurred during the latter part of the 20th
century. These reforms included regional integration of the management of primary and
secondary health care under one umbrella. Integration of the systems was achieved
through decentralisation and the enactment of the National Health Services Act in 1997
(National Health Services Act, 1997). Under the provisions of this Act, four semi-
autonomous RHAs were established. The RHAs, which are defined by geographical
boundaries, are of varying sizes and have overarching responsibility for a number of
parishes (Figure 2). It is important to note that the parishes assigned to the RHAs differ
somewhat from county parishes mentioned earlier. The four RHAs comprise:
Figure 2. Hospitals and population by parish in the health regions (Source: Auditor General‘s Department,
Jamaica, 2011). Reproduced with permission.
The North East Regional Health Authority. NERHA is mainly rural and has a
land mass of 2,637.1 km2. It consists of three parishes, Portland, St. Mary and St. Ann,
and in 2010 served a population of 371,900 (13.7% of the total population). NERHA is
the smallest region with four hospitals, three health departments (a health department is
located in each parish, is the administrative arm for PHC, is responsible and accountable
for supplies such as vaccines for the parish and houses the office of the Medical Officer of
Health) and 74 health centres (NERHA, 2009; PIOJ, 2011; Ward & Grant, 2005).
The Southern Regional Health Authority. SRHA is mainly rural and has a land
mass of 3,238.8 km2. It has three parishes, Clarendon, Manchester and St. Elizabeth, and
served a population of 591,500 (21.9% of total population) in 2010. The health facilities
28
in this region include five hospitals, three health departments and 73 health centres (PIOJ,
2011; SRHA, 2011; Ward & Grant, 2005).
Western Regional Health Authority. WRHA is mainly rural and has four parishes,
Trelawny, St. James, Hanover and Westmoreland. It has a land mass of 2,726.9 km2 and
served a population of 477,300 (17.6% of total population) in 2010. It has four hospitals,
four health departments and 78 health centres (PIOJ, 2011; Ward & Grant, 2005; WRHA,
2009).
South East Regional Health Authority. SERHA is mainly urban and has three
parishes: Kingston and St. Andrew, St. Catherine and St. Thomas. The region served a
population of 1,265,100 (46.7% of the total population) in 2010 and has a land mass of
2,387.7km2. It is the largest RHA and provides health services through a network of 10
hospitals, three health departments and 88 health centres (PIOJ, 2011; SERHA, 2010;
Ward & Grant, 2005).
Structure and functions of the RHAs. RHAs are decentralised bodies with three
overarching roles: policymaking, programme formulation, and programme execution
(Health Sector Task Force, 2007). Policymaking is, however, not a primary role but rather
a function of the MOH. Subsumed under these three roles are the RHAs‘ mandate to
manage the allotted budgetary support, human resources, health related programmes and
the delivery of health services within their geographic boundaries generally. They also
have a responsibility to ensure that the services offered are affordable, acceptable and
accessible to the populations in the areas served (Ward & Grant, 2005).
A significant element of this 1997 reform process was the transfer of the decision-
making capacity from the hospitals to the RHAs. The Hospital Boards of Management
were dismantled and replaced with a reporting structure that involves the Director of
Nursing Services or Matron, the Senior Medical Officer, and other heads of departments
reporting to a Chief Executive Officer (CEO). The CEO in turn reports to a Health
Committee headed by an administrator. While the CEOs are equipped with management
skills, there have been criticisms about their lack of nursing and medical knowledge that
some believe is required to effectively oversee a hospital (Health Sector Task Force,
2007).
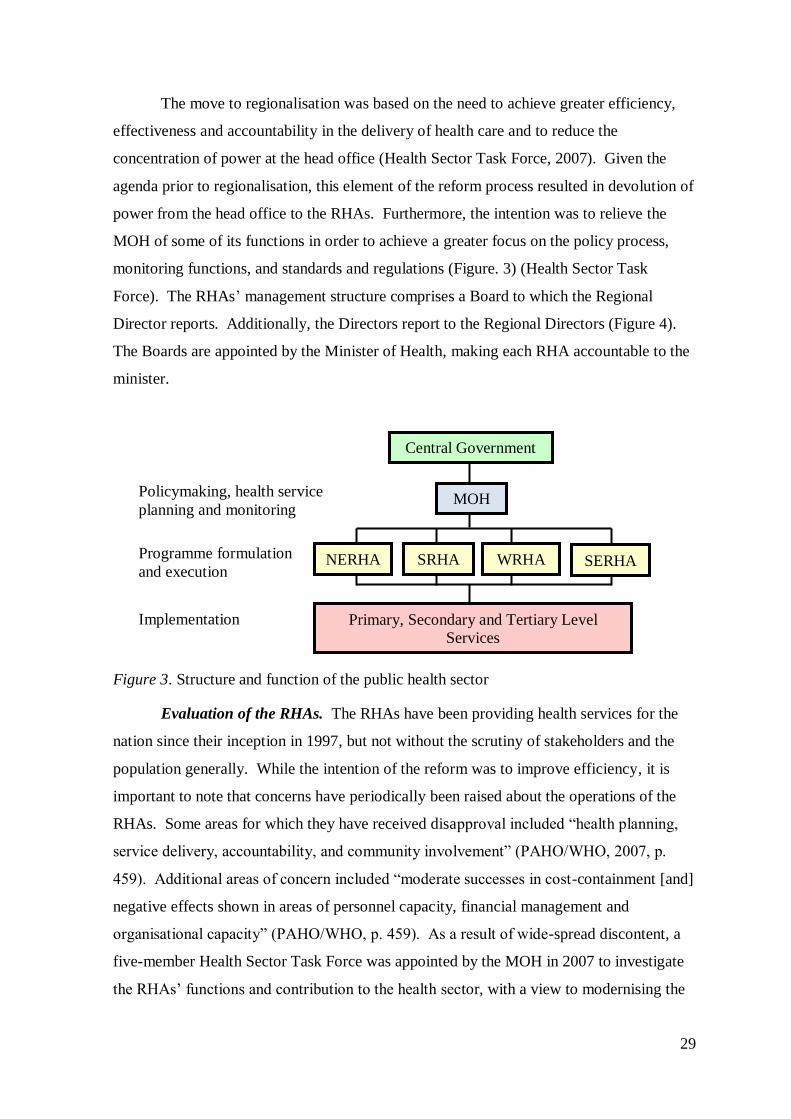
29
The move to regionalisation was based on the need to achieve greater efficiency,
effectiveness and accountability in the delivery of health care and to reduce the
concentration of power at the head office (Health Sector Task Force, 2007). Given the
agenda prior to regionalisation, this element of the reform process resulted in devolution of
power from the head office to the RHAs. Furthermore, the intention was to relieve the
MOH of some of its functions in order to achieve a greater focus on the policy process,
monitoring functions, and standards and regulations (Figure. 3) (Health Sector Task
Force). The RHAs‘ management structure comprises a Board to which the Regional
Director reports. Additionally, the Directors report to the Regional Directors (Figure 4).
The Boards are appointed by the Minister of Health, making each RHA accountable to the
minister.
Figure 3. Structure and function of the public health sector
Evaluation of the RHAs. The RHAs have been providing health services for the
nation since their inception in 1997, but not without the scrutiny of stakeholders and the
population generally. While the intention of the reform was to improve efficiency, it is
important to note that concerns have periodically been raised about the operations of the
RHAs. Some areas for which they have received disapproval included ―health planning,
service delivery, accountability, and community involvement‖ (PAHO/WHO, 2007, p.
459). Additional areas of concern included ―moderate successes in cost-containment [and]
negative effects shown in areas of personnel capacity, financial management and
organisational capacity‖ (PAHO/WHO, p. 459). As a result of wide-spread discontent, a
five-member Health Sector Task Force was appointed by the MOH in 2007 to investigate
the RHAs‘ functions and contribution to the health sector, with a view to modernising the
Central Government
MOH
SERHA NERHA SRHA WRHA
Primary, Secondary and Tertiary Level
Services
Programme formulation
and execution
Policymaking, health service
planning and monitoring
Implementation
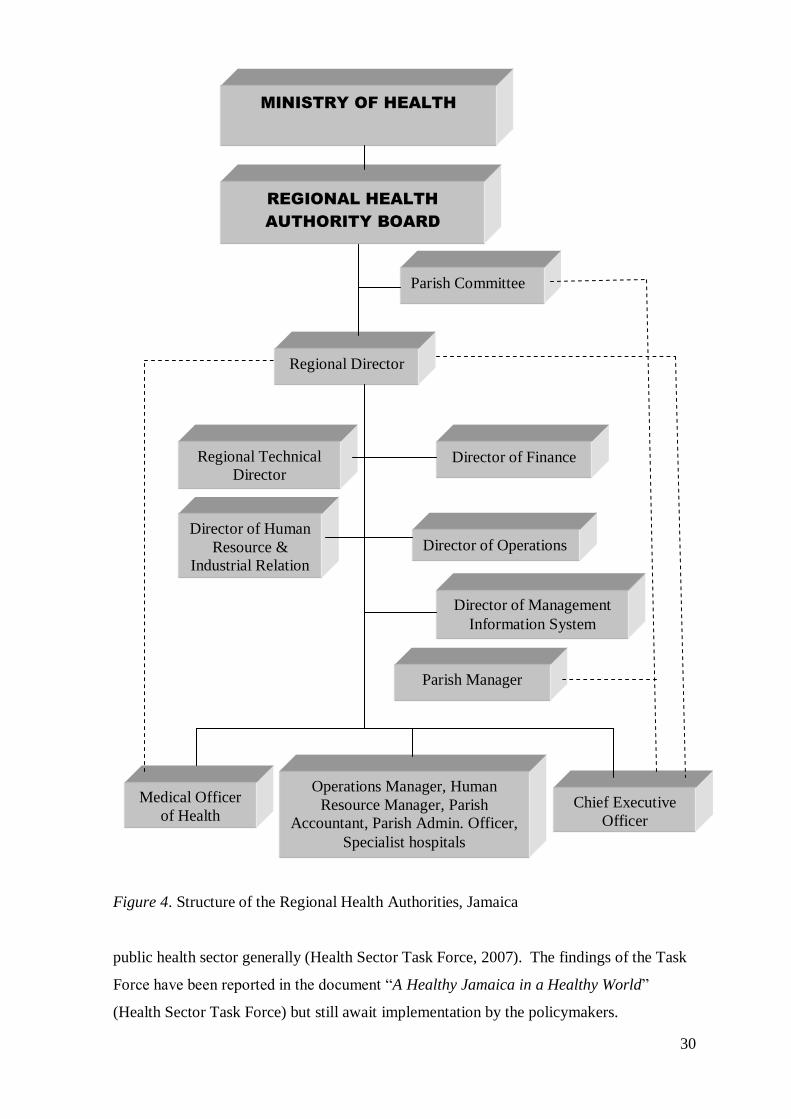
30
Figure 4. Structure of the Regional Health Authorities, Jamaica
public health sector generally (Health Sector Task Force, 2007). The findings of the Task
Force have been reported in the document ―A Healthy Jamaica in a Healthy World‖
(Health Sector Task Force) but still await implementation by the policymakers.
Regional Director
Director of Operations
Director of Finance
Director of Human
Resource &
Industrial Relation
Regional Technical
Director
Director of Management
Information System
Operations Manager, Human
Resource Manager, Parish
Accountant, Parish Admin. Officer,
Specialist hospitals
Parish Manager
Chief Executive
Officer
Medical Officer
of Health
Parish Committee
REGIONAL HEALTH
AUTHORITY BOARD
MINISTRY OF HEALTH
31
Reform of the public health services in 2007 & 2008. Reform of the health
services in the 21st century included the abolition of user fees in May, 2007 for children
under 18 years and for the Jamaican public in April 2008. The intentions of these policy
interventions were to improve access to health care for poor Jamaicans; reduce inequity in
accessing health services; reorient the public health system to reflect a primary care focus;
enhance staff efficiency by providing the right skill mix for service delivery; and find
suitable financing and service delivery mechanisms (MOH, 2008b). Under this new policy
a number of health services were now free to users of the public health system.
To finance the latter policy, which was projected to lose $1.7m (approximately
12.0% of the health expenditure) by abolishing user fees, central government injected
$3.85m to offset the health budget for 2008/2009 and meet the projected 30.0% increase in
patient load (MOH, 2008b). Generally the Ministry of Finance & Planning earmarked
$100m to fund the preparatory phase of the policy, which was disbursed to the RHAs
incrementally. These funds were to be utilised for infrastructural improvement;
purchasing materials, supplies and equipment; and provision of transportation for staff,
patients and supplies for efficient service delivery (MOH).
For effective policy implementation, strategies were adopted to address the
perennial staff shortages. To respond to the projected increases in patient load, RHAs
were advised to recruit and employ personnel such as nurses, doctors, pharmacists, and
CHAs on a sessional or temporary basis; redeploy some staff; and employ public/private
partnerships to acquire services such as medical and diagnostic (MOH, 2008b).
2.4. Summary
It is apparent that the Jamaican social and health systems have been through a
number of developmental stages, each resulting in reform. From the arrival of the
Europeans to the gaining of Independence, each stage has been influenced by social,
economic and political occurrences locally and globally. The transformation of the
country included graduating from colonial governance to self-governance; from an era
with limited emphasis on human rights to one in which human rights are entrenched in its
constitution; from an ad hoc health system to one that is more structured and formalised;
from a society, in which health services were hierarchical with provision for select few, to
universal health care, despite some inequity remaining in the system. Even though there
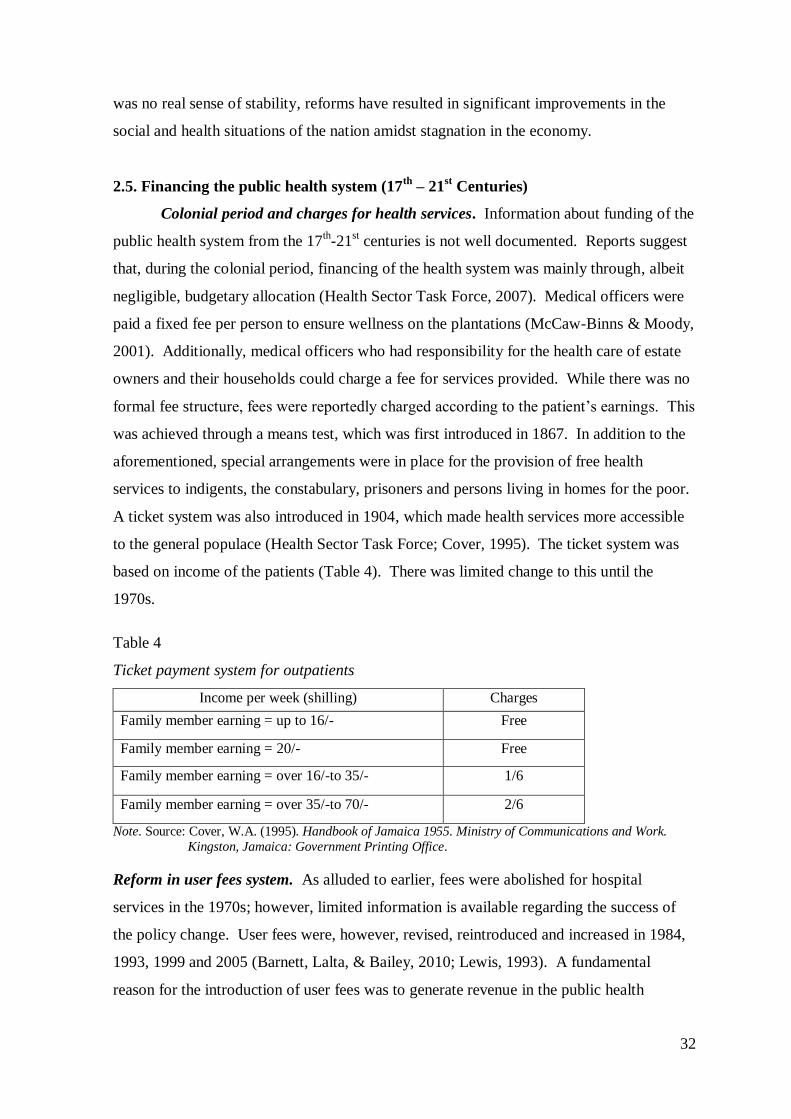
32
was no real sense of stability, reforms have resulted in significant improvements in the
social and health situations of the nation amidst stagnation in the economy.
2.5. Financing the public health system (17th
– 21st Centuries)
Colonial period and charges for health services. Information about funding of the
public health system from the 17th-21
st centuries is not well documented. Reports suggest
that, during the colonial period, financing of the health system was mainly through, albeit
negligible, budgetary allocation (Health Sector Task Force, 2007). Medical officers were
paid a fixed fee per person to ensure wellness on the plantations (McCaw-Binns & Moody,
2001). Additionally, medical officers who had responsibility for the health care of estate
owners and their households could charge a fee for services provided. While there was no
formal fee structure, fees were reportedly charged according to the patient‘s earnings. This
was achieved through a means test, which was first introduced in 1867. In addition to the
aforementioned, special arrangements were in place for the provision of free health
services to indigents, the constabulary, prisoners and persons living in homes for the poor.
A ticket system was also introduced in 1904, which made health services more accessible
to the general populace (Health Sector Task Force; Cover, 1995). The ticket system was
based on income of the patients (Table 4). There was limited change to this until the
1970s.
Table 4
Ticket payment system for outpatients
Income per week (shilling) Charges
Family member earning = up to 16/- Free
Family member earning = 20/- Free
Family member earning = over 16/-to 35/- 1/6
Family member earning = over 35/-to 70/- 2/6
Note. Source: Cover, W.A. (1995). Handbook of Jamaica 1955. Ministry of Communications and Work.
Kingston, Jamaica: Government Printing Office.
Reform in user fees system. As alluded to earlier, fees were abolished for hospital
services in the 1970s; however, limited information is available regarding the success of
the policy change. User fees were, however, revised, reintroduced and increased in 1984,
1993, 1999 and 2005 (Barnett, Lalta, & Bailey, 2010; Lewis, 1993). A fundamental
reason for the introduction of user fees was to generate revenue in the public health
33
system. Revenue raised from the fees, however, was minimal, and some individuals cited
out-of-pocket payment as having an adverse impact on access to health services (PIOJ &
STATIN, 2008). Moreover, the exemption process was considered demeaning by some
individuals from the lower socioeconomic group. This compounded the problem of
access; therefore, successive governments have proposed the abolition of user fees in order
to improve access to health services.
The fee payment system was regarded as oppressive for some users, especially the
poor, who did not utilise the services although there was a need (PIOJ & STATIN, 2008).
For this reason, on May 28, 2007 user fees were abolished for children under the age of 18
years, and on April 1, 2008 for services in the public health system generally. Under this
new arrangement, health services at the 23 public hospitals and over 313 health centres
were provided without charges to the users. According to the MOH (2008b), the free
services included but were not limited to:
registration, doctor‘s examination, hospital stay, diagnostic services (x-rays and
laboratory tests of various kinds), drugs, physiotherapy, surgeries, family planning,
immunisation, antenatal care, renal dialysis, drugs for chemotherapy, radiation
therapy, certain high cost diagnostic services such as MRI [and] certain high cost
appliances. (p. 2)
Fees were retained by the public health system for several services. These included fees
paid by private patients (persons with insurance and non-residents); fees for morgue
services except for specific cases; medical examinations and reports obtained from PHC
for business use; food handlers‘ fees; and medications and drugs for international travel
(MOH).
Other funding initiatives. Other funding initiatives by the government included
public-private partnerships, which have contributed significantly to the public health
system and initiatives such as the JADEP, CHASE and NHF. The JADEP was established
as part of the reform process in 1996. Under this programme, all Jamaicans aged 60 and
older benefit from subsidised drugs for 10 chronic diseases including hypertension and
diabetes. A JADEP membership card enables beneficiaries to access pharmaceuticals at
reduced costs at participating public and private pharmacies (NHF, 2008).
The CHASE Fund of 2002 assists with financing of the public health system. It
―receives, distributes, administers and manages monetary contributions from the lottery
34
industry‖ (CHASE, 2008, para. 1), a percentage of which contributes to national
development. The funds are allocated as follows: Sports Development (40.0%); Early
Childhood Education (25.0%), Health (20.0%), and Arts and Culture (15.0%) (CHASE).
The NHF, a statutory body, was established in 2003. The fund is generated from
―20.0% of special consumption tax charged on tobacco products; 5.0% of special
consumption tax collected; and [0.5%] of annual earnings up to $500,000 paid by
employee and employer, collected by the NIS‖ (NHF, 2008, para. 6). It provides
additional funding for the health sector by subsidising the cost of drugs and providing
support for the training of health workers, as well as providing assistance for the
implementation of health-related programmes and infrastructural improvement.
The NHF is the conduit through which patients benefit from National Health
Insurance-type services, which constitute a component of the health reform process
(PAHO/WHO, 2007) as envisioned in the Green Paper of 1997 (Barrett & Lalta, 2004).
The NHF embraced universal coverage for Jamaicans and its main objective is to improve
the standard of services in the public health system by assisting individuals and institutions
to better manage chronic diseases. NHF offers individual and institutional benefits.
Approximately 50.0% of funds support individual benefits, while institutional benefits are
available under two arrangements: one deals with health promotion, and the other with
health support (Barrett & Lalta).
Beneficiaries access 1300 pharmaceutical services at both private (80.0%) and
public (20.0%) facilities with the NHF card, which is also used to monitor individuals‘ use
of services. The facilities are reimbursed on a weekly basis through a managed-fee-for
service arrangement (NHF, 2008). Of note is that a co-payment is required from the NHF
beneficiaries. People pay the difference between the NHF remuneration and the price
charged by the provider (NHF): ―This serves as an incentive to be more deliberate in
choosing where one gets a prescription filled‖ (Barrett & Lalta, p. 29).
Divestment of health services. The divestment of some services in the health
sector must not be discounted, because it constituted a part of the reform process in the
1990s. Through this mechanism, external resources were mobilised to foster efficiency
and sustainability in the public health sector, further reducing health institutions‘ recurrent
expenses. Among the health services divested were training of health personnel, dietary
35
services, janitorial services and pharmaceuticals services (Figueroa, 2001; Shepard,
Anthony, McNaught, & Davis, 1998).
Budgetary allocation. The Ministry of Finance has overarching control of the
budgetary allocation to the MOH at the central level, which is further distributed to RHAs
for service delivery (Health Task Force, 2007, 2009; PIOJ, 2011). Budgetary allocation to
the RHAs is based mainly on the population served. RHAs are autonomous and
independently allocate funds to the health facilities. Currently, the thrust is to reorient
PHC and, as such, much budgetary support is given to curative services (PIOJ). RHAs
may also adopt creative means to generate additional budgetary support for the
programmes and services they offer.
In addition to the budgetary allocation from the Government of Jamaica, health
funding is obtained through health insurance and gifts and donations from non-
governmental (NGO) and international development partners such as the NHF, the Global
Fund, United States Agency for Development (USAID), IDB, UNICEF, and PAHO/WHO.
Generally, the support from these organisations included financing, maintenance,
provision of health personnel and training (MOH, 2008a). Approximately 4.0-5.5% of
Jamaica‘s national budget is spent on health services, which is considerably below the
recommended proportion of 10.0-15.0% (PIOJ & MFAFT, 2009). This limited funding is
further compounded by the reality that Jamaica is now classified as an upper middle
income country and no longer qualifies for assistance from some donor organisations.
Health insurance. Health insurance improves access to health care (PIOJ &
STATIN, 2008) and, according to Gertler and Sturm (1997), may be a suitable mechanism
to alleviate the financial pressure on the public health sector. A dual health insurance
system exists in Jamaica: the British National Health Service model in the public sector,
under which individuals obtain care at nominal cost, and the private health insurance
model that provides coverage for 10.0% of the population (Health Sector Task Force,
2009). Individuals may have either private or government health insurance coverage. In
contrast to public health insurance, private health insurance is largely unregulated (Health
Sector Task Force) and obtained individually or cooperatively through an organisation.
Health insurance may be obtained by self-employed and informal workers; however, it is
mainly available to government and private company employees. The unemployed are
usually excluded (Bourne, 2009).
36
The government‘s health insurance schemes are collaborative arrangements with
private insurance companies. One example is the health insurance coverage for
government employees, the Government Employees Administrative Services Only
(GEASO) Health Care Programme administered by Sagicor Life Jamaica. Under this
arrangement, public sector workers are eligible for health insurance that is funded jointly
by the government and the employees. The government makes a monthly contribution of
80.0%, while employees contribute 20.0%. There is also a Pensioners‘ Plan for retirees
who are not eligible for individual or group coverage, and NI GOLD (National Insurance
GOLD) for pensioners in the National Insurance Scheme (NIS). These arrangements
allow pensioners continued access to health care benefits (Sagicor Life Jamaica, 2012).
Health insurance companies work collaboratively with participating health care providers,
namely hospitals, pharmacies, private doctors, dentists, laboratories and eye care
specialists to meet the health care needs of the insured. Services covered under the health
insurance schemes include hospitalisation, outpatient care, surgical procedures, doctors‘
hospital visits, doctors‘ home visits, dental services, prescription drugs, diagnostic services
and consultation fees (Sagicor Life Jamaica).
Individuals who hold health insurance have easier access to health services in both
the public and private health sectors, since it ―lowers treatment cost of illnesses...[and]
lowers the psychosocial stressor on income, and [on] the family‘s wellbeing‖ (Bourne,
2009, p. 197). Individuals also have easier access to more expensive medications,
diagnostic investigations and medical procedures. The Jamaica Survey of Living
Conditions 2009 reported that more people in metropolitan areas had higher health
insurance coverage compared to those in rural areas. The report also revealed that most
persons with insurance had private coverage. Despite an increase in the number of persons
with health insurance coverage in the poorest Quintiles (Quintile 1 & Quintile 2) in 2009,
this group still had the lowest health insurance coverage generally (PIOJ & STATIN,
2010).
2.6. Health service delivery and utilisation of the health care system
Jamaica operates a health system in which approximately 95.0% of health services
are offered by public health facilities, while the private sector provides the remaining
5.0%. The formal relationship between the private and public sectors is, however,
negligible, despite the new thrust under the 2008 health sector reform process to forge and
37
strengthen public-private partnerships in areas such as secondary care, and diagnostic and
pharmaceutical services (Health Sector Task Force, 2009; Watson Williams, 2008).
Among the providers of private health services are eight private secondary level facilities
and over 2000 doctors working in urban and rural areas. Additionally, the private sector
provides outpatient and PHC services, pharmaceuticals, health insurance and financing.
The health services offered are usually more technologically-advanced than those offered
in the public sector and include advanced services such as Computer Axial Tomography
(CAT) scans, Magnetic Resonance Imaging (MRI), and specialised laser and cardiac
surgeries among other cutting edge surgical procedures (Health Sector Task Force).
Despite being largely unregulated, the private health sector is accountable to the MOH,
which has overarching responsibility for health. Moreover, the private health sector is
required to adhere to the laws governing health practice in the country, for example, the
Public Health Act.
The private sector is not without its share of challenges. For example, there is a
perennial problem of a lack of resources for hospitalised patients and an inability to attract
people from all socioeconomic backgrounds to utilise the services offered. This is often
due to individuals‘ inability to afford the services in the absence of health insurance
coverage. Policymakers, however, have attempted to alleviate the problems by providing
tax relief for the providers of private health services and offering subsidised public health
services to private patients. Of note is that information regarding the financing and
performance of the private sector is not readily available (Health Sector Task Force, 2009).
Health service delivery. The public health system, the evolution of which was
discussed earlier in this chapter, is regulated by the MOH and services are delivered by the
RHAs through a network of 23 hospitals and over 313 health centres (Table 5). The
services provided by the institutions may be at the primary, secondary, or tertiary level.
Primary level services are located in the community at health centres or community
hospitals, secondary level services in hospitals, and tertiary level services at Type A public
hospitals (e.g. Kingston Public Hospital, Cornwall Regional Hospital). Tertiary level
institutions are also referred to as regional or teaching hospitals (PIOJ, 2011).
Types of Hospitals. Type A hospitals are located mainly in major cities and deliver
tertiary level services. They receive referrals from Types B and C hospitals. Type B
hospitals are also located mainly in urban locales and are the referral institutions for Type
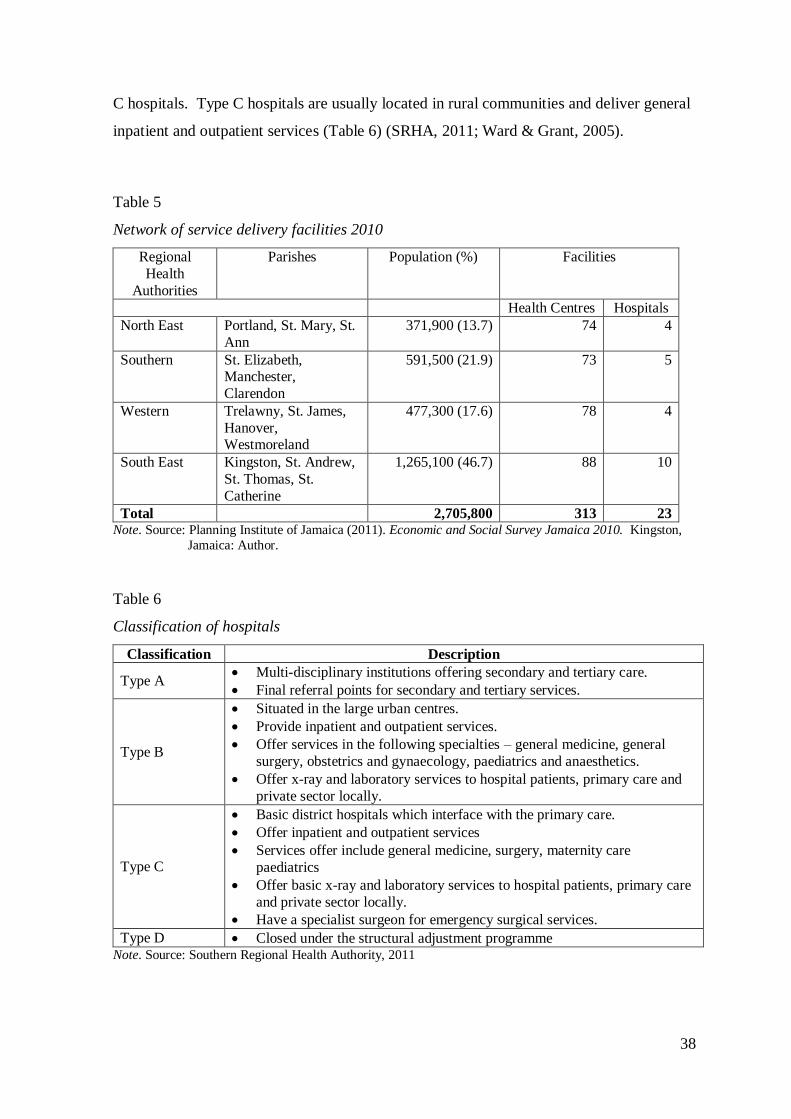
38
C hospitals. Type C hospitals are usually located in rural communities and deliver general
inpatient and outpatient services (Table 6) (SRHA, 2011; Ward & Grant, 2005).
Table 5
Network of service delivery facilities 2010
Regional
Health
Authorities
Parishes Population (%) Facilities
Health Centres Hospitals
North East Portland, St. Mary, St.
Ann
371,900 (13.7) 74 4
Southern St. Elizabeth, Manchester,
Clarendon
591,500 (21.9) 73 5
Western Trelawny, St. James,
Hanover, Westmoreland
477,300 (17.6) 78 4
South East Kingston, St. Andrew,
St. Thomas, St.
Catherine
1,265,100 (46.7) 88 10
Total 2,705,800 313 23 Note. Source: Planning Institute of Jamaica (2011). Economic and Social Survey Jamaica 2010. Kingston,
Jamaica: Author.
Table 6
Classification of hospitals
Classification Description
Type A Multi-disciplinary institutions offering secondary and tertiary care.
Final referral points for secondary and tertiary services.
Type B
Situated in the large urban centres.
Provide inpatient and outpatient services.
Offer services in the following specialties – general medicine, general
surgery, obstetrics and gynaecology, paediatrics and anaesthetics.
Offer x-ray and laboratory services to hospital patients, primary care and
private sector locally.
Type C
Basic district hospitals which interface with the primary care.
Offer inpatient and outpatient services
Services offer include general medicine, surgery, maternity care
paediatrics
Offer basic x-ray and laboratory services to hospital patients, primary care
and private sector locally.
Have a specialist surgeon for emergency surgical services.
Type D Closed under the structural adjustment programme Note. Source: Southern Regional Health Authority, 2011
39
Types of Health Centres. Similarly, health centres are classified as Type I – Type
V based on the type and level of services, as well as the population served. Type I health
centres provide services in maternal and child health including immunisation, family
planning, nutrition, and health education. Health personnel at these facilities include a
registered midwife (RM) and at least two CHAs. The population served should be a
maximum of 4000. Type II centres provide services that are similar to but more advanced
than the Type I facilities. Additional health personnel at Type II facilities include NPs,
PHNs, staff nurses, doctors, PHIs and pharmacists. The population served should be
approximately 12,000 (SRHA, 2011).
Type III health centres have a similar staff complement to Type II and serve a
population of approximately 20,000. Services offered by Type III health centres include
curative, maternal and child health, family planning, immunisation, nutrition, dental,
environmental health, treatment of Sexually Transmitted Infections (STIs), contact
investigation, pharmacy, mental health, counselling, and child guidance. Type IV health
centres are usually administrative departments with service delivery is at the parish level.
These facilities are mainly located on a hospital compound for easier access to diagnostic
services.
Type IV health centres offer the same services as Types I-III centres with the
addition of mental health, Sexually Transmission Infection/Human Immunodeficiency
Virus (STI/HIV) and dental services inter alia. Other categories of staff such as social
workers, contact investigators and nutritionists may work in these facilities. Type V health
centres are known as comprehensive health centres and provide all the services offered at
the above-mentioned facilities. They are usually found in main cities (SRHA, 2011).
Additionally, there are satellite stations among the PHC facilities (Health Sector Task
Force, 2007). They offer services that parallel those of Type I health centres. These
satellite stations are health centre outstations, which lack a physical structure.
Staffing for health facilities. Staffing of secondary care and PHC facilities is
achieved through full-time and part-time employment. The RHAs employ various
categories of staff mostly on a full time basis; however, some employees work part time.
Individuals may opt to have dual employment status, whereby they work full time in one
facility, usually a public facility, and on a part time basis in private facilities, and in
exceptional cases they may have two part time jobs. For this reason, it is not uncommon to
40
have health personnel who are employed simultaneously by both the private and public
health sectors.
The main categories of health personnel employed in secondary facilities include
the director of nursing services or matron who has administrative responsibility for nursing
services, medical doctors (including specialists), RNs (including specialists), RMs,
enrolled assistant nurses, patient care assistants/ward assistants, emergency response
technicians, PHNs (some hospitals), NPs (some hospitals), physiotherapists, speech
therapists, radiographers, medical technologists, pharmacists, electrocardiogram
technicians, nutritionists, and dieticians (Figure 5). Heads of department in secondary care
facilities report to a CEO. Services offered at hospital vary according to the type of
facilities. For example a cardiology unit may not be found in a Type C hospital.
The medical officer of health has leadership of the PHC services and works in
collaboration with PHNs, NPs and other health practitioners (Figure 6). The requirement
for employment in the health sector involves health personnel meeting the eligibility
criteria for practice, which entail obtaining the necessary training from accredited
institutions, registration, and licensure from the respective regulatory bodies.
Nursing categories. Given this research is mainly focusing on the work of the
professional nurse, a brief description of the nurses‘ main categories is provided.
Categories include the staff nurse or Level I nurse, the specialist nurse or Level II nurse,
the nurse manager or Level III nurse, the PHNs, and the NPs. Figure 7 illustrates the
nursing structure from MOH to hospital and health centres. A Level I/Nurse I/Professional
Nurse I is the entry-level professional nurse or staff nurse. As a new graduate, a staff
nurse possesses the professional skills to practise within prescribed scope as a member of
the health team. A staff nurse has direct and indirect responsibility for the nursing care
and management of individuals, families and communities in primary, secondary and
tertiary health facilities with the exception of intranatal care/delivery of babies (MOH,
1992).
A Level II nurse or specialist nurse is a staff nurse who has obtained training in a
specialised field of nursing. The scope of practice includes administering advanced level
care to individuals, families, and communities with life-threatening illnesses, those
requiring surgical procedures, or whose health conditions require specialised nursing
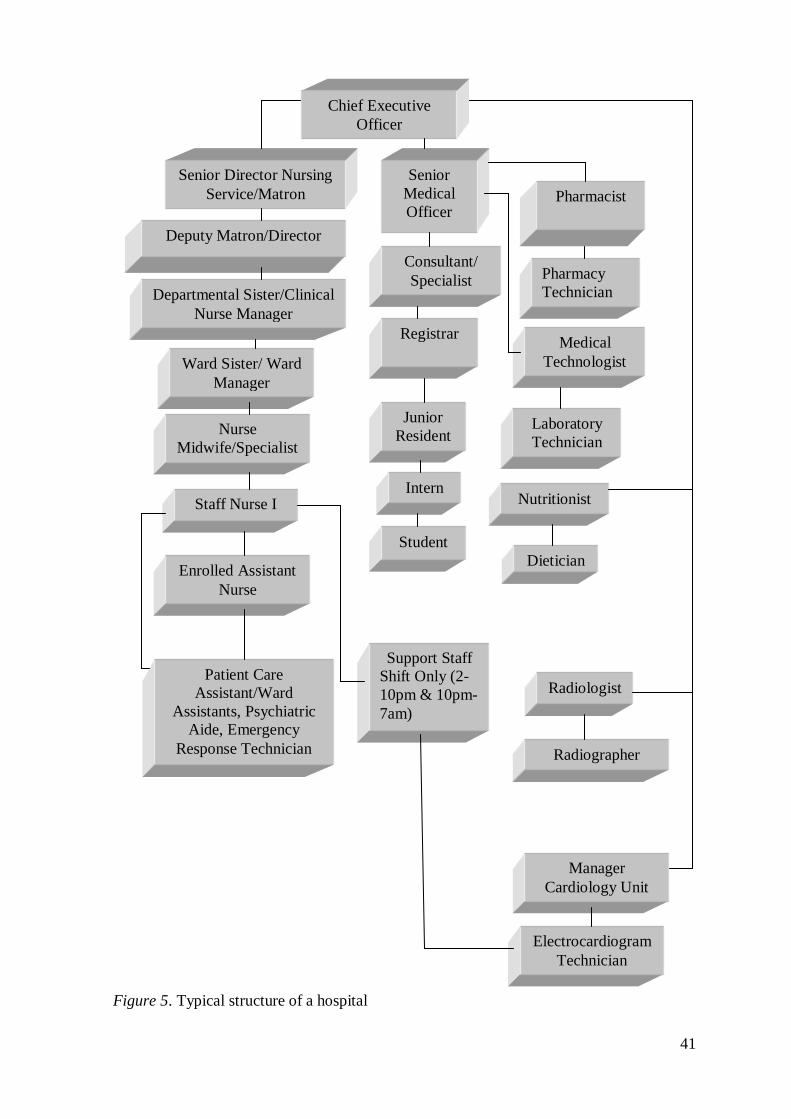
41
Figure 5. Typical structure of a hospital
Departmental Sister/Clinical
Nurse Manager
Nurse
Midwife/Specialist
s
Pharmacy
Technician
Staff Nurse I Intern
Junior
Resident
Medical
Technologist
Enrolled Assistant
Nurse
Patient Care
Assistant/Ward
Assistants, Psychiatric
Aide, Emergency
Response Technician
Student
Pharmacist
Ward Sister/ Ward
Manager
Registrar
Laboratory
Technician
Support Staff
Shift Only (2-
10pm & 10pm-
7am)
Deputy Matron/Director
Consultant/
Specialist
Senior
Medical
Officer
Senior Director Nursing
Service/Matron
Dietician
Nutritionist
Electrocardiogram
Technician
Radiographer
Radiologist
Manager
Cardiology Unit
Chief Executive
Officer
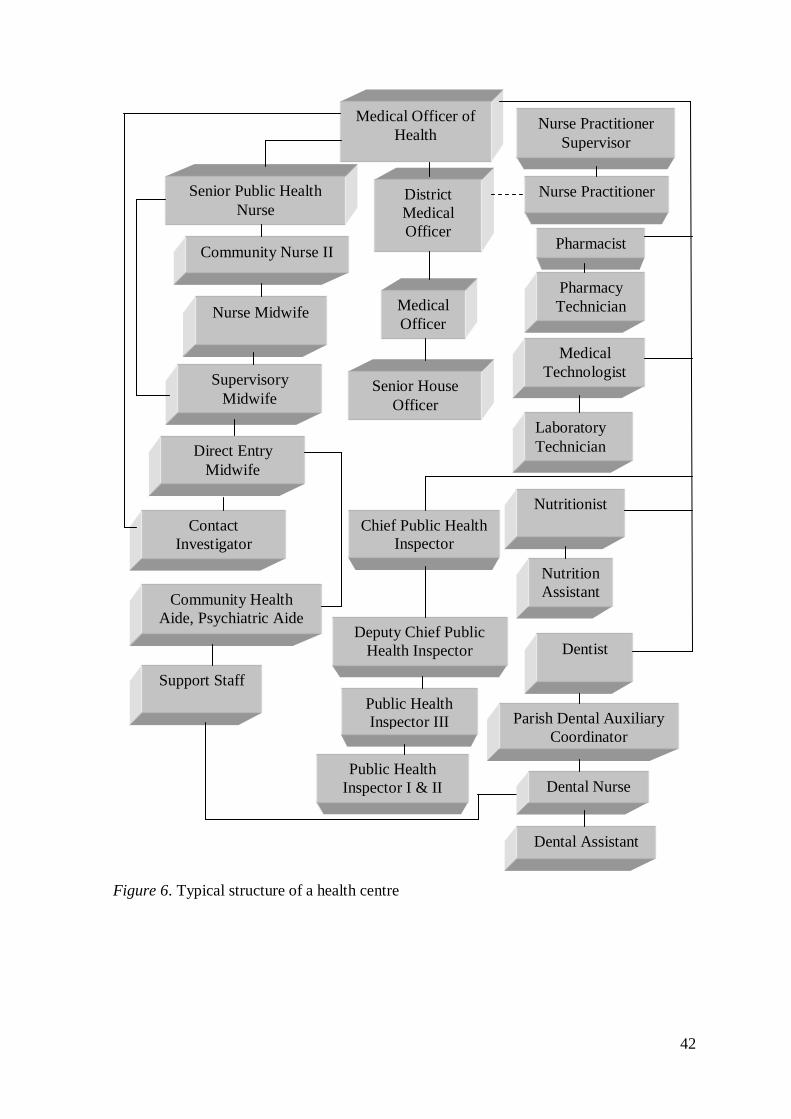
42
Figure 6. Typical structure of a health centre
Nurse Practitioner
Nurse Midwife
Pharmacy
Technician
Direct Entry
Midwife
Senior House
Officer
Medical
Officer
Medical
Technologist Supervisory
Midwife
Community Health
Aide, Psychiatric Aide
Pharmacist
Laboratory
Technician
Support Staff
Community Nurse II
District
Medical
Officer
Senior Public Health
Nurse
Nutrition
Assistant
Nutritionist
Contact
Investigator
Parish Dental Auxiliary
Coordinator
Dentist
Chief Public Health
Inspector
Deputy Chief Public
Health Inspector
Medical Officer of
Health
Dental Nurse
Dental Assistant
Public Health
Inspector III
Public Health
Inspector I & II
Nurse Practitioner
Supervisor
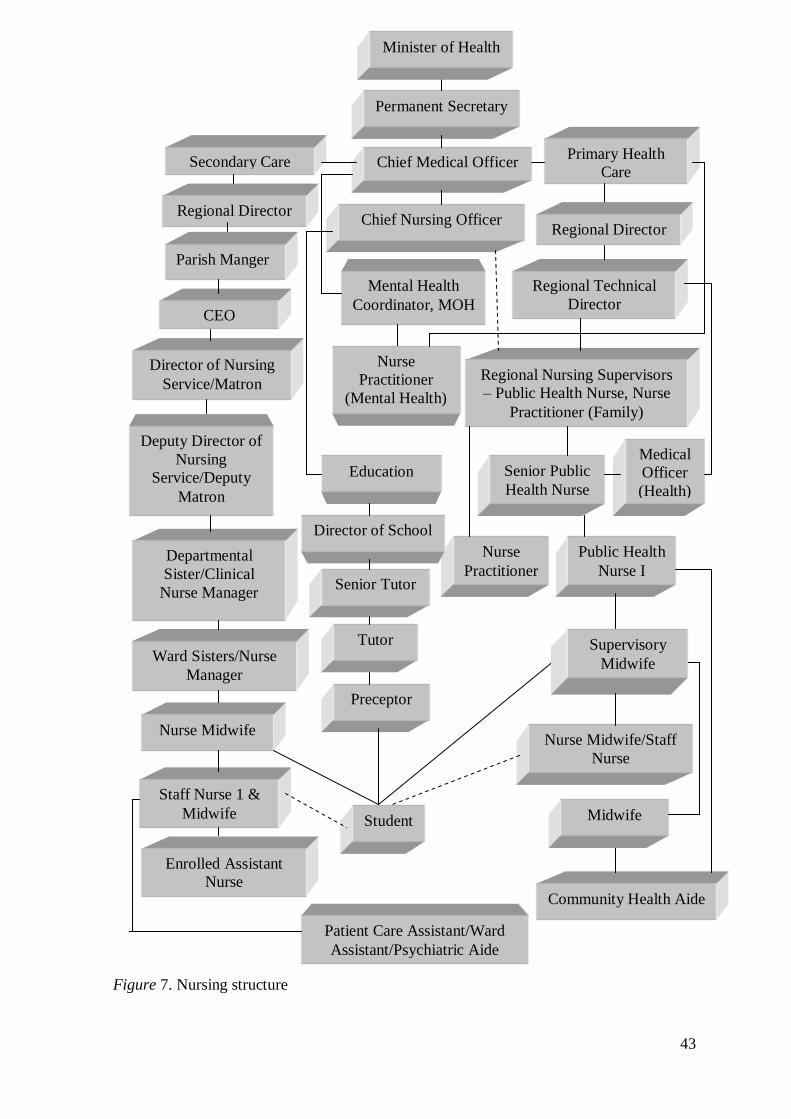
43
Figure 7. Nursing structure
Departmental
Sister/Clinical
Nurse Manager
Deputy Director of
Nursing
Service/Deputy
Matron
Nurse
Practitioner
Nurse Midwife/Staff
Nurse
Community Health Aide
Ward Sisters/Nurse
Manager
Midwife
Primary Health
Care
Public Health
Nurse I
Senior Public
Health Nurse
Director of Nursing
Service/Matron
Chief Medical Officer
Education
Secondary Care
Chief Nursing Officer
Permanent Secretary
Regional Nursing Supervisors
– Public Health Nurse, Nurse
Practitioner (Family)
Enrolled Assistant
Nurse
Staff Nurse 1 &
Midwife
Nurse Midwife
Patient Care Assistant/Ward
Assistant/Psychiatric Aide
Director of School
Senior Tutor
Tutor
Preceptor
Student
s
Minister of Health
Regional Technical
Director
Supervisory
Midwife
Medical
Officer
(Health)
CEO
Regional Director
Parish Manger
Regional Director
Mental Health
Coordinator, MOH
Nurse
Practitioner
(Mental Health)
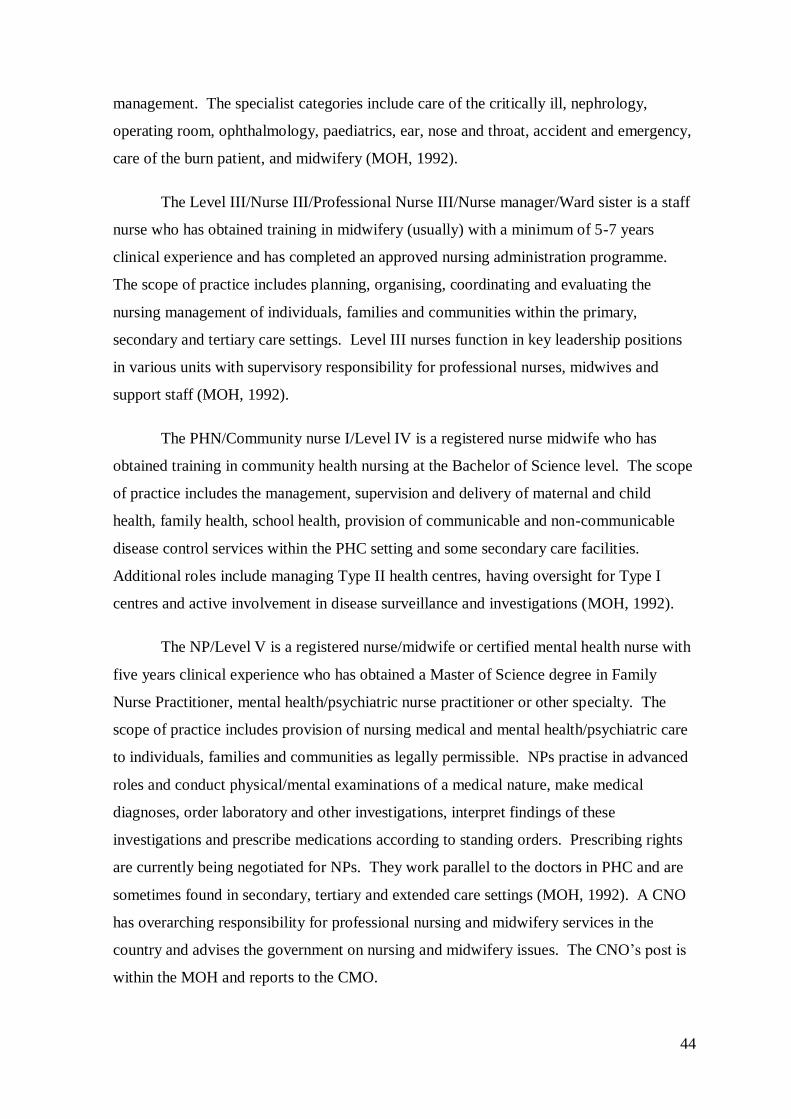
44
management. The specialist categories include care of the critically ill, nephrology,
operating room, ophthalmology, paediatrics, ear, nose and throat, accident and emergency,
care of the burn patient, and midwifery (MOH, 1992).
The Level III/Nurse III/Professional Nurse III/Nurse manager/Ward sister is a staff
nurse who has obtained training in midwifery (usually) with a minimum of 5-7 years
clinical experience and has completed an approved nursing administration programme.
The scope of practice includes planning, organising, coordinating and evaluating the
nursing management of individuals, families and communities within the primary,
secondary and tertiary care settings. Level III nurses function in key leadership positions
in various units with supervisory responsibility for professional nurses, midwives and
support staff (MOH, 1992).
The PHN/Community nurse I/Level IV is a registered nurse midwife who has
obtained training in community health nursing at the Bachelor of Science level. The scope
of practice includes the management, supervision and delivery of maternal and child
health, family health, school health, provision of communicable and non-communicable
disease control services within the PHC setting and some secondary care facilities.
Additional roles include managing Type II health centres, having oversight for Type I
centres and active involvement in disease surveillance and investigations (MOH, 1992).
The NP/Level V is a registered nurse/midwife or certified mental health nurse with
five years clinical experience who has obtained a Master of Science degree in Family
Nurse Practitioner, mental health/psychiatric nurse practitioner or other specialty. The
scope of practice includes provision of nursing medical and mental health/psychiatric care
to individuals, families and communities as legally permissible. NPs practise in advanced
roles and conduct physical/mental examinations of a medical nature, make medical
diagnoses, order laboratory and other investigations, interpret findings of these
investigations and prescribe medications according to standing orders. Prescribing rights
are currently being negotiated for NPs. They work parallel to the doctors in PHC and are
sometimes found in secondary, tertiary and extended care settings (MOH, 1992). A CNO
has overarching responsibility for professional nursing and midwifery services in the
country and advises the government on nursing and midwifery issues. The CNO‘s post is
within the MOH and reports to the CMO.
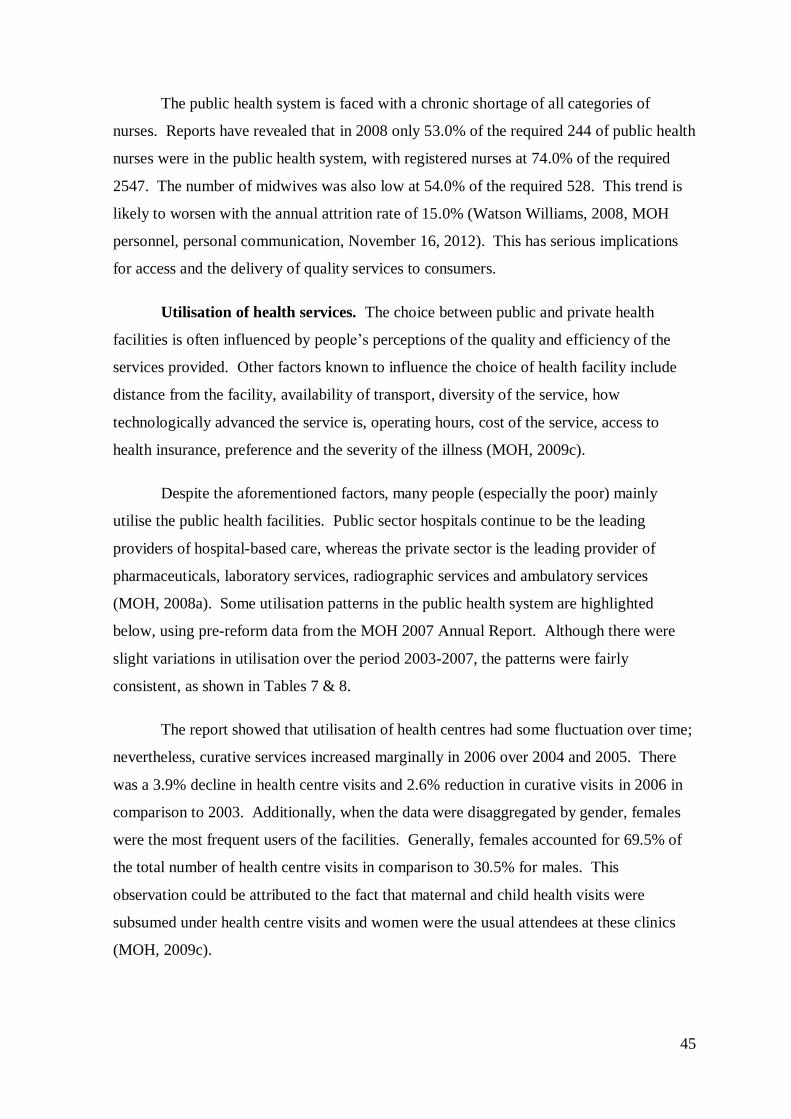
45
The public health system is faced with a chronic shortage of all categories of
nurses. Reports have revealed that in 2008 only 53.0% of the required 244 of public health
nurses were in the public health system, with registered nurses at 74.0% of the required
2547. The number of midwives was also low at 54.0% of the required 528. This trend is
likely to worsen with the annual attrition rate of 15.0% (Watson Williams, 2008, MOH
personnel, personal communication, November 16, 2012). This has serious implications
for access and the delivery of quality services to consumers.
Utilisation of health services. The choice between public and private health
facilities is often influenced by people‘s perceptions of the quality and efficiency of the
services provided. Other factors known to influence the choice of health facility include
distance from the facility, availability of transport, diversity of the service, how
technologically advanced the service is, operating hours, cost of the service, access to
health insurance, preference and the severity of the illness (MOH, 2009c).
Despite the aforementioned factors, many people (especially the poor) mainly
utilise the public health facilities. Public sector hospitals continue to be the leading
providers of hospital-based care, whereas the private sector is the leading provider of
pharmaceuticals, laboratory services, radiographic services and ambulatory services
(MOH, 2008a). Some utilisation patterns in the public health system are highlighted
below, using pre-reform data from the MOH 2007 Annual Report. Although there were
slight variations in utilisation over the period 2003-2007, the patterns were fairly
consistent, as shown in Tables 7 & 8.
The report showed that utilisation of health centres had some fluctuation over time;
nevertheless, curative services increased marginally in 2006 over 2004 and 2005. There
was a 3.9% decline in health centre visits and 2.6% reduction in curative visits in 2006 in
comparison to 2003. Additionally, when the data were disaggregated by gender, females
were the most frequent users of the facilities. Generally, females accounted for 69.5% of
the total number of health centre visits in comparison to 30.5% for males. This
observation could be attributed to the fact that maternal and child health visits were
subsumed under health centre visits and women were the usual attendees at these clinics
(MOH, 2009c).
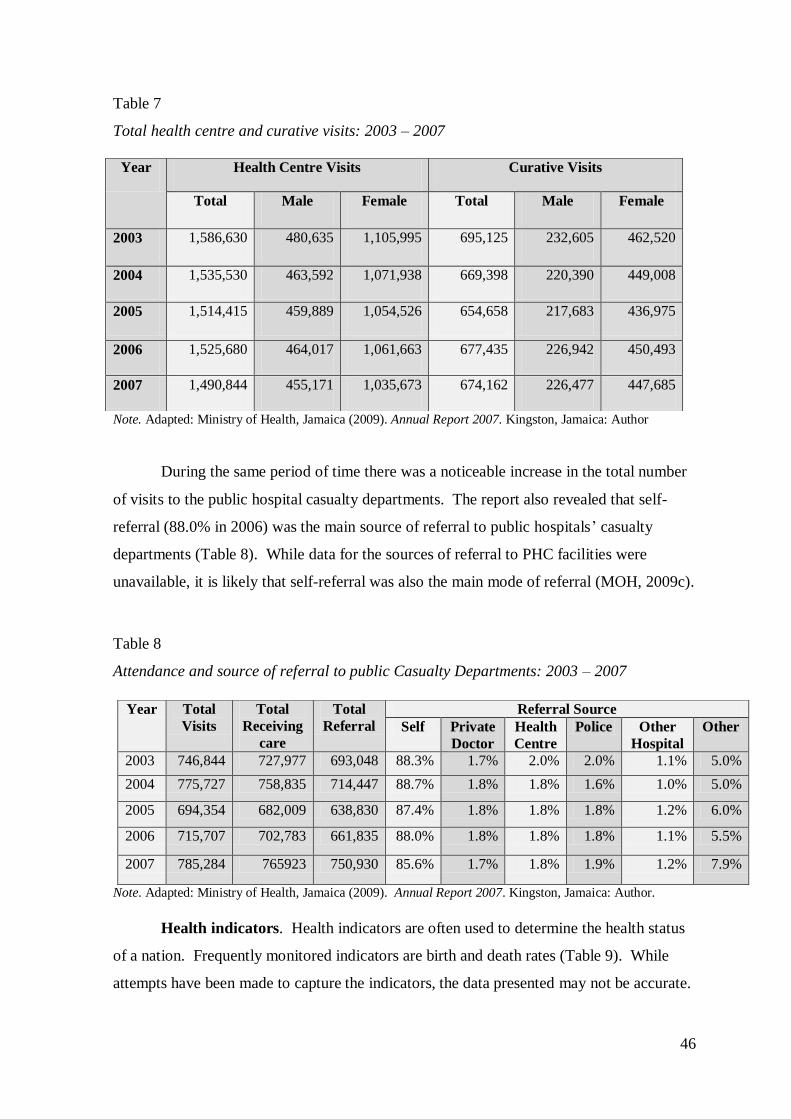
46
Table 7
Total health centre and curative visits: 2003 – 2007
Note. Adapted: Ministry of Health, Jamaica (2009). Annual Report 2007. Kingston, Jamaica: Author
During the same period of time there was a noticeable increase in the total number
of visits to the public hospital casualty departments. The report also revealed that self-
referral (88.0% in 2006) was the main source of referral to public hospitals‘ casualty
departments (Table 8). While data for the sources of referral to PHC facilities were
unavailable, it is likely that self-referral was also the main mode of referral (MOH, 2009c).
Table 8
Attendance and source of referral to public Casualty Departments: 2003 – 2007
Note. Adapted: Ministry of Health, Jamaica (2009). Annual Report 2007. Kingston, Jamaica: Author.
Health indicators. Health indicators are often used to determine the health status
of a nation. Frequently monitored indicators are birth and death rates (Table 9). While
attempts have been made to capture the indicators, the data presented may not be accurate.
Year Health Centre Visits Curative Visits
Total Male Female Total Male Female
2003 1,586,630 480,635 1,105,995 695,125 232,605 462,520
2004 1,535,530 463,592 1,071,938 669,398 220,390 449,008
2005 1,514,415 459,889 1,054,526 654,658 217,683 436,975
2006 1,525,680 464,017 1,061,663 677,435 226,942 450,493
2007 1,490,844 455,171 1,035,673 674,162 226,477 447,685
Year Total
Visits
Total
Receiving
care
Total
Referral
Referral Source
Self Private
Doctor
Health
Centre
Police Other
Hospital
Other
2003 746,844 727,977 693,048 88.3% 1.7% 2.0% 2.0% 1.1% 5.0%
2004 775,727 758,835 714,447 88.7% 1.8% 1.8% 1.6% 1.0% 5.0%
2005 694,354 682,009 638,830 87.4% 1.8% 1.8% 1.8% 1.2% 6.0%
2006 715,707 702,783 661,835 88.0% 1.8% 1.8% 1.8% 1.1% 5.5%
2007 785,284 765923 750,930 85.6% 1.7% 1.8% 1.9% 1.2% 7.9%
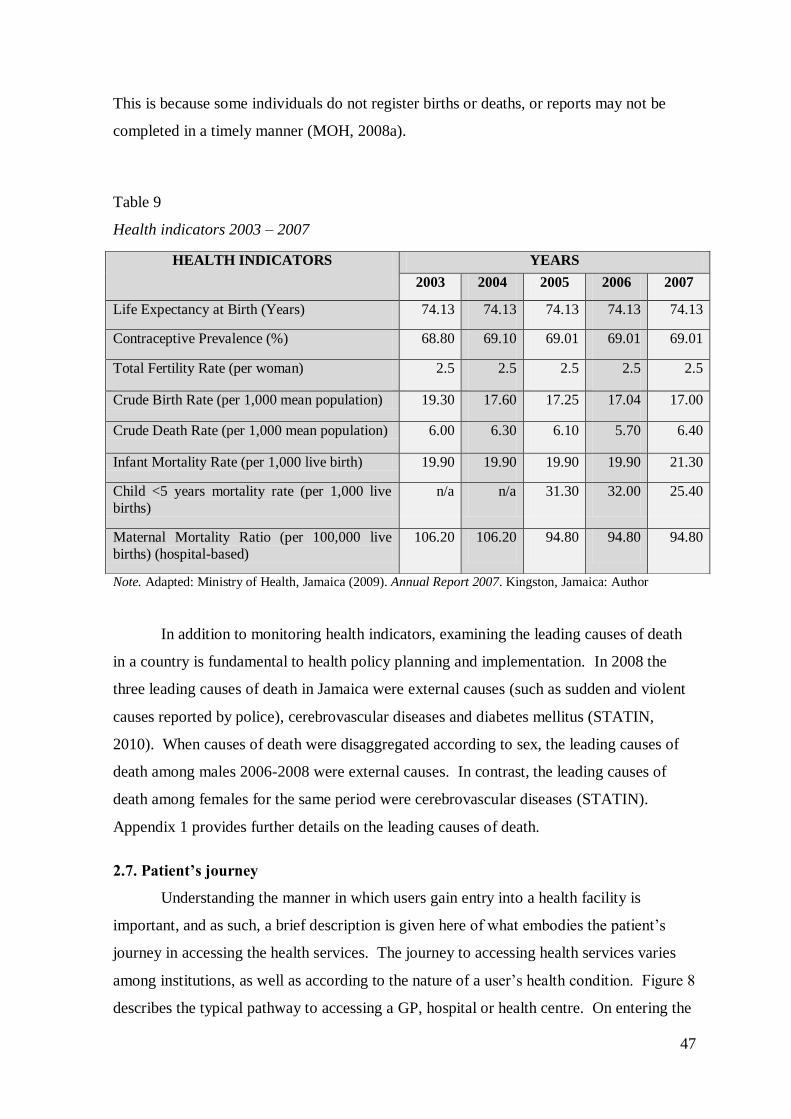
47
This is because some individuals do not register births or deaths, or reports may not be
completed in a timely manner (MOH, 2008a).
Table 9
Health indicators 2003 – 2007
Note. Adapted: Ministry of Health, Jamaica (2009). Annual Report 2007. Kingston, Jamaica: Author
In addition to monitoring health indicators, examining the leading causes of death
in a country is fundamental to health policy planning and implementation. In 2008 the
three leading causes of death in Jamaica were external causes (such as sudden and violent
causes reported by police), cerebrovascular diseases and diabetes mellitus (STATIN,
2010). When causes of death were disaggregated according to sex, the leading causes of
death among males 2006-2008 were external causes. In contrast, the leading causes of
death among females for the same period were cerebrovascular diseases (STATIN).
Appendix 1 provides further details on the leading causes of death.
2.7. Patient’s journey
Understanding the manner in which users gain entry into a health facility is
important, and as such, a brief description is given here of what embodies the patient‘s
journey in accessing the health services. The journey to accessing health services varies
among institutions, as well as according to the nature of a user‘s health condition. Figure 8
describes the typical pathway to accessing a GP, hospital or health centre. On entering the
HEALTH INDICATORS YEARS
2003 2004 2005 2006 2007
Life Expectancy at Birth (Years) 74.13 74.13 74.13 74.13 74.13
Contraceptive Prevalence (%) 68.80 69.10 69.01 69.01 69.01
Total Fertility Rate (per woman) 2.5 2.5 2.5 2.5 2.5
Crude Birth Rate (per 1,000 mean population) 19.30 17.60 17.25 17.04 17.00
Crude Death Rate (per 1,000 mean population) 6.00 6.30 6.10 5.70 6.40
Infant Mortality Rate (per 1,000 live birth) 19.90 19.90 19.90 19.90 21.30
Child <5 years mortality rate (per 1,000 live
births)
n/a n/a 31.30 32.00 25.40
Maternal Mortality Ratio (per 100,000 live
births) (hospital-based)
106.20 106.20 94.80 94.80 94.80
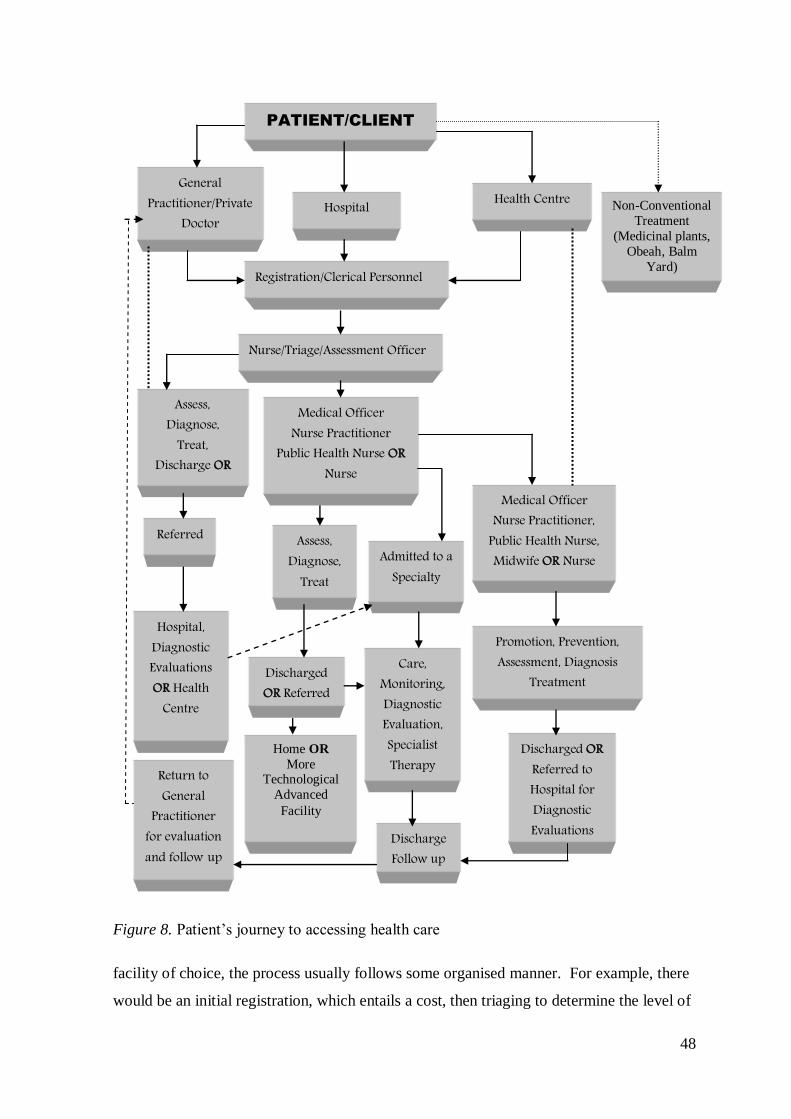
48
Figure 8. Patient‘s journey to accessing health care
facility of choice, the process usually follows some organised manner. For example, there
would be an initial registration, which entails a cost, then triaging to determine the level of
PATIENT/CLIENT
Care, Monitoring, Diagnostic Evaluation, Specialist Therapy
General Practitioner/Private
Doctor Office
Health Centre
Nurse/Triage/Assessment Officer
Hospital
Discharged OR Referred
Home OR
More Technological
Advanced
Facility
Admitted to a Specialty
Hospital, Diagnostic Evaluations OR Health
Centre
Assess, Diagnose,
Treat
Assess, Diagnose,
Treat, Discharge OR
Referred
Return to General
Practitioner for evaluation and follow up
Registration/Clerical Personnel
Medical Officer Nurse Practitioner
Public Health Nurse OR Nurse
Discharge Follow up
Medical Officer Nurse Practitioner,
Public Health Nurse, Midwife OR Nurse
Promotion, Prevention, Assessment, Diagnosis
Treatment
Discharged OR Referred to Hospital for Diagnostic Evaluations
Non-Conventional
Treatment
(Medicinal plants,
Obeah, Balm
Yard)
49
treatment required. Once the treatment modality is determined the patient is treated and
discharged, referred or admitted for further management.
While the typical pathway is widely-known and accepted, it is important to
mention the alternative pathways frequently adopted to obtain non-conventional modes of
treatment. It is not uncommon for individuals across the socio-economic spectrum to
concomitantly utilise conventional and non-conventional modes of treatment for their
health conditions. Self-medication with medicinal herbs is embedded in the Jamaican
culture and was found to be prevalent among retirees and individuals 65 years and over
(Picking, Younger, Mitchell, & Delgoda, 2011). In 2009, 49.0% of persons reported using
home remedies for their illness instead of seeking care (PIOJ & STATIN, 2010).
Folk culture and health-seeking behaviour. Culturally, elements of African
ancestry are threaded throughout the Jamaican experience. This is evident in the country‘s
language, belief system and religion. There is also a strong link between health-seeking
behaviours and African traditions, of which Folk medicine remains a popular choice.
Despite the advancement in scientific medicine some Jamaicans continue to adopt various
forms of traditional healing practices or Folk medicine for their ailments (Seaga, 2005;
Weaver, 2003). This practice is not confined to any particular socioeconomic group and is
present in both urban and rural communities. Common practices included obtaining
treatment from the ―doctor shop‖ (pharmacy) for self-treatment, use of home
remediesespecially those made from herbs and medicinal plants, and engaging the services
of herbalist, spiritual healers and ‗obeah man/woman‘, albeit in a clandestine manner
(Seaga; Weaver).
It is also true to say that the spiritual component of sickness and health is integral
to the practice of Folk medicine in Jamaica and its use is not influenced by religious
persuasion. Additionally, belief in African spirits has strongly influenced health-seeking
behaviour and is evident among individuals who seek treatment at the ‗balm yard‘ for
diseases or problems perceived to be the result of a curse. A ‗balm yard‘ is operated by
revival/spiritual healers and is a form of Pukumina, which is derived from African religion.
Connecting with the spirit world and the gift of discernment are key attributes of spiritual
healers and healing ceremonies may take several forms, including baptism, bathing,
sprinkling of rum, ‗read-up‘, purification with fire, and herbal drinks and other concoctions
considered to have healing properties. Healers may also give their patients prescriptions.
50
While ceremonies may be held in a ‗balm-yard‘, they are also held in churches, offices or
public spaces. Venue is often dependent on the nature of the illness. Therefore, it may be
on holy (usually in a church) or ordinary ground (Weaver, 2003). Ceremonies are often
accompanied by invocation of spirits through singing and beating of drums. In addition,
paraphernalia such as consecrated water, bottles of wine and white rum, candles,
frankincense and myrrh, herbs and other concoctions are used to achieve spiritual healing.
Faith plays a significant role in obtaining the desired effects from spiritual therapy (Seaga,
2005).
2.8. Conclusion
Undoubtedly, the Jamaican public health system has demonstrated resilience over
time, responding to changes in the country‘s social, economic, and political situations. Several
policy directives consistent with national priorities have been promulgated. As a result, the
Jamaican health service has seen expansion of the public health system in the post-
independence period; contraction under the IMF structural adjustment programme, which
resulted in shortage of resources, staff-cuts, closure and downsizing of health facilities and
attrition of health personnel such as nurses; changes in modes of funding of the public health
system; re-introduction of user fees; training of new cadres of health practitioners;
decentralisation and the establishment of RHAs; and the abolition of user fees in 2007 and
2008. These reforms have had significant impacts on the health system.
Despite the promulgation of Acts, the appointment of commissions and
implementation of various reform processes to improve efficiency and effectiveness in the
public health system, poor access to health services remains a problem for some people; the
system is underfunded; and the cadre of health workers, especially nurses, remains deficient.
This thesis examined people‘s ability to access care, and the work of the professional nurse,
since the reform in 2008.
The following chapter presents the literature used to inform this study on the impact of
user fees and evaluation of the removal of user fees. It also highlights the search strategy
adopted and provides information on the knowledge gaps that exist in this area of study.
51
Chapter 3: Literature review
3.1. Introduction
This chapter presents an outline of the search strategy, followed by the findings of
the literature review employed for the study. It presents the existing evidence on user fees,
mainly from a developing world experience. In addition to clarifying the concept of user
fees, the review highlights key limitations of the existing literature; the impact of user fees
in health systems; the impact of abolishing user fees; and what is known about the
Jamaican experience in terms of user fees and the impact of their abolition on work of the
health workers and the professional nurse. The chapter also provides a conclusion and
serves as a catalyst for the theoretical framework of the study.
3.2. Search strategy
Searching research evidence for this study was undertaken during 2009-2012 and
used several strategies. Among the strategies adopted were the use of electronic databases
such as Cumulative Index of Nursing and Allied Health Literature (CINAHL), ProQuest,
Jstor (Journal Storage), ScienceDirect, Medline Cochrane and Google Scholar. Resources
such as books and articles were also obtained from the library, online catalogue, interloan
services and international thesis databases. Books from the researcher‘s collection were
also used.
References in relevant scholarly publications were used to find many of the articles
used for this review. The literature search was undertaken under the following main
headings: funding, access to health care, user fees in developing countries, Jamaican health
system, and nursing and health. The search terms used to find literature relevant to each
heading included (1) funding - ‗user fees‘, ‗charges and health services‘, ‗out-of-pocket
payment‘, ‗health financing‘, ‗user fees or charges‘; (2) access to health care - ‗health
care‘, universal health care‘, ‗access and equity in health‘ ‗equity in health‘, ‗access to
health care‘, ‗health disparities‘, ‗determinants of inequity in health‘, ‗barriers to access‘,
‗barriers to equity in health‘, ‗public health care system in developing countries‘, ‗health
reform‘; (3) user fees in developing countries - ‗developing countries and user fees‘, ‗user
fees and Africa‘, ‗impact of user fees‘, ‗economic impact of user fees‘, ‗abolition and user
fees‘, ‗removal of user fees‘, ‗evaluation of the removal of user fees‘; (4) Jamaican health
system - ‗health system in Jamaica‘, ‗Jamaica and health‘, ‗Jamaica and user fees‘; (5)
nursing and health care - ‗nursing and access to health care‘, ‗nursing and user fees‘,
52
‗nurse-led services‘, and ‗funding and nursing services‘. Additional literature was also
sourced from reference lists in books and articles.
3.3. Key limitations of literature review
Although user fees is a mode of funding in several developed and developing
countries, the setting for most of the literature accessed for this review was in African
countries. Additionally, these studies were often all conducted by the same authors, with
some variation in topic, design, setting and co-authorship. A decision was, nevertheless,
made to utilise these sources because of the economic similarities between these countries
and Jamaica. Generally, the literature reviewed was mainly scholarly and of good
standard. Authors were knowledgeable about the topic and engaged the work of experts in
the field to identify the existing gaps and conduct scientific work on the topic in their
settings.
3.4. Impact of user fees
Modes of financing for health care in both developed and developing countries
include direct out-of-pocket payment, user fees or cost sharing, government budgetary
allocation, social insurance, private insurance and charitable organisations (Bitran &
Giedion, 2002; Health Sector Task Force, 2009; PIOJ, 2011; Powell & Wessen, 1999).
Organisation for Economic Cooperation and Development (OECD) countries utilise a mix
of taxation, social and private insurance modes of financing for health services (Gordon-
Strachan et al., 2010; Scott, 2001). For example, health systems in the United Kingdom
(UK) and New Zealand are predominantly financed by general taxation, whereas health
financing in the USA is through employment and voluntary insurance largely through
private providers, with some federal and state funding for targeted groups. In contrast, the
health system in the Netherlands is financed through a mix of social and private
insurances, primarily through private providers (Scott; van Doorslaer et al., 1999). The
1948 reform of the UK‘s National Health Service (NHS) resulted in free health care at the
point of service for the entire population (Powell & Wessen, 1999). Given the different
time period and different economic situation within which it operates, a decision was made
not to draw on the extensive literature of the UK experience.
User fees are mechanisms adopted by several countries, especially developing
countries, to mobilise resources to foster efficiency in health services delivery. This
fosters service delivery that is commensurate with demographic changes and demand for
53
health care generally (Bitran & Giedion, 2002; Burnham et al., 2004; James et al., 2006).
Despite the plethora of information on user fees, the concept lacks clear definition. For the
purpose of this research, James et al.‘s definition was used: ―user fees refer to official fees
charged by public health providers‖ (p. 139). They also pointed out that this definition of
user fees does not include out-of-pocket payments for health services in non-public
settings, that is, by privately-owned providers. Their definition captures the manner in
which the concept is used and interpreted in most literature (Akashi, Yamada, Huot, Kanal,
& Sugimoto, 2004; Asfaw, Braun, & Klasen, 2004; Bitran & Giedion; Gilson, 1997;
Hjertqvist, 2002; Messen, Van Damme, Tashobya, & Tibouti, 2006).
To further clarify the concept, user fees have been operationalised as a financing
mechanism with two main characteristics: payment is made at the point of service use and
there is no risk sharing (Lagarde & Palmer, 2008). Risk sharing is defined as:
Any system which allows payors to share some of the financial risk associated with
a particular patient population with providers. Providers agree to adhere to fixed
fee schedules in exchange for an increase in their payor base and a chance to
benefit from cost containment measures. Common risk-sharing methods are
prospective payment schedules, capitation, diagnosis-related fees and pre-
negotiated fees. (Reference.Md, 2012, para 1)
The origin of user fees in developing countries has its link to the IMF. During the
1980s, the World Bank consistently raised concerns about free social services in resource-
constrained countries. Ultimately, this resulted in the imposition of user fees for health
care in most developing countries. Two models for the implementation of user fees were
identified in the African context. These are the standard model based on the premise that
user fees mobilise resources, as well as foster efficiency and equity, and the Bamako
Initiative model, which emphasises that revenue can be generated and controlled at the
community level (Nolan & Turbat, 1995).
As the ‗no user fees‘ versus ‗user fees‘ debate heightens, proponents and critics
frequently defend their positions on the possible outcomes of fees for health services or
cost recovery. Proponents of user fees have embraced and underscored the potential of
this health financing mechanism to:
increase demand for services owing to the improvement in quality; reduce out-of-
pocket and other costs, even for the poor, by substituting public services sold at
54
relatively modest fees for higher-priced and less accessible private services;
promote more efficient consumption patterns, by reducing spurious demand and
encouraging the use of cost-effective health services; encourage patients to exert
their right to obtain good quality services and make health workers more
accountable to patients; when combined with a system of waivers and exemptions,
serve as an instrument to target public subsidies to the poor and to reduce the
leakage of subsidies to the non-poor. (Britran & Giedion, 2002, pp. 5-6)
In contrast, critics have argued that user fees:
are rarely used to achieve significant improvements in quality of care, either
because their revenue generating potential is marginal or because fee revenue is not
used to finance quality gains; do not curtail spurious demand because in poor
countries there is a lack not an excess demand; fail to promote cost-effective
demand patterns because the government health system fails to make cost-effective
services available to users; hurt access by the poor, and thus harm equity, because
appropriate waivers and exemption systems are seldom implemented. (Britran &
Giedion, p. 6)
Through the Bamako Initiative, a number of developing countries in Africa
adopted user fees policies in the 1980s. The driving force behind this initiative was the
loan conditions imposed by the IMF and the World Bank at the time. In Jamaica, the
elements of a fee payment structure had already existed under colonial governance, despite
occasional suspension of its use. It was subsequently reintroduced, and increased in some
cases, under the IMF Structural Adjustment programme of the 1980s. User fees in the
public health sector were revised in 1984, 1993, 1999 and 2005, but contributed only a
small proportion of the cost of health services. A means test was applied to improve
access for those who could not pay. Three key objectives of user fees were identified in
the Jamaican context: ―(1) to raise revenue through cost-sharing, (2) to deter frivolous
demand, and (3) to instil a cost conscious mind-set among providers‖ (Lalta 1995, p. 15).
Studies have shown that the implementation of user fees has had varied impacts
(positive, negative or mixed) on access to health care. For example, in Benin and Guinea,
positive outcomes were achieved because the demand for preventive and curative services
increased, despite implementation of the user fees policy. The increased utilisation was
attributed to the good quality of care being offered, especially the availability of drugs
55
(Soucat et al., 1997). Equally, countries such as Cambodia, Cameroon, Mali, Mauritania
and Niger experienced increased uptake of health services to some extent following the
introduction of user fees in the public health system, mainly for PHC services (Akashi et
al., 2004; Audibert & Mathonnat, 2000; Barber, Bonnet, & Bekedam, 2004; Chawla &
Ellis, 2000; Litvack & Bodart, 1993; Mariko, 2003).
Analyses of the impact of user fees have also shown utilisation of health services
tended to decline in some countries following its introduction. This was true especially for
developing countries such as Ghana (Biritwum, 1994) and Sudan, in which 70.0% of the
poor communities viewed user fees as a deterrent to accessing health care when needed
(Yates, 2009). Additionally, individuals with neurological disorders such as epilepsy in
Zambia experienced financial barriers in accessing physician consultations (Birbeck &
Munsat, 2002). According to the JSLC 2007, approximately 50.8% of Jamaicans in the
lower quintiles cited cost as the reason for not seeking care when needed (MOH, 2009c).
The negative effects of payment for health services on utilisation are not unique to low
income countries; they have also been experienced by some middle income countries,
countries in transition, and developed countries such as Thailand and USA (Graham, 2009;
Xu et al., 2003).
Even though the effects of user fees in Cambodia were generally positive, it is
important to note that the uptake of services by the poor decreased, despite an overall
increase in utilisation. The poor often incurred costs by borrowing to pay medical
expenses (Jacobs & Price, 2006). While there was an overall improvement in quality of
care in the Democratic Republic of Congo, utilisation decreased following the introduction
of user fees (Haddad & Foumier, 1995). Similarly, access to health services in other
countries was negatively affected by the introduction of user fees. In Burkina Faso, the
demand for curative services decreased (Ridde, 2003), and in China utilisation of
preventive services declined (Liu & Mills, 2002). In Vietnam, inpatient admissions
decreased by 52.0% following the introduction of user fees (Sepehri, Chernomas, &
Akram-Lodhi, 2005). Utilisation also fell in Niger, which experienced a 41.0% decline in
new outpatient referrals despite some positive effects. More monitoring of quality, more
medical equipment, and increased number of drugs were reported prior to nationwide
implementation of the user fees policy (Diop, Yazbeck, & Bitran, 1995; Meuwissen,
2002). Uganda and Zimbabwe also experienced a reduction in the utilisation of health
56
services following the introduction of user fees (Kipp, Kamugisha, Jacobs, Burnham, &
Rubaale, 2001; Zigora, as cited in James et al., 2006).
Introduction of user fees for services in the aforementioned countries took into
consideration those individuals who would be disadvantaged by the policies and, as such,
provisions were made for services to be provided free for some groups. For example, in
Sudan, exemptions for pregnant women and children under five affected by malaria,
resulted in increased utilisation by these groups following the introduction of user fees
(Abdu et al., 2004). The exemption policy was an initiative supported by international
agencies such as the World Bank. They were of the view that user fees had a negative
impact on access for some groups and, as such, suggested that appropriate waiver systems
be instituted wherever user fees were implemented (Bitran & Giedion, 2002). However,
exemption policies did not achieved the desired effects in countries such as Burundi (Bate
& Witter, as cited in James et al., 2006), Ethiopia (Russell & Abdella, 2002), Ghana
(Biritwum, 1994; Nyonator & Kutzin, 1999), Kenya (Mbugua, Bloom, & Segall, 1995),
Sierra Leone (Fabricant, Kamara, & Mills, 1999) and Tanzania (Laterveer, Munga, &
Schwerzel, 2004).
In addition to the ineffective exemption policy in Tanzania, the use of outpatient
services decreased by 50.0% in the aftermath of user fees implementation (Hussein &
Mujinja, 1997). Noteworthy is that some countries experienced mixed results following
the introduction of user fees. For example, in Zambia utilisation decreased for paid
services but increased for exempted services (Blas & Limbambala, 2001), while in Nigeria
utilisation of malaria services increased. The increase in malaria services was attributed to
improved quality services through trained staff and adequate drug supplies. These services
were, however, utilised mainly by the rich and educated (Uzochukwu, Onwujekwe, &
Eriksson, 2004). Conversely, findings from a study in Mali revealed that, even when the
quality of services was satisfactory, it did not mitigate the undesired effects of user fees
(Ponsar et al., 2011). A longitudinal study in Zaire on the quality, cost, and utilisation of
health services in developing countries further supported the claim that increases in the
cost for health care have negative effects on the uptake of services (Haddad & Fournier,
1995).
The demand ‗reduction‘ - ―number of drop-out from the health care market in
favour of self-care‖; and demand ‗diversion‘ - ―diversion of demand from one provider to
57
another provider based on the price and other signals‖ - (Asfaw et al., 2004, p. 2067)
effects of user fees in rural public clinics in Ethiopia were examined. Asfaw et al. found
that individuals‘ decisions to seek medical care over self-treatment hinged on the
provider‘s price, and the poorest households did not participate in the health care market
when user fees increased. Furthermore, they found that household income influenced the
choice between modern medical care and self-treatment that essentially constituted a
barrier to accessing health care when required. Equally, distance from the health facilities
and long waiting times to be seen by providers were disincentives even if individuals had
the funds to pay for services (Asfaw et al.). This resulted in the assertion that ―the demand
for public clinics is price elastic‖ (Asfaw et al., p. 2074), suggesting that, when prices
increased, demand for health services declined, thereby demonstrating a crowding out
effect (people do not participate in the public health care market because of increasing user
fees). In Ethiopia, a high crowding out effect was observed in government clinics. For
this reason the authors concluded that:
the poorest segment of the population is extremely sensitive to price changes in
private clinics and that increasing user fees in publicly owned health centres and
clinics is likely to drive out a significant portion of the poorest households from the
health care market. Poor rural households in Ethiopia are too poor to overcome
price barriers in seeking medical care from publicly-owned clinics (Asfaw et al., p.
2075).
In some countries, although user fees were only small in some public health
facilities, poor quality of care, under-the-counter payment, and poor access limited the use
of public health services by the poor (Bitran & Giedion, 2002; DeVoe et al., 2007;
Hardeman et al., 2004; Kiwanuka et al., 2008; PIOJ & STATIN, 2008; Yates, 2006).
Furthermore, when the user fees situation was examined in Santo Domingo and El
Salvador, even though prices in the private sector were found to be higher than public
facilities, most persons obtained care from the private sector (Bitran & Giedion). A
possible explanation for this is a preference for quality service in spite of cost. To mitigate
the adverse effects of user fees, various governments and international agencies such as the
World Bank have now advocated the abolition of user fees, predicated on four factors: (1)
user fees are barriers to access; (2) user fees negatively affect compliance with expensive
treatment regimes; (3) user fees retard a country‘s ability to achieve international targets
such as the United Nations‘ MDGs; and (4) the total revenue raised from user fees is
58
generally negligible (Gilson, Russell, & Buse, 1995; James et al., 2006; Russell & Gilson,
1997; Xu et al., 2003).
3.5. Jamaica and other Caribbean countries’ experience with user fees
In the 1990s, it was found that the Jamaican public health system was
underfinanced. As a result, the system was ailing from the reduced number of qualified
staff, unavailability of pharmaceuticals, decreases in the quantity and quality of care
provided, and dissatisfaction among workers and the wider populace. These challenges
resulted in the introduction of a more extensive use of user fees for public health services.
Revenue generated was to be utilised to boost expenditure on primary and secondary care
services. The belief was that user fees would not adversely affect access to care or
utilisation of the public health services. In addition, it was felt that revenue from user fees
would be utilised to support management and overcome some of the challenges such as
staff and drug shortages, and staff and patient dissatisfaction (Shepard, 1993).
Exemption Policy. Caribbean countries such as St. Kitts, St. Lucia, St. Vincent
and the Grenadines, Dominica and Grenada also resorted to user fees to improve access to
basic public health services. Each of these countries had exemptions for those who could
not pay. In Jamaica, to enforce the exemption policy whereby people who could not afford
out-of-pocket payments received services at no charge or at a subsidised rate, assessment
officers were trained and deployed to the public health facilities. This arrangement was
often disregarded by health facilities, especially for preventive services (Gordon-Strachan
et al., 2010). The ineffective exemption process affected some individuals‘ ability to
access health care, mainly due to their inability to pay out-of-pocket. One factor
contributing to the ineffectiveness of the exemption policy was that users were often
―afraid of being embarrassed‖ by assessment officers and health personnel for not being
able to pay. This practice negatively affected the success of the policy (Gordon-Strachan
et al., p. 147).
Van Doorslaer and Wagstaff measured horizontal equity (where people with equal
need utilise the same amount of health care) in utilisation patterns in Jamaica through the
application of a comparative econometric test on the Jamaica Survey Living Conditions
1989. They found that utilisation of curative and preventive services in the public health
system favoured the rich despite the poor having a greater demand (as cited in Gordon-
Strachan et al., 2010). This further highlighted the ineffective exemption mechanism,
59
which clearly did not protect the poor from the adverse effects of out-of-pocket payment
for health care.
Studies in the Jamaican context on the effects of user fees on utilisation were
varied and inconclusive in some cases. For example, Lewis and Parker (1991) found that
revenue generated from user fees increased significantly for the period they studied;
however, they offered no conclusion regarding the impact on utilisation patterns (as cited
in Gordon-Strachan et al., 2010). Additionally, Shepard (1993) examined the impact of
user fees in the public health system and found that hospital revenue increased annually
following the introduction of user fees. There was, however, an inverse relationship with
utilisation, as the utilisation trend of public facilities declined over the period studied. The
decline was attributed to the quality of the services provided and not the increase in user
fees. Bailey, Wynter, Jackson and Lee (1994) examined the effect of user fees on access
to family planning services at a quasi-health facility. Fees for this service were introduced
in the facility in 1993. The study found that utilisation decreased by 28.0% between 1992
and 1993, and the decline was more pronounced among new users and users of injectable
contraceptives. The authors concluded that users were unwilling to pay for a service that
had previously been free. Equally, Alleyne (2010), in examining the impact of user fees
on health costs and health burden among patients with diabetes and hypertension, found
that user fees had a negative impact on health-seeking behaviour among Jamaicans.
Individuals were found to reduce health-related costs by employing practices such as
delaying or not seeking care when ill, purchasing only a portion of their prescribed
medications, and using home remedies.
User fees were also found to have negative effects on the elderly. Evidence
revealed that, despite the JADEP, the elderly who often required treatment for co-
morbidities were unable to meet not only the costs for services, but also indirect costs for
transportation, especially in rural areas. Elderly persons who were unable to access
services in the primary preventive services often resorted to home remedies to manage
their health conditions (Gordon-Strachan et al., 2010).
3.6. The impact of the abolition of user fees
Experience has shown that removal of user fees can result in increased access and
serve as a catalyst for increased utilisation to health services (Abdu et al., 2004; James et
al., 2005). Based on this premise, some countries have abolished charges for health
60
services to facilitate changes in people‘s attitudes towards seeking health services, improve
access, reduce morbidity, increase life expectancy and achieve better health outcomes,
particularly among the underserved and vulnerable (Ansah et al., 2009; Turner, 2009;
Yates, 2006). Although removing user fees for everyone may not in itself reduce inequity
and disparity, it was hoped in Jamaica that this intervention would enhance equal access
for equal need in the health system, as well as reducing disparities among the various
social strata.
There is a plethora of literature on the reduction or the abolition of user fees for
public health care, especially in African countries such as South Africa, Uganda, Ghana,
and Zambia. Due to some similarities in economic status, the experiences of these African
countries are among many used to highlight the potential impact of the abolition of user
fees policy in Jamaica and to inform this research.
To determine the effects of the abolition of user fees in the public health system,
researchers have employed a number of strategies. An evaluation approach with both
quantitative and qualitative research methods was the main mechanism through which the
desired outcome of the policy change was investigated. Studies were either longitudinal or
cross-sectional in nature. National surveys of living conditions or poverty assessment
tools were often utilised to obtain population data. Researchers gathered data using
interviews (group and individual), participant observation, document reviews and surveys,
and key informants were often selected from national, district or health facility levels.
Non-probability sampling techniques were generally used and the samples included health
workers, health unit management committee members, households and users of the health
facilities. Settings for the studies varied and were often dependent on the geographic area
of the country in which the policy was implemented. For example, some countries may
have abolished user fees for primary care services in rural communities. Therefore, a mix
of urban and rural settings, as well as selected private and public health facilities was
utilised.
Findings from various studies have shown that utilisation increased considerably in
South Africa, Uganda, Ghana, and Zambia following the removal of user fees (Ansah et
al., 2009; Burnham et al., 2004; Fafchamps & Minten, 2007; Maisiye et al., 2008; Ridde &
Morestin, 2011; Wilkinson et al., 2001; Yates, 2009). The increase in utilisation, however,
did not always occur for the ―vulnerable‖ or ―underserved.‖
61
South African experience with the abolition of user fees. In 1994, South Africa
abolished user fees for pregnant and lactating women and children under six years; in
1997, South Africa then abolished fees for all PHC services. The intention was to increase
access to health services by the poorest. When utilisation of mobile PHC services in one
health district was evaluated, the findings revealed that removal of user fees resulted in an
immediate influx of individuals seeking curative services, a demand that may have been
attributed to Human Immunodeficiency Virus (HIV)-related illnesses. There was,
however, a noticeable decline in the number of women seeking antenatal care or children
being immunised, services that were previously free at the point of service (Wilkinson et
al., 2001). Possible explanations given by the authors included the resultant congestion
and reduced consultation time users experienced in the clinics. These factors also
constituted a deterrent to women seeking antenatal care and child health services such as
growth monitoring and immunisation (Jacobs & McCoy, 1997; Wilkinson et al.). Further
reports indicated that fertility rates were declining because of HIV, thus reducing the need
for maternal and child health preventive services. In contrast, there was a 46.0% increase
in utilisation of primary health dental services after the removal of user fees (Bhayat &
Cleaton-Jones, 2003). In addition, the above studies have shown that medical attention
was sought for non-urgent conditions and hospital referrals declined. The decline in
hospital referral was attributed to the early provision of more efficient and effective
treatment, thereby reducing the need for hospital referral.
Ugandan experience with the abolition of user fees. Studies have shown that in
Uganda, the utilisation of health services increased following the abolition of user fees in
2001 (Burnham et al., 2004; Deininger & Mpuga, 2005; Nabyonga et al., 2005; Xu et al.,
2006). One study revealed that, following the policy change, utilisation increased by
10.0% with 18.5% new cases in the under-five age group and 31.0% in the over-five age
group. There was also an increase in referrals (26.0%), maternity delivery services
(28.0%), and postnatal services (34.0%). When compared to the year 2000, utilisation of
public hospitals increased by 25.5% in 2001 and 55.3% in 2002. Utilisation of health
centres increased by 44.2% in 2001 and 77.1% in 2002 (Nabyonga et al.).
The social benefits of the policy change in Uganda were estimated to be notably
larger than the loss of revenue. This is because the underserved population experienced
improved access to health care, resulting in reduced rationing, and the probability of
62
becoming sick fell by 1.5% among adults and 4.4% among children. The latter may be
attributed to easier access to the health services, more specifically, preventive measures.
The domino effect of the outcome of the policy change led to economic benefits, for
example, reduction of work hours lost to sickness by approximately 1.3 days. This finding
was more pronounced among the poor. Equally, the number of persons reporting cost as a
barrier to accessing health services in 2002 reduced by 15.0% (Deininger & Mpuga, 2005).
One study also found that there was increased utilisation among the non-poor in
2003 over 2000 (Xu et al., 2006). Xu et al. further revealed that, although removal of user
fees improved access to health services for both the poor and non-poor, catastrophic health
expenditures remained unchanged for the poor and declined for the non-poor. The
explanation for this experience for the poor is that lack of drugs in the public facilities
necessitated out-of-pocket payments to obtain medications at private pharmacies. Drug
availability fluctuated and stock shortages were frequent occurrences. When patients did
not receive the prescribed medications, they either forewent the treatment or purchased the
drugs from private pharmacies (Nabyonga-Orem et al., 2008). Use of private pharmacies
placed further strain on the patients who were required to pay out-of-pocket for expensive
drugs. This, however, did not affect the sustained increased in utilisation, which remained
higher than during the cost-sharing period (Nabyonga et al., 2005; Nabyonga-Orem et al.).
The reports further noted that drug supply improved in subsequent years (Burnham
et al., 2004; Nabyonga et al., 2005; Nabyonga-Orem et al., 2008) and users of public and
private not-for-profit facilities experienced improved health outcomes (Nabyonga-Orem et
al.). To avert any strain on the resources in the Ugandan health system following the
abolition of user fees, the government proactively addressed the issues through increased
budgetary allocation to the health sector. Attempts were made to ensure adequate supply
of drugs and recruitment of additional health personnel (Nabyonga-Orem et al.) such as
nurses (Masiye et al., 2008) was initiated. Despite these efforts, however, one study
revealed that supplies such as syringes and needles were often inadequate and the
cleanliness of the health facilities was worse after the discontinuation of cost sharing
(Nabyonga-Orem et al.).
Even though there was increased utilisation generally following the removal of user
fees, a study in Uganda found that the increase was more among adults than children.
Additionally, ages and health conditions of patients remained unchanged in the PHC
63
setting. The findings further revealed that outreach services remained the same or better in
some areas, while there was discontinuation of some committee meetings, such as those of
health units. The policy change also resulted in Central government assuming more
responsibility in the administration of health units (Burnham et al., 2004).
Subsequent to the abolition of user fees in Uganda, utilisation of public and private
health care providers by febrile children was examined. The findings revealed that
caregivers of febrile children sought treatment mainly from drug shops/private clinics
(62.7%) and government health facilities (33.1%). Drug shop/private clinics were often
the first point of contact for care, despite free health care from government institutions
(Rutebemberwa, Pariyo, Peterson, Tomson, & Kallander, 2009). The explanations given
for this practice were that the treatment from drugs shops/private clinics was viewed as
first aid, and the treatment was nearby, cheap and could be had on credit. The authors
further argued that obtaining treatment on credit was suggestive of the caregiver‘s inability
to pay for treatment or travel when required. This finding further suggested that the
abolition of user fees may not have improved access to health services, since there were
indirect costs such as travel costs that were associated with accessing care (Rutebemberwa
et al.).
Ghanaian experience with the abolition of user fees. In 2003, the MOH Ghana
introduced free maternity delivery care through an exemption scheme in order to improve
utilisation, access and quality of the delivery services (normal and assisted deliveries,
caesarean sections and medical and surgical complications in delivery) (Bosu, Bell,
Armar-Klemesu, & Tornui, 2007; Ofori-Adjei, 2007; Penfold, Harrison, Bell, &
Fitzmaurice, 2007). The purpose of the policy was to remove financial barriers to
maternal services, as well as to increase the number of deliveries attended by a
professional health worker, and to reduce Maternal Mortality rates and poverty (Asante,
Chikwama, Daniels, & Armar-Klemesu, 2007; Witter & Adjei, 2007). Evaluation of the
policy change revealed mixed responses in the various regions in Ghana (Witter, Arhinful,
Kusi, & Zakariah-Akoto, 2007a). Nonetheless, there was increased utilisation of health
facilities for deliveries among the poor and less educated women, despite the rich
benefiting more. As a result of the policy change, there was a reduction in out-of-pocket
payments for maternal services and more deliveries were attended by midwives rather than
traditional birth attendants (Asante et al.; Penfold et al.). There was also a commensurate
64
decline in the number of delivery-related deaths, contrary to expected increase despite
there being an increased patient load. However, respondents expressed dissatisfaction
regarding the quality of services provided and the attitude of some midwives (Bosu et al.;
Witter, Adjei, Amar-Klemesu, & Graham, 2009; Witter et al.).
While providers in Ghana embraced the policy generally, there were concerns
about the implementation process, including inadequate financial support (Witter & Adjei,
2007), the policy being pro-rich in nature, poor quality services, costs of transportation,
costs of medicine and supplies, distances to health facilities, cultural and social barriers
and preference for traditional birth attendants. The general feeling was that the policy
lacked effective monitoring systems; therefore, useful data were not captured. Funds were
often reimbursed where user fees were used to offset health facilities‘ administrative costs.
Reimbursement to clinical facilities was, however, untimely, resulting in providers
reverting to user fees, thereby making the policy ineffective. One researcher suggested
measures whereby policymakers could reduce perinatal and maternal morbidity and
mortality within the Ghanaian context (Ofori-Adjei, 2007). These measures included:
behaviour change strategies for providers and users; improving clinical quality of
care and provider competencies; ensuring availability of funds to cover the
exemptions; creating an enabling environment to address cultural barriers;
identifying ways to improve the imbalance between the rich and the poor; and
strengthen[ing] the culture of performing policy analysis. (Ofori-Adjei, p. 94)
In Ghana a study was done to determine the effects of free PHC, drugs and limited
free secondary care services on health outcomes and utilisation among under five year old
children with anaemia. Participants were enrolled in a household randomised control trial
pre-payment scheme. The findings revealed that utilisation increased marginally but there
was no appreciable impact on malaria-associated health outcomes (Ansah et al., 2009).
This finding suggests that, while removal of user fees may result in changes in utilisation
patterns, it may not translate into improved health outcomes.
Another important finding from the evaluation in Ghana showed that, when health
care was free, it reduced the probability of households seeking care from the informal
health sector. Conversely, when households had to pay for health care or when distances
posed a challenge, individuals resorted to ―informal care (traditional healers, chemical
sellers, and home remedies)‖ (Ansah et al., 2009, p. 52). The authors concluded that in
65
addition to user fees, there may be other barriers to accessing care in mainstream health
system. They recommended the following variables, ―distance from the health care
facility, lack of knowledge or incorrect perception of health care services and when to
utilise them‖ ( p. 55), be accorded some consideration in order to address access issues in
an effective manner. Of note is that consumers‘ assessment of the quality of care
following the removal of user fees appeared to be unchanged in most health facilities in
Ghana (Ansah et al.).
Zambian experience with abolition of user fees. User fees were abolished for
PHC in Zambia in 2006. Evaluation of the policy revealed a 50.0% increase in utilisation
among the poorer rural communities, especially among five year olds, one year after the
implementation of the policy. Conversely, utilisation for children under the age of five
years declined (Masiye et al., 2008), a phenomenon for which the researchers offered no
explanation. There was, however, a contrasting difference with utilisation patterns in the
urban communities, where there was no noticeable change in the aftermath of the policy
implementation. This trend was suggestive of improved access to public health services in
rural communities. The findings of the study, however, offered no conclusive evidence
regarding which group of patients was using the system more (Masiye et al.), although the
policy was intended to benefit persons who could not afford to pay out-of-pocket for
health care.
The quality of services provided after the policy change was also evaluated
(Masiye et al., 2008). Findings revealed that drug utilisation among the poor increased by
40.0%. However, 20.0% of people reported unavailability of drugs. Due to increased
utilisation, drug supplies fluctuated, resulting in increased procurement of drugs. There
were no changes in the waiting times to receive treatment, which ranged from 48–55
minutes. No noticeable changes were reported in health workers‘ attitudes or the quality
of consultations (Masiye et al.).
Similar to Uganda, user fees were often used to finance various aspects of the
health system, including payment of wages to some categories of staff. It was, therefore,
not uncommon for health workers in Zambia to lose their jobs following the policy change.
Another important role of user fees involved forging community participation. Fees
collected in health units were used as incentives for community personnel who mobilised
community resources, as well as disseminating health information. As a result of the user
66
fees removal, this community financial incentive was lost, which ultimately affected the
continuation of outreach activities. In addition, meetings to foster partnerships among the
community, health care providers, and policymakers were no longer held in some
situations (Masiye et al., 2008). Furthermore, staff workload, especially in rural areas,
increased, albeit this was short lived. Staff workload in urban areas remained unchanged.
These reported changes had the potential to jeopardise the success of the policy change in
several ways, including forcing facilities to revert to charges for health services. A lack of
confidence in the policy also had the potential to limit its effectiveness (Masiye et al.).
Experience in Mali, Madagascar, Niger, Burundi, Kenya and Afghanistan
with abolition of user fees. In 2006, user fees were abolished for children under five and
for pregnant women in Mali. Utilisation of malaria-related health services in 2007
increased three times more than in 2006 (Ponsar et al., 2011). Equally, when user fees
were temporarily abolished in Madagascar in 2002, there was a 22.0% increase in health
centre visits (Fafchamps & Minten, 2007). The increase in utilisation was attributed to
patients‘ repeat visits to the facilities for the same ailments (World Bank, 2005).
In Niger, a process evaluation was conducted on a non-governmental organisation
user fee-free intervention for children under five and pregnant women. The intervention
was introduced in 2006 and had a positive impact on utilisation, which was beneficial to
the vulnerable (Ridde, Diarra, & Moha, 2011). Burundi experienced no clear impact on
utilisation following the removal of user fees in 2006 for children under five or women
giving birth. Possible explanations for this outcome were the hurried implementation
process and lack of adherence to ―the policy process that leads to the adoption of the
reform, setting clear objectives, accurate targeting and the economic consequences of
abolishing user fees‖ (Nimpagaritse & Bertone, 2011, p. 68). The policy change also
resulted in reduced funding to health facilities, frequent drug shortages, decreased quality
of service, longer waiting times, and decreased contact time with health personnel. Of
note is that the decision regarding the policy change was taken at the central government
level without the involvement of MOH stakeholders (Nimpagaritse & Bertone).
In Kenya, user fees were removed for dispensaries and health centre services in
2004, with the exception of the 10/20 (Kenya Shillings (KES) 10 and KES 20) policy for
registration fees. Evaluation revealed that there was poor adherence to the policy, which
was attributed mainly to the shortage of drugs. To overcome this, facilities often increased
67
the registration fee or levied extra charges in order to purchase drugs. Other concerns that
hindered the success of the policy included ineffective policy processes, staff attitudes
toward the policy, lack of clarity regarding the policy among health workers, lack of
knowledge about the 10/20 policy among community members, long waiting times,
increased workloads due to increased utilisation and inability of health workers to provide
quality health services (Chuma, Musimbi, Okungu, Goodman, & Molyneux, 2009).
Similarly, Afghanistan banned user fees for basic health services in 2008 at some
health facilities. Results of a pilot study revealed that the quality of services improved and
utilisation increased by 400.0%, creating a demand for additional resources from
providers. The findings further revealed that ―structural and process quality of care‖ was
not affected because user fees contributed minimally to the operating budget of the
facilities (Steinhardt et al., 2011, p. 100). Increase was more pronounced in curative
services than preventive and promotion services. The explanation offered for this
phenomenon was that promotion services, for example, births in health facilities, were
previously free. The utilisation of existing free services such as antenatal care and
immunisation increased with policy change; the increase was, however, not sustained. To
ensure effectiveness of the policy change, additional inputs such as staff, and resources
such as drugs were provided; working hours were extended; and the aesthetics of health
facilities were improved (Steinhardt et al.).
A significant point is that most countries that abolished user fees, including Kenya
and Afghanistan, often relied on external sources of funding from donors to support the
health system and sustain the policy change. For example, the Danish International
Development Agency compensated health facilities in Kenya for lost revenue. In addition,
some donors also increased their contributions to compensate for lost revenue. This
ensured that resources such as drugs were available, as well as staff adequately
remunerated (Chuma et al., 2009; Steinhardt et al., 2011).
3.7. Jamaican experience with the abolition of user fees
Examination of the Jamaican health financing and expenditure pattern since the
1980s established some concerns, which undoubtedly affected policymakers‘ ability to
provide equitable and available health services to the population. The concerns included:
overall budgetary stringency in the public sector affecting the availability of funds
for health services; declining concessional aid; inadequate resources for
68
maintenance and supplies; inadequate compensation packages to attract and retain
most categories of health professionals; cost escalation of health services in the
public and private sectors; inadequate insurance cover among the population; large
public subsidies to health insurance companies and to consultants using public
facilities for private patients; equity and access with respect to lower income
persons; absence of incentives in the public health system for innovativeness and
cost effective care. (Lalta, 1995, p. 16)
Furthermore, the political influence on a country‘s health system shapes the
delivery of health care. Maharaj (2010), in addressing the relationship between the health
care system and political economy, asserted the following about the Jamaican Post
Emancipation (1838-1938) experience:
Jamaica inherited from its colonial past, a health service system for which money
was derived from general tax revenue and spent largely on hospitals and traditional
public health measures. Availability and ability to pay for medical services were
constraints for local inhabitants. Several variations of ―fee-for-service‖
arrangements did not solve the problem of those unable to pay and thus gain access
to acceptable standards of healthcare. (p. 707)
Policymakers have, therefore, attempted to address these issues in order to improve
access and equity in the delivery of health services despite the impact of ―upheaval in
geopolitical and global economic system[s]‖ (Maharaj, 2010, p. 708). According to
Maharaj, during the Post-World War II and New Millennium periods, ―successive
governments have wrestled with the challenge of access and equity and have succeeded to
varying degrees ranging from ‗free‘ healthcare to cost recovery to free access to some
services and back to free access to all services‖ (p. 708). This was evident from the
implementation of free access for most health services in 2007 and 2008.
Despite the policy changes being hurried and politically motivated, there were
immediate positive results from user fees removal. There were marked increases in
utilisation at the Bustamante Hospital for Children in 2007 and in the public health system
generally during 2008. Reports from the MOH noted that increases in utilisation were
seen in admissions, pharmaceuticals, health centre visits, outpatient and accident and
emergency (A&E) department visits (MOH, 2009a).
69
Noteworthy is that the above report made no reference to which groups in the
population were utilising the health services. However, one report stated that the no-user-
fees policy ―has brought health care within the reach of over 50.0% of the poorest quintile
of Jamaicans who previously reported an illness but could not afford to get treatment‖ (JIS,
2009, p. 1). Due to the lack of data in this area, this current study further investigated the
characteristics of the users to provide some insight into the beneficiaries of the policy
change.
Drug availability has been used as an indicator to determine the effectiveness of the
policy change in Jamaica. Drug utilisation increased, prompting the government to
embark on various programmes to improve drug supplies and increase human resources,
especially personnel to assist in pharmacies. After the policy change, the MOH launched a
new Government of Jamaica (GOJ) Health Card on August 20, 2009 for users of the public
health system. The intention was to improve access to prescribed drugs on the Vital,
Essential and Necessary (VEN) List at all public and selected private pharmacies. Drugs
on the VEN list are determined using specific criteria and procured and distributed by the
Government. The list contains over 800 drugs, which are dispensed free at public health
facilities. Additionally, the card provides a mechanism by which users‘ drug usage can be
tracked. There are no out-of-pocket payments for the drugs and the card can only be
presented with prescriptions obtained at a public health institution. This initiative was
undertaken in partnership with the NHF (JIS, 2009) but had not yet been fully
implemented at the time of data collection for this research in 2010.
The impact of the policy change on the workload of health personnel in Jamaica has
not been formally evaluated. However, the government has made attempts to address the
critical shortages of certain health personnel through recruitment and training. For
example, two initiatives included the drive to train pharmacy technicians, as well as
rotating new registered nurses through primary facilities in order to strengthen PHC.
There was also a thrust by the policymakers to legally empower NPs with prescribing
rights (JIS, 2010). Additionally, infrastructural improvement was made to some facilities
such as health centres (JIS, 2009).
Quality of care was also evaluated in 2009 subsequent to the policy change and
appeared to have remained unchanged in most health facilities. Users‘ satisfaction with
the quality of care was reported by Turner (2009). Evaluation of the impact of the policy
70
change on waiting times revealed no change, because waiting for extended periods to
receive health care was typical of the Jamaican public health system (Turner). Of note is
that some of these results are reporting on a similar period as this research.
3.8. The impact of the abolition of user fees on health workers
Generally, the views regarding the impact of user fees removal on health workers
in African countries varied. While some health workers appreciated the policy (Witter,
Dieng, Mbengue, Moreira, & De Brouwere, 2010), it was unpopular among others (Chuma
et al., 2009; Ridde & Diarra, 2009). In addition, ambivalence was evident among health
workers in some countries who, on the one hand, expressed being motivated professionally
by their ability to assist with improving the health of people but, on the other hand, were
dissatisfied with the poor uptake of the services provided and the effects on their work.
Some health workers were also not sufficiently informed about the various policies being
introduced. As a result, they were unprepared to administer the provisions of the policy
and chaos prevailed in some facilities (Gilson & McIntyre, 2005). This section presents an
international perspective on health workers‘ workload, motivation and income following
the removal of user fees.
Health workers’ workload. In the aftermath of the removal of user fees in
African countries, there was increased utilisation of health services. As a result, health
professionals experienced increased workload (Bhayat & Cleaton-Jones, 2003; Burnham et
al., 2004; Kajula, Kintu, Barugahare, & Neema, 2004; Walker & Gilson, 2004; Witter et
al., 2007a). In Uganda, findings revealed increased workload in most facilities (Burnham
et al.; Nabyonga-Orem et al., 2008). According to one report, there was a 47.0% increase
in workload for some health workers (Burnham et al.). This was attributed to the lack of
adequate numbers of health workers in the health facilities to cope with the increased
utilisation of services.
To best describe and quantify health workers‘ workload, researchers examined
several factors, including number of clients seen, number of hours worked and
involvement with additional tasks. In Ghana, workload equalled the mean client numbers
per week for each health worker. Reports were that client numbers ranged from 30- 120,
whereas untrained health workers saw only six clients apiece (Chuma et al., 2007). On the
other hand, health workers in Senegal experienced mixed results regarding workload
following implementation of the free delivery and caesarean policy. While midwives at
71
regional facilities experienced an increase in deliveries from 27 to 31, others had a
reduction from 11 to 8 deliveries. At district level, however, deliveries per midwife per
month ranged from 12 to 125. Generally, the average increased was from 53 per month in
2004 to 73 in 2005 (an increase of 33.0%) (Witter et al., 2010). Increased work hours
varied among health workers. Hours worked were also reflective of the change over a
two-year period. Part-timers worked an average of 20 hours per week while full time
employees worked an average 129 hours per week (Witter, Aikins, & Kusi, 2007b). Of
note is that working hours were extended for some health workers (Steinhardt et al., 2011).
Another factor influencing the workload and working hours of health workers was the
geographic location of services (Witter et al.).
For some health workers, the increased workload was attributed to additional tasks
imposed as a mechanism to enhance smooth implementation of the policy. For example,
some health workers engaged in administrative tasks, including processing patients for
exemptions in addition to their routine duties of administering health care (Nimpagaritse &
Bertone, 2011). Similarly, the work of health workers was reorganised in Niger to
accommodate crowds. An NGO triaging system was introduced following the
implementation of the exemption policy, in which health workers were actively involved.
This system also empowered community health workers to assist nursing staff in carrying
out their duties (Steinhardt et al., 2011).
Additionally, the increases in workload and overcrowding in some facilities were
attributed to people‘s excessive and inappropriate use of services. This was the case in
most of the countries, including Afghanistan and Madagascar, where health workers
voiced concerns about contact with patients who were not sick. Even more concerning to
health workers was patients visiting the health facilities late at nights for minor ailments.
Health-seeking behaviours such as these suggested that patients were attempting to abuse
the system (Gilson & McIntyre, 2005; Ridde & Diarra, 2009; Steinhardt et al., 2011)
Health workers’ morale. It is apparent that the removal of user fees and resultant
increase in workload affected health workers‘ levels of motivation and morale (Burnham
et al., 2004; Nabyonga-Orem et al., 2008). One factor contributing to this outcome was
the lack of consultation with frontline workers prior to the implementation of the policy
(Messen et al., 2011). Likewise, there were negative effects of the loss of revenues from
user fees on compensation and motivation strategies for some categories of staff (Witter et
72
al., 2010). For example, in Zambia, some health workers lost their jobs following the
removal of user fees. The explanation given for this outcome was that the revenue
generated from fees no longer existed to support this activity. The funds were normally
used to offset the cost of wages for some staff and, as incentives for community health
committee representatives, as well as for purchasing resources such as drugs (Masiye et
al., 2008). Similarly, in Uganda, revenue from user fees were utilised to pay wages for
some health personnel, especially support and technical staff. Therefore, it was not
uncommon for health workers to be made redundant following the abolition of user fees.
Furthermore, inadequate support services such as poor lighting, inadequate water,
insufficient allowances, drug unavailability, limited transport, and reduced staff numbers
were concerning to health workers (Nabyonga-Orem et al.).
As a result of the aforementioned conditions, health workers‘ motivation and
morale were negatively affected. For instance, health workers in Uganda were found to
lack positive attitudes toward their work (Burnham et al., 2004). One study revealed that
staff members were not motivated and their levels of motivation progressively declined.
In addition, some health workers felt exploited and raised concerns about working too
hard, lacking motivation and contemplating resignation (Ridde & Morestin, 2011). The
negative effect on staff members‘ morale may have affected their interaction with patients.
Patients complained about poor treatment and health workers‘ negative attitude towards
them (Gilson & McIntyre, 2005; Ridde & Diarra, 2009). Of note also is that individuals
expressed dissatisfaction regarding the quality of services provided and the attitude of
some midwives to the women in Ghana (Bosu et al., 2007; Witter et al., 2007a, 2009).
Researchers recommended that, for subsequent policy changes, strategies should be
adopted to improve staff morale, and maintain motivation and a supportive work
environment. This, essentially, would promote access to free and effective health services
(Campbell, Oulton, McPake, & Buchan, 2009). Motivational measures recommended in
Uganda included ―allowances, verbal appraisal and encouragement, ensuring staff are paid
timely, offering free treatment to staff, and allowing them to work elsewhere such as
teaching during their free periods‖ (Nabyonga-Orem et al., 2008, p. 7).
Health workers’ income. Health workers‘ income was also affected by the
removal of user fees in most countries. Some reported an increase in salary andothers
claimed they had experienced a reduction in allowances. In Ghana and Uganda, health
73
professionals received increased remuneration and incentives following the removal of
user fees (Nabyonga-Orem et al., 2008; Witter et al., 2007a, 2007b). This incentive was
the mechanism used to reduce potential discontent among health workers, which might
negatively affect the success of the policy (Yates, 2006). On the other hand, there were
reports of insufficient compensation and loss of revenue available to supplement staff
salaries in Uganda and Zambia (Gilson & McIntyre, 2005; Masiye et al., 2008; Messen et
al., 2011).
3.9. Impact of the abolition of user fees on the work of the professional nurse
While the direct impact of the abolition of user fees on health workers has been
highlighted in international literature, very little is known about the professional nurse
specifically. Nurses constitute a significant part of the health workforce; therefore, one
can extrapolate from the above findings on health workers that nurses‘ workloads,
motivation and income were also likely to be affected by the policy change. Additional
information on the impact of the removal of user fees on the work of the nurse is provided
below.
Using a case study approach, a study into the effects of user fees removal on nurses
working in large urban community health centres in South Africa was conducted. The
findings revealed ambivalence among nurses. While nurses embraced the free health care
ideology from a professional standpoint and saw a resultant improvement in access to
health care, they also expressed negative views about the policy change. For example,
common opinions noted lack of involvement in the policy process prior to its
implementation, increased workload, and patients ‗abusing‘ the system (Walker & Gilson,
2004).
Studies have also revealed that nurses in countries where user fees were removed
experienced increased workload (Bhayat & Cleaton-Jones, 2003; Walker & Gilson, 2004;
Witter et al., 2007b). In Ghana, community health nurses worked an average 56 hours per
week and were among the group of health workers who experienced increases in patient
numbers, ranging from 7-17 patients (Witter et al.). Nurses in South Africa, in describing
the impact of the increased workload, claimed they felt ―a strong pressure to spend less
time with each patient than formerly and some found their work more frustrating and tiring
than it used to be‖ (Wilkinson et al., 2001, p. 669). Adding to the frustration was the
74
general feeling among nurses that the significant increase in workload was viewed with
scant regard by policymakers in some countries (Walker & Gilson).
Morale among nurses was negatively affected following the removal of user fees
(Burnham et al., 2004). Contributing factors to the decline in morale included lack of
involvement in the policy process prior to its implementation (Walker & Gilson, 2004).
Moreover, nurses felt unrecognised. These problems were exacerbated by on-going
contentious issues in the work environment such as feeling isolated from other members of
the health team; scarcity of resources; lack of sufficient planning; and ineffective
communication. A study examining provision of free health services in the Limpopo
Province, South Africa revealed that they felt inadequate in their efforts to provide
satisfactory primary care services to the patients. This was attributed to the increased
workload, inappropriate use of the service, and anxiety resulting from the lack of adequate
security in health facilities (Netshandama, Nemathaga, & Shai-Mahoko, 2005).
Nurses‘ income improved in most countries affected by the removal of user fees. In
Niger, nurses received incentives in the form of bonuses, which enhanced the quality of
care and contributed to the effectiveness of the policy change (Ridde & Diarra, 2009).
Nurses in Ghana received increased salaries and other incentives as motivational measures
(Witter et al., 2007b).
Ridde and Diarra (2009) noted the impact on the work of nurses in Niger following
the removal of user fees. They reported that the power differences in the nurse-patient
relationship portrayed authority and passivity. In addition, another study reported that
nurses were of the impression that patients abused the system and only some deserved to
benefit from free care. The study further found that nurses imposed their ―value systems‖
on patients, as well as being judgmental of some categories of patients, for example,
―pregnant teenagers, teenage mothers, patients with HIV/AIDS and poor patients‖ (Walker
& Gilson, 2004, p. 1259).
3.10. Conclusion
User fees policies were found to have positive, negative and mixed impacts on
utilisation of health services. Fees, however, created a barrier to accessing health services
by some socioeconomic groups. Experience has shown that abolition of user fees in
developing countries served as a catalyst for increased utilisation. Evidence further
75
suggests that the impact of the user fees policy varied with each country mentioned above.
While some effects such as utilisation and drug availability were easily determined, key
gaps were also apparent. For example, the impact on health workers has been mentioned,
but very little information is available on the impact on main categories of health
practitioners such as the professional nurse in non-African countries. There was no clear
indication regarding which specific groups in the population were benefiting from the
policy change. While studies have evaluated the effects of the abolition of user fees in the
African context, there is a lack of sufficient data from non-African countries with similar
policy changes. Additionally, there were limited studies to provide data on the national
and regional policymaker perspectives, or on different categories of practitioners and user
perspectives in the one study. Some studies, for example, engaged administrators at the
national level who may not have been key stakeholders in the policy process.
Given these gaps, a decision was made to utilise a multi-layered approach to
determine the impact of the abolition of user fees at the national and regional
policymakers‘ levels, providers‘ level and the users‘ level in Jamaica. The study was
designed to examine whether the removal of user fees in the Jamaican context had an
impact on utilisation of public health services, access to health care generally, and the
work of the professional nurse.
The next chapter presents the theoretical framework for the study. It provides
information on the meaning of the concept of access and its multidimensional nature.
76
Chapter 4: Theoretical framing
4.1. Introduction
Theoretical frameworks serve many purposes, for example, ―providing direction
and impetus, as well as guiding and generating ideas for research‖ (Polit & Tatano Beck,
2008, p. 145). The theoretical framework for this study was used to inform the research
design, guide data collection, and answer the research questions regarding access to health
care. This chapter discusses the concept ―access‖ under the following headings: definition
of access, access and consumers (socioeconomic status, geographic location, ethnic
background, and gender), providers and access (availability and affordability),
policymakers and access, nursing and access, and funding for nurse-led services.
4.2. Access defined
According to World Health Assembly resolution 58.33 (as cited in WHO, 2010b),
everyone should have access to health services without incurring any financial burden.
The literature is, however, replete with research reports on the disparities in access to
health services by some groups of individuals. Policy documents such as the WHO (1978)
Alma Ata Declaration Health For All clearly addresses this issue. Despite the challenges
encountered, it is important to note that access to health care remains a basic human right
and is paramount to maintaining good health, gaining improved health and remaining free
of sickness (Gulliford, Figueroa-Munoz, & Morgan, 2003). The interpretation of access,
however, varies amongst countries; for example, in low income countries access may be
understood within the context of availability of basic health services such as an
individual‘s ability to obtain services from a physician or receive maternal and child health
care (Gulliford et al.; Oliver & Mossialos, 2004). In contrast, in high-income countries,
individuals have access to a wide range of health services and, as such, the concept is
interpreted through a different lens. For example, access is often viewed in the context of
how all-inclusive, timely, and equitable services are, as well as the desirability of the
health outcomes generated by having good access to care (Gulliford et al.). Even where
services are free, access can be compromised by high transport costs, loss of income,
unavailability of services, and long distances to health facilities (Asfaw et al., 2004;
WHO).
In some countries, universal health coverage, whereby all people have access to
health services without incurring financial burden, is non-existent (WHO, 2010b);
77
therefore, it is not uncommon for some individuals to pay out-of pocket for health services.
As a result, those who utilise the health services are often impoverished because of
catastrophic spending (Asfaw et al., 2004; Nimpagaritse & Bertone, 2011; Ponsar et al.,
2010; WHO, 2010a). For this reason, low-income earners may encounter significant
challenges in accessing quality health services, which have implications for the
achievement of equal access for equal need. In some countries, ―migrants, ethnic
minorities and indigenous people use services less than other population groups, even
though their need may be greater‖ (WHO, p. 7). It was found that abolishing payment for
health care assists the underserved and vulnerable in obtaining care. Hence, poor access to
health care by some individuals has been one of the driving forces motivating policy
change regarding universal coverage and free health care by some policymakers
(Kiwanuka et al., 2008; PIOJ & STATIN, 2008; Ridde & Diarra, 2009).
The concept of access is a complex one and its interpretation may be influenced by a
number of factors or series of events. In addition, it is multidimensional and, as such, a
clear definition has eluded many researchers and the concept is often misconstrued. For
instance, ―access‖ may be interpreted as meaning availability of resources (material,
finance and human resources) (WHO, 2010b). The literature presented in this chapter is
used to clarify and simplify the concept access. It also highlights the dimensions that have
potential impact on access to health services.
It was a challenge separating out the concepts, of access and availability. However,
access has been operationalised by some researchers to mean the appropriate use of
services by consumers according to their actual or perceived needs (Peters et al., 2008).
Despite the interpretation of this definition being questioned (Guilliford, 2009), a
conceptual framework by McIntyre, Thiede and Birch (2009) defined access to health care
―as the empowerment of an individual to use health care and as a multidimensional concept
based on the interaction (or degree of fit) between health care systems and individuals,
households and communities‖ (p. 179). In defining the concept from a patient‘s
perspective, the Institute of Medicine (1993) stated that access is ―the degree to which
patients are able to obtain needed services from the medical system and the timely use of
personal health services to achieve the best possible outcomes‖ (p. 4). Equally, access has
also been interpreted as the correlation between need, provision and utilisation of health
services (Guilliford et al., 2001).
78
Need. Despite dissimilar views among researchers, some commentators on access to
health care argue that care is best distributed based on patients‘ need, and, as such, the
concept is highlighted briefly. Need for care is defined by Culyer and Wagstaff (1993) as
one‘s capacity to benefit from the care provided. The authors further stated that an entity
can only be needed if it is an important factor in achieving a goal. Additionally, the
authors emphasised that need is not equivalent to ill health. To further expand on the
concept, the work of Social Need theorist Jonathan Bradshaw was used to highlight its
scope. Bradshaw‘s need taxonomy distinguishes four varieties of need: normative, felt,
expressed, and comparative (as cited in Culyer & Wagstaff). Normative need is defined
by experts using professional standards, for example, a diagnosis of hypertension by a
medical doctor. Felt need is what the individual perceives, for example, having abdominal
pain. Individuals‘ beliefs of need may significantly influence their felt need. When
formulated into demand, felt need is converted into an expressed need, such as individual
taking action by seeking treatment for the abdominal pain. Comparative need is defined
by comparing the variation in individuals‘ access to resources, for example, access to
health services. In addition, need is described as a ―horizontal version (persons in equal
need should be treated the same) and a vertical version (persons with greater needs should
be treated more favourably than those with lesser needs)‖ (Culyer & Wagstaff, p. 433).
Utilisation. It is important to make a distinction between access and utilisation
because it is often the perception that increased utilisation equates to improved access.
Utilisation is the actual use of services and relates to the interaction between availability
(supply) of a service and demand for that service. It is often reliant on the affordability,
accessibility and acceptability of services and not only the adequacy of supply. Utilising
health services hinges on an individual‘s perception of need, as well as the attitude, belief
system and experience of previous encounters with the health system. Access, on the other
hand, posits the individual‘s awareness of health services, and their active use of socially-
accepted services to achieve the best possible health outcomes. Additionally, access aligns
well with people‘s familiarity with the health services, as well as their knowledge of
available services (Guilliford et al., 2001).
While access may be viewed in relation to the availability of services, the timeliness
of these services, as well as their settings should also be given consideration (Rogers,
Flowers, & Pencheon, 1999). Moreover, access is frequently used to determine the
79
effectiveness of the services being offered. A Service that is accessible and utilised by the
people who require it may positively impact on the quality of service delivery.
Furthermore, equity is achieved when people with equal needs utilise equally accessible
services. The equitability of the services provided may result in unnecessary
consequences, whereby there is uptake by people with minimal capacity to benefit from
the offerings. This ultimately compromises the efficiency of the services provided.
Similarly, the services provided should also match with and respond to the need of the
population if they are to be qualified as accessible (Guilliford et al., 2001). The fact that
the uptake of some, such as preventive services, may be minimal among some segments of
society should not be discounted.
To fully understand the dynamics at work in the manner in which people utilise
health services, the Health Belief Model has been used by some commentators to explain
the phenomenon. When the model was applied to people‘s use of health services, the
following barriers to the optimal uptake of preventive services were identified:
(1) Service provision – the poorer provision and organisation of primary care
services, including systems for notification and recall, is identified as contributing to
lower rates of uptake of preventive services in disadvantaged areas; (2) Mobility of
populations – this presents particular difficulties for preventive services in inner city
areas, although the extent to which mobile populations receive services in other areas
or miss out on services altogether is not known; (3) Access costs – low rates of car
ownership and time off work are identified as important barriers for poorer groups;
(4) Attitudes and beliefs – concerns about side effects have formed a deterrent to the
uptake of childhood immunisations (and influenza vaccinations for elderly people)
among all social groups. A further barrier to the uptake of preventive services among
some disadvantaged groups is the existence of a more ‗fatalistic‘ approach to health
(i.e. a belief that one has little control or ability to influence events); (5) Knowledge
and language – some ethnic minorities and new immigrant groups experience
particular barriers to the uptake of services through language problems and a lack of
familiarity with services (e.g. knowledge of eligibility for screening). (Guilliford et
al., 2001, pp. 28-29)
80
Access the multidimensional concept. Although dated, the definition of access by
Panchansky and Thomas (1981) remains current. They described access as a
multidimensional concept, which includes the following characteristics:
Acceptability - refers to attitudes and beliefs of users and providers about each
other‘s characteristics. Affordability - applies to the cost implications to the patient
in relation to need; this includes both direct and indirect costs and perceptions of
value. Availability - refers to the adequacy of supply given by the relationship
between volume and type of services (provision) and volume and type of needs
(demand). Physical accessibility - is defined by the suitability of the location of the
service in relation to the location and mobility of the patient (geographical and
physical barriers). Accommodation - refers to the way services are organised in
relation to the client‘s needs and the patient‘s perception of their appropriateness
(opening times, booking facilities, waiting times). (p. 128)
Arguably, facilitating access requires empowering individuals to demand quality
health care supply for a better health status. Accordingly, access is dependent on factors
such as the availability of services; barriers that may prevent access include organisational,
financial, social and cultural impediments, the relevance and effectiveness of the service;
and the differing perceptions, health needs and the diversity of the population (Guilliford
et al., 2001).
Andersen (1995) adopted a behavioural theory approach to capture the fundamental
nature of access and described four dimensions of accessibility: potential access, which
encompasses the enabling resources required for the use of health services; realised access,
which is the actual uptake of services; equitable access, which results when demographics
and need influence the variation in the uptake of services; and inequitable access, which
occurs when utilisation of health services is determined by social structures, individuals‘
health beliefs and income.
Andersen‘s (1995) dimensions of access posit that access may be interpreted
through the lens of the inextricable link between providers and clients. This link
determines the manner in which health services are utilised. Access is therefore, centred
on the processes that influence entry into the health care system. It is not uncommon for
the concept to be used within the contexts of ‗having access‘ and ‗gaining access‘.
According to Guilliford et al. (2001):
81
(1) Having access denotes the theoretical potential to utilise a service if required.
To have access to a service means that the service required exists, is available,
and that there are systems in place that would allow service utilisation
following a contact with the health care service. (2) Gaining access alludes to
the actual procedure of admission into the processes of utilising the service.
Here, if access has been gained it means that the service has been utilised. (p.
19)
The theoretical positions on access, therefore, have contributed significantly to my
understanding of the concept. To adopt a particular position regarding this concept, the
definition by the University of North Texas was chosen for this research in order to
provide context and avoid any ambiguity. Access is ―the degree to which individuals are
inhibited or facilitated in their ability to gain entry to and receive care from the health care
system‖ (University of North Texas, 2007, p. 1).
It is clear from the above descriptions of access that a patient‘s entry into the health
system can be influenced by a number of variables at various levels in the system. These
variables can be at the policy level, the provider level or the consumer level (Guilliford et
al., 2001; Kiwanuka et al., 2008). Inaccessibility to health services and disparities in
health care quality and health status have been well documented (Culyer, 2001; Culyer &
Wagstaff, 1993; Goddard & Smith, 2001; Guilliford et al.; Kiwanuka et al.; Mooney,
2009). While access can be understood from the perspective of non-use of the health
facilities, it is important to highlight that this phenomenon can be understood from various
dimensions. This view was used in this study to discuss the access issues in health,
including policymakers and access, providers and access, consumers and access, and
nursing and access.
Understanding access to health services from the consumer‘s (user or patient) point
of view is multidimensional and involves the socioeconomic status, ethnic background and
geographic location of the consumer, as well as gender. The probability that a person will
use the health system is dependent on the balance between the person‘s ―biological and
psychosocial perception of need and his or her attitudes, beliefs and previous experience
with the health system‖ (Guilliford et al., 2001, p. 21). Additionally, barriers to accessing
health services may be encountered at any stage in the person‘s journey through the
process. Barriers may occur while making contact, at the point of entry or during uptake
82
of services, or affect the ability to achieve the desired health outcomes. It is evident that
barriers are multi-factorial and may be related to cost, the manner in which the service is
organised, location, individuals‘ knowledge, language problems, cultural practices, belief
systems and attitudes regarding health problems, or people‘s preferences, expectations and
main concerns regarding treatment (Guilliford et al.).
4.3. Policymakers and access to health care
Initiatives implemented by WHO and the World Bank, such as the MDGs and the
World Bank Reports on Health, to improve access to health care have targeted
policymakers to engage them in identifying inequities in health with a concomitant resolve
to improve access to health services (WHO, 2000; World Bank, 2006). Although these
initiatives have made modest gains, poor access to health services by some individuals
globally remains a challenge. To improve access to health services, policymakers need to
adopt a participatory type of decision-making strategy where the people are involved in
making decisions about their health (Peters et al., 2008). In addition, adequate resources
need to be allocated to the health sector, including increased budgetary allocation, proper
staffing of facilities, adequate numbers of and improved, well-equipped health facilities,
and adequate medical supplies and drugs (Hardeman et al., 2004; Howden-Chapman &
Cram, 1998; Klemick et al., 2009; Peters et al.).
Although removal of user fees for services in the health sector has yielded positive
results in some countries, policymakers need to address other major issues that segregate
groups of individuals, creating a disparity in accessing basic amenities such as health care.
Addressing issues such as poverty alleviation, a responsive health care system, a high
quality education system, high quality housing and suitable road conditions will make a
dent in the disparity to access and health care experienced by some individuals (Hardeman
et al., 2004; Peters et al., 2008). Even though cost appears to be the main deterrent to
accessing health care, policymakers should take care not to make far-reaching decisions or
policy changes without scrutinising the other contributing factors.
4.4. Providers and access
Health care availability and affordability. While lengthy waiting lists and long
waiting times can pose a barrier to service utilisation, they may also be suggestive of the
―inefficient use of existing capacity or a failure to design services around the needs of
patients‖ (Guilliford et al., 2002, p. 187). Consumers can also be selective in their choice
83
of health care providers. Choice of facility is often informed by variables such as
perceived quality of care, availability of drugs, adequately skilled staff, health
practitioners‘ attitudes and knowledge of the services available (Kiwanuka et al., 2008).
Moreover, sufficient resources are required if health services are to be accessible to people
in need. As a result, availability of services from the provider‘s perspective involves the
location, number and characteristics of health facilities and the services provided. In some
settings, availability is measured traditionally by the number of physicians and hospital
beds (Guilliford et al.). However, the following characteristics often define the services
that should be provided to enhance access: responsive to the needs of the populace, an
efficient ambulance service, ease of access to qualified health personnel, and adequate
provision of resources such as drugs and technologically updated equipment (Peters et al.,
2008).
Health economists have posited that, to determine the availability of health
services, the costs for travel and difficulties encountered while obtaining or forgoing care
need to be estimated (Mooney, 1983). For example, when distance from health facilities is
considered the costs could be astronomical. Individuals who cannot afford to travel
sometimes delay accessing care or may be unable to obtain basic services because of the
distance from primary and secondary health care facilities available to them in a particular
geographic location.
As established earlier, cost may be a deterrent to patients utilising the health
services, even in settings where the services are free. Out-of-pocket payment is often
required for dental care, drugs, time lost from work, and travel. Financial incentives to
providers can impact on the availability, as well as type of services (Guilliford et al.,
2002), thereby improving access. It is important for health services to be affordable
generally, in order for individuals to access care in a timely manner. In the absence of
adequate financial resources, individuals have opted for self-treatment or engaged the
services of shopkeepers or traditional healers who may be more accessible in terms of
cheaper services (Hardeman et al., 2004; Jacobs & Price, 2006; Peters et al., 2008). These
actions are sometimes adopted on the premise that the condition is not serious enough to
travel far distances or pay exorbitant costs for health services. It is also thought that
traditional healers are more cost-effective, understanding, and familiar with the socio-
cultural positions of these individuals and their opening hours are convenient for the users
84
(Peters et al.; Rutebemberwa et al., 2009). While this practice of seeking alternative
treatment may achieve an immediate benefit, it is important to note the long-term
deleterious effects on the health of individuals and the burden on the health system. This
burden occurs because some health conditions may be in advanced stages by the time an
appropriate diagnosis is made. Additionally, disease conditions at an advanced stage
require more technologically-advanced therapy and also increase mortality rates (Flores et
al., 1998; Hardeman et al.; Peters et al.). Providers, therefore, need to mobilise the
necessary resources to ensure services are available and affordable.
Despite untiring efforts by policymakers and health care providers to improve
access to health care by underserved populations, a segment of society still experiences
inequity and disparity in accessing quality health services. While the abolition of user fees
and the provision of universal health coverage in some countries have been advantageous,
policymakers and health care providers are still grappling to find innovative means of
creating an accessible health care system.
4.5. Consumers and access to health care
Socioeconomic status. Socioeconomic status is a contributing factor to disparities in
health and constitutes a barrier to accessing health services (Goddard & Smith, 1998,
2001; Mooney, 2009; Schoen & Doty, 2004). Health disparity, a term used
interchangeably with health inequity, occurs when people‘s characteristics such as race,
ethnicity, gender, socioeconomic status, and geographic location constitute obstacles to
health. Disparity to access exists when people are hindered from accessing required health
services due to unavailability, costs, or lack of insurance (Braveman, 2006; Department of
Health and Human Services (US), 2010). Whitehead (1991) defined health inequity as the
―differences in health which, are not only unnecessary and avoidable but, in addition, are
considered unfair and unjust‖ (p. 220).
Data gleaned from studies conducted in developed countries suggested that the
problem is not unique to developing countries (DeVoe et al., 2007; Hussey et al., 2007;
van Doorslaer, Masseria, & Koolman, 2006), despite numerous interventions to improve
access to health services. Hussey et al. examined trends in socioeconomic disparities in
general health care quality in various countries including England, New Zealand, the USA
and Canada, and found divergent socioeconomic situations in regard to quality and health
status. While the studies in these countries identified disparity between social status and
85
quality of health care, the phenomenon requires further investigation to fully understand
the problem. Given the health systems that operate in these countries, it is of concern that
distinct variations in health among people exist. Large segments of these populations
continue to receive substandard health care and experience undesirable health status. It is
also not uncommon for these segments to be in the lower strata of society and without
health insurance (Hussey et al.).
Individuals‘ ability to pay out-of-pocket for health services hinges greatly on their
social status and determines whether they will seek or postpone care when required
(Kiwanuka et al., 2008). In the absence of an adequately financed health system, cost
becomes a disincentive to positive health-seeking behaviour, as well as to the provision of
quality health services (Guilliford et al., 2001). This constitutes an obstacle to accessing
health care since consumers will avoid the financial hardship resulting from seeking care.
Moreover, indirect costs such as drugs, lost income and travel create additional financial
burdens for some persons. Of note is that access to health services is also a problem in
countries where even small fees were imposed for health care. In this case, health-seeking
behaviours of individuals were linked to their perception of the costs that might be
incurred in obtaining care. Furthermore, studies have corroborated the notion that cost,
among other factors, is an impediment to accessing health care among the poorer segment
of society in some countries (DeVoe et al., 2007; Kiwanuka et al.; WHO, 2010b).
People from low socioeconomic backgrounds were 10.0% less likely to access
preventive care at a general practitioner (GP) in the United Kingdom (Goddard & Smith,
1998). Additionally, it was found that people living in deprived communities who were
diagnosed with angina had a 50.0% lower revascularisation rate than people living in
affluent communities. Equally, lack of health insurance coverage was found to be an
obstacle for consumers diagnosed with angina to access health care in the UK, despite a
universal health system (Goddard & Smith). In the absence of health insurance, some
individuals do not have equal access to health care. This is the reality for people of low
socioeconomic status, and a probable explanation for some individuals‘ apathy in seeking
health care, even though there is a need. This represents an important barrier to access that
may have eluded policymakers over time. This supports data from other studies, which
investigated barriers to access or disparities in access to health care, and found that a lack
of insurance coverage constituted a barrier to accessing health care (Flores et al., 1998;
86
Hussey et al., 2007; Phillips, Mayer, & Aday, 2000). The inextricable link between health
insurance coverage and access to health services is unequivocal.
Socioeconomic status has also been shown to influence GPs‘ decisions regarding
patients. For example Scott, Shiell and King (1996) found that, when compared to those
of low socioeconomic status, people of high socioeconomic status in Australia had a
higher probability of having a diagnostic test but a lower chance of receiving a prescription
from a GP. This was especially true among the 15-64 years age group. Furthermore,
socioeconomic status was found to relate to the decision for follow-up of patients. These
authors argued that these findings substantiated that the socioeconomic status of patients
independently influenced GPs‘ decision making in certain circumstances.
Additionally, health literacy among people of low socioeconomic status was found
to impact on their ability to access health services. The minimal degree of health literacy
was a concern among the community-dwelling elderly population in the USA. According
to Sudore et al. (2006), limited health literacy correlated with disparities in health and
access to health service, which, they claimed has the potential to produce undesired health
outcomes. Additionally, it is argued that limited health literacy is common among some
ethnic minority groups and predisposes the individuals to unacceptable health status and
increased risk of admission to hospital (Cooper, Hill, & Powe, 2002).
Yamada et al. (2009), in a study on children‘s access to health services, concluded
that accessibility involved a number of variables such as ―paying cash for health care
services, family earnings, educational status of caregiver, the type of private and public
health insurances, ease of seeing a health personnel and the interface between service
provider and users‖ (p. 448).
Geographic location. Distance from health facilities can be a deterrent to
consumers‘ use of health facilities even though there is a need. This can be understood in
terms of the individual‘s location, nature of the roads to be used, and transportation
systems, as well as the communication systems in the areas. Studies have shown that
consumers either delay or forgo care if it requires significant loss of time or the travel cost
is astronomical. This results in increased mortality in some cases, especially maternal
mortality (Hardeman et al., 2004; Jacobs & Price, 2006; Klemick, Leonard, & Masatu,
87
2009; McCaw-Binns, Standard-Goldson, Ashley, Walker, & MacGillivray, 2001; Peters et
al., 2008).
In a study on the impact of geographic proximity to cardiac revascularisation
services in the USA, it was found that distance from the patient‘s home influenced the
utilisation of services at health facilities. According to the authors, ―geographic proximity
of patient‘s residence to cardiac revascularisation services and availability of these services
at the hospital nearest to the patient‘s residence was found to be strongly associated with
utilisation, even across a relatively small geographic area‖ (Gregory et al., 2000, p. 54).
Ethnic background. The literature is replete with documentation on ethnic
disparities in accessing health care, as well as cultural diversities that influence an
individual‘s ability to access health care (Flores et al., 1998; Howden-Chapman & Cram,
1998; Nandi et al., 2008; Phillips et al., 2000). Included among the barriers to access
encountered by various ethnic groups are distance, cost, lack of health insurance, culturally
inappropriate health services, knowledge deficit regarding services, language barrier, low
educational level, individual‘s attitude, cultural practices and expectations of the service
providers. Of equal importance is an individual‘s responsiveness to or acceptability of the
services provided because this may be an obstacle to accessing health care in a timely
manner. Additionally, individuals from some ethnic groups are faced with the challenge of
receiving poor quality care and having to wait for long periods of time to receive care
(Wells, Klap, Koike, & Sherbourne, 2001).
Barriers to health services experienced by some ethnic groups are largely
associated with unfamiliarity with the services, apprehension related to the negative
perception associated with some diagnoses and anxiety about entitlement to certain
services, as well as inequity in the services provided. Despite attempts to minimise the
disproportionate use of health services, some ethnic groups continue to experience inequity
(Guilliford et al., 2001). Goddard and Smith (1998), in an account on the utilisation of
mental health services among some ethnic groups in the UK, stated that ―South Asian
migrants from India, Pakistan, Bangladesh, [and] Hong Kong have relatively low hospital
admission rates for mental illness relative to people born in England (average of 283
admissions per 100,000 population compared with 504)‖ (p. 56). Of note also is that
socioeconomic status, negative perceptions and meanings attached to mental illness may
have contributed to the poor uptake of the services (Lipsedge, 1993). Moreover, studies to
88
investigate the high rates of schizophrenia and psychosis among Caribbean people living
in the UK found that recorded rates were potentially affected by variations in patients‘
presentation and doctors‘ diagnostic and management practices (Cochrane & Sashidharan,
1996).
In the USA, a study on ethnic disparities in unmet needs for alcoholism, drug abuse
and mental health care revealed dissimilarities among Hispanics, African Americans and
whites. Hispanics and African Americans were found to have ―less access to care, poor
quality of care, and greater unmet need for alcoholism, drug abuse, and mental health
treatment‖ when compared to whites (Wells et al., 2001, p. 2030). Equally, a study on
access to care for children with special needs found that disparate access to and utilisation
of health services existed among racial and ethnic minority children in comparison to
white children. In addition to racial and ethnic disparity, income and insurance coverage
were also shown to contribute to poor access to health services by children with special
needs in the USA (Newacheck, Hung, & Wright, 2002).
In New Zealand, when the interface between ethnicity and the health system was
analysed, it was revealed that Māori (indigenous people) uptake of GP services was less
than non-Māori; they had greater mortality from unavoidable deaths than other groups;
they accessed specialist care for some chronic diseases less; they might not be treated for
conditions such as myocardial infarction and received less advanced treatment for
conditions such as coronary artery bypass (Howden-Chapman & Cram, 1998).
Gender and access to health care. Gender plays a role in creating disparities for
access to health, in that women are sometimes marginalised (Flores et al. 1998; Howden-
Chapman & Cram, 1998; Nanda, 2002; Nandi et al., 2008; Phillips et al., 2000).
Conversely, research has shown that women utilising GP services in Australia were more
likely to receive a prescription regardless of health or socioeconomic status (Scott et al.,
1996) than their male counterparts. Additionally, a study examining factors associated
with gender differences in having health insurance coverage and a usual source of medical
care in low-income communities in the USA found that employed women had more
insurance coverage than employed males. While there was no means by which to explain
the gender differential, the author concluded that private and public health insurance
should be more available to men in low income communities (Merzel, 2000).
89
Having examined all the above descriptions of the concept of access, one can
conclude that it is indeed a complex term to capture in any one definition. Undoubtedly,
the barriers described above negatively affect individuals‘ ability to access health services,
as well as contributing to delayed health care access (Goodard & Smith, 2001; Guilliford
et al., 2001).
4.6. Nursing and access
The nursing workforce is fundamental to achieving access to health care by
vulnerable groups. While employing more nursing personnel constitutes part of the
solution, it is also prudent to mention that nurses themselves have adopted new roles,
expanded the scope of their practice, relocated where services are being delivered, and
have targeted at risk groups in order to improve access to health care. The literature is
replete with information on myriads of innovative strategies that have been adopted by
nurses globally to meet the health needs of the vulnerable population (Chapple, Rogers,
Macdonald, & Sergison, 2000; Dick, Clarke, van Zyl, & Daniels, 2007; International
Council Nursing [ICN], 2009; Miles, Clutterbuck, Seito, Sebego, & Riley, 2007). This
research only highlights a few.
The theme for International Nurses Day 2009 was Delivering Quality, Serving
Communities: Nurses Leading Care Innovation (ICN, 2009). This theme was indeed a
timely reminder of the contribution nurses were making to improve access to health care
that is cost-effective, as well as improving and preserving the quality of care offered to
consumers, especially the most vulnerable groups (ICN, 2009). According to the ICN
(2009), ―nurses worldwide are engaged in innovative activities on a daily basis; activities
motivated by the desired to improve patient outcome and the need to reduce costs to the
health care system‖ (p. 1). Nurses are leading the charge as the first point of contact for
individuals who encounter difficulties accessing mainstream health services (Minami &
Benton, in ICN, 2009)
Nursing innovations or nurse-led services have had positive effects on the lives of
underserved populations. Some examples of nurse-led services include the following. In
Papua New Guinea, a nurse-led PHC service utilised community leaders, women and
youths in several villages to raise consciousness regarding HIV and AIDS. Short wave
radios, outdoor remote broadcasting systems, newspapers and workshops were used to
disseminate information on HIV and AIDS and other preventable diseases, such as
90
diabetes and hypertension. The nurses also operated remote clinics in these villages. This
initiative was successful in changing the lifestyles and health-seeking behaviours in this
community (ICN, 2009).
Nurses in Botswana have taken on the role of managing HIV and AIDS patients on
Antiretroviral Therapy (ART) in rural areas. Nurses were equipped with the necessary
knowledge and skills and deployed to manage patients clinically. This service resulted in
reduced waiting lists and improvement in the monitoring and follow-up services for the
patients (Miles et al., 2007).
In South Africa, PHC nurses improved the provision of equitable health care. This
was achieved through combined efforts in implementing an outreach programme among
poor and underserved farm workers. In order to combat noncompliance to anti-
tuberculosis (TB) medication and further control the disease among this group, nurses
trained farm workers‘ peers as community lay health workers, with a view that peer groups
would effectively assist to control TB. The lay health workers were involved in health
promotion and social development activities. Using this group of health workers improved
the management and control of TB, as well as reducing costs to the health authorities
(Dick et al., 2007).
Nurses have offered services to populations in areas that physicians have chosen
not to serve (Safriet, 1992). For example, in New Zealand the Tairawhiti Innovative
Nursing Team offered outreach services, health care management and counselling to
deprived and underserved members of the population. This project resulted in reduced
morbidity and a decline in certain diseases. Nurses in New Zealand have also been
engaged in a number of additional services to improve access, including nurse-led
newborn resuscitation in an urban neonatal unit (Neal, Stewart, & Grant, 2008) and the use
of telenursing triage, especially among disadvantaged groups (St. George et al., 2008).
Nurses are also offering cardiovascular disease risk management intervention for patients
with gout (McLachlan, Kerr, Lee, & Dalbeth, 2011) in addition to being the main
providers of diabetes services in PHC (Kenealy et al., 2004).
Similarly, practice nurses in the UK were improving access to health services by
managing diabetes services to provide better quality services and foster patient-centred
care (Robinson, 2004). Moreover, nurse-led services were channels that fostered patient
91
satisfaction through continual health-related and social support (Chapple et al., 2000).
Nurses are continually seeking novel strategies to achieve this goal. For example, the use
of telephone nursing and triage in ambulatory and PHC services to improve access has
been well documented. Nurses utilise the telephone to conduct counselling sessions,
triage, give advice and do health status checks (Huber & Blanchfield, 1999). These
services are cost-effective and patients experience a high level of satisfaction due to their
capacity to use the nurse-led services (Chapple et al.).
Clearly, the literature comprehensively covers the many areas in which nurse-led
services are dominant. While these services may be offered by various categories of
nurses, the scope and practice of NPs are integral to this type of service delivery. NPs are
employed as a substitute for the doctor in some practice settings, especially in areas where
there may be increased burden of certain health challenges (Safriet, 1992). Additionally,
NPs were sometimes the sole health care worker delivering health services in rural areas
with individuals of low socioeconomic backgrounds (Bednarski, 2009). They increased
access to essential health services in various geographic and practice settings and have
established a reputation for delivering quality health care and services. Of note is that NPs
often took on medical responsibilities and offered quality care and services despite the lack
of legislative endorsement in some practice settings. It is also true that NPs were more
strategically positioned than doctors to deal with culturally-related access barriers in order
to improve patient outcomes (Safriet).
Funding for nurse-led services. Health services administered by nurses equal or
exceed the outcomes provided by a doctor in most cases. This occurs because of the
―patients‘ adherence to care regimes, the lower cost of training and the collateral benefit of
consumer choice and satisfaction‖ (Safriet, 1992). Even though health services offered by
nurses have been innovative and creative with a direct impact on cost, little is documented
on incentives for nurse-led services or their funding. Funding for nursing services is often
incorporated into the main budgetary allocation for health services in most countries and as
such, there is no set budgetary allocation for nursing services. Nevertheless, nurse
administrators prepare a budget for the day-to-day operations in nursing services.
In New Zealand, the Ministry of Health‘s Elective Services Initiatives (ESIF)
provided financial support for nurse-led initiatives, to assist with training of staff and
offset wages (Dellagiacoma, 2007). Of note also is the funding provided by the
92
Department of Human Services, Victoria, to improve health outcomes for a nurse-led
asthma management programme in Australia (Wyatt, 2006). Support for nurse-led
services may also be obtained through collaborative efforts. A case in point is a nurse-led
outreach programme targeting street sex workers in Australia which obtained support from
stakeholders such as public health partners and advocacy groups (Bush, Moss, & Wallis,
2006).
The areas of incentive and funding for nursing services are not adequately captured
in the literature. Furthermore, there is limited recognition or publicity among nurses and
the public regarding nurses‘ contribution to health care innovation and the health system as
a whole (ICN, 2009). It is, therefore, important for the funding of nursing services to be
extensively explored in order to highlight nursing‘s contribution, as well as policymakers‘
funding arrangements for nursing innovations.
4.7. Conclusion
The concept of access is elusive, despite attempts by scholars over recent decades
to simplify it. While improving access is concerned with empowering individuals to take
responsibility for their health, as well as the manner in which health care resources are
offered, some individuals continue to experience poor access to health services. Barriers
to access may be associated with the characteristics of the policymaker, the provider or the
consumer, and challenges can be encountered at any stage on the journey to accessing
care. Therefore, in this study access was investigated from three levels: (1) policymakers‘
perspective, (2) providers‘ perspective, and (3) users‘ perspective. This framework was
also used to inform the research design and provide direction for the research generally.
The next chapter provides details about the methodology for the research. It
presents information on the mixed methods evaluation multi-layered study, research
design, and ethical considerations.
93
Chapter 5: Methodology and research design
This chapter presents the methodology and methods used to answer the research
questions. It commences with an overview of the evaluation study and clarifies concepts
where appropriate. It provides information on the study design, including sampling,
instruments, data collection, data analysis, ethical considerations for the study, and how
rigour and validity were achieved. The study used a multi-layered mixed methods
evaluation design from national, provider and user perspectives. The decision to use this
method was informed by the literature. While a multi-layered study was not adopted in
most studies, some scholars adopted both qualitative and quantitative data collection
techniques to evaluate the impact of user fees. Additionally, no formal evaluation of the
policy change had been conducted in Jamaica prior to the time of data collection in 2010.
Therefore, an evaluation study was appropriate for this project.
The design, while intended to capture wide perspectives across RHAs, facilities,
professional groups and users did not explore a number of variables due to the time frame
within which the study had to be conducted and the years examined (2006 and 2009) in the
study. Variables such as health outcomes were not explicitly examined however, views
expressed by practitioners regarding health status by some users and user‘s views on
satisfaction with their current health status were obtained.
5.1. Evaluation
Evaluation is defined as investigation into the extent to which a policy, practice, or
programme is effective (Polit & Tatano Beck, 2008). Additionally, it is described as a
methodical assessment of the worth of something (Brophy, Snooks, & Griffiths, 2008).
Owen (2006) posited that evaluation should be viewed as ―the production of knowledge,
based on systematic inquiry to assist decision-making about a programme‖ (p. 18). In
other words, knowledge gained from evaluation will result in improvement in planning and
implementation of other policies, allow modification to be made and inform the decisions
regarding continuation and expansion of the policy (Brophy et al.).
Evaluation seeks to gather data to inform and make effective decisions about a
policy or programme at varying stages and, as such, there are different types. The
categories include proactive, which is conducted prior to the design of the programme;
clarificative, which focuses on the internal structure and function of a programme;
interactive, which concentrates on stakeholders‘ responsibility to manage and control the
94
evaluation of the interventions; monitoring, which is done after the intervention has been
launched and is progressing; and impact, which determines the effectiveness of an on-
going intervention (Owen, 2006). An impact evaluation was utilised in this study to
examine the outcomes after the implementation of the abolition of user fees policy.
According to Khandker, Koolwal, and Samad (2010), impact evaluation helps
policymakers decide whether programs are generating intended effects; to promote
accountability in the allocation of resources across public programs; and to fill gaps
in understanding what works, what does not, and how measured changes in
wellbeing are attributable to a particular project or policy intervention. (p. 3)
This type of evaluation is aimed at facilitating learning and accountability. As a
result, the findings may be used as a guide for future policy processes and monitoring.
Additionally, it is expected that stakeholders should take responsibility for the outcome of
the policy change. The major focus of the evaluation was implementation versus outcome.
Therefore, the overall approach to this evaluation study was a process-outcome approach.
Evaluation was selected as the appropriate design for this study because the outcome of a
programme was judged against the objectives it intended to achieve. Future decision
making regarding the policy may hinge on the study‘s findings, in addition to adding value
to future programmes (Weiss as cited in Vedung, 1997).
For an evaluation to be effective, it requires achievable objectives, adequate
planning, and appropriate design and methods. Similarly, a well-designed evaluation
permits the involvement of all stakeholders in a programme. For example in this policy
evaluation, policymakers, practitioners and patients shared varying perspectives.
Furthermore, the need for the evaluation and the intended use of the results shape the
evaluation questions (Brophy et al., 2008).
This study aimed to determine the impact of the abolition of user fees in the
Jamaican public health system at three levels: 1) national and regional policymakers, 2)
providers in both urban and rural hospitals and health centres, and 3) users in both urban
and rural health facilities (Figure 9). Trends regarding utilisation patterns, impact on the
work of health care providers, specifically the professional nurse, and patients‘ access to
health services since the abolition of user fees were examined. The study focused on the
use of the public health system before and after the policy change.
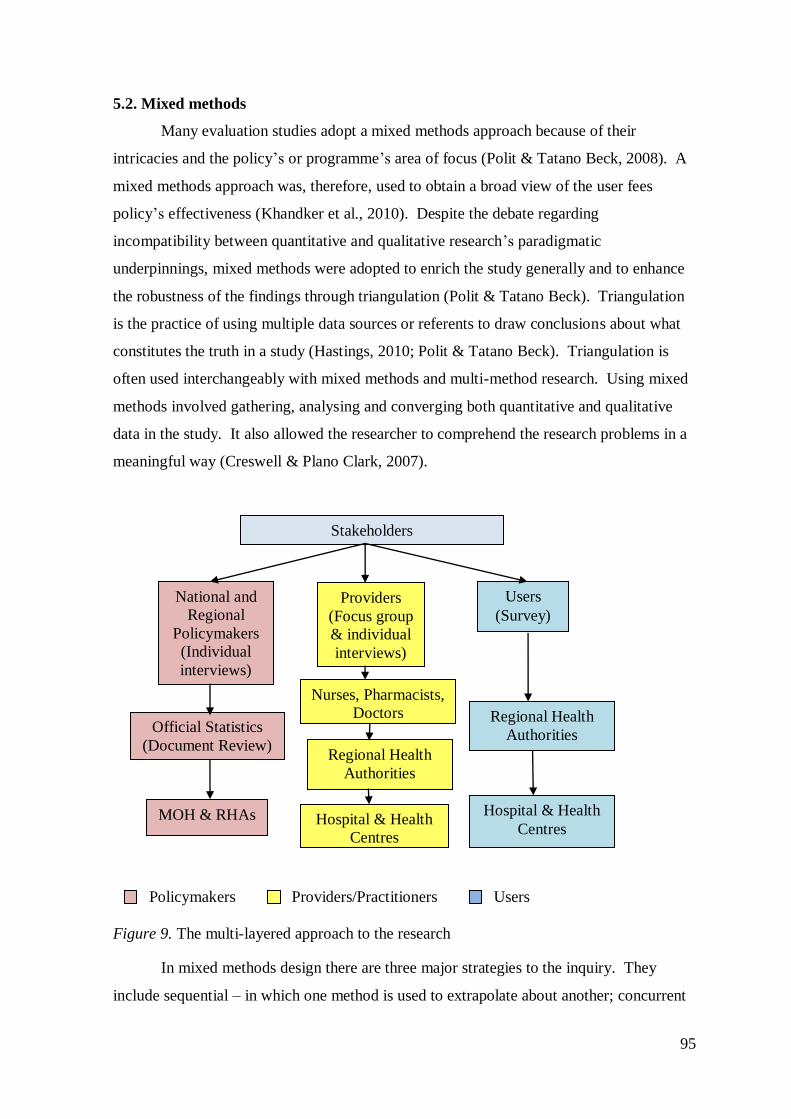
95
5.2. Mixed methods
Many evaluation studies adopt a mixed methods approach because of their
intricacies and the policy‘s or programme‘s area of focus (Polit & Tatano Beck, 2008). A
mixed methods approach was, therefore, used to obtain a broad view of the user fees
policy‘s effectiveness (Khandker et al., 2010). Despite the debate regarding
incompatibility between quantitative and qualitative research‘s paradigmatic
underpinnings, mixed methods were adopted to enrich the study generally and to enhance
the robustness of the findings through triangulation (Polit & Tatano Beck). Triangulation
is the practice of using multiple data sources or referents to draw conclusions about what
constitutes the truth in a study (Hastings, 2010; Polit & Tatano Beck). Triangulation is
often used interchangeably with mixed methods and multi-method research. Using mixed
methods involved gathering, analysing and converging both quantitative and qualitative
data in the study. It also allowed the researcher to comprehend the research problems in a
meaningful way (Creswell & Plano Clark, 2007).
Policymakers Providers/Practitioners Users
Figure 9. The multi-layered approach to the research
In mixed methods design there are three major strategies to the inquiry. They
include sequential – in which one method is used to extrapolate about another; concurrent
National and
Regional
Policymakers
(Individual
interviews)
Providers
(Focus group
& individual
interviews)
Stakeholders
Users
(Survey)
MOH & RHAs
Official Statistics
(Document Review) Regional Health
Authorities
Nurses, Pharmacists,
Doctors
Regional Health
Authorities
Hospital & Health
Centres Hospital & Health
Centres
M
O
H
&
R
H
A
s
M
O
H
&
R
H
A
s
M
O
H
&
R
H
A
s
96
– in which data from different sources are converged for a thorough analysis of the
research problem; and transformative – in which a theoretical framework is used to
underpin the procedure (Creswell, 2003). The research methods commonly adopted for a
mixed methods approach include ―a) predetermined and emerging methods, b) open and
closed-ended questions, c) multiple forms of data drawing on all possibilities, d) statistical
and textual analysis and e) across databases interpretation‖ (Creswell, 2009, p.15).
The researcher who utilises a mixed methods approach is involved in the research
process in several ways. For example, the researcher has to be involved in gathering both
quantitative and qualitative data, substantiating the use of the chosen method, combining
data at different stages of the research process, presenting diagrammatic representation of
the procedures in the study, and adhering to the ideologies of the qualitative and
quantitative inquiries (Creswell, 2003).
While a mixed methods approach may be a useful approach it has some
weaknesses. Common weaknesses that need to be managed for rigorous findings are that
1) data collection is widespread and time-consuming; 2) analysing both qualitative (text)
and quantitative (numeric) data is a lengthy process; and 3) the researcher has to be au fait
with the approaches involved in both quantitative and qualitative inquiries (Creswell,
2003).
For this study a concurrent triangulation mixed methods strategy was used in which
quantitative and qualitative data were collected concurrently. Each method was weighted
equally in that neither the quantitative nor qualitative approach was given priority in the
study. The results were analysed in a multi-layered manner: 1) national level
(policymakers), 2) provider level (practitioners), and 3) user level. Data were analysed
within and across data sets, then within and across the levels. Integration of the findings
was done during the interpretation phase (Creswell & Plano Clark, 2007; Onwuegbuzie &
Johnson, 2006) (Figure 10). The process was further guided by a selected philosophical
assumption.
5.3. Philosophical underpinning
Research designs require interaction among worldviews, strategies of inquiry and
appropriate methods. In research, philosophical assumptions such as postpositivism,
constructivism, and pragmatism are often used to guide the inquiries. These knowledge
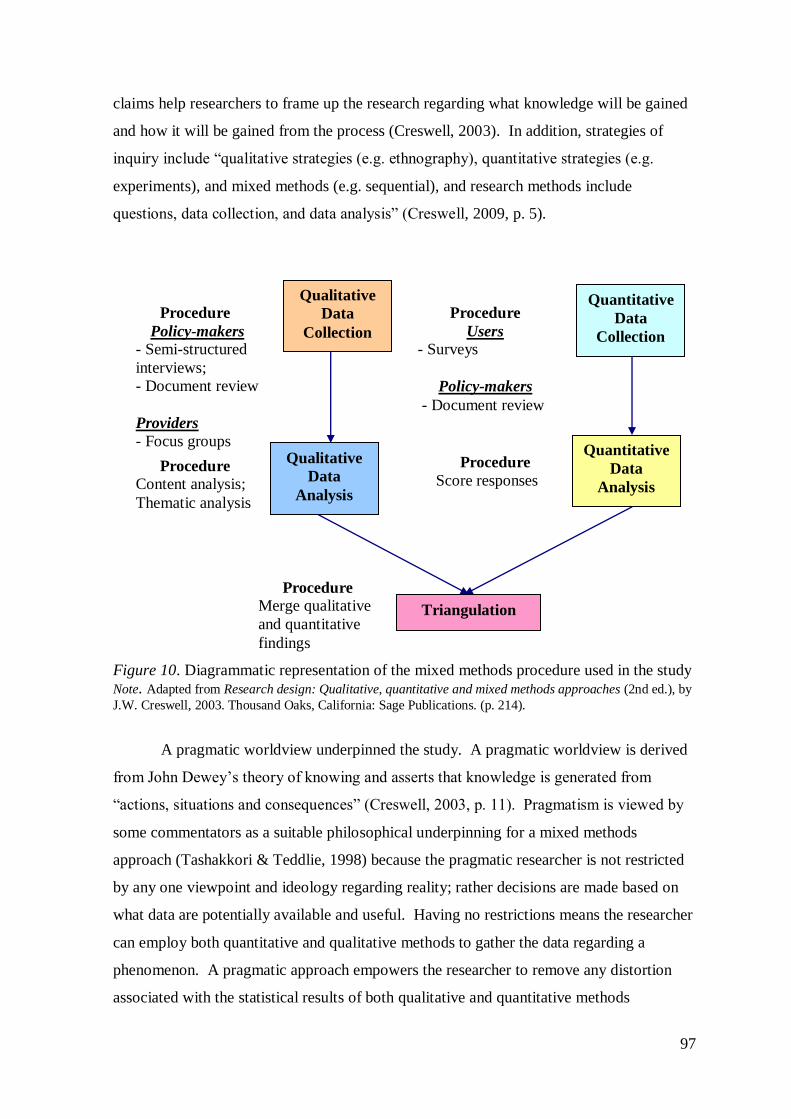
97
claims help researchers to frame up the research regarding what knowledge will be gained
and how it will be gained from the process (Creswell, 2003). In addition, strategies of
inquiry include ―qualitative strategies (e.g. ethnography), quantitative strategies (e.g.
experiments), and mixed methods (e.g. sequential), and research methods include
questions, data collection, and data analysis‖ (Creswell, 2009, p. 5).
Figure 10. Diagrammatic representation of the mixed methods procedure used in the study
Note. Adapted from Research design: Qualitative, quantitative and mixed methods approaches (2nd ed.), by
J.W. Creswell, 2003. Thousand Oaks, California: Sage Publications. (p. 214).
A pragmatic worldview underpinned the study. A pragmatic worldview is derived
from John Dewey‘s theory of knowing and asserts that knowledge is generated from
―actions, situations and consequences‖ (Creswell, 2003, p. 11). Pragmatism is viewed by
some commentators as a suitable philosophical underpinning for a mixed methods
approach (Tashakkori & Teddlie, 1998) because the pragmatic researcher is not restricted
by any one viewpoint and ideology regarding reality; rather decisions are made based on
what data are potentially available and useful. Having no restrictions means the researcher
can employ both quantitative and qualitative methods to gather the data regarding a
phenomenon. A pragmatic approach empowers the researcher to remove any distortion
associated with the statistical results of both qualitative and quantitative methods
Qualitative
Data
Collection
Quantitative
Data
Collection
Triangulation
Quantitative
Data
Analysis
Qualitative
Data
Analysis
Procedure
Policy-makers
- Semi-structured
interviews;
- Document review
Providers
- Focus groups
discussions
Procedure
Users
- Surveys
Policy-makers
- Document review
Procedure Content analysis;
Thematic analysis
Procedure
Score responses
Procedure Merge qualitative
and quantitative
findings
98
(Creswell). Biesta (2010), in explaining another view on the usefulness of pragmatism to
mixed methods research, suggested that the philosophy does not offer a ―paradigmatic
underpinning or a wholesale justification of mixed methods research, but rather a set of
insights that can help us to have a more precise discussion about the strengths and
weaknesses of mixed methods approaches‖ (p. 97). This observation by Biesta was used
to determine the strengths and manage the weaknesses of this mixed methods study.
5.4. Design
The study was conducted in selected health facilities in the public health system in
all four RHAs and at the MOH in Jamaica during 2010. Of note is that the policy change
was implemented in 2008. Both probability and non-probability methods of sampling
were utilised to determine the sample for both the qualitative and quantitative methods.
For example, both systematic and purposive sampling techniques were used. Participants
were selected from among key policymakers at the national and regional levels, various
categories of practitioners in hospitals and health centres, as well as users of the public
health system. Participants for the survey were selected from among patients attending the
health facilities on the day of the survey using every 5th patient on the patients‘ register,
while participants for the interviews and focus groups were selected based on their level of
involvement in the health system and policy process.
Quantitative and qualitative techniques were used to determine utilisation patterns,
effects on the work of the practitioners especially the professional nurse, and users‘ access
to health services (Table 10). Data sources included interviews, review of documents,
focus groups and surveys. Discussions and interviews were audio-recorded and notes were
taken. Prior to the interviews, focus groups and surveys, all participants received an
information sheet outlining the terms and conditions of the study. This provided sufficient
information that enabled them to sign the consent forms and allowed the participants to
accept or refuse to participate in the study (Fink, 2003; Polit & Tatano Beck, 2008).
Analysis focused on the changes that have occurred since the removal of user fees in the
public health system.
National level (Policymakers). A purposive sample of key stakeholders was
selected from the MOH and the RHAs. Participants were recruited through a letter of
invitation, which explained the purpose of the project and invited them to participate
(Appendix 2). Key stakeholders in the MOH included the Minister of Health, the
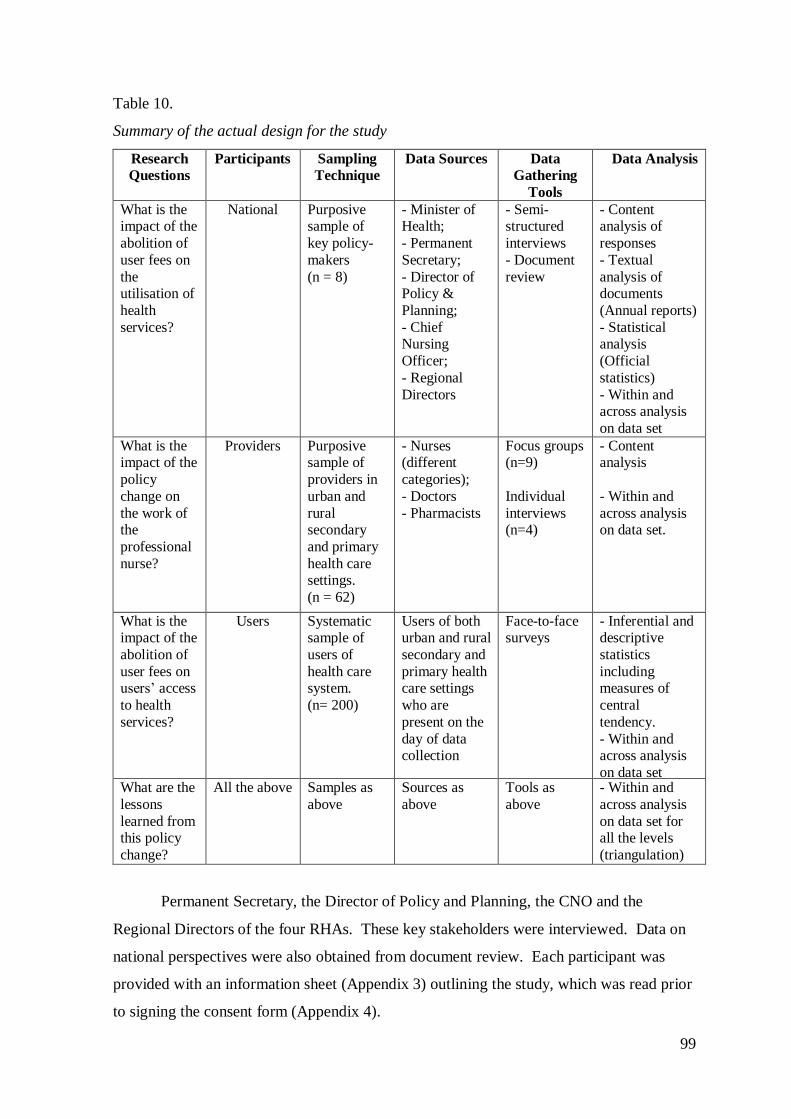
99
Table 10.
Summary of the actual design for the study
Research
Questions
Participants Sampling
Technique
Data Sources Data
Gathering
Tools
Data Analysis
What is the impact of the
abolition of
user fees on
the utilisation of
health
services?
National Purposive sample of
key policy-
makers
(n = 8)
- Minister of Health;
- Permanent
Secretary;
- Director of Policy &
Planning;
- Chief Nursing
Officer;
- Regional
Directors
- Semi-structured
interviews
- Document
review
- Content analysis of
responses
- Textual
analysis of documents
(Annual reports)
- Statistical analysis
(Official
statistics)
- Within and across analysis
on data set
What is the impact of the
policy
change on
the work of the
professional
nurse?
Providers Purposive sample of
providers in
urban and
rural secondary
and primary
health care settings.
(n = 62)
- Nurses (different
categories);
- Doctors
- Pharmacists
Focus groups (n=9)
Individual
interviews (n=4)
- Content analysis
- Within and
across analysis on data set.
What is the impact of the
abolition of
user fees on users‘ access
to health
services?
Users Systematic sample of
users of
health care system.
(n= 200)
Users of both urban and rural
secondary and
primary health care settings
who are
present on the
day of data collection
Face-to-face surveys
- Inferential and descriptive
statistics
including measures of
central
tendency.
- Within and across analysis
on data set
What are the
lessons
learned from this policy
change?
All the above Samples as
above
Sources as
above
Tools as
above
- Within and
across analysis
on data set for all the levels
(triangulation)
Permanent Secretary, the Director of Policy and Planning, the CNO and the
Regional Directors of the four RHAs. These key stakeholders were interviewed. Data on
national perspectives were also obtained from document review. Each participant was
provided with an information sheet (Appendix 3) outlining the study, which was read prior
to signing the consent form (Appendix 4).
100
Interviews are data collection methods that enhance flexible, one-one interaction
with the participants (Yin, 2009). This fosters guided discussion in a non-threatening
environment where individuals are free to express themselves and the interviewer can
extract more information from participants through follow-up questions. Interview guides
ensure that important areas are covered in the interview. Key stakeholders were asked
about their perceptions of the policy change and its impact (Yin). Semi-structured
interviews give the interviewer the freedom to manage the progress of the interview, as
well as use prompts to generate further discussion (Vanderstoep & Johnston, 2009). Open-
ended questions were used and responses were audio-recorded; in addition, notes were
taken systematically to enhance the analysis process.
Questions asked concerned the stakeholders‘ roles in the development and
implementation of the policy; their understanding of the policy objectives; the
implementation plan for the policy change; whether the policy objectives were achieved;
how monitoring of the policy change is occurring; current challenges to accessing the
health care by other consumers; other policies regarding education, road infrastructure, and
housing, which could be implemented to ease the problem with access to health care by the
vulnerable; and their general impression of the policy change to date (Appendix 5). The
stakeholders were also asked their views on affordability of services and available
resources, including manpower, materials such as medical equipment and funding of the
health service. The interviews were audio-recorded with permission from participants,
who signed the consent form.
National level (Document review for official statistics). Document review is a
discreet and inexpensive means of gathering data from existing documents in order to
determine trends since the implementation of a new policy. Data from documents can
substantiate and supplement data from other sources. Conclusions can also be drawn
regarding a particular phenomenon (Yin, 2009). Document review was useful in
answering some evaluation questions, as well as influencing the questions for the
interviews. Documents reviewed included annual reports of the MOH and the RHAs. A
checklist (Appendix 6) was used to obtain the required data.
Despite user fees being abolished in 2008 for all persons utilising the public health
system, it is important to note that in 2007 user fees had been abolished for children under
the age of 18 years. It was, therefore, imperative that this study examined the utilisation
101
pattern of the public health system prior to any form of abolition of user fees and for a full
year after the policy change. To achieve this, the years 2006 and 2009 were included in
the document review. Although it was arguably too early to evaluate the impact of the
policy change on health outcomes in 2009, the manner in which people used the public
health system was apparent early in the change process.
The MOH Annual reports included the health statistics obtained from the RHAs
while the Annual reports for the RHAs included health statistics obtained from the
secondary and PHC facilities in each parish. Additionally, data were provided by other
personnel from the MOH and RHAs. Some MOH data were extracted from the published
2006 and 2007 Annual reports. The data for some indicators for 2009 were obtained from
the STATIN. Data obtained included utilisation patterns for 2006 and 2009, health
conditions currently seen at the health facilities, main health indicators such as mortality
rates, and the various modes of referral to the health facilities. The accuracy of the
findings hinged on the data provided by the personnel at the MOH and the RHAs. Some
statistics were preliminary data and in some cases there were areas of inconsistency.
Where inconsistencies were detected, the MOH data were utilised.
Provider level (Practitioners). A purposive sample of professional nurses,
doctors and pharmacists from selected urban and rural hospitals and health centres in all
four RHAs was used. Participants were selected based on their professional levels in terms
of job classification, as well as level of involvement in the health system, for example,
those with administrative responsibility. Participants were recruited through a letter of
invitation, which invited them to participate and explained the purpose of the project
(Appendix 7), and they were required to sign a consent form before participating
(Appendix 4). Group and management meetings, such as NPs quarterly meetings, were
targeted to obtain the sample. In addition to ensuring homogeneity of the sample for each
focus group, it was a convenient way of having the groups together in one setting. Data
were collected using focus groups.
Focus groups involved group interviews that engaged 5-10 professional nurses,
doctors and pharmacists in selected health facilities. Nine focus groups were conducted.
Five were conducted in urban settings, while four were conducted in rural settings.
Despite the urban-rural mix, it was not uncommon to have practitioners from a rural health
facility participating in an urban focus group. Not only were the participants attendees at
102
their regional group meetings, but the RHAs comprise urban and rural facilities at which
the participants were employed. According to Posavac and Carey (2007) focus groups
―serve particularly well in learning about reactions to potential services or changes in
current services of community agencies or private organisations‖ (p. 124). Focus groups
also enhance careful reflection by participants about their opinions, which may not be
achieved in an individual interview (Posavac & Carey).
Questions focused on practitioners‘ roles in the abolition of user fees policy
process; changes in work since the introduction of the policy; satisfaction with the current
work environment; current quality and effectiveness of the care provided; contribution to
improving access to health services; experience with funding and resources in the public
health system; and general impressions of the free health care policy (Appendix 8). The
researcher facilitated the focus groups while a scribe recorded the key points from the
discussions. The interviews were audio-recorded with permission from the participants.
Guidelines consistent with the conduct of a focus group were discussed prior to the start of
the session (Brophy et al., 2008; Davies, 2007; Owen, 2006; Polit & Tatano Beck, 2008).
Group sessions lasted a minimum of 60 minutes. Participants‘ perspectives were sought
on issues concerning the participants‘ work, types of conditions and number of people seen
daily, morale, job satisfaction, funding of the health services, quality of care, health
outcomes, waiting times, referral processes, and innovations to improve access to health
care.
User level. A systematic sample of 200 users of the public health system was
identified from selected urban and rural hospitals and health centres. Two hospitals and
two health centres were selected from each of the four RHAs. This sample was not a
population sample since participants were only selected from the users at the health
facilities on the day of data collection. Participants were recruited using the registration
book, which consisted of the list of users who were registered for the day. From the lists
of registrants every fifth user was selected for the project. Each user was provided with
the information sheet about the study, which they read or was read to them. According to
Fink (2003), ―survey participants must give their informed consent before taking part in a
survey‖ (p. 91), and, as such, each respondent signed a consent form prior to completing
the questionnaire (Appendix 9).
103
Data were collected using face-to-face questionnaire surveys. Surveys are useful to
capture quantitative information regarding trends, distribution, opinions, attitudes, and
interrelations of variables within a population (Creswell, 2009; Polit & Tatano Beck,
2008). In addition they are conducted for a specific reason and are extensively used for
political-related objectives and policy research (Davies, 2007; Posavac & Carey, 2007).
This method is advantageous for studies intending to cover a broad geographic area.
Furthermore, surveys are flexible and broad in scope. Survey data may be collected
through self-administered surveys, self-reports, personal interviews, telephone interviews,
structured observations, structured record reviews, and computer assisted interviews
(Creswell; Polit & Tatano Beck). Information was obtained from respondents by way of
self-report. In this survey, self-administered surveys (Appendix 10) were used. Close
attention was given to the development of the instrument in order to avert ambiguities or
complexity.
Face-to-face surveys were chosen in order to accommodate participants with low
reading ability. The survey was pre-tested at a hospital and a health centre, which were
not included in the sample. No changes were made because the questions were understood
by respondents and answers were consistent with the questions asked. This pre-test was to
ensure reliability of the data. The survey was administered either by the researcher, a
trained nursing student researcher, or the individual user. Training sessions were held for
nursing students who participated in surveying people. Where users independently
completed the survey, the surveys were usually checked for completeness by the
researcher or a nursing student. Despite being checked at the time of completion, there
were some missing responses; therefore, the denominator changes in the reporting of some
data. There was no consistent pattern to the missing data, but for one respondent two
pages of responses regarding utilisation, affordability, quality of service and availability of
service were missing due to the pages sticking together. All 200 surveys were sufficiently
completed for them to be used in the analysis. Where literacy levels were low,
respondents were assisted with completion of the surveys. The researcher posed the
questions and recorded the responses in writing. Of note is that nursing student
researchers assisted with the data collection process initially, but following a State of
Emergency, data collection was conducted by the researcher without assistance. This did
not compromise the process in any way.
104
Questions focused on the impact of the abolition of user fees on users‘ access to
health services. Answers were sought for issues concerning people‘s socio-demographics
and health history, access to health care, availability of drugs, perceptions regarding health
personnel, waiting times, the referral system, use of alternative methods of treatment,
distance to health facilities, aesthetics of the health facilities, satisfaction with the services,
knowledge about the health services, expectations of the health system, social status and
involvement in the decision-making process (Appendix 10).
5.5. Data analysis
In the pre-analysis stage, administrative tasks included organising the surveys, as
per identification numbers, according to RHAs and health facilities; listening to the audio-
recordings to get acquainted prior to transcription; transcription; entering data into the
statistical package and cleaning the data where applicable; perusing official statistics from
the annual reports and obtaining additional information from Jamaica. Data were analysed
in a multi-layered manner using a triangulation approach at all three levels to compare and
cross check among data sets. Analysis was done within and across data sets at each level,
then within and across the different levels. The focus was on 1) whether or not the policy
was implemented as planned; 2) how differences between the original plan and
implementation of the policy affected the outcomes; 3) the extent to which the objectives
had been achieved; 4) the extent to which the policy change was benefiting the target
group; and 5) whether there were unintended outcomes and cost implications. The aims,
generally, were to identify participants‘ perceptions regarding the impact of the policy
change and determine if factors other than user fees were contributing to poor access to
health services. Examples were selected to elucidate important findings.
National level (Policymakers). The recorded interviews were transcribed to
identify what participants had to say and to organise the data for analysis (Brophy et al.,
2008). Coding and analysis of the data were enhanced by content analysis techniques
(Carley, 1993). Content and thematic processes were used to analyse the policymakers‘
data: ―Content analysis is a research technique for making replicable and valid inferences
from texts (or other meaningful matter) to the context of their use‖ (Krippendorff, 2010, p.
2). It captures patterns and recurring themes in qualitative data, while thematic analysis
determines regularities, trends and inconsistencies for the themes (Polit & Tatano Beck,
2008).
105
Emergent ideas were extracted and coded into themes for interpretation. Coding is
done to reduce large amount of data into a form that gives an accurate description of the
variety of responses (Brophy et al., 2008; Davies 2007). Codes are labels assigned to
sentences, phrases or words from the information obtained in interviews and focus groups
(Miles & Huberman, 1994). Miles and Huberman (1994) asserted that ―coding is
analysis...which involves how you differentiate and combine the data you have retrieved
and the reflections you make about this information‖ (p. 56). For ease of interpretation
and confidentiality, alphanumeric characters were used to identify the national and
regional policymakers‘ interviewees, for example NPM1 (national policymaker 1) and
RPM1 (regional policymaker 1). The main themes identified are presented in narrative
form. Direct quotes are used to substantiate each theme.
Challenges encountered with interviewing the policymakers included some being
new in their position, who, as such, had different experiences of the abolition of user fees
policy. Besides, some had minimal involvement with the policy process. In addition to
policymakers‘ inability to articulate sufficiently about the policy process, it was evident
they had disparate views on some issues. When the transcription notes were sent to
participants for amendments, additional information and comments, only one was returned.
Official statistics were extracted from annual reports using a checklist. Textual
analysis was undertaken on the documents to determine trends: ―Textual analysis is a
method of data analysis which closely examines either the content and meaning of texts or
their structure and discourse‖ (Lockyer, 2008, p. 2). Following analysis, the data were
summarised statistically and presented graphically and in narrative form. Data reflected
utilisation patterns of the public health system, key health indicators such as infant and
maternal mortality rates, death rates and prevalent health conditions such as hypertension,
diabetes mellitus and asthma one year prior to any abolition of user fees – 2006, and one
year after the policy change – 2009. Of note is that the data presented for 2009 are
preliminary reports; therefore, there may have been adjustments to this data subsequent to
it being published by the MOH. While attempts were made to obtain complete and
accurate information some data may be incomplete and inaccurate. There were also
inconsistencies with the statistics from the MOH and RHAs. To obtain additional data and
determine the accuracy of those previously collected, regular updates were sought from
Jamaica via telephone calls and emails. This was often a tedious task.
106
Provider level (Practitioners). Data from audio-recording the focus groups were
analysed using content and thematic analyses as described above. Emergent ideas
extracted from transcription notes were coded and organised into themes for interpretation.
For ease of interpretation and confidentiality, alphanumeric characters were used to
identify the focus groups and the interviewees, for example, RNFG1 (registered nurse
focus group 1) and Pharm1 (pharmacist 1). Determining the unit of analysis for each focus
group was sometimes a challenge during this phase. Results are presented in narrative
form, in which direct quotes are used to substantiate main themes.
Challenges encountered with sampling practitioners including difficulties obtaining
certain categories, such as pharmacists and doctors. This was due mainly to a shortage of
qualified personnel. Practitioners‘ focus group notes were transcribed and checked against
the audio-recordings, after which the notes were sent to participants for additional
information and comments. Of the 13 transcription notes sent out only two were returned.
Generally, coding of the policymaker and provider data produced a number of
categories. Both emerging (extracted from the interviews) and predetermined (extracted
from the interview schedule) codes were adopted. The codes were then clustered into
topics to address the questions asked in the interview. The topics were then used to create
themes, sub-themes and subsequently the headings for the policymaker‘s and provider‘s
findings section. Quotations were further utilised to convey the findings of the analysis for
each theme. Themes that are presented in this study reflect the topics in the interview
schedule as well as support and strengthen the access theoretical framework.
User level. There was a 100.0% completion rate for the survey. Surveys were
organised according to RHAs and health facilities and identification numbers affixed.
Data from the surveys were analysed using the Statistical Packages for Social Sciences
(SPSS) version 18. SPSS is a tool widely used for data analysis among survey researchers
(Davies, 2007). Inferential and descriptive statistics, including measures of central
tendency, were employed. Descriptive statistics involves statistical techniques such as
mean and standard deviation to describe and summarise data (Kato & Bart, 2008; Polit &
Tatano Beck, 2008). Inferential statistics, on the other hand, involve the process of
induction, in which results from a sample are used to make conclusions about a population
(Polit & Tatano Beck; Thorndike, 2008). A two way Analysis of Variance (ANOVA) test
was used to determine the level of variability of variables such as access and quality of
107
care across RHAs and facilities. ANOVA is a statistical measured utilised to examine the
differences among groups by determining the variability between and within groups (Polit
& Tatano Beck).
Challenges encountered with the surveys included incomplete data, despite the
survey being sufficiently completed to be included in the analysis, and superficial answers
to questions. More in-depth answers by users would have added to the robustness of the
data. Managing the data, as well as the output statistically was sometimes a challenge.
This was due to the number of layers and the many tables and charts.
5.6. Triangulation
In addition to using multiple methods to conduct the study, through the process of
triangulation, the national, provider and user perspectives were analysed. Triangulation
was used to determine the level of compatibility among the various data sets. This meant
identifying the similarities and differences in what the different levels of stakeholders
reported about the policy change. This comparison increased the credibility of the study;
aligned all three levels of data to enrich the manner, in which the research questions were
answered; and provided multiple lenses through which to understand the impact of the
policy change (Hastings, 2010). To achieve this, within and across analyses were done for
all three levels of data set. For example, policymakers‘ data were analysed separately,
then compared with providers‘ data to answer the research question regarding the work of
the professional nurse since the policy change. Furthermore, national and regional
policymakers‘ perspectives, official statistics, providers‘ and users‘ perspectives were
analysed and cross-checked to identify consistency in the information regarding utilisation
and access to health services since the policy change.
5.7. Ethical considerations
Research that involves human subjects requires consideration regarding ethical
issues, for example, protecting the rights of participants (Polit & Tatano Beck, 2008). In
explaining the concept, Israel and Hay (2006) asserted that ―ethics is about what is right,
good and virtuous‖ (p. 1). In addition, the authors stated that ―ethical behaviour helps
protect individuals, communities and environment and offers the potential to increase the
sum of good in the world‖ (p. 2). Researchers are, therefore, expected to embrace ethical
behaviour, which includes protecting the research participants, fostering a trusting
relationship, and maintaining the veracity of the research.
108
In observing good ethical practice for this research, considerations were given to
possible ethical issues throughout the entire research process, for example, in the statement
of problem, purpose, research questions, data collection, analysis, interpretation and
manner in which the data are being disseminated. Approval to conduct the study was,
sought and obtained from the Human Ethics Committee, Victoria University of Wellington
(Appendix 11); and the Ministry of Health, Jamaica (Appendix 12). Permission was also
obtained from each of the RHAs and selected secondary and primary health care facilities,
Jamaica.
There was a delay in obtaining ethical approval from the MOH and RHAs. The
delay was further compounded by a State of Emergency triggered by social unrest, a
problem that was not envisaged. This disrupted plans regarding gaining assistance from
the nursing student researchers who were scheduled to administer the survey. Data
collection was, nevertheless, completed in the specified time. Nursing student researchers
had to sign a confidentiality agreement prior to assisting with the survey (Appendix 13).
They assisted with only three health facilities.
Informed consent was obtained from all participants. Confidentiality was
maintained through de-identifying and strict handling and management of data.
Confidentiality was assured during the surveys and personal names were not affixed to the
surveys. Confidentiality, however, could not be assured for the interviews, in which key
stakeholders might be identified by virtue of their positions, not by their names. To
control for confidentiality issues, an alphanumeric naming system was used to identify the
national and regional policymakers, as well as interviewees and focus group participants.
For example, NPM1 stands for National Policymaker one, RPM1 for Regional
Policymaker one, and FG1 for focus group one. Participants in the focus group who
largely knew each other were advised that issues discussed in the session should not be
discussed externally. No control can, however, be exercised over the participants outside
of the focus group settings, and as such, confidentiality cannot be assured.
It is not anticipated that any cultural, social or legal impediments will affect the
reporting of this study.
109
5.8. Rigour/validity
Despite suggestions for the concept ‗Legitimisation‘ (Onwuegbuzie & Johnson,
2006) to be used to describe validity in mixed methods research, lack of an acceptable
concept still exists. This study, however, observed procedures that ensured the validity or
trustworthiness of the findings. To avert any threat to the validity - ―the extent to which a
finding is well-grounded, justified, [and] under-pinned‖ (Vedung, 2009, p. 312) - of the
study, a number of measures were adopted. This was to enhance generalisability and make
the findings persuasive (Polit & Tatano Beck, 2008). These measures included ensuring
proper procedures were used during the development of tools. This included researcher‘s
frequent consultation with her supervisors. Requirements for developing semi-structured
interviews, checklist and survey were ascertained (Creswell, 2009; Davies, 2007; Polit &
Tatano Beck). Appropriate tools were adopted where necessary. For example, a survey
was used to capture opinions from a wide cross-section of people (Mrug, 2010). To refine
the tools, pretesting was conducted before administration. This was to achieve reliability.-
―the degree of consistency or dependability with which an instrument measures an
attribute‖ (Polit & Tatano Beck, p. 764). In addition, there was audio-recording of focus
groups and interviews to accurately capture participants‘ perspectives. Notes were taken
and kept in the strictest of confidence. The notes were then transcribed and summaries
sent to participants to determine accuracy, as well as to obtain their feedback regarding any
area of concern. Draft transcripts were read by the researcher and discussed with her
supervisors to ensure proper procedures were adhered to. Notes were returned to
participants for feedback and additional comments to ensure accuracy of recorded data.
During the analysis stage, emerging transcribed themes were coded for accurate
analysis and interpretation. The process entailed a systematic process to ensure that the
participants‘ voices were evident. Additionally, the researcher made frequent checks with
her supervisors during the analysis phase to ensure that the procedures being used were
accurate. To further ensure confidentially and anonymity while managing the data, access
to data was restricted and identifying features were removed. Survey data were also
reworked and some variables recoded to ensure accuracy. Recoding is data transformation
which included creating dummy variables and new variables. For example, levels of
satisfaction were recoded to reflect very satisfied and satisfied as ‗satisfied‘ and very
dissatisfied and dissatisfied as ‗dissatisfied‘ in order to enhance statistical analysis (Polit &
Tatano Beck, 2008). Triangulation was also done to ensure validity.
110
5.9. Conclusion
This chapter outlined the mechanisms adopted to structure and conduct the study
within ethical boundaries, as well as to reduce any extraneous variables that might
compromise the reliability and validity of the study. Through this means, perspectives
were sought from policymakers, practitioners and users regarding the impact of the
abolition of user fees on the utilisation of health services, access, and the work of the
professional nurse. The following chapter will outline the results from the national,
practitioner, and user perspectives.
111
Chapter 6: Results – National and user perspectives
6.1. Introduction
This chapter, the first of two findings chapters, presents the results from the multi-
layered study on the impact of the abolition of user fees in the Jamaican public health
system on access, care provided, and work of the professional nurse. Findings are
presented in three sections: (1) policymakers, (2) official statistics, and (3) users. The next
chapter will present the findings on the impact of the policy change on the work of main
health practitioners (doctors and pharmacists) and the professional nurse as viewed by the
health workers themselves. This chapter, however, presents policymakers‘ perspectives on
the issues affecting health workers since the policy change. The qualitative findings are
presented according to the themes that were identified. Quotations are used to give
meaning to each theme. The quantitative results are presented in tables, charts and
narrative form. In addition some supplementary data are located in the appendices.
6.2. Policymakers
This section captures the perspectives of a purposive sample of key policymakers
in the MOH (Minister of Health; Permanent Secretary; Director of Policy, Planning and
Development Division; and CNO) and key policymakers (Regional Directors) in the four
RHAs regarding the impact of the user fees policy. Findings from interviews with the
policymakers are presented under 11 headings: involvement in the policy process;
understanding of policy objectives; reaching the target group; achievement of policy
objectives; funding of the health system within the new policy framework; impact of the
policy on service delivery; impact of the policy on the health workforce; monitoring the
policy; issues regarding consumers‘ groups other than the poor; additional policies to assist
the vulnerable; and impressions of the policy change generally. Policymakers from the
MOH are identified as NPM 1-4 and policymakers from the RHAs as RPM 1-4 (Table 11).
Involvement in the policy process. National policymakers were integrally
involved in the policy from its inception. For NPM1, ongoing involvement with the policy
development meant setting the policy guidelines and spearheading the implementation
phase. None of the regional policymakers interviewed was actively involved in
developing the initial policy. This may be due to the fact that the user fees policy
constituted a fraction of the broader political agenda, as mentioned by RPM2: ―there was a
new administration that came into office in ‘07 and the removal of user fees was a
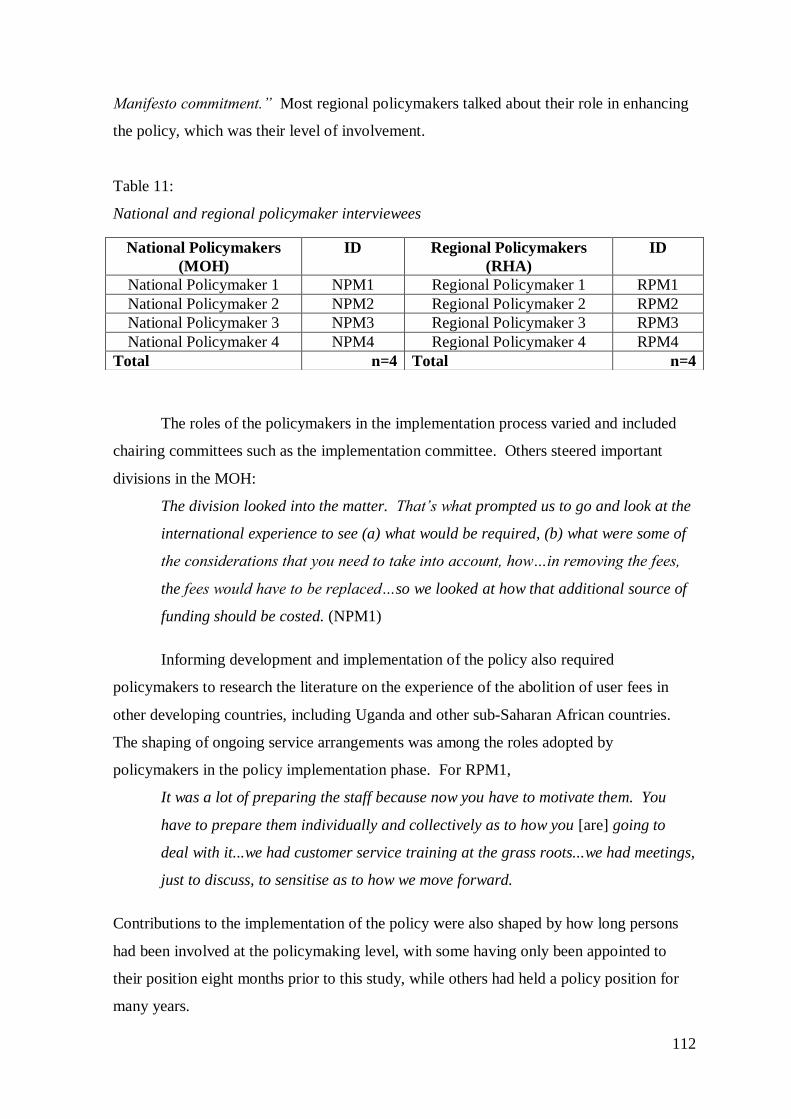
112
Manifesto commitment.‖ Most regional policymakers talked about their role in enhancing
the policy, which was their level of involvement.
Table 11:
National and regional policymaker interviewees
The roles of the policymakers in the implementation process varied and included
chairing committees such as the implementation committee. Others steered important
divisions in the MOH:
The division looked into the matter. That‘s what prompted us to go and look at the
international experience to see (a) what would be required, (b) what were some of
the considerations that you need to take into account, how…in removing the fees,
the fees would have to be replaced…so we looked at how that additional source of
funding should be costed. (NPM1)
Informing development and implementation of the policy also required
policymakers to research the literature on the experience of the abolition of user fees in
other developing countries, including Uganda and other sub-Saharan African countries.
The shaping of ongoing service arrangements was among the roles adopted by
policymakers in the policy implementation phase. For RPM1,
It was a lot of preparing the staff because now you have to motivate them. You
have to prepare them individually and collectively as to how you [are] going to
deal with it...we had customer service training at the grass roots...we had meetings,
just to discuss, to sensitise as to how we move forward.
Contributions to the implementation of the policy were also shaped by how long persons
had been involved at the policymaking level, with some having only been appointed to
their position eight months prior to this study, while others had held a policy position for
many years.
National Policymakers
(MOH)
ID Regional Policymakers
(RHA)
ID
National Policymaker 1 NPM1 Regional Policymaker 1 RPM1
National Policymaker 2 NPM2 Regional Policymaker 2 RPM2
National Policymaker 3 NPM3 Regional Policymaker 3 RPM3
National Policymaker 4 NPM4 Regional Policymaker 4 RPM4
Total n=4 Total n=4
113
Understanding of policy objectives. There was general consensus among
policymakers regarding the objectives for the user fees policy; they all agreed the intent of
the policy was to improve access to health care and services for the poor and vulnerable:
My understanding is that, based on information that the Ministry of Health had at
its disposal, they recognised that there were a number of Jamaicans [who] were
not presenting themselves for treatment or visiting any of their health facilities
because there was a barrier they found and that there was a cost. (NPM4)
The widespread supposition was that some people had not been accessing health care
because of their inability to pay out-of-pocket. This supposition was supported by the
Jamaica Survey of Living Conditions 2007, which revealed that, despite an exemption
mechanism being in place in the public health facilities, the costs of health care and
services remained a barrier to some people even though they experienced ill-health:
The main objective...is improvement in the access to basic health care...Our Survey
of Living Conditions…asked a question about barriers to access...if [the] user fee
was a barrier….there were a number of responses:
1. that the cost of health care was a barrier
2. persons said they didn‘t think they were sick enough to seek health care
3. some said that they used alternative interventions
In my mind, I view...[these] as proxies for saying that you can‘t afford it. (NPM1)
Although policymakers reported that the overarching objective of the policy was to
improve access to health care and services, NPM2 asserted that the policy was also a
driver behind the renewed focus to reorient the system to primary health care (PHC).
Strengthening PHC was viewed as a necessary strategy because of the worrying recurrent,
inappropriate use of the public secondary care facilities by some individuals. Additionally,
re-packaging the PHC services in a manner that attracted users was considered one
measure that would impact positively on the new policy, as well as on service delivery at
the secondary care level:
Location of health facilities is very critical not just location of the facilities but
what services you offer from where you are located. Because you will have a
health centre in a community and people bypass that centre to go to another one
because they don‘t believe that the doctor is going to be there nor the
pharmaceuticals are going to be there so they go to one where they can see the
doctor, get the drugs, get the x-ray, get everything...So how we offer, the package
114
of service we offer, where we offer it, is going to in the long run [to] dictate how we
sustain this policy. (NPM3)
Reaching the target group. While policymakers reported that one of the
objectives of the user fees policy was to improve access to health care and services for
persons who experienced cost as a barrier, they could not agree on who constituted the
target group. NPM1 commented: ―the only particular group would be the persons who
are not private patients and persons who don‘t have health insurance or persons who are
not [from] overseas. It was open to all public patients.‖ However, several others
maintained that the policy was meant to benefit the vulnerable and those viewed as unable
to pay for health services. For example, RPM1 intimated that ―The poor are benefiting.
The poor have benefited tremendously and as a manager I can look at [it] and say it is a
good thing for the poor.‖ Highlighting the fact that poor people were benefiting suggests
that the poor may have been the target group.
Policy objectives achieved. Both national and regional policymakers reported that
the objective to make care accessible without immediate cost to the client had been
achieved. In effect, the user fees policy created a public health system whereby all
Jamaicans could access care without any out-of-pocket payment. The assessment of the
extent to which this goal had been achieved ranged from policymakers saying it was fully
achieved to others maintaining it was only partially achieved:
Access is just one thing you know...it‘s kinda difficult in two years or three years to
say that the objectives have been met because interventions like these are longer
term interventions. Access is one but outcome in terms of improvement in health
status....We never saw it as an event…we abolished user fees in public facilities…to
public patients in ‘08 and then it‘s finished…it‘s still in our mind an ongoing
project because this is now the reality that we are experiencing. So we have to
ensure that this reality is meeting in essence the health care needs of the Jamaican
people. (NPM1)
In addition to understanding the intent of the policy objectives, policymakers were
actively devising and implementing the necessary interventions to mitigate the unexpected
outcomes of the policy. The policymakers indicated that they were constantly in reaction
mode, often anticipating possible deleterious consequences of the policy on the health
115
system. They instituted creative measures to ensure that the policy objectives could be
achieved. RPM1 commented:
We have not gotten complaints that people are not getting the care that they
deserve. We had, as expected, a run on the health centre during the first couple of
months so you would understand that we had to extend clinic hours to evenings,
Saturdays, just to facilitate some of the persons that were now coming out...It was
not people coming willy-nilly, it was people who really need service...So we had
that run on the system, the objectives were met, people were given medication. A
lot of people [who] came in were hospitalised too...hospitalisation increased.
All policymakers were concerned with monitoring and managing the changes
associated with the policy change, and those in the regions were also proactive in ensuring
that service delivery was not compromised, especially in the management of emergency
cases:
If the aim was to improve access, I think access has certainly increased. A lot
more persons are accessing the service. In fact the first year saw a significant
increase in the number of clients attending and you would have noticed that even
surgical lists would have gotten longer because these patients are now coming in.
So access has increased...it‘s now all a matter of managing the care so the most
urgent patients are seen first...We‘ve also noticed a trending up in the number of
primary health care visits so that augurs well for our country. (RPM2)
Funding of the health system within the new policy framework. To further
determine the extent to which the objectives of the policy had been achieved, policymakers
were asked to provide information on a number of indicators, including funding, for the
services being provided, and the responses of the Jamaican public and the health system to
the policy as a whole. Arguably, the success of the policy was contingent on how well-
resourced and -funded the health system was. There were disparate views among
policymakers about the effects of the new policy on health sector funding. One
policymaker maintained that funding had not been affected by the policy and that there
was an increased budgetary allocation to the MOH to support the policy change. All the
other policymakers had different views. National policymakers spoke more about the
provision of additional funding, whereas regional policymakers spoke of the shortfalls in
116
funding. RPM2 considered that the cost of health care had risen astronomically on the
introduction of the policy:
Well, the cost of the service has increased tremendously. In fact the liabilities
across regions have grown tremendously because the policy has also been
implemented at a time when we were having a global recession...while you are
offering care without people paying out-of-pocket, you are also curtailed by
budgetary limitations. So while your cost is going up your budget remains
relatively flat, compared to what is required. So the cost has certainly increased
and that is something that has to be managed carefully.
This comment by RPM2 does not negate that there had been an increased
budgetary allocation to the MOH at some time. Policymaker RPM1 commented:
The first year [after] abolition of user fees, funding was very good, the government
was able to give you what you requested in your budget. The second year the
budget was cut and, therefore, it affected...especially the patients who needed
appliances. So for example we probably spent [JM] $2 billion just buying
appliances for patients but after that we don‘t have that $2 billion to spend. So
here we are now, caught [between] a hard rock and a deep place and we are
saying now, what do we do?...So some people choose to buy their appliances
themselves.
Even though there were increases in budgetary allocation, RPM2 emphasised that, ―based
on the numbers that have come in, the cost has grown more than the financial resources
available...So that is why you end up with liabilities of much more than you would have
had in former years.‖ A different perspective was expressed by RPM3, who intimated
that funding for the health sector generally was inadequate, which could not be blamed on
the new policy.
Escalating health costs required policymakers to adopt stringent measures and
engage creative means, such as private and public partnerships in obtaining funds, to meet
the demands of the system:
Because we are in an inflationary environment and there has also been some
service expansion and improvements...I think we are all aware there are resource
constraints...the problem with the financing of health care did not start with
abolition of user fees...our current state, I believe, is a testimony to our struggles
117
over the years. This has placed us in a position of having to deal with
inadequacies in our equipment and infrastructure...As stakeholders who play a role
in policy decisions, we will continue to seek more funding for health care and we
will have to intensify our efforts in forging viable partnerships. (RPM3)
As users of the public health system could now access care at no cost, the reality
was that the demand on the system exceeded the funding allocated, which was of concern
to some policymakers. How funds were spent was an issue for one policymaker. NPM3
reported improvements in the MOH‘s budget but lamented that a large proportion of the
budget was being utilised to offset health personnel salaries:
Health was one of two or three ministries that did not experience a budget cut. I
think though, the resources we need, and how we are deploying the resources we
have, must become a matter for serious debate. As it now stands, 76.0% of the
budget is [spent] on compensation.
Despite the health system being underfunded, NPM1 was quick to point out that an
improved health system was still expected within the allocated budget.
Impact of the policy on service delivery. One major benefit of the user fees
policy to the Jamaican public, according to all stakeholders, was people‘s ability to access
health services without any out-of-pocket payment, even though the cost to the sector was
escalating. NPM4 commented:
We have a wide range of services that patients are offered which include primary
and secondary care services....medical services, surgical services…the patients
would not need to pay for any…the patients would not be paying for surgical
interventions...[A] patient who enters the health system at any point is seen by a
number of health…practitioners and does not have to pay a registration fee, moves
on to get investigations and does not have to pay for these investigations…blood
investigations, x-rays, high tech investigations and CAT Scans, etc…and one
analysis that was conducted did show that these were substantial to the patient,
based on the ability to access these services free of cost.
Two regional policymakers were of differing views in highlighting the effects of
the policy on service delivery:
Well, I think the services provided are relatively good and we have pockets of
excellence in many places. What has changed is our waiting time. We‘ll have to
118
do a lot more to improve on the waiting time, especially in areas like the
pharmacy, where there is a major shortage of pharmacists and the increase in
patients has not resulted in a major change in the number [of pharmacists] so you
now have extended waiting times. (RPM2)
For RPM3, the quality of service was also negatively affected. In particular, there was
occasional equipment failure and insufficient capital funding. In RHAs where the service
delivery was viewed as adequate by policymakers, they still frequently had to adopt
innovative strategies to enhance service delivery and meet the additional demand. Such
measures included increasing the number of staff and extending working hours.
Impact on the health workforce. In talking about the impact of the user fees
policy on the health workforce, policymakers shared varying perspectives. The health
workforce is such that policymakers were forced to rethink how the policy change could
be better managed or whether it needed modification:
I think the debate still continues: should the user fees [have] been abolished for
everything in the health service?...Just last weekend some medical group had a
conference in which this matter was being debated. So we need to take a look at
some of these things. (NPM3)
It was noted, particularly by the regional policymakers, that the public health
system lacked a health workforce complement that paralleled the demands of the policy
change. Therefore, the increased demand created pressure on the limited workforce:
In the area of drugs, medications, pharmaceuticals supplies...we see tremendous
increase in the demand...it has put severe stress on the persons that work in that
area because we have not been able to parallel, make more persons available to
work in the sector, that‘s in the pharmacies. (NPM3)
Policymakers mentioned that some health personnel did not embrace the policy
change with enthusiasm. There had been disquiet and ‗blame games‘ regarding the
perceived problems associated with the policy:
It is time that we shift our focus from the policy of abolition of user fees and stop
blaming this policy for all the problems in health care. I believe there is sufficient
evidence both in our operations and in our financial statements to indicate that our
problems have not changed in any significant way over the years. So I think, for
the staff at all levels, we need to get out of the mode of identifying abolition of user
119
fees as the problem and getting into the mode of seeking and identifying more
creative and constructive approaches to address our financing needs. (RPM3)
Generally, policymakers felt that health workers had responded well to the policy
change, despite pockets of disquiet: ―The consensus on the ground was that this was a
good policy…The providers themselves were a bit overwhelmed…there were complaints in
terms of coping with the numbers‖ (NPM3). In addition, RPM2 gave an account of the
commitment of the health workforce:
The staff, excellent. I think without the hard work and the competence that has
been displayed then the policy would have been more difficult to implement and the
achievements would have been far less...The staff has...been very professional even
amidst major challenges with patient discipline and patients‘ perception of what
should be.
Policymakers’ perspectives on the impact of the policy change on the work of the
professional nurse. In talking about the impact of the policy change on the work of the
professional nurse, national and regional policymakers made reference to the preparatory
phases of the policy, nurses‘ current workloads, effects of the increased demand for service
and various interventions to improve the nurses‘ work situation generally. NPM2
commented on preparatory meetings held with some stakeholders, including nurses:
The nurses, the doctors, the community nurse, the midwife. I had meetings with all
these interest groups before its [the policy‘s] rolling out. Therefore, when it was
rolled out I had the backing of all the groups. The day before it was rolled out we
had a press conference downstairs and all the people endorsed it, because it‘s a
good programme.
Another policymaker spoke of the effects of the policy change on nurses:
I think the challenges that the nurses are facing are not tied specifically to the
abolition of user fees. I‘ve not heard a lot of complaints about workload. Even
that was monitored in the initial stage. The response —‗burn-out we heard for
some people‘, ‗overwhelmed‘ and those kinds of terms. But now we are not
hearing such complaints in a long time. (NPM1)
In talking about creative means to enhance the work of nurses, the following areas
were highlighted:
120
This is an area that speaks to a critical component of service delivery. We are
caught in what‘s called the MoU [Memorandum of Understanding]. Salaries,
which [are] one of the boosting factors for any health care practitioner, [are] at a
stage that could be and should be improved...The next area would be the
environment in which our health care providers work. There have been complaints
in terms of equipment that are needed in the facilities to allow systems to function
better and the Ministry has embarked on a project to upgrade our facilities with
equipment, etc. These are actually positive things for the workers, for the nurses,
to allow them to work better, in a better environment, with the equipment that is
needed to actually deliver the care. (NPM3)
Furthermore, it was felt by NPM4 that the division of labour among the categories
of nurses needed to be examined, as well as providing legislative protection for NPs‘
prescribing. As a result, NPs would have more autonomy in prescribing, further increasing
the capacity of the facilities to deal with the increased patient load.
One regional policymaker commented on the ripple effects of the increased
workload on the nurses: ―They are stretched to the limit. At one time we saw where
absenteeism had increased. People were asking for vacation time. It has been tight
because we haven‘t increased the numbers [of nurses] either or by much‖ (RPM4).
Additionally, RPM3 gave an account of the policy impact on the nurses:
The health sector has always experienced a shortage in many of our technical
groups, nurses being one. Hence, an increase in the usage of our services will
further stretch our limited nursing resources. We have a number of complaints
from our nurses, including having to work multiple sessions to compensate for the
shortage. This not only results in burnout of the individuals, but it impacts on our
costs, as the sessions attract a premium rate.
Policymakers commended nurses, alongside other health professionals, for their work
since the policy change: ―I think we have to give credit to the health care professionals.
They do well with the little they have and they always display resilience despite the
constraints‖ (RPM3).
Policymakers considered measures that could be implemented to specifically
enhance nurses‘ work, which included improvements in equipment:
121
We have increased technology. For example, where the nurse would have to be
fanning a thermometer, the nurse [now] has a monitor that she just connects up to
the patient and she gets pulse, blood pressure that sort of thing.
In addition to improved equipment, policymakers noted that more nurses had been
employed in the system:
One of the things that happened is that we have gotten more nurses in the system
since February of this year [2010] from the nursing schools and I think that has
helped tremendously in terms of that burnout that we would have gotten complaints
about. (RPM1)
One policymaker talked about the creativity of nurses in steering the health units,
as well as the regions‘ pre-policy preparation for nurses:
I think the nursing staff have been very creative in managing their areas and we‘ll
continue to add more nurses. There have been very limited complaints. In
addition we have created ‗restrooms‘ for all the nurses with all the necessary
facilities. That was in preparation for the policy. (RPM2)
Monitoring the policy. It was apparent that no formal monitoring system had
been put in place to capture the effects of the policy change. Monitoring, therefore, was
done in an ad hoc manner, with no on-going or active evaluation:
While a system was not implemented to monitor this particular policy, the normal
monitoring systems do capture the changes in the relevant variables. We also
intend to conduct a before and after evaluation to make an assessment of the effects
of the policy and to inform our continuous improvement efforts going forward...At
our quarterly regional reviews we do evaluate the statistics and use them to put
measures in place to improve our operations and mitigate negative impacts.
(RPM3)
Despite having no formal monitoring system, some policymakers and
administrators, such as the CMO and the CNO in the MOH, were charged with
responsibility to monitor the system. Data gathered were channelled or communicated to
those in the health hierarchy. These individuals were also expected to intervene to ensure
there was no major fallout from the policy change. Monitoring of the policy was also done
at the regional level:
122
We have the parishes…a Parish Manager, you have the Medical Officer of Health
in each parish, you have the hospital and the CEOs, you have the other people in
the whole system that you‘re utilising to make sure that things are in place.
(RPM4)
Policymakers also relied on the statistics that were available at their disposal.
These data were used to guide them in managing problems encountered with the policy
change. For example, RPM2 talked about examining the number of people utilising A&E
and the abandonment rate as a guide to the decision-making process.
Meeting the needs of consumers other than the poor. The aim of the user fees
policy was to improve access for public patients. The unavailability of separate private
facilities in the public system was a challenge for ‗non-public‘ patients. Discussion with
policymakers regarding the challenges encountered by persons who were often classified
as private patients revealed that they were benefiting from the policy change. RPM3
noted:
Well, if they [other users] come, they will get the service. It is likely, however, that,
because of the resource constraints, the waiting time would be longer than in the
private sector. For this reason, persons who can afford to pay might opt to go to a
private provider. They would definitely have to join the waiting line and conform
to the normal public health procedures.
NPM4 also agreed that private patients were benefiting from the policy change:
Overall, I would say the cost of health services across the world is very high so,
even if people do not fall in category listed poor, accessing health care would be a
challenge to other strata of society...all levels of society would benefit from this
policy.
Policymakers were not equally aware of the public system arrangements for private
patients. RPM1 commented: ―What we do not have, is we do not have private service in
the public system. So people coming in must know that we do not offer private service in
the public system.‖ On the contrary, RPM3 commented:
We do have a facility though where persons can be private in the public system.
Doctors at a certain level have Private Practice privileges. So they are able to do
surgeries and they are able to have patients on the wards that are private patients
and paying. That is one privilege they are allowed.
123
To accommodate this arrangement prior to the policy change, a fees schedule
system had differentiated between the two types of users:
[There was] a set of fees for public patients and a set for private patients. Now the
private patient fees would relate to persons, who have health insurance, would
relate to persons from overseas who are in Jamaica and needed to…it also related
to private patients because, in our system, physicians have dual practice, so their
clients using the public facility pay private fees. (NPM1)
Other policies to assist the vulnerable. The abolition of user fees in the Jamaican
public health system may not be the solution to patients‘ inability to access health services
when required. This is because fees for services may only be one of many barriers to
access. In addressing what could potentially ease the problems associated with accessing
health care, national policymakers identified other policies that could be implemented to
further improve access. All other policies were, however, linked to the health portfolio:
There are other policies that we can‘t touch…if they have transportation issues in
terms of fares to get to point A to point B…we can‘t do anything about that...The
process is outside our mandate and scope [because] we are trying to put a primary
health care facility within 5 kilometres of a community. What can be examined
though…and that‘s a policy intervention to be pursued…mobile type…taking the
service to the patient...The other thing that could be used too is to encourage more
self-care…it‘s not really addressing the vulnerable but it is empowering the
individual to take responsibility for their care. (NPM1)
NPM3, in addressing other health-related policies, also raised the need to have
services in the right locations. In addition, there were concerns about the manner in which
health care was offered to individuals:
For example, our elderly, they sometimes would not be able to access care simply
because...caregivers are not in place to assist them with accessing care...We have
adolescents who feel uncomfortable coming into the facility with adults…How do
we treat that group of persons? How do we treat people who are HIV positive?
What HIV policies can be put in place that will allow for that population or any
other population to want to access care. When people come into the system, they
[should] feel that they are welcome...that they are there because they need care.
And they [should] feel confident in the health care provider that they are going to
124
give them the best of service, regardless of the fact that they are not paying directly
out of their pockets for it.
Some areas of concern raised by regional policymakers included the 40 hour work
week policy, the roles of some health personnel, inadequate diagnostic facilities such as
MRI, and the manner in which A&E services were utilised and offered:
Well, we could look at...no direct entry to your A&Es without it being a genuine
emergency, so you‘d have to go through primary care, but of course would include
significant improvement in the primary care infrastructure; we could look at the
role of Family NPs in delivering care and how they could work in places like
Accident and Emergency; we could look at things like nurse triage; things to make
the job easier; you could review the role of pharmacy technicians to see how they
can even provide a better role; nurses could look at the role of their ward
assistants in doing some checks. [I] mean, really looking at job enlargement.
Sometimes we tend to sort of embrace some activities, not realising that we can
empower people to do other things to make our work easier and to make the
patient experience better. (RPM2)
Policymakers’ overall impression of the policy change. In reporting their
impressions of the user fees policy, policymakers were generally of the view that the
policy had resulted in improved access to health services. In addition, the change was
considered worthwhile in meeting the needs of the nation‘s people, and equitable in that
receiving care was no longer dependent on people‘s ability to pay. Policymakers,
however, considered that a number of systems were required to ensure efficiency and
sustainability. The policy was also viewed as a conduit to establishing public/private
partnerships to improve efficiency and service delivery in the public health system.
Although the impression of the policy was favourable, policymakers identified service and
administrative areas that could further improve access to health services:
The community health system has to be improved...it mightn‘t be always that the
patient can come for varying number of reasons, so there must be a system in place
whether community health aides or until we have the doctors and nurses on hand
to visit and follow up. (NPM2)
125
I believe we are a little slow in ensuring that the parallel systems are put in place
so that the policy can run efficiently. I‘m not so convinced that it is an absolute
lack of financial resources why we are not doing better. (NPM3)
In conclusion, RPM2 noted that, ―The policy change has helped to improve access but it
has also opened our eyes to the need to invest heavily in capital improvement, staff
development and […] quality assurance and monitoring of our health system.‖
National statistics obtained from the MOH and RHA Annual Reports, as well as
documents provided by personnel from the MOH, are presented in the next section.
6.3. Official statistics from Document Review
This section addresses the utilisation patterns of the public health system, key
health indicators such as infant and maternal mortality rates, death rates and prevalent
health conditions such as hypertension, diabetes mellitus and asthma in 2006, one year
prior to the abolition of user fees for children under 18 years, and in 2009, one year after
the general abolition of user fees for the remainder of the population (Table 12). To fully
understand how people utilised the public health system, it is necessary to present the data
on the population for Jamaica generally, as well as for each RHA. In 2009, the population
was 2,698,810, which reflects a 1.1% growth compared with that of 2006.
Utilisation of the public health system 2006-2009. Findings from the data
provided revealed that, one year after the abolition of user fees, utilisation of public health
facilities had increased. This was reflected in the number of persons who were admitted to
hospital for treatment or observation. Of note is that one person might have been admitted
to the same facility on several occasions, with each admission counting as an individual
admission. There was a 12.1% increase in hospital admissions in 2009 over 2006. During
2009, there were 175,546 admissions to public hospitals, excluding the University Hospital
of the West Indies, while there were 156,538 discharges from public hospitals in 2006.
SERHA, the largest RHA, had the greatest number of admissions, with 78,009.
The average time in hospital for inpatient treatment and observation was 5.4 days in 2009,
a decrease from 6.4 days in 2006. The average length of stay among RHAs in 2009 ranged
from a high of 5.7 days to a low of 4.6 days. Secondary care facilities experienced an
increase in the number of persons utilising the outpatient department for health conditions
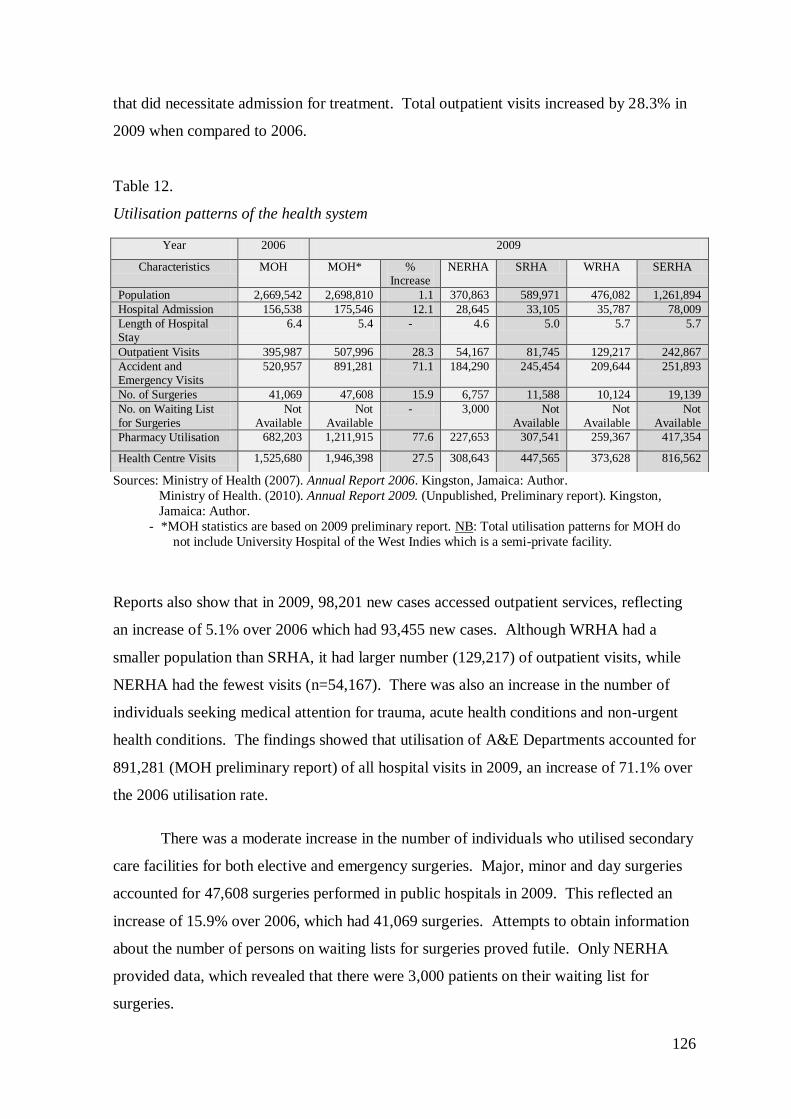
126
that did necessitate admission for treatment. Total outpatient visits increased by 28.3% in
2009 when compared to 2006.
Table 12.
Utilisation patterns of the health system
Sources: Ministry of Health (2007). Annual Report 2006. Kingston, Jamaica: Author.
Ministry of Health. (2010). Annual Report 2009. (Unpublished, Preliminary report). Kingston,
Jamaica: Author.
- *MOH statistics are based on 2009 preliminary report. NB: Total utilisation patterns for MOH do
not include University Hospital of the West Indies which is a semi-private facility.
Reports also show that in 2009, 98,201 new cases accessed outpatient services, reflecting
an increase of 5.1% over 2006 which had 93,455 new cases. Although WRHA had a
smaller population than SRHA, it had larger number (129,217) of outpatient visits, while
NERHA had the fewest visits (n=54,167). There was also an increase in the number of
individuals seeking medical attention for trauma, acute health conditions and non-urgent
health conditions. The findings showed that utilisation of A&E Departments accounted for
891,281 (MOH preliminary report) of all hospital visits in 2009, an increase of 71.1% over
the 2006 utilisation rate.
There was a moderate increase in the number of individuals who utilised secondary
care facilities for both elective and emergency surgeries. Major, minor and day surgeries
accounted for 47,608 surgeries performed in public hospitals in 2009. This reflected an
increase of 15.9% over 2006, which had 41,069 surgeries. Attempts to obtain information
about the number of persons on waiting lists for surgeries proved futile. Only NERHA
provided data, which revealed that there were 3,000 patients on their waiting list for
surgeries.
Year 2006 2009
Characteristics MOH MOH* % Increase
NERHA SRHA WRHA SERHA
Population 2,669,542 2,698,810 1.1 370,863 589,971 476,082 1,261,894
Hospital Admission 156,538 175,546 12.1 28,645 33,105 35,787 78,009
Length of Hospital Stay
6.4 5.4 - 4.6 5.0 5.7 5.7
Outpatient Visits 395,987 507,996 28.3 54,167 81,745 129,217 242,867
Accident and Emergency Visits
520,957 891,281 71.1 184,290 245,454 209,644 251,893
No. of Surgeries 41,069 47,608 15.9 6,757 11,588 10,124 19,139
No. on Waiting List
for Surgeries
Not
Available
Not
Available
- 3,000 Not
Available
Not
Available
Not
Available
Pharmacy Utilisation 682,203 1,211,915 77.6 227,653 307,541 259,367 417,354
Health Centre Visits 1,525,680 1,946,398 27.5 308,643 447,565 373,628 816,562
127
Utilisation of the pharmaceutical services in both hospitals and health centres for
2009 almost doubled the rate of 2006. The findings revealed that, in 2006, a total of
682,203 individuals were seen at pharmacies in the secondary and PHC settings, while
1,211,915 were seen in 2009, an increase of 77.6%. Equally, there were increased
numbers of individuals utilising primary care facilities for services such as curative, dental,
maternal and child health, family planning, and some screening tests such as papanicolaou
smears. The data revealed that in 2009 there were 1,946,398 health centre visits, an
increase of 27.5% over 2006.
Common health conditions presenting at health facilities. While patients
received care for a range of illnesses during the period being investigated, this study
focused on the use of the public health facilities for four main health conditions, namely
hypertension, diabetes mellitus, asthma and malignant neoplasm, one year after the
abolition of user fees. These conditions are among the leading causes of morbidity and
mortality in Jamaica. The data regarding these conditions reflect the statistics for public
hospital inpatients and outpatients and for health centres for the year 2009 (Table 13). The
data revealed that a number of persons obtained care at hospitals or health centres for
varying health conditions, among them chronic lifestyle disorders and malignant
neoplasm. An important observation is that the treatment for malignant neoplasm was
administered exclusively in hospitals.
In 2006 people seeking hospital care for diabetes was 2.2% of total discharges
(156,538) while 25,454 accessed PHC facilities. Others sought hospital care for
hypertension (1.6% of total discharges), malignant neoplasm (Inpatient: 25,330;
Outpatient: 5,541) and asthma (A&E: 35,601; Outpatient: 1,511). Utilisation of PHC
services for hypertension was 123,521 and asthma 9,750. Noteworthy is that, during 2009,
most patients with health conditions such as diabetes mellitus, hypertension and asthma
accessed care as hospital inpatients or outpatients and at PHC facilities. More patients
accessed hospital outpatients‘ services for hypertension (167,246) and diabetes mellitus
(31,186) than PHC services. NERHA, relative to other RHAs, had more (602) individuals
accessing care as hospital inpatients for diabetes mellitus. SERHA, the largest RHA, had
more individuals (16,026) accessing care for diabetes mellitus at PHC facilities. Equally,
SERHA had more persons (68,643) accessing care for hypertension at PHC facilities,
while there were approximately 47.0% fewer persons accessing care for the same health
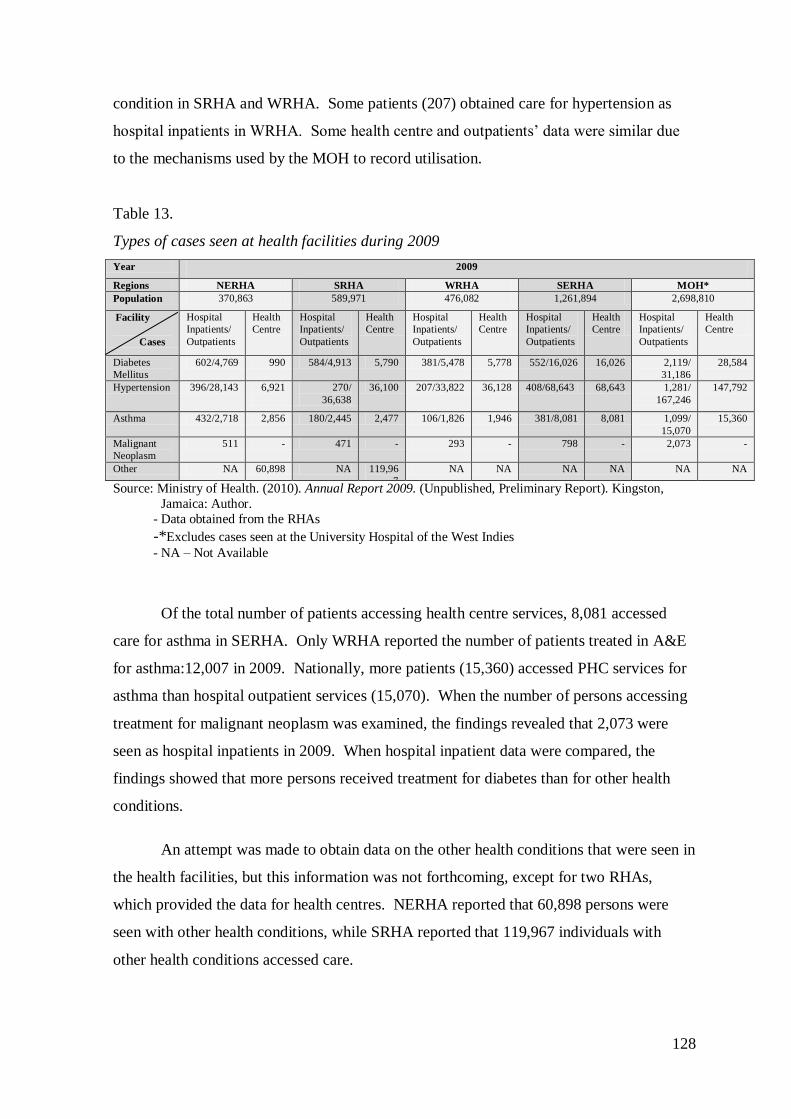
128
condition in SRHA and WRHA. Some patients (207) obtained care for hypertension as
hospital inpatients in WRHA. Some health centre and outpatients‘ data were similar due
to the mechanisms used by the MOH to record utilisation.
Table 13.
Types of cases seen at health facilities during 2009
Year 2009
Regions NERHA SRHA WRHA SERHA MOH*
Population 370,863 589,971 476,082 1,261,894 2,698,810
Facility
Cases
Hospital
Inpatients/
Outpatients
Health
Centre
Hospital
Inpatients/
Outpatients
Health
Centre
Hospital
Inpatients/
Outpatients
Health
Centre
Hospital
Inpatients/
Outpatients
Health
Centre
Hospital
Inpatients/
Outpatients
Health
Centre
Diabetes
Mellitus
602/4,769 990 584/4,913 5,790 381/5,478 5,778 552/16,026 16,026 2,119/
31,186
28,584
Hypertension 396/28,143 6,921
270/
36,638
36,100 207/33,822 36,128 408/68,643 68,643 1,281/
167,246
147,792
Asthma 432/2,718 2,856 180/2,445 2,477 106/1,826 1,946 381/8,081 8,081 1,099/
15,070
15,360
Malignant
Neoplasm
511 - 471 - 293 - 798 - 2,073 -
Other NA 60,898 NA 119,96
7
NA NA NA NA NA NA
Source: Ministry of Health. (2010). Annual Report 2009. (Unpublished, Preliminary Report). Kingston,
Jamaica: Author.
- Data obtained from the RHAs
-*Excludes cases seen at the University Hospital of the West Indies
- NA – Not Available
Of the total number of patients accessing health centre services, 8,081 accessed
care for asthma in SERHA. Only WRHA reported the number of patients treated in A&E
for asthma:12,007 in 2009. Nationally, more patients (15,360) accessed PHC services for
asthma than hospital outpatient services (15,070). When the number of persons accessing
treatment for malignant neoplasm was examined, the findings revealed that 2,073 were
seen as hospital inpatients in 2009. When hospital inpatient data were compared, the
findings showed that more persons received treatment for diabetes than for other health
conditions.
An attempt was made to obtain data on the other health conditions that were seen in
the health facilities, but this information was not forthcoming, except for two RHAs,
which provided the data for health centres. NERHA reported that 60,898 persons were
seen with other health conditions, while SRHA reported that 119,967 individuals with
other health conditions accessed care.
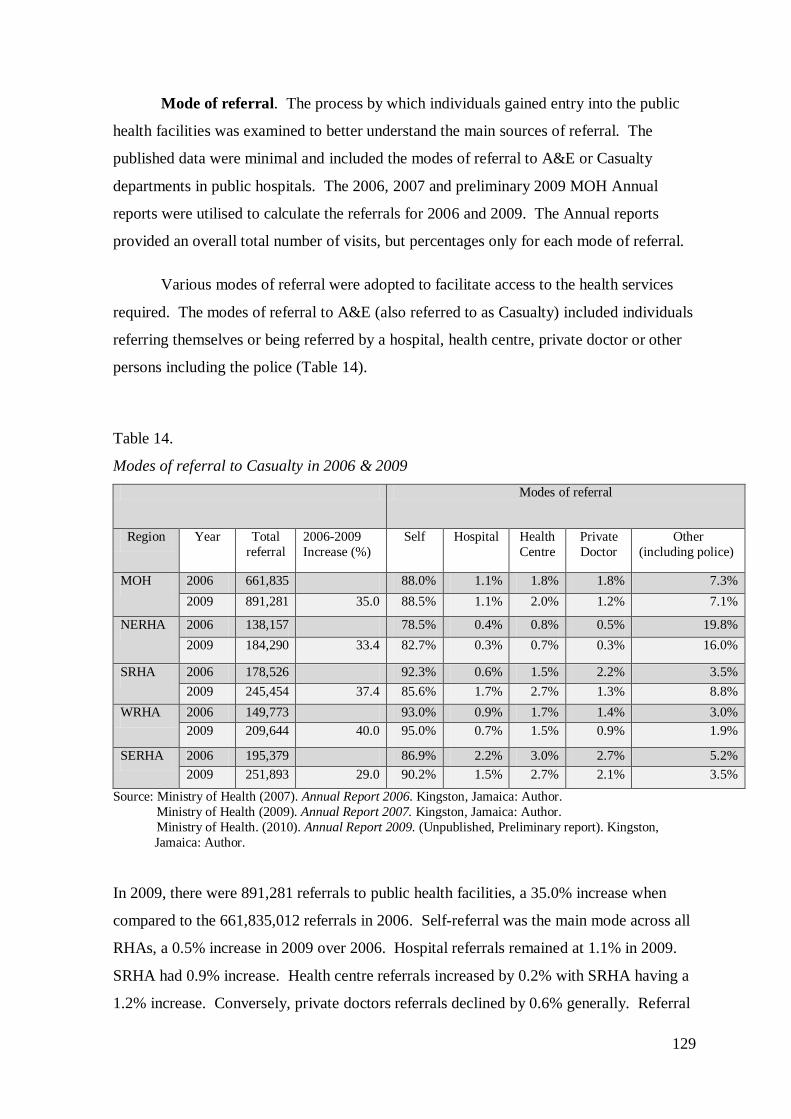
129
Mode of referral. The process by which individuals gained entry into the public
health facilities was examined to better understand the main sources of referral. The
published data were minimal and included the modes of referral to A&E or Casualty
departments in public hospitals. The 2006, 2007 and preliminary 2009 MOH Annual
reports were utilised to calculate the referrals for 2006 and 2009. The Annual reports
provided an overall total number of visits, but percentages only for each mode of referral.
Various modes of referral were adopted to facilitate access to the health services
required. The modes of referral to A&E (also referred to as Casualty) included individuals
referring themselves or being referred by a hospital, health centre, private doctor or other
persons including the police (Table 14).
Table 14.
Modes of referral to Casualty in 2006 & 2009
Modes of referral
Region Year Total
referral
2006-2009
Increase (%)
Self Hospital Health
Centre
Private
Doctor
Other
(including police)
MOH 2006 661,835 88.0% 1.1% 1.8% 1.8% 7.3%
2009 891,281 35.0 88.5% 1.1% 2.0% 1.2% 7.1%
NERHA 2006 138,157 78.5% 0.4% 0.8% 0.5% 19.8%
2009 184,290 33.4 82.7% 0.3% 0.7% 0.3% 16.0%
SRHA 2006 178,526 92.3% 0.6% 1.5% 2.2% 3.5%
2009 245,454 37.4 85.6% 1.7% 2.7% 1.3% 8.8%
WRHA 2006 149,773 93.0% 0.9% 1.7% 1.4% 3.0%
2009 209,644 40.0 95.0% 0.7% 1.5% 0.9% 1.9%
SERHA 2006 195,379 86.9% 2.2% 3.0% 2.7% 5.2%
2009 251,893 29.0 90.2% 1.5% 2.7% 2.1% 3.5%
Source: Ministry of Health (2007). Annual Report 2006. Kingston, Jamaica: Author.
Ministry of Health (2009). Annual Report 2007. Kingston, Jamaica: Author.
Ministry of Health. (2010). Annual Report 2009. (Unpublished, Preliminary report). Kingston,
Jamaica: Author.
In 2009, there were 891,281 referrals to public health facilities, a 35.0% increase when
compared to the 661,835,012 referrals in 2006. Self-referral was the main mode across all
RHAs, a 0.5% increase in 2009 over 2006. Hospital referrals remained at 1.1% in 2009.
SRHA had 0.9% increase. Health centre referrals increased by 0.2% with SRHA having a
1.2% increase. Conversely, private doctors referrals declined by 0.6% generally. Referral
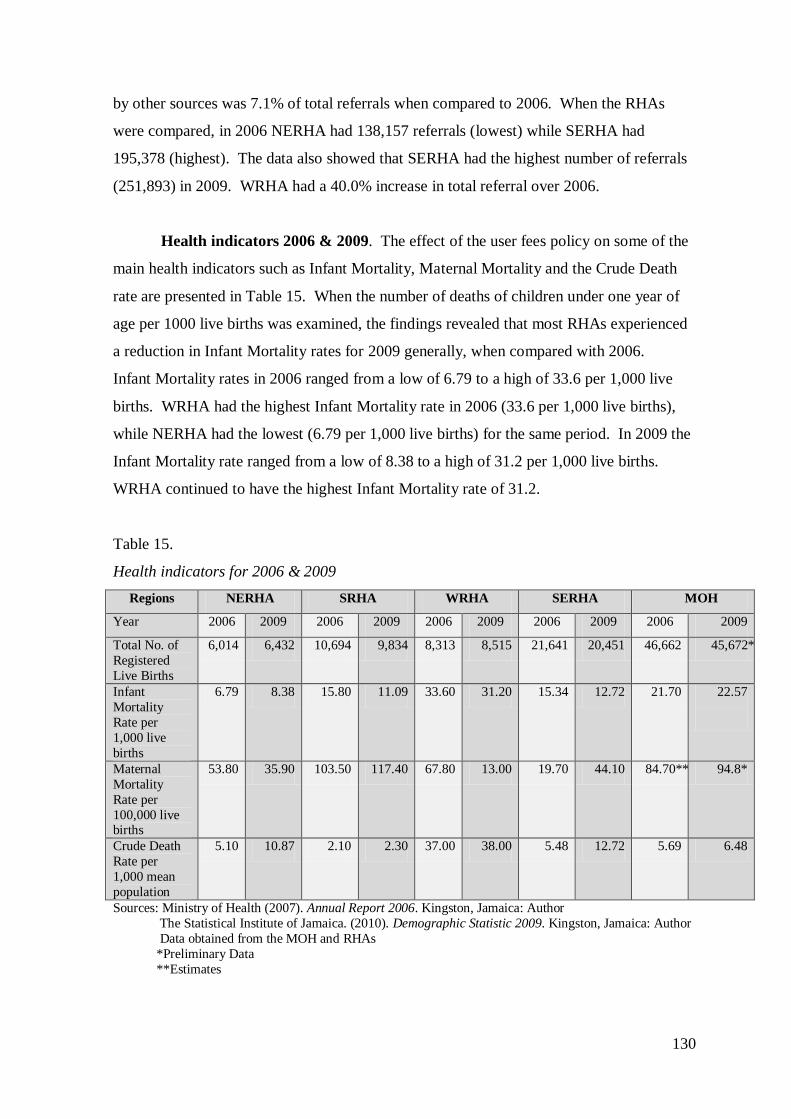
130
by other sources was 7.1% of total referrals when compared to 2006. When the RHAs
were compared, in 2006 NERHA had 138,157 referrals (lowest) while SERHA had
195,378 (highest). The data also showed that SERHA had the highest number of referrals
(251,893) in 2009. WRHA had a 40.0% increase in total referral over 2006.
Health indicators 2006 & 2009. The effect of the user fees policy on some of the
main health indicators such as Infant Mortality, Maternal Mortality and the Crude Death
rate are presented in Table 15. When the number of deaths of children under one year of
age per 1000 live births was examined, the findings revealed that most RHAs experienced
a reduction in Infant Mortality rates for 2009 generally, when compared with 2006.
Infant Mortality rates in 2006 ranged from a low of 6.79 to a high of 33.6 per 1,000 live
births. WRHA had the highest Infant Mortality rate in 2006 (33.6 per 1,000 live births),
while NERHA had the lowest (6.79 per 1,000 live births) for the same period. In 2009 the
Infant Mortality rate ranged from a low of 8.38 to a high of 31.2 per 1,000 live births.
WRHA continued to have the highest Infant Mortality rate of 31.2.
Table 15.
Health indicators for 2006 & 2009
Regions NERHA SRHA WRHA SERHA MOH
Year 2006 2009 2006 2009 2006 2009 2006 2009 2006 2009
Total No. of
Registered
Live Births
6,014 6,432 10,694 9,834 8,313 8,515 21,641 20,451 46,662 45,672*
Infant
Mortality
Rate per
1,000 live
births
6.79 8.38 15.80 11.09 33.60 31.20 15.34 12.72 21.70 22.57
Maternal
Mortality
Rate per
100,000 live births
53.80 35.90 103.50 117.40 67.80 13.00 19.70 44.10 84.70** 94.8*
Crude Death
Rate per
1,000 mean
population
5.10 10.87 2.10 2.30 37.00 38.00 5.48 12.72 5.69 6.48
Sources: Ministry of Health (2007). Annual Report 2006. Kingston, Jamaica: Author
The Statistical Institute of Jamaica. (2010). Demographic Statistic 2009. Kingston, Jamaica: Author
Data obtained from the MOH and RHAs
*Preliminary Data
**Estimates
131
Despite the Infant Mortality rate trending down for most RHAs, it is important to note that
the Infant Mortality rate for NERHA was on the increase: 6.79 per 1,000 live births in
2006 and 8.38 per 1,000 live births in 2009. These rates are comparable to global trends.
When the number of maternal deaths per 100,000 live births was examined, the
data showed that, while the rates were trending down in some RHAs, the converse was
true for others. In 2006, the Maternal Mortality rate ranged from 19.7 to 103.5 maternal
deaths per 100,000 live births. SRHA had the highest Maternal Mortality rate for both
years, increasing from 103.5 in 2006 to 117.4 maternal deaths per 100,000 live births in
2009. SERHA also experienced an increase in Maternal Mortality rates, from 19.4 in 2006
to 44.1 maternal deaths per 100,000 live births in 2009. Rates were, however, trending
down in NERHA, from 53.8 in 2006 to 35.9 maternal deaths per 100,000 live births in
2009. WRHA saw a major reduction in the Maternal Mortality rates, decreasing from 67.8
in 2006 to 13.0 maternal deaths per 100,000 live births in 2009. The overall Maternal
Mortality rate showed improvement when compared to global trends.
The total number of deaths per 1,000 people was examined for both 2006 and 2009
to determine any change since the abolition of user fees in the public health system. The
results showed that crude death rates increased in all RHAs. In 2006, the rates ranged
from 2.1 to 37.0 deaths per 1,000 mean population. SRHA had the lowest Crude Death
rate in 2006, whereas WRHA had the highest at 37.0 deaths per 1,000 mean population. In
2009, the Crude Death rate ranged from a low of 2.3 to 38.8 deaths per 1,000 mean
population. The crude death rates for NERHA and SERHA increased exponentially in
2009. NERHA recorded an increase in Crude Death rate of 5.10 in 2006 to 10.87 deaths
per 1000 mean population in 2009, and SERHA‘s rate increased from 5.48 in 2006 to
12.72 deaths per 1000 mean population in 2009 (Table 26). The increase in the other two
RHAs was marginal. Crude death rates were consistent with global trends.
While it is apparent that changes in health indicators have occurred since the policy
change, and that the user fees policy may have exacerbated the conditions influencing
health indicators, these changes cannot be exclusively attributed to the policy.
6.4. User results
This section presents data obtained from the survey of 200 patients who used the
public health system. Table 16 shows the sample distribution across the RHAs and
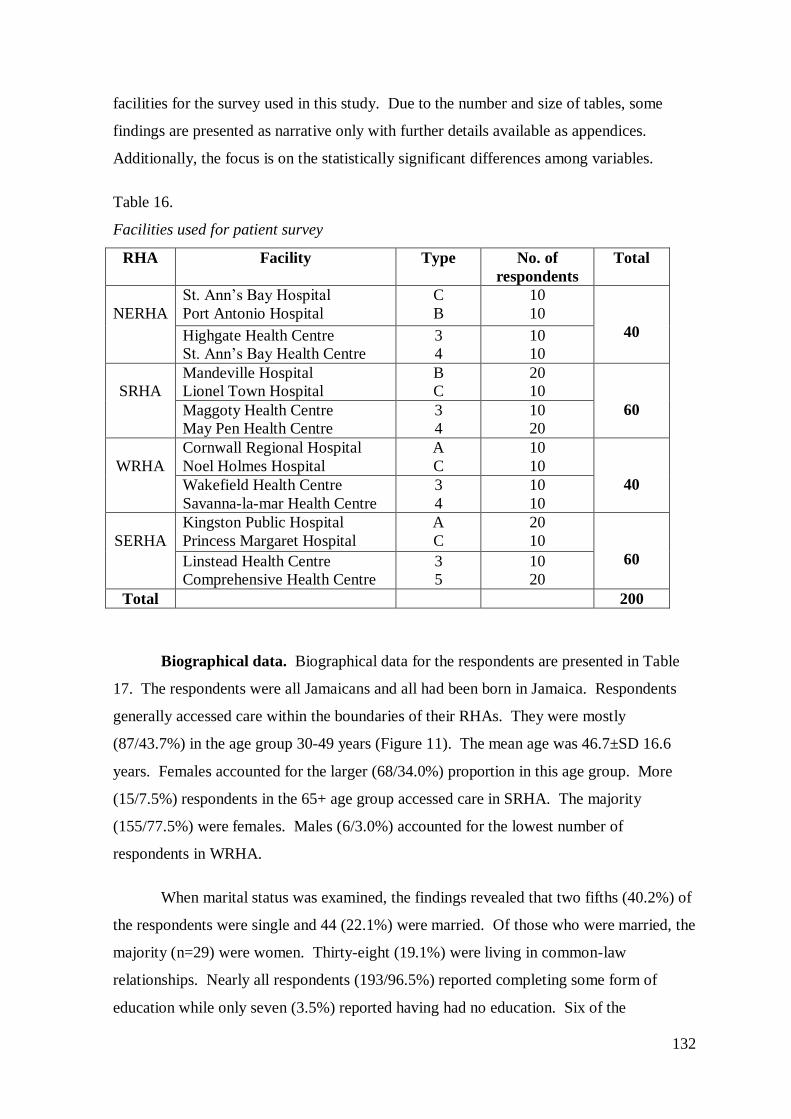
132
facilities for the survey used in this study. Due to the number and size of tables, some
findings are presented as narrative only with further details available as appendices.
Additionally, the focus is on the statistically significant differences among variables.
Table 16.
Facilities used for patient survey
RHA Facility Type No. of
respondents
Total
NERHA
St. Ann‘s Bay Hospital
Port Antonio Hospital
C
B
10
10
40 Highgate Health Centre
St. Ann‘s Bay Health Centre
3
4
10
10
SRHA
Mandeville Hospital
Lionel Town Hospital
B
C
20
10
60 Maggoty Health Centre
May Pen Health Centre
3
4
10
20
WRHA
Cornwall Regional Hospital
Noel Holmes Hospital
A
C
10
10
40 Wakefield Health Centre
Savanna-la-mar Health Centre
3
4
10
10
SERHA
Kingston Public Hospital
Princess Margaret Hospital
A
C
20
10
60 Linstead Health Centre
Comprehensive Health Centre
3
5
10
20
Total 200
Biographical data. Biographical data for the respondents are presented in Table
17. The respondents were all Jamaicans and all had been born in Jamaica. Respondents
generally accessed care within the boundaries of their RHAs. They were mostly
(87/43.7%) in the age group 30-49 years (Figure 11). The mean age was 46.7±SD 16.6
years. Females accounted for the larger (68/34.0%) proportion in this age group. More
(15/7.5%) respondents in the 65+ age group accessed care in SRHA. The majority
(155/77.5%) were females. Males (6/3.0%) accounted for the lowest number of
respondents in WRHA.
When marital status was examined, the findings revealed that two fifths (40.2%) of
the respondents were single and 44 (22.1%) were married. Of those who were married, the
majority (n=29) were women. Thirty-eight (19.1%) were living in common-law
relationships. Nearly all respondents (193/96.5%) reported completing some form of
education while only seven (3.5%) reported having had no education. Six of the
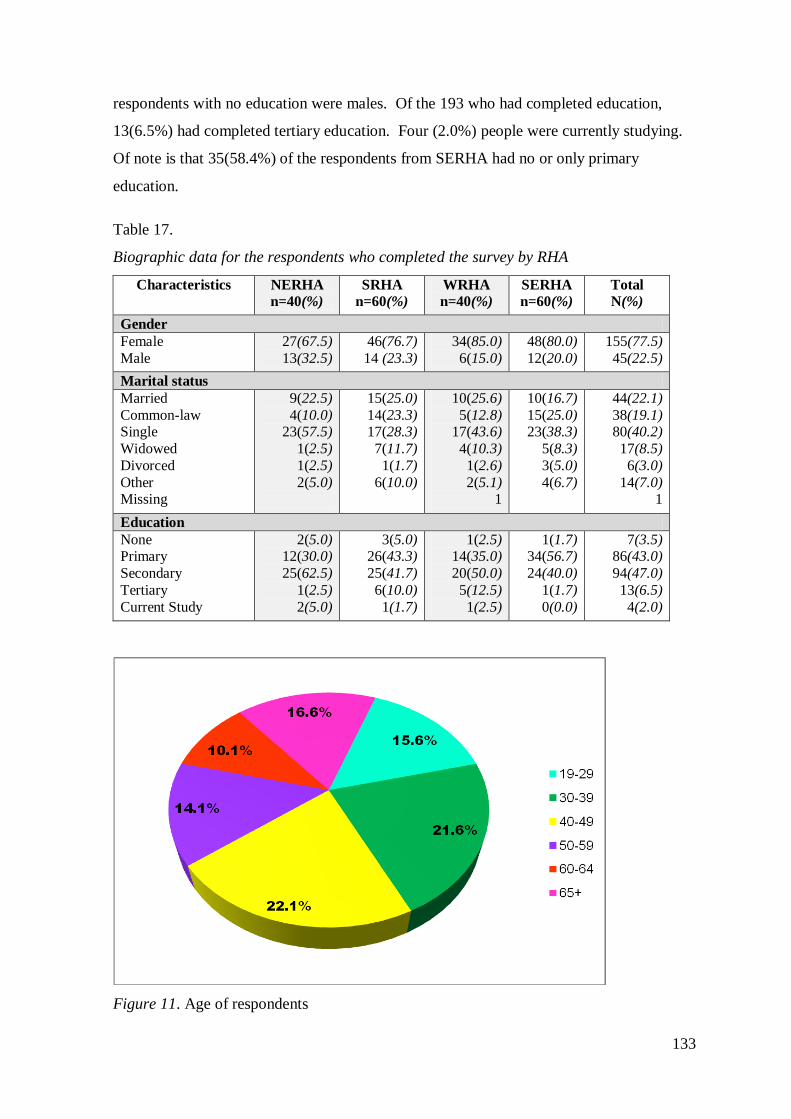
133
respondents with no education were males. Of the 193 who had completed education,
13(6.5%) had completed tertiary education. Four (2.0%) people were currently studying.
Of note is that 35(58.4%) of the respondents from SERHA had no or only primary
education.
Table 17.
Biographic data for the respondents who completed the survey by RHA
Characteristics NERHA
n=40(%)
SRHA
n=60(%)
WRHA
n=40(%)
SERHA
n=60(%)
Total
N(%)
Gender
Female
Male
27(67.5)
13(32.5)
46(76.7)
14 (23.3)
34(85.0)
6(15.0)
48(80.0)
12(20.0)
155(77.5)
45(22.5)
Marital status
Married
Common-law Single
Widowed
Divorced
Other Missing
9(22.5)
4(10.0) 23(57.5)
1(2.5)
1(2.5)
2(5.0)
15(25.0)
14(23.3) 17(28.3)
7(11.7)
1(1.7)
6(10.0)
10(25.6)
5(12.8) 17(43.6)
4(10.3)
1(2.6)
2(5.1) 1
10(16.7)
15(25.0) 23(38.3)
5(8.3)
3(5.0)
4(6.7)
44(22.1)
38(19.1) 80(40.2)
17(8.5)
6(3.0)
14(7.0) 1
Education
None Primary
Secondary
Tertiary
Current Study
2(5.0) 12(30.0)
25(62.5)
1(2.5)
2(5.0)
3(5.0) 26(43.3)
25(41.7)
6(10.0)
1(1.7)
1(2.5) 14(35.0)
20(50.0)
5(12.5)
1(2.5)
1(1.7) 34(56.7)
24(40.0)
1(1.7)
0(0.0)
7(3.5) 86(43.0)
94(47.0)
13(6.5)
4(2.0)
Figure 11. Age of respondents
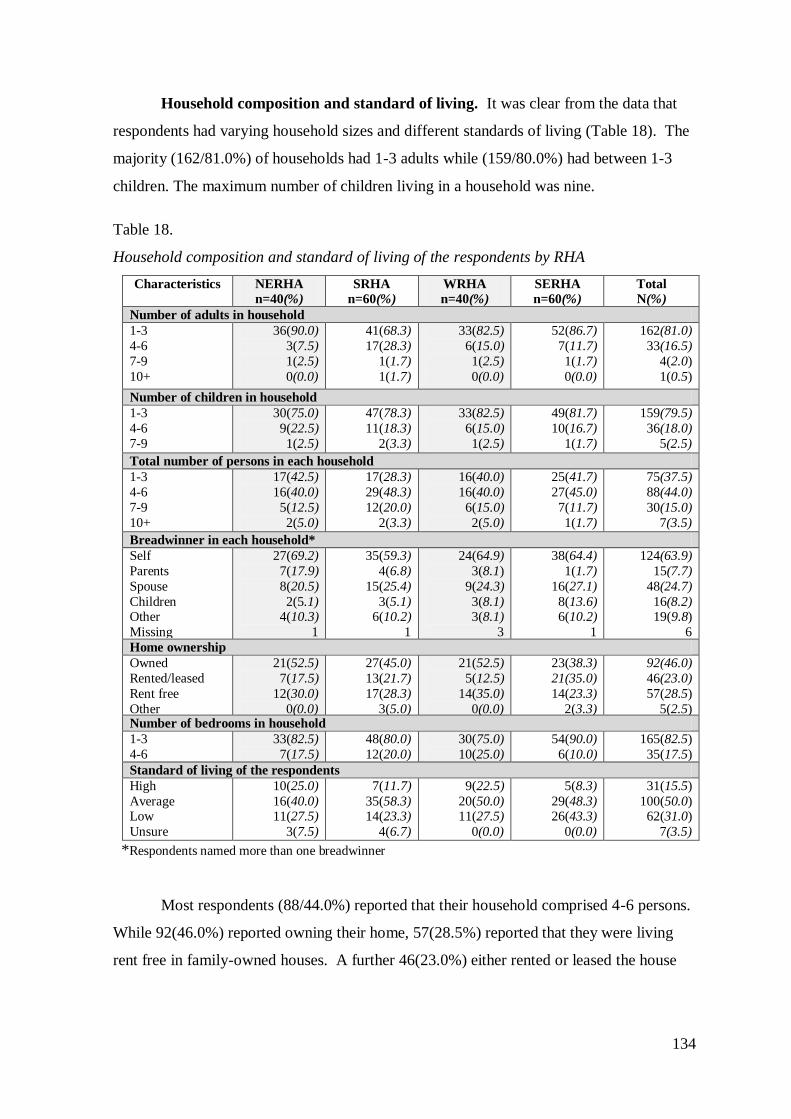
134
Household composition and standard of living. It was clear from the data that
respondents had varying household sizes and different standards of living (Table 18). The
majority (162/81.0%) of households had 1-3 adults while (159/80.0%) had between 1-3
children. The maximum number of children living in a household was nine.
Table 18.
Household composition and standard of living of the respondents by RHA
Characteristics NERHA
n=40(%)
SRHA
n=60(%)
WRHA
n=40(%)
SERHA
n=60(%)
Total
N(%)
Number of adults in household
1-3
4-6
7-9
10+
36(90.0)
3(7.5)
1(2.5)
0(0.0)
41(68.3)
17(28.3)
1(1.7)
1(1.7)
33(82.5)
6(15.0)
1(2.5)
0(0.0)
52(86.7)
7(11.7)
1(1.7)
0(0.0)
162(81.0)
33(16.5)
4(2.0)
1(0.5)
Number of children in household
1-3
4-6
7-9
30(75.0)
9(22.5)
1(2.5)
47(78.3)
11(18.3)
2(3.3)
33(82.5)
6(15.0)
1(2.5)
49(81.7)
10(16.7)
1(1.7)
159(79.5)
36(18.0)
5(2.5)
Total number of persons in each household
1-3
4-6
7-9
10+
17(42.5)
16(40.0)
5(12.5)
2(5.0)
17(28.3)
29(48.3)
12(20.0)
2(3.3)
16(40.0)
16(40.0)
6(15.0)
2(5.0)
25(41.7)
27(45.0)
7(11.7)
1(1.7)
75(37.5)
88(44.0)
30(15.0)
7(3.5)
Breadwinner in each household*
Self
Parents
Spouse
Children Other
Missing
27(69.2)
7(17.9)
8(20.5)
2(5.1) 4(10.3)
1
35(59.3)
4(6.8)
15(25.4)
3(5.1) 6(10.2)
1
24(64.9)
3(8.1)
9(24.3)
3(8.1) 3(8.1)
3
38(64.4)
1(1.7)
16(27.1)
8(13.6) 6(10.2)
1
124(63.9)
15(7.7)
48(24.7)
16(8.2) 19(9.8)
6
Home ownership
Owned
Rented/leased
Rent free
Other
21(52.5)
7(17.5)
12(30.0)
0(0.0)
27(45.0)
13(21.7)
17(28.3)
3(5.0)
21(52.5)
5(12.5)
14(35.0)
0(0.0)
23(38.3)
21(35.0)
14(23.3)
2(3.3)
92(46.0)
46(23.0)
57(28.5)
5(2.5) Number of bedrooms in household
1-3
4-6
33(82.5)
7(17.5)
48(80.0)
12(20.0)
30(75.0)
10(25.0)
54(90.0)
6(10.0)
165(82.5)
35(17.5)
Standard of living of the respondents
High
Average Low
Unsure
10(25.0)
16(40.0) 11(27.5)
3(7.5)
7(11.7)
35(58.3) 14(23.3)
4(6.7)
9(22.5)
20(50.0) 11(27.5)
0(0.0)
5(8.3)
29(48.3) 26(43.3)
0(0.0)
31(15.5)
100(50.0) 62(31.0)
7(3.5)
*Respondents named more than one breadwinner
Most respondents (88/44.0%) reported that their household comprised 4-6 persons.
While 92(46.0%) reported owning their home, 57(28.5%) reported that they were living
rent free in family-owned houses. A further 46(23.0%) either rented or leased the house
135
they were living in. While most (165/82.5%) homes had 1-3 bedroom homes, the total
number of bedrooms ranged from 1-6.
When asked about the breadwinner of the house, the majority (124/63.9%)
identified themselves as the breadwinner while 48(24.7%) identified their spouse
(husband, partner, wife) as the breadwinner. Respondents who reported themselves as the
breadwinner were largely female (88/45.4%). In some cases, respondents named more
than one breadwinner. In reporting their standard of living, half (n=100) of the
respondents categorised their standard of living as average and a third (62/31.0%) ranked
their standard of living as low.
Nationality, income and employment status. Nearly half (98/49.0%) of the
respondents earned their main income from employment, while just over an eighth
(13.0%) were reliant on government benefits and a tenth (n=20) were on a pension. There
were no respondents on a retirement pension in NERHA (Table 19). Income was
generally low, with the majority (174/87.0%) reporting an income of under JM$200,000
before tax in the last 12 months. For those not earning a regular income, the money
available for spending each month was taken into consideration. Only 31.0% (n=62)
stated that their income was meeting their daily needs.
Of the respondents who were employed, 79(39.5%) were employed full time, while
23(11.5%) were employed on a part time basis. When the number of hours worked by the
23 part-timers was examined, the findings revealed that they worked between 1-24 hours
per week. Some of the 17%(n=34) of respondents who were retirees were still in paid
employment. Of the third (n=65) of respondents who were unemployed, 43(66.2%) were
looking for a job. Only two (1.0%) respondents reported that they were self-employed and
both were looking for a job. Just under a sixth (16.0%) of respondents were working as
service, shop and market sales workers, while a tenth (10.0%) reported working in
agriculture, forestry, fishing and craft and related trades. Only three (1.5%) were
professionals.
The type of work respondents were engaged in prior to being unemployed was also
examined. Of the 65 who were unemployed, the majority (n=31) identified their last work
as being in the category ‗service worker, shop and market sales worker‘ while 11(5.5%)
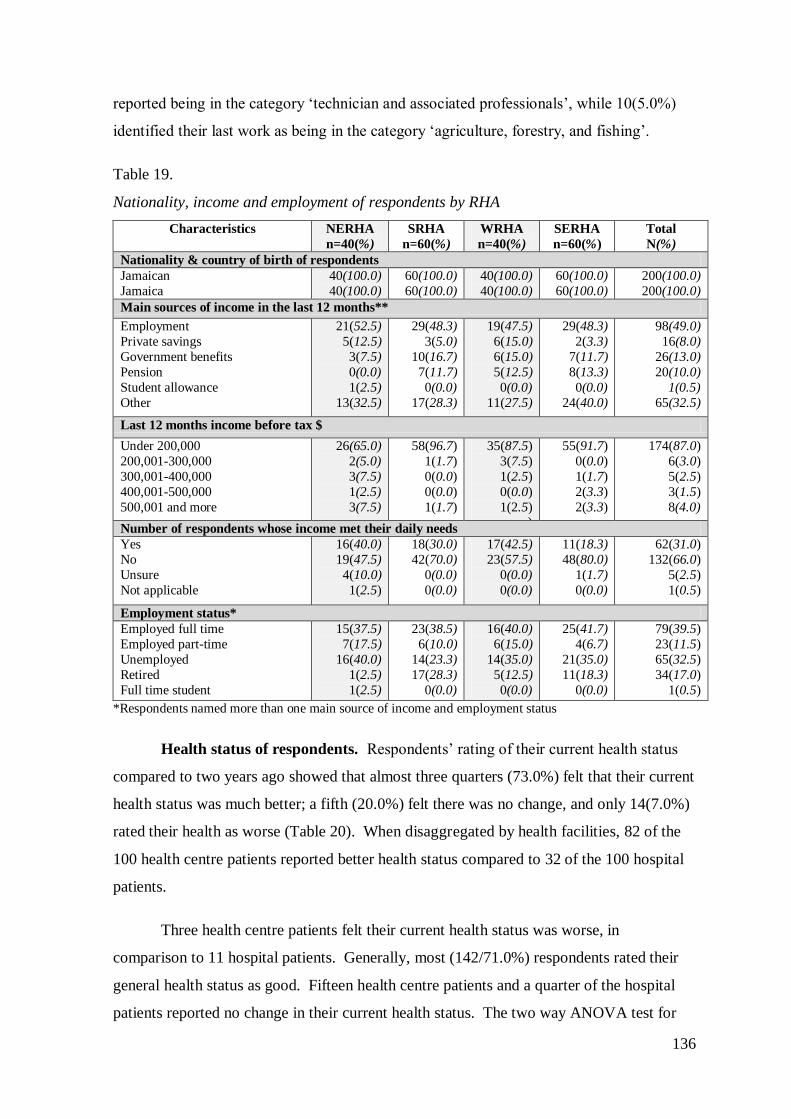
136
reported being in the category ‗technician and associated professionals‘, while 10(5.0%)
identified their last work as being in the category ‗agriculture, forestry, and fishing‘.
Table 19.
Nationality, income and employment of respondents by RHA
Characteristics NERHA
n=40(%)
SRHA
n=60(%)
WRHA
n=40(%)
SERHA
n=60(%)
Total
N(%)
Nationality & country of birth of respondents
Jamaican
Jamaica
40(100.0)
40(100.0)
60(100.0)
60(100.0)
40(100.0)
40(100.0)
60(100.0)
60(100.0)
200(100.0)
200(100.0)
Main sources of income in the last 12 months**
Employment
Private savings
Government benefits
Pension
Student allowance
Other
21(52.5)
5(12.5)
3(7.5)
0(0.0)
1(2.5)
13(32.5)
29(48.3)
3(5.0)
10(16.7)
7(11.7)
0(0.0)
17(28.3)
19(47.5)
6(15.0)
6(15.0)
5(12.5)
0(0.0)
11(27.5)
29(48.3)
2(3.3)
7(11.7)
8(13.3)
0(0.0)
24(40.0)
98(49.0)
16(8.0)
26(13.0)
20(10.0)
1(0.5)
65(32.5)
Last 12 months income before tax $
Under 200,000
200,001-300,000
300,001-400,000
400,001-500,000
500,001 and more
26(65.0)
2(5.0)
3(7.5)
1(2.5)
3(7.5)
58(96.7)
1(1.7)
0(0.0)
0(0.0)
1(1.7)
35(87.5)
3(7.5)
1(2.5)
0(0.0)
1(2.5) )
55(91.7)
0(0.0)
1(1.7)
2(3.3)
2(3.3)
174(87.0)
6(3.0)
5(2.5)
3(1.5)
8(4.0)
Number of respondents whose income met their daily needs
Yes
No
Unsure
Not applicable
16(40.0)
19(47.5)
4(10.0)
1(2.5)
18(30.0)
42(70.0)
0(0.0)
0(0.0)
17(42.5)
23(57.5)
0(0.0)
0(0.0)
11(18.3)
48(80.0)
1(1.7)
0(0.0)
62(31.0)
132(66.0)
5(2.5)
1(0.5)
Employment status*
Employed full time
Employed part-time
Unemployed
Retired
Full time student
15(37.5)
7(17.5)
16(40.0)
1(2.5)
1(2.5)
23(38.5)
6(10.0)
14(23.3)
17(28.3)
0(0.0)
16(40.0)
6(15.0)
14(35.0)
5(12.5)
0(0.0)
25(41.7)
4(6.7)
21(35.0)
11(18.3)
0(0.0)
79(39.5)
23(11.5)
65(32.5)
34(17.0)
1(0.5)
*Respondents named more than one main source of income and employment status
Health status of respondents. Respondents‘ rating of their current health status
compared to two years ago showed that almost three quarters (73.0%) felt that their current
health status was much better; a fifth (20.0%) felt there was no change, and only 14(7.0%)
rated their health as worse (Table 20). When disaggregated by health facilities, 82 of the
100 health centre patients reported better health status compared to 32 of the 100 hospital
patients.
Three health centre patients felt their current health status was worse, in
comparison to 11 hospital patients. Generally, most (142/71.0%) respondents rated their
general health status as good. Fifteen health centre patients and a quarter of the hospital
patients reported no change in their current health status. The two way ANOVA test for
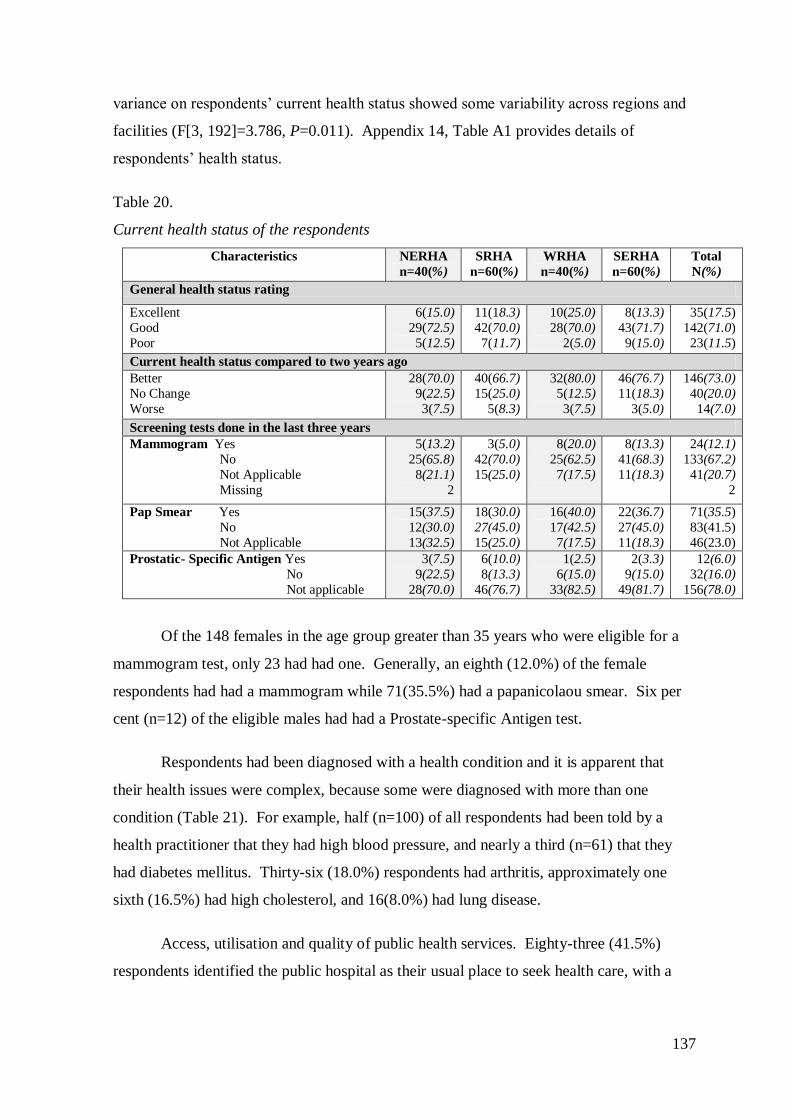
137
variance on respondents‘ current health status showed some variability across regions and
facilities (F[3, 192]=3.786, P=0.011). Appendix 14, Table A1 provides details of
respondents‘ health status.
Table 20.
Current health status of the respondents
Characteristics NERHA
n=40(%)
SRHA
n=60(%)
WRHA
n=40(%)
SERHA
n=60(%)
Total
N(%)
General health status rating
Excellent
Good
Poor
6(15.0)
29(72.5)
5(12.5)
11(18.3)
42(70.0)
7(11.7)
10(25.0)
28(70.0)
2(5.0)
8(13.3)
43(71.7)
9(15.0)
35(17.5)
142(71.0)
23(11.5)
Current health status compared to two years ago
Better
No Change
Worse
28(70.0)
9(22.5)
3(7.5)
40(66.7)
15(25.0)
5(8.3)
32(80.0)
5(12.5)
3(7.5)
46(76.7)
11(18.3)
3(5.0)
146(73.0)
40(20.0)
14(7.0)
Screening tests done in the last three years
Mammogram Yes
No
Not Applicable
Missing
5(13.2)
25(65.8)
8(21.1)
2
3(5.0)
42(70.0)
15(25.0)
8(20.0)
25(62.5)
7(17.5)
8(13.3)
41(68.3)
11(18.3)
24(12.1)
133(67.2)
41(20.7)
2
Pap Smear Yes
No
Not Applicable
15(37.5)
12(30.0)
13(32.5)
18(30.0)
27(45.0)
15(25.0)
16(40.0)
17(42.5)
7(17.5)
22(36.7)
27(45.0)
11(18.3)
71(35.5)
83(41.5)
46(23.0)
Prostatic- Specific Antigen Yes
No
Not applicable
3(7.5)
9(22.5)
28(70.0)
6(10.0)
8(13.3)
46(76.7)
1(2.5)
6(15.0)
33(82.5)
2(3.3)
9(15.0)
49(81.7)
12(6.0)
32(16.0)
156(78.0)
Of the 148 females in the age group greater than 35 years who were eligible for a
mammogram test, only 23 had had one. Generally, an eighth (12.0%) of the female
respondents had had a mammogram while 71(35.5%) had a papanicolaou smear. Six per
cent (n=12) of the eligible males had had a Prostate-specific Antigen test.
Respondents had been diagnosed with a health condition and it is apparent that
their health issues were complex, because some were diagnosed with more than one
condition (Table 21). For example, half (n=100) of all respondents had been told by a
health practitioner that they had high blood pressure, and nearly a third (n=61) that they
had diabetes mellitus. Thirty-six (18.0%) respondents had arthritis, approximately one
sixth (16.5%) had high cholesterol, and 16(8.0%) had lung disease.
Access, utilisation and quality of public health services. Eighty-three (41.5%)
respondents identified the public hospital as their usual place to seek health care, with a
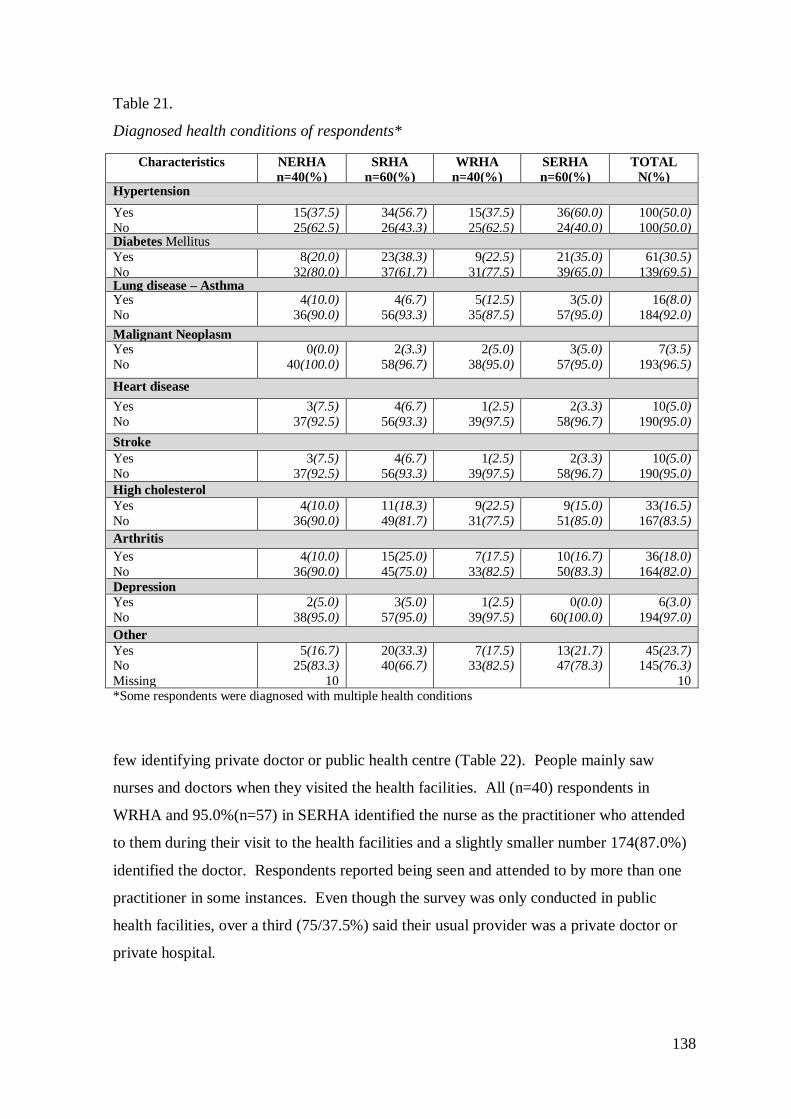
138
Table 21.
Diagnosed health conditions of respondents*
few identifying private doctor or public health centre (Table 22). People mainly saw
nurses and doctors when they visited the health facilities. All (n=40) respondents in
WRHA and 95.0%(n=57) in SERHA identified the nurse as the practitioner who attended
to them during their visit to the health facilities and a slightly smaller number 174(87.0%)
identified the doctor. Respondents reported being seen and attended to by more than one
practitioner in some instances. Even though the survey was only conducted in public
health facilities, over a third (75/37.5%) said their usual provider was a private doctor or
private hospital.
Characteristics NERHA
n=40(%)
SRHA
n=60(%)
WRHA
n=40(%)
SERHA
n=60(%)
TOTAL
N(%) Hypertension
Yes
No
15(37.5)
25(62.5)
34(56.7)
26(43.3)
15(37.5)
25(62.5)
36(60.0)
24(40.0)
100(50.0)
100(50.0) Diabetes Mellitus
Yes
No
8(20.0)
32(80.0)
23(38.3)
37(61.7)
9(22.5)
31(77.5)
21(35.0)
39(65.0)
61(30.5)
139(69.5) Lung disease – Asthma Yes
No
4(10.0)
36(90.0)
4(6.7)
56(93.3)
5(12.5)
35(87.5)
3(5.0)
57(95.0)
16(8.0)
184(92.0)
Malignant Neoplasm
Yes
No
0(0.0)
40(100.0)
2(3.3)
58(96.7)
2(5.0)
38(95.0)
3(5.0)
57(95.0)
7(3.5)
193(96.5)
Heart disease
Yes
No
3(7.5)
37(92.5)
4(6.7)
56(93.3)
1(2.5)
39(97.5)
2(3.3)
58(96.7)
10(5.0)
190(95.0)
Stroke
Yes
No
3(7.5)
37(92.5)
4(6.7)
56(93.3)
1(2.5)
39(97.5)
2(3.3)
58(96.7)
10(5.0)
190(95.0)
High cholesterol
Yes
No
4(10.0)
36(90.0)
11(18.3)
49(81.7)
9(22.5)
31(77.5)
9(15.0)
51(85.0)
33(16.5)
167(83.5)
Arthritis
Yes
No
4(10.0)
36(90.0)
15(25.0)
45(75.0)
7(17.5)
33(82.5)
10(16.7)
50(83.3)
36(18.0)
164(82.0)
Depression
Yes
No
2(5.0)
38(95.0)
3(5.0)
57(95.0)
1(2.5)
39(97.5)
0(0.0)
60(100.0)
6(3.0)
194(97.0)
Other
Yes No
Missing
5(16.7) 25(83.3)
10
20(33.3) 40(66.7)
7(17.5) 33(82.5)
13(21.7) 47(78.3)
45(23.7) 145(76.3)
10 *Some respondents were diagnosed with multiple health conditions
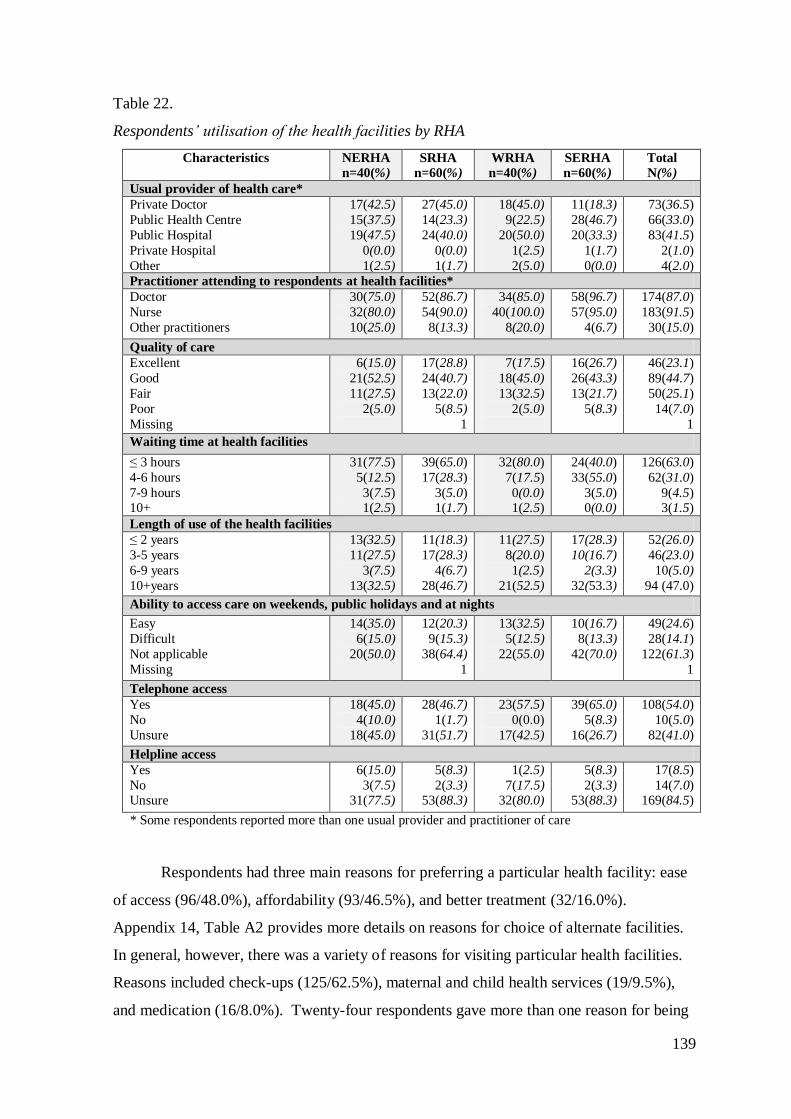
139
Table 22.
Respondents‘ utilisation of the health facilities by RHA
Characteristics NERHA
n=40(%)
SRHA
n=60(%)
WRHA
n=40(%)
SERHA
n=60(%)
Total
N(%)
Usual provider of health care*
Private Doctor
Public Health Centre
Public Hospital
Private Hospital
Other
17(42.5)
15(37.5)
19(47.5)
0(0.0)
1(2.5)
27(45.0)
14(23.3)
24(40.0)
0(0.0)
1(1.7)
18(45.0)
9(22.5)
20(50.0)
1(2.5)
2(5.0)
11(18.3)
28(46.7)
20(33.3)
1(1.7)
0(0.0)
73(36.5)
66(33.0)
83(41.5)
2(1.0)
4(2.0)
Practitioner attending to respondents at health facilities*
Doctor
Nurse
Other practitioners
30(75.0)
32(80.0)
10(25.0)
52(86.7)
54(90.0)
8(13.3)
34(85.0)
40(100.0)
8(20.0)
58(96.7)
57(95.0)
4(6.7)
174(87.0)
183(91.5)
30(15.0)
Quality of care
Excellent
Good
Fair
Poor
Missing
6(15.0)
21(52.5)
11(27.5)
2(5.0)
17(28.8)
24(40.7)
13(22.0)
5(8.5)
1
7(17.5)
18(45.0)
13(32.5)
2(5.0)
16(26.7)
26(43.3)
13(21.7)
5(8.3)
46(23.1)
89(44.7)
50(25.1)
14(7.0)
1
Waiting time at health facilities
≤ 3 hours
4-6 hours
7-9 hours 10+
31(77.5)
5(12.5)
3(7.5) 1(2.5)
39(65.0)
17(28.3)
3(5.0) 1(1.7)
32(80.0)
7(17.5)
0(0.0) 1(2.5)
24(40.0)
33(55.0)
3(5.0) 0(0.0)
126(63.0)
62(31.0)
9(4.5) 3(1.5)
Length of use of the health facilities
≤ 2 years
3-5 years
6-9 years
10+years
13(32.5)
11(27.5)
3(7.5)
13(32.5)
11(18.3)
17(28.3)
4(6.7)
28(46.7)
11(27.5)
8(20.0)
1(2.5)
21(52.5)
17(28.3)
10(16.7)
2(3.3)
32(53.3)
52(26.0)
46(23.0)
10(5.0)
94 (47.0)
Ability to access care on weekends, public holidays and at nights
Easy
Difficult
Not applicable
Missing
14(35.0)
6(15.0)
20(50.0)
12(20.3)
9(15.3)
38(64.4)
1
13(32.5)
5(12.5)
22(55.0)
10(16.7)
8(13.3)
42(70.0)
49(24.6)
28(14.1)
122(61.3)
1
Telephone access
Yes
No
Unsure
18(45.0)
4(10.0)
18(45.0)
28(46.7)
1(1.7)
31(51.7)
23(57.5)
0(0.0)
17(42.5)
39(65.0)
5(8.3)
16(26.7)
108(54.0)
10(5.0)
82(41.0)
Helpline access
Yes
No Unsure
6(15.0)
3(7.5) 31(77.5)
5(8.3)
2(3.3) 53(88.3)
1(2.5)
7(17.5) 32(80.0)
5(8.3)
2(3.3) 53(88.3)
17(8.5)
14(7.0) 169(84.5)
* Some respondents reported more than one usual provider and practitioner of care
Respondents had three main reasons for preferring a particular health facility: ease
of access (96/48.0%), affordability (93/46.5%), and better treatment (32/16.0%).
Appendix 14, Table A2 provides more details on reasons for choice of alternate facilities.
In general, however, there was a variety of reasons for visiting particular health facilities.
Reasons included check-ups (125/62.5%), maternal and child health services (19/9.5%),
and medication (16/8.0%). Twenty-four respondents gave more than one reason for being
140
at the health facility at the time of the survey. Details on reasons for visiting a health
facility are in Appendix 14, Table A3.
Respondents‘ rating of the quality of care they had received since the policy change
was largely positive (Table 22). Eighty-nine (44.7%) rated the quality of care as good,
while 46 (23.1%) rated it as excellent, and 64 (32.1%) rated it as fair or poor. When
disaggregated by facilities, (37.0%) hospital (n=100) and (52.5%) health centre (n=99)
respondents rated the quality of care as good. While respondents rated the quality of care
as good generally, an equal number of hospital-based (23.0%) and (23.2%) health centre-
based respondents rated it as excellent, those rating the quality of care as fair were
hospitals (31.0%) and health centres (19.2%). Nine hospital patients rated the quality as
poor. A two way ANOVA test for variance across the regions and facilities on
respondents‘ perception of quality care since the abolition of user fees showed no
significant variability (F[3, 191]= 0.011, P=0.998). Appendix 14, Table A1 provides more
details on respondents‘ rating of quality care.
When asked about the time taken to obtain care at the health facilities, respondents
reported that waiting time ranged from nine minutes to 12 hours. The majority
(170/85.0%), however, reported having to wait for between 1-6 hours. Of these,
108(54.0%) waited between 1-3 hours, while 62(31.0%) waited for up to 6 hours for care
(Table 22). Eighty per cent of people in WRHA and 77.5% in NERHA waited ≤ 3 hours
to be seen, while 40.0% of people in SERHA had similar waiting times. Although the
variability was not significant, 64.0% of people using health centres waited ≤ 3 hours in
comparison to 62.0% using hospitals. Mean waiting time was 3.1 hours. More details on
waiting time can be seen in Appendix 14, Table A1.
Respondents had been receiving care at the particular health facility for ≤ 2 years
up to 64 years. Ninety-four (47.0%) had used the facility for more than 10 years, while
52(26.0%) had used the facility for up to two years. More people in SERHA (53.3%) and
in WRHA (52.5%) had used the health facilities for 10 years and more. Length of use did
not show much variability by hospital (49.0%) or health centre (45.0%). Mean length of
use of facility was 12.3 years. Forty-nine (24.6%) of the respondents said they found it
easy to obtain care from public health facilities on weekends, on public holidays, and at
night, while 28(14.1%) said they found it difficult. Fourteen respondents in NERHA
found it easy to access the facilities on weekends, on public holidays, and at night, as did
141
12 people from SRHA (Table 22). Comparison between hospitals and health centres is not
necessary for these data, because health centres were often closed during these periods
unless there was an extended work week.
Respondents used other public and private facilities when they were unable to
obtain care at their usual health facility. Among the facilities accessed were public
hospitals (83/41.3%), private doctors (64/32.0%), and public health centres (48/24.0%).
Eighteen people used other health centres in NERHA and WRHA, while 24 and 23
accessed other health centres in SRHA and SERHA respectively. When respondents were
asked to state the last time they had used an alternate health facility, the times ranged from
≤ 12 months to 25+ months. Just over a third (n=138) reported that the last time they had
used an alternate health facility was up to one year ago, while others reported up to two
years (23/11.5%). Appendix 14, Table A4 provides more details on alternate facilities and
last use. Among the reasons for choosing an alternate facility were shorter waiting times
(49/24.5%), convenience (46/23.0%), for medical attention (38/19.0%), affordability
(35/17.5%), better treatment (18/9.0%), health centre closed (14/7.0%), availability of
services (13/6.5%), being referred (9/4.5%), and for medication (4/2.0%).
Telephone and help lines were used in some health facilities to encourage
individuals to access public health services. One hundred and eight (54.0%) respondents
said that it was possible to contact the health facilities by telephone, but (82/41.0%) were
unsure. More respondents had access to telephones in WRHA and SERHA than in the
other RHAs. Most (169/84.5%) respondents were unsure about helpline access, with only
17(8.5%) saying there was a helpline. Of these, 11 completed the survey in a hospital and
six in a health centre (Table 22).
Respondents‘ rating of the health services they had received since the policy
change indicated mixed experiences on variables such as access and overall satisfaction.
Just over half (52.8%) rated access as excellent or good. Two regions (NERHA, SERHA)
had higher proportions of respondents saying access was poor (Table 23). When
disaggregated by facilities, approximately half of the health centre-based (53.0%) and the
hospital-based respondents (52.0%) said access was excellent or good. Seventeen
hospital-based patients indicated that access was poor in comparison to 13 health centre-
based patients. A two way ANOVA test for variance across the regions and facilities on
respondents‘ perception of access to health services since the abolition of user fees showed
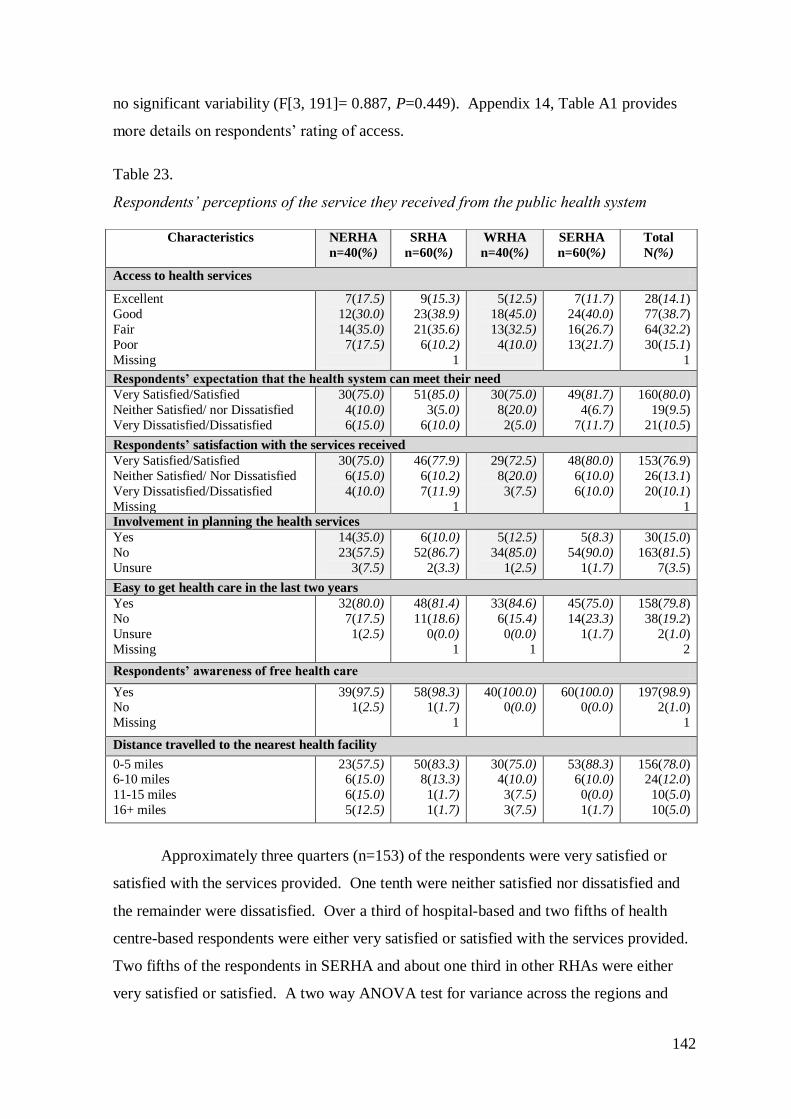
142
no significant variability (F[3, 191]= 0.887, P=0.449). Appendix 14, Table A1 provides
more details on respondents‘ rating of access.
Table 23.
Respondents‘ perceptions of the service they received from the public health system
Approximately three quarters (n=153) of the respondents were very satisfied or
satisfied with the services provided. One tenth were neither satisfied nor dissatisfied and
the remainder were dissatisfied. Over a third of hospital-based and two fifths of health
centre-based respondents were either very satisfied or satisfied with the services provided.
Two fifths of the respondents in SERHA and about one third in other RHAs were either
very satisfied or satisfied. A two way ANOVA test for variance across the regions and
Characteristics NERHA
n=40(%)
SRHA
n=60(%)
WRHA
n=40(%)
SERHA
n=60(%)
Total
N(%)
Access to health services
Excellent
Good
Fair
Poor
Missing
7(17.5)
12(30.0)
14(35.0)
7(17.5)
9(15.3)
23(38.9)
21(35.6)
6(10.2)
1
5(12.5)
18(45.0)
13(32.5)
4(10.0)
7(11.7)
24(40.0)
16(26.7)
13(21.7)
28(14.1)
77(38.7)
64(32.2)
30(15.1)
1
Respondents’ expectation that the health system can meet their need
Very Satisfied/Satisfied
Neither Satisfied/ nor Dissatisfied
Very Dissatisfied/Dissatisfied
30(75.0)
4(10.0)
6(15.0)
51(85.0)
3(5.0)
6(10.0)
30(75.0)
8(20.0)
2(5.0)
49(81.7)
4(6.7)
7(11.7)
160(80.0)
19(9.5)
21(10.5)
Respondents’ satisfaction with the services received
Very Satisfied/Satisfied
Neither Satisfied/ Nor Dissatisfied
Very Dissatisfied/Dissatisfied
Missing
30(75.0)
6(15.0)
4(10.0)
46(77.9)
6(10.2)
7(11.9)
1
29(72.5)
8(20.0)
3(7.5)
48(80.0)
6(10.0)
6(10.0)
153(76.9)
26(13.1)
20(10.1)
1 Involvement in planning the health services
Yes
No
Unsure
14(35.0)
23(57.5)
3(7.5)
6(10.0)
52(86.7)
2(3.3)
5(12.5)
34(85.0)
1(2.5)
5(8.3)
54(90.0)
1(1.7)
30(15.0)
163(81.5)
7(3.5)
Easy to get health care in the last two years
Yes
No
Unsure
Missing
32(80.0)
7(17.5)
1(2.5)
48(81.4)
11(18.6)
0(0.0)
1
33(84.6)
6(15.4)
0(0.0)
1
45(75.0)
14(23.3)
1(1.7)
158(79.8)
38(19.2)
2(1.0)
2
Respondents’ awareness of free health care
Yes No
Missing
39(97.5) 1(2.5)
58(98.3) 1(1.7)
1
40(100.0) 0(0.0)
60(100.0) 0(0.0)
197(98.9) 2(1.0)
1
Distance travelled to the nearest health facility
0-5 miles 6-10 miles
11-15 miles
16+ miles
23(57.5) 6(15.0)
6(15.0)
5(12.5)
50(83.3) 8(13.3)
1(1.7)
1(1.7)
30(75.0) 4(10.0)
3(7.5)
3(7.5)
53(88.3) 6(10.0)
0(0.0)
1(1.7)
156(78.0) 24(12.0)
10(5.0)
10(5.0)
143
facilities on respondents‘ level of satisfaction with the services provided since the abolition
of user fees showed no significant differences (F[3, 191]=1.251, P=0.293). Scores for this
level of satisfaction were combined to reflect very satisfied and satisfied as ‗satisfied‘ and
very dissatisfied and dissatisfied as ‗dissatisfied‘. Appendix 14, Table A1 provides
additional details on respondents‘ rating of level of satisfaction.
In response to the question regarding their expectations of the health system, over
three quarters of the respondents stated that they expected quality service; 35(17.5%)
expected friendly staff, and just under a seventh (14.0%) expected adequate resources,
while others had no expectations. Fifty-eight people in SERHA and 54 in SRHA expected
quality service from a health facility, in comparison to 39 in WRHA and 32 in NERHA.
Ninety-two respondents in hospitals and 91 in health centres expected quality service from
the health facilities. Appendix 14, Table A5 provides more details on respondents‘
expectations of the health system. One hundred and sixty (80.0%) respondents were
satisfied their expectations of the health facilities had been met, while just over a tenth
(10.5%) were dissatisfied. Scores for this variable were combined to reflect very satisfied
and satisfied as ‗satisfied‘ and very dissatisfied and dissatisfied as ‗dissatisfied‘.
Being involved in planning is important in order to make health care more
acceptable and accessible. The majority (96.5%) of respondents believed that users should
be involved in the planning of the health services. They also identified ways in which they
could be involved, including talking to and asking questions of health care professionals
(63.0%), attending meetings and seminars (19.5%), having suggestion boxes at the
facilities (6.0%) and undertaking surveys (3.0%).
On the contrary, a few (3.5%) felt that patients should not be involved in the
planning of health services. Appendix 14, Table A6 provides additional responses on
patient involvement. Approximately a third (32.0%) of respondents felt that patients‘
involvement in the planning of health services was happening in the public health system;
just over a quarter (27.5%) felt it was not happening, and others were unsure. Appendix
14, Table A7 provides more details. While 30(15.0%) respondents reported having been
involved in the planning of the health services offered to them, most (81.5%) said they
were not involved, and others were unsure of their involvement.
144
To access public health services, respondents travelled varying distances (Table
23). Generally, respondents travelled between 0.25 and 40 miles to the nearest health
facility. One hundred and fifty-six (78.0%) respondents travelled between 0-5 miles to the
nearest health facility of their choice. More respondents in SRHA and SERHA travelled
up to 5 miles to the health facility of choice. It is important to point out that this facility
was not necessarily the nearest facility to the respondents‘ home.
The majority of respondents (158/79.8%) reported that they had found it easy to
access health care in the last two years, with the remainder saying access had not been
easy. Furthermore, the survey ascertained respondents‘ knowledge regarding free health
care. Most (197/98.9%) were aware of the free health care but only a few (15/7.5%) were
aware of all the services that could be accessed freely. Sixteen per cent (n=32) of the
respondents were able to identify four free services, while 65(32.5%) identified three free
services. Twenty six per cent identified two free services and 12(6.0%) were aware that
only some drugs could be accessed free. Twenty eight people in SRHA and 25 in SERHA
were aware of 2-4 free services, generally in health centres (n=83) and hospitals (n=66)
were aware (Table 24).
In talking about their experiences, fewer than half the respondents reported not
having had problems with the public health services since the policy change. For others,
problems encountered included long waiting times (61/30.5%), drug unavailability
(60/30.0%), negative attitudes of health personnel (16/8.0%), slow response times
(7/3.5%), limited resources (5/2.5%), overcrowding (5/2.5%), problems retrieving dockets
(4/2.0%) and the aesthetics of the environment (2/1.0%) (Figure 12). Appendix 14, Table
A8 provides more details on the problems respondents encountered.
In reflecting on their observations since the abolition of user fees, respondents
reported that they had observed more people using the health system (164/82.0%), free
health care helping those who could not afford it (40/20.0%), good service (25/12.5%),
poor service (22/11.0%), and positive staff attitudes (2/1.0%). Other changes reported
included health practitioners working faster (8/4.0%), shortage of resources (9/4.5%) and
abuse of the system by users (4/2.0%). Six (3.0%) respondents reported not having
observed any change in the health system. Additional results regarding changes in the
health system are provided in Appendix 14. Table A9. Some respondents (80/40.0%)
stated they were now using the system more, others (22/11.0%) were using it less, but
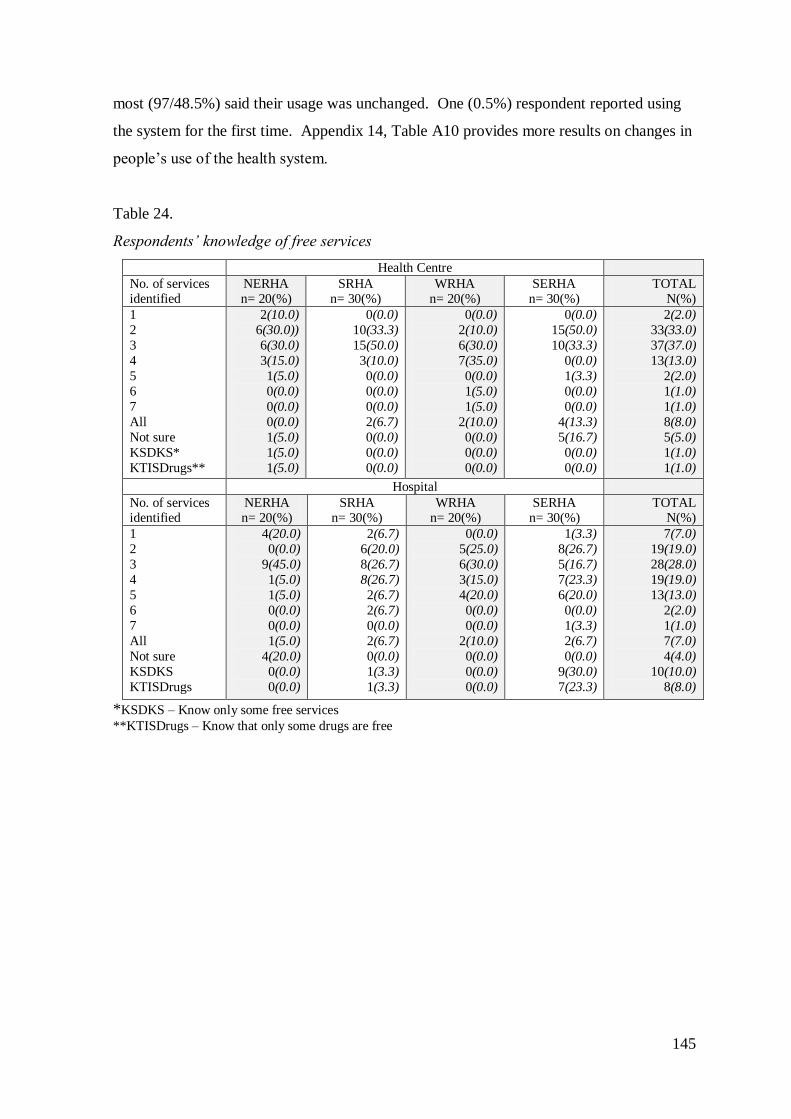
145
most (97/48.5%) said their usage was unchanged. One (0.5%) respondent reported using
the system for the first time. Appendix 14, Table A10 provides more results on changes in
people‘s use of the health system.
Table 24.
Respondents‘ knowledge of free services
Health Centre
No. of services identified
NERHA n= 20(%)
SRHA n= 30(%)
WRHA n= 20(%)
SERHA n= 30(%)
TOTAL N(%)
1
2
3
4
5
6
7
All
Not sure
KSDKS*
KTISDrugs**
2(10.0)
6(30.0))
6(30.0)
3(15.0)
1(5.0)
0(0.0)
0(0.0)
0(0.0)
1(5.0)
1(5.0)
1(5.0)
0(0.0)
10(33.3)
15(50.0)
3(10.0)
0(0.0)
0(0.0)
0(0.0)
2(6.7)
0(0.0)
0(0.0)
0(0.0)
0(0.0)
2(10.0)
6(30.0)
7(35.0)
0(0.0)
1(5.0)
1(5.0)
2(10.0)
0(0.0)
0(0.0)
0(0.0)
0(0.0)
15(50.0)
10(33.3)
0(0.0)
1(3.3)
0(0.0)
0(0.0)
4(13.3)
5(16.7)
0(0.0)
0(0.0)
2(2.0)
33(33.0)
37(37.0)
13(13.0)
2(2.0)
1(1.0)
1(1.0)
8(8.0)
5(5.0)
1(1.0)
1(1.0)
Hospital
No. of services identified
NERHA n= 20(%)
SRHA n= 30(%)
WRHA n= 20(%)
SERHA n= 30(%)
TOTAL N(%)
1
2
3
4
5
6
7
All
Not sure
KSDKS
KTISDrugs
4(20.0)
0(0.0)
9(45.0)
1(5.0)
1(5.0)
0(0.0)
0(0.0)
1(5.0)
4(20.0)
0(0.0)
0(0.0)
2(6.7)
6(20.0)
8(26.7)
8(26.7)
2(6.7)
2(6.7)
0(0.0)
2(6.7)
0(0.0)
1(3.3)
1(3.3)
0(0.0)
5(25.0)
6(30.0)
3(15.0)
4(20.0)
0(0.0)
0(0.0)
2(10.0)
0(0.0)
0(0.0)
0(0.0)
1(3.3)
8(26.7)
5(16.7)
7(23.3)
6(20.0)
0(0.0)
1(3.3)
2(6.7)
0(0.0)
9(30.0)
7(23.3)
7(7.0)
19(19.0)
28(28.0)
19(19.0)
13(13.0)
2(2.0)
1(1.0)
7(7.0)
4(4.0)
10(10.0)
8(8.0)
*KSDKS – Know only some free services
**KTISDrugs – Know that only some drugs are free
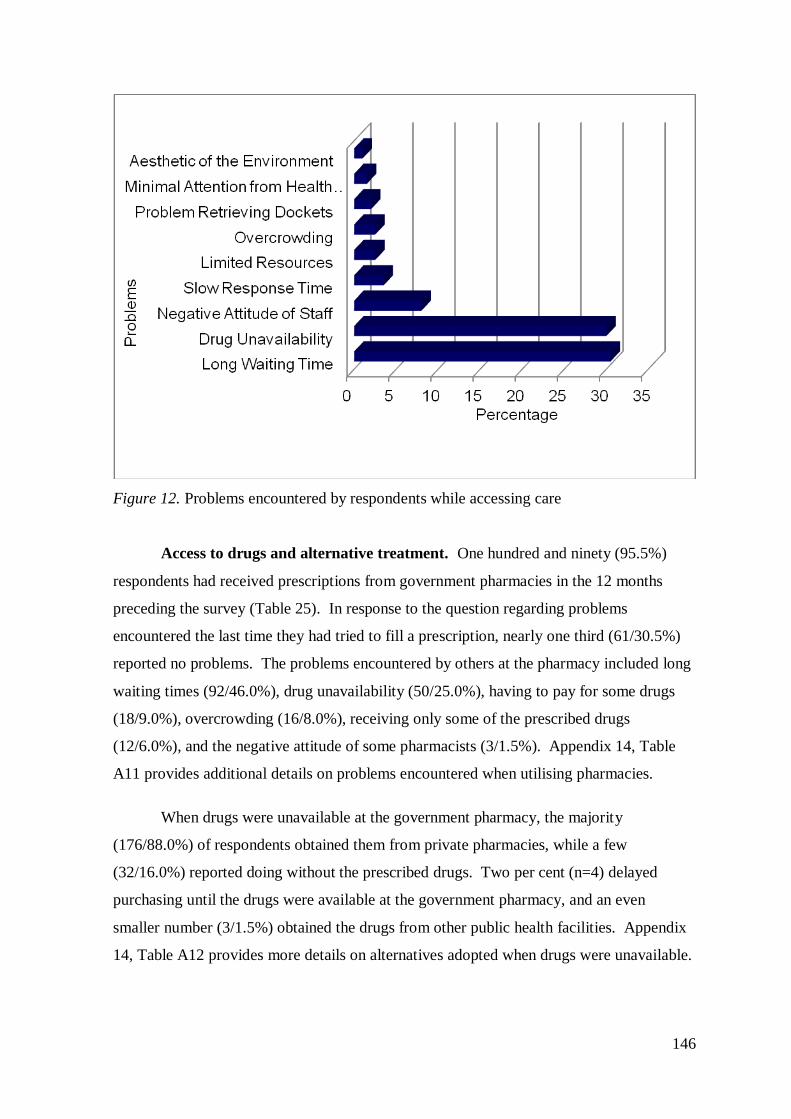
146
Figure 12. Problems encountered by respondents while accessing care
Access to drugs and alternative treatment. One hundred and ninety (95.5%)
respondents had received prescriptions from government pharmacies in the 12 months
preceding the survey (Table 25). In response to the question regarding problems
encountered the last time they had tried to fill a prescription, nearly one third (61/30.5%)
reported no problems. The problems encountered by others at the pharmacy included long
waiting times (92/46.0%), drug unavailability (50/25.0%), having to pay for some drugs
(18/9.0%), overcrowding (16/8.0%), receiving only some of the prescribed drugs
(12/6.0%), and the negative attitude of some pharmacists (3/1.5%). Appendix 14, Table
A11 provides additional details on problems encountered when utilising pharmacies.
When drugs were unavailable at the government pharmacy, the majority
(176/88.0%) of respondents obtained them from private pharmacies, while a few
(32/16.0%) reported doing without the prescribed drugs. Two per cent (n=4) delayed
purchasing until the drugs were available at the government pharmacy, and an even
smaller number (3/1.5%) obtained the drugs from other public health facilities. Appendix
14, Table A12 provides more details on alternatives adopted when drugs were unavailable.
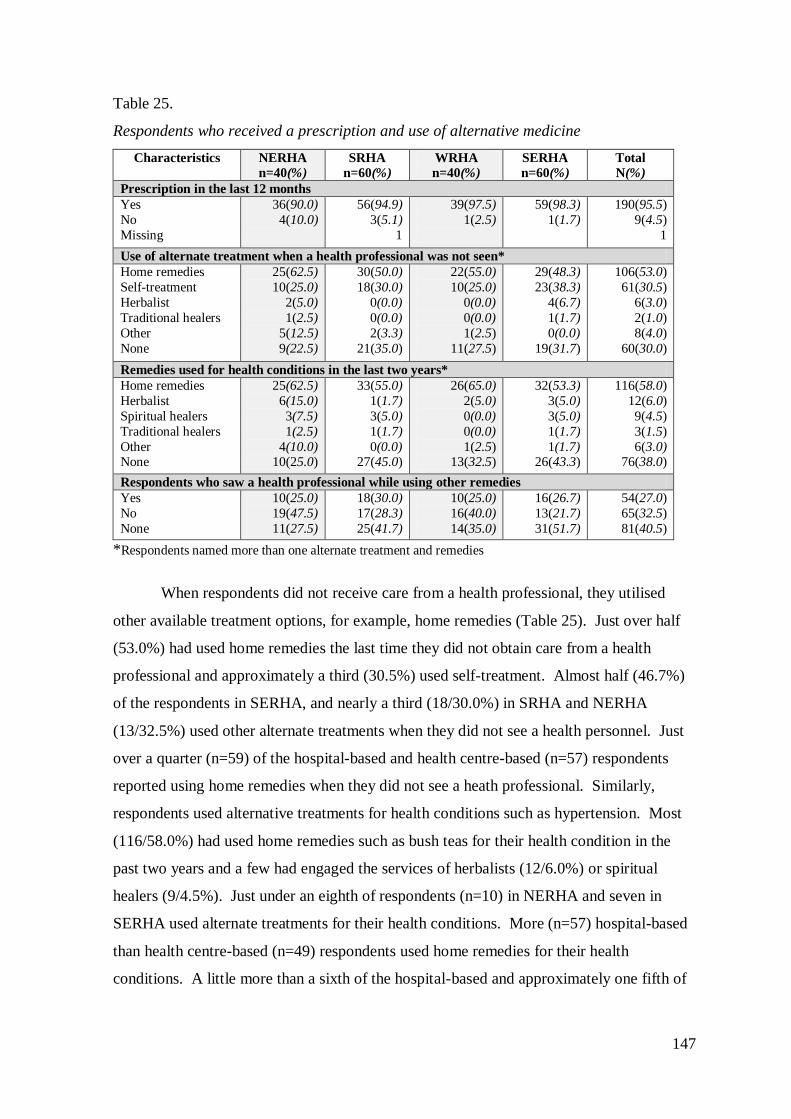
147
Table 25.
Respondents who received a prescription and use of alternative medicine
Characteristics NERHA
n=40(%)
SRHA
n=60(%)
WRHA
n=40(%)
SERHA
n=60(%)
Total
N(%)
Prescription in the last 12 months
Yes
No
Missing
36(90.0)
4(10.0)
56(94.9)
3(5.1)
1
39(97.5)
1(2.5)
59(98.3)
1(1.7)
190(95.5)
9(4.5)
1
Use of alternate treatment when a health professional was not seen*
Home remedies
Self-treatment
Herbalist
Traditional healers
Other
None
25(62.5)
10(25.0)
2(5.0)
1(2.5)
5(12.5)
9(22.5)
30(50.0)
18(30.0)
0(0.0)
0(0.0)
2(3.3)
21(35.0)
22(55.0)
10(25.0)
0(0.0)
0(0.0)
1(2.5)
11(27.5)
29(48.3)
23(38.3)
4(6.7)
1(1.7)
0(0.0)
19(31.7)
106(53.0)
61(30.5)
6(3.0)
2(1.0)
8(4.0)
60(30.0)
Remedies used for health conditions in the last two years*
Home remedies
Herbalist
Spiritual healers
Traditional healers
Other None
25(62.5)
6(15.0)
3(7.5)
1(2.5)
4(10.0) 10(25.0)
33(55.0)
1(1.7)
3(5.0)
1(1.7)
0(0.0) 27(45.0)
26(65.0)
2(5.0)
0(0.0)
0(0.0)
1(2.5) 13(32.5)
32(53.3)
3(5.0)
3(5.0)
1(1.7)
1(1.7) 26(43.3)
116(58.0)
12(6.0)
9(4.5)
3(1.5)
6(3.0) 76(38.0)
Respondents who saw a health professional while using other remedies
Yes
No
None
10(25.0)
19(47.5)
11(27.5)
18(30.0)
17(28.3)
25(41.7)
10(25.0)
16(40.0)
14(35.0)
16(26.7)
13(21.7)
31(51.7)
54(27.0)
65(32.5)
81(40.5)
*Respondents named more than one alternate treatment and remedies
When respondents did not receive care from a health professional, they utilised
other available treatment options, for example, home remedies (Table 25). Just over half
(53.0%) had used home remedies the last time they did not obtain care from a health
professional and approximately a third (30.5%) used self-treatment. Almost half (46.7%)
of the respondents in SERHA, and nearly a third (18/30.0%) in SRHA and NERHA
(13/32.5%) used other alternate treatments when they did not see a health personnel. Just
over a quarter (n=59) of the hospital-based and health centre-based (n=57) respondents
reported using home remedies when they did not see a heath professional. Similarly,
respondents used alternative treatments for health conditions such as hypertension. Most
(116/58.0%) had used home remedies such as bush teas for their health condition in the
past two years and a few had engaged the services of herbalists (12/6.0%) or spiritual
healers (9/4.5%). Just under an eighth of respondents (n=10) in NERHA and seven in
SERHA used alternate treatments for their health conditions. More (n=57) hospital-based
than health centre-based (n=49) respondents used home remedies for their health
conditions. A little more than a sixth of the hospital-based and approximately one fifth of
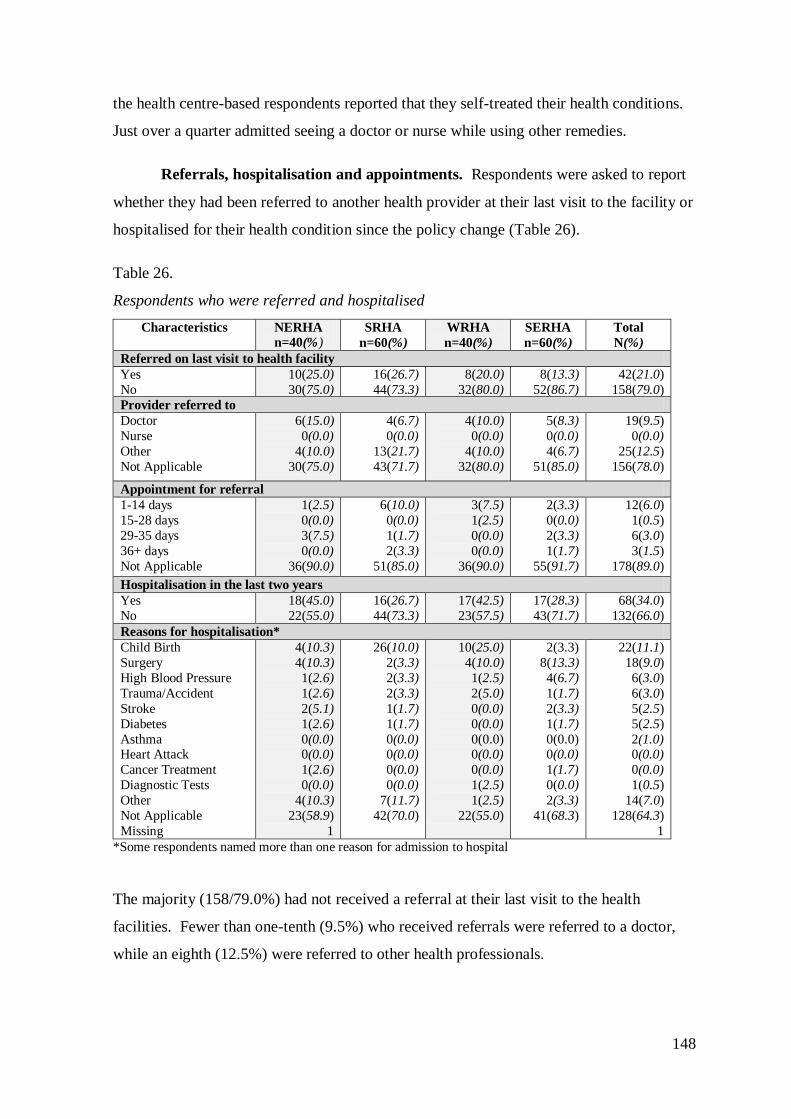
148
the health centre-based respondents reported that they self-treated their health conditions.
Just over a quarter admitted seeing a doctor or nurse while using other remedies.
Referrals, hospitalisation and appointments. Respondents were asked to report
whether they had been referred to another health provider at their last visit to the facility or
hospitalised for their health condition since the policy change (Table 26).
Table 26.
Respondents who were referred and hospitalised
Characteristics NERHA
n=40(%) SRHA
n=60(%)
WRHA
n=40(%)
SERHA
n=60(%)
Total
N(%)
Referred on last visit to health facility
Yes
No
10(25.0)
30(75.0)
16(26.7)
44(73.3)
8(20.0)
32(80.0)
8(13.3)
52(86.7)
42(21.0)
158(79.0)
Provider referred to
Doctor
Nurse
Other
Not Applicable
6(15.0)
0(0.0)
4(10.0)
30(75.0)
4(6.7)
0(0.0)
13(21.7)
43(71.7)
4(10.0)
0(0.0)
4(10.0)
32(80.0)
5(8.3)
0(0.0)
4(6.7)
51(85.0)
19(9.5)
0(0.0)
25(12.5)
156(78.0)
Appointment for referral
1-14 days
15-28 days
29-35 days
36+ days
Not Applicable
1(2.5)
0(0.0)
3(7.5)
0(0.0)
36(90.0)
6(10.0)
0(0.0)
1(1.7)
2(3.3)
51(85.0)
3(7.5)
1(2.5)
0(0.0)
0(0.0)
36(90.0)
2(3.3)
0(0.0)
2(3.3)
1(1.7)
55(91.7)
12(6.0)
1(0.5)
6(3.0)
3(1.5)
178(89.0)
Hospitalisation in the last two years
Yes
No
18(45.0)
22(55.0)
16(26.7)
44(73.3)
17(42.5)
23(57.5)
17(28.3)
43(71.7)
68(34.0)
132(66.0)
Reasons for hospitalisation*
Child Birth
Surgery
High Blood Pressure
Trauma/Accident
Stroke
Diabetes
Asthma Heart Attack
Cancer Treatment
Diagnostic Tests
Other
Not Applicable
Missing
4(10.3)
4(10.3)
1(2.6)
1(2.6)
2(5.1)
1(2.6)
0(0.0) 0(0.0)
1(2.6)
0(0.0)
4(10.3)
23(58.9)
1
26(10.0)
2(3.3)
2(3.3)
2(3.3)
1(1.7)
1(1.7)
0(0.0) 0(0.0)
0(0.0)
0(0.0)
7(11.7)
42(70.0)
10(25.0)
4(10.0)
1(2.5)
2(5.0)
0(0.0)
0(0.0)
0(0.0) 0(0.0)
0(0.0)
1(2.5)
1(2.5)
22(55.0)
2(3.3)
8(13.3)
4(6.7)
1(1.7)
2(3.3)
1(1.7)
0(0.0) 0(0.0)
1(1.7)
0(0.0)
2(3.3)
41(68.3)
22(11.1)
18(9.0)
6(3.0)
6(3.0)
5(2.5)
5(2.5)
2(1.0) 0(0.0)
0(0.0)
1(0.5)
14(7.0)
128(64.3)
1
*Some respondents named more than one reason for admission to hospital
The majority (158/79.0%) had not received a referral at their last visit to the health
facilities. Fewer than one-tenth (9.5%) who received referrals were referred to a doctor,
while an eighth (12.5%) were referred to other health professionals.
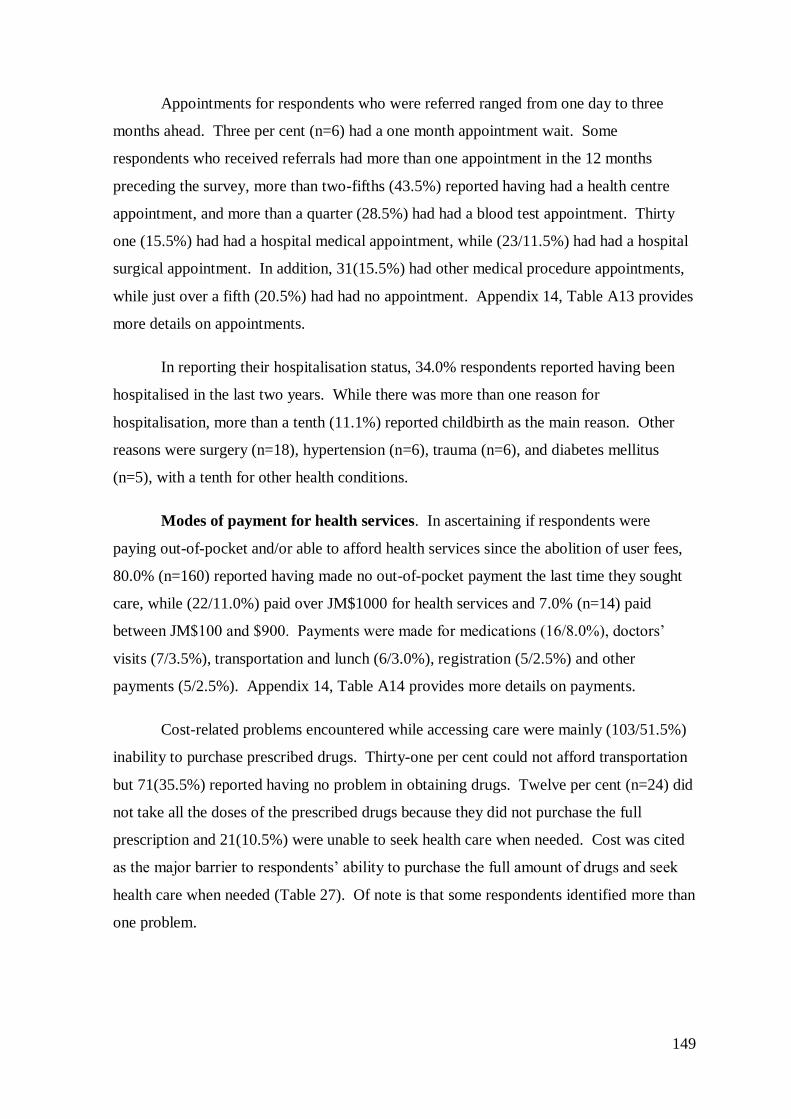
149
Appointments for respondents who were referred ranged from one day to three
months ahead. Three per cent (n=6) had a one month appointment wait. Some
respondents who received referrals had more than one appointment in the 12 months
preceding the survey, more than two-fifths (43.5%) reported having had a health centre
appointment, and more than a quarter (28.5%) had had a blood test appointment. Thirty
one (15.5%) had had a hospital medical appointment, while (23/11.5%) had had a hospital
surgical appointment. In addition, 31(15.5%) had other medical procedure appointments,
while just over a fifth (20.5%) had had no appointment. Appendix 14, Table A13 provides
more details on appointments.
In reporting their hospitalisation status, 34.0% respondents reported having been
hospitalised in the last two years. While there was more than one reason for
hospitalisation, more than a tenth (11.1%) reported childbirth as the main reason. Other
reasons were surgery (n=18), hypertension (n=6), trauma (n=6), and diabetes mellitus
(n=5), with a tenth for other health conditions.
Modes of payment for health services. In ascertaining if respondents were
paying out-of-pocket and/or able to afford health services since the abolition of user fees,
80.0% (n=160) reported having made no out-of-pocket payment the last time they sought
care, while (22/11.0%) paid over JM$1000 for health services and 7.0% (n=14) paid
between JM$100 and $900. Payments were made for medications (16/8.0%), doctors‘
visits (7/3.5%), transportation and lunch (6/3.0%), registration (5/2.5%) and other
payments (5/2.5%). Appendix 14, Table A14 provides more details on payments.
Cost-related problems encountered while accessing care were mainly (103/51.5%)
inability to purchase prescribed drugs. Thirty-one per cent could not afford transportation
but 71(35.5%) reported having no problem in obtaining drugs. Twelve per cent (n=24) did
not take all the doses of the prescribed drugs because they did not purchase the full
prescription and 21(10.5%) were unable to seek health care when needed. Cost was cited
as the major barrier to respondents‘ ability to purchase the full amount of drugs and seek
health care when needed (Table 27). Of note is that some respondents identified more than
one problem.
150
Table 27.
Respondents‘ perceptions regarding cost-related problems and access to the health
insurance
Characteristics NERHA
n=40(%)
SRHA
n=60(%)
WRHA
n=40(%)
SERHA
n=60(%)
Total
N(%)
Cost-related Problems to Access Care*
No problems
Unable to seek health care when need
Inability to buy prescribed drugs Did not take all doses of prescribed drugs
Unable to obtain prescribed tests and
treatment
Did not go for follow-up care
Could not afford transportation
Other
12(30.0)
6(15.0)
21(52.5) 2(5.0)
4(10.0)
8(20.0)
20(50.0)
1(2.5)
19(31.7)
9(15.0)
31(51.7) 6(10.0)
4(6.7)
3(5.0)
16(26.7)
8(13.3)
21(52.5)
2(5.0)
13(32.5) 11(27.5)
2(5.0)
7(17.5)
8(20.0)
0(0.0)
19(31.7)
4(6.7)
38(63.3) 5(8.3)
8(13.3)
1(1.7)
18(30.0)
0(0.0)
71(35.5)
21(10.5)
103(51.5) 24(12.0)
18(9.0)
19(9.5)
62(31.0)
9(4.5) Use of Health Insurance
Yes
No
5(12.5)
35(87.5)
4(6.7)
56(93.3)
8(20.0)
32(80.0)
8(13.3)
52(86.7)
25(12.5)
175(87.5)
Type of Health Insurance*
Government
Private
Both
None
3(7.5)
1(2.5)
1(2.5)
35(87.5)
3(5.0)
1(1.7)
0(0.0)
56(93.3)
5(12.5)
3(7.5)
0(0.0)
32(80.0)
6(10.0)
2(3.3)
0(0.0)
52(86.7)
17(8.5)
7(3.5)
1(0.5)
175(87.5) Payment of Premium for Health Insurance
Self
Family Member Employer
Other
Not Applicable
Missing
1(2.6)
0(0.0) 0(0.0)
2(5.0)
35(92.1)
2
0(0.0)
1(1.7) 0(0.0)
3(5.0)
56(93.3)
3(7.5)
1(2.5) 2(5.0)
2(5.0)
32(80.0)
3(5.0)
1(1.7) 2(3.3)
2(3.3)
52(86.7)
7(3.5)
5(2.5) 4(2.0)
9(4.5)
175(88.4)
2
Holders of National Health Fund Card
Yes
No
9(22.5)
31(77.5)
28(46.7)
32(53.3)
15(37.5)
25(62.5)
33(55.0)
27(45.0)
85(42.5)
115(57.5)
*Some respondents named more than one problem encountered and more than one type of health insurance
Most (175) respondents did not have health insurance. Of the 25 who did, the type
varied: 17 were holders of government health insurance, seven belonged to private
companies and one respondent reported having both government and private health
insurances. In reporting who was responsible for insurance premiums, seven said they
made the payments, while family members (n=5), employers (n=4) and other individuals
(n=8) also assisted with payments (Table 27). Thirteen respondents in hospitals and 12 in
health centres reported having health insurance.
Most respondents (115/57.5%) were not holders of the NHF card that would have
entitled them to subsidised drugs (see Chapter 2). Less than a quarter of the respondents in
NERHA and over half (55.0%) in SERHA were holders of the NHF Card.
151
6.5. Conclusion
This chapter provided an account of the findings from the multi-layered study.
Themes extracted from the individual interviews and focus groups described perspectives
on the user fees policy from the policymakers‘ points of view. Policymakers were
generally satisfied with the policy change and the increased utilisation of services by
people who required the care. Official statistics from MOH, RHAs and MOH personnel
highlighted some of the dynamics in the public health system regarding utilisation of
services since the policy change. Although changes cannot be exclusively attributed to the
policy, there were noticeable increases in the use of services such as A&E and
pharmaceuticals. Referrals to Casualty increased, as well as health indicators such as
Maternal Mortality rates.
Equally, the findings from the survey revealed users‘ interactions with the public
health system within the new policy framework. It was apparent that people were satisfied
with the new policy arrangements, changes in their health status, and the quality services
provided. Ironically, this was, despite long waiting times, inability to access some services
such as drugs, travelling far distances, negative attitude of some staff and not being
adequately involved in planning the services offered. Findings regarding the impact of the
policy change on the work of main health practitioners and professional nurses will be
discussed in Chapter 7. To make sense of the data for future practical and theoretical
utility one needs to further interpret the findings. This will be set out in Chapter 8.
152
Chapter 7: Impact of the abolition of user fees on the work of main health
practitioners and the professional nurse
7.1. Introduction
This section captures the main health practitioners‘(doctors and pharmacists) and
professional nurses‘ perceptions regarding the impact of the user fees policy under the
following seven headings: involvement in the policy process; changes in their work since
the policy change; funding and resources in the public health system; quality and
effectiveness of care; contribution to improving access to health services; satisfaction with
their work environment; and overall impression of the user fees policy generally.
Policymakers‘ perspectives on the impact of the policy change on practitioners were
highlighted in Chapter 6.
Data were obtained through focus groups with the three main practitioner groups in
the public health system. Focus groups involved nurses (Registered Nurses [RN]), who
were selected based on their levels of professional classification. RNs at Levels 1, 2 and 3
(ward managers) participated in the discussions. Additionally, there were focus groups
with PHC Public Health Nurses (PHN) and PHC Nurse Practitioners (NP), medical
doctors (DR) and pharmacists.
To maintain confidentiality, practitioners are identified by their Focus Group
number (FG1-9): for example, RNFG1-2 comprised RNs assigned to hospitals; PHNFG3-
4 consisted of PHNs from various PHC settings, NPFG5-6 comprised Family NPs from
various PHC settings, DRFG7-8 consisted of doctors from primary and secondary care
facilities, and PharmFG9 comprised a mix of pharmacists from primary and secondary
care settings. In addition, due to the shortage of pharmacists in the public health system,
three pharmacists from one RHA were interviewed. These pharmacists are represented as
Pharm1-3 and comprised a mix of primary and secondary care pharmacists. The
individual doctor, represented as DR1, was employed at a hospital (Table 28). The results
are presented according to the themes extracted from the discussions with practitioners and
nurses about their level of involvement with the policy process. Quotations from the focus
groups and interviews are used to support each theme.
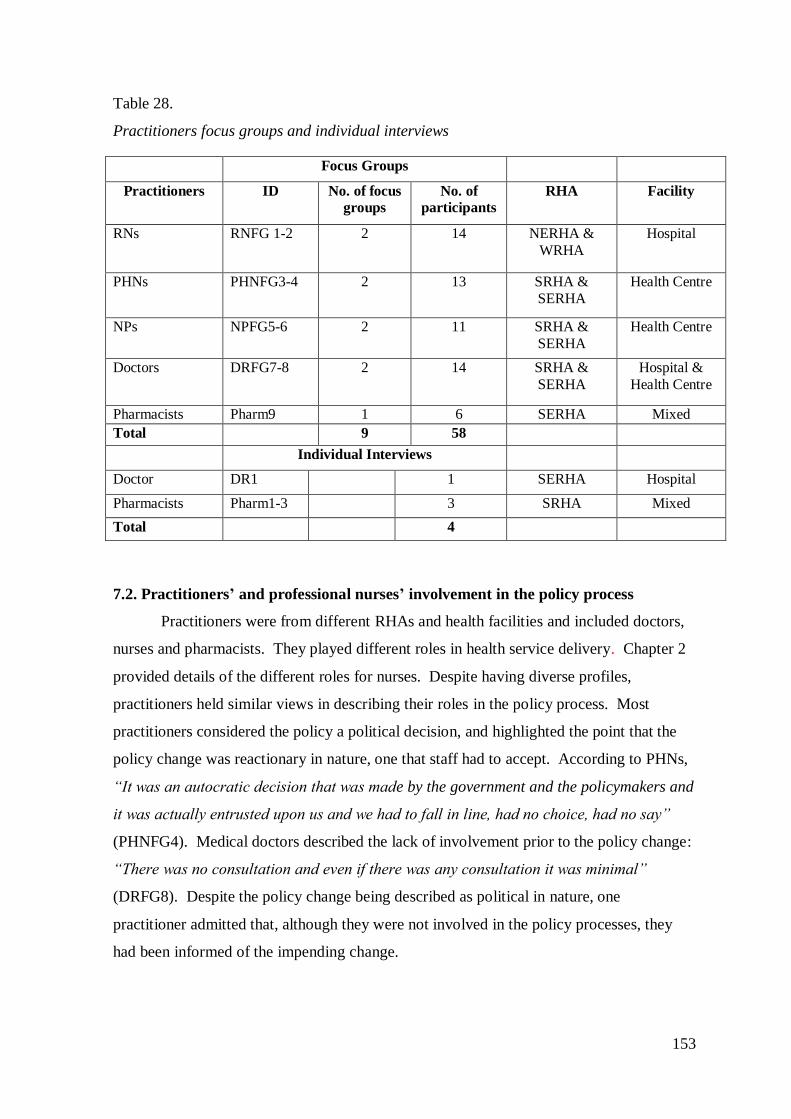
153
Table 28.
Practitioners focus groups and individual interviews
7.2. Practitioners’ and professional nurses’ involvement in the policy process
Practitioners were from different RHAs and health facilities and included doctors,
nurses and pharmacists. They played different roles in health service delivery. Chapter 2
provided details of the different roles for nurses. Despite having diverse profiles,
practitioners held similar views in describing their roles in the policy process. Most
practitioners considered the policy a political decision, and highlighted the point that the
policy change was reactionary in nature, one that staff had to accept. According to PHNs,
―It was an autocratic decision that was made by the government and the policymakers and
it was actually entrusted upon us and we had to fall in line, had no choice, had no say‖
(PHNFG4). Medical doctors described the lack of involvement prior to the policy change:
―There was no consultation and even if there was any consultation it was minimal‖
(DRFG8). Despite the policy change being described as political in nature, one
practitioner admitted that, although they were not involved in the policy processes, they
had been informed of the impending change.
Focus Groups
Practitioners ID No. of focus
groups
No. of
participants
RHA Facility
RNs RNFG 1-2 2 14 NERHA &
WRHA
Hospital
PHNs PHNFG3-4 2 13 SRHA &
SERHA
Health Centre
NPs NPFG5-6 2 11 SRHA &
SERHA
Health Centre
Doctors DRFG7-8 2 14 SRHA &
SERHA
Hospital &
Health Centre
Pharmacists Pharm9 1 6 SERHA Mixed
Total 9 58
Individual Interviews
Doctor DR1 1 SERHA Hospital
Pharmacists Pharm1-3 3 SRHA Mixed
Total 4
154
The positions practitioners held in the health system also determined whether or
not they had been invited by policymakers to be part of the discussions regarding the
impending policy change:
I think I was invited to a meeting here at the hospital to give my perspective on the
pros and cons of it and I did make that submission orally at that meeting. There
was a subsequent meeting at the Ministry of Health with the Minister in which we
aired our concerns. A number of pharmacists met with him and aired our concerns
as to how it would have impacted. (PharmFG9)
The hospital-based doctor also commented on the role administrators played in the
policymaking process:
I was part of the team that led to the implementation of the policy. The policy was
only passed down to myself and other administrators...well the idea...and we
should find ways to implement the policy. The guidelines were given to us...what
guidelines we should work with...so we took part in the implementation process
and of course ongoing evaluation of the project. (DR1)
The practitioners‘ role in the policy change was largely at the implementation
phase and included anticipating the increase in the number of persons using the health
facilities, as well as effectively managing the increased patient load. Essentially, they
were expected to facilitate the process:
We were expected to control [the] crowd that was expected so we were being asked
to be crowd controllers, to be facilitators of the process, people would be coming
in and with the limited number of health care providers and the overwhelming
clientele, then you would have some bottle-necking and as a result we were
expected to cause things to run smoothly. (PHNFG3)
The practitioners‘ roles also included preparing resources and systems to meet the
impending demands on the system. It was clear that practitioners had minimal time to
prepare. The time from the announcement of the policy in September 2007 to its
implementation on April 1, 2008 was only 6-7 months. Pharm1 explained, ―After we were
notified that there was a set date for the project to be implemented, then we just had to
prepare our resources and have our staff ready for the implementation of the free health
care.‖
155
For some practitioners, the policy change meant a philosophical shift, especially
regarding the manner in which patients were managed:
We had little training on how to behave to the customers, customer is always right.
We [were] made to understand that the patients would now become the customers
or the clients and we were expected to give them good service by being courteous.
(PHNFG3)
7.3. Changes in the work of the practitioners since the policy change
Practitioners generally found their work was more stressful following the policy
change. The impact of the policy resulted in an exponential increase in workload, which
had implications for how services were delivered and the satisfactory outcome of the
policy as a whole. These changes were reported during the interviews:
I think in the first month we went to 100.0% of more than what we are normally
doing and it has settled off to about a 60.0%, 65.0% over what we would normally
do on a daily basis and it continues on the weekends. Because what we are seeing
on a Saturday is what we would have normally seen during the week. What we are
seeing on Sunday is what we would see on Saturday as outpatients. (PharmFG9)
Some practitioners alluded to the increased workload, increased waiting times and
changes in how surgical cases were done on a given day:
Workload has increased, probably 40.0-50.0%. Initially, it probably went up to
about 100.0-120.0% but it has dropped back because we can only do so much and
no more. For instance if the surgeon put 20 cases on the list but the work day is
just eight hours, we can do only eight or ten, that‘s it. (DRFG8)
The increased patient load translated into longer waiting times for patients in all facilities.
The impact extended beyond the public system. Pharmacists working in a semi-
private pharmacy (these pharmacies previously dispensed subsidised drugs to public
patients but were now dispensing free pharmaceuticals to all public patients as part of the
policy change) where the staff complement was significantly greater than in the public
facilities, reported that:
Our opening hours have been extended. It‘s now a 12 hour work day...each person
does an 8 hour shift...staggered shift. We do far more prescriptions...we are seeing
a lot more clients...more strenuous...more stressful. (Pharm3)
156
Practitioners generally agreed that, despite the increase in patient workload, the
services offered remained the same. They were, however, concerned about the move from
the private sector to the public sector by some patients, which some considered an abuse of
the system: ―I think they are abusing the government funds‖ (DRFG7).
Impact on the work of the professional nurses. Most nurses identified there had
been changes to their work since the policy implementation, which they suggested
involved many challenges. An observation, however, is that references to their work were
often made in terms of the impact of the policy change on the patients. Nurses in PHC
talked about their work since the abolition of user fees: ―The free health care system is
really putting stress on the staff...all members of staff...all categories of staff because you
have to think of maintaining order in the health centre when you have a big crowd‖
(PHNFG3).
Some NPs did not experience any change in workload, but others reported seeing
more people. The increased workload was attributed to (a) NPs‘ need to conduct school
medicals, which are required by all students before entry into school; (b) more middle
class people utilising the public facilities, (c) private doctors referring patients to public
facilities, and (d) unnecessary utilisation of health facilities by some patients.
Another change experienced by some practitioners was overcrowding in the health
facilities. This could partly be due to users‘ lack of knowledge regarding the use of the
facilities and the types of conditions for which they should seek care at the various
facilities. NPs commented,
The work is overwhelm[ing]. Because of the lack of knowledge and understanding
of the people, they use the clinic as a first aid centre...They come and ask you
―check and see if this baby has fever for me‖ or ―I have a toothache; can I have
two Panadols!‖ (NPFG6)
The increased patient load meant nurses spent less time assessing patients. This
negatively affected the nurses‘ ability to maintain the standards required to provide quality
care. However, they were also active in developing new strategies to address concerns:
A client might come with...what one thinks is a medical condition but on interview
realises that it is more than that...one would have wanted to spend more time
extricating information...to help that patient you cannot totally do that [now]
157
because of the number that you have to deal with. The quality has deteriorated a
bit because of the quantity; it‘s not that you are giving bad service it‘s just that you
cannot do what you are trained to do, to deal with the total person at the particular
time. (NPFG5)
NPs could not agree on the number of patients they usually saw on a daily basis.
The number varied because of factors such as the type of clinic being held and the
availability of a doctor at the health centre. Of note is that NPs and doctors performed
similar roles in the health centres. Moreover, some health centres were managed solely by
NPs:
In my health centre, the patients are registered, their checks are done and the
dockets are disseminated around to the doctors and the NPs...No special case...the
doctors go faster than the NPs, so they see more patients. There are some health
centres that are manned by the NPs alone. Where they are manned by the NPs
alone, she sees the patients. (NPFG5)
NPs spent more time assessing their patients than doctors and, as such, sometimes
saw fewer patients than the doctors. Furthermore, information provided by the NPs
suggested that the number of patients seen at the health centre on a particular day may just
have been a percentage of the total number of persons who visited the facility for care. It
would not have been uncommon for over 200 patients to show up at the health centre.
However, after triaging, NPs might see an average number of 25-30 patients daily.
Commenting on the changes in number of patients and time spent with each, NPs
said:
Where time factor is concerned…It‘s like you are almost being forced to go
through a ritual whereas you probably have a little time to sit and maybe counsel
with a patient, you really are pressed. Assessment takes so much time, when you
have to assess maybe 100 patients to ensure that you work it out to maybe to be 70,
60 odd and the doctors are coming in and they complain ―how many numbers did
you give out this morning?‖ It‘s every day, it‘s not like in the past you would look
forward to an easier day…once or twice in the week…And people are
inconsiderate because the patient [fusses] if you walk out of your office, it‘s as if
they want you to announce if you‘re going to the bathroom or if you are just going
to catch a bite…it‘s not like taking a lunch break. (NPFG6)
158
PHNs talked about the increased numbers of patients using the health centres.
Some clinics such as antenatal and child health were spoken of as particularly challenging
for PHNs, who sometimes had to see between 60 and 100 patients in a day. In secondary
care, RNs‘ response to the increase in workload and stressful nature of their work was to
adjust things to deliver nursing care.
Other RNs noted that workload had increased because of social issues. In hospital,
an increase in the number of persons with social problems or terminal illnesses contributed
to the increased workload. This occurred because there were sometimes no relatives to
accept discharged patients and many of those who were terminally ill preferred to return to
hospital to die.
I work on the maternity ward and cases [like] hyperemesis that is triggered by
social issues, for example, coming in [at] eight weeks gestation and within a day of
coming into hospital her vomiting ceases; you send her home, two days after,
within 48 hours, [she‘s] coming back with the vomiting uncontrollable and within
minutes of being in the hospital it resolves. (RNFG1)
Additionally, RNs reported minor changes to the type of health conditions seen in hospital
A&Es, including more trauma cases such as stab wounds and chops.
Professional nurses’ perspectives on staffing numbers and working
arrangements. The increased patient load created by the policy change affected staffing in
the health facilities, and created challenges in achieving continuity of care:
I find that covering the clinics is really a painstaking thing. I think that [the impact
of] moving an officer from one area to the next has on the whole system is that
there is no continuity of care. This week one nurse is here, she builds that
relationship with a client and the next week you have to take her away and as a
result, every time the clientele comes [there] is a new staff [member] or the person
they had built this trust with is not there that week, so they really get frustrated.
They don‘t bother to come back, some. And even when they come, that surety, that
certainty that you‘ll get that high standard of nursing care is just not there. It‘s a
real greater struggle to maintain that standard. It was not like that before. It was
much easier because the system was much more facilitatory. (PHNFG3)
The policy change also meant extended work hours or shift systems. These had
been introduced with the aim of accommodating the increased patient load without
159
creating extreme pressure on the limited number of staff. However, PHNs commented on
the issue:
We have been working on Saturdays now and we are given limited time to work
with...and the amount of clients, like Saturday...they were about 400 persons for
medicals and some of them came from as early as 2am to get numbers...we could
only see 200 and send away the rest to come back [the following] Saturday.
(PHNFG3)
In addition, shift work had been introduced in health centres. Shifts, however, sometimes
resulted in people having to work into the next shift, which was not sustainable:
They had to do like a 7-3 and a 10-6 shift and after a while it caused a problem
because the nurses were complaining that they were tired...we were having the
whole burnout syndrome...We had to reverse back to our 8:30-4. (PHNFG3)
Equally, RNs in hospitals noted their observations regarding staff trying to
construct duty schedules: ―When you‘re writing your duties...for the 7-3 shift [it] is the
same persons working on the 2-10 shift...you have to ask them to work on...so they are
overworked‖ (RNFG1).
There was also a shortage of some categories of staff, making it difficult for nurses
to refer patients appropriately. NPs gave an account of the challenges they encountered
when trying to refer certain patients to other members of the health team:
Another…problem that we face also is you‘ll find problem and you don‘t know
where to refer them because you don‘t have like a social worker…those
issues…especially in that area you find problems, patients don‘t have this, don‘t
have that and you don‘t know where to refer them. If you refer, you come against a
wall…so it‘s a big problem for us. (NPFG6)
The availability of various categories of staff, on the other hand, resulted in greater
levels of satisfaction. Some NPs expressed satisfaction with the services being provided
by staff at their health centre, ―I appreciate the fact that we have a social worker, a special
clinic for the HIV/AIDS cases [and] a very good nutritionist and much education go on
around there‖ (NPFG6).
Attrition of staff. One effect of the policy change was that staff were leaving the
public health institutions. Importantly, this attrition was not necessarily associated with
160
remuneration but with the lack of supplies to work with, especially in the hospitals. The
attrition of staff had serious implications for nurses who took on extra responsibilities in
the absence of sufficient doctors. This movement of staff was evident across the facilities
in the RHA. They gave an account of their experience, ―We cannot retain the nurses and
the doctors. They come in and they are leaving like in a couple months or a year after...we
are not retaining anybody‖ (PHNFG3).
In hospitals, the challenge was similar. RNs from across all the RHAs gave their
accounts of the existing situation:
I find that nowadays…sometimes it‘s not even the monetary part of it, why you
have people leaving…like out of nursing…like going abroad but it‘s because of the
supplies. They cannot be bothered, they have to walk up and down, they‘ve to be
begging and sometimes they have to send even to other hospitals to beg, which is
ridiculous so these are some of the things that are pushing some people out of the
public system. (RNFG2)
Overseas Nurses. Due to the shortage of nurses in the public health system, nurses
from other countries such as Cuba, India, Nigeria, and the Philippines were often recruited
to boost numbers. However, this solution to the nursing shortage did not sufficiently
relieve the situation. This was because overseas nurses often required close supervision.
Local nurses reported issues with language, accents, and patient care generally. Another
issue with overseas nurses was that the local nurses were unhappy overseas nurses
received better remuneration packages. Additionally, the nurses felt they needed to take
extra responsibility for the overseas nurses. RNs recounted the challenges they
experienced while working with some overseas nurses:
There was this issue where the [overseas] nurse was going with Augmentin to give
to the wrong patient. On the ward, I‘m the most senior nurse, I stopped her
because I saw my certificate going down the drain...I called her back instantly and
said it is not time, let us just wait awhile until after breakfast. (RNFG1)
Other RNs also agreed that working with some overseas nurses was stressful:
I‘ve worked with a few of them and it just put more stress on me because you have
to be watching. Even if you assign [them] to, say, do this, as soon as you
turn...they are going to do something else. They don‘t know about a sterile
dressing...they don‘t know about passing a female U. Cath [Urinary
161
Catheter]...they don‘t understand...they just take up gloves, put [them] on and
ready to go. There was a situation where one just came, took a nurse‘s notes from
the day before and just copied everything. (RNFG1)
Teamwork. While comments differed regarding the current rapport among team
members since the policy change, it is clear that changes had taken place. Some nurses
were satisfied with the level of support received from administrative staff such as CEOs
while others lamented the lack of support:
I‘ve worked as a FNP in another parish and we had what was known as clinicians
meeting. I am yet to see that since transfer into this parish that I am. There is
absolutely no clinicians‘ meeting and I think it is so important that you meet as
clinicians because you have commonalities, you have new things in the way you
manage things. The doctor does not know everything. He can learn from a
practitioner, as well as the practitioner learns from him. (NPFG5)
7.4. Practitioners’ perspectives on funding and resources in the public health system
While some practitioners were not au fait with the budgetary allocations to the
public health sector, the general view was that the health sector was underfunded and
required more resources. DR1 alluded to the funding situation and the assistance to the
local facility from other sources:
Public health facilities are underfunded. We obtain aid from a number of persons
and organisations such as Scotia Bank assisting with our dialysis unit and the care
of patients with scoliosis; Jamaica National [Bank]; Supreme Ventures;
Missionaries and Food for the Poor assisting with equipment and disposables.
Sometimes we have private persons who were treated here or families of private
persons or even the employers of some persons who have been here and see the
need and they choose to donate something.
Others sources of funding noted were CHASE, NHF and JSIF (Jamaica Social Investment
Fund) (see Chapter 2 for more details).
In contrast, Pharm3 viewed the continuation of the policy as an indication that
there were adequate funds in the public health system:
The drug bill is a massive bill. I think the government in their wisdom must have
set aside some plan for the sustenance of this programme. The fact that the
programme is continuing... it is being funded. I‘m not sure if the funds are being
162
exhausted or if they are near exhaustion. We‘ve never had to worry that we are
closing down because we can‘t access drugs.
Some doctors in primary care also expressed satisfaction with the resources available in
the public health facilities. However, in expressing this, they noted the pressure on
resources due to some patients abusing the system.
Professional nurses’ perspectives on the availability and quality of resources.
Nurses expressed concerns regarding the lack of resources since the policy change, which,
they claimed was adding more stress to their work. In some health centres, there was a
lack of stationery and paper towels for some and of equipment for others. The lack of
adequate funding also affected the way nurses executed their duties, and as such they were
concerned that previously ―we could go and do home visits that might be 10 miles away
[but now] you cannot do that home visit because your mileage is cut down because of
funding, it affects everything‖ (NPFG5).
The policy change and decentralisation generally, meant that there was no
flexibility in terms of generating additional funds from fees or setting one‘s own charges.
PHNs talked about the difference in resources in the public health system prior to and after
the abolition of user fees:
Prior to decentralisation we were much better. When we were handling our own
cash, collecting our own fees and purchasing, we never ran out of Depo [Depo
Provera], we never had a problem with OCP [Oral Contraceptive Pills] and any of
these services…and since decentralisation especially now with the free [health
care] it‘s terrible. (PHNFG3)
The lack of adequate resources to carry out their work on a daily basis forced
practitioners to change the ways in which they delivered care. Some hospital-based RNs
reported resorting to personal funds to administer required services to patients. ―I know
nurses who personally collected funds among themselves to give proper patient care to
persons they care for. On the medical ward they help to buy nutritional liquid‖ (RNFG2).
The ambulance service in some hospitals was also a problem. RNs noted their experience:
―We don‘t have any working ambulances, sometimes we only have one. We have to get
one from Red Cross which [the hospital has] to pay‖ (RNFG1). Hospitals sometimes
resorted to borrowing ambulances from other facilities. Due to the shortage of working
163
ambulances, relatives sometimes assisted with transporting patients home or between
facilities.
Lack of resources also included inadequate funding to pay salaries in a timely
manner; provide training for some staff such as customer services personnel and obtain
adequate materials to work with. PHNs commented on the changes encountered with
payment of salaries:
Not to mention our salaries...sometimes they are late and I think if it wasn‘t for the
[abolition of] user fees they would be able to pay us some of the things on time.
Sometimes they don‘t even tell you that they can‘t pay...sometimes it‘s at the last
minute. (PHNFG3)
The attitude of the RHAs to the late payment of salaries had a de-motivating effect on
some nurses. PHNs also talked about how they had to reduce travelling, especially for
home visits, due to the cut in travelling allowances.
The view that there was inequity in the allocation of resources to the various
institutions also resonated with hospital-based RNs:
There are many things that are allocated to specialty areas that are not given to
general areas. There are some hospitals that are not functioning to capacity and
[yet] they are getting equal amount of resources and staff. There needs to be
proper allocation of human and material resources. (RNFG2)
Professional nurses’ perspectives on equipment. The policy change negatively
affected the manner in which care was administered. This was due mainly to the lack of
requisite supplies and equipment. This lack of equipment was stressful for staff and meant
they needed to develop new systems and policies:
Sometimes when patients come for a particular medication, you can‘t find any
syringe to give them the injections and they do not understand. They think that you
are the one that doesn‘t want to give it to them and you are wasting time when you
do not have what to use. That is very stressful. (RNFG2)
Expanding on this sentiment, those in RNFG1 said:
It [the situation] has changed a lot in terms of more work. You are not able to give
the type of quality care that you ought to give because of the amount of persons
that you are seeing all at once. You have to be changing up...some of the hospital
policies to try and accommodate...you have to be trying new things.
164
PHNs noted the deplorable state of the equipment they had to work with. For some
NPs, equipment was ―adequate to a point. We have to find our own instruments to work
with,‖ but for others it was a concern:
As NPs the roles we carry need the use of some little things and some big things.
Little things, [like] a stethoscope, a sphyg [sphygmomanometer], a thermometer.
Big things like the diagnostic set that has otoscope and auroscope...these are
things if we cannot buy, we cannot have to use. (NPFG5)
Additionally, malfunctioning equipment was not repaired in a timely manner. RNs
highlighted the challenge in hospitals:
The equipment are overused, they are overworked, sometimes you can‘t even trust
the reading that you are getting....because each time you ask for someone to
service it, the artisan might just come and patch it up and you get to use it for a
couple of days and then it starts malfunctioning again. (RNFG1)
RNs also pointed out a lack of supplies and equipment to work with and their
dependence on gifts:
We have limited resources to work with...no bed, bed without rails. We did not
have overhead trolleys at each bed, defibrillators are not working, crash carts,
when you pull them they stick on you, [the] dynamap you have to borrow, [there is]
shortage of staff...Without gifts we don‘t know where we would be. (RNFG1)
RNs were sometimes also faced with the problem of using incompatible and older
gadgets. For example, RNs talked about the experience when monitoring blood glucose
levels:
The government provides some strips for [one] glucometer…they stopped getting
those strips and they send another machine [that] the strips cannot work with. You
[then] have to wait longer time for them to purchase those. They [also] tell you
that money is not in the budget for that at this time. (RNFG1)
Professional nurses’ views on materials and supplies. Lack of resources also
meant inadequate materials and supplies in health centres and hospitals to deliver care:
Resources, example: condoms, we don‘t have pills, Depo; we have to be sending
away clients. Clients are on the pill for years and they come to the clinic, you have
to send [them] to go and purchase pills…they don‘t want to switch to the injection;
165
they want to stay on the pill. These are clients who are financially unstable, what
guarantee do you have that they are going to purchase pills? (PHNFG4)
There were also problems with getting some screening tests done and difficulty in getting
results. This impacted on patients‘ treatment, as well as how they were cared for.
Another problem that we‘ve been having, since couple months ago…the VDRL
results have been coming back to us not done because they don‘t have the reagents
to test. It has been proposed that we send the clients to private labs to have it
done. (PHNFG4)
In hospitals, the stress nurses experienced was sometimes due to lack of basic
resources such as syringes to administer injections. While this was stressful in itself, it
was compounded by the attitude of patients who interpreted this lack of resources as
nurses' reluctance to administer care:
It is very stressful on us. Sometimes when patients come for a particular
medication, you can‘t find any syringe to give them the injections and they do not
understand…they think that you are the one that doesn‘t want to give it to them and
you are wasting time when you do not have what [you need] to use. (RNFG2)
RNs experienced frustration due to the lack of resources and had to develop
strategies to address the issues. Addressing the issues also meant loss of patient care time:
―Lack of basic sundries [syringes, needles etc.] has frustrated myself and a lot of my co-
workers. You have to be improvising, walking, begging, and it has affected optimal patient
care (RNFG2). However, administrative support from people like the CEO had improved
the situation in some hospitals.
Shortage of resources in A&E resulted in having to care for patients on stretchers
on some occasions. RNs gave an account of the challenges they encountered within A&E:
I have a gentleman [on] one of those [beds] they used to transfer patients from a
stretcher to a chopper. I have a lady who is in respiratory distress sitting up in a
wheelchair; I have a 96 year gentleman who fell in his bathroom this morning and
has multiple lacerations to his head, I have him sitting in a wheelchair. I have
patients who require a bed and have to be sitting up…There have been instances
where we have to wake patients up out of their beds…stretchers…because an
emergency came in that required the stretchers…wake them and put them on a
chair to sit, then you take the stretcher. (RNFG2)
166
The main response to such shortages was for the nurses to feel dissatisfied. In
addition, they sometimes responded by buying the supplies themselves: ―I‘m very
dissatisfied because of what we don‘t have to use. The patient [is] in pain and [we have]
no injection needles. It is terrible and I don‘t feel good about that‖ (RNFG2). Other RNs
noted similar concerns:
We need better working conditions, enough equipment, [and] proper equipment to
work with. Simple things like hand soap...hand towels you have to buy it for
yourself or your staff pool together and buy it...Conditions need to improve.
(RNFG1)
7.5. Quality and effectiveness of care
The study also ascertained practitioners‘ perceptions on the quality and
effectiveness of the care provided. In describing the changes in quality, one pharmacist
commented, ―I think the quality of service [has] deteriorated. It can‘t be just [the
increased] numbers we are serving. I have seen more dispensing errors under this system
and I have had more complaints coming to me‖ (Pharm2). Doctors shared a similar view
regarding the indirect effects of the policy change:
The quality of care would be affected because you don‘t have time to explore what
you need to explore with each individual patient. Because in the back of your
mind, you have 40 people waiting to come...my stomach is growling and I‘ll soon
pass out from hunger so let me just hurry up, deal with the basic issue and move
on. (DRFG7)
Seeing 100 patients in a timely manner, in A&E, for example, without
compromising the quality of care was reported as being difficult. In addition to issues with
assessment, there were concerns about the review of patients:
You have a sick patient there, you have so many to deal with and you don‘t get
around [to] reviewing him in a timely manner, the patient gets into trouble. The
monitoring; in terms of individuals; in terms of equipment…If you have a pulse
oximeter beeping, then you can look around, but you don‘t even have that.
(DRFG8)
The doctor based in administration endorsed the views expressed by others on the
negative effects of the policy change on the quality of care. This comment also
highlighted the impact of the policy on waiting times to obtain treatment for some medical
167
conditions and the need for practitioners to respond with more invasive treatment in the
first instance in order to manage these cases:
In waiting a long time [patients‘] conditions can progress to emergencies or they
may even die...let‘s consider a patient with breast cancer…a lady who has breast
cancer…you don‘t have to do mastectomies for all breast cancers; you can do
lumpectomy and treat them with radiation [which] is just as good as a mastectomy.
Now if I do a lumpectomy on that patient, they need to get radiation in six weeks of
their surgery…the date for radiation for that patient is nine months…so what I‘m
doing, I‘m going to expose that patient to the risk of recurrence or the spread of
the disease?…I would tell that patient that it‘s best to have a mastectomy all the
time rather than save the breast although it can be saved…and it goes for other
illnesses also. (DR1)
Professional nurses’ perceptions of quality and effectiveness of care. RNs also
pointed out the effect of the policy change on both human resources and their ability to
offer the necessary care to patients:
It‘s more quantity than quality. Human resources [are] falling short. Both doctors
and nurses are looking to going out. You are always in need of more human
resources and the number of patients you see is not getting any less. So, you have
to spread yourself thin. It‘s like a touch and go. You have to pay attention to the
most critical. That social and psychological support that you want to offer...you
see that you‘re not giving it...You don‘t have enough time, not enough energy or
the resources to offer it. (RNFG1)
The quality of care in relation to waiting times, drug availability and resources was
argued as being negatively affected. Patients were frustrated when services were not
available and, as such vented, their feeling on the practitioners:
We try to give quality but it‘s not always [possible]. With waiting hours and with
the drugs they are given prescriptions, they cannot be filled. We have lack of
resources. No blood pressure machine, no infant scale. So you have to be learning
to juggle weighing mother and baby then minus so it‘s added stress on the staff.
(PHNFG3)
Conversely, some practitioners maintained that the quality of care had improved, as
evidenced by positive health outcomes and patient satisfaction:
168
Even our chronic disease patients, they know now that they don‘t have to pay for
the blood test…So you find that we have all the things that we need to do for them.
So in fact the quality of care has been improved greatly. You have patient
satisfaction. Some of them are so happy that they come too often because the care
has been good. Those persons who have left the private doctor to come in they
would say to you, ―Nurse this was happening to me for so long and nobody could
find it out and thank you for sending me down for x, y and z.‖ Therefore, you can
assess from that, that the quality of care is good. The time factor is as such that we
would have spent a little more time but that does not necessarily compromise what
you‘re delivering to them. What you do, is say it a different way, in a shorter time
because…there is pressure of time. I have seen the pressures [blood pressures]
that are staying down. (NPFG6)
7.6. Contribution to improving access to health services
Practitioners identified several areas in which they had improved access to health
services. These areas included extending the work hours:
Because of the long waiting list we have introduced a system where we can
actually extend the day of each operating session because [the] operating session
goes from 8-4pm and we will extend the day to 10 o‘clock or even operate on
Saturdays for non-emergency cases, and the doctors do it without pay. (DR1)
Equally, hospital-based doctors were improving access by procuring
technologically-advanced diagnostic equipment such as a CT scanners and introducing
new services such as dialysis units in some hospitals. Doctors at one PHC facility had also
introduced a screening book (which documented patients‘ data without requiring formal
registration): ―it allows you to see more patients‖ (DRFG7).
Professional nurses contributions to improving access to health services.
Nurses were very pragmatic in finding solutions to cope with the increased number of
patients, as well as with the impacts of the policy change generally. One such solution was
the introduction of a shift system in some PHC facilities, where previously there was none.
While the aim of this solution was to improve access, it also sought to ensure staff did not
suffer burnout. Some PHNs adjusted their clinic schedules to accommodate patients by
making home visits on the way to and from work instead of during the day. They also
encouraged patients to visit other clinics when resources were short. For example, when
169
patients did not receive Depo Provera at a Family Planning clinic they were
accommodated at another clinic day when supplies were available. Another area of
contribution by nurses was an increase in patient education, especially for the elderly.
Additionally, nurses assisted at, as well as independently conducted, health fairs
where patients could obtain services such as blood pressure and blood glucose checks.
This also reduced the number of people visiting the health facilities. At-risk patients were
often identified at these fairs and referred for more advanced services if necessary: ―Most
of the nurses go to church when they do have their health fair; they come and they recruit
doctors and nurses. The health fair cuts down on the [number] of persons that would
come in‖ (RNFG2).
Another measure adopted by some specialist practitioners included seeing clients in
PHC facilities. This helped clients by minimising the hassle of travelling to the hospital
and waiting for long periods of time. Engaging in other one-off activities aimed at
improving access to health care was not uncommon for practitioners. NPs collaborated
with pharmacists to make more informed choices when prescribing, as well as ensuring
patients could receive the medications prescribed: ―we call to find out what drugs are
available before prescribing it so the patient can obtain it‖ (NPFG5). Furthermore,
doctors in primary care alluded to the increased use of other categories of staff to improve
access. Additionally, some practitioners in hospitals developed a new patient monitoring
system for discharged patients: ―We...on the ward call them at a certain time at home to
make sure that they keep their appointments, find out what amount of medication they
have, remind them that they need to come [in]‖ (RNFG1).
Nurses’ perspectives of patient profile and behaviour. Nurses in PHC reported
how the people using the system had changed. For example, people with uncommon
conditions were now accessing services directly from the health centres instead of being
referred by other health practitioners. In addition, more males and females with conditions
of the reproductive system were utilising the centres. Procedures such as removal of
sutures and dressings were also on the increase, especially for patients who had had
surgeries in hospital. NPs commented:
Some of [those, who] possibly before free health care would not have come to you,
they are now coming from the private practitioners so it increases our clientele and
some of [those, who] are not so urgent would have to be given another
170
appointment or [be] seen another day...so it means that they might come to the
health centre and not necessarily get seen that day depending on the severity of the
cases. (NPFG5)
Although the NPs could not all agree on the types of health conditions seen, some
reported that, despite the increased number of patients seeking care, the types of health
conditions seen remained the same. Others, however, had observed increases in the
number of patients seeking care for conditions such as hypertension, diabetes and
rheumatic heart disease. Nurses were also seeing more persons with social problems, more
referrals from private doctors and paying institutions and more users for some family
planning methods.
According to RNs, people were also presenting to the A&E with health conditions
that were always not consistent with those classified as emergencies.
We normally have true emergencies, persons with cardiac conditions, asthmatics,
motor vehicle accidents, gunshot wounds, diabetics, the regular, you might have a
one and two pop-ins but since the abolition of user fees we [are] having persons
coming in with skin rashes, persons coming in with back pain for about two years,
somebody...fell... ―I hit my chest when I was a child and now I find that I‘m having
some pain‖...[a] 30 something year old person... just come to get an x-ray...
persons coming in: ―boy, I feel like I have the flu‖ ―What have you taken?‖ ―I
don‘t really take anything but that‘s why I come to the doctor.‖ (RNFG1)
While improving users‘ health seeking behaviour was considered part of the policy
change, some NPs did not find that to be true. For example, patients were found to be non-
compliant in some instances. Some users were failing to attend their appointment then
later showing up unexpectedly at the health centres expecting to receive the services:
I find that because they hear there [are] extended hours, they come in any
time…they come in one o‘clock, two o‘clock [in the afternoon] and no matter how
many patients you have there waiting…regardless of the health worker‘s state, they
come in [at] three o‘clock [in the afternoon] they must be seen…it might be a
chronic case that missed their appointment or they say ―I missed last month, rain
was falling or because of the State of Emergency I didn‘t come.‖ (NPFG6)
171
Nurses viewed this type of behaviour by people as abuse of the system. According
to NPs:
[Users] abuse the system in that we tend to give them longer appointments for the
chronic cases. Once they come in we assess them they are stable, we might give
them a three month appointment and you provide the means by which they can
have their prescription repeated monthly until...[the] three months period elapses.
By next month they are back there [because] they can‘t find it [prescription] or
somebody had taken it or things like they didn‘t get it back from the pharmacist.
They [sometimes] dispose of it [prescription]…and when you check some of them
they have a pharmacy at home…they come with a whole bag…and you wonder
what sometimes happens with these elderly, if they are not poisoning
themselves…when the name of the drug changes they don‘t know, they get another
supply, they carry it home and they put it down. (NPFG6)
Users were also found to be roving across health centres, as well as hoarding
medications. This perception by practitioners of some users abusing the system and roving
from institution to institution resulted in NPs recommending greater educational
programmes to achieve changes in users‘ health-seeking behaviour. According to PHNs,
―The number has increased and the fact that they were told that they can go anywhere
now, I find people hopping from one clinic to another‖ (PHNFG3). Using multiple
facilities was problematic in terms of continuity of care: ―I have to call other health
centres to get sometimes their immunisation status because they keep hopping...because
that freedom was given to them to access the health care wherever‖ (PHNFG3).
While NPs agreed that those who needed care were utilising the services, they also
pointed to unnecessary use by some people, noting the measures adopted to manage the
behaviour. Non-urgent cases were often assessed and given appointments to return for
treatment. Patients were also expected to change the manner in which they used the
facilities, as well as being more considerate towards the nurses. Nurses also believed
patients‘ expectations of them had increased despite the increase in workload, further
adding to their frustration. Not having to pay also meant some people returned more often:
―We have them coming frequently, they come today, they did not think what the doctor said
to them was ok, they come back tomorrow again, another prescription is given. It‘s like
they [are] collecting the prescriptions‖ (PHNFG3).
172
Some hospital-based nurses highlighted their dissatisfaction, as well as the mood
changes they experienced prior to commencing duty daily. RNs commented: ―Not
satisfied...I am depressed sometimes...for example you know you are coming on duty...you
have medical clinic Mondays, Wednesdays and Thursdays and you know that you‘re going
to come on and see at least 50-something patients for the day‖ (RNFG1).
Secondary care nurses also commented on how users utilised the hospitals,
especially the A&E, and how this negatively impacted on the working relationships
between nurses in A&E and the wards:
You do find cases coming in the wee hours of the morning that you considered can
be seen [during the] daytime, you will see those in the nights. A child who has a
fever who has not fitted…for a day or two but they just decide to take the child to
A&E at this point in time…they have been having diarrhoea and vomiting but they
decide to come 1 or 2 o‘clock in the mornings because they assume that at that
point in time you won‘t have to wait. (RNFG2)
A significant impact for the nurses was the changed socioeconomic status of the
users they saw. This meant more people from the middle class were now accessing care at
the public health facilities compared to prior to the policy change. As a consequence of
this change, nurses found that they had to spend more time, as these patients asked more
questions about their health and were more aware of their health conditions: ―If you can
by chance bypass anything with a client from the lower socioeconomic group, you couldn‘t
do that with the middle class persons...because they would ask a lot of questions and they
take up more of your time‖ (NPFG5).
In addition, doctors in hospitals with private practice privileges also referred their
patients to the hospitals offering free services, further increasing the patient load:
What you find happening now [is] a lot [of] people who could afford the care
outside [are] coming in and a lot of the doctors who have their private practice
their patients do come in…they refer them to come into stay, do their surgery….get
their care here. They access the pharmacy, they access the lab, they access the CT
[Computer Tomography], they access the echo, they do everything in the one
hospital so they just come in as their private patients. (RNFG2)
173
7.7. Practitioners’ satisfaction with their work environment since the policy change
Practitioners were mostly dissatisfied and frustrated with the lack of resources,
especially equipment, in the work environment. Patients‘ negative attitudes also affected
practitioners‘ feelings about their work environment:
With the environment, there is much to be desired; we could do with some
improvements...because some of these locations you don‘t have any computer to
work with...Some of them even lack units, like even a fan and other equipment,
which would make the work quite easy like the Public Announcement (PA) system
so working conditions can be very uncomfortable...consider writing labels
for...even 400 labels by hand to deal with that quantity of prescription. (Pharm1)
Additionally, PharmFG9 commented, ―I‘ve noticed between then [the policy change] and
now...that the patients have become exceptionally abusive. And that‘s understandable
because [they‘re] waiting so long for service.‖ These threats had moved from being
verbal to physical.
A few practitioners expressed satisfaction with the work being done by NGOs such
as the NHF and the JSIF to refurbish some health facilities and space. However,
inadequate staff workspace continued to be a contributing factor to the dissatisfaction
some practitioners experienced. Difficulties resulted from the facilities not being spacious
enough to accommodate the large number of people now accessing the services:
We have the problem of overcrowding...the facility itself needs expansion,
particularly the area where the assessment, dressing, general first aid like
nebulisation is usually done. For a while, we‘ve been lobbying for a proper
dressing room and an area for assessment (NPFG6)
Furthermore, many were critical of the lack of equipment maintenance in the
facilities.
The other thing is that the frustration also exists in maintenance of equipment. All
equipment has a finite period for [its] lifetime and maintenance is really at [a] low
ebb. Any equipment from a blood pressure machine right up to a CT scan,
maintenance has been very poor, so we have frequent break downs and we‘re
unable to get it back up to working level in a reasonable time. (DR1)
One doctor, in an administrative role at a hospital, also expressed frustration with
the poor maintenance and inadequate equipment and supplies in the work environment:
174
It creates a lot of frustration on my part and, of course, I can speak for the others.
The other doctors report to me; the other departments report to me and I hear their
frustration and their frustration is their inability to deliver the service. Before,
there was a limitation in delivering but we had the option to ask the patient to
purchase some of the inputs into their care from private sources, for example, if
you have a hernia operation, there‘s an appliance we used called the mesh and we
could ask the patient…we can do your surgery if you go [to] the supplier and can
buy the mesh and bring it to us [and] we will do your operation. But now we have
limited ability to supply this mesh so the operation doesn‘t get done. (DR1)
Conversely, some pharmacists and NPs were satisfied with their work environment,
despite the challenges encountered, including abuse from clients.
Doctors shared their frustration regarding adhering to previous health policies
amidst the increased patient load. Furthermore, they expressed views on how adherence to
the new policy was impacting on their health:
Let us paint a picture. You have two doctors working at health centre, you have 60
people already registered, [and] you also have 20 people waiting to be screened.
You cannot turn anybody back, [because] that‘s not our policy but there are two of
you there. There is no lunch time; you feel pressured, you don‘t want to get up and
use the bathroom because you just want to hurry up and finish, go through the lot
and leave. So [you] end up with your ulcer stomach, bad digestive system, your
UTI [Urinary Tract Infection] but the patients are happy because the patients have
been seen. (DRFG7)
Others were also dissatisfied with the work environment. As a result, some had
opted to leave or resign from the public health system for more lucrative jobs in the private
sector and overseas. This was often due to the workload. Doctors commented:
I think with the free health care and the increase in the load of patients coming into
the hospital, the junior staff feel overworked, they are getting frustrated. They are
not as excited as before. So pretty much, my staff have been cut by more than
50.0% [due to resignations]. (DRFG8)
Impact of the policy on professional nurses’ physical work environment. In
talking about their physical work environment, NPs voiced their dissatisfaction with the
conditions at their work places in PHC:
175
For the past 21 years, I‘ve been using the same work desk...Sometimes you have
rats in there, since the drawers are bad it allows space for rat to come in. I‘ve
been asking for that desk [to]...change. I remember falling off [a] chair...that is
why I‘m speaking. (NPFG5)
Equally, PHNs were dissatisfied with their work environment: ―The building is in
a terrible state; heavily infested with termites all over. The electrical wiring [is] not up to
standard, the spacing...the place is terrible‖ (PHNFG3). Another nurse also reported
challenges in the work environment: ―Spacing is a problem. It is chaotic from Monday to
Friday. Sometimes I have to forfeit my office to facilitate somebody coming in from
outside like social workers‖ (PHNFG3).
NPs pointed out their dissatisfaction with the physical environment at some
outstations (rented properties utilised as health centres):
Some of the out-stations leave much to be desired. There is nowhere comfortable
for you to work. Most of the time they are rented buildings so you just work. Not
to mention the bathroom situation. I think if we are offering health care to people
then we should work in an environment that is fairly comfortable for us to do our
jobs. (NPFG5)
Despite refurbishment of some facilities, there was still need for more space and
suitable furniture: ―We are seeing refurbishing of the building itself but in terms of
furniture and space, we still have that problem...the furniture really deplorable‖ (NPFG5).
A similar situation existed in other parishes:
Some amount of effort has been made by NHF and JSIF to refurbish a number of
health centres and there are plans afoot to do some others…In terms of spacing,
the original structure for many of these facilities was not built to facilitate the
overwhelming crowd that we are getting now, so space is a problem.‖ (PHNFG3)
Nurses were not only concerned with space and furnishings, but also with the
temperature in the buildings:
The place is hot...I have a back problem...I have to be shifting around chairs just to
find a comfortable one. You don‘t have a proper fan system. The place is burning,
[it‘s] summer now. They put in AC [air conditioning unit] but the place wasn‘t
wired for it. You sit there looking at the AC and you‘re pouring wet. (NPFG5)
176
The lack of adequate ventilation in the buildings was another matter raised by the
nurses. NPs detailed their concerns:
When the facilities were made the persons who designed them did not think of
ventilation. These little areas that we work [in] have one little window and it‘s not
a window that can be thrown open. There is not much air coming in. There is no
cross ventilation. (NPFG5)
PHNs felt that the lack of adequate space was also affecting patient assessments.
They talked about how administration was addressing the problem:
Where I am, we have two offices. We have to be using outstations like you have a
desk on the outside, you have partitions, but it is not enclosed that you can have
your one-to-one. I feel because people can hear sometimes you don‘t actually get
what [information] you are supposed to get from the client. We have discussed that
in meetings but for the upper level management to deal with it, we haven‘t seen
anything as yet. (PHNFG4)
Some health facilities were better equipped than others. When working in less-equipped
facilities, nurses did not have the convenience of a lunchroom, therefore they took
shortened lunch breaks at their workstations, which lacked comfort and privacy and where
they were frequently disturbed by waiting patients.
General satisfaction among professional nurses. In talking about their general
satisfaction, nurses highlighted the areas of concern below. Nurses considered that feeling
a part of an organisation was as important to job satisfaction as the physical environment:
For me it‘s not only the physical environment because that‘s not all there is to a
work. I love to know that I feel a part of the organisation with which I work. Some
of us don‘t feel a part of the system because we are not involved in decision-making
at all. A little thank you sometime…If our supervisors or those who are in
authority visit us sometimes in our clinical areas, [it] makes a difference...come to
see how we are doing in the environment...and ask ―How are you doing?‖, ―How
[are] you getting on?‖ (NPFG5)
In commenting generally on the negative effects of the policy change on the current
situation in the work environment, PHNs were concerned about the decrease in quality
care:
177
The training that you had…personally you feel like you are not doing the job that
you are equipped to do...because you don‘t have the space and when clients come
you‘re not able to look after them the way you‘d like to; for example, if you had say
50 clients, the time you spend with one you‘re not able to because you‘re thinking
that the other 49 [are] thinking that I‘m spending too much time with one person.
(PHNFG3)
Due to the shortages of staff, large numbers of patients, and need to be present for
each patient, nurses found it difficult to take break periods and, as such, some had
developed ill health. RNs noted,
Nurses are exposed to every possible illness, and most of them are stress related. I
did not come into nursing with a peptic ulcer disease, I have it...UTIs are so
frequent [because] you can‘t even get a bathroom break. (RNFG1)
Additionally, nurses were very vocal about their welfare in the work place. They
were dissatisfied with the resources available to them and argued that more systems and
resources were required in the public health system to improve comfort on the job. RNs
talked about their concerns, which resonated with all other groups, and included the need
for training of more nurses; improved working conditions; provision of child-care support
such as a crèche for nurses of childbearing age; provision of a lunch room or lounge for
rest periods and lunch breaks; adequate medical supplies and equipment in all RHAs; and
other support for nurses such as counselling services. An RN commented on the need for
rest areas:
When I supervise at nights and I see the conditions under which the nurses work,
it‘s a shame...staff in general, the doctors will go into the patient‘s bed and sleep,
go on the cupboard tops, put their head on the desks. One chair on the female
ward...and there‘s a hole in it...people sitting there so long and they take the IV
[intravenous] fluid box and put in there... just for rest...we want better working
conditions. (RNFG1)
Generally, RNs felt that they were sought after by many overseas countries and, as
such, believed more should be done to retain them in Jamaica. In addition to an increase in
salary, nurses considered they could be given incentives such as ―recognition, houses, car
and concessions‖ (RNFG1) as a means of motivation. Despite the increased workload,
178
however, nurses remained committed to the professional code of ethics for nursing
practice.
Physical and emotional effect of professional nurses since the policy change.
Nurses spoke about the physical and emotional effects of the policy change on them. All
categories noted that their work was challenging and stressful. Besides increased
workload, nurses considered the policy change had resulted in extreme additional pressure
on them, tiredness, and stress. They felt service delivery could be negatively affected:
―I‘m stressed to the limit right now with work…can‘t cope much longer. It‘s two clinics,
it‘s almost the same staff so we are stressed, we are overworked‖ (NPFG5). NPs also felt:
―If you don‘t mind, when you think you are delivering quality health care, you are
compromising your health and also the patient‘s health.‖ (NPFG6)
In secondary care, nurses were also affected by the chronic workload and attitudes
of people toward them: ―You find that you are tired, you are overworked...I think it has
impacted on most of us in a negative light‖ RNFG2. RNs further commented,
I‘m normally cheerful...I worked in A&E for over a year as [a] Charge nurse.
Because of the constant abuse, verbal and threats...I remember requesting from the
matron that I be assigned somewhere else. I was becoming unhappy; I was
becoming very defensive, tense. I just needed to get out there. It‘s not so much the
workload, it‘s only because of the abuse [from] the patients. (RNFG1)
Other RNs also considered resigning as a result of the work burden: ―You are
frustrated, you are depressed, you don‘t know what to do. Some of the days I feel like I‘m
ready to leave now and go to another profession and do something different‖ (RNFG1).
This feeling of being overwhelmed resonated with RNs:
The other day I felt as if I was at a cross road...I even started looking for a job, I
was thinking to venture into something else apart from nursing. Just fed-up...I was
surprised because I never knew that day would ever come when I would feel this
way. (RNFG1)
7.8. Practitioners’ overall impression of the abolition of user fees policy
Practitioners expressed various views about the policy generally, ranging from the
policy being good, to having required more work prior to implementation, to requiring
revisiting to ensure sustainability and address the lack of resources. In comparing the
179
current policy with other countries, one practitioner suggested that a basic minimum
package was necessary. The negative impact of the policy on pharmaceuticals and the idea
that some patients should pay were opinions also expressed by the practitioners, who
considered these measures necessary if the government was to sustain the policy:
I think it‘s a learning process. Free health care is possible under certain
guidelines....We should arrive at a basic minimum that we [Jamaica] can
afford...There‘s a package, which means you won‘t die, you won‘t suffer severely
but if you want to go further then you have to pay for it…sophisticated
investigations or so. We can‘t have a blanket statement that all health care will be
free because if I look at examples from other countries that have free health
care…there are guidelines that are put in place and for one thing there is a basic
minimum, which is guaranteed, and above that the patient will pay...One of the
areas which suffers terribly from this free health care is the pharmaceuticals
because that is the area where we see a 100.0% or 120.0% increase...I think the
reason for this is that the patients are double or triple dipping into the
pharmaceuticals. In my opinion, the patient should pay something and there
should be an assessment process for patients who are indigent so they don‘t suffer
unnecessarily from inability to pay. (DR1)
Despite concerns about the implementation process, the benefits of the policy for
persons in need were highlighted:
Definitely there are persons out there who need the medication, who need the
health care and cannot really afford it. However, I think that it could have been
better implemented and the necessary controls should have really been put in place
to monitor patients and prevent abuse of the system. It is working but whether it‘s
working effectively or efficiently that‘s a different thing...It needs to be tweaked
some more...the efficiency part of it needs to be improved on... For the
effectiveness, there‘s certainly some amount of effectiveness. (Pharm1)
Systems to facilitate the smooth transition of the policy were apparently lacking.
Pharm2 noted that patients‘ behaviour in accessing pharmaceuticals had changed and, as
such, suggested necessary actions for the way forward:
Systems were not put in place to ensure that (1) patients did not abuse pharmacy
services [and] (2) adequate staff was put in place. The patients were lining up from
180
2 o‘clock in the morning. Free health care had good intentions but for [the]
pharmacy, the way forward, the major hospitals need a 24 hour service.
Pharmacists expressed the view that improved access negatively affected staffing
and quality of care, especially the ability to engage in their roles on hospital wards:
The access is now really greatly improved and they [persons] are now able to
access medications for conditions in which the medications are very, very, very
expensive. So in that sense there‘s a great benefit to the patient...We are not able to
optimise on the quality that we output, for example, when you look at our staff
shortage we are not able to extend ourselves even within the facility itself.
So...going on the ward and being able to audit the drugs and interact with the
health care team and the patients, then we are unable to deliver the type of quality
health care that we really ought to. (PharmFG9)
Similarly, doctors concluded that an evaluation of the policy was necessary, and
should happen before any further changes were implemented. The doctors who argued
that the policy had not been properly planned and should be revisited for more positive
results stated:
Free health care is not necessarily a bad thing if it is well-planned. If it‘s poorly
planned, poorly executed, it will be a bad thing. So we need to do away with what
we have and come with a well thought out plan...I think we would have a better
result. (DRFG7)
Professional nurses’ overall impression of the Abolition of User Fees policy.
RNs felt that the policy had more negative than positive impacts:
The patients benefit in one way but they suffer in many other ways. They wait
longer periods for investigations; some of them have to be done privately so the
money they would have paid to access the system, [they] end up paying three times
more [for] procedures privately or they end up suffering or dying without it
because they can‘t afford it or if they have to wait on the appointment time they
deteriorate even further. For the staff here, definitely no positives and the
resources are being depleted. (RNFG1)
This opinion resonated with other categories of nurses. For example, although NPs felt
that patients who were lost in the system now had access to specialist treatment and
surgeries, this came at a cost to nurses who sometimes were unable to take lunch breaks.
181
According to RNs, the policy was not working and required fundamental changes:
―It needs to be scrapped and other measures implemented‖ (RNFG2). Measures
suggested included returning to the previous arrangement for children under 18 years;
reverting to the use of assessment officers to determine who could pay; and free services
for children and the elderly. Nurses also maintained that some people were willing to pay
for health services.
PHNs noted that the quality of the services was questionable and that holders of
health insurance should utilise it. Furthermore, NPs felt that the policy should be revisited
with the involvement of key stakeholders. Areas in which nurses considered the policy
failed included:
In terms of funding, compromising nursing care and even medical care, in terms of
provision of medication...in terms of the time that the patient has to wait for an
urgent surgery...they have to get long appointment dates, [in terms of] equipment.
(RNFG1)
7.9. Conclusion
The policy change meant significant challenges for practitioners and nurses in
hospitals and PHC settings. Themes extracted from the individual interviews and focus
groups revealed practitioners‘ and nurses‘ perspectives of the user fees policy. Themes
highlighted included changes in workload and work environments; the number of staff
available to administer care; new working arrangements, which in some cases entailed
extended working hours or shift systems; the types of patients, as well as the conditions
seen; limited resources, which impacted on the treatment received and nurses‘ ability to
deliver quality care; and levels of satisfaction with the system in general since the policy
change. Practitioners and nurses were generally unhappy with the changes produced by
the policy and the scant regard shown for their welfare. Some even contemplated
resigning from the public health service. These findings have significant implications for
future policy development and implementation, staff retention, nursing practice and quality
service delivery generally. Despite these concerns, health workers adapted to their adverse
working conditions and made the system work. The next chapter will discuss the findings
of the study.
182
Chapter 8: Discussion
8.1. Introduction
This evaluation study used a multi-layered mixed methods approach to determine
the impact of the abolition of user fees in the Jamaican public health system from three
perspectives: policymakers, practitioners and users. The main objective of the policy
change was to improve access to health services for all Jamaicans, with the expectation
that people who had deferred care because of costs would now access the services.
Evaluating the impact of the policy change one year after its implementation in 2009 may
be viewed as too soon, since any change in the system might not yet have been
appreciable. However, it is clear that changes to the public health system were apparent as
soon as the policy was implemented and, as such, this study captured the early days
following the introduction of the policy, including the implementation process and issues
that required attention.
The previous two chapters demonstrated that, in the aftermath of the
implementation of the user fees policy, widespread changes came about in the Jamaican
public health system. This chapter will discuss the findings by drawing out parallels and
differences in relation to international experiences, as well as new understandings that
have emerged regarding the impact of the abolition of user fees on utilisation, access, and
the work of main care practitioners. The changes included significant increases in
utilisation, an indication of increased access to services, and far-reaching effects on the
work of practitioners, including the professional nurse.
This chapter provides an overview of the key findings regarding the abolition of
user fees and discusses (a) general impressions of the policy change, (b) impact on access,
and (c) impact on the work of health practitioners with a focus on the professional nurse.
Recommendations and implications are threaded throughout the chapter. Specific
categories of nurses will be referred to where appropriate while any reference to nurses
elsewhere in this chapter means all categories of nurses. The term ‗patients‘ is used
interchangeably with ‗users‘ throughout the chapter.
8.2. Overview of findings
The study revealed the potential of the abolition of user fees to improve utilisation
of the health services. For instance, visits to public hospitals and health centres had
183
increased following the abolition of user fees when compared to 2006. Additionally, there
was an immediate large increase in the use of pharmaceutical services at public health
facilities. The study also revealed that people obtained, stored and filled prescriptions
several times in order to take advantage of the free health care, which was widely
publicised in the media and at health facilities. The increase in utilisation was so far-
reaching it prompted policymakers and practitioners to describe it as a ―run on the
system.‖ In the absence of analysis that takes into account confounding variables, the
change in utilisation patterns may be an indication of the policy‘s success in regards to
access. Consequences of the increased utilisation were overcrowding and increased
workloads for practitioners. Users‘ behaviours in this scenario challenges the
interpretation of access by some proponents who argue that, access is the appropriate use
of services by consumers according to their actual or perceived needs.
Stakeholders had different perceptions regarding the policy change. Policymakers
were optimistic about the policy change and the subsequent increase in utilisation,
although not all had been equally involved in the development of the policy. The decision
to abolish user fees was made at the level of central government as a pre-election
manifesto. Accordingly, many national and regional policymakers merely steered the
implementation process and were not integrally involved in the entire policy process. To
put it in context, a policy process comprises approximately four stages: problem
identification or agenda-setting stage, policy formulation, policy implementation, and
evaluation (Hercot, Messen, Ridde, & Gilson, 2011; McPake, Brikci, Cometto, Schmidt, &
Araujo, 2011; Messen et al., 2011). Involvement in the entire process helps engender
additional support and mobilise resources for the successful implementation of the policy.
Conversely, lack of involvement often results in apathy on the part of stakeholders (Gilson
& McIntyre, 2005; Hercot et al.; McPake et al.; Ridde & Morestin, 2011). This was not
the case in Jamaica. There was no evidence of apathy; rather, it was apparent that national
and regional policymakers were significant players in the implementation phase despite a
lack of involvement in all stages of the policy. Policymakers were aware of their
responsibility to identify inequities and improve access to health services.
Generally, the view of policymakers was that the policy was a good policy, one
that was assisting them to (a) forge private and public partnerships, (b) invest in capital
improvement, staff development, and quality assurance, and (c) monitor the health system.
184
Equally, policymakers believed access to health services had improved and services were
now more equitable. The study also found that policymakers had novel ideas to further
improve access for the vulnerable. One such idea was the strengthening of community
health services in order to introduce a mechanism by which non-ambulatory users could be
monitored without having to visit an acute care health facility. Such a strategy should
improve access because services would be packaged in a manner that is responsive to
users‘ needs.
In contrast to policymakers, health practitioners were more cynical about the
policy‘s wide scale provision of free health care. While they thought the policy had good
intentions, they argued it required some amendments and suggested better systems were
required to make it effective and sustainable. They raised several concerns related to their
increased workload, the pressure exerted by the increased demand on the resource-
constrained health system, and government‘s ability to sustain the policy change. In
addition, practitioners were critical of their lack of involvement in the development of the
policy. Despite this criticism, policymakers claimed that meetings had been held with all
interest groups in the health sector prior to the implementation of the policy, suggesting
that practitioners had been involved with the policy prior to its implementation. One of
these meetings was a press conference, held the day prior to the implementation of the
policy. Practitioners‘ involvement, therefore, was largely at the implementation phase and
encompassed roles such as guiding the implementation process and establishing the
various arrangements in the policy at facility level. Practitioners‘ involvement in the other
stages of the policy process could have averted some of the concerns associated with the
policy change. This is because their work entailed daily interaction with the health system
to ensure access and, as such, was positioned to identify areas requiring strengthening.
In addition, professional nurses in both urban and rural secondary and PHC
facilities in Jamaica embraced the user fees policy and adopted measures to make it work
to improve access. Generally, nurses reported that the policy change has improved access
to care for those who could not afford to pay. They felt however, that the lack of
consultation prior to the policy change contributed to problems such as overcrowding and
inadequate drug supplies. The findings also showed that the policy change had negative
consequences on the workload of nurses.
185
Users were receptive to the policy and generally satisfied. They viewed the policy
change as a ‗good move‘ by government; moreover, they felt empowered to utilise the
health services without incurring any cost. Achieving a high level of satisfaction among
users augurs well for the success of the policy, as this may translate into increased uptake
of the services. It is, therefore, not unusual that each region revealed an immediate
increase in demand for services subsequent to the removal of the user fees in the public
health system. All stakeholders (policymakers, practitioners, users) agreed that more
people were accessing health services since the policy change. Furthermore, the increased
uptake of services was supported by data supplied by the MOH and extracted from the
RHAs‘ annual reports. This finding may be an indication that people had had unmet needs
and were now more comfortable seeking care under the new policy. It could also suggest
that removal of the direct cost for health care empowered people to access the required
care.
The study found that monitoring of the policy was haphazard. Nonetheless, the
CMO of Health and other staff in the MOH and RHAs were charged with responsibility to
obtain regular feedback regarding the policy. To fulfil this mandate, some policymakers
utilised statistics from regional reviews and various departments such as A&E to
extrapolate about the effects within each given region and institution. It was found that
policymakers were also using these data to modify the system and put necessary measures
in place. This finding implies there had been inadequate planning prior to the policy
implementation. It also suggests that important information about the changes caused by
the impact of the policy might not have been comprehensively captured.
8.3. Overall impression of the policy change
Policymakers. The stakeholders had varied impressions of the policy.
Policymakers were very positive and keen on setting up systems parallel to other countries
with similar policy changes to ensure sustainability of the policy and improve access
generally. A possible explanation for such optimism could be that there had been no
official evaluation of the policy, despite some practitioners publicly expressing concerns
about the negative effects of the policy. The optimism of policymakers, although not
studied extensively, has also been reported in some African countries (Ridde & Diarra,
2009; Ridde & Morestin, 2011). This does not negate that policymakers need to address
other issues that target individuals to limit disparity in access to health services.
186
Practitioners. Practitioners were desirous of having the policy revisited and
possibly reversed. They were more interested in a targeted system rather than a universal
system. Opinions voiced by practitioners included the following: (a) the policy should
have been implemented on a phased basis; (b) free health services should only be available
to children and the elderly; (c) a basic package should be created whereby persons would
pay for more sophisticated tests; (d) a zoning system should be introduced to limit users to
a particular geographic area, in order to control roving users who were sometimes triple
dipping in terms of pharmaceuticals; (e) those who can afford to should pay out-of-pocket
for services; and (f) those with health insurance should be required to use their insurance.
The current arrangement did not allow the insured to use their health insurance to access
health care in the public system. While above opinions were not all expressed in other
studies in African countries, some studies revealed that practitioners considered only
certain people should have access to free health care (Ridde & Diarra, 2009; Walker &
Gilson, 2004).
There was no shortage of criticism of the policy change from practitioners, who felt
the policy had been poorly executed and, as such, required revisiting. Some described it as
a failure, making references to the lack of funding and increased risk of compromising the
services being offered to the users. The reason behind practitioners being so critical of the
policy change may be due to them being at the operational level and strategically
positioned to evaluate the extent to which the policy was working. Furthermore, their
work had been acutely affected by the policy change. Even though practitioners in African
countries did not extensively voice these opinions, studies did reveal concerns about the
manner in which similar policies were implemented (Ridde & Diarra, 2009; Walker &
Gilson, 2004; Witter et al., 2009).
Professional nurses’ general perceptions of the abolition of user fees in
Jamaica. While nurses embraced the policy and were endeavouring to make it work
under trying circumstances, they had several concerns. Generally, they were concerned
about the physical working environment: poor infrastructure of buildings and furniture;
lack of temperature control and adequate ventilation; limited space for assessment of users;
and lack of restroom and lunchroom facilities. Despite these concerns, however, some
facilities had been refurbished by governmental and non-governmental organisations. The
study further found that, amidst the existing situation, some nurses were hopeful that the
187
work environment would improve. Moreover, some nurses worked in environments with
basic amenities, unconducive to the delivery of health care. The findings regarding the
poor physical working environment may be the result of pre-existing maintenance
problems rather than the removal of user fees. The increased demand created by user fees,
however, might have exacerbated the conditions. This corroborates findings from a study
in Africa, which reported poor working conditions for nurses, although it did not outline
the details (Walker & Gilson, 2004). Addressing these working situations is vital to
improving satisfaction among nurses.
Nurses frequently complained of being tired, stressed, depressed, ‗fed-up‘, and
overworked, and having altered mood and emotional states. Nurses felt demoralised by
the lack of recognition for their contribution to the health system generally and by their
non-involvement in the policy process as frontline workers. Furthermore, they sometimes
contemplated resigning under the pressure, especially when their workload was
exacerbated by verbal abuse from users. A possible explanation for the nurses‘ experience
is that the poor working conditions were a perennial problem worsened by the increased
workload and other effects of the policy change. This supports findings from studies in
South Africa where, despite some ambivalence, nurses felt the abolition of user fees
contributed to their feelings of being exploited, overworked and de-motivated to the point
of wanting to resign. South African nurses also felt left out of the decision-making
process. Some nurses in Africa felt professionally accomplished by attending to more
patients, despite having to care for patients who, they claimed, abused the free system
(Burnham et al., 2004; Kajula et al., 2004; Ridde & Morestin, 2011; Walker & Gilson,
2004). Conversely, other nurses in South Africa reported the urge to spend less time with
patients and found their work frustrating and tiring (Wilkinson et al., 2001).
In addition to the aforementioned concerns, nurses raised the following issues: lack
of consultative meetings among team members since the policy change; lack of visits by
supervisors; development of health conditions such as UTI and digestive disorders among
nurses since the policy change; lack of facilities such as crèches for nurses‘ children; and
poor remuneration. These concerns on the part of nurses might have resulted from
working in pre-existing disempowering environments. In contrast, some NPs reported
enjoying good rapport with other members of the team, and some administrative staff, such
as CEOs, were commended by hospital-based nurses for their support since the policy
188
change. Of note also, is that some concerns such as poor remuneration and lack of
facilities for nurses cannot be attributed to the user fees policy. The variation in views
regarding health team relationships is in contrast with studies from South Africa, which
reported that working relationships among team members remained unchanged (Walker &
Gilson, 2004). The finding regarding administrative support is, however, consistent with
results from some studies in African countries that reported nurses received support from
staff in authority at the health facility, which helped them cope with the free health care
experience (Walker & Gilson). While some of the issues above were not raised by nurses
in the African studies, the findings reinforce reports about lack of support from
supervisors, and nurses‘ feeling un-recognised and unrewarded for their contributions in
some countries (Walker & Gilson). These findings have implications for the successful
implementation of future policies and empowerment of nurses.
Users. Amidst policymakers‘ optimism and practitioners‘ and nurses‘ discontent,
there was a high level of satisfaction among the users who were the greatest beneficiaries.
The finding that the users surveyed were satisfied with the new system, despite voicing
concerns about the challenges they encountered while trying to access health services have
also been reported in African countries and is one of the factors contributing to increased
utilisation (Burnham et al., 2004; Ridde & Diarra, 2009).
Monitoring. No specific system for monitoring the policy had been established.
This resulted in reliance on existing systems, which may not have been an efficient
mechanism to capture those changes associated with the new policy. Although not
discussed extensively in the literature on abolition of user fees, monitoring mechanisms
were often lacking, resulting in insufficient data being captured about the impact of the
policy change in several countries (Messen et al., 2011; Ofori-Adjei, 2007; Ridde &
Morestin, 2011; Steinhardt et al., 2011). This has implications for recognising the changes
and addressing problems in a timely manner. Ineffective monitoring may also affect the
success of the policy.
8.4. Impact of the abolition of user fees on access to health services
To fully understand the study‘s results in terms of access, the perspectives of
policymakers, practitioners and the users on access and availability of resources since the
policy change were taken into consideration. While the findings regarding increased
utilisation of the health facilities are unequivocal, it is pertinent to discuss the findings
189
regarding the other dimensions to access, because increased utilisation is dependent on
people‘s ability to gain entry into the health system.
The literature presented in Chapter 3 highlighted multiple perspectives from which
‗access‘ may be interpreted, so the variety of ways in which people interpreted access in
this study was not surprising. Based on the findings, users‘ interpretation of this concept
might not be clear cut, because there were reports that access to health services was easier
since the policy change despite people having to wait in long queues at the pharmacy, in
treatment rooms and for surgical procedures. For users, having to wait to be seen was less
of an issue than receiving the medications and treatment. Reports by some users,
practitioners and policymakers indicated that access to health services such as
pharmaceuticals was particularly problematic. There were issues with buying drugs at
private pharmacies, having to pay for the drugs that were not on the VEN list at
government pharmacies, only being able to purchase a portion of the prescribed
medications, foregoing prescribed drugs generally, and waiting until medication was
available at the government pharmacy. Many users were not holders of health insurance
and, while some had a National Health Fund card, access to medications and health care
generally was still a challenge. Therefore, an increase in the number of people visiting the
health facilities may not translate into improved access to health services. Additionally,
availability of services may need to be considered in terms of difficulties encountered
while obtaining and forgoing care (Mooney 1983).
These findings corroborate studies that showed various factors impacting on the
supply of drugs in African countries following the abolition of user fees. For example,
there were issues with funding in Ghana (Witter & Adejei, 2007) and, while drug shortage
was initially prevalent in Uganda, it improved gradually (Burnham et al., 2004; Dieninger
& Mpuga, 2004). It is apparent that the drug supply issues in Jamaica were two-fold.
First, the supply of drugs was inadequate, and, second, expensive drugs were not on the
VEN list. This has implications for the procurement of drugs and revision of the VEN list.
Although a number of measures were taken by the Jamaican government including
expanding the VEN drug list to provide access to more pharmaceuticals in government
pharmacies; instituting a government card for easy access to drugs in private pharmacies;
and procuring cheaper drugs in larger amounts from international agencies, more
intervention is needed. For example, alleviating these problems in Jamaica might entail
190
establishing a mechanism whereby only listed drugs are prescribed, expensive drugs are
subsidised, or frequently prescribed expensive drugs are added to the list. Drug problems
have been found to influence health-seeking behaviour (Chuma et al., 2009) and several
studies in African countries also reported the unavailability of drugs (Burnham et al., 2004;
Nabyonga-Orem et al., 2008; Walker & Gilson, 2004). This further reinforces the
responsibility policymakers and providers have to ensure services are available, affordable
and responsive to people‘s need.
Another important finding was that some users were roving between health
facilities and would frequently hoard the drugs obtained at these facilities. The extent of
this practice is not known. This finding was unexpected and suggests that users did not
trust that the policy would be sustained and that more patient education is required
regarding the purpose of the policy change, the use of pharmaceuticals, and the use of the
health services in general. The lack of trust that the system would last may be attributed to
the nation‘s historical background, one tainted with mistrust and oppression under
Plantocracy. Double dipping in pharmaceutical supplies puts additional financial strain on
an already resource-constrained health system and was concerning to practitioners, who
were unable to track patient records for continuity of care. To manage the problem,
practitioners proposed a mechanism whereby standardised, centralised, and computerised
systems would be established in all health facilities to track people‘s utilisation patterns.
In some countries such as Australia tracking is managed by requiring people to
present a unique identification card in order to access services. These cards, known as
Low Income Earner or concession cards, enable holders to access subsidised services
(Scott, 2001). The mechanism could also be used to prevent overuse of the system. A
similar arrangement exists in Jamaica through registration with the NHF; however, it is
available to all Jamaicans, not exclusively low-income earners, and has not been
established or utilised as a tracking mechanism. Nevertheless, this arrangement entitles
holders to subsidised drugs and could be adopted as a useful mechanism for tracking
pharmaceutical uptake. The NHF could be reformed based on the Australian system as a
mechanism to also improve access for the poor. The findings regarding users hoarding
drugs and abusing the health system corroborate a study in Niger, which also noted that
users hoarded or created a supply of medication following the removal of user fees (Ridde
& Diarra, 2009). Additionally in South Africa, users were found to ‗shop‘ around clinics
191
in the aftermath of the policy change (Walker & Gilson, 2004). This level of mobility
among people has implications for policymakers to establish suitable mechanisms to
address these problems for successful policy outcome. This behaviour could be an
indication of low health literacy (Sudore et al., 2006) among users. Addressing health
literacy wouldrequire substantial work to understand its impact on the uptake and use of
pharmaceuticals.
New information was revealed about access to helplines, telephones, out-of-hours
services, and lack of resources in the facilities within the Jamaican context. Users were
generally unsure about the availability of helpline or telephone facilities to assist them in
obtaining assistance from a health professional. Although this lack of knowledge may be
interpreted as a barrier to access, it is the researcher‘s belief that having access to helplines
and telephones may not necessarily translate into better health-seeking behaviour. Other
concerns raised by users included problems in accessing health services on weekends,
public holidays and at night at some secondary care facilities, and the lack of resources
(staff and equipment) generally. For these reasons, users adopted behaviours to cope with
the issues, such as visiting private doctors for better and faster treatment. Access to
helplines, telephones, and out-of-hours use of secondary care facilities are unreported.
This finding, regarding some individuals reverting to the use of private facilities over
public offerings, corroborates the JSLC 2009 report that investigated people‘s experiences
since the abolition of user fees (PIOJ & STATIN, 2010). For some, the experience meant
forgoing care when required, which was often linked to cost-related factors. Practitioners
gave several accounts of users being sent away after initial assessment and asked to come
back due to overcrowding and insufficient staff to address their health needs. Despite the
increase in utilisation of services following the policy change, users were still confronted
with other access issues.
Nevertheless, users continued to visit these facilities for health care. The
overcrowding did not deter users, who often changed their behaviour and queued up at
health facilities very early in order to be seen. A possible explanation for the attitude
toward such obstacles while accessing care is that users were not fully aware of what
access constituted; therefore, visiting a health facility and being told to return for treatment
on another day did not distort their perception of access. The finding about users being
sent home because of overcrowding has not been previously described in other research.
192
This is an important finding because it is unclear how assessments or the decision
regarding whom to send home was made, which may also indicate that people are
experiencing other barriers to accessing health services. Returning home without being
treated could result in worsened health conditions for the users. There has been limited
investigation into users‘ access to helplines and telephones in countries with removal of
user fees, but reports regarding lack of resources and people reverting to private
practitioners and other sources for treatment have been documented in countries such as
Ethiopia (Asfaw et al., 2004), Ghana (Chuma et al., 2009) and Uganda (Nabyonga et al.,
2005; Rutebemberwa et al., 2009; Xu et al., 2006). A significant phenomenon in the
Jamacian experience is that users were reverting to private practitioners and other sources
for care, suggesting that their health-seeking behaviours were not only linked with the cost
of obtaining care.
The findings revealed users were pleased that their expectations of the health
system were being met. They were satisfied with the services provided and rated the
quality of care received as good. Despite these favourable ratings and services now being
free, the study confirmed some users continued to use alternative means of treatment such
as home remedies, often in the form of bush tea; self-treatment; and the services of
herbalists, spiritual healers, and traditional healers, whilst simultaneously obtaining
treatment from health facilities. There was no clear explanation for this finding; however,
it is likely to be due to the cultural practices that embody the Jamaican society. Other
factors possibly contributing to this behaviour were lack of confidence in the health
system; belief that illness is the result of a curse (Seaga, 2005; Spence et al., 2010); or
having had more positive health outcomes from alternative treatment in comparison to
conventional treatments (Picking et al., 2011). While adopting self-care measures are
positive health behaviours and consistent with international trends (WHO, 2002, 2008), the
researcher, however, has concerns regarding the possible herb-drug interactions and
efficacy of some treatments. This finding regarding simultaneously utilising health
facilities and alternative treatment is supported by several studies in countries such as
Uganda. A study in Uganda on utilisation of public or private health care practitioners by
febrile children after removal of user fees showed that, despite free care being offered in
government facilities, caregivers also visited a drug shop or private clinic for treatment
(Rutebemberwa et al., 2009). In Ghana people also resorted to other sources for treatment
rather than the arrangement provided by government (Ansah et al., 2009). Such treatments
193
were considered cheaper, located nearer to users, or available on credit. The paradox here
is that in the absence of financial resources to access health services, individuals opted for
other forms of treatment (Hardeman et al., 2004; Jacobs & Price, 2006; Peters et al., 2008)
however, when costs were removed for services such behaviours continued. Despite
international endorsement, the use of alternative medicines may produce undesirable
health outcomes if inappropriately used. Therefore, this has implications for patient
education; research into alternative treatments and their effects; and dialogue among
stakeholders on the concomitant use of herbs and prescribed medications. While the use of
alternative treatment is topical and is utilised in the Americas, this study did not explore
the literature on the topic further.
The need to travel long distances to access care may have contributed to the use of
alternative or informal treatments, especially when transportation costs were a problem.
Travelling across borders is often attributed to people‘s need to find facilities that offer all
the services they need. Accordingly, policymakers should ensure all facilities are fully-
equipped with the necessary resources to meet the needs of the population they serve.
Travelling across borders contributed to overcrowding in some facilities and disrupted
continuity of care; therefore, measures should be implemented to enforce the use of
services within particular borders. This recommendation endorses the suggestions by
some participants to (1) institute zoning, and (2) introduce mobile services to make
services more accessible to people. These findings are not fully explored in other studies,
although in Ghana a randomised control study found that use of informal care increased in
relation to the distance from formal health facilities (Ansah et al., 2009). The impact of
delaying or forgoing care by users when travel cost are astronomical needs further
investigation as these impacts can increase mortality (Hardeman et al., 2004; McCaw-
Binns et al., 2001).
While users were aware that user fees had been abolished, many were unable to
identify all the services and drugs that were free. This suggests that some users were not
knowledgeable about the package being offered to them and, therefore, may not have
accessed some free services even if they had the need. This finding corroborates the report
from the JSLC 2009, which found that some persons in the lower quintile were still not
accessing care despite it being free. This could be attributed to people‘s lack of knowledge
regarding the new service arrangements due to the precipitous nature of the policy change.
194
Otherwise, it might be due to people‘s reluctance to learn about the details of the services
available to them. Messen et al. (2011) reported a similar situation in sub-Saharan African
countries, in which the lack of planning affected the implementation of the policy,
including dissemination of information to users. Dissemination of information about the
policy in Jamaica was done via several channels, including print and electronic media,
posters in health facilities, and health personnel. It is apparent that the dissemination of
information process assumed some level of health literacy on the part of the users. Health
literacy has been shown to influence how people access and use health services (Cooper,
Hill, & Powe, 2002). It is also possible that those already engaged with the system had
more exposure to the policy change than those who were not. The limited level of
knowledge regarding free services is indicative of the need for further clarification of the
policy for end-users. In Ghana, some communities did not sufficiently understand the
abolition measures due to inadequate planning and consultation prior to the policy
implementation, which ultimately affected how the services were utilised (Witter et al.,
2007a). The findings from the Jamaican study have implications for a more targeted
public education campaign regarding the terms and conditions of policies prior to
implementation.
A large percentage of the users had been using the health facilities for protracted
periods of time, which may explain the expressed levels of satisfaction with access to
services, although there were concerns about lack of involvement in the planning of the
services offered to them. Some users even travelled far distances to access the health
facilities of their choice, which were not always the closest to their homes. Among the
reasons given for their general choice of facilities were, good treatment, convenience, easy
access both geographically and for appointments, and affordable services. Additional
costs for transportation and meals were incurred when individuals travelled far distances
and waited long periods for care at health facilities. This suggests that people‘s
perceptions of the services a facility offers influence choice (Kiwanuka et al., 2008).
Equally, people who waited a long time for appointments, which could be over one year,
were at risk of deteriorating health conditions that might require more extensive treatment,
further adding pressure to the health system. These were cited as problems users
encountered while accessing care. People were also frustrated and vented their feelings on
the practitioners when they waited a long time for care. These findings suggest a need for
alacrity in addressing the demand for resources that may result in reduced waiting times.
195
While no standardised instrument was used to capture the quality of services data,
concerns raised by practitioners related to the limited time available to assess users due to
the large number of persons; increase in dispensing errors since the policy change;
inability to care for users holistically; and increase in users‘ complaints. The lens through
which practitioners viewed these concerns might be explained in part by (1) the type of
heath facility to which the practitioner was assigned, (2) the health outcomes of users since
the policy change, (3) the staff complement at the facility, (4) whether the facility was
rural or urban, (5) the level of teamwork in the facility, and (6) the availability of resources
such as drugs. The views, however, are invaluable since practitioners functioned at the
operational level of the health facilities and had sufficient experience to judge the quality
of services being offered. The inability to administer care according to expected standards
not only jeopardised the lives of patients but also constituted additional stress for the
practitioners and increased the likelihood of litigation. The threat of litigation was not
explored in this study. Some practitioners were however, concerned about their inability
to deliver care in a manner consistent with their training, as well as the risk of losing their
registration status. These quality concerns reflect the need for additional resources to
ensure safe, effective and efficient service delivery. Equally, the quality of services in
South Africa was found to be reduced in the presence of increased patient loads, less time
spent with users, and lack of privacy (Walker & Gilson, 2004). In Uganda there were
reports of long waiting times, unfriendly staff and poor aesthetics in the work environment
(Burnham et al., 2004; Kajula et al., 2004), although the lack of cleanliness and poor staff
attitudes in Uganda were subsequently refuted by another study (Nabyonga et al., 2005).
These findings are indicative of the need for policymakers to monitor quality indicators to
ensure an efficient service delivery system.
This study found that there had been a reorienting of the Jamaican health system to
accommodate the impact of the policy change. This included restructuring and
strengthening the PHC system to reduce the pressure on secondary care services and
promote preventive services. To accomplish this, health centres had been refurbished and
new ones constructed, additional staff deployed to these areas, and people who utilised
secondary services ‗inappropriately‘ as suggested by practitioners, were frequently
diverted to primary care facilities. Reorienting the public health system also meant
training new categories of staff such as dialysis technicians, recruiting additional health
practitioners locally and overseas, extending the opening hours, adjusting the shift system
196
in some PHC facilities, and collaborating with private and semi-private organisations.
These measures were adopted to ensure the efficiency of the public health system and
success of the policy. Although there is no evidence from other studies to suggest health
services had been redefined to address the effects of the policy change, researchers in
Uganda (Nabyonga-Orem et al., 2008) and Madagascar (Fafchamps & Minten, 2007)
described efforts made by governments to strengthen their health systems by procuring
more pharmaceuticals, increasing budgetary allocations to the health system and training
new staff. Of note is that practitioners in Jamaica, Uganda and Madagascar complied with
the various changes and adjustments to their work situation in order to make the policy
work.
Policymakers felt that, in order to ensure access, other health-related policies could
be implemented, for example, encouraging more self-care and introducing mobile-type
services to alleviate problems associated with transportation when care was required.
They were interested in improving services for particular population groups such as the
elderly, adolescents and persons affected by HIV and AIDS. By the same token, others
were concerned with policies that would foster utilisation of PHC facilities for non-
emergency problems rather than A&E, with a caveat that the infrastructural arrangements
in the PHC facilities would need to be improved. Expanding the scope of practice for
some health practitioners such as NPs, pharmacy technicians and patient care/ward
assistants and clarifying the 40-hour work week were other means suggested by
policymakers to make services more accessible to persons. While these proposals augur
well for the policymakers, the impact of such interventions on health care delivery should
be carefully assessed. These mechanisms, if addressed, would serve dual purposes. They
could further improve users‘ access to health services, and avert any deleterious effects on
staff. Health system modifications of this nature to improve access have not been
mentioned in previous studies on the abolition of user fees.
Even though access to health services was a problem for some persons, self-referral
was the main mode of entry to the health facilities by individuals requiring care. This
suggests people were empowered to exhibit positive health-seeking behaviour. The mix of
services also meant that people initiated and accessed care at various health facilities. This
study found a slight increase in self-referral for 2009 in comparison to 2006 (Table 14).
This increase may be attributed to the lack of gatekeeping in accessing health services,
197
acceptance of self-referral as the main mode of entry into the health system, freedom to
access care based on preference, and greater awareness of health needs under the new
service arrangement. Gatekeeping by practitioners in primary care can reduce demand on
hospital services (Forrest, 2003). This finding of high self-referral has not been described
in other studies on the abolition of user fees. However, a decline in people being referred
to hospital by practitioners after the removal of user fees was reported in Africa, possibly
due to improvements in the services offered resulting in reductions in referral, or
reluctance by lower level facilities to refer people to regional facilities for fear of losing
reimbursement (Witter et al., 2007a).
Socioeconomic group and impact of abolition of user fees. While this study did
not categorically identify the socioeconomic status of who was utilising the services,
several conclusions can be drawn from the data. Very low monthly incomes were reported
by the majority of the users who completed the patient survey. Policymakers and
practitioners reported that they considered the poor were benefiting from the policy change
and that persons who had not been able to afford the services prior to the abolition of user
fees were now accessing these services. Additionally, reports of an emerging trend
whereby discharged users remained on the wards as borders for longer than necessary
because family members chose not to receive them or continue their care at home are also
indicative of the low socioeconomic status of people using the services.
While these accounts offer a suitable explanation for the socioeconomic status of
the persons utilising the system, caution must be exercised in interpreting them. This is
because the observed increase could also be attributed to what some practitioners
described as an increase in the number of users being referred from private institutions
since the policy change, as well as inappropriate use of the health facilities by some users.
Of note is that some doctors working in the public sector also worked in private health
facilities and it appeared that, since the policy change, they were now frequently referring
their private patients to the public facilities. In addition to increasing the patient load, this
suggests diversity in the social status of the users. These findings regarding the social
status of the people utilising the health system supports studies in Uganda, Ghana and
South Africa, which found that more poor people utilised the health services following the
removal of user fees (Burnham et al., 2004; Penfold et al., 2007; Walker & Gilson, 2004;
Wilkinson et al., 2001). There were also reports that both poor and non-poor in Uganda
198
contributed to the increase in utilisation (Xu et al., 2006). Some researchers were able to
determine the socioeconomic status of the users through household surveys, while others
expressed caution that their findings did not clearly identify the socioeconomic status of
the persons contributing to the increase in utilisation. People remaining in some Jamaican
hospitals because families did not take them home and reports of low income may be
indicative of users‘ social status. It may be evidence that this group of users were
experiencing disparity in accessing required services. Socioeconomic status has been
shown to be a barrier to accessing health services (Goddard & Smith, 1998, 2001;
Mooney, 2009; Schoen & Doty, 2004). Nevertheless, appropriate measures need to be
established by policymakers to determine who is actually benefiting from the policy
change, as this has implications for sustainability of the policy, future policy direction, and
access.
Impact on utilisation of health services. Utilisation increased following the
removal of user fees. Reports by policymakers, practitioners, and users corroborated data
from the MOH and RHAs annual reports, showing increases in the following areas:
hospital admissions, outpatient visits, A&E department visits, pharmacy utilisation, and
health centre visits, as well as the total number of surgeries performed one year after the
abolition of user fees. While hospital admissions increased in Jamaica, they remained
stable in Uganda (Nabyonga et al., 2005; Yates, Cooper, & Holland, 2006). The
explanations offered for this Ugandan finding were related to cost-related issues (people
who could pay were charged a fee) and hospital capacity limits (Nabyonga et al.). The
situation was different in the Jamaican context, since services offered in hospitals were
free regardless of users‘ ability to pay.
These findings are similar to changes in PHC utilisation patterns following the
removal of user fees observed in African countries such as Uganda, which had an increase
44.2% in 2001 and 77.1% in 2002 (Burnham et al., 2004, Nabyonga et al., 2005; Yates et
al., 2006) and Madagascar (Fafchamps & Minten, 2007). Utilisation patterns varied for
some countries, which may be a result of how wide-spread the policy change was. For
example, Uganda implemented a nation-wide policy change, while exemption or abolition
of user fees was limited to certain populations groups or geographic areas in other
countries.
199
MOH data showed that, there was an increase in the total number of new cases in
2009 over 2006 (MOH, 2010). Analysis of this data however, indicates that those persons
using the services were mostly repeat users, returning for treatment for the same or new
illnesses. This was deduced from the number of years people had been using the system.
As such, this may not be a true reflection of increased access. This raises a very important
issue concerning people who might be ill yet still not accessing the required care, as well
as others who may have reverted to the use of private facilities and other modes of
treatment, a finding which is supported by the JSLC 2009 (PIOJ & STATIN, 2010).
Conversely, reports from South Africa revealed a sustained number of new registrations
for curative services following removal of user fees; however, attendance by children
under the age of six declined. The explanation offered for the decline was that congestion
in the facilities and reduced consultation time deterred women from seeking maternal and
child health services (Wilkinson et al., 2001). In Uganda, new cases increased following
cost-sharing, but a decline in attendance was observed seven months after the policy
change. Similarly, utilisation in Jamaica declined six to nine months after the
implementation of the policy, which suggests that the significant initial increase may have
been due to gaps in the system, people who were ill having delayed seeking care prior to
the policy change, or people possibly being disenchanted with overcrowding in the
facilities.
Evidently, the aforementioned findings regarding utilisation in Uganda and South
Africa (Burnham et al., 2004; Wilkinson et al., 2001) showed comparable impacts
regarding utilisation following the removal of user fees in the public health systems. The
findings, however, regarding the decline in utilisation after implementation of the policy
occurred at varying time periods. Despite the reported decline, the study revealed
sustained daily overcrowding at the health facilities. This has implications for health
practitioners‘ workloads and levels of satisfaction, as well as for the supply of resources.
Regional variation in utilisation of some services. Regional variations were
evident in the manner in which people utilised the services. Most diabetics accessed
hospital inpatient care in NERHA (the smallest region) whereas most of those accessing
PHC facilities did so in the largest region, SERHA. People affected by hypertension
accessed care in PHC settings in SERHA generally. Studies from other countries have
revealed regional variations in the manner in which people utilised health services. For
200
example, in Uganda, utilisation of health services was higher in the western side of the
country in comparison to the northern side (Dieninger & Mpuga, 2005). It is not possible
to explain the regional variation in Jamaica from this research however, this phenomenon
may be due to several factors including users‘ preference of facility, the manner in which
facilities offer services, people in an acute state seeking care from hospitals rather than
PHC, PHC users possibly having better health-seeking behaviours and being more aware
of the services available to them; or supportive follow up systems in the health institutions.
Other studies have provided evidence of regional, demographic and geographic variations
in surgical procedures such as tonsillectomies and appendectomies, and other treatment
procedures (Boss, Marstellar, & Simon, 2012; Lopushinsky, Austin, Rabeneck, &
Kulkarni, 2007; To & Langer, 2010). Such regional variations need to be investigated
further to determine the factors that influence the service delivery mechanisms and health-
seeking behaviours of users.
Data obtained from the MOH and RHAs‘ annual reports revealed there was an
overall increase in the Maternal and Infant Mortality and Crude Death rates in 2009.
Three regions (SRHA, WRHA, and SERHA) recorded a decreased Infant Mortality rate.
The increase in the crude death rate, however, was across all four RHAs. Also found was
an overall increase in Maternal Mortality rates generally, with marked increases in SRHA
and SERHA. The changes in Maternal Mortality rates might not necessarily be associated
with the policy change, as they might be influenced by demographic changes, as well as
the recording mechanisms used by the MOH and RHAs. Nevertheless, the high maternal
mortality rate recorded in SRHA is of concern and requires further examination to
establish the contributing factors. As alluded to earlier, in the absence of analyses to take
into account any confounding variables, there are no clear explanations for these
unanticipated findings. These results should be interpreted judiciously as they have not
been previously observed in other studies, in South Africa for example the uptake of
maternal and child health services declined following the removal of user fees. This
problem was attributed to the congestion in health facilities and reduced consultation time
(Wilkinson et al. 2001). In Ghana delivery-related-deaths declined (Asante et al., 2007).
8.5. Impact on the work of main health practitioners and the professional nurse
The study revealed practitioners‘ workloads increased following the policy change.
Practitioners embraced the policy change, although there were feelings of discontent about
201
a number of issues such as their non-involvement in the policy development. This finding
was endorsed by policymakers, who reported that the health workforce had embraced the
policy and offered excellent service in some facilities even though they were pressured.
Practitioners‘ concerns included feeling stressed and overburdened by the increased
workload since the policy change. Such experiences, however, did not negatively affect
their resolve to make the policy work. This supports the findings of studies on abolition of
user fees in Ghana where health workers were shown to embrace the policy change, citing
opportunities to improve professionally and serve people although workloads had
increased (Witter et al., 2007a, 2007b, 2010). Staff morale was also negatively affected in
Uganda (Burnham et al., 2004; Gilson & McIntyre, 2005). Although Jamaican health
practitioners‘ job security was not threatened, it was not uncommon for staff in countries
such as Zambia and Uganda to lose their jobs because revenue previously generated from
user fees to pay salaries was no longer available (Masiye et al., 2008; Nabyonga-Orem et
al., 2008).
Practitioners‘ increase in workload may be the consequence of a number of factors:
(a) additional workload not only from people genuinely in need of health care but also the
inappropriate and haphazard manner in which other persons used the facilities, (b) having
to work and manage facilities with inadequate staff, and (c) having to improvise in the face
of limited resources in order to offer quality service. Similarly, in Uganda, Ghana and
South Africa (Bhayat & Cleaton-Jones, 2003; Burnham et al., 2004; Chuma et al., 2009;
Witter et al., 2007a, 2007b), the increased workload for health workers in the aftermath of
the policy change was sometimes attributed to unnecessary use of facilities by some
persons (Ridde & Diarra, 2009; Walker & Gilson, 2004). To address this type of user
behaviour, policymakers need to reinforce existing measures and establish new ones in
order to sensitise people about the appropriate use of the different types of health services.
Mechanisms to ensure adherence to the measures should also be introduced.
As well as increased patient loads, practitioners reported seeing existing health
conditions in larger numbers. For example, they were seeing more users with chronic
diseases such as hypertension, diabetes and lung disorders, rather than new conditions.
This finding suggested that the case mix had remained the same for most facilities and
existing users were utilising the services more often. While most of the results regarding
changes in the manner in which practitioners offered services have not been fully
202
described in the literature, similar findings on case mix have been reported. A study in
Uganda also showed that the case mix attending health facilities remained unchanged after
the removal of user fees (Burnham et al., 2004). Nevertheless, the profile of the users of
the Jamaican health system since the policy change needs more targeted investigation.
Professional nurses’ workload. Clinically, the work of professional nurses
increased significantly following the implementation of the no user fees policy. The study
found nurses perceived that the policy change created additional pressure and destabilised
their working situation, and compromised their ability to maintain professional practice.
Measures were, however, adopted for effective implementation of the policy. Nurses, who
are integral to improving access, frequently had to prioritise patient care in relation to the
resources available to them. This also required improvisation to ensure an acceptable
standard of service delivery. It was not unusual for nurses to make critical decisions
regarding patient care despite inadequate resources and increased demand for service. For
this reason, some patient care was often deferred due to resource constraints, for example,
inadequate numbers of staff. This finding corroborates reports from most of the work in
this field in Africa, in which nurses and health workers generally were found to experience
increased workloads following the abolition of user fees (Burnham et al., 2004; Kajula et
al., 2004; Ridde & Diarra, 2009; Ridde & Morestin, 2011; Walker & Gilson, 2004;
Wilkinson et al., 2001; Witter et al., 2007a, 2007b). Of note however, is that increased
workload for health workers, including nurses, in some countries was commensurate with
an increase in pay (Witter et al., 2007a, 2007b). As will be shown below, the impact of the
policy change on the work of the nurse in the Jamaican context differed in several ways
from the findings of other research.
When the nursing groups were disaggregated by the researcher, their views
regarding the impact on work differed. Some PHNs engaged in ‗crowd control‘ in PHC
facilities in order to maintain a harmonious work environment. This task frequently
created additional stress, which could contribute to burnout. This also meant time that
should be spent administering nursing care was spent on non-nursing activities, which had
implications for effective service delivery. Equally, NPs reported having to find strategies
to manage the increased numbers of patients, which included brief assessment times and
postponement of care. When care was postponed, patients were initially assessed and
given appointments to return for care. Although deferring care to another day was a
203
temporary solution to manage patient load, it contributed to a recurrent cycle of sending
patients away, which might have negatively impacted on patients‘ wellbeing because their
conditions could deteriorate while waiting to be seen. In addition, when patients returned,
this contributed to the workload of another day and had implications for mobilising
sufficient resources to manage the increased number of persons using the system.
The unnecessary use of the services by some people not only put strain on the
limited resources in the health system but also contributed to the stress and workload of
nurses. Nurses reported that users from the private health system and middle classes, were
now sometimes presenting for non-urgent problems. Managing this issue requires
fundamental changes in people‘s health-seeking behaviour and may be achieved through
patient education. Furthermore, it was difficult for nurses to consistently practise within
their training and regulatory standards. For example, nurses expressed concern about their
inability to care for patients holistically due to the increased numbers. They often
administered physical care in a hurried manner with limited time to counsel and educate
patients. Nurses‘ ability to create a patient-friendly waiting environment was also
negatively affected by overcrowding. These issues may impact negatively on health
outcomes, because managing a patient holistically, coupled with patient education, not
only improves health status but may also encourage compliance with therapy. In addition,
hurried care negatively affects the nurse-patient relationship, reduces the quality of service
offered to individuals and increases the risk of litigation.
The study further found that NPs and doctors performed similar roles in the health
centres; however, as a key role, NPs single-handedly managed services such as school
medical examinations. All children need a school medical; in the absence of this
certification, children are denied entry into schools. While NPs working parallel to doctors
is not an outcome of the policy change, their presence has increased the number of persons
with the requisite skills to assess and diagnose, thereby alleviating the pressure on the few
doctors in the system. By virtue of their training NPs have the knowledge and skills to
perform many tasks that are similar to a doctor. Patients have been found to be more
satisfied with services offered by NPs; they offer better quality care, had longer
consultation time and ordered more diagnostic tests (Horrocks, Anderson, & Salisbury,
2002). This further contributed to the effective implementation of the policy in terms of
the presence of skilled personnel to respond to the demand for care. There is little or no
204
discussion on the above issues in the literature from other countries that have experienced
removal of user fees. While a few studies have reported the impact of removal of user fees
policy on the work of the nurse, there is seldom mention of the particular categories of
nurse or details of how their work changed (Witter et al., 2007b; Walker & Gilson, 2004).
Nevertheless, in South Africa, PHC nurses reported compromised professional standards
as a result of being ‗stretched‘ by a large number of patients (Walker & Gilson, 2004).
Assessment of the effects of removal of user fees on the work of professional nurses is
important because it has implications for adequate staffing and future policy
implementation. This is because nurses such as NPs have been found to increase access to
quality and effective health care in some geographic areas and are strategically positioned
to manage culturally-related access barriers (Safriet, 1992).
Individual nurses care for different numbers of patients and they were sometimes
unhappy with patients‘ attitudes toward the health system generally. This current study
showed that NPs could not agree on the number of patients they were now attending.
According to data obtained from the NPs, the number of patients did not apparently vary
significantly from the pre-reform figures of approximately 25-30 patients per day. In
contrast, PHNs offering maternal and child health services had to manage larger numbers
of users. Thus, overcrowding was a daily occurrence for most primary and secondary care
facilities. The study further found that some patients were considered inappropriate by the
nurses, whereby they were non-urgent cases or could pay for the services. While previous
studies did not mention the number of patients seen or number of hours worked by all
categories of professional nurses, Walker and Gilson (2004) reported that nurses in Africa
were concerned about overcrowding and increased workload, which suggests there were
large numbers of patients to care for. Additionally, studies mentioned extended or long
working hours and high mean client numbers per week for doctors and midwives in
Afghanistan, Ghana and Senegal, with midwives‘ daily workloads dependent on whether
they were in a regional or local facility (Steinhart et al., 2011; Witter et al., 2007b, 2009,
2010).
Nurses were also concerned that the quality of services offered to clients had
deteriorated since the policy change, and the increased patient load had affected their
ability to adequately assess patients. Increased numbers resulted in reduced assessment
time for each patient. Nurses were unhappy with this practice, which could jeopardise the
205
users‘ wellbeing and the nurses‘ professional status. As a result, information crucial to
making an accurate diagnosis could be missed. In addition, attempting to meet the needs
of all patients could result in burnout, forcing nurses to perform poorly on the job, stay
away from work, or resign. All these factors potentially affect the sustainability of the
policy.
In addition to the compromised quality of services, the nurses reported that there
was sometimes a lack of privacy when attending to patients. This was a concern for PHC
nurses because lack of privacy could prevent patients from sharing important information
required for accurate treatment. The study revealed that these factors affected the nurses‘
ability to maintain minimum standards of quality care and might have serious implications
for access and the success of the policy generally. This is consistent with studies in South
Africa and Uganda, which also reported that practitioners, including nurses, considered
that services provided since the introduction free health care were of lower quality, with
reduced time available for each patient; and a lack of privacy when attending to patients
(Burnham et al., 2004; Deininger & Mpuga, 2004; Kajula et al., 2004; Nabyonga et al.,
2005; Nabyonga-Orem et al., 2008; Walker & Gilson, 2004). Generally, the workload of
nurses increased in the aftermath of the policy change, resulting in unanticipated
consequences such as nurses being pressured to made critical decisions about their work
and the delivery of patient care. It is apparent that while some services were available to
the users, they may not have met their needs. These findings are vital to the success of the
policy and future policy direction.
Resources and the work of main health practitioners. Compounding the
increased workload of practitioners were a number of other factors including under-
equipped facilities, lack of computerised systems in some pharmacies, and poorly-
functioning equipment. While the experience with equipment may be related to untimely
maintenance, it may also be due to the additional strain from the increased demand and the
low priority given to repair equipment by policymakers due to a shift in focus to other
matters. The claim regarding resources resonated with both policymakers and
practitioners. Supplies such as family planning methods and reagents for diagnostic tests
were inadequate. Practitioners were often frustrated because of their inability to provide
the services required; in some circumstances users were asked to purchase their own
materials in order to access procedures such as hernia repair. This finding revealed that
206
only some users could afford to purchase materials and, as such, inequities continued in
the system. Equally, poor access to family planning methods predisposes a childbearing
family to unplanned pregnancies, STIs and economic hardship.
Inadequate resources such as equipment have not been discussed extensively in the
literature, however, countries such as Uganda experienced problems with equipment and
supplies in the aftermath of the policy change (Burnham et al., 2004). Additional
budgetary allocation was injected into the Ugandan health system for support prior to the
policy change (Dieninger & Mpuga, 2004). Jamaica also received additional budgetary
support, which was insufficient to meet the increased demand. Except for countries in
which the policy was not fully understood and facilities reverted to charging for services
(Chuma et al., 2009), there is limited discussion in the literature regarding patients having
to purchase supplies after the removal of user fees. Patients having to pay out-of-pocket
for supplies, indicates that the policy, which was meant to improve access, was now
creating barriers and inequity.
Of significance is that this study found practitioners changed the manner in which
they offered care in order to contribute to improving access to health services. Changes
included extending health facilities‘ working days and working hours; adjusting some
institutions‘ policies, especially those related to when and where staff would work;
financially assisting users to obtain diagnostic procedures; patient education and additional
pressure to complete duty schedules/rosters with the limited staff; collaboration with other
units such as pharmacies; and new measures by which to monitor discharged users. Some
amount of lobbying was also underway to obtain well-needed equipment such as CT
scanners and MRI machines. It is apparent that practitioners were committed to making
the policy work.
There was, however, a lack of appropriate casual space for some staff and, as such,
staff often had to take their lunch breaks at their workstations in the presence of waiting
users. These users were sometimes ‗abusive‘ and ‗insensitive‘ to the needs of the
practitioners. One explanation for these attitudes is that sometimes users would arrive at
the facilities at very early hours of the morning and by lunchtime had already waited for
long periods of time prior to receiving care. Of note is that some institutions made efforts
to provide rest areas for staff. The finding that practitioners had to take their lunch breaks
in the presence of waiting patients due to lack of an appropriate staff facility has not been
207
previously reported in studies on the abolition of user fees. A few studies have, however,
documented the negative effects of the policy change on practitioner-patient relationships
(Burnham et al., 2004; Ridde, Robert, & Messen, 2012; Ridde & Diarra, 2009; Walker &
Gilson, 2004). This suggests that practitioners‘ working conditions require more in-depth
investigation. Measures by policymakers to maintain practitioners‘ health in order to
enhance effective performance on the job are important. Satisfaction is paramount to
retaining practitioners in the system and, as such, should receive the required attention.
In regards to staffing, policymakers alluded to an increase in staff for some health
facilities; however, practitioners were of a different view, since the perennial shortage of
staff prior to the policy change had still not been sufficiently addressed. As a result,
practitioners were now working longer hours sometimes without lunch or bathroom break
periods. The increased working hours and lack of breaks resulted in staff experiencing
health conditions such as digestive disorders and UTIs. While it may not have been
effective, minimal work had initially been done to improve staffing in Jamaica. Efforts
were made post implementation to recruit and train some categories of staff, for example,
pharmacists and dialysis technicians, in order to boost the complement in the facilities
(MOH, 2008b). These measures were intended to alleviate the pressure on the staff in the
facilities, make the services available to users and maintain the quality of services
provided, as well as minimise waiting times. This finding is consistent with studies in
Uganda and Niger, which also reported that health workers were recruited to support the
policy change (Nabyonga-Orem et al., 2008; Ridde & Diarra, 2009). Improving staff
numbers was necessary to improve access, the main objective of the policy, and must
remain an on-going priority.
Despite there being several possible explanations, the aforementioned issues could
be attributed to the limited budgetary support injected into the system prior to the policy
change and the hurried nature in which the policy was implemented. Regional
policymakers and practitioners considered the public health system to be underfunded and
felt this should have received serious attention prior to the implementation of the policy.
The budgetary shortfall meant lack of basic supplies such as syringes and needles.
National policymakers, on the other hand, reported that there had been additional
budgetary support to offset the policy implementation. Evidently, this allocation was
insufficient and policymakers need to mobilise more funds to address the demands
208
resulting from the policy change. Budgetary support has been reported in other countries
as vital to ensure implementation and sustainability of the policy change (Burnham et al.,
2004; Nabyonga-Orem et al., 2008).
The policy had not allowed sufficient time for the key stakeholders to be engaged
fully in the process, a concern that resonated with most practitioners. They reiterated the
point that the policy change would have been more effectively managed if they were
involved throughout all the stages of the policy process. An important lesson here is that
all stakeholders must be integrally engaged in all phases of the policy process if it is to
achieve widespread credibility and sustainability. Practitioners are also important in
getting users to buy into new policies. Involvement of some key stakeholders in the policy
process has also been described in other countries with similar policy changes, but there
was a lack of consultation with practitioners in some countries such as Uganda and Ghana
(Kajula et al., 2004; Witter & Adjei, 2007). Although practitioners in Jamaica embraced
the policy generally, it is important to note that they were trying to make the policy work
under stressful and difficult circumstances. Practitioners were often disenchanted with the
increased workloads, overcrowding, limited resources, poor working conditions, and
reduced time able to be spent with users in order to accommodate more persons. These
opinions suggest that it is important for policymakers to address these issues in order to
improve satisfaction among practitioners.
Resources and the work of professional nurses. The study found that nurses in
both primary and secondary care were concerned about the resources available generally
and their ability to deliver care in an acceptable manner. This corroborates studies in
Africa in which nurses and health workers were frustrated by the lack of resources such as
drugs (Gilson & McIntyre, 2005; Walker & Gilson, 2004). There was a shortage of basic
materials and equipment to work with across both primary and secondary facilities in all
four RHAs. Inadequate equipment ranged from basic necessary items such as blood
pressure machines to more advanced technologies such as CT and MRI machines. Other
unavailable items included needles, syringes, stethoscopes and diagnostic sets. There was
also a shortage of stretchers, especially in A&E departments which had seen a large
increase in patient presentation. Often this was because the stretchers were being used as
additional beds. It was further found that whenever an emergency case arrived at the A&E
Department and there was need for a stretcher, these patients were then moved to chairs.
209
This meant that the services required by persons could not be provided. This put people‘s
lives at risk, resulting in possibly deteriorating health conditions, frustration for users,
increased stress and frustration for the nurses who often felt powerless or had to find
creative means to manage the problems, and tensions within the health workforce and
among staff and patients. In addition, the policy resulted in situations that constituted a
barrier to access where the reverse should have been achieved.
Drugs, contraceptives and other supplies were often quickly depleted due to the
increased demand. This posed a challenge for nurses for two main reasons: the free care
policy, which was intended to improve access, appeared to be a barrier in itself, and some
patients were of the view that nurses were to blame for the problems they encountered
while accessing care. This supports findings from research in African countries where
nurses reported stock out of medical supplies and lack of resources generally, which
impacted negatively on nurse-patient relationships. An acrimonious relationship between
nurses and patients can occur when drugs are not available or nurses have to dispense in
the absence of a pharmacist (Burnham et al., 2004; Deininger & Mpuga, 2005; Nabyonga
et al., 2005; Nabyonga-Orem et al., 2008; Ridde & Diarra, 2009; Walker & Gilson, 2004).
Policymakers and providers
It was found that nurses were concerned about the effects of this shortage of
resources. Areas of concern included the risk of asking people who were financially
challenged to purchase materials and supplies, such as family planning methods, at private
facilities if they were unavailable at government facilities. Patients who lacked the
necessary financial resources not only added pressure to the system but their reluctance to
buy contraceptives in the private sector also put them at risk of unplanned pregnancies.
Additionally, nurses were frustrated and stressed when items such as glucometers for
testing blood glucose were incompatible with the strips supplied. Shortages of, or
overused and malfunctioning equipment, were equally frustrating for the nurses, since
defective equipment produced inaccurate results. It was further found that when supplies
were unavailable, nurses had to request support from other departments and hospitals or
walk to other departments to obtain the required supplies. Nurses found this
overwhelming and an impediment to administering quality care. Nevertheless, the study
found there was support from some administrative staff to mobilise resources. Overall,
however, the finding that nurses were stressed and frustrated by the lack of necessary
210
resources has implications for nurses‘ and users‘ wellbeing, as well as nurses‘ contribution
and commitment to the success of the policy. Having to travel between departments not
only added stress to the nurses‘ work but would also reduce the amount of time available
to administer nursing care in an effective manner.
Possible explanations for the aforementioned concerns are that shortage of
resources was a perennial problem, which the abolition of user fees merely exacerbated
and insufficient resources had been infused into the system to support the increased
demand arising from the removal of user fees. Despite limited discussion in the literature
on creative measures adopted by nurses to overcome the challenges of inadequate
resources, the Jamaican findings are consistent with studies in South Africa where nurses
found the shortages of equipment and other resources frustrating, a situation further
compounded by the free health care policy. Even in countries where policymakers
injected additional funding and other resources, similar problems were experienced
(Burnham et al., 2004; Deininger & Mpuga, 2005; Nabyonga et al., 2005; Nabyonga-Orem
et al., 2008; Walker & Gilson, 2004).
A shortage of suitable workspace and ambulances in hospitals was also found to be
affecting the work of the nurse. Nurses sometimes arranged for the transfer of patients, as
well as accompanying the patients. This further placed pressure on the nurses who often
experienced stress when there was a shortage of ambulances. To alleviate such problems,
private ambulances were brought in, at a cost to the facilities or relatives assisted in
transporting their kin. These solutions were a concern for nurses who were sometimes
required to accompany patients but experienced some level of discomfort when travelling
in the vehicles of users‘ relatives. Equally, space to administer care was found to be
inadequate in the PHC facilities. While other studies in Africa have mentioned the
shortage of resources generally, no specific details exist about ambulance services.
However, reports about congestion and overcrowding in facilities suggest there were also
workspace problems (Walker & Gilson, 2004; Witter et al., 2007a, 2007b; Wilkinson et
al., 2001).
Even though policymakers reported recruiting extra staff locally and overseas and
training new categories of staff, the findings showed nurses were often concerned about
the shortages of staff in addition to the archaic cadres (established number of trained
professionals in the public health system) in the facilities generally. This was because of
211
inadequate coverage with insufficient personnel to assign to particular areas. Nurses were
frequently redeployed to other facilities to ensure minimal coverage. For this reason,
continuity and accepted standards of care by nurses could not be guaranteed. Furthermore,
nurses‘ work hours were extended or adjusted in some health centres to compensate for the
shortfalls in staff. This included a shift system for some and assignments on Saturdays for
others. Of note is that the new shift system in health centres created an additional burden
for nurses who complained of being overworked, tired and suffering from burnout. This
resonated with hospital-based nurses where the same nursing staff worked repeat shifts, for
approximately 16 hours or more. This finding has implications for patient safety and the
potential to influence nurses‘ decisions to leave the organisation. When nurses work for
long hours, the risk of errors has been found to increase (Rogers, Hwang, Scott, Aiken, &
Dinges, 2004; Scott, Rogers, Hwang, & Zhang, 2006). The effect of long working hours
on the nurse was not explored further.
While the above findings regarding the shortage of staff have been mentioned in
studies from other countries with free health care (Walker & Gilson, 2004; Witter et al.,
2007b), the adjustment to working hours and shift schedules by professional nurses is yet
to be documented. Community health nurses, midwives and doctors, however, reported
working long hours after the abolition of user fees in Ghana (Bosu et al., 2007; Witter et
al., 2009). Additionally, prior to the removal of user fees, policymakers in some African
countries recruited additional staff (Dieninger & Mpuga, 2005). While the specific
category of staff was not mentioned, the Zambian MOH recruited mainly nurses (Masiye
et al., 2008). In Jamaica, policymakers also expressed interest in empowering and up-
skilling some categories of staff such as the NPs for capacity building and strengthening of
the policy.
Another contributing factor to the shortage of staff was the turnover rate. The
study revealed that nurses were thinking about leaving due to the lack of necessary
supplies. This is contrary to the popular belief among Jamaicans that remuneration is the
main reason for nurses leaving the public health system, and may be explained by the
finding that nurses were frustrated by the need to source supplies when out of stock.
Nurses were equally disenchanted by the lack of recognition for their work and worth.
Evidently, nurses felt disempowered, even while ensuring their users‘ rights were
observed. This was an unexpected finding. While personnel migrated regionally and
212
internationally, it was found that some nurses were also attracted to the incentives offered
locally in the private sector. This supports findings from studies in Africa where a
perceived deterioration in working conditions was one of the driving forces for nurses to
resign in favour of more lucrative job offers in the private health sector or overseas
(Walker & Gilson, 2004). In addition to staff turnover implications for continuity of care,
there is also a significant amount of time required to orientate new staff, which might
ultimately result in negative impacts on the effective and efficient performance of the
Jamaican nursing workforce.
The solution of recruiting overseas nurses for capacity building in the health
facilities created additional stress. The study found that nurses in hospitals were especially
vocal about the added responsibility and additional stress experienced when supervising
and interacting with these nurses on the wards. Language barriers and practices that might
potentially jeopardise the lives of the patients were dominant opinions. Nurses also
reported that overseas nurses were given more attractive remuneration and gratuity
packages than locals. They perceived this practice as a disincentive to the Jamaican
nurses. As a result, nurses suggested that policymakers revisit the terms and conditions for
recruiting overseas nurses, as well the remuneration for local nurses. Clearly, nurses were
dissatisfied with the strain placed on them by having to monitor and supervise overseas
nurses. They also felt betrayed because of the discrepancy created by policymakers
regarding remuneration packages offered to overseas nurses relative to theirs. These
tensions may have existed prior to the introduction of free care. However, the impact of
the policy had the potential to create anxiety among the groups, especially when combined
with increased workload and shortage of staff. The interaction between the two groups of
nurses might have been influenced by the history of having overseas workers enjoying
better working situations than locals under Plantocracy. The impact of free care on the
interaction between overseas nurses and locals has not been described as a problem in
other countries with similar policies, and was not explored further in this study.
Additional problems encountered by nurses in PHC settings included the inability
to refer some patients when there was a need. This was a result of a particular category of
health personnel not being assigned to the facility or a shortage of that category, for
example, social workers in the public health system generally. Some nurses were,
however, satisfied with the categories of personnel at their disposal in the health centres.
213
The type of facility may have influenced the availability of certain categories of staff (see
Chapter 2 for types of facilities). While shortage of resources, including staff, has been
mentioned in the literature, no details were provided relating to the experiences of different
categories of staff. To improve access, policymakers and providers have a responsibility
to ensure that resources such as trained staff are available to deliver care. This also
influences users‘ choice of facility (Kiwanuka et al., 2008).
Nurses were equally dissatisfied with other experiences in the workplace that were
effects of or exacerbated by the policy change. For example, the late payment of salaries,
about which they were seldom advised, had been a contentious issue for some PHNs. This
was attributed to the inadequate funding of the health system and a possible result of the
policy change. Late payments were compounded by the reduction in payments for
travelling for home visits. In response to reduced travel funding, nurses reported a
reduction in the number of home visits and the manner in which they were conducted.
This finding meant some persons had limited access to services and were at risk of
deteriorating health. The reduction in payment for travel may be a reflection of inadequate
funding as part of the policy change, as well as a shift in focus, which saw funds being
diverted to strengthen other areas of the health system. Undoubtedly, this constituted a de-
motivating factor for nurses. Policies which significantly reduce the budgetary allocation
to nursing services have serious implication for improved access, because nurses are
integral to enhancing access to health services and such change can limit their creative and
innovative efforts.
While studies have not extensively reported late payment of salaries to nurses,
mention has been made about late reimbursement to some facilities, which may also
include payment for nurses (Witter et al., 2007a, 2010). In contrast, some authors have
reported increased salaries and other incentives for health workers including nurses,
(Witter et al., 2007b), while others mentioned that loss of revenue from user fees
contributed to job losses for some categories of workers, and reductions in the number of
committee meetings and outreach programmes (Burnham et al., 2004; Gilson & McIntyre,
2005; Kajula et al., 2004; Masiye et al., 2008; Nabyonga-Orem et al., 2008). Nurses in
hospitals were also concerned about the effects of inadequate budgetary support on the
training of some categories of staff in some RHAs. The lack of budgetary support for
training of staff is unreported in the studies on the abolition of user fees. Even though
214
nurses attributed these problems to the removal of the user fees policy, other
administrative factors may have contributed to the budgetary and payment issues, which
require further investigations.
Change in patient profile on the work of the professional nurse. The study
found that, despite the increased patient load, the types of health conditions patients
presented with did not change with the removal of user fees. There was, however, an
increase in the uptake of some services such as curatives and family planning services.
Nurses in health centres also reported seeing more private patients for post-surgery
services such as removal of sutures and dressings. Possible explanations for this finding
are that the free system was more accommodating; patients no longer delayed seeking care
when required; and gaps in the system may have prevented people from fully utilising the
services prior to the policy change. While nurses were confident the health needs of
Jamaicans who could not afford out-of-pocket payments were now being met, they were
concerned about the increased number of private patients utilising the PHC services since
the policy change. Studies in African countries have shown that, while there was
increased utilisation of curative services, there was no change in the case mix. Nurses also
felt that people who could not afford health care were benefiting from the free care
(Burnham et al., 2004; Wilkinson et al., 2001). While studies in Africa did not extensively
discuss the increase in private patients utilising public facilities, nurses felt that people
who could afford to pay for health care should pay (Ridde & Diarra, 2009; Walker &
Gilson, 2004). These findings have implications for future policy change; in terms of
mobilising the required resources including human resources, to address anticipated and
unanticipated changes associated with the policy.
Furthermore, the nurses, in describing the impact of the policy change on their
work, usually made reference to the changed manner in which people were utilising the
health system. Despite the extended work hours, nurses gave accounts of patients arriving
as early as 2am, to obtain a number to be seen, as well as late at night for non-urgent
conditions. This suggests that overcrowding in the facilities had inspired patients to
develop new coping strategies when seeking treatment. A possible explanation for this
behaviour is that people did not trust the longevity of the policy change. In addition, this
created more stress on nurses and burdened the system generally. The study further found
that nurses felt patients lacked good judgement in utilising the facilities, were not sensitive
215
to the nurses‘ needs, for example, their need for lunch breaks, and were inclined to vent
their frustration on the nurses whenever they did not receive the required services.
Negative attitudes to nurses may be associated with people arriving at early hours and
having to wait for long periods of time to be seen. This supports findings from a study in
South Africa, in which nurses viewed some users‘ attitudes as uncouth (Walker & Gilson,
2004). While mention was made of people arriving late at night for care in Africa, the
situation in Jamaica occurred both at night and early in the morning and for different
reasons (Ridde & Diarra, 2009).
8.6. Conclusion
There were varied views among policymakers, practitioners and users about the
impact of the policy change. Utilisation of services increased immediately following the
policy change; however, there was an initial decline 6-9 months after with a sustained
increase over the pre-policy period. Access was improved for all, which can be viewed
positively, nonetheless, the policy also had some downsides, which may be additional
barriers encountered by users in an attempt to access health services.
In support of the access theoretical framework the study has revealed that for
people to gain access to health services a number of factors must synchronise for the
desired effects to be achieved. User fees were abolished in Jamaica to remove the cost
barrier however insufficient budgetary allocation and planning to sustain the policy
accompanied the change. The increased utilisation; overcrowding; and lack of resources
such as drugs, and working equipment resulted in an increased workload for nurses and
other health practitioners which meant care provided was sometimes compromised.
Policymakers need to address issues regarding all the main characteristics of access –
availability, affordability, accessibility, accommodation and acceptability – in a realistic
manner if they are to reap meaningful gains in addressing access issues and inequities in
health service.
The practitioners and nurses interviewed embraced the user fees policy, despite
concerns about several issues such as lack of involvement in the policy process prior to
implementation. Although these practitioners including nurses perceived that people were
benefiting from the change, they also had concerns, which included the following: the
health system‘s capacity to sustain the policy, increased workloads and overcrowding,
poor working conditions, inadequate resources such as drugs and equipment, inadequate

216
workspaces, misuse of the system and low morale. The next chapter will provide a
conclusion to the study.
217
Chapter 9: Conclusion
9.1. Introduction
This study used a multi-layered mixed method approach to evaluate and provide
new insights into the impact of the abolition of user fees in the Jamaican public health
system on access, care provided and the work of the professional nurse. This chapter
commences with highlights of the major findings, and then outlines the strengths and
limitations of the study, lessons learned, implications for future policy, practice and
research, and finally makes recommendations for future programme and policy
development. This study evaluated the impact of the user fees policy from three
perspectives: the policymaker, the provider and the user. The objectives of the study were
to examine the utilisation of services in public health facilities during the period 2006-
2009 to establish whether barriers to access had remained a problem for consumers since
the abolition of user fees; to analyse the effects of the abolition of user fees on the work of
the professional nurse; and to identify the lessons learned for Jamaica and developing
countries regarding the abolition of user fees. The findings provide additional evidence
with respect to the impact of abolishing user fees in public health systems and make
several contributions to the existing literature on the experience of free health care policies
in developing countries and its impact on the work of the professional nurse.
For this study access theory was utilised to shed new light on access to health
services while other scholars have opted to use theories such as policy implementation
theory. In addition, access theory has frequently been discussed from the users‘
perspectives however, this study expanded on this by looking at the policymakers and
providers‘ perspectives especially that of the professional nurse. The findings revealed
that when health services were made available users changed their behaviours. For
example there was inappropriate use of the facilities, they hoarded the medications and
they queued up at the facilities at early hours in the mornings. These behaviours suggest
that people did not trust the system to last. The study also showed that cost is only one
barrier to access because users encountered a number of other challenges.
The decision to introduce the user fees policy in Jamaica was determined and
ratified at the level of central government, in other words, was politically motivated. This
meant little or no consultation regarding the policy process with key stakeholders,
especially frontline workers such as nurses. Given the level at which the policy was
218
determined, it was not unusual for the some stakeholders interviewed to consider that the
implementation phase had been politicised. This view may be attributed to the policy‘s
inclusion in the then government‘s Election Manifesto. Drawbacks to the process,
moreover, were the hurried manner in which the policy was implemented and the lack of
participation by key stakeholders in the process. This suggests that the planning and
implementation processes lacked sufficient analysis of the likely effects of the policy and
the support needed to ensure its effective implementation. For a policy change of such
magnitude, specific arrangements should have been put in place for timely and accurate
monitoring of the possible effects, yet this had not been the case in the Jamaican context.
Planning and consultation with health practitioners is important as such policies have far-
reaching effects on their work and has implications for how practitioners can help improve
access. Monitoring of the policy was done through existing systems. While these systems
captured some effects, the monitoring might not have been sufficiently targeted to capture
all the changes associated with the policy. This had implications for prompt management
of the impact of the policy and for future policy development.
The experiences of African countries with similar economic situations to Jamaica
were utilised by the Jamaican government to guide the process of introducing the removal
of user fees. A possible reason for utilising these experiences may have been the paucity
of data on contexts and policy implementation processes for free health care within
Jamaica and the Caribbean generally. This influenced the manner in which policymakers
interpreted the feasibility of the project. For policymakers, the aim of the policy change
was to remove the financial constraints that constituted a barrier to access to health care.
For them, a window of opportunity presented itself and, to fulfil the mandate of the
government, the policy had to be implemented at any cost. In contrast, practitioners,
including nurses, thought the policy change was politicised and over-ambitious. Dominant
practitioners‘ opinions regarding measures that might have improved the success of the
policy included reverting to exemption policy; providing a basic minimum package;
retaining the free care policy for children under 18 years; and provision of free services for
children and the elderly. Practitioners considered these would be more realistic and
practical solutions to addressing poor access to services in a resource-constrained public
health system. Users‘ understanding of the policy varied. While they were aware of the
availability of free care, most could not identify all the services that were free. This
indicates that they did not fully grasp the arrangements in the policy, that more education
219
of the public regarding the policy was required and that the users‘ experiences may reflect
the lack of consultation with key stakeholders whose role included dissemination of
information to end-users. The lack of knowledge regarding the available services can be
interpreted as a barrier to access, which, of course, is counter-productive and incongruous
with the policy objective of improving access to health services. It also has implication for
health literacy and a better understanding of the multidimensional nature of the concept
access.
Despite the political context within which the policy originated, experience shows
that rapid changes took place as a direct result of the policy. One significant finding from
this study was that utilisation of the public health facilities increased markedly
immediately after the implementation of the policy. This was evident in the uptake of all
services in the public secondary and primary care facilities. The use of A&E, curative, and
pharmaceutical services were most pronounced. Although there were reports by the MOH
that utilisation rates declined after the first nine months, there was, however, an overall
increase between 2006 and 2009. This increased utilisation resulted in practitioners being
concerned about the sustained daily overcrowding at the facilities. In addition, when
patients were unable to obtain free care from their usual health facilities, many resorted to
paying for services, a finding that was supported by the PIOJ, which reported that people
from all quintiles were increasingly trending back to the private sector for health care.
There were no clear explanations for this phenomenon. However, it suggests that they are
other barriers to access or a growing disenchantment with the system and has implications
for the success of a policy intended to improve access.
It is apparent that people who utilised the health services were from various social
backgrounds; encountered problems in accessing the services; and were inclined to revert
to using private services when care could not be obtained at the public facilities. The
socioeconomic status of users generally could not be clearly established from this research,
as those surveyed indicated that people from all social backgrounds utilised the services.
Problems that users encountered included travel costs, having to purchase drugs at private
facilities and long waiting times. These issues, however, did not dissuade people from
seeking care at facilities, even amidst claims that the use of private facilities was
increasing. Although only people who used the public health system were surveyed, the
220
use of private services may translate into a barrier to access and requires the attention of
policymakers.
Perspectives regarding the policy among policymakers, practitioners and users
were dissimilar. Policymakers remained optimistic about the policy generally and were
satisfied with its immediate impact on utilisation. In the absence of any specific formal
evaluation of the policy, they were guided by data provided by the facilities, parishes and
RHAs, to respond to the positive and negative impacts of the policy. Policymakers were
conscious of the areas within the system that required strengthening. Practitioners were
highly dissatisfied with their working conditions, increased workloads, and lack of
involvement in the policy process. While they felt the policy had good intentions and was
benefiting those who could not afford care, they also believed that people who could afford
to pay should pay for the services. Equally, they cited the need for practitioners to be
involved in the policymaking process. Ironically, users were generally satisfied with the
services provided, even though they encountered long waiting times, drug unavailability,
and decreased assessment times inter alia. However, a possible lack of understanding of
the policy resulted in patients roving among health facilities and hoarding drugs. These
practices implied that users did not trust the system would last.
The findings revealed that the policy resulted in changes to the work of health
practitioners generally. It further demonstrated how nurses contributed to improved access
to health services as well as how health policies impact their work and other health
professionals. Despite the policy change being politically motivated, professional nurses
made the policy work under trying circumstances. Dominant opinions expressed by
research participants included a call for greater analysis, planning and consultation to have
preceded the policy change; low morale; lack of recognition; poor remuneration; poor
working conditions; overcrowding; and increased workload resulting in ill health among
nurses, and reduced patient assessment times. Even though some additional staff had been
employed, nurses gave accounts of inadequate resources forcing them to make harsh
decisions regarding patient care; additional stress in monitoring overseas nurses; lack of
facilities such as lounge and child care services; misuse of the services by some persons;
and hostility from patients. Nurses adopted new roles, which included crowd control and
worked under stressful and frustrating conditions, to make the policy work. Generally, the
perception among nurses was that the pre-existing conditions of a resource-constrained
221
health system had exacerbated their current work situation. In addition to working with
limited resources, nurses reported having to change the manner in which they offered care.
Those in PHC modified their work schedules in order to conduct home visits and provide
family planning services. Given the above issues and lack of adequate administrative
support, it was not uncommon for nurses to resign from the public service. These findings
add substantially to the understanding of nurses as actors in the free health care
environment, not only as implementers of the policy but they ensured the sustainability of
the abolition of user fees policy.
Ultimately, the policy change was not just a political rhetoric because it addressed
a need that existed. Increased utilisation of health services was achieved, despite
inferences that user fees may just be one of the problems encountered by users of the
health system. However, the policy change had serious implications for budgetary
allocation, resource allocation, human resources, information transfer and monitoring
mechanisms. Inadequate funding and perverse incentives, such as limited resources, lack
of additional incentives for increased workload, and lack of adequate administrative
support, were undermining the policy. These problems could have been averted or
minimised if careful analysis had been undertaken prior to its implementation. Taken
together, these results suggest that the concerns raised by nurses and other practitioners
might have been influenced by the policy implementation processes.
9.2. Strengths and limitations of the study
Strengths. There are seven major strengths of the study. First, methodologically,
the study took the evaluation of policy change further by adopting a multi-layered mixed
methods approach to provide three tiers of data, across regions, across primary and
secondary care facilities, among policymakers, across professions and among users. This
provided competing perspectives that add to the robustness of the findings on the impact of
the policy change. Second, most researchers have studied the impact of free health care on
health workers in rural and urban PHC settings. However, this study examined the
perspectives of main practitioners, including the professional nurse, in rural and urban
primary and secondary care public facilities in four RHAs. The RHAs differed
geographically, demographically and epidemiologically, so gathering data from each
added to the depth of the study. Obtaining data from secondary care facilities added
substantially to the study and the existing literature on the abolition of user fees. Third,
222
transcription was completed by the researcher, which aided familiarity with the data, an
advantage that was used to enhance the analysis and interpretation phase of the study. In
addition, all data were collected by the researcher except for some user surveys and
national statistical data.
Fourth, the study employed member checking, whereby participants were asked to
provide comments and feedback on interview notes. Fifth, the process of triangulation was
used to further interpret the findings within and across groups, and between the document
review, interviews and focus groups. Sixth, the study provided evidence of key
perspectives through the use of quotations, numerical data and statistical inferences.
Additionally, where figures were inconsistent, clarification was sought from the MOH in
order to achieve accuracy. Seventh, the researcher was neither involved with the policy
change nor worked in the health system at the time of the policy change or during the
study. Moreover, data were analysed outside of the country, making them free from any
interference. As a result, bias was reduced and the researcher was open to possibilities
within the findings.
Limitations. There are five main limitations of the study. First, the use of non-
probability sampling techniques to recruit policymakers and practitioners potentially
reduces the generalisability of the findings. Eight eligible policymakers (national and
regional) were selected based on their roles and positions in the public health system. This
provided no possibility of assessing the typicalness of the participants and, by virtue of
their roles and positions, confidentiality could not be assured. Despite using a systematic
sampling technique to recruit users, persons utilising the health facilities on the days of
data collection may not have been representative of the general population.
Second, data collection had to be done within specific time frames and, as such,
only persons using the main service areas on those specified dates and times were
included. Additionally, the decision to survey 200 users was a pragmatic one. Once the
quota was reached, other users were automatically eliminated. Similarly, the study
excluded non-users of the public health system. This was because the study aimed to
capture the perspectives of users of facilities where services were free. Private facilities
still charge a fee for the services provided. Additionally, no strong inference can be
provided about the social status of the group who utilised the services at the time of the
223
survey, although it was apparent people from varying social backgrounds utilised the
facilities.
Third, due to unforeseen circumstances, the researcher had to administer some
surveys in the absence of student researchers. This could be viewed as an advantage from
the perspective that the researcher was able to clarify any concerns for the respondent
regarding the study. However, controlling for bias was also important. Nurses in the
facilities were, therefore, asked to assist with the selection of participants by choosing
every fifth person from the registration book. Fourth, despite checking for completeness
of the surveys, there were some missing responses to the variable ―quality of service‖ in
one survey, due to the pages sticking together. This, however, did not affect the analysis
generally, since the survey was sufficiently completed to be included in the data analysis.
Finally, as part of the document review, official statistics were obtained from the
MOH and the RHAs. Annual reports and additional documents provided by the MOH
statistician and other MOH personnel were also utilised to determine trends in utilisation
patterns since the abolition of user fees. The data from the MOH should essentially reflect
the national figures, but this was not so for some statistics. Some inconsistencies were
detected on examination of the data provided by the MOH and the RHAs. The decision
was, therefore, taken to focus conclusions on the data provided by the MOH for most
variables.
9.3. Lessons learned
While many lessons can be deduced from the findings of this study, only those
judged to be the most important for Jamaican and international audiences will be
mentioned here. The study revealed that decisions for the policy change in Jamaica were
made at the central government level, resulting in a top-down administration of the
arrangements. This also implies that the process was not participative and, as such, some
stakeholders were not involved in the initial stages. In addition to highlighting the
political nature of the policy, the study revealed the impact policies influenced by political
agendas can have on health system and the work of professional nurses. The policy was
unplanned and implemented in a precipitous manner. Nevertheless, the abolition of user
fees increased utilisation and, as such, preparation for this far-reaching change was
paramount. Engaging stakeholders at all stages of the policy process to engender
consensus and success of the implementation process was lacking. Policymakers should
224
also have mobilised the necessary resources in anticipation of the increase in demand.
Furthermore, for a policy change of this magnitude to achieve success and sustainability
political will and commitment are required. Commitment to the programme can be only
achieved through the provision of the necessary resources and funding to sustain the
changes. While some resources were provided, the ‗run on the system‘ indicates those
were insufficient.
Additionally, nurses and other practitioners were integral players in the policy
change and should have been involved at all stages of the policy process; this however,
was lacking, resulting in nurses feeling demoralised, frustrated and powerless to anticipate
all the possible effects of the policy change. Even though they expressed concerns about
poor working conditions, increased workload, inadequate resources and lack of
recognition, nurses made a significant contribution to the implementation of the policy. It
may be necessary for policymakers to provide incentives for nurses as recompense for the
increased workload. This is necessary because nurses and all practitioners worked hard to
make the system work under trying and difficult working conditions. Furthermore,
policymakers need to implement strategies to train and retain Jamaican nurses in order to
effectively manage the contentious situation regarding overseas nurses. In other words,
strategies should be adopted to reduce the need to recruit or employ overseas nurses.
Implications for policy and practice. The findings bring into focus implications
for policy and practice in an environment free of health service charges. For any policy
change to be successful it requires all stakeholders to take ownership of its provisions. It,
therefore, means engaging participants at each stage of the policy process (agenda setting,
formulation, implementation and evaluation). Although the debate on user fees was
progressively on-going, no consensus on how to reform the system had been determined in
Jamaica. The context within which the policy was implemented, the ‗big bang‘ approach
adopted for its implementation, and the response of stakeholders, such as nurses and other
practitioners, suggest a level of uncertainty regarding adherence to the policy process
stages leading up to the implementation. Despite embracing and actively implementing
the changes, nurses and other practitioners had serious concerns about the impact of the
policy on their work. It is, therefore, important that policymakers engage with and amass
the views of all stakeholders such as nurses for future policy development and
implementation. Nurses ensure the sustainability of the policy change.
225
Communication is essential for the success of any policy change, especially
between implementers and end-users. This fosters clear interpretations of the tenets of the
policy. A policy may be interpreted by different stakeholders in different ways, so, for
uniformity in implementation, clear, targeted communication is required. While there was
some level of uniformity across the RHAs in Jamaica, not all users could identify the
services available to them under the new policy. This lack of awareness has implications
for the increased use of the services, which, by extension, was the aim of the policy.
Users‘ lack of knowledge regarding the available services undermines the main objective
of the policy. Despite publicity via avenues such as print and electronic media, a level of
misunderstanding prevailed. This may be a reflection of users‘ health literacy and
educational levels. For future policy, therefore, it is important to employ simplified,
unambiguous guidelines and effective communication strategies for disseminating
information to stakeholders and users.
The study revealed that no formal, specific monitoring or evaluation mechanisms
had been instituted prior to the implementation of the policy. Such mechanisms are
necessary to capture early and on-going changes, as well as to provide feedback to further
enhance policymakers‘ ability to improve outcomes and expeditiously address problems
within the system. Additionally, a monitoring system would enhance the policy by
identifying workforce issues and increased areas of utilisation, as well as misuse: both
sources of further strain on the health system. It was apparent that facilities, parishes and
RHAs had obtained data regarding changes in the system in a haphazard manner, which
suggests weaknesses in the policy processes and has implications for future monitoring.
While some policymakers agreed that the public health system had received
additional budgetary support for the policy change, others were of the view that the system
lacked sufficient recurrent and capital budgetary support. This meant some RHAs had to
adopt creative means, such as private-public partnerships, to generate additional funding.
The lack of insight into the extent to which increased utilisation would affect the already
resource-constrained health facilities was apparent. There was widespread shortage of
resources, which negatively affected the morale and work of practitioners, especially the
professional nurse. Furthermore, some stakeholders favoured the previous exemption
system and were averse to the new system, which they felt could not be sustained within
the current resource-constrained health system and existing economic climate. Arguably,
226
there should have been extensive planning to identify a reliable and sustainable source of
funding to meet the demands of the new system. Moreover, cost-benefit analysis and
needs assessment would have been instrumental in determining gaps in the system, as well
as the resources required to address the needs. Careful attention in these areas may be
appropriate for future policy development. Examination of the long term effect of the
policy is critical to achieving access to health services.
Implications for future research. While the mixed methods study presents useful
information on the impact of the user fees policy in the Jamaican public health system,
further research using other designs such as quantitative and/or qualitative longitudinal
studies is required. This would enhance comparability, as well as strengthen the credibility
of these findings. Additionally, the study confirmed that abolition of user fees in Jamaica
had resulted in increased utilisation. The implementation process, however, lacked
sufficient planning and may require research to determine the best practices for
implementing such policies, as well as to determine the real costs of abolishing user fees.
Nurses in this study expressed concerns about working with overseas nurses, an
area of research that remains untapped within the Jamaican context. It might, therefore, be
necessary to undertake an examination of the efficiency of migrant nurses. Equally, staff
turnover should be investigated to determine its impact on a cost-constrained environment,
such as the public health system.
Even though health care was now free, people were returning to the private sector.
This behaviour could be indicative of people returning to their usual providers following
attempts to use the public system or a result of the demands on the system. Practitioners
also reported non-compliance of some users and daily overcrowding in the facilities, which
suggests there may be additional factors affecting the health-seeking behaviours of users.
It would be instructive, therefore, to examine reasons for the shift from utilising the free
services to paid health care, to investigate why people were non-compliant and who and
what factors were contributing to the daily overcrowding at the facilities. This research
might help detect impacts that require immediate attention.
The study also found that there were variations in health indicators such as Infant
and Maternal Mortality rates, and Crude Death rates across the RHAs, but that more
people were utilising the facilities and were generally comfortable with their current health
227
status. However, people continued to use home remedies and other forms of treatment.
Further research into the impact of the abolition of user fees on health outcomes and health
indicators, such as mortality rates, as well as the concomitant use of alternative treatments
and health services, should be undertaken.
The study demonstrated that the utilisation of health services had increased in the
aftermath of the policy change. There was, however, no clear indication as to the
socioeconomic groups utilising the services. While this study used the income provided
by users to predict their socioeconomic status, more research is required to clarify the
issues regarding the social status of people benefiting from the policy. Additionally,
research is required into other known barriers to access, such as geographic location of
health facilities and transportation issues, as well as the costs for users to overcome these
challenges.
Materials and supplies were often inadequate to meet the demands of the increased
uptake of services, and were further compounded by malfunctioning or lack of equipment.
This was a source of frustration for nurses and other health practitioners. Evaluation of the
policy to examine the effects on resourcing and maintenance issues is, therefore, also
necessary in order to determine the adequacy of supplies, such as family planning
resources and other preventive measures.
9.4. Recommendations
This section provides key recommendations may be instrumental for future policy
and programme development and implementation. While the study was conducted in
Jamaica, the findings have international merit and, as such, these recommendations may be
applied to other countries contemplating or undergoing a similar change.
It is recommended that a review of the user fees policy be conducted in the current
Jamaican public health system to determine if the findings of this study remain valid. This
is necessary because stakeholder data for this study were gathered in 2010 and, with a
dynamic political and social system operating in Jamaica, matters identified in the early
period of the policy change may have settled or new issues emerged. No significant
changes to the policy should be implemented until such a review happens.
It is important to conduct a needs assessment to determine the gaps in a health
system prior to any further policy change. Preparation and planning contribute
228
significantly to the policy‘s successful outcome, and as such, are mandatory. For
consensus, consultation should be undertaken through effective communication with main
stakeholders, such as nurses and other health practitioners, to engender their support.
Resources, including human resources, funding, equipment, material and
pharmaceuticals, should be mobilised and regularly maintained in order to strengthen
service delivery. Institutions should be reimbursed for funds no longer generated from
user fees, in order to purchase supplies locally, for example, contributions toward
contraceptive supplies in health centres. Sufficient funds should also be made available at
parish and facility levels for small-scale local expenses.
Formal, systematic monitoring and evaluation mechanisms should be established
for the existing policy and for future ones. Such systems are necessary to provide prompt
and accurate feedback on the facilities‘ experiences in order for early intervention.
Standardised and computerised systems should be set up to track the use of services,
especially pharmaceuticals, and could also prove a viable solution to the problem of
patients roving between facilities or hoarding drugs.
Policymakers must actively manage the effects of the policy change on the work
situation of nurses and other health practitioners. This requires addressing working
conditions and remuneration, and providing adequate resources including supplies and
staff in order to counter issues such as staff shortages and burnout. Policymakers should
also recognise nurses‘ contributions in sustaining policy change such as the user fees
policy and provide opportunities for discussions regarding impending policy changes.
Ideas articulated by nurses could positively influence the policy process, build consensus
and improve morale. One strategy to reduce the workload of nurses and other health
practitioners would be fast tracking of licensure for NPs in order to expand their role into
the area of prescribing. This is already happening internationally and urgently needs to be
addressed within the Jamaican context.
In conclusion, this study found that the removal of user fees in the Jamaican public
health system generally had positive effects on access, as indicated by the increased
utilisation of health services. However, the study reinforced the need for policymakers to
adhere to policy processes, mobilise resources to meet the anticipated increases in demand,
and hold consultation with key stakeholders such as nurses. Equally, it highlighted the
229
need for policymakers to implement strategies to buffer the effects of the policy change on
the work of nurses, who were sometimes forced to change the manner in which they
offered care in order to make the policy work. Nurses operated under difficult working
conditions, including a lack of clinical resources and suitable facilities; some suffered
burnout symptoms and were demoralised by the lack of recognition for their contribution.
Urgent attention to the aforementioned would result in more successful policy
implementation that will benefit practitioners and users in the Jamaican public health
system.
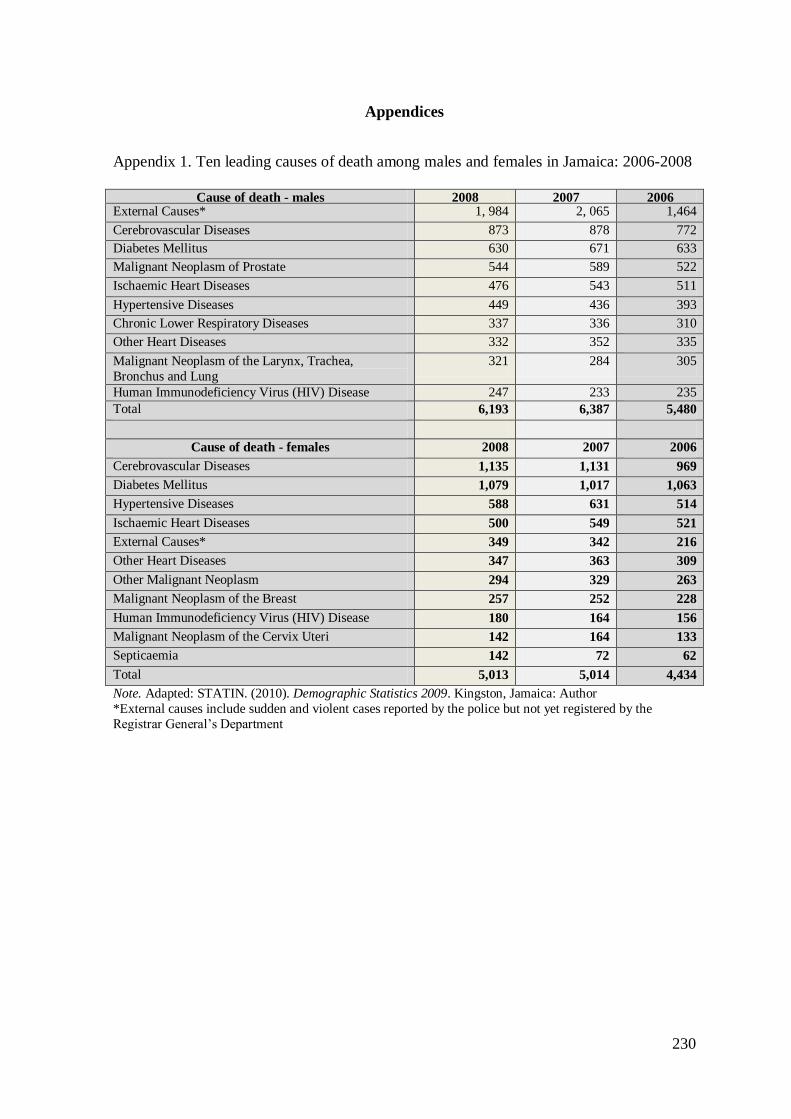
230
Appendices
Appendix 1. Ten leading causes of death among males and females in Jamaica: 2006-2008
Cause of death - males 2008 2007 2006
External Causes* 1, 984 2, 065 1,464
Cerebrovascular Diseases 873 878 772
Diabetes Mellitus 630 671 633
Malignant Neoplasm of Prostate 544 589 522
Ischaemic Heart Diseases 476 543 511
Hypertensive Diseases 449 436 393
Chronic Lower Respiratory Diseases 337 336 310
Other Heart Diseases 332 352 335
Malignant Neoplasm of the Larynx, Trachea,
Bronchus and Lung
321 284 305
Human Immunodeficiency Virus (HIV) Disease 247 233 235
Total 6,193 6,387 5,480
Cause of death - females 2008 2007 2006
Cerebrovascular Diseases 1,135 1,131 969
Diabetes Mellitus 1,079 1,017 1,063
Hypertensive Diseases 588 631 514
Ischaemic Heart Diseases 500 549 521
External Causes* 349 342 216
Other Heart Diseases 347 363 309
Other Malignant Neoplasm 294 329 263
Malignant Neoplasm of the Breast 257 252 228
Human Immunodeficiency Virus (HIV) Disease 180 164 156
Malignant Neoplasm of the Cervix Uteri 142 164 133
Septicaemia 142 72 62
Total 5,013 5,014 4,434
Note. Adapted: STATIN. (2010). Demographic Statistics 2009. Kingston, Jamaica: Author
*External causes include sudden and violent cases reported by the police but not yet registered by the
Registrar General‘s Department
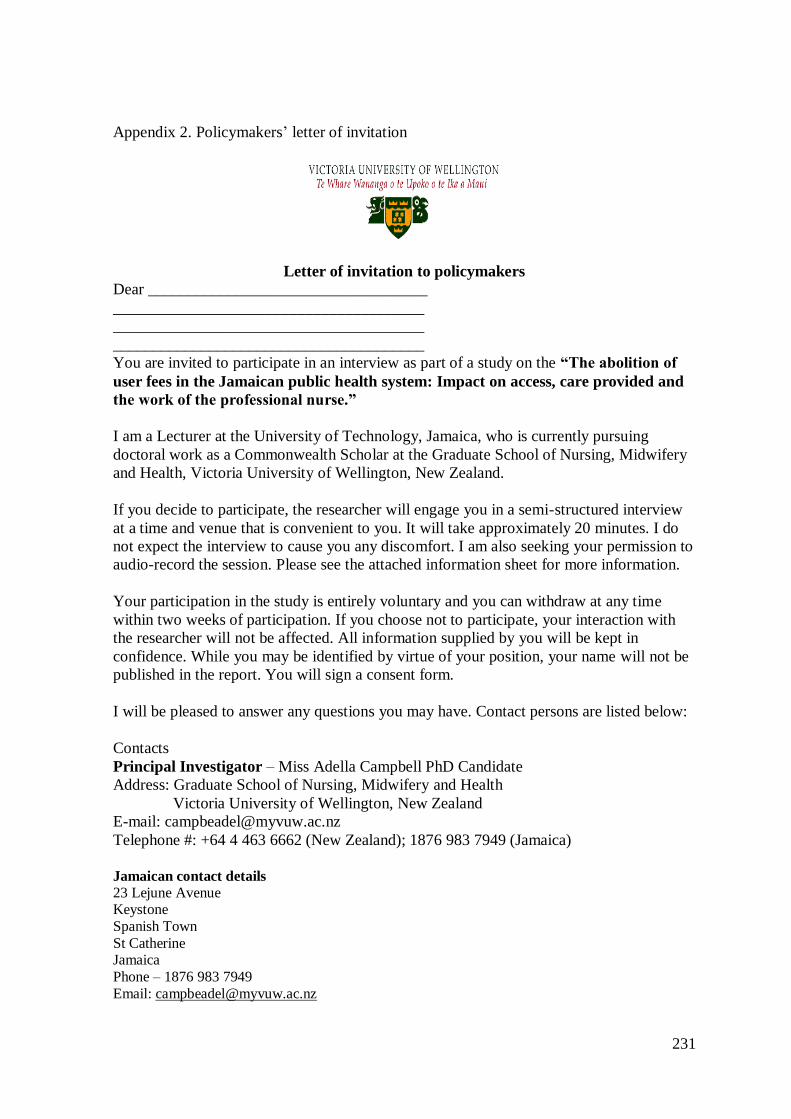
231
Appendix 2. Policymakers‘ letter of invitation
Letter of invitation to policymakers
Dear ___________________________________
_______________________________________
_______________________________________
_______________________________________
You are invited to participate in an interview as part of a study on the “The abolition of
user fees in the Jamaican public health system: Impact on access, care provided and
the work of the professional nurse.”
I am a Lecturer at the University of Technology, Jamaica, who is currently pursuing
doctoral work as a Commonwealth Scholar at the Graduate School of Nursing, Midwifery
and Health, Victoria University of Wellington, New Zealand.
If you decide to participate, the researcher will engage you in a semi-structured interview
at a time and venue that is convenient to you. It will take approximately 20 minutes. I do
not expect the interview to cause you any discomfort. I am also seeking your permission to
audio-record the session. Please see the attached information sheet for more information.
Your participation in the study is entirely voluntary and you can withdraw at any time
within two weeks of participation. If you choose not to participate, your interaction with
the researcher will not be affected. All information supplied by you will be kept in
confidence. While you may be identified by virtue of your position, your name will not be
published in the report. You will sign a consent form.
I will be pleased to answer any questions you may have. Contact persons are listed below:
Contacts
Principal Investigator – Miss Adella Campbell PhD Candidate
Address: Graduate School of Nursing, Midwifery and Health
Victoria University of Wellington, New Zealand
E-mail: [email protected]
Telephone #: +64 4 463 6662 (New Zealand); 1876 983 7949 (Jamaica)
Jamaican contact details
23 Lejune Avenue Keystone
Spanish Town
St Catherine Jamaica
Phone – 1876 983 7949
Email: [email protected]
232
Primary Supervisor – Dr. Katherine Nelson
Address: Graduate School of Nursing, Midwifery and Health
Victoria University of Wellington, New Zealand
E-mail: [email protected]
Telephone #: +64 4 463 6138
Second Supervisor – Associate Professor Jackie Cumming
Director, Health Services Research Centre
Victoria University of Wellington, New Zealand
E-mail: [email protected]
Telephone #: +64 4 463 6567
Independent Advisor – Dr. Philip Onuoha
Head of School,
School of Allied Health and Nursing
University of Technology, Jamaica
237 Old Hope Road
Kingston 6
Jamaica
Email: [email protected]
Telephone #: 1876 927 1680
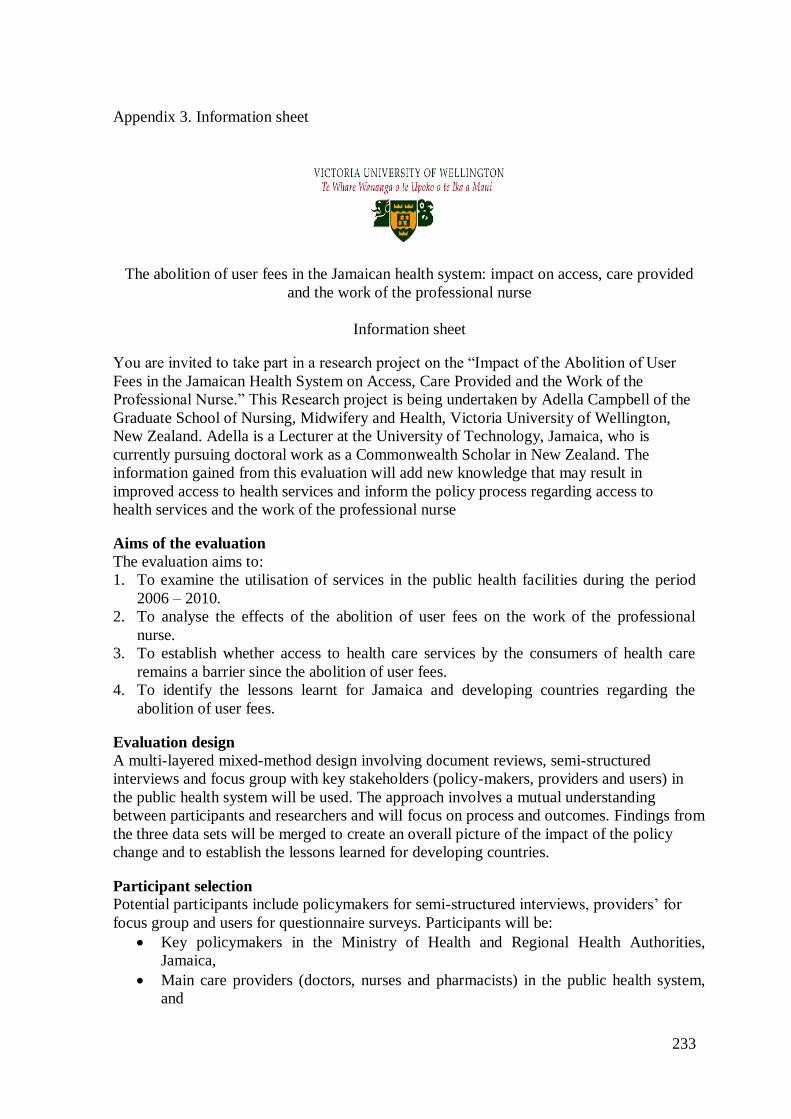
233
Appendix 3. Information sheet
The abolition of user fees in the Jamaican health system: impact on access, care provided
and the work of the professional nurse
Information sheet
You are invited to take part in a research project on the ―Impact of the Abolition of User
Fees in the Jamaican Health System on Access, Care Provided and the Work of the
Professional Nurse.‖ This Research project is being undertaken by Adella Campbell of the
Graduate School of Nursing, Midwifery and Health, Victoria University of Wellington,
New Zealand. Adella is a Lecturer at the University of Technology, Jamaica, who is
currently pursuing doctoral work as a Commonwealth Scholar in New Zealand. The
information gained from this evaluation will add new knowledge that may result in
improved access to health services and inform the policy process regarding access to
health services and the work of the professional nurse
Aims of the evaluation
The evaluation aims to:
1. To examine the utilisation of services in the public health facilities during the period
2006 – 2010.
2. To analyse the effects of the abolition of user fees on the work of the professional
nurse.
3. To establish whether access to health care services by the consumers of health care
remains a barrier since the abolition of user fees.
4. To identify the lessons learnt for Jamaica and developing countries regarding the
abolition of user fees.
Evaluation design
A multi-layered mixed-method design involving document reviews, semi-structured
interviews and focus group with key stakeholders (policy-makers, providers and users) in
the public health system will be used. The approach involves a mutual understanding
between participants and researchers and will focus on process and outcomes. Findings from
the three data sets will be merged to create an overall picture of the impact of the policy
change and to establish the lessons learned for developing countries.
Participant selection
Potential participants include policymakers for semi-structured interviews, providers‘ for
focus group and users for questionnaire surveys. Participants will be:
Key policymakers in the Ministry of Health and Regional Health Authorities,
Jamaica,
Main care providers (doctors, nurses and pharmacists) in the public health system,
and
234
Users of the public health system.
What is required?
The semi-structured interview for policy-makers will focus on issues concerning the
country‘s implementation plan prior to the removal of user fees; utilisation pattern;
availability of services such as the location of health facilities and adequate drugs;
affordability of services; resources including manpower, materials such as medical
equipment and funding of the health service; social policies to address access and the
inequity in the health system – policies such as those regarding education, housing and road
infrastructure. The interviews will be for a minimum of 25 minutes and with consent will be
recorded. Tapes will be transcribed by researcher.
Focus group discussion for providers will be focussed on participants‘ work, types and
number of cases seen daily, morale, satisfaction, funding of services, quality of care, health
outcomes, waiting time, referral process and innovations to improve access to health care.
The focus group discussion will last approximately 60 minutes and with consent will be
recorded. There will be a moderator and an assistant working with each focus group – one to
facilitate the questions and discussion, and the other to take notes, manage the tape recorder
and monitor the group process. Tapes will be transcribed by researcher.
Questionnaire surveys for users will focus on issues concerning health condition, access to
health care, availability of drugs, perception regarding health personnel, waiting time, the
referral system, use of alternative methods of treatment, distance from health facility,
aesthetics of the health facilities, satisfaction with the services, knowledge of the health
services, expectations of the health system, social status and involvement in the decision-
making process. Nursing students will assist with the questionnaire survey. They will sign a
confidentiality agreement.
Consent
You are not obligated in any way to participate in this study and should you decide not to
participate, this information will remain confidential to the researchers. If you agree to take
part, you will be asked to sign a consent form. You are free to withdraw from the study at
any time. If you withdraw, your interview or questionnaire data will be destroyed but if you
are part of a focus group the data will still be used.
Confidentiality
Every effort will be made to ensure all participants are not identified in the thesis and in any
presentations, but by virtue of positions held by some key stakeholders who are interviewed,
it is possible that some people may be recognised.
Data Storage
Once the study is completed, all tape recordings will be electronically erased, and
transcriptions and interview notes will be stored for five years in sealed envelopes and then
destroyed. Surveys will be securely stored and destroyed after five years.
Study Findings
This study will be written up as a report and submitted to the university as my thesis. The
study findings may also be submitted for publication to health-related journals and presented
at conferences. A summary of the findings will be made available to all study participants
who request it.
235
Approval
This study has received ethical approval from the Victoria University of Wellington Human
Ethics Committee and from the Ministry of Health and Regional Health Authorities,
Jamaica.
Further Information
For further information or questions regarding this study, please contact the researchers.
Contacts
As per previous letter
236
Appendix 4. Policymakers‘ and providers‘ consent form
The abolition of user fees in the Jamaican health system: impact on access, care provided
and the work of the professional nurse
Consent form – policymakers and providers
I have read and understood the information sheet for participants in this research
project to evaluate the impact of the abolition of user fees in the Jamaican public
health system.
I have had the opportunity to discuss the study and am satisfied with the
information I have been given.
I understand that participation in this study is voluntary (my choice) and that I may
withdraw from the study at any time and this will in no way affect my continuing
involvement with the researcher.
I understand that my participation in this study is confidential and that every effort
will be made not to identify me in any reports on this study.
I know who to contact if I have any questions or concerns about the study or during
the study.
I agree to have the interview /focus group audiotaped.
I understand that the findings of this report will be presented to the Victoria
University of Wellington and that I will be sent a summary of this if I request it. I
also understand that journal articles and conference presentations may be extracted
from the research.
I ____________________________________________________
hereby consent to taking part in this study
Signature ____________________________ Date____________________________
Researcher____________________________________________________________
Address if you would like to receive a copy of the summary of the research.
_____________________________________________________________________
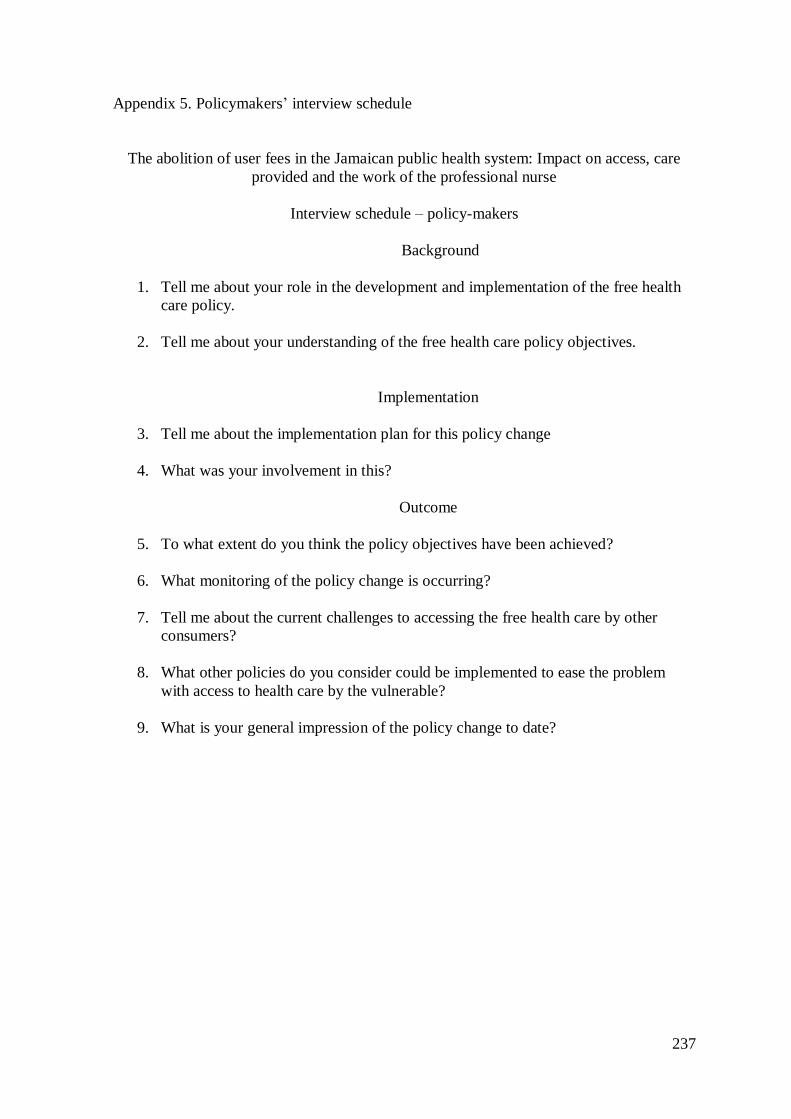
237
Appendix 5. Policymakers‘ interview schedule
The abolition of user fees in the Jamaican public health system: Impact on access, care
provided and the work of the professional nurse
Interview schedule – policy-makers
Background
1. Tell me about your role in the development and implementation of the free health
care policy.
2. Tell me about your understanding of the free health care policy objectives.
Implementation
3. Tell me about the implementation plan for this policy change
4. What was your involvement in this?
Outcome
5. To what extent do you think the policy objectives have been achieved?
6. What monitoring of the policy change is occurring?
7. Tell me about the current challenges to accessing the free health care by other
consumers?
8. What other policies do you consider could be implemented to ease the problem
with access to health care by the vulnerable?
9. What is your general impression of the policy change to date?
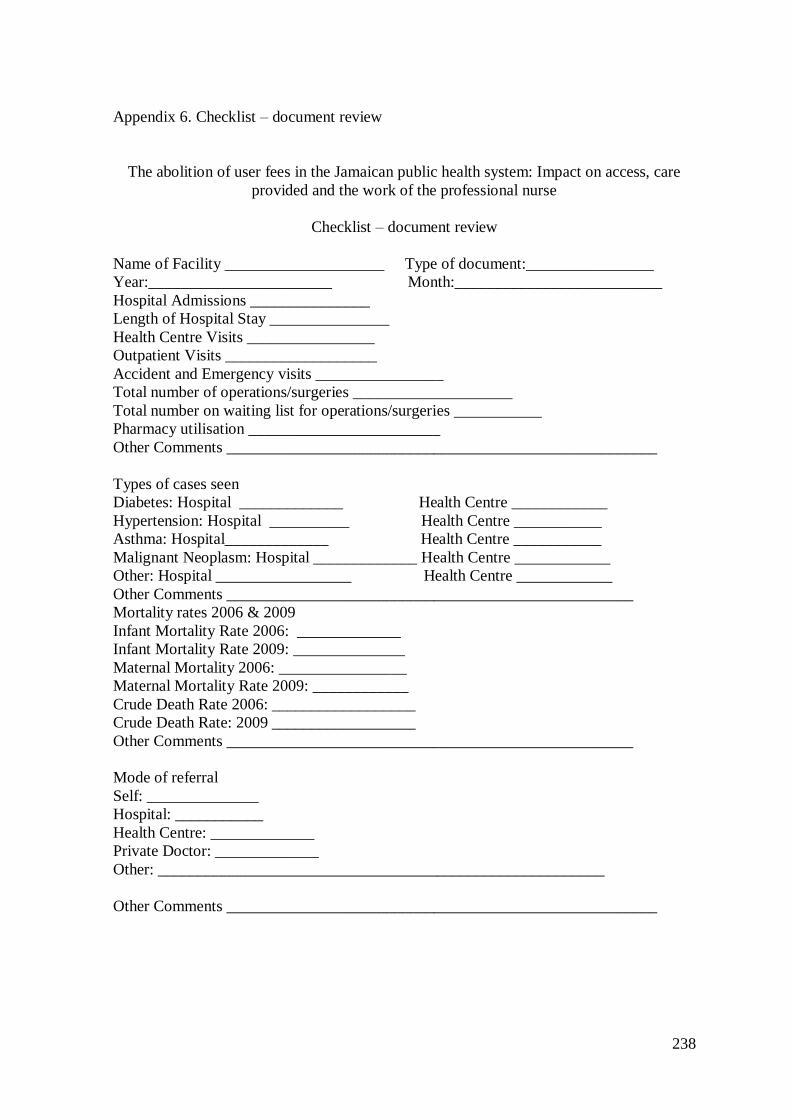
238
Appendix 6. Checklist – document review
The abolition of user fees in the Jamaican public health system: Impact on access, care
provided and the work of the professional nurse
Checklist – document review
Name of Facility ____________________ Type of document:________________
Year:_______________________ Month:__________________________
Hospital Admissions _______________
Length of Hospital Stay _______________
Health Centre Visits ________________
Outpatient Visits ___________________
Accident and Emergency visits ________________
Total number of operations/surgeries ____________________
Total number on waiting list for operations/surgeries ___________
Pharmacy utilisation ________________________
Other Comments ______________________________________________________
Types of cases seen
Diabetes: Hospital _____________ Health Centre ____________
Hypertension: Hospital __________ Health Centre ___________
Asthma: Hospital_____________ Health Centre ___________
Malignant Neoplasm: Hospital _____________ Health Centre ____________
Other: Hospital _________________ Health Centre ____________
Other Comments ___________________________________________________
Mortality rates 2006 & 2009
Infant Mortality Rate 2006: _____________
Infant Mortality Rate 2009: ______________
Maternal Mortality 2006: ________________
Maternal Mortality Rate 2009: ____________
Crude Death Rate 2006: __________________
Crude Death Rate: 2009 __________________
Other Comments ___________________________________________________
Mode of referral
Self: ______________
Hospital: ___________
Health Centre: _____________
Private Doctor: _____________
Other: ________________________________________________________
Other Comments ______________________________________________________
239
Appendix 7. Providers‘ letter of invitation
Letter of invitation to providers
Dear ___________________________________
You are invited to participate in a Focus Group Discussion as part of a study on the ―The
abolition of user fees in the Jamaican public health system: Impact on access, care
provided and the work of the professional nurse.”
I am a Lecturer at the University of Technology, Jamaica, who is currently pursuing
doctoral work as a Commonwealth Scholar at the Graduate School of Nursing, Midwifery
and Health, Victoria University of Wellington, New Zealand.
If you decide to participate, the researcher will engage you in a discussion with other
participants at a time and venue that is convenient to you. It will take approximately 30
minutes – one hour. I do not expect the discussion to cause you any discomfort. I am also
seeking your permission to audio-record the session. Please see the attached information
sheet for more details.
Your participation in the study is entirely voluntary and you can withdraw at any time
within two weeks of participation. If you choose not to participate, your interaction with
the researcher will not be affected. All information supplied by you will be kept in
confidence. While you may be identified by virtue of you position, your name will not be
published in the report. You will sign a consent form.
I will be pleased to answer any questions you may have. Contact persons are listed below:
Contacts
As per previous letter
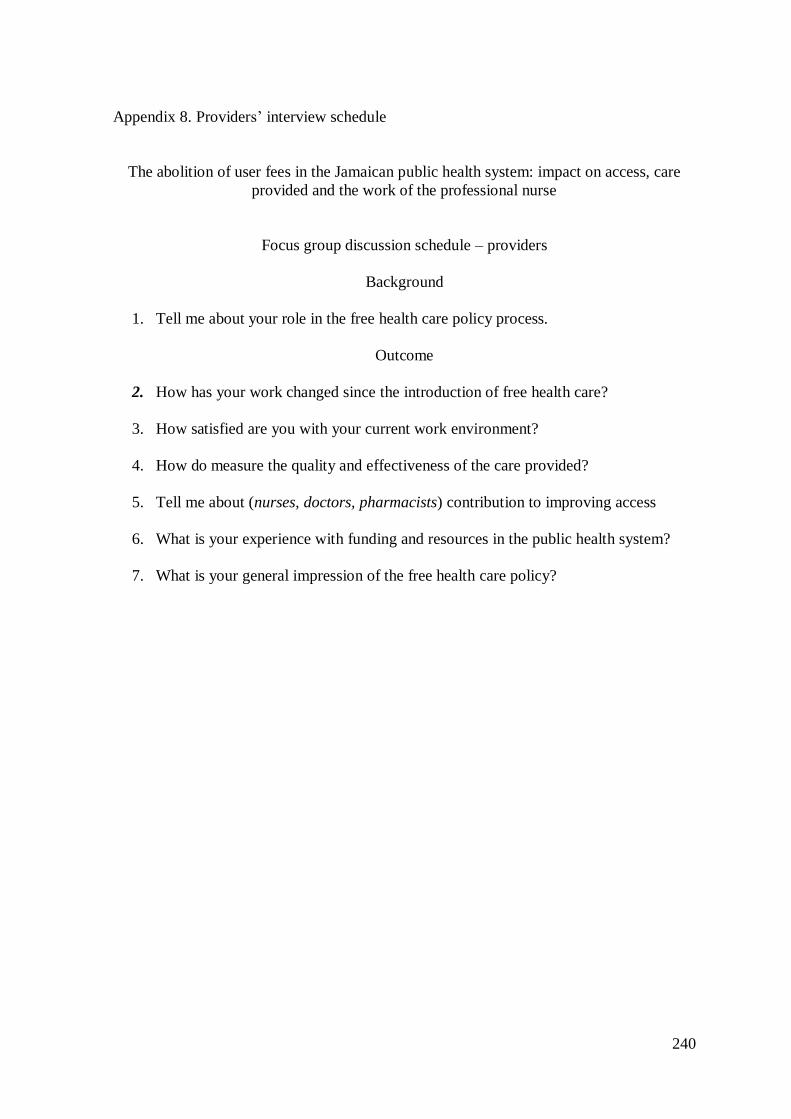
240
Appendix 8. Providers‘ interview schedule
The abolition of user fees in the Jamaican public health system: impact on access, care
provided and the work of the professional nurse
Focus group discussion schedule – providers
Background
1. Tell me about your role in the free health care policy process.
Outcome
2. How has your work changed since the introduction of free health care?
3. How satisfied are you with your current work environment?
4. How do measure the quality and effectiveness of the care provided?
5. Tell me about (nurses, doctors, pharmacists) contribution to improving access
6. What is your experience with funding and resources in the public health system?
7. What is your general impression of the free health care policy?
241
Appendix 9. Patients‘ consent form
The abolition of user fees in the Jamaican public health system: impact on access, care
provided and the work of the professional nurse
Consent form - patients
You are invited to participate in a study on the ―The abolition of user fees in the Jamaican
public health system: Impact on access, care provided and the work of the professional
nurse.‖
If you decide to participate, the researcher will ask you 68 questions. The questionnaire
will take approximately 55 minutes. I do not expect the questions to cause you any
discomfort.
Your participation in the study is entirely voluntary and you can withdraw at any time. If
you choose not to participate, your contact with the health facility will not be affected. All
information supplied by you will be kept in confidence. Your name will not be published in
the report. Journal articles and conference presentation may be extracted from the report.
No potential risk or harm to participants during the study is anticipated.
I will be pleased to answer any questions you may have. Contact persons are listed below:
Contacts
As per previous letters
I have read the above or it has been explained to me and I had time to consider
participation. I understand that I do not have to answer any question that I do not wish to. I
agree to take part in the study.
Name of Respondent:___________________Signature of Respondent:___________
Date:______________________________ Witness: _________________________
Name of Researcher:_______________________
For independent advice about your rights as study participants please contact:
Dr. Sheila Campbell Forrester
CMO
MOH, Jamaica
Telephone #: 967-1100-6
Email: [email protected]
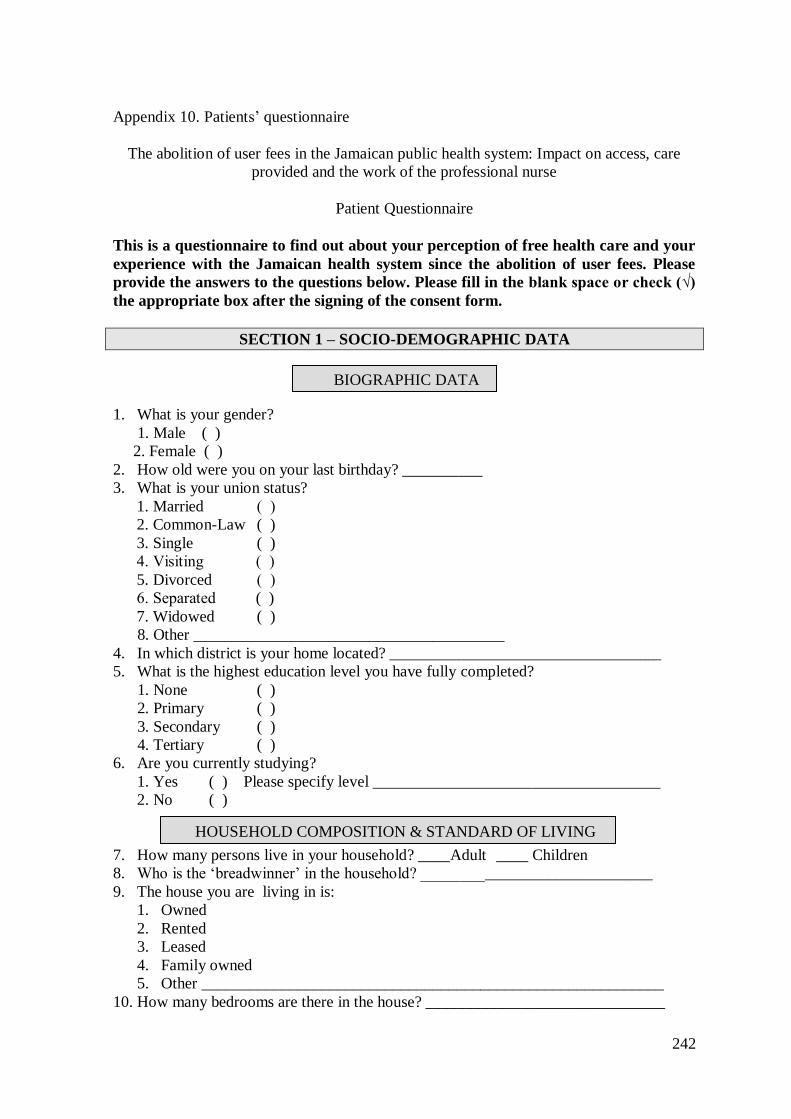
242
Appendix 10. Patients‘ questionnaire
The abolition of user fees in the Jamaican public health system: Impact on access, care
provided and the work of the professional nurse
Patient Questionnaire
This is a questionnaire to find out about your perception of free health care and your
experience with the Jamaican health system since the abolition of user fees. Please
provide the answers to the questions below. Please fill in the blank space or check (√)
the appropriate box after the signing of the consent form.
SECTION 1 – SOCIO-DEMOGRAPHIC DATA
1. What is your gender?
1. Male ( )
2. Female ( )
2. How old were you on your last birthday? __________
3. What is your union status?
1. Married ( )
2. Common-Law ( )
3. Single ( )
4. Visiting ( )
5. Divorced ( )
6. Separated ( )
7. Widowed ( )
8. Other _______________________________________
4. In which district is your home located? __________________________________
5. What is the highest education level you have fully completed?
1. None ( )
2. Primary ( )
3. Secondary ( )
4. Tertiary ( )
6. Are you currently studying?
1. Yes ( ) Please specify level ____________________________________
2. No ( )
7. How many persons live in your household? ____Adult ____ Children
8. Who is the ‗breadwinner‘ in the household? _____________________________
9. The house you are living in is:
1. Owned
2. Rented
3. Leased
4. Family owned
5. Other __________________________________________________________
10. How many bedrooms are there in the house? ______________________________
BIOGRAPHIC DATA
HOUSEHOLD COMPOSITION & STANDARD OF LIVING
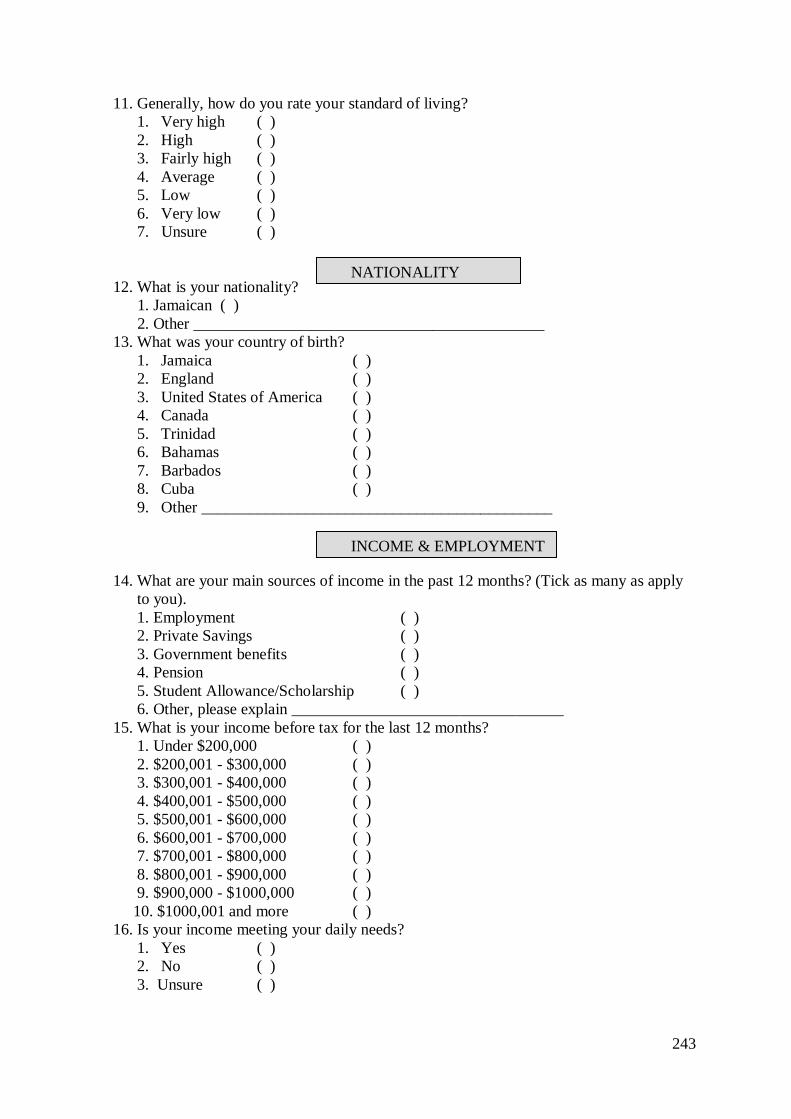
243
11. Generally, how do you rate your standard of living?
1. Very high ( )
2. High ( )
3. Fairly high ( )
4. Average ( )
5. Low ( )
6. Very low ( )
7. Unsure ( )
12. What is your nationality?
1. Jamaican ( )
2. Other ____________________________________________
13. What was your country of birth?
1. Jamaica ( )
2. England ( )
3. United States of America ( )
4. Canada ( )
5. Trinidad ( )
6. Bahamas ( )
7. Barbados ( )
8. Cuba ( )
9. Other ____________________________________________
14. What are your main sources of income in the past 12 months? (Tick as many as apply
to you).
1. Employment ( )
2. Private Savings ( )
3. Government benefits ( )
4. Pension ( )
5. Student Allowance/Scholarship ( )
6. Other, please explain __________________________________
15. What is your income before tax for the last 12 months?
1. Under $200,000 ( )
2. $200,001 - $300,000 ( )
3. $300,001 - $400,000 ( )
4. $400,001 - $500,000 ( )
5. $500,001 - $600,000 ( )
6. $600,001 - $700,000 ( )
7. $700,001 - $800,000 ( )
8. $800,001 - $900,000 ( )
9. $900,000 - $1000,000 ( )
10. $1000,001 and more ( )
16. Is your income meeting your daily needs?
1. Yes ( )
2. No ( )
3. Unsure ( )
NATIONALITY
INCOME & EMPLOYMENT
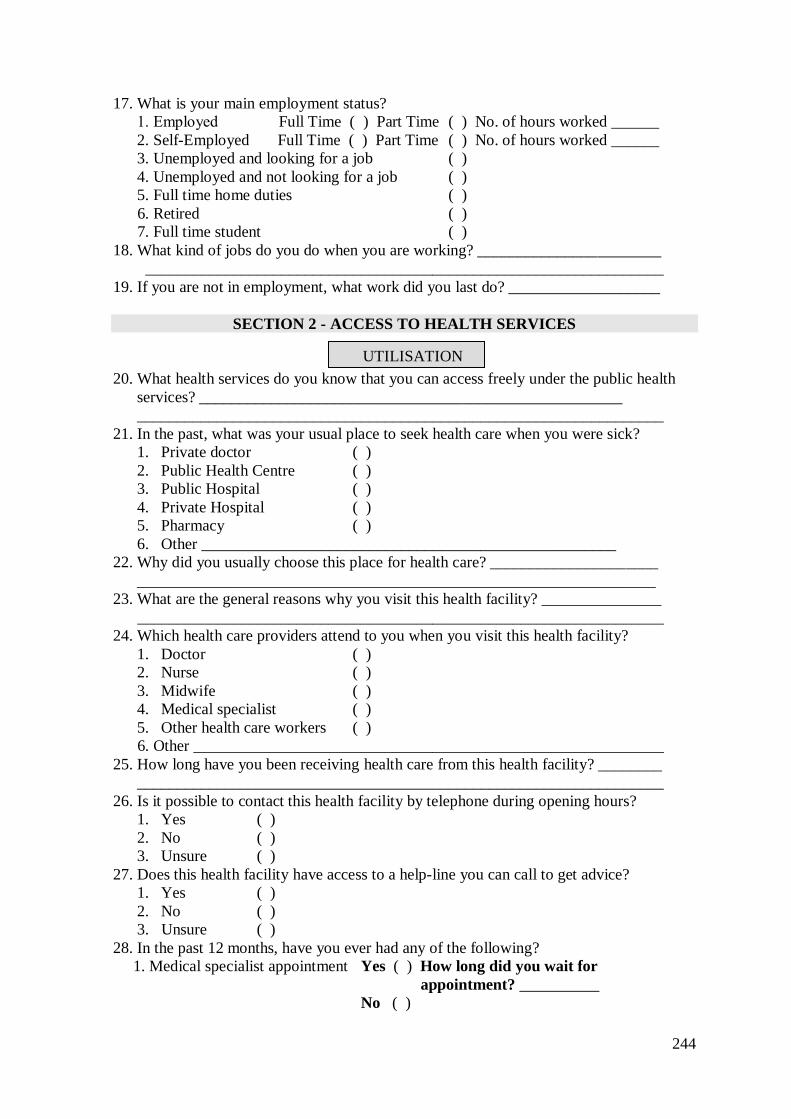
244
17. What is your main employment status?
1. Employed Full Time ( ) Part Time ( ) No. of hours worked ______
2. Self-Employed Full Time ( ) Part Time ( ) No. of hours worked ______
3. Unemployed and looking for a job ( )
4. Unemployed and not looking for a job ( )
5. Full time home duties ( )
6. Retired ( )
7. Full time student ( )
18. What kind of jobs do you do when you are working? _______________________
_________________________________________________________________
19. If you are not in employment, what work did you last do? ___________________
SECTION 2 - ACCESS TO HEALTH SERVICES
20. What health services do you know that you can access freely under the public health
services? _____________________________________________________
__________________________________________________________________
21. In the past, what was your usual place to seek health care when you were sick?
1. Private doctor ( )
2. Public Health Centre ( )
3. Public Hospital ( )
4. Private Hospital ( )
5. Pharmacy ( )
6. Other ____________________________________________________
22. Why did you usually choose this place for health care? _____________________
_________________________________________________________________
23. What are the general reasons why you visit this health facility? _______________
__________________________________________________________________
24. Which health care providers attend to you when you visit this health facility?
1. Doctor ( )
2. Nurse ( )
3. Midwife ( )
4. Medical specialist ( )
5. Other health care workers ( )
6. Other ___________________________________________________________
25. How long have you been receiving health care from this health facility? ________
__________________________________________________________________
26. Is it possible to contact this health facility by telephone during opening hours?
1. Yes ( )
2. No ( )
3. Unsure ( )
27. Does this health facility have access to a help-line you can call to get advice?
1. Yes ( )
2. No ( )
3. Unsure ( )
28. In the past 12 months, have you ever had any of the following?
1. Medical specialist appointment Yes ( ) How long did you wait for
appointment? __________
No ( )
UTILISATION
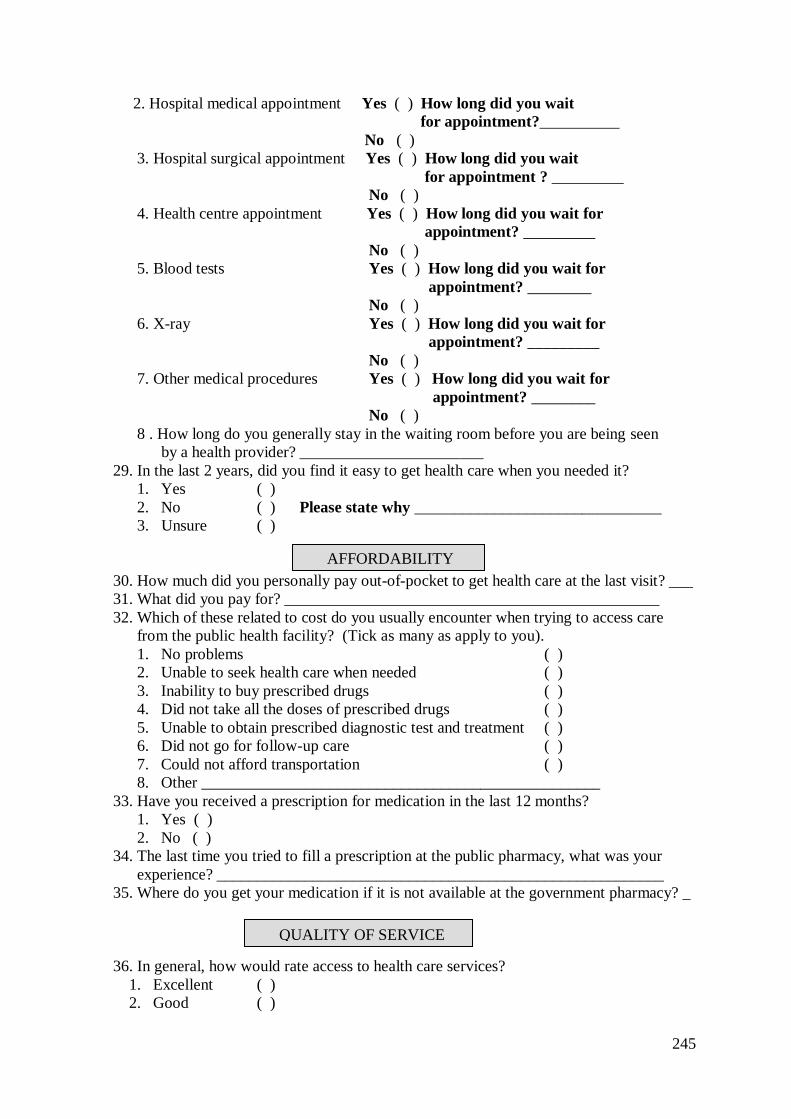
245
2. Hospital medical appointment Yes ( ) How long did you wait
for appointment?__________
No ( )
3. Hospital surgical appointment Yes ( ) How long did you wait
for appointment ? _________
No ( )
4. Health centre appointment Yes ( ) How long did you wait for
appointment? _________
No ( )
5. Blood tests Yes ( ) How long did you wait for
appointment? ________
No ( )
6. X-ray Yes ( ) How long did you wait for
appointment? _________
No ( )
7. Other medical procedures Yes ( ) How long did you wait for
appointment? ________
No ( )
8 . How long do you generally stay in the waiting room before you are being seen
by a health provider? _______________________
29. In the last 2 years, did you find it easy to get health care when you needed it?
1. Yes ( )
2. No ( ) Please state why _______________________________
3. Unsure ( )
30. How much did you personally pay out-of-pocket to get health care at the last visit? ___
31. What did you pay for? _______________________________________________
32. Which of these related to cost do you usually encounter when trying to access care
from the public health facility? (Tick as many as apply to you).
1. No problems ( )
2. Unable to seek health care when needed ( )
3. Inability to buy prescribed drugs ( )
4. Did not take all the doses of prescribed drugs ( )
5. Unable to obtain prescribed diagnostic test and treatment ( )
6. Did not go for follow-up care ( )
7. Could not afford transportation ( )
8. Other __________________________________________________
33. Have you received a prescription for medication in the last 12 months?
1. Yes ( )
2. No ( )
34. The last time you tried to fill a prescription at the public pharmacy, what was your
experience? ________________________________________________________
35. Where do you get your medication if it is not available at the government pharmacy? _
36. In general, how would rate access to health care services?
1. Excellent ( )
2. Good ( )
AFFORDABILITY
QUALITY OF SERVICE
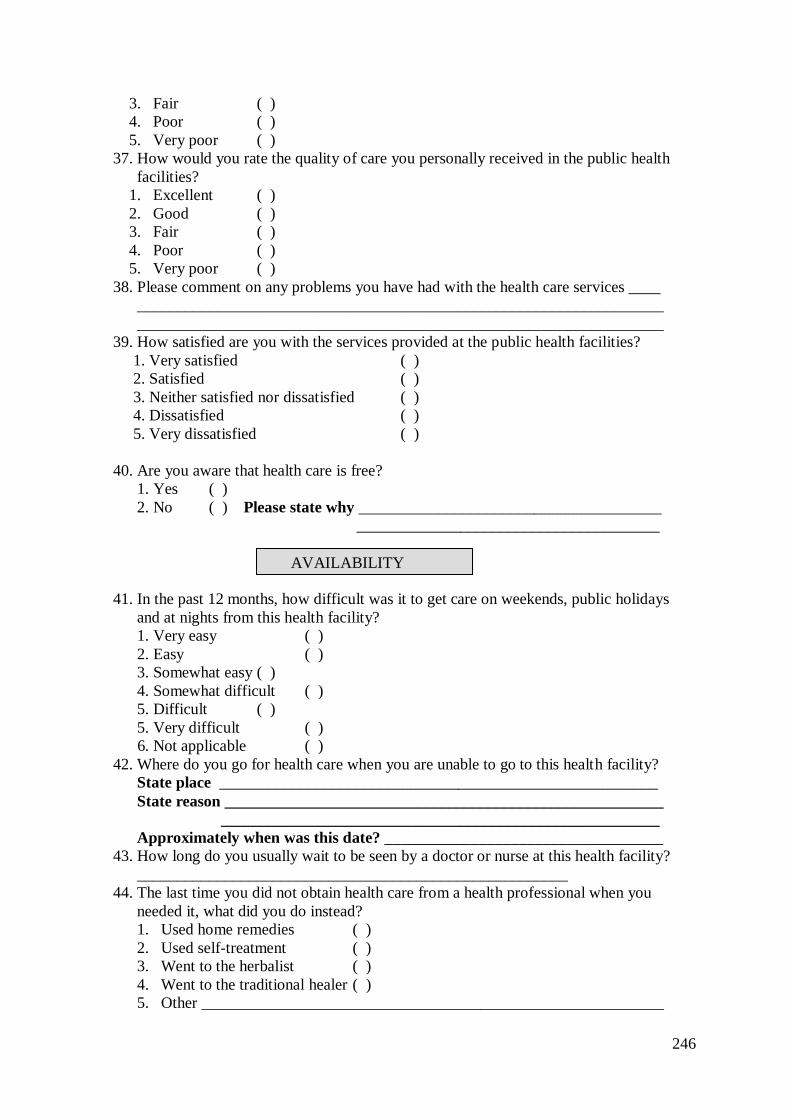
246
3. Fair ( )
4. Poor ( )
5. Very poor ( )
37. How would you rate the quality of care you personally received in the public health
facilities?
1. Excellent ( )
2. Good ( )
3. Fair ( )
4. Poor ( )
5. Very poor ( )
38. Please comment on any problems you have had with the health care services ____
__________________________________________________________________
__________________________________________________________________
39. How satisfied are you with the services provided at the public health facilities?
1. Very satisfied ( )
2. Satisfied ( )
3. Neither satisfied nor dissatisfied ( )
4. Dissatisfied ( )
5. Very dissatisfied ( )
40. Are you aware that health care is free?
1. Yes ( )
2. No ( ) Please state why ______________________________________
______________________________________
41. In the past 12 months, how difficult was it to get care on weekends, public holidays
and at nights from this health facility?
1. Very easy ( )
2. Easy ( )
3. Somewhat easy ( )
4. Somewhat difficult ( )
5. Difficult ( )
5. Very difficult ( )
6. Not applicable ( )
42. Where do you go for health care when you are unable to go to this health facility?
State place _______________________________________________________
State reason _______________________________________________________
_______________________________________________________
Approximately when was this date? ___________________________________
43. How long do you usually wait to be seen by a doctor or nurse at this health facility?
______________________________________________________
44. The last time you did not obtain health care from a health professional when you
needed it, what did you do instead?
1. Used home remedies ( )
2. Used self-treatment ( )
3. Went to the herbalist ( )
4. Went to the traditional healer ( )
5. Other __________________________________________________________
AVAILABILITY
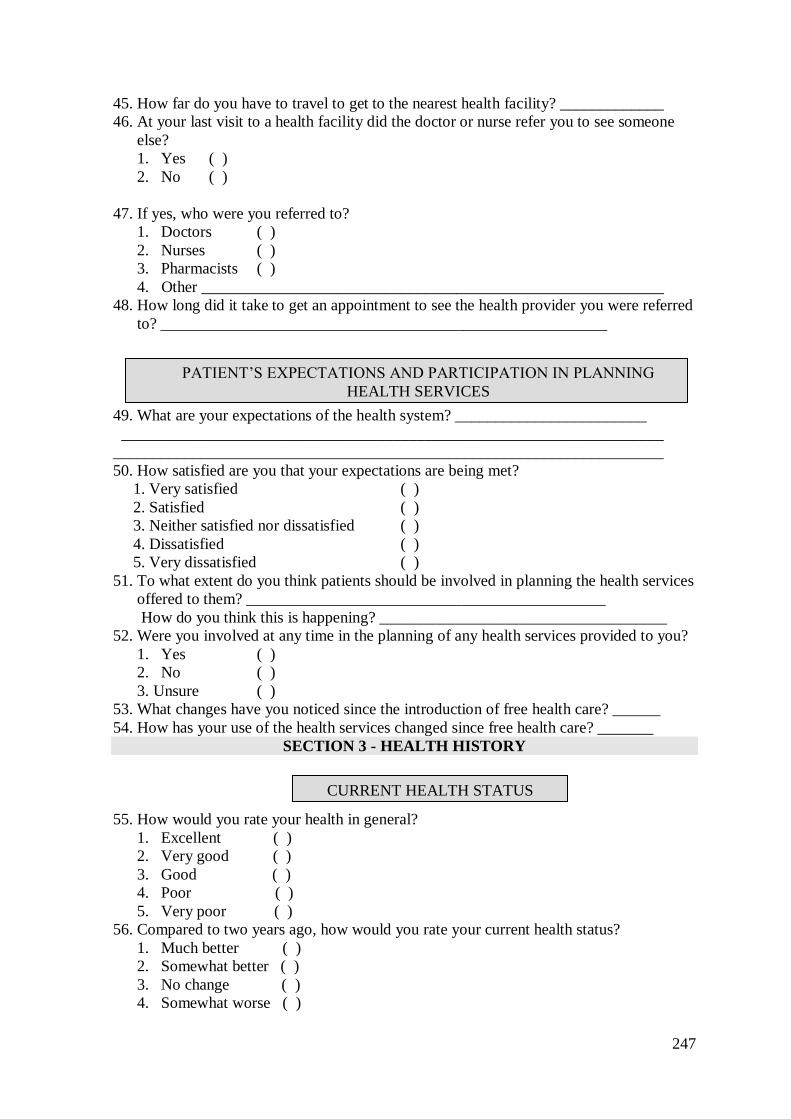
247
45. How far do you have to travel to get to the nearest health facility? _____________
46. At your last visit to a health facility did the doctor or nurse refer you to see someone
else?
1. Yes ( )
2. No ( )
47. If yes, who were you referred to?
1. Doctors ( )
2. Nurses ( )
3. Pharmacists ( )
4. Other __________________________________________________________
48. How long did it take to get an appointment to see the health provider you were referred
to? ________________________________________________________
49. What are your expectations of the health system? ________________________
____________________________________________________________________
_____________________________________________________________________
50. How satisfied are you that your expectations are being met?
1. Very satisfied ( )
2. Satisfied ( )
3. Neither satisfied nor dissatisfied ( )
4. Dissatisfied ( )
5. Very dissatisfied ( )
51. To what extent do you think patients should be involved in planning the health services
offered to them? _____________________________________________
How do you think this is happening? ____________________________________
52. Were you involved at any time in the planning of any health services provided to you?
1. Yes ( )
2. No ( )
3. Unsure ( )
53. What changes have you noticed since the introduction of free health care? ______
54. How has your use of the health services changed since free health care? _______
SECTION 3 - HEALTH HISTORY
55. How would you rate your health in general?
1. Excellent ( )
2. Very good ( )
3. Good ( )
4. Poor ( )
5. Very poor ( )
56. Compared to two years ago, how would you rate your current health status?
1. Much better ( )
2. Somewhat better ( )
3. No change ( )
4. Somewhat worse ( )
CURRENT HEALTH STATUS
PATIENT‘S EXPECTATIONS AND PARTICIPATION IN PLANNING
HEALTH SERVICES
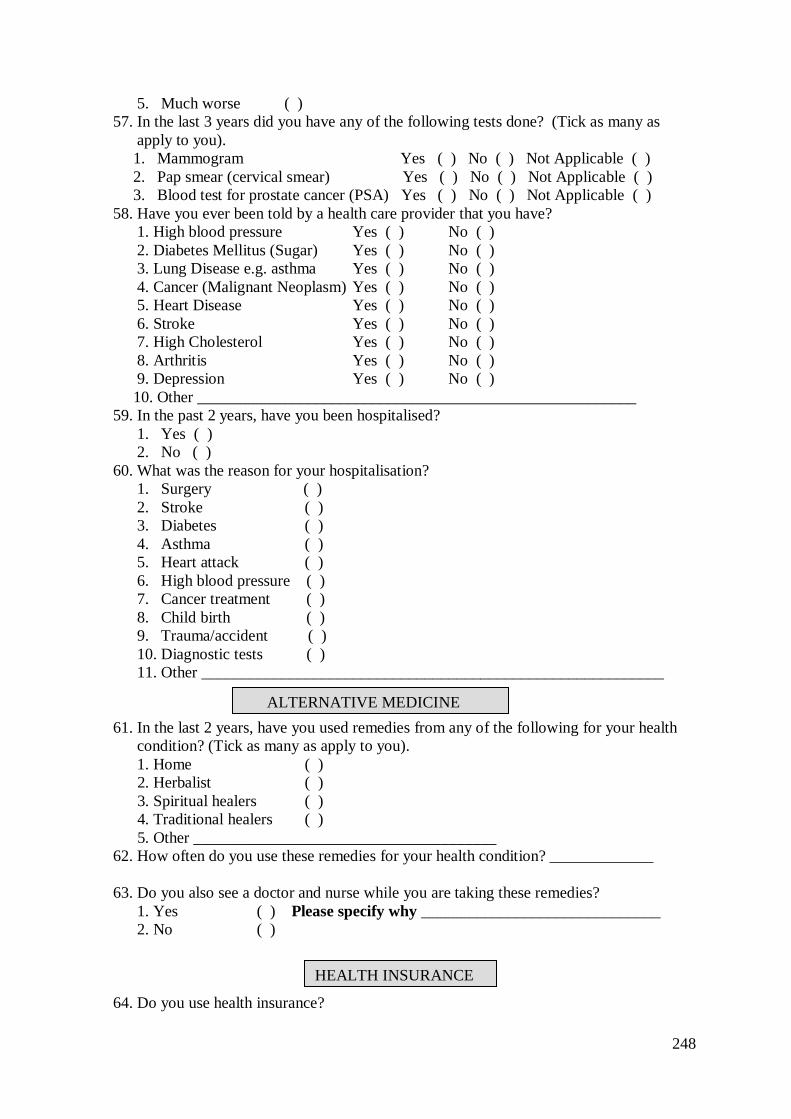
248
5. Much worse ( )
57. In the last 3 years did you have any of the following tests done? (Tick as many as
apply to you).
1. Mammogram Yes ( ) No ( ) Not Applicable ( )
2. Pap smear (cervical smear) Yes ( ) No ( ) Not Applicable ( )
3. Blood test for prostate cancer (PSA) Yes ( ) No ( ) Not Applicable ( )
58. Have you ever been told by a health care provider that you have?
1. High blood pressure Yes ( ) No ( )
2. Diabetes Mellitus (Sugar) Yes ( ) No ( )
3. Lung Disease e.g. asthma Yes ( ) No ( )
4. Cancer (Malignant Neoplasm) Yes ( ) No ( )
5. Heart Disease Yes ( ) No ( )
6. Stroke Yes ( ) No ( )
7. High Cholesterol Yes ( ) No ( )
8. Arthritis Yes ( ) No ( )
9. Depression Yes ( ) No ( )
10. Other _______________________________________________________
59. In the past 2 years, have you been hospitalised?
1. Yes ( )
2. No ( )
60. What was the reason for your hospitalisation?
1. Surgery ( )
2. Stroke ( )
3. Diabetes ( )
4. Asthma ( )
5. Heart attack ( )
6. High blood pressure ( )
7. Cancer treatment ( )
8. Child birth ( )
9. Trauma/accident ( )
10. Diagnostic tests ( )
11. Other __________________________________________________________
61. In the last 2 years, have you used remedies from any of the following for your health
condition? (Tick as many as apply to you).
1. Home ( )
2. Herbalist ( )
3. Spiritual healers ( )
4. Traditional healers ( )
5. Other ______________________________________
62. How often do you use these remedies for your health condition? _____________
63. Do you also see a doctor and nurse while you are taking these remedies?
1. Yes ( ) Please specify why ______________________________
2. No ( )
64. Do you use health insurance?
HEALTH INSURANCE
ALTERNATIVE MEDICINE
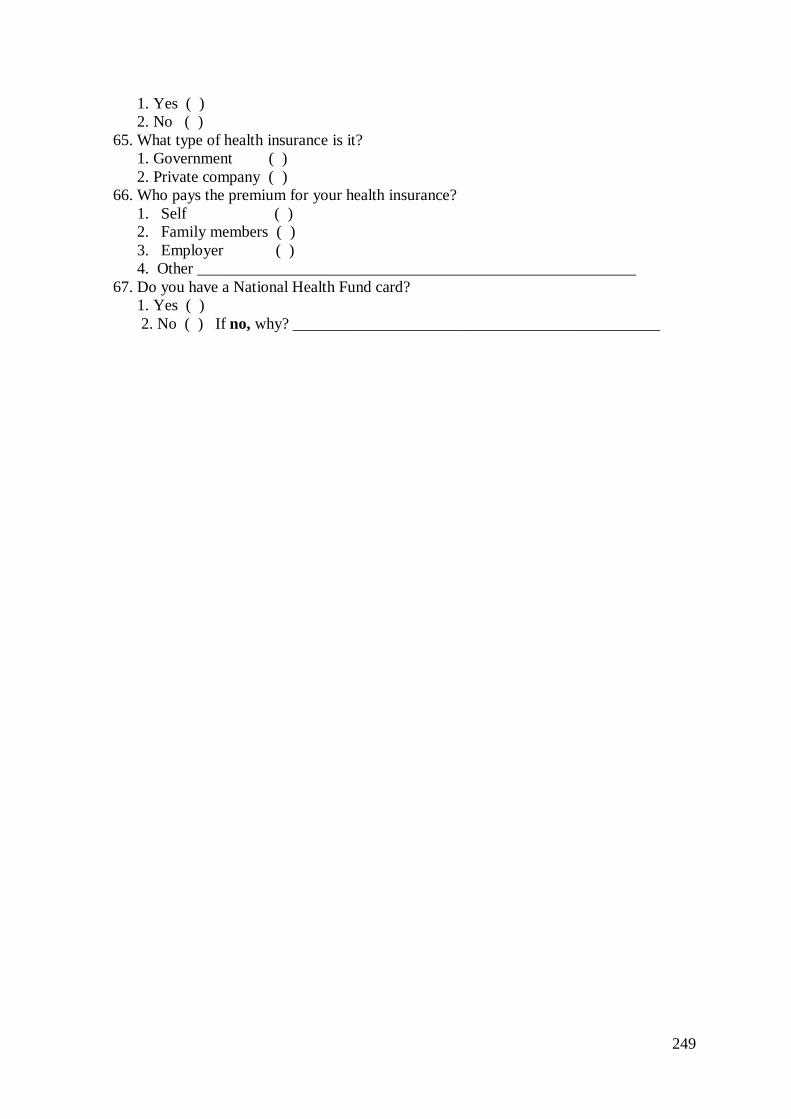
249
1. Yes ( )
2. No ( )
65. What type of health insurance is it?
1. Government ( )
2. Private company ( )
66. Who pays the premium for your health insurance?
1. Self ( )
2. Family members ( )
3. Employer ( )
4. Other _______________________________________________________
67. Do you have a National Health Fund card?
1. Yes ( )
2. No ( ) If no, why? ______________________________________________
250
Phone 0-4-463 5676
Fax 0-4-463 5209
Email [email protected]
Appendix 11. Victoria University of Wellington ethical approval
TO Adella Campbell
COPY TO Katherine Nelson, Jackie Cumming
FROM Dr Allison Kirkman, Convener, Human Ethics Committee
DATE December 18 2009
PAGES 1
SUBJECT Ethics Approval: No 17157, The Abolition of User Fees in the
Jamaican Public Health System: Impact on Access, Care Provided
and the Work of the Professional Nurse
Thank you for your application for ethical approval, which has now been considered by the Standing
Committee of the Human Ethics Committee.
Your application has been approved from the above date and this approval continues until 30 March
2012. If your data collection is not completed by this date you should apply to the Human Ethics
Committee for an extension to this approval.
Best wishes with the research.
Allison Kirkman
Convener
251
Appendix 12. Ministry of Health, Jamaica ethical approval

252
Appendix 13. Confidentiality agreement for nursing students
Confidentiality agreement for nursing students
of a research study
“The abolition of user fees in the Jamaican public health system: Impact on access,
care provided and the work of the professional nurse”
Researcher: Adella Campbell
I have read the information sheet outlining this study. I have discussed with the researcher
the nature of the research and have had any questions that I had, answered to my
satisfaction. My role as the patient interviewer has been outlined to me by the researcher.
At all times the research information surveys will be inaccessible to other persons. The
researcher has assured me that she will debrief me following data collection to address any
issues that may arise.
Most importantly, I understand and agree to keep the information I hear in the course of
data collection confidential to the researcher and myself.
Full Name:____________________________________________________________
Signature:____________________________________________________________
Date:________________________________________________________________
Researcher‘s Signature:__________________________________________________
Date:________________________________________________________________
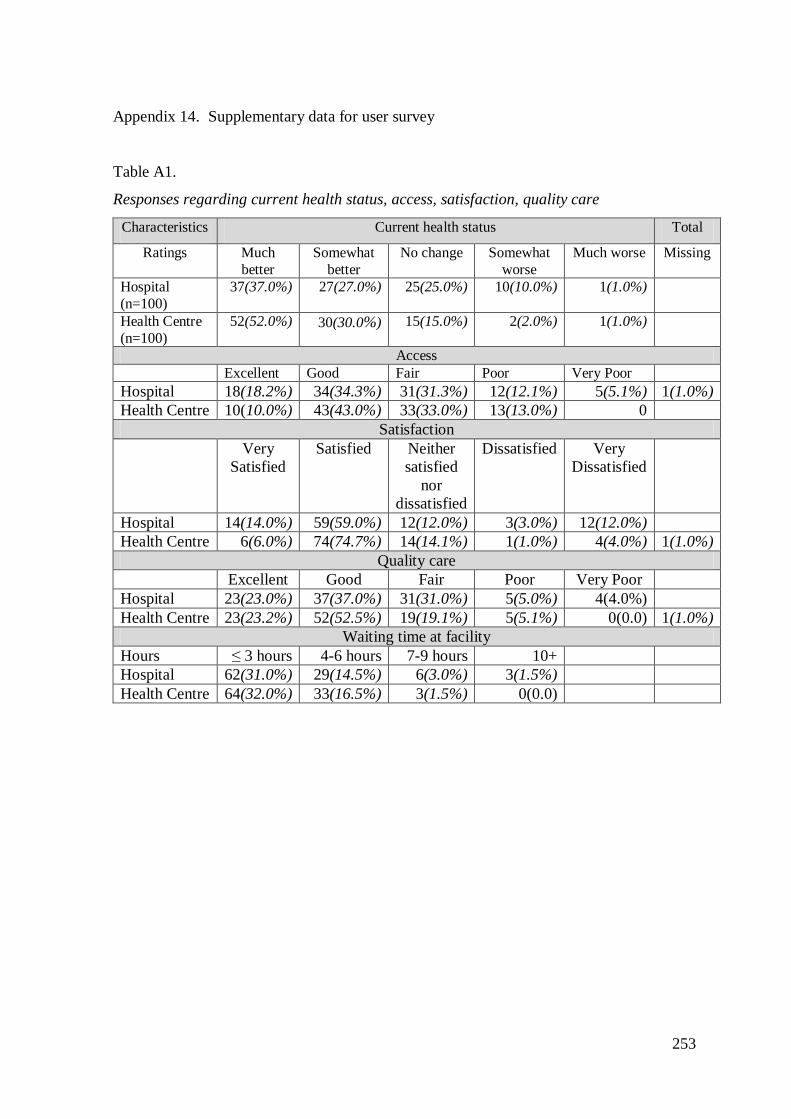
253
Appendix 14. Supplementary data for user survey
Table A1.
Responses regarding current health status, access, satisfaction, quality care
Characteristics Current health status Total
Ratings Much
better
Somewhat
better
No change Somewhat
worse
Much worse Missing
Hospital
(n=100)
37(37.0%) 27(27.0%) 25(25.0%) 10(10.0%) 1(1.0%)
Health Centre
(n=100)
52(52.0%) 30(30.0%) 15(15.0%) 2(2.0%) 1(1.0%)
Access Excellent Good Fair Poor Very Poor
Hospital 18(18.2%) 34(34.3%) 31(31.3%) 12(12.1%) 5(5.1%) 1(1.0%)
Health Centre 10(10.0%) 43(43.0%) 33(33.0%) 13(13.0%) 0
Satisfaction
Very
Satisfied
Satisfied Neither
satisfied
nor
dissatisfied
Dissatisfied Very
Dissatisfied
Hospital 14(14.0%) 59(59.0%) 12(12.0%) 3(3.0%) 12(12.0%)
Health Centre 6(6.0%) 74(74.7%) 14(14.1%) 1(1.0%) 4(4.0%) 1(1.0%)
Quality care
Excellent Good Fair Poor Very Poor
Hospital 23(23.0%) 37(37.0%) 31(31.0%) 5(5.0%) 4(4.0%)
Health Centre 23(23.2%) 52(52.5%) 19(19.1%) 5(5.1%) 0(0.0) 1(1.0%)
Waiting time at facility
Hours ≤ 3 hours 4-6 hours 7-9 hours 10+
Hospital 62(31.0%) 29(14.5%) 6(3.0%) 3(1.5%)
Health Centre 64(32.0%) 33(16.5%) 3(1.5%) 0(0.0)
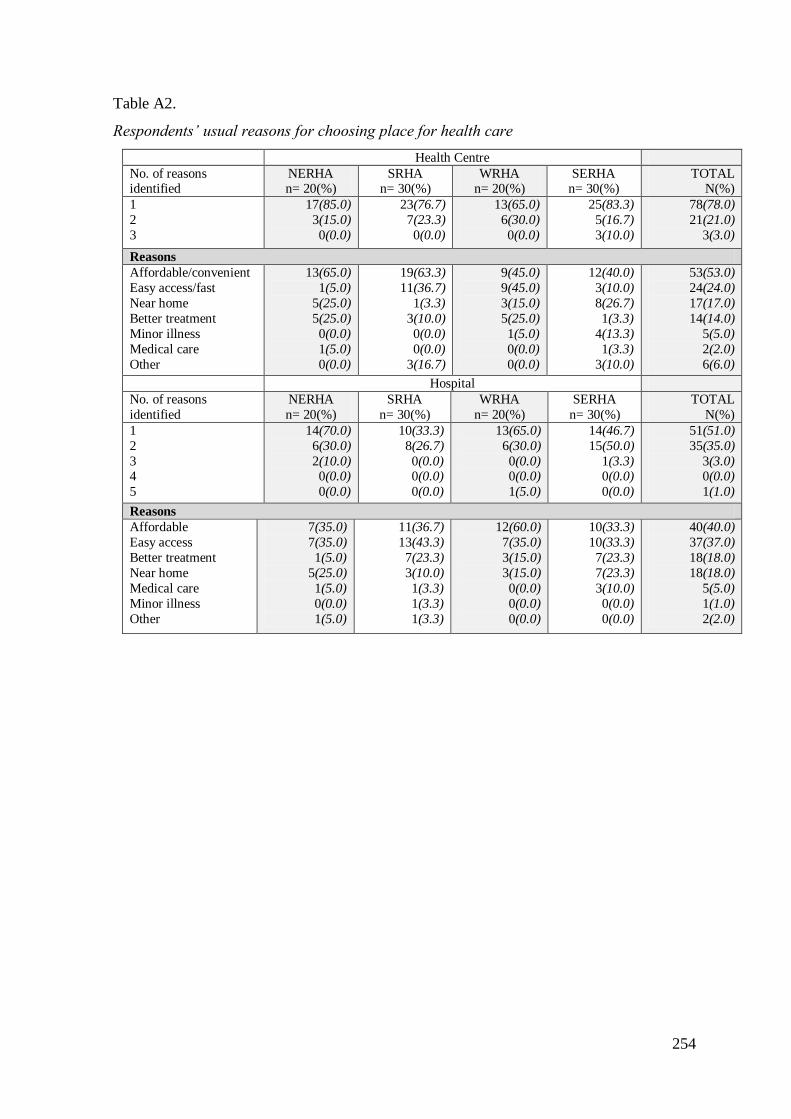
254
Table A2.
Respondents‘ usual reasons for choosing place for health care
Health Centre
No. of reasons identified
NERHA n= 20(%)
SRHA n= 30(%)
WRHA n= 20(%)
SERHA n= 30(%)
TOTAL N(%)
1
2
3
17(85.0)
3(15.0)
0(0.0)
23(76.7)
7(23.3)
0(0.0)
13(65.0)
6(30.0)
0(0.0)
25(83.3)
5(16.7)
3(10.0)
78(78.0)
21(21.0)
3(3.0)
Reasons
Affordable/convenient
Easy access/fast
Near home
Better treatment
Minor illness
Medical care
Other
13(65.0)
1(5.0)
5(25.0)
5(25.0)
0(0.0)
1(5.0)
0(0.0)
19(63.3)
11(36.7)
1(3.3)
3(10.0)
0(0.0)
0(0.0)
3(16.7)
9(45.0)
9(45.0)
3(15.0)
5(25.0)
1(5.0)
0(0.0)
0(0.0)
12(40.0)
3(10.0)
8(26.7)
1(3.3)
4(13.3)
1(3.3)
3(10.0)
53(53.0)
24(24.0)
17(17.0)
14(14.0)
5(5.0)
2(2.0)
6(6.0)
Hospital
No. of reasons
identified
NERHA
n= 20(%)
SRHA
n= 30(%)
WRHA
n= 20(%)
SERHA
n= 30(%)
TOTAL
N(%)
1
2
3 4
5
14(70.0)
6(30.0)
2(10.0) 0(0.0)
0(0.0)
10(33.3)
8(26.7)
0(0.0) 0(0.0)
0(0.0)
13(65.0)
6(30.0)
0(0.0) 0(0.0)
1(5.0)
14(46.7)
15(50.0)
1(3.3) 0(0.0)
0(0.0)
51(51.0)
35(35.0)
3(3.0) 0(0.0)
1(1.0)
Reasons
Affordable
Easy access
Better treatment
Near home
Medical care
Minor illness
Other
7(35.0)
7(35.0)
1(5.0)
5(25.0)
1(5.0)
0(0.0)
1(5.0)
11(36.7)
13(43.3)
7(23.3)
3(10.0)
1(3.3)
1(3.3)
1(3.3)
12(60.0)
7(35.0)
3(15.0)
3(15.0)
0(0.0)
0(0.0)
0(0.0)
10(33.3)
10(33.3)
7(23.3)
7(23.3)
3(10.0)
0(0.0)
0(0.0)
40(40.0)
37(37.0)
18(18.0)
18(18.0)
5(5.0)
1(1.0)
2(2.0)
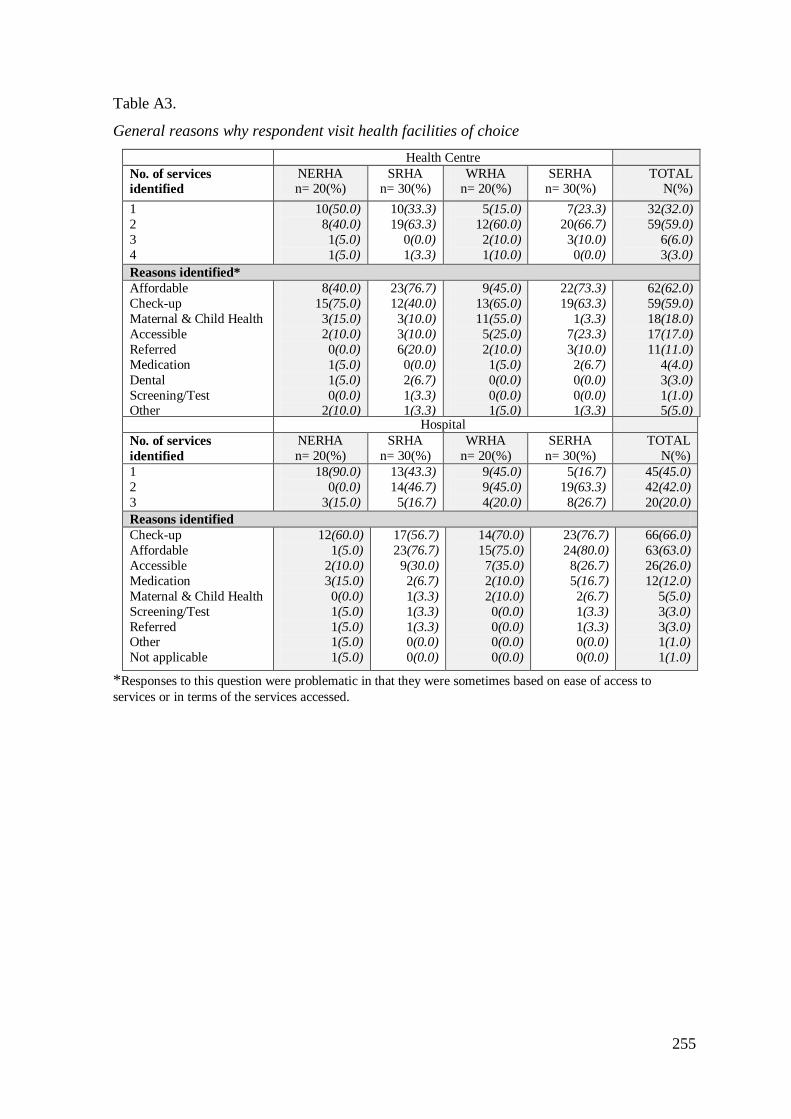
255
Table A3.
General reasons why respondent visit health facilities of choice
Health Centre
No. of services
identified
NERHA n= 20(%)
SRHA n= 30(%)
WRHA n= 20(%)
SERHA n= 30(%)
TOTAL N(%)
1
2
3
4
10(50.0)
8(40.0)
1(5.0)
1(5.0)
10(33.3)
19(63.3)
0(0.0)
1(3.3)
5(15.0)
12(60.0)
2(10.0)
1(10.0)
7(23.3)
20(66.7)
3(10.0)
0(0.0)
32(32.0)
59(59.0)
6(6.0)
3(3.0)
Reasons identified*
Affordable
Check-up
Maternal & Child Health
Accessible
Referred
Medication
Dental
Screening/Test Other
8(40.0)
15(75.0)
3(15.0)
2(10.0)
0(0.0)
1(5.0)
1(5.0)
0(0.0) 2(10.0)
23(76.7)
12(40.0)
3(10.0)
3(10.0)
6(20.0)
0(0.0)
2(6.7)
1(3.3) 1(3.3)
9(45.0)
13(65.0)
11(55.0)
5(25.0)
2(10.0)
1(5.0)
0(0.0)
0(0.0) 1(5.0)
22(73.3)
19(63.3)
1(3.3)
7(23.3)
3(10.0)
2(6.7)
0(0.0)
0(0.0) 1(3.3)
62(62.0)
59(59.0)
18(18.0)
17(17.0)
11(11.0)
4(4.0)
3(3.0)
1(1.0) 5(5.0)
Hospital
No. of services
identified
NERHA
n= 20(%)
SRHA
n= 30(%)
WRHA
n= 20(%)
SERHA
n= 30(%)
TOTAL
N(%)
1
2
3
18(90.0)
0(0.0)
3(15.0)
13(43.3)
14(46.7)
5(16.7)
9(45.0)
9(45.0)
4(20.0)
5(16.7)
19(63.3)
8(26.7)
45(45.0)
42(42.0)
20(20.0)
Reasons identified
Check-up
Affordable
Accessible
Medication
Maternal & Child Health
Screening/Test
Referred Other
Not applicable
12(60.0)
1(5.0)
2(10.0)
3(15.0)
0(0.0)
1(5.0)
1(5.0) 1(5.0)
1(5.0)
17(56.7)
23(76.7)
9(30.0)
2(6.7)
1(3.3)
1(3.3)
1(3.3) 0(0.0)
0(0.0)
14(70.0)
15(75.0)
7(35.0)
2(10.0)
2(10.0)
0(0.0)
0(0.0) 0(0.0)
0(0.0)
23(76.7)
24(80.0)
8(26.7)
5(16.7)
2(6.7)
1(3.3)
1(3.3) 0(0.0)
0(0.0)
66(66.0)
63(63.0)
26(26.0)
12(12.0)
5(5.0)
3(3.0)
3(3.0) 1(1.0)
1(1.0)
*Responses to this question were problematic in that they were sometimes based on ease of access to
services or in terms of the services accessed.
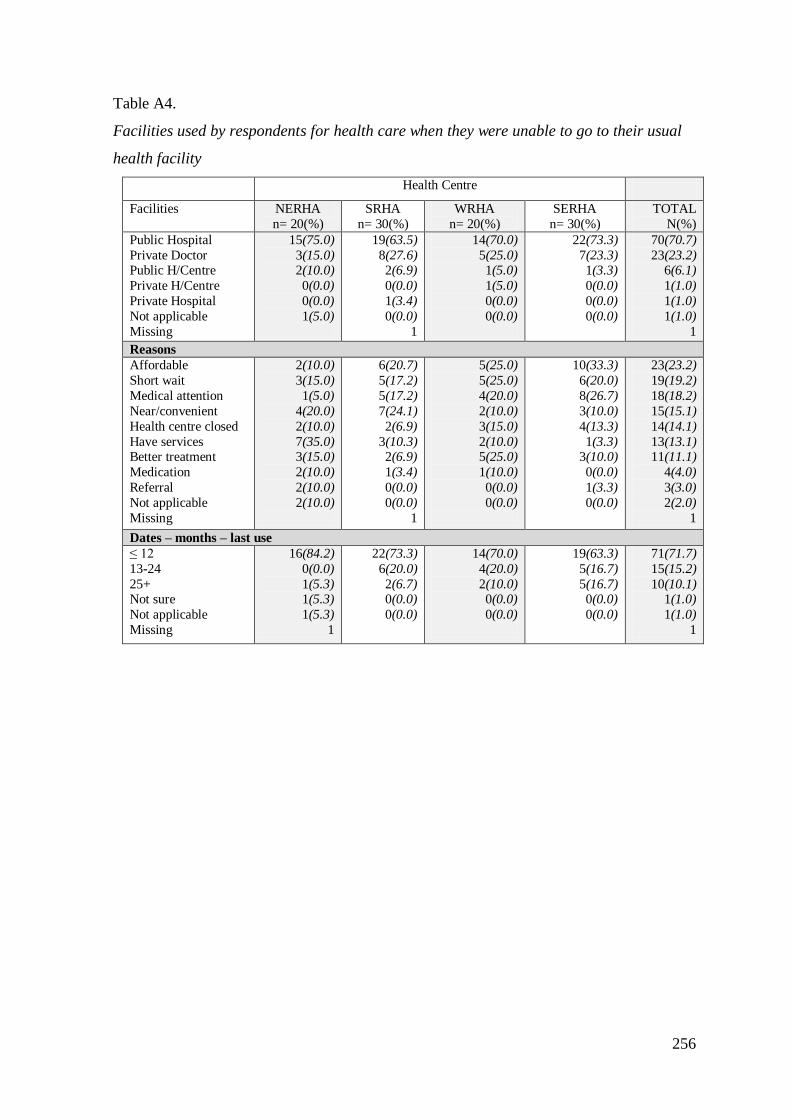
256
Table A4.
Facilities used by respondents for health care when they were unable to go to their usual
health facility
Health Centre
Facilities NERHA
n= 20(%)
SRHA
n= 30(%)
WRHA
n= 20(%)
SERHA
n= 30(%)
TOTAL
N(%)
Public Hospital
Private Doctor Public H/Centre
Private H/Centre
Private Hospital
Not applicable
Missing
15(75.0)
3(15.0) 2(10.0)
0(0.0)
0(0.0)
1(5.0)
19(63.5)
8(27.6) 2(6.9)
0(0.0)
1(3.4)
0(0.0)
1
14(70.0)
5(25.0) 1(5.0)
1(5.0)
0(0.0)
0(0.0)
22(73.3)
7(23.3) 1(3.3)
0(0.0)
0(0.0)
0(0.0)
70(70.7)
23(23.2) 6(6.1)
1(1.0)
1(1.0)
1(1.0)
1
Reasons
Affordable
Short wait
Medical attention
Near/convenient
Health centre closed
Have services Better treatment
Medication
Referral
Not applicable
Missing
2(10.0)
3(15.0)
1(5.0)
4(20.0)
2(10.0)
7(35.0) 3(15.0)
2(10.0)
2(10.0)
2(10.0)
6(20.7)
5(17.2)
5(17.2)
7(24.1)
2(6.9)
3(10.3) 2(6.9)
1(3.4)
0(0.0)
0(0.0)
1
5(25.0)
5(25.0)
4(20.0)
2(10.0)
3(15.0)
2(10.0) 5(25.0)
1(10.0)
0(0.0)
0(0.0)
10(33.3)
6(20.0)
8(26.7)
3(10.0)
4(13.3)
1(3.3) 3(10.0)
0(0.0)
1(3.3)
0(0.0)
23(23.2)
19(19.2)
18(18.2)
15(15.1)
14(14.1)
13(13.1) 11(11.1)
4(4.0)
3(3.0)
2(2.0)
1
Dates – months – last use
≤ 12
13-24
25+ Not sure
Not applicable
Missing
16(84.2)
0(0.0)
1(5.3) 1(5.3)
1(5.3)
1
22(73.3)
6(20.0)
2(6.7) 0(0.0)
0(0.0)
14(70.0)
4(20.0)
2(10.0) 0(0.0)
0(0.0)
19(63.3)
5(16.7)
5(16.7) 0(0.0)
0(0.0)
71(71.7)
15(15.2)
10(10.1) 1(1.0)
1(1.0)
1
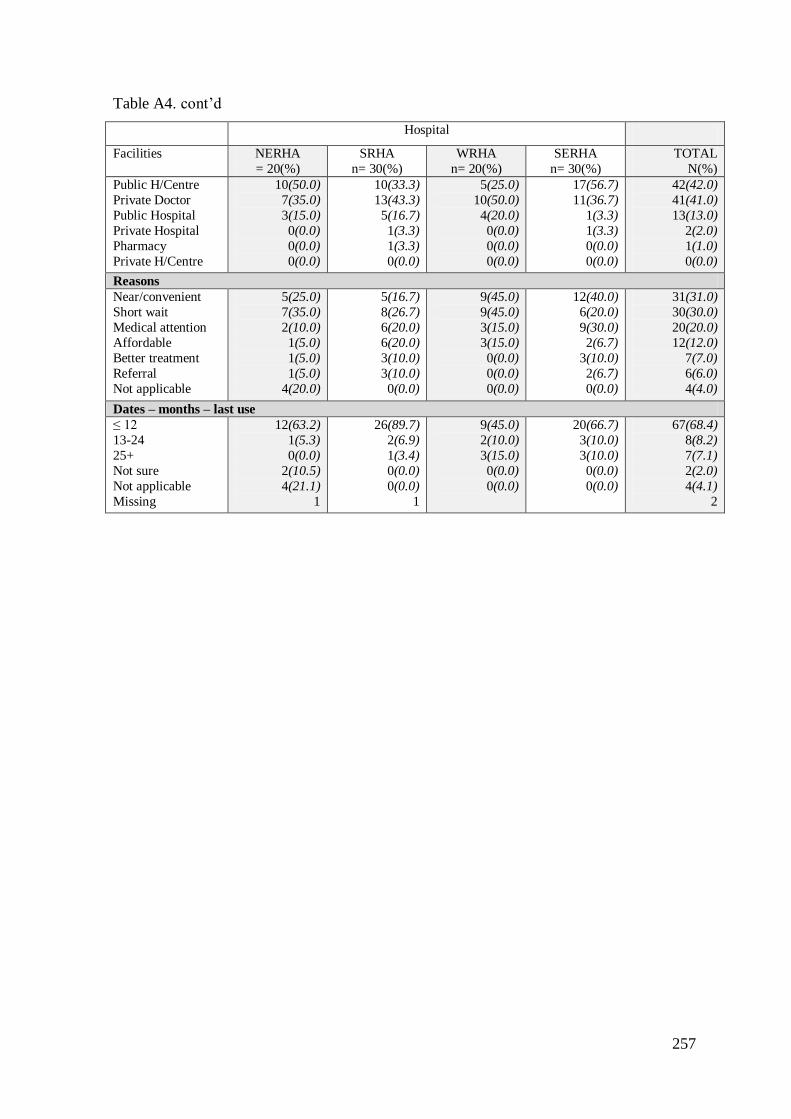
257
Table A4. cont‘d
Hospital
Facilities NERHA
= 20(%)
SRHA
n= 30(%)
WRHA
n= 20(%)
SERHA
n= 30(%)
TOTAL
N(%)
Public H/Centre
Private Doctor
Public Hospital
Private Hospital
Pharmacy
Private H/Centre
10(50.0)
7(35.0)
3(15.0)
0(0.0)
0(0.0)
0(0.0)
10(33.3)
13(43.3)
5(16.7)
1(3.3)
1(3.3)
0(0.0)
5(25.0)
10(50.0)
4(20.0)
0(0.0)
0(0.0)
0(0.0)
17(56.7)
11(36.7)
1(3.3)
1(3.3)
0(0.0)
0(0.0)
42(42.0)
41(41.0)
13(13.0)
2(2.0)
1(1.0)
0(0.0)
Reasons
Near/convenient
Short wait
Medical attention
Affordable
Better treatment
Referral
Not applicable
5(25.0)
7(35.0)
2(10.0)
1(5.0)
1(5.0)
1(5.0)
4(20.0)
5(16.7)
8(26.7)
6(20.0)
6(20.0)
3(10.0)
3(10.0)
0(0.0)
9(45.0)
9(45.0)
3(15.0)
3(15.0)
0(0.0)
0(0.0)
0(0.0)
12(40.0)
6(20.0)
9(30.0)
2(6.7)
3(10.0)
2(6.7)
0(0.0)
31(31.0)
30(30.0)
20(20.0)
12(12.0)
7(7.0)
6(6.0)
4(4.0)
Dates – months – last use
≤ 12
13-24
25+
Not sure
Not applicable
Missing
12(63.2)
1(5.3)
0(0.0)
2(10.5)
4(21.1)
1
26(89.7)
2(6.9)
1(3.4)
0(0.0)
0(0.0)
1
9(45.0)
2(10.0)
3(15.0)
0(0.0)
0(0.0)
20(66.7)
3(10.0)
3(10.0)
0(0.0)
0(0.0)
67(68.4)
8(8.2)
7(7.1)
2(2.0)
4(4.1)
2
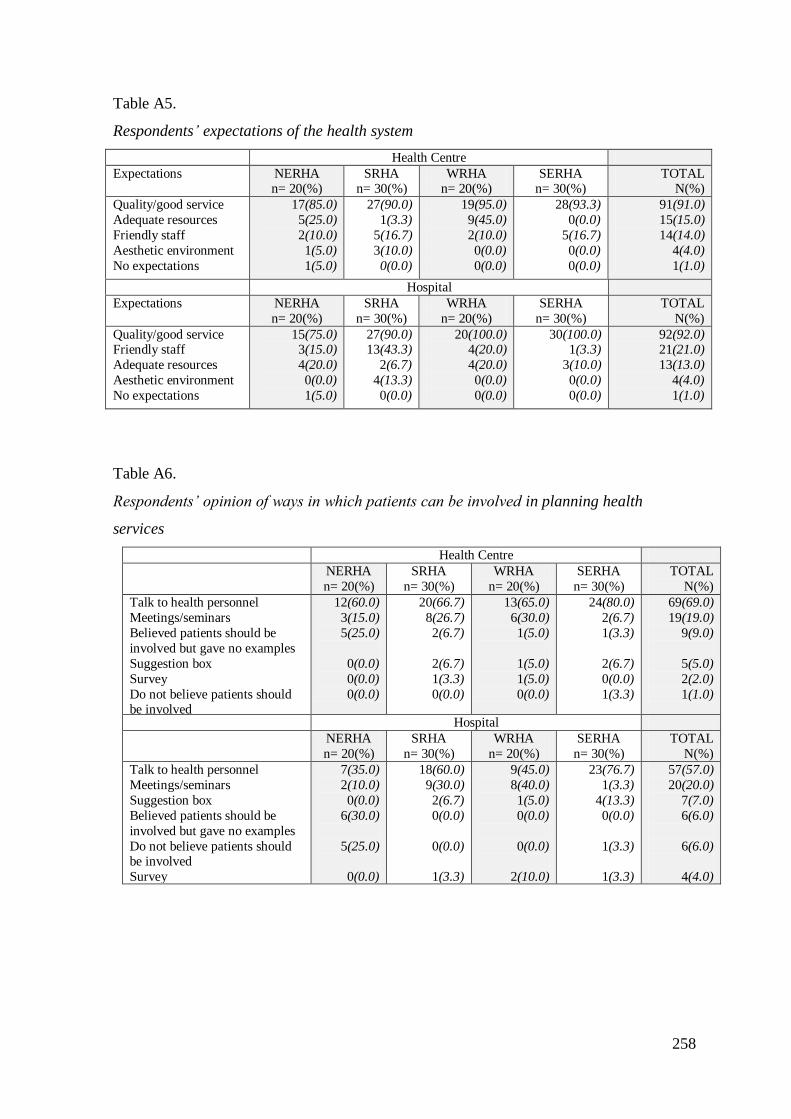
258
Table A5.
Respondents‘ expectations of the health system
Health Centre
Expectations NERHA n= 20(%)
SRHA n= 30(%)
WRHA n= 20(%)
SERHA n= 30(%)
TOTAL N(%)
Quality/good service
Adequate resources
Friendly staff
Aesthetic environment
No expectations
17(85.0)
5(25.0)
2(10.0)
1(5.0)
1(5.0)
27(90.0)
1(3.3)
5(16.7)
3(10.0)
0(0.0)
19(95.0)
9(45.0)
2(10.0)
0(0.0)
0(0.0)
28(93.3)
0(0.0)
5(16.7)
0(0.0)
0(0.0)
91(91.0)
15(15.0)
14(14.0)
4(4.0)
1(1.0)
Hospital
Expectations NERHA
n= 20(%)
SRHA
n= 30(%)
WRHA
n= 20(%)
SERHA
n= 30(%)
TOTAL
N(%)
Quality/good service Friendly staff
Adequate resources
Aesthetic environment
No expectations
15(75.0) 3(15.0)
4(20.0)
0(0.0)
1(5.0)
27(90.0) 13(43.3)
2(6.7)
4(13.3)
0(0.0)
20(100.0) 4(20.0)
4(20.0)
0(0.0)
0(0.0)
30(100.0) 1(3.3)
3(10.0)
0(0.0)
0(0.0)
92(92.0) 21(21.0)
13(13.0)
4(4.0)
1(1.0)
Table A6.
Respondents‘ opinion of ways in which patients can be involved in planning health
services
Health Centre
NERHA
n= 20(%)
SRHA
n= 30(%)
WRHA
n= 20(%)
SERHA
n= 30(%)
TOTAL
N(%)
Talk to health personnel
Meetings/seminars
Believed patients should be
involved but gave no examples
Suggestion box
Survey
Do not believe patients should be involved
12(60.0)
3(15.0)
5(25.0)
0(0.0)
0(0.0)
0(0.0)
20(66.7)
8(26.7)
2(6.7)
2(6.7)
1(3.3)
0(0.0)
13(65.0)
6(30.0)
1(5.0)
1(5.0)
1(5.0)
0(0.0)
24(80.0)
2(6.7)
1(3.3)
2(6.7)
0(0.0)
1(3.3)
69(69.0)
19(19.0)
9(9.0)
5(5.0)
2(2.0)
1(1.0)
Hospital
NERHA
n= 20(%)
SRHA
n= 30(%)
WRHA
n= 20(%)
SERHA
n= 30(%)
TOTAL
N(%)
Talk to health personnel
Meetings/seminars
Suggestion box
Believed patients should be
involved but gave no examples
Do not believe patients should be involved
Survey
7(35.0)
2(10.0)
0(0.0)
6(30.0)
5(25.0)
0(0.0)
18(60.0)
9(30.0)
2(6.7)
0(0.0)
0(0.0)
1(3.3)
9(45.0)
8(40.0)
1(5.0)
0(0.0)
0(0.0)
2(10.0)
23(76.7)
1(3.3)
4(13.3)
0(0.0)
1(3.3)
1(3.3)
57(57.0)
20(20.0)
7(7.0)
6(6.0)
6(6.0)
4(4.0)
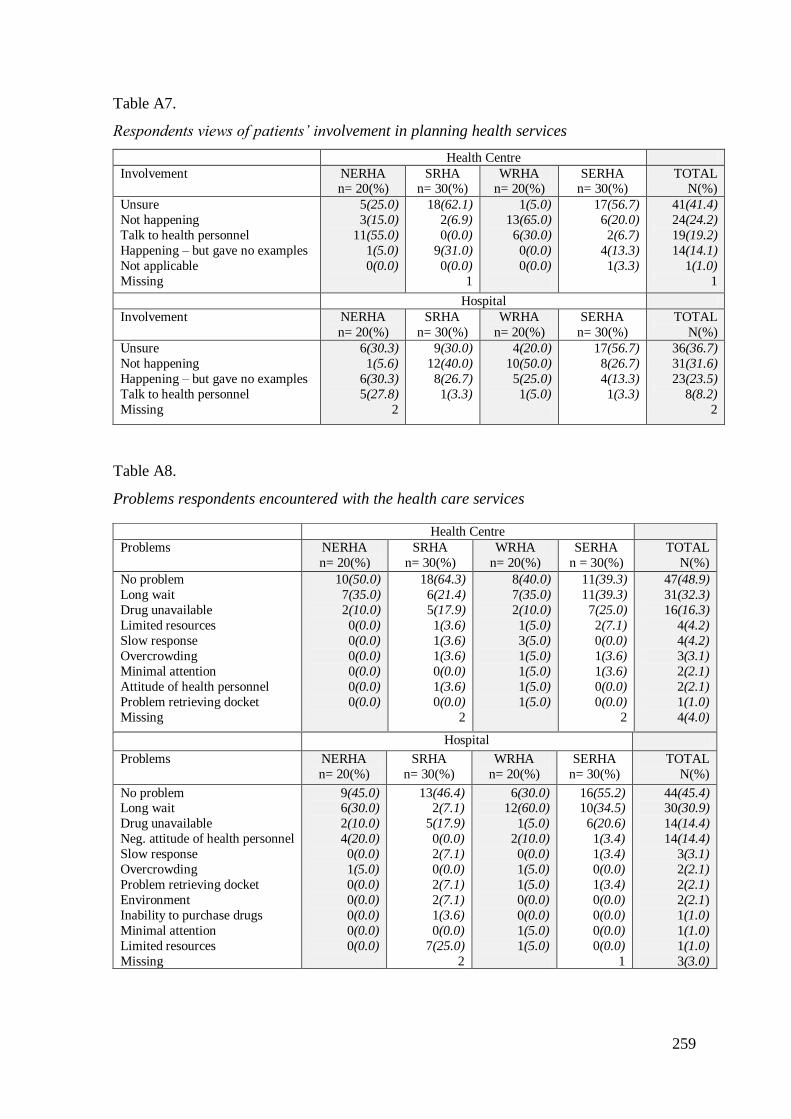
259
Table A7.
Respondents views of patients‘ involvement in planning health services
Health Centre
Involvement NERHA n= 20(%)
SRHA n= 30(%)
WRHA n= 20(%)
SERHA n= 30(%)
TOTAL N(%)
Unsure
Not happening
Talk to health personnel
Happening – but gave no examples
Not applicable
Missing
5(25.0)
3(15.0)
11(55.0)
1(5.0)
0(0.0)
18(62.1)
2(6.9)
0(0.0)
9(31.0)
0(0.0)
1
1(5.0)
13(65.0)
6(30.0)
0(0.0)
0(0.0)
17(56.7)
6(20.0)
2(6.7)
4(13.3)
1(3.3)
41(41.4)
24(24.2)
19(19.2)
14(14.1)
1(1.0)
1
Hospital
Involvement NERHA
n= 20(%)
SRHA
n= 30(%)
WRHA
n= 20(%)
SERHA
n= 30(%)
TOTAL
N(%)
Unsure
Not happening
Happening – but gave no examples
Talk to health personnel
Missing
6(30.3)
1(5.6)
6(30.3)
5(27.8)
2
9(30.0)
12(40.0)
8(26.7)
1(3.3)
4(20.0)
10(50.0)
5(25.0)
1(5.0)
17(56.7)
8(26.7)
4(13.3)
1(3.3)
36(36.7)
31(31.6)
23(23.5)
8(8.2)
2
Table A8.
Problems respondents encountered with the health care services
Hospital
Problems NERHA
n= 20(%)
SRHA
n= 30(%)
WRHA
n= 20(%)
SERHA
n= 30(%)
TOTAL
N(%)
No problem Long wait
Drug unavailable
Neg. attitude of health personnel
Slow response
Overcrowding
Problem retrieving docket
Environment
Inability to purchase drugs
Minimal attention
Limited resources
Missing
9(45.0) 6(30.0)
2(10.0)
4(20.0)
0(0.0)
1(5.0)
0(0.0)
0(0.0)
0(0.0)
0(0.0)
0(0.0)
13(46.4) 2(7.1)
5(17.9)
0(0.0)
2(7.1)
0(0.0)
2(7.1)
2(7.1)
1(3.6)
0(0.0)
7(25.0)
2
6(30.0) 12(60.0)
1(5.0)
2(10.0)
0(0.0)
1(5.0)
1(5.0)
0(0.0)
0(0.0)
1(5.0)
1(5.0)
16(55.2) 10(34.5)
6(20.6)
1(3.4)
1(3.4)
0(0.0)
1(3.4)
0(0.0)
0(0.0)
0(0.0)
0(0.0)
1
44(45.4) 30(30.9)
14(14.4)
14(14.4)
3(3.1)
2(2.1)
2(2.1)
2(2.1)
1(1.0)
1(1.0)
1(1.0)
3(3.0)
Health Centre
Problems NERHA
n= 20(%)
SRHA
n= 30(%)
WRHA
n= 20(%)
SERHA
n = 30(%)
TOTAL
N(%)
No problem
Long wait
Drug unavailable
Limited resources
Slow response
Overcrowding
Minimal attention
Attitude of health personnel
Problem retrieving docket
Missing
10(50.0)
7(35.0)
2(10.0)
0(0.0)
0(0.0)
0(0.0)
0(0.0)
0(0.0)
0(0.0)
18(64.3)
6(21.4)
5(17.9)
1(3.6)
1(3.6)
1(3.6)
0(0.0)
1(3.6)
0(0.0)
2
8(40.0)
7(35.0)
2(10.0)
1(5.0)
3(5.0)
1(5.0)
1(5.0)
1(5.0)
1(5.0)
11(39.3)
11(39.3)
7(25.0)
2(7.1)
0(0.0)
1(3.6)
1(3.6)
0(0.0)
0(0.0)
2
47(48.9)
31(32.3)
16(16.3)
4(4.2)
4(4.2)
3(3.1)
2(2.1)
2(2.1)
1(1.0)
4(4.0)
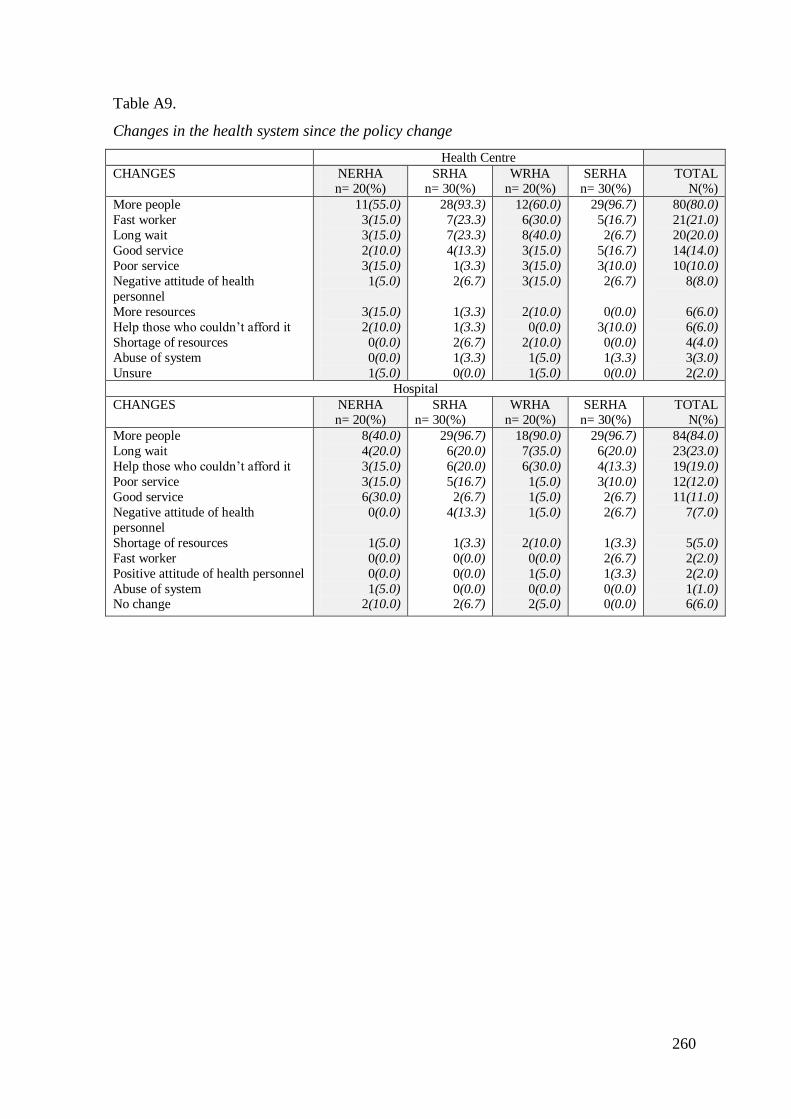
260
Table A9.
Changes in the health system since the policy change
Health Centre
CHANGES NERHA n= 20(%)
SRHA n= 30(%)
WRHA n= 20(%)
SERHA n= 30(%)
TOTAL N(%)
More people
Fast worker
Long wait
Good service
Poor service
Negative attitude of health
personnel
More resources
Help those who couldn‘t afford it
Shortage of resources
Abuse of system
Unsure
11(55.0)
3(15.0)
3(15.0)
2(10.0)
3(15.0)
1(5.0)
3(15.0)
2(10.0)
0(0.0)
0(0.0)
1(5.0)
28(93.3)
7(23.3)
7(23.3)
4(13.3)
1(3.3)
2(6.7)
1(3.3)
1(3.3)
2(6.7)
1(3.3)
0(0.0)
12(60.0)
6(30.0)
8(40.0)
3(15.0)
3(15.0)
3(15.0)
2(10.0)
0(0.0)
2(10.0)
1(5.0)
1(5.0)
29(96.7)
5(16.7)
2(6.7)
5(16.7)
3(10.0)
2(6.7)
0(0.0)
3(10.0)
0(0.0)
1(3.3)
0(0.0)
80(80.0)
21(21.0)
20(20.0)
14(14.0)
10(10.0)
8(8.0)
6(6.0)
6(6.0)
4(4.0)
3(3.0)
2(2.0)
Hospital
CHANGES NERHA n= 20(%)
SRHA n= 30(%)
WRHA n= 20(%)
SERHA n= 30(%)
TOTAL N(%)
More people
Long wait
Help those who couldn‘t afford it
Poor service
Good service
Negative attitude of health
personnel
Shortage of resources
Fast worker
Positive attitude of health personnel
Abuse of system No change
8(40.0)
4(20.0)
3(15.0)
3(15.0)
6(30.0)
0(0.0)
1(5.0)
0(0.0)
0(0.0)
1(5.0) 2(10.0)
29(96.7)
6(20.0)
6(20.0)
5(16.7)
2(6.7)
4(13.3)
1(3.3)
0(0.0)
0(0.0)
0(0.0) 2(6.7)
18(90.0)
7(35.0)
6(30.0)
1(5.0)
1(5.0)
1(5.0)
2(10.0)
0(0.0)
1(5.0)
0(0.0) 2(5.0)
29(96.7)
6(20.0)
4(13.3)
3(10.0)
2(6.7)
2(6.7)
1(3.3)
2(6.7)
1(3.3)
0(0.0) 0(0.0)
84(84.0)
23(23.0)
19(19.0)
12(12.0)
11(11.0)
7(7.0)
5(5.0)
2(2.0)
2(2.0)
1(1.0) 6(6.0)
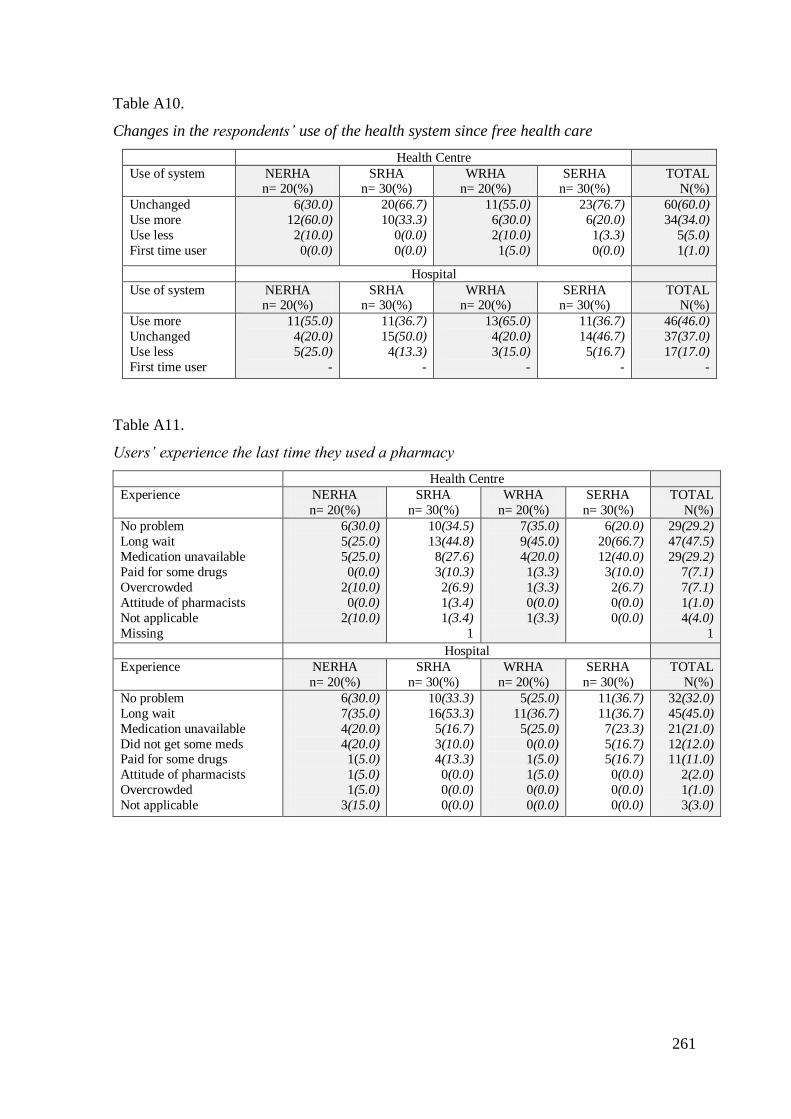
261
Table A10.
Changes in the respondents‘ use of the health system since free health care
Health Centre
Use of system NERHA n= 20(%)
SRHA n= 30(%)
WRHA n= 20(%)
SERHA n= 30(%)
TOTAL N(%)
Unchanged
Use more
Use less
First time user
6(30.0)
12(60.0)
2(10.0)
0(0.0)
20(66.7)
10(33.3)
0(0.0)
0(0.0)
11(55.0)
6(30.0)
2(10.0)
1(5.0)
23(76.7)
6(20.0)
1(3.3)
0(0.0)
60(60.0)
34(34.0)
5(5.0)
1(1.0)
Hospital
Use of system NERHA n= 20(%)
SRHA n= 30(%)
WRHA n= 20(%)
SERHA n= 30(%)
TOTAL N(%)
Use more
Unchanged
Use less
First time user
11(55.0)
4(20.0)
5(25.0)
-
11(36.7)
15(50.0)
4(13.3)
-
13(65.0)
4(20.0)
3(15.0)
-
11(36.7)
14(46.7)
5(16.7)
-
46(46.0)
37(37.0)
17(17.0)
-
Table A11.
Users‘ experience the last time they used a pharmacy
Health Centre
Experience NERHA
n= 20(%)
SRHA
n= 30(%)
WRHA
n= 20(%)
SERHA
n= 30(%)
TOTAL
N(%)
No problem
Long wait
Medication unavailable
Paid for some drugs
Overcrowded
Attitude of pharmacists
Not applicable
Missing
6(30.0)
5(25.0)
5(25.0)
0(0.0)
2(10.0)
0(0.0)
2(10.0)
10(34.5)
13(44.8)
8(27.6)
3(10.3)
2(6.9)
1(3.4)
1(3.4)
1
7(35.0)
9(45.0)
4(20.0)
1(3.3)
1(3.3)
0(0.0)
1(3.3)
6(20.0)
20(66.7)
12(40.0)
3(10.0)
2(6.7)
0(0.0)
0(0.0)
29(29.2)
47(47.5)
29(29.2)
7(7.1)
7(7.1)
1(1.0)
4(4.0)
1
Hospital
Experience NERHA
n= 20(%)
SRHA
n= 30(%)
WRHA
n= 20(%)
SERHA
n= 30(%)
TOTAL
N(%)
No problem
Long wait
Medication unavailable
Did not get some meds Paid for some drugs
Attitude of pharmacists
Overcrowded
Not applicable
6(30.0)
7(35.0)
4(20.0)
4(20.0) 1(5.0)
1(5.0)
1(5.0)
3(15.0)
10(33.3)
16(53.3)
5(16.7)
3(10.0) 4(13.3)
0(0.0)
0(0.0)
0(0.0)
5(25.0)
11(36.7)
5(25.0)
0(0.0) 1(5.0)
1(5.0)
0(0.0)
0(0.0)
11(36.7)
11(36.7)
7(23.3)
5(16.7) 5(16.7)
0(0.0)
0(0.0)
0(0.0)
32(32.0)
45(45.0)
21(21.0)
12(12.0) 11(11.0)
2(2.0)
1(1.0)
3(3.0)
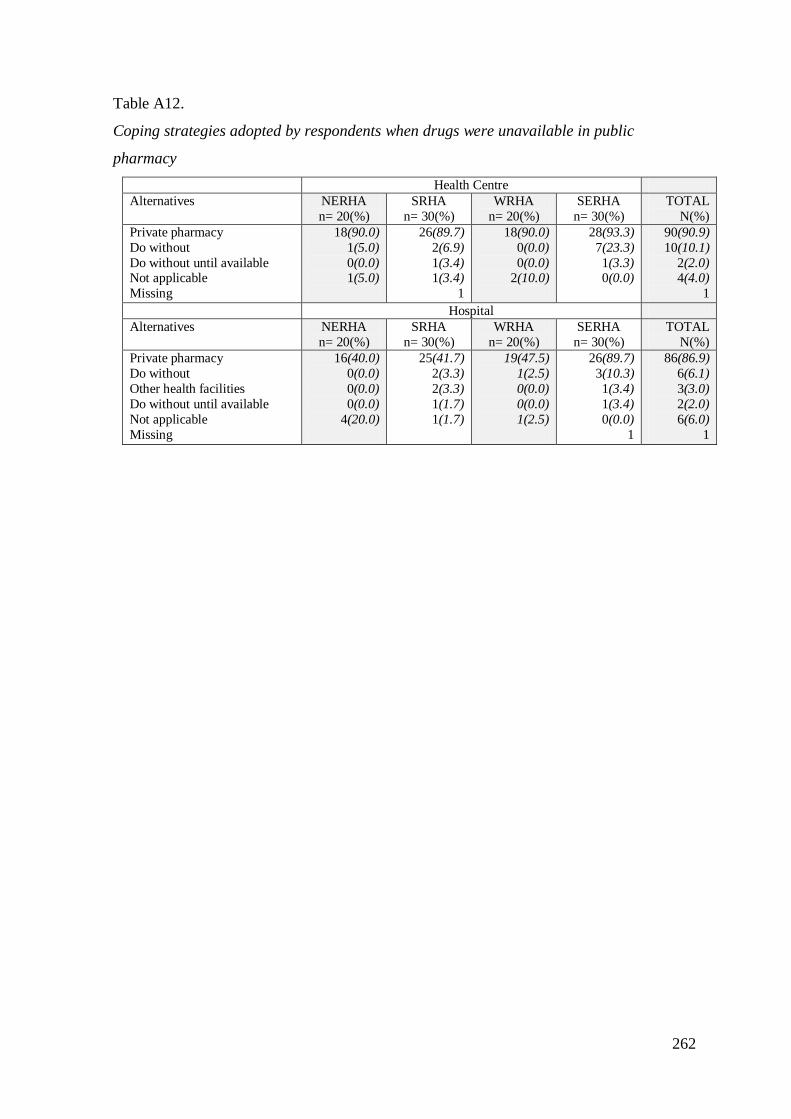
262
Table A12.
Coping strategies adopted by respondents when drugs were unavailable in public
pharmacy
Health Centre
Alternatives NERHA
n= 20(%)
SRHA
n= 30(%)
WRHA
n= 20(%)
SERHA
n= 30(%)
TOTAL
N(%)
Private pharmacy
Do without
Do without until available Not applicable
Missing
18(90.0)
1(5.0)
0(0.0) 1(5.0)
26(89.7)
2(6.9)
1(3.4) 1(3.4)
1
18(90.0)
0(0.0)
0(0.0) 2(10.0)
28(93.3)
7(23.3)
1(3.3) 0(0.0)
90(90.9)
10(10.1)
2(2.0) 4(4.0)
1
Hospital
Alternatives NERHA
n= 20(%)
SRHA
n= 30(%)
WRHA
n= 20(%)
SERHA
n= 30(%)
TOTAL
N(%)
Private pharmacy
Do without
Other health facilities
Do without until available
Not applicable
Missing
16(40.0)
0(0.0)
0(0.0)
0(0.0)
4(20.0)
25(41.7)
2(3.3)
2(3.3)
1(1.7)
1(1.7)
19(47.5)
1(2.5)
0(0.0)
0(0.0)
1(2.5)
26(89.7)
3(10.3)
1(3.4)
1(3.4)
0(0.0)
1
86(86.9)
6(6.1)
3(3.0)
2(2.0)
6(6.0)
1
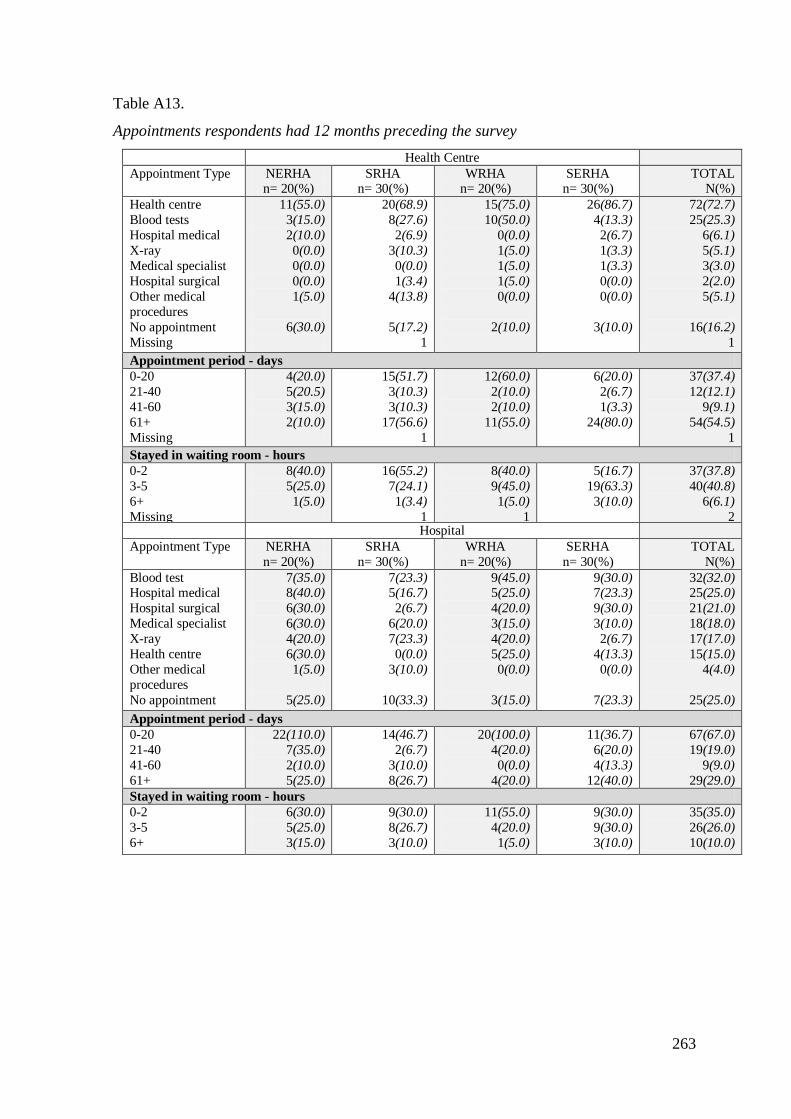
263
Table A13.
Appointments respondents had 12 months preceding the survey
Health Centre
Appointment Type NERHA n= 20(%)
SRHA n= 30(%)
WRHA n= 20(%)
SERHA n= 30(%)
TOTAL N(%)
Health centre
Blood tests
Hospital medical
X-ray
Medical specialist
Hospital surgical
Other medical
procedures
No appointment
Missing
11(55.0)
3(15.0)
2(10.0)
0(0.0)
0(0.0)
0(0.0)
1(5.0)
6(30.0)
20(68.9)
8(27.6)
2(6.9)
3(10.3)
0(0.0)
1(3.4)
4(13.8)
5(17.2)
1
15(75.0)
10(50.0)
0(0.0)
1(5.0)
1(5.0)
1(5.0)
0(0.0)
2(10.0)
26(86.7)
4(13.3)
2(6.7)
1(3.3)
1(3.3)
0(0.0)
0(0.0)
3(10.0)
72(72.7)
25(25.3)
6(6.1)
5(5.1)
3(3.0)
2(2.0)
5(5.1)
16(16.2)
1
Appointment period - days
0-20
21-40
41-60
61+
Missing
4(20.0)
5(20.5)
3(15.0)
2(10.0)
15(51.7)
3(10.3)
3(10.3)
17(56.6)
1
12(60.0)
2(10.0)
2(10.0)
11(55.0)
6(20.0)
2(6.7)
1(3.3)
24(80.0)
37(37.4)
12(12.1)
9(9.1)
54(54.5)
1
Stayed in waiting room - hours
0-2
3-5
6+
Missing
8(40.0)
5(25.0)
1(5.0)
16(55.2)
7(24.1)
1(3.4)
1
8(40.0)
9(45.0)
1(5.0)
1
5(16.7)
19(63.3)
3(10.0)
37(37.8)
40(40.8)
6(6.1)
2 Hospital
Appointment Type NERHA
n= 20(%)
SRHA
n= 30(%)
WRHA
n= 20(%)
SERHA
n= 30(%)
TOTAL
N(%)
Blood test Hospital medical
Hospital surgical
Medical specialist
X-ray
Health centre
Other medical
procedures
No appointment
7(35.0) 8(40.0)
6(30.0)
6(30.0)
4(20.0)
6(30.0)
1(5.0)
5(25.0)
7(23.3) 5(16.7)
2(6.7)
6(20.0)
7(23.3)
0(0.0)
3(10.0)
10(33.3)
9(45.0) 5(25.0)
4(20.0)
3(15.0)
4(20.0)
5(25.0)
0(0.0)
3(15.0)
9(30.0) 7(23.3)
9(30.0)
3(10.0)
2(6.7)
4(13.3)
0(0.0)
7(23.3)
32(32.0) 25(25.0)
21(21.0)
18(18.0)
17(17.0)
15(15.0)
4(4.0)
25(25.0)
Appointment period - days
0-20
21-40
41-60
61+
22(110.0)
7(35.0)
2(10.0)
5(25.0)
14(46.7)
2(6.7)
3(10.0)
8(26.7)
20(100.0)
4(20.0)
0(0.0)
4(20.0)
11(36.7)
6(20.0)
4(13.3)
12(40.0)
67(67.0)
19(19.0)
9(9.0)
29(29.0)
Stayed in waiting room - hours
0-2
3-5
6+
6(30.0)
5(25.0)
3(15.0)
9(30.0)
8(26.7)
3(10.0)
11(55.0)
4(20.0)
1(5.0)
9(30.0)
9(30.0)
3(10.0)
35(35.0)
26(26.0)
10(10.0)
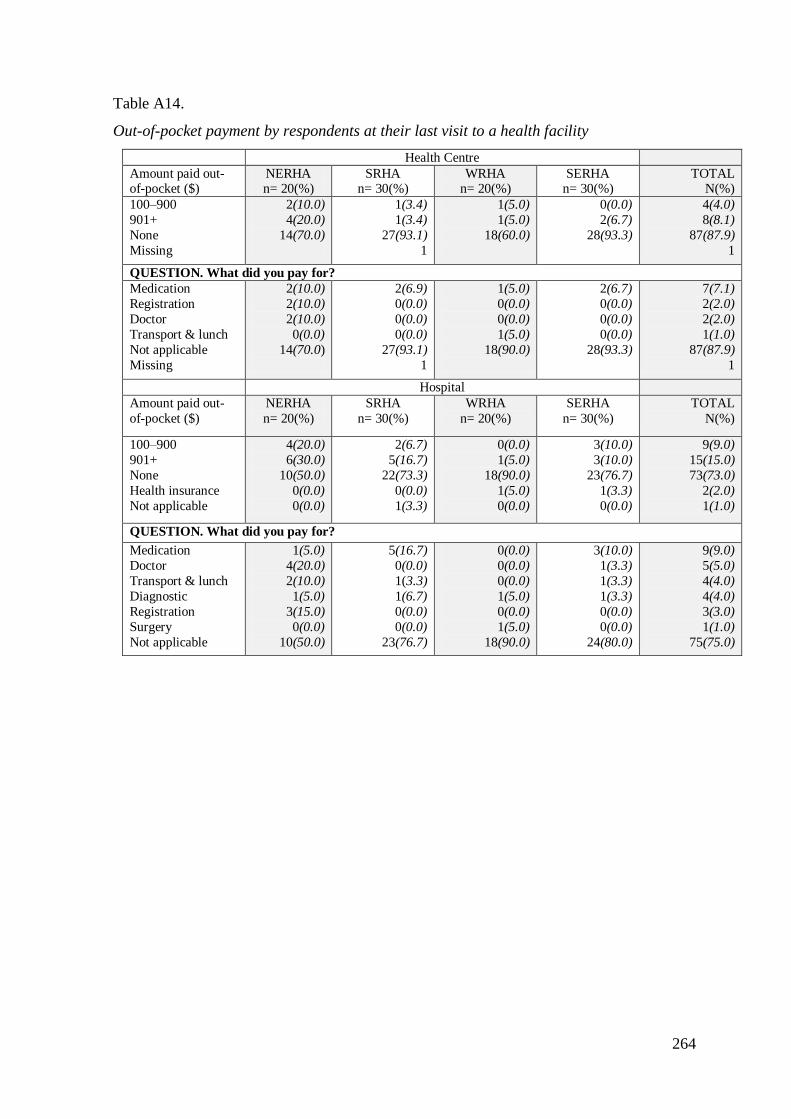
264
Table A14.
Out-of-pocket payment by respondents at their last visit to a health facility
Health Centre
Amount paid out-of-pocket ($)
NERHA n= 20(%)
SRHA n= 30(%)
WRHA n= 20(%)
SERHA n= 30(%)
TOTAL N(%)
100–900
901+
None
Missing
2(10.0)
4(20.0)
14(70.0)
1(3.4)
1(3.4)
27(93.1)
1
1(5.0)
1(5.0)
18(60.0)
0(0.0)
2(6.7)
28(93.3)
4(4.0)
8(8.1)
87(87.9)
1
QUESTION. What did you pay for?
Medication
Registration
Doctor
Transport & lunch
Not applicable
Missing
2(10.0)
2(10.0)
2(10.0)
0(0.0)
14(70.0)
2(6.9)
0(0.0)
0(0.0)
0(0.0)
27(93.1)
1
1(5.0)
0(0.0)
0(0.0)
1(5.0)
18(90.0)
2(6.7)
0(0.0)
0(0.0)
0(0.0)
28(93.3)
7(7.1)
2(2.0)
2(2.0)
1(1.0)
87(87.9)
1
Hospital
Amount paid out-
of-pocket ($)
NERHA
n= 20(%)
SRHA
n= 30(%)
WRHA
n= 20(%)
SERHA
n= 30(%)
TOTAL
N(%)
100–900
901+
None
Health insurance
Not applicable
4(20.0)
6(30.0)
10(50.0)
0(0.0)
0(0.0)
2(6.7)
5(16.7)
22(73.3)
0(0.0)
1(3.3)
0(0.0)
1(5.0)
18(90.0)
1(5.0)
0(0.0)
3(10.0)
3(10.0)
23(76.7)
1(3.3)
0(0.0)
9(9.0)
15(15.0)
73(73.0)
2(2.0)
1(1.0)
QUESTION. What did you pay for?
Medication
Doctor
Transport & lunch
Diagnostic
Registration
Surgery
Not applicable
1(5.0)
4(20.0)
2(10.0)
1(5.0)
3(15.0)
0(0.0)
10(50.0)
5(16.7)
0(0.0)
1(3.3)
1(6.7)
0(0.0)
0(0.0)
23(76.7)
0(0.0)
0(0.0)
0(0.0)
1(5.0)
0(0.0)
1(5.0)
18(90.0)
3(10.0)
1(3.3)
1(3.3)
1(3.3)
0(0.0)
0(0.0)
24(80.0)
9(9.0)
5(5.0)
4(4.0)
4(4.0)
3(3.0)
1(1.0)
75(75.0)
265
References
Abdu, Z., Mohammed, Z., Bashier, I., & Eriksson, B. (2004). The impact of user fee
exemption on service utilisation and treatment seeking behaviour: The case of
malaria in Sudan. International Journal of Health Planning and Management,
19(S1), S95-S106. doi:10.1002/hpm.777
Akashi, H., Yamada, T., Huot, E., Kanal, K., & Sugimoto, T. (2004). User fees at a public
hospital in Cambodia: Effects on hospital performance and provider attitudes.
Social Science & Medicine, 58(3), 553-564. doi: 10.1016/S0277-9536(03)00240-5
Alleyne, D. (2010). The impact of user fees on health costs and health burdens in Jamaica:
The cases of diabetes and hypertension. Social and Economic Studies, 59(1), 91-
121,315-316,326. Retrieved from
http://search.proquest.com/docview/749698043?accountid=14782
Andersen, R.M. (1995). Revisiting the behavioural model and access to medical care:
Does it matter? Journal of Health and Social Behavior, 36(1), 1-10. Retrieved from
http://search.proquest.com/docview/201658072
Ansah, E.K., Narh-Bana, S., Asiamah, S., Dzordzordzi, V., Biantey, K., Dickson, K., ...
Whitty, C.J.M. (2009). Effect of removing direct payment for health care on
utilisation and health outcomes in Ghanaian children: A randomised controlled
trial. PLoS Med, 6(1), 48-58. Retrieved from
http://search.proquest.com/docview/66861174
Asante, F.A., Chikwama, C., Daniel, A., & Armar-Klemesu, M. (2007). Evaluating the
economic outcomes of the policy of fee exemption for maternal delivery care in
Ghana. Ghana Medical Journal, 41(3), 110-117. Retrieved from
http://www.ajol.info/index.php/gmj/article/viewFile/55277/43743
Asfaw, A., Braun, J.V., & Klasen, S. (2004). How big is the crowding-out effect of user
fees in the rural areas of Ethiopia? Implications for equity and resources
mobilisation. World Development, 32(12), 2065-2081. doi:
10.1016/j.worlddev.2004.07.004
Audibert, M., & Mathonnat, J. (2000). Cost recovery in Mauritania: Initial lessons. Health
Policy and Planning, 15(1), 66-75. doi: 10.1093/heapol/15.1.66
Auditor General‘s Department, Jamaica. (2011). Performance Audit Report of the Ministry
of Health‘s management of the supply of prescription drugs to meet the needs
of the population. Retrieved from
266
http://www.auditorgeneral.gov.jm/files/u5/PRESCRIPTION_DRUGS_PERFORM
ANCE_AUDIT_REPORT.pdf
Bailey, W., Wynter, H.H., Lee, A., Oliver, P., & Jackson, J. (1994). The effect of user fees
on the utilisation of family planning services. A clinical study [Abstract]. West
Indian Medical Journal, 43(2), 43-5.
http://www.ncbi.nlm.nih.gov/pubmed/7941495
Barber, S., Bonnet, F., & Bekedam, H. (2004). Formalising under-the-table payments to
control out-of-pocket hospital expenditures in Cambodia. Health Policy and
Planning, 19(4), 199-208. doi: 10.1093/heapol/czh025
Barnett, J., Lalta, S., & Bailey, W. (2010). Towards alternative financing proposals for
health care for the elderly with chronic conditions - Jamaica. Social and Economic
Studies, 59(1), 153-180,318-319,326-327. Retrieved from
http://search.proquest.com/docview/749698273
Barrett, R.D., & Lalta, S. (2004). Health financing innovations in the Caribbean: EHPO
and the National Health Fund. (Technical Papers Series). Washington, D.C:
Inter‐American Development Bank, Sustainable Development Department.
Retrieved from http://www.eldis.org/vfile/upload/1/document/0708/DOC19862
Bednarski, D. (2009). The value of nursing. Nephrology Nursing Journal, 36(2), 115-7.
Retrieved from http://search.proquest.com/docview/216533789?accountid=14782
Bhayat, A., & Cleaton-Jones, P. (2003). Dental clinic attendance in Soweto, South Africa,
before and after the introduction of free primary dental health services. Community
Dentistry and Oral Epidemiology, 31(2), 105-110. doi: 10.1034/j.1600-
0528.2003.00006.x
Biesta, G. (2010). Pragmatism and the philosophical foundations of mixed methods
research. In A. Tashakkori & C. Teddlie (Eds.), Sage handbook of mixed methods
in social and behavioural research (pp. 95-118). Los Angeles, CA: SAGE
Publications Ltd.
Birbeck, G.L., & Munsat, T. (2002). Neurologic services in Sub-Saharan Africa: A case
study among Zambian primary healthcare workers. Journal of the Neurological
Sciences, 200(1–2), 75-78. doi: 10.1016/S0022-510X(02)00132-6
Biritwum, R.B. (1994). The cost of sustaining the Ghana's ―cash and carry‖ system of
health care financing at a rural health centre [Abstract]. West African Journal of
Medicine, 13(2), 124-7. Retrieved from
http://www.ncbi.nlm.nih.gov/pubmed/7803327
267
Bitran, R., & Giedion, U. (2002). Waivers and exemptions for health services in
developing countries. Washington, DC: World Bank. Retrieved from www.ihf-
fih.org
Black, C. (2011). History of Jamaica. United Kingdom: Longman Group Publishing.
Blas, E., & Limbambala, M. (2001). User-payment, decentralisation and health service
utilisation in Zambia. Health Policy and Planning, 16(suppl 2), 19-28. doi:
10.1093/heapol/16.suppl_2.19
Boss, E.F., Marsteller, J.A., & Simon, A.E. (2012). Outpatient tonsillectomy in children:
Demographic and geographic variation in the United States, 2006. The Journal of
Pediatrics, 160(5), 814-819. doi: 10.1016/j.jpeds.2011.11.041
Bosu, W.K., Bell, J.S., Armar-Klemesu, M., & Tornui, J.A. (2007). Effect of delivery
care user fee exemption policy on institutional maternal deaths in the Central and
Volta regions of Ghana. Ghana Medical Journal, 41(3). Retrieved from
http://www.ajol.info/index.php/gmj/article/viewFile/55278/43744
Bourne, P.A. (2009). Health insurance coverage in Jamaica: Multivariate analyses using
two cross-sectional survey data for 2002 and 2007. International Journal of
Collaborative Research on Internal Medicine & Public Health, 1(8), 195-213.
Braveman, P. (2006). Health disparities and health equity: Concepts and measurement.
Annual Review of Public Health, 27(1), 167-194.
doi:10.1146/annurev.publhealth.27.021405.10
Brophy, S., Snooks, H., & Griffiths, L. (2008). Small-scale evaluation in
health: A practical guide. Los Angeles, CA: SAGE Publications Ltd.
Burnham, G.M., Pariyo, G., Galiwango, E., & Wabwire-Mangen, F. (2004).
Discontinuation of cost sharing in Uganda. Bulletin of the World Health
Organisation, 82(3), 187-195. Retrieved from
http://dx.doi.org/10.1590/S0042-96862004000300008
Bush, M., Moss, L., & Wallis, S. (2006). Hustling to health - a nurse led outreach service.
Australian Nursing Journal, 14(4), 35-35. Retrieved from
http://search.proquest.com/docview/236650765?accountid=14782
Campbell, C. (2002). Early emancipation Jamaica: The historiography of plantation
culture, 1834-1865. In K.E.A. Monteith & G. Richards (Eds.), Jamaica in Slavery
and freedom: Heritage, history and culture (pp. 52-69). Kingston, Jamaica: The
University of the West Indies Press.
268
Campbell, J., Oulton, J.A., McPake, B., & Buchan, J. (2009). Removing user fees?
Engage the health workforce. The Lancet, 374(9706), 1966. doi:10.1016/S0140-
6736(09)62118-8
Carley, K. (1993). Coding choices for textual analysis: A comparison of content analysis
and map analysis. Sociological Methodology, 23, 75-126. Retrieved from
http://www.jstor.org.helicon.vuw.ac.nz/stable/pdfplus/271007.pdf?
Chapman, J.L., Zechel, A., Carter, Y.H., & Abbott, S. (2004) Systematic review of recent
innovations in service provision to improve access to primary care. British Journal
of General Practice, 54(502), 374-381. Retrieved from
http://www.ncbi.nlm.nih.gov/pmc/articles/PMC1266174/
Chapple, A., Rogers, A., Macdonald, W., & Sergison, M. (2000). Patients‘ perceptions of
changing professional boundaries and the future of ‗nurse-led‘ services. Primary
Health Care Research & Development, 1(01), 51-59.
doi:10.1191/146342300674617169
CHASE Foundation, Jamaica. (2008). Retrieved from http://www.chase.org.jm/
Chawla, M., & Ellis, R.P. (2000). The impact of financing and quality changes on health
care demand in Niger. Health Policy and Planning, 15(1), 76-84. doi:
10.1093/heapol/15.1.76
Chuma, J., Musimbi, J., Okungu, V., Goodman, C., & Molyneux, C. (2009). Reducing
user fees for primary health care in Kenya: Policy on paper or policy in practice?
International Journal for Equity in Health, 8(1), 15.
http://www.equityhealthj.com/content/pdf/1475-9276-8-15.pdf
Cochrane, R., & Sashidharan, S.P. (1996). Ethnicity and health: Reviews of literature and
guidance for purchasers in the areas of cardiovascular disease, mental health and
haemoglobinopathies. NHS Centre for reviews and dissemination. York, UK:
University of York.
Cooper, L.A., Hill, M.N., & Powe, N.R. (2002). Designing and evaluating interventions to
eliminate racial and ethnic disparities in health care. Journal of General Internal
Medicine, 17(6), 477-486. doi: 10.1046/j.1525-1497.2002.10633.x
Cover, W.A. (1995). Handbook of Jamaica 1955 (65th ed.). Ministry of Communications
and Works. Kingston, Jamaica: Government Printing Office.
Creswell, J.W. (2003). Research design: Qualitative, quantitative and mixed methods
approaches (2nd
ed.). Thousand Oaks, CA: Sage Publications Inc.
269
Creswell, J.W. (2009). Research design: Qualitative, quantitative and mixed methods
approaches (3rd
ed.). Thousand Oaks, CA: Sage Publications Inc.
Creswell, J.W., & Plano Clark, V.L. (2007). Designing and conducting mixed methods
research. Thousand Oaks, CA: Sage Publication Inc.
Culyer, A.J. (2001). Equity: Some theory and its policy implications. Journal of Medical
Ethics, 27(4), 275-283. doi:10.1136/jme.27.4.275
Culyer, A.J., & Wagstaff, A. (1993). Equity and equality in health and health care. Journal
of Health Economics, 12(4), 431-457. doi: 10.1016/0167-6296(93)90004-X
Davies, M.B. (2007). Doing a successful research project using qualitative and
quantitative methods. New York, NY: Palgrave Macmillan.
Deininger, K., & Mpuga, P. (2005). Economic and welfare impact of the abolition of
health user fees: Evidence from Uganda. Journal of African Economies, 14(1), 55-
91. Retrieved from
http://web.ebscohost.com.helicon.vuw.ac.nz/ehost/pdfviewer/pdfviewer
Dellagiacoma, T. (2007). Eight essential factors for successful nurse-led services.
Australian Nursing Journal, 14(10), 28-31. Retrieved from
http://search.proquest.com/docview/236620896?accountid=14782
Department of health and human services (USA). (2010). Healthy People 2020: Health
disparity. Washington, DC. Retrieved from
http://healthypeople.gov/2020/about/DisparitiesAbout.aspx
DeVoe, J.E., Baez, A., Angier, H., Krois, L., Edlund, C., & Carney, P.A. (2007). Insurance
+ access ? Health care: Typology of barriers to health care access for low-income
families. Annals of Family Medicine, 5(6), 511-518. doi: 10.1370/afm.748
Dick, J., Clarke, M., Van Zyl, H., & Daniels, K. (2007). Primary health care nurses
implement and evaluate a community outreach approach to health care in the South
African agricultural sector. International Nursing Review, 54(4), 383-390. doi:
10.1111/j.1466-7657.2007.00566.x
Diop, F., Yazbeck, A., & Bitran, R. (1995). The impact of alternative cost recovery
schemes on access and equity in Niger. Health Policy and Planning, 10(3), 223-
240. doi: 10.1093/heapol/10.3.223
ECOSOC. (2009). ECOSOC High-level segment. Annual ministerial review: National
voluntary presentations of Bolivia, China, Jamaica, Japan, Mali, Sri Lanka, Sudan.
Informal Summary. Retrieved from
270
http://www.un.org/en/ecosoc/julyhls/pdf/09%20nvp%20summary%209%20july%2
0final.pdf
Fabricant, S.J., Kamara, C.W., & Mills, A. (1999). Why the poor pay more: Household
curative expenditures in rural Sierra Leone. International Journal of Health
Planning and Management, 14(3), 179-199. doi: 10.1002/(sici)1099-
1751(199907/09)14:3<179::aid-hpm548>3.0.co;2-n
Fafchamps, M., & Minten, B. (2007). Public service provision, user fees and political
turmoil. Journal of African Economies, 16(3), 485-518. doi: 10.1093/jae/ejl040
Figueroa, J.P. (2001). Health trends in Jamaica: Significant progress and a vision for the
21st century. West Indian Medical Journal, 50(Supplement 4), 15-22.
Fink, A. (2003). The survey handbook (2nd
ed.). Thousand Oaks, CA: SAGE Publications.
Retrieved from
http://books.google.co.nz/books?id=s_7GVySNWVgC&pg=PA75&source=gbs_se
lected_pages&cad=3#v=onepage&q&f=false
Flores, G., Abreu, M., Olivar, M.A., & Kastner, B. (1998). Access barriers to health care
for Latino children. Archives of Pediatrics and Adolescent Medicine, 152, 1119 -
1125. Retrieved from
https://mywebspace.wisc.edu/anoguera/web/med/Reading.for.class_11-02.pdf
Forrest, C. B. (2003). Primary care gatekeeping and referrals: Effective filter or failed
experiment? BMJ, 326(7391), 692-695. doi: 10.1136/bmj.326.7391.692
Gertler, P., & Sturm, R. (1997). Private health insurance and public expenditures in
Jamaica. Journal of Econometrics, 77(1), 237-257. doi: 10.1016/s0304-
4076(96)01814-3
Gilson, L. (1997). The lessons of user fee experience in Africa. Health Policy and
Planning, 12(3), 273-285. Retrieved from
http://heapol.oxfordjournals.org/content/12/3/273.full.pdf+html
Gilson, L., & McIntyre, D. (2005). Removing user fees for primary care in Africa: The
need for careful action. British Medical Journal, 331(7519), 762-765. doi:
10.1136/bmj.331.7519.762
Gilson, L., Russell, S., & Buse, K. (1995). The political economy of user fees with
targeting: Developing equitable health financing policy. Journal of International
Development, 7(3), 369-401. doi: 10.1002/jid.3380070305
Goddard, M., Smith, P. (1998). Equity of access to health care. Centre for Health
Economics Occasional Paper, UK: University of York. Author. Retrieved from
271
https://www.york.ac.uk/media/che/documents/papers/occasionalpapers/CHE%20O
occasional%20Paper%2032.pdf
Goddard, M., & Smith, P. (2001). Equity of access to health care services: Theory and
evidence from the UK. Social Science & Medicine, 53(9), 1149-1162. doi:
10.1016/S0277-9536(00)00415-9
Gordon-Strachan, G., Bailey, W., Henry-Lee, A., Barnett, J., Lalta, S., & Alleyne, D.
(2010). The impact of user fees for preventive health care - Jamaica. Social and
Economic Studies, 59(1& 2), 123-152. Retrieved from
http://go.galegroup.com.helicon.vuw.ac.nz/ps/retrieve.do?retrieveFormat=PDF
Graham, S. (2009, August 15). The IMF and the no user fees policy in health. Jamaica
Observer. Retrieved from
http://www.jamaicaobserver.com/columns/html/20090814T200000-0500_157495
Gregory, P.M., Malka, E.S., Kostis, J.B., Wilson, A.C., Arora, J.K., & Rhoads, G.G.
(2000). Impact of geographic proximity to cardiac revascularisation services on
service utilisation. Medical Care, 38(1), 45-57. Retrieved from
http://www.jstor.org/stable/3767101
Gulliford, M. (2009). Modernising concepts of access and equity. Health Economics,
Policy and Law, 4(2), 223-230. doi: 10.1017/s1744133109004940
Gulliford, M., Morgan, M., Hughes, D., Beech, R., Figeroa-Munoz, J., Gibson, B., ...
Sedgwick, J. (2001). Access to health care. Report of a scoping exercise for the
National Co-ordinating Centre for NHS Service Delivery and Organisation R & D
(NCCSDO). London, UK. Author.
Gulliford, M., Figueroa-Munoz, J., Morgan, M., Hughes, D., Gibson, B., Beech, R., &
Hudson, M. (2002). What does ‗access to health care‘ mean? Journal of Health
Services Research & Policy, 7(3), 186-188.
Gulliford, M., Figueroa-Munoz, J., & Morgan, M. (2003). Meaning of ‗access‘ in health
care. In M. Gulliford & M. Morgan (Eds.), Access to health care (pp. 1-12).
Retrieved from
http://books.google.co.nz/books?hl=en&lr=&id=mOXP05u5alAC&oi=fnd&pg=PR
Haddad, S., & Fournier, P. (1995). Quality, cost and utilisation of health services in
developing countries. A longitudinal study in Zaïre. Social Science & Medicine,
40(6), 743-753. doi: 10.1016/0277-9536(94)00134-f
272
Hardeman, W., Van Damme, W., Van Pelt, M., Por, I., Kimvan, H., & Meessen, B. (2004).
Access to health care for all? User fees plus a Health Equity Fund in Sotnikum,
Cambodia. Health Policy and Planning, 19(1), 22-32. doi: 10.1093/heapol/czh003
Hastings, S. (2010). Triangulation. In N. Salkind (Ed.), Encyclopaedia of research design.
(pp. 1538-1541). Thousand Oaks, CA: SAGE Publications, Inc. doi:
10.4135/9781412961288.n469
Hay Ho Sang, E.P. (1985). The development of nursing education in Jamaica, West Indies:
1900-1975. Retrieved from ProQuest Dissertations & Theses. (Ann Arbor 48106).
Health Sector Task Force. (2007). A healthy Jamaica in a healthy world. Kingston,
Jamaica: Ministry of Health & Environment.
Health Sector Task Force. (2009). Vision 2030 Jamaica national development plan: (Draft
Health sector plan). Kingston, Jamaica: Ministry of Health & Environment.
Hercot, D., Meessen, B., Ridde, V., & Gilson, L. (2011). Removing user fees for health
services in low-income countries: A multi-country review framework for assessing
the process of policy change. Health Policy and Planning, 26, ii5-ii15. doi:
10.1093/heapol/czr063
Higman, B.W. (2005). Plantation Jamaica 1750-1850: Capital and control in a colonial
economy. Kingston, Jamaica: The University of the West Indies Press.
Hjertqvist, J. (2002, May). User fees for health care in Sweden: A two-tier threat or a tool
for solidarity? Health Care Commentary #6. Atlantic Institute for Market Studies.
Retrieved from http://www.aims.ca/site/media/aims/newsletter6
Horrocks, S., Anderson, E., & Salisbury, C. (2002). Systematic review of whether nurse
practitioners working in primary care can provide equivalent care to doctors. BMJ,
324(7341), 819-823. doi: 10.1136/bmj.324.7341.819
Howden-Chapman, P. & Cram, F. (1998). Social, economic and cultural determinants of
health (National Health Committee: Health determinants programme. Background
paper 1). Wellington, New Zealand: Ministry of Health.
Huber, D. & Blanchfield, K. (1999). Telephone nursing in ambulatory care. Journal of
Nursing Administration, 29(3), 38-44.
http://ovidsp.tx.ovid.com.helicon.vuw.ac.nz/sp-3.6.0b/ovidweb.cgi?
Hussein, A.K., & Mujinja, P.G. (1997). Impact of user charges on government health
facilities in Tanzania [Abstract]. East African Medical Journal, 74(12), 751-757.
Retrieved from http://ukpmc.ac.uk/abstract/MED/9557416
273
Hussey, P., Anderson, G., Berthelot, J.M., Feek, C., Kelley, E., Osborn, R., ... Epstein, A.
(2007). Trends in socioeconomic disparities in health care quality in four countries.
International Journal for Quality in Health Care, 20(1), 53-61. doi:
10.1093/intqhc/mzm055
Institute of Medicine. (1993). In M. L. Millman (Ed.), Access to health care in America
National Academies Press. Retrieved from
http://search.proquest.com/docview/868142123?accountid=14782
ICN. (2009). Delivering quality, serving communities: Nurses leading care innovations.
International Nurses Day 2011 Toolkit. Retrieved from
http://www.icn.ch/images/stories/documents/publications/ind/indkit2009.pdf
Israel, M., & Hay, I. (2006). Research ethics for social scientists: Between ethical conduct
and regulatory compliance. London, UK: SAGE Publications Ltd. Retrieved from
http://books.google.co.nz/books?id=EfNLH99zlcEC&pg=PR5&source=gbs_select
ed_pages&cad=3#v=onepage&q&f=false
Jacobs, B., & Price, N. (2006). Improving access for the poorest to public sector health
services: Insights from Kirivong Operational Health District in Cambodia. Health
Policy Planning, 21, 27-39. doi: 10.1093/heapol/czj001
Jacobs, M., & McCoy, D. (1997). Free care for pregnant women and children under six.
The Lancet, 349(9064), 1541-1542. Retrieved from
http://search.proquest.com/docview/199061669?accountid=14782
Jamaica Constitution 1962. Retrieved from http://www.jis.gov.jm/special_sections/Bills
Jamaica Ethnic Groups. (2009). In The encyclopaedia of the nations. Retrieved from
http://www.nationsencyclopaedia.com/Americas/Jamaica-ETHNIC-GROUPS.html
JIS. (2007). National symbols. Retrieved from
http://www.jis.gov.jm/special_sections/Independence/symbols.html
JIS. (2008, March 11). Special attention being paid to primary health care system.
Retrieved from http://www.jis.gov.jm/news/archive/14479
JIS. (2009, March 25). Poorest Jamaicans accessing health care. Retrieved from
http://www.jis.gov.jm/news/106-health/18977-health-poorest-jamaicans-accessing-
health-care
JIS. (2010, April 15). Government renewing primary health care system this year.
Retrieved from http://www.jis.gov.jm/news/archive/23599
James, C.D., Hanson, K., McPake, B., Balabanova, D., Gwatkin, D., Hopwood, I., ...
Kirunga, C. (2006). To retain or remove user fees? Reflections on the current
274
debate in low- and middle-income countries. Applied Health Economics and
Health Policy, 5(3), 137-153. Retrieved from
http://go.galegroup.com.helicon.vuw.ac.nz/ps/retrieve.do?retrieveFormat=PDF
James, C., Morris, S.S., Keith, R., & Taylor, A. (2005). Impact on child mortality of
removing user fees: Simulation model. British Medical Journal, 331(7519), 747-
749. doi: 10.1136/bmj.331.7519.747
JAMPRO. (2010). Jamaica at a glance. Retrieved from
http://www.jamaicatradeandinvest.org/index.php?action=content&id=at_glance
Johnston, J. & Montecino, J.A. (2011). Jamaica: Macroeconomic policy, debt and the
IMF. Washington D.C, USA: Centre for Economic and Policy Research. Retrieved
from http://www.cepr.net/documents/publications/jamaica-qr-2011-04.pdf
Kajula, P.W., Kintu, F., Barugahare, J., & Neema, S. (2004). Political analysis of rapid
change in Uganda's health financing policy and consequences on service delivery
for malaria control. International Journal of Health Planning and Management,
19(S1), S133-S153. doi: 10.1002/hpm.772
Kato, K., & Bart, W. (2008). Descriptive statistics. In N. Salkind (Ed.), Encyclopaedia of
educational psychology. (pp. 237-239). Thousand Oaks, CA: SAGE Publications,
Inc. doi: 10.4135/9781412963848.n65
Kenealy, T., Arroll, B., Kenealy, H., Docherty, B., Scott, D., Scragg, R., & Simmons, D.
(2004). Diabetes care: Practice nurse roles, attitudes and concerns. Journal of
Advanced Nursing, 48(1), 68-75. doi: 10.1111/j.1365-2648.2004.03173.x
Khandker, S.R., Koolwal, G.B., & Samad, H.A. (2010). Handbook on impact evaluation:
Quantitative methods and practices. The International Bank for Reconstruction and
Development/World Bank. Washington, DC: World Bank.
Kipp, W., Kamugisha, J., Jacobs, P., Burnham, G., & Rubaale, T. (2001). User fees, health
staff incentives, and service utilisation in Kabarole District, Uganda. Bulletin of the
World Health Organisation, 79(11), 1032-1037. Retrieved from
http://www.who.int/bulletin/archives/79(11)1032.pdf
Kiwanuka, S.N., Ekirapa, E.K., Peterson, S., Okui, O., Hafizur Rahman, M., Peters, D.,
Pariyo, G.W. (2008). Access to and utilisation of health services for the poor in
Uganda: A systematic review of available evidence. Royal Society of Tropical
Medicine and Hygiene, 102, 1067-1074. doi:10.1016/j.trstmh.2008.04.023
Klemick, H., Leonard, K.L., & Masatu, M.C. (2009). Defining access to health care:
Evidence on the importance of quality and distance in rural Tanzania. American
275
Journal of Agricultural Economics, 91(2), 347-358. doi: 10.1111/j.1467-
8276.2009.01252.x
Krippendorff, K. (2010). Content analysis. In N. Salkind (Ed.), Encyclopaedia of research
design. (pp. 234-239). Thousand Oaks, CA: SAGE Publications, Inc. doi:
10.4135/9781412961288.n73
Lagarde, M., & Palmer, N. (2008). The impact of user fees on health service utilisation in
low- and middle-income countries: How strong is the evidence? Bulletin of the
World Health Organisation, 86(11), 839-848. Retrieved from
http://search.proquest.com/docview/229652775
Lalta, S. (1995). Review of health financing in Jamaica and a survey of the feasibility of
national health insurance. Kingston, Jamaica: University of the West Indies,
Mona, Institute of Social and Economic Research (SALISES). Retrieved from
http://www.healthsystems2020.org/content/resource/detail/994/
Laterveer, L., Munga, M., & Schwerzel, P. (2004). Equity implications of health sector
user fees in Tanzania: Do we retain the user fee or do we set the user f(r)ee?
Leusden, The Netherlands: ETC Crystal.
Lewis, M.A. (1993). User fees in public hospitals: Comparison of three country case
studies. Economic Development and Cultural Change, 41(3), 513-532.
http://www.jstor.org/stable/1154314
Lipsedge, M. (1993). Mental health: Access to care for black and ethnic
minority group people. In A. Hopkins & V. Bahl (Eds.), Access to health care for
ethnic minorities (pp. 169-185). London, UK: Royal College of Physicians of
London.
Litvack, J.I., & Bodart, C. (1993). User fees plus quality equals improved access to health
care: Results of a field experiment in Cameroon. Social Science & Medicine, 37(3),
369-383. doi: 10.1016/0277-9536(93)90267-8.
Liu, X., & Mills, A. (2002). Financing reforms of public health services in China: Lessons
for other nations. Social Science & Medicine, 54(11), 1691-1698. doi:
10.1016/s0277-9536(01)00337-9
Lockyer, S. (2008). Textual analysis. In L. Given (Ed.), The SAGE encyclopaedia of
qualitative research methods. (pp. 866-867). Thousand Oaks, CA: SAGE
Publications, Inc. doi: 10.4135/9781412963909.n449
276
Lopushinsky, S.R., Austin, P.C., Rabeneck, L., Kulkarni, G.S., & Urbach, D.R. (2007).
Regional Variation in Surgery for Gastroesophageal Reflux Disease in Ontario.
Surgical Innovation, 14(1), 35-40. doi: 10.1177/1553350606298967
Luton, D. (2009, February 23). Free health flop - Avalanche of woes predicted before user
fees scrapped. Jamaica Gleaner. Retrieved from http://jamaica-
gleaner.com/gleaner/20090223/lead/lead1.html
Maharaj, S. (2010). The relationship between healthcare services and the political
economy with reference to the Jamaican experience. West Indian Medical Journal,
59, 706-708. Retrieved from http://caribbean.scielo.org/pdf/wimj/v59n6/v59n6a19
Mariko, M. (2003). Quality of care and the demand for health services in Bamako, Mali:
The specific roles of structural, process, and outcome components. Social Science
& Medicine, 56(6), 1183-1196. doi: 10.1016/S0277-9536(02)00117-X.
Masiye, F., Chitah, B.M., Chanda, P., & Simeo, F. (2008). Removal of user fees at primary
health care facilities in Zambia: A study of the effects on utilisation and quality of
care. Harare, Zimbabwe: University of Zambia & University of Cape Town.
Retrieved from http://www.equinetafrica.org/bibl/docs/Dis57FINchitah.pdf
Mbugua, J.K., Bloom, G.H., & Segall, M.M. (1995). Impact of user charges on vulnerable
groups: The case of Kibwezi in rural Kenya. Social Science & Medicine, 41(6),
829-835. doi: 10.1016/0277-9536(94)00400-n
McCaw-Binns, A. (2008). Can research accelerate progress toward Millennium
Development Goal 5 (Maternal Health) in Jamaica? West Indian Medical Journal;
57(6): 549. Retrieved from http://dspace.mona.uwi.edu/handle/123456789/265
McCaw-Binns, A. M., Moody, C. O., & Standard, K. L. (1998). Forty years: An
introduction to the development of a Caribbean public health. West Indian Medical
Journal, 47(Supplement 4), 8-12.
McCaw-Binns, A., & Moody, C.O. (2001). The development of primary health care in
Jamaica. West Indian Medical Journal, 50 (Supplement 4), 6-10.
McCaw-Binns, A., Standard-Goldson, A., Ashley, D., Walker, G., & MacGillivray, I.
(2001). Access to care and maternal mortality in Jamaican hospitals: 1993–1995.
International Journal of Epidemiology, 30(4), 796-801. doi: 10.1093/ije/30.4.796
McIntyre, D.I., Thiede, M., & Birch, S. (2009). Access as a policy-relevant concept in
low- and middle-income countries. Health Economics, Policy and Law, 4(2), 179-
193. doi: 10.1017/s1744133109004836
277
McLachlan, A., Kerr, A., Lee, M., & Dalbeth, N. (2011). Nurse-led cardiovascular disease
risk management intervention for patients with gout. European Journal of
Cardiovascular Nursing, 10(2), 94-100. doi: 10.1016/j.ejcnurse.2010.05.001
McPake, B., Brikci, N., Cometto, G., Schmidt, A., & Araujo, E., (2011). Removing user
fees: Learning from international experience to support the process. Health Policy
and Planning, 26, ii104-ii117. doi:10.1093/heapol/czr064
McPake, B., Schmidt, A., Araujo, E., & Tashobya, C.K. (2008). Freeing up healthcare: A
guide to removing user fees. London, UK: The Save the Children Fund.
http://eresearch.qmu.ac.uk/1360/1/eResearch_1360.pdf
Meessen, B., Hercot, D., Noirhomme, M., Ridde, V., Tibouti, A., Tashobya, C.K., &
Gilson, L. (2011). Removing user fees in the health sector: A review of policy
processes in six sub-Saharan African countries. Health Policy and Planning,
26(suppl 2), ii16-ii29. doi: 10.1093/heapol/czr062
Meessen, B., Van Damme, W., Tashobya, C.K., & Tibouti, A. (2006). Poverty and user
fees for public health care in low-income countries: Lessons from Uganda and
Cambodia. Lancet, 368, 2253–57. Retrieved from
http://www.strengtheninghealthsystems.be/doc/1/
Merzel, C. (2000). Gender differences in health care access indicators in an urban, low-
income community. American Journal of Public Health. 90(6), 909–916. Retrieved
from http://www.ncbi.nlm.nih.gov/pmc/articles/PMC1446268/pdf/10846508.pdf
Meuwissen, L.E. (2002). Problems of cost recovery implementation in district health care:
A case study from Niger. Health Policy and Planning, 17(3), 304-313. doi:
10.1093/heapol/17.3.304
Miles, K., Clutterbuck, D.J., Seitio, O., Sebego, M., & Riley, A. (2007). Antiretroviral
treatment roll-out in a resource-constrained setting: Capitalising on nursing
resources in Botswana. Bulletin of the World Health Organisation, 85(7), 555-60.
http://www.scielosp.org/pdf/bwho/v85n7/a14v85n7.pdf
Miles, M.B., & Huberman, A.M. (1994). An expanded sourcebook: Qualitative data
analysis (2nd
ed.). Thousand Oaks, CA: SAGE Publications Inc.
MOH. (1992). Job descriptions (professional nurses). Kingston, Jamaica: Author.
MOH. (2008a). Annual report 2006. Kingston, Jamaica: Author.
MOH. (2008b, March 28). Statement on abolition of user fees in public health facilities.
[News release]. Kingston, Jamaica: Author.
278
MOH. (2008c, March 28). Question and answer sheet on abolition of user fees. [News
release]. Kingston, Jamaica: Author.
MOH. (2008d, April 9). Successful first week for the abolition of fees with 58% increase in
accident and emergency registration. [News release]. Kingston, Jamaica: Author.
MOH. (2009a). Patient utilisation one year after the abolition of user fees. Retrieved from
http://www.moh.gov.jm/general/latestnews/1-news?start=24
MOH. (2009b, February 24). Jamaicans saved over 1 billion dollars under no user fees
policy. [News release]. Kingston, Jamaica: Author.
MOH. (2009c). Annual report 2007. Kingston, Jamaica: Author.
MOH. (2010). Annual Report 2009. (Unpublished, Preliminary Report). Kingston,
Jamaica: Author.
Mooney, G.H. (1983). Equity in health care: Confronting the confusion. Effective Health
Care, 1(4), 179-185.
Mooney, G.H. (2009). Is it not time for health economists to rethink equity and access?
Health Economics, Policy and Law, 4(02), 209-221.
doi:10.1017/S1744133109004848
Mrug, S. (2010). Survey. In N. Salkind (Ed.), Encyclopaedia of research design. (pp.
1473-1477). Thousand Oaks, CA: SAGE Publications, Inc. doi:
10.4135/9781412961288.n449
Nabyonga, J., Desmet, M., Karamagi, H., Kadama, P., Omaswa, F., & Walker, O. (2005).
Abolition of cost-sharing is pro-poor: Evidence from Uganda. Health Policy and
Planning, 20(2), 100-108. doi: 10.1093/heapol/czi012
Nabyonga-Orem, J., Karamagi, H., Atuyambe, L., Bagenda, F., Okuonzi, S.A., & Walker,
O. (2008). Maintaining quality of health services after abolition of user fees: A
Uganda case study. BMC Health Services Research, 8, 102-111. doi:
10.1186/1472-6963-8-102
Nanda, P. (2002). Gender dimensions of user fees: Implications for women‘s utilisation of
health care. Reproductive Health Matters, 10(20), 127-134. Retrieved from
http://www.jstor.org/stable/3776333
Nandi, A., Galea, S., Lopez, G., Nandi, V., Strongarone, S., & Ompad, D.C. (2008).
Access to and use of health services among undocumented Mexican immigrants in
United States urban area. American Journal of Public Health, 98(11), 2011-2020.
doi: 10.2105/AJPH.2006.096222
279
NHF. (2008). Aims and objectives. Retrieved from
http://www.nhf.org.jm/dynaweb.dti?dynasection=aboutus&dynapage=aims_objecti
ves
National Health services Act 1997. Retrieved from http://www.moj.gov.jm/node/77
Neal, D., Stewart, D., & Grant, C.C. (2008). Nurse-led newborn resuscitation in an urban
neonatal unit. Acta Pædiatrica, 97(12), 1620-1624. doi: 10.1111/j.1651-
2227.2008.01000.x.
NERHA. (2009). Retrieved from http://www.nerha.gov.jm/aboutus.html
Netshandama, V.O., Nemathaga, L & Shai-Mahoko, S.N. (2005). Experiences of primary
health care nurses regarding the provision of free health care services in the
northern region of the Limpopo Province [Abstract]. Curationis, 28(1), 59-68.
Retrieved from http://www.ncbi.nlm.nih.gov/pubmed/15850154
Newacheck, P.W., Hung, Y.Y., & Wright, K.K. (2002). Racial and ethnic disparities in
access to care for children with special health care needs. Ambulatory Pediatrics,
2(4), 247-254. doi: 10.1367/1539-4409(2002)002<0247
Nimpagaritse, M., & Bertone, M.P. (2011). The sudden removal of user fees: The
perspective of a frontline manager in Burundi. Health Policy and Planning,
26(suppl 2), ii63-ii71. doi: 10.1093/heapol/czr061
Nolan, B., & Turbat, V. (1995). Cost recovery in public health services in Sub Saharan
Africa. World Bank Publication. [Books Google]. Retrieved from
http://books.google.co.nz/books?hl=en&lr=&id=NeH__9wKDbwC&oi=fnd&pg=P
R5&dq=Nolan+and+turbat&ots
Nyonator, F., & Kutzin, J. (1999). Health for some? The effects of user fees in the Volta
Region of Ghana. Health Policy and Planning, 14(4), 329-341. Retrieved from
http://heapol.oxfordjournals.org/content/14/4/329.full.pdf+html
Ofori-Adjei, D. (2007). Ghana's free delivery care policy. Ghana Medical Journal, 41(3),
94-95. Retrieved from http://www.ncbi.nlm.nih.gov/pmc/articles/PMC2279087/
Oliver, A., & Mossialos, E. (2004). Equity of access to health care: Outlining the
foundations for action. Journal of Epidemiology and Community Health (1979-),
58(8), 655-658. Retrieved from
http://www.jstor.org.helicon.vuw.ac.nz/stable/pdfplus/25570447.pdf
Onwuegbuzie, A. J., & Johnson, R. B. (2006). The validity issue in mixed research.
Research in the Schools, 13(1), 48-63. doi: 10.1037/0003-066x.50.9.741
280
Owen, J.M. (2006). Program evaluation: Forms and approaches (3rd ed.). New York,
NY: The Guilford Press.
Pan American Health Organisation & World Health Organisation. (2007). Jamaica.
(Health in the Americas Volume II). Retrieved from
http://www.paho.org/hia/archivosvol2/
Penchansky, R., & Thomas, J.W. (1981). The concept of access: Definition and
relationship to consumer satisfaction. Medical Care, 19(2), 127-140. Retrieved
from http://www.jstor.org/stable/3764310
Penfold, S., Harrison, E., Bell, J., & Fitzmaurice A. (2007). Evaluation of the delivery fee
exemption policy in Ghana: Population estimates of changes in delivery service
utilisation in two regions. Ghana Medical Journal, 41(3), 100–109. Retrieved from
http://www.ncbi.nlm.nih.gov/pmc/articles/PMC2279083/
Peters, D.H., Garg, A., Bloom, G., Walker, D.G., Breiger, W.R., & Hafizur Rahman, M.
(2008). Poverty and access to health care in developing countries. Annals of New
York Academy of Science, 1136, 161-171. doi: 10.1196/annals.1425.011
Phillips, K.A., Mayer, M.L., & Aday, L.A. (2000). Barriers to care among racial/ethnic
groups under managed care. Health Affairs, 19(4), 65-75. doi:
10.1377/hlthaff.19.4.65
Picking, D., Younger, N., Mitchell, S., & Delgoda, R. (2011). The prevalence of herbal
medicine home use and concomitant use with pharmaceutical medicines in
Jamaica. Journal of Ethnopharmacology, 137, 305–311. Retrieved from
http://www.tramil.net/files/Jamaican_survey.pdf
Pie a la Mode Productions © Action 4 Reel Filmworks. (2011). Map of Jamaica. Retrieved
from http://piealamodeproductions.com/images/akwantu-map-jamaica-02.png
PIOJ. (2009). National report of Jamaica on Millennium Development Goals for the
United Nations Economic and Social Council annual ministerial review. Retrieved
from
http://www.jm.undp.org/files/GOJ%20National%20Report%20to%20UNAMR-
Final.pdf
PIOJ. (2011). Economic and social survey Jamaica 2010. Kingston, Jamaica: Author.
PIOJ & MFAFT. (2009). National report of Jamaica on Millennium Development Goals
for the United Nations Economic and Social Council annual ministerial review.
Retrieved from
281
http://www.jm.undp.org/files/GOJ%20National%20Report%20to%20UNAMR-
Final.pdf
PIOJ & STATIN. (2008). Jamaica survey of living conditions 2007. Kingston, Jamaica:
Author.
PIOJ & STATIN. (2010). Jamaica survey of living conditions 2009. Kingston, Jamaica:
Author.
Polit, D.F., & Tatano Beck, C. (2008). Nursing Research: Generating and assessing
evidence for nursing practice (8th
ed.). Philadelphia, PA: Lippincott Williams &
Wilkins.
Ponsar, F., Van Herp, M., Zachariah, R., Gerard, S., Philips, M., & Jouquet, G. (2011).
Abolishing user fees for children and pregnant women trebled uptake of malaria-
related interventions in Kangaba, Mali. Health Policy and Planning, 26(suppl 2),
ii72-ii83. doi: 10.1093/heapol/czr068
Posavac, E.J., & Carey, R.G. (2007). Program evaluation: Methods and case studies (7th
ed.). Upper Saddle River, NJ: Pearson Education Inc.
Powell, F.D., & Wessen, A.F. (1999). Health care systems in transition: An international
perspective. Thousand Oaks, CA. Sage Publications Inc.
Public Health Act. (1985). Retrieved from
http://www.moj.gov.jm/sites/default/files/laws/Public%20Health%20Act.pdf
Reference.Md. (2012). Risk sharing. Retrieved from
http://www.reference.md/files/D020/mD020414.html
Ridde, V. (2003). Fees-for-services, cost recovery, and equity in a district of Burkina Faso
operating the Bamako Initiative. Bulletin of the World Health Organisation, 81(7),
532-8. Retrieved from
http://search.proquest.com/docview/229634770?accountid=14782
Ridde, V., & Diarra, A. (2009). A process evaluation of user fees abolition for pregnant
women and children under five years in two districts in Niger (West Africa).
Biomedical Central Health Services Research, 9, 89. doi: 10.1186/1472-6963-9-89
Ridde, V., Diarra, A., & Moha, M. (2011). User fees abolition policy in Niger: Comparing
the under five years exemption implementation in two districts. Health Policy, 99,
219–225. Retrieved from http://www.lasdel.net/Niger_userfees.pdf
Ridde, V., & Morestin, F. (2011). A scoping review of the literature on the abolition of
user fees in health care services in Africa. Health Policy and Planning, 26(1), 1-11.
doi: 10.1093/heapol/czq021
282
Ridde, V., Robert, E., & Messen, B. (2012). A literature review of the disruptive effects of
user fee exemption policies on health systems. Biomedical Central Public Health,
12, 289. doi:10.1186/147-2458-12-289.
Robertson, J. (2002). ―Stories‖ and ―Histories‖ in late seventeenth century Jamaica. In
K.E.A. Monteith & G. Richards (Eds.) Jamaica in slavery and freedom: Heritage,
history and culture (pp. 25-51). Kingston, Jamaica: The University of the West
Indies Press.
Robinson, F. (2004). Nurse-led diabetes care. Community Practitioner, 77(3), 82-84.
Retrieved from http://search.proquest.com/docview/213329430?accountid=14782
Rogers, A., Flowers, J., & Pencheon, D. (1999). Improving access needs a whole systems
approach: and will be important in averting crises in the millennium winter. British
Medical Journal, 319(7214), 866-867. Retrieved from
http://www.jstor.org/stable/25185940
Rogers, A.E., Hwang, W-T., Scott, L.D., Aiken, L.H., & Dinges, D.F. (2004). The
working hours of hospital staff nurses and patient safety. Health Affairs, 23(4),
202-212. doi: 10.1377/hlthaff.23.4.202
Russell, S., & Abdella, K. (2002). Too poor to be sick: Coping with the cost of illness in
East Hararghe, Ethiopia. London, UK: The Save the Children Fund. Retrieved
from
http://www.savethechildren.org.uk/sites/default/files/docs/Too_Poor_to_be_Sick_
Ethiopia_1.pdf
Russell, S., & Gilson, L. (1997). User fee policies to promote health service access for the
poor: A wolf in sheep's clothing [Abstract]? International Journal of Health
Services, 27(2), 359-379.
http://baywood.metapress.com.helicon.vuw.ac.nz/app/home/contribution.asp?
Rutebemberwa, E., Pariyo, G., Peterson, S., Tomson, G., & Kallander, K. (2009).
Utilisation of public or private health care providers by febrile children after user
fee removal in Uganda. Malaria Journal, 8(1), 45. doi:10.1186/1475-2875-8-45
Safriet, B.J. (1992). Health care dollars and regulatory sense: The role of advanced
practice nursing. Yale Journal on Regulation, 9, 417-488.
http://www.lexisnexis.com.helicon.vuw.ac.nz/hottopics/lnacademic/?verb=sr&csi=
7384
Sagicor Life Jamaica. (2012). Retrieved from http://www.sagicorjamaica.com/
283
Schoen, C., & Doty, M. M. (2004). Inequities in access to medical care in five countries:
Findings from the 2001 Commonwealth Fund International Health Policy Survey.
Health Policy, 67(3), 309-322. doi: 10.1016/j.healthpol.2003.09.006
Scott, C. (2001). Public and private roles in health care systems. Suffolk, UK: St
Edmundsbury Press.
Scott, A., Shiell, A., & King, M. (1996). Is general practitioner decision making associated
with patient socio-economic status? Social Science & Medicine, 42(1), 35-46. doi:
10.1016/0277-9536(95)00063-1
Scott, L.D., Rogers, A.E., Hwang, W-T, & Zhang, Y. (2006). Effects of critical care
nurses‘ work hours on vigilance and patients‘ safety. American Journal of Critical
Care, 15(1), 30-7. Retrieved from http://search.proquest.com/docview/227910762?
Seaga, E. (2005). The folk roots of Jamaican cultural identity. Caribbean Quarterly, 51(2),
79-95. Retrieved from http://www.jstor.org/stable/40654507
Sepehri, A., Chernomas, R., & Akram-Lodhi, H. (2005). Penalising patients and rewarding
providers: User charges and health care utilisation in Vietnam. Health Policy and
Planning, 20(2), 90-99. doi: 10.1093/heapol/czi011
Shepard, D.S. (1993). Cost recovery in Jamaican health facilities. Kingston, Jamaica:
Health Sector Initiatives Project/Ministry of Health.
Shepard, D., Anthony, Y., McNaught, A., & Davis, K.L. (1998). Evaluation of health
sector initiatives program. Prepared for USAID, Kingston, Jamaica. Retrieved
from http://people.brandeis.edu/~shepard/j-eval3.PDF
Soucat, A., Gandaho, T., Levy-Bruhl, D., de Bethune, X., Alihonou, E., Ortiz, C., ...
Knippenberg, R. (1997). Health seeking behaviour and household health
expenditures in Benin and Guinea: The equity implications of the Bamako
Initiative. International Journal of Health Planning and Management, 12, S137–
S163. doi: 10.1002/(SICI)1099-1751(199706)12:1+<S137::AID-
HPM469>3.0.CO;2-G
SRHA. (2011). Retrieved from http://www.srha.gov.jm/RegionProfile.aspx
SERHA. (2010). Retrieved from http://www.serha.gov.jm/ProfileRegion.aspx
Spence, D., Crath, R., Hibbert, A., Phillips-Jackson, K., Barillas, A., Castagnier, T.,
...Webley, N. (2010). Supporting cancer patients in Jamaica – A needs assessment
survey. West Indian Medical Journal, 59(1), 59-66.
STATIN. (2010). Demographic statistics 2009. Kingston, Jamaica: Author.
284
Steinhardt, L.C., Aman, I., Pakzad, I., Kumar, B., Singh, L.P., & Peters, D.H. (2011).
Removing user fees for basic health services: A pilot study and national roll-out in
Afghanistan. Health Policy and Planning, 26(suppl 2), ii92-ii103. doi:
10.1093/heapol/czr069
St George, I., Cullen, M., Gardiner, L., Karabatsos, G., Ng, J. Y., Patterson, A., & Wilson,
A. (2008). Universal telenursing triage in Australia and New Zealand: A new
primary health service. Australian Family Physician, 37(6), 476-9. Retrieved from
http://search.proquest.com/docview/216300274?accountid=14782
Sudore, R.L., Mehta, K M., Simonsick, E.M., Harris, T.B., Newman, A.B., Satterfield, S.,
... Yaffe, K. (2006). Limited literacy in older people and disparities in health and
healthcare access. Journal of American Geriatrics Society, 54, 770-776. doi:
10.1111/j.1532-5415.2006.00691.x
Swaby, G. (2005). Profession of nursing. Kingston, Jamaica: Stephensons Litho Press Ltd.
Tashakkori, A., & Teddlie, C. (1998). Mixed methodology: Combining qualitative and
quantitative approaches. Thousand Oaks, CA: SAGE Publications Ltd.
Thorndike, R. (2008). Inferential statistics. In N. Salkind (Ed.), Encyclopaedia of
educational psychology. (pp. 525-531). Thousand Oaks, CA: SAGE Publications,
Inc. doi: 10.4135/9781412963848.n141
To, T., & Langer, J. (2010). Does access to care affect outcomes of appendicitis in
children? A population-based cohort study. BMC Health Services Research, 10(1),
250. doi:10.1186/1472-6963-10-250
Turner, R. (2009, April 8). ―Free‖ care prompts staff upgrade at health centres. Jamaica
Gleaner. Retrieved from http://www.jamaica-gleaner.com/gleaner/20090408/
UNDP. (2011). International human development indicators. Retrieved from
http://hdrstats.undp.org/en/countries/profiles/JAM.html
UNICEF. (2010). Jamaica statistics. Retrieved from
http://www.unicef.org/infobycountry/jamaica_statistics.html
University of North Texas. (2007). Health disparity search terms. Retrieved from
http://library.hsc.unt.edu/guides/HealthDisparitySearchTerms.cfm
Uzochukwu, B., Onwujekwe, O., & Eriksson, B. (2004). Inequity in the Bamako Initiative
programme—Implications for the treatment of malaria in South-East Nigeria. The
International Journal of Health Planning and Management, 19(S1), S107-S116.
doi: 10.1002/hpm.779
285
Vanderstoep, S.W., & Johnston, D.D. (2009). Research methods for everyday life:
Blending qualitative and quantitative approaches. San Francisco, CA: John Wiley
& Sons Inc.
van Doorslaer, E., Masseria, C., & Koolman, X. (2006). Inequalities in access to medical
care by income in developed countries. Canadian Medical Association Journal,
174(2), 177-183. doi: 10.1503/cmaj.050584.
van Doorslaer, E., Wagstaff, A., van der Burg, H., Christiansen, T., Citoni, G., Di Biase,
R., ... Winkelhake, O. (1999). The redistributive effect of health care finance in
twelve OECD countries. Journal of Health Economics, 18(3), 291-313. doi:
10.1016/s0167-6296(98)00043-5
Vedung, E. (1997). Public policy and programme evaluation. New Brunswick, NJ:
Transaction Publishers.
Walker, L., & Gilson, L. (2004). ‗We are bitter but we are satisfied‘: Nurses as street-level
bureaucrats in South Africa. Social Science and Medicine, 59(6), 1251-1261. doi:
10.1016/j.socscimed.2003.12.020
Ward, E., & Grant, A. (2005). Epidemiological profile of selected health conditions and
services in Jamaica 1990 – 2002. Kingston, Jamaica: Ministry of Health &
Environment.
Warner Lewis, M. (2002). The character of African-Jamaican culture. In K.E.A. Monteith
& G. Richards (Eds.), Jamaica in slavery and freedom: Heritage, history and
culture (pp. 89-114). Kingston, Jamaica: The University of the West Indies Press.
Watson Williams, C. (2008). Realising rights through social guarantees: The case of
Jamaica. Final Report submitted to the World Bank. Retrieved from
http://siteresources.worldbank.org/EXTSOCIALDEV/Resources/3177394-
1168615404141/3328201-1192042053459/Jamaica_fullReport.pdf?
Weaver, S.R. (2003). Health and illness in a rural community: A study of traditional
health care practices in the parish of St. Thomas, Jamaica (Unpublished PhD
thesis). University of the West Indies, Mona, Kingston, Jamaica. [Email
communication].
Wells, K., Klap, R., Koike, A., & Sherbourne, C. (2001). Ethnic disparities in unmet need
for alcoholism, drug abuse, and mental health care. The American Journal of
Psychiatry, 158(12), 2027-32. Retrieved from
http://search.proquest.com/docview/220467437?
286
West India Commission Report 1945. (2006). House of Commons Parliamentary Papers
online. London, UK: ProQuest Information and Learning Company.
Whitehead, M. (1991). The concepts and principles of equity and health. Health
Promotion International, 6(3), 217-228. doi: 10.1093/heapro/6.3.217
Wilkinson, D., Gouws, E., Sach, M., & Abdool Karim, S.S. (2001). Effect of removing
user fees on attendance for curative and preventive primary health care services in
rural South Africa. Bulletin of the World Health Organization, 79(7), 665-671.
Retrieved from http://www.scielosp.org/pdf/bwho/v79n7/v79n7a12.pdf
Witter, S., & Adjei, S. (2007). Start-stop funding, its causes and consequences: A case
study of the delivery exemptions policy in Ghana. International Journal of Health
Planning and Management, 22(2), 133-143. doi: 10.1002/hpm.867
Witter, S., Adjei, S., Armar-Klemesu, M., & Graham, W. (2009). Providing free maternal
health care: Ten lessons from an evaluation of the national delivery exemption
policy in Ghana. Global Health Action, 2. doi:10.3402/gha.v2i0.1881
Witter, S., Arhinful, D.K., Kusi, A., & Zakariah-Akoto, S. (2007a). The experience of
Ghana in implementing a user fee exemption policy to provide free delivery care.
Reproductive Health Matters, 15(30), 61-71. doi: 10.1016/S0968-8080(07)30325-
X
Witter, S., Dieng, T., Mbengue, D., Moreira, I., & De Brouwere, V. (2010). The national
free delivery and caesarean policy in Senegal: Evaluating process and outcomes.
Health Policy and Planning, 25(5), 384-392. doi: 10.1093/heapol/czq013
Witter, S., Kusi, A., & Aikins, M. (2007b). Working practices and incomes of health
workers: evidence from an evaluation of a delivery fee exemption scheme in
Ghana. Human Resources for Health, 5(1), 2. doi:10.1186/1478-4491-5-2
World Bank. (2005). Madagascar health sector note. Washington, DC
2005. Retrieved from
http://web.worldbank.org/WBSITE/EXTERNAL/PROJECTS/0,,contentMDK:209
78587~pagePK:41367~piPK:51533~theSitePK:40941~isCURL:Y,00.html
World Bank. (2006). Health, nutrition and population. Retrieved from
http://www.worldbank.org/povertyandhealth
World Bank. (2011). World development indicators, Jamaica. International Bank for
Reconstruction and Development/ The World Bank, Washington D.C. Retrieved
from http://www.worldbank.org
287
WHO. (2000). Millennium development goals. Retrieved from
http://www.who.int/topics/millennium_development_goals/en/
WHO. (2002). Traditional medicine strategy 2002–2005. Retrieved from
http://whqlibdoc.who.int/hq/2002/WHO_EDM_TRM_2002.1.pdf
WHO. (2008). Beijing declaration 2008. Retrieved from
http://www.who.int/medicines/areas/traditional/TRM_BeijingDeclarationEN.pdf
WHO. (2010a). Country cooperation strategy at a glance: Jamaica. Retrieved from
http://www.who.int/countryfocus/cooperation_strategy/
WHO. (2010b). The World Health report 2010. Retrieved from
http://www.who.int/whr/2010/10_summary_en.pdf
WRHA. (2009). Retrieved from http://www.wrha.gov.jm/content/wrha_profile.html
Wyatt, L. (2006). A nurse-led community approach to asthma management for children.
Australian Nursing Journal, 14(6), 18-18. Retrieved from
http://search.proquest.com/docview/236640730?accountid=14782
Xu, K., Evans, D.B., Kadama, P., Nabyonga, J., Ogwal, P.O., Nabukhonzo, P., & Aguilar,
A.M. (2006). Understanding the impact of eliminating user fees: Utilisation and
catastrophic health expenditures in Uganda. Social Science & Medicine, 62(4),
866-876. doi: 10.1016/j.socscimed.2005.07.004
Xu, K., Evans, D.B., Kawabata, K., Zeramdini, R., Klavus, J., & Murray, C.J.L. (2003).
Household catastrophic health expenditure: A multi-country analysis. Lancet,
362(9378), 111-117. doi: 10.1016/S0140-6736(03)13861-5
Yamada, T., Chen, C.C., Yamada, T., Chiu, I.M., & Smith, J. (2009). Healthcare services
accessibility of children in the USA. Applied Economics, 41(4), 437-450. doi:
10.1080/00036840701720762
Yates, R. (2006). International experiences in removing user fees for health services:
Implication for Mozambique. London, UK: DFID Resource Centre.
Yates, R. (2009). Universal health care and the removal of user fees. The Lancet,
373(9680), 2078-81. Retrieved from
http://search.proquest.com/docview/199041142?accountid=14782
Yates, J., Cooper, R., & Holland, J. (2006). Social protection and health: Experiences in
Uganda. Development Policy Review, 24(3), 339-356. doi: 10.1111/j.1467-
7679.2006.00328.x
Yin, R.K. (2009). Case study research: Design and methods. Los Angeles, CA: Sage
Publications.