territorial outlook economic forecast - open government
TRANSCRIPT

Report Summer 2019
Territorial Outlook Economic Forecast

AcknowledgementsThe articles were written by:
Overview—Marie-Christine Bernard, Director, Provincial and Territorial Forecast
Nunavut—Kip Beckman, Principal Economist, Richard Forbes, Economist, and Stephen Spence, Economist
Northwest Territories—Kip Beckman, Principal Economist, Richard Forbes, Economist, and Stephen Spence, Economist
Yukon—Kip Beckman, Principal Economist, Richard Forbes, Economist, and Stephen Spence, Economist
For the exclusive use of Laurie Gravelines, [email protected], Northwest Territories Department of Finance.

Contents Foreword
i Overview
Nunavut 1 Mining sector in good shape 3 Mining 8 Construction 8 Demographics 10 Labour market 12 Public accounts
Northwest Territories 24 Challenging times for the Northwest Territories 26 Mining 30 Oil and gas 31 Construction 31 Demographics 33 Labour markets 35 Public accounts
Yukon 47 Weaker growth in Yukon this year but rebound expected in 2020 49 Overview 50 Mining 53 Construction 54 Demographics 56 Labour markets 57 Public accounts
© The Conference Board of Canada. All rights reserved. Please contact cboc.ca/ip with questions or concerns about the use of this material.

Territorial Outlook
Overview
For the exclusive use of Laurie Gravelines, [email protected], Northwest Territories Department of Finance.

Find Conference Board research at conferenceboard.ca. ii
Territorial Outlook Economic ForecastSummer 2019
New mines to propel growth in territorial economies
The setting in which the territorial economies find themselves today is one of a more sluggish Canadian economy due to a big contraction in exports and residential investment.
As well, the global economy is shifting gears. Weaker growth in global trade (a result of higher tariffs, capacity constraints, and tightening financial conditions in some countries) is the main factor behind our more sluggish outlook for global growth—less than 3 per cent this year and next. Also, higher geopolitical risks, including the uncertainty surrounding Brexit and the trade tensions between the United States and China, will continue to have an impact on the global economy.
On the positive side, ongoing strength in the U.S. economy should ensure that the world economy continues to expand. Although the impacts of the expansionary fiscal policies implemented last year by the Trump administration are waning, U.S. growth will still be strong enough to offset some of the weaker gains in Europe and China. As well, China’s government, in response to slower growth, has implemented modest stimulus measures to make sure that real GDP growth in that country remains above the 6.0 per cent mark. Another positive for growth is that the more subdued global economic conditions have led most of the world’s major central banks to reverse course and back away from tightening monetary conditions any further, at least for now.
Despite the weakening state of global and Canadian economic growth, the mining sector, seven years after the end of the last commodity super cycle, is getting back on its feet in Yukon and expanding in Nunavut, as more greenfield mining projects are planned. The exception is the Northwest Territories, where the diamond industry’s more mature state leads to a cautious outlook. The diamond industry will be winding down over the next decade, and mining in the N.W.T. will focus on metals that will be in demand for batteries to power electric vehicles. After being on a declining trend or remaining at a standstill in the later part of last year, most metal and mineral prices have started to improve. That is encouraging news, and metal prices are expected to continue their recovery this year and in 2020. Mineral exploration investment in the three territories is expected to decline this year, according to Natural Resources Canada’s latest (March 2019) Exploration and Deposit Appraisal Expenditures survey. Nevertheless, a number of mining projects are expected to propel the territorial economies going forward.
Nunavut’s economy will post solid growth over the near and medium terms thanks to strength in the mining sector. The outlook for gold mining is bright amid high prices. In the next
© The Conference Board of Canada. All rights reserved. Please contact cboc.ca/ip with questions or concerns about the use of this material.

Overview | The Conference Board of Canada
Find Conference Board research at conferenceboard.ca. iii
two years, gold production will more than double. The Meliadine mine began commercial production in May and, along with the Amaruq satellite deposit and Sabina’s Back River project, will help Nunavut to produce more than 1 million ounces of gold by 2022. Nunavut’s economy grew by double digits last year and is set to grow by 10.3 per cent this year. In 2020, economic growth will slow to 3.0 per cent before accelerating again over the medium term. Most of the new jobs created in Nunavut’s mining industry will, unfortunately, go to non-residents as companies are forced to bring in workers from other parts of Canada due to a lack of specific mining skills within the resident population and to the remoteness of the mine sites.
After the gradual shutdown of the last mine in operation in Yukon (Capstone’s Minto mine), a new mining project—Victoria’s Gold Eagle gold mine—will kick off a new mining era in the territory. The Eagle gold mine is expected to be in operation by September. With construction at Eagle set to wind down, Goldcorp is planning to begin building its Coffee gold mine, with first production there expected around 2022. Both Eagle and Coffee will be dwarfed by the third mine scheduled to be constructed in Yukon, the Casino mine. This $2.5-billion mining project is under review and could become a reality in the next decade. Together, these projects will provide a significant boost to Yukon’s economy, which is forecast to grow 2.2 per cent in 2019, 10.0 per cent in 2020, and by an average of 3.6 per cent annually between 2021 and 2025.
The economic outlook for the Northwest Territories is more modest due to the shutdowns of diamond mine projects over the next decade. Mining plans at Gahcho Kué, Diavik, and Ekati
indicate that the territory’s diamond production has reached its peak. Diavik’s operating life is scheduled to end in 2025 and Gahcho Kué’s in 2028. Ekati will outlast them both and produce well into the 2030s, but that is contingent on developing the Jay pipe, something that remains uncertain. While there are plans for new metal mines in the medium term, they will not be enough to offset the shrinking of the diamond mining industry. The Northwest Territories’ real GDP will grow by just over 2 per cent this year and next. Over the long term, growth will be uneven and will decline in some years due to mine closures.
Overall, looking at all three territorial economies combined, real growth is forecast to average a solid 5.3 per cent in 2019 and 4.4 per cent in 2020 before averaging 1.5 per cent a year between 2021 and 2025. (See Chart 1.)
Chart 1Solid growth ahead for the territories(real GDP, all three territorial economies, percentage change*)
f = forecast*based on 2012 $Sources: The Conference Board of Canada; Statistics Canada.
2010 15 20f 25f
–4
–2
0
2
4
6
8
For the exclusive use of Laurie Gravelines, [email protected], Northwest Territories Department of Finance.

Nunavut
Mining sector in good shape
© The Conference Board of Canada. All rights reserved. Please contact cboc.ca/ip with questions or concerns about the use of this material.

Highlights• Nunavut’s economy will grow at a solid pace over the near and medium
terms thanks to strength in the mining sector.
• The outlook for gold mining is optimistic, as prices remain at recent highs.
• Nunavut’s population profile is different from what we see in other parts of the country. Fertility rates are high and labour force growth will be solid, but the unemployment rate will remain sharply higher than in Yukon or the Northwest Territories.
• Most of the new jobs created in Nunavut’s mining industry will go to non-residents, as companies must bring in workers from other parts of Canada due to the shortage of specific mining skills in the resident population.
For the exclusive use of Laurie Gravelines, [email protected], Northwest Territories Department of Finance.

Find Conference Board research at conferenceboard.ca. 3
Nunavut | The Conference Board of Canada
Nunavut’s economy grew by double digits last year and is set to grow by 10.3 per cent this year. In 2020, economic growth will slow to 3.0 per cent before accelerating again over the medium term. (See Chart 1.)
As is generally the case, the ups and down of the territory’s economy are closely linked to the health of the mining sector, which will remain in good shape over the next few years. The unemployment rate will remain at double-digit levels over the forecast period, sharply higher than in the Northwest Territories and Yukon. This is due to the low participation rate in Nunavut, a situation that is linked to the shortage of specific skills in the territory’s young labour force.
The difficulty for Nunavut—one that also plagues the other territories—is that most of the workers who staff Nunavut’s mining and construction
sites are brought in from other regions of the country. Consequently, much of the money that the workers earn ends up being spent outside the region, and the positive multiplier impacts on the local economy attributable to expenditures are absent. In addition, residents of Nunavut participate in the formal economy at lower rates than we see in other parts of Canada, which also lowers government revenues from tax collections.
On the fiscal front, we expect program spending requirements to rise. Health care improvements are enabling Canadians to live longer than ever before, and Nunavut is no exception. While the territory’s population of seniors will grow, Nunavut’s higher fertility rate will ensure that the youth share of the population will stay steady. That combination will mean more spending on both health care and education.
MiningNunavut’s existing mines at Meadowbank and Hope Bay produced a combined 408,000 ounces of gold last year, while an estimated 5.1 million tonnes of iron ore were shipped out of Mary River. In the next two years, gold production will more than double. Meliadine began commercial production in May and, along with the Amaruq satellite deposit and Sabina’s Back River project,
Chart 1Nunavut’s real GDP growth(average annual growth, per cent)
f = forecast Sources: The Conference Board of Canada; Statistics Canada.
2006–10 11–15 16–20f 21–25f 26–30f 31–35f 36–40f
–4
–2
0
2
4
6
8
10Forecast
© The Conference Board of Canada. All rights reserved. Please contact cboc.ca/ip with questions or concerns about the use of this material.
Find Conference Board research at conferenceboard.ca. 4
Territorial Outlook Economic ForecastSummer 2019
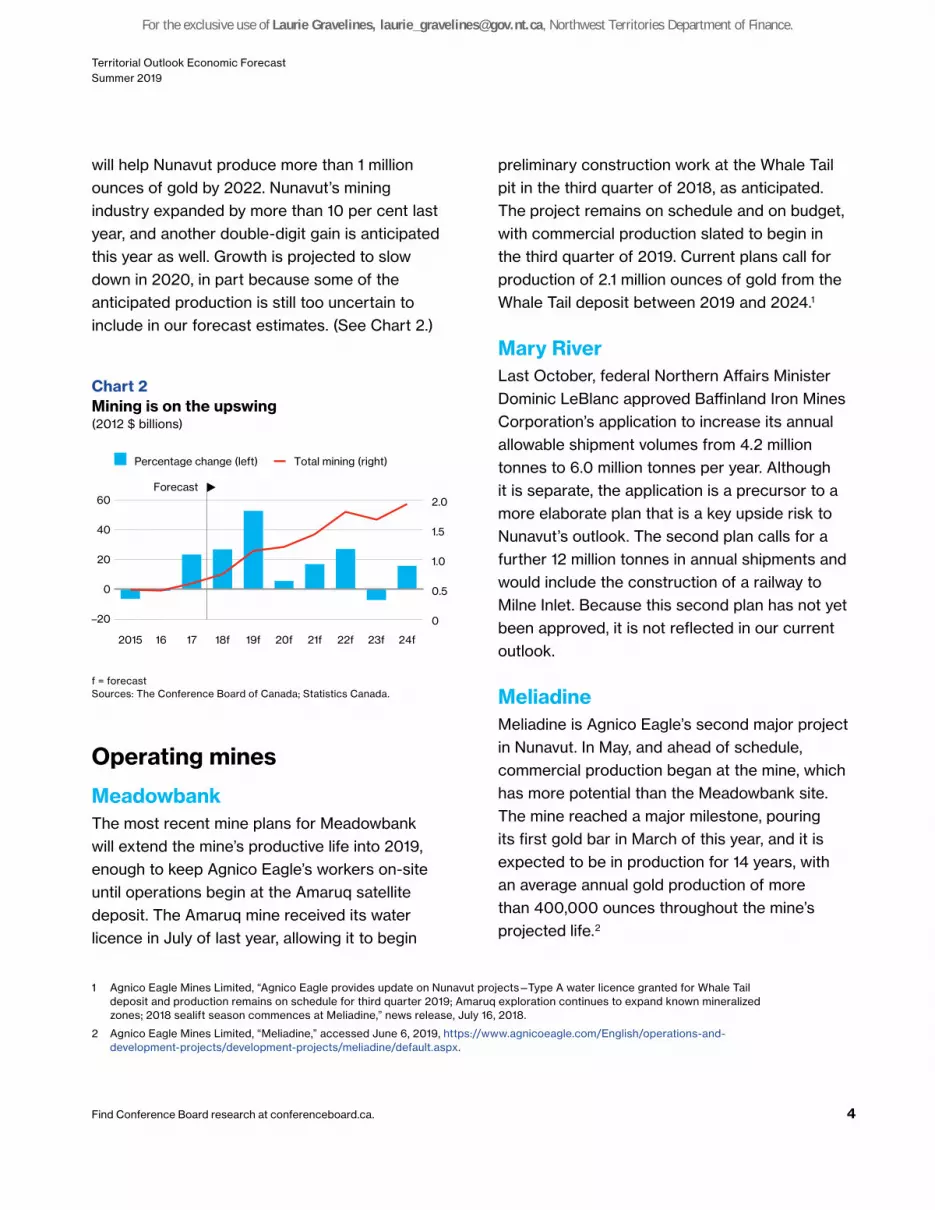
will help Nunavut produce more than 1 million ounces of gold by 2022. Nunavut’s mining industry expanded by more than 10 per cent last year, and another double-digit gain is anticipated this year as well. Growth is projected to slow down in 2020, in part because some of the anticipated production is still too uncertain to include in our forecast estimates. (See Chart 2.)
Operating mines
MeadowbankThe most recent mine plans for Meadowbank will extend the mine’s productive life into 2019, enough to keep Agnico Eagle’s workers on-site until operations begin at the Amaruq satellite deposit. The Amaruq mine received its water licence in July of last year, allowing it to begin
1 Agnico Eagle Mines Limited, “Agnico Eagle provides update on Nunavut projects—Type A water licence granted for Whale Tail deposit and production remains on schedule for third quarter 2019; Amaruq exploration continues to expand known mineralized zones; 2018 sealift season commences at Meliadine,” news release, July 16, 2018.
2 Agnico Eagle Mines Limited, “Meliadine,” accessed June 6, 2019, https://www.agnicoeagle.com/English/operations-and-development-projects/development-projects/meliadine/default.aspx.
preliminary construction work at the Whale Tail pit in the third quarter of 2018, as anticipated. The project remains on schedule and on budget, with commercial production slated to begin in the third quarter of 2019. Current plans call for production of 2.1 million ounces of gold from the Whale Tail deposit between 2019 and 2024.1
Mary RiverLast October, federal Northern Affairs Minister Dominic LeBlanc approved Baffinland Iron Mines Corporation’s application to increase its annual allowable shipment volumes from 4.2 million tonnes to 6.0 million tonnes per year. Although it is separate, the application is a precursor to a more elaborate plan that is a key upside risk to Nunavut’s outlook. The second plan calls for a further 12 million tonnes in annual shipments and would include the construction of a railway to Milne Inlet. Because this second plan has not yet been approved, it is not reflected in our current outlook.
MeliadineMeliadine is Agnico Eagle’s second major project in Nunavut. In May, and ahead of schedule, commercial production began at the mine, which has more potential than the Meadowbank site. The mine reached a major milestone, pouring its first gold bar in March of this year, and it is expected to be in production for 14 years, with an average annual gold production of more than 400,000 ounces throughout the mine’s projected life.2
Chart 2Mining is on the upswing(2012 $ billions)
f = forecast Sources: The Conference Board of Canada; Statistics Canada.
2015 16 17 18f 19f 20f 21f 22f 23f 24f
–20
0
20
40
60
0
0.5
1.0
1.5
2.0
Percentage change (left) Total mining (right)
Forecast
For the exclusive use of Laurie Gravelines, [email protected], Northwest Territories Department of Finance.

Find Conference Board research at conferenceboard.ca. 5
Nunavut | The Conference Board of Canada
Hope BayTMAC Resources had been experiencing capacity problems with its processing plant at Hope Bay, but the company now believes that these issues have been resolved. The mine managed to produce 40,050 ounces of gold in the first quarter of 20193 and is scheduled to ramp up its annual production to about 200,000 ounces per year by 2020.
Developing mines
Back RiverThe Sabina site has come a long way since filing its first feasibility study in 2015. The project was initially halted by the Nunavut Impact Review Board, but this decision was overturned by the minister of Crown–Indigenous Relations and Northern Affairs, Carolyn Bennett. For now, the project’s proponents must wait longer before the mine ramps up production. Financing has taken longer than expected, meaning that the mine is now expected to begin operations one year later than anticipated—sometime before the end of 2022. However, this delay was announced after the forecast was completed and is, therefore, not reflected in our forecast. Back River will require an initial capital investment of approximately $415 million and could produce an average of 200,000 ounces of gold annually for 11 years once production begins.4
3 TMAC Resources Inc., “TMAC Resources announces record Q1 2019 production of 40,050 ounces and improved underground mine and plant performance,” news release, April 7, 2019.
4 Sabina Gold & Silver Corp., Technical report for the initial project feasibility study on the Back River gold property, Nunavut, Canada (Vancouver: Sabina Gold & Silver, 2015).
ExplorationAccording to preliminary estimates from Natural Resources Canada, spending on mineral exploration declined to $149.6 million in 2018, down from $177 million in 2017. An additional drop in spending intentions to $144.3 million is anticipated for 2019. (See Chart 3.) This is somewhat surprising, as gold prices, which support one of Nunavut’s most important natural resources, have been generally increasing since the later part of 2018. While Nunavut is home to several promising projects, a lack of infrastructure makes it more difficult to develop new mines there than in other parts of Canada.
According to preliminary estimates from Natural Resources Canada, spending on mineral exploration
declined to $149.6 million in 2018, down from $177 million in 2017.
© The Conference Board of Canada. All rights reserved. Please contact cboc.ca/ip with questions or concerns about the use of this material.

Find Conference Board research at conferenceboard.ca. 6
Territorial Outlook Economic ForecastSummer 2019
GoldGold prices have generally been recovering from the slump that began in February and saw prices fall below US$1,300 per ounce in April. Political uncertainty and the decision by many of the world’s major central banks to hold off on further interest rate increases are the main factors behind the rebound in gold prices. This is encouraging for gold producers in Nunavut, although the latest Natural Resources Canada exploration survey showed no indication of any pickup in exploration for precious metals this year.
DiamondsDiamonds have industrial and household uses, but a more temperate global economy will limit demand for them over the forecast period. Also, the industrial market for diamonds faces other challenges in addition to the current state of the global economy. The quality of synthetic
diamonds, an alternative to mined diamonds, is improving steadily, and they can be engineered to exhibit specific qualities that clients require. Consequently, they pose a major threat to the traditional diamond market. In addition, preferences among younger people have been shifting away from diamonds and, as the global population ages, the consumer base will shrink sharply.
Despite the ongoing challenges in the diamond business, there is still some potential for diamond producers in Nunavut. Its most promising project is the Chidliak diamond mine, north-east of Iqaluit. Chidliak was the focus of the Peregrine Diamonds company until it was taken over by DeBeers Canada in September 2018. Peregrine completed a new, preliminary economic assessment in May of last year, which revealed a potential of 17.96 million carats. However, as the economic viability of this site has yet to be established, this project is not yet included in our current territorial
Chart 3Mining exploration remains subdued($ millions)
p = preliminary estimatesi = spending intentionsSource: Natural Resources Canada, from the federal-provincial-territorial Survey of Mineral Exploration, Deposit Appraisal and Mine Complex Development Expenditures.
2005 06 07 08 09 10 11 12 13 14 15 16 17 18p 19i
0
100
200
300
400
500
600
For the exclusive use of Laurie Gravelines, [email protected], Northwest Territories Department of Finance.
Find Conference Board research at conferenceboard.ca. 7
Nunavut | The Conference Board of Canada
forecast. Nonetheless, the project has some potential and could be brought into operation as soon as 2021.5
Other materialsMany of Nunavut’s resource-rich areas are also some of the most remote areas in the world, leaving transportation as one of the most crucial logistical problems to solve before mining operations can begin. The underdeveloped state of Nunavut’s infrastructure makes resource development even more challenging. Nunavut has mined diamonds and, more recently, iron ore, but gold is its most popular mined resource. Refining gold ore can be done at the mine itself and is less capital intensive than for many other commodities.
For mines such as MMG’s Izok Corridor in the Slave Geological Province (which would produce copper, lead, zinc, and silver), infrastructure problems are delaying development. Izok would require a third party to build an all-weather road and port so that ores could be shipped to smelters and processing plants in other parts of the world.6 To date, the federal and territorial governments have backed away from the proposal.7 But in April of this year, the Kitikmeot Inuit Association re-applied for federal funding to build the road.8
5 Peregrine Diamonds Ltd., “Peregrine files 2018 preliminary economic assessment technical report for the Chidliak project,” news release, July 5, 2018.
6 Jim Bell, “Nunavut adds huge Grays Bay road-port scheme to its shopping list,” Nunatsiaq News, February 29, 2016.
7 Nick Murray, “Grays Bay project dealt huge blow as federal funding denied,” CBC News, April 16, 2018, https://www.cbc.ca/news/canada/north/grays-bay-project-funding-denied-1.4620802.
8 Jane George, “Grays Bay road and port gets going again,” Nunatsiaq News, April 9, 2019, https://nunatsiaq.com/stories/article/grays-bay-road-and-port-gets-on-the-go-again/.
Long-term production assumptionsThe mine plan for Hope Bay extends to 2036, making it the longest active mine in Nunavut. It should outlast Agnico Eagle’s plans for Meliadine and Amaruq, as well as Sabina’s at Back River. Many of the mines in Nunavut will likely shut down operations before 2040, the final year for our long-term outlook. Consequently, real output growth in the mining industry will turn negative during the later years of the outlook for Nunavut.
Despite infrastructure and labour challenges, the long-term potential of Nunavut’s mining industry is strong. (See Chart 4.) The territory is vast and geological mapping shows that there are still many potential new mining developments in the region. We have decided to include some of these operations in our long-term outlook for Nunavut even though they are not currently in the “committed” stage that is generally required before we include such projects in our forecasts.
© The Conference Board of Canada. All rights reserved. Please contact cboc.ca/ip with questions or concerns about the use of this material.

Find Conference Board research at conferenceboard.ca. 8
Territorial Outlook Economic ForecastSummer 2019
ConstructionWith production under way at Meliadine and set to begin soon at Amaruq, construction activity will wind down, and real output in the construction industry will drop by 14.2 per cent this year. (See Chart 5.) Thanks to ongoing work at Sabina’s Back River project, growth in the construction industry will briefly return to positive territory in 2020 but will subsequently decline in 2021. At that point, the new mines will be up and running, and construction activity will come to an end.
DemographicsNunavut is the only territory or province in Canada where fertility rates are elevated enough to ensure that the population can continue to
Chart 4Hypothetical gold production(ounces, 000s)
f = forecastSources: The Conference Board of Canada; financial reports.
2016 18f 20f 22f 24f 26f 28f 30f 32f 34f 36f 38f 40f
0
200
400
600
800
1,000
1,200
1,400
1,600
Agnico Eagle—Meadowbank Agnico Eagle—Meliadine TMAC—Hope Bay Sabina—Back River Hypothetical
Forecast
Chart 5Construction output to decline once mines enter operation(2007 $ millions)
f = forecast Sources: The Conference Board of Canada; financial reports.
2016 17 18f 19f 20f 21f 22f 23f 24f 25f
0
100
200
300
400
500
600
Agnico Eagle—Amaruq
Agnico Eagle—Meliadine
TMAC—Hope Bay
Sabina—Back River
Forecast
For the exclusive use of Laurie Gravelines, [email protected], Northwest Territories Department of Finance.

Find Conference Board research at conferenceboard.ca. 9
Nunavut | The Conference Board of Canada
expand at a healthy pace. The fertility rate in Nunavut is 2.9, well above the replacement rate of 2.1 (the rate at which the population replaces itself from one generation to another). As a point of comparison, the fertility rate for Canada as a whole is 1.6. Nunavut’s population is projected to reach 51,481 by the end of the forecast period, up from 39,004 in 2019. Population growth in Nunavut will increase at an average annual pace of about 1.3 per cent, well above the pace in the other two territories, both of which have far lower fertility rates. This increase in population will occur at the same time as Nunavut’s typical migration flows subtract from population growth. (See Chart 6.)
The higher fertility rate in Nunavut implies that its population is younger than the rest of Canada. This trend will continue over the next two decades even though Nunavut’s seniors are living longer. The number of people in Nunavut aged 65 and over, which now stands at around 1,827, will almost triple by 2030. (See Chart 7.)
Chart 7Nunavut’s senior population will grow(population by age)
Sources: The Conference Board of Canada; Statistics Canada.
0
10
20
30
40
50
60
70
80
90
100
600 400 200 0 200 400 600
Men, 2017
Men, 2040
Women, 2017
Women, 2040
Chart 6Nunavut’s population growth depends on births(contribution to population growth, annual average)
f = forecastSources: The Conference Board of Canada; Statistics Canada.
2001–05 06–10 11–15 16–20f 21–25f 26–30f 31–35f 36–40f
–400
–200
0
200
400
600
800
Natural population change Net international migration Net domestic migration
Forecast
© The Conference Board of Canada. All rights reserved. Please contact cboc.ca/ip with questions or concerns about the use of this material.

Find Conference Board research at conferenceboard.ca. 10
Territorial Outlook Economic ForecastSummer 2019
The larger number of seniors in Nunavut over the long term implies that working-age people will have to pay for a higher number of people who depend on government services. Today, for every 100 people aged 20 to 64, there are 8.8 people aged 65 or over. This will more than double by 2030, while the share of young people will remain steady. (See Chart 8.) These trends mean that Nunavut’s total dependency ratio—youth and seniors combined as a share of the total population—will be higher than that of almost any other region in Canada. This will place an added burden on working-age people in Nunavut who will have to support a growing number of young people and seniors at a time when economic growth remains weak.
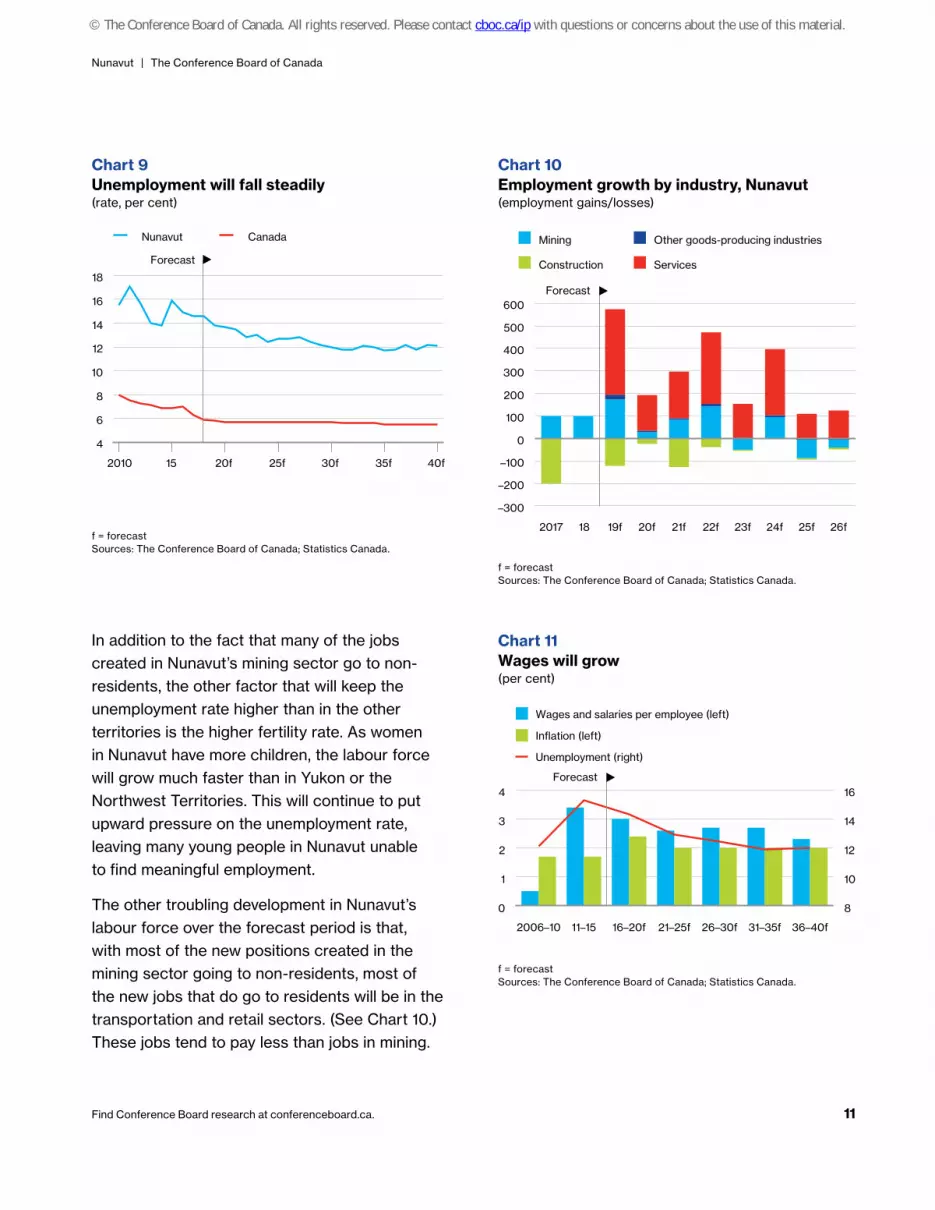
Labour marketNunavut’s unemployment rate is higher than in the rest of Canada—almost 2.5 times the national average. (See Chart 9.) As new mining production comes online over the near term, job growth will pick up significantly and expand by 3.4 per cent this year. However, this will not put much of a dent in Nunavut’s unemployment rate. Around one-third of the jobs created in Nunavut are typically filled by people who live in other parts of Canada and, consequently, are not counted in the territory’s job numbers. By 2025, the unemployment rate will drop to 12.7 per cent, down from current levels of close to 14 per cent, but will still be much higher than in the rest of the country.
Chart 8Dependency ratios, Nunavut(number of dependants per 100 population of working age)
f = forecastSources: The Conference Board of Canada; Statistics Canada.
2015 1716 19f18f 21f20f 23f 25f 27f 29f 31f 33f 35f 37f 39f22f 24f 26f 28f 30f 32f 34f 36f 38f 40f
0
20
40
60
80
100
Youth Seniors
Forecast
For the exclusive use of Laurie Gravelines, [email protected], Northwest Territories Department of Finance.
Find Conference Board research at conferenceboard.ca. 11
Nunavut | The Conference Board of Canada
In addition to the fact that many of the jobs created in Nunavut’s mining sector go to non-residents, the other factor that will keep the unemployment rate higher than in the other territories is the higher fertility rate. As women in Nunavut have more children, the labour force will grow much faster than in Yukon or the Northwest Territories. This will continue to put upward pressure on the unemployment rate, leaving many young people in Nunavut unable to find meaningful employment.
The other troubling development in Nunavut’s labour force over the forecast period is that, with most of the new positions created in the mining sector going to non-residents, most of the new jobs that do go to residents will be in the transportation and retail sectors. (See Chart 10.) These jobs tend to pay less than jobs in mining.
Chart 9Unemployment will fall steadily(rate, per cent)
f = forecastSources: The Conference Board of Canada; Statistics Canada.
2010 15 20f 25f 30f 35f 40f
4
6
8
10
12
14
16
18
Nunavut Canada
Forecast
Chart 10Employment growth by industry, Nunavut(employment gains/losses)
f = forecastSources: The Conference Board of Canada; Statistics Canada.
2017 18 19f 20f 21f 22f 23f 24f 25f 26f
–300
–200
–100
0
100
200
300
400
500
600
Mining
Construction
Other goods-producing industries
Services
Forecast
Chart 11Wages will grow(per cent)
f = forecastSources: The Conference Board of Canada; Statistics Canada.
2006–10 11–15 16–20f 21–25f 26–30f 31–35f 36–40f
0
1
2
3
4
8
10
12
14
16
Wages and salaries per employee (left)
Inflation (left)
Unemployment (right)
Forecast
© The Conference Board of Canada. All rights reserved. Please contact cboc.ca/ip with questions or concerns about the use of this material.
Find Conference Board research at conferenceboard.ca. 12
Territorial Outlook Economic ForecastSummer 2019
Many of the young people in Nunavut today don’t have the skills needed to work in the mining industry, and they end up unemployed. Over the forecast, mining and construction companies will continue to bring in workers from other parts of Canada to meet their labour requirements.
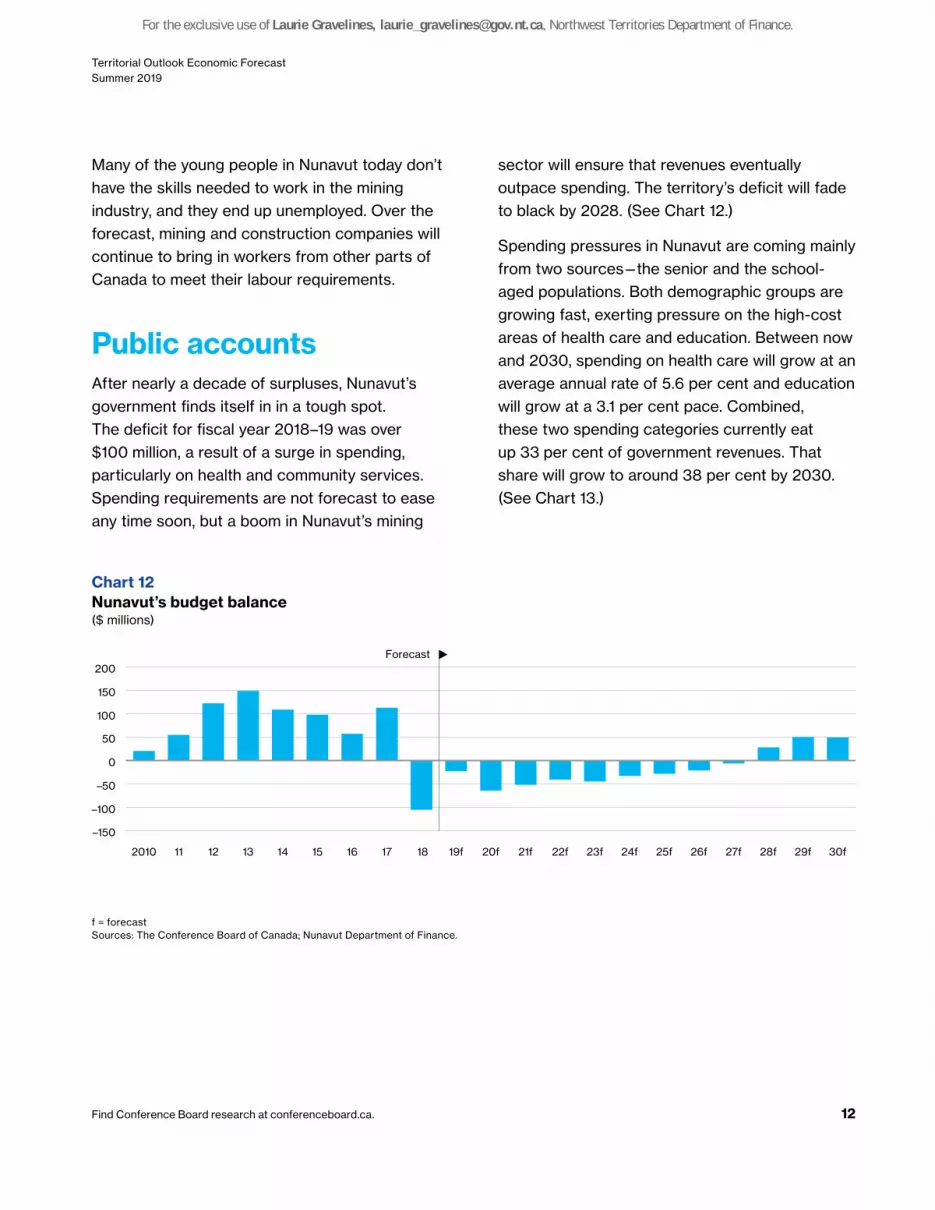
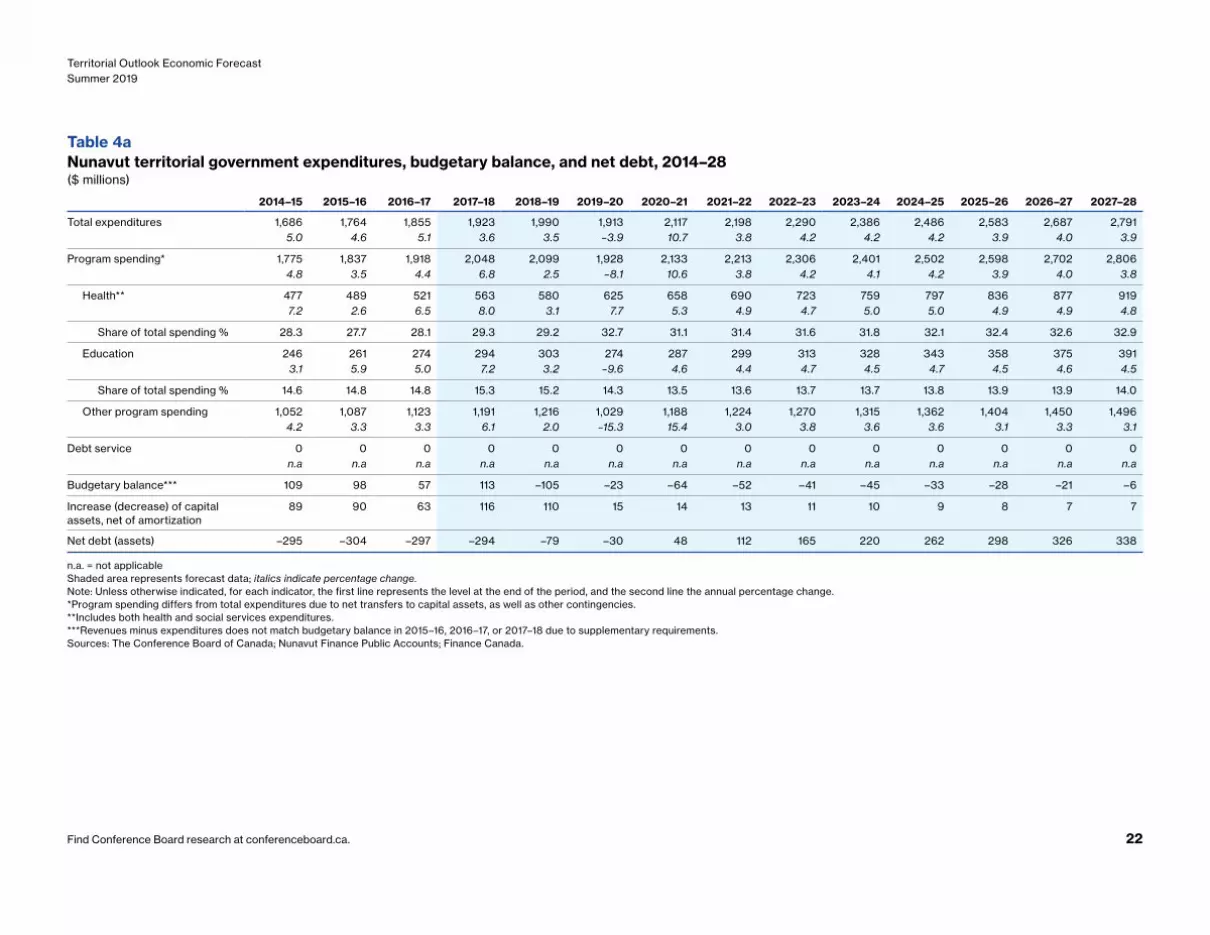
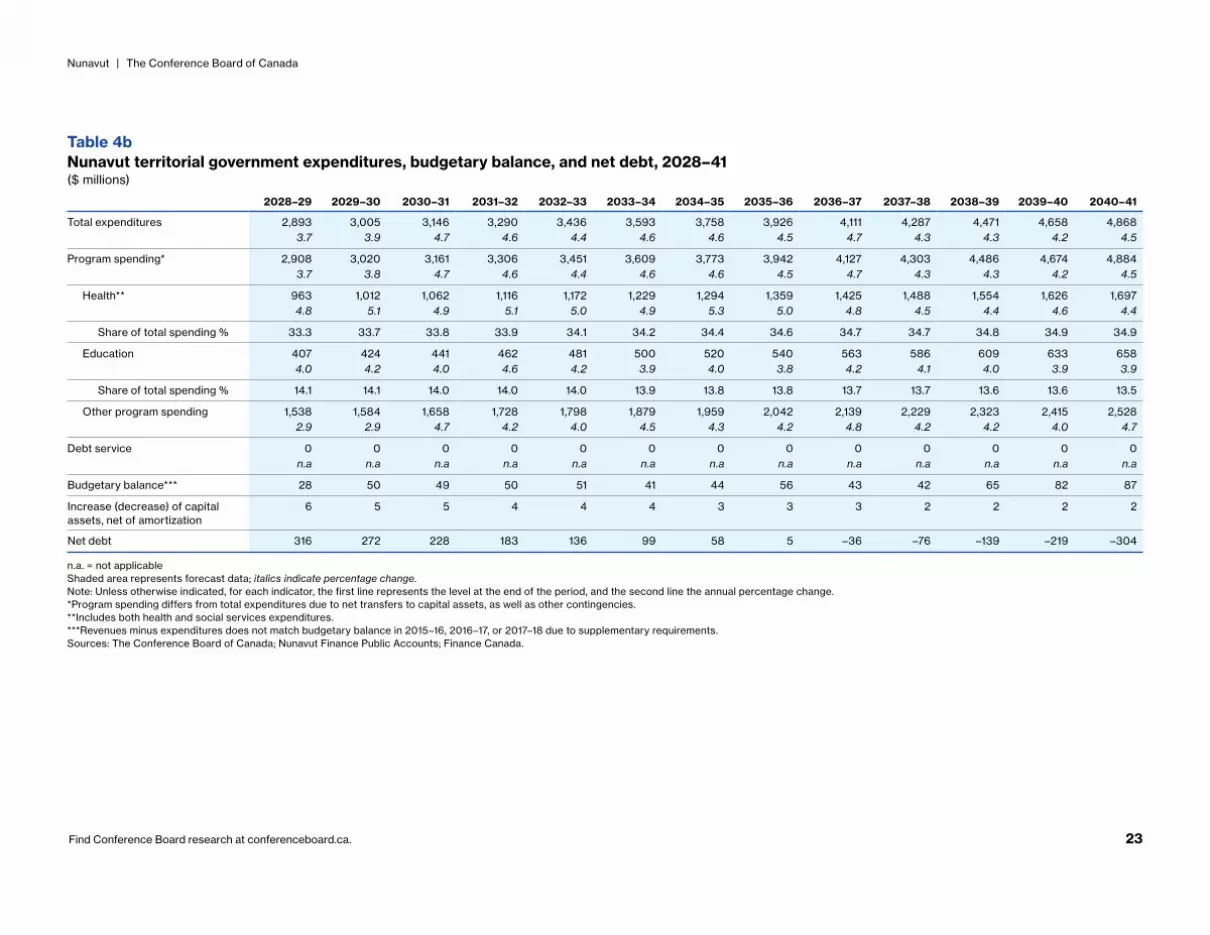
Public accountsAfter nearly a decade of surpluses, Nunavut’s government finds itself in in a tough spot. The deficit for fiscal year 2018–19 was over $100 million, a result of a surge in spending, particularly on health and community services. Spending requirements are not forecast to ease any time soon, but a boom in Nunavut’s mining
sector will ensure that revenues eventually outpace spending. The territory’s deficit will fade to black by 2028. (See Chart 12.)
Spending pressures in Nunavut are coming mainly from two sources—the senior and the school-aged populations. Both demographic groups are growing fast, exerting pressure on the high-cost areas of health care and education. Between now and 2030, spending on health care will grow at an average annual rate of 5.6 per cent and education will grow at a 3.1 per cent pace. Combined, these two spending categories currently eat up 33 per cent of government revenues. That share will grow to around 38 per cent by 2030. (See Chart 13.)
Chart 12Nunavut’s budget balance($ millions)
f = forecastSources: The Conference Board of Canada; Nunavut Department of Finance.
2010 11 12 13 14 15 16 17 18 19f 20f 21f 22f 23f 24f 25f 26f 27f 28f 29f 30f
–150
–100
–50
0
50
100
150
200Forecast
For the exclusive use of Laurie Gravelines, [email protected], Northwest Territories Department of Finance.

Overview | The Conference Board of Canada
Find Conference Board research at conferenceboard.ca. 13
Fortunately, with new mines expected to enter operation in the next few years, revenues will be up able to keep up with the higher spending. Corporate and personal income taxes are forecast to rise at an average rate of 9.4 per cent per year between now and 2030. At the same
time, a slowdown in the outflow of people from Nunavut to other parts of Canada will help to boost population growth. That will lead to more generous transfers from the federal government. These transfers account for almost 90 per cent of the territory’s revenues.
Chart 13Rising dependency ratios all around(average annual increase, per cent)
f = forecastSources: The Conference Board of Canada; Nunavut Department of Finance.
2001–05 06–10 11–15 16–20f 21–25f 26–30f 31–35f 36–40f
0
2
4
6
8
10
Health Other programsEducation Revenues
Forecast
© The Conference Board of Canada. All rights reserved. Please contact cboc.ca/ip with questions or concerns about the use of this material.
Find Conference Board research at conferenceboard.ca. 14
Territorial Outlook Economic ForecastSummer 2019
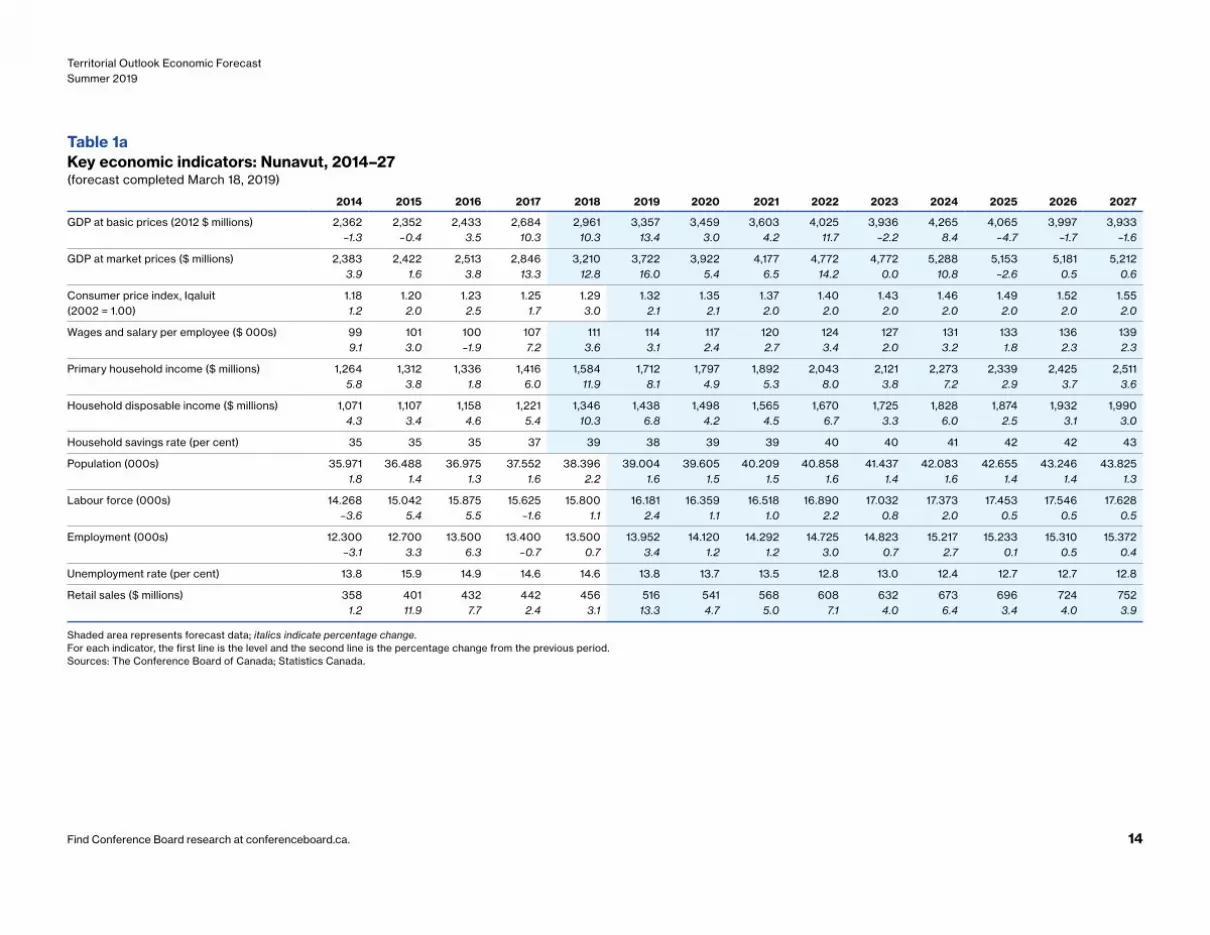
Table 1aKey economic indicators: Nunavut, 2014–27(forecast completed March 18, 2019)
2014 2015 2016 2017 2018 2019 2020 2021 2022 2023 2024 2025 2026 2027
GDP at basic prices (2012 $ millions) 2,362 2,352 2,433 2,684 2,961 3,357 3,459 3,603 4,025 3,936 4,265 4,065 3,997 3,933–1.3 –0.4 3.5 10.3 10.3 13.4 3.0 4.2 11.7 –2.2 8.4 –4.7 –1.7 –1.6
GDP at market prices ($ millions) 2,383 2,422 2,513 2,846 3,210 3,722 3,922 4,177 4,772 4,772 5,288 5,153 5,181 5,2123.9 1.6 3.8 13.3 12.8 16.0 5.4 6.5 14.2 0.0 10.8 –2.6 0.5 0.6
Consumer price index, Iqaluit 1.18 1.20 1.23 1.25 1.29 1.32 1.35 1.37 1.40 1.43 1.46 1.49 1.52 1.55(2002 = 1.00) 1.2 2.0 2.5 1.7 3.0 2.1 2.1 2.0 2.0 2.0 2.0 2.0 2.0 2.0
Wages and salary per employee ($ 000s) 99 101 100 107 111 114 117 120 124 127 131 133 136 1399.1 3.0 –1.9 7.2 3.6 3.1 2.4 2.7 3.4 2.0 3.2 1.8 2.3 2.3
Primary household income ($ millions) 1,264 1,312 1,336 1,416 1,584 1,712 1,797 1,892 2,043 2,121 2,273 2,339 2,425 2,5115.8 3.8 1.8 6.0 11.9 8.1 4.9 5.3 8.0 3.8 7.2 2.9 3.7 3.6
Household disposable income ($ millions) 1,071 1,107 1,158 1,221 1,346 1,438 1,498 1,565 1,670 1,725 1,828 1,874 1,932 1,9904.3 3.4 4.6 5.4 10.3 6.8 4.2 4.5 6.7 3.3 6.0 2.5 3.1 3.0
Household savings rate (per cent) 35 35 35 37 39 38 39 39 40 40 41 42 42 43
Population (000s) 35.971 36.488 36.975 37.552 38.396 39.004 39.605 40.209 40.858 41.437 42.083 42.655 43.246 43.8251.8 1.4 1.3 1.6 2.2 1.6 1.5 1.5 1.6 1.4 1.6 1.4 1.4 1.3
Labour force (000s) 14.268 15.042 15.875 15.625 15.800 16.181 16.359 16.518 16.890 17.032 17.373 17.453 17.546 17.628–3.6 5.4 5.5 –1.6 1.1 2.4 1.1 1.0 2.2 0.8 2.0 0.5 0.5 0.5
Employment (000s) 12.300 12.700 13.500 13.400 13.500 13.952 14.120 14.292 14.725 14.823 15.217 15.233 15.310 15.372–3.1 3.3 6.3 –0.7 0.7 3.4 1.2 1.2 3.0 0.7 2.7 0.1 0.5 0.4
Unemployment rate (per cent) 13.8 15.9 14.9 14.6 14.6 13.8 13.7 13.5 12.8 13.0 12.4 12.7 12.7 12.8
Retail sales ($ millions) 358 401 432 442 456 516 541 568 608 632 673 696 724 7521.2 11.9 7.7 2.4 3.1 13.3 4.7 5.0 7.1 4.0 6.4 3.4 4.0 3.9
Shaded area represents forecast data; italics indicate percentage change.For each indicator, the first line is the level and the second line is the percentage change from the previous period. Sources: The Conference Board of Canada; Statistics Canada.
For the exclusive use of Laurie Gravelines, [email protected], Northwest Territories Department of Finance.

Find Conference Board research at conferenceboard.ca. 15
Nunavut | The Conference Board of Canada
Table 1bKey economic indicators: Nunavut, 2028–40(forecast completed March 18, 2019)
2028 2029 2030 2031 2032 2033 2034 2035 2036 2037 2038 2039 2040
GDP at basic prices (2012 $ millions) 4,224 4,315 4,417 4,441 4,338 4,087 4,085 4,211 4,048 3,778 3,837 3,901 3,7877.4 2.1 2.4 0.6 –2.3 –5.8 0.0 3.1 –3.9 –6.7 1.6 1.7 –2.9
GDP at market prices ($ millions) 5,725 5,980 6,260 6,436 6,428 6,192 6,329 6,672 6,558 6,259 6,500 6,758 6,7099.8 4.5 4.7 2.8 –0.1 –3.7 2.2 5.4 –1.7 –4.6 3.9 4.0 –0.7
Consumer price index, Iqaluit 1.58 1.61 1.64 1.67 1.71 1.74 1.78 1.81 1.85 1.89 1.92 1.96 2.00(2002 = 1.00) 2.0 2.0 2.0 2.0 2.0 2.0 2.0 2.0 2.0 2.0 2.0 2.0 2.0
Wages and salary per employee ($ 000s) 143 147 152 156 160 163 168 173 177 181 186 189 1943.2 2.7 3.0 2.9 2.5 2.1 2.8 3.2 2.4 1.8 3.2 1.4 2.9
Primary household income ($ millions) 2,662 2,786 2,933 3,077 3,194 3,277 3,419 3,600 3,723 3,798 3,991 4,060 4,2206.0 4.6 5.3 4.9 3.8 2.6 4.3 5.3 3.4 2.0 5.1 1.7 3.9
Household disposable income ($ millions) 2,090 2,170 2,264 2,354 2,423 2,469 2,550 2,653 2,718 2,749 2,849 2,872 2,9455.0 3.8 4.3 3.9 3.0 1.9 3.3 4.0 2.4 1.1 3.6 0.8 2.5
Household savings rate (per cent) 44 45 46 47 48 49 50 51 53 54 56 57 59
Population (000s) 44.457 45.064 45.684 46.300 46.889 47.451 48.049 48.666 49.236 49.772 50.377 50.913 51.4811.4 1.4 1.4 1.3 1.3 1.2 1.3 1.3 1.2 1.1 1.2 1.1 1.1
Labour force (000s) 17.898 18.076 18.290 18.472 18.564 18.556 18.682 18.881 18.928 18.849 19.017 18.945 18.9971.5 1.0 1.2 1.0 0.5 0.0 0.7 1.1 0.2 –0.4 0.9 –0.4 0.3
Employment (000s) 15.685 15.865 16.101 16.297 16.370 16.309 16.436 16.670 16.698 16.558 16.765 16.641 16.6942.0 1.1 1.5 1.2 0.4 –0.4 0.8 1.4 0.2 –0.8 1.3 –0.7 0.3
Unemployment rate (per cent) 12.4 12.2 12.0 11.8 11.8 12.1 12.0 11.7 11.8 12.2 11.8 12.2 12.1
Retail sales ($ millions) 795 832 875 916 951 979 1,019 1,068 1,104 1,128 1,178 1,200 1,2415.7 4.7 5.1 4.7 3.8 2.9 4.1 4.8 3.4 2.2 4.4 1.9 3.4
Shaded area represents forecast data; italics indicate percentage change.For each indicator, the first line is the level and the second line is the percentage change from the previous period. Sources: The Conference Board of Canada; Statistics Canada.
© The Conference Board of Canada. All rights reserved. Please contact cboc.ca/ip with questions or concerns about the use of this material.

Find Conference Board research at conferenceboard.ca. 16
Territorial Outlook Economic ForecastSummer 2019
Table 2aReal gross domestic product: Nunavut, 2014–27(2012 $ millions; forecast completed March 18, 2019)
2014 2015 2016 2017 2018 2019 2020 2021 2022 2023 2024 2025 2026 2027
Other primary sector 3 3 3 3 4 4 4 4 4 4 4 4 4 4–40.0 0.0 3.0 0.0 3.4 3.2 3.1 2.9 2.8 2.6 2.5 2.4 2.2 2.1
Mining 518 485 480 592 751 1,148 1,213 1,419 1,803 1,672 1,935 1,705 1,598 1,4896.0 –6.4 –1.0 23.4 26.8 52.8 5.7 16.9 27.1 –7.3 15.8 –11.9 –6.3 –6.8
Metal ore mining 480 459 471 596 737 1,130 1,194 1,400 1,780 1,650 1,911 1,683 1,577 1,4688.2 –4.3 2.7 26.4 23.8 53.3 5.7 17.2 27.2 –7.3 15.8 –11.9 –6.3 –6.9
Non-metal mining 0 0 0 0 0 0 0 0 0 0 0 0 0 0n.a. n.a. n.a. n.a. n.a. n.a. n.a. n.a. n.a. n.a. n.a. n.a. n.a. n.a.
Mining services 57 47 34 31 48 52 53 53 57 56 59 57 56 55–1.2 –19.0 –27.1 –8.6 56.3 8.0 1.7 –0.5 7.1 –1.8 5.5 –3.5 –1.5 –1.5
Manufacturing 11 10 12 13 7 8 8 8 8 8 9 9 9 90.0 –7.3 13.7 15.5 –44.5 2.9 2.7 2.7 2.6 2.4 2.3 2.2 2.1 2.0
Construction 285 277 320 439 526 452 454 347 327 340 353 362 371 384–15.2 –2.9 15.5 37.5 19.8 –14.2 0.5 –23.5 –6.0 4.1 3.9 2.4 2.5 3.4
Utilities 62 65 65 66 70 76 79 82 86 88 91 92 93 944.6 5.2 0.6 0.8 6.5 8.3 3.4 4.2 5.5 1.7 4.1 0.8 1.2 1.1
Goods-producing industries 876 837 872 1,096 1,340 1,669 1,739 1,841 2,209 2,093 2,374 2,153 2,057 1,962–2.4 –4.5 4.2 25.7 22.3 24.5 4.2 5.9 20.0 –5.2 13.4 –9.3 –4.5 –4.6
Transportation and warehousing 56 57 60 64 68 77 78 81 87 85 89 86 85 837.0 1.6 5.2 6.0 6.7 13.2 1.4 4.2 6.8 –1.8 3.9 –3.0 –1.6 –1.7
Information and cultural industries 52 52 53 53 56 58 61 64 66 69 71 74 76 79–0.6 1.0 1.2 0.4 5.5 4.7 4.4 4.2 4.1 3.8 3.8 3.5 3.4 3.2
Wholesale and retail trade 116 110 123 143 131 142 145 150 157 161 168 170 174 178–11.6 –4.6 11.3 16.7 –8.7 8.5 2.5 3.0 5.0 2.4 4.3 1.5 2.1 2.2
Finance, insurance, real estate, and renting, 306 306 315 317 332 355 362 373 388 390 401 401 403 405leasing, and management of companies and enterprises
–1.9 –0.1 2.9 0.9 4.7 6.7 1.9 3.0 4.1 0.5 2.9 0.0 0.6 0.5
Professional, scientific, and technical services 31 26 27 29 31 34 35 37 39 40 42 43 43 443.0 –13.8 3.4 8.1 6.9 8.7 3.8 4.8 5.8 2.1 4.5 1.4 2.0 1.8
Administrative and support, waste management, 52 52 53 52 55 59 61 64 67 69 71 72 73 74and remediation services –6.0 –1.0 1.9 –1.9 6.4 8.2 3.3 4.4 5.4 1.7 4.1 1.1 1.6 1.5
(continued …)
For the exclusive use of Laurie Gravelines, [email protected], Northwest Territories Department of Finance.

Find Conference Board research at conferenceboard.ca. 17
Nunavut | The Conference Board of Canada
Table 2a (cont’d)Real gross domestic product: Nunavut, 2014–27(2012 $ millions; forecast completed March 18, 2019)
2014 2015 2016 2017 2018 2019 2020 2021 2022 2023 2024 2025 2026 2027
Arts, entertainment, and recreation 1 1 1 1 1 1 1 1 1 0 0 0 0 0–47.6 –18.2 0.0 –22.2 –5.0 –5.7 –5.8 –5.8 –5.5 –5.3 –4.7 –4.1 –3.8 –3.7
Accommodation and food services 24 27 30 32 33 34 34 35 36 36 37 37 37 38–10.4 10.0 12.8 5.7 2.9 3.8 1.4 1.9 2.5 0.6 1.8 0.3 1.2 1.1
Other services 27 26 26 24 25 25 26 26 27 27 28 28 29 29–0.7 –2.6 –0.4 –5.8 2.9 2.1 2.0 1.9 2.0 1.8 1.9 1.7 1.7 1.6
Educational services 192 201 201 203 216 219 220 221 223 226 229 231 234 2382.1 4.4 –0.1 1.3 6.5 1.0 0.4 0.5 1.3 1.4 1.3 0.9 1.2 1.8
Health care and social assistance 149 156 158 161 156 165 172 178 184 191 200 208 216 2242.1 4.4 1.8 1.8 –3.1 5.9 3.9 3.5 3.6 3.9 4.4 4.0 3.9 3.7
Public administration 487 504 519 531 538 540 547 554 561 568 575 581 589 5982.4 3.5 2.8 2.4 1.3 0.5 1.2 1.3 1.3 1.2 1.2 1.1 1.4 1.5
Services-producing industries 1,488 1,512 1,560 1,605 1,637 1,704 1,736 1,778 1,832 1,859 1,907 1,928 1,956 1,987–0.6 1.6 3.1 2.9 2.0 4.1 1.9 2.4 3.1 1.4 2.6 1.1 1.5 1.6
GDP 2,362 2,352 2,433 2,684 2,961 3,357 3,459 3,603 4,025 3,936 4,265 4,065 3,997 3,933–1.3 –0.4 3.5 10.3 10.3 13.4 3.0 4.2 11.7 –2.2 8.4 –4.7 –1.7 –1.6
n.a. = not applicableShaded area represents forecast data; italics indicate percentage change.For each indicator, the first line is the level and the second line is the percentage change from the previous period.All data are seasonally adjusted at annual rates. Sources: The Conference Board of Canada; Statistics Canada.
© The Conference Board of Canada. All rights reserved. Please contact cboc.ca/ip with questions or concerns about the use of this material.
Find Conference Board research at conferenceboard.ca. 18
Territorial Outlook Economic ForecastSummer 2019
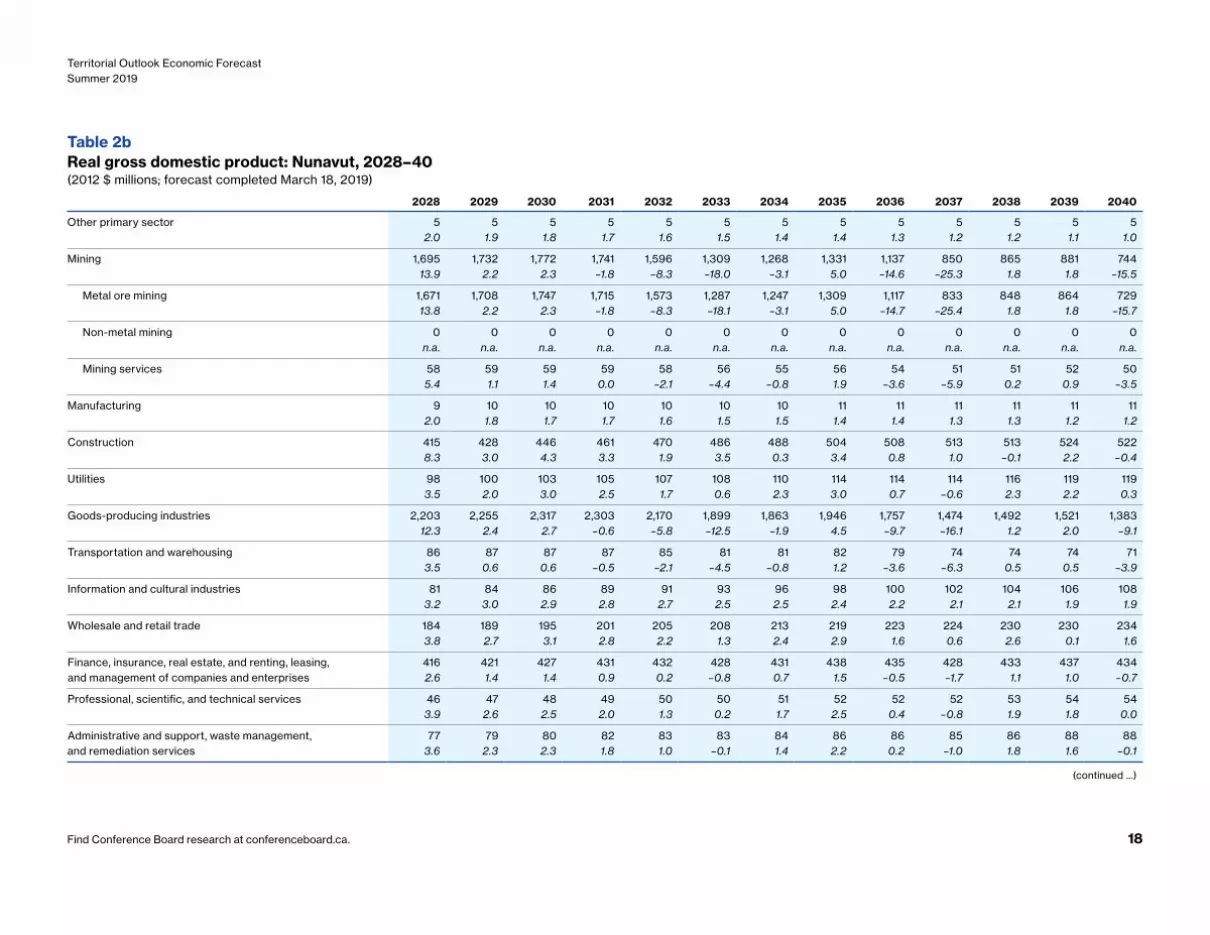
Table 2bReal gross domestic product: Nunavut, 2028–40(2012 $ millions; forecast completed March 18, 2019)
2028 2029 2030 2031 2032 2033 2034 2035 2036 2037 2038 2039 2040
Other primary sector 5 5 5 5 5 5 5 5 5 5 5 5 52.0 1.9 1.8 1.7 1.6 1.5 1.4 1.4 1.3 1.2 1.2 1.1 1.0
Mining 1,695 1,732 1,772 1,741 1,596 1,309 1,268 1,331 1,137 850 865 881 74413.9 2.2 2.3 –1.8 –8.3 –18.0 –3.1 5.0 –14.6 –25.3 1.8 1.8 –15.5
Metal ore mining 1,671 1,708 1,747 1,715 1,573 1,287 1,247 1,309 1,117 833 848 864 72913.8 2.2 2.3 –1.8 –8.3 –18.1 –3.1 5.0 –14.7 –25.4 1.8 1.8 –15.7
Non-metal mining 0 0 0 0 0 0 0 0 0 0 0 0 0n.a. n.a. n.a. n.a. n.a. n.a. n.a. n.a. n.a. n.a. n.a. n.a. n.a.
Mining services 58 59 59 59 58 56 55 56 54 51 51 52 505.4 1.1 1.4 0.0 –2.1 –4.4 –0.8 1.9 –3.6 –5.9 0.2 0.9 –3.5
Manufacturing 9 10 10 10 10 10 10 11 11 11 11 11 112.0 1.8 1.7 1.7 1.6 1.5 1.5 1.4 1.4 1.3 1.3 1.2 1.2
Construction 415 428 446 461 470 486 488 504 508 513 513 524 5228.3 3.0 4.3 3.3 1.9 3.5 0.3 3.4 0.8 1.0 –0.1 2.2 –0.4
Utilities 98 100 103 105 107 108 110 114 114 114 116 119 1193.5 2.0 3.0 2.5 1.7 0.6 2.3 3.0 0.7 –0.6 2.3 2.2 0.3
Goods-producing industries 2,203 2,255 2,317 2,303 2,170 1,899 1,863 1,946 1,757 1,474 1,492 1,521 1,38312.3 2.4 2.7 –0.6 –5.8 –12.5 –1.9 4.5 –9.7 –16.1 1.2 2.0 –9.1
Transportation and warehousing 86 87 87 87 85 81 81 82 79 74 74 74 713.5 0.6 0.6 –0.5 –2.1 –4.5 –0.8 1.2 –3.6 –6.3 0.5 0.5 –3.9
Information and cultural industries 81 84 86 89 91 93 96 98 100 102 104 106 1083.2 3.0 2.9 2.8 2.7 2.5 2.5 2.4 2.2 2.1 2.1 1.9 1.9
Wholesale and retail trade 184 189 195 201 205 208 213 219 223 224 230 230 2343.8 2.7 3.1 2.8 2.2 1.3 2.4 2.9 1.6 0.6 2.6 0.1 1.6
Finance, insurance, real estate, and renting, leasing, 416 421 427 431 432 428 431 438 435 428 433 437 434and management of companies and enterprises 2.6 1.4 1.4 0.9 0.2 –0.8 0.7 1.5 –0.5 –1.7 1.1 1.0 –0.7
Professional, scientific, and technical services 46 47 48 49 50 50 51 52 52 52 53 54 543.9 2.6 2.5 2.0 1.3 0.2 1.7 2.5 0.4 –0.8 1.9 1.8 0.0
Administrative and support, waste management, 77 79 80 82 83 83 84 86 86 85 86 88 88and remediation services 3.6 2.3 2.3 1.8 1.0 –0.1 1.4 2.2 0.2 –1.0 1.8 1.6 –0.1
(continued …)
For the exclusive use of Laurie Gravelines, [email protected], Northwest Territories Department of Finance.
Find Conference Board research at conferenceboard.ca. 19
Nunavut | The Conference Board of Canada
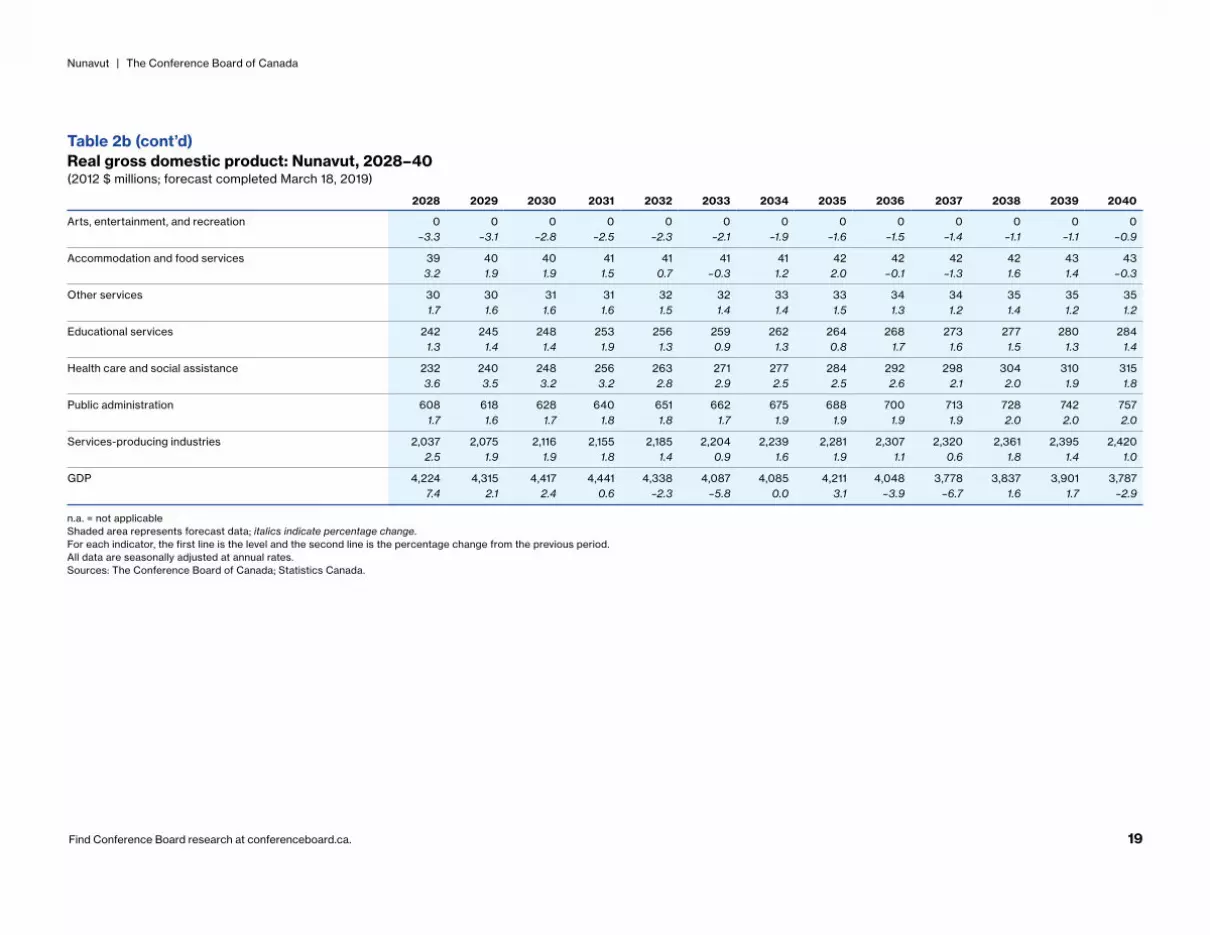
Table 2b (cont’d)Real gross domestic product: Nunavut, 2028–40(2012 $ millions; forecast completed March 18, 2019)
2028 2029 2030 2031 2032 2033 2034 2035 2036 2037 2038 2039 2040
Arts, entertainment, and recreation 0 0 0 0 0 0 0 0 0 0 0 0 0–3.3 –3.1 –2.8 –2.5 –2.3 –2.1 –1.9 –1.6 –1.5 –1.4 –1.1 –1.1 –0.9
Accommodation and food services 39 40 40 41 41 41 41 42 42 42 42 43 433.2 1.9 1.9 1.5 0.7 –0.3 1.2 2.0 –0.1 –1.3 1.6 1.4 –0.3
Other services 30 30 31 31 32 32 33 33 34 34 35 35 351.7 1.6 1.6 1.6 1.5 1.4 1.4 1.5 1.3 1.2 1.4 1.2 1.2
Educational services 242 245 248 253 256 259 262 264 268 273 277 280 2841.3 1.4 1.4 1.9 1.3 0.9 1.3 0.8 1.7 1.6 1.5 1.3 1.4
Health care and social assistance 232 240 248 256 263 271 277 284 292 298 304 310 3153.6 3.5 3.2 3.2 2.8 2.9 2.5 2.5 2.6 2.1 2.0 1.9 1.8
Public administration 608 618 628 640 651 662 675 688 700 713 728 742 7571.7 1.6 1.7 1.8 1.8 1.7 1.9 1.9 1.9 1.9 2.0 2.0 2.0
Services-producing industries 2,037 2,075 2,116 2,155 2,185 2,204 2,239 2,281 2,307 2,320 2,361 2,395 2,4202.5 1.9 1.9 1.8 1.4 0.9 1.6 1.9 1.1 0.6 1.8 1.4 1.0
GDP 4,224 4,315 4,417 4,441 4,338 4,087 4,085 4,211 4,048 3,778 3,837 3,901 3,7877.4 2.1 2.4 0.6 –2.3 –5.8 0.0 3.1 –3.9 –6.7 1.6 1.7 –2.9
n.a. = not applicableShaded area represents forecast data; italics indicate percentage change.For each indicator, the first line is the level and the second line is the percentage change from the previous period.All data are seasonally adjusted at annual rates. Sources: The Conference Board of Canada; Statistics Canada.
© The Conference Board of Canada. All rights reserved. Please contact cboc.ca/ip with questions or concerns about the use of this material.

Find Conference Board research at conferenceboard.ca. 20
Territorial Outlook Economic ForecastSummer 2019
Table 3aNunavut territorial government revenues, 2014–28($ millions)
2014–15 2015–16 2016–17 2017–18 2018–19 2019–20 2020–21 2021–22 2022–23 2023–24 2024–25 2025–26 2026–27 2027–28
Total revenues 1,795 1,862 1,912 2,100 2,199 2,174 2,284 2,376 2,479 2,571 2,683 2,785 2,896 3,0152.3 3.7 2.7 9.8 4.7 –1.1 5.1 4.0 4.3 3.7 4.4 3.8 4.0 4.1
Own-source revenues 304 202 218 253 229 235 247 260 280 289 309 314 324 334–3.9 –33.5 7.7 16.0 –9.4 2.9 4.9 5.2 8.0 2.9 7.0 1.8 3.0 3.0
Personal income taxes 28 30 33 23 34 38 41 44 50 52 58 61 64 67–4.7 6.3 10.8 –29.6 43.1 12.7 7.5 8.1 12.7 5.6 11.3 4.0 5.3 5.1
Corporate taxes 15 19 13 18 20 26 28 30 37 36 42 38 37 365.4 28.0 –31.1 40.4 6.9 30.8 7.0 9.2 23.5 –3.5 16.1 –7.9 –2.6 –2.5
Tobacco taxes 16 17 18 21 23 24 25 26 27 28 29 30 31 321.8 2.1 6.3 20.2 5.7 4.8 4.6 4.0 3.3 3.9 3.6 3.6 3.4 3.7
Payroll taxes 25 25 26 29 33 36 38 40 43 45 48 50 51 535.6 2.8 1.1 14.1 13.1 8.5 5.0 5.4 8.4 3.7 7.5 2.7 3.5 3.4
Royalties 0 0 0 0 0 0 0 0 0 0 0 0 0 00.0 0.0 0.0 0.0 0.0 0.0 0.0 0.0 0.0 0.0 0.0 0.0 0.0 0.0
Other own-source revenues 219 111 128 160 120 112 116 120 124 128 132 136 141 145–5.8 –49.5 15.2 25.2 –25.2 –6.4 3.5 3.3 3.3 3.3 3.3 3.2 3.2 3.2
Transfers from Government 1,491 1,660 1,694 1,847 1,970 1,938 2,037 2,116 2,198 2,283 2,374 2,470 2,572 2,681of Canada 3.7 11.3 2.1 9.0 6.7 –1.6 5.1 3.9 3.9 3.8 4.0 4.0 4.1 4.3
Canada Health Transfer 33 35 37 38 40 42 43 45 47 49 51 53 56 58(CHT) 3.1 6.1 5.7 2.7 5.3 4.3 3.8 4.5 4.5 4.2 4.3 4.0 4.0 4.0
Canada Social Transfer 13 13 14 14 15 15 16 16 17 17 18 19 19 20(CST) 8.3 0.0 7.7 0.0 7.1 0.7 3.8 3.4 3.5 3.4 3.5 3.3 3.4 3.4
Territorial Formula Financing 36 158 155 265 336 240 248 257 266 275 285 295 305 315–16.5 334.2 –1.8 71.3 26.8 –28.7 3.6 3.5 3.6 3.4 3.6 3.4 3.4 3.3
Other transfers from 1,409 1,454 1,489 1,530 1,579 1,642 1,730 1,798 1,868 1,941 2,020 2,103 2,193 2,289Government of Canada 4.3 3.2 2.4 2.8 3.2 4.0 5.4 3.9 3.9 3.9 4.1 4.1 4.2 4.4
Shaded area represents forecast data; italics indicate percentage change.Note: Unless otherwise indicated, for each indicator, the first line represents the level at the end of the period, and the second line the annual percentage change. Sources: The Conference Board of Canada; Nunavut Finance Public Accounts; Finance Canada.
For the exclusive use of Laurie Gravelines, [email protected], Northwest Territories Department of Finance.
Find Conference Board research at conferenceboard.ca. 21
Nunavut | The Conference Board of Canada
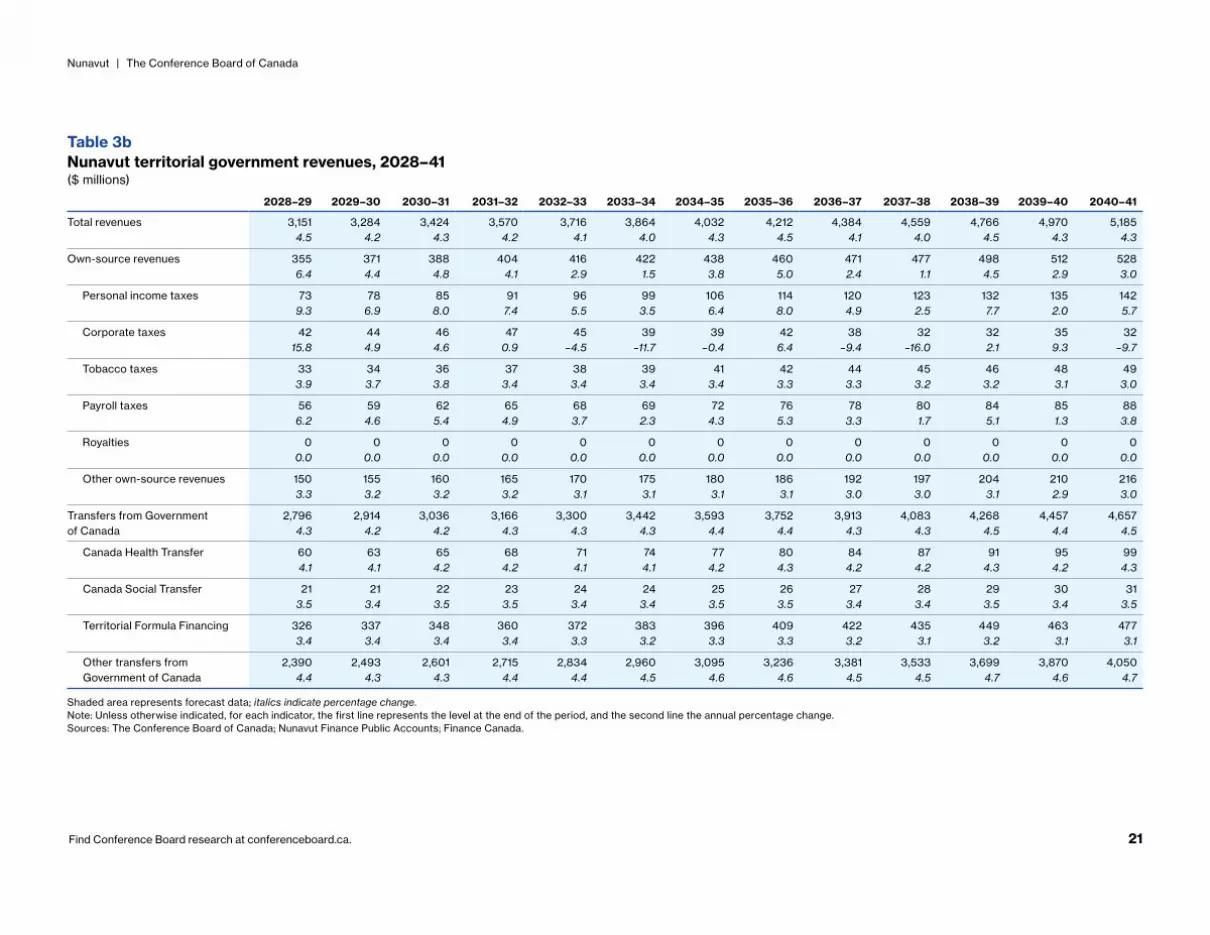
Table 3bNunavut territorial government revenues, 2028–41($ millions)
2028–29 2029–30 2030–31 2031–32 2032–33 2033–34 2034–35 2035–36 2036–37 2037–38 2038–39 2039–40 2040–41
Total revenues 3,151 3,284 3,424 3,570 3,716 3,864 4,032 4,212 4,384 4,559 4,766 4,970 5,1854.5 4.2 4.3 4.2 4.1 4.0 4.3 4.5 4.1 4.0 4.5 4.3 4.3
Own-source revenues 355 371 388 404 416 422 438 460 471 477 498 512 5286.4 4.4 4.8 4.1 2.9 1.5 3.8 5.0 2.4 1.1 4.5 2.9 3.0
Personal income taxes 73 78 85 91 96 99 106 114 120 123 132 135 1429.3 6.9 8.0 7.4 5.5 3.5 6.4 8.0 4.9 2.5 7.7 2.0 5.7
Corporate taxes 42 44 46 47 45 39 39 42 38 32 32 35 3215.8 4.9 4.6 0.9 –4.5 –11.7 –0.4 6.4 –9.4 –16.0 2.1 9.3 –9.7
Tobacco taxes 33 34 36 37 38 39 41 42 44 45 46 48 493.9 3.7 3.8 3.4 3.4 3.4 3.4 3.3 3.3 3.2 3.2 3.1 3.0
Payroll taxes 56 59 62 65 68 69 72 76 78 80 84 85 886.2 4.6 5.4 4.9 3.7 2.3 4.3 5.3 3.3 1.7 5.1 1.3 3.8
Royalties 0 0 0 0 0 0 0 0 0 0 0 0 00.0 0.0 0.0 0.0 0.0 0.0 0.0 0.0 0.0 0.0 0.0 0.0 0.0
Other own-source revenues 150 155 160 165 170 175 180 186 192 197 204 210 2163.3 3.2 3.2 3.2 3.1 3.1 3.1 3.1 3.0 3.0 3.1 2.9 3.0
Transfers from Government 2,796 2,914 3,036 3,166 3,300 3,442 3,593 3,752 3,913 4,083 4,268 4,457 4,657of Canada 4.3 4.2 4.2 4.3 4.3 4.3 4.4 4.4 4.3 4.3 4.5 4.4 4.5
Canada Health Transfer 60 63 65 68 71 74 77 80 84 87 91 95 994.1 4.1 4.2 4.2 4.1 4.1 4.2 4.3 4.2 4.2 4.3 4.2 4.3
Canada Social Transfer 21 21 22 23 24 24 25 26 27 28 29 30 313.5 3.4 3.5 3.5 3.4 3.4 3.5 3.5 3.4 3.4 3.5 3.4 3.5
Territorial Formula Financing 326 337 348 360 372 383 396 409 422 435 449 463 4773.4 3.4 3.4 3.4 3.3 3.2 3.3 3.3 3.2 3.1 3.2 3.1 3.1
Other transfers from 2,390 2,493 2,601 2,715 2,834 2,960 3,095 3,236 3,381 3,533 3,699 3,870 4,050Government of Canada 4.4 4.3 4.3 4.4 4.4 4.5 4.6 4.6 4.5 4.5 4.7 4.6 4.7
Shaded area represents forecast data; italics indicate percentage change.Note: Unless otherwise indicated, for each indicator, the first line represents the level at the end of the period, and the second line the annual percentage change. Sources: The Conference Board of Canada; Nunavut Finance Public Accounts; Finance Canada.
© The Conference Board of Canada. All rights reserved. Please contact cboc.ca/ip with questions or concerns about the use of this material.
Find Conference Board research at conferenceboard.ca. 22
Territorial Outlook Economic ForecastSummer 2019
Table 4aNunavut territorial government expenditures, budgetary balance, and net debt, 2014–28($ millions)
2014–15 2015–16 2016–17 2017–18 2018–19 2019–20 2020–21 2021–22 2022–23 2023–24 2024–25 2025–26 2026–27 2027–28
Total expenditures 1,686 1,764 1,855 1,923 1,990 1,913 2,117 2,198 2,290 2,386 2,486 2,583 2,687 2,7915.0 4.6 5.1 3.6 3.5 –3.9 10.7 3.8 4.2 4.2 4.2 3.9 4.0 3.9
Program spending* 1,775 1,837 1,918 2,048 2,099 1,928 2,133 2,213 2,306 2,401 2,502 2,598 2,702 2,8064.8 3.5 4.4 6.8 2.5 –8.1 10.6 3.8 4.2 4.1 4.2 3.9 4.0 3.8
Health** 477 489 521 563 580 625 658 690 723 759 797 836 877 9197.2 2.6 6.5 8.0 3.1 7.7 5.3 4.9 4.7 5.0 5.0 4.9 4.9 4.8
Share of total spending % 28.3 27.7 28.1 29.3 29.2 32.7 31.1 31.4 31.6 31.8 32.1 32.4 32.6 32.9
Education 246 261 274 294 303 274 287 299 313 328 343 358 375 3913.1 5.9 5.0 7.2 3.2 –9.6 4.6 4.4 4.7 4.5 4.7 4.5 4.6 4.5
Share of total spending % 14.6 14.8 14.8 15.3 15.2 14.3 13.5 13.6 13.7 13.7 13.8 13.9 13.9 14.0
Other program spending 1,052 1,087 1,123 1,191 1,216 1,029 1,188 1,224 1,270 1,315 1,362 1,404 1,450 1,4964.2 3.3 3.3 6.1 2.0 –15.3 15.4 3.0 3.8 3.6 3.6 3.1 3.3 3.1
Debt service 0 0 0 0 0 0 0 0 0 0 0 0 0 0n.a n.a n.a n.a n.a n.a n.a n.a n.a n.a n.a n.a n.a n.a
Budgetary balance*** 109 98 57 113 –105 –23 –64 –52 –41 –45 –33 –28 –21 –6
Increase (decrease) of capital assets, net of amortization
89 90 63 116 110 15 14 13 11 10 9 8 7 7
Net debt (assets) –295 –304 –297 –294 –79 –30 48 112 165 220 262 298 326 338
n.a. = not applicableShaded area represents forecast data; italics indicate percentage change.Note: Unless otherwise indicated, for each indicator, the first line represents the level at the end of the period, and the second line the annual percentage change. *Program spending differs from total expenditures due to net transfers to capital assets, as well as other contingencies. **Includes both health and social services expenditures.***Revenues minus expenditures does not match budgetary balance in 2015–16, 2016–17, or 2017–18 due to supplementary requirements.Sources: The Conference Board of Canada; Nunavut Finance Public Accounts; Finance Canada.
For the exclusive use of Laurie Gravelines, [email protected], Northwest Territories Department of Finance.
Find Conference Board research at conferenceboard.ca. 23
Nunavut | The Conference Board of Canada
Table 4bNunavut territorial government expenditures, budgetary balance, and net debt, 2028–41($ millions)
2028–29 2029–30 2030–31 2031–32 2032–33 2033–34 2034–35 2035–36 2036–37 2037–38 2038–39 2039–40 2040–41
Total expenditures 2,893 3,005 3,146 3,290 3,436 3,593 3,758 3,926 4,111 4,287 4,471 4,658 4,8683.7 3.9 4.7 4.6 4.4 4.6 4.6 4.5 4.7 4.3 4.3 4.2 4.5
Program spending* 2,908 3,020 3,161 3,306 3,451 3,609 3,773 3,942 4,127 4,303 4,486 4,674 4,8843.7 3.8 4.7 4.6 4.4 4.6 4.6 4.5 4.7 4.3 4.3 4.2 4.5
Health** 963 1,012 1,062 1,116 1,172 1,229 1,294 1,359 1,425 1,488 1,554 1,626 1,6974.8 5.1 4.9 5.1 5.0 4.9 5.3 5.0 4.8 4.5 4.4 4.6 4.4
Share of total spending % 33.3 33.7 33.8 33.9 34.1 34.2 34.4 34.6 34.7 34.7 34.8 34.9 34.9
Education 407 424 441 462 481 500 520 540 563 586 609 633 6584.0 4.2 4.0 4.6 4.2 3.9 4.0 3.8 4.2 4.1 4.0 3.9 3.9
Share of total spending % 14.1 14.1 14.0 14.0 14.0 13.9 13.8 13.8 13.7 13.7 13.6 13.6 13.5
Other program spending 1,538 1,584 1,658 1,728 1,798 1,879 1,959 2,042 2,139 2,229 2,323 2,415 2,5282.9 2.9 4.7 4.2 4.0 4.5 4.3 4.2 4.8 4.2 4.2 4.0 4.7
Debt service 0 0 0 0 0 0 0 0 0 0 0 0 0n.a n.a n.a n.a n.a n.a n.a n.a n.a n.a n.a n.a n.a
Budgetary balance*** 28 50 49 50 51 41 44 56 43 42 65 82 87
Increase (decrease) of capital assets, net of amortization
6 5 5 4 4 4 3 3 3 2 2 2 2
Net debt 316 272 228 183 136 99 58 5 –36 –76 –139 –219 –304
n.a. = not applicableShaded area represents forecast data; italics indicate percentage change.Note: Unless otherwise indicated, for each indicator, the first line represents the level at the end of the period, and the second line the annual percentage change. *Program spending differs from total expenditures due to net transfers to capital assets, as well as other contingencies. **Includes both health and social services expenditures.***Revenues minus expenditures does not match budgetary balance in 2015–16, 2016–17, or 2017–18 due to supplementary requirements.Sources: The Conference Board of Canada; Nunavut Finance Public Accounts; Finance Canada.
© The Conference Board of Canada. All rights reserved. Please contact cboc.ca/ip with questions or concerns about the use of this material.

Northwest Territories
Challenging times for the Northwest Territories
For the exclusive use of Laurie Gravelines, [email protected], Northwest Territories Department of Finance.

Highlights• Economic growth will be modest over the near term, hovering in the 2.0 per
cent range, but will subsequently slump sharply over the long term due primarily to weaker investment in the mining sector.
• Diamond production has reached its peak and will decline for most of the forecast period. However, two new metal mines will open, offsetting some, but not all, of the losses in the mining sector.
• More tepid growth in mining will have repercussions on other areas of the economy, notably construction activity.
• Weaker economic growth will encourage more workers to exit the territory, leaving a smaller working-age population to cover the costs that come with growth in the number of seniors.
• The only sector of the economy that will record employment growth is non-commercial services, which includes the health care sector.
© The Conference Board of Canada. All rights reserved. Please contact cboc.ca/ip with questions or concerns about the use of this material.

Find Conference Board research at conferenceboard.ca. 26
Territorial Outlook Economic ForecastSummer 2019
Mining plans at Gahcho Kué, Diavik, and Ekati indicate that the territory’s diamond production has attained its high-water mark. While there are plans for new metal mining in the medium term, they will not be enough to offset the shrinking in the diamond mining industry, a crucial part of the economy in this region.
The Northwest Territories’ real GDP will grow by just over 2 per cent this year and next. Over the long term, however, growth will be uneven and will decline in some years due to mine closures. (See Chart 1.)
The Northwest Territories’ employment picture over the forecast period is bleak, and the number of jobs will decline frequently. The unemployment
rate will fluctuate between 6.0 and 7.0 per cent over the near and medium terms, but this relatively low rate (in 2015, the unemployment rate was above 8.0 per cent) is the result mainly of discouraged workers leaving for other parts of Canada.
MiningDiamond production at the Northwest Territories’ three mines—Gahcho Kué, Diavik, and Ekati—once again topped the 20-million carat mark in 2018, but geotechnical studies indicate that production will be weaker over the forecast period. Diavik’s operating life is scheduled to end in 2025, and Gahcho Kué’s will wrap up in 2028. Ekati should outlast them both and produce well into the 2030s, but that is contingent on developing the Jay pipe, which remains uncertain. (See Chart 2.) New metal mining production will offset these losses somewhat, but not entirely. Diamond mining will decline by 2.6 per cent this year and further reductions are expected over the medium term. (See Chart 3.)
Chart 1Northwest Territories’ real GDP growth(per cent)
f = forecastSources: The Conference Board of Canada; Statistics Canada.
2012 13 14 15 16 17 18f 19f 20f 21f 22f 23f 24f 25f
–4
–2
0
2
4
6Forecast
For the exclusive use of Laurie Gravelines, [email protected], Northwest Territories Department of Finance.

Find Conference Board research at conferenceboard.ca. 27
Northwest Territories | The Conference Board of Canada
1 Rio Tinto, “Rio Tinto announces $7.2 billion of returns to shareholders comprising $3.2 billion from operations and $4.0 billion from asset disposals,” news release, August 1, 2018.
Current operations
Gahcho KuéNews from Gahcho Kué has been positive so far. Compared with the original mine plan, production at Gahcho Kué handily beat expectations in 2018, and the most recent guidance indicates that it will continue to do so through 2021. Extraction rates will hold up; and, the two existing kimberlite pits, 5034 and Hearne, will be joined by a third in 2019. The new pipe, Tuzo, will ramp up just as activity on Hearne is winding down, allowing the mine to maintain annual extraction rates of about 3 million tonnes of ore per year. Ore grades will generally increase over the forecast period, particularly at the Gahcho Kué site where ore grades in the 1.8-to-2.0-carats-per-tonne range are anticipated. If the improved grades manage to continue to outperform over Gahcho Kué’s mine life, we expect the direct impact to the Northwest Territories’ economy to amount to $240 million over the next 10 years, or about a 2 per cent boost to the mining industry’s GDP.
DiavikDiavik’s A21 project began producing last August, well ahead of schedule.1 The new production at the A21 pipe makes up for some, but not all, of the production declines from the A418 pit, which produced 55 per cent of the diamonds delivered to Diavik’s plant in 2017. The A21 open pit will produce 9.4 million carats between 2019 and 2023. But, beyond 2023, production from this diamond mine will gradually slow down, and the last of its kimberlite pipes, A154N, will stop producing in 2025.
Chart 2Diamonds aren’t forever(carats, millions)
f = forecastSources: The Conference Board of Canada; Financial Reports.
2016 18 20f 22f 24f 26f 28f 30f 32f 34f 36f
0
5
10
15
20
25Forecast
Gahcho Kué Ekati Diavik
Chart 3Mining output heading lower(output, 2012 $ billions; change, per cent)
f = forecastSources: The Conference Board of Canada; Statistics Canada.
2015 16 17 18f 19f 20f 21f 22f 23f 24f
–1.0
–0.5
0
0.5
1.0
1.5
2.0
–20
–10
0
10
20
30
40
Total mining (left) Percentage change (right)
Forecast
© The Conference Board of Canada. All rights reserved. Please contact cboc.ca/ip with questions or concerns about the use of this material.

Find Conference Board research at conferenceboard.ca. 28
Territorial Outlook Economic ForecastSummer 2019
EkatiBoth Gahcho Kué and Diavik will wind down operations in the 2020s, implying that the Ekati mine will be the only one still operating over the long term. Ekati is the oldest diamond mine in Canada and has been operating continuously since 1998. There are currently four kimberlite pipes in operation, with another one, Sable, scheduled to come online in 2020. The pipes at Sable will keep the mine open until 2026.
The outlook for a sixth kimberlite pipe, Jay, at the Ekati site is uncertain right now. There are potentially close to 80 million carats to be mined in the Jay pipe, making it almost eight times as large as the Sable pipe. Prior to being purchased by the Washington Companies, Dominion Diamond Mines (the owner of the Jay mine) stated that it would begin construction of the Jay pipe in 2017. However, the owners subsequently put the project on hold on two different occasions. We are currently including the Jay pipe in our Territorial economic outlook, but this could change when the company makes a final decision on whether to proceed with the project, something we expect to hear within the next few months. Without the Jay pipe, Ekati’s diamond mining operations will end in 2026, 10 years sooner than the current projected mine life. (See Chart 4.) Although diamond exploration projects are ongoing at several sites in the Northwest Territories, so far none have turned out to be viable. If Jay is not approved, the Northwest Territories could be out of the diamond business entirely in about 10 years.
Developing minesThe Northwest Territories has not mined metals since 2015, but that will change after 2021, when production ramps up again. Canadian Zinc’s Prairie Creek and Fortune Minerals’ NICO mines will bring a mix of different metals online, including zinc and cobalt—two commodities currently in high demand. These operations will sustain the territory’s mining industry at a time when diamond production will no longer be a prominent source of growth for the mining sector. Real metal output is expected to expand by over 300 per cent in 2023.
Prairie CreekCanadian Zinc is in the process of raising the $280 million required to develop its Prairie Creek mine. The feasibility study, released in 2017, projected $1.3 billion in earnings over the 15-year projected life of the mine. Production was originally expected to begin in 2020, but that has since been pushed back to 2022 as the company continues to raise funds and await final permits.
Chart 4Jay pipe is a key risk(carats, millions)
f = forecastSources: The Conference Board of Canada; financial reports.
2018f 20f 22f 24f 26f 28f 30f 32f 34f 36f
0
2
4
6
8
10
Jay Other pipes
For the exclusive use of Laurie Gravelines, [email protected], Northwest Territories Department of Finance.

Find Conference Board research at conferenceboard.ca. 29
Northwest Territories | The Conference Board of Canada
The process of gaining approval for an all-season road through the Nahanni National Park has entered the final stages. Construction of the road should begin in 2020, be completed by 2022, and take place in parallel with the development of the mine.2
NICOFortune Minerals is in the process of securing financing to begin construction of its NICO mine. The mine contains reserves of gold, bismuth, and copper, but the most important metal at the site is cobalt. The mine contains 82 million pounds of proven and probable cobalt reserves, a key component in lithium-ion battery technology—an important input in electric cars, which are growing in popularity.3 Construction is slated to begin in 2020 and take two years to complete.
2 Canadian Zinc Corporation, “Canadian Zinc reports results for Q2 2018 & operations update,” news release, August 10, 2018.
3 Fortune Minerals, “NICO cobalt-gold-bismuth-copper project,” accessed June 10, 2019, www.fortuneminerals.com/assets/nico/nico-resources-reserves/default.aspx.
4 Fortune Minerals, NICO project presentation: June 2018 (London, ON: Fortune Minerals, 2018), s1.q4cdn.com/337451660/files/doc_presentations/2018/06/180620-Fortune-Minerals-NICO-Project-Presentation.pdf.
The 2014 feasibility study projected a mine life of 21 years with the possibility of a three-year extension. Total capital costs for the project are $589 million.4
ExplorationExploration spending in the Northwest Territories has shown little movement for most of the last 10 years, holding steady at around $90 million. Last year, preliminary estimates indicate that exploration spending was $109 million, but a drop to $67.2 million is anticipated this year, according to the latest Natural Resources Canada survey. (See Chart 5.) While there are a handful of promising exploration projects in the Northwest Territories, because of the high risk attached to them, we have not included them in the forecast.
Chart 5Mining exploration spending($ millions)
p = preliminary estimatesi = spending intentionsSource: Natural Resources Canada, from the federal-provincial-territorial Survey of Mineral Exploration, Deposit Appraisal and Mine Complex Development Expenditures.
2005 06 07 08 09 10 11 12 13 14 15 16 17 18p 19i
0
50
100
150
200
© The Conference Board of Canada. All rights reserved. Please contact cboc.ca/ip with questions or concerns about the use of this material.

Find Conference Board research at conferenceboard.ca. 30
Territorial Outlook Economic ForecastSummer 2019
DiamondsDiamonds have industrial and household uses, but a more temperate global economy will limit demand for them over the forecast period. Also, the industrial market for diamonds faces other challenges in addition to the current state of the global economy. The quality of synthetic diamonds, an alternative to mined diamonds, is improving steadily, and they can be engineered to exhibit specific qualities that clients require. Consequently, they pose a major threat to the traditional diamond market. In addition, preferences among younger people have been shifting away from diamonds and, as the global population ages, the consumer base for diamonds will shrink sharply.
GoldThere haven’t been any gold mining operations in the Northwest Territories in more than 10 years. Although the projects nearest completion do not focus exclusively on gold, a handful of sites are currently in the exploratory phase. Outside Yellowknife, TerraX Minerals is exploring what it considers to be a potentially high-grade site, immediately adjacent to the former Giant mine, which operated for 50 years. In addition, exploratory activities are ongoing at Seabridge Gold’s Courageous Lake property and at Nighthawk Gold’s Colomac Gold Project at Indin Lake. The current price of gold is above US$1,300 an ounce, making these potential mine developments more enticing.
5 Osisko Metals, “Summer drill campaign is accelerated at Pine Point as Osisko Metals increases the drill count,” news release, July 24, 2018.
6 Avalon Advanced Materials Inc., “Avalon re-activates Nechalacho rare earth elements project, NWT, Canada on growing demand for neodymium,” news release, May 15, 2018.
Other metalsThe Northwest Territories is connected by both road and rail to the rest of North America, a major advantage over neighbouring Nunavut. This has allowed prospective miners in the territory to move forward with developments that capitalize on the generally positive price outlook for metals such as zinc, lead, copper, cobalt, and bismuth. The highway also adds to the potential for new mines. Zinc, in particular, is central to Osisko Metals’ plans for its Pine Point property, which is an important upside risk to our outlook for the Northwest Territories. The mine could benefit from the railhead in Hay River (about 65 kilometres away), which can deliver zinc to Southern Canada. Osisko acquired the Pine Point property in December 2016 and has accelerated its exploratory drilling programs to take advantage of strong market conditions.5 Also, the positive price outlook for rare earth metals, such as zirconium, beryllium, tantalum, and niobium,6 led Avalon Advanced Materials to reactivate its Nechalacho project in May of last year.
Oil and gasOil production in the Northwest Territories came to a halt in 2017. Enbridge shut down its Line 21 pipeline from Norman Wells to Alberta due to concerns about land stability in the area where the pipeline crosses the Mackenzie River
For the exclusive use of Laurie Gravelines, [email protected], Northwest Territories Department of Finance.

Find Conference Board research at conferenceboard.ca. 31
Northwest Territories | The Conference Board of Canada
east of Fort Simpson. That forced Imperial Oil to suspend production at its Norman Wells oil field. The $53-million repair project wrapped up last fall, and Imperial Oil restarted production in September. The return to operations is welcome news for the Northwest Territories’ economy, but the field’s most productive years are behind it. Oil and gas output will decline over the forecast period.
ConstructionThe boom in construction that came with the development of the Gahcho Kué mine is over, and this will leave a hole in the construction industry, which will contract by 10.4 per cent this year. Alleviating some of the sluggishness in this sector is investment at the Ekati site in the Sable kimberlite pipe. (See Chart 6.) The activity at Sable and some other projects will cause construction activity to expand by 16.1 per cent next year and 20.0 per cent in 2021. After the construction of these mines is completed, we expect real output in this sector to decline for the remainder of the forecast.
Unfortunately, the anticipated downturn in private sector construction activity beyond 2021 won’t be offset by gains in the public sector. Growth in spending on construction by the government will remain well below 1.0 per cent per year over the long term. The completion of the Inuvik–Tuktoyaktuk Highway will mean less construction activity, although those losses will be offset somewhat by the start of construction of an all-season road to Whati. Slower population growth in the Northwest Territories will lead to weaker growth in nominal GDP and, consequently, less funding for the government to use to finance
construction projects. The only upside risk to this outlook is the federal government’s concerns about a lack of infrastructure in Canada’s North. However, ongoing fiscal deficits in Canada could preclude higher infrastructure funding in the North.
DemographicsIn many parts of Canada, population aging will make immigration a key pillar of population growth. But this is not the case in the Northwest Territories, as its harsh climate will continue to make it difficult to attract new residents.
Chart 6New mining investment in the Northwest Territories(2007 $ millions)
f = forecastSources: The Conference Board of Canada; financial reports.
2017 18f 19f 20f 21f 22f 23f 24f 25f
0
50
100
150
200
250
300
350
400
450Forecast
Prairie Creek
A21 (Diavik)
Misery Open Pit (Ekati)
Jay
Gahcho Kué
NICO
Sable
© The Conference Board of Canada. All rights reserved. Please contact cboc.ca/ip with questions or concerns about the use of this material.

Find Conference Board research at conferenceboard.ca. 32
Territorial Outlook Economic ForecastSummer 2019
(See Chart 7.) Population growth will be dismal beyond 2022, and turn negative after 2027. Flat and declining population growth, combined with a lack of new immigrants, implies that labour force and employment growth will also be weak or negative over the forecast period. At the same time, those residents of the Northwest Territories who decide not to leave tend to be older people who are close to their retirement years. This combination will force the government to somehow finance its public services from a much smaller tax base.
The challenges facing the Northwest Territories’ economy over the forecast period implies that an average of 2,160 people will leave the territory for other parts of Canada each year—385 more than the number who will settle there. Meanwhile, the average woman in the Northwest Territories has 1.9 live births in her lifetime. Although that is slightly short of the 2.1 that is required to fully replace the population, it is enough to keep
natural population changes—the number of births minus the number of deaths—in positive territory for the foreseeable future. Thanks to health care improvements, people live longer now than ever before. And that means that the population of the Northwest Territories, which is currently concentrated in younger age cohorts, will grow steadily older through 2040. (See Chart 8.)
Today, about 8.6 per cent of the population is over the age of 65. But an annual average of 270 residents will reach this milestone over the forecast period. Residents depend on the government for services, particularly health care, but funding these services will become increasingly challenging over the long term. For instance, in 2018, there were 13 seniors per 100 working-aged people in the Northwest Territories. By 2030, that number that will almost triple, placing additional pressures on government finances. (See Chart 9.)
Chart 7Northwest Territories’s population growth(contribution to population growth, annual average)
f = forecastSources: The Conference Board of Canada; Northwest Territories Department of Finance.
2001–05 06–10 11–15 16–20f 21–25f 26–30f 31–35f 36–40f
–800
–600
–400
–200
0
200
400
600
800Forecast
Natural population change Net international migration Net domestic migration
For the exclusive use of Laurie Gravelines, [email protected], Northwest Territories Department of Finance.
Find Conference Board research at conferenceboard.ca. 33
Northwest Territories | The Conference Board of Canada
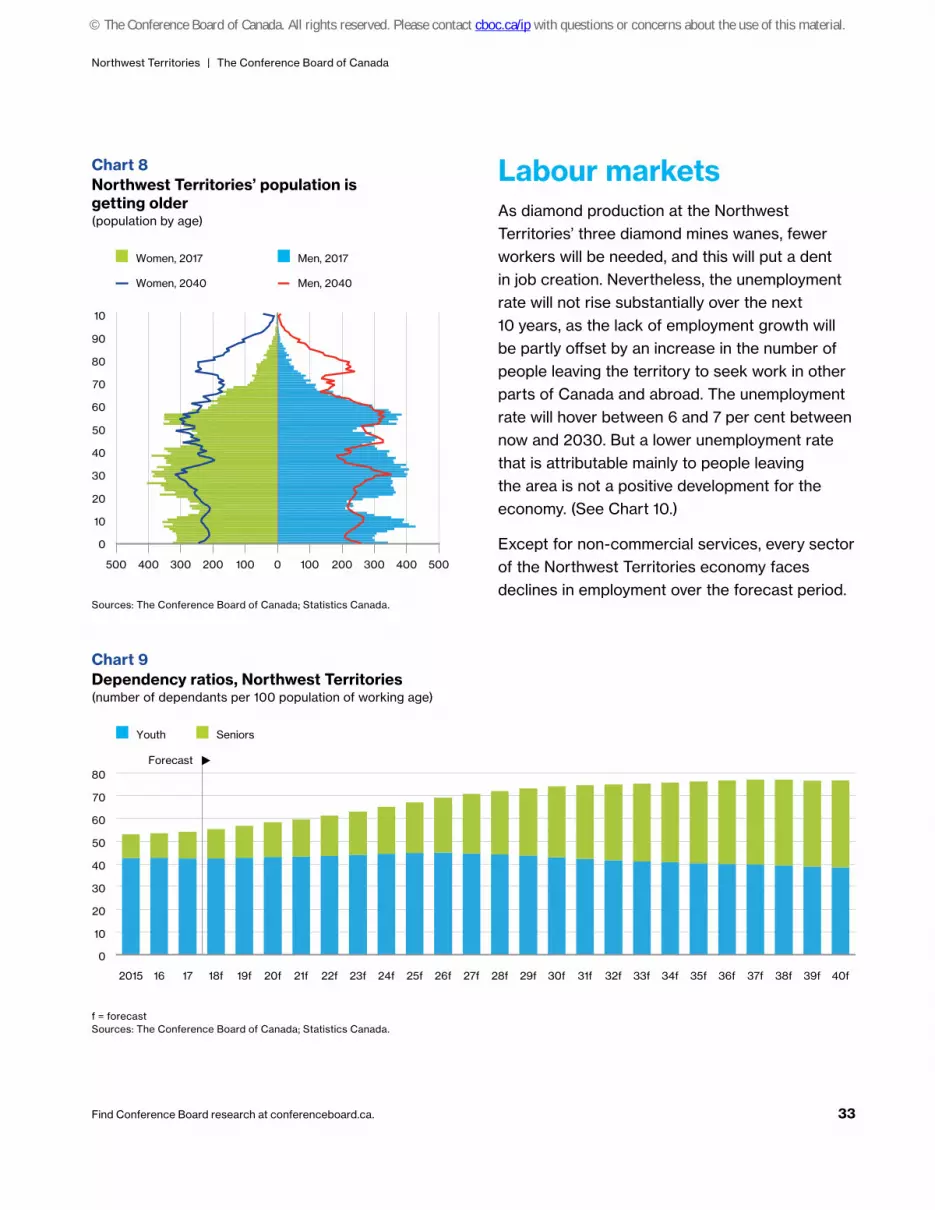
Labour marketsAs diamond production at the Northwest Territories’ three diamond mines wanes, fewer workers will be needed, and this will put a dent in job creation. Nevertheless, the unemployment rate will not rise substantially over the next 10 years, as the lack of employment growth will be partly offset by an increase in the number of people leaving the territory to seek work in other parts of Canada and abroad. The unemployment rate will hover between 6 and 7 per cent between now and 2030. But a lower unemployment rate that is attributable mainly to people leaving the area is not a positive development for the economy. (See Chart 10.)
Except for non-commercial services, every sector of the Northwest Territories economy faces declines in employment over the forecast period.
Chart 9Dependency ratios, Northwest Territories(number of dependants per 100 population of working age)
f = forecastSources: The Conference Board of Canada; Statistics Canada.
2015 16 17 18f 19f 20f 21f 22f 23f 24f 25f 26f 27f 28f 29f 30f 31f 32f 33f 34f 35f 36f 37f 38f 39f 40f
0
10
20
30
40
50
60
70
80
Youth Seniors
Forecast
Chart 8Northwest Territories’ population is getting older(population by age)
Sources: The Conference Board of Canada; Statistics Canada.
0
10
20
30
40
50
60
70
80
90
10
500 400 300 200 100 0 100 200 300 400 500
Men, 2017
Men, 2040
Women, 2017
Women, 2040
© The Conference Board of Canada. All rights reserved. Please contact cboc.ca/ip with questions or concerns about the use of this material.

Find Conference Board research at conferenceboard.ca. 34
Territorial Outlook Economic ForecastSummer 2019
The situation is particularly grim in the construction sector, as the lack of mining activity beyond 2021 implies that employment will decline by about 40 per cent between 2021 and 2040. Even public sector employment will gradually drop, as cutbacks will be required due to the weakness in government tax revenues that comes with weaker economic growth. The gain in employment in non-commercial services is due to job increases in health care as demand from an aging population grows. (See Chart 11.)
Wage increases will ramp up in the early 2020s as some new mines come on stream. This will force mine operators to raise wages in order to attract workers in an economy with weak labour force growth. However, as economic activity eases over the long term, wage increases per employee will average 2.0 per cent per year—equal to the increase in consumer prices. This implies that gains in discretionary income will be limited through 2040. (See Chart 12.)
Chart 10Unemployment on the rise(rate, per cent)
f = forecastSources: The Conference Board of Canada; Statistics Canada.
2010 15 20f 25f 30f 35f 40f
5
6
7
8
9
10Forecast
Northwest Territories Canada
Chart 11Employment growth by industry, Northwest Territories(employment gains/losses)
f = forecastSources: The Conference Board of Canada; Statistics Canada.
2017 18 19f 20f 21f 22f 23f 24f 25f 26f
–1,400
–1,200
–1,000
–800
–600
–400
–200
200
0
400
600Forecast
Mining
Construction
Other goods-producing industries
Services
Chart 12Wages will struggle(per cent)
f = forecastSources: The Conference Board of Canada; Statistics Canada.
2006−10 11−15 16−20f 21−25f 26−30f 31−35f 36−40f
0
2
4
6
0
3
6
9
Wages and salaries per employee (left)
Inflation (left)
Unemployment (right)
Forecast
For the exclusive use of Laurie Gravelines, [email protected], Northwest Territories Department of Finance.

Find Conference Board research at conferenceboard.ca. 35
Northwest Territories | The Conference Board of Canada
Public accountsCurrently, the Northwest Territories is on solid fiscal ground. However, tepid economic growth going forward will constrict the tax base, temper population growth, and put pressure on the government for the delivery of services. As a result, the government will see its fiscal position erode over the next decade. Fortunately, the territory is in a good position to weather the anticipated tough times. And, despite the worsening of the fiscal situation, we do not expect the government to slip into deficit any time soon. (See Chart 13.)
Weakening economic growth will have a two-pronged effect on public spending in the Northwest Territories. Outmigration will lead to slower population growth, keeping demand for some government services in check. But the people who do leave are more likely to be younger workers. That means that there will be little in the way of reprieve for the territory
in terms of health care requirements. So, while government spending on education and some other programs will rise at a slower pace, growth in health care spending will accelerate.
Chart 13Northwest Territories’ budget balance($ millions)
f = forecastSources: The Conference Board of Canada; Northwest Territories Department of Finance.
2010 11 12 13 14 15 16 17 18 19f 20f 21f 22f 23f 24f 25f 26f 27f 28f 29f 30f
–50
0
50
100
150
200Forecast
Tepid economic growth going forward will constrict the tax base, temper population growth, and put pressure on the government for the
delivery of services.
© The Conference Board of Canada. All rights reserved. Please contact cboc.ca/ip with questions or concerns about the use of this material.

Find Conference Board research at conferenceboard.ca. 36
Territorial Outlook Economic ForecastSummer 2019
(See Chart 14.) Health care already eats up just over a quarter of government revenues, and, by 2030, that will grow to over a third. Total spending will grow at an average annual rate of 3.3 per cent over the forecast period.
Overall, due to weakening revenue growth (revenues are expected to grow by an average of 2.9 per cent a year over the forecast period),
the recent string of surpluses over $100 million will come to an end, fading to $35 million by 2030. As such, the territory will feel a corresponding pressure on its ability to provide front-line services and invest in infrastructure, as well as to repay short-term borrowing and maintain total debt levels below the federally imposed borrowing limit.
Chart 14Health care costs will rise(average annual increase, per cent)
f = forecastSources: The Conference Board of Canada; Northwest Territories Department of Finance.
2001−05 06−10 11−15 16−20f 21−25f 26−30f 31−35f 36−40f
0
1
2
3
4
5
6
7
Health Other programsEducation Revenues
Forecast
For the exclusive use of Laurie Gravelines, [email protected], Northwest Territories Department of Finance.
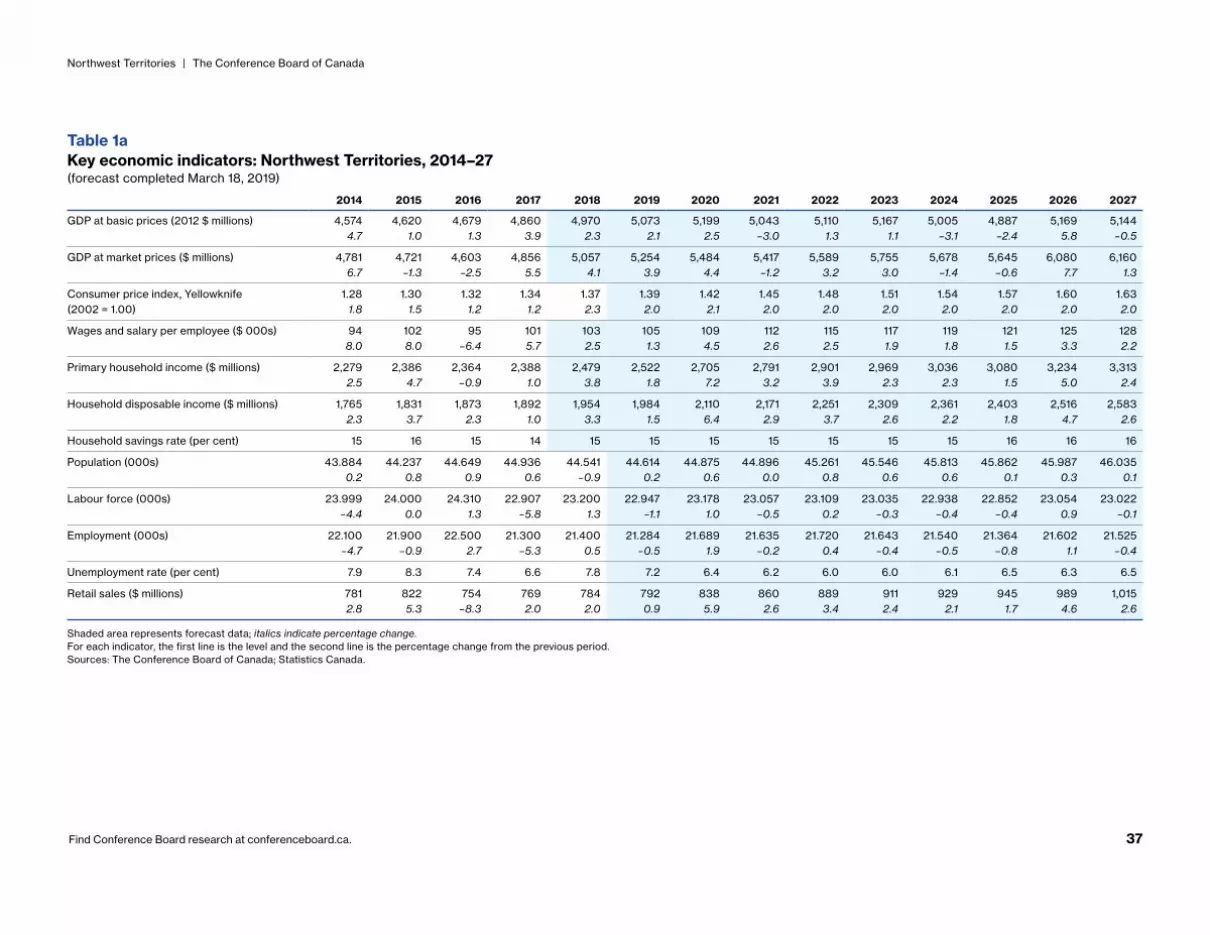
Find Conference Board research at conferenceboard.ca. 37
Northwest Territories | The Conference Board of Canada
Table 1aKey economic indicators: Northwest Territories, 2014–27(forecast completed March 18, 2019)
2014 2015 2016 2017 2018 2019 2020 2021 2022 2023 2024 2025 2026 2027
GDP at basic prices (2012 $ millions) 4,574 4,620 4,679 4,860 4,970 5,073 5,199 5,043 5,110 5,167 5,005 4,887 5,169 5,1444.7 1.0 1.3 3.9 2.3 2.1 2.5 –3.0 1.3 1.1 –3.1 –2.4 5.8 –0.5
GDP at market prices ($ millions) 4,781 4,721 4,603 4,856 5,057 5,254 5,484 5,417 5,589 5,755 5,678 5,645 6,080 6,1606.7 –1.3 –2.5 5.5 4.1 3.9 4.4 –1.2 3.2 3.0 –1.4 –0.6 7.7 1.3
Consumer price index, Yellowknife 1.28 1.30 1.32 1.34 1.37 1.39 1.42 1.45 1.48 1.51 1.54 1.57 1.60 1.63(2002 = 1.00) 1.8 1.5 1.2 1.2 2.3 2.0 2.1 2.0 2.0 2.0 2.0 2.0 2.0 2.0
Wages and salary per employee ($ 000s) 94 102 95 101 103 105 109 112 115 117 119 121 125 1288.0 8.0 –6.4 5.7 2.5 1.3 4.5 2.6 2.5 1.9 1.8 1.5 3.3 2.2
Primary household income ($ millions) 2,279 2,386 2,364 2,388 2,479 2,522 2,705 2,791 2,901 2,969 3,036 3,080 3,234 3,3132.5 4.7 –0.9 1.0 3.8 1.8 7.2 3.2 3.9 2.3 2.3 1.5 5.0 2.4
Household disposable income ($ millions) 1,765 1,831 1,873 1,892 1,954 1,984 2,110 2,171 2,251 2,309 2,361 2,403 2,516 2,5832.3 3.7 2.3 1.0 3.3 1.5 6.4 2.9 3.7 2.6 2.2 1.8 4.7 2.6
Household savings rate (per cent) 15 16 15 14 15 15 15 15 15 15 15 16 16 16
Population (000s) 43.884 44.237 44.649 44.936 44.541 44.614 44.875 44.896 45.261 45.546 45.813 45.862 45.987 46.0350.2 0.8 0.9 0.6 –0.9 0.2 0.6 0.0 0.8 0.6 0.6 0.1 0.3 0.1
Labour force (000s) 23.999 24.000 24.310 22.907 23.200 22.947 23.178 23.057 23.109 23.035 22.938 22.852 23.054 23.022–4.4 0.0 1.3 –5.8 1.3 –1.1 1.0 –0.5 0.2 –0.3 –0.4 –0.4 0.9 –0.1
Employment (000s) 22.100 21.900 22.500 21.300 21.400 21.284 21.689 21.635 21.720 21.643 21.540 21.364 21.602 21.525–4.7 –0.9 2.7 –5.3 0.5 –0.5 1.9 –0.2 0.4 –0.4 –0.5 –0.8 1.1 –0.4
Unemployment rate (per cent) 7.9 8.3 7.4 6.6 7.8 7.2 6.4 6.2 6.0 6.0 6.1 6.5 6.3 6.5
Retail sales ($ millions) 781 822 754 769 784 792 838 860 889 911 929 945 989 1,0152.8 5.3 –8.3 2.0 2.0 0.9 5.9 2.6 3.4 2.4 2.1 1.7 4.6 2.6
Shaded area represents forecast data; italics indicate percentage change.For each indicator, the first line is the level and the second line is the percentage change from the previous period. Sources: The Conference Board of Canada; Statistics Canada.
© The Conference Board of Canada. All rights reserved. Please contact cboc.ca/ip with questions or concerns about the use of this material.

Find Conference Board research at conferenceboard.ca. 38
Territorial Outlook Economic ForecastSummer 2019
Table 1bKey economic indicators: Northwest Territories, 2028–40(forecast completed March 18, 2019)
2028 2029 2030 2031 2032 2033 2034 2035 2036 2037 2038 2039 2040
GDP at basic prices (2012 $ millions) 4,849 4,962 5,037 5,158 5,124 5,224 5,222 5,202 5,001 4,514 3,771 3,859 3,768–5.7 2.3 1.5 2.4 –0.7 2.0 0.0 –0.4 –3.9 –9.7 –16.5 2.3 –2.4
GDP at market prices ($ millions) 5,912 6,161 6,369 6,641 6,717 6,973 7,099 7,200 7,048 6,478 5,509 5,740 5,707–4.0 4.2 3.4 4.3 1.1 3.8 1.8 1.4 –2.1 –8.1 –15.0 4.2 –0.6
Consumer price index, Yellowknife 1.67 1.70 1.73 1.77 1.80 1.84 1.88 1.91 1.95 1.99 2.03 2.07 2.11(2002 = 1.00) 2.0 2.0 2.0 2.0 2.0 2.0 2.0 2.0 2.0 2.0 2.0 2.0 2.0
Wages and salary per employee ($ 000s) 129 133 136 141 144 148 152 156 153 155 154 159 1631.1 2.9 2.7 3.0 2.4 2.9 2.5 2.4 –1.4 1.0 –0.8 3.4 2.4
Primary household income ($ millions) 3,323 3,444 3,560 3,688 3,772 3,897 3,995 4,091 3,958 3,937 3,792 3,921 3,9760.3 3.6 3.4 3.6 2.3 3.3 2.5 2.4 –3.2 –0.5 –3.7 3.4 1.4
Household disposable income ($ millions) 2,605 2,696 2,786 2,879 2,945 3,036 3,112 3,186 3,123 3,124 3,050 3,132 3,1720.9 3.5 3.3 3.3 2.3 3.1 2.5 2.4 –2.0 0.0 –2.4 2.7 1.3
Household savings rate (per cent) 16 16 16 17 17 17 17 18 17 17 17 18 18
Population (000s) 45.971 45.937 45.954 45.876 45.760 45.744 45.672 45.599 45.336 44.974 44.441 43.888 43.287–0.1 –0.1 0.0 –0.2 –0.3 0.0 –0.2 –0.2 –0.6 –0.8 –1.2 –1.2 –1.4
Labour force (000s) 22.768 22.798 22.820 22.820 22.699 22.683 22.592 22.487 21.963 21.559 20.874 20.747 20.438–1.1 0.1 0.1 0.0 –0.5 –0.1 –0.4 –0.5 –2.3 –1.8 –3.2 –0.6 –1.5
Employment (000s) 21.177 21.228 21.255 21.281 21.143 21.132 21.026 20.902 20.226 19.750 18.913 18.889 18.618–1.6 0.2 0.1 0.1 –0.6 –0.1 –0.5 –0.6 –3.2 –2.4 –4.2 –0.1 –1.4
Unemployment rate (per cent) 7.0 6.9 6.9 6.7 6.9 6.8 6.9 7.0 7.9 8.4 9.4 9.0 8.9
Retail sales ($ millions) 1,024 1,058 1,093 1,128 1,153 1,187 1,215 1,243 1,219 1,219 1,191 1,220 1,2330.9 3.4 3.2 3.2 2.2 3.0 2.4 2.2 –1.9 0.0 –2.3 2.4 1.1
Shaded area represents forecast data; italics indicate percentage change.For each indicator, the first line is the level and the second line is the percentage change from the previous period. Sources: The Conference Board of Canada; Statistics Canada.
For the exclusive use of Laurie Gravelines, [email protected], Northwest Territories Department of Finance.

Find Conference Board research at conferenceboard.ca. 39
Northwest Territories | The Conference Board of Canada
Table 2aReal gross domestic product: Northwest Territories, 2014–27(2012 $ millions; forecast completed March 18, 2019)
2014 2015 2016 2017 2018 2019 2020 2021 2022 2023 2024 2025 2026 2027
Other primary sector 16 11 11 12 11 11 11 11 11 11 11 11 11 112.6 –28.8 0.9 2.7 –0.6 –0.6 –0.5 –0.5 –0.5 –0.5 –0.4 –0.4 –0.4 –0.3
Mining 1,403 1,327 1,379 1,818 1,837 1,951 1,969 1,724 1,752 1,859 1,690 1,599 1,833 1,78914.4 –5.4 3.9 31.8 1.1 6.2 0.9 –12.4 1.6 6.1 –9.1 –5.3 14.6 –2.4
Metal ore mining 40 21 0 0 0 0 0 0 80 382 408 343 390 402–3.1 –48.0 n.a. n.a. n.a. n.a. n.a. n.a. n.a. 378.2 6.7 –15.9 13.8 3.0
Non-metal mining 1,020 988 1,101 1,813 1,812 1,765 1,770 1,527 1,482 1,292 1,107 1,089 1,279 1,23129.2 –3.2 11.4 64.7 –0.1 –2.6 0.3 –13.7 –3.0 –12.8 –14.4 –1.6 17.4 –3.8
Mining services 95 93 69 77 91 89 88 84 83 82 79 76 80 78–6.9 –2.6 –25.1 10.5 18.0 –2.1 –1.0 –4.6 –1.3 –0.4 –4.0 –3.5 4.5 –1.6
Manufacturing 15 12 15 25 31 31 32 32 33 33 34 34 35 357.2 –22.8 31.3 64.2 24.7 1.5 1.5 1.7 1.6 1.4 1.3 1.4 1.5 1.4
Construction 438 566 509 376 431 386 448 538 540 453 449 414 405 4015.4 29.1 –10.0 –26.2 14.7 –10.4 16.1 20.0 0.4 –16.1 –0.9 –7.9 –2.1 –0.9
Utilities 68 67 70 71 71 72 72 71 71 70 70 69 70 69–0.7 –1.3 3.9 2.0 0.5 0.2 –0.1 –1.3 –0.1 –0.4 –1.0 –0.8 1.4 –0.9
Goods-producing industries 1,930 1,973 1,960 2,163 2,243 2,313 2,393 2,238 2,268 2,288 2,115 1,989 2,215 2,16711.4 2.2 –0.7 10.3 3.7 3.1 3.4 –6.5 1.3 0.9 –7.6 –6.0 11.4 –2.2
Transportation and warehousing 270 256 279 273 273 278 278 270 271 275 269 265 275 2736.3 –5.3 8.8 –2.1 0.3 1.6 0.2 –3.1 0.4 1.5 –2.3 –1.3 3.7 –0.6
Information and cultural industries 89 91 91 89 89 90 91 92 93 94 95 95 96 96–6.2 1.5 0.8 –2.1 –0.2 0.9 1.3 0.7 1.4 1.2 1.0 0.5 0.6 0.5
Wholesale and retail trade 289 293 290 290 307 308 323 327 334 337 339 339 350 3540.2 1.3 –1.1 0.2 5.5 0.6 4.6 1.4 2.2 0.8 0.5 0.0 3.2 1.4
Finance, insurance, real estate, and renting, 517 527 543 555 553 559 562 556 561 568 565 563 572 572leasing, and management of companies and enterprises
0.0 2.1 2.9 2.3 –0.3 1.0 0.7 –1.1 0.8 1.2 –0.5 –0.4 1.7 –0.1
Professional, scientific, and technical services 101 89 95 97 98 100 102 103 105 107 108 109 112 1134.7 –12.5 7.3 2.4 0.8 2.3 2.0 0.1 2.2 2.4 0.7 0.6 2.8 0.9
Administrative and support, waste management, 65 64 65 66 67 69 71 71 73 75 75 76 78 79and remediation services –5.9 –1.5 1.9 1.2 1.3 2.7 2.4 0.5 2.5 2.7 1.0 0.8 2.9 1.0
(continued …)
© The Conference Board of Canada. All rights reserved. Please contact cboc.ca/ip with questions or concerns about the use of this material.

Find Conference Board research at conferenceboard.ca. 40
Territorial Outlook Economic ForecastSummer 2019
Table 2a (cont’d)Real gross domestic product: Northwest Territories, 2014–27(2012 $ millions; forecast completed March 18, 2019)
2014 2015 2016 2017 2018 2019 2020 2021 2022 2023 2024 2025 2026 2027
Arts, entertainment, and recreation 9 7 6 6 6 6 6 6 5 5 5 5 5 5–23.7 –24.4 –19.1 7.3 –2.6 –1.5 –1.0 –1.5 –0.7 –0.8 –0.8 –1.0 –0.8 –0.8
Accommodation and food services 99 93 93 95 94 95 96 95 96 97 96 96 98 98–9.3 –6.3 0.0 1.6 –0.5 1.0 0.8 –1.1 1.0 1.3 –0.4 –0.4 1.7 –0.1
Other services 58 58 58 59 59 58 58 58 58 58 58 58 58 587.9 0.2 0.9 2.2 –1.4 –0.4 0.0 –0.5 0.2 0.1 0.0 –0.4 –0.2 –0.4
Educational services 213 210 211 213 216 210 207 205 204 205 207 208 209 2110.1 –1.6 0.7 0.8 1.4 –2.6 –1.2 –1.4 –0.1 0.5 0.7 0.6 0.5 1.0
Health care and social assistance 277 289 299 303 309 320 331 342 354 365 378 390 405 4184.2 4.4 3.4 1.4 2.0 3.6 3.5 3.3 3.5 3.2 3.5 3.2 3.8 3.4
Public administration 670 692 701 705 710 720 734 735 741 745 748 748 750 7520.9 3.3 1.3 0.5 0.8 1.4 2.0 0.1 0.8 0.6 0.4 0.0 0.3 0.3
Services-producing industries 2,659 2,666 2,728 2,748 2,778 2,810 2,857 2,855 2,892 2,929 2,941 2,949 3,004 3,0270.8 0.3 2.3 0.7 1.1 1.2 1.7 0.0 1.3 1.3 0.4 0.3 1.9 0.8
GDP 4,574 4,620 4,679 4,860 4,970 5,073 5,199 5,043 5,110 5,167 5,005 4,887 5,169 5,1444.7 1.0 1.3 3.9 2.3 2.1 2.5 –3.0 1.3 1.1 –3.1 –2.4 5.8 –0.5
n.a. = not applicableShaded area represents forecast data; italics indicate percentage change.Note: For each industry, the first line is the level and the italicized second line is the percentageAll data are seasonally adjusted at annual rates.Sources: The Conference Board of Canada; Statistics Canada.
For the exclusive use of Laurie Gravelines, [email protected], Northwest Territories Department of Finance.

Find Conference Board research at conferenceboard.ca. 41
Northwest Territories | The Conference Board of Canada
Table 2bReal gross domestic product: Northwest Territories, 2028–40(2012 $ millions; forecast completed March 18, 2019)
2028 2029 2030 2031 2032 2033 2034 2035 2036 2037 2038 2039 2040
Other primary sector 11 11 11 11 11 11 11 11 11 11 11 11 11–0.3 –0.3 –0.3 –0.3 –0.2 –0.2 –0.2 –0.2 –0.2 –0.2 –0.2 –0.2 –0.2
Mining 1,505 1,585 1,629 1,719 1,670 1,742 1,722 1,687 1,504 1,049 387 446 374–15.9 5.4 2.7 5.6 –2.9 4.3 –1.1 –2.0 –10.8 –30.3 –63.1 15.5 –16.3
Metal ore mining 406 423 435 451 353 371 353 339 320 259 261 321 2541.1 4.1 2.8 3.7 –21.8 5.2 –4.7 –4.0 –5.8 –19.0 0.7 23.2 –20.8
Non-metal mining 955 1,025 1,062 1,140 1,196 1,252 1,256 1,241 1,083 701 54 55 55–22.4 7.2 3.6 7.4 4.8 4.7 0.3 –1.2 –12.7 –35.3 –92.2 0.5 0.5
Mining services 73 74 75 76 74 75 74 74 71 63 50 52 50–6.4 1.2 0.3 1.3 –1.5 0.9 –0.8 –1.0 –4.2 –10.7 –20.7 4.3 –4.0
Manufacturing 36 36 37 37 38 39 39 40 40 41 42 42 431.6 1.5 1.4 1.5 1.5 1.4 1.5 1.5 1.5 1.5 1.5 1.5 1.5
Construction 398 397 396 396 398 399 402 405 406 402 386 393 391–0.9 –0.2 –0.2 –0.1 0.6 0.3 0.7 0.7 0.1 –0.9 –4.0 1.8 –0.4
Utilities 68 68 68 69 68 69 68 68 67 64 60 60 58–2.2 –0.3 0.8 0.7 –0.2 0.6 –0.6 –0.4 –1.7 –3.8 –7.2 –0.3 –3.4
Goods-producing industries 1,879 1,959 2,003 2,094 2,047 2,121 2,104 2,073 1,890 1,429 746 814 738–13.3 4.3 2.2 4.5 –2.2 3.6 –0.8 –1.5 –8.8 –24.4 –47.8 9.0 –9.3
Transportation and warehousing 262 266 267 271 270 273 273 272 268 258 238 247 242–4.0 1.3 0.7 1.4 –0.4 1.1 –0.1 –0.3 –1.4 –3.8 –7.9 3.9 –2.0
Information and cultural industries 97 97 97 98 98 98 98 98 98 98 97 97 960.3 0.3 0.4 0.2 0.1 0.3 0.1 0.1 –0.2 –0.3 –0.5 –0.5 –0.6
Wholesale and retail trade 353 361 368 375 380 387 392 396 381 377 364 369 368–0.3 2.0 2.0 2.0 1.2 1.9 1.3 1.0 –3.7 –1.2 –3.4 1.3 –0.1
Finance, insurance, real estate, and renting, leasing, 562 566 568 571 570 572 572 571 567 557 537 541 534and management of companies and enterprises –1.6 0.6 0.4 0.5 –0.2 0.5 –0.1 –0.1 –0.7 –1.8 –3.5 0.7 –1.3
Professional, scientific, and technical services 112 114 115 117 117 119 120 120 120 118 114 116 114–0.7 1.5 1.3 1.4 0.4 1.3 0.7 0.5 –0.4 –1.5 –3.3 1.2 –1.0
Administrative and support, waste management, 79 80 81 82 82 83 84 84 84 83 80 81 80and remediation services –0.6 1.6 1.3 1.4 0.4 1.3 0.6 0.4 –0.4 –1.5 –3.4 1.1 –1.1
(continued …)
© The Conference Board of Canada. All rights reserved. Please contact cboc.ca/ip with questions or concerns about the use of this material.

Find Conference Board research at conferenceboard.ca. 42
Territorial Outlook Economic ForecastSummer 2019
Table 2b (cont’d)Real gross domestic product: Northwest Territories, 2028–40(2012 $ millions; forecast completed March 18, 2019)
2028 2029 2030 2031 2032 2033 2034 2035 2036 2037 2038 2039 2040
Arts, entertainment, and recreation 5 5 5 5 5 5 5 5 5 5 5 5 5–0.9 –0.8 –0.3 –0.3 –0.3 –0.2 –0.2 –0.2 –0.4 –0.4 –0.6 –0.6 –0.6
Accommodation and food services 96 97 97 97 97 98 97 97 97 95 91 92 90–1.6 0.5 0.4 0.5 –0.2 0.5 –0.1 –0.1 –0.8 –1.9 –3.7 0.5 –1.4
Other services 57 57 57 57 57 57 56 56 56 56 55 55 55–0.5 –0.4 –0.2 –0.3 –0.3 –0.2 –0.2 –0.2 –0.4 –0.5 –0.7 –0.7 –0.8
Educational services 214 216 217 217 217 215 214 211 209 208 207 206 2061.2 0.9 0.5 0.3 –0.3 –0.6 –0.7 –1.3 –0.9 –0.8 –0.3 –0.4 –0.4
Health care and social assistance 432 444 457 466 475 482 490 497 505 512 518 523 5283.2 2.7 2.9 2.2 1.7 1.6 1.6 1.5 1.5 1.3 1.3 0.9 1.1
Public administration 754 756 759 761 763 767 770 773 774 773 770 768 7640.2 0.3 0.4 0.3 0.3 0.5 0.4 0.4 0.1 –0.1 –0.4 –0.4 –0.5
Services-producing industries 3,021 3,054 3,085 3,115 3,127 3,153 3,168 3,180 3,161 3,136 3,075 3,096 3,081–0.2 1.1 1.0 1.0 0.4 0.8 0.5 0.4 –0.6 –0.8 –1.9 0.7 –0.5
GDP 4,849 4,962 5,037 5,158 5,124 5,224 5,222 5,202 5,001 4,514 3,771 3,859 3,768–5.7 2.3 1.5 2.4 –0.7 2.0 0.0 –0.4 –3.9 –9.7 –16.5 2.3 –2.4
Shaded area represents forecast data; italics indicate percentage change.Note: For each industry, the first line is the level and the italicized second line is the percentageAll data are seasonally adjusted at annual rates.Sources: The Conference Board of Canada; Statistics Canada.
For the exclusive use of Laurie Gravelines, [email protected], Northwest Territories Department of Finance.
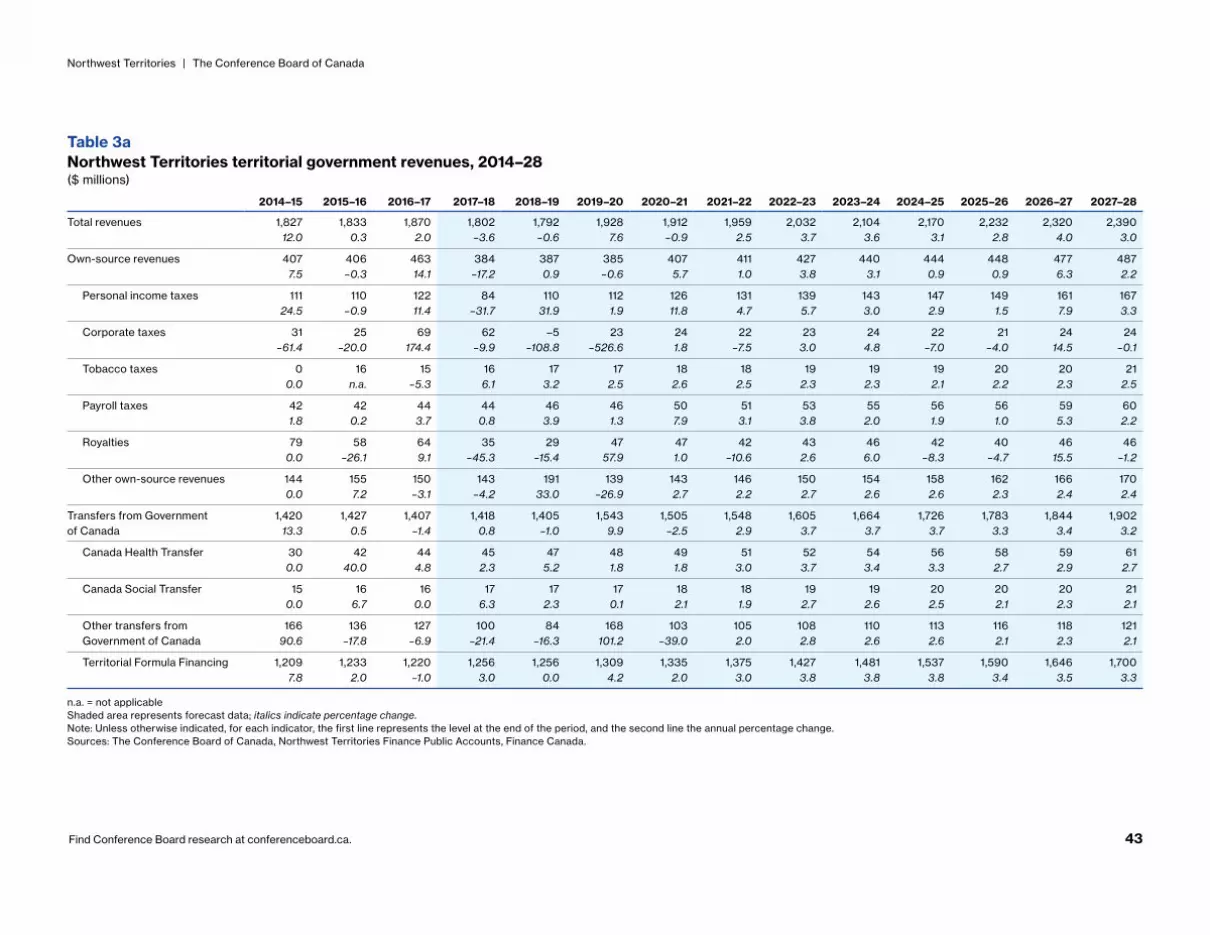
Find Conference Board research at conferenceboard.ca. 43
Northwest Territories | The Conference Board of Canada
Table 3aNorthwest Territories territorial government revenues, 2014–28($ millions)
2014–15 2015–16 2016–17 2017–18 2018–19 2019–20 2020–21 2021–22 2022–23 2023–24 2024–25 2025–26 2026–27 2027–28
Total revenues 1,827 1,833 1,870 1,802 1,792 1,928 1,912 1,959 2,032 2,104 2,170 2,232 2,320 2,39012.0 0.3 2.0 –3.6 –0.6 7.6 –0.9 2.5 3.7 3.6 3.1 2.8 4.0 3.0
Own-source revenues 407 406 463 384 387 385 407 411 427 440 444 448 477 4877.5 –0.3 14.1 –17.2 0.9 –0.6 5.7 1.0 3.8 3.1 0.9 0.9 6.3 2.2
Personal income taxes 111 110 122 84 110 112 126 131 139 143 147 149 161 16724.5 –0.9 11.4 –31.7 31.9 1.9 11.8 4.7 5.7 3.0 2.9 1.5 7.9 3.3
Corporate taxes 31 25 69 62 –5 23 24 22 23 24 22 21 24 24–61.4 –20.0 174.4 –9.9 –108.8 –526.6 1.8 –7.5 3.0 4.8 –7.0 –4.0 14.5 –0.1
Tobacco taxes 0 16 15 16 17 17 18 18 19 19 19 20 20 210.0 n.a. –5.3 6.1 3.2 2.5 2.6 2.5 2.3 2.3 2.1 2.2 2.3 2.5
Payroll taxes 42 42 44 44 46 46 50 51 53 55 56 56 59 601.8 0.2 3.7 0.8 3.9 1.3 7.9 3.1 3.8 2.0 1.9 1.0 5.3 2.2
Royalties 79 58 64 35 29 47 47 42 43 46 42 40 46 460.0 –26.1 9.1 –45.3 –15.4 57.9 1.0 –10.6 2.6 6.0 –8.3 –4.7 15.5 –1.2
Other own-source revenues 144 155 150 143 191 139 143 146 150 154 158 162 166 1700.0 7.2 –3.1 –4.2 33.0 –26.9 2.7 2.2 2.7 2.6 2.6 2.3 2.4 2.4
Transfers from Government 1,420 1,427 1,407 1,418 1,405 1,543 1,505 1,548 1,605 1,664 1,726 1,783 1,844 1,902of Canada 13.3 0.5 –1.4 0.8 –1.0 9.9 –2.5 2.9 3.7 3.7 3.7 3.3 3.4 3.2
Canada Health Transfer 30 42 44 45 47 48 49 51 52 54 56 58 59 610.0 40.0 4.8 2.3 5.2 1.8 1.8 3.0 3.7 3.4 3.3 2.7 2.9 2.7
Canada Social Transfer 15 16 16 17 17 17 18 18 19 19 20 20 20 210.0 6.7 0.0 6.3 2.3 0.1 2.1 1.9 2.7 2.6 2.5 2.1 2.3 2.1
Other transfers from 166 136 127 100 84 168 103 105 108 110 113 116 118 121Government of Canada 90.6 –17.8 –6.9 –21.4 –16.3 101.2 –39.0 2.0 2.8 2.6 2.6 2.1 2.3 2.1
Territorial Formula Financing 1,209 1,233 1,220 1,256 1,256 1,309 1,335 1,375 1,427 1,481 1,537 1,590 1,646 1,7007.8 2.0 –1.0 3.0 0.0 4.2 2.0 3.0 3.8 3.8 3.8 3.4 3.5 3.3
n.a. = not applicableShaded area represents forecast data; italics indicate percentage change.Note: Unless otherwise indicated, for each indicator, the first line represents the level at the end of the period, and the second line the annual percentage change. Sources: The Conference Board of Canada, Northwest Territories Finance Public Accounts, Finance Canada.
© The Conference Board of Canada. All rights reserved. Please contact cboc.ca/ip with questions or concerns about the use of this material.
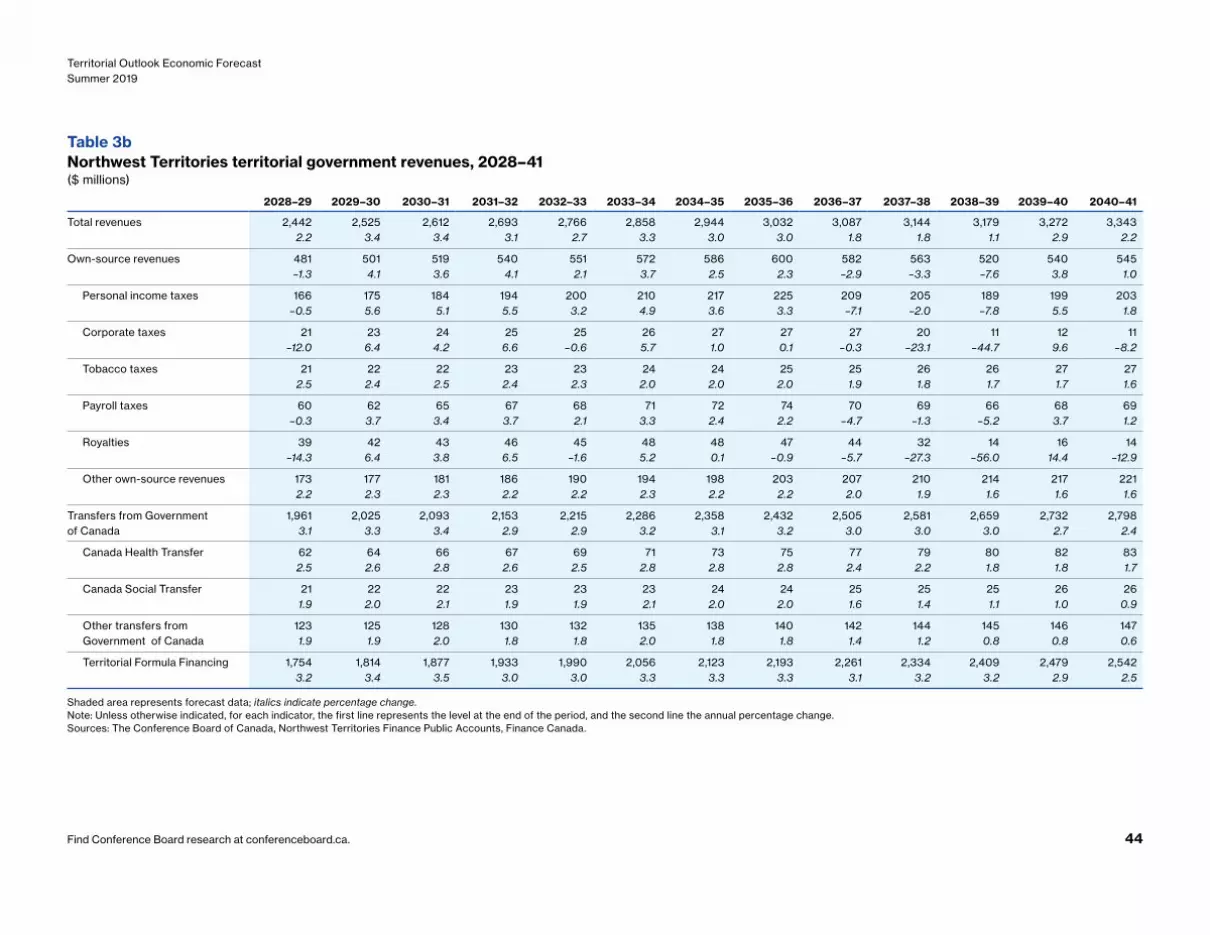
Find Conference Board research at conferenceboard.ca. 44
Territorial Outlook Economic ForecastSummer 2019
Table 3bNorthwest Territories territorial government revenues, 2028–41($ millions)
2028–29 2029–30 2030–31 2031–32 2032–33 2033–34 2034–35 2035–36 2036–37 2037–38 2038–39 2039–40 2040–41
Total revenues 2,442 2,525 2,612 2,693 2,766 2,858 2,944 3,032 3,087 3,144 3,179 3,272 3,3432.2 3.4 3.4 3.1 2.7 3.3 3.0 3.0 1.8 1.8 1.1 2.9 2.2
Own-source revenues 481 501 519 540 551 572 586 600 582 563 520 540 545–1.3 4.1 3.6 4.1 2.1 3.7 2.5 2.3 –2.9 –3.3 –7.6 3.8 1.0
Personal income taxes 166 175 184 194 200 210 217 225 209 205 189 199 203–0.5 5.6 5.1 5.5 3.2 4.9 3.6 3.3 –7.1 –2.0 –7.8 5.5 1.8
Corporate taxes 21 23 24 25 25 26 27 27 27 20 11 12 11–12.0 6.4 4.2 6.6 –0.6 5.7 1.0 0.1 –0.3 –23.1 –44.7 9.6 –8.2
Tobacco taxes 21 22 22 23 23 24 24 25 25 26 26 27 272.5 2.4 2.5 2.4 2.3 2.0 2.0 2.0 1.9 1.8 1.7 1.7 1.6
Payroll taxes 60 62 65 67 68 71 72 74 70 69 66 68 69–0.3 3.7 3.4 3.7 2.1 3.3 2.4 2.2 –4.7 –1.3 –5.2 3.7 1.2
Royalties 39 42 43 46 45 48 48 47 44 32 14 16 14–14.3 6.4 3.8 6.5 –1.6 5.2 0.1 –0.9 –5.7 –27.3 –56.0 14.4 –12.9
Other own-source revenues 173 177 181 186 190 194 198 203 207 210 214 217 2212.2 2.3 2.3 2.2 2.2 2.3 2.2 2.2 2.0 1.9 1.6 1.6 1.6
Transfers from Government 1,961 2,025 2,093 2,153 2,215 2,286 2,358 2,432 2,505 2,581 2,659 2,732 2,798of Canada 3.1 3.3 3.4 2.9 2.9 3.2 3.1 3.2 3.0 3.0 3.0 2.7 2.4
Canada Health Transfer 62 64 66 67 69 71 73 75 77 79 80 82 832.5 2.6 2.8 2.6 2.5 2.8 2.8 2.8 2.4 2.2 1.8 1.8 1.7
Canada Social Transfer 21 22 22 23 23 23 24 24 25 25 25 26 261.9 2.0 2.1 1.9 1.9 2.1 2.0 2.0 1.6 1.4 1.1 1.0 0.9
Other transfers from 123 125 128 130 132 135 138 140 142 144 145 146 147Government of Canada 1.9 1.9 2.0 1.8 1.8 2.0 1.8 1.8 1.4 1.2 0.8 0.8 0.6
Territorial Formula Financing 1,754 1,814 1,877 1,933 1,990 2,056 2,123 2,193 2,261 2,334 2,409 2,479 2,5423.2 3.4 3.5 3.0 3.0 3.3 3.3 3.3 3.1 3.2 3.2 2.9 2.5
Shaded area represents forecast data; italics indicate percentage change.Note: Unless otherwise indicated, for each indicator, the first line represents the level at the end of the period, and the second line the annual percentage change. Sources: The Conference Board of Canada, Northwest Territories Finance Public Accounts, Finance Canada.
For the exclusive use of Laurie Gravelines, [email protected], Northwest Territories Department of Finance.
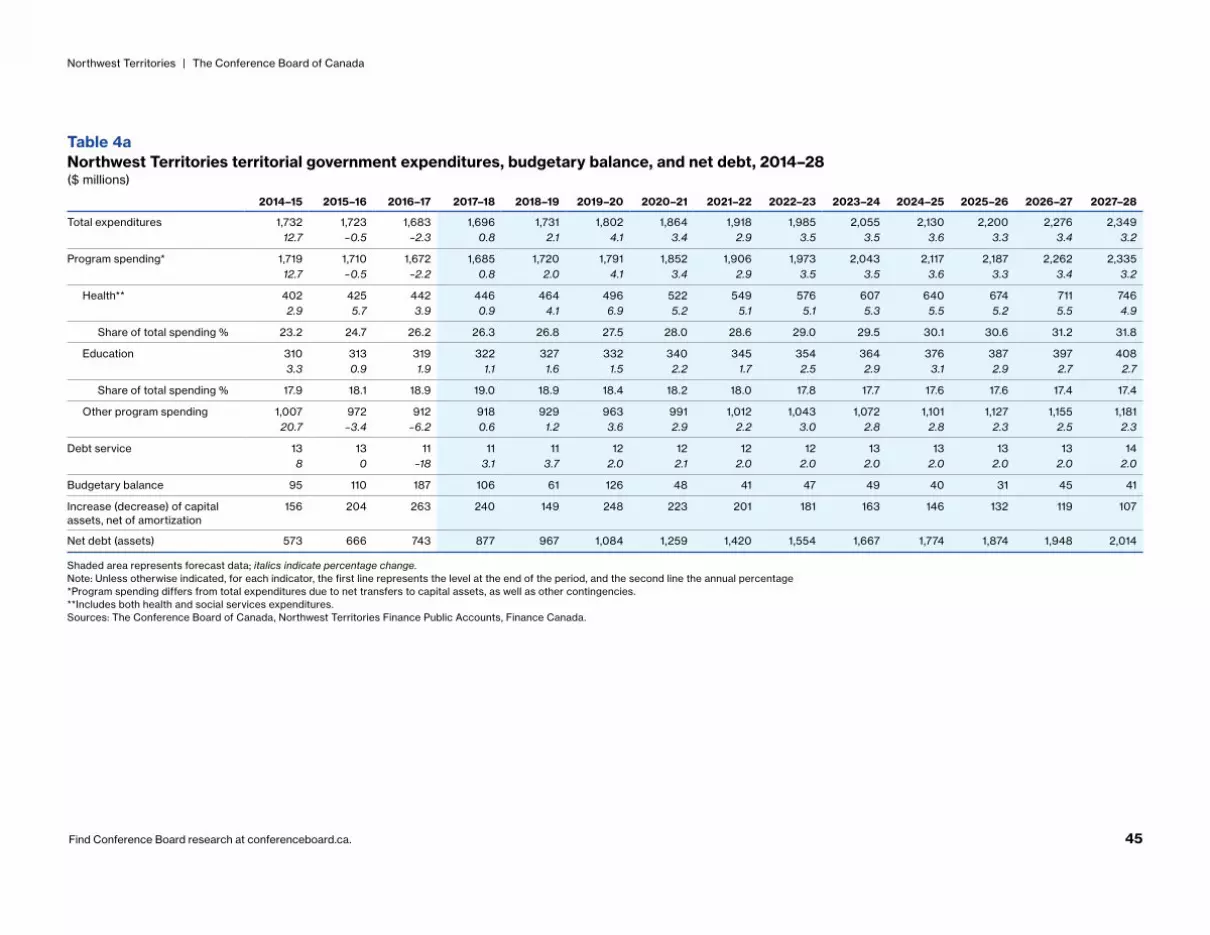
Find Conference Board research at conferenceboard.ca. 45
Northwest Territories | The Conference Board of Canada
Table 4aNorthwest Territories territorial government expenditures, budgetary balance, and net debt, 2014–28($ millions)
2014–15 2015–16 2016–17 2017–18 2018–19 2019–20 2020–21 2021–22 2022–23 2023–24 2024–25 2025–26 2026–27 2027–28
Total expenditures 1,732 1,723 1,683 1,696 1,731 1,802 1,864 1,918 1,985 2,055 2,130 2,200 2,276 2,34912.7 –0.5 –2.3 0.8 2.1 4.1 3.4 2.9 3.5 3.5 3.6 3.3 3.4 3.2
Program spending* 1,719 1,710 1,672 1,685 1,720 1,791 1,852 1,906 1,973 2,043 2,117 2,187 2,262 2,33512.7 –0.5 –2.2 0.8 2.0 4.1 3.4 2.9 3.5 3.5 3.6 3.3 3.4 3.2
Health** 402 425 442 446 464 496 522 549 576 607 640 674 711 7462.9 5.7 3.9 0.9 4.1 6.9 5.2 5.1 5.1 5.3 5.5 5.2 5.5 4.9
Share of total spending % 23.2 24.7 26.2 26.3 26.8 27.5 28.0 28.6 29.0 29.5 30.1 30.6 31.2 31.8
Education 310 313 319 322 327 332 340 345 354 364 376 387 397 4083.3 0.9 1.9 1.1 1.6 1.5 2.2 1.7 2.5 2.9 3.1 2.9 2.7 2.7
Share of total spending % 17.9 18.1 18.9 19.0 18.9 18.4 18.2 18.0 17.8 17.7 17.6 17.6 17.4 17.4
Other program spending 1,007 972 912 918 929 963 991 1,012 1,043 1,072 1,101 1,127 1,155 1,18120.7 –3.4 –6.2 0.6 1.2 3.6 2.9 2.2 3.0 2.8 2.8 2.3 2.5 2.3
Debt service 13 13 11 11 11 12 12 12 12 13 13 13 13 148 0 –18 3.1 3.7 2.0 2.1 2.0 2.0 2.0 2.0 2.0 2.0 2.0
Budgetary balance 95 110 187 106 61 126 48 41 47 49 40 31 45 41
Increase (decrease) of capital assets, net of amortization
156 204 263 240 149 248 223 201 181 163 146 132 119 107
Net debt (assets) 573 666 743 877 967 1,084 1,259 1,420 1,554 1,667 1,774 1,874 1,948 2,014
Shaded area represents forecast data; italics indicate percentage change.Note: Unless otherwise indicated, for each indicator, the first line represents the level at the end of the period, and the second line the annual percentage*Program spending differs from total expenditures due to net transfers to capital assets, as well as other contingencies. **Includes both health and social services expenditures.Sources: The Conference Board of Canada, Northwest Territories Finance Public Accounts, Finance Canada.
© The Conference Board of Canada. All rights reserved. Please contact cboc.ca/ip with questions or concerns about the use of this material.

Find Conference Board research at conferenceboard.ca. 46
Territorial Outlook Economic ForecastSummer 2019
Table 4bNorthwest Territories territorial government expenditures, budgetary balance, and net debt, 2028–41($ millions)
2028–29 2029–30 2030–31 2031–32 2032–33 2033–34 2034–35 2035–36 2036–37 2037–38 2038–39 2039–40 2040–41
Total expenditures 2,422 2,499 2,577 2,656 2,730 2,810 2,892 2,974 3,054 3,130 3,202 3,277 3,3523.1 3.2 3.1 3.1 2.8 2.9 2.9 2.9 2.7 2.5 2.3 2.3 2.3
Program spending* 2,408 2,485 2,563 2,642 2,715 2,794 2,876 2,958 3,037 3,113 3,185 3,259 3,3343.2 3.2 3.1 3.1 2.8 2.9 2.9 2.9 2.7 2.5 2.3 2.3 2.3
Health** 784 824 865 909 951 995 1,043 1,093 1,145 1,196 1,247 1,301 1,3585.1 5.1 5.0 5.1 4.6 4.7 4.8 4.8 4.7 4.5 4.3 4.4 4.3
Share of total spending % 32.4 33.0 33.5 34.2 34.8 35.4 36.1 36.8 37.5 38.2 38.9 39.7 40.5
Education 419 430 439 448 454 461 467 471 476 481 488 493 4992.7 2.6 2.2 2.0 1.5 1.5 1.3 0.9 1.1 1.1 1.3 1.2 1.2
Share of total spending % 17.3 17.2 17.0 16.9 16.6 16.4 16.2 15.8 15.6 15.4 15.2 15.1 14.9
Other program spending 1,206 1,231 1,259 1,285 1,310 1,338 1,366 1,394 1,416 1,436 1,451 1,465 1,4772.1 2.1 2.2 2.0 2.0 2.2 2.0 2.0 1.6 1.4 1.0 1.0 0.8
Debt service 14 14 15 15 15 15 16 16 16 17 17 17 182.0 2.0 2.0 2.0 2.0 2.0 2.0 2.0 2.0 2.0 2.0 2.0 2.0
Budgetary balance 19 26 34 37 37 48 52 58 34 14 –23 –5 –9
Increase (decrease) of capital assets, net of amortization
96 87 78 70 63 57 51 46 41 37 34 30 27
Net debt 2,091 2,151 2,194 2,228 2,254 2,263 2,262 2,250 2,258 2,281 2,337 2,372 2,408
Shaded area represents forecast data; italics indicate percentage change.Note: Unless otherwise indicated, for each indicator, the first line represents the level at the end of the period, and the second line the annual percentage*Program spending differs from total expenditures due to net transfers to capital assets, as well as other contingencies. **Includes both health and social services expenditures.Sources: The Conference Board of Canada, Northwest Territories Finance Public Accounts, Finance Canada.
For the exclusive use of Laurie Gravelines, [email protected], Northwest Territories Department of Finance.
Yukon
Weaker growth in Yukon this year but rebound expected in 2020
© The Conference Board of Canada. All rights reserved. Please contact cboc.ca/ip with questions or concerns about the use of this material.

Highlights• Economic growth in Yukon will slow this year but then rebound in 2020.
• New mines coming online will drive growth in 2020.
• The unemployment rate will remain well below 4.0 per cent over the forecast period, and labour shortages will become a problem.
• Wages will grow at an average annual pace of 3.0 per cent between now and 2025, much faster than inflation.
• Yukoners are older than their Northern neighbours, and domestic migration will account for most of the population growth over the forecast.
For the exclusive use of Laurie Gravelines, [email protected], Northwest Territories Department of Finance.
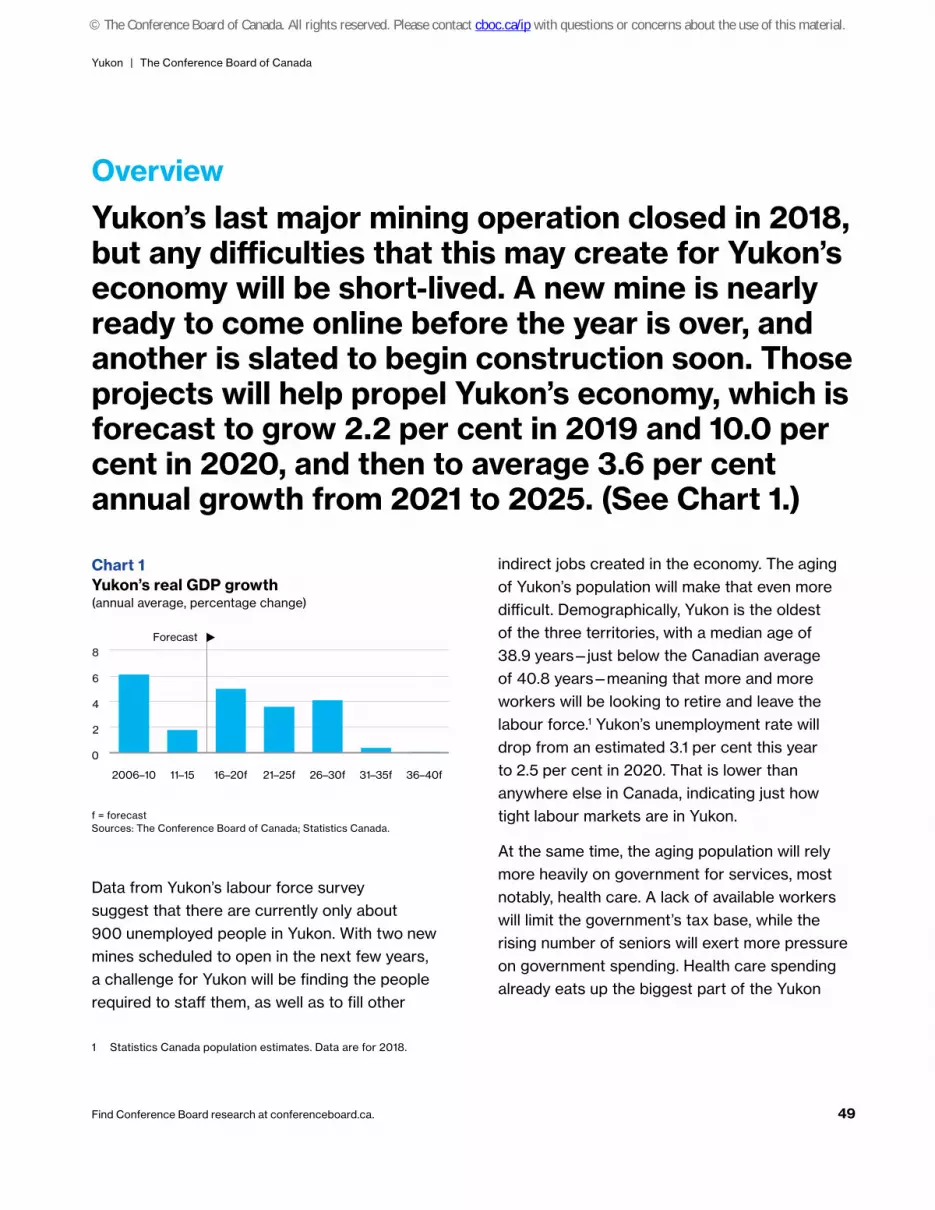
Find Conference Board research at conferenceboard.ca. 49
Yukon | The Conference Board of Canada
Overview
1 Statistics Canada population estimates. Data are for 2018.
Yukon’s last major mining operation closed in 2018, but any difficulties that this may create for Yukon’s economy will be short-lived. A new mine is nearly ready to come online before the year is over, and another is slated to begin construction soon. Those projects will help propel Yukon’s economy, which is forecast to grow 2.2 per cent in 2019 and 10.0 per cent in 2020, and then to average 3.6 per cent annual growth from 2021 to 2025. (See Chart 1.)
Data from Yukon’s labour force survey suggest that there are currently only about 900 unemployed people in Yukon. With two new mines scheduled to open in the next few years, a challenge for Yukon will be finding the people required to staff them, as well as to fill other
indirect jobs created in the economy. The aging of Yukon’s population will make that even more difficult. Demographically, Yukon is the oldest of the three territories, with a median age of 38.9 years—just below the Canadian average of 40.8 years—meaning that more and more workers will be looking to retire and leave the labour force.1 Yukon’s unemployment rate will drop from an estimated 3.1 per cent this year to 2.5 per cent in 2020. That is lower than anywhere else in Canada, indicating just how tight labour markets are in Yukon.
At the same time, the aging population will rely more heavily on government for services, most notably, health care. A lack of available workers will limit the government’s tax base, while the rising number of seniors will exert more pressure on government spending. Health care spending already eats up the biggest part of the Yukon
Chart 1Yukon’s real GDP growth(annual average, percentage change)
f = forecastSources: The Conference Board of Canada; Statistics Canada.
2006–10 11–15 16–20f 21–25f 26–30f 31–35f 36–40f
0
2
4
6
8Forecast
© The Conference Board of Canada. All rights reserved. Please contact cboc.ca/ip with questions or concerns about the use of this material.

Find Conference Board research at conferenceboard.ca. 50
Territorial Outlook Economic ForecastSummer 2019
government’s budget. And, with the territory’s population aging steadily, health care costs can only grow over the forecast period.
MiningMineral production slumped in the last few months of 2018, and this trend will continue in 2019 as well. The Minto gold and copper mine was the last remaining hardrock mine in the territory before it ceased production in October 2018. There will be no other large-scale mining operations in Yukon until Victoria Gold’s Eagle project begins operating in the second half of this year. Since 2010, Yukon’s mining production has been trending downward, including a drop of close to 30 per cent in 2018. However, the
2 Capstone Mining, “Capstone mining places Minto mine on temporary care and maintenance,” news release, October 11, 2018, https://capstonemining.com/news/news-details/2018/Capstone-Mining-Places-Minto-Mine-on-Temporary-Care-and-Maintenance/default.aspx.
opening of some new mines over the near and medium terms will lead to a strong rebound in activity. Real mineral production is expected to increase by 31.3 per cent this year and 81.1 per cent in 2020. (See Chart 2.)
Current operations
MintoPrior to the suspension of production in the fourth quarter of 2018, Capstone’s Minto mine was the only major mining operation in Yukon. The decision to suspend operations came after the mine’s sale to Pembridge Resources failed to pan out,2 and the company announced last October that it would transition the mine to care and maintenance. Minto produced 9,251 ounces of gold and 10,421 tonnes of copper in 2018, and its closure will hurt an otherwise bright year for the mining industry. When production ceased, the mine still had an estimated three years of operating life remaining, but we do not anticipate a return to full production over the forecast period.
Placer miningPlacer mining, which involves recovering gold from gravel and dirt that lies on the surface, contributes to Yukon’s economy, although the operations are small. We expect annual placer production in 2019 and beyond to be similar to the approximately 72,000 ounces of gold recovered in 2018.
Chart 2Mining industry gaining ground(2012 $ millions)
f = forecastSources: The Conference Board of Canada; Statistics Canada.
2015 16 17 18f 19f 20f 21f 22f 23f 24f
0
100
200
300
400
500
600
–60
–40
–20
0
20
40
60
Total mining (left) Percentage change (right)
Forecast
For the exclusive use of Laurie Gravelines, [email protected], Northwest Territories Department of Finance.
Find Conference Board research at conferenceboard.ca. 51
Yukon | The Conference Board of Canada
Developing projects
EagleConstruction is nearing completion at the Eagle Gold site, where owner Victoria Gold expects to pour its first gold bar in the second half of this year.3 The project will cause Yukon’s total mining output to surge by 81.1 per cent in 2020. The open pit operation will continue to ramp up its production to a peak of 213,000 ounces of gold per year in 2021–22.
CoffeeJust as construction at Eagle Gold begins winding down, Newmont Goldcorp plans to begin construction at its Coffee mine. Last year, Goldcorp signed a collaboration agreement with the Tr’ondëk Hwëch’in First Nation.4 This is an important step forward, as one of the major stumbling blocks for Goldcorp had been its consultations with First Nations. Newmont recently acquired Goldcorp and has promised to honour all agreements in place between Goldcorp and First Nations. Goldcorp had signalled its intentions to begin construction of a plant and access road sometime in 2019, with the mine turning out its first gold ingots about two years after that. In addition, infrastructure is an advantage here; the territorial and federal governments have committed a combined $360 million for projects in this area of Yukon.
Newmont Mining paid US$10 billion to acquire all of Goldcorp’s outstanding shares while, at the same time, dealing with a hostile takeover
3 Victoria Gold Corp, “Victoria Gold: Eagle Mine construction update, Dublin Gulch, Yukon,” news release, February 25, 2019.
4 Goldcorp Inc., “Tr’ondëk Hwëch’in and Goldcorp sign collaboration agreement,” news release, April 30, 2018.
5 Western Copper and Gold Corporation, Casino Project Form 43-101F1 Technical Report Feasibility Study (Tucson, AZ: M3 Engineering & Technology Corporation, January 2013).
bid from Barrick Gold. Barrick later withdrew its takeover bid. The new company—Newmont Goldcorp—says it still plans to begin commercial production at the Coffee mine in 2021.
CasinoBoth Eagle and Coffee will be dwarfed by the third and largest mine that will be constructed in Yukon. The Casino mine will employ 1,000 people at peak construction and 600 people at peak production and produce for 22 years. Construction costs are estimated at about US$2.45 billion,5 with building to begin in the early 2020s. After about five years of construction, Casino will begin producing in 2026. Over its lifetime, it will produce an average of 130 million pounds of copper annually, doubling the territory’s gold production.
Casino’s project application has been referred to a full panel review by the Yukon Environmental and Socio-Economic Assessment Board (YESAB), the first such review in the Board’s history. Western Copper and Gold now plans to submit its Environmental and Socio-economic Effects Statement to the YESAB by the end of 2019. Once received, the YESAB will establish a panel within one month. The YESAB processed 135 project applications in 2017 and has experience with routine reviews and smaller mineral development projects. But Casino’s unprecedented size and the complexity for the assessor mean that the project could face hurdles on the path to obtaining approval on a basis that is competitive with other leading mineral
© The Conference Board of Canada. All rights reserved. Please contact cboc.ca/ip with questions or concerns about the use of this material.

Find Conference Board research at conferenceboard.ca. 52
Territorial Outlook Economic ForecastSummer 2019
jurisdictions in terms of cost and timelines for review. As well, Western Copper and Gold will require time to finance and design the project. Consequently, the timing of the development of the Casino project remains uncertain.
ExplorationAfter hovering around the $100-million mark for four straight years, preliminary numbers from Natural Resources Canada’s survey of mineral exploration intentions show that Yukon’s exploration spending jumped to $169 million in 2017 and hit $186 million in 2018. However, exploration intentions are forecast to slow to $129 million in 2019. (See Chart 3.)
Precious metalsGold and silver prices slumped in the second half of 2018 but have trended upward since the beginning of 2019. Uncertainty in the global
6 Alexco Resource Corp., “Alexco Reports Second Quarter 2018 Results,” news release, August 13, 2018.
economy and the fact that the U.S. Federal Reserve is backing away from additional interest rate increases over the near term are the main factors behind the rebound in gold prices. This is encouraging for companies such as Golden Predator, which is in the early stages of developing its 3 Aces deposit and bringing back production at Brewery Creek. Although silver prices have not increased as much as gold prices since the start of this year current silver prices of around US$15 per ounce, could be enough to entice Alexco to revive the Keno Hill mine. Keno Hill shut down five years ago amid low commodity prices. The company had originally expected to deliver a pre-feasibility study by the end of 2018, but this has been postponed into this year due to permitting delays.6
Chart 3Mining exploration expected to decline($ millions)
p = preliminary estimatesi = spending intentionsSource: Natural Resources Canada, from the federal-provincial-territorial Survey of Mineral Exploration, Deposit Appraisal and Mine Complex Development Expenditures.
2005 06 07 08 09 10 11 12 13 14 15 16 17 18p 19i
0
100
200
300
400
For the exclusive use of Laurie Gravelines, [email protected], Northwest Territories Department of Finance.
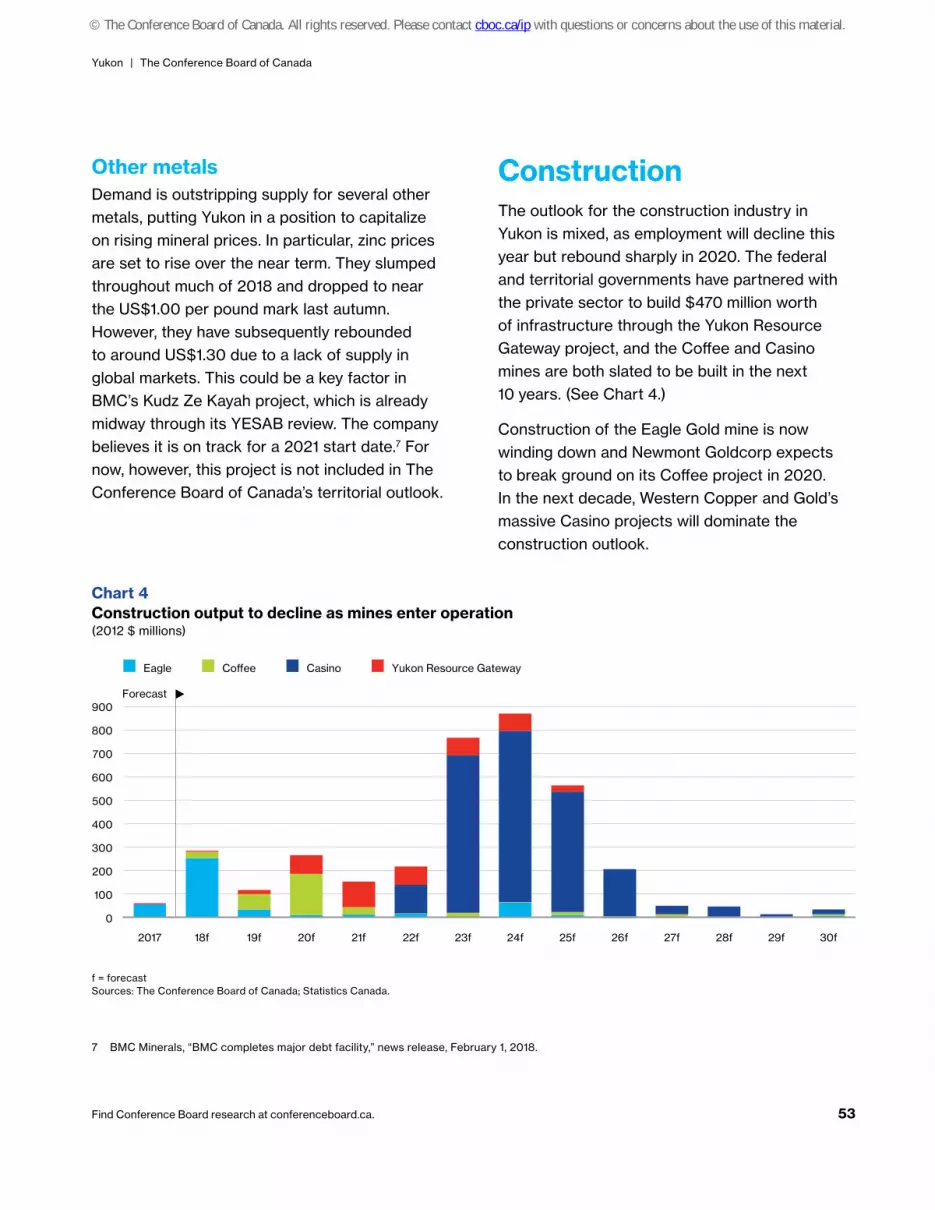
Find Conference Board research at conferenceboard.ca. 53
Yukon | The Conference Board of Canada
Other metalsDemand is outstripping supply for several other metals, putting Yukon in a position to capitalize on rising mineral prices. In particular, zinc prices are set to rise over the near term. They slumped throughout much of 2018 and dropped to near the US$1.00 per pound mark last autumn. However, they have subsequently rebounded to around US$1.30 due to a lack of supply in global markets. This could be a key factor in BMC’s Kudz Ze Kayah project, which is already midway through its YESAB review. The company believes it is on track for a 2021 start date.7 For now, however, this project is not included in The Conference Board of Canada’s territorial outlook.
7 BMC Minerals, “BMC completes major debt facility,” news release, February 1, 2018.
ConstructionThe outlook for the construction industry in Yukon is mixed, as employment will decline this year but rebound sharply in 2020. The federal and territorial governments have partnered with the private sector to build $470 million worth of infrastructure through the Yukon Resource Gateway project, and the Coffee and Casino mines are both slated to be built in the next 10 years. (See Chart 4.)
Construction of the Eagle Gold mine is now winding down and Newmont Goldcorp expects to break ground on its Coffee project in 2020. In the next decade, Western Copper and Gold’s massive Casino projects will dominate the construction outlook.
Chart 4Construction output to decline as mines enter operation(2012 $ millions)
f = forecastSources: The Conference Board of Canada; Statistics Canada.
2017 18f 19f 20f 21f 22f 23f 24f 25f 26f 27f 28f 29f 30f
0
100
200
300
400
500
600
700
800
900
Eagle Co�ee Casino Yukon Resource Gateway
Forecast
© The Conference Board of Canada. All rights reserved. Please contact cboc.ca/ip with questions or concerns about the use of this material.
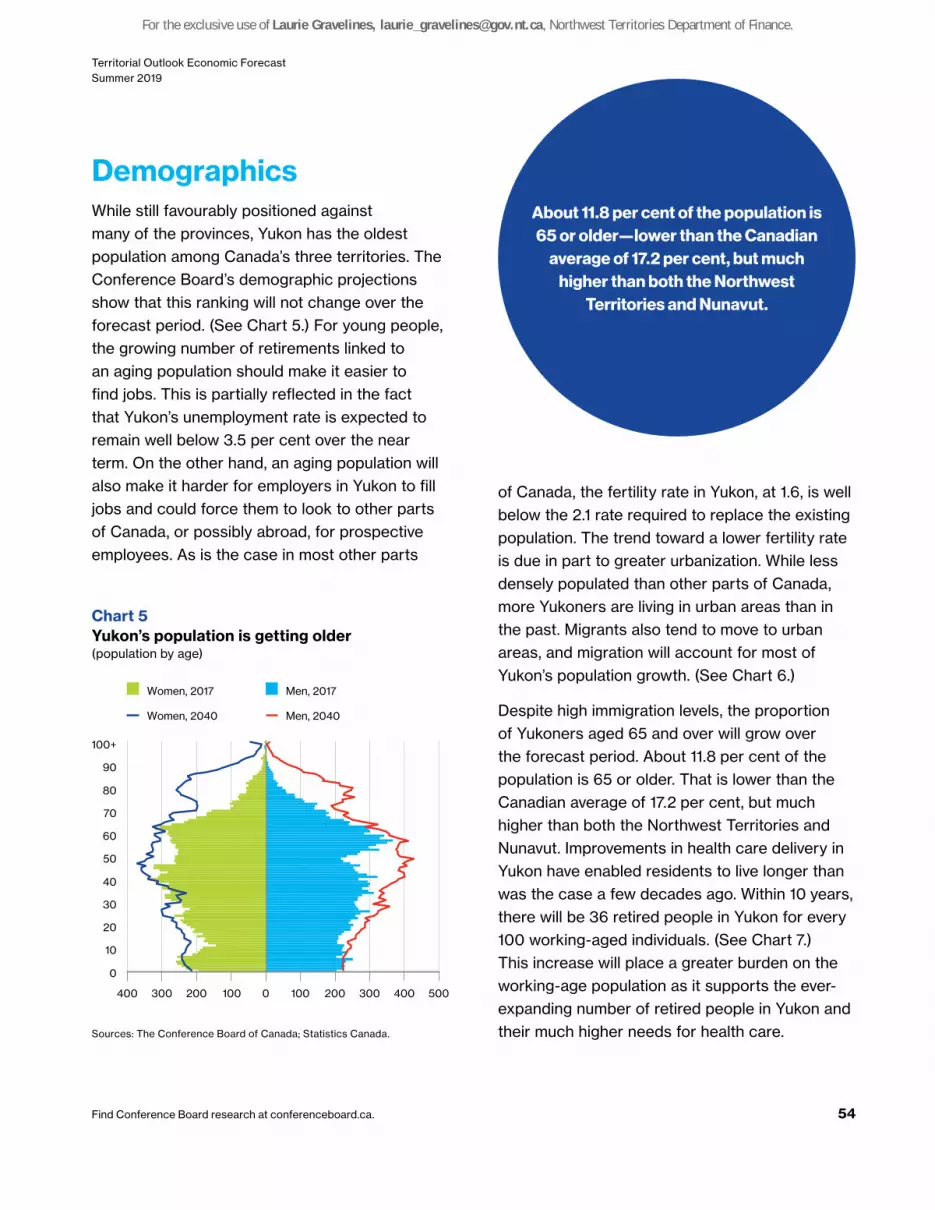
Find Conference Board research at conferenceboard.ca. 54
Territorial Outlook Economic ForecastSummer 2019
DemographicsWhile still favourably positioned against many of the provinces, Yukon has the oldest population among Canada’s three territories. The Conference Board’s demographic projections show that this ranking will not change over the forecast period. (See Chart 5.) For young people, the growing number of retirements linked to an aging population should make it easier to find jobs. This is partially reflected in the fact that Yukon’s unemployment rate is expected to remain well below 3.5 per cent over the near term. On the other hand, an aging population will also make it harder for employers in Yukon to fill jobs and could force them to look to other parts of Canada, or possibly abroad, for prospective employees. As is the case in most other parts
of Canada, the fertility rate in Yukon, at 1.6, is well below the 2.1 rate required to replace the existing population. The trend toward a lower fertility rate is due in part to greater urbanization. While less densely populated than other parts of Canada, more Yukoners are living in urban areas than in the past. Migrants also tend to move to urban areas, and migration will account for most of Yukon’s population growth. (See Chart 6.)
Despite high immigration levels, the proportion of Yukoners aged 65 and over will grow over the forecast period. About 11.8 per cent of the population is 65 or older. That is lower than the Canadian average of 17.2 per cent, but much higher than both the Northwest Territories and Nunavut. Improvements in health care delivery in Yukon have enabled residents to live longer than was the case a few decades ago. Within 10 years, there will be 36 retired people in Yukon for every 100 working-aged individuals. (See Chart 7.) This increase will place a greater burden on the working-age population as it supports the ever-expanding number of retired people in Yukon and their much higher needs for health care.
Chart 5Yukon’s population is getting older(population by age)
Sources: The Conference Board of Canada; Statistics Canada.
0
10
20
30
40
50
60
70
80
90
100+
400 300 200 100 0 100 200 300 400 500
Men, 2017
Men, 2040
Women, 2017
Women, 2040
About 11.8 per cent of the population is 65 or older—lower than the Canadian
average of 17.2 per cent, but much higher than both the Northwest
Territories and Nunavut.
For the exclusive use of Laurie Gravelines, [email protected], Northwest Territories Department of Finance.

Find Conference Board research at conferenceboard.ca. 55
Yukon | The Conference Board of Canada
Chart 6Migration accounts for most of Yukon’s population growth(contribution to population growth, annual average)
f = forecastSources: The Conference Board of Canada; Statistics Canada.
2001–05 06–10 11–15 16–20f 21–25f 26–30f 31–35f 36–40f
–400
–200
0
200
400
600
800
1,000
Natural population change Net international migration Net domestic migration
Forecast
Chart 7Dependency ratios, Yukon(number of dependants per 100 population of working age)
f = forecastSources: The Conference Board of Canada; Statistics Canada.
2015 17 19f 21f 23f 25f 27f 29f 31f 33f 35f 37f 39f16 18f 20f 22f 24f 26f 28f 30f 32f 34f 36f 38f 40f
0
20
40
60
80
Youth Seniors
Forecast
© The Conference Board of Canada. All rights reserved. Please contact cboc.ca/ip with questions or concerns about the use of this material.
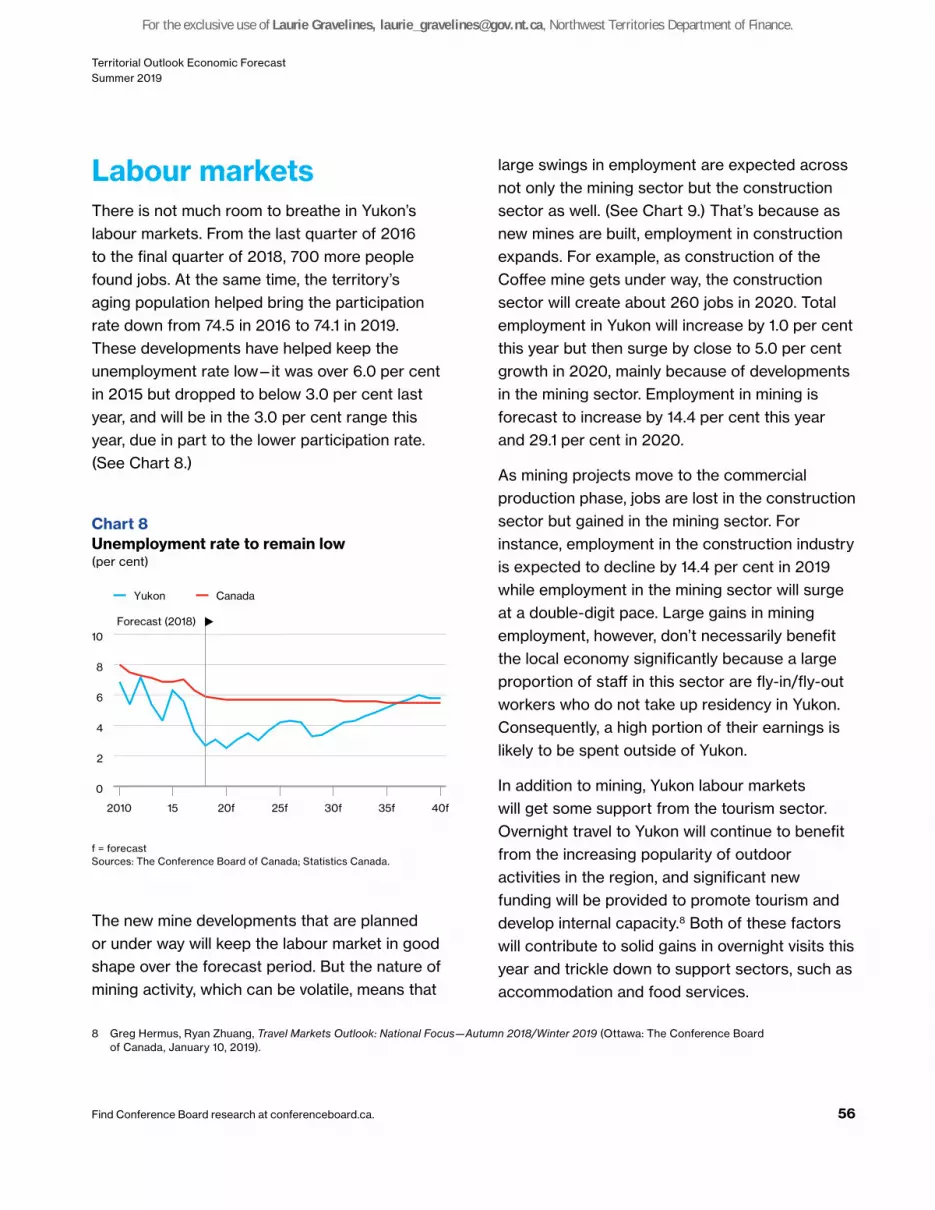
Find Conference Board research at conferenceboard.ca. 56
Territorial Outlook Economic ForecastSummer 2019
Labour marketsThere is not much room to breathe in Yukon’s labour markets. From the last quarter of 2016 to the final quarter of 2018, 700 more people found jobs. At the same time, the territory’s aging population helped bring the participation rate down from 74.5 in 2016 to 74.1 in 2019. These developments have helped keep the unemployment rate low—it was over 6.0 per cent in 2015 but dropped to below 3.0 per cent last year, and will be in the 3.0 per cent range this year, due in part to the lower participation rate. (See Chart 8.)
The new mine developments that are planned or under way will keep the labour market in good shape over the forecast period. But the nature of mining activity, which can be volatile, means that
8 Greg Hermus, Ryan Zhuang, Travel Markets Outlook: National Focus—Autumn 2018/Winter 2019 (Ottawa: The Conference Board of Canada, January 10, 2019).
large swings in employment are expected across not only the mining sector but the construction sector as well. (See Chart 9.) That’s because as new mines are built, employment in construction expands. For example, as construction of the Coffee mine gets under way, the construction sector will create about 260 jobs in 2020. Total employment in Yukon will increase by 1.0 per cent this year but then surge by close to 5.0 per cent growth in 2020, mainly because of developments in the mining sector. Employment in mining is forecast to increase by 14.4 per cent this year and 29.1 per cent in 2020.
As mining projects move to the commercial production phase, jobs are lost in the construction sector but gained in the mining sector. For instance, employment in the construction industry is expected to decline by 14.4 per cent in 2019 while employment in the mining sector will surge at a double-digit pace. Large gains in mining employment, however, don’t necessarily benefit the local economy significantly because a large proportion of staff in this sector are fly-in/fly-out workers who do not take up residency in Yukon. Consequently, a high portion of their earnings is likely to be spent outside of Yukon.
In addition to mining, Yukon labour markets will get some support from the tourism sector. Overnight travel to Yukon will continue to benefit from the increasing popularity of outdoor activities in the region, and significant new funding will be provided to promote tourism and develop internal capacity.8 Both of these factors will contribute to solid gains in overnight visits this year and trickle down to support sectors, such as accommodation and food services.
Chart 8Unemployment rate to remain low(per cent)
f = forecastSources: The Conference Board of Canada; Statistics Canada.
2010 15 20f 25f 30f 35f 40f
0
2
4
6
8
10Forecast (2018)
Yukon Canada
For the exclusive use of Laurie Gravelines, [email protected], Northwest Territories Department of Finance.

Find Conference Board research at conferenceboard.ca. 57
Yukon | The Conference Board of Canada
Overall, Yukon’s unemployment rate will stay below 4 per cent over the near and medium terms, and this will put upward pressure on wages. Wages and salaries per employee are forecast to increase by 2.6 per cent this year and 4.3 per cent in 2020. Average wages and salaries per employee will grow at a more rapid pace than inflation through the medium term, implying that residents of Yukon should have more discretionary income to spend. (See Chart 10.)
Public accountsThe strong economic growth expected in Yukon will benefit the government’s balance sheet over the forecast period. Although Yukon’s population is the oldest of the three territories, the opening of three new mines will attract new workers and lift the territorial economy. As such, steady gains in employment and wages will arrive at the same time as the steady rise in health care costs that come with a growing and aging population. On net, the fiscal health of the territory is positive. (See Chart 11.)
Between now and 2030, revenues will grow faster than spending. Most of Yukon’s budget comes from federal transfers under the Territorial Financing Formula, which will get a boost from population growth. Own-source revenues, which currently make up around 15 per cent of government revenues, will grow at a faster clip and make up over 18 per cent of revenues by 2030. Most of the growth here comes from strong gains in corporate taxation and in personal income taxes from the stronger wage and employment gains.
Chart 9Employment growth by industry, Yukon(change in employment, 000s)
f = forecastSources: The Conference Board of Canada; Statistics Canada.
2017 18f 19f 20f 21f 22f 23f 24f 25f 26f
–0.6
–0.4
–0.2
0
0.2
0.4
0.6
0.8
1.0
1.2Forecast
Mining
Construction
Other goods-producing industries
Services
Chart 10Wages will post solid growth(per cent)
f = forecastSources: The Conference Board of Canada; Statistics Canada.
2006–10 11–15 16–20f 21–25f 26–30f 31–35f 36–40f
0
2
4
6
8
3
4
5
6
7Forecast
Wages and salaries per employee (left)
Inflation (left)
Unemployment rate (right)
© The Conference Board of Canada. All rights reserved. Please contact cboc.ca/ip with questions or concerns about the use of this material.

Find Conference Board research at conferenceboard.ca. 58
Territorial Outlook Economic ForecastSummer 2019
The aging of Yukon’s population will have effects on government spending priorities. As is typical with an aging population, spending shifts from education to health care. Over the next decade, health care will grow at an annual pace of around 4.5 per cent, while education will grow by just
under 4 per cent. By 2030, health care spending will eat up 37.5 per cent of the government’s revenues, which is more than five percentage points higher than what is expected in 2018–19. (See Chart 12.)
Chart 11Yukon’s budget balance{$ millions)
f = forecastSources: The Conference Board of Canada; Finance Yukon.
2010 11 12 13 14 15 16 17 18f 19f 20f 21f 22f 23f 24f 25f 26f 27f 28f 29f 30f
–20
0
20
40
60
80
100
120Forecast
Chart 12Health care costs will rise(average annual increase, per cent)
f = forecastSources: The Conference Board of Canada; Yukon Department of Finance.
2001–05 06–10 11–15 16–20f 21–25f 26–30f 31–35f 36–40f
0
2
4
6
8
10
Health Other programsEducation Revenues
Forecast
For the exclusive use of Laurie Gravelines, [email protected], Northwest Territories Department of Finance.

Find Conference Board research at conferenceboard.ca. 59
Yukon | The Conference Board of Canada
Table 1aKey economic indicators: Yukon, 2014–27(forecast completed March 18, 2019)
2014 2015 2016 2017 2018 2019 2020 2021 2022 2023 2024 2025 2026 2027
GDP at basic prices (2012 $ millions) 2,510 2,319 2,481 2,553 2,627 2,685 2,953 3,110 3,257 3,481 3,575 3,530 3,641 3,9690.6 –7.6 7.0 2.9 2.9 2.2 10.0 5.3 4.7 6.9 2.7 –1.3 3.2 9.0
GDP at market prices ($ millions) 2,744 2,632 2,715 2,895 3,029 3,148 3,522 3,774 4,020 4,369 4,565 4,584 4,810 5,3343.5 –4.1 3.2 6.6 4.6 3.9 11.9 7.2 6.5 8.7 4.5 0.4 4.9 10.9
Consumer price index, Whitehorse 1.24 1.24 1.25 1.28 1.31 1.33 1.36 1.39 1.42 1.45 1.48 1.51 1.54 1.57(2002 = 1.00) 1.3 –0.2 1.1 1.7 2.4 2.1 2.1 2.0 2.0 2.0 2.0 2.1 2.1 2.0
Wages and salary per employee ($ 000s) 61 62 61 63 65 67 69 72 74 76 78 80 83 86–2.1 1.9 –0.6 2.3 3.3 2.6 4.3 3.5 2.8 2.8 2.2 2.6 3.9 4.7
Primary household income ($ millions) 1,738 1,810 1,856 1,987 2,070 2,148 2,336 2,466 2,609 2,797 2,926 2,998 3,125 3,3263.6 4.1 2.5 7.1 4.2 3.8 8.7 5.6 5.8 7.2 4.6 2.5 4.2 6.4
Household disposable income ($ millions) 1,485 1,559 1,620 1,742 1,806 1,873 2,017 2,127 2,246 2,393 2,505 2,579 2,688 2,8474.3 5.0 3.9 7.5 3.7 3.7 7.7 5.5 5.6 6.5 4.7 2.9 4.2 5.9
Household savings rate (per cent) 18 20 19 22 22 22 23 23 23 23 23 23 23 23
Population (000s) 37.137 37.690 38.547 39.628 40.476 41.165 41.879 42.531 43.267 44.004 44.803 45.607 46.395 47.0811.7 1.5 2.3 2.8 2.1 1.7 1.7 1.6 1.7 1.7 1.8 1.8 1.7 1.5
Labour force (000s) 20.692 20.710 21.395 22.003 21.900 22.204 23.166 23.689 24.370 25.395 26.021 25.940 26.017 26.5601.5 0.1 3.3 2.8 –0.5 1.4 4.3 2.3 2.9 4.2 2.5 –0.3 0.3 2.1
Employment (000s) 19.800 19.400 20.200 21.200 21.300 21.523 22.587 22.948 23.510 24.633 25.050 24.842 24.897 25.4562.6 –2.0 4.1 5.0 0.5 1.0 4.9 1.6 2.4 4.8 1.7 –0.8 0.2 2.2
Unemployment rate (per cent) 4.3 6.3 5.6 3.6 2.7 3.1 2.5 3.1 3.5 3.0 3.7 4.2 4.3 4.2
Retail sales ($ millions) 663 698 751 800 834 848 911 959 1,010 1,074 1,123 1,156 1,205 1,2771.6 5.2 7.7 6.4 4.3 1.7 7.4 5.2 5.3 6.4 4.6 2.9 4.2 6.0
Shaded area represents forecast data; italics indicate percentage change. Sources: The Conference Board of Canada; Statistics Canada.
© The Conference Board of Canada. All rights reserved. Please contact cboc.ca/ip with questions or concerns about the use of this material.

Find Conference Board research at conferenceboard.ca. 60
Territorial Outlook Economic ForecastSummer 2019
Table 1bKey economic indicators: Yukon, 2028–40(forecast completed March 18, 2019)
2028 2029 2030 2031 2032 2033 2034 2035 2036 2037 2038 2039 2040
GDP at basic prices (2012 $ millions) 4,549 4,521 4,319 4,153 4,248 4,316 4,371 4,415 4,401 4,429 4,406 4,440 4,43814.6 –0.6 –4.5 –3.8 2.3 1.6 1.3 1.0 –0.3 0.6 –0.5 0.8 0.0
GDP at market prices ($ millions) 6,220 6,288 6,110 5,976 6,216 6,426 6,618 6,799 6,894 7,057 7,140 7,319 7,44116.6 1.1 –2.8 –2.2 4.0 3.4 3.0 2.7 1.4 2.4 1.2 2.5 1.7
Consumer price index, Whitehorse 1.60 1.63 1.67 1.70 1.74 1.77 1.81 1.84 1.88 1.92 1.96 2.00 2.04(2002 = 1.00) 2.0 2.1 2.1 2.1 2.0 2.0 2.0 2.0 2.0 2.0 2.0 2.0 2.0
Wages and salary per employee ($ 000s) 91 94 95 96 99 101 104 106 109 111 114 117 1205.7 2.3 1.1 1.4 2.8 2.6 2.5 2.5 2.1 2.5 2.1 2.8 2.7
Primary household income ($ millions) 3,614 3,711 3,745 3,783 3,906 4,019 4,125 4,226 4,316 4,420 4,506 4,621 4,7178.6 2.7 0.9 1.0 3.3 2.9 2.6 2.5 2.1 2.4 2.0 2.5 2.1
Household disposable income ($ millions) 3,059 3,145 3,192 3,237 3,340 3,436 3,527 3,614 3,694 3,783 3,860 3,948 4,0267.4 2.8 1.5 1.4 3.2 2.9 2.6 2.5 2.2 2.4 2.0 2.3 2.0
Household savings rate (per cent) 23 23 23 23 23 24 24 24 24 24 24 24 25
Population (000s) 47.792 48.444 49.006 49.349 49.554 49.708 49.804 49.787 49.710 49.594 49.409 49.165 48.8721.5 1.4 1.2 0.7 0.4 0.3 0.2 0.0 –0.2 –0.2 –0.4 –0.5 –0.6
Labour force (000s) 27.375 27.350 27.127 26.832 26.951 27.010 27.019 26.982 26.924 26.858 26.740 26.566 26.3123.1 –0.1 –0.8 –1.1 0.4 0.2 0.0 –0.1 –0.2 –0.2 –0.4 –0.7 –1.0
Employment (000s) 26.473 26.421 26.084 25.717 25.789 25.772 25.699 25.584 25.451 25.328 25.143 25.013 24.7734.0 –0.2 –1.3 –1.4 0.3 –0.1 –0.3 –0.4 –0.5 –0.5 –0.7 –0.5 –1.0
Unemployment rate (per cent) 3.3 3.4 3.8 4.2 4.3 4.6 4.9 5.2 5.5 5.7 6.0 5.8 5.8
Retail sales ($ millions) 1,373 1,411 1,431 1,451 1,497 1,539 1,579 1,617 1,652 1,690 1,723 1,760 1,7937.5 2.8 1.4 1.4 3.1 2.8 2.6 2.4 2.1 2.3 1.9 2.2 1.9
Shaded area represents forecast data; italics indicate percentage change. Sources: The Conference Board of Canada; Statistics Canada.
For the exclusive use of Laurie Gravelines, [email protected], Northwest Territories Department of Finance.
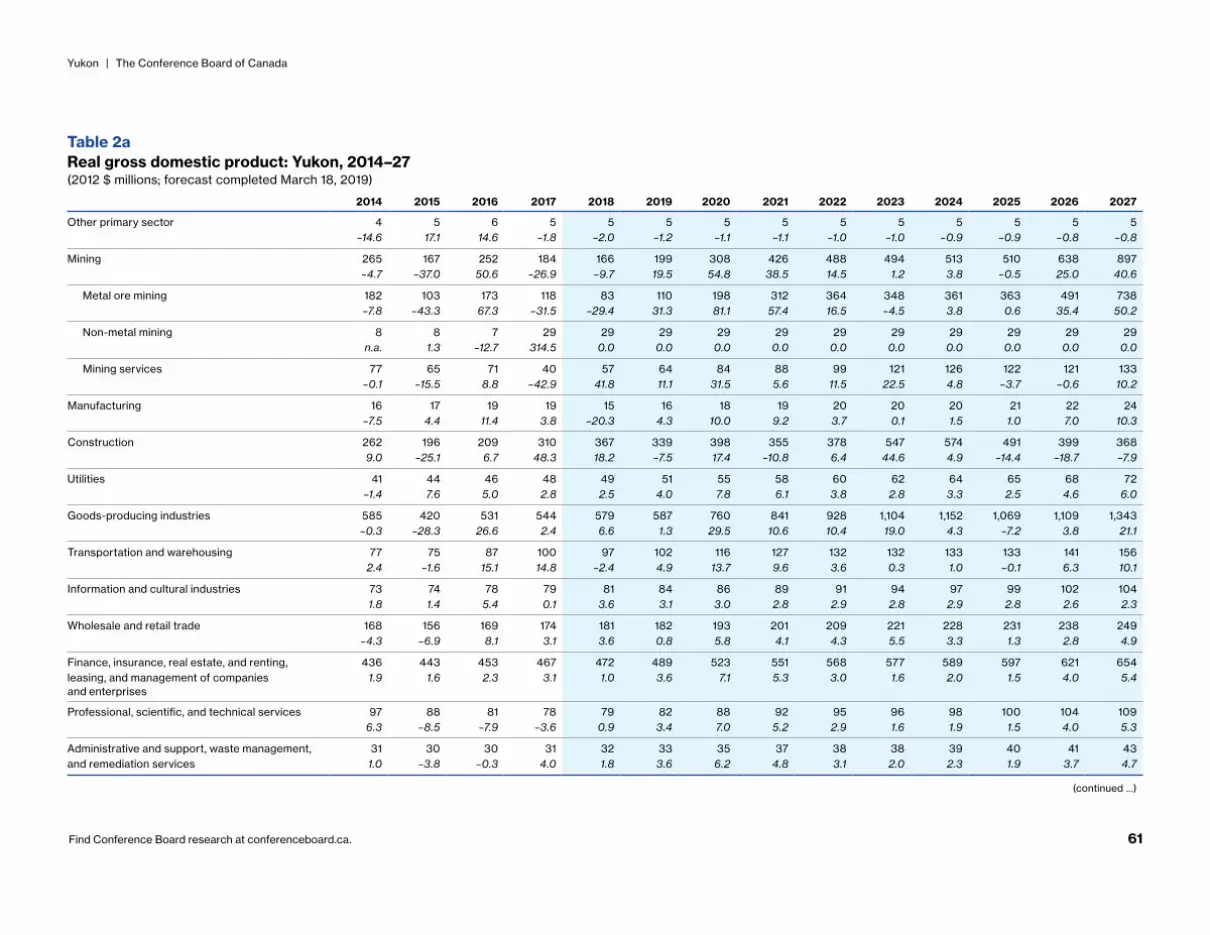
Find Conference Board research at conferenceboard.ca. 61
Yukon | The Conference Board of Canada
Table 2aReal gross domestic product: Yukon, 2014–27(2012 $ millions; forecast completed March 18, 2019)
2014 2015 2016 2017 2018 2019 2020 2021 2022 2023 2024 2025 2026 2027
Other primary sector 4 5 6 5 5 5 5 5 5 5 5 5 5 5–14.6 17.1 14.6 –1.8 –2.0 –1.2 –1.1 –1.1 –1.0 –1.0 –0.9 –0.9 –0.8 –0.8
Mining 265 167 252 184 166 199 308 426 488 494 513 510 638 897–4.7 –37.0 50.6 –26.9 –9.7 19.5 54.8 38.5 14.5 1.2 3.8 –0.5 25.0 40.6
Metal ore mining 182 103 173 118 83 110 198 312 364 348 361 363 491 738–7.8 –43.3 67.3 –31.5 –29.4 31.3 81.1 57.4 16.5 –4.5 3.8 0.6 35.4 50.2
Non-metal mining 8 8 7 29 29 29 29 29 29 29 29 29 29 29n.a. 1.3 –12.7 314.5 0.0 0.0 0.0 0.0 0.0 0.0 0.0 0.0 0.0 0.0
Mining services 77 65 71 40 57 64 84 88 99 121 126 122 121 133–0.1 –15.5 8.8 –42.9 41.8 11.1 31.5 5.6 11.5 22.5 4.8 –3.7 –0.6 10.2
Manufacturing 16 17 19 19 15 16 18 19 20 20 20 21 22 24–7.5 4.4 11.4 3.8 –20.3 4.3 10.0 9.2 3.7 0.1 1.5 1.0 7.0 10.3
Construction 262 196 209 310 367 339 398 355 378 547 574 491 399 3689.0 –25.1 6.7 48.3 18.2 –7.5 17.4 –10.8 6.4 44.6 4.9 –14.4 –18.7 –7.9
Utilities 41 44 46 48 49 51 55 58 60 62 64 65 68 72–1.4 7.6 5.0 2.8 2.5 4.0 7.8 6.1 3.8 2.8 3.3 2.5 4.6 6.0
Goods-producing industries 585 420 531 544 579 587 760 841 928 1,104 1,152 1,069 1,109 1,343–0.3 –28.3 26.6 2.4 6.6 1.3 29.5 10.6 10.4 19.0 4.3 –7.2 3.8 21.1
Transportation and warehousing 77 75 87 100 97 102 116 127 132 132 133 133 141 1562.4 –1.6 15.1 14.8 –2.4 4.9 13.7 9.6 3.6 0.3 1.0 –0.1 6.3 10.1
Information and cultural industries 73 74 78 79 81 84 86 89 91 94 97 99 102 1041.8 1.4 5.4 0.1 3.6 3.1 3.0 2.8 2.9 2.8 2.9 2.8 2.6 2.3
Wholesale and retail trade 168 156 169 174 181 182 193 201 209 221 228 231 238 249–4.3 –6.9 8.1 3.1 3.6 0.8 5.8 4.1 4.3 5.5 3.3 1.3 2.8 4.9
Finance, insurance, real estate, and renting, 436 443 453 467 472 489 523 551 568 577 589 597 621 654leasing, and management of companies and enterprises
1.9 1.6 2.3 3.1 1.0 3.6 7.1 5.3 3.0 1.6 2.0 1.5 4.0 5.4
Professional, scientific, and technical services 97 88 81 78 79 82 88 92 95 96 98 100 104 1096.3 –8.5 –7.9 –3.6 0.9 3.4 7.0 5.2 2.9 1.6 1.9 1.5 4.0 5.3
Administrative and support, waste management, 31 30 30 31 32 33 35 37 38 38 39 40 41 43and remediation services 1.0 –3.8 –0.3 4.0 1.8 3.6 6.2 4.8 3.1 2.0 2.3 1.9 3.7 4.7
(continued …)
© The Conference Board of Canada. All rights reserved. Please contact cboc.ca/ip with questions or concerns about the use of this material.

Find Conference Board research at conferenceboard.ca. 62
Territorial Outlook Economic ForecastSummer 2019
Table 2a (cont’d)Real gross domestic product: Yukon, 2014–27(2012 $ millions; forecast completed March 18, 2019)
2014 2015 2016 2017 2018 2019 2020 2021 2022 2023 2024 2025 2026 2027
Arts, entertainment, and recreation 12 11 12 12 12 12 12 12 12 13 13 13 13 132.6 –5.1 3.6 3.4 1.0 0.6 0.6 0.5 0.8 0.9 1.1 1.3 1.3 1.1
Accommodation and food services 75 75 76 78 78 80 84 87 88 89 90 91 93 97–3.6 –0.3 1.7 2.2 0.3 2.2 4.9 3.6 1.9 0.9 1.2 0.9 2.7 3.7
Other services 38 35 35 35 35 35 35 36 36 36 37 37 38 38–0.8 –8.2 –0.3 –0.9 1.2 0.8 0.8 0.7 0.9 0.9 1.0 1.1 1.0 0.8
Educational services 130 131 133 134 138 140 142 143 145 146 147 147 149 1502.0 0.7 1.6 0.2 3.0 2.0 1.4 0.4 1.7 0.8 0.3 0.3 0.9 1.0
Health care and social assistance 209 210 218 226 236 245 256 265 275 285 294 303 311 3192.1 0.8 3.9 3.4 4.8 3.7 4.4 3.6 3.5 3.6 3.2 3.1 2.8 2.6
Public administration 580 583 581 600 610 617 625 634 643 653 662 673 684 6960.7 0.4 –0.3 3.3 1.6 1.1 1.4 1.4 1.5 1.5 1.5 1.6 1.7 1.6
Services-producing industries 1,928 1,915 1,956 2,016 2,054 2,104 2,199 2,276 2,335 2,383 2,430 2,467 2,539 2,6321.0 –0.6 2.1 3.1 1.9 2.4 4.5 3.5 2.6 2.0 1.9 1.6 2.9 3.7
GDP 2,510 2,319 2,481 2,553 2,627 2,685 2,953 3,110 3,257 3,481 3,575 3,530 3,641 3,9690.6 –7.6 7.0 2.9 2.9 2.2 10.0 5.3 4.7 6.9 2.7 –1.3 3.2 9.0
Shaded area represents forecast data; italics indicate percentage change.All data are seasonally adjusted at annual rates.Sources: The Conference Board of Canada; Statistics Canada.
For the exclusive use of Laurie Gravelines, [email protected], Northwest Territories Department of Finance.
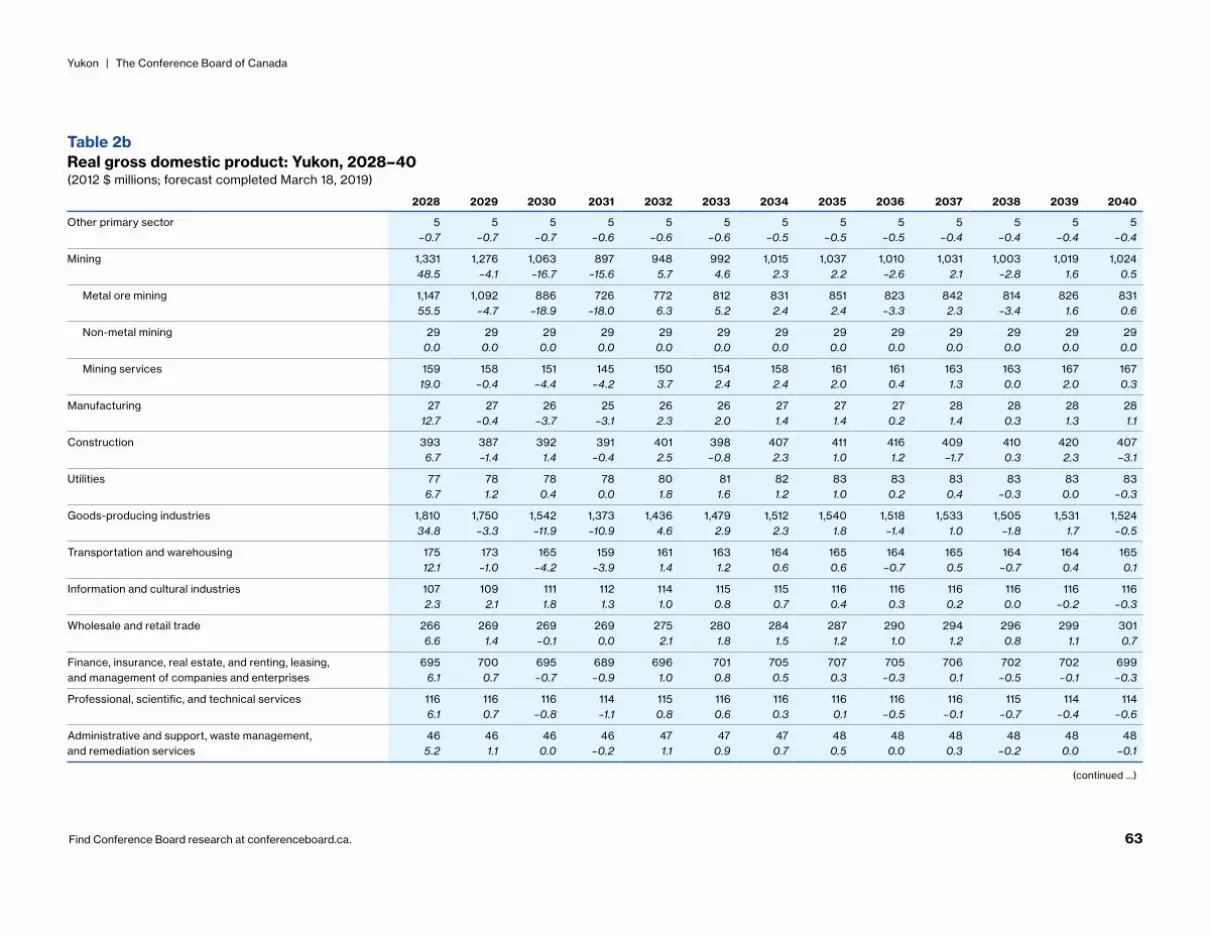
Find Conference Board research at conferenceboard.ca. 63
Yukon | The Conference Board of Canada
Table 2bReal gross domestic product: Yukon, 2028–40(2012 $ millions; forecast completed March 18, 2019)
2028 2029 2030 2031 2032 2033 2034 2035 2036 2037 2038 2039 2040
Other primary sector 5 5 5 5 5 5 5 5 5 5 5 5 5–0.7 –0.7 –0.7 –0.6 –0.6 –0.6 –0.5 –0.5 –0.5 –0.4 –0.4 –0.4 –0.4
Mining 1,331 1,276 1,063 897 948 992 1,015 1,037 1,010 1,031 1,003 1,019 1,02448.5 –4.1 –16.7 –15.6 5.7 4.6 2.3 2.2 –2.6 2.1 –2.8 1.6 0.5
Metal ore mining 1,147 1,092 886 726 772 812 831 851 823 842 814 826 83155.5 –4.7 –18.9 –18.0 6.3 5.2 2.4 2.4 –3.3 2.3 –3.4 1.6 0.6
Non-metal mining 29 29 29 29 29 29 29 29 29 29 29 29 290.0 0.0 0.0 0.0 0.0 0.0 0.0 0.0 0.0 0.0 0.0 0.0 0.0
Mining services 159 158 151 145 150 154 158 161 161 163 163 167 16719.0 –0.4 –4.4 –4.2 3.7 2.4 2.4 2.0 0.4 1.3 0.0 2.0 0.3
Manufacturing 27 27 26 25 26 26 27 27 27 28 28 28 2812.7 –0.4 –3.7 –3.1 2.3 2.0 1.4 1.4 0.2 1.4 0.3 1.3 1.1
Construction 393 387 392 391 401 398 407 411 416 409 410 420 4076.7 –1.4 1.4 –0.4 2.5 –0.8 2.3 1.0 1.2 –1.7 0.3 2.3 –3.1
Utilities 77 78 78 78 80 81 82 83 83 83 83 83 836.7 1.2 0.4 0.0 1.8 1.6 1.2 1.0 0.2 0.4 –0.3 0.0 –0.3
Goods-producing industries 1,810 1,750 1,542 1,373 1,436 1,479 1,512 1,540 1,518 1,533 1,505 1,531 1,52434.8 –3.3 –11.9 –10.9 4.6 2.9 2.3 1.8 –1.4 1.0 –1.8 1.7 –0.5
Transportation and warehousing 175 173 165 159 161 163 164 165 164 165 164 164 16512.1 –1.0 –4.2 –3.9 1.4 1.2 0.6 0.6 –0.7 0.5 –0.7 0.4 0.1
Information and cultural industries 107 109 111 112 114 115 115 116 116 116 116 116 1162.3 2.1 1.8 1.3 1.0 0.8 0.7 0.4 0.3 0.2 0.0 –0.2 –0.3
Wholesale and retail trade 266 269 269 269 275 280 284 287 290 294 296 299 3016.6 1.4 –0.1 0.0 2.1 1.8 1.5 1.2 1.0 1.2 0.8 1.1 0.7
Finance, insurance, real estate, and renting, leasing, 695 700 695 689 696 701 705 707 705 706 702 702 699and management of companies and enterprises 6.1 0.7 –0.7 –0.9 1.0 0.8 0.5 0.3 –0.3 0.1 –0.5 –0.1 –0.3
Professional, scientific, and technical services 116 116 116 114 115 116 116 116 116 116 115 114 1146.1 0.7 –0.8 –1.1 0.8 0.6 0.3 0.1 –0.5 –0.1 –0.7 –0.4 –0.6
Administrative and support, waste management, 46 46 46 46 47 47 47 48 48 48 48 48 48and remediation services 5.2 1.1 0.0 –0.2 1.1 0.9 0.7 0.5 0.0 0.3 –0.2 0.0 –0.1
(continued …)
© The Conference Board of Canada. All rights reserved. Please contact cboc.ca/ip with questions or concerns about the use of this material.
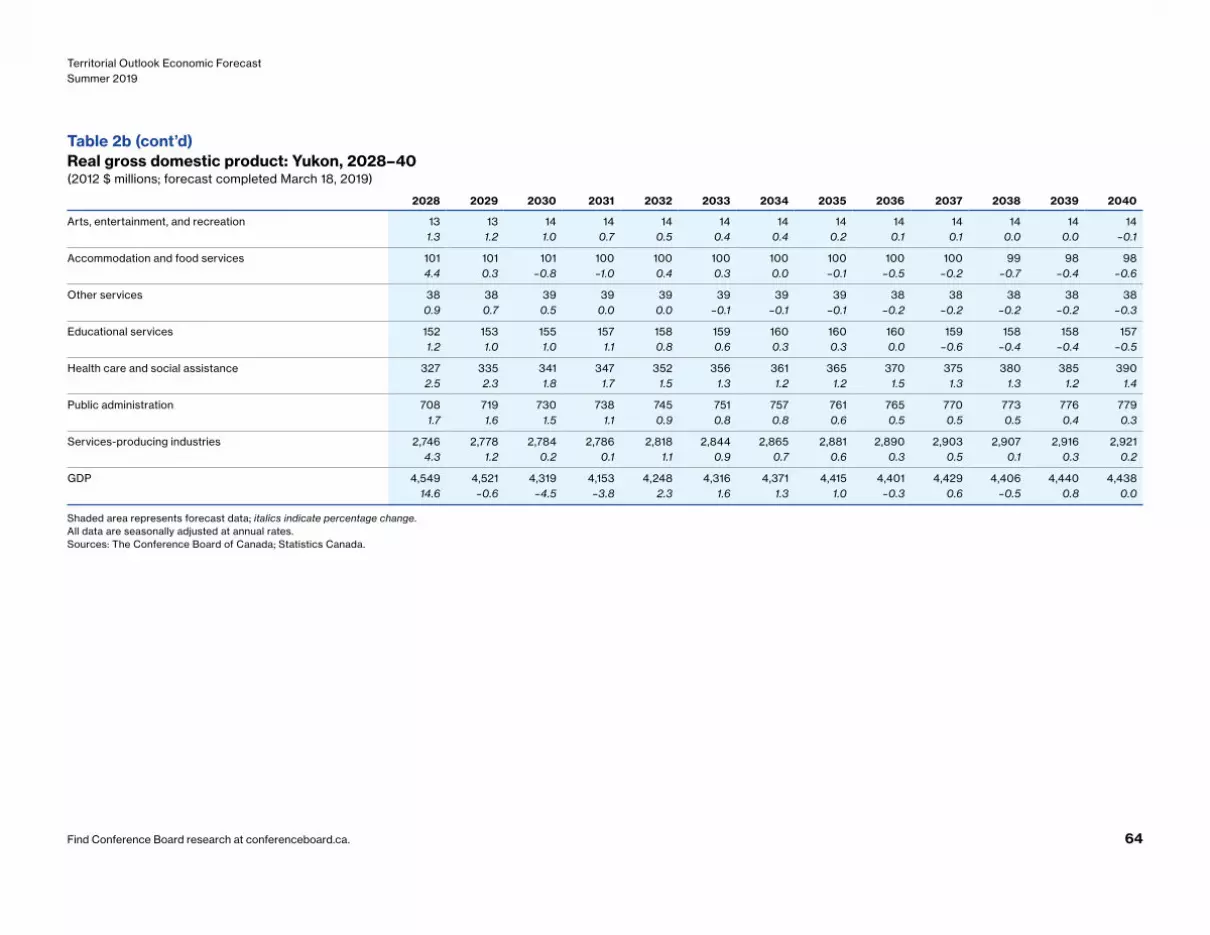
Find Conference Board research at conferenceboard.ca. 64
Territorial Outlook Economic ForecastSummer 2019
Table 2b (cont’d)Real gross domestic product: Yukon, 2028–40(2012 $ millions; forecast completed March 18, 2019)
2028 2029 2030 2031 2032 2033 2034 2035 2036 2037 2038 2039 2040
Arts, entertainment, and recreation 13 13 14 14 14 14 14 14 14 14 14 14 141.3 1.2 1.0 0.7 0.5 0.4 0.4 0.2 0.1 0.1 0.0 0.0 –0.1
Accommodation and food services 101 101 101 100 100 100 100 100 100 100 99 98 984.4 0.3 –0.8 –1.0 0.4 0.3 0.0 –0.1 –0.5 –0.2 –0.7 –0.4 –0.6
Other services 38 38 39 39 39 39 39 39 38 38 38 38 380.9 0.7 0.5 0.0 0.0 –0.1 –0.1 –0.1 –0.2 –0.2 –0.2 –0.2 –0.3
Educational services 152 153 155 157 158 159 160 160 160 159 158 158 1571.2 1.0 1.0 1.1 0.8 0.6 0.3 0.3 0.0 –0.6 –0.4 –0.4 –0.5
Health care and social assistance 327 335 341 347 352 356 361 365 370 375 380 385 3902.5 2.3 1.8 1.7 1.5 1.3 1.2 1.2 1.5 1.3 1.3 1.2 1.4
Public administration 708 719 730 738 745 751 757 761 765 770 773 776 7791.7 1.6 1.5 1.1 0.9 0.8 0.8 0.6 0.5 0.5 0.5 0.4 0.3
Services-producing industries 2,746 2,778 2,784 2,786 2,818 2,844 2,865 2,881 2,890 2,903 2,907 2,916 2,9214.3 1.2 0.2 0.1 1.1 0.9 0.7 0.6 0.3 0.5 0.1 0.3 0.2
GDP 4,549 4,521 4,319 4,153 4,248 4,316 4,371 4,415 4,401 4,429 4,406 4,440 4,43814.6 –0.6 –4.5 –3.8 2.3 1.6 1.3 1.0 –0.3 0.6 –0.5 0.8 0.0
Shaded area represents forecast data; italics indicate percentage change.All data are seasonally adjusted at annual rates.Sources: The Conference Board of Canada; Statistics Canada.
For the exclusive use of Laurie Gravelines, [email protected], Northwest Territories Department of Finance.

Find Conference Board research at conferenceboard.ca. 65
Yukon | The Conference Board of Canada
Table 3aYukon territorial government revenues, 2014–28($ millions)
2014–15 2015–16 2016–17 2017–18 2018–19 2019–20 2020–21 2021–22 2022–23 2023–24 2024–25 2025–26 2026–27 2027–28
Total revenues 1,210 1,215 1,250 1,288 1,341 1,430 1,505 1,568 1,639 1,718 1,797 1,877 1,968 2,0662.6 0.4 2.9 3.1 4.1 6.6 5.2 4.2 4.5 4.8 4.6 4.4 4.8 5.0
Own-source revenues 184 174 200 189 204 221 241 256 271 292 306 315 331 358–8.8 –5.6 14.9 –5.7 8.4 8.0 9.0 6.2 6.3 7.4 5.1 2.8 5.2 8.0
Personal income taxes 64 57 71 66 72 75 86 94 103 115 123 127 135 150–11.0 –12.0 25.2 –6.6 8.1 4.5 15.0 8.9 9.4 12.1 7.2 3.2 6.5 10.7
Corporate taxes 16 8 10 15 19 12 15 16 18 20 21 20 21 26–49.5 –51.4 25.2 45.1 30.0 –36.6 21.5 11.7 8.6 12.4 4.4 –3.9 6.9 21.2
Tobacco taxes 10 10 10 11 13 13 14 14 15 16 16 17 17 17–1.9 –4.1 2.0 12.1 17.5 –0.9 5.0 2.8 4.4 3.4 3.1 2.9 2.8 2.9
Payroll taxes 0 0 0 0 0 0 0 0 0 0 0 0 0 00.0 0.0 0.0 0.0 0.0 0.0 0.0 0.0 0.0 0.0 0.0 0.0 0.0 0.0
Royalties 0 3 2 2 2 2 3 4 5 5 5 5 6 813.1 577.5 –18.4 2.3 –20.1 17.8 42.9 31.0 11.9 4.1 3.9 –1.7 19.8 34.3
Other own-source revenues 93 97 107 94 99 118 123 127 132 136 141 147 152 1577.4 4.3 10.4 –11.8 4.9 20.1 3.8 3.4 3.7 3.6 3.7 3.6 3.6 3.4
Transfers from Government 1,026 1,041 1,050 1,100 1,137 1,209 1,264 1,313 1,368 1,426 1,491 1,562 1,636 1,708of Canada 5.0 1.5 0.9 4.7 3.4 6.4 4.5 3.8 4.2 4.3 4.6 4.7 4.8 4.4
Canada Health Transfer 32 38 38 40 43 44 46 48 50 52 55 57 60 627.8 18.9 0.6 3.7 9.1 2.9 3.2 4.5 4.6 4.5 4.6 4.5 4.4 4.1
Canada Social Transfer 13 14 14 15 15 16 17 17 18 18 19 20 21 21–0.1 7.4 3.0 3.7 0.2 9.3 3.4 3.5 3.7 3.7 3.8 3.8 3.7 3.5
Other transfers from 130 127 126 126 129 151 157 163 169 175 182 189 196 203Government of Canada 10.1 –2.0 –0.7 –0.3 2.0 17.7 3.8 3.6 3.8 3.7 3.9 3.8 3.8 3.5
Territorial Formula Financing 851 874 895 919 950 997 1,044 1,085 1,131 1,180 1,235 1,296 1,360 1,4224.2 2.7 2.3 2.8 3.3 5.0 4.7 3.9 4.2 4.4 4.7 4.9 4.9 4.6
Shaded area represents forecast data; italics indicate percentage change. Sources: The Conference Board of Canada; Yukon Finance Public Accounts; Finance Canada.
© The Conference Board of Canada. All rights reserved. Please contact cboc.ca/ip with questions or concerns about the use of this material.
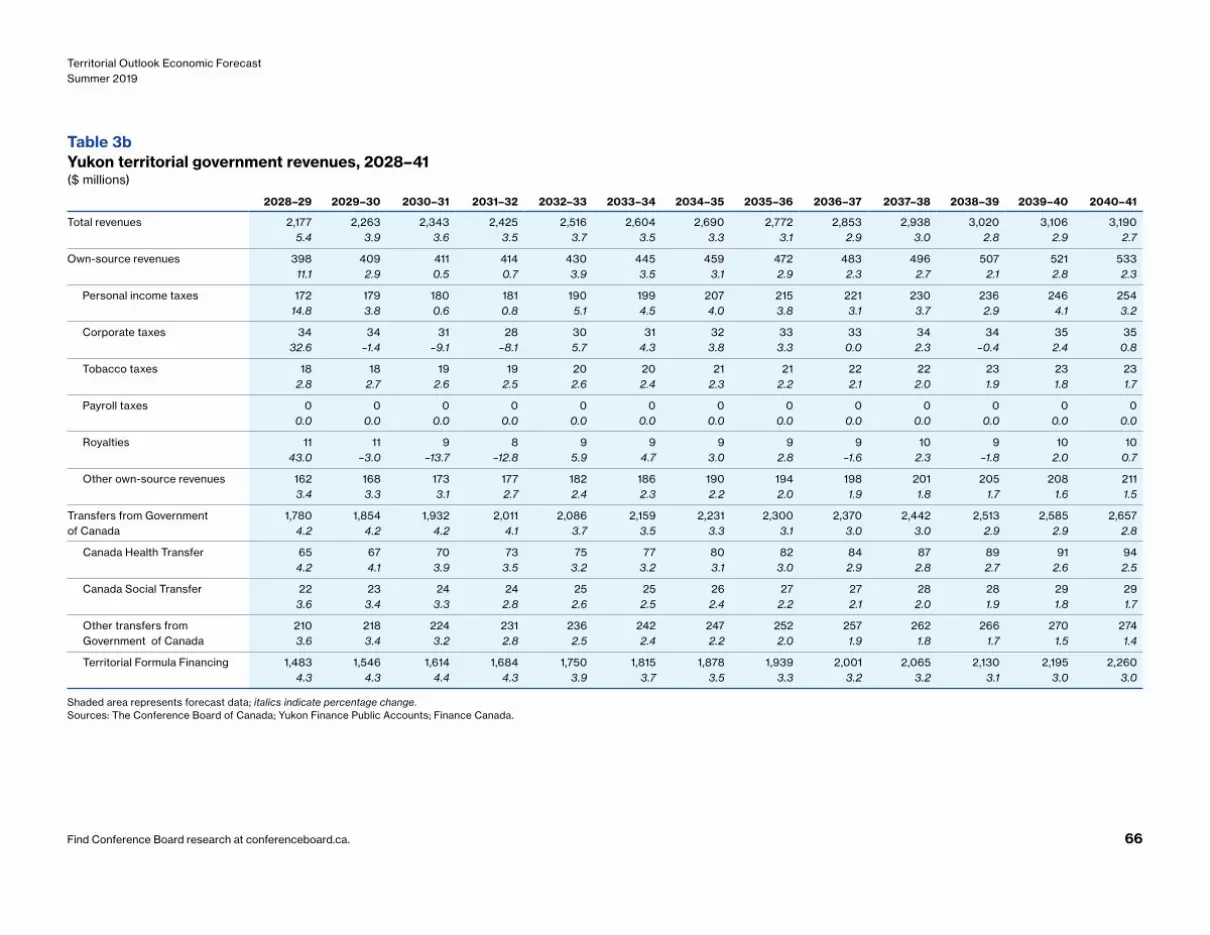
Find Conference Board research at conferenceboard.ca. 66
Territorial Outlook Economic ForecastSummer 2019
Table 3bYukon territorial government revenues, 2028–41($ millions)
2028–29 2029–30 2030–31 2031–32 2032–33 2033–34 2034–35 2035–36 2036–37 2037–38 2038–39 2039–40 2040–41
Total revenues 2,177 2,263 2,343 2,425 2,516 2,604 2,690 2,772 2,853 2,938 3,020 3,106 3,1905.4 3.9 3.6 3.5 3.7 3.5 3.3 3.1 2.9 3.0 2.8 2.9 2.7
Own-source revenues 398 409 411 414 430 445 459 472 483 496 507 521 53311.1 2.9 0.5 0.7 3.9 3.5 3.1 2.9 2.3 2.7 2.1 2.8 2.3
Personal income taxes 172 179 180 181 190 199 207 215 221 230 236 246 25414.8 3.8 0.6 0.8 5.1 4.5 4.0 3.8 3.1 3.7 2.9 4.1 3.2
Corporate taxes 34 34 31 28 30 31 32 33 33 34 34 35 3532.6 –1.4 –9.1 –8.1 5.7 4.3 3.8 3.3 0.0 2.3 –0.4 2.4 0.8
Tobacco taxes 18 18 19 19 20 20 21 21 22 22 23 23 232.8 2.7 2.6 2.5 2.6 2.4 2.3 2.2 2.1 2.0 1.9 1.8 1.7
Payroll taxes 0 0 0 0 0 0 0 0 0 0 0 0 00.0 0.0 0.0 0.0 0.0 0.0 0.0 0.0 0.0 0.0 0.0 0.0 0.0
Royalties 11 11 9 8 9 9 9 9 9 10 9 10 1043.0 –3.0 –13.7 –12.8 5.9 4.7 3.0 2.8 –1.6 2.3 –1.8 2.0 0.7
Other own-source revenues 162 168 173 177 182 186 190 194 198 201 205 208 2113.4 3.3 3.1 2.7 2.4 2.3 2.2 2.0 1.9 1.8 1.7 1.6 1.5
Transfers from Government 1,780 1,854 1,932 2,011 2,086 2,159 2,231 2,300 2,370 2,442 2,513 2,585 2,657of Canada 4.2 4.2 4.2 4.1 3.7 3.5 3.3 3.1 3.0 3.0 2.9 2.9 2.8
Canada Health Transfer 65 67 70 73 75 77 80 82 84 87 89 91 944.2 4.1 3.9 3.5 3.2 3.2 3.1 3.0 2.9 2.8 2.7 2.6 2.5
Canada Social Transfer 22 23 24 24 25 25 26 27 27 28 28 29 293.6 3.4 3.3 2.8 2.6 2.5 2.4 2.2 2.1 2.0 1.9 1.8 1.7
Other transfers from 210 218 224 231 236 242 247 252 257 262 266 270 274Government of Canada 3.6 3.4 3.2 2.8 2.5 2.4 2.2 2.0 1.9 1.8 1.7 1.5 1.4
Territorial Formula Financing 1,483 1,546 1,614 1,684 1,750 1,815 1,878 1,939 2,001 2,065 2,130 2,195 2,2604.3 4.3 4.4 4.3 3.9 3.7 3.5 3.3 3.2 3.2 3.1 3.0 3.0
Shaded area represents forecast data; italics indicate percentage change. Sources: The Conference Board of Canada; Yukon Finance Public Accounts; Finance Canada.
For the exclusive use of Laurie Gravelines, [email protected], Northwest Territories Department of Finance.

Find Conference Board research at conferenceboard.ca. 67
Yukon | The Conference Board of Canada
Table 4aYukon territorial government expenditures, budgetary balance, and net debt, 2014–28($ millions)
2014–15 2015–16 2016–17 2017–18 2018–19 2019–20 2020–21 2021–22 2022–23 2023–24 2024–25 2025–26 2026–27 2027–28
Total expenditures 1,145 1,227 1,260 1,281 1,348 1,436 1,509 1,564 1,641 1,715 1,789 1,861 1,937 2,0151.6 7.1 2.7 1.7 5.2 6.5 5.1 3.6 4.9 4.5 4.4 4.0 4.1 4.0
Program spending 1,145 1,227 1,260 1,281 1,348 1,436 1,509 1,564 1,641 1,715 1,789 1,861 1,937 2,0151.6 7.1 2.7 1.7 5.2 6.5 5.1 3.6 4.9 4.5 4.4 4.0 4.1 4.0
Health* 323 396 449 475 433 443 477 503 538 572 606 642 679 718–5.6 22.6 13.4 5.8 –8.8 2.4 7.5 5.5 7.0 6.3 6.0 5.9 5.6 5.8
Share of total spending % 28.2 32.3 35.6 37.1 32.1 30.9 31.6 32.2 32.8 33.4 33.9 34.5 35.0 35.6
Education 165 168 189 192 193 215 224 231 240 249 257 266 275 2840.6 1.8 12.5 1.6 0.3 11.4 4.6 2.7 4.2 3.5 3.2 3.3 3.6 3.3
Share of total spending % 14.4 13.7 15.0 15.0 14.3 14.9 14.9 14.8 14.7 14.5 14.4 14.3 14.2 14.1
Other program spending 657 663 622 614 722 778 807 830 862 894 926 953 984 1,0135.8 0.9 –6.1 –1.3 17.6 7.7 3.8 2.8 3.9 3.6 3.6 3.0 3.2 3.0
Debt service 0 0 0 0 0 0 0 0 0 0 0 0 0 0
n.a n.a n.a n.a n.a n.a n.a n.a n.a n.a n.a n.a n.a n.a
Budgetary balance** 68 14 –5 7 –7 –6 –4 5 –2 3 8 15 30 51
Increase (decrease) of capital assets, net of amortization
40 84 60 65 44 40 36 32 29 26 23 21 19 17
Net debt –223 –153 –88 –30 21 66 106 133 164 187 202 207 196 162
n.a. = not applicableShaded area represents forecast data; italics indicate percentage change. *Includes both health and social services expenditures.**Includes other adjustments in 2015–16 of 25.9 million and 4.5 million in 2016–17.Sources: The Conference Board of Canada; Yukon Finance Public Accounts; Finance Canada.
© The Conference Board of Canada. All rights reserved. Please contact cboc.ca/ip with questions or concerns about the use of this material.
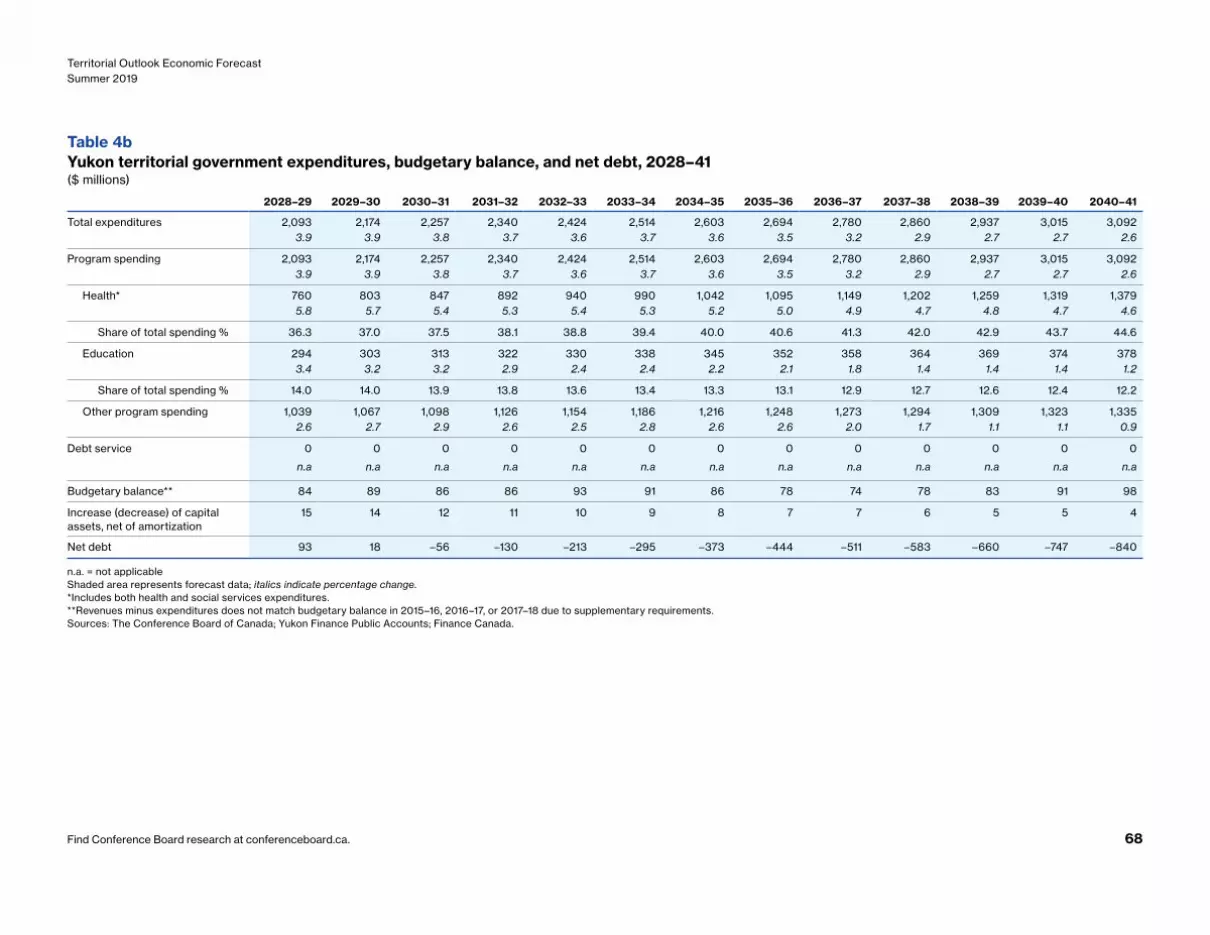
Find Conference Board research at conferenceboard.ca. 68
Territorial Outlook Economic ForecastSummer 2019
Table 4bYukon territorial government expenditures, budgetary balance, and net debt, 2028–41($ millions)
2028–29 2029–30 2030–31 2031–32 2032–33 2033–34 2034–35 2035–36 2036–37 2037–38 2038–39 2039–40 2040–41
Total expenditures 2,093 2,174 2,257 2,340 2,424 2,514 2,603 2,694 2,780 2,860 2,937 3,015 3,0923.9 3.9 3.8 3.7 3.6 3.7 3.6 3.5 3.2 2.9 2.7 2.7 2.6
Program spending 2,093 2,174 2,257 2,340 2,424 2,514 2,603 2,694 2,780 2,860 2,937 3,015 3,0923.9 3.9 3.8 3.7 3.6 3.7 3.6 3.5 3.2 2.9 2.7 2.7 2.6
Health* 760 803 847 892 940 990 1,042 1,095 1,149 1,202 1,259 1,319 1,3795.8 5.7 5.4 5.3 5.4 5.3 5.2 5.0 4.9 4.7 4.8 4.7 4.6
Share of total spending % 36.3 37.0 37.5 38.1 38.8 39.4 40.0 40.6 41.3 42.0 42.9 43.7 44.6
Education 294 303 313 322 330 338 345 352 358 364 369 374 3783.4 3.2 3.2 2.9 2.4 2.4 2.2 2.1 1.8 1.4 1.4 1.4 1.2
Share of total spending % 14.0 14.0 13.9 13.8 13.6 13.4 13.3 13.1 12.9 12.7 12.6 12.4 12.2
Other program spending 1,039 1,067 1,098 1,126 1,154 1,186 1,216 1,248 1,273 1,294 1,309 1,323 1,3352.6 2.7 2.9 2.6 2.5 2.8 2.6 2.6 2.0 1.7 1.1 1.1 0.9
Debt service 0 0 0 0 0 0 0 0 0 0 0 0 0
n.a n.a n.a n.a n.a n.a n.a n.a n.a n.a n.a n.a n.a
Budgetary balance** 84 89 86 86 93 91 86 78 74 78 83 91 98
Increase (decrease) of capital assets, net of amortization
15 14 12 11 10 9 8 7 7 6 5 5 4
Net debt 93 18 –56 –130 –213 –295 –373 –444 –511 –583 –660 –747 –840
n.a. = not applicableShaded area represents forecast data; italics indicate percentage change. *Includes both health and social services expenditures.**Revenues minus expenditures does not match budgetary balance in 2015–16, 2016–17, or 2017–18 due to supplementary requirements.Sources: The Conference Board of Canada; Yukon Finance Public Accounts; Finance Canada.
For the exclusive use of Laurie Gravelines, [email protected], Northwest Territories Department of Finance.

To cite this report: The Conference Board of Canada. Territorial Outlook Economic Forecast: Summer 2019. Ottawa: The Conference Board of Canada, 2019.
©2019 The Conference Board of Canada* Published in Canada | All rights reserved | Agreement No. 40063028 | *Incorporated as AERIC Inc.
An accessible version of this document for the visually impaired is available upon request. Accessibility Officer, The Conference Board of Canada Tel.: 613-526-3280 or 1-866-711-2262 E-mail: [email protected]
®The Conference Board of Canada is a registered trademark of The Conference Board, Inc. Forecasts and research often involve numerous assumptions and data sources, and are subject to inherent risks and uncertainties. This information is not intended as specific investment, accounting, legal, or tax advice. The findings and conclusions of this report do not necessarily reflect the views of the external reviewers, advisors, or investors. Any errors or omissions in fact or interpretation remain the sole responsibility of The Conference Board of Canada.
Where insights meet impact
Territorial Outlook Economic ForecastThe Conference Board of Canada
Publication 10321Price: $1,235
conferenceboard.ca
© The Conference Board of Canada. All rights reserved. Please contact cboc.ca/ip with questions or concerns about the use of this material.