temporal variations of adenosine metabolism in human blood
TRANSCRIPT
CHRONOBIOLOGY INTERNATIONAL, 13(3), 163-177 (1996)
TEMPORAL VARIATIONS OF ADENOSINE METABOLISM IN HUMAN BLOOD
Victoria Chagoya de Sanchez,’ Roland0 Hernandez-Muiioz,’ Jorge Suarez,’ Susana Vidrio,’ Lucia Yaiiez,’ Raid Aguilar-Roblero:
Arie Ohenberg? Arturo Vega-Gonzalez: Luis Villalobos: Leon Rosenthal: Federico Fernandez-Cancino,Z+ Rene Drucker-Colin,z”
and Mauricio Diaz-Muiioz Departamentos de ’Bioenerg&tica y ’Neurociencias, Instituto de Fisiologia
Celular, and ’Departamento de Fisiologia, Facultad de Medicina Universidad Nacional Audnoma de MCxico, Apdo. Postal 70-243, 045 10
MGxico D.F., Mexico
ABSTRACT
Eight diurnally active (06:OO-23:OO h) subjects were adapted for 2 days to the room conditions where the experiments were performed. Blood sam- pling for adenosine metabolites and metabolizing enzymes was done hourly during the activity span and every 30 min during sleep. The results showed that adenosine and its catabolites (inosine, hypoxanthine, and uric acid), adenosine synthesizing (S-adenosylhomocysteine hydrolase and 5’-nucleoti- dase), degrading (adenosine deaminase) and nucleotide-forming (adenosine kinase) enzymes as well as adenine nucieotides (AMP, ADP, and ATP) un- dergo statistically significant fluctuations (ANOVA) during the 24 h. How- ever, energy charge was invariable. Glucose and lactate chronograms were determined as metabolic indicators. The same data analyzed by the chi-square periodogram and Fourier series indicated ultradian oscillatory periods for all the metabolites and enzymatic activities determined, and 24-h oscillatory components for inosine, hypoxanthine, adenine nucleotides, glucose, and the activities of SAH-hydrolase, 5’-nucleotidase, and adenosine kinase. The sin- gle cosinor method showed significant oscillatory components exclusively
Received July 6, 1995; returned for revision October 19, 1995; accepted December 18, 1995.
*Present address: A. Oksenberg, Department of Neurology, Beilinson Medical Center, Peteh Tiqva, Israel. L. Rosenthal, Sleep Disorders and Research Center, Henry Ford Hospital, Detroit, MI 48202.
$Deceased. Address correspondence to: Victoria Chagoya de SBnchez, Ph.D., Instituto de Fisiologia
Celular, Universidad Nacional Aut6noma de Mexico, Apartado Postal 70-243, Mexico 045 10, D.F., Mexico.
163
0 1996 International Society for Chronobiology
Chr
onob
iol I
nt D
ownl
oade
d fr
om in
form
ahea
lthca
re.c
om b
y U
NA
M o
n 08
/03/
10Fo
r pe
rson
al u
se o
nly.
164 CHAGOYA DE S h C H E Z ET AL.
ADP IMP
for lactate. As a whole, these results suggest that adenosine metabolism may play a role as a biological oscillator coordinating and/or modulating the en- ergy homeostasis and physiological status of erythrocytes in vivo and could be an important factor in the distribution of purine rings for the rest of the organism. (Chronobiology International, 13(3), 163-1 77, 1996)
Key Words: Adenosine-Adenine nucleotides-Purines-Biological rhythm-Human blood.
INTRODUCTION
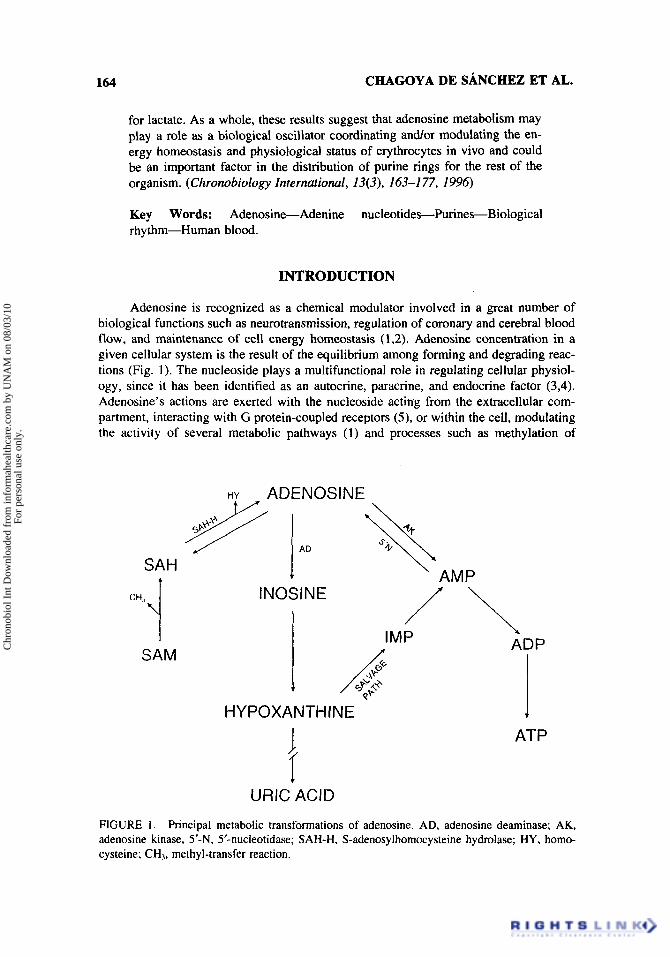
Adenosine is recognized as a chemical modulator involved in a great number of biological functions such as neurotransmission, regulation of coronary and cerebral blood flow, and maintenance of cell energy homeostasis (1,2). Adenosine concentration in a given cellular system is the result of the equilibrium among forming and degrading reac- tions (Fig. 1). The nucleoside plays a multifunctional role in regulating cellular physiol- ogy, since it has been identified as an autocrine, paracrine, and endocrine factor (3,4). Adenosine’s actions are exerted with the nucleoside acting from the extracellular com- partment, interacting with G protein-coupled receptors (5 ) , or within the cell, modulating the activity of several metabolic pathways (1) and processes such as methylation of
SAH
SAM
+ URIC ACID
ATP
FIGURE I . Principal metabolic transformations of adenosine. AD, adenosine deaminase; AK, adenosine kinase, 5’-N, 5’-nucleotidase; SAH-H, S-adenosylhomocysteine hydrolase; HY, homo- cysteine; CH,, methyl-transfer reaction.
Chr
onob
iol I
nt D
ownl
oade
d fr
om in
form
ahea
lthca
re.c
om b
y U
NA
M o
n 08
/03/
10Fo
r pe
rson
al u
se o
nly.
RHYTHM OF ADENOSINE METABOLISM IN HUMAN BLOOD 165
biomolecules (6,7). Some of the effectors associated with the transduction mechanisms linked to G-proteins in which adenosine acts as a primary ligand are adenylate cyclase, phospholipase C, ion channels, and systems that control free radical production (8).
Another dimension of the relevance of adenosine as a cellular regulator of physio- logical significance is given by the rhythmic oscillations in it and its related metabolites in coordination with its metabolizing enzymes during the day-night cycle as exemplified by several tissues of the rat, such as blood, liver, and brain (2,7,9). As a consequence, adenosine has been proposed as a metabolic oscillator that may be involved in replenish- ing the molecular frameworks for tissues incapable of de novo purine synthesis (lo), in modulating membrane structure and function (lo), and as a putative regulatory factor for cyclic functions, such as the feeding-metabolic pattern ( I 0) and the sleep-wake cycle (9,lO).
The present study was undertaken to examine whether adenosine, as well as its metabolites and metabolizing enzymes, exhibits rhythmic changes in human blood of healthy volunteers.
SUBJECTS AND METHODS
Subjects
Eight young diurnally active healthy male volunteers (students from the School of Medicine, Universidad Nacional Autdnoma de MCxico) participated as experimental subjects. To become familiarized with the facilities where the experiments were per- formed, the subjects (21-25 years old) came on a given Friday in groups of two and slept overnight in the laboratory. Meals were taken at fixed times: breakfast OR30 h, lunch 14:30 h, and dinner 20:30 h. On Saturday, electrodes were placed to perform a sleep study (results to be presented elsewhere). On Sunday, at 07:OO h, a heparhized catheter was introduced into the superficial radial vein. The use of long sections of tubing during the blood sampling was avoided to preserve the biochemical integrity of all metabolites and enzymes studied. Each sample was processed to obtain plasma and a perchloric acid extract. Blood samples (3 ml) were taken every hour until 23:OO h, and thereafter every 30 min, while the subject's sleep pattern was again recorded. The total number of blood samples was 32. The experiment was completed on Monday morning at 06:OO h. The analysis of the data in search of diurnal variations in adenosine metabo- lism focused on the 24 samples taken at 1-h intervals during the experimental period.
Reagents
All nucleosides and nucleotides, S-adenosylmethionine and S-adenosylhomocys- teine, coenzymes and enzymes were purchased from Sigma Chemical Co. (St. Louis, MO). Radioactive material was obtained from Amersham (Buckinghamshire, U.K.). Other chemicals used were of reagent grade and of the best quality available.
Metabolites
Blood samples intended for determination of adenosine metabolites were immedi- ately treated with 2 vol of ice-cold 6% perchloric acid. The acid extract was centrifuged at 9000 g for 10 min at 4"C, and the supernatant was frozen in liquid nitrogen for further
Chr
onob
iol I
nt D
ownl
oade
d fr
om in
form
ahea
lthca
re.c
om b
y U
NA
M o
n 08
/03/
10Fo
r pe
rson
al u
se o
nly.
166 CHAGOYA DE SANCHEZ ET AL.
studies. When the acid extracts were thawed for metabolite determination, they were neutralized with 5 M K2C03. The neutralized samples were centrifuged at 9000 g for 10 min at 4°C to remove the precipitates formed during the neutralizing process. Adenosine, inosine, and hypoxanthine were quantified in a double-beam spectrophotometer by the method of Olsson (1 1). Adenine nucleotides were assayed by enzymatic methods, AMP and ADP according to Adam (I2), and ATP by the method of Lamprecht and Trautschol (13). Energy charge was calculated according to Atkinson (14). Inorganic phosphate was determined by the technique reported by Summer (15) and lactate according to Hohorst (16). Serum glucose and uric acid were quantified by conventional techniques (17,18).
Enzymes
To determine enzymatic activities, blood samples were diluted with 4 vol of cold water. The enzymatic activities measured were adenosine kinase (ATP:adenosine 5‘-pho- sphotransferase, EC 2.7.1.20) by the method of de Jong and Kalkman (19); adenosine deaminase (adenosine aminohydrolase, EC 3.5.4.4) and 5’-nucleotidase (5’4bonucleo- tide phosphohydrolase, EC 3.1.3.5) were assayed with the micro procedure described by Kisaki and Sakurada (20). Adenosylhomocysteinase (S-adenosyl-L-homocysteine hydro- lase, EC 3.3.1.1) activity was determined at 25°C in the hydrolytic direction by the method of Palmer and Abeles (21) with modifications described by Hohrnan and Veron (22).
Protein Determination
Protein was measured by the biuret method (23).
Statistical Analyses
Data were analyzed in two stages: (1) Linear analysis (ANOVA) was used to detect clock-time differences within each set of data; significance was estimated by the Scheffk multiple range test with an a level set at 0.05; and (2) rhythmic properties were analyzed by applying the following strategy: the data of the eight studied subjects were placed consecutively to be examined, as if they were a continuous time series. The periodicity of each parameter was estimated by the chi-square periodrogram (24) and by spectral analysis using fast Fourier transform (25). With this protocol the main oscillatory compo- nents of each parameter were described. The most conspicuous periods were then ana- lyzed by the single cosinor method (26) to select the parameters with significant ampli- tude and sinusoidality.
RESULTS Adenosine and Adenosine Catabolites
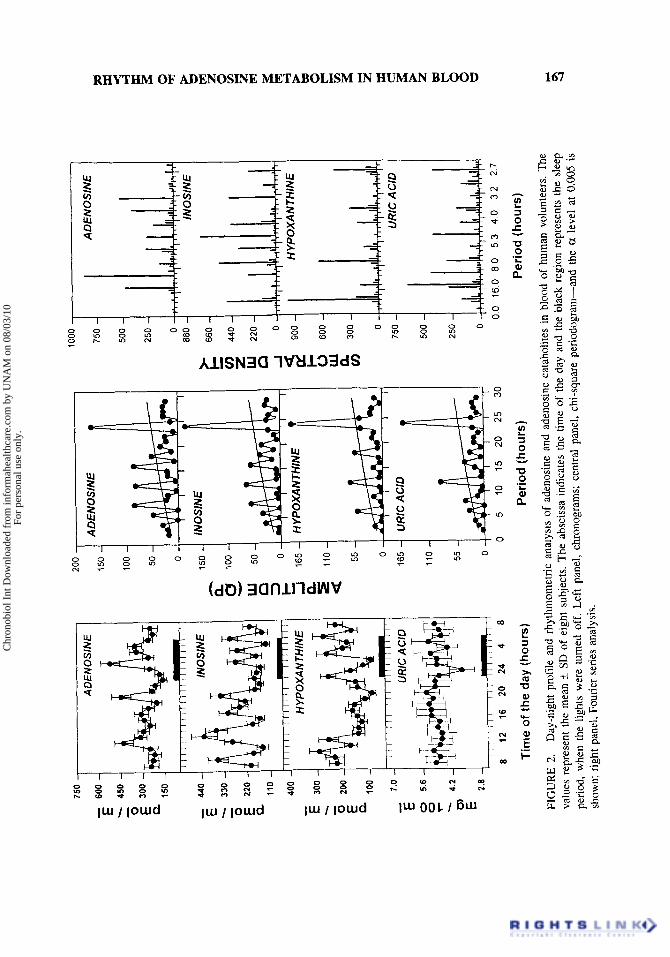
Figure 2 left panel shows the temporal variations of adenosine and its catabolites, inosine, hypoxanthine, and uric acid in the blood of healthy young humans. All purine molecules displayed complex temporal patterns characterized by multiple peaks. When analyzed by ANOVA, adenosine showed peak values at 12:00, 2090, 02:00, and 0490 h; inosine at 09:00, 13:00, 17:00, 20:00, 02:00, 04:00, and 06:OO h; hypoxanthine at
Chr
onob
iol I
nt D
ownl
oade
d fr
om in
form
ahea
lthca
re.c
om b
y U
NA
M o
n 08
/03/
10Fo
r pe
rson
al u
se o
nly.
750
.
- 60
0 .
E - 450
-
300
.
150
-
- Q - 440
+ 330
0
P
E E 22
0
-
110
400
E 30
0 - I
- E 10
0
7.0
- E 0 5.6
0
r
4.2
2. a 2.
8 E
AD
ENO
SlN
E T
I,
I I
t
/l
lI
ll
ll
Il
HY
PO
XA
NTH
INE
T
-
1 '
. 1 'i
I I
I'
1 i
, I~
i I
I I
I I F
a 12
16
20
24
4
0
Tim
e of
the
day
(h
ou
rs)
200
-
15
0.
100.
50 .
0.
150
E- a
100
0
=o
k
E
110
W
w
50
-J
165
a a
55 0
165
110 55 0
A A
DE
NO
SIN
E
/NO
SIN
E
n H
YP
OX
A N
TH
INE
II U
RIC
AC
ID
1000
I
AD
EN
OS
INE
750 -I
I
880 4
INO
SIN
E
HY
PO
XA
NTH
INE
i I
UR
IC A
CID
500
I 25
0 -
0-
0 5
10
15
20
25
30
Per
iod
(hou
rs)
00
16
0 8
0 53 4
0
32
2
7
Per
iod
(ho
urs
)
FIG
UR
E 2.
D
ay-n
ight
pro
file
and
rhyt
hmom
etri
c an
alys
is o
f ad
enos
ine
and
aden
osin
e ca
tabo
lites
in
bloo
d of
hum
an v
olun
teer
s. Th
e va
lues
rep
rese
nt t
he m
ean
SD o
f ei
ght
subj
ects
. T
he a
bsci
ssa
indi
cate
s th
e tim
e of
the
day
and
the
bla
ck r
egio
n re
pres
ents
the
slee
p pe
riod,
whe
n th
e lig
hts
wer
e tu
rned
off
. Lef
t pa
nel,
chro
nogr
ams;
cen
tral
pane
l, ch
i-squ
are
perio
dogr
am-a
nd
the
a le
vel
at 0
.005
is
show
n; r
ight
pan
el, F
ourie
r se
ries
anal
ysis
.
M
Chr
onob
iol I
nt D
ownl
oade
d fr
om in
form
ahea
lthca
re.c
om b
y U
NA
M o
n 08
/03/
10Fo
r pe
rson
al u
se o
nly.
168 CHAGOYA DE Sh'CHEZ ET AL.
lO:OO, 12:00, 2390, 03:00, and 06:OO h. As an exception, uric acid presented a very uniform pattern with a single low value at midnight. There were no differences in the average of these purines when comparing the diurnal against the nocturnal rest values (data not shown). The central panel of Figure 2, shows the data analysis by chi-square periodogram. The rhythms of adenosine and its catabolites presented 24-h and ultradian oscillatory components. Figure 2 (right panel) shows the rhythms of adenosine and its catabolites when analyzed by Fourier series. This analytical method enables the detection of the most significant oscillatory periods suggesting putative harmonic components. The spectral analysis documented 24-h oscillations in only inosine and hypoxanthine in comparison to ultradian ones in all adenosine catabolites. Maximal spectral density for adenosine corresponded to periods of 9, 3, and 12 h. For inosine, maximal spectral density occurred at the 5-h period, with important peaks also at 8, 4, and 3 h. Hypoxan- thine presented the strongest spectral density at 24 h, with significant components also at 8 and 2 h. Uric acid's major oscillatory components were present at 12, 5 , and 3 h. Cosinor analysis did not detect significant sinusoidality in the periodicities of these metabolites. Interestingly, in spite of being consecutive metabolites in the same metabolic pathway, no coincidence nor evident relation among peaks was observed. Moreover, there was a striking difference in peak frequency between the rhythms of adenosine and its catabolites, inosine and hypoxanthine. The latter showed twice the number of peaks as adenosine.
Adenosine-Derived Nucleotides
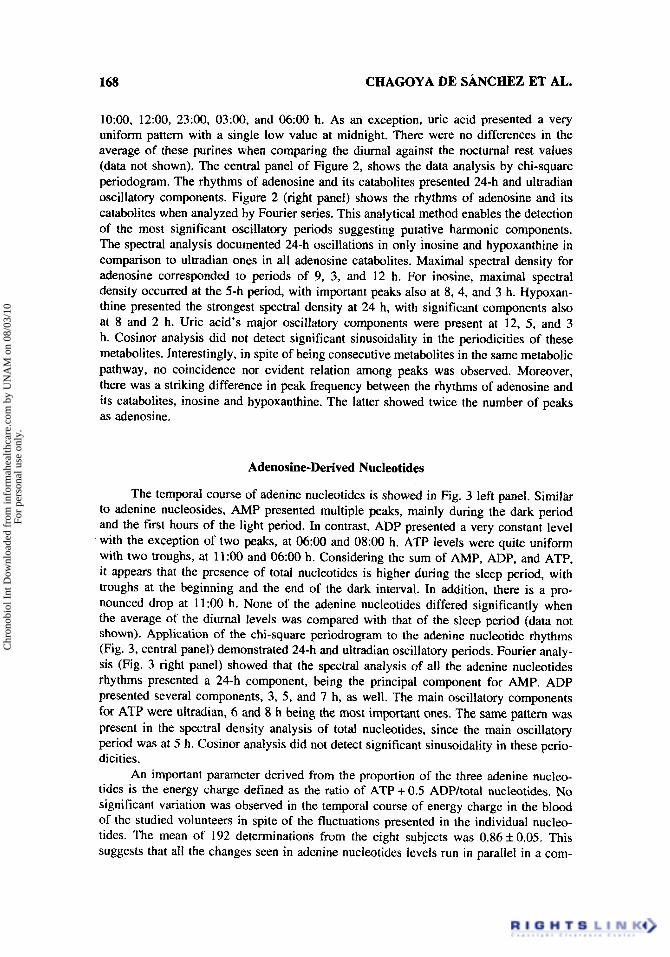
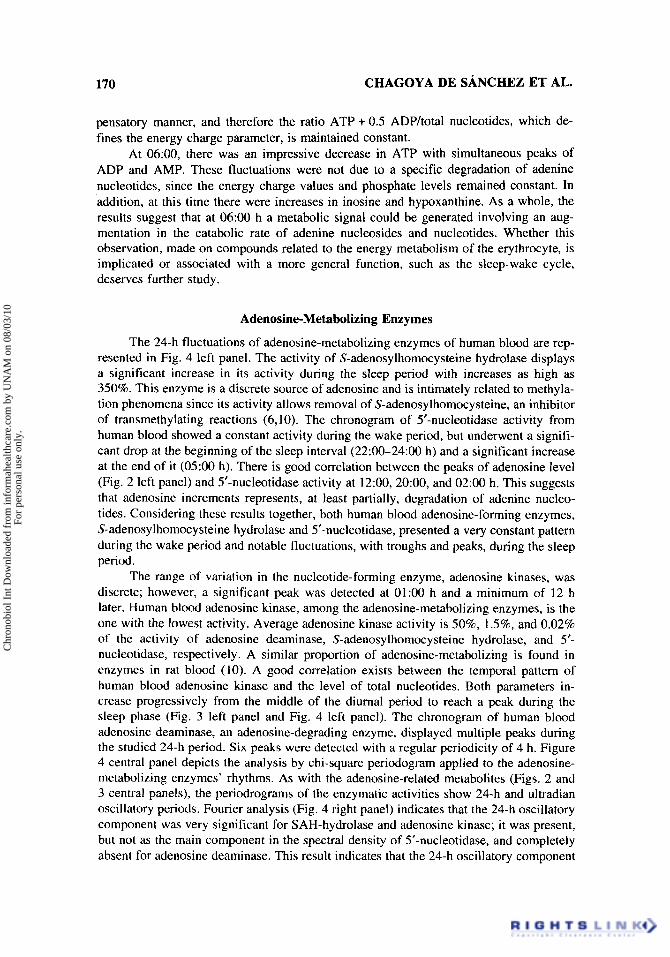
The temporal course of adenine nucleotides is showed in Fig. 3 left panel. Similar to adenine nucleosides, AMP presented multiple peaks, mainly during the dark period and the first hours of the light period. In contrast, ADP presented a very constant level
. with the exception of two peaks, at 0600 and 08:OO h. ATP levels were quite uniform with two troughs, at 11 :OO and 06:OO h. Considering the sum of AMP, ADP, and ATP, it appears that the presence of total nucleotides is higher during the sleep period, with troughs at the beginning and the end of the dark interval. In addition, there is a pro- nounced drop at 11:OO h. None of the adenine nucleotides differed significantly when the average of the diurnal levels was compared with that of the sleep period (data not shown). Application of the chi-square periodrogram to the adenine nucleotide rhythms (Fig. 3, central panel) demonstrated 24-h and ultradian oscillatory periods. Fourier analy- sis (Fig. 3 right panel) showed that the spectral analysis of all the adenine nucleotides rhythms presented a 24-h component, being the principal component for AMP. ADP presented several components, 3, 5 , and 7 h, as well. The main oscillatory components for ATP were ultradian, 6 and 8 h being the most important ones. The same pattern was present in the spectral density analysis of total nucleotides, since the main oscillatory period was at 5 h. Cosinor analysis did not detect significant sinusoidality in these perio- dicities.
An important parameter derived from the proportion of the three adenine nucleo- tides is the energy charge defined as the ratio of ATP + 0.5 ADPItotal nucleotides. No significant variation was observed in the temporal course of energy charge in the blood of the studied volunteers in spite of the fluctuations presented in the individual nucleo- tides. The mean of 192 determinations from the eight subjects was 0.86*0.05. This suggests that all the changes seen in adenine nucleotides levels run in parallel in a com-
Chr
onob
iol I
nt D
ownl
oade
d fr
om in
form
ahea
lthca
re.c
om b
y U
NA
M o
n 08
/03/
10Fo
r pe
rson
al u
se o
nly.
AM
P T
12
00 -
800 -
400 4
AD
P, A,
- C
2oo
100 i I
II
II
II
II
11
11
11
11
11
1 I
I
- A
TP
800
- l-
r
I
E 40
0 C
6o
o i TO
TAL
NU
CLE
OTI
DE
S
0
1
250
llllllllllllllllllllll
a 12
16
20
24
4
8
Tim
e of
the
day
(hou
rs)
200
150
100 50 0
150
A 4 Y
loo
=o
t
W
50
n 2
165
a 11
0
n 165 1 TO
TAL
NU
CLE
OTI
DE
S
110 55 0
0 5
10
15
20
25
30
Per
iod
(hou
rs)
1600
AM
P
450
300
v) 5
150
no
-I
900
2 600
W
v)
300 0
1400
n
0.0 160 80 53 40 32 27
Per
iod
(hou
rs)
FIG
URE
3.
Day
-nig
ht p
rofil
e an
d rh
ythm
omet
ric a
naly
sis
of a
deni
ne n
ucle
otid
es in
blo
od o
f hu
man
vol
unte
ers.
The
valu
es r
epre
sent
th
e m
ean f
SD o
f ei
ght s
ubje
cts.
The
absc
issa
indi
cate
s th
e tim
e of
the
day
and
the
blac
k re
gion
rep
rese
nts
the
slee
p pe
riod,
whe
n th
e lig
hts w
ere
turn
ed o
ff. L
eft p
anel
, chr
onog
ram
s; c
entra
l pan
el, c
hi-s
quar
e pe
riodo
gram
-the
cx le
vel a
t 0.0
05 is
show
n; ri
ght p
anel
, Fou
rier
serie
s an
alys
is.
2 W s 8
Chr
onob
iol I
nt D
ownl
oade
d fr
om in
form
ahea
lthca
re.c
om b
y U
NA
M o
n 08
/03/
10Fo
r pe
rson
al u
se o
nly.
170 CHAGOYA DE SANCHEZ ET AL.
pensatory manner, and therefore the ratio ATP + 0.5 ADPitotal nucleotides, which de- fines the energy charge parameter, is maintained constant.
At 06:OO, there was an impressive decrease in ATP with simultaneous peaks of ADP and AMP. These fluctuations were not due to a specific degradation of adenine nucleotides, since the energy charge values and phosphate levels remained constant. In addition, at this time there were increases in inosine and hypoxanthine. As a whole, the results suggest that at 06:OO h a metabolic signal could be generated involving an aug- mentation in the catabolic rate of adenine nucleosides and nucleotides. Whether this observation, made on compounds related to the energy metabolism of the erythrocyte, is implicated or associated with a more general function, such as the sleep-wake cycle, deserves further study.
Adenosine-Metabolizing Enzymes
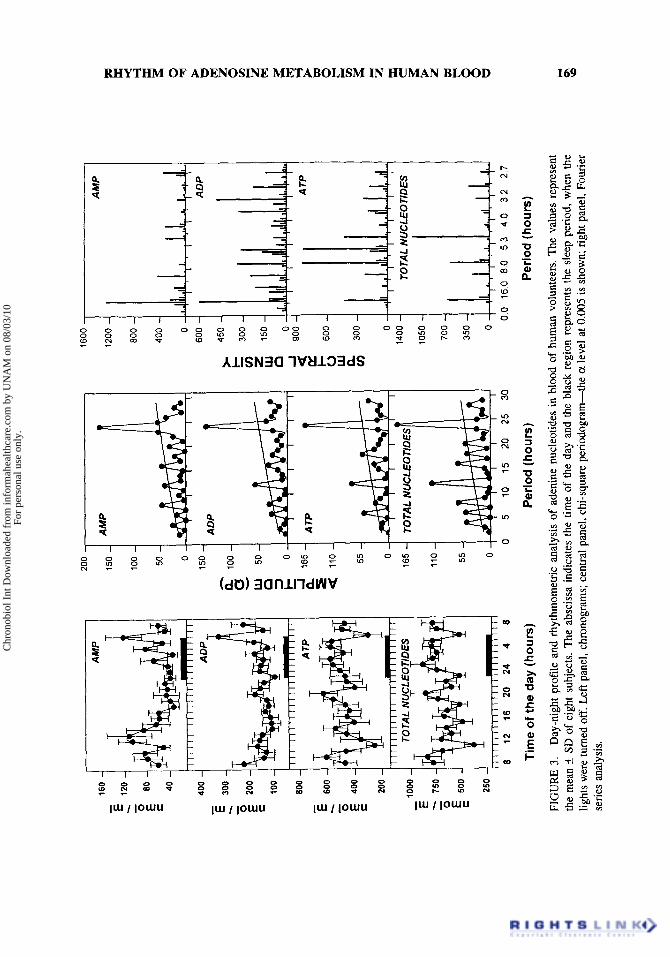
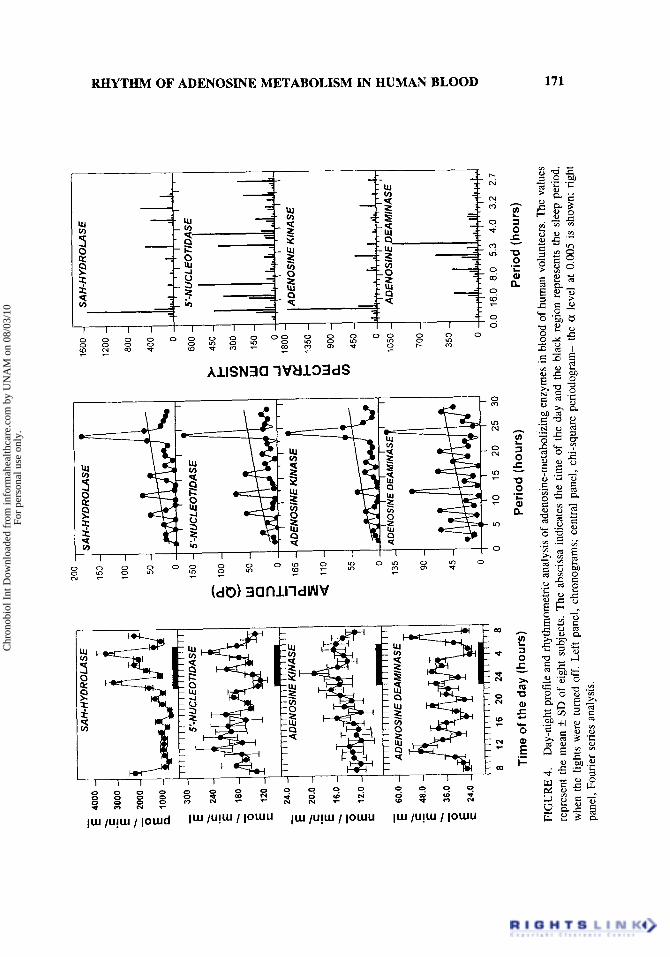
The 24-h fluctuations of adenosine-metabolizing enzymes of human blood are rep- resented in Fig. 4 left panel. The activity of S-adenosylhomocysteine hydrolase displays a significant increase in its activity during the sleep period with increases as high as 350%. This enzyme is a discrete source of adenosine and is intimately related to methyla- tion phenomena since its activity allows removal of S-adenosylhomocysteine, an inhibitor of transmethylating reactions (6,lO). The chronogram of 5‘-nucleotidase activity from human blood showed a constant activity during the wake period, but underwent a signifi- cant drop at the beginning of the sleep interval (22:OO-24:OO h) and a significant increase at the end of it (05:OO h). There is good correlation between the peaks of adenosine level (Fig. 2 left panel) and 5’-nucleotidase activity at 12:00, 20:00, and 02:OO h. This suggests that adenosine increments represents, at least partially, degradation of adenine nucleo- tides. Considering these results together, both human blood adenosine-forming enzymes, S-adenosylhomocysteine hydrolase and 5’-nucleotidase, presented a very constant pattern during the wake period and notable fluctuations, with troughs and peaks, during the sleep period.
The range of variation in the nucleotide-forming enzyme, adenosine kinases, was discrete; however, a significant peak was detected at 01:OO h and a minimum of 12 h later. Human blood adenosine kinase, among the adenosine-metabolizing enzymes, is the one with the lowest activity. Average adenosine kinase activity is 50%, l.5%, and 0.02% of the activity of adenosine deaminase, S-adenosylhomocysteine hydrolase, and 5’- nucleotidase, respectively. A similar proportion of adenosine-metabolizing is found in enzymes in rat blood (10). A good correlation exists between the temporal pattern of human blood adenosine kinase and the level of total nucleotides. Both parameters in- crease progressively from the middle of the diurnal period to reach a peak during the sleep phase (Fig. 3 left panel and Fig. 4 left panel). The chronogram of human blood adenosine deaminase, an adenosine-degrading enzyme, displayed multiple peaks during the studied 24-h period. Six peaks were detected with a regular periodicity of 4 h. Figure 4 central panel depicts the analysis by chi-square periodogram applied to the adenosine- metabolizing enzymes’ rhythms. As with the adenosine-related metabolites (Figs. 2 and 3 central panels), the periodrograms of the enzymatic activities show 24-h and ultradian oscillatory periods. Fourier analysis (Fig. 4 right panel) indicates that the 24-h oscillatory component was very significant for SAH-hydrolase and adenosine kinase; it was present, but not as the main component in the spectral density of 5’-nucleotidase, and completely absent for adenosine deaminase. This result indicates that the 24-h oscillatory component
Chr
onob
iol I
nt D
ownl
oade
d fr
om in
form
ahea
lthca
re.c
om b
y U
NA
M o
n 08
/03/
10Fo
r pe
rson
al u
se o
nly.
- E 4
00
0.
3000
-
- 20
00 .
0 .
E .
1000
- 30
0
c 24
0
- 180
0
E E .
.- - g 12
0
24.0
- E
'r
20.0
E
.- ~ 16
.0
0 E
12.0
E
- - E 60
.0
.g
48.0
- 36
.0
0
24.0
.
E -
SAH
-HYD
RO
LASE
S'-N
UC
LEO
TID
AS€
AD
ENO
SIN
E K
INA
SE
T
AD
ENO
SIN
E D
EAM
INA
SE T
I I I
lllI
Illllll~
8
12
16
20
24
4 8
Tim
e of
the
day
(hou
rs)
100 50 -
0-
n 15
0 1 5'-N
UC
LEO
TID
ASE
,.
..
n A
DEN
OSI
NE
KIN
AS
E
II
55 0
135 90
45 0
0 5
10
15
20
25
30
Per
iod
(hou
rs)
1600
-/ , SA
H-H
YD
RO
LAS
E
1200
800 j I
400 -
0-
I
I I
.I .
1..
..
..
I
0.0
16.0
8.0
5.3
4.0
3.2
2.7
Per
iod
(hou
rs)
FIG
UR
E 4.
Day
-nig
ht p
rofil
e an
d rh
ythm
omet
ric a
naly
sis o
f ad
enos
ine-
met
abol
izin
g en
zym
es in
blo
od o
f hum
an v
olun
teer
s. Th
e va
lues
re
pres
ent t
he m
ean
k S
D of
eig
ht s
ubje
cts.
The
absc
issa
indi
cate
s th
e tim
e of
the
day
and
the
bla
ck r
egio
n re
pres
ents
the
sle
ep p
erio
d,
whe
n th
e lig
hts
wer
e tu
rned
off
. Lef
t pa
nel,
chro
nogr
ams;
cen
tral p
anel
, chi
-squ
are
perio
dogr
am-th
e a
leve
l at 0.005
is s
how
n; r
ight
pa
nel,
Four
ier
serie
s ana
lysi
s.
Chr
onob
iol I
nt D
ownl
oade
d fr
om in
form
ahea
lthca
re.c
om b
y U
NA
M o
n 08
/03/
10Fo
r pe
rson
al u
se o
nly.
172 CHAGOYA DE S h C H E Z ET AL.
detected for adenosine deaminase by the chi-square periodogram is an harmonic element. The main oscillatory period for 5’-nucleotidase was around 4 and 8 h. For adenosine deaminase, the main oscillation had a period of 5 h. The cosinor method did not reveal significant sinusoidality in any of the adenosine-metabolizing enzymes’ rhythms.
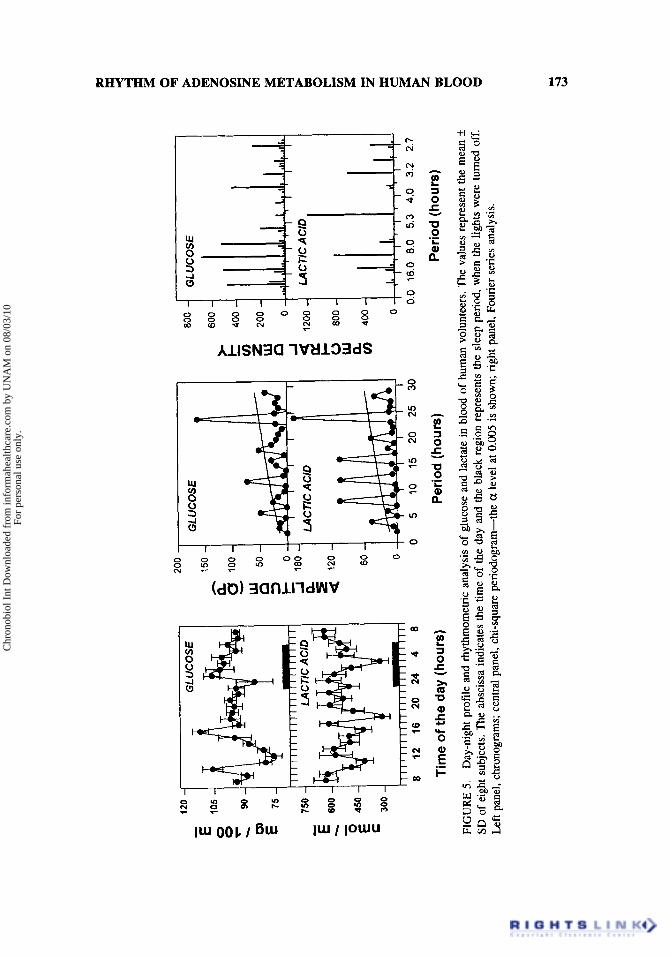
Figure 5 left panel shows the chronograms of serum glucose and lactate. As ex- pected, the pattern displayed by glucose correlates closely with the meal schedule. With the exception of the evening meal, very clear glucemia peaks occurred after breakfast and lunch, at 1O:OO and 1690 h, respectively. Lactate showed three main diminutions at 11:OO, 18:00, and 03:OO h. Figure 5 central panel shows the chi-square periodrogram for glucose and lactate. Again, this analytical methodology detected 24-h and ultradian oscillatory periods. However, with the Fourier analysis (Fig. 5 right panel), it was evident that only glucose has a 24-h component, being the one postulated for lactate, an harmonic component. The spectral analysis demonstrated that the main oscillatory periods for glu- cose and lactate were 12 and 5 h, respectively. Lactate levels during the wake period depict the activity of the muscular system, but during the sleep period they represent an index of brain metabolism. Lactate was the only parameter in this study that manifested statistically significant cosinosoidality, when analyzed by cosinor method (period: 4 h; mesor: 527 pmoYm1; acrophase: OO:36, amplitude 63 pmol/ml). Phosphate was also mea- sured, but ANOVA did not document significant rhythmicity (2.26 k 0.46 pmoVml mean of 192 determinations from eight subjects).
DISCUSSION
Blood acts as a storer and transporter, but not as a generator, of molecular frame- works for tissues unable to synthesize the purine rings de novo, such as brain, heart, and skeletal muscle. The liver, being the metabolic pathway of purine formation, has been recognized as the main source of purine molecules and the principal emitter of these molecules to the rest of the organism (25). For a different point of view, see Arnuld and Cyzyk (28) and Zhang and Lautt (29). Taking these results together with the changing pattern of the blood purines observed in Fig. 2, we might suggest a final equilibrium between the local purine metabolism of blood cells, hepatic contribution of the purine rings, delivery of purines from blood to peripheral tissues, and urinary excretion.
Comparison with the Rat’s Adenosine Metabolism Rhythm
Comparing the temporal pattern of the quantified purines in blood of humans and rats reveals several differences. In general, the rhythms described in the rat show frequen- cies close to 24 h, with very few ultradian patterns. In particular, murine adenosine fluctuations are not as regular as in humans, with peaks more or less every 8 h, since the rat presents low constant values during the day, but during the dark period exhibits three peaks at 24:00, 0290, and 07:OO h (2). Oscillations of inosine and hypoxanthine in rat blood are characterized by high levels of both molecules throughout the light period up until 24:OO h. At this time, there is dramatic decrease of both nucleosides that coincides with the maximal adenosine level (2). In contrast, human blood inosine and hypoxanthine show multiple peaks during the sleep and wake periods with a correlation between high levels of adenosine or inosine concomitant with drops of hypoxanthine (13:00, 20:00, and 02:OO h, Fig. 2). Uric acid in rat blood shows a rhythm with a clear decrease during
Chr
onob
iol I
nt D
ownl
oade
d fr
om in
form
ahea
lthca
re.c
om b
y U
NA
M o
n 08
/03/
10Fo
r pe
rson
al u
se o
nly.
120
- 10
5 0
0
\
90
a
E 7
s
r
1 T
G
LUC
OS
E
.-
II
II
II
II
II
II
II
75
0 -
LAC
TIC
AC
ID
E E
300
11
11
11
11
11
1 1
11
1
8 12
16
20
24
4
8
Tim
e of
the
day
(hou
rs)
200
,
150
A n
n a
100
w
n
50
3 5
A8:
n
v 2
120 60 0 0
5 10
15
20
25
30
Per
iod
(hou
rs)
600 ,OOj
GLu
cr
400
200
iij
no
w
2 120
0
I- 0
800
w $
400 0 0.
0 16
.0 8.0
5.3
4.0
3.2
2.7
Per
iod
(hou
rs)
FIG
UR
E 5.
D
ay-n
ight
pro
file
and
rhyt
hmom
etrk
ana
lysi
s of
glu
cose
and
lac
tate
in b
lood
of
hum
an v
olun
teer
s. Th
e va
lues
repr
esen
t the
mea
n k
SD o
f eig
ht s
ubje
cts.
The
absc
issa
indi
cate
s th
e tim
e of
the
day
and
the
blac
k re
gion
rep
rese
nts
the
slee
p pe
riod,
whe
n th
e lig
hts
wer
e tu
rned
off
. Le
ft pa
nel,
chro
nogr
ams;
cen
tral p
anel
, chi
-squ
are
perio
dogr
am-th
e a
leve
l at 0
.005
is s
how
n; ri
ght
pane
l, Fo
urie
r ser
ies
anal
ysis
.
Chr
onob
iol I
nt D
ownl
oade
d fr
om in
form
ahea
lthca
re.c
om b
y U
NA
M o
n 08
/03/
10Fo
r pe
rson
al u
se o
nly.
174 CHAGOYA DE SANCHEZ ET AL.
the dark period (2). In this mammal, uric acid is further catabolized to allantoin. In human blood, uric acid also shows temporal variations; nevertheless, this purine is the final catabolic product in humans (28). The lowest value of human uric acid in blood (at 24:OO h) is coincident with low values of all the other purines (Fig. 2).
Adenine nucleotides in rat blood also present oscillatory patterns (8). As in humans murine adenine nucleotides undergo important changes during the dark period, mainly decrease in ATP and enhancement of ADP and AMP levels. These changes cannot be related to the sleep-wake cycle of these two organisms, since rats and humans have opposite sleep patterns; therefore, this observation might represent a local metabolic ad- justment in the energy status of blood cells.
In the rat, S-adenosylhomocysteine hydrolase activity displays a significant in- crease during the light period, during the rest/sleep span (1 0). Regarding 5’-nucleotidase activity, in the same way as in the rat blood the human enzyme presents the highest activity among all adenosine-metabolizing enzymes. In rat blood, this enzyme exhibits a more monotonous pattern with a peak at the initial phase of the light period (08:00-12:00 h) and with lower and constant activity during the rest of the 24-h period (10). Consider- ing these results together, both human blood adenosine-forming enzymes, S-adenosylho- mocysteine hydrolase and 5’-nucleotidase, present a very constant pattern during the wake period and notable fluctuation during the sleep period. Adenosine kinase activity in the rat rises to a unique peak at 08:OO h. In both rats and humans the increased activity of adenosine kinase occurs during the first third of the sleep period. In contrast, rat blood adenosine deaminase shows a major peak at 0890 h, with almost no changes throughout the rest of the 24 h (10). It is known that the activity of the adenosine-metabolizing enzymes can regulate the action of the nucleoside, functioning as a chemical messenger or a metabolic modulator; for example, it has been reported that the pharmacological inhibition of adenosine kinase and adenosine deaminase modulates adenosine and opioid agonist-induced antinociception in mice (29).
Rhythmometric and Nonrhythmometric Analysis
The variations presented by the metabolites and enzymatic activities along the 24 h were analyzed by two approaches. In the first one, by ANOVA test, significant varia- tions among the values during the 24 h were detected. Fourteen of the initial 16 quanti- fied parameters showed statistically significant differences among their values. In the second approach, the characteristics and properties of the temporal variations were deter- mined. To detect the diurnal and ultradian components presented in chronograms, a chi- square periodrogram was applied. Then, as an alternative approach, a spectral analysis by fast Fourier transform was conducted. For estimation of the most pertinent periods, the single cosinor analysis was applied. Based on these analyses, it was shown that all the study parameters, metabolites and enzymatic activities, presented ultradian oscilla- tions. In contrast, adenosine, uric acid, lactate, and adenosine deaminase did not show significant 24-h periodicities. The cosinor method is a powerful analytical tool for identi- fying the main parameters that characterize biological rhythms (25). This procedure is able to detect periodic components in short and noisy time series, which is usually pres- ent in experimental situations involving humans. Because of the complexity of the rhythms and the nonsinusoidality shown by the adenosine metabolites and adenosine- metabolizing enzymes in the blood of the volunteers, the applications of the single cosi-
Chr
onob
iol I
nt D
ownl
oade
d fr
om in
form
ahea
lthca
re.c
om b
y U
NA
M o
n 08
/03/
10Fo
r pe
rson
al u
se o
nly.
RHYTHM OF ADENOSINE METABOLISM IN HUMAN BLOOD 175
nor method in our conditions was very limited. In fact, only the temporal pattern in lactate could be reasonably well represented by a cosine curve.
Adenosine Metabolism as a Biological Oscillator
Diurnal variations of the nucleoside represent profound biological implications. Previous reports suggested that diurnal variations of adenosine might act as a key link supporting the rhythmicity of a coordinated network of metabolic pathways and cellular activities (2,7,9,10). It has been shown that fluctuations in adenosine metabolism in sev- eral tissues of the rat are balanced to coordinate several processes, such as the energy homeostasis of the cell, adjustment of membrane structure, and modulation of hormonal action (10).
in the rat, adenosine has been postulated as a putative molecular oscillator capable of influencing rhythmic activities such as food consumption or the sleep-wake cycle (10). A possible origin for adenosine oscillations is the periodic changes of its metabolizing enzymes, specially those of the liver and brain (9,lO). It remains to be proven, however, whether adenosine rhythmicity is an endogenous oscillator. Furthermore, diurnal varia- tions of the nucleoside are complemented by the oscillatjon of some adenosine-G protein- coupled receptors in several tissues of the rat, such as the brain (30).
Adenosine metabolism also exhibits diurnal variations in human blood as demon- strated by the results presented here. It was not unexpected that the rhythms displayed by the metabolites and enzymes in humans failed to correspond with their counterparts in rat blood, since the two organisms have different metabolic patterns and distinct habits and life-styles. We do not know whether the changes in adenosine metabolism found in blood samples reflect the purine and energy metabolism in tissues such as liver, brain, and muscle. But the constancy in energy charge suggests an important role in the mainte- nance of energy homeostasis. Based on the metabolic network around adenosine metabo- lism among different tissues in the rat, it is possible to hypothesize that a similar situation might occur in humans, particularly if it is considered that most of human tissues are unable to synthesize purine rings de novo and that their energy requirements depend on the delivery of these molecules from the liver. As in the rat, it remains to be elucidated whether fluctuations of adenosine metabolism are independent of environmental clues and, therefore, endogenous. Ultradian fluctuations shown by most parameters quantified in this study might be entrained to environmental factors such as the lighting andor feeding schedule.
In conclusion, we report temporal variations in metabolites and enzymatic activities related to adenosine metabolism in the blood of human volunteers. Most of the parame- ters quantified in this study presented significant ultradian rhythms during the 24-h pe- riod. Further connections with other physiological activities remain to be described, and more studies are needed to assess the possible role of adenosine metabolism as a physio- logical oscillator of biological rhythms.
ACKNOWLEDGMENTS
The authors acknowledge critical comments from Drs. Carolina Escobar and Rafael Villalobos-Molina, the assistance of Fernando Ldpez Barrera (Lic. en Nutricidn) in the preparation of figures, and the expert typewriting of Mrs. Yolanda Diaz.
Chr
onob
iol I
nt D
ownl
oade
d fr
om in
form
ahea
lthca
re.c
om b
y U
NA
M o
n 08
/03/
10Fo
r pe
rson
al u
se o
nly.
176 CHAGOYA DE S h C H E Z ET AL.
1.
2.
3.
4.
5.
6.
7.
8.
9.
10.
11.
12.
13.
14.
15.
16.
17.
18.
REFERENCES
Fox IH, Kelley WN. The role of adenosine and 2'deoxyadenosine in mammalian cells. Annu Rev Biochem 1978; 47:655-86. Chagoya de SBnchez V, HernBndez-Muiioz R, Diaz-Muiioz M, Villalobos R, Glender W, Vidrio S, YBfiez L. Circadian variations of adenosine level in blood and liver and its possible physiological significance. Life Sci 1983; 33:1057-64. Williams M. Adenosine: the prototypic neuromodulator. Neurochem Inr 1989; 14:249-64. Arch JRS, Newsholme EA. The control of the metabolism and the honnonal role of adenosine. London: Academic Press, 1978. Stone TW. Receptors for adenosine and adenine nucleotides. Cen Pharmacol 1991;
Kredich NM, Hershfield MS, Johonton JM. Transmethylation. In: Heylen L, ed. Covalent modifications of biomolecules. North Holland: Elsevier, 1979:65-79. Chagoya de Shchez V, Hernhdez-Muiioz R, Sgnchez L, Vidrio S, Y6iiez L, Su- rirez J. Twenty-four hour changes of S-adenosylmethionine, S-adenosylhomocyst- eine, adenosine and its metabolizing enzymes in rat liver: possible physiological significance in phospholipid methylation. Int J Biochem 1991; 23: 1439-43. Daval JL, Nehlig A, Nicolas F. Physiological and pharmacological properties of adenosine: therapeutic implications. Life Sci 1991; 49: 1435-53. Chagoya de SBnchez V, HernBndez-Muiioz R, Surirez J, Vidrio S, YBiiez L, Diaz- Muiioz M. Day-night variations of adenosine and its metabolizing enzymes in the brain cortex of the rat: possible significance for the energetic homeostasis and the sleep-wake cycle. Brain Res 1993; 612:115-21. Chagoya de SBnchez V. Circadian variations of adenosine and of its metabolism: could adenosine be a molecular oscillator for circadian rhythms? Can J Physiol Phannacol 1995; 73:339-55. Olsson RA. Changes in content of purine nucleoside in canine myocardium during coronary occlusion. Cir Res 1970; 26:301-6. Adam H. Adenosine-5-diphosphate and adenosine-5-monophosphate. In: Berg- mayer HU, ed. Methods of enzymatic analysis. New York Academic Press,
Lamprecht W, Trautschol I. ATP determination with hexokinase and glucose-6- phosphate dehydrogenase. In: Bergmeyer HU, ed. Methods of enzymatic analysis. New York: Academic Press, 1965543-5 1. Atkinson DE. Adenylate control and the adenylate energy charge. In Atkinson DE, ed. Cellular energy metabolism and its regulation. London: Academic Press,
Summer JB. A method for the colorimetric determination of phosphorus. Science
Hohorst HJ. Lactate determination with lactatic dehydrogenase and DPN. In: Berg- meyer HU, ed. Methods of enzymatic analysis. New York: Academic Press, 1965:266-70. Hultman E. Specific method for determination of aldosaccharides in body fluids. Nature 1959: 183:108-10. Caraway WT. Determination of uric acid in serum by carbonate method. Am J Clin Pathol 1955; 25:840-5.
22125-31.
1965 573-7.
1977~85-106.
1944; 10014 13-1 4.
Chr
onob
iol I
nt D
ownl
oade
d fr
om in
form
ahea
lthca
re.c
om b
y U
NA
M o
n 08
/03/
10Fo
r pe
rson
al u
se o
nly.
RHYTHM OF ADENOSINE METABOLISM IN HUMAN BLOOD 177
19.
20.
21.
22.
23.
24.
25.
26.
27.
28.
29.
30.
31.
32.
de Jong JW, Kalkman C. Myocardial adenosine kinase: activity and localization determined by rapid radiometric assay. Biochim Biophys Actu 1973; 320:388-96. %saki H, Sakurada T. Simple micro-assay for enzymes of purine metabolism. J Lab Clin Med 1977; 89: 1 135-44. Palmer JL, Abeles RH. The mechanism of action of S-adenosylhomocysteinase. J Biol Chem 1979; 254:1217-25. Hohman RJ, Veron M. S-adenosyl homocysteine hydrolase from Dictyosteliun dis- coideum is inactivated by CAMP and reactivated by NAD+. FEBS Lett 1984; 165:254-68. Gornall AG, Bardawill CJ, David MM. Determination of serum proteins by means of the biuret reaction. J Biol Chem 1949; 177:751-66. Skolove PG, Bushel WN. The chi-square periodrogram: its utility analysis of circa- dian rhythms. J Theor Biol 1978; 72:131-60. Anderson TW. In: Estimation of spectral density. The statistical analysis of time series. New York: Wiley, 1971:501-58. Nelson WL, Tong YL, Lee JK, Halberg F. Methods for cosinor rhythmometry. Chronobiologia 1979; 6:305-23. Lerner MH, Lowy BA. The formation of adenosine in rabbit liver and its possible role as a direct precursor of erythrocyte adenine nucleotides. J Biol Chem 1974;
Arnuld ST, Cyzyk RL. Adenosine export from the liver: oxygen dependency. Am J Physiol 1986; 25 1 :634-9. Zhang Y, Lautt WW. The liver does not export adenosine under physiological conditions. Proc West Pharmacol Soc 1993; 36:181-4. Hause E, Nicolau GY, Lakatua D, Sackett-Lundeen L. Reference values for chrono- pharmacology. Annu Rev Chronopharmacol 1988; 4:333-424. Keil GJ, Delander GE. Adenosine kinase and adenosine deaminase inhibition mod- ulate spinal adenosine- and agonist-induced antinociception in mice. Eur J Pharma- col 1994; 27 1 t37-46. Virus RM, Baglajewski T, Radulovacki M. Circadian variations of t3H]N6-(~-phe- nylisopropyl) adenosine binding in rat brain. Neurosci Lett 1984; 46:219-23.
249: 95 9-66.
Chr
onob
iol I
nt D
ownl
oade
d fr
om in
form
ahea
lthca
re.c
om b
y U
NA
M o
n 08
/03/
10Fo
r pe
rson
al u
se o
nly.