temporal and spatial variation of episodic wind erosion in unburned and burned semiarid shrubland
TRANSCRIPT

WHICKER ET AL.: WIND EROSION IN UNBURNED AND BURNED SHRUBLAND 599
rus export coefficicents for CORINE land cover types. Water Sci. ing environmentally sound soil phosphorus levels. J. Soil WaterTechnol. 39:47–53. Conserv. 51:160–166.
Menon, R.G., L.L Hammond, and H.A. Sissingh. 1988. Determination Sharpley, A.N., M.J. Hedley, E. Sibbesen, A. Hillbricht-Ilkowska,of plant available phosphorus by the iron-oxide impregnated filter A.W. House, and L. Ryszkowski. 1995. Phosphorus transfers frompaper (Pi) soil test. Soil Sci. Soc. Am. J. 53:110–115. terrestrial to aquatic ecosystems. p. 171–200. In H. Tiessen (ed.)
Morgan, M.F. 1941. Chemical soil diagnosis by the Universal Soil Phosphorus in the global environment: Transfers, cycles and man-Testing System. Bull. 450. Connecticut Agric. Exp. Stn., New Haven. agement. Wiley Press, Chichester, UK.
Pionke, H.B., W.J. Gburek, A.N. Sharpley, and J.A. Zollweg. 1997. Stamm, C., H. Fluhler, R. Gachter, J. Leuenberger, and H. Wunderli.Hydrological and chemical controls on phosphorus loss from catch- 1998. Preferential transport of phosphorus in drained grasslandments. p. 225–242. In H. Tunney et al. (ed.) Phosphorus loss from soils. J. Environ. Qual. 27:515–522.soil to water. CAB Int., Wallingford, UK. Stevens, R.J., and R.V. Smith. 1978. A comparison of discrete andRyden, J.C., J.K. Syers, and R.F. Harris. 1973. Phosphorus in runoff intensive sampling for measuring the loads of nitrogen and phos-and streams. p. 1–45. In N.C. Brady (ed.) Advances in agronomy
phorus in the River Main, County Antrim. Water Res. 12:823–830.25. Academic Press, New York.Tufford, D.L., H.N. McKellar, and J.R. Hussey. 1998. In-stream non-SAS Institute. 1988. SAS/STAT user’s guide. Release 6.03 ed. SAS
point source nutrient prediction with land-use proximity and sea-Inst., Cary, NC.sonality. J. Environ. Qual. 27:100–111.Sharpley, A.N. 1995. Dependence of runoff phosphorus on extractable
Tunney, H., B. Coulter, K. Daly, I. Kurz, C. Coxon, D. Jeffrey, P.soil phosphorus. J. Environ. Qual. 24:920–926.Mills, G. Kiely, and G. Morgan. 2000. Quantification of phosphorusSharpley, A.N., T.C. Daniel, and D.R. Edwards. 1993. Phosphorus(P) loss to water due to soil P desorption. Environmental Protectionmovement in the landscape. J. Prod. Agric. 6:492–500.
Sharpley, A.N., T.C. Daniel, J.T. Sims, and D.H. Pote. 1996. Determin- Agency, Wexford, Ireland.
Temporal and Spatial Variation of Episodic Wind Erosion in Unburned and BurnedSemiarid Shrubland
Jeffrey J. Whicker,* David D. Breshears, Piotr T. Wasiolek, Thomas B. Kirchner, Rebecca A. Tavani,David A. Schoep, and John C. Rodgers
ABSTRACT Soil is redistributed and transported by wind erosionin semiarid ecosystems. Rates of wind erosion fun-Redistribution of soil, nutrients, and contaminants is often driven
by wind erosion in semiarid shrublands. Wind erosion depends on damentally depend on the characteristics of wind in awind velocity (particularly during episodic, high-velocity winds) and complex fashion (Bagnold, 1941). For example, windon vegetation, which is generally sparse and spatially heterogeneous erosion exhibits a threshold-like response to increasingin semiarid ecosystems. Further, the vegetation cover can be rapidly wind velocities (Bagnold, 1941; Gillette et al., 1980;and greatly altered due to disturbances, particularly fire. Few studies, Nicholson, 1993; Belnap and Gillette, 1998). Similarly,however, have evaluated key temporal and spatial components of concentrations of airborne dust and soil contaminantswind erosion with respect to (i) erosion rates on the scale of weeks are predicted to increase as a power function with veloc-as a function of episodic high-velocity winds, (ii) rates at unburned
ity (Woodruff and Siddoway, 1965; Anspaugh et al.,and burned sites, and (iii) within-site spatial heterogeneity in erosion.1975). Because of these nonlinear relationships, windMeasuring wind erosion in unburned and recently burned Chihuahuanerosion may occur primarily during episodic, high-winddesert shrubland, we found (i) weekly wind erosion was related moreevents (Helgren and Prospero, 1987; Cahill et al., 1996;to daily peak wind velocities than to daily average velocities as consis-Goossens and Offer, 1997; Godon and Todhunter, 1998;tent with our findings of a threshold wind velocity at approximately
7 m s�1; (ii) greater erodibility in burned vs. unburned shrubland as Stout, 2001). However, few studies have evaluated howindicated by erosion thresholds, aerodynamic roughness, and near- wind erosion over longer time frames (e.g., weeks) re-ground soil movement; and (iii) burned shrubland lost soil from inter- lates to net soil redistribution and transport of associ-canopy and especially canopy patches in contrast to unburned shrub- ated nutrients and contaminants during episodic, high-land, where soil accumulated in canopy patches. Our results are among velocity wind events.the first to quantify post-fire wind erosion and highlight the impor- Wind erosion also fundamentally depends on land-tance of accounting for finer temporal and spatial variation in surface characteristics of vegetation structure and asso-shrubland wind erosion. This finer-scale variation relates to semiarid ciated ground cover (Fryrear, 1985). Characteristics ofland degradation, and is particularly relevant for predictions of con-
the vegetation matrix that are particularly influentialtaminant resuspension and redistribution, both of which historicallyon wind erosion include the amount, type, and spatialignore finer-scale temporal and spatial variation in wind erosion.pattern of vegetation (Raupach et al., 1993; Wolfe andNickling, 1996). One of the key characteristics of thismatrix is the proportion and spacing of two fundamen-Jeffrey J. Whicker, Pitor T. Wasiolek, Rebecca A. Tavani, and John
C. Rodgers, Health Physics Measurements, Los Alamos National Lab- tally different patch types: the canopy patches associatedoratory, Mail Stop G761, Los Alamos, NM 87545. David D. Breshears, with woody plants (trees and shrubs) and the intercan-Environmental Dynamics and Spatial Analysis, Earth and Environ- opy patches that separate them (Belsky and Canham,mental Sciences Division, Los Alamos National Laboratory, Mail Stop
1994; Scholes and Archer, 1997; Breshears and Barnes,J495, Los Alamos, NM 87545. Thomas B. Kirchner and David A.Schoep, Carlsbad Environmental Monitoring and Research Center, 1999). These two patch types differ in a number of1400 University Drive, Carlsbad, NM 88220. Received 27 Mar. 2001.*Corresponding author ([email protected]).
Abbreviations: DOE, United States Department of Energy; TSP, totalsuspended particulate; WIPP, Waste Isolation Pilot Plant.Published in J. Environ. Qual. 31:599–612 (2002).
600 J. ENVIRON. QUAL., VOL. 31, MARCH–APRIL 2002
microclimatic conditions (McPherson, 1997; Breshears surface types (Gillette et al., 1980; Nicholson, 1993; Bel-nap and Gillette, 1998). However, this approach is lim-et al., 1997, 1998; Martens et al., 2000), and variation
in height and spatial pattern of the two patch types is ited in its potential to simulate the complexity of naturalwind conditions, particularly winds associated with large,a major determinant of aerodynamic roughness (Rau-
pach et al., 1993; Wolfe and Nickling, 1996; Dong et al., episodic wind events that may play a disproportionaterole in determining wind erosion (Stout, 1998, 2001).2001), an index of erodibility. Because these two patch
types are the dominant components of the land surface Wind tunnel studies also require isolation of a subsec-tion of the system of interest from its surrounding topog-matrix in semiarid shrublands, the amount of wind-
driven redistribution of soil between these two patch raphy and surface cover, thereby including only a limitedamount of spatial heterogeneity in vegetation (Okin andtypes is tightly interrelated with the net loss or gain of
soil by wind erosion at a site. Gillette, 2001).The second approach, frequently associated with moni-The vegetation matrix and associated ground cover
can be changed rapidly at a site in response to distur- toring for air quality, is based on measurements of airconcentrations and wind velocities over periods ofbance, such as heavy grazing, drought, and human activi-
ties (Schlesinger et al., 1990; Bahre, 1995; Allen and weeks to months. This approach has the advantage ofcapturing data on wind erosion in response to a fullBreshears, 1998; Breshears and Allen, 2002). These
changes can, in turn, result in increased wind erosion distribution of naturally occurring wind conditions.However, data obtained using this approach (e.g., aero-(Zobeck et al., 1989; Okin et al., 2001; Reynolds et al.,
2001). Of particular concern are the rapid and large sol concentrations) and associated meteorological con-ditions are often aggregated over the longer time scaleschanges in land surface characteristics that can accom-
pany fire (Paysen et al., 2000). Historically, fire occurred of weeks to months to achieve required sensitivity(Cember, 1988). This aggregation precludes quantifica-frequently in semiarid shrublands and grasslands (Mc-
Pherson, 1995). The fire probability in shrublands is tion of relationships of air quality with episodic windevents. Although the monitoring approach can be usefulprobably related to the proportion of cover from herba-
ceous and woody plants. In general, when herbaceous for comparing estimates of wind-driven soil fluxes fromdifferent sites, it generally does not assess net changescover is high, fire is likely to spread. When the amount
of woody cover is intermediate and herbaceous cover within a system, that is, whether there is a net lossor gain of soil from the site. Furthermore, neither theis low, as in many degraded shrublands, fire is unlikely
to spread; when the amount of woody cover is very high, monitoring nor the wind-tunnel approach generallyevaluates redistribution of soil within the system (e.g.,fire is likely to spread and to be intense. The role of
fire is likely to become more important in the future among vegetation patch types) and how this spatial re-distribution relates to net system changes in soil. Abecause fire suppression over the past century has re-
sulted in greatly increased fuel loads as a result of in- more comprehensive approach addressing some of thelimitations of the two general approaches could yieldcreasing density of woody plants (Grover and Musick,
1990; Archer et al., 1995; Covington et al., 1997; Fule an improved understanding of wind erosion dynamics.Improved quantification of wind erosion relationshipset al., 1997; Mast et al., 1999; Van Auken, 2000). Further,
frequencies of extreme climatic events that make fire is needed to better understand the role of wind erosionin semiarid land degradation. Extensive semiarid landsmore probable (e.g., drought) increased during the past
century and are expected to increase further in coming have become degraded over the past century throughtransformation of grasslands to shrublands, a processdecades (Easterling et al., 2000). Hence, fire is likely to
become increasingly important (Swetnam et al., 1999; often referred to as desertification (Grover and Musick,1990; Schlesinger et al., 1990; Burgess, 1995; Van Auken,Swetnam and Betancourt, 1998) and may result in large
increases in wind erosion rates in shrublands. Wind ero- 2000; Okin et al., 2001). These transitions are thoughtto be interrelated with long-term erosional changes atsion in undisturbed and disturbed sites, including a
burned site, was studied by Zobeck et al. (1989), but the scale of canopy and intercanopy patches (Schle-singer et al., 1990; Havstad et al., 2000), whereby soil andthis study was limited to direct measurements of sedi-
ment catch and nutrient movement and did not include nutrients are thought to be redistributed to the canopypatches of the woody shrubs. Long-term historical stud-other more generally predictive metrics for wind ero-
sion. Although this study found large increases in wind ies have quantified changes in surface topography insemiarid shrublands (Gibbens et al., 1983; Hennessyerosion at the burned site, there are few, if any, other
studies of post-fire wind erosion in any ecosystem, for et al., 1986; Havstad et al., 2000), but redistribution ofsoil with respect to canopy and intercanopy patches hassemiarid shrubland or otherwise.
Quantification of the complex dependencies of wind not been quantified. An improved understanding of howthis redistribution relates to net losses or gains of soilerosion on the effects of meteorological conditions (e.g.,
wind characteristics) and land-surface characteristics is needed, as well as how such changes relate to distur-bance such as fire.(e.g., vegetation structure and cover) has generally been
approached in one of two ways. The first approach uses Understanding the relative role of redistribution ofsoil within a system, and how that redistribution de-wind tunnels and provides a means for quantifying wind
erosion relationships under controlled conditions. This pends on episodic events, is directly relevant to ad-dressing the general issue of contaminant transport inapproach has led to quantification of threshold veloci-
ties under controlled conditions as a function of land semiarid ecosystems. There are many semiarid lands
WHICKER ET AL.: WIND EROSION IN UNBURNED AND BURNED SHRUBLAND 601
with low concentrations of contaminants over large ar- particular interest because it has been the focus of winderosion studies dating back decades to the 1930s (Gib-eas. For example, within the Department of Energy
(DOE) complex in the western United States, there are bens et al., 1983; Hennessy et al., 1983, 1986), it is thebasis for much of our knowledge about desertificationextensive arid and semiarid lands with low concentra-
tions of radioactively and chemically contaminated soil (Schlesinger et al., 1990), and it is the dominant ecosys-tem type for the WIPP site and is similar to other(e.g., Rocky Flats, Hanford, Idaho National Engineering
and Environmental Laboratory, the Nevada Test Site, shrubland sites within the DOE complex for which winderosion of contaminated soil is of concern. Our studyand Los Alamos National Laboratory) (Riley et al.,
1992). There are other sites within the DOE complex was designed to not only contribute to site-specific mon-itoring at WIPP, but also to provide more general insightfor which potential future contamination is of concern.
One such site, the Waste Isolation Pilot Plant (WIPP) into wind erosion processes. Our results indicate thesignificance of episodic winds and disturbance in in-in southeastern New Mexico, is a repository for transu-
ranic wastes where future drilling for natural resources creasing erosion, show differences at the canopy–inter-canopy patch scale, and highlight the importance of ac-could result in release of contaminants to surface soils,
where they would become subject to wind erosion (Lee, counting for finer temporal and spatial variation in winderosion of soils for predictions related to land degrada-1997). Other federal agencies (e.g., U.S. Department of
Defense) and private landowners (e.g., farms and min- tion and contaminant transport.ing companies) also have tracts of land where redistribu-tion of contaminated soil by wind erosion may be of MATERIALS AND METHODSconcern. Wind erosion, in contrast to water erosion or Our primary study site was an unburned shrubland site thatmigration through the vadose zone, may be the domi- corresponded to an air quality monitoring site operated by thenant transport mechanism for contaminated surface Carlsbad Environmental Monitoring and Research Center,soils across semiarid sites within the DOE complex sites, operated by New Mexico State University. This site met theas suggested by model calculations (Johnson et al., electrical power requirements for operation of our total sus-
pended particulate air samplers over the study period. Our2000). The relative importance of wind erosion can be-secondary site was a burned site where there was an intensecome even greater following disturbance such as firewildfire that occurred about a week before the initiation of(Johnson et al., 2000). An improved understanding ofour measurements and resulted in loss of nearly all groundthe temporal and spatial variability associated with windcover within 6 km2. We measured several site characteristicserosion prior to and following fire is required for accu-and components of wind erosion at both the unburned andrate long-term assessment of public risk for nearby resi- recently burned shrubland sites. Our measurements included
dents. Indeed, our ability to predict resuspension of friction velocities, aerodynamic roughness lengths, aerosolcontaminated soils is generally referred to as qualitative measurements (by mass and number concentrations, and byand preclusive of quantitative risk assessment (Nichol- particle size), micrometeorological conditions, and changes inson, 1994). surface microtopography. The time scale of these measure-
ments ranged from static to minutes to months.Collectively then, few studies have evaluated key tem-poral and spatial components of wind erosion with re-spect to (i) relating erosion rates over longer periods Site Characteristicsof weeks to short, episodic, high-wind gusts; (ii) rates Both the unburned and the burned sampling sites were onin undisturbed and disturbed sites, particularly un- U.S. Bureau of Land Management lands and within 20 km toburned and burned sites; and (iii) within-site spatial the east of the WIPP boundary. The WIPP is located in theheterogeneity at the scale of vegetation patches (e.g., southeast corner of the state of New Mexico approximately
42 km east of Carlsbad at an elevation of 1040 m. The samplingcanopies of woody plants vs. intercanopy patches be-sites were representative of similar areas located in and aroundtween them). Our overall goal was to evaluate temporalthe WIPP site (Carlsbad Environmental Monitoring and Re-and spatial components of variability associated withsearch Center, 1998).wind erosion at finer scales than typically studied and to
Precipitation amounts in Carlsbad are approximately 300specifically evaluate changes in wind erosion followingmm annually, mainly from intense spring and summer thun-wildfire. Our objectives were to (i) evaluate longer-term derstorms (United States Department of Energy, 1980). Winds
(i.e., weekly) wind erosion rates as a function of average are predominately from the southeast. Over the course of theor peak gust velocities, and supplement this work with study, June 1998 through February 1999, the unburned siteshorter-term measurements (i.e., minutes) of airborne had a total rainfall of 124 mm and a mean daily wind velocitysoil that also differentiate by soil particle size; (ii) evalu- of 2.4 m s�1, with monthly peak gusts ranging from 12.5 to
22.4 m s�1. Similarly, the burned site had a total rainfall ofate a burned shrubland site and an unburned shrubland118 mm and a mean daily wind velocity of 2.9 m s�1, withsite with respect to several metrics related to erodibility,monthly peak gusts ranging from 15.2 to 22.4 m s�1.including aerodynamic roughness, erosion thresholds,
The two sites were also similar with respect to some keyand soil movement (�1 m height); and (iii) determinesurface characteristics, although there were some differencesdifferences in net soil loss or gain at the canopy–associated with vegetation. Soil formed in dunes around shrubsintercanopy scale within the unburned and burned sites. at both sites. The soil texture for the top 3 cm of the profile,
Our approach was to measure wind erosion at multi- that portion most subject to wind resuspension, was similarple temporal and spatial scales at unburned and recently between the unburned site (92% sand, 4% silt, 4% clay) andburned sites in Chihuahuan Desert shrubland located the burned site (93% sand, 2% silt, 5% clay). Further, the
proportion of soil particles in the top 3 cm with sizes smallernear the WIPP. This shrubland ecosystem type is of
602 J. ENVIRON. QUAL., VOL. 31, MARCH–APRIL 2002
than 10 �m in aerodynamic diameter, the proportion consid- where u�, v�, and w� are the instantaneous wind velocity com-ponents in both horizontal (x and y) and vertical (z) directions.ered respirable, was measured using a pipette method for
particle size analysis (Black et al., 1965) and was approximately We used the latter approach and measured the instantaneouswind velocity components using a factory-calibrated sonic ane-5% at both sites. With regards to vegetation, both sites are
located in the Chihuahuan Desert, which generally include mometer (Model CSAT3; Campbell Scientific, Logan, UT)with sampling frequency set to 10 Hz.mesquite (Prosopis glandulosa Torr.), creosotebush [Larrea
tridentata (Sesse & Moc. ex DC.) Coville], shinnery oak (Quer-cus havardii Rydb.), sand sage (Artemisia filifolia Torr.), vari- Aerosol Measurementsous yucca species (Yucca spp.), smallhead snakeweed [Gutier-
We measured aerosol concentrations using a number ofrezia microcephala (DC.) A. Gray], and threeawn grassesinstruments over the study period. Our approach included(Aristida spp.) along with other various forbs and grassessampling periods that ranged from a minute to several months,(Dick-Peddie, 1993). We characterized vegetation at bothdepending on the instrument, so that we could determine long-study sites using a line transect to estimate overall groundterm averages as well as short-term fluctuations in wind erosion.cover, which included persistent litter, nonpersistent litter,
To address our first objective (evaluation of the short- andvegetation ground cover, and rocks. Overall ground cover waslong-term relations between wind velocities and erosion), wesimilar at the two sites, 66% for the unburned site and 64%collected total suspended particulate (TSP) samples weeklyfor the burned site, although more of the litter at the unburned(long term) at two heights (1 and 3 m) allowing for determina-site was nonpersistent. Percent canopy cover (as viewed fromtion of the concentration gradient with height (d/dz). Hereabove) from shrubs was comparable between the sites, with is the mass concentration measured during the week and za 28% cover for the unburned site and 18% cover for theis the sampling height. We collected TSP air samples with aburned site (based on measurements of the defoliated canopysampling rate of about 6.8 m3 h�1 using a sampling inlet (Fig.following the fire). However, at the unburned site there was1a) based on the PM-10 design of Liu and Pui (1981). Thea higher shrub density (0.20 m�2 for the unburned site com-inlet is not directionally dependent, and it provides accuratepared with 0.01 m�2 for the burned site). The shrubs at thesampling for predominant airborne particle sizes (�10 �m inunburned site were smaller, with an average shrub height ofdiameter) measured at our study sites and for intermediate0.73 0.21 m (standard deviation) compared with 1.3 0.19wind velocities. Aspiration efficiencies for particles of aerody-m for the burned site, and an average shrub diameter of 1.2 namic diameters of 8.5 and 11 �m were 100 10% at wind0.6 m for the unburned site compared with and 3.8 1.2 mspeeds up to 2.8 m s�1 (Liu and Pui, 1981). We modified thisfor the burned site. The dominant shrub at the unburned siteinlet to collect all airborne particulate rather than just particleswas creosote, whereas mesquite was dominant at the burnedless than 10 �m. These modifications included placing thesite. Due to the differences in shrub patch structure, lateralfilter close to the bottom plate and adding a coarse wire screencover or roughness density—a metric defining the density ofto keep insects and larger debris out of the filter. To supple-the frontal silhouette area (Musick and Gillette, 1990)—wasment the Liu and Pui (1981) study, tests of the modified sam-calculated for both sites (0.18 for the unburned site and 0.07pling inlet at high-wind velocities of 12, 15, and 17 m s�1 and forfor the burned site). Although lateral cover differed somewhatlarge particle sizes (5, 10, and 30 �m) indicated that collectionbetween the two sites, calculations and literature data indicateefficiencies were approximately 120% (an oversampling ofthat the differences we observed in erosion metrics between20%) for 5-�m particles and approximately 50% for both 10-the sites were primarily the result of the effects of fire ratherand 30-�m particles (Rodgers et al., 2000). The results of thisthan differences between vegetation alone.study suggested that collection efficiencies at these high-windvelocities, although affected by particle size, were not affectedby wind velocity in the range tested. A correction for sampleAerosol and Meteorological Conditions at Varyingefficiency was precluded because we could not measure parti-Time Scales as Related to Vertical Soil Fluxcle size in real time during these measurement intervals.
Vertical Soil Flux Measurements We measured aerosol concentrations over 1-min time inter-vals (short-term) using two types of optical laser particle count-We measured vertical soil flux (F) using the gradienters (LPCs) that measure number of particles as a function ofmethod (Stull, 1988), for which it is determined as the productparticle size. Particles sizes � 0.5 and � 5.0 �m were measuredof the eddy diffusivity coefficient (Kz ) and the mass concentra-at 1- and 3-m heights using the smaller LPCs (Model 7550;tion () gradient with height (z):Particle Measuring Systems, Boulder, CO). Particle concentra-tions of 0.3, 0.5, 1, 5, and 10 �m were measured at a height
F � Kz �d
dz[1] of 3 m using the Met One optical counter (Model A2408; Met
One, Grants Pass, OR). Sampling occurred during the daylighthours of 23 July 1998, 1 and 2 Sept. 1998, and 27 and 28The eddy diffusivity coefficient itself is a function of theOct. 1998.friction velocity (u*):
Kz � kvzu* [2] Micrometeorological Measurements
At each sampling site, a 3-m-high Weather Monitor II mete-where kv � von Karman dimensionless constant (approxi-orological station from Davis Instruments (Hayward, CA) wasmately 0.4) and z � height of the measurement. The frictionused to measure local meteorological conditions at a samplingvelocity, a measure of the boundary shear created as windsfrequency of 2 h. Horizontal wind conditions were measuredpass over vegetation and soils, can be estimated for a givenusing a cup anemometer for velocity (average and peak gust)terrain and wind velocity by measuring the wind velocity pro-and a wind vane for direction. For each sampling period (gen-file with height (Bagnold, 1941), or by using high-frequency,erally 7 d), two summary statistics were calculated for thethree-dimensional measurements of wind velocities (Stull,horizontal wind velocities. One was the mean of the daily1988):averaged wind velocities, and the second was the mean of the
u2* � �u�w�2 � v�w�2�1/2 [3] daily peak or maximum gust velocity. Temperature, relative

WHICKER ET AL.: WIND EROSION IN UNBURNED AND BURNED SHRUBLAND 603
humidity, and rainfall were also measured, and the means ofthe daily averages were calculated for each weekly samplingperiod. The sampling frequency was typically 2 h, but wasadjusted to 60 s when the optical particle counters were used.
Indices of Erosion Potential at Unburnedand Burned Sites
Erosion Thresholds, Friction Velocity,and Roughness Lengths
For the unburned and burned sites, we estimated erosionthresholds, friction velocities, and roughness lengths as partialindices of site erosion potential, all of which relate surfacecharacteristics to airflow at the atmospheric boundary layer.Erosion thresholds were measured using 1-min LPC measure-ments of aerosol concentration evaluated with horizontal windvelocity and friction velocity. As noted above, friction veloci-ties were estimated from sonic anemometer measurementsusing Eq. [3]. Aerodynamic roughness length, the height abovethe ground where the average wind velocity is equal to zero,was estimated for both sites by:
ln z0 � ln z �Ukv
u*
[4]
where zo is the aerodynamic roughness length, z is the mea-surement height (3 m), U is the average horizontal wind veloc-ity during the measurement interval, kv is the von Karmanconstant (0.4), and u* is the friction velocity. For locationswhere the canopy cover is very dense and uniform, a displace-ment height should be considered in Eq. [4] (Stull, 1988).However, the vegetation in desert shrubland is generallysparse. Specifically, our measurements of Lc and area coverageat our two sites are within the range measured by Wolfe andNickling (1996) in similarly vegetated desert shrubland sites.Although we did not make measurements needed to deter-mine displacement height, Wolfe and Nickling (1996) foundthat the displacement height was insignificant in all their studysites. Therefore, we did not include a correction for displace-ment height.
While measurements of U, u�, v�, and w� were made at afrequency of 10 Hz, they were averaged over a 30-min timeperiod. To estimate friction velocities and roughness lengths,we used a subset of data that would more closely approximatethe ideal conditions of neutral atmospheric conditions (ClassD in the Pasquill stability class system). Measurements weremostly made at night in the late fall when the sun was low inthe horizon, and we analyzed only those values where thehorizontal wind velocity was greater than 2 m s�1 (Zannetti, Fig. 1. Schematics of omni-directional sampler used for total particu-1989). To better determine the Pasquill stability class for our late aerosol measurements (a ) and the passive soil collector (b ).measurement periods, we used fine wire thermometers to mea-sure temperature gradients. Mean temperature gradients were
size has not been characterized like other passive samplers�0.03�C m�1 for the unburned site and 0.12�C m�1 for the(Fryrear, 1986), the samplers provide a quantitative means forburned site, suggesting that average atmospheric conditionsdetermining relative differences in wind-driven soil movementwere not always neutral and were mostly in the slightly stablebetween the two sites.category (Class E).
Spatial Heterogeneity in Erosion between CanopySoil Movement Measurementsand Intercanopy Patches
We used passive soil collectors, which are self-orienting inWe measured changes in surface microtopography at thethe strong winds associated with wind erosion events, to collect
scale of canopy and intercanopy patches for both sites usingwindblown soil at six heights less than 1 m above the surfaceerosion bridges (Wilcox et al., 1996). An erosion bridge is(Fig. 1b). At both sites, three of these samplers were placedinstalled by placing two pieces of rebar into the ground suchin a triangle with samplers 20 m apart. Samples from thethat an approximately 1.9-m level gauge across them is level.passive samplers were generally collected weekly and the dryThe distance from the bottom of the level to the top of themass in each of the boxes was measured. Although the sam-
pling efficiency as a function of wind velocity and particle land surface was then measured at 5-cm intervals. We installed
604 J. ENVIRON. QUAL., VOL. 31, MARCH–APRIL 2002
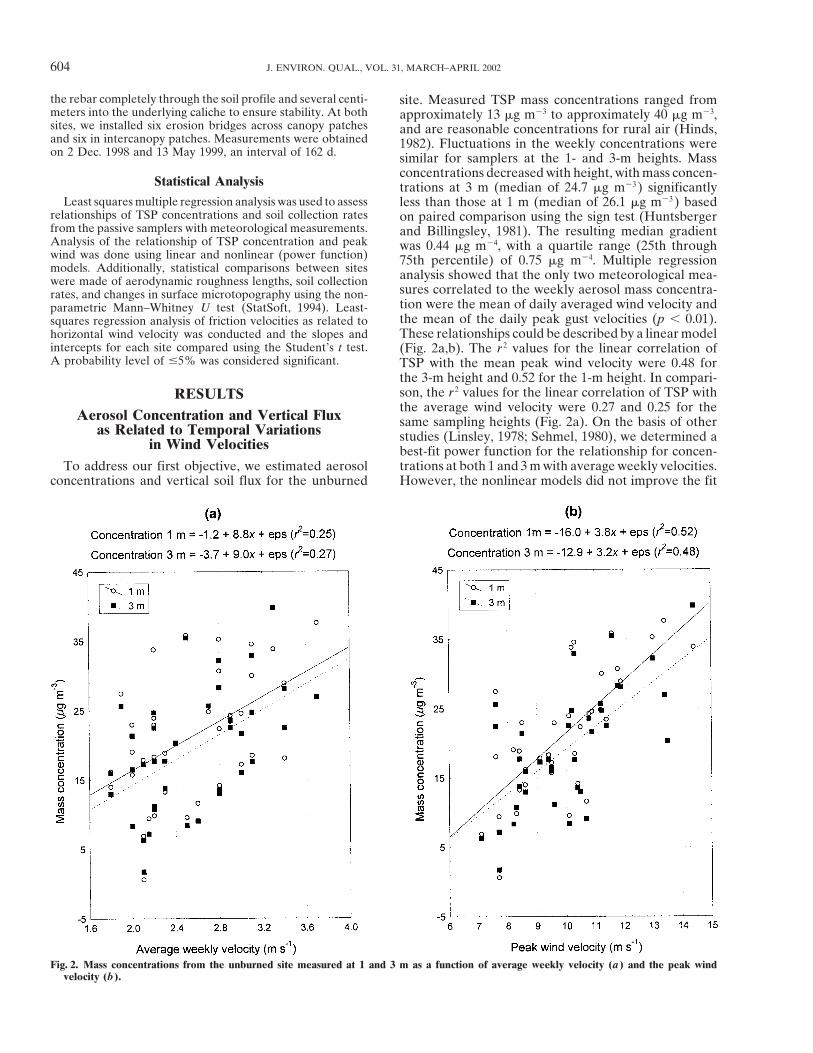
the rebar completely through the soil profile and several centi- site. Measured TSP mass concentrations ranged frommeters into the underlying caliche to ensure stability. At both approximately 13 �g m�3 to approximately 40 �g m�3,sites, we installed six erosion bridges across canopy patches and are reasonable concentrations for rural air (Hinds,and six in intercanopy patches. Measurements were obtained 1982). Fluctuations in the weekly concentrations wereon 2 Dec. 1998 and 13 May 1999, an interval of 162 d. similar for samplers at the 1- and 3-m heights. Mass
concentrations decreased with height, with mass concen-Statistical Analysis trations at 3 m (median of 24.7 �g m�3 ) significantly
Least squares multiple regression analysis was used to assess less than those at 1 m (median of 26.1 �g m�3 ) basedrelationships of TSP concentrations and soil collection rates on paired comparison using the sign test (Huntsbergerfrom the passive samplers with meteorological measurements. and Billingsley, 1981). The resulting median gradientAnalysis of the relationship of TSP concentration and peak was 0.44 �g m�4, with a quartile range (25th throughwind was done using linear and nonlinear (power function) 75th percentile) of 0.75 �g m�4. Multiple regressionmodels. Additionally, statistical comparisons between sites analysis showed that the only two meteorological mea-were made of aerodynamic roughness lengths, soil collection
sures correlated to the weekly aerosol mass concentra-rates, and changes in surface microtopography using the non-tion were the mean of daily averaged wind velocity andparametric Mann–Whitney U test (StatSoft, 1994). Least-the mean of the daily peak gust velocities (p � 0.01).squares regression analysis of friction velocities as related toThese relationships could be described by a linear modelhorizontal wind velocity was conducted and the slopes and
intercepts for each site compared using the Student’s t test. (Fig. 2a,b). The r 2 values for the linear correlation ofA probability level of �5% was considered significant. TSP with the mean peak wind velocity were 0.48 for
the 3-m height and 0.52 for the 1-m height. In compari-son, the r 2 values for the linear correlation of TSP withRESULTSthe average wind velocity were 0.27 and 0.25 for theAerosol Concentration and Vertical Flux same sampling heights (Fig. 2a). On the basis of otheras Related to Temporal Variations studies (Linsley, 1978; Sehmel, 1980), we determined ain Wind Velocities best-fit power function for the relationship for concen-trations at both 1 and 3 m with average weekly velocities.To address our first objective, we estimated aerosol
concentrations and vertical soil flux for the unburned However, the nonlinear models did not improve the fit
Fig. 2. Mass concentrations from the unburned site measured at 1 and 3 m as a function of average weekly velocity (a ) and the peak windvelocity (b ).
WHICKER ET AL.: WIND EROSION IN UNBURNED AND BURNED SHRUBLAND 605
(r 2 values of 0.25 for 1 m and 0.27 for 3 m). An analysis of vided insight to wind erosion processes. Particle numberthe linear model showed that the residuals were evenly concentrations measured by the optical counters showeddistributed about the regression line at all peak wind considerable minute-to-minute variability over the 1-minvelocities, indicating that there is not prediction bias measurement intervals. This variation was especiallyover the velocities encountered. The vertical soil flux, pronounced for larger particles. For example, 10-�mF (�g s�1 m�2 ), at the unburned site could therefore be particles measured at a height of 3 m show a nonlinearestimated using the model as given by combining Eq. increase in particle concentration with increases in hori-[1] and Eq. [2]: zontal wind velocity (Fig. 4). These data were obtained
during the approach of a thunderstorm, with wind veloc-F � 0.4 � 3 � (0.004 � 0.113 � up) � �1 � 3
2 � [5] ities increasing from approximately 4 m s�1 to morethan 7 m s�1 in a minute. There was an increase innumber concentration as the wind velocity exceeded aIn Eq. [5], 0.4 is the von Karman constant, 3 is thethreshold of about 7 m s�1 for all particle sizes, with themeasurement height for wind velocity in meters, the lin-concentration increase being especially dramatic for theear equation with up is the function describing the rela-larger particle sizes. For example, the concentration oftionship between the mean of the daily peak wind veloc-10-�m particles increased by more than a factor of 20,ity (up ) and the friction velocity at the unburned sitewhereas the particle concentration of 0.3-�m particles(introduced later in Eq. [7]), and the concentration gra-
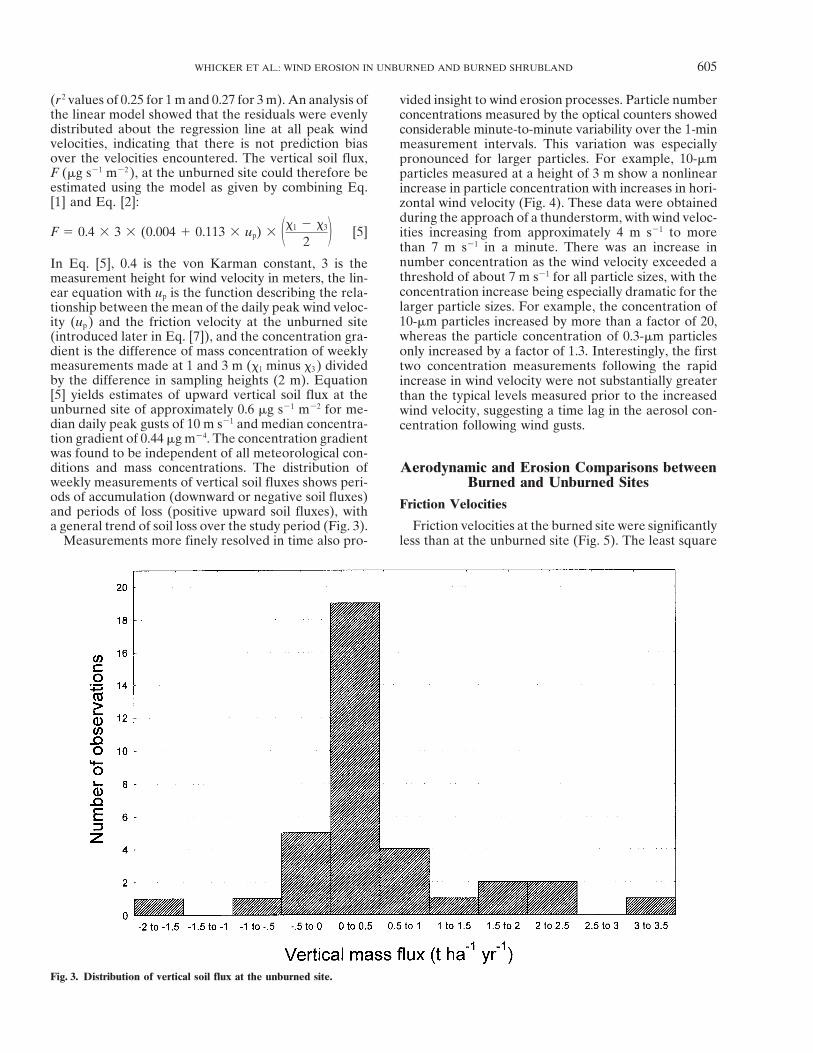
dient is the difference of mass concentration of weekly only increased by a factor of 1.3. Interestingly, the firstmeasurements made at 1 and 3 m (1 minus 3 ) divided two concentration measurements following the rapidby the difference in sampling heights (2 m). Equation increase in wind velocity were not substantially greater[5] yields estimates of upward vertical soil flux at the than the typical levels measured prior to the increasedunburned site of approximately 0.6 �g s�1 m�2 for me- wind velocity, suggesting a time lag in the aerosol con-dian daily peak gusts of 10 m s�1 and median concentra- centration following wind gusts.tion gradient of 0.44 �g m�4. The concentration gradientwas found to be independent of all meteorological con-ditions and mass concentrations. The distribution of Aerodynamic and Erosion Comparisons betweenweekly measurements of vertical soil fluxes shows peri- Burned and Unburned Sitesods of accumulation (downward or negative soil fluxes) Friction Velocitiesand periods of loss (positive upward soil fluxes), with
Friction velocities at the burned site were significantlya general trend of soil loss over the study period (Fig. 3).Measurements more finely resolved in time also pro- less than at the unburned site (Fig. 5). The least square
Fig. 3. Distribution of vertical soil flux at the unburned site.

606 J. ENVIRON. QUAL., VOL. 31, MARCH–APRIL 2002
Fig. 4. One-minute concentrations of 10-�m particles as a function of horizontal wind velocity. Line is hand drawn and is for illustrativepurposes only.
regressions relating friction velocity to horizontal wind cantly different (Student’s t test) and the unburned sitehad greater intercept and slope. Using a threshold windvelocity were:velocity of 7 m s�1 (Fig. 4), Eq. [7] gives a thresholdBurn Site: u*(m s�1) � �0.07 � 0.99 � up friction velocity of around 0.80 m s�1 for the unburned
(r 2 � 0.90) [6] site.
Unburned Site: u*(m s�1) � �0.004 � 0.11 � up Aerodynamic Roughness Lengths(r 2 � 0.90) [7] Distributions of aerodynamic roughness lengths ap-
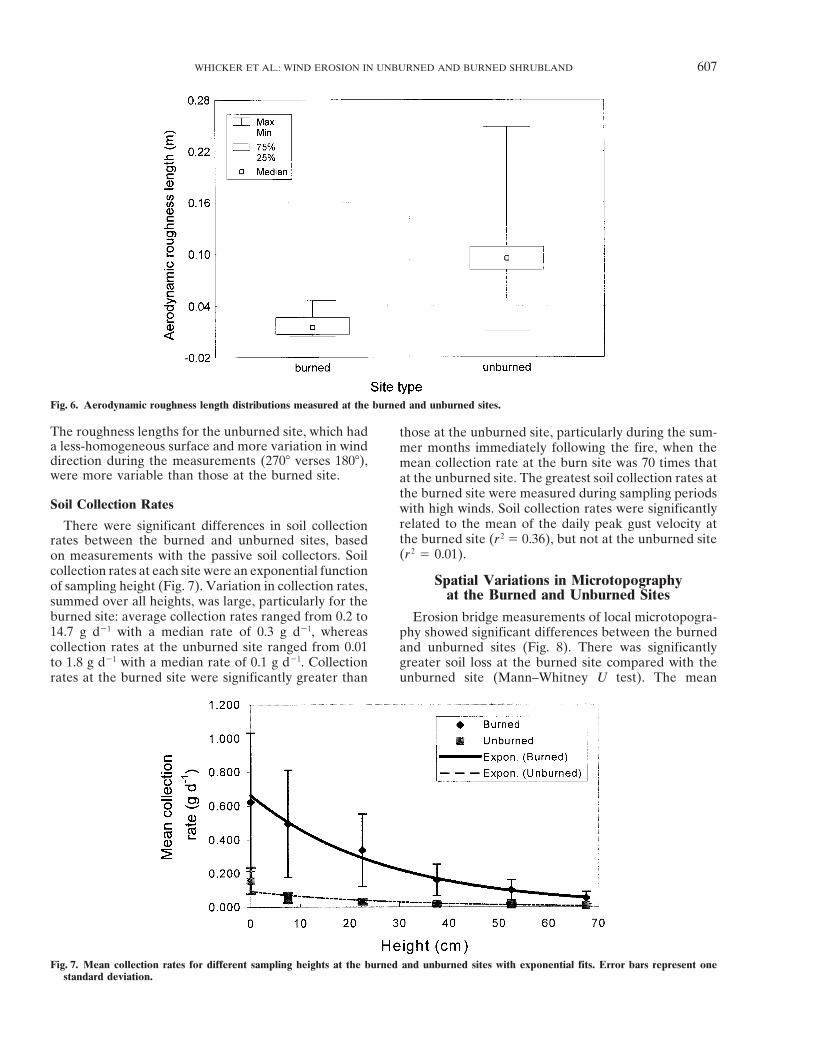
pear skewed, with median lengths of 0.02 m (quartilewhere up is the mean of the daily peak wind velocity inm s�1. The residuals were scattered evenly about the range 0.02 m) for the burned site and 0.1 m (quartile
range 0.03 m) for the unburned site (Fig. 6). The rough-regression line, suggesting that the linear relationshipmodel is appropriate for these two data sets. The slopes ness lengths at the unburned site were significantly greater
than those at the burned site (Mann–Whitney U test).and the intercepts of the two equations were signifi-
Fig. 5. Aerodynamic friction velocities measured at the burned and unburned sites as a function of the horizontal wind velocity.
WHICKER ET AL.: WIND EROSION IN UNBURNED AND BURNED SHRUBLAND 607
Fig. 6. Aerodynamic roughness length distributions measured at the burned and unburned sites.
The roughness lengths for the unburned site, which had those at the unburned site, particularly during the sum-a less-homogeneous surface and more variation in wind mer months immediately following the fire, when thedirection during the measurements (270� verses 180�), mean collection rate at the burn site was 70 times thatwere more variable than those at the burned site. at the unburned site. The greatest soil collection rates at
the burned site were measured during sampling periodsSoil Collection Rates with high winds. Soil collection rates were significantly
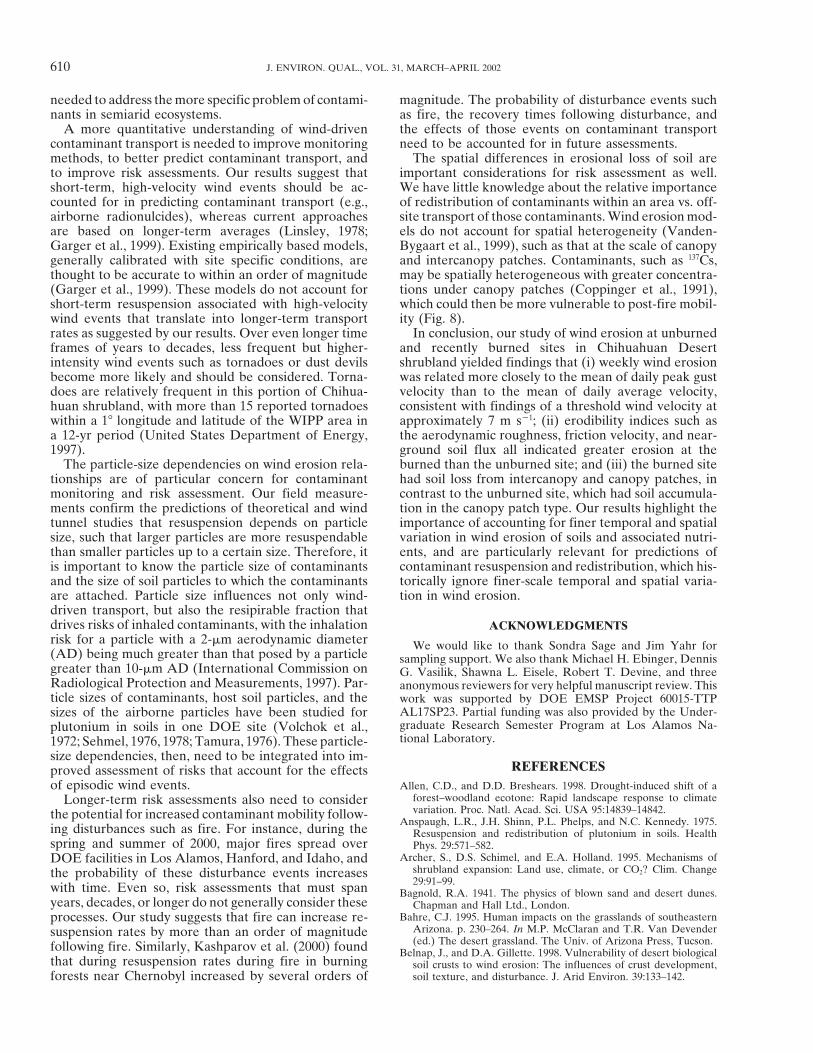
related to the mean of the daily peak gust velocity atThere were significant differences in soil collectionthe burned site (r 2 � 0.36), but not at the unburned siterates between the burned and unburned sites, based(r 2 � 0.01).on measurements with the passive soil collectors. Soil
collection rates at each site were an exponential functionSpatial Variations in Microtopographyof sampling height (Fig. 7). Variation in collection rates,
at the Burned and Unburned Sitessummed over all heights, was large, particularly for theburned site: average collection rates ranged from 0.2 to Erosion bridge measurements of local microtopogra-14.7 g d�1 with a median rate of 0.3 g d�1, whereas phy showed significant differences between the burnedcollection rates at the unburned site ranged from 0.01 and unburned sites (Fig. 8). There was significantlyto 1.8 g d�1 with a median rate of 0.1 g d�1. Collection greater soil loss at the burned site compared with the
unburned site (Mann–Whitney U test). The meanrates at the burned site were significantly greater than
Fig. 7. Mean collection rates for different sampling heights at the burned and unburned sites with exponential fits. Error bars represent onestandard deviation.

608 J. ENVIRON. QUAL., VOL. 31, MARCH–APRIL 2002
Fig. 8. Changes in surface height categorized by site and intercanopy verses canopy.
velocity at which wind erosion greatly increases (Hel-change in surface topography at the burned site wasgren and Prospero, 1987; Godon and Todhunter, 1998;�5.8 mm (standard deviation of 18.0 mm) while theStout, 2001), and it builds on them by highlighting howmean change at the unburned site was 1.9 mm (standardvery short-term, high-velocity wind events may translatedeviation of 11.0 mm). We also found a significantlyinto prediction of wind erosion rates on a longer-term,greater loss of soil in the canopy compared with theweekly basis. In addition, our study indicates how theseintercanopy patches at the burned site, in contrast torelationships depend on particle size. Although the im-the unburned sites, where we did not find significantportance of episodic wind events in estimating winddifferences between patch types. Changes in soil topog-erosion certainly has been recognized previously, thisraphy were normally distributed, except at the burn siteknowledge is not always factored into improving longer-in the canopy, which showed a slight bimodal distribu-term predictions of wind erosion.tion with a small grouping of measurements (14 out of
132) where there was significant loss of surface soil( 50 mm). Effect of Fire on Wind Erosion
Comparisons of erosion thresholds, roughness lengths,DISCUSSION and soil collection rates all showed significant differ-
ences between sites and indicated that the burned siteThe Episodic Nature of Wind Erosionis much more erodible than the unburned site. The large
Our results highlight episodic dynamics in wind ero- differences in these metrics are not readily attributablesion and indicate that improved prediction of wind ero- to the site differences in shrub size and density, butsion requires consideration of short-term, high-velocity rather appear to be largely attributable to the effectswind events. We were able to predict weekly wind ero- of burning. For instance, our estimates of lateral coversion rates better using means of daily peak gust veloci- were 0.18 for the unburned site and 0.07 for the burnedties instead of using means of the daily average wind site with foliage. Both these values correspond with highvelocities (Fig. 2). At a finer time scale of minutes, threshold friction velocities relative to that for bare soilwe observed large increases in wind erosion once a (Raupach et al., 1993). In contrast, the threshold frictionthreshold wind velocity of about 7 m s�1 was exceeded. velocity at the burned site, with no foliage present andOur results also show how the effect of exceeding the hence little lateral cover, should approach that of barethreshold wind velocity can differentially resuspend soil soil. Our estimate of the threshold friction velocity at theparticles of different sizes, as predicted from theory unburned site was about 0.8 m s�1, which is significantly(Slinn, 1974). Although we have only limited data for higher than that found by Gillette et al. (1980) for barewind erosion over relatively short time frames, these sand dune soils, which were similar in soil texture andfield measurements of particle number concentration ground cover to that at our burned site (range fromfor multiple-sized aerosol particles over time and as a 0.25 to 0.59 m s�1 ) or for highly disturbed landscapesfunction of wind velocity are rare. Additional field stud- (Gillette and Chen, 2001). Further, the friction velocitiesies are needed to quantify more systematically the rela- and roughness lengths at the unburned site comparetionships between airborne soil particles of different well with other similarly vegetated sites, whereas thesizes and meteorological conditions. Our study is consis- same metrics at the burned site compare favorably with
values reported for highly disturbed sites with little ortent with other field studies finding a threshold wind

WHICKER ET AL.: WIND EROSION IN UNBURNED AND BURNED SHRUBLAND 609
no vegetation (Wolfe and Nickling, 1996). Finally, we ences between canopy and intercanopy patches, it isfound a threshold wind velocity of about 7 m s�1 at the insufficient to fully address hypotheses about the impor-vegetated site, whereas Stout (2001) found a much lower tance of redistribution of soil between patch types rela-threshold wind velocity for dry bare soil of 4 m s�1 in tive to net system soil loss or gain. In a long-term studythe neighboring state of Texas. Hence, the differences of wind erosion in the Chihuahuan Desert from 1933that we observed in erosion thresholds, roughness to 1978, there was large soil loss from a grassland–lengths, and friction velocities are probably due primar- shrubland ecotone, smaller loss from a site with partialily to effects of the fire rather than simply differences shrubland encroachment, and accumulation in a shrub-in vegetation cover. land with large dunes (Gibbens et al., 1983). Size sorting
In addition to differences in erosion thresholds, of soil was also evident in areas of high wind erosionroughness lengths, and friction velocities, we found sig- (Hennessy, 1986). Vegetation changes occurred duringnificantly greater soil collection rates for the burned the study period, with the site that was originally asite. Soil movement was greater at the burned site by grassland–shrubland ecotone converting to shrublanda factor of 3 over the whole study period and a factor over the course of the study (Hennessy et al., 1983).of 70 times shortly following the fire during periods of Nutrients were concurrently redistributed to canopyhigh-velocity winds. These results highlight the interac- patches, apparently with little net loss of nutrients fromtion between episodic high winds and changes in vegeta- the site (Schlesinger et al., 1996; Havstad et al., 2000).tion cover, and concur with the results from Zobeck et Our findings are consistent with hypotheses of soil accu-al. (1989) showing that a burned area had significantly mulation in shrublands, although they do not allow ushigher rates of wind erosion relative to other less-dis-
to test specifically if that process is related to redistribu-turbed areas. Even though there were some differencestion of soil from intercanopy to canopy patches, as hasin vegetation cover between our two sites, they werebeen hypothesized.generally more similar than those in the Zobeck et al.
The relationship between local redistribution and net(1989) study, and thus provide a more direct comparisonsystem loss or gain has largely been unaddressed in windof wind erosion in burned and unburned shrubland.erosion studies. However, recent water erosion studiesIn summary, our results indicate that all metrics ofhave documented such relationships. At a semiarid pi-erodibility were much greater at the burned site in com-non (Pinus edulis Engelm.)–juniper [Juniperus mo-parison with the unburned site. These differences arenosperma (Engelm.) Sarg.] woodland site with relativelyunlikely due primarily to the site differences in shrubhigh percent ground cover, there is an enormous amountdensity, but rather are probably related to large in-of redistribution of water and eroded sediment betweencreases in soil erodibility following fire. More generally,patch types within the site with very little loss from theour study highlights how disturbance can dramaticallysite as a whole (Reid et al., 1999; Wilcox et al., 1996).increase wind erosion.Hence, understanding small-scale generation of runoffand water erosion alone is insufficient to understandSpatial Heterogeneity in Wind Erosionthe larger-scale processes that lead to losses from the
Our erosion bridge measurements build on our find- system (Davenport et al., 1998; Ludwig et al., 1997).ings of differences in metrics of wind erosion between These advances in understanding water erosion are rele-the burned and the unburned site. Although we mea- vant for wind erosion because each of the wind erosion–sured substantial near-surface soil movement and up- related measurements, including vertical flux, aerosolward vertical flux at the unburned site, these measure- concentrations, near-ground soil movement–saltation,ments do not provide direct evidence of a net loss of soil. and changes in microtopography, only provides partialTherefore, erosion bridge measurements were made to information about the redistribution and net change ofprovide a better estimate of net changes in soil. The soil for a site.results of the erosion bridge measurements suggest anet loss of soil from the burned site (Fig. 8). In contrast, Implications of Finer Temporal- and Spatial-the unburned site did not lose soil, but rather had a Scale Variability in Wind Erosionslight increase of soil in the canopy. Water erosion cancontribute to the measured net soil movement, but it Our results indicate the importance of post-fire in-
creases in wind erosion. More generally, they highlightwas not likely significant relative to wind erosion at ourstudy. Rainfall simulation studies at a nearby study site the importance of considering finer temporal- and spa-
tial-scale variability in wind erosion measurement andindicate that annual water erosion rates may be ordersof magnitude less than annual wind erosion rates (Jo- estimation. Improved predictability can result from fac-
toring in metrics that characterize the short-term epi-hansen et al., 2001).The soil erosion bridge measurements highlight the sodic nature of wind events and changes in vegetation
cover and patch pattern following disturbance. An im-importance of evaluating differences between canopyand intercanopy patches. At the burned site, the topo- proved understanding of these processes, particularly
as related to the formation of canopy dunes and thegraphically higher canopy patches (raised sand dunesafter the fire) lost significantly more soil than the inter- redistribution and loss of nutrients, is needed to better
address degradation of semiarid grasslands and shrub-canopy patches (Fig. 8). In contrast, at the unburnedsite there was not a significant difference between patch lands and associated desertification processes. An im-
proved understanding of these processes, in turn, istypes. While our study quantifies some important differ-
610 J. ENVIRON. QUAL., VOL. 31, MARCH–APRIL 2002
needed to address the more specific problem of contami- magnitude. The probability of disturbance events suchas fire, the recovery times following disturbance, andnants in semiarid ecosystems.
A more quantitative understanding of wind-driven the effects of those events on contaminant transportneed to be accounted for in future assessments.contaminant transport is needed to improve monitoring
methods, to better predict contaminant transport, and The spatial differences in erosional loss of soil areimportant considerations for risk assessment as well.to improve risk assessments. Our results suggest that
short-term, high-velocity wind events should be ac- We have little knowledge about the relative importanceof redistribution of contaminants within an area vs. off-counted for in predicting contaminant transport (e.g.,
airborne radionulcides), whereas current approaches site transport of those contaminants. Wind erosion mod-els do not account for spatial heterogeneity (Vanden-are based on longer-term averages (Linsley, 1978;
Garger et al., 1999). Existing empirically based models, Bygaart et al., 1999), such as that at the scale of canopyand intercanopy patches. Contaminants, such as 137Cs,generally calibrated with site specific conditions, are
thought to be accurate to within an order of magnitude may be spatially heterogeneous with greater concentra-tions under canopy patches (Coppinger et al., 1991),(Garger et al., 1999). These models do not account for
short-term resuspension associated with high-velocity which could then be more vulnerable to post-fire mobil-ity (Fig. 8).wind events that translate into longer-term transport
rates as suggested by our results. Over even longer time In conclusion, our study of wind erosion at unburnedand recently burned sites in Chihuahuan Desertframes of years to decades, less frequent but higher-
intensity wind events such as tornadoes or dust devils shrubland yielded findings that (i) weekly wind erosionwas related more closely to the mean of daily peak gustbecome more likely and should be considered. Torna-
does are relatively frequent in this portion of Chihua- velocity than to the mean of daily average velocity,consistent with findings of a threshold wind velocity athuan shrubland, with more than 15 reported tornadoes
within a 1� longitude and latitude of the WIPP area in approximately 7 m s�1; (ii) erodibility indices such asthe aerodynamic roughness, friction velocity, and near-a 12-yr period (United States Department of Energy,
1997). ground soil flux all indicated greater erosion at theburned than the unburned site; and (iii) the burned siteThe particle-size dependencies on wind erosion rela-
tionships are of particular concern for contaminant had soil loss from intercanopy and canopy patches, incontrast to the unburned site, which had soil accumula-monitoring and risk assessment. Our field measure-
ments confirm the predictions of theoretical and wind tion in the canopy patch type. Our results highlight theimportance of accounting for finer temporal and spatialtunnel studies that resuspension depends on particle
size, such that larger particles are more resuspendable variation in wind erosion of soils and associated nutri-ents, and are particularly relevant for predictions ofthan smaller particles up to a certain size. Therefore, it
is important to know the particle size of contaminants contaminant resuspension and redistribution, which his-torically ignore finer-scale temporal and spatial varia-and the size of soil particles to which the contaminants
are attached. Particle size influences not only wind- tion in wind erosion.driven transport, but also the resipirable fraction thatdrives risks of inhaled contaminants, with the inhalation ACKNOWLEDGMENTSrisk for a particle with a 2-�m aerodynamic diameter We would like to thank Sondra Sage and Jim Yahr for(AD) being much greater than that posed by a particle sampling support. We also thank Michael H. Ebinger, Dennisgreater than 10-�m AD (International Commission on G. Vasilik, Shawna L. Eisele, Robert T. Devine, and threeRadiological Protection and Measurements, 1997). Par- anonymous reviewers for very helpful manuscript review. Thisticle sizes of contaminants, host soil particles, and the work was supported by DOE EMSP Project 60015-TTP
AL17SP23. Partial funding was also provided by the Under-sizes of the airborne particles have been studied forgraduate Research Semester Program at Los Alamos Na-plutonium in soils in one DOE site (Volchok et al.,tional Laboratory.1972; Sehmel, 1976, 1978; Tamura, 1976). These particle-
size dependencies, then, need to be integrated into im-REFERENCESproved assessment of risks that account for the effects
of episodic wind events. Allen, C.D., and D.D. Breshears. 1998. Drought-induced shift of aforest–woodland ecotone: Rapid landscape response to climateLonger-term risk assessments also need to considervariation. Proc. Natl. Acad. Sci. USA 95:14839–14842.the potential for increased contaminant mobility follow-
Anspaugh, L.R., J.H. Shinn, P.L. Phelps, and N.C. Kennedy. 1975.ing disturbances such as fire. For instance, during the Resuspension and redistribution of plutonium in soils. Healthspring and summer of 2000, major fires spread over Phys. 29:571–582.
Archer, S., D.S. Schimel, and E.A. Holland. 1995. Mechanisms ofDOE facilities in Los Alamos, Hanford, and Idaho, andshrubland expansion: Land use, climate, or CO2? Clim. Changethe probability of these disturbance events increases29:91–99.with time. Even so, risk assessments that must span Bagnold, R.A. 1941. The physics of blown sand and desert dunes.
years, decades, or longer do not generally consider these Chapman and Hall Ltd., London.Bahre, C.J. 1995. Human impacts on the grasslands of southeasternprocesses. Our study suggests that fire can increase re-
Arizona. p. 230–264. In M.P. McClaran and T.R. Van Devendersuspension rates by more than an order of magnitude(ed.) The desert grassland. The Univ. of Arizona Press, Tucson.following fire. Similarly, Kashparov et al. (2000) found Belnap, J., and D.A. Gillette. 1998. Vulnerability of desert biological
that during resuspension rates during fire in burning soil crusts to wind erosion: The influences of crust development,soil texture, and disturbance. J. Arid Environ. 39:133–142.forests near Chernobyl increased by several orders of

WHICKER ET AL.: WIND EROSION IN UNBURNED AND BURNED SHRUBLAND 611
Belsky, A.J., and C.D. Canham. 1994. Forest gaps and isolated savanna Godon, N.A., and P.E. Todhunter. 1998. A climatology of airbornedust for the Red River Valley of North Dakota. Atmos. Envi-trees. BioScience 44:77–84.
Black, C.A., D.D. Evans, J.L. White, L.E. Ensminger, F.E. Clark, and ron. 32(9):1587–1594.Goossens, D., and Z.Y. Offer. 1997. Aeolian dust erosion on differentR.C. Dinauer. 1965. Methods of soil analysis. Part 1. Physical and
mineralogical properties, including statistics of measurement and types of hills in a rocky desert: Wind tunnel simulations and fieldmeasurements. J. Arid Environ. 37:209–229.sampling. Agron. Monogr. 9. ASA, Madison, WI.
Breshears, D.D., and C.D. Allen. 2002. The importance of rapid distur- Grover, H.D., and H.B. Musick. 1990. Shrubland encroachment insouthern New Mexico, U.S.A.: An analysis of desertification pro-bance-induced losses in carbon management and sequestration.
Global Ecol. Biogeogr. 11:1–5. cesses in the American southwest. Clim. Change 17:305–330.Havstad, K.M., J.E. Herrick, and W.H. Schlesinger. 2000. DesertBreshears, D.D., and F.J. Barnes. 1999. Interrelationships between
plant functional types and soil moisture heterogeneity for semiarid rangelands, degradation and nutrients. p. 77–87. In O. Arnaldsand S. Archer (ed.) Rangeland desertification. Kluwer Academiclandscapes within the grassland/forest continuum: A unified con-
ceptual model. Landscape Ecol. 14:465–478. Publishers, Dordrecht, the Netherlands.Helgren, D.M., and J.M. Prospero. 1987. Wind velocities associatedBreshears, D.D., J.W. Nyhan, C.E. Heil, and B.P. Wilcox. 1998. Effects
of woody plants on microclimate in a semiarid woodland: Soil with dust deflation events in the western Sahara. J. Clim. Appl.Meteorol. 26:1147–1151.temperature and evaporation in canopy and intercanopy patches.
Int. J. Plant Sci. 159:1010–1017. Hennessy, J.T., R.P. Gibbens, J.M. Tromble, and M. Cardenas. 1983.Vegetation changes from 1935 to 1980 in Mesquite dunelands andBreshears, D.D., P.M. Rich, F.J. Barnes, and K. Campbell. 1997.
Overstory-imposed heterogeneity in solar radiation and soil mois- former grasslands of southern New Mexico. J. Range Manage.36(3):370–374.ture in a semiarid woodland. Ecol. Applic. 7:1201–1215.
Burgess, T.L. 1995. Desert grassland, mixed shrub savanna, shrub Hennessy, J.T., B. Kies, R.P. Gibbens, and J.M. Tromble. 1986. Soilsorting by forty-five years of wind erosion on a southern Newsteppe, or semidesert scrub? The dilemma of coexisting growth
forms. p. 31–67. In M.P. McClaran and T.R. Van Devender (ed.) Mexico range. Soil Sci. Soc. Am. J. 50:391–394.Hinds, W.C. 1982. Aerosol technology: Properties, behavior, and mea-The desert grassland. The Univ. of Arizona Press, Tucson.
Cahill, T.A., T.E. Gill, J.S. Reid, E.A. Gearhart, and D.A. Gillette. surement of airborne particles. John Wiley & Sons, New York.Huntsberger, D.V., and P. Billingsley. 1981. Elements of statistical1996. Saltating particles, playa crusts and dust aerosols at Owens
(Dry) Lake, California. Earth Surf. Processes Landforms 21:621– inference. Allyn and Bacon, Boston.International Commission on Radiological Protection and Measure-639.
Cember, H. 1988. Introduction to health physics. Pergamon Press, ments. 1997. Human respiratory tract model for radiological protec-tion. ICRP Publ. 66, Ann. ICRP 24(1–4). Pergamon Press, Oxford.Elmsford, NY.
Carlsbad Environmental Monitoring and Research Center. 1998. 1997 Johansen, M.P., T.E. Hakonson, F.W. Whicker, J.R. Simanton, andJ.J. Stone. 2001. Hydrologic response and radionuclide transportreport [Online]. Available at www.cemrc.nmsu.edu (verified 14
Nov. 2001). CEMRC, Carlsbad, NM. following fire at semiarid sites. J. Environ. Qual. 30:2010–2017.Johnson, S.R., D.D. Breshears, and T.B. Kirchner. 2000. Multi-path-Coppinger, K.D., W.A. Reiners, I.C. Burke, and R.K. Olson. 1991.
Net erosion on a sagebrush steppe landscape as determined by way, multi-site contaminant transport: Assessing vertical migration,wind erosion, and water erosion at semiarid DOE sites. Healthcesium-137 distribution. Soil Sci. Soc. Am. J. 55:254–258.
Covington, W.W., P.Z. Fule, M.M. Moore, S.C. Hart, T.E. Kolb, J.N. Phys. 78(6):S159.Kashparov, V.A., S.M. Lundin, A.M. Kadygrib, V.P. Protsak, S.E.Mast, S.S. Sackett, and M.R. Wagner. 1997. Restoring ecosystem
health in ponderosa pine forests of the southwest. J. For. 95(4): Levtchuk, V.I. Yoschenko, V.A. Kashpur, and N.M. Talerko. 2000.Forest fires in the territory contaminated as a result of the Cherno-23–29.
Davenport, D.W., D.D. Breshears, B.P. Wilcox, and C.D. Allen. 1998. byl accident: Radioactive aerosol resuspension and exposure offire-fighters. J. Environ. Radioactivity 51:281–298.Viewpoint: Sustainability of pinon–juniper ecosystems: A unifying
perspective on soil erosion thresholds. J. Range Manage. 51:231– Lee, W.W.-L. 1997. A critical evaluation of the 1992 performanceassessment for the Waste Isolation Plant. Nucl. Eng. Des. 168:325–240.
Dick-Peddie, W.A. 1993. New Mexico vegetation, past, present and 338.Linsley, G.S. 1978. Resuspension of transuranium elements—A re-future. Univ. of New Mexico Press, Albuquerque.
Dong, Z.B., S.Y. Gao, and D.W. Fryrear. 2001. Drag coefficients, view of existing data. NRPB-R75. Natl. Radiation ProtectionBoard, Didcot, UK.roughness length and zero-plane displacement height as disturbed
by artificial standing vegetation. J. Arid Environ. 49:485–505. Liu, B.Y.H., and D.Y.H. Pui. 1981. Aerosol sampling inlets and inhala-ble particles. Atmos. Environ. 15:589–600.Easterling, D.R., G.A. Meehl, C. Parmesan, S.A. Changnon, T.A.
Karl, and L.O. Mearns. 2000. Climate extremes: Observations, Ludwig, J.A., D.J. Tongway, D.O. Freudenberger, J.C. Noble, andK.C. Hodgkinson (ed.) 1997. Landscape ecology, function and man-modeling, and impacts. Science 289:2068–2074.
Fryrear, D.W. 1985. Soil cover and wind erosion. Trans. ASAE 28: agement, principles from Austrailia’s rangelands. CSIRO Publ.,Collingwood, Australia.781–784.
Fryrear, D.W. 1986. A field dust sampler. J. Soil Water Conserv. 41: Martens, S.N., D.D. Breshears, and C.W. Meyer. 2000. Spatial distribu-tions of understory light along the grassland/forest continuum: Ef-117–120.
Fule, P.Z., W.W. Covington, and M.M. Moore. 1997. Determining fects of cover, height, and spatial pattern of tree canopies. Ecol.Modell. 126:79–93.reference conditions for ecosystem management of southwestern
ponderosa pine forests. Ecol. Applic. 7(3):895–908. Mast, J.N., P.Z. Fule, M.M. Moore, W.W. Covington, and A.E.M.Waltz. 1999. Restoration of presettlement age structure of an Ari-Garger, E.K, F.O. Hoffman, K.M. Thiessen, D. Galeriu, A.I. Kryshev,
T. Lev, C.W. Miller, S.K. Nair, N. Talerko, and B. Watkins. 1999. zona ponderosa pine forest. Ecol. Applic. 9(1):228–239.McPherson, G.R. 1995. The role of fire in the desert grasslands. p.Test of existing mathematical models for atmospheric resuspension
of radionuclides. J. Environ. Radioact. 42:157–175. 130–151. In M.P. McClaran and T.R. Van Devender (ed.) Thedesert grassland. The Univ. of Arizona Press, Tucson.Gibbens, R.P., J.M. Tromble, J.T. Hennessy, and M. Cardenas. 1983.
Soil movement in mesquite dunelands and former grasslands of McPherson, G.R. 1997. Ecology and management of North Americansavannas. The Univ. of Arizona Press, Tucson.southern New Mexico from 1933 to 1980. J. Range Manage. 36(2):
145–148. Musick, H.B., and D.A. Gillette. 1990. Field evaluation of relation-ships between a vegetation structural parameter and shelteringGillette, D.A., J. Adams, A. Endo, and D. Smith. 1980. Threshold
velocities for input of soil particles into the air by desert soils. J. against wind erosion. Land Degrad. Rehabil. 2:87–94.Nicholson, K.W. 1993. Wind tunnel experiments on the resuspensionGeophys. Res. [Oceans Atmos.] 85(C10):5621–5630.
Gillette, D.A., and W.A. Chen. 2001. Particle production and aeolian of particulate material. Atmos. Environ. Part A 27A(2):181–188.Nicholson, K.W. 1994. Resuspension in the outdoor environment. J.transport from a “supply-limited” source area in the Chihuahuan
desert, New Mexico, United States. J. Geophys. Res. [Atmos.] Aerosol Sci. 25(5):743–744.Okin, G.S., and D.A. Gillette. 2001. Distribution of vegetation in wind-106(D6):5267–5278.
612 J. ENVIRON. QUAL., VOL. 31, MARCH–APRIL 2002
dominated landscapes: Implications for wind erosion modeling and Symp. Atmosphere–Surface Exchange of Particulate and GaseousPollutants, Richland, WA. 3–6 Sept. 1974. CONF-740921. Natl.landscape processes. J. Geophys. Res. [Atmos.] 106(D9):9673–
9683. Tech. Info. Serv., Springfield, VA.StatSoft. 1994. STATISTICA for Windows Volume 1: General con-Okin, G.S., B. Murray, and W.H. Schlesinger. 2001. Degradation of
ventions and statistics I. StatSoft Release 5.0. StatSoft, Tulsa, OK.sandy arid shrubland environments: Observations, process model-Stout, J.E. 1998. Effect of averaging time on apparent threshold forling, and management implications. J. Arid Environ. 47:123–144.
aeolian transport. J. Arid Environ. 39:395–401.Paysen, T.E., R.J. Ansley, J.K. Brown, G.J. Gottfried, S.M. Haase,Stout, J.E. 2001. Dust and environment in the Southern High PlainsM.G. Harrington, M.G. Narog, S.S. Sackett, and R.C. Wilson. 2000.
of North America. J. Arid Environ. 47:425–441.Fire in western shrubland, woodland, and grassland ecosystems.Stull, R.B. 1988. An introduction to boundary layer meteorology.p. 121–159. In J.K. Brown and J.K. Smith (ed.) Wildland fire in
Kluwer Academic Publ., Dordrecht, the Netherlands.ecosystems, effects of fire on flora. Rep. RMRS-GTR-42. VolumeSwetnam, T.W., C.D. Allen, and J.L. Betancourt. 1999. Applied histor-2. USDA, Ft. Collins, CO.
ical ecology: Using the past to manage for the future. Ecol. Ap-Raupach, M.R., D.A. Gillette, and J.F. Leys. 1993. The effect ofplic. 9(4):1189–1206.roughness elements on wind erosion threshold. J. Geophys. Res.
Swetnam, T.W., and J.L. Betancourt. 1998. Mesoscale disturbance and[Atmos.] 98(D2):3023–3029.ecological response to decadal climactic variability in the AmericanReid, K.D., B.P. Wilcox, D.D. Breshears, and L. MacDonald. 1999.southwest. J. Clim. 11(12):3128–3147.Runoff and erosion in a pinon–juniper woodland: Influence of
Tamura, T. 1976. Physical and chemical characteristics of plutoniumvegetation patches. Soil Sci. Soc. Am. J. 63:1869–1879.in existing contaminated soils and sediments. p. 213–229. In Trans-Reynolds, R., J. Belnap, M. Reheis, P. Lamothe, and F. Luiszer. 2001.uranium nuclides in the environment. Proc. Symp., San Francisco.Aeolian dust in Colorado Plateau soils: Nutrient inputs and recent17–21 Nov. 1975. STI/PUB/410. IAEA, Vienna.change in source. Proc. Natl. Acad. Sci. USA 98:7123–7127.
United States Department of Energy. 1980. Final environmental im-Riley, R.G., J.M. Zachara, and F.J. Wobber. 1992. Chemical contami-pact statement, Waste Isolation Pilot Plant. DOE/EIS-0026.nants on DOE lands and selection of contaminant mixtures forUSDOE, Washington, DC.subsurface science research. DOE/ER-0547T. Available from the
United States Department of Energy. 1997. Waste Isolation Pilot PlantNatl. Tech. Info. Serv., U.S. Dep. of Commerce, Springfield, VA. disposal phase final supplemental environmental impact statement.Rodgers, J.C., P.T. Wasiolek, J.J. Whicker, C. Eberhart, K. Saxton, DOE/EIS-0026-S-2. USDOE, Washington, DC.and D. Chandler. 2000. Performance evaluation of LANL environ- Van Auken, O.W. 2000. Shrub invasions of North American semiaridmental radiological air monitoring inlets at high wind velocities grasslands. Annu. Rev. Ecol. Syst. 31:197–215.associated with resuspension. Rep. LA-UR-00-3091. Los Alamos VandenBygaart, A.J., D.J. King, P.H. Groenevelt, and R. Protz. 1999.Natl. Lab., Los Alamos, NM. Cautionary notes on the assumptions made in erosion studies using
Schlesinger, W.H., J.A. Raikes, A.E. Hartley, and A.E. Cross. 1996. fallout 137Cs as a marker. Can. J. Soil Sci. 79(2):395–397.On the spatial pattern of soil nutrients in desert ecosystems. Ecol- Volchok, H.L., R.H. Knuth, and M.T. Kleinman. 1972. The respirableogy 77(2):364–374. fraction of plutonium at Rocky Flats. Health Phys. 23:395–396.
Schlesinger, W.H., J.F. Reynolds, G.L. Cunningham, L.F. Huenneke, Wilcox, B.P., J. Pitlick, C.D. Allen, and D.W. Davenport. 1996. RunoffW.M. Jarrell, R.A. Virginia, and W.G. Whitford. 1990. Biological and erosion from a rapidly eroding pinyon–juniper hillslope. p.feedbacks in global desertification. Science 247:1043–1048. 61–71. In M.G. Anderson and S.M. Brooks (ed.) Advances in
Scholes, R.J., and S.R. Archer. 1997. Tree–grass interactions in savan- hillslope processes. John Wiley & Sons, New York.nas. Annu. Rev. Ecol. Syst. 28:517–544. Wolfe, S.A., and W.G. Nickling. 1996. Shear stress partitioning in
Sehmel, G.A. 1976. Airborne 238Pu and 239Pu associated with the larger sparsely vegetated desert canopies. Earth Surf. Processes Land-than ‘respirable’ particles at Rocky Flats during July 1973. BNWL- forms 21:607–619.2119. Pacific Northwest Lab., Richland, WA. Woodruff, N.P., and F.H. Siddoway. 1965. A wind erosion equation.
Sehmel, G.A. 1978. Plutonium concentrations in airborne soil at Soil Sci. Soc. Am. Proc. 29:602–608.Rocky Flats and Hanford determined during resuspension experi- Zannetti, P. 1989. Simulating short-term, short-range air quality dis-ments. PNL-SA-6720. Pacific Northwest Lab., Richland, WA. persion phenomena. p. 159–196. In Encyclopedia of environmental
Sehmel, G.A. 1980. Particle resuspension: A review. Environ. Int. control technology. Volume 2. Gulf Publ. Company, Houston, TX.4:107–127. Zobeck, T.M., D.W. Fryrear, and R.D. Pettit. 1989. Management
Slinn, W.G.N. 1974. Dry deposition and resuspension of aerosol parti- effects on wind-eroded sediment and plant nutrients. J. Soil WaterConserv. 44:160–163.cles—A new look at some old problems. p. 1–40. In Proc. of the