temporal and spatial variabilities of atmospheric polychlorinated biphenyls (pcbs), organochlorine...
TRANSCRIPT
www.elsevier.com/locate/scitotenv
Science of the Total Environm
Temporal and spatial variabilities of atmospheric polychlorinated
biphenyls (PCBs), organochlorine (OC) pesticides and polycyclic
aromatic hydrocarbons (PAHs) in the Canadian Arctic:
Results from a decade of monitoring
H. Hunga,T, P. Blancharda, C.J. Halsallb, T.F. Bidlemanc, G.A. Sternd, P. Felline,
D.C.G. Muirf, L.A. Barrieg, L.M. Jantunena, P.A. Helmd, J. Maa, A. Konoplevh
aMeteorological Service of Canada, 4905 Dufferin Street, Downsview, ON, Canada M3H 5T4bEnvironmental Science Department, Lancaster University, Lancaster, Lancashire LA1 4YQ, UKcCentre for Atmospheric Research Experiments, 6248 Eighth Line, Egbert, ON, Canada L0L 1N0
dFreshwater Institute, 501 University Crescent, Winnipeg, MB, Canada R3T 2N6eAir ZOne, 2240 Speakman Drive, Mississauga, ON, Canada L5K 1A9
fNational Water Research Institute, Environment Canada, 867, Lakeshore Road Burlington, ON, Canada L7R 4A6gAtmospheric Research and Environment Programme, World Meteorological Organization, 7 bis, Avenue de la Paix,
BP2300, CH-1211 Geneva 2, SwitzerlandhSPA Typhoon, Lenin Avenue 82, Obninsk, 249038, Russia
Abstract
The Northern Contaminants Program (NCP) baseline monitoring project was established in 1992 to monitor for persistent
organic pollutants (POPs) in Arctic air. Under this project, weekly samples of air were collected at four Canadian and two
Russian arctic sites, namely Alert, Nunavut; Tagish, Yukon; Little Fox Lake, Yukon; Kinngait, Nunavut; Dunai Island, Russia
and Amderma, Russia. Selected POPs, including polycyclic aromatic hydrocarbons (PAHs), polychlorinated biphenyls (PCBs)
and organochlorine (OC) pesticides, were analyzed in both the gas and particulate phases.
This paper summarizes results obtained from this project in the past 5 years. Temporal trends were developed for
atmospheric PCBs and OCs observed at Alert using a digital filtration (DF) technique. It was found that trends developed with 5
years of data (1993–1997) did not differ significantly from those determined with 7 years of data (1993–1999). This implies that
with the DF technique, long-term trends can still be developed with less than 10 years of data. An acceleration in decline of OC
and PCB air concentrations was noted in 1999 for some compounds, although the reason is unknown. Monitoring efforts must
continue to assess the effect of this decline on the long-term trends of POPs in the Canadian Arctic.
Occasional high trans-/cis-chlordane ratios and heptachlor air concentrations measured at Alert between 1995 and 1997
suggests sporadic fresh usage of chlordane-based pesticides. However, significant decreasing trends of chlordanes along with
0048-9697/$ - s
doi:10.1016/j.sc
T Correspondi
E-mail addr
ent 342 (2005) 119–144
ee front matter. Crown Copyright D 2004 Published by Elsevier B.V. All rights reserved.
itotenv.2004.12.058
ng author. Tel.: +1 416 739 5944; fax: +1 416 739 5708.
ess: [email protected] (H. Hung).
H. Hung et al. / Science of the Total Environment 342 (2005) 119–144120
their chemical signatures has provided evidence that emission of old soil residues is replacing new usage as an important source
to the atmosphere.
Measurements of OC air concentrations conducted at Kinngait in 1994–1995 and 2000–2001 indicated faster OC removal at
this location than at Alert. This may be attributed to the proximity of Kinngait to temperate regions where both biotic and
abiotic degradation rates are faster.
The PAH concentrations observed at Alert mimic those at mid-latitudes and are consistent with long-range transport to the
Arctic, particularly for the lighter PAHs. A decline in particulate PAH was observed, similar to atmospheric sulphate aerosol and
can be attributed to the collapse of industrial activity in the former Soviet Union between 1991 and 1995.
Spatial comparisons of OC seasonality at Alert, Tagish, Dunai and Kinngait show elevated air concentrations of some
compounds in spring. However, elevated spring concentrations were observed for different compounds at different sites.
Potential causes are discussed. Further investigation in the atmospheric flow pattern in spring which is responsible for the
transport of POPs into the Arctic is required. OC and PCB air concentrations at Alert were found to be influenced by two
climate variation patterns, the North Atlantic Oscillation (NAO) and the Pacific North American (PNA) pattern. Planetary
atmospheric patterns must be taken into account in the global prediction and modelling of POPs in the future.
Crown Copyright D 2004 Published by Elsevier B.V. All rights reserved.
Keywords: Persistent organic pollutants (POPs); Arctic air monitoring; Spatial variations; Seasonality; Temporal trends; Climate variation
patterns
1. Introduction
Since the 1980s, there has been increasing evi-
dence that the seemingly remote and pristine environ-
ment of the Arctic has been contaminated by
anthropogenic contaminants, such as the persistent
organic pollutants (POPs), mercury and heavy metals.
As most of these chemicals are not used or emitted in
the Arctic region, they must have been transported
over great distances from their sources in the south.
The atmosphere has been regarded as one of the most
important and rapid route of transport for POPs to the
Arctic. Air samples collected in the Canadian and
European Arctic during the 1980s confirmed the
presence of these chemicals in Arctic air (Patton et
al., 1989, 1991; Pacyna and Oehme, 1988). Since
these contaminants tend to bioaccumulate through the
foodchain and has been known to be toxic to humans
and many organisms, a long-term monitoring project
for POPs in Arctic air was initiated in 1992 under the
Canadian-operated Northern Contaminant Program
(NCP). Weekly air samples (particulate and gaseous)
have been taken from stations in the Canadian and
Russian arctic for the determination of POP concen-
trations in the Arctic atmosphere. These atmospheric
pollutants include the polychlorinated biphenyls
(PCBs), polycyclic aromatic hydrocarbons (PAHs)
and various organochlorine pesticides (OCs) and
synthetic industrial compounds. Sampling sites
(sampling period) include: Alert, Nunavut (1992–
ongoing); Tagish, Yukon (December 1992–March
1995); Little Fox Lake, Yukon (July 2002–July
2003); Kinngait, Nunavut (March 1994–February
1996, October 2000–September 2002); Dunai Island,
Russia (April 1993–May 1995) and Amderma, Russia
(1999–2001). As part of the Arctic Monitoring and
Assessment Program (AMAP) Work Plan, data
collected under this project, as well as those collected
at various European Arctic monitoring sites (e.g.
Pallas, Finland; Storhofdi, Iceland; Zeppelin, Norway,
etc.), are presented at the international negotiation
table in order to achieve the appropriate restrictions on
release of pollutants of concern for the Arctic
environment.
Arctic atmospheric data for PCBs, PAHs and OC
pesticides through 1994 collected under this program
were presented for the sites of Alert (Nunavut), Tagish
(Yukon) and Dunai Island in Russia in the first
Canadian Arctic Contaminants Assessment Report
(CACAR) (DIAND, 1997). Results included a varia-
tion in the PCBs homologue pattern according to the
origin of air masses affecting the receptor sites. For
the OCs, the lack of spatial differences indicated
widespread atmospheric contamination while levels at
Tagish reflected relative proximity to North American
and Asian source regions. The particle/gas partitio-
ning of PAHs during the haze season at Alert was
successfully represented using the Junge–Pankow
H. Hung et al. / Science of the Total Environment 342 (2005) 119–144 121
model (Pankow, 1987; Halsall et al., 1997). The PAH
partitioning was also well correlated with vapour
pressure at Alert and Tagish, similar to temperate sites
around the Great Lakes. This demonstrated that
temperature dependent vapour pressure was a good
descriptor of gas/particle distribution of PAHs even at
extremely cold Arctic temperatures.
Since CACAR, several articles have been pub-
lished reporting results from the air monitoring
program under NCP. These are reported in CACAR
II (DIAND, 2003). In this paper, we intend to
summarize, as well as update, the results of this
program for the past few years. These include: (1) the
development of time trends from PCB and OC (1993–
1999) air concentrations obtained at Alert; (2)
evidence that bpast-useQ pesticides, such as chlordane
and heptachlor, might still be in use sporadically, but
general sources of such compounds have shifted from
fresh application to a greater proportion brecycledQfrom soil; (3) spatial variations in seasonality of OC
air concentrations observed at different Arctic sta-
tions; as well as (4) evidence of climate variation
patterns on atmospheric transport of POPs to the
Canadian High Arctic. Based on these results,
recommendations will be provided for future air
monitoring studies in Arctic regions.
2. Experimental procedures and data analysis
2.1. Sample collection and chemical analysis
The locations of the five sampling sites and a
sampling timeline are shown in Fig. 1. At each site,
weekly air samples were collected using a high-
volume air sampler. The sampling and analytical
procedures for this program have been given else-
where (Hung et al., 2002, Halsall et al., 1998, Stern et
al., 1997). In summary, each air sample represents
~13000 m3 of air sampled over 7 days, resulting in
approximately 52 samples per year. For each sample,
air was drawn through a 20 cm glass fibre filter (GFF)
and two polyurethane foam (PUF) plugs (each: 20 cm
diameter�4 cm thick), to collect the respective
particle and vapour fractions. Field blanks were
collected every 4 weeks by handling a PUF and filter
in the same manner as a sample but without airflow.
Collected samples were soxhlet extracted and the
resulting extracts were split. One half of the extract
was archived and the other subjected to analysis for
PAHs, PCBs and OCs.
2.2. Data handling and quality assurance
The system of data handling and quality assurance
has been described in details by Stern et al. (1997).
Quality assurance measures included the calculation of
method detection limits (MDLs) for each sampling
year (average blank value of each sampling medium
(filter or PUFs) plus three standard deviations from the
mean), inclusion of recovery and internal standards in
each sample extract, analysis of EPA standard reference
materials, routine reanalysis of extracts and participa-
tion in interlaboratory comparison studies. Air con-
centration data reported under this program have not
been blank- or recovery-corrected. A statistical data-
base in SAS called the Research Data Management and
Quality Control System (RDMQ) with an extensive
flagging system is used to track and calculate all air
concentration data and quality control information.
Although sampling started at Alert in 1992, OC
and PCB data from the first year have not been
included in analyses in this article due to the exceed-
ence of certain quality control criteria, which were
discussed in Stern et al. (1997). To retain the
maximum amount of information, samples with
concentrations below MDLs are included in all
analysis. Samples that were found to be below
instrument detection limits (IDL) were replaced with
2/3 IDL of the corresponding compound.
2.3. Temporal trends and apparent first order halflives
Atmospheric concentrations for semi-volatile pol-
lutants, including PCBs and OCs, often exhibit
seasonality. If a temporal trend is to be determined, it
is important that the intra-annual variability be
reduced. As part of the data analysis, a statistical time
series analysis technique (digital filtration, DF) was
employed to smooth any seasonality in the air data
(Nakazawa et al., 1997). For each compound, an
approximate long-term trend and an average seasonal
cycle were determined by fitting a smoothing Reinsch-
type cubic spline and Fourier components to the data,
respectively. Long- and short-term variations of the
trend and the seasonal cycle were then extracted using
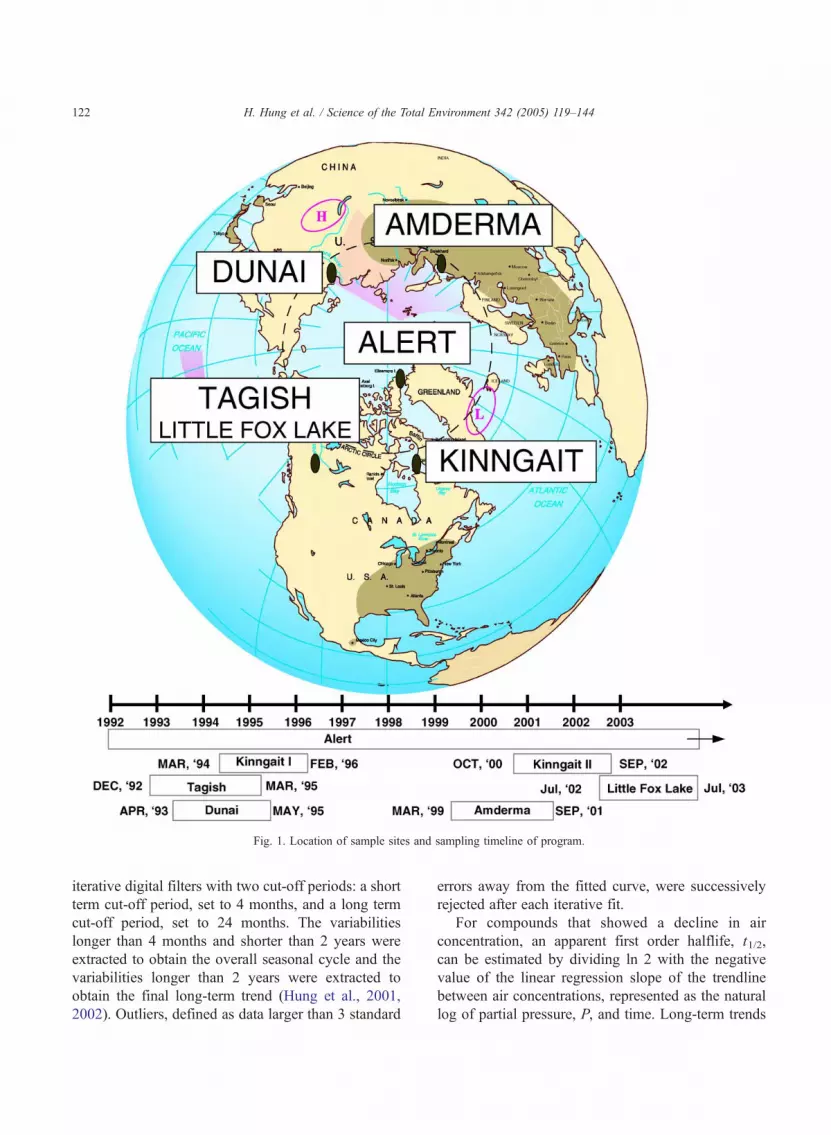
Fig. 1. Location of sample sites and sampling timeline of program.
H. Hung et al. / Science of the Total Environment 342 (2005) 119–144122
iterative digital filters with two cut-off periods: a short
term cut-off period, set to 4 months, and a long term
cut-off period, set to 24 months. The variabilities
longer than 4 months and shorter than 2 years were
extracted to obtain the overall seasonal cycle and the
variabilities longer than 2 years were extracted to
obtain the final long-term trend (Hung et al., 2001,
2002). Outliers, defined as data larger than 3 standard
errors away from the fitted curve, were successively
rejected after each iterative fit.
For compounds that showed a decline in air
concentration, an apparent first order halflife, t1/2,
can be estimated by dividing ln 2 with the negative
value of the linear regression slope of the trendline
between air concentrations, represented as the natural
log of partial pressure, P, and time. Long-term trends
H. Hung et al. / Science of the Total Environment 342 (2005) 119–144 123
and t1/2 of PCBs and OCs in Alert air (1993–1997)
have been reported previously by Hung et al. (2001,
2002). In this paper, we are updating these results with
2 more years of data, through the end of 1999.
Temporal trends were only developed using the
vapour phase concentrations because the majority of
PCBs and OCs in Arctic air samples were found in the
gas phase.
Results of the trend analyses are presented in
Sections 3.2.1 and 3.2.2 for the PCBs and OCs,
respectively. Also summarized in the OC section
(Section 3.2.2) are results of a study on the correlation
between chlordane isomers and enantiomers, and the
time trends of chlordane isomers in air based on
compiled data from 1984 to 1998 observed at four
Arctic stations, including Alert (Bidleman et al.,
2002).
Alert is the only location in this study with multi-
year air concentration data where long-term trends and
t1/2 can be developed. However, the Kinngait site
located in the Eastern Canadian Arctic has been re-
activated in October 2000 (Kinngait II) to compare
with results obtained in 1994–1996 (Kinngait I). As
this paper goes to press, only data from 2000 week 43
to 2001 week 15 from Kinngait II are available.
Changes in OC concentrations observed during the
same time period of the year between Kinngait I and II
are briefly discussed in Section 3.3.
2.4. Data for spatial comparisons of OCs
Spatial comparisons of OCs at Alert, Tagish and
Dunai between 1993 and 1994 have been reported
previously by Halsall et al. (1998). However, only 1
year of data from Dunai was available at that time.
Also, air concentration data from Kinngait have never
been reported before although there was a one-year
overlap in sampling period (March 1994–March
1995) with the other three sites. Weekly air samples
were taken at this site but only 19 samples were
analysed individually as weekly extracts while the
rest were analysed as four-week composites. An
update on the spatial comparison in the 1993–1995
co-sampling period is provided in Section 3.4,
focusing on the differences in OC seasonality
observed at the four sites.
3. Results and discussions
3.1. Annual mean concentrations
3.1.1. PCBs
The mean and range of APCB concentrations in both particulate and vapour phases for 102 congeners, as well
as a subset of the 10 AMAP congeners are listed in Table 1. As observed in CACAR (DIAND, 1997) for 1993, the
PCB levels for 1995–1996 were generally lower at Alert than those reported for other AMAP Arctic sites. For
example, annual means (1995 and 1996) for the 10 AMAP congeners were 16.9 and 19.4 pg/m3 at Storhofdi,
Iceland and 68.2 and 165 pg/m3 at Spitsbergen, Norway (AMAP, 1999). The mean vapour phase concentrations
observed at Amderma, Russia and Kinngait, Nunavut more recently (1999–2001) were similar to that observed at
Alert. A selected set of 25 samples collected at Amderma between 1999 and 2000 showed a mean vapour phase
concentration of 4.05 pg/m3 (AMAP subset). At Kinngait II, 12 samples collected between 20 November 2000 and
12 March 2001 showed a mean vapour phase concentration of 3.28 pg/m3 (AMAP subset). The mean vapour
phase concentrations of APCBs (102 congeners) in 1994, when the four NCP sites were operating simultaneously,
were 26, 27, 30 and 35 pg/m3 for Tagish, Kinngait I, Alert and Dunai, respectively. In comparison to the temperate
IADN sites of Eagle Harbour (APCB=128F12 pg/m3), Sleeping Bear Dunes (160F10 pg/m3) and Sturgeon Point
(315F20 pg/m3) over 1991 to 1995 (Hillery et al., 1997), levels observed at the four sites were 5- to 11-fold lower.
3.1.2. OCs
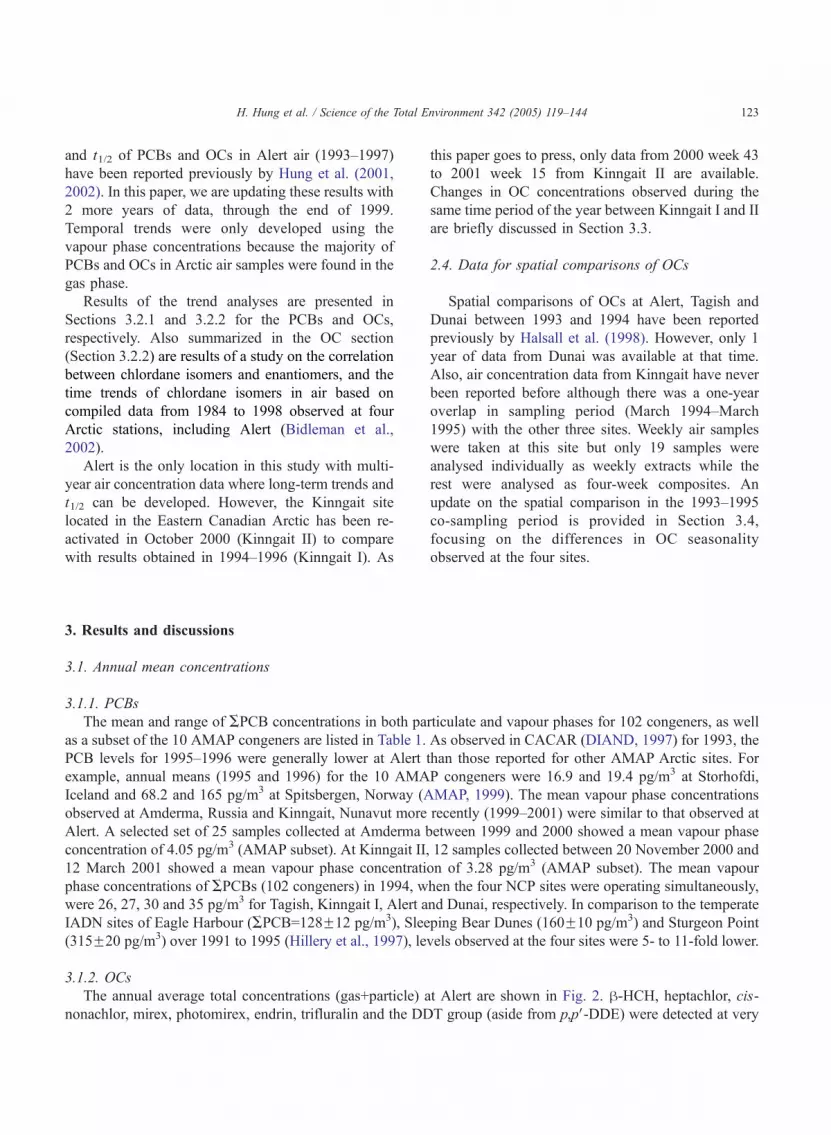
The annual average total concentrations (gas+particle) at Alert are shown in Fig. 2. h-HCH, heptachlor, cis-nonachlor, mirex, photomirex, endrin, trifluralin and the DDT group (aside from p,pV-DDE) were detected at very
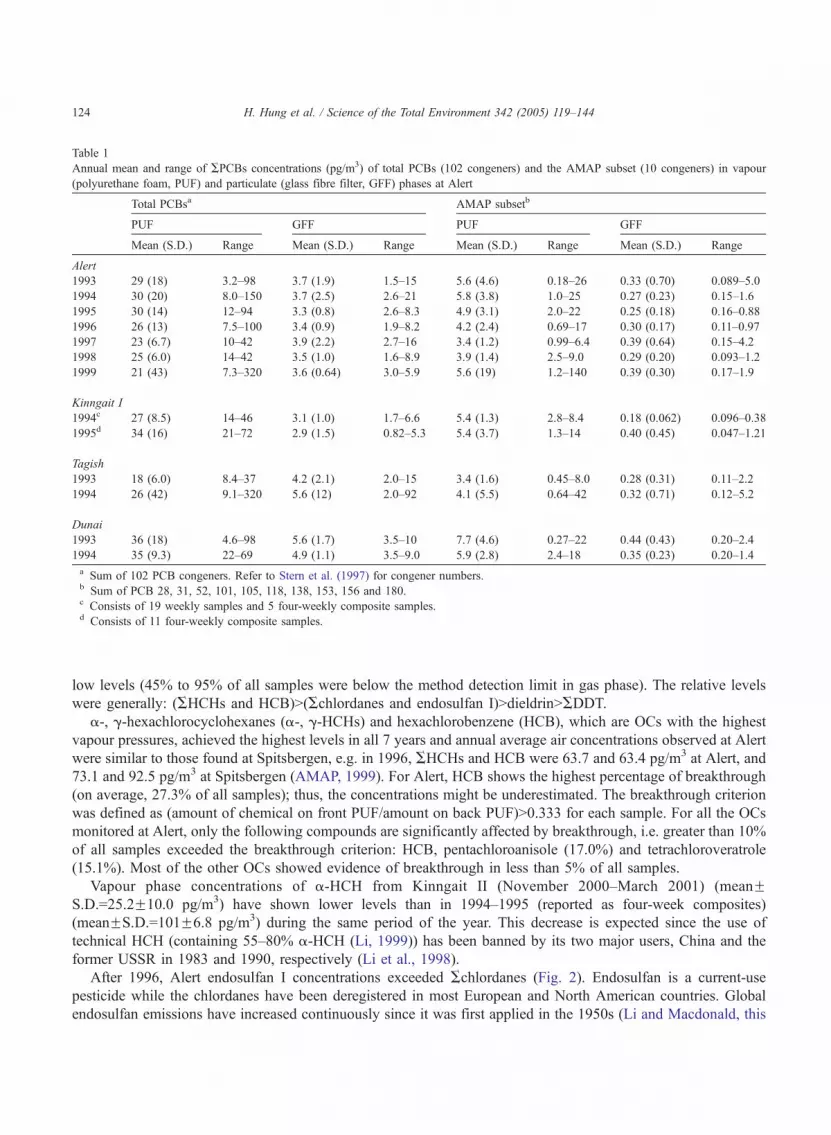
Table 1
Annual mean and range of APCBs concentrations (pg/m3) of total PCBs (102 congeners) and the AMAP subset (10 congeners) in vapour
(polyurethane foam, PUF) and particulate (glass fibre filter, GFF) phases at Alert
Total PCBsa AMAP subsetb
PUF GFF PUF GFF
Mean (S.D.) Range Mean (S.D.) Range Mean (S.D.) Range Mean (S.D.) Range
Alert
1993 29 (18) 3.2–98 3.7 (1.9) 1.5–15 5.6 (4.6) 0.18–26 0.33 (0.70) 0.089–5.0
1994 30 (20) 8.0–150 3.7 (2.5) 2.6–21 5.8 (3.8) 1.0–25 0.27 (0.23) 0.15–1.6
1995 30 (14) 12–94 3.3 (0.8) 2.6–8.3 4.9 (3.1) 2.0–22 0.25 (0.18) 0.16–0.88
1996 26 (13) 7.5–100 3.4 (0.9) 1.9–8.2 4.2 (2.4) 0.69–17 0.30 (0.17) 0.11–0.97
1997 23 (6.7) 10–42 3.9 (2.2) 2.7–16 3.4 (1.2) 0.99–6.4 0.39 (0.64) 0.15–4.2
1998 25 (6.0) 14–42 3.5 (1.0) 1.6–8.9 3.9 (1.4) 2.5–9.0 0.29 (0.20) 0.093–1.2
1999 21 (43) 7.3–320 3.6 (0.64) 3.0–5.9 5.6 (19) 1.2–140 0.39 (0.30) 0.17–1.9
Kinngait I
1994c 27 (8.5) 14–46 3.1 (1.0) 1.7–6.6 5.4 (1.3) 2.8–8.4 0.18 (0.062) 0.096–0.38
1995d 34 (16) 21–72 2.9 (1.5) 0.82–5.3 5.4 (3.7) 1.3–14 0.40 (0.45) 0.047–1.21
Tagish
1993 18 (6.0) 8.4–37 4.2 (2.1) 2.0–15 3.4 (1.6) 0.45–8.0 0.28 (0.31) 0.11–2.2
1994 26 (42) 9.1–320 5.6 (12) 2.0–92 4.1 (5.5) 0.64–42 0.32 (0.71) 0.12–5.2
Dunai
1993 36 (18) 4.6–98 5.6 (1.7) 3.5–10 7.7 (4.6) 0.27–22 0.44 (0.43) 0.20–2.4
1994 35 (9.3) 22–69 4.9 (1.1) 3.5–9.0 5.9 (2.8) 2.4–18 0.35 (0.23) 0.20–1.4
a Sum of 102 PCB congeners. Refer to Stern et al. (1997) for congener numbers.b Sum of PCB 28, 31, 52, 101, 105, 118, 138, 153, 156 and 180.c Consists of 19 weekly samples and 5 four-weekly composite samples.d Consists of 11 four-weekly composite samples.
H. Hung et al. / Science of the Total Environment 342 (2005) 119–144124
low levels (45% to 95% of all samples were below the method detection limit in gas phase). The relative levels
were generally: (AHCHs and HCB)N(Achlordanes and endosulfan I)NdieldrinNADDT.a-, g-hexachlorocyclohexanes (a-, g-HCHs) and hexachlorobenzene (HCB), which are OCs with the highest
vapour pressures, achieved the highest levels in all 7 years and annual average air concentrations observed at Alert
were similar to those found at Spitsbergen, e.g. in 1996, AHCHs and HCB were 63.7 and 63.4 pg/m3 at Alert, and
73.1 and 92.5 pg/m3 at Spitsbergen (AMAP, 1999). For Alert, HCB shows the highest percentage of breakthrough
(on average, 27.3% of all samples); thus, the concentrations might be underestimated. The breakthrough criterion
was defined as (amount of chemical on front PUF/amount on back PUF)N0.333 for each sample. For all the OCs
monitored at Alert, only the following compounds are significantly affected by breakthrough, i.e. greater than 10%
of all samples exceeded the breakthrough criterion: HCB, pentachloroanisole (17.0%) and tetrachloroveratrole
(15.1%). Most of the other OCs showed evidence of breakthrough in less than 5% of all samples.
Vapour phase concentrations of a-HCH from Kinngait II (November 2000–March 2001) (meanFS.D.=25.2F10.0 pg/m3) have shown lower levels than in 1994–1995 (reported as four-week composites)
(meanFS.D.=101F6.8 pg/m3) during the same period of the year. This decrease is expected since the use of
technical HCH (containing 55–80% a-HCH (Li, 1999)) has been banned by its two major users, China and the
former USSR in 1983 and 1990, respectively (Li et al., 1998).
After 1996, Alert endosulfan I concentrations exceeded Achlordanes (Fig. 2). Endosulfan is a current-use
pesticide while the chlordanes have been deregistered in most European and North American countries. Global
endosulfan emissions have increased continuously since it was first applied in the 1950s (Li and Macdonald, this
0.1
1
10
100
1993 1994 1995 1996 1997 1998 1999
Year
CA (
pg
/m3 )
HCHs HCB Chlordanes Endosulfan Dieldrin DDT
Fig. 2. Relative concentrations of selected OCs at Alert (1993–1999).
H. Hung et al. / Science of the Total Environment 342 (2005) 119–144 125
issue of Sci Total Environ). Li and Macdonald (this issue) have also reviewed the global usage and emission of
DDT. Although DDT has been banned or severely restricted in many countries, it is still being used in others,
especially those in the tropical region, to control insects that carry diseases such as malaria and typhus.
Summertime DDT/DDE ratios at Alert were of the order of 1–1.5 whereas for the Russian Arctic site of Amderma
(1999–2001), the DDT/DDE ratios were about 3. Technical DDT is made up of 80% p,pV-DDT and 20% o,pV-DDE(Ramesh et al., 1989). A larger DDT/DDE ratio has also been observed at Tagish in Western Canada and is linked
to trans-Pacific transport from Asia (Bailey et al., 2000).
Table 2 presents annual average and range of OC concentrations for Kinngait, Tagish and Dunai between 1993
and 1995. As Halsall et al. (1998) have found, concentrations of OCs were similar at all sites indicating a uniformity
in contamination in Arctic air. Spatial differences in seasonality of air concentrations will be discussed in Section 3.3.
3.1.3. PAHs
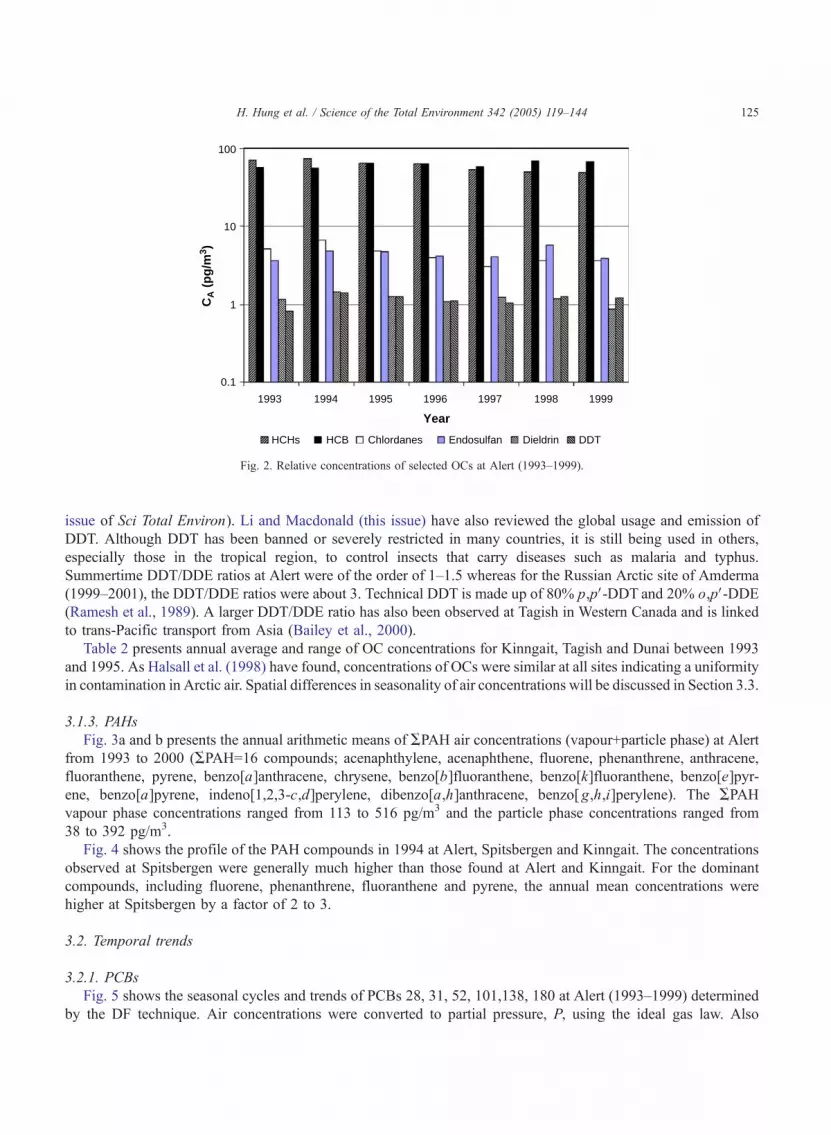
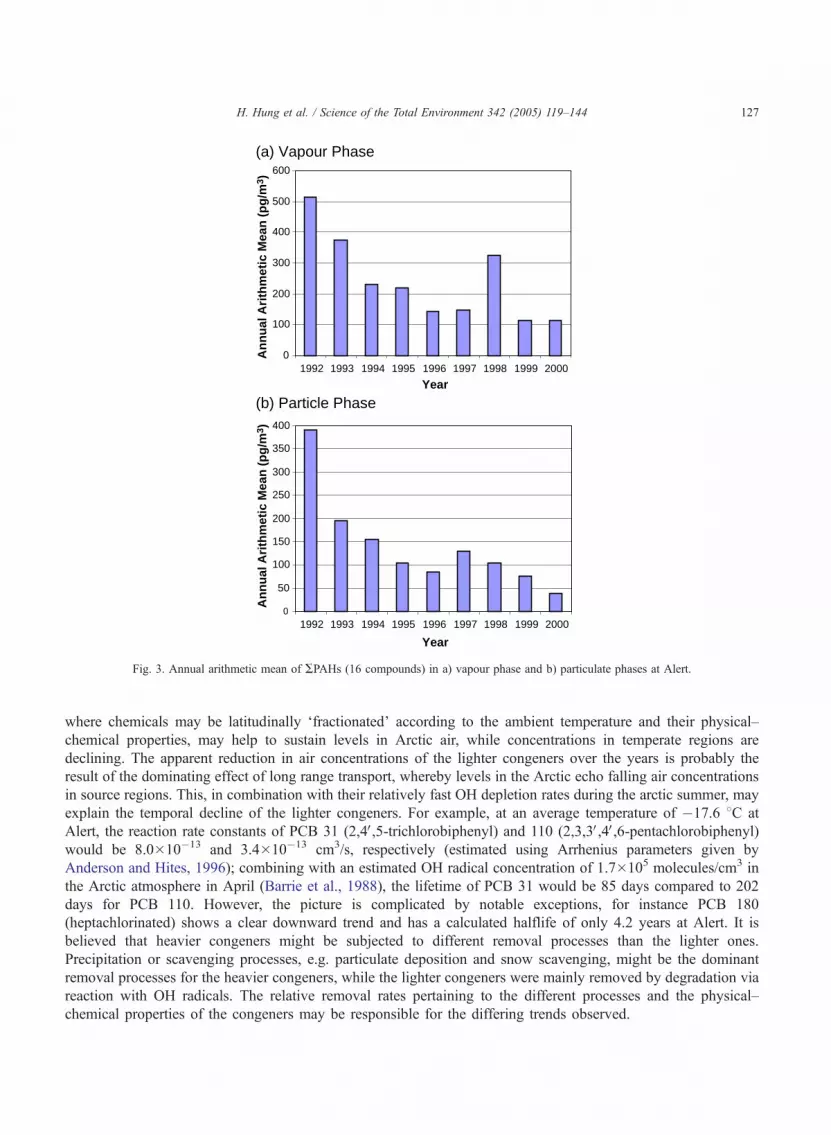
Fig. 3a and b presents the annual arithmetic means of APAH air concentrations (vapour+particle phase) at Alert
from 1993 to 2000 (APAH=16 compounds; acenaphthylene, acenaphthene, fluorene, phenanthrene, anthracene,
fluoranthene, pyrene, benzo[a]anthracene, chrysene, benzo[b]fluoranthene, benzo[k]fluoranthene, benzo[e]pyr-
ene, benzo[a]pyrene, indeno[1,2,3-c,d]perylene, dibenzo[a,h]anthracene, benzo[ g,h,i]perylene). The APAHvapour phase concentrations ranged from 113 to 516 pg/m3 and the particle phase concentrations ranged from
38 to 392 pg/m3.
Fig. 4 shows the profile of the PAH compounds in 1994 at Alert, Spitsbergen and Kinngait. The concentrations
observed at Spitsbergen were generally much higher than those found at Alert and Kinngait. For the dominant
compounds, including fluorene, phenanthrene, fluoranthene and pyrene, the annual mean concentrations were
higher at Spitsbergen by a factor of 2 to 3.
3.2. Temporal trends
3.2.1. PCBs
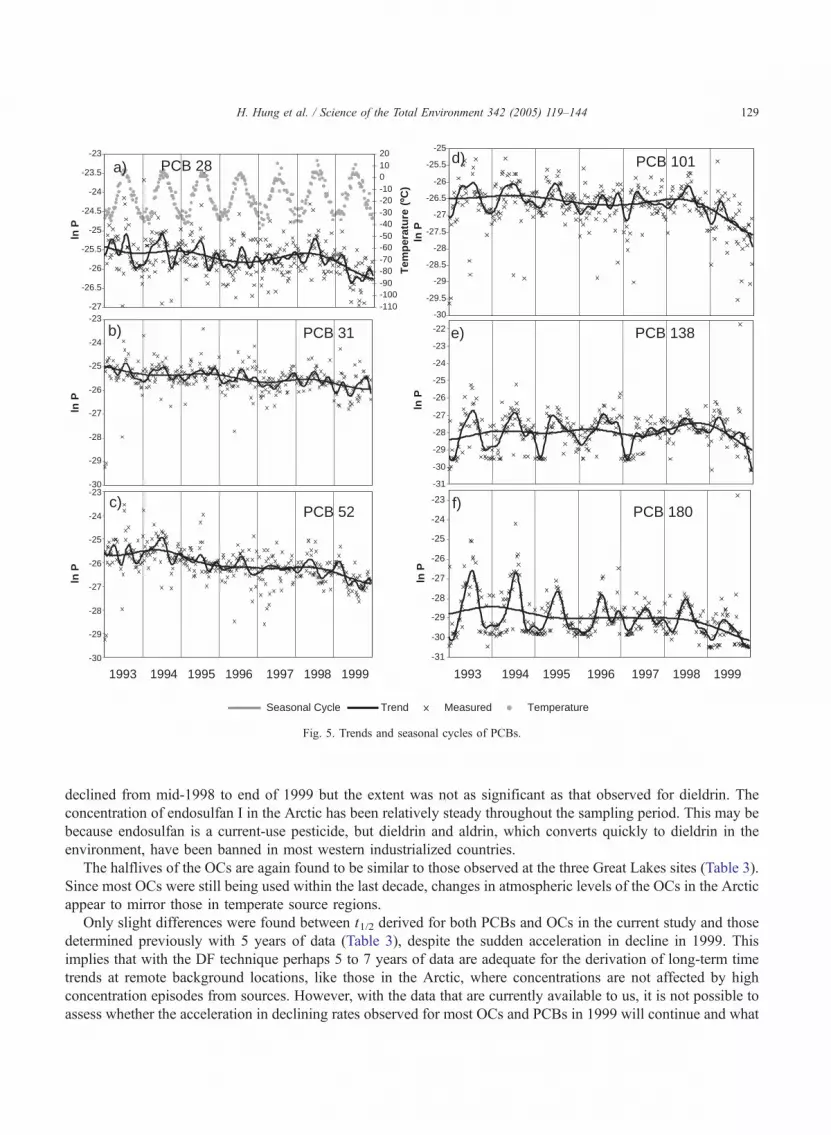
Fig. 5 shows the seasonal cycles and trends of PCBs 28, 31, 52, 101,138, 180 at Alert (1993–1999) determined
by the DF technique. Air concentrations were converted to partial pressure, P, using the ideal gas law. Also
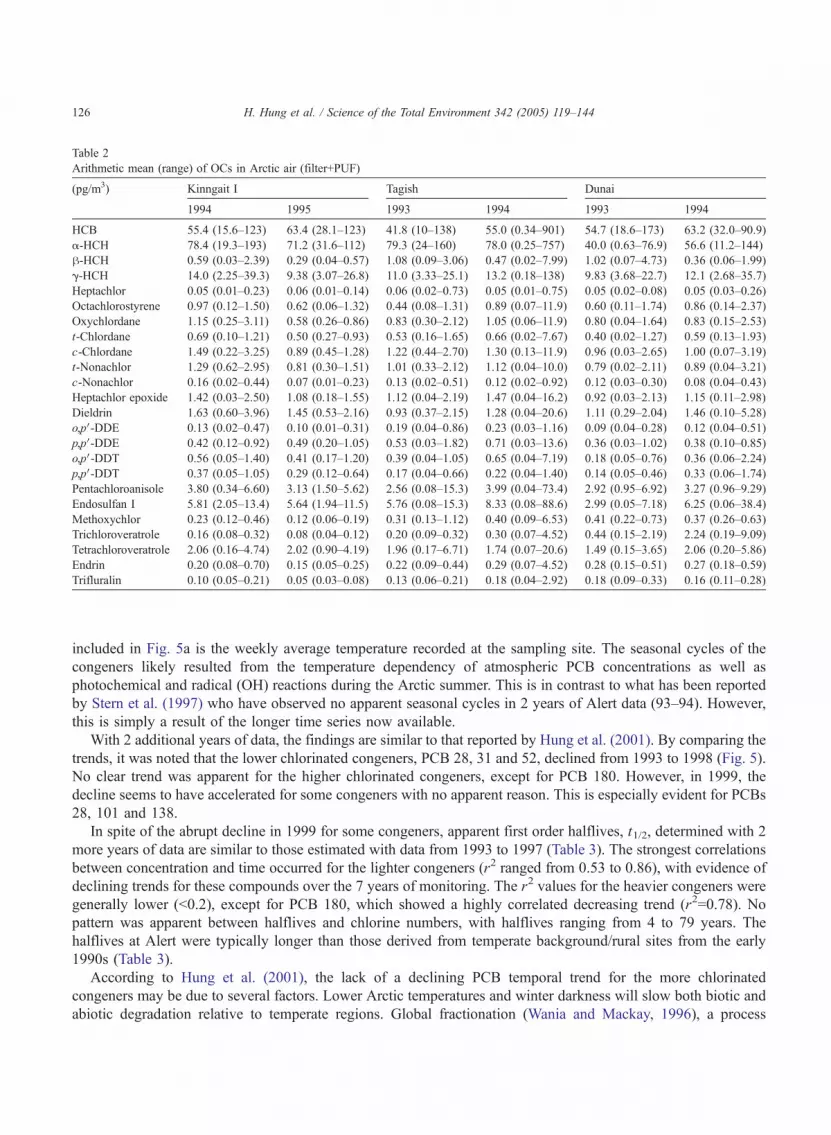
Table 2
Arithmetic mean (range) of OCs in Arctic air (filter+PUF)
(pg/m3) Kinngait I Tagish Dunai
1994 1995 1993 1994 1993 1994
HCB 55.4 (15.6–123) 63.4 (28.1–123) 41.8 (10–138) 55.0 (0.34–901) 54.7 (18.6–173) 63.2 (32.0–90.9)
a-HCH 78.4 (19.3–193) 71.2 (31.6–112) 79.3 (24–160) 78.0 (0.25–757) 40.0 (0.63–76.9) 56.6 (11.2–144)
h-HCH 0.59 (0.03–2.39) 0.29 (0.04–0.57) 1.08 (0.09–3.06) 0.47 (0.02–7.99) 1.02 (0.07–4.73) 0.36 (0.06–1.99)
g-HCH 14.0 (2.25–39.3) 9.38 (3.07–26.8) 11.0 (3.33–25.1) 13.2 (0.18–138) 9.83 (3.68–22.7) 12.1 (2.68–35.7)
Heptachlor 0.05 (0.01–0.23) 0.06 (0.01–0.14) 0.06 (0.02–0.73) 0.05 (0.01–0.75) 0.05 (0.02–0.08) 0.05 (0.03–0.26)
Octachlorostyrene 0.97 (0.12–1.50) 0.62 (0.06–1.32) 0.44 (0.08–1.31) 0.89 (0.07–11.9) 0.60 (0.11–1.74) 0.86 (0.14–2.37)
Oxychlordane 1.15 (0.25–3.11) 0.58 (0.26–0.86) 0.83 (0.30–2.12) 1.05 (0.06–11.9) 0.80 (0.04–1.64) 0.83 (0.15–2.53)
t-Chlordane 0.69 (0.10–1.21) 0.50 (0.27–0.93) 0.53 (0.16–1.65) 0.66 (0.02–7.67) 0.40 (0.02–1.27) 0.59 (0.13–1.93)
c-Chlordane 1.49 (0.22–3.25) 0.89 (0.45–1.28) 1.22 (0.44–2.70) 1.30 (0.13–11.9) 0.96 (0.03–2.65) 1.00 (0.07–3.19)
t-Nonachlor 1.29 (0.62–2.95) 0.81 (0.30–1.51) 1.01 (0.33–2.12) 1.12 (0.04–10.0) 0.79 (0.02–2.11) 0.89 (0.04–3.21)
c-Nonachlor 0.16 (0.02–0.44) 0.07 (0.01–0.23) 0.13 (0.02–0.51) 0.12 (0.02–0.92) 0.12 (0.03–0.30) 0.08 (0.04–0.43)
Heptachlor epoxide 1.42 (0.03–2.50) 1.08 (0.18–1.55) 1.12 (0.04–2.19) 1.47 (0.04–16.2) 0.92 (0.03–2.13) 1.15 (0.11–2.98)
Dieldrin 1.63 (0.60–3.96) 1.45 (0.53–2.16) 0.93 (0.37–2.15) 1.28 (0.04–20.6) 1.11 (0.29–2.04) 1.46 (0.10–5.28)
o,pV-DDE 0.13 (0.02–0.47) 0.10 (0.01–0.31) 0.19 (0.04–0.86) 0.23 (0.03–1.16) 0.09 (0.04–0.28) 0.12 (0.04–0.51)
p,pV-DDE 0.42 (0.12–0.92) 0.49 (0.20–1.05) 0.53 (0.03–1.82) 0.71 (0.03–13.6) 0.36 (0.03–1.02) 0.38 (0.10–0.85)
o,pV-DDT 0.56 (0.05–1.40) 0.41 (0.17–1.20) 0.39 (0.04–1.05) 0.65 (0.04–7.19) 0.18 (0.05–0.76) 0.36 (0.06–2.24)
p,pV-DDT 0.37 (0.05–1.05) 0.29 (0.12–0.64) 0.17 (0.04–0.66) 0.22 (0.04–1.40) 0.14 (0.05–0.46) 0.33 (0.06–1.74)
Pentachloroanisole 3.80 (0.34–6.60) 3.13 (1.50–5.62) 2.56 (0.08–15.3) 3.99 (0.04–73.4) 2.92 (0.95–6.92) 3.27 (0.96–9.29)
Endosulfan I 5.81 (2.05–13.4) 5.64 (1.94–11.5) 5.76 (0.08–15.3) 8.33 (0.08–88.6) 2.99 (0.05–7.18) 6.25 (0.06–38.4)
Methoxychlor 0.23 (0.12–0.46) 0.12 (0.06–0.19) 0.31 (0.13–1.12) 0.40 (0.09–6.53) 0.41 (0.22–0.73) 0.37 (0.26–0.63)
Trichloroveratrole 0.16 (0.08–0.32) 0.08 (0.04–0.12) 0.20 (0.09–0.32) 0.30 (0.07–4.52) 0.44 (0.15–2.19) 2.24 (0.19–9.09)
Tetrachloroveratrole 2.06 (0.16–4.74) 2.02 (0.90–4.19) 1.96 (0.17–6.71) 1.74 (0.07–20.6) 1.49 (0.15–3.65) 2.06 (0.20–5.86)
Endrin 0.20 (0.08–0.70) 0.15 (0.05–0.25) 0.22 (0.09–0.44) 0.29 (0.07–4.52) 0.28 (0.15–0.51) 0.27 (0.18–0.59)
Trifluralin 0.10 (0.05–0.21) 0.05 (0.03–0.08) 0.13 (0.06–0.21) 0.18 (0.04–2.92) 0.18 (0.09–0.33) 0.16 (0.11–0.28)
H. Hung et al. / Science of the Total Environment 342 (2005) 119–144126
included in Fig. 5a is the weekly average temperature recorded at the sampling site. The seasonal cycles of the
congeners likely resulted from the temperature dependency of atmospheric PCB concentrations as well as
photochemical and radical (OH) reactions during the Arctic summer. This is in contrast to what has been reported
by Stern et al. (1997) who have observed no apparent seasonal cycles in 2 years of Alert data (93–94). However,
this is simply a result of the longer time series now available.
With 2 additional years of data, the findings are similar to that reported by Hung et al. (2001). By comparing the
trends, it was noted that the lower chlorinated congeners, PCB 28, 31 and 52, declined from 1993 to 1998 (Fig. 5).
No clear trend was apparent for the higher chlorinated congeners, except for PCB 180. However, in 1999, the
decline seems to have accelerated for some congeners with no apparent reason. This is especially evident for PCBs
28, 101 and 138.
In spite of the abrupt decline in 1999 for some congeners, apparent first order halflives, t1/2, determined with 2
more years of data are similar to those estimated with data from 1993 to 1997 (Table 3). The strongest correlations
between concentration and time occurred for the lighter congeners (r2 ranged from 0.53 to 0.86), with evidence of
declining trends for these compounds over the 7 years of monitoring. The r2 values for the heavier congeners were
generally lower (b0.2), except for PCB 180, which showed a highly correlated decreasing trend (r2=0.78). No
pattern was apparent between halflives and chlorine numbers, with halflives ranging from 4 to 79 years. The
halflives at Alert were typically longer than those derived from temperate background/rural sites from the early
1990s (Table 3).
According to Hung et al. (2001), the lack of a declining PCB temporal trend for the more chlorinated
congeners may be due to several factors. Lower Arctic temperatures and winter darkness will slow both biotic and
abiotic degradation relative to temperate regions. Global fractionation (Wania and Mackay, 1996), a process
(a) Vapour Phase
0
100
200
300
400
500
600
1992 1993 1994 1995 1996 1997 1998 1999 2000
Year
Year
An
nu
al A
rith
met
ic M
ean
(p
g/m
3 )A
nn
ual
Ari
thm
etic
Mea
n (
pg
/m3 )
(b) Particle Phase
0
50
100
150
200
250
300
350
400
1992 1993 1994 1995 1996 1997 1998 1999 2000
Fig. 3. Annual arithmetic mean of APAHs (16 compounds) in a) vapour phase and b) particulate phases at Alert.
H. Hung et al. / Science of the Total Environment 342 (2005) 119–144 127
where chemicals may be latitudinally dfractionatedT according to the ambient temperature and their physical–
chemical properties, may help to sustain levels in Arctic air, while concentrations in temperate regions are
declining. The apparent reduction in air concentrations of the lighter congeners over the years is probably the
result of the dominating effect of long range transport, whereby levels in the Arctic echo falling air concentrations
in source regions. This, in combination with their relatively fast OH depletion rates during the arctic summer, may
explain the temporal decline of the lighter congeners. For example, at an average temperature of �17.6 8C at
Alert, the reaction rate constants of PCB 31 (2,4V,5-trichlorobiphenyl) and 110 (2,3,3V,4V,6-pentachlorobiphenyl)would be 8.0�10�13 and 3.4�10�13 cm3/s, respectively (estimated using Arrhenius parameters given by
Anderson and Hites, 1996); combining with an estimated OH radical concentration of 1.7�105 molecules/cm3 in
the Arctic atmosphere in April (Barrie et al., 1988), the lifetime of PCB 31 would be 85 days compared to 202
days for PCB 110. However, the picture is complicated by notable exceptions, for instance PCB 180
(heptachlorinated) shows a clear downward trend and has a calculated halflife of only 4.2 years at Alert. It is
believed that heavier congeners might be subjected to different removal processes than the lighter ones.
Precipitation or scavenging processes, e.g. particulate deposition and snow scavenging, might be the dominant
removal processes for the heavier congeners, while the lighter congeners were mainly removed by degradation via
reaction with OH radicals. The relative removal rates pertaining to the different processes and the physical–
chemical properties of the congeners may be responsible for the differing trends observed.

acen
apht
hyle
ne
acen
apht
hene
fluor
ene
phen
anth
rene
anth
race
ne
anth
ene
pyre
ne
rete
ne
B[a
]A
chry
sene
B[e
]P
B[a
]P
Ind-
P
B[g
hi]P
dibe
nzth
ioph
ene
pery
lene
25
50
75
100
125
150
175
200
225
250
500
525
Alert SpitzbergenKinngait
l
r anth
ene
pyre
ne
rete
ne
B[a
]A
chry
sene
B[e
]P
B[a
]P
Ind-
P
B[g
hi]P
dibe
nzth
ioph
ene
pery
lene
Arit
hmet
ic M
ean
Con
cent
ratio
ns (
pg/m
3 )
0
550
Alert SpitzbergenKinngait
fluor
fluor
Fig. 4. PAH profiles at Alert, Spitsbergen and Kinngait in 1994. Kinngait data are arithmetic mean concentrations from Week 16, 1994 to Week
15, 1995.
H. Hung et al. / Science of the Total Environment 342 (2005) 119–144128
3.2.2. OCs
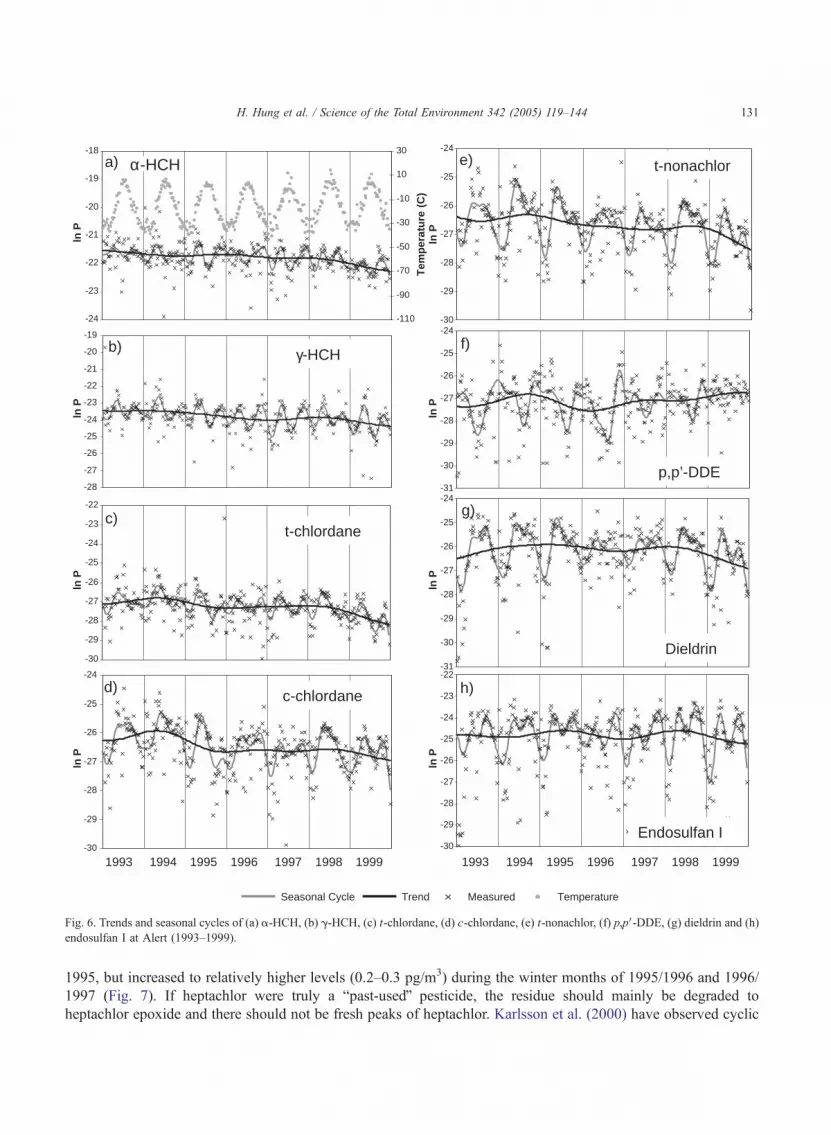
Fig. 6 shows the seasonal cycles and trends of selected OCs. Most of the selected OCs showed declining trends
over the 7 years. Similar to the PCBs, temporal trends and halflives (Table 3) developed with 7 years of OC
concentration data (1993–1999) do not show significant differences from those developed with only 5 years of data
from 1993 to 1997, except for a-HCH. Two years of additional data resulted in a shortening of the t1/2 for a-HCH,
a major component of technical HCH, from 17 to 9 years. This probably reflects the continuous decline in global
emission of technical HCH as many countries have banned its use since the 1970s (Li and Macdonald, this issue).
From Fig. 1 of Li and Macdonald (this issue), it can be seen that global a-HCH emission continued to decline
throughout the 1990s. Another component of technical HCH, h-HCH, has shown rapid decline in Arctic air
concentrations between 1993 and 1995 (median concentrations: 0.45, 0.27 and 0.07 pg/m3 for 1993, 1994 and
1995, respectively. Median concentrations are reported here due to high percentage of non-detects). Its
concentrations then remain steady till the end of 1999 (annual median concentrations range from 0.04 to 0.09 pg/
m3) with greater than 70% of all samples below method detection limits after 1995. Since its concentrations were
non-detectable in many samples, a valid halflife and trend cannot be determined for h-HCH.The accelerations in decline in 1999 are not only noted for the PCBs but are also observed for the OCs in
Arctic air. Among the selected OCs shown in Fig. 6, this phenomenon is especially apparent for trans-chlordane
(TC), trans-nonachlor (TN) and dieldrin, but is also shown in the trends of a- and g-HCH, cis-chlordane (CC) and
endosulfan I. Since the analysis has been performed in the same laboratory using the same equipment and
analytical procedures by the same staff and the phenomenon was observed for both PCBs and OCs, this
acceleration in decline appears to be real.
Dieldrin and endosulfan I, which did not show a decline in trends when data from 1993 to 1995 were used,
showed halflives of 13 and 38 years, respectively, with the 2 additional years of data. For dieldrin, this is evidently
the result of the downturn in air concentrations starting early in 1998 and continued until the end of 1999. Before
then, dieldrin levels in Alert air had been fairly steady between 1994 and 1997. For endosulfan I, the level also
-30
-29
-28
-27
-26
-25
-24
-23
-30
-29
-28
-27
-26
-25
-24
-23
ln P
PCB 31b)
-27
-26.5
-26
-25.5
-25
-24.5
-24
-23.5
-23
ln P
-110-100-90-80-70-60-50-40-30-20-1001020
Tem
per
atu
re (ºC
)
PCB 28a)
ln P
1993 1994 1995 1996 1997 1998 1999
PCB 52c)
-31
-30
-29
-28
-27
-26
-25
-24
-23
ln P
1993 1994 1995 1996 1997 1998 1999
PCB 180f)
-31
-30
-29
-28
-27
-26
-25
-24
-23
-22
ln P
ln P
PCB 138e)-30
-29.5
-29
-28.5
-28
-27.5
-27
-26.5
-26
-25.5
-25
PCB 101d)
Seasonal Cycle Trend Measured Temperature
Fig. 5. Trends and seasonal cycles of PCBs.
H. Hung et al. / Science of the Total Environment 342 (2005) 119–144 129
declined from mid-1998 to end of 1999 but the extent was not as significant as that observed for dieldrin. The
concentration of endosulfan I in the Arctic has been relatively steady throughout the sampling period. This may be
because endosulfan is a current-use pesticide, but dieldrin and aldrin, which converts quickly to dieldrin in the
environment, have been banned in most western industrialized countries.
The halflives of the OCs are again found to be similar to those observed at the three Great Lakes sites (Table 3).
Since most OCs were still being used within the last decade, changes in atmospheric levels of the OCs in the Arctic
appear to mirror those in temperate source regions.
Only slight differences were found between t1/2 derived for both PCBs and OCs in the current study and those
determined previously with 5 years of data (Table 3), despite the sudden acceleration in decline in 1999. This
implies that with the DF technique perhaps 5 to 7 years of data are adequate for the derivation of long-term time
trends at remote background locations, like those in the Arctic, where concentrations are not affected by high
concentration episodes from sources. However, with the data that are currently available to us, it is not possible to
assess whether the acceleration in declining rates observed for most OCs and PCBs in 1999 will continue and what
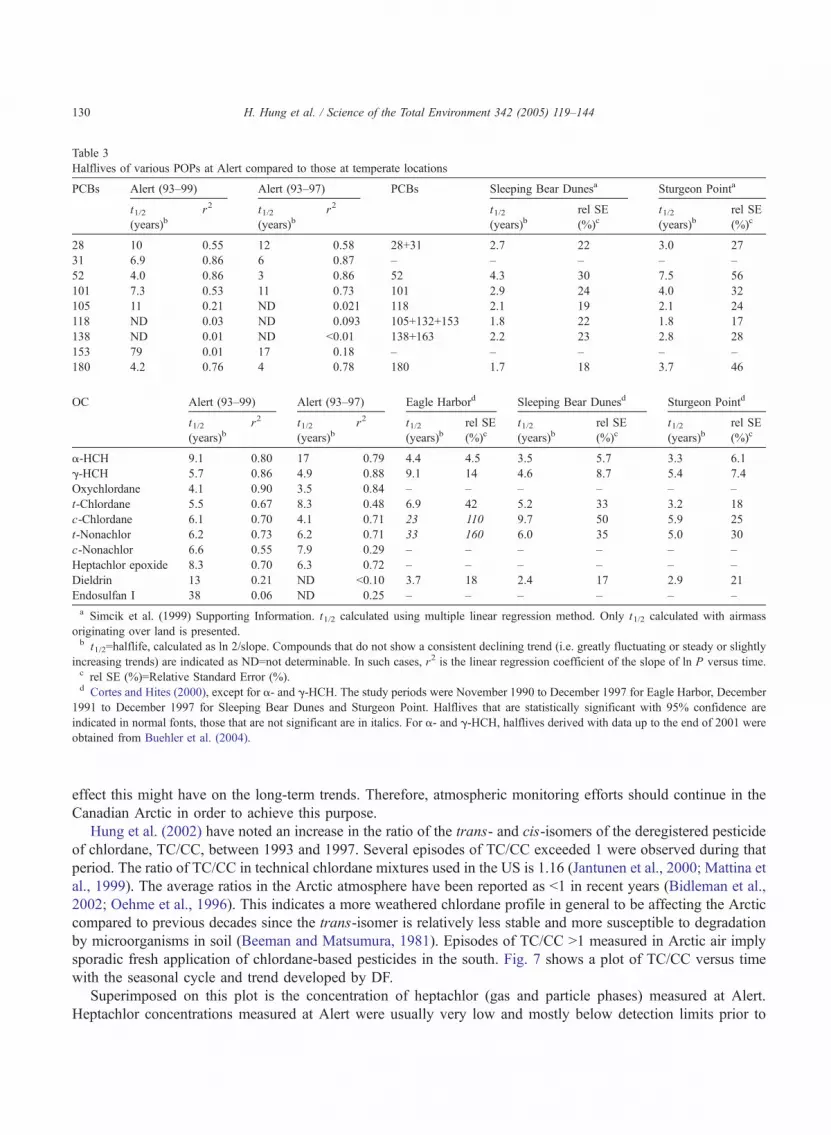
Table 3
Halflives of various POPs at Alert compared to those at temperate locations
PCBs Alert (93–99) Alert (93–97) PCBs Sleeping Bear Dunesa Sturgeon Pointa
t1/2(years)b
r2 t1/2(years)b
r2 t1/2(years)b
rel SE
(%)ct1/2(years)b
rel SE
(%)c
28 10 0.55 12 0.58 28+31 2.7 22 3.0 27
31 6.9 0.86 6 0.87 – – – – –
52 4.0 0.86 3 0.86 52 4.3 30 7.5 56
101 7.3 0.53 11 0.73 101 2.9 24 4.0 32
105 11 0.21 ND 0.021 118 2.1 19 2.1 24
118 ND 0.03 ND 0.093 105+132+153 1.8 22 1.8 17
138 ND 0.01 ND b0.01 138+163 2.2 23 2.8 28
153 79 0.01 17 0.18 – – – – –
180 4.2 0.76 4 0.78 180 1.7 18 3.7 46
OC Alert (93–99) Alert (93–97) Eagle Harbord Sleeping Bear Dunesd Sturgeon Pointd
t1/2(years)b
r2 t1/2(years)b
r2 t1/2(years)b
rel SE
(%)ct1/2(years)b
rel SE
(%)ct1/2(years)b
rel SE
(%)c
a-HCH 9.1 0.80 17 0.79 4.4 4.5 3.5 5.7 3.3 6.1
g-HCH 5.7 0.86 4.9 0.88 9.1 14 4.6 8.7 5.4 7.4
Oxychlordane 4.1 0.90 3.5 0.84 – – – – – –
t-Chlordane 5.5 0.67 8.3 0.48 6.9 42 5.2 33 3.2 18
c-Chlordane 6.1 0.70 4.1 0.71 23 110 9.7 50 5.9 25
t-Nonachlor 6.2 0.73 6.2 0.71 33 160 6.0 35 5.0 30
c-Nonachlor 6.6 0.55 7.9 0.29 – – – – – –
Heptachlor epoxide 8.3 0.70 6.3 0.72 – – – – – –
Dieldrin 13 0.21 ND b0.10 3.7 18 2.4 17 2.9 21
Endosulfan I 38 0.06 ND 0.25 – – – – – –
a Simcik et al. (1999) Supporting Information. t1/2 calculated using multiple linear regression method. Only t1/2 calculated with airmass
originating over land is presented.b t1/2=halflife, calculated as ln 2/slope. Compounds that do not show a consistent declining trend (i.e. greatly fluctuating or steady or slightly
increasing trends) are indicated as ND=not determinable. In such cases, r2 is the linear regression coefficient of the slope of ln P versus time.c rel SE (%)=Relative Standard Error (%).d Cortes and Hites (2000), except for a- and g-HCH. The study periods were November 1990 to December 1997 for Eagle Harbor, December
1991 to December 1997 for Sleeping Bear Dunes and Sturgeon Point. Halflives that are statistically significant with 95% confidence are
indicated in normal fonts, those that are not significant are in italics. For a- and g-HCH, halflives derived with data up to the end of 2001 were
obtained from Buehler et al. (2004).
H. Hung et al. / Science of the Total Environment 342 (2005) 119–144130
effect this might have on the long-term trends. Therefore, atmospheric monitoring efforts should continue in the
Canadian Arctic in order to achieve this purpose.
Hung et al. (2002) have noted an increase in the ratio of the trans- and cis-isomers of the deregistered pesticide
of chlordane, TC/CC, between 1993 and 1997. Several episodes of TC/CC exceeded 1 were observed during that
period. The ratio of TC/CC in technical chlordane mixtures used in the US is 1.16 (Jantunen et al., 2000; Mattina et
al., 1999). The average ratios in the Arctic atmosphere have been reported as b1 in recent years (Bidleman et al.,
2002; Oehme et al., 1996). This indicates a more weathered chlordane profile in general to be affecting the Arctic
compared to previous decades since the trans-isomer is relatively less stable and more susceptible to degradation
by microorganisms in soil (Beeman and Matsumura, 1981). Episodes of TC/CC N1 measured in Arctic air imply
sporadic fresh application of chlordane-based pesticides in the south. Fig. 7 shows a plot of TC/CC versus time
with the seasonal cycle and trend developed by DF.
Superimposed on this plot is the concentration of heptachlor (gas and particle phases) measured at Alert.
Heptachlor concentrations measured at Alert were usually very low and mostly below detection limits prior to
-24
-23
-22
-21
-20
-19
-18
ln P
ln P
ln P
ln P
ln P
ln P
ln P
-110
-90
-70
-50
-30
-10
10
30
Tem
per
atu
re (
C)
-28
-27
-26
-25
-24
-23
-22
-21
-20
-19
γ-HCH
-30
-29
-28
-27
-26
-25
-24
-23
-22
t-chlordane
-30
-29
-28
-27
-26
-25
-24
c-chlordane
b)
c)
d)
a) α-HCH
-30
-29
-28
-27
-26
-25
-24
ln P
t-nonachlor
-31
-30
-29
-28
-27
-26
-25
-24
p,p’-DDE
-31
-30
-29
-28
-27
-26
-25
-24
Dieldrin
-30
-29
-28
-27
-26
-25
-24
-23
-22
Endosulfan I
h)
g)
f)
e)
1993 1994 1995 1996 1997 1998 1999 1993 1994 1995 1996 1997 1998 1999
Seasonal Cycle Trend Measured Temperature
Fig. 6. Trends and seasonal cycles of (a) a-HCH, (b) g-HCH, (c) t-chlordane, (d) c-chlordane, (e) t-nonachlor, (f) p,pV-DDE, (g) dieldrin and (h)endosulfan I at Alert (1993–1999).
H. Hung et al. / Science of the Total Environment 342 (2005) 119–144 131
1995, but increased to relatively higher levels (0.2–0.3 pg/m3) during the winter months of 1995/1996 and 1996/
1997 (Fig. 7). If heptachlor were truly a bpast-usedQ pesticide, the residue should mainly be degraded to
heptachlor epoxide and there should not be fresh peaks of heptachlor. Karlsson et al. (2000) have observed cyclic

0
0.2
0.4
0.6
0.8
1
1.2
1.4
1.6
TC
/CC
0
0.1
0.2
0.3
0.4
0.5
0.6
Hep
tach
lor
con
c. (
gas
+ p
arti
cle)
(p
g/m
3 )
Seasonal Cycle Trend Measured Heptachlor
1993 1994 1995 1996 1997 1998 1999
Fig. 7. TC/CC and heptachlor concentration at Alert (1993–1999).
H. Hung et al. / Science of the Total Environment 342 (2005) 119–144132
temporal patterns of heptachlor at Senga Bay, South Africa, between 1997 and 1998 which indicates that there
has been repeated use of heptachlor rather than technical chlordane. Therefore, fresh inputs into the Arctic
atmosphere are not surprising. Nonetheless, technical chlordane mixtures contain some heptachlor (~7%) (Gooch
et al., 1990) and technical heptachlor is contaminated with chlordane isomers, especially TC (Bidleman et al.,
2002). When the TC/CC peaked together with heptachlor, for instance 5 to 12 February 1996, it may suggest
fresh usage of either heptachlor or chlordane mixtures. Five-day back trajectories calculated by Hung et al. (2002)
at 925 hPa during the periods when TC/CC N1 indicated that Alert was subjected to stronger than normal
influence from the Eurasian sector but the actual source regions of the fresh input episodes cannot be determined.
In the last 2 years of 1998 and 1999, the TC/CC ratio apparently declined at Alert (Fig. 7). After 1997, there
was only one episode that TC/CC exceeded 1. Heptachlor concentrations also remained low for most of 1999.
Velsicol, the sole producer of technical chlordane and heptachlor, has stopped its production of both pesticides in
May 1997 (PANUPS, 1997). Therefore, it can be expected that the TC/CC would generally remain less than 1 in
Arctic air as the technical chlordane stockpile depletes.
Bidleman et al. (2002) have compiled TC, CC and TN measurements in Arctic air from 1984 to 1998 at the
monitoring stations of Alert (1993–1997), Tagish (1993–1994), Dunai (1993–1994) and the AMAP station of
Pallas, Finland (68858V N, 24 807V E) (1996–1998). (Data from Pallas was kindly supplied by Eva Brorstrfm-
Lunden (Swedish Environmental Research Institute) and Sirkka Juntto (Finnish Meteorological Organisation).)
The data set contains over 500 measurements, 70% from 1993 to 1998 and 30% from earlier. Significant declines
in TC, CC and TN concentrations over the 14-year period in both summer–fall (May–October) and winter–spring
(November–April) were observed ( pb0.001). Apparent values of halflives, t1/2, obtained by regressing the natural
logarithm of concentration versus year (first order plot) were (summer–fall, winter–spring) 4.9, 6.4 years (TC), 6.7,
9.7 years (CC) and 7.4, 6.3 years (TN). They are similar to the time trends observed between 1993 and 99 at Alert,
which were 5.5 years for TC, 6.1 years for CC and 6.2 years for TN (Table 3).
As seen in Fig. 7 and in other studies over many years (Bidleman et al., 2002; Halsall et al., 1998; Oehme et
al., 1996), the ratio of TC/CC undergoes seasonal cycles in Arctic air, higher in winter–spring and lower in
summer–fall. Between 1984 and 1997, the fraction of TC=FTC=TC/(TC+CC) declined significantly in both
winter–spring ( pb0.001) and summer–fall ( p=0.014) seasons. This again suggests that sources of chlordane in
Arctic air have changed over the last 14 years and are now more depleted in TC. The FTC in technical chlordane
H. Hung et al. / Science of the Total Environment 342 (2005) 119–144 133
is 0.54, and when weighed for the slightly higher vapour pressure of TC the expected atmospheric FTC in
equilibrium with technical chlordane is 0.62 (Jantunen et al., 2000). The FTC in soils is about the same or lower
than in technical chlordane (Aigner et al., 1998; Jantunen et al., 2000). Confounding the interpretation of FTC
values is the fact that technical heptachlor was also used in agriculture and as a termiticide. As mentioned above,
technical heptachlor is contaminated with chlordane isomers, especially TC, so higher FTC in soils or air could be
associated with this source.
In two studies, Bidleman et al. (2002, 2004) have used chlordane enantiomers in air samples from the arctic
stations at Alert (1993–1996 and summer of 1999); Dunai (mostly 1994–1995, with a few from 1993 and 1996);
Pallas (1998, 2001); and a European Monitoring and Assessment Program (EMEP) station at Rfrvik (1998, 2001)
on the Swedish west coast (57825VN, 11856VE) as an indicator of historical residue emissions, since non-racemic
chlordanes have been found in soils (Aigner et al., 1998; Jantunen et al., 2000; Meijer et al., 2001; Wiberg et al.,
2000) and in ambient air from the Great Lakes region (Bidleman et al., 1998; Ulrich and Hites, 1998). Depletion of
the (+)TC and (�)CC enantiomers was found for most of the samples. The average enantiomer fraction, EF=(+)/
[(+)+(�)], of TC was different from racemic (racemic EF=0.500) at a high level of significance ( pb0.001) at Alert
(1993–1996: 0.471F0.011; 1999 summer: 0.470F0.0090), Pallas (1998: 0.477F0.0061; 2001: 0.471F0.012),
Dunai (1994–1995: 0.471F0.0087) and the temperate coastal station Rfrvik (1998: 0.463F0.013; 2001:
0.454F0.026). The average EFs of CC were also significantly non-racemic at Rfrvik (1998: 0.511F0.0054,
pb0.001; 2001: 0.514F0.0071, pb0.001) and Pallas (1998: 0.507F0.0050, pb0.01; 2001: 0.510F0.0042,
pb0.001) but not at Dunai (1994–1995: 0.503F0.0046, pN0.2) and Alert (1993–1996: 0.504F0.0048, pN0.1; 1999
summer: 0.507F0.0043, pN0.2). At Alert (1993–1996), the EF of TC was positively correlated with FTC (r2=0.41,
p=0.0032), but not at Dunai (r2=0.0024, pN0.9) nor Pallas (r2=0.029, pN0.6). The mean EFs at each station in
1999/2001 (Bidleman et al., 2004) were not significantly different ( pN0.05 to N0.2) from those obtained during the
previous campaign (Bidleman et al., 2002). However, there appeared to be a slight drift toward more nonracemic
signatures in 2001.
Have chlordanes in Arctic air always been non-racemic, even in the mid-1980s and earlier? To examine this
question, the EFs of chlordanes were determined in archived samples of atmospheric deposition that were collected
in Sweden, Iceland and Slovakia during 1971–1973 (Bidleman et al., 2004). The average EFs of TC and CC in the
historical samples were 0.496F0.0025 and 0.500F0.0027, racemic for CC and nearly so for TC. Sediment layers
from Lake DV-09 on Devon Island in the Canadian Archipelago also showed a trend in the EFs of TC, from more
nearly racemic in the 1950s and 1960s to less racemic in recent times (Stern et al., this issue; Bidleman et al.,
2004).
Heptachlor exo-epoxide (HEPX) was significantly ( pb0.001) non-racemic in the 1994–1998 air samples from
all stations and showed an excess of the (+) enantiomer. Sources of HEPX include metabolism of heptachlor in
soils and photochemical oxidation of heptachlor. The former process is thought to yield HEPX enriched in the (+)
enantiomer, as occurs when heptachlor is metabolised by rat liver microsomes, while the second yields racemic
HEPX (Buser and Muller, 1994). HEPX in ambient air samples from temperate regions is also non-racemic,
suggesting that emission from soils is the primary source (Bidleman et al., 1998).
Although occasional spikes of high TC/CC and heptachlor air concentrations were seen at Alert between 1995
and 1997 suggesting that these pesticides might still be in use sporadically, from the study of enantiomer fractions,
it appears that general sources of chlordane have shifted over time, from atmospheric transport of the freshly
applied pesticide to a greater proportion of chlordane brecycledQ from soils. The non-racemic HEPX in Arctic air
exemplifies the volatilisation of soil residues on a large scale and influence on atmospheric levels in remote regions.
3.2.3. PAHs
Attempts were made to extract trends using the DF technique from the entire PAH dataset and from segregated
winter/spring data, but the data were extremely scattered and reliable trends could not be derived. This is mainly due
to the extreme seasonality of PAH concentrations at Alert (Halsall et al., 1997), more years of data are required to
obtain reliable temporal trends. Nonetheless annual means (Fig. 3a and b) can be used to discuss general tendencies.
H. Hung et al. / Science of the Total Environment 342 (2005) 119–144134
The decrease observed at Alert for gas phase PAH (Fig. 3a) between 1993 and 1996 follows measurements
around the Great Lakes (Cortes and Hites, 2000) and at urban sites in the UK (Halsall et al., 1994, Coleman et al.,
1997). The UK decreasing trends have been attributed to a substantial decline in domestic consumption of fossil
fuels for space heating and improvement in domestic and industrial combustion devices. Given the importance of
long range transport of PAHs to the Arctic (Halsall et al., 2001), it is not surprising that the levels observed at Alert
mimic the declining trends at mid-latitudes. The decline in particulate phase PAHs from 1993 to 1996 (Fig. 3b) is
consistent with the general declining trend of atmospheric sulphate aerosol at Alert after 1991 reported by Sirois
and Barrie (1999). Particulate-sulphate accounts for the majority of the aerosol loading in the Arctic (Halsall et al.,
1997) and the size distribution of sulphate (V1 Am) corresponds to the range where most PAHs have been observed
(Allen et al., 1996). Sirois and Barrie (1999) have shown that between 1985 and 1990, there was a lack of decline
in sulphate concentration at Alert and Barrow reflecting emission data from the former Soviet Union. Between
1991 and 1995, they have attributed the decline in sulphate concentrations to the collapse of industry during the
early years of the new Eurasian republics. It is hypothesized that the decline in PAH air concentrations observed at
Alert could also be due to such a collapse in industrial activities or, alternatively, it could be caused by a change in
emission source and/or transport pathway which influence the site. As a result of global climate change,
contaminant transport pathways may change accordingly. The potential influence of climate change on the
transport of contaminants to the Arctic is discussed in detail in Macdonald et al. (this issue). Longer air
concentration time series of PAHs are required in order to test these hypotheses and to determine the cause behind
their decreasing concentrations observed in Arctic air.
The observed profiles at the three Arctic stations of Alert, Spitzbergen and Kinngait (Fig. 4), dominated by
lighter compounds such as fluorene, phenanthrene, fluoranthene and pyrene, confirm the modelling result
presented by Halsall et al. (2001). They have found that lighter compounds, such as fluorene and phenanthene
would be able to reach the Arctic while most of the heavier compounds, such as benzo[a]pyrene (B[a]P), would
have been removed from the atmosphere before reaching the Arctic, either by reaction with OH radicals or
deposition along the transport pathway.
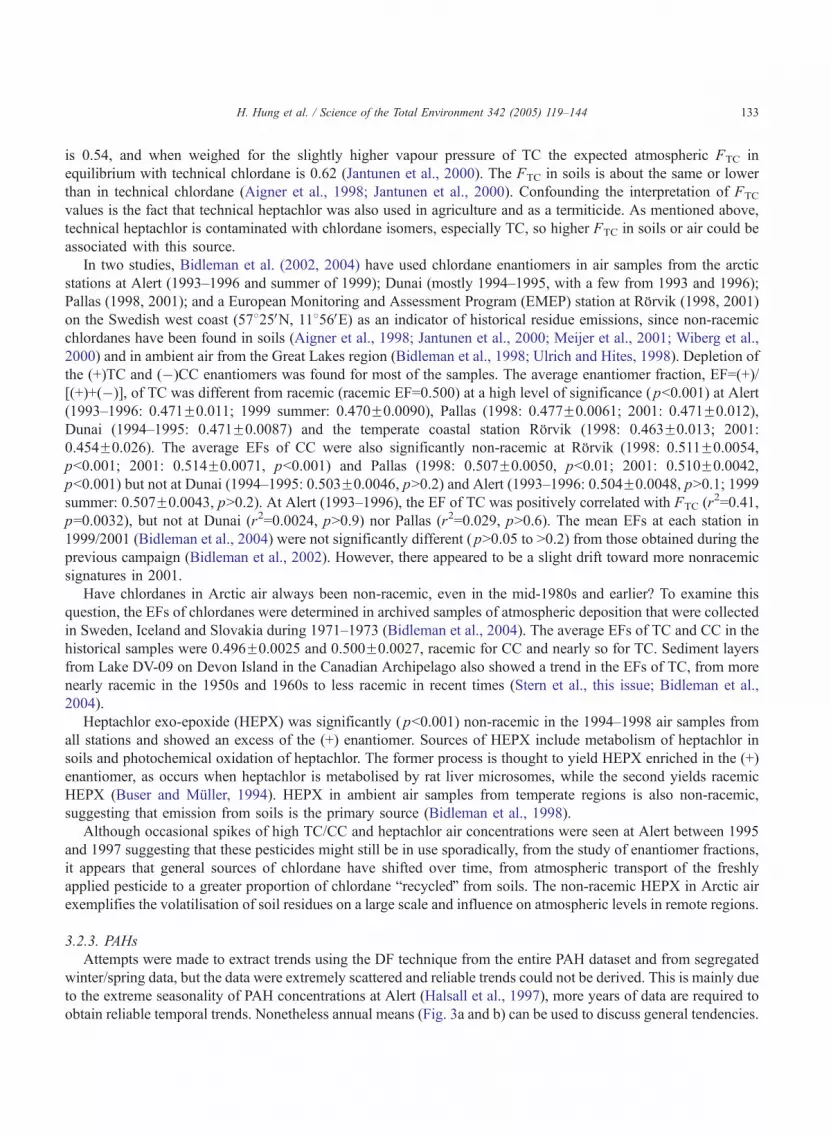
3.3. Kinngait—changes in OC air concentrations (2000–2001 vs. 1994–1995)
Although air monitoring at the site of Kinngait has not been continuous, it is still possible to compare the relative
changes in OC air concentrations at this location and those observed at Alert through the ratios of air concentrations
measured recently and those observed in 1994–1995. These bNow-to-ThenQ ratios, N:T, are defined as:
N : T ¼ Now Concentration ðKinngait : 2000� 2001; Alert : 1998� 1999ÞThen Concentration ð1994� 1995Þ ð1Þ
Four-week composite concentrations at Kinngait were calculated from the 2000–2001 weekly data for
comparison with monthly composite concentrations measured during the same weeks in 1994–1995. N:T ratios of
2000–2001 to 1994–1995 composite concentrations of the HCHs and chlordanes are presented in Fig. 8. Also
shown in Fig. 8 are the ratios of the 1998–1999 to 1994–1995 composite concentrations for Alert. Alert 2000–
2001 air concentrations are still under analysis and are not available at this time. The N:T ratios at both sites were
mostly less than 1, indicating lower atmospheric concentrations in recent years compared to 1994–1995.
The N:T ratios at Kinngait were generally much lower than those at Alert, indicating faster OC removal at
Kinngait. Despite the 2-year difference between the bnowQ data used to calculate the ratios for the two sites, the
atmospheric decline rates of OCs, expressed as halflives at Alert (Table 3), cannot explain the difference between
the N:T ratios of the two locations. To confirm this, air concentrations at Alert in 1998–1999 and 2000–2001 were
estimated using measured concentrations in 1994–1995 and halflives determined from OC trends at Alert between
1993 and 1999 (Table 3). The corresponding halflife-estimated ratios are presented in Fig. 8 for comparisons (grey
[1998–1999] and white [2000–2001] bars). It is believed that OC air concentrations seem to decline faster at
Kinngait because it is closer to temperate regions, where both biotic and abiotic degradation rates are usually faster.
(a) α-HCH
0
0.2
0.4
0.6
0.8
1
1.2
1.4
Composite 4(wk 43-46)
Composite 5(wk 47-49)
Composite 6(wk 5-8)
Composite 7(wk 9-12)
Composite 8 Composite 4 Composite 5 Composite 6 Composite 7 Composite 8
(wk 13-16)
Composite 4(wk 43-46)
Composite 5(wk 47-49)
Composite 6(wk 5-8)
Composite 7(wk 9-12)
Composite 8(wk 13-16)
N:T
(b) γ-HCH
0
0.2
0.4
0.6
0.8
1
1.2
(wk 43-46) (wk 47-49) (wk 5-8) (wk 9-12) (wk 13-16)
Composite 4 Composite 5 Composite 6 Composite 7 Composite 8(wk 43-46) (wk 47-49) (wk 5-8) (wk 9-12) (wk 13-16)
N:T
(c) t-chlordane
0
0.2
0.4
0.6
0.8
1
1.2
1.4
1.6
1.8
2
N:T
(d) c-chlordane
0
0.5
1
1.5
2
2.5
3
N:T
Kinngait Alert Estimated Alert 98-99 Estimated Alert 00-01
Fig. 8. bNow-to-ThenQ ratios, N:T, of (a) a-HCH, (b) g-HCH, (c) t-chlordane and (d) c-chlordane N:T ratios estimated for Alert 98–99 and Alert
00–01 were determined using 94–95 measured Alert air concentrations and 93–99 halflives determined using DF.
H. Hung et al. / Science of the Total Environment 342 (2005) 119–144 135
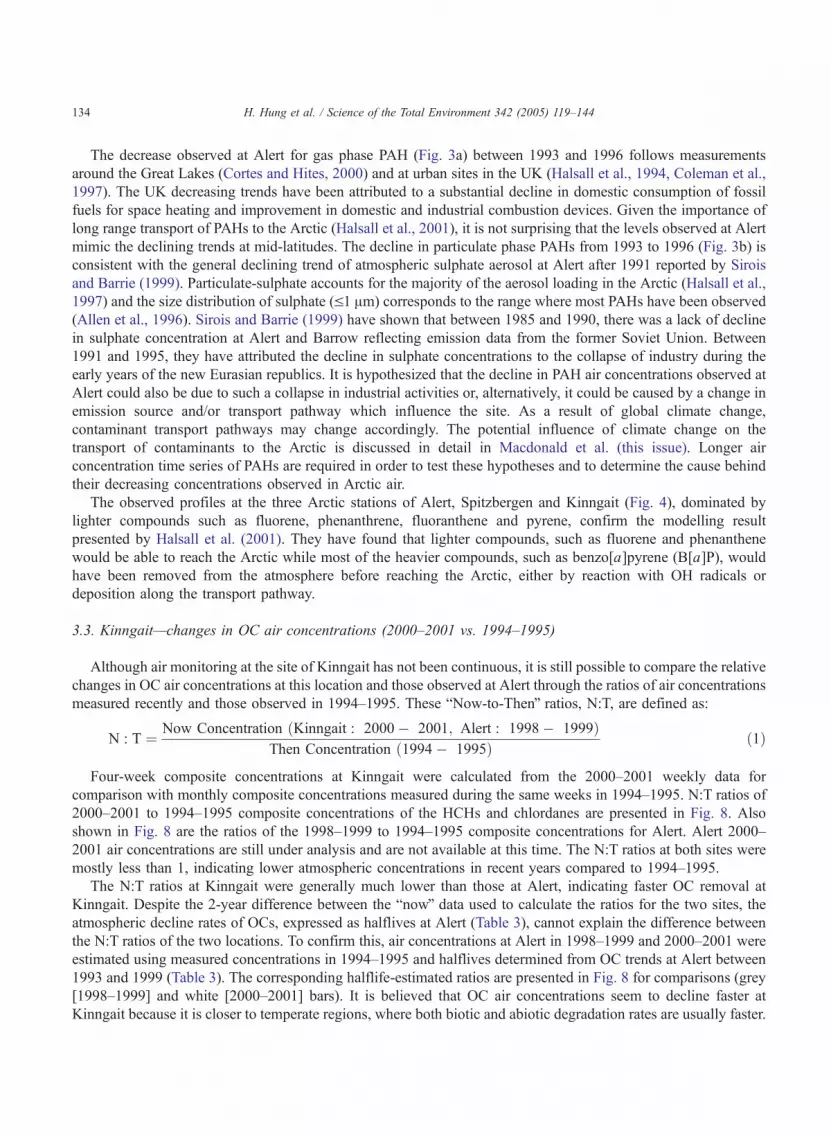
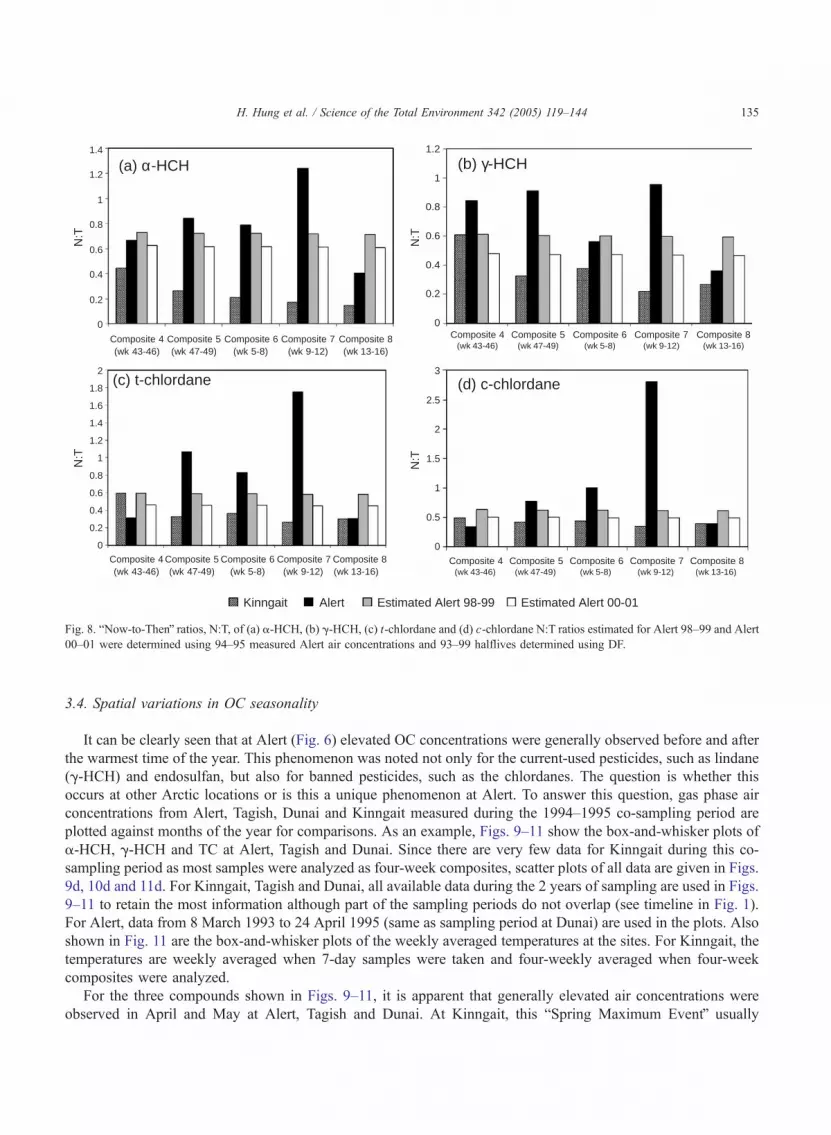
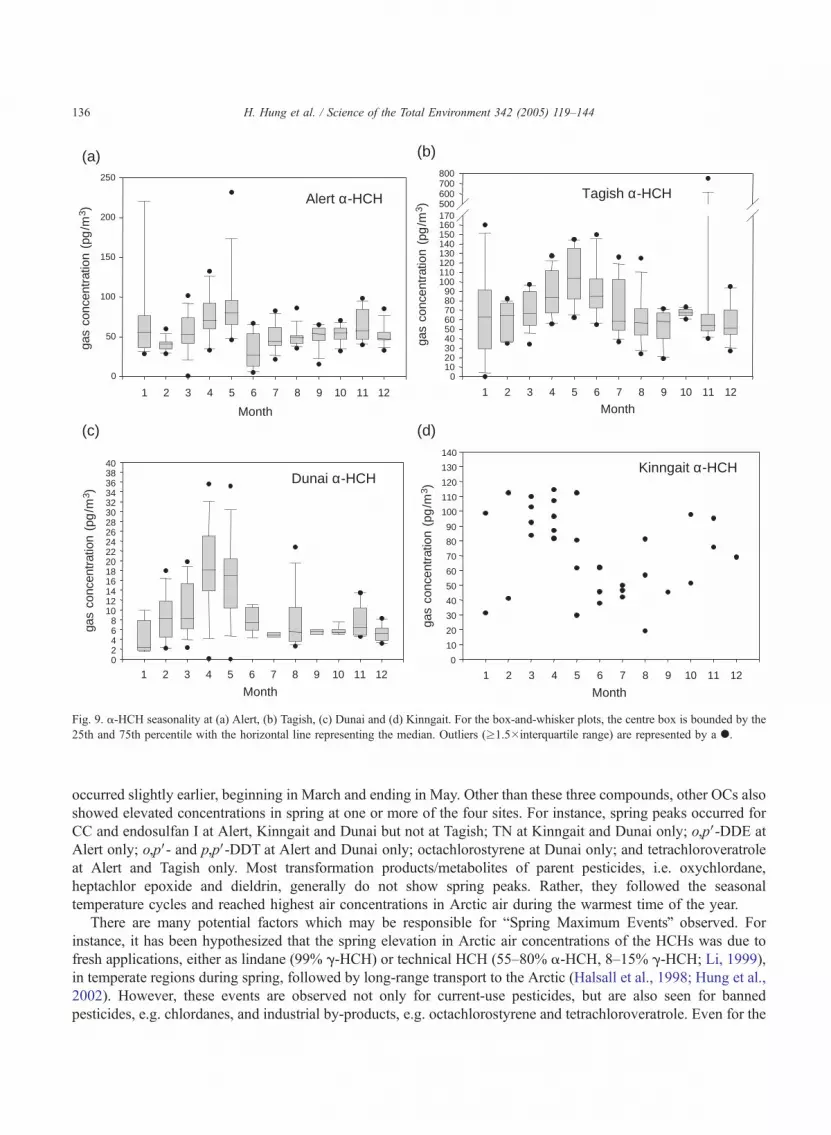
3.4. Spatial variations in OC seasonality
It can be clearly seen that at Alert (Fig. 6) elevated OC concentrations were generally observed before and after
the warmest time of the year. This phenomenon was noted not only for the current-used pesticides, such as lindane
(g-HCH) and endosulfan, but also for banned pesticides, such as the chlordanes. The question is whether this
occurs at other Arctic locations or is this a unique phenomenon at Alert. To answer this question, gas phase air
concentrations from Alert, Tagish, Dunai and Kinngait measured during the 1994–1995 co-sampling period are
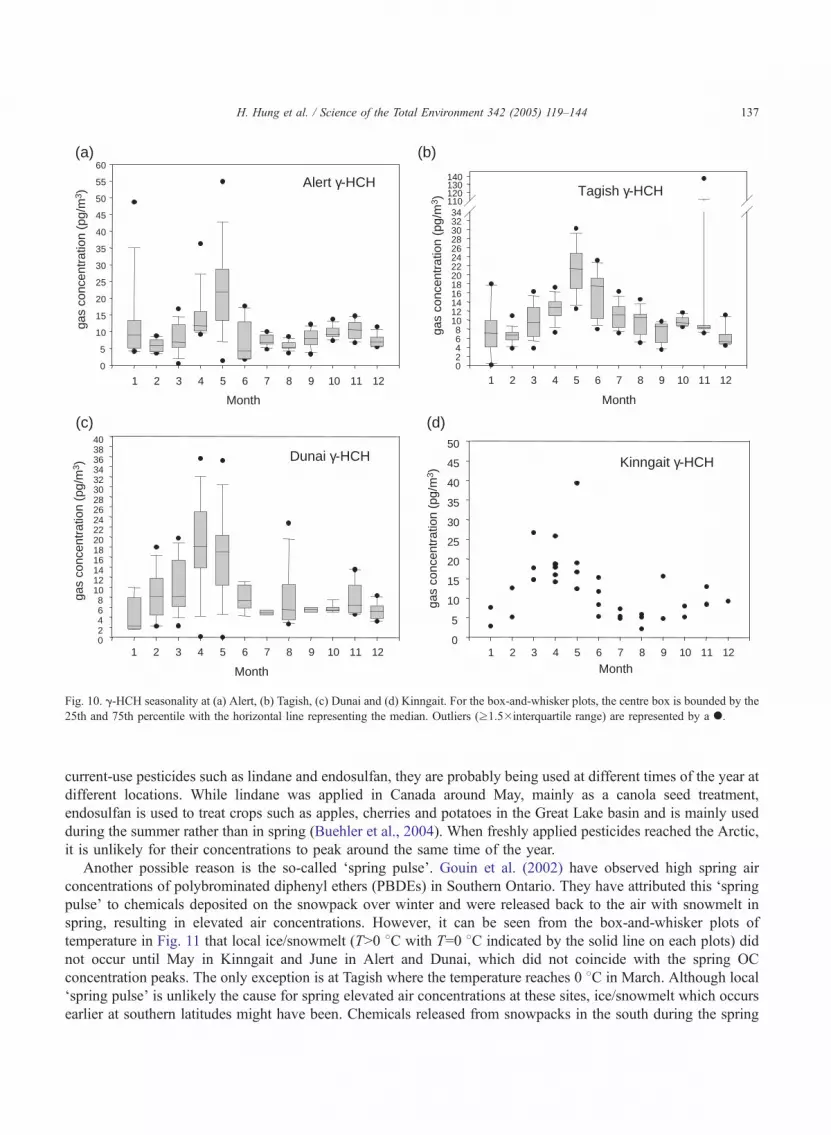
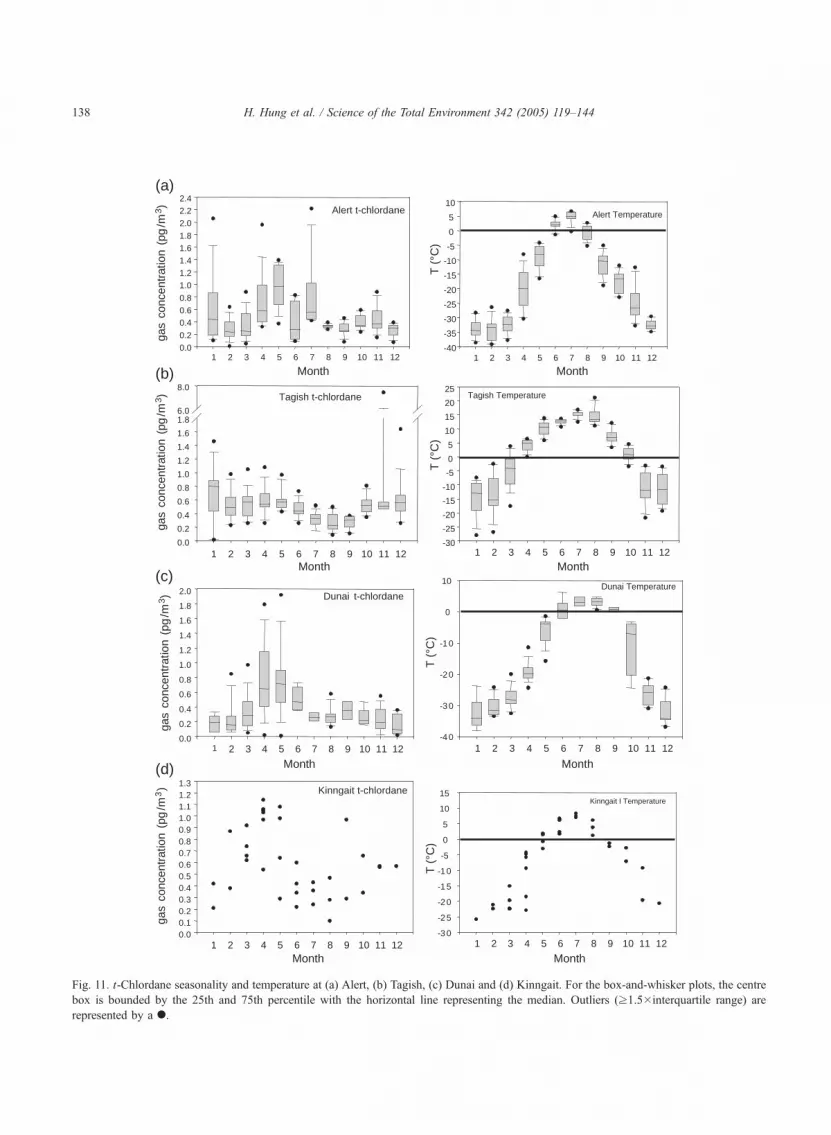
plotted against months of the year for comparisons. As an example, Figs. 9–11 show the box-and-whisker plots of
a-HCH, g-HCH and TC at Alert, Tagish and Dunai. Since there are very few data for Kinngait during this co-
sampling period as most samples were analyzed as four-week composites, scatter plots of all data are given in Figs.
9d, 10d and 11d. For Kinngait, Tagish and Dunai, all available data during the 2 years of sampling are used in Figs.
9–11 to retain the most information although part of the sampling periods do not overlap (see timeline in Fig. 1).
For Alert, data from 8 March 1993 to 24 April 1995 (same as sampling period at Dunai) are used in the plots. Also
shown in Fig. 11 are the box-and-whisker plots of the weekly averaged temperatures at the sites. For Kinngait, the
temperatures are weekly averaged when 7-day samples were taken and four-weekly averaged when four-week
composites were analyzed.
For the three compounds shown in Figs. 9–11, it is apparent that generally elevated air concentrations were
observed in April and May at Alert, Tagish and Dunai. At Kinngait, this bSpring Maximum EventQ usually
Dunai α-HCH
1 2 3 4 5 6 7 8 9 10 11 12
1 2 3 4 5 6 7 8 9 10 11 12 1 2 3 4 5 6 7 8 9 10 11 12
1 2 3 4 5 6 7 8 9 10 11 12
02468
10121416182022242628303234363840
Month
Alert α-HCH
gas
con
cent
ratio
n (p
g/m
3 )ga
s c
once
ntra
tion
(pg
/m3 )
gas
con
cent
ratio
n (p
g/m
3 )ga
s c
once
ntra
tion
(pg
/m3 )
0
50
100
150
200
250
Month
Kinngait α-HCH
0
10
20
30
40
50
60
70
80
90
100
110
120
130
140
Month
Tagish α-HCH
0102030405060708090
100110120130140150160170500600700800
Month
(a) (b)
(c) (d)
Fig. 9. a-HCH seasonality at (a) Alert, (b) Tagish, (c) Dunai and (d) Kinngait. For the box-and-whisker plots, the centre box is bounded by the
25th and 75th percentile with the horizontal line representing the median. Outliers (z1.5�interquartile range) are represented by a ..
H. Hung et al. / Science of the Total Environment 342 (2005) 119–144136
occurred slightly earlier, beginning in March and ending in May. Other than these three compounds, other OCs also
showed elevated concentrations in spring at one or more of the four sites. For instance, spring peaks occurred for
CC and endosulfan I at Alert, Kinngait and Dunai but not at Tagish; TN at Kinngait and Dunai only; o,pV-DDE at
Alert only; o,pV- and p,pV-DDT at Alert and Dunai only; octachlorostyrene at Dunai only; and tetrachloroveratrole
at Alert and Tagish only. Most transformation products/metabolites of parent pesticides, i.e. oxychlordane,
heptachlor epoxide and dieldrin, generally do not show spring peaks. Rather, they followed the seasonal
temperature cycles and reached highest air concentrations in Arctic air during the warmest time of the year.
There are many potential factors which may be responsible for bSpring Maximum EventsQ observed. For
instance, it has been hypothesized that the spring elevation in Arctic air concentrations of the HCHs was due to
fresh applications, either as lindane (99% g-HCH) or technical HCH (55–80% a-HCH, 8–15% g-HCH; Li, 1999),
in temperate regions during spring, followed by long-range transport to the Arctic (Halsall et al., 1998; Hung et al.,
2002). However, these events are observed not only for current-use pesticides, but are also seen for banned
pesticides, e.g. chlordanes, and industrial by-products, e.g. octachlorostyrene and tetrachloroveratrole. Even for the
(a) (b)
(c) (d)
gas
conc
entr
atio
n (p
g/m
3 )
Month
Alert γ-HCH
0
5
10
15
20
25
30
35
40
45
50
55
60
Tagish γ-HCH
02468
10121416182022242628303234
110120130140
gas
conc
entr
atio
n (p
g/m
3 )
Month
Kinngait γ-HCH
0
5
10
15
20
25
30
35
40
45
50ga
s co
ncen
trat
ion
(pg/
m3 )
Month
gas
conc
entr
atio
n (p
g/m
3 )
Month
Dunai γ-HCH
02468
10121416182022242628303234363840
1 2 3 4 5 6 7 8 9 10 11 12
1 2 3 4 5 6 7 8 9 10 11 12 1 2 3 4 5 6 7 8 9 10 11 12
1 2 3 4 5 6 7 8 9 10 11 12
Fig. 10. g-HCH seasonality at (a) Alert, (b) Tagish, (c) Dunai and (d) Kinngait. For the box-and-whisker plots, the centre box is bounded by the
25th and 75th percentile with the horizontal line representing the median. Outliers (z1.5�interquartile range) are represented by a ..
H. Hung et al. / Science of the Total Environment 342 (2005) 119–144 137
current-use pesticides such as lindane and endosulfan, they are probably being used at different times of the year at
different locations. While lindane was applied in Canada around May, mainly as a canola seed treatment,
endosulfan is used to treat crops such as apples, cherries and potatoes in the Great Lake basin and is mainly used
during the summer rather than in spring (Buehler et al., 2004). When freshly applied pesticides reached the Arctic,
it is unlikely for their concentrations to peak around the same time of the year.
Another possible reason is the so-called dspring pulseT. Gouin et al. (2002) have observed high spring air
concentrations of polybrominated diphenyl ethers (PBDEs) in Southern Ontario. They have attributed this dspringpulseT to chemicals deposited on the snowpack over winter and were released back to the air with snowmelt in
spring, resulting in elevated air concentrations. However, it can be seen from the box-and-whisker plots of
temperature in Fig. 11 that local ice/snowmelt (TN0 8C with T=0 8C indicated by the solid line on each plots) did
not occur until May in Kinngait and June in Alert and Dunai, which did not coincide with the spring OC
concentration peaks. The only exception is at Tagish where the temperature reaches 0 8C in March. Although local
dspring pulseT is unlikely the cause for spring elevated air concentrations at these sites, ice/snowmelt which occurs
earlier at southern latitudes might have been. Chemicals released from snowpacks in the south during the spring
(b)
(a)
(c)
(d)
Alert t-chlordane
1 2 3 4 5 6 7 8 9 10 11 120.00.2
0.40.60.8
1.01.21.41.61.8
2.02.22.4
gas
con
cent
ratio
n (p
g/m
3 )ga
s c
once
ntra
tion
(pg
/m3 )
gas
con
cent
ratio
n (p
g/m
3ga
s c
once
ntra
tion
(pg
/m3
))
Month
Month
T (
°C)
Alert Temperature
1 2 3 4 5 6 7 8 9 10 11 12-40
-35
-30
-25
-20
-15
-10
-5
0
5
10
Month
T (
°C)
Month
Tagish Temperature
1 2 3 4 5 6 7 8 9 10 11 12-30
-25
-20
-15
-10
-5
0
5
10
15
20
25
Month
T (
°C)
Dunai Temperature
1 2 3 4 5 6 7 8 9 10 11 12-4 0
-3 0
-2 0
-1 0
0
10
T (
°C)
Month
Kinngait I Temperature
1 2 3 4 5 6 7 8 9 10 11 12-3 0
-2 5
-2 0
-1 5
-1 0
-5
0
5
10
15
Tagish t-chlordane
1 2 3 4 5 6 7 8 9 10 11 120.0
0.2
0.4
0.6
0.8
1.0
1.2
1.4
1.6
1.86.0
8.0
Month
Dunai t-chlordane
1 2 3 4 5 6 7 8 9 10 11 120.0
0.2
0.4
0.6
0.8
1.0
1.2
1.4
1.6
1.8
2.0
Month
Kinngait t-chlordane
1 2 3 4 5 6 7 8 9 10 11 120.00.10.20.30.40.50.60.70.80.91.01.11.21.3
Fig. 11. t-Chlordane seasonality and temperature at (a) Alert, (b) Tagish, (c) Dunai and (d) Kinngait. For the box-and-whisker plots, the centre
box is bounded by the 25th and 75th percentile with the horizontal line representing the median. Outliers (z1.5�interquartile range) are
represented by a ..
H. Hung et al. / Science of the Total Environment 342 (2005) 119–144138

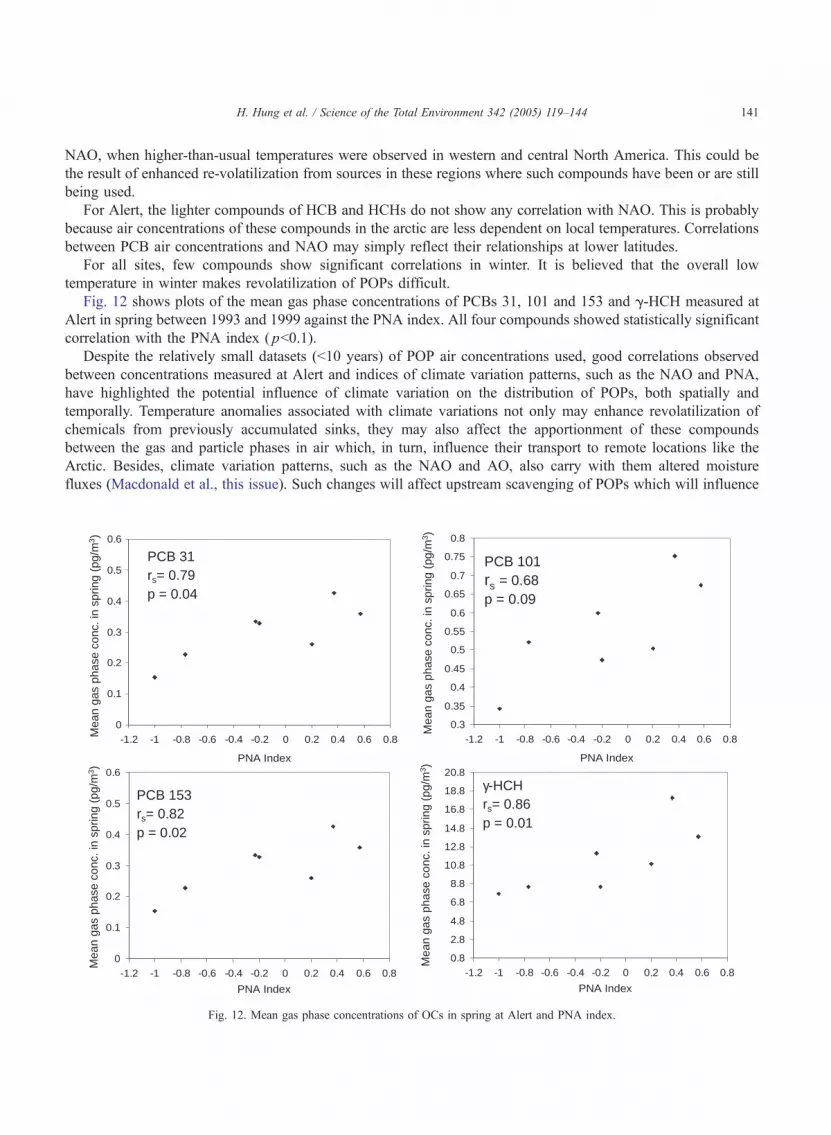
H. Hung et al. / Science of the Total Environment 342 (2005) 119–144 139
snowmelt might be transported to the Arctic by advection resulting in higher Arctic air concentrations at this time
of the year. On the other hand, it is impossible to explain why only some OCs showed elevated concentrations in
spring but not others, especially the transformation products/ metabolites, and only at some sites but not others. If
chemicals trapped and re-released from snowpack in spring was the reason for the dspring maximum eventsT in the
Arctic, both parent pesticides and metabolites should show high concentrations in air during snowmelt, although
some compounds might be more subjected to snow scavenging, revolatilization and long-range transport than
others due to their physical–chemical properties.
The delevatedT concentrations observed in the Arctic in spring could be an artifact resulted from increased
atmospheric removal in late spring/summer. After polar sunrise around April, removal rates of OCs by
photodegradation and depletion reactions with OH radicals would increase, resulting in a decrease in air
concentrations during the summertime. Yet, if this was the only reason for the seemingly high air concentrations in
spring, the dspring maximum eventT should occur at all sites, not just some sites for some compounds.
Another process that might reduce atmospheric concentrations in late spring/summer is scavenging by forests
along the transport pathway to the Arctic during the growing season (Wania and McLachlan, 2001). At leaf burst in
late spring, the waxy cuticle on the new leaves would adsorb semivolatile organic compounds in air in the vicinity
of forests. This process would reduce the amount of chemicals in air available for transport to the Arctic, resulting
in a decrease in Arctic air concentrations in late spring/summer.
Why certain compounds show a spring peak in Arctic air at some locations is probably the result of a
combination of the above factors. Spring is a sensitive time of the year when various activities happen in the
Arctic as well as at southern latitudes. In the Arctic, polar sunrise occurs at this time and removal by
photodegradation and reaction with OH radicals increase over the summer. In the south, agricultural activities
start to revive hence the application of pesticides; the snow and ice starts to melt hence re-releasing of OCs
trapped in snowpacks; temperature starts to rise resulting in enhanced revolatilization from secondary sources;
and leaves start to burst in late spring/summer scavenging OCs from air thus reducing the amount of chemicals
available for transport to the Arctic. Yet, the atmospheric circulation pattern between the south and the Arctic in
spring, which controls the movement of contaminants into, through and out of the Arctic, has not been well
characterized. Barrie et al. (1992) have summarized air flow patterns in both winter and summer. In the winter,
air is driven by the strong Siberian anticyclone and flows mainly from Eurasia into the Arctic, then out over
North America, enhances transport of pollutants into the Arctic region. In the summer, the Siberian high
dissipates and the south-to-north transport from Eurasia is replaced by weak north-to-south transport. In order to
understand the dspring maximum eventT, one must understand how the atmospheric circulation pattern changed
between winter and summer, and the relationship between this spring flow pattern and the locations of potential
sources. For example, the air concentrations of lindane may be high in the Canadian Prairies during the spring
planting season but if the air flow pattern does not encourage transport to Alert, air concentrations may not have
peaked in spring at this specific site. To determine the influence of each of the abovementioned factors on the
dspring maximum eventT of different OCs at different locations, further investigation in the atmospheric flow
pattern in spring is required.
3.5. Influence of atmospheric variation patterns on Arctic air concentrations of OCs
Another factor which may affect transport of pollutants to the Arctic, which is closely related to atmospheric
circulation patterns, is climate fluctuations. Ma et al. (2003) have found strong association between air
concentrations of hexachlorobenzene (HCB) measured in the Great Lakes region and the El Nino–Southern
Oscillation (ENSO) during the 1990s. They have attributed this correlation to enhanced revolatilization from soil
contaminated due to past usage as a result of surface air temperature increase in North America associated with the
El Nino events. Their findings implied the potential influence of climate variation on the global distribution of
POPs. Climate variations not only affect the revolatilization of POPs from secondary sources but also the
atmospheric circulation patterns which are responsible for their distribution around the globe. In this section, some
H. Hung et al. / Science of the Total Environment 342 (2005) 119–144140
evidence of the influence of two climate variation patterns, the North Atlantic Oscillation (NAO) and the Pacific
North American (PNA) pattern, on the atmospheric concentrations of OCs at Alert will be presented.
The NAO refers to a meridional shift in atmospheric mass between subpolar and subtropical latitudes. It is an
indication of the strength of westerly winds blowing across the North Atlantic Ocean between 40 8N and 60 8N.Such strength influences the surface air temperature and balance of precipitation and evaporation across the
Atlantic Ocean and the adjoining landmasses (Stenseth et al., 2002). In spring, sea level pressure anomaly patterns
shift between the Arctic and the northern Atlantic during the positive and negative phases of the NAO, influencing
surface air temperatures. During the positive NAO phase, western and central North America experiences warmer
than normal spring. Roughly reversed conditions occur during the negative NAO phases when eastern and central
North America experiences colder springs. The NAO is correlated with the Arctic Oscillation (AO) pattern which
is a surface manifestation of the strength of the polar vortex (Macdonald et al., this issue). The PNA is
characterized by atmospheric flow in which the west coast of North America is out of phase with the Eastern
Pacific and Southeast United States. During its positive phase, wavy flow occurs over the continent with increased
temperatures and decreased storminess in the Northwest and cold temperatures in the Southeast (NOAA-CIRES
Climate Diagnostic Center, http://www.cdc.noaa.gov/Teleconnections/pna.html).
The NAO and the PNA are represented by the NAO and PNA indices, respectively. These indices can be
obtained from the Climate Diagnostics Center of the National Oceanic and Atmospheric Administration (NOAA)
at bhttp://www.cdc.noaa.gov/Teleconnections/pna.htmlN.
The Spearman rank-order correlation is used to determine the association of HCB, HCHs and PCB air
concentrations observed at Alert and the 5 Great Lakes sites with the NAO index. The Spearman rank-order
correlation is a distribution-free, nonparametric measure of association based on the rank of the data values which
is exact for small sample sizes and weakens the effect of outliers (Sachs, 1984). Relationships are assessed using
seasonal averages of all parameters in winter (December–February) and spring (March–May). During these two
seasons, the influence of these climatic patterns is most prominent.
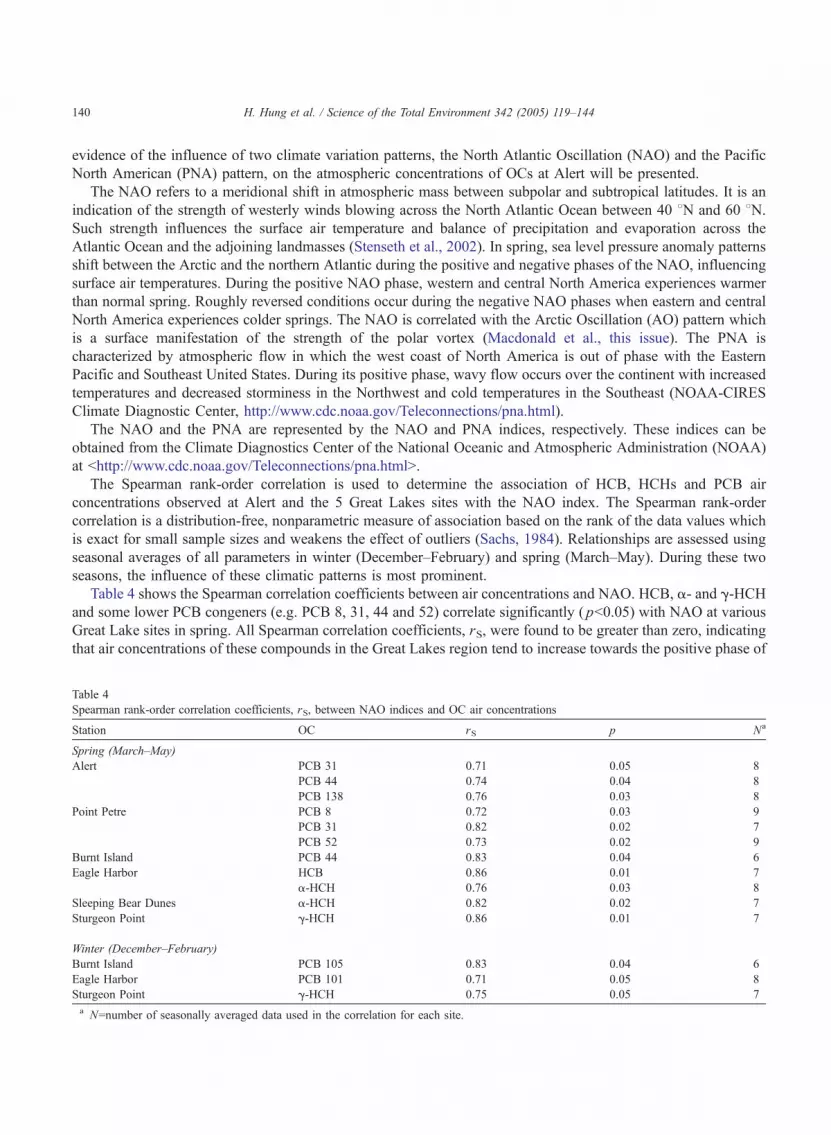
Table 4 shows the Spearman correlation coefficients between air concentrations and NAO. HCB, a- and g-HCH
and some lower PCB congeners (e.g. PCB 8, 31, 44 and 52) correlate significantly ( pb0.05) with NAO at various
Great Lake sites in spring. All Spearman correlation coefficients, rS, were found to be greater than zero, indicating
that air concentrations of these compounds in the Great Lakes region tend to increase towards the positive phase of
Table 4
Spearman rank-order correlation coefficients, rS, between NAO indices and OC air concentrations
Station OC rS p Na
Spring (March–May)
Alert PCB 31 0.71 0.05 8
PCB 44 0.74 0.04 8
PCB 138 0.76 0.03 8
Point Petre PCB 8 0.72 0.03 9
PCB 31 0.82 0.02 7
PCB 52 0.73 0.02 9
Burnt Island PCB 44 0.83 0.04 6
Eagle Harbor HCB 0.86 0.01 7
a-HCH 0.76 0.03 8
Sleeping Bear Dunes a-HCH 0.82 0.02 7
Sturgeon Point g-HCH 0.86 0.01 7
Winter (December–February)
Burnt Island PCB 105 0.83 0.04 6
Eagle Harbor PCB 101 0.71 0.05 8
Sturgeon Point g-HCH 0.75 0.05 7
a N=number of seasonally averaged data used in the correlation for each site.
H. Hung et al. / Science of the Total Environment 342 (2005) 119–144 141
NAO, when higher-than-usual temperatures were observed in western and central North America. This could be
the result of enhanced re-volatilization from sources in these regions where such compounds have been or are still
being used.
For Alert, the lighter compounds of HCB and HCHs do not show any correlation with NAO. This is probably
because air concentrations of these compounds in the arctic are less dependent on local temperatures. Correlations
between PCB air concentrations and NAO may simply reflect their relationships at lower latitudes.
For all sites, few compounds show significant correlations in winter. It is believed that the overall low
temperature in winter makes revolatilization of POPs difficult.
Fig. 12 shows plots of the mean gas phase concentrations of PCBs 31, 101 and 153 and g-HCH measured at
Alert in spring between 1993 and 1999 against the PNA index. All four compounds showed statistically significant
correlation with the PNA index ( pb0.1).
Despite the relatively small datasets (b10 years) of POP air concentrations used, good correlations observed
between concentrations measured at Alert and indices of climate variation patterns, such as the NAO and PNA,
have highlighted the potential influence of climate variation on the distribution of POPs, both spatially and
temporally. Temperature anomalies associated with climate variations not only may enhance revolatilization of
chemicals from previously accumulated sinks, they may also affect the apportionment of these compounds
between the gas and particle phases in air which, in turn, influence their transport to remote locations like the
Arctic. Besides, climate variation patterns, such as the NAO and AO, also carry with them altered moisture
fluxes (Macdonald et al., this issue). Such changes will affect upstream scavenging of POPs which will influence
0
0.1
0.2
0.3
0.4
0.5
0.6
-1.2 -1 -0.8 -0.6 -0.4 -0.2 0 0.2 0.4 0.6 0.8
PNA Index
0.8
2.8
4.8
6.8
8.8
10.8
12.8
14.8
16.8
18.8
20.8
-1.2 -1 -0.8 -0.6 -0.4 -0.2 0 0.2 0.4 0.6 0.8
PNA Index
PCB 153γ-HCHrs= 0.86p = 0.01
rs= 0.82p = 0.02
PCB 31rs= 0.79p = 0.04
0
0.1
0.2
0.3
0.4
0.5
0.6
-1.2 -1 -0.8 -0.6 -0.4 -0.2 0 0.2 0.4 0.6 0.8
PNA Index
0.3
0.35
0.4
0.45
0.5
0.55
0.6
0.65
0.7
0.75
0.8
-1.2 -1 -0.8 -0.6 -0.4 -0.2 0 0.2 0.4 0.6 0.8
PNA Index
PCB 101rs = 0.68p = 0.09
Mea
n ga
s ph
ase
conc
. in
sprin
g (p
g/m
3 )M
ean
gas
phas
e co
nc. i
n sp
ring
(pg/
m3 )
Mea
n ga
s ph
ase
conc
. in
sprin
g (p
g/m
3 )M
ean
gas
phas
e co
nc. i
n sp
ring
(pg/
m3 )
Fig. 12. Mean gas phase concentrations of OCs in spring at Alert and PNA index.
H. Hung et al. / Science of the Total Environment 342 (2005) 119–144142
the transport potential of these compounds. The air flow, precipitation and surface air temperatures associated
with each climatic pattern must be investigated carefully in order to explain how the transport of POPs to the
Arctic would change in response to such pattern. Since climate variations occur on a decadal time scale in the
Arctic (Nakamura and Oort, 1988), many more years of POP air concentration data are required to reveal the
underlying mechanisms.
4. Conclusions and recommendations
Long-term trends of PCB and OC air concentra-
tions measured at Alert were developed using a digital
filtration technique with data from 1993 to 1999. It
was found that most banned pesticides showed
declining trends while current-use pesticide, endo-
sulfan I, exhibits a slow decline with t1/2 of 38 years.
Trends developed with 5 years of data are similar to
those developed with 7 years of data. Although this
indicates that less than 10 years of data may be
adequate for deriving trends for remote background
locations, atmospheric measurement must be contin-
ued. The notable acceleration in decline of air
concentrations for some OCs and PCBs in 1999
may affect the long-term trend and the 5 to 10 years of
atmospheric data currently available barely provide
enough information to develop statistically significant
trends for forecasting purposes.
Both bcurrent-useQ and banned pesticides showed
spring maxima events. However, only some com-
pounds show such peaks at some sites but not others.
Relationships between potential sources and atmos-
pheric circulation pattern in spring must be inves-
tigated. The correlation between air concentrations of
POPs measured at Alert and climate variation patterns
indicates that planetary atmospheric patterns must be
taken into account in the global prediction and
modelling of POPs in the future. It is important to
bear in mind that temperature is not the only
parameter of climate variation that would affect the
transport processes of such compounds. For instance,
changes in other climate parameters, e.g. quantity,
quality and spatial variation of rain and snow
associated with various climate patterns would also
affect scavenging and deposition of organic pollu-
tants. Therefore, it is essential to continue long-term
atmospheric monitoring of POPs in the Arctic as well
as in temperate North America to further establish
relationships between POP concentrations and the
fluctuations of different climate parameters. As it
stands, the POP air concentration dataset is too small
to fully characterize the effect of climate variations on
global transport of POPs.
Acknowledgement
Financial support for this work was provided by
the Arctic Environmental Strategy Northern Contam-
inants Program, Department of Indian Affairs and
Northern Development (DIAND). We would like to
thank D.C.G. Muir for his effort in developing this
project and continual support of our work.
References
Aigner EJ, Leone AD, Falconer RL. Concentrations and enantio-
meric ratios of organochlorine pesticides in soils from the US
Cornbelt. Environ Sci Technol 1998;32:1162–8.
Allen JO, Dookeran NM, Smith KA, Sarofim AF, Taghizadeh K,
Lafleur AL. Measurement of polycyclic aromatic hydrocarbons
associated with size-segregated atmospheric aerosols in Massa-
chusetts. Environ Sci Technol 1996;30:1023–31.
AMAP. AMAP data report: arctic pollution issues. Arctic Monitor-
ing and Assessment Programme (AMAP), Oslo, Norway. xii +
859 pp. 1999.
Anderson PN, Hites RA. OH radical reactions: the major removal
pathway for polychlorinated biphenyls from the atmosphere.
Environ Sci Technol 1996;30:1756–63.
Bailey R, Barrie LA, Halsall CJ, Fellin P, Muir DCG. Atmospheric
organochlorine pesticides in the western Canadian arctic:
evidence of transpacific transport. J Geophys Res 2000;
105(D9):11805–11.
Barrie LA, Bottenheim JW, Schnell RC, Crutzen PJ, Rasmussen
RA. Ozone destruction and photochemical reactions at polar
sunrise in the lower arctic atmosphere. Nature 1988;334:
138–41.
Barrie LA, Gregor D, Hargrave B, Lake R, Muir D, Shearer R, et al.
Arctic contaminants: sources, occurrence and pathways. Sci
Total Environ 1992;122:1–74.
Beeman RW, Matsumura F. Metabolism of cis- and trans-chlordane
by a soil microorganism. J Agric Food Chem 1981;29:84–9.
Bidleman TF, Jantunen LMM, Wiberg K, Harner T, Brice K, Su K,
et al. Soil as a source of atmospheric heptachlor epoxide.
Environ Sci Technol 1998;32:1546–8.
H. Hung et al. / Science of the Total Environment 342 (2005) 119–144 143
Bidleman TF, Jantunen LMM, Helm PA, Brorstrfm-Lunden E,
Juntto S. Chlordane enantiomers and temporal trends of
chlordane isomers in Arctic air. Environ Sci Technol 2002;
36:539–44.
Bidleman TF, Wong F, Backe C, Sfdergren A, Brorstrfm-Lunden E,
Helm PA, et al. Chiral signatures of chlordanes indicate changing
source to the atmosphere over past 30 years. Atmos Environ
2004;38:5963–70.
Buehler SS, Basu I, Hites RA. Causes of variability in pesticide and
PCB concentrations in air near the great lakes. Environ Sci
Technol 2004;38:414–22.
Buser H-R, Mqller MD. Identification of the (+) and (�)
enantiomers of chiral chlordane compounds using chiral high
performance liquid chromatography–chiroptic detection and
chiral high resolution gas chromatography–mass spectrometry.
Anal Chem 1994;66:2155–62.
Coleman PJ, Lee RGM, Alcock RE, Jones KC. Observations on
PAH, PCB, and PCDD/F trends in UK urban air, 1991–1995.
Environ Sci Technol 1997;31:2120–4.
Cortes DR, Hites RA. Detection of statistically significant trends in
atmospheric concentrations of semivolatile compounds. Environ
Sci Technol 2000;34:2826–9.
DIAND (Department of Indian Affairs and Northern Development).
Canadian Arctic Contaminants Assessment Report (CACAR),
Department of Indian Affairs and Northern Development,
Ottawa, Ontario, Canada. 1997, 459 pp.
DIAND (Department of Indian Affairs and Northern Development).
Canadian Arctic Contaminants Assessment Report II (CACAR
II). Sources, occurrence, trends and pathways in the physical
environment. Department of Indian Affairs and Northern
Development, Ottawa, Ontario, Canada. 2003, 332 pp.
Gooch JW, Matsumura F, Zabik MJ. Chlordane residues in great
lakes lake trout: acute toxicity and interaction at the Gaba
receptor of rat and lake trout brain. Chemosphere 1990;21:
393–406.
Gouin T, ThomasGO, Cousins I, Barber J,MackayD, Jones KC. Air-
surface exchange of polybrominated diphenyl ethers and poly-
chlorinated biphenyls. Environ Sci Technol 2002;36:1426–34.
Halsall CJ, Coleman PJ, Davis BJ, Burnett V, Waterhouse KS,
Harding-Jones P, et al. PAHs in UK urban air. Environ Sci
Technol 1994;28:2380–6.
Halsall CJ, Barrie LA, Fellin P, Muir DCG, Billeck BN, Lockhart L,
et al. Spatial and temporal variation of polycyclic aromatic
hydrocarbons in the Arctic atmosphere. Environ Sci Technol
1997;31:3593–9.
Halsall CJ, Bailey R, Stern GA, Barrie LA, Fellin P, Muir DCG, et
al. Atmospheric organochlorine pesticides in the western
Canadian Arctic: evidence of transpacific transport. Environ
Pollut 1998;102:51–62.
Halsall CJ, Sweetman AJ, Barrie LA, Jones KC. Modelling the
behaviour of PAHs during atmospheric transport from the UK to
the Arctic. Atmos Environ 2001;35:255–67.
Hillery BR, Basu I, Sweet CW, Hites RA. Temporal and spatial
trends in a long-term study of gas-phase PCB concentrations
near the Great Lakes. Environ Sci Technol 1997;31:1811–6.
Hung H, Halsall CJ, Blanchard P, Li HH, Fellin P, Stern G, et al.
Are PCBs in the Canadian Arctic atmosphere declining?
Evidence from 5 years of monitoring. Environ Sci Technol
2001;35:1303–11.
Hung H, Halsall CJ, Blanchard P, Li HH, Fellin P, Stern G, et al.
Temporal trends of organochlorine pesticides in the Canadian
arctic atmosphere. Environ Sci Technol 2002;36:862–8.
Jantunen LMM, Bidleman TF, Harner T, Parkhurst WJ. Toxaphene
and other organochlorine pesticides in Alabama air. Environ Sci
Technol 2000;34:5097–105.
Karlsson H, Muir DCG, Teixiera CF, Burniston DA, Strachan WMJ,
Hecky RE, et al. Persistent chlorinated pesticides in air, water,
and precipitation from the Lake Malawi area, Southern Africa.
Environ Sci Technol 2000;34:4490–5.
Li YF. Global technical hexachlorocyclohexane usage and its
contamination consequences in the environment: from 1948 to
1997. Sci Total Environ 1999;232:121–58.
Li YF, Macdonald RW. Sources and pathways of selected organo-
chlorine pesticides to the Arctic and the effect of pathway
divergency on HCH trends in biota: a review. Sci Total Environ
2004;342:87–106 [this issue].
Li YF, Bidleman TF, Barrie LA, McConnell LL. Global
hexachlorocyclohexane use trends and their impact on the
arctic atmospheric environment. Geophys Res Lett 1998;25:
39–41.
Ma J, Venkatesh S, Jantunen LM. Evidence of the impact of
ENSO events on temporal trends of hexachlorobenzene air
concentrations over the Great lakes. Sci Total Environ 2003;
313:177–84.
Macdonald RW, Harner T, Fyfe J. Recent climate change in the
Arctic and its impact on contaminant pathways and interpreta-
tion of temporal trend data. Sci Total Environ 2004;342:5–86
[this issue].
Mattina MJI, Lannucci-Berger W, Dykas L, Pardus J. Impact of
long-term weathering, mobility and land use on chlordane
residues in soils. Environ Sci Technol 1999;33:2425–31.
Meijer SN, Halsall CJ, Harner T, Peters AJ, Ockenden WA, Jones
KC. Organochlorine pesticide residues in archived UK soil.
Environ Sci Technol 2001;35:1989–95.
Nakamura N, Oort AH. Atmospheric heat budgets of the polar
regions. J Geophys Res 1988;93(D8):9510–24.
Nakazawa T, Ishizawa M, Higuchi K, Trivett NBA. Two curve
fitting methods applied to CO2 flask data. Environmetrics
1997;8:197–218.
Oehme M, Haugen J-E, Schlabach M. Seasonal changes and
relations between levels of organochlorines in Arctic ambient
air: first results of an all-year-round monitoring program at Ny-
2lesund, Svalbard, Norway. Environ Sci Technol 1996;30:
2294–304.
Pacyna JM, Oehme M. Long-range transport of some organic
compounds in the Norwegian arctic. Atmos Environ 1988;
22:243–57.
Pankow JF. Review and comparative analysis of the theories on
partitioning between the gas and aerosol particulate phases in
the atmosphere. Atmospheric Environment Atmospheric Envi-
ronment 1987;21:2275–83.
PANUPS (Pesticide Action Network North America). http://
www.igc.org/panna/resources/_ pestis/PESTIS.1997.43.html
(May 23, 1997).
H. Hung et al. / Science of the Total Environment 342 (2005) 119–144144
Patton GW, Hinckley DA, Walla MD, Bidleman TF, Hargrave BT.
Airborne organochlorines in the Canadian high arctic. Tellus
1989;41B:243–55.
Patton GW, Walla MD, Bidleman TF, Barrie LA. Polycyclic
aromatic and organochlorine compounds in the atmosphere of
northern Ellesmere Island, Canada. J Geophys Res 1991;
96:10867–77.
Ramesh A, Tanabe S, Tatsukawa R, Subramanian AN, Palanichamy
D, Mohan D, et al. Seasonal variations of organochlorine
insecticide residues in air from Porto Novo, South India.
Environ Pollut 1989;62:213–22.
Sachs L. Applied statistics. A handbook of techniques. New York
(U.S.A.)7 Springer-Verlag New York Inc.; 1984. p. 395.
Simcik M, Basu I, Sweet CW, Hites RA. Temperature dependence
and temporal trends of polychlorinated biphenyl congeners in
the Great Lakes atmosphere. Environ Sci Technol 1999;33:
1991–5.
Sirois A, Barrie LA. Arctic lower tropospheric aerosol trends and
composition at Alert, Canada: 1980–1995. J Geophys Res
1999;104(D9):11599–618.
Stenseth NC, Mysterud A, Ottersen G, Hurrell JW, Chan K-S, Lima
M. Ecological effects of climate fluctuations. Science 2002;297:
1292–96.
Stern GA, Halsa CJ, Barrie LA, Muir DCG, Fellin P, Rosenberg B,
et al. Polychlorinated biphenyls in Arctic air: 1. Temporal and
spatial trends: 1992–1994. Environ Sci Technol 1997;31:
3619–28.
Stern GA, Braekevelt E, Helm PA, Bidleman TF, Outridge PM,
Lockhart WL, et al. Modern and historical fluxes of halogenated
organic contaminants to a lake in the Canadian arctic, as
determined from annually laminated sediment cores. Sci Total
Environ 2005;342:223–43 [this issue].
Ulrich EM, Hites RA. Enantiomer ratios of chlordane-related
compounds in air near the Great Lakes. Environ Sci Technol
1998;32:1870–4.
Wania F, Mackay D. Tracking the distribution of persistent organic
pollutants. Environ Sci Technol 1996;30:A390–6.
Wania F, McLachlan M. Estimating the influence of forests on the
overall fate of semivolatile organic compounds using a multi-
media fate model. Environ Sci Technol 2001;35:582–90.
Wiberg K, Letcher RJ, Sandau CD, Norstrom RJ, Tysklind M,
Bidleman TF. The enantioselective bioaccumulation of chiral
chlordane and a-HCH contaminants in the polar bear food
chain. Environ Sci Technol 2000;34:2668–74.