temperature- and cholesterol-induced changes in eicosapentaenoic acid limitation of daphnia magna...
TRANSCRIPT
Temperature- and cholesterol-induced changes in eicosapentaenoic acid limitation of
Daphnia magna determined by a promising method to estimate growth
saturation thresholds
Erik Sperfeld* and Alexander Wacker
Department of Theoretical Aquatic Ecology, Institute of Biochemistry and Biology, University of Potsdam, Potsdam, Germany
Abstract
We present data on eicosapentaenoic acid (EPA)-limited growth responses of Daphnia magna under differenttemperatures and different dietary cholesterol availabilities to assess how EPA growth saturation thresholdsdepend on changing environmental conditions. D. magna was raised on gradients of dietary EPA at 15uC and20uC with high cholesterol supply and at 20uC with low and high cholesterol supply in laboratory experiments. Anew method was applied to estimate EPA growth saturation thresholds on the basis of fitted saturation curvesusing bootstrapped data. The EPA threshold at which 75% and 90% of maximum growth was reached rangedfrom 0.7 to 1.6 mg EPA (mg dietary C)21 and 2.0 to 4.9 mg EPA (mg dietary C)21, respectively. Previouslyreported EPA concentrations in natural seston of many different lakes suggest that the thresholds measured hereindicate a frequent potential for at least moderate EPA limitation in nature. Furthermore, the calculated EPAthresholds were higher in treatments of low compared with high temperature and higher in treatments of lowcompared with high cholesterol availability. The EPA-dependent growth responses were more strongly affectedby temperature than by cholesterol availability. Our results suggest that EPA growth saturation thresholds for aparticular Daphnia species probably vary in nature under different environmental conditions.
Polyunsaturated fatty acids (PUFAs) are essentialnutritional components for most animals because theycannot be synthesized de novo (Beenakkers et al. 1985).Eicosapentaenoic acid (EPA, 20:5v3), an omega three (v3-)PUFA with 20 carbon atoms and 5 double bonds, is animportant cell membrane component and serves as precur-sor for eicosanoids, cell signaling molecules, which arethought to be relevant in invertebrate reproduction (Stanley-Samuelson 1994; Heckmann et al. 2008). For the importantaquatic herbivore Daphnia spp., EPA might be conditionallydispensable because daphnids have the ability to synthesizeEPA from other v3-PUFAs such as a-linolenic acid (ALA,18:3v3) or docosahexaenoic acid (DHA, 22:6v3). However,the synthesis efficiency might be too low to match therequirements for optimal growth (Weers et al. 1997; VonElert 2002). This was repeatedly supported by observationsof enhanced growth rates when diets of ALA-rich but EPA-lacking chlorophyceae were supplemented with EPA (VonElert 2002; Becker and Boersma 2003; Ravet and Brett2006). Also, EPA-lacking cyanobacterial food can beimproved by EPA supplementation when Daphnia issupplied with sufficient amounts of sterols (Von Elert et al.2003; Martin-Creuzburg et al. 2009). These results suggestthat EPA limitation may be expected in nature if green algaeor cyanobacteria dominate seston composition. Defininglimiting concentrations of EPA in the food of herbivorouszooplankton species is important to predict their growth andpopulation dynamics. Experimentally measured EPAgrowth saturation thresholds (i.e., minimum dietary EPAconcentrations that are necessary to allow EPA-unlimitedgrowth) give an indication about potentially EPA-limitingconditions in nature.
Only one study has examined growth responses ofDaphnia to a gradient in dietary EPA supply (Becker andBoersma 2005). In two experiments, dietary EPA availabil-ity for Daphnia magna was manipulated using mixtures ofEPA-enriched and unenriched Scenedesmus obliquus(Chlorophyceae), applying the bovine serum albumin(BSA) method (Von Elert 2002) to add EPA-BSAcomplexes to algal cells. Becker and Boersma (2005)reported an extremely low growth saturation threshold onthe basis of one of their experiments, a threshold value thatwas recently criticized by Brett (2010). Finally, there is stilla lack of knowledge regarding EPA thresholds for Daphniagrowth in particular and PUFA thresholds in general(Becker and Boersma 2010).
In the present study we provide new EPA growthsaturation thresholds and point out potential variations inthese thresholds. Nutrient thresholds may vary because ofmethodological reasons, for example, the method used togenerate the nutrient gradient (e.g., the choice of distancesbetween different nutrient levels along the nutrient gradient)or the statistical method for threshold estimation (e.g.,analysis of variance [ANOVA] approaches compared withanalyses of saturation curves). However, and more ecolog-ically relevant, nutrient thresholds may vary because ofphysiological reasons. Other factors potentially influencinggrowth, e.g., temperature or the availability of other foodconstituents, may have interactive effects on the nutrient-dependent growth responses (Sperfeld and Wacker 2009;Martin-Creuzburg et al. 2010). Intra- and interspecificvariation in Daphnia’s sensitivity to nutritional limitations(Brzezinski and Von Elert 2007; Seidendorf et al. 2007) mayalso cause differences in nutrient thresholds.
Here we contribute new insights to the issue of EPAgrowth saturation thresholds by experimentally demon-* Corresponding author: [email protected]
Limnol. Oceanogr., 56(4), 2011, 1273–1284
E 2011, by the American Society of Limnology and Oceanography, Inc.doi:10.4319/lo.2011.56.4.1273
1273
strating how these thresholds might change under differentenvironmental conditions. For that purpose we chose aDaphnia species that previously showed a sufficientsensitivity to EPA deficiency (Martin-Creuzburg et al.2009, 2010) and used a single clone to ensure that theobserved responses are not confounded by genetic variance.In one experiment we examined how the availability ofanother essential nutrient affects the EPA-dependentgrowth of D. magna by manipulating the availability ofthe sterol cholesterol, which is an indispensable cellmembrane component. The sterol availability for herbivo-rous crustaceans might depend on phytoplankon compo-sition and environmental conditions (Piepho et al. 2010)and it has been shown that EPA availability affects thecholesterol-dependent growth responses of D. magna(Martin-Creuzburg et al. 2009). Vice versa, differences inEPA-dependent growth responses between dietary choles-terol treatments might be expected, which may lead todifferences in EPA growth saturation thresholds. In asecond experiment we examined how temperature affectsthe EPA growth saturation of D. magna. We expectedtemperature-dependent differences in EPA growth satura-tion thresholds because more EPA is required to adapt tolower temperatures (Schlechtriem et al. 2006; Masclaux etal. 2009). We developed a method on the basis of fittedsaturation curves using bootstrapped growth rate data tocalculate nutrient growth saturation thresholds. Thevariability associated with these threshold values makesstatistical comparisons among different treatments possi-ble. To assess the importance of our determined EPAgrowth saturation thresholds we compared them withpreviously reported EPA concentrations in the seston ofvarious lakes and ponds. Finally, we deliver a concisereview of factors that should be considered when dealingwith EPA growth thresholds.
Methods
Cultivation of organisms—The stock culture of a clone ofD. magna, originally isolated from the shallow hypertro-phic lake Großer Binnensee (Lampert 1991), was main-tained at 20uC in filtered lake water (0.2-mm pore-sizedmembrane filter) and fed ad libitum with the chlorophyte S.obliquus (Sammlung von Algenkulturen Gottingen [SAG]strain SAG 276-3a, culture collection Gottingen, Ger-many). For growth experiments, the well-ingestible, non-toxic, and sterol- and PUFA-free cyanobacterium Syne-chococcus elongatus (strain SAG 89.79) was used as foodfor D. magna (Martin-Creuzburg et al. 2009). S. elongatuswas cultured semicontinuously (daily dilution of 20%) inWC medium with vitamins (Guillard 1975) at 20uC and anillumination of 40 mmol photons m22 s21 (16 : 8 h light : -dark cycle) in aerated 2-liter flasks. These culture condi-tions ensure high phosphorus and nitrogen concentrationsof S. elongatus (see below).
Preparation of food—During experiments, carbon con-centrations of S. elongatus were estimated from photomet-ric light extinction (800 nm) measurements using apreviously determined carbon-extinction equation. To test
for potential contamination of the used S. elongatus culturein terms of sterols and PUFAs, we sampled and analyzed S.elongatus (according to Martin-Creuzburg et al. 2009)several times during the experiments and detected neithersterols (e.g., cholesterol) nor PUFAs (e.g., EPA). For thedetermination of particulate carbon and nitrogen concen-tration S. elongatus was filtered onto precombusted glass-fiber filters (Whatman GF/F, 25 mm diameter) and afterdrying for at least 2 d at 50uC analyzed for particulateorganic carbon (POC) and nitrogen using an elementalanalyzer (HEKAtech GmbH, EuroEA 3000). For thedetermination of particulate phosphorus concentration, S.elongatus was filtered onto polysulfon filters (25 mm,0.45 mm, Pall Corporation) and analyzed using themolybdate–ascorbic acid method (Murphy and Riley1962) after dissolving tissues with sulfuric acid and anoxidative hydrolyzation by K2S2O8 at 120uC for 60 min.The N and P concentration of S. elongatus was high (mean6 SD, n 5 4; C : N 5 5.29 6 0.26; C : P 5 148.2 6 7.3);therefore, a limitation of D. magna by N or P was unlikely.
Cholesterol and EPA-containing liposomes were pre-pared according to Martin-Creuzburg et al. (2008) andused as food supplements in growth experiments. Liposomesuspensions were stored at 225uC until the experimentalfood treatments were prepared. The amount of cholesteroland EPA in subsamples of liposomes was determined usinggas chromatography according to Martin-Creuzburg et al.(2009). No sterols and PUFA were detected in subsamplesof S. elongatus. For the calculation of carbon-basedcholesterol and EPA concentrations, the amount ofcholesterol or EPA added by liposomes was related to thePOC concentrations of S. elongatus in food suspensions.
Experiments—Fourth-clutch juveniles of D. magnahatched within 12 h in filtered lake water containing S.elongatus as food source were used for standardized growthexperiments in glass beakers filled with 200 mL of filteredlake water. Initial individual dry weight of D. magna wasmeasured in three subsamples of 10–15 juveniles. In growthexperiments, juveniles were raised on saturating amounts(2 mg C L21) of the sterol- and PUFA-free S. elongatus.During the experiments D. magna showed very low weight-specific growth rates on pure S. elongatus (, 0.1 d21),which indicated the inadequacy of this cyanobacterial foodsource in terms of sterols and PUFA. Because sufficientsterol has to be provided by diet to allow a growth responsedue to EPA supply (Martin-Creuzburg et al. 2009), weadded defined amounts of cholesterol-containing liposomesto S. elongatus. This base food (S. elongatus + cholesterol)represents the EPA-free control treatments. To examinejuvenile growth as a function of dietary EPA availability,we conducted two experiments in which we added differentamounts of EPA-containing liposomes to the EPA-freebase food. In one experiment, we provided two differentamounts of cholesterol at constant temperature to examinehow the availability of another essential food componentaffects the EPA-dependent growth response (expt. I). Wecarried out the second experiment at two differenttemperatures on the same cholesterol amount to revealhow abiotic conditions influence the EPA-dependent
1274 Sperfeld and Wacker
growth (expt. II). Expt. I was conducted at 20uC for 5.5 dwith both low (8.0 mg mg C21) and high (17.4 mg mg C21)cholesterol availability in duplicates at eight differentdietary EPA levels ranging from 0 to 8.9 mg (mg C)21.Each replicate started with six juveniles per beaker. Expt. IIwas conducted at high cholesterol availability(14.3 mg mg C21) both at 15uC and 20uC in triplicate atseven different dietary EPA levels ranging from 0 to 10.3 mg(mg C)21. Each replicate of expt. II started with sixjuveniles per beaker and temperature series were terminatedafter 5 d at 20uC and after 7 d at 15uC to obtain animals ofsimilar size. In both experiments juveniles were transferreddaily to freshly prepared food suspensions.
Juvenile weight-specific growth rate g (d21) was deter-mined as the increase in dry weight from the beginning (drywt0) to the end of an experiment (dry wtt) using the equation
g~ ln dry wtt{ln dry wt0ð Þt{1 ð1Þ
where t is the duration of the experiments in days.
Statistical analyses—To estimate EPA growth saturationthresholds we applied two statistical methods.
Post hoc test following ANOVA: We used ANOVAfollowed by a post hoc test to determine growth saturationthresholds; an approach that has been used before (Martin-Creuzburg et al. 2009), including studies that haveaddressed the EPA threshold issue (Becker and Boersma2005; Brett 2010). For each EPA-dependent growthresponse of expts. I and II, ANOVAs were used to indicategrowth differences between dietary EPA treatments. If theANOVA was significant (a 5 0.05), the Tukey’s honestlysignificant difference test (Tukey’s HSD) was used toidentify which dietary EPA treatments differed in theirmean growth rates. These differences were indicated usingdifferent letters in ascending order beginning from theEPA-free control treatment. EPA treatments with the lastletter (in alphabetic order) indicated the growth saturationplateau. The lowest dietary EPA concentration of thesaturation plateau was defined as the EPA growthsaturation threshold.
Saturation curve procedure: Because nutrient-dependentgrowth responses mostly follow saturation curves over arelevant range of nutrient availability we estimated EPAthresholds on the basis of saturation curve fitting.Compared with other saturation curve models, such asthe Von Bertalanffy (1957) growth function, the Monodfunction (Monod 1950) described the growth data best (i.e.,showed the highest adjusted R2). Therefore, we used amodified form of the Monod function to describe theweight-specific growth rate (g, d21) of D. magna inresponse to dietary EPA concentration (S) in mg (mg C)21
g~g0z g?{g0ð Þ|S= SzKSð Þ ð2Þ
with the parameters g0 as estimated growth rate (d21)without EPA supply (‘‘zero’’ EPA), g‘ as asymptoticgrowth rate (d21), and KS as half saturation constant in mg(mg C)21.
We developed a bootstrapping method to estimate theuncertainty of EPA thresholds depending on the variabilityof growth data. By randomly leaving out one replicate ofeach dietary EPA treatment we generated a new data set.This data set consists of one replicate for each of the eightdietary EPA treatments in expt. I (n 5 8) or two replicatesfor each of the seven dietary EPA treatments in expt. II (n5 14). This way we created 1000 data sets for each EPA-dependent growth response and fitted Eq. 2 throughgrowth rates of each data set using the nonlinear least-squares method. We calculated parameter values of Eq. 2(g0, g‘, and KS) as median of the 1000 estimated parametersfrom the nonlinear fits. The 95% confidence intervals ofeach parameter were calculated by eliminating the upperand lower 25 extreme values of the 1000-parameterestimates.
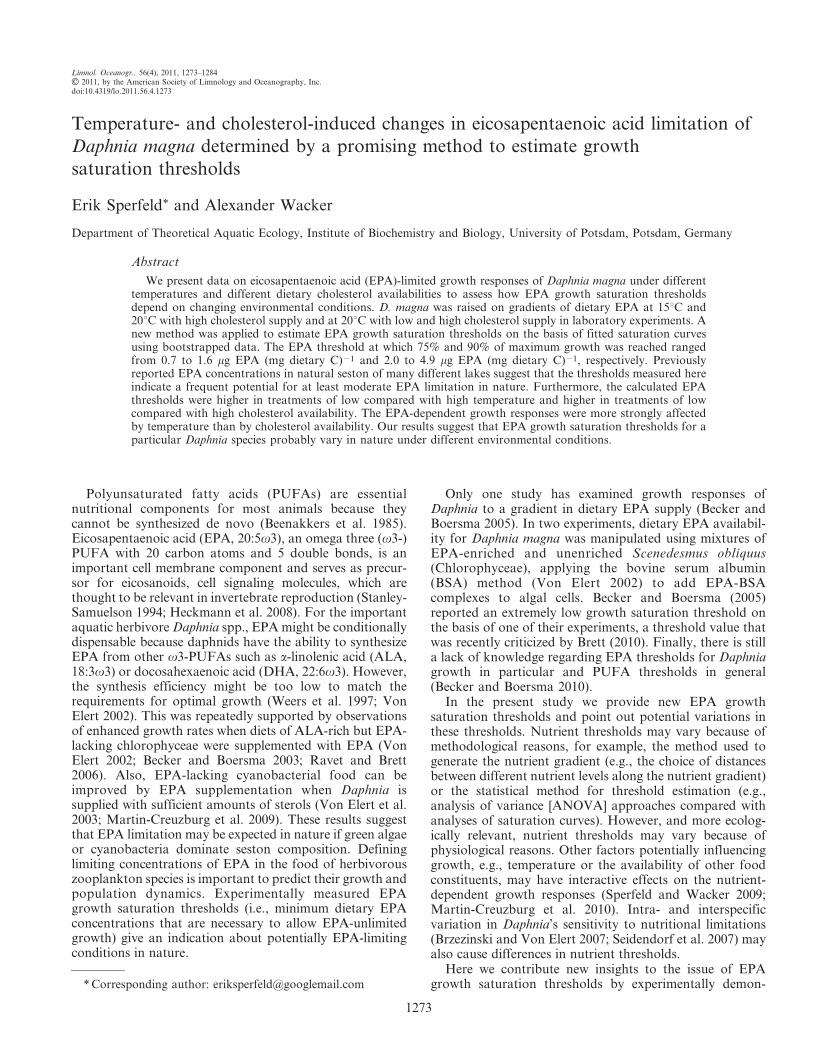
The asymptotic growth rate g‘ cannot be used asestimation for growth saturation in the range of theapplied nutrient gradient because saturation curves reachg‘ only at infinity (Fig. 1). Therefore, we defined growthsaturation somewhat beneath g‘ and calculated EPAthreshold concentrations for growth levels between 75%and 90% (g75%, g80%, g85%, g90%) on the basis of themaximum potential growth improvement by EPA supply(Fig. 1A). The maximum potential improvement in growthby EPA supply was defined as the increment in growthfrom the mean of replicates without EPA addition (EPA-free control treatments) to the estimated median g‘
(Fig. 1A). Note that growth rates of the EPA-free controltreatments were not zero because of cholesterol supple-mentation, which means that a growth level of, e.g., 75%does not indicate a reduction of the overall growth rate by25%. Instead this growth level indicates a 25% reduction inthe potential growth increment caused solely by EPAsupplementation. We defined, for instance, the 90%saturation threshold as the dietary EPA concentration atwhich the regression line (i.e., fitted growth rate) passes theline of the respective growth level (e.g., g90%, see Fig 1A).Calculating intersections of growth levels with the 1000regression lines of the bootstrapped data resulted in 1000EPA threshold concentrations within a certain range of thedietary EPA gradient (Fig. 1B). This variability in EPAthreshold concentrations should increase with increasingconvergence to g‘ because of a larger range of intersectionpoints along the x-axis (Fig. 1B). EPA growth saturationthresholds were specified as median of the 1000 calculateddietary EPA concentrations and the corresponding uncer-tainty of these thresholds as 95% confidence intervals byeliminating the upper and lower 25 extremes of these 1000values.
Calculating EPA thresholds for growth saturation levelsabove 90% is not recommended, since in this range theoccurrence of bootstrapped regression curves that do notintersect with the line of the growth level (e.g., g95%) islikely. This might lead to biased EPA threshold estimationdue to neglecting some bootstrapped data sets. To avoidthis bias, we used growth levels # 90%. Nevertheless, the90% growth level (g90%) is a good approximation forsaturated growth because it is close to the estimatedasymptotic growth, g‘ (see Fig. 1).
Eicosapentaenoic acid growth limitation of Daphnia 1275
Results
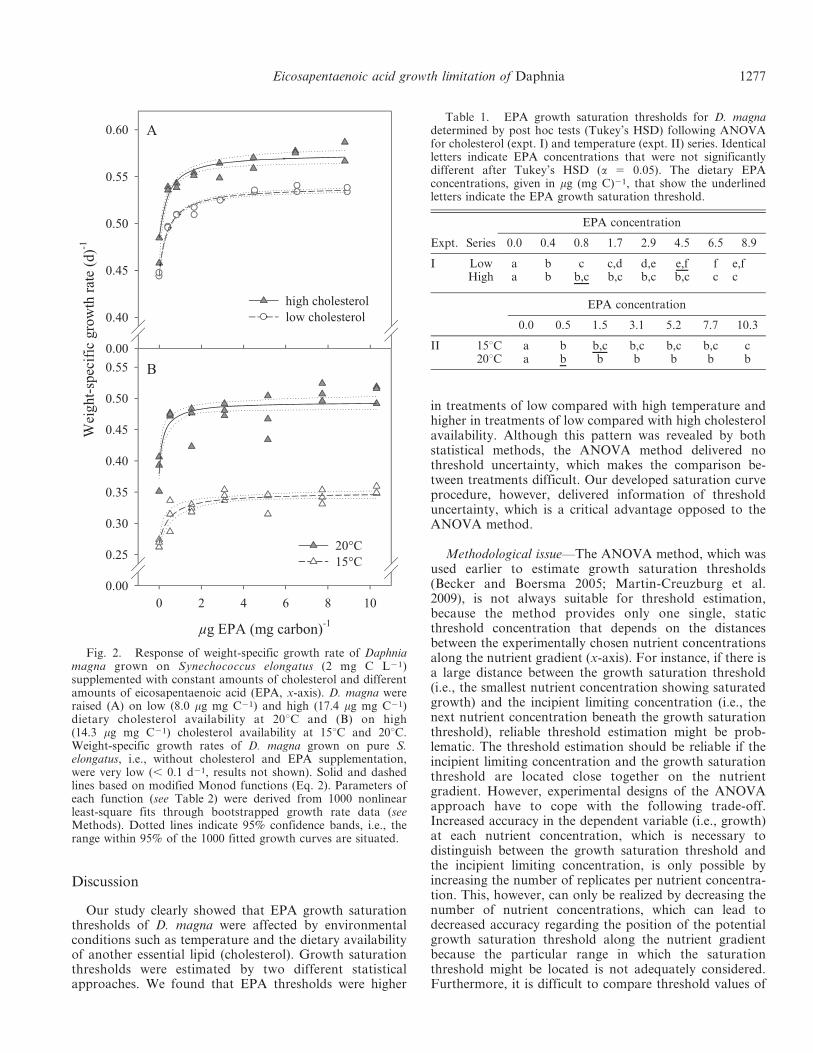
Growth—Growth rates of D. magna followed theexpected typical saturation curve in both experiments,i.e., growth increased with increasing EPA supply up to asaturation plateau (Fig. 2). Dietary cholesterol (expt. I,Fig. 2A) and temperature (expt. II, Fig. 2B) affected theshape and elevation of the saturation curves. The growth inthe control treatments (without addition of EPA lipo-somes) was already high and the maximum growthimprovement by EPA supply accounted for only anadditional ,15% to 25% of the overall growth rate.
Post hoc test following ANOVA—ANOVAs indicateddifferences in growth rates between dietary EPA treatmentsof expt. I (low cholesterol: F7,8 5 209.5, p , 0.001; highcholesterol: F7,8 5 23.7, p , 0.001) and expt. II (15uC: F6,14
5 13.7, p , 0.001; 20uC: F7,8 5 10.2, p , 0.001). In expt. I,Tukey’s HSD post hoc tests indicated EPA growthsaturation thresholds at 4.5 and 0.8 mg EPA (mg C)21 forlow and high cholesterol supply, respectively (Table 1). Inexpt. II, post hoc tests indicated the saturation thresholdsat 1.5 and 0.5 mg EPA (mg C)21 for 15uC and 20uC,respectively.
Saturation curve procedure—Growth rates were welldescribed by saturation curves on the basis of the Monodfunction (Fig. 2, Table 2). Clear differences in estimatedasymptotic growth rates (g‘) were observed betweencholesterol treatments in expt. I and temperature treat-ments in expt. II. On the basis of 95% confidence intervals,g‘ was higher at high than at low cholesterol supply in expt.I and higher at 20uC than at 15uC in expt. II (Table 2). Inexpt. I, half-saturation constants (KS) were similar, whereasin expt. II the half-saturation constant tended to be higherat 15uC than at 20uC (Table 2).
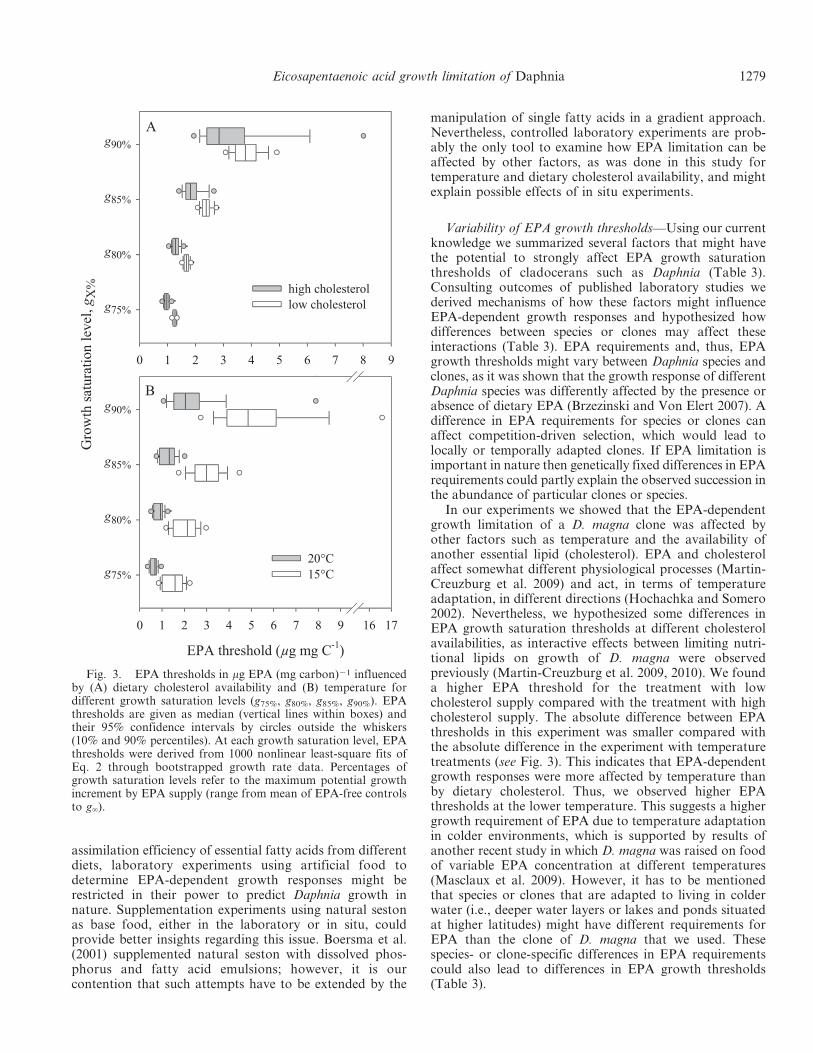
Using the fitted saturation curves, we calculated EPAthresholds for growth levels of 90%, 85%, 80%, and 75%.EPA thresholds as well as their variability increased withincreasing growth level (Fig. 3). The median EPA thresh-olds of both cholesterol treatments were in a similar rangeacross growth levels (Fig. 3, low: 1.3–3.8 mg EPA mg C21;high: 1.0–2.9 mg EPA mg C21) and strong overlaps ofconfidence intervals were found for the 90% and 85%growth levels. However, there was only a slight overlap ofthe confidence intervals of both cholesterol treatments atthe 80% growth level and no overlap at the 75% level,indicating significantly higher EPA thresholds in the low-cholesterol treatment. This suggests that EPA thresholdswere substantially influenced by other dietary resources, inthis case, cholesterol. An effect is also apparent fortemperature treatments, because median EPA thresholdswere generally higher at 15uC (range: 1.6–4.9 mg EPAmg C21) compared with 20uC (range: 0.7–2.0 mg EPAmg C21). Similar to the cholesterol treatments, confidenceintervals of EPA thresholds between both temperaturesoverlapped at the 90% and 85% growth levels, but overlapsat the 80% and 75% growth levels were very small (Fig. 3).The higher EPA thresholds at 15uC suggest that growthwas more strongly EPA limited at the lower temperature.
Fig. 1. Conceptual figure regarding the calculation ofnutrient thresholds for particular growth saturation levels. (A)Fitting saturation functions through bootstrapped growth ratedata provides an estimate for asymptotic growth (median g‘, seeMethods for detailed description). Growth saturation levels aregiven in percentage (e.g., g75% or g90%) of the potential maximumgrowth increment caused by nutrient addition, which is the rangefrom growth rates without nutrient addition (mean of nutrient-free control treatments, dotted line) to median g‘ (thick solid line).The 75% and 90% growth saturation thresholds (vertical dashedlines) are calculated as the nutrient concentrations at which thesaturation curve (solid line) passes the line of respective growthlevels (g75% and g90%, respectively, horizontal dashed lines).Circles represent artificially produced growth rate data. (B)Nonlinear regressions through bootstrapped growth data (seeMethods) resulted in different saturation curves (five curves areshown as example, solid lines). Saturation curves pass the line of aparticular growth level (e.g., g90%) at different nutrient concen-trations, leading to nutrient thresholds within a certain rangealong the x-axis expressed as box plots.
1276 Sperfeld and Wacker
Discussion
Our study clearly showed that EPA growth saturationthresholds of D. magna were affected by environmentalconditions such as temperature and the dietary availabilityof another essential lipid (cholesterol). Growth saturationthresholds were estimated by two different statisticalapproaches. We found that EPA thresholds were higher
in treatments of low compared with high temperature andhigher in treatments of low compared with high cholesterolavailability. Although this pattern was revealed by bothstatistical methods, the ANOVA method delivered nothreshold uncertainty, which makes the comparison be-tween treatments difficult. Our developed saturation curveprocedure, however, delivered information of thresholduncertainty, which is a critical advantage opposed to theANOVA method.
Methodological issue—The ANOVA method, which wasused earlier to estimate growth saturation thresholds(Becker and Boersma 2005; Martin-Creuzburg et al.2009), is not always suitable for threshold estimation,because the method provides only one single, staticthreshold concentration that depends on the distancesbetween the experimentally chosen nutrient concentrationsalong the nutrient gradient (x-axis). For instance, if there isa large distance between the growth saturation threshold(i.e., the smallest nutrient concentration showing saturatedgrowth) and the incipient limiting concentration (i.e., thenext nutrient concentration beneath the growth saturationthreshold), reliable threshold estimation might be prob-lematic. The threshold estimation should be reliable if theincipient limiting concentration and the growth saturationthreshold are located close together on the nutrientgradient. However, experimental designs of the ANOVAapproach have to cope with the following trade-off.Increased accuracy in the dependent variable (i.e., growth)at each nutrient concentration, which is necessary todistinguish between the growth saturation threshold andthe incipient limiting concentration, is only possible byincreasing the number of replicates per nutrient concentra-tion. This, however, can only be realized by decreasing thenumber of nutrient concentrations, which can lead todecreased accuracy regarding the position of the potentialgrowth saturation threshold along the nutrient gradientbecause the particular range in which the saturationthreshold might be located is not adequately considered.Furthermore, it is difficult to compare threshold values of
Fig. 2. Response of weight-specific growth rate of Daphniamagna grown on Synechococcus elongatus (2 mg C L21)supplemented with constant amounts of cholesterol and differentamounts of eicosapentaenoic acid (EPA, x-axis). D. magna wereraised (A) on low (8.0 mg mg C21) and high (17.4 mg mg C21)dietary cholesterol availability at 20uC and (B) on high(14.3 mg mg C21) cholesterol availability at 15uC and 20uC.Weight-specific growth rates of D. magna grown on pure S.elongatus, i.e., without cholesterol and EPA supplementation,were very low (, 0.1 d21, results not shown). Solid and dashedlines based on modified Monod functions (Eq. 2). Parameters ofeach function (see Table 2) were derived from 1000 nonlinearleast-square fits through bootstrapped growth rate data (seeMethods). Dotted lines indicate 95% confidence bands, i.e., therange within 95% of the 1000 fitted growth curves are situated.
Table 1. EPA growth saturation thresholds for D. magnadetermined by post hoc tests (Tukey’s HSD) following ANOVAfor cholesterol (expt. I) and temperature (expt. II) series. Identicalletters indicate EPA concentrations that were not significantlydifferent after Tukey’s HSD (a 5 0.05). The dietary EPAconcentrations, given in mg (mg C)21, that show the underlinedletters indicate the EPA growth saturation threshold.
Expt. Series
EPA concentration
0.0 0.4 0.8 1.7 2.9 4.5 6.5 8.9
I Low a b c c,d d,e e,f f e,fHigh a b b,c b,c b,c b,c c c
EPA concentration
0.0 0.5 1.5 3.1 5.2 7.7 10.3
II 15uC a b b,c b,c b,c b,c c20uC a b b b b b b
Eicosapentaenoic acid growth limitation of Daphnia 1277
different treatments or experiments if statistical methods(e.g., ANOVA) do not provide information of thresholduncertainty.
Potential problems of threshold estimation by theANOVA approach are due to the saturation form of theEPA-limited growth responses, i.e., growth rate initiallyincreases strongly and afterward converges slowly tosaturated conditions with increasing dietary EPA concen-trations. This makes the determination of a particularsaturation threshold nearly impossible. Therefore, theanalyses of saturation curves, as done here with ournonlinear fitting approach and bootstrapped data, is moremeaningful. We generated numerous possible saturationcurves depending on the variability of the data usingbootstrapping. This allows the estimation of nutrientthresholds along with a measurement of uncertainty, whichis important for statistical comparisons of thresholdsderived from different nutrient-dependent growth respons-es. We used the Monod function to describe growthsaturation curves, which fitted the data very well and betterthan other growth functions. The half-saturation constant(KS) of the Monod function may also be used to comparedifferent saturation curves (Martin-Creuzburg et al. 2009,2010), but it does not give information about nutrientthresholds near saturated growth conditions. However, thiscan be done with the saturation curve procedure presentedhere, which provides EPA thresholds for defined growthlevels, i.e., for different points on the growth curve. The90% growth level is close to the estimated asymptoticgrowth (g‘) and therefore is appropriate to describe EPAthresholds for saturated growth. Also, the 75% growth leveldelivers a useful EPA threshold, which can be interpretedas the EPA concentration where growth is reduced by 25%because of EPA deficiency. It is important to note that thegrowth increment by EPA supply (i.e., gain in growth fromthe mean of EPA-free controls to g‘) accounted for , 20%of the overall growth rate (i.e., the growth from g 5 0 to g‘)in our study (see Fig. 2). The percentages of growth levelswere related to this growth increment of 20% and not to theoverall growth rate. That means in the present case that the75% growth level indicates an absolute growth reduction of, 5% and the 90% growth level a growth reduction of only, 2% related to the overall growth rate.
The relatively low increment of juvenile somatic growthrates by EPA supply (20%) was caused by the high growthrates reached by the EPA-lacking but cholesterol-supple-mented control treatments. High juvenile somatic growthrates of D. magna with sufficient cholesterol supply were
observed previously using the same experimental setup(0.42 d21, Martin-Creuzburg et al. 2008; 0.37 d21, Martin-Creuzburg et al. 2009; 0.40 d21, Martin-Creuzburg et al.2010) and were reached probably because of maternalPUFA provision to the offspring. The maternal PUFAprovision, especially with ALA, can be substantial, sincemothers were raised on the ALA-rich chlorophyte Scene-desmus obliquus. The juveniles of the growth experimentsmight have used the PUFA storage achieved by mothers togrow at high rates even when raised on the cyanobacteriumSynechococcus elongatus supplemented solely with choles-terol. However, growth rates in general should be stronglylimited after exhaustion of the neonatal PUFA storage.This assumption is supported by observed populationgrowth rates of D. magna with sufficient cholesterol supply,which were remarkably more EPA limited than juvenilesomatic growth rates (Martin-Creuzburg et al. 2009, 2010).Variations in maternal PUFA provision might have causeddifferences in the achieved juvenile somatic growth ratesbetween our two experiments. For instance, the growthrates of the EPA-free control treatments supplemented with‘‘high’’ cholesterol at 20uC were higher in expt. I (0.46–0.48 d21) than in expt. II (0.35–0.41 d21). However,potential maternal effects were equal in treatments alongthe EPA concentration gradient of each experiment.Therefore, maternal effects might be strong on the achievedsomatic growth rates (y-axis), but rather weak on the EPA-dependent growth response (x-axis) and thus, EPA growthsaturation thresholds. Even though our determined EPAthresholds were rather unaffected by maternal effects interms of PUFA provision, this issue is an importantquestion for future examinations.
Another important issue in discussing nutrient satura-tion thresholds is the reliability of the x-axis, i.e., theinformational value of the nutrient gradient. As mentionedby Muller-Navarra (2008), the bioavailability of the targetfood component in artificial diets compared with itsbioavailability in natural food is not clear. In artificialdiets, the bioavailability of the target nutrient may alsovary depending on the supplementation method used. Thismight have influenced the differences in EPA thresholdsreported in this study using liposome supplementationcompared with the study of Becker and Boersma (2005)using the BSA method, in which algae are supplementedwith BSA–fatty acid complexes. However, it would bedifficult to distinguish between the bioavailability of anutrient and its assimilation efficiency by the animal.Considering the potential differences in bioavailability or
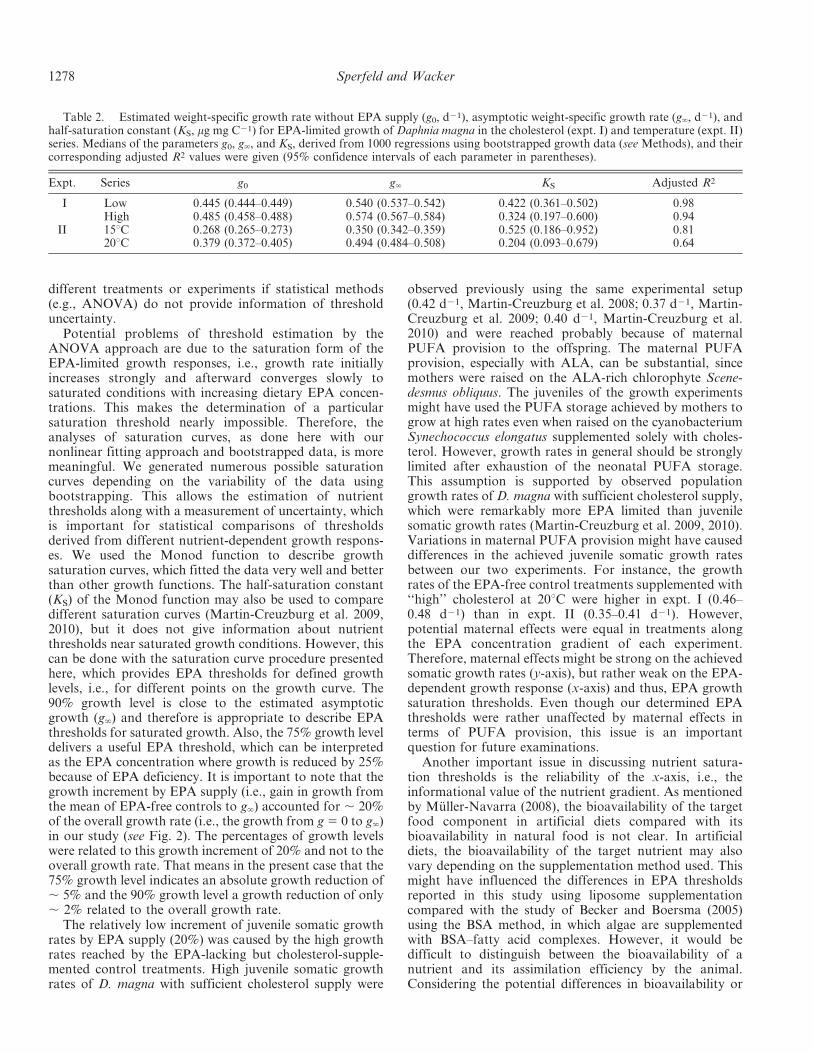
Table 2. Estimated weight-specific growth rate without EPA supply (g0, d21), asymptotic weight-specific growth rate (g‘, d21), andhalf-saturation constant (KS, mg mg C21) for EPA-limited growth of Daphnia magna in the cholesterol (expt. I) and temperature (expt. II)series. Medians of the parameters g0, g‘, and KS, derived from 1000 regressions using bootstrapped growth data (see Methods), and theircorresponding adjusted R2 values were given (95% confidence intervals of each parameter in parentheses).
Expt. Series g0 g‘ KS Adjusted R2
I Low 0.445 (0.444–0.449) 0.540 (0.537–0.542) 0.422 (0.361–0.502) 0.98High 0.485 (0.458–0.488) 0.574 (0.567–0.584) 0.324 (0.197–0.600) 0.94
II 15uC 0.268 (0.265–0.273) 0.350 (0.342–0.359) 0.525 (0.186–0.952) 0.8120uC 0.379 (0.372–0.405) 0.494 (0.484–0.508) 0.204 (0.093–0.679) 0.64
1278 Sperfeld and Wacker
assimilation efficiency of essential fatty acids from differentdiets, laboratory experiments using artificial food todetermine EPA-dependent growth responses might berestricted in their power to predict Daphnia growth innature. Supplementation experiments using natural sestonas base food, either in the laboratory or in situ, couldprovide better insights regarding this issue. Boersma et al.(2001) supplemented natural seston with dissolved phos-phorus and fatty acid emulsions; however, it is ourcontention that such attempts have to be extended by the
manipulation of single fatty acids in a gradient approach.Nevertheless, controlled laboratory experiments are prob-ably the only tool to examine how EPA limitation can beaffected by other factors, as was done in this study fortemperature and dietary cholesterol availability, and mightexplain possible effects of in situ experiments.
Variability of EPA growth thresholds—Using our currentknowledge we summarized several factors that might havethe potential to strongly affect EPA growth saturationthresholds of cladocerans such as Daphnia (Table 3).Consulting outcomes of published laboratory studies wederived mechanisms of how these factors might influenceEPA-dependent growth responses and hypothesized howdifferences between species or clones may affect theseinteractions (Table 3). EPA requirements and, thus, EPAgrowth thresholds might vary between Daphnia species andclones, as it was shown that the growth response of differentDaphnia species was differently affected by the presence orabsence of dietary EPA (Brzezinski and Von Elert 2007). Adifference in EPA requirements for species or clones canaffect competition-driven selection, which would lead tolocally or temporally adapted clones. If EPA limitation isimportant in nature then genetically fixed differences in EPArequirements could partly explain the observed succession inthe abundance of particular clones or species.
In our experiments we showed that the EPA-dependentgrowth limitation of a D. magna clone was affected byother factors such as temperature and the availability ofanother essential lipid (cholesterol). EPA and cholesterolaffect somewhat different physiological processes (Martin-Creuzburg et al. 2009) and act, in terms of temperatureadaptation, in different directions (Hochachka and Somero2002). Nevertheless, we hypothesized some differences inEPA growth saturation thresholds at different cholesterolavailabilities, as interactive effects between limiting nutri-tional lipids on growth of D. magna were observedpreviously (Martin-Creuzburg et al. 2009, 2010). We founda higher EPA threshold for the treatment with lowcholesterol supply compared with the treatment with highcholesterol supply. The absolute difference between EPAthresholds in this experiment was smaller compared withthe absolute difference in the experiment with temperaturetreatments (see Fig. 3). This indicates that EPA-dependentgrowth responses were more affected by temperature thanby dietary cholesterol. Thus, we observed higher EPAthresholds at the lower temperature. This suggests a highergrowth requirement of EPA due to temperature adaptationin colder environments, which is supported by results ofanother recent study in which D. magna was raised on foodof variable EPA concentration at different temperatures(Masclaux et al. 2009). However, it has to be mentionedthat species or clones that are adapted to living in colderwater (i.e., deeper water layers or lakes and ponds situatedat higher latitudes) might have different requirements forEPA than the clone of D. magna that we used. Thesespecies- or clone-specific differences in EPA requirementscould also lead to differences in EPA growth thresholds(Table 3).
Fig. 3. EPA thresholds in mg EPA (mg carbon)21 influencedby (A) dietary cholesterol availability and (B) temperature fordifferent growth saturation levels (g75%, g80%, g85%, g90%). EPAthresholds are given as median (vertical lines within boxes) andtheir 95% confidence intervals by circles outside the whiskers(10% and 90% percentiles). At each growth saturation level, EPAthresholds were derived from 1000 nonlinear least-square fits ofEq. 2 through bootstrapped growth rate data. Percentages ofgrowth saturation levels refer to the maximum potential growthincrement by EPA supply (range from mean of EPA-free controlsto g‘).
Eicosapentaenoic acid growth limitation of Daphnia 1279
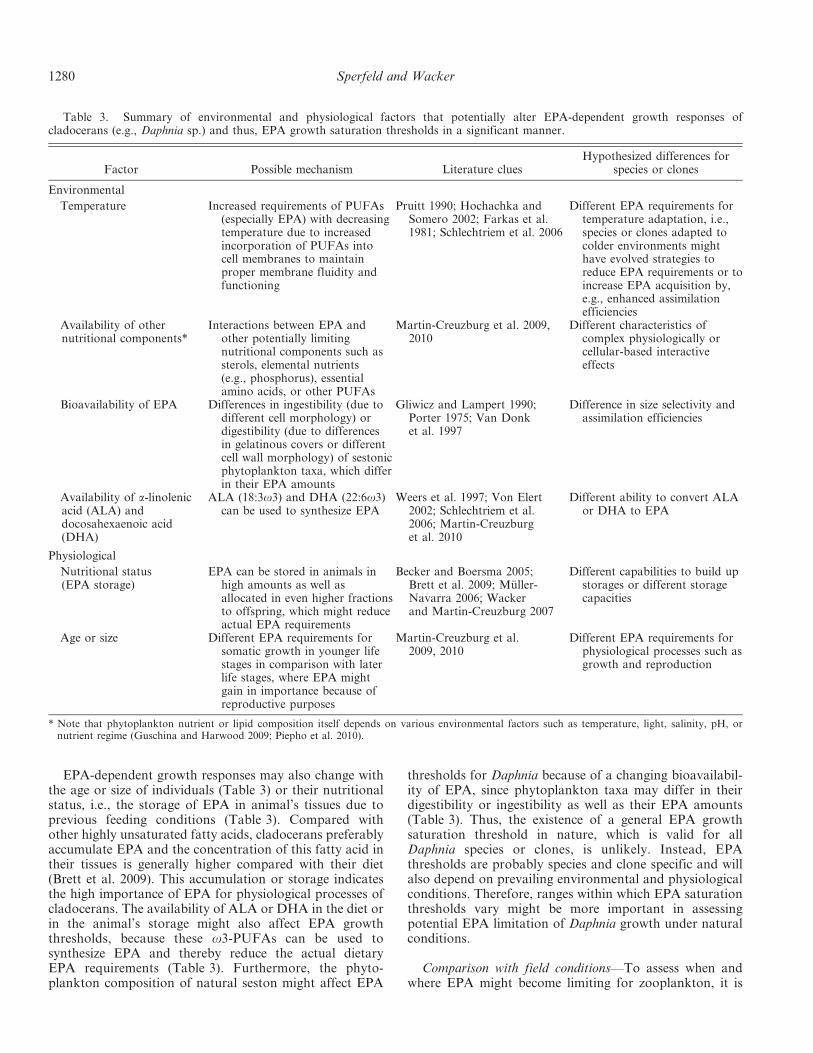
EPA-dependent growth responses may also change withthe age or size of individuals (Table 3) or their nutritionalstatus, i.e., the storage of EPA in animal’s tissues due toprevious feeding conditions (Table 3). Compared withother highly unsaturated fatty acids, cladocerans preferablyaccumulate EPA and the concentration of this fatty acid intheir tissues is generally higher compared with their diet(Brett et al. 2009). This accumulation or storage indicatesthe high importance of EPA for physiological processes ofcladocerans. The availability of ALA or DHA in the diet orin the animal’s storage might also affect EPA growththresholds, because these v3-PUFAs can be used tosynthesize EPA and thereby reduce the actual dietaryEPA requirements (Table 3). Furthermore, the phyto-plankton composition of natural seston might affect EPA
thresholds for Daphnia because of a changing bioavailabil-ity of EPA, since phytoplankton taxa may differ in theirdigestibility or ingestibility as well as their EPA amounts(Table 3). Thus, the existence of a general EPA growthsaturation threshold in nature, which is valid for allDaphnia species or clones, is unlikely. Instead, EPAthresholds are probably species and clone specific and willalso depend on prevailing environmental and physiologicalconditions. Therefore, ranges within which EPA saturationthresholds vary might be more important in assessingpotential EPA limitation of Daphnia growth under naturalconditions.
Comparison with field conditions—To assess when andwhere EPA might become limiting for zooplankton, it is
Table 3. Summary of environmental and physiological factors that potentially alter EPA-dependent growth responses ofcladocerans (e.g., Daphnia sp.) and thus, EPA growth saturation thresholds in a significant manner.
Factor Possible mechanism Literature cluesHypothesized differences for
species or clones
Environmental
Temperature Increased requirements of PUFAs(especially EPA) with decreasingtemperature due to increasedincorporation of PUFAs intocell membranes to maintainproper membrane fluidity andfunctioning
Pruitt 1990; Hochachka andSomero 2002; Farkas et al.1981; Schlechtriem et al. 2006
Different EPA requirements fortemperature adaptation, i.e.,species or clones adapted tocolder environments mighthave evolved strategies toreduce EPA requirements or toincrease EPA acquisition by,e.g., enhanced assimilationefficiencies
Availability of othernutritional components*
Interactions between EPA andother potentially limitingnutritional components such assterols, elemental nutrients(e.g., phosphorus), essentialamino acids, or other PUFAs
Martin-Creuzburg et al. 2009,2010
Different characteristics ofcomplex physiologically orcellular-based interactiveeffects
Bioavailability of EPA Differences in ingestibility (due todifferent cell morphology) ordigestibility (due to differencesin gelatinous covers or differentcell wall morphology) of sestonicphytoplankton taxa, which differin their EPA amounts
Gliwicz and Lampert 1990;Porter 1975; Van Donket al. 1997
Difference in size selectivity andassimilation efficiencies
Availability of a-linolenicacid (ALA) anddocosahexaenoic acid(DHA)
ALA (18:3v3) and DHA (22:6v3)can be used to synthesize EPA
Weers et al. 1997; Von Elert2002; Schlechtriem et al.2006; Martin-Creuzburget al. 2010
Different ability to convert ALAor DHA to EPA
Physiological
Nutritional status(EPA storage)
EPA can be stored in animals inhigh amounts as well asallocated in even higher fractionsto offspring, which might reduceactual EPA requirements
Becker and Boersma 2005;Brett et al. 2009; Muller-Navarra 2006; Wackerand Martin-Creuzburg 2007
Different capabilities to build upstorages or different storagecapacities
Age or size Different EPA requirements forsomatic growth in younger lifestages in comparison with laterlife stages, where EPA mightgain in importance because ofreproductive purposes
Martin-Creuzburg et al.2009, 2010
Different EPA requirements forphysiological processes such asgrowth and reproduction
* Note that phytoplankton nutrient or lipid composition itself depends on various environmental factors such as temperature, light, salinity, pH, ornutrient regime (Guschina and Harwood 2009; Piepho et al. 2010).
1280 Sperfeld and Wacker
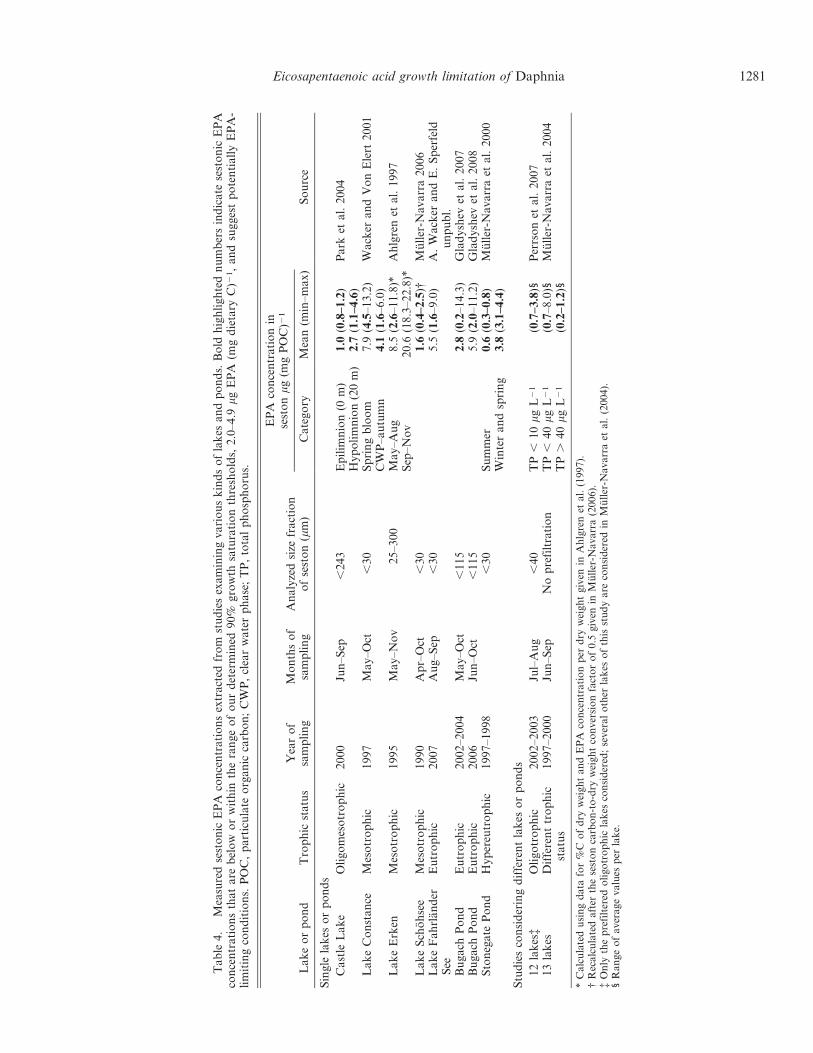
Table
4.
Mea
sure
dse
sto
nic
EP
Aco
nce
ntr
ati
on
sex
tra
cted
fro
mst
ud
ies
exa
min
ing
va
rio
us
kin
ds
of
lak
esa
nd
po
nd
s.B
old
hig
hli
gh
ted
nu
mb
ers
ind
ica
tese
sto
nic
EP
Aco
nce
ntr
ati
on
sth
at
are
bel
ow
or
wit
hin
the
ran
ge
of
ou
rd
eter
min
ed9
0%
gro
wth
satu
rati
on
thre
sho
lds,
2.0
–4
.9m
gE
PA
(mg
die
tary
C)2
1,
an
dsu
gg
est
po
ten
tia
lly
EP
A-
lim
itin
gco
nd
itio
ns.
PO
C,
pa
rtic
ula
teo
rga
nic
carb
on
;C
WP
,cl
ear
wa
ter
ph
ase
;T
P,
tota
lp
ho
sph
oru
s.
La
ke
or
po
nd
Tro
ph
icst
atu
sY
ear
of
sam
pli
ng
Mo
nth
so
fsa
mp
lin
gA
na
lyze
dsi
zefr
act
ion
of
sest
on
(mm
)
EP
Aco
nce
ntr
ati
on
inse
sto
nm
g(m
gP
OC
)21
So
urc
eC
ate
go
ryM
ean
(min
–m
ax
)
Sin
gle
lak
eso
rp
on
ds
Ca
stle
La
ke
Oli
go
mes
otr
op
hic
20
00
Jun
–S
ep,
24
3E
pil
imn
ion
(0m
)1
.0(0
.8–
1.2
)P
ark
eta
l.2
00
4H
yp
oli
mn
ion
(20
m)
2.7
(1.1
–4
.6)
La
ke
Co
nst
an
ceM
eso
tro
ph
ic1
99
7M
ay
–O
ct,
30
Sp
rin
gb
loo
m7
.9(4
.5–
13
.2)
Wa
cker
an
dV
on
Ele
rt2
00
1C
WP
–a
utu
mn
4.1
(1.6
–6
.0)
La
ke
Erk
enM
eso
tro
ph
ic1
99
5M
ay
–N
ov
25
–3
00
Ma
y–
Au
g8
.5(2
.6–
11
.8)*
Ah
lgre
net
al.
19
97
Sep
–N
ov
20
.6(1
8.3
–2
2.8
)*L
ak
eS
cho
hse
eM
eso
tro
ph
ic1
99
0A
pr–
Oct
,3
01
.6(0
.4–
2.5
){M
ull
er-N
av
arr
a2
00
6L
ak
eF
ah
rla
nd
erS
eeE
utr
op
hic
20
07
Au
g–
Sep
,3
05
.5(1
.6–
9.0
)A
.W
ack
era
nd
E.
Sp
erfe
ldu
np
ub
l.B
ug
ach
Po
nd
Eu
tro
ph
ic2
00
2–
20
04
Ma
y–
Oct
,1
15
2.8
(0.2
–1
4.3
)G
lad
ysh
evet
al.
20
07
Bu
ga
chP
on
dE
utr
op
hic
20
06
Jun
–O
ct,
11
55
.9(2
.0–
11
.2)
Gla
dy
shev
eta
l.2
00
8S
ton
ega
teP
on
dH
yp
ereu
tro
ph
ic1
99
7–
19
98
,3
0S
um
mer
0.6
(0.3
–0
.8)
Mu
ller
-Na
va
rra
eta
l.2
00
0W
inte
ra
nd
spri
ng
3.8
(3.1
–4
.4)
Stu
die
sco
nsi
der
ing
dif
fere
nt
lak
eso
rp
on
ds
12
lak
es{
Oli
go
tro
ph
ic2
00
2–
20
03
Jul–
Au
g,
40
TP
,1
0m
gL
21
(0.7
–3
.8)1
Per
rso
net
al.
20
07
13
lak
esD
iffe
ren
ttr
op
hic
sta
tus
19
97
–2
00
0Ju
n–
Sep
No
pre
filt
rati
on
TP
,4
0m
gL
21
(0.7
–8
.0)1
Mu
ller
-Na
va
rra
eta
l.2
00
4T
P.
40
mg
L2
1(0
.2–
1.2
)1
*C
alc
ula
ted
usi
ng
da
tafo
r%
Co
fd
ryw
eigh
tan
dE
PA
con
cen
trati
on
per
dry
wei
gh
tgiv
enin
Ah
lgre
net
al.
(1997).
{R
eca
lcu
late
da
fter
the
sest
on
carb
on
-to
-dry
wei
gh
tco
nv
ersi
on
fact
or
of
0.5
giv
enin
Mu
ller
-Na
va
rra
(20
06
).{
On
lyth
ep
refi
lter
edo
ligo
tro
ph
icla
kes
con
sid
ered
;se
ver
al
oth
erla
kes
of
this
stu
dy
are
con
sid
ered
inM
ull
er-N
av
arr
aet
al.
(20
04).
1R
an
ge
of
av
era
ge
va
lues
per
lak
e.
Eicosapentaenoic acid growth limitation of Daphnia 1281
important to know when and where EPA concentrations ofnatural seston fall below potential growth saturationthresholds. In pelagic freshwater ecosystems, sestonicEPA concentrations can show strong seasonal and annualfluctuations (Muller-Navarra 1995; Wacker and Von Elert2001; Gladyshev et al. 2007, 2008). These fluctuations aredriven for the most part by the seasonal and interannualvariation in phytoplankton community composition (Mull-er-Navarra et al. 2000; Gladyshev et al. 2007). Addition-ally, EPA concentrations can show diurnal and verticalvariability (Park et al. 2004).
We summarized measured carbon-based EPA concen-trations of seston from a variety of studies examiningdifferent lakes and ponds (Table 4) and compared themwith our EPA thresholds determined for D. magna.Sestonic EPA concentrations varied considerably amongsampled lakes and ponds of different trophic status,suggesting different dietary EPA availability for herbivo-rous zooplankton. Becker and Boersma (2010) statedduring a recent debate with Brett (2010) that, using a moreconservative interpretation of their data (Becker andBoersma 2005), the EPA growth saturation threshold forD. magna would be between 0.05 and 0.6 mg EPA (mg C)21.This range of dietary EPA concentrations is below theaverage sestonic EPA concentrations of most sampled lakesand ponds (Table 4). Our estimated EPA thresholdsshowed higher values than 0.6 mg EPA (mg C)21, evenfor the 75% growth level, where median EPA thresholdsranged from 0.7 to 1.6 mg EPA (mg C)21 across alltreatments. The 90% EPA growth saturation thresholdsshowed even medians as high as 2.0 to 4.9 mg EPA(mg C)21. Many of the sampled lakes and ponds showedaverage EPA concentrations below or within the range ofthe 90% EPA growth saturation threshold (Table 4),whereas others showed only minimum EPA concentrationsbelow or within that range, suggesting potential for dietaryEPA limitation at least for parts of the season. However,mean EPA concentrations fell far below our determined75% growth saturation thresholds of 0.7–1.6 mg EPA(mg C)21 in only some of the lakes and ponds representedin our survey (Table 4). This suggests a moderate EPAlimitation in many lakes most of the time, which is furthersupported, since 12 of 30 lakes summarized by Persson etal. (2007) showed average sestonic EPA concentrations ,1.6 mg EPA (mg C)21 and only 2 of the 30 lakes showedconcentrations , 0.7 mg EPA (mg C)21.
Extremely low sestonic EPA concentrations were ob-served in eutrophic ponds, which might be caused by theseasonal dominance of cyanobacteria (Muller-Navarra etal. 2000; Gladyshev et al. 2007). Thus, strong EPAlimitation can be expected in eutrophic lakes and pondsduring cyanobacterial blooms. Since cyanobacteria have acompetitive advantage at elevated water temperatures,climate change (i.e., global warming) favors the occurrenceof cyanobacterial blooms (Paerl and Huisman 2008).During summer, this might lead more frequently to EPAlimitation, particularly for pond species, because watertemperatures in shallow ponds are expected to be tightlycoupled to air temperatures. However, our recent finding,i.e., smaller EPA requirements of Daphnia for growth at
higher temperature, has to be considered when interpretingpotential EPA limitation in nature. During summer in thetemperate zone, when dietary EPA availability in sestoncan be low because of dominance of cyanobacteria, lowerEPA requirements of the herbivores might alleviate thepotential EPA limitation and dietary sterol deficiencymight gain in importance (Sperfeld and Wacker 2009).When the water temperature is low, e.g., during spring andautumn, PUFA-rich cryptomonads or diatoms oftendominate seston composition, which leads to high dietaryEPA availability and therefore EPA limitation is ratherunlikely. However, it has yet to be tested if cold-adaptedspecies or clones might have considerably higher EPArequirements than the clone of D. magna we used. Theinterrelationship between temperature and fatty acidrequirements strictly recommend the consideration oftemperature in future studies, analyzing seston compositionin terms of potential food-quality constraints for zooplank-ton (Ahlgren et al. 1997).
Care should be taken when thresholds are given asvolumetric concentrations, e.g., the previously reportedgrowth saturation thresholds of 0.8 mg EPA L21 forDaphnia galeata (Muller-Navarra 1995) and 13 mg EPAL21 for Daphnia from the longispina group (Gladyshev etal. 2008), because these thresholds are based on correlationanalyses with prefiltered natural seston. Gladyshev et al.(2008) found a positive relationship between growth andEPA concentration up to ,13 mg L21. Notably, thesignificant relationship based on EPA concentrations L21
was not observed when EPA concentration was consideredon a per carbon basis, i.e., when EPA ranged up to ,5 mg(mg C)21. This indicates that thresholds based onvolumetric concentrations are not directly comparable withthresholds based on amounts per unit of food (e.g., percarbon or per dry weight). Additionally, although correl-ative analysis is an important tool to deliver first cluesabout what factors might be limiting in natural systems,they do not necessarily provide unequivocally proof ofcause and effect. Therefore, it has to be shown by EPAsupplementation experiments involving natural seston thatEPA shortage does significantly limit growth of herbivo-rous crustaceans. Furthermore, other life history parame-ters, such as reproduction and viability of offspring, haveto be examined, because these parameters can show evenmore pronounced responses than growth (Martin-Creuz-burg et al. 2009, 2010).
AcknowledgmentsWe thank S. Heim for technical assistance, A. Montana for
improving the English, and D. Martin-Creuzburg, E. Von Elert,P. Fink, and two anonymous reviewers for valuable comments onearlier drafts of this manuscript. This study was supported by theGerman Research Foundation (DFG, WA2445/3-1).
References
AHLGREN, G., W. GOEDKOOP, H. MARKENSTEN, L. SONESTEN, AND
M. BOBERG. 1997. Seasonal variations in food quality forpelagic and benthic invertebrates in Lake Erken—the role offatty acids. Freshw. Biol. 38: 555–570, doi:10.1046/j.1365-2427.1997.00219.x
1282 Sperfeld and Wacker
BECKER, C., AND M. BOERSMA. 2003. Resource quality effects onlife histories of Daphnia. Limnol. Oceanogr. 48: 700–706,doi:10.4319/lo.2003.48.2.0700
———, AND ———. 2005. Differential effects of phosphorus andfatty acids on Daphnia magna growth and reproduction.Limnol. Oceanogr. 50: 388–397, doi:10.4319/lo.2005.50.1.0388
———, AND ———. 2010. Limiting levels of eicosapentaenoicacid: What do we really know? Limnol. Oceanogr. 55: 459–462.
BEENAKKERS, A. M. T., D. J. VAN DER HORST, AND W. J. A. VAN
MARREWIJK. 1985. Insect lipids and lipoproteins, and theirphysiological processes. Prog. Lipid Res. 24: 19–67,doi:10.1016/0163-7827(85)90007-4
BOERSMA, M., C. SCHOPS, AND E. MCCAULEY. 2001. Nutritionalquality of seston for the freshwater herbivore Daphnia galeata3 hyalina: Biochemical versus mineral limitations. Oecologia129: 342–348.
BRETT, M. T. 2010. Is a low EPA growth saturation thresholdsupported by the data presented in Becker and Boersma(2005)? Limnol. Oceanogr. 55: 455–458.
———, D. C. MULLER-NAVARRA, AND J. PERSSON. 2009. Crusta-cean zooplankton fatty acid composition, p. 115–146. In M.T. Arts, M. T. Brett, and M. J. Kainz [eds.], Lipids in aquaticecosystems. Springer.
BRZEZINSKI, T., AND E. VON ELERT. 2007. Biochemical food qualityeffects on a Daphnia hybrid complex. Limnol. Oceanogr. 52:2350–2357, doi:10.4319/lo.2007.52.6.2350
FARKAS, T., K. KARIKO, AND I. CSENGERI. 1981. Incorporation of[1-C-14] acetate into fatty acids of the crustaceans Daphniamagna and Cyclops strenus in relation to temperature. Lipids16: 418–422, doi:10.1007/BF02535008
GLADYSHEV, M. I., N. N. SUSHCHIK, O. P. DUBOVSKAYA, O. N.MAKHUTOVA, AND G. S. KALACHOVA. 2008. Growth rate ofDaphnia feeding on seston in a Siberian reservoir: The role ofessential fatty acid. Aquat. Ecol. 42: 617–627, doi:10.1007/s10452-007-9146-7
———, ———, A. A. KOLMAKOVA, G. S. KALACHOVA, E. S.KRAVCHUK, E. A. IVANOVA, AND O. N. MAKHUTOVA. 2007.Seasonal correlations of elemental and omega 3 PUFAcomposition of seston and dominant phytoplankton speciesin a eutrophic Siberian Reservoir. Aquat. Ecol. 41: 9–23,doi:10.1007/s10452-006-9040-8
GLIWICZ, Z. M., AND W. LAMPERT. 1990. Food thresholds inDaphnia species in the absence and presence of blue-greenfilaments. Ecology 71: 691–702, doi:10.2307/1940323
GUILLARD, R. R. 1975. Cultures of phytoplankton for feeding ofmarine invertebrates, p. 26–60. In W. L. Smith and M. H.Chanley [eds.], Culture of marine invertebrate animals. PlenumPress.
GUSCHINA, I. A., AND J. L. HARWOOD. 2009. Algal lipids and effectof the environment on their biochemistry, p. 1–24. In M. T.Arts, M. T. Brett, and M. Kainz [eds.], Lipids in aquaticecosystems. Springer.
HECKMANN, L. H., R. M. SIBLY, M.J.T.N. TIMMERMANS, AND A.CALLAGHAN. 2008. Outlining eicosanoid biosynthesis in thecrustacean Daphnia. Front. Zool. 5: 11, doi:10.1186/1742-9994-5-11
HOCHACHKA, P. W., AND G. N. SOMERO. 2002. Biochemicaladaptation: Mechanism and process in physiological evolu-tion. Oxford Univ. Press.
LAMPERT, W. 1991. The dynamics of Daphnia in a shallow lake.Verh. Int. Ver. Limnol. 24: 795–798.
MARTIN-CREUZBURG, D., E. SPERFELD, AND A. WACKER. 2009.Colimitation of a freshwater herbivore by sterols and polyun-saturated fatty acids. Proc. R. Soc. Ser. B 276: 1805–1814,doi:10.1098/rspb.2008.1540
———, E. VON ELERT, AND K. H. HOFFMANN. 2008. Nutritionalconstraints at the cyanobacteria–Daphnia magna interface:The role of sterols. Limnol. Oceanogr. 53: 456–468,doi:10.4319/lo.2008.53.2.0456
———, A. WACKER, AND T. BASEN. 2010. Interactions betweenlimiting nutrients and associated consequences for growth andreproduction of Daphnia magna. Limnol. Oceanogr. 55:2597–2607, doi:10.4319/lo.2010.55.6.2597
MASCLAUX, H., A. BEC, M. J. KAINZ, C. DESVILETTES, L. JOUVE,AND G. BOURDIER. 2009. Combined effects of food quality andtemperature on somatic growth and reproduction of twofreshwater cladocerans. Limnol. Oceanogr. 54: 1323–1332,doi:10.4319/lo.2009.54.4.1323
MONOD, J. 1950. La technique de culture continue. Theorie etapplication. Ann. Inst. Pasteur 79: 390–410. [Technique ofcontinuous cultures. Theory and applications.]
MULLER-NAVARRA, D. C. 1995. Evidence that a highly unsaturat-ed fatty acid limits Daphnia growth in nature. Arch.Hydrobiol. 132: 297–307.
———. 2006. The nutritional importance of polyunsaturated fattyacids and their use as trophic markers for herbivorouszooplankton: Does it contradict? Arch. Hydrobiol. 167:501–513, doi:10.1127/0003-9136/2006/0167-0501
———. 2008. Food web paradigms: The biochemical view ontrophic interactions. Int. Rev. Hydrobiol. 93: 489–505,doi:10.1002/iroh.200711046
———, M. T. BRETT, A. M. LISTON, AND C. R. GOLDMAN. 2000. Ahighly unsaturated fatty acid predicts carbon transfer betweenprimary producers and consumers. Nature 403: 74–77,doi:10.1038/47469
———, ———, S. PARK, S. CHANDRA, A. P. BALLANTYNE, E.ZORITA, AND C. R. GOLDMAN. 2004. Unsaturated fatty acidcontent in seston and tropho-dynamic coupling in lakes.Nature 427: 69–72, doi:10.1038/nature02210
MURPHY, J., AND J. P. RILEY. 1962. A modified single solutionmethod for determination of phosphate in natural waters. Anal.Chim. Acta 27: 31–36, doi:10.1016/S0003-2670(00)88444-5
PAERL, H. W., AND J. HUISMAN. 2008. Climate—blooms like it hot.Science 320: 57–58, doi:10.1126/science.1155398
PARK, S., S. CHANDRA, D. C. MULLER-NAVARRA, AND C. R.GOLDMAN. 2004. Diel and vertical variability of seston foodquality and quantity in a small subalpine oligomesotrophic lake.J. Plankton Res. 26: 1489–1498, doi:10.1093/plankt/fbh136
PERSSON, J., M. T. BRETT, T. VREDE, AND J. L. RAVET. 2007. Foodquantity and quality regulation of trophic transfer betweenprimary producers and a keystone grazer (Daphnia) in pelagicfreshwater food webs. Oikos 116: 1152–1163, doi:10.1111/j.0030-1299.2007.15639.x
PIEPHO, M., D. MARTIN-CREUZBURG, AND A. WACKER. 2010.Simultaneous effects of light intensity and phosphorus supplyon the sterol content of phytoplankton. PLoS ONE 5: e15828,doi:10.1371/journal.pone.0015828
PORTER, K. G. 1975. Viable gut passage of gelatinous green algaeingested by Daphnia. Verh. Internat. Verein. Limnol. 19:2840–2850.
PRUITT, N. L. 1990. Adaptations to temperature in the cellularmembranes of crustacea—membrane structure and metabolism.J. Therm. Biol. 15: 1–8, doi:10.1016/0306-4565(90)90040-O
RAVET, J. L., AND M. T. BRETT. 2006. Phytoplankton essentialfatty acid and phosphorus content constraints on Daphniasomatic growth and reproduction. Limnol. Oceanogr. 51:2438–2452, doi:10.4319/lo.2006.51.5.2438
SCHLECHTRIEM, C., M. T. ARTS, AND I. D. ZELLMER. 2006. Effect oftemperature on the fatty acid composition and temporaltrajectories of fatty acids in fasting Daphnia pulex (Crustacea,Cladocera). Lipids 41: 397–400, doi:10.1007/s11745-006-5111-9
Eicosapentaenoic acid growth limitation of Daphnia 1283
SEIDENDORF, B., M. BOERSMA, AND K. SCHWENK. 2007. Evolutionarystoichiometry: The role of food quality for clonal differentiationand hybrid maintenance in a Daphnia species complex. Limnol.Oceanogr. 52: 385–394, doi:10.4319/lo.2007.52.1.0385
SPERFELD, E., AND A. WACKER. 2009. Effects of temperature anddietary sterol availability on growth and cholesterol allocationof the aquatic keystone species Daphnia. J. Exp. Biol. 212:3051–3059, doi:10.1242/jeb.031401
STANLEY-SAMUELSON, D. W. 1994. The biological significance ofprostaglandins and related eisosanoids in invertebrates. Am.Zool. 34: 589–598.
VAN DONK, E., M. LURLING, D. O. HESSEN, AND G. M. LOKHORST.1997. Altered cell wall morphology in nutrient-deficientphytoplankton and its impact on grazers. Limnol. Oceanogr.42: 357–364, doi:10.4319/lo.1997.42.2.0357
VON BERTALANFFY, L. 1957. Quantitative laws in metabolism andgrowth. Q. Rev. Biol. 32: 217–231, doi:10.1086/401873
VON ELERT, E. 2002. Determination of limiting polyunsaturatedfatty acids in Daphnia galeata using a new method to enrichfood algae with single fatty acids. Limnol. Oceanogr. 47:1764–1773, doi:10.4319/lo.2002.47.6.1764
———, D. MARTIN-CREUZBURG, AND J. R. LE COZ. 2003. Absenceof sterols constrains carbon transfer between cyanobacteriaand a freshwater herbivore (Daphnia galeata). Proc. R. Soc.Ser. B 270: 1209–1214, doi:10.1098/rspb.2003.2357
WACKER, A., AND D. MARTIN-CREUZBURG. 2007. Allocation ofessential lipids in Daphnia magna during exposure to poorfood quality. Funct. Ecol. 21: 738–747, doi:10.1111/j.1365-2435.2007.01274.x
———, AND E. VON ELERT. 2001. Polyunsaturated fatty acids:Evidence for nonsubstitutable biochemical resources inDaphnia galeata. Ecology 82: 2507–2520.
WEERS, P. M. M., K. SIEWERTSEN, AND R. D. GULATI. 1997. Is thefatty acids composition of Daphnia galeata determined by thefatty acid composition of the ingested diet? Freshw. Biol. 38:731–738, doi:10.1046/j.1365-2427.1997.00238.x
Associate editor: Thomas Kiørboe
Received: 07 October 2010Amended: 04 April 2011Accepted: 06 April 2011
1284 Sperfeld and Wacker