technical trading support system (ttss); a stock market
TRANSCRIPT

UNIVERSITY OF NAIROBI SCHOOL OF COMPUTING AND INFORMATICS
Technical Trading Support System (TTSS); A Stock Market Analyst Support System V
I ■■ By/ Ndiritu John Mwangi
P56/P/7781/02
Supervisor
GL Muchemi
February 2010
Submitted in partial fulfillment of the requirements of Masters of Science in
Information System.
University of N AIR O BI Library
B>4
Declaration
This project, as presented in this report, is my original work and has not
been presented for any other university award.
Student: John Mwangi Ndiritu (P56/P/7781/02)
Mi Z<sDate
AH
• b ^ H
This project has been submitted as partial fulfillment o f the requirement for
Masters of Science in Information System of the University of Nairobi with
my approval as the university supervisor
Supervisor: G L Muchemi.^School of Computing & informatics
University of NA IROBI
___BeSignature:. 1../................N AlflQB I Date: 2 - * 0 .
11
AbstractStock exchanges like the Nairobi Stock Exchange (NSE) release daily, weekly, and other periodic
data. This data, if filtered and stored can be of important use for stock market analysis using
technical analysis methods. Currently technical analysis tools are being developed due to their
perceived added advantage to those analysts who use them over those who don’t.
Emphasis has been on moving average based trading systems which are the simplest and most
popular trend-following systems among practitioners. According to the (dual) moving average
method is one of the few technical trading procedures that is statistically well defined.
Both the Simple Moving Average (SMA) and the Exponential Moving Average (EMA) have
been used in the system decision support. The Dual Moving Average Crossover system
generates trading signals by identifying when the short-term trend rises above or below the long
term trend
The goal of this project is to develop a Technical Trading Support System (TTSS), an
information system that uses selected technical indicators and charts overlay tool that can be
used by market analysts and professionals.
The system is developed to enable the users to store the data, to generate charts that aid data
visualization, identify trend and enhance analyst decision making process. System analysis, design
and development methods are used to analyze, design, document, build and test the system.
Technical Trading Support System (TTSS) J 2010
iii
I

Ackn o vvl edgment
I would like ro thank God by whose strength all this work is possible. 1 would like to
pass my sincere gratitude to my supervisor, L G Muchemi, for his support and guidance, and to
all the academic staff at the School of Computing and Informatics, University of Nairobi for
their effort ro ensure our success in this course.
My gratitude to all the specialist, stock brokerage firms and marker analysts who helped
me understand the technical trading rules and availed important information and data reouired
tor this project. They also gave genuine and fair criticism of the system during analysis, desighn,
development and evaluation stages.
My sincere thanks goes to my family, faith my wife and Children for their patience. Last
but nor least ro my fellow students during the entire period of this course. I say thanks to all. “Asanre Sana”

Technical Trading Support System (TTSS) 2010
Contents
Declaration...............................................................................................................................iiAbstract..................................................................................................................................iiiAcknowledgment.......................................................................................................................ivList of Figures.......................................................................................................................... viiiList of Abbreviations................................................................................................................... xGlossary..................................................................................................................................xiCHAPTER ONE........................................................................................................................... 1General Introduction.................................................................................................................. 1
1.1 Introduction.....................................................................................................................1
1.2 Background..................................................................................................................... 1
1.3 Statement of the Problem....................................................................................................2
1.4 Aim and objectives:............................................................................................................3
1.4.1 General Objective....................................................................................................... 3
1.4.2 Specific Objectives...................................................................................................... 3
1.5 Technical Trading Support System (TTSS)................................................................................ 3
CHAPTER TWO.......................................................................................................................... 5Literature Review......................................................................................................................5
2.1 Survey Studies..................................................................................................................5
2.2 Technical Analysis indicators and charts.................................................................................8
2.2.1 Time series............................................................................................................... 8
2.2.2 Moving Averages....................................................................................................... 9
2.2.3 MACD Decision System.............................................................................................. 13
2.2.4 Bollinger Bands (BB):..................................................................................................14
2.2.5 Momentum.............................................................................................................15
CHAPTER THREE..................................................................................................................... 16System Analysis and Design....................................................................................................... 16
3.1 Introduction.................................................................................................................. 16
3.2 System Analysis.............................................................................................................. 16
3.2.1 Stake holders.......................................................................................................... 16
3.2.2 Survey of ICT usage and features..................................................................................17
3.2.3 Requirements analysis...............................................................................................18
3.3 Analysis and design models for TTSS....................................................................................20
3.3.1 System context diagram for TTSS................................................................................. 20
3.3.2 Use case diagrams.................................................................................................... 20
3.3.3 Data Flow Diagrams.................................................................................................. 23
V
3.4 Data warehouse 26
3.5 Data base Design............................................................................................................27
3.6 Web Design...................................................................................................................29
3 .7 The Data centered Architecture..........................................................................................31
3.8 System Decomposition.....................................................................................................31
3.9 Modules Coding Strategy..................................................................................................34
CHAPTER FOUR.......................................................................................................................35System Implementation........................................................................................................... 35
4.1 Introduction..................................................................................................................35
4.2 Testing Strategy............................................................................................................. 35
4.3 Results.......................................................................................................................... 36
4.3.1 Home Page.............................................................................................................36
4.3.2 NSE index and stocks trend visualisation....................................................................... 37
4.3.2 Charts overlay module..............................................................................................38
4.3.3 Trend identification module.......................................................................................39
4.3.4 Comparative analysis tool..........................................................................................39
4.4 Comparison with similar and related tools........................................................................... 40
CHAPTER FIVE....................................................................................................................... 42Discussion............................................................................................................................ 42
5.1 TTSS Information System ................................................................................................ 42
5.2 Challenges................................................................................................................... 44
5.3 Research opportunities...................................................................................................44
5.4 Conclusion................................................................................................................... 45
Appendix A ..........................................................................................................................46
Daily Data from N S E ............................................................................................................46
Weekly Summary release on the N S E ............................................................................................ 48
Appendix ............................................................................................................................52
TTSS Evaluation Form 1.........................................................................................................$2
TTSS Evaluation Form 2........................................................................................................ -*5
Appendix ........................................................................................................................... 57
Sample code; ...................................................................................................................57
Sample Code. Graph console...............................................................................................58
Sample Code. Graph generator............................................................................................. 65
vi

Technical Trading Support System (TTSS) 5 2010
Sample code: Trend Identification... ................. 68
.................70.................... 74
Vit
List of FiguresFigure 2.1 NSE20 rime series..............................................................
Figure 2.2. Simple moving average....................................................
Figure 2.3. MACD and MACDH.....................................................
Figure 2.4. Negative and Positive diverge......................................
Figure 2.5. Bollinger bands.................................................................
Figure 3.1 System context diagram....................................................
Figure 3.2 Use Case Diagram 1...........................................................
Figure 3.3 Use Case Diagram 2...........................................................
Figure 3.4 Use Case Diagram 3...........................................................
Figure 3.5 Use Case Diagram 4...........................................................
Figure 3.6 Use Case Diagram 5...........................................................
Figure 3. Use Case Diagram 6...........................................................
Figure 3.8 Data Flow Diagram Level 0 .............................................
Figure 3.9 Data F low Diagram Level 1 ..............................................
Figure 3.10 Data Flow Diagram Level 2 ............................................
Fugure 3.1 1 Data Flow Diagram Level 2 ............................................
Figure 3.12 Data Flow Diagram Level 3 ............................................
Figure 3.13 Activity Diagram...............................................................
Figure 3.14 Data Warehouse Architecture........................................
Figure 3.15 Entity Relationship Diagram..........................................
Figure 3.16 Web Engineering process.................................................
Figure 3.17. TTSS Dara-centered architecture...................................
Figure 3.18a TTSS chart: Sub-programs architecture 1...................
Figure 3.18b TTSS Sub-programs architecture 2..............................
Figure 3.18c TTSS Sub-programs architecture 3..............................
Figure 3.19 TTSS modules coding strategy........................................
Figure 4.1 T TSS Testing Strategy..........................................................
r-’igure 4.1 I TSS home page...................................................................
Figure 4.2 TTSS Stock Analysis web page 1.......................................
Figure 4.3 TTSS Stock Analysis web page 2.......................................
Figure 4.4 NSF.20 index trend and Bamburi......................................
lgurv 4.5 Chart Overlay NSF.20 index trend and Bamburi k Ltd.
viii
...n
.. 10
..13
..13
. 14
.2d
.20
.21
21
21
22
23
.. 23
.. 24
.24
.24
25
.26
29
30
31
*.. .)j
.. 33
.. 34
. 35
.36
. 37
37
38
38

Technical Trading Support System (TTSS) \ 2010
Figure 4.6 Lagging Indicators.................................................................................................39Figure 4.7 Trend Identification and Decisions........................................................................39
Figure 4.8 Cycles Comparison and Analysis............................................................................40

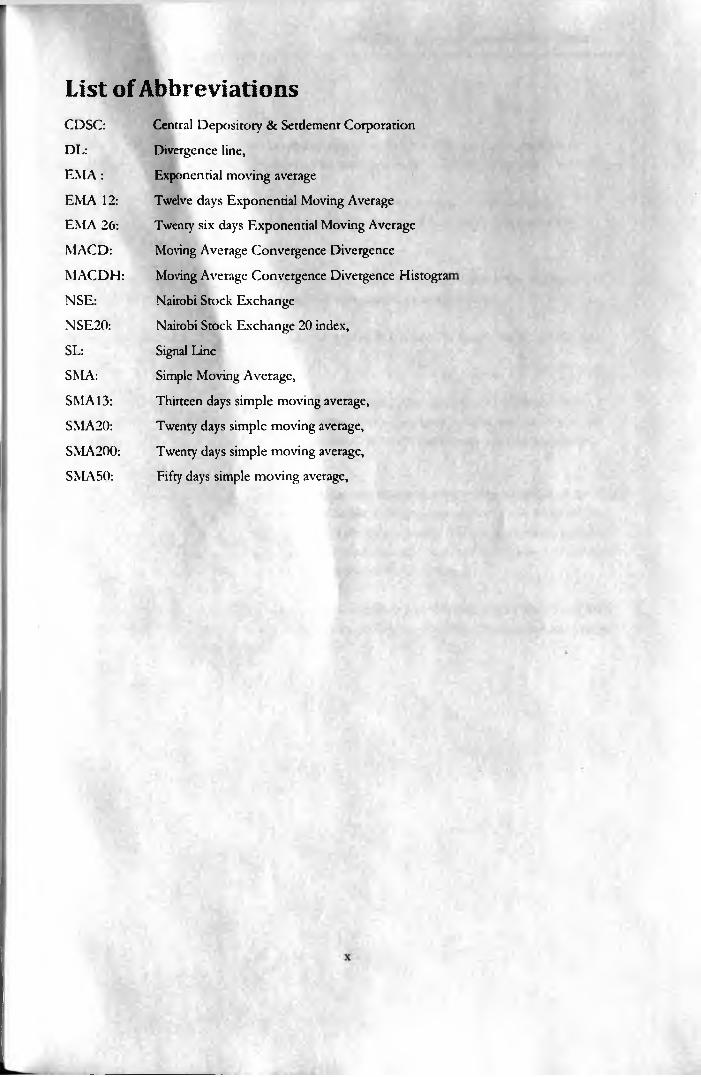
List of AbbreviationsCDSC: Central Depository & Settlement CorporationDL: Divergence line,EMA : Exponential moving average
EMA 12: Twelve days Exponential Moving AverageEMA 26: Twenty six days Exponential Moving Average
MACD: Moving Average Convergence Divergence
MACDH: Moving Average Convergence Divergence Histogra
NSE: Nairobi Stock ExchangeNSE20: Nairobi Stock Exchange 20 index,SL: Signal LineSMA: Simple Moving Average,
SMA13: Thirteen days simple moving average,
SMA20: Twenty days simple moving average,
SMA200: Twenty days simple moving average,
SMA 50: Fifty days simple moving average,


Technical Trading Support System (TTSS) | 2010
Glossary
DFD: A Data Flow Diagram is a graphical representation of the flow of data through an information system. DFDs can also be used for the visualization of data processing
ERD: Entity Relation Modeling is a data modeling technique that creates a graphical representation of the entities and the relationships between entities within an informationsystem.
Fundamental analysis: of a business involves analyzing its financial statements and health, its management and competitive advantages, and its competitors and markets.
Rule-based trading: Rule-based trading is an approach intended to create trading plans using strict and clear-cut niles.
MACD which stands for Moving Average Convergence / Divergence, is a technical analysis indicator shows the difference between a fast and slow exponential moving average (EMA) of closing prices. Since it is based on moving averages, MACD is inherently a lagging indicator
Technical Analysis: ‘The technical approach to investment is essentially a reflection of the idea that prices move in trends that are determined by the changing attitudes of investors toward a variety of economic, monetary, political, and psychological forces. The art of technical analysis, lor it is an art, is to identify a trend reversal at a relatively early stage and ride on that trend until the weight of the evidence shows or proves that the trend has reversed”.
Technical System: A technical trading system consists of a set of trading rules that result from parameterizations, and each trading rule generates trading signals (long, short, or out of market) according to their parameter values.
xi

Technical Trading Support System (TTSS) 2010
CHAPTER ONE
General Introduction
1.1 Introduction
Technical Trading Support System (TTSS) is an information system that responds to the business needs of Nairobi Stock Exchange (NSE) market analysts or professional. It transforms index and stock prices data released periodically at the NSE to useful information. The data is filtered before being stored in a repository, the analyst can then generate charts, identify trend and establish appropriate investment timing by the use of this system by use of technical indicators.
1.2 BackgroundThe financial markets are dominated by powerful computer systems and driven by the
needs of demanding and cost-conscious investors who want the capability to trade rapidly across dme zones, currencies and types of securities. In addition, the dramatic increase in the use of the Internet is opening up new avenues of trading opportunity at a rapid pace and therefore increasing the pressure on stock exchange.
The growth of the NSE securities market and the corresponding demand for immediate and accurate information processing have driven the need for improvement of ICT at the stock exchange. NSE, register stock trading companied, Central Depository & Settlement Corporation (CDSC) and regulating bodies have information systems their core functions, e.g., to support online trading and securities ownership management systems.
The transaction processing and operation system at the NSE and individual listed companies generate periodic data that provide scant information on general market trends. ITiese data include (see Appendix A);
• Daily NSE20 index, NSE All index and stock prices that give the daily trading summaries,
• Weekly summary index and stocks data,• Company reports that include quarterly semiannual and annual reports, and• Other market statistics and company reports
1

Analyst and trader, even if will, cannot follow and interpret these voluminous numerica There thus need for tools to store the data, generate visible graphs and charts. Existing tc the market provide limited choice of indicators and are not flexible to the user’s needs. Inv< stock market analysts, technical and professional staff require readily available tool for coi this data that is released by the NSE, extracting and visualizing important timely inforn from these data to support their trading decisions.
Computerization has increased productivity at the NSE. The introduction of compute trading has done away with the trading floor and trading clerks. But there is need to inc interest and understanding of market trends to increase investor’s confidence and participa Tools to assist in visualization and interpretation of the voluminous periodic data released the exchange transaction processing systems.
Investors and analysts need to find market-related information such as scientific analyse stock prices, bond and stock index and public announcements through the internet. There 01
to be systems to provide economic and financial information from both fundamental ana and technical analysis of market data. TTSS is one tool that seeks to build on existing tool use technical trading rules.
In this project is aimed at
• Conducting a pilot survey to establish the use of technical trading support tools : identify areas that required improvements.
• Design and build a tools for data visualization, chart overlay, identifying market trei and supporting trading decisions,
1-3 Statement of the Problem
The NSE, Companies listed on the NSE, and individual listed companies release dai weekly and other periodic data from the trading at the NSE and company reports and financ statements. Most of this data is not collated or represented in a ways investment managers at trader can visualize market trends and acquire business intelligence. In this project, tools for: da warehousing, calculating technical analysis benchmarks, visualizing cycles and pattern overlaying graphs, will be developed.
Individual analyst, technical and professional staff in the share investment industry ca increase their returns by analyzing stock exchange index and stock prices data released by th exchange on periodic basis. There is need for tools to support the analyst visualize and extrac important information available in these voluminous data. Technical analysis chart overlay ant trading mles if implemented would provide the necessary support system. Therefore, in order t( support individual analysts, companies and portfolio managers in data warehousing, extracting business intelligence, calculating technical analysis benchmarks, identifying trends, visualizing trends and overlaying graphs required tools are developed.
2
Technical Trading Support System [TTSS) I 2010
1.4 Aim and objectives:
1.4.1 General Objective
To develop easily accessible tools for storing, analyzing and visualizing trends and cycles using technical analysis methods, with a goal to informing and supporting decision making for the market professionals, investment managers and other interested stakeholders.
1.4.2 Specific ObjectivesThe main focus of this project is to develop tools:
• To establish a database to collate all data frequendy released by the NSE on daily weekly and monthly
• To calculate technical analysis indicators necessary for decision making, the concepts of Simple moving average, Exponential moving average, Moving average convergence divergence (MACD) are calculated and necessary charts generated.
• To develop tools for identifying and visualizing existing patterns in the enormous volumes of data.
• To offer the analyst and investment managers’ decision support tools with the hope that in the long run it will lead to profitable investment decisions.
1.5 Technical Trading Support System (TTSS)
A technical trading system comprises a set of trading rules that can be used to generate trading signals. In general, a simple trading system has one or two parameters that determine the timing of trading signals. Each rule contained in a trading system is the results of parameterizations. For example, the Dual Moving Average Crossover system with two parameters (a short moving average and a long moving average) may be composed of hundreds of trading rules that can be generated by altering combinations of the two parameters. Among technical trading systems, the most well-known types of systems are moving averages, channels (support and resistance), Bollinger bands, momentum oscillators, and filters. These systems have been widely used by academics, market participants or both, and, with the exception of filter rules, have been prominendy featured in well-known books on technical analysis, such as Schwager (1996), Kaufman (1998), and Pring (2002). The trading rules in our system will be based on simple and exponential moving averages.
The final product of this project is an information system referred to as Technical Trading Support System (TTSS) that capture and manages data to produce useful charts and information that support investment managers, market traders, stock brokers, investors, investment analysts and other parties interested in performing market analysis. The aim is to place the interested party at a competitive advantage while trading and investing in the market.
3

Data for the NSE index and stock prices is filtered from the daily data released from t exchange. Important technical analysis indicators; simple moving averages (SMA), exponent moving averages (EMA), moving average convergence divergence (MACD) and MAC' histogram are calculated and stored in a data base. The system enables the user perform char overlay which is an important part in technical trading systems. The user can also view a: identify market trend, and acquire buy or sell (go long or go short) decision support for tit general market index and also for the individual stocks.
TTSS can be generally classified as knowledge worker system for it is aimed as technical ao; professional staff in the share investment industry. Its theme is market analysis using techma analysis methods an area that presumes that market behavior is not random but portray predictable cyclic behavior. It thus focuses on the data analysis as well as generating time information for decisions on market related issues.
TTSS has been constructed using a web user interface to enhance the chance of a remote user. This would enable organizations, e.g. an investment bank, stockbrokerage film or investment advisers to host it on their web page to enhance on their customer services.
Chapters are arranged such that they follow the system analysis and design procedure. We star: with general introductions in chapter one and move to literature review that looks at retiree work in techmcal analysis and give the required foundation. The other chapters are, system analysis, system design, system implementation, and finally discussions.
4

Technical Trading Support System (TTSS) 2010
CHAPTER TWO
Literature Review
2.1 Survey StudiesTechnical analysis is a forecasting method of price movements using past prices, volume,
and open interest. Pring (2002), a leading technical analyst, provides a more specific definidon: “The technical approach to investment is essentially a reflection of the idea that prices move in trends that are determined by the changing attitudes of investors toward a variety of economic, monetary, political, and psychological forces. The art of technical analysis, for it is an art, is to identify a trend reversal at a relatively early stage and ride on that trend until the weight of the evidence shows or proves that the trend has reversed.”
Technical analysis is a form of analysis which seeks to make judgments about the performance of a share based solely on its historic and current price behavior and without reference to the underlying business, the sector the company's in, or the economy as a whole.
The technician uses charts and computer programs to identify and project price trends. The analysis includes studying price movements and trading volumes to determine patterns such as Head and Shoulder Formations and W Formations. Other indicators include support and resistance levels, and moving averages. In contrast to fundamental analysis, technical analysis does not consider a corporation's financial data.
The concept of trend trading is posited on the belief that trends, whether positive or negative, can be identified early and taken advantage of by astute investors. The study of such trends is called technical analysis. Technical analysts believe in the idea that all relevant information on a security's value is reflected in its market price. And that, over time, price and volume movements create patterns that can reveal the future moves of a security in question, and taken advantage of. This is in contrast to the well established form of security analysis termed fundamental analysis, wherein analysts study financial statements and reports of various firms so as to identify strong performers according to various ratios, and statistics. To a true fundamental analyst, temporal price and volume action may be completely unrelated to fundamental aspects of a security's strength.
Technical Analysis is sometimes erroneously believed to be a relative newcomer among the various philosophies of trading. It is actually one of the oldest. Technical analysis methods
5
can be traced back to the late 19 century. The idea of market indices that would offer the public with information on business activity in the emerging markets started to emerge. Technical analysis methods have since been used to predict future movements of security prices.
Technical trading rules have been used in financial markets for over a century. Numerous studies have been performed to determine whether such rules can be employed to provide superior investing performance. Considerable research has been conducted on the effectiveness of technical analysis and mechanical trading rules to ascertain the efficiency of the stock and commodity futures markets. By and large, the recent academic literature suggests that technical trading rules are capable of producing valuable economic signals.
In efficient market models, such as the martingale model and random walk models, technical trading profits are not feasible because, by definition, in efficient markets current pnces reflect all available information (Fama, 1970) or it is impossible to make risk-adjusted profits net of all transaction costs by trading on the basis of past price history (Jensen (1978)). Ever since the inception of the “random walk” model o f stock and futures prices promoted by Samuelson (1965) and Fama (1970), the utility of technical trading systems has been largely discounted on a theoretical basis. Since the random walk model contends that price fluctuations occur randomly, technical systems which rely upon the existence of price trends cannot be profitable in the long run.
Neftci and Policano (1984) examined the efficacy of two mechanical trading rules as applied to gold and Treasury bill futures, and found that such rules could be profitable over certain time periods. Tomek and Querin (1984) studied simulated data to show the existence of trends in a random series of numbers, implying that mechanical trading rules could perform a useful role. However, they found that these trends did not recur with measurable regularity.
Numerous studies in the finance literature have investigated technical analysis to determine its validity as an investment tool. Several of these studies conclude that technical analysis does have merit. Recent empirical studies, including Carter and Van Auken's (1990) survey of U.S. based investment managers and Taylor and Allen's (1992) survey of London based foreign exchange dealers, have confirmed the extensive use of technical analysis models for trading and portfolio management by market professionals.
Financial technical analysts mainly use microcomputer systems relieving chartists of manual chart keeping, a review of technology is provided by Schmerken (1989). However, in Taylor and Allen's (1992) study, forecasting was largely undertaken by a visual inspection of charted historic prices.
From the Technical Analysis literature, works by LeBaron et al. (1995), provided strong support for the technical analysis being able to predict some variability on the financial markets. They tested the two most popular trading rules - Moving Averages and Trading Range Break by utilising the Dow Jones Index from 1 <897 to 1986.
6
Technical Trading Support System (TTSS) I 2010
In more comprehensive study of technical trading rules using 90 years of daily stock pnces, Brock, Lakonishok, and LeBaron (1992) found that 26 technical trading rules applied to the Dow Jones Industrial Average significandy outperformed a benchmark of holding cash.Their findings are especially strong since every single one of the trading rules they considered was capable of beating the benchmark. When taken at face value, these results indicate either that the stock market is not efficient even in the weak form although a class of researcher contend this assertion.
Chart pattern studies test the profitability or forecasting ability of visual chart patterns widely used by technical analysts. Well-known chart patterns, whose names are usually derived from their shapes in bar charts, are gaps, spikes, flags, pennants, wedges, saucers, triangles, head- and-shoulders, and various tops and bottoms (Schwager 1996). The tools developed in this project will generate chart useful in indentifying these chart patterns for analysts.
Over time, investors have experimented with technical trading rules drawn from a very wide universe, in principle, thousands of parameterizadons of a variety of types of rules. As time progresses, the rules that happened to perform well historically receive more attention and are considered ‘serious contenders’ by the investment community, while unsuccessful trading rules are more likely to be forgotten. After a long sample period, only a small set of trading rules may be left for consideration, and these rules’ historical track record will be cited as evidence of their merits. If enough trading rules are considered over time, some rules are bound by pure luck, even in a very large sample, to produce superior performance even if they do not genuinely possess predictive power over asset returns.
While there is no final agreement between traders and academicians about the efficiency of the foreign exchange or stock market, the old fashioned view in economic books that exchange rates and equity prices follow a random walk has been dismissed by many research works [Tenti 1996]. There is however strong evidence indicating the returns are not independent of past changes.
The prices of many commodities reflect seasonal cycles. Due to the agricultural nature of most commodities, these cycles are easily explained and understood. However, for some securities, the cyclical nature is more difficult to explain. Theories as to why certain securities exhibit cyclical patterns range from weather and sun spots, to planetary movement and basic human psychology. I feel human psychology is responsible.
We know that prices are a consensus of human expectations. These expectations are always changing, shifting the supply and demand lines, and causing prices to oscillate between overbought and oversold levels. Fluctuations in prices are a natural process of changing expectations and lead to cyclical patterns.
One of the limitations is that Technical Analysis or Time Series Analysis techniques do not include or take into account a number of factors such as macroeconomical or political
7

effects, whether it be national or international, which may seriously influence the equity marker Technical Analysis as its name suggests does not study the cause of the price move; it is the studies of the pattern o f the price movements.
From one of the most detailed review on the profitability of technical analysis, Park Cheol- Ho and Irwin S H. (2004), states and I quote, “Early studies indicated that technical trading strategies were profitable in foreign exchange markets and futures markets, but not in stock markets before the 1980s. Modern studies indicated that technical trading strategies consistently generated economic profits in a variety of speculative markets at least until the early 1990s. Among a total of 92 modern studies, 58 studies found positive results regarding technical trading strategies, while 24 studies obtained negative results. Ten studies indicated mixed results. Despite the positive evidence on the profitability of technical trading strategies, it appears that most empirical studies are subject to various problems in their testing procedures, e.g., data snooping, ex post selection of trading rules or search technologies, and difficulties in estimation of risk and transaction costs”. Future research must address these deficiencies in testing in order to provide conclusive evidence on the profitability of technical trading strategies.
More studies and research has been done on application of information systems in financial markets and profitability of technical trading rule including in areas such as recurrent neural networks, and Artificial Intelligence, (See Tend, Paolo 1996, Trippi, et. al. 1996), Mehta, Mahendra, 1998)
The investments and the market timing signals as implemented in outsourced systems may not address trading rules at the NSE, transaction cost, and market characteristic specific to the NSE and its mvestors. It’s also important to note that outsourced systems may be not be suitable for NSE investors depending on their specific investment objectives and financial position. There is thus a need for continued research and effort to develop local system and tool for emerging markets.
This project builds on the wide research work on technical analysis trading methods by automating some of the basic chart generation and overlay methods, trend identification and trading rules. This is a foundation to more research in the area of automated trading system. We will not thus focus on the profitability but rather the procedures used in chart generation and technical indicator calculation
2.2 Technical Analysis indicators and charts
2.2.1 Time seriesAny series of measurements of anything at all that are usually taken at regular inten als. A
time series is a sequence of data points, measured typically at successive times, spaced at (otren
uniform) time intervals. Time series forecasting is the use of a model to forecast future c\ ent-
based on known past events. To forecast future data points before they are measured. A
8
Technical Trading Support System (TTSS) 2010
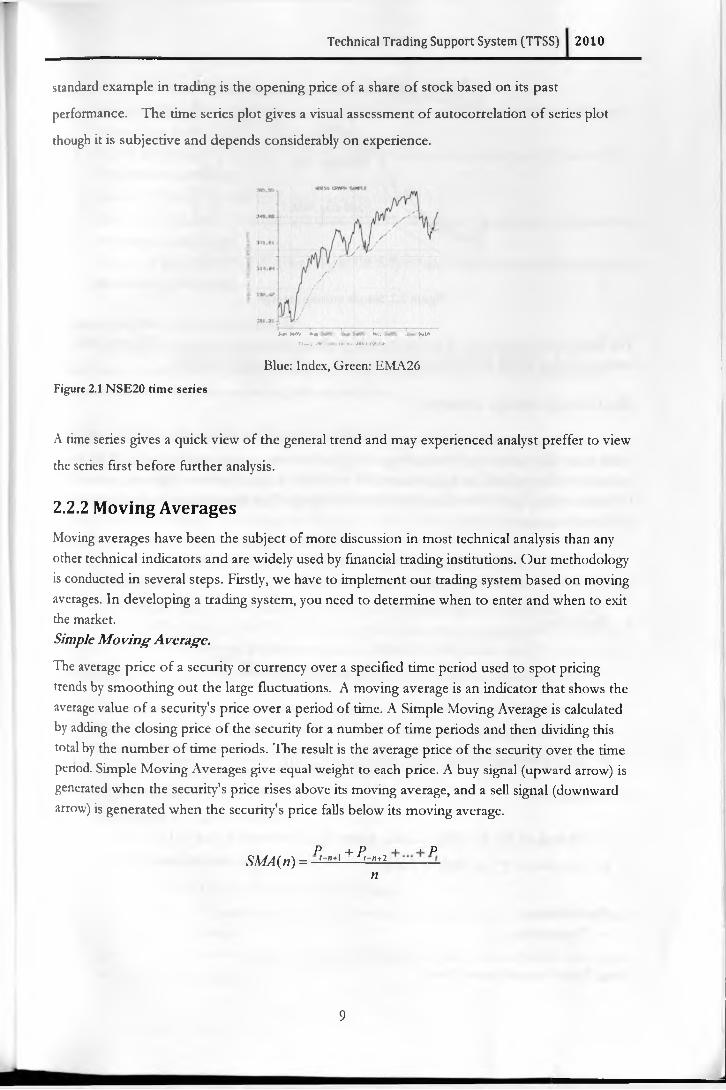
standard example in trading is the opening price of a share of stock based on its past
performance. The time series plot gives a visual assessment of autocorrelation of series plot
though it is subjective and depends considerably on experience.
*in K /fi frju IV,. Jvl<*
u*- i «'*••• t * t . /oi*> <•* :/
Blue: Index, Green: EMA26Figure 2.1 NSE20 rime series
A time series gives a quick view of the general trend and may experienced analyst preffer to view
the series first before further analysis.
2.2.2 Moving AveragesMoving averages have been the subject of more discussion in most technical analysis than any other technical indicators and are widely used by financial trading institutions. Our methodology is conducted in several steps. Firstly, we have to implement our trading system based on moving averages. In developing a trading system, you need to determine when to enter and when to exit the market.Simple M oving A verage.
The average price of a security or currency over a specified time period used to spot pricing trends by smoothing out the large fluctuations. A moving average is an indicator that shows the average value of a security's price over a period of time. A Simple Moving Average is calculated by adding the closing price of the security for a number of time periods and then dividing this total by the number of time periods. The result is the average price of the security over the time penod. Simple Moving Averages give equal weight to each price. A buy signal (upward arrow) is generated when the security's price rises above its moving average, and a sell signal (downward arrow) is generated when the security's price falls below its moving average.
P A- P i i pSMA(n) = - ^ + l 1'-*+2
n
9

Figure 2.2. Simple moving average
The figure above shows two of the most popular simple moving averages: the 200 days simple moving average (SMA 200) and the 50 day simple moving average (SMA50).
D ual M oving A verage C rossover
Moving average based trading systems are the simplest and most popular trend-following systems among practitioners. According to the (dual) moving average method is one of the few technical trading procedures that is statistically well defined. The Dual Moving Average Crossover system generates trading signals by identifying when the short-term trend rises above or below the long-term trend.
Although the period and type of the moving average can change the general specifications of the moving average system are as follows:
a. Definition.V
V p ci-i+\• Shorter Moving Average over s days at time t, SMA, = —--------, where P,c is the close at
stime s and s <t.
• Longer Moving Average over 1 days at time t, SML, = ——---- , where s < 1 £ t
b. Trading rules
• Go long at P°+x if, SMA, > LMA, where /£, is the open at time t +1.
• Go short at P°+] if SMA, < LMA,
c. Parameters• Parameters: s, /.
Long Trend identification Rules
10
Technical Trading Support System (TTSS) 2010
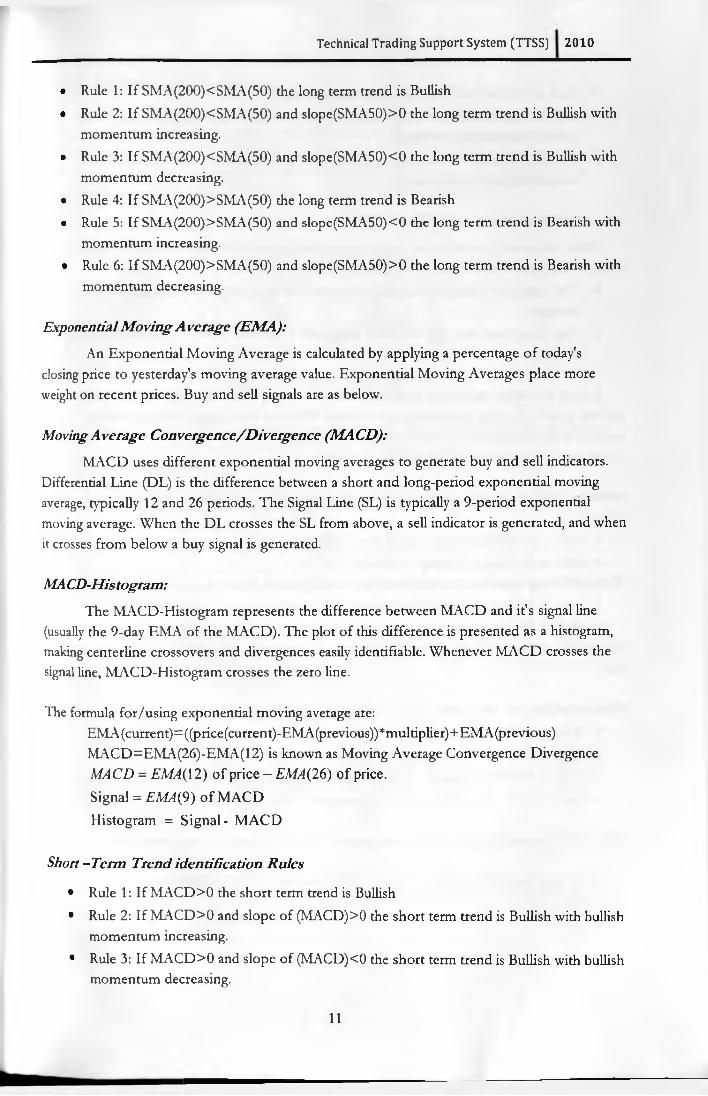
• Rule 1: If SMA(200)<SMA(50) the long term trend is Bullish• Rule 2: If SMA(200)<SMA(50) and slope(SMA50)>0 the long term trend is Bullish with
momentum increasing.• Rule 3: If SMA(200)<SMA(50) and slope(SMA50)<0 the long term trend is Bullish with
momentum decreasing.• Rule 4: If SMA(200)>SMA(50) the long term trend is Bearish• Rule 5: If SMA(200)>SMA(50) and slopc(SMA50)<0 the long term trend is Bearish with
momentum increasing.• Rule 6: If SMA(200)>SMA(50) and slope(SMA50)>0 the long term trend is Bearish with
momentum decreasing.
Exponential M oving A verage (EMA):
An Exponential Moving Average is calculated by applying a percentage of today's closing price to yesterday's moving average value. Exponential Moving Averages place more weight on recent prices. Buy and sell signals are as below.
Moving Average Convergence/Divergence (MACD):
MACD uses different exponential moving averages to generate buy and sell indicators. Differential Line (DL) is the difference between a short and long-period exponential moving average, typically 12 and 26 periods. The Signal Line (SL) is typically a 9-period exponential moving average. When the DL crosses the SL from above, a sell indicator is generated, and when it crosses from below a buy signal is generated.
MA CD-Histogram:
The MACD-Histogram represents the difference between MACD and it's signal line (usually the 9-day EMA of the MACD). The plot of this difference is presented as a histogram, making centerline crossovers and divergences easily identifiable. Whenever MACD crosses the signal line, MACD-Histogram crosses the zero line.
The formula for/using exponential moving average are:EMA (current)=((price(current)-EMA(previous))*multiplier)+EMA (previous) MACD=EMA(26)-EMA(12) is known as Moving Average Convergence Divergence MACD = EMA{ 12) of price - EMA{26) of price.Signal = EMA{9) of MACD Histogram = Signal - MACD
Short -Term Trend identification Rules
• Rule 1: If MACD>0 the short term trend is Bullish• Rule 2: If MACD>0 and slope of (MACD)>0 the short term trend is Bullish with bullish
momentum increasing.
• Rule 3: If MACD>0 and slope of (MACD)<0 the short term trend is Bullish with bullish momentum decreasing.
11
• Rule 4: If MACD<0 the short term trend is Bearish• Rule 5: If MACD<0 and slope o f (MACD)<0 the short term trend is Beansh with
bearish momentum increasing.• Rule 6: If MACD<0 and slope o f (MACD)>0 the short term trend is Bearish with
bearish momentum decreasing.
B uy & S e ll decisions using SM A & EM A
When two moving averages are employed, the longer one is used for trend identification i: a longer term) and the shorter one for timing purposes or indicator.
• The Long term decisions are made using the 200 days and 50 days simple moving averages.
• The Short term decisions are made using the 26 days and 12 days exponential moving averages.
Buying and selling signals are generated when the short period moving average rises above (or falls below), the long period moving averages. When the short-period moving average penetrates the long-period moving averages, a trend is considered to exist, and theoretically traders can generate profits from trading the market.
Mathematically the trading rules in their simplest form can be expressed as follows using SMA(n):
• Rule 1: If (SMA(n period) < Pt) then "Sell", and• Rule 2: If (SMA(n period) > Pt) then "Buy".
Where SMA(n period) is the simple moving average price of n period, and P t: the current price• Rule 3: If (EMA(n period) < Pt) then "Sell", and• Rule 4: If (EMA(n period) > Pt) then "Buy".
Where EMA(n period) is the exponential moving average price of n period, and P t: the current price.
When including the Transaction costs as bands then the trading rules can be modified to:• Rule 1: If SMA(n period) - Pt > Transaction Costs then "Sell",• Rule 2: If Pt - SMA(n period) > Transaction Costs then "Buy",• Rule 3: If EMA(n period) - Pt > Transaction Costs then "Sell", and• Rule 4: If Pt - EMA(n period) > I ransaction Costs then "Buy".
Where SMA(n period): the moving average price of n period, and P t : the current price.
The rules were extended so that the signals were generated only if the differences cover the transaction costs.
12

Technical Trading Support System (TTSS) 2010...........................................................J-Mfnntn, rnM(M.n>trrnMm. r. r , rr. . r1. . , , , nnrnr, , |,nf, n, r. , 1111, „ . , 1m, , , Mrf, rpwtwwttwM(ww 8tM w tw(| wwwwww^ WMC>Mw.
2.2.3 MACD Decision SystemT he MACD-Histogram represents the difference between the MACD and its trigger line,
the T day EMA ot MACD. The plot ot this difference is presented as a histogram, making centerline crossovers and divergences easily identifiable. A centerline crossover for the MACD- Histogram is the same as a moving average crossover tor MACD. If you will recall, a moving average crossover occurs when MACD moves above or below the trigger line.
Figure 2.3. MACD and MACDH
• Buy when MACD-histogram declines below its centerline and its slope turns up. Place a stop-loss order below the low of the price bar corresponding to the lowest bar of MACD-Histogram.
• Sell when M ACD-histogram rallies above its centerline and then its slope nuns down. Place a stop-loss order above the high of the price bar that corresponds to the highest bar of MACD-histogram.
• The best buy signals are given by bullish divergences between MACD-histogram and price. When prices decline to a lower or equal low but MACD-histogram holds above its previous low, buy as soon as the indicator ticks higher, Place a stop below the price low corresponding to the Latest bottom in MACD-histogram.
• 1 he best signals to sell short are given by bearish divergences between MACD-histogram and Price. When prices rise to a new high but MACD-histogram makes a lower top, sell as soon as the indicator ticks lower. Place a stop above the high associated with the tallest bar of MACD-histogram at the second top.
Figure 2.4. Negative and Positive diverge
1 The first point shows a sharp positive divergence in the MACD Histogram that preceded a Bullish Moving Average Crossover.
13

I
2. On the second point, rhe M AO) continued to new Highs but the MACD-Histogram ion-net,: two equal Highs. Aithough not a textbook case ot Positive Divergence, rhe equal High failed to confirm the strength seen in rhe MACD.
>. A Positive Divergence formed when the M.ACD-Histogram formed a higher Low and -K MACD continued lower.
4. A Negative Divergence formed when rhe MACD-Histogram formed a lower High and f M ACD continued higher.
MACDH rules.
1. IT- {|MACDH<()]&&|slope (MACDH)>()| then place a stop loss- buy order,2. IP {[MACDH>()]&&[slope (MACDH)<0| then place a stop loss- sell order,3. IP {|MACDH<()]&&|slope (MACDH)>0]&&[sIope (price)<0]} THEN Bullish Diverges^
IMPIA place stop-loss buv signal.4. IP {[MACDH >0]&&[slope (MACDH)<0|&&[slope (price)>0]} THEN Bearish Divergen
1 MPT A place stop-loss sell signal.
2.2.4 Bollinger Bands (BB):Developed bv John Bollinger, Bollinger Bands are an indicator that allows users to c< par-
volatility and relative price levels over a period time. The indicator consists of three bands designed to encompass the majority of a security's price action.
• A simple moving average in the middle. The centre band is the 20-day simple moving average.
• An upper band (SMA plus 2 standard deviations)• A lower band (SMA minus 2 standard deviations)
Using the standard deviation ensures that the bands will react quickly to price movement and reflect periods of high and low volatility. Sharp price increases (or decreases), and hence volatility, will lead to a widening of the bands. Closing prices are most often used to compute Bollinger Bands.
Figure 2.5. Bollinger bands
By themselves, Bollinger Bands serve two primary functions:• To identify periods of high and low volatility• To identify periods when prices are at extreme, and possibly unsustainable, !e\ek
Other aspects of technical analysis, such as momentum, moving averages and rcrracemen >. ».-■ then be employed to help determine the direction of the potential breakout.
14

Technical Trading Support System (TTSS) \ 2010
2.2.5 Momentum
Momentum is the measure of a price difference (change) over time. The amount of price change and how long it took arc the basis for many different indicators that have been developed to help provide information on price, volume and trend integrity. Momentum is a technical analysis indicator calculated by subtracting a stock's closing price N days ago from the today's closing price, where N is an input parameter.
15
f
CHAPTER THREE
System Analysis and Design
3.1 Introduction
A high technology system encompasses a number of elements: software, hardware, people, database, documentation and procedures. System engineering helps to translate requirements into a model ot a system that makes use of one or more of these elements.
In order to attain the goals of this project, I, have endeavored to apply systematic, disciplined, quantifiable approach to the development, operation, and maintenance of software; that is, the application of software engineering.
System engineering begins bv taking a world view. A business domain or product is analyzed to establish all the product requirements. Focus is then narrowed to domain view (module) where each ot the system elements is analyzed individually.
3.2 System Analysis3.2.1 Stake holders
TTSS can be generally classified as knowledge worker system for it is aimed as technical and professional staff in the share investment industry. Its theme is market analysis using technical analysis methods an area that presumes that market behavior is nor random but portrays predictable cyclic behavior. It thus focuses on the data analysis as well as generating timely information for decisions on marker related issues. The core stakeholders can be identified as; •
• Technical and professional staff in the share investment industry, these include o Market analysts involved in the equities trading business, o Brokers and stock brokerage firms, o Investment banks and asset managers, o Interested exchange officials,o Tactician/Financial analyst and Foreign Exchange specialists
16
O Traders, Dealers, Portfolio Managers, Commodities , Derivatives and Fixed Income markets analysts,
• Remote web users; TTSS has been constructed using a web user in mind to enhance the chance ol a remote user. This would enable organizations, e.g. an investment bank, stockbrokerage film or investment advisers to host it on their web page to enhance on their customer services.
• The system designer and system builder; This is the goal of this project and 1 thus play the role of the system analyst and builder.
3.2.2 Survey of ICT usage and features
A pilot study conducted to identify feature available and general ICT usage in the enterprises of the equity market financial sector and regulating bodies. The goal of this preliminary survey was to evaluate the current status of ICT usage, marker players’ awareness of technical trading methods. This survey, although very general, helped to establish the compatibility of the system envisioned to data and other systems in use within the sector. The survey was conducted by;
• F valuation of web sites of enterprises of the equity market financial sector,• Interviewing officials and trading clerical of brokerage firms,• Interviewing officials and trading clerical at the NSF, and• ( )bservarional visits to the NSF trading floor and online trading points at registered
brokerage firms.
From the survey we realised that ICT usage among enterprises of the equity marker financial sector is wide spread into almost all their operations. These include
• E-banking; this was evident between banks and stockbrokers and investment banks where stockbrokerage firms can monitor their account status online.
• Electronic fund transfer is applied by stock brokers to pay investors, and by the NSF registered companies to pay dividends to investors.
• Share ownership management tools; Share ownership and changes in ownership of all securities are effected by book entries in the securities accounts that shareholders maintain with the brokerage firms and updates made with the Central Depository Settlement Corporation (CDSC) (a statutory body that manage equity ownership).
• Portfolio management tools. These were maintained by agents, stock brokerage firms and investment banks.
The NSF. is responsible for the system which connects brokerage companies to NSF. and allows for the processing and delivery of orders, order-match execution, execution confirmation and the dissemination of market information on behalf of NSF. The computerized system at the NSF. provides a fair and transparent order routing and execution trading system with price and time priority'. It is also more efficient as trades are matched instantaneously, regardless of volume, resulting in capacity for high nirnover. This makes for a more liquid marker.
Technical Trading Support System (TTSS) I; 2010
17
Wirh scripless settlement at the NSE, the number of back office staff has decreased, and there is no need for manual sorting of share certificates. Stockbrokers' workstations provide comprehensive information about the market, such as market summary, aggregate quantity of outstanding orders at each price, number of shares transacted at each price, and corporate actions. Such information has increased the transparency of the marker and stockbrokers are in j better position to inform investors.
Feature not available: The following features were identified as missing or leastdeveloped;• Investment research tools to collate and map the summary data released on periodic
basis by the NSE,• Historical stock charts generating and overlay tools.• Access to real-time quotes, trend identification and biiv/sell decision support tools• Online analysts’ evaluation and opinion of the market trends and events. This is a
common feature in developed online trading sites.
3.2.3 Requirements analysis
Requirements engineering provides a bridge to design and constructions. Requirements analysis provides the appropriate mechanism for understanding what user wants, analyzing need, assessing feasibility, negotiating or prioritize a reasonable solution, specifying the solution unambiguously, validating the specification, and managing the requirements as they are transformed into an operational system
The requirements analysis process can be described in distinct steps• A feasibility study, is conducted during system initialization,• Requirements elicitation: Ask the specialist, users, and others what the objectives tor the
system or product are, what is to be accomplished, how the system or product tits into the needs of the business, and finally, how the system or product is to be used on a day-ro-da. basis.
• Requirements analysis and negotiation: Analysis categorizes requirements and organi/.o them into related subsets; explores each requirement in relationship to others, exam.nr requirements for consistency, omissions, and ambiguity; and ranks requirements based on needs of specialist or users.
• Requirements specification; A specification can be a written document, a graphical oiodtl •• formal mathematical model, a collection of usage scenarios, a prototype, or any combination these. Requirements are represented in a manner that ultimately leads to successful implementation.
• System modeling; From the model, it would be relatively easy to assess the efficienct <>t the workflow
• Requirements validation; Requirements validation examines the specification t<> 01
all system requirements have been stated unambiguously; that inconsistencies, onus. 1 - ^errors have been detected and corrected; and that the work products contonu to rlu established for the process, the project, and the product.
18

Technical Trading Support System (TTSS) i| 2010
• Requirements management: Requirements management is a set of activities that help the project ream to identify, control, and track requirements and changes to requirements at any rime as the project proceeds.
• Prototyping; Evaluation Form 2 (see appendix B) is a questionnaire used during the system analysis and design iterations to elicit requirements and prompt users feelings about the system. Form 1 (see appendix B) was used during the evaluation at the last stages of implementation.
Requirements analysis is the first technical step in the software process. It is at rhis point that a general statement ot software scope is refined into a concrete specification that becomes the foundation lor all software engineering activities that follow.
An important step in developing technical trading support system is to identify the technical trading indicators to be used for charts generation, analysis and decision support. Some ot the charts and indicators that can be selected includes among others;
Absolute Breadth index (AB1)Advance Decline Ratio Advance/Decline Index ADXAndrews Pitchfork Bollinger Bands Breadth Thrust Indicator,Bullish Percent Index,Chaikin Money Flow Indicator Chande Momentum Oscillator (CMO) Climactic Volume Commodity Channel Index (CCI) Commodity Selection Index (CS1) Displaced Moving Average (DMA) Exponential Moving Average (EMA) Fan Principle - Technical Indicator Fibonacci TradingMoving average convergence divergence MACD
• Money Flow Index
On Balance Volume (OBV)Parabolic SAR Indicator Positive Volume Index Price Rate ot Change (ROC)Projection Oscillator Public Short Ratio QstickRandom Walk Index Rate of Change (ROC)Relative Volatility Index (RVI)Relative strength index RSI.Sentiment Indicators Simple Moving Average Slow Stochastic Oscillator Swing TradingTechnical Analysis and Market Sell Otis Tick VolumeUpside Downside Volume Indicator Volume Analysis Volume Rate of Change
There are many other technical analysis indicators and thus selecting the most used and well understood by users requires to be prioritized. There is need to identify indicators that are dependent on other and thus ought to be developer as dependent modules.
19

3.3 Analysis and design models for TTSS
3.3.1 System context diagram for TTSS
Figure 3.1 System context diagram
The diagram above pur rhe system context in different classification; the top segment is the usu interface processing, the left and tight segments are the input processing and output processing respectively, the bottom segment is the maintenance and self-test, and rhe center segment is in- process and control functions
3.3.2 Use case diagrams1. Use case diagram for a user/analyst:
20

Figure 3.3 Use Case Diagram 2
3. Extension use case: extends rhe list scenario of use case above (figure 3.3)
<<uxtcnsion>>< < Cxteu sion>>
Technical Trading Support System (TTSS) i; 2010-- . ■ W.--if•--.•■■-■■■----A--W
2. I se ease diagram for NSE Index Analyst:
Figure 3.4 Use Case Diagram 3
The use case “request N'SE charts” can be extended by lower level use cases that make rhe function complete.
4. Use ease diagram for a specified stock/bond Analyst:
21
1
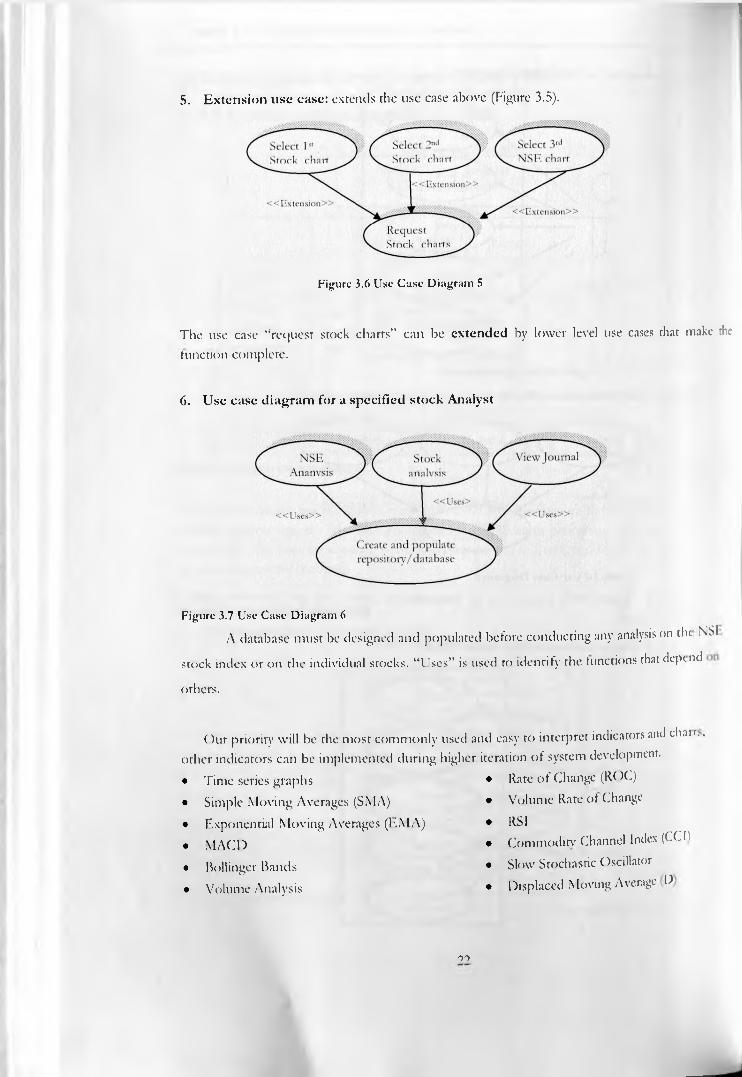
5. Extension use case: extends the use case above (Figure 3.5).
Figure 3.6 Use Case Diagram 5
The use case “request stock charts” can be extended by lower level use cases that make the function complete.
6. Use case diagram for a specified stock Analyst
Figure 3.7 Use Case Diagram 6
A database must be designed and populated before conducting any analysis on tlu NSI
stock index or on the individual stocks. “Uses” is used to identify the functions that depend
others.
Our priority will be the most commonly used and easy to interpret indicators and clutr., other indicators can be implemented during higher iteration of system development.
Time series graphs Simple Moving Averages (SMA) Exponential Moving Averages (EMA) MACD
Rate of Change (ROC)Volume Rare of Change RSICommodity Channel Index (CCh
Bollinger Bands Volume Analysis
Slow Stochastic Oscillator Displaced Moving Average .D
07

Technical Trading Support System (TTSS)c >x<<c-xvv>>>>>x<<<>ocooc<<<<<ococ vcoooc<<»oocoo<»>oocooo«>ooooo»oooooco»oooooooooooooooooooooooooooocoooooooooooc<
2010
3.3.3 Data Flow Diagrams
The purpose of data flow diagram is to provide a semantic bridge between users and system developers.
Level 0 DFD: The TTSS system context
Figure 3.8 Data Flow Diagram Level 0
Level 1 DFD: TTSS system,
Breaks the system into two sub modules, •
Figure 3.9 Data Flow Diagram Level 1
• The system accepts user data, request on technical analysis from a monitor or PC.• The system is fundamentally a data processing system using data store in a database. The
database must be updated periodically.• Outputs of the system are either on a monitor of a connected computer or stored in a
database.
23

Level 2 DFD: TTSS NSE index analysis sub-system
Figure 3.10 Data Flow Diagram Level 2
Level 2 DFD: TTSS stocks analysis sub-system
Figure 3.11 Data Flow Diagram Level 2
Level 3 DFD: select charts subsystem
Figure 3.12 Data Flow Diagram Level 3Prepares graph canvas and plots the charts
24
Technical Trading Support System (TTSS) i; 2010......... • ••••■■ • ■ • --:• .... ........ ... .. ........• ........................ ............... ..... ..... .... .... ........................... ..............
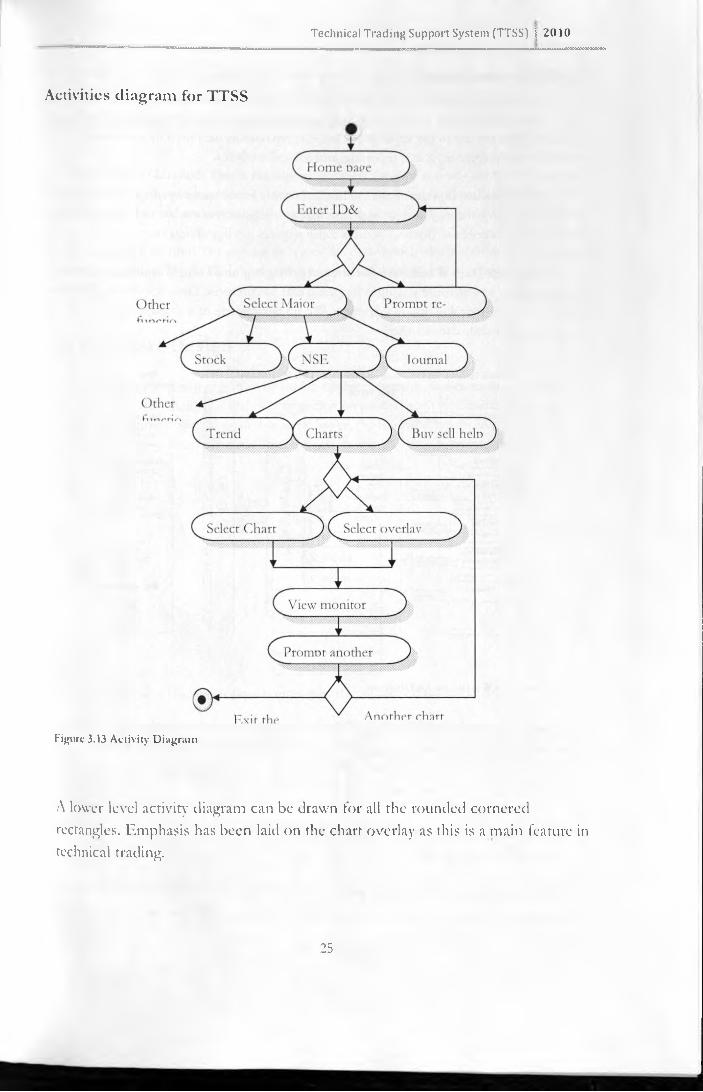
Activities diagram for TTSS
Figure 3.13 Activity Diagram
A lower level activity diagram can be drawn for all the rounded cornered rectangles. Emphasis has been laid on the chart overlay as this is a main feature in technical trading.
25

3.4 Data warehouse
Data warehouse: A data warehouse is a separate data environment that is not directly integrated with the day to day applications bur encompasses all data used bv a business. TTSS supports data integration, query, reporting, analysis and analytics.
Business intelligence: Business Intelligence is a broad category of applications and technologies for gathering, storing, analyzing, and providing access to data to help clients make better business decisions. Business success today requires intelligent data use.
Two tier Data Warehouse Architecture- Staging and Data Warehouse: This is the scenario where an enterprise staging is supplying data to enterprise Data Warehouse. This is close to point of arrival in data management. We are talking here of a single staging area leading to an enterprise-wide data warehouse.
Source Systems Staging Area Data Warehouse OLAP End User Tools
Figure 3.14 Data Warehouse Architecture
Source systems and databases; Source Systems are all those 'transaction or produc tion raw data providers, from where the details are pulled out for making it suitable tor data warehousing. The sources can be quite diverse:
• Production databases like Oracle, Sybase, SQL.• Excel Sheets.• Database of small time applications like in MS Access.• ASCI I/Data flat files.
Data Staging; The data staging area is the place where all 'grooming is dom on dar.
is pulled from the Source Systems. The end point of grooming is tor the data to lx LadiT
26
Technical Trading Support System (TTSS) \ 2010' ■ • ••' •••••••••••••• ... ......... ................ ................................................... ............. ...............................................................j.................................
rhe Analysis or presentation server'. Data staging covers most of the 'back bone' activities of a
Dara-\\ arehouse, which typically are also rhe biggest analytical and technical challenge of a project. These activities are extraction and transformation,
Presentation/Loaded; 1 his is rhe repository where rhe data is finally loaded after going through all the works of extraction and transformation. This becomes rhe ultimate source for information for various reasons ranging from queries to advanced data modeling.
Dimensional Model; The presentation area has data model, which is different from that of production system. This is called dimensional model. It is the way data is organized in data- warehouse.
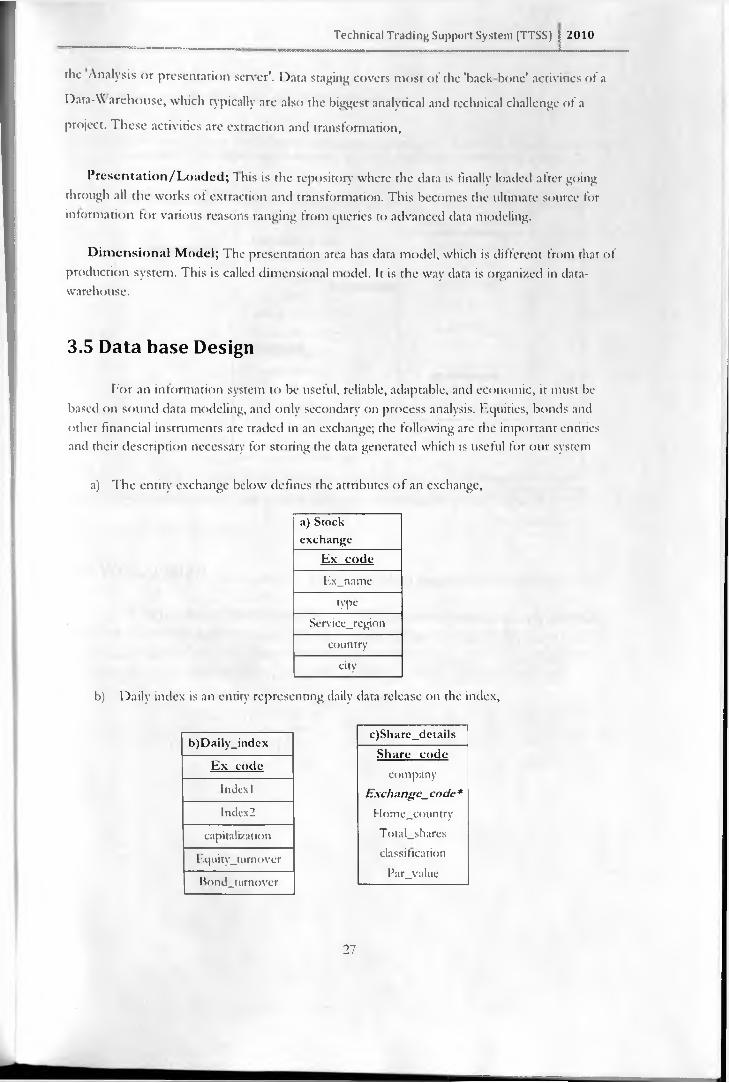
3.5 Data base Design
For an information system to be useful, reliable, adaptable, and economic, it must be based on sound data modeling, and only secondary on process analysis. Equities, bonds and other financial instruments are traded in an exchange; rhe following are the important entities and their description necessary for storing the data generated which is useful for our system
a) The entity exchange below defines the attributes of an exchange,
a) Stock exchange
Ex codeEx_name
typeService_region
countrycity
b) Daily index is an entity representing daily data release on the index,
c)Share_detailsb)Daily_indexShare code
companyExchange_ code *
Ex codeIndex 1lndcx2 Home_country
capitalization Total_shares
Equity_turnovcr classificationPar_valuehond_tumover
27

28
c) Share_details entity describes different equities being traded at the exchange,
d) Daily and e) weekly statistics can be described using daily_statistics and weekly_statisoc>respectively.
The primary key are in bold and underlined, where as foreign keys are in italics*.
Data design and component level; The low level data type and operation are• Dates are of data type date, it allows conversion form DD/MM/YYYV to l. NIX tin
and form UNIX time to DD/MM/YYYY. The data type and operations allow date addition operations, conversion to various date formats and displaying on a graphic.
• Open, low, high, close and derived variables are of currency data type. The main operations are finding moving averages and displaying on a graphic.
• Volume and other derive variable are of floating point data types and retrieved for display.
d)Daily_statistics Day number
Price_dateShnre_code*
openhighlow
closevolume
Trading_status
e)Weeklv_statistics week number
YVeek_dateShare_code*
vwapTranding_status
Price_changeShare_tradedcapitalization
EPSDPSPE
dividend

Technical Trading Support System (TTSS) 2010
Entity relationship diagram for TTSS database
The Entity relation diagram (HRD) give a data model showing the entities and their relationship.
Figure 3.15 Entity Relationship Diagram
3.6 Web Design
A design model encompasses content, aesthetics, architecture, interface, navigation, and component-level design issues are the primary work product of web engineering design. Technical attributes that lead to high quality web application include Usability, functionality, reliability, efficiency, maintainability, availability, scalability, security' and time to market.
The WebE process (sec Pressman (2005)) must be adapted to fit the specific area of application. The generic process framework -communication, planning, modeling, construction, and deployment is applicable to webE.
29

Acceptance rest
Content Interface1 teration Function
Configuration
Figure 3.16 Web Engineering process.
The webE process is predicated on three points: incremental deliver)’, continuous cha. - and short timeline. Web Applications can be assessed using a variety of quality criteria that include usability, functionality, reliability, efficiency, maintainability, security, availability, and onto marker.
Since this is a web based application six major steps are recommended driven by information obtained during analysis:
• Content Design: Design of content object and their relationships,• Graphic design: the look and feel that the end user sees,• Architectural design: focuses on the overall hypermedia of all content objects and
functions,• Interface design: the overall layout and interaction mechanisms that define the u
interaction• Navigation design: defines how the end user navigates through the hypermedia
structure,• Component design; represent the derailed internal structure of the functional Ji.m
Among the techniques required for successful web application design are component ba software engineering, networking, architectural and navigational design, internet
30
Technical Trading Support System (TTSS) 2010
standards/languages, human interface design, graphics design, content layout, and web application testing.
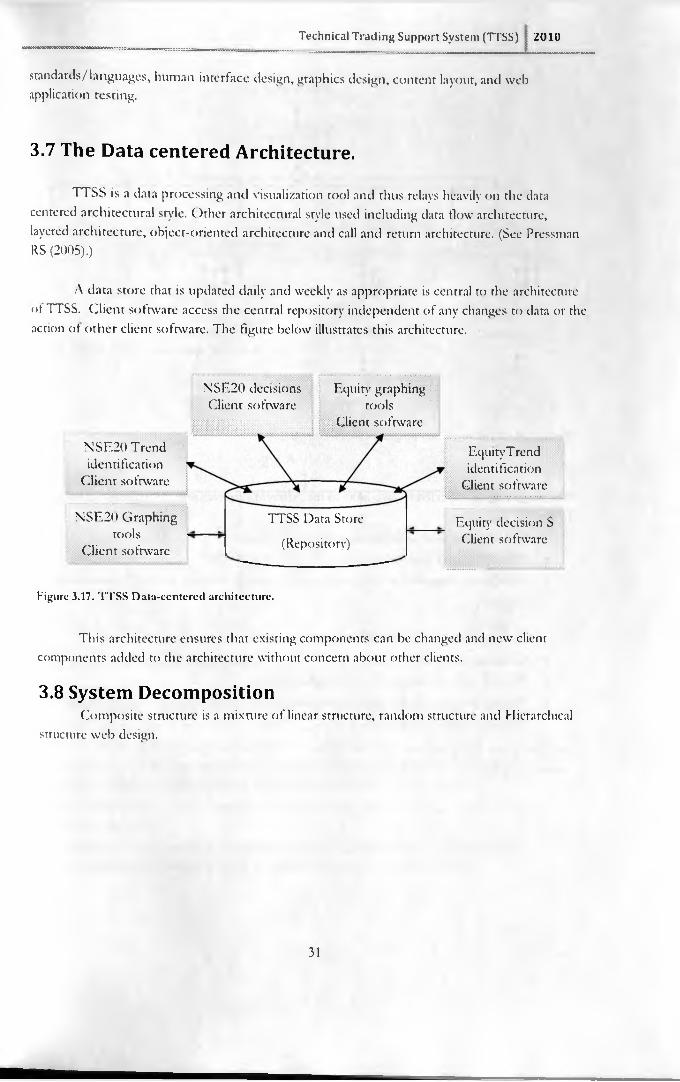
3.7 The Data centered Architecture.
TTSS is a data processing and visualization tool and thus relays heavily on the data centered architectural style. Other architectural style used including data flow architecture, layered architecture, object-oriented architecture and call and return architecture. (See Pressman RS (2005).)
A data store that is updated daily and weekly as appropriate is central to the architecture ot TTSS. Client software access the central repository independent of any changes to data or the action ot other client software. The figure below illustrates this architecture.
NSE20 Trendidentification
Client software
NSE20 Graphing tools
Client software
\'SE20 decisions Client software
Equity graphing tools
Client software
TTSS Data Store
(Repository)
EquityTrend identification
Client software
Equity decision S Client software
Figure 3.17. TTSS Data-ccntcred architecture.
This architecture ensures that existing components can be changed and new client components added to the architecture without concern about other clients.
3.8 System DecompositionComposite structure is a mixture of linear structure, random structure and Hierarchical
structure web design.
31

INS I" 20Analysis
JournalNews
NSE20Modules
$Derail
ik Help
Home Page
IUser/adminLogin Page
A____ ::_____
StocksAnalysis
.....▼Pictorial
StocksModules
t1 Detail
ik Help
BondAnalysis
1BondModule
tDetail
ik Help
ContactUs
fRegister
Figure 3.18a TTSS chart: Sub-programs architecture 1.
The home page is expected to gi\re links to the different modules and information. After loggtr in the user can access;
• NSE20 index analysis modules• Individual stock analysis modules• Information support modules including registration, contact, pictorial, journal and even
modules,
The analysis modules as in figure below enable users to• Generate and overlay charts,• Identify trend in the market or individual shares,• Provide buy and sell decision support that ensure timely decision while combined with
the chart generation module,
mil..................Technical Trading Support System (TTSS) 2010
NSE20Analysis
Graph overlay Trend System support NSE20Tool identification .... ::: information
|Detail/
1Detail/
1Detail/
.1Detail/
Help Help Help Help
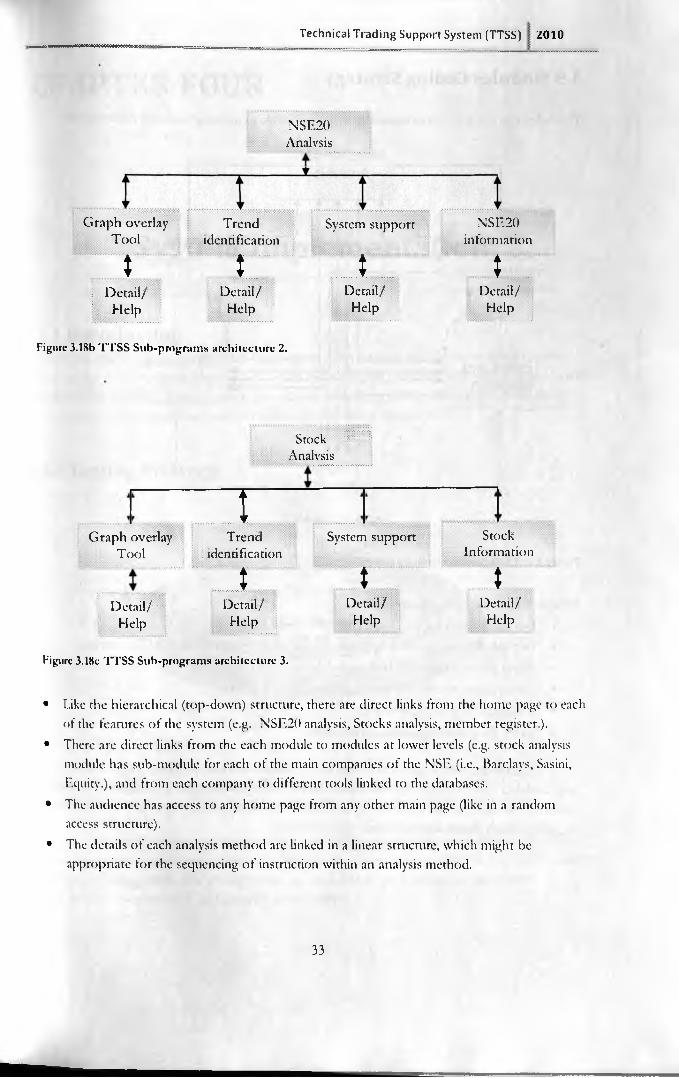
Figure 3.18b TTSS Sub-programs architecture 2.
StockAnalysis
Graph overlay Tool
Detail/Help
TTrend
identification
3Detail/Help
System support
IDetail/Help
StockInformation
IDetail/Help
Figure 3.18c TTSS Sub-programs architecture 3.
• Like the hierarchical (top-down) structure, there are direct links from the home page to each of the features of the system (e.g. NSE20 analysis, Stocks analysis, member register.).
• There are direct links from the each module to modules at lower levels (e.g. stock analysis module has sub-module for each of the main companies of the NSE (i.e., Barclays, Sasini, Equity.), and from each company to different tools linked to the databases.
• The audience has access to any home page from any other main page (like in a randomaccess structure).
• The details of each analysis method are linked in a linear structure, which might be appropriate for the sequencing of instruction within an analysis method.
33

3.9 Modules Coding Strategy
The following software development cycle is used while generating code for each module:
Figure 3.19 TTSS modules coding strategy.
Functions of the web based tool are:Get the periods for which the graphs are to be generated,Get the different series to be displayed for comparison and those to be overlaid, Select the best scale for given period and series for which the graphs are required. Create a grid with both the axis calibrated,Generate the graphs on prompt,Label the generated graphs appropriately
The goal in module design is to ensure high cohesion and low coupling. High cohtsic>n implies that a component or class encapsulates only attributes and operations that are L related to one another and to the component itself. Coupling is a quantitative measure <>. r e degree to which classes are connected to one another
*
34

Technical Trading Support System (TTSS) 2010
CHAPTER FOUR
System Implementation
4.1 IntroductionTo ensure that TTSS meets the users requirement a test strategy that accommodates low-level tests are necessary to verity that a small source code segment has been well implemented as well as high-level tests that validate major functions against the product requirements. Reusable source code is debugged and tested to ensure compliance to requirement.
4.2 Testing Strategy.
Svstem testingValidation testing
Integration
CodeDesign
Requirementf igure 4.1 TTSS Testing Strategy.
System Engineering
Testing begins at the core of the spiral, unit testing, as you move outward in a spiral mechanism you encounter higher level testing with corresponding system requirements.
The goal of web applications testing is to exercise each of the many dimensions of the web application quality with intent of finding errors or uncovering issues that may lead to quality failures. Testing focuses on among others, content, functions, structure, usability, and navigability, performance, and capacity and securin’.
35

The end point of grooming is tor the data to be loaded into the analysis or presentation serve: Data staging covers most of the 'back-bone' activities of a data-warehouse. This ensures the . application passes performance and stress resting. For security purpose the users are required- enter username and password for authentication purpose.
4.3 Results
4.3.1 Home Page
j T i
Home
. Stocks
, Journal
- p * ■ •-/'
Technical Trading Support System: NSE
11 t U «9k •: Sxg !-.<■> vvrtcw $5» M to**)** * Con>pwnr ! RrtKSV >>$?»w v .
Features Available
< 2006-*9*£ /tio M N & & Fre»fii»3 a; pome « on MsoialwauK/a Svrtfoo) I ’vN
“ a
. PictorialNSE20 Analysis Stock Analysis
. Contact
. Register llsc-i UivHO Admin login
f1! wjwj #
Figure 4.1 TTSS home page
The home page offers links to the available features among the
• User and adiministrator login page
• NSE20 anlysis for Nairobi stock exchange index analysis,
• Stock Analysis for individual stock evaluation page, (see fugure 4.2 below),
• Register: enables new members to register before accessing rhe analysis tools
• journal and pictorials offers orherews and information important t<> markert |
• Contact: this page enables a person to send comment on the web tacilir\ with
and receive instant acknoledgement, and
• Other facilities eg links to bond analysis, companys annual reports and hither analysis
tool. These tool were not fully developed bbv the time limit provided.
36

Figure 4.2TTSS Stock Analysis web page 1.
wmm • -■«»
. Hon:<-
. Stocks
. Journal
! ;
Please cuter dotation aod tclect chart* f»i cn/eriay {Ba rob iu i)
:: m *iu ?k a .................................... ......... !oj*’V£.V.V.........
' W n a w /
. Pictorial :' $ • W — £ * » J
. Contact
. Register i
• 5kK»;;>
• Stoil'*:. rroJJi'M'MCAfco• fcfflv. *• EaffiteiL JCfiaSMUtt
A 1 ;v / v '\Tv?
V •'• vA / /
r /p /
••••• • * : * : * : * ; > : • * • ' ' ' • •*:''' :: :*•. • --ox* -a _ >•*... a > 'w . *.?•<'<>••..a
Figure 4.3 TTSS Stock Analysis web page 2.
4.3.2 NSE index and stocks trend visualisation
The ability to visualize the general trend for both the index and individual stock is the simplest and an important first step in any to any further analysis. Some analysts believe that viewing the trend is sufficient to make their investment decision. From the charts generating module it’s possible to visualize trends as given in the two graphs below (Figure 4.4 ).
37

(a) (b)Figure 4.4 NSE20 index trend and Bamburi
4.3.2 Charts overlay module
In strong trending markets, some indicators work well while others fail to give good results. In consolidating or trading markets, those indicators that failed during trending market environments often work best. Before analyzing a security with a set of indicators, it is essential to determine the trend of the security and then apply the appropriate indicators in the analysis.
Figures 4.5 (a) demonstrate chart overlay for closing price, SMA(50), and SMA(200). A crossover of the blue SMA50 above SMA200 indicates a long term change in trend and hence a long term buyer should make a buy investment. Figures 4.5 (b) demonstrate chart overlay tor closing price, EMA(12), and EMA(26). It shows that exponential moving average are more sensitive to price movements
Figure 4.5 (a) and (b) below, give moving average overlay charts for Bamburi stock price from 27/06/2008 to 17/02/2010.
Label 1: CLOSii Label 2: SMA50 Label 3: SMA2U0 (b) Label 1: CLOSE Label 2: EMA12 Label 3. EI-J'^j
Figure 4.5 Chart Overlay NSE20 index trend and Bamburi K Ltd.
38
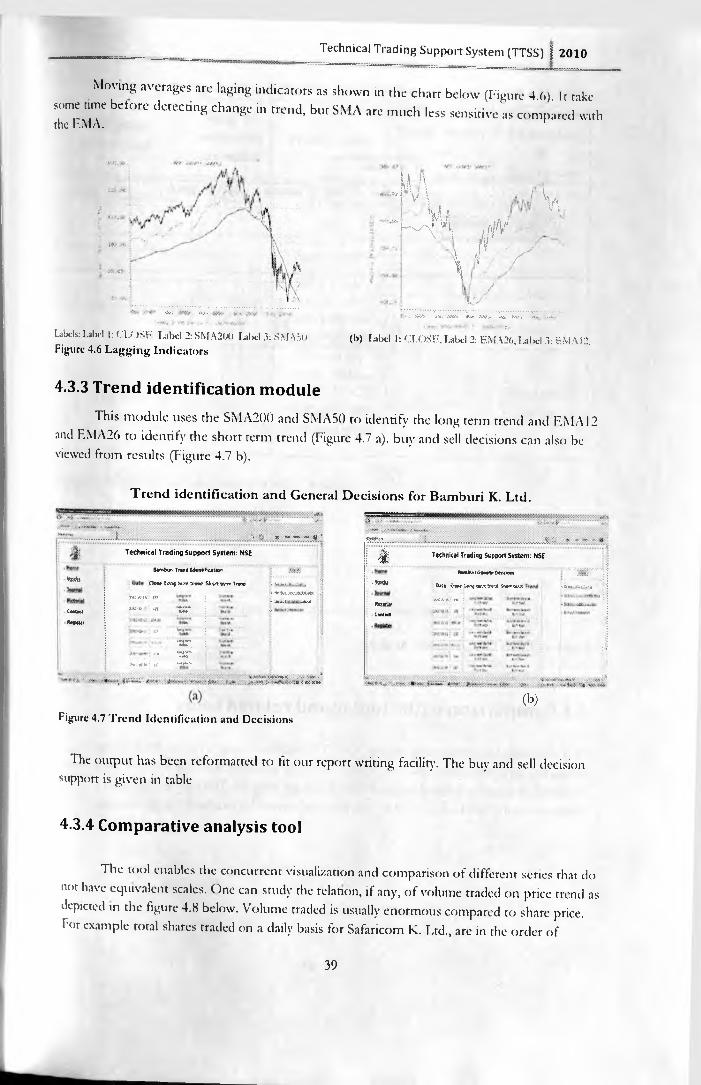
Technical Trading Support System (TTSS) j 2010
Moving averages are laging indicators as shown in the chart below (Figure 4.6). It takesome time betore detecting change in trend, but SMA are much less sensitive as compared with the EMA. 1
*.V; v.,..
Libels: Label 1: CLOSE Libel 2: SMA200 Label 3: SMA bo Figure 4.6 Lagging Indicators
U !\M \•?H V \
! a, h c.V. "IV. l!w v nv\.d
f\ r ' s '\ \
/!v7
•\V.» *v>. NV,
. I L ,Vt>.
( b ) Label 1: CLOSE. Label 2: EMA26. Label 3: EMA 12.
4.3.3 Trend identification moduleThis module uses the SMA200 and SMA50 to identify the long term trend and EMA 12
and EMA26 to identify the short term trend (Figure 4.7 a), buy and sell decisions can also be viewed from results (Figure 4.7 b).
Trend identification and General Decisions for Bamburi K. Ltd.
....... i
tte&s
tonUctRcwUf
Technical Trad ing Support System: NS£
&»mburi Tr*nd IdtntiLcatiOflO ow long term treoc* S h v t vims* Tctoo
;M :« t% t**J .va . , » 'XJST
. t.»‘Sr|< ««>***•M
>i:cco*: i#7 >T£**~*
\ . . .
y ** V.N r+ i ) •v . r . v . v . . . .
1. C . . . . . . i •5 tw *»
» u t a w A t t A r :> ;• i l t . l iXk.jp ■ PiC5GM;...
ContKt
«V .v + y • : • '*• : « : v . x « .
Figure 4.7 Trend Identification and Decisions
- ■.....................................L
Technical Trading Support System: NSE
Bwtbun Gwm- Owxiom0»:« C w l«Pi)W .ttri^ * > o r t ( V A -ifj» 'u rA tf
.vc.i.iv !1* ; ,
(b )
The output has been reformatted to tit our report writing facility. The buy and sell decision support is given in table
4.3.4 Comparative analysis tool
The tool enables the concurrent visualization and comparison of different series that do not have equivalent scales. One can study rhe relation, if any, of volume traded on price trend as depicted in the figure 4.8 below. Volume traded is usually enormous compared to share price, for example total shares traded on a daily basis for Safaricom K. Ltd., are in the order of
39
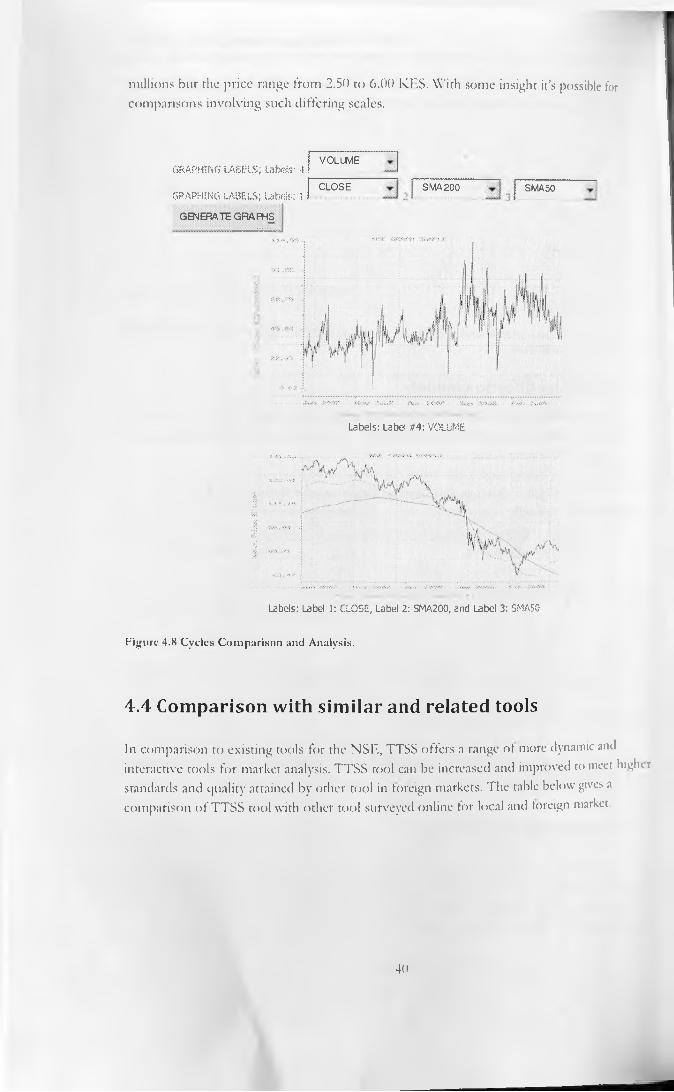
millions bur rhe price range from 2.50 ro 6.00 KES. With some insight it’s possible for comparisons involving such differing scales.
VOLUMEGRAPHING LABELS; Labels: -1!
j CLOSEGRAPHING LA3ELS; Latieis: I 1
GENERATE GRAPHS
SMA200 | SMA50
Labels: Label /H : VOLUME
Labels: Label 1: CLOSE, Label 2: SMA200, and Label 3: 5MA5G
Figure 4.8 Cycles Comparison and Analysis.
4.4 Comparison with similar and related tools
In comparison to existing tools for the NSE, TTSS offers a range ot more dynamic and interactive tools for marker analysis. TTSS tool can be increased and improved to m e et higher standards and quality attained by other tool in foreign markets. The table below gives a comparison of TTSS tool with other tool surveyed online for local and foreign market.
40
—
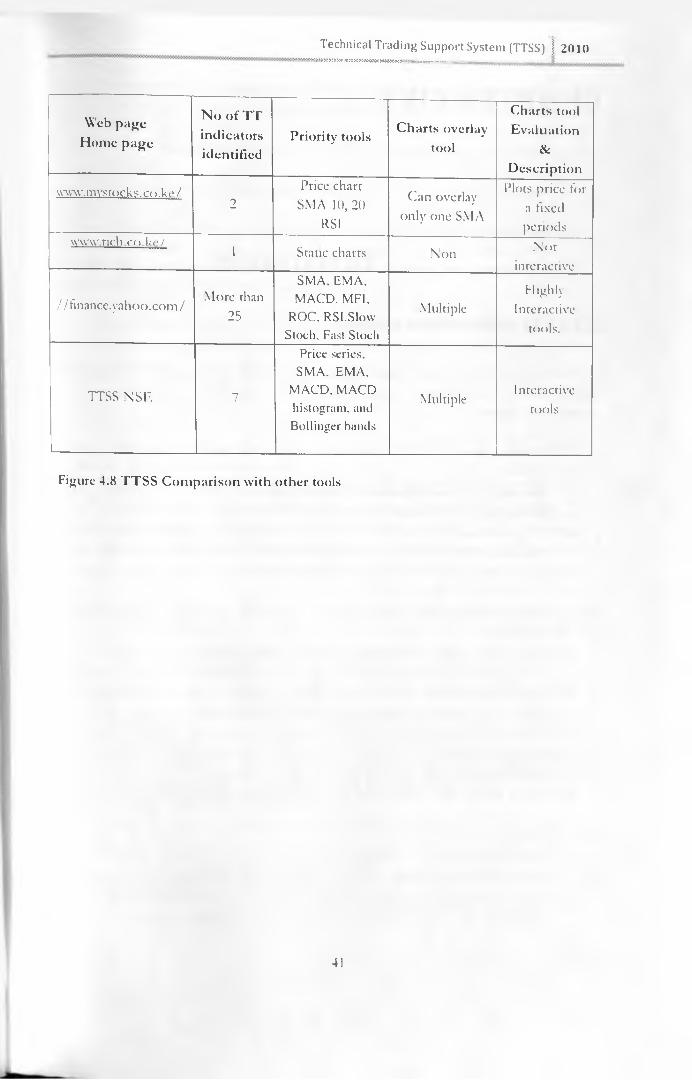
Technical Trading Support System (TTSS) f 2010. . . . . . . . . r . f in n n n iTiiiiiinnnnnnnnnoo oo nnno nooou!
Web page Home page
No of TT indicators identified
Priority tools Charts overlay tool
Charts tool Evaluation
ScDescription
www. m vs rocks. co.k e / 2Price chart SMA 10, 20
RSI
Can overlay only one SMA
Plots price for a fixed periods
www.ridi.co.ke/1 Static charts Non N or
interactive
/ / finance.yahoo.com / More than 25
SMA. EMA. MACD. MFI.
ROC. RSI.Slow Stoch, Fasl Stock
MultipleHighly
Interactivetools.
TTSS NSE n/
Price series. SMA. EMA,
MACD. MACD histogram, and Bollinger bands
Multiple Interactivetools
Figure 4.8 TTSS Comparison with other tools
41

CHAPTER FIVE
Discussion
5.1 TTSS Information System
The modules and tools that we have implemented in TTSS demonstrate the important role data analysis and visualization in extracting business information. The modules successfully implemented include;
NSE20 index module: NSE20 index module is useful for analysis of past NSE20 index series. It includes:
• Chart generating and overlay module: using this module enable one to generate and overlay charts for both long term and short term moving averages.
• The trend identification module: this module can be used to identify whether the market is trending upward (Bullish Trend) or the markets are trending downwards (Bearish).
• Help or information for the working of the module and market related inlormanon.
Share analysis modules: Share analysis modules are useful for analysis of past share prices. Such modules include:
• Chart generating and overlay module: using this module enable one to generate and overlay charts for individual stocks tor both long term and short term moving averages.
• The trend identification module: this module can be used to identify whether individual share prices are trending upward (Bullish Trend) or downwards (Bearish).
• Buy and sell decision support module that using moving average crossover determine most appropriate time to buy or sell. The SMA methods are slower than EM A methods in detecting trend change and moving average crossover.
• Help or information tor the working of the module and market related information.
It is important to note that;• The modules perform the analysis and decisions based on simple mo\ingaverage,
exponential moving average or MACD technical trading rules,• It is evident that the 200-50 simple moving averages system is less sensitive to trend
change than 26-12 days exponential moving averages system.
42

• The importance of being able ro visualize trend and overlay charts cannot be overstated in stock market analysis. It is easy to visualise the type of cross over and whether the market are in oscillating.
• The trend identification module simplify the need to identify the crossover points in the charts, and
• Technical analysis is a useful tool to create a trading system that is profitable.
Using difterent indicators relationships can be found to improve forecasting and hence improve protit margins even atter accounting for transaction cost. If implemented this framework would help decision makers ro accurately predict stock price directions, marker direction and hence enhance decision on stock trading.
The following table gives a summary of the steps take in the system development stages. These steps ensure that TTSS meet the cjualiry standards of computer software development process and product.
Technical Trading Support System (TTSS) | 2010
Table 5.1 TTSS System development summary
Stage Deliverable, methods and tools1 Project scope
Problem definitionTo develop a technical trading system that stores and uses periodic data from the NSE to generate and overlay charts, both for the NSE index and individual stocks. The system should also enable the analyst to identify trend and support buy and sell decisions using the same data. Support information and help should be availed on request.
2 Problem analysis Identify which technical analysis methods to be used due to the advantages available
3 RequirementAnalysis
Establish all the required objects, technical indicators, charts, decisions, and their data and process requirements for TTSS
4 Logical design Use case diagram are have used for functional analysis andDesign analysis DFD’s to study behavioral analysis of the system
5 Physical design Physical database, process and interface design for TTSS6 Construction and
testing, Installation and delivery
Tools used include My-sql database, PEIP, WAMPSERVER,Code and module testing was done on the entire system
It’s important to note that the TTSS information system can be classified as an expert system; • Can support individual or entire team and can be hosted in a webpage to increase on
customers awareness.
43
• Ir will be used repeatedly and constantly as long as data is updated,• It has three major components: data, models, and user interface,• It would help the user to make faster, smarter, better decisions.
The data warehouse and models base can be extended to include other financial tin. including interest rates, exchange rates, bond yields, and quarterly earnings per share of a company.
The finding of the research confirms that technical analysis is a useful tool to create a trading system that is profitable. It is especially true in trending markets (upward or downward where moving average method proves to be one of the best simple methods available.
TTSS can easily be modified to help educate and create interest in the public on the stoc’k market business and analysis methods. This would attract a larger numbers of investors into t: capital market. TTSS, if customized to target those investors situated in the countryside and wh have no access to a financial analyst’s advice, can help them access such information on the internet.
5.2 ChallengesSome challenges realized in this project include;• Web applications are usually vast in size and thus require longer periods of time ot
incremental development to attain the complete system. There was a short timeline required to complete the application, this mitigates against the voluminous development processes.
• Multiple changes occurred as a result of changing user “‘feeling ” of the prototype and due evaluation of delivered modules,
• Availability of the entire data set for all the NSE20 index and historical prices tor all equine' traded at the NSF. was not entirely possible tor all the required attributes. The tools v ere developed in such a way to encourage scalability and thus it’s easy to add new atmbutcs.
• The current business reporting, though having standards, does not have a unique easih adaptable electronic format. Documents tor different companies are in different toimar> am their adoption into the data warehouse would clearly be challenging.
• TTSS database data compatibility with the format released by the NSE was challenging. . h. data released require filtering and formatting before loading into the database.
• There are many more technical indicators, and different analysts have different inclin.ui the best indicators and charring formats.
5.3 Research opportunities
The following were identified as possible research opportunities that can be n.ul this work or give alternative approaches;
• Developing a more interactive and sophisticated charts geneiaring and o\ula>
44
Technical Trading Support System (TTSS) \ 2010
• Ideally a system should encourage more units to be bought or sold when the signals appear to be very strong. In other words, this research does not look at any money management technique, an area where more research work can be done.
• Future research can be conducted to investigate how long traders should hold securities and how much he or she should buy or sell every time a signal is generated.
• We can expand our data warehouse to cater for data necessary for macroeconomic factor models, fundamental factor model and statistical factor models.The data warehouse and model base can be expanded to cater for return analysis. Three types of factor models are available lor studying asset returns.o The first type is the macroeconomic factor models that use macroeconomic variables such as
growth rate of GDP, interest rates, inflation rate, and unemployment numbers to describe the common behaviour of asset returns. Here the factors are observable and the model can be estimated via linear regression methods.
0 The second type is the fundamental factor models that use firm or asset specific attributes such as firm '■axe, book and market values, and industrial classification to construct common tactors.
o The third type is the statisticalfactor models that treat the common factors as unobservable or latent variables to be estimated from the returns series.
• New methods of analysis to describe alternative approaches to volatility modelling, including use of high-frequency transactions data and daily high and low prices of an asset are possible with TTSS database.
• More research can be performed on advanced models such as soft computing, generic algorithms and neuro-networks in pattern recognition algorithms and their analysis.
5.4 Conclusion
In the process of designing and developing this system important system analysis and design issues have arisen, the challenge faced by a during system analysis, system design and system implementation and resting stages have increased the learning process.
Although the NST and listed companies continue to capture a great amount of data and information they are loosely integrated in the support of market analysts anti interested stakeholders. TTSS is one such step in an effort to integrate data and create knowledge.
TTSS has been designed and built for the internet architecture due to the growing trend towards e-business and e-commerce application and can easily be used to adtl value to web application in the stock market services. More remote users can also be able to access the tools availed by TTSS. It’s my hope that more studies will be conducted in the area and that these tools will find their place in the Kenyan stock market.
45

Appendix A
Daily Data from NSEThe stock exchange has multiple stocks classified according to different categories. The tot4
number of share at a given date (10/12/2008):
T O T A L NO OF
S H A R E S IS S U E D M R T C A P '0 0 0 ' 12-Oct
Company
U n ile ve r Tea K en ya Ltd O rd 10.00 48,875,000 2,223,813 4550
S H A R E S IS S U E D Kakuzi O rd .5.00 19,599,999 779,100 39 75J
R e a V ip in g o P la n ta tio n s Ltd O rd 5.00 60,000,000 1,194,000 1990
Sasini Ltd O rd 5.00 228,055,500 3,181,374 13.95j
C O M M E R C IA L A N D SERV ICES
A c c e s s k e n y a Ltd O rd . 1.00 199,885,578 7,195,881 3 6 0 0
C a r & G e n e ra l (K) Ltd O rd 5.00 22,279,616 1,125,121 50.50
C M C H o ld ings Ltd O rd 5.00 582,709,440 12,236,898 2100
H u tch in g s B iem er Ltd O rd 5.00 360,000 7,290 2025
K e n y a A irw ays Ltd O rd 5.00 461,615,484 22,849,966 4950
M arshalls (E.A.) Ltd O rd 5.00 14,393,106 467,776 32 50
N a tio n M e d ia G ro u p O rd . 5.00 71,305,260 24,386,399 342 00
S a fa ric o m Ltd O rd .0 .05 40000000000 290,000,000 7.25
S c a n G ro u p O rd . 1.00 159,000,000 5,207,250 32 75
S ta n d a rd G ro u p Ltd O rd 5.00 73,275,029 4,323,227 59 00
TPS Eastern A fr ic a (S erena) Ltd O rd 1.00 105,864,742 7,622,261 72.00
U ch um i S u p e rm a rk e t Ltd O rd 5.00 180,000,000 2,610,000 14 50
FINAN CE A N D INVESTMENT
B arclays Bank Ltd O rd 10.00 1,357,884,000 95,051,88070 00
C.F.C Bank Ltd o rd .5.00 273,684,211 30.378,94711100
46
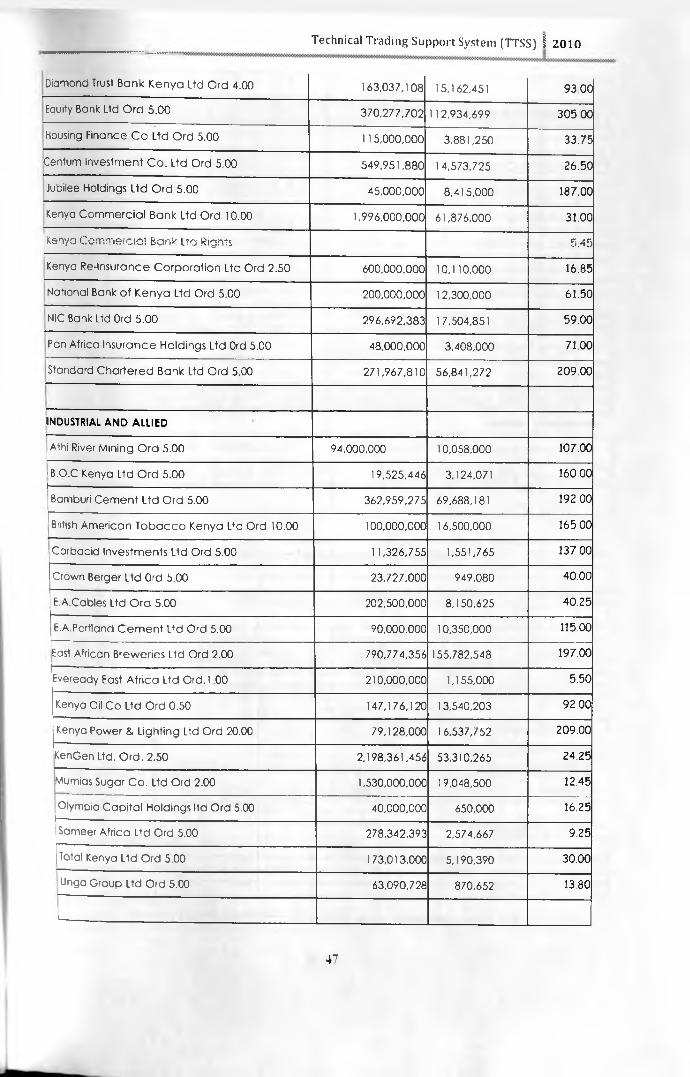
Technical Trading Support System (TTSS) I 2010
Diamond Trust B a n k K e n y a Ltd O rd 4.00 ---------------------------------------------------------- -----------------------------
163,037,108 15.162,451 9 3 0 0
Equity Bank Ltd O rd 5 .00 370,277,702 112.934.699 305.00
Housing F inance C o L td O rd 5.00 11 5,000,000 3,881,250 33.75
Centum In ve s tm e n t C o . L td O rd 5.00 549,951,880 14.573,725 26.50
Jubilee H oldings L td O rd 5.00 45,000,000 8,415,000 187.00
Kenya C o m m e rc ia l B an k Ltd O rd 10.00 1,996,000,000 61,876,000 31.00
Kenya Com m ercia l B ank Ltd Rights 5.45
Kenya R e -In su ra nce C o rp o ra t io n L td O rd 2.50 600,000,000 10,110,000 16.85
N ational Bank o t K e n y a L td O rd 5.00 200,000,000 12,300,000 61.50
NIC Bank Ltd Ord 5 .00 296,692,383 17,504,851 59.00
Pan A frica In s u ra n c e H o ld in g s L td Ord 5.00 48,000,000 3,408,000 71.00
Standard C h a r te re d B ank Ltd O rd 5.00 271,967,810 56,841,272 209.00
INDUSTRIAL A N D A L L IE D____________________________
1 A thi River M in in g O rd 5.00 94,000,000 10,058,000 107.00
'B.O.C Kenya Ltd O rd 5.00 ________________________
19,525,446 3.124,071 160.00
1 Bamburi C e m e n t L td O rd 5.00 362,959,275 69,688,181 192.00
^British A m e ric a n T o b a c c o K en ya Ltd O rd 10.00 100,000,000 1 6,500,000 165.00
C a rb a c id In v e s tm e n ts L td O rd 5.00 11,326,755 1,551,765 137.00
Crown Berger L td Ord 5.00 23,727,000 949,080 40.00
E.A.Cables Ltd O rd 5.00 202,500,000 8,150,625 40.25
E.A.Portland C e m e n t L td O rd 5.00 90,000,000 10,350,000 115.00
East A frican B rew erie s Ltd O rd 2.00 790,774,356 155.782,548 197.00
Eveready East A fr ic a L td O rd . l .00 210,000,000 1,155,000 5.50
Kenya Oil C o L td O rd 0.50 147,176,120 13,540,203 92.00
Kenya Pow er & L ig h tin g Ltd O rd 20.00 79,128,000 16,537,752 209.00
KenGen Ltd. O rd . 2.50 2,198,361,456 53,310,265 24.25
Mumias Sugar C o . Ltd O rd 2.00 1,530,000,000 19,048,500 12.45
O lym pia C a p ita l H o ld ings ltd O rd 5.00 )------------ -----------------------------------------------------
40,000,000 650,000 16.25
Sameer A fr ic a Ltd O rd 5.00 278,342,393 2,574,667 9.25
Total Kenya L td O rd 5.00 173,013,000 5,190,390 30.00
Unga G ro u p Ltd O rd 5.00 63,090,728 870,652 13.80
1_______
47
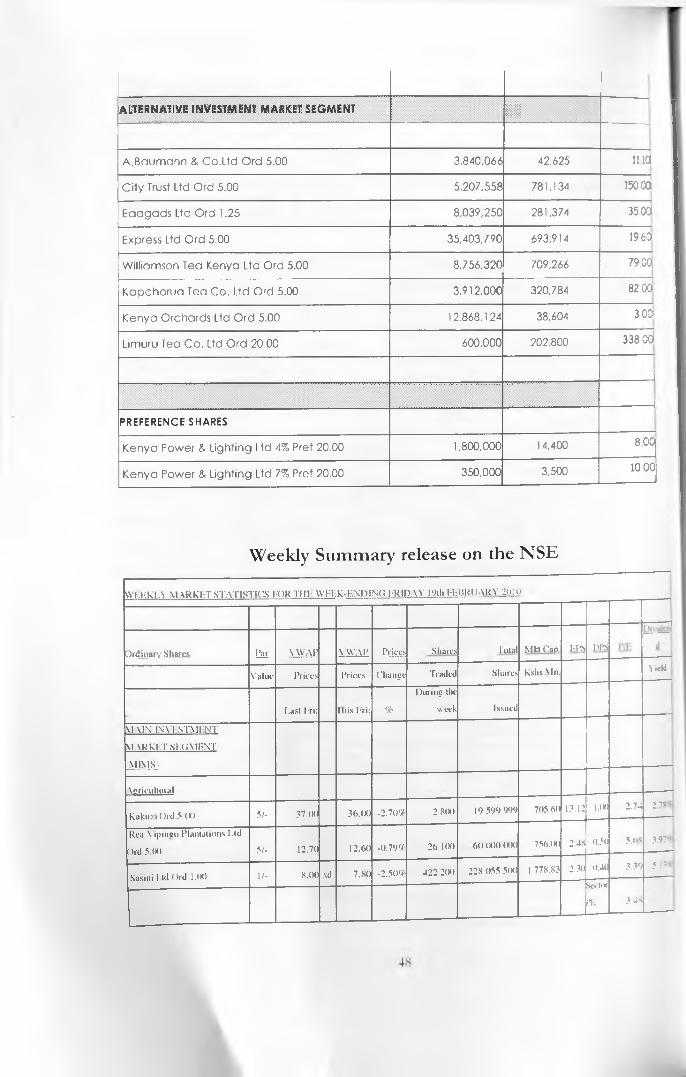
A L T E R N A T IV E IN V E S T M E N T M A R K E T S E G M E N T I f
A .B a u m a n n & C o .L td O rd 5.00 3,840,066 42,625 i i id
C ity Trust Ltd O rd 5.00 5,207,558 781,134 150 00
E a a g a d s Ltd O rd 1.25 8,039,250 281,374 35.00
Express Ltd O rd 5.00 35,403,790 693,914 19.6a
W illia m son Tea K enya L td O rd 5.00 8,756,320 709,266 79.00j
K a p c h o ru a Tea C o . Ltd O rd 5.00 3,912,000 320,784 82.001
K e n y a O rc h a rd s Ltd O rd 5.00 12,868,124 38,604 3,oa
L im uru Tea C o . Ltd O rd 20.00 600,000 202,800 338.00j—
----------------- i
----------------- 1
P R E F E R E N C E S H A R E S
K e n y a P ow er & L ig h tin g Ltd 4% Pref 20.00 1,800,000 14,400 8.00
K e n y a P o w e r & L ig h tin g Ltd 7% Pref 20.00 350,000 3,500 1000
Weekly Summary release on the NSE
WI.LKIA M VRKKT STATISTICS LOR Till- WLLk-LNDING FRIDAY 19th ITTmiJARYJOjO
TT-r-J
Ordinary Shares Par VWAP \ WAP Prices Shares Total Mkt Cap. EPS DPS d I
Value Prices Prices Change Traded Shares kslis M11. Yield
Last In: l his Fri: %During the
week IssuedM \IN IN\ 1 STMIM MARKET SHGMLNT MIMS.
\ericullural
Kakuzi Ord.5 (H) 5/- 37.00 36.(H) -2.70% 2 800 19 599 999 705.60 13.12 1.00 2.74 2 %
Rea \ ipniso Plantations I,td Ord 5.1 HI 5/- 12.70 12.60 -0.79% 26 100 60 000 000 756.00 2.48 0.50 5.08 3.9?<H
Sasini 1 .id < )rd 1.00 1/- 8.00 xd 7.80 -2.50% 422 200 228 055 500 1 778.83 2.30 0.40 3.39 5.1?'nSectorPfi 348
------'
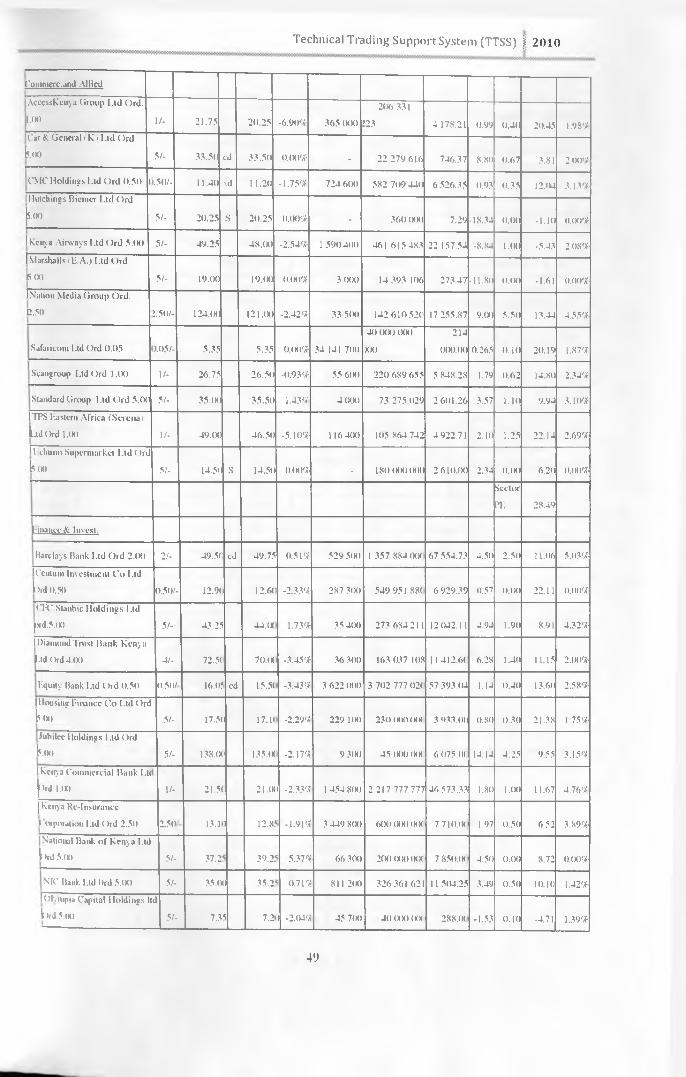
Technical Trading Support System (TTSS) j: 2010
ronimerc.und AlliedAccesskenya Group L.td ()rd. 1.00 1/- 21.75 20.25 -6.90% 365 (KM)
206 331 >23 4 178.21 0.99 0.40 20.45 1.98%
( ar & General i k i Ltd ()rdkoo 51- 33.50 cd 33.50 0.00% - 22 279 616 746.37 8.80 0.67 3.81 200%CMC Holdings Ltd ()rd 0.50 (.50/- 11.40 \d 11.20 -1.75% 724 600 582 709 440 6 526.35 0.93 0.35 12.04 3.13%1 Hutchings Bienier Ltd ()rd koo 5/- 20.25 S 20.25 0.00% - 360 000 7.29-18.34 0.00 -1.10 0.00%1 kenya Airways L.td ()rd 5.00 5/- 49.25 48.00 -2.54% 1 590 400 461 615 483 22 157.54 -8.84 l.oo -5.43 2.08%I Marshalls i E.A..) Ltd Ord koo 51- 19.00 19.00 0.00% 3 (MX) 14 393 106 273.47■11.80 0.00 -1.61 0.00%1 Nation Media Group Ord. Q.50 1.50/- 124.00 121.00 -2.42% 33 5<M> 142 610 520 17 255.87 9.00 5.50 13.44 4.55%.
Safaricoin Ltd Ord 0.05 >.05/- 5.35 5.35 0.00% 34 141 70040 (XX.) (MX) MM)
214000.00 0.265 0.10 20.19 1.87%
Scangroup Ltd Ord LOO 1/- 26.75 26.50 -0.93% 55 6(H) 220 689 655 5 848.28 1.79 0.62 14.80 2.34%
Standard Group Ltd Ord 5.00 5/- 35.00 35.50 1.43% 4 000 73 275 029 2 601.26 3.57 1.10 9.94 3.10%1 TPS Eastern Africa (Serena i Ltd Ord 1.00 1/- 49.00 46.50 -5.10% 116 400 105 864 742 4 922.71 2.10 1.25 22.14 2.69%11 cliuini Supermarket 1 -td ()rdkoo 5/- 14.50 s 14.50 0.00% - 180 000 000 2 610.00 2.34 0.00 6.20 0.00%
SectorPE 28.49
Finance & Invest.
Barclays Bank Ltd Ord 2.00 2/- 49.5C cd 49.75 0.51% 529 500 1 357 884 001 67 554.73 4.50 2.50 11.06 5.03%ICentum Investment Co Ltd l )rd 0.50 0.50/- 12.9< 12.6< -2.33% 287 300 549 951 8S( 6 929.39 0.57 0.00 22.11 0.00%CEC Stanbic Holdings Ltd prd.5.00 51- 43.25 44.Ot 1.73% 35 400 273 684 211 12 042.11 4.94 1.90 8.91 4.32%1 Diamond Trust Bank Kenya l.td Ord 4.00 41- 72.5< 70.(X -3.45% 36 300 163 037 108 11 412.61 6.28 1.40 11.15 2.oo%
Equity Bank Ltd Ord 0.50 o.5() / 16.0! cd 15.5C -3.43'; 3 622 000 3 702 777 02< 57 393.04 1.14 0.40 13.60 2.58%1 Housing Finance Co Ltd Ordk(X) 5/- 17.5(l 17.lt -2.29% 229 l(K) 230 000 00( 3 933.00 0.80 0.30 21.38 1.75%Jubilee Holdings l.td Ord koo 5/- 138.1 M■ 135.(X -2.17% 9 3(H) 45 (KM) (XM 6 075.0( 14.14 4.25 9.55 3.15%1 kenya Commercial Bank Lit | >rd LOO 1/- 21.51 21 .Of> -2.33% 1 454 800 2 217 777 777 46 573 .33 1.80 1.00 11.67 4.76%| kenya Re-Insurance F orporation Ltd ()rd 2.50 2.50 13.1 l 12.8! -1.91% 3 449 800 600 (X)O(MM 7 710.01 1.97 0.50 6.52 3.89%National Bank of Kenya Ltd l )rd 5.00 51- 37.2 39.2. 5.37% 66 300 200 (X)OO(M 7 85<>.(M 4.50 0.0(1 8.72 0.00%NIC Bank Ltd Ord 5.00 51- 35.0n 35.2 0.71% 811 200 326 361 621 11 504.25 3.49 0.50 10.10 1.42%’1 OKntpia Capital Holdings It lord 5.00
d5/- 7.3s 7.2> -2.04% 45 700 40 (XM) (XX 2S8.0< -1.53 0.10 -4.71 1.39%
49

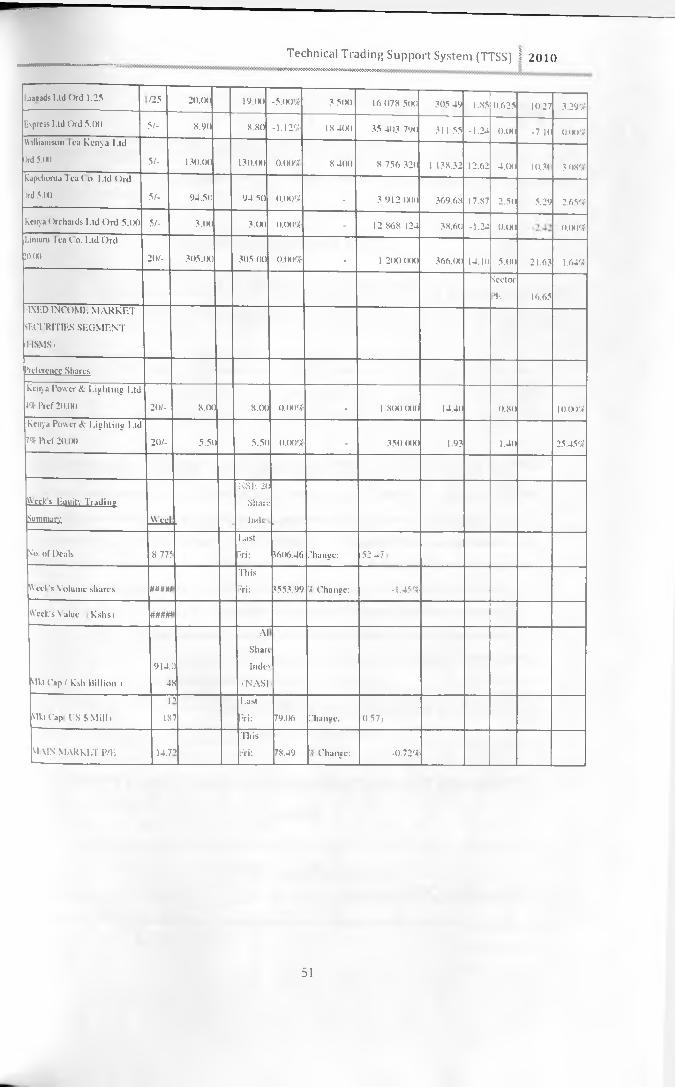
Technical Trading Support System (TTSS) I 2010........................ ...........
Eaaeads l.ld ()rd 1.25 n s 20.1X1 19.(H) -5.00% 3 500 16 078 500 305.49 1.85 0.625 10.27 3.29%Express Ltd Ord 5.00 51- 8.90 8.80 -1.129E> 18 400 35 403 79(1 311.55 -1.24 0.00 -7.10 O.l H)%Williamson lea Kenya I.id Ord 5.00 51- 130.00 130.00 0.00% 8 400 8 756 320 1 138.32 12.62 4.00 10.3< 3.08%kapchorua 1 ea t o. Ltd ()vdOrd 5.00 51- 94.50 94.50 0.00% - 3 912 OCX) 369.68 17.87 2.50 5.29 2.65%keir/a (Orchards l.ld Ord 5.00 5/- 3.00 3.00 0.00% - 12 868 124 38.60 -1.24 0.00 0.00%Limuru lea t o. l.ld Ord20.00 20/- 305.00 305.00 0.00% - 1 2(H) (HH) 366.00 14.10 5.00 21.63 1.64%
SectorPE 16.65
fixed income MARKET SECURITIES SEGMENT 1 ISMS.
Preference SharesKenya Power & Lighting Ltd 4% Pref 20.00 20/- 8.00 8.00 0.(M)% - 1 8(H)(Hid 14.40 0.80 10.01)%Kenya Power & Lighting Ltd 7% Pref 20 (H) 20/- 5.50 5.50 0.(H)% - 350 000 1.93 1.40 25.45%
Week s Etpiilx Trading Summary Wed
NSfr. l i : Share UmIc
So. of Deals 8 775LastFri: 3606.46 Change: 52 -7;
W eel 's Volume shares ####/ThisFri: XSXX 99 % Change: -1.45%
Week's Value Kshsi m m
51 kt Cap i Ksh Billion t914.
408
AlSharehides
(NASI
Mkt Cap US S Mill i1
18T7
LastFri: 79.(X) Change: 0 57,)
51AIN MARKET P/E 14.7oThisFri: 78.49 "i Change: -0.72%
51

Appendix BThis appendix contain questionnaires used to evaluate the system during protonping 7T"
Evaluation form 2), and during evaluation of the complete system ( ITSS evaluation form .
TTSS Evaluation Form 1.D a t e . . 72010
This information will be used to evaluate Technical Trading Information Support Sxsteni.
Name:................................................................Institution:.............................................
I. Under which category would you classify yourself? check as many as appropriate Market Analyst/profcssional. Individual Analyst. Cooperate Analyst.Stock Trader research/student Others (Specify...............)
Rating: Please use the following rating when answering the questions
Scale: 5 highest; 1 -lowest; 0 does not exist/apply. Circle the most appropriate number.
bulleted items are overall questions that arc weighted separately from each section.1. How would you rate your familiarity and understanding of technical analysis indicators, chart
overlay, and technical trading rules? 0 1 2 3 4 52. Do you have any computerised information system that helps you visualise trends and M'PP,,rts
your decisions on trading at the NSC (check as appropriate) ----Yes ----No3. If you have such a system, “as in 3” which of the following indicators and charts arc available
(check as many as appropriate)
Time scries graphs Simple Moving Averages (SM A) Exponential Moving Averages (EMA) MACDbollinger bands Volume \nalvsis
Rate of (Tange (R()C)Volume Rate of Change RSICommodity Channel Index (CCl) Slow Stochastic Oscillator Displaced Moving Average (DM V
Technical Trading Information Support System (1 fsS)Security
4. 1 found it easy to register/ logjn/logput, and important icons and links were available.0 1
User Interface/Navigation5. There were links icons or other graphical tools appropriate to aid in searching and navigating
0 1 2 3 4 5the resource.

Technical Trading Support System (TTSS) 2010
6. The directions for doing a search were brief, but complete and clear.
0 1 2 3 4 57. This resource provides links bv (check as many as appropriate):
_Question (natural language query) ___Topic. __ Keyword
__Pull down menu __ Search __ others (please specify)
TTSS charts generating tools8. It was clear and easv on how to generate Charts and 1 tound it comfortable to use the tools
0 1 2 3 4 5
9. The chart generating tools gives enough choice to meet your analysis needs0 1 2 3 4 5
10. \\ hat other charts/indicators do you teel are important and should be included in the choices'
11. 1 could complete a successful query/generate graph without system stalling.0 1 2 3 4 5
12. Approximately what times did it take to generate a chart? Check as appropriate._Very fast ___<1/2 minutes. ___<1 Minute. __ <2 minute. _very slow.13. Circle the most appropriate response concerning using the chart generating tools.
• 5 Most analysts were/will able to use the tools without any training session.• 4 Most analysts were/will be able to use the tools after one training sessions.
• 3 Most analysts who were/will able to use the tools need two individual training.• 2 Only very advanced analyst will able to use the tools with a minimum ol training.
• 1 no stock market analyst will able to use this tool at all.
Other TTSS tools. (Trend identification and Buy/sell support)
14. The trend identification and buy/sell support tools are useful.0 1 2 3 4 5
15. There is information found that is appropriate tor understanding background issues for each
traded at the NSC. 0 1 2 3 4 5
16. Does the tool provide easy remote access? 0 1 2 3 4 5
17. The tools and pages were easily customized' 0 1 2 3 4 5
TTSS Overall evaluation18. 1 believe TTSS resource is a powerful tool for performing market analysis tor professional analysts
0 1 2 3 4 5
53

Comments:19. Any comment or observation that you would like to convey tor consideration on any impmvi - -
required on TTSS........................................................................................................................
54
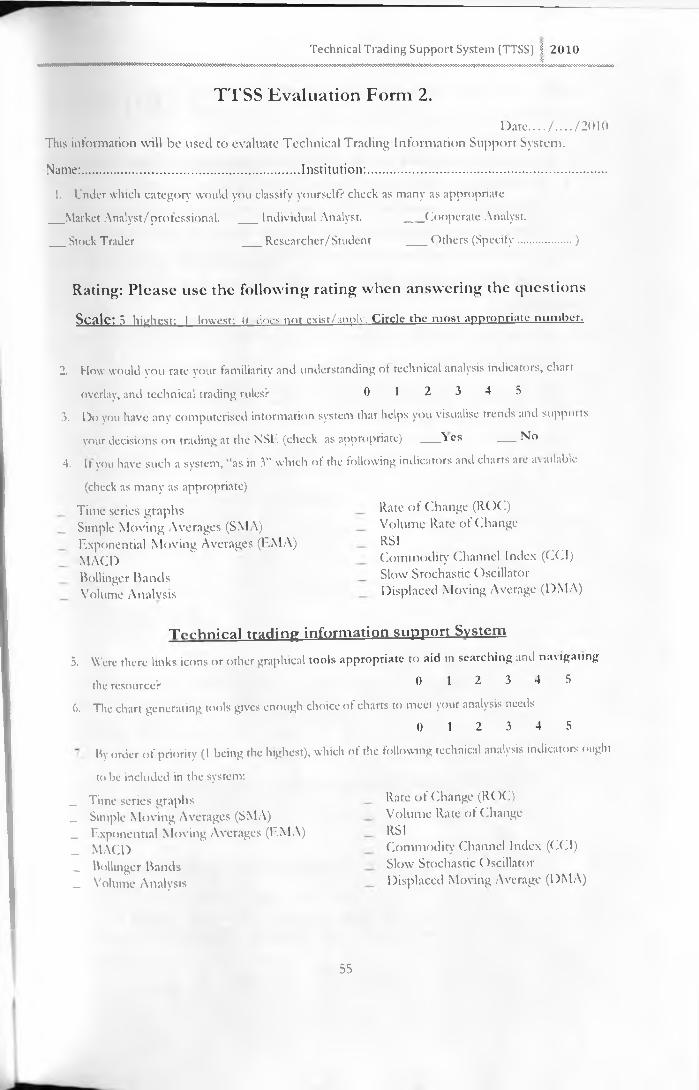
Technical Trading Support System (TTSS) f 2010.... k> x \v w w w < w iw il l loiDQOi8iOiDOOOBOCC »w w wooowow oowoooo8occoow9oocowowooocwcmfloooowowoooooowwocootooooocootooowoccooooo<«&8wwoooo<oo>yoooowwowwoowcw ow oooooooooowowooofltotocft
TTSS Evaluation Form 2.Dare__/__ /2010
This information will be used to evaluate Technical Trading Information Support System.
Name:....................................................................Institution:...........................................................................
1. Under which category would you classify yourself? check as many as appropriate__Market Analyst/professional. __ Individual Analyst. __ Cooperate Analyst.__Stock Trader __ Researcher/Student ___ Others (Specify................. )
R atin g : P le a s e u se th e fo llo w in g ra t in g w h en a n sw e r in g the q u e s t io n s
Seale: 3 highest: 1 lowest: (1 docs not cxist/applv. Circle the most appropriate number.
2. How would you rate your familiarity and understanding of technical analysis indicators, chart
overlay, and technical trading rules? 0 1 2 3 4 5
3. Do you have any computerised information system that helps you visualise trends and suppoits
vour decisions on trading at the NSE (check as appropriate) ----A es ----No4. If you have such a system, “as in 3” which of the following indicators and charts aie available
(check as many as appropriate)
Time series graphs Simple Moving Averages (SMA) Exponential Moving Averages (EMA) MACDBollinger Bands Volume Analvsis
Rate of Change (ROC)Volume Rate of Change RSICommodity Channel Index (CCI) Slow Stochastic Oscillator Displaced Moving Average (DMA)
Technical trading information support System5. Were there links icons or other graphical tools appropriate to aid in searching and navigating
the resource? 0 1 2 3 4 56. The chart generating tools gives enough choice of charts to meet your analysis needs
0 1 2 3 4 5
By order of priority (1 being the highest), which of the following technical analysis indicators ought
to be included in the system:
_ Time series graphs _ Simple Moving Averages (SMA)_ Exponential Moving Averages (EMA) _ MACD _ Bollinger Bands _ Volume Analysis
Rate of Change (R( )C)Volume Rate of Change RSICommodity Channel Index (CCI) Slow Stochastic Oscillator Displaced Moving Average (DMA)
55

8. What other eh arts/indicators do you feel are important and should be included in the choices
provided...................................................................................................................................
9. C ircle the m ost appropriate response co n cern in g u s in g the chart generating tools.
• 5 Most analysis were/will able to use the tools without any training session.• 4 Most analysts were/will he able to use the tools alter one training sessions.• 3 Most analysts who were/will able to use the tools need two individual training.
• 2 Only very advanced analyst will able to use the tools with a minimum ol training
• I No stock market analyst will able to use this tool at all.
Comments:10. Any comment or observation that you would like to convey for consideration during an\
improvement on TTSS..............................................................................................................
56
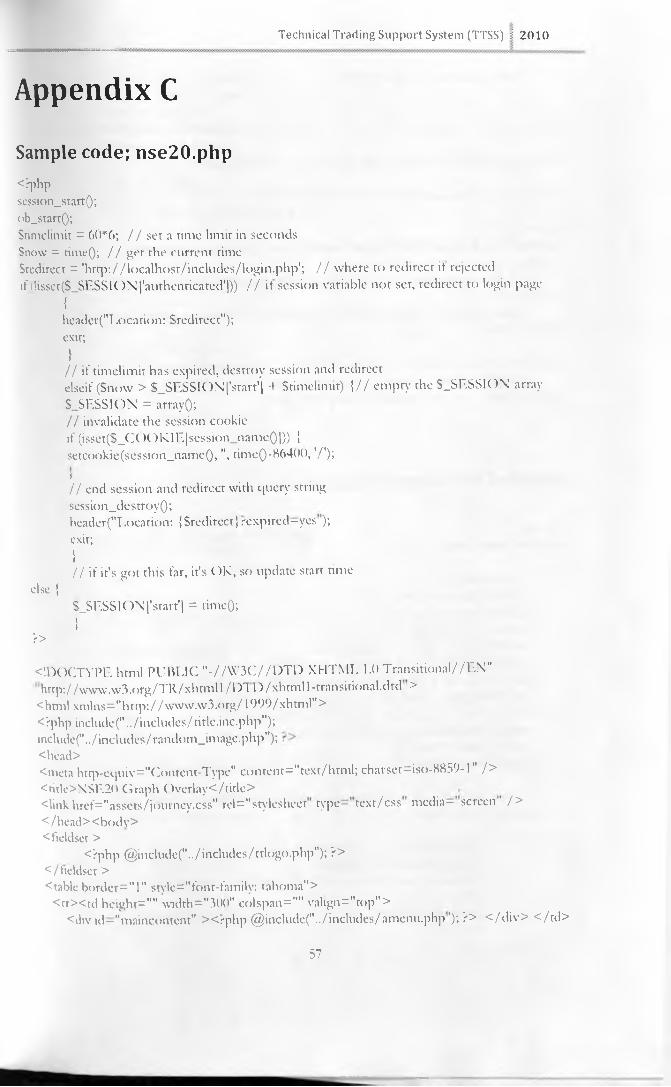
Appendix C
Technical Trading Support System (TTSS) ;i 2010
Sample code; nse20.php<?phpsession_start();ob_startO;Stimelimit = 60*6; / / set a time limit in seconds Snow = rime(); / / get the current timeSrcdirect = 'http://localhost/includes/login.php'; // where to redirect it rejected if : !isset($_SESSION ('authenticated'|)) // it session variable not set, redirect to login page
{header("Location: Sredirect"); exit;} .......................................//it timelimit has expired, destroy session and redirectelseif (Snow > S_SESSION[’start'] + Stimelimit) {// empty the $_SESSION array $_SESSION = arrayO;// invalidate the session cookieit* (issct(S_COOKlE[session_nameOD) {setcookie(session_nameQ,", timeQ-86400,'/');j// end session and redirect with query string session_destroy();header("Location: {Sredirect} .•'expired—yes );exit;xi// if it's got this far, it's OK, so update start time
else {S_SESSI ON ['start'] = time(); xj
?>
<!DOCTYPE html PUBLIC "-//W3C//DTO XHTML 1.0 Transitional//EN" http://www.w3.org/TR/xhttTill /DT O/xhtml 1-transitional.dtd >
<hrml xmlns="htrp://www.w3.org/1999/xhtml">Ophp include("../includes/title.inc.php");include("../includes/random_image.php");<head><meta http-equiv="Content-Type" content="text/html; charset=iso-8859-l" /> <ritle>XSE20 Graph Overlay</ritle><link href="assets/journey.css" rel="stylesheet type— text/css media— screen /></ head><bodv><fieldset >
<?php @include("../includes/ttlogo.php"); ?></tieldset ><table border="l" style="font-family: tahoma">
<tr><td height="" width="300" colspan="" valign="top"><div id—"maincontent" ><?php @include("../includes/amenu.php'); ?> </div> </td>
57

<ttl valign=top width-"90()">
<!— dynamic plots section------------
<?php @include('\./includes/time_seriestool_nse20.php");r,>
<!— dynamic plots section = = = ===
</p></td><td width=300 va lign -’top" align="cenrer"><fieldset> , . ^ ^
<div ><p><?php includeC../includes/logout.inc.php), /p</fieldset> . -____ ^
<div align=left><?php @indu<!e("../includes/nse20menu.php );r-x/cliv></td></tr></td></table>
<table><tr><rd width=300></rd><td width=700 ><div id="footer"><?php include("../includes/footer.inc.php ),
</div></td> < / tr> </table></body></html>
Sample Code. Graph console.
<?phpclass timeSeriesGraph/i
private Simg;private Sheight = 500;private Swidth — 600;private SvAxixScale — 1;public Sr'itlc = ’This is the Graph Title;public SxLabel = ’And X-Axis Comes^ Here (Time);public SyLabel = ’Y-Axis Also Here (Scale)’;public Strom;public $to;public Sdata = array0; public $data2 = arrayQ; public Sdata3 = arrayQ;
public function _construct($title,$xT.abel,SyLabel, arrayQ,Sdata2=arrayQ,$data3 - arrayO)
/i
Strom,Sto,Sdata —
!*** Initialize data* Sdata is a one
for the graphdimensional array indexed by rime points
*/Sthis->title = S title;
58

Technical Trading Support System (TTSS) i; 2010| > IMD}0900WOOC<CCWCWOOC<W»WWWWCWOWW>OWCCWW fl< «W »X «W O W W O W W iO W W O W ^
$this->xLabel = SxLabel;$this->vLabel — SyLabel;Sthis->data = Sdata;Sthis->data2 = Sdata2;$this->data3 = Sdata3;$this->from - Strom;Sthis->to = Sto;j - i k *
* (Create the image resource tirst;*/Sthis->img — imagecreatetruecolot($this->width,$this->height),j * *
* Prepare the canvas back ground*/$this->bgAxesQ;!*■** Caliberate the Axes */$this->caliberateQ;j > k *
* Label Axes */Sthis->labelAxesQ;/*** Render the image as a png graph*/$this->doTheGraphO; header('Content-type: image/png'); imagepng($this->img); imagedestrov(Srhis->img);
}j it.* .
* Draw meshed back ground and label the axes */private function bgAxesQ
Sbg = imagecolorallocate($this->irng,255,255,255);imagehlledrectangle($this->img,0,0,$this->widrh,Sthis->height,$bg);Smesh = imagecolorallocate(Sthis->img,241,241,241);imagerectangie(Sthis->img,0,0,(Srhis->widrh- l),(Sthis->heigln- l),Smesh);j aac a*c
* Mesh vertically first*/Sx=0;while(Sx<Sthis-> width)
imageline($this->img,$x,0,Sx,$this->height,Smesh);Sx +=20;
\ij M m
* Now Mesh horizontally
59

*/$y=0;\vhile($y<$rhis->heighr)/\
imageline($rhis->img,0,Sy,$rhis->\vidrh,$y,$mesh);Sv +=20;
x//*** Label the axes and ridesVSlabels = iinagecolorallocare($this->img,0,1 ”9,0);Sw = imagefonr\vidrh(10)*strlen($this-> title);Spw = ($this->widrh - S\v)/2;imagesrring(Srhis->img,10,Sp\v, 5, Srhis->nrle, Slabels);
ivare function caliberareQ
Slabels = imagecolorallocate(Sthis->img,0,1 9,0); imageline($this->img, 1 (H),2(), 10( >,44( >, Slabels); imageline($this->img, 100,440,$this->\vidth,440,Slabels);Sbg = imagecolorallocate(Srhis->img,255,255,255); imageline($rhis->img,l 00,420,100,440,$bg); imageline($this->img,l(K),435,100,440, Slabels); imageline($this->img,l 00,420,105,425,Slabels); imageline(Sthis->img,105,425,95,430,Slabels); imageline($this->img,95,430,100,435,Slabels);!*** Caliberate X - axisV$x=100;\vhile(Sx<Sthis->\vidth)/
imageline(Sthis->img,Sx,445,Sx,440,Slabels);$x+ = 100;
j$y=420;\vhile($y>—20)/
imageline($this->img,95,$v,l 00,Sy,Slabels);Sv-—40;
xtif(is_array(Srhis->data)&&$rhis->dara!=:null)
Sdif = $this->yAxisCalibre(max(Srhis->data));
Smin = number_format(min(Sthis->data)/Sdit,2,. , , ) ; $NV = 100 - (imagefontwidth(10)*strlen($min)+10); imagestnng(Sthis->img,10,$\v,410,Smin,Slabels);
Smax = number_format(max($rhis->dara)/Sdif,2,. , , )
60

1i
Technical Trading Support System (TTSS) 5 2010
Sw = 100 - (imagefont\vidth(10)*strlen($max)4-10); imagestring(Sthis->img,10,$w,10,$max,$labels);Sscalc = (max($this->data)-min($this->data))/5; $y=330;$val — min(Sthis->data)+$scale; while($v>20){
Svals = number_format($val/$dit, 2,' imagesrring(Sthis->img, 10,$w,Sy,Svals,Slabels);Sval T^Sscale;$y-=80;
}Sthis->vAxixScalc - 80/Sscale; Srhis->xAxisCaliblrcQ;
iiprivate function yAxisCalibre(Smax)i
Ssrtlen = strlen(number_format($max, 2,'Sdif = Ssrtlen-6; if($dif<=0)f\
return 1;}else{
Sscalc = po\v(10,Sdif);$ th is-> yL abel'(x1.Sscalc.')'; return Sscale;
}}private function xAxisCaliblreQ
Slabcls = imagecolorallocate(Sthis->img,0,1 "9,0); SdateScale = (Srhis->to - $this->from)/5; it (SdateScale <—864(X>){
Sprcfx-";Sdate = 'D jS’;
}elseif($dateScale<—4-320()())/t
$prefx=";Sdate = ’1)’;
}clscif(SdateScalc<—6( >48( X))r\
$prefx='WK ';Sdate = 'W ;
»
61
elseif($dareScale<=2592000)/i
Sprefx- Sdate = 'M jS';
jelseif(SdateScale<=l 2960000){
Sprefx - ';Sdare = \M V;
elseif(SdateScale<=31 104000)
}else
Sprefx-"; Sdare = \M V;
Sprefx—"; Sdare = 'V;
Srime = $rhis->from;for($x=100;$x<Srhis->widrh;Sx = Sx+100)
Sshoxvtime — date(Sda re, Srime);images tring(Sthis->img, 10,$x,450,Spretx.Sshowtime,Slabels),Srime +=SdareScale;
private function labclAxesQ
Slabels — imagecc >lorallocare(Srhis->img,0,200,200);
* Label the x - axis*/Sw — imagelont\vidrh(10)*strlen($this->xLabel);Sh = imagefonrheight(10)+5;Spw = ($rhis->width - S\v)/2;imagesrring(Sthis->img,10,Spw,($rhis->heighr-$h),Srhis->xLabel,Slabels);j **x Label the y-axis */Sh — im agefontw id rh (1 ())' strlen(Sthis->yI -alx 1).Sph = ($this->height - Sh)/2; .imagestringup($this->img,10,l,(Sthis->height-Sph),$this->yLabel,Slabels),
private function doTheGraphQ
Slabels = imagecoloraUocate($this->img,200,0,0);SM = counr(Sthis->dara);Smin — min($this->dara);
62

Technical Trading Support System (TTSS) | 2010
SxAxisScalc = ($this->\vidth-100)/$M;SpointAj'x'] = 100;SpointA [V] = 420 - ((Sthis->dataJO]-Smin)*Sthis->yAxixScale);$n=l;\vhilc(Sn<SM){
SpoinrB [V] = (SpointA j'x']4-$xAxisScale);SpointBj'y'] = 420 - ((Sthis->dataf$n]-Smin)*$this->yAxixScale); imageline(Sthis-
>img,SpointAj'x'],SpointA jy],$pointB|'x'],SpointBj'y'],Slabels);Spoint A I’x'l = $pointB|'x'];SpointAj'y'] - SpointBj'y1];++$n;
i)$this->data = Sthis->data2;Slabcls = imagecolorallocate(Sthis->img,0,0,200);SM = count($this->dara);Smin = min(Sthis->data);SxAxisScale = ($this->\vidrh-100)/$M;SpointA|'x'| - 100;SpointAj'y'] = 420 - (($rhis->data[0]-$min)*$this->yAxixScale);$n=l;\vhile($n<$M)f\
SpointB|'x'] = (SpointA j’x'j+SxAxisScale);SpoinrBI’y'l = 420 - (($this->data[$n]-$min)*$this->yAxixScale); imagclinc(Sthis-
> img,$pointA('x'], Spoint A jY],$pointB['x'j,$pointB|'y'],Slabels);SpointAj'x'] = $pointB|'x'];SpointA j'y'l = SpoinrB j'y'|;++Sn;
}Sthis->data = Sthis->data3;Slabcls = imagecolorallocate($this->img,0,200,0);SM = count($this->data);Smin = min(Srhis->data);SxAxisScalc = ($this->\vidth-100)/$M;SpointAj'x'] = 100;SpointA j 'y ' j = 420 - (($this->data[0]-$min)*$this->yAxixScale);Sn^l;\vhilc(Sn<SM)/\
SpointBj'x'j = (SpointA[’x'|+$xAxisScalc);SpointB['yr| = 420 - ((Sthts->data[$n|-$min)*$rhis->yAxixScale); imageline(Sthis-
> img,Spoint A j'xl,SpointAJ'y'j,SpointBj’x'j,SpointB |'y'j,Slabcls);SpointAj'x'] = SpointB|'x'|;SpointA j’y'l = SpointBj'y'];++$n;
63
1J
/**- PREPARE TO DRAW GRAPHS*/ j *** x*xx*x**x*x****x********xx********x**J<*****'*x*x>:*******x*****;*******J'***»‘*** CONNECT TO MYSQL DATABASE*//"CONNECTION VARIABLES*/SdbHost - "; //database serverSdbName = 'shares'; //ENTER NAME OF DATABASE SdbUser = 'root'; //Database user name SdbPass = "; //database passowrd /* ACTUAL CONNECTION */Scon = mysql_connect($dbHost,$dbUser,$dbPass)or die(mvsql_errorQ); mysql_select_db(SdbName,Scon)or die(mysc]l_error());/*NOW WE CAN EXECUTE QUERIES*/
Squerv = "SELECT '".$_GET|'labell'|."' FROM knse2(>' WHERE'date' >="’ .$_GET[’datefrom'].'" AND ‘date*<="'.S_GET['dateto'j.... ;//echo Squery.'<br>';Sresource = mvsql_querv(Squery)or die(mysql_errorQ);Si—0;
\vhile(Sro\v = mvsql_fetch_array(S resource))j
Sdata[$i] = Srow[S_GET|'label l'||;++$i;
Squerv = "SELECT '".S_GET|’label2'|."' FROM knse2(V WHERE'date'>="’.$_GETf dare from'].’" AND ‘date‘<="'.S_GET|'dareto']....//echo Squery.'<br>';Sresource = mysql_query($querv)or die(mysql_errorQ);$i=0;\vhile(Sr< >\v = mysql_fetch_arrav($resource))j
Sdata2f$i] = Sro\v|S_GET|'label2'||;++$i;
Squerv = "SELECT '".$_GET|'label3'|."' FROM “knse20‘ WHERE' dare' > .S_GETf date f rom' ] AND date'<="’.S_GET|'dateto'|. ;//echo $querv.'<br>';Sresource — rnysql_query($querv)or die(mysql_errorQ);Si=0:\vhile(Sro\v = mysql_fetch_array($resource))I
$data3[$i] = Sro\v[$_GET|'label3']j; ++Si;
ii
64
>X4eoooMOM
Sgraph - new timeSeriesGraphCNSE GRAPH SAMPLE','Time: '.$_GET|'datefrom').' to \$_GET[’dateto'],'Approx. Prices:K.r.S',$_CiET|'fromUnix'],$_G ET['toUnix'|,Sdata,$data2,$data3);?>
Technical Trading Support System (TTSS) | 2010
Sample Code. Graph generator.
/** timeseries_tool_nse20 Ophp
:*******x***************************************- CONNECT TO MYSQL DATABASE*//*CC)NNECTI()N VARIABI.ESQSdbHost = "; //database serverSdbName = 'shares'; //ENTER NAME OF DATABASESdbUser = 'root'; //Database user nameSdbPass = "; //database passwordi* ACTUAL CONNECTION */Scon = mysql_connect($dbHost,$dbUser,$dbPass)or die(mysc]l_errot Q), myscil_select_db($dbName,$con)or die(myscil_errorQ);
'NOW W’E CAN EXECUTE QUERIES*//*** XX. XX XX*X*********** XX. x.X.xxx-x***'**3*-*-**-**-****-* * j*cx** *xx****************
*/Squery = "SELECT * FROM *nse20* LIMIT 0,0"; Sresource — mysql_query($query)or die(mysc]l_error());
* CREATE FIELD NAMES ARRAY TOR LABELS*/S]—0;$ fields = arravQ;tor($i=0;$i<mysql_mim_fields($resource);++$i)f\
Sr = my scjl_fetch_field (Sresource);if(Si>l)/*SKIP the first & second field(id and date fields)*/
Sfields|Sj| = Sr->name ;++Sj;//echo '<option value= ',Sr->name,'">'.strtoupper($r->name).'</oprion>';
j at a«t
*/Stroma = '16/03/1982'; Stoa = '22/02/2010';

if($_G ET I' froma' |!=")j
Stroma = $_GETffroma'|;Sroa = $_GET['toa'];
}j **
*/Strom = '16/03/1982';Sro = '22/02/2010'; if(S_GET|'from'|!=''){
Strom — $_GLT['from'];Sto = S_GET|'ro'];
is?>Ophp cclio Serror;?></font><br /><form method—"get" action—""><fieldset stjde—"font-family: tahoma"> ^< legend style-'color: red"><h2>Please enter duration and select charts tor overlay (NM . J 1
Index)</h2></lcgend><font color—"red"><font color="red"><?php echo Serror;?></f<Snt><br /> (< field set style=" color: green; font-family: tahoma"><legend style="color: blue">DUR/\T10N</legend>From: <inp«t type="text" name="ftom" value=”<?php echo Sfrom?>7> To <mput ty p e - ’text" name="to"valne="<?php echo $to?>"/><br />Date Format: DD/MM/3 3 3 3 </fieldset><br /> ()< field set srvle="color: green; font-family: tahoma"><legend Style=''color: blue">GRAPHING LABF.IJS</legend>Labels: # 1<select name="label 1 "><?phpfor($i=0;$i<count($fields)-4;++$i)
if(S_GET|,labeir]==$tieldsfSil)
echo '<option
Ssel — ' selected—”yes >value=m,$fields[Si|,,m,$sel/>,.strtoupper($tields[Si]).'</opnon>;
Ssel—n .
\i
66

Technical Trading Support System (T TSS)
V></select>
7^select nam e=,,label2"><>nhptor:;$i=0;Si<count($fields)-4;++$i)it
i f ($_G ET [' label2']==$ field s | $i])f\
Sscl = ’ selected="yes"'; xecho '<option value=',',Sfields[$i],"",$sel,,>'.strtC)upper($fields[$i]).'</optionSsel=”;
?></select>£3<select name—"label3"><?phptor $i=0;Si<count($fields)-4;++Si)
if($_GETl,label3,l==$fields[$il)\
Ssel — ' selected—"yes'";
echo '<option value="',$fields|$il,"",$sei;>'.strtoupper($fields[$i|).'</opaon
Ssel=";\ r ></select><br /><input type—"submit" name—"action < / fieldset> < / form><?php
" value="GENERATE GRAPHS"/>
if S_G ET ['action' | =='G EN ER ATE G R A PHS')i
Stroma = explode (Y\$_GET| froma |),Sdate_from = $ froma ( 2 ] froma [ ll.'-'.SfromafO]; SfromL’nix = mktime(0,0,0,$froma[ 1 ],$homa[0],$froma|2]); Stoa = explode('/',S_CiET|'toa'|);Sdate_to = Stoa[2].'-'.$toa[l|.'-'.$toa|0|;StoUnix = mktime(0,0,0,Stoa[ 1 ],$toa[0],Stoa[2]);SlabeU = $_GETClabel4'];
Sfrom — explode(7',S_GET|'trom |);Sdate_from2 = $from[2].’-\$trom[ l].'-'.$from[0]; SfromUmx2 = mktimc(0,0,0,$from| 1 l,$fromlO],Sfrom[2]); Sto = explode(7',S_(iET|'to'|);Sdate_to2 = $to[2].'-\$to[ 1 |.'-\SrolO|;StoL'nix2 = mktime(0,(),0,Sto|l|,$to|n|,$to[2|);SlabeU = $_GET['labell'];Slabel2 = $_GET['label2'];
67
2010
SlabeB = $_GET['label3'|;tielse(
SfromUnix = mktimc(0,0,0,16,0.),1982); $date_from — '1982-03-16';SroUnix = mktime(0,0,0,22,02,2010); $date_to — '2010-02-22';SlabeU = 'close';
$fromUnix2 — mktime(0,0,0,16,03,1982); Sdare_from2 — '1982-03-16';SroUnix2 = mktime(0,0,0,22,02,2010); Sdate_to2 = '2010-02-22';Slabell = 'open';Slabel2 = 'high';Slabel3 = 'low';
</fieldset>< field set ><?php$IRT AlueryString = "label 1 =".$label 1 .,'&label2=".Slabel2.,'&label3=',.$labcl3; SUREQueryString .="&fromUnix=".$fromUnix2."&roUnix=".Stol nix2. ; SUREQueryString .="&datefrom=".$date_from2."&dateto=".Sdate_to2;
<img src="graph_plot_nse20.php?<?php echo SURLQuetyString?>"/><br />Labels:<br/> ,Isabel #1: <font color="red"><?php echo strroupper($labell)r'></tont><br / Label #2: <font color="blue"><?php echo strroupper($label2)?></font><br Isabel #3: <font color="green"><?php echo srrroupper($label3)?></font><br</fieldset>
Sample code: Trend Identification
<?php//DB CONECTION----------- -----------------------------Scon = mvsql_connecr(",'root',")or die(mysql_errorO); mysql_selecr_db('shares',$con)or die(mysql_errorO);
^ ^ 'S E L E C T 'date‘,'close‘, ‘ltrend',"sttend‘,'etnadifr,'smadiff FRC>M nse20 ORDER
BY date DESC" ;Srcs = mysql_query($query)or die(mysql_error());Srow = mvsql_fetch_object($res);echo "<hi alii>hn='center'> NSE20 General Desic.ons</h-> ;echo '< table border^' 1" cellspacmg="8" style="font-family: cahoma > ,
68
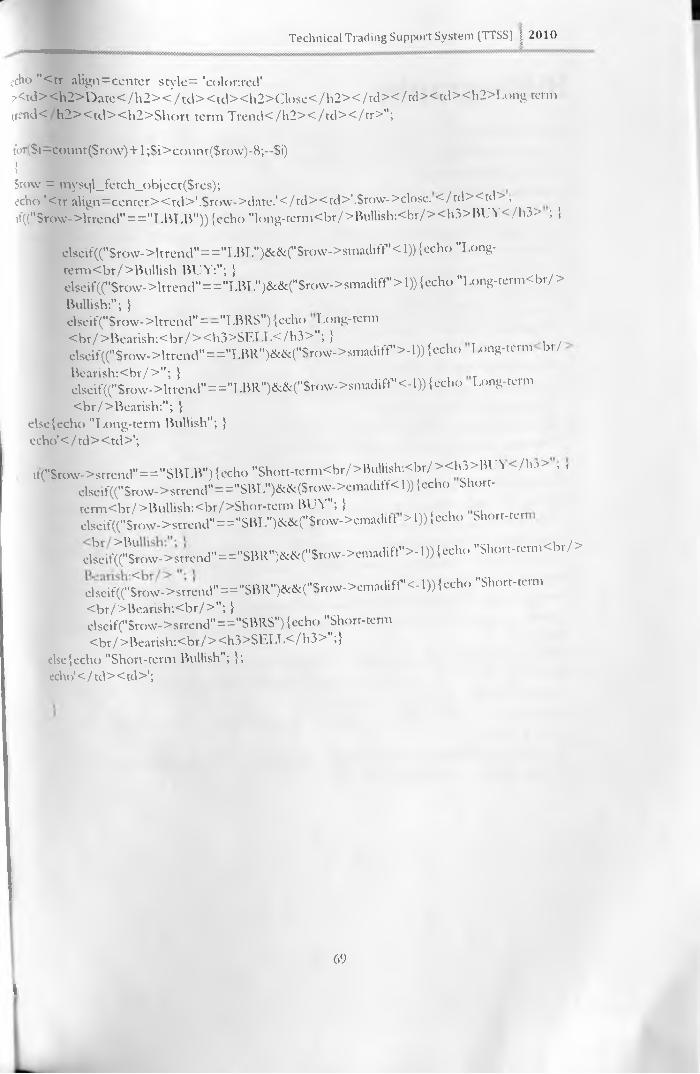
echo ”<rr align=center styles 'coloured'?<td><h2>Date</h2></td><td><h2>Close</h2></td></td><td><h2>Long term[ttnd< h2><td><h2>Short term Trend</h2></td></tr>";
Technical Trading Support System (TTSS) | 2010
foT.Si—count($rc >\v)+1 ;$i>count($ro\v)-8;—$i)i>Srow = mysql_fetch_object($res);echo ‘<tr align=center><td>'.$ro\v->date.'</td><td>'.$ro\v->close. </td><tel> ,if(("$ro\v->ltrend"=="LBLB")){echo "long-term<br/>BuUish:<br/><h3>BUY</h3> ; i)
elseif(("$ro\v->krend"=:z=''LBL'')&&("§ro\v->srnaditT'< l)){echo "Long-term<br/>Bullish BUY:"; }elseif(("$ro\v->ltrend"=="LBL")&&(,,$ro\v->smadifP,>l)){echo "Long-term<br/ >Bullish:"; }elseif("Srow->ltrend"=—"LBRS"){echo Long-term <br/>Bearish:<br/><h3>SELL</h3>"; }elseif((MSrow->ltrend"=="LBR")&&("$row->smadiff’>-l)){echo T^ng-term bt/
Bearish:<br/>"; }elseif(("$row->lttend"==',I.BR")&&(''Srow->smadiff,<-l)){echo Long-term
<br/>Bearish:"; { else {echo "Long-term Bullish"; } echo'</td><td>';
tt("$ro\v->strend"=="SBLB"){echo "Short-term<br/>Bumsh:<br/><h3>BL^ < / h » > *elseif((M$row->strend"==,,SBL,,)&&($row->emadiff<l)) {echo bhort- term<br/>Bullish:<br/>Shor-tenn BUY";}elseif(("$row->strend"=="SBL")&&("$rovv->emadi11 >l)){ccho Short-tcrr
d^eif^' lmw->sttend"=="SBR,,)&&("$to\v->emadifr,>-l)){cchc) "Short-term<br/>
ciseif(C'^ro\v->strcnd"==,,SBR")&&(''Srow->emadiff'<-l)){echo "Short-term
<br/>Bearish:<br/>"; {elseif("$ro\v->strend"=="SBRS"){echo "Short-term <br/>Bearish:<br/><h3>SLLL</h3>";}
else {echo "Short-term Bullish"; }; echo' < / td >< td >';
69
\

Bibliography1. Brock, William and Lakonishok, Josef and Lebaron, Blake, 1992, Simple Technical Trading
Rules and the Stochastic Properties of Stock Returns, The Journal of Finance, Vol XLYIl, no. 5, December 1992.
2. Brock, William, Josef Lakonishok, and Blake LeBaron, (1992), Simple Technical Trading Rules and the Stochastic Properties of Stock Returns, Journal of Finance 4~, 1731-1764.
3. Cheung, Y. W., and M. 1). Chinn (2001). “Currency Traders and Exchange Rate Dynamics:A Survey of the US Market.” Journal of International Money and Finance, 20(2001):439-471
4. Date C.|. kannan A. Swamvnarhan S. (2005), an Introduction to Database Systems, 8" I'd. DollingKindersley (India) Pvt. Ltd.
5. Fama, F..F. (1970), “F.fficienr (Capital Markets: A Review of the Theory and F.mpirical Evidence,” Journal of Finance 25, May 1970.
6. Jensen, M. (2.(1978) “Some Anomalous Evidence Regarding Marker Efficiency.' Journal ot Financial Economics, 6 (1978):95-101.
7. Lehmann, B. \. (1990), Fad, martingales, and marker efficiency, Quarterly Journal of Economics, Vol.105, pp. 1 -228.
8. Mehta, Mahendra, (1998), Neural Network directed Trading in Financial Markers using High Frequency Data, Neural Network World 2/98, pp 167-179.
9. Menkhoff, L. and Schlumberger, M. (1995), Persistent Profitability of Technical Analysis on Foreign Exchange Markets? BNL Quarterly Review, Vol. 193, 1995, pp. 189 - 216.
10. Nefrci, S.N. and Policano, A.J. (1984), “Can Chartists Outperform The Marker? Market Efficiency Tests for Technical Analysis,” Journal of Futures Markers, Vol. 4, No. 4, 1784.
11. Papadamou, S. and Stephanides, G. (2005), 4th WSLAS I nr. Conf. on non-linear analysis, non-linear systems and chaos, Sofia, Bulgaria, October 27-29, 2005 (pp 129-134).
12. Papadamou, S. and Stephanides, C 4., (2003) A New Matlab-Based Toolbox For Computer Aided Dynamic Technical Trading, FinancialEngineering News, Vol. May/June, No.31.
13. Pressman R.S.,(2005), Software engineering a practitioner’s approach, 6" Ed., N3 : McGraw- Hill, USA.
14. Pring, M. J. (2002), Technical Analysis Explained. New York, N3 : McGraw-Hill, 2002.15. Samuelson, P.A. (1965), “Proof that Properly Anticipated Prices Fluctuate Randomly,
Industrial Management Review, Spring 1965.16. Schwager, J. D. (1996), Schwager on Futures: Technical Analysis. New 3 ork, N3 : John
Wiley & Sons.17. Tomek, W. and Qucrin, S., “Random Processes in Prices and Technical Analysis,”Journal <>t
Futures Markets, Vol. 4, No. 1, 1984.
70
