technical report 2012-06 - mont terri project
TRANSCRIPT
ANDRA BGR CHEVRON CRIEPI DOE ENRESA ENSI FANC GRS
IRSN JAEA NAGRA NWMO OBAYASHI SCKCEN SWISSTOPO
Mont Terri Project
TECHNICAL REPORT 2012-06 December 2015
DS Experiment
Review of In Situ Stress Measurements and Their
Context
T. Doe, Golder Associates, Germany
T. Vietor, nagra, Switzerland
Mont Terri Project, TR 2012-06
Distribution:
Standard distribution:
ANDRA (S. Dewonck)
BGR (K. Schuster)
CHEVRON (P. Connolly)
CRIEPI (T. Oyama)
DOE (P.Nair, J. Birkholzer)
ENRESA (J.C. Mayor)
ENSI (M. Herfort)
FANC (F. Bernier)
GRS (K. Wieczorek)
IRSN (J.-M. Matray)
JAEA (N. Shigeta)
NAGRA (T. Vietor)
NWMO (M. Jensen)
OBAYASHI (M. Fukaya)
SCKCEN (C. Bruggeman)
SWISSTOPO (P. Bossart, A. Möri and Ch. Nussbaum)
Additional distribution:
Every organisation & contractor takes care of their own distribution.

2nd December 2015
TR 2012-06 MONT TERRI DS EXPERIMENT
Review of In Situ Stress Measurements and Their Context
T. Doe (Golder Associates) and T. Vietor (Nagra)
RE
PO
RT
Report Number 13505170278
Distribution:
Swisstopo- 1 PDF Copy
Golder Associates - 1 PDF Copy
Nagra – 1 PDF Copy
Submitted to:
Mont Terri Consortium swisstopo Rue de la gare 63 CH-2882 St. Ursanne Switzerland

TR 2012-06 DS-EXPERIMENT IN SITU STRESS MEASUREMENTS
22nd July 2014 Report No. 13505170278 ii
TR 2012-06 DS-EXPERIMENT IN SITU STRESS MEASUREMENTS
22nd July 2014 Report No. 13505170278 iii
Table of Contents
1.0 INTRODUCTION ........................................................................................................................................................ 1
1.1 Purpose of Report and Report Organization ................................................................................................. 1
1.2 Geologic and Topographic Setting ................................................................................................................ 1
1.3 State of Tectonic Stress in North-Western Switzerland ................................................................................ 2
1.4 Overview of Stress Measurement Programs at Mont Terri ........................................................................... 3
2.0 STRESS MEASUREMENT METHODS USED AT MONT TERRI ............................................................................. 7
2.1 Hydraulic Methods ........................................................................................................................................ 7
2.1.1 Basic Principles ....................................................................................................................................... 7
2.1.2 Determination of Maximum Stress .......................................................................................................... 8
2.1.3 Determination of Minimum Stress ........................................................................................................... 9
2.1.3.1 Shut in Pressure and Instantaneous Shut in Pressure (ISIP) .............................................................. 9
2.1.3.2 Shut in pressure decline methods........................................................................................................ 9
2.1.3.3 Hydraulic Jacking............................................................................................................................... 10
2.1.3.4 Fracture orientation and direction of maximum stress ....................................................................... 11
2.2 Strain Relief Methods ................................................................................................................................. 12
2.2.1 Borehole Slotter Tests ........................................................................................................................... 12
2.2.2 Undercoring and Under-Excavation Stress Measurements (ROSAS)................................................... 13
2.2.3 CSIRO Overcoring Measurements........................................................................................................ 14
2.2.4 BGR Borehole Deformation Gauge Measurements .............................................................................. 15
2.2.5 CRIEPI Overcoring Methods: 3DD-G Borehole Deformation Gauge and Compact Conical-
Ended (CCBO) Gauge Overcoring ........................................................................................................ 16
2.3 Quality Assessment of Strain Relief Methods ............................................................................................. 19
2.3.1 Strain Relief Data Quality ...................................................................................................................... 19
2.3.2 Quality of the Rock Property Data ......................................................................................................... 20
2.3.3 Quality of the Stress Solution ................................................................................................................ 20
2.3.4 Assessment of Strain Relief Measurement Quality ............................................................................... 21
3.0 RESULTS AT STRESS MEASUREMENT SITES (FROM SOUTH TO NORTH) .................................................... 23
3.1 Park Niche .................................................................................................................................................. 23
3.1.1 Rock types and tests performed ........................................................................................................... 23
3.1.2 Minimum Horizontal Stress ................................................................................................................... 23
3.1.3 BDS-2 Maximum Horizontal Stress ....................................................................................................... 25
TR 2012-06 DS-EXPERIMENT IN SITU STRESS MEASUREMENTS
22nd July 2014 Report No. 13505170278 iv
3.1.4 BDS-2 fracture orientation ..................................................................................................................... 27
3.1.5 Stresses at Park Niche .......................................................................................................................... 29
3.2 IS Niche ...................................................................................................................................................... 30
3.2.1 Rock Types and Tests Performed ......................................................................................................... 30
3.2.2 ROSAS Undercoring Tests ................................................................................................................... 30
3.2.3 Borehole Slotter Stress Measurements ................................................................................................. 31
3.2.4 Hydraulic Fracturing .............................................................................................................................. 33
3.2.5 Stress at IS Niche ................................................................................................................................. 33
3.3 Rock Laboratory ......................................................................................................................................... 35
3.3.1 Rock types and tests performed ........................................................................................................... 35
3.3.2 Hydraulic Fracturing in BDS-4 ............................................................................................................... 36
3.3.3 GS Experiment Work ............................................................................................................................ 38
3.3.4 EZA Experiment Overcoring ................................................................................................................. 39
3.3.5 CRIEPI 3DD-G tests ............................................................................................................................. 41
3.3.6 State of Stress at the Rock Laboratory ................................................................................................. 42
3.4 Ventilation Cavern ...................................................................................................................................... 44
3.4.1 Rock Types and Tests Performed ......................................................................................................... 44
3.4.2 Hydraulic fracturing in BDS-1 ................................................................................................................ 44
3.4.3 Overcoring in BDS-1 and BDS-3 ........................................................................................................... 45
3.4.3.1 Results ............................................................................................................................................... 47
3.4.3.2 Documentation of Overcoring Results ............................................................................................... 48
3.4.3.3 Comparison of CRIEPI and BGR Results .......................................................................................... 48
3.4.3.4 Questions of Elastic Properties .......................................................................................................... 49
3.4.4 State of Stress at the Ventilation Cavern Site ....................................................................................... 50
3.5 Derrière Mont Terri ..................................................................................................................................... 52
3.5.1 Test records .......................................................................................................................................... 52
3.5.2 Orientations ........................................................................................................................................... 52
3.5.3 Magnitude of the stresses ..................................................................................................................... 54
3.5.3.1 Minimum horizontal stress ................................................................................................................. 54
3.5.3.2 Maximum horizontal stress ................................................................................................................ 56
3.5.4 Effects of Drilling Mud on Hydraulic Fracturing ..................................................................................... 58
3.5.5 State of Stress at Derrière Mont Terri ................................................................................................... 58
4.0 DISCUSSION AND RECOMMENDATIONS ............................................................................................................ 61
TR 2012-06 DS-EXPERIMENT IN SITU STRESS MEASUREMENTS
22nd July 2014 Report No. 13505170278 v
4.1 Topics of Discussion ................................................................................................................................... 61
4.2 Topographic Versus Tectonic Controls on Stress at Mont Terri.................................................................. 61
4.3 Importance of Elastic Properties ................................................................................................................. 64
4.4 State of Stress in the Carbonate Units ........................................................................................................ 69
4.5 State of Stress in the Opalinus Clay ........................................................................................................... 70
4.6 Recommendations ...................................................................................................................................... 71
5.0 REFERENCES ......................................................................................................................................................... 73
TABLES
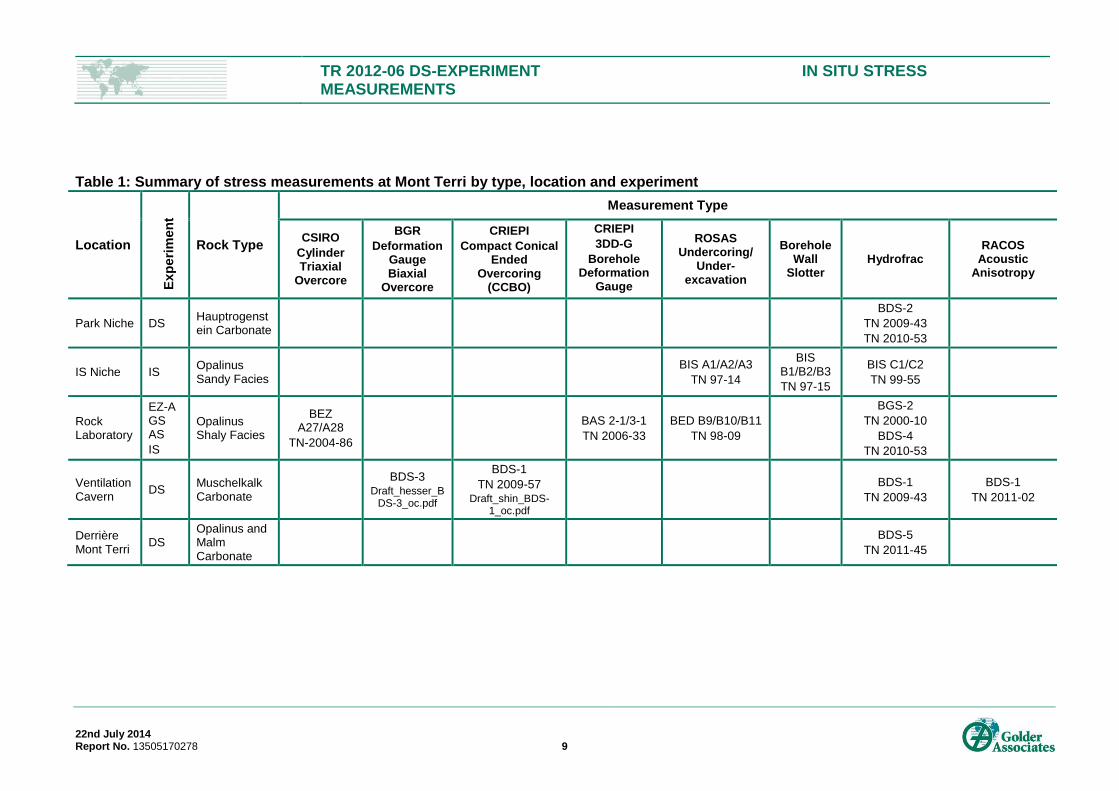
Table 1: Summary of stress measurements at Mont Terri by type, location and experiment .............................................. 9
Table 2.Strain relief quality criteria. ................................................................................................................................... 22
Table 3: Lithostatic and minimum horizontal stress in BDS-2 0 – 40 m below tunnel level (Mesy) ................................... 24
Table 4: Minimum horizontal stress in BDS-2 40 – 80 m below tunnel level (Golder) ....................................................... 24
Table 5: Pore pressure and hydrostatic pressure of borehole BDS-2 0 – 40 m below tunnel level ................................... 25
Table 6: Maximum horizontal stress in BDS--2 ................................................................................................................. 25
Table 7: Fracture dip azimuth and dip inclination of induced fractures in BDS-20 - 40 m below tunnel level .................... 27
Table 8: Fracture orientation of borehole BDS-2 40 - 80 m below tunnel level ................................................................. 28
Table 9. Borehole slotter stresses from BIS-B2 (stresses in bedding plane) .................................................................... 33
Table 10: Summary of stress results in the IS Niche ......................................................................................................... 35
Table 11. CSIRO Results in the Gallery 98 for the EZ-A Experiments (Lahaye, 2005). ................................................... 41
Table 12: BGR overcoring results in BDS-3 ...................................................................................................................... 47
Table 13: Fracture orientations of borehole BDS-5 ........................................................................................................... 52
Table 14: Lithostatic and minimum horizontal stress in BDS-5 (Opalinus Clay) ................................................................ 54
Table 15: Lithostatic and minimum horizontal stress in BDS-5 (Limestone) ..................................................................... 54
Table 16: Pore pressure and hydrostatic pressure of borehole BDS-5 ............................................................................. 56
Table 17: Maximum horizontal stress in BDS-5 (Opalinus Clay) ....................................................................................... 56
Table 18: Maximum horizontal stress in BDS-5 (Limestone)............................................................................................. 56
Table 19: Summary of Young's Modulus data from stress measurement programs, static values in shaded boxes, dynamic in italics. ............................................................................................................................................. 68
Table 20: Test evaluation table for borehole BDS-5 .......................................................................................................... 80
Table 21: Test evaluation table for borehole BDS-1 .......................................................................................................... 82
Table 22: Test evaluation table for borehole BDS-2 0 – 40 m ........................................................................................... 84
Table 23: Test evaluation table for borehole BDS-2 40 – 80 m ......................................................................................... 85
Table 24: Test evaluation table for borehole BDS-4 .......................................................................................................... 88
TR 2012-06 DS-EXPERIMENT IN SITU STRESS MEASUREMENTS
22nd July 2014 Report No. 13505170278 vi
FIGURES
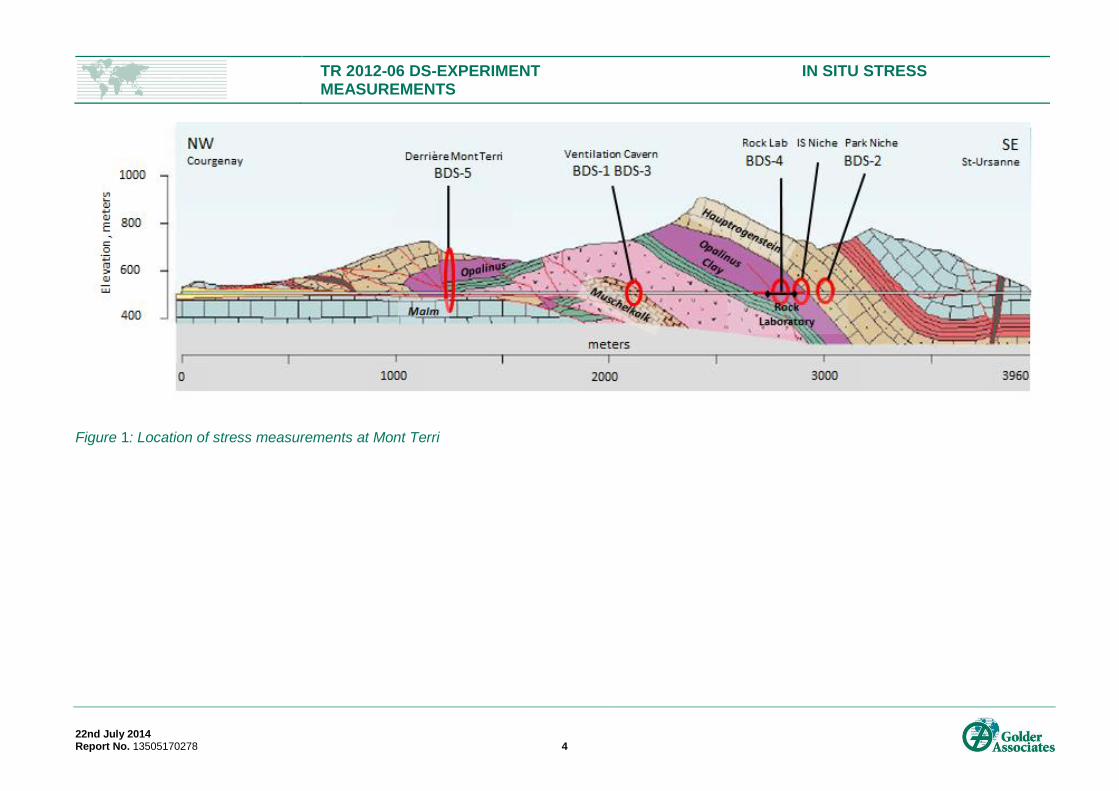
Figure 1: Location of stress measurements at Mont Terri ................................................................................................... 4
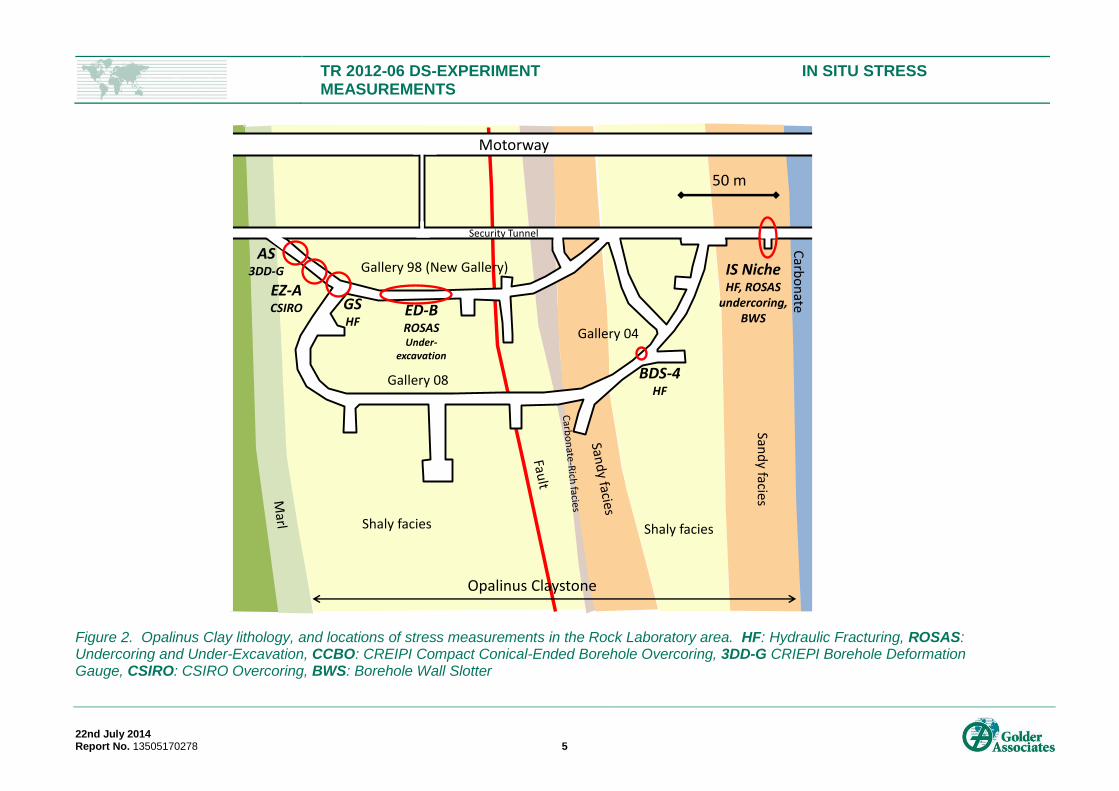
Figure 2. Opalinus Clay lithology, and locations of stress measurements in the Rock Laboratory area. HF: Hydraulic Fracturing, ROSAS: Undercoring and Under-Excavation, CCBO: CREIPI Compact Conical-Ended Borehole Overcoring, 3DD-G CRIEPI Borehole Deformation Gauge, CSIRO: CSIRO Overcoring, BWS: Borehole Wall Slotter ............................................................................................................ 5
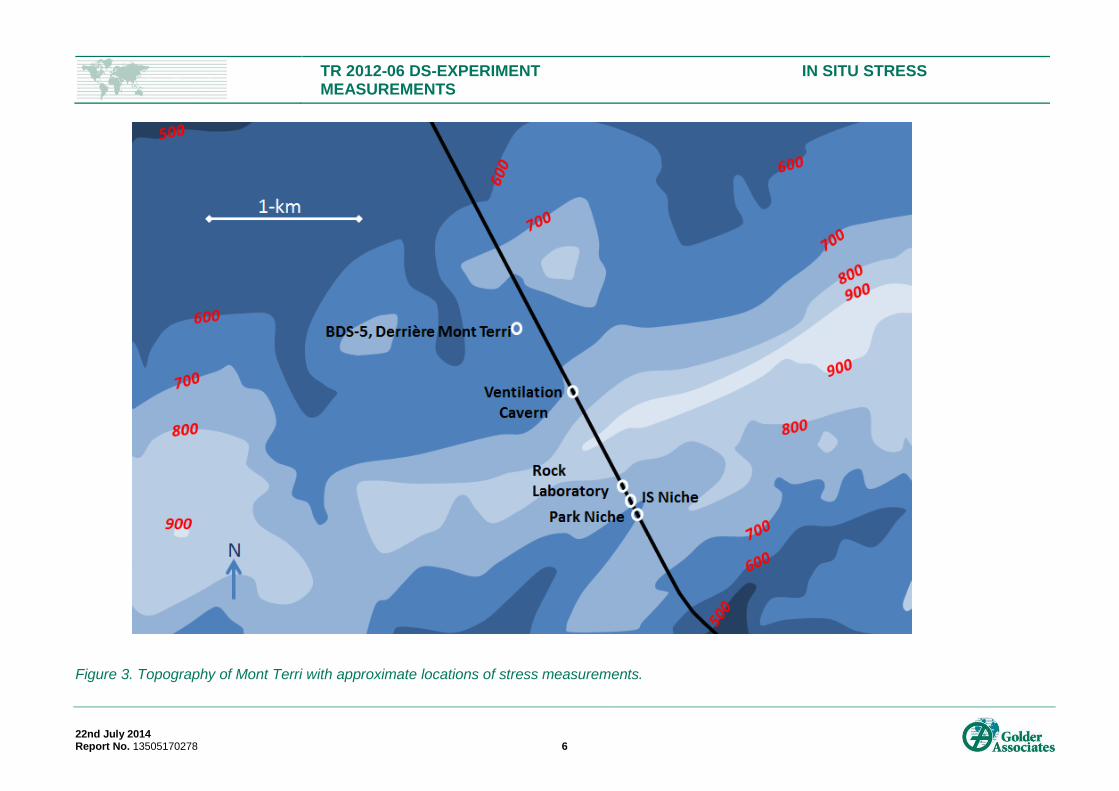
Figure 3. Topography of Mont Terri with approximate locations of stress measurements. ................................................. 6
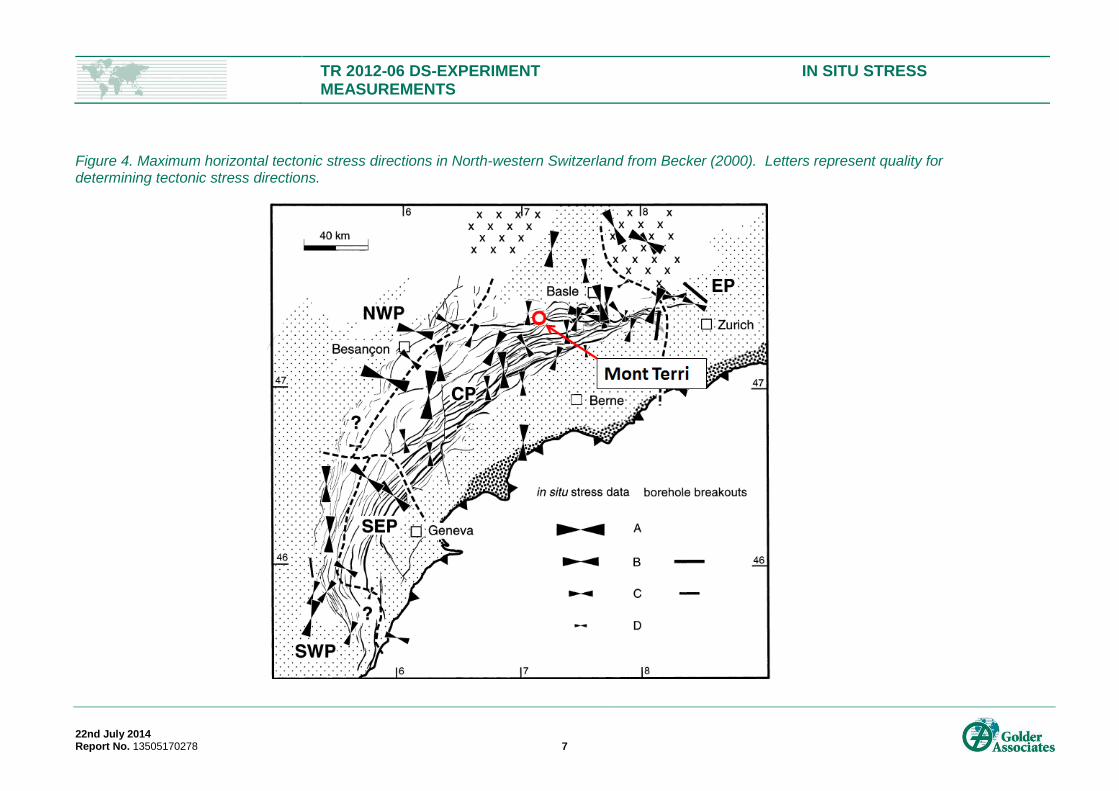
Figure 4. Maximum horizontal tectonic stress directions in North-western Switzerland from Becker (2000). Letters represent quality for determining tectonic stress directions. ............................................................................... 7
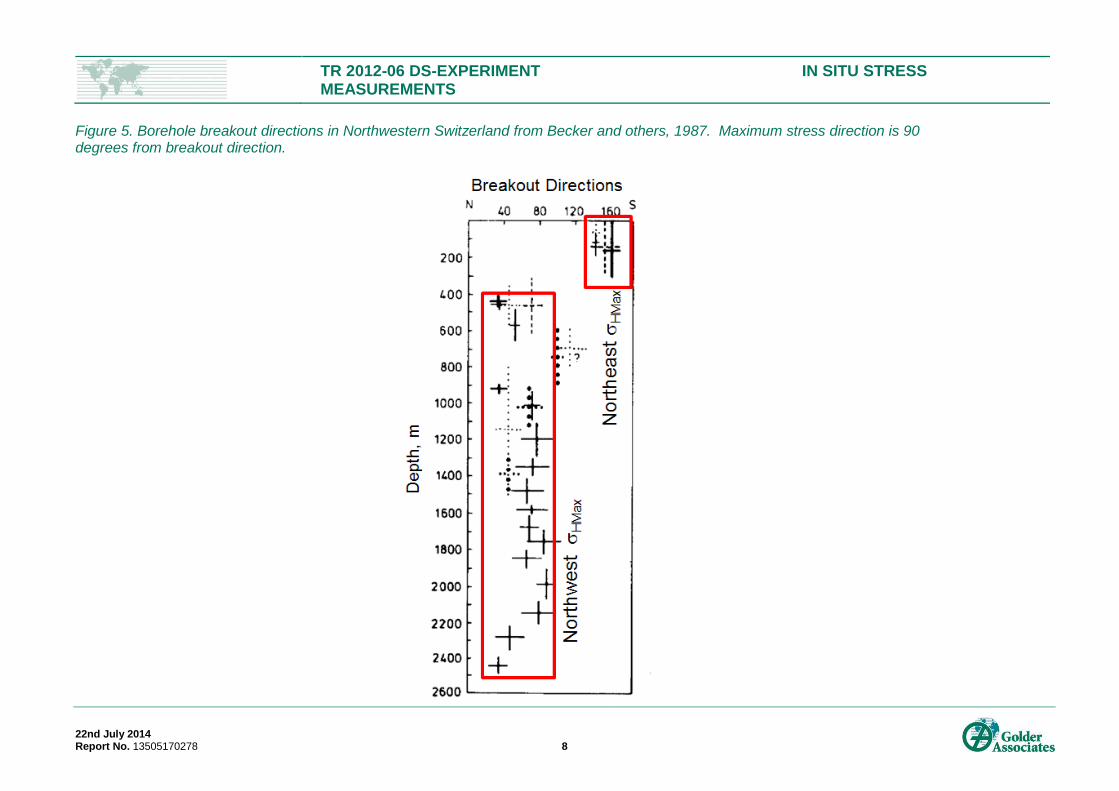
Figure 5. Borehole breakout directions in Northwestern Switzerland from Becker and others, 1987. Maximum stress direction is 90 degrees from breakout direction. ...................................................................................... 8
Figure 6: Ideal hydrofrac test record with pressure and flow rate plot. ................................................................................ 7
Figure 7: ISIP for cases of little and large leakoff ................................................................................................................ 9
Figure 8: Sketch of borehole slots in a hole parallel to the bedding planes (not to scale) ................................................. 12
Figure 9: Sketch of ROSAS1 undercoring geometry in IS Niche (not to scale) ................................................................. 14
Figure 10: CSIRO overcoring cell (Lehaye, 2005) ............................................................................................................. 15
Figure 11: BGR probe in granite core specimen from Grimsel laboratory. Gauge opened to show internal components (Pahl et. al, 1989) ........................................................................................................................ 16
Figure 12: CREIPI 3DD-G tool (Shin, 2011) ...................................................................................................................... 17
Figure 13: CRIEPI compact conical-ended borehole overcoring gauge shown before installation and as recovered with it overcore sample (Shin, 2013) ................................................................................................................ 18
Figure 14: Diagram of CRIEPI CCBO overcoring strain gauge rosettes superposed of image of limestone in 38-mm pilot borehole (Shin, 2013) ........................................................................................................................ 18
Figure 15. Hydraulic fracturing stress results in BDS-2 .................................................................................................... 26
Figure 16: Left: Stereonet plot of all hydraulic fracture poles of borehole BDS-2 0 - 40 m below tunnel level. Right:
Rose plot of strikes of steeply (>60) dipping hydraulic fractures. Strike mean corresponds to HMax direction. ........................................................................................................................................................... 27
Figure 17: Left: stereonet plot of hydraulic fracture poles in borehole BDS-2 40 - 80 m below tunnel level. Right:
Rose plot of steeply (>60) hydraulic fractures. ................................................................................................ 29
Figure 18: Example of strain record from ROSAS undercoring experiment (Bigarré, 1997) ............................................. 31
Figure 19: ROSAS-1 "best fit" stress solution (Bigarré, 1997) ........................................................................................... 31
Figure 20. Borehole slotter stresses from BIS-B2 (stresses in bedding plane, dip direction 150,50) ............................... 32
Figure 21: Example of hydraulic fracturing test cycle in the Opalinus clay from IS Niche (Evans, and others., 1999) ...... 34
Figure 22: Example of hydraulic fracturing record form BDS-4 ......................................................................................... 36
Figure 23: Minimum stress versus depth in BDS-4 ........................................................................................................... 37
Figure 24: Borehole breakouts from BDS-4 ...................................................................................................................... 38
Figure 25: CSIRO overcoring results from the Gallery 98 area (Lahaye, 2005). Left: Results without Test 4. Right: All results. Single points are stress directions those recommended by Bossart and Wermeille (2003). UPPER HEMISPHERE PLOTS RELATIVE TO THE SECURITY GALLERY DIRECTION. ................ 40
Figure 26: Rock stress orientation and magnitude from 3DD-G overcoring measurements in the Opalinus clay. Insert shows Young's modulus versus bedding plane orientation. ................................................................... 42
TR 2012-06 DS-EXPERIMENT IN SITU STRESS MEASUREMENTS
22nd July 2014 Report No. 13505170278 vii
Figure 27: Typical pressure-flow-time record for BDS-1 hydraulic fracturing test. Mesy's pick of shut in pressures of 3.5 MPa shown as straight line. .................................................................................................................... 44
Figure 28: Minimum stress from shut in pressure, BDS-1 ................................................................................................. 45
Figure 29: Left: Stereonet plot of hydraulic fractures in BDS-1 ; Right: Rose plot of strikes of steeply dipping
fractures. Strike indicates direction of Hmax .................................................................................................... 46
Figure 30: Ventilation cavern stress data. CCBO overcoring results shown as ellipsoids; BGR deformation gauge biaxial data shown as ellipses normal to hole; BDS-1 are the orientations of hydraulic fractures. The hydraulic fracture visualization is offset from its actual position ....................................................................... 46
Figure 31: Summary of stresses in BDS-1 from CCBO overcoring (Shin, 2013) ............................................................... 47
Figure 32: Biaxial stresses in MPa from the CRIEPI conical cell in the plane x = N 325, y = vertical. Gray lines are the results of five measurements. Red line is the average. Despite axis labels all values are positive. ........... 49
Figure 33: Biaxial stresses in MPa from the BGR borehole deformation gauge (gray) compared with average of CRIEPI triaxial results (red) in the plane x=N 325 y=vertical. ........................................................................... 50
Figure 34: Orientations of hydraulic fractures in BDS-5 within the Opalinus Clay and above the main thrust; Right::
Rose diagram of fracture strikes. Strike is the Hmax direction. ........................................................................ 53
Figure 35: Orientations of hydraulic fractures in BDS-5 within the limestones below the main thrust Left:
Stereonet plot of fracture poles ; Right: Rose diagram of fracture strikes. Strike is the Hmax direction. ........ 53
Figure 36: Lithostatic and minimum horizontal stress in borehole BDS-5 ......................................................................... 55
Figure 37: Lithostatic and maximum horizontal stress in borehole BDS-5. ....................................................................... 57
Figure 38: Pressure time record of Test 8 at 182.5 m in BDS-5 with signs of drilling mud present ................................... 59
Figure 39: Hydraulic fracture strike directions from steeply dipping fractures in BDS-1, BDS-2, and BDS-5. The Opalinus Clay rose diagram is located at the collar of BDS-5. The deep limestone rose diagram is offset from the collar. ........................................................................................................................................ 63
Figure 40: Horizontal stress directions in the basement and sedimentary cover of the Jura Mountains (from Wermeille and Bossart, 1999) together with the stress directions at the Mt. Terri site distinguished as tectonic and topographic .................................................................................................................................. 64
Figure 41: Example overcoring record from CSIRO cell of the Opalinus clay (Lahaye, 2005) .......................................... 65
Figure 42: Example of overcoring strain record from CCBO overcoring in the Muschelkalk of the Ventilation Cavern (Shin, 2009) ......................................................................................................................................... 65
Figure 43: Dynamic Young’s Modulus from FWS logs in BDS-2 (Carbonate) ................................................................... 69
Figure 44: Dynamic Young's modulus from FWS logs in BDS-4 ( Opalinus Clay) ............................................................ 69
APPENDIX A Test evaluation table for borehole BDS-5
APPENDIX B Test evaluation table for borehole BDS-1
APPENDIX C Test evaluation table for borehole BDS-2
APPENDIX D Test evaluation table for borehole BDS-4
User Note: This Table of Contents section acts as a reference point for the Record of Issue, Executive
Summary and Study Limitations sections as and when they might be required. Therefore, the structure of
this section must not be altered in any way.

TR 2012-06 DS-EXPERIMENT IN SITU STRESS MEASUREMENTS
22nd July 2014 Report No. 13505170278 viii
TR 2012-06 DS-EXPERIMENT IN SITU STRESS MEASUREMENTS
22nd July 2014 Report No. 13505170278 ix
EXECUTIVE SUMMARY/ABSTRACT
The Mont Terri Laboratory has been a major underground laboratory for shale research for nearly 20 years.
The mechanical behaviour of the shale is a key issue that affects the stability of the underground openings,
the closure of boreholes, and the properties of potential groundwater pathways. Many experiments in the
laboratory are influenced by the mechanical behaviour of the rock, which is controlled by the its geological
history, the mechanical properties of the rock, the pore pressure, coupled hydro-chemo-mechanical
processes, and the state of in situ stress. This report is an overview of the knowledge of the state of stress
that has developed from the experimental results conducted at the laboratory with particular emphasis on the
recently completed DS (determination of stress) program.
In situ stress measurements have been undertaken as part of five experiments at Mont Terri, two of which
were specific to in situ stress – the IS program (1996-1998) and the DS program (2010-2011). Additional
stress measurements were carried out in the early 2000’s as part of excavation damage experiments (EZ-A)
and gas fracturing (GS) experiments. These programs have used a wide range of stress measurement
methods including hydraulic fracturing, undercoring (ROSAS), overcoring, and borehole slotter methods.
Taken together, the stress measurement results indicate a variable stress field that reflects the topographic
and tectonic setting of the laboratory as well as the variability of the shale and carbonate rock types and their
mechanical properties. The shales, furthermore, display non-elastic behaviours that are influenced by
chemical interactions of the clays with porewater.
The stress measurement methods used fall into two major types: hydraulic fracturing and strain-relief.
Hydraulic fracturing measurements are essentially biaxial and are particularly good for measuring stress over
larger scales and for obtaining minimum stresses and their directions. Hydraulic fracturing is less effective at
measuring the maximum stresses due to uncertainties in the borehole stress concentrations and the rock’s
tensile strength. As to strain relief methods, both biaxial and triaxial methods have been applied. Some
methods (CRIEPI Compact Conical Ended gauge, CSIRO hollow cylinder, and ROSAS undercoring) are
triaxial, that is, they measure the complete state of stress. Others applied measure in one plane and are
biaxial (borehole slotter, BGR deformation gauge); they require integrating data from multiple holes to obtain
the complete stress field. A major uncertainty in the stress relief methods comes from having adequate
knowledge of the elastic properties – not only their values but also their magnitude and scale of
heterogeneity. Also in shale the mechanical properties are highly anisotropic. Not all the measurement
methods have taken the anisotropy into account, and are therefore suspect (particularly the borehole slotter).
There is also a concern about the validity of the elastic assumptions for the Opalinus Clay, however, a
review of the strain records that are available suggests that the time-scale of the measurement is sufficiently
rapid that viscoelastic effects are not a major problem. Ideally, for overcoring tests the elastic properties are
measured using a biaxial cell on the actual overcored specimen with the gauge in place. Unfortunately none
of the tests used this method. Rather, stress measurements have relied on a variety of in situ and laboratory
tests, and each program has used its own methods, which have yielded highly variable results. Further
attempts to interpret stress from overcore data would require a detailed review of the elastic property data.
The early stress measurements programs attempted to measure the state of stress in the laboratory in the
Opalinus Clay in terms of the far-field stress. An overview of those results suggests that none of the
measurements provided the far field values. Rather, the measurements at any given location are a unique
reflection of the local contributions of topography, tectonics, and local rock properties, and possibly test
method. Hence, this report recognizes five distinct locations where stress measurements have been
performed, which are (from southeast to northwest):
The Park Niche along the Security Gallery (DS program, 2008-2012)
The IS Niche along the Security Gallery (IS program, 1996-1998)
The Rock Laboratory consisting of the main area of excavation for experimental work (EZ-A, 2004;
GS, 2000, and DS programs (2008-2010),
The Ventilation Cavern (DS program, 2008-2012)
The Derrière Mont Terri surface borehole site (2011).
TR 2012-06 DS-EXPERIMENT IN SITU STRESS MEASUREMENTS
22nd July 2014 Report No. 13505170278 x
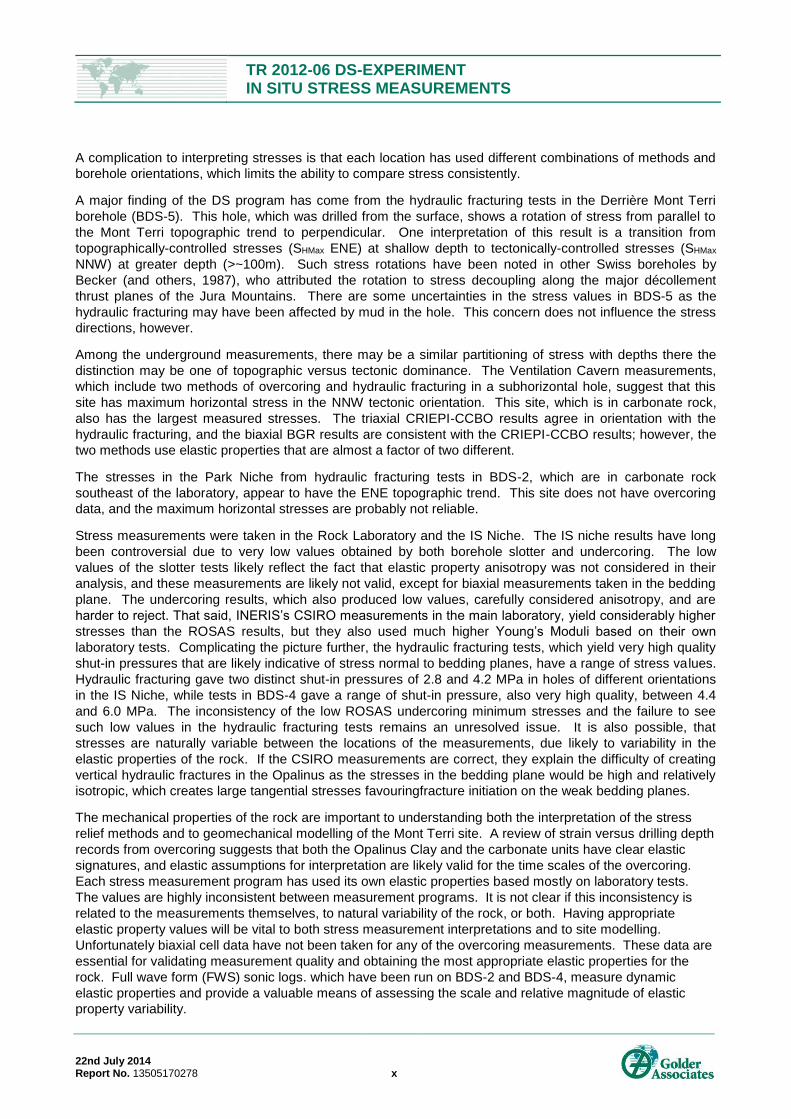
A complication to interpreting stresses is that each location has used different combinations of methods and
borehole orientations, which limits the ability to compare stress consistently.
A major finding of the DS program has come from the hydraulic fracturing tests in the Derrière Mont Terri
borehole (BDS-5). This hole, which was drilled from the surface, shows a rotation of stress from parallel to
the Mont Terri topographic trend to perpendicular. One interpretation of this result is a transition from
topographically-controlled stresses (SHMax ENE) at shallow depth to tectonically-controlled stresses (SHMax
NNW) at greater depth (>~100m). Such stress rotations have been noted in other Swiss boreholes by
Becker (and others, 1987), who attributed the rotation to stress decoupling along the major décollement
thrust planes of the Jura Mountains. There are some uncertainties in the stress values in BDS-5 as the
hydraulic fracturing may have been affected by mud in the hole. This concern does not influence the stress
directions, however.
Among the underground measurements, there may be a similar partitioning of stress with depths there the
distinction may be one of topographic versus tectonic dominance. The Ventilation Cavern measurements,
which include two methods of overcoring and hydraulic fracturing in a subhorizontal hole, suggest that this
site has maximum horizontal stress in the NNW tectonic orientation. This site, which is in carbonate rock,
also has the largest measured stresses. The triaxial CRIEPI-CCBO results agree in orientation with the
hydraulic fracturing, and the biaxial BGR results are consistent with the CRIEPI-CCBO results; however, the
two methods use elastic properties that are almost a factor of two different.
The stresses in the Park Niche from hydraulic fracturing tests in BDS-2, which are in carbonate rock
southeast of the laboratory, appear to have the ENE topographic trend. This site does not have overcoring
data, and the maximum horizontal stresses are probably not reliable.
Stress measurements were taken in the Rock Laboratory and the IS Niche. The IS niche results have long
been controversial due to very low values obtained by both borehole slotter and undercoring. The low
values of the slotter tests likely reflect the fact that elastic property anisotropy was not considered in their
analysis, and these measurements are likely not valid, except for biaxial measurements taken in the bedding
plane. The undercoring results, which also produced low values, carefully considered anisotropy, and are
harder to reject. That said, INERIS’s CSIRO measurements in the main laboratory, yield considerably higher
stresses than the ROSAS results, but they also used much higher Young’s Moduli based on their own
laboratory tests. Complicating the picture further, the hydraulic fracturing tests, which yield very high quality
shut-in pressures that are likely indicative of stress normal to bedding planes, have a range of stress values.
Hydraulic fracturing gave two distinct shut-in pressures of 2.8 and 4.2 MPa in holes of different orientations
in the IS Niche, while tests in BDS-4 gave a range of shut-in pressure, also very high quality, between 4.4
and 6.0 MPa. The inconsistency of the low ROSAS undercoring minimum stresses and the failure to see
such low values in the hydraulic fracturing tests remains an unresolved issue. It is also possible, that
stresses are naturally variable between the locations of the measurements, due likely to variability in the
elastic properties of the rock. If the CSIRO measurements are correct, they explain the difficulty of creating
vertical hydraulic fractures in the Opalinus as the stresses in the bedding plane would be high and relatively
isotropic, which creates large tangential stresses favouringfracture initiation on the weak bedding planes.
The mechanical properties of the rock are important to understanding both the interpretation of the stress
relief methods and to geomechanical modelling of the Mont Terri site. A review of strain versus drilling depth
records from overcoring suggests that both the Opalinus Clay and the carbonate units have clear elastic
signatures, and elastic assumptions for interpretation are likely valid for the time scales of the overcoring.
Each stress measurement program has used its own elastic properties based mostly on laboratory tests.
The values are highly inconsistent between measurement programs. It is not clear if this inconsistency is
related to the measurements themselves, to natural variability of the rock, or both. Having appropriate
elastic property values will be vital to both stress measurement interpretations and to site modelling.
Unfortunately biaxial cell data have not been taken for any of the overcoring measurements. These data are
essential for validating measurement quality and obtaining the most appropriate elastic properties for the
rock. Full wave form (FWS) sonic logs. which have been run on BDS-2 and BDS-4, measure dynamic
elastic properties and provide a valuable means of assessing the scale and relative magnitude of elastic
property variability.
TR 2012-06 DS-EXPERIMENT IN SITU STRESS MEASUREMENTS
22nd July 2014 Report No. 13505170278 1
1.0 INTRODUCTION
1.1 Purpose of Report and Report Organization
The Mont Terri Rock Lab in the Jura Mountains of northwest Switzerland has been an international research
test facility since 1995. It is the world’s longest running underground test facility for radioactive waste
disposal in argillaceous rocks. The host rock for the laboratory is the Jurassic age Opalinus Clay, which is
interbedded with carbonate rocks and marls. The facility takes advantage of the underground access
provided by the security tunnel associated with a major motorway tunnel through the mountain.
Coupled thermal, chemical, hydrological, and geomechanical processes affect the geologic disposal of
radioactive waste. The in situ stress state is an important geomechanical parameter both for the
interpretation of experiments at the Mont Terri Rock Lab and for the performance of an ultimate repository in
argillaceous rock. The lithology, tectonic setting, and topographic setting combine to make stress
measurement at the Rock Lab potentially complex. This has been borne out in a Mont Terri stress database
that contains variable and sometimes internally contradictory results.
This report reviews the rock stress measurements that have been performed as part of the Determination of
Stress (DS) program, which was initiated to resolve questions of the stress state in the Rock Lab. The DS
program was performed between 2008 and 2012. The report also draws on previous stress measurement
programs that have been initiated since the beginning of the laboratory.
This report first reviews all the methods that have provided stress data for the Mont Terri Laboratory (Section
2) and discusses factors that affect the quality and reliability of rock stress measurements both by strain
relief and by hydraulic fracturing. We provide some criteria for stress measurement reliability and use those
criteria to discuss the reliability of the measurement.
Section 3 examines the state of stress at the five locations where stress measurements have been carried
out (Figure 1). These locations are the following:
Park Niche
IS Niche
Rock Laboratory (the main underground experimental area)
Ventilation Cavern
Derrière Mont Terri surface hole (BDS-5).
These sites represent varied combinations of lithology, mechanical properties, and depth of cover.
Finally Section 4 discusses the database as a whole and assesses what information can be extracted to
support an updated conceptual model of the rock stress conditions. The conclusions also identify areas of
remaining uncertainty with recommendations for their resolution.
1.2 Geologic and Topographic Setting
The Mont Terri Laboratory lies in the folded Jura of north-western Switzerland. The laboratory occupies
underground openings excavated alongside the security gallery of the AutoRoute 16 tunnel through the
mountain. Figure 1 is a cross section of Mont Terri along the highway tunnel showing the major rock units
and their attitudes. The lithology is dominated by carbonate rocks that vary in their dolomitization and purity,
with clays and anhydrite being the major secondary constituents. The three carbonate units that hosted in
situ stress measurements were the Upper Jurassic Malm, Middle Jurassic Hauptrogenstein, and the Middle
Triassic Muschelkalk.
The Opalinus Clay, which is the focus of laboratory activities, lies between the Hauptrogenstein and
Muschelkalk carbonate units. While dominated by clay shale, this unit also varies in composition
stratigraphically with clay contents varying between 40% and 80% and variable quantities of clay minerals
with different swelling behaviours. The sandy and silty facies of the Opalinus may contain from 10% to 40%
quartz and from 5% to 40% calcite (Figure 2). The variability in lithology translates into variability of

TR 2012-06 DS-EXPERIMENT IN SITU STRESS MEASUREMENTS
22nd July 2014 Report No. 13505170278 2
mechanical behaviours both in strength and in deformational properties. While the carbonates may be
expected to have brittle elastic behaviours, the clay shales may have complex mechanical responses that
may include elastic, visco-elastic and plastic components with further dependencies on porosity and pore
fluid compositions. Furthermore, these clay shale behaviours may depend on the clay contents, the types of
clay minerals, and the amounts of secondary quartz and calcite.
The geologic structure of Mont Terri is also complex. The structure is a thrust-faulted anticline where the
laboratory lies in southeast dipping layers of the southeast limb. The décollement thrust fault does not
appear in the laboratory itself, but has an intersection in the vertical hole, BDS-5, on the northwest limb of
the fold where the fault has thrust Hauptrogenstein carbonates and Opalinus Clay over younger Malm
carbonate rocks (Figure 1). Secondary branches of the thrust pass through the laboratory within the
Opalinus Clay.
The topography of Mont Terri (Figure 1 and Figure 3) is dominated by a pair of ENE trending ridges. The
laboratory lies under 200-300 meters of cover beneath the higher, more dominant, and more continuous of
the two ridges. The surface elevations vary from under 500 m above sea level to slightly over 900 meters.
The surface borehole, BDS-5, at Derrière Mont Terri is drilled just below the second and less continuous
ridge.
In summary, the Mont Terri Laboratory should have a highly complex and variable in situ stress field due to
the lithology, tectonics, and topography. About the only relatively simple aspect to the setting is the linear
alignment of Mont Terri which may justify treating the topographic effects in a two-dimensional, plane-strain
manner, that is, where the net strain from topography in the direction of the topographic grain (ENE) is zero.
1.3 State of Tectonic Stress in North-Western Switzerland
The state of stress at any point in the mountain will reflect the applied stresses, the variability of the material
properties, and the physical boundaries. The applied stresses from the tectonic forces are associated with
the Alpine orogeny and the collision of the Eurasian plate with the northward-moving African plate. In the
regions of the Jura Mountains this convergence has create a series of folds and thrust faults that are the
dominant structural features of Mont Terri. An important question for geologists is whether or not the folding
and faulting represents an active tectonic stress state or one that has changed since the formation of the
Jura Mountains.
The topography also affects stress both in the presence of the free-surface of the earth and the variable
gravitational loading caused by topography. The variability of the deformational properties of the rock is third
component to the stress state. Stiffer rocks with higher elastic moduli tend to concentrate stresses, while
less stiff materials may act as soft inclusions that shed stresses. Thus in rock with variable deformational
properties, stresses will vary depending on the scale and shape of lenses, beds, and inclusions of stiffer or
softer material.
Wermeille and Bossart (1999) compiled stress data from northern and north-western Switzerland for
comparison with results from Mont Terri. Their compilation draws its data mainly from Becker (and others,
1987) and Becker (2000). The data types are mainly from borehole slotter measurements in quarries with
some data from overcoring measurements, other values from breakouts, and one hydraulic fracture test in
deeper holes. The points represent mainly Jurassic carbonate rocks with a few granites, sandstones, and
one anhydrite. All of the rocks are relatively competent and none of the measurements come from clay
shales.
Figure 4 presents Becker’s (2000) data set. The size of the symbol reflects his assessment of data quality
for use in defining the current tectonic in situ stress field. The major criterion for lowering data quality with
respect to tectonic stress determination is the presence of likely topographic effects. Becker defines five
stress provinces, which he identifies as having consistent stress orientations. The Mont Terri Laboratory lies
within his Central Province where the maximum horizontal stress is oriented in a N to NNW.
Breakouts are a particularly interesting part of Becker (and others, 1987) stress story. Figure 5 shows the
breakout orientations from northern Swiss deep boreholes. A striking feature is a stress rotation with depth
from a NE maximum horizontal stress above about 300 meters to NW direction at greater depths. Becker
TR 2012-06 DS-EXPERIMENT IN SITU STRESS MEASUREMENTS
22nd July 2014 Report No. 13505170278 3
(2000) relates breakout and stress rotation with depth to a décollement or decoupling horizon that for some
locations is an anhydrite layer. He notes, however, that whether or not the stresses decouple along the
décollement horizon is still a “matter of debate”.
1.4 Overview of Stress Measurement Programs at Mont Terri
The measurement of in situ stress has been a topic of interest since the establishment of the Mont Terri
laboratory. In situ stress measurements have been taken throughout the laboratory’s history from 1996 to
2010. The measurement efforts have included:
Eight measurement types,
o Hydraulic fracturing,
o CSIRO overcoring
o 3DD-G deformation gauge overcoring
o Compact conical-ended borehole overcoring (CCBO)
o Borehole deformation gauge overcoring
o Borehole slotter
o Stress monitoring of excavation (ROSAS undercoring)
o Velocity anisotropy measurement (RACOS, which is not covered in this report)
Two Mont Terri experimental programs focused on stress measurement and modelling
o In-Situ Stress (IS) with its main activity between 1996 and 1998
o Determination of Stress (DS) with its main activity between 2008 and 2011
Three Mont Terri experimental programs, which included stress measurement as part of their activity
o EZ-A, excavation damage zone experiment, 2004
o GS, gasfrac self-sealing experiment, 2000
o AS, rock anisotropy, 2008
Five stress-measurement sites (from southeast to northwest, Figure 1)
o Park niche
o IS niche
o Rock laboratory
o Ventilation cavern
o Derrière Mont Terri surface borehole
Two rock types and four stratigraphic units or sub-units
o Opalinus Clay: both sandy and shaly facies (Figure 2)
o Carbonate (dolomite and limestone): Hauptrogenstein, Muschelkalk, and Malm units.
With over 12 years of activity, the stress measurement activity has been varied and complex. Table 1 cross-
references the locations, measurement types and the experiments which included stress measurements.
The table also includes the boreholes used for each activity and the TN numbers of technical reports that
contain the results.
The result of this stress measurement activity is an exceedingly rich database albeit one that challenges
attempts at synthesis due to the variability of the rock, the complex constitutive behaviour of the shale, and
the complexity of the topography. Furthermore, each of the five major stress measurement sites uses a
different set of measurement types with different ranges of borehole orientation. Hence, building a single
conceptual model of rock stress at Mont Terri requires some assessment of differences between methods as
well as difference in stress magnitudes at different locations.
TR 2012-06 DS-EXPERIMENT IN SITU STRESS MEASUREMENTS
22nd July 2014 Report No. 13505170278 4
Figure 1: Location of stress measurements at Mont Terri
TR 2012-06 DS-EXPERIMENT IN SITU STRESS MEASUREMENTS
22nd July 2014 Report No. 13505170278 5
Figure 2. Opalinus Clay lithology, and locations of stress measurements in the Rock Laboratory area. HF: Hydraulic Fracturing, ROSAS: Undercoring and Under-Excavation, CCBO: CREIPI Compact Conical-Ended Borehole Overcoring, 3DD-G CRIEPI Borehole Deformation Gauge, CSIRO: CSIRO Overcoring, BWS: Borehole Wall Slotter
Sand
y facies
Shaly faciesShaly facies
50 m
Carb
on
ate
Opalinus Claystone
Motorway
Security Tunnel
Gallery 98 (New Gallery)
Gallery 08
Gallery 04
IS NicheHF, ROSAS
undercoring, BWS
EZ-ACSIRO GS
HF
BDS-4HF
AS3DD-G
ED-B ROSASUnder-
excavation
TR 2012-06 DS-EXPERIMENT IN SITU STRESS MEASUREMENTS
22nd July 2014 Report No. 13505170278 6
Figure 3. Topography of Mont Terri with approximate locations of stress measurements.
TR 2012-06 DS-EXPERIMENT IN SITU STRESS MEASUREMENTS
22nd July 2014 Report No. 13505170278 7
Figure 4. Maximum horizontal tectonic stress directions in North-western Switzerland from Becker (2000). Letters represent quality for determining tectonic stress directions.
TR 2012-06 DS-EXPERIMENT IN SITU STRESS MEASUREMENTS
22nd July 2014 Report No. 13505170278 8
Figure 5. Borehole breakout directions in Northwestern Switzerland from Becker and others, 1987. Maximum stress direction is 90 degrees from breakout direction.
TR 2012-06 DS-EXPERIMENT IN SITU STRESS MEASUREMENTS
22nd July 2014 Report No. 13505170278 9
Table 1: Summary of stress measurements at Mont Terri by type, location and experiment
Location
Exp
eri
men
t
Rock Type
Measurement Type
CSIRO
Cylinder Triaxial
Overcore
BGR
Deformation Gauge Biaxial
Overcore
CRIEPI
Compact Conical Ended
Overcoring (CCBO)
CRIEPI
3DD-G
Borehole Deformation
Gauge
ROSAS Undercoring/
Under-excavation
Borehole Wall
Slotter Hydrofrac
RACOS Acoustic
Anisotropy
Park Niche DS Hauptrogenstein Carbonate
BDS-2
TN 2009-43
TN 2010-53
IS Niche IS Opalinus Sandy Facies
BIS A1/A2/A3
TN 97-14
BIS B1/B2/B3
TN 97-15
BIS C1/C2
TN 99-55
Rock Laboratory
EZ-A GS AS
IS
Opalinus Shaly Facies
BEZ A27/A28
TN-2004-86
BAS 2-1/3-1
TN 2006-33
BED B9/B10/B11
TN 98-09
BGS-2
TN 2000-10
BDS-4
TN 2010-53
Ventilation Cavern
DS Muschelkalk Carbonate
BDS-3
Draft_hesser_BDS-3_oc.pdf
BDS-1
TN 2009-57 Draft_shin_BDS-
1_oc.pdf
BDS-1
TN 2009-43
BDS-1
TN 2011-02
Derrière Mont Terri
DS Opalinus and Malm Carbonate
BDS-5
TN 2011-45

TR 2012-06 DS-EXPERIMENT IN SITU STRESS MEASUREMENTS
22nd July 2014 Report No. 13505170278 6
TR 2012-06 DS-EXPERIMENT IN SITU STRESS MEASUREMENTS
22nd July 2014 Report No. 13505170278 7
2.0 STRESS MEASUREMENT METHODS USED AT MONT TERRI
2.1 Hydraulic Methods
Hydraulic fracturing is a well-established method for stress measurement. It is the most widely applied
method at the Mont Terri Lab, with measurements performed by several different contractors:
Solexperts with ETH (Evans, 1999) as part of the original IS program of stress measurement in the
Opalinus
Golder Associates with SJ Geotech as part of the gas fracturing (GS) tests in the Opalinus
(Enachescu and others, 2000). As part of the DS-program, Golder also performed measurements
(Enachescu, 2010) in BDS-2 (Muschelkalk Carbonate) and BDS-4 (Opalinus)
Mesy performed tests underground in the Hauptrogenstein and Muschelkalk carbonates (BDS-1 and
BDS-2) as part of the DS program ( Rummel and others, 2012). After merging with Solexperts they
also did the measurements in the surface hole, BDS-5 (Klee, 2012).
The measures of quality for assessing hydraulic fracturing data are discussed for maximum stress, minimum
stress and orientation. These are assessed for each hydraulic fracturing test in the Appendices.
2.1.1 Basic Principles
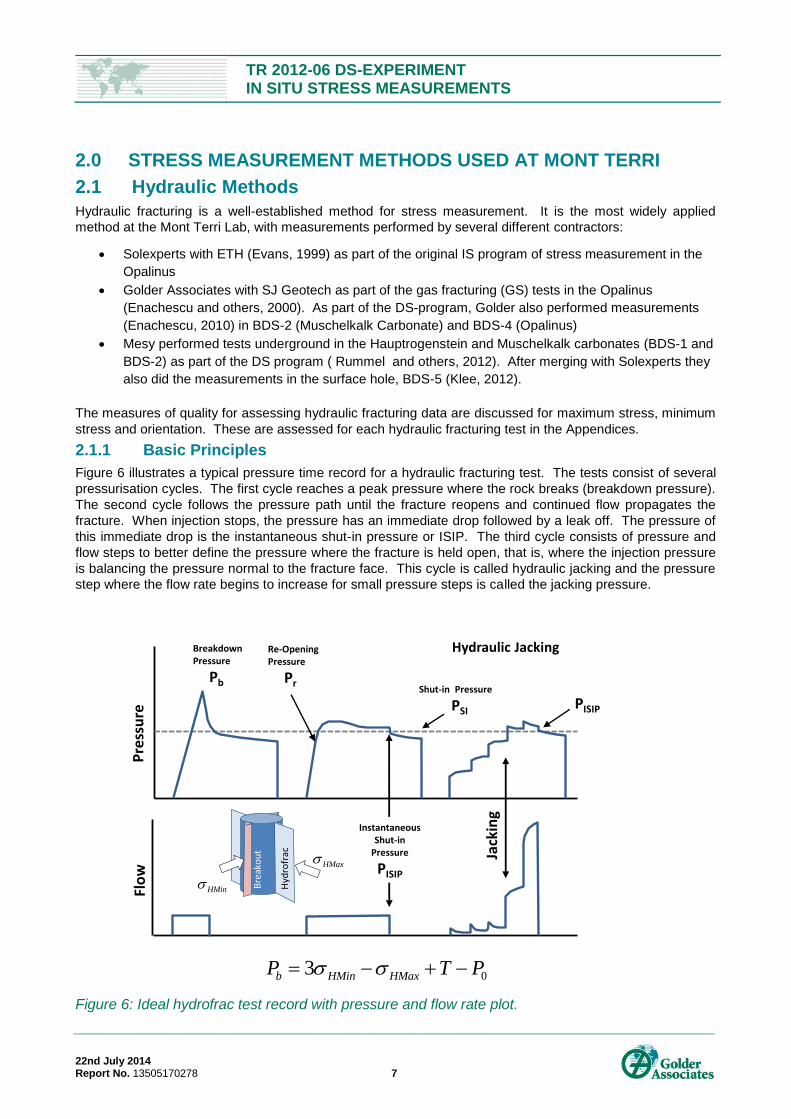
Figure 6 illustrates a typical pressure time record for a hydraulic fracturing test. The tests consist of several
pressurisation cycles. The first cycle reaches a peak pressure where the rock breaks (breakdown pressure).
The second cycle follows the pressure path until the fracture reopens and continued flow propagates the
fracture. When injection stops, the pressure has an immediate drop followed by a leak off. The pressure of
this immediate drop is the instantaneous shut-in pressure or ISIP. The third cycle consists of pressure and
flow steps to better define the pressure where the fracture is held open, that is, where the injection pressure
is balancing the pressure normal to the fracture face. This cycle is called hydraulic jacking and the pressure
step where the flow rate begins to increase for small pressure steps is called the jacking pressure.
Figure 6: Ideal hydrofrac test record with pressure and flow rate plot.
Breakdown Pressure
Pb
Re-Opening Pressure
PrShut-in Pressure
PSI
Hydraulic Jacking
Pre
ssu
reFl
ow
Jack
ing
InstantaneousShut-in
Pressure
PISIP
PISIP
03b HMin HMaxP T P
HMax
HMin Bre
ako
ut
Hyd
rofr
ac
TR 2012-06 DS-EXPERIMENT IN SITU STRESS MEASUREMENTS
22nd July 2014 Report No. 13505170278 8
The basic principles of hydraulic fracturing are
1. The fracture initiates from the borehole when the pressure exceeds the stress concentrations around
the borehole.
2. The shut-in pressure reflects the minimum stress normal to the fracture,
3. The fracture propagates in the maximum stress direction.
2.1.2 Determination of Maximum Stress
The stress calculation assigns the minimum stress equal to the shut-in pressure, and then calculates the
maximum stress from the plane-stress Kirsch solution for stresses around a hole in an elastic material
(Jaeger and Cook, 1976, §1.4; Hubbert and Willis, 1957):
max 03b Hmin HP T P (Equation 1)
Where, Pb, is the breakdown pressure, T is the tensile strength of the rock, and P0 is the pore pressure.
The validity of the maximum horizontal stress magnitude has been questioned for various reasons which
include
Uncertainty in the tensile strength
Uncertainty in the stress concentration around the hole
Uncertainty in the pore pressure.
There is considerable uncertainty in the appropriate tensile strength. A standard way to get around the
tensile strength issue is to use the second breakdown (or reopening) pressure (Bredehoeft, and others,
1976); however, this has problems with the assumption that the previously-generated hydraulic fracture is
perfectly impervious (Rutqvist and others, 2000). Also, the second breakdown may be less than the shut-in
pressure or even negative if the maximum to minimum horizontal stress ratio is large. Furthermore, the
minimum horizontal stress has a multiplier of 3, hence any uncertainty in the minimum stress is amplified in
the uncertainty of the maximum horizontal stress.
Rummel (1987) proposed a fracture mechanics approach to assessing maximum stress where
max 0b Hmin HP A B T P (Equation 2)
The approach assumes the breakdown occurs by propagating pre-existing flaws in the rock. A and B are
functions of stress intensity and fracture toughness. For fully-pressurized cracks, these terms converge to
the Kirsch solution values, A=3 and B=-1, as the crack length approaches zero. Unfortunately they rapidly
change with increasing crack length to A=1 and B=0, thus providing one more reason to question the
maximum stress value. Although Mesy’s work for Mont Terri includes tests for fracture mechanics properties
(Klee, 2012), their actual assessment of the maximum stress uses the Kirsch-based analysis (Equation 1)
rather than the fracture mechanics approaches.
The fracture mechanics method points out that the presence of microcracks affects the stress concentration
around the holes with respect to fracture initiation. Use of either the Kirsch solution or the fracture
mechanics approach also assumes that stress concentrations are elastic, and that visco-elastic or ductile
deformations that may be operating in clay-rich rocks are not important.
Finally, there is the question of pore pressure. Measurements performed from surface holes usually assume
the pore pressure is given by the hydrostatic gradient. Underground holes, where there may be some
amount of de-pressurization or desaturation, have less clear pore pressures. Furthermore, the particular
chemical activity of clays creates osmotic pore pressures that arise from variable pore-water ionic strength.
Such osmotic pressures appear when the salinity of drilling water contrasts with that of the pore water, and it
can lead to clay swelling and borehole degradation.
For all of these reasons, hydraulic fracturing is reliable primarily for the minimum stress determination. This
report tabulates the maximum horizontal stress determinations from hydraulic fracturing campaigns, but it is
TR 2012-06 DS-EXPERIMENT IN SITU STRESS MEASUREMENTS
22nd July 2014 Report No. 13505170278 9
generally preferable to use overcoring or some other method to complement or corroborate the maximum
stress value from hydraulic fracturing.
Hydraulic fracturing is also reliable for determining maximum stress orientation provided the borehole is not
far off the direction of one of the principal stress, preferably the intermediate stress. If the borehole is not
aligned with the principal stress direction it is common for the fractures to be inclined relative to the borehole
or to form en echelon fractures in bands along the fracture strike direction the borehole.
2.1.3 Determination of Minimum Stress
2.1.3.1 Shut in Pressure and Instantaneous Shut in Pressure (ISIP)
Although different testing groups have performed the hydraulic fracturing stress measurements, all have
used two basic methods of obtaining the minimum stress – shut-in pressure and hydraulic jacking
Shut-in means the sudden cessation of injection. Very shortly after the injection ceases the pressure
gradient along the fracture disappears as the flow rate goes to zero. The loss of this pressure gradient
causes the pressure in the test interval to drop sharply to a pressure that presumably reflects the value
which is just sufficient to keep the fracture open. The pressure at the end of this sharp drop is called the
instantaneous shut in pressure, or ISIP, and it is one of the most commonly applied measures for the shut in
pressure value.
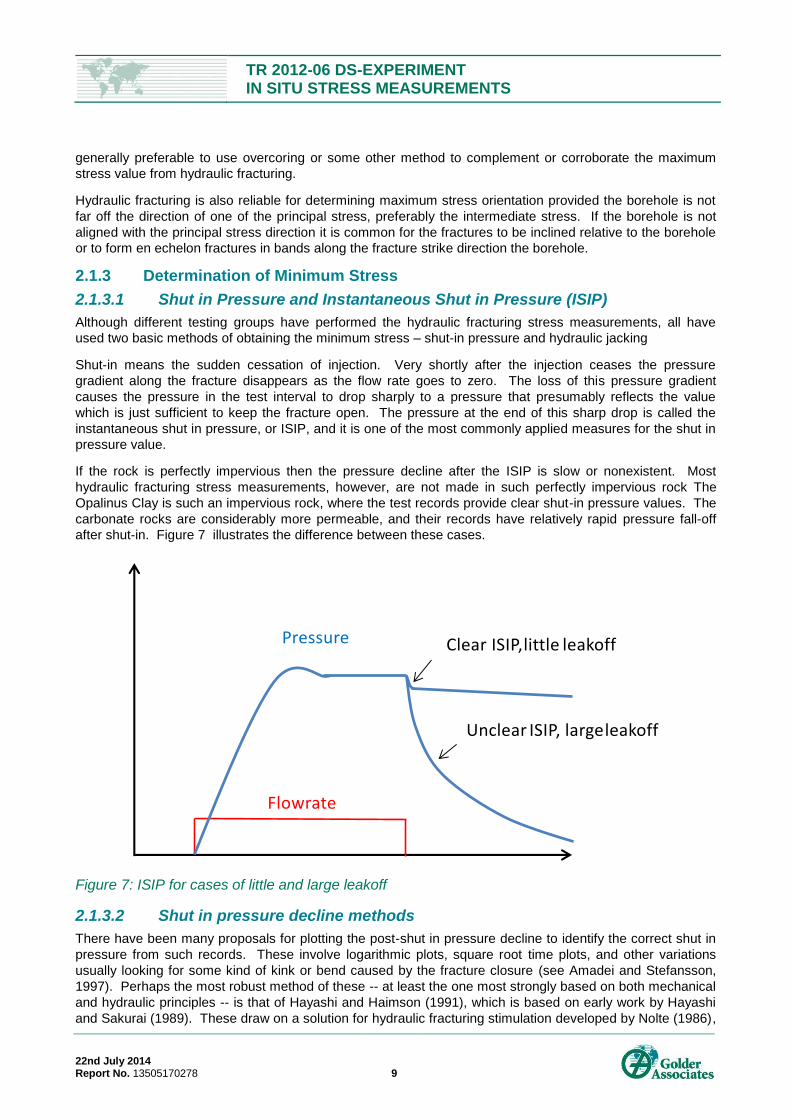
If the rock is perfectly impervious then the pressure decline after the ISIP is slow or nonexistent. Most
hydraulic fracturing stress measurements, however, are not made in such perfectly impervious rock The
Opalinus Clay is such an impervious rock, where the test records provide clear shut-in pressure values. The
carbonate rocks are considerably more permeable, and their records have relatively rapid pressure fall-off
after shut-in. Figure 7 illustrates the difference between these cases.
Figure 7: ISIP for cases of little and large leakoff
2.1.3.2 Shut in pressure decline methods
There have been many proposals for plotting the post-shut in pressure decline to identify the correct shut in
pressure from such records. These involve logarithmic plots, square root time plots, and other variations
usually looking for some kind of kink or bend caused by the fracture closure (see Amadei and Stefansson,
1997). Perhaps the most robust method of these -- at least the one most strongly based on both mechanical
and hydraulic principles -- is that of Hayashi and Haimson (1991), which is based on early work by Hayashi
and Sakurai (1989). These draw on a solution for hydraulic fracturing stimulation developed by Nolte (1986),
Flowrate
Pressure Clear ISIP, little leakoff
Unclear ISIP, large leakoff
TR 2012-06 DS-EXPERIMENT IN SITU STRESS MEASUREMENTS
22nd July 2014 Report No. 13505170278 10
which is in widespread use today for the burgeoning unconventional oil and gas development industry.
Nolte’s approach identifies three stages of fracture closure -- a first stage immediately after shut in when the
fractures are still propagating and fluid is leaking off over the fracture surface, a second stage where the
fractures closing progressively from the tip back to the borehole, and a third stage where the fractures
closed. Hayashi and his co-authors made the contribution of coupling Nolte’s method to fracture mechanics
principles. They developed a semi-analytical solution that included the fracture mechanics properties, the
mechanical properties the rock, compliances of the test equipment, and leakage coefficient for the rock itself.
They presented sensitivity analyses of their solution to the crack length, the compliance of the equipment,
and the leakage factor. The pressure fall off after shut in primarily depends on the compliance the
equipment and the rock leakage factor. In this case higher compliance helps to maintain the pressure after
shut in and retards the leakage rate.
The analysis of their solutions showed that stage I and stage III were linear in terms of the pressure decay
rate, dpdt, and pressure. Thus a plot of dpdt against pressure should show the fracture closure from the
intersection of two fitted linear lines. Significantly they found that as long as the decay rate was not great,
that is in cases of high equipment compliance or low permeability rock, most of the shut in pressure
measures all gave similar values. Where they tend to diverge is where there is a relatively fast pressure
falloff.
The experience of hydraulic fracturing stress measurement from Mont Terri shows that measurements in the
clay shales have distinct ISIP behaviors and low leakage rates thus producing measurements with highly
confident shut in pressure values. Measurements in the carbonates on the other hand have much higher
leakage rates often lacking distinct ISIP values.
Section 3 discusses in more detail the results of hydraulic fracturing measurements at Mont Terri. As part of
the assessment of data quality for this report, the pressure-time records were re-analysed using several
methods described above, specifically, the dp-dt, ISIP, and the methods programmed into Mesy’s analysis
tools. In general, tests with small leak-off, as in the Opalinus shale had results that did not depend on the
analysis method. Even for tests with high leakoff, the shut-in pressure determinations did not vary greatly
with which methods was used. The Appendices evaluate the quality of each hydraulic fracture test in terms
of leak off rate.
A final uncertainty in shut-in pressure determination is the infuence of drilling mud. Only the surface hole,
BDS-5, used drilling mud for reasons of hole stability. Mud may serve to plug the fracture during both the
fracturing and the shut-in phases. During the fracturing, the pressure-record will have multiple apparent
“breakdowns” as the fracture plugs and re-opens. These multiple breakdowns complicate the maximum
stress interpretation. Mud may also produce false shut-in pressures, as the pressure decline after shut-in
may abruptly stop with plugging and the pressure will take on a stable value. These stable values may lack
consistency between pressurisation cycles. Section 3.5 discusses the BDS-5 test results and decribes these
behaviors in more detail.
2.1.3.3 Hydraulic Jacking
The other common method of obtaining the shut in pressure involves equating this value with a so-called
hydraulic jacking pressure. Most practitioners of hydraulic fracturing stress measurements include a stepped
pressure and flow test as one of the injection cycles (see right side of Figure 6). The cycles usually
performed after two or more constant rate injection cycles, that is, after hydraulic fractures have been
developed. Ideally each pressure-flow step should reach a more or less steady value usually within a few
minutes. Below the jacking pressure value there should be a linear relationship between flow rate and
injection pressure, which reflects the laminar flow into the low permeability fracture. Once injection
pressures reach the jacking pressure value, the flow rates dramatically rise often with relatively small
changes the injection pressure. A plot of the steady pressures and flows against one another is called a P-Q
plot which should show distinctively these two regimes that are above and below the jacking pressure.
In addition to the P-Q plot the transient flows in pressures before stabilization also provide indications of
whether or not the fractures are opening under pressure. In principle each step should create either a
transient pressure or transient flow or both. Below the jacking pressure, when the fracture is not opening,
TR 2012-06 DS-EXPERIMENT IN SITU STRESS MEASUREMENTS
22nd July 2014 Report No. 13505170278 11
this transient behavior should express itself either by increasing pressure or by decreasing flow rate.
However, once the jacking pressure is exceeded and the fractures actively open, these transient behaviors
reverse, that is, the pressure drops with time, the flow rate increases with time, or both (Figure 6).
To capture these jacking phenomenon, it is important to have pressure steps that are both below and above
the jacking value. In practice this means controlling the pressure and measuring relatively low flows below
the jacking pressure, and then controlling the test by flow rate steps once the jacking pressure is exceeded.
Quality criteria- Shut in Pressure and Hydraulic Jacking
To summarize this discussion of shut in pressure, a high-quality test is one where there is a clear ISIP and
the pressure fall off after shut it is not rapid. In such cases most of the various methods for obtaining shut in
pressure will be in agreement. Hydraulic jacking tests under such circumstances also yield values similar to
the ISIP and the other measures. Hydraulic fracturing tests that have higher levels of uncertainty are those
which lack clear ISIP values and where the pressure fall off is strong making it difficult to determine a clear
point of fracture closure. A high-quality jacking test further has three or more pressure and flow points below
the jacking pressure along with a clear inflection in the P-Q curve as the fracture opens. The appendices
present tables of these qulaity criteria for each hydraulic fracturing test.
Both the two groups working on hydraulic fracturing in the DS experiment used hydraulic jacking but in
different ways. The Mesy group aimed for 4-5 steps of flow rate, while the Golder group used 8-12 steps
using pressure below the jacking pressure and flow above. Ideally, the jacking plot of flow versus pressure
should have points above and below the jacking pressure to define an inflection. Steps below the jacking
pressure may have very low flow rates. If one uses a flow-defined step as Mesy did, the first step may be
above the jacking pressure, thus there may be no points below the jacking pressure to define the inflection.
2.1.3.4 Fracture orientation and direction of maximum stress
The orientation of the maximum principal stress comes from a determination of the fracture direction.
Hydraulic fracturing stress measurement generally assumes that the borehole is aligned with one of the
principal stresses, ideally the intermediate stress. In this situation the hydraulic fracture will open axially
along the borehole. If the borehole is vertical, then this fracture is also vertical with two wings on opposite
sides of the borehole in the maximum stress direction (as in Figure 6).
Originally hydraulic fracturing stress measurements used core to select unfractured zones for testing and
then oriented the fractures using impression packers. Impression packers inflate a rubber gland with a soft
rubber coating onto the test section in the borehole. The packer inflation opens the fracture, which the soft
rubber intrudes to make a fracture impression, The orientation is usually recorded with a downhole
compass. This method is still common for short holes drilled from underground. For longer holes impression
packers are laborious as each one requires a separate trip with tubing or wireline. Consequently acoustic
televiewer logs have largely replaced impression packers for deeper holes both for test zone selection and
for hydraulic fracture orientation. The weakness of acoustic televiewers is that they sometimes miss pre-
existing fractures. Technology advances have greatly improved the ability to find hydraulic fractures, but the
televiewer does not open fractures that may be closed in the way that an impression packer can.
The orientation of the stresses is most ambiguous when the test opens a pre-existing fracture, bedding
planes, or some other plane of weakness. The experience in hydraulic fracture tests in the Opalinus clay
shale has been the opening primarily of bedding planes. There is been more success particularly in the
Mesy measurements at opening axial fractures in the carbonates.
Quality criteria
In summary, a high-quality tests from the standpoint of fracture orientation are those with a clear axial
fracture with wings on opposite sides of borehole. Intermediate quality tests will produce clear signs of new
fractures although they may be in directions that are not actually in the borehole axis or coincide with pre-
existing fractures or planes of weakness. The most ambiguous tests are those where the impression
packers or acoustic televiewer finds no evidence of a new fracture from the test.
TR 2012-06 DS-EXPERIMENT IN SITU STRESS MEASUREMENTS
22nd July 2014 Report No. 13505170278 12
Among the characteristics of rock stress data in which one may have high confidence is the relationship of hydraulic fracture orientation to maximum horizontal stress direction. As long as one is obtaining clear vertical fractures either from vertical boreholes or from horizontal holes that are aligned in the maximum stress direction, clear and consistent, steeply-dipping hydraulic fractures are strong indicator of the maximum horizontal stress direction.
2.2 Strain Relief Methods
Strain-relief measurements calculate stress from strains in the rock recorded during and after removing rock
from its stressed environment. In simple form, consider a uniaxially loaded rock sample in a laboratory. If
one applies axial strain gauges to the rock while it was under load, and then removes the load, one would
record an axial extension and a circumferential contraction. Repeating this experiment under different loads
would produce a set of strain values as a function of applied load or stress. For a linearly elastic material,
which is the material behaviour most commonly assumed in stress measurements, this relationship would be
linear. The assumption of stress-strain linearity will produce errors in stress measurement to the extent that
the stress-strain properties are not linear due to viscoelastic, ductile, or poroelastic behaviours. Furthermore,
the unloading of an initially saturated rock may lead to partial saturation and accompanying stiffening if the
rock behaves in an undrained manner (Wild and others, 2014).
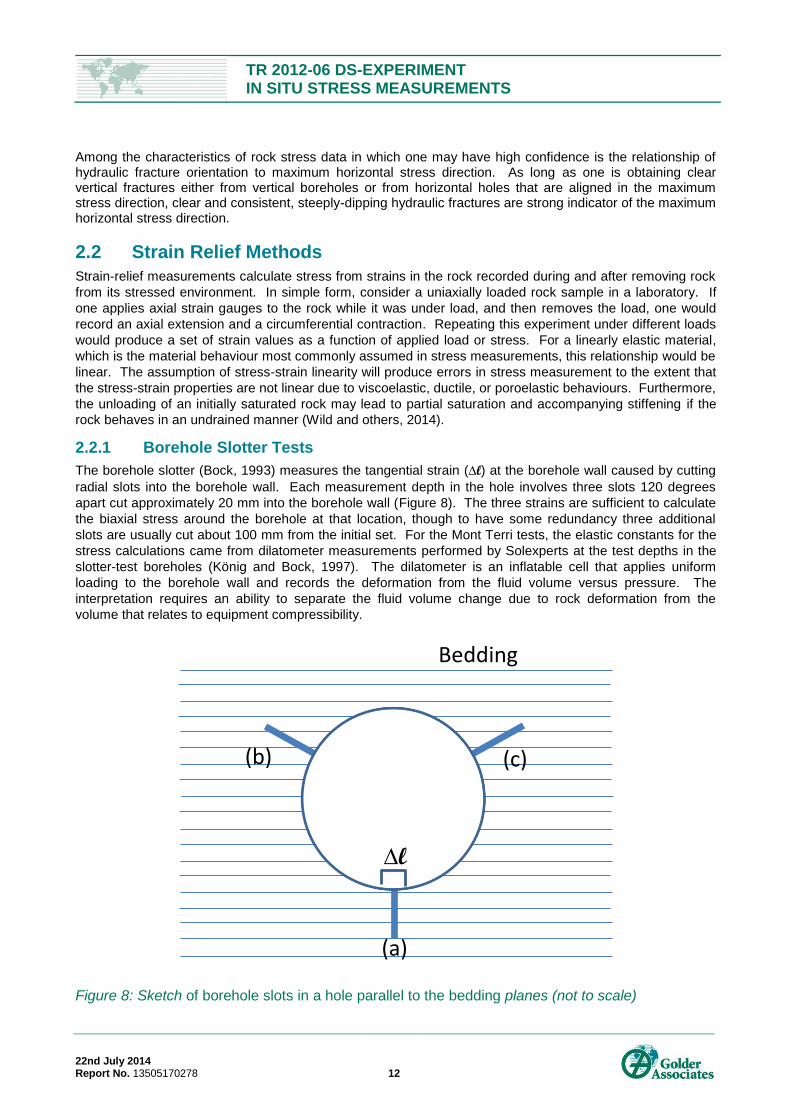
2.2.1 Borehole Slotter Tests
The borehole slotter (Bock, 1993) measures the tangential strain (l) at the borehole wall caused by cutting
radial slots into the borehole wall. Each measurement depth in the hole involves three slots 120 degrees
apart cut approximately 20 mm into the borehole wall (Figure 8). The three strains are sufficient to calculate
the biaxial stress around the borehole at that location, though to have some redundancy three additional
slots are usually cut about 100 mm from the initial set. For the Mont Terri tests, the elastic constants for the
stress calculations came from dilatometer measurements performed by Solexperts at the test depths in the
slotter-test boreholes (König and Bock, 1997). The dilatometer is an inflatable cell that applies uniform
loading to the borehole wall and records the deformation from the fluid volume versus pressure. The
interpretation requires an ability to separate the fluid volume change due to rock deformation from the
volume that relates to equipment compressibility.
Figure 8: Sketch of borehole slots in a hole parallel to the bedding planes (not to scale)
l
Bedding
(a)
(c)(b)
TR 2012-06 DS-EXPERIMENT IN SITU STRESS MEASUREMENTS
22nd July 2014 Report No. 13505170278 13
Combining the results of biaxial measurements from boreholes in three orthogonal directions in principle
allows calculation of the three-dimensional stress tensor. For the Mont Terri measurements, König and Bock
(1997) assume that stress was varying with distance from the tunnel, so they combined the biaxial
measurements at similar depths in the three different holes to calculate the 3-D stresses to provide six
values ranging in “depth” from 5.0 to 19.2 meters.
There are two major concerns about the slotter tests. The first one involves the assumptions of isotropy and
homogeneity. The isotropy is particularly important because the Opalinus Clay is clearly an anisotropic rock,
as reflected in Solexpert’s dilatometer measurements, which were an important part of the slotter test
analyses. The hole perpendicular to bedding (BIS-B2) had Young’s modulus values varying from 6.8 to 7.0
GPa, while . The other two boreholes had modulus values of 2.2 to 3.6 GPa, which are dominated by the
bedding.
The modulus measurements by the dilatometer neglect the rock anisotropy. This is less of a problem in the
borehole perpendicular to bedding, where the modulus would be more likely to be biaxially isotropic, that is,
all slots are perpendicular to bedding. It is more of a problem for the holes drilled at an angle to or in the
bedding plane. Referencing Figure 8, a slot that perpendicular to the bedding plane (point a) plane will have
a very different modulus than a slot that is 60 degrees from the bedding plane (points b and cFigure 8).
The second concern is the use of statistics to assess the quality of the stress result. Standard practice for
strain-based measurements is to take more measurements than the minimum required and calculate
stresses on multiple combinations of strains. The results using different redundant strain combinations
seldom agree exactly in part due to rock heterogeneity. The quality of the overall stress result is reflected in
the consistency of the different combinations. König and Bock report a variance for their biaxial
measurements, that is the results for measurement point along individual holes, but they do not provide any
statistics on the three-dimensional measurements where they are combining biaxial results from different
holes.
For both of the these reasons – lack of accounting for anisotropy in the modulus and stress calculation and
lack of statistical analysis of the 3-D stress results, the slotter tests should be given a low weight in assessing
the state of stress at Mont Terri except possibly for the results of the borehole perpendicular to bedding
where anisotropy is less of an issue.
2.2.2 Undercoring and Under-Excavation Stress Measurements (ROSAS)
Undercoring is a stress measurement method where stress gauges are installed in an array surrounding a
volume of rock that is later removed by drilling or excavation. Two such experiments were undertaken in the
Mont Terri Laboratory, one in the IS niche and the other in the ED-B gallery of the main laboratory. The
undercoring in the IS Niche used an array of CSIRO stress cells surrounding a 600-mm vertical hole (Figure
9), while the ED-B gallery experiment monitored the strains produced by the gallery excavation. Bigarré and
Lizeur (1997) refer to their computer code for calculating stress from strain data as ROSAS (Rock Stress
Analysis System), and the two experiments are called ROSAS1 and ROSAS2 respectively (Bigarré and
Lizeur, 1997; Bigarré, 1998). Only the ROSAS1 test in the IS niche was successful in producing a stress
result (Martin and Lanyon, 2003).
The undercoring in the IS niche used four observation boreholes with CSIRO HI cells, BIS-A1, A2, A3 and
A4. All boreholes were vertical (Figure 9). The experiment had a radial geometry with a central observation
hole (BIS-A4) and three holes at 600 mm from the central hole along radii 120 degrees apart (BIS-A1 to A3).
The three radial holes had their CSIRO cells installed with midpoints at 12 meters depth. The central
observation hole had its CSIRO cell at 12.6 meters. The four observation holes had diameters of 86-mm to
a depth just above the gauges. From there a 38-mm pilot hole as drilled for the actual gauge installation.
This geometry is the same used for overcoring, except the 86-mm holes were not extended to drill out the
gauges.
The actual undercoring involved drilling a 600-mm diameter hole, BIS-A5, along the central observation hole
to a depth of 12 meters, or just above the gauge installed in BIS-A4. The choice of 12 meters as a depth for
the gauges was to avoid the stress concentrations of the IS niche itself.
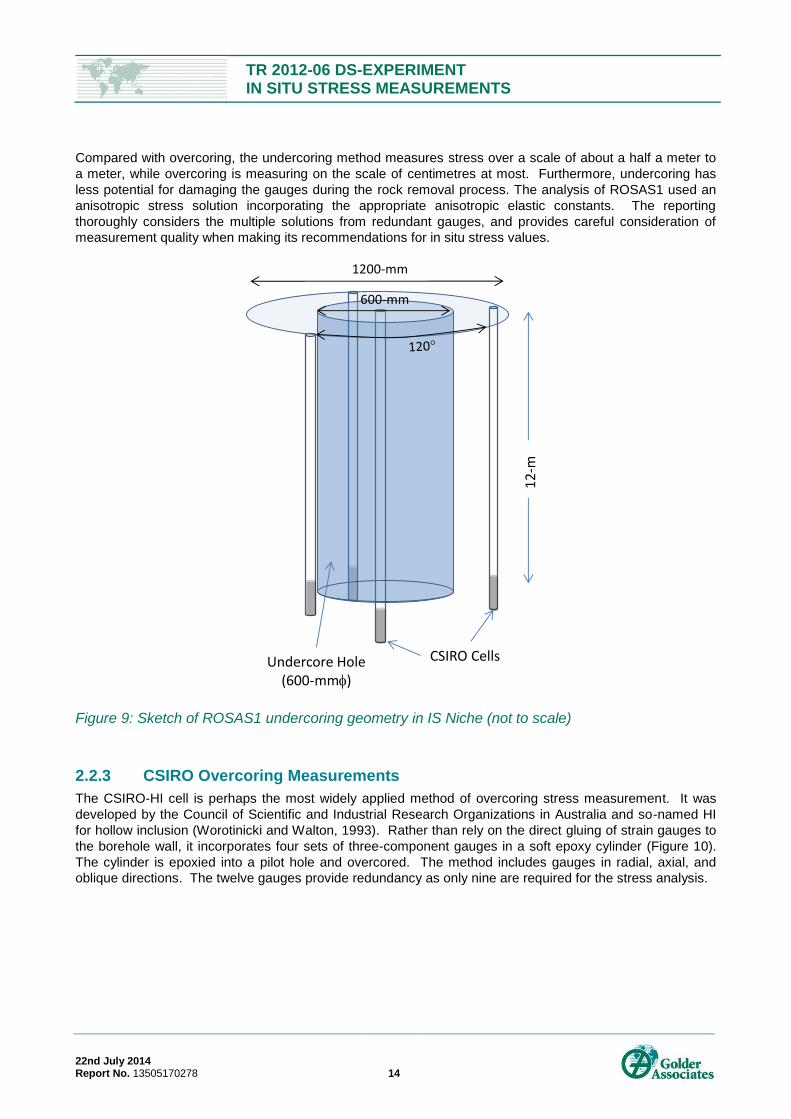
TR 2012-06 DS-EXPERIMENT IN SITU STRESS MEASUREMENTS
22nd July 2014 Report No. 13505170278 14
Compared with overcoring, the undercoring method measures stress over a scale of about a half a meter to
a meter, while overcoring is measuring on the scale of centimetres at most. Furthermore, undercoring has
less potential for damaging the gauges during the rock removal process. The analysis of ROSAS1 used an
anisotropic stress solution incorporating the appropriate anisotropic elastic constants. The reporting
thoroughly considers the multiple solutions from redundant gauges, and provides careful consideration of
measurement quality when making its recommendations for in situ stress values.
Figure 9: Sketch of ROSAS1 undercoring geometry in IS Niche (not to scale)
2.2.3 CSIRO Overcoring Measurements
The CSIRO-HI cell is perhaps the most widely applied method of overcoring stress measurement. It was
developed by the Council of Scientific and Industrial Research Organizations in Australia and so-named HI
for hollow inclusion (Worotinicki and Walton, 1993). Rather than rely on the direct gluing of strain gauges to
the borehole wall, it incorporates four sets of three-component gauges in a soft epoxy cylinder (Figure 10).
The cylinder is epoxied into a pilot hole and overcored. The method includes gauges in radial, axial, and
oblique directions. The twelve gauges provide redundancy as only nine are required for the stress analysis.
600-mm
1200-mm
CSIRO CellsUndercore Hole (600-mm)
12
-m
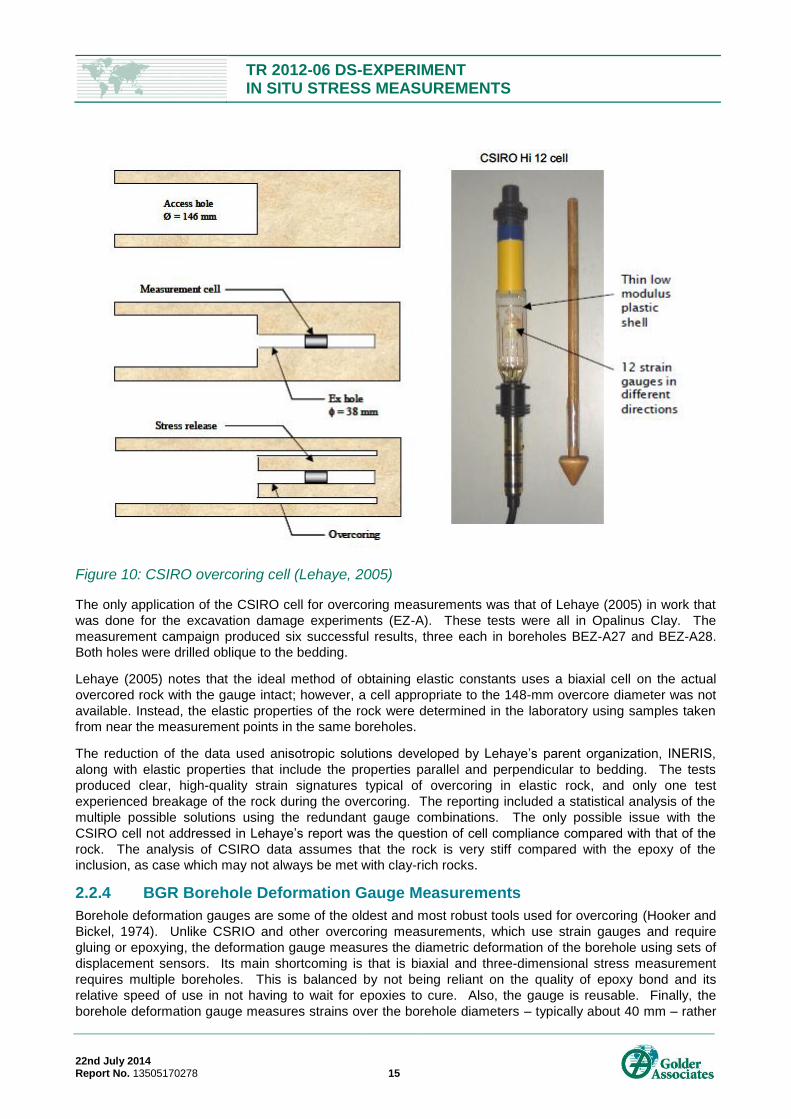
TR 2012-06 DS-EXPERIMENT IN SITU STRESS MEASUREMENTS
22nd July 2014 Report No. 13505170278 15
Figure 10: CSIRO overcoring cell (Lehaye, 2005)
The only application of the CSIRO cell for overcoring measurements was that of Lehaye (2005) in work that
was done for the excavation damage experiments (EZ-A). These tests were all in Opalinus Clay. The
measurement campaign produced six successful results, three each in boreholes BEZ-A27 and BEZ-A28.
Both holes were drilled oblique to the bedding.
Lehaye (2005) notes that the ideal method of obtaining elastic constants uses a biaxial cell on the actual
overcored rock with the gauge intact; however, a cell appropriate to the 148-mm overcore diameter was not
available. Instead, the elastic properties of the rock were determined in the laboratory using samples taken
from near the measurement points in the same boreholes.
The reduction of the data used anisotropic solutions developed by Lehaye’s parent organization, INERIS,
along with elastic properties that include the properties parallel and perpendicular to bedding. The tests
produced clear, high-quality strain signatures typical of overcoring in elastic rock, and only one test
experienced breakage of the rock during the overcoring. The reporting included a statistical analysis of the
multiple possible solutions using the redundant gauge combinations. The only possible issue with the
CSIRO cell not addressed in Lehaye’s report was the question of cell compliance compared with that of the
rock. The analysis of CSIRO data assumes that the rock is very stiff compared with the epoxy of the
inclusion, as case which may not always be met with clay-rich rocks.
2.2.4 BGR Borehole Deformation Gauge Measurements
Borehole deformation gauges are some of the oldest and most robust tools used for overcoring (Hooker and
Bickel, 1974). Unlike CSRIO and other overcoring measurements, which use strain gauges and require
gluing or epoxying, the deformation gauge measures the diametric deformation of the borehole using sets of
displacement sensors. Its main shortcoming is that is biaxial and three-dimensional stress measurement
requires multiple boreholes. This is balanced by not being reliant on the quality of epoxy bond and its
relative speed of use in not having to wait for epoxies to cure. Also, the gauge is reusable. Finally, the
borehole deformation gauge measures strains over the borehole diameters – typically about 40 mm – rather
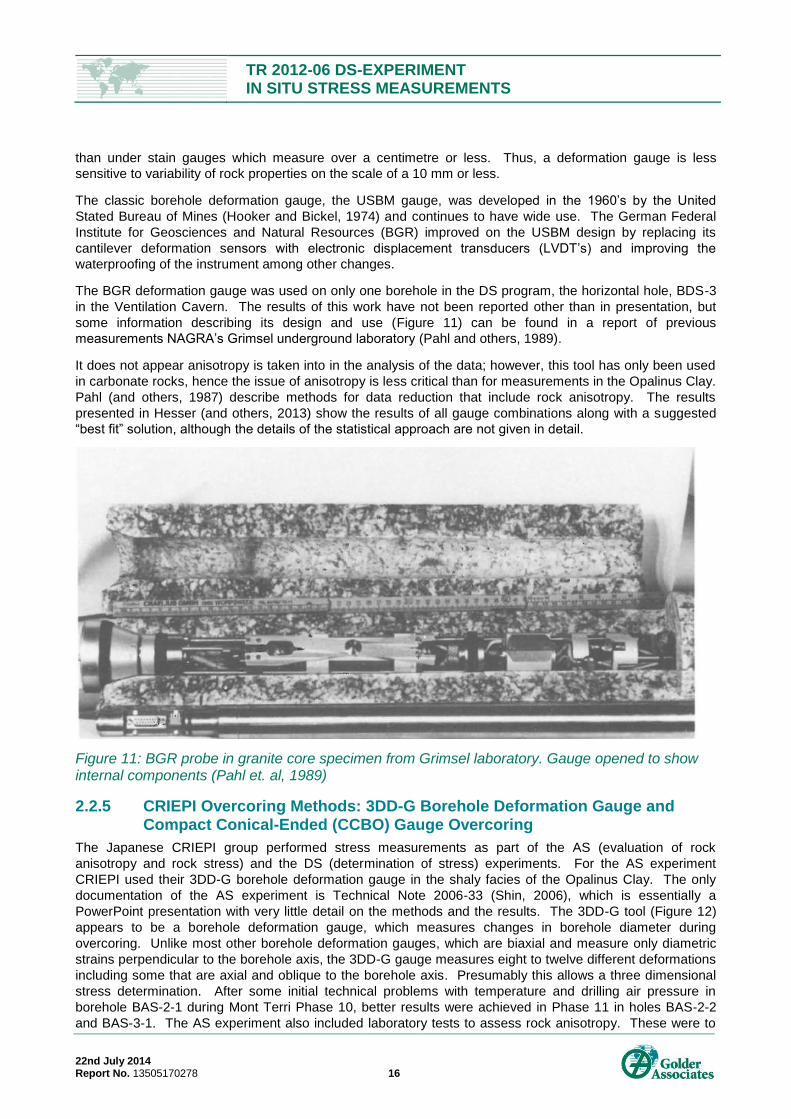
TR 2012-06 DS-EXPERIMENT IN SITU STRESS MEASUREMENTS
22nd July 2014 Report No. 13505170278 16
than under stain gauges which measure over a centimetre or less. Thus, a deformation gauge is less
sensitive to variability of rock properties on the scale of a 10 mm or less.
The classic borehole deformation gauge, the USBM gauge, was developed in the 1960’s by the United
Stated Bureau of Mines (Hooker and Bickel, 1974) and continues to have wide use. The German Federal
Institute for Geosciences and Natural Resources (BGR) improved on the USBM design by replacing its
cantilever deformation sensors with electronic displacement transducers (LVDT’s) and improving the
waterproofing of the instrument among other changes.
The BGR deformation gauge was used on only one borehole in the DS program, the horizontal hole, BDS-3
in the Ventilation Cavern. The results of this work have not been reported other than in presentation, but
some information describing its design and use (Figure 11) can be found in a report of previous
measurements NAGRA’s Grimsel underground laboratory (Pahl and others, 1989).
It does not appear anisotropy is taken into in the analysis of the data; however, this tool has only been used
in carbonate rocks, hence the issue of anisotropy is less critical than for measurements in the Opalinus Clay.
Pahl (and others, 1987) describe methods for data reduction that include rock anisotropy. The results
presented in Hesser (and others, 2013) show the results of all gauge combinations along with a suggested
“best fit” solution, although the details of the statistical approach are not given in detail.
Figure 11: BGR probe in granite core specimen from Grimsel laboratory. Gauge opened to show internal components (Pahl et. al, 1989)
2.2.5 CRIEPI Overcoring Methods: 3DD-G Borehole Deformation Gauge and Compact Conical-Ended (CCBO) Gauge Overcoring
The Japanese CRIEPI group performed stress measurements as part of the AS (evaluation of rock
anisotropy and rock stress) and the DS (determination of stress) experiments. For the AS experiment
CRIEPI used their 3DD-G borehole deformation gauge in the shaly facies of the Opalinus Clay. The only
documentation of the AS experiment is Technical Note 2006-33 (Shin, 2006), which is essentially a
PowerPoint presentation with very little detail on the methods and the results. The 3DD-G tool (Figure 12)
appears to be a borehole deformation gauge, which measures changes in borehole diameter during
overcoring. Unlike most other borehole deformation gauges, which are biaxial and measure only diametric
strains perpendicular to the borehole axis, the 3DD-G gauge measures eight to twelve different deformations
including some that are axial and oblique to the borehole axis. Presumably this allows a three dimensional
stress determination. After some initial technical problems with temperature and drilling air pressure in
borehole BAS-2-1 during Mont Terri Phase 10, better results were achieved in Phase 11 in holes BAS-2-2
and BAS-3-1. The AS experiment also included laboratory tests to assess rock anisotropy. These were to
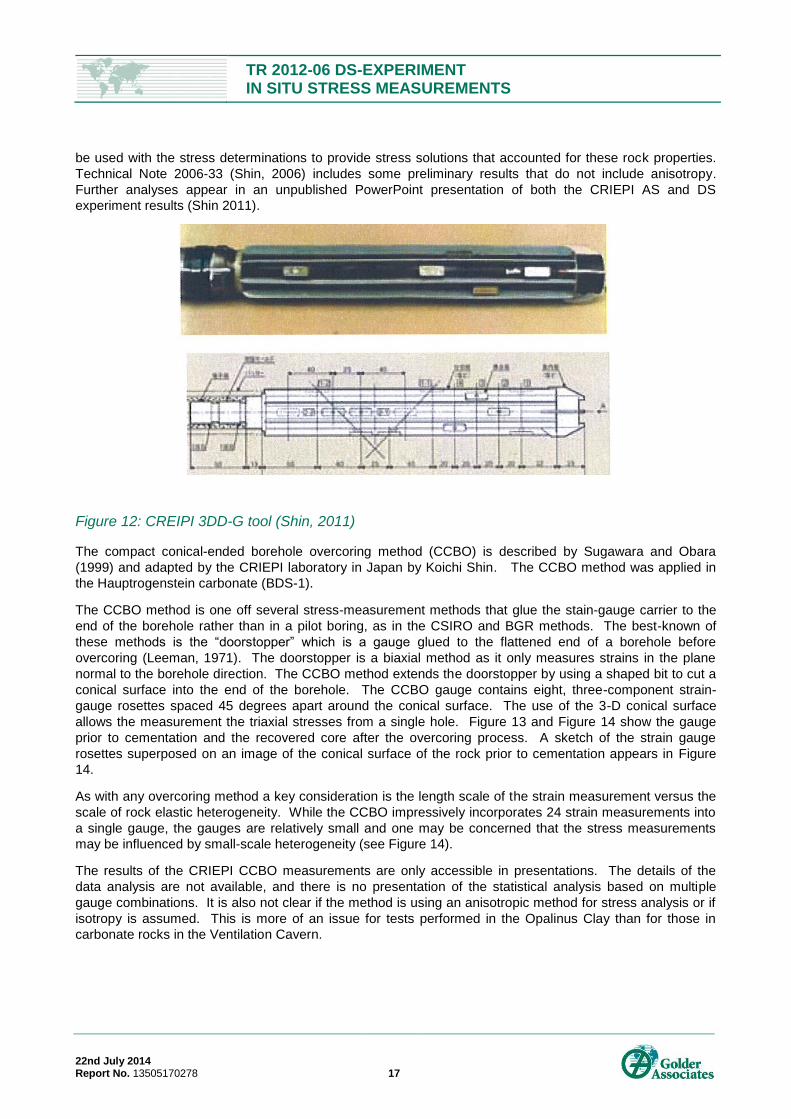
TR 2012-06 DS-EXPERIMENT IN SITU STRESS MEASUREMENTS
22nd July 2014 Report No. 13505170278 17
be used with the stress determinations to provide stress solutions that accounted for these rock properties.
Technical Note 2006-33 (Shin, 2006) includes some preliminary results that do not include anisotropy.
Further analyses appear in an unpublished PowerPoint presentation of both the CRIEPI AS and DS
experiment results (Shin 2011).
Figure 12: CREIPI 3DD-G tool (Shin, 2011)
The compact conical-ended borehole overcoring method (CCBO) is described by Sugawara and Obara
(1999) and adapted by the CRIEPI laboratory in Japan by Koichi Shin. The CCBO method was applied in
the Hauptrogenstein carbonate (BDS-1).
The CCBO method is one off several stress-measurement methods that glue the stain-gauge carrier to the
end of the borehole rather than in a pilot boring, as in the CSIRO and BGR methods. The best-known of
these methods is the “doorstopper” which is a gauge glued to the flattened end of a borehole before
overcoring (Leeman, 1971). The doorstopper is a biaxial method as it only measures strains in the plane
normal to the borehole direction. The CCBO method extends the doorstopper by using a shaped bit to cut a
conical surface into the end of the borehole. The CCBO gauge contains eight, three-component strain-
gauge rosettes spaced 45 degrees apart around the conical surface. The use of the 3-D conical surface
allows the measurement the triaxial stresses from a single hole. Figure 13 and Figure 14 show the gauge
prior to cementation and the recovered core after the overcoring process. A sketch of the strain gauge
rosettes superposed on an image of the conical surface of the rock prior to cementation appears in Figure
14.
As with any overcoring method a key consideration is the length scale of the strain measurement versus the
scale of rock elastic heterogeneity. While the CCBO impressively incorporates 24 strain measurements into
a single gauge, the gauges are relatively small and one may be concerned that the stress measurements
may be influenced by small-scale heterogeneity (see Figure 14).
The results of the CRIEPI CCBO measurements are only accessible in presentations. The details of the
data analysis are not available, and there is no presentation of the statistical analysis based on multiple
gauge combinations. It is also not clear if the method is using an anisotropic method for stress analysis or if
isotropy is assumed. This is more of an issue for tests performed in the Opalinus Clay than for those in
carbonate rocks in the Ventilation Cavern.
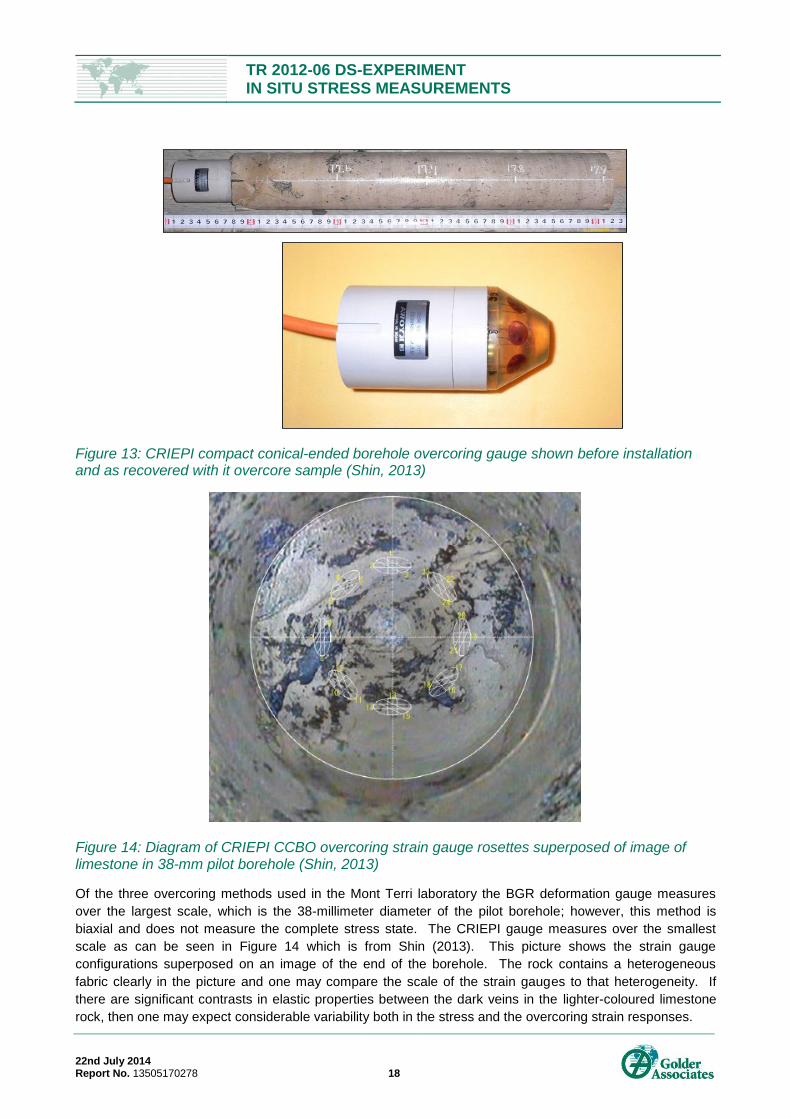
TR 2012-06 DS-EXPERIMENT IN SITU STRESS MEASUREMENTS
22nd July 2014 Report No. 13505170278 18
Figure 13: CRIEPI compact conical-ended borehole overcoring gauge shown before installation and as recovered with it overcore sample (Shin, 2013)
Figure 14: Diagram of CRIEPI CCBO overcoring strain gauge rosettes superposed of image of limestone in 38-mm pilot borehole (Shin, 2013)
Of the three overcoring methods used in the Mont Terri laboratory the BGR deformation gauge measures
over the largest scale, which is the 38-millimeter diameter of the pilot borehole; however, this method is
biaxial and does not measure the complete stress state. The CRIEPI gauge measures over the smallest
scale as can be seen in Figure 14 which is from Shin (2013). This picture shows the strain gauge
configurations superposed on an image of the end of the borehole. The rock contains a heterogeneous
fabric clearly in the picture and one may compare the scale of the strain gauges to that heterogeneity. If
there are significant contrasts in elastic properties between the dark veins in the lighter-coloured limestone
rock, then one may expect considerable variability both in the stress and the overcoring strain responses.
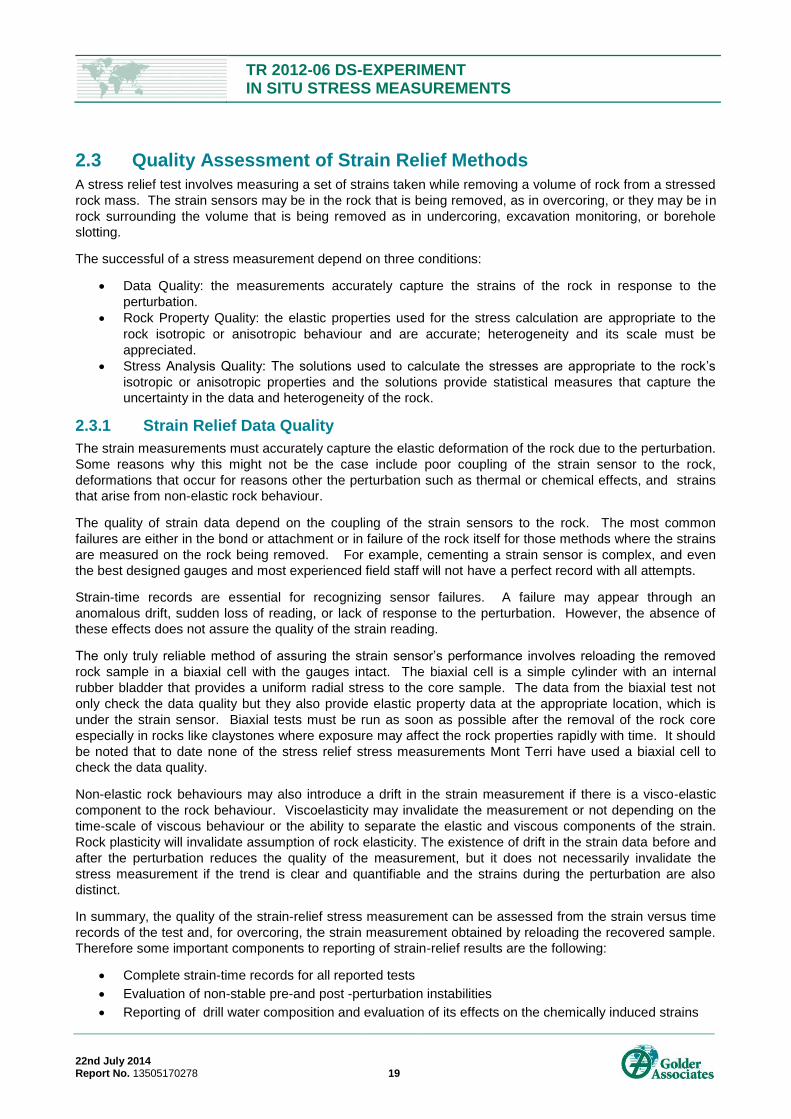
TR 2012-06 DS-EXPERIMENT IN SITU STRESS MEASUREMENTS
22nd July 2014 Report No. 13505170278 19
2.3 Quality Assessment of Strain Relief Methods
A stress relief test involves measuring a set of strains taken while removing a volume of rock from a stressed
rock mass. The strain sensors may be in the rock that is being removed, as in overcoring, or they may be in
rock surrounding the volume that is being removed as in undercoring, excavation monitoring, or borehole
slotting.
The successful of a stress measurement depend on three conditions:
Data Quality: the measurements accurately capture the strains of the rock in response to the
perturbation.
Rock Property Quality: the elastic properties used for the stress calculation are appropriate to the
rock isotropic or anisotropic behaviour and are accurate; heterogeneity and its scale must be
appreciated.
Stress Analysis Quality: The solutions used to calculate the stresses are appropriate to the rock’s
isotropic or anisotropic properties and the solutions provide statistical measures that capture the
uncertainty in the data and heterogeneity of the rock.
2.3.1 Strain Relief Data Quality
The strain measurements must accurately capture the elastic deformation of the rock due to the perturbation.
Some reasons why this might not be the case include poor coupling of the strain sensor to the rock,
deformations that occur for reasons other the perturbation such as thermal or chemical effects, and strains
that arise from non-elastic rock behaviour.
The quality of strain data depend on the coupling of the strain sensors to the rock. The most common
failures are either in the bond or attachment or in failure of the rock itself for those methods where the strains
are measured on the rock being removed. For example, cementing a strain sensor is complex, and even
the best designed gauges and most experienced field staff will not have a perfect record with all attempts.
Strain-time records are essential for recognizing sensor failures. A failure may appear through an
anomalous drift, sudden loss of reading, or lack of response to the perturbation. However, the absence of
these effects does not assure the quality of the strain reading.
The only truly reliable method of assuring the strain sensor’s performance involves reloading the removed
rock sample in a biaxial cell with the gauges intact. The biaxial cell is a simple cylinder with an internal
rubber bladder that provides a uniform radial stress to the core sample. The data from the biaxial test not
only check the data quality but they also provide elastic property data at the appropriate location, which is
under the strain sensor. Biaxial tests must be run as soon as possible after the removal of the rock core
especially in rocks like claystones where exposure may affect the rock properties rapidly with time. It should
be noted that to date none of the stress relief stress measurements Mont Terri have used a biaxial cell to
check the data quality.
Non-elastic rock behaviours may also introduce a drift in the strain measurement if there is a visco-elastic
component to the rock behaviour. Viscoelasticity may invalidate the measurement or not depending on the
time-scale of viscous behaviour or the ability to separate the elastic and viscous components of the strain.
Rock plasticity will invalidate assumption of rock elasticity. The existence of drift in the strain data before and
after the perturbation reduces the quality of the measurement, but it does not necessarily invalidate the
stress measurement if the trend is clear and quantifiable and the strains during the perturbation are also
distinct.
In summary, the quality of the strain-relief stress measurement can be assessed from the strain versus time
records of the test and, for overcoring, the strain measurement obtained by reloading the recovered sample.
Therefore some important components to reporting of strain-relief results are the following:
Complete strain-time records for all reported tests
Evaluation of non-stable pre-and post -perturbation instabilities
Reporting of drill water composition and evaluation of its effects on the chemically induced strains
TR 2012-06 DS-EXPERIMENT IN SITU STRESS MEASUREMENTS
22nd July 2014 Report No. 13505170278 20
Reporting of post-measurement biaxial reloading data.
2.3.2 Quality of the Rock Property Data
Stress-relief stress measurements require the elastic constants of the rock. The quality of the stress result is
no better than the quality of elastic constants.
The presence of elastic anisotropy greatly complicates stress-measurement interpretation. A full description
of anisotropic stress-strain relationships requires at least 21 independent components (Amadei, 1996).
There seldom, if ever, has been a rock characterized to that level of description, let alone incorporating that
description into a stress measurement. A more tractable approach assumes transverse anisotropy, which
considers isotropy in two directions and anisotropy in the direction perpendicular to the other two. This
condition is appropriate for bedded or foliated rocks like claystones. The simplification reduces the number
of elastic constants to five (Amadei, 1996), Young’s moduli in the parallel and perpendicular directions to
bedding, Poisson’s ratio parallel and perpendicular to bedding, and shear modulus.
It is not the purpose of this report to provide details on the solutions for reducing the strain data to stresses,
but it is sufficient to say that uncertainty or errors in the rock’s elastic property data translate directly and with
similar multiplying factors to uncertainty and errors in the stress calculation (Amadei and Stefansson, 1997).
Young’s modulus values for Opalinus Clay vary from 1.6 GPa to over 22 GPa depending on the facies,
location, direction relative to bedding, and method of determination. For the carbonates this range is from
37.1 to 71.4 GPa. Applying the elastic constants from the wrong direction and wrong location can easily
change the stress determination by a factor of two or more.
The elastic property data for strain-relief measurements comes from a wide variety of sources – laboratory
data on cores, dynamic determinations using acoustic wave velocities from cores and geophysical well logs,
and dilatometer measurements in boreholes.
Because rocks are heterogeneous, the elastic properties of the rock should come from exactly the same
location as the stress measurement itself wherever possible. For overcoring measurements, the ideal case
is a biaxial-cell measurement taken on the overcored sample using the stress gauge itself for the
measurement. Amadei and Stefansson (1997) discuss the derivation of elastic properties from biaxial data,
including criteria for determining anisotropic behaviours. They note (p. 252) that biaxial data can indicate
qualitatively the presence of anisotropy but there is not a quantitative method of deducing anisotropic
properties from biaxial results. Hence biaxial data must be complemented by laboratory test data.
As non-elastic effects may arise from the inherent properties of the rock or from changing moisture content,
the elastic property measurement should be done on site as soon as the overcored sample is removed from
the rock mass. As discussed above, the on-site biaxial test also provides an important check on the quality
of the gauge bonding to the rock.
In summary, elastic property data should have the following quality characteristics:
Taken from the same rock as the measurement,
Taken immediately after the measurement (on-site biaxial cell),
Complemented by laboratory data to provide anisotropic properties, minimally Young’s modulus and
Poisson’s ratio parallel and perpendicular to bedding in the transversely anisotropic claystones as
well as shear modulus.
Account for heterogeneity.
2.3.3 Quality of the Stress Solution
The stress solution requires multiple strain measurements to produce a solution for the stress tensor. For
three-dimensional overcoring stress determinations in an isotropic rock, the stress solution requires strain
measurements in nine independent directions. Typically stress cells contain additional strain components,
so there are multiple combinations of the gauges that can provide the complete solution. These redundant
strain measurements allow for a successful test even if some of the gauges fail. If all the gauges work
perfectly, different valid combinations of gauges may give different stress results. Using an isotropic
TR 2012-06 DS-EXPERIMENT IN SITU STRESS MEASUREMENTS
22nd July 2014 Report No. 13505170278 21
solution when the rock is anisotropic can account for some of this variability, but a more likely cause of
divergence is elastic heterogeneity on the scale of the strain measurement (see Figure 14). Vugs, shells, or
other local inclusions will affect both the local stress and the strain that a gauge will read; hence, the
variability of the stress results may reflect both measurement error and actual heterogeneity in the stresses.
Because of the variability of solutions for the same measurement, the quality of the result will improve with
multiple redundant solutions. A stress solution will use typically linear regression optimizations both for
calculating the stress results from one set of strains and also for multiple combinations of strains among the
redundant possibilities.
The presentation of the results should include all possible solutions as well as statistical measures of the
goodness of fit both of the individual gauge results to each solution and the different solutions to the reported
best-fit result. This may involve comparing the measured strain with the strains of the best-fit solution. The
reporting should also make clear which gauges or strains may have been discarded from calculations and
the reason for their exclusion.
In summary, the quality indicators for stress-relief methods based on the stress solutions should include the
following:
The stress solution should consider the transverse anisotropy of the elastic properties.
The presentation of results should compare measured and best fit strains for each set of strains that
provides a valid solution.
The stress result should calculate multiple solutions using all valid strain combinations (redundant
solutions) with a statistical measure of the goodness of fit to the overall set of solutions.
2.3.4 Assessment of Strain Relief Measurement Quality
Table 2 presents an assessment of the strain relief stress measurement results using the qualitative criteria
given above. The largest quality issue with the data is the absence of detailed reporting for some of the
results. In some cases only PowerPoint presentations are available and these only calculated stress results
without backup on strain time records. None of the overcoring measurements used biaxial cells to check the
gauges and provide elastic property data. The only tests that contain full reporting of strain-time results and
use anisotropic solutions for the stresses are those that used the ROSAS data reduction methods. These
included the undercoring tests in the IS-Niche and the CSIRO tests in the EZ-A experiment. Also only the
tests using the ROSAS reduction software provided any statistical analysis of the solutions.
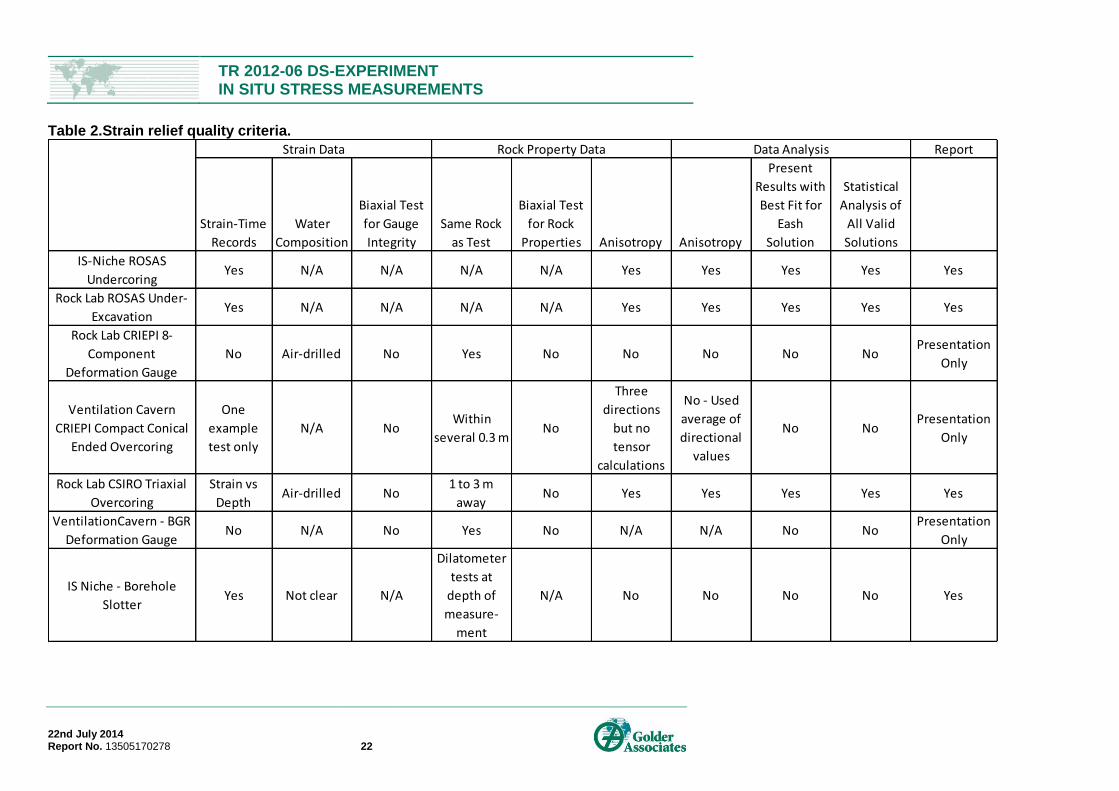
TR 2012-06 DS-EXPERIMENT IN SITU STRESS MEASUREMENTS
22nd July 2014 Report No. 13505170278 22
Table 2.Strain relief quality criteria.
Report
Strain-Time
Records
Water
Composition
Biaxial Test
for Gauge
Integrity
Same Rock
as Test
Biaxial Test
for Rock
Properties Anisotropy Anisotropy
Present
Results with
Best Fit for
Eash
Solution
Statistical
Analysis of
All Valid
Solutions
IS-Niche ROSAS
UndercoringYes N/A N/A N/A N/A Yes Yes Yes Yes Yes
Rock Lab ROSAS Under-
ExcavationYes N/A N/A N/A N/A Yes Yes Yes Yes Yes
Rock Lab CRIEPI 8-
Component
Deformation Gauge
No Air-drilled No Yes No No No No NoPresentation
Only
Ventilation Cavern
CRIEPI Compact Conical
Ended Overcoring
One
example
test only
N/A NoWithin
several 0.3 mNo
Three
directions
but no
tensor
calculations
No - Used
average of
directional
values
No NoPresentation
Only
Rock Lab CSIRO Triaxial
Overcoring
Strain vs
DepthAir-drilled No
1 to 3 m
awayNo Yes Yes Yes Yes Yes
VentilationCavern - BGR
Deformation GaugeNo N/A No Yes No N/A N/A No No
Presentation
Only
IS Niche - Borehole
SlotterYes Not clear N/A
Dilatometer
tests at
depth of
measure-
ment
N/A No No No No Yes
Strain Data Rock Property Data Data Analysis

TR 2012-06 DS-EXPERIMENT IN SITU STRESS MEASUREMENTS
22nd July 2014 Report No. 13505170278 23
3.0 RESULTS AT STRESS MEASUREMENT SITES (FROM SOUTH TO NORTH)
3.1 Park Niche
3.1.1 Rock types and tests performed
The Park Niche is located along the Security Gallery approximately 200 m southeast of the main laboratory.
The stress measurement work was part of the DS experiment, and the host rock was the Hauptrogenstein
carbonate. As with the measurements at the Ventilation Cavern northwest of laboratory, the primary
motivation for testing of this location was obtaining stress data in the stiffer carbonate units that bound the
Opalinus clay.
BDS-2 is the only borehole at the site. It has a collar elevation of 508.9 m, and the ground surface above the
niche has an elevation of approximately 700 m making its direct cover depth approximately 190 m. The
borehole is vertical with a total depth of slightly over 80 m. Only hydraulic fracturing measurements were
performed at this location. The tests were performed in two stages and by two different contractors. The
first phase (upper portion) was performed by Mesy (Rummel and others, 2012) from 0 to 40 m, and the
second phase (lower portion) was performed by Golder Associates from 40 to 70 m (Enachescu and Zieger,
2010).
Both Mesy and Golder assumed an overburden depth of 250 m for the Park Niche. Comparison with
topography (Figure 3) suggests that the elevation of the ground surface is about 700m above sea level. With
a BDS-2 collar elevation of 508, the cover is actually closer to 190 m. That said, the Park Niche appears to
lie beneath a small incision in the Mont Terri, and the surface elevations are higher along the tunnel in both
directions, rising to about 740 m at the IS niche and 780m above the laboratory. Golder compared the
minimum stress data to lithostatic trends using Mesy’s density of 2530 km/m3. They noted that the gradient
of the minimum stresses was parallel to the lithostatic trend minus about 2 MPa. If one uses the actual cover
thickness at the Park Niche, the minimum horizontal stresses are very close to the lithostatic trend (Figure
15). In this report the stress-depth plots for this location present lithostatic gradients based on both the 190-
m and 250-m cover thickness.
The stress results appear in Figure 15 with more description below. Fracture orientation data are shown as
stereonets of fracture poles and rose diagrams of fracture strike (for dips greater than 60 degrees) in Figure
16 and Figure 17. The strike direction coincides with that of HMax.
Mesy was able to obtain good vertical hydraulic fractures (Figure 16) for the shallow portion of BDS-2;
hence, their maximum horizontal stress direction has very high confidence. Golder’s fracture impressions
were generally indistinct having relatively short segments sometimes following bedding. These appear in
Figure 17 but have low confidence.
Due to the quality of the fractures traces only the Mesy shallow results are used for calculating the maximum
horizontal stresses. The Golder data are used for the maximum stress calculations but are not high
confidence, although they follow a consistent trend with the shallower Mesy test results.
3.1.2 Minimum Horizontal Stress
The testing in the upper portion (<40 m) was performed by Mesy. The minimum horizontal stress was
determined according to three different methods: hydraulic jacking, ISIP, and dpdt. The stress results for
both portions of the hole appear in Figure 15. The Mesy jacking cycles use four fixed flow steps starting at l
litre/minute. This rate is usually sufficient to cause hydraulic jacking, hence their results do not have
pressure and flow points below the jacking pressure. While having points both above and below the jacking
pressure is desirable, it does not invalidate the results.
Table 3 lists the lithostatic stress and the magnitude of the minimum horizontal stresses for the upper portion
tests. Test 3, Test 4, Test 9 and Test 10 were not included due to the limited quality of the test records given
in Table 22 of Appendix B. The lithostatic stress is calculated for both the assumed 250 m of cover and the
actual 190 m.
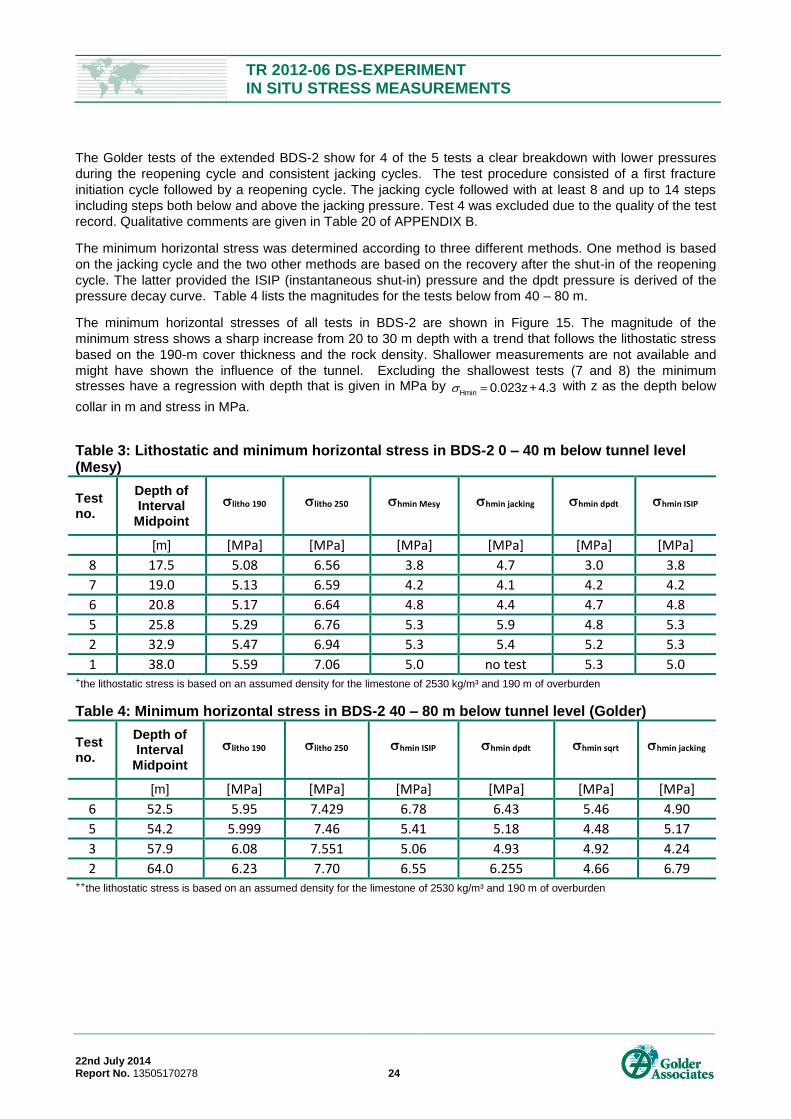
TR 2012-06 DS-EXPERIMENT IN SITU STRESS MEASUREMENTS
22nd July 2014 Report No. 13505170278 24
The Golder tests of the extended BDS-2 show for 4 of the 5 tests a clear breakdown with lower pressures
during the reopening cycle and consistent jacking cycles. The test procedure consisted of a first fracture
initiation cycle followed by a reopening cycle. The jacking cycle followed with at least 8 and up to 14 steps
including steps both below and above the jacking pressure. Test 4 was excluded due to the quality of the test
record. Qualitative comments are given in Table 20 of APPENDIX B.
The minimum horizontal stress was determined according to three different methods. One method is based
on the jacking cycle and the two other methods are based on the recovery after the shut-in of the reopening
cycle. The latter provided the ISIP (instantaneous shut-in) pressure and the dpdt pressure is derived of the
pressure decay curve. Table 4 lists the magnitudes for the tests below from 40 – 80 m.
The minimum horizontal stresses of all tests in BDS-2 are shown in Figure 15. The magnitude of the
minimum stress shows a sharp increase from 20 to 30 m depth with a trend that follows the lithostatic stress
based on the 190-m cover thickness and the rock density. Shallower measurements are not available and
might have shown the influence of the tunnel. Excluding the shallowest tests (7 and 8) the minimum stresses have a regression with depth that is given in MPa by Hmin 0.023z+4.3 with z as the depth below
collar in m and stress in MPa.
Table 3: Lithostatic and minimum horizontal stress in BDS-2 0 – 40 m below tunnel level (Mesy)
Test no.
Depth of Interval
Midpoint
litho 190 litho 250 hmin Mesy hmin jacking hmin dpdt hmin ISIP
[m] [MPa] [MPa] [MPa] [MPa] [MPa] [MPa]
8 17.5 5.08 6.56 3.8 4.7 3.0 3.8
7 19.0 5.13 6.59 4.2 4.1 4.2 4.2
6 20.8 5.17 6.64 4.8 4.4 4.7 4.8
5 25.8 5.29 6.76 5.3 5.9 4.8 5.3
2 32.9 5.47 6.94 5.3 5.4 5.2 5.3
1 38.0 5.59 7.06 5.0 no test 5.3 5.0 +the lithostatic stress is based on an assumed density for the limestone of 2530 kg/m³ and 190 m of overburden
Table 4: Minimum horizontal stress in BDS-2 40 – 80 m below tunnel level (Golder)
Test no.
Depth of Interval
Midpoint
litho 190 litho 250 hmin ISIP hmin dpdt hmin sqrt hmin jacking
[m] [MPa] [MPa] [MPa] [MPa] [MPa] [MPa]
6 52.5 5.95 7.429 6.78 6.43 5.46 4.90
5 54.2 5.999 7.46 5.41 5.18 4.48 5.17
3 57.9 6.08 7.551 5.06 4.93 4.92 4.24
2 64.0 6.23 7.70 6.55 6.255 4.66 6.79 ++the lithostatic stress is based on an assumed density for the limestone of 2530 kg/m³ and 190 m of overburden
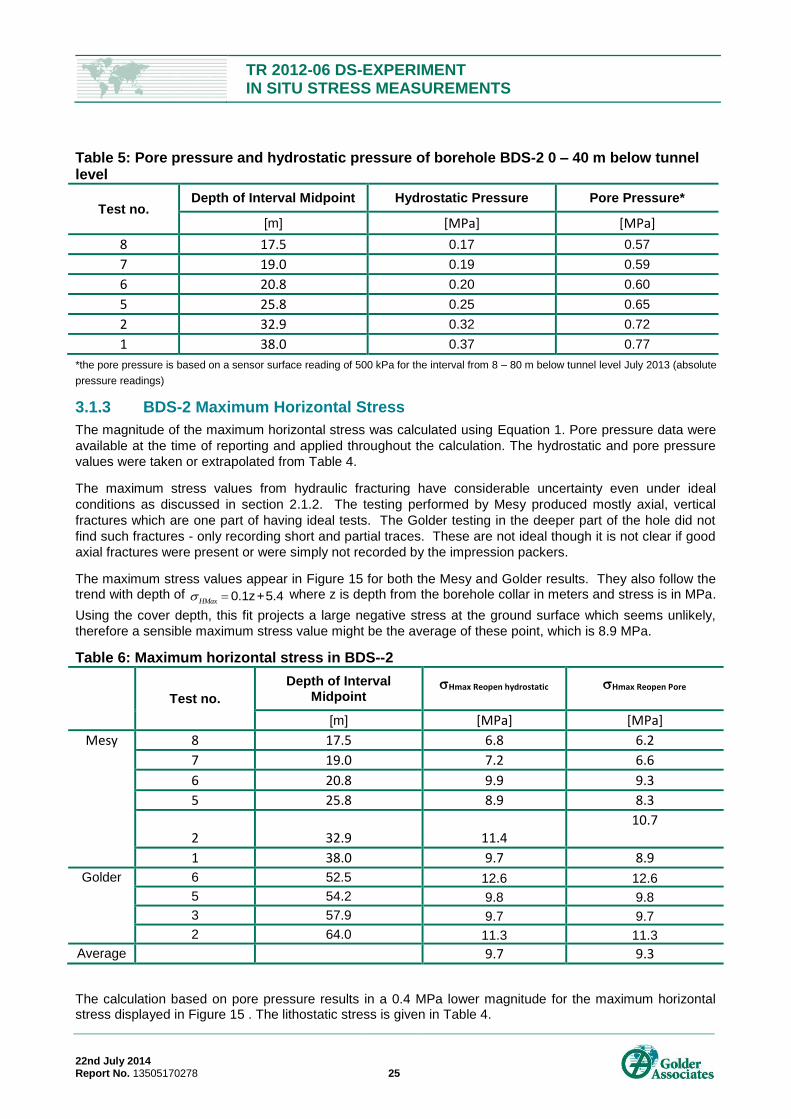
TR 2012-06 DS-EXPERIMENT IN SITU STRESS MEASUREMENTS
22nd July 2014 Report No. 13505170278 25
Table 5: Pore pressure and hydrostatic pressure of borehole BDS-2 0 – 40 m below tunnel level
Test no. Depth of Interval Midpoint Hydrostatic Pressure Pore Pressure*
[m] [MPa] [MPa]
8 17.5 0.17 0.57
7 19.0 0.19 0.59
6 20.8 0.20 0.60
5 25.8 0.25 0.65
2 32.9 0.32 0.72
1 38.0 0.37 0.77
*the pore pressure is based on a sensor surface reading of 500 kPa for the interval from 8 – 80 m below tunnel level July 2013 (absolute
pressure readings)
3.1.3 BDS-2 Maximum Horizontal Stress
The magnitude of the maximum horizontal stress was calculated using Equation 1. Pore pressure data were
available at the time of reporting and applied throughout the calculation. The hydrostatic and pore pressure
values were taken or extrapolated from Table 4.
The maximum stress values from hydraulic fracturing have considerable uncertainty even under ideal
conditions as discussed in section 2.1.2. The testing performed by Mesy produced mostly axial, vertical
fractures which are one part of having ideal tests. The Golder testing in the deeper part of the hole did not
find such fractures - only recording short and partial traces. These are not ideal though it is not clear if good
axial fractures were present or were simply not recorded by the impression packers.
The maximum stress values appear in Figure 15 for both the Mesy and Golder results. They also follow the trend with depth of
HMax 0.1z+5.4 where z is depth from the borehole collar in meters and stress is in MPa.
Using the cover depth, this fit projects a large negative stress at the ground surface which seems unlikely,
therefore a sensible maximum stress value might be the average of these point, which is 8.9 MPa.
Table 6: Maximum horizontal stress in BDS--2
Test no.
Depth of Interval Midpoint
Hmax Reopen hydrostatic Hmax Reopen Pore
[m] [MPa] [MPa]
Mesy 8 17.5 6.8 6.2
7 19.0 7.2 6.6
6 20.8 9.9 9.3
5 25.8 8.9 8.3
2 32.9 11.4 10.7
1 38.0 9.7 8.9
Golder 6 52.5 12.6 12.6 5 54.2 9.8 9.8 3 57.9 9.7 9.7 2 64.0 11.3 11.3
Average 9.7 9.3
The calculation based on pore pressure results in a 0.4 MPa lower magnitude for the maximum horizontal stress displayed in Figure 15 . The lithostatic stress is given in Table 4.
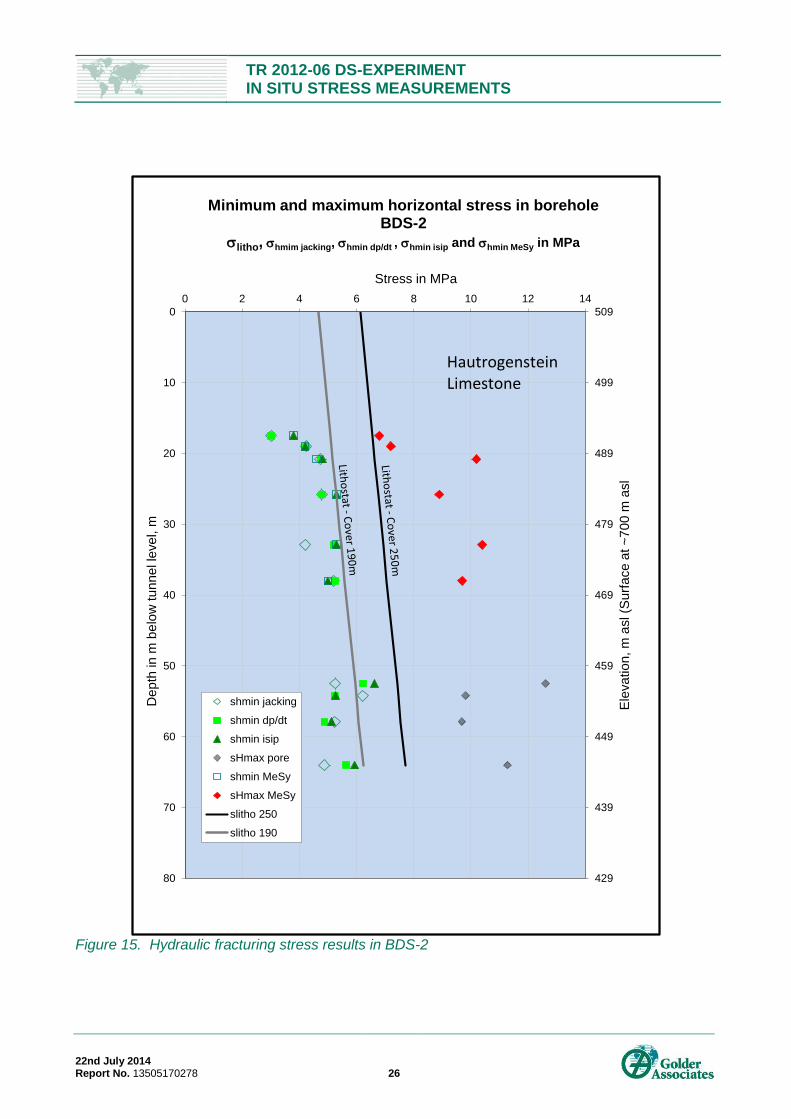
TR 2012-06 DS-EXPERIMENT IN SITU STRESS MEASUREMENTS
22nd July 2014 Report No. 13505170278 26
Figure 15. Hydraulic fracturing stress results in BDS-2
429
439
449
459
469
479
489
499
5090
10
20
30
40
50
60
70
80
0 2 4 6 8 10 12 14
Ele
va
tio
n, m
asl (S
urf
ace
at
~7
00
m a
sl
Dep
th in m
be
low
tu
nn
el le
ve
l, m
Stress in MPa
Minimum and maximum horizontal stress in borehole BDS-2
litho, hmim jacking, hmin dp/dt , hmin isip and hmin MeSy in MPa
shmin jacking
shmin dp/dt
shmin isip
sHmax pore
shmin MeSy
sHmax MeSy
slitho 250
slitho 190
Hautrogenstein Limestone
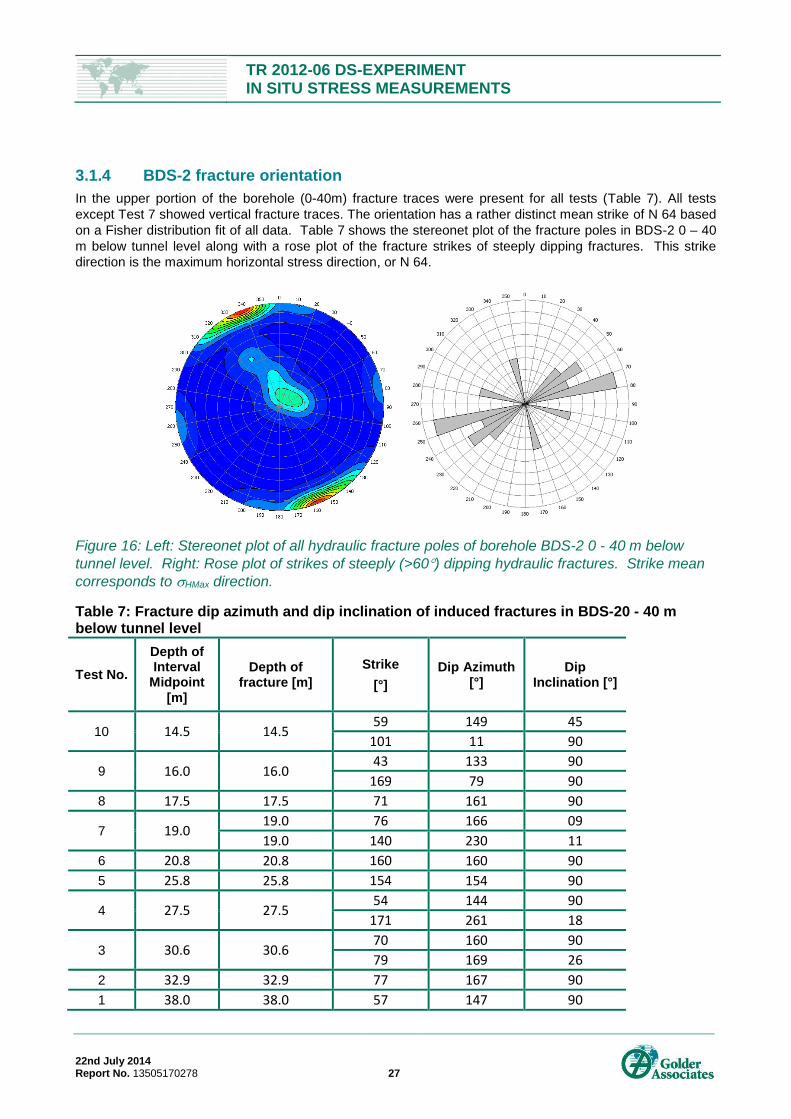
TR 2012-06 DS-EXPERIMENT IN SITU STRESS MEASUREMENTS
22nd July 2014 Report No. 13505170278 27
3.1.4 BDS-2 fracture orientation
In the upper portion of the borehole (0-40m) fracture traces were present for all tests (Table 7). All tests
except Test 7 showed vertical fracture traces. The orientation has a rather distinct mean strike of N 64 based
on a Fisher distribution fit of all data. Table 7 shows the stereonet plot of the fracture poles in BDS-2 0 – 40
m below tunnel level along with a rose plot of the fracture strikes of steeply dipping fractures. This strike
direction is the maximum horizontal stress direction, or N 64.
Figure 16: Left: Stereonet plot of all hydraulic fracture poles of borehole BDS-2 0 - 40 m below
tunnel level. Right: Rose plot of strikes of steeply (>60) dipping hydraulic fractures. Strike mean
corresponds to HMax direction.
Table 7: Fracture dip azimuth and dip inclination of induced fractures in BDS-20 - 40 m below tunnel level
Test No.
Depth of Interval
Midpoint [m]
Depth of fracture [m]
Strike
[°]
Dip Azimuth [°]
Dip Inclination [°]
10 14.5 14.5 59 149 45
101 11 90
9 16.0 16.0 43 133 90
169 79 90
8 17.5 17.5 71 161 90
7 19.0 19.0 76 166 09
19.0 140 230 11
6 20.8 20.8 160 160 90
5 25.8 25.8 154 154 90
4 27.5 27.5 54 144 90
171 261 18
3 30.6 30.6 70 160 90
79 169 26
2 32.9 32.9 77 167 90
1 38.0 38.0 57 147 90
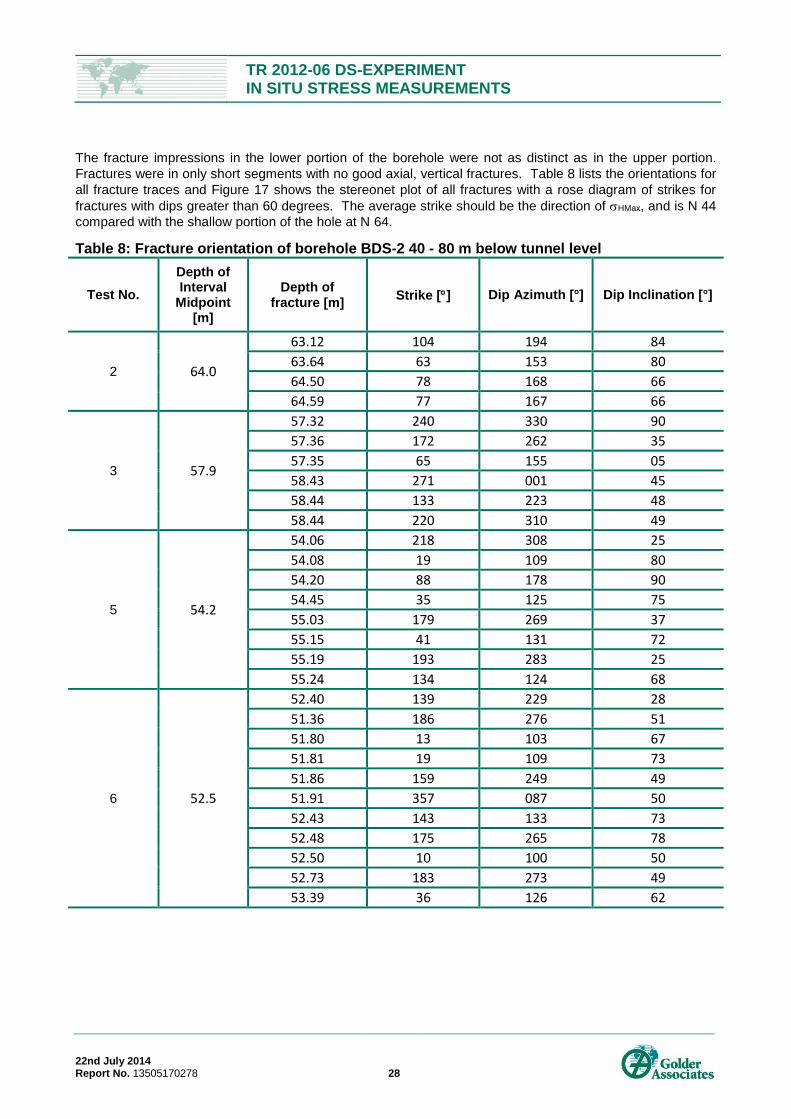
TR 2012-06 DS-EXPERIMENT IN SITU STRESS MEASUREMENTS
22nd July 2014 Report No. 13505170278 28
The fracture impressions in the lower portion of the borehole were not as distinct as in the upper portion.
Fractures were in only short segments with no good axial, vertical fractures. Table 8 lists the orientations for
all fracture traces and Figure 17 shows the stereonet plot of all fractures with a rose diagram of strikes for
fractures with dips greater than 60 degrees. The average strike should be the direction of HMax, and is N 44
compared with the shallow portion of the hole at N 64.
Table 8: Fracture orientation of borehole BDS-2 40 - 80 m below tunnel level
Test No.
Depth of Interval
Midpoint [m]
Depth of fracture [m]
Strike [] Dip Azimuth [°] Dip Inclination [°]
2 64.0
63.12 104 194 84
63.64 63 153 80
64.50 78 168 66
64.59 77 167 66
3 57.9
57.32 240 330 90
57.36 172 262 35
57.35 65 155 05
58.43 271 001 45
58.44 133 223 48
58.44 220 310 49
5 54.2
54.06 218 308 25
54.08 19 109 80
54.20 88 178 90
54.45 35 125 75
55.03 179 269 37
55.15 41 131 72
55.19 193 283 25
55.24 134 124 68
6 52.5
52.40 139 229 28
51.36 186 276 51
51.80 13 103 67
51.81 19 109 73
51.86 159 249 49
51.91 357 087 50
52.43 143 133 73
52.48 175 265 78
52.50 10 100 50
52.73 183 273 49
53.39 36 126 62
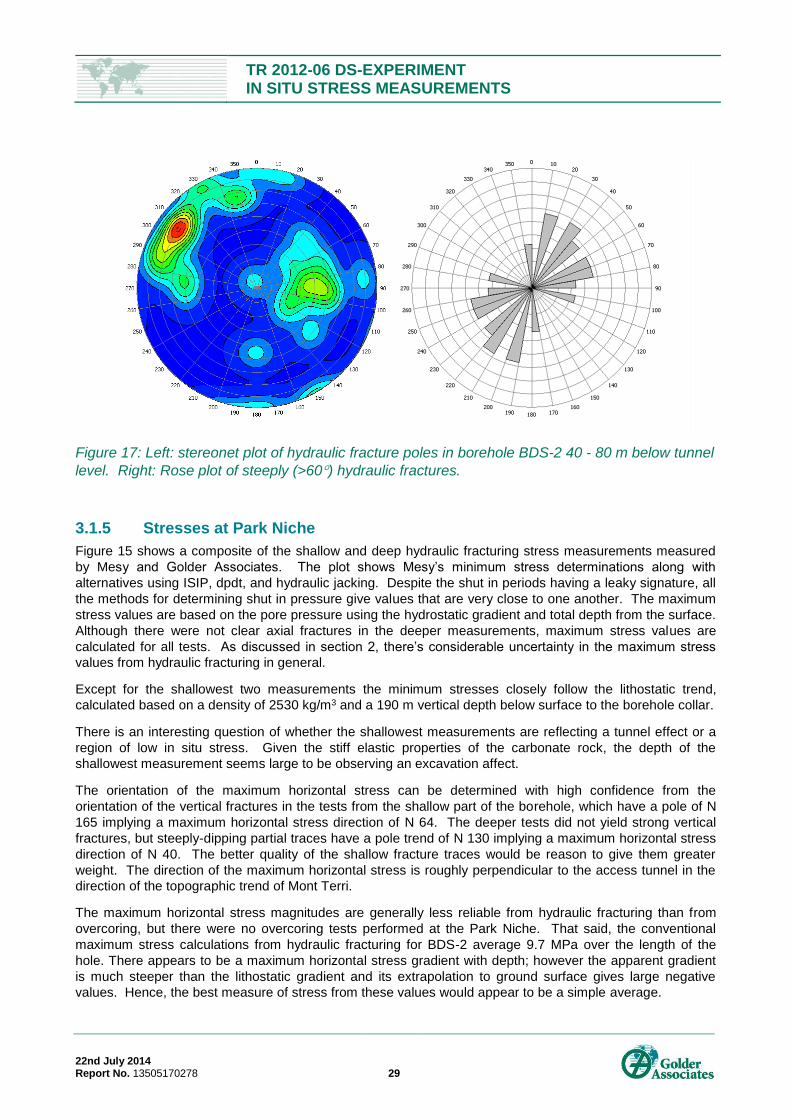
TR 2012-06 DS-EXPERIMENT IN SITU STRESS MEASUREMENTS
22nd July 2014 Report No. 13505170278 29
Figure 17: Left: stereonet plot of hydraulic fracture poles in borehole BDS-2 40 - 80 m below tunnel
level. Right: Rose plot of steeply (>60) hydraulic fractures.
3.1.5 Stresses at Park Niche
Figure 15 shows a composite of the shallow and deep hydraulic fracturing stress measurements measured
by Mesy and Golder Associates. The plot shows Mesy’s minimum stress determinations along with
alternatives using ISIP, dpdt, and hydraulic jacking. Despite the shut in periods having a leaky signature, all
the methods for determining shut in pressure give values that are very close to one another. The maximum
stress values are based on the pore pressure using the hydrostatic gradient and total depth from the surface.
Although there were not clear axial fractures in the deeper measurements, maximum stress values are
calculated for all tests. As discussed in section 2, there’s considerable uncertainty in the maximum stress
values from hydraulic fracturing in general.
Except for the shallowest two measurements the minimum stresses closely follow the lithostatic trend,
calculated based on a density of 2530 kg/m3 and a 190 m vertical depth below surface to the borehole collar.
There is an interesting question of whether the shallowest measurements are reflecting a tunnel effect or a
region of low in situ stress. Given the stiff elastic properties of the carbonate rock, the depth of the
shallowest measurement seems large to be observing an excavation affect.
The orientation of the maximum horizontal stress can be determined with high confidence from the
orientation of the vertical fractures in the tests from the shallow part of the borehole, which have a pole of N
165 implying a maximum horizontal stress direction of N 64. The deeper tests did not yield strong vertical
fractures, but steeply-dipping partial traces have a pole trend of N 130 implying a maximum horizontal stress
direction of N 40. The better quality of the shallow fracture traces would be reason to give them greater
weight. The direction of the maximum horizontal stress is roughly perpendicular to the access tunnel in the
direction of the topographic trend of Mont Terri.
The maximum horizontal stress magnitudes are generally less reliable from hydraulic fracturing than from
overcoring, but there were no overcoring tests performed at the Park Niche. That said, the conventional
maximum stress calculations from hydraulic fracturing for BDS-2 average 9.7 MPa over the length of the
hole. There appears to be a maximum horizontal stress gradient with depth; however the apparent gradient
is much steeper than the lithostatic gradient and its extrapolation to ground surface gives large negative
values. Hence, the best measure of stress from these values would appear to be a simple average.
TR 2012-06 DS-EXPERIMENT IN SITU STRESS MEASUREMENTS
22nd July 2014 Report No. 13505170278 30
A proposed stress for the Park Niche, given the uncertainties discussed above, would use the averages of
the maximum horizontal stress and the interpolation of the minimum horizontal stress, which would be 4.3
MPa and 8.9 MPa respectively; however these should be considered uncertain. The orientation of the
maximum horizontal stress would be N 64 which is approximately the topographic trend of Mont Terri (Figure
3). The vertical stress at the borehole collar depth would be either 6.3 MPa or 4.7 MPa depending on the
assumption of a cover of 250m or 190m.
3.2 IS Niche
3.2.1 Rock Types and Tests Performed
This IS experiment, which ran from 1996-1998, was the first program focused on measurements of in situ
stress. The successful measurements were all run in the IS niche, which is located along the security gallery
approximately 100 meters from the main laboratory. The rock type is entirely in the sandy facies of the
Opalinus clay. Martin and Lanyon (2003) as well as Wermeille and Bossart (1999) provide an excellent
summary of the results.
The IS Niche has a floor elevation of approximately 511 m and the overlying surface elevation is
approximately 760 m, hence the depth of cover at the niche is about 250 m. The bedding dip and dip
direction are 150/50 or a strike of N 60 with a dip of 50 to the SE.
The IS niche has three methods applied:
~ 1-m scale undercoring (Bigarré and Lizeur, 1997)
Borehole slotter (König and Bock, 1997)
Hydraulic fracturing (Evans, and others., 1999).
3.2.2 ROSAS Undercoring Tests
The undercoring for the IS-Niche (ROSAS-1) produced reasonably elastic behaviours for the strains (Figure
18). The data were analysed using elastic properties obtained from laboratory tests under triaxial conditions
with a confining pressure of 7.8 MPa and samples parallel, perpendicular, and oblique to the bedding. The
laboratory results suggested a transversely anisotropic material with Young’s modulus values of 12.3 GPa
and 4.1 GPa parallel and perpendicular to bedding respectively. These anisotropic values were used in the
ROSAS calculations of stress. The numbers of gauges are above the minimum required for a stress
solution; hence, the statistics of the stress solution are relatively robust.
Bigarré’s (1997) recommended analysis of the stress (Figure 19) gives a 1 between 6.5 and 8.0 MPa that is
subvertical. The minor principal stresses are oblique to the bedding and subhorizontal. 2, the intermediate
and maximum horizontal stress is 4.0 to 5.5 MPa oriented N 50, which is approximately perpendicular to the
tunnel axis (N 28 W) and parallel to the topographic orientation of the ridge line of Mont Terri. The minimum
principal stress, 3, is between 0.6 and 1.1 MPa running N 320 which is approximately 10 degrees counter
clockwise of the tunnel axis and perpendicular to the trend of Mont Terri. The solution gives the vertical
stress as 6.5 MPa, which is reasonably consistent with calculated overburden stresses.
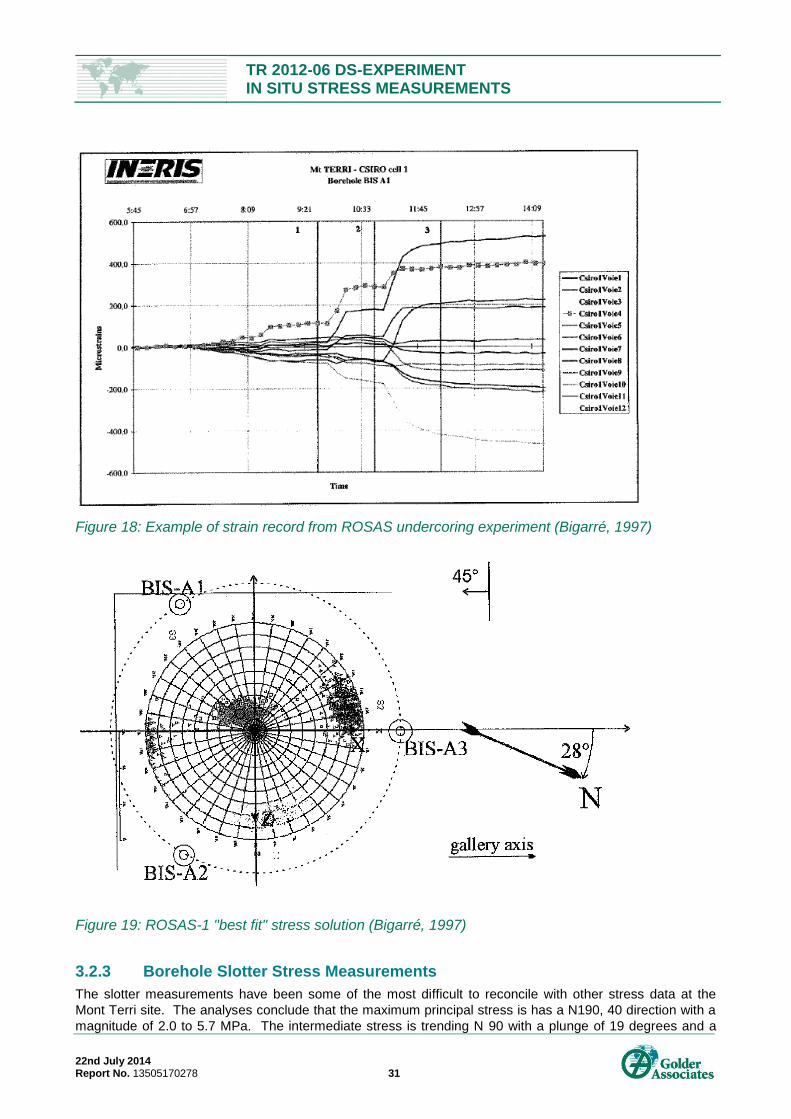
TR 2012-06 DS-EXPERIMENT IN SITU STRESS MEASUREMENTS
22nd July 2014 Report No. 13505170278 31
Figure 18: Example of strain record from ROSAS undercoring experiment (Bigarré, 1997)
Figure 19: ROSAS-1 "best fit" stress solution (Bigarré, 1997)
3.2.3 Borehole Slotter Stress Measurements
The slotter measurements have been some of the most difficult to reconcile with other stress data at the
Mont Terri site. The analyses conclude that the maximum principal stress is has a N190, 40 direction with a
magnitude of 2.0 to 5.7 MPa. The intermediate stress is trending N 90 with a plunge of 19 degrees and a
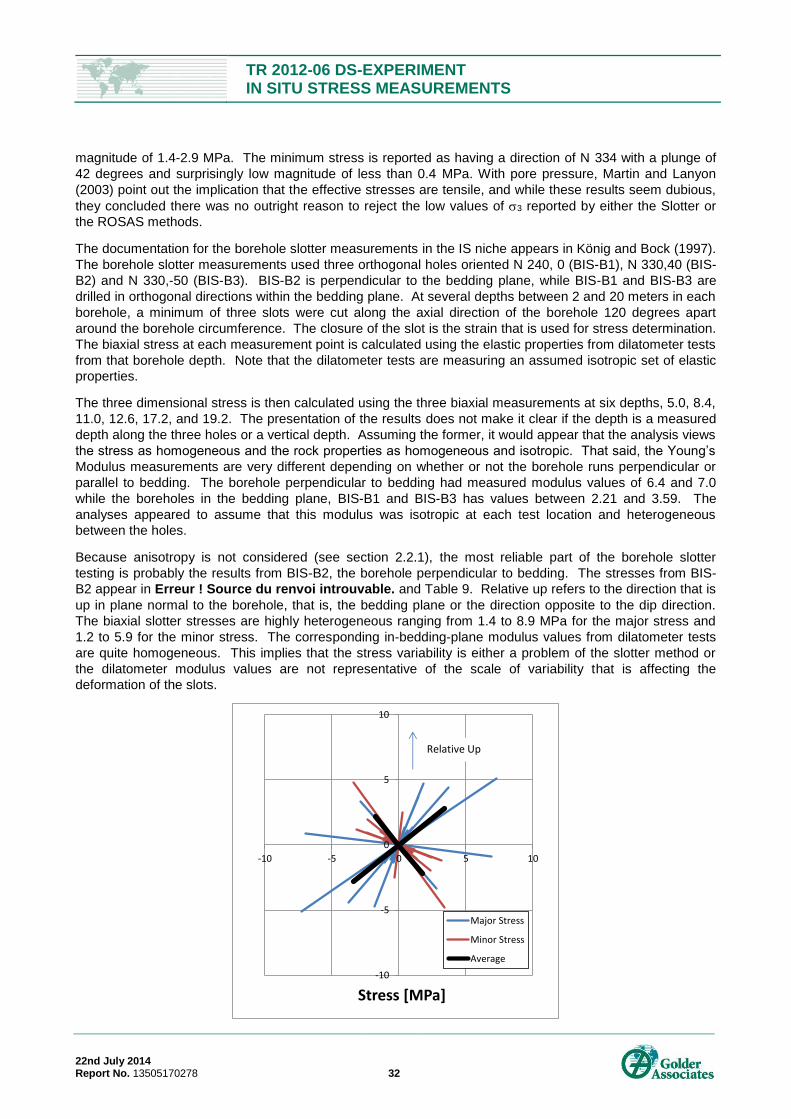
TR 2012-06 DS-EXPERIMENT IN SITU STRESS MEASUREMENTS
22nd July 2014 Report No. 13505170278 32
magnitude of 1.4-2.9 MPa. The minimum stress is reported as having a direction of N 334 with a plunge of
42 degrees and surprisingly low magnitude of less than 0.4 MPa. With pore pressure, Martin and Lanyon
(2003) point out the implication that the effective stresses are tensile, and while these results seem dubious,
they concluded there was no outright reason to reject the low values of 3 reported by either the Slotter or
the ROSAS methods.
The documentation for the borehole slotter measurements in the IS niche appears in König and Bock (1997).
The borehole slotter measurements used three orthogonal holes oriented N 240, 0 (BIS-B1), N 330,40 (BIS-
B2) and N 330,-50 (BIS-B3). BIS-B2 is perpendicular to the bedding plane, while BIS-B1 and BIS-B3 are
drilled in orthogonal directions within the bedding plane. At several depths between 2 and 20 meters in each
borehole, a minimum of three slots were cut along the axial direction of the borehole 120 degrees apart
around the borehole circumference. The closure of the slot is the strain that is used for stress determination.
The biaxial stress at each measurement point is calculated using the elastic properties from dilatometer tests
from that borehole depth. Note that the dilatometer tests are measuring an assumed isotropic set of elastic
properties.
The three dimensional stress is then calculated using the three biaxial measurements at six depths, 5.0, 8.4,
11.0, 12.6, 17.2, and 19.2. The presentation of the results does not make it clear if the depth is a measured
depth along the three holes or a vertical depth. Assuming the former, it would appear that the analysis views
the stress as homogeneous and the rock properties as homogeneous and isotropic. That said, the Young’s
Modulus measurements are very different depending on whether or not the borehole runs perpendicular or
parallel to bedding. The borehole perpendicular to bedding had measured modulus values of 6.4 and 7.0
while the boreholes in the bedding plane, BIS-B1 and BIS-B3 has values between 2.21 and 3.59. The
analyses appeared to assume that this modulus was isotropic at each test location and heterogeneous
between the holes.
Because anisotropy is not considered (see section 2.2.1), the most reliable part of the borehole slotter
testing is probably the results from BIS-B2, the borehole perpendicular to bedding. The stresses from BIS-
B2 appear in Erreur ! Source du renvoi introuvable. and Table 9. Relative up refers to the direction that is
up in plane normal to the borehole, that is, the bedding plane or the direction opposite to the dip direction.
The biaxial slotter stresses are highly heterogeneous ranging from 1.4 to 8.9 MPa for the major stress and
1.2 to 5.9 for the minor stress. The corresponding in-bedding-plane modulus values from dilatometer tests
are quite homogeneous. This implies that the stress variability is either a problem of the slotter method or
the dilatometer modulus values are not representative of the scale of variability that is affecting the
deformation of the slots.
-10
-5
0
5
10
-10 -5 0 5 10
Stress [MPa]
Major Stress
Minor Stress
Average
Relative Up
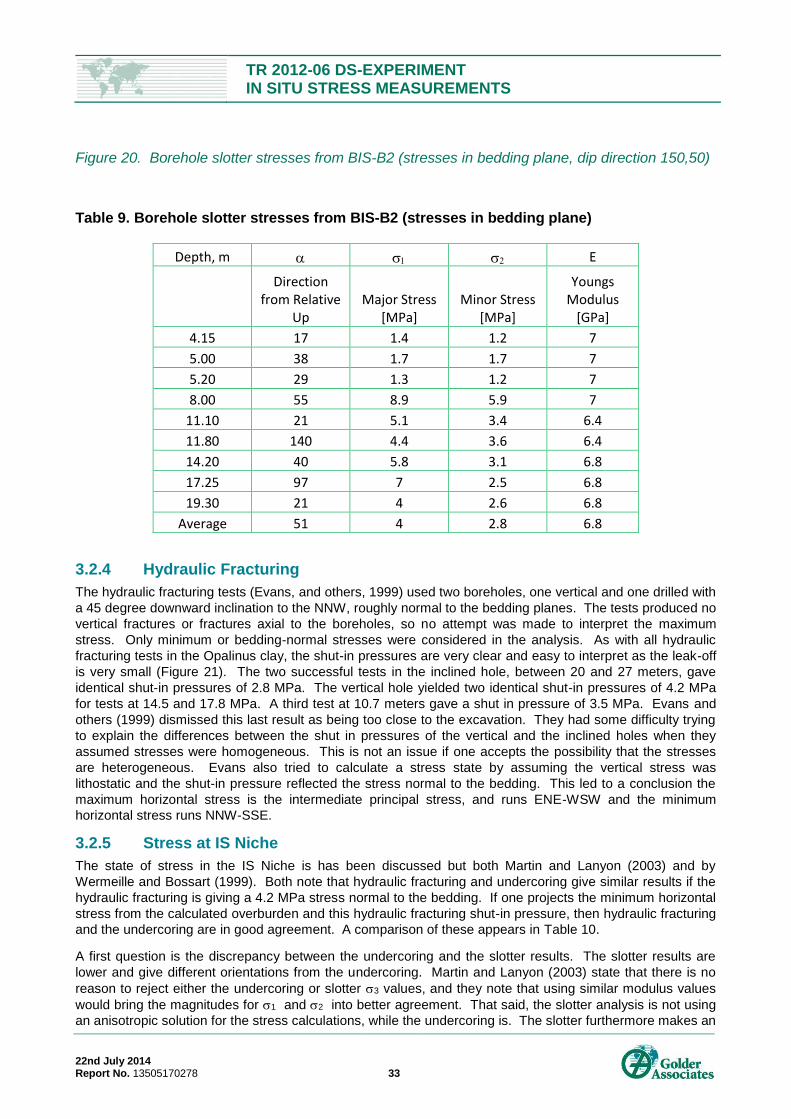
TR 2012-06 DS-EXPERIMENT IN SITU STRESS MEASUREMENTS
22nd July 2014 Report No. 13505170278 33
Figure 20. Borehole slotter stresses from BIS-B2 (stresses in bedding plane, dip direction 150,50)
Table 9. Borehole slotter stresses from BIS-B2 (stresses in bedding plane)
Depth, m E
Direction from Relative
Up Major Stress
[MPa] Minor Stress
[MPa]
Youngs Modulus
[GPa]
4.15 17 1.4 1.2 7
5.00 38 1.7 1.7 7
5.20 29 1.3 1.2 7
8.00 55 8.9 5.9 7
11.10 21 5.1 3.4 6.4
11.80 140 4.4 3.6 6.4
14.20 40 5.8 3.1 6.8
17.25 97 7 2.5 6.8
19.30 21 4 2.6 6.8
Average 51 4 2.8 6.8
3.2.4 Hydraulic Fracturing
The hydraulic fracturing tests (Evans, and others, 1999) used two boreholes, one vertical and one drilled with
a 45 degree downward inclination to the NNW, roughly normal to the bedding planes. The tests produced no
vertical fractures or fractures axial to the boreholes, so no attempt was made to interpret the maximum
stress. Only minimum or bedding-normal stresses were considered in the analysis. As with all hydraulic
fracturing tests in the Opalinus clay, the shut-in pressures are very clear and easy to interpret as the leak-off
is very small (Figure 21). The two successful tests in the inclined hole, between 20 and 27 meters, gave
identical shut-in pressures of 2.8 MPa. The vertical hole yielded two identical shut-in pressures of 4.2 MPa
for tests at 14.5 and 17.8 MPa. A third test at 10.7 meters gave a shut in pressure of 3.5 MPa. Evans and
others (1999) dismissed this last result as being too close to the excavation. They had some difficulty trying
to explain the differences between the shut in pressures of the vertical and the inclined holes when they
assumed stresses were homogeneous. This is not an issue if one accepts the possibility that the stresses
are heterogeneous. Evans also tried to calculate a stress state by assuming the vertical stress was
lithostatic and the shut-in pressure reflected the stress normal to the bedding. This led to a conclusion the
maximum horizontal stress is the intermediate principal stress, and runs ENE-WSW and the minimum
horizontal stress runs NNW-SSE.
3.2.5 Stress at IS Niche
The state of stress in the IS Niche is has been discussed but both Martin and Lanyon (2003) and by
Wermeille and Bossart (1999). Both note that hydraulic fracturing and undercoring give similar results if the
hydraulic fracturing is giving a 4.2 MPa stress normal to the bedding. If one projects the minimum horizontal
stress from the calculated overburden and this hydraulic fracturing shut-in pressure, then hydraulic fracturing
and the undercoring are in good agreement. A comparison of these appears in Table 10.
A first question is the discrepancy between the undercoring and the slotter results. The slotter results are
lower and give different orientations from the undercoring. Martin and Lanyon (2003) state that there is no
reason to reject either the undercoring or slotter 3 values, and they note that using similar modulus values
would bring the magnitudes for 1 and 2 into better agreement. That said, the slotter analysis is not using
an anisotropic solution for the stress calculations, while the undercoring is. The slotter furthermore makes an
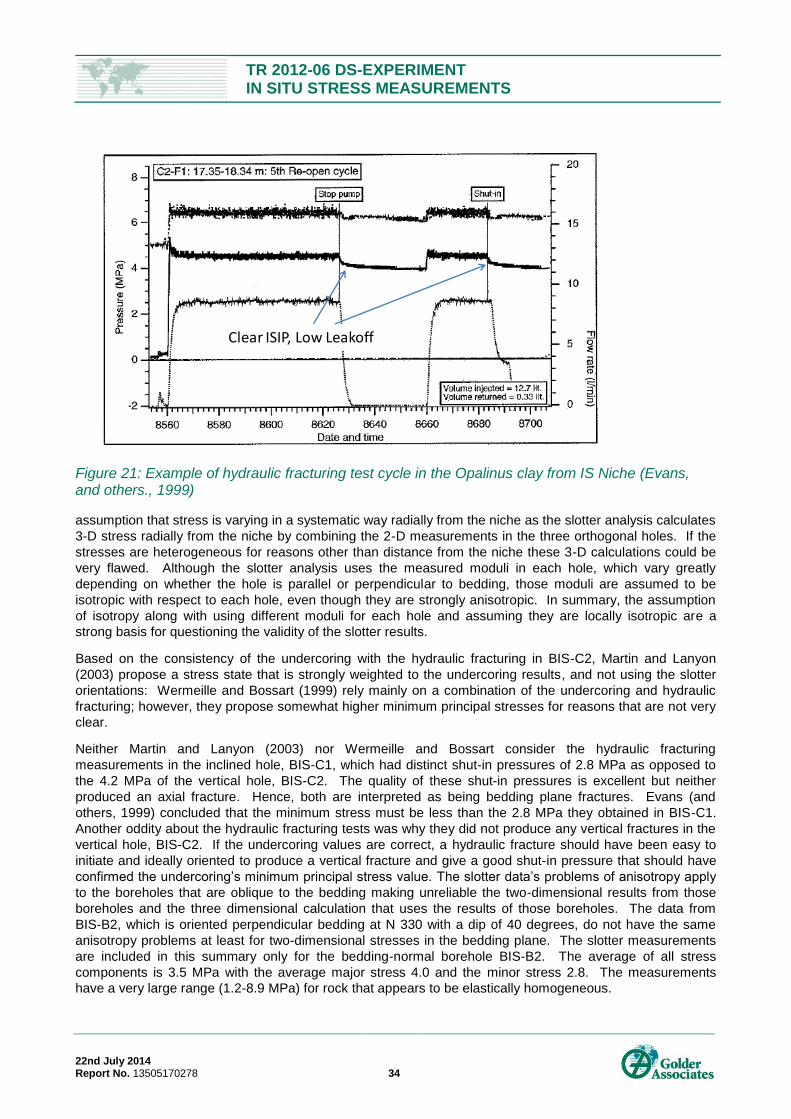
TR 2012-06 DS-EXPERIMENT IN SITU STRESS MEASUREMENTS
22nd July 2014 Report No. 13505170278 34
Figure 21: Example of hydraulic fracturing test cycle in the Opalinus clay from IS Niche (Evans, and others., 1999)
assumption that stress is varying in a systematic way radially from the niche as the slotter analysis calculates
3-D stress radially from the niche by combining the 2-D measurements in the three orthogonal holes. If the
stresses are heterogeneous for reasons other than distance from the niche these 3-D calculations could be
very flawed. Although the slotter analysis uses the measured moduli in each hole, which vary greatly
depending on whether the hole is parallel or perpendicular to bedding, those moduli are assumed to be
isotropic with respect to each hole, even though they are strongly anisotropic. In summary, the assumption
of isotropy along with using different moduli for each hole and assuming they are locally isotropic are a
strong basis for questioning the validity of the slotter results.
Based on the consistency of the undercoring with the hydraulic fracturing in BIS-C2, Martin and Lanyon
(2003) propose a stress state that is strongly weighted to the undercoring results, and not using the slotter
orientations: Wermeille and Bossart (1999) rely mainly on a combination of the undercoring and hydraulic
fracturing; however, they propose somewhat higher minimum principal stresses for reasons that are not very
clear.
Neither Martin and Lanyon (2003) nor Wermeille and Bossart consider the hydraulic fracturing
measurements in the inclined hole, BIS-C1, which had distinct shut-in pressures of 2.8 MPa as opposed to
the 4.2 MPa of the vertical hole, BIS-C2. The quality of these shut-in pressures is excellent but neither
produced an axial fracture. Hence, both are interpreted as being bedding plane fractures. Evans (and
others, 1999) concluded that the minimum stress must be less than the 2.8 MPa they obtained in BIS-C1.
Another oddity about the hydraulic fracturing tests was why they did not produce any vertical fractures in the
vertical hole, BIS-C2. If the undercoring values are correct, a hydraulic fracture should have been easy to
initiate and ideally oriented to produce a vertical fracture and give a good shut-in pressure that should have
confirmed the undercoring’s minimum principal stress value. The slotter data’s problems of anisotropy apply
to the boreholes that are oblique to the bedding making unreliable the two-dimensional results from those
boreholes and the three dimensional calculation that uses the results of those boreholes. The data from
BIS-B2, which is oriented perpendicular bedding at N 330 with a dip of 40 degrees, do not have the same
anisotropy problems at least for two-dimensional stresses in the bedding plane. The slotter measurements
are included in this summary only for the bedding-normal borehole BIS-B2. The average of all stress
components is 3.5 MPa with the average major stress 4.0 and the minor stress 2.8. The measurements
have a very large range (1.2-8.9 MPa) for rock that appears to be elastically homogeneous.
Clear ISIP, Low Leakoff
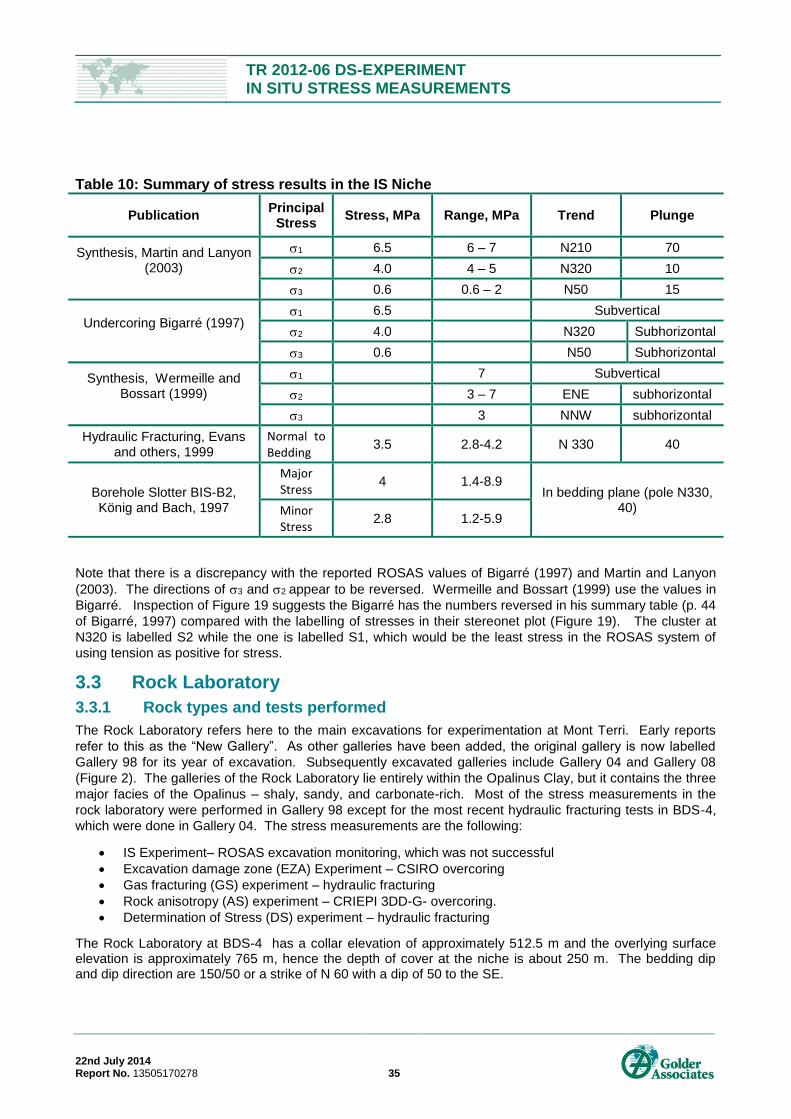
TR 2012-06 DS-EXPERIMENT IN SITU STRESS MEASUREMENTS
22nd July 2014 Report No. 13505170278 35
Table 10: Summary of stress results in the IS Niche
Publication Principal
Stress Stress, MPa Range, MPa Trend Plunge
Synthesis, Martin and Lanyon (2003)
1 6.5 6 – 7 N210 70
2 4.0 4 – 5 N320 10
3 0.6 0.6 – 2 N50 15
Undercoring Bigarré (1997)
1 6.5 Subvertical
2 4.0 N320 Subhorizontal
3 0.6 N50 Subhorizontal
Synthesis, Wermeille and Bossart (1999)
1 7 Subvertical
2 3 – 7 ENE subhorizontal
3 3 NNW subhorizontal
Hydraulic Fracturing, Evans and others, 1999
Normal to Bedding
3.5 2.8-4.2 N 330 40
Borehole Slotter BIS-B2, König and Bach, 1997
Major Stress
4 1.4-8.9 In bedding plane (pole N330,
40) Minor Stress
2.8 1.2-5.9
Note that there is a discrepancy with the reported ROSAS values of Bigarré (1997) and Martin and Lanyon
(2003). The directions of 3 and 2 appear to be reversed. Wermeille and Bossart (1999) use the values in
Bigarré. Inspection of Figure 19 suggests the Bigarré has the numbers reversed in his summary table (p. 44
of Bigarré, 1997) compared with the labelling of stresses in their stereonet plot (Figure 19). The cluster at
N320 is labelled S2 while the one is labelled S1, which would be the least stress in the ROSAS system of
using tension as positive for stress.
3.3 Rock Laboratory
3.3.1 Rock types and tests performed
The Rock Laboratory refers here to the main excavations for experimentation at Mont Terri. Early reports
refer to this as the “New Gallery”. As other galleries have been added, the original gallery is now labelled
Gallery 98 for its year of excavation. Subsequently excavated galleries include Gallery 04 and Gallery 08
(Figure 2). The galleries of the Rock Laboratory lie entirely within the Opalinus Clay, but it contains the three
major facies of the Opalinus – shaly, sandy, and carbonate-rich. Most of the stress measurements in the
rock laboratory were performed in Gallery 98 except for the most recent hydraulic fracturing tests in BDS-4,
which were done in Gallery 04. The stress measurements are the following:
IS Experiment– ROSAS excavation monitoring, which was not successful
Excavation damage zone (EZA) Experiment – CSIRO overcoring
Gas fracturing (GS) experiment – hydraulic fracturing
Rock anisotropy (AS) experiment – CRIEPI 3DD-G- overcoring.
Determination of Stress (DS) experiment – hydraulic fracturing
The Rock Laboratory at BDS-4 has a collar elevation of approximately 512.5 m and the overlying surface elevation is approximately 765 m, hence the depth of cover at the niche is about 250 m. The bedding dip and dip direction are 150/50 or a strike of N 60 with a dip of 50 to the SE.
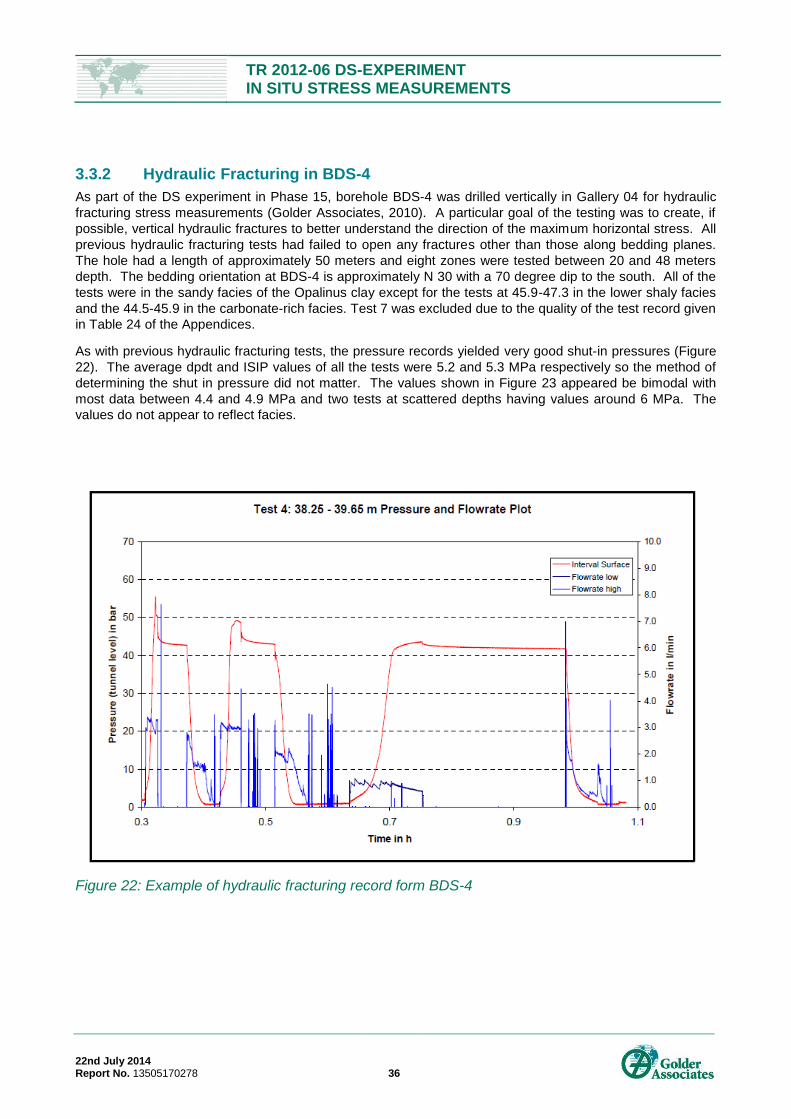
TR 2012-06 DS-EXPERIMENT IN SITU STRESS MEASUREMENTS
22nd July 2014 Report No. 13505170278 36
3.3.2 Hydraulic Fracturing in BDS-4
As part of the DS experiment in Phase 15, borehole BDS-4 was drilled vertically in Gallery 04 for hydraulic
fracturing stress measurements (Golder Associates, 2010). A particular goal of the testing was to create, if
possible, vertical hydraulic fractures to better understand the direction of the maximum horizontal stress. All
previous hydraulic fracturing tests had failed to open any fractures other than those along bedding planes.
The hole had a length of approximately 50 meters and eight zones were tested between 20 and 48 meters
depth. The bedding orientation at BDS-4 is approximately N 30 with a 70 degree dip to the south. All of the
tests were in the sandy facies of the Opalinus clay except for the tests at 45.9-47.3 in the lower shaly facies
and the 44.5-45.9 in the carbonate-rich facies. Test 7 was excluded due to the quality of the test record given
in Table 24 of the Appendices.
As with previous hydraulic fracturing tests, the pressure records yielded very good shut-in pressures (Figure
22). The average dpdt and ISIP values of all the tests were 5.2 and 5.3 MPa respectively so the method of
determining the shut in pressure did not matter. The values shown in Figure 23 appeared be bimodal with
most data between 4.4 and 4.9 MPa and two tests at scattered depths having values around 6 MPa. The
values do not appear to reflect facies.
Figure 22: Example of hydraulic fracturing record form BDS-4
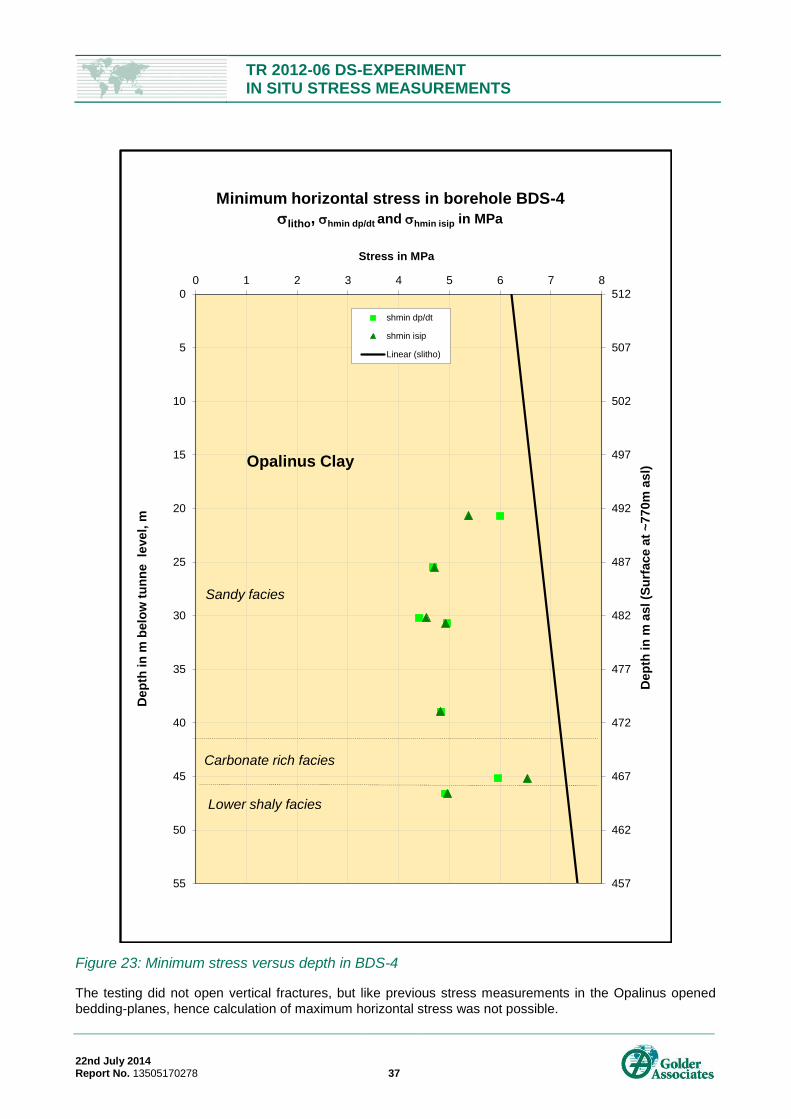
TR 2012-06 DS-EXPERIMENT IN SITU STRESS MEASUREMENTS
22nd July 2014 Report No. 13505170278 37
Figure 23: Minimum stress versus depth in BDS-4
The testing did not open vertical fractures, but like previous stress measurements in the Opalinus opened
bedding-planes, hence calculation of maximum horizontal stress was not possible.
457
462
467
472
477
482
487
492
497
502
507
5120
5
10
15
20
25
30
35
40
45
50
55
0 1 2 3 4 5 6 7 8
Dep
th in
m a
sl (S
urf
ace a
t ~
770m
asl)
Dep
th in
m b
elo
w t
un
ne le
vel,
m
Stress in MPa
Minimum horizontal stress in borehole BDS-4
litho, hmin dp/dt and hmin isip in MPa
shmin dp/dt
shmin isip
Linear (slitho)
Opalinus Clay
Lower shaly facies
Carbonate rich facies
Sandy facies
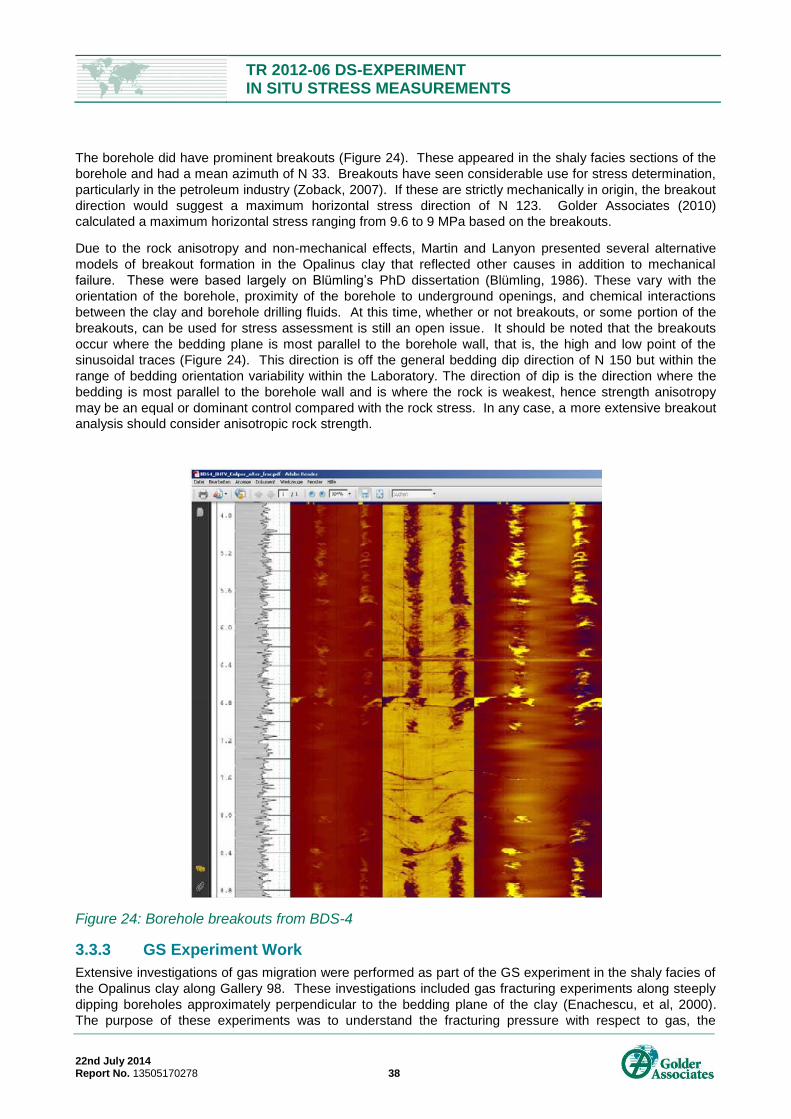
TR 2012-06 DS-EXPERIMENT IN SITU STRESS MEASUREMENTS
22nd July 2014 Report No. 13505170278 38
The borehole did have prominent breakouts (Figure 24). These appeared in the shaly facies sections of the
borehole and had a mean azimuth of N 33. Breakouts have seen considerable use for stress determination,
particularly in the petroleum industry (Zoback, 2007). If these are strictly mechanically in origin, the breakout
direction would suggest a maximum horizontal stress direction of N 123. Golder Associates (2010)
calculated a maximum horizontal stress ranging from 9.6 to 9 MPa based on the breakouts.
Due to the rock anisotropy and non-mechanical effects, Martin and Lanyon presented several alternative
models of breakout formation in the Opalinus clay that reflected other causes in addition to mechanical
failure. These were based largely on Blümling’s PhD dissertation (Blümling, 1986). These vary with the
orientation of the borehole, proximity of the borehole to underground openings, and chemical interactions
between the clay and borehole drilling fluids. At this time, whether or not breakouts, or some portion of the
breakouts, can be used for stress assessment is still an open issue. It should be noted that the breakouts
occur where the bedding plane is most parallel to the borehole wall, that is, the high and low point of the
sinusoidal traces (Figure 24). This direction is off the general bedding dip direction of N 150 but within the
range of bedding orientation variability within the Laboratory. The direction of dip is the direction where the
bedding is most parallel to the borehole wall and is where the rock is weakest, hence strength anisotropy
may be an equal or dominant control compared with the rock stress. In any case, a more extensive breakout
analysis should consider anisotropic rock strength.
Figure 24: Borehole breakouts from BDS-4
3.3.3 GS Experiment Work
Extensive investigations of gas migration were performed as part of the GS experiment in the shaly facies of
the Opalinus clay along Gallery 98. These investigations included gas fracturing experiments along steeply
dipping boreholes approximately perpendicular to the bedding plane of the clay (Enachescu, et al, 2000).
The purpose of these experiments was to understand the fracturing pressure with respect to gas, the
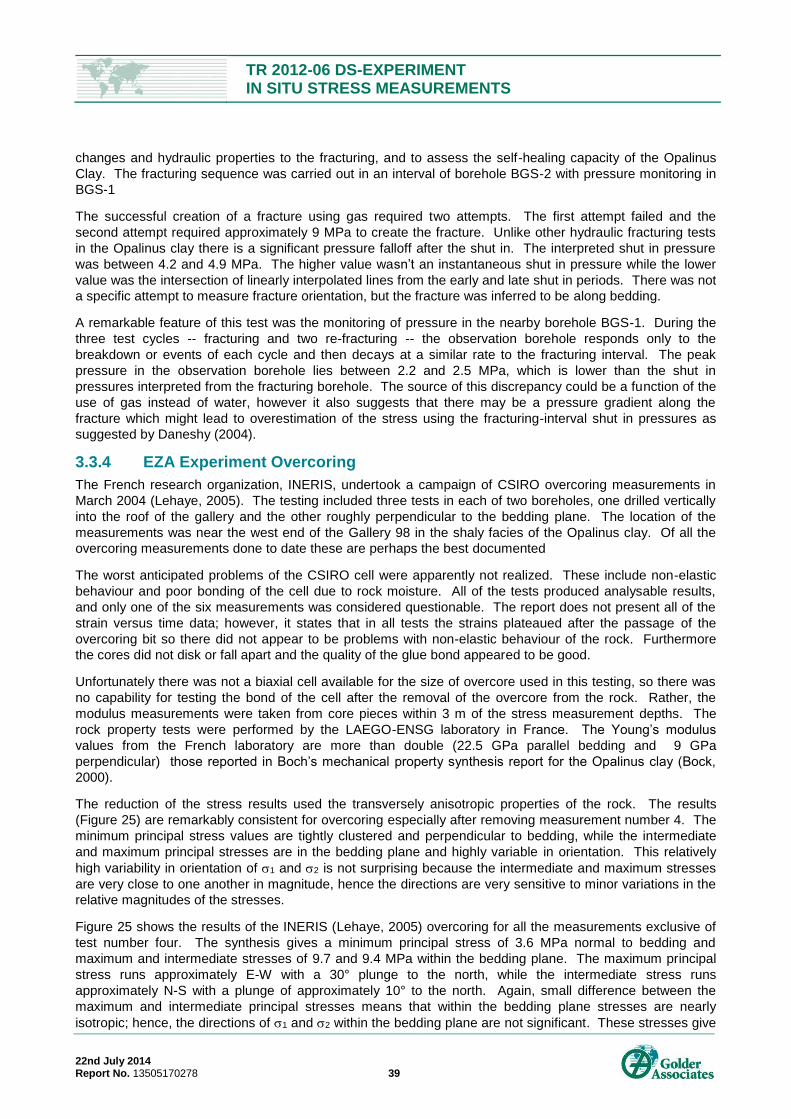
TR 2012-06 DS-EXPERIMENT IN SITU STRESS MEASUREMENTS
22nd July 2014 Report No. 13505170278 39
changes and hydraulic properties to the fracturing, and to assess the self-healing capacity of the Opalinus
Clay. The fracturing sequence was carried out in an interval of borehole BGS-2 with pressure monitoring in
BGS-1
The successful creation of a fracture using gas required two attempts. The first attempt failed and the
second attempt required approximately 9 MPa to create the fracture. Unlike other hydraulic fracturing tests
in the Opalinus clay there is a significant pressure falloff after the shut in. The interpreted shut in pressure
was between 4.2 and 4.9 MPa. The higher value wasn’t an instantaneous shut in pressure while the lower
value was the intersection of linearly interpolated lines from the early and late shut in periods. There was not
a specific attempt to measure fracture orientation, but the fracture was inferred to be along bedding.
A remarkable feature of this test was the monitoring of pressure in the nearby borehole BGS-1. During the
three test cycles -- fracturing and two re-fracturing -- the observation borehole responds only to the
breakdown or events of each cycle and then decays at a similar rate to the fracturing interval. The peak
pressure in the observation borehole lies between 2.2 and 2.5 MPa, which is lower than the shut in
pressures interpreted from the fracturing borehole. The source of this discrepancy could be a function of the
use of gas instead of water, however it also suggests that there may be a pressure gradient along the
fracture which might lead to overestimation of the stress using the fracturing-interval shut in pressures as
suggested by Daneshy (2004).
3.3.4 EZA Experiment Overcoring
The French research organization, INERIS, undertook a campaign of CSIRO overcoring measurements in
March 2004 (Lehaye, 2005). The testing included three tests in each of two boreholes, one drilled vertically
into the roof of the gallery and the other roughly perpendicular to the bedding plane. The location of the
measurements was near the west end of the Gallery 98 in the shaly facies of the Opalinus clay. Of all the
overcoring measurements done to date these are perhaps the best documented
The worst anticipated problems of the CSIRO cell were apparently not realized. These include non-elastic
behaviour and poor bonding of the cell due to rock moisture. All of the tests produced analysable results,
and only one of the six measurements was considered questionable. The report does not present all of the
strain versus time data; however, it states that in all tests the strains plateaued after the passage of the
overcoring bit so there did not appear to be problems with non-elastic behaviour of the rock. Furthermore
the cores did not disk or fall apart and the quality of the glue bond appeared to be good.
Unfortunately there was not a biaxial cell available for the size of overcore used in this testing, so there was
no capability for testing the bond of the cell after the removal of the overcore from the rock. Rather, the
modulus measurements were taken from core pieces within 3 m of the stress measurement depths. The
rock property tests were performed by the LAEGO-ENSG laboratory in France. The Young’s modulus
values from the French laboratory are more than double (22.5 GPa parallel bedding and 9 GPa
perpendicular) those reported in Boch’s mechanical property synthesis report for the Opalinus clay (Bock,
2000).
The reduction of the stress results used the transversely anisotropic properties of the rock. The results
(Figure 25) are remarkably consistent for overcoring especially after removing measurement number 4. The
minimum principal stress values are tightly clustered and perpendicular to bedding, while the intermediate
and maximum principal stresses are in the bedding plane and highly variable in orientation. This relatively
high variability in orientation of 1 and 2 is not surprising because the intermediate and maximum stresses
are very close to one another in magnitude, hence the directions are very sensitive to minor variations in the
relative magnitudes of the stresses.
Figure 25 shows the results of the INERIS (Lehaye, 2005) overcoring for all the measurements exclusive of
test number four. The synthesis gives a minimum principal stress of 3.6 MPa normal to bedding and
maximum and intermediate stresses of 9.7 and 9.4 MPa within the bedding plane. The maximum principal
stress runs approximately E-W with a 30° plunge to the north, while the intermediate stress runs
approximately N-S with a plunge of approximately 10° to the north. Again, small difference between the
maximum and intermediate principal stresses means that within the bedding plane stresses are nearly
isotropic; hence, the directions of 1 and 2 within the bedding plane are not significant. These stresses give
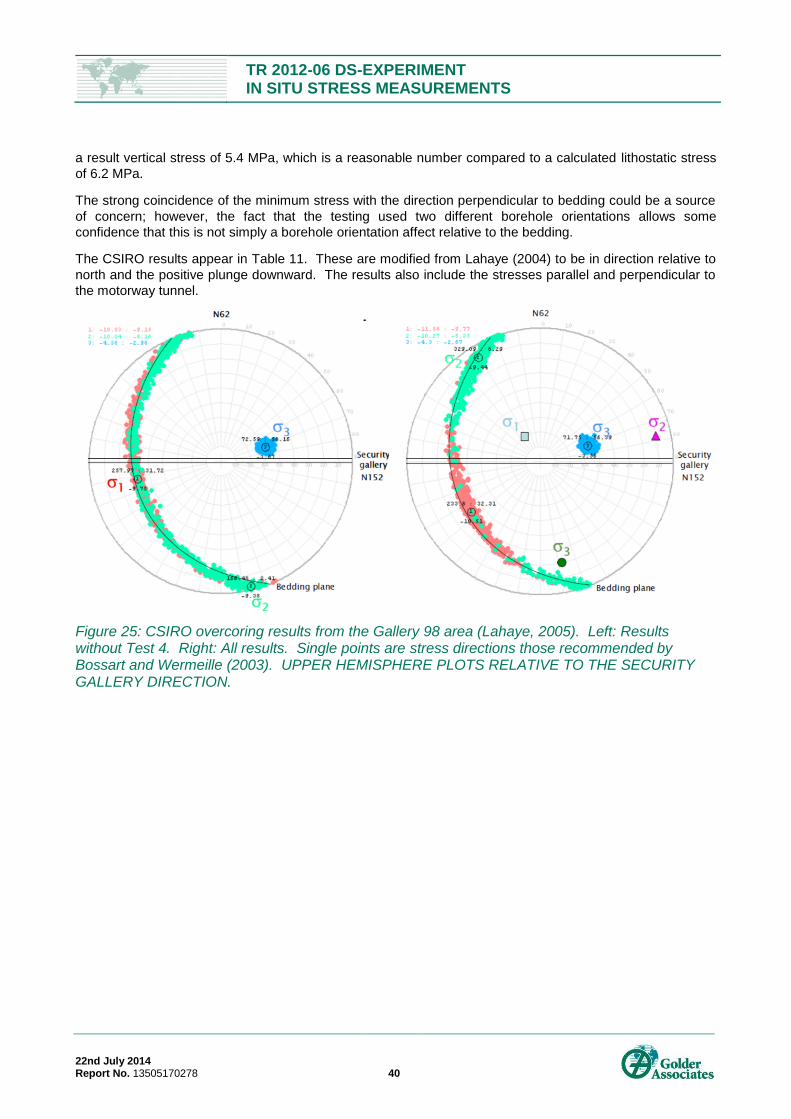
TR 2012-06 DS-EXPERIMENT IN SITU STRESS MEASUREMENTS
22nd July 2014 Report No. 13505170278 40
a result vertical stress of 5.4 MPa, which is a reasonable number compared to a calculated lithostatic stress
of 6.2 MPa.
The strong coincidence of the minimum stress with the direction perpendicular to bedding could be a source
of concern; however, the fact that the testing used two different borehole orientations allows some
confidence that this is not simply a borehole orientation affect relative to the bedding.
The CSIRO results appear in Table 11. These are modified from Lahaye (2004) to be in direction relative to
north and the positive plunge downward. The results also include the stresses parallel and perpendicular to
the motorway tunnel.
Figure 25: CSIRO overcoring results from the Gallery 98 area (Lahaye, 2005). Left: Results without Test 4. Right: All results. Single points are stress directions those recommended by Bossart and Wermeille (2003). UPPER HEMISPHERE PLOTS RELATIVE TO THE SECURITY GALLERY DIRECTION.
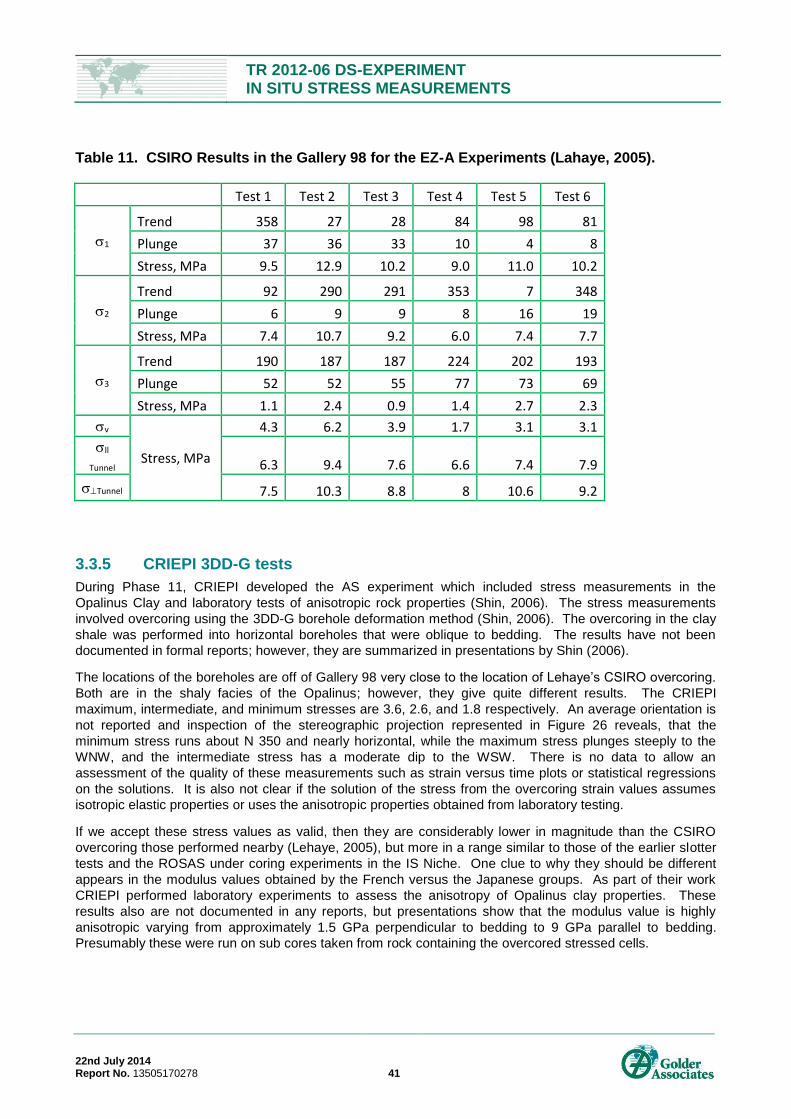
TR 2012-06 DS-EXPERIMENT IN SITU STRESS MEASUREMENTS
22nd July 2014 Report No. 13505170278 41
Table 11. CSIRO Results in the Gallery 98 for the EZ-A Experiments (Lahaye, 2005).
Test 1 Test 2 Test 3 Test 4 Test 5 Test 6
1
Trend 358 27 28 84 98 81
Plunge 37 36 33 10 4 8
Stress, MPa 9.5 12.9 10.2 9.0 11.0 10.2
2
Trend 92 290 291 353 7 348
Plunge 6 9 9 8 16 19
Stress, MPa 7.4 10.7 9.2 6.0 7.4 7.7
3
Trend 190 187 187 224 202 193
Plunge 52 52 55 77 73 69
Stress, MPa 1.1 2.4 0.9 1.4 2.7 2.3
v
Stress, MPa
4.3 6.2 3.9 1.7 3.1 3.1
ll
Tunnel 6.3 9.4 7.6 6.6 7.4 7.9
Tunnel 7.5 10.3 8.8 8 10.6 9.2
3.3.5 CRIEPI 3DD-G tests
During Phase 11, CRIEPI developed the AS experiment which included stress measurements in the
Opalinus Clay and laboratory tests of anisotropic rock properties (Shin, 2006). The stress measurements
involved overcoring using the 3DD-G borehole deformation method (Shin, 2006). The overcoring in the clay
shale was performed into horizontal boreholes that were oblique to bedding. The results have not been
documented in formal reports; however, they are summarized in presentations by Shin (2006).
The locations of the boreholes are off of Gallery 98 very close to the location of Lehaye’s CSIRO overcoring.
Both are in the shaly facies of the Opalinus; however, they give quite different results. The CRIEPI
maximum, intermediate, and minimum stresses are 3.6, 2.6, and 1.8 respectively. An average orientation is
not reported and inspection of the stereographic projection represented in Figure 26 reveals, that the
minimum stress runs about N 350 and nearly horizontal, while the maximum stress plunges steeply to the
WNW, and the intermediate stress has a moderate dip to the WSW. There is no data to allow an
assessment of the quality of these measurements such as strain versus time plots or statistical regressions
on the solutions. It is also not clear if the solution of the stress from the overcoring strain values assumes
isotropic elastic properties or uses the anisotropic properties obtained from laboratory testing.
If we accept these stress values as valid, then they are considerably lower in magnitude than the CSIRO
overcoring those performed nearby (Lehaye, 2005), but more in a range similar to those of the earlier slotter
tests and the ROSAS under coring experiments in the IS Niche. One clue to why they should be different
appears in the modulus values obtained by the French versus the Japanese groups. As part of their work
CRIEPI performed laboratory experiments to assess the anisotropy of Opalinus clay properties. These
results also are not documented in any reports, but presentations show that the modulus value is highly
anisotropic varying from approximately 1.5 GPa perpendicular to bedding to 9 GPa parallel to bedding.
Presumably these were run on sub cores taken from rock containing the overcored stressed cells.
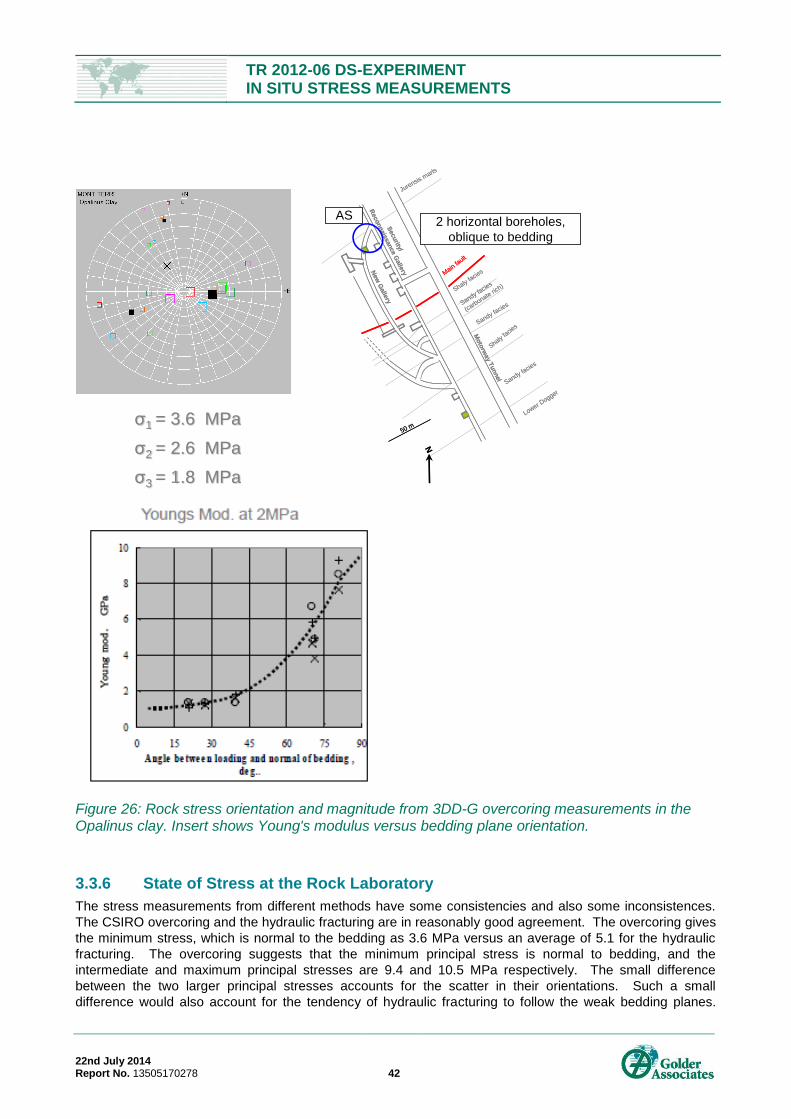
TR 2012-06 DS-EXPERIMENT IN SITU STRESS MEASUREMENTS
22nd July 2014 Report No. 13505170278 42
Figure 26: Rock stress orientation and magnitude from 3DD-G overcoring measurements in the Opalinus clay. Insert shows Young's modulus versus bedding plane orientation.
3.3.6 State of Stress at the Rock Laboratory
The stress measurements from different methods have some consistencies and also some inconsistences.
The CSIRO overcoring and the hydraulic fracturing are in reasonably good agreement. The overcoring gives
the minimum stress, which is normal to the bedding as 3.6 MPa versus an average of 5.1 for the hydraulic
fracturing. The overcoring suggests that the minimum principal stress is normal to bedding, and the
intermediate and maximum principal stresses are 9.4 and 10.5 MPa respectively. The small difference
between the two larger principal stresses accounts for the scatter in their orientations. Such a small
difference would also account for the tendency of hydraulic fracturing to follow the weak bedding planes.
Moto
rway
Tunnel
Security/
Reconnais
sance
Galle
ryNew
Galle
ry
50 m
N
Jurensismarls
Sha
lyfa
cies
Shalyfacies
Sandy facies
Shalyfa
cies
Sandy facies
(carb
onateric
h)
Sandy facies
Lower Dogger
Main fa
ult
Moto
rway
Tunnel
Security/
Reconnais
sance
Galle
ryNew
Galle
ry
50 m
N
Jurensismarls
Sha
lyfa
cies
Shalyfacies
Sandy facies
Shalyfa
cies
Sandy facies
(carb
onateric
h)
Sandy facies
Lower Dogger
Main fa
ult
2 horizontal boreholes,
oblique to bedding
AS
σ1 = 3.6 MPa
σ2 = 2.6 MPa
σ3 = 1.8 MPa
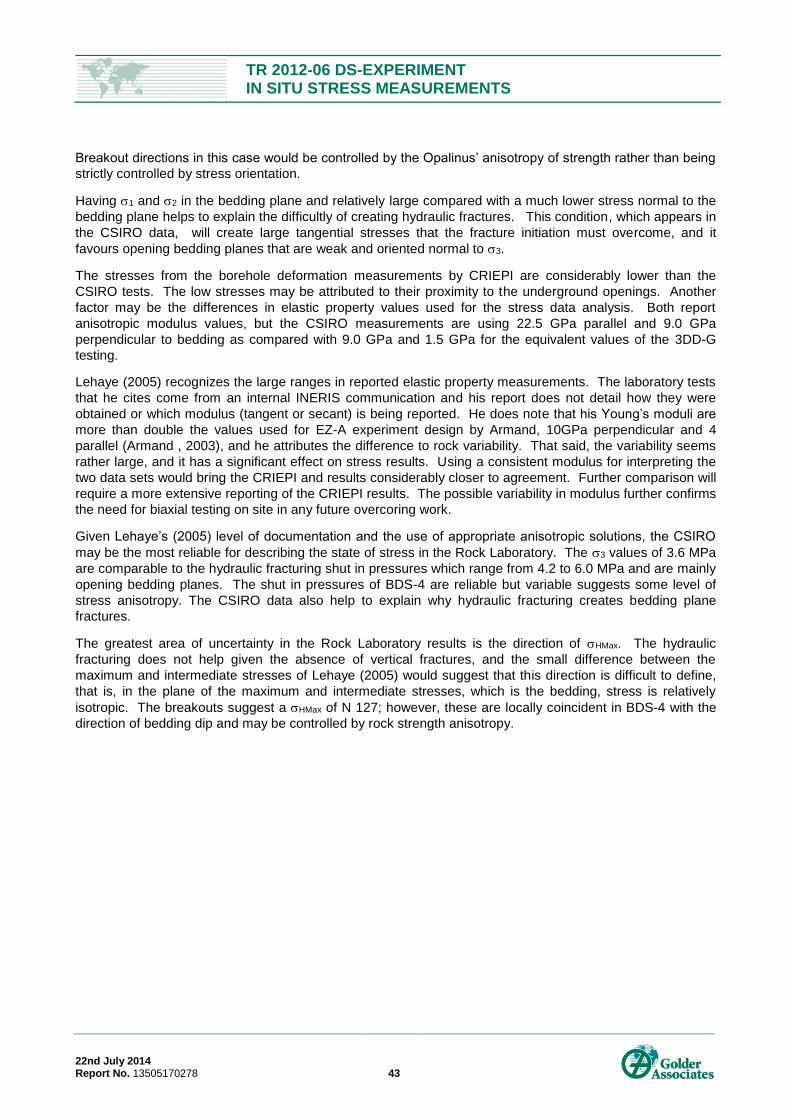
TR 2012-06 DS-EXPERIMENT IN SITU STRESS MEASUREMENTS
22nd July 2014 Report No. 13505170278 43
Breakout directions in this case would be controlled by the Opalinus’ anisotropy of strength rather than being
strictly controlled by stress orientation.
Having 1 and 2 in the bedding plane and relatively large compared with a much lower stress normal to the
bedding plane helps to explain the difficultly of creating hydraulic fractures. This condition, which appears in
the CSIRO data, will create large tangential stresses that the fracture initiation must overcome, and it
favours opening bedding planes that are weak and oriented normal to 3.
The stresses from the borehole deformation measurements by CRIEPI are considerably lower than the
CSIRO tests. The low stresses may be attributed to their proximity to the underground openings. Another
factor may be the differences in elastic property values used for the stress data analysis. Both report
anisotropic modulus values, but the CSIRO measurements are using 22.5 GPa parallel and 9.0 GPa
perpendicular to bedding as compared with 9.0 GPa and 1.5 GPa for the equivalent values of the 3DD-G
testing.
Lehaye (2005) recognizes the large ranges in reported elastic property measurements. The laboratory tests
that he cites come from an internal INERIS communication and his report does not detail how they were
obtained or which modulus (tangent or secant) is being reported. He does note that his Young’s moduli are
more than double the values used for EZ-A experiment design by Armand, 10GPa perpendicular and 4
parallel (Armand , 2003), and he attributes the difference to rock variability. That said, the variability seems
rather large, and it has a significant effect on stress results. Using a consistent modulus for interpreting the
two data sets would bring the CRIEPI and results considerably closer to agreement. Further comparison will
require a more extensive reporting of the CRIEPI results. The possible variability in modulus further confirms
the need for biaxial testing on site in any future overcoring work.
Given Lehaye’s (2005) level of documentation and the use of appropriate anisotropic solutions, the CSIRO
may be the most reliable for describing the state of stress in the Rock Laboratory. The 3 values of 3.6 MPa
are comparable to the hydraulic fracturing shut in pressures which range from 4.2 to 6.0 MPa and are mainly
opening bedding planes. The shut in pressures of BDS-4 are reliable but variable suggests some level of
stress anisotropy. The CSIRO data also help to explain why hydraulic fracturing creates bedding plane
fractures.
The greatest area of uncertainty in the Rock Laboratory results is the direction of HMax. The hydraulic
fracturing does not help given the absence of vertical fractures, and the small difference between the
maximum and intermediate stresses of Lehaye (2005) would suggest that this direction is difficult to define,
that is, in the plane of the maximum and intermediate stresses, which is the bedding, stress is relatively
isotropic. The breakouts suggest a HMax of N 127; however, these are locally coincident in BDS-4 with the
direction of bedding dip and may be controlled by rock strength anisotropy.
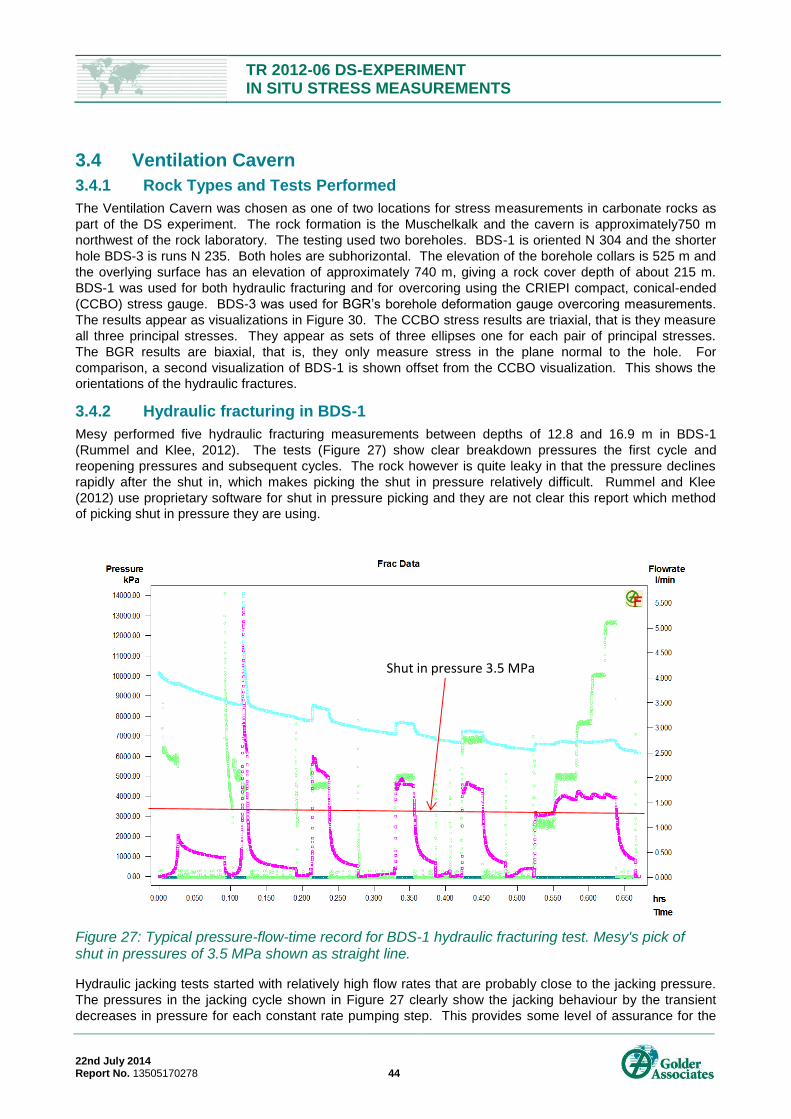
TR 2012-06 DS-EXPERIMENT IN SITU STRESS MEASUREMENTS
22nd July 2014 Report No. 13505170278 44
3.4 Ventilation Cavern
3.4.1 Rock Types and Tests Performed
The Ventilation Cavern was chosen as one of two locations for stress measurements in carbonate rocks as
part of the DS experiment. The rock formation is the Muschelkalk and the cavern is approximately750 m
northwest of the rock laboratory. The testing used two boreholes. BDS-1 is oriented N 304 and the shorter
hole BDS-3 is runs N 235. Both holes are subhorizontal. The elevation of the borehole collars is 525 m and
the overlying surface has an elevation of approximately 740 m, giving a rock cover depth of about 215 m.
BDS-1 was used for both hydraulic fracturing and for overcoring using the CRIEPI compact, conical-ended
(CCBO) stress gauge. BDS-3 was used for BGR’s borehole deformation gauge overcoring measurements.
The results appear as visualizations in Figure 30. The CCBO stress results are triaxial, that is they measure
all three principal stresses. They appear as sets of three ellipses one for each pair of principal stresses.
The BGR results are biaxial, that is, they only measure stress in the plane normal to the hole. For
comparison, a second visualization of BDS-1 is shown offset from the CCBO visualization. This shows the
orientations of the hydraulic fractures.
3.4.2 Hydraulic fracturing in BDS-1
Mesy performed five hydraulic fracturing measurements between depths of 12.8 and 16.9 m in BDS-1
(Rummel and Klee, 2012). The tests (Figure 27) show clear breakdown pressures the first cycle and
reopening pressures and subsequent cycles. The rock however is quite leaky in that the pressure declines
rapidly after the shut in, which makes picking the shut in pressure relatively difficult. Rummel and Klee
(2012) use proprietary software for shut in pressure picking and they are not clear this report which method
of picking shut in pressure they are using.
Figure 27: Typical pressure-flow-time record for BDS-1 hydraulic fracturing test. Mesy's pick of shut in pressures of 3.5 MPa shown as straight line.
Hydraulic jacking tests started with relatively high flow rates that are probably close to the jacking pressure.
The pressures in the jacking cycle shown in Figure 27 clearly show the jacking behaviour by the transient
decreases in pressure for each constant rate pumping step. This provides some level of assurance for the
Shut in pressure 3.5 MPa
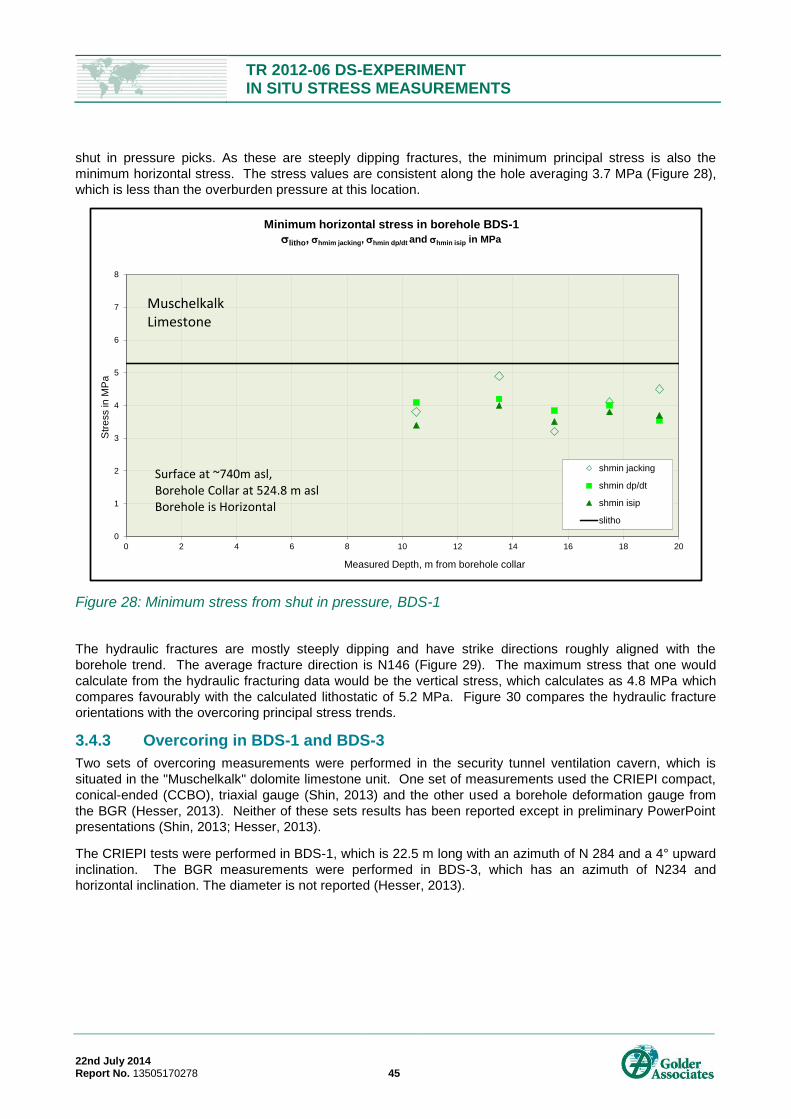
TR 2012-06 DS-EXPERIMENT IN SITU STRESS MEASUREMENTS
22nd July 2014 Report No. 13505170278 45
shut in pressure picks. As these are steeply dipping fractures, the minimum principal stress is also the
minimum horizontal stress. The stress values are consistent along the hole averaging 3.7 MPa (Figure 28),
which is less than the overburden pressure at this location.
Figure 28: Minimum stress from shut in pressure, BDS-1
The hydraulic fractures are mostly steeply dipping and have strike directions roughly aligned with the
borehole trend. The average fracture direction is N146 (Figure 29). The maximum stress that one would
calculate from the hydraulic fracturing data would be the vertical stress, which calculates as 4.8 MPa which
compares favourably with the calculated lithostatic of 5.2 MPa. Figure 30 compares the hydraulic fracture
orientations with the overcoring principal stress trends.
3.4.3 Overcoring in BDS-1 and BDS-3
Two sets of overcoring measurements were performed in the security tunnel ventilation cavern, which is
situated in the "Muschelkalk" dolomite limestone unit. One set of measurements used the CRIEPI compact,
conical-ended (CCBO), triaxial gauge (Shin, 2013) and the other used a borehole deformation gauge from
the BGR (Hesser, 2013). Neither of these sets results has been reported except in preliminary PowerPoint
presentations (Shin, 2013; Hesser, 2013).
The CRIEPI tests were performed in BDS-1, which is 22.5 m long with an azimuth of N 284 and a 4° upward
inclination. The BGR measurements were performed in BDS-3, which has an azimuth of N234 and
horizontal inclination. The diameter is not reported (Hesser, 2013).
0
1
2
3
4
5
6
7
8
0 2 4 6 8 10 12 14 16 18 20
Str
ess in
MP
a
Measured Depth, m from borehole collar
Minimum horizontal stress in borehole BDS-1
litho, hmim jacking, hmin dp/dt and hmin isip in MPa
shmin jacking
shmin dp/dt
shmin isip
slitho
Muschelkalk Limestone
Surface at ~740m asl, Borehole Collar at 524.8 m aslBorehole is Horizontal
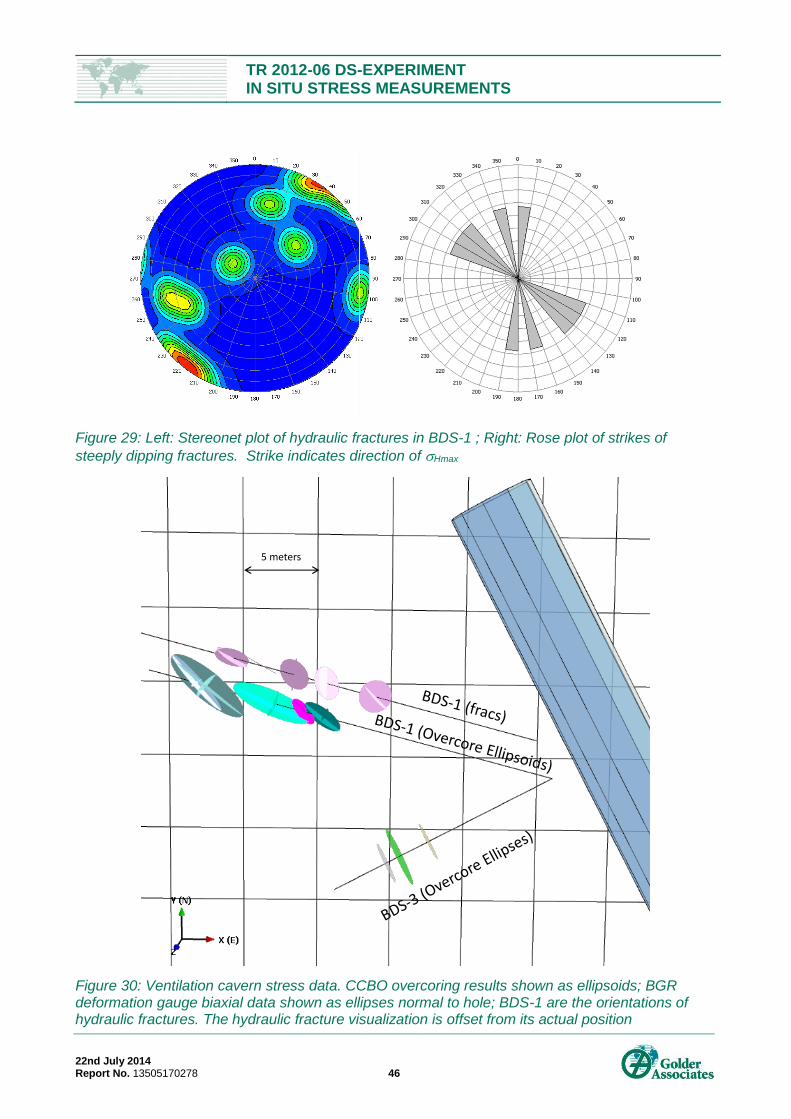
TR 2012-06 DS-EXPERIMENT IN SITU STRESS MEASUREMENTS
22nd July 2014 Report No. 13505170278 46
Figure 29: Left: Stereonet plot of hydraulic fractures in BDS-1 ; Right: Rose plot of strikes of
steeply dipping fractures. Strike indicates direction of Hmax
Figure 30: Ventilation cavern stress data. CCBO overcoring results shown as ellipsoids; BGR deformation gauge biaxial data shown as ellipses normal to hole; BDS-1 are the orientations of hydraulic fractures. The hydraulic fracture visualization is offset from its actual position
5 meters
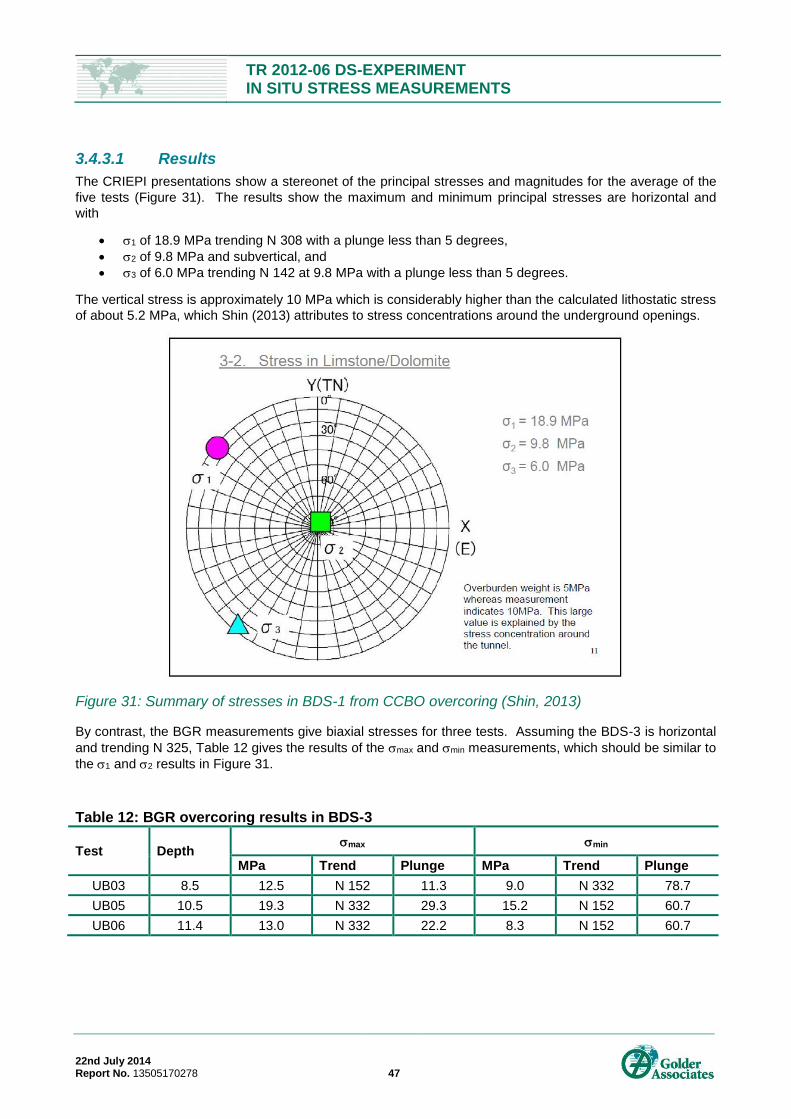
TR 2012-06 DS-EXPERIMENT IN SITU STRESS MEASUREMENTS
22nd July 2014 Report No. 13505170278 47
3.4.3.1 Results
The CRIEPI presentations show a stereonet of the principal stresses and magnitudes for the average of the
five tests (Figure 31). The results show the maximum and minimum principal stresses are horizontal and
with
1 of 18.9 MPa trending N 308 with a plunge less than 5 degrees,
2 of 9.8 MPa and subvertical, and
3 of 6.0 MPa trending N 142 at 9.8 MPa with a plunge less than 5 degrees.
The vertical stress is approximately 10 MPa which is considerably higher than the calculated lithostatic stress
of about 5.2 MPa, which Shin (2013) attributes to stress concentrations around the underground openings.
Figure 31: Summary of stresses in BDS-1 from CCBO overcoring (Shin, 2013)
By contrast, the BGR measurements give biaxial stresses for three tests. Assuming the BDS-3 is horizontal
and trending N 325, Table 12 gives the results of the max and min measurements, which should be similar to
the 1 and 2 results in Figure 31.
Table 12: BGR overcoring results in BDS-3
Test Depth max min
MPa Trend Plunge MPa Trend Plunge
UB03 8.5 12.5 N 152 11.3 9.0 N 332 78.7
UB05 10.5 19.3 N 332 29.3 15.2 N 152 60.7
UB06 11.4 13.0 N 332 22.2 8.3 N 152 60.7
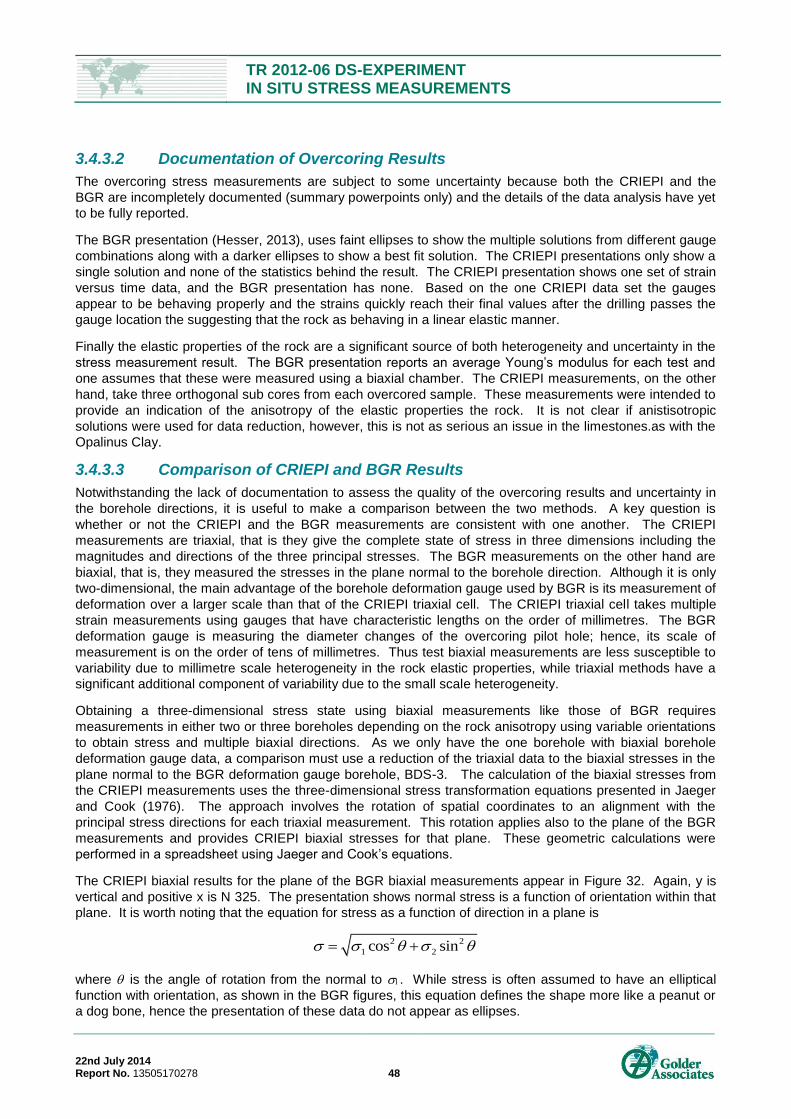
TR 2012-06 DS-EXPERIMENT IN SITU STRESS MEASUREMENTS
22nd July 2014 Report No. 13505170278 48
3.4.3.2 Documentation of Overcoring Results
The overcoring stress measurements are subject to some uncertainty because both the CRIEPI and the
BGR are incompletely documented (summary powerpoints only) and the details of the data analysis have yet
to be fully reported.
The BGR presentation (Hesser, 2013), uses faint ellipses to show the multiple solutions from different gauge
combinations along with a darker ellipses to show a best fit solution. The CRIEPI presentations only show a
single solution and none of the statistics behind the result. The CRIEPI presentation shows one set of strain
versus time data, and the BGR presentation has none. Based on the one CRIEPI data set the gauges
appear to be behaving properly and the strains quickly reach their final values after the drilling passes the
gauge location the suggesting that the rock as behaving in a linear elastic manner.
Finally the elastic properties of the rock are a significant source of both heterogeneity and uncertainty in the
stress measurement result. The BGR presentation reports an average Young’s modulus for each test and
one assumes that these were measured using a biaxial chamber. The CRIEPI measurements, on the other
hand, take three orthogonal sub cores from each overcored sample. These measurements were intended to
provide an indication of the anisotropy of the elastic properties the rock. It is not clear if anistisotropic
solutions were used for data reduction, however, this is not as serious an issue in the limestones.as with the
Opalinus Clay.
3.4.3.3 Comparison of CRIEPI and BGR Results
Notwithstanding the lack of documentation to assess the quality of the overcoring results and uncertainty in
the borehole directions, it is useful to make a comparison between the two methods. A key question is
whether or not the CRIEPI and the BGR measurements are consistent with one another. The CRIEPI
measurements are triaxial, that is they give the complete state of stress in three dimensions including the
magnitudes and directions of the three principal stresses. The BGR measurements on the other hand are
biaxial, that is, they measured the stresses in the plane normal to the borehole direction. Although it is only
two-dimensional, the main advantage of the borehole deformation gauge used by BGR is its measurement of
deformation over a larger scale than that of the CRIEPI triaxial cell. The CRIEPI triaxial cell takes multiple
strain measurements using gauges that have characteristic lengths on the order of millimetres. The BGR
deformation gauge is measuring the diameter changes of the overcoring pilot hole; hence, its scale of
measurement is on the order of tens of millimetres. Thus test biaxial measurements are less susceptible to
variability due to millimetre scale heterogeneity in the rock elastic properties, while triaxial methods have a
significant additional component of variability due to the small scale heterogeneity.
Obtaining a three-dimensional stress state using biaxial measurements like those of BGR requires
measurements in either two or three boreholes depending on the rock anisotropy using variable orientations
to obtain stress and multiple biaxial directions. As we only have the one borehole with biaxial borehole
deformation gauge data, a comparison must use a reduction of the triaxial data to the biaxial stresses in the
plane normal to the BGR deformation gauge borehole, BDS-3. The calculation of the biaxial stresses from
the CRIEPI measurements uses the three-dimensional stress transformation equations presented in Jaeger
and Cook (1976). The approach involves the rotation of spatial coordinates to an alignment with the
principal stress directions for each triaxial measurement. This rotation applies also to the plane of the BGR
measurements and provides CRIEPI biaxial stresses for that plane. These geometric calculations were
performed in a spreadsheet using Jaeger and Cook’s equations.
The CRIEPI biaxial results for the plane of the BGR biaxial measurements appear in Figure 32. Again, y is
vertical and positive x is N 325. The presentation shows normal stress is a function of orientation within that
plane. It is worth noting that the equation for stress as a function of direction in a plane is
2 2
1 2cos sin
where is the angle of rotation from the normal to . While stress is often assumed to have an elliptical
function with orientation, as shown in the BGR figures, this equation defines the shape more like a peanut or
a dog bone, hence the presentation of these data do not appear as ellipses.
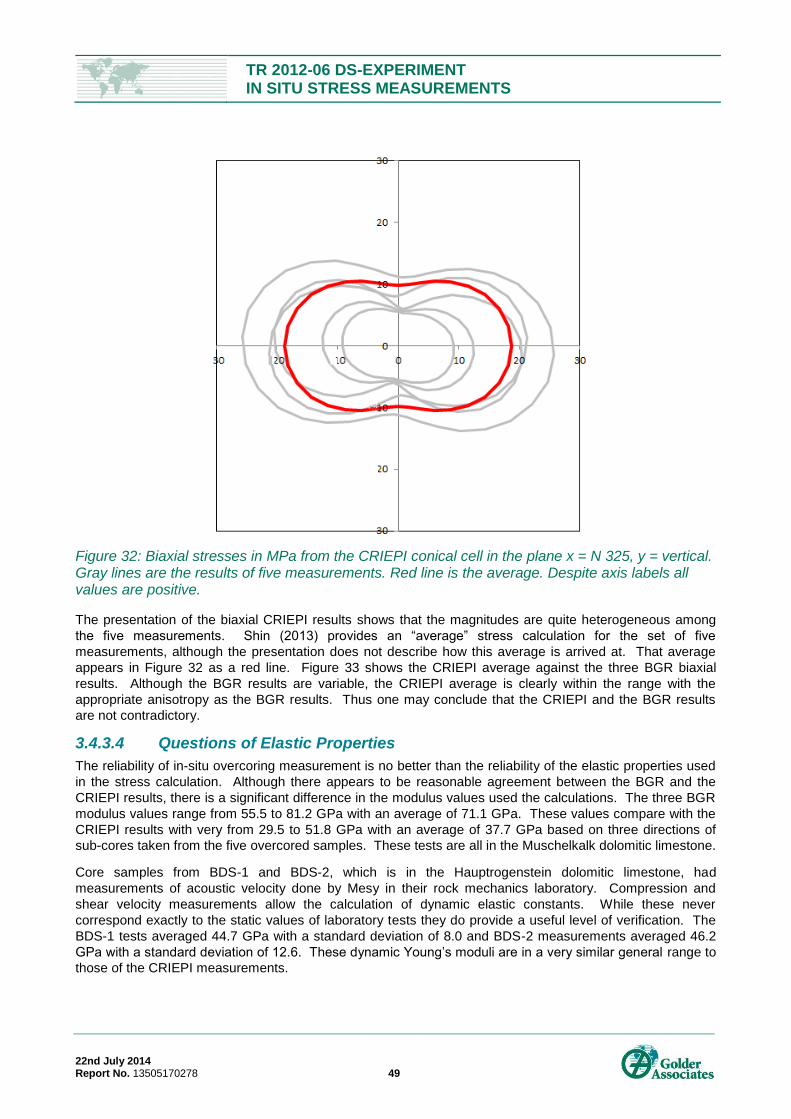
TR 2012-06 DS-EXPERIMENT IN SITU STRESS MEASUREMENTS
22nd July 2014 Report No. 13505170278 49
Figure 32: Biaxial stresses in MPa from the CRIEPI conical cell in the plane x = N 325, y = vertical. Gray lines are the results of five measurements. Red line is the average. Despite axis labels all values are positive.
The presentation of the biaxial CRIEPI results shows that the magnitudes are quite heterogeneous among
the five measurements. Shin (2013) provides an “average” stress calculation for the set of five
measurements, although the presentation does not describe how this average is arrived at. That average
appears in Figure 32 as a red line. Figure 33 shows the CRIEPI average against the three BGR biaxial
results. Although the BGR results are variable, the CRIEPI average is clearly within the range with the
appropriate anisotropy as the BGR results. Thus one may conclude that the CRIEPI and the BGR results
are not contradictory.
3.4.3.4 Questions of Elastic Properties
The reliability of in-situ overcoring measurement is no better than the reliability of the elastic properties used
in the stress calculation. Although there appears to be reasonable agreement between the BGR and the
CRIEPI results, there is a significant difference in the modulus values used the calculations. The three BGR
modulus values range from 55.5 to 81.2 GPa with an average of 71.1 GPa. These values compare with the
CRIEPI results with very from 29.5 to 51.8 GPa with an average of 37.7 GPa based on three directions of
sub-cores taken from the five overcored samples. These tests are all in the Muschelkalk dolomitic limestone.
Core samples from BDS-1 and BDS-2, which is in the Hauptrogenstein dolomitic limestone, had
measurements of acoustic velocity done by Mesy in their rock mechanics laboratory. Compression and
shear velocity measurements allow the calculation of dynamic elastic constants. While these never
correspond exactly to the static values of laboratory tests they do provide a useful level of verification. The
BDS-1 tests averaged 44.7 GPa with a standard deviation of 8.0 and BDS-2 measurements averaged 46.2
GPa with a standard deviation of 12.6. These dynamic Young’s moduli are in a very similar general range to
those of the CRIEPI measurements.
TR 2012-06 DS-EXPERIMENT IN SITU STRESS MEASUREMENTS
22nd July 2014 Report No. 13505170278 50
Figure 33: Biaxial stresses in MPa from the BGR borehole deformation gauge (gray) compared with average of CRIEPI triaxial results (red) in the plane x=N 325 y=vertical.
It is possible that the difference in modulus between the CRIEPI and the BGR testing comes from
differences in the rock between BDS-1, the CRIEPI hole, and BDS-3, the BGR hole. The carbonate rocks in
the surface borehole, BDS-5, were also sampled for a dynamic testing (Mesy, 2012). These are younger
upper Jurassic rocks than those of BDS-1 and 2, but they have considerably higher dynamic Young’s moduli
varying from 60.4 to 82.1 GPa with an average of 70.2. These values are similar to those of BGR’s testing in
BDS-3.
Assuming that there are no errors in testing or reporting the Young’s modulus results, one may conclude that
there is considerable variability in the elastic properties of the carbonate rocks in Mont Terri. This variability
may occur within a carbonate unit such as the Muschelkalk or between carbonate units.
3.4.4 State of Stress at the Ventilation Cavern Site
Given the consistency of the BGR and CCBO results, the overcoring would suggest stresses in the Ventilation Cavern of:
1 of 18.9 MPa trending N 308 with a plunge less than 5 degrees,
2 of 9.8 MPa subvertical, and
3 of 6.0 MPa trending N 218 with a plunge less than 5 degrees.
The directions of the stresses are consistent between these results and the hydraulic fracturing, which produce subvertical fractures along the subhorizontal borehole largely in the borehole’s direction of trend
(which is the general direction of 1). However, the he shut-in pressures for the vertical hydraulic fractures,
TR 2012-06 DS-EXPERIMENT IN SITU STRESS MEASUREMENTS
22nd July 2014 Report No. 13505170278 51
which average 3.7 MPa, are significantly lower than both the CRIEPI and the BGR overcoring results of 6 MPa. This comparison suggests the overcoring may be overestimating the stresses. The fact that the hydraulic fracturing produced vertical and not horizontal fractures from a horizontal hole strongly indicates that the minimum horizontal stress is horizontal and not vertical. The hydraulic fracturing gives maximum stresses, which in this case would correspond to the intermediate principal stresses of the overcoring, of 4.7 MPa. This value is somewhat less than the lithostatic stress of approximately 6 MPa, and considerably less than the 10 MPa vertical stress of the CRIEPI overcoring. The CRIEPI and the BGR results are consistent with one another to the extent of a comparison of the BGR’s biaxial results the CRIEPI results in that biaxial plane. The BGR method was not run in the necessary number or orientation of boreholes to provide a calculation of the full triaxial stress field. While this comparison is reassuring, it is important to note that the elastic constants used for the CRIEPI and BGR stress analyses were significantly different, the BGR values being much higher. As with all the stress-relief methods applied at the Mont Terri site, the elastic constants in the Ventilation Cavern are a significant issue.
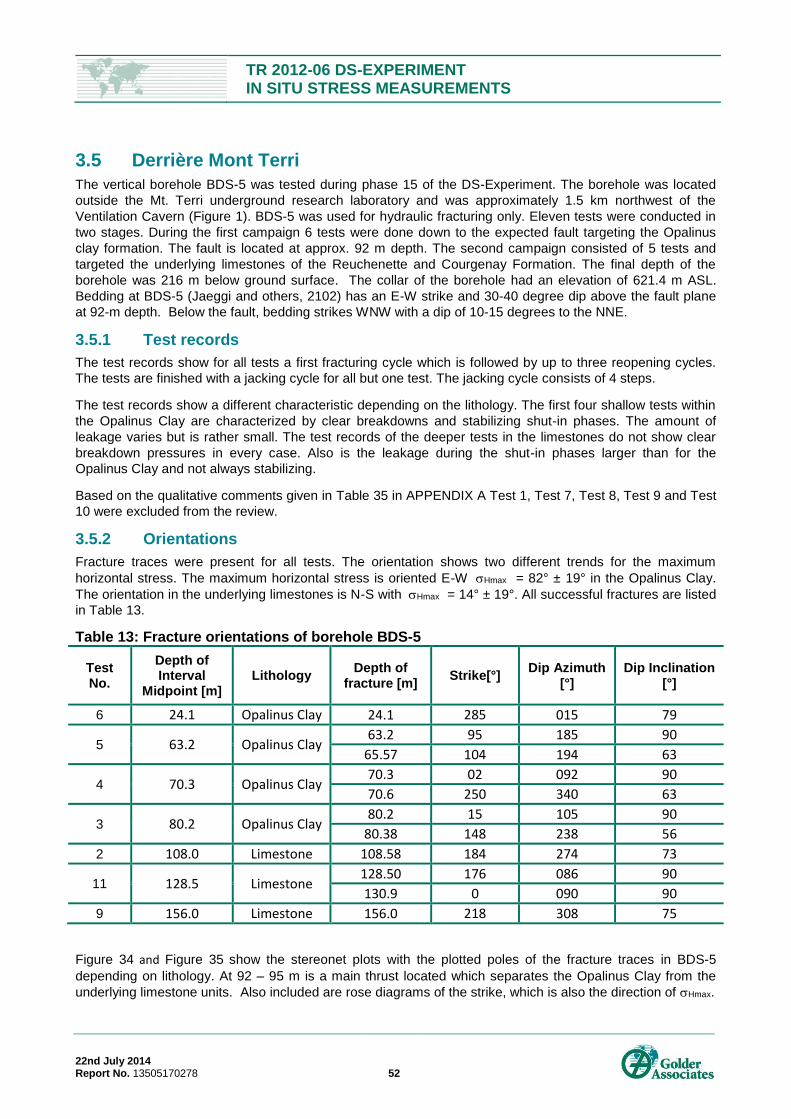
TR 2012-06 DS-EXPERIMENT IN SITU STRESS MEASUREMENTS
22nd July 2014 Report No. 13505170278 52
3.5 Derrière Mont Terri
The vertical borehole BDS-5 was tested during phase 15 of the DS-Experiment. The borehole was located
outside the Mt. Terri underground research laboratory and was approximately 1.5 km northwest of the
Ventilation Cavern (Figure 1). BDS-5 was used for hydraulic fracturing only. Eleven tests were conducted in
two stages. During the first campaign 6 tests were done down to the expected fault targeting the Opalinus
clay formation. The fault is located at approx. 92 m depth. The second campaign consisted of 5 tests and
targeted the underlying limestones of the Reuchenette and Courgenay Formation. The final depth of the
borehole was 216 m below ground surface. The collar of the borehole had an elevation of 621.4 m ASL.
Bedding at BDS-5 (Jaeggi and others, 2102) has an E-W strike and 30-40 degree dip above the fault plane
at 92-m depth. Below the fault, bedding strikes WNW with a dip of 10-15 degrees to the NNE.
3.5.1 Test records
The test records show for all tests a first fracturing cycle which is followed by up to three reopening cycles.
The tests are finished with a jacking cycle for all but one test. The jacking cycle consists of 4 steps.
The test records show a different characteristic depending on the lithology. The first four shallow tests within
the Opalinus Clay are characterized by clear breakdowns and stabilizing shut-in phases. The amount of
leakage varies but is rather small. The test records of the deeper tests in the limestones do not show clear
breakdown pressures in every case. Also is the leakage during the shut-in phases larger than for the
Opalinus Clay and not always stabilizing.
Based on the qualitative comments given in Table 35 in APPENDIX A Test 1, Test 7, Test 8, Test 9 and Test
10 were excluded from the review.
3.5.2 Orientations
Fracture traces were present for all tests. The orientation shows two different trends for the maximum
horizontal stress. The maximum horizontal stress is oriented E-W Hmax = 82° ± 19° in the Opalinus Clay.
The orientation in the underlying limestones is N-S with Hmax = 14° ± 19°. All successful fractures are listed
in Table 13.
Table 13: Fracture orientations of borehole BDS-5
Test No.
Depth of Interval
Midpoint [m] Lithology
Depth of fracture [m]
Strike[°] Dip Azimuth
[°] Dip Inclination
[°]
6 24.1 Opalinus Clay 24.1 285 015 79
5 63.2 Opalinus Clay 63.2 95 185 90
65.57 104 194 63
4 70.3 Opalinus Clay 70.3 02 092 90
70.6 250 340 63
3 80.2 Opalinus Clay 80.2 15 105 90
80.38 148 238 56
2 108.0 Limestone 108.58 184 274 73
11 128.5 Limestone 128.50 176 086 90
130.9 0 090 90
9 156.0 Limestone 156.0 218 308 75
Figure 34 and Figure 35 show the stereonet plots with the plotted poles of the fracture traces in BDS-5
depending on lithology. At 92 – 95 m is a main thrust located which separates the Opalinus Clay from the
underlying limestone units. Also included are rose diagrams of the strike, which is also the direction of Hmax.
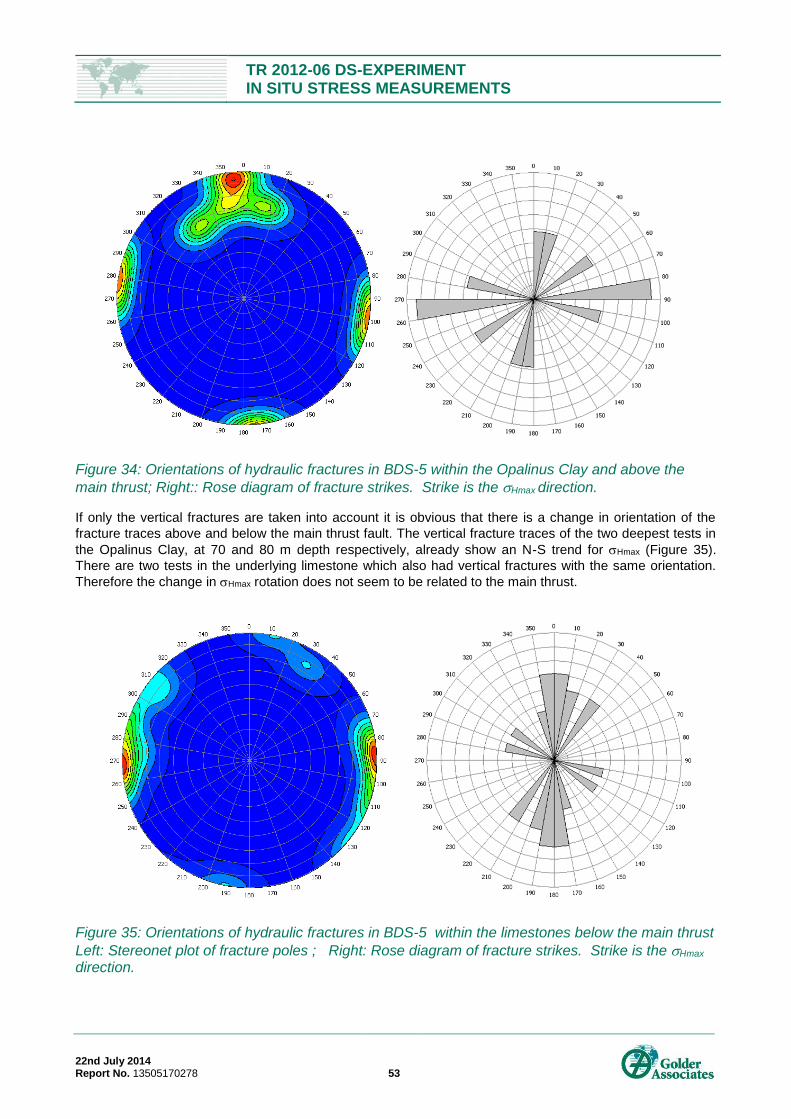
TR 2012-06 DS-EXPERIMENT IN SITU STRESS MEASUREMENTS
22nd July 2014 Report No. 13505170278 53
Figure 34: Orientations of hydraulic fractures in BDS-5 within the Opalinus Clay and above the
main thrust; Right:: Rose diagram of fracture strikes. Strike is the Hmax direction.
If only the vertical fractures are taken into account it is obvious that there is a change in orientation of the
fracture traces above and below the main thrust fault. The vertical fracture traces of the two deepest tests in
the Opalinus Clay, at 70 and 80 m depth respectively, already show an N-S trend for Hmax (Figure 35).
There are two tests in the underlying limestone which also had vertical fractures with the same orientation.
Therefore the change in Hmax rotation does not seem to be related to the main thrust.
Figure 35: Orientations of hydraulic fractures in BDS-5 within the limestones below the main thrust
Left: Stereonet plot of fracture poles ; Right: Rose diagram of fracture strikes. Strike is the Hmax
direction.
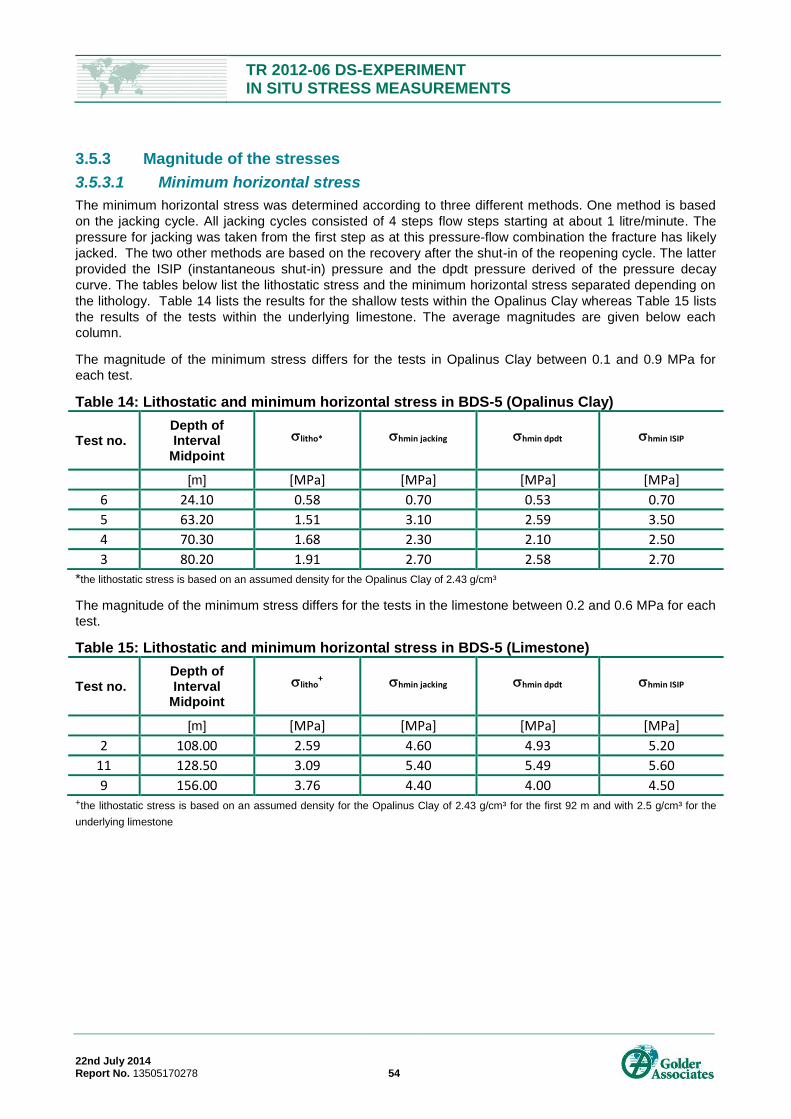
TR 2012-06 DS-EXPERIMENT IN SITU STRESS MEASUREMENTS
22nd July 2014 Report No. 13505170278 54
3.5.3 Magnitude of the stresses
3.5.3.1 Minimum horizontal stress
The minimum horizontal stress was determined according to three different methods. One method is based
on the jacking cycle. All jacking cycles consisted of 4 steps flow steps starting at about 1 litre/minute. The
pressure for jacking was taken from the first step as at this pressure-flow combination the fracture has likely
jacked. The two other methods are based on the recovery after the shut-in of the reopening cycle. The latter
provided the ISIP (instantaneous shut-in) pressure and the dpdt pressure derived of the pressure decay
curve. The tables below list the lithostatic stress and the minimum horizontal stress separated depending on
the lithology. Table 14 lists the results for the shallow tests within the Opalinus Clay whereas Table 15 lists
the results of the tests within the underlying limestone. The average magnitudes are given below each
column.
The magnitude of the minimum stress differs for the tests in Opalinus Clay between 0.1 and 0.9 MPa for
each test.
Table 14: Lithostatic and minimum horizontal stress in BDS-5 (Opalinus Clay)
Test no. Depth of Interval
Midpoint
litho* hmin jacking hmin dpdt hmin ISIP
[m] [MPa] [MPa] [MPa] [MPa]
6 24.10 0.58 0.70 0.53 0.70
5 63.20 1.51 3.10 2.59 3.50
4 70.30 1.68 2.30 2.10 2.50
3 80.20 1.91 2.70 2.58 2.70
*the lithostatic stress is based on an assumed density for the Opalinus Clay of 2.43 g/cm³
The magnitude of the minimum stress differs for the tests in the limestone between 0.2 and 0.6 MPa for each
test.
Table 15: Lithostatic and minimum horizontal stress in BDS-5 (Limestone)
Test no. Depth of Interval
Midpoint
litho+ hmin jacking hmin dpdt hmin ISIP
[m] [MPa] [MPa] [MPa] [MPa]
2 108.00 2.59 4.60 4.93 5.20
11 128.50 3.09 5.40 5.49 5.60
9 156.00 3.76 4.40 4.00 4.50 +the lithostatic stress is based on an assumed density for the Opalinus Clay of 2.43 g/cm³ for the first 92 m and with 2.5 g/cm³ for the
underlying limestone
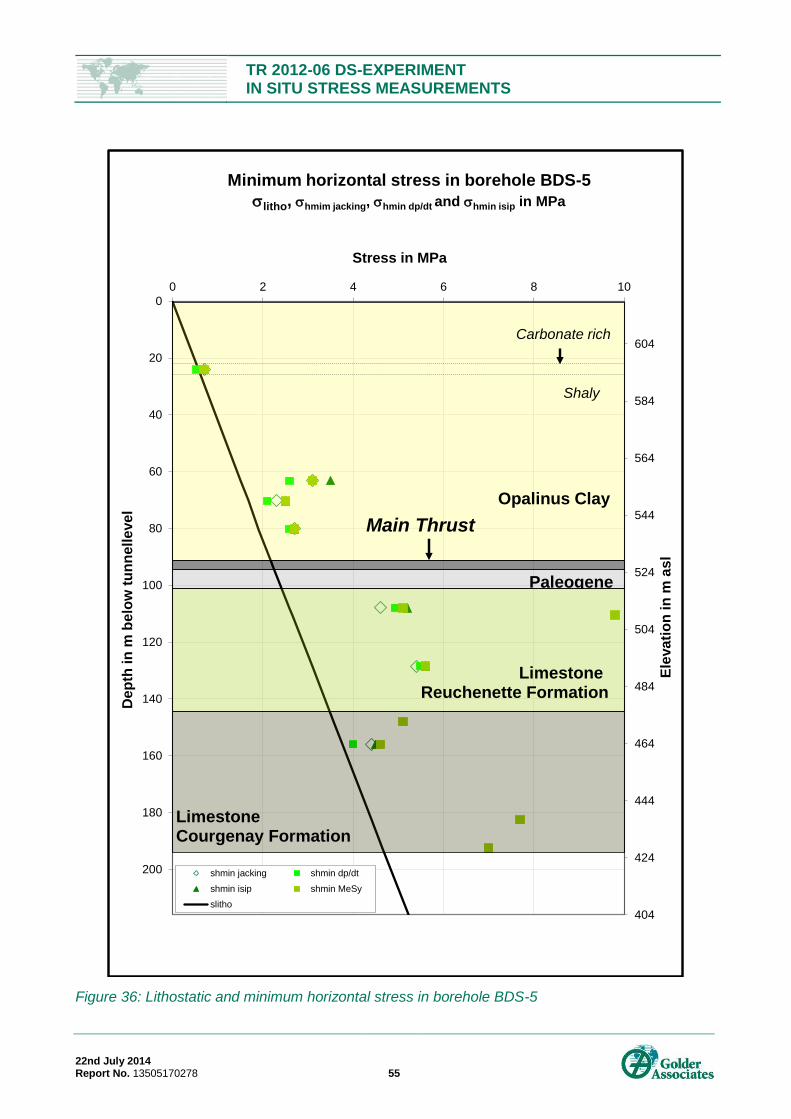
TR 2012-06 DS-EXPERIMENT IN SITU STRESS MEASUREMENTS
22nd July 2014 Report No. 13505170278 55
Figure 36: Lithostatic and minimum horizontal stress in borehole BDS-5
404
424
444
464
484
504
524
544
564
584
604
0
20
40
60
80
100
120
140
160
180
200
0 2 4 6 8 10
Ele
va
tio
n i
n m
as
l
Dep
th in
m b
elo
w t
un
nell
evel
Stress in MPa
Minimum horizontal stress in borehole BDS-5
litho, hmim jacking, hmin dp/dt and hmin isip in MPa
shmin jacking shmin dp/dt
shmin isip shmin MeSy
slitho
Opalinus Clay
Main Thrust
Shaly
Carbonate rich
LimestoneReuchenette Formation
LimestoneCourgenay Formation
Paleogene
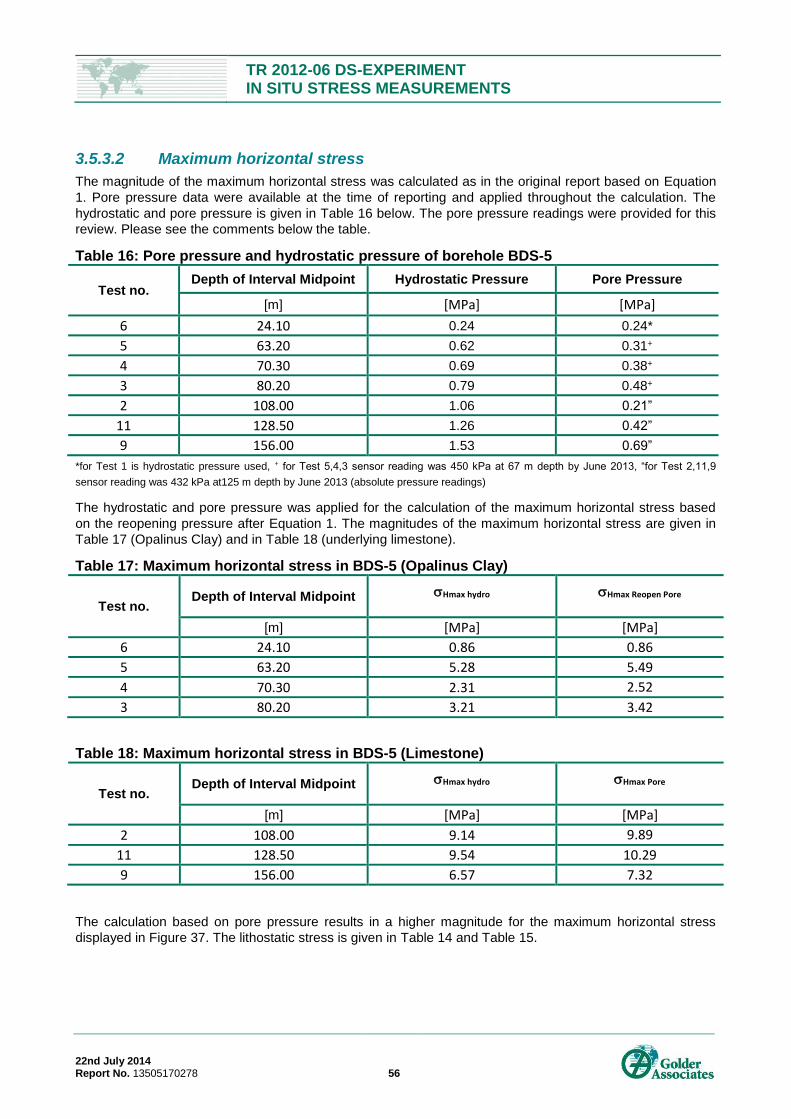
TR 2012-06 DS-EXPERIMENT IN SITU STRESS MEASUREMENTS
22nd July 2014 Report No. 13505170278 56
3.5.3.2 Maximum horizontal stress
The magnitude of the maximum horizontal stress was calculated as in the original report based on Equation
1. Pore pressure data were available at the time of reporting and applied throughout the calculation. The
hydrostatic and pore pressure is given in Table 16 below. The pore pressure readings were provided for this
review. Please see the comments below the table.
Table 16: Pore pressure and hydrostatic pressure of borehole BDS-5
Test no. Depth of Interval Midpoint Hydrostatic Pressure Pore Pressure
[m] [MPa] [MPa]
6 24.10 0.24 0.24*
5 63.20 0.62 0.31+
4 70.30 0.69 0.38+
3 80.20 0.79 0.48+
2 108.00 1.06 0.21”
11 128.50 1.26 0.42”
9 156.00 1.53 0.69”
*for Test 1 is hydrostatic pressure used, + for Test 5,4,3 sensor reading was 450 kPa at 67 m depth by June 2013, “for Test 2,11,9
sensor reading was 432 kPa at125 m depth by June 2013 (absolute pressure readings)
The hydrostatic and pore pressure was applied for the calculation of the maximum horizontal stress based
on the reopening pressure after Equation 1. The magnitudes of the maximum horizontal stress are given in
Table 17 (Opalinus Clay) and in Table 18 (underlying limestone).
Table 17: Maximum horizontal stress in BDS-5 (Opalinus Clay)
Test no. Depth of Interval Midpoint Hmax hydro Hmax Reopen Pore
[m] [MPa] [MPa]
6 24.10 0.86 0.86
5 63.20 5.28 5.49
4 70.30 2.31 2.52
3 80.20 3.21 3.42
Table 18: Maximum horizontal stress in BDS-5 (Limestone)
Test no. Depth of Interval Midpoint Hmax hydro Hmax Pore
[m] [MPa] [MPa]
2 108.00 9.14 9.89
11 128.50 9.54 10.29
9 156.00 6.57 7.32
The calculation based on pore pressure results in a higher magnitude for the maximum horizontal stress
displayed in Figure 37. The lithostatic stress is given in Table 14 and Table 15.
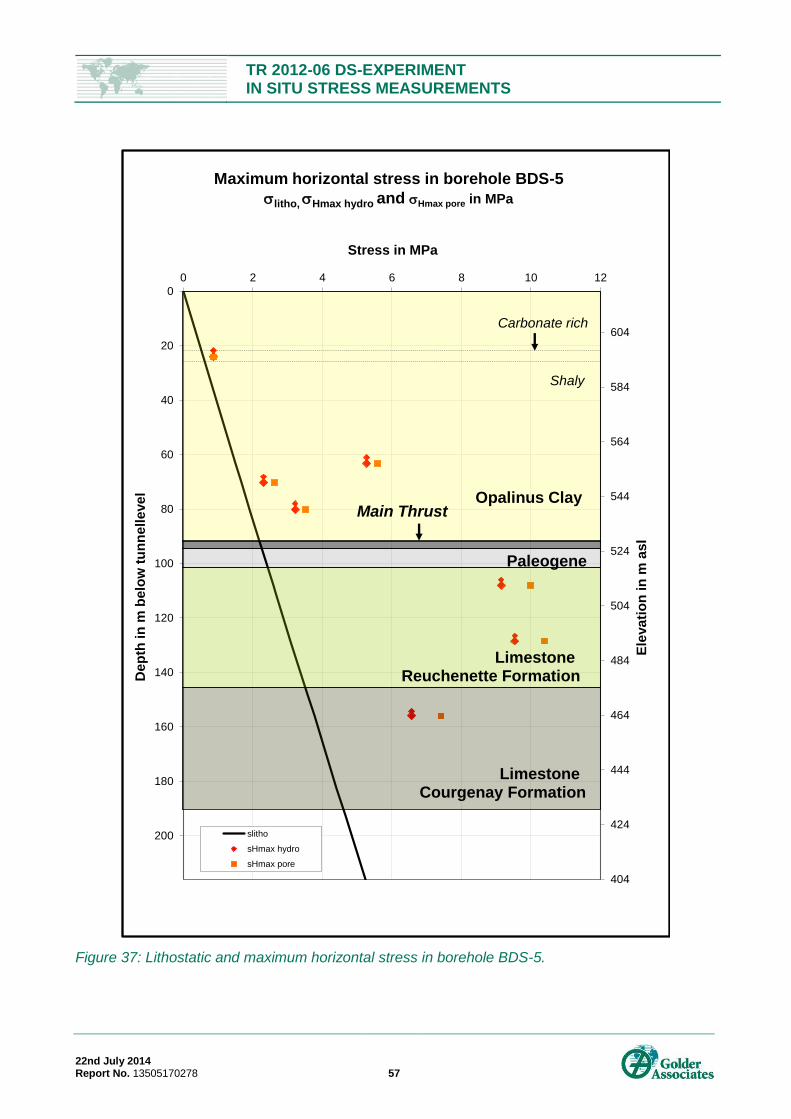
TR 2012-06 DS-EXPERIMENT IN SITU STRESS MEASUREMENTS
22nd July 2014 Report No. 13505170278 57
Figure 37: Lithostatic and maximum horizontal stress in borehole BDS-5.
404
424
444
464
484
504
524
544
564
584
604
0
20
40
60
80
100
120
140
160
180
200
0 2 4 6 8 10 12
Ele
va
tio
n i
n m
as
l
Dep
th in
m b
elo
w t
un
nell
evel
Stress in MPa
Maximum horizontal stress in borehole BDS-5
litho, Hmax hydro and Hmax pore in MPa
slitho
sHmax hydro
sHmax pore
Opalinus ClayMain Thrust
Shaly
Carbonate rich
LimestoneReuchenette Formation
LimestoneCourgenay Formation
Paleogene
TR 2012-06 DS-EXPERIMENT IN SITU STRESS MEASUREMENTS
22nd July 2014 Report No. 13505170278 58
3.5.4 Effects of Drilling Mud on Hydraulic Fracturing
Drilling mud can affect the behaviour of hydraulic fracturing tests, and in extreme cases the mud effects can
compromise the test results. Klee (2012) in Table 2.1 points out that water and polymer were the borehole
fluid. Mud was likely necessary to maintain the stability of the BDS-5 through the Opalinus Clay and the
fault sections.
The main effect that mud can have on hydraulic fracturing stress measurement is plugging the fracture
during the pressurization and shut-in cycles. During pumping, plugging expresses itself by strong increases
in pressure as the fracture plugs followed by pressure drops as the fracture reopens. During shut-in the
common expression of mud is the abrupt stabilization of the falling shut-in pressure when the mud seals the
fracture and prevents further fluid exchange between the hole and the hydraulic fracture.
The tests in BDS-5 show some features that may be associated with mud in the borehole. One can suspect
the presence of mud from several characteristics of the pressure-time records. These are illustrated in
Figure 38, which is the pressure time record for the test at 182.5 m in BDS-5. A normal hydraulic fracture
has a pressure peak followed by stabilization during the pumping or by a slow decline in pressure until the
test is shut in. Mud may form blockages along the hydraulic fracture which block the flow causing the
pressure to increase, sometimes above the initial breakdown pressure. This blockage may reopen and then
reform creating oscillating pressure peaks and drops. All of the fracturing cycles in this example test are
showing this cyclic behaviour of repeating pressure build ups and breakdowns.
A second feature of hydraulic fracture tests with mud is a sharp pressure decline on shut in followed by a
very slow decline in pressure during the shut in period. The transition between the pressure declines in the
stable period may be very sharp as appears in the first cycle of the 182.5 m test.
A final behaviour that may be associated with mud is extreme variability in the shut in pressures from cycle to
cycle. The 182.5 m test record shows apparent decrease in shut in pressure from cycles one through four,
but the shut in pressure from cycle five is considerably higher. The ability of mud to block the fracture
reduces the reliability of both the shut in pressure determinations and the recognition of a true breakdown
pressure that reflects the properties the rock rather than temporary blockages by the mud.
3.5.5 State of Stress at Derrière Mont Terri
Despite the likelihood of mud effects on the pressure-time records and their interpretation the shut-in
pressures for BDS-5 are reasonably consistent along the hole. The range of shut-in pressures is from 0.7
MPa at 24.1 meters depth to approximately 7-8 MPa for the deepest tests at 156 m depth. The tests follow a
trend that is slightly higher than lithostatic with the exception of one outlier, which is the test at 110.5 meters.
This test could be either one that is more strongly affected by the mud than others, or it could represent a
stress concentration below the main thrust fault at 92 meters; however, the test at 108.0 meters is also below
the fault and it has a shut in pressure that followed the trend of the other results in the borehole.
For the minimum horizontal stress, the minimum stress values, excluding the outlier at 110.5, are likely
reliable. Klee (2010) gives the regressions for the minimum and maximum horizontal stresses as
hmin [MPa] = (1.1 ± 0.5) + (0.0365 ± 0.005) · (z [m] - 24)
hmax [MPa] = (1.4 ± 1.1) + (0.0600 ± 0.010) · (z [m] - 24).
The minimum horizontal stress trend is slightly greater than lithostatic, indicating that BDS-5 is in a thrust-
fault state of stress over its entire length.
If one accepts a linear trend to the stresses, it would appear that the thrust fault and the different lithologies
are having no effect on the stress values. An alternate look at the data could view the minimum horizontal
stresses as having three distinct values, one the Opalinus Clay above the fault, which would be about 2.8
MPa, a second value of 6.0 MPa between the fault and about 160 meters depth, and a pair of deep values
around 7.4 MPa below 180 meters. This range of minimum stress values, except for the deepest values, is
the same as the range of hydraulic fracturing minimum stresses of all measurements in the laboratory.
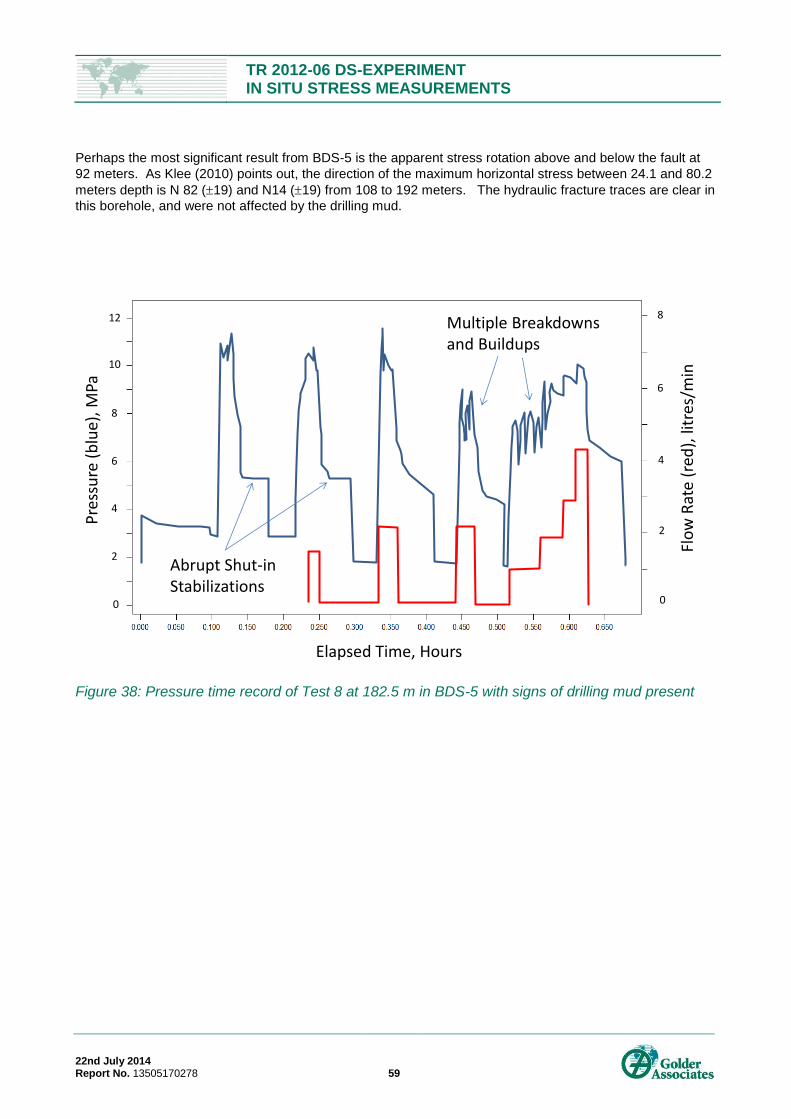
TR 2012-06 DS-EXPERIMENT IN SITU STRESS MEASUREMENTS
22nd July 2014 Report No. 13505170278 59
Perhaps the most significant result from BDS-5 is the apparent stress rotation above and below the fault at
92 meters. As Klee (2010) points out, the direction of the maximum horizontal stress between 24.1 and 80.2
meters depth is N 82 (19) and N14 (19) from 108 to 192 meters. The hydraulic fracture traces are clear in
this borehole, and were not affected by the drilling mud.
Figure 38: Pressure time record of Test 8 at 182.5 m in BDS-5 with signs of drilling mud present
Breakdown and Pressurebuild up
Abrupt shut-instabilization
12
6
4
2
8
10
0
6
4
2
8
0
Pre
ssu
re (
blu
e), M
Pa
Flo
w R
ate
(red
), li
tres
/min
Elapsed Time, Hours
Abrupt Shut-in Stabilizations
Multiple Breakdowns and Buildups

TR 2012-06 DS-EXPERIMENT IN SITU STRESS MEASUREMENTS
22nd July 2014 Report No. 13505170278 60
TR 2012-06 DS-EXPERIMENT IN SITU STRESS MEASUREMENTS
22nd July 2014 Report No. 13505170278 61
4.0 DISCUSSION AND RECOMMENDATIONS
4.1 Topics of Discussion
The preceding sections of this report have reviewed both the measurement methods used at Mont Terri and
the results of stress measurements at five specific locations along a cross section of the mountain. The
stress distribution appears to be controlled by the following:
1. The depth of the measurements with respect to the topography or tectonic features.
2. Rock types with varying deformation moduli. Volumes of rock that have contrasting deformational
properties to their surroundings may concentrate or relieve the stress magnitude depending on the
modulus contrast. This phenomenon has been documented in underground mines in sedimentary
rocks (Cartwright, 1997). In rocks with heterogeneous deformational properties, no point
measurement of rock stress represents the far field condition. Rather, the far-field stress can only be
determined by obtaining values and directions at multiple locations in rock with known deformational
properties and inverting the observations using analytical or numerical stress analysis. Section 4.3
examines how the variability of modulus values used in the analysis of stress measurements may
affect results at Mont Terri.
Becker (and others 1987) note the rotation of stress with depth at several Swiss sites ascribing it to
decoupling on thrust faults. Stress rotations may also reflect a stress decoupling due to topography, where
locations in ridges above the base topographic relief have Hman direction parallel to the topographic grain
and perpendicular to the topographic grain below the base relief. This effect may be important where the
direction of the topographic ridges is caused by crustal shortening. An example of such a topographic
decoupling is the program comes from hydraulic fracturing stress measurements for the underground test
facility that the US DOE built in Gable Mountain on the Hanford reservation in the northwest USA (Haimson,
1983). The tectonic setting, which is still acting today, is one of strong north-south compression, which has
created east-west anticlinal ridges. Gable Mountain is one of these ridges. The test facility was developed
by excavating sub-horizontal access adits into the mountain; hence, the facility was at or above the base of
the topographic relief. Despite the strong north south compression, the direction of hydraulic fractures, and
thus the direction of the maximum horizontal stress at this facility was east-west parallel to the trend of the
mountain. Later stress measurements performed at repository depth near 1 km confirmed the north-south
tectonic stress direction. The stress rotation in BDS-5 may be a similar effect within Mont Terri.
The second major control on stress comes from the deformational properties of the rock, particularly the
Young’s Modulus. Volumes of rock that have contrasting deformational properties to their surroundings act
as inclusions where stress may be concentrated or relieved depending on the modulus contrast. In rocks
with heterogeneous deformational properties, no single point measurement of rock stress represents the far
field condition. Rather, the far-field stress can only be determined by obtaining values and directions at
multiple locations in rock with known deformational properties and inverting the observations using analytical
or numerical stress analysis. The question of deformational properties further influences strongly the validity
of stress relief stress measurement methods. These give stress results that are no better than the modulus
values that go in the analysis. Section 4.3 looks at how the variability of modulus values used in the analysis
of stress measurements may affect results. Understanding these variabilities also affects the way they need
to be incorporated in geomechanical models of the Mont Terri site.
Finally Sections 4.4 and 4.5 discuss what one may infer about the state of stress in the carbonate units and
the Opalinus Clay. Section 4.6 provides recommendations for further work.
4.2 Topographic Versus Tectonic Controls on Stress at Mont Terri
The question of topographic versus tectonic control is a key one for understanding the rock stress at Mont
Terri. In regions with topography that is dominated by folding and controlled by current tectonic conditions,
one may expect a transition of stress with depth. Above the base of topographic relief one may expect a
TR 2012-06 DS-EXPERIMENT IN SITU STRESS MEASUREMENTS
22nd July 2014 Report No. 13505170278 62
decoupling from the tectonic stress field such that the maximum horizontal stress is aligned perpendicular to
the topographic ridges. As the topography aligns itself perpendicular to the major tectonic compression, one
may expect a rotation of the maximum principal stress to the direction of this compression. Hence a 90°
rotation from topographic to tectonic control is a reasonable expectation.
When topography controls stress, 1 is subvertical. When thrust fault tectonics are active, 1 is
subhorizontal. Whether the tectonic 1 is parallel or perpendicular to the ridges could be many reasons, but
the important point is that the tectonic 1 is now subhorizontal. At what depth tectonic 1 is aligned with the
plate motion NW-SE is unknown. One would expect it to be below all the local valleys, which would suggest
below St-Ursanne but this might require a 3D model for further confirmation.
The topographic-tectonic transition may appear in several of the data sets of the Mont Terri laboratory. The
clearest appears in BDS-5. The hydraulic fracturing stress measurements (Klee, 2012) found a hydraulic
fracture rotation from ENE above 100 m depth to N-S below hundred meters depth.
A similar contrast in orientation appears in the measurements comparing the Ventilation Cavern
measurements (BDS-1 and BDS-3) with those of the Park Niche (BDS-2) when applying a filtering of the
fracture orientations to those which are steeply dipping (> 60°). Figure 39 shows the hydraulic fracture strike
directions as rosettes. On the left are the trends for the shallow part of BDS-5 at Derrière Mont Terri and the
Park Niche (BDS-2). On the right are the trends for the Ventilation Cavern (BDS-1) and the deep portion of
BDS-5 at Derrière Mont Terri. The hydraulic fractures in BDS-2 dominantly align in the ENE topographic
trend of Mont Terri, while steeply dipping fractures in BDS-1 run NW or approximately perpendicular to the
topography in the expected tectonic stress direction.
The Ventilation Cavern appears to be in the tectonically-controlled stress regime based both on orientation
and on the relatively high values of maximum horizontal stress measured by overcoring. The average
maximum principal stress from the overcoring trends N 315 as compared with N 310 for the steeply dipping
hydraulic fractures. The magnitudes of the maximum, intermediate, and minimum principal stresses from the
overcoring average 19.5, 9.7, and 5.6 MPa respectively. These relatively large stress values would be
consistent with what one might find in a deeper tectonically controlled stress regime. The minimum stress
values from hydraulic fracturing do not fit this concept clearly. Klee’s (2012) minimum horizontal stresses
from BDS-1 average 3.7 MPa compares well with the minimum horizontal stress with this report’s
determinations of 4.0 MPa based on ISIP and 2.6 based on dpdt methods.
Figure 40 compares maximum stress rosettes of the hypothesized Mont Terri tectonic and topographic
controlled stress directions with regional stress data and the trends of Jura Mountain ridges (Wermeille and
Bossart, 1999, Bossart and Wermeille, 2003). Again the hypothesized topographic stress locations are the
Park Niche and the shallow part of Derriere Mont Terri. Tectonic-controlled stresses are the Ventilation
Cavern and the deep portion of Derrière Mont Terri. The comparisons of (a) Mont Terri topographic stress to
Jura ridge trends and (b) Mont Terri tectonic stress to regional stress measurement data is very good.
It is not clear at what depth there is a tectonic-topographic transition at the Rock Laboratory location. The
CSIRO overcoring of Lehaye (2005) has a minimum stress vertical which would be consistent with a
compressional tectonic regime of the Jura. On the other hand, some of the low stresses like the IS-Niche
undercoring suggest much lower stresses. The data by themselves do not allow any further delineation of
the topography-tectonic transition depth. It would be interesting to speculate that the faults that cross BDS-5
and the laboratory define stress regime changes, but that hypothesis would require further analysis, probably
using modelling. Further insights may come from numerical modelling of Mont Terri geomechanics.
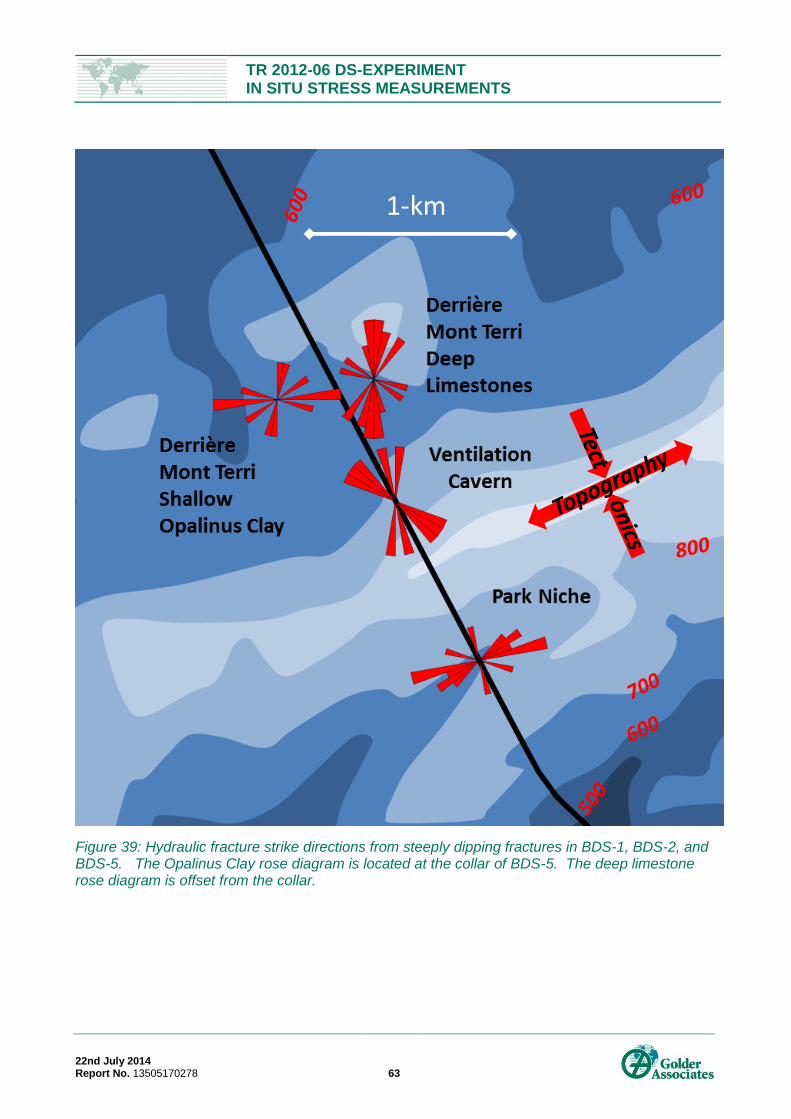
TR 2012-06 DS-EXPERIMENT IN SITU STRESS MEASUREMENTS
22nd July 2014 Report No. 13505170278 63
Figure 39: Hydraulic fracture strike directions from steeply dipping fractures in BDS-1, BDS-2, and BDS-5. The Opalinus Clay rose diagram is located at the collar of BDS-5. The deep limestone rose diagram is offset from the collar.
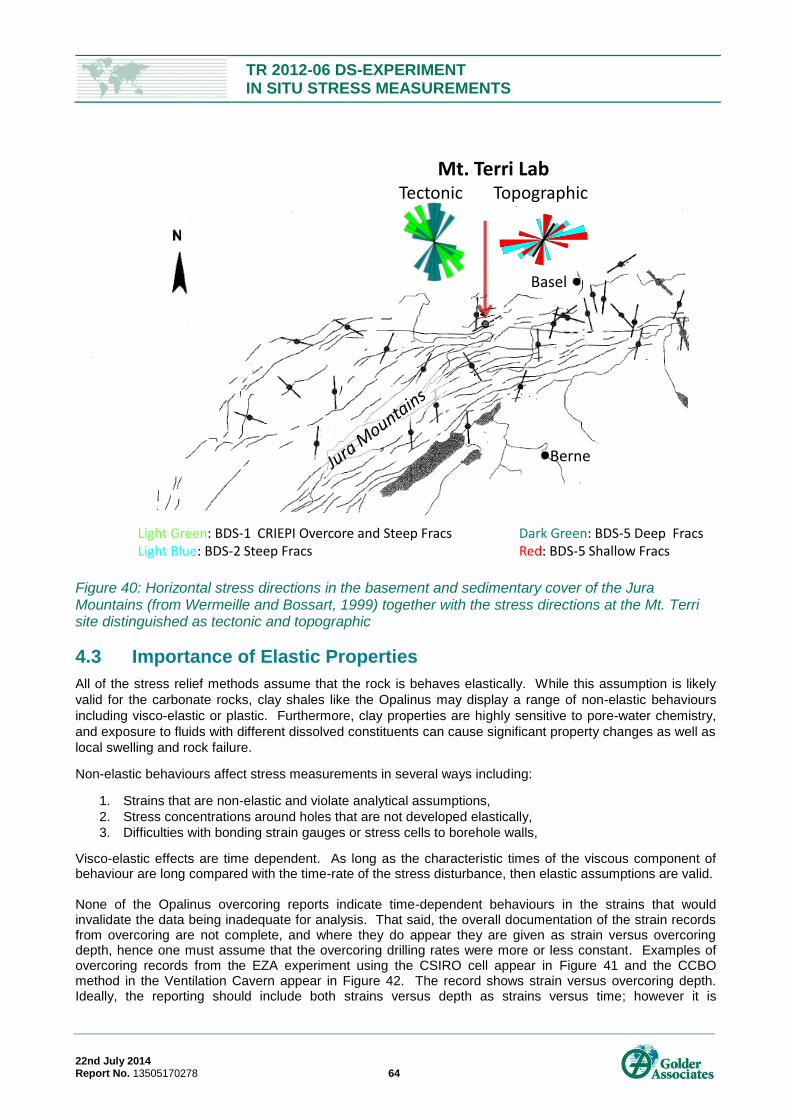
TR 2012-06 DS-EXPERIMENT IN SITU STRESS MEASUREMENTS
22nd July 2014 Report No. 13505170278 64
Figure 40: Horizontal stress directions in the basement and sedimentary cover of the Jura Mountains (from Wermeille and Bossart, 1999) together with the stress directions at the Mt. Terri site distinguished as tectonic and topographic
4.3 Importance of Elastic Properties
All of the stress relief methods assume that the rock is behaves elastically. While this assumption is likely
valid for the carbonate rocks, clay shales like the Opalinus may display a range of non-elastic behaviours
including visco-elastic or plastic. Furthermore, clay properties are highly sensitive to pore-water chemistry,
and exposure to fluids with different dissolved constituents can cause significant property changes as well as
local swelling and rock failure.
Non-elastic behaviours affect stress measurements in several ways including:
1. Strains that are non-elastic and violate analytical assumptions,
2. Stress concentrations around holes that are not developed elastically,
3. Difficulties with bonding strain gauges or stress cells to borehole walls,
Visco-elastic effects are time dependent. As long as the characteristic times of the viscous component of behaviour are long compared with the time-rate of the stress disturbance, then elastic assumptions are valid. None of the Opalinus overcoring reports indicate time-dependent behaviours in the strains that would invalidate the data being inadequate for analysis. That said, the overall documentation of the strain records from overcoring are not complete, and where they do appear they are given as strain versus overcoring depth, hence one must assume that the overcoring drilling rates were more or less constant. Examples of overcoring records from the EZA experiment using the CSIRO cell appear in Figure 41 and the CCBO method in the Ventilation Cavern appear in Figure 42. The record shows strain versus overcoring depth. Ideally, the reporting should include both strains versus depth as strains versus time; however it is
Mt. Terri LabTectonic Topographic
Light Green: BDS-1 CRIEPI Overcore and Steep Fracs Dark Green: BDS-5 Deep FracsLight Blue: BDS-2 Steep Fracs Red: BDS-5 Shallow Fracs
Basel
Berne
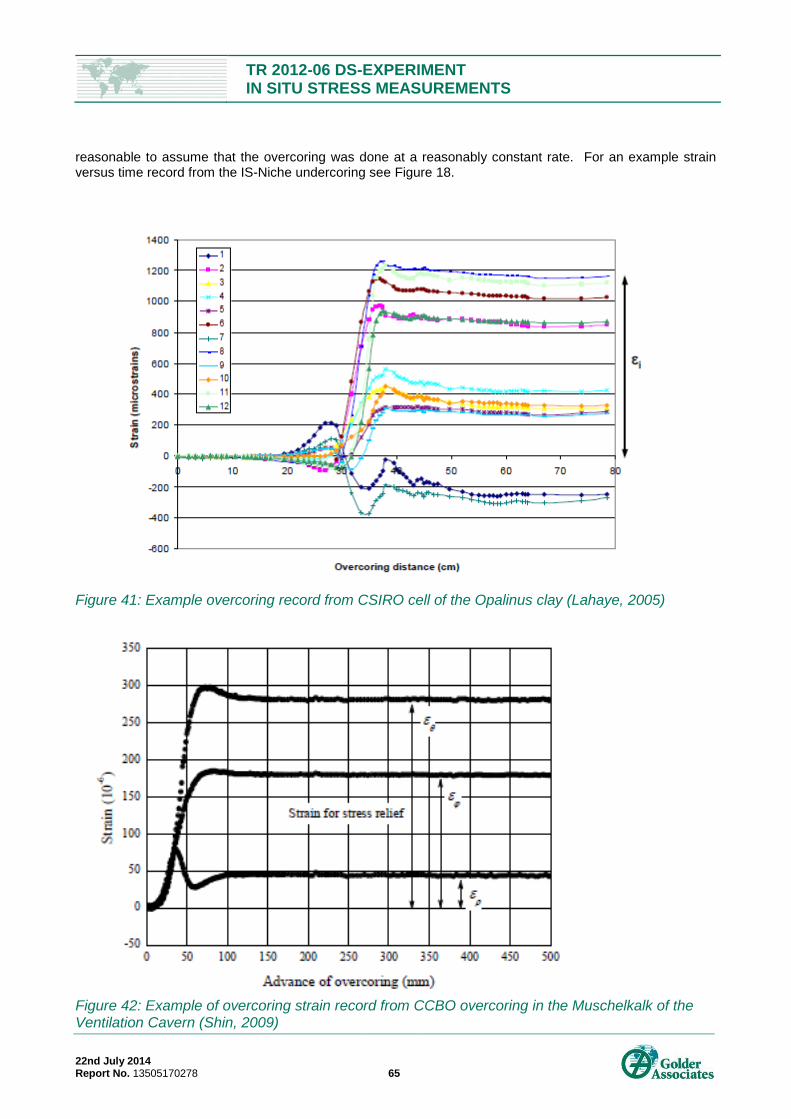
TR 2012-06 DS-EXPERIMENT IN SITU STRESS MEASUREMENTS
22nd July 2014 Report No. 13505170278 65
reasonable to assume that the overcoring was done at a reasonably constant rate. For an example strain versus time record from the IS-Niche undercoring see Figure 18.
Figure 41: Example overcoring record from CSIRO cell of the Opalinus clay (Lahaye, 2005)
Figure 42: Example of overcoring strain record from CCBO overcoring in the Muschelkalk of the Ventilation Cavern (Shin, 2009)
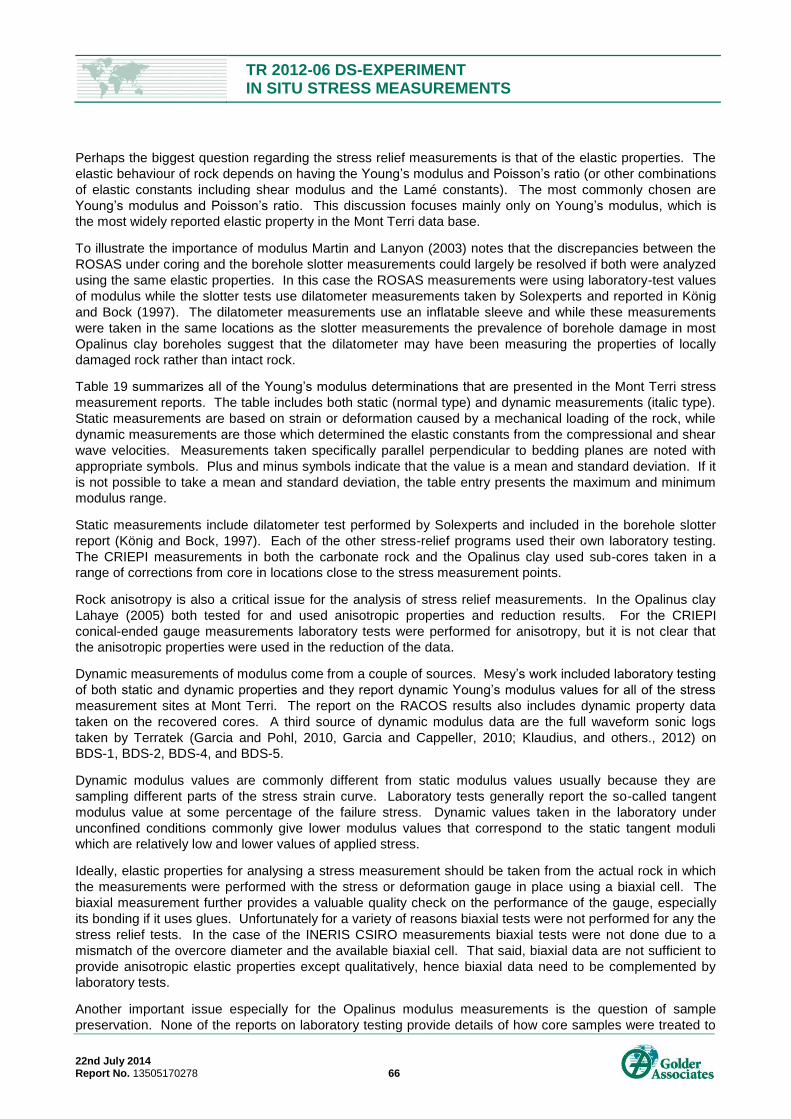
TR 2012-06 DS-EXPERIMENT IN SITU STRESS MEASUREMENTS
22nd July 2014 Report No. 13505170278 66
Perhaps the biggest question regarding the stress relief measurements is that of the elastic properties. The
elastic behaviour of rock depends on having the Young’s modulus and Poisson’s ratio (or other combinations
of elastic constants including shear modulus and the Lamé constants). The most commonly chosen are
Young’s modulus and Poisson’s ratio. This discussion focuses mainly only on Young’s modulus, which is
the most widely reported elastic property in the Mont Terri data base.
To illustrate the importance of modulus Martin and Lanyon (2003) notes that the discrepancies between the
ROSAS under coring and the borehole slotter measurements could largely be resolved if both were analyzed
using the same elastic properties. In this case the ROSAS measurements were using laboratory-test values
of modulus while the slotter tests use dilatometer measurements taken by Solexperts and reported in König
and Bock (1997). The dilatometer measurements use an inflatable sleeve and while these measurements
were taken in the same locations as the slotter measurements the prevalence of borehole damage in most
Opalinus clay boreholes suggest that the dilatometer may have been measuring the properties of locally
damaged rock rather than intact rock.
Table 19 summarizes all of the Young’s modulus determinations that are presented in the Mont Terri stress
measurement reports. The table includes both static (normal type) and dynamic measurements (italic type).
Static measurements are based on strain or deformation caused by a mechanical loading of the rock, while
dynamic measurements are those which determined the elastic constants from the compressional and shear
wave velocities. Measurements taken specifically parallel perpendicular to bedding planes are noted with
appropriate symbols. Plus and minus symbols indicate that the value is a mean and standard deviation. If it
is not possible to take a mean and standard deviation, the table entry presents the maximum and minimum
modulus range.
Static measurements include dilatometer test performed by Solexperts and included in the borehole slotter
report (König and Bock, 1997). Each of the other stress-relief programs used their own laboratory testing.
The CRIEPI measurements in both the carbonate rock and the Opalinus clay used sub-cores taken in a
range of corrections from core in locations close to the stress measurement points.
Rock anisotropy is also a critical issue for the analysis of stress relief measurements. In the Opalinus clay
Lahaye (2005) both tested for and used anisotropic properties and reduction results. For the CRIEPI
conical-ended gauge measurements laboratory tests were performed for anisotropy, but it is not clear that
the anisotropic properties were used in the reduction of the data.
Dynamic measurements of modulus come from a couple of sources. Mesy’s work included laboratory testing
of both static and dynamic properties and they report dynamic Young’s modulus values for all of the stress
measurement sites at Mont Terri. The report on the RACOS results also includes dynamic property data
taken on the recovered cores. A third source of dynamic modulus data are the full waveform sonic logs
taken by Terratek (Garcia and Pohl, 2010, Garcia and Cappeller, 2010; Klaudius, and others., 2012) on
BDS-1, BDS-2, BDS-4, and BDS-5.
Dynamic modulus values are commonly different from static modulus values usually because they are
sampling different parts of the stress strain curve. Laboratory tests generally report the so-called tangent
modulus value at some percentage of the failure stress. Dynamic values taken in the laboratory under
unconfined conditions commonly give lower modulus values that correspond to the static tangent moduli
which are relatively low and lower values of applied stress.
Ideally, elastic properties for analysing a stress measurement should be taken from the actual rock in which
the measurements were performed with the stress or deformation gauge in place using a biaxial cell. The
biaxial measurement further provides a valuable quality check on the performance of the gauge, especially
its bonding if it uses glues. Unfortunately for a variety of reasons biaxial tests were not performed for any the
stress relief tests. In the case of the INERIS CSIRO measurements biaxial tests were not done due to a
mismatch of the overcore diameter and the available biaxial cell. That said, biaxial data are not sufficient to
provide anisotropic elastic properties except qualitatively, hence biaxial data need to be complemented by
laboratory tests.
Another important issue especially for the Opalinus modulus measurements is the question of sample
preservation. None of the reports on laboratory testing provide details of how core samples were treated to
TR 2012-06 DS-EXPERIMENT IN SITU STRESS MEASUREMENTS
22nd July 2014 Report No. 13505170278 67
preserve their moisture contents. Cores of shale are notoriously susceptible to slaking unless the cores are
sealed against moisture loss as soon as possible after the removal from their natural environment (Lehaye,
2005).
Considerable inconsistencies in modulus values are immediately apparent in Table 19. Consider first the
values from the Opalinus clay. Lahaye’s (2005) modulus values for Opalinus clay are as high as 22 GPa
(parallel) and 9 GPa (perpendicular) as compared with 6.7 and 2.3 GPa from the dilatometer measurements
and 9 and 1.5 from CRIEPI’s tests. The data used for the ROSAS are intermediate between these results at
12.2 and 4.2 GPa. Mesy’s dynamic modulus data, which are taken from both the rock laboratory and the IS
Niche, are much closer to Lahaye’s results with the parallel value at about 23 GPa and the perpendicular at
9.3. The full waveform sonic modulus values range from 11.5 to 15.3, and they probably represent a
direction intermediate between parallel and perpendicular to bedding.
There are similar variabilities in the modulus values for the carbonate rocks. CRIEPI’s average modulus
value in the Ventilation Cavern is 46.6 GPa versus 71.4 GPa for BGR’s results. The dynamic data are not as
helpful for the carbonates as they give results over a similar range from Mesy’s mean of 44.7 GPa in the
Ventilation Cavern along with a mean of 70.2 in carbonates at BDS-5.
As part of the DS experiment, Terratek ran full wave form sonic (FWS) logs on one carbonate borehole
(Garcia and Pohl, 2010;BDS-2) and one clay borehole (Garcia and Capeller, 2010; BDS-4). FWS logs
record both compressional and shear wave velocities, which allow the calculation of dynamic elastic
constants. While dynamic constants may not be identical to static constants, the FWS log shows the range
and scale of variability which should be similar for both (Figure 43 and Figure 44). The logs span a range of
40 to 75 GPa in the carbonate and 10 to 15 GPa in the Opalinus Clay. The FWS moduli are very similar to
the range found in the Ventilation Cavern, suggesting that the differences between the BGR and CRIEPI
static moduli may reflect actual variability in the rock rather than being an artefact of the measurement
methods. The FWS values for the Opalinus Clay are intermediate to the parallel and perpendicular bedding
static values obtained for the CSIRO overcoring and the ROSAS undercoring. This is not surprising given
that the FWS reflects properties in the direction of the borehole, which has an oblique angle to the bedding.
The FWS values are considerably higher than the moduli obtained using the Solexperts dilatometer and the
laboratory values of CRIEPI. Again, it is not clear if these reflect natural variability in the Opalinus or some
effect of the static modulus measurements.
The pattern of FWS modulus variability is particularly interesting in both BDS-2 and BDS-4. The minimum
stress values from hydraulic fracturing are given also for comparison. The modulus values in the Opalinus
Clay increase gradually from 10 GPa at 10 meters depth to 14 GPa at about 37 meters below which they
abruptly fall to 10 GPa. This variation may reflect either changes in the bedding orientation, or more likely,
natural variability controlled by sedimentary processes. The log of BDS-2 in the carbonate has a strong low-
modulus anomaly in the shallow portion of the log from 18 to 22 m where the modulus more than doubles
from 20 GPa to 50 GPa. Curiously the stress values show a similar pattern of change but at a different
depth.
In summary, one of the major outstanding issues for rock stress at the Mont Terri laboratory has been
inconsistency of results between methods especially the stress relief methods. These inconsistencies seem
particularly prevalent in the Opalinus clay. Martin and Lanyon (2003) pointed this out, and subsequent
measurements for the EZA and DS programs in the Opalinus clay do not resolve these issues. Re-analysis
of the strain data using a consistent set of elastic properties could resolve some of these discrepancies.
Sorting out whether or not this variability is due to measurement, rock quality, or natural variability the rock is
very important to understanding the overall Mont Terri stress data set. The carbonates also show
considerable modulus variability. As these rocks are not prone to slaking and are stiffer it is more likely that
the variability is a reflection of the rock itself. Even so, numerical modelling of stress at Mont Terri will
depend very strongly on the selection of the appropriate modulus values especially for the carbonates.
Hence understanding the source of modulus variability is critical to the question of stress at Mont Terri.
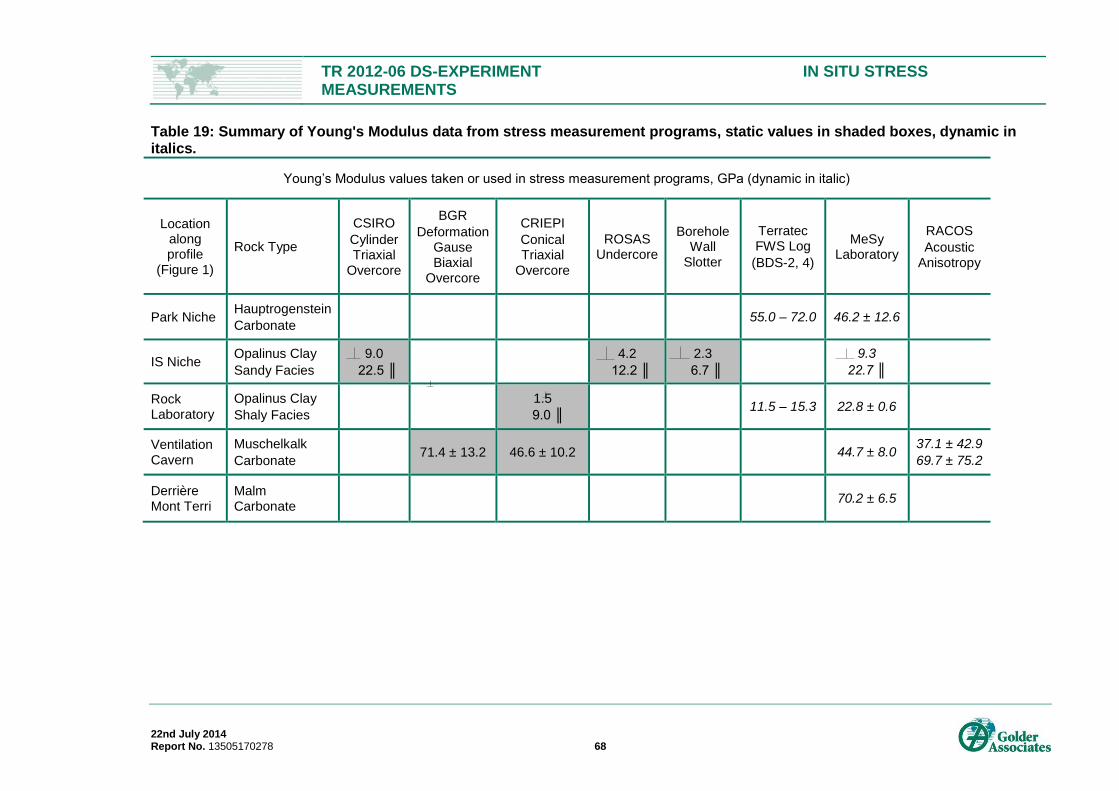
TR 2012-06 DS-EXPERIMENT IN SITU STRESS MEASUREMENTS
22nd July 2014 Report No. 13505170278 68
Table 19: Summary of Young's Modulus data from stress measurement programs, static values in shaded boxes, dynamic in italics.
Young’s Modulus values taken or used in stress measurement programs, GPa (dynamic in italic)
Location along profile
(Figure 1)
Rock Type
CSIRO
Cylinder Triaxial
Overcore
BGR
Deformation Gause Biaxial
Overcore
CRIEPI
Conical Triaxial
Overcore
ROSAS Undercore
Borehole Wall
Slotter
Terratec FWS Log
(BDS-2, 4)
MeSy Laboratory
RACOS
Acoustic Anisotropy
Park Niche Hauptrogenstein
Carbonate 55.0 – 72.0 46.2 ± 12.6
IS Niche Opalinus Clay
Sandy Facies
9.0
22.5 ║
4.2
12.2 ║
2.3
6.7 ║
9.3
22.7 ║
Rock Laboratory
Opalinus Clay
Shaly Facies
1.5
9.0 ║ 11.5 – 15.3 22.8 ± 0.6
Ventilation Cavern
Muschelkalk
Carbonate 71.4 ± 13.2 46.6 ± 10.2 44.7 ± 8.0
37.1 ± 42.9
69.7 ± 75.2
Derrière Mont Terri
Malm Carbonate
70.2 ± 6.5

TR 2012-06 DS-EXPERIMENT IN SITU STRESS MEASUREMENTS
22nd July 2014 Report No. 13505170278 69
Figure 43: Dynamic Young’s Modulus from FWS logs in BDS-2 (Carbonate)
Figure 44: Dynamic Young's modulus from FWS logs in BDS-4 ( Opalinus Clay)
4.4 State of Stress in the Carbonate Units
The DS Experiment focussed on defining the far-field stress state at Mont Terri using a broader range of rock
types and locations than previous experimental programs that included rock stress measurement. The
planning for these tests recognized that the stresses might vary among the rock types as stiffer rocks, such
as the carbonate units would likely carry more stress than the shale units, which would be softer elastically or
non-elastic.
The stress measurements were conducted in three different carbonate units, the Malm (BDS-5) at Derrière
Mont Terri, Muschelkalk (BDS-1 and BDS-3) in the Ventilation Cavern and, and the Hauptrogenstein (BDS-2)
at the Park Niche. Except for orientation and minimum stress it is difficult to completely compare the
measurements at these three sites as the same techniques and hole orientations were not applied at all
three. The Ventilation Cavern holes were subhorizontal and employed both overcoring and hydraulic
fracturing, while the holes at Derrière Mont Terri and the Park Niche and were vertical and used only
0
1
2
3
4
5
6
7
8
0
10,000
20,000
30,000
40,000
50,000
60,000
70,000
80,000
0 20 40 60 80 100
Min
imu
m S
tres
s, M
Pa
You
ng'
s M
od
ulu
s, M
Pa
Depth, m
BDS-2 Dynamic Modulus from Sonic Log
Modulus
Stress
0
1
2
3
4
5
6
7
8
0
2,000
4,000
6,000
8,000
10,000
12,000
14,000
16,000
0 10 20 30 40 50 60
Min
imu
m S
tres
s M
Pa
You
ng'
s M
od
ulu
s, M
Pa
Depth, m
BDS-4 Dynamic Modulus from Sonic Log
Modulus
Stress
TR 2012-06 DS-EXPERIMENT IN SITU STRESS MEASUREMENTS
22nd July 2014 Report No. 13505170278 70
hydraulic fracturing. Furthermore, as discussed above, the Derrière Mont Terri hydraulic fracturing tests may
have been influenced by the use of drilling mud.
Nonetheless, some interesting comparisons can be made between the different locations. Of all the stress
indicators that come from the measurements, perhaps the most unambiguous is the hydraulic fracture
orientation, at least in places where it is clearly defined at BDS-2 and BDS-1. A major finding of the DS
program was the stress rotation at about 100 meters depth in the surface hole, BDS-5. The rotation appears
may reflect a change from topographic dominance to tectonic dominance at depth or a decoupling of stress
across the main thrust of Mont Terri.
Comparing the hydraulic fracture orientations of the Park Niche and the Ventilation Cavern suggest that
these locations may also be in different regimes, as the hydraulic fracture orientations of the Park Niche are
consistent with the topographic trend. The fracture directions are a little less clear in the Ventilation Cavern
as the testing used a horizontal hole; the CCBO overcoring indicates that that maximum stress is about 18.9
MPa in the direction of tectonic stress. BDS-1 was drilled approximately in the tectonic stress direction, and
the hydraulic fractures were axial with the hole, a direction consistent with the tectonic stress concept.
At the Ventilation Cavern, the maximum stress results are more reliable from overcoring than from hydraulic
fracturing, hence the maximum stress is relatively certain only in the Muschelkalk. At this site, the two
overcoring methods give comparable results and the maximum principal stress appears to be about 18.9
MPa with a subhorizontal trend of N 308. The overcoring has a subvertical intermediate stress of 9.8 MPa
and a minimum principal stress of 6 MPa and subhorizontal at 218. What is not consistent in this
interpretation are the minimum stress estimates from the hydraulic fracturing which average 3.7 MPa, which
are less than both the overcoring minimum stress and the lithostatic stress. That hydraulic fracturing value
averages 4.7 MPa which is less than the lithostatic. Especially important is the fact that the hydraulic
fractures are vertical, which indicates to a higher level of confidence than the overcoring results that the
horizontal stresses are less than lithostatic, otherwise the hydraulic fractures would have been horizontal.
The stress magnitudes at the Park Niche are only from hydraulic fracturing. As discussed in section 2, the
minimum stresses are more reliable than the maximum stress. That said, the minimum stresses follow a
trend that follows the lithostatic gradient based on the cover thickness immediately above the borehole.
Excluding a set of very low numbers around 15 meters in BDS-2, the average of the minimum stresses is
around 4 MPa, which is in a similar range as shut in pressures in the Opalinus Clay.
It is interesting that similar shut-in pressures and minimum stress values appear at Derrière Mont Terri,
where, if one excludes some 10 MPa values that are likely mud effects, minimum stresses between 100 and
160 meters depth are about 5 MPa, which is close to lithostatic.
While it is not possible to have overcoring data from Derrière Mont Terri, having similar overcoring and
hydraulic fracturing data from the two underground carbonate sites – the Park Niche and the Ventilation
Cavern – would increase the confidence in the results. Specifically, it would be useful to have a vertical hole
for hydraulic fracturing at the Ventilation Cavern and some form of overcoring data from the Park Niche.
These overcoring tests could use any of the triaxial methods (CCBO or CSIRO) or possibly the BGR
deformation gauge in a vertical borehole.
4.5 State of Stress in the Opalinus Clay
Hydraulic fracturing has had limited success in defining stresses in the Opalinus Clay as all attempts have
failed to open any fractures other than those along bedding planes. While these tests do not meet the
classic criteria for the method, the results do put some constraints on what the state of stress can be. The
shut in pressures in the Opalinus are all excellent quality with very clear ISIP’s and slow leakoffs. They
nonetheless have considerable variability between 2.8 and 4.0 in the IS-Niche and between 4.4 and 6.0 in
BDS-4 along the Gallery 04, and averaging 5.2 to 5.3 depending on whether one uses dpdt or ISIP. This
variability in shut in pressure suggests strongly that the stress tensor in the Opalinus Clay is not
homogeneous.
TR 2012-06 DS-EXPERIMENT IN SITU STRESS MEASUREMENTS
22nd July 2014 Report No. 13505170278 71
The overcoring data also gave quite variable results. The very low results of the borehole slotting can be
disregarded due to the lack of anisotropy consideration, but, as Martin and Lanyon (2003) point out, there is
no good reason to reject the undercoring unless it is incompatible with the hydraulic fracturing.
The best data in this regard are the undercoring experiments in the IS Niche and the CSIRO tests in the New
Gallery. These produced quite different results, possible because they are using different modulus values
for the analysis.
The inability of the hydraulic fracturing method to create anything other than bedding plane fractures in
Opalinus Clay, suggests that the conditions are not favourable to opening vertical fractures. This would be
the case if the vertical stress axially along a hole like BDS-4 were relatively low and the horizontal stresses
were relatively high and isotropic. This is the stress state that the CSIRO measurements for the EZ-A
experiment indicate. The CSIRO tests give the minimum stress as 5.4 MPa acting normal to the bedding.
This compares very well with the hydraulic with the BDS-4 average of 5.2 to 5.3. Furthermore, the stresses
acting in plane of the bedding are between 9.4 and 10.5. The direction of the maximum stress is not well
defined because the intermediate and the maximum stresses are very close in value. If the horizontal
stresses were very unequal there would be a very low tangential stress in the borehole wall and it should be
very easy to created vertical fractures – unless the rock is behaving non-elastically and not maintaining the
elastic stress concentration. An alternative explanation for the lack of cross-bedding fractures in the Opalinus
Clay is that the bedding planes are weak with relatively little or no cohesion.
Although the undercoring in the IS Niche and the CSIRO of the Rock Laboratory give different results, they
are closest in the vertical stress. The undercoring has the vertical stress as 6.5-8 MPa compared with the
lower value of 5.4 in the CSIRO measurement. After that the undercoring gives highly anisotropic horizontal
stresses (maximum 4.0 to 5.5 MPa and minimum 0.6 to 1.1 MPa) while the CSIRO are between 9.4 and 10.5
MPa as noted above. The direction of the minimum stress is roughly perpendicular to Mont Terri topographic
trend. As discussed below, a major feature of the stress results is the partitioning of stress between
topographic and tectonic dominated regimes. It is interesting to consider whether or not the IS Niche and the
Rock Laboratory are in these different regimes. If so, the distance between the two locations is not great,
however they do lie on either side of a major thrust fault that passes through the laboratory.
4.6 Recommendations
The state of stress at the Mont Terri underground laboratory has been studied for over fifteen years. Much
has been learned over that period of time, and this report has attempted to rationalize the results into a
common framework. Nonetheless there remain areas of uncertainty and possible inconsistencies in the
reported results. This review of stress measurement supports the following recommendations.
Complete documentation of past work. The first recommendation is to encourage all groups that have
performed stress measurements to fully document their work. In particular, assessing the deformation gauge
and CCBO results is hampered by only having documentation of summary results.
Perform additional measurements to have comparable suites of test results at different locations.
Five locations within Mont Terri have hosted stress measurement work. Each of these locations has a
different set of measurement using different orientations of holes in different rock types, including the
Opalinus Clay, which has multiple facies with different properties. If there is any stress measurement work in
the future, it may be useful to have the same data sets at the two carbonate sites. This would mean adding
some overcoring to the Park Niche site, where there is only hydraulic fracturing, and vertical-hole hydraulic
fracturing at the Ventilation Cavern site. Overcoring at the Park Niche site would provide better values for
the maximum and intermediate stresses, as the hydraulic fracturing is most reliable only for the minimum
stress. Hydraulic fracturing in a vertical hole at the Ventilation Cavern site would give increased confidence
in the direction of the maximum stress and also provide shut-in pressure data to better constrain the
minimum stress values.
Expand characterization of deformational properties. Understanding the deformational properties of the
rock is essential for (1) analysing the stress-relief methods and resolving their discrepancies, (2) for having
critical inputs to the mountain-scale geomechanical model, and (3) understanding how decametre and larger
TR 2012-06 DS-EXPERIMENT IN SITU STRESS MEASUREMENTS
22nd July 2014 Report No. 13505170278 72
scale variabilities can affect the behaviour of experiments within the laboratory. Laboratory measurements
are too small in number and scale to help with this.
The appropriate measure of deformational properties for interpreting strain relief tests comes from biaxial cell
measurements on overcores taken immediately after core removal. Young’s Modulus values should employ
the secant of the stress-strain behaviour. As pointed out by Amadei and Stefansson (1997) biaxial data can
indicate anisotropy qualitatively when triaxial stress cells are used. Future stress measurement effort should
employ biaxial measurements after overcoring, but the biaxial tests need to be complemented by laboratory
data to provide anisotropic properties, particularly in the Opalinus Clay.
Understanding deformational variability at the scale of meters to hundreds of meters is essential to
understanding the variability between stress measurements and for site geomechanics modelling.
Geophysics provides an efficient approach to obtaining these data. While the dynamic elastic constants of
geophysical measurements are not the same as the static values, geophysics provides the scale and range
variability. Full wave-form sonic logging of boreholes gives excellent profiles of property variability.
TR 2012-06 DS-EXPERIMENT IN SITU STRESS MEASUREMENTS
22nd July 2014 Report No. 13505170278 73
5.0 REFERENCES
Amadei, B., 1996, Importance of anisotropy when estimating and measuring in situ stress, Int. Jour. Rock
Mech. and Min Sci., v. 33, p. 293-325.
Amadei, B.; Stephansson, O., 1997, Rock Stress and its Measurement. London: Chapman and Hall.
Armand, G., 2003, Test plan of the EZ_A experiment, Mont-Terri Technical Note TN 2004-33
Becker, A; Werner, D., 1995, Neotectonic state of stress in the Jura Mountains. Geodinamica Acta, Vol. 8/2
1995, pp. 99-111.
Becker, A.; Blümling, P.; Müller, W.H., 1984, Rezentes Spannungsfeld in der zentralen Nordschweiz. Nagra,
Techn. Ber. NTB 84-37.
Becker, A., P. Blümling, and W. Müller, 1987, Recent stress and neotectonics in the eastern Jura Mountains,
Switzerland. Tectonophysics, v. 135, p. 277-288
Becker, A., 2000, The Jura Mountains – an active foreland fold-and-thrust belt?, Tectonophysics, v. 321, p.
381-406.
Bigarré, P., 1998, ED-B: Stress Measurement Experiment. Mont Terri Project, Technical Note 98-09.
Bigarré, P.; Lizeur, A., 1997, In-situ Stress measurement (IS-A): Results of the in-situ experiment: calculation
of the stresses. Technical Note 97-14
Blümling, P., 1986, In situ Spannungsmessung in Tiefbohrungen mit Hilfe von Bohrlochrandausbrüchen in
die Spannungverteilung in der Kruste Mitteleruropas und Australiens, Ph.D. dissertation, University of
Karlsruhe.
Bock, H., 1993, Measuring in-situ rock stress by borehole slotting, in Comprehensive Rock Engineering (J.
Hudson, ed.), Pergamon Press, v. 3, p. 433-443.
Bossart, P. and S. Wermeille, 2003, The stress field in the Mont Terri region: data compilation in Mont Terri
Project –geology, paleohydrology, and stress field of the Mont Terri Regions, reports of the FOWG Geology
serives no. 4, eds. P. Heitzmann and J-P Tripet, p. 65-92
Bredehoeft, J.D.; Wolff, R.G.; Keys, W.S.; Sutter, E., 1976,: Hydraulic fracturing to determine the regional in-
situ stress field, Piceane Basin, Colorado. Geol. Soc. Am. Bull., Vol. 87, pp. 250-258.
Cartwright, P. B., 1997, A review of recent in-situ stress measurements in United Kingdom coal measures
strata. In K. Sugawara and Y. Obara, editors, Proc. Int. Symp. on Rock Stress, Kumamoto, pages 469–474.
A. A. Balkema, Rotterdam
Daneshy, A.; Blümling, P.; Marschall, P.; Zuidema, P., 2004, Interpretation of field experiments and
observation of fracturing process, paper presented at the SPE International Symposium and Exhibition on
Formation Damage Control, Lafayett, La. 18.-20.Feb. 2004
Evans, K.; Piedevache, M.; Portmann, F., 1999,: IS-Experiment: Hydrofracture Stress Tests in boreholes
BIS-C1 and BIS-C2. Mont Terri Project, Technical Note 99-55.
Enachescu, C.; Jäggi, K.; Pine, R.J.; Schmid, A.: GS Experiment: Hydraulic fracturing in borehole BGS-2.
(2000) Mont Terri Project, Technical Note 2000-10.
Enachescu, C.; Zieger, M., 2010, Hydraulic Fracturing Tests in BDS-2 and BDS-4 at the Mt. Terri
Underground Research Facility. Mont Terri Project, Technical Note 2010-53.
Garcia, M. and Capeller, 2010, BDS-4 Full wave sonic log, Borehole log.
Garcia, M. and Pohl, C., 2010, BDS-2 Full wave sonic log, Borehole log.
TR 2012-06 DS-EXPERIMENT IN SITU STRESS MEASUREMENTS
22nd July 2014 Report No. 13505170278 74
Haimson, B.C., 1984, A comparative study of deep hydraulic fracturing and overcoring stress measurements
at six locations with particular interest for the Nevada Test Site. In Zoback, M. ed, Hydraulic Fracturing
Stress measurements, National Academy Press, p. 107-118
Hayashi, K. and Haimson, B.C., 1991, Characteristics of shut-in curves in hydraulic fracturing stress
measurements and the determination of the in situ minimum compressive stress. J.Geophys. Res., Vol. 96,
pp. 311-318
Hayashi, K.; Sakurai, I., 1989, Interpretation of hydraulic fracturing shut-in curves for tectonic stress
measurement. Int. J. Rock Mech. Min. Sci. & Geomech. Abstr., 26(6): 477-482.
Hesser, J., 2013, Rock stress measurements – experiment DS BGR-Overcoring method in BDS-3.
Presentation.
Heitzmann, P. and J.-P. Tripet (eds), 2003, Mont Terri Project – Geology, Paleohydrology and Stress Field of
the Mont Terri Region, Reports of the FOWG, Geology Series No. 4 – Berne
Hooker, V., and D. Bickel, 1974, Overcoring equipment and techniques used in rock stress determination,
US Bureau of Mines Report of Investigation RI 8616
Hubbert, M. K.,and D. G. Willis, 1957,Mechanics of hydraulic fracturing, Petroleum Transactions AIME, v.
210, p. 153-166
Jaeger, J.C.; Cook, N.G.W., 1976, Fundamentals in Rock Mechanics. Xviiii+588 pp., numerous figs. London:
Chapman and Hall.
Jaeggi, D.; Müller, P.; Nussbaum, C., 2012, DS(determination of stress) Experiment: Report about drilling
activities and the geology/hydrogeology encountered at borehole BDS-5 Location: Derrière Mont Terri,
Courgenay (Switzerland). Mont Terri Project, Technical Report 2012-05.
Jahns, E., 2011, DS-Experiment: BDS-1: Determination of the 3D total and effective stress using RACOS®,
Technical Note 2011-02.
Klaudius, J.; Gracia, M.; Fischer, D.; Pohl, C., 2011, Borehole logging in Derrière Mont Terri, in the hole
BDS-5 15th June – 01st July 2011. Logging report
Klee, G., 2012, Determination of Stress (DS) Experiment: Hydraulic fracturing stress measurements in BDS-
5 borehole at Derrière Mont Terri. Mont Terri Project, Technical Note 2011-45 rev.
König, E.; Bock, E., 1997, IS-B Experiment, Phase 2 In-Situ Stress Measurements with the INTERFELS
Borehole slotter method along boreholes BIS-B1, BIS-B2, BIS-B3. Mont Terri Project, Technical Note 97-15.
Lahaye, F., 2005, Stress measurements campaign by overcoring in the Mont Terri Laboratory using CSIRO
cells. Mont Terri Project, Technical Note 2004-86.
Leeman, E.R., 1971, The CSIRO doorstopper and triaxial rock stress measurement measuring instruments,
Rock Mechanics, v. 3, p. 25-50.
Martin, C.D.; Lanyon, G.W., 2003, Measurement of in-situ stress in weak rocks at Mont Terri Rock
Laboratory, Switzerland. Int. J. of Rock Mech. & Min. Sci., 2003, Vol. 40, pp. 1077-1088.
Nolte, K., 1986, A general analysis of fracturing pressure decline with application to three models. SPE
Formation evaluation, SPE 12941, pp. 571-583.
Pahl, A., St. Heusermann, V. Bräuer, and W. Glogger, 1989, Grimsel Test Site Rock Stress Investigations,
NAGRA Technical Report 88-39E
Rummel, F., 1987, Fracture mechanics approach to hydraulic fracturing stress measurements. Atkinson
(ed.): Fracture Mechanics of Rock, pp. 217-240. London: Academic Press.
TR 2012-06 DS-EXPERIMENT IN SITU STRESS MEASUREMENTS
22nd July 2014 Report No. 13505170278 75
Rummel, F.; Klee, G.; Weber, U., 2012, DS Experiment: DS (Determination of stress): Results from the
hydro-fracturing and hydro-jacking in BDS-1 and BDS-2 boreholes. (2012) Mont Terri Project, Technical Note
2009-43.
Rutquist, J.; Tsang, C.F.; Stephansson, O., 2000, Uncertainty in the maximum principal stress estimated
from hydraulic fracturing measurements due to the presence of the induced fracture. Int. Jour. Rock Mech.
And Min, Sci., Vol. 37, pp. 107-120.
Shin, K., 2006, AS experiment: Results from in-situ tests. Short Report about the current state of AS
experiment. Mont Terri Project, Technical Note 2006-33.
Shin, K., 2009, DS (Determination of stress) Experiment: Overcoring stress measurement by CCBO. Data
report. Mont Terri Project, Technical Note 2009-57.
Shin, K., 2013, The anisotropy and rock stress test (AS) & Determination of stress (DS)- overcoring. 2013
Presentation.
Sugawara, K. and Y. Obara, 1999, Draft ISRM suggested method for in situ stress measurement using the
compact conical-ended borehole overcoring (CCBO) technique. International Journal of Rock Mechanics and
Mining Science, vol. 36. pp. 307–322
Wermeille S., and P. Bossart, 1999, In situ stresses in the Mont Terri region data compilation, Mont Terri
Project Technical Report 99-02.
Wild, Katrin M, Linda P Wymann, Sebastian Zimmer, Reto Thoeny, and Florian Amann. “Water Retention
Characteristics and State-Dependent Mechanical and Petro-Physical Properties of a Clay Shale.” Rock
Mechanics and Rock Engineering, March 15, 2014, 1–13. doi:10.1007/s00603-014-0565-1.
Worotnicki, G., 1993, CSIRO triaxial stress measurement cell, in Comprehensive Rock Engineering (J.
Hudson, ed.), Pergamon Press, v. 3, p. 329-394.

TR 2012-06 DS-EXPERIMENT IN SITU STRESS MEASUREMENTS
22nd July 2014 Report No. 13505170278 76
TR 2012-06 DS-EXPERIMENT IN SITU STRESS MEASUREMENTS
22nd July 2014 Report No. 13505170278 77
Report Signature Page
Dr. Thomas W . Doe
Principal
Author:TD/CE/MZ
Company Registered in England No.1125149
At Attenborough House, Browns Lane Business Park, Stanton-on-the-Wolds, Nottinghamshire NG12 5BL
VAT No. 209 0084 92
Golder, Golder Associates and the GA globe design are trademarks of Golder Associates Corporation.
c:\users\tdoe\desktop\13514370278_nagra stress report review final.docx

TR 2012-06 DS-EXPERIMENT IN SITU STRESS MEASUREMENTS
22nd July 2014 Report No. 13505170278 78
APPENDIX A
22nd July 2014
Report No. 13505170278 79
APPENDIX A Test evaluation table for borehole BDS-5
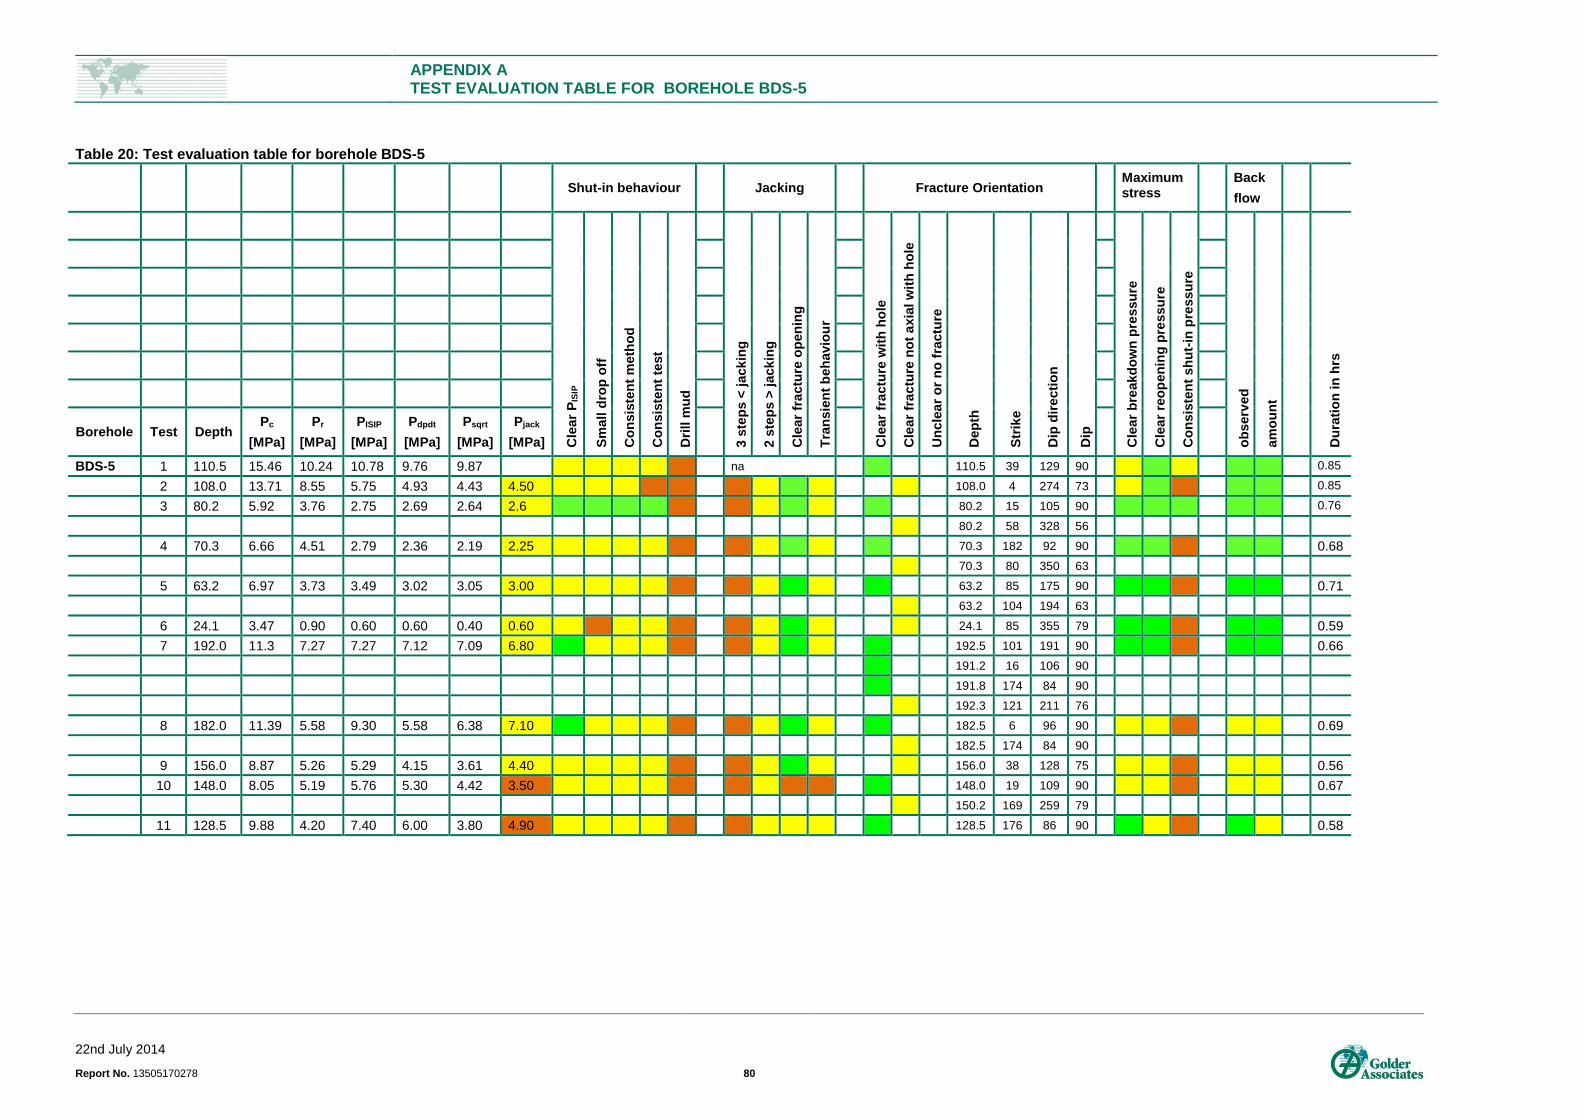
APPENDIX A TEST EVALUATION TABLE FOR BOREHOLE BDS-5
22nd July 2014
Report No. 13505170278 80
Table 20: Test evaluation table for borehole BDS-5
Shut-in behaviour Jacking Fracture Orientation Maximum
stress Back
flow
Cle
ar
PIS
IP
Sm
all
dro
p o
ff
Co
nsis
ten
t m
eth
od
Co
nsis
ten
t te
st
Dri
ll m
ud
3 s
tep
s <
jack
ing
2 s
tep
s >
jack
ing
Cle
ar
fra
ctu
re o
pen
ing
Tra
nsie
nt
beh
avio
ur
Cle
ar
fra
ctu
re w
ith
ho
le
Cle
ar
fra
ctu
re n
ot
axia
l w
ith
ho
le
Un
cle
ar
or
no
fra
ctu
re
Dep
th
Str
ike
Dip
dir
ecti
on
Dip
Cle
ar
bre
akd
ow
n p
ressu
re
Cle
ar
reo
pen
ing
pre
ssu
re
Co
nsis
ten
t sh
ut-
in p
ress
ure
ob
serv
ed
am
ou
nt
Du
rati
on
in
hrs
Borehole Test Depth Pc
[MPa]
Pr
[MPa]
PISIP
[MPa]
Pdpdt
[MPa]
Psqrt
[MPa]
Pjack
[MPa]
BDS-5 1 110.5 15.46 10.24 10.78 9.76 9.87 na 110.5 39 129 90 0.85
2 108.0 13.71 8.55 5.75 4.93 4.43 4.50 108.0 4 274 73 0.85
3 80.2 5.92 3.76 2.75 2.69 2.64 2.6 80.2 15 105 90 0.76
80.2 58 328 56
4 70.3 6.66 4.51 2.79 2.36 2.19 2.25 70.3 182 92 90 0.68
70.3 80 350 63
5 63.2 6.97 3.73 3.49 3.02 3.05 3.00 63.2 85 175 90 0.71
63.2 104 194 63
6 24.1 3.47 0.90 0.60 0.60 0.40 0.60 24.1 85 355 79 0.59
7 192.0 11.3 7.27 7.27 7.12 7.09 6.80 192.5 101 191 90 0.66
191.2 16 106 90
191.8 174 84 90
192.3 121 211 76
8 182.0 11.39 5.58 9.30 5.58 6.38 7.10 182.5 6 96 90 0.69
182.5 174 84 90
9 156.0 8.87 5.26 5.29 4.15 3.61 4.40 156.0 38 128 75 0.56
10 148.0 8.05 5.19 5.76 5.30 4.42 3.50 148.0 19 109 90 0.67
150.2 169 259 79
11 128.5 9.88 4.20 7.40 6.00 3.80 4.90 128.5 176 86 90 0.58
APPENDIX B
22nd July 2014
Report No. 13505170278 81
APPENDIX B Test evaluation table for borehole BDS-1
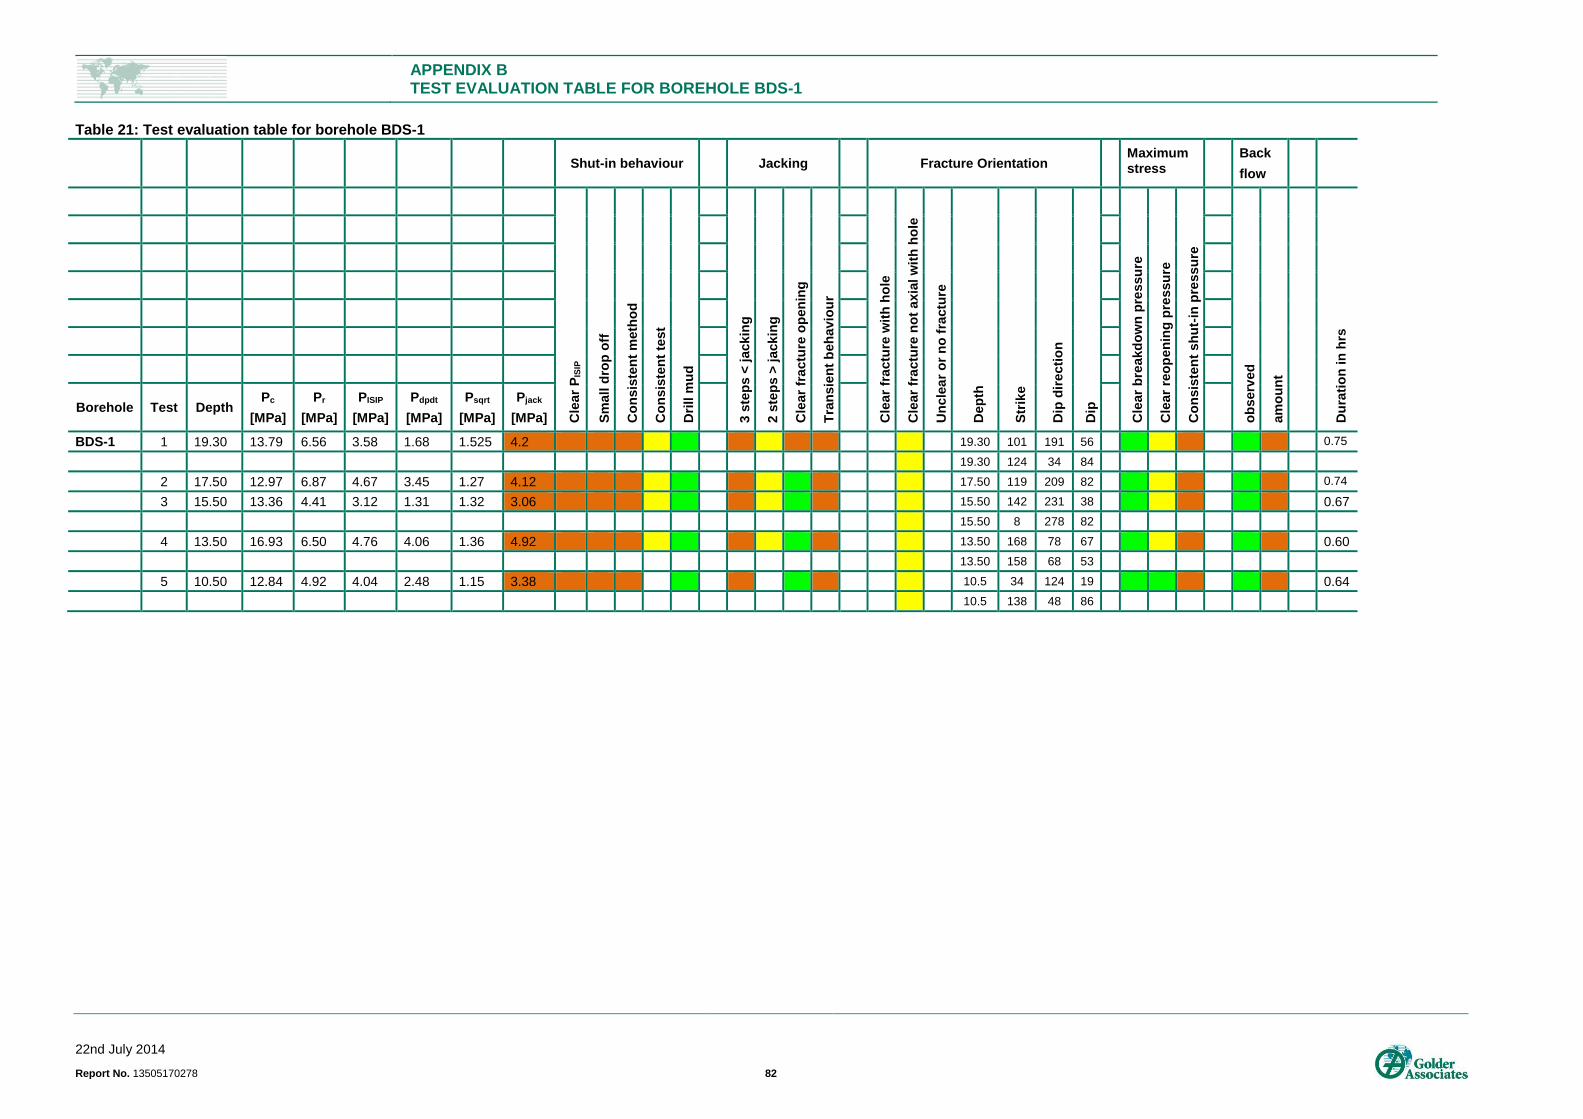
APPENDIX B TEST EVALUATION TABLE FOR BOREHOLE BDS-1
22nd July 2014
Report No. 13505170278 82
Table 21: Test evaluation table for borehole BDS-1
Shut-in behaviour Jacking Fracture Orientation Maximum
stress Back
flow
Cle
ar
PIS
IP
Sm
all
dro
p o
ff
Co
nsis
ten
t m
eth
od
Co
nsis
ten
t te
st
Dri
ll m
ud
3 s
tep
s <
jack
ing
2 s
tep
s >
jack
ing
Cle
ar
fra
ctu
re o
pen
ing
Tra
nsie
nt
beh
avio
ur
Cle
ar
fra
ctu
re w
ith
ho
le
Cle
ar
fra
ctu
re n
ot
axia
l w
ith
ho
le
Un
cle
ar
or
no
fra
ctu
re
Dep
th
Str
ike
Dip
dir
ecti
on
Dip
Cle
ar
bre
akd
ow
n p
ressu
re
Cle
ar
reo
pen
ing
pre
ssu
re
Co
nsis
ten
t sh
ut-
in p
ress
ure
ob
serv
ed
am
ou
nt
Du
rati
on
in
hrs
Borehole Test Depth Pc
[MPa]
Pr
[MPa]
PISIP
[MPa]
Pdpdt
[MPa]
Psqrt
[MPa]
Pjack
[MPa]
BDS-1 1 19.30 13.79 6.56 3.58 1.68 1.525 4.2 19.30 101 191 56 0.75
19.30 124 34 84
2 17.50 12.97 6.87 4.67 3.45 1.27 4.12 17.50 119 209 82 0.74
3 15.50 13.36 4.41 3.12 1.31 1.32 3.06 15.50 142 231 38 0.67
15.50 8 278 82
4 13.50 16.93 6.50 4.76 4.06 1.36 4.92 13.50 168 78 67 0.60
13.50 158 68 53
5 10.50 12.84 4.92 4.04 2.48 1.15 3.38 10.5 34 124 19 0.64
10.5 138 48 86
APPENDIX C
22nd July 2014
Report No. 13505170278 83
APPENDIX C Test evaluation table for borehole BDS-2
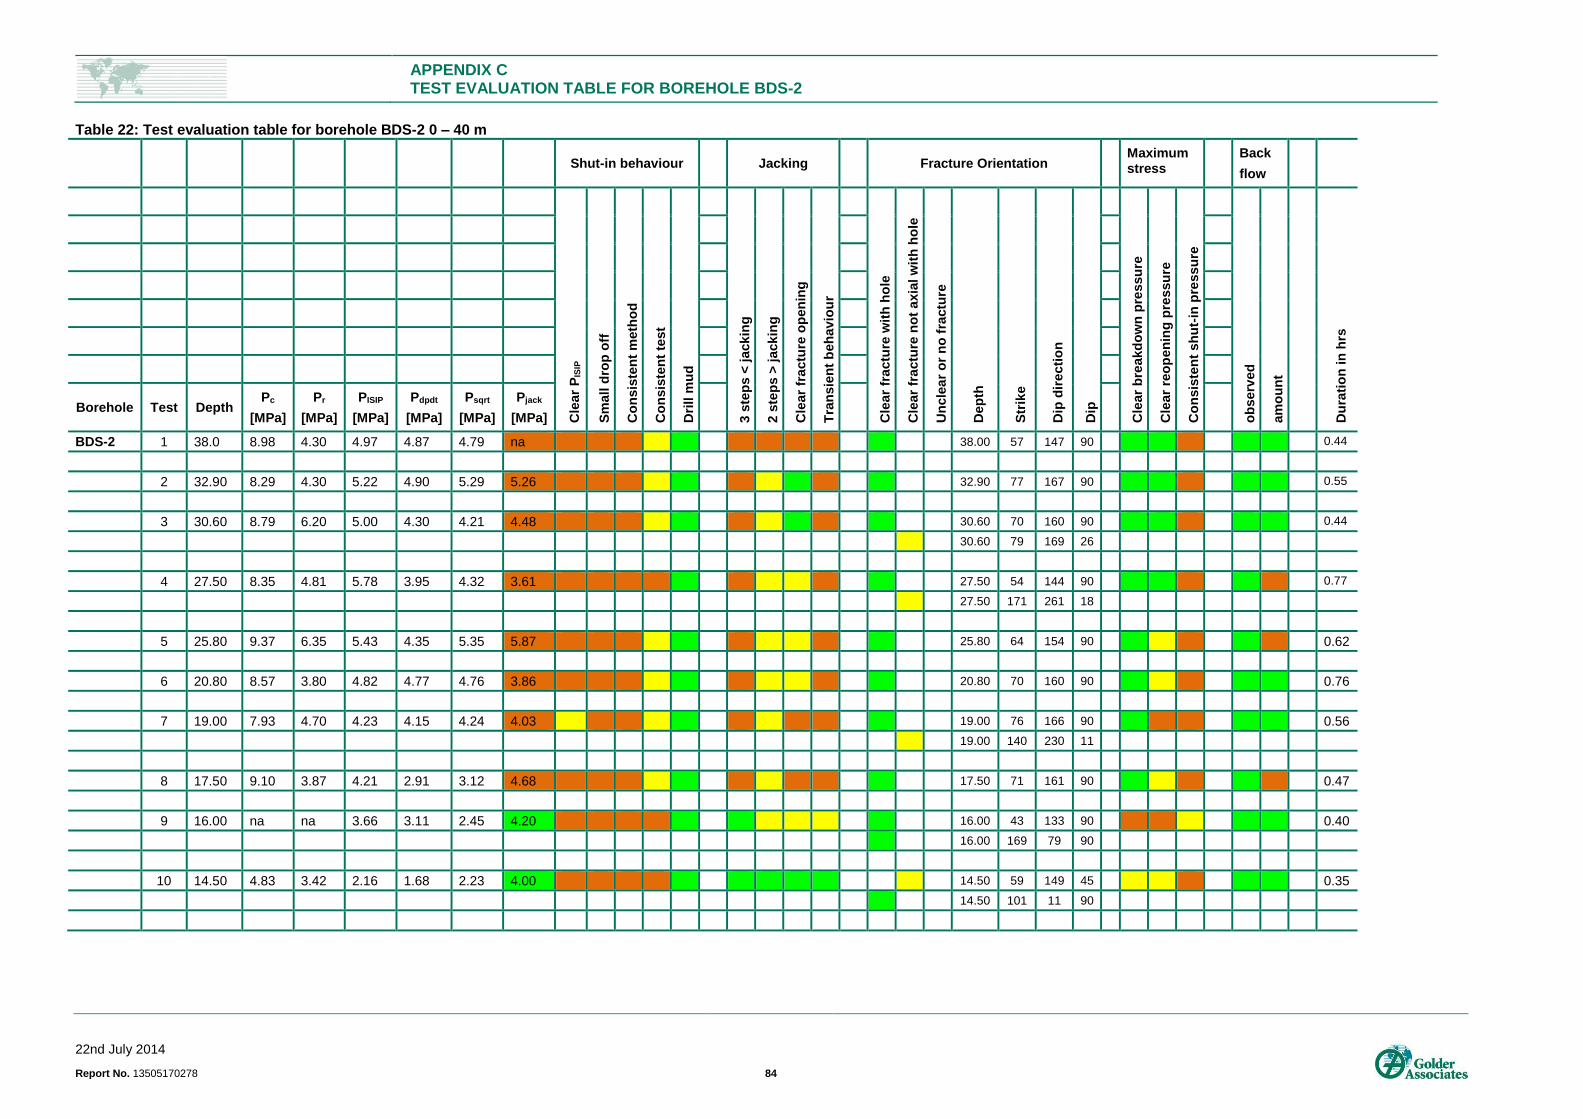
APPENDIX C TEST EVALUATION TABLE FOR BOREHOLE BDS-2
22nd July 2014
Report No. 13505170278 84
Table 22: Test evaluation table for borehole BDS-2 0 – 40 m
Shut-in behaviour Jacking Fracture Orientation Maximum
stress Back
flow
Cle
ar
PIS
IP
Sm
all
dro
p o
ff
Co
nsis
ten
t m
eth
od
Co
nsis
ten
t te
st
Dri
ll m
ud
3 s
tep
s <
jack
ing
2 s
tep
s >
jack
ing
Cle
ar
fra
ctu
re o
pen
ing
Tra
nsie
nt
beh
avio
ur
Cle
ar
fra
ctu
re w
ith
ho
le
Cle
ar
fra
ctu
re n
ot
axia
l w
ith
ho
le
Un
cle
ar
or
no
fra
ctu
re
Dep
th
Str
ike
Dip
dir
ecti
on
Dip
Cle
ar
bre
akd
ow
n p
ressu
re
Cle
ar
reo
pen
ing
pre
ssu
re
Co
nsis
ten
t sh
ut-
in p
ress
ure
ob
serv
ed
am
ou
nt
Du
rati
on
in
hrs
Borehole Test Depth Pc
[MPa]
Pr
[MPa]
PISIP
[MPa]
Pdpdt
[MPa]
Psqrt
[MPa]
Pjack
[MPa]
BDS-2 1 38.0 8.98 4.30 4.97 4.87 4.79 na 38.00 57 147 90 0.44
2 32.90 8.29 4.30 5.22 4.90 5.29 5.26 32.90 77 167 90 0.55
3 30.60 8.79 6.20 5.00 4.30 4.21 4.48 30.60 70 160 90 0.44
30.60 79 169 26
4 27.50 8.35 4.81 5.78 3.95 4.32 3.61 27.50 54 144 90 0.77
27.50 171 261 18
5 25.80 9.37 6.35 5.43 4.35 5.35 5.87 25.80 64 154 90 0.62
6 20.80 8.57 3.80 4.82 4.77 4.76 3.86 20.80 70 160 90 0.76
7 19.00 7.93 4.70 4.23 4.15 4.24 4.03 19.00 76 166 90 0.56
19.00 140 230 11
8 17.50 9.10 3.87 4.21 2.91 3.12 4.68 17.50 71 161 90 0.47
9 16.00 na na 3.66 3.11 2.45 4.20 16.00 43 133 90 0.40
16.00 169 79 90
10 14.50 4.83 3.42 2.16 1.68 2.23 4.00 14.50 59 149 45 0.35
14.50 101 11 90
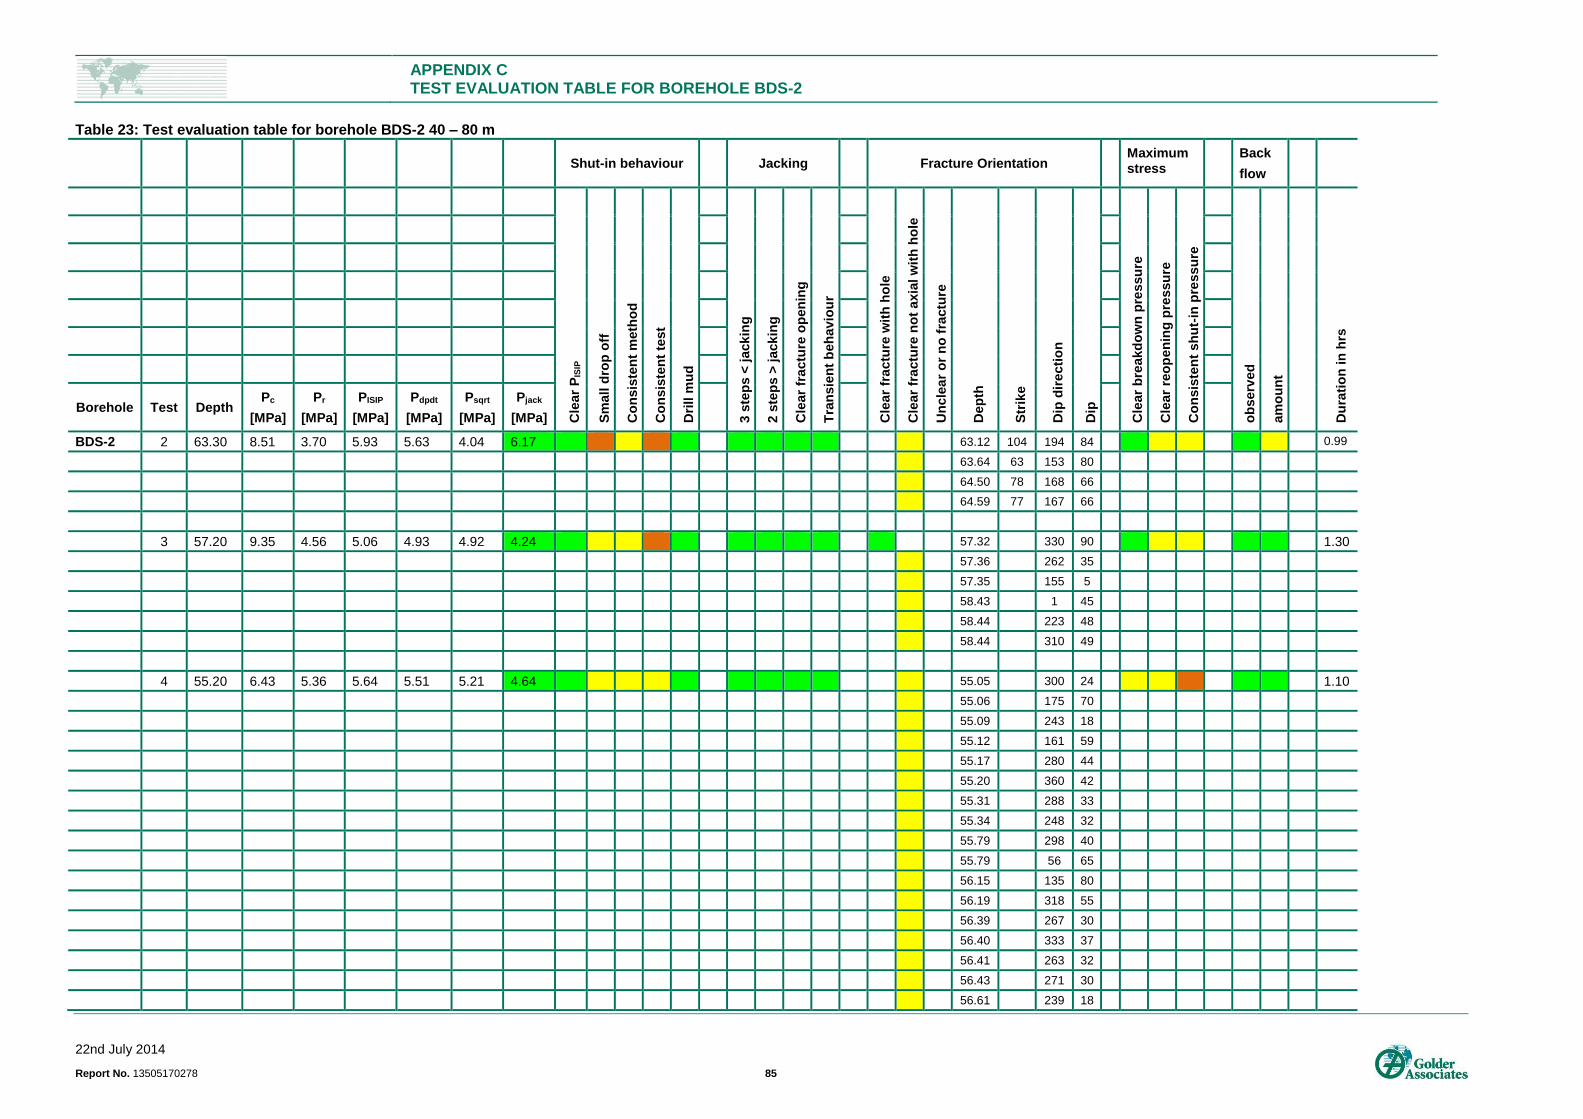
APPENDIX C TEST EVALUATION TABLE FOR BOREHOLE BDS-2
22nd July 2014
Report No. 13505170278 85
Table 23: Test evaluation table for borehole BDS-2 40 – 80 m
Shut-in behaviour Jacking Fracture Orientation Maximum
stress Back
flow
Cle
ar
PIS
IP
Sm
all
dro
p o
ff
Co
nsis
ten
t m
eth
od
Co
nsis
ten
t te
st
Dri
ll m
ud
3 s
tep
s <
jack
ing
2 s
tep
s >
jack
ing
Cle
ar
fra
ctu
re o
pen
ing
Tra
nsie
nt
beh
avio
ur
Cle
ar
fra
ctu
re w
ith
ho
le
Cle
ar
fra
ctu
re n
ot
axia
l w
ith
ho
le
Un
cle
ar
or
no
fra
ctu
re
Dep
th
Str
ike
Dip
dir
ecti
on
Dip
Cle
ar
bre
akd
ow
n p
ressu
re
Cle
ar
reo
pen
ing
pre
ssu
re
Co
nsis
ten
t sh
ut-
in p
ress
ure
ob
serv
ed
am
ou
nt
Du
rati
on
in
hrs
Borehole Test Depth Pc
[MPa]
Pr
[MPa]
PISIP
[MPa]
Pdpdt
[MPa]
Psqrt
[MPa]
Pjack
[MPa]
BDS-2 2 63.30 8.51 3.70 5.93 5.63 4.04 6.17 63.12 104 194 84 0.99
63.64 63 153 80
64.50 78 168 66
64.59 77 167 66
3 57.20 9.35 4.56 5.06 4.93 4.92 4.24 57.32 330 90 1.30
57.36 262 35
57.35 155 5
58.43 1 45
58.44 223 48
58.44 310 49
4 55.20 6.43 5.36 5.64 5.51 5.21 4.64 55.05 300 24 1.10
55.06 175 70
55.09 243 18
55.12 161 59
55.17 280 44
55.20 360 42
55.31 288 33
55.34 248 32
55.79 298 40
55.79 56 65
56.15 135 80
56.19 318 55
56.39 267 30
56.40 333 37
56.41 263 32
56.43 271 30
56.61 239 18
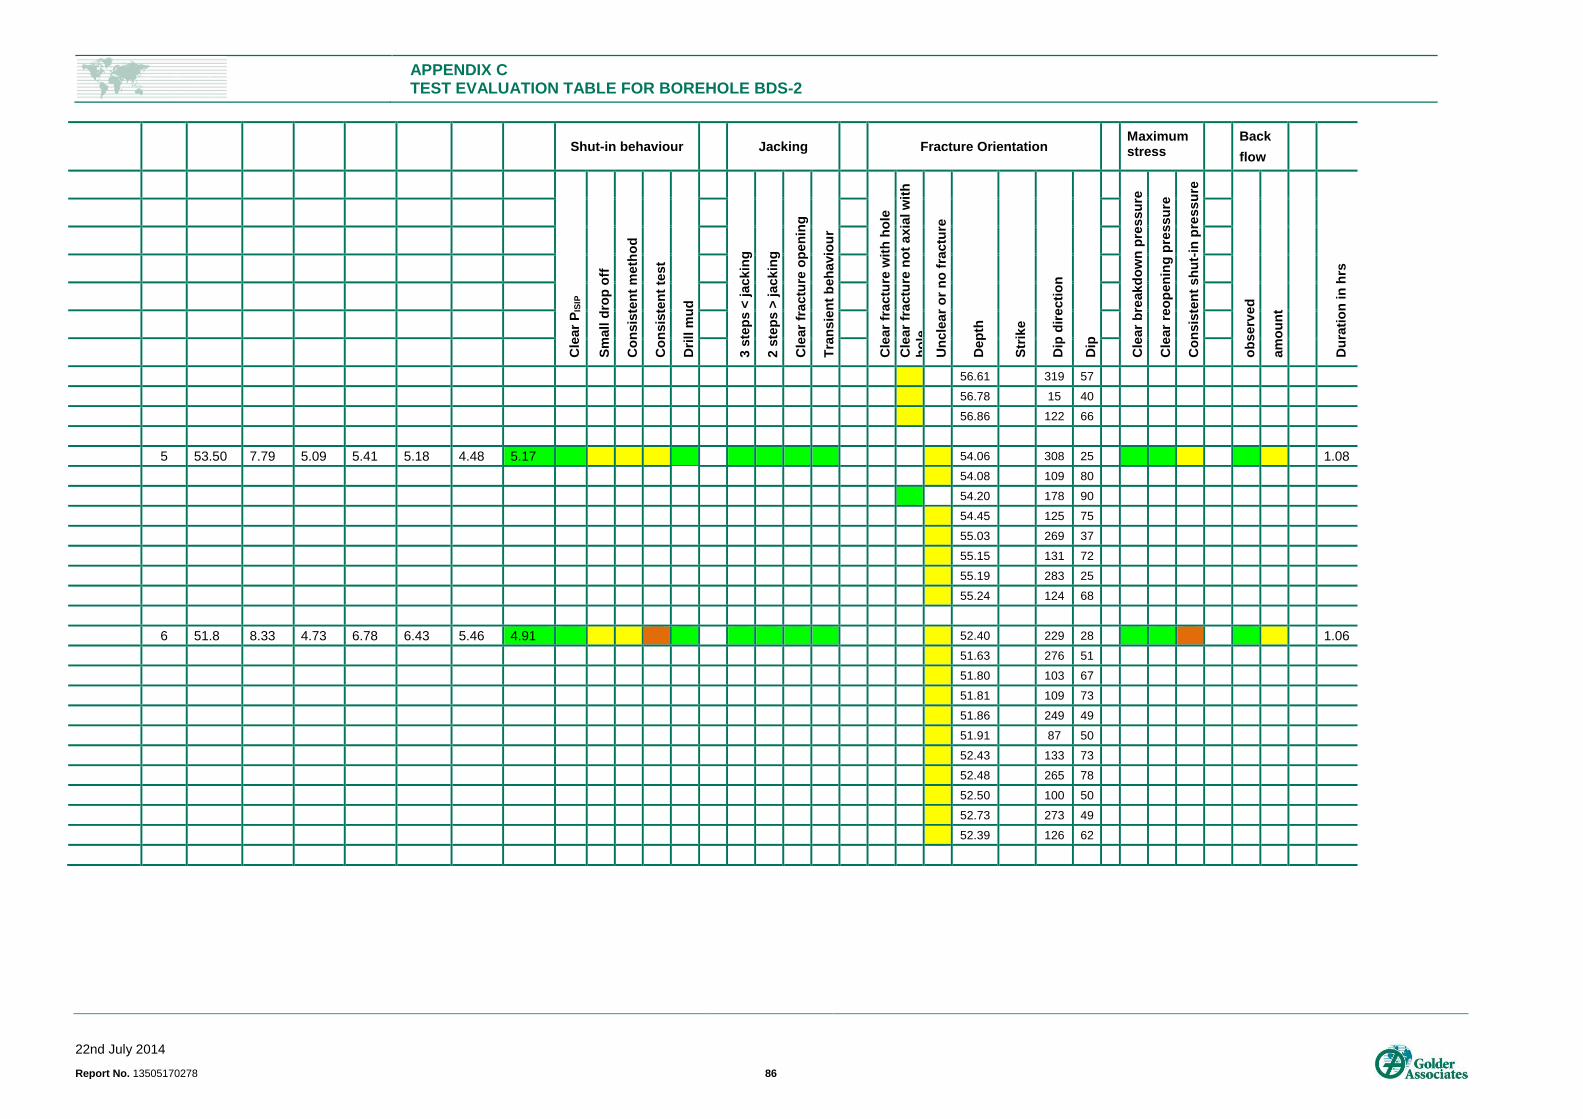
APPENDIX C TEST EVALUATION TABLE FOR BOREHOLE BDS-2
22nd July 2014
Report No. 13505170278 86
Shut-in behaviour Jacking Fracture Orientation Maximum
stress Back
flow
Cle
ar
PIS
IP
Sm
all
dro
p o
ff
Co
nsis
ten
t m
eth
od
Co
nsis
ten
t te
st
Dri
ll m
ud
3 s
tep
s <
jack
ing
2 s
tep
s >
jack
ing
Cle
ar
fra
ctu
re o
pen
ing
Tra
nsie
nt
beh
avio
ur
Cle
ar
fra
ctu
re w
ith
ho
le
Cle
ar
fra
ctu
re n
ot
axia
l w
ith
ho
le
Un
cle
ar
or
no
fra
ctu
re
Dep
th
Str
ike
Dip
dir
ecti
on
Dip
Cle
ar
bre
akd
ow
n p
ressu
re
Cle
ar
reo
pen
ing
pre
ssu
re
Co
nsis
ten
t sh
ut-
in p
ress
ure
ob
serv
ed
am
ou
nt
Du
rati
on
in
hrs
56.61 319 57
56.78 15 40
56.86 122 66
5 53.50 7.79 5.09 5.41 5.18 4.48 5.17 54.06 308 25 1.08
54.08 109 80
54.20 178 90
54.45 125 75
55.03 269 37
55.15 131 72
55.19 283 25
55.24 124 68
6 51.8 8.33 4.73 6.78 6.43 5.46 4.91 52.40 229 28 1.06
51.63 276 51
51.80 103 67
51.81 109 73
51.86 249 49
51.91 87 50
52.43 133 73
52.48 265 78
52.50 100 50
52.73 273 49
52.39 126 62
APPENDIX D
22nd July 2014
Report No. 13505170278 87
APPENDIX D Test evaluation table for borehole BDS-4
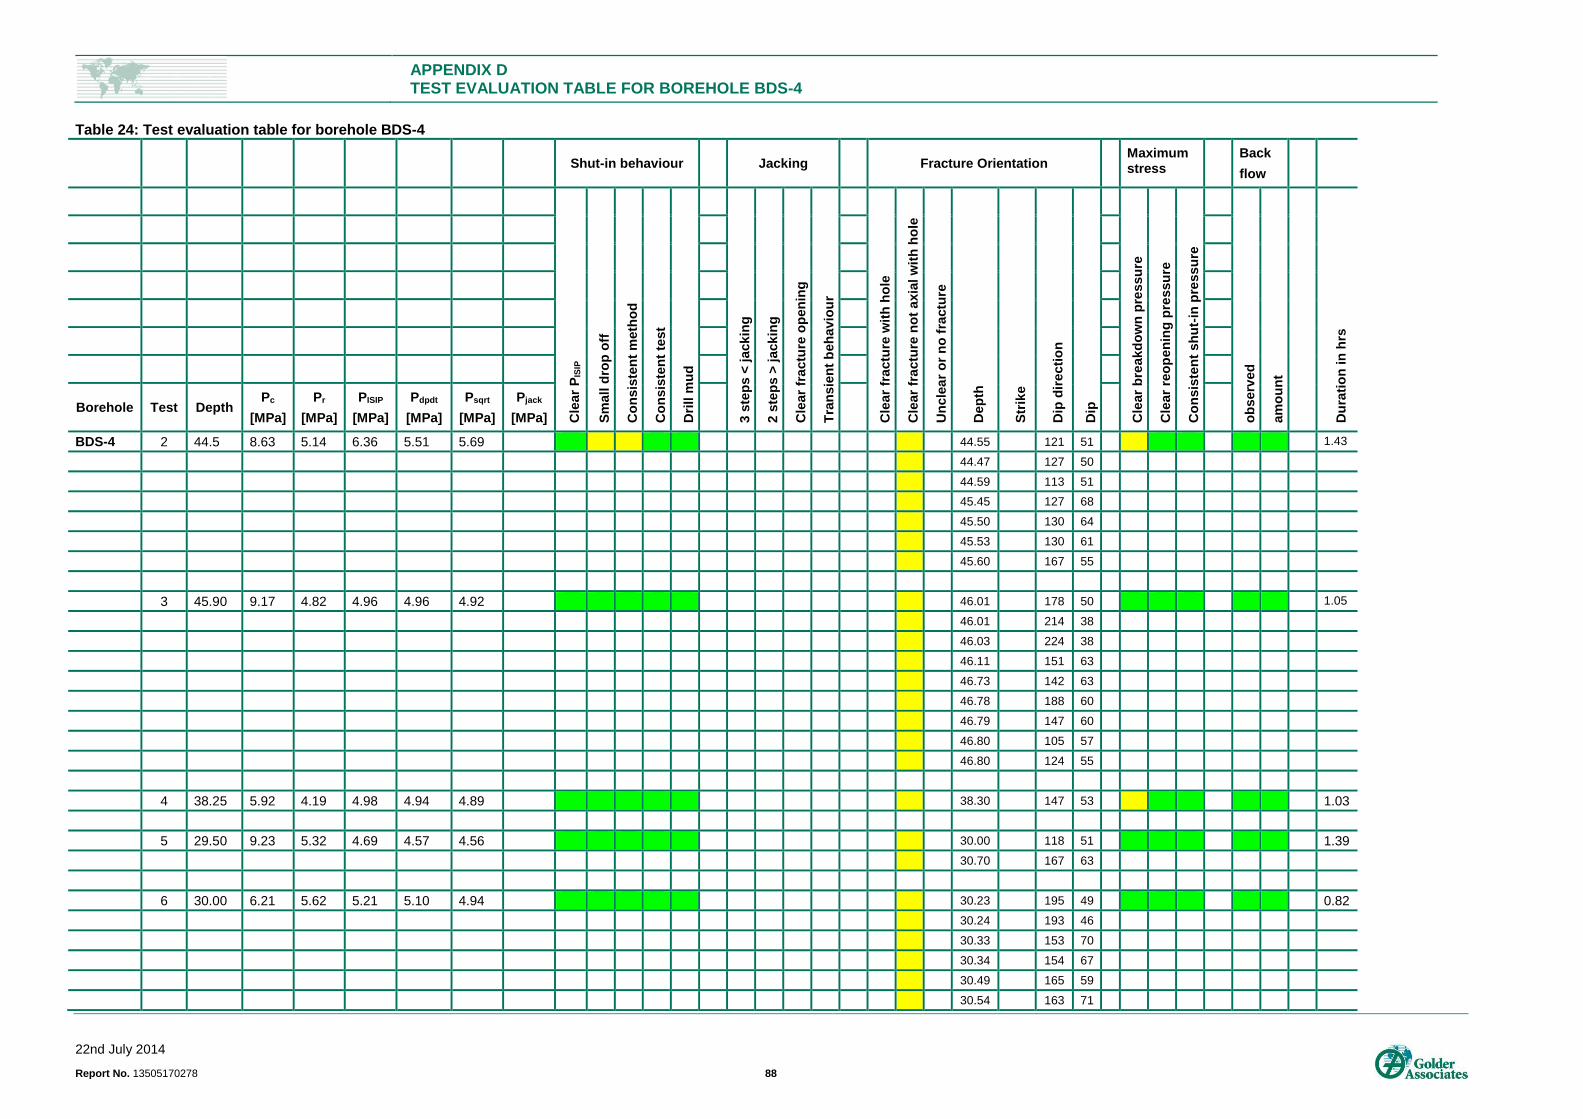
APPENDIX D TEST EVALUATION TABLE FOR BOREHOLE BDS-4
22nd July 2014
Report No. 13505170278 88
Table 24: Test evaluation table for borehole BDS-4
Shut-in behaviour Jacking Fracture Orientation Maximum
stress Back
flow
Cle
ar
PIS
IP
Sm
all
dro
p o
ff
Co
nsis
ten
t m
eth
od
Co
nsis
ten
t te
st
Dri
ll m
ud
3 s
tep
s <
jack
ing
2 s
tep
s >
jack
ing
Cle
ar
fra
ctu
re o
pen
ing
Tra
nsie
nt
beh
avio
ur
Cle
ar
fra
ctu
re w
ith
ho
le
Cle
ar
fra
ctu
re n
ot
axia
l w
ith
ho
le
Un
cle
ar
or
no
fra
ctu
re
Dep
th
Str
ike
Dip
dir
ecti
on
Dip
Cle
ar
bre
akd
ow
n p
ressu
re
Cle
ar
reo
pen
ing
pre
ssu
re
Co
nsis
ten
t sh
ut-
in p
ress
ure
ob
serv
ed
am
ou
nt
Du
rati
on
in
hrs
Borehole Test Depth Pc
[MPa]
Pr
[MPa]
PISIP
[MPa]
Pdpdt
[MPa]
Psqrt
[MPa]
Pjack
[MPa]
BDS-4 2 44.5 8.63 5.14 6.36 5.51 5.69 44.55 121 51 1.43
44.47 127 50
44.59 113 51
45.45 127 68
45.50 130 64
45.53 130 61
45.60 167 55
3 45.90 9.17 4.82 4.96 4.96 4.92 46.01 178 50 1.05
46.01 214 38
46.03 224 38
46.11 151 63
46.73 142 63
46.78 188 60
46.79 147 60
46.80 105 57
46.80 124 55
4 38.25 5.92 4.19 4.98 4.94 4.89 38.30 147 53 1.03
5 29.50 9.23 5.32 4.69 4.57 4.56 30.00 118 51 1.39
30.70 167 63
6 30.00 6.21 5.62 5.21 5.10 4.94 30.23 195 49 0.82
30.24 193 46
30.33 153 70
30.34 154 67
30.49 165 59
30.54 163 71
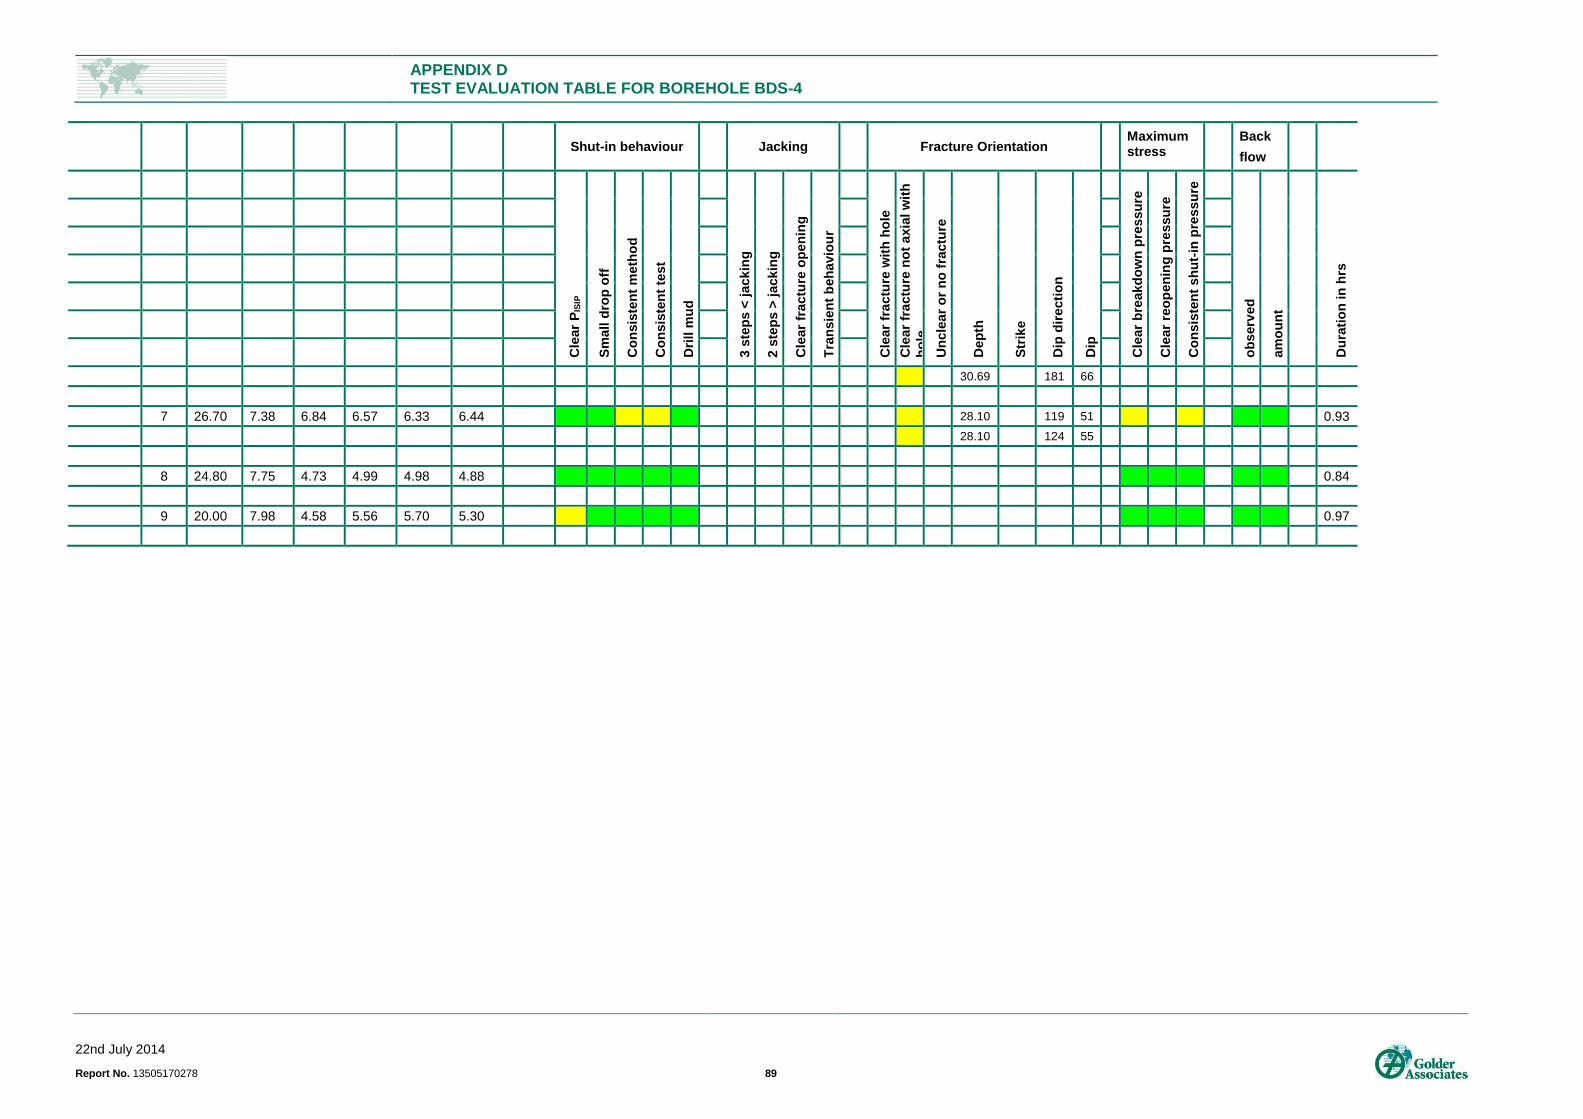
APPENDIX D TEST EVALUATION TABLE FOR BOREHOLE BDS-4
22nd July 2014
Report No. 13505170278 89
Shut-in behaviour Jacking Fracture Orientation Maximum
stress Back
flow
Cle
ar
PIS
IP
Sm
all
dro
p o
ff
Co
nsis
ten
t m
eth
od
Co
nsis
ten
t te
st
Dri
ll m
ud
3 s
tep
s <
jack
ing
2 s
tep
s >
jack
ing
Cle
ar
fra
ctu
re o
pen
ing
Tra
nsie
nt
beh
avio
ur
Cle
ar
fra
ctu
re w
ith
ho
le
Cle
ar
fra
ctu
re n
ot
axia
l w
ith
ho
le
Un
cle
ar
or
no
fra
ctu
re
Dep
th
Str
ike
Dip
dir
ecti
on
Dip
Cle
ar
bre
akd
ow
n p
ressu
re
Cle
ar
reo
pen
ing
pre
ssu
re
Co
nsis
ten
t sh
ut-
in p
ress
ure
ob
serv
ed
am
ou
nt
Du
rati
on
in
hrs
30.69 181 66
7 26.70 7.38 6.84 6.57 6.33 6.44 28.10 119 51 0.93
28.10 124 55
8 24.80 7.75 4.73 4.99 4.98 4.88 0.84
9 20.00 7.98 4.58 5.56 5.70 5.30 0.97

Golder Associates GmbH
Vorbruch 3
29227 Celle
Germany
T: [+49] 5141 98960
Caption Text