technical efficiency, technological change and total factor productivity growth in chinese...
TRANSCRIPT
MPRAMunich Personal RePEc Archive
Technical efficiency, technological changeand total factor productivity growth inMalaysian manufacturing sector
Jajri, Idris and Ismail, Rahmah
University of Malaya
2006
Online at http://mpra.ub.uni-muenchen.de/1956/
MPRA Paper No. 1956, posted 07. November 2007 / 02:07
1
Technical Efficiency, Technological Change and Total Factor Productivity Growth in Malaysian Manufacturing Sector
Associate Profesor Dr. Idris Jajri
Faculty of Economics and Administration University of Malaya
Kuala Lumpur, Malaysia Profesor Dr. Rahmah Ismail
Faculty of Economics and Business Universiti Kebangsaan Malaysia
Bangi Selangor e-mail: [email protected]
Absrtact The manufacturing sector is becoming more important for the Malaysia economy. The contribution of output and employment from this sector is continuously increasing since the 1980 an, except for certain period when an economy experiences recession. Viewing from its capacity to spearhead economic growth the government has given emphasis to the manufacturing sector in achieving industrialized nation by year 2020. It is a claim that productivity for this sector had not yet achieved optima level and in certain years, the growth of productivity was smaller than the growth of wages. Even though the concept of productivity usually referred to labour productivity, this concept is very much related to total factor productivity (TFP). This paper attempts to analysis trend of, technical efficiency, technological change and TFP growth in the Malaysian manufacturing sector. The analysis is based on data from the Industrial Manufacturing Survey of 1985 to 2000 collected by the Department of Statistics Malaysia using Data Envelopment Analysis (DEA). The results show that during the period under study, TFP growth is increasing and the major contribution of TFP growth in technical efficiency. Nevertheless, technological change show increasing trend over time. The industries that experienced high technical efficiency are food, wood, chemical and iron products. However, for food and wood industries technical progress is higher than technical progress. The other industry that shows larger technical progress than technical efficiency is textile industry but both values are below unity. I Introduction The structure of the Malaysian economy has achieved a remarkable change after
independence in 1957. It has been transformed from an agriculture-based economy,
which heavily reliant on primary commodities production for exports to a manufacturing-
based economy. The share of the agriculture sector in the gross domestic product (GDP)
dropped from 29 percent in 1970 to 13 percent in 1996 and further to 8 percent in 2005.
On the other hand, the share of the manufacturing sector jumped from 14 percent in 1970
to 35 percent in 1996 and 40 percent in 2005 (Ministry of Finance, 2004).
Consequently, a commendable structural change in employment has been witnessed by a
drop in agricultural jobs from 53 percent in 1970 to 16 in 1996, 18 percent in 2000 but
13.3 percent in 2004. All other sectors of the economy have experienced impressive

2
increase in their shares of employment especially the manufacturing industry, whose
share increased from 8.7 percent in 1970 to 30 percent in 1996 and 29.1 percent in 2004.
Another important structural change has been achieved in the export composition, where
the manufacturing share increased sharply from 12 percent in 1970 to 82 percent in 1996
and 82.6 percent in 2004. The share of the major agricultural products exports decreased
from 55 percent in 1970 to 9 percent in 1996 and further 4 percent in 2004.
The manufacturing sector has now become the main contributor to the Malaysian GDP
superseding the agricultural sector. Accordingly, the structure of employment has
changed from concentration on agricultural activities to manufacturing industries and
high labour intensive industries towards high capital-intensive industries.
A combination of factors viz. improved productivity of resources, appropriate
trade strategies, favorable external environment and sound macro-economic management,
contributed to rapid and sustained economic growth and structural transformation of the
economy. Structural transformation of the economy was even more rapid in the 1980s
and 1990s. The early 1980s witnessed the start of a heavy industrialization drive and a
second round of import substitution following a successful export-oriented
industrialization strategy implemented from the beginning of the 1970s. In the 1990s
there was a shift in development emphasis towards total factor productivity growth (TFP)
growth (Malaysia, 2001)The Seventh Malaysia Plan). However, the economic recession
of 1998 as a result of The East Asian Financial Crisis exposed some of the major
weaknesses of the Malaysian economy. Among the weaknesses exposed were: over-
dependence on bank loans as a source of financing, FDI and short-term capital flows to
finance growing current accounts deficits, and on imports of intermediate and capital
goods for the manufacturing sector.
It is evident that Malaysia's manufacturing industry relies heavily on foreign investment.
The economic growth which is driven by inputs and mainly new investments and capital
accumulation is inevitably subject to diminishing returns to scale and may not be
sustainable in the long run (Kim and Lau 1994). Hence, the government is now pursuing
the economic growth through productivity improvement and productivity driven
strategies that emphasize on enhancing TFP growth rather than investment driven growth.
The transition from a production-based economy (P-economy) to a knowledge-based

3
economy (K-economy) implies that the manufacturing industry will face a new set of
challenges.
This paper calculates output-oriented Malmquist indices of Total Factor
Productivity (TFP) growth, technological change (TECHCH), and technical efficiency
change (EFFCH) of the Malaysian manufacturing industries. This paper attempts to
answer the following questions: (1) what are the sources of TFP growth in the Malaysian
manufacturing industries from 1985 to 2000? (2) how is the trend of TFP growth in
selected industries over the period covered? This paper is organized into five sections.
Section II highlights the literature reviews that related to this study. Section III discusses
the Data Envelopment Analysis (DEA) framework and model followed by source of data
in. Section IV. Section V analyses the empirical results from the estimation and Section
IV is conclusions and policy implications.
II Review of Literature
The majority of early studies on productivity focused on input productivity such as labour
or capital as a measure of input efficiency. An increase in the level of productivity
reflects an increase in the efficiency of inputs. Hence, the same level of inputs can
produce higher output level, which means that cost of production reduces. In other
words, it reflects an improvement in the quality of inputs. In general, there are several
factors affecting productivity such as level of technology and socio-demographic (Bhatia,
1990). Other factors like human resource development (HRD), human resource
management (HRM), institutional restructuring may also influence productivity. Bhatia
(1990) argued that lower level of technology and unstable socio-demographic changes
causing low productivity in India as compared to the United States and the United
Kingdom. In his study of manufacturing sector using 1965-1985 data, it was shown that
factor efficiency was influenced by factor of production, workplace and working
condition, socio-economic and socio-politics.
Technological advancement is closely related to capital intensity. Accordingly, in
capital- intensive firms, productivity may be higher. For example, Hishashi (1991) found
that in Japan the contribution of capital to productivity growth was larger in the capital-

4
intensive industry as compared with the labour-intensive industry. Another important
determinant of productivity is capital-labour ratio. In fact, this ratio is frequently used as
an indicator of level of technology where a higher capital-labour ratio is associated with
higher level of technology. In the United Kingdom, for example, between the year 1980
and 1986, a study in 81 firms showed that productivity increased by 4.7 per cent. Of this
2.2 per cent was due to the growth of capital-labour ratio (Haskel and Martin 1993).
Further, this study revealed that a decrease in skilled labour by 2.63 per cent led to
productivity reduction by 0.7 per cent each year. In other words, if there was no
reduction in the number of skilled labour, productivity would have increased higher than
4.7 per cent to achieve 5.4 per cent.
Overtime the concept of total factor productivity (TFP) growth is more
emphasized in research. The advantage of this concept relies on its ability to explain
productivity for the whole inputs used in the production process. TFP can also reflect
technological progress that takes place in a country. Even though TFP growth does not
merely mean technological improvement, but also improvement in the quality of inputs
or efficiency due to other factors like HRD and HRM, many researchers argue that TFP
growth is an approximate measure of technological advancement (Solow, 1957; Katz,
1969; Abdulkhadirin and Pickles, 1990). Therefore, many researchers use TFP growth
that obtains from the residual of the production function as a measure of technology. Katz
calculated residual factors to show the contribution of technological progress to output
and labour productivity growth in Argentina in the period 1946-1961. He concluded that
capital was the major determinant of labour productivity besides TFP growth.
Abdulkhadirin and Pickles (1990) looked at the economic growth in Iraq and found that
apart from technological improvement experienced by this country, capital was still the
main contribution to output growth.
The latest empirical research on productivity includes the effect of technical
efficiency (TE) change as a major component of TFP growth, the frontier approach will
be essential in this concern. The importance of the frontier approach comes from its
ability to decompose TFP growth into many components. Such components could be

5
stated as TE change and Technological Progress (TP) as proposed by Nishimizu and Page
(1982) or TE change, TP and scale effect as proposed by Lansink, (2000). Chuang (1996)
studied the source of growth in Taiwan’s manufacturing industry and found that a major
part of external effects among two digits industries was generated by trade-induced
learning, which accounted for about three-fourth of the measured external effect. The
study showed that the trade- induced learning variable explained most of TFPG in that
sector accounted over 40% of Taiwan manufacturing output growth.
Mahadevan (2002a) using the South Korean Manufacturing Industry data of
1980-1994 estimated TFP growth in four industries, namely food, textile, chemical and
fabricated metal using the stochastic frontier approach. She found the output growth in
these four industries was increasingly productivity-driven. The export oriented industry
experienced higher contribution of TFP growth. Further, her study showed that in the
light industry like food and textile, technical efficiency change was negative but in the
heavy industry, ie, chemical and fabricated metal, it was positive.
Study by Yanrui Wu (2000) in all APEC countries using the stochastic frontier
approach showed that TFP growth was positive for all countries. This study includes
seven APEC developed countries and nine APEC developing countries and found that
APEC developed countries performed better in terms pf TFP growth contribution. In all
countries, the study found that technical progress was a dominant contribution of TFPG,
while the technical change even though positive but very small.
In Singapore, there were few studies on TFP growth in the manufacturing sector
using stochastic frontier approach (Tay 1992; Mahadevan 2000). Other studies in
Singapore that measure total TFP growth were done by Young (1992), Krugman (1994)
and Leung (1997). The results of these studies showed that the contribution of TFP
growth to the output was still low.
Earlier studies of TFP growth in Malaysia were more concern about the
contribution of TFP growth to the output growth. Maisom & Arshad (1992) using data of
manufacturing survey in Malaysia from 1973-1989 showed that TFP growth increased
each year but its contribution to the manufacturing sector growth was still small. Further
in their study, it was shown that TFP growth was larger in the foreign owned firms as
6
compared to the local ones. They concluded that foreign investors had achieved higher
benefits from technological progress in Malaysia.
Using the same data source, Nik Hashim (1998) focused his study on the
contribution of TFP growth to output or productivity growth in the manufacturing sector
in Malaysia as a whole between the year 1985 and 1994. No attempt was made to
segregate the data by industrial size or even by types of sub-industries. His study
revealed that capital was a major determinant of productivity growth, and TFP growth
still played a very minimal role.
Rahmah and Idris (2000) studied the contribution of TFP growth to output of the
large scale enterprises in Malaysia using data of 1982-1994. They found that more capital
intensive industries like chemical, non-metallic mineral products, transport equipment
and rubber products enjoyed higher TFP growth. Whereas TFP growth in the light
industries likes food, textiles and plastics products was quite low. Rahmah and Idris
(2001) studied TFP growth in the small and medium scale industries using the same
source of data as the earlier study. They found that the heavy industry like non-metallic
mineral products, still maintain high TFP growth but TFP growth was higher in the light
industries like food and plastics products as well in the export oriented labour intensive
industries like electrical and electronics industry.
Rahmah and Nyet Fung (2002) using data of the Malaysian Manufacturing
Survey of 1981-1994 studied contributin of TFP growth in six manufacturing industries.
They adopted the stochastic frontier approach and found that in the small scale
enterprises the technical efficiency change decreased but it increased in the medium scale
industries. However, the contribution of technical progress was positive in both industrial
sizes. TFP growth was higher in the medium scale industries but the contribution of TFP
growth to output growth was higher in the small scale.
Mahadevan (2001) studied TFP growth using stochastic frontier approach using
the Malaysian Manufacturing Survey data of 1981-1996. She divided the data into three
periods namely 1981-1984, 1987-1990 and 1991-1996. She found that the contribution of
input has increased over time but the contribution of TFP growth was negative in the last

7
two periods that due to different reasons.. During the second period, the negative
contribution of TFP growth was due to a negative contribution of technical progress,
whereas during the third period it was due to a negative change in technical efficiency.
Using the same data set, Mahadevan (2002b) estimated TFP growth using data
envelopment analysis (DEA) technique. She found that all 28 industries at three digits
level except the petroleum industry enjoyed a positive TFP growth. Most TFP growth
came from technical efficiency change, ie the catching effect rather than technical
change/progress or frontier effect. This means that the learning-by-doing benefits or the
actual diffusion in the knowledge of technology use outweighed the gains from the use of
better technology and capital equipment. Further Mahadevan (2002c) compare both
methods of calculating TFP growth, ie, the parametric method (Stochastic frontier) with
the non-parametric method (DEA). Even though the results were different, both methods
showed a decline of TFP growth after 1990, increasing contribution of technical change
and declining contribution of technical efficiency change.
Zulridah et al. (2004) studied TFP growth in the ICT industry in Malaysia using DEA
approach. They found that for the whole sector under study TFP growth was greater than
unity with rate of growth at 7.0%. Most of the TFP growth is from technological progress
which grows at about 6.9%, while the growth of technical efficiency was very low at
about 0.1%. They also found that TFP growth increased over time except for the period
of 1989 to 1992. Further, the study found that industries under study experiencing a
positive growth with greater contribution from technological progress except radio and
industry.
Nik Hashim and Basri (2004) measured TFP growth of Malaysian manufacturing
sector using stochastic frontier approach with translog production function. They found
that between 1990 and 2000 TFP growth was very low for some industries at below unity
or even negative for E&E, transport and food industries. The positive growth is achieved
in chemical, textiles, rubber, petroleum and wood. This study found that technical
efficiency was a major contribution of TFP growth except in chemical, paper and

8
petroleum. The highest technological progress was attained in petroleum. A highest
technical efficiency is in electrical and electronic industry, while the lowest in food.
III DEA Framework and Model
The Data Envelopment Analysis (DEA) is a special mathematical linear programming model and test to assess efficiency and productivity. It allows use of panel data to estimate changes in total factor productivity and breaking it down into two components namely, technological change (TECHCH) and technical efficiency change (EFFCH).
TFP growth measures how much productivity grows or declines over time. When there are more outputs relative to the quantity of given inputs, then TFP has grown or increased. TFP can grow when adopting innovations such as electronics, improved design, or which we call "technological change" (TECHCH). TFP can also grow when the industry uses their existing technology and economic inputs more efficiently; they can produce more while using the same capital, labor and technology, or more generally by increases in "technical efficiency" (EFFCH). TFP change from one year to the next is therefore comprised of technological change and changes in technical efficiency.
This study uses the output-oriented model of DEA-Malmquist to put much weight on the expansion of output quantity out of a given amount of inputs. Therefore, TFP index is a ratio of the weighted aggregate outputs to weighted aggregate inputs, using multiple outputs and inputs.
Input and output quantities of industries are sets of data used to construct a piece-wise frontier over the data points. Efficiency measures are then calculated relative to this frontier that represents an efficient technology. The best-practice industry determines the production frontier, that is, those that have the highest level of production given a level of economic inputs. Points that lie below the piece-wise frontier are considered inefficient while points that lie on or above the frontier are efficient.
Since many inputs are used, and shared outputs may be produced, the Malmquist approach was developed to combine inputs and outputs and then measure changes. The

9
Malmquist index measures the total factor productivity change (TFPCH), between two data points over time, by calculating the ratio of distances of each data points relative to a common technology.
Fare et al. (1994) specify the Malmquist productivity change index as:
21
1,1
,
111
1
1 ])(
)(),(
),([),,(++++
+
+
+ =tt
to
ttto
ttto
ttto
ttto xydxyd
xxydxydxyym (1)
The above equation represents the productivity of the production point (xt+1,yt+1) relative to the production point (xt,yt). This index uses period t technology and the other period t+1 technology. TFP growth is the geometric mean of two output-based Malmquist-TFP indices from period t to period t+1. A value greater than one will indicate a positive TFP growth from period t to period t+1 while, a value lesser than one will indicate a decrease in TFP growth or performance relative to the previous year.
The Malmquist index of total factor productivity change (TFPCH) is the product of technical efficiency change (EFFCH) and technological change (TECHCH) as expressed (Cabanda, 2001):
TFPCH = EFFCH x TECHCH (2)
The Malmquist productivity change index, therefore, can be written as:
M0 (yt+1, xt+1, yt, xt) = EFFCH x TECHCH (3)
Technical efficiency change (catch-up) measures the change in efficiency between current (t) and next (t+1) periods, while the technological change (innovation) captures the shift in frontier technology.
As expressed by Squires and Reid (2004), technological change (TECHCH) is the development of new products or the development of new technologies that allows methods of production to improve and results in the shifting upwards of the production frontier. More specifically, technological change includes both new production processes, called process innovation and the discovery of new products called product innovation. With process innovation, firms figure out more efficient ways of making existing

10
products allowing output to grow at a faster rate than economic inputs are growing. The cost of production declines over time with process innovations --new ways of making things.
Technical efficiency change, on the other hand, can make use of existing labor, capital, and other economic inputs to produce more of same product. An example is increase in skill or learning by doing. As producers gain experience at producing something they become more and more efficient at it. Labor find new ways of doing things so that relatively minor modifications to plant and procedures can contribute to higher levers of productivity.
IV Data Source
Seven industries were chosen: food, beverages and tobacco; textile, wearing apparel and
leather; wood and wood products; paper and paper products; chemicals, petroleum, coal,
rubber and plastic products; non-metallic mineral and iron and steel products industries.
This study used annual time series data for the above mentioned industries for the period
1984-2000. Data on capital, labour and value added outputs were compiled from the
Annual Survey of Manufacturing Industries, published by the Department of Statistics,
Malaysia. As data on capital expenditure was not published, fixed capital stock was used
instead and for labour, the number of workers employed was used. The value added
variable was deflated by the GDP deflator for the manufacturing sector and the capital
variable was deflated using the gross domestic fixed capital formation deflator. Both
deflators with 1987 as the base year were obtained from The Economic Report, published
by the Ministry of Finance, Malaysia. Table 1 provides summary statistics on the
manufacturing industries.
11
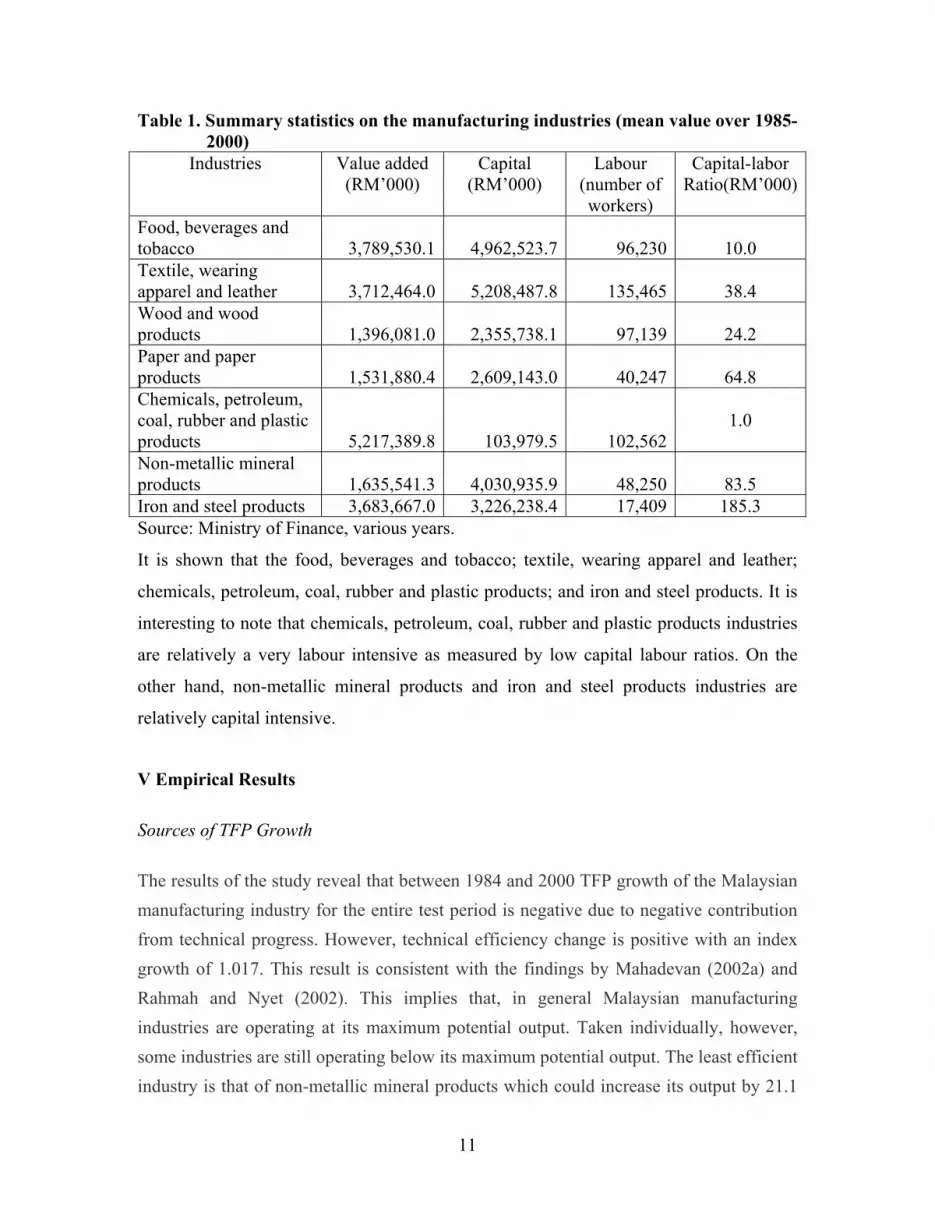
Table 1. Summary statistics on the manufacturing industries (mean value over 1985- 2000)
Industries Value added (RM’000)
Capital (RM’000)
Labour (number of workers)
Capital-labor Ratio(RM’000)
Food, beverages and tobacco 3,789,530.1 4,962,523.7 96,230
10.0
Textile, wearing apparel and leather 3,712,464.0 5,208,487.8 135,465
38.4
Wood and wood products 1,396,081.0 2,355,738.1 97,139
24.2
Paper and paper products 1,531,880.4 2,609,143.0 40,247
64.8
Chemicals, petroleum, coal, rubber and plastic products 5,217,389.8 103,979.5 102,562
1.0
Non-metallic mineral products 1,635,541.3 4,030,935.9 48,250
83.5
Iron and steel products 3,683,667.0 3,226,238.4 17,409 185.3 Source: Ministry of Finance, various years.
It is shown that the food, beverages and tobacco; textile, wearing apparel and leather;
chemicals, petroleum, coal, rubber and plastic products; and iron and steel products. It is
interesting to note that chemicals, petroleum, coal, rubber and plastic products industries
are relatively a very labour intensive as measured by low capital labour ratios. On the
other hand, non-metallic mineral products and iron and steel products industries are
relatively capital intensive.
V Empirical Results
Sources of TFP Growth
The results of the study reveal that between 1984 and 2000 TFP growth of the Malaysian manufacturing industry for the entire test period is negative due to negative contribution from technical progress. However, technical efficiency change is positive with an index growth of 1.017. This result is consistent with the findings by Mahadevan (2002a) and Rahmah and Nyet (2002). This implies that, in general Malaysian manufacturing industries are operating at its maximum potential output. Taken individually, however, some industries are still operating below its maximum potential output. The least efficient industry is that of non-metallic mineral products which could increase its output by 21.1
12
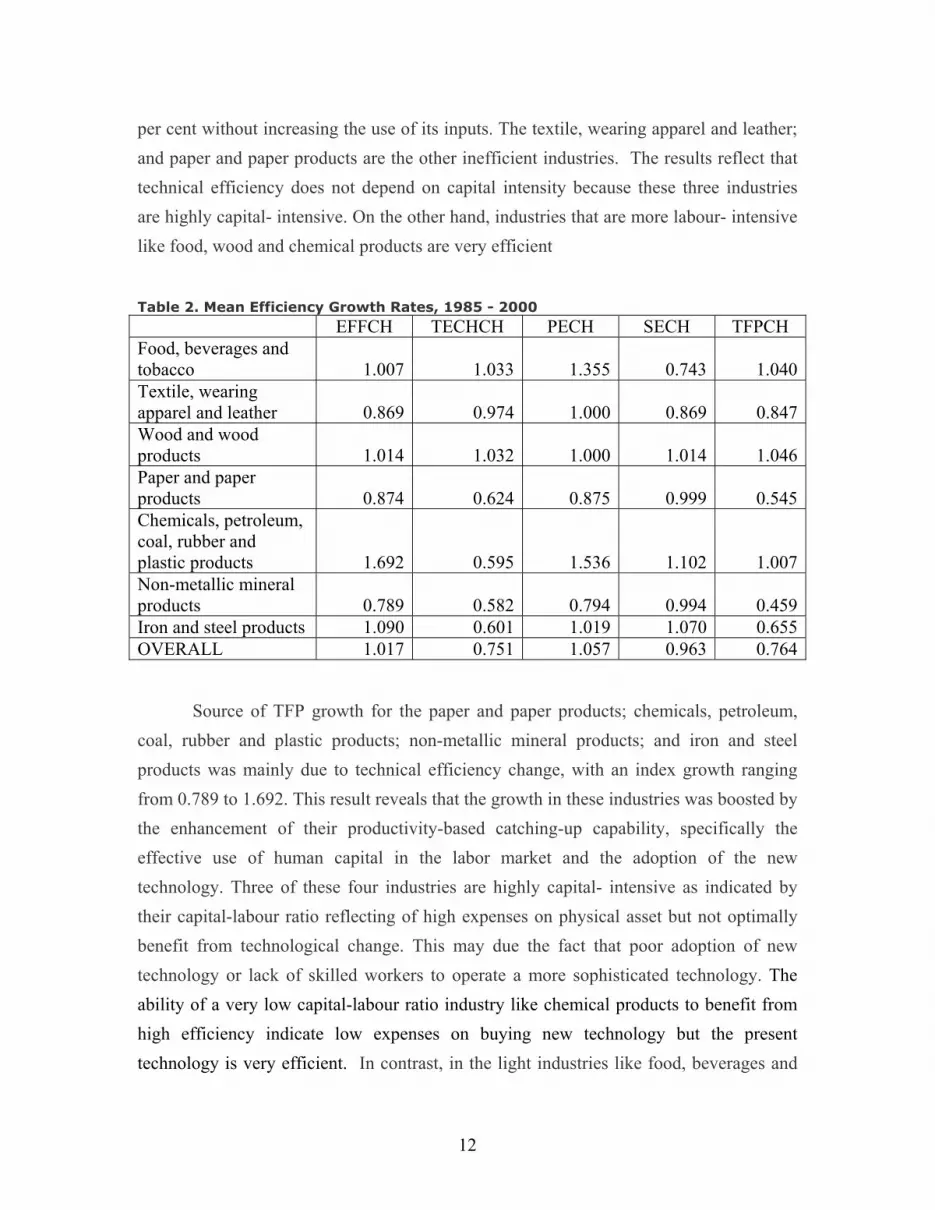
per cent without increasing the use of its inputs. The textile, wearing apparel and leather; and paper and paper products are the other inefficient industries. The results reflect that technical efficiency does not depend on capital intensity because these three industries are highly capital- intensive. On the other hand, industries that are more labour- intensive like food, wood and chemical products are very efficient
Table 2. Mean Efficiency Growth Rates, 1985 - 2000 EFFCH TECHCH PECH SECH TFPCH Food, beverages and tobacco 1.007 1.033 1.355 0.743 1.040Textile, wearing apparel and leather 0.869 0.974 1.000 0.869 0.847Wood and wood products 1.014 1.032 1.000 1.014 1.046Paper and paper products 0.874 0.624 0.875 0.999 0.545Chemicals, petroleum, coal, rubber and plastic products 1.692 0.595 1.536 1.102 1.007Non-metallic mineral products 0.789 0.582 0.794 0.994 0.459Iron and steel products 1.090 0.601 1.019 1.070 0.655OVERALL 1.017 0.751 1.057 0.963 0.764
Source of TFP growth for the paper and paper products; chemicals, petroleum, coal, rubber and plastic products; non-metallic mineral products; and iron and steel products was mainly due to technical efficiency change, with an index growth ranging from 0.789 to 1.692. This result reveals that the growth in these industries was boosted by the enhancement of their productivity-based catching-up capability, specifically the effective use of human capital in the labor market and the adoption of the new technology. Three of these four industries are highly capital- intensive as indicated by their capital-labour ratio reflecting of high expenses on physical asset but not optimally benefit from technological change. This may due the fact that poor adoption of new technology or lack of skilled workers to operate a more sophisticated technology. The ability of a very low capital-labour ratio industry like chemical products to benefit from high efficiency indicate low expenses on buying new technology but the present technology is very efficient. In contrast, in the light industries like food, beverages and
13
tobacco; textile, wearing apparel and leather; and wood and wood products industries’ source of TFP growth is technological change, with index scores of 1.033, 0.974 and 1.032, respectively. The result reflects that level of technology in these industries is still moderate and technological adoption can take place much easier.
There are variations in the TFP growth for the period 1985 to 2000. It reveals that
all industries except food, beverages and tobacco; wood and wood products; and
chemicals, petroleum, coal, rubber and plastic products industries are efficient or have
TFP growth equal or above one. The remaining industries suffered a declining TFP
growth over the time period. This means that only food, beverages and tobacco; wood
and wood products; and chemicals, petroleum, coal, rubber and plastic products
industries were able to cause shifts in their own frontier due to innovation. Wood and
wood products industries registered the highest TFP growth at the rate of 4.6 per cent per
annum, followed by food, beverages and tobacco with growth rate 4.0 per cent and
chemicals, petroleum, coal, rubber and plastic products industries with growth rate 0.7
per cent.
Although chemicals, petroleum, coal, rubber and plastic products; and iron and steel products industries have low TECHCH, their EFFCH score was above one. The result shows that these industries' source of TFP growth was technical efficiency or catching-up. This can be attributed to the advantages that the industries enjoy, such as economies of scale, market power, and strategic grouping by firms.
Table 3 shows the mean efficiency growth rates for the industries over various time periods to investigate the trend of the change in the efficiency measures. It can be seen that TFP growth had improved over time. Index of TFP growth has been consistently increasing from 0.234 in 1985-1989 to 0.662 in 1987-1992, to 0.815 in 1990-1996 and finally 0.864 in 1995-2000. This result is consistent with Mahadevan (2002). This trend was heavily influenced by the trend in the technological change, with an index score increases fourfold from 0.332 in 1985-1989 to 1.217 in 1995-2000. The change in technical efficiency is less remarkable, from 0.476 in 1985-1989 to only 0.784 in 1995-2000.

14
Table3. Trends of Efficiency Growth Rates in the Manufacturing Sector (per cent) Time period EFFCH TECHCH PECH SECH TFPCH 1985-1989 0.476 0.332 1.172 0.406 0.234 1987-1992 0.583 0.436 0.882 0.627 0.662 1990-1996 0.838 1.026 1.031 0.813 0.815 1995-2000 0.784 1.217 0.912 0.859 0.864
Although on average over 1985-2000, most of the TFP growth is driven by technical efficiency rather than technical change, and this was true for the decade of 1980’s and early 1990’s. Interestingly, the source of TFP growth reversed for the period 1990-1996, index scores of technological change was 1.026 as compared to 0.838 for the technical efficiency change. In 1995-2000, index of technological change increased to 1.217 but index of technical efficiency declined to 0.784. This reflect technological change that is taking place in the Malaysian manufacturing sector is better and more advance as compare to the previous one when the stage of development was still at the early stage. A decrease in efficiency after the 1996 may be resulted from economic recession due to financial crises. VI Conclusions and Policy Implications The results from this study show that TFP growth is mainly contributed by technical efficiency. It implies that we can increase output using the same level of inputs or technology. However, trend of efficiency declines over time especially after the 1996. In terms of technical change, even though it is low at the early stage of industrial development, it is increasing and supercedes the technical efficiency at the latter year. This reflects improvement in technological transfer or development that yields new innovation and better technological adoption amongst companies. An increase in skilled workers through human resource development reduces skills shortages that hinder technological adoption.
Analysis by industry shows that there is no positive relationship between capital intensity and efficiency, technological change and TFP growth. Some industries which are capital- intensive like iron, non metallic and paper products are more efficient, while some labour- intensive industries like food and wood products experiencing high efficiency and technological change.
15
The study suggests that the Malaysian manufacturing sector must increase TFP growth in most industries under study especially in those with TFP growth below unity. In all industries except iron, both efficiency and technological change must be increase. In the industries like food, wood and chemical product, even though TFP growth is positive, they are still low. In the chemical industry for example, technical efficiency change is still negative.
Since TFP growth is a yield of two components, namely technical efficiency and
technical change, these two element must be improved. An improvement in technical efficiency requires improvement in quality of inputs like capital and labour. In order to improve labour quality, human resource development through training is the best strategy. Training will workers productivity and efficiency. In terms of capital, management aspect is very important. Both strategies will consequently improve technical change since the effectiveness of technical change will also rely on managing technology and adoption capability of a company when new technology is introduced.
As a conclusion, we would like to suggest further research in this area. The
limitation of this paper is the classification of industries is too aggregated using two digits
Malaysian Industrial Classification (MIC) level. This reduces number of observation and
characteristics of sub industries within that broad classification. Future research may
utilize data at five digits level to have bigger number of observation, hence may improve
the results of estimation. The use of more detail MIC level will able the researcher to
have a detail study on particular industry.

16
References Abdulkhadiri, H. and T.A. Pickles. 1990. Technology Transfer, Technical Change in a
Socialist, Oil Exporting, Developing Countries, the Case of the Iraqi Manufacturing Sector. The Indian Economic Journal, 38(2):89-96.
Chuang, Y.C. 1996. Identifying the Sources of Growth in Taiwan’s Manufacturing Industry. Journal of Development Studies, 32(3):445-63. Department of Statistics. Industrial Manufacturing Survey, various years. Kuala
Lumpur. Government Publication. Fare, R., S. Grosskopf, M. Noris and Z. Zhang. 1994. Productivity Growth, Technical
Progress and Efficiency Changes in Industrialized Countries. American Economic Review, 30(3): 655-666.
Haskel J. & Martin, C. 1993. Do Skill Shortages Reduce Productivity? Theory and
Evidence from the United Kingdom? The Economic Journal: 386-394. Hishashi Yokohama. 1991. Structural Change in the 1980’s: Malaysian Economy in
Transition. Tokyo: Institute of Developing Economies. Kartz, J.M. 1969. Production Functions, Foreign Investment and Growth, A Study Based
on the Manufacturing Sector 1946-1961. Amsterdam: North Holland Publishing Company.
Kim, J. I. and L. J. Lau. 1994. The Sources of Economic Growth of the East Asian Newly
Industrialised Countries. Journal of the Japanese and International Economies. 8.
Krugman, P. 1994. The myth of Asia’s Miracle. Foreign Affair, 73(6):62-67. Lansink, Alfons. O. 2000. Productivity Growth and Efficiency Measurement: A Dual
Approach. European Review of Agricultural Economics. 27 (1). Leung, H.M. 1997.Total Factor Productivity Growth in Singapore Manufacturing
Industries. Applied Economic Letter, 4:525-528. Mahadevan, R. 2000. How Technically Efficient are Singapore’s Manufacturing
Industries? Applied Economic Letter, 32: 2007-2014. Mahadevan, R. 2001. Assessing the Output and Productivity Growth of Malaysia’s
Manufacturing Sector. Journal of Asian Economics, 12(4):587-597. Mahadevan, R. 2002c. Is there the Real TFP Growth Measure for the Malaysia’s
Manufacturing Sector. ASEAN Economic Bulletin, 19(2):178-190.

17
Mahadevan, R. 2002b. A DEA Approach to Understanding the Productivity Growth of
Malaysia’s Manufacturing Industries, Asia Pacific Journal of Management, 19(4):587-600.
Mahadevan, R. 2002a. Is Output Growth of Korean Manufacturing Firms Productivity
Driven? Paper presented at the 8th Convention of the East Asian Economic Association, 4-5 November, 2002, Kuala Lumpur.
Maisom Abdullah & Arshard Marshidi. 1992. Pattern of Total Productivity Growth in
Malaysia Manufacturing Industries, 1973-1989. Serdang: Universiti Pertanian Malaysia.
Malaysia. 2001. The Seventh Malaysia Plan, 2001-2005. Kuala Lumpur: National
Publication. Ministry of Finance Malaysia.2004. Economic Report, 2004-2005 :Kuala Lumpur:
Government Publication. Nik Hashim Nik Mustapha. 1998. Output Versus Productivity Growth in the
Manufacturing Industry. An Experience for Sustainable Development Planning, Faculty of Economics Workshop, 19-21 Jun, Port Dickson.
Nik Hashim Nik Mustapha & Basri Mohd Talib. 2004. Technical Efficiency and Total
Fcator Growth in Selected Malaysian Manufacturing Industries. In Doris Padmini, Poo Bee Tin & Mohd Nasir Mohd Saukani (ed), proceeding Seminar Economic and Social Competitiveness Towards Strengthening Economic development, 11-13 June, 2004, Port Dickson Malaysia
Nishimizu, M. and J. M. Jr. Page. 1982. Total Factor Productivity Growth, Technological
Progress and Technical Efficiency: Dimensions of Productivity Change In Yugoslavia, 1965-78. The Economic Journal. 92:920-936.
64).
Rahmah Ismail and Idris Jajri. 2000. Sources of Productivity Growth in Large Scale Industries in Malaysia. Journal Ekonomi Malaysia 34:59-57.
Rahmah Ismail and Idris Jajri. 2001. Comparing Total Factor Productivity in Small and
Medium Scale Enterprises. In SMEs at the Crossroad, ed. Moha Asri Abdullah. United Kingdom: Wisdom House Publication.
Rahmah Ismail and Chai Nyet Fung. 2002. Sumbangan Produktiviti Keseluruhan
terhadap Output Industri Skel Kecil dan Sederhana: Satu Analisis Perbatasan Stokastik. Jurnal Analisis, 9:77-99.
18
Squires and Reid. 2004. Tay, S.T.1992. Determinants of Production Efficiency: An Econometrics Analysis of the
Manufacturing Industries in Singapore, Working Paper Series No. 10-92, School of Accountancy and Business, Nanyang Technological University
Yanrui Wu. 2000.Openness, Productivity and Growth in the Asian-Pacific Economics:
An Alternative Approach. Paper presented at the 7th Convention of the East Asian Economic Association, 17-18 November, 2000, Singapore.
Young, A. 1992. A Tale of Two Cities: Factor Accumulation of Technical Change in
Hong Kong and Singapore, NBER Cambridge: 13-54. Zulridah Mohd Noor, Hasmiah Kasimin & Liew Chei Siang. 2004. Productivity and
Technical Change: A Case Study in ICT Industry in Malaysia. In Doris Padmini, Poo Bee Tin & Mohd Nasir Mohd Saukani (ed), proceeding Seminar Economic and Social Competitiveness Towards Strengthening Economic development, 11-13 June, 2004, Port Dickson Malaysia