tb-doped iron oxide: bifunctional fluorescent and magnetic nanocrystals
TRANSCRIPT
PAPER www.rsc.org/materials | Journal of Materials Chemistry
Publ
ishe
d on
20
Apr
il 20
09. D
ownl
oade
d by
Ric
e U
nive
rsity
on
21/0
9/20
14 1
8:37
:16.
View Article Online / Journal Homepage / Table of Contents for this issue
Tb-doped iron oxide: bifunctional fluorescent and magnetic nanocrystals†
Yunxia Zhang,‡ Gautom Kumar Das,‡ Rong Xu* and Timothy Thatt Yang Tan*
Received 30th September 2008, Accepted 16th March 2009
First published as an Advance Article on the web 20th April 2009
DOI: 10.1039/b817159a
A new class of fluorescent and superparamagnetic bifunctional nanocrystal has been successfully
prepared by a facile, non-hydrolytic method. The synthesized Tb-doped g-Fe2O3 nanocrystals are
highly monodispersed with a diameter of 13 nm, show superparamagnetic behaviour with saturation
magnetism strength of 30 emu g�1, and exhibit photoluminescence at room temperature. The
nanocrystals are amine-functionalized to render them water-dispersible and ease of further
functionalization by other biomolecules. In vitro cytotoxicity tests indicate that these nanocrystals are
non-toxic. Nanocrystals of such bifunctionality are envisioned to have potential as probes in integrated
imaging technique, of which at least two imaging modalities (for example magnetic resonance imaging
(MRI) and fluorescence microscopy) are combined to provide enhanced visualization at tissues and
cellular levels.
1. Introduction
Magnetic materials have been found with a variety of applica-
tions due to their interesting properties in many traditional areas
including magnetic data storage, ferrofluid technology, magne-
torheological polishing, and energy storage. Recent advances in
superparamagnetic colloidal synthesis has enhanced their
potential for many other fields related to biology, pharmacy, and
diagnostic, including magnetic fluids, magnetic bioseparation of
labelled cells and biological entities,1,2 magnetic resonance
imaging (MRI) contrast agents,3 targeted drug delivery,4 radio
frequency induced destruction of cells and tumours via hyper-
thermia5 and biosensing.6 For example, Zhao et al.7 have
demonstrated a highly efficient collection of a trace amount of
DNA/mRNA from a mixture, down to femtomolar concentra-
tions, by using such nanoparticles. In a targeting drug-delivery
system, the magnetic labelling of drugs could be easily adminis-
tered and transported to the tumour under the guidance of an
external magnetic field, leading to a safer and more effective
tissues-specific release of drugs.8
In bioanalysis, luminescence has been extensively exploited for
detection and sensing. There are several classes of materials that
are currently employed as fluorescent emitters/probes, including
organic, metal–organic dye molecules, fluorescent proteins,
semiconductor quantum dots (QDs), and polymer/dye-based
nanoparticles, etc.9 Usually, dye molecules suffer from photo-
bleaching and quenching due to interactions with solvent mole-
cules and reactive species such as oxygen or ions dissolved in
solution when they are exposed to a variety of harsh
School of Chemical and Biomedical Engineering, Nanyang TechnologicalUniversity, Singapore 637459, Singapore. E-mail: [email protected];[email protected]; Fax: +65 6794 7553; Tel: +65 6316 8829
† Electronic supplementary information (ESI) available: Energydispersive X-ray spectroscopy (EDS) analysis of ZnS coated Tb-dopedg-Fe2O3 nanocrystals (Fig. S1). XRD pattern of undoped and dopediron oxide nanocrystals (Fig. S2). Percentage weight loss of theas-prepared Tb-doped iron oxide nanocrystal using TGA (Fig. S3). SeeDOI: 10.1039/b817159a
‡ Y. Z. and G. K. D. contributed equally to this article.
3696 | J. Mater. Chem., 2009, 19, 3696–3703
environments.10 Luminescent QDs exhibit higher photostability
and show narrower emission peaks compared to organic fluo-
rophores.11 However, they are generally composed of heavy
metal ions such as Pb2+ or Cd2+, so their use exposes researchers
and experimental systems to these toxic materials as well as
generating a toxic waste stream into the environment.12 To solve
these issues, it is important to develop new photostable and
nontoxic or less toxic labelling materials.
Multi- or bifunctional nanomaterials such as hybrid nano-
crystals or nanocomposites can provide a new platform for both
diagnostics and treatment of disease due to their enhanced
functionality and multifunctional properties in contrast to their
single counterparts. Efforts have been devoted to synthesize and
investigate nanocomposite materials which comprise fluorescent
nanocrystals incorporated into silica shells,13,14 magnetic nano-
crystals attached to fluorescent nanocrystals by means of ligand
molecules,15 or magnetic and luminescent nanoparticles encap-
sulated into silica spheres.16,17 Another strategy is to produce
hybrid nanostructures by colloidal syntheses, where each nano-
crystal could be made of any desired inorganic materials
purposely assembled together for tailored applications.18–20
These methods of tailoring multifunctional nanocomposites are
rather tedious in the sense that they involve synthesizing the
functional nanocrystals separately, and then putting them into
one entity.
In our previous work, we have achieved doping and co-doping
of rare-earth ions into oxide nanomaterials.21,22 The rare-earth
ions exhibit intense narrow-band intra-4f luminescence in a wide
range of hosts. The shielding provided by the 5s2 and 5p6 elec-
trons causes rare-earth radiative transition in solid hosts to
resemble those of the free ions. They are hence a good choice for
biological labelling and medical diagnostics due to their large
Stokes shift, sharp emission spectra, long lifetime, multiphoton
and up-conversion excitation, low toxicity and reduced photo-
bleaching over semiconductor nanocrystals like quantum dots
and organic phosphors.23–26 In this work, we demonstrate a new
strategy to fabricate novel Tb-doped g-Fe2O3 nanocrystals,
which combine two useful functions, superparamagnetism and
This journal is ª The Royal Society of Chemistry 2009
Publ
ishe
d on
20
Apr
il 20
09. D
ownl
oade
d by
Ric
e U
nive
rsity
on
21/0
9/20
14 1
8:37
:16.
View Article Online
luminescence into the same nanocrystal. We have further
improved the luminescence of the synthesized nanocrystals by
affording surface-passivation with a thin layer of ZnS coating,
demonstrated amine surface-functionalization which renders this
bifunctional nanocrystal suitable for further functionalization
for bio-conjugation, and conducted in vitro cytotoxicity studies
of the synthesized nanocrystals.
2. Experimental
2.1. Chemicals
All chemicals were used as received without further purification.
Terbium(III) chloride hexahydrate (99.9%), 1-octadecene (tech.
90%), diethylzinc (1.0 M solution in hexanes), tetramethy-
lammoniumhydroxide (25 wt% in methanol) (TMAH) and Igepal
CO-520 (polyoxyethylene(5)nonylphenylether) were purchased
from Aldrich. Iron(III) chloride hexahydrate (98%) and oleic acid
(tech. 90%) were purchased from Alfa Aesar. NaOH (reagent
grade, 97%, beads), 3-aminopropyltrimethoxysilane (APS) (97%)
trioctylphosphine (TOP), hexamethyl disilthiane were purchased
from Fluka. Ethanol, hexane, cyclohexane and chloroform were
of analytical reagent grade.
2.2. Tb-doped g-Fe2O3 nanocrystals
Magnetic-fluorescent Tb-doped g-Fe2O3 nanocrystals were
synthesized based on a modified method developed by Hyeon
et al.27 In a typical synthesis process, 2 mmol (0.54 g) of
FeCl3$6H2O and 0.2 mmol (0.075 g) of TbCl3$6H2O was dissolved
in 3 mL of deionized water. To this mixture, 1.9 mL (6.0 mmol) of
oleic acid, 7 mL of hexane and 4 mL of ethanol were added and
stirred at room temperature for 30 min. Then, 6.25 mmol (0.25 g) of
NaOH was added to the reaction mixture and heated with stirring
in a close vessel at 70 �C for 4 h. The resultant solution was allowed
to form two different layers in a separatory funnel. The top organic
layer containing Fe (Tb)-oleate complex was collected, washed with
30 mL of water and then heated at 70 �C overnight in order to
remove the hexane. The sticky Fe (Tb)-oleate precursor was
dispersed in 1.5 mL (4.7 mmol) of oleic acid and 12 mL (37.5 mmol)
of 1-octadecene. The mixture solution was degassed with N2 for 30
min at room temperature. After that, the mixture was heated to 320�C at 3 �C min�1 and maintained at that temperature for 30 min
under N2 flow. Afterwards, the solution was cooled to room
temperature and precipitated by excess ethanol. The precipitate was
collected by centrifugation and the supernatant decanted. The
isolated solid was re-dispersed in hexane and then precipitated with
ethanol. The precipitation–re-dispersion process was repeated for
several times to purify the as-prepared nanocrystals. The above
procedure was also carried out in the absence of Tb source for the
synthesis of undoped g-Fe2O3 nanocrystals.
2.3. ZnS coated Tb-doped g-Fe2O3 nanocrystals
The as-prepared oxide nanocrystals were dried at 70 �C overnight.
A method similar to literatures28,29 was adopted to form ZnS
coating onto Tb-doped g-Fe2O3 nanocrystals. 30 mg of dried
nanocrystals was dispersed in 2 g (5.4 mmol) of trioctylphosphine
(TOP). The solution mixture was then degassed with N2 for 30 min
at room temperature and slowly heated up to 280 �C under N2
This journal is ª The Royal Society of Chemistry 2009
flow. A solution of 250 mL (1.185 mmol) of hexamethyl disilathiane
and 1 mL (5.88 mmol) of diethylzinc pre-mixed in 2 g (5.4 mmol) of
TOP was injected very slowly into the hot reaction mixture and the
reaction was kept at that temperature for 1 h under N2.
2.4. Quantum yield (QY) measurement
QY was estimated by comparing the integrated emission inten-
sity of the nanocrystals to that of reference organic dye (Fluo-
rescein QY ¼ 95%) at the same optical density and excitation
wavelength.30
2.5 Amine functionalizations
Silanization and amine functionalization were carried out in
a similar process described by Selvan et al.31 In a typical process,
nanocrystals dispersed in hexane were separated by centrifuga-
tion and 4 mg of the nanocrystals were re-dispersed in chloro-
form. Micelles were prepared by dissolving 0.2 g (0.453 mmol) of
Igepal CO-520 in 4 mL of cyclohexane and the mixture was
stirred vigorously for 1 h. Next, 200 mL of nanocrystals in
chloroform was added to the mixture and stirred for 15 min.
Subsequently 50 mL (0.286 mmol) of aminopropyl trimethox-
ysilane (APS) was added and the mixture was stirred for another
1 h. Then, 20 mL (0.19 mmol) of tetramethylammonium
hydroxide (TMAH) in methanol was added. After 1 h of stirring,
10 mL of deionized water was added and stirred for another 30
min. At this stage, some globules were formed and settled at the
bottom of the flask leaving a transparent organic phase at the
top. The transparent organic phase was then discarded and
globules containing the nanocrystals were washed with chloro-
form and ethanol for the complete removal of excess surfactant
and other reactants from the surface. The silica-coated nano-
crystals were then dispersed in deionized water.
2.6. In vitro cytotoxicty studies
Three types of nanocrystals (CdSe, g-Fe2O3 and Tb-doped
g-Fe2O3) were synthesized and then amine-functionalized. CdSe
nanocrystals were synthesized using methods described in liter-
ature.32 Three types of sample solutions were prepared with the
synthesized nanocrystals: (1) 0.25 mg mL�1 dissolved nano-
materials in phosphate buffer solution (PBS), (2) leachate of
nanomaterials at 70 �C for 24 h in PBS, and (3) leachate of
nanomaterials at 121 �C for 1 h in PBS. Samples from (1) were
used in direct contact method of which the nanomaterials
were incubated directly with the cells. Samples from (2) and (3)
were prepared according to American National Standard ISO
10993-5 for quantification and identification of degradation
products from biomaterials. Two most extreme leaching condi-
tions (at 70 and 121 �C) were chosen out of the four prescribed in
the Standard using 0.25 mg mL�1 as the starting nanomaterial
concentrations. Cell viability test was performed to evaluate the
cytotoxcity of the samples. HepG2 cells were seeded at a seeding
density of 1 � 104 cells mL�1 and cultured with 125 mL well�1
medium in 96-well flat-bottom microassay plates for 24 h before
adding the sample solution. A volume of 25 mL of the sample
solution was added into each well and the cells were cultured at
37 �C for 24 and 48 h. To evaluate cell viability, 10 mL of alamar
blue was added to the culture media and incubated for 4 h at
J. Mater. Chem., 2009, 19, 3696–3703 | 3697
Publ
ishe
d on
20
Apr
il 20
09. D
ownl
oade
d by
Ric
e U
nive
rsity
on
21/0
9/20
14 1
8:37
:16.
View Article Online
37 �C. The optical fluorescence (excitation: 530 nm, emission:
590 nm) was obtained by a GENios Pro multilabel counter
(Tecan). The experiments were repeated three times to ensure
reproducibility.
2.7. Characterizations
The as-prepared samples were characterized by powder X-ray
diffraction (XRD) (D8 X-ray diffractometer), transmission
electron microscopy (TEM), high resolution TEM (HRTEM)
(JEOL JEM-3010) and Energy Dispersive X-ray Spectroscopy
(EDS) supported by TEM. X-Ray photoelectron spectroscopy
(XPS) investigation was conducted on a VGESCALAB 250
spectrometer using a monochromatic Al Ka X-ray source
(1486.6 eV). All binding energies (BEs) were referenced to the C
1s peak (BE ¼ 284.6 eV) arising from surface hydrocarbons.
Photoluminescence spectra were collected on a Shimadzu RF-
5301 PC Spectrofluorophotometer using 150 W xenon lamp as
an excitation source. The magnetic properties of these iron oxide
nanocrystals were studied using a vibrating sample magnetom-
eter (VSM) (Lake Shore, 7300). Concentrations of Cd, Fe, and
Tb ions in leachate solutions were determined using High
Dispersion Induction Coupled Plasma Optical Emission Spec-
troscopy ICP-OES (Teledyne Prodigy). Thermogravimetric
analysis was performed using a Diamond TG/DTA (Perkin
Elmer). Dynamic light scattering (DLS) experiments were per-
formed with a Brookhaven 05-LHP-928 laser light scattering
system (He–Ne laser, 35 mW).
3. Results and discussion
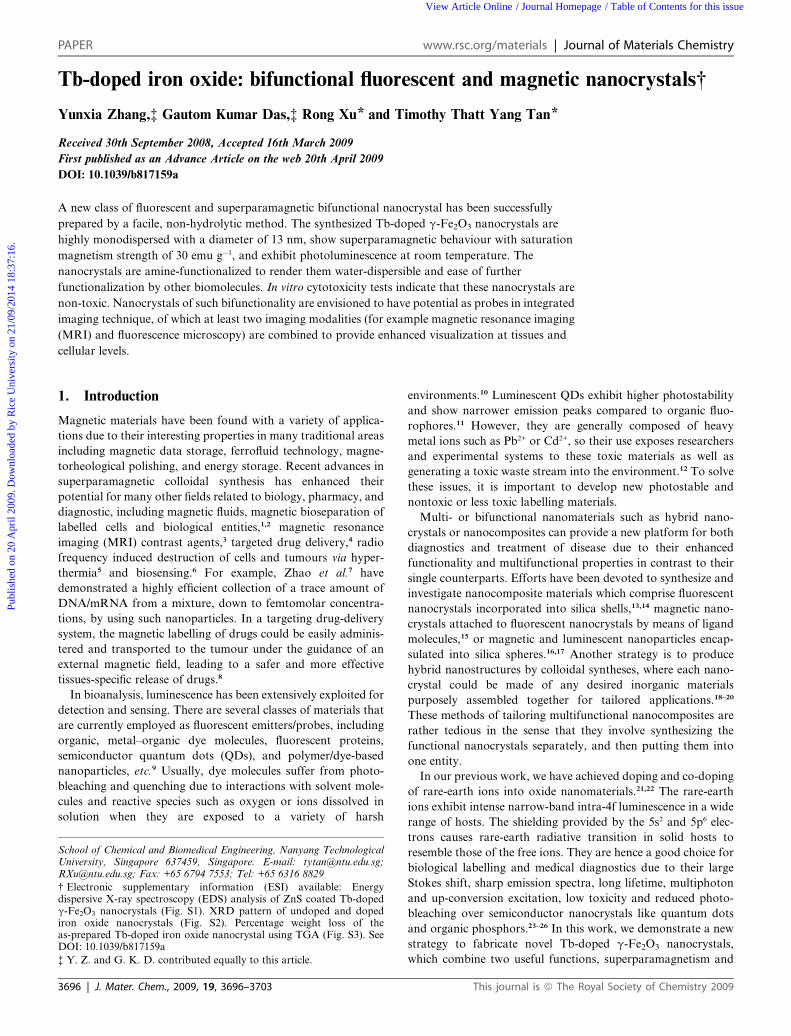
Fig. 1a shows a typical TEM image of as-synthesized Tb-doped
g-Fe2O3 samples. It is easily seen that almost all the nanocrystals
are spherical in shape and highly monodispersed with an average
diameter of 13 nm. The clear lattice fringes in the inset show their
highly crystalline nature of the g-Fe2O3 nanoparticles. The
distance between two adjacent planes is measured to be about
0.29 nm, corresponding to (220) lattice planes in the spinel-
structured g-Fe2O3. The composition of these nanocrystals was
also analyzed by energy dispersive X-ray spectroscopy (EDS).
Fig. 1b shows that these nanocrystals are composed of C (from
the surfactant and carbon film on TEM copper grid), Fe, O and
Tb. The peaks of Cu element are from the copper TEM grid.
Quantitative analysis shows that the atomic ratio of Fe to Tb is
about 10.5 : 1.
Fig. 1 (a) A typical TEM image of Tb-doped g-Fe2O3 nanocrystals; the
inset showing HRTEM image of a single nanocrystal. (b) Energy
dispersive X-ray spectroscopy (EDS) result of the nanocrystals.
3698 | J. Mater. Chem., 2009, 19, 3696–3703
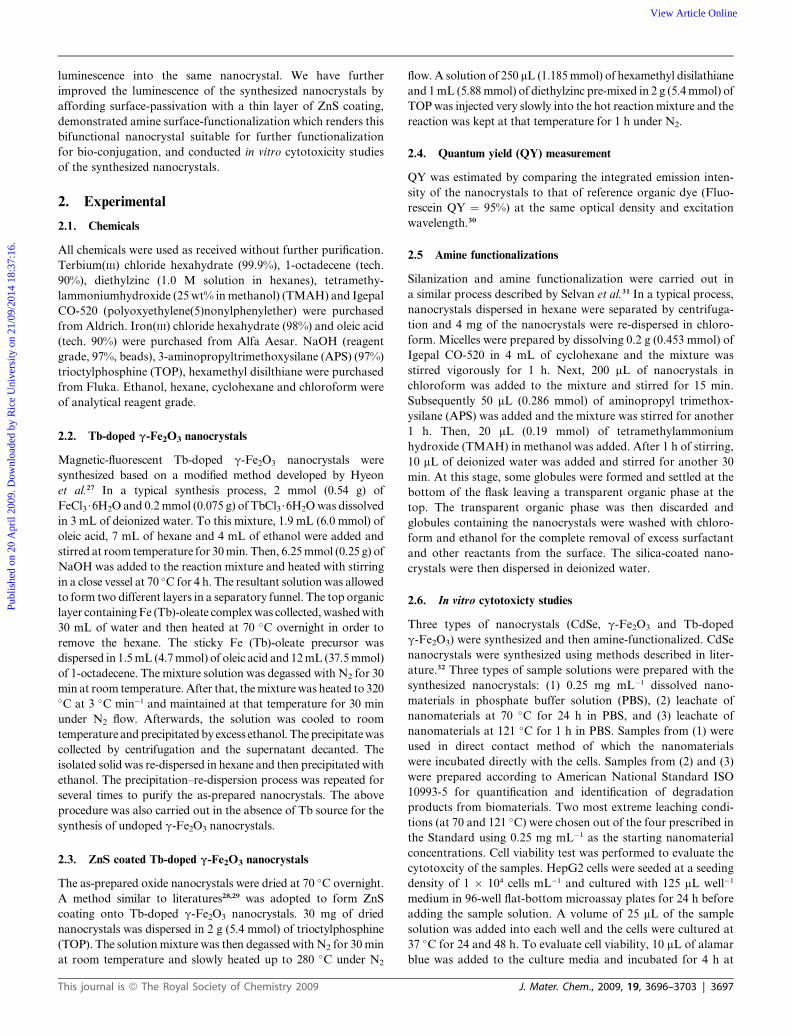
The X-ray powder diffraction pattern of the as-prepared
sample shown in Fig. 2a confirms that all the peaks match very
well with the XRD pattern of g-Fe2O3 (maghemite) (PDF no. 04-
0755). The diffraction peaks at 30.3, 35.5, 43.1, 53.5 57.1 and
62.5� can be indexed as (220), (311), (400), (422), (511) and (440)
planes of g-Fe2O3. The broadening of the peaks indicates small
crystalline size of the resulting iron oxide particles. As calculated
using Sherrer’s formula,33 the average size of these iron oxide
nanoparticles is about 12.8 nm, which is quite consistent with the
result obtained from TEM analysis. The hydrodynamic size of
the colloidal suspension was also obtained using dynamic light
scattering (DLS) (as shown in Fig. 2b). According to the particle
size distribution plot, the average particle size is about 12.7 nm,
which is close to the results from TEM and XRD. XRD patterns
for Tb-doped and undoped g-Fe2O3 are also compared (ESI,
Fig. S2).† Comparing the two patterns, it can be observed that
there is a slight shift towards the lower angles for the Tb-doped
sample. Due to a larger ionic radius of Tb3+ cation compared to
that of Fe3+ cation, such a phenomenon indicates that solid
solution was likely formed by incorporating Tb3+ into the
structure of g-Fe2O3.
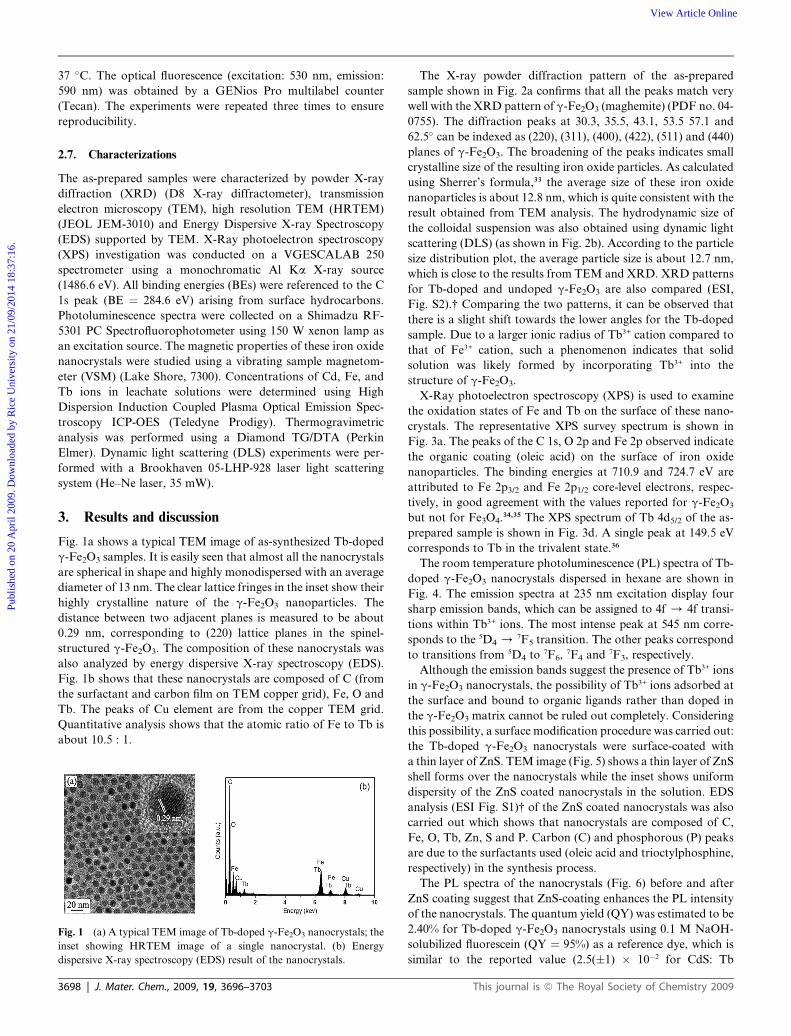
X-Ray photoelectron spectroscopy (XPS) is used to examine
the oxidation states of Fe and Tb on the surface of these nano-
crystals. The representative XPS survey spectrum is shown in
Fig. 3a. The peaks of the C 1s, O 2p and Fe 2p observed indicate
the organic coating (oleic acid) on the surface of iron oxide
nanoparticles. The binding energies at 710.9 and 724.7 eV are
attributed to Fe 2p3/2 and Fe 2p1/2 core-level electrons, respec-
tively, in good agreement with the values reported for g-Fe2O3
but not for Fe3O4.34,35 The XPS spectrum of Tb 4d5/2 of the as-
prepared sample is shown in Fig. 3d. A single peak at 149.5 eV
corresponds to Tb in the trivalent state.36
The room temperature photoluminescence (PL) spectra of Tb-
doped g-Fe2O3 nanocrystals dispersed in hexane are shown in
Fig. 4. The emission spectra at 235 nm excitation display four
sharp emission bands, which can be assigned to 4f / 4f transi-
tions within Tb3+ ions. The most intense peak at 545 nm corre-
sponds to the 5D4 / 7F5 transition. The other peaks correspond
to transitions from 5D4 to 7F6, 7F4 and 7F3, respectively.
Although the emission bands suggest the presence of Tb3+ ions
in g-Fe2O3 nanocrystals, the possibility of Tb3+ ions adsorbed at
the surface and bound to organic ligands rather than doped in
the g-Fe2O3 matrix cannot be ruled out completely. Considering
this possibility, a surface modification procedure was carried out:
the Tb-doped g-Fe2O3 nanocrystals were surface-coated with
a thin layer of ZnS. TEM image (Fig. 5) shows a thin layer of ZnS
shell forms over the nanocrystals while the inset shows uniform
dispersity of the ZnS coated nanocrystals in the solution. EDS
analysis (ESI Fig. S1)† of the ZnS coated nanocrystals was also
carried out which shows that nanocrystals are composed of C,
Fe, O, Tb, Zn, S and P. Carbon (C) and phosphorous (P) peaks
are due to the surfactants used (oleic acid and trioctylphosphine,
respectively) in the synthesis process.
The PL spectra of the nanocrystals (Fig. 6) before and after
ZnS coating suggest that ZnS-coating enhances the PL intensity
of the nanocrystals. The quantum yield (QY) was estimated to be
2.40% for Tb-doped g-Fe2O3 nanocrystals using 0.1 M NaOH-
solubilized fluorescein (QY ¼ 95%) as a reference dye, which is
similar to the reported value (2.5(�1) � 10�2 for CdS: Tb
This journal is ª The Royal Society of Chemistry 2009
Fig. 2 (a) XRD pattern of as-prepared Tb-doped g-Fe2O3 nanocrystals, showing the cubic spinel structures; (b) particle size distribution of Tb-doped
g-Fe2O3 nanocrystals.
Publ
ishe
d on
20
Apr
il 20
09. D
ownl
oade
d by
Ric
e U
nive
rsity
on
21/0
9/20
14 1
8:37
:16.
View Article Online
nanocrystals) by Chengelis et al.37 As expected, the QY of ZnS-
coated Tb-doped g-Fe2O3 nanocrystals was increased to 2.99%.
The difference in luminescence properties can be ascribed to
quantum confinement effect, various dimensions, morphologies
and crystal structure. Previous studies elucidated that surface
states play a key factor for the occurrence of band-gap states that
quench the excitation luminescence.38,39 ZnS is a higher bandgap
material which may help to enhance the fluorescence through the
passivation of the nanocrystalline surface.15 The ZnS shell can
reduce luminescence quenching at the nanocrystal surface and
increase the stability of nanocrystal to photochemical corrosion,
which improve the QY. Here, the increase of QY after ZnS
Fig. 3 XPS spectra of the as-prepared Tb-doped g-
This journal is ª The Royal Society of Chemistry 2009
coating is not very significant. The PL spectrum of ZnS-coated
Tb-doped g-Fe2O3 also strongly evidences the incorporation of
Tb3+ ions in the g-Fe2O3 matrix instead of present as adsorbates
on the nanocrystal surface.40 For comparison, the QY for ZnS
coated CdSe quantum dots was measured to be 24.5%.
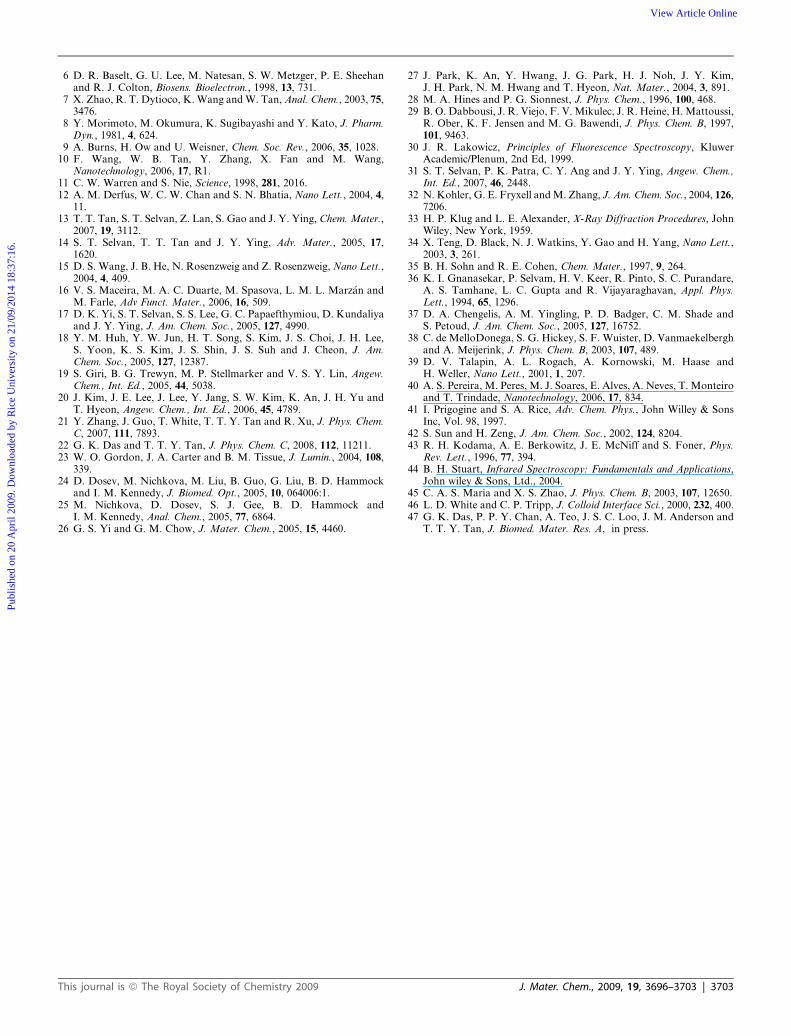
Fig. 7 shows the room-temperature hysteresis magnetization
of undoped, Tb-doped and silanized g-Fe2O3 nanocrystals. The
coercivity values of undoped and Tb-doped g-Fe2O3 nano-
crystals at room temperature are almost negligible at 8.52 G and
3.53 G, respectively, which is a typical characteristic of super-
paramagnetic materials.41 This also indicates that the thermal
energy can overcome the anisotropy energy barrier of a single
Fe2O3: (a) survey; (b) Fe 2p; (c) O 1s; (d) Tb 4d.
J. Mater. Chem., 2009, 19, 3696–3703 | 3699
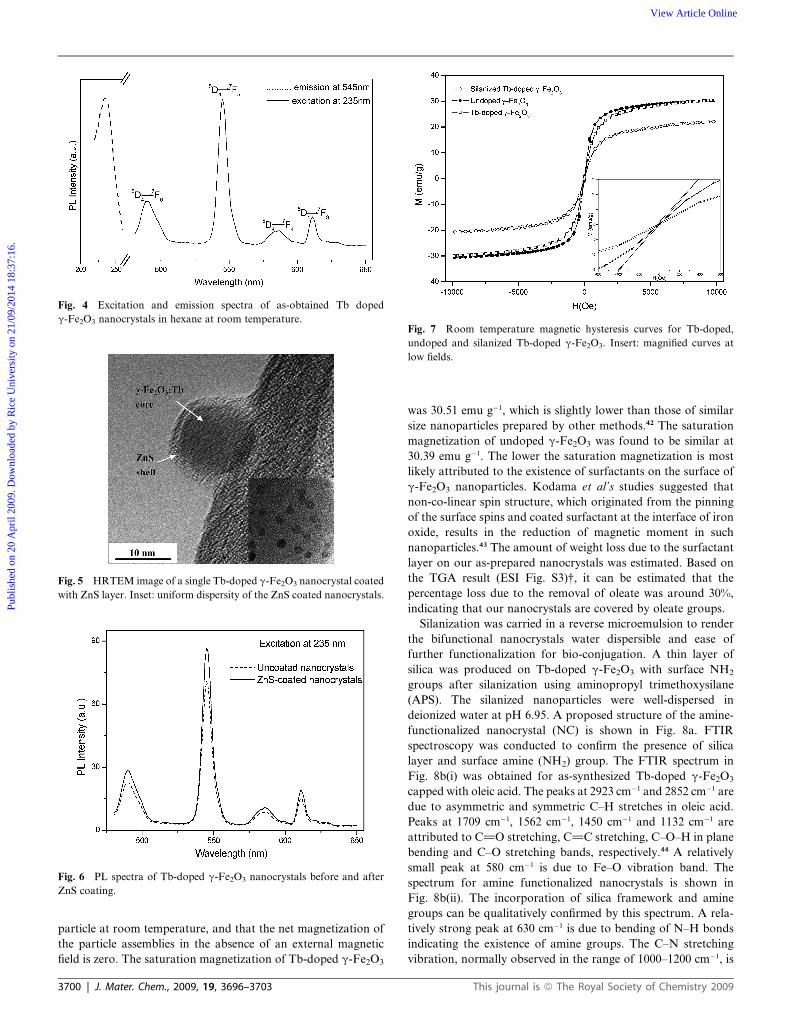
Fig. 4 Excitation and emission spectra of as-obtained Tb doped
g-Fe2O3 nanocrystals in hexane at room temperature.
Fig. 5 HRTEM image of a single Tb-doped g-Fe2O3 nanocrystal coated
with ZnS layer. Inset: uniform dispersity of the ZnS coated nanocrystals.
Fig. 6 PL spectra of Tb-doped g-Fe2O3 nanocrystals before and after
ZnS coating.
Fig. 7 Room temperature magnetic hysteresis curves for Tb-doped,
undoped and silanized Tb-doped g-Fe2O3. Insert: magnified curves at
low fields.
Publ
ishe
d on
20
Apr
il 20
09. D
ownl
oade
d by
Ric
e U
nive
rsity
on
21/0
9/20
14 1
8:37
:16.
View Article Online
particle at room temperature, and that the net magnetization of
the particle assemblies in the absence of an external magnetic
field is zero. The saturation magnetization of Tb-doped g-Fe2O3
3700 | J. Mater. Chem., 2009, 19, 3696–3703
was 30.51 emu g�1, which is slightly lower than those of similar
size nanoparticles prepared by other methods.42 The saturation
magnetization of undoped g-Fe2O3 was found to be similar at
30.39 emu g�1. The lower the saturation magnetization is most
likely attributed to the existence of surfactants on the surface of
g-Fe2O3 nanoparticles. Kodama et al’s studies suggested that
non-co-linear spin structure, which originated from the pinning
of the surface spins and coated surfactant at the interface of iron
oxide, results in the reduction of magnetic moment in such
nanoparticles.43 The amount of weight loss due to the surfactant
layer on our as-prepared nanocrystals was estimated. Based on
the TGA result (ESI Fig. S3)†, it can be estimated that the
percentage loss due to the removal of oleate was around 30%,
indicating that our nanocrystals are covered by oleate groups.
Silanization was carried in a reverse microemulsion to render
the bifunctional nanocrystals water dispersible and ease of
further functionalization for bio-conjugation. A thin layer of
silica was produced on Tb-doped g-Fe2O3 with surface NH2
groups after silanization using aminopropyl trimethoxysilane
(APS). The silanized nanoparticles were well-dispersed in
deionized water at pH 6.95. A proposed structure of the amine-
functionalized nanocrystal (NC) is shown in Fig. 8a. FTIR
spectroscopy was conducted to confirm the presence of silica
layer and surface amine (NH2) group. The FTIR spectrum in
Fig. 8b(i) was obtained for as-synthesized Tb-doped g-Fe2O3
capped with oleic acid. The peaks at 2923 cm�1 and 2852 cm�1 are
due to asymmetric and symmetric C–H stretches in oleic acid.
Peaks at 1709 cm�1, 1562 cm�1, 1450 cm�1 and 1132 cm�1 are
attributed to C]O stretching, C]C stretching, C–O–H in plane
bending and C–O stretching bands, respectively.44 A relatively
small peak at 580 cm�1 is due to Fe–O vibration band. The
spectrum for amine functionalized nanocrystals is shown in
Fig. 8b(ii). The incorporation of silica framework and amine
groups can be qualitatively confirmed by this spectrum. A rela-
tively strong peak at 630 cm�1 is due to bending of N–H bonds
indicating the existence of amine groups. The C–N stretching
vibration, normally observed in the range of 1000–1200 cm�1, is
This journal is ª The Royal Society of Chemistry 2009
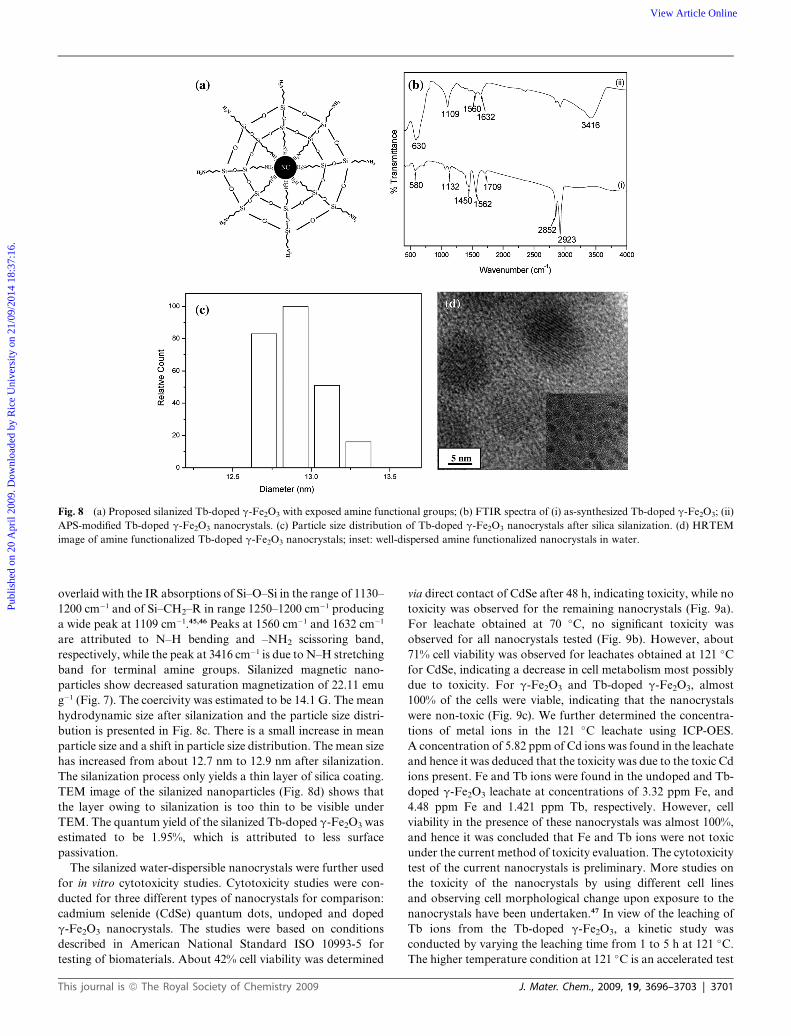
Fig. 8 (a) Proposed silanized Tb-doped g-Fe2O3 with exposed amine functional groups; (b) FTIR spectra of (i) as-synthesized Tb-doped g-Fe2O3; (ii)
APS-modified Tb-doped g-Fe2O3 nanocrystals. (c) Particle size distribution of Tb-doped g-Fe2O3 nanocrystals after silica silanization. (d) HRTEM
image of amine functionalized Tb-doped g-Fe2O3 nanocrystals; inset: well-dispersed amine functionalized nanocrystals in water.
Publ
ishe
d on
20
Apr
il 20
09. D
ownl
oade
d by
Ric
e U
nive
rsity
on
21/0
9/20
14 1
8:37
:16.
View Article Online
overlaid with the IR absorptions of Si–O–Si in the range of 1130–
1200 cm�1 and of Si–CH2–R in range 1250–1200 cm�1 producing
a wide peak at 1109 cm�1.45,46 Peaks at 1560 cm�1 and 1632 cm�1
are attributed to N–H bending and –NH2 scissoring band,
respectively, while the peak at 3416 cm�1 is due to N–H stretching
band for terminal amine groups. Silanized magnetic nano-
particles show decreased saturation magnetization of 22.11 emu
g�1 (Fig. 7). The coercivity was estimated to be 14.1 G. The mean
hydrodynamic size after silanization and the particle size distri-
bution is presented in Fig. 8c. There is a small increase in mean
particle size and a shift in particle size distribution. The mean size
has increased from about 12.7 nm to 12.9 nm after silanization.
The silanization process only yields a thin layer of silica coating.
TEM image of the silanized nanoparticles (Fig. 8d) shows that
the layer owing to silanization is too thin to be visible under
TEM. The quantum yield of the silanized Tb-doped g-Fe2O3 was
estimated to be 1.95%, which is attributed to less surface
passivation.
The silanized water-dispersible nanocrystals were further used
for in vitro cytotoxicity studies. Cytotoxicity studies were con-
ducted for three different types of nanocrystals for comparison:
cadmium selenide (CdSe) quantum dots, undoped and doped
g-Fe2O3 nanocrystals. The studies were based on conditions
described in American National Standard ISO 10993-5 for
testing of biomaterials. About 42% cell viability was determined
This journal is ª The Royal Society of Chemistry 2009
via direct contact of CdSe after 48 h, indicating toxicity, while no
toxicity was observed for the remaining nanocrystals (Fig. 9a).
For leachate obtained at 70 �C, no significant toxicity was
observed for all nanocrystals tested (Fig. 9b). However, about
71% cell viability was observed for leachates obtained at 121 �C
for CdSe, indicating a decrease in cell metabolism most possibly
due to toxicity. For g-Fe2O3 and Tb-doped g-Fe2O3, almost
100% of the cells were viable, indicating that the nanocrystals
were non-toxic (Fig. 9c). We further determined the concentra-
tions of metal ions in the 121 �C leachate using ICP-OES.
A concentration of 5.82 ppm of Cd ions was found in the leachate
and hence it was deduced that the toxicity was due to the toxic Cd
ions present. Fe and Tb ions were found in the undoped and Tb-
doped g-Fe2O3 leachate at concentrations of 3.32 ppm Fe, and
4.48 ppm Fe and 1.421 ppm Tb, respectively. However, cell
viability in the presence of these nanocrystals was almost 100%,
and hence it was concluded that Fe and Tb ions were not toxic
under the current method of toxicity evaluation. The cytotoxicity
test of the current nanocrystals is preliminary. More studies on
the toxicity of the nanocrystals by using different cell lines
and observing cell morphological change upon exposure to the
nanocrystals have been undertaken.47 In view of the leaching of
Tb ions from the Tb-doped g-Fe2O3, a kinetic study was
conducted by varying the leaching time from 1 to 5 h at 121 �C.
The higher temperature condition at 121 �C is an accelerated test
J. Mater. Chem., 2009, 19, 3696–3703 | 3701
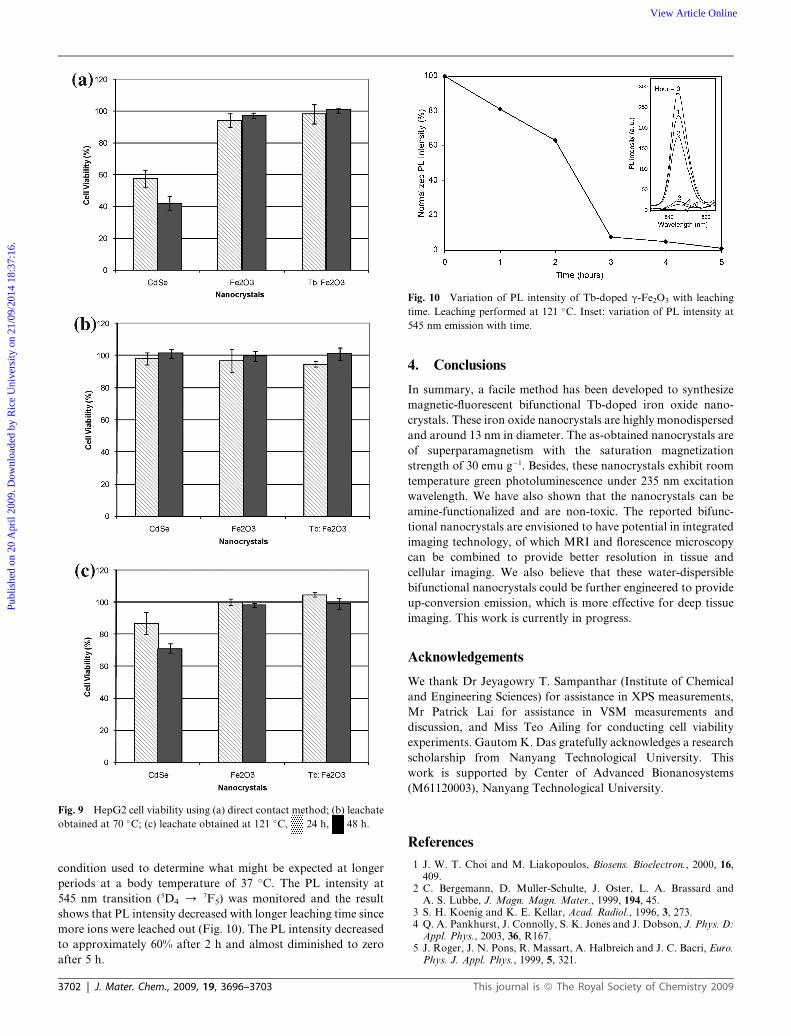
Fig. 9 HepG2 cell viability using (a) direct contact method; (b) leachate
obtained at 70 �C; (c) leachate obtained at 121 �C, 24 h, 48 h.
Fig. 10 Variation of PL intensity of Tb-doped g-Fe2O3 with leaching
time. Leaching performed at 121 �C. Inset: variation of PL intensity at
545 nm emission with time.
Publ
ishe
d on
20
Apr
il 20
09. D
ownl
oade
d by
Ric
e U
nive
rsity
on
21/0
9/20
14 1
8:37
:16.
View Article Online
condition used to determine what might be expected at longer
periods at a body temperature of 37 �C. The PL intensity at
545 nm transition (5D4 / 7F5) was monitored and the result
shows that PL intensity decreased with longer leaching time since
more ions were leached out (Fig. 10). The PL intensity decreased
to approximately 60% after 2 h and almost diminished to zero
after 5 h.
3702 | J. Mater. Chem., 2009, 19, 3696–3703
4. Conclusions
In summary, a facile method has been developed to synthesize
magnetic-fluorescent bifunctional Tb-doped iron oxide nano-
crystals. These iron oxide nanocrystals are highly monodispersed
and around 13 nm in diameter. The as-obtained nanocrystals are
of superparamagnetism with the saturation magnetization
strength of 30 emu g�1. Besides, these nanocrystals exhibit room
temperature green photoluminescence under 235 nm excitation
wavelength. We have also shown that the nanocrystals can be
amine-functionalized and are non-toxic. The reported bifunc-
tional nanocrystals are envisioned to have potential in integrated
imaging technology, of which MRI and florescence microscopy
can be combined to provide better resolution in tissue and
cellular imaging. We also believe that these water-dispersible
bifunctional nanocrystals could be further engineered to provide
up-conversion emission, which is more effective for deep tissue
imaging. This work is currently in progress.
Acknowledgements
We thank Dr Jeyagowry T. Sampanthar (Institute of Chemical
and Engineering Sciences) for assistance in XPS measurements,
Mr Patrick Lai for assistance in VSM measurements and
discussion, and Miss Teo Ailing for conducting cell viability
experiments. Gautom K. Das gratefully acknowledges a research
scholarship from Nanyang Technological University. This
work is supported by Center of Advanced Bionanosystems
(M61120003), Nanyang Technological University.
References
1 J. W. T. Choi and M. Liakopoulos, Biosens. Bioelectron., 2000, 16,409.
2 C. Bergemann, D. Muller-Schulte, J. Oster, L. A. Brassard andA. S. Lubbe, J. Magn. Magn. Mater., 1999, 194, 45.
3 S. H. Koenig and K. E. Kellar, Acad. Radiol., 1996, 3, 273.4 Q. A. Pankhurst, J. Connolly, S. K. Jones and J. Dobson, J. Phys. D:
Appl. Phys., 2003, 36, R167.5 J. Roger, J. N. Pons, R. Massart, A. Halbreich and J. C. Bacri, Euro.
Phys. J. Appl. Phys., 1999, 5, 321.
This journal is ª The Royal Society of Chemistry 2009
Publ
ishe
d on
20
Apr
il 20
09. D
ownl
oade
d by
Ric
e U
nive
rsity
on
21/0
9/20
14 1
8:37
:16.
View Article Online
6 D. R. Baselt, G. U. Lee, M. Natesan, S. W. Metzger, P. E. Sheehanand R. J. Colton, Biosens. Bioelectron., 1998, 13, 731.
7 X. Zhao, R. T. Dytioco, K. Wang and W. Tan, Anal. Chem., 2003, 75,3476.
8 Y. Morimoto, M. Okumura, K. Sugibayashi and Y. Kato, J. Pharm.Dyn., 1981, 4, 624.
9 A. Burns, H. Ow and U. Weisner, Chem. Soc. Rev., 2006, 35, 1028.10 F. Wang, W. B. Tan, Y. Zhang, X. Fan and M. Wang,
Nanotechnology, 2006, 17, R1.11 C. W. Warren and S. Nie, Science, 1998, 281, 2016.12 A. M. Derfus, W. C. W. Chan and S. N. Bhatia, Nano Lett., 2004, 4,
11.13 T. T. Tan, S. T. Selvan, Z. Lan, S. Gao and J. Y. Ying, Chem. Mater.,
2007, 19, 3112.14 S. T. Selvan, T. T. Tan and J. Y. Ying, Adv. Mater., 2005, 17,
1620.15 D. S. Wang, J. B. He, N. Rosenzweig and Z. Rosenzweig, Nano Lett.,
2004, 4, 409.16 V. S. Maceira, M. A. C. Duarte, M. Spasova, L. M. L. Marz�an and
M. Farle, Adv Funct. Mater., 2006, 16, 509.17 D. K. Yi, S. T. Selvan, S. S. Lee, G. C. Papaefthymiou, D. Kundaliya
and J. Y. Ying, J. Am. Chem. Soc., 2005, 127, 4990.18 Y. M. Huh, Y. W. Jun, H. T. Song, S. Kim, J. S. Choi, J. H. Lee,
S. Yoon, K. S. Kim, J. S. Shin, J. S. Suh and J. Cheon, J. Am.Chem. Soc., 2005, 127, 12387.
19 S. Giri, B. G. Trewyn, M. P. Stellmarker and V. S. Y. Lin, Angew.Chem., Int. Ed., 2005, 44, 5038.
20 J. Kim, J. E. Lee, J. Lee, Y. Jang, S. W. Kim, K. An, J. H. Yu andT. Hyeon, Angew. Chem., Int. Ed., 2006, 45, 4789.
21 Y. Zhang, J. Guo, T. White, T. T. Y. Tan and R. Xu, J. Phys. Chem.C, 2007, 111, 7893.
22 G. K. Das and T. T. Y. Tan, J. Phys. Chem. C, 2008, 112, 11211.23 W. O. Gordon, J. A. Carter and B. M. Tissue, J. Lumin., 2004, 108,
339.24 D. Dosev, M. Nichkova, M. Liu, B. Guo, G. Liu, B. D. Hammock
and I. M. Kennedy, J. Biomed. Opt., 2005, 10, 064006:1.25 M. Nichkova, D. Dosev, S. J. Gee, B. D. Hammock and
I. M. Kennedy, Anal. Chem., 2005, 77, 6864.26 G. S. Yi and G. M. Chow, J. Mater. Chem., 2005, 15, 4460.
This journal is ª The Royal Society of Chemistry 2009
27 J. Park, K. An, Y. Hwang, J. G. Park, H. J. Noh, J. Y. Kim,J. H. Park, N. M. Hwang and T. Hyeon, Nat. Mater., 2004, 3, 891.
28 M. A. Hines and P. G. Sionnest, J. Phys. Chem., 1996, 100, 468.29 B. O. Dabbousi, J. R. Viejo, F. V. Mikulec, J. R. Heine, H. Mattoussi,
R. Ober, K. F. Jensen and M. G. Bawendi, J. Phys. Chem. B, 1997,101, 9463.
30 J. R. Lakowicz, Principles of Fluorescence Spectroscopy, KluwerAcademic/Plenum, 2nd Ed, 1999.
31 S. T. Selvan, P. K. Patra, C. Y. Ang and J. Y. Ying, Angew. Chem.,Int. Ed., 2007, 46, 2448.
32 N. Kohler, G. E. Fryxell and M. Zhang, J. Am. Chem. Soc., 2004, 126,7206.
33 H. P. Klug and L. E. Alexander, X-Ray Diffraction Procedures, JohnWiley, New York, 1959.
34 X. Teng, D. Black, N. J. Watkins, Y. Gao and H. Yang, Nano Lett.,2003, 3, 261.
35 B. H. Sohn and R. E. Cohen, Chem. Mater., 1997, 9, 264.36 K. I. Gnanasekar, P. Selvam, H. V. Keer, R. Pinto, S. C. Purandare,
A. S. Tamhane, L. C. Gupta and R. Vijayaraghavan, Appl. Phys.Lett., 1994, 65, 1296.
37 D. A. Chengelis, A. M. Yingling, P. D. Badger, C. M. Shade andS. Petoud, J. Am. Chem. Soc., 2005, 127, 16752.
38 C. de MelloDonega, S. G. Hickey, S. F. Wuister, D. Vanmaekelberghand A. Meijerink, J. Phys. Chem. B, 2003, 107, 489.
39 D. V. Talapin, A. L. Rogach, A. Kornowski, M. Haase andH. Weller, Nano Lett., 2001, 1, 207.
40 A. S. Pereira, M. Peres, M. J. Soares, E. Alves, A. Neves, T. Monteiroand T. Trindade, Nanotechnology, 2006, 17, 834.
41 I. Prigogine and S. A. Rice, Adv. Chem. Phys., John Willey & SonsInc, Vol. 98, 1997.
42 S. Sun and H. Zeng, J. Am. Chem. Soc., 2002, 124, 8204.43 R. H. Kodama, A. E. Berkowitz, J. E. McNiff and S. Foner, Phys.
Rev. Lett., 1996, 77, 394.44 B. H. Stuart, Infrared Spectroscopy: Fundamentals and Applications,
John wiley & Sons, Ltd., 2004.45 C. A. S. Maria and X. S. Zhao, J. Phys. Chem. B, 2003, 107, 12650.46 L. D. White and C. P. Tripp, J. Colloid Interface Sci., 2000, 232, 400.47 G. K. Das, P. P. Y. Chan, A. Teo, J. S. C. Loo, J. M. Anderson and
T. T. Y. Tan, J. Biomed. Mater. Res. A, in press.
J. Mater. Chem., 2009, 19, 3696–3703 | 3703