talk about mouth speculums: collocational competence and spoken fluency in non-native...
TRANSCRIPT

TALK ABOUT MOUTH SPECULUMS:
COLLOCATIONAL COMPETENCE AND SPOKEN FLUENCY IN
NON-NATIVE ENGLISH-SPEAKING UNIVERSITY LECTURERS
by
PETER NILS WESTBROOK (Student no: 1309154)
A dissertation submitted to the
College of Arts and Law
of the University of Birmingham
in part fulfilment of the requirements
for the degree of
Master of Arts
in
Applied Linguistics
This dissertation consists of 14,971 words
Supervisor: Phyllis Chen
English Language and Applied
Linguistics Dept.
University of Birmingham
Edgbaston, Birmingham B15 2TT
United Kingdom
March 2015

ii
ABSTRACT
Despite the large body of research into formulaic language and fluency, there seems to be a
lack of empirical evidence for how collocations, often considered a subset of formulaic
language, might impact on fluency. To address this problem, this dissertation examined to
what extent correlations might exist between overall language proficiency, collocational
competence and spoken fluency in non-native English-speaking university lecturers.
The data came from 15 20-minute mini-lectures recorded between 2009 and 2011 for an
English oral proficiency test for lecturers employed at the University of Copenhagen. The 15
lecturers came from three departments: Large Animal Science, Information Technology and
Mathematics. Test examiners’ global and fluency scores from the test were analysed against
collocational competence, measured as collocations produced per thousand words spoken, and
three temporal fluency measures calculated for each lecturer.
Initial findings across all lecturers showed no correlation between collocational competence
and either overall proficiency or fluency. However, further analysis of lecturers by department
revealed that possible correlations were hidden by variations in the proportion of general
collocations to domain-specific collocations used across the three disciplines represented. The
relative density of domain-specific collocations seemed to affect both how collocational
competence was measured and how examiners perceived fluency.
iii
Acknowledgements
I would like to thank my tutor, David Moroney, and my dissertation supervisor, Phyllis Chen,
for their invaluable comments and advice on my MA work; my colleague, Christian Jensen,
for giving me access to his excellent speech analysis files; my brother-in-law, Jeff Readman,
for his expert advice on compiling and applying statistics; and my colleague, Nina
Rasmussen, for eagle-eyed proof-reading of the final version of the dissertation.
Finally, I would like to thank my wife, Pia, for her unwavering support and for giving me the
time and space to put in the hours.
iv
CONTENTS
1. Introduction .............................................................................................................................. 1
2. Literature Review ...................................................................................................................... 4
2.1 Fluency ............................................................................................................................. 4
2.1.1 Defining fluency ...................................................................................................... 4
2.1.2 Research into fluency .............................................................................................. 5
2.2 Formulaic language .......................................................................................................... 8
2.2.1 Types of formulaic language .................................................................................. 8
2.2.2 Formulaic language and fluency............................................................................ 10
2.3 Collocations .................................................................................................................... 11
2.3.1 Defining and identifying collocations ................................................................... 11
2.3.2 Collocations and formulaic language .................................................................... 15
2.3.3 Research into learners’ collocational competence................................................. 16
2.4 Summary ......................................................................................................................... 19
3. Methodology ............................................................................................................................ 20
3.1 Origin of the data ............................................................................................................... 20
3.1.1 The TOEPAS certification test .............................................................................. 21
3.1.2 Access to the data sources ..................................................................................... 23
3.1.3 Data selection ........................................................................................................ 24
3.1.4 Extraction of the speech analysis files ................................................................... 26
3.2 Data processing for this dissertation ............................................................................... 26
3.2.1 Verification of collocations ................................................................................... 27
3.2.2 Identification of collocations and deviant collocations ......................................... 28
3.2.3 Calculating collocational competence ................................................................... 30
3.2.4 Measuring fluency ................................................................................................. 31
3.3 Initial statistical analyses ................................................................................................... 34
3.4 Additional analyses ........................................................................................................... 36
3.4.1 Spearman analyses of the Large Animal Science and Maths departments ........... 36
3.4.2 AntConc analyses ................................................................................................... 37
3.4.3 Deviant collocations .............................................................................................. 38
3.5 Summary ............................................................................................................................ 38
4. Results ..................................................................................................................................... 41
4.1 Initial analyses across all lecturers .................................................................................... 41
4.1.1 Fluency and overall language proficiency ............................................................. 41
4.1.2 Collocational competence and overall language proficiency ................................ 43

v
4.1.3 Collocational competence and fluency .................................................................. 45
4.2 Additional analyses across departments ............................................................................ 46
4.2.1 Comparing the Large Animal Science and Maths department lecturers ............... 47
4.2.2 Domain-specific collocations ................................................................................ 49
4.2.3 Deviant collocations .............................................................................................. 52
4.3 Summary ............................................................................................................................ 53
5. Discussion .................................................................................................................................. 56
5.1 Interpretations of the results .............................................................................................. 57
5.1.1 Domain-specific collocations ................................................................................ 57
5.1.2 Examiners’ perceptions of fluency ........................................................................ 59
5.1.3 Deviant collocations .............................................................................................. 61
5.1.4 Collocations versus formulaic language ................................................................ 63
5.1.5 Effect of genre on research results ........................................................................ 64
5.2 Limitations of the research ................................................................................................ 65
5.3 Suggestions for future research ......................................................................................... 66
5.4 Summary ............................................................................................................................ 68
6. Conclusions ............................................................................................................................... 70
References ..................................................................................................................................... 76
Appendices .................................................................................................................................... 80
A. TOEPAS global score descriptors .................................................................................. 80
B. TOEPAS internal analytic criteria level descriptors....................................................... 81
C. Lecturers’ global scores, internal fluency scores and university departments ............... 83
D. All collocations found for the lecturers from the Large Animal Science Dept. ............. 84
E. All collocations found for the lecturers from the Information Technology Dept. ......... 92
F. All collocations found for the lecturers from the Mathematics Dept. ............................ 97
G. Potentially deviant collocations and rater assessments ................................................ 104
H. Deviant collocations by lecturer ................................................................................... 107
I. Chart for converting fluency criterion scores to a single fluency index figure ............ 109
J. Fluency measure scores per lecturer ............................................................................. 110
K. Collocational competence per lecturer ......................................................................... 111
L. Comparison of lexical items and their word partners across the three departments .... 112
List of tables ................................................................................................................................... vi
List of figures ................................................................................................................................. vi
List of abbreviations ...................................................................................................................... vii

vi
LIST OF TABLES
Table 2.1 Summary of categories of formulaic language by researcher ............................... 8
Table 2.2 Howarth’s collocational continuum .................................................................... 13
Table 3.1 TOEPAS overall certification scores and results, 2009-2014 ............................. 22
Table 3.2 Summary of the measures used for the analyses ................................................. 39
Table 4.1 Spearman rank correlations between global certification scores and fluency
variables ............................................................................................................... 42
Table 4.2 Spearman rank correlations between global certification scores and
collocational competence variables ..................................................................... 44
Table 4.3 Spearman rank correlations between fluency variables and collocational
competence variables ........................................................................................... 45
Table 4.4 Spearman rank correlations for the lecturers from the Large Animal Science
Dept. .................................................................................................................... 47
Table 4.5 Spearman rank correlations for the lecturers from the Mathematics Dept. ......... 49
Table 4.6 General collocation types plus domain-specific collocation types ...................... 51
Table 4.7 General collocation tokens plus domain-specific collocation tokens .................. 51
Table 4.8 Deviant collocation tokens and averages per thousand words, by department ... 53
Table 6.1 Summary of the measures used for the analyses ................................................. 71
LIST OF FIGURES
Figure 2.1 Cowie’s classification of word combinations ...................................................... 12
Figure 3.1 Histogram showing non-normal distribution of fluency index scores ................ 34
vii
LIST OF ABBREVIATIONS
UCPH University of Copenhagen
CIP Centre for Internationalisation and Parallel Language Use
TOEPAS Test of Oral English Proficiency for Academic Staff
LAS Department of Large Animal Science, University of Copenhagen
IT Department of Information Technology, University of Copenhagen
Maths Department of Mathematics, University of Copenhagen
OCD Oxford Collocations Dictionary (Second Edition, 2009)

- 1 -
1. INTRODUCTION
Linguistic research indicates that native speakers, far from selecting one word at a time, tend
to produce language by choosing from a stock of thousands of fixed and semi-fixed lexical
phrases (Pawley and Syder 1983). As first language (L1) learners, young children assign
meaning to chunks of language, for example, wassat? to ask about a particular object. Only
later do they start analysing these chunks to extract the individual words, in this case, what is
that. What is interesting is that, even after unpacking the chunk, the child retains the
unanalysed chunk and the analysed individual words, giving him or her access to both forms
(Cowie 1988). Sinclair (1987) proposes that these two forms represent two linguistic systems.
The first he calls the ‘idiom principle’, where two or more words operate as a single language
item, as in of course, and the second is the ‘open choice principle’, whereby individual words
are selected one at a time in a given utterance (Sinclair 1987).
Sinclair’s idiom principle acknowledges the formulaic aspect of language, an aspect which is
considered to be important to language proficiency in general (Pawley and Syder 1983;
Nattinger and DeCarrico 1992; Wray 2002). In particular, Pawley and Syder suggest that
formulaic language, as well as enabling language to be processed idiomatically, also
contributes to the native speaker’s ability to produce ‘fluent stretches of spontaneous
connected discourse’ (1983:191). A number of other studies have provided empirical
evidence of this relationship between formulaic language and fluency (e.g. Towell et al. 1996;
Boers et al. 2006; Wood 2010).

- 2 -
The overall concept of formulaic language covers a wide range of different types of word
combinations, including idioms (beat about the bush), pragmatic formulas (how are you),
discourse markers (let me see now), and lexicalized sentence stems (this means that…).
Although there seems to be a degree of uncertainty among researchers, collocations (make a
decision, major catastrophe, afraid of) are also often regarded as a subset of formulaic
language (Nation 2001; Wood 2010; Henriksen 2012). As such, they are, by association, also
assumed to contribute positively to fluency. However, research seems to indicate that even
advanced learners experience problems producing native-like collocations (e.g. Nesselhauf
2005; Laufer and Waldman 2011; Henriksen 2012).
This situation leads to the following conundrum: if formulaic language, including
collocations, is equated with fluency, yet even advanced learners have problems producing
native-like collocations, how can this be reconciled with their status as advanced learners,
given that fluency is an important component of overall language proficiency? Despite the
studies seeming to support links between formulaic language and fluency, there appears to be
a lack of empirical evidence documenting the relationship between collocations and fluency.
It is this gap in collocational research that was the motivation behind this dissertation, and
which led to the formulation of the following research questions:

- 3 -
1. Is there any correlation between lecturers’ overall language proficiency and their
spoken fluency?
2. Is there any correlation between lecturers’ overall language proficiency and their
collocational competence?
3. Is there any correlation between lecturers’ collocational competence and their spoken
fluency?
4. Is there any evidence that collocations function in a similar way to other types of
formulaic language in facilitating spoken fluency?
To investigate these questions, I was given access to data from 15 simulated 20-minute mini-
lectures given by non-native English-speaking lecturers at the University of Copenhagen
(UCPH) during an oral performance test of English academic speaking skills. From these data
sources, I produced measures for the overall performance, collocational competence and
fluency of each lecturer. Statistical software was then used to establish whether there were
any significant correlations between these different sets of variables. The hypothesis was that
if collocations are a subset of formulaic language, some kind of positive correlation would be
found.
The dissertation is divided up as follows: Chapter 2 is a literature review and discusses in
more detail research related to fluency, formulaic language, collocations, and the relationships
between them. This is followed by Chapter 3, which covers the methodology used to collect
and analyse the data. Chapter 4 presents the results from the analyses carried out, and Chapter
5 is a discussion of the results. The dissertation finishes with some conclusions in Chapter 6.

- 4 -
2. LITERATURE REVIEW
Chapter 2 starts off by examining the different elements that make up fluency and the various
methods used to measure them, before moving on to Section 2.2, which looks at the concept
of formulaic language and the various types of linguistic phenomena that the term covers.
This is followed by Section 2.3, which focuses on collocations, what defines them, how they
might differ from other types of formulaic language, and what collocational competence
might entail. The chapter finishes off with a summary.
2.1 FLUENCY
2.1.1 Defining fluency
The focus of this dissertation is on spoken fluency, which is a difficult concept to pin down.
This is partly because the whole process of planning and articulating speech in a
comprehensible form is incredibly complex, and partly because the term ‘fluency’ itself is not
always used to refer to the same language phenomena. For example, in a broad sense, fluency
is often equated with overall language proficiency, while in a narrower sense, it refers more to
the ease and smoothness of speaking.
Researchers who take the broader view of fluency seem to conflate temporal aspects of
fluency with appropriateness of form. Segalowitz, for example, examines fluency in terms of

- 5 -
‘speed, fluidity and accuracy’ (2000:200). This view, however, seems to run counter to
Skehan’s (1998) cognitive hypothesis, which states that because of limited processing
capacity, there may be a trade-off between linguistic accuracy, fluency and complexity when
carrying out a given language task. This hypothesis theoretically means that a learner, in order
to improve fluency, may have to compromise on accuracy. Hence, a learner’s utterances may
be fluent yet erroneous.
In order to separate fluency in the narrower sense from other aspects of oral proficiency,
researchers assign the term a number of different components, involving both temporal
elements like speed of delivery and a degree of freedom from various dysfluency markers,
such as repetitions, self-corrections and filled pauses (Lennon 1990). One aspect of spoken
fluency that is regarded as crucially different from other elements of oral proficiency is that it
is ‘purely a performance phenomenon; there is (presumably) no fluency “store”’ (Lennon
1990:391). In contrast, elements such as the ability to be idiomatic and syntactically complex,
and to use a wide range of vocabulary can all be assigned to a store of linguistic knowledge.
2.1.2 Research into fluency
Research into fluency falls into two broad categories: research investigating how some
intervention (for example, studying abroad for a period of time) affects fluency through
measuring fluency variables before and after (Towell et al. 1996), or research comparing
fluency variables with independent rater assessments of language proficiency and fluency
- 6 -
(Kormos and Denes 2004; Ginther et al. 2010), or a combination of both (Lennon 1990).
Measures used to test fluency are split into two main sets: ‘positive’ temporal variables
basically measuring speed of speaking, and ‘negative’ hesitation phenomena relating to
dysfluency.
Towell et al. (1996) carried out a study into the development of fluency of 12 advanced
learners of French. They found that, after a period of living abroad, the learners performed a
specific task more fluently than before as measured by speech rate. An increase in the mean
length of run was found to be the most important temporal variable contributing to this. They
concluded that this was in part attributable to increased use of formulaic language (Towell et
al. 1996:84).
The study by Kormos and Denes (2004) looked at teachers’ perceptions of the fluency of 16
Hungarian learners of English. Spoken samples from the learners were split into two distinct
levels of proficiency, and temporal fluency measures and linguistic measures were correlated
with the teachers’ fluency scores. The study found that the best predictors of rater scores were
speech rate, mean length of run, phonation-time ratio, and the number of stressed words
produced per minute. However, teachers differed on how much weight they put on accuracy,
lexical diversity and mean length of pauses. Dysfluency measures were not found to influence
rater scores.
Ginther et al. (2010) compared 15 temporal variables to overall speaking proficiency in an
analysis of spoken samples of 150 respondents on the Oral English Proficiency Test. They
- 7 -
found that the variables with the strongest correlations to test scores were speech rate, mean
length of run, articulation rate, and the number and length of unfilled pauses.
Lennon (1990) compared eight temporal and four hesitancy measures against 10 native
speaker rater scores for global fluency of the spoken performances of four non-native speaker
learners before and after a six-month residency in Britain. He found that three variables
correlated significantly for fluency improvement across all subjects in the study: speech rate
(in words per minute), filled pauses per T-Unit, and percentage of T-Units followed by a
pause, a T-Unit being ‘one main clause and all its attendant subordinate clauses and non-
clausal units’ (Lennon 1990:406).
In line with these studies, in particular Kormos and Denes (2004), who found that the
following three variables provided a relatively robust indication of differences in fluency
levels, the temporal fluency measures chosen for this dissertation were:
Speech rate: measured as the average number of syllables uttered per minute over the
total response time.
Mean length of run: measured as the average number of syllables produced per run,
defined as stretches of speech between unfilled pauses of 0.25 seconds and above.
Phonation-time ratio: measured as the percentage of time spent speaking as a
percentage proportion of the time taken to produce the speech sample.

- 8 -
2.2 FORMULAIC LANGUAGE
2.2.1 Types of formulaic language
One of the problems with researching formulaic language is one of terminology. Wray
(2002:9) lists over 40 different terms used to describe aspects of formulaicity, which
sometimes makes it difficult to know precisely what a researcher is referring to: for example,
whether a multi-word unit (Moon 1997) covers the same linguistic phenomena as a formulaic
sequence (Wray 2002). In addition, the various types of language phenomena covered by the
term are often labelled and defined in different ways. Table 2.1 gives a summary of some of
the different kinds of formulaic language identified by researchers.
Table 2.1: Summary of categories of formulaic language by researcher
Researchers Category Example*
Pawley and Syder
(1983:205-210)
memorized sequences you can’t be too careful
lexicalized sentence stem I’m sorry to keep you waiting
Nattinger and DeCarrico
(1992:38-47)
clichés no doubt about it
collocations rancid butter
polywords so to speak
institutionalised expressions nice meeting you
phrasal constraints a ____ ago
sentence builders it’s only in X that Y
Moon
(1997:45-47)
discourse markers on the other hand
socially pragmatic formulas have a nice day
standardized similes as quick as lightning
proverbs a stitch in time...
phrasal verbs make out
Henriksen
(2012:2)
idioms spill the beans
figurative expressions frozen to the spot
* Examples are those provided in the cited sources.

- 9 -
Two of the main differences between these categories of formulaic language are the degrees
of fixedness and contiguousness of the expressions. To illustrate the first aspect, Pawley and
Syder’s example in Table 2.1, I’m sorry to keep you waiting, allows for some flexibility
through the substitution of variables. These include inflections (e.g. Mr X is instead of I’m)
and expansions (e.g. adding all this time at the end) (Pawley and Syder 1983:210). Other
expressions, however, are more rigidly fixed, for example, as quick as lightning or you can’t
be too careful.
The second aspect, contiguousness, relates to how far the words that make up the sequence
allow substitutable items to be included within their structure. This is shown, for example, by
considering Nattinger and DeCarrico’s (1992) a ____ ago phrasal constraint. This requires a
word or phrase inserted in the middle to complete it: a while ago, a few days ago and so on. In
contrast, a polyword such as so to speak allows no such insertions.
Despite these differences, what these sequences all seem to have in common is the concept of
prefabrication. Thus, a useful working definition of formulaic language is ‘a sequence,
continuous or discontinuous, of words or other elements which is, or appears to be,
prefabricated: that is, stored and retrieved whole from memory’ (Wray 2002:9).

- 10 -
2.2.2 Formulaic language and fluency
Research over the last 30 years or so has led to increasing recognition that formulaic language
is central to how language is produced (Pawley and Syder 1983; Sinclair, 1987; Nattinger and
DeCarrico 1992). Native speakers seem to be able to utter relatively long uninterrupted strings
of discourse, longer than would be expected given the limited processing capacity of short-
term memory, estimated at only about seven or eight words at a time (Wood 2010). This is
achieved by utilizing formulaic language held in memory as a single unit, thereby allowing
the speaker to retrieve strings of words quickly and efficiently, rather than focusing on the
selection of individual items. It is this phenomenon that is recognised as fluency. Pawley and
Syder (1983) estimate that the lexicon of a native speaker of English includes several hundred
thousand formulaic sequences, which may just make up, to use Lennon’s words from Section
2.1.1, a speaker’s fluency “store” (Lennon 1990:391).
Therefore, from a theoretical perspective, there is good reason to suppose that use of
formulaic language is crucial to fluency. Although this relationship has not been investigated
empirically in great depth, three studies seem to support the theory. Firstly, Towell et al.
(1996), in their study described in Section 2.1.2, concluded that increases in informants’
fluency, as measured by mean length of run, were partly due to their increased utilization of
lexical phrases.
Secondly, Boers et al. (2006) split 32 second language (L2) speakers majoring in English into
two groups. The experimental group was made explicitly aware of standardized formulaic
sequences, while the control group was taught using the traditional lexis-grammar dichotomy.

- 11 -
The study showed that the oral proficiency of the experimental group, as assessed by two
judges, was higher than that of the control group. A count of formulaic sequences used by the
two groups also correlated well with the oral proficiency ratings, suggesting that helping
learners build up a store of formulaic sequences can contribute to improving their oral
proficiency.
Finally, Wood (2010) carried out a longitudinal study of 11 adult English L2 learners
studying abroad for six months. Regular speech samples were collected and analysed using
temporal variables associated with fluency. Discourse analysis was carried out to uncover use
of formulaic language, and this was correlated with the fluency variables. The study found a
relationship between speech fluency development and the use of formulaic language in L2
speakers.
2.3 COLLOCATIONS
2.3.1 Defining and identifying collocations
Collocations are frequently recurring two-to-three word combinations, such as make a
decision and bitter disappointment, which co-occur ‘with a mutual expectancy greater than
chance’ (Nattinger and DeCarrico 1992:36). They tend to be conventionalised combinations,
displaying a certain degree of predictability for native speakers.

- 12 -
Two main approaches have been adopted by researchers to identify collocations in a given
text or corpus: the frequency-based approach and the phraseological approach. The
frequency-based approach is associated with computer-based searches of large language
corpora. These searches involve identifying words that occur within a short span, usually four
words, either side of a headword, or ‘node’. If the node occurs together with another word or
words within this span ‘at a frequency greater than chance would predict, then the result is a
collocation’ (Nattinger and DeCarrico 1992:20). Thus, collocations are not necessarily
contiguous, although they can be. They can also be realised in different lexical combinations.
The collocation strong argument, for example, can be realised as: it is a strong argument, he
argued strongly for, the argument is a strong one, and so on.
Frequency criteria alone, however, will not necessarily yield collocations. The phraseological
approach employs a more intuitive syntactic and semantic analysis of word combinations and
is helpful in defining collocations more precisely. A useful starting point is Cowie’s (1988,
2001) categorisation of word combinations as shown in Figure 2.1.

- 13 -
Figure 2.1: Classification of word combinations (after Cowie 1988, 2001)
Cowie (1988, 2001) classifies word combinations into what he terms formulae and
composites. Formulae function as autonomous utterances at the sentence level and cover
socially pragmatic phrases such as How are you doing, you know what I mean and mind the
step. Composites, on the other hand, are semantic combinations which function within a
sentence and have a referential function. Cowie subdivides composites into pure idioms,
figurative idioms and restricted collocations. Collocations are the subject of this dissertation
and can be further split into lexical collocations, i.e., combinations made up of verbs, nouns,
adjectives, and adverbs, e.g., make a claim or ulterior motive, and grammatical collocations,
which include a preposition as in talk about or in advance.
Howarth (1998), basing his work on Cowie, conceived these different composite forms as
being placed somewhere along a continuum as shown in Table 2.2.
word combinations
composites
restricted collocations
lexical collocations
grammatical collocations
figurative idioms
pure idioms
formulae
routine formulae
speech formulae

- 14 -
Table 2.2: Collocational continuum showing examples of collocations ranging from free
combinations to fixed idioms (from Howarth, 1998:28)
Type of composite
Free
combinations
Restricted
collocations
Figurative
idioms
Pure idioms
Lexical composites
(e.g. verb + noun)
blow a
trumpet
blow a fuse
blow your
own trumpet
blow the
gaff
Grammatical composites
(e.g. preposition + noun)
under the
table
under attack
under the
microscope
under the
weather
The continuum ranges from freely substitutable and transparent word combinations at one end
through restricted collocations, which are semi-transparent and have a limited number of
(restricted) collocates, to idioms at the other end. Idioms are considered non-transparent, in
that the meaning is difficult to work out just from the individual elements and more or less
completely restricted, i.e., fixed in form. This concept of restrictedness is especially important
for identifying collocations. The verb see can be combined with virtually any noun (see a
river, see a house, see a cat, etc.); there are no constraints on which nouns it can combine
with. See a river would therefore not be considered a collocation. On the other hand, a verb
like perform, as in perform a task, can only be used with a relatively small number of nouns
and would be considered having restricted senses. Perform a task would be considered a
collocation.
- 15 -
2.3.2 Collocations and formulaic language
There seems to be some uncertainty about whether collocations can actually be considered
formulaic language, and therefore how far Wray’s (2002) definition of formulaic language
given in Section 2.2.1 covers the term. Some researchers explicitly categorize collocations as
a subset of formulaic language (Nation 2000; Henriksen 2012). Others more implicitly refer
to collocations under a general discussion of formulaic language (Moon 1997; Wood 2010;
Laufer and Waldman 2011).
However, Wray (2002) casts doubt on the question by pointing out that as collocational
meaning is merely due to the tendency of lexical items to ‘prefer’ certain word partners over
others, this may not be fixed enough for collocations to function similarly to other formulaic
language. Since there is so much potential for variation, such pairings could easily be
constructed via Sinclair’s open-choice principle (Wray 2002:52). As a result, Wray asserts
that:
It is far from being the case that all commentators see collocational associations as
“formulaic” in any useful sense at all. Whereas other types of formulaic sequence are entirely
or partly fixed, so there is a central internal stability, collocation is much more fluid (Wray
2002:51).
The question seems to boil down to how far collocations are word combinations which are
stored in long-term memory as if they were ‘single lexical units’, as other types of formulaic
language are hypothesized to do. This seems intuitively to apply to more fixed types of
formulaic language such as idioms, beat about the bush, or pragmatic formulae, Have a nice
day. But is the same true for more flexible combinations like collocations?

- 16 -
The hypothesis for this dissertation is that if collocations are to be considered a subset of
formulaic language, and formulaic language is seen to promote fluency, the expectation
would be that there might be some kind of relationship between collocations and fluency.
This is the reasoning behind the investigation carried out in this dissertation.
2.3.3 Research into learners’ collocational competence
Researchers seem to use a variety of terms for referring to collocations and to errors that
learners make when producing collocations. Following Nesselhauf (2005), Laufer and
Waldman (2011) and Henriksen (2012), this dissertation uses the term ‘deviant collocations’
to refer to word combinations which contain some kind of error.
Research into collocational competence, the ability to produce or recognise native-like
collocations, seems to show two conflicting sets of findings. Firstly, there are the studies that
have found a positive correlation between collocational competence and overall language
proficiency. For example, Groom (2009) looked at grammatical collocations in a written
corpus of Swedish learners and found a positive correlation between L2 immersion (a period
spent in an L2-speaking country) and collocational accuracy. The implication is that
improvements in general proficiency, assuming learners improve overall from time spent in
an L2 environment, are accompanied by enhanced collocational competence.

- 17 -
Keshavarz and Salimi (2007) tested both the collocational competence and overall proficiency
of 100 English major university students in Iran. Their findings suggest that learners’
collocational competence and language proficiency level were closely and positively
correlated.
Nizonkiza (2011), using a collocations dictionary to design a collocational competence test
administered to English majors at the University of Burundi, found that mastery of
collocations predicted lexical competence, which in turn seemed to be a reliable predictor of
language proficiency.
In contrast to these findings, however, is a body of research that seems to suggest the exact
opposite: that learners’ collocational competence lags behind their general language
proficiency. Bahns and Eldaw (1993) showed that, for advanced German speakers of English,
collocations present a major problem in the production of correct English. Investigating verb-
noun collocations in a translation task and a cloze test, they found that the number of
collocational errors was twice as high as the number of errors involving single lexical items in
the translation tasks they assigned.
Nesselhauf (2005) reports on the collocational use of verb-noun combinations in academic
writing by non-native English-speaking students. She concludes that even advanced learners
have considerable difficulties in producing certain native-like collocations. Findings showed
that particularly challenging for learners were the semi-transparent collocations and
collocations formed with a different constituent part compared to the L1 equivalent.

- 18 -
Laufer and Waldman (2011) compared native English speakers and different levels of
Hebrew-speaking non-native learners of English with regard to the frequency and correctness
of their respective use of collocations. They found that learners at all levels of proficiency
produced far fewer collocations than the native speakers. In addition, while increases were
registered at the most advanced learner level, deviant collocations, especially those arising
from interlanguage differences, continued to persist.
Finally, De Cock (2000), one of the few researchers to conduct research into spoken L2
collocational use, concluded that learners have a tendency to overuse, underuse, and misuse
native-like collocations and often produce deviant collocations.
Pawley and Syder (1983) contend that a speaker’s store of familiar collocations will enable
them to make idiomatic, native-like selections and to process language fluently. Lennon goes
so far as to claim that, ‘The greatest barriers both to purely temporal fluency and to higher-
order fluency at advanced levels of English as a foreign language would appear to be lexical
in nature; conversely, felicitous [i.e. native-like] lexical collocations contribute positively to
fluent performance’ (Lennon, 2000:40). However, in the studies cited above, collocational
competence seems to be operationalised as the ability to apply correct, frequent and varied
collocations, i.e., conform to native speaker norms. It seems logical that this would enable the
learner to produce more native-like utterances, what Pawley and Syder call ‘native-like
selection’ (1983). For example, saying I did my homework rather than the erroneous I made
my homework is more accurate and sounds more native-like. What is less clear is how this
might promote fluency. Furthermore, if even advanced learners appear to produce the

- 19 -
numbers of deviant collocations that the research suggests they do, how might this affect their
fluency?
2.4 SUMMARY
The term ‘fluency’ is used both in a broad sense to refer to the ability to produce language
easily, smoothly and accurately, and in a narrow sense referring to the more temporal aspects
of speech. The research into temporal fluency shows that there are several elements involved
in the process. However, three temporal measures appear to be particularly robust at
predicting spoken fluency: speech rate, mean length of run and phonation-time ratio.
Research into formulaic language, defined as prefabricated strings of words stored and
produced as single units, seems to have established a positive relationship between formulaic
language and fluency. Collocations, two-to-three word combinations such as bitterly cold and
fond of, are often considered a subset of formulaic language and would therefore in theory be
expected to behave in a similar way. However, if collocational competence is the ability to
produce native-like collocations, how might learners’ deviant collocations impact on their
fluency? There seems to be a lack of empirical evidence into collocational competence and
fluency to shed light on these questions. It is this research gap that was the motivation for this
dissertation.

- 20 -
3. METHODOLOGY
The aim of this dissertation is to find out whether there is any kind of correlation between use
of collocations and fluency. The methodology therefore sets up various measures for overall
language proficiency, collocational competence and spoken fluency, and applies statistical
tools to test for any correlations between them. The chapter covers the origin of the data
source (Section 3.1), and the procedure followed for calculating collocational competence and
fluency measures (Section 3.2). Section 3.3 describes the initial statistical analyses applied.
This is followed by the additional procedures designed to test potentially important aspects of
the data set not included in the original methodology design (Section 3.4). The chapter
finishes with a summary.
3.1 ORIGIN OF THE DATA
The data used for this dissertation originated from an oral proficiency test for lecturers at
UCPH, where I work. I was given access to a number of data sources to enable me to
undertake this dissertation. This section gives a description of the test and then goes on to
explain procedures that were followed to produce the data, prior to my work on it.

- 21 -
3.1.1 The TOEPAS certification test
Over the last 20 years or so, increasing internationalisation at UCPH has led to more and
more graduate-level study programmes being run through the medium of English. As a result,
in the autumn of 2009, University management introduced an oral English certification test
for lecturers: the Test of English Proficiency for Academic Staff (TOEPAS). Since then,
nearly 400 non-native English-speaking lecturers from the University have taken the test.
TOEPAS was intended to test whether lecturers, who were already employed at UCPH, had
the necessary English language proficiency to teach on elite English-medium instruction
courses at the University.
The TOEPAS test takes place at UCPH’s Centre for Internationalisation and Parallel
Language Use (CIP). During each certification session, three lecturers from the same
discipline each deliver a 20-minute mini-lecture from their own field of research to their two
colleagues. They, in turn, act as ‘graduate students’ and are encouraged to ask questions, both
during the lecture and in a question-and-answer session afterwards, in order to simulate a
degree of classroom interaction.
The three mini-lectures given per session are assessed by two examiners from CIP. These
examiners are described by CIP (2014) as ‘researchers and research assistants specialised in
second language acquisition with an emphasis on academic English’. Directly following the
examination session, the two examiners independently rate the test takers’ performances, by
awarding each lecturer a global score from 5 (highest score) down to 1, where a score of 5, 4
or 3 is certified to teach English-medium courses, and a score of 2 or 1 is uncertified. This

- 22 -
global score is the score the lecturers themselves receive from CIP as their certification result.
Appendix A contains a description of the global score bands
Table 3.1 gives an overview of the results for all 394 certifications from August 2009 to
August 2014. As can be seen, there is an overwhelming number of 3s and 4s (92.1%), with
only a relatively small number of lecturers achieving the top score of 5, and even fewer
(2.8%) failing to be certified (a score of 2). No lecturer has yet been given a score of 1. This
table serves to illustrate that the lecturers taking the certification test are relatively advanced
non-native speakers of English.
Table 3.1: TOEPAS overall certification scores and results, 2009-2014
Global
Score
English
Proficiency
Level
No. of
Lecturers
(394 total)
% of Total
Lecturers
Certification
Awarded
5
equivalent to a
native speaker
20
5.1
yes
4
Excellent
182
46.2
yes
3
Good
181
45.9
yes
2
less than
sufficient
11
2.8
no
1
Limited
0
0
n/a
As well as a global score, the examiners also score five analytic criteria, namely: fluency,
pronunciation, vocabulary, grammar and interaction, the descriptors for which are shown in
Appendix B. These analytic criteria are used purely for internal purposes and are also scored
on a scale from 5 to 1, but may be qualified by a plus or minus. Thus, a lecturer may score 3+

- 23 -
for fluency, 4- for vocabulary and so on. On occasions, there is disagreement between the
examiners as to the exact internal score for a particular analytic criterion; this disagreement is
also recorded internally. A lecturer may therefore be given a fluency score of 3 by one
examiner and 3+ by the other. The internal fluency score was used as part of the data for this
dissertation (described in Section 3.2.3).
Each lecturer’s mini-lecture for the certification procedure is recorded in stereo directly onto a
Mac computer, using a Panasonic mini digital video recorder. One channel is connected to a
personal wireless microphone worn by the lecturer giving the mini-lecture. The other channel
is connected to an overhead microphone positioned just above the other two lecturers, in order
to pick up any comments and questions they might have. The recording results in digital video
and audio files.
3.1.2 Access to data sources
In October 2011, CIP applied for and was awarded funds to have 15 of the certification mini-
lectures transcribed for research purposes. This resulted in a number of data sources, which,
as an employee at CIP, I was given access to. These data sources made it possible for me to
embark on this dissertation and included the following material:
- 24 -
overall totals for the 394 certifications that have been held so far (Table 3.1 in Section
3.1.1);
a transcription of each of the 15 mini-lectures, together with the accompanying audio
and video files;
text file versions of the 15 transcriptions;
copies of the certification reports for each of the 15 lecturers, which gave me access to
the examiners’ global scores and fluency scores;
two files of speech analysis data, which a colleague of mine had extracted in 2012
from the 15 mini-lectures for his own research. The procedure he used to produce the
files is explained in Section 3.1.4. I have called these files Speech Analysis File 1 and
Speech Analysis File 2, as they gave me the raw material to be able to calculate the
temporal measures for fluency, explained in Section 3.2.4.
3.1.3 Data selection
Out of the 96 certifications that had been carried out by October 2011, the 15 mini-lectures to
be transcribed were randomly selected by computer, albeit meeting a number of
predetermined criteria:
Only certifications after 1 January 2010 were to be used. The reason for this was that
the assessment procedure had not been fully standardised prior to this date.
For ease of transcription, rather than each lecturer coming from a different
certification session, the 15 lecturers had to be distributed over just five sessions, with
three lecturers in each session (as described in Section 3.1.1).

- 25 -
As the lecturers should represent a spread in global ratings, the procedure needed to
produce a stratified sample to satisfy the following conditions:
o 3 lecturers with a score of 5
o 3 lecturers with a score of 2
o at least 4 lecturers with a score of 3
o at least 4 lecturers with a score of 4
The 15 lecturers that had been selected by this method were used as the informants in this
dissertation. They came from three university departments: Large Animal Science (LAS),
Information Technology (IT) and Mathematics (Maths). For the purposes of this dissertation,
I have given each lecturer an identification number from 01 to 15 together with a prefix L, I or
M according to which department they came from. Appendix C shows their identification
number, university department, global scores and the internal fluency scores from each of the
two examiners. The final distribution of global scores was three 5s, five 4s, four 3s and three
2s. The lecturers had all signed consent forms at the time of certification, allowing the
anonymous use of their recordings for research purposes.
The audio files for each of the 15 mini-lectures selected were orthographically transcribed
manually using the Transcriber program, which also aligned the audio file with the
transcription file. These were then converted into TextGrid files in the speech analysis
program Praat. In order to produce a text file, the orthographically transcribed speech of each
lecturer was extracted from the Praat TextGrid file and saved in a separate plain text file. This
file I called the Collocations Text File, and it was used to identify collocations (Section 3.2.2).

- 26 -
3.1.4 Extraction of the speech analysis files
In order to produce the two speech analysis files that I was later given access to, my colleague
extracted and numbered runs from the Praat files using a simple script program. A phonetics
transcription was added using the program PhoTransEdit. This included syllable boundaries
making it possible to produce a count of the number of syllables uttered by a speaker. The
resultant two files listed consecutively all 15 mini-lectures including question-and-answer
sessions. Speech Analysis File 1 contained data about all speech runs between unfilled pauses
of 0.15 seconds or more (as my colleague had originally set the pause cut-off time to 0.15
seconds for his own research purposes) and showed timed filled and unfilled pauses, and
incomplete words. Speech Analysis File 2 showed all speech runs with the respective number
of syllables for each run. I used these two files to calculate the three temporal fluency
measures (Section 3.2.3).
3.2 DATA PROCESSING FOR THIS DISSERTATION
From the data I was given access to, I needed to extract the specific information used in this
dissertation. This section tracks my own procedures for doing this. It should be noted that
although the data originally consisted of a mini-lecture followed by a question-and-answer
session, my data set was restricted to the mini-lecture itself, roughly 20 minutes for each
lecturer.

- 27 -
3.2.1 Verification of collocations
A number of researchers, including Nesselhauf (2005), Laufer and Waldman (2011) and
Nizonkiza (2011), have used monolingual dictionaries to verify word combinations found in
their data. According to Nesselhauf, such dictionaries constitute ‘the best existing sources
recording the combinability of lexical items’ (2005:54). In the interests of applying a
standardized and objective yardstick to the data under investigation, this was also the method
I adopted for verifying collocations.
The dictionary chosen was the Oxford Collocations Dictionary for Students of English
(OCD), second edition (2009). The advantage of using a collocations dictionary over other
types of (learner) dictionaries is that this type of dictionary, being dedicated to listing
collocations, constitutes a more comprehensive and direct source of collocations than a more
traditional dictionary. The OCD draws on corpus data from the two-billion-word Oxford
English Corpus, deals with a reasonably formal register (Barfield and Gyllstad 2009), and is
aimed at upper-intermediate learners and above. It was chosen over other collocations
dictionaries as, with over 9,000 headwords, it was the most comprehensive. By comparison,
the Macmillan Collocations Dictionary (2010) has 4,500 headwords and the LTP Dictionary
of Selected Collocations (2002) only 3,200.
The OCD is based on the lexical frequency/co-occurrence view of collocation, but it explicitly
only includes collocations which roughly correspond to the restricted collocations on
Howarth’s (1998) continuum, described in Section 2.3.2. The dictionary includes fairly weak
collocations (see a movie) through to strong and more restricted collocations (see reason).

- 28 -
However, it excludes completely free combinations such as see a river as well as completely
fixed idioms like not see the wood for the trees (OCD 2009:v). The OCD was therefore
considered an appropriate tool for verifying collocations for this dissertation.
3.2.2 Identification of collocations and deviant collocations
Collocations were identified manually by going through the Collocation Text Files for each
lecturer and underlining any word combinations which potentially constituted either lexical
collocations (e.g., draw a graph, subtle difference, etc.) or grammatical collocations (e.g., in
fact, talk about, etc.), as described in Section 2.3.2 above. The manual approach allowed me
to capture collocates further away from the node word than four each side, as in the following
example: the time schedule for when to deliver and what to deliver it needed to be adjusted
(lecturer I08). The verb adjust is listed in the OCD as a collocate for schedule, but in the data
it was positioned 13 words away.
Once a particular combination had been underlined, it was checked to see if it was listed in
the OCD. A number of decisions were made to determine whether a word combination was in
fact a verifiable collocation according to the OCD. They were as follows:
1. A word combination was counted as a collocation if it was listed in the OCD.
2. Phrasal verbs (look for, find out, look up) were not included in themselves, if these
were listed in OCD as single items.
- 29 -
3. Combinations listed as ‘phrases’ in the OCD were also ignored as these constituted
more fixed idiomatic phrases, which did not fall under the definition of collocations
that this dissertation is following.
4. If a collocation where one of the component parts was an adjective, and the adjective
occurred in a collocations file with the comparative form of the adjective, then that
was included as a collocation. For example, the OCD lists good result as a collocation.
One of the lecturers says better result, which was included in his list of verified
collocations.
5. Nested collocations, i.e., two (or more) collocational pairings on the same headword,
were counted as two separate collocations. For example, use a different method was
counted as two collocations (use a method and different method).
If a word combination was counted as a collocation, it was added to the list for that lecturer.
In this way, a list was compiled of all the lexical and grammatical collocations produced by
each lecturer in their mini-lecture. These were then sequenced alphabetically in order to group
repeat uses of particular collocations, thereby enabling the calculation of collocation types and
collocation tokens for both lexical and grammatical collocations. This in turn yielded the total
number of collocation types and tokens used by each lecturer. Appendix D, E and F list all the
collocations found for each lecturer in the LAS, IT and Maths departments respectively.
If a word combination was not verified as a collocation, there were two possibilities: either
the word combination was deemed to be acceptable, although not verifiably a collocation, in
which case it was simply ignored, or it was deemed potentially deviant in some way.
Potentially deviant collocations (e.g., do a procedure, violent pain, extremely many) were
logged against the lecturer that produced them. Following Nesselhauf’s (2005:50-51)

- 30 -
procedure for deciding acceptability of word combinations, I collated all potentially deviant
collocations into one list and sent the list out to five raters. These raters were either native
English speakers and/or trained TOEPAS certification examiners. They were instructed to
indicate acceptability of the word combinations on a three-point scale: acceptable,
unacceptable, or not sure. If three of the five raters judged a combination as unacceptable, it
was listed as a deviant collocation against the lecturer who had produced it. The full list of
potentially deviant collocations and the raters’ assessments is listed in Appendix G. Appendix
H contains the final list of all deviant collocations by lecturer.
3.2.3 Calculating collocational competence
As explained in Section 3.2.1, three variables indicating collocational use were produced for
each lecturer: number of collocation types (different collocations used), collocation tokens (all
collocations produced including repetitions) and deviant collocations. However, the 15 mini-
lectures were all slightly different in length. Therefore, in order to produce comparable
measures, collocational competence was defined as the number of verifiable collocation types
(as listed in the OCD), collocation tokens (frequency of use) and deviant collocations per
thousand words spoken. The number of words was calculated by copying the Collocations
Text File over to a Word file, removing all laughter (transcribed in the file as ‘ha’), filled
pauses (transcribed as ‘uh’), incomprehensible utterances (transcribed as ‘xxx’) and
incomplete words (transcribed as part of a word with a dash, for example, ea- represents an
- 31 -
incomplete each). The remaining word count in Word was then noted for each lecturer as
number of words spoken.
In addition, the type/token ratio was calculated for each lecturer by dividing the number of
collocation types by the number of collocation tokens. This was done to test for possible
patterns of collocational ‘overuse’. If every collocation only occurs once, this figure will be 1,
and therefore the nearer to 1 the type/token ration is, the more varied the collocational use is
considered to be. On the other hand, a low type/token ratio indicates that the same
collocations are used several times through the mini-lecture.
3.2.4 Measuring fluency
The temporal fluency measures chosen for this dissertation were calculated as follows:
Speech rate: number of syllables uttered per minute. This gives an indication of how
fast speech is produced overall.
Mean length of run: the average number of syllables produced in utterances between
pauses of 0.25 seconds and above. This gives an indication of how long a speaker can
‘keep going’ before each pause.
Phonation-time ratio: percentage of time spent speaking words as a percentage of the
time taken to produce the speech sample. Overall, the higher the ratio figure, the more

- 32 -
time a speaker spends on actually speaking rather than producing filled or unfilled
pauses or incomplete words.
In order to identify and calculate these measures, each lecturer was analysed manually in turn,
applying the following procedures to Speech Analysis Files 1 and 2 (from Section 3.1.3):
1. As the other two lecturers, who were acting as graduate students, were supposed to ask
questions during the mini-lecture itself, there were a number of runs not actually spoken
by the lecturer giving the mini-lecture. Therefore, these two lecturers’ run and pause times
were deleted from Speech Analysis File 1, and their spoken runs deleted from Speech
Analysis File 2.
2. I needed to calculate runs using as my boundary unfilled pauses of 0.25 seconds or more
(based on the research into temporal fluency variables in Section 2.1.2). However, many
of the runs listed in Speech Analysis File 2 were separated only by filled pauses,
incomplete words and/or pauses of less than 0.25 seconds, as my colleague had originally
set the pause cut-off time to 0.15 seconds. Therefore, runs separated in this way were
combined.
3. Speech Analysis File 2 listed syllables per run, and so the total number of syllables used
by the lecturer could be established. This figure divided by the total number of spoken
runs, as calculated in step 2, yielded the mean length of run.
4. The times for spoken runs were then separated from the non-speech times for the lecturer
and totalled. This yielded the total speaking time and total non-speaking time, from which
both speech rate (in syllables per minute) and phonation-time ratio (as a percentage) could
be calculated. It should be noted that, matching up with the number of words included in
each mini-lecture sample (as explained in 3.3.2 above), ‘speaking time’ does not include
laughter, filled pauses, incomprehensible utterances or incomplete words. Non-speaking
time includes these features plus unfilled pauses.

- 33 -
As outlined in Section 3.1.3 above, all the lecturers in the data set had received internal scores
on five analytic criteria, including fluency, from each of the two CIP examiners. Each of the
examiners’ fluency scores were converted into an integer between 0 and 14 from each
examiner based on the conversion chart shown in Appendix I, and then added together to
provide a single value, which could be used in the statistical analyses. A lecturer could
therefore score between 0 (if awarded 0 by both examiners) up to a top score of 28 (if the
lecturer was awarded 5 by each examiner) for fluency. So, for example, lecturer L01 was
awarded a 4- for fluency from one examiner and a 3+ from the other examiner, giving him an
overall fluency index of 19 (10+9). The individual examiner’s fluency scores and the
corresponding fluency index for each lecturer can be found in the table in Appendix C.
It is worth noting at this point that the analytic criterion which would correlate most closely
with collocational competence would in theory be vocabulary. This is because particularly
low frequency and consistently appropriate collocations, as well as deviant collocations,
would presumably be noted by the examiners under this criterion. Although it might have
been interesting to examine other analytic criteria, I only used the internal scores for fluency
and ignored the other four analytic criteria, since this dissertation focused on investigating the
relationship between collocational competence and fluency.

- 34 -
3.3 INITIAL STATISTICAL ANALYSES ACROSS LECTURERS
The data collected for each lecturer were collated in a table and statistical analyses carried out
using IBM’s SPSS statistics package. To perform a meaningful parametric test, such as
Pearson’s r test, generally requires at least 30 informants; however, the data in this study
consisted of only 15 lecturers. Furthermore, the data proved to follow a non-normal
distribution, as shown in the histogram in Figure 3.1, which plots the frequency distribution of
the 15 lecturers according to their fluency index (Fl. Index on Figure 3.1).
Figure 3.1: Histogram showing non-normal distribution of fluency index scores
- 35 -
The non-normal distribution was mainly due to the overrepresentation of participants with
fluency indices of 28, so a non-parametric test was considered more appropriate. Therefore,
following the study by Kormos and Denes (2004), I applied the Spearman rank-order test to
investigate correlations between temporal fluency variables, linguistic variables and
examiner-based variables.
The initial step in the analysis phase was to compare the collocational competence measures,
i.e., collocation types per thousand words, collocation tokens per thousand words, type/token
ratio, and deviant collocations per thousand words, with overall proficiency, operationalised
as the global certification score. These figures were collated and grouped according to global
score and set out in a table. Then a Spearman rank-order correlation test was run against the
five variables in order to find out whether there were any significant correlations between any
of them. The deviant collocations per thousand words scores were given a minus sign as they
constituted a negative variable. For example, -0.49 deviant collocations per thousand words
would be considered ‘better’ than -2.72 deviant collocations per thousand words so would be
expected to correlate with correspondingly higher language proficiency scores. The Spearman
test produced a correlation grid across the five variables.
The procedure described above was repeated but this time for the three temporal fluency
variables: speech rate, mean length of run and phonation-time ratio, plus the examiners’
global scores and internal fluency scores, expressed as fluency index.

- 36 -
The third step involved the Spearman rank correlation test being run against the four
collocational competence variables together with the four fluency variables. This again
produced a correlation grid.
3.4 ADDITIONAL ANALYSES ACROSS DEPARTMENTS
The analyses described in this section were not part of the original planned methodology.
They were added to investigate how far initial results were influenced by domain-specific
language use across the three departments represented by the 15 lecturers. Therefore, for the
following analyses, the lecturers were grouped according to the department they came from:
six from LAS, three from IT and six from Maths.
3.4.1 Spearman analyses of the LAS and Maths departments
In order to investigate whether correlation patterns per department might be any different to
the initial results, the Spearman rank correlation test was again run against the global score,
collocational competence variables and fluency variables, first across the six lecturers from
the LAS department and then across the six lecturers from the Maths department. As there
were only three lecturers making up the IT department, they were not included in this part of
the analysis.
- 37 -
3.4.2 AntConc analyses
As a supplement to the Spearman test, the software program AntConc 3.4.3 (Anthony 2014)
was chosen to find out if there were any potential domain-specific collocations across the
texts for each of the three departments. Among other things, AntConc allows the user to list
words in the text in order of frequency, shows frequent word partnerships present in the texts,
and can display concordance lines for a particular word, with the additional option of sorting
the lines according to the co-text to the left or right of the node word. Thus, the program
enables the identification of clusters of word partnerships which form potential (domain-
specific) collocations.
The texts from the three different fields, Maths, LAS and IT, were analysed in turn using the
following procedure. First, I went through the word list produced by AntConc, in order of
frequency, for each of the three sets of texts and selected the first (i.e., the most frequent) ten
lexical items (i.e., nouns, verbs, adjectives and adverbs, thereby ignoring function words like
the, only, one, etc.) which could potentially be used to form domain-specific word
partnerships. Using AntConc’s concordance program, I then extracted any words that formed
partners with these ten items, occurred at least twice, and were not listed in the OCD. For
example, equation was one of the initial top ten words for the Maths texts. One of the word
partnerships found with equation was differential equation, which occurred 15 times.
However, as this particular collocation is listed in the OCD, it was not included in the list of
domain-specific word partnerships. On the other hand, closed graph theorem, occurring 13
times, was included as a domain-specific collocation as it is not listed in the OCD.

- 38 -
3.4.3 Deviant collocations
Deviant collocations were added up, and the average numbers of deviant collocations per
thousand words produced per lecturer for each department were calculated. To ensure
compatibility across the departments, which had slightly different overall global mean scores,
these figures were adjusted using the IT mean score of 4 as a base line. Thus, the LAS
department had a global mean score of 3.17 (79.25% of the IT mean score), and the Maths
department had a global mean score of 3.67 (91.75% of the IT score). The LAS and Maths
average deviant collocations per thousand words scores were therefore adjusted by
multiplying them by 0.7925 and 0.9175, respectively, in order to allow comparability with the
IT department score.
In addition, a calculation was made of the overall proportion of deviant collocation tokens as
a percentage of total collocation tokens across all lecturers.
3.5 SUMMARY
The data for this dissertation came from 15 lecturers employed at three different university
departments who each took an oral proficiency test at UCPH. A number of data sources from
these tests were made available to me, including sound files, transcriptions, test scores and
speech analysis files. From these sources, I was able to extract the eight measures shown in
Table 3.2.

- 39 -
Table 3.2: Measures used to calculate language proficiency, collocational competence and
fluency
Type of measure Measure Definition
Measures from the
oral proficiency test
examiners’ scores
Global score Between 5 and 2, 5 being the highest, and 2
being a fail.
Fluency index The two examiners’ internal scores for
fluency, converted to a single figure
between 0 and 28.
Temporal fluency
measures
Speech rate Number of syllables uttered per minute of
lecturing time.
Mean length of run Average number of syllables uttered in
each run of speech between silent pauses of
0.25 seconds or longer.
Phonation-time ratio The amount of time spent actually speaking
as a percentage of total time to produce the
speech sample, i.e., the lecturing time.
Collocational
competence
measures
Collocation types per
thousand words
Number of different collocations produced,
as verified in the Oxford Collocations
Dictionary (2009), expressed per thousand
words spoken during the mini-lecture.
Collocation tokens per
thousand words
Total number of collocations produced, as
verified in the Oxford Collocations
Dictionary (2009), expressed per thousand
words spoken during the mini-lecture.
Type/token ratio Total number of collocation types produced
divided by the total number of collocation
tokens produced.
Deviant collocations
per thousand words
Total number of deviant collocations
produced, as judged by a panel of five
raters, expressed per thousand words
spoken during the mini-lecture.
Correlations among these different measures were examined using the Spearman rank
correlation test. This was done initially across all 15 lecturers. This was followed up by
additional analyses testing for correlations among the same variables across the three

- 40 -
departments. A concordance program, AntConc, was used to identify potential domain-
specific collocations across departments. The results of these analyses and statistical tests are
shown in Chapter 4.

- 41 -
4. RESULTS
The first section of this chapter, Section 4.1, looks at the results of the initial set of analyses
across all 15 lecturers: how fluency correlates with overall language proficiency (Section
4.1.1); how collocational competence correlates with overall language proficiency (Section
4.1.2); and whether there are any statistical correlations between collocational competence
and fluency (Section 4.1.3). Section 4.2 shows the results from the additional set of analyses
carried out across the three departments: LAS, IT and Maths. The chapter finishes with a
summary of the results.
4.1 INITIAL ANALYSES ACROSS ALL LECTURERS
4.1.1 Fluency and overall language proficiency
Appendix J shows the results for the four fluency measures (fluency index plus the three
temporal variables) across the 15 lecturers, who are grouped according to global score. The
average scores per variable have also been calculated and are given in the last row of the
table.
The highest correlation seemed to be between fluency index and global score in that all score
4s and 5s had a fluency index above the mean score of 21, and all the 3s and 2s fluency index
values were below the mean. This is not unexpected as both these two numbers originated

- 42 -
from the same source: the certification examiners. However, the picture did not look so clear-
cut when the three temporal fluency measures were compared with global score, so Spearman
rank tests were applied to the data to identify any correlations between the measures. These
are shown in Table 4.1.
Table 4.1: Spearman rank correlations between global certification
scores and fluency variables (N=15)
Variables
Fluency
Index
Speech
rate
Mean
length of
run
Phonation-
time ratio
Global score:
Correlation Coefficient
Sig. (2-tailed)
.907**
.000
.625*
.013
.425
.114
.379
.163
Fluency Index:
Correlation Coefficient
Sig. (2-tailed)
1.000
.688**
.005
.464
.082
.458
.086
Speech rate:
Correlation Coefficient
Sig. (2-tailed)
1.000
.932**
.000
.875**
.000
Mean length of run:
Correlation Coefficient
Sig. (2-tailed)
1.000
.889**
.000
**Correlation is significant at the 0.01 level (2-tailed)
*Correlation is significant at the 0.05 level (2-tailed)
The grey shaded areas indicate significant correlations, either at the 0.01 or 0.05 level. These
show that two fluency measures correlate significantly with global score: fluency index, with
a correlation coefficient of 0.907 (significant at the 0.01 level), and speech rate, with a slightly
lower correlation coefficient of 0.625 (significant at the 0.05 level). Speech rate is the only
variable to correlate significantly with all the other four variables: at the 0.01 level for fluency
index, mean length of run and phonation-time ratio, although only at the 0.05 level for global
score. The three temporal fluency measures all correlate significantly with each other at the
0.01 level.

- 43 -
4.1.2 Collocational competence and overall language proficiency
Appendix K shows the figures for the collocation types per thousand words, collocation
tokens per thousand words, collocational type/token ratio, and deviant collocations per
thousand words for each lecturer, again grouped according to global score.
With a mean value of 30.7, the number of collocation types per thousand words ranged from
46.5 for lecturer I07, who scored a global 4 on the certification, down to 13.2 for lecturer
M10, who was in fact awarded a global score of 5. The next lowest value was gained by
lecturer M11, who scored a global 4, indicating that there may not be a clear relationship
between collocational competence and overall proficiency.
A similar pattern emerged for the collocation tokens per thousand words used. There was, in
fact, a close relationship between the two measures. As shown in Table 4.2, the Spearman
rank correlation test between collocation types per thousand words and collocation tokens per
thousand words yields a coefficient of 0.954, which is significant at the 0.01 level (shaded in
grey). Apart from this correlation, however, Table 4.2 shows no significant correlation
between global score and any of the four collocational measures.

- 44 -
Table 4.2: Spearman rank correlations between global certification scores and
collocational competence variables (N=15)
Variables
Collocation
types per
1000 words
Collocation
tokens per
1000 words
Collocation
type/token
ratio
Deviant
collocations
per 1000
words
Global score:
Correlation Coefficient
Significance (2-tailed)
.183
.514
.248
.373
-.002
.995
.488
.065
Collocation types
per 1000 words:
Correlation Coefficient
Significance (2-tailed)
1.000
.954**
.000
.368
.177
-.215
.441
Collocation tokens
per 1000 words:
Correlation Coefficient
Significance (2-tailed)
1.000
.361
.187
-.072
.800
Collocation
type/token ratio:
Correlation Coefficient
Significance (2-tailed)
1.000
-.366
.180
**Correlation is significant at the 0.01 level (2-tailed)
The pattern for deviant collocations per thousand words is equally unclear. While the three
lecturers with a global score of 5 all have deviant collocations per thousand words scores of
below 0.5, so does lecturer M13, who actually failed the certification. Furthermore, the
likelihood of having no deviant collocations per thousand words at all seems to be equal
whether a lecturer has a global score of 3, 4 or 5. These results are reflected in Table 4.2
which shows that there are no significant correlations between deviant collocations per
thousand words and either global score of any of the other three collocational variables.

- 45 -
4.1.3 Collocational competence and fluency
Table 4.3 shows the results of the Spearman rank-order test as applied to three collocational
competence variables and the four fluency variables. Note that as collocational type/token
ratio seemed to be unrelated to global score (correlation coefficient of -0.002 in Table 4.2), it
was not included as a variable in the remainder of the analyses.
Table 4.3: Spearman rank correlations between fluency variables and collocational
competence variables (N=15)
Variables
Speech
rate
Mean
length
of run
Phonat
ion-
time
ratio
Coll.
types
per
1000
words
Coll.
tokens
per
1000
words
Deviant
colls per
1000
words
Fluency Index:
Corr. Coefficient
Sig. (2-tailed)
.688**
.005
.464
.082
.458
.086
.061
.829
.043
.879
.429
.111
Speech rate:
Corr. Coefficient
Sig. (2-tailed
1.000
.932**
.000
.875**
.000
-.161
.567
-.204
.467
.237
.396
Mean length of run:
Corr. Coefficient
Sig. (2-tailed
1.000
.889**
.000
-.168
.550
-.232
.405
.054
.849
Phonation-time ratio:
Corr. Coefficient
Sig. (2-tailed)
1.000
-.021
.940
-.079
.781
-.014
.960
Coll. types per 1000
words:
Corr. Coefficient
Sig. (2-tailed)
1.000
.954**
.000
-.215
.441
Coll. tokens per 1000
words:
Corr. Coefficient
Sig. (2-tailed)
1.000
-.072
.800
**Correlation is significant at the 0.01 level (2-tailed)
*Correlation is significant at the 0.05 level (2-tailed)
- 46 -
Here, again, there were no significant correlations across any of the two sets of variables. On
this basis, there appeared to be very little evidence that collocational competence plays any
role in either certification examiners’ perception of fluency or in determining temporal
fluency.
From the initial results across all lecturers, therefore, there seemed to be no significant
relationship either between global certification score and collocational competence, or
between fluency and collocational competence. The results from the additional analyses
across departments are given in the next section.
4.2 ADDITIONAL ANALYSES ACROSS DEPARTMENTS
This section looks at the results from the four additional analyses carried out to identify
collocational use in the lecturers across the three departments. As described in Section 3.4,
these analyses consisted of three stages: comparing Spearman rank correlation tests from the
LAS and Maths departments respectively, identifying potential domain-specific collocations
from the lecturers per department, and analysing deviant collocations.

- 47 -
4.2.1 Comparing the LAS and Maths department lecturers
Table 4.4 shows the Spearman rank combined correlations for global score, fluency index, the
three temporal fluency variables (speech rate, mean length of run and phonation-time ratio),
and the three collocational competence variables (collocation types per thousand words,
collocation tokens per thousand words, and deviant collocations per thousand words) for the
six lecturers from the LAS department.
Table 4.4: Spearman rank correlations between the global score, fluency variables, and
collocational competence variables: LAS lecturers (N=6)
LARGE ANIMAL
SCIENCE
Variables
Fluency
index
Speech
rate
Mean
length
of run
Phon-
time
ratio
Coll.
types
per
1000
words
Coll.
tokens
per
1000
words
Deviant
colls.
per 1000
words
Global score:
Corr Coefficient
Sig. (2-tailed)
.985**
.000
.324
.531
.059
.912
.059
.912
.971**
.001
.971**
.001
.324
.531
Fluency index:
Corr Coefficient
Sig. (2-tailed)
1.000
.406
.425
.174
.742
.174
.742
.986**
.000
.928**
.008
.232
.658
Speech rate:
Corr Coefficient
Sig. (2-tailed)
1.000
.943**
.005
.943**
.005
.314
.544
.143
.787
-.371
.468
Mean length run:
Corr Coefficient
Sig. (2-tailed)
1.000
1.000**
.000
.086
.872
-.143
.787
-.600
.208
Phon-time ratio:
Corr Coefficient
Sig. (2-tailed)
1.000
.086
.872
-.143
.787
-.600
.208
Coll. types per
1000 words:
Corr Coefficient
Sig. (2-tailed)
1.000
.943**
.005
.314
.544
Coll. tokens per
1000 words:
Corr Coefficient
Sig. (2-tailed)
1.000
.486
.329
**Correlation is significant at the 0.01 level (2-tailed)

- 48 -
Here, there were mutually significant correlations (at the 0.01 level, shaded in dark grey)
across the four variables: collocation types per thousand words, collocation tokens per
thousand words, global score and fluency index. However, there were no significant
correlations between deviant collocations per thousand words and either global score or
fluency index. At the same time, the table shows that while all three temporal fluency
variables correlated significantly with each other (also at the 0.01 level, shaded in light grey),
there seemed to be no relationship between these two sets of variables. None of the individual
variables from the one set correlated significantly with any of the variables making up the
other set.
Table 4.5 shows the same eight variables tested for the six Maths lecturers. The picture here
was rather different from the equivalent table for the LAS lecturers. With the exception of the
correlation between global score and phonation-time ratio (correlational coefficient 0.759), all
the four fluency variables and the global scores were mutually significantly correlated, at least
to the 0.05 level. On the other hand, there was no significant correlation at all between the
three collocational competence variables and the five fluency/global score variables.

- 49 -
Table 4.5: Spearman rank correlations for global score, fluency variables, and
collocational competence variables: Maths lecturers (N=6)
MATHS
Variables
Fluency
index
Speech
rate
Mean
length
of run
Phon-
ation-
time
ratio
Coll.
types
per
1000
words
Coll.
tokens
per
1000
words
Deviant
colls
per
1000
words
Global score:
Corr. Coefficient
Sig. (2-tailed)
.832*
.040
.880*
.021
.941**
.005
.759
.080
-.273
.600
-.395
.439
-.400
.431
Fluency Index:
Corr. Coefficient
Sig. (2-tailed)
1.000
.986**
.000
.928**
.008
.928**
.008
-.522
.288
-.696
.125
-.191
.717
Speech rate:
Corr. Coefficient
Sig. (2-tailed)
1.000
.943**
.005
.886*
.019
-.543
.266
-.714
.111
-.261
.618
Mean length of
run:
Corr. Coefficient
Sig. (2-tailed)
1.000
.829*
.042
-.486
.329
-.600
.208
-.174
.742
Phonation-time
ratio:
Corr. Coefficient
Sig. (2-tailed)
1.000
-.429
.397
-.543
.266
-.058
.913
Coll. types per
1000 words:
Corr. Coefficient
Sig. (2-tailed)
1.000
.943**
.005
-.493
.321
Coll. tokens per
1000 words:
Corr. Coefficient
Sig. (2-tailed)
1.000
-.232
.658
*Correlation is significant at the 0.05 level (2-tailed)
**Correlation is significant at the 0.01 level (2-tailed)
4.2.2 Domain-specific collocations
The results of the AntConc analysis are shown in Appendix L. It should be borne in mind that
these figures are derived only from the first ten most frequent content words in the word list,
- 50 -
and do not include possible domain-specific collocations, which only occurred once in the
data. Nevertheless, they do reveal some notable differences between the lexical items
extracted from AntConc and their partners in the data, i.e., what are being considered as
potential domain-specific collocations across the three departments.
The number of domain-specific word partnership types from the Maths texts (29) is twice the
number collected from the IT or LAS texts (14 and 15, respectively). This difference is even
more pronounced in the figures for the word partnership tokens. For Maths, a total of 238
word partnership tokens are used from the ten most frequent content words compared to only
68 each for the IT and LAS texts. This would appear to be a significant number of word
partnerships when compared with the equivalent figures relating to general collocations found
for the various texts.
To test how these new figures might affect the results, the domain-specific word partnerships
were added to the original number of collocations found by group. Table 4.6 shows the
average number of collocation types per thousand words from the original data set (i.e.,
collocations verified in the OCD) per department. To these figures were added the respective
number of domain-specific collocation types per thousand words, found through AntConc, to
give new totals of collocation types and tokens per thousand words spoken across the three
groups.

- 51 -
Table 4.6: Original number of collocation types per thousand words plus additional
potential domain-specific collocation types by department
Department
Original
number of
collocation
types per
1000 words
Additional
domain-
specific
word
partnership
types per
1000 words
Total
collocation/
word
partnership
types per
1000 words
Percentage
increase
after adding
the domain-
specific
types per
1000 words
Large Animal Science
(N=6)
35.5
1.0
36.5 2.8
Information Technology
(N=3)
37.1
1.4
38.5
3.8
Mathematics
(N=6) 22.3 2.0 24.3 9.0
The same procedure was then carried out for the collocation tokens per thousand words plus
the respective number of domain-specific word partnership tokens per thousand words for
each department. The results are shown in Table 4.7.
Table 4.7: Original number of collocation tokens per thousand words plus additional
potential domain-specific collocation tokens by department
Department
Original
number of
collocation
tokens per
1000 words
Additional
domain-
specific
word
partnership
tokens per
1000 words
Total
collocation/
word
partnership
tokens per
1000 words
Percentage
increase
after adding
the domain-
specific
tokens per
1000 words
Large Animal Science
(N=6)
45.2
4.1
49.3
9.1
Information Technology
(N=3)
49.9
6.6
56.5
13.2
Mathematics
(N=6)
31.7
16.3
48.0
51.4
- 52 -
This rough comparison shows that, for the six Maths lecturers, domain-specific word
partnership tokens accounted for an additional 16.3 potential collocation tokens per thousand
words spoken, equivalent to an extra 51.4%. For the IT lecturers, the corresponding figures
were 6.6 additional collocation tokens per thousand words, representing a further 13.2% of
the collocation tokens, and for LAS, 4.1 additional collocation tokens per thousand words,
representing a 9.1% increase. This may explain why the Maths lecturers, as a group, produced
fewer general collocations than did the IT and LAS lecturers; a larger proportion of the
collocations used by the Maths department were in fact domain-specific. The majority of
these would not be picked up by consulting a general collocations dictionary like the OCD.
4.2.3 Deviant collocations
Table 4.8 shows the deviant collocations produced and averaged per department, and reveals
considerable differences across the departments. Taking the comparable adjusted figures (far
right column), the lowest figure is for the Maths department (0.38 deviant collocations per
thousand words), IT has a 50% higher figure (0.61), and then there is a jump up to the figure
for the LAS department, which has an adjusted mean number of deviant collocations per
thousand words of 2.16, over five times that of the Maths lecturers.

- 53 -
Table 4.8: Deviant collocation tokens and averages per thousand words, by department
Department
Mean global
score
Total
number of
deviant
collocation
tokens
Total
number of
words
spoken
Average
deviant
collocation
(tokens) per
thousand
words
Average
deviant
collocations
(tokens) per
thousand
words,
adjusted
figure
LAS (N=6)
3.17 42 15,362
2.73
2.16
IT (N=3)
4.00 6 10,296
0.58
0.58
Maths (N=6)
3.67 6 14,608
0.41
0.38
Totals
3.65 54 40,266
1.24
1.04
The total number of deviant collocation tokens was 54 (from 49 types as five deviant
collocations were repeated). There were 1,675 collocation tokens in all, so the percentage of
deviant collocations to verified native-like collocations was 3.1%.
4.3 SUMMARY
Initial results indicated a relationship between overall language performance and two of the
fluency variables: fluency index and speech rate. In addition, the three temporal fluency
variables were all mutually significantly correlated. However, there were no significant
correlations between any of the collocational competence variables and overall language
proficiency, or between collocational competence and fluency.

- 54 -
Results from the additional analyses across departments revealed some differences in the
collocational use by lecturers across the three departments. For the lecturers from the LAS
department, a significant correlation was found between collocational competence and both
overall language proficiency and fluency, but only as measured by fluency index. There was
no correlation between collocational competence and temporal fluency.
For the Maths lecturers, there were mutually significant correlations among global score,
fluency index and all three temporal fluency measures (except between global score and
phonation-time ratio). However, no relationship was found between any collocational
competence and either overall language proficiency or fluency at all.
The AntConc analysis resulted in the following percentage increases in collocation tokens per
thousand words after adding the top ten most frequent domain-specific headwords and their
collocates for each department:
LAS – 9.1%
IT – 13.2%
Maths – 51.4%
The percentage of deviant collocation tokens (totalling 54) compared to number of collocation
tokens (totalling 1,675) was found to be 3.1%. The figures for deviant collocations per
thousand words per department were:
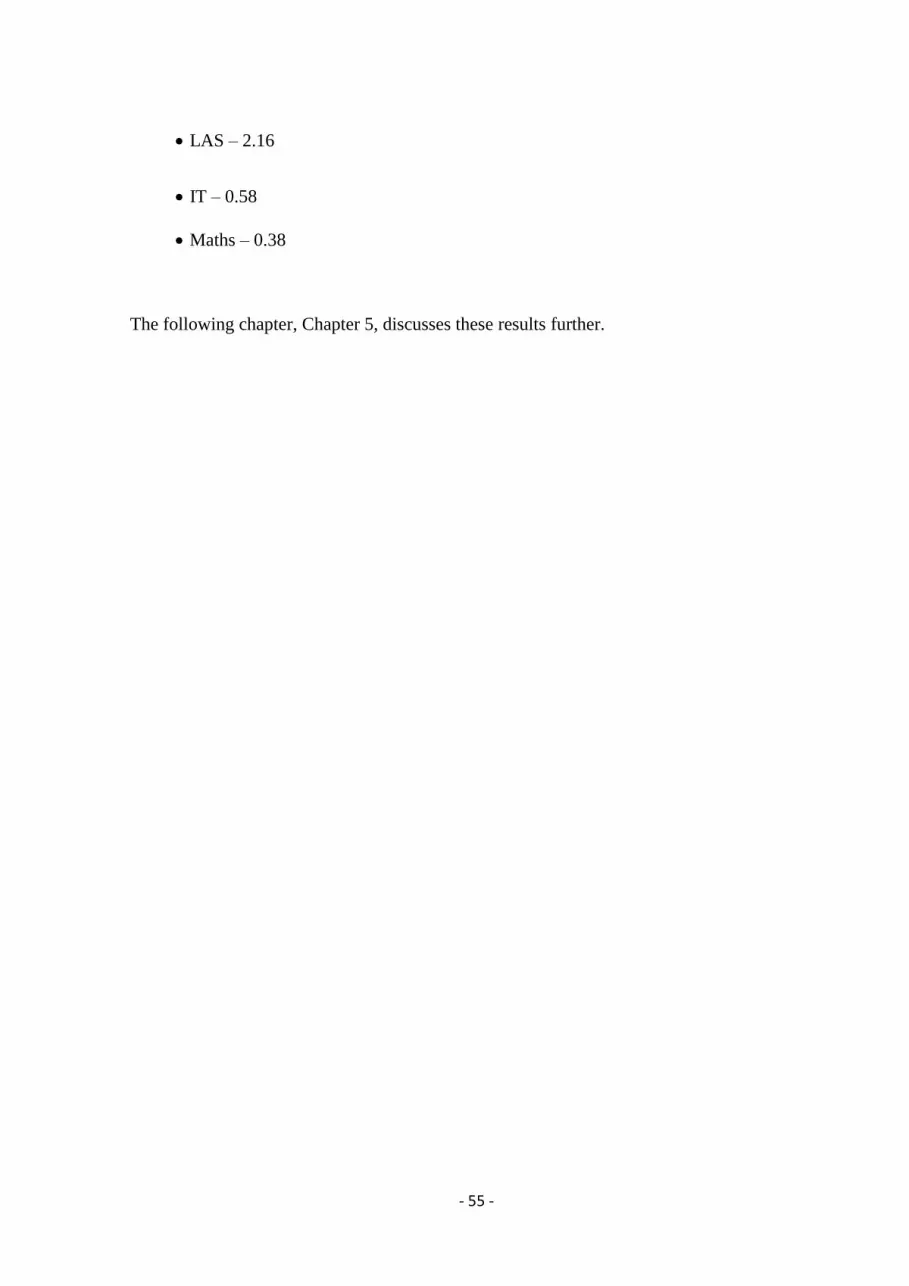
- 55 -
LAS – 2.16
IT – 0.58
Maths – 0.38
The following chapter, Chapter 5, discusses these results further.
- 56 -
5. DISCUSSION
This chapter discusses the results found in Chapter 4 and how far they answer the research
questions posed in Chapter 1, which were the following:
1. Is there any correlation between lecturers’ overall language proficiency and their
spoken fluency?
2. Is there any correlation between lecturers’ overall language proficiency and their
collocational competence?
3. Is there any correlation between lecturers’ collocational competence and their spoken
fluency?
4. Is there any evidence that collocations function in a similar way to other types of
formulaic language in facilitating spoken fluency?
Section 5.1 looks at the role of domain-specific collocations, the examiners’ perceptions of
fluency, the role of deviant collocations, collocations compared to other types of formulaic
language and the importance of genre. The chapter also consider limitations of the research
carried out (Section 5.2) and puts forward some suggestions for further research (Section 5.3),
before finishing with a summary.

- 57 -
5.1 INTERPRETATIONS OF THE RESULTS
5.1.1 Domain-specific collocations
Ananiadou and McNaught (1995), in a paper on the relationship between fields of
terminology and translation, conclude that technical ‘sublanguages’ contain very high
incidences of collocational use, perhaps even more so than general language, and that:
‘collocations are highly distinctive in characterizing the language of the field’ (1995:51). In
this dissertation, the AntConc analysis, described in Section 4.5, seemed to uncover evidence
of these sublanguages through variations in domain-specific collocational use across the three
departments. These differences manifested themselves in two ways: first, the density of
domain-specific collocations, and second, how technical those domain-specific collocations
tended to be.
To take the first point: the ratio of domain-specific collocations to general collocations
appears to be a lot higher for Maths than for the other two departments. In this sense, Maths
as a sublanguage appears more technical and specialized than the LAS sublanguage. IT seems
to lie between these two extremes.
The second major difference was the degree of technicality of the (potential) domain-specific
collocations, from very highly technical (Maths) through IT to LAS (the least technical). To
illustrate this, one of the most frequent collocations in the LAS lectures was broiler chickens,
which may be considered a domain-specific collocation as this was the topic of the mini-
lecture in which it occurred. But it is also listed in the OCD, indicating that it is only a weak
- 58 -
domain-specific collocation and likely to be known by people outside the field. Other
examples of LAS domain-specific word partnerships are listed in Appendix L and include
terms such as: colic episode, hoarding birds and mouth speculum. Even if the exact meanings
of these terms are not understood by the layman, what they refer to is at least partially
comprehensible. Compare these with some examples from the Maths domain: Banach space,
tensor algebra, Cartesian product. These terms are impenetrable to the layman. Again, IT
terms seem to lie midway between these two extremes; some are difficult to understand, like
Church-Rosser property¸ while others are more accessible, e.g., Java code.
These two aspects of technicality are reflected in research into single-item technical
vocabulary. Chung and Nation (2004) found that different academic disciplines not only had
varying coverage of technical language, but that some disciplines, e.g., anatomy, may have a
high density of words which are peculiar to that particular discipline, and which are virtually
never found outside that domain.
As a result, it may be hypothesized that if all domain-specific collocations as well as general
collocations across all lecturers were taken into consideration, this might have resulted in
closer correlations between collocational competence and fluency (research question 3).
- 59 -
5.1.2 Examiners’ perceptions of fluency
The initial results across all lecturers (Section 4.1) seem to indicate that for research question
1, the answer is partly yes: there does seem to be some kind of relationship between overall
language proficiency and fluency, but only as far as fluency index and speech rate are
concerned. It is not so surprising that the data showed a significant correlation between global
score and fluency index because both scores originated from the two certification examiners.
However, it does confirm that the examiners regarded fluency as an important component in
determining overall language proficiency. That speech rate was the only temporal fluency
measure to significantly correlate with fluency index and global score is in line with the
fluency studies cited in Section 2.1.2, all of which found speech rate to be the most reliable
predictor of rater scores.
The additional Spearman analyses across the LAS and Maths departments (Section 4.2),
however, yielded two rather different patterns of fluency. These findings suggest that the test
examiners may have perceived fluency somewhat differently according to which academic
field they were assessing. In the analysis of the LAS lecturers, fluency index correlated
significantly with their collocational competence but not with any temporal fluency variables.
This implies that it was the more lexical cues, collocations, which assumed importance in
determining the test examiners’ perception of fluency. What is unexpected is that there were
no significant correlations between fluency index and any of the temporal fluency variables,
not even speech rate. Meaning seemed to override the need to focus on temporal measures.
- 60 -
Conversely, as discussed in Section 5.1.1, the Maths lecturers used very technical language,
indicated by the high incidence of domain-specific collocations. The examiners were
linguistic specialists rather than either Maths or LAS specialists, so they may conceivably
have had more difficulty understanding the full content of the Maths lectures. Consequently,
they may have had to draw on other than lexical criteria and meaning to make their
assessments. The significant correlations between the examiners’ fluency index and the
temporal fluency measures for the Maths lecturers seem to reflect a perception of fluency as a
purely temporal phenomenon.
This issue centres on the discussion in Section 2.1.1 concerning the elements that make up
fluency, and the difference between the narrow, temporal meaning and the broader meaning
of fluency in terms of ‘speed, fluidity and accuracy’ (Segalowitz 2000:200). When listening to
the LAS lecturers, the examiners seemed to incorporate accuracy, as represented by producing
native-like collocations (collocational competence) into their fluency assessments. This
matches with Lennon’s assertion that ‘felicitous [i.e. native-like] lexical collocations
contribute positively to fluent performance’ (2000:40). However, the lack of significant
correlations between fluency index and temporal fluency measures seems to indicate that the
examiners did not find speed and fluidity so important. In contrast, when assessing the Maths
lecturers, the examiners seemed to view fluency in the narrower sense, showing a similar
pattern to that in the study by Kormos and Denes (2004), which found a positive relationship
between the same three temporal variables and rater fluency scores.
The certification descriptors for the fluency criteria, shown in Appendix B, focus on speech
being produced at an appropriate rate, smoothly, coherently and effortlessly, and without
- 61 -
unnatural language-related pauses or hesitations. This description seems to be closer to the
narrow view of fluency, and yet when assessing the LAS lecturers, examiners apparently
focused on lexical cues rather than temporal ones. This seems to support Lennon’s claim that
‘for the listener it is likely that fluency cannot be fully divorced from other elements of oral
proficiency’ (1990:395).
5.1.3 Deviant collocations
The lack of any kind of significant correlation between deviant collocations per thousand
words and any of the other variables, examiner-based or temporal, may possibly be due to: a)
the small data sample, and b) the low percentage of deviant collocations to collocation tokens,
3.1%, compared to other studies. Nesselhauf found that out of 2,082 verb-noun combinations
produced by the informants, 304 of them, or 14.6%, were deviant (2005:66). Laufer and
Waldman (2011), also investigating verb-noun collocations, calculated that 31.9% of
combinations produced were deviant for their advanced group of learners. The figures seem to
lend support to the notion that the general proficiency level of the lecturers was relatively
high, as mentioned in Section 3.1.1.
Despite no correlations being found for deviant collocations, two interesting individual cases
deserve closer inspection. These were investigated with reference to the results in Appendix J
(fluency measure scores per lecturer) and Appendix K (collocational competence measure
scores per lecturer). Firstly, lecturer L04 was only awarded a global score of 3 and a fluency

- 62 -
index of 19. In addition, she produced the highest number of deviant collocations of all
lecturers: 18, twice as many as the next highest figure and equivalent to 5.79 deviant
collocations per thousand words. At the same time, she also showed evidence of overusing
certain word combinations, as did De Cock’s learners (2000). For example, lecturer L04 uses
have a possibility six times during her mini-lecture, five of them within a 200-word stretch in
the middle. What is surprising, though, is that lecturer L04 recorded both the highest mean
length of run (17.8 syllables a minute) and the highest phonation-time ratio (79.9%) of all the
lecturers. Furthermore, at 202.4 syllables a minute, her speech rate was the fourth highest.
From a temporal point of view, this is relatively fluent. The implication here is that lecturer
L04 sacrificed accuracy for fluency, in line with Skehan’s (1998) cognitive hypothesis
mentioned in Section 2.1.1. That lecturer L04 did not achieve higher scores with the
examiners is likely to be due to several factors, but one of them may be the use of so many
deviant collocations.
Secondly, in contrast to lecturer L04, lecturer L06, who failed the certification, also gained
the lowest fluency index score, 12, and the lowest scores for speech rate, mean length of run,
and phonation-time ratio across all lecturers. Surprisingly though, he only had three deviant
collocations, equivalent to 1.27 deviant collocations per thousand words. This was the second
lowest deviant collocations per thousand word score of all the LAS lecturers, second only in
fact to lecturer L03, who had top scores from the examiners and produced no deviant
collocations at all. Again, there were certainly other reasons for his low scores, but juxtaposed
with the data from lecturer L04, it may very well be that lecturer L06 was possibly over-
cautious in his delivery, thereby sacrificing fluency for accuracy.

- 63 -
5.1.4 Collocations versus formulaic language
As discussed in Section 2.3.2, there is some uncertainty as to how far collocations are a subset
of formulaic language. Even if they are, it is unclear as to whether they function in a similar
way to other types of formulaic language in being prefabricated and thereby contributing to
enhanced spoken fluency. If collocations did function in this way, it might be expected that
some correlation between collocational competence and temporal fluency would be apparent
from the dissertation data. However, no such correlation emerged at all. As discussed in
Section 5.1.1, this could be accounted for by the absence of a robust measure for domain-
specific collocations; except that this also seems to be the case with the six LAS lecturers.
This group produced a higher density of general collocations in their lectures, which in theory
would lead to a more complete picture of their collocational competence, as there were fewer
domain-specific collocations to take account of. If any correlation between collocational
competence and temporal fluency was present in the data, it would be expected to be from
these six lecturers. However, that was not the case.
The answer to research question 4 is, therefore, that there is no evidence in the data set that
collocations function in a similar way to other types of formulaic language in facilitating
spoken fluency. There are a number of possible explanations for this. It may be that
collocations, unlike other kinds of formulaic language, are not prefabricated and stored in a
way that has much of an impact on speakers’ temporal fluency.
Another possibility is that all formulaic language aids fluency, but that different types of
formulaic language have greater or lesser effect on fluency according to where on the
- 64 -
fixedness/contiguousness continuum they lie. Collocations, placed at the flexible end of the
continuum, might only have a minimal effect on fluency; too little, perhaps, to be gauged by
the investigation in this dissertation. This minimal effect may also partly be due to
collocations tending to consist of much shorter word combinations than more fixed formulae.
While lexical phrases can be several words long, e.g., Do you think I was born yesterday?
(Pawley and Syder 1983:213), collocations are typically only two or three words long (strong
argument, perform an operation). Thus, the combination of less fixedness and fewer
component words may lead to collocations having a reduced effect on aiding short-term
memory.
5.1.5 Effect of genre on research results
The results from this dissertation may deviate from other research studies because the data
comes from a particular genre of language use, i.e., that of an academic lecture. Most of the
data sources for research into collocational competence seem to be written (e.g., Bahns and
Eldaw 1993; Nesselhauf 2005; Laufer and Waldman 2011). Even for studies into spoken
language, the genres are different. Pawley and Syder (1983) base their assertions about how
formulaic language contributes to native-like selection and fluency on everyday conversation.
De Cock (2000) uses informal interviews with her informants.
While the TOEPAS certification tests did include more spontaneous speech in relation to
questions asked, this was minor compared to the formal lecture section. Most of the data came

- 65 -
from mini-lectures, which were prepared and could even have been rehearsed. This possibility
may have manifested itself in the lecturers having artificially increased fluency compared
with data from spontaneous speech.
5.2 LIMITATIONS OF THE RESEARCH
One limitation was the relatively small sample (15) of lecturers. As a result, deviations from
expected results could be put down to random outliers in the sample. Lecturers M10 and M11,
for example, registered the lowest collocational competence scores of the whole sample,
while being awarded the highest scores in both fluency and global score from the certification
examiners. This made it harder to draw meaningful conclusions from statistical analyses and
renders any findings about collocations and fluency less generalizable to a larger population.
The scope of generalizability may even have been further narrowed by the specialised nature
of the lectures.
A possible limitation linked to the small sample may have been that the data was restricted to
lecturers from only three departments. Given that some of the most interesting results came
from differences across departments, it might have been more beneficial to have, not only
more lecturers, but also more departments represented.
Finally, the data was extracted from mini-lectures given by specialist lecturers in an academic
context. As such, the lectures were prepared and practised beforehand; in some cases, no

- 66 -
doubt, they had even been presented in a real classroom situation. This may have affected the
measurement of fluency, in that lecturers were likely to be relatively more fluent in the
certification situation than they would be in a situation requiring more spontaneous speech. In
addition, the lecturers have been shown to be relatively advanced adult learners of English.
This brings into question how representative they were of a more general population of
language learners, even advanced learners. It is possible that these particular lecturers
represent too rarefied a sample to extrapolate findings on the effects of collocational
competence on perceptions of fluency to a more general context.
5.3 SUGGESTIONS FOR FURTHER RESEARCH
Despite the relatively small sample size, the dissertation does give an indication of the
direction that further, more comprehensive research might take. The certification data has
almost 400 recorded mini-lectures by lecturers at UCPH across a range of different
disciplines, and from this databank, it would be possible to select a considerably larger sample
for analysis than this dissertation was able to use. This would enable further research into the
relationship between fluency and collocations, although the methodology applied in this study
would have to be supplemented with some method of identifying not only general but also
domain-specific collocations. Such research would, as the discussion above suggests, benefit
from analysing lecturers across academic disciplines, and should also cover fields such as
humanities and social sciences, whose sublanguages are likely to vary considerably from
those investigated in this dissertation. To verify that word combinations actually do constitute

- 67 -
domain-specific collocations would involve further investigation, for example, by using a
technical dictionary from the particular field, as Chung and Nation (2004) suggest for
technical vocabulary in general, or by obtaining verification from experts in the field.
In order to establish what differences there might be between the relative impact of
collocations as opposed to more fixed types of formulaic language (e.g., lexical phrases,
discourse marker, pragmatic phrases, etc.) on fluency, one possibility might be to use the
certification data to test the relative frequency of both types of formulaic language and
compare these to the same fluency measures used in this dissertation.
It would be useful to apply a similar methodology as this dissertation has employed but on a
different and more general data source, for example, where informants describe pictures or
give a talk on an unprepared topic. Ideally, a monologic sample of speech should be used,
where informants have the opportunity of speaking uninterrupted for a period of time. This
would make it easier to transcribe and analyse for fluency variables as well as avoid the
problem of informants potentially ‘picking up’ collocations from their interlocutors, as may
be the case if, for example, a conversational situation were employed.
Finally, it would be interesting to compare collocational use across genres. Using the same
informants for both tasks, a study could be designed that compared collocational use in a
prepared mini-lecture with collocations produced in a more spontaneous genre, such as an
unprepared talk or a question-and-answer session.

- 68 -
5.4 SUMMARY
This chapter offered the following interpretations from the results:
The inclusion of domain-specific collocations into the calculations might conceivably
have resulted in closer correlations between collocational competence and fluency.
Both the proportion of domain-specific collocations and their respective level of
technicality varied considerably across the three departments.
The correlation between fluency index and global score was unsurprising as both
originated from the test examiners. The correlation between speech rate and fluency
index was seen to be in line with previous research. Differences in correlations across
the variables for the LAS and Maths departments seemed to show evidence that
examiners’ perceptions of fluency were influenced by lexical cues when assessing less
technical disciplines, but by more temporal fluency measures when assessing fields
with more technical domain-specific collocations.
The relatively low number of deviant collocations across the data sample was regarded
as an indication of the generally high proficiency level of the lecturers. Data from two
individual lecturers provided evidence of trade-offs between accuracy and fluency.
There was little evidence that collocations functioned in a similar way to other types
of formulaic language in promoting temporal fluency. This may be due to the relative
flexibility and shorter length of collocations, or a combination of the two.
- 69 -
The main limitations were the small sample of 15 lecturers, the fact that only three university
departments were represented in the data, and the prepared mini-lecture genre, which may
have artificially enhanced levels of fluency.
Suggestions for further research included using the same data source but with more
informants representing a greater number of departments from more diverse academic fields.
Such research would also need to take in to account both general collocations and domain-
specific collocations. Other possible research areas included examining the differences
between collocations and more fixed expressions on the same data set; applying the same
methodology on a more general and spontaneous data set; and comparing collocational use
across different genres.
- 70 -
6. CONCLUSIONS
Research seems to indicate that formulaic language, i.e., prefabricated strings of words stored
in memory as single units, makes a considerable contribution to language proficiency, in
particular fluency. However, some uncertainty seems to exist as to how far collocations, often
regarded as a subset of formulaic language, function in the same way. In addition, there seems
to be a lack of empirical evidence about the relationship between collocations and fluency.
This dissertation aimed to address this gap in collocational research by investigating the
following research questions:
1. Is there any correlation between lecturers’ overall language proficiency and their
spoken fluency?
2. Is there any correlation between lecturers’ overall language proficiency and their
collocational competence?
3. Is there any correlation between lecturers’ collocational competence and their spoken
fluency?
4. Is there any evidence that collocations function in a similar way to other types of
formulaic language in facilitating spoken fluency?
The data came from 15 mini-lectures, each lasting approximately 20 minutes, recorded for an
oral proficiency test at the University of Copenhagen. The 15 lecturers in the data sample
came from three different university departments: Large Animal Science (LAS), Information
Technology (IT), and Mathematics (Maths). From data provided to me by the University, I
was able to use or calculate the measures shown in Table 6.1 for each lecturer.

- 71 -
Table 6.1: Measures used to calculate language proficiency, collocational competence and
fluency
Type of measure Measure Definition
Measures from the
oral proficiency test
examiners’ scores
Global score Between 5 and 2, 5 being the highest, and 2
being a fail.
Fluency index The two examiners’ internal scores for
fluency, converted to a single figure
between 0 and 28.
Temporal fluency
measures
Speech rate Number of syllables uttered per minute of
lecturing time.
Mean length of run Average number of syllables uttered in
each run of speech between silent pauses of
0.25 seconds or longer.
Phonation-time ratio The amount of time spent actually speaking
as a percentage of total time to produce the
speech sample, i.e., the lecturing time.
Collocational
competence
measures
Collocation types per
thousand words
Number of different collocations produced
as verified in the Oxford Collocations
Dictionary (2009), expressed per thousand
words spoken during the mini-lecture.
Collocation tokens per
thousand words
Total number of collocations produced as
verified in the Oxford Collocations
Dictionary (2009), expressed per thousand
words spoken during the mini-lecture.
Type/token ratio Total number of collocation types produced
divided by the total number of collocation
tokens produced.
Deviant collocations
per thousand words
Total number of deviant collocations
produced as judged by a panel of five
raters, expressed per thousand words
spoken during the mini-lecture.
Appendix J shows the four fluency measure scores per lecturer against global score, and
Appendix K shows the four collocational competence measure scores against global score.
Spearman rank-order correlation tests were run against these measures across all lecturers.

- 72 -
The discovery of significant numbers of potential domain-specific collocations in the data
prompted an additional set of Spearman tests to be run across the LAS and Maths
departments. Using the text concordancing software AntConc, an analysis was then carried
out to establish a rough estimate for the density and technicality of potential domain-specific
collocations for each department, and to ascertain how these factors might affect the overall
collocational competence measures. Finally, deviant collocations for each lecturer were
totalled and collated by department.
Initial results across all lecturers indicated a relationship between overall language
performance and two of the fluency variables: fluency index and speech rate. In addition, the
three temporal fluency variables were all mutually significantly correlated. However, there
were no significant correlations between any of the collocational competence variables and
overall language proficiency, or between collocational competence and fluency.
Results from the additional analyses across the LAS and Maths departments revealed
considerable differences between the two. The data from the six LAS lecturers showed a
significant correlation between collocational competence and fluency index, but no
correlation between collocational competence and temporal fluency. From the Maths
lecturers’ data, significant correlations were found between fluency index and all three
temporal fluency measures, but there was no correlation between collocational competence
and fluency at all.

- 73 -
The AntConc analysis resulted in the following percentage increases in collocation tokens per
thousand words after adding the top ten most frequent domain-specific headwords and their
collocates for each department:
LAS – 9.1%
IT – 13.2%
Maths – 51.4%
The percentage of deviant collocation tokens (totalling 54) compared to number of collocation
tokens (totalling 1,675) was found to be 3.1%. The figures for deviant collocations per
thousand words per department were:
LAS – 2.16
IT – 0.58
Maths – 0.38
The additional analyses carried out on the data indicated that sublanguages used across the
three academic departments varied in both the density and technicality of domain-specific
collocations used. The Maths mini-lectures contained a high ratio of domain-specific
collocations to general collocations, and the domain-specific collocations used tended to be
rather arcane and difficult to comprehend for the layman. The LAS mini-lectures featured
much lower ratios of domain-specific collocations to general collocations, and the domain-
specific collocations used were considerably more accessible in meaning. The discourse used
by the Information Technology lecturers seemed to lie somewhere in the middle. If all
- 74 -
domain-specific collocations as well as general collocations were taken into consideration,
this might have resulted in closer correlations between collocational competence and fluency
for the whole data set.
The marked variations in department sublanguages were seen as affecting how the test
examiners perceived and assessed fluency. When assessing the LAS lecturers, whose
discourse was relatively comprehensible, the examiners seemed to have been influenced by
lexical cues, i.e., collocational competence, and not by temporal fluency at all. On the other
hand, the examiners may have had some difficulty following the content of the Maths mini-
lectures, due the greater proportion of highly technical domain-specific collocations. This
appeared to be reflected in the examiners’ reliance on temporal fluency measures to make
their assessments. Surprisingly, given that the content of the Maths lectures was probably less
comprehensible than that of the LAS lectures, the assessment for the Maths lecturers seemed
to be more compliant with the oral proficiency test descriptors for fluency.
The relatively low number of deviant collocations across the data sample compared to other
research studies was regarded as an indication of the generally high proficiency level of the
lecturers. In addition, the deviant collocation data provided two interesting case studies in
showing that a high level of deviant collocations can be associated with higher levels of
temporal fluency, and vice versa, providing possible evidence of accuracy/fluency trade-offs.
There was little evidence that collocations functioned in a similar way to other types of
formulaic language in promoting temporal fluency. This may be due to the relative flexibility
and shorter length of collocations, or a combination of the two.
- 75 -
The main limitation was the small sample of 15 lecturers, combined with the fact that only
three university departments were represented. Furthermore, the genre from which the data
originated, a prepared and perhaps practiced mini-lecture, could possibly have led to
somewhat enhanced fluency compared to a more spontaneous genre.
Suggestions for further research included using the same data source but with more
informants representing a greater number of departments from more diverse academic fields.
Domain-specific collocations, as well as general collocations, would also have to be taken
into account. Another research area could be to examine the differences between collocations
and more fixed expressions in the same data set. Conversely, the same methodology could be
used on a more general and spontaneous data set. Finally, it would be very interesting to
compare collocational use across genres: for example, how a prepared mini-lecture compares
to a more spontaneous genre such as an unprepared talk or explanation.
It seems clear from this dissertation that collocations exist not only as a general concept for
‘typical language use’, but that every genre, discipline and indeed situation may potentially
have its own set of collocations. Moreover, significant differences between purely temporal
fluency and the subjective perception of fluency by examiners appear to render separating
temporal fluency from a broader definition of fluency, including accuracy, a difficult task.
These factors seem to affect how collocational competence and fluency are defined and
measured, and how examiners perceive and assess fluency in a test situation. Clarification of
these issues requires further investigation with a larger sample and a robust method for
identifying domain-specific collocations.

- 76 -
REFERENCES
Ananiadou, S. and McNaught, J. 1995. Terms are not alone: term choice and choice terms.
Journal of Aslib Proceedings 47/2: 47-60.
Anthony, L. 2014. AntConc 3.4.3: A freeware corpus analysis toolkit for concordancing and
text analysis. http://www.laurenceanthony.net/software.html (Accessed December 2014).
Bahns, J. and Eldaw, M. 1993. Should we teach EFL students collocations? System 21/1:
101-114. Pergamon Press Ltd.
Boers, F., Eyckmans, J., Jenny Kappel, J., Stengers, H. and Demecheleer, M. 2006.
Formulaic sequences and perceived oral proficiency: putting a Lexical Approach to the test.
Language Teaching Research 10/3: 245–261.
Centre for Internationalisation and Parallel Language Use. 2014. Certification website
http://cip.ku.dk/english/certification (Accessed January 2015).
Chung, T.M. and Nation, P. 2004. Identifying technical vocabulary. System 32/2: 251-263.
Cowie, A.P. 1988. Stable and creative aspects of vocabulary use. In R. Carter and M.J.
McCarthy (Eds.): Vocabulary and Language Teaching 126-137. London: Longman.
Cowie, A.P. 2001. Speech formulae in English: problems of analysis and dictionary
treatment. In G. van ter Meer and A.G.B. ter Meulen (Eds.): Making Senses: From Lexeme to
Discourse. In Honor of Werner Abraham 1-12. Groninger Arbeiten zur germanistischen
Linguistik 44. Centre for Language and Cognition Groningen.
De Cock, S. 2000. Repetitive Phrasal Chunkiness and Advanced EFL Speech and Writing. In
C. Mair and M. Hundt M. (Eds.): Corpus Linguistics and Linguistic Theory: 51-68.
Amsterdam: Rodopi.

- 77 -
Ginther, A., Dimova, S. and Yang, R. 2010. Conceptual and empirical relationships
between temporal measures of fluency and oral English proficiency with implications for
automated scoring. Language Testing 27/3: 379-399.
Groom, N. 2009. Effects of Second Language Immersion on Second Language Collocational
Development. In A. Barfield and H. Gyllstad (Eds.): Researching collocations in another
language: Multiple interpretations 21-33. Basingstoke: Palgrave Macmillan.
Henriksen, B. 2012. Researching L2 learners’ collocational competence and development - a
progress report. L2 vocabulary acquisition, knowledge and use. Eurosla Monographs Series
2. L2 Vocabulary Acquisition and Use: 29-56. Stockholm: Eurosla.
Howarth, P. 1998. Phraseology and second language proficiency. Applied Linguistics 19/1:
24-44.
Keshavarz, M. H. and Salimi, H. 2007. Collocational competence and cloze test
performance: a study of Iranian EFL learners. International Journal of Applied Linguistics
17/1: 81-92
Kormos, J. and Dénes, M. 2004. Exploring measures and perceptions of fluency in the
speech of second language learners. System 32/2: 145-164.
Laufer, B. and Waldman, T. 2011. Verb-Noun Collocations in Second-Language Writing:
A Corpus Analysis of Learners’ English. Language Learning 61/2: 647-672.
Lennon, P. 1990. Investigating fluency in EFL: a quantitative approach. Language Learning
40/3: 387-417.
Lennon, P. 2000. The Lexical Element in Spoken Second Language Fluency. In H.
Riggenbach (Ed.): Perspectives on Fluency 25-42. Michigan: University of Michigan Press.
LTP Dictionary of Selected Collocations. 2002. London: Heinle.

- 78 -
Macmillan Collocations Dictionary. 2010. Oxford: Macmillan.
Moon, R. 1997. Vocabulary connections: multi-word items in English. In N. Schmitt and M.
McCarthy (Eds.): Vocabulary Description, Acquisition and Pedagogy 40-63. Cambridge:
Cambridge University Press.
Nation, I.S.P. 2001. Learning Vocabulary in Another Language. Cambridge: Cambridge
University Press.
Nattinger, J.R. and DeCarrico, J.S. 1992. Lexical phrases and language teaching. Oxford:
Oxford University Press.
Nesselhauf, N. 2005. Collocations in a learner corpus. Studies in Corpus Linguistics, 14.
Amsterdam: John Benjamins.
Nizonkiza, D. 2011. Relationship between lexical competence, collocational competence and
second language proficiency. English Test Construction 4/1: 113-146.
Oxford Collocations Dictionary for Students of English. 2009. Oxford: Oxford University
Press.
Pawley, A. and Syder, F. 1983. Two puzzles for linguistic theory: native-like selection and
native-like fluency. In J. Richards and R. Schmidt (Eds.): Language and communication 191-
226. London: Longman.
Segalowitz, N. 2000. Automaticity and attentional skill in fluent performance. In H.
Riggenbach (Ed.): Perspectives on fluency 200-219. Ann Arbor: University of Michigan
Press.
Sinclair, J. 1987. Collocation: a progress report. In R. Steele and T. Threadgold (Eds.):
Language Topics: Essays in Honour of Michael Halliday. Vol. 2 319-332. Amsterdam: John
Benjamins.

- 79 -
Skehan, P. 1998. A Cognitive Approach to Language Learning. Oxford: Oxford University
Press.
Towell, R., Hawkins, R. and Bazergui, N. 1996. The development of fluency in advanced
learners of French. Applied Linguistics 17/1: 84-119.
Wood, D. 2010. Formulaic language and second language speech fluency. Background,
Evidence and Classroom Applications. London: Continuum International Publishing Group.
Wray, A. 2002. Formulaic language and the lexicon. Cambridge: Cambridge University
Press.

- 80 -
APPENDIX A
TOEPAS global score descriptors (from CIP’s website:
http://cip.ku.dk/certificering/CIP_certificering_bed_mmelsesskala.pdf)
The overall certification result is based on a combined assessment of the lecturer’s fluency,
pronunciation, vocabulary, grammar and interaction skills in English for university
teaching
5: The lecturer has demonstrated English language proficiency for university teaching
equivalent to that of a highly articulate, well-educated native speaker of English. The lecturer
has been certified to teach English-medium courses. No training is required.
4: The lecturer has demonstrated excellent English language proficiency for university
teaching. The lecturer has been certified to teach English-medium courses. No training is
required.
3: The lecturer has demonstrated good English language proficiency for university teaching.
The lecturer has been certified to teach English-medium courses. No training is required, but
training may be beneficial in one or more of the assessed areas.
2: The lecturer has demonstrated less than sufficient English language proficiency for
university teaching. The lecturer has not been certified to teach English-medium courses.
Training is required.
1: The lecturer has demonstrated limited English language proficiency for university teaching.
The lecturer has not been certified to teach English-medium courses. Significant training is
required.

- 81 -
APPENDIX B
TOEPAS internal analytic criteria level descriptors (fluency, pronunciation, vocabulary,
grammar and interaction)
Fluency Pronunciation Vocabulary Grammar Interaction
5 Equivalent to a highly articulate, well-educated native speaker
4 Speech is
produced
smoothly,
coherently and
effortlessly
Can produce
extended speech,
using a wide range
of discourse
markers and
connectors,
without unnatural
language-related
pauses/hesitations
Speech rate is
appropriate
Although L1
accent may be
perceptible, this
causes virtually no
strain to the
listener and does
not impede
effective
communication
Produces almost
all phonological
contrasts with
good accuracy
Places stress
correctly, and uses
intonation to
convey a range of
pragmatic
meanings
Broad range of
general, academic
and domain-
specific
vocabulary for
effective
communication
Good command of
formulaic
language
Consistently
correct and
appropriate use of
vocabulary
Can vary
vocabulary to
convey nuances of
meaning
Consistently
displays a high
degree of
grammatical
accuracy in both
simple and
complex structures
Responds
appropriately and
effectively to
questions/commen
ts without
language-related
hesitation
Fully capable of
interactively
negotiating
meaning through
comprehension
checks,
clarification
requests or
confirmation
checks
Fully capable of
dealing with
unclear questions
or
misunderstandings
when necessary
3 Speech is
produced
smoothly,
coherently and
almost effortlessly
Can produce
extended speech,
using a variety of
discourse markers
and connectors,
although some
unnatural,
language-related
pauses may occur
Speech rate is
generally
While
pronunciation is
marked by L1
features, this only
occasionally
causes strain to the
listener or
compromises
intelligibility
Produces most
phonological
contrasts with
fairly good
accuracy
Generally places
stress correctly
and uses intonation
Sufficient range of
general, academic
and domain-
specific
vocabulary for
effective
communication
Few significant
vocabulary errors
occur
Lexical gaps are
successfully
overcome with
circumlocution
Generally displays
sufficient
grammatical
accuracy in both
simple and
complex structures
Grammatical
errors do occur but
do not lead to
misunderstanding
Usually responds
appropriately and
effectively to
questions/commen
ts although some
language-related
hesitation may
occur
Good ability to
interactively
negotiate meaning
through
comprehension
checks,
clarification
requests or
confirmation

- 82 -
appropriate to convey basic
pragmatic meaning
checks
Good ability to
deal with unclear
questions or
misunderstandings
when necessary
2 Can generally
produce extended
speech. However,
only uses a limited
number of
discourse markers
and connectors.
Speech is marked
by unnatural
language-related
pauses which may
lead to a loss of
coherence
Speech rate may
be inappropriate
Pronunciation is
strongly marked
by L1 features
Although
pronunciation is
generally
intelligible,
imprecise
pronunciation of
certain sounds,
stress errors, and
failure to uphold
phonological
contrasts causes
strain to the
listener
Very limited or
inappropriate use
of intonation to
indicate pragmatic
meaning
Less than
sufficient range of
general, academic
and/or domain-
specific
vocabulary for
effective
communication
Lexical inaccuracy
or incorrect word
choice may cause
some confusion
Lexical gaps result
in noticeably less
precision
Displays less than
sufficient
grammatical
accuracy and/or
range of structures
Grammatical
errors can be
distracting and
may lead to
misunderstanding
Sometimes
responds
appropriately and
effectively to
questions/commen
ts. Due to
language-related
hesitation response
time may be slow
Less than
sufficient ability to
interactively
negotiate meaning
through
comprehension
checks,
clarification
requests or
confirmation
checks
Less than
sufficient ability to
deal with unclear
questions or
misunderstandings
when necessary
1 Speech is
disrupted and
fragmented due to
excessive pauses,
hesitations or false
starts, especially in
longer stretches of
free production
Rarely uses
discourse markers
or connectors
Pronunciation
impedes effective
communication
Pronunciation is
marked by features
that may be
understandable
only to those
familiar with the
speaker’s L1
Limited range of
general, academic
and/or domain-
specific
vocabulary
Frequent lexical
errors impede
effective
communication
Displays limited
accuracy and
range of
grammatical
structures
Frequent errors
cause
misunderstanding
or
incomprehensibilit
y
Does not respond
appropriately and
effectively to
questions and
comments
Limited ability to
interactively
negotiate meaning
through
comprehension
checks,
clarification
requests or
confirmation
checks
Limited ability to
deal with unclear
questions or
misunderstandings
when necessary

- 83 -
APPENDIX C
Table showing the 15 lecturers’ global scores, internal fluency scores (raw and
converted to a single fluency index figure) and university department, grouped by global
score
Lecturer
ID
number
University of
Copenhagen
Department
Global
score
Internal fluency scores
Examiner
1
Examiner
2
Fluency
index
L03 Large Animal Science 5 5 5 28
M10 Mathematics 5 5 5 28
I09 Information Technology 5 5 4 25
M11 Mathematics 4 5 5 28
M12 Mathematics 4 4+ 5 26
L02 Large Animal Science 4 4+ 4 23
I07 Information Technology 4 4 4 22
M15 Mathematics 4 4 4 22
L01 Large Animal Science 3 4- 3+ 19
L04 Large Animal Science 3 3+ 4- 19
I08 Information Technology 3 3+ 3+ 18
M14 Mathematics 3 3 3 16
M13 Mathematics 2 3 3+ 17
L05 Large Animal Science 2 3- 3- 14
L06 Large Animal Science 2 2+ 2+ 12
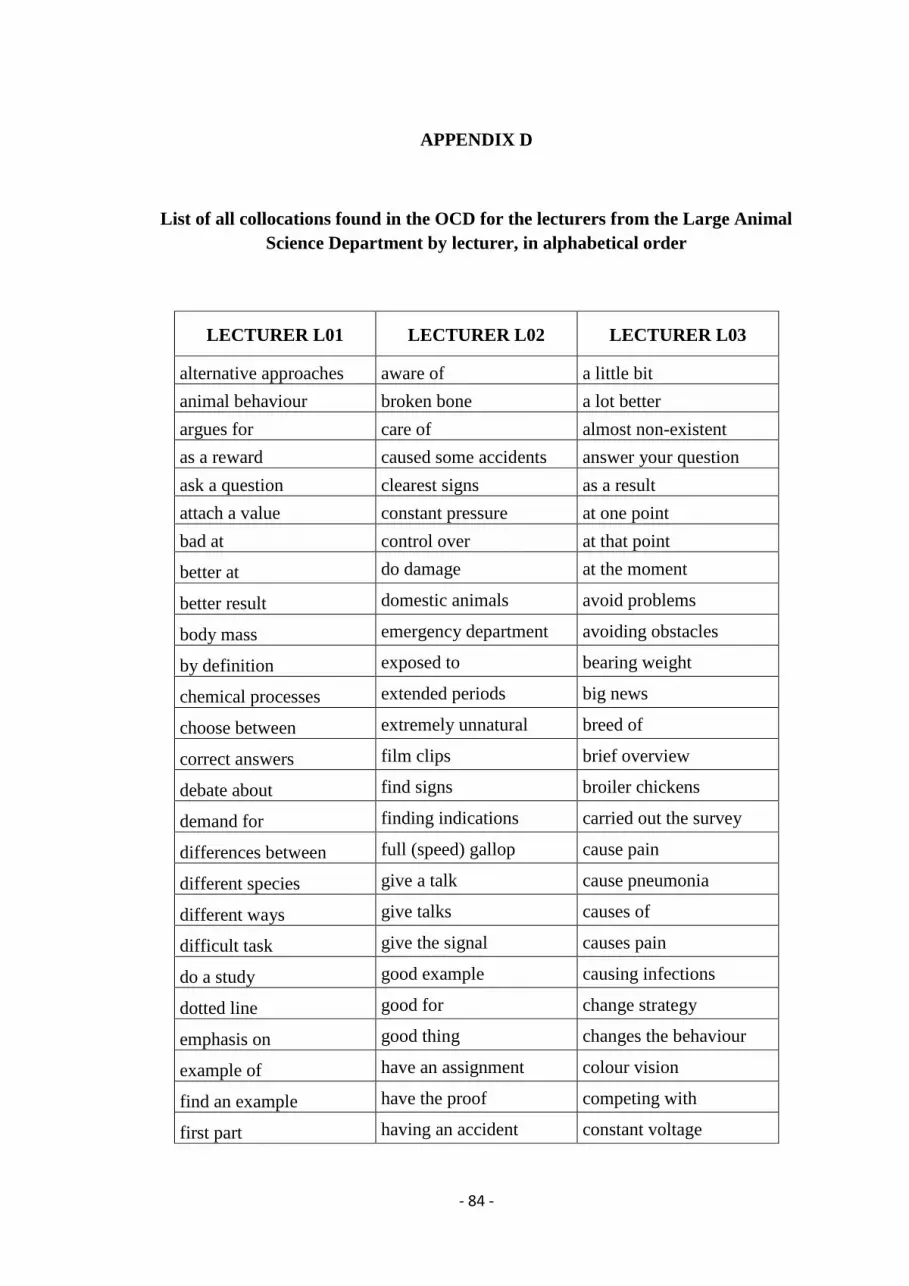
- 84 -
APPENDIX D
List of all collocations found in the OCD for the lecturers from the Large Animal
Science Department by lecturer, in alphabetical order
LECTURER L01 LECTURER L02 LECTURER L03
alternative approaches aware of a little bit
animal behaviour broken bone a lot better
argues for care of almost non-existent
as a reward caused some accidents answer your question
ask a question clearest signs as a result
attach a value constant pressure at one point
bad at control over at that point
better at do damage at the moment
better result domestic animals avoid problems
body mass emergency department avoiding obstacles
by definition exposed to bearing weight
chemical processes extended periods big news
choose between extremely unnatural breed of
correct answers film clips brief overview
debate about find signs broiler chickens
demand for finding indications carried out the survey
differences between full (speed) gallop cause pain
different species give a talk cause pneumonia
different ways give talks causes of
difficult task give the signal causes pain
do a study good example causing infections
dotted line good for change strategy
emphasis on good thing changes the behaviour
example of have an assignment colour vision
find an example have the proof competing with
first part having an accident constant voltage

- 85 -
good for heated discussion cut it short
good thing horse (back) rider cut-off point
have an assignment horseback riding die of
for example in a hospital differ from
forget about in the world ease the transition
general public key problem eat food
get a reward little bit electrical currents
get frustrated little girls equal amount
get it right looks like eye infections
give rewards lost control finish off
good at main areas focus on
graduate students main problem for example
guess right main theme giving this lecture
have notions main topic good question
high ability making sure group discussion
high value negative reinforcement grow quickly
highly efficient on (its) back hang upside down
huge demand on the television have any experience
looks like pieces of equipment have knowledge
lost control pressure on have problems
human infants put pressure have vision
infer from puts its feets improve the welfare
inferred from quarter of in a house
interest from quite famous in a minute
interfere with quite recent in comparison
large area quite small in the air
lead you to recent study in the direction
little bit reduce that risk in the house
make errors reduce the severity in total
makes it difficult respond to interesting project
measure the size rides the horse level of consciousness
pressure on riding schools lifting its feet
- 86 -
mental processes safety equipment looked at
move into the area serious accidents low key
much better short video lower percentage
noisy environment small girls main causes
number of smaller proportion main concern
observed directly special circumstance main focus
Old Man step backwards main problem
over time tail swishing marked reduction
personal opinion take care media attention
prefer to take the pictures new breed
presented to taken to hospital new legislation
problems of talk about number of
question of talk on on a scale
quiet room this summer over the years
quite difficult time period past years
rather worse took the pictures per year
reach a level train horses prior knowledge
reach a plateau treat their diseases problems beginning
right number tugging lightly problems caused
scientific study tugging on problems of
scientific study tugging the reins produce chickens
simple task used for produce eggs
take care very big production system
social network very fast quite low
solve a problem very important quite unfortunate
species of bird very restrained random number
support for video clip reach maturity
talking about wagging its tail really good
think of wear a helmet reduce problems
types of wear boots reduced dramatically
various parts working on related to
very bad result in

- 87 -
very difficult ritual slaughter
treat their diseases scoring system
tugging lightly selective breeding
very good sexual maturity
very much faster shifted towards
very much slower sit down
very much smarter six point scale
very nice slaughter pigs
very noisy survey carried out
very quiet talk about
very simple throughout the period
very small transition between
visual stimuli twenty-four-hour period
well adapted used for
wild animals very brief
working with very crucial
yield a result very elegant
very good
very noticeable
very remote
very short
video clips
wood shavings
worked on
LECTURER L04 LECTURER L05 LECTURER L06
abdominal pain at home action on
abdominal surgery at the zoo amniotic fluid
advanced course aware of at the moment
answer to be aware aware of
at my office broken teeth be aware
at the hospital careful examination blood from

- 88 -
aware of common problem blood sugar
be aware CT scan care of
books about cut with the knife damage to the brain
cardiovascular system did some x-ray during the night
care of do an examination during the pregnancy
caused this colic do surgery during the weeks
chapters to read domesticated animals front leg
clinical examination eating the food general overview
correlation between exotic animals general practice
curling the lips first time give them a lecture
decreased intensity for (six) weeks had colic
do (a lot of) introduction for weeks had pain
do work gentle movements have a look
doing research good source have an assignment
doing this examination had a baby have the opportunity
extremely small had symptoms hear about
focus on have a look hind legs
general rule have duties in a box
get a feeling have food in the area
giving a lectures having problem in the blood
going into shock have teeth in the corner
good feeling in a box interested in
great interest in the box into the box
have a look in captivity last 2 or 3 weeks
have colic in the world listen to
have control in the zoo long time
having interest in zoo low content
having pain in captivity low level
hear a sound in the forest lungs are working
identify (what is) the intermittent diarrhoea make an examination

- 89 -
problem
important thing last thing next time
in practice left side normal reaction
in a situation light source on the floor
in addition looks (most) funny quite still
in chapter loose teeth reacting against
in intensity lower part signs of
in mind make comments silky coat
in the clinic on the left standing still
in the corner on the table successful operation
in the evening pretty sure superficial examination
in the field problems with take action
in the world put her on antibiotics take care
increased intensity right side take long
increased risk right side take time
interest in sharp knife this time
interesting subject sharp teeth tie her up
large diameter surgery on umbilical cord
large openings third time vaccination programme
last time took x-ray very aggressive
laying down use time very bad
lecture on very (most) famous very easy
lying down very bad very expensive
main subject very careful very fast
main things very common very late
make an examination very creamy very low
make sure very exceptional very painful
make your decision very gentle very quick
modern times very ill very slow
next time very important very soft

- 90 -
next year very interested very steep
night duties very nice very weak
on the ground very sharp wandering around
on the internet very shy with success
on the subject very strange
pawing the ground very sure
professional life very thick
read books weight loss
rectal examination welcome to
reduced rate well developed
serious is the condition whole world
small diameter work we did
small intestine x-ray department
specific diagnosis
spend your time
stomach is full
stressful situation
subject of
symptoms developed
take care
take the pulse
take the temperature
talk about
talking to
thorough examination
university hospital
use time
variation among
very expensive
very great

- 91 -
very important
very large
very nice
very quick
very small
very stressful
vital sign
water supply
weak pulse
welcome to
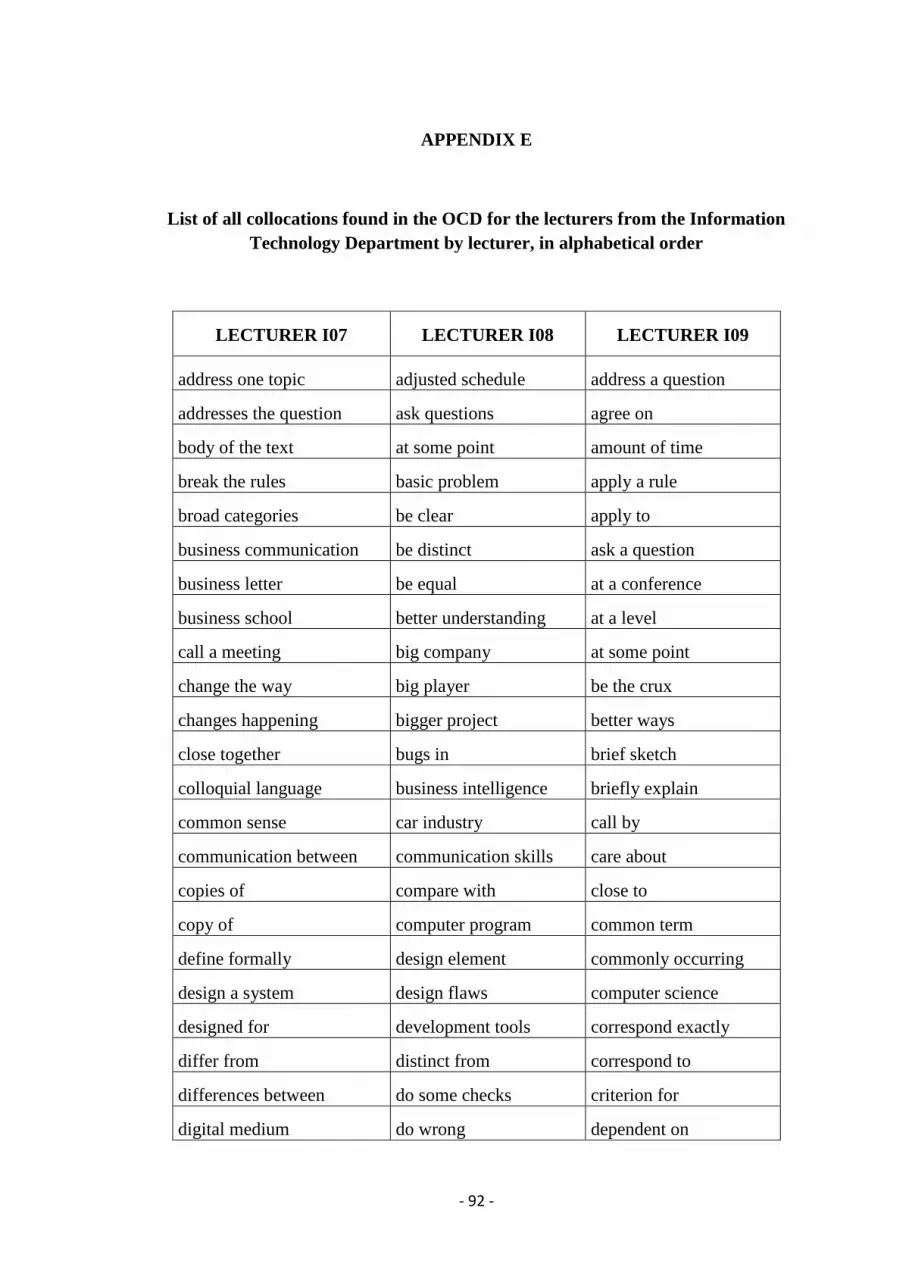
- 92 -
APPENDIX E
List of all collocations found in the OCD for the lecturers from the Information
Technology Department by lecturer, in alphabetical order
LECTURER I07 LECTURER I08 LECTURER I09
address one topic adjusted schedule address a question
addresses the question ask questions agree on
body of the text at some point amount of time
break the rules basic problem apply a rule
broad categories be clear apply to
business communication be distinct ask a question
business letter be equal at a conference
business school better understanding at a level
call a meeting big company at some point
change the way big player be the crux
changes happening bigger project better ways
close together bugs in brief sketch
colloquial language business intelligence briefly explain
common sense car industry call by
communication between communication skills care about
copies of compare with close to
copy of computer program common term
define formally design element commonly occurring
design a system design flaws computer science
designed for development tools correspond exactly
differ from distinct from correspond to
differences between do some checks criterion for
digital medium do wrong dependent on

- 93 -
discussion about enhancing understanding devise a plan
dispersed geographically essay about devise a system
dreamed of excited about discuss the problem
early days experience a problem do a thing
experts in fairly decent do calculations
facilitate communication find bugs do exercises
familiar with fix some errors do work
film and / media studies for instance dotted lines
focus on get a deal equal to
for instance get enthusiastic every kind
formal letter get excited extremely large
formal meeting get information fairly cool
freely choose give you a demo fairly easy
front page give you a taste fairly old
fuss about gotten big fairly simple
get drunk graphs showing find our way
getting confused had a meeting finite number
give a presentation have a rule first row
give an assignment have an opinion first step
give an example heart stops first thing
go to sleep heart surgeon focus on
gotten used to important points for instance
group work in comparison (to/with) for reasons
groups of in this file for simplicity
had the job in this part fundamental question
handwritten letter informed decisions funny thing
have aims interact with give a proof
have trouble interested in give an example
hold the meeting label as give an indication
important concept last week give the answer

- 94 -
in a relationship make a note good question
in an e-book make a statement graduate program
in connection with make decisions grow large
in fact make improvement have a problem
in groups make instruments have a proof
in that case make life better have rules
in that way marketing department high level
in the analysis medical instruments in (different) ways
in the beginning meeting with in a direction
in the organization morally wrong in a program
interested in moving towards in all cases
interesting thing need information in fact
intimate knowledge need more time in practice
introduce concepts new release in the century
invent ways next week in the sense
involved in obey rules in the universe
is that clear opinion about in the valley
know the difference oral exam infinite number
know the rules over time interest in
large corporations part of interesting question
large organizations past experience kind of
little child present as larger number
make a search pretty good last time
make it easier problem area last year
make observations product manager last year
meet a need project manager lead back
music genre put time (into) level of
need for quality of main criterion
new ways question about
mathematic and
computation course

- 95 -
newspaper site questions regarding new way
newspaper websites really excited next time
nineteenth century really good number of
notable differences really urgent obvious reasons
notion of recognize as occur in
over time reliable information old student
perform actions responsible for on your chest
physical differences rule for plan for
popular press rules about pretty straightforward
process of set of problem of
provide some suggestions set of tools programming languages
question of silly thing programming course
quite formal size has grown pure science
quite intuitive small company rather technical
reading a text source code rather weak
recognize as start with reason for
recommendations for statement about run a program
related to strict rules run into
remarkably stable talk about school yard
retrieve documents talk to several ways
right way taste of shorter time
scientific paper think about simple rules
send out an invitation understood about simple things
short answer very hard sketch of
sit comfortably web browser small reductions
social aspect work as spend your time
social phenomena work part-time start with
speak a language worked with stay in
specific context write an essay substitute for
sports section write code take a course
- 96 -
start by take an interest
study of take another direction
subject matter take steps
suggestions for take time
sunny day talk about
take minutes technical terms
talk about tell the truth
telephone communication terms mean
telephone conversation think about
twentieth century this morning
use routinely top left
used for twentieth century
useful for use examples
very broad use strategies
very common use this rule
very different very hard
very easy very low
very formal very similar
very good wait a minute
very practical way to
very uncomfortable whole truth
well defined worry about
work assignment write a program
write a letter
written communication

- 97 -
APPENDIX F
List of all collocations found in the OCD for the lecturers from the Mathematics
Department by lecturer, in alphabetical order
LECTURER M10 LECTURER M11 LECTURER M12
ask about a little bit along the way
at the end a little harder at that point
be okay a little odd basic concept
begin with absolutely sure be surprised
by definition at every point cite papers
change colour at the point class of
divide into ball rolling completely independent
draw a diagram basic formulas complex numbers
draw a graph care about concrete examples
establish continuity common mistake considered a factor
find (counter)examples different method correspondence between
have equality different way deduce from
important for differential equation equal numbers
in fact does (the same) thing equal to
in the future down the hill example of
in this case fairly trivial for example
in trouble get a result for this purpose
know the answer go quickly from the left
on the test had this formula from the right
point at hand in homework give an example

- 98 -
point of have the formula good sense
say about high school got inspiration
subtle difference horizontal line have (no) idea
talk about in school have a system
very important in the family have time
very useful in this case heard about
work with left-hand side homework assignment
lose points idea about
make sure important thing
on the side in a way
positive number in effect
product of in fact
quite complicated in his youth
quite important in the discussion
right-hand side in this case
rolling down in this way
slightly (more)
complicated independent of
smooth curves interesting examples
solves the problem interesting question
special cases introduction to
standard formula know about
strange coincidence know for sure
take a path know the answer
take care know very well
think of little bit

- 99 -
twist around make sense
use a method obtain this result
use the rule positive numbers
very bad product of
very important provide a proof
very simple quite surprising
quite useful
rather deep
rather simple
rational numbers
real mess
remind you of
sequence of
sequence of numbers
set of
simple fact
small thing
sum of
talk about
tell about
thinking about
use theory
useful way
very different
very good
very interesting

- 100 -
very useful
very young
was young
write down
LECTURER M13 LECTURER M14 LECTURER M15
at the moment ask a question ask a question
basic point at the point ask about
basic question be clear ask for
be technical be different ask questions
begin with classical mechanics at a level
behaves like classical model attached to
category of completely different background in
class of complex number basic question
difference between connection with basic structure
different ways correspond to be right
each time develop a theory beyond the scope of
each time difference from by definition
example of do things care about
fairly obvious emphasis on certain number
few words explain to consider a question
for example for instance decide the question
give a lecture formal definition discuss a topic
glued together fundamental question easy exercise
good example give a definition equal to
groups of give an answer equivalent to

- 101 -
have a notion have a function first thing
have properties hear about for instance
have time in detail general interest
in a minute in the system general purpose
in fact in the version give an assignment
in this case in this language give an impression
introduction to kind of given the fact
kind of little bit group of
make life easier make a difference have a background
notion of make a drawing have this fact
of this type make a measurement important fact
other end make a model important property
part of make precise in addition
put parentheses make sense addition to
question of Newtonian mechanics in detail
quite different nice thing in fact
relations between physical phenomenon in most cases
say about physical world in that case
say words play a role in this range
slightly weaker put emphasis in this sense
start by quantum mechanics kind of
start with relate to know about
think about simply defined lead to
unanswered question take time little bit
very different talk about logically impossible
wait a minute think of make sense

- 102 -
with respect to very early
mathematical point of
view
write down very fruitful named after
very fundamental next step
work on next week
notion of
notion of
number of
obvious question
occurs in
provide a solution
questions about
rational numbers
real life
real solutions
reduce the number
remember correctly
resolved by
say about
set of
simple equation
simple statement
solutions to
specific question
statements about
take a course

- 103 -
take the step
talk about
tell about
this time
understand intuitively
very big
very interesting
well defined
write a word
- 104 -
APPENDIX G
List of potentially deviant collocations and assessments as judged by the five raters, in
alphabetical order
a/A=acceptable, u/U=unacceptable, ?=not sure
(x2)=number of occurrences if the word partnership occurred more than once
Word partnership Rater 1 Rater 2 Rater 3 Rater 4 Rater 5
Final
assess-
ment
afterbirth has arrived a u u a a A
attention to a a a a a A
baby foal u u a ? ? ?
big brains (x5) a a a ? a A
big proportion (x3) a u a u u U
caught animals u a u ? u U
come with a sound u u u u u U
conserve teeth a a a a u A
cutting research a ? u u u U
damage a foal a a a a a A
damage your hand a a a ? a A
debate intensively u a u ? a ?
demand of u u u u u U
do a diagnostic a u u ? a ?
do a palpation (x2) u a a u u U
do a procedure a u a u u U
do a sedation u u u u a U
do a stomach tubing a a ? u a A
do an extraction a a a a a A
do an extraction (x2) a a a a a A
do animals u u u ? a U
do auscultation a a ? ? ? ?
do colic u a u u u U
do dentistry a a a a a A
do medicine a u a ? a A
do reasoning a u u ? a ?
do treatment u u u a a U
extremely many u u u u u U
former picture a a a u u A
- 105 -
full speed gallop u a u a a A
get a sound a a a a a A
get antibodies a a a a a A
get indications a a u a a A
get relations u u u u u U
give a possibility u u u u u U
give problems a u a a a A
give salience u u u u u U
grow chickens a a a u u A
handle an environment a a a ? a A
handle medical(ly) u u u ? ? U
handle surgical(ly) u u u ? ? U
have a foaling u u ? ? ? ?
have a possibility (x6) a a a a a A
have a prognosis a a u a a A
have salience u a u u u U
high listed animal u a ? u u U
high salience (x2) u a u u u U
high sound u u u u a U
how long time u u u u u U
in a course u a a u u U
in a course (x7) a a u a a A
in proper time u a u a a A
incredible strong u u u u u U
judge an attitude a a ? a a A
killing procedure a a ? a a A
large expenses a a u a a A
large variation a a a ? a A
make a bug u u u u u U
make a coalition u u u u u U
make a defect go away a u a u u U
make a layout ? a a ? ? A
make an auscultation u ? ? ? ? ?
make an infusion u a a a a A
make plasma a ? ? ? ? ?
make (this kind of)
reasoning u u ? u u U
make something survive a u a u u U
medicate control u u u u u U
mild problem a a a ? u A
model something after a u a ? a A

- 106 -
something
nice rule a a ? ? a A
nice test a a a ? a A
on a hospital u u u u u U
on a pressure u ? u u u U
on-hand handling ? u u ? u U
pain control a ? a a a A
perform a book u u u u a U
perform a lecture u u u u u U
poor prognosis a a a a a A
prove results u u a u u U
prove something
barehandedly u u u u u U
put in anaesthesia u a u u u U
put something equal u u ? ? u U
quick interference u/a a u u u U
react fast a a a a a A
red numbers a a ? u u ?
reduce problems a a a a a A
refer someone for (a
hospital) x2 u u u u u U
release pressure a a a a a A
severe weight loss a a a a a A
small essay a u a u u U
small sound a u u u u U
solve a question u u u u u U
surgical colic a a a ? ? A
take a gallop u u u a a U
take a test a a ? a a A
take in medicine u u u u u U
take long time u u u u u U
take out sound a u a a a A
tell your name u u u u u U
through the phone u u u u u U
trauma medicine a a a u ? A
urgent injury a u a ? a A
use money u a u a a A
use time u a a a u A
use time u a u a a A
violent(ly) pain u u u u u U

- 107 -
APPENDIX H
List of deviant collocations as judged by the panel of raters, by lecturer (in the order
they appeared in the texts)
Department Lecturer Deviant collocations
(number of occurrences if more
than one)
Large Animal
Science L01 caught animals
small sound
have salience
high salience (x2)
high sound
give salience
L02 incredible strong
take a gallop
big proportion (x3)
on a pressure
L03 -
L04 do a palpation (x2)
do a procedure
quick interference
through the phone
refer someone for (a hospital) (x2)
do colic
handle medical(ly)
handle surgical(ly)
on a hospital
perform a lecture
perform a book
give a possibility
- 108 -
violent(ly) pain
medicate control
in a course
demand of
L05 do treatment
do a sedation
high listed animal
do animals
take in medicine
put in anaesthesia
make something survive
make a coalition
L06 take long time
come with a sound
how long time
Information
Technology I07 tell your name
I08 solve a question
make a bug
small essay
make a defect go away
I09 cutting research
Mathematics M10 make (this kind of) reasoning
M11 -
M12 prove something barehandedly
prove results
M13 get relations (between variables)
M14 -
M15 put something equal
extremely many

- 109 -
APPENDIX I
Chart for converting examiner fluency criterion scores to a single fluency index figure
(see Appendix C for application of the chart)
Fluency score
given by one
examiner
0
1-
1
1+
2-
2
2+
3-
3
3+
4-
4
4+
5-
5
Converted
fluency index
score
0
1
2
3
4
5
6
7
8
9
10
11
12
13
14
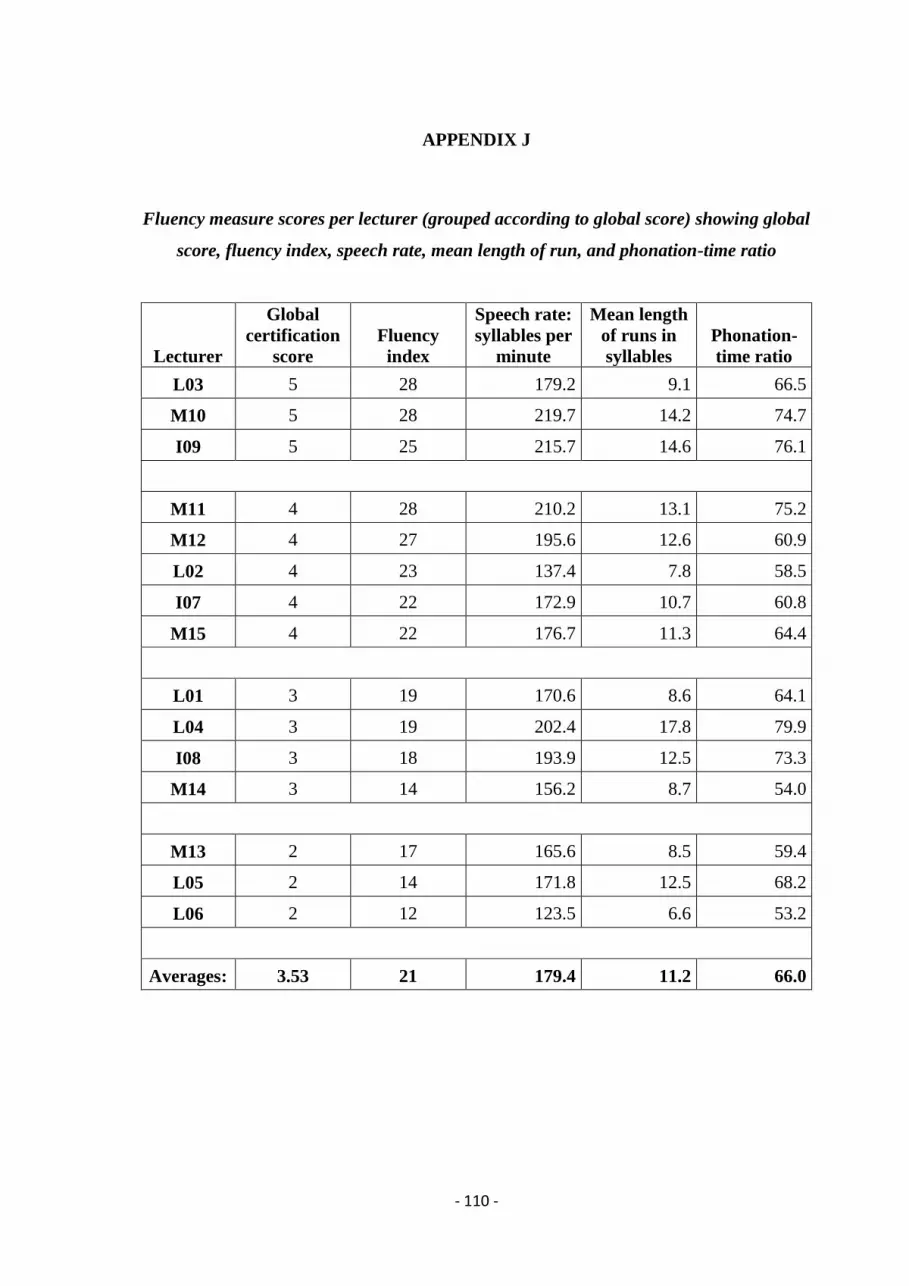
- 110 -
APPENDIX J
Fluency measure scores per lecturer (grouped according to global score) showing global
score, fluency index, speech rate, mean length of run, and phonation-time ratio
Lecturer
Global
certification
score
Fluency
index
Speech rate:
syllables per
minute
Mean length
of runs in
syllables
Phonation-
time ratio
L03 5 28 179.2 9.1 66.5
M10 5 28 219.7 14.2 74.7
I09 5 25 215.7 14.6 76.1
M11 4 28 210.2 13.1 75.2
M12 4 27 195.6 12.6 60.9
L02 4 23 137.4 7.8 58.5
I07 4 22 172.9 10.7 60.8
M15 4 22 176.7 11.3 64.4
L01 3 19 170.6 8.6 64.1
L04 3 19 202.4 17.8 79.9
I08 3 18 193.9 12.5 73.3
M14 3 14 156.2 8.7 54.0
M13 2 17 165.6 8.5 59.4
L05 2 14 171.8 12.5 68.2
L06 2 12 123.5 6.6 53.2
Averages: 3.53 21 179.4 11.2 66.0

- 111 -
APPENDIX K
Collocational competence per lecturer (grouped according to global score) showing
collocation types per thousand words, collocation tokens per thousand words, collocational
type/token ratio and deviant collocations produced per thousand words
Lecturer
Global
certification
score
Collocation
types per
1000 words
Collocation
tokens per
1000 words
Collocation
type/token
ratio
Deviant
collocations
per 1000
words
L03 5 44.2 58. 9 0.65 0.00
M10 5 13.2 16.7 0.69 0.49
I09 5 31.9 46.4 0.76 0.24
M11 4 16.2 25.0 0.63 0.00
M12 4 29.0 35.3 0.79 0.81
L02 4 39.7 48.4 0.85 2.74
I07 4 46.5 61.5 0.79 0.34
M15 4 30.5 43.8 0.81 0.78
L01 3 37.3 45.8 0.81 2.72
L04 3 33.8 42.5 0.82 5.59
I08 3 35.4 43.9 0.69 1.26
M14 3 22.4 35.8 0.80 0.00
M13 2 21.1 32.8 0.74 0.45
L05 2 30.2 38.0 0.64 3.14
L06 2 29.3 39.5 0.75 1.27
Averages 3.53 30.7 40.9 0.75 0.93

- 112 -
APPENDIX L
Comparison of the ten most frequent lexical items and their word partners not listed in
the Oxford Collocations Dictionary from the three departments (extracted using
AntConc software). Headwords are written in bold type.
Dept. Most frequent word
partnerships Frequency
Most frequent word
partnerships
Frequency
Maths c star algebra(s) 48 topological space 3
differential graded algebra(s) 11 closed graph theorem 13
matrix algebra(s) 4 open mapping theorem 5
tensor algebra 5 big theorem 3
A-infinity algebras 2 famous theorem 3
z star 8 y prime 25
r squared 5 u prime 4
x squared 22 Cartesian product 2
y squared 20 inner product 4
z squared 5 tensor product 2
Banach space 9 rational point 5
dual space 2 continuous function(s) 6
Hausdorff space 3 continuous map(s) 5
Hilbert space 9 A-infinity map 3
measure space 2
Total number of domain-specific partnerships for Maths (types): 29
Total number of domain-specific partnerships for Maths (tokens): 238
IT organisational communication 7 new media 9
communication genre 6 function of 4
Semmle code 3 static analysis 2
C plus plus code 2 Church-Rosser theorem 2
Java code 2 Church-Rosser diagrams 2
lambda term 4 Church-Rosser property 4
lambda calculus 17 declarative language(s) 4
Total number of domain-specific partnerships for IT (types): 14
Total number of domain-specific partnerships for IT (tokens): 68
LAS colic horse(s) 5 horse welfare 2
SNP foal test 2 welfare issue 2
manifestation colic 2 gait score 14
colic episode 3 Malayan tapir(s) 4
colic case 2 hoarding birds 3
leg problems 11 mouth speculum 2
eye problems 2 animal cognition 2
welfare problem(s) 7
Total number of domain-specific partnerships for LAS (types): 15
Total number of domain-specific partnerships for LAS (tokens): 63

- 113 -