tackling health inequalities in post-devolution britain: do targets matter
TRANSCRIPT
doi: 10.1111/j.1467-9299.2009.01782.x
TACKLING HEALTH INEQUALITIES INPOST-DEVOLUTION BRITAIN: DO TARGETS MATTER?
TIM BLACKMAN, EVA ELLIOTT, ALEX GREENE, BARBARA HARRINGTON,DAVID HUNTER, LINDA MARKS, LORNA MCKEE, KAT SMITH ANDGARETH WILLIAMS
Since devolution in 1998, many aspects of public policy in Great Britain have diverged betweenEngland, Scotland and Wales, including how targets and performance assessment are used in theNational Health Service and local government. Health inequality is an example where all threecountries have recognized a need to act but approaches to performance assessment differ. Basedon interviews with senior managers, the complexity of health inequality as an object of localintervention is explored and compared. Despite contrasting approaches to targets, local discoursesin all three countries had significant similarities. Health inequality had to compete against apreoccupation with improving access to acute services generally and balancing budgets over theshort term. There was a bias in the interventions described towards targeting health behaviours, butwith limited use of evidence about efficacy, and indications that measuring progress with reducinghealth inequalities was starting to lead to an emphasis on ‘quick wins’ from pharmacologicalinterventions.
INTRODUCTION
The United Kingdom’s National Health Service (NHS) is based on universalist principlesof providing care free at the point of need funded from general taxation. However, sincedevolution in Great Britain in 1998, and the restoration of devolved powers in NorthernIreland in 2007, the NHS has been under the separate policy regimes of the ScottishGovernment, the Welsh Assembly Government, the Northern Ireland Assembly and,in England, the Department of Health. Although some aspects of health administrationin each country were distinctive prior to devolution, each government has adoptedapproaches that give its NHS and wider public health policies a particular nationalcharacter (Greer and Rowland 2007).
Tackling health inequalities has remained a commitment for the new devolvedassemblies but approaches to the issue differ, especially regarding the use of targets(NHS Scotland 2005; NHS Wales 2005; Secretary of State for Health 2005). Healthinequality is a ‘wicked problem’ that presents particular challenges for targets and theiruse in performance assessment (Blackman et al. 2006; Rainham 2007; Smith et al. 2009).Relationships between cause and effect are complex and often not well understood, andeven the definition of the problem may be contested (Rittel and Webber 1973). Healthinequality is also a cross-cutting issue, with action needed across several fronts by bothhealth and other public services.
Some of the features of health policy in Scotland and Wales, such as the emphasis onintegration and partnerships in Scotland, and on local autonomy and joint strategies in
Tim Blackman is Professor of Sociology and Social Policy and Barbara Harrington Research Fellow, Wolfson ResearchInstitute, Durham University. Eva Elliott is RCUK Fellow, Cardiff Institute for Society, Health and Ethics and GarethWilliams is Professor of Sociology, School of Social Sciences, Cardiff University. Alex Greene is Research Fellow andLorna McKee Professor of Management, Health Services Research Unit, University of Aberdeen. David Hunter isProfessor of Health Services Management and Linda Marks Senior Research Fellow, School of Medicine and Health,Durham University. Kat Smith is Research Officer, School for Health, University of Bath.
Public Administration Vol. 87, No. 4, 2009 (762–778)© 2009 The Authors. Journal compilation © 2009 Blackwell Publishing Ltd, 9600 Garsington Road, Oxford OX4 2DQ,UK and 350 Main Street, Malden, MA 02148, USA.

TACKLING HEALTH INEQUALITIES IN BRITAIN 763
Wales, imply a particularly good context for tackling health inequalities, encouragingjoined-up working and experimentation (Greer 2006). In contrast, England has beencharacterized as having a ‘command and control’ approach to local public services, witha strong audit culture of centrally driven targets and performance assessment. This maydeliver when tackling an issue like reducing waiting times for treatment but does notseem to fit well with the complexity of health inequalities where there is little knowledgeand even less guidance about how to get from ‘here to there’ (Smith 2005; Bevan and Hood2006a; Propper et al. 2007). National health inequality targets may focus the attention oflocal actors on the issue, especially if they are held to account for measures of progress,but may be ignored or contested if there is not the support, motivation or political will toachieve them (Lindberg and Wilhelmsson 2007).
This article reports on a study of health inequality that examines the discourses of localactors in the NHS, local government and multi-agency partnerships in England, Scotlandand Wales. These are considered in the context of national differences in local governance,performance assessment and targets. The study excludes Northern Ireland because at thetime of the fieldwork its assembly was suspended. When the fieldwork was undertakenin 2006, Labour Party administrations were in power in all three countries, althoughfollowing elections a year later the Scottish Nationalist Party took control of the ScottishGovernment, and in Wales the Labour Party lost majority control and formed a coalitionwith nationalist Plaid Cymru.
Senior figures at a local strategic level in the NHS, local government and variouslocal partnerships were interviewed and the interview transcripts were analysed for keythemes. The results discussed in this article are drawn primarily from 130 interviewscarried out between June and August 2006. We also gathered and read local plans,strategies and reports, and used national policy documents to contextualize interviewees’accounts. Localities for the interviews were selected to be broadly comparable and in eachcountry a regional city and post-industrial hinterland area was part of the selection, allwith relatively high deprivation. In addition to the local interviews, a small number ofcontextualizing interviews were undertaken with senior civil servants.
THE POLICY CONTEXTS
Before presenting an analysis of the interviews, this section describes some key features ofthe three national policy contexts. Policy documents current at the time of the interviewsreveal some differences in emphasis regarding policies to tackle health inequality. InEngland, health inequality targets aimed for faster than average health improvementsamong the most disadvantaged groups and areas, primarily by encouraging healthierlifestyles:
Despite overall improvements, there remain big – and in some communitiesincreasing – differences in health between those at the top and bottom ends of thesocial scale . . . Our fundamental aim must be to create a society where more people,particularly those in disadvantaged groups or areas, are encouraged and enabledto make healthier choices. In order to close the gap, we must ensure that the mostmarginalised and excluded groups and areas in society see faster improvements inhealth . . . We have included targets to improve people’s chances for better health andreduce inequalities in the Public Service Agreement (PSA) framework, which drivesforward the Government’s highest priorities. . . . (Secretary of State for Health 2005,pp. 10–11)
Public Administration Vol. 87, No. 4, 2009 (762–778)© 2009 The Authors. Journal compilation © 2009 Blackwell Publishing Ltd.

764 TIM BLACKMAN ET AL.
In Scotland, the equivalent policy document also emphasises increasing the rate ofhealth improvement among the most disadvantaged groups, but highlights tackling thewider determinants of health inequality rather than individual behaviour change:
There are unacceptable differences in healthy life expectancy in Scotland. . . . TheExecutive’s approach to closing the opportunity gap by tackling poverty anddisadvantage in Scotland will benefit the health of people living in the mostdeprived communities by addressing aspects of poverty such as improving people’semployability, increasing young people’s confidence and skills and regenerating themost disadvantaged neighbourhoods. . . . We have made clear our determination toachieve progress by settings targets to increase the rate of improvement . . . for themost disadvantaged communities. (NHS Scotland 2005, pp. 22, 24)
In both England and Scotland, the NHS is also regarded as being able to do more totackle health inequalities by targeting resources at greatest needs. In Wales, however, thereis an overriding emphasis on the NHS itself compared to either encouraging healthierlifestyles or tackling wider determinants. Modernizing services and improving accessto care across the population are emphasized in its key policy document of the time,Designed for Life (NHS Wales 2005). ‘A new vision’ for the NHS in Wales includes anaim to ‘improve health and reduce, and where possible eliminate, inequalities in health’(p. 4) but the approach is more tentative than in the other two countries, with the issueprimarily one for future action:
We will assess how much progress we have made in improving the health of Wales andreducing health inequalities. Having completed this, we will publish a revised healthinequalities strategy in 2009. This will:
– build on success;– bring renewed impetus to our service improvement agenda;– adjust for the growing maturity of our partnerships. It is likely that many of these
will have become developed and sophisticated enough to become ‘self directive’requiring only a light touch from the centre. (NHS Wales 2005, p. 42)
This last point reveals a more cautious approach in Wales to using performancemanagement from the centre to achieve change locally. Designed for Life contains acommitment to strengthening performance management but only in relation to serviceimprovements in the NHS and not health inequalities. In England, targets set at the centreare presented as ‘driving forward’ health priorities at the local level across the NHSand local government, including targets for health inequalities and local partnerships.Scotland occupies a middle position, with central targets that include health inequalitiesbut none of England’s language of ‘command and control’ and instead an emphasis onmonitoring and support for improvement.
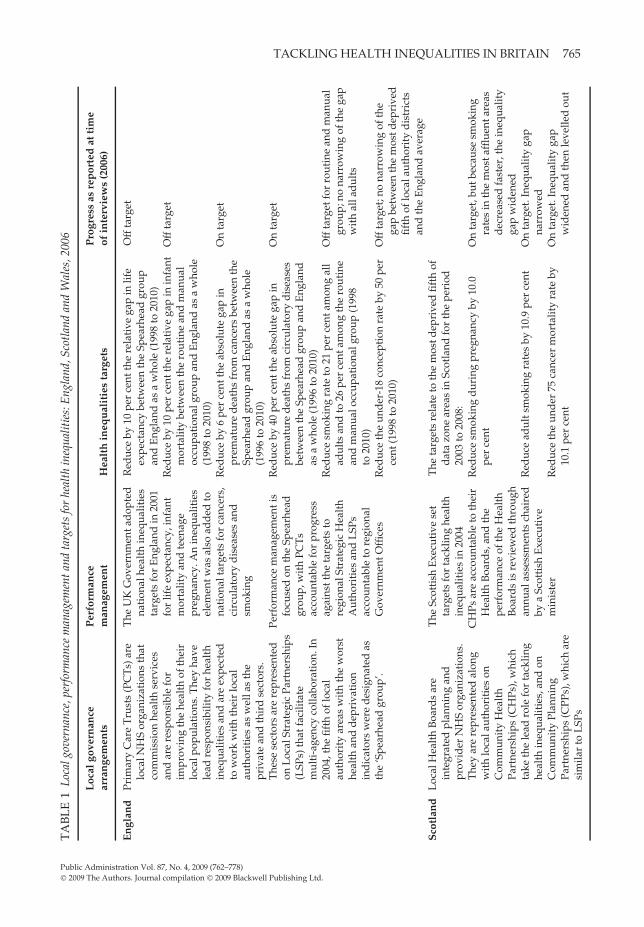
Table 1 presents further detail on these national contexts, including local governancearrangements, performance management, targets, and progress at the time of our field-work. England’s NHS has a commissioner/provider split. Locally, Primary Care Trusts(PCTs) are responsible for commissioning health services from general practitioners, NHSprovider trusts and, on occasion, private and voluntary sector providers (some aspectsof commissioning are also being devolved to GPs). All the PCTs in our study includedSpearhead areas, a Department of Health designation given in 2004 to the 20 per centof local authority areas in England with the poorest health and deprivation indicators.
Public Administration Vol. 87, No. 4, 2009 (762–778)© 2009 The Authors. Journal compilation © 2009 Blackwell Publishing Ltd.
TACKLING HEALTH INEQUALITIES IN BRITAIN 765T
AB
LE
1Lo
calg
over
nanc
e,pe
rfor
man
cem
anag
emen
tand
targ
ets
for
heal
thin
equa
litie
s:E
ngla
nd,S
cotl
and
and
Wal
es,2
006
Loc
algo
vern
ance
Per
form
ance
Pro
gres
sas
rep
orte
dat
tim
ear
ran
gem
ents
man
agem
ent
Hea
lth
ineq
ual
itie
sta
rget
sof
inte
rvie
ws
(200
6)
En
glan
dPr
imar
yC
are
Tru
sts
(PC
Ts)
are
loca
lNH
Sor
gani
zati
ons
that
com
mis
sion
heal
thse
rvic
esan
dar
ere
spon
sibl
efo
rim
prov
ing
the
heal
thof
thei
rlo
calp
opul
atio
ns.T
hey
have
lead
resp
onsi
bilit
yfo
rhe
alth
ineq
ualit
ies
and
are
expe
cted
tow
ork
wit
hth
eir
loca
lau
thor
itie
sas
wel
las
the
priv
ate
and
thir
dse
ctor
s.T
hese
sect
ors
are
repr
esen
ted
onL
ocal
Stra
tegi
cPa
rtne
rshi
ps(L
SPs)
that
faci
litat
em
ulti
-age
ncy
colla
bora
tion
.In
2004
,the
fifth
oflo
cal
auth
orit
yar
eas
wit
hth
ew
orst
heal
than
dd
epri
vati
onin
dic
ator
sw
ere
des
igna
ted
asth
e‘S
pear
head
grou
p’.
The
UK
Gov
ernm
enta
dop
ted
nati
onal
heal
thin
equa
litie
sta
rget
sfo
rE
ngla
ndin
2001
for
life
expe
ctan
cy,i
nfan
tm
orta
lity
and
teen
age
preg
nanc
y.A
nin
equa
litie
sel
emen
twas
also
add
edto
nati
onal
targ
ets
for
canc
ers,
circ
ulat
ory
dis
ease
san
dsm
okin
g
Perf
orm
ance
man
agem
enti
sfo
cuse
don
the
Spea
rhea
dgr
oup,
wit
hPC
Ts
acco
unta
ble
for
prog
ress
agai
nstt
heta
rget
sto
regi
onal
Stra
tegi
cH
ealt
hA
utho
riti
esan
dL
SPs
acco
unta
ble
tore
gion
alG
over
nmen
tOffi
ces
Red
uce
by10
per
cent
the
rela
tive
gap
inlif
eex
pect
ancy
betw
een
the
Spea
rhea
dgr
oup
and
Eng
land
asa
who
le(1
998
to20
10)
Red
uce
by10
per
cent
the
rela
tive
gap
inin
fant
mor
talit
ybe
twee
nth
ero
utin
ean
dm
anua
loc
cupa
tion
algr
oup
and
Eng
land
asa
who
le(1
998
to20
10)
Red
uce
by6
per
cent
the
abso
lute
gap
inpr
emat
ure
dea
ths
from
canc
ers
betw
een
the
Spea
rhea
dgr
oup
and
Eng
land
asa
who
le(1
996
to20
10)
Red
uce
by40
per
cent
the
abso
lute
gap
inpr
emat
ure
dea
ths
from
circ
ulat
ory
dis
ease
sbe
twee
nth
eSp
earh
ead
grou
pan
dE
ngla
ndas
aw
hole
(199
6to
2010
)R
educ
esm
okin
gra
teto
21pe
rce
ntam
ong
all
adul
tsan
dto
26pe
rce
ntam
ong
the
rout
ine
and
man
ualo
ccup
atio
nalg
roup
(199
8to
2010
)R
educ
eth
eun
der
-18
conc
epti
onra
teby
50pe
rce
nt(1
998
to20
10)
Off
targ
et
Off
targ
et
On
targ
et
On
targ
et
Off
targ
etfo
rro
utin
ean
dm
anua
lgr
oup;
nona
rrow
ing
ofth
ega
pw
ith
alla
dul
ts
Off
targ
et;n
ona
rrow
ing
ofth
ega
pbe
twee
nth
em
ostd
epri
ved
fifth
oflo
cala
utho
rity
dis
tric
tsan
dth
eE
ngla
ndav
erag
eS
cotl
and
Loc
alH
ealt
hB
oard
sar
ein
tegr
ated
plan
ning
and
prov
ider
NH
Sor
gani
zati
ons.
The
yar
ere
pres
ente
dal
ong
wit
hlo
cala
utho
riti
eson
Com
mun
ity
Hea
lth
Part
ners
hips
(CH
Ps),
whi
chta
keth
ele
adro
lefo
rta
cklin
ghe
alth
ineq
ualit
ies,
and
onC
omm
unit
yPl
anni
ngPa
rtne
rshi
ps(C
PPs)
,whi
char
esi
mila
rto
LSP
s
The
Scot
tish
Exe
cuti
vese
tta
rget
sfo
rta
cklin
ghe
alth
ineq
ualit
ies
in20
04C
HPs
are
acco
unta
ble
toth
eir
Hea
lth
Boa
rds,
and
the
perf
orm
ance
ofth
eH
ealt
hB
oard
sis
revi
ewed
thro
ugh
annu
alas
sess
men
tsch
aire
dby
aSc
otti
shE
xecu
tive
min
iste
r
The
targ
ets
rela
teto
the
mos
tdep
rive
dfif
thof
dat
azo
near
eas
inSc
otla
ndfo
rth
epe
riod
2003
to20
08:
Red
uce
smok
ing
dur
ing
preg
nanc
yby
10.0
per
cent
Red
uce
adul
tsm
okin
gra
tes
by10
.9pe
rce
nt
Red
uce
the
und
er75
canc
erm
orta
lity
rate
by10
.1pe
rce
nt
On
targ
et,b
utbe
caus
esm
okin
gra
tes
inth
em
osta
fflue
ntar
eas
dec
reas
edfa
ster
,the
ineq
ualit
yga
pw
iden
edO
nta
rget
.Ine
qual
ity
gap
narr
owed
On
targ
et.I
nequ
alit
yga
pw
iden
edan
dth
enle
velle
dou
t
Public Administration Vol. 87, No. 4, 2009 (762–778)© 2009 The Authors. Journal compilation © 2009 Blackwell Publishing Ltd.
766 TIM BLACKMAN ET AL.
TA
BL
E1
(Con
tinu
ed).
Loc
algo
vern
ance
Per
form
ance
Pro
gres
sas
rep
orte
dat
tim
ear
ran
gem
ents
man
agem
ent
Hea
lth
ineq
ual
itie
sta
rget
sof
inte
rvie
ws
(200
6)
Red
uce
the
und
er75
coro
nary
hear
tdis
ease
mor
talit
yra
teby
27.1
per
cent
On
targ
et.I
nequ
alit
yga
pna
rrow
edR
educ
ete
enag
epr
egna
ncy
rate
per
1000
13–1
5ye
arol
ds
from
12.6
to8.
4O
ffta
rget
.Ine
qual
ity
gap
wid
ened
Wal
esL
ocal
Hea
lth
Boa
rds
(LH
Bs)
are
loca
lNH
Sor
gani
zati
ons
that
com
mis
sion
heal
thse
rvic
esan
dar
ere
spon
sibl
efo
rim
prov
ing
the
heal
thof
thei
rlo
calp
opul
atio
ns.L
HB
san
dlo
cala
utho
riti
esha
vea
dut
yto
wor
kto
geth
erto
del
iver
join
tH
ealt
h,So
cial
Car
ean
dW
ell-
bein
gSt
rate
gies
that
add
ress
heal
thim
prov
emen
tan
din
equa
litie
s
In20
03–0
4th
eW
elsh
Ass
embl
yG
over
nmen
tre
vise
dit
she
alth
gain
targ
ets
toin
clud
ein
dic
ator
sfo
rm
onit
orin
ghe
alth
ineq
ualit
ies.
Inad
dit
ion,
in20
06a
seri
esof
child
pove
rty
targ
ets
wer
epu
blis
hed
that
incl
uded
seve
ralh
ealt
hin
equa
lity
targ
ets
LH
Bs
repo
rtth
eir
perf
orm
ance
onva
riou
sm
easu
res
and
stan
dar
ds
toth
eW
elsh
Ass
embl
yG
over
nmen
t,bu
tth
isd
oes
noti
nclu
de
heal
thin
equa
lity
ind
icat
ors
Red
uce
coro
nary
hear
tdis
ease
age-
stan
dar
diz
edm
orta
lity
in65
–74
year
old
sto
400
by20
12an
dat
the
sam
eti
me
aim
for
am
ore
rapi
dim
prov
emen
tin
the
mos
td
epri
ved
grou
ps.
Red
uce
canc
erag
e-st
and
ard
ised
mor
talit
yin
thos
eag
edbe
low
75by
20pe
rce
ntbe
twee
n20
02an
d20
12an
dat
the
sam
eti
me
aim
for
am
ore
rapi
dim
prov
emen
tin
the
mos
td
epri
ved
grou
psR
educ
eth
era
tio
inth
ein
fant
mor
talit
yra
tebe
twee
nth
em
ostd
epri
ved
and
affl
uent
fifth
sof
the
popu
lati
onfr
om1.
61in
1998
–200
2to
1.3
in20
20R
educ
eth
era
tio
inth
elo
wbi
rth
wei
ghtr
ate
betw
een
the
mos
tdep
rive
dan
daf
flue
ntfif
ths
ofth
epo
pula
tion
from
1.23
in19
98–2
002
to1.
12in
2020
Red
uce
the
rati
oin
the
und
er-1
6co
ncep
tion
rate
betw
een
the
high
estl
ocal
auth
orit
yar
eara
tean
dth
eav
erag
efo
rW
ales
from
1.61
in19
99–2
001
tono
mor
eth
an1.
3in
2020
No
repo
rtin
gca
rrie
dou
t
Public Administration Vol. 87, No. 4, 2009 (762–778)© 2009 The Authors. Journal compilation © 2009 Blackwell Publishing Ltd.
TACKLING HEALTH INEQUALITIES IN BRITAIN 767
Targets for PCTs to reduce gaps in life expectancy and infant mortality by 10 per centcompared to the national average were introduced in 2001, the former based on the gapwith what became the Spearhead areas; further more detailed targets followed. PCTs havelead responsibility for these targets and are assessed for their performance by regionalStrategic Health Authorities. They are expected to work with local authorities (LAs) andother partners with coordination through local strategic partnerships (LSPs). The targetsshould shape PCTs’ decisions about the services they commission. Since 2005/06, theperformance of both PCTs and NHS provider trusts against both national targets and aset of public health standards that include health inequalities has been independentlyassessed annually by the Healthcare Commission.
In Scotland, Health Boards (HBs) both plan and provide health care, thus operatingwithout England’s commissioner/provider split. GPs largely remain independentcontractors. This integration was further developed in 2004 with the introductionof community health partnerships (CHPs), which brought together HBs and LAs toimprove the coordination of health and social care services and take joint leadershipfor tackling health inequality. The latter includes targets for the most disadvantagedneighbourhoods in Scotland to increase the rate of improvement across a range of healthindicators. Community planning partnerships (CPPs) were also introduced in 2004 aslocal multi-agency regeneration vehicles that include health improvement in their remit,similar to English LSPs. All the CHPs in which we conducted interviews were pilots inScotland’s Prevention 2010 initiative aimed at improving access to primary care servicesand promoting healthier lifestyles. The progress of HBs and CHPs against their targetsis considered in annual performance assessment visits by Scottish government officials,often with the health minister, and with a follow-up letter from the minister setting outconclusions from the visit.
Wales retains the split between commissioning health services, undertaken by localhealth boards (LHBs), and the provision of these services by NHS trusts, althoughwithout the additional use of private and voluntary sector providers seen in England’squasi-market. Unlike Scotland and England, where some but not all PCTs and HBswere coterminous with LAs at the time of our interviews, in Wales all the LHBs werecoterminous with LAs. Although this implies better joint planning, both LHBs and LAswere relatively small compared to most of their equivalents in England and Scotland.This had consequences for their ability to commission services strategically, especially forhealth improvement and for tackling health inequality. This small scale of governance,which is now under review, reflected the localist paradigm in which devolution inWales was implemented and within which local government had more influence andautonomy than its English and Scottish counterparts, including less intensive performanceassessment from the centre (Blackman et al. 2006). NHS trusts are often larger in scalethan the LHBs, resulting in claims that hospitals are too powerful and therefore consumeresources that could be spent on public health measures in the community. Partially inresponse to this, in 2003, the Welsh Assembly Government introduced a duty requiringLHBs and LAs to work together with other local partners to develop and deliver jointHealth, Social Care and Well-being Strategies. These became operational from April 2005.The strategies are expected to address inequalities in health and well-being alongsidewider determinants of health, health promotion and improving access to services (NHSWales 2005).
There are some interesting points to note from these comparisons. England introducedmeasurable national targets for reducing health inequalities in 2001, constructed on the
Public Administration Vol. 87, No. 4, 2009 (762–778)© 2009 The Authors. Journal compilation © 2009 Blackwell Publishing Ltd.
768 TIM BLACKMAN ET AL.
basis of narrowing gaps between the least healthy areas or socioeconomic groups and thenational average. These targets were included in the performance assessment regimes ofboth PCTs and LSPs (although not LAs). Scotland introduced targets a few years laterbut as improvement targets for the most deprived areas rather than ‘gap narrowing’targets. Performance assessment of the Scottish targets includes reviewing how HBs areprogressing with improving health indicators, but generally without the emphasis onwhether gaps are narrowing that is evident in English assessments. Wales introducednational targets at the same time as Scotland, aiming for a more rapid improvement inhealth among the most deprived fifth of the country’s population, but did not includethese targets in local performance assessments of LHBs or LAs.
Overall, therefore, with all three governments apparently committed to tackling healthinequalities, there was a gradient in the extent of a target culture to tackle these inequalities.England’s PCTs and LSPs were formally accountable for their progress in narrowing gapsin mortality and smoking rates and reducing teenage pregnancy rates; Scotland’s HBswere accountable for the rate at which they were reducing smoking, mortality ratesand teenage pregnancies in their most deprived areas; and Wales’ LHBs had no formalrequirement to account for their progress in tackling health inequalities, despite severalnational targets.
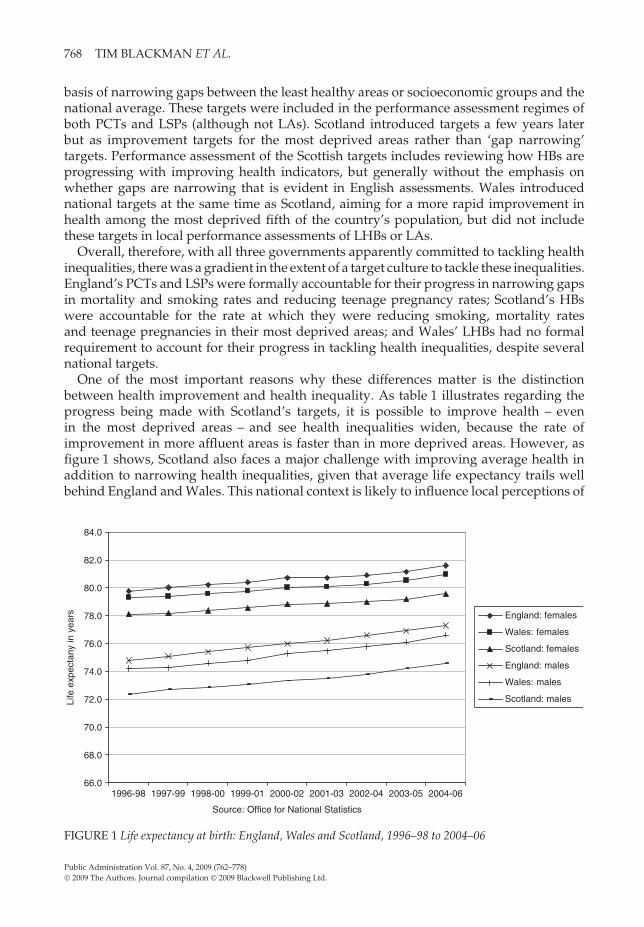
One of the most important reasons why these differences matter is the distinctionbetween health improvement and health inequality. As table 1 illustrates regarding theprogress being made with Scotland’s targets, it is possible to improve health – evenin the most deprived areas – and see health inequalities widen, because the rate ofimprovement in more affluent areas is faster than in more deprived areas. However, asfigure 1 shows, Scotland also faces a major challenge with improving average health inaddition to narrowing health inequalities, given that average life expectancy trails wellbehind England and Wales. This national context is likely to influence local perceptions of
66.0
68.0
70.0
72.0
74.0
76.0
78.0
80.0
82.0
84.0
1996-98 1997-99 1998-00 1999-01 2000-02 2001-03 2002-04 2003-05 2004-06
Source: Office for National Statistics
Life
exp
ecta
ny in
yea
rs England: females
Wales: females
Scotland: females
England: males
Wales: males
Scotland: males
FIGURE 1 Life expectancy at birth: England, Wales and Scotland, 1996–98 to 2004–06
Public Administration Vol. 87, No. 4, 2009 (762–778)© 2009 The Authors. Journal compilation © 2009 Blackwell Publishing Ltd.
TACKLING HEALTH INEQUALITIES IN BRITAIN 769
whether it is concentrating on differences in health between individuals and groups thatmatters or whether the challenge is to improve average health. As discussed later in thearticle, the ostensible national commitment to tackling the former in all three countries wasinterpreted differently at the local level, with some targets other than health inequalitiesbeing perceived as more important.
INTERVENING IN HEALTH INEQUALITIES
This section begins an analysis of the interviews carried out by considering howinterviewees conceptualized and operationalized health inequalities for the purposeof intervention. The analysis also sought to discover the priority respondents perceivedthe issue as having both in national policy and in their local organizations.
Interviewees were asked how health inequality was defined in their organization. Manydifferent types of health issue were talked about and there was little consistency in thedefinitions used, with national targets having little prominence in their accounts. Mostinterviewees focused on the need to improve the health-related lifestyles of people livingin deprived areas, although in Wales there was a stronger narrative about improvingaccess to care services and treatment. Healthier lifestyles were widely described as achallenging objective because deprivation meant that local people were seen as lessreceptive than in more affluent areas to changing their behaviour. The lifestyles discoursein England perhaps reflected the emphasis on behaviours in national strategy documents,but this discourse was apparent among our interviewees in all three countries. Indeed,there was often a view that lifestyle interventions were not resourced sufficiently becauseof the priority given by national governments in all three countries to funding health careand treatment, especially the spending on hospitals.
There was a surprising lack of scepticism about lifestyle interventions, given how limitedthe evidence is that these interventions can be effective among low income groups, andthe time and effort they generally need compared to their mostly modest results (Jain2006; Michie et al. 2008). None of our interviewees explained a plausible relationshipbetween action in these areas and a measurable impact on health inequality. Often thiswas regarded as impossible to demonstrate because tackling health inequality was widelyseen as a long-term matter. There was, therefore, also scepticism about how performanceassessment systems could be useful given their focus on short-term measures. Healthindicators were commonly regarded as demonstrating how much needed to be donerather than a means of assessing whether the right things were being done.
In England, the incorporation of indicators of inequality into targets meant that therewas a distinctive narrative about whether localities were ‘narrowing their gap’. Theprocess was explained by one of the PCT directors of public health as follows:
What we’ve done is we’ve looked at our male and female life expectancy compared tothe England average, we’ve done projections to show whether we’re likely to meet ournational targets or not. . . . Then we put that into a reporting mechanism that goes tothe board. . . . We’ve also taken the same national target for the reduction in the gap inlife expectancy between the worst quintile of local authorities and the England averageand we’ve said okay let’s take that same challenge and apply it within (the locality).
This narrative about the gap was also evident in Scotland, although more in terms ofnarrowing local gaps than reducing inequality measured at a national level. A director ofpublic health (DPH) in one of the HBs commented:
Public Administration Vol. 87, No. 4, 2009 (762–778)© 2009 The Authors. Journal compilation © 2009 Blackwell Publishing Ltd.

770 TIM BLACKMAN ET AL.
Although mortality in the under 75 population from coronary heart disease has beenin decline, it’s declining more rapidly in the more affluent population than it is in themore deprived populations and that gap is not narrowing. We’ve been set a target bythe Scottish Executive through the Prevention 2010 initiative to try and close that gap,to reverse the widening trend.
In contrast to England, there were no references in the Scottish interviews or policydocuments to narrowing the gap with the national average. One of the Scottish civilservants we interviewed explained that aiming for national averages was not goodenough because those in Scotland for the main health outcomes were too poor to betargets, while the alternative of measuring health gaps against a UK or English averagewould not be acceptable to a Scottish government. Tackling health inequalities wastherefore operationalized as increasing the rate of health improvement in the mostdeprived areas, with narrowing the gap between these and the most affluent areas subjectto monitoring but not performance management by the Scottish government. Althoughthe use of such performance measures in England meant that localities were measuringtheir gaps, the effect on the ground was little different to Scotland, with both countriestargeting health improvement measures on deprived areas, mainly to promote healthierlifestyles such as stopping smoking and taking more exercise.
In Wales, there was an awareness of ‘gaps’ but they were not talked about as targetsfor intervention. Rather than the narrative of how far or how fast the gap was narrowing,interviewees tended to see the issue they faced as one of poor absolute health that was alegacy of past health-damaging heavy industrial employment, which meant that accessto care and treatment was a higher priority than prevention. An LHB planning andpartnership manager explained:
Well most of our work is looking at the management of long-term conditions, chronicdisease management and, you know, the issues surrounding health and the history ofdeprivation in the area.
Interviewees in Wales found it difficult to talk about health inequality in terms of targetsat all. The issue tended to be conceptualized in qualitative and largely absolute terms asone of widespread chronic illness in these localities. No national targets for tackling healthinequalities were passed down to the local NHS. In addition, at the time of our study,there was widespread media coverage of the very high rates of both limiting long-termillness and incapacity benefit claims in the Welsh localities that skewed local narrativestowards managing demand on acute services and investing more in community healthservices. This was reinforced by Welsh Assembly Government policy documents onhealth, where the priority was to improve access to health care services in the community.This dominant focus was a reflection of the recent political history of Welsh governmentminister Jane Hutt. In 2005, Hutt had been moved from her role as Minister for Healthand Social Services in the Welsh Assembly Government, where she had pursued a strongpublic health emphasis, following media and political controversy over rising waitingtimes for NHS treatment, which were often contrasted with the falling waiting times inEngland.
In England and Scotland there was a common perception among our intervieweesthat doing something about health inequality had moved from being an undercurrentin national policy to an explicit objective. Government adoption of targets, with localaccountability for them, was clearly an important part of this perception. In contrast, in
Public Administration Vol. 87, No. 4, 2009 (762–778)© 2009 The Authors. Journal compilation © 2009 Blackwell Publishing Ltd.

TACKLING HEALTH INEQUALITIES IN BRITAIN 771
Wales, interviewees tended to see reducing health inequality as an ‘underlying direction’,and health policy was regarded as being dominated by tackling pressures on acute careservices. At the time of our interviews, the LHBs in Wales were dealing with over-spendswhile at the same time being under pressure to reduce waiting times for acute servicesand emergency admissions. The situation was summed up by one LHB chief executive as:
It’s almost like an ideological thing in a sense that it is a real drive from the Assembly tolook at inequalities. But a lot of the performance management is around the hard stuffand the hard stuff at the moment is the waiting times and chronic disease management.
A DPH in another LHB explained that:
You end up having to go for the health care access issue . . . so you know it’s acceptableto talk about rectifying health inequalities through more equal access to health careservices, which obviously is a determinant of health (but) you’d have wanted to tacklethe health inequalities in lots of other ways.
In England, all the interviewees in the PCTs regarded health inequality as somethingon which they needed to focus. This emphasis, however, varied from some describingit as a ‘key priority’ to others talking of it as a ‘responsibility’ among several others.The overriding priority was dealing with local NHS deficits and achieving waiting timetargets, the former reflecting the high priority the then Secretary of State for Health wasplacing on tackling deficits at the time of the interviews. Health inequality, therefore, wasnot an issue that interviewees felt under any great pressure to resolve or in a position todeliver quickly.
The priority given to waiting times and annual budgetary performance in how NHSinterviewees described their work was as evident in Scotland as in England and Wales.An NHS chief executive in Scotland described the situation as follows:
To some extent chief executives have to make sure that they achieve the things thatthey are going to get sacked for before they achieve anything else. . . . There are somechief executives who would stop at that and there are others who kind of get that doneas their licence to then go and do things that they would want to get done. . . . Some ofthe priorities are more immediate, more measurable and waiting times and money aremore politically sensitive than others.
In our interviews, we asked specifically about teenage pregnancy rates because of theway national policies differed in framing this issue and its strong link with deprivation(Social Exclusion Unit 2005; see also table 1, above). In England, teenage pregnancieshave been the subject of a national strategy and targets since 2000, with all localauthorities required to have measures in place to meet local reduction targets. A teenagepregnancy target was also introduced in Scotland in 2000 and was built on as a 15per cent improvement target for the most deprived areas in 2005, when the target wasincorporated into a national sexual health strategy (Scottish Office 1999; Scottish Executive2005). A target to reduce teenage pregnancies was introduced in Wales in 2000 as part ofa national sexual health strategy, although the target appears not to have been quantifieduntil incorporated into the Welsh Assembly Government’s child poverty strategy in 2006(Welsh Assembly Government 2006).
As a target, teenage pregnancy was only mentioned by interviewees in England,typically in the following terms as expressed by one of the PCT heads of performancemanagement:
Public Administration Vol. 87, No. 4, 2009 (762–778)© 2009 The Authors. Journal compilation © 2009 Blackwell Publishing Ltd.

772 TIM BLACKMAN ET AL.
30
35
40
45
50
55
60
1998 1999 2000 2001 2002 2003 2004 2005 2006
Source: Office for National Statistics
rate
per
100
0 w
om
en a
ged
15-
17
England
Scotland
Wales
FIGURE 2 Teenage conception rate: England, Wales and Scotland, 1998 to 2006
Teenage pregnancies is one of our key targets, must do targets. All the time, we’ve gotprobably 65 or 70 targets that I carry round in my head that we’re measuring. . . .
In Scotland and Wales, teenage pregnancy was constructed as part of a wider sexual healthmatter that was the subject of programmes focusing on sexually transmitted diseases. ADPH in Wales commented that although there were no targets:
we have some strategies and we have some related projects but I guess the area ofactually biggest concern is actually sexual health services . . . and how non-responsivethey are. . . .
In some Scottish and Welsh localities, teenage pregnancies were regarded byinterviewees as rare, despite these areas having rates similar to the English localitieswhere incidence was regarded as high and needing intervention. Although there werenational differences in the degree of focus on the issue, the national trends in teenagepregnancy rates from 2000 to 2006 do not reflect this (see figure 2). Wales has the highestrates but has also seen the greatest reduction, despite lacking a national target until 2006and despite all interviewees in our study saying there were no local targets. England hasalso seen rates decline, although at a slower rate since a national target was introduced.Scotland has seen its downward trend reverse in recent years.
CAUSE AND EFFECT
This section considers to what extent having targets for tackling health inequalityencouraged local actors to work with cause-and-effect models. Interviewees in Englandwere much more likely than in Scotland or Wales to talk about health inequality in terms oftargets and performance assessment. This did seem to encourage a questioning of whetherinterventions were working. The following comment about the teenage pregnancy targetis an example:
Public Administration Vol. 87, No. 4, 2009 (762–778)© 2009 The Authors. Journal compilation © 2009 Blackwell Publishing Ltd.
TACKLING HEALTH INEQUALITIES IN BRITAIN 773
We started driving teenage pregnancy down and all of a sudden it goes back up andnow we’re the highest in the region. . . . We have to revisit our strategy and make surewe’ve got the right plans in place, and that’s exactly what we’re doing.
However, there was little evidence to show that it was locally planned actions that weredriving these trends. Why local trends were going in the direction that they were wasessentially a ‘black box’ issue. One DPH commented with regard to the good progress inhis locality that was being made with narrowing inequalities between small areas that:
We don’t know why we’re doing it right . . . whether it’s due to anything we’re doingto the actual incidence of disease or whether it’s about accessibility of treatments, wedon’t know. . . . Our message to the service providers has been to keep on doing whatyou’re doing!
In Wales, there were few references to measures or quantified targets. Local analysiswas undertaken but its implications were often said to be overshadowed by the powerfulposition of hospitals, as this LHB chief executive commented:
We have the general goal of bringing up the health of the poorest to those who are ofthe highest level which is actually talking about a ten year gap in life expectancy. . . .So it gets in there as a rational kind of analysis . . . you know, the biggest killers arecardiovascular disease, therefore we should be doing something about that. What arethe determinants of cardiovascular disease . . . ? We go through that process but thenat some point I think the linkage is lost and decisions only tend to be made at themargin, so the great edifice which is the hospital sails on and decisions are made onlyon the margin.
In Scotland, health inequality was also not primarily talked about in terms of targetsand instead tended to be considered more generally as an issue of social inclusion andsocial justice. There was a common view that health inequality measures were hard todefine, systematize and use for anything other than long-term monitoring, discouragingtheir use to evaluate whether interventions were working.
In all three countries, the long-term nature of change in population health and problemsof causal attribution were often mentioned as obstacles to understanding the effectivenessof interventions. Interviewees often said that decision making was now more evidencebased, and it was clear that decisions were expected to be supported by evidence eitherabout need or about different ways of working. Peer-reviewed, published research,however, rarely figured compared to examples of good practice gleaned from conferencesor official publications. Very few interviewees pointed to evidence that their localprogrammes to tackle health inequalities were having a measurable effect, and althoughlocal evaluations were occasionally cited as a source of learning about what works, someinterviewees commented on the lost opportunities to learn from local projects. Thereappeared to be a lack of awareness about evaluations that had been undertaken, usuallynationally, with the implication that learning from these had been limited. There were alsosaid to be imperatives that could override ‘evidence’, such as local political difficultiesabout steering resources away from less to more deprived areas, and the political prioritygiven to waiting time targets. The latter was summed up by a performance manager inone of the Welsh LHBs as follows:
Public Administration Vol. 87, No. 4, 2009 (762–778)© 2009 The Authors. Journal compilation © 2009 Blackwell Publishing Ltd.

774 TIM BLACKMAN ET AL.
They’ve set targets all about waiting times . . . that’s what you’re judged on and if yourjob depends on it, why are you going to disinvest from that and invest long term withpreventative services?
This perspective also influenced views on partnership working. As an ideal,partnerships were rarely questioned, given the multifactorial causes of health inequality,but the reality was that other priorities could detract from partnership working. Forexample, in England, joint appointments of directors of public health (DsPH) betweenthe PCT and the LA were generally regarded very positively, but DsPH themselves couldbe frustrated by the way health inequality was not a shared priority. They were oftenpositive about working with LAs, but some contrasted this with how difficult it wasto keep health inequality on the agenda of the NHS. One commented that, ‘It’s almostlike having a Trojan horse . . . to see if I can infect people with public health thinking’.Another explained that, ‘right now, people’s jobs are driven by patient demand and GPdemand, custom and practice’. LSPs were regarded as important local planning vehiclesfor tackling health inequality, for which they had a series of targets, but their role wassaid to be largely confined to supporting various short-term health improvement projects.These were often cited as examples of good partnership working ‘on the ground’ but,as yet, there was little evidence from interviewees’ accounts of LSPs having an impacton health inequality at a strategic level, where organizations were said still to be largelyfocused on their own priorities.
Scottish interviewees were very positive about their own integrated NHS, contrastingit with England’s perceived fragmented and competitive system, but there was littleevidence from the interviews that this created a more receptive context for tacklinghealth inequalities. There was often felt to be little coherent planning to address theissue, with the NHS instead preoccupied with waiting times and service reconfiguration.Although there were innovative projects going on in Scotland, they were described astoo often short-term and sometimes lacking in coordination. Comments were also madeabout local objectives not being focused enough, resulting in a lack of clarity about whowas leading and accountable for what. CHPs were viewed as positive developmentsbecause they meant that the NHS and local authorities could act together, but their degreeof engagement with health inequality was said to vary, reflecting local histories andexperiences. As in England, successful examples of partnership working on the groundwere sometimes contrasted with the difficulty of working in partnership at a strategiclevel when organizations had separate budgets and accountabilities. There were somesigns, however, that strategic partnerships were beginning to work, as explained by thisHB chief executive:
For example, we got £1 million and we took that to the local council and said we’ve gotthis money to do these things, and they invested £200,000 on top of the £1 million forus to make it that bit more integrated with what they do. In the olden days that wouldhave been ‘our money, our priority’ but because we’ve got really good partnershipstructures we’re able to go and say you know this is what we’re going to try andachieve, how can we add value to it. Often it isn’t financial resource, often it’s just yeswe’ll help you do it, yes we’ll support it as a priority, yes we’ll put it on the agendaof that meeting, yes we’ll give you space in that school to do that on a Friday night orwhatever it is.
Public Administration Vol. 87, No. 4, 2009 (762–778)© 2009 The Authors. Journal compilation © 2009 Blackwell Publishing Ltd.
TACKLING HEALTH INEQUALITIES IN BRITAIN 775
In Wales, the Health, Social Care and Well-being Strategies were said to be successfulin engaging LAs with health improvement, and these strategies were often described ashaving objectives for tackling health inequality, informed by the health needs assessmentsrequired to be undertaken before formulating them. An LHB director of corporatedevelopment commented that:
We focused really for the first time on communities in this locality . . . it’s a firstopportunity to look directly at the needs of the population, not as before just as a partof some larger regional or countywide entity.
This LHB view was echoed by the LA’s chief executive:
We had an event earlier in the year with all the partners and I’ve got to be honesttwo years ago we couldn’t have even hoped to have put something on like this. That’show far we’ve come with partnership working . . . I’ve been in local government thirtyyears and I haven’t always been that close with health colleagues before.
However, there was a view that the Health, Social Care and Well-being Strategiescontained too many objectives and were aspirational rather than specific. In reality,interviewees in Wales felt that joint action still tended to be dominated by issues abouthospital discharges and transfers of care between the NHS and local authorities.
LA interviewees in all three countries rarely considered how health could be improvedthrough their services except in general terms, such as the general health benefits ofimproving housing, or by particular project initiatives. The latter included schemes suchas ‘exercise on prescription’ or other lifestyle projects often dependent on short-termfunding. There was an assumption that local government services were beneficial tohealth but little evidence that they were the best option or delivered in the best way tonarrow health inequalities. Some interviewees in the LAs, in all three countries, cited thelack of any specific mainstream funding for health improvement or prevention as thereason why they did not engage more with these issues.
CONCLUSIONS
The aphorism that ‘what’s measured is what matters’ (Bevan and Hood 2006b, p. 517)clearly needs qualifying in the case of national policies for tackling health inequalitiesin Great Britain. Measurement may occur, even for performance assessment, but havelittle practical effect. Thus, interviewees in England tended to describe measuring changein health inequality indicators in more sophisticated terms because there were morereporting requirements than pertained in the other countries; this monitoring, however,was at a high level and there was little connection with implementation.
All three countries expressed policies for reducing health inequality in terms ofquantified measures. England was notable in embedding measurable targets withinlocal performance assessment regimes at commissioning and strategic levels. Healthinequalities were described in key English policy documents as ‘not acceptable’ andneeding a specific focus that included performance management (Secretary of State forHealth 2005, p. 11). This sent a signal to local actors that health inequalities were a priority,but our interviewees’ accounts revealed that in practice other priorities mattered more.This meant that health inequalities were measured locally and various initiatives werein play, but also that there was little motivation or support to model the effect of theseinitiatives or to evaluate whether they were the right things to do or being done on a
Public Administration Vol. 87, No. 4, 2009 (762–778)© 2009 The Authors. Journal compilation © 2009 Blackwell Publishing Ltd.
776 TIM BLACKMAN ET AL.
sufficient scale. This may be one reason why the issue lost ground compared with waitingtimes and the issue of short-term financial balance. If impact could not be demonstratedover a short timescale, it was difficult for DsPH and other advocates to make the casefor large-scale and long-term interventions that might divert funding away from othertargets such as waiting times and balancing the budget each year. Crucially, while missingwaiting time and budgetary targets meant that senior officers’ jobs could be on the line,this was not perceived to be the case for health inequality targets.
The situation was similar in Scotland, where health inequalities were described inequivalent policy documents in the same terms: as ‘unacceptable’ and the focus of targetsfor improvement (NHS Scotland 2005, p. 22). The perceived reality, as apparent from ourinterviews, was, as in England, that the targets which mattered most were those that weremost politically sensitive relating to access to care and financial management. There wasa hierarchy of priorities in which waiting times and balancing the budget overshadowedhealth inequality, so the issue was ‘a’ priority but not ‘the’ priority. It was thereforea question of demonstrating that something was being done but without pressure toactually deliver the targets (a finding echoed in Hunter and Marks 2005).
The policy documents in England and Scotland do not present health inequality targetsas of lesser importance; in these documents, all targets are written about as if they matterequally, even though in local practice some targets mattered more than others. It wasonly in the Welsh policy documents that the secondary importance of tackling healthinequalities is apparent, although this is more implicit than explicit and reflected inthe briefer attention the issue receives compared with modernizing NHS services andimproving access (NHS Wales 2005).
Our interviewees felt that there was little local pressure for the situation to change. InScotland and England public consultations about health inequalities and how to tacklethem were said to be rare. In Wales, the Health, Social Care and Well-being Strategieshad been developed with significant community engagement but local priorities weredominated by access issues and waiting times, and this was said to reflect wherethe public’s concerns really lay. This then became ‘political reality’. There was even aquestioning of the extent to which there could be bottom-up pressure to reduce healthinequality from the people most affected: ‘You know, quite often you’re dealing withpeople that don’t want to live another ten years. Life’s pretty hellish for them, why wouldthey want another ten years of it?’. Another interviewee added: ‘People bury their heads inthe sand in this locality and don’t want to even think about cancer’. These interpretationscould, of course, be contested but are evidence of the lack of bottom-up as well astop-down pressure that our interviewees felt they were under. Public and communityopposition was also described as making it difficult to ‘bend’ spending into the areas withthe greatest health needs if, as a consequence, other areas would be seen to lose out.
There is a lack of any apparent relationship between the different national policycontexts or our interviewees’ accounts and the degree of progress with meeting nationaltargets summarized in table 1, above. However, given the different national targets,measures, and reporting arrangements, it is difficult to make like-with-like comparisons.The focus on inequalities in cancers and circulatory diseases in England and Scotlandmay be behind the progress made by 2006, when the interviews were conducted. InEngland, progress against the life expectancy and infant mortality targets was off-coursein 2006, while Scotland had not adopted targets for these indicators. Despite both thesecountries investing significant resources in supporting people in deprived areas to stopsmoking, England’s inequality gap (although the gap is measured in different ways) was
Public Administration Vol. 87, No. 4, 2009 (762–778)© 2009 The Authors. Journal compilation © 2009 Blackwell Publishing Ltd.
TACKLING HEALTH INEQUALITIES IN BRITAIN 777
not narrowing while the gap was narrowing in Scotland. Reflecting the lower priorityof health inequality targets in Wales, no data were reported at the time of the study onprogress against the Welsh targets. Data on teenage pregnancy rates can be comparedacross the three countries and are interesting given the different national policy prioritiesaccorded to this issue. As discussed above, the extent of targeting in either policydocuments or as described by our interviewees did not show any obvious relationshipwith trends in rates.
Targets and performance assessment systems extended most to health inequalities inEngland. There were signs at the time of the study that the lack of progress with the lifeexpectancy target was starting to influence policy and practice: by mirroring, however, theshort-termism of performance assessment with ‘quick win’ interventions. Reflecting recentDepartment of Health guidance, some interviewees talked about how they were startingto target deprived areas and groups with significant increases in drug therapies to controlrisk factors, notably statins, antihypertensives and aids to quit smoking (Department ofHealth 2005).
The development and affordability of new preventative treatments such as statinsillustrates the shifting landscape in which work to tackle health inequalities takes place(Watt and Mackay 2006; Lester and Fitzgerald 2008). The political landscape is also shifting;since we undertook our interviews in 2006 there have been changes of government inScotland and Wales and a change of prime minister in the UK government, with anew ministerial leadership in England’s Department of Health. These changes have seenreviews of progress and strategies for tackling health inequalities and some interestingshifts in approach, such as more local negotiation about targets in England and an apparentintention to strengthen health inequality targets and their performance assessmentin Scotland (Welsh Assembly Government 2007; Department of Health 2008; ScottishGovernment 2008). In recognition of this dynamism, we are returning to our localities tore-interview local actors to understand how these changes affect their narratives. A lotis likely to depend on whether waiting times and financial balance are sufficiently undercontrol to allow the messages from measuring health inequalities to register on decisionmaking, and whether these decisions make a difference to the inequalities. Especiallygiven the impact of high public debt on government spending following the financialcrisis, if more progress with narrowing health inequalities is to be made then local actorsneed much more than targets to focus their resources effectively on inequalities ratherthan on competing priorities that may have higher public and media profiles.
ACKNOWLEDGEMENT
This article draws on findings from a project funded by the UK Economic and SocialResearch Council under the Public Services Programme (ref. RES-153-25-0079). We wouldlike to thank for their contributions our interviewees, two anonymous referees and theproject’s advisory group: Sir Derek Wanless, Kay Barton, Martin Gibbs, Tony Elson andBeverley Frowen. Responsibility for the interpretations and conclusions made in thearticle lies entirely with the authors.
REFERENCESBevan, G. and C. Hood. 2006a. ‘Have Targets Improved Performance in the English NHS?’, British Medical Journal, 33, 2, 419–22.Bevan, G. and C. Hood. 2006b. ‘What’s Measured is What Matters: Targets and Gaming in the English Public Health Care
System’, Public Administration, 84, 3, 517–38.
Public Administration Vol. 87, No. 4, 2009 (762–778)© 2009 The Authors. Journal compilation © 2009 Blackwell Publishing Ltd.
778 TIM BLACKMAN ET AL.
Blackman, T., B. Harrington, E. Elliott, et al. 2006. ‘Performance Assessment and Wicked Issues: The Case of Health Inequalities’,Public Policy and Administration, 21, 2, 66–80.
Busse, R. and M. Wismar. 2002. ‘Health Target Programmes and Health Care Services – Any Link? A Conceptual andComparative Study (part 1)’, Health Policy, 59, 209–21.
Department of Health. 2001. From Vision to Reality. London: DH.Department of Health. 2005. Tackling Health Inequalities: What Works. Best Practice Guidance. London: DH.Department of Health. 2006. Tackling Health Inequalities: Status Report on the Programme for Action – 2006 Update of Headlines Indica-
tors. London: DH.Department of Health. 2008. Health Inequalites: Progress and Next Steps. London: DH.Greer, S. 2006. ‘The Politics of Health Policy Divergence’, in J. Adams and K. Schmueker (eds), Devolution in Practice 2006: Public
Policy Differences within the UK. Newcastle Upon Tyne: IPPR North.Greer, S.L. and D. Rowland (eds). 2007. Devolving Policy, Diverging Values? The Values of the United Kingdom’s National Health
Services. London: The Nuffield Trust.Hunter, D.J. and L. Marks. 2005. Managing for Health. What Incentives Exist for NHS Managers to Focus on Wider Health Issues?
London: King’s Fund.Jain, A. 2006. ‘Treating Obesity in Individuals and Populations’, British Medical Journal, 331, 1387–90.Lester, N. and K. Fitzgerald. 2008. Coronary Heart Disease Mortality and Statin Prescribing in Wales. Cardiff: National Public Health
Service for Wales.Lindberg, M. and S. Wilhelmsson. 2007. ‘National Public Health Target Awareness of Staff at Two Organisational Levels in
Health Care’, Health Policy, 84, 243–8.Michie, S., K. Jochelson, W.A. Markham and C. Bridle. 2008. Low-income Groups and Behaviour Change Interventions. London:
King’s Fund.NHS Scotland. 2005. Building a Health Service Fit for the Future (Kerr Report). Edinburgh: Scottish Executive.NHS Wales. 2005. Designed for Life: Creating World Class Health and Social Care for Wales in the 21st Century. Cardiff: Welsh
Assembly Government.Propper, C., M. Sutton, C. Witnall and F. Windmeijer. 2007. Did Targets and Terror Reduce Waiting Times in England for Hospital
Care? CMPO Working Paper Series no. 07/179.Rainham, D. 2007. ‘Do Differences in Health Make a Difference? A Review for Health Policymakers’, Health Policy, 84, 2, 123–32.Rittel, H. and M. Webber. 1973. ‘Dilemmas in a General Theory of Planning’, Policy Sciences, 4, 155–69.Scottish Executive. 2004. Building a Better Scotland Spending Proposals 2005–2008: Enterprise, Opportunity, Fairness. Edinburgh:
Scottish Executive.Scottish Executive. 2005. Delivering for Health. Edinburgh: Scottish Executive.Scottish Government. 2006. Delivering a Healthy Scotland Meeting the Challenge: Health Improvement in Scotland Annual Report.
Edinburgh: Scottish Government.Scottish Government. 2008. Equally Well: Report of the Ministerial Task Force on Health Inequalities. Edinburgh: Scottish Government.Scottish Office. 1999. Towards a Healthier Scotland. Cm 4269. Edinburgh: The Stationery Office.Secretary of State for Health. 2005. Choosing Health: Making Healthier Choices Easier. Cm 6374. London: TSO.Smith, K.E., D.J. Hunter, T. Blackman, et al. 2009. ‘Divergence or Convergence? Health Inequalities and Policy in a Devolved
Britain’, Critical Social Policy, 29, 2, 216–42.Smith, P.C. 2005. ‘Performance Measurement in Health Care: History, Challenges and Prospects’, Public Money & Management,
25, 3, 213–20.Social Exclusion Unit (SEU). 1999. Teenage Pregnancies. London: SEU.Watt, G. and D. Mackay. 2006. The Prescribing of Statins in General Practices Serving the Most Deprived Populations in Scotland and
NHS Greater Glasgow. Report 4. Glasgow: General Practice and Primary Care, University of Glasgow.Welsh Assembly Government. 2004. Targeting Health Improvement For All: Health Gain Targets – National High-level Targets and
Indicators for Wales. Cardiff: WAG.Welsh Assembly Government. 2006. Eradicating Child Poverty in Wales – Measuring Success. Cardiff: Welsh Assembly
Government.Welsh Assembly Government. 2007. One Wales: A Progressive Agenda for the Government of Wales. Cardiff: Labour Party Wales
and Plaid Cymru.
Date received 24 March 2008. Date accepted 1 September 2008.
Public Administration Vol. 87, No. 4, 2009 (762–778)© 2009 The Authors. Journal compilation © 2009 Blackwell Publishing Ltd.