systemic dysregulation of ceacam1 in melanoma patients
TRANSCRIPT
Cancer Immunol Immunother
DOI 10.1007/s00262-009-0740-5ORIGINAL ARTICLE
Systemic dysregulation of CEACAM1 in melanoma patients
Gal Markel · Rona Ortenberg · Rachel Seidman · Sivan Sapoznik · Nira Koren-Morag · Michal J. Besser · Jair Bar · Ronnie Shapira · Adva Kubi · Gil Nardini · Ariel Tessone · Avraham J. Treves · Eyal Winkler · Arie Orenstein · Jacob Schachter
Received: 28 January 2009 / Accepted: 5 July 2009© Springer-Verlag 2009
Abstract It was previously shown that CEACAM1 onmelanoma cells strongly predicts poor outcome. Here, weshow a statistically signiWcant increase of serum CEA-CAM1 in 64 active melanoma patients, as compared to 48patients with no evidence of disease and 37 healthy donors.Among active patients, higher serum CEACAM1 corre-lated with LDH values and with decreased survival. Multi-variate analysis with neutralization of LDH showed thatincreased serum CEACAM1 carries a hazard ratio of 2.40.In vitro, soluble CEACAM1 was derived from CEA-
CAM1(+), but neither from CEACAM1(¡) melanomacells nor from CEACAM1(+) lymphocytes, and directlycorrelated with the number of CEACAM1(+) melanomacells. Production of soluble CEACAM1 depended on intactde novo protein synthesis and secretion machineries, butnot on metalloproteinase function. An unusually high per-centage of CEACAM1(+) circulating NK and T lympho-cytes was demonstrated in melanoma patients. CEACAM1inhibited killing activity in functional assays. CEACAM1expression could not be induced on lymphocytes by serumfrom patients with high CEACAM1 expression. Further,expression of other NK receptors was impaired, which col-lectively indicate on a general abnormality. In conclusion,the systemic dysregulation of CEACAM1 in melanomapatients further denotes the role of CEACAM1 in mela-noma and may provide a basis for new tumor monitoringand prognostic platforms.
Keywords Melanoma · CEACAM1 · Biomarker · Inhibition · Lymphocytes · Serum
Introduction
The prevalence of malignant melanoma (MM) is continu-ously rising, eVectively almost tripling over the last30 years [1]. MM is the most common cancer among youngindividuals between the age of 20–30 years old, accountingfor more than 11% of all malignancies at this age [2]. MMis sometimes characterized by an aggressive course withwidespread metastasis and poor prognosis. Moreover, mel-anoma poses a serious clinical challenge to oncologists, asit has an extraordinary ability to remain dormant andrelapse sometimes a decade or more after the removal of asmall localized tumor [3]. Pathological risk stratiWcation
G. Markel and R. Ortenberg have contributed equally to this work.
G. Markel (&) · R. Ortenberg · R. Seidman · S. Sapoznik · M. J. Besser · R. Shapira · A. Kubi · A. J. Treves · J. SchachterThe Ella Institute for Melanoma Research and Treatment, Sheba Cancer Research Center, Sheba Medical Center, 52621 Tel Hashomer, Israele-mail: [email protected]
G. MarkelTalpiot Medical Leadership Program, Sheba Medical Center, 52621 Tel Hashomer, Israel
G. Markel · R. OrtenbergDepartment of Clinical Microbiology and Immunology, Sackler School of Medicine, Tel Aviv University, Tel Aviv, Israel
N. Koren-MoragDivision of Epidemiology and Preventive Medicine, Sackler School of Medicine, Tel Aviv University, Tel Aviv, Israel
J. Bar · R. Shapira · J. SchachterDivision of Oncology, Sheba Medical Center, 52621 Tel Hashomer, Israel
G. Nardini · A. Tessone · E. Winkler · A. OrensteinDepartment of Plastic Surgery, Sheba Medical Center, 52621 Tel Hashomer, Israel
123
Cancer Immunol Immunother
studies have determined the depth of primary tumorinvasion as the most important prognostic factor usingBreslow’s score [4–6]. However, using Breslow’s scoreallows initial stratiWcation and categorization of patientsbut not continuous follow-up. Follow-up of MM patientsincludes mainly history taking and physical examination,supplemented by periodical imaging and routine blood tests[7, 8]. Currently, there are no simple objective availabletests that enable accurate monitoring of melanoma patientsin the outpatient setting. Serum levels of LDH, S100 andCRP, which provide some limited information [9, 10], arestill experimental.
The human carcinoembryonic Ag (CEA) protein familyencompasses several forms of proteins with diVerent bio-chemical features. All CEA family genes have been classi-Wed into two major subfamilies: the CEA cell adhesionmolecule (CEACAM) and the pregnancy-speciWc glyco-protein subgroups [11]. The CEACAM proteins, which arepart of the larger Ig superfamily, include CEACAM1, -3,-4, -5, -6, -7, and -8. They share a common basic structure ofsequentially ordered diVerent Ig-like domain(s) with con-siderable degree of homology. CEACAM5 is GPI-linked tocell surface [11], but it also appears in a soluble form in theperipheral blood where it is more recognized as the tumormarker CEA used to monitor colorectal cancer patients[12, 13]. CEACAM1 is a transmembrane protein that can bedetected on some immune cells as well as on epithelial cells[14]. In 2002, a striking association was observed betweenthe presence of cell-bound CEACAM1 on primary cutane-ous melanoma lesions and the development of metastaticdisease with poor prognosis [15]. The prognostic strengthof melanoma-associated CEACAM1 was similar or evensuperior to the widely accepted Breslow score [15].Remarkably, a similar association was observed in lungadenocarcinoma speciWcally [16] but also generally in non-small cell lung cancers [17].
The role of CEACAM1 in melanoma has been, there-fore, the target of various investigations. It was shown thatCEACAM1 enhances invasiveness of melanoma cells invitro [18]. We have previously identiWed a novel MHCclass I-independent inhibitory mechanism that is mediatedby the CEACAM1 homophilic interactions of natural killercells [19, 20] and tumor inWltrating lymphocytes (TIL)[21]. Recently, we provided evidence for a sophisticatedmechanism of melanoma cells that survive direct immuneattack and respond by active up-regulation of CEACAM1[22]. This active up-regulation is mediated by IFN� releaseby the attacking lymphocytes [22]. These studies investi-gated direct eVects of CEACAM1 on melanoma cells,which provide melanoma with enhanced invasiveness andimmune evasion attributes [18–22], and support the clinicalstrong association with poor prognosis [15]. However, thepotential systemic involvement of CEACAM1 in mela-
noma patients is still elusive. Systemic involvement caninclude, e.g., alterations in serum soluble CEACAM1 andin CEACAM1 expression proWle on circulating lympho-cytes. Interestingly, the presence of human soluble CEA-CAM1 protein has been observed in the serum of healthydonors [23–25] and was found elevated in the sera ofpatients with biliary diseases including obstructive jaundice[23–25], primary biliary cirrhosis [24], autoimmune hepati-tis, and cholangiocarcinoma [24]. Furthermore, it has beenrecently shown that serum CEACAM1 level is increased insome pancreatic adenocarcinoma patients [26], presentingevidence for the potential role of soluble CEACAM1 as atumor marker. There is still no gold standard assay forquantiWcation of serum CEACAM1. Normally, circulatinglymphocytes do not express CEACAM1 [27, 28], as it isup-regulated on lymphocytes mainly following activation[27, 28]. Here, we study the systemic involvement of CEA-CAM1 in melanoma patients, including serum CEACAM1concentrations as well as CEACAM1 expression on circu-lating lymphocytes.
Materials and methods
Patients and controls
Patients with pathologically veriWed cutaneous MM in allAJCC stages of disease were included. There were noexclusion criteria. Patients were broadly categorized clini-cally into two groups: (a) patients with no evidence of dis-ease (NED) at the time of blood sampling who were furthersubdivided into low risk of recurrence (AJCC stage I or II)and high risk of recurrence (AJCC stage III or IV); (b)patients with evidence of active disease (WED) at the timeof blood sampling who were subcategorized accordingAJCC criteria. High-risk NED patients (AJCC stages IIIand IV) have received prior therapy that yielded diseaseregression. All normal controls were in excellent health atthe time of the study. All melanoma patients and healthyvolunteers gave written informed consent prior to their par-ticipation in this study. This study was approved by theSheba Medical Center Institutional Review Board.
Specimen characteristics
Blood samples were obtained from healthy individuals andpatients by veno-puncture and standard handling proce-dures. Eight milliliters of blood were collected in heparin-ized tubes (BD Biosciences) and then centrifuged in 700gfor 15 min in room temperature to obtain plasma. Allplasma samples were collected and divided into aliquotsand frozen in ¡80°C until analysis. Peripheral blood lym-phocytes were puriWed using a density gradient and deep
123
Cancer Immunol Immunother
frozen in liquid nitrogen. Anonymous samples (markedonly with ID number) were linked only to clinical–patho-logical data. Samples were obtained from September 2005through September 2006 and clinical data were analyzed atSeptember 2007.
Assay methods—CEACAM1 sandwich ELISA
NC8 or Kat4c monoclonal antibodies diluted in 100 �l PBSto a concentration of 2 �g/ml were adsorbed to immuno-plates (Nunc Maxisorp) overnight at 4°C. Plates were thenwashed with 200 �l wash solution (PBS/Tween 0.05%),blocked for 1 h in room temperature with 200 �l PBS/BSA1% and washed again 3 times. 100 �l/well of standard pro-teins diluted in HBSS to the speciWed concentrations or ofundiluted serum samples were applied and incubated for 2–3 h at room temperature. Recombinant CEACAM1-Ig orCEACAM5-Ig proteins were used as standards. After eachstep hereafter four washing rounds with wash solution wereperformed. Biotinylated polyclonal antibodies againstCEACAM1, -5, -6, -8 were used as detection antibodies,and were added at a Wnal concentration of 1 �g/ml dilutedin PBS/Tween 0.05% + BSA 1%. 100 �l/well of detectionantibody was incubated for 1 h at room temperature. Bind-ing of HRP-conjugated streptavidin diluted in PBS/Tween0.05% + BSA 1% at a concentration of 1 �g/ml wasallowed for 30 min. Finally, the substrate TMB (Dako,Glustrup, Denmark) was added for the development ofchemical reaction with optical readout that was stoppedwith 2 N sulfuric acid. Optic density was determined atwavelength of 405 nm. The assay was validated by twodiVerent experimenters. The intra-assay and inter-assaycoeYcient of variance were 5 and 10%, respectively.Experimenters were blinded during the study to the type ofspecimen (patients or controls).
Study design
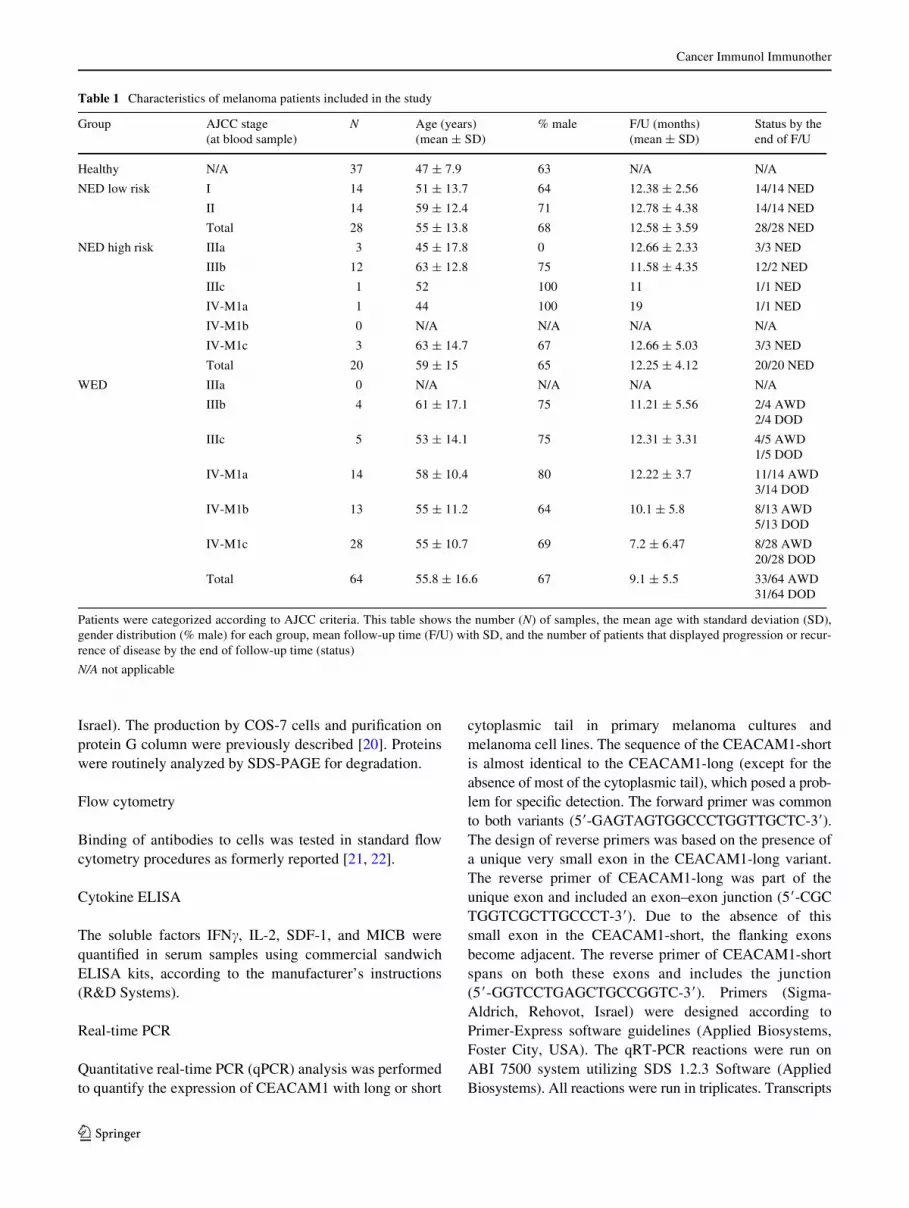
Blood was obtained in the melanoma clinic with no caseselection. None of the patients underwent surgery near thetime of blood sampling. Study was retrospective: a singleblood sample was obtained from all patients, frozen andanalyzed at a later, technically convenient, point. Each sam-ple was tested two independent times in triplicate repeats.Samples were obtained from September 2005 through Sep-tember 2006 and clinical data were analyzed retrospec-tively at December 2007. Follow-up in this study beganfrom time of blood sampling. The mean follow-up time was12 months for all groups, except for stage IV-M1c WEDpatients, due to death of some of the patients shortly afterblood sampling (Table 1). The clinical endpoints examinedwere disease free period (DFP) for NED patients and sur-vival for WED patients.
Statistical analysis
Spearman’s test was used to analyze the correlationbetween soluble CEACAM1 and outcome in WEDpatients. Multivariate analysis of soluble CEACAM1against LDH and clinical outcome was performed on 37stage IV patients using Cox regression analysis. Mann–Whitney and Kruskal–Wallis tests were used for signiW-cance analysis of various serum proteins between two orthree test groups, respectively. All statistical analyses wereperformed with SPSS.
Cells
The CEACAM-negative 721.221 (221) cells were used inthis work [20], as well 221 cells transfected either with theCEACAM1 cDNA (221/CCM1) [20]. Primary melanomacultures were developed from surgically resected tumors aspreviously described [22] and included 003mel, 005mel,009mel, 014mel, and 019mel. Melanoma cell lines were526mel and 624mel. Melanoma cells were maintained aspreviously described [21, 22]. CEACAM1-positive TILsuch as JKF6, L2D8 [21, 22] were used as well.
Antibodies
Antibodies directed against CEACAM proteins included inthis work were as follows: murine anti-human CEACAM1monoclonal antibodies NC8 [29], murine anti-human CEA-CAM1, -5, -6, -8 monoclonal antibody Kat4c (Dako, Glustrup,Denmark), and puriWed rabbit polyclonal anti-human CEA-CAM1, -5, -6 antibodies (Dako, Glustrup, Denmark). Thefollowing conjugated monoclonal antibodies were used:anti-human CD3-FITC (IQ), anti-human CD56-PE/Cy5.5(eBioscience), anti-human NKp46-APC (eBioscience),anti-human NKp30-APC (eBioscience), anti-human CD16-PE (eBioscience), anti-human NKG2D-APC (R&D Systems,Minneapolis, MN, USA), biotinylated NC8 and biotinyla-ted rabbit polyclonal anti-human CEACAM1, -5, -6 anti-bodies. Secondary reagents included PE-conjugatedF(ab�)2 fragments of goat anti-human-Fc IgG (JacksonImmunoresearch), FITC-conjugated F(ab�)2 fragments ofgoat anti-mouse-Fc IgG (ICN), and PE-conjugated strepta-vidin (Jackson Immunoresearch). Biotinylation of antibod-ies was performed with SS biotin (Chemicon) according tomanufacturer’s instructions.
Generation of fusion proteins
The genetic constructs of the CD99-Ig, CEACAM1-Ig, andCEACAM5-Ig were generated as previously described [19,30]. The CEACAM1(N)-Ig fusion protein was a kind giftof Dr Ofer Mandelboim (Hebrew University, Jerusalem,
123
Cancer Immunol Immunother
Israel). The production by COS-7 cells and puriWcation onprotein G column were previously described [20]. Proteinswere routinely analyzed by SDS-PAGE for degradation.
Flow cytometry
Binding of antibodies to cells was tested in standard Xowcytometry procedures as formerly reported [21, 22].
Cytokine ELISA
The soluble factors IFN�, IL-2, SDF-1, and MICB werequantiWed in serum samples using commercial sandwichELISA kits, according to the manufacturer’s instructions(R&D Systems).
Real-time PCR
Quantitative real-time PCR (qPCR) analysis was performedto quantify the expression of CEACAM1 with long or short
cytoplasmic tail in primary melanoma cultures andmelanoma cell lines. The sequence of the CEACAM1-shortis almost identical to the CEACAM1-long (except for theabsence of most of the cytoplasmic tail), which posed a prob-lem for speciWc detection. The forward primer was commonto both variants (5�-GAGTAGTGGCCCTGGTTGCTC-3�).The design of reverse primers was based on the presence ofa unique very small exon in the CEACAM1-long variant.The reverse primer of CEACAM1-long was part of theunique exon and included an exon–exon junction (5�-CGCTGGTCGCTTGCCCT-3�). Due to the absence of thissmall exon in the CEACAM1-short, the Xanking exonsbecome adjacent. The reverse primer of CEACAM1-shortspans on both these exons and includes the junction(5�-GGTCCTGAGCTGCCGGTC-3�). Primers (Sigma-Aldrich, Rehovot, Israel) were designed according toPrimer-Express software guidelines (Applied Biosystems,Foster City, USA). The qRT-PCR reactions were run onABI 7500 system utilizing SDS 1.2.3 Software (AppliedBiosystems). All reactions were run in triplicates. Transcripts
Table 1 Characteristics of melanoma patients included in the study
Patients were categorized according to AJCC criteria. This table shows the number (N) of samples, the mean age with standard deviation (SD),gender distribution (% male) for each group, mean follow-up time (F/U) with SD, and the number of patients that displayed progression or recur-rence of disease by the end of follow-up time (status)
N/A not applicable
Group AJCC stage (at blood sample)
N Age (years) (mean § SD)
% male F/U (months) (mean § SD)
Status by the end of F/U
Healthy N/A 37 47 § 7.9 63 N/A N/A
NED low risk I 14 51 § 13.7 64 12.38 § 2.56 14/14 NED
II 14 59 § 12.4 71 12.78 § 4.38 14/14 NED
Total 28 55 § 13.8 68 12.58 § 3.59 28/28 NED
NED high risk IIIa 3 45 § 17.8 0 12.66 § 2.33 3/3 NED
IIIb 12 63 § 12.8 75 11.58 § 4.35 12/2 NED
IIIc 1 52 100 11 1/1 NED
IV-M1a 1 44 100 19 1/1 NED
IV-M1b 0 N/A N/A N/A N/A
IV-M1c 3 63 § 14.7 67 12.66 § 5.03 3/3 NED
Total 20 59 § 15 65 12.25 § 4.12 20/20 NED
WED IIIa 0 N/A N/A N/A N/A
IIIb 4 61 § 17.1 75 11.21 § 5.56 2/4 AWD2/4 DOD
IIIc 5 53 § 14.1 75 12.31 § 3.31 4/5 AWD1/5 DOD
IV-M1a 14 58 § 10.4 80 12.22 § 3.7 11/14 AWD3/14 DOD
IV-M1b 13 55 § 11.2 64 10.1 § 5.8 8/13 AWD5/13 DOD
IV-M1c 28 55 § 10.7 69 7.2 § 6.47 8/28 AWD20/28 DOD
Total 64 55.8 § 16.6 67 9.1 § 5.5 33/64 AWD31/64 DOD
123
Cancer Immunol Immunother
were detected using 2£ SYBR Green Master Mix (AppliedBiosystems) according to manufacturer’s instructions andwere normalized to GAPDH. �Ct represents the diVerencebetween the Ct values of the tested variant and GAPDH.Ratio of CEACAM1 variants was calculated using theformula X = 2¡��Ct. ��Ct is the diVerence between the�Ct value of the long variant and the �Ct value of the shortvariant.
Inhibition of metalloproteinase activity, protein synthesis, and intracellular transport
Inhibition of metalloproteinase activity was performedby culturing of 75,000 melanoma cells per well in six-well plate in the presence of 5 �M of the broad metallo-proteinase inhibitor BB94 [31] for 3 days. Since BB94 isemulsiWed in DMSO, an identical volume of DMSO wasadded as control. An inhibitory activity of BB94 wasconWrmed by blocking the shedding of NKp46 from NKcells activated with PMA, as previously demonstrated(data not shown) [32]. Protein synthesis was inhibited in250,000 melanoma cells cultured in 24-well dish in thepresence of 0.1 �g/ml of cycloheximide (Sigma-Aldrich)for 24 h. Cells were seeded in triplicate wells. Intracellu-lar transport was inhibited by adding Monensin (BDBiosciences) at a dilution of 1:1,000 for overnightperiod.
Cytotoxicity assays
Killing assays were performed as formerly reported [22].CFSE (Sigma-Aldrich) pre-labeled target cells were co-incubated for 5 h with eVector cells in indicated eVector-to-target ratios. Percentage of speciWc lysis was quantiWed byPI-costaining (10 �g/ml) and determined as ((CFSE+PI+/CFSE+)with eVector ¡ (CFSE+PI+/CFSE+)background) £ 100.Background PI staining was <15% in all experiments.
Results
Establishment of standardized ELISA for quantiWcation of soluble CEACAM1
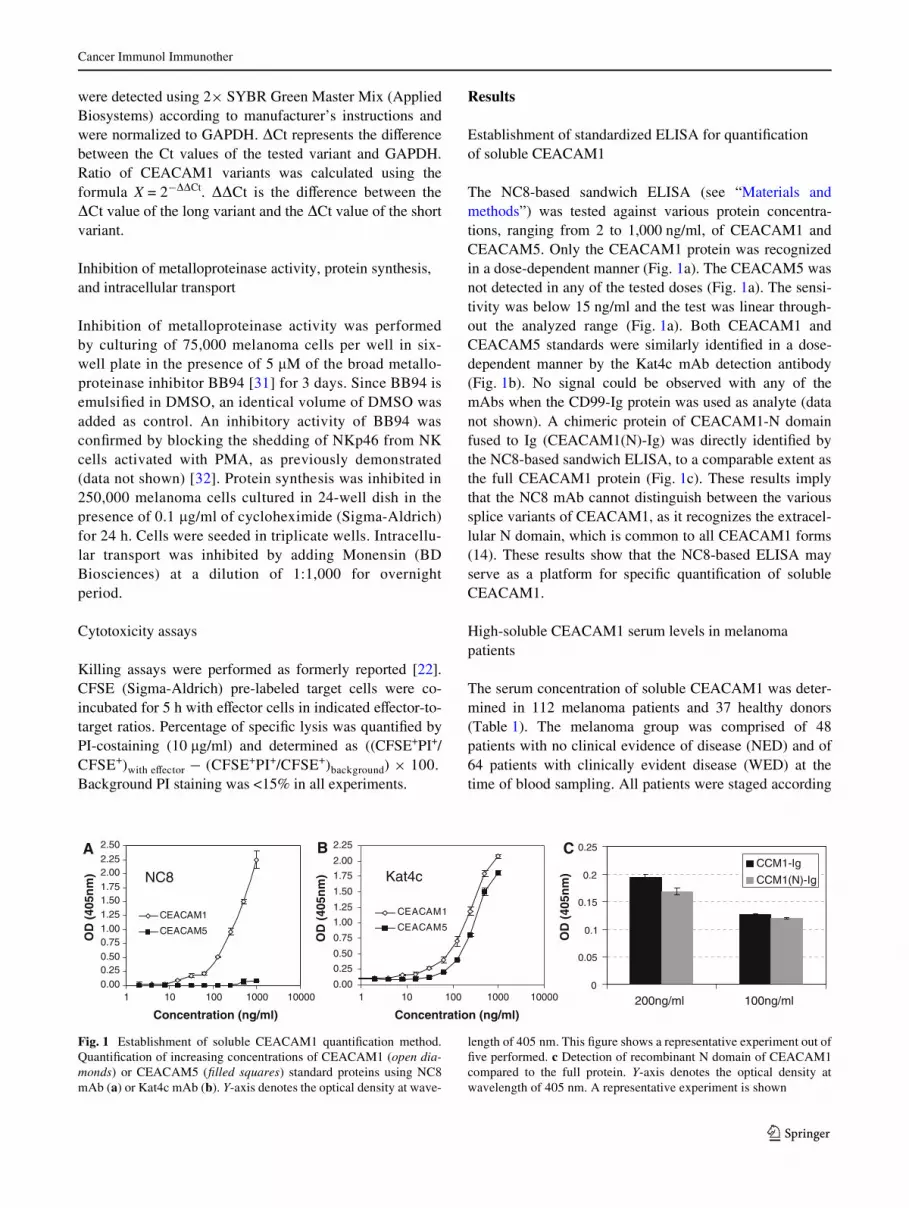
The NC8-based sandwich ELISA (see “Materials andmethods”) was tested against various protein concentra-tions, ranging from 2 to 1,000 ng/ml, of CEACAM1 andCEACAM5. Only the CEACAM1 protein was recognizedin a dose-dependent manner (Fig. 1a). The CEACAM5 wasnot detected in any of the tested doses (Fig. 1a). The sensi-tivity was below 15 ng/ml and the test was linear through-out the analyzed range (Fig. 1a). Both CEACAM1 andCEACAM5 standards were similarly identiWed in a dose-dependent manner by the Kat4c mAb detection antibody(Fig. 1b). No signal could be observed with any of themAbs when the CD99-Ig protein was used as analyte (datanot shown). A chimeric protein of CEACAM1-N domainfused to Ig (CEACAM1(N)-Ig) was directly identiWed bythe NC8-based sandwich ELISA, to a comparable extent asthe full CEACAM1 protein (Fig. 1c). These results implythat the NC8 mAb cannot distinguish between the varioussplice variants of CEACAM1, as it recognizes the extracel-lular N domain, which is common to all CEACAM1 forms(14). These results show that the NC8-based ELISA mayserve as a platform for speciWc quantiWcation of solubleCEACAM1.
High-soluble CEACAM1 serum levels in melanoma patients
The serum concentration of soluble CEACAM1 was deter-mined in 112 melanoma patients and 37 healthy donors(Table 1). The melanoma group was comprised of 48patients with no clinical evidence of disease (NED) and of64 patients with clinically evident disease (WED) at thetime of blood sampling. All patients were staged according
Fig. 1 Establishment of soluble CEACAM1 quantiWcation method.QuantiWcation of increasing concentrations of CEACAM1 (open dia-monds) or CEACAM5 (Wlled squares) standard proteins using NC8mAb (a) or Kat4c mAb (b). Y-axis denotes the optical density at wave-
length of 405 nm. This Wgure shows a representative experiment out ofWve performed. c Detection of recombinant N domain of CEACAM1compared to the full protein. Y-axis denotes the optical density atwavelength of 405 nm. A representative experiment is shown
0.000.250.500.751.001.251.501.752.002.252.50
1 10 100 1000 10000
Concentration (ng/ml)
OD
(40
5nm
)
CEACAM1
CEACAM5
0.00
0.25
0.50
0.75
1.00
1.25
1.50
1.75
2.00
2.25
1 10 100 1000 10000
Concentration (ng/ml)
OD
(40
5nm
)
CEACAM1
CEACAM5
Kat4cNC8
A B C
0
0.05
0.1
0.15
0.2
0.25
200ng/ml 100ng/ml
CCM1-Ig
CCM1(N)-Ig
OD
(40
5nm
)
123
Cancer Immunol Immunother
to the accepted AJCC staging criteria (34). NED patientswere further categorized according to the risk for relapse;28 patients had a localized disease (AJCC stage I or II) andthus a low relapse risk, and the other 20 patients had alocal-regional or systemic disease (AJCC stage III or IV)and thus a high risk for relapse. The 64 WED patients weresubcategorized according to AJCC staging criteria.Although the mean age of the healthy group was slightlylower than the mean age of the patients’ groups, the diVer-ence was not signiWcant statistically. The gender distribu-tion was similar among all groups.
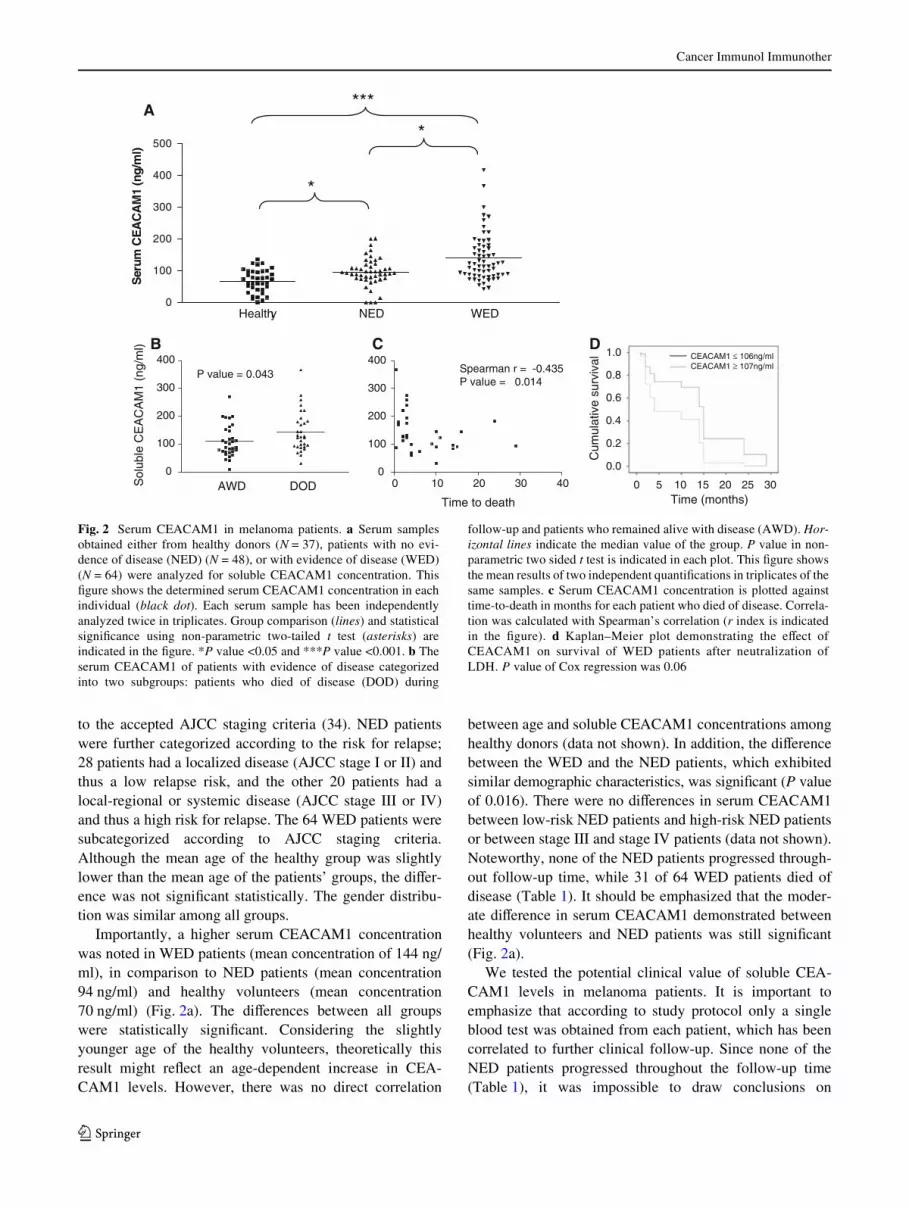
Importantly, a higher serum CEACAM1 concentrationwas noted in WED patients (mean concentration of 144 ng/ml), in comparison to NED patients (mean concentration94 ng/ml) and healthy volunteers (mean concentration70 ng/ml) (Fig. 2a). The diVerences between all groupswere statistically signiWcant. Considering the slightlyyounger age of the healthy volunteers, theoretically thisresult might reXect an age-dependent increase in CEA-CAM1 levels. However, there was no direct correlation
between age and soluble CEACAM1 concentrations amonghealthy donors (data not shown). In addition, the diVerencebetween the WED and the NED patients, which exhibitedsimilar demographic characteristics, was signiWcant (P valueof 0.016). There were no diVerences in serum CEACAM1between low-risk NED patients and high-risk NED patientsor between stage III and stage IV patients (data not shown).Noteworthy, none of the NED patients progressed through-out follow-up time, while 31 of 64 WED patients died ofdisease (Table 1). It should be emphasized that the moder-ate diVerence in serum CEACAM1 demonstrated betweenhealthy volunteers and NED patients was still signiWcant(Fig. 2a).
We tested the potential clinical value of soluble CEA-CAM1 levels in melanoma patients. It is important toemphasize that according to study protocol only a singleblood test was obtained from each patient, which has beencorrelated to further clinical follow-up. Since none of theNED patients progressed throughout the follow-up time(Table 1), it was impossible to draw conclusions on
Fig. 2 Serum CEACAM1 in melanoma patients. a Serum samplesobtained either from healthy donors (N = 37), patients with no evi-dence of disease (NED) (N = 48), or with evidence of disease (WED)(N = 64) were analyzed for soluble CEACAM1 concentration. ThisWgure shows the determined serum CEACAM1 concentration in eachindividual (black dot). Each serum sample has been independentlyanalyzed twice in triplicates. Group comparison (lines) and statisticalsigniWcance using non-parametric two-tailed t test (asterisks) areindicated in the Wgure. *P value <0.05 and ***P value <0.001. b Theserum CEACAM1 of patients with evidence of disease categorizedinto two subgroups: patients who died of disease (DOD) during
follow-up and patients who remained alive with disease (AWD). Hor-izontal lines indicate the median value of the group. P value in non-parametric two sided t test is indicated in each plot. This Wgure showsthe mean results of two independent quantiWcations in triplicates of thesame samples. c Serum CEACAM1 concentration is plotted againsttime-to-death in months for each patient who died of disease. Correla-tion was calculated with Spearman’s correlation (r index is indicatedin the Wgure). d Kaplan–Meier plot demonstrating the eVect ofCEACAM1 on survival of WED patients after neutralization ofLDH. P value of Cox regression was 0.06
0 10 20 30 400
100
200
300
400Spearman r = -0.435P value = 0.014
Time to death
C
Healthy NED WED0
100
200
300
400
500S
erum
CE
AC
AM
1 (n
g/m
l)
***
*
*
0
100
200
300
400
Sol
uble
CE
AC
AM
1 (n
g/m
l)
AWD DOD
B
P value = 0.043
A
0 5 10 15 20 25 30
0.0
0.2
0.4
0.6
0.8
1.0
Time (months)
Cum
ulat
ive
surv
ival
DCEACAM1 ≤ 106ng/mlCEACAM1 ≥ 107ng/ml
123
Cancer Immunol Immunother
predictive value for relapse. Therefore, the clinical courseof WED patients was analyzed. By the end of follow-uptime, 31 WED patients died of disease (DOD), while theother 33 patients were alive with disease (AWD) (Table 1).Comparison of soluble CEACAM1 levels between thesetwo groups demonstrated signiWcantly higher serum CEA-CAM1 concentrations in patients who died of diseasewithin follow-up period (Fig. 2b). Furthermore, amongDOD patients, a strong inverse correlation was observedbetween the serum concentration of CEACAM1 and time-to-death (in months) from sampling time (Fig. 2c). Itshould be noted that blood samples were obtained fromWED patients at an arbitrary time point, and not necessarilyat entrance into stage IV. The mean time from entrance intostage IV to time of blood sampling was similar betweenDOD patients (14.8 months, range 0–4 years) and AWDpatients (17.7 months, range 0–4 years) (P value = 0.42).Therefore, the prognostic diVerence is probably not just amere reXection of the time point in which blood washarvested.
LDH is used as a serum biomarker in metastatic mela-noma (9). We, therefore, tested the prognostic relevance ofCEACAM1 in a multivariate analysis against LDH. LDHlevels were concomitantly determined in 37 WED patients.In these patients, a signiWcant positive correlation wasobserved between LDH and serum CEACAM1 levels(Spearman’s r = 0.382, P value < 0.05). Accordingly, eachof these biomarkers independently negatively correlatedwith survival (Spearman’s r = ¡0.474 and ¡0.451 for LDHand CEACAM1, respectively. The P value was <0.01 forboth markers). Cox regression multivariate analysis forCEACAM1 (LDH neutralized) revealed a strong trendtowards hazard ratio of 2.40 (95% CI 0.963–6.186), but didnot reach statistical signiWcance (P value = 0.06). Similaranalysis for LDH (CEACAM1 neutralized) revealed astrong trend towards a hazard ratio of 2.89 (95% CI 0.977–8.425) (P value = 0.055). Plotting of the eVect of serumCEACAM1 on survival implies that even a single CEA-CAM1 measurement provides signiWcant predictive value,which is especially signiWcant in a range of 12 months(Fig. 2d).
Other immunomodulating factors in healthy donors and melanoma patients
Three other soluble immunomodulating factors includingSDF-1, IFN�, and IL-2 were concomitantly quantiWedamong healthy, NED, and WED patients (Fig. 3). In addi-tion, we quantiWed the amount of soluble MICB, whichmay be secreted from tumors and cause systemic down-reg-ulation of the killing receptor NKG2D to evade eliminationby immune cells [33]. It has been shown previously thatMICB is expressed on melanoma cells in situ [34], but
there is only scarce information on soluble MICB in theserum of melanoma patients. QuantiWcation was performedwith commercial ELISA kits and displayed similar scatterdistribution and mean values (Fig. 3). There were no statis-tically signiWcant diVerences between the three maingroups (Fig. 3).
Soluble CEACAM1 originates from melanoma cellsin vitro
Soluble CEACAM1 was quantiWed in conditioned mediumof melanoma cell lines with variable CEACAM1 levels,ranging from background levels (MFI of 3) to high expres-sion levels (MFI of 400). Melanoma cells were seeded in aconstant number of 105 cells per well in six-well plates andcultured for 3 days. Due to diVerent proliferation rates, theconcentration of soluble CEACAM1 was normalizedaccording to the number of cells at the time of harvesting.No soluble CEACAM1 could be detected in the condi-tioned media of Wbroblasts, CEACAM1-negative or -lowmelanoma cells (Fig. 4a). In contrast, various normalizedconcentrations of soluble CEACAM1 were observedamong melanoma cells that strongly expressed CEACAM1,ranging from 2 to 14 ng/105 melanoma cells (Fig. 4a).There was no correlation between the strength of surfaceexpression of CEACAM1 and the normalized concentra-tion of soluble CEACAM1 (Fig. 4a). Analysis of solubleCEACAM1 in conditioned media during 3 days inuntreated culture revealed a direct correlation with thenumber of melanoma cells in CEACAM1-positive 009mel(R2 value of 0.98) and 019mel (R2 value of 0.965) cells(Fig. 4b). No soluble CEACAM1 could be detected in theconditioned media of the CEACAM1-negative 003melcells (Fig. 4b). Soluble CEACAM1 was not detected in theconditioned media of CEACAM1-positive lymphocytes,such as T cell clone JKF6 [21], T bulk cultures TIL14 orbulk NK culture NK-AZ (Fig. 4b), despite surface expres-sion of CEACAM1 (Fig. 4c). Similar observations weredocumented with other CEACAM1-positive and -negativemelanoma cells (data not shown).
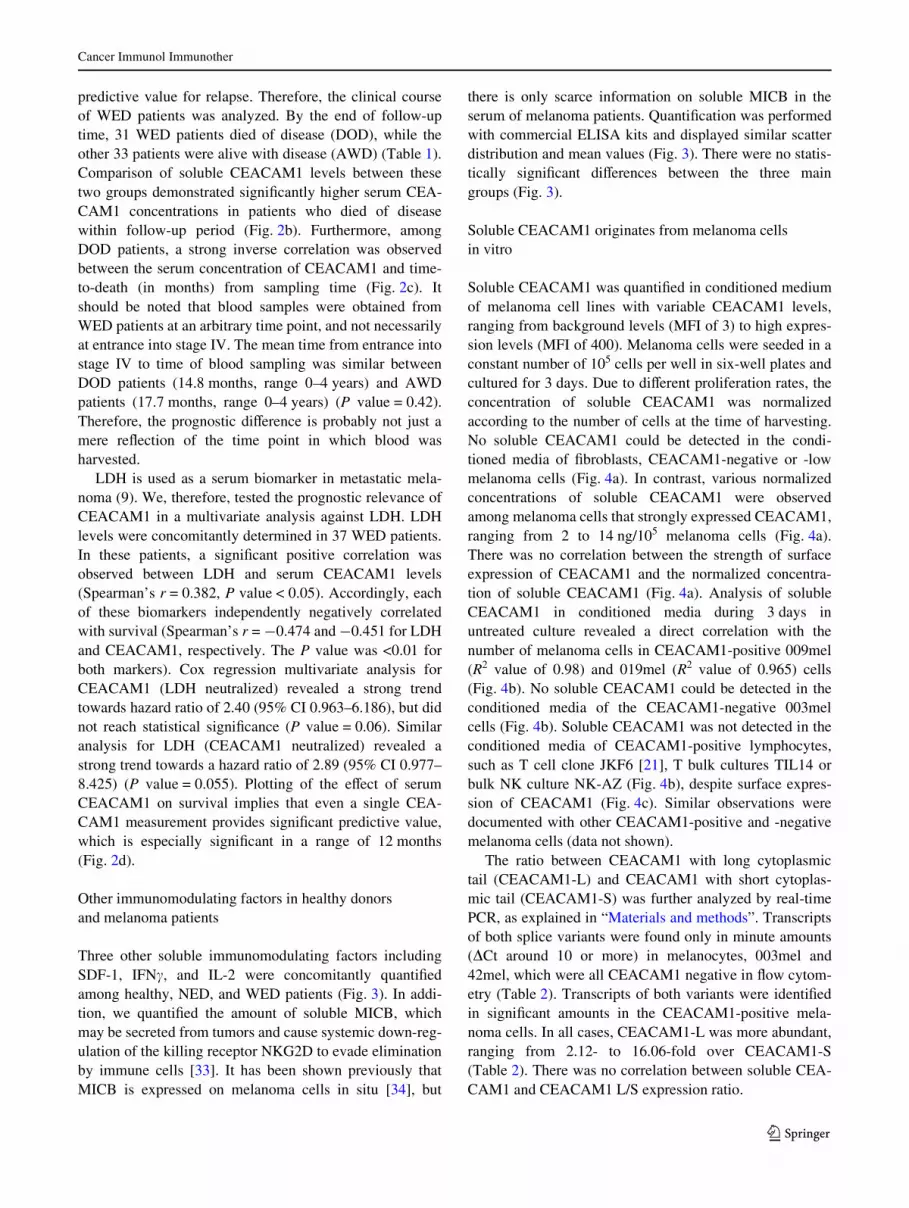
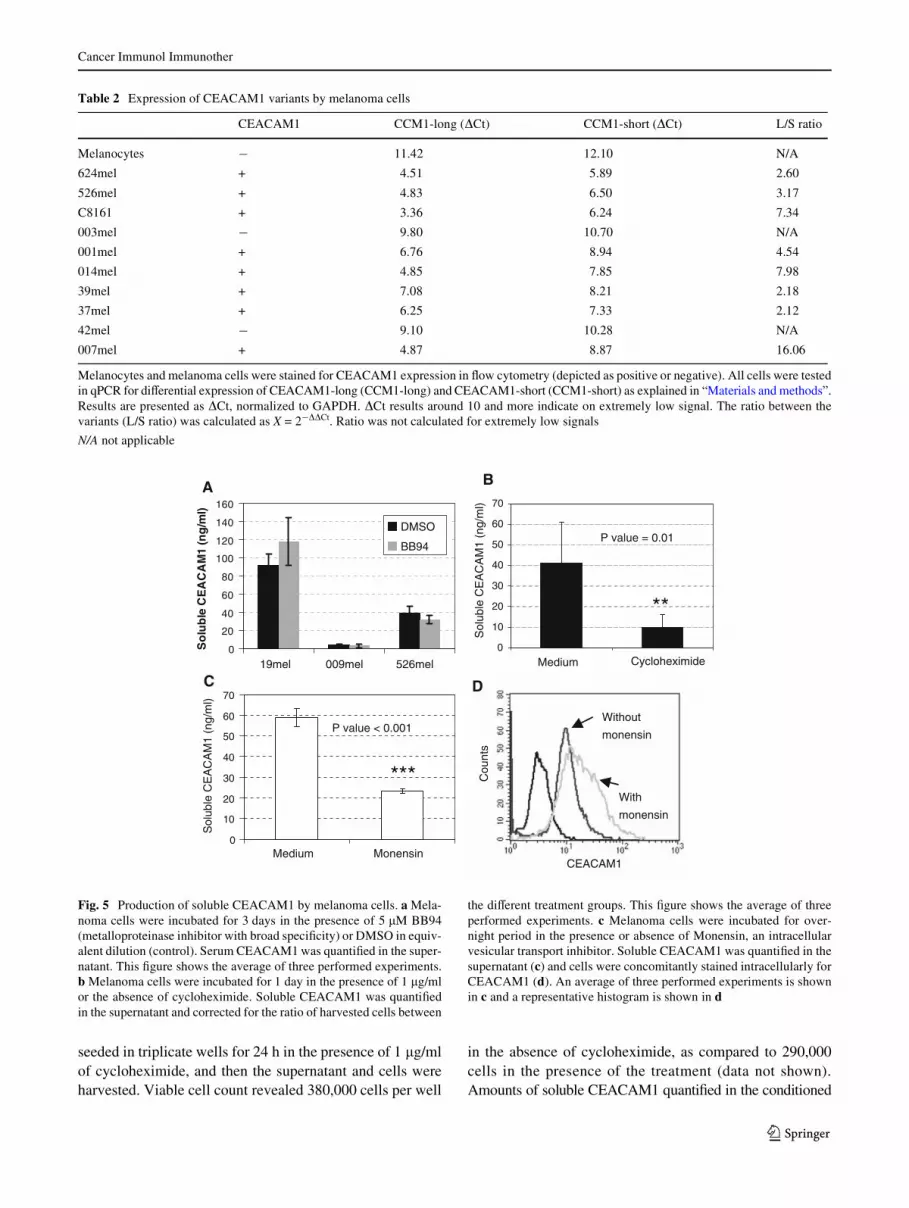
The ratio between CEACAM1 with long cytoplasmictail (CEACAM1-L) and CEACAM1 with short cytoplas-mic tail (CEACAM1-S) was further analyzed by real-timePCR, as explained in “Materials and methods”. Transcriptsof both splice variants were found only in minute amounts(�Ct around 10 or more) in melanocytes, 003mel and42mel, which were all CEACAM1 negative in Xow cytom-etry (Table 2). Transcripts of both variants were identiWedin signiWcant amounts in the CEACAM1-positive mela-noma cells. In all cases, CEACAM1-L was more abundant,ranging from 2.12- to 16.06-fold over CEACAM1-S(Table 2). There was no correlation between soluble CEA-CAM1 and CEACAM1 L/S expression ratio.
123

Cancer Immunol Immunother
The production of soluble CEACAM1 is not metalloproteinase dependent
It can be speculated that CEACAM1 originates from mela-noma cells, either through shedding, active secretion or fromdead cells. Cultures were still less than 80% conXuent at timeof harvesting and viable cell count with trypan blue revealedthat >97% of the cells were viable (data not shown). CEA-CAM1-positive melanoma cells were cultured for 3 days inthe absence or presence of 5 �M of the broad metalloprotein-ase inhibitor BB94 [31]. Conditioned medium was collected
and soluble CEACAM1 quantiWed. No signiWcant diVer-ences between the presence and absence of BB94 wereobserved in several diVerent melanoma cells (Fig. 5a). Thisimplies that production of soluble CEACAM1 is probablynot mediated by metalloproteinase-mediated cleavage.
Production of soluble CEACAM1 depends on protein synthesis and secretion
Melanoma cells were cultured in the presence of the proteinsynthesis inhibitor cycloheximide. 250,000 cells were
Fig. 3 No diVerence in serum levels of four immunomodulatingfactors between healthy donors and melanoma patients. This Wgureshows scatter distribution of all samples. There are three main groupsof samples, healthy donors (Wlled squares), no evidence of disease(NED) patients (Wlled upright triangles) and patients with evidence ofdisease (ED) (Wlled inverse triangles). Each individual shape
represents a single sample from the same group. Each of the fourpanels represents the results for a given immunomodulating factor, asindicated in the Wgure. Y-axis denotes quantiWed concentration. Hori-zontal lines indicate the median value of the group. P values in Kruskal–Wallis test are indicated in each plot. This Wgure shows the mean resultsof two independent quantiWcations in triplicates of the same samples
0
1000
2000
3000
4000HealthyNEDED
MIC
B (
pg/m
l)
Healthy NED ED0
25
50
75HealthyNEDED
IFN
γ (p
g/m
l)
Healthy NED ED0
1000
2000
3000HealthyNEDED
IL-2
(p
g/m
l)
Healthy NED ED0
100
200
300HealthyNEDED
SD
F-1
(p
g/m
l) 867.0 = eulav P317.0 = eulav P
509.0 = eulav P569.0 = eulav P
SDF-1MICB
IFNγ IL-2
Healthy NED ED
Fig. 4 Soluble CEACAM1 originates in vitro from CEACAM1-posi-tive melanoma cells. a One hundred thousand cells from each indicatedtype were seeded per well in six-well plates for 3 days. Soluble CEA-CAM1 was quantiWed in the conditioned medium, cells were har-vested, counted and stained for CEACAM1 expression. Black barsrepresent amount of CEACAM1 normalized per 105 melanoma cells(primary Y-axis). Open diamonds represent MFI of CEACAM1 stain-
ing (secondary Y-axis). b Plotting the number of seeded melanomacells or lymphocytes (X-axis) against quantiWed soluble CEACAM1 inthe conditioned medium (Y-axis). This Wgure shows a representativeexperiment out of three performed. c CEACAM1 surface expressionby lymphocyte cultures. Y-axis denotes the median Xuorescence inten-sity (MFI). This Wgure shows representative staining values
A
CEACAM1High CEACAM1Low
B
0.02.04.06.08.0
10.012.014.016.0
526m
el
624m
el
009m
el
019m
el
938m
el
003m
el
005m
el
014m
el
Fib
robl
asts
No
rmal
ized
CE
AC
AM
1 co
nc.
050100150200250300350400
CE
AC
AM
1 (M
FI)CEACAM1 (ng)
per 100,000 cells
MFI
0
50
100
150
200
250
300
350
0 100 200 300 400 500
003mel
009mel
019mel
JKF6
TIL14
NK-AZ
Sol
uble
CE
AC
AM
1 (n
g/m
l)
Seeded cells per well (x1000)
Lymphocytes
Melanoma cells003mel009mel019melJKF6TIL14NK-AZ
0
5
10
15
20
25
30
35
JKF6 TIL-14 NK-AZC
EA
CA
M1
(M
FI)
C
123
Cancer Immunol Immunother
seeded in triplicate wells for 24 h in the presence of 1 �g/mlof cycloheximide, and then the supernatant and cells wereharvested. Viable cell count revealed 380,000 cells per well
in the absence of cycloheximide, as compared to 290,000cells in the presence of the treatment (data not shown).Amounts of soluble CEACAM1 quantiWed in the conditioned
Table 2 Expression of CEACAM1 variants by melanoma cells
Melanocytes and melanoma cells were stained for CEACAM1 expression in Xow cytometry (depicted as positive or negative). All cells were testedin qPCR for diVerential expression of CEACAM1-long (CCM1-long) and CEACAM1-short (CCM1-short) as explained in “Materials and methods”.Results are presented as �Ct, normalized to GAPDH. �Ct results around 10 and more indicate on extremely low signal. The ratio between thevariants (L/S ratio) was calculated as X = 2¡��Ct. Ratio was not calculated for extremely low signals
N/A not applicable
CEACAM1 CCM1-long (�Ct) CCM1-short (�Ct) L/S ratio
Melanocytes ¡ 11.42 12.10 N/A
624mel + 4.51 5.89 2.60
526mel + 4.83 6.50 3.17
C8161 + 3.36 6.24 7.34
003mel ¡ 9.80 10.70 N/A
001mel + 6.76 8.94 4.54
014mel + 4.85 7.85 7.98
39mel + 7.08 8.21 2.18
37mel + 6.25 7.33 2.12
42mel ¡ 9.10 10.28 N/A
007mel + 4.87 8.87 16.06
Fig. 5 Production of soluble CEACAM1 by melanoma cells. a Mela-noma cells were incubated for 3 days in the presence of 5 �M BB94(metalloproteinase inhibitor with broad speciWcity) or DMSO in equiv-alent dilution (control). Serum CEACAM1 was quantiWed in the super-natant. This Wgure shows the average of three performed experiments.b Melanoma cells were incubated for 1 day in the presence of 1 �g/mlor the absence of cycloheximide. Soluble CEACAM1 was quantiWedin the supernatant and corrected for the ratio of harvested cells between
the diVerent treatment groups. This Wgure shows the average of threeperformed experiments. c Melanoma cells were incubated for over-night period in the presence or absence of Monensin, an intracellularvesicular transport inhibitor. Soluble CEACAM1 was quantiWed in thesupernatant (c) and cells were concomitantly stained intracellularly forCEACAM1 (d). An average of three performed experiments is shownin c and a representative histogram is shown in d
0
10
20
30
40
50
60
70
Medium Cycloheximide
BA
P value = 0.01
**
0
20
40
60
80
100
120
140
160
19mel 009mel 526mel
So
lub
le C
EA
CA
M1
(ng
/ml)
DMSO
BB94
C
Sol
uble
CE
AC
AM
1 (n
g/m
l)
Sol
uble
CE
AC
AM
1 (n
g/m
l)
D
0
10
20
30
40
50
60
70
Medium Monensin
P value < 0.001
***
CEACAM1
With
monensin
Without
monensin
Cou
nts
123
Cancer Immunol Immunother
media were, therefore, corrected accordingly. SolubleCEACAM1 quantiWcation in the conditioned mediashowed a signiWcant decrease in the presence of cyclohexi-mide as compared to control treatment (Fig. 5b). Further-more, addition of Monensin, an inhibitor of intracellularvesicular transport, resulted in a signiWcant decrease inCEACAM1 concentration in the culture medium (Fig. 5c)and in a concomitant increase in intracellular staining ofCEACAM1 (Fig. 5d). In conclusion, the combined obser-vations suggest that soluble CEACAM1 is derived fromlive CEACAM1-positive melanoma cells, directly corre-lates with number of cells, depends on active protein syn-thesis and secretion, and is not mediated via proteincleavage and shedding.
Unusually high percentage of CEACAM1-positive NK and T cells in the peripheral blood of melanoma patients
The CEACAM1 expression pattern was determined ongated NK and T cells derived from peripheral blood lym-phocytes of healthy donors and the melanoma patients.Lymphocytes were derived from the same blood samples
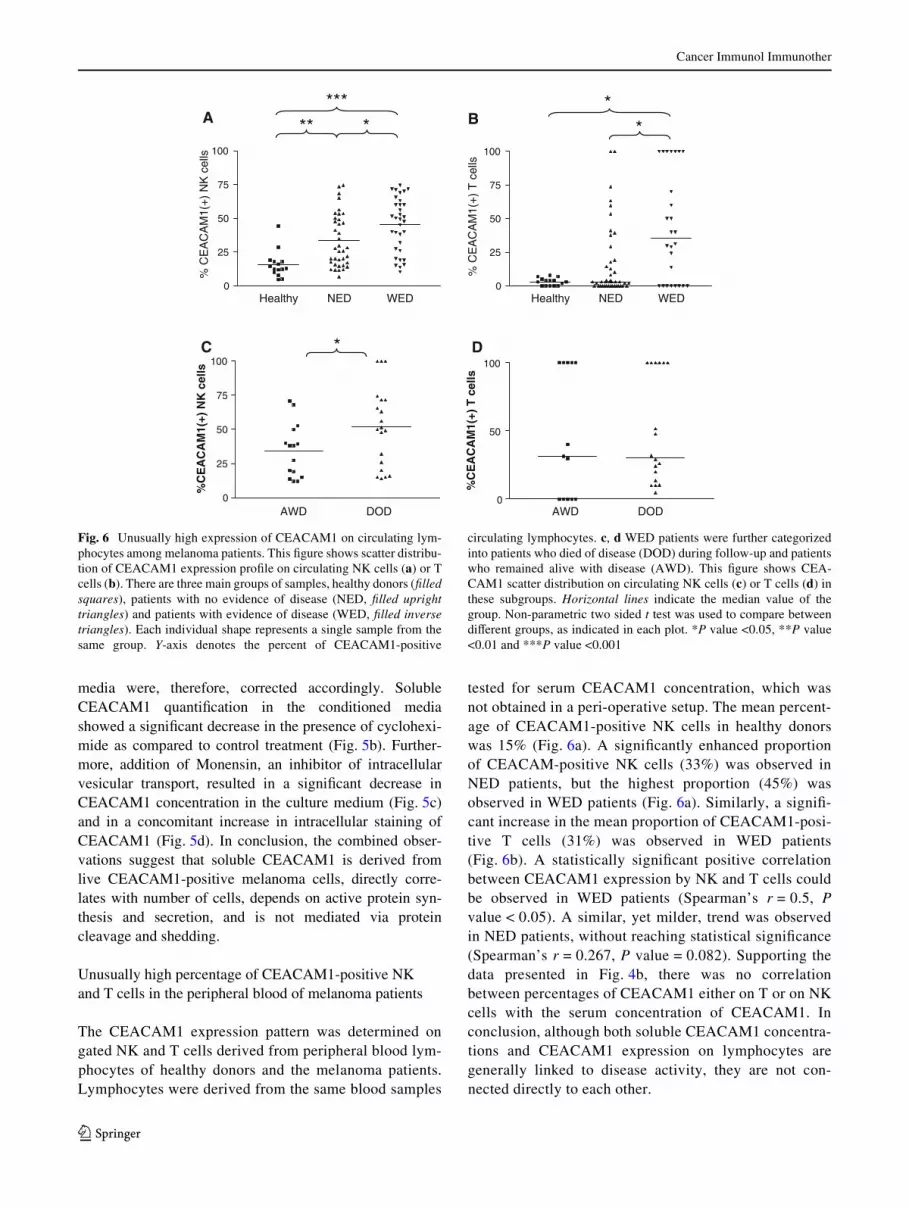
tested for serum CEACAM1 concentration, which wasnot obtained in a peri-operative setup. The mean percent-age of CEACAM1-positive NK cells in healthy donorswas 15% (Fig. 6a). A signiWcantly enhanced proportionof CEACAM-positive NK cells (33%) was observed inNED patients, but the highest proportion (45%) wasobserved in WED patients (Fig. 6a). Similarly, a signiW-cant increase in the mean proportion of CEACAM1-posi-tive T cells (31%) was observed in WED patients(Fig. 6b). A statistically signiWcant positive correlationbetween CEACAM1 expression by NK and T cells couldbe observed in WED patients (Spearman’s r = 0.5, Pvalue < 0.05). A similar, yet milder, trend was observedin NED patients, without reaching statistical signiWcance(Spearman’s r = 0.267, P value = 0.082). Supporting thedata presented in Fig. 4b, there was no correlationbetween percentages of CEACAM1 either on T or on NKcells with the serum concentration of CEACAM1. Inconclusion, although both soluble CEACAM1 concentra-tions and CEACAM1 expression on lymphocytes aregenerally linked to disease activity, they are not con-nected directly to each other.
Fig. 6 Unusually high expression of CEACAM1 on circulating lym-phocytes among melanoma patients. This Wgure shows scatter distribu-tion of CEACAM1 expression proWle on circulating NK cells (a) or Tcells (b). There are three main groups of samples, healthy donors (Wlledsquares), patients with no evidence of disease (NED, Wlled uprighttriangles) and patients with evidence of disease (WED, Wlled inversetriangles). Each individual shape represents a single sample from thesame group. Y-axis denotes the percent of CEACAM1-positive
circulating lymphocytes. c, d WED patients were further categorizedinto patients who died of disease (DOD) during follow-up and patientswho remained alive with disease (AWD). This Wgure shows CEA-CAM1 scatter distribution on circulating NK cells (c) or T cells (d) inthese subgroups. Horizontal lines indicate the median value of thegroup. Non-parametric two sided t test was used to compare betweendiVerent groups, as indicated in each plot. *P value <0.05, **P value<0.01 and ***P value <0.001
Healthy NED WED0
25
50
75
100
Healthy NED WED0
25
50
75
100
BA
% C
EA
CA
M1(
+)
NK
cel
ls
% C
EA
CA
M1(
+)
T c
ells
***** * *
*
AWD DOD0
25
50
75
100
%C
EA
CA
M1(
+) N
K c
ells
AWD DOD0
50
100
%C
EA
CA
M1(
+) T
cel
ls
DC *
123
Cancer Immunol Immunother
Indeed, when WED patients were further categorizedinto DOD and AWD patients, the mean proportion of CEA-CAM1-positive NK cells among DOD patients (51.9%)was signiWcantly higher than in AWD patients (34.4%)(Fig. 6c). However, there was no clear correlation betweenthe percentage of CEACAM1 expression and time-to-deathamong these patients (data not shown). There was no diVer-ence in the percentage of CEACAM1-positive T cellsbetween DOD and AWD patients (Fig. 6d).
Enhanced CEACAM1 expression is functional and inhibits NK-mediated lysis
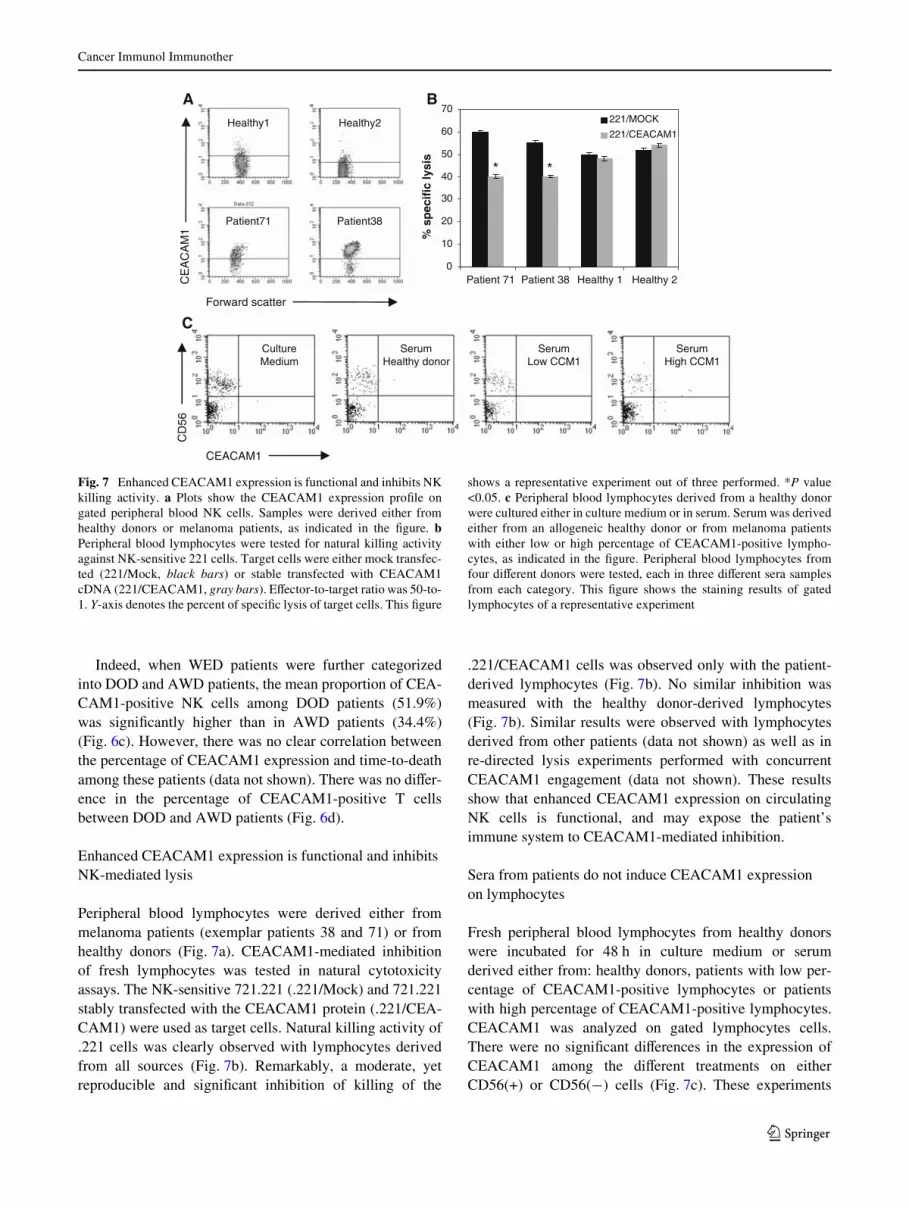
Peripheral blood lymphocytes were derived either frommelanoma patients (exemplar patients 38 and 71) or fromhealthy donors (Fig. 7a). CEACAM1-mediated inhibitionof fresh lymphocytes was tested in natural cytotoxicityassays. The NK-sensitive 721.221 (.221/Mock) and 721.221stably transfected with the CEACAM1 protein (.221/CEA-CAM1) were used as target cells. Natural killing activity of.221 cells was clearly observed with lymphocytes derivedfrom all sources (Fig. 7b). Remarkably, a moderate, yetreproducible and signiWcant inhibition of killing of the
.221/CEACAM1 cells was observed only with the patient-derived lymphocytes (Fig. 7b). No similar inhibition wasmeasured with the healthy donor-derived lymphocytes(Fig. 7b). Similar results were observed with lymphocytesderived from other patients (data not shown) as well as inre-directed lysis experiments performed with concurrentCEACAM1 engagement (data not shown). These resultsshow that enhanced CEACAM1 expression on circulatingNK cells is functional, and may expose the patient’simmune system to CEACAM1-mediated inhibition.
Sera from patients do not induce CEACAM1 expression on lymphocytes
Fresh peripheral blood lymphocytes from healthy donorswere incubated for 48 h in culture medium or serumderived either from: healthy donors, patients with low per-centage of CEACAM1-positive lymphocytes or patientswith high percentage of CEACAM1-positive lymphocytes.CEACAM1 was analyzed on gated lymphocytes cells.There were no signiWcant diVerences in the expression ofCEACAM1 among the diVerent treatments on eitherCD56(+) or CD56(¡) cells (Fig. 7c). These experiments
Fig. 7 Enhanced CEACAM1 expression is functional and inhibits NKkilling activity. a Plots show the CEACAM1 expression proWle ongated peripheral blood NK cells. Samples were derived either fromhealthy donors or melanoma patients, as indicated in the Wgure. bPeripheral blood lymphocytes were tested for natural killing activityagainst NK-sensitive 221 cells. Target cells were either mock transfec-ted (221/Mock, black bars) or stable transfected with CEACAM1cDNA (221/CEACAM1, gray bars). EVector-to-target ratio was 50-to-1. Y-axis denotes the percent of speciWc lysis of target cells. This Wgure
shows a representative experiment out of three performed. *P value<0.05. c Peripheral blood lymphocytes derived from a healthy donorwere cultured either in culture medium or in serum. Serum was derivedeither from an allogeneic healthy donor or from melanoma patientswith either low or high percentage of CEACAM1-positive lympho-cytes, as indicated in the Wgure. Peripheral blood lymphocytes fromfour diVerent donors were tested, each in three diVerent sera samplesfrom each category. This Wgure shows the staining results of gatedlymphocytes of a representative experiment
0
10
20
30
40
50
60
70
Patient 71 Patient 38 Healthy 1 Healthy 2
% s
pec
ific
lysi
s
221/MOCK
221/CEACAM1
BAHealthy1 Healthy2
Patient71 Patient38
CE
AC
AM
1
CultureMedium
C
SerumHealthy donor
SerumLow CCM1
SerumHigh CCM1
Forward scatter
CD
56
CEACAM1
* *
123
Cancer Immunol Immunother
suggest that the high expression of CEACAM1 on lympho-cytes observed in some melanoma patients is probably notdue to systemic soluble factors.
The phenotype of circulating NK cells in melanoma patients is generally abnormal
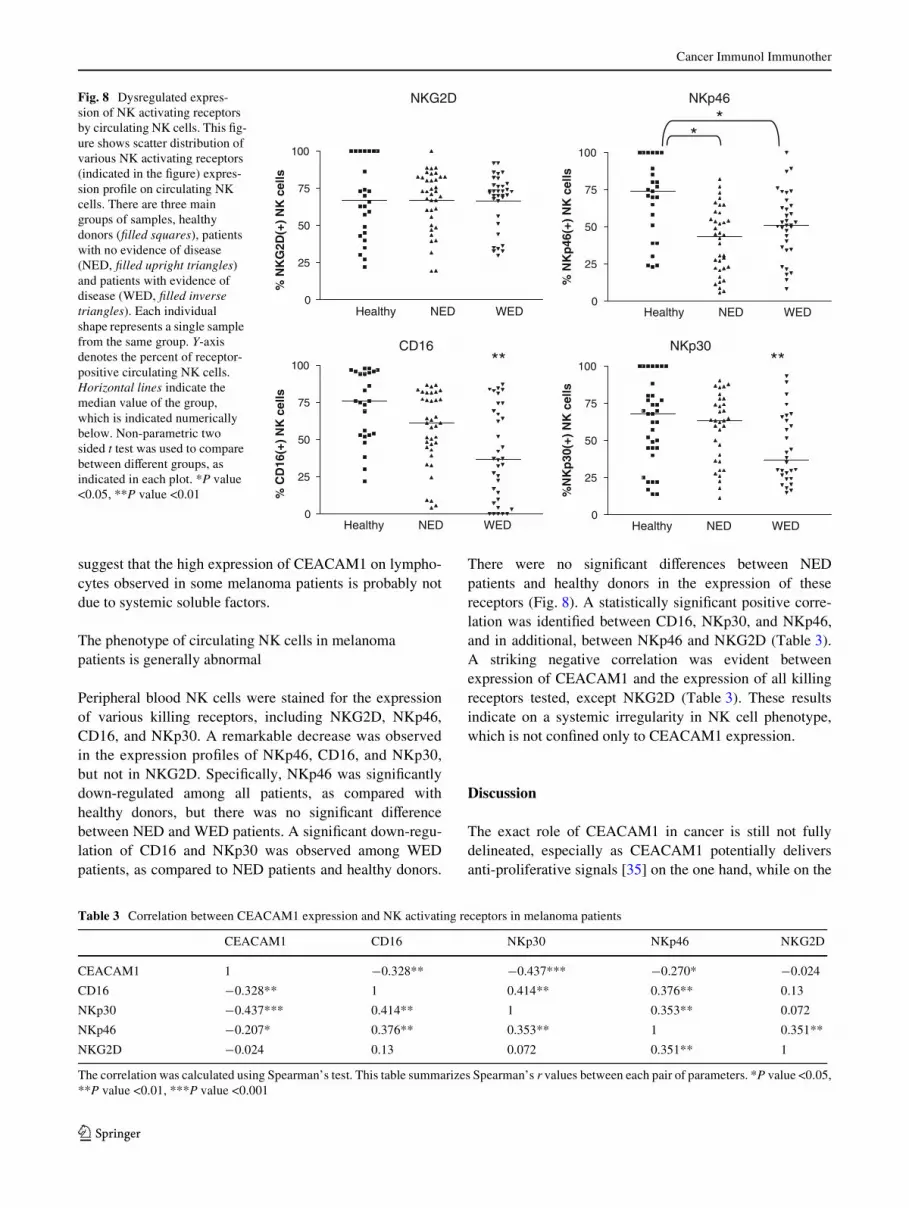
Peripheral blood NK cells were stained for the expressionof various killing receptors, including NKG2D, NKp46,CD16, and NKp30. A remarkable decrease was observedin the expression proWles of NKp46, CD16, and NKp30,but not in NKG2D. SpeciWcally, NKp46 was signiWcantlydown-regulated among all patients, as compared withhealthy donors, but there was no signiWcant diVerencebetween NED and WED patients. A signiWcant down-regu-lation of CD16 and NKp30 was observed among WEDpatients, as compared to NED patients and healthy donors.
There were no signiWcant diVerences between NEDpatients and healthy donors in the expression of thesereceptors (Fig. 8). A statistically signiWcant positive corre-lation was identiWed between CD16, NKp30, and NKp46,and in additional, between NKp46 and NKG2D (Table 3).A striking negative correlation was evident betweenexpression of CEACAM1 and the expression of all killingreceptors tested, except NKG2D (Table 3). These resultsindicate on a systemic irregularity in NK cell phenotype,which is not conWned only to CEACAM1 expression.
Discussion
The exact role of CEACAM1 in cancer is still not fullydelineated, especially as CEACAM1 potentially deliversanti-proliferative signals [35] on the one hand, while on the
Fig. 8 Dysregulated expres-sion of NK activating receptors by circulating NK cells. This Wg-ure shows scatter distribution of various NK activating receptors (indicated in the Wgure) expres-sion proWle on circulating NK cells. There are three main groups of samples, healthy donors (Wlled squares), patients with no evidence of disease (NED, Wlled upright triangles) and patients with evidence of disease (WED, Wlled inverse triangles). Each individual shape represents a single sample from the same group. Y-axis denotes the percent of receptor-positive circulating NK cells. Horizontal lines indicate the median value of the group, which is indicated numerically below. Non-parametric two sided t test was used to compare between diVerent groups, as indicated in each plot. *P value <0.05, **P value <0.01
0
25
50
75
100
% N
KG
2D(+
) N
K c
ells
Healthy NED WED0
25
50
75
100
% C
D16
(+)
NK
cel
ls
0
25
50
75
100
% N
Kp
46(+
) N
K c
ells
Healthy NED WED0
25
50
75
100
%N
Kp
30(+
) N
K c
ells
NKG2D NKp46
CD16 NKp30
**
****
Healthy NED WED Healthy NED WED
Table 3 Correlation between CEACAM1 expression and NK activating receptors in melanoma patients
The correlation was calculated using Spearman’s test. This table summarizes Spearman’s r values between each pair of parameters. *P value <0.05,**P value <0.01, ***P value <0.001
CEACAM1 CD16 NKp30 NKp46 NKG2D
CEACAM1 1 ¡0.328** ¡0.437*** ¡0.270* ¡0.024
CD16 ¡0.328** 1 0.414** 0.376** 0.13
NKp30 ¡0.437*** 0.414** 1 0.353** 0.072
NKp46 ¡0.207* 0.376** 0.353** 1 0.351**
NKG2D ¡0.024 0.13 0.072 0.351** 1
123
Cancer Immunol Immunother
other hand it mediates angiogenesis [36], adhesion [37],metastasis [38], and immune suppression [39]. The strongpredictive association of surface CEACAM1 expression bymelanoma cells with poor prognosis [15] mandates furtherevaluation of the role of this protein in mechanism of dis-ease, as well as a readily available tool for clinical use.
We show that serum CEACAM1 concentration is sub-stantially elevated in WED patients as compared to NEDpatients or healthy donors (Fig. 2). This result could implythat serum CEACAM1 is an indicator for sub-clinical evi-dence of disease. Another intriguing possibility is that highCEACAM1 levels might be a marker of MM predisposition,possibly appropriate in screening of populations at risk. Thepresence of serum CEACAM1 has been previously demon-strated in pancreatic adenocarcinoma patients [26]. Sincenone of the NED patients recurred during period of follow-up (Table 1), we concentrated on the WED patients. AmongWED patients, higher CEACAM1 concentrations wereobserved in patients that died during period of follow-up,compared to patients that remained alive with disease(Fig. 2). Moreover, among DOD patients, patients withhigher serum CEACAM1 concentrations died earlier(Fig. 2). Multivariate analysis showed that CEACAM1 has ahazard ratio of 2.4 when LDH was neutralized with border-line statistical signiWcance of P = 0.06, probably due to therelatively small sample size of 37 patients. The eVect ofserum CEACAM1 on survival was demonstrated, mainly forthe subsequent 12 months after blood sample (Fig. 2d).These results strongly suggest on the systemic involvementof CEACAM1 in melanoma, as well as its potential clinicalimportance as a biomarker with functional signiWcance inmelanoma. Future larger prospective studies are required tovalidate the prognostic value of serum CEACAM1.
We further show that soluble CEACAM1 originates invitro from live CEACAM1-positive melanoma cells andcorrelates with number of tumor cells. Mechanistically, it isnot produced through metalloproteinase-mediated cleav-age and shedding, but depends on de novo protein synthesisand intact secretion machineries (Fig. 5). These resultscould be explained by speciWc production of a soluble formof the CEACAM1 protein. CEACAM proteins are sub-jected to alternative splicing [40] and it has been previouslyshown that alternative splicing can yield soluble CEA-CAM1 in rats [41]. The observations that soluble CEA-CAM1 was produced by CEACAM1-positive melanomacells but not by CEACAM1-positive lymphocytes could beexplained by diVerential splicing activity.
Despite the statistically signiWcant diVerence in meanvalues, distribution analysis of serum CEACAM1 concen-trations reveals an overlap between NED and WED groups.This may reXect the heterogeneity of subjects comprisingdiVerent subgroups within the cohort (Table 1). Indeed,as described above, it seems that soluble CEACAM1
originates from CEACAM1-positive melanoma cells butnot from CEACAM1-negative melanoma cells (Fig. 4).Further, no quantitative correlation between surfaceCEACAM1 expression intensity and normalized solubleCEACAM1 concentration could be observed (Fig. 4). Cur-rently, it is impossible to predict the quantity of solubleCEACAM1 that will be derived from any given CEA-CAM1-positive melanoma cells. DiVerential characteristicsof melanoma cells may aVect serum CEACAM1 concentra-tions. Soluble CEACAM1 is not derived from CEACAM1-positive circulating lymphocytes, which point towards amechanistic diVerence between melanoma cells andlymphocytes. The overlap may stem from the heterogenicattributes of melanoma cells between diVerent patients,combined with the fact that the presence of CEACAM1 onthe melanoma cells in majority of the tested patients wasunknown. Therefore, a prospective large cohort study withdeWned patient subgroups and CEACAM1 expression sta-tus is mandated. Nevertheless, the statistically signiWcantdiVerence that is still apparent emphasizes the potential roleof CEACAM1 as a tumor marker in melanoma.
Another point is that serum CEACAM1 was alsodetected in healthy donors, which means that it is normallyproduced in low levels. It is currently impossible to distin-guish between tumor-derived soluble CEACAM1 and “nor-mal” serum CEACAM1, as they have a similar molecularweight (data not shown) and both are similarly recognizedby the test. Tumor-derived soluble CEACAM1 could diVerfrom “normal” CEACAM1 in other biochemical properties,such as glycosylation patterns, which require further inves-tigation. The concentrations of serum CEACAM1 mea-sured in healthy donors in this study were higher than thosereported in the study reported by Simeone et al. [26]. ThesediVerences may be attributed to a lack of standardized mea-suring test. Although both tests were ELISA-based, theydiVered in capturing mAb, detection methods, sample han-dling, and general ELISA protocols (incubation times,buVers, dilutions, etc.). Indeed, in a third study conductedby Draáberová et al. [23], the mean normal concentrationdetected was signiWcantly higher than in our study (300 ng/ml). In that study, CEACAM1 was quantiWed by immuno-precipitation with a completely diVerent mAb. As theseconcentrations are signiWcant, serum CEACAM1 may carrya physiological role. Soluble CEACAM1 could function asa competitive antagonist and modulate CEACAM1 homo-philic interactions. These interactions can occur normallybetween activated lymphocytes and activated endothelialcells. Thus, modulation of these interactions could aVectrolling, adhesion, and recruitment of lymphocytes. Alterna-tively, soluble CEACAM1 could function agonistically andmodulate other CEACAM1-mediated processes such asangiogenesis and insulin clearance. The function of solubleCEACAM1 in vivo thus remains to be determined.
123
Cancer Immunol Immunother
Tumor markers are utilized in the clinical arena mainlyto support diagnosis of disease and clinical monitoring ofpatients. Our observations show that serum CEACAM1reXects disease activity and has some prognostic eVect onsurvival (Fig. 2). Nevertheless, additional blood tests andfollow-up of speciWc patients might have demonstrated anincrease in CEACAM1 levels with the progression of dis-ease. Since in our study only one CEACAM1 test was per-formed for each patient, this possibility cannot be ruled out.Indeed, the personal tumor marker proWle in a given patientindicates tumor burden regarding other tumor markers suchas PSA [42] and CEA [12, 13]. Our results suggest thatsoluble CEACAM1 may be indicative of tumor burden, assoluble CEACAM1 concentration was dependent on theabsolute number of melanoma cells (Fig. 4). We assumethat personal serum CEACAM1 monitoring over time mayprovide reliable clinical information, similar to PSA orCEA monitoring. Analysis of 50 melanoma specimensderived from metastatic lesions shows that surface CEA-CAM1 is signiWcantly expressed in 70% of the cases(unpublished results). Thus, CEACAM1 monitoring maybe relevant for a substantial portion of melanoma patients.Future prospective studies should, therefore, include serialserum CEACAM1 analysis in each melanoma patient, inorder to correlate changes in CEACAM1 levels over timewith clinical course of disease.
Importantly, a systemic involvement of CEACAM1 wasalso noted in the surface marker expression proWle of circu-lating NK and T cells. A striking increase in CEACAM1expression was observed in melanoma patients compared tohealthy donors (Figs. 6, 7). The highest CEACAM1 expres-sion percentages on NK cells were observed amongpatients who died of disease during follow-up (Fig. 6a; Pvalue < 0.05). Further, the CEACAM1 expression patternof NK cells positively correlated with the CEACAM1expression pattern of T cells (Fig. 6c). Remarkably,increased CEACAM1 expression was functional and inhib-ited NK killing activity in an MHC class I-independentmanner (Fig. 7). These combined observations provide aWrst link between melanoma patients, mainly those withworse prognosis, and systemic overexpression of functionalCEACAM1 by circulating lymphocytes. A similar systemicoverexpression of CEACAM1 among circulating NK cellswas previously reported in Ankylosing Spondilitis patients[43] and in Bare Lymphocyte Syndrome type I patients[44]. It is tempting to speculate that overexpression ofinhibitory CEACAM1 leads to immune inhibition and isinvolved in cancer progression. Yet, it remains to be deter-mined whether the state of disseminated melanoma dictatesphenotypic alterations in circulating lymphocytes, such asoverexpression of CEACAM1.
This phenomenon could be explained by systemic stimu-lation, as CEACAM1 expression is activation dependent
and driven by IL-2 [27, 28] or by IFN� [22, 45]. However,as shown in Fig. 2, there was no signiWcant diVerence eitherin IL-2 or in IFN� levels. Alternatively, it can be accountedfor abnormal development of NK cells. Disseminatedmalignancies may have systemic eVects through multiplemechanisms and may thus aVect the repertoire of immunecells. This possibility is supported by the concomitant pro-found abnormality in the expression proWle of activatingreceptors CD16, NKp46, and NKG2D (Fig. 8). This obser-vation concurs with a previous report on down-regulatedexpression of CD161 and NKG2D in metastatic melanomapatients [46]. The inverse correlation between activatingNK receptors and CEACAM1 is highly signiWcant statisti-cally (Table 3), which indicates a common regulationmechanism that potentially impairs NK cell function.Indeed, CEACAM1 is normally expressed on CD16-nega-tive NK cells [28], which Wts with the strong inverse corre-lation observed here between CEACAM1 and CD16(Table 3). Moreover, we have previously reported a gener-alized CEACAM1 up-regulation accompanied by dysregu-lated expression proWle of other NK receptors in BLS type Ipatients [44]. Thus, evidence for global dysregulation ofNK cell repertoire aVecting both inhibitory and activatingreceptors is presented. It remains to be determined whetherimpaired development of NK cells results in progression ofmelanoma, or whether disseminated progressive melanomadirectly aVects NK cell repertoire and selects for potentiallyless reactive NK cells.
We show that both the increased serum concentration ofCEACAM1 and surface expression of CEACAM1 on cir-culating NK cells are probably linked to progressive mela-noma. Nevertheless, there is no direct correlation betweenthese two phenomena. It is known that CEACAM1-positivemelanoma is associated with poor prognosis and here wefurther provide evidence that soluble CEACAM1 can bederived from CEACAM1-positive melanoma cells. Thus,serum CEACAM1 concentrations are probably aVecteddirectly by the melanoma cells. However, dysregulation ofNK cell repertoire could potentially occur regardless ofCEACAM1. If this process is indeed orchestrated by tumorcells, it is expected that NK cells with diminished expres-sion or function of activating receptors will be favored. Inthat case, since CEACAM1 expression is linked to dimin-ished expression of activating NK receptors (such as CD16[28]), CEACAM1 overexpression may be secondary toanother process, even in patients bearing CEACAM1-nega-tive melanoma. Noteworthy, 70% of metastatic melanomaspecimens express CEACAM1, and may thus be able toimpose additional inhibitory eVect that might result inworse prognosis.
In conclusion, systemic dysregulation of serum and lym-phocyte cell surface CEACAM1 not only providesimproved knowledge on pathogenesis of disease, but may
123
Cancer Immunol Immunother
also potentially serve in the future as novel monitoringplatform in melanoma patients, including tumor burden,relapse of disease, overall prognosis, and prediction ofresponse to immunotherapy.
Acknowledgments Many special thanks to Haya and Nehemia Lem-elbaum for the enormous support allowing the authors to conduct thesestudies. The authors would also like to thank the volunteers who donat-ed blood samples and Mr. Amit Markel for technical support.
References
1. National Cancer Institute. Surveillance epidemiology and endresults. http://seer.cancer.gov/csr/1975_2004/results_merged/sect_16_melanoma.pdf. Last accessed at 28 January 2009
2. National Cancer Institute. Surveillance epidemiology and endresults. http://seer.cancer.gov/publications/aya/5_melanoma.pdf.Last accessed at 28 January 2009
3. Herlyn M (1990) Human melanoma: development and progres-sion. Cancer Metastasis Rev 9:101–112
4. Breslow A (1970) Thickness, cross-sectional areas and depth ofinvasion in the prognosis of cutaneous melanoma. Ann Surg172:902–908
5. Soong S-J, Shaw HM, Balch CM et al (1992) Predicting survivaland recurrence in localized melanoma: a multivariate approach.World J Surg 16:191–195
6. Schuchter L, Schultz DJ, Synnestvedt M et al (1996) A prognosticmodel for predicting 10-year survival in patients with primarymelanoma. Ann Intern Med 125:369–375
7. Christianson DF, Anderson CM (2003) Close monitoring and life-time follow-up is optimal for patients with a history of melanoma.Semin Oncol 30:369–374
8. Garbe C, Paul A, Kohler-Späth H et al (2003) Prospective evalua-tion of a follow-up schedule in cutaneous melanoma patients: rec-ommendations for an eVective follow-up strategy. J Clin Oncol21:520–529
9. Deichmann M, Benner A, Bock M et al (1999) S100-Beta, mela-noma-inhibiting activity, and lactate dehydrogenase discriminateprogressive from nonprogressive American Joint Committee onCancer stage IV melanoma. J Clin Oncol 17:1891–1896
10. Deichmann M, Kahle B, Moser K et al (2004) Diagnosing mela-noma patients entering American Joint Committee on Cancerstage IV, C-reactive protein in serum is superior to lactate dehy-drogenase. Br J Cancer 91:699–702
11. Beauchemin N, Draber P, Dveksler G et al (1999) RedeWnednomenclature for members of the carcinoembryonic antigen fam-ily. Exp Cell Res 252:243–249
12. Vogelzang NJ, Lange PH, Goldman A (1982) Acute changes of�-fetoprotein and human chorionic gonadotropin duringinduction chemotherapy of germ cell tumors. Cancer Res42:4855–4861
13. Locker GY, Hamilton S, Harris J et al (2006) ASCO 2006 updateof recommendations for the use of tumor markers in gastrointesti-nal cancer. J Clin Oncol 24:5313–5327
14. Hammarström S (1999) The carcinoembryonic antigen (CEA)family: structures, suggested functions and expression in normaland malignant tissues. Semin Cancer Biol 9:67–81
15. Thies A, Moll I, Berger J et al (2002) CEACAM1 expression incutaneous malignant melanoma predicts the development of met-astatic disease. J Clin Oncol 20:2530–2536
16. Laack E, Nikbakht H, Peters A et al (2002) Expression of CEA-CAM1 in adenocarcinoma of the lung: a factor of independentprognostic signiWcance. J Clin Oncol 20:4279–4284
17. Sienel W, Dango S, WoelXe U et al (2003) Elevated expression ofcarcinoembryonic antigen-related cell adhesion molecule 1 pro-motes progression of non-small cell lung cancer. Clin Cancer Res9:2260–2266
18. Ebrahimnejad A, Streichert T, Nollau P et al (2004) CEACAM1enhances invasion and migration of melanocytic and melanomacells. Am J Pathol 165:1781–1787
19. Markel G, Wolf D, Hanna J et al (2002) Pivotal role of CEACAM1protein in the inhibition of activated decidual lymphocyte func-tions. J Clin Invest 110:943–953
20. Markel G, Lieberman N, Katz G et al (2002) CD66a interactionsbetween human melanoma and NK cells: a novel class I MHC-independent inhibitory mechanism of cytotoxicity. J Immunol168:2803–2810
21. Markel G, Seidman R, Stern N et al (2006) Inhibition of humantumor-inWltrating lymphocyte eVector functions by the homophiliccarcinoembryonic cell adhesion molecule 1 interactions. J Immu-nol 177:6062–6071
22. Markel G, Seidman R, Cohen Y et al. (2008) Dynamic expressionof protective CEACAM1 on melanoma cells during speciWcimmune attack. Immunology [Epub ahead of print]
23. Dráberová L, Cerná H, Brodská H et al (2000) Soluble isoforms ofCEACAM1 containing the A2 domain: increased serum levels inpatients with obstructive jaundice and diVerences in 3-fucosyl-N-acetyl-lactosamine moiety. Immunology 101:279–287
24. Kondo Y, Hinoda Y, Akashi H et al (2001) Measurement of circu-lating biliary glycoprotein (CD66a) in liver diseases. J Gastroen-terol 36:470–475
25. Svenberg T, Wahren B, Hammarström S (1979) Elevated serumlevels of a biliary glycoprotein (BGP I) in patients with liver orbiliary tract disease. Clin Exp Immunol 36:317–325
26. Simeone DM, Ji B, Banerjee M et al (2007) CEACAM1, a novelserum biomarker for pancreatic cancer. Pancreas 34:436–443
27. Moller MJ, Kammerer R, Grunert F et al (1996) Biliary glycopro-tein (BGP) expression on T cells and on a natural-killer-cellsub-population. Int J Cancer 65:740–745
28. Kammerer R, Hahn S, Singer BB et al (1998) Biliary glycoprotein(CD66a), a cell adhesion molecule of the immunoglobulin super-family, on human lymphocytes: structure, expression and involve-ment in T cell activation. Eur J Immunol 28:3664–3674
29. Albarran-Somoza B, Franco-Topete R, Delgado-Rizo V et al(2006) CEACAM1 in cervical cancer and precursor lesions:association with human papillomavirus infection. J HistochemCytochem 54:1393–1399
30. Markel G, Gruda R, Achdout H et al (2004) The critical role of res-idues 43R and 44Q of carcinoembryonic antigen cell adhesionmolecules-1 in the protection from killing by human NK cells.J Immunol 173:3732–3739
31. Takino T, Saeki H, Miyamori H et al (2007) Inhibition of mem-brane-type 1 matrix metalloproteinase at cell–matrix adhesions.Cancer Res 67:11621–11629
32. Markel G, Achdout H, Katz G et al (2004) Biological function ofthe soluble CEACAM1 protein and implications in TAP2-deW-cient patients. Eur J Immunol 34:2138–2148
33. Groh V, Wu J, Yee C et al (2002) Tumour-derived soluble MICligands impair expression of NKG2D and T-cell activation. Nature419:734–738
34. Vetter CS, Groh V, thor Straten P et al (2002) Expression of stress-induced MHC class I related chain molecules on human mela-noma. J Invest Dermatol 118:600–605
35. Izzi L, Turbide C, Houde C et al (1999) cis-Determinants in thecytoplasmic domain of CEACAM1 responsible for its tumorinhibitory function. Oncogene 18:5563–5572
36. Horst AK, Ito WD, Dabelstein J et al (2006) Carcinoembryonicantigen-related cell adhesion molecule 1 modulates vascularremodeling in vitro and in vivo. J Clin Invest 116:1596–1605
123
Cancer Immunol Immunother
37. Wikström K, Kjellström G, Obrink B (1996) Homophilic intercel-lular adhesion mediated by C-CAM is due to a domain 1-domain1 reciprocal binding. Exp Cell Res 227:360–366
38. Thies A, Mauer S, Fodstad O et al (2007) Clinically proven mark-ers of metastasis predict metastatic spread of human melanomacells engrafted in scid mice. Br J Cancer 96:609–616
39. Gray-Owen SD, Blumberg RS (2006) CEACAM1: contact-depen-dent control of immunity. Nat Rev Immunol 6:433–446
40. Barnett TR, Drake L, Pickle WII (1993) Human biliary glycopro-tein gene: characterization of a family of novel alternativelyspliced RNAs and their expressed proteins. Mol Cell Biol13:1273–1282
41. Budt M, Michely B, Müller MM (2002) Secreted CEACAM1splice variants in rat cell lines and in vivo in rat serum. BiochemBiophys Res Commun 292:749–755
42. Stamey TA, Yang N, Hay AR et al (1987) Prostate-speciWc anti-gen as a serum marker for adenocarcinoma of the prostate. N EnglJ Med 317:909–916
43. Azuz-Lieberman N, Markel G, Mizrahi S et al (2005) InvolvementNatural Killer cells and CEACAM1 in Ankylosing Spondylitis. IntImmunol 17:837–845
44. Markel G, MussaY H, Ling KL et al (2004) The mechanisms con-trolling NK cell autoreactivity in TAP2-deWcient patients. Blood10:31770–31778
45. Takahashi H, Okai Y, Paxton RJ et al (1993) DiVerential regula-tion of carcinoembryonic antigen and biliary glycoprotein by gam-ma-interferon. Cancer Res 53:1612–1619
46. KonjeviT G, MirjaciT MartinoviT K, VuletiT A et al (2007) Lowexpression of CD161 and NKG2D activating NK receptor is asso-ciated with impaired NK cell cytotoxicity in metastatic melanomapatients. Clin Exp Metastasis 24:1–11
123