synthesis of c10-c16 linear symmetrical ethers from n
TRANSCRIPT
Synthesis of C10--C16 linear symmetrical ethers from n-alcohols over heterogeneous
acid catalysts
Carlos Casas Fernández
ADVERTIMENT. La consulta d’aquesta tesi queda condicionada a l’acceptació de les següents condicions d'ús: La difusió d’aquesta tesi per mitjà del servei TDX (www.tdx.cat) i a través del Dipòsit Digital de la UB (diposit.ub.edu) ha estat autoritzada pels titulars dels drets de propietat intel·lectual únicament per a usos privats emmarcats en activitats d’investigació i docència. No s’autoritza la seva reproducció amb finalitats de lucre ni la seva difusió i posada a disposició des d’un lloc aliè al servei TDX ni al Dipòsit Digital de la UB. No s’autoritza la presentació del seu contingut en una finestra o marc aliè a TDX o al Dipòsit Digital de la UB (framing). Aquesta reserva de drets afecta tant al resum de presentació de la tesi com als seus continguts. En la utilització o cita de parts de la tesi és obligat indicar el nom de la persona autora. ADVERTENCIA. La consulta de esta tesis queda condicionada a la aceptación de las siguientes condiciones de uso: La difusión de esta tesis por medio del servicio TDR (www.tdx.cat) y a través del Repositorio Digital de la UB (diposit.ub.edu) ha sido autorizada por los titulares de los derechos de propiedad intelectual únicamente para usos privados enmarcados en actividades de investigación y docencia. No se autoriza su reproducción con finalidades de lucro ni su difusión y puesta a disposición desde un sitio ajeno al servicio TDR o al Repositorio Digital de la UB. No se autoriza la presentación de su contenido en una ventana o marco ajeno a TDR o al Repositorio Digital de la UB (framing). Esta reserva de derechos afecta tanto al resumen de presentación de la tesis como a sus contenidos. En la utilización o cita de partes de la tesis es obligado indicar el nombre de la persona autora. WARNING. On having consulted this thesis you’re accepting the following use conditions: Spreading this thesis by the TDX (www.tdx.cat) service and by the UB Digital Repository (diposit.ub.edu) has been authorized by the titular of the intellectual property rights only for private uses placed in investigation and teaching activities. Reproduction with lucrative aims is not authorized nor its spreading and availability from a site foreign to the TDX service or to the UB Digital Repository. Introducing its content in a window or frame foreign to the TDX service or to the UB Digital Repository is not authorized (framing). Those rights affect to the presentation summary of the thesis as well as to its contents. In the using or citation of parts of the thesis it’s obliged to indicate the name of the author.
�Synthesis�of�C10�C16�linear�symmetrical�ethers�from�n�alcohols�over�heterogeneous�acid�catalysts�
�
Carlos�Casas�Fernández�
�Programa�de�doctorado�de�
Ingeniería�y�Tecnologías�Avanzadas�
�
�
�
�
�
�
�
�
Under�the�supervision�of�
�
Dr.�Javier�Tejero�Salvador�
�
Chemical�Engineering�Department.�University�of�Barcelona�
Dr.�Monsterrat�Iborra�Urios
Chemical�Engineering�Department�University�of�Barcelona

�
�
�
�
�
�
�
�
�
�
�
�
�
�
�
�
�
�
�
�
�
�
�
�
�
�
�
PhD�thesis�to�obtain�the�degree�of�doctor�in�Engineering�and�Advanced�Technologies�by�the�University�of�Barcelona�
�
Presented�by:�
Carlos�Casas�Fernández�
�
�
�
�
�
�
�
�
�
�
�
Carried�out�in�the�research�group�of�“Applied�Kinetics�and�Catalysis”�at�the��
Chemical�Engineering�Department�of�the�University�of�Barcelona�
Approved�by:�
�
�
�
Dr.�Javier�Tejero�Salvador�
�
University�of�Barcelona�
Dr.�Monsterrat�Iborra�Urios
University�of�Barcelona
�
LIST�OF�PUBLICATIONS�C.Casas,�J.�Guilera,�E.�Ramírez,�R.�Bringué,�M.�Iborra,�J.�Tejero,�“Reliability�of�the�synthesis�of�C10�C16�linear�ethers�from�1�alkanols�over�acidic�ion�exchange�resins,”�Biomass�Convers.�Bioref.,�vol.�3,�pp.�27�37,�2013.�
C.�Casas,�C.�Fité,�M.�Iborra,�J.�Tejero,�F.�Cunill,”Study�of�the�chemical�equilibrium�of�the�liquid�phase�dehydration�of�1�octanol�to�di�n�octyl�ether,”�J.�Chem.�Eng.�Data,�vol.�58,�pp.�741�748,�2012.�
C.�Casas,�R.�Bringué,�E.�Ramírez,�M.�Iborra,�J.�Tejero,”Liquid�phase�Dehydration�of�1�octanol,�1�hexanol�and�1�pentanol�to�linear�symmetrical�ethers�over�ion�exchange�resins,”�App.�Catal.�A:�Gen.,�vol.�396,�pp.�129�139,�2011.�
C.�Casas,�R.�Bringué,�E.�Ramírez,�M.�Iborra,�J.�Tejero,�“Deshidratación�de�1�octanol�sobre�zeolitas�y�resinas�de�intercambio�iónico,”�Ingeniería�Química,�vol.�494,�pp.�70�74,�2011.�
�
WORKS�IN�PROGRESS�
C.�Casas,�R.�Bringué,�E.�Ramírez,�M.�Iborra,�J.�Tejero,�“Zeolite�catalyzed�dehydration�of�linear�alcohol�to�C10�C16�symmetrical�ether�in�the�liquid�phase”.�Submitted�to�Microporous�&�Mesoporous�Materials�on�September�2013.�
C.�Casas,�J.�Tejero,�M.�Iborra,�C.�Fité,�R.�Bringué,�“Kinetics�of�1�octanol�dehydration�to�di�n�octyl�ether�on�Amberlyst�70”.�In�preparation.�
�
CONGRESS�PARTICIPATIONS�
Europacat�XI,�Kinetics�of�the�bimolecular�dehydration�of�1�octanol�to�di�n�octyl�ether�over�Amberlyst�70.�C.�Casas,�R.�Bringué,�M.�Iborra,�C.�Fité,�J.�Tejero.�Lyon�(France),�2013.�Poster.�
XIX�International�symposium�on�alcohol�fuels�(ISAF�XIX),�Reliability�of�the�synthesis�of�C10�C16�linear�ethers�from�1�alkanols�over�acidic�ion�exchange�resins.�C.�Casas,�J.�Guilera,�E.�Ramírez,�R.�Bringué,�M.�Iborra,�J.�Tejero.�Verona�(Italy),�2011.�Poster.�
XIII�National�Congress�of�Chemical�Engineering�(CNIQ2010),�Deshidratación�de�1�octanol�sobre�zeolitas�y�resinas�de�intercambio�iónico.�C.�Casas,�R.�Bringué,�E.�Ramírez,�M.�Iborra�y�J.�Tejero.�Madrid�(Spain),�2010.�Poster.�
UBiochem,�Synthesis�of�ethyl�octyl�ether�from�diethyl�carbonate�and�1�octanol�over�solid�catalysts.�J.�Guilera,�C.Casas,�E.�Ramírez,�R.�Bringué,�M.�Iborra,�F.�Cunill�and�J.�Tejero.�Córdoba�(Spain),�2010.�Poster.�
EuropaCat�IX,�Effect�of�the�textural�properties�of�ion�exchange�resins�on�the�liquid�phase�dehydration�of�alcohols�to�linear�ethers.�C.�Casas,�R.�Bringué,�J.�Tejero,�M.�Iborra,�C.�Fité,�J.F.�Izquierdo�and�F.�Cunill.�Salamanca�(Spain),�2009.�Poster.�
11th�Mediterranean�Congress�of�Chemical�Engineering,�Dehydration�to�linear�ether�of�1�octanol,�1�hexanol�and�1�pentanol�in�liquid�phase�over�ion�exchange�resins.�C.Casas,�J.Tejero,�M.�Iborra,�R.�Bringué,�F.�Cunill,�J.F�Izquierdo,�C.�Fité.�Barcelona�(Spain),�2008.�Poster.�
�
�
�
�
�
�
�
�
�
�
�
�
�
�
�
�
�
�
�

�
�
�
�
�
�
�
�
�
�
�
�
�
�
�
�
�
�
�
�
�
�
�
�
�
�
7�
CONTENTS�CHAPTER�1.INTRODUCTION�
1.1�The�diesel� 15
1.2�Problematic�of�diesel�engine�emissions 16
1.2.1�The�combustion�process�of�diesel�in�the�diesel�engine 16
1.2.2�Diesel�exhausts� 20
1.3�Properties�of�diesel� 24
1.3.1�Ignition�quality� 24
1.3.2�Density�and�heating�value 25
1.3.3�Flash�point 25
1.3.4�Water�content� 25
1.3.5�Corrosion,�lubricity� 25
1.3.6�Viscosity� 26
1.3.7�Cold�performance�properties 26
1.3.8�Cetane�number�and�cetane�index 26
1.4�How�to�solve�the�problem�of�diesel�engine�emissions 28
1.4.1�In�cylinder�control�systems 29
1.4.2�End�pipe�solutions� 29
1.4.3�Fuel�modification:�additives�for�diesel 31
1.4.3.1�Alcohols� 34
1.4.3.2�Esters 34
8�
1.4.3.3�Carbonates� 35
1.4.3.4�Ethers 35
1.5�Syntheses�of�C10�C10+2n�linear�symmetrical�ethers 37
1.5.1�Catalysts� 39
1.5.2�Ion�exchange�resins� 39
1.5.2.1�Polystyrene�divinylbenzene�(PS�DVB) resins 40
1.5.2.2�Perfluoroalkane�sulfonic�resins�(Nafion) 43
1.5.3�Zeolites� 43
1.6�Kinetics�in�heterogeneous�catalysis 45
CHAPTER�2.�SCOPE 51
CHAPTER�3.�EXPERIMENTAL�
3.1�Chemicals� 55
3.2�Catalysts� 55
3.2.1�Acidic�ion�exchange�resins 55
3.2.2�Acidic�zeolites� 56
3.3�Set�up,�analysis�and�experimental�procedure 57
3.3.1�Set�up� 57
3.3.2�Analysis� 57
3.3.3�Experimental�Procedure� 59
3.4�Physical�and�textural�characterization�of�ion�exchange�resins 61
3.5�Physical�and�textural�characterization�of�zeolites 68
9�
CHAPTER�4.�INFLUENCE�OF�PROPERTIES�AND�TEXTURAL�PARAMETERS�OF�PS�DVB�
RESINS�ON�THE�SYNTHESIS�OF�DNOE.�A�COMPARISON�WITH�DNHE�AND�DNPE�
SYNTHESES�
4.1�Abstract� 75
4.2�Results�and�discussion� 75
4.2.1�Reaction�scheme�of�catalytic�dehydration�of�1�octanol�to�DNOE� 75
4.2.2�Conversion�of�1�octanol,�selectivity�to�DNOE�and�initial�reaction�rates�at�
423K�
78
4.3�Comparison�of�DNHE,�DNPE�and�DNOE�synthesis�data 85
4.3.1�Conversion 86
4.3.2�Selectivity 88
4.3.3�Initial�reaction�rates� 90
4.4�Conclusions� 91
CHAPTER�5.�INFLUENCE�OF�TEXTURAL�PROPERTIES�OF�ZEOLITES�ON�THE�
CATALYZED�DEHYDRATION�OF�LINEAR�ALCOHOLS�TO�C10�C16�SYMMETRICAL�
ETHERS�
5.1�Abstract� 95
5.2�Results�and�discussion� 95
5.2.1�Alcohol�conversion� 99
5.2.1.1�Response�surfaces� 101
5.2.2�Selectivity 104
5.2.3�Yield� 107
5.2.4�Initial�reaction�rates� 108
10�
5.3�Conclusions� 109
CHAPTER�6.CHEMICAL�EQUILIBRIUM�OF�THE�LIQUID�PHASE�DEHYDRATION�OF�1�
OCTANOL�TO�DNOE�
6.1�Abstract� 113
6.2�Results�and�discussion� 113
6.2.1�Experimental�equilibrium�constants,�enthalpy and�entropy�changes� 114
6.2.2�Confidence�regions�of�parameters 121
6.2.3�Enthalpy�and�entropy�changes�accounting�enthalpy�variation�with�
temperature�
125
6.2.4�Estimation�of�thermodynamic�state�functions 127
6.2.5�Comparison�of�DNOE,�DNHE�and�DNPE�thermochemical�data� 128
6.3�Conclusions� 131
CHAPTER�7.KINETIC�STUDY�
7.1�Abstract� 135
7.2�Results�and�discussion� 135
7.2.1�Kinetic�analysis�of�DNOE�rate�data�on�Amberlyst�70 140
7.2.1.1�Preliminary�experiments 140
7.2.1.2�Kinetic�models� 143
7.2.2�Kinetic�analysis�on�zeolites 154
7.3�Conclusions� 159
CHAPTER�8.�SUMMARY�� 163
�
11�
CHAPTER�9.�REFERENCES,�NOMENCLATURE,�LIST�OF�TABLES,�EQUATIONS�AND�
FIGURES��
9.1�References� 169
9.2�Nomenclature� 179
9.3�List�of�Tables� 186
9.4�List�of�Equations 189
9.5�List�of�Figures� 193
CHAPTER�10.�APPENDICES�
APPENDIX�I� 199
APPENDIX�II� 200
APPENDIX�III� 203
APPENDIX�IV� 204
APPENDIX�V� 206
APPENDIX�VI� 207
APPENDIX�VII� 209
APPENDIX�VIII� 214
CHAPTER�11.�RESUMEN�DEL�TRABAJO�(SPANISH) 219
�
�
�
�
�

�
�

��
CHAPTER�1��
INTRODUCTION��
�
�
�
�
�
�
�
�
�
�
�
�
�
�
�

�
�
�
�
�
�
�
�
�
�
�
�
�
�
�
�
�
�
�
�
�
�
1.�Introduction�
15�
1.1�The�diesel�
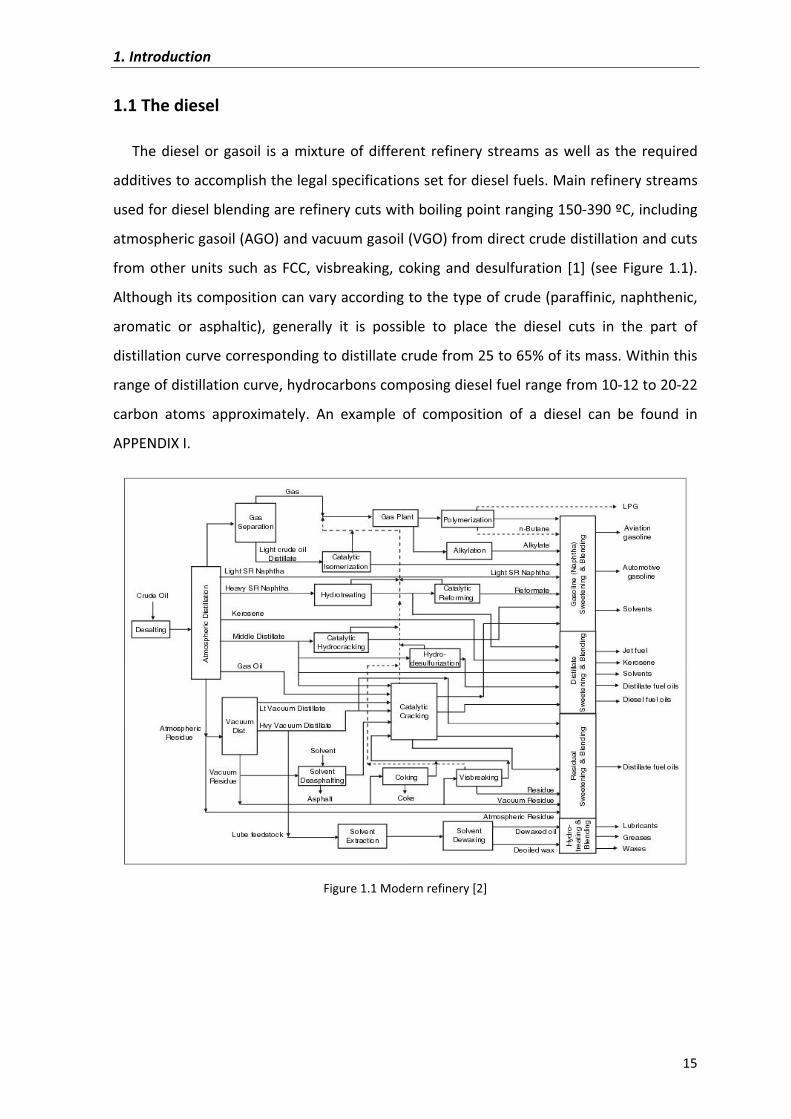
The�diesel�or�gasoil� is�a�mixture�of�different� refinery�streams�as�well�as� the� required�
additives�to�accomplish�the�legal�specifications�set�for�diesel�fuels.�Main�refinery�streams�
used�for�diesel�blending�are�refinery�cuts�with�boiling�point�ranging�150�390�ºC,�including�
atmospheric�gasoil�(AGO)�and�vacuum�gasoil�(VGO)�from�direct�crude�distillation�and�cuts�
from�other�units� such�as�FCC,�visbreaking,�coking�and�desulfuration� [1]� (see�Figure�1.1).�
Although�its�composition�can�vary�according�to�the�type�of�crude�(paraffinic,�naphthenic,�
aromatic� or� asphaltic),� generally� it� is� possible� to� place� the� diesel� cuts� in� the� part� of�
distillation�curve�corresponding�to�distillate�crude�from�25�to�65%�of�its�mass.�Within�this�
range�of�distillation�curve,�hydrocarbons�composing�diesel�fuel�range�from�10�12�to�20�22�
carbon� atoms� approximately.� An� example� of� composition� of� a� diesel� can� be� found� in�
APPENDIX�I.�
�
Figure�1.1�Modern�refinery�[2]� �
1.�Introduction�
16�
1.2�Problematic�of�diesel�engines�emissions�
1.2.1�The�combustion�process�of�diesel�in�the�diesel�engine�
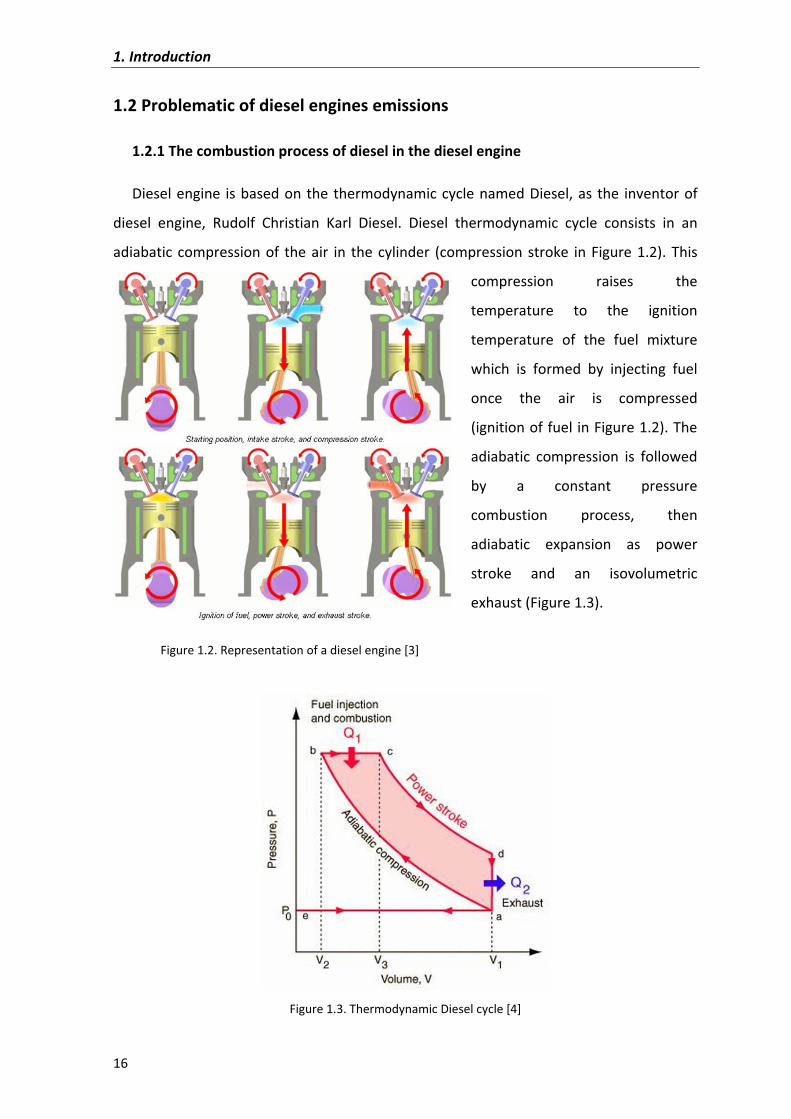
Diesel�engine� is�based�on�the�thermodynamic�cycle�named�Diesel,�as� the� inventor�of�
diesel� engine,� Rudolf� Christian� Karl� Diesel.� Diesel� thermodynamic� cycle� consists� in� an�
adiabatic�compression�of� the�air� in� the�cylinder� (compression�stroke� in�Figure�1.2).�This�
compression� raises� the�
temperature� to� the� ignition�
temperature� of� the� fuel� mixture�
which� is� formed� by� injecting� fuel�
once� the� air� is� compressed�
(ignition�of�fuel�in�Figure�1.2).�The�
adiabatic� compression� is� followed�
by� a� constant� pressure�
combustion� process,� then�
adiabatic� expansion� as� power�
stroke� and� an� isovolumetric�
exhaust�(Figure�1.3).�
�
�
�Figure�1.3.�Thermodynamic�Diesel�cycle�[4]�
Figure�1.2.�Representation�of�a�diesel�engine [3]
1.�Introduction�
17�
In�order� to�get�a�proper�combustion,� fuel�must�vaporize� in� the� injection.�Volatility�of�
hydrocarbon� compound� decreases� as� molecular� weight� increases� and� thus,� the�
combustion� process� gets� more� complex.� As� well,� air� and� fuel� must� be� mixed� and� must�
feed�ignition�and�combustion�zones.�
Ignition�of�fuel�will�take�place�when�the�fine�fuel�droplets�have�enough�temperature�in�
the�combustion�chamber.�However,�if�the�molecules�of�fuel�are�large�and/or�there�is�not�
enough�oxygen�and/or�low�temperature,�the�combustion�of�fuel�will�be�partial,�and�it�will�
be�oxidized�forming�soot�particles�and�other�contaminant�particles.��
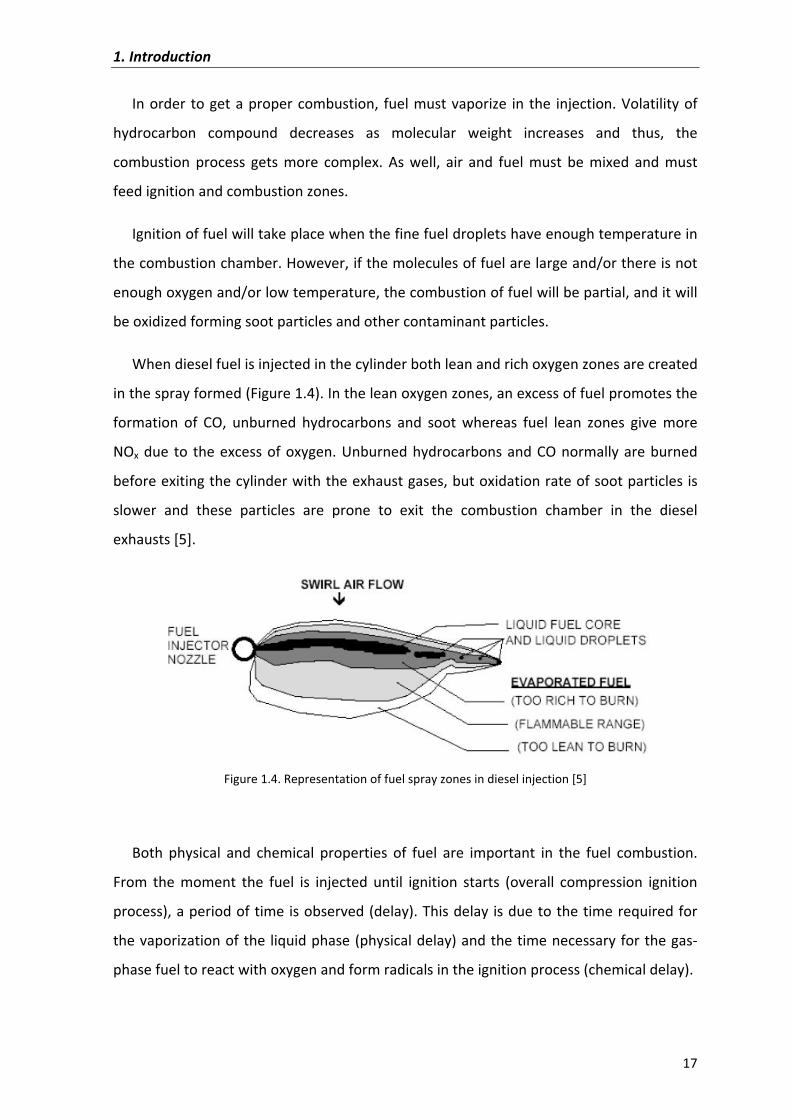
When�diesel�fuel�is�injected�in�the�cylinder�both�lean�and�rich�oxygen�zones�are�created�
in�the�spray�formed�(Figure�1.4).�In�the�lean�oxygen�zones,�an�excess�of�fuel�promotes�the�
formation� of� CO,� unburned� hydrocarbons� and� soot� whereas� fuel� lean� zones� give� more�
NOx�due� to� the�excess�of�oxygen.�Unburned�hydrocarbons�and�CO�normally�are�burned�
before�exiting�the�cylinder�with�the�exhaust�gases,�but�oxidation�rate�of�soot�particles�is�
slower� and� these� particles� are� prone� to� exit� the� combustion� chamber� in� the� diesel�
exhausts�[5].�
�
Figure�1.4.�Representation�of�fuel�spray�zones�in�diesel�injection�[5]�
�
Both� physical� and� chemical� properties� of� fuel� are� important� in� the� fuel� combustion.�
From� the� moment� the� fuel� is� injected� until� ignition� starts� (overall� compression� ignition�
process),�a�period�of�time�is�observed�(delay).�This�delay� is�due�to�the�time�required�for�
the�vaporization�of�the�liquid�phase�(physical�delay)�and�the�time�necessary�for�the�gas�
phase�fuel�to�react�with�oxygen�and�form�radicals�in�the�ignition�process�(chemical�delay).�
�
1.�Introduction�
18�
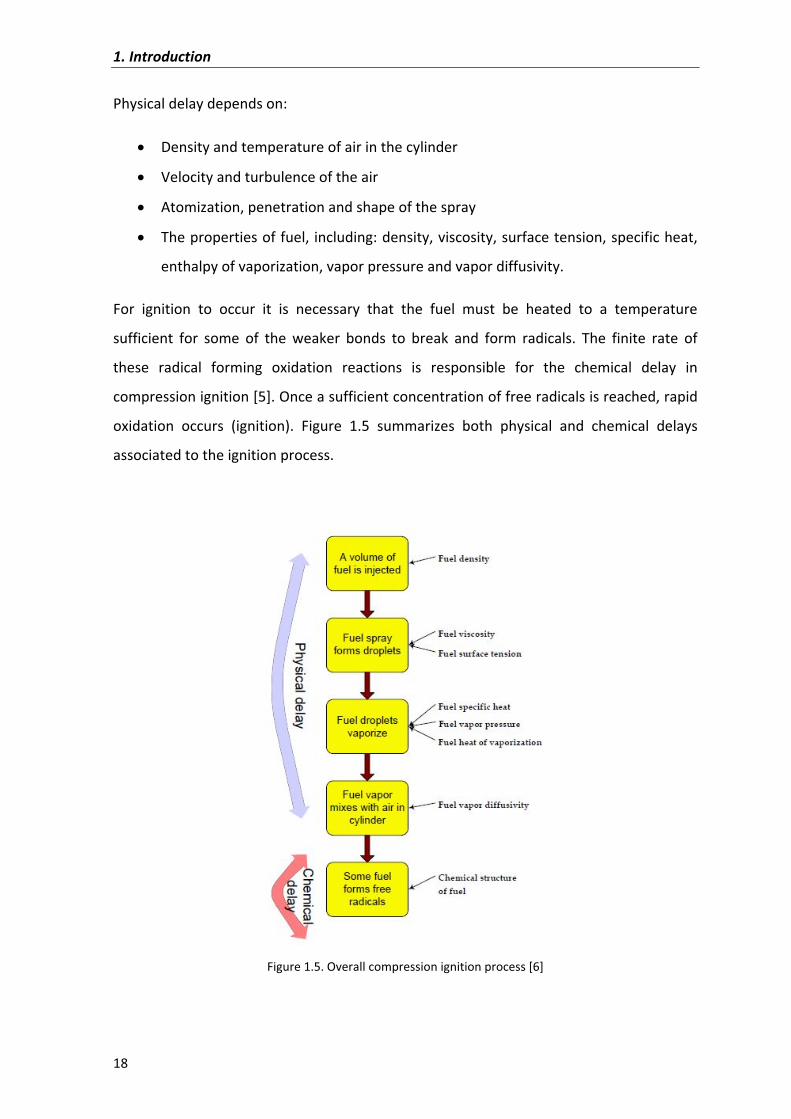
Physical�delay�depends�on:��
� Density�and�temperature�of�air�in�the�cylinder�
� Velocity�and�turbulence�of�the�air�
� Atomization,�penetration�and�shape�of�the�spray�
� The�properties�of�fuel,� including:�density,�viscosity,�surface�tension,�specific�heat,�
enthalpy�of�vaporization,�vapor�pressure�and�vapor�diffusivity.�
For� ignition� to� occur� it� is� necessary� that� the� fuel� must� be� heated� to� a� temperature�
sufficient� for� some� of� the� weaker� bonds� to� break� and� form� radicals.� The� finite� rate� of�
these� radical� forming� oxidation� reactions� is� responsible� for� the� chemical� delay� in�
compression�ignition�[5].�Once�a�sufficient�concentration�of�free�radicals�is�reached,�rapid�
oxidation� occurs� (ignition).� Figure� 1.5� summarizes� both� physical� and� chemical� delays�
associated�to�the�ignition�process.�
�
�
Figure�1.5.�Overall�compression�ignition�process�[6]�
1.�Introduction�
19�
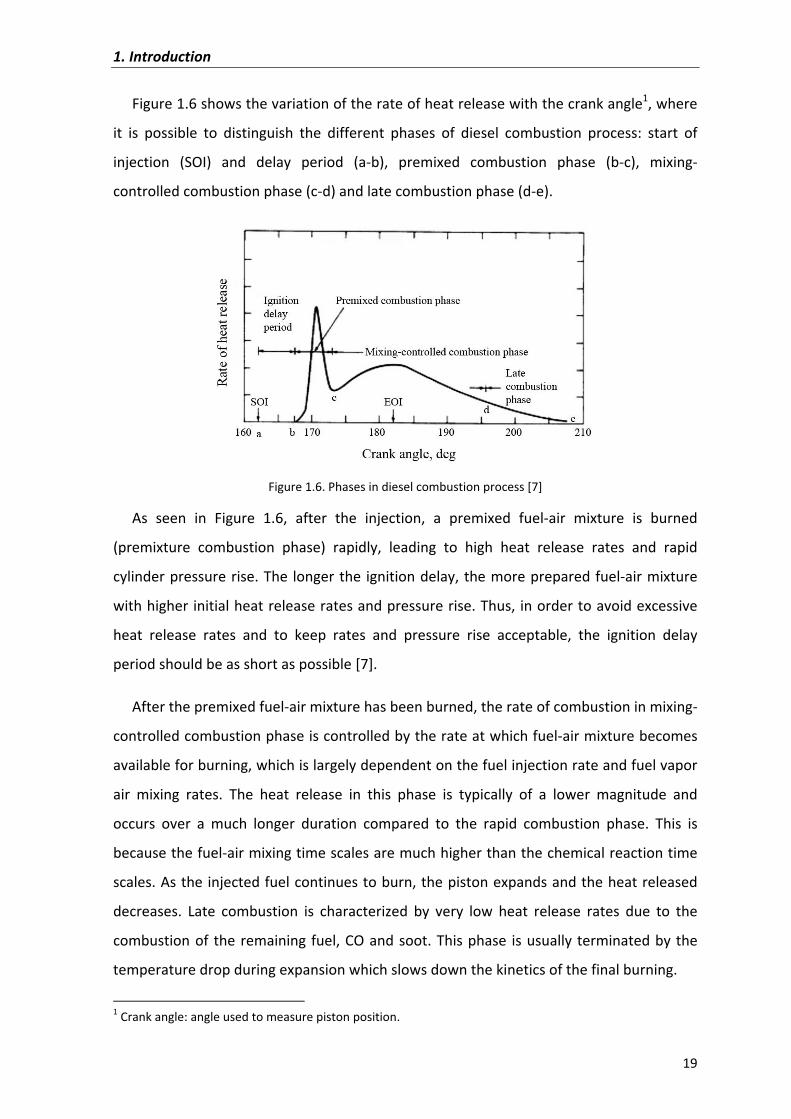
Figure�1.6�shows�the�variation�of�the�rate�of�heat�release�with�the�crank�angle1,�where�
it� is� possible� to� distinguish� the� different� phases� of� diesel� combustion� process:� start� of�
injection� (SOI)� and� delay� period� (a�b),� premixed� combustion� phase� (b�c),� mixing�
controlled�combustion�phase�(c�d)�and�late�combustion�phase�(d�e).�
�
Figure�1.6.�Phases�in�diesel�combustion�process�[7]�
As� seen� in� Figure� 1.6,� after� the� injection,� a� premixed� fuel�air� mixture� is� burned�
(premixture� combustion� phase)� rapidly,� leading� to� high� heat� release� rates� and� rapid�
cylinder�pressure�rise.�The� longer�the� ignition�delay,�the�more�prepared�fuel�air�mixture�
with�higher�initial�heat�release�rates�and�pressure�rise.�Thus,� in�order�to�avoid�excessive�
heat� release� rates� and� to� keep� rates� and� pressure� rise� acceptable,� the� ignition� delay�
period�should�be�as�short�as�possible�[7].��
After�the�premixed�fuel�air�mixture�has�been�burned,�the�rate�of�combustion�in�mixing�
controlled�combustion�phase�is�controlled�by�the�rate�at�which�fuel�air�mixture�becomes�
available�for�burning,�which�is�largely�dependent�on�the�fuel�injection�rate�and�fuel�vapor�
air� mixing� rates.� The� heat� release� in� this� phase� is� typically� of� a� lower� magnitude� and�
occurs� over� a� much� longer� duration� compared� to� the� rapid� combustion� phase.� This� is�
because�the�fuel�air�mixing�time�scales�are�much�higher�than�the�chemical�reaction�time�
scales.�As�the�injected�fuel�continues�to�burn,�the�piston�expands�and�the�heat�released�
decreases.� Late� combustion� is� characterized� by� very� low� heat� release� rates� due� to� the�
combustion�of� the�remaining� fuel,�CO�and�soot.�This�phase� is�usually�terminated�by�the�
temperature�drop�during�expansion�which�slows�down�the�kinetics�of�the�final�burning.�
������������������������������������������������������������1�Crank�angle:�angle�used�to�measure�piston�position.�
1.�Introduction�
20�
1.2.2�Diesel�exhausts�
The� exhaust� from� diesel� engines� is� made� of� two� main� parts,� gases� and� soot�
(particulate).� The� gas� portion� of� diesel� exhaust� is� mostly� CO2,� CO,� NOx� (nitric� oxide� and�
nitrogen� dioxide),� sulfur� oxides� and� hydrocarbons,� including� polycyclic� aromatic�
hydrocarbons� (PAHs).� The� soot� portion� of� diesel� exhausts� is� made� of� particles� such� as�
carbon,�organic�materials�(including�PAHs),�and�traces�of�metallic�compounds.�
Carbon�dioxide�(CO2)�
CO2� is� the� main� gas� in� the� diesel� exhaust;� it� is� not� toxic� but� as� a� greenhouse� gas� its�
excess� in� the� atmosphere� contributes� to� the� global� warming.� However,� comparison� of�
diesel�and�gasoline�engines�shows�that�diesel�engine�thermal�efficiency�is�higher�than�that�
of� gasoline� engine.� Actually,� diesel� engine� has� the� highest� thermal� efficiency� of� any�
standard�external�or�internal�combustion�engine.�From�this�point�of�view,�diesel�engines�
have�the�clear�advantage�of�consuming�less�fuel�than�gasoline�ones,�which�is�reflected�in�
lower�CO2�emissions�per�km�on�road�transport�than�gasoline�powered�vehicles.�
Carbon�monoxide�(CO)�
Carbon�monoxide�is�a�colorless�odorless�and�toxic�gas.�Its�toxicological�effects�are�due�
to�the�formation�of�carboxyhemoglobin�in�the�blood,�which�inhibits�the�oxygen�intake.�At�
low� concentrations,� CO� causes� fatigue� in� healthy� people� and� chest� pain� in� people� with�
heart� disease.� CO� can� cause� as� well� flu�like� symptoms� and� at� very� high� concentrations�
causes�death�[8].��
In�diesel�engine,�CO� formation� is�promoted�when�the�combustion� takes�place�at� low�
pressure�and�temperature�in�the�rich�fuel�zones�[5].��
Nitrogen�oxides�(NOx)�
Nitrogen� oxides� (NOx)� comprises,� N2O,� NO,� N2O2,� N2O3,� NO2,� N2O4,� and� N2O5,� being�
N2O3� and� N2O5� solids� and� the� rest� gases� at� ambient� conditions.� NOx� emissions� from�
combustion� are� primarily� in� the� form� of� NO� and� as� well� NO2� because� NO� is� rapidly�
converted�to�NO2.�NO2�is�present�in�the�atmosphere�and�in�acid�rain�in�the�form�of�HNO3.�
1.�Introduction�
21�
Both� NO� and� NO2� participate� in� the� ozone� formation� from� the� photo� reaction� of� VOC�
(volatile�organic�compounds)�[9].�
At� the� United� States,� transportation� related� sources� (on�road,� nonroad� and�
aircraft/locomotive/marine)� account� for� approximately� 60%� of� total� anthropogenic�
emissions� of� NOx,� while� stationary� sources� (electrical� utilities� and� industrial� boilers)�
account�for�most�of�the�remainder�[10].�
In� diesel� engines� NOx� comes� from� the� oxidation� of� N2� of� the� air� in� the� intake.� Its�
formation�is�associated�with�high�combustion�pressures�and�temperatures�and�also�to�an�
excess�of�air�or�lack�of�fuel�in�the�combustion�mixture�[5].�
Sulfur�oxides�(SOx)�
SO2� is� the�component�of�greatest�concern� in�SOx�and� is�used�as� the� indicator� for� the�
larger�group�of�gaseous�sulfur�oxides�(SOx).�Short�term�exposures�to�SO2�are�related�with�
an� array� of� adverse� respiratory� effects� including� bronchoconstriction� and� increased�
asthma�symptoms.�SOx�can�react�with�other�compounds�in�the�atmosphere�to�form�small�
particles,� which� penetrate� deeply� into� sensitive� parts� of� the� lungs� and� cause� or�worsen�
respiratory�diseases�[8].�
In�diesel�engines�SOx�emissions�are�directly�related�with�the�sulfur�content�of�the�fuel,�
which�has�been�lowered�continuously�by�legislation.�In�Europe,�directive�2009/30/EC�set�
in�10�ppm�the�maxim�sulfur�content�of�diesel�and�in�United�States,�Ultra�Low�Sulfur�Diesel�
(ULSD)� with� �� 15� ppm� was� phased� in� for� highway� diesel� from� 2006� to� 2010� [8].�
Anthropogenic�emissions�of�SO2� in�United�States�are�mainly�due�to�combustion�of� fossil�
fuels,� being� electrical� generation� and� industrial� point� sources� the� major� contributors�
(85%)�whereas�transport�related�sources�only�contribute�by�7%.�
Although�contribution�of�transport�related�sources�to�anthropogenic�emissions�of�SO2�
is� low,� lowering�sulfur� in�the�fuel� is� important�to�avoid�catalyst�poisoning� in�the�current�
after�treatment�devices�and�also�to�prevent�sulfate�particles�formation.�
�
�
1.�Introduction�
22�
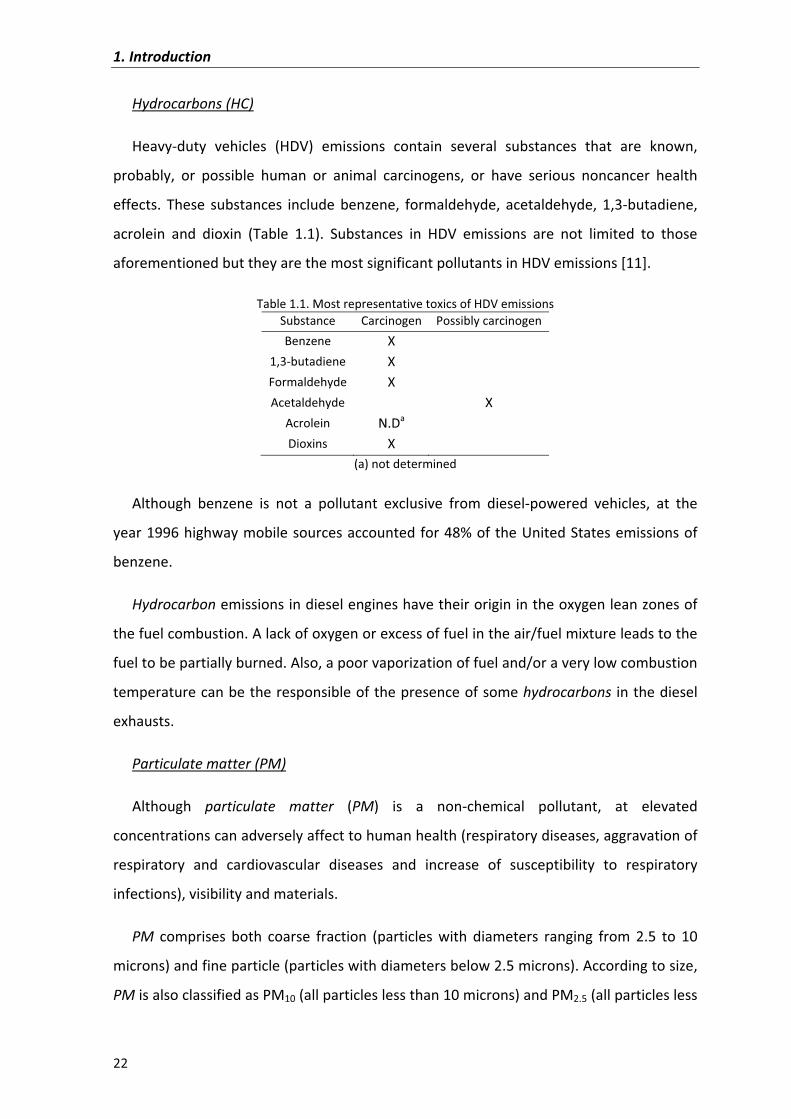
Hydrocarbons�(HC)�
Heavy�duty� vehicles� (HDV)� emissions� contain� several� substances� that� are� known,�
probably,� or� possible� human� or� animal� carcinogens,� or� have� serious� noncancer� health�
effects.� These� substances� include� benzene,� formaldehyde,� acetaldehyde,� 1,3�butadiene,�
acrolein� and� dioxin� (Table� 1.1).� Substances� in� HDV� emissions� are� not� limited� to� those�
aforementioned�but�they�are�the�most�significant�pollutants�in�HDV�emissions�[11].�
Table�1.1.�Most�representative�toxics�of�HDV�emissions�Substance Carcinogen Possibly�carcinogenBenzene� X� �
1,3�butadiene� X� �Formaldehyde� X� �Acetaldehyde� � X�
Acrolein� N.Da� �Dioxins� X� �
(a)�not�determined�
Although� benzene� is� not� a� pollutant� exclusive� from� diesel�powered� vehicles,� at� the�
year�1996�highway�mobile�sources�accounted�for�48%�of�the�United�States�emissions�of�
benzene.�
Hydrocarbon�emissions�in�diesel�engines�have�their�origin�in�the�oxygen�lean�zones�of�
the�fuel�combustion.�A�lack�of�oxygen�or�excess�of�fuel�in�the�air/fuel�mixture�leads�to�the�
fuel�to�be�partially�burned.�Also,�a�poor�vaporization�of�fuel�and/or�a�very�low�combustion�
temperature�can�be�the�responsible�of�the�presence�of�some�hydrocarbons� in�the�diesel�
exhausts.��
Particulate�matter�(PM)�
Although� particulate� matter� (PM)� is� a� non�chemical� pollutant,� at� elevated�
concentrations�can�adversely�affect�to�human�health�(respiratory�diseases,�aggravation�of�
respiratory� and� cardiovascular� diseases� and� increase� of� susceptibility� to� respiratory�
infections),�visibility�and�materials.��
PM� comprises� both� coarse� fraction� (particles� with� diameters� ranging� from� 2.5� to� 10�
microns)�and�fine�particle�(particles�with�diameters�below�2.5�microns).�According�to�size,�
PM�is�also�classified�as�PM10�(all�particles�less�than�10�microns)�and�PM2.5�(all�particles�less�
1.�Introduction�
23�
than�2.5�microns).�According�to�the�moment�of�formation,�PM�can�be�divided�in�primary�
and�secondary�particles.�Primary�particles�are�those�emitted�directly� to� the�atmosphere�
whereas� secondary� particles� are� formed� by� transformations� of� gaseous� emissions� of�
sulfur�dioxide,�nitrogen�oxides�and�VOCs�(volatile�organic�compounds).�
Primary� diesel� particles� mainly� consist� of� carbonaceous� material,� with� a� small�
contribution�from�sulfuric�acid�and�ash�(trace�metals).�Many�of�these�particles�exist�in�the�
atmosphere� as� carbon� core� with� a� coating� of� organic� carbon� compounds,� or� as� sulfuric�
acid�and�ash,�sulfuric�acid�aerosols,�or�sulfate�particles�associated�with�organic�carbon.�As�
well,� the� soluble� organic� fraction� (SOF),� which� consists� in� unburned� hydrocarbons� that�
have�condensed�into�liquid�droplets�from�diesel�exhausts.���
While� representing� a� very� small� portion� (less� than� one� percent)� of� the� emissions� of�
metals,�and�representing�a�small�portion�of�diesel�particulate�matter�(1�to�5%),�it�should�
be� noted� that� several� trace� metals� that� may� have� general� toxicological� significance�
depending� on� the� specific� species� are� also� emitted� by� diesel� engines� in� small� amounts�
including� chromium,� manganese,� mercury� and� nickel.� In� addition,� small� amounts� of�
dioxins� have� been� measured� in� diesel� exhaust,� some� of� which� may� partition� into� the�
particle�phase.��
Approximately� 80�95%� of� diesel� particle� mass� is� in� the� size� range� from� 0.05� to� 1.0�
micrometers� with� a� mean� particle� diameter� of� about� 0.2� micrometres.� These� fine�
particles� have� a� very� specific� surface� area,� which� make� them� excellent� carriers� for�
adsorbed�inorganic�and�organic�compounds�that�can�effectively�reach�the�lowest�airways�
of�the� lung.�Approximately�50�90%�of�particles� in�diesel�exhaust�are� in�the�ultrafine�size�
range�from�0.005�0.05�micrometers,�averaging�about�0.02�micrometers.�While�accounting�
for� the�majority�of� the�number�of�particles,�ultrafine�diesel�particulate�matter�accounts�
for�1�20%�(w/w)�of�diesel�particulate�matter�[11].��
1.�Introduction�
24�
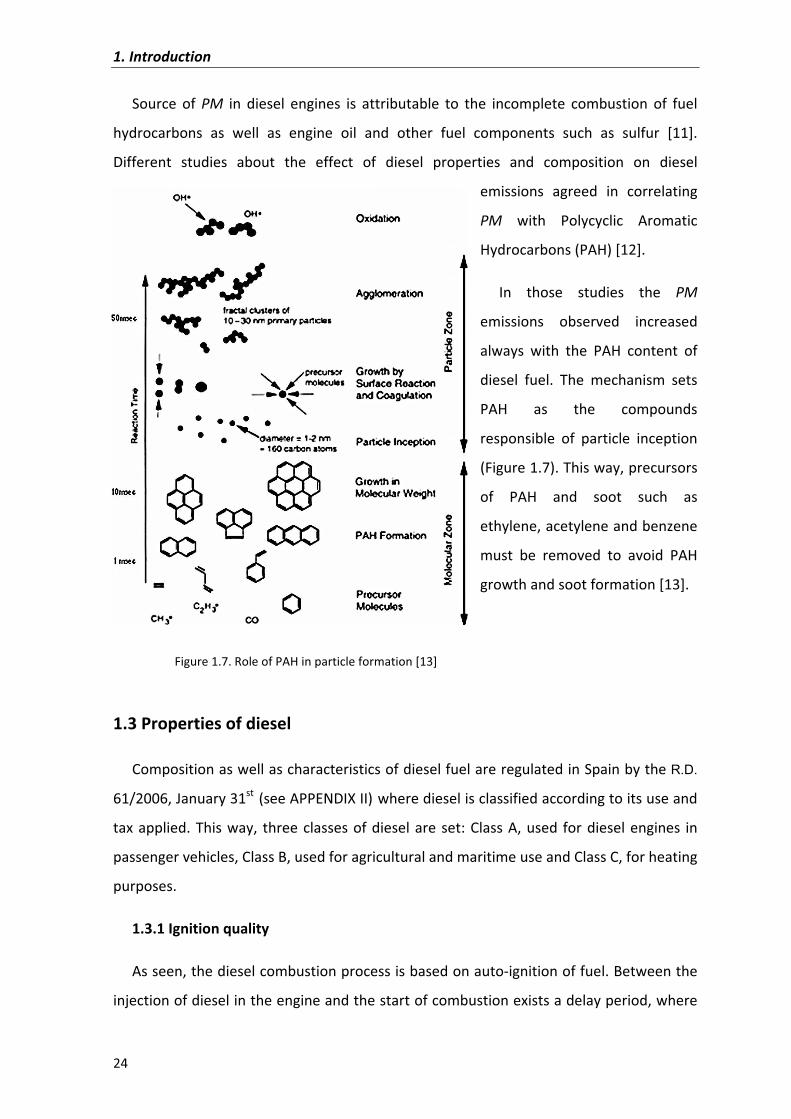
Source� of� PM� in� diesel� engines� is� attributable� to� the� incomplete� combustion� of� fuel�
hydrocarbons� as� well� as� engine� oil� and� other� fuel� components� such� as� sulfur� [11].�
Different� studies� about� the� effect� of� diesel� properties� and� composition� on� diesel�
emissions� agreed� in� correlating�
PM� with� Polycyclic� Aromatic�
Hydrocarbons�(PAH)�[12].��
In� those� studies� the� PM�
emissions� observed� increased�
always� with� the� PAH� content� of�
diesel� fuel.� The� mechanism� sets�
PAH� as� the� compounds�
responsible� of� particle� inception�
(Figure�1.7).�This�way,�precursors�
of� PAH� and� soot� such� as�
ethylene,�acetylene�and�benzene�
must� be� removed� to� avoid� PAH�
growth�and�soot�formation�[13].�
�
�
1.3�Properties�of�diesel�
Composition�as�well�as�characteristics�of�diesel�fuel�are�regulated�in�Spain�by�the�R.D.
61/2006,�January�31st (see�APPENDIX�II) where�diesel�is�classified�according�to�its�use�and�
tax�applied.�This�way,� three�classes�of�diesel�are�set:�Class�A,�used� for�diesel�engines� in�
passenger�vehicles,�Class�B,�used�for�agricultural�and�maritime�use�and�Class�C,�for�heating�
purposes.�
1.3.1�Ignition�quality��
As�seen,�the�diesel�combustion�process�is�based�on�auto�ignition�of�fuel.�Between�the�
injection�of�diesel�in�the�engine�and�the�start�of�combustion�exists�a�delay�period,�where�
Figure�1.7.�Role�of�PAH�in�particle�formation [13]
1.�Introduction�
25�
fuel� is� atomized,� evaporated,� mixed� with� air� and� ignited.� Using� fuels� with� low� ignition�
quality� increases� the� ignition� delay,� the� amount� of� fuel� injected� during� ignition� delay�
period�and�the�share�of�premixed�combustion.�All�this,�results�in�high�pressure�gradients,�
rough� engine� operation,� high� noise� levels,� and� even� in� increased� NOx� emissions.� Good�
ignition�properties�are�thus,�important.�For�conventional�hydrocarbon�fuels,�either�cetane�
number� determined� by� a� test� engine� or� a� calculated� cetane� index� is� used� to� describe�
ignition� quality.� Straight�chain� paraffinic� compounds� have� the� highest� ignition� quality,�
which�improves�as�the�chain�length�increases.�On�the�contrary,�aromatic�compounds�have�
poor�ignition�quality,�as�do�the�alcohols�[13].�
1.3.2�Density�and�heating�value�
All� diesel� fuel� injection� systems� are� based� on� volumetric� metering.� To� control�
maximum�engine�output�and�emissions,�standard�EN�590�sets�a� relatively�narrow�range�
for� density,� 820�845� kg/m3� at� 15� ºC.� At� a� constant� heating� value,� lower� density� means�
reduced�maximum�power�output,�higher�density�increased�output�and�increased�particle�
formation.�For�conventional�diesel�fuel,�heating�value�is�about�36�MJ/L�[13].�
1.3.3�Flash�point�
Flash�point� is�the� lowest�temperature�for�the�formation�of�an� ignitable�air�fuel�vapor�
mixture.� Storage� and� handling� regulations� for� fuels� are� based� on� the� flash� point.� In�
Europe,�diesel�fuel�has�to�have�a�flash�point�higher�than�55�ºC�while�in�the�US,�the�Class�II�
liquid�requirement�for�flash�point�is�higher�than�38ºC.�
1.3.4�Water�content�
The�solubility�of�water�into�commercial�diesel�fuel�is�very�limited.�Free�water�even�in�a�
very� small� quantity� will� cause� problems,� for� example� freezing� at� low� temperatures� and�
damaging� the� injection� systems.� A� high� water� content� will� increase� as� well� the� risk� of�
phase�separation�and�even�the�risk�of�biological�instability.�
1.3.5�Corrosion,�lubricity�
The�high�pressure� injection�system� is�prone�to�wear�and�corrosion.�Most�diesel� fuels�
are� treated� with� multi�functional� additive� packages� to� improve� lubricity� and� suppress�
1.�Introduction�
26�
corrosion.�Wear�of�injection�systems�was�a�big�issue�when�low�sulfur�or�sulfur�free�fuels�
were�introduced.�
1.3.6�Viscosity�
Viscosity�and�fuel�density�are�two�important�parameters�when�designing�fuel�systems.�
As�the�fuel�density,�viscosity�should�also�be�kept�in�a�rather�narrow�window.�Low�viscosity�
will� increase� leakage� and� delay� start� of� injection� in� fully� mechanical� injection� systems.�
High�viscosity�will�impose�additional�loads�on�the�injection�system.�
1.3.7�Cold�performance�properties.��
Diesel� fuels� generally� develop� start�up� and� operability� problems� when� vehicles� and�
fuel�systems�are�subjected�to�cold�temperatures.�As�ambient�temperatures�cool�towards�
their� crystallization� temperature,� high�molecular� weight� paraffins� (n�alkanes� C18–C30)� in�
diesel�nucleate�and�form�wax�crystals�suspended�in�a�liquid�phase�composed�of�shorter�
chain�n�alkanes�and�aromatics.�The�solid�wax�crystals�may�plug�or� restrict� flow� through�
filters�causing�start�up�and�operability�problems�[14].�
Several�parameters�have�been�used�to�monitor�cold�properties�of�diesel.�Cloud�point2�
(CP),� pour� point3� (PP),� cold� filter� plugging� point4� (CFPP),� and� low�temperature� flow� test�
(LTFT)�are�used�to�characterize�the�performance�of�diesel�in�tanks�and�fuel�systems�during�
cold�weathers.��
1.3.8�Cetane�number�and�cetane�index�
Both� cetane� number� and� cetane� index� are� used� to� measure� diesel� ignition� quality.�
However,�their�differences�must�be�highlighted�since�cetane�index�is�used�as�a�estimation�
of�cetane�number.�
Within�characteristics�of�diesel�set� in�the�R.D.�61/2006,�cetane�number� is�one�of�the�
most� important� parameter� for� measuring� diesel� fuel� ignition� quality.� During� the� 1930s,�
������������������������������������������������������������2�Cloud�point�(CP):�temperature�where�components�form�crystals�and�become�visible�forming�a�hazy�or�cloudy�suspension.�3�Pour�point�(PP):�lowest�temperature�where�the�fuel�flows�or�can�be�pumped.�4�Cold�filter�plugging�point�(CFPP):�lowest�temperature�at�which�a�given�volume�of�fuel�passes�through�a�standardized�filtration�device.��
1.�Introduction�
27�
Boerlage�and�Broeze�sought�a�procedure�to�determine�the� ignition�quality�of�diesel� fuel�
that� was� similar� to� the� octane� rating� method� for� gasoline� using� two� reference�
hydrocarbon�fuels:�1�hexadecene�and���methyl�naphthalene.�The�first�reference�fuel,�1�
hexadecene,� also� known� as� cetene� or� ketene,� has� a� long,� straight� chain� structure� and�
oxidizes�relatively�easily.�This�fuel�was�assigned�a�cetene�(ketene)�number�of�100.�
The� second� reference� fuel,� ��methyl� naphthalene,� also� known� as� 1�
methylnaphthalene,�has�two�aromatic�rings�and�is�highly�resistant�to�oxidation.�This�fuel�
was�assigned�a�cetene�number�of�0.�The�cetene�number�of�a�fuel�was�deemed�to�be�the�
percentage�(by�mass)�of�cetene�in�a�blend�of�cetene�and���methyl�naphthalene�that�gave�
the�same�ignition�performance�as�the�fuel�under�test.�
Cetane�number�appeared�later�because�cetene�is�difficult�to�prepare�and�it�is�prone�to�
oxidation�during�storage.�This�way,�cetane� (n�hexadecane)�was�used�as�a�reference� fuel�
instead�of�cetene.��
Because� of� experimental� difficulties� in� working� with� ��methyl� naphthalene,� the�
reference� fuel� for� the� lower� end� of� the� cetane� number� scale� was� later� changed� to�
2,2,4,4,6,8,8�heptamethylnonane,� with� an� assigned� cetane� number� of� 15.� In� terms� of�
these�two�reference�fuels,�the�cetane�number�scale�is�then�defined�as�follows:��
CN�=�%�(v/v)�hexadecane�+�0.15��(%�(v/v)�heptamethylnonane)� (1.1)
As� seen,� evaluation� of� cetane� number� always� imply� a� fuel� performance� test,� for� this�
reason� cetane� index� was� created� as� an� estimation� of� cetane� number.� Environmental�
Protection�Agency�(EPA)�suggests�the�method�ASTM�D976�based�in�two�variables,�density�
and�T50�(Temperature�corresponding�to�the�ASTM�D86�50%�distilled�point)�but�the�newest�
equation�stands�up�for�a�four�variable�equation�described�via�ASTM�D4737:�
�� � ���� ���� ���� � ���� ����� ��� ��������� �� � �����
���� ���� � ��� ����� � ��� ���� ����� �� � ����� � ����
��!� � ��� ��� ����� � ����" � ��!� � ���"� �#�
���� ����� �� � ����� � �� � ��������� �� � ����� � ��"�
(1.2)
�
1.�Introduction�
28�
where�
CI�=�Cetane�index.�
T10�=�Distillation�property�via�ASTM�D86:�temperature�in�oF�at�which�10�%�(v/v)�has�
evaporated.�
T50�=�Distillation�property�via�ASTM�D86:�temperature�in�oF�at�which�50�%�(v/v)�has�
evaporated.�
T90�=�Distillation�property�via�ASTM�D86:�temperature�in�oF�at�which�90�%�(v/v)�has�
evaporated.�
D�=�Density�in�g/ml�at�15�oC,�via�ASTM�D1298.�
�
The�Ethyl�corporation�showed�that�cetane�index�does�not�have�a�1:1�correlation�with�
natural� cetane� number� and� the� following� equation� appears� to� provide� a� much� more�
precise�relationship�[12]:�
Natural�cetane�number =�1.154�cetane�index�9.231 (1.3)
�
1.4�How�to�solve�the�problem�of�diesel�engine�emissions�
It�has�been�seen�that�exhaust�management�is�a�complex�process,�air�excess�and�high�
combustion� temperatures�must�be� avoided� to� minimize�NOx�emissions�but�at� the�same�
time,� combustion� temperature� and� oxygen� content� in� the� fuel/air� mixture� must� be�
acceptable�enough�to�avoid�unburned�hydrocarbons�CO�and�PM.�Ideally,�the�combustion�
of� diesel� would� proceed� with� a� short� ignition� delay� and� a� short� premixed� combustion�
phase� with� a� moderate� rate� of� heat� release� so� excessive� temperature� increase� and� the�
subsequent�formation�of�NOx�are�avoided.�An�ideal�diesel�would�at�the�same�time�shorten�
the� premixed� combustion� phase� and� extend� the� controlled� combustion,� where� fuel/air�
mixture�would�have�enough�oxygen�content� to�ensure�complete�combustion�of�CO�and�
hydrocarbons,� specially� aromatics� and� polycyclic� aromatic� hydrocarbons,� so� soot�
formation�and�particle�agglomeration�are�minimized.��
The�solution�to�make�the�combustion�of�diesel�a�cleaner�process�involves�a�good�spray�
formation,�which�means�that�air�and�fuel�are�quickly�and�homogeneously�mixed.�Both�fuel�
1.�Introduction�
29�
injection� technology� and� fuel� properties� are� involved� to� get� a� quick� vaporization� of� the�
fuel�as�well�as�good�contact�air�fuel.��Short�ignition�delays�require�quality�fuels�with�high�
cetane�numbers.�Despite�the�upgrade�in�injection�technologies�and�good�fuel�properties,�
some�of� the�pollutants�described�might�be�released� in� the�combustion�process.�For� this�
reason�end�pipe�solutions�such�as�diesel�particle�filters�(DPF),�in�cylinder�control�systems�
and�fuel�modification�can�be�needed�to�lower�diesel�emissions.��
1.4.1�In�cylinder�control�systems�
Most�effective� in�cylinder�control� systems� in� reducing�exhaust�emissions�are�exhaust�
gas� recirculation� (EGR),� advanced� injection� systems� (e.g.� Common� Rail� Systems)� and�
electronic�controls�[15].��
EGR�system�works�introducing�part�of�the�exhaust�gases�into�the�combustion�chamber.�
This�way,�oxygen�content�of�the�intake�air�is�displaced�with�exhaust�gases�that�have�much�
lower�oxygen�content.�Although�EGR�system�has�been�applied�in�light�duty�diesel�engines�
and� has� been� effective� in� reducing� tail�pipe� NOx� emissions,� the� reduction� of� NOx� is� at�
expense�of�an� increase� in�other�emissions� from�the�engine�(such�as�PM),�an� increase� in�
engine� wear� and� fuel� consumption� [15].� EGR� systems� are� usually� accompanied� of�
sophisticated� and� controlled� injection� systems� such� as� common� rail,� which� allows� high�
pressure� injection�and�multiple� injection�events�along�with�air�handling�systems�such�as�
EGR.�
1.4.2�End�pipe�solutions�
End�pipe� devices� to� control� NOx� emissions� were� developed� in� the� 1970s.� They� are�
called� three�way� catalysts� because� these� devices� contain� zeolites� and� precious� metals�
(platinum)�to�reduce�emissions�of�NOx,�unburned�hydrocarbons�(HC)�and�CO�at�the�same�
time.� Zeolites� act� as� adsorber� of� HC� from� the� exhaust� stream.� Once� adsorbed� on� the�
zeolite,� hydrocarbons� will� oxidize� and� create� a� locally� oxygen� poor� region� that� is� more�
conducive�to�reducing�NOx�to�N2.�The�catalyst�can�incorporate�platinum�or�other�precious�
metals� to� promote� HC� oxidation� at� lower� temperatures.� However,� the� presence� of� the�
precious�metals�can�lead�to�production�of�sulfate�PM.�As�well,�modern�diesel�engines�do�
1.�Introduction�
30�
not� emit� enough� unburned� hydrocarbons� in� the� exhaust� to� greatly� reduce� NOx� since�
diesel�engines�operate�under�oxygen�rich�conditions.��
Nowadays,� three�way� catalysts� are� used� in� combination� with�NOx� adsorbers,� which�
store� NOx� in� oxygen� rich� conditions� such� as� those� of� diesel� engines.� Unfortunately,� the�
storage� capacity� of� the� NOx� adsorber� is� limited,� requiring� that� the� stored� NOX� be�
periodically�purged�from�the�storage�component.�If�the�stored�NOx�is�released�when�the�
net�exhaust�chemistry�is�at�stoichiometric�or�net�fuel�rich�conditions,�then�the�three�way�
catalyst�portion�of�the�catalyst�can�reduce�the�NOx�oxidizing�HC�and�CO�to�water�and�CO2.�
The�NOx�storage�process�can�be�further�broken�down�into�two�steps:�
�
� First� the� NO� in� the� exhaust� is� oxidized� to� NO2� across� an� oxidation� promoting�
catalyst,�typically�platinum�[11].��
� Then� the� NO2� is� further� oxidized� and� stored� on� the� surface� of� the� catalyst� as� a�
metallic�nitrate�(MNO3).��
�
The� storage� components� are� typically� alkali� or� alkaline� earth� metals� that� can� form�
stable� metallic� nitrates.� The� most� common� storage� component� is� barium� carbonate�
(BaCO3)� which� can� store� NO2� as� barium� nitrate� (Ba(NO3)2)� while� releasing� CO2� [11].� In�
order� to� the� NOx� storage� function� to� work,� the� NOx� must� be� oxidized� to� NO2� prior� to�
storage� and� a� storage� site� must� be� available� (the� device� cannot� be� “full”).� During� this�
oxygen�rich�portion�of�operation,�NOx� is�stored�while�HC�and�CO�emissions�are�oxidized�
across� the� three�way� catalyst� components� by� oxygen� in� the� exhaust.� This� can� result� in�
near�zero�emissions�of�NOx,�HC,�and�CO�under�the�net�oxygen�rich�operating�conditions�
typical�of�diesel�engines.�
�
In� order� to� regenerate� the� NOx� adsorber,� fuel� rich� operating� conditions� are� needed.�
The� metallic� nitrate� becomes� unstable� under� net� fuel� rich� operating� conditions,�
decomposing� and� releasing� the� stored� NOx.� Then� the� NOx� is� reduced� to� N2� by� reducing�
agents�in�the�exhaust�(CO�and�HC)�across�a�three�way�catalyst�system.��
�
1.�Introduction�
31�
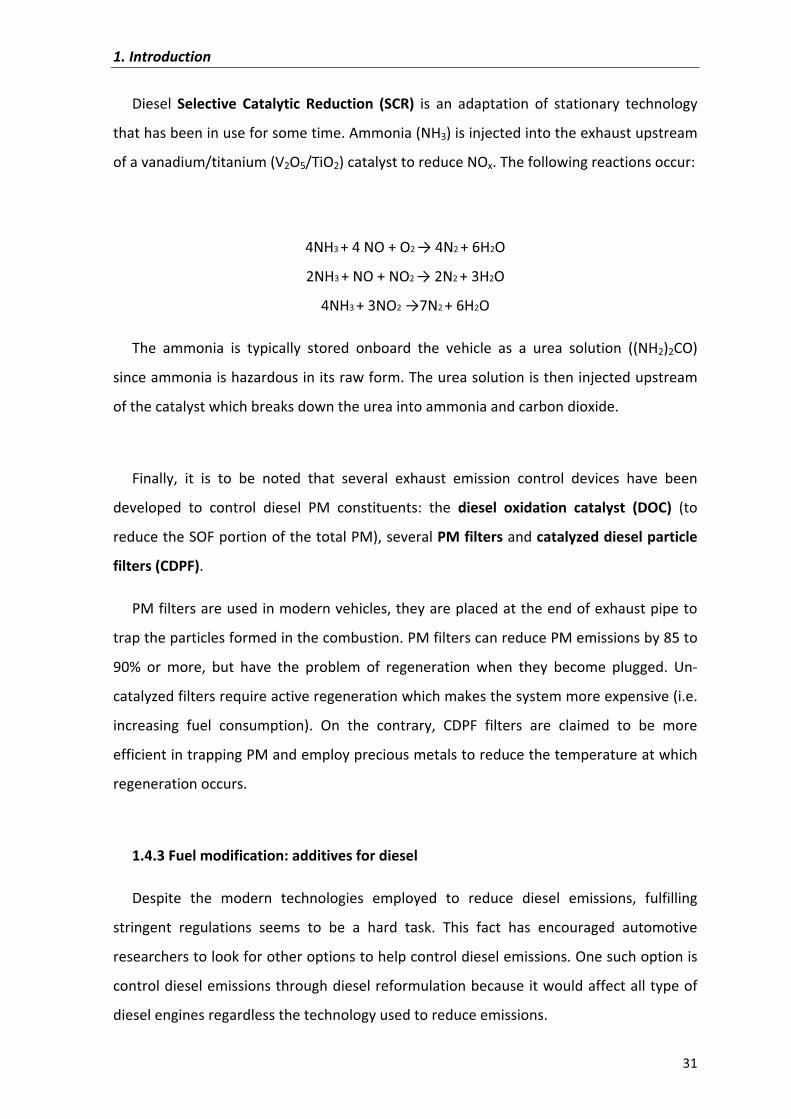
Diesel� Selective� Catalytic� Reduction� (SCR)� is� an� adaptation� of� stationary� technology�
that�has�been�in�use�for�some�time.�Ammonia�(NH3)�is�injected�into�the�exhaust�upstream�
of�a�vanadium/titanium�(V2O5/TiO2)�catalyst�to�reduce�NOx.�The�following�reactions�occur:�
�
4NH3�+�4�NO�+�O2���4N2�+�6H2O�
2NH3�+�NO�+�NO2���2N2�+�3H2O�
4NH3�+�3NO2��7N2�+�6H2O�
The� ammonia� is� typically� stored� onboard� the� vehicle� as� a� urea� solution� ((NH2)2CO)�
since�ammonia�is�hazardous�in�its�raw�form.�The�urea�solution�is�then�injected�upstream�
of�the�catalyst�which�breaks�down�the�urea�into�ammonia�and�carbon�dioxide.��
�
Finally,� it� is� to� be� noted� that� several� exhaust� emission� control� devices� have� been�
developed� to� control� diesel� PM� constituents:� the� diesel� oxidation� catalyst� (DOC)� (to�
reduce�the�SOF�portion�of�the�total�PM),�several�PM�filters�and�catalyzed�diesel�particle�
filters�(CDPF).�
PM�filters�are�used�in�modern�vehicles,�they�are�placed�at�the�end�of�exhaust�pipe�to�
trap�the�particles�formed�in�the�combustion.�PM�filters�can�reduce�PM�emissions�by�85�to�
90%� or� more,� but� have� the� problem� of� regeneration� when� they� become� plugged.� Un�
catalyzed�filters�require�active�regeneration�which�makes�the�system�more�expensive�(i.e.�
increasing� fuel� consumption).� On� the� contrary,� CDPF� filters� are� claimed� to� be� more�
efficient�in�trapping�PM�and�employ�precious�metals�to�reduce�the�temperature�at�which�
regeneration�occurs.��
�
1.4.3�Fuel�modification:�additives�for�diesel�
Despite� the� modern� technologies� employed� to� reduce� diesel� emissions,� fulfilling�
stringent� regulations� seems� to� be� a� hard� task.� This� fact� has� encouraged� automotive�
researchers�to�look�for�other�options�to�help�control�diesel�emissions.�One�such�option�is�
control�diesel�emissions�through�diesel�reformulation�because�it�would�affect�all�type�of�
diesel�engines�regardless�the�technology�used�to�reduce�emissions.��
1.�Introduction�
32�
Fuel�modification�not�only�can�successfully�help�to�reduce�diesel�emissions�in�a�simple�
way.�Legislation�is�becoming�progressively�stringent�with�mandatory�diesel�specifications,�
forcing�oil� industry�to�modify� its�composition� in�order�to�accomplish�the�new�standards.�
European� Parliament� enforced� measures� to� improve� air� quality� of� diesel� engines� with�
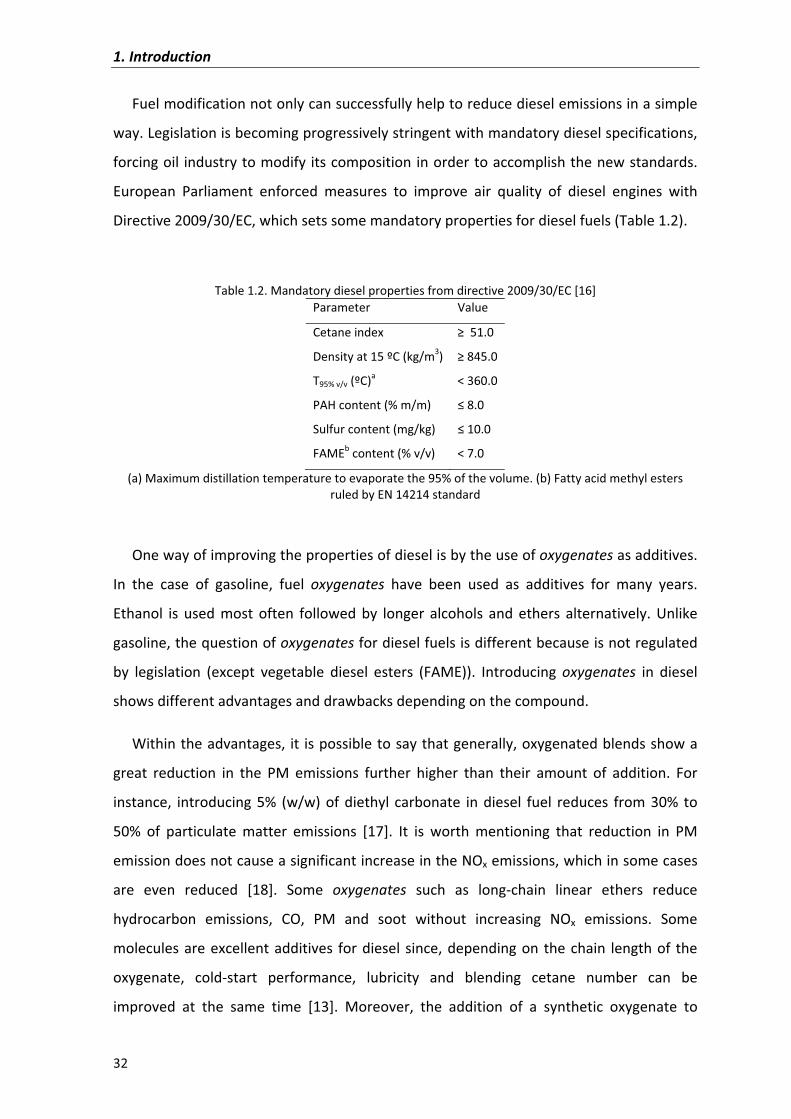
Directive�2009/30/EC,�which�sets�some�mandatory�properties�for�diesel�fuels�(Table�1.2).�
�
Table�1.2.�Mandatory�diesel�properties�from�directive�2009/30/EC�[16]�Parameter Value
Cetane�index ���51.0
Density�at�15�ºC�(kg/m3) ��845.0
T95%�v/v (ºC)a <�360.0
PAH�content�(%�m/m) ��8.0
Sulfur�content�(mg/kg) ��10.0
FAMEb content�(%�v/v) <�7.0
(a)�Maximum�distillation�temperature�to�evaporate�the�95%�of�the�volume.�(b)�Fatty�acid�methyl�esters�ruled�by�EN�14214�standard�
�
One�way�of�improving�the�properties�of�diesel�is�by�the�use�of�oxygenates�as�additives.�
In� the� case� of� gasoline,� fuel� oxygenates� have� been� used� as� additives� for� many� years.�
Ethanol� is� used� most� often� followed� by� longer� alcohols� and� ethers� alternatively.� Unlike�
gasoline,�the�question�of�oxygenates�for�diesel�fuels�is�different�because�is�not�regulated�
by� legislation� (except� vegetable� diesel� esters� (FAME)).� Introducing� oxygenates� in� diesel�
shows�different�advantages�and�drawbacks�depending�on�the�compound.��
Within�the�advantages,� it� is�possible�to�say�that�generally,�oxygenated�blends�show�a�
great� reduction� in� the� PM� emissions� further� higher� than� their� amount� of� addition.� For�
instance,� introducing� 5%� (w/w)� of� diethyl� carbonate� in� diesel� fuel� reduces� from� 30%� to�
50%� of� particulate� matter� emissions� [17].� It� is� worth� mentioning� that� reduction� in� PM�
emission�does�not�cause�a�significant�increase�in�the�NOx�emissions,�which�in�some�cases�
are� even� reduced� [18].� Some� oxygenates� such� as� long�chain� linear� ethers� reduce�
hydrocarbon� emissions,� CO,� PM� and� soot� without� increasing� NOx� emissions.� Some�
molecules�are�excellent�additives� for�diesel� since,�depending�on� the�chain� length�of� the�
oxygenate,� cold�start� performance,� lubricity� and� blending� cetane� number� can� be�
improved� at� the� same� time� [13].� Moreover,� the� addition� of� a� synthetic� oxygenate� to�
1.�Introduction�
33�
diesel�will�always� imply�a�reduction�of�undesirable�compounds�(such�as�sulfur�and�PAH)�
due�to�the�dilution�effect.��
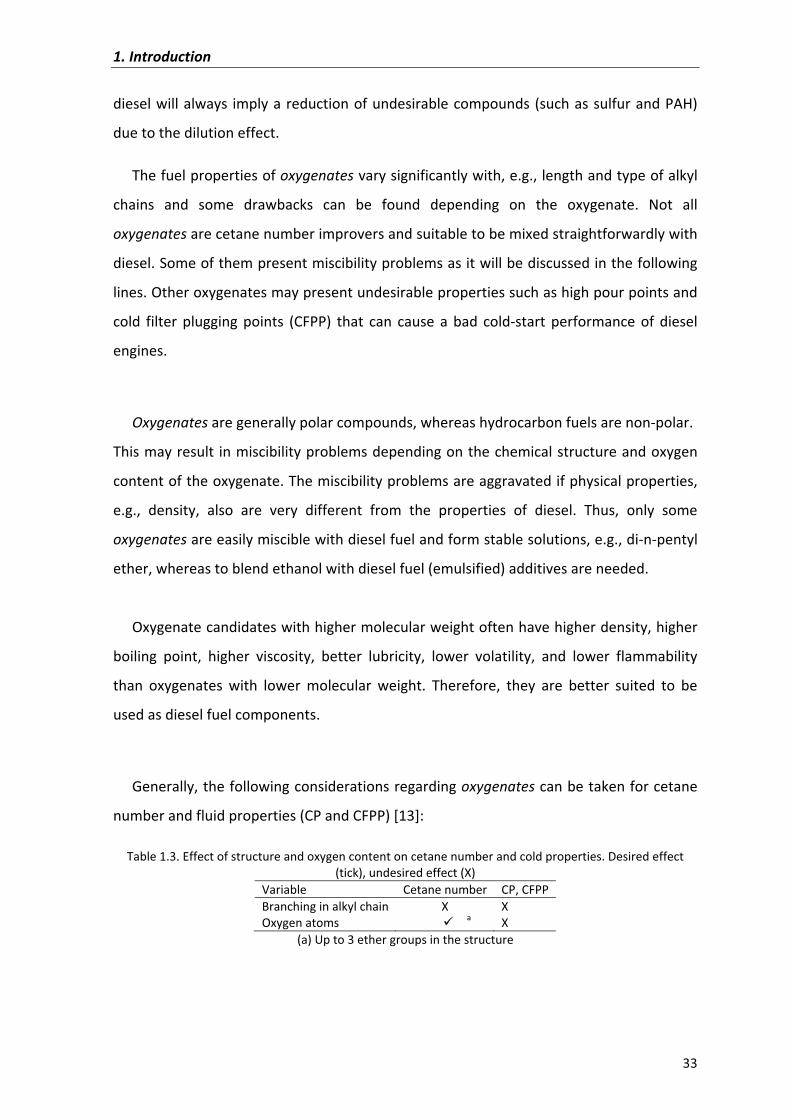
The�fuel�properties�of�oxygenates�vary�significantly�with,�e.g.,�length�and�type�of�alkyl�
chains� and� some� drawbacks� can� be� found� depending� on� the� oxygenate.� Not� all�
oxygenates�are�cetane�number�improvers�and�suitable�to�be�mixed�straightforwardly�with�
diesel.�Some�of�them�present�miscibility�problems�as�it�will�be�discussed�in�the�following�
lines.�Other�oxygenates�may�present�undesirable�properties�such�as�high�pour�points�and�
cold� filter� plugging� points� (CFPP)� that� can� cause� a� bad� cold�start� performance� of� diesel�
engines.�
�
Oxygenates�are�generally�polar�compounds,�whereas�hydrocarbon�fuels�are�non�polar.�
This�may�result� in�miscibility�problems�depending�on�the�chemical�structure�and�oxygen�
content�of�the�oxygenate.�The�miscibility�problems�are�aggravated�if�physical�properties,�
e.g.,� density,� also� are� very� different� from� the� properties� of� diesel.� Thus,� only� some�
oxygenates�are�easily�miscible�with�diesel�fuel�and�form�stable�solutions,�e.g.,�di�n�pentyl�
ether,�whereas�to�blend�ethanol�with�diesel�fuel�(emulsified)�additives�are�needed.�
�
Oxygenate�candidates�with�higher�molecular�weight�often�have�higher�density,�higher�
boiling� point,� higher� viscosity,� better� lubricity,� lower� volatility,� and� lower� flammability�
than� oxygenates� with� lower� molecular� weight.� Therefore,� they� are� better� suited� to� be�
used�as�diesel�fuel�components.��
�
Generally,�the�following�considerations�regarding�oxygenates�can�be�taken�for�cetane�
number�and�fluid�properties�(CP�and�CFPP)�[13]:�
Table�1.3.�Effect�of�structure�and�oxygen�content�on�cetane�number�and�cold�properties.�Desired�effect�(tick),�undesired�effect�(X)�
Variable� Cetane�number CP,�CFPPBranching�in�alkyl�chain Oxygen�atoms � a
(a)�Up�to�3�ether�groups�in�the�structure�
1.�Introduction�
34�
Summarizing,�the�oxygenates�capable�of�being�introduced�into�diesel�blends�are�mainly�
alcohols,�esters,�ethers�and�carbonates.�Thus,�the�following�lines�will�be�focused�on�these�
possible�components.�
�
1.4.3.1�Alcohols�
The�most�studied�oxygenated�compound� is�ethanol.�First� research�was�carried�out� in�
South� Africa� in� the� 1970s� and� continued� in� Germany� and� the� United� States� during� the�
1980s.� Nowadays,� ethanol� is� a� form� of� renewable� energy� that� can� be� produced� from�
agricultural�feedstocks.� It�can�be�obtained�from�very�common�crops�such�as�sugar�cane,�
potato,� manioc� and� maize� (corn).�The� production� of� bio�ethanol� has� been� doubled� in� 5�
years.� The� main� producers� are� Brazil� and� United� States,� however,� China� has� sharply�
increased� its� production� in� the� last� years.� On� the� other� hand,� ethanol� also� is� obtained�
from� petroleum� products.� It� is� mainly� obtained� by� means� of� the� catalytic� hydration� of�
ethylene.�Two�million�tons�of�petroleum�derived�ethanol�are�produced�annually�[19].�
Several�properties�must�be�considered�to�make�compatible�the�technology�of�a�diesel�
engine�with�the�properties�of�ethanol�diesel�blends.�When�ethanol�content�was�20�40%,�
high�concentrations�of�additives�are�needed�to�stabilize�the�mixture�or�attain�the�required�
cetane�number.�In�summary,�ethanol�addition�reduces�the�cetane�number,�fuel�viscosity�
and�the�mixture�stability�[20�22].�
�
1.4.3.2�Esters�
Nowadays,�ester�fuels�are�produced�from�renewable�resources.�Bio�diesel�is�the�name�
for�a�variety�of�ester�based�oxygenated�fuel� from�biological�materials�such�as�vegetable�
oils,�recycled�cooking�oils,�animal�fats�and�plant�or�forest�waste�products.�The�use�of�bio�
diesel�has�presented�a�promising�alternative�in�the�world.��
Using�a�mixture�of�esters�provides�a�reduction�of�many�harmful�exhaust�emissions.�A�
nearly� complete� absence� of� sulfur� emissions,� reduction� in� PAH� emissions� and� PM� is�
observed�with�ester�mixtures.�Nevertheless,�bio�diesel�has�high�pour�point�temperatures�
that�could�present�cold�flow�problems�due�to�fuel�gelling�[23�28].�
1.�Introduction�
35�
As�petroleum�supplies�are�becoming�constrained,�bio�diesel�is�a�growing�source�of�fuel�
for�engines.�However,�vegetable�esters�are�not�cetane�number�enhancers.�Methyl�esters�
in� diesel� blends� will� not� achieve� the� mandatory� cetane� number� of� the� Directive�
2009/30/EC�(>51)�since�they�have� low�cetane�numbers.�Longer�chain� length�esters� than�
methyl�esters� should�be�used�since� longer�esters� such�as�propyl�esters�have�better� fuel�
properties:� higher� cetane� number,� calorific� value,� melting� point� and� viscosity� [29].� In�
order�to�synthesize�longer�esters,�longer�alcohols�are�needed.��
�
1.4.3.3�Carbonates��
The� main� advantage� of� the�carbonates� is� the� high� oxygen� content� in� their� structure.�
This� fact� implies� less� CO� and� PM� emissions,� without� an� increase� in� NOx� emissions.� For�
instance,�a�5%�(w/w)�mixture�in�diethyl�carbonate�increases�from�30�to�50�of�reduction�in�
particulate� matter� [17]� Moreover� dimethyl� and� diethyl� carbonates� are� readily� prepared�
from�methanol�or�ethanol�[17],�so�they�can�be�produced�from�renewable�resources.�
As� it� occurs� with� esters,� short� carbon� chain� of� these� mentioned� carbonates� makes�
difficult� to� introduce� them�directly�because�of� their� low�cetane�number�and�high� latent�
heat� of� vaporization� [30].� Consequently,� in� order� to� use� cetane� improvers,� longer�
carbonates�are�needed.�For�example,�dioctyl�carbonate�has�a�cetane�number�of�63.9�and�
dioleyl�carbonate�a�cetane�number�of�107.2�[31].�However,� it�has�to�be�mentioned�that�
for� the� same� number� of� carbon� atoms,� cetane� number� is� higher� in� esters� than� in�
carbonates.��
�
1.4.3.4�Ethers�
When�ethers�are�added�to�a�diesel�fuel�in�a�quantity�ranging�from�5�to�20�%�(vol/vol)�all�
diesel�properties�are�substantially�improved�[32].�Extensive�engine�tests�have�shown�that�
overall� exhaust� emissions� are� reduced� [33�34].� Due� to� similar� properties� of� ethers� to�
commercial�diesel,�these�ethers�can�be�used�themselves�as�a�fuel.��
Between� ethers,� an� interesting� group� is� the� glycol�ethers� one,� since� they� can� be�
obtained�from�glycols�which�are�an�undesired�byproduct�of�the�bio�diesel�production�[35].�
1.�Introduction�
36�
Moreover�at�the�same�fuel�oxygen�content,�glycol�ethers�show�a�lower�sooting�tendency�
than� in�an�ether�blend�[36].�However,�more�research�studies�to�synthesize�glycol�ethers�
are�required.�
Finally,�as�the�other�groups,�to�maintain�the�commercial�diesel�properties,� long�chain�
ethers�are�the�most�suitable.�Unfortunately,�due�to�the�higher�price�of�the�reactants,�long�
ethers�are�the�most�expensive�ones.�The�most� important�property�of�ethers� is�that�they�
have�much�higher�cetane�numbers�than�diesel�fuel,�while�alcohols�have�very�low�cetane�
number.� Moreover,� comparing� compounds� with� the� same� number� of� carbon� atoms� in�
their� structure,� ethers� also� have� much� higher� cetane� numbers� than� alcohols� [37].� For�
instance,�butanol�has�a�cetane�number�of�25�[38]�and�diethyl�ether�a�value�around�90.�
�
Within� the� group� of� long� chain� ethers,� it� was� shown� that� linear� symmetrical� and�
asymmetrical�mono�ethers�with�more�than�9�carbon�atoms�are�the�most�suitable�to�be�
added� to� diesel� pool� since� they� seem� to� give� the� best� compromise� between� cetane�
characteristics�and�the�behavior�at�low�temperature�[39].�Starting�with�10�carbon�atoms,�
asymmetrical�and�symmetrical� linear�ethers�such�as�di�n�pentyl�ether� (DNPE)�and�ethyl�
octyl�ether�(EOE)�are� interesting�because�both�are�cetane�number�enhancers�and� lower�
the�pour�and�cloud�points�of�diesel�blend�[40].�Since�European�directives�2009/28/EC�and�
2009/30/EC�impose�the�introduction�of�bio�compounds�in�the�automobile�fuels�there�is�a�
raising� interest� in� introducing� bio�ethanol� to� diesel� market.� This� way,� linear� ethyl�alkyl�
ethers�produced�from�bimolecular�dehydration�of�ethanol�and�n�alcohols�could�be�a�way�
to� incorporate� bio�ethanol� to� diesel� pool� avoiding� the� problems� of� direct� blending� to�
diesel�fuels�[22].�
Some�properties�of�linear�symmetrical�(ROR)�and�asymmetrical�(R1OR2)�ethers�as�diesel�
additives�are�summarized�in�Table�1.4.�In�Table�1.4�linear�symmetrical�ethers�DNPE,�DNHE�
and�DNOE�as�well�as�linear�asymmetrical�ether�EOE�are�compared�to�commercial�diesel.�
�
�
�
1.�Introduction�
37�
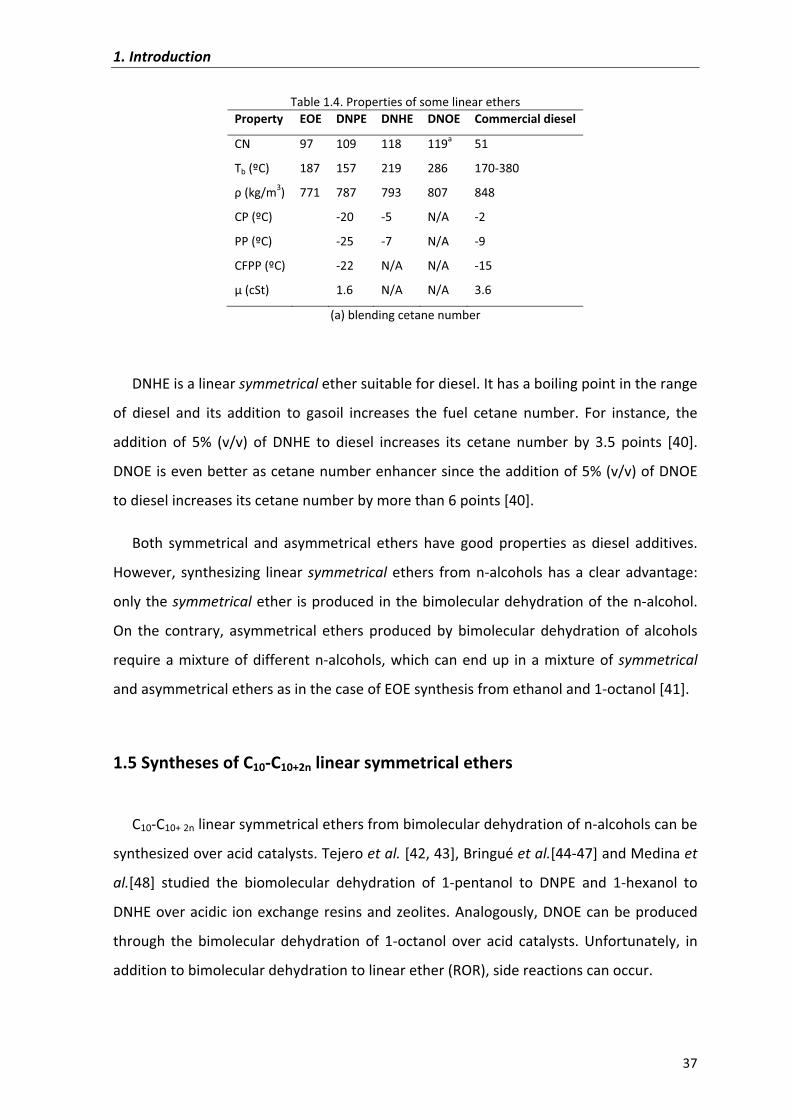
Table�1.4.�Properties�of�some�linear�ethers�Property� EOE� DNPE DNHE DNOE Commercial�diesel�
CN� 97� 109 118 119a 51
Tb�(ºC)� 187� 157 219 286 170�380
�(kg/m3)� 771� 787 793 807 848
CP�(ºC)� � �20 �5 N/A �2
PP�(ºC)� � �25 �7 N/A �9
CFPP�(ºC)� � �22 N/A N/A �15
��(cSt)�� � 1.6 N/A N/A 3.6
(a)�blending�cetane�number�
�
DNHE�is�a�linear�symmetrical�ether�suitable�for�diesel.�It�has�a�boiling�point�in�the�range�
of� diesel� and� its� addition� to� gasoil� increases� the� fuel� cetane� number.� For� instance,� the�
addition� of� 5%� (v/v)� of� DNHE� to� diesel� increases� its� cetane� number� by� 3.5� points� [40].�
DNOE�is�even�better�as�cetane�number�enhancer�since�the�addition�of�5%�(v/v)�of�DNOE�
to�diesel�increases�its�cetane�number�by�more�than�6�points�[40].��
Both� symmetrical� and� asymmetrical� ethers� have� good� properties� as� diesel� additives.�
However,� synthesizing� linear�symmetrical� ethers� from�n�alcohols�has�a� clear�advantage:�
only�the�symmetrical�ether� is�produced�in�the�bimolecular�dehydration�of�the�n�alcohol.�
On� the� contrary,� asymmetrical� ethers� produced� by� bimolecular� dehydration� of� alcohols�
require�a�mixture�of�different�n�alcohols,�which�can�end�up� in�a�mixture�of�symmetrical�
and�asymmetrical�ethers�as�in�the�case�of�EOE�synthesis�from�ethanol�and�1�octanol�[41].�
�
1.5�Syntheses�of�C10�C10+2n�linear�symmetrical�ethers�
�
C10�C10+�2n�linear�symmetrical�ethers�from�bimolecular�dehydration�of�n�alcohols�can�be�
synthesized�over�acid�catalysts.�Tejero�et�al.�[42,�43],�Bringué�et�al.[44�47]�and�Medina�et�
al.[48]� studied� the� biomolecular� dehydration� of� 1�pentanol� to� DNPE� and� 1�hexanol� to�
DNHE�over�acidic� ion�exchange�resins�and�zeolites.�Analogously,�DNOE�can�be�produced�
through� the� bimolecular� dehydration� of� 1�octanol� over� acid� catalysts.� Unfortunately,� in�
addition�to�bimolecular�dehydration�to�linear�ether�(ROR),�side�reactions�can�occur.�
1.�Introduction�
38�
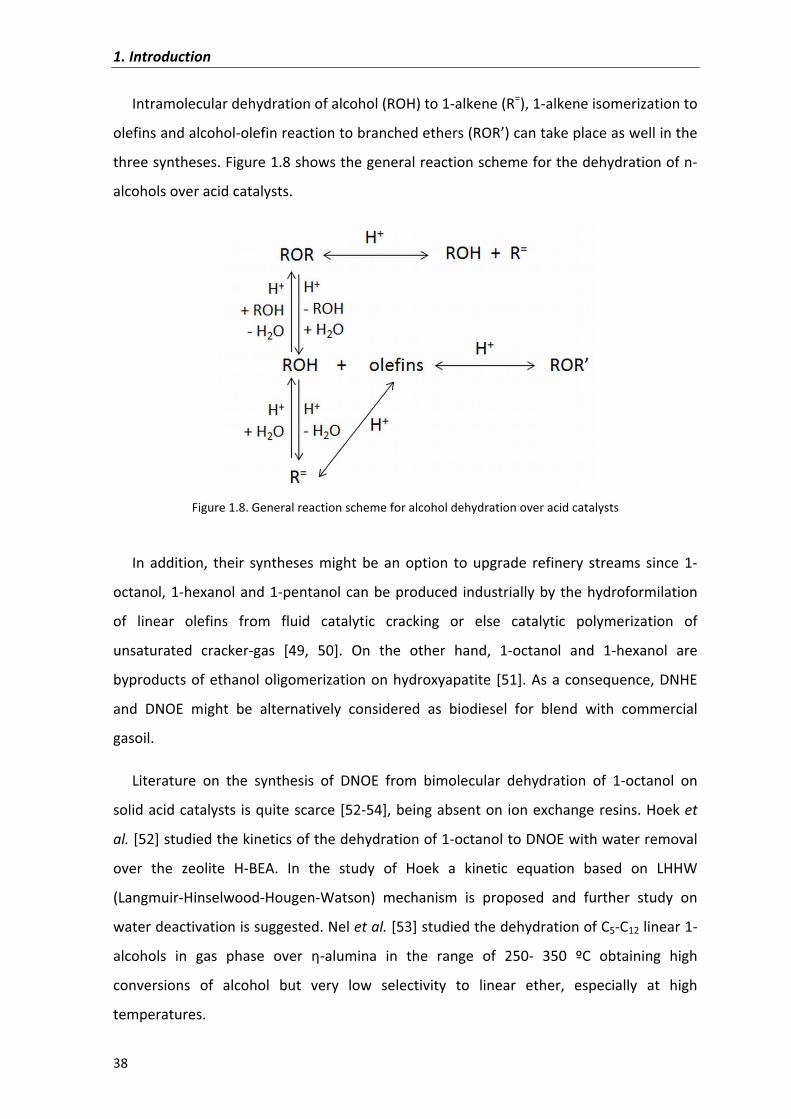
Intramolecular�dehydration�of�alcohol�(ROH)�to�1�alkene�(R=),�1�alkene�isomerization�to�
olefins�and�alcohol�olefin�reaction�to�branched�ethers�(ROR’)�can�take�place�as�well�in�the�
three�syntheses.�Figure�1.8�shows�the�general�reaction�scheme�for�the�dehydration�of�n�
alcohols�over�acid�catalysts.�
�Figure�1.8.�General�reaction�scheme�for�alcohol�dehydration�over�acid�catalysts�
�
In� addition,� their� syntheses� might� be� an� option� to� upgrade� refinery� streams� since� 1�
octanol,�1�hexanol�and�1�pentanol�can�be�produced� industrially�by�the�hydroformilation�
of� linear� olefins� from� fluid� catalytic� cracking� or� else� catalytic� polymerization� of�
unsaturated� cracker�gas� [49,� 50].� On� the� other� hand,� 1�octanol� and� 1�hexanol� are�
byproducts�of�ethanol�oligomerization�on�hydroxyapatite� [51].�As�a�consequence,�DNHE�
and� DNOE� might� be� alternatively� considered� as� biodiesel� for� blend� with� commercial�
gasoil.��
Literature� on� the� synthesis� of� DNOE� from� bimolecular� dehydration� of� 1�octanol� on�
solid�acid�catalysts� is�quite�scarce�[52�54],�being�absent�on�ion�exchange�resins.�Hoek�et�
al.�[52]�studied�the�kinetics�of�the�dehydration�of�1�octanol�to�DNOE�with�water�removal�
over� the� zeolite� H�BEA.� In� the� study� of� Hoek� a� kinetic� equation� based� on� LHHW�
(Langmuir�Hinselwood�Hougen�Watson)� mechanism� is� proposed� and� further� study� on�
water�deactivation�is�suggested.�Nel�et�al.�[53]�studied�the�dehydration�of�C5�C12�linear�1�
alcohols� in� gas� phase� over� ��alumina� in� the� range� of� 250�� 350� ºC� obtaining� high�
conversions� of� alcohol� but� very� low� selectivity� to� linear� ether,� especially� at� high�
temperatures.�
1.�Introduction�
39�
1.5.1�Catalysts�
As� seen,� bimolecular� dehydration� of� primary� alcohols� to� linear� ethers� requires� acid�
catalysis.� Traditionally,� industrial� processes� for� obtaining� linear� ethers� make� use� of�
sulfuric�acid�as�catalyst� [55].�However,� solid�acid�catalysts�have� the�advantage�of�easier�
separation� from� the� reaction� mixture� [56],� and� also� to� yield� a� reaction� product� free� of�
blacken�compounds.�Zeolites�and�aluminas�can�be�used�as�catalysts�in�these�dehydration�
reactions� [52�54];� but� both� types� of� catalysts� require� relatively� high� temperatures� to�
achieve� valuable� alcohol� conversions� and� are� more� suitable� to� intermolecular�
dehydration� because� of� their� high� selectivity� to� olefin� formation.� Nevertheless,� some�
zeolites�have�high�selectivity� to� linear�ether�and�present� the�advantage�of�high� thermal�
resistance,� allowing� this� way� increasing� the� activity� by� increasing� the� working�
temperature.� On� the� contrary,� ion� exchange� resins� have� shown� good� performances� in�
etherification� of� alcohols.� They� require� lower� temperatures� and� their� selectivity� to�
symmetrical�ether�is�normally�higher�than�those�of�zeolites.��
�
1.5.2�Ion�exchange�resins�
Ion� exchange� resins� are� polymeric� materials� functionalized� so� they� are� able� to�
exchange� ions� with� the� environment.� They� offer� the� advantage� of� being� insoluble,�
thermally� and� mechanically� resistant.� The� polymeric� matrix� is� formed� by� hydrocarbon�
chains,�and�a�crosslinking�agent�that�can�be�present� in�the�polymeric�matrix� in�different�
extent,� resulting� in� a� three�dimensional� hydrophobic� structure.� Polymeric� matrix� is�
functionalized�with�the�so�called�functional�groups,�which�are�attached�to�the�matrix�and�
give� the� resins� acid,� basic� or� both� characteristics� according� to� the� nature� of� functional�
groups.�Thermal�and�mechanical�resistance�of�ion�exchangers�depends�on�both�degree�of�
crosslinking�and�nature�of�functional�groups.�
�
Within� ion� exchangers,� different� types� of� polystyrene�divinylbenzene� (PS�DVB)� resins�
are�commonly�used�in�catalysis�as�well�as�a�perfluoroalkane�sulfonic�resin�called�Nafion®.�
The�following�lines�briefly�describe�composition�and�characteristics�of�these�two�type�of�
acidic�ion�exchange�resins.�
1.�Introduction�
40�
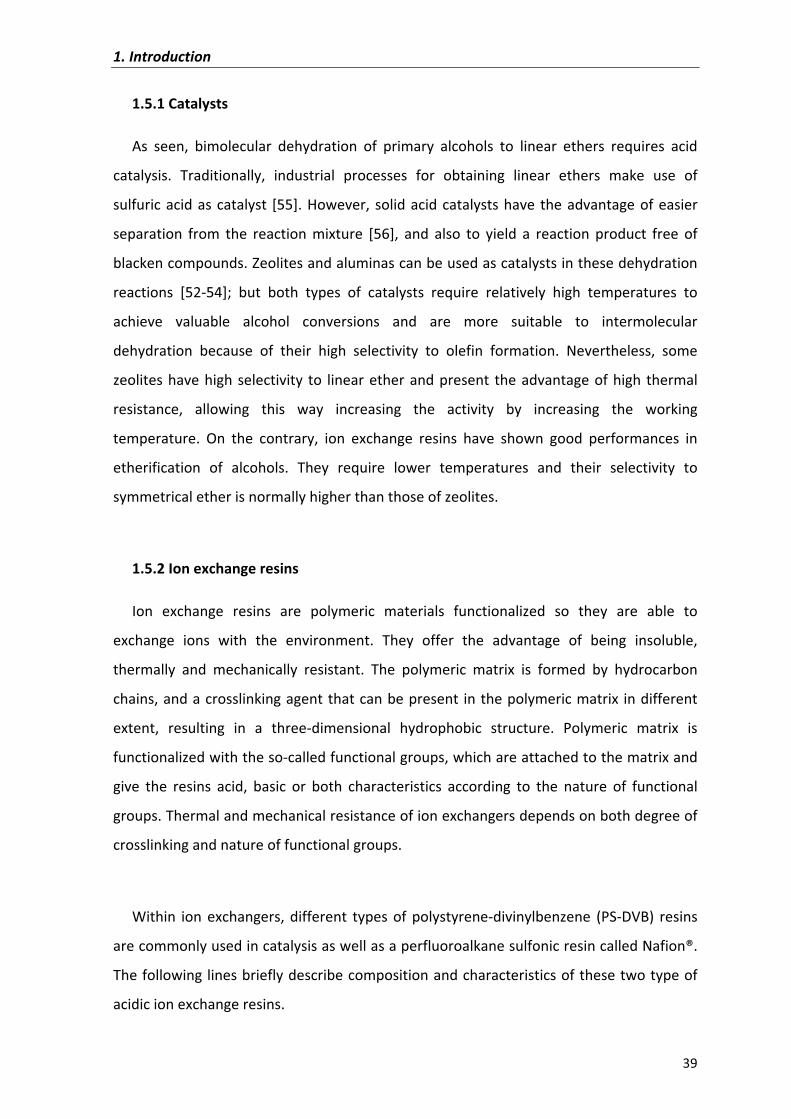
1.5.2.1�Polystyrene�divinylbenzene�(PS�DVB)�resins�
PS�DVB�ion�exchange�resins�are�based�on�a�polystyrene�matrix�and�a�crosslinking�agent�
consisting� of� divinylbenzene� (DVB).� The� resulting� copolymer� can� be� functionalized� by�
means�of:�
� Acid:� As� a� result,� the� resin� is� a� cation� exchanger.� Acids� employed� can� be� strong�
such� as� sulfuric� acid� resulting� in� sulfonic� groups� (Figure� 1.9)� or� weak� carboxylic�
acids�giving�carboxylic�exchange�sites.�
� Base:� The� resulting� resins� exchange� anions� and� functional� groups� can� be� either�
quaternary�ammonia�based�groups�or�polyamines.��
�
�Figure�1.9.�Structure�of�a�sulfonated�PS�DVB�ion�exchange�resin�
�
PS�DVB� ion�exchange�resins�are� industrially�produced�by�copolymerization�of�styrene�
and�DVB�in�water�solution�in�a�stirred�reactor.�In�the�process,�all�the�liquids�are�mixed�and�
styrene�DVB�forms�big�drops�in�suspension�which�become�smaller�as�mixing�speed�rises.�
When�the�size�of�drops�is�about�1�mm,�benzoic�peroxide�is�added�and�the�polymerization�
starts,� generating� small� plastic� spheres� as� those� shown� in� Figure� 1.10.� Attending� to�
physical� structure� of� the� polymer� matrix� after� being� produced,� PS�DVB� resins� can� be�
divided�in�macroreticular�and�gel�tpye�resins.��
1.�Introduction�
41�
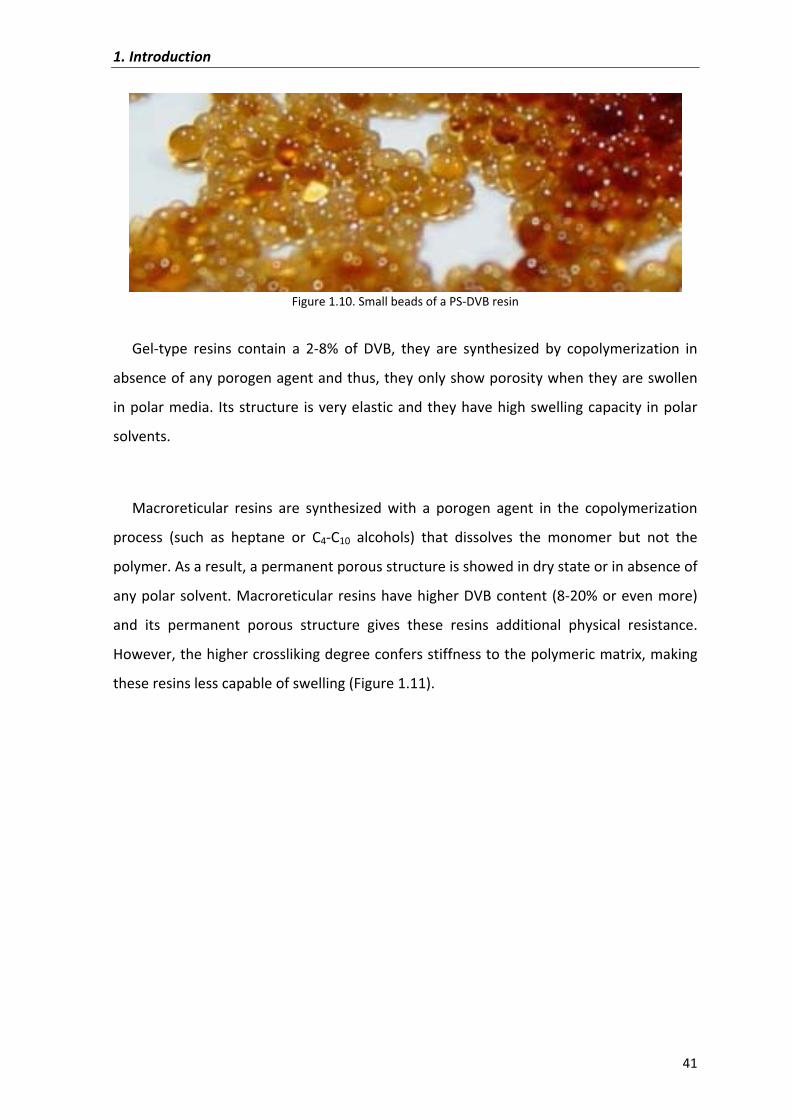
�Figure�1.10.�Small�beads�of�a�PS�DVB�resin�
�
Gel�type� resins� contain� a� 2�8%� of� DVB,� they� are� synthesized� by� copolymerization� in�
absence�of�any�porogen�agent�and�thus,�they�only�show�porosity�when�they�are�swollen�
in�polar�media.� Its�structure� is�very�elastic�and�they�have�high�swelling�capacity� in�polar�
solvents.�
�
Macroreticular� resins� are� synthesized� with� a� porogen� agent� in� the� copolymerization�
process� (such� as� heptane� or� C4�C10� alcohols)� that� dissolves� the� monomer� but� not� the�
polymer.�As�a�result,�a�permanent�porous�structure�is�showed�in�dry�state�or�in�absence�of�
any�polar�solvent.�Macroreticular�resins�have�higher�DVB�content�(8�20%�or�even�more)�
and� its� permanent� porous� structure� gives� these� resins� additional� physical� resistance.�
However,�the�higher�crossliking�degree�confers�stiffness�to�the�polymeric�matrix,�making�
these�resins�less�capable�of�swelling�(Figure�1.11).�
1.�Introduction�
42�
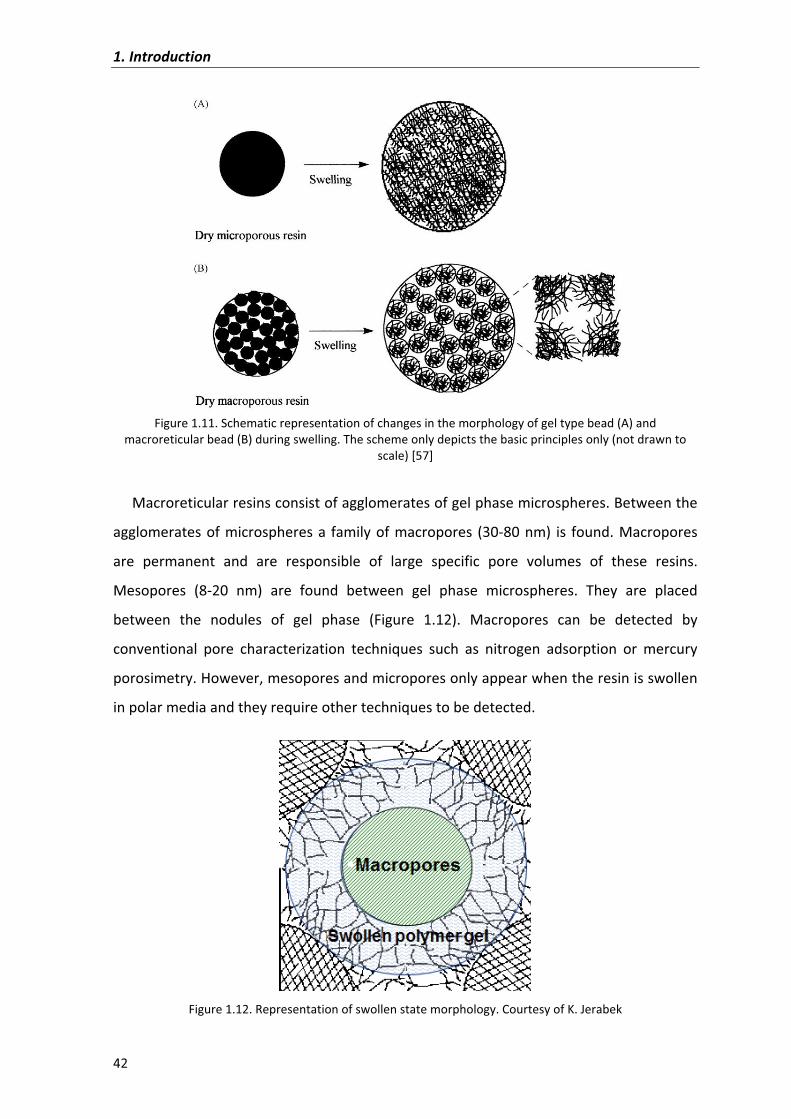
�Figure�1.11.�Schematic�representation�of�changes�in�the�morphology�of�gel�type�bead�(A)�and�
macroreticular�bead�(B)�during�swelling.�The�scheme�only�depicts�the�basic�principles�only�(not�drawn�to�scale)�[57]�
�
Macroreticular�resins�consist�of�agglomerates�of�gel�phase�microspheres.�Between�the�
agglomerates�of�microspheres�a� family�of�macropores� (30�80�nm)� is� found.�Macropores�
are� permanent� and� are� responsible� of� large� specific� pore� volumes� of� these� resins.�
Mesopores� (8�20� nm)� are� found� between� gel� phase� microspheres.� They� are� placed�
between� the� nodules� of� gel� phase� (Figure� 1.12).� Macropores� can� be� detected� by�
conventional� pore� characterization� techniques� such� as� nitrogen� adsorption� or� mercury�
porosimetry.�However,�mesopores�and�micropores�only�appear�when�the�resin�is�swollen�
in�polar�media�and�they�require�other�techniques�to�be�detected.��
�Figure�1.12.�Representation�of�swollen�state�morphology.�Courtesy�of�K.�Jerabek�
1.�Introduction�
43�
Until� now,� only� ISEC� (Inverse� Steric� Exclusion� Chromatography)� technique� has� been�
able� to� characterize� the� swollen� structure� of� PS�DVB� resins.� The� technique� consists� on�
measuring� the� elution� volumes� of� different� solutes� of� known� molecular� size,� by� using� a�
chromatographic�column�filled�with�the�investigated�swollen�polymer�[58].�This�technique�
permits�obtaining�polymer�density�distributions�and�it�will�be�described�in�chapter�3.�
�
1.5.2.2�Perfluoroalkane�sulfonic�resins�(Nafion)�
Nafion�is�the�commercial�name�of�an�ion�exchange�resin�based�on�the�copolymer�made�
of� tetrafluoroethylene� (Teflon®)� and� perfluorinated� monomers� functionalized� with�
sulfonic� groups.� Teflon®� chain� acts� as� a� main� skeleton� and� is� crossed� by� the� other�
monomer� periodically.� Its� structure� is� not� completely� known� but� Nafion� can� be�
assimilated� as� hydrophilic� regions� where� ions� gather� around� sulfonic� groups.� Nafion�
presents� the� advantage� of� having� high� thermal� resistance� (up� to� 210� ºC).� Also,� the�
presence�of��CF2��groups�in�hollow�position�to�sulfonic�groups�increases�the�acid�strength�
of�such�acid�groups.�Its�high�price,�low�porosity,�low�surface�and�poor�exchange�capacity�
are�clear�disadvantages.�
�
1.5.3�Zeolites�
Zeolites�are�aluminosilicates�of�metals�of�group�I�and�II�of�the�periodic�table.�They�are�
built�with�tetrahedrons�TO4,�where�T�is�Si4+,�Al3+�and�they�are�organized�in�such�a�way�that�
uniform�size� micropores� are� generated� (pore� diameter� <� 2� nm).� They� can� be� natural� or�
synthetic�and� it� is�possible� to�control� their�composition,�porous�diameter�and�topology.�
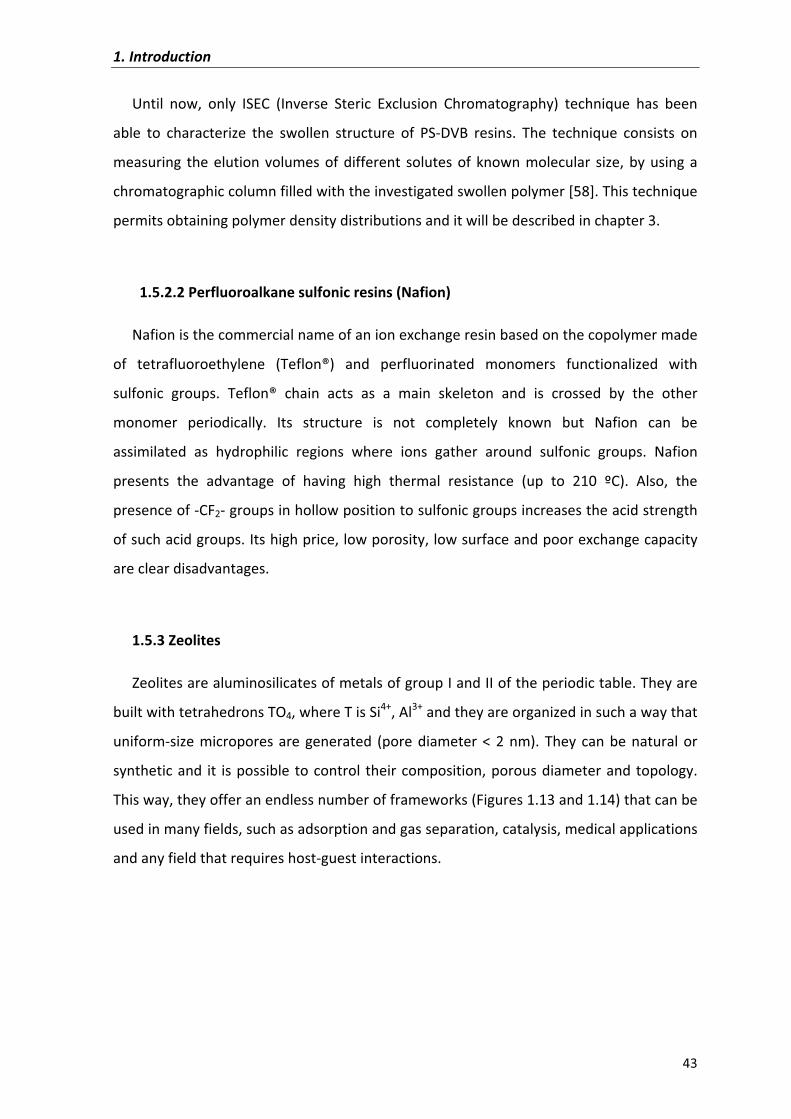
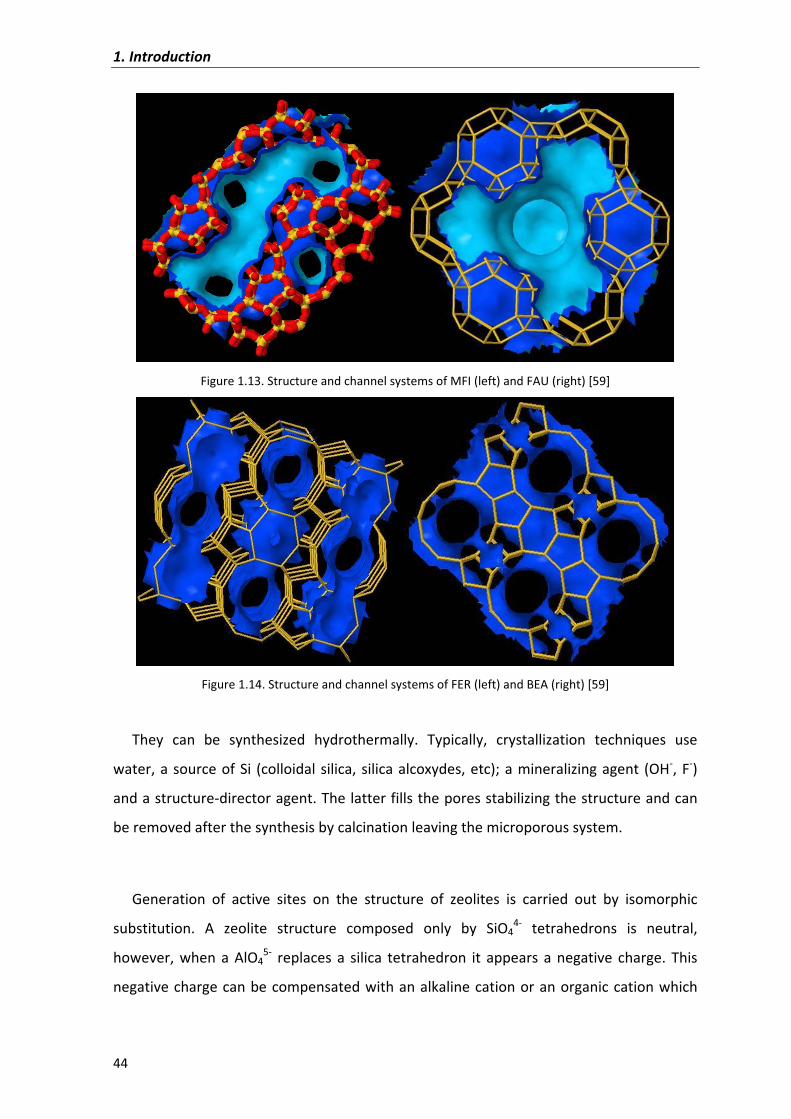
This�way,�they�offer�an�endless�number�of�frameworks�(Figures�1.13�and�1.14)�that�can�be�
used�in�many�fields,�such�as�adsorption�and�gas�separation,�catalysis,�medical�applications�
and�any�field�that�requires�host�guest�interactions.�
1.�Introduction�
44�
�Figure�1.13.�Structure�and�channel�systems�of�MFI�(left)�and�FAU�(right)�[59]�
�Figure�1.14.�Structure�and�channel�systems�of�FER�(left)�and�BEA�(right)�[59]�
�
They� can� be� synthesized� hydrothermally.� Typically,� crystallization� techniques� use�
water,�a�source�of�Si� (colloidal�silica,�silica�alcoxydes,�etc);�a�mineralizing�agent� (OH�,�F�)�
and�a�structure�director�agent.�The�latter�fills�the�pores�stabilizing�the�structure�and�can�
be�removed�after�the�synthesis�by�calcination�leaving�the�microporous�system.�
�
Generation� of� active� sites� on� the� structure� of� zeolites� is� carried� out� by� isomorphic�
substitution.� A� zeolite� structure� composed� only� by� SiO44�� tetrahedrons� is� neutral,�
however,� when� a� AlO45�� replaces� a� silica� tetrahedron� it� appears� a� negative� charge.� This�
negative�charge�can�be�compensated�with�an�alkaline�cation�or�an�organic�cation�which�
1.�Introduction�
45�
acts�as�a�structure�director�agent.�Acidic�zeolites�can�be�synthesized�with�ammonium�salts�
as�structure�director�agent,�releasing�ammonia�when�calcined�and�leaving�a�H+�attached�
to�the�zeolite�structure.�
�
1.6�Kinetics�in�heterogeneous�catalysis��
�
As�seen,�dehydration�reactions�of�alcohols�to�linear�symmetrical�can�take�place�in�solid�
catalysts.�Since�it�is�a�heterogeneous�process�and�thus,�a�surface�phenomenon�is�involved,�
reactants� must� reach� the� acid� sites� of� the� catalyst� and� products� must� be� able� to� leave�
them�and�get�the�bulk�phase�for�the�reaction�to�take�place.�
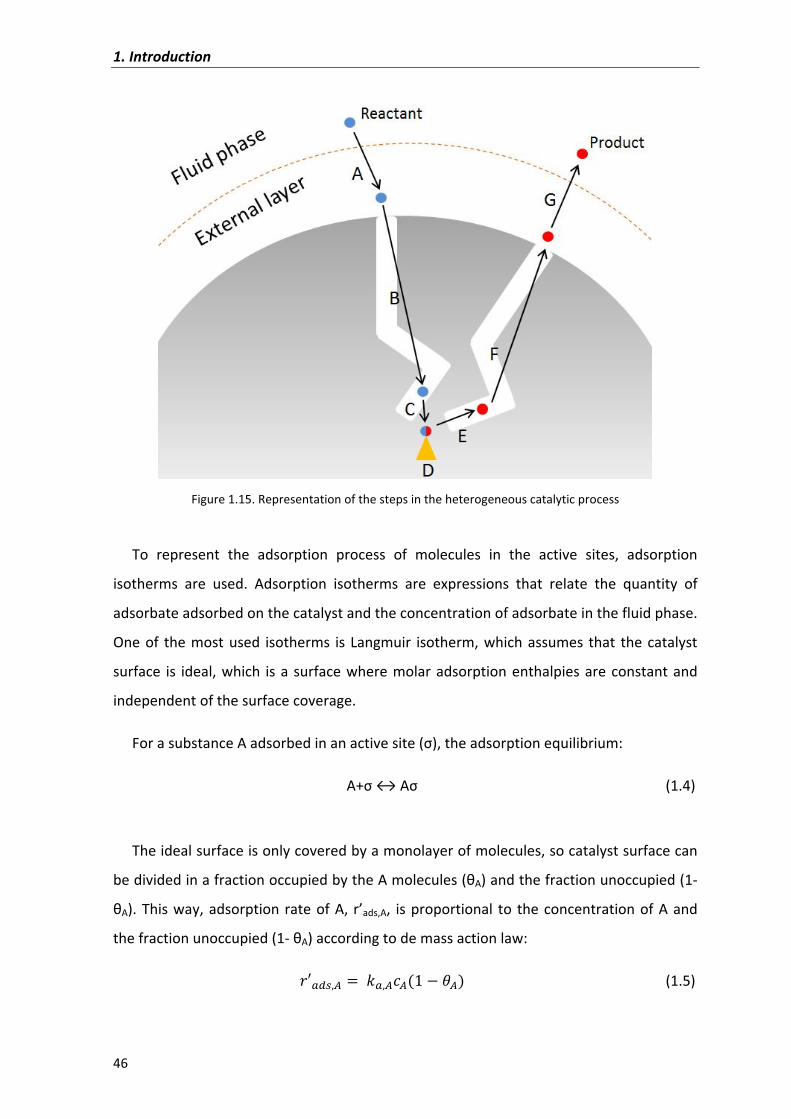
The� heterogeneous� catalytic� process� by� consist� of� the� following� elementary� steps�
(Figure�1.15):�
�
A. Diffusion� of� reactants� from� fluid� phase� (bulk� phase)� to� the� external� layer�
surrounding�the�catalyst�(external�mass�transfer).�
B. Diffusion�of�reactants�through�the�catalyst�pores�(internal�mass�transfer).�
C. Adsorption�of�reactants�on�the�active�site/s.�
D. Chemical�reaction�at�the�active�site/s,�which�can�imply�reaction�between�adsorbed�
compounds�or�adsorbed�compounds�with�unadsorbed�compounds.�
E. Desorption�of�products�on�the�active�site/s.�
F. Diffusion�of�products�through�the�catalyst�pores�(internal�mass�transfer).�
G. Diffusion�of�products�from�external�layer�to�fluid�phase�(external�mass�transfer).��
�
Steps�A,�B,�F�and�G�are�physical�processes�whereas�C,�D�and�E�are�of�chemical�nature.�
To�determine�the�rate�of�chemical�reaction�(process�C�D�E),�it� is�necessary�to�make�sure�
that� external� and� internal� mass� transfers� occur� at� higher� speed� than� rate� of� chemical�
reaction.� Mass� transfers� depend� on� catalyst� particle� size,� flow� conditions� at� which� the�
reactants� and� products� are� in� the� reactor� which� can� be� easily� varied� to� ensure� such�
catalyst�and�reactor�operating�conditions�to�avoid�mass�transfer�limitations.�
1.�Introduction�
46�
�Figure�1.15.�Representation�of�the�steps�in�the�heterogeneous�catalytic�process�
�
To� represent� the� adsorption� process� of� molecules� in� the� active� sites,� adsorption�
isotherms� are� used.� Adsorption� isotherms� are� expressions� that� relate� the� quantity� of�
adsorbate�adsorbed�on�the�catalyst�and�the�concentration�of�adsorbate�in�the�fluid�phase.�
One�of� the�most�used� isotherms� is�Langmuir� isotherm,�which�assumes� that� the�catalyst�
surface� is� ideal,�which� is�a�surface�where�molar�adsorption�enthalpies�are�constant�and�
independent�of�the�surface�coverage.��
For�a�substance�A�adsorbed�in�an�active�site�( ),�the�adsorption�equilibrium:�
A+ ���A (1.4)
�
The�ideal�surface�is�only�covered�by�a�monolayer�of�molecules,�so�catalyst�surface�can�
be�divided�in�a�fraction�occupied�by�the�A�molecules�(�A)�and�the�fraction�unoccupied�(1��
�A).�This�way,�adsorption�rate�of�A,� r’ads,A,� is�proportional� to� the�concentration�of�A�and�
the�fraction�unoccupied�(1���A)�according�to�de�mass�action�law:�
$%&'()* � +&)*,*�� � -*� (1.5)
1.�Introduction�
47�
�
Correspondingly,�desorption�rate�is�then:�
$%'.()* � +')*-* (1.6)
In� the� equilibrium,� adsorption� and� desorption� rates� are� the� same,� thus,� surface�
coverage�can�be�written:�
-* � /*,*� /*,*� (1.7)�
�
where,�KA�is�the�adsorption�equilibrium�constant�ka,A/kd,A.�
Equation�1.7�is�the�general�expression�for�Langmuir�isotherm�for�single�site�adsorption�
of�species�A.��
To�express�the�chemical�reaction�rate�in�the�active�surface�of�the�catalysts,�formalisms�
based� on� Langmuir�Hinselwood�Hougen�Watson� (LHHW)� and� Rideal�Eley� (RE)�
mechanisms�are�used.�In�those�mechanisms�three�hypothesis�are�considered:�
1. The�catalyst�surface�has�a�fix�number�of�active�sites.�
2. All�active�sites�are�identical.�
3. Reactivity�of�active�sites�only�depends�on�the�temperature�and�does�not�depend�
on�neither�the�nature�nor�the�quantity�of�other�compounds�present�in�the�surface�
during�the�reaction.�
LHHW�mechanisms�assume�that�all�the�reactants�are�adsorbed�in�the�catalyst�whereas�
RE�mechanisms�are�a�subclass�of�LHHW�mechanisms�that�consider�that�some�unadsorbed�
reactants�take�part�in�the�chemical�reaction.�
For�a�simple�reaction,�A�P,�the�general�approach�is�a�mechanism�with�the�following�
elemental�steps:�
1. Adsorption�of�A�in�an�active�site:�A+ ���A �
2. Surface�chemical�reaction:�A ���P �
3. Desorption�of�P�adsorbed�in�an�active�site:�P ���P+ �
Rate�of�adsorption�of�A�can�be�written�by�the�law�of�mass�action�as:�
1.�Introduction�
48�
$%&)* � +&)* 0,*,12 � ,1*/*3� (1.8)�
where�,12�is�the�concentration�of�free�active�sites�and�,1*�the�concentration�of�A�adsorbed.�
Rate�of�surface�chemical�reaction:�
$%( � +4,1* � +4%,15 � +4 0,1* � ,15/6 3� (1.9)�
where�,15 is� the�concentration�of�P�adsorbed�and�/6� the�equilibrium�constant�of� surface�
chemical�reaction.�
Rate�of�desorption�of�P�is:�
$%')5 � +&)5 0,15/5 � ,5,123� (1.10)
�
These�three�elemental�steps�take�place�in�series,�but�a�rate�expression�accounting�the�
three�steps�would�be�too�complex.�For�this�reason�is�common�to�assume�that�one�of�the�
steps�is�the�rate�limiting�one,�leading�to�a�more�simple�equations�for�reaction�rate,�all�of�
them�with�the�general�scheme:�
�
$7 � �/89:;8, <$=>?��@$8A89< B=$,:��CDE=$?;8=9 ;:$F�G � (1.11)
�
The� kinetic� group� is� the� product� of� rate� constant� of� the� limiting� stage,� one� or� more�
equilibrium�constants�and�the�total�number�of�active�sites�powered�to�exponent�n,�which�
is� the� number� of� active� sites� involved� in� the� reaction.� Total� number� of� active� sites� is�
usually�unknown�and� thus,� it� is�generally� incorporated� to� the�kinetic�group.� The�driving�
force� is� what� makes� the� reaction� to� take� place,� being� null� at� the� equilibrium.� The�
resistance� caused� by� the� adsorption� processes� in� the� active� sites� is� represented� by� the�
adsorption�term�and�its�form�depends�on�the�limiting�step�[60].�
�

�
�
CHAPTER�2�
SCOPE��
�
�
�
�
�
�
�
�
�
�
�
�
�
�
�
�

�
�
�
�
�
�
�
�
�
�
�
�
�
�
�
�
�
�
�
�
�
�
�
�
2.�Scope�
51�
In�this�work,�previous�studies�focused�on�the�synthesis�of�the�linear�symmetrical�ethers�
di�n�pentyl� ether� (DNPE)� and� di�n�hexyl� ether� (DNHE)� from� 1�pentanol� and� 1�hexanol�
respectively�have�been�extended.�At�the�same�time,�to�continue�with�the�series�of�linear�
symmetrical� ethers,� di�n�octyl� ether� (DNOE)� synthesis� from� 1�octanol� has� been�
extensively�studied,�as�well�as�compared�with�the�syntheses�of�DNPE�and�DNHE.��
For�the�mentioned�purposes,�the�following�objectives�have�been�settled:�
�
1. Check�that�1�octanol�dehydration�to�DNOE�can�be�successfully�carried�out�over�
acid�solid�catalysts�such�as�zeolites�and�PS�DVB�ion�exchange�resins.�
�
2. Carry� out� a� catalyst� screening� over� PS�DVB� ion� exchange� resins� for� DNPE,�
DNHE� and� DNOE� syntheses� to� evaluate� the� influence� of� morphological�
characteristics�of�PS�DVB�resins�on�the�synthesis�of�DNOE�and�compare�it�with�
DNHE�and�DNPE�syntheses.�
�
3. Carry� out� a� catalyst� screening� to� evaluate� the� influence� of� zeolites� textural�
parameters� and� different� zeolites� frameworks� on� the� syntheses� of� DNOE,�
DNHE�and�DNPE.�
�
4. Evaluate�the�equilibrium�constant�of�the�dehydration�reaction�of�1�octanol�to�
DNOE�and�main�side�reactions.�
�
5. Carry� out� a� kinetic� study� and� propose� a� kinetic� equation� with� mechanistical�
basis� for� the� 1�octanol� dehydration� to� DNOE� over� the� thermostable� ion�
exchange�resin�Amberlyst�70�and�compare� it�with�DNHE�and�DNPE�syntheses�
found�in�the�literature.��
�
7� Carry� out� a� kinetic� study� and� propose� a� kinetic� equation� for� the� 1�octanol�
dehydration�to�DNOE�and�1�hexanol�to�DNHE�over�zeolites�and�compare�them�
with� the� kinetic� equation� for� DNPE� synthesis� found� in� the� literature.

�
�
� �

�
�
CHAPTER�3�
EXPERIMENTAL��
�
�
�
�
�
�
�
�
�
�
�
�
�
�
�
�

�
�
�
�
�
�
�
�
�
�
�
�
�
�
�
�
�
�
�
�
�
�
�
�
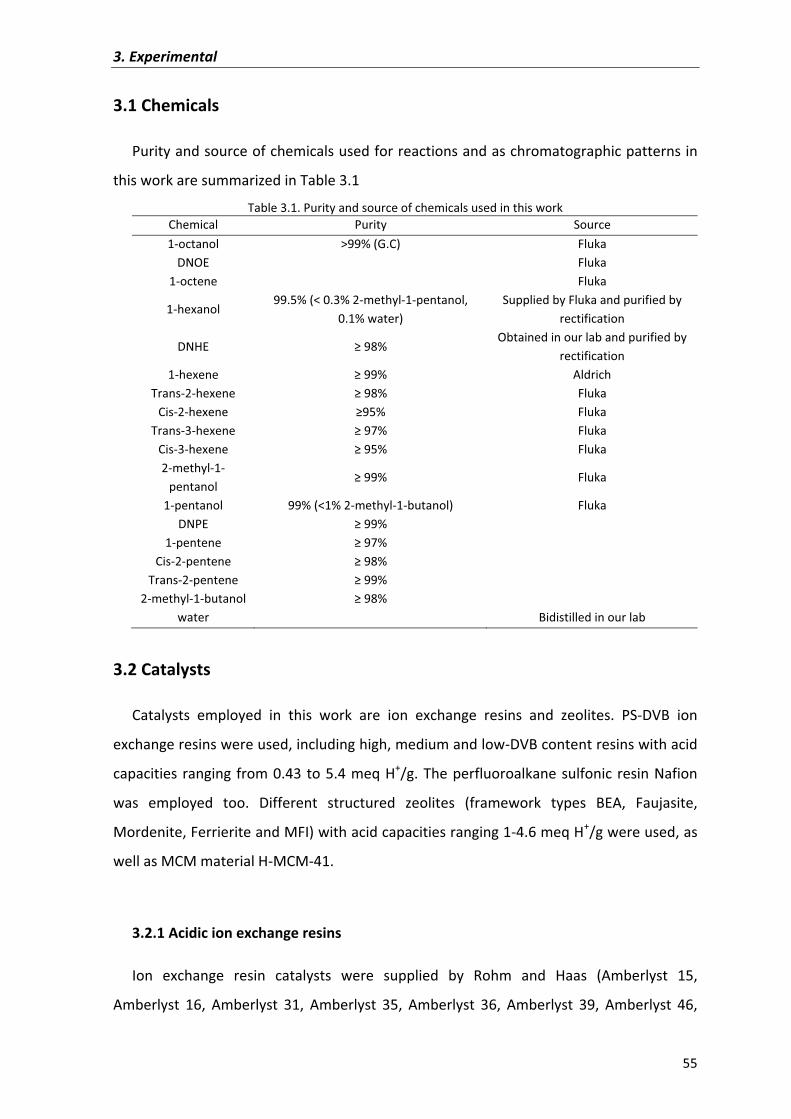
3.�Experimental�
55�
3.1�Chemicals�
Purity�and�source�of�chemicals�used�for�reactions�and�as�chromatographic�patterns�in�
this�work�are�summarized�in�Table�3.1�
Table�3.1.�Purity�and�source�of�chemicals�used�in�this�work�Chemical� Purity Source�1�octanol� >99% (G.C) Fluka�
DNOE� Fluka�1�octene� Fluka�
1�hexanol�99.5%�(<�0.3%�2�methyl�1�pentanol,�
0.1%�water)�Supplied�by�Fluka�and�purified�by�
rectification�
DNHE� ��98%�Obtained�in�our�lab�and�purified�by�
rectification�1�hexene� ��99% Aldrich�
Trans�2�hexene ��98% Fluka�Cis�2�hexene� �95% Fluka�
Trans�3�hexene ��97% Fluka�Cis�3�hexene� ��95% Fluka�2�methyl�1�
pentanol���99%� Fluka�
1�pentanol� 99%�(<1%�2�methyl�1�butanol) Fluka�DNPE� ��99% �
1�pentene� ��97% �Cis�2�pentene� ��98% �
Trans�2�pentene ��99% �2�methyl�1�butanol� ��98% �
water� Bidistilled�in�our�lab�
�
3.2�Catalysts�
Catalysts� employed� in� this� work� are� ion� exchange� resins� and� zeolites.� PS�DVB� ion�
exchange�resins�were�used,�including�high,�medium�and�low�DVB�content�resins�with�acid�
capacities� ranging� from�0.43�to�5.4�meq�H+/g.�The�perfluoroalkane�sulfonic� resin�Nafion�
was� employed� too.� Different� structured� zeolites� (framework� types� BEA,� Faujasite,�
Mordenite,�Ferrierite�and�MFI)�with�acid�capacities�ranging�1�4.6�meq�H+/g�were�used,�as�
well�as�MCM�material�H�MCM�41.��
�
3.2.1�Acidic�ion�exchange�resins�
Ion� exchange� resin� catalysts� were� supplied� by� Rohm� and� Haas� (Amberlyst� 15,�
Amberlyst� 16,� Amberlyst� 31,� Amberlyst� 35,� Amberlyst� 36,� Amberlyst� 39,� Amberlyst� 46,�
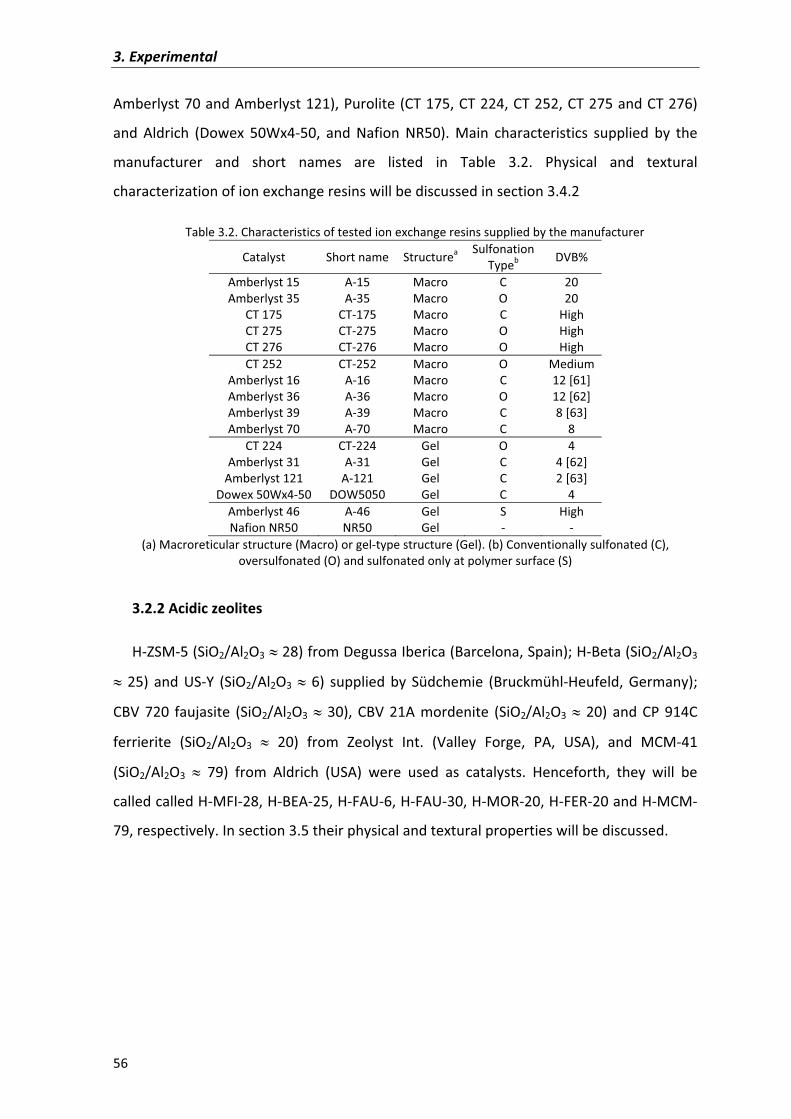
3.�Experimental�
56�
Amberlyst�70�and�Amberlyst�121),�Purolite�(CT�175,�CT�224,�CT�252,�CT�275�and�CT�276)�
and� Aldrich� (Dowex� 50Wx4�50,� and� Nafion� NR50).� Main� characteristics� supplied� by� the�
manufacturer� and� short� names� are� listed� in� Table� 3.2.� Physical� and� textural�
characterization�of�ion�exchange�resins�will�be�discussed�in�section�3.4.2�
Table�3.2.�Characteristics�of�tested�ion�exchange�resins�supplied�by�the�manufacturer�Catalyst� Short�name� Structurea� Sulfonation�
Typeb� DVB%�
Amberlyst�15� A�15 Macro C 20�Amberlyst�35� A�35 Macro O 20�
CT�175� CT�175 Macro C High�CT�275� CT�275 Macro O High�CT�276� CT�276 Macro O High�CT�252� CT�252 Macro O Medium�
Amberlyst�16� A�16 Macro C 12�[61]�
Amberlyst�36� A�36 Macro O 12�[62]�
Amberlyst�39� A�39 Macro C 8�[63]�
Amberlyst�70� A�70 Macro C 8�CT�224� CT�224 Gel O 4�
Amberlyst�31� A�31 Gel C 4�[62]�
Amberlyst�121� A�121 Gel C 2�[63]�
Dowex�50Wx4�50� DOW5050 Gel C 4�Amberlyst�46� A�46 Gel S High�Nafion�NR50� NR50 Gel � ��
(a)�Macroreticular�structure�(Macro)�or�gel�type�structure�(Gel).�(b)�Conventionally�sulfonated�(C),�oversulfonated�(O)�and�sulfonated�only�at�polymer�surface�(S)�
�
3.2.2�Acidic�zeolites�
H�ZSM�5�(SiO2/Al2O3���28)�from�Degussa�Iberica�(Barcelona,�Spain);�H�Beta�(SiO2/Al2O3�
�� 25)� and� US�Y� (SiO2/Al2O3��� 6)� supplied� by� Südchemie� (Bruckmühl�Heufeld,� Germany);�
CBV� 720� faujasite� (SiO2/Al2O3��� 30),� CBV� 21A� mordenite� (SiO2/Al2O3��� 20)� and� CP� 914C�
ferrierite� (SiO2/Al2O3� �� 20)� from� Zeolyst� Int.� (Valley� Forge,� PA,� USA),� and� MCM�41�
(SiO2/Al2O3� �� 79)� from� Aldrich� (USA)� were� used� as� catalysts.� Henceforth,� they� will� be�
called�called�H�MFI�28,�H�BEA�25,�H�FAU�6,�H�FAU�30,�H�MOR�20,�H�FER�20�and�H�MCM�
79,�respectively.�In�section�3.5�their�physical�and�textural�properties�will�be�discussed.��
�
�
�
�
�
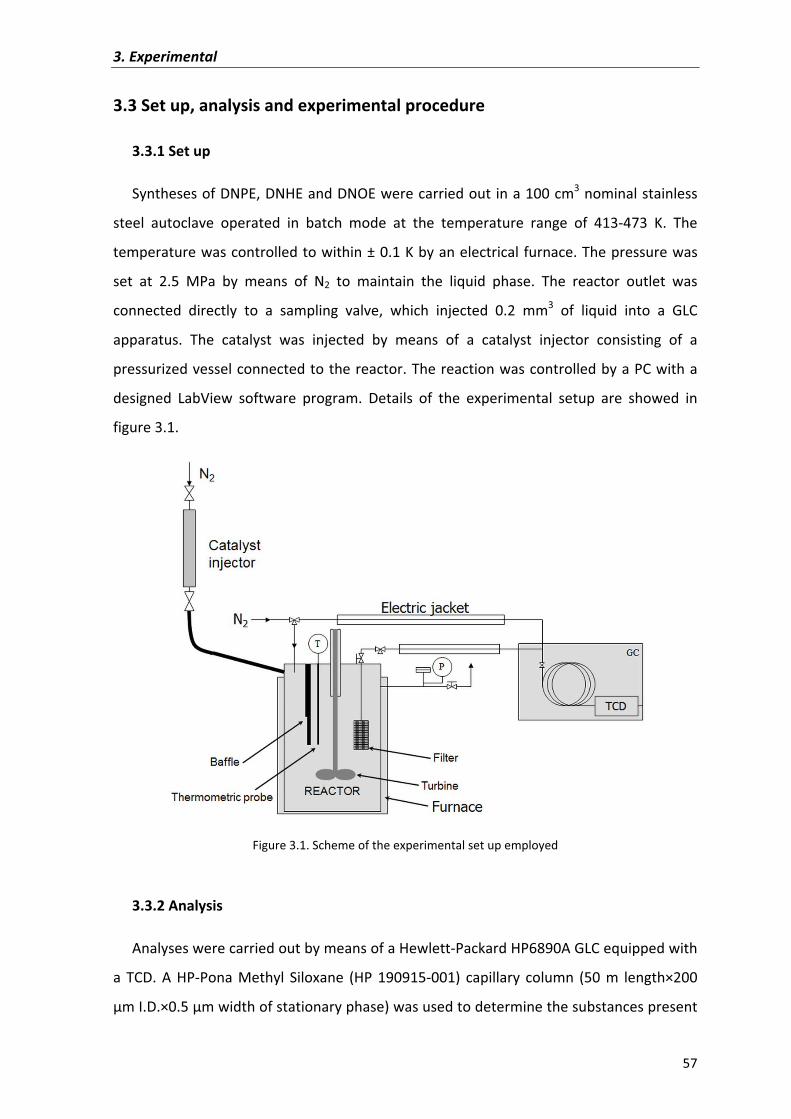
3.�Experimental�
57�
3.3�Set�up,�analysis�and�experimental�procedure�
3.3.1�Set�up�
Syntheses�of�DNPE,�DNHE�and�DNOE�were�carried�out�in�a�100�cm3�nominal�stainless�
steel� autoclave� operated� in� batch� mode� at� the� temperature� range� of� 413�473� K.� The�
temperature�was�controlled�to�within�±�0.1�K�by�an�electrical�furnace.�The�pressure�was�
set� at� 2.5� MPa� by� means� of� N2� to� maintain� the� liquid� phase.� The� reactor� outlet� was�
connected� directly� to� a� sampling� valve,� which� injected� 0.2� mm3� of� liquid� into� a� GLC�
apparatus.� The� catalyst� was� injected� by� means� of� a� catalyst� injector� consisting� of� a�
pressurized�vessel�connected�to�the�reactor.�The�reaction�was�controlled�by�a�PC�with�a�
designed� LabView� software� program.� Details� of� the� experimental� setup� are� showed� in�
figure�3.1.��
�
Figure�3.1.�Scheme�of�the�experimental�set�up�employed�
�
3.3.2�Analysis�
Analyses�were�carried�out�by�means�of�a�Hewlett�Packard�HP6890A�GLC�equipped�with�
a� TCD.� A� HP�Pona� Methyl� Siloxane� (HP� 190915�001)� capillary� column� (50� m� length×200�
�m�I.D.×0.5��m�width�of�stationary�phase)�was�used�to�determine�the�substances�present�
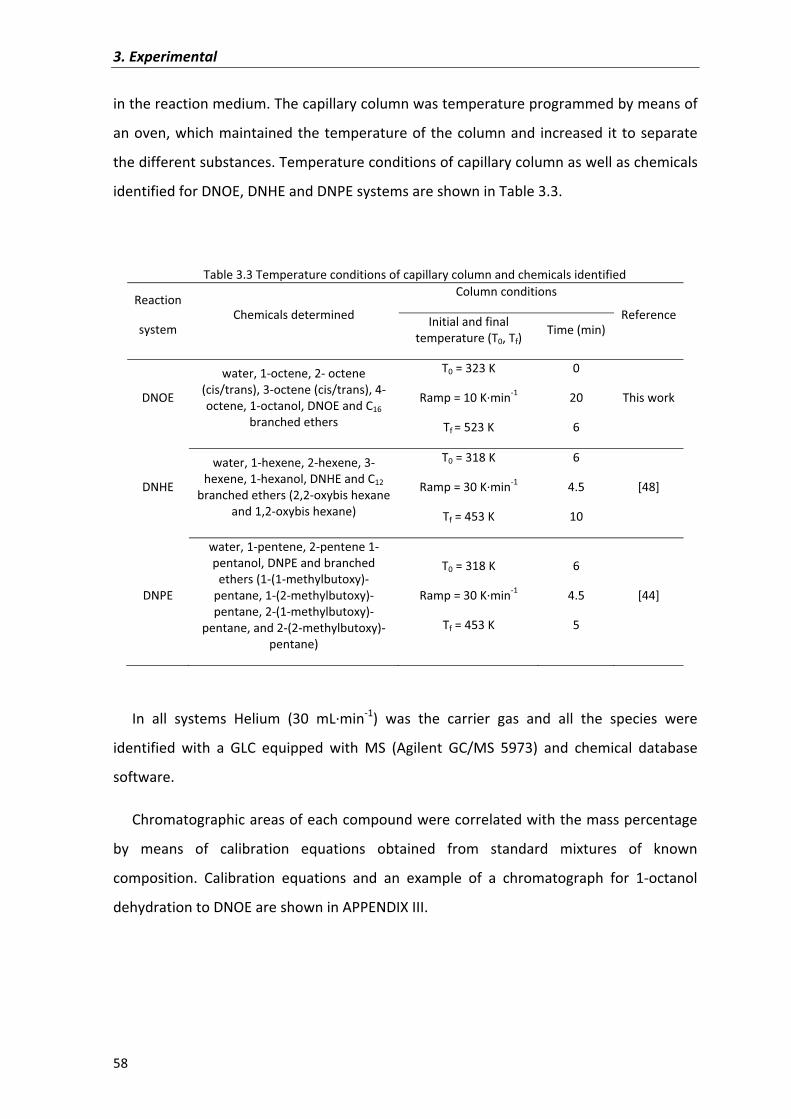
3.�Experimental�
58�
in�the�reaction�medium.�The�capillary�column�was�temperature�programmed�by�means�of�
an�oven,�which�maintained�the�temperature�of�the�column�and�increased� it�to�separate�
the�different�substances.�Temperature�conditions�of�capillary�column�as�well�as�chemicals�
identified�for�DNOE,�DNHE�and�DNPE�systems�are�shown�in�Table�3.3.�
�
Table�3.3�Temperature�conditions�of�capillary�column�and�chemicals�identified�
Reaction��
system�Chemicals�determined�
Column�conditions
Reference�Initial�and�final�temperature�(T0,�Tf)�
Time�(min)�
DNOE�
water,�1�octene,�2��octene�(cis/trans),�3�octene�(cis/trans),�4�octene,�1�octanol,�DNOE�and�C16�
branched�ethers�
T0 =�323�K
Ramp�=�10�K�min�1�
Tf�=�523�K�
0�
20�
6�
This�work�
DNHE�
water,�1�hexene,�2�hexene,�3�hexene,�1�hexanol,�DNHE�and�C12�
branched�ethers�(2,2�oxybis�hexane�and�1,2�oxybis�hexane)�
T0 =�318�K
Ramp�=�30�K�min�1�
Tf�=�453�K�
6�
4.5�
10�
[48]�
DNPE�
water,�1�pentene,�2�pentene�1�pentanol,�DNPE�and�branched�
ethers�(1�(1�methylbutoxy)�pentane,�1�(2�methylbutoxy)�pentane,�2�(1�methylbutoxy)�
pentane,�and�2�(2�methylbutoxy)�pentane)�
T0�=�318�K�
Ramp�=�30�K�min�1�
Tf�=�453�K�
6�
4.5�
5�
[44]�
�
In� all� systems� Helium� (30� mL�min�1)� was� the� carrier� gas� and� all� the� species� were�
identified� with� a� GLC� equipped� with� MS� (Agilent� GC/MS� 5973)� and� chemical� database�
software.�
Chromatographic�areas�of�each�compound�were�correlated�with�the�mass�percentage�
by� means� of� calibration� equations� obtained� from� standard� mixtures� of� known�
composition.� Calibration� equations� and� an� example� of� a� chromatograph� for� 1�octanol�
dehydration�to�DNOE�are�shown�in�APPENDIX�III.��
�
�
�
3.�Experimental�
59�
3.3.3�Experimental�procedure�
The�catalysts�used�were�pretreated�as�follows:�
Ion�exchange�resins�were�dried�at�383�K�firstly�at�1�bar�for�at�least�1�h�and�secondly�in�a�
vacuum�oven�for�15�h�at�10�mbar�and�373�K.��
Zeolites� were� activated� at� the� optimal� temperature� in� a� muffle� furnace.� Optimal�
activation� temperature� was� found� to� be� 773� K� for� all� the� zeolites� tested� but� H�MFI�28,�
which� was� 673� K� [65].� DSC� and� TG� analysis� showed� that� at� such� temperatures� all� the�
zeolites�have�a�nearly�constant�weight�after�losing�water�and�ammonia.�After�activation,�
catalysts�were�maintained�in�a�vacuum�oven�for�15�h�at�10�mbar�and�373�K.�
The�procedure�with�the�batch�reactor�varied�according�to�the�type�of�experiment:�
For� the� catalytic� screening� with� ion� exchange� resins� and� zeolites� the� reactor� was�
loaded�with�70�cm3�of�liquid.�The�liquid�mixture�was�then�pressurized�at�2.5�MPa,�warmed�
up� to� the� working� temperature� (423�473� K)� and� stirred� at� 500� rpm.� Once� the� working�
temperature� was� reached,� 1� gram� of� dried� catalyst� was� placed� in� the� catalyst� injector,�
pressurized� and� quickly� injected� into� the� reactor� by� means� of� the� pressure� difference�
between�the�catalyst�injector�and�the�reactor.�The�moment�the�catalyst�was�injected�was�
considered�as�the�zero�time�of�the�experiment.�Samples�were�taken�hourly�until�the�end�
of�experiment�(6�h).�
In� such� operating� conditions,� dehydration� of� 1�pentanol� to� DNPE� and� 1�hexanol� to�
DNHE�take�place�free�of�the�influence�of�mass�transfer�limitations�[44,48].�Liquid�samples�
were� taken� out� hourly� and� analyzed� online� to� follow� the� reaction� until� the� end� of� the�
experiment� for� 6� h.� In� each� experiment,� the� alcohol� conversion� (HIJK),� selectivity� to�
linear� symmetrical�ether� (LIJKIJI),�olefins� (LIJKMN),�and�branched�ethers� (LIJKIJIO),�as�well�as�
yield� of� linear� symmetrical� ether� (PIJKIJI)� relative� to� alcohol,� were� estimated� by� the�
expressions� 3.1�3.5.� Estimated� values� of� conversion,� selectivity� and� yield� did� not� vary�
further�than�2%�within�replicated�experiments.�
HIJK�Q� � RST� SU VTWSXST Y�VWQ�ZRST� SU VTWSXST [\[Q[VTT] � \IJK� � \IJK�Q�\IJK� ^ � �� (3.1)�
3.�Experimental�
60�
� � \IJK�Q� \MN�Q� � \IJI�Q�\IJK�Q� � \IJI�Q� \_N�Q� � \IJIO�Q� ^ � `a RSTRSTb�
LIJKIJI�Q� � cST� SU VTWSXST Y�VWQ�Z QS USYR T[\�VY �QX�YcST� SU VTWSXST Y�VWQ�Z ^ � �� � \IJI�Q�� \IJI�Q� \MN�Q� � \IJIO�Q� ^ � `a RSTRSTb�
(3.2)�
LIJKMN �Q� � \MN�Q�� \IJI�Q� \MN�Q� � \IJIO�Q� ^ � `a RSTRSTb� (3.3)�
LIJKIJIO�Q� � � \IJIO�Q�� \IJI�Q� \MN�Q� � \IJIO�Q� ^ � `a RSTRSTb� (3.4)�
PIJKIJI�Q� � cST� SU VTSWXST Y�VWQ�Z QS USYR T[\�VY �QX�Y\IJK� ^ � �� LIJKIJI�Q� HIJK�Q�� `a RSTRSTb�
(3.5)�
�
Initial� reaction� rates� of� symmetrical� ether� (ROR)� formation� and� alcohol� (ROH)�
consumption�were�computed�from�the� functions�of�variation�of�nROR� (mole�of�ROR)�and�
nROH�(mol�of�alcohol),�respectively,�vs.�time:�
YIJI� � �d 0Z\IJIZQ 3ef� ` RSTX ghWVQb� (3.6)�
�YIJK� � �d 0Z\IJKZQ 3ef� ` RSTX ghWVQb� (3.7)�
Initial� turnover� frequency,� TOF,� for� both� ROR� formation� and� ROH�consumption� were�
estimating�by�dividing�YIJI� �and�YIJK� �by�the�acid�capacity,�respectively:��
�ijIJI� � YIJI�VW[Z WV�VW[Q] ` RSTX �k lmb� (3.8)�
�ijIJK� � YIJK�VW[Z WV�VW[Q] ` RSTX �k lmb� (3.9)�
From� equations� 3.6� to� 3.9� it� follows� that� linear� ether� formation� and� alcohol�
consumption�rates,�and�turnover�numbers,�are�related�by:��
YIJI � LIJKIJI �YIJK� � (3.10)�
�ijIJI � LIJKIJI ��ijIJK� � (3.11)�
3.�Experimental�
61�
For�equilibrium�determination�experiments,�reactor�was� loaded�with�70�cm3�of� liquid�
and� 4� grams� of� dried� Amberlyst� 70.� Amberlyst� 70� was� selected� for� equilibrium�
experiments�because�of�its�thermal�stability�and�high�selectivity�to�linear�ether�formation.�
Pressure�was�set�at�2.5�MPa,�working� temperature� ranged�413�453�K�and�stirred�speed�
was�set�at�300�rpm�to�avoid�catalyst�attrition.�Samples�were�taken�daily�until�reaching�a�
constant�composition�with�time�(50�75�h).�
For�the�kinetic�type�experiments�over�Amberlyst�70,�reactor�was�loaded�with�70�cm3�of�
liquid,�pressurized�at�2.5�MPa,�warmed�up�at� the�working�temperature� (413�453�K)�and�
stirred�in�the�range�100�800�rpm.�Once�the�working�temperature�was�reached,�0.5�4�g�of�
Amberlyst� 70� (dp� =� 0.12�0.9� mm)� were� injected� into� the� reactor.� Liquid� samples� were�
taken�hourly�to�follow�the�reaction�until�the�end�of�experiment�for�6�7�h.��
Kinetic�experiments�over�zeolites�were�analogue�to�those�over�Amberlyst�70.�Working�
temperature�was�423�473�K,�1�gram�of�zeolite�was�used�and�stirring�speed�was�set�at�500�
rpm.�
�
3.4�Physical�and�textural�characterization�of�ion�exchange�resins�
Macroreticular� resins� used� include� polymers� of� low� (Amberlyst� 39� and� 70),� medium�
(Amberlyst� 16� and� 36,� and� CT� 252)� and� high� crosslinking� degree� (Amberlyst� 15� and� 35,�
and� CT� 175,� CT� 275� and� CT� 276);� gel� type� ones� include� resins� containing� from� 2� to� 8�
DVB%.� As� for� sulfonation� degree,� selected� resins� include� conventionally� sulfonated� (a� –
SO3H� group� per� styrene� ring)� and� oversulfonated� (a� –SO3H� group� per� benzene� ring).�
Amberlyst� 35� and� 36� (acid� capacity� >� 5� meq� H+/g)� are� oversulfonated� versions� of�
Amberlyst�15�and�35�(acid�capacity���5�meq�H+/g),�respectively,�and�CT�275�and�CT�276�of�
CT� 175� (see� Table� 3.4).� Special� properties� of� Amberlyst� 70� (with� hydrogen� atoms� of�
polymer� chain� substituted� by� chlorine),� Amberlyst� 46� (sulfonated� only� at� the� polymer�
surface)� and� NR50� (a� gel�type� copolymer� of� Teflon®� and� perfluoro�alkanesulfonic�
monomers)�have� to�be�emphasized.�Fluorine�atoms�of�polymer�chains�upgrade� thermal�
stability�of�NR50�and�give�a�higher�acid�strength�than�PS�DVB�resins.��
�
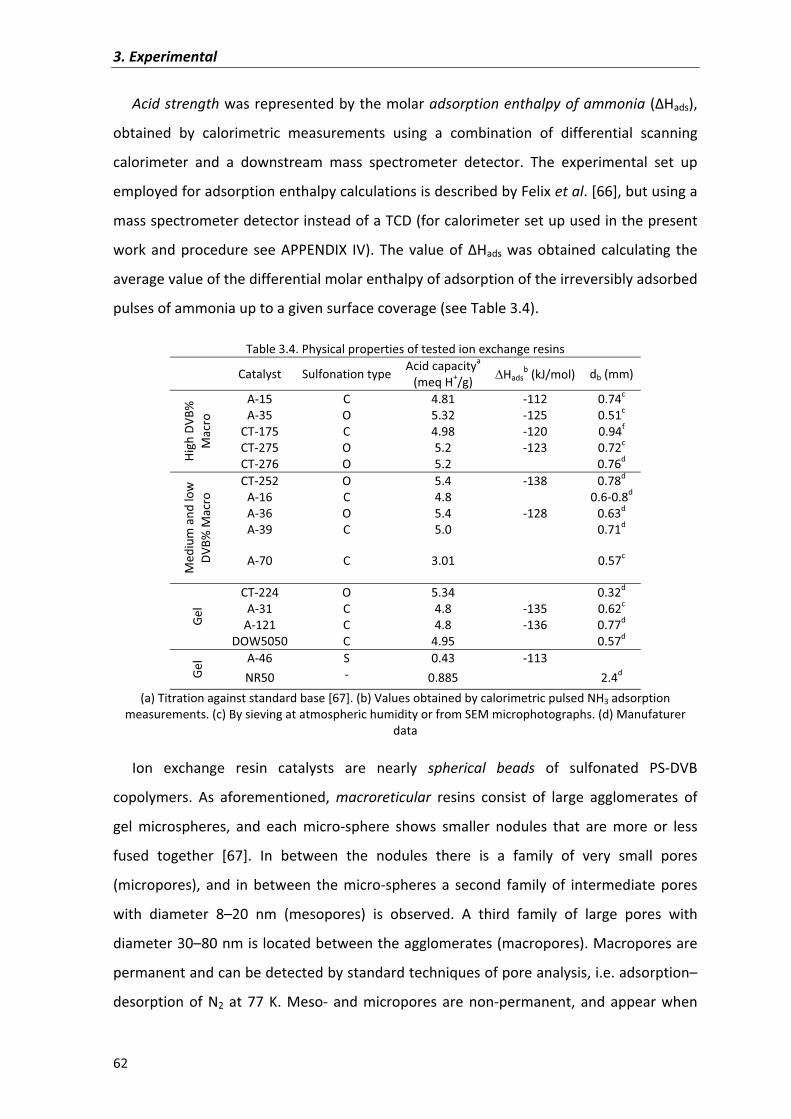
3.�Experimental�
62�
Acid�strength�was�represented�by�the�molar�adsorption�enthalpy�of�ammonia� (�Hads),�
obtained� by� calorimetric� measurements� using� a� combination� of� differential� scanning�
calorimeter� and� a� downstream� mass� spectrometer� detector.� The� experimental� set� up�
employed�for�adsorption�enthalpy�calculations�is�described�by�Felix�et�al.�[66],�but�using�a�
mass�spectrometer�detector�instead�of�a�TCD�(for�calorimeter�set�up�used�in�the�present�
work�and�procedure�see�APPENDIX� IV).�The�value�of��Hads�was�obtained�calculating� the�
average�value�of�the�differential�molar�enthalpy�of�adsorption�of�the�irreversibly�adsorbed�
pulses�of�ammonia�up�to�a�given�surface�coverage�(see�Table�3.4).��
Table�3.4.�Physical�properties�of�tested�ion�exchange�resins�� Catalyst� Sulfonation�type� Acid�capacitya
(meq�H+/g)� �Hadsb�(kJ/mol)� db�(mm)�
High
�DVB
%�
Mac
ro�
A�15� C 4.81 �112 0.74c�
A�35� O 5.32 �125 0.51c�
CT�175� C 4.98 �120 0.94f�
CT�275� O 5.2 �123 0.72c�
CT�276� O 5.2 0.76d�
Med
ium
�and
�low
�DV
B%�M
acro
� CT�252� O 5.4 �138 0.78d�
A�16� C 4.8 0.6�0.8d�
A�36� O 5.4 �128 0.63d�
A�39� C 5.0 0.71d�
A�70� C� 3.01� � 0.57c�
Gel�
CT�224� O 5.34 0.32d�
A�31� C 4.8 �135 0.62c�
A�121� C 4.8 �136 0.77d�
DOW5050� C 4.95 0.57d�
Gel� A�46� S 0.43 �113 �
NR50� � 0.885� 2.4d�
(a)�Titration�against�standard�base�[67].�(b)�Values�obtained�by�calorimetric�pulsed�NH3�adsorption�measurements.�(c)�By�sieving�at�atmospheric�humidity�or�from�SEM�microphotographs.�(d)�Manufaturer�
data��
Ion� exchange� resin� catalysts� are� nearly� spherical� beads� of� sulfonated� PS�DVB�
copolymers.� As� aforementioned,� macroreticular� resins� consist� of� large� agglomerates� of�
gel� microspheres,� and� each� micro�sphere� shows� smaller� nodules� that� are� more� or� less�
fused� together� [67].� In� between� the� nodules� there� is� a� family� of� very� small� pores�
(micropores),� and� in� between� the� micro�spheres� a� second� family� of� intermediate� pores�
with� diameter� 8–20� nm� (mesopores)� is� observed.� A� third� family� of� large� pores� with�
diameter�30–80�nm�is�located�between�the�agglomerates�(macropores).�Macropores�are�
permanent�and�can�be�detected�by�standard�techniques�of�pore�analysis,�i.e.�adsorption–
desorption� of� N2� at� 77� K.� Meso�� and� micropores� are� non�permanent,� and� appear�when�
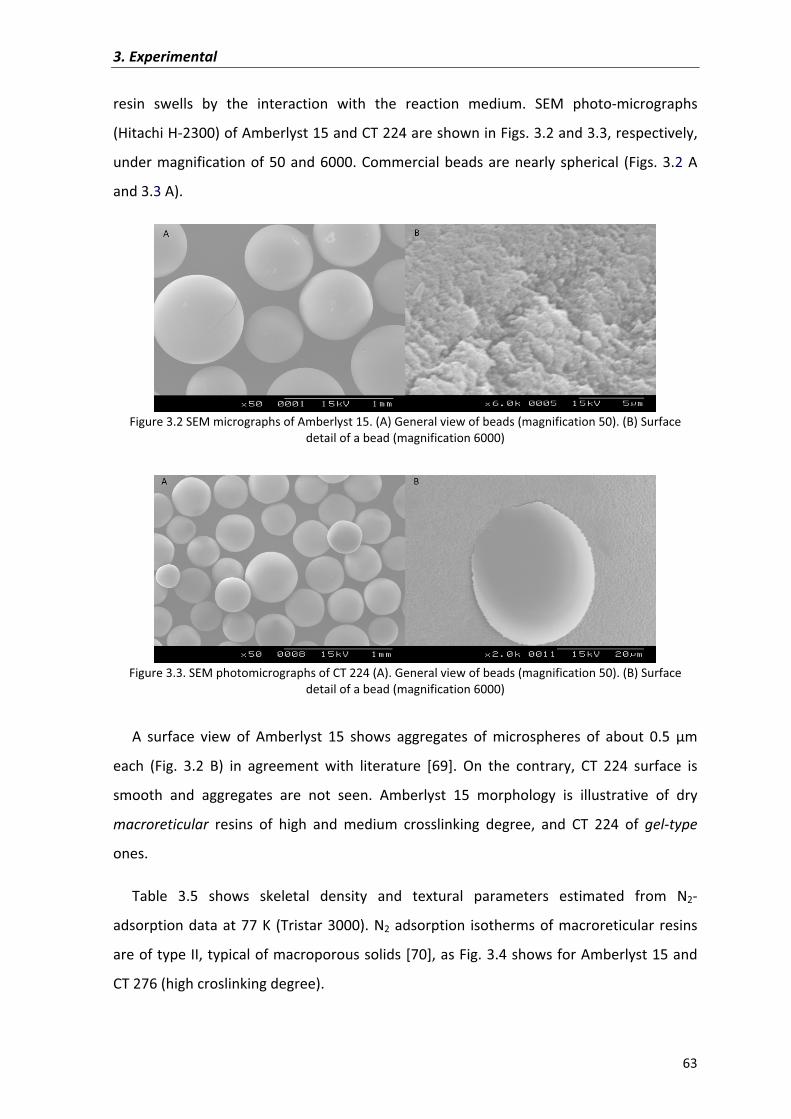
3.�Experimental�
63�
resin� swells� by� the� interaction� with� the� reaction� medium.� SEM� photo�micrographs�
(Hitachi�H�2300)�of�Amberlyst�15�and�CT�224�are�shown�in�Figs.�3.2�and�3.3,�respectively,�
under�magnification�of�50�and�6000.�Commercial�beads�are�nearly�spherical� (Figs.�3.2�A�
and�3.3�A).�
�Figure�3.2�SEM�micrographs�of�Amberlyst�15.�(A)�General�view�of�beads�(magnification�50).�(B)�Surface�
detail�of�a�bead�(magnification�6000)��
�Figure�3.3.�SEM�photomicrographs�of�CT�224�(A).�General�view�of�beads�(magnification�50).�(B)�Surface�
detail�of�a�bead�(magnification�6000)��
A� surface� view� of� Amberlyst� 15� shows� aggregates� of� microspheres� of� about� 0.5� �m�
each� (Fig.� 3.2� B)� in� agreement� with� literature� [69].� On� the� contrary,� CT� 224� surface� is�
smooth� and� aggregates� are� not� seen.� Amberlyst� 15� morphology� is� illustrative� of� dry�
macroreticular� resins� of� high� and� medium� crosslinking� degree,� and� CT� 224� of� gel�type�
ones.��
Table� 3.5� shows� skeletal� density� and� textural� parameters� estimated� from� N2�
adsorption�data�at�77�K� (Tristar�3000).�N2�adsorption� isotherms�of�macroreticular� resins�
are�of�type�II,�typical�of�macroporous�solids�[70],�as�Fig.�3.4�shows�for�Amberlyst�15�and�
CT�276�(high�croslinking�degree).��
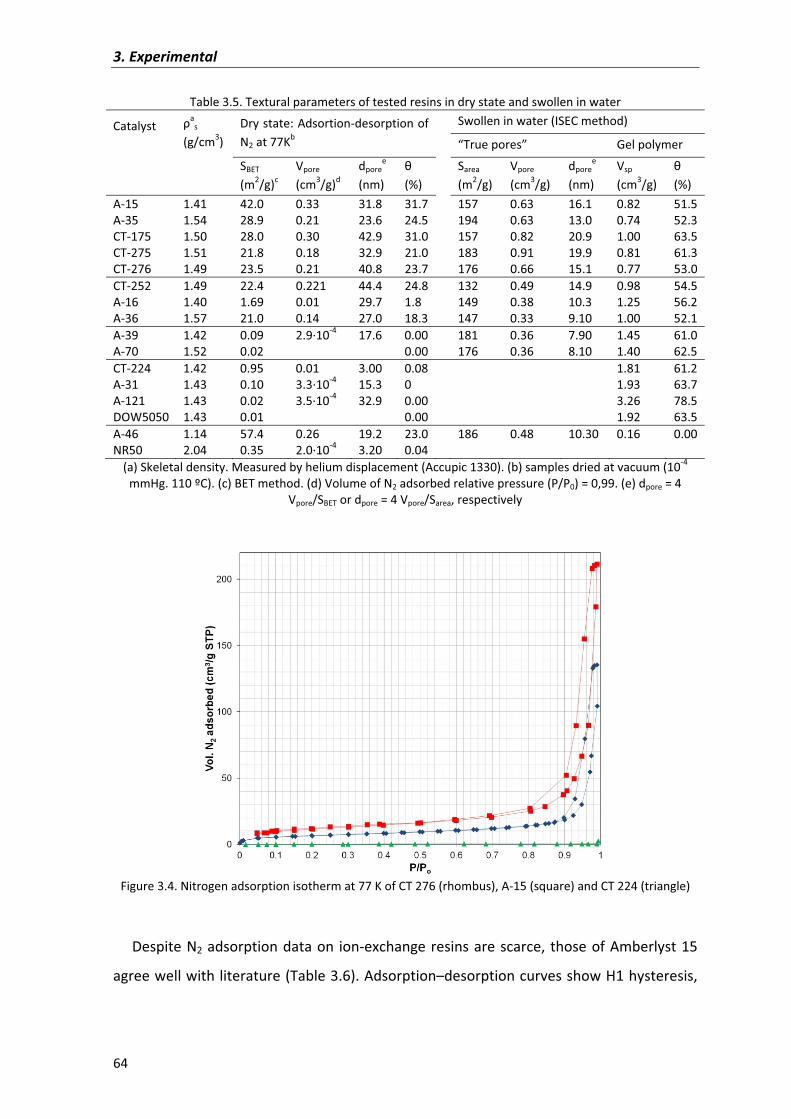
3.�Experimental�
64�
Table�3.5.�Textural�parameters�of�tested�resins�in�dry�state�and�swollen�in�water�
Catalyst� as�
(g/cm3)�Dry�state:�Adsortion�desorption�of�N2�at�77Kb� �
Swollen�in�water�(ISEC�method)�
“True�pores”� Gel�polymer�
� � SBET�(m2/g)c�
Vpore�(cm3/g)d�
dporee
(nm)���(%)�
�Sarea
(m2/g)�Vpore
(cm3/g)�dpore
e�(nm)�
Vsp�(cm3/g)�
��(%)�
A�15� 1.41� 42.0� 0.33� 31.8 31.7 157 0.63 16.1� 0.82� 51.5A�35� 1.54� 28.9� 0.21� 23.6 24.5 194 0.63 13.0� 0.74� 52.3CT�175� 1.50� 28.0� 0.30� 42.9 31.0 157 0.82 20.9� 1.00� 63.5CT�275� 1.51� 21.8� 0.18� 32.9 21.0 183 0.91 19.9� 0.81� 61.3CT�276� 1.49� 23.5� 0.21� 40.8 23.7 176 0.66 15.1� 0.77� 53.0CT�252� 1.49� 22.4� 0.221� 44.4 24.8 132 0.49 14.9� 0.98� 54.5A�16� 1.40� 1.69� 0.01� 29.7 1.8 149 0.38 10.3� 1.25� 56.2A�36� 1.57� 21.0� 0.14� 27.0 18.3 147 0.33 9.10� 1.00� 52.1A�39� 1.42� 0.09� 2.9�10�4 17.6 0.00 181 0.36 7.90� 1.45� 61.0A�70� 1.52� 0.02� � 0.00 176 0.36 8.10� 1.40� 62.5CT�224� 1.42� 0.95� 0.01� 3.00 0.08 � 1.81� 61.2A�31� 1.43� 0.10� 3.3�10�4 15.3 0 � 1.93� 63.7A�121� 1.43� 0.02� 3.5�10�4 32.9 0.00 � 3.26� 78.5DOW5050� 1.43� 0.01� � 0.00 � 1.92� 63.5A�46� 1.14� 57.4� 0.26� 19.2 23.0 186 0.48 10.30� 0.16� 0.00NR50� 2.04� 0.35� 2.0�10�4 3.20 0.04 � �
(a)�Skeletal�density.�Measured�by�helium�displacement�(Accupic�1330).�(b)�samples�dried�at�vacuum�(10�4�mmHg.�110�ºC).�(c)�BET�method.�(d)�Volume�of�N2�adsorbed�relative�pressure�(P/P0)�=�0,99.�(e)�dpore�=�4�
Vpore/SBET�or�dpore�=�4�Vpore/Sarea,�respectively���
�Figure�3.4.�Nitrogen�adsorption�isotherm�at�77�K�of�CT�276�(rhombus),�A�15�(square)�and�CT�224�(triangle)�
�
Despite�N2�adsorption�data�on� ion�exchange�resins�are�scarce,� those�of�Amberlyst�15�
agree�well�with�literature�(Table�3.6).�Adsorption–desorption�curves�show�H1�hysteresis,�
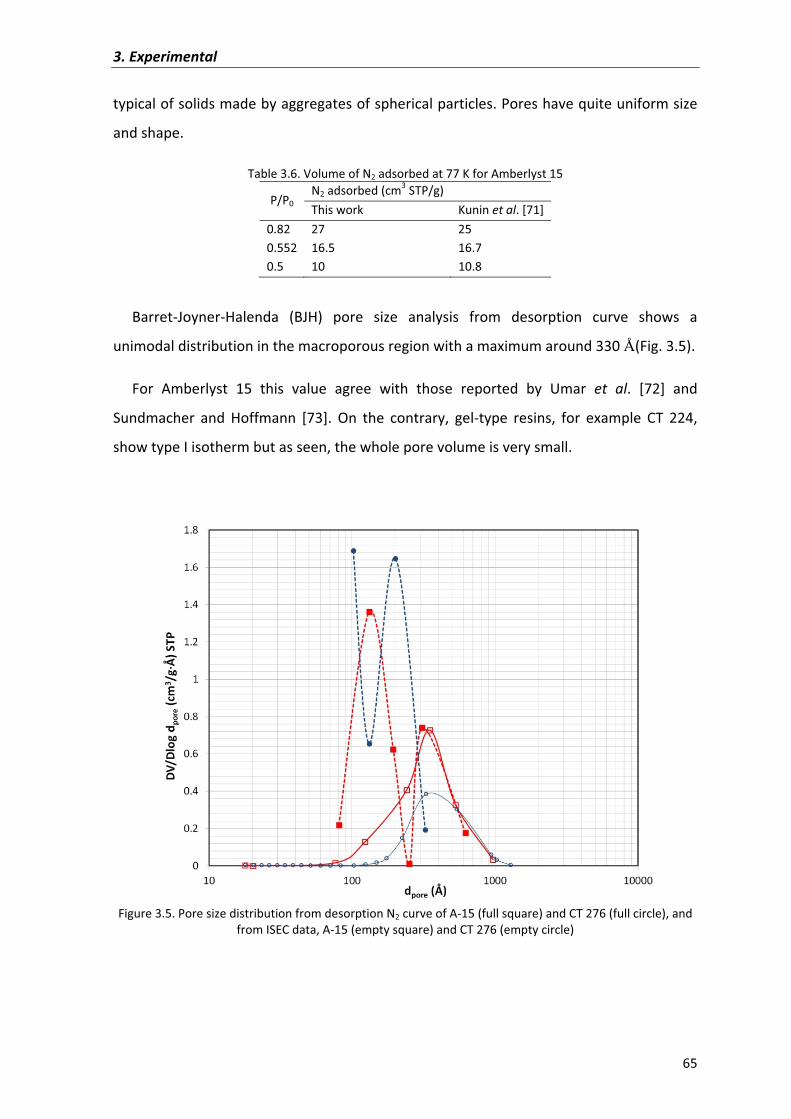
3.�Experimental�
65�
typical�of�solids�made�by�aggregates�of�spherical�particles.�Pores�have�quite�uniform�size�
and�shape.��
Table�3.6.�Volume�of�N2�adsorbed�at�77�K�for�Amberlyst�15�
P/P0�N2�adsorbed�(cm3 STP/g)This�work Kunin�et�al.�[71]�
0.82� 27� 250.552� 16.5 16.70.5� 10� 10.8
�
Barret�Joyner�Halenda� (BJH)� pore� size� analysis� from� desorption� curve� shows� a�
unimodal�distribution�in�the�macroporous�region�with�a�maximum�around�330�Å(Fig.�3.5).�
For� Amberlyst� 15� this� value� agree� with� those� reported� by� Umar� et� al.� [72]� and�
Sundmacher� and� Hoffmann� [73].� On� the� contrary,� gel�type� resins,� for� example� CT� 224,�
show�type�I�isotherm�but�as�seen,�the�whole�pore�volume�is�very�small.��
�
�Figure�3.5.�Pore�size�distribution�from�desorption�N2�curve�of�A�15�(full�square)�and�CT�276�(full�circle),�and�
from�ISEC�data,�A�15�(empty�square)�and�CT�276�(empty�circle)�
�
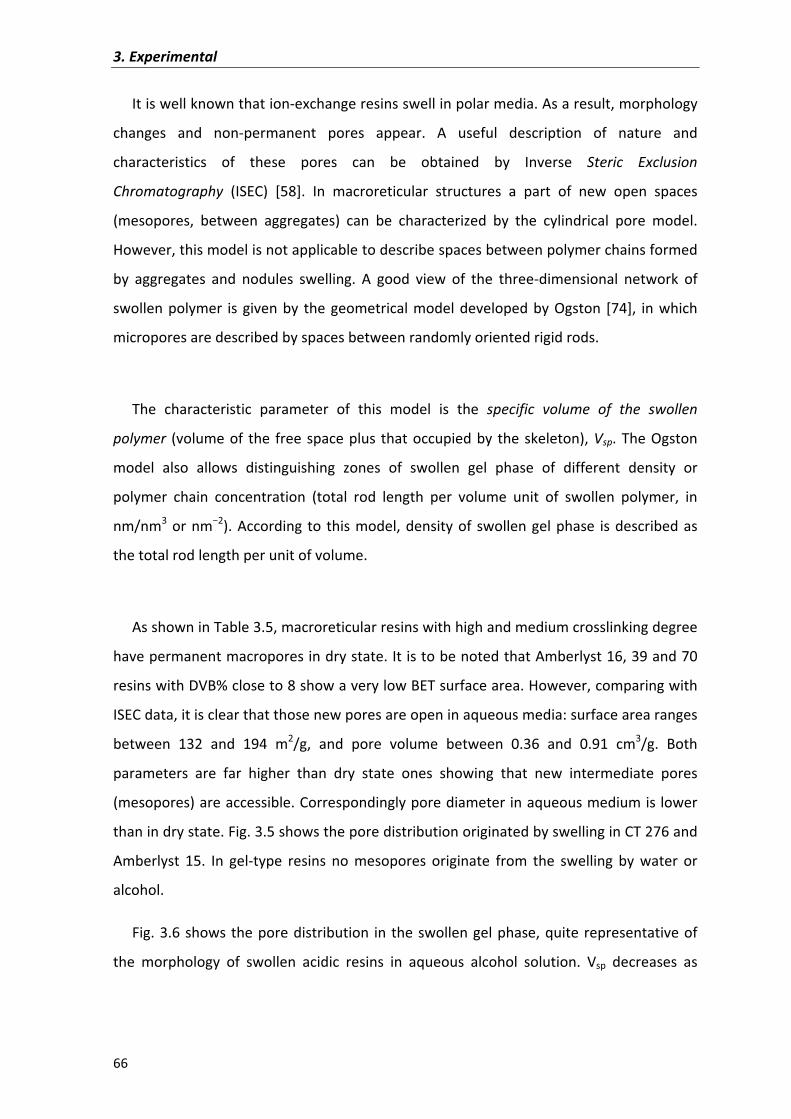
3.�Experimental�
66�
It�is�well�known�that�ion�exchange�resins�swell�in�polar�media.�As�a�result,�morphology�
changes� and� non�permanent� pores� appear.� A� useful� description� of� nature� and�
characteristics� of� these� pores� can� be� obtained� by� Inverse� Steric� Exclusion�
Chromatography� (ISEC)� [58].� In� macroreticular� structures� a� part� of� new� open� spaces�
(mesopores,� between� aggregates)� can� be� characterized� by� the� cylindrical� pore� model.�
However,�this�model�is�not�applicable�to�describe�spaces�between�polymer�chains�formed�
by� aggregates� and� nodules� swelling.� A� good� view� of� the� three�dimensional� network� of�
swollen�polymer� is�given�by� the�geometrical�model�developed�by�Ogston� [74],� in� which�
micropores�are�described�by�spaces�between�randomly�oriented�rigid�rods.��
�
The� characteristic� parameter� of� this� model� is� the� specific� volume� of� the� swollen�
polymer� (volume�of� the� free�space�plus� that�occupied�by� the�skeleton),�Vsp.�The�Ogston�
model� also� allows� distinguishing� zones� of� swollen� gel� phase� of� different� density� or�
polymer� chain� concentration� (total� rod� length� per� volume� unit� of� swollen� polymer,� in�
nm/nm3�or�nm�2).�According� to� this�model,�density�of� swollen�gel�phase� is�described�as�
the�total�rod�length�per�unit�of�volume.�
�
As�shown�in�Table�3.5,�macroreticular�resins�with�high�and�medium�crosslinking�degree�
have�permanent�macropores�in�dry�state.�It�is�to�be�noted�that�Amberlyst�16,�39�and�70�
resins�with�DVB%�close�to�8�show�a�very�low�BET�surface�area.�However,�comparing�with�
ISEC�data,�it�is�clear�that�those�new�pores�are�open�in�aqueous�media:�surface�area�ranges�
between� 132� and� 194� m2/g,� and� pore� volume� between� 0.36� and� 0.91� cm3/g.� Both�
parameters� are� far� higher� than� dry� state� ones� showing� that� new� intermediate� pores�
(mesopores)�are�accessible.�Correspondingly�pore�diameter�in�aqueous�medium�is�lower�
than�in�dry�state.�Fig.�3.5�shows�the�pore�distribution�originated�by�swelling�in�CT�276�and�
Amberlyst� 15.� In� gel�type� resins� no� mesopores� originate� from� the� swelling� by� water� or�
alcohol.�
Fig.�3.6�shows�the�pore�distribution� in� the�swollen�gel�phase,�quite�representative�of�
the� morphology� of� swollen� acidic� resins� in� aqueous� alcohol� solution.� Vsp� decreases� as�
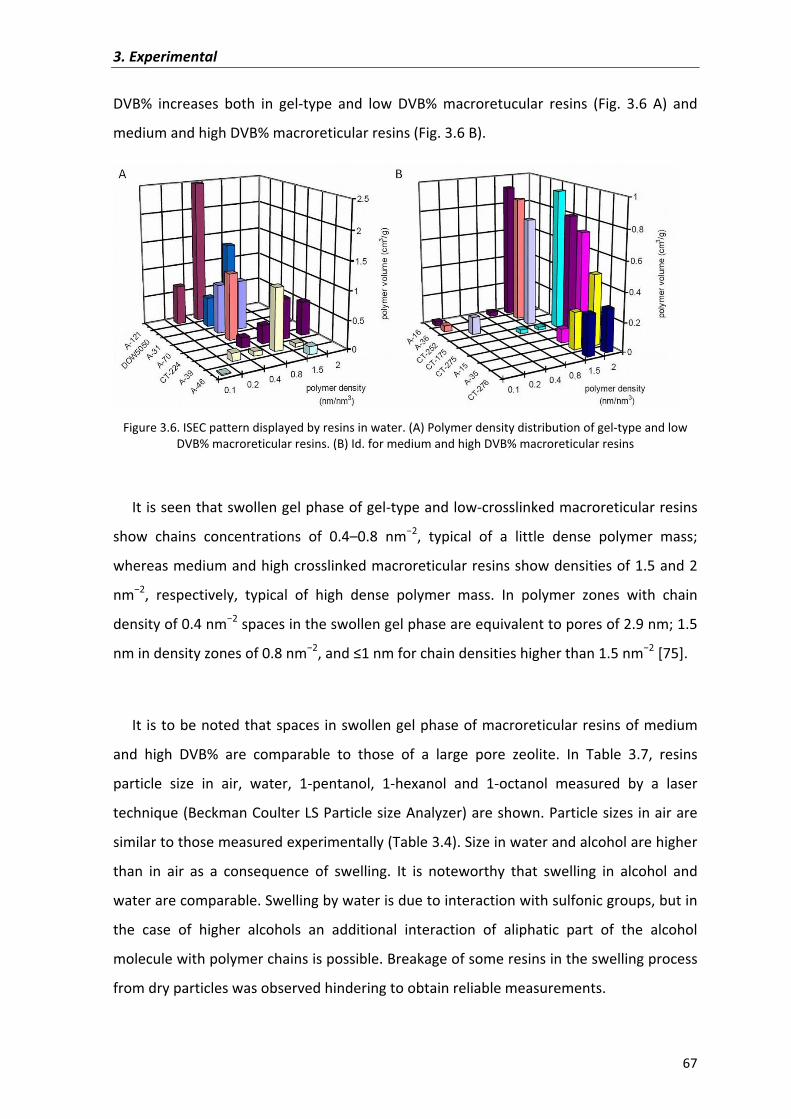
3.�Experimental�
67�
DVB%� increases� both� in� gel�type� and� low� DVB%� macroretucular� resins� (Fig.� 3.6� A)� and�
medium�and�high�DVB%�macroreticular�resins�(Fig.�3.6�B).�
�Figure�3.6.�ISEC�pattern�displayed�by�resins�in�water.�(A)�Polymer�density�distribution�of�gel�type�and�low�
DVB%�macroreticular�resins.�(B)�Id.�for�medium�and�high�DVB%�macroreticular�resins��
�
It�is�seen�that�swollen�gel�phase�of�gel�type�and�low�crosslinked�macroreticular�resins�
show� chains� concentrations� of� 0.4–0.8� nm�2,� typical� of� a� little� dense� polymer� mass;�
whereas�medium�and�high�crosslinked�macroreticular�resins�show�densities�of�1.5�and�2�
nm�2,� respectively,� typical� of� high� dense� polymer� mass.� In� polymer� zones� with� chain�
density�of�0.4�nm�2�spaces�in�the�swollen�gel�phase�are�equivalent�to�pores�of�2.9�nm;�1.5�
nm�in�density�zones�of�0.8�nm�2,�and��1�nm�for�chain�densities�higher�than�1.5�nm�2�[75].�
�
It� is�to�be�noted�that�spaces� in�swollen�gel�phase�of�macroreticular�resins�of�medium�
and� high� DVB%� are� comparable� to� those� of� a� large� pore� zeolite.� In� Table� 3.7,� resins�
particle� size� in� air,� water,� 1�pentanol,� 1�hexanol� and� 1�octanol� measured� by� a� laser�
technique�(Beckman�Coulter�LS�Particle�size�Analyzer)�are�shown.�Particle�sizes�in�air�are�
similar�to�those�measured�experimentally�(Table�3.4).�Size�in�water�and�alcohol�are�higher�
than� in� air� as� a� consequence� of� swelling.� It� is� noteworthy� that� swelling� in� alcohol� and�
water�are�comparable.�Swelling�by�water�is�due�to�interaction�with�sulfonic�groups,�but�in�
the� case� of� higher� alcohols� an� additional� interaction� of� aliphatic� part� of� the� alcohol�
molecule�with�polymer�chains�is�possible.�Breakage�of�some�resins�in�the�swelling�process�
from�dry�particles�was�observed�hindering�to�obtain�reliable�measurements.�
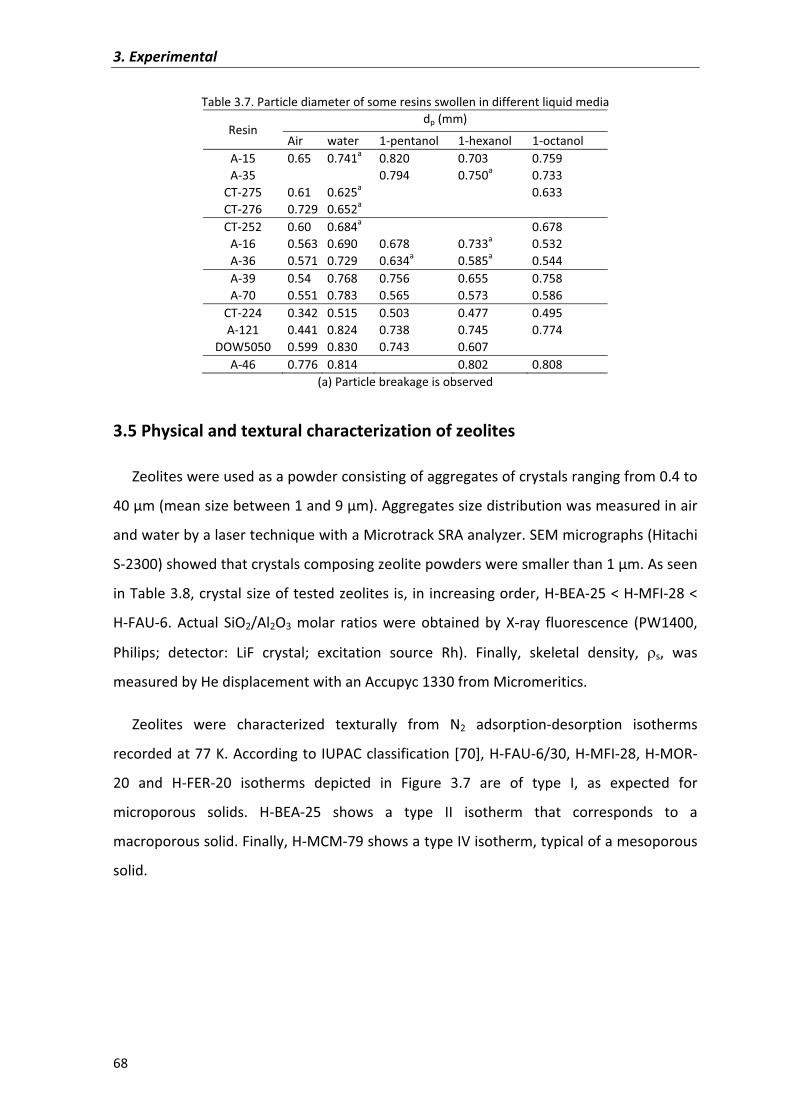
3.�Experimental�
68�
Table�3.7.�Particle�diameter�of�some�resins�swollen�in�different�liquid�media�
Resin�dp (mm)
Air� water� 1�pentanol� 1�hexanol� 1�octanol�A�15� 0.65� 0.741a� 0.820� 0.703� 0.759�A�35� � � 0.794� 0.750a� 0.733�
CT�275� 0.61� 0.625a� � � 0.633�CT�276� 0.729� 0.652a� � � �CT�252� 0.60� 0.684a� � � 0.678�
A�16� 0.563� 0.690� 0.678� 0.733a 0.532�A�36� 0.571� 0.729� 0.634a� 0.585a� 0.544�A�39� 0.54� 0.768� 0.756� 0.655� 0.758�A�70� 0.551� 0.783� 0.565� 0.573� 0.586�
CT�224� 0.342� 0.515� 0.503� 0.477� 0.495�A�121� 0.441� 0.824� 0.738� 0.745� 0.774�
DOW5050� 0.599� 0.830� 0.743� 0.607� �A�46� 0.776� 0.814� � 0.802� 0.808�
(a)�Particle�breakage�is�observed��
3.5�Physical�and�textural�characterization�of�zeolites�
Zeolites�were�used�as�a�powder�consisting�of�aggregates�of�crystals�ranging�from�0.4�to�
40��m�(mean�size�between�1�and�9��m).�Aggregates�size�distribution�was�measured�in�air�
and�water�by�a�laser�technique�with�a�Microtrack�SRA�analyzer.�SEM�micrographs�(Hitachi�
S�2300)�showed�that�crystals�composing�zeolite�powders�were�smaller�than�1��m.�As�seen�
in�Table�3.8,�crystal�size�of�tested�zeolites�is,� in�increasing�order,�H�BEA�25�<�H�MFI�28�<�
H�FAU�6.� Actual� SiO2/Al2O3� molar� ratios� were� obtained� by� X�ray� fluorescence� (PW1400,�
Philips;� detector:� LiF� crystal;� excitation� source� Rh).� Finally,� skeletal� density,� �s,� was�
measured�by�He�displacement�with�an�Accupyc�1330�from�Micromeritics.�
Zeolites� were� characterized� texturally� from� N2� adsorption�desorption� isotherms�
recorded�at�77�K.�According�to�IUPAC�classification�[70],�H�FAU�6/30,�H�MFI�28,�H�MOR�
20� and� H�FER�20� isotherms� depicted� in� Figure� 3.7� are� of� type� I,� as� expected� for�
microporous� solids.� H�BEA�25� shows� a� type� II� isotherm� that� corresponds� to� a�
macroporous�solid.�Finally,�H�MCM�79�shows�a�type�IV�isotherm,�typical�of�a�mesoporous�
solid.��
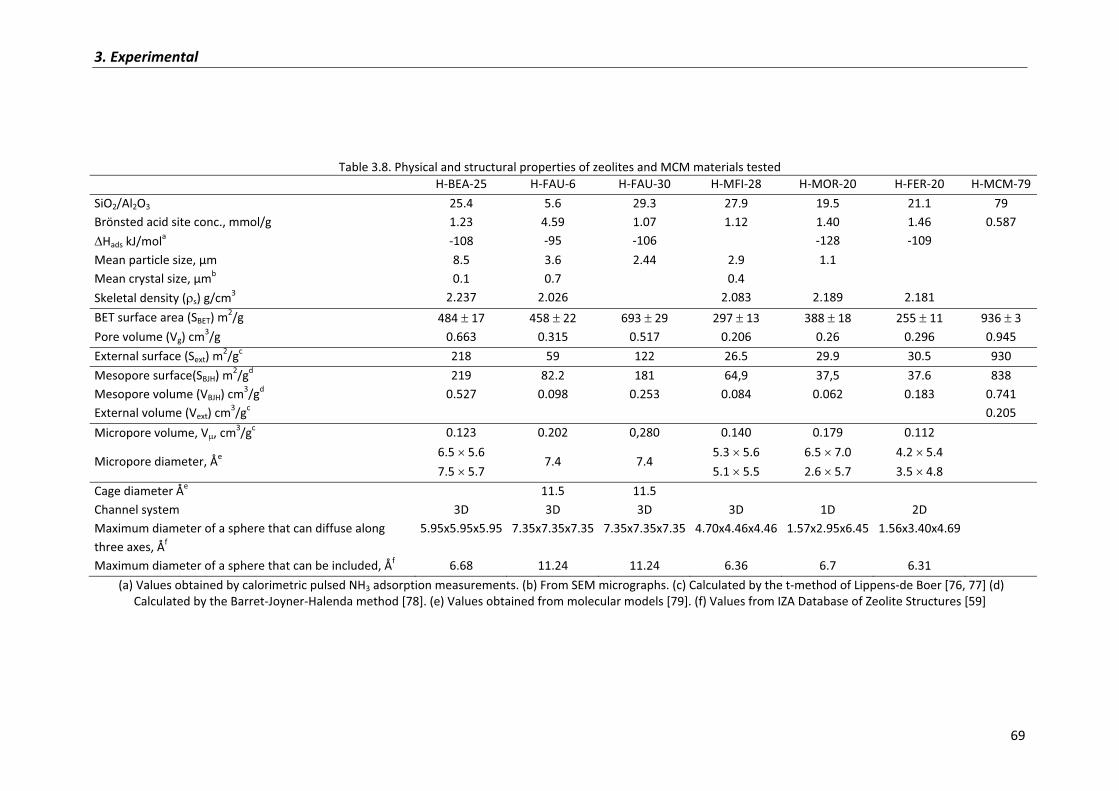
3.�Experimental�
69�
����
Table�3.8.�Physical�and�structural�properties�of�zeolites�and�MCM�materials�tested�� H�BEA�25 H�FAU�6 H�FAU�30 H�MFI�28 H�MOR�20 H�FER�20 H�MCM�79�SiO2/Al2O3� 25.4 5.6 29.3 27.9 19.5 21.1 79�Brönsted�acid�site�conc.,�mmol/g� 1.23 4.59 1.07 1.12 1.40 1.46 0.587��Hads�kJ/mola� �108� �95 �106 �128 �109Mean�particle�size,��m 8.5 3.6 2.44 2.9 1.1Mean�crystal�size,��mb 0.1 0.7 � 0.4Skeletal�density�(�s)�g/cm3� 2.237 2.026 � 2.083 2.189 2.181BET�surface�area�(SBET)�m
2/g� 484���17� 458���22� 693���29� 297���13� 388���18� 255���11� 936���3�Pore�volume�(Vg)�cm3/g 0.663 0.315 0.517 0.206 0.26 0.296 0.945�External�surface�(Sext)�m
2/gc� 218 59 122 26.5 29.9 30.5 930�Mesopore�surface(SBJH)�m2/gd� 219 82.2 181 64,9 37,5 37.6 838�Mesopore�volume�(VBJH)�cm3/gd� 0.527 0.098 0.253 0.084 0.062 0.183 0.741�External�volume�(Vext)�cm3/gc� � 0.205�Micropore�volume,�V�,�cm3/gc� 0.123� 0.202� 0,280� 0.140� 0.179� 0.112� �
Micropore�diameter,�Åe�6.5���5.6�7.5���5.7�
7.4� 7.4�5.3���5.6�5.1���5.5�
6.5���7.0�2.6���5.7�
4.2���5.4�3.5���4.8�
Cage�diameter�Åe
Channel�system�Maximum�diameter�of�a�sphere�that�can�diffuse�along�three�axes,�Åf�
Maximum�diameter�of�a�sphere�that�can�be�included,�Åf�
3D�5.95x5.95x5.95�
6.68�
11.53D�
7.35x7.35x7.35�
11.24�
11.53D�
7.35x7.35x7.35�
11.24�
3D�4.70x4.46x4.46�
6.36�
1D�1.57x2.95x6.45�
6.7�
2D�1.56x3.40x4.69�
6.31�
�
�(a)�Values�obtained�by�calorimetric�pulsed�NH3�adsorption�measurements.�(b)�From�SEM�micrographs.�(c)�Calculated�by�the�t�method�of�Lippens�de�Boer�[76,�77]�(d)�Calculated�by�the�Barret�Joyner�Halenda�method�[78].�(e)�Values�obtained�from�molecular�models�[79].�(f)�Values�from�IZA�Database�of�Zeolite�Structures�[59]�
�
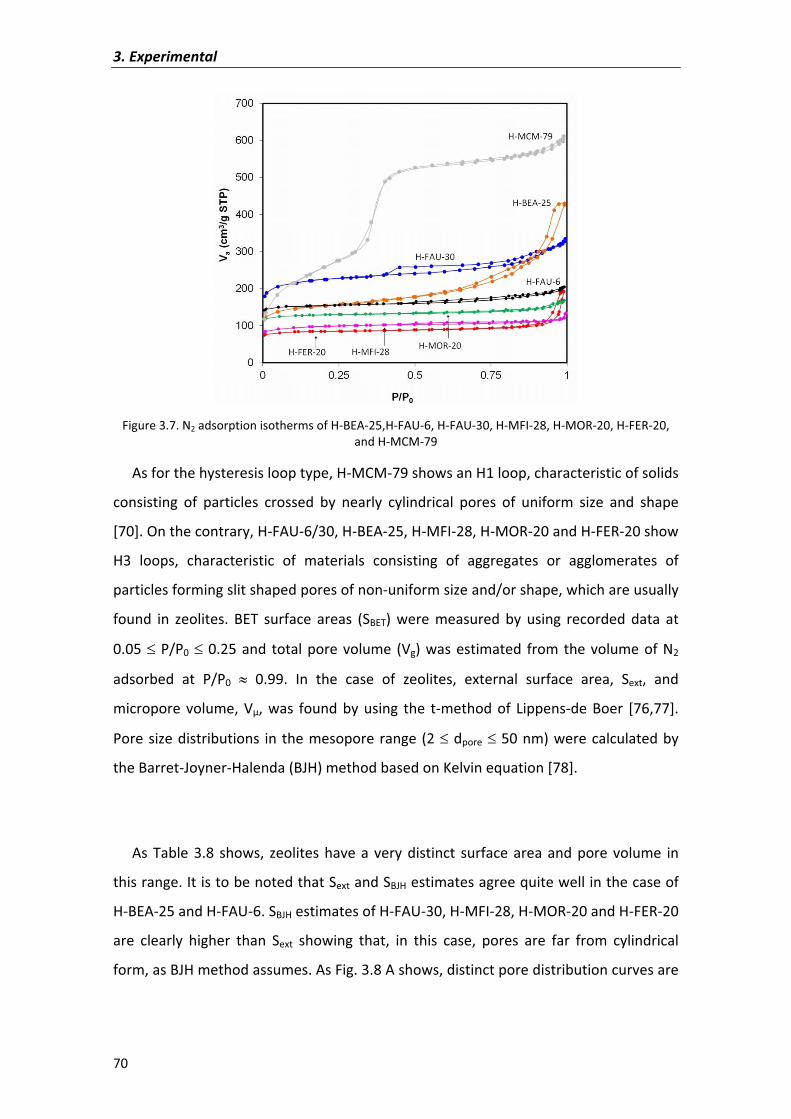
3.�Experimental�
70�
�
Figure�3.7.�N2�adsorption�isotherms�of�H�BEA�25,H�FAU�6,�H�FAU�30,�H�MFI�28,�H�MOR�20,�H�FER�20,�and�H�MCM�79�
As�for�the�hysteresis�loop�type,�H�MCM�79�shows�an�H1�loop,�characteristic�of�solids�
consisting� of� particles� crossed� by� nearly� cylindrical� pores� of� uniform� size� and� shape�
[70].�On�the�contrary,�H�FAU�6/30,�H�BEA�25,�H�MFI�28,�H�MOR�20�and�H�FER�20�show�
H3� loops,� characteristic� of� materials� consisting� of� aggregates� or� agglomerates� of�
particles�forming�slit�shaped�pores�of�non�uniform�size�and/or�shape,�which�are�usually�
found� in� zeolites.� BET� surface� areas� (SBET)� were� measured� by� using� recorded� data� at�
0.05��P/P0��0.25�and� total�pore�volume� (Vg)�was�estimated� from�the�volume�of�N2�
adsorbed� at� P/P0� �� 0.99.� In� the� case� of� zeolites,� external� surface� area,� Sext,� and�
micropore� volume,� V�,� was� found� by� using� the� t�method� of� Lippens�de� Boer� [76,77].�
Pore�size�distributions� in� the�mesopore�range�(2��dpore��50�nm)�were�calculated�by�
the�Barret�Joyner�Halenda�(BJH)�method�based�on�Kelvin�equation�[78].�
�
As� Table� 3.8� shows,� zeolites� have�a� very� distinct� surface�area� and� pore� volume� in�
this�range.�It�is�to�be�noted�that�Sext�and�SBJH�estimates�agree�quite�well�in�the�case�of�
H�BEA�25�and�H�FAU�6.�SBJH�estimates�of�H�FAU�30,�H�MFI�28,�H�MOR�20�and�H�FER�20�
are� clearly� higher� than� Sext� showing� that,� in� this� case,� pores� are� far� from� cylindrical�
form,�as�BJH�method�assumes.�As�Fig.�3.8�A�shows,�distinct�pore�distribution�curves�are�
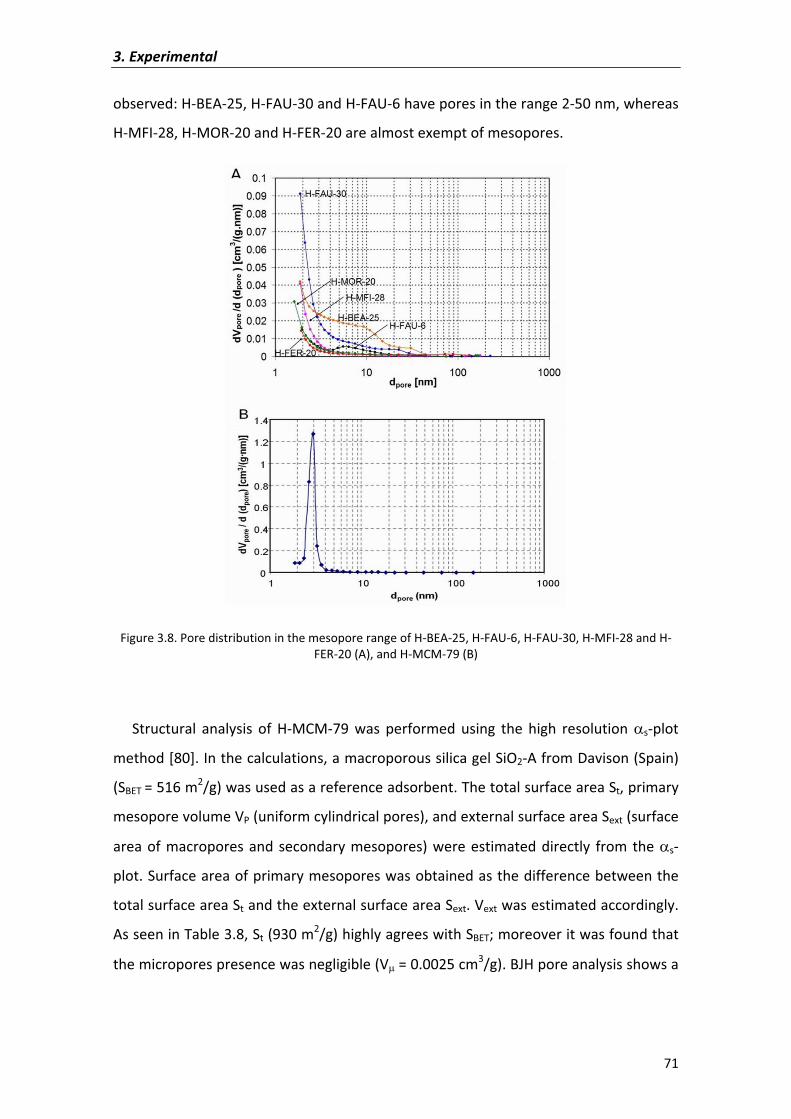
3.�Experimental�
71�
observed:�H�BEA�25,�H�FAU�30�and�H�FAU�6�have�pores�in�the�range�2�50�nm,�whereas�
H�MFI�28,�H�MOR�20�and�H�FER�20�are�almost�exempt�of�mesopores.�
�
Figure�3.8.�Pore�distribution�in�the�mesopore�range�of�H�BEA�25,�H�FAU�6,�H�FAU�30,�H�MFI�28�and�H�FER�20�(A),�and�H�MCM�79�(B)�
�
Structural� analysis� of� H�MCM�79� was� performed� using� the� high� resolution�s�plot�
method�[80].�In�the�calculations,�a�macroporous�silica�gel�SiO2�A�from�Davison�(Spain)�
(SBET�=�516�m2/g)�was�used�as�a�reference�adsorbent.�The�total�surface�area�St,�primary�
mesopore�volume�VP�(uniform�cylindrical�pores),�and�external�surface�area�Sext�(surface�
area�of�macropores�and�secondary�mesopores)�were�estimated�directly� from�the�s�
plot.�Surface�area�of�primary�mesopores�was�obtained�as�the�difference�between�the�
total�surface�area�St�and�the�external�surface�area�Sext.�Vext�was�estimated�accordingly.�
As�seen�in�Table�3.8,�St�(930�m2/g)�highly�agrees�with�SBET;�moreover�it�was�found�that�
the�micropores�presence�was�negligible�(V��=�0.0025�cm3/g).�BJH�pore�analysis�shows�a�
3.�Experimental�
72�
narrow� pore� distribution� about� 3� nm,� which� proves� the� pore� uniformity� of� such�
materials�(Figure�3.8�B).��
Nature�of�acid�sites�in�zeolites�can�be�both�Brönsted�and�Lewis�type.�H�BEA�25�has�
been�associated�with�a�significant�number�of�SiOH�groups�at�the�surface�[81],�but�the�
bridging� hydroxyl� groups� (Si(OH)Al)� and� Lewis� acid� sites� can� be� involved� as� well� in�
alcohol�dehydration�reactions�[82].�Acid�site�densities�were�estimated�by�assuming�one�
Brönsted� acid� site� per� lattice� Al� free� of� residual� cations� such� as� Na+� [83].� As� in� ion�
exchange� resins,� acid� strength� was� represented� by� the� molar� adsorption� enthalpy�of�
ammonia�(�Hads)�calculated�in�the�present�work�with�the�set�up�showed�in�APPENDIX�
IV.�
�
�
�
�
�
�
�
�
CHAPTER�4�
Influence�of�properties�and�textural�parameters�of�PS�DVB�resins�on�the�synthesis�of�DNOE.�A�comparison�with�DNHE�and�DNPE�syntheses��
�
�
�
�
�
�
�
�
�

�
�
�
�
�
�
�
�
�
�
�
�
�
�
�
�
�
�
�
�
�
�
�
�
�
�
�
�
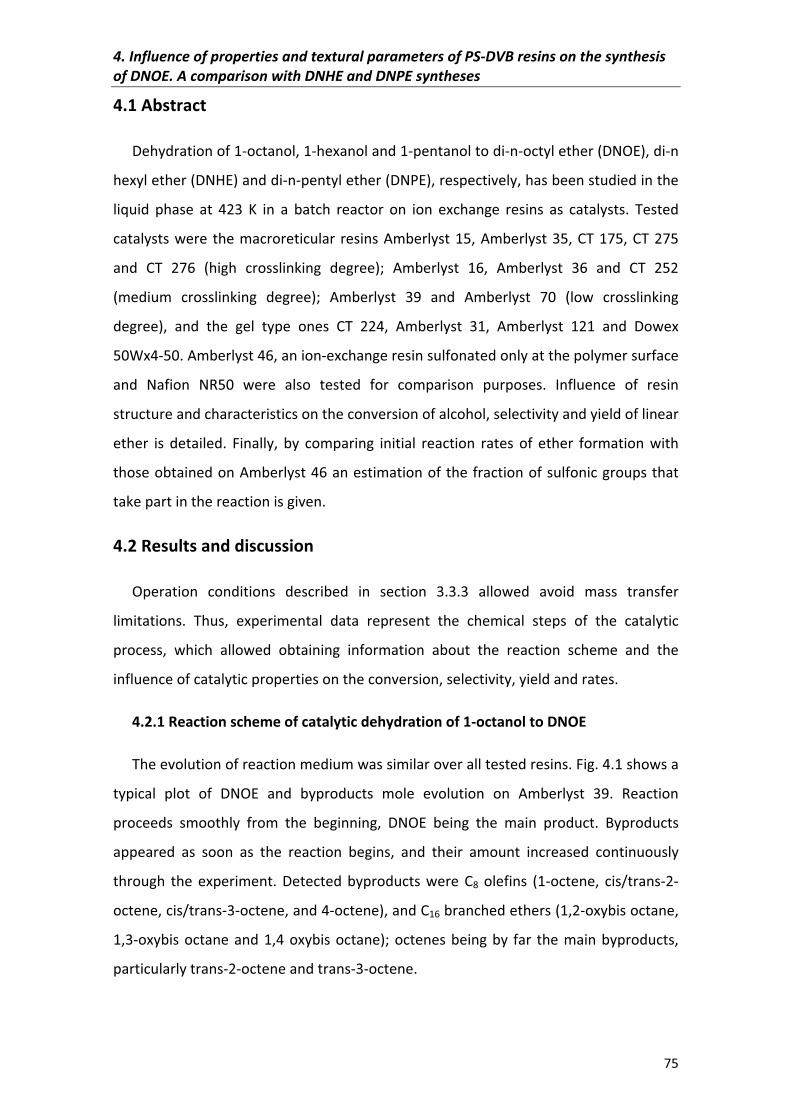
4.�Influence�of�properties�and�textural�parameters�of�PS�DVB�resins�on�the�synthesis�of�DNOE.�A�comparison�with�DNHE�and�DNPE�syntheses�
75�
4.1�Abstract�
Dehydration�of�1�octanol,�1�hexanol�and�1�pentanol�to�di�n�octyl�ether�(DNOE),�di�n�
hexyl�ether�(DNHE)�and�di�n�pentyl�ether�(DNPE),�respectively,�has�been�studied�in�the�
liquid� phase� at� 423� K� in� a� batch� reactor� on� ion� exchange� resins� as� catalysts.� Tested�
catalysts�were� the�macroreticular� resins�Amberlyst�15,�Amberlyst�35,�CT�175,�CT�275�
and� CT� 276� (high� crosslinking� degree);� Amberlyst� 16,� Amberlyst� 36� and� CT� 252�
(medium� crosslinking� degree);� Amberlyst� 39� and� Amberlyst� 70� (low� crosslinking�
degree),� and� the� gel� type� ones� CT� 224,� Amberlyst� 31,� Amberlyst� 121� and� Dowex�
50Wx4�50.�Amberlyst�46,�an�ion�exchange�resin�sulfonated�only�at�the�polymer�surface�
and� Nafion� NR50� were� also� tested� for� comparison� purposes.� Influence� of� resin�
structure�and�characteristics�on�the�conversion�of�alcohol,�selectivity�and�yield�of�linear�
ether� is� detailed.� Finally,� by� comparing� initial� reaction� rates� of� ether� formation� with�
those�obtained�on�Amberlyst�46�an�estimation�of�the�fraction�of�sulfonic�groups�that�
take�part�in�the�reaction�is�given.��
4.2�Results�and�discussion�
Operation� conditions� described� in� section� 3.3.3� allowed� avoid� mass� transfer�
limitations.� Thus,� experimental� data� represent� the� chemical� steps� of� the� catalytic�
process,� which� allowed� obtaining� information� about� the� reaction� scheme� and� the�
influence�of�catalytic�properties�on�the�conversion,�selectivity,�yield�and�rates.�
4.2.1�Reaction�scheme�of�catalytic�dehydration�of�1�octanol�to�DNOE�
The�evolution�of�reaction�medium�was�similar�over�all�tested�resins.�Fig.�4.1�shows�a�
typical� plot� of� DNOE� and� byproducts� mole� evolution� on� Amberlyst� 39.� Reaction�
proceeds� smoothly� from� the� beginning,� DNOE� being� the� main� product.� Byproducts�
appeared� as� soon� as� the� reaction� begins,� and� their� amount� increased� continuously�
through� the� experiment.� Detected� byproducts� were� C8� olefins� (1�octene,� cis/trans�2�
octene,�cis/trans�3�octene,�and�4�octene),�and�C16�branched�ethers�(1,2�oxybis�octane,�
1,3�oxybis�octane�and�1,4�oxybis�octane);�octenes�being�by� far� the�main�byproducts,�
particularly�trans�2�octene�and�trans�3�octene.�
�
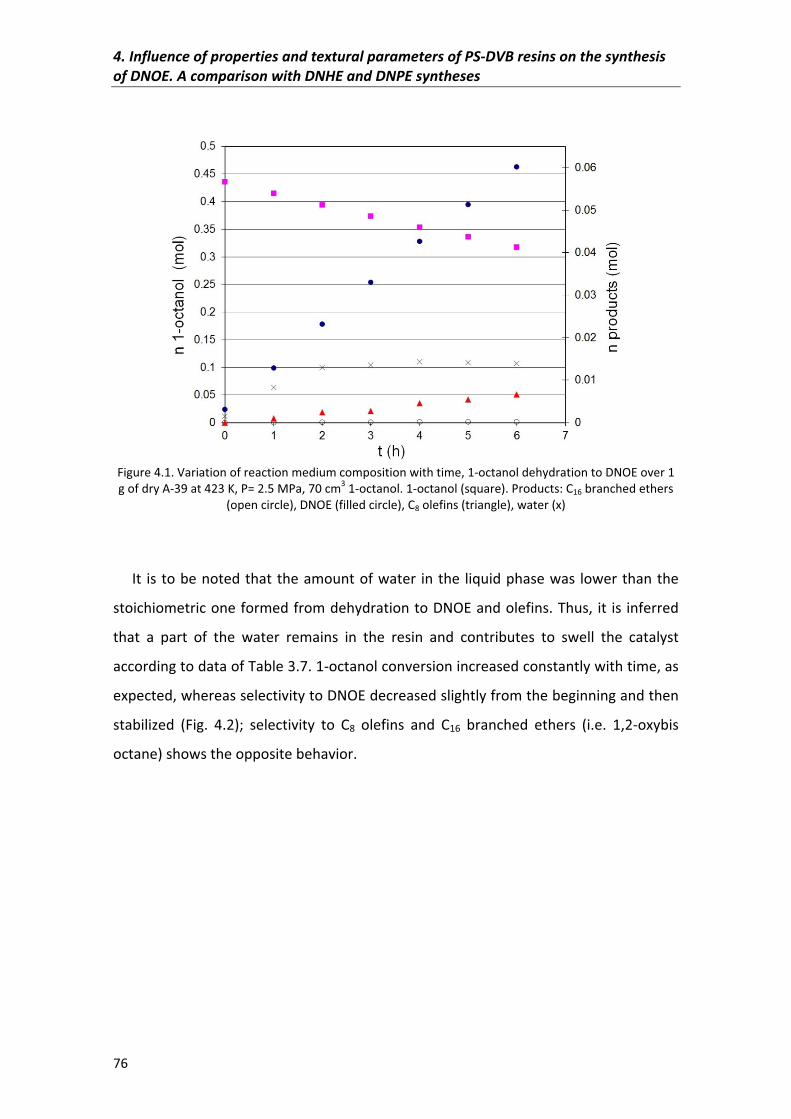
4.�Influence�of�properties�and�textural�parameters�of�PS�DVB�resins�on�the�synthesis�of�DNOE.�A�comparison�with�DNHE�and�DNPE�syntheses�
76�
�
�Figure�4.1.�Variation�of�reaction�medium�composition�with�time,�1�octanol�dehydration�to�DNOE�over�1�g�of�dry�A�39�at�423�K,�P=�2.5�MPa,�70�cm3�1�octanol.�1�octanol�(square).�Products:�C16�branched�ethers�
(open�circle),�DNOE�(filled�circle),�C8�olefins�(triangle),�water�(x)�
�
It� is�to�be�noted�that�the�amount�of�water� in�the� liquid�phase�was� lower�than�the�
stoichiometric�one�formed�from�dehydration�to�DNOE�and�olefins.�Thus,� it� is� inferred�
that� a� part� of� the� water� remains� in� the� resin� and� contributes� to� swell� the� catalyst�
according�to�data�of�Table�3.7.�1�octanol�conversion�increased�constantly�with�time,�as�
expected,�whereas�selectivity�to�DNOE�decreased�slightly�from�the�beginning�and�then�
stabilized� (Fig.� 4.2);� selectivity� to� C8� olefins� and� C16� branched� ethers� (i.e.� 1,2�oxybis�
octane)�shows�the�opposite�behavior.��
�
�
�
�
�
�
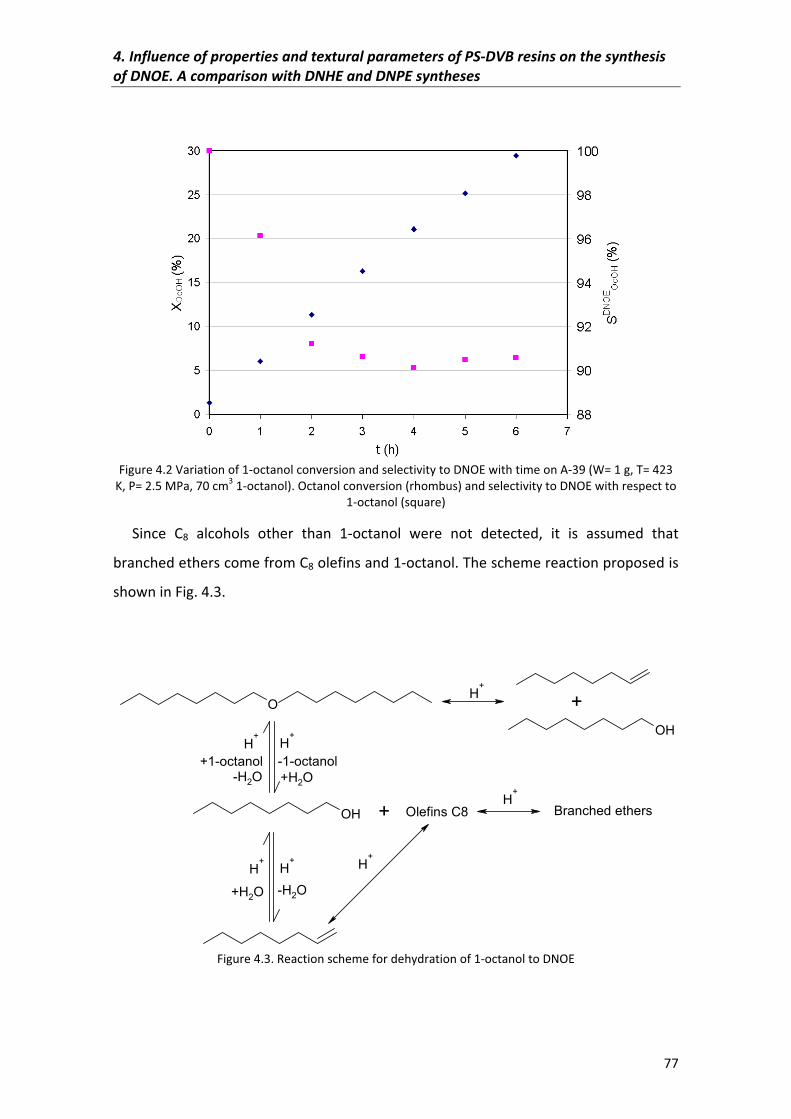
4.�Influence�of�properties�and�textural�parameters�of�PS�DVB�resins�on�the�synthesis�of�DNOE.�A�comparison�with�DNHE�and�DNPE�syntheses�
77�
�
�Figure�4.2�Variation�of�1�octanol�conversion�and�selectivity�to�DNOE�with�time�on�A�39�(W=�1�g,�T=�423�
K,�P=�2.5�MPa,�70�cm3�1�octanol).�Octanol�conversion�(rhombus)�and�selectivity�to�DNOE�with�respect�to�1�octanol�(square)�
Since� C8� alcohols� other� than� 1�octanol� were� not� detected,� it� is� assumed� that�
branched�ethers�come�from�C8�olefins�and�1�octanol.�The�scheme�reaction�proposed�is�
shown�in�Fig.�4.3.�
�
OH
H+
H+
H+
O
H+
H+
H+
H+
OH
Branched ethers+ Olefins C8
+1-octanol
-H2O+H2O
-H2O-1-octanol+H2O
+
�Figure�4.3.�Reaction�scheme�for�dehydration�of�1�octanol�to�DNOE�
�
�
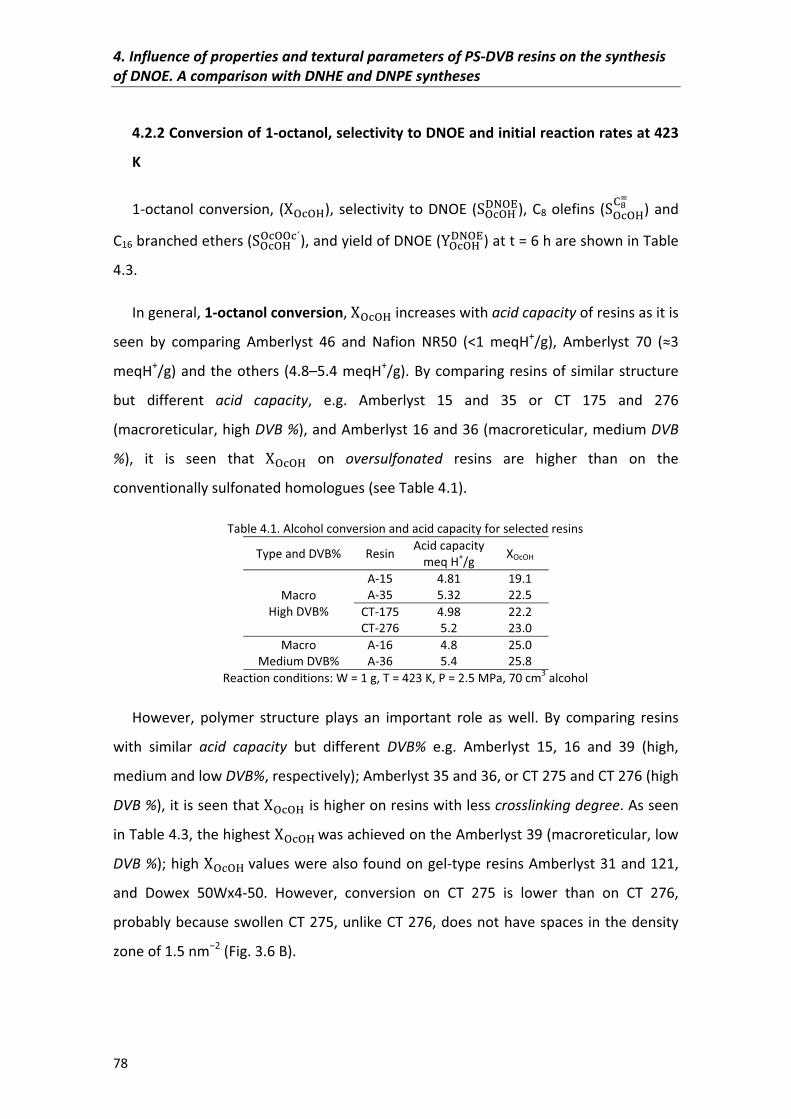
4.�Influence�of�properties�and�textural�parameters�of�PS�DVB�resins�on�the�synthesis�of�DNOE.�A�comparison�with�DNHE�and�DNPE�syntheses�
78�
�
4.2.2�Conversion�of�1�octanol,�selectivity�to�DNOE�and�initial�reaction�rates�at�423�
K�
1�octanol�conversion,� (HJ_JK),� selectivity� to�DNOE� (LJ_JKnoJp),�C8�olefins� (LJ_JKMqN )�and�
C16�branched�ethers�(LJ_JKJ_JJ_O),�and�yield�of�DNOE�(PJ_JKnoJp)�at�t�=�6�h�are�shown�in�Table�
4.3.��
In�general,�1�octanol�conversion, HJ_JK�increases�with�acid�capacity�of�resins�as�it�is�
seen� by� comparing� Amberlyst� 46� and� Nafion� NR50� (<1� meqH+/g),� Amberlyst� 70� (�3�
meqH+/g)�and�the�others�(4.8–5.4�meqH+/g).�By�comparing�resins�of�similar�structure�
but� different� acid� capacity,� e.g.� Amberlyst� 15� and� 35� or� CT� 175� and� 276�
(macroreticular,�high�DVB�%),�and�Amberlyst�16�and�36�(macroreticular,�medium�DVB�
%),� it� is� seen� that� HJ_JK� on� oversulfonated� resins� are� higher� than� on� the�
conventionally�sulfonated�homologues�(see�Table�4.1).�
Table�4.1.�Alcohol�conversion�and�acid�capacity�for�selected�resins��
Type�and�DVB%� Resin� Acid�capacitymeq�H+/g� XOcOH�
Macro�High�DVB%�
A�15 4.81 19.1A�35 5.32 22.5
CT�175 4.98 22.2CT�276 5.2 23.0
Macro�Medium�DVB%�
A�16 4.8 25.0A�36 5.4 25.8
Reaction�conditions:�W�=�1�g,�T�=�423�K,�P�=�2.5�MPa,�70�cm3�alcohol�
However,� polymer� structure� plays� an� important� role� as� well.� By� comparing� resins�
with� similar� acid� capacity� but� different� DVB%� e.g.� Amberlyst� 15,� 16� and� 39� (high,�
medium�and�low�DVB%,�respectively);�Amberlyst�35�and�36,�or�CT�275�and�CT�276�(high�
DVB�%),�it�is�seen�that�HJ_JK�is�higher�on�resins�with�less�crosslinking�degree.�As�seen�
in�Table�4.3,�the�highest�HJ_JK was�achieved�on�the�Amberlyst�39�(macroreticular,�low�
DVB�%);�high�HJ_JK values�were�also�found�on�gel�type�resins�Amberlyst�31�and�121,�
and� Dowex� 50Wx4�50.� However,� conversion� on� CT� 275� is� lower� than� on� CT� 276,�
probably�because�swollen�CT�275,�unlike�CT�276,�does�not�have�spaces�in�the�density�
zone�of�1.5�nm�2�(Fig.�3.6�B).��
�
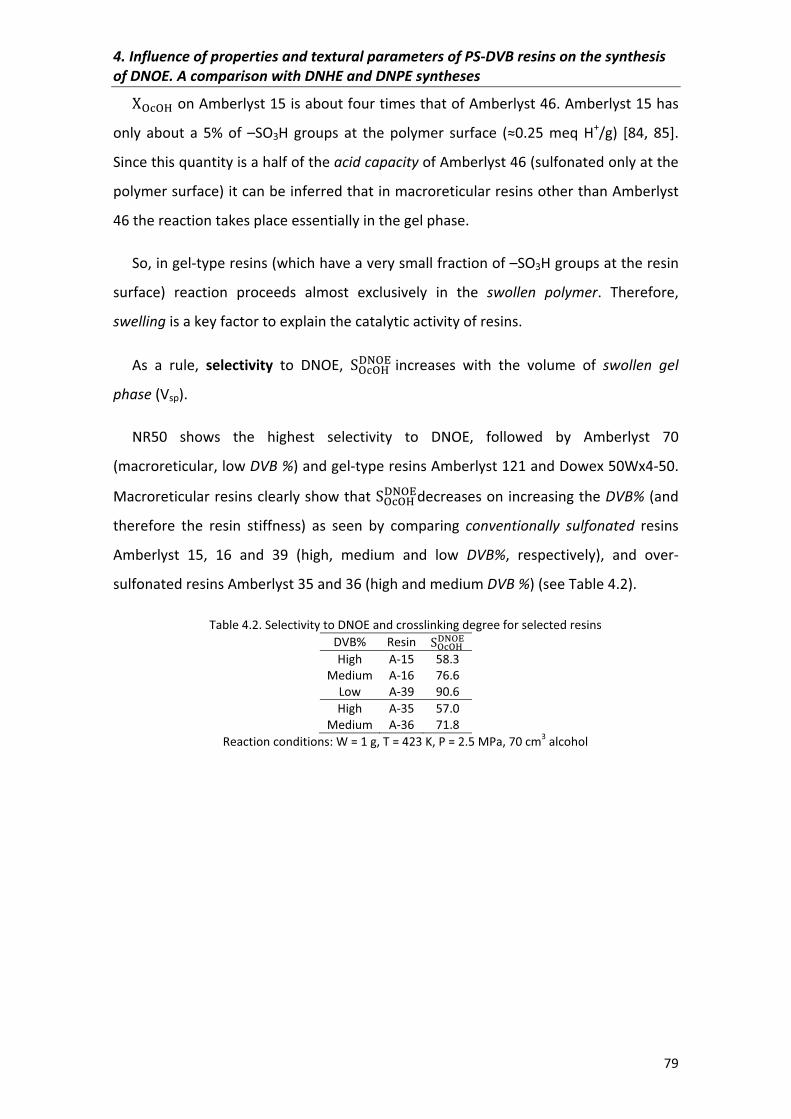
4.�Influence�of�properties�and�textural�parameters�of�PS�DVB�resins�on�the�synthesis�of�DNOE.�A�comparison�with�DNHE�and�DNPE�syntheses�
79�
HJ_JK�on�Amberlyst�15�is�about�four�times�that�of�Amberlyst�46.�Amberlyst�15�has�
only� about� a� 5%� of� –SO3H� groups� at� the� polymer� surface� (�0.25� meq� H+/g)� [84,� 85].�
Since�this�quantity�is�a�half�of�the�acid�capacity�of�Amberlyst�46�(sulfonated�only�at�the�
polymer�surface)�it�can�be�inferred�that�in�macroreticular�resins�other�than�Amberlyst�
46�the�reaction�takes�place�essentially�in�the�gel�phase.�
So,�in�gel�type�resins�(which�have�a�very�small�fraction�of�–SO3H�groups�at�the�resin�
surface)� reaction� proceeds� almost� exclusively� in� the� swollen� polymer.� Therefore,�
swelling�is�a�key�factor�to�explain�the�catalytic�activity�of�resins.��
As� a� rule,� selectivity� to� DNOE,� LJ_JKnoJp increases� with� the� volume� of� swollen� gel�
phase�(Vsp).��
NR50� shows� the� highest� selectivity� to� DNOE,� followed� by� Amberlyst� 70�
(macroreticular,�low�DVB�%)�and�gel�type�resins�Amberlyst�121�and�Dowex�50Wx4�50.�
Macroreticular�resins�clearly�show�that�LJ_JKnoJpdecreases�on�increasing�the�DVB%�(and�
therefore� the� resin� stiffness)� as� seen� by� comparing� conventionally� sulfonated� resins�
Amberlyst� 15,� 16� and� 39� (high,� medium� and� low� DVB%,� respectively),� and� over��
sulfonated�resins�Amberlyst�35�and�36�(high�and�medium�DVB�%)�(see�Table�4.2).��
Table�4.2.�Selectivity�to�DNOE�and�crosslinking�degree�for�selected�resins��DVB%� Resin� LJ_JKnoJpHigh A�15 58.3
Medium A�16 76.6Low A�39 90.6High A�35 57.0
Medium A�36 71.8Reaction�conditions:�W�=�1�g,�T�=�423�K,�P�=�2.5�MPa,�70�cm3�alcohol�
�
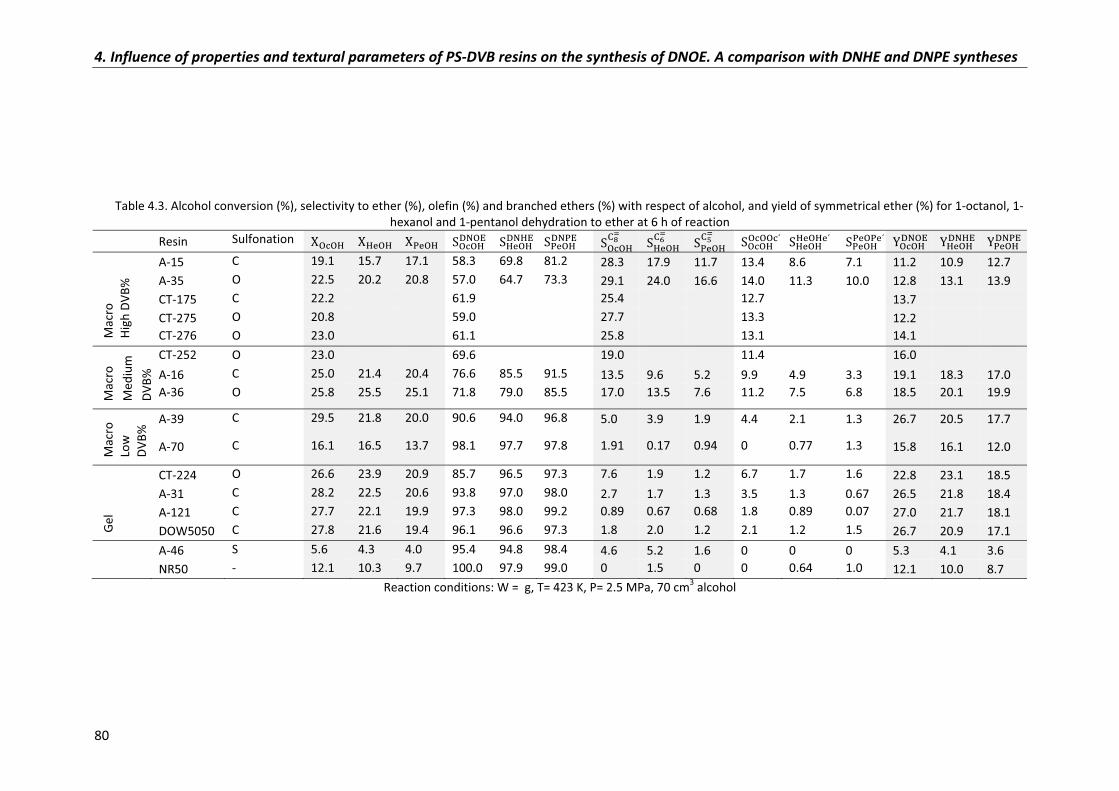
4.�Influence�of�properties�and�textural�parameters�of�PS�DVB�resins�on�the�synthesis�of�DNOE.�A�comparison�with�DNHE�and�DNPE�syntheses�
80�
Table�4.3.�Alcohol�conversion�(%),�selectivity�to�ether�(%),�olefin�(%)�and�branched�ethers�(%)�with�respect�of�alcohol,�and�yield�of�symmetrical�ether�(%)�for�1�octanol,�1�hexanol�and�1�pentanol�dehydration�to�ether�at�6�h�of�reaction�
� Resin� Sulfonation� HJ_JK HKrJK HsrJK LJ_JKnoJp LKrJKnoKp LsrJKnosp� LJ_JKMqN � LKrJKMtN � LsrJKMuN � LJ_JKJ_JJ_O LKrJKKrJKrO� LsrJKsrJsrO PJ_JKnoJp PKrJKnoKp PsrJKnosp�
Mac
ro�
High
�DVB
%�
A�15� C� 19.1 15.7 17.1 58.3 69.8 81.2 28.3� 17.9� 11.7� 13.4� 8.6� 7.1� 11.2� 10.9� 12.7�A�35� O� 22.5 20.2 20.8 57.0 64.7 73.3 29.1� 24.0� 16.6� 14.0� 11.3� 10.0� 12.8� 13.1� 13.9�CT�175� C� 22.2 61.9 25.4� � 12.7 13.7� � �CT�275� O� 20.8 59.0 27.7� � 13.3 12.2� � �CT�276 O� 23.0 61.1 25.8� � 13.1 14.1 �
Mac
ro�
Med
ium
�DV
B%�
CT�252 O� 23.0 69.6 19.0� � 11.4 16.0 �A�16� C� 25.0 21.4 20.4 76.6 85.5 91.5 13.5� 9.6� 5.2� 9.9� 4.9� 3.3� 19.1� 18.3� 17.0�A�36 O� 25.8 25.5 25.1 71.8 79.0 85.5 17.0� 13.5 7.6 11.2 7.5 6.8 18.5 20.1 19.9�
Mac
ro�
Low
�DV
B%� A�39� C� 29.5 21.8 20.0 90.6 94.0 96.8 5.0� 3.9� 1.9� 4.4� 2.1� 1.3� 26.7� 20.5� 17.7�
A�70� C� 16.1� 16.5� 13.7� 98.1� 97.7� 97.8� 1.91� 0.17� 0.94� 0� 0.77� 1.3� 15.8� 16.1� 12.0�
Gel�
CT�224� O� 26.6 23.9 20.9 85.7 96.5 97.3 7.6� 1.9 1.2 6.7 1.7 1.6 22.8� 23.1� 18.5�A�31� C� 28.2 22.5 20.6 93.8 97.0 98.0 2.7� 1.7� 1.3� 3.5� 1.3� 0.67� 26.5� 21.8� 18.4�A�121� C� 27.7 22.1 19.9 97.3 98.0 99.2 0.89� 0.67 0.68 1.8 0.89 0.07 27.0� 21.7� 18.1�DOW5050� C� 27.8 21.6 19.4 96.1 96.6 97.3 1.8� 2.0 1.2 2.1 1.2 1.5 26.7� 20.9� 17.1�
� A�46� S� 5.6 4.3 4.0 95.4 94.8 98.4 4.6� 5.2� 1.6� 0� 0� 0� 5.3� 4.1� 3.6�� NR50� �� 12.1 10.3 9.7 100.0 97.9 99.0 0 1.5 0 0 0.64 1.0 12.1� 10.0� 8.7�
Reaction�conditions:�W�=��g,�T=�423�K,�P=�2.5�MPa,�70�cm3�alcohol��
�
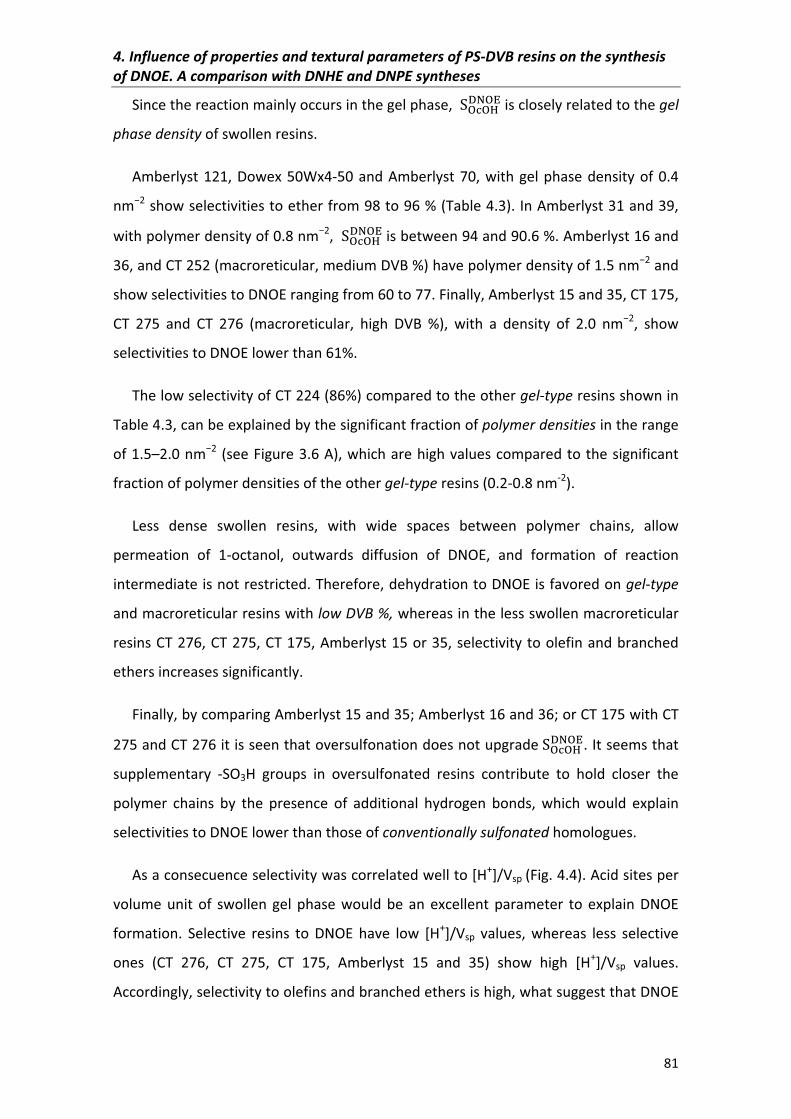
4.�Influence�of�properties�and�textural�parameters�of�PS�DVB�resins�on�the�synthesis�of�DNOE.�A�comparison�with�DNHE�and�DNPE�syntheses�
81�
Since�the�reaction�mainly�occurs�in�the�gel�phase,� LJ_JKnoJp is�closely�related�to�the�gel�
phase�density�of�swollen�resins.��
Amberlyst�121,�Dowex�50Wx4�50�and�Amberlyst�70,�with�gel�phase�density�of�0.4�
nm�2�show�selectivities�to�ether�from�98�to�96�%�(Table�4.3).�In�Amberlyst�31�and�39,�
with�polymer�density�of�0.8�nm�2,� LJ_JKnoJp is�between�94�and�90.6�%.�Amberlyst�16�and�
36,�and�CT�252�(macroreticular,�medium�DVB�%)�have�polymer�density�of�1.5�nm�2�and�
show�selectivities�to�DNOE�ranging�from�60�to�77.�Finally,�Amberlyst�15�and�35,�CT�175,�
CT� 275� and� CT� 276� (macroreticular,� high� DVB� %),� with� a� density� of� 2.0� nm�2,� show�
selectivities�to�DNOE�lower�than�61%.��
The�low�selectivity�of�CT�224�(86%)�compared�to�the�other�gel�type�resins�shown�in�
Table�4.3,�can�be�explained�by�the�significant�fraction�of�polymer�densities�in�the�range�
of�1.5–2.0�nm�2�(see�Figure�3.6�A),�which�are�high�values�compared�to�the�significant�
fraction�of�polymer�densities�of�the�other�gel�type�resins�(0.2�0.8�nm�2).�
Less� dense� swollen� resins,� with� wide� spaces� between� polymer� chains,� allow�
permeation� of� 1�octanol,� outwards� diffusion� of� DNOE,� and� formation� of� reaction�
intermediate�is�not�restricted.�Therefore,�dehydration�to�DNOE�is�favored�on�gel�type�
and�macroreticular�resins�with�low�DVB�%,�whereas�in�the�less�swollen�macroreticular�
resins�CT�276,�CT�275,�CT�175,�Amberlyst�15�or�35,�selectivity�to�olefin�and�branched�
ethers�increases�significantly.��
Finally,�by�comparing�Amberlyst�15�and�35;�Amberlyst�16�and�36;�or�CT�175�with�CT�
275�and�CT�276�it�is�seen�that�oversulfonation�does�not�upgrade LJ_JKnoJp.�It�seems�that�
supplementary� �SO3H� groups� in� oversulfonated� resins� contribute� to� hold� closer� the�
polymer� chains� by� the� presence� of� additional� hydrogen� bonds,� which� would� explain�
selectivities�to�DNOE�lower�than�those�of�conventionally�sulfonated�homologues.��
As�a�consecuence�selectivity�was�correlated�well�to�[H+]/Vsp�(Fig.�4.4).�Acid�sites�per�
volume� unit� of� swollen� gel� phase� would� be� an� excellent� parameter� to� explain� DNOE�
formation.� Selective� resins� to� DNOE� have� low� [H+]/Vsp� values,� whereas� less� selective�
ones� (CT� 276,� CT� 275,� CT� 175,� Amberlyst� 15� and� 35)� show� high� [H+]/Vsp� values.�
Accordingly,�selectivity�to�olefins�and�branched�ethers�is�high,�what�suggest�that�DNOE�
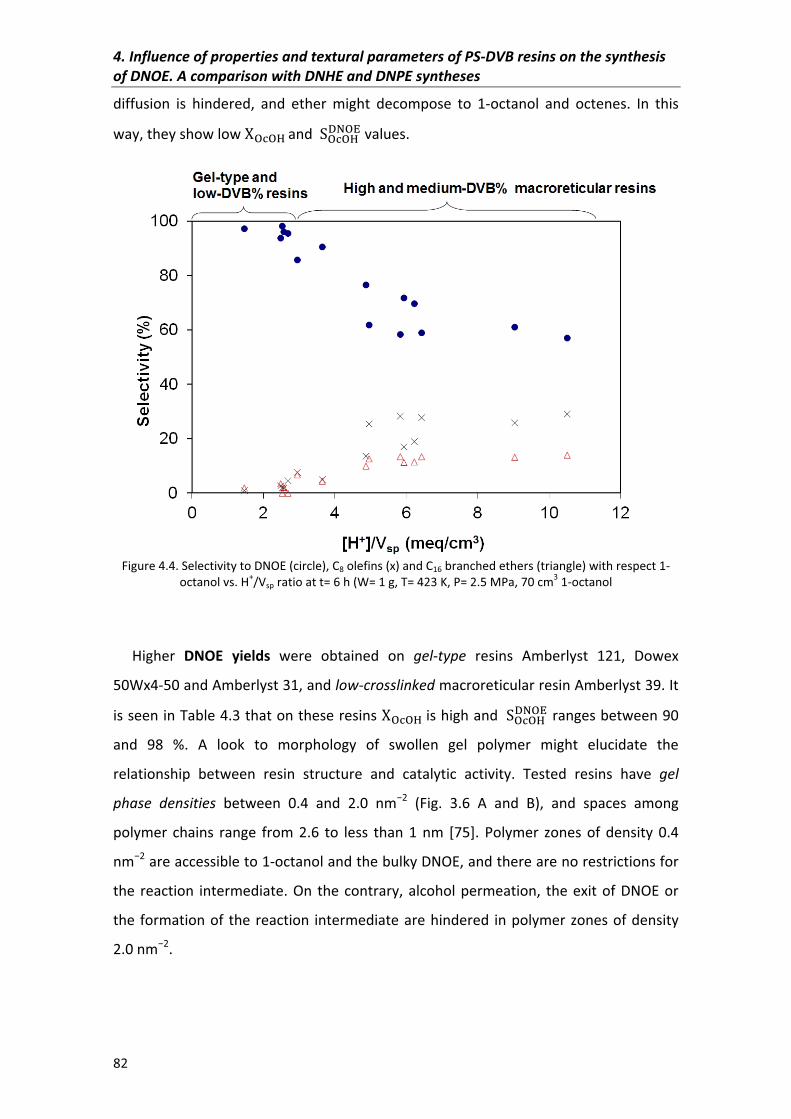
4.�Influence�of�properties�and�textural�parameters�of�PS�DVB�resins�on�the�synthesis�of�DNOE.�A�comparison�with�DNHE�and�DNPE�syntheses�
82�
diffusion� is� hindered,� and� ether� might� decompose� to� 1�octanol� and� octenes.� In� this�
way,�they�show�low�HJ_JK and� LJ_JKnoJp values.�
�Figure�4.4.�Selectivity�to�DNOE�(circle),�C8�olefins�(x)�and�C16�branched�ethers�(triangle)�with�respect�1�
octanol�vs.�H+/Vsp�ratio�at�t=�6�h�(W=�1�g,�T=�423�K,�P=�2.5�MPa,�70�cm3�1�octanol�
�
Higher� DNOE� yields� were� obtained� on� gel�type� resins� Amberlyst� 121,� Dowex�
50Wx4�50�and�Amberlyst�31,�and�low�crosslinked�macroreticular�resin�Amberlyst�39.�It�
is�seen�in�Table�4.3�that�on�these�resins�HJ_JK is�high�and� LJ_JKnoJp�ranges�between�90�
and� 98� %.� A� look� to� morphology� of� swollen� gel� polymer� might� elucidate� the�
relationship� between� resin� structure� and� catalytic� activity.� Tested� resins� have� gel�
phase� densities� between� 0.4� and� 2.0� nm�2� (Fig.� 3.6� A� and� B),� and� spaces� among�
polymer� chains� range� from� 2.6� to� less� than� 1� nm� [75].� Polymer� zones� of� density� 0.4�
nm�2�are�accessible�to�1�octanol�and�the�bulky�DNOE,�and�there�are�no�restrictions�for�
the� reaction� intermediate.�On� the�contrary,�alcohol�permeation,� the�exit�of�DNOE�or�
the� formation�of� the�reaction� intermediate�are�hindered� in�polymer�zones�of�density�
2.0�nm�2.��
4.�Influence�of�properties�and�textural�parameters�of�PS�DVB�resins�on�the�synthesis�of�DNOE.�A�comparison�with�DNHE�and�DNPE�syntheses�
83�
Resins�have� to� swell�by�1�octanol�and�water� released� for� the� reaction� takes�place�
with�high�DNOE�yield.� In� this�way,�gel�type�resins�showing�at� the�same�time�high�Vsp�
values�and�swollen�polymer�densities�of�0.4–0.8�nm�2�(spaces�of�2.9–1.5�nm)�give�the�
best�DNOE� yields.�Gel�type� resins�greatly� swell� in�1�octanol�water�mixtures� so� that�a�
high� portion� of� –SO3H� groups� are� able� to� take� part� in� the� reaction.� As� a� result,�HJ_JK values� are� high.� As� for� selectivity,� the� wide� spaces� between� polymer� chains�
favor�the�formation�and�diffusion�of�DNOE.�
As� seen� in� Table� 4.3,� initial� DNOE� formation� (YnoJp� )� and� 1�octanol� consumption�
(�YJ_JK� )�rates�fit�quite�well�Eq.�3.10,�which�is�a�proof�of�data�reliability.�YnoJp� values�
are�higher�on�gel�type�resins�Dowex�50Wx4�50,�Amberlyst�31,�and�Amberlyst�121,� in�
line�with�the�high�yield�of�DNOE�observed.�As�for�1�octanol�consumption,�Amberlyst�36�
and� 39� show� higher� �YJ_JK� � values� mainly� due� to� significant� formation� of� C8� olefins�
and�C16�branched�ethers.�
As� for� TOF� (turn� over� frequency),� NR50� shows� the� highest� initial� value.� It� is�
explained�by�the�higher�acid�strength�of�–SO3H�groups,�due�to�the�presence�of�fluorine�
in� Nafion� chains,� as� compared� to� those� of� PS�DVB� resins� [44].� Ammonia� adsorption�
enthalpies� tabulated� in� Table� 3.4� varied� slightly� between� oversulfonated� and�
conventionally�sulfonated�resins�(e.g.�Amberlyst�15�and�35)�but�generally,�acid�sites�in�
PS�DVB� resins� have� rather� similar� acid� strength� [86]� and� it� is� inferred� that� TOFDNOE�
values�depend�on�the�total�number�of�acid�sites.�Amberlyst�46,�sulfonated�only�at�the�
polymer�surface,�should�be�outlined.� Its� initial�TOFDNOE� is�clearly�higher�than�those�of�
the� other� PS�DVB� resins.� This� fact� disclose� that� in� swollen� PS�DVB� resins� there� is� a�
fraction� of� –SO3H� groups,� located� in� very� dense� polymer� zones,� unavailable� for�
reaction.��
So,�assuming�that�all�sulfonic�groups�of�Amberlyst�46�take�part�in�the�reaction,�the�
fraction�of�active�sites�taking�part�in�the�reaction�in�the�rest�of�resins�can�be�estimated�
comparing�TOFDNOE�values�with�that�of�Amberlyst�46.�This�way,�in�the�more�active�and�
selective�to�DNOE�Dowex�50Wx4�50,�Amberlyst�31,�121�and�70�between�64�and�61%�of�
sulfonic�groups�take�part�in�the�reaction,�but�in�the�less�active�and�selective�Amberlyst�
15� and� 35,� CT� 175,� CT� 275� and� CT� 276� only� a� fraction� of� 32–27%� participates.�
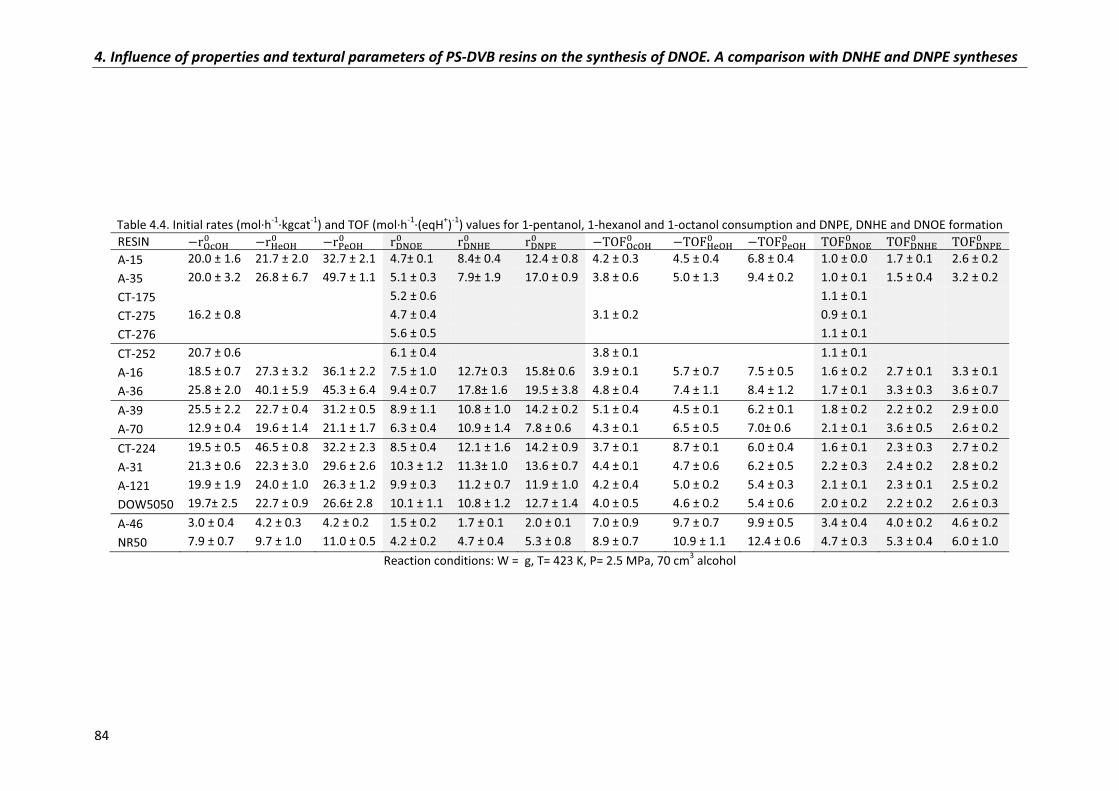
4.�Influence�of�properties�and�textural�parameters�of�PS�DVB�resins�on�the�synthesis�of�DNOE.�A�comparison�with�DNHE�and�DNPE�syntheses�
84�
Table�4.4.�Initial�rates�(mol�h�1�kgcat�1)�and�TOF�(mol�h�1�(eqH+)�1)�values�for�1�pentanol,�1�hexanol�and�1�octanol�consumption�and�DNPE,�DNHE�and�DNOE�formation�RESIN� �YJ_JK� �YKrJK� � �YsrJK� YnoJp� YnoKp� Ynosp� ��ijJ_JK� � ��ijKrJK� ��ijsrJK� �ijnoJp� �ijnoKp� �ijnosp� �A�15� 20.0�±�1.6� 21.7�±�2.0� 32.7�±�2.1 4.7±�0.1 8.4±�0.4 12.4�±�0.8 4.2�±�0.3� 4.5�±�0.4 6.8�±�0.4 1.0�±�0.0 1.7�±�0.1 2.6�±�0.2�A�35� 20.0 ±�3.2� 26.8�±�6.7� 49.7�±�1.1 5.1�±�0.3 7.9±�1.9 17.0�±�0.9 3.8�±�0.6� 5.0�±�1.3 9.4�±�0.2 1.0�±�0.1 1.5�±�0.4 3.2�±�0.2�CT�175� � � 5.2�±�0.6 1.1�±�0.1CT�275� 16.2�±�0.8� � � 4.7�±�0.4 3.1�±�0.2� 0.9�±�0.1CT�276� � � 5.6�±�0.5 1.1�±�0.1CT�252� 20.7�±�0.6� � � 6.1�±�0.4 3.8�±�0.1� 1.1�±�0.1A�16� 18.5�±�0.7� 27.3�±�3.2� 36.1�±�2.2 7.5�±�1.0 12.7±�0.3 15.8±�0.6 3.9�±�0.1� 5.7�±�0.7 7.5�±�0.5 1.6�±�0.2 2.7�±�0.1 3.3�±�0.1�A�36� 25.8�±�2.0� 40.1�±�5.9� 45.3�±�6.4 9.4�±�0.7 17.8±�1.6 19.5�±�3.8 4.8�±�0.4� 7.4�±�1.1 8.4�±�1.2 1.7�±�0.1 3.3�±�0.3 3.6�±�0.7�A�39� 25.5�±�2.2� 22.7�±�0.4� 31.2�±�0.5 8.9�±�1.1 10.8�±�1.0 14.2�±�0.2 5.1�±�0.4� 4.5�±�0.1 6.2�±�0.1 1.8�±�0.2 2.2�±�0.2 2.9�±�0.0�A�70� 12.9�±�0.4� 19.6�±�1.4� 21.1�±�1.7 6.3�±�0.4 10.9�±�1.4 7.8�± 0.6 4.3�±�0.1� 6.5�±�0.5 7.0±�0.6 2.1�±�0.1 3.6�±�0.5 2.6�±�0.2�CT�224� 19.5�±�0.5� 46.5�±�0.8� 32.2�±�2.3 8.5�±�0.4 12.1�±�1.6 14.2�±�0.9 3.7�±�0.1� 8.7�±�0.1 6.0�±�0.4 1.6�±�0.1 2.3�±�0.3 2.7�±�0.2�A�31� 21.3�±�0.6� 22.3�±�3.0� 29.6�±�2.6 10.3�±�1.2 11.3±�1.0 13.6�±�0.7 4.4�±�0.1� 4.7�±�0.6 6.2�±�0.5 2.2�±�0.3 2.4�±�0.2 2.8�±�0.2�A�121� 19.9�±�1.9� 24.0�±�1.0� 26.3�±�1.2 9.9�±�0.3 11.2�±�0.7 11.9�±�1.0 4.2�±�0.4� 5.0�±�0.2 5.4�±�0.3 2.1�±�0.1 2.3�±�0.1 2.5�±�0.2�DOW5050� 19.7±�2.5� 22.7�±�0.9� 26.6±�2.8 10.1�±�1.1 10.8�±�1.2 12.7�±�1.4 4.0�±�0.5� 4.6�±�0.2 5.4�±�0.6 2.0�±�0.2 2.2�±�0.2 2.6�±�0.3�A�46� 3.0�±�0.4� 4.2�±�0.3� 4.2�±�0.2 1.5�±�0.2 1.7�±�0.1 2.0�±�0.1 7.0�±�0.9� 9.7�±�0.7 9.9�±�0.5 3.4�±�0.4 4.0�±�0.2 4.6�±�0.2�NR50� 7.9�±�0.7� 9.7�±�1.0� 11.0�±�0.5 4.2�±�0.2 4.7�±�0.4 5.3�±�0.8 8.9�±�0.7� 10.9�±�1.1 12.4�±�0.6 4.7�±�0.3 5.3�±�0.4 6.0�±�1.0�
Reaction�conditions:�W�=��g,�T=�423�K,�P=�2.5�MPa,�70�cm3�alcohol���
�
�
�
4.�Influence�of�properties�and�textural�parameters�of�PS�DVB�resins�on�the�synthesis�of�DNOE.�A�comparison�with�DNHE�and�DNPE�syntheses�
85�
As�for�initial�–TOFOcOH,�Nafion�NR50�shows�the�highest�value,�a�little�higher�than�that�
of�Amberlyst�46,� in�agreement�with�their�different�acid�strength.�PS�DVB�resins�show�
smaller� values� because� a� fraction� of� active� sites� is� inaccessible� to� 1�octanol.� By�
comparing�with�Amberlyst�46�TOF�it�is�seen�that�accessible�sites�to�alcohol�range�from�
73%�(Amberlyst�39)�to�54%�(Amberlyst�35).��
��ijJ_JK� values�are�greater�than�twice���ijnoJp � ones,�suggesting�again�that�in�
resins�with�very�dense�swollen�gel�phase,�it�is�partially�accessible�to�1�octanol�but�the�
formation�and�diffusion�of�DNOE� is�actually�hindered.�Unlike�fluorine�atoms� in�NR50,�
chlorine�atoms� in�Amberlyst�70�chains�do�not�upgrade�acid� strength.�Chlorine�atoms�
give�Amberlyst�70�additional� thermal�stability�allowing�at�the�same�time�the�swelling�
phenomenon�in�aqueous�media.�As�a�result,�selectivity�to�DNOE�is�slightly�higher�than�
that�of�Amberlyst�39� (similar�crosslinking�degree�but�conventionally� sulfonated).�Due�
to�its�thermal�stability,�Amberlyst�70�could�be�a�suitable�catalyst�for�industrial�use.�
�
4.3�Comparison�of�DNHE,�DNPE�and�DNOE�synthesis�data�
Synthesis� of� DNPE� and� DNHE� from� 1�pentanol� and� 1�hexanol,� respectively,� was�
studied�on�resins�of�Table�3.2,�but�CT�175,�CT�275,�CT�276�and�CT�252.�Despite�DNOE�
yield�was�low�on�macroreticular�resins�with�high�or�medium�DVB%,�Amberlyst�15,�35,�
16� and� 36� were� used� for� comparison� purposes� (see� APPENDIX� V� for� detailed�
information� about� the� resins� tested� in� this� work).� Data� of� DNPE� synthesis� on�
Dowex50Wx4�50,� CT� 224,� Amberlyst� 70� and� 36,� and� NR50� are� in� agreement� with�
reported� previously� [44].� Byproducts� of� DNPE� and� DNHE� syntheses� were� C5� and� C6�
olefins,� respectively;� however,� unlike� 1�octanol� dehydration� to� DNOE,� traces� of�
secondary,�tertiary�and�branched�alcohols�were�detected�in�1�pentanol�and�1�hexanol�
dehydrations.�1�pentanol�and�1�hexanol�dehydrations�show�a�similar�pattern�to�that�of�
1�octanol,�and�the�variation�of�1�pentanol�(HsrJK)�and�1�hexanol�(HKrJK)�conversion,�
and�selectivity�to�DNPE�(LsrJKnosp)�and�DNHE�(LKrJKnoKp)�with�time�is�analogue�to�that�found�
in�DNOE�synthesis.��
�
4.�Influence�of�properties�and�textural�parameters�of�PS�DVB�resins�on�the�synthesis�of�DNOE.�A�comparison�with�DNHE�and�DNPE�syntheses�
86�
�
4.3.1�Conversion�
In�this�way,�HsrJK�and�HKrJK�were�higher�on�increasing�resins�acid�capacity�(Table�
4.2),� and� alcohol� conversions� were� higher� on� oversulfonated� resins� than� on�
conventionally� sulfonated� homologues� in� both� DNPE� and� DNHE� synthesis� (see�
Amberlyst�15�and�35;�or�Amberlyst�16�and�36).�Resin�morphology�is�also�an�important�
factor�to�achieve�high�conversions.�The�same�as�in�DNOE�synthesis,�the�highest�v5.wx�
and� HKrJK values� were� found� on� gel�type,� macroreticular� resins� of� low� crosslinking�
degree�as�well�as�Amberlyst�36.�In�general,�it�is�seen�that�HJ_JK y HKrJK y HsrJK�for�
each�resin.��
However,� this� fact� could� be� misleading� as� for� comparing� the� resin� activity� in� the�
three� reaction� systems.� All� experiments� were� performed� by� using� the� same� alcohol�
volume�and�catalysts�mass.�Since� the� three�alcohols�have�different�molecular�weight�
and�density,�the�initial�ratio�alcohol�moles�(\IJK� )�to�catalyst�mass�(W)�greatly�changes�
from� 1�pentanol� to� 1�octanol.� So,� to� compare� catalysts� activity� suitably,� the� factor�
HIJK \IJK� dz �is�used.��
As� seen� in� Fig.� 4.5� this� factor� decreases� as� alcohol� is� longer� on� macroreticular�
Amberlyst�15,�Amberlyst�35,�Amberlyst�16�and� Amberlyst�36� (high�and� medium�DVB�
%).�On�the�contrary,�on�gel�type�Amberlyst�31,�121,�CT�224�and�Dowex�50Wx4�50�and�
on�low�DVB%�macroreticular�Amberlyst�39�and�70�conversions�are�similar�for�the�three�
alcohols.� In� swollen� state� the� first� group� of� macroreticular� resins� has� spaces� in� gel�
phase�less�than�1�nm,�where�1�octanol�motion�could�be�more�restricted�than�that�of�1�
pentanol�and�1�hexanol.�
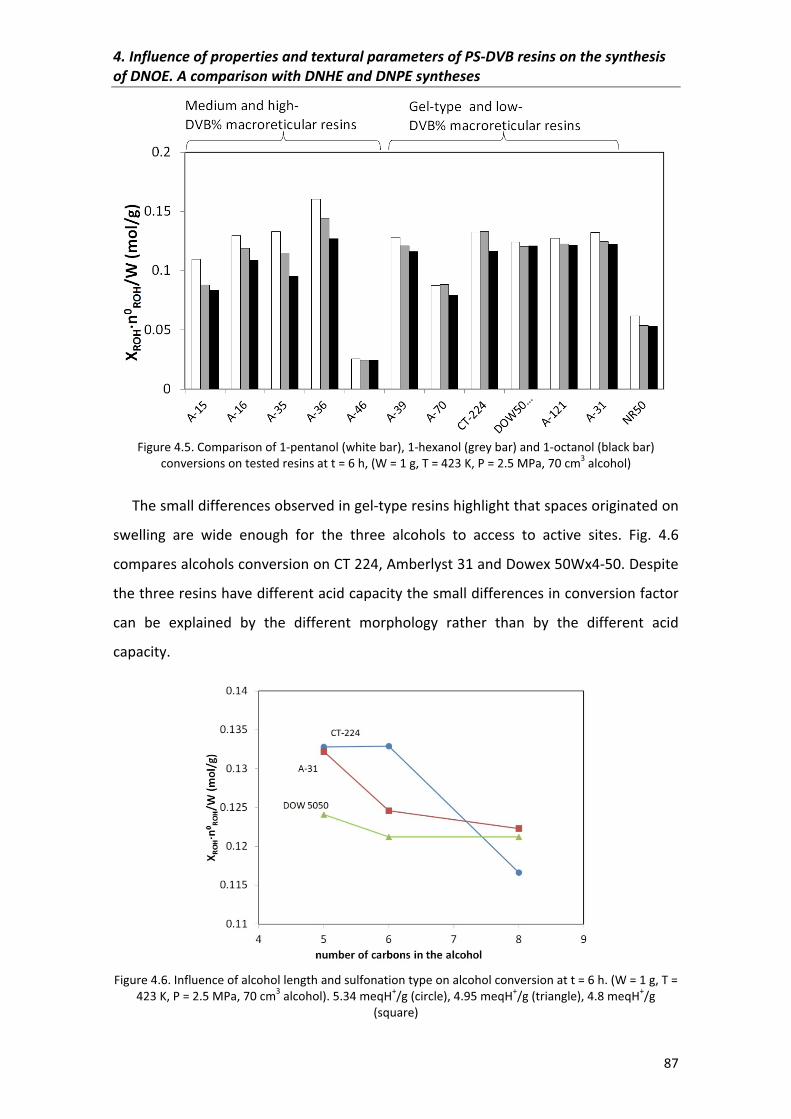
4.�Influence�of�properties�and�textural�parameters�of�PS�DVB�resins�on�the�synthesis�of�DNOE.�A�comparison�with�DNHE�and�DNPE�syntheses�
87�
�Figure�4.5.�Comparison�of�1�pentanol�(white�bar),�1�hexanol�(grey�bar)�and�1�octanol�(black�bar)�
conversions�on�tested�resins�at�t�=�6�h,�(W�=�1�g,�T�=�423�K,�P�=�2.5�MPa,�70�cm3�alcohol)��
The�small�differences�observed�in�gel�type�resins�highlight�that�spaces�originated�on�
swelling� are� wide� enough� for� the� three� alcohols� to� access� to� active� sites.� Fig.� 4.6�
compares�alcohols�conversion�on�CT�224,�Amberlyst�31�and�Dowex�50Wx4�50.�Despite�
the�three�resins�have�different�acid�capacity�the�small�differences�in�conversion�factor�
can� be� explained� by� the� different� morphology� rather� than� by� the� different� acid�
capacity.��
�Figure�4.6.�Influence�of�alcohol�length�and�sulfonation�type�on�alcohol�conversion�at�t�=�6�h.�(W�=�1�g,�T�=�
423�K,�P�=�2.5�MPa,�70�cm3�alcohol).�5.34�meqH+/g�(circle),�4.95�meqH+/g�(triangle),�4.8�meqH+/g�(square)�
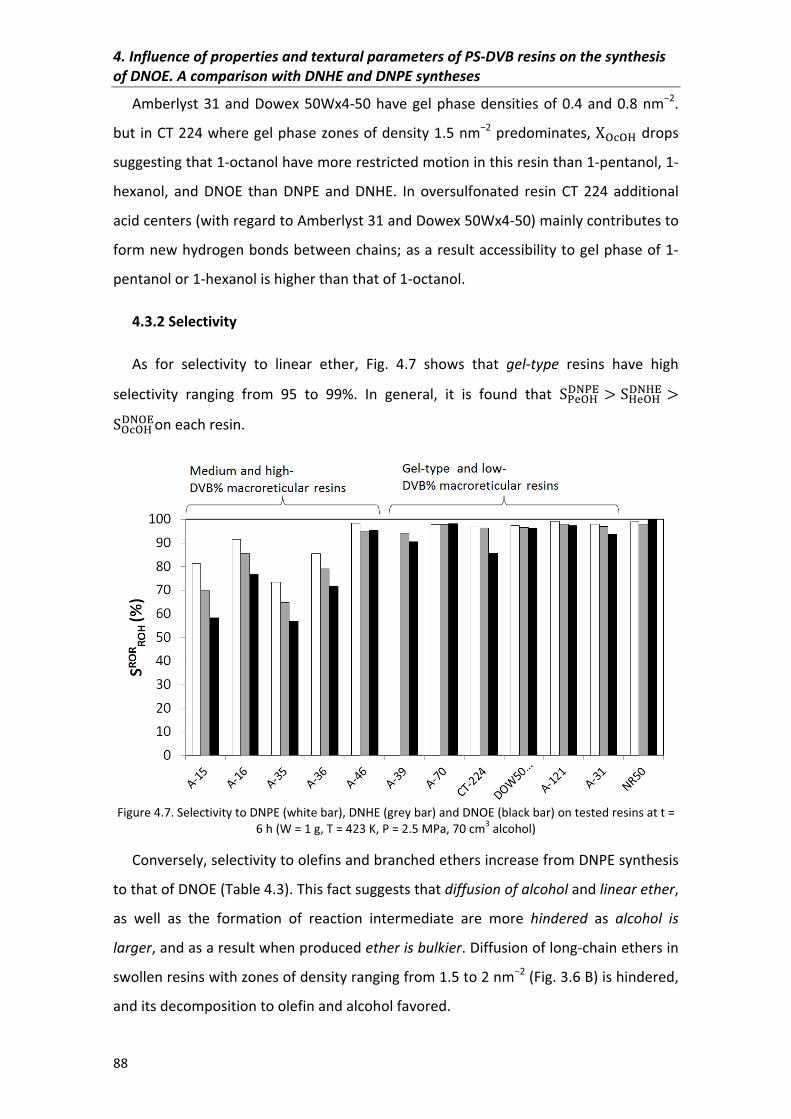
4.�Influence�of�properties�and�textural�parameters�of�PS�DVB�resins�on�the�synthesis�of�DNOE.�A�comparison�with�DNHE�and�DNPE�syntheses�
88�
Amberlyst�31�and�Dowex�50Wx4�50�have�gel�phase�densities�of�0.4�and�0.8�nm�2.�
but� in�CT�224�where�gel�phase�zones�of�density�1.5�nm�2�predominates,�HJ_JK�drops�
suggesting�that�1�octanol�have�more�restricted�motion�in�this�resin�than�1�pentanol,�1�
hexanol,� and� DNOE� than� DNPE� and� DNHE.� In� oversulfonated� resin� CT� 224� additional�
acid�centers�(with�regard�to�Amberlyst�31�and�Dowex�50Wx4�50)�mainly�contributes�to�
form�new�hydrogen�bonds�between�chains;�as�a�result�accessibility�to�gel�phase�of�1�
pentanol�or�1�hexanol�is�higher�than�that�of�1�octanol.��
4.3.2�Selectivity�
As� for� selectivity� to� linear� ether,� Fig.� 4.7� shows� that� gel�type� resins� have� high�
selectivity� ranging� from� 95� to� 99%.� In� general,� it� is� found� that� LsrJKnosp { LKrJKnoKp {LJ_JKnoJpon�each�resin.��
�Figure�4.7.�Selectivity�to�DNPE�(white�bar),�DNHE�(grey�bar)�and�DNOE�(black�bar)�on�tested�resins�at�t�=�
6�h�(W�=�1�g,�T�=�423�K,�P�=�2.5�MPa,�70�cm3�alcohol)�
Conversely,�selectivity�to�olefins�and�branched�ethers�increase�from�DNPE�synthesis�
to�that�of�DNOE�(Table�4.3).�This�fact�suggests�that�diffusion�of�alcohol�and�linear�ether,�
as� well� as� the� formation� of� reaction� intermediate� are� more� hindered� as� alcohol� is�
larger,�and�as�a�result�when�produced�ether�is�bulkier.�Diffusion�of�long�chain�ethers�in�
swollen�resins�with�zones�of�density�ranging�from�1.5�to�2�nm�2�(Fig.�3.6�B)�is�hindered,�
and�its�decomposition�to�olefin�and�alcohol�favored.��
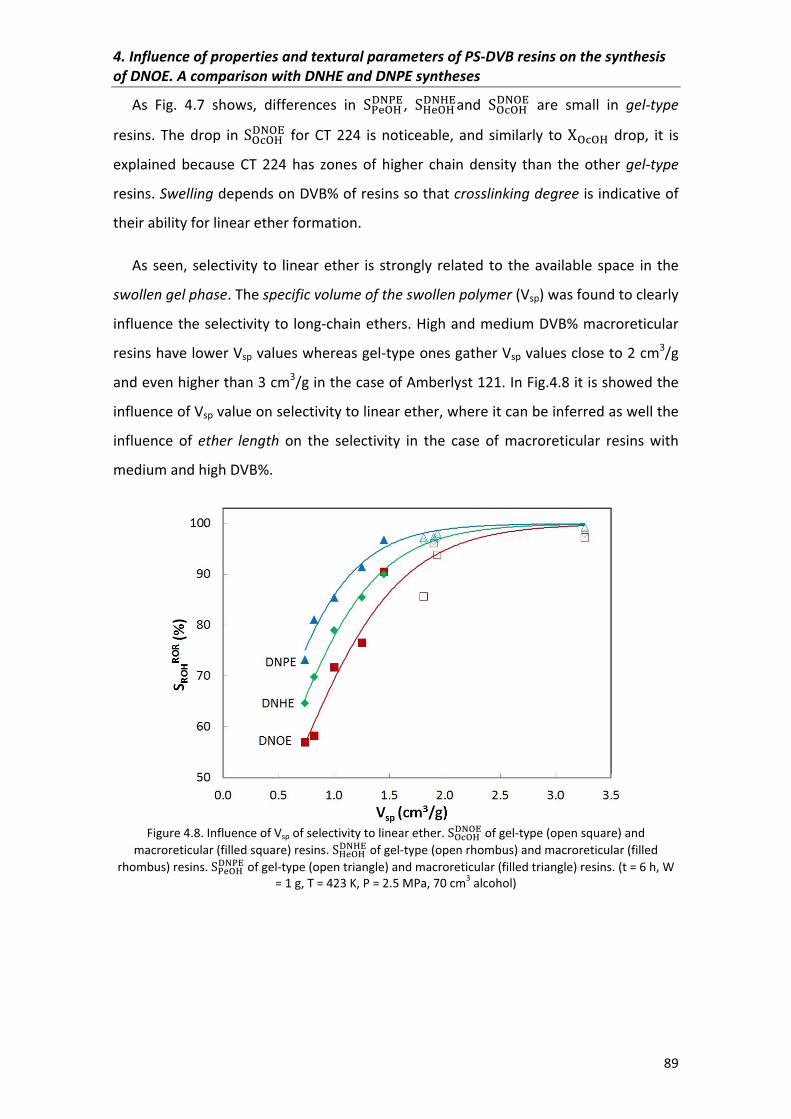
4.�Influence�of�properties�and�textural�parameters�of�PS�DVB�resins�on�the�synthesis�of�DNOE.�A�comparison�with�DNHE�and�DNPE�syntheses�
89�
As� Fig.� 4.7� shows,� differences� in� LsrJKnosp,� LKrJKnoKpand� LJ_JKnoJp� are� small� in� gel�type�
resins.� The� drop� in� LJ_JKnoJp� for� CT� 224� is� noticeable,�and� similarly� to� HJ_JK� drop,� it� is�
explained� because� CT� 224� has� zones� of� higher� chain� density� than� the� other� gel�type�
resins.�Swelling�depends�on�DVB%�of�resins�so�that�crosslinking�degree�is�indicative�of�
their�ability�for�linear�ether�formation.��
As�seen,� selectivity� to� linear�ether� is� strongly� related� to� the�available�space� in� the�
swollen�gel�phase.�The�specific�volume�of�the�swollen�polymer�(Vsp)�was�found�to�clearly�
influence�the�selectivity�to� long�chain�ethers.�High�and�medium�DVB%�macroreticular�
resins�have�lower�Vsp�values�whereas�gel�type�ones�gather�Vsp�values�close�to�2�cm3/g�
and�even�higher�than�3�cm3/g�in�the�case�of�Amberlyst�121.�In�Fig.4.8�it�is�showed�the�
influence�of�Vsp�value�on�selectivity�to�linear�ether,�where�it�can�be�inferred�as�well�the�
influence� of� ether� length� on� the� selectivity� in� the� case� of� macroreticular� resins� with�
medium�and�high�DVB%.�
�Figure�4.8.�Influence�of�Vsp�of�selectivity�to�linear�ether. LJ_JKnoJp�of�gel�type�(open�square)�and�
macroreticular�(filled�square)�resins.�LKrJKnoKp�of�gel�type�(open�rhombus)�and�macroreticular�(filled�rhombus)�resins.�LsrJKnosp�of�gel�type�(open�triangle)�and�macroreticular�(filled�triangle)�resins.�(t�=�6�h,�W�
=�1�g,�T�=�423�K,�P�=�2.5�MPa,�70�cm3�alcohol)��
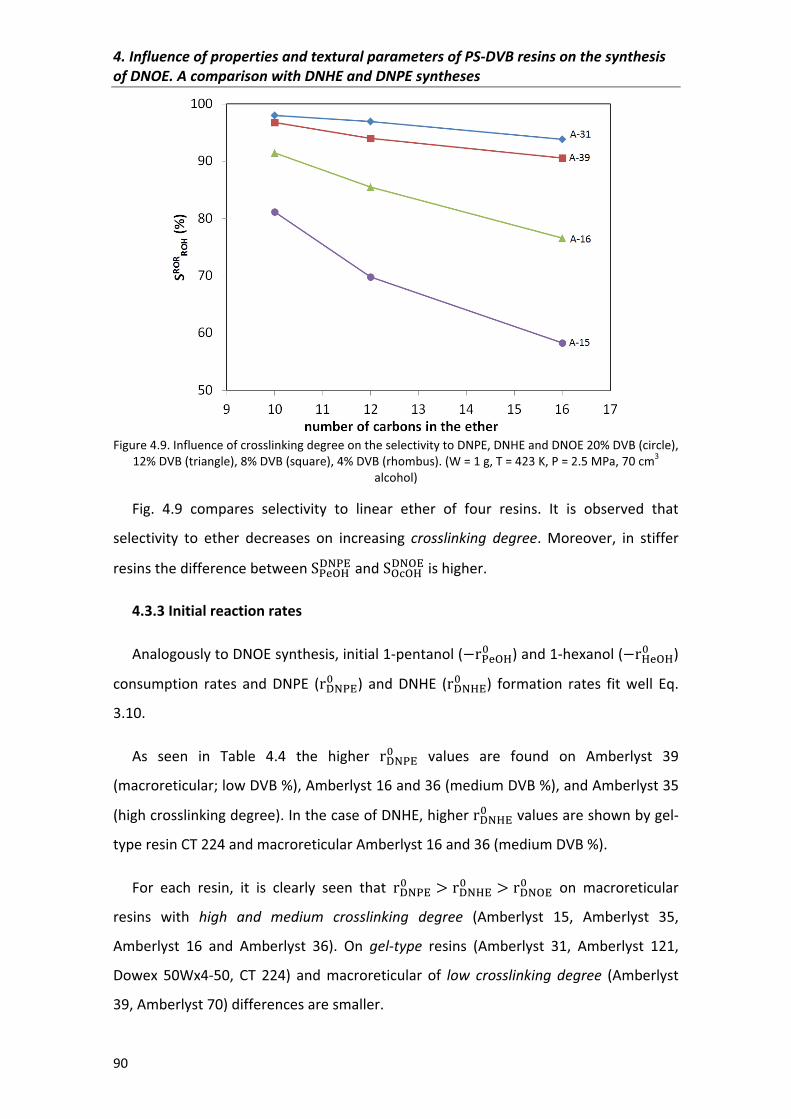
4.�Influence�of�properties�and�textural�parameters�of�PS�DVB�resins�on�the�synthesis�of�DNOE.�A�comparison�with�DNHE�and�DNPE�syntheses�
90�
�Figure�4.9.�Influence�of�crosslinking�degree�on�the�selectivity�to�DNPE,�DNHE�and�DNOE�20%�DVB�(circle),�
12%�DVB�(triangle),�8%�DVB�(square),�4%�DVB�(rhombus).�(W�=�1�g,�T�=�423�K,�P�=�2.5�MPa,�70�cm3�alcohol)�
Fig.� 4.9� compares� selectivity� to� linear� ether� of� four� resins.� It� is� observed� that�
selectivity� to� ether� decreases� on� increasing� crosslinking� degree.� Moreover,� in� stiffer�
resins�the�difference�between�LsrJKnosp�and�LJ_JKnoJp�is�higher.��
4.3.3�Initial�reaction�rates�
Analogously�to�DNOE�synthesis,�initial�1�pentanol�(�YsrJK� )�and�1�hexanol�(�YKrJK� )�
consumption� rates� and� DNPE� (Ynosp� )� and� DNHE� (YnoKp� )� formation� rates� fit� well� Eq.�
3.10.��
As� seen� in� Table� 4.4� the� higher� Ynosp� � values� are� found� on� Amberlyst� 39�
(macroreticular;�low�DVB�%),�Amberlyst�16�and�36�(medium�DVB�%),�and�Amberlyst�35�
(high�crosslinking�degree).�In�the�case�of�DNHE,�higher�YnoKp� �values�are�shown�by�gel�
type�resin�CT�224�and�macroreticular�Amberlyst�16�and�36�(medium�DVB�%).��
For� each� resin,� it� is� clearly� seen� that� Ynosp� { YnoKp� { YnoJp� � on� macroreticular�
resins� with� high� and� medium� crosslinking� degree� (Amberlyst� 15,� Amberlyst� 35,�
Amberlyst� 16� and� Amberlyst� 36).� On� gel�type� resins� (Amberlyst� 31,� Amberlyst� 121,�
Dowex� 50Wx4�50,� CT� 224)� and� macroreticular� of� low� crosslinking� degree� (Amberlyst�
39,�Amberlyst�70)�differences�are�smaller.��
4.�Influence�of�properties�and�textural�parameters�of�PS�DVB�resins�on�the�synthesis�of�DNOE.�A�comparison�with�DNHE�and�DNPE�syntheses�
91�
Bulkier�ethers�production�is�more�hindered�by�the�less�swollen�macroreticular�resins�
in�agreement�with�initial�rate�data.�The�less�dense�gel�phase�of�swollen�gel�type�resins�
even�the�rates�of�DNPE,�DNHE�and�DNOE�syntheses,�as�they�are�able�to�accommodate�
better� bulky� molecules.� Once� more,� the� slightly� denser� structure� of� CT� 224� is�
highlighted�due�to�higher�YIJI� �differences�than�the�other�gel�type�resins.��
As� observed� in� DNOE� synthesis,� NR50� shows� the� highest� �ijIJI� � values,� and�
Amberlyst�46�achieves�the�highest�values�on�PS�DVB�resins.�Taking�as�a�reference�initial�
TOF� of� DNPE� and� DNHE� formation� on� Amberlyst� 46,� it� can� be� drawn� that� in�
macroreticular�resins�Amberlyst�15,�Amberlyst�35,�Amberlyst�16�and�Amberlyst�36�the�
fraction� of� active� centers� taking� part� in� DNPE� synthesis� ranges� from� 56� to� 79%;� it� is�
between� 44� and� 67%� in� DNHE� synthesis� and� between� 29� and� 52%� in� the� DNOE�
synthesis.��
It�is�also�seen�that�the�fraction�of�active�sites�taking�part�in�the�reaction�decreases�in�
the�order�DNPE>DNHE>DNOE�syntheses� (i.e.�a�56%�of�Amberlyst�15�active� sites� take�
part�in�DNPE�synthesis,�a�44%�in�DNHE�one�and�a�29%�in�that�of�DNOE).��
In� relation� to� high�selective� resins� (Amberlyst� 70,� Amberlyst� 39,� Amberlyst� 121,�
Amberlyst�31,�and�Dowex50x4)�the�fraction�of�active�sites�involved�in�ether�synthesis�is�
nearly� the� same� in� the� three� reaction� systems� (54–61%),� i.e.� 54%� of� acid� sites� of�
Amberlyst�121�are�accessible� for�DNPE� formation,�58%�for�DNHE� formation�and�61%�
for�that�of�DNOE.�In�the�case�of�CT�224,�it�is�seen�again�that�the�fraction�of�sites�taking�
part� in� DNOE� synthesis� is� lower� (47%)� than� in� DNPE� and� DNHE� ones� (58%).� Similar�
trends�are�found�in�alcohol�consumption.�
4.4�Conclusions�
The�dehydration�of�1�octanol�to�DNOE�at�423�K�and�2.5�MPa�takes�place�successfully�
over�ion�exchange�resins�as�well�as�1�hexanol�and�1�pentanol�dehydrations.�High�PIJKIJI�
values�are�found�on�resins�with�high�acid�capacity�and�Vsp�values.�Best�resins�for�DNOE�
synthesis�are�gel�type�resins�with�2–4�DVB%.� In�general�oversulfonated�resins�do�not�
upgrade� the� behavior� of� their� conventionally� sulfonated� homologues.� By� comparing�
the� synthesis� of� DNPE,� DNHE� and� DNOE� it� is� found� as� a� rule� for� each� resin� that�
4.�Influence�of�properties�and�textural�parameters�of�PS�DVB�resins�on�the�synthesis�of�DNOE.�A�comparison�with�DNHE�and�DNPE�syntheses�
92�
HsrJK \srJK� d { HKrJK \KrJK� d { HJ_JK \J_JK� d zzz ,� but� differences� are�
small� in� gel�type� resins.� It� is� also� observed� that� |}~����}� { |�~������ { |��������� on�
macroreticular� resins� but� differences� in� selectivity� lessens� on� decreasing� the�
crosslinking�degree.�High�selectivity�to�symmetrical�linear�ether�was�found�on�gel�type�
resins�for�the�three�ethers.�Swelling�is�a�key�factor�to�achieve�high�selectivity�to�linear�
ether,�and�a�clear�relationship�between�volume�of�swollen�polymer�(Vsp)�and�the�ratio�
H+/Vsp� and� selectivity� is� observed.� NR50� showed� the� highest� TOF0� values� due� to� its�
higher� acid� strength.� TOF0� values� of� Amberlyst� 46,� a� special� resin� with� all� sulfonic�
groups�at� the�polymer�surface,�and�so�wholly�accessible� to�alcohol,�were�the�highest�
between�PS�DVB�resins.� Lower�TOF0�values� shown�by� the�other�PS�DVB�resins� reveal�
that�only�a�fraction�of�active�centers�is�available�for�reaction,�so�that�ether�formation�is�
hindered� in� less� swollen� polymers.� Linear� ether� formation� is� influenced� by� resin�
swelling�and�it�is�generally�observed�that� $��5�� { $��x�� { $��w�� .�
�
�
�
�
�
�
�
�
CHAPTER�5��
Influence�of�textural�properties�of�zeolites�on�the�catalyzed�dehydration�of�linear�alcohols�to�C10�C16�symmetrical�ethers��
�
�
�
�
�
�
�

�
�
�
�
�
�
�
�
�
�
�
�
�
�
�
�
�
�
�
�
�
�
�
�
5.�Influence�of�textural�properties�of�zeolites�on�the�catalyzed�dehydration�of�linear�alcohols�to�C10�C16�symmetrical�ethers�
95�
5.1�Abstract�
The� liquid�phase� dehydration� of� 1�octanol,� 1�hexanol� and� 1�pentanol� to� di�n�octyl�
ether�(DNOE),�di�n�hexyl�ether�(DNHE)�and�di�n�pentyl�ether�(DNPE),�respectively,�has�
been�studied�over�H�MFI�28,�H�BEA�25,�H�FAU�6,�H�FAU�30,�H�FER�20,�H�MOR�20�and�
H�MCM�79�at�423�473�K�and�2.5�MPa�in�a�batch�reactor�(see�APPENDIX�V�for�detailed�
information� about� the� zeolites� tested� in� this� work).� Dependence� of� textural�
parameters� of� large� and� medium� pore� zeolites� on� the� activity� and� selectivity� at�
different�temperatures�is�shown.�
5.2�Results�and�discussion�
Catalytic�activity�of�zeolites�depends�on�their�structure,�and�also�on�concentration,�
nature� and� acid� strength� of� acid� sites.� It� has� been� observed� that� acid�catalyzed�
reactions� undergone� by� aliphatic� alcohols� on� zeolites� yield� symmetrical� ethers� (by�
intermolecular� dehydration)� and� also� the� corresponding� alkenes� (by� intramolecular�
dehydration),� though� the� catalytic� requirements� for� these� two� competitive� reactions�
are�quite�different�[87�93].��
Mechanistic� studies� on� 2�butanol� dehydration� [93],� and� the� formation� of� methyl�
tert�butyl� ether� from� methanol� and� tert�butanol� [92]� revealed� that� etherification� of�
alcohols� over� acid� zeolites� follows� a� reaction� pathway� compatible� with� a� typical� SN2�
mechanism�with�a�total�inversion�of�configuration�and�retention�of�the�heavier�alcohol�
oxygen.� Accordingly,� it� can� be� assumed� that� the� dehydration� reaction� of� alcohol� to�
ether� involves� the� in� situ� formation� of� an� oxonium� ion� at� the� catalyst� surface� [94].�
Linear�ether�is�formed�by�the�nucleophilic�attack�of�a�second�alcohol�molecule�on�the�
oxonium�ion�in�a�SN2�type�bimolecular�reaction,�and�the�alcohol�molecule�acting�as�an�
electrophile�undergoes� inversion�of� its�configuration� [93�95].�On�the�other�hand,� the�
oxonium�ion�can�also�give�place�to�1�olefin�via�an�E1�elimination�reaction.�In�such�case,�
water�exiting�leads�to�a�carbocation�and�double�bond�is�consequently�created.�
In�order�that�alcohol�dehydration�reaction�takes�place�fast�and�selectively,�reactants�
have� to� reach�all�active�sites�and�reaction� intermediates� fit�pores�suitably.�Literature�
suggests�that�pore�diameter�must�be�larger�than�2.5�times�the�random�coil�diameter�of�
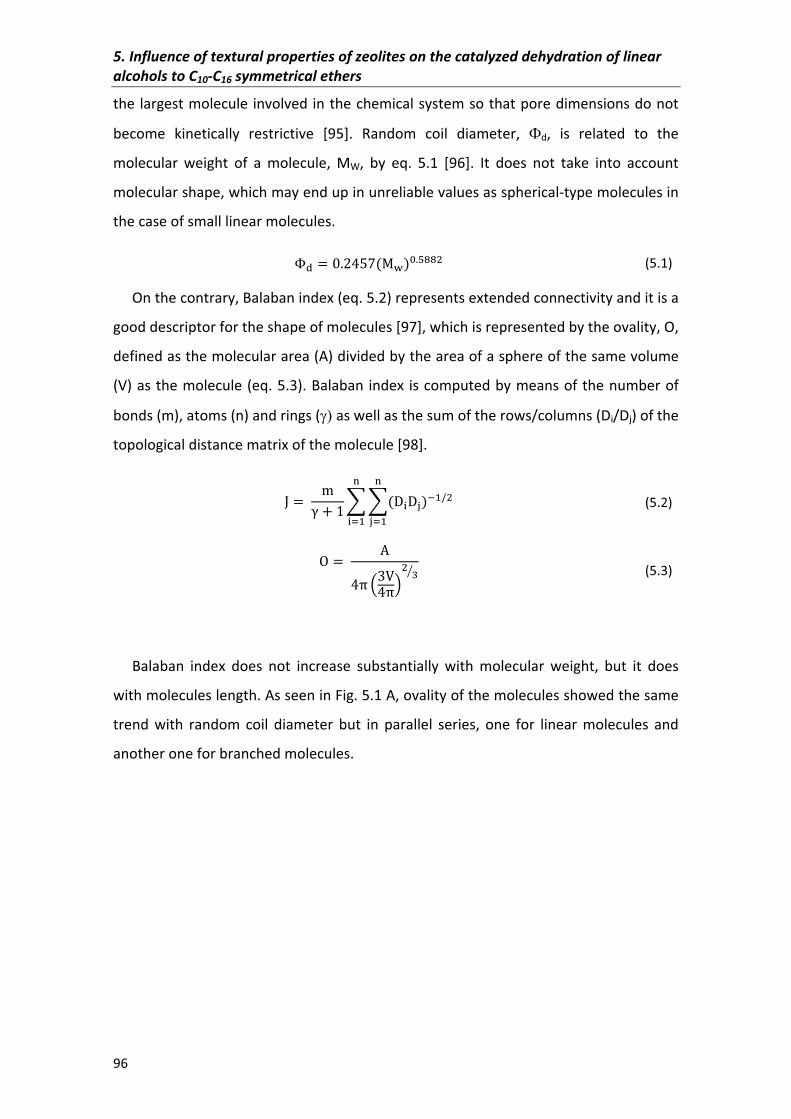
5.�Influence�of�textural�properties�of�zeolites�on�the�catalyzed�dehydration�of�linear�alcohols�to�C10�C16�symmetrical�ethers�
96�
the�largest�molecule� involved�in�the�chemical�system�so�that�pore�dimensions�do�not�
become� kinetically� restrictive� [95].� Random� coil� diameter,� �d,� is� related� to� the�
molecular� weight� of� a� molecule,� MW,� by� eq.� 5.1� [96].� It� does� not� take� into� account�
molecular�shape,�which�may�end�up�in�unreliable�values�as�spherical�type�molecules�in�
the�case�of�small�linear�molecules.��
�� � ����#�c�������"� (5.1)�
On�the�contrary,�Balaban�index�(eq.�5.2)�represents�extended�connectivity�and�it�is�a�
good�descriptor�for�the�shape�of�molecules�[97],�which�is�represented�by�the�ovality,�O,�
defined�as�the�molecular�area�(A)�divided�by�the�area�of�a�sphere�of�the�same�volume�
(V)�as�the�molecule�(eq.�5.3).�Balaban� index� is�computed�by�means�of�the�number�of�
bonds�(m),�atoms�(n)�and�rings�(� �as�well�as�the�sum�of�the�rows/columns�(Di/Dj)�of�the�
topological�distance�matrix�of�the�molecule�[98].��
� � R� � � ����������"��f�
��f� � (5.2)�
i � ��� ������" �� � (5.3)�
�
Balaban� index� does� not� increase� substantially� with� molecular� weight,� but� it� does�
with�molecules�length.�As�seen�in�Fig.�5.1�A,�ovality�of�the�molecules�showed�the�same�
trend� with� random� coil� diameter� but� in� parallel� series,� one� for� linear� molecules� and�
another�one�for�branched�molecules.��
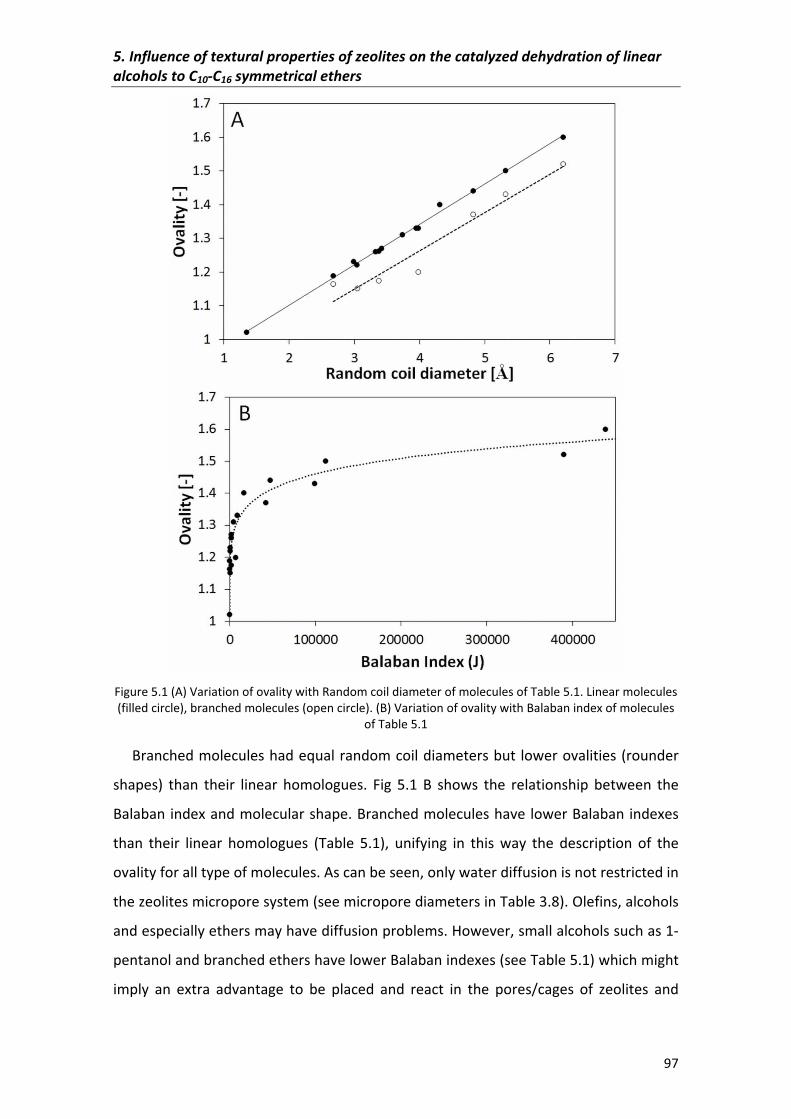
5.�Influence�of�textural�properties�of�zeolites�on�the�catalyzed�dehydration�of�linear�alcohols�to�C10�C16�symmetrical�ethers�
97�
�
Figure�5.1�(A)�Variation�of�ovality�with�Random�coil�diameter�of�molecules�of�Table�5.1.�Linear�molecules�(filled�circle),�branched�molecules�(open�circle).�(B)�Variation�of�ovality�with�Balaban�index�of�molecules�
of�Table�5.1�
Branched�molecules�had�equal�random�coil�diameters�but� lower�ovalities�(rounder�
shapes)� than� their� linear� homologues.� Fig� 5.1� B� shows� the� relationship� between� the�
Balaban�index�and�molecular�shape.�Branched�molecules�have�lower�Balaban�indexes�
than� their� linear� homologues� (Table� 5.1),� unifying� in� this� way� the� description� of� the�
ovality�for�all�type�of�molecules.�As�can�be�seen,�only�water�diffusion�is�not�restricted�in�
the�zeolites�micropore�system�(see�micropore�diameters�in�Table�3.8).�Olefins,�alcohols�
and�especially�ethers�may�have�diffusion�problems.�However,�small�alcohols�such�as�1�
pentanol�and�branched�ethers�have�lower�Balaban�indexes�(see�Table�5.1)�which�might�
imply� an� extra� advantage� to� be� placed� and� react� in� the� pores/cages� of� zeolites� and�
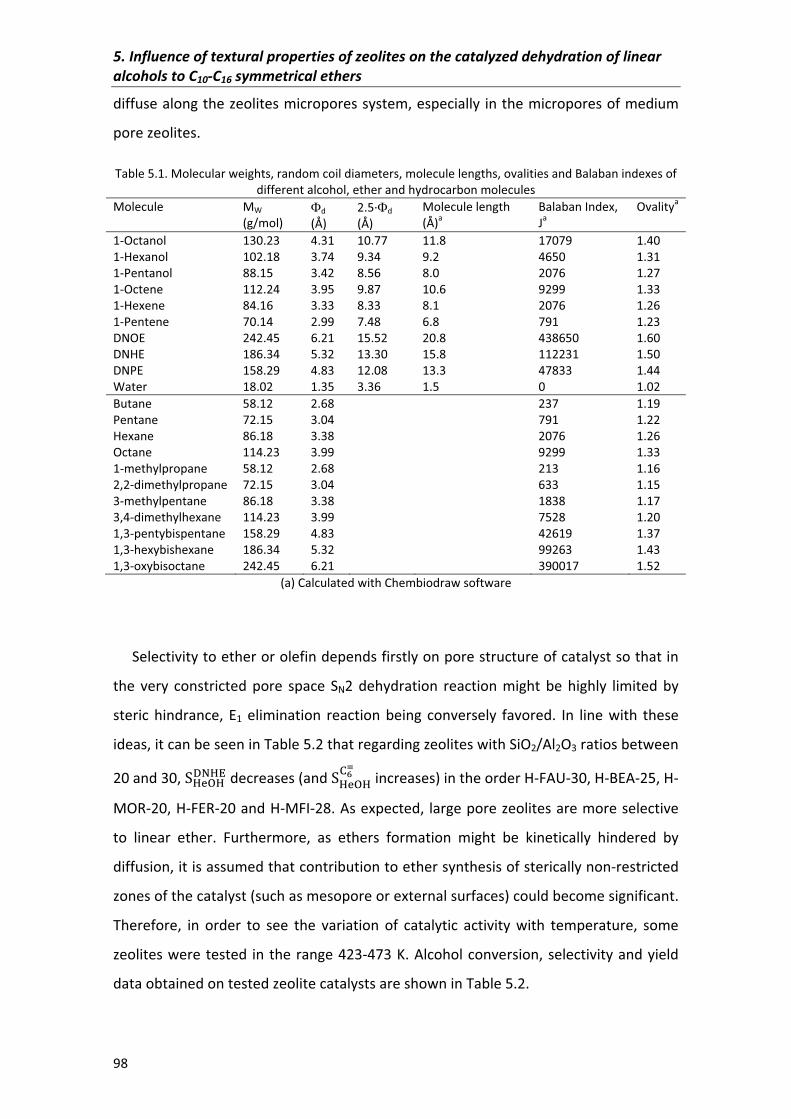
5.�Influence�of�textural�properties�of�zeolites�on�the�catalyzed�dehydration�of�linear�alcohols�to�C10�C16�symmetrical�ethers�
98�
diffuse�along�the�zeolites�micropores�system,�especially� in�the�micropores�of�medium�
pore�zeolites.�
Table�5.1.�Molecular�weights,�random�coil�diameters,�molecule�lengths,�ovalities�and�Balaban�indexes�of�different�alcohol,�ether�and�hydrocarbon�molecules�
Molecule� MW�(g/mol)�
�d�(Å)�
2.5��d�(Å)�
Molecule�length�(Å)a�
Balaban�Index,�Ja�
Ovalitya
1�Octanol�1�Hexanol�1�Pentanol�
130.23�102.18�88.15�
4.313.74�3.42�
10.779.34�8.56�
11.89.2�8.0�
17079�4650�2076�
1.401.31�1.27�
1�Octene�1�Hexene�1�Pentene�
112.24�84.16�70.14�
3.953.33�2.99�
9.878.33�7.48�
10.68.1�6.8�
9299�2076�791�
1.331.26�1.23�
DNOE�DNHE�DNPE�
242.45�186.34�158.29�
6.215.32�4.83�
15.5213.30�12.08�
20.815.8�13.3�
438650�112231�47833�
1.601.50�1.44�
Water� 18.02� 1.35 3.36 1.5 0 1.02Butane� 58.12� 2.68 237 1.19Pentane� 72.15� 3.04 791 1.22Hexane� 86.18� 3.38 2076� 1.26Octane� 114.23� 3.99 9299� 1.331�methylpropane� 58.12� 2.68 213 1.162,2�dimethylpropane� 72.15� 3.04 633 1.153�methylpentane� 86.18� 3.38 1838� 1.173,4�dimethylhexane�1,3�pentybispentane�1,3�hexybishexane�1,3�oxybisoctane�
114.23�158.29�186.34�242.45�
3.994.83�5.32�6.21�
7528�42619�99263�390017�
1.201.37�1.43�1.52�
(a)�Calculated�with�Chembiodraw�software�
�
Selectivity�to�ether�or�olefin�depends�firstly�on�pore�structure�of�catalyst�so�that�in�
the� very� constricted� pore� space� SN2� dehydration� reaction� might� be� highly� limited� by�
steric� hindrance,� E1� elimination� reaction� being� conversely� favored.� In� line� with� these�
ideas,�it�can�be�seen�in�Table�5.2�that�regarding�zeolites�with�SiO2/Al2O3�ratios�between�
20�and�30,�LKrJKnoKp�decreases�(and�LKrJKMtN �increases)�in�the�order�H�FAU�30,�H�BEA�25,�H�
MOR�20,�H�FER�20�and�H�MFI�28.�As�expected,� large�pore�zeolites�are�more�selective�
to� linear� ether.� Furthermore,� as� ethers� formation� might� be� kinetically� hindered� by�
diffusion,�it�is�assumed�that�contribution�to�ether�synthesis�of�sterically�non�restricted�
zones�of�the�catalyst�(such�as�mesopore�or�external�surfaces)�could�become�significant.�
Therefore,� in� order� to� see� the� variation� of� catalytic� activity� with� temperature,� some�
zeolites�were�tested� in�the�range�423�473�K.�Alcohol�conversion,�selectivity�and�yield�
data�obtained�on�tested�zeolite�catalysts�are�shown�in�Table�5.2.��
5.�Influence�of�textural�properties�of�zeolites�on�the�catalyzed�dehydration�of�linear�alcohols�to�C10�C16�symmetrical�ethers�
99�
�
5.2.1�Alcohol�conversion�
Alcohol�conversion�increased�with�temperature�regardless�the�alcohol� length.�As�a�
whole,�conversion�levels�of�the�three�alcohols�are�similar�at�each�temperature�and�no�
clear� trend� is� depicted.� Only� a� slight� trend� is� observed� at� 453� K� on� H�FAU�6,� being�HsrJK � HKrJK � HJ_JK.� By� comparing� H�BEA�25,� H�FAU�6� and� H�FAU�30� it� is� seen�
that�conversions�on�H�FAU�6�are�a�bit�higher�at�the�lower�temperatures�of�the�range,�
but�at�the�higher�temperatures�H�BEA�25�and�H�FAU�30�gave�higher�conversions.�
However,� in� all� the� cases� selectivity� to� linear� ether� is� lower� on� H�FAU�6,� and�
conversely� selectivity� to� alkenes� is� higher.� To� explain� this� behavior� it� is� suitable� to�
consider�both�acid�sites�number�and�zeolites�morphology.�H�FAU�6�(4.59�mmol/g)�has�
much�higher�acid�site�concentration�than�H�BEA�25�(1.23�mmol/g)�and�H�FAU�30�(1.07�
mmol/g),�but�mesoporous�surface�is�clearly�smaller�(82�m2/g�in�front�of�219�and�181,�
respectively).� So,� it� is� likely� that� the� relatively� bulky� alcohols� react� preferably� in� the�
sterically� non�restricted� mesoporous� surface.� In� the� case� of� H�FAU�6,� the� noticeable�
selectivity�to�olefins�and�branched�ethers�suggests�that�the�microporous�system�could�
take�part�in�a�significant�extent�favoring�the�least�sterically�demanding�E1�dehydration�
to�olefin.��
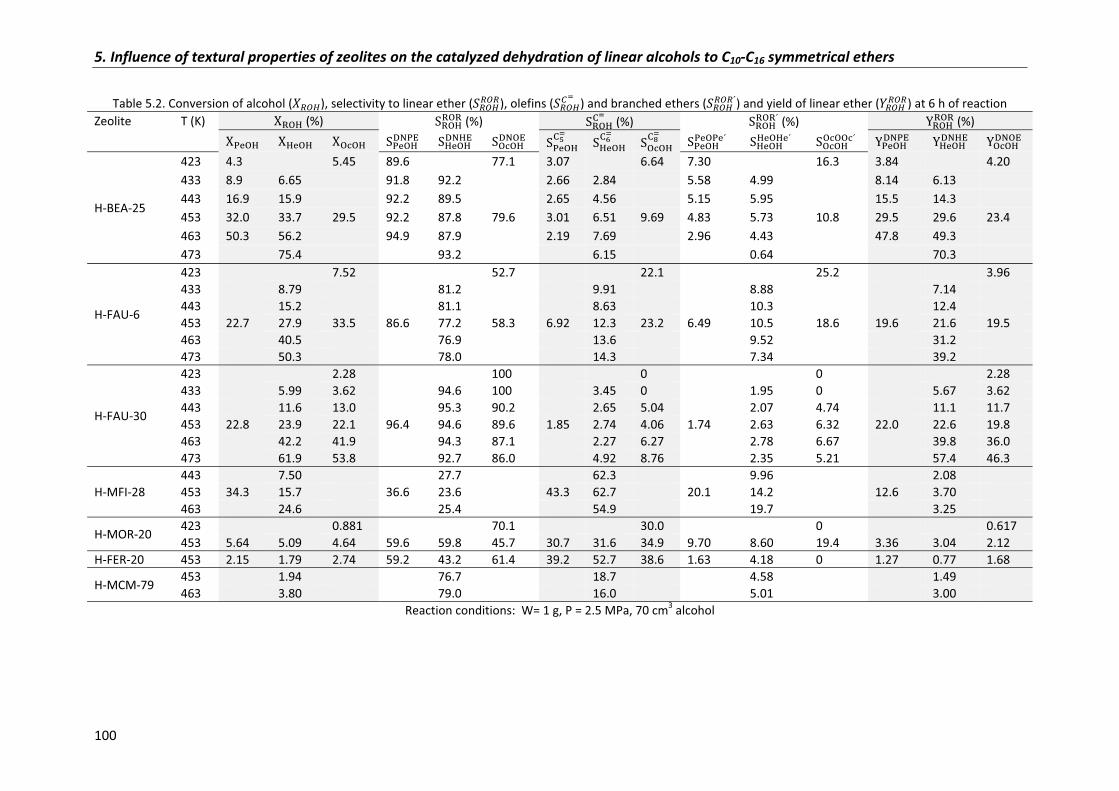
5.�Influence�of�textural�properties�of�zeolites�on�the�catalyzed�dehydration�of�linear�alcohols�to�C10�C16�symmetrical�ethers�
100�
Table�5.2.�Conversion�of�alcohol�(v�wx),�selectivity�to�linear�ether�(��wx�w�),�olefins�(��wx�N)�and�branched�ethers�(��wx�w�O)�and�yield�of�linear�ether�(��wx�w�)�at�6�h�of�reaction�
Zeolite� T�(K)� HIJK�(%)� LIJKIJI�(%)� LIJKMN�(%)� LIJKIJIO�(%)� PIJKIJI�(%)�
� � HsrJK � HKrJK � HJ_JK � LsrJKnosp� LKrJKnoKp� LJ_JKnoJp� LsrJKMuN � LKrJKMtN � LJ_JKMqN � LsrJKsrJsrO� LKrJKKrJKrO� LJ_JKJ_JJ_O� PsrJKnosp� PKrJKnoKp� PJ_JKnoJp�
H�BEA�25�
423� 4.3� � 5.45� 89.6� � 77.1� 3.07� � 6.64� 7.30� � 16.3� 3.84� � 4.20�433� 8.9� 6.65� � 91.8� 92.2� � 2.66� 2.84� � 5.58� 4.99� � 8.14� 6.13� �443� 16.9� 15.9� � 92.2� 89.5� � 2.65� 4.56� � 5.15� 5.95� � 15.5� 14.3� �453� 32.0� 33.7� 29.5� 92.2� 87.8� 79.6� 3.01� 6.51� 9.69� 4.83� 5.73� 10.8� 29.5� 29.6� 23.4�463� 50.3� 56.2� � 94.9� 87.9� � 2.19� 7.69� � 2.96� 4.43� � 47.8� 49.3� �473� � 75.4� � � 93.2� � � 6.15� � � 0.64� � � 70.3� �
H�FAU�6�
423 � 7.52 52.7 22.1 25.2 3.96�433 8.79� 81.2 9.91� � 8.88 7.14 �443 15.2� 81.1 8.63� � 10.3 12.4 �453 22.7� 27.9� 33.5 86.6 77.2 58.3 6.92 12.3� 23.2 6.49 10.5 18.6 19.6 21.6 19.5�463 40.5� 76.9 13.6� � 9.52 31.2 �473 50.3� 78.0 14.3� � 7.34 39.2 �
H�FAU�30�
423 � 2.28 100 0� 0 2.28�433 5.99� 3.62 94.6 100 3.45� 0� 1.95 0 5.67 3.62�443 11.6� 13.0 95.3 90.2 2.65� 5.04 2.07 4.74 11.1 11.7�453 22.8� 23.9� 22.1 96.4 94.6 89.6 1.85 2.74� 4.06 1.74 2.63 6.32 22.0 22.6 19.8�463 42.2� 41.9 94.3 87.1 2.27� 6.27 2.78 6.67 39.8 36.0�473 61.9� 53.8 92.7 86.0 4.92� 8.76 2.35 5.21 57.4 46.3�
H�MFI�28�443 7.50� 27.7 62.3� � 9.96 2.08 �453 34.3� 15.7� 36.6 23.6 43.3 62.7� � 20.1 14.2 12.6 3.70 �463 24.6� 25.4 54.9� � 19.7 3.25 �
H�MOR�20�423 � 0.881 70.1 30.0 0 0.617�453 5.64� 5.09� 4.64 59.6 59.8 45.7 30.7 31.6� 34.9 9.70 8.60 19.4 3.36 3.04 2.12�
H�FER�20� 453 2.15� 1.79� 2.74 59.2 43.2 61.4 39.2 52.7� 38.6 1.63 4.18 0 1.27 0.77 1.68�
H�MCM�79�453 1.94� 76.7 18.7� � 4.58 1.49 �463 3.80� 79.0 16.0� � 5.01 3.00 �
Reaction�conditions:��W=�1�g,�P�=�2.5�MPa,�70�cm3�alcohol�
�
5.�Influence�of�textural�properties�of�zeolites�on�the�catalyzed�dehydration�of�linear�alcohols�to�C10�C16�symmetrical�ethers�
101�
H�MFI�28� has� 4.5�4.7� � micropores� (see� Table�3.8),� very� close� to� 1�octanol� and� 1�
hexanol� random� coil� diameters.� As� seen� in� Table� 5.2,� conversion� greatly� decreases�
from� 1�pentanol� to� 1�hexanol;� being� 1�pentanol� conversion� twice� that� of� 1�hexanol.�
This�fact�might�be�in�line�with�the�smaller�random�coil�diameter�of�1�pentanol�and�also�
by� its� molecular� shape,� closer� to� a� sphere� than� 1�hexanol.� H�FER�20� and� H�MOR�20�
showed� poor� conversions.� Their� low� mesoporous� surface� and� narrow� micropores�
represented�a�clear�hindrance�for�the�alcohols�to�react.��
H�MCM�79�showed�very�low�conversions.�The�very�low�acid�site�concentration�(0.6�
mmol/g)�effect�cannot�be�compensated�by�its�very�high�mesoporous�surface.��
5.2.1.1�Response�surfaces�
Data�at�453�K� for�H�BEA�25,�H�FAU�30,�H�FAU�6,�H�MOR�20�and�H�FER�20�allowed�
comparing�the�influence�of�zeolite�morphology�and�number�of�acid�sites�on�conversion�
for� the� three� reacting� systems.� In� order� to� figure� out� the� influence� of� textural�
properties� on� alcohol� conversion,� response� surfaces� based� on� mesoporous� surface�
(SBJH),�external�surface�(Sext),�BET�surface�(SBET),�microporous�surface�(Smicro�=�SBET�SBJH),�
acid� site� concentration� ([H+])� and� acid� strength� (in� terms� of� ammonia� adsorption�
enthalpy,� �Hads)� were� fitted� to� conversion� data.� The� response� surfaces� tested� are�
displayed�in�Table�5.3�as�well�as�their�residual�sum�of�squares.�It�is�seen�that�the�above�
mentioned�morphological�properties�affect�conversion�in�a�different�way�as�a�function�
of�the�alcohol�length.�Since�1�pentanol,�1�hexanol�and�1�octanol�have�different�density�
and� molecular� weight,� initial� mass� of� alcohol� and� thus,� the� initial� number� of� moles�
(\IJK� )� were� slightly� different.� Therefore,� the� number� of� alcohol� moles� consumed,�
defined�by�eq.�5.4,�was�used�to�compare�the�conversion�of�the�three�alcohols.�
IJK � HIJK \IJK� � (5.4)�
Since� reaction� can� occur� in� both� mesoporous� and� microporous� surface,� different�
combinations� of� these� surfaces� areas� were� fitted� to� conversion� data.� Most� surface�
response� equations� are� functions� of� acid� site� concentration� and� the� ratio� of�
mesoporous�and�microporous�areas�to�BET�surface�area.�Equations�where�mesoporous�
and� microporous� surface� areas� are� in� separated� terms� gave� better� fits.� This� fact�
suggests�that�conversion�is�related�to�surface�areas�closer�than�to�surface�areas�ratios.�
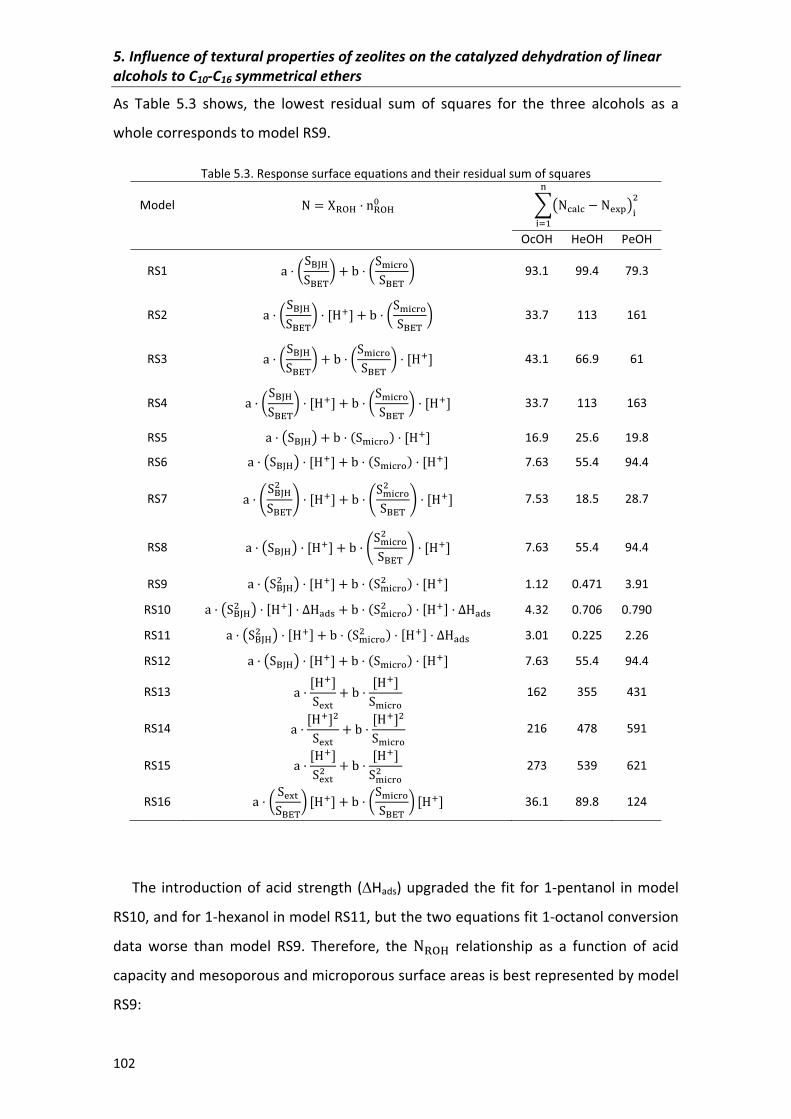
5.�Influence�of�textural�properties�of�zeolites�on�the�catalyzed�dehydration�of�linear�alcohols�to�C10�C16�symmetrical�ethers�
102�
As� Table� 5.3� shows,� the� lowest� residual� sum� of� squares� for� the� three� alcohols� as� a�
whole�corresponds�to�model�RS9.��
Table�5.3.�Response�surface�equations�and�their�residual�sum�of�squares�
Model� � HIJK \IJK�� �¡ _¢£_ � r¤¥¦�"
��f� �
� OcOH HeOH� PeOH�
RS1� V 0L§¨KL§p©3 ª 0L«�_¬L§p© 3� 93.1� 99.4� 79.3�
RS2� V 0L§¨KL§p©3 �lm� ª 0L«�_¬L§p© 3� 33.7� 113� 161�
RS3� V 0L§¨KL§p©3 ª 0L«�_¬L§p© 3 �lm�� 43.1� 66.9� 61�
RS4� V 0L§¨KL§p©3 �lm� ª 0L«�_¬L§p© 3 �lm�� 33.7� 113� 163�
RS5� V ¡L§¨K¦ ª �L«�_¬� �lm�� 16.9� 25.6� 19.8�
RS6� V ¡L§¨K¦ �lm� ª �L«�_¬� �lm�� 7.63� 55.4� 94.4�
RS7� V ®L§¨K"L§p©¯ �lm� ª ®L«�_¬"L§p© ¯ �lm�� 7.53� 18.5� 28.7�
RS8� V ¡L§¨K¦ �lm� ª ®L«�_¬"L§p© ¯ �lm�� 7.63� 55.4� 94.4�
RS9� V ¡L§¨K" ¦ �lm� ª �L«�_¬" � �lm�� 1.12� 0.471� 3.91�
RS10� V ¡L§¨K" ¦ �lm� °l¢�± ª �L«�_¬" � �lm� °l¢�±� 4.32� 0.706� 0.790�
RS11� V ¡L§¨K" ¦ �lm� ª �L«�_¬" � �lm� °l¢�±� 3.01� 0.225� 2.26�
RS12� V ¡L§¨K¦ �lm� ª �L«�_¬� �lm�� 7.63� 55.4� 94.4�
RS13� V �lm�Lr¤e ª �lm�L«�_¬� 162� 355� 431�
RS14� V �lm�"Lr¤e ª �lm�"L«�_¬� 216� 478� 591�
RS15� V �lm�Lr¤e" ª �lm�L«�_¬" � 273� 539� 621�
RS16� V 0 Lr¤eL§p©3 �lm� ª 0L«�_¬L§p© 3 �lm�� 36.1� 89.8� 124�
�
The� introduction�of�acid�strength� (�Hads)�upgraded�the� fit� for�1�pentanol� in�model�
RS10,�and�for�1�hexanol�in�model�RS11,�but�the�two�equations�fit�1�octanol�conversion�
data� worse� than� model� RS9.� Therefore,� the� IJK� relationship� as� a� function� of� acid�
capacity�and�mesoporous�and�microporous�surface�areas�is�best�represented�by�model�
RS9:�
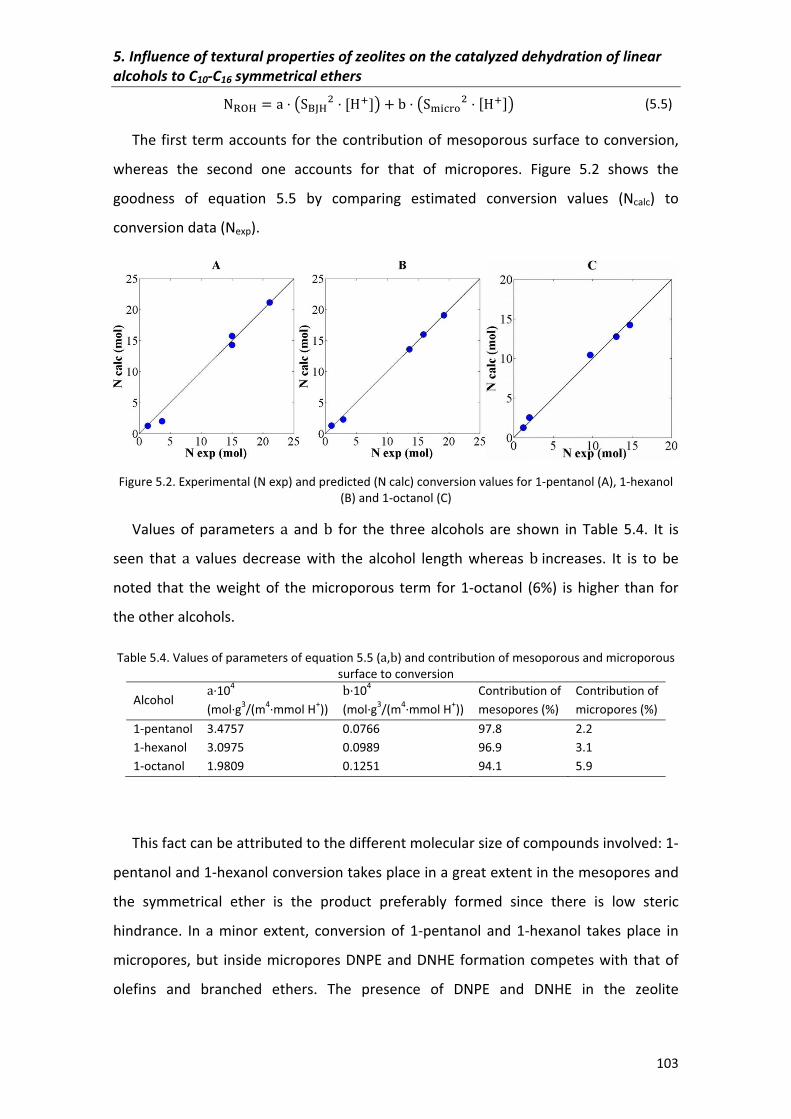
5.�Influence�of�textural�properties�of�zeolites�on�the�catalyzed�dehydration�of�linear�alcohols�to�C10�C16�symmetrical�ethers�
103�
IJK � V ¡L§¨K" �lm�¦ ª ¡L«�_¬" �lm�¦� (5.5)�
The�first� term�accounts� for�the�contribution�of�mesoporous�surface�to�conversion,�
whereas� the� second� one� accounts� for� that� of� micropores.� Figure� 5.2� shows� the�
goodness� of� equation� 5.5� by� comparing� estimated� conversion� values� (Ncalc)� to�
conversion�data�(Nexp).�
�
Figure�5.2.�Experimental�(N�exp)�and�predicted�(N�calc)�conversion�values�for�1�pentanol�(A),�1�hexanol�(B)�and�1�octanol�(C)�
Values� of� parameters� V� and� ª� for� the� three� alcohols� are� shown� in� Table� 5.4.� It� is�
seen� that� V� values� decrease� with� the� alcohol� length� whereas� ª increases.� It� is� to� be�
noted� that� the� weight� of� the� microporous� term� for� 1�octanol� (6%)� is� higher� than� for�
the�other�alcohols.��
Table�5.4.�Values�of�parameters�of�equation�5.5�(V,ª)�and�contribution�of�mesoporous�and�microporous�surface�to�conversion�
Alcohol�V�104
(mol�g3/(m4�mmol�H+))�ª�104
(mol�g3/(m4�mmol�H+))�Contribution�of�mesopores�(%)�
Contribution�ofmicropores�(%)�
1�pentanol� 3.4757 0.0766 97.8 2.2�1�hexanol� 3.0975 0.0989 96.9 3.1�1�octanol� 1.9809 0.1251 94.1 5.9�
�
This�fact�can�be�attributed�to�the�different�molecular�size�of�compounds�involved:�1�
pentanol�and�1�hexanol�conversion�takes�place�in�a�great�extent�in�the�mesopores�and�
the� symmetrical� ether� is� the� product� preferably� formed� since� there� is� low� steric�
hindrance.� In� a� minor� extent,� conversion� of� 1�pentanol� and� 1�hexanol� takes� place� in�
micropores,�but� inside�micropores�DNPE�and�DNHE� formation�competes�with� that�of�
olefins� and� branched� ethers.� The� presence� of� DNPE� and� DNHE� in� the� zeolite�
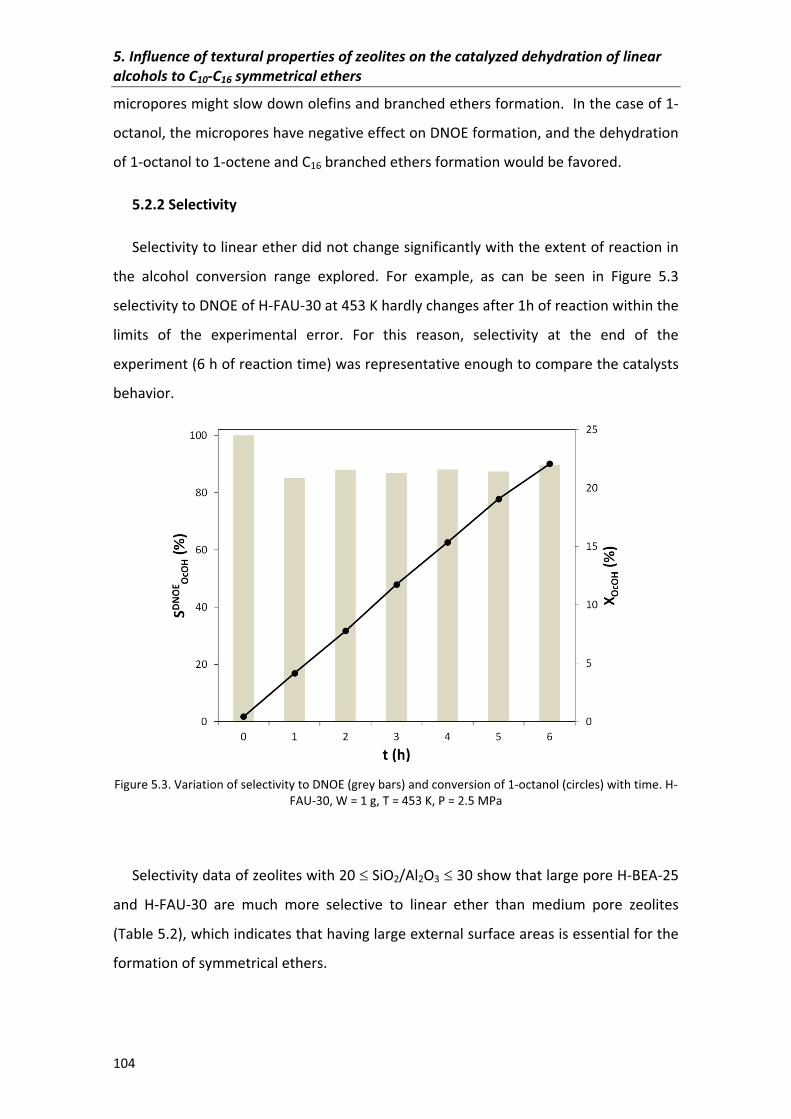
5.�Influence�of�textural�properties�of�zeolites�on�the�catalyzed�dehydration�of�linear�alcohols�to�C10�C16�symmetrical�ethers�
104�
micropores�might�slow�down�olefins�and�branched�ethers�formation.��In�the�case�of�1�
octanol,�the�micropores�have�negative�effect�on�DNOE�formation,�and�the�dehydration�
of�1�octanol�to�1�octene�and�C16�branched�ethers�formation�would�be�favored.��
5.2.2�Selectivity�
Selectivity�to�linear�ether�did�not�change�significantly�with�the�extent�of�reaction�in�
the� alcohol� conversion� range� explored.� For� example,� as� can� be� seen� in� Figure� 5.3�
selectivity�to�DNOE�of�H�FAU�30�at�453�K�hardly�changes�after�1h�of�reaction�within�the�
limits� of� the� experimental� error.� For� this� reason,� selectivity� at� the� end� of� the�
experiment�(6�h�of�reaction�time)�was�representative�enough�to�compare�the�catalysts�
behavior.�
�
Figure�5.3.�Variation�of�selectivity�to�DNOE�(grey�bars)�and�conversion�of�1�octanol�(circles)�with�time.�H�FAU�30,�W�=�1�g,�T�=�453�K,�P�=�2.5�MPa�
�
Selectivity�data�of�zeolites�with�20��SiO2/Al2O3��30�show�that�large�pore�H�BEA�25�
and� H�FAU�30� are� much� more� selective� to� linear� ether� than� medium� pore� zeolites�
(Table�5.2),�which�indicates�that�having�large�external�surface�areas�is�essential�for�the�
formation�of�symmetrical�ethers.��
�
5.�Influence�of�textural�properties�of�zeolites�on�the�catalyzed�dehydration�of�linear�alcohols�to�C10�C16�symmetrical�ethers�
105�
H�MOR�20�and�H�FER�20�
It� is� interesting� to� compare� the� medium� pore� zeolites� H�MOR�20� and� H�FER�20.�
They� have� similar� acid� site� number� and� mesoporous� surface� but� different� pore�
structure.� The� 1D� pore� system� of� H�MOR�20� has� 6.45� � channels� and� 6.7� � cages�
whereas� H�FER�20� has� a� 2D� channel� system� with� narrow� pores� (4.69� Å)� and� 6.31� Å�
cages�[59]�(Table�3.8).�In�the�case�of�1�octanol,�it�is�not�likely�a�significant�formation�of�
DNOE�in�the�narrow�pores�of�H�FER�20.�As�a�result,�DNOE�synthesis�takes�place�at�the�
mesoporous�surface�whereas�olefin�formation�is�promoted�in�H�FER�20�micropores.�
However,� selectivity� to� branched� ethers� showed� a� noticeable� trend.� As� seen,�
random� coil� diameter� set� the� same� molecular� size� for� branched� and� linear� ethers�
(Table�5.1),�not�taking�into�account�that�branched�ethers�are�rounder�molecules�than�
linear�ethers.�On�the�contrary�Balaban�indexes�of�branched�ethers�are�lower�than�their�
respective�linear�homologues.�This�way,�taking�a�look�to�Balaban�indexes�it�is�possible�
to� infer� that� branched� ethers� are� less� space�demanding� molecules� to� be� created� in�
narrow�structures�than�linear�ethers.�Since�branched�ethers�are�smaller�molecules�than�
their�linear�homologues,�they�could�fit�the�micropores�to�some�extent.�This�is�generally�
seen� comparing LJ_JKJ_JJ_O,� LKrJKKrJKrOand� LsrJKsrJsrOof� H�MOR�20.� Its� selectivity� to� olefins� is�
similar�for�the�three�reaction�systems�but� LJ_JKJ_JJ_Ois�clearly�the�highest;�showing�that�in�
this�case�C16�branched�ethers�formation�competes�with�DNOE�formation.�
The� absence� of� C16� branched� ethers� on� H�FER�20� (Table� 5.2),� suggests� that� olefin�
alcohol� reaction� does� not� take� place� at� mesoporous� surface� of� H�FER�20,� and� its�
narrow�micropores�are�not�able�to�accommodate�them.�On�the�contrary,�C10�and�C12�
branched� ethers� are� likely� to� fit� in� the� micropores� someway.� From� LJ_JKJ_JJ_O� values� at�
453� K� (Table� 5.2)� it� is� seen� that� H�MOR�20� was� able� to� accommodate� C16� branched�
ethers�better�than�H�FER�20.�As�a�result,�it�can�be�deduced�that�the�micropore�critical�
size�to�give�place�to�C16�branched�ethers�lies�between�that�of�H�MOR�20�and�H�FER�20�
micropores.�
�
�
5.�Influence�of�textural�properties�of�zeolites�on�the�catalyzed�dehydration�of�linear�alcohols�to�C10�C16�symmetrical�ethers�
106�
Large�pore�zeolites�
The�3D�pore�systems�of�H�BEA�25,�H�FAU�6�and�H�FAU�30�have�large�pore�and�wide�
cages.� A� clear� trend� on� selectivity� to� linear� ether� is� seen� on� these� zeolites:� LsrJKnosp {LKrJKnoKp { LJ_JKnoJp�is�generally�observed�at�all�temperatures.�Selectivity�values�reveal�that�
large�molecules�are�sterically�hindered�in�a�large�extent�in�the�micropores.��
H�FAU�6�and�H�FAU�30�have�the�same�micropore�structure�but�highly�different�acid�
site�concentrations�and�mesopore�surfaces.� Selectivity� to� linear�ether� is�higher�on�H�
FAU�30� with� lower� acid� site� concentration� but� higher� external� (and� mesoporous)�
surface�than�H�FAU�6.�Small�mesoporous�surface�of�H�FAU�6�could�force�the�alcohol�to�
react�within�micropores�in�a�higher�extent�than�on�H�FAU�30,�and�thus,�selectivity�of�H�
FAU�6�to�bulky�linear�ethers�is�less�than�over�H�FAU�30�as�seen�in�Table�5.2.�Conversely�
selectivity�to�olefins�is�much�higher�on�H�FAU�6.�
H�MFI�28�and�H�MCM�79�
The�lowest�selectivity�to�linear�ether�was�found�on�H�MFI�28�(Table�5.2).�Despite�it�
has� higher� mesoporous� surface� than� H�MOR�20� and� H�FER�20,� its� micropores� are�
almost� cylindrical� and� wide� enough� to� allow� alcohols� react� toward� olefins� and�
branched�ethers,�but�too�narrow�to�work�for�linear�ether�formation.��
As�for�H�MCM�79,�its�high�BET�surface�fully�corresponded�to�the�mesoporous�part,�
with�almost�uniform�mesopores�around�3�nm�width.�Comparing�pore�distributions� in�
Fig.� 3.8� (see� section� 3.5)� it� is� seen� that� H�BEA�25� or� H�FAU�30� mesopores� are� wider�
than�those�of�H�MCM�79,�which�is�reflected�in�the�higher�selectivity�to�linear�ether�of�
the�former�zeolites.�
It� is� seen� that� dependence� of� selectivity� to� ether,� olefin� or� branched� ether� on�
morphology� of� zeolites� is� quite� complex.� Shape� selectivity� was� observed� since� some�
zeolites�promoted�olefin�or�branched�ethers�formation�instead�of�that�of�linear�ether.�
It�is�to�be�noted�that�reactant,�product�as�well�as�transition�state�shape�selectivity�can�
play�an�important�role�in�the�products�distribution�of�many�reactions�carried�out�over�
different�zeolites�[99].�In�this�case�we�have�not�enough�data�to�quantify�the�observed�
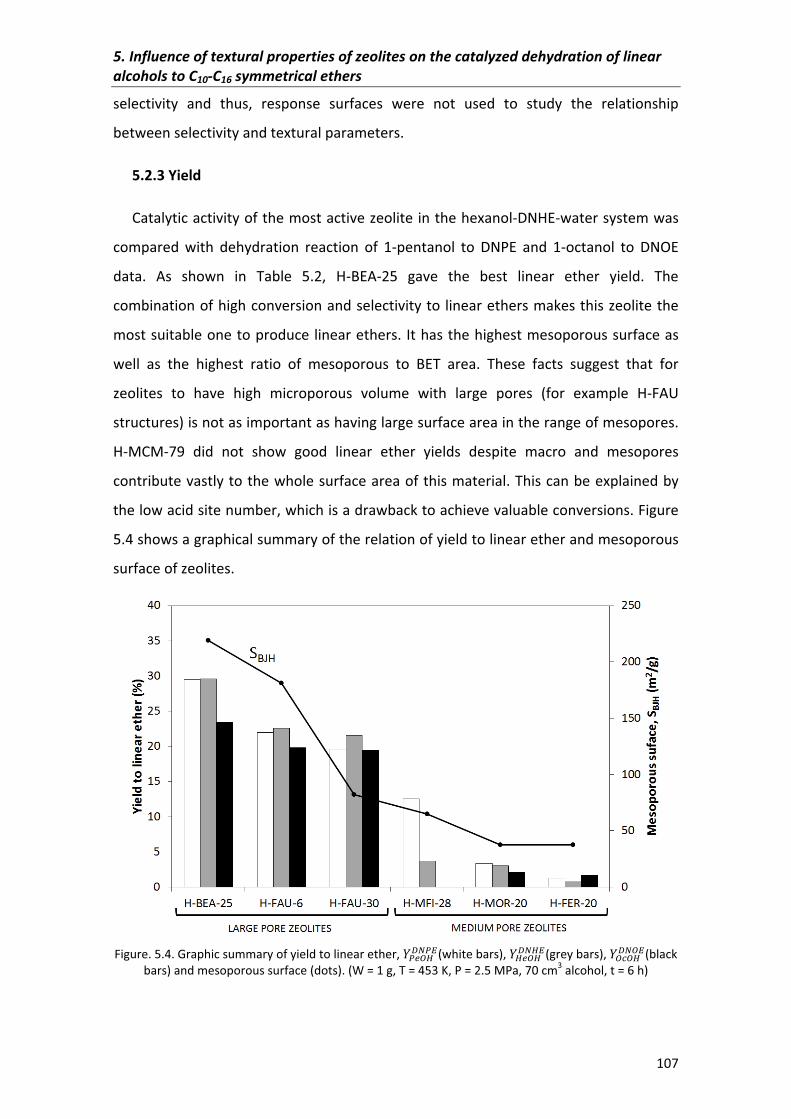
5.�Influence�of�textural�properties�of�zeolites�on�the�catalyzed�dehydration�of�linear�alcohols�to�C10�C16�symmetrical�ethers�
107�
selectivity� and� thus,� response� surfaces� were� not� used� to� study� the� relationship�
between�selectivity�and�textural�parameters.��
5.2.3�Yield�
Catalytic�activity�of�the�most�active�zeolite�in�the�hexanol�DNHE�water�system�was�
compared� with� dehydration� reaction� of� 1�pentanol� to� DNPE� and� 1�octanol� to� DNOE�
data.� As� shown� in� Table� 5.2,� H�BEA�25� gave� the� best� linear� ether� yield.� The�
combination�of�high�conversion�and�selectivity�to� linear�ethers�makes�this�zeolite�the�
most�suitable�one�to�produce�linear�ethers.� It�has�the�highest�mesoporous�surface�as�
well� as� the� highest� ratio� of� mesoporous� to� BET� area.� These� facts� suggest� that� for�
zeolites� to� have� high� microporous� volume� with� large� pores� (for� example� H�FAU�
structures)�is�not�as�important�as�having�large�surface�area�in�the�range�of�mesopores.�
H�MCM�79� did� not� show� good� linear� ether� yields� despite� macro� and� mesopores�
contribute�vastly�to�the�whole�surface�area�of�this�material.�This�can�be�explained�by�
the�low�acid�site�number,�which�is�a�drawback�to�achieve�valuable�conversions.�Figure�
5.4�shows�a�graphical�summary�of�the�relation�of�yield�to�linear�ether�and�mesoporous�
surface�of�zeolites.�
�
Figure.�5.4.�Graphic�summary�of�yield�to�linear�ether,��5.wx��5�(white�bars),��x.wx��x�(grey�bars),��w²wx��w�(black�bars)�and�mesoporous�surface�(dots).�(W�=�1�g,�T�=�453�K,�P�=�2.5�MPa,�70�cm3�alcohol,�t�=�6�h)�
�
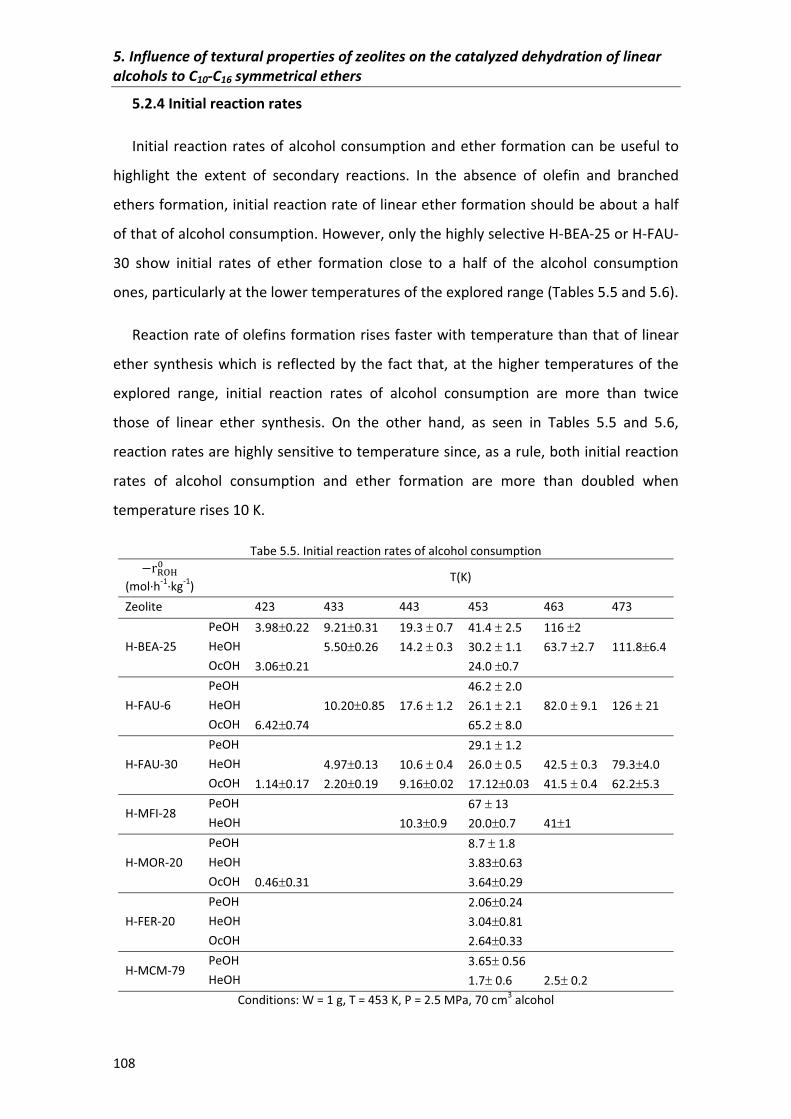
5.�Influence�of�textural�properties�of�zeolites�on�the�catalyzed�dehydration�of�linear�alcohols�to�C10�C16�symmetrical�ethers�
108�
5.2.4�Initial�reaction�rates�
Initial� reaction�rates�of�alcohol�consumption�and�ether� formation�can�be�useful� to�
highlight� the� extent� of� secondary� reactions.� In� the� absence� of� olefin� and� branched�
ethers�formation,�initial�reaction�rate�of�linear�ether�formation�should�be�about�a�half�
of�that�of�alcohol�consumption.�However,�only�the�highly�selective�H�BEA�25�or�H�FAU�
30� show� initial� rates� of� ether� formation� close� to� a� half� of� the� alcohol� consumption�
ones,�particularly�at�the�lower�temperatures�of�the�explored�range�(Tables�5.5�and�5.6).�
Reaction�rate�of�olefins�formation�rises�faster�with�temperature�than�that�of�linear�
ether�synthesis�which� is�reflected�by�the�fact�that,�at� the�higher�temperatures�of�the�
explored� range,� initial� reaction� rates� of� alcohol� consumption� are� more� than� twice�
those� of� linear� ether� synthesis.� On� the� other� hand,� as� seen� in� Tables� 5.5� and� 5.6,�
reaction�rates�are�highly�sensitive�to�temperature�since,�as�a�rule,�both�initial�reaction�
rates� of� alcohol� consumption� and� ether� formation� are� more� than� doubled� when�
temperature�rises�10�K.��
Tabe�5.5.�Initial�reaction�rates�of�alcohol�consumption���YIJK� �(mol�h�1�kg�1)�
� T(K)�
Zeolite� � 423� 433� 443� 453� 463� 473�
H�BEA�25�PeOH 3.98�0.22� 9.21�0.31� 19.3���0.7� 41.4���2.5� 116��2� �HeOH � 5.50�0.26� 14.2���0.3� 30.2���1.1� 63.7��2.7� 111.8�6.4�OcOH 3.06�0.21� � 24.0��0.7� �
H�FAU�6�PeOH � � 46.2���2.0� �HeOH � 10.20�0.85� 17.6���1.2� 26.1���2.1� 82.0���9.1� 126���21�OcOH 6.42�0.74� � 65.2���8.0� �
H�FAU�30�PeOH � � 29.1���1.2� �HeOH � 4.97�0.13� 10.6���0.4� 26.0���0.5� 42.5���0.3� 79.3�4.0�OcOH 1.14�0.17� 2.20�0.19� 9.16�0.02� 17.12�0.03� 41.5���0.4� 62.2�5.3�
H�MFI�28�PeOH � � 67���13� �HeOH � � 10.3�0.9� 20.0�0.7� 41�1� �
H�MOR�20�PeOH � � 8.7���1.8� �HeOH � � 3.83�0.63� �OcOH 0.46�0.31� � 3.64�0.29� �
H�FER�20�PeOH � � 2.06�0.24� �HeOH � � 3.04�0.81� �OcOH � � 2.64�0.33� �
H�MCM�79�PeOH � � 3.65��0.56� �HeOH � � 1.7��0.6� 2.5��0.2� �
Conditions:�W�=�1�g,�T�=�453�K,�P�=�2.5�MPa,�70�cm3�alcohol�
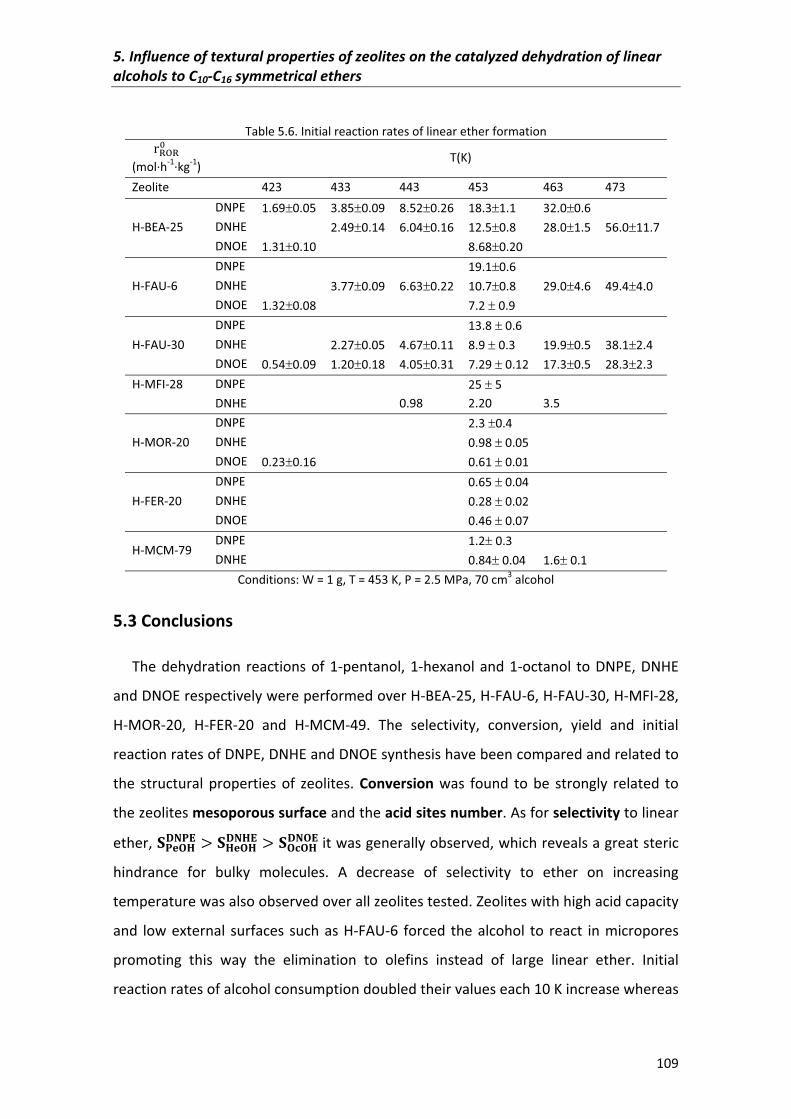
5.�Influence�of�textural�properties�of�zeolites�on�the�catalyzed�dehydration�of�linear�alcohols�to�C10�C16�symmetrical�ethers�
109�
�
Table�5.6.�Initial�reaction�rates�of�linear�ether�formation�YIJI� �(mol�h�1�kg�1)�
� T(K)�
Zeolite� � 423� 433� 443� 453� 463� 473�
H�BEA�25�DNPE� 1.69�0.05� 3.85�0.09� 8.52�0.26� 18.3�1.1� 32.0�0.6� �DNHE� � 2.49�0.14� 6.04�0.16� 12.5�0.8� 28.0�1.5� 56.0�11.7�DNOE� 1.31�0.10� 8.68�0.20� �
H�FAU�6�DNPE� � 19.1�0.6� �DNHE� � 3.77�0.09� 6.63�0.22� 10.7�0.8� 29.0�4.6� 49.4�4.0�DNOE� 1.32�0.08� 7.2���0.9� �
H�FAU�30�DNPE� � 13.8���0.6� �DNHE� � 2.27�0.05� 4.67�0.11� 8.9���0.3� 19.9�0.5� 38.1�2.4�DNOE� 0.54�0.09� 1.20�0.18� 4.05�0.31� 7.29���0.12� 17.3�0.5� 28.3�2.3�
H�MFI�28� DNPE� � 25���5� �� DNHE� � 0.98 2.20 3.5� �
H�MOR�20�DNPE� � 2.3��0.4� �DNHE� � 0.98���0.05� �DNOE� 0.23�0.16� 0.61���0.01� �
H�FER�20�DNPE� � 0.65���0.04� �DNHE� � 0.28���0.02� �DNOE� � 0.46���0.07� �
H�MCM�79�DNPE� � 1.2��0.3� �DNHE� � 0.84��0.04� 1.6��0.1� �
Conditions:�W�=�1�g,�T�=�453�K,�P�=�2.5�MPa,�70�cm3�alcohol�
5.3�Conclusions�
The�dehydration�reactions�of�1�pentanol,�1�hexanol�and�1�octanol� to�DNPE,�DNHE�
and�DNOE�respectively�were�performed�over�H�BEA�25,�H�FAU�6,�H�FAU�30,�H�MFI�28,�
H�MOR�20,� H�FER�20� and� H�MCM�49.� The� selectivity,� conversion,� yield� and� initial�
reaction�rates�of�DNPE,�DNHE�and�DNOE�synthesis�have�been�compared�and�related�to�
the� structural� properties� of� zeolites.�Conversion� was� found� to� be� strongly� related� to�
the�zeolites�mesoporous�surface�and�the�acid�sites�number.�As�for�selectivity�to�linear�
ether,�|}~����}� { |�~������ { |�������� it�was�generally�observed,�which�reveals�a�great�steric�
hindrance� for� bulky� molecules.� A� decrease� of� selectivity� to� ether� on� increasing�
temperature�was�also�observed�over�all�zeolites�tested.�Zeolites�with�high�acid�capacity�
and� low�external� surfaces� such�as�H�FAU�6� forced� the�alcohol� to� react� in�micropores�
promoting� this� way� the� elimination� to� olefins� instead� of� large� linear� ether.� Initial�
reaction�rates�of�alcohol�consumption�doubled�their�values�each�10�K�increase�whereas�
5.�Influence�of�textural�properties�of�zeolites�on�the�catalyzed�dehydration�of�linear�alcohols�to�C10�C16�symmetrical�ethers�
110�
initial�reaction�rates�of�ether�formation�did�not�because�of�the�rise�of�olefin�formation�
with�temperature.�H�BEA�25�gave�the�best�yield�of�linear�ether,�as�a�consequence�of�
showing�high�alcohol�conversion�and�selectivity�to�linear�ether.�
�
�
�
�
�
�
�
�
�
�
CHAPTER�6�
Chemical�equilibrium�of�the�liquid�phase�dehydration�of�1�octanol�to�DNOE��
�
�
�
�
�
�
�
�
�
�
�

�
�
�
�
�
�
�
�
�
�
�
�
�
�
�
�
�
�
�
�
�
�
�
�
6.�Chemical�equilibrium�of�the�liquid�phase�dehydration�of�1�octanol�to�DNOE�
113�
6.1�Abstract�
The� equilibrium� constants� for� the� liquid�phase� dehydration� of� 1�octanol� to� di�n�
octyl� ether� (DNOE)� and� water� have� been� determined� in� the� temperature� range� 413�
453� K� over� Amberlyst� 70.� The� equilibrium� constants� for� the� main� side� reactions,�
intramolecular�dehydration�of�1�octanol�to�1�octene�and�1�octene�isomerization�to�2�
octene,� have� been� determined� as� well.� Etherification� of� 1�octanol� was� shown� to� be�
exothermic,� whereas� intramolecular� dehydration� of� 1�octanol� has� been� found� to� be�
endothermic�and� isomerization�of�1�octene�to�2�octene�exothermic.�An�experimental�
value�for�the�standard�molar�entropy�in�the�liquid�phase�for�DNOE�has�been�proposed.�
6.2�Results�and�discussion�
Exploratory�experiments�carried�out�in�the�batch�reactor�in�the�temperature�range�
413�453� K� over� Amberlyst� 70,� starting� from� pure� 1�octanol,� show� that� alcohol�
equilibrium� conversion� was� higher� than� 96� %.� Amberlyst� 70� was� selected� for�
equilibrium� experiments� because� of� its� high� selectivity� and� activity� and� thermal�
resistance,�which�permitted�to�work�in�a�wider�range�of�temperatures�than�the�other�
PS�DVB�resins.��
It�was�considered�that�chemical�equilibrium�was�reached�when�the�composition�of�
the�reaction�medium�remained�constant,�and�in�addition,�thermodynamic�equilibrium�
constants� reached� a� constant� value� over� time� within� the� limits� of� the� experimental�
error.� Experiments� carried� out� at� 413� and� 453� K� were� repeated� to� evaluate� the�
reliability�of�data.�
Since�water� is�partially�miscible� in�1�octanol,�and�DNOE�is�practically� immiscible� in�
water,� at� such� alcohol� conversions� some� problems� arose� by� the� split� of� reaction�
medium�into�two�immiscible�phases�by�the�presence�of�water�in�large�amounts.�First,�
taking� online� reliable� liquid� samples� of� each� phase� without� stopping� the� reaction� is�
difficult.�In�addition,�analysis�of�data�is�complex�with�simultaneous�chemical�and�phase�
equilibria.�Therefore,�mixtures�of�composition�close� to�equilibrium�were�used�as� raw�
material�instead�of�pure�alcohol.��
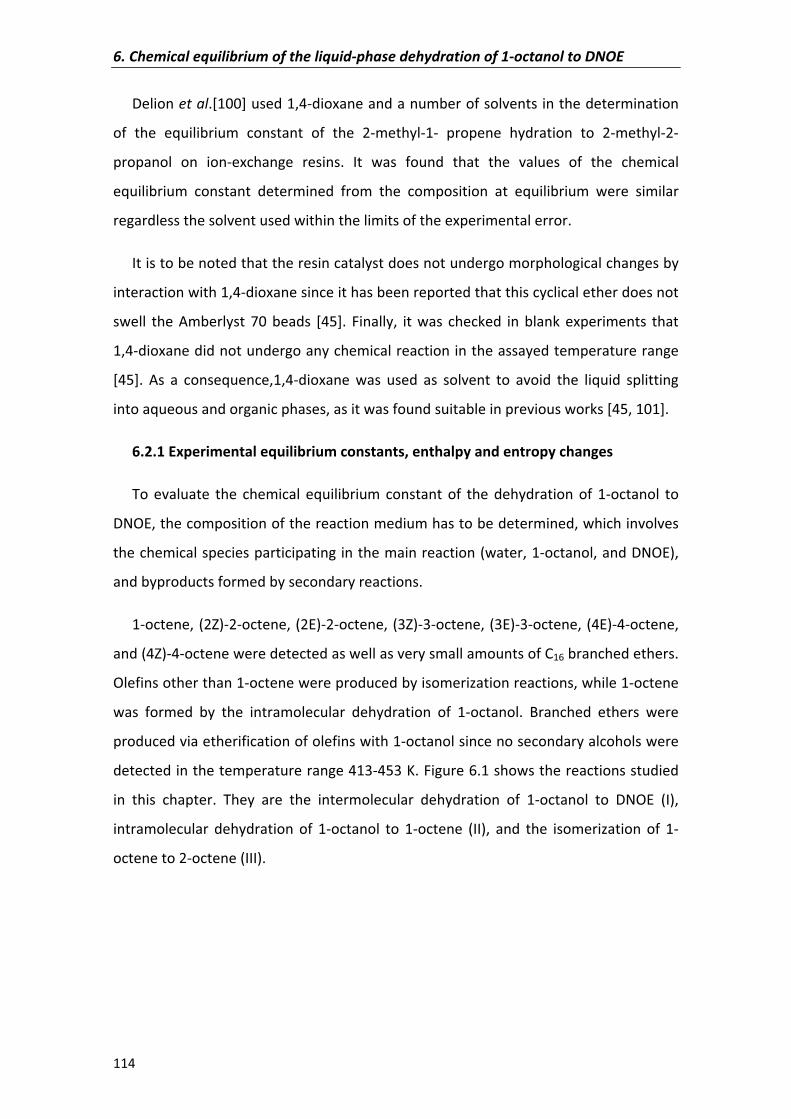
6.�Chemical�equilibrium�of�the�liquid�phase�dehydration�of�1�octanol�to�DNOE�
114�
Delion�et�al.[100]�used�1,4�dioxane�and�a�number�of�solvents�in�the�determination�
of� the� equilibrium� constant� of� the� 2�methyl�1�� propene� hydration� to� 2�methyl�2�
propanol� on� ion�exchange� resins.� It� was� found� that� the� values� of� the� chemical�
equilibrium� constant� determined� from� the� composition� at� equilibrium� were� similar�
regardless�the�solvent�used�within�the�limits�of�the�experimental�error.��
It�is�to�be�noted�that�the�resin�catalyst�does�not�undergo�morphological�changes�by�
interaction�with�1,4�dioxane�since�it�has�been�reported�that�this�cyclical�ether�does�not�
swell� the� Amberlyst� 70� beads� [45].� Finally,� it� was� checked� in� blank� experiments� that�
1,4�dioxane�did�not�undergo�any�chemical�reaction�in�the�assayed�temperature�range�
[45].� As� a� consequence,1,4�dioxane� was� used� as� solvent� to� avoid� the� liquid� splitting�
into�aqueous�and�organic�phases,�as�it�was�found�suitable�in�previous�works�[45,�101].��
6.2.1�Experimental�equilibrium�constants,�enthalpy�and�entropy�changes��
To� evaluate� the� chemical� equilibrium� constant� of� the� dehydration� of� 1�octanol� to�
DNOE,�the�composition�of�the�reaction�medium�has�to�be�determined,�which�involves�
the�chemical�species�participating�in�the�main�reaction�(water,�1�octanol,�and�DNOE),�
and�byproducts�formed�by�secondary�reactions.�
1�octene,�(2Z)�2�octene,�(2E)�2�octene,�(3Z)�3�octene,�(3E)�3�octene,�(4E)�4�octene,�
and�(4Z)�4�octene�were�detected�as�well�as�very�small�amounts�of�C16�branched�ethers.�
Olefins�other�than�1�octene�were�produced�by�isomerization�reactions,�while�1�octene�
was� formed� by� the� intramolecular� dehydration� of� 1�octanol.� Branched� ethers� were�
produced�via�etherification�of�olefins�with�1�octanol�since�no�secondary�alcohols�were�
detected�in�the�temperature�range�413�453�K.�Figure�6.1�shows�the�reactions�studied�
in� this� chapter.� They� are� the� intermolecular� dehydration� of� 1�octanol� to� DNOE� (I),�
intramolecular� dehydration� of� 1�octanol� to� 1�octene� (II),� and� the� isomerization� of� 1�
octene�to�2�octene�(III).�
�
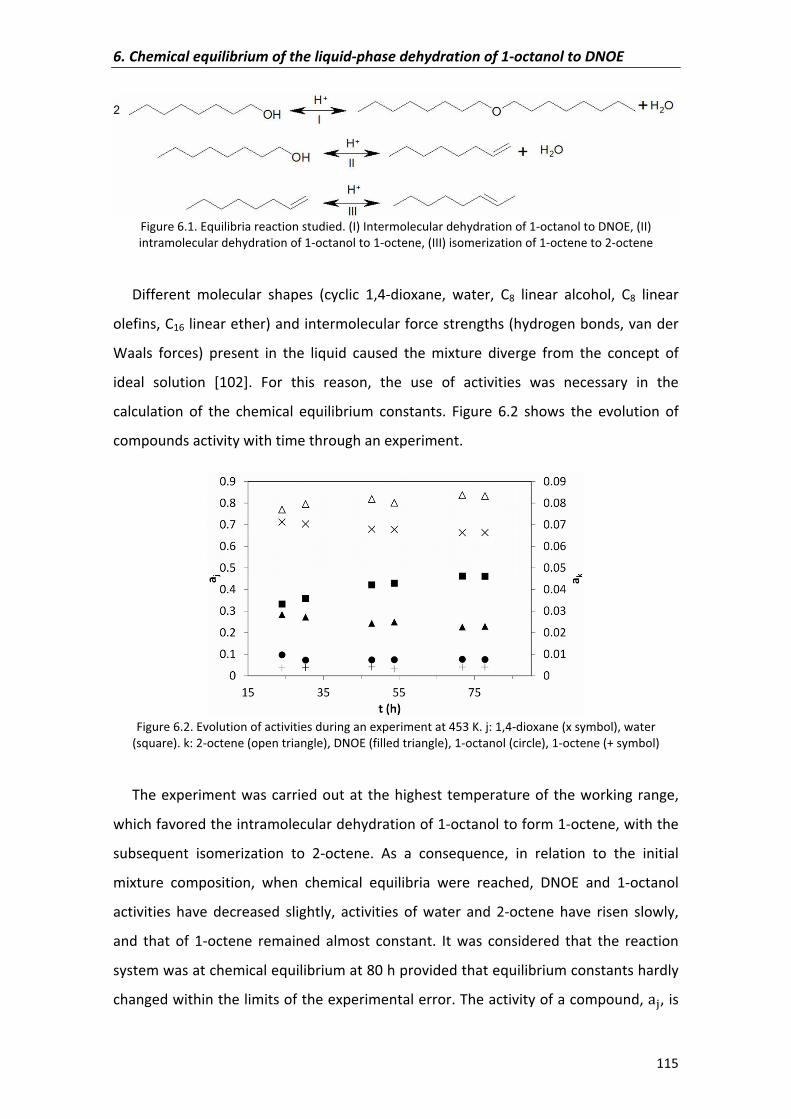
6.�Chemical�equilibrium�of�the�liquid�phase�dehydration�of�1�octanol�to�DNOE�
115�
�Figure�6.1.�Equilibria�reaction�studied.�(I)�Intermolecular�dehydration�of�1�octanol�to�DNOE,�(II)�intramolecular�dehydration�of�1�octanol�to�1�octene,�(III)�isomerization�of�1�octene�to�2�octene�
�
Different� molecular� shapes� (cyclic� 1,4�dioxane,� water,� C8� linear� alcohol,� C8� linear�
olefins,�C16�linear�ether)�and�intermolecular�force�strengths�(hydrogen�bonds,�van�der�
Waals� forces)� present� in� the� liquid� caused� the� mixture� diverge� from� the� concept� of�
ideal� solution� [102].� For� this� reason,� the� use� of� activities� was� necessary� in� the�
calculation� of� the� chemical� equilibrium� constants.� Figure� 6.2� shows� the� evolution� of�
compounds�activity�with�time�through�an�experiment.�
�Figure�6.2.�Evolution�of�activities�during�an�experiment�at�453�K.�j:�1,4�dioxane�(x�symbol),�water�
(square).�k:�2�octene�(open�triangle),�DNOE�(filled�triangle),�1�octanol�(circle),�1�octene�(+�symbol)��
The�experiment�was�carried�out�at�the�highest�temperature�of�the�working�range,�
which�favored�the�intramolecular�dehydration�of�1�octanol�to�form�1�octene,�with�the�
subsequent� isomerization� to� 2�octene.� As� a� consequence,� in� relation� to� the� initial�
mixture� composition,� when� chemical� equilibria� were� reached,� DNOE� and� 1�octanol�
activities� have� decreased� slightly,� activities� of� water� and� 2�octene� have� risen� slowly,�
and� that� of� 1�octene� remained� almost� constant.� It� was� considered� that� the� reaction�
system�was�at�chemical�equilibrium�at�80�h�provided�that�equilibrium�constants�hardly�
changed�within�the�limits�of�the�experimental�error.�The�activity�of�a�compound,�V�,�is�
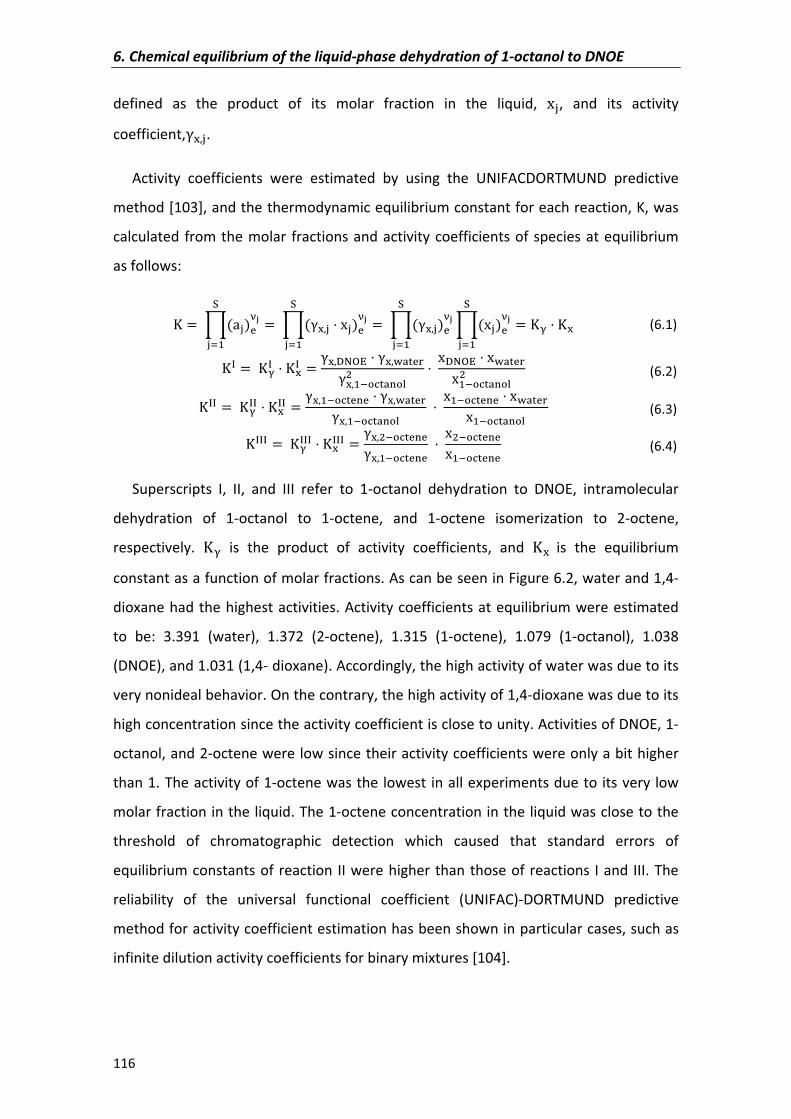
6.�Chemical�equilibrium�of�the�liquid�phase�dehydration�of�1�octanol�to�DNOE�
116�
defined� as� the� product� of� its� molar� fraction� in� the� liquid,� ��,� and� its� activity�
coefficient,�¤)�.�Activity� coefficients� were� estimated� by� using� the� UNIFACDORTMUND� predictive�
method�[103],�and�the�thermodynamic�equilibrium�constant�for�each�reaction,�K,�was�
calculated� from�the�molar� fractions�and�activity�coefficients�of�species�at�equilibrium�
as�follows:�
³ � ´�V��rµ¶·�f� � ´��¤)� ���rµ¶·
�f� � ´��¤)��rµ¶·�f� ´����rµ¶·
�f� � ³¸ ³¤� (6.1)�
³¹ � ³¹̧ ³¤¹ � �¤)noJp �¤)�¢er¬�¤)��_e¢�£" �noJp ��¢er¬���_e¢�£" � (6.2)�
³¹¹ � ³¹̧¹ ³¤¹¹ � �¤)��_er�r �¤)�¢er¬�¤)��_e¢�£ ���_er�r ��¢er¬���_e¢�£ � (6.3)�
³¹¹¹ � ³¹̧¹¹ ³¤¹¹¹ � �¤)"�_er�r�¤)��_er�r �"�_er�r���_er�r� (6.4)�
Superscripts� I,� II,� and� III� refer� to� 1�octanol� dehydration� to� DNOE,� intramolecular�
dehydration� of� 1�octanol� to� 1�octene,� and� 1�octene� isomerization� to� 2�octene,�
respectively.� ³¸� is� the� product� of� activity� coefficients,� and� ³¤ � is� the� equilibrium�
constant�as�a�function�of�molar�fractions.�As�can�be�seen�in�Figure�6.2,�water�and�1,4�
dioxane�had�the�highest�activities.�Activity�coefficients�at�equilibrium�were�estimated�
to� be:� 3.391� (water),� 1.372� (2�octene),� 1.315� (1�octene),� 1.079� (1�octanol),� 1.038�
(DNOE),�and�1.031�(1,4��dioxane).�Accordingly,�the�high�activity�of�water�was�due�to�its�
very�nonideal�behavior.�On�the�contrary,�the�high�activity�of�1,4�dioxane�was�due�to�its�
high�concentration�since�the�activity�coefficient�is�close�to�unity.�Activities�of�DNOE,�1�
octanol,�and�2�octene�were�low�since�their�activity�coefficients�were�only�a�bit�higher�
than�1.�The�activity�of�1�octene�was�the�lowest� in�all�experiments�due�to�its�very�low�
molar�fraction�in�the�liquid.�The�1�octene�concentration�in�the�liquid�was�close�to�the�
threshold� of� chromatographic� detection� which� caused� that� standard� errors� of�
equilibrium�constants�of�reaction� II�were�higher�than�those�of�reactions� I�and� III.�The�
reliability� of� the� universal� functional� coefficient� (UNIFAC)�DORTMUND� predictive�
method�for�activity�coefficient�estimation�has�been�shown�in�particular�cases,�such�as�
infinite�dilution�activity�coefficients�for�binary�mixtures�[104].�
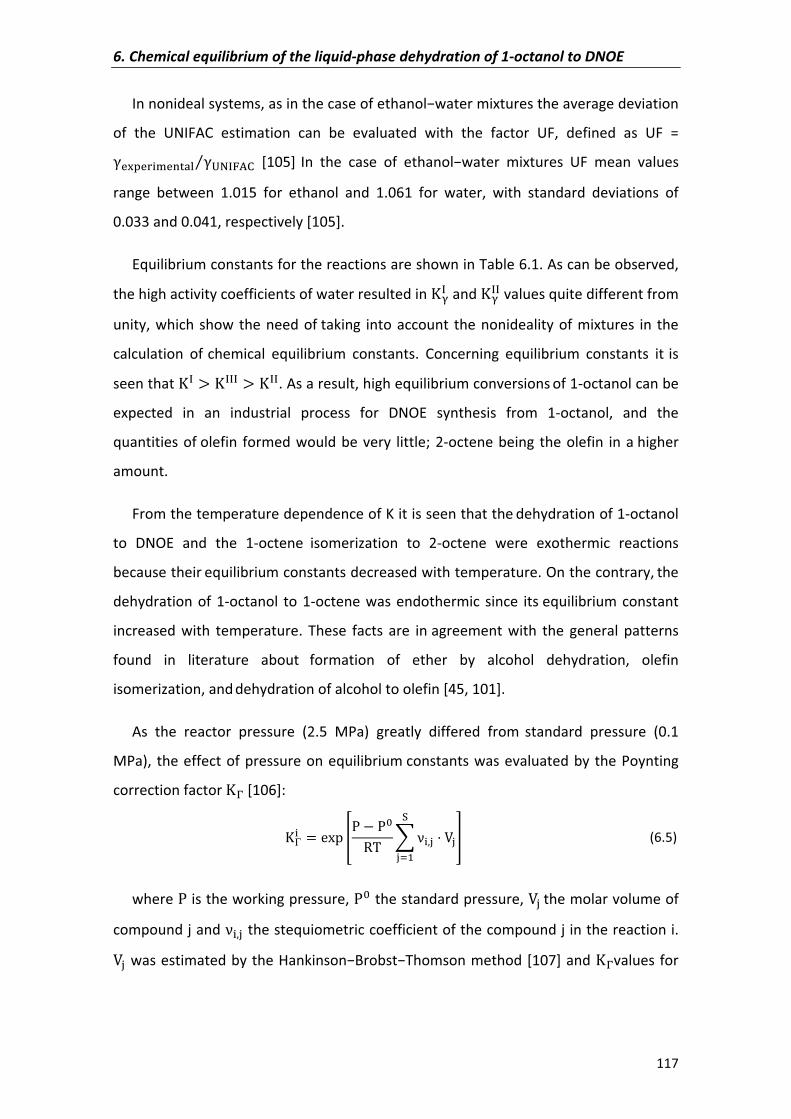
6.�Chemical�equilibrium�of�the�liquid�phase�dehydration�of�1�octanol�to�DNOE�
117�
In�nonideal�systems,�as�in�the�case�of�ethanol�water�mixtures�the�average�deviation�
of� the� UNIFAC� estimation� can� be� evaluated� with� the� factor� UF,� defined� as� UF� =��r¤¥r¬�«r�e¢£ �ºo¹»¼Mz � [105]� In� the� case� of� ethanol�water� mixtures� UF� mean� values�
range� between� 1.015� for� ethanol� and� 1.061� for� water,� with� standard� deviations� of�
0.033�and�0.041,�respectively�[105].�
Equilibrium�constants�for�the�reactions�are�shown�in�Table�6.1.�As�can�be�observed,�
the�high�activity�coefficients�of�water�resulted�in�³¹̧ �and�³¹̧¹�values�quite�different�from�
unity,�which�show�the�need�of� taking� into�account� the�nonideality�of�mixtures� in� the�
calculation� of� chemical� equilibrium� constants.� Concerning� equilibrium� constants� it� is�
seen�that�³¹ { ³¹¹¹ { ³¹¹.�As�a�result,�high�equilibrium�conversions�of�1�octanol�can�be�
expected� in� an� industrial� process� for� DNOE� synthesis� from� 1�octanol,� and� the�
quantities�of� olefin� formed�would�be�very� little;�2�octene�being� the�olefin� in�a� higher�
amount.��
From�the�temperature�dependence�of�K�it�is�seen�that�the�dehydration�of�1�octanol�
to� DNOE� and� the� 1�octene� isomerization� to� 2�octene� were� exothermic� reactions�
because�their�equilibrium�constants�decreased�with�temperature.�On�the�contrary,�the�
dehydration�of�1�octanol� to�1�octene�was�endothermic� since� its� equilibrium�constant�
increased� with� temperature.� These� facts� are� in� agreement� with� the� general� patterns�
found� in� literature� about� formation� of� ether� by� alcohol� dehydration,� olefin�
isomerization,�and�dehydration�of�alcohol�to�olefin�[45,�101].�
As� the� reactor� pressure� (2.5� MPa)� greatly� differed� from� standard� pressure� (0.1�
MPa),� the�effect�of�pressure�on�equilibrium� constants�was�evaluated�by�the�Poynting�
correction�factor�³½�[106]:�
³�� � ��� ¾¿ � ¿�À� � Á�)� ��
·�f� Â� (6.5)�
where�¿�is�the�working�pressure,�¿��the�standard�pressure,��� �the�molar�volume�of�
compound�j�and�Á�)��the�stequiometric�coefficient�of�the�compound�j�in�the�reaction�i.�
���was�estimated�by�the�Hankinson�Brobst�Thomson�method�[107]�and�³½values�for�
6.�Chemical�equilibrium�of�the�liquid�phase�dehydration�of�1�octanol�to�DNOE�
118�
all� reactions� were� found� to� be� very� close� to� unity� (0.995� for� reactions� I� and� III,� and�
1.040�for�reaction�II).�
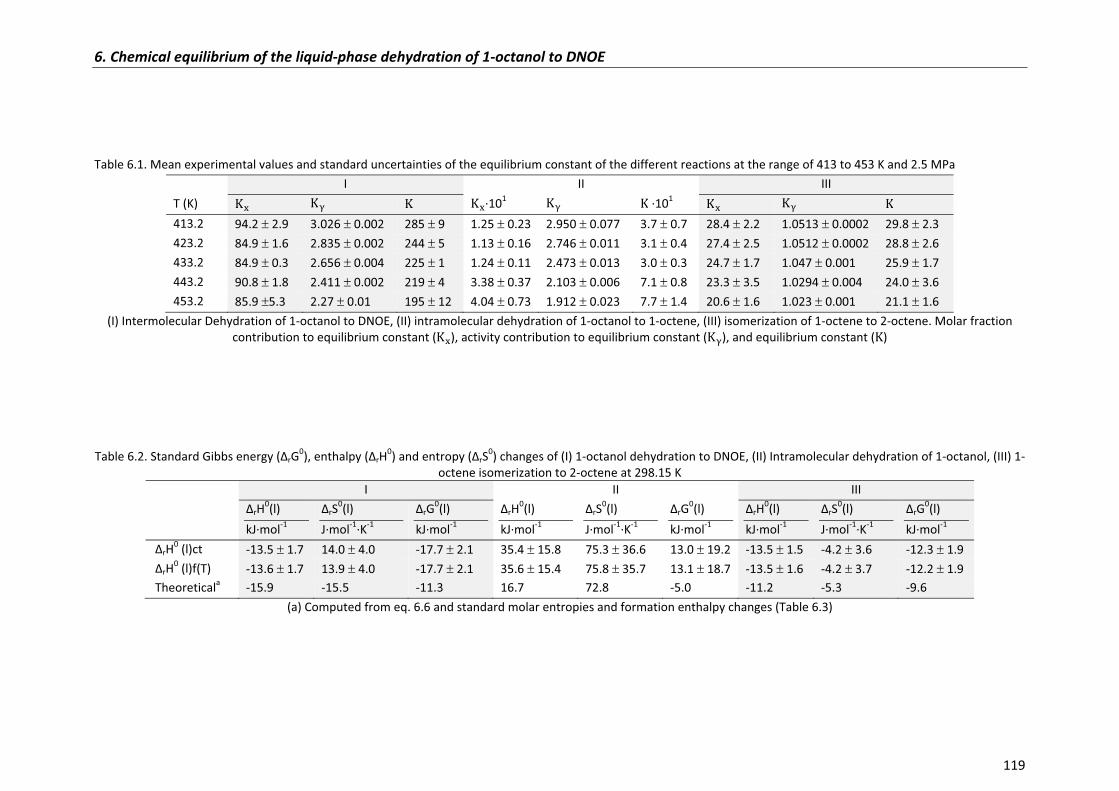
6.�Chemical�equilibrium�of�the�liquid�phase�dehydration�of�1�octanol�to�DNOE�
119�
����Table�6.1.�Mean�experimental�values�and�standard�uncertainties�of�the�equilibrium�constant�of�the�different�reactions�at�the�range�of�413�to�453�K�and�2.5�MPa�
I II IIIT�(K)� ³¤� ³¸� ³� ³¤�101 ³¸� ³��101 ³¤� ³¸� ³�413.2� 94.2���2.9� 3.026���0.002� 285���9� 1.25���0.23 2.950���0.077� 3.7���0.7 28.4���2.2 1.0513���0.0002� 29.8���2.3�423.2�� 84.9���1.6� 2.835���0.002� 244���5� 1.13���0.16� 2.746���0.011� 3.1���0.4� 27.4���2.5� 1.0512���0.0002� 28.8���2.6�433.2�� 84.9���0.3� 2.656���0.004� 225���1� 1.24���0.11� 2.473���0.013� 3.0���0.3� 24.7���1.7� 1.047���0.001� 25.9���1.7�443.2�� 90.8���1.8� 2.411���0.002� 219���4� 3.38���0.37� 2.103���0.006� 7.1���0.8� 23.3���3.5� 1.0294���0.004� 24.0���3.6�453.2�� 85.9��5.3� 2.27���0.01 195���12 4.04���0.73 1.912���0.023� 7.7���1.4 20.6���1.6� 1.023���0.001� 21.1���1.6�
(I)�Intermolecular�Dehydration�of�1�octanol�to�DNOE,�(II)�intramolecular�dehydration�of�1�octanol�to�1�octene,�(III)�isomerization�of�1�octene�to�2�octene.�Molar�fraction�contribution�to�equilibrium�constant�(³¤),�activity�contribution�to�equilibrium�constant�(³¸),�and�equilibrium�constant�(³)�
�
�
�
Table�6.2.�Standard�Gibbs�energy�(�rG0),�enthalpy�(�rH
0)�and�entropy�(�rS0)�changes�of�(I)�1�octanol�dehydration�to�DNOE,�(II)�Intramolecular�dehydration�of�1�octanol,�(III)�1�
octene�isomerization�to�2�octene�at�298.15�K�I II� III
��rH
0(l)�kJ�mol�1�
�rS0(l)�
J�mol�1�K�1�
�rG0(l)�
kJ�mol�1��rH
0(l)kJ�mol�1�
�rS0(l)�
J�mol�1�K�1��rG
0(l)�
kJ�mol�1��rH
0(l)�
kJ�mol�1��rS
0(l)�
J�mol�1�K�1��rG
0(l)�
kJ�mol�1��rH
0�(l)ct� �13.5���1.7� 14.0���4.0� �17.7���2.1� 35.4���15.8� 75.3���36.6� 13.0���19.2� �13.5���1.5� �4.2���3.6� �12.3���1.9��rH
0�(l)f(T)� �13.6���1.7� 13.9���4.0� �17.7���2.1� 35.6���15.4� 75.8���35.7� 13.1���18.7� �13.5���1.6� �4.2���3.7� �12.2���1.9�Theoreticala �15.9� �15.5 �11.3 16.7 72.8 �5.0 �11.2 �5.3 �9.6
(a)�Computed�from�eq.�6.6�and�standard�molar�entropies�and�formation�enthalpy�changes�(Table�6.3)��
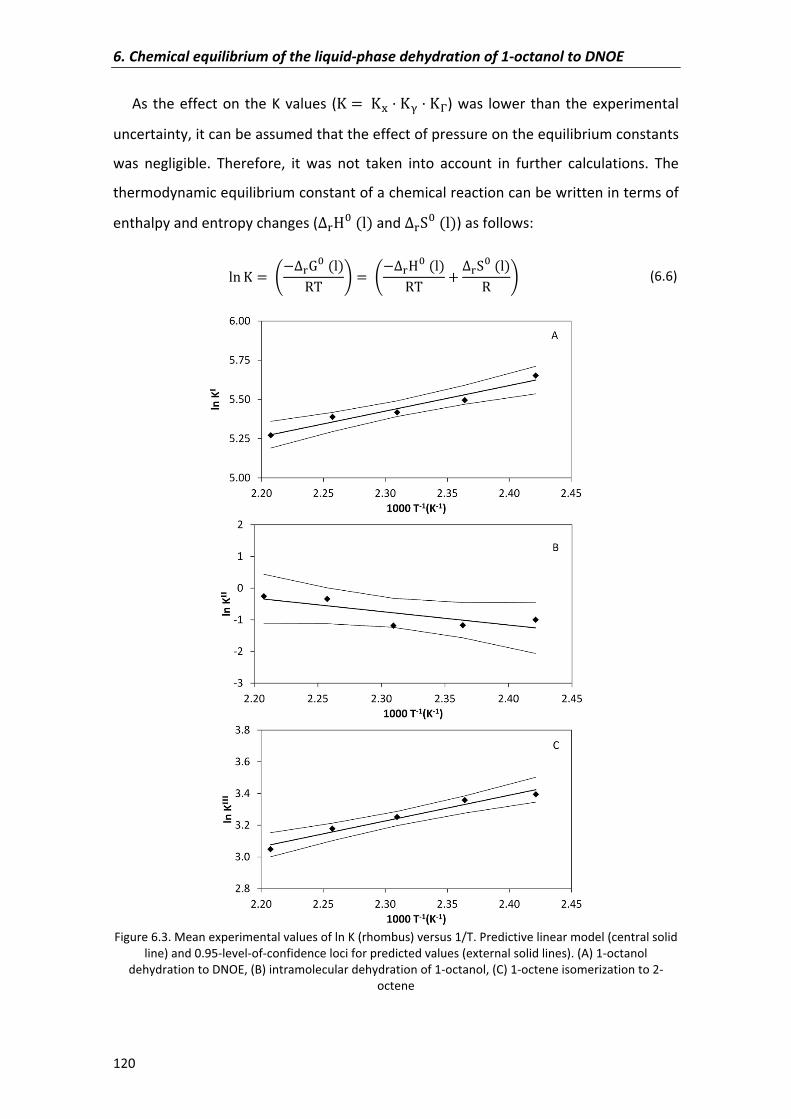
6.�Chemical�equilibrium�of�the�liquid�phase�dehydration�of�1�octanol�to�DNOE�
120�
As� the�effect�on� the�K�values� (³ � ³¤ ³¸ ³½)�was� lower� than� the�experimental�
uncertainty,�it�can�be�assumed�that�the�effect�of�pressure�on�the�equilibrium�constants�
was� negligible.� Therefore,� it� was� not� taken� into� account� in� further� calculations.� The�
thermodynamic�equilibrium�constant�of�a�chemical�reaction�can�be�written�in�terms�of�
enthalpy�and�entropy�changes�(°¬l� �T��and�°¬L� �T�)�as�follows:�
T\ ³ � ®�°¬Ã� �T�À� ¯ � ®�°¬l� �T�À� °¬L� �T�À ¯� (6.6)�
�Figure�6.3.�Mean�experimental�values�of�ln�K�(rhombus)�versus�1/T.�Predictive�linear�model�(central�solid�
line)�and�0.95�level�of�confidence�loci�for�predicted�values�(external�solid�lines).�(A)�1�octanol�dehydration�to�DNOE,�(B)�intramolecular�dehydration�of�1�octanol,�(C)�1�octene�isomerization�to�2�
octene��
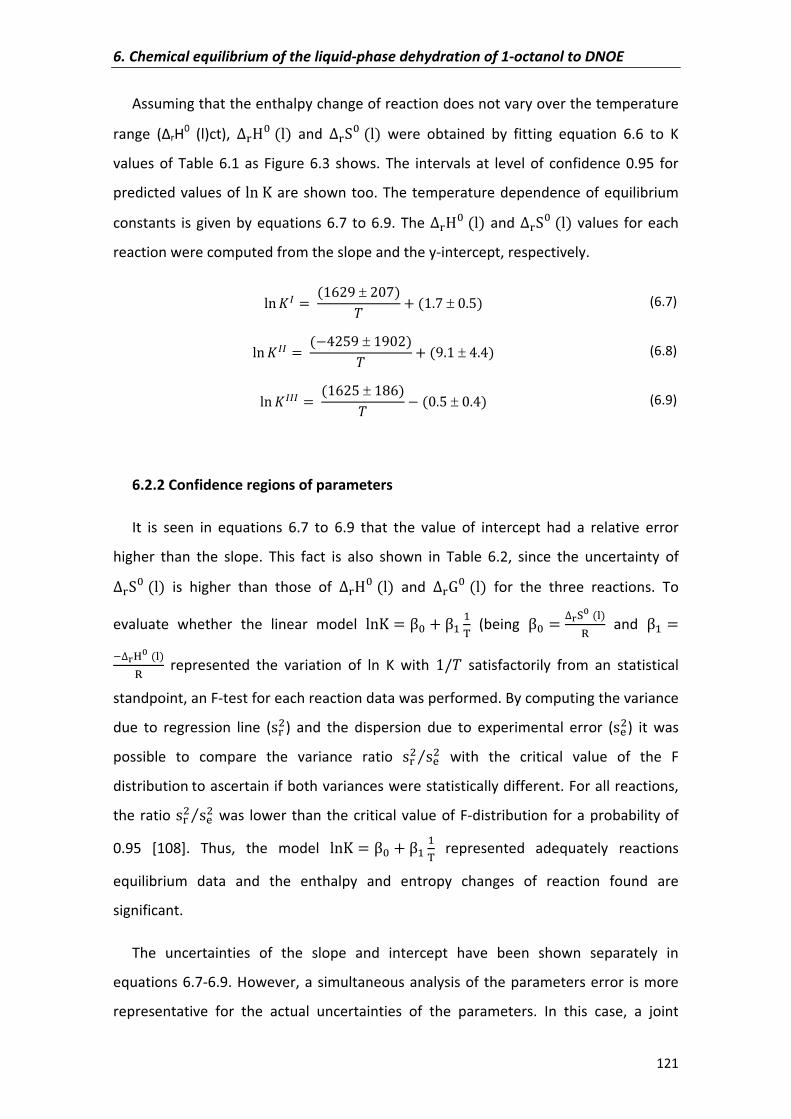
6.�Chemical�equilibrium�of�the�liquid�phase�dehydration�of�1�octanol�to�DNOE�
121�
Assuming�that�the�enthalpy�change�of�reaction�does�not�vary�over�the�temperature�
range� (�rH0� (l)ct),� °¬l� �T�� and� °¬L� �T�� were� obtained� by� fitting� equation� 6.6� to� K�
values� of� Table� 6.1� as� Figure� 6.3� shows.� The� intervals� at� level� of� confidence� 0.95� for�
predicted�values�of� T\ ³�are�shown�too.�The�temperature�dependence�of�equilibrium�
constants� is�given�by�equations�6.7� to�6.9.�The�°¬l� �T��and�°¬L� �T�� values� for�each�
reaction�were�computed�from�the�slope�and�the�y�intercept,�respectively.�
T\ /Ä � ����� � �#�Å ���# � ���� (6.7)�
T\ /ÄÄ � ������ � ����Å ���� � ����� (6.8)�
T\ /ÄÄÄ � ����� � ����Å � ��� � ���� (6.9)�
�
6.2.2�Confidence�regions�of�parameters�
It� is� seen� in� equations� 6.7� to� 6.9� that� the� value� of� intercept� had� a� relative� error�
higher� than� the� slope.� This� fact� is� also� shown� in� Table� 6.2,� since� the� uncertainty� of�
°¬L� �T�� is� higher� than� those� of� °¬l� �T�� and� °¬Ã� �T�� for� the� three� reactions.� To�
evaluate� whether� the� linear� model� T\³ � Æ� Æ� �©� (being� Æ� � °Ç·È �£�I � and� Æ� ��°ÇKÈ �£�I � represented� the� variation� of� ln� K� with� ��Å� satisfactorily� from� an� statistical�
standpoint,�an�F�test�for�each�reaction�data�was�performed.�By�computing�the�variance�
due� to� regression� line� (ɬ")� and� the� dispersion� due� to� experimental� error� (Ér")� it� was�
possible� to� compare� the� variance� ratio� ɬ" Ér"z � with� the� critical� value� of� the� F�
distribution�to�ascertain�if�both�variances�were�statistically�different.�For�all�reactions,�
the�ratio�ɬ" Ér"z �was� lower�than�the�critical�value�of�F�distribution� for�a�probability�of�
0.95� [108].� Thus,� the� model� T\³ � Æ� Æ� �©� represented� adequately� reactions�
equilibrium� data� and� the� enthalpy� and� entropy� changes� of� reaction� found� are�
significant.�
The� uncertainties� of� the� slope� and� intercept� have� been� shown� separately� in�
equations�6.7�6.9.�However,�a�simultaneous�analysis�of� the�parameters�error� is�more�
representative� for� the� actual� uncertainties� of� the� parameters.� In� this� case,� a� joint�
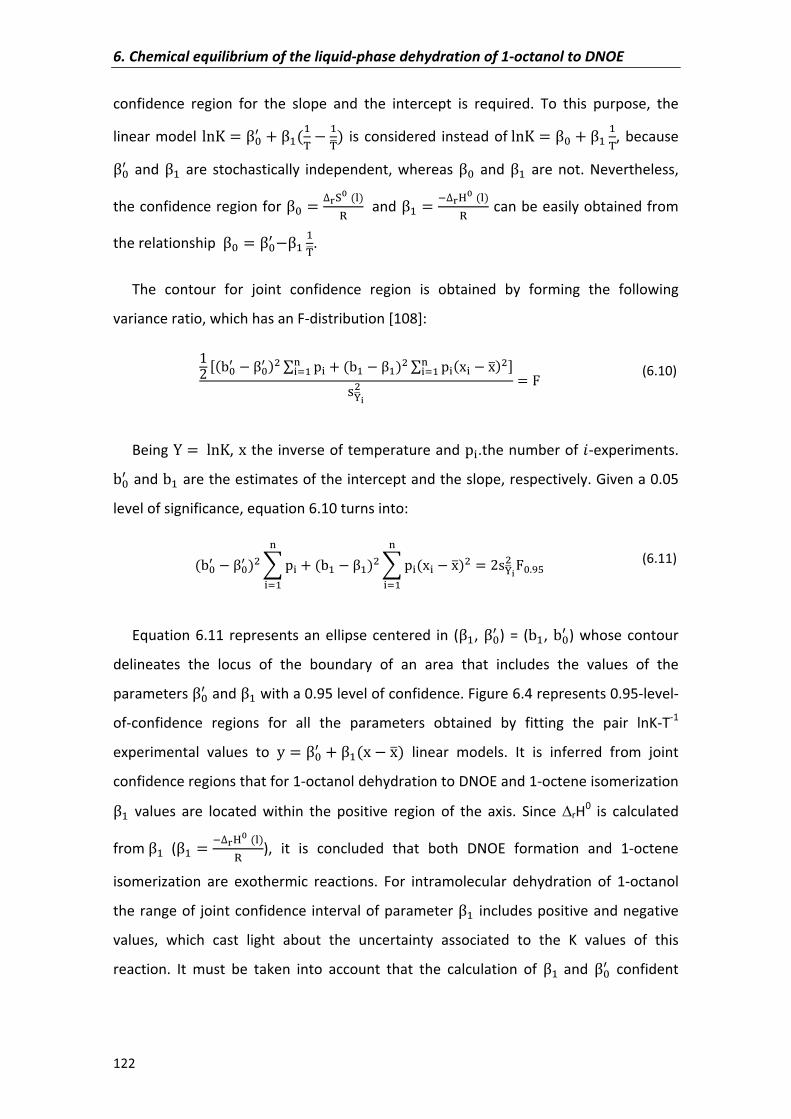
6.�Chemical�equilibrium�of�the�liquid�phase�dehydration�of�1�octanol�to�DNOE�
122�
confidence� region� for� the� slope� and� the� intercept� is� required.� To� this� purpose,� the�
linear�model� T\³ � Æ�7 Æ���© � �©Ê�� is� considered� instead�of T\³ � Æ� Æ� �©,�because�
�7 � and� �� are� stochastically� independent,� whereas� �� and� �� are� not.� Nevertheless,�
the�confidence�region�for�Æ� � °Ç·È �£�I � �and�Æ� � �°ÇKÈ �£�I �can�be�easily�obtained�from�
the�relationship� Æ� � Æ�7 �Æ� �©Ê.�
The� contour� for� joint� confidence� region� is� obtained� by� forming� the� following�
variance�ratio,�which�has�an�F�distribution�[108]:�
�� ��ª�7 � Æ�7 �" Ë ����f� �ª� � Æ��" Ë ����� � �Ì�"��f� �ÉÍÊÎ" � j�(6.10)�
�
Being�P � T\³,���the�inverse�of�temperature�and���.the�number�of�8�experiments.�ª�7 �and�ª��are�the�estimates�of�the�intercept�and�the�slope,�respectively.�Given�a�0.05�
level�of�significance,�equation�6.10�turns�into:�
�ª�7 � Æ�7 �" � ���
�f� �ª� � Æ��" � ����� � �Ì�"��f� � �ÉÍÊÎ" j��!�� (6.11)�
�
Equation� 6.11� represents� an� ellipse� centered� in� (Æ�,� Æ�7 )� =� (ª�,� ª�7 )� whose� contour�
delineates� the� locus� of� the� boundary� of� an� area� that� includes� the� values� of� the�
parameters��7 �and���with�a�0.95�level�of�confidence.�Figure�6.4�represents�0.95�level�
of�confidence� regions� for� all� the� parameters� obtained� by� fitting� the� pair� lnK�T�1�
experimental� values� to� ] � �7 ��� � ��� linear� models.� It� is� inferred� from� joint�
confidence�regions�that�for�1�octanol�dehydration�to�DNOE�and�1�octene�isomerization�
�� values� are� located� within� the� positive� region� of� the� axis.� Since��rH0� is� calculated�
from Æ�� (Æ� � �°ÇKÈ �£�I ),� it� is� concluded� that� both� DNOE� formation� and� 1�octene�
isomerization� are� exothermic� reactions.� For� intramolecular� dehydration� of� 1�octanol�
the�range�of� joint�confidence� interval�of�parameter��� includes�positive�and�negative�
values,� which� cast� light� about� the� uncertainty� associated� to� the� K� values� of� this�
reaction.� It� must� be� taken� into� account� that� the� calculation� of� �� and� �7 � confident�
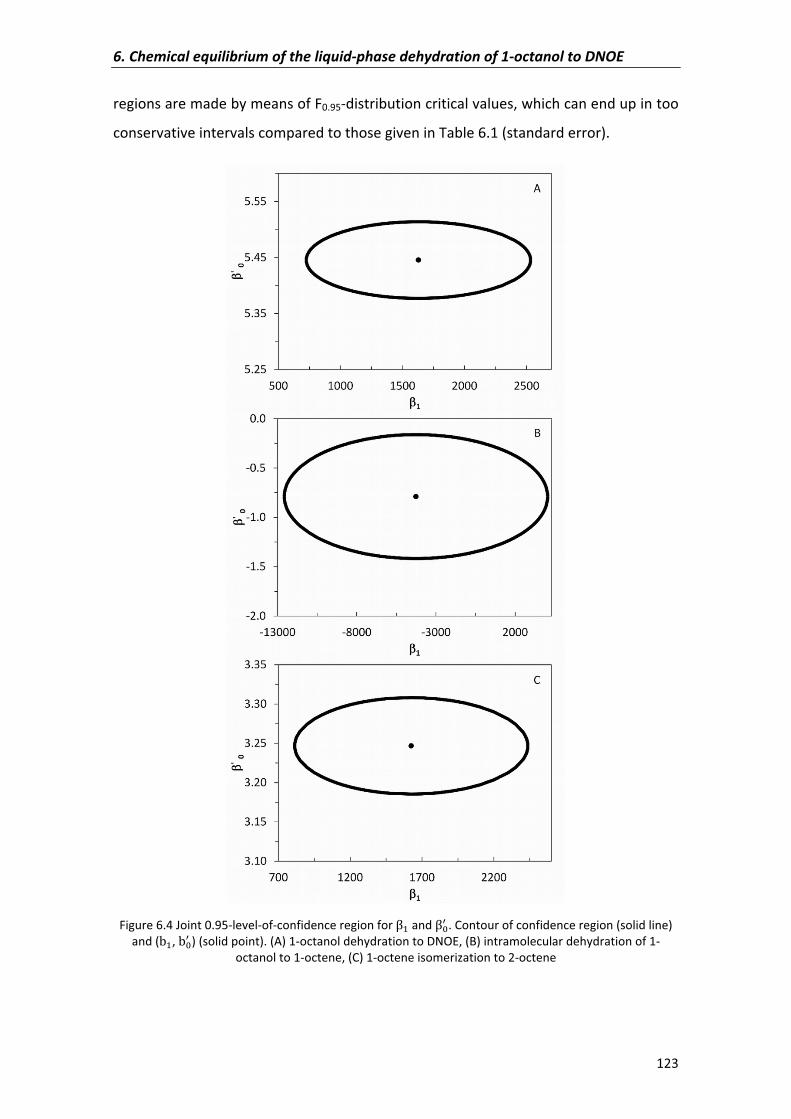
6.�Chemical�equilibrium�of�the�liquid�phase�dehydration�of�1�octanol�to�DNOE�
123�
regions�are�made�by�means�of�F0.95�distribution�critical�values,�which�can�end�up�in�too�
conservative�intervals�compared�to�those�given�in�Table�6.1�(standard�error).�
�
Figure�6.4�Joint�0.95�level�of�confidence�region�for�Æ��and�Æ�7 .�Contour�of�confidence�region�(solid�line)�and�(ª�,�ª�7 )�(solid�point).�(A)�1�octanol�dehydration�to�DNOE,�(B)�intramolecular�dehydration�of�1�
octanol�to�1�octene,�(C)�1�octene�isomerization�to�2�octene�
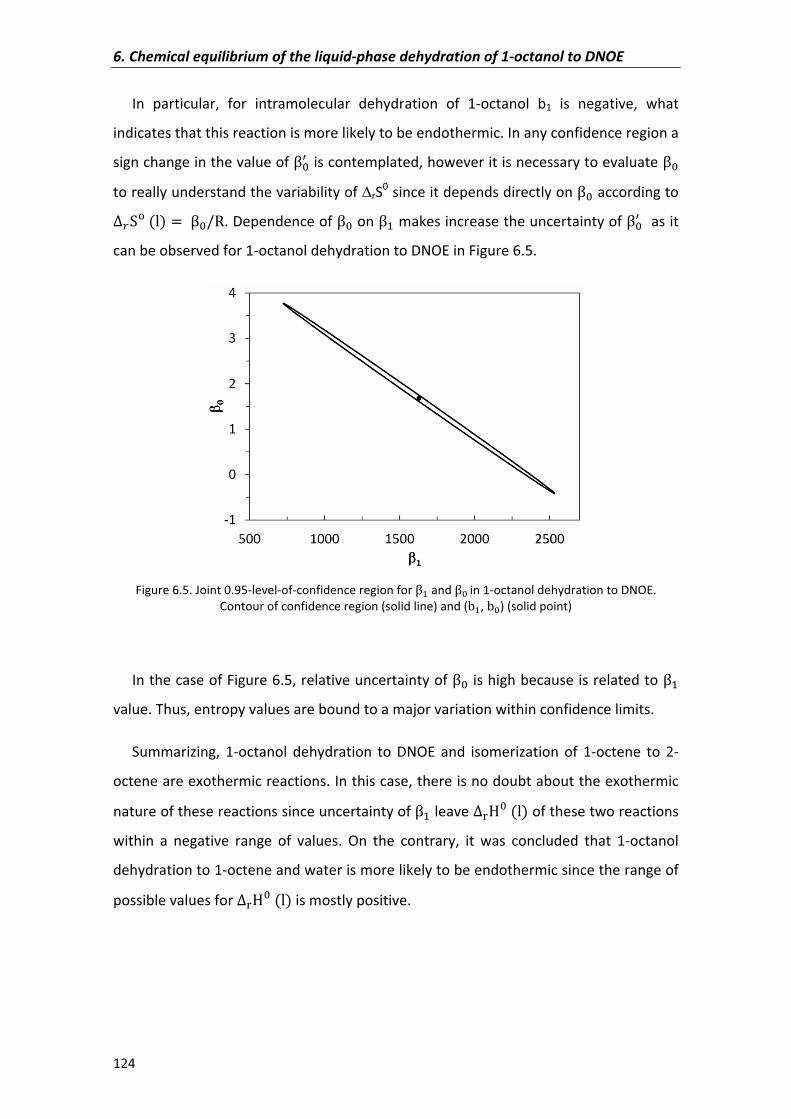
6.�Chemical�equilibrium�of�the�liquid�phase�dehydration�of�1�octanol�to�DNOE�
124�
In� particular,� for� intramolecular� dehydration� of� 1�octanol� b1� is� negative,� what�
indicates�that�this�reaction�is�more�likely�to�be�endothermic.�In�any�confidence�region�a�
sign�change�in�the�value�of��7 �is�contemplated,�however�it�is�necessary�to�evaluate���
to�really�understand�the�variability�of��rS0�since�it�depends�directly�on���according�to�
ÏÐL �T� � Æ��À.�Dependence�of�Æ��on�Æ��makes�increase�the�uncertainty�of�Æ�7 ��as�it�
can�be�observed�for�1�octanol�dehydration�to�DNOE�in�Figure�6.5.�
�
Figure�6.5.�Joint�0.95�level�of�confidence�region�for�Æ��and�Æ��in�1�octanol�dehydration�to�DNOE.�Contour�of�confidence�region�(solid�line)�and�(ª�, ª�)�(solid�point)�
�
In�the�case�of�Figure�6.5,�relative�uncertainty�of��� is�high�because�is�related�to���
value.�Thus,�entropy�values�are�bound�to�a�major�variation�within�confidence�limits.�
Summarizing,� 1�octanol� dehydration� to� DNOE� and� isomerization� of� 1�octene� to� 2�
octene�are�exothermic�reactions.�In�this�case,�there�is�no�doubt�about�the�exothermic�
nature�of�these�reactions�since�uncertainty�of�Æ��leave�°¬l� �T��of�these�two�reactions�
within� a� negative� range� of� values.� On� the� contrary,� it� was� concluded� that� 1�octanol�
dehydration�to�1�octene�and�water�is�more�likely�to�be�endothermic�since�the�range�of�
possible�values�for�°¬l� �T��is�mostly�positive.�
�
�
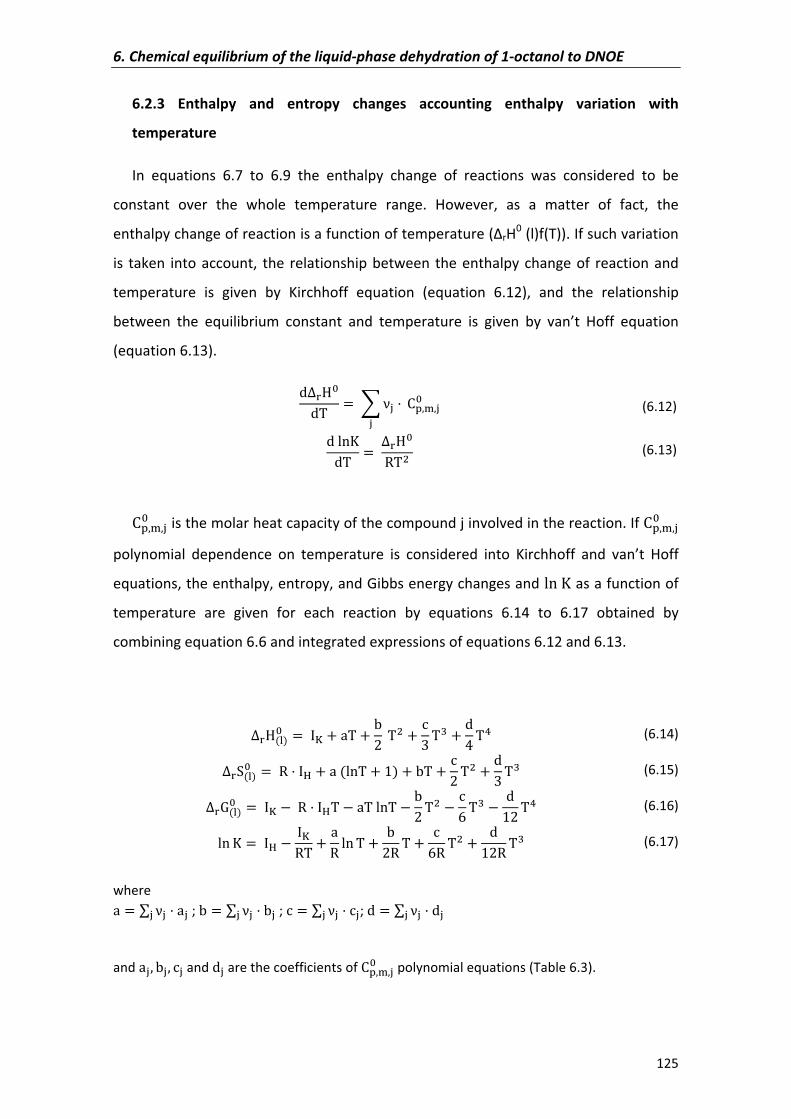
6.�Chemical�equilibrium�of�the�liquid�phase�dehydration�of�1�octanol�to�DNOE�
125�
6.2.3� Enthalpy� and� entropy� changes� accounting� enthalpy� variation� with�
temperature�
In� equations� 6.7� to� 6.9� the� enthalpy� change� of� reactions� was� considered� to� be�
constant� over� the� whole� temperature� range.� However,� as� a� matter� of� fact,� the�
enthalpy�change�of�reaction�is�a�function�of�temperature�(�rH0�(l)f(T)).�If�such�variation�
is� taken� into�account,� the� relationship�between� the�enthalpy�change�of� reaction�and�
temperature� is� given� by� Kirchhoff� equation� (equation� 6.12),� and� the� relationship�
between� the� equilibrium� constant� and� temperature� is� given� by� van’t� Hoff� equation�
(equation�6.13).�
Z°¬l�Z� � � Á� � �¥)«)�� � (6.12)�
Z T\³Z� � °¬l�À�" � (6.13)�
�
�¥)«)�� �is�the�molar�heat�capacity�of�the�compound�j�involved�in�the�reaction.�If��¥)«)�� �
polynomial� dependence� on� temperature� is� considered� into� Kirchhoff� and� van’t� Hoff�
equations,�the�enthalpy,�entropy,�and�Gibbs�energy�changes�and�T\ ³�as�a�function�of�
temperature� are� given� for� each� reaction� by� equations� 6.14� to� 6.17� obtained� by�
combining�equation�6.6�and�integrated�expressions�of�equations�6.12�and�6.13.�
�
°¬l�£�� � �Ñ V� ª� �" W� �� Z� �Ò� (6.14)
°¬L�£�� � À �K V �T\� �� ª� W� �" Z� ��� (6.15)
°¬Ã�£�� � �Ñ � À �K� � V� T\� � ª� �" � W� �� � Z�� �Ò� (6.16)
T\ ³ � �K � �ÑÀ� VÀ T\ � ª�À � W�À �" Z��À ��� (6.17)
�where�V � Ë Á� V�� �;�ª � Ë Á� ª�� �;�W � Ë Á� W�� ;�Z � Ë Á� Z�� �
�and�V�) ª�) W��and�Z��are�the�coefficients�of��¥)«)�� �polynomial�equations�(Table�6.3).�
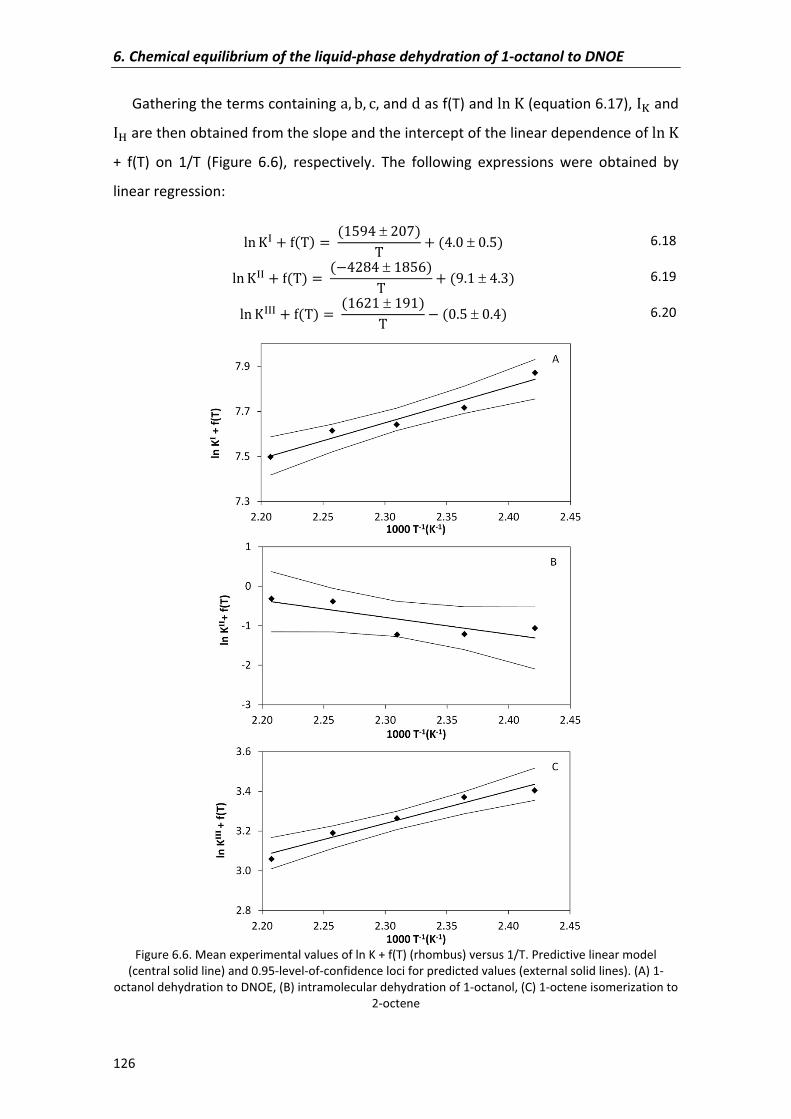
6.�Chemical�equilibrium�of�the�liquid�phase�dehydration�of�1�octanol�to�DNOE�
126�
Gathering�the�terms�containing�V) ª) W)�and�Z�as�f(T)�and�T\ ³�(equation�6.17),��Ñ�and��K�are�then�obtained�from�the�slope�and�the�intercept�of�the�linear�dependence�of�T\ ³�
+� f(T)� on� 1/T� (Figure� 6.6),� respectively.� The� following� expressions� were� obtained� by�
linear�regression:�
T\ ³¹ U��� � ����� � �#�� ��� � ���� 6.18�
T\ ³¹¹ U��� � ������ � ������ ���� � ����� 6.19�
T\ ³¹¹¹ U��� � ����� � ����� � ��� � ���� 6.20�
�Figure�6.6.�Mean�experimental�values�of�ln�K�+�f(T)�(rhombus)�versus�1/T.�Predictive�linear�model�
(central�solid�line)�and�0.95�level�of�confidence�loci�for�predicted�values�(external�solid�lines).�(A)�1�octanol�dehydration�to�DNOE,�(B)�intramolecular�dehydration�of�1�octanol,�(C)�1�octene�isomerization�to�
2�octene�
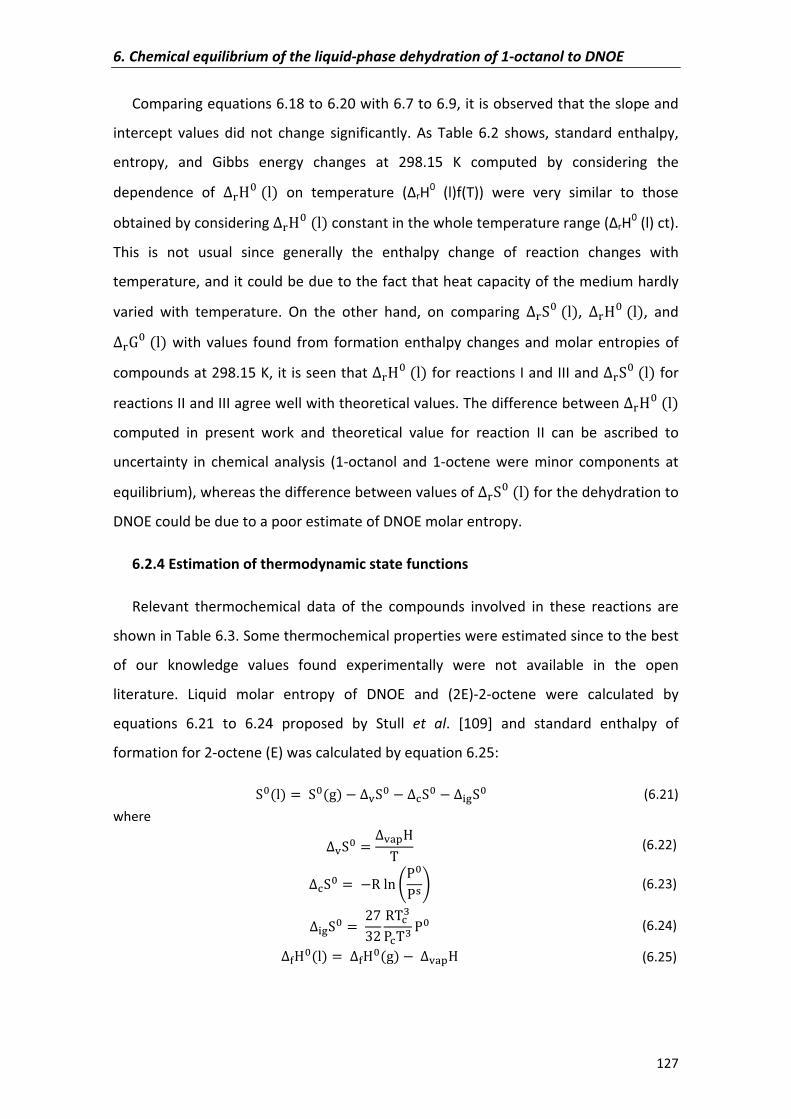
6.�Chemical�equilibrium�of�the�liquid�phase�dehydration�of�1�octanol�to�DNOE�
127�
Comparing�equations�6.18�to�6.20�with�6.7�to�6.9,�it�is�observed�that�the�slope�and�
intercept� values� did� not� change� significantly.� As� Table� 6.2� shows,� standard� enthalpy,�
entropy,� and� Gibbs� energy� changes� at� 298.15� K� computed� by� considering� the�
dependence� of� °¬l� �T�� on� temperature� (�rH0� (l)f(T))� were� very� similar� to� those�
obtained�by�considering�°¬l� �T��constant�in�the�whole�temperature�range�(�rH0�(l)�ct).�
This� is� not� usual� since� generally� the� enthalpy� change� of� reaction� changes� with�
temperature,�and�it�could�be�due�to�the�fact�that�heat�capacity�of�the�medium�hardly�
varied� with� temperature.� On� the� other� hand,� on� comparing� °¬L� �T�,� °¬l� �T�,� and�
°¬Ã� �T��with�values� found� from� formation� enthalpy�changes�and� molar�entropies�of�
compounds�at�298.15�K,�it�is�seen�that�°¬l� �T��for�reactions�I�and�III�and�°¬L� �T��for�
reactions�II�and�III�agree�well�with�theoretical�values.�The�difference�between�°¬l� �T��
computed� in� present� work� and� theoretical� value� for� reaction� II� can� be� ascribed� to�
uncertainty� in� chemical� analysis� (1�octanol� and� 1�octene� were� minor� components� at�
equilibrium),�whereas�the�difference�between�values�of�°¬L� �T��for�the�dehydration�to�
DNOE�could�be�due�to�a�poor�estimate�of�DNOE�molar�entropy.�
6.2.4�Estimation�of�thermodynamic�state�functions�
Relevant� thermochemical� data� of� the� compounds� involved� in� these� reactions� are�
shown�in�Table�6.3.�Some�thermochemical�properties�were�estimated�since�to�the�best�
of� our� knowledge� values� found� experimentally� were� not� available� in� the� open�
literature.� Liquid� molar� entropy� of� DNOE� and� (2E)�2�octene� were� calculated� by�
equations� 6.21� to� 6.24� proposed� by� Stull� et� al.� [109]� and� standard� enthalpy� of�
formation�for�2�octene�(E)�was�calculated�by�equation�6.25:�
L��T� � L��h� � °ÓL� � °_L� � °�ÔL�� (6.21)where�
°ÓL� � °Ó¢¥l� � (6.22)�
°_L� � �À T\ ®¿�¿±¯� (6.23)�
°�ÔL� � �#�� À�_�¿_�� ¿�� (6.24)�
°Õl��T� � °Õl��h� � °Ó¢¥l� (6.25)�
6.�Chemical�equilibrium�of�the�liquid�phase�dehydration�of�1�octanol�to�DNOE�
128�
Equation� 6.21� takes� into� account� the� entropy� variations� due� to� phase� change� at�
298.15�K�(°ÓL�),�vapor�compression�from�saturation�pressure�at�298.15�K�to�101.325�
kPa� (°_L�),� and� the� deviation� of� ideality� of� the� vapor� at� 298.15� K� and� 101.325� kPa�
(°�ÔL�).�Saturation�pressures�(¿±)�of�DNOE�and�2�octene�at�298.15�K�were�estimated�by�
the� Gomez�Thodos� vapor� pressure� equation� [107].The� critical� temperature� and�
pressure� of� DNOE� were� estimated� by� the� Jobak� method� [107]� while� 2�octene� values�
were� obtained� experimentally� and� found� in� the� open� literature� [107].The� entropy�
increment� due� to� effect� of� pressure� depends� on� the� saturation� pressure� of� the�
substance,� and� for� substances� with� low� saturation� pressure� this� increment� became�
very�significant�in�the�calculation�of�L��T�.�The�need�for�the�correction�due�to�the�effect�
of� pressure� was� already� showed� in� previous� works� [101].� For� example,� in� the�
calculation� of� L�(DNOE,� l,� 298.15)� the� vapor� compression� increment� (°_L�)�
represented� 18� %� of� the� L��h� � °ÓL�� value.� In� the� case� of� 2�octene,� with� a� higher�
saturation�pressure,�this�value�dropped�to�10�%.��
6.2.5�Comparison�of�DNOE,�DNHE�and�DNPE�thermochemical�data�
By�comparing�the�values�obtained�for�DNOE�synthesis�in�this�work�with�other�n�alkyl�
ether� synthesis� such� as� those� of� DNPE� [45]� and� DNHE� [101],� it� is� observed� that� the�
standard�enthalpy�and�Gibbs�energy�changes�of�reaction�become�more�negative�as�the�
length�of�the�ether�increases�(Table�6.4).��
It� is� also� seen� that� the� assumption� of� °¬l� �T�� to� be� constant� over� the� whole�
temperature� range� is� not� fulfilled� in� the� DNPE� synthesis,� but� °¬l� �T�� is� almost�
independent�of�temperature�for�DNHE�and�DNOE�formation.��
On�the�other�hand,�the�standard�entropy�change�of�reaction�does�not�have�a�clear�
trend.�Nevertheless,�values�of� standard�entropy�change� found� from�equilibrium�data�
are� positive� and� have� the� same� magnitude� order.� As� can� be� seen� in� Table� 6.4,� the�
standard� entropy� change� found� from� equilibrium� data� did� not� match� the� estimated�
one�from�standard�molar�entropies� in�liquid�phase�(Theoretical�values�in�Table�6.4)�in�
the�case�of�DNPE�and�DNOE�systems.�For�DNPE,�the�standard�molar�entropy�was�not�
calculated�taking� into�account�the�contributions�of�equations�6.23�and�6.24.�This�fact�
could� have� been� the� cause� of� the� discrepancy� between� experimental� and� estimated�
6.�Chemical�equilibrium�of�the�liquid�phase�dehydration�of�1�octanol�to�DNOE�
129�
from� molar� entropy� values� shown� in� the� work� of� Bringué� et� al.[45].� In� the� present�
work,�L�(DNOE,�l,�298.15)�was�calculated�from�the�standard�molar�entropies�of�water�
and�1�octanol�(Table�6.3)�and�the�standard�entropy�of�reaction,�°¬L� (l,�298.15).�From�
°¬L� (l,�298.15)�values�found�by�considering�first�°¬l� �T��constant,�and�after�°¬l� �T���
=�f(T),�L�(DNOE,�l,�298.15)�was�computed�to�be�(658�±�4)�J�mol�1�K�1.�
�
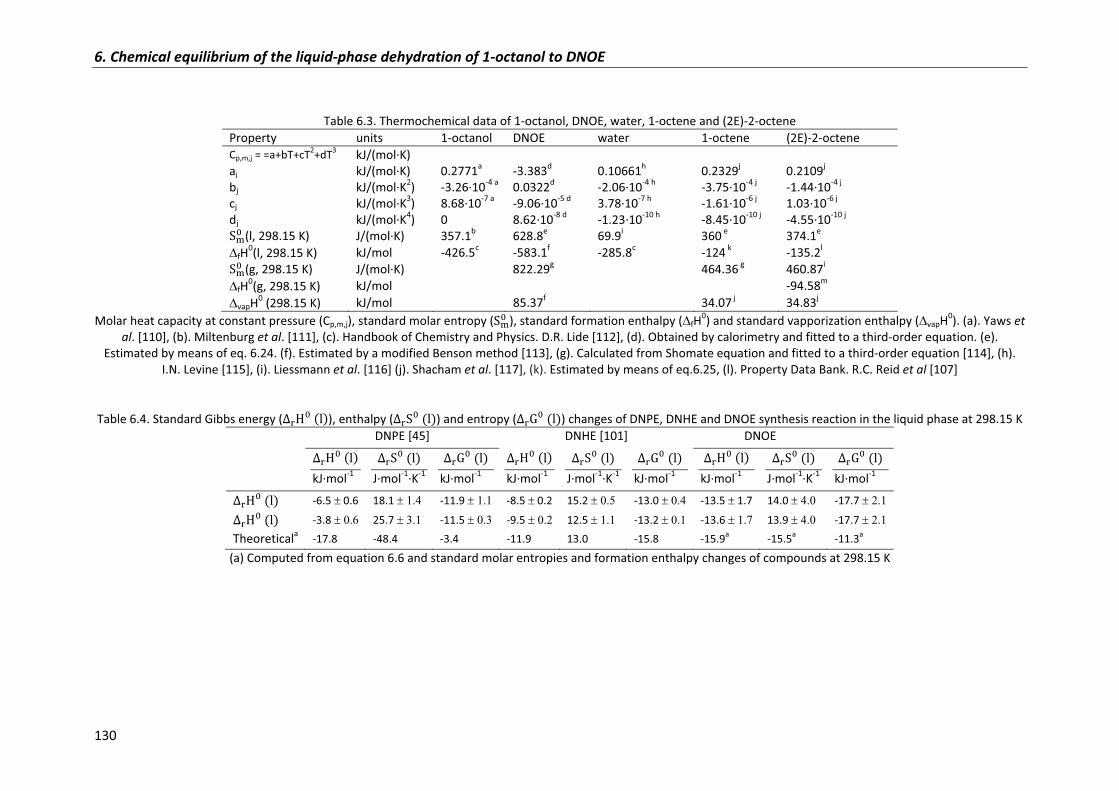
6.�Chemical�equilibrium�of�the�liquid�phase�dehydration�of�1�octanol�to�DNOE�
130�
Table�6.3.�Thermochemical�data�of�1�octanol,�DNOE,�water,�1�octene�and�(2E)�2�octene�Property� units 1�octanol DNOE water� 1�octene (2E)�2�octeneCp,m,j�=�=a+bT+cT2+dT3 kJ/(mol�K)aj� kJ/(mol�K) 0.2771a �3.383d 0.10661h� 0.2329j 0.2109j
bj� kJ/(mol�K2) �3.26�10�4�a 0.0322d �2.06�10�4�h �3.75�10�4�j �1.44�10�4�j
cj� kJ/(mol�K3) 8.68�10�7�a �9.06�10�5�d 3.78�10�7�h� �1.61�10�6�j 1.03�10�6�j
dj� kJ/(mol�K4) 0 8.62�10�8�d �1.23�10�10�h �8.45�10�10�j �4.55�10�10�jL«� (l,�298.15�K)� J/(mol�K)� 357.1b 628.8e 69.9i� 360 e 374.1e
�fH0(l,�298.15�K)� kJ/mol� �426.5c �583.1f �285.8c� �124 k �135.2lL«� (g,�298.15�K)� J/(mol�K) 822.29g 464.36 g 460.87i
�fH0(g,�298.15�K)� kJ/mol� � � � � �94.58m
�vapH0�(298.15�K)� kJ/mol� � 85.37f � 34.07 j 34.83j
Molar�heat�capacity�at�constant�pressure�(Cp,m,j),�standard�molar�entropy�(L«� ),�standard�formation�enthalpy�(�fH0)�and�standard�vapporization�enthalpy�(�vapH0).�(a).�Yaws�et�
al.�[110],�(b).�Miltenburg�et�al.�[111],�(c).�Handbook�of�Chemistry�and�Physics.�D.R.�Lide�[112],�(d).�Obtained�by�calorimetry�and�fitted�to�a�third�order�equation.�(e).�Estimated�by�means�of�eq.�6.24.�(f).�Estimated�by�a�modified�Benson�method�[113],�(g).�Calculated�from�Shomate�equation�and�fitted�to�a�third�order�equation�[114],�(h).�
I.N.�Levine�[115],�(i).�Liessmann�et�al.�[116]�(j).�Shacham�et�al.�[117],�(k).�Estimated�by�means�of�eq.6.25,�(l).�Property�Data�Bank.�R.C.�Reid�et�al�[107]���
Table�6.4.�Standard�Gibbs�energy�(°¬l� �T�),�enthalpy�(°¬L� �T�)�and�entropy�(°¬Ã� �T�)�changes�of�DNPE,�DNHE�and�DNOE�synthesis�reaction�in�the�liquid�phase�at�298.15�K��� DNPE [45] DNHE [101]� DNOE �� °¬l� �T� °¬L� �T� °¬Ã� �T� °¬l� �T� °¬L� �T�� °¬Ã� �T� °¬l� �T� °¬L� �T� °¬Ã� �T�� kJ�mol�1 J�mol�1�K�1 kJ�mol�1 kJ�mol�1 J�mol�1�K�1� kJ�mol�1 kJ�mol�1 J�mol�1�K�1 kJ�mol�1°¬l� �T�� �6.5���0.6� 18.1������� �11.9������� �8.5���0.2� 15.2������� �13.0������� �13.5���1.7� 14.0������� �17.7�������°¬l� �T�� �3.8������� 25.7������� �11.5������� �9.5������� 12.5������� �13.2������� �13.6������� 13.9������� �17.7�������
Theoreticala� �17.8 �48.4 �3.4 �11.9 13.0 �15.8 �15.9a �15.5a �11.3a
(a)�Computed�from�equation�6.6�and�standard�molar�entropies�and�formation�enthalpy�changes�of�compounds�at�298.15�K����
6.�Chemical�equilibrium�of�the�liquid�phase�dehydration�of�1�octanol�to�DNOE�
131�
On�the�other�hand,�from�equations�6.21�to�6.24,�L�(DNOE,�l,�298.15)�was�estimated�
to�be�628.8�J�mol�1�K�1.�As�seen,�the�last�value�is�lower�by�5�%�than�the�one�obtained�
from� equilibrium� data.� Consequently,� the� value� L�(DNOE,� l,� 298.15)� =� (658� ±� 4)�
J�mol�1�K�1�has�been�proposed�since�it�explains�satisfactorily�equilibrium�reaction�data.��
As�for�the�standard�formation�enthalpy�change�of�DNOE,��fH0�(DNOE,�l,�298.15)�was�
computed� from� standard� enthalpy� change� of� reaction� and� standard� formation�
enthalpy�of�water�and�1�octanol.��fH0(DNOE,�l,�298.15)�was�computed�to�be�(�581�±�2)�
kJ�mol�1,� which� greatly� coincides� with� the� one� estimated� from� a� Benson� modified�
method�by�Verevkin�[113]�(�583.1�kJ�mol�1)�shown�in�Table�6.3.�Both�values�differ�by�
0.4� %.� Thus,� it� can� be� concluded� that� values� of� contributing� groups� proposed� in�
Verevkin�work�[113]�resulted�in�a�proper�estimation�of��fH0(DNOE,�l,�298.15).�
�
6.3�Conclusions�
1�octanol� dehydration� to� DNOE� and� water� proved� to� be� exothermic,� with� an�
enthalpy� change� of� reaction� of� (�13.6� ±� 1.7)� kJ�mol�1� at� 298.15� K.� The� standard�
formation�enthalpy�of�DNOE�computed�from�the�standard�enthalpy�change�of�reaction�
was� found� to� be� (�581� ±� 2)� kJ�mol�1� which� was� in� good� agreement� with� the� one�
estimate�by�a�modified�Benson�method.�Although�the�correction�factor�concerning�the�
pressure� change� improved� the� estimation� of� L�(DNOE,� l,� 298.15),� some� differences�
between�the�values�of�°¬L� (l,�298.15)�estimated�from�standard�molar�entropies�and�
computed� from� equilibrium� data� were� observed.� Based� on� this� fact,� the� value�
|Ö(DNOE,�l,�298.15)�=�(658�±�4)�J�mol�1�K�1�was�proposed.�As�for�secondary�reactions,�
1�octene� isomerization� to� 2�octene� was� proved� to� be� exothermic,� whereas�
intramolecular�dehydration�of�1�octanol�to�1�octene�and�water�was�endothermic.�
The� comparison� of� the� experimental� values� for� dehydrations� to� DNPE,� DNHE,� and�
DNOE� indicates� that,� as� the� ether� chain� gets� longer,� the� reaction� enthalpy� change�
tends�to�be� lower�(more�exothermic).�However,� the�reaction�entropy�change�did�not�
show�a�clear�trend�since�its�determination�was�associated�to�a�higher�uncertainty.�
�

�
�
�
�
�
�
�
�
�
�
�
�
�
�
�
�
�
�
�
�
�
�
�

�
�
CHAPTER�7�
KINETIC�STUDY��
�
�
�
�
�
�
�
�
�
�
�
�
�
�
�
�

�
�
�
�
�
�
�
�
�
�
�
�
�
�
�
�
�
�
�
�
�
�
�
�
7.�Kinetic�study�
135�
7.1�Abstract�
The�kinetics�of�alcohol�dehydration�to�linear�ether�was�investigated�on�zeolites�and�
the�PS�DVB�resin�Amberlyst�70.��
Over� Amberlyst� 70,� the�kinetics� of� the� dehydration� of� 1�octanol� to� DNOE� and� the�
influence�of�products�and�solvent�(1,4�dioxane)�on�the�reaction�rate�was�investigated.�
The�kinetic�analysis�was�performed�by�fitting�reaction�rate�models�based�on�Langmuir�
Hinshelwood�Hougen�Watson� and� Eley�Rideal� mechanisms� to� rate� data.� From� 1�
octanol�experiments,�kinetic�models�where�all�active�sites�are�occupied�and�water�and�
1�octanol� are� the� compounds� preferentially� adsorbed� on� the� catalyst� were� selected.�
Influence�of�DNOE,�water�and�solvent�(1,4�dioxane)�on�the�reaction�rate�was�evaluated�
too.�Water�effect�on�reaction�rate�was�quantified�by�correction� factors�based�on� the�
estimation�of�the�fraction�of�active�sites�not�blocked�by�water.�
On�zeolites,�the�kinetics�of�1�octanol�and�1�hexanol�dehydration�to�DNOE�and�DNHE�
respectively� were� evaluated.� Moreover,� kinetic� models� found� in� this� work� for� DNOE�
and�DNHE�synthesis�were�compared�to�those�of�DNPE�synthesis�over�H�BEA�25�in�the�
literature.�Rate�models�that�better�represent�rate�data�on�zeolites�assume�that�surface�
reaction�is�the�rate�limiting�step�and�the�fraction�of�free�active�sites�is�negligible.��
�
7.2�Results�and�discussion�
Kinetic�analysis�
Because� it�deals�with�non�ideal�mixtures,� the�rate�equations�are�given� in� terms�of�
alcohol� (ROH)� linear� ether� (ROR)� and� water� activities.� Activities� were� calculated� by�
means� of� UNIFAC�DORTMUND� predictive� method� [103].� Kinetic� models� proposed� in�
this�work�are�based�on�the�well�known�Langmuir�Hinselwood�Hougen�Watson�(LHHW)�
mechanism�and�its�derived�form,�Eley�Rideal�(ER).�Considering�the�chemical�reaction�as�
the�rate�limiting�step,�the�following�mechanisms�were�considered:�
�
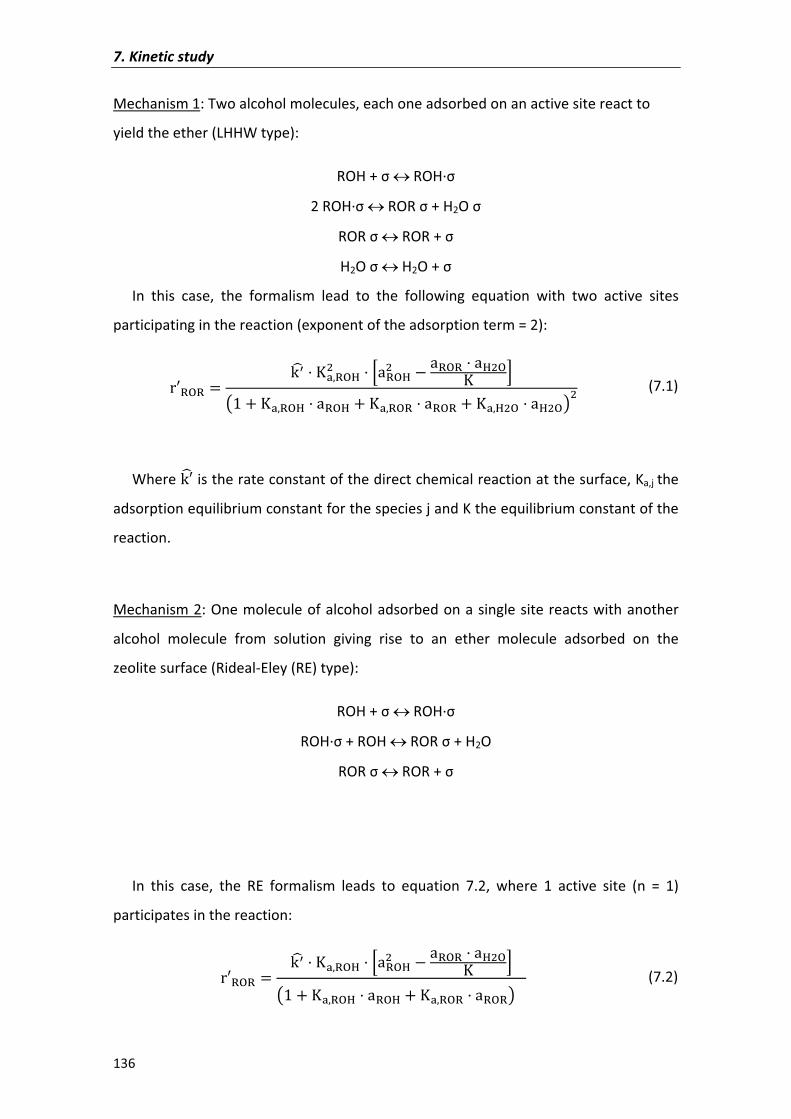
7.�Kinetic�study�
136�
Mechanism�1:�Two�alcohol�molecules,�each�one�adsorbed�on�an�active�site�react�to�
yield�the�ether�(LHHW�type):�
ROH�+� ���ROH� �
2�ROH� ���ROR� �+�H2O� �
ROR� ���ROR�+� �
H2O� ���H2O�+� �
In� this� case,� the� formalism� lead� to� the� following� equation� with� two� active� sites�
participating�in�the�reaction�(exponent�of�the�adsorption�term�=�2):�
Y%IJI � g76 ³¢)IJK" ×VIJK" � VIJI VK"J³ Ø¡� ³¢)IJK VIJK ³¢)IJI VIJI ³¢)K"J VK"J¦"� (7.1)
Where�g%6 �is�the�rate�constant�of�the�direct�chemical�reaction�at�the�surface,�Ka,j�the�
adsorption�equilibrium�constant�for�the�species�j�and�K�the�equilibrium�constant�of�the�
reaction.�
�
Mechanism�2:�One�molecule�of�alcohol�adsorbed�on�a�single�site�reacts�with�another�
alcohol� molecule� from� solution� giving� rise� to� an� ether� molecule� adsorbed� on� the�
zeolite�surface�(Rideal�Eley�(RE)�type):�
ROH�+� ���ROH� �
ROH� �+�ROH���ROR� �+�H2O�
ROR� ���ROR�+� �
�
�
In� this� case,� the� RE� formalism� leads� to� equation� 7.2,� where� 1� active� site� (n� =� 1)�
participates�in�the�reaction:�
Y%IJI � g76 ³¢)IJK ×VIJK" � VIJI VK"J³ Ø¡� ³¢)IJK VIJK ³¢)IJI VIJI¦ � (7.2)
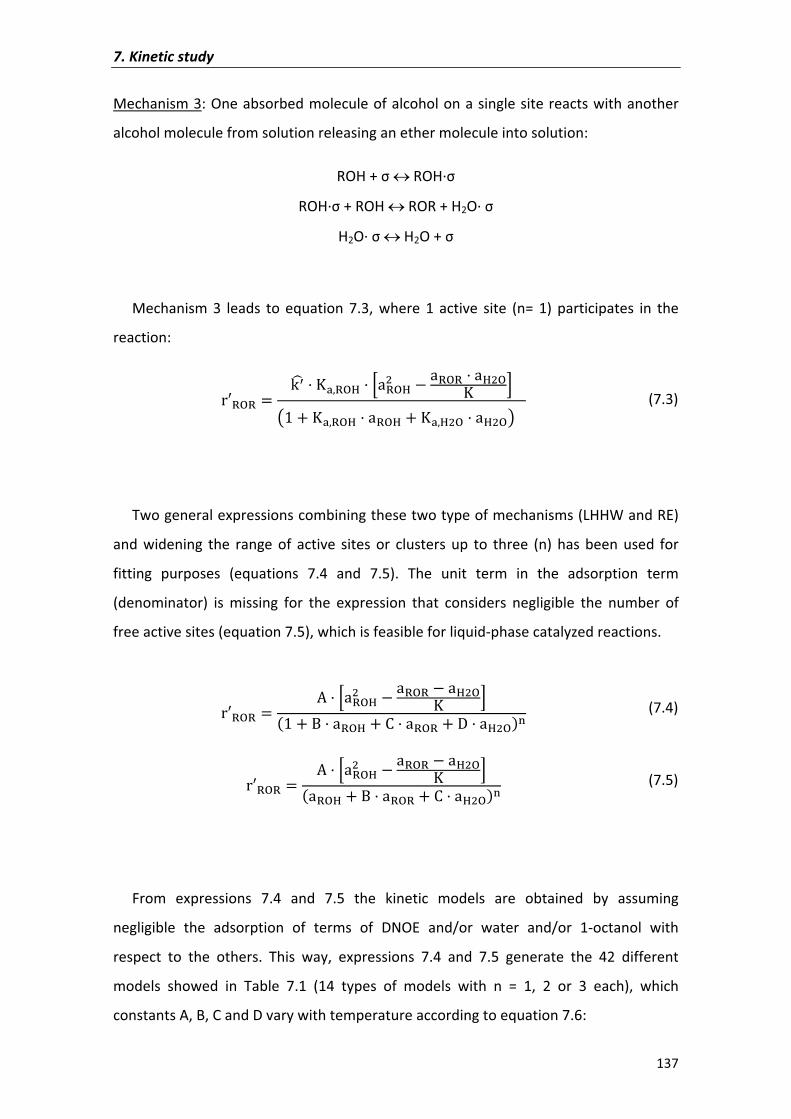
7.�Kinetic�study�
137�
Mechanism�3:�One�absorbed�molecule�of�alcohol�on�a�single�site�reacts�with�another�
alcohol�molecule�from�solution�releasing�an�ether�molecule�into�solution:�
ROH�+� ���ROH� �
ROH� �+�ROH���ROR�+�H2O�� �
H2O�� ���H2O�+� �
�
Mechanism� 3� leads� to� equation� 7.3,� where� 1� active� site� (n=� 1)� participates� in� the�
reaction:�
Y%IJI � g76 ³¢)IJK ×VIJK" � VIJI VK"J³ Ø¡� ³¢)IJK VIJK ³¢)K"J VK"J¦ � (7.3)
�
Two�general�expressions�combining�these�two�type�of�mechanisms�(LHHW�and�RE)�
and� widening� the� range� of� active� sites� or� clusters� up� to� three� (n)� has� been� used� for�
fitting� purposes� (equations� 7.4� and� 7.5).� The� unit� term� in� the� adsorption� term�
(denominator)� is� missing� for� the� expression� that� considers� negligible� the� number� of�
free�active�sites�(equation�7.5),�which�is�feasible�for�liquid�phase�catalyzed�reactions.��
Y%IJI � � ×VIJK" � VIJI � VK"J³ Ø�� Ù VIJK � VIJI � VK"J��� (7.4)
Y%IJI � � ×VIJK" � VIJI � VK"J³ Ø�VIJK Ù VIJI � VK"J��� (7.5)
�
From� expressions� 7.4� and� 7.5� the� kinetic� models� are� obtained� by� assuming�
negligible� the� adsorption� of� terms� of� DNOE� and/or� water� and/or� 1�octanol� with�
respect� to� the� others.� This� way,� expressions� 7.4� and� 7.5� generate� the� 42� different�
models� showed� in� Table� 7.1� (14� types� of� models� with� n� =� 1,� 2� or� 3� each),� which�
constants�A,�B,�C�and�D�vary�with�temperature�according�to�equation�7.6:�
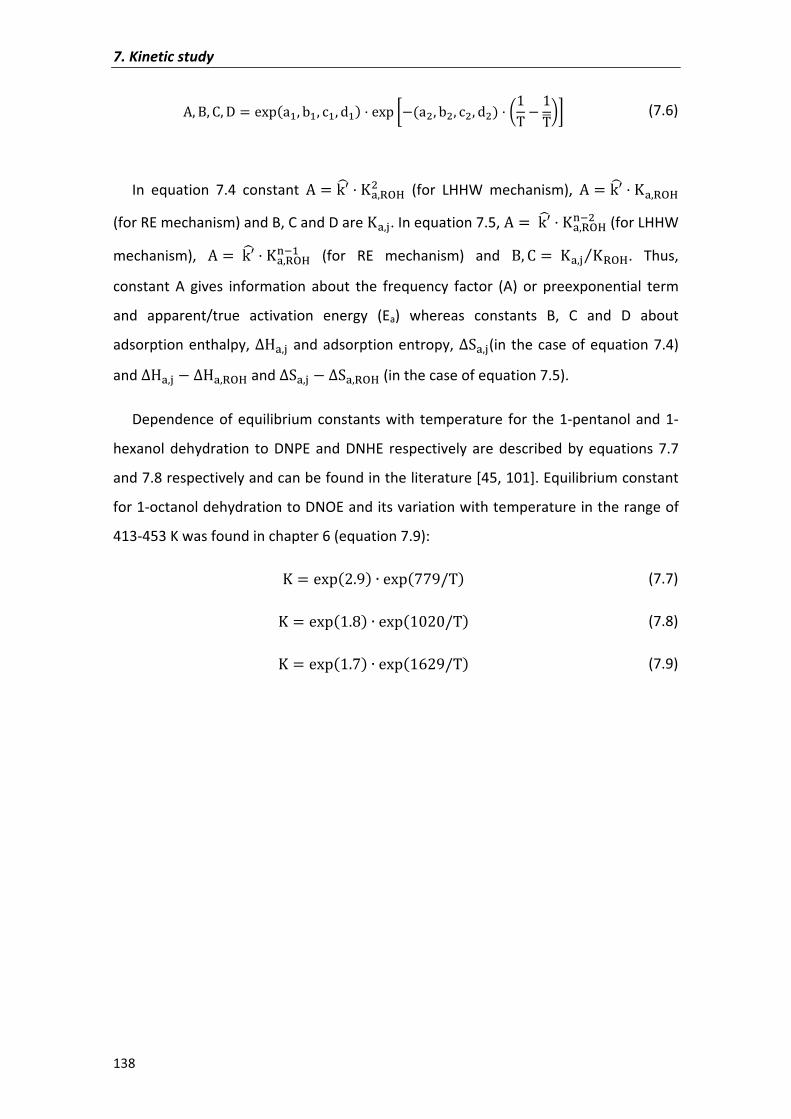
7.�Kinetic�study�
138�
�) Ù) �) � � ����V�) ª�) W�) Z�� ��� `��V") ª") W") Z"� 0�� � ��Ê3b� (7.6)
In� equation� 7.4� constant� � � g%6 ³¢)IJK" � (for� LHHW� mechanism),� � � g%6 ³¢)IJK�
(for�RE�mechanism)�and�B,�C�and�D�are�³¢)�.�In�equation�7.5,�� � g%6 ³¢)IJK��" �(for�LHHW�
mechanism),� � � g%6 ³¢)IJK��� � (for� RE� mechanism)� and� Ù) � � ³¢)� ³IJKz .� Thus,�
constant� A� gives� information� about� the� frequency� factor� (A)� or� preexponential� term�
and� apparent/true� activation� energy� (Ea)� whereas� constants� B,� C� and� D� about�
adsorption�enthalpy,�°l¢)��and�adsorption�entropy,�°L¢)�(in� the�case�of�equation�7.4)�
and�°l¢)� � °l¢)IJK�and�°L¢)� � °L¢)IJK�(in�the�case�of�equation�7.5).�
Dependence�of�equilibrium�constants�with� temperature� for� the�1�pentanol�and�1�
hexanol� dehydration� to� DNPE� and� DNHE� respectively� are� described� by� equations� 7.7�
and�7.8�respectively�and�can�be�found�in�the�literature�[45,�101].�Equilibrium�constant�
for�1�octanol�dehydration�to�DNOE�and�its�variation�with�temperature�in�the�range�of�
413�453�K�was�found�in�chapter�6�(equation�7.9):�
³ � �������� Ú ����##����� (7.7)
³ � �������� Ú ���������� (7.8)
³ � ������#� Ú ������������ (7.9)
�������������������
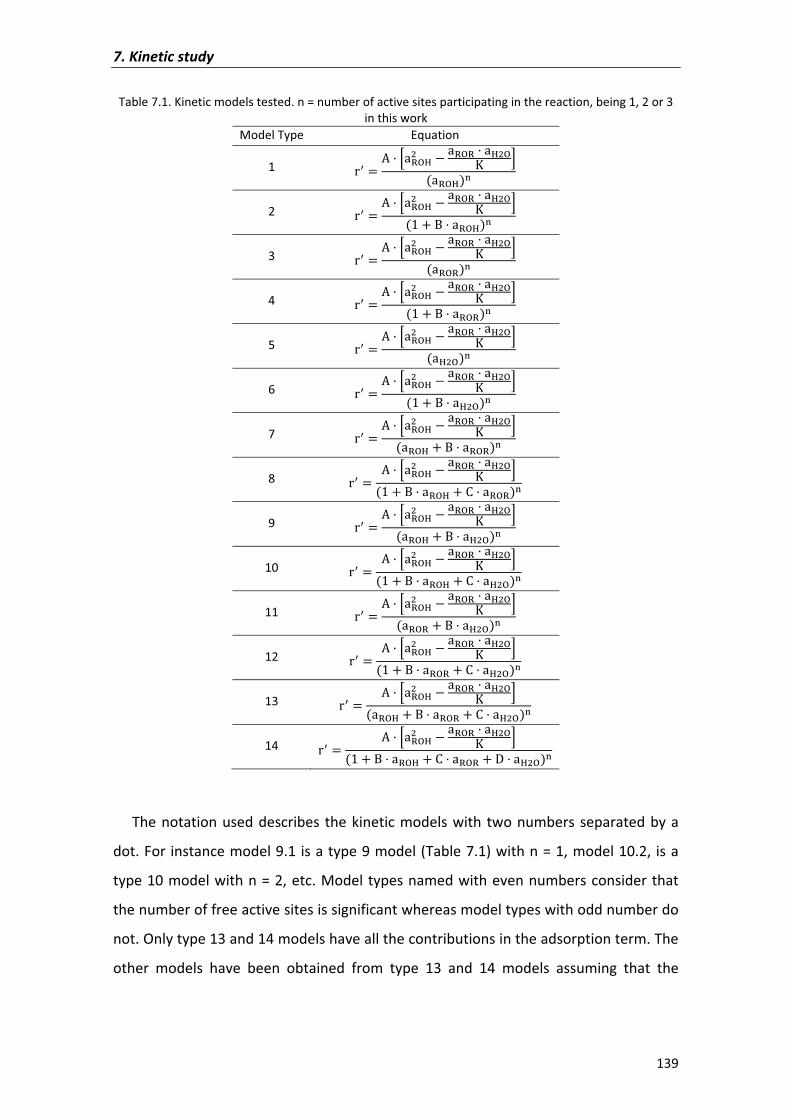
7.�Kinetic�study�
139�
Table�7.1.�Kinetic�models�tested.�n�=�number�of�active�sites�participating�in�the�reaction,�being�1,�2�or�3�in�this�work�
Model�Type� Equation
1� Y7 � � ×VIJK" � VIJI VK"J³ Ø�VIJK�� �
2� Y7 � � ×VIJK" � VIJI VK"J³ Ø�� Ù VIJK�� �
3� Y7 � � ×VIJK" � VIJI VK"J³ Ø�VIJI�� �
4� Y7 � � ×VIJK" � VIJI VK"J³ Ø�� Ù VIJI�� �
5� Y7 � � ×VIJK" � VIJI VK"J³ Ø�VK"J�� �
6� Y7 � � ×VIJK" � VIJI VK"J³ Ø�� Ù VK"J�� �
7� Y7 � � ×VIJK" � VIJI VK"J³ Ø�VIJK Ù VIJI�� �
8� Y7 � � ×VIJK" � VIJI VK"J³ Ø�� Ù VIJK � VIJI���
9� Y7 � � ×VIJK" � VIJI VK"J³ Ø�VIJK Ù VK"J�� �
10� Y7 � � ×VIJK" � VIJI VK"J³ Ø�� Ù VIJK � VK"J���
11� Y7 � � ×VIJK" � VIJI VK"J³ Ø�VIJI Ù VK"J�� �
12� Y7 � � ×VIJK" � VIJI VK"J³ Ø�� Ù VIJI � VK"J���
13� Y7 � � ×VIJK" � VIJI VK"J³ Ø�VIJK Ù VIJI � VK"J���
14� Y7 � � ×VIJK" � VIJI VK"J³ Ø�� Ù VIJK � VIJI � VK"J���
�
The�notation�used�describes� the�kinetic�models�with� two�numbers�separated�by�a�
dot.�For�instance�model�9.1�is�a�type�9�model�(Table�7.1)�with�n�=�1,�model�10.2,� is�a�
type�10�model�with�n�=�2,�etc.�Model�types�named�with�even�numbers�consider�that�
the�number�of�free�active�sites�is�significant�whereas�model�types�with�odd�number�do�
not.�Only�type�13�and�14�models�have�all�the�contributions�in�the�adsorption�term.�The�
other� models� have� been� obtained� from� type� 13� and� 14� models� assuming� that� the�
7.�Kinetic�study�
140�
adsorption� of� one� or� more� species� is� negligible� with� respect� to� that� of� the� other�
species.�
7.2.1�Kinetic�analysis�of�DNOE�rate�data�on�Amberlyst�70�
As� seen� in� chapter� 4,� gel� type� and� macroreticular� resin� with� low� DVB%� were� the�
most�selective�to�linear�symmetrical�ether.�However,�only�Amberlyst�70�and�Nafion�are�
stable�at�high�temperatures.�Amberlyst�70�is�highly�selective�to�DNOE�formation,�stable�
up�to�463�K�and�more�active�than�Nafion.�Thus,�Amberlyst�70�was�selected�to�perform�
the�kinetic�analysis.��
7.2.1.1�Preliminary�experiments�
In� order� to� figure� out� the� operation� conditions� to� avoid� mass� transfer� limitations�
when�measuring�the�reaction�rate,�a�set�of�preliminary�experiments�were�conducted.�
Influence� of� the� mass� of� catalyst� (W),� the� stirring� speed� (N)� and� the� bead� size� of�
Amberlyst�70�on�the�reaction�rate�was�evaluated.�
Influence�of�the�mass�of�catalyst�on�reaction�rate�was�conducted�starting�with�pure�
1�octanol� over� Amberlyst� 31� at� 423� K.� High� selectivity� and� activity� at� 423� K� of�
Amberlyst�31�allowed�working�with�pure�1�octanol�and�a�wide�range�of�catalyst�masses�
without� yielding� high� quantities� of� water,� avoiding� phase� splitting.� External� mass�
transfer� depends� on� the� liquid� (viscosity� and� density),� on� the� diffusivity� of� the�
reactants� and� products� in� the� mixture� and� as� well� as� on� the� particle� diameter� and�
mixing� conditions.� Thus,� maintaining� the� same� liquid� (1�octanol)� and� mixing� speed,�
type�of�catalyst�will�not�affect�when�evaluating�the�effect�of�mass�(W)�on�the�reaction�
rate�since�bead�sizes�of�tested�resins�are�similar.��
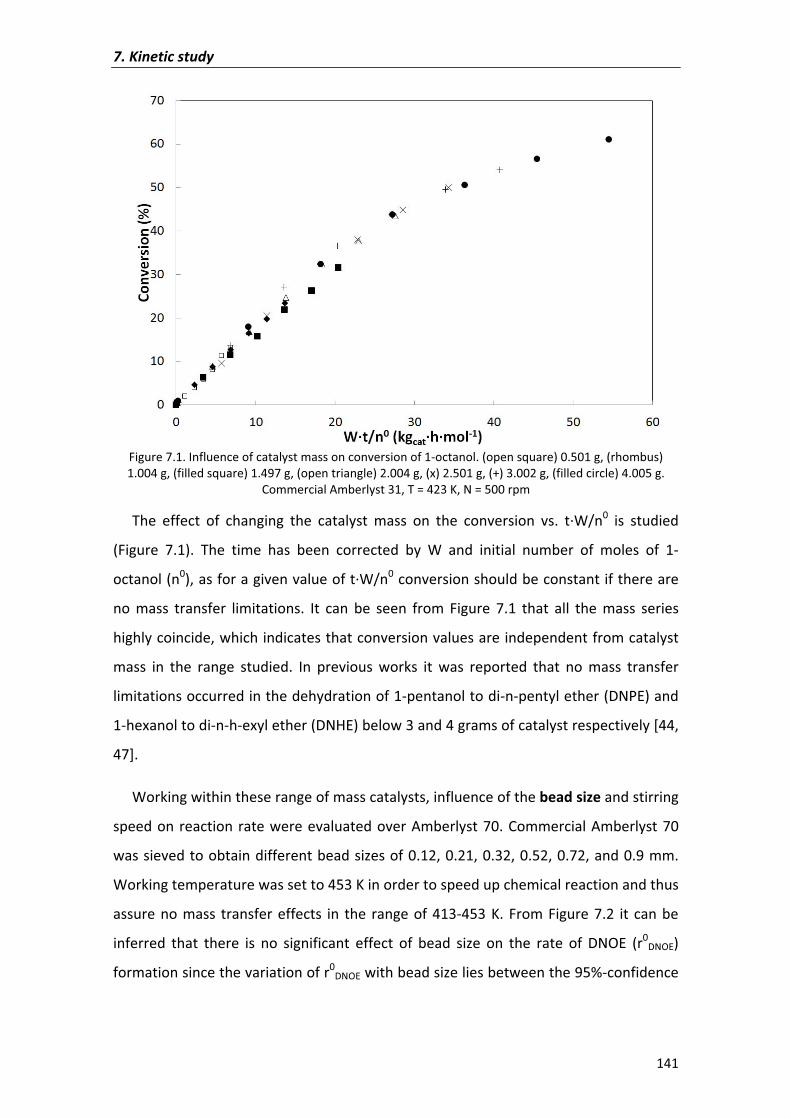
7.�Kinetic�study�
141�
�Figure�7.1.�Influence�of�catalyst�mass�on�conversion�of�1�octanol.�(open�square)�0.501�g,�(rhombus)�1.004�g,�(filled�square)�1.497�g,�(open�triangle)�2.004�g,�(x)�2.501�g,�(+)�3.002�g,�(filled�circle)�4.005�g.�
Commercial�Amberlyst�31,�T�=�423�K,�N�=�500�rpm�
The� effect� of� changing� the� catalyst� mass� on� the� conversion� vs.� t�W/n0� is� studied�
(Figure� 7.1).� The� time� has� been� corrected� by� W� and� initial� number� of� moles� of� 1�
octanol�(n0),�as�for�a�given�value�of�t�W/n0�conversion�should�be�constant�if�there�are�
no� mass� transfer� limitations.� It� can� be� seen� from� Figure� 7.1� that� all� the� mass� series�
highly�coincide,�which�indicates�that�conversion�values�are�independent�from�catalyst�
mass� in� the� range� studied.� In� previous� works� it� was� reported� that� no� mass� transfer�
limitations�occurred�in�the�dehydration�of�1�pentanol�to�di�n�pentyl�ether�(DNPE)�and�
1�hexanol�to�di�n�h�exyl�ether�(DNHE)�below�3�and�4�grams�of�catalyst�respectively�[44,�
47].�
Working�within�these�range�of�mass�catalysts,�influence�of�the�bead�size�and�stirring�
speed�on�reaction�rate�were�evaluated�over�Amberlyst�70.�Commercial�Amberlyst�70�
was�sieved�to�obtain�different�bead�sizes�of�0.12,�0.21,�0.32,�0.52,�0.72,�and�0.9�mm.�
Working�temperature�was�set�to�453�K�in�order�to�speed�up�chemical�reaction�and�thus�
assure�no�mass� transfer�effects� in� the� range�of�413�453� K.�From�Figure�7.2� it� can�be�
inferred� that� there� is� no� significant� effect� of� bead� size� on� the� rate� of� DNOE� (r0DNOE)�
formation�since�the�variation�of�r0DNOE�with�bead�size�lies�between�the�95%�confidence�
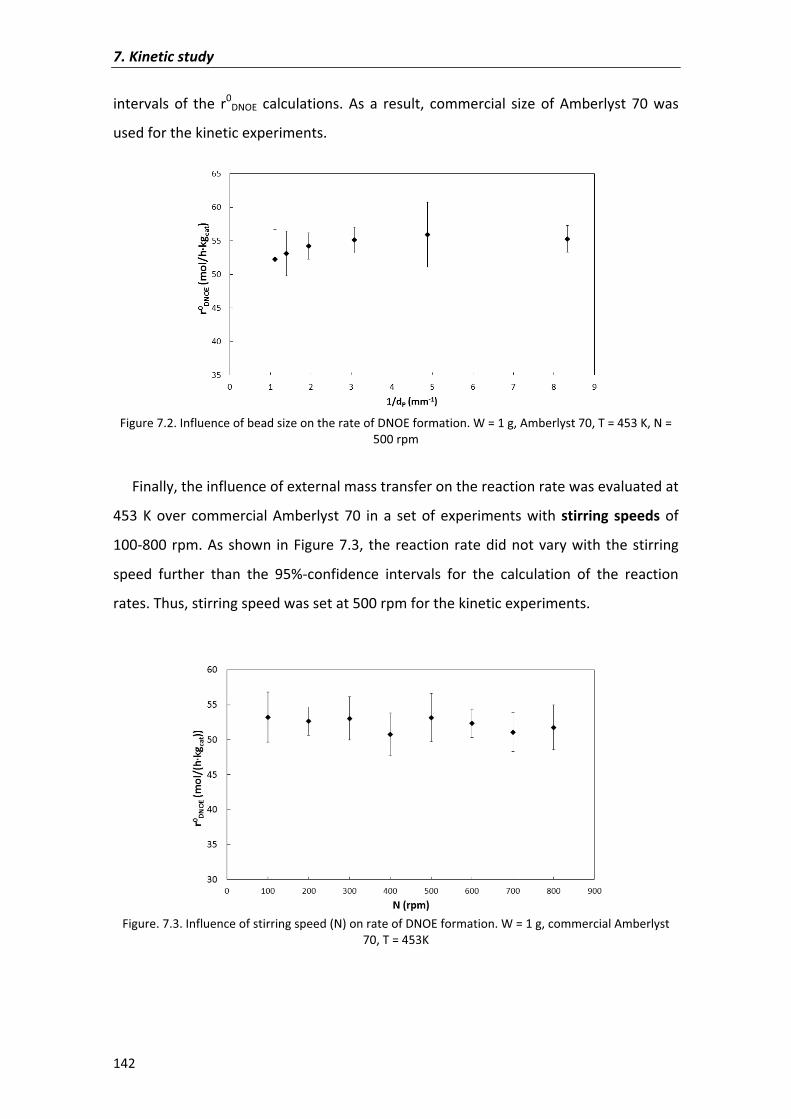
7.�Kinetic�study�
142�
intervals� of� the� r0DNOE� calculations.� As� a� result,� commercial� size� of� Amberlyst� 70� was�
used�for�the�kinetic�experiments.��
Figure�7.2.�Influence�of�bead�size�on�the�rate�of�DNOE�formation.�W�=�1�g,�Amberlyst�70,�T�=�453�K,�N�=�
500�rpm��
Finally,�the�influence�of�external�mass�transfer�on�the�reaction�rate�was�evaluated�at�
453� K� over� commercial� Amberlyst� 70� in� a� set� of� experiments� with�stirring� speeds� of�
100�800�rpm.�As�shown� in�Figure�7.3,� the�reaction�rate�did�not�vary�with�the�stirring�
speed� further� than� the� 95%�confidence� intervals� for� the� calculation� of� the� reaction�
rates.�Thus,�stirring�speed�was�set�at�500�rpm�for�the�kinetic�experiments.�
�
�Figure.�7.3.�Influence�of�stirring�speed�(N)�on�rate�of�DNOE�formation.�W�=�1�g,�commercial�Amberlyst�
70,�T�=�453K��
�
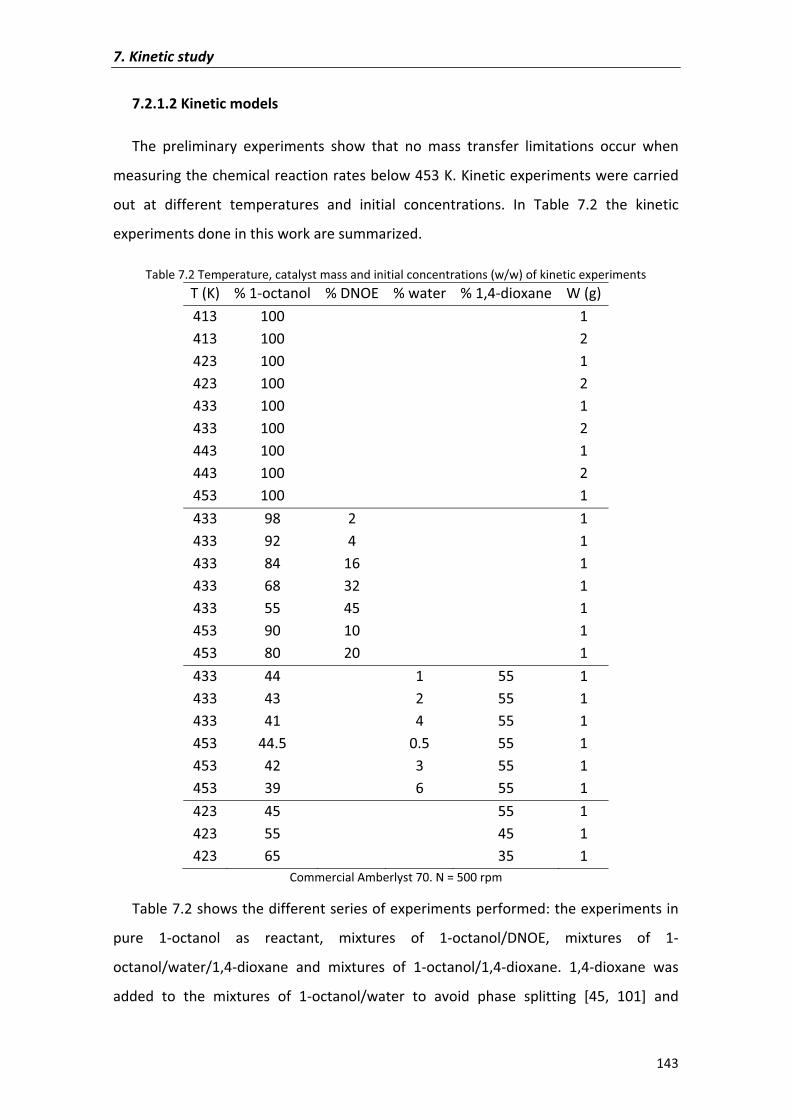
7.�Kinetic�study�
143�
7.2.1.2�Kinetic�models�
The� preliminary� experiments� show� that� no� mass� transfer� limitations� occur� when�
measuring�the�chemical�reaction�rates�below�453�K.�Kinetic�experiments�were�carried�
out� at� different� temperatures� and� initial� concentrations.� In� Table� 7.2� the� kinetic�
experiments�done�in�this�work�are�summarized.�
Table�7.2�Temperature,�catalyst�mass�and�initial�concentrations�(w/w)�of�kinetic�experiments�T�(K)� %�1�octanol� %�DNOE %�water %�1,4�dioxane W�(g)�413� 100� 1�413� 100� 2�423� 100� 1�423� 100� 2�433� 100� 1�433� 100� 2�443� 100� 1�443� 100� 2�453� 100� 1�433� 98� 2 1�433� 92� 4 1�433� 84� 16 1�433� 68� 32 1�433� 55� 45 1�453� 90� 10 1�453� 80� 20 1�433� 44� 1 55 1�433� 43� 2 55 1�433� 41� 4 55 1�453� 44.5� 0.5 55 1�453� 42� 3 55 1�453� 39� 6 55 1�423� 45� 55 1�423� 55� 45 1�423� 65� 35 1�
Commercial�Amberlyst�70.�N�=�500�rpm�
Table�7.2�shows�the�different�series�of�experiments�performed:�the�experiments�in�
pure� 1�octanol� as� reactant,� mixtures� of� 1�octanol/DNOE,� mixtures� of� 1�
octanol/water/1,4�dioxane� and� mixtures� of� 1�octanol/1,4�dioxane.� 1,4�dioxane� was�
added� to� the� mixtures� of� 1�octanol/water� to� avoid� phase� splitting� [45,� 101]� and�
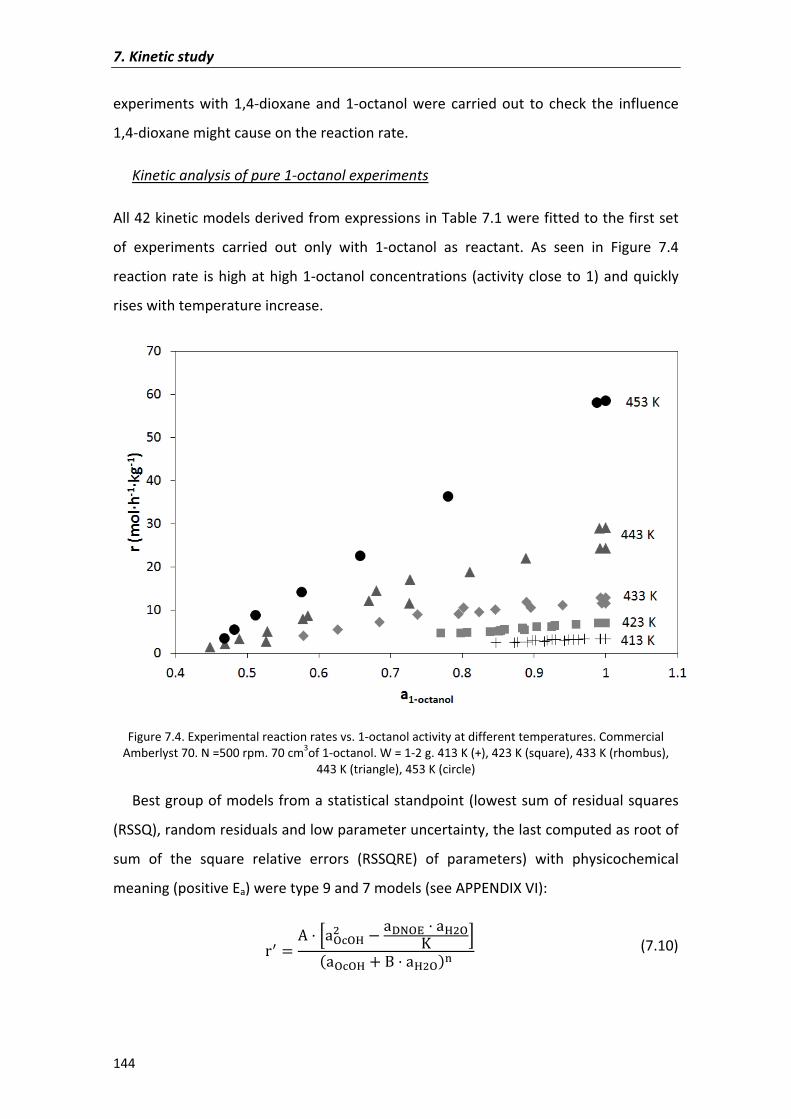
7.�Kinetic�study�
144�
experiments� with� 1,4�dioxane� and� 1�octanol� were� carried� out� to� check� the� influence�
1,4�dioxane�might�cause�on�the�reaction�rate.�
Kinetic�analysis�of�pure�1�octanol�experiments�
All�42�kinetic�models�derived�from�expressions�in�Table�7.1�were�fitted�to�the�first�set�
of� experiments� carried� out� only� with� 1�octanol� as� reactant.� As� seen� in� Figure� 7.4�
reaction�rate� is�high�at�high�1�octanol�concentrations�(activity�close�to�1)�and�quickly�
rises�with�temperature�increase.��
�
Figure�7.4.�Experimental�reaction�rates�vs.�1�octanol�activity�at�different�temperatures.�Commercial�Amberlyst�70.�N�=500�rpm.�70�cm3of�1�octanol.�W�=�1�2�g.�413�K�(+),�423�K�(square),�433�K�(rhombus),�
443�K�(triangle),�453�K�(circle)�
Best�group�of�models�from�a�statistical�standpoint�(lowest�sum�of�residual�squares�
(RSSQ),�random�residuals�and�low�parameter�uncertainty,�the�last�computed�as�root�of�
sum� of� the� square� relative� errors� (RSSQRE)� of� parameters)� with� physicochemical�
meaning�(positive�Ea)�were�type�9�and�7�models�(see�APPENDIX�VI):�
Y7 � � ×VJ_JK" � VnoJp VK"J³ Ø�VJ_JK Ù VK"J�� � (7.10)
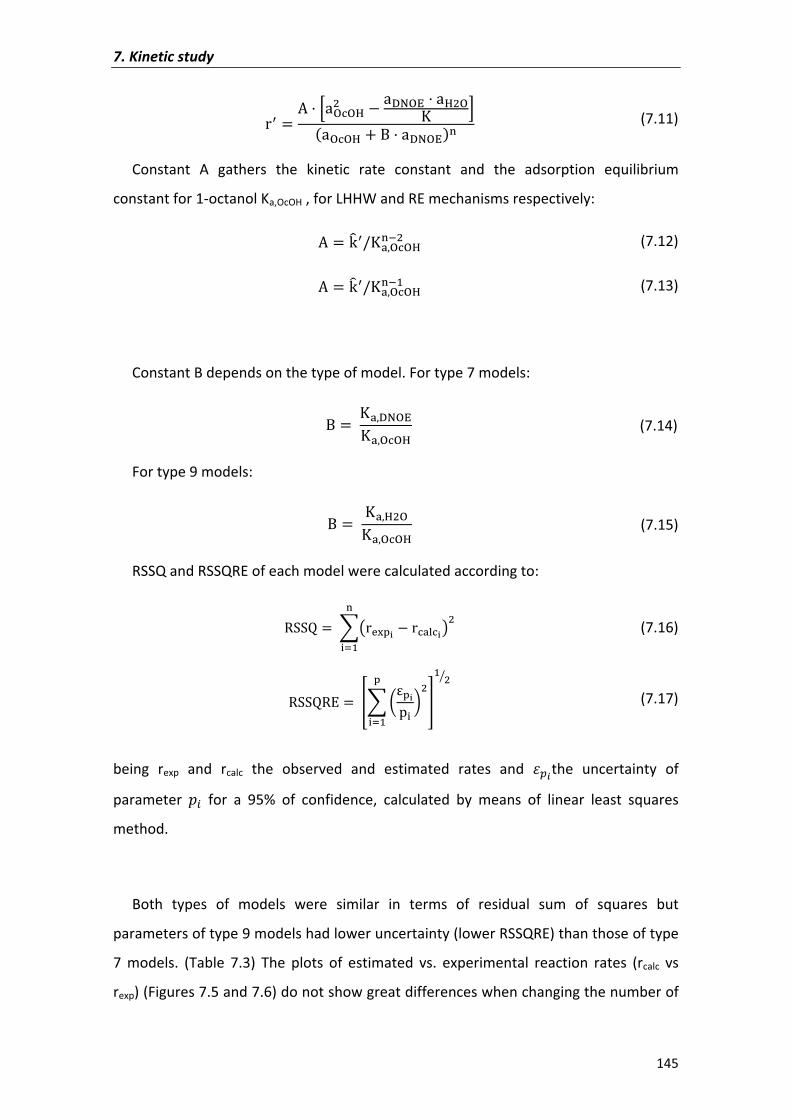
7.�Kinetic�study�
145�
Y7 � � ×VJ_JK" � VnoJp VK"J³ Ø�VJ_JK Ù VnoJp�� � (7.11)
Constant� A� gathers� the� kinetic� rate� constant� and� the� adsorption� equilibrium�
constant�for�1�octanol�Ka,OcOH�,�for�LHHW�and�RE�mechanisms�respectively:��
� � g4 7�³¢)J_JK��" � (7.12)
� � g4 7�³¢)J_JK��� � (7.13)
�
Constant�B�depends�on�the�type�of�model.�For�type�7�models:�
Ù � ³¢)noJp³¢)J_JK � (7.14)�
For�type�9�models:�
Ù � ³¢)K"J³¢)J_JK� (7.15)
RSSQ�and�RSSQRE�of�each�model�were�calculated�according�to:�
ÀLLÛ � �¡Yr¤¥Î � Y_¢£_Φ"��f� � (7.16)
ÀLLÛÀÜ � ¾� 0Ý¥Î�� 3"¥�f� Â
� "�� (7.17)
being� rexp� and� rcalc� the� observed� and� estimated� rates� and� Þßàthe� uncertainty� of�
parameter� ?á� for� a� 95%� of� confidence,� calculated� by� means� of� linear� least� squares�
method.�
�
Both� types� of� models� were� similar� in� terms� of� residual� sum� of� squares� but�
parameters�of�type�9�models�had�lower�uncertainty�(lower�RSSQRE)�than�those�of�type�
7� models.� (Table� 7.3)� The� plots� of� estimated� vs.� experimental� reaction� rates� (rcalc� vs�
rexp)�(Figures�7.5�and�7.6)�do�not�show�great�differences�when�changing�the�number�of�
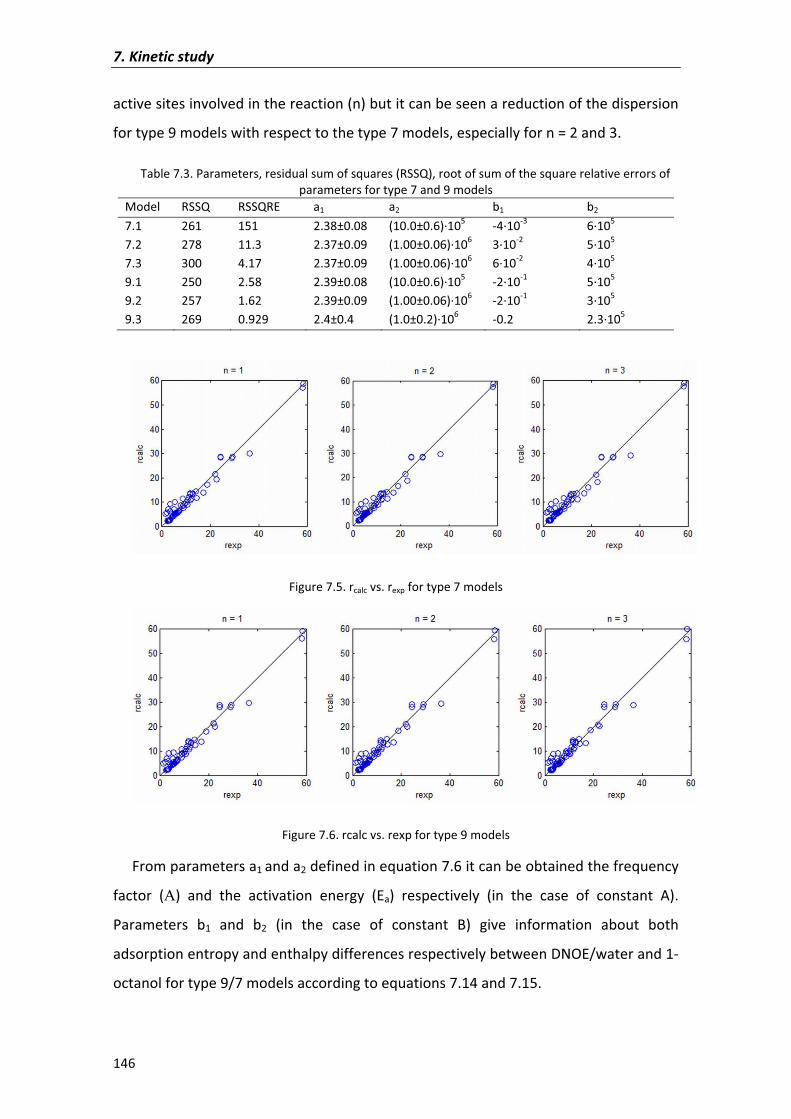
7.�Kinetic�study�
146�
active�sites�involved�in�the�reaction�(n)�but�it�can�be�seen�a�reduction�of�the�dispersion�
for�type�9�models�with�respect�to�the�type�7�models,�especially�for�n�=�2�and�3.��
Table�7.3.�Parameters,�residual�sum�of�squares�(RSSQ),�root�of�sum�of�the�square�relative�errors�of�parameters�for�type�7�and�9�models�
Model� RSSQ� RSSQRE� a1� a2� b1� b2�
7.1� 261� 151� 2.38±0.08 (10.0±0.6)�105 �4�10�3 6�105�
7.2� 278� 11.3� 2.37±0.09 (1.00±0.06)�106 3�10�2 5�105�
7.3� 300� 4.17� 2.37±0.09 (1.00±0.06)�106 6�10�2 4�105�
9.1� 250� 2.58� 2.39±0.08 (10.0±0.6)�105 �2�10�1 5�105�
9.2� 257� 1.62� 2.39±0.09 (1.00±0.06)�106 �2�10�1 3�105�
9.3� 269� 0.929� 2.4±0.4 (1.0±0.2)�106 �0.2 2.3�105�
�
�
Figure�7.5.�rcalc�vs.�rexp�for�type�7�models�
�
Figure�7.6.�rcalc�vs.�rexp�for�type�9�models�
From�parameters�a1�and�a2�defined�in�equation�7.6�it�can�be�obtained�the�frequency�
factor� (A)� and� the� activation� energy� (Ea)� respectively� (in� the� case� of� constant� A).�
Parameters� b1� and� b2� (in� the� case� of� constant� B)� give� information� about� both�
adsorption�entropy�and�enthalpy�differences�respectively�between�DNOE/water�and�1�
octanol�for�type�9/7�models�according�to�equations�7.14�and�7.15.��
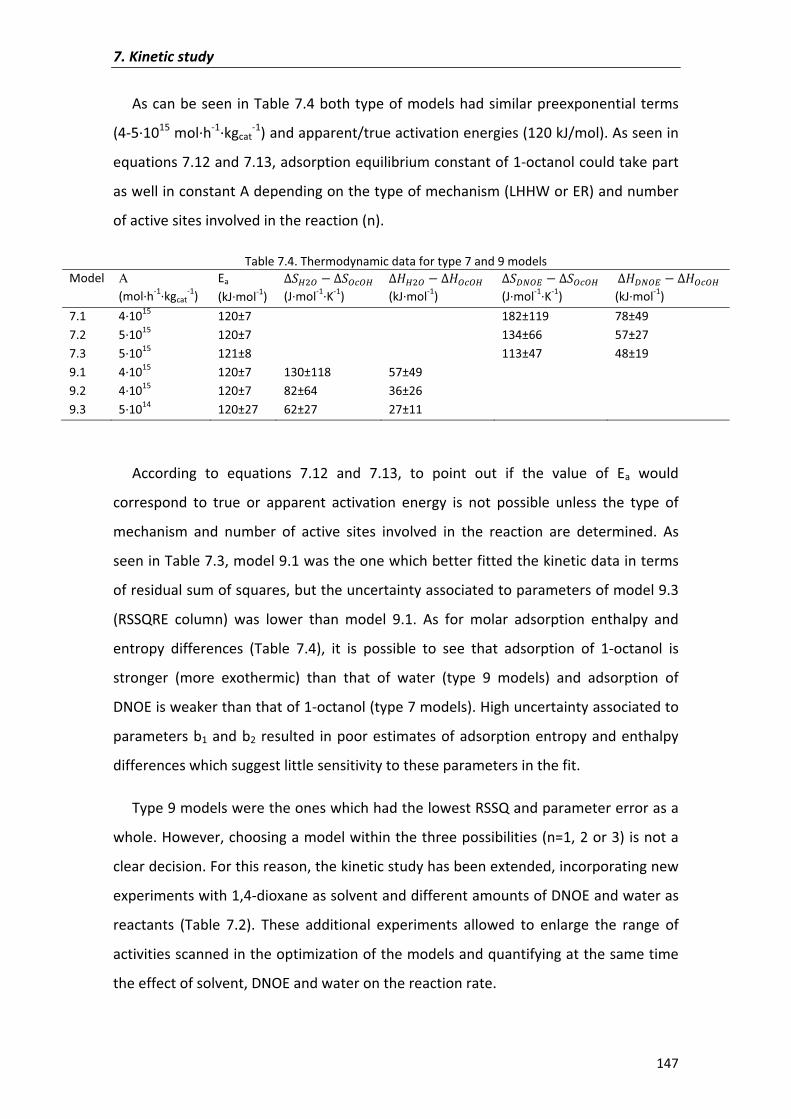
7.�Kinetic�study�
147�
As�can�be�seen�in�Table�7.4�both�type�of�models�had�similar�preexponential�terms�
(4�5�1015�mol�h�1�kgcat�1)�and�apparent/true�activation�energies�(120�kJ/mol).�As�seen�in�
equations�7.12�and�7.13,�adsorption�equilibrium�constant�of�1�octanol�could�take�part�
as�well�in�constant�A�depending�on�the�type�of�mechanism�(LHHW�or�ER)�and�number�
of�active�sites�involved�in�the�reaction�(n).��
Table�7.4.�Thermodynamic�data�for�type�7�and�9�models�Model� A
(mol�h�1�kgcat�1)�
Ea�(kJ�mol�1)�
°�x"w � °�w²wx�(J�mol�1�K�1)�
°âx"w � °âw²wx�(kJ�mol�1)�
°���w� � °�w²wx�(J�mol�1�K�1)�
°â��w� � °âw²wx�(kJ�mol�1)�
7.1� 4�1015� 120±7� � 182±119 78±49�7.2� 5�1015� 120±7� � 134±66 57±27�7.3� 5�1015� 121±8� � 113±47 48±19�9.1� 4�1015� 120±7� 130±118 57±49 �9.2� 4�1015� 120±7� 82±64� 36±26 �9.3� 5�1014� 120±27� 62±27� 27±11 �
�
According� to� equations� 7.12� and� 7.13,� to� point� out� if� the� value� of� Ea� would�
correspond� to� true� or� apparent� activation� energy� is� not� possible� unless� the� type� of�
mechanism� and� number� of� active� sites� involved� in� the� reaction� are� determined.� As�
seen�in�Table�7.3,�model�9.1�was�the�one�which�better�fitted�the�kinetic�data�in�terms�
of�residual�sum�of�squares,�but�the�uncertainty�associated�to�parameters�of�model�9.3�
(RSSQRE� column)� was� lower� than� model� 9.1.� As� for� molar� adsorption� enthalpy� and�
entropy� differences� (Table� 7.4),� it� is� possible� to� see� that� adsorption� of� 1�octanol� is�
stronger� (more� exothermic)� than� that� of� water� (type� 9� models)� and� adsorption� of�
DNOE�is�weaker�than�that�of�1�octanol�(type�7�models).�High�uncertainty�associated�to�
parameters�b1�and�b2� resulted� in�poor�estimates�of�adsorption�entropy�and�enthalpy�
differences�which�suggest�little�sensitivity�to�these�parameters�in�the�fit.�
Type�9�models�were�the�ones�which�had�the�lowest�RSSQ�and�parameter�error�as�a�
whole.�However,�choosing�a�model�within�the�three�possibilities�(n=1,�2�or�3)�is�not�a�
clear�decision.�For�this�reason,�the�kinetic�study�has�been�extended,�incorporating�new�
experiments�with�1,4�dioxane�as�solvent�and�different�amounts�of�DNOE�and�water�as�
reactants� (Table� 7.2).� These� additional� experiments� allowed� to� enlarge� the� range� of�
activities�scanned�in�the�optimization�of�the�models�and�quantifying�at�the�same�time�
the�effect�of�solvent,�DNOE�and�water�on�the�reaction�rate.��
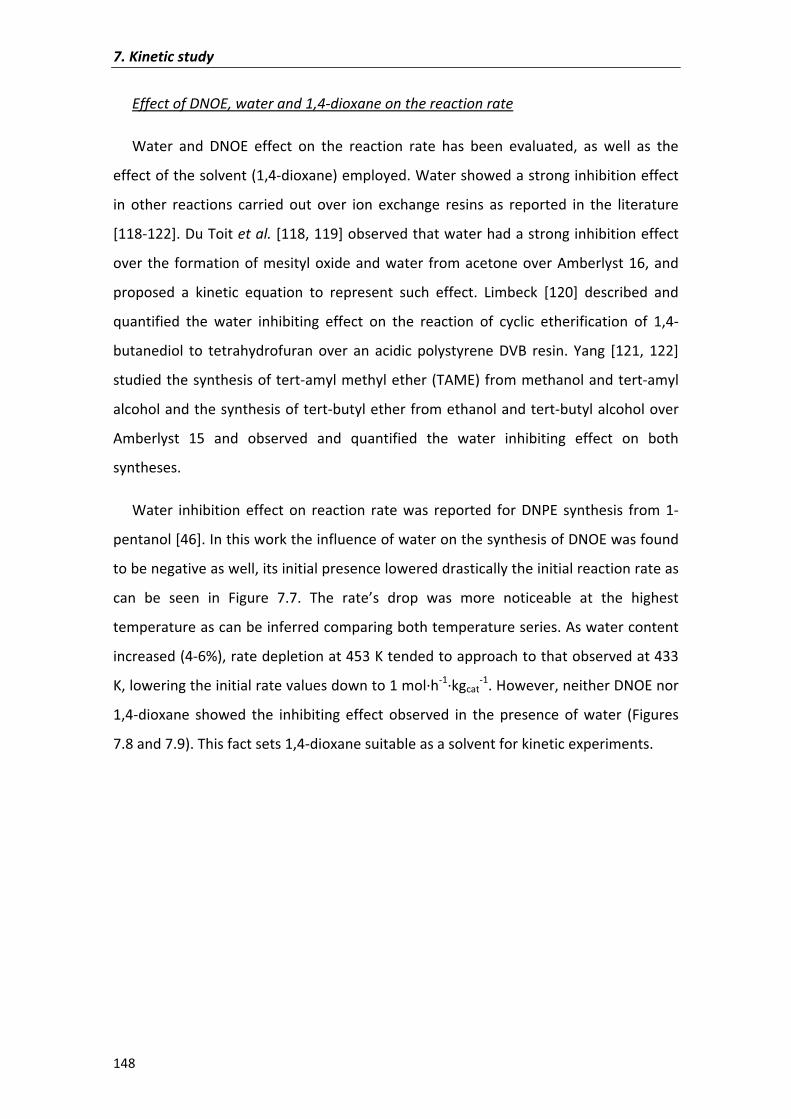
7.�Kinetic�study�
148�
Effect�of�DNOE,�water�and�1,4�dioxane�on�the�reaction�rate�
Water� and� DNOE� effect� on� the� reaction� rate� has� been� evaluated,� as� well� as� the�
effect�of�the�solvent�(1,4�dioxane)�employed.�Water�showed�a�strong�inhibition�effect�
in� other� reactions� carried� out� over� ion� exchange� resins� as� reported� in� the� literature�
[118�122].�Du�Toit�et�al.�[118,�119]�observed�that�water�had�a�strong�inhibition�effect�
over� the� formation�of�mesityl�oxide�and�water� from�acetone�over�Amberlyst�16,�and�
proposed� a� kinetic� equation� to� represent� such� effect.� Limbeck� [120]� described� and�
quantified� the� water� inhibiting� effect� on� the� reaction� of� cyclic� etherification� of� 1,4�
butanediol� to� tetrahydrofuran� over� an� acidic� polystyrene� DVB� resin.� Yang� [121,� 122]�
studied�the�synthesis�of�tert�amyl�methyl�ether�(TAME)�from�methanol�and�tert�amyl�
alcohol�and�the�synthesis�of�tert�butyl�ether�from�ethanol�and�tert�butyl�alcohol�over�
Amberlyst� 15� and� observed� and� quantified� the� water� inhibiting� effect� on� both�
syntheses.�
Water� inhibition� effect� on� reaction� rate� was� reported� for� DNPE� synthesis� from� 1�
pentanol�[46].�In�this�work�the�influence�of�water�on�the�synthesis�of�DNOE�was�found�
to�be�negative�as�well,�its�initial�presence�lowered�drastically�the�initial�reaction�rate�as�
can� be� seen� in� Figure� 7.7.� The� rate’s� drop� was� more� noticeable� at� the� highest�
temperature�as�can�be�inferred�comparing�both�temperature�series.�As�water�content�
increased�(4�6%),�rate�depletion�at�453�K�tended�to�approach�to�that�observed�at�433�
K,�lowering�the�initial�rate�values�down�to�1�mol�h�1�kgcat�1.�However,�neither�DNOE�nor�
1,4�dioxane� showed� the� inhibiting� effect� observed� in� the� presence� of� water� (Figures�
7.8�and�7.9).�This�fact�sets�1,4�dioxane�suitable�as�a�solvent�for�kinetic�experiments.�
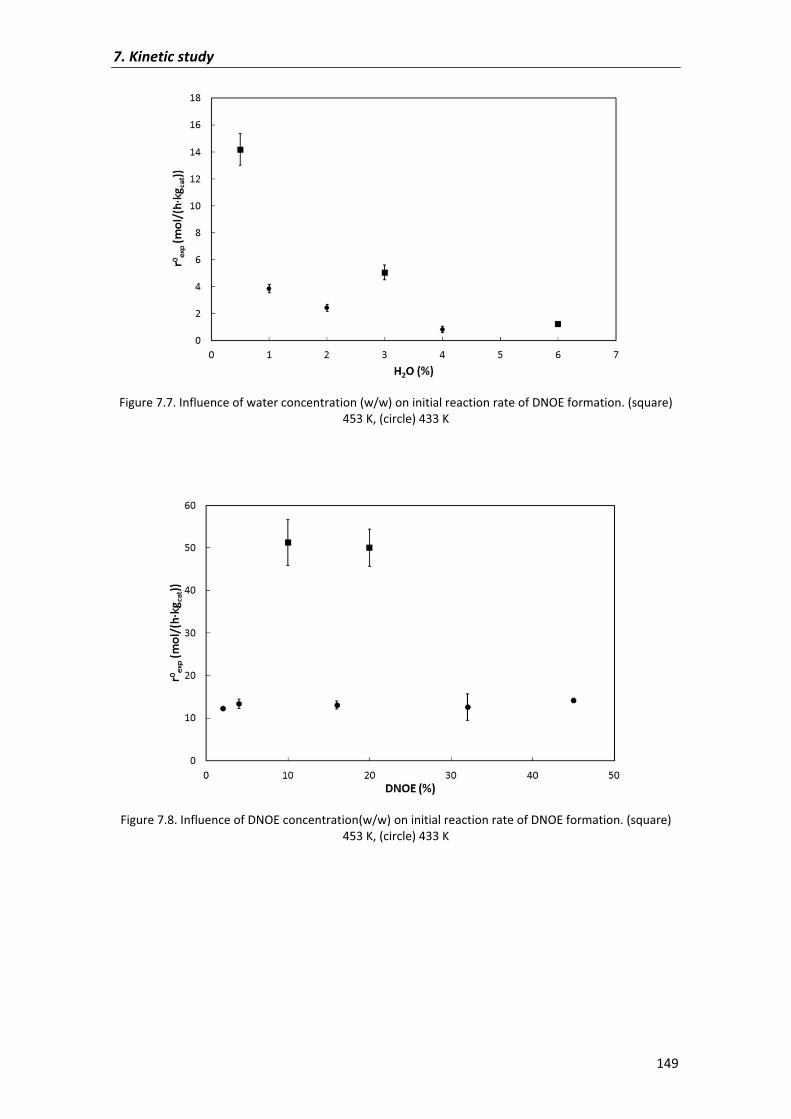
7.�Kinetic�study�
149�
�
Figure�7.7.�Influence�of�water�concentration�(w/w)�on�initial�reaction�rate�of�DNOE�formation.�(square)�453�K,�(circle)�433�K�
�
�
�
Figure�7.8.�Influence�of�DNOE�concentration(w/w)�on�initial�reaction�rate�of�DNOE�formation.�(square)�453�K,�(circle)�433�K�
�
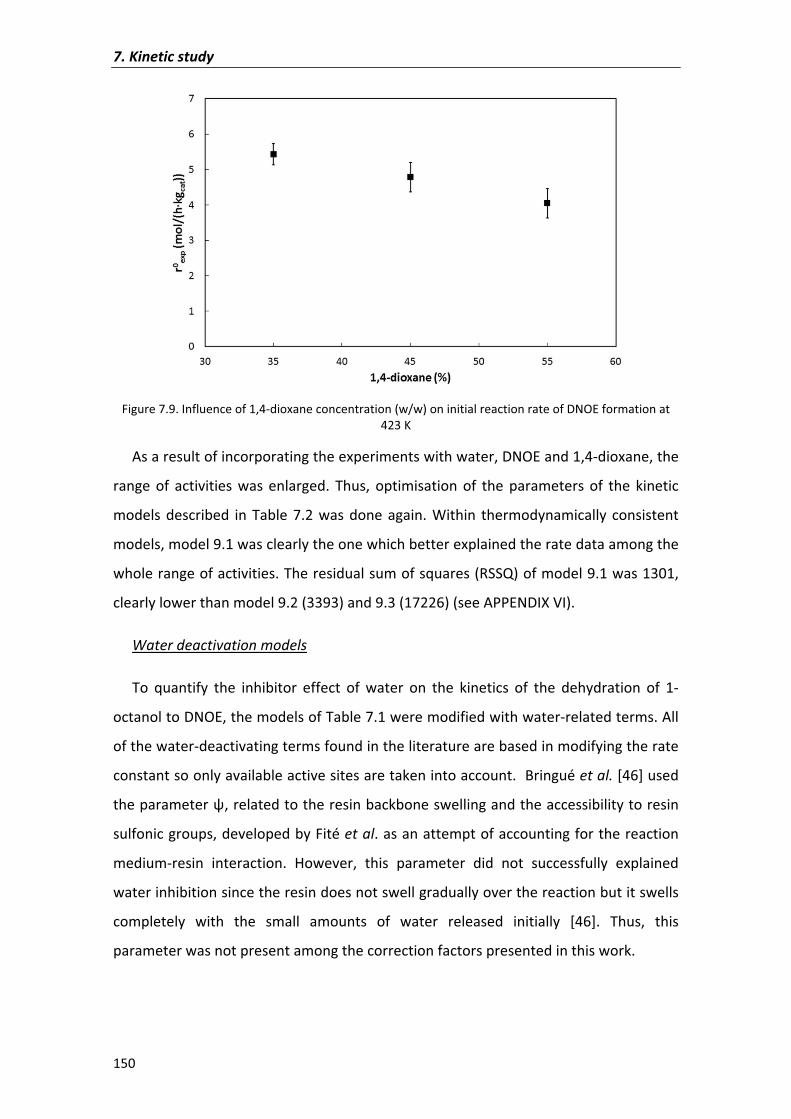
7.�Kinetic�study�
150�
�
Figure�7.9.�Influence�of�1,4�dioxane�concentration�(w/w)�on�initial�reaction�rate�of�DNOE�formation�at�423�K�
As�a�result�of�incorporating�the�experiments�with�water,�DNOE�and�1,4�dioxane,�the�
range� of� activities� was� enlarged.� Thus,� optimisation� of� the� parameters� of� the� kinetic�
models� described� in� Table� 7.2� was� done� again.� Within� thermodynamically� consistent�
models,�model�9.1�was�clearly�the�one�which�better�explained�the�rate�data�among�the�
whole�range�of�activities.�The�residual�sum�of�squares�(RSSQ)�of�model�9.1�was�1301,�
clearly�lower�than�model�9.2�(3393)�and�9.3�(17226)�(see�APPENDIX�VI).��
Water�deactivation�models�
To� quantify� the� inhibitor� effect� of� water� on� the� kinetics� of� the� dehydration� of� 1�
octanol�to�DNOE,�the�models�of�Table�7.1�were�modified�with�water�related�terms.�All�
of�the�water�deactivating�terms�found�in�the�literature�are�based�in�modifying�the�rate�
constant�so�only�available�active�sites�are�taken�into�account.��Bringué�et�al.�[46]�used�
the�parameter��,�related�to�the�resin�backbone�swelling�and�the�accessibility�to�resin�
sulfonic�groups,�developed�by�Fité�et�al.�as�an�attempt�of�accounting�for�the�reaction�
medium�resin� interaction.� However,� this� parameter� did� not� successfully� explained�
water�inhibition�since�the�resin�does�not�swell�gradually�over�the�reaction�but�it�swells�
completely� with� the� small� amounts� of� water� released� initially� [46].� Thus,� this�
parameter�was�not�present�among�the�correction�factors�presented�in�this�work.��
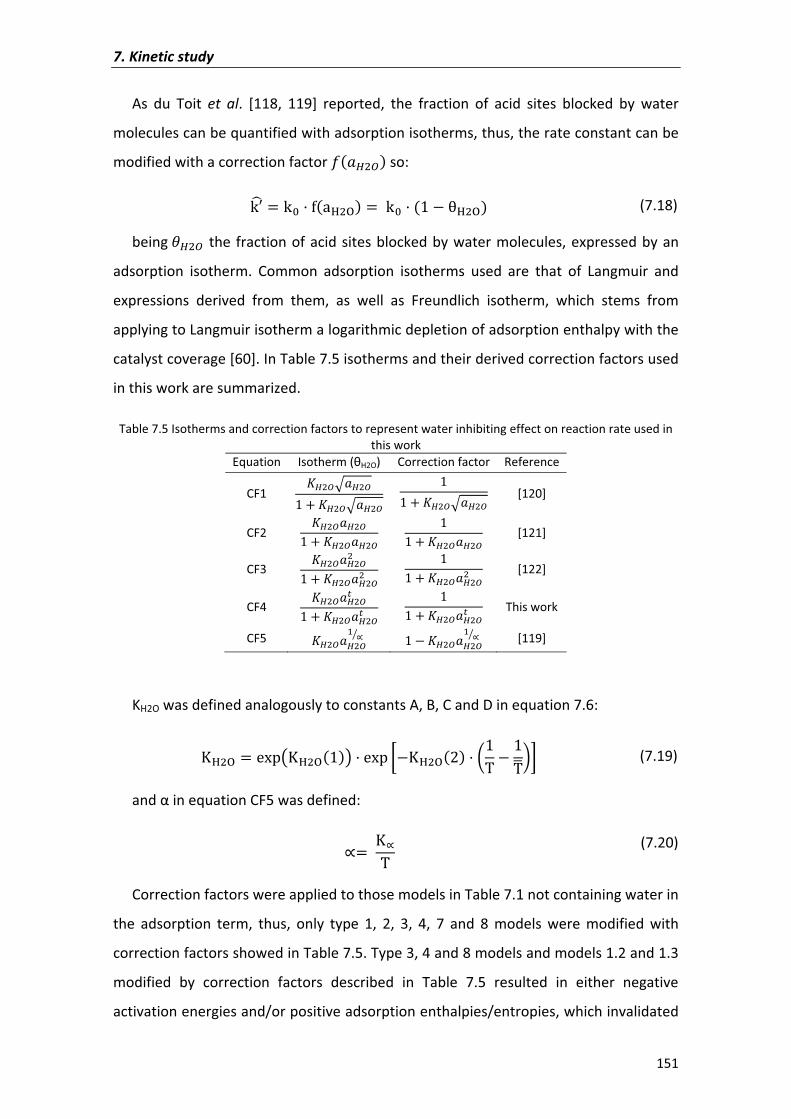
7.�Kinetic�study�
151�
As� du� Toit� et� al.� [118,� 119]� reported,� the� fraction� of� acid� sites� blocked� by� water�
molecules�can�be�quantified�with�adsorption�isotherms,�thus,�the�rate�constant�can�be�
modified�with�a�correction�factor�B�ãx"w��so:�
g%6 � g� U�VK"J� � g� �� � äK"J�� (7.18)�
being -x"w� the� fraction�of�acid�sites�blocked�by�water�molecules,�expressed�by�an�
adsorption� isotherm.� Common� adsorption� isotherms� used� are� that� of� Langmuir� and�
expressions� derived� from� them,� as� well� as� Freundlich� isotherm,� which� stems� from�
applying�to�Langmuir�isotherm�a�logarithmic�depletion�of�adsorption�enthalpy�with�the�
catalyst�coverage�[60].�In�Table�7.5�isotherms�and�their�derived�correction�factors�used�
in�this�work�are�summarized.�
Table�7.5�Isotherms�and�correction�factors�to�represent�water�inhibiting�effect�on�reaction�rate�used�in�this�work�
Equation� Isotherm�(�H2O) Correction�factor Reference
CF1�/x"wåãx"w� /x"wåãx"w�
�� /x"wåãx"w� [120]�
CF2�/x"wãx"w� /x"wãx"w�
�� /x"wãx"w� [121]�
CF3�/x"wãx"w"� /x"wãx"w" �
�� /x"wãx"w" � [122]�
CF4�/x"wãx"wæ� /x"wãx"wæ �
�� /x"wãx"wæ � This�work�
CF5� /x"wãx"w� ç� � � � /x"wãx"w� ç� � [119]�
�
KH2O�was�defined�analogously�to�constants�A,�B,�C�and�D�in�equation�7.6:�
³K"J � ���¡³K"J���¦ ��� `�³K"J��� 0�� � ��Ê3b� (7.19)�
and���in�equation�CF5�was�defined:�
ç� ³ç� � (7.20)
Correction�factors�were�applied�to�those�models�in�Table�7.1�not�containing�water�in�
the� adsorption� term,� thus,� only� type� 1,� 2,� 3,� 4,� 7� and� 8� models� were� modified� with�
correction�factors�showed�in�Table�7.5.�Type�3,�4�and�8�models�and�models�1.2�and�1.3�
modified� by� correction� factors� described� in� Table� 7.5� resulted� in� either� negative�
activation�energies�and/or�positive�adsorption�enthalpies/entropies,�which�invalidated�
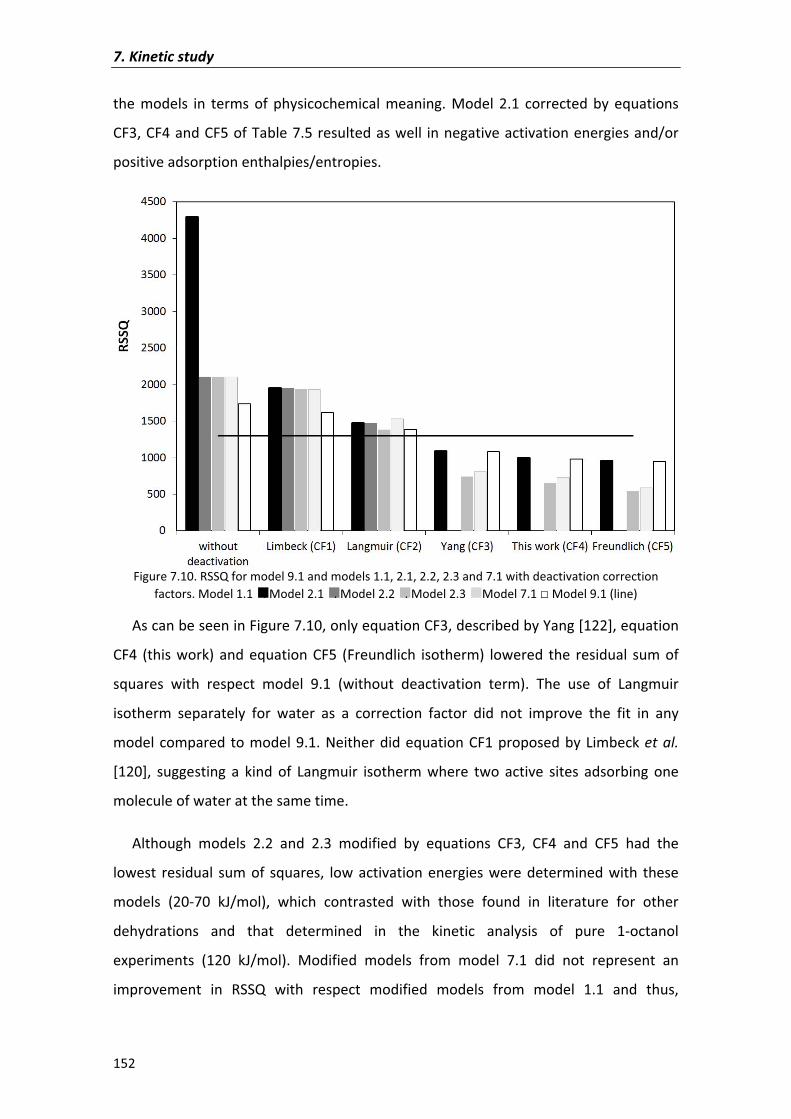
7.�Kinetic�study�
152�
the� models� in� terms� of� physicochemical� meaning.� Model� 2.1� corrected� by� equations�
CF3,�CF4�and�CF5�of�Table�7.5�resulted�as�well� in�negative�activation�energies�and/or�
positive�adsorption�enthalpies/entropies.��
Figure�7.10.�RSSQ�for�model�9.1�and�models�1.1,�2.1,�2.2,�2.3�and�7.1�with�deactivation�correction�factors.�Model�1.1� .�Model�2.1� .�Model�2.2� .�Model�2.3� .�Model�7.1���Model�9.1�(line)�
As�can�be�seen�in�Figure�7.10,�only�equation�CF3,�described�by�Yang�[122],�equation�
CF4� (this� work)� and� equation� CF5� (Freundlich� isotherm)� lowered� the� residual� sum� of�
squares� with� respect� model� 9.1� (without� deactivation� term).� The� use� of� Langmuir�
isotherm� separately� for� water� as� a� correction� factor� did� not� improve� the� fit� in� any�
model�compared�to�model�9.1.�Neither�did�equation�CF1�proposed�by�Limbeck�et�al.�
[120],� suggesting� a� kind� of� Langmuir� isotherm� where� two� active� sites� adsorbing� one�
molecule�of�water�at�the�same�time.��
Although� models� 2.2� and� 2.3� modified� by� equations� CF3,� CF4� and� CF5� had� the�
lowest� residual� sum� of� squares,� low� activation� energies� were� determined� with� these�
models� (20�70� kJ/mol),� which� contrasted� with� those� found� in� literature� for� other�
dehydrations� and� that� determined� in� the� kinetic� analysis� of� pure� 1�octanol�
experiments� (120� kJ/mol).� Modified� models� from� model� 7.1� did� not� represent� an�
improvement� in� RSSQ� with� respect� modified� models� from� model� 1.1� and� thus,�
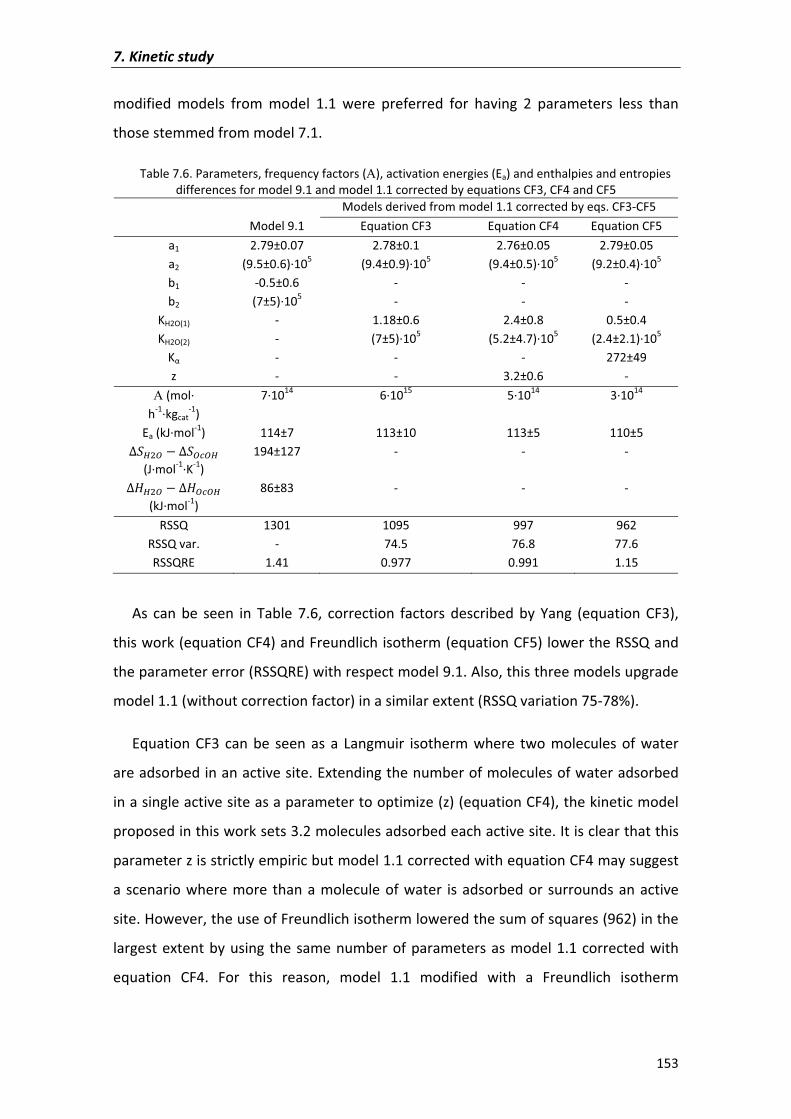
7.�Kinetic�study�
153�
modified� models� from� model� 1.1� were� preferred� for� having� 2� parameters� less� than�
those�stemmed�from�model�7.1.��
Table�7.6.�Parameters,�frequency�factors�(A),�activation�energies�(Ea)�and�enthalpies�and�entropies�differences�for�model�9.1�and�model�1.1�corrected�by�equations�CF3,�CF4�and�CF5�
� Models�derived�from�model�1.1�corrected�by�eqs.�CF3�CF5� Model�9.1� Equation�CF3 Equation�CF4 Equation�CF5
a1� 2.79±0.07� 2.78±0.1 2.76±0.05 2.79±0.05�a2� (9.5±0.6)�105� (9.4±0.9)�105 (9.4±0.5)�105 (9.2±0.4)�105
b1� �0.5±0.6� � � ��b2� (7±5)�105� � � ��
KH2O(1)� �� 1.18±0.6 2.4±0.8 0.5±0.4�KH2O(2)� �� (7±5)�105 (5.2±4.7)�105 (2.4±2.1)�105
K�� �� � � 272±49�z� �� � 3.2±0.6 ��
A�(mol��h�1�kgcat
�1)�7�1014� 6�1015 5�1014 3�1014�
Ea�(kJ�mol�1)� 114±7� 113±10 113±5 110±5�°�x"w � °�w²wx�(J�mol�1�K�1)�
194±127� � � ��
°âx"w � °âw²wx��(kJ�mol�1)�
86±83� � � ��
RSSQ� 1301� 1095 997 962�RSSQ�var.� �� 74.5 76.8 77.6�RSSQRE� 1.41� 0.977 0.991 1.15�
�
As� can� be� seen� in� Table� 7.6,� correction� factors� described� by� Yang� (equation� CF3),�
this�work�(equation�CF4)�and�Freundlich�isotherm�(equation�CF5)�lower�the�RSSQ�and�
the�parameter�error�(RSSQRE)�with�respect�model�9.1.�Also,�this�three�models�upgrade�
model�1.1�(without�correction�factor)�in�a�similar�extent�(RSSQ�variation�75�78%).��
Equation� CF3� can� be� seen� as� a� Langmuir� isotherm� where� two� molecules� of� water�
are�adsorbed�in�an�active�site.�Extending�the�number�of�molecules�of�water�adsorbed�
in�a�single�active�site�as�a�parameter�to�optimize�(z)�(equation�CF4),�the�kinetic�model�
proposed�in�this�work�sets�3.2�molecules�adsorbed�each�active�site.�It�is�clear�that�this�
parameter�z�is�strictly�empiric�but�model�1.1�corrected�with�equation�CF4�may�suggest�
a�scenario�where�more� than�a�molecule�of�water� is�adsorbed�or�surrounds�an�active�
site.�However,�the�use�of�Freundlich�isotherm�lowered�the�sum�of�squares�(962)�in�the�
largest�extent�by�using�the�same�number�of�parameters�as�model�1.1�corrected�with�
equation� CF4.� For� this� reason,� model� 1.1� modified� with� a� Freundlich� isotherm�
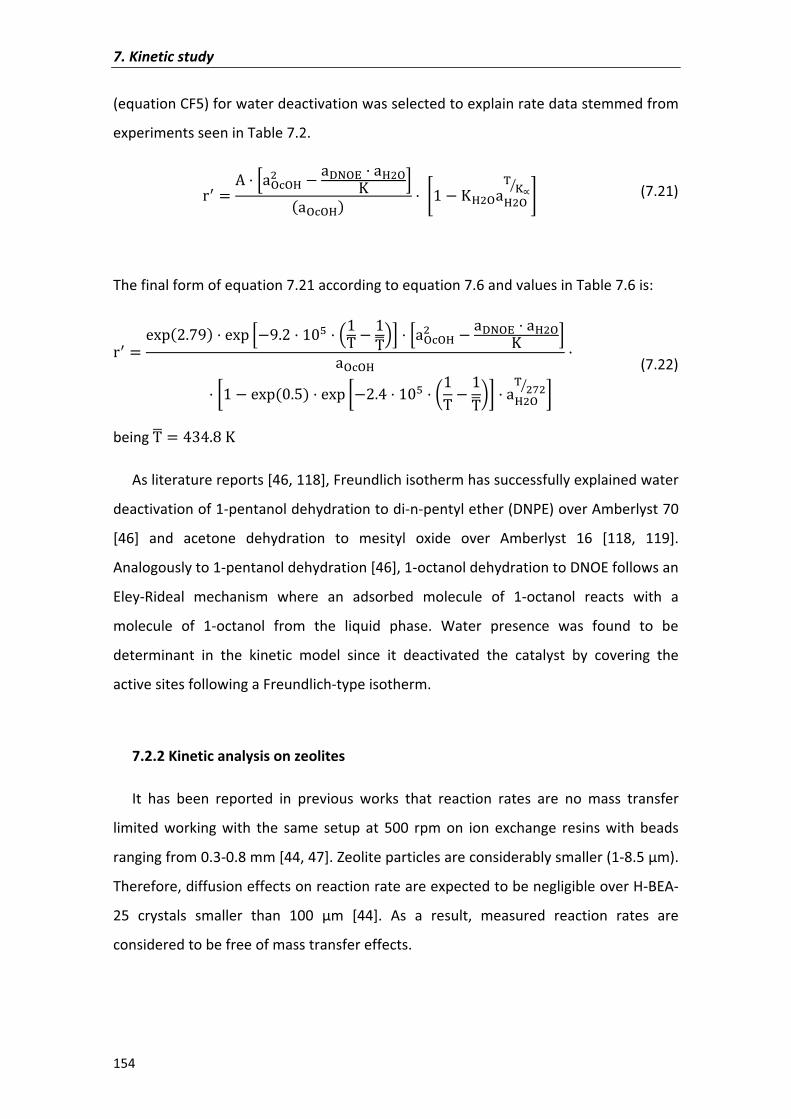
7.�Kinetic�study�
154�
(equation�CF5)�for�water�deactivation�was�selected�to�explain�rate�data�stemmed�from�
experiments�seen�in�Table�7.2.��
Y7 � � ×VJ_JK" � VnoJp VK"J³ Ø�VJ_JK� è� � ³K"JVK"J© Ñç� é� (7.21)
�
The�final�form�of�equation�7.21�according�to�equation�7.6�and�values�in�Table�7.6�is:�
Y7 � ������#�� ��� ×���� �� ��� � ��Ê�Ø ×VJ_JK" � VnoJp VK"J³ ØVJ_JK `� � ��� ���� ��� `���� �� 0�� � ��Ê3b VK"J© "ê"� b�
(7.22)
being��Ê � ����� ³�
As�literature�reports�[46,�118],�Freundlich�isotherm�has�successfully�explained�water�
deactivation�of�1�pentanol�dehydration�to�di�n�pentyl�ether�(DNPE)�over�Amberlyst�70�
[46]� and� acetone� dehydration� to� mesityl� oxide� over� Amberlyst� 16� [118,� 119].�
Analogously�to�1�pentanol�dehydration�[46],�1�octanol�dehydration�to�DNOE�follows�an�
Eley�Rideal� mechanism� where� an� adsorbed� molecule� of� 1�octanol� reacts� with� a�
molecule� of� 1�octanol� from� the� liquid� phase.� Water� presence� was� found� to� be�
determinant� in� the� kinetic� model� since� it� deactivated� the� catalyst� by� covering� the�
active�sites�following�a�Freundlich�type�isotherm.�
�
7.2.2�Kinetic�analysis�on�zeolites�
It� has� been� reported� in� previous� works� that� reaction� rates� are� no� mass� transfer�
limited� working� with� the� same� setup� at� 500� rpm� on� ion� exchange� resins� with� beads�
ranging�from�0.3�0.8�mm�[44,�47].�Zeolite�particles�are�considerably�smaller�(1�8.5��m).�
Therefore,�diffusion�effects�on�reaction�rate�are�expected�to�be�negligible�over�H�BEA�
25� crystals� smaller� than� 100� �m� [44].� As� a� result,� measured� reaction� rates� are�
considered�to�be�free�of�mass�transfer�effects.�
�
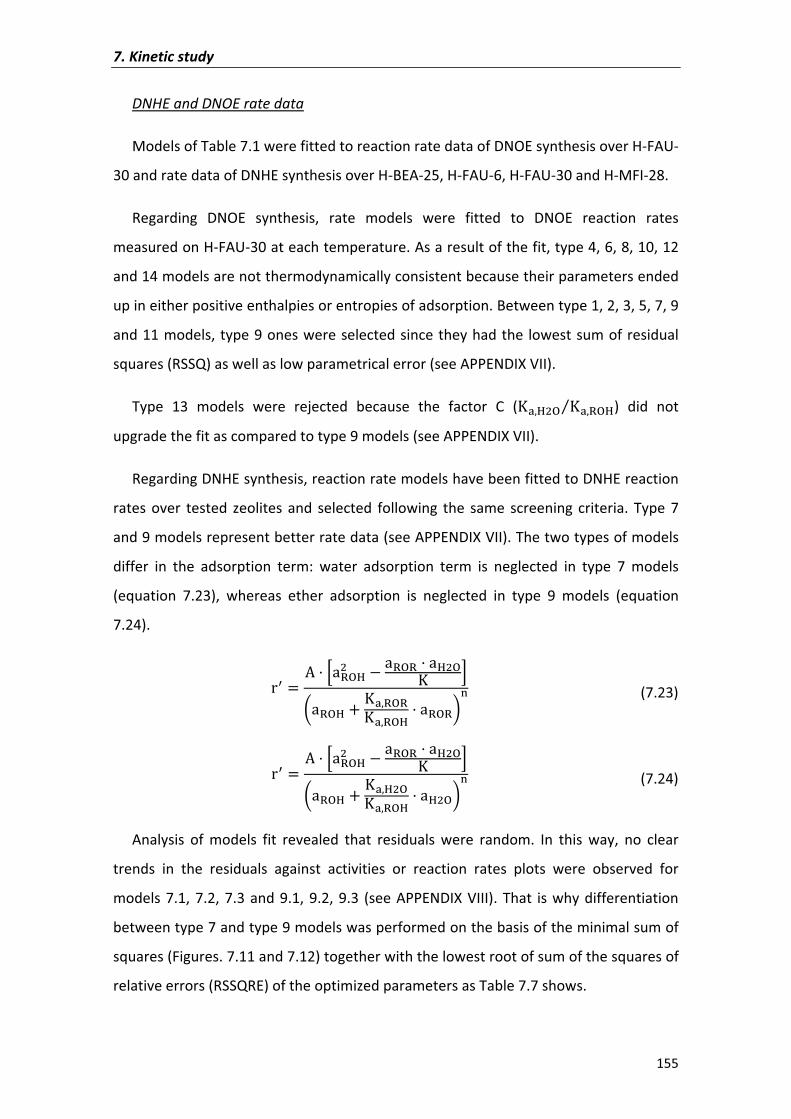
7.�Kinetic�study�
155�
DNHE�and�DNOE�rate�data�
Models�of�Table�7.1�were�fitted�to�reaction�rate�data�of�DNOE�synthesis�over�H�FAU�
30�and�rate�data�of�DNHE�synthesis�over�H�BEA�25,�H�FAU�6,�H�FAU�30�and�H�MFI�28.��
Regarding� DNOE� synthesis,� rate� models� were� fitted� to� DNOE� reaction� rates�
measured�on�H�FAU�30�at�each�temperature.�As�a�result�of�the�fit,�type�4,�6,�8,�10,�12�
and�14�models�are�not�thermodynamically�consistent�because�their�parameters�ended�
up�in�either�positive�enthalpies�or�entropies�of�adsorption.�Between�type�1,�2,�3,�5,�7,�9�
and�11�models,�type�9�ones�were�selected�since�they�had�the� lowest�sum�of�residual�
squares�(RSSQ)�as�well�as�low�parametrical�error�(see�APPENDIX�VII).��
Type� 13� models� were� rejected� because� the� factor� C� (³¢)K"J ³¢)IJKz )� did� not�
upgrade�the�fit�as�compared�to�type�9�models�(see�APPENDIX�VII).�
Regarding�DNHE�synthesis,�reaction�rate�models�have�been�fitted�to�DNHE�reaction�
rates� over� tested� zeolites� and� selected� following� the� same� screening� criteria.� Type� 7�
and�9�models�represent�better�rate�data�(see�APPENDIX�VII).�The�two�types�of�models�
differ� in� the� adsorption� term:� water� adsorption� term� is� neglected� in� type� 7� models�
(equation� 7.23),� whereas� ether� adsorption� is� neglected� in� type� 9� models� (equation�
7.24).�
Y7 � � ×VIJK" � VIJI VK"J³ Ø0VIJK ³¢)IJI³¢)IJK VIJI3�� (7.23)
Y7 � � ×VIJK" � VIJI VK"J³ Ø0VIJK ³¢)K"J³¢)IJK VK"J3�� (7.24)
Analysis� of� models� fit� revealed� that� residuals� were� random.� In� this� way,� no� clear�
trends� in� the� residuals� against� activities� or� reaction� rates� plots� were� observed� for�
models�7.1,�7.2,�7.3�and�9.1,�9.2,�9.3� (see�APPENDIX�VIII).�That� is�why�differentiation�
between�type�7�and�type�9�models�was�performed�on�the�basis�of�the�minimal�sum�of�
squares�(Figures.�7.11�and�7.12)�together�with�the�lowest�root�of�sum�of�the�squares�of�
relative�errors�(RSSQRE)�of�the�optimized�parameters�as�Table�7.7�shows.��
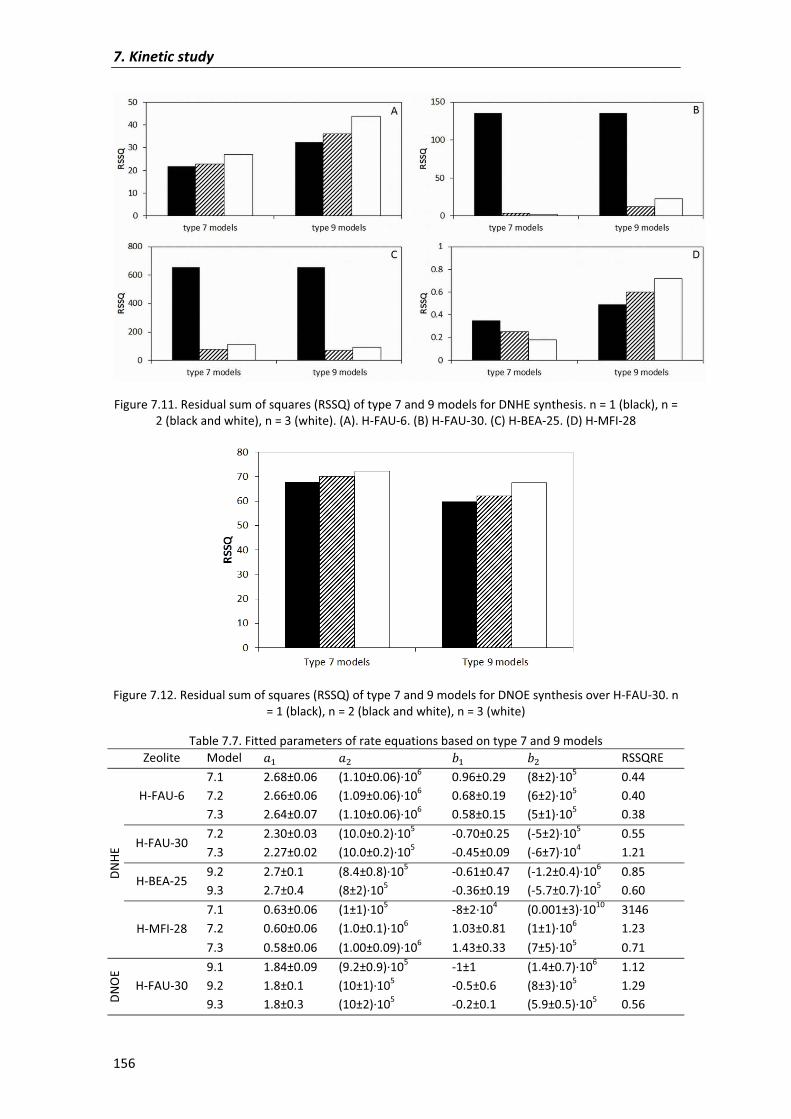
7.�Kinetic�study�
156�
�
Figure�7.11.�Residual�sum�of�squares�(RSSQ)�of�type�7�and�9�models�for�DNHE�synthesis.�n�=�1�(black),�n�=�2�(black�and�white),�n�=�3�(white).�(A).�H�FAU�6.�(B)�H�FAU�30.�(C)�H�BEA�25.�(D)�H�MFI�28�
�
Figure�7.12.�Residual�sum�of�squares�(RSSQ)�of�type�7�and�9�models�for�DNOE�synthesis�over�H�FAU�30.�n�=�1�(black),�n�=�2�(black�and�white),�n�=�3�(white)�
Table�7.7.�Fitted�parameters�of�rate�equations�based�on�type�7�and�9�models�� Zeolite� Model ã�� ã"� ë�� ë"� RSSQRE
DNHE
�
H�FAU�6�7.1� 2.68±0.06� (1.10±0.06)�106 0.96±0.29 (8±2)�105� 0.44�7.2� 2.66±0.06� (1.09±0.06)�106 0.68±0.19 (6±2)�105� 0.40�7.3� 2.64±0.07� (1.10±0.06)�106 0.58±0.15 (5±1)�105� 0.38�
H�FAU�30�7.2� 2.30±0.03� (10.0±0.2)�105 �0.70±0.25 (�5±2)�105� 0.55�7.3� 2.27±0.02� (10.0±0.2)�105 �0.45±0.09 (�6±7)�104� 1.21�
H�BEA�25�9.2� 2.7±0.1� (8.4±0.8)�105 �0.61±0.47 (�1.2±0.4)�106� 0.85�9.3� 2.7±0.4� (8±2)�105 �0.36±0.19 (�5.7±0.7)�105� 0.60�
H�MFI�28�7.1� 0.63±0.06� (1±1)�105 �8±2�104 (0.001±3)�1010� 3146�7.2� 0.60±0.06� (1.0±0.1)�106 1.03±0.81 (1±1)�106� 1.23�7.3� 0.58±0.06� (1.00±0.09)�106 1.43±0.33 (7±5)�105� 0.71�
DNO
E�
H�FAU�30�9.1� 1.84±0.09� (9.2±0.9)�105 �1±1 (1.4±0.7)�106� 1.12�9.2� 1.8±0.1� (10±1)�105 �0.5±0.6 (8±3)�105� 1.29�9.3� 1.8±0.3� (10±2)�105 �0.2±0.1 (5.9±0.5)�105� 0.56�
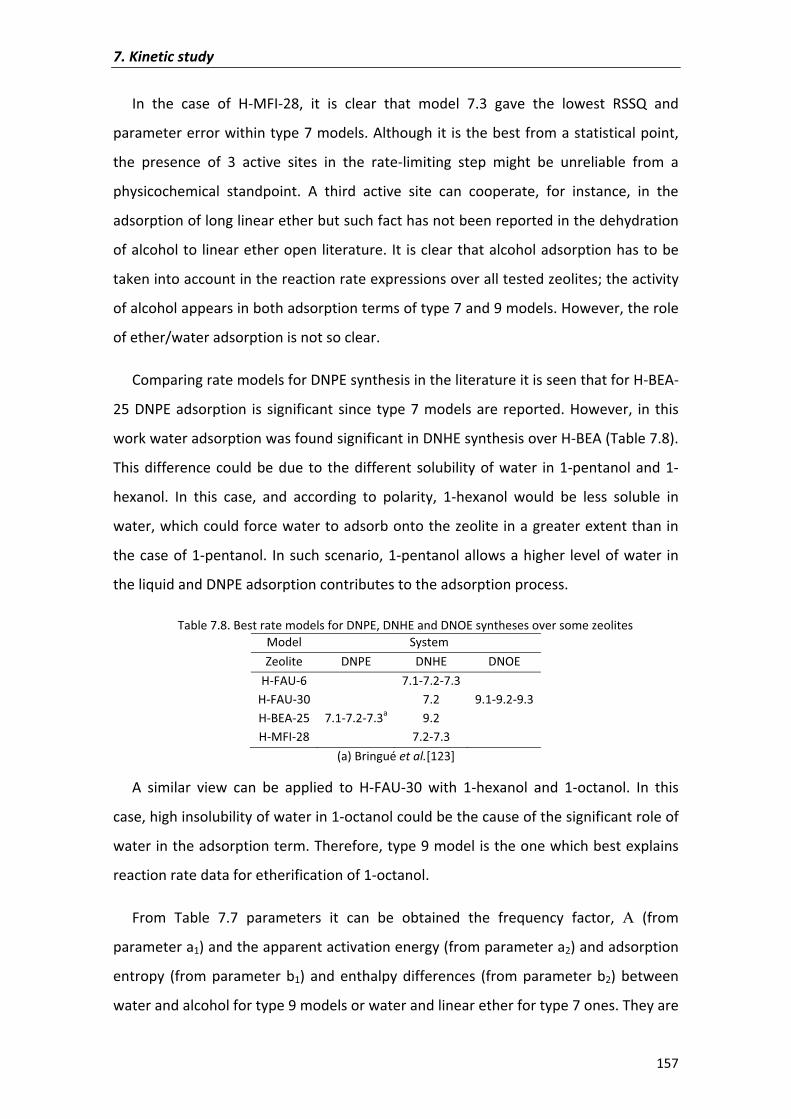
7.�Kinetic�study�
157�
In� the� case� of� H�MFI�28,� it� is� clear� that� model� 7.3� gave� the� lowest� RSSQ� and�
parameter�error�within�type�7�models.�Although�it� is�the�best�from�a�statistical�point,�
the� presence� of� 3� active� sites� in� the� rate�limiting� step� might� be� unreliable� from� a�
physicochemical� standpoint.� A� third� active� site� can� cooperate,� for� instance,� in� the�
adsorption�of�long�linear�ether�but�such�fact�has�not�been�reported�in�the�dehydration�
of�alcohol�to� linear�ether�open�literature.� It� is�clear�that�alcohol�adsorption�has�to�be�
taken�into�account�in�the�reaction�rate�expressions�over�all�tested�zeolites;�the�activity�
of�alcohol�appears�in�both�adsorption�terms�of�type�7�and�9�models.�However,�the�role�
of�ether/water�adsorption�is�not�so�clear.�
Comparing�rate�models�for�DNPE�synthesis�in�the�literature�it�is�seen�that�for�H�BEA�
25�DNPE�adsorption� is� significant�since� type�7�models�are�reported.�However,� in� this�
work�water�adsorption�was�found�significant�in�DNHE�synthesis�over�H�BEA�(Table�7.8).�
This�difference�could�be�due� to� the�different�solubility�of�water� in�1�pentanol�and�1�
hexanol.� In� this� case,� and� according� to� polarity,� 1�hexanol� would� be� less� soluble� in�
water,�which�could�force�water�to�adsorb�onto�the�zeolite�in�a�greater�extent�than�in�
the�case�of�1�pentanol.� In�such�scenario,�1�pentanol�allows�a�higher� level�of�water� in�
the�liquid�and�DNPE�adsorption�contributes�to�the�adsorption�process.��
Table�7.8.�Best�rate�models�for�DNPE,�DNHE�and�DNOE�syntheses�over�some�zeolites�Model� SystemZeolite� DNPE DNHE DNOE
H�FAU�6� 7.1�7.2�7.3H�FAU�30� 7.2 9.1�9.2�9.3H�BEA�25� 7.1�7.2�7.3a 9.2H�MFI�28� 7.2�7.3
(a)�Bringué�et�al.[123]�
A� similar� view� can� be� applied� to� H�FAU�30� with� 1�hexanol� and� 1�octanol.� In� this�
case,�high�insolubility�of�water�in�1�octanol�could�be�the�cause�of�the�significant�role�of�
water�in�the�adsorption�term.�Therefore,�type�9�model�is�the�one�which�best�explains�
reaction�rate�data�for�etherification�of�1�octanol.�
From� Table� 7.7� parameters� it� can� be� obtained� the� frequency� factor,� A� (from�
parameter�a1)�and�the�apparent�activation�energy�(from�parameter�a2)�and�adsorption�
entropy� (from� parameter� b1)� and� enthalpy� differences� (from� parameter� b2)� between�
water�and�alcohol�for�type�9�models�or�water�and�linear�ether�for�type�7�ones.�They�are�
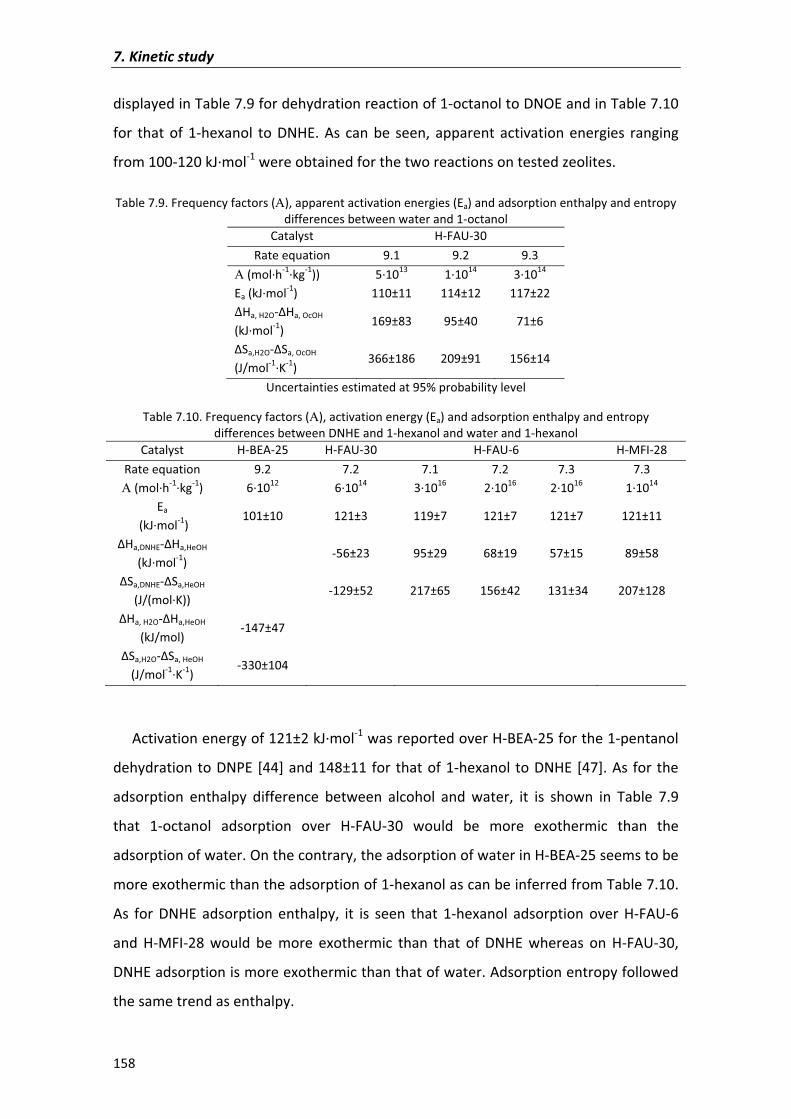
7.�Kinetic�study�
158�
displayed�in�Table�7.9�for�dehydration�reaction�of�1�octanol�to�DNOE�and�in�Table�7.10�
for� that� of� 1�hexanol� to� DNHE.� As� can� be� seen,� apparent� activation�energies� ranging�
from�100�120�kJ�mol�1�were�obtained�for�the�two�reactions�on�tested�zeolites.�
Table�7.9.�Frequency�factors�(A),�apparent�activation�energies�(Ea)�and�adsorption�enthalpy�and�entropy�differences�between�water�and�1�octanol�
Catalyst� H�FAU�30�Rate�equation 9.1 9.2 9.3
A (mol�h�1�kg�1))� 5�1013 1�1014 3�1014
Ea�(kJ�mol�1)� 110±11 114±12 117±22°Ha,�H2O��Ha,�OcOH��(kJ�mol�1)�
169±83� 95±40� 71±6�
�Sa,H2O��Sa,�OcOH��(J/mol�1�K�1)�
366±186� 209±91� 156±14�
Uncertainties�estimated�at�95%�probability�level�
Table�7.10.�Frequency�factors�(A),�activation�energy�(Ea)�and�adsorption�enthalpy�and�entropy�differences�between�DNHE�and�1�hexanol�and�water�and�1�hexanol�
Catalyst� H�BEA�25� H�FAU�30 H�FAU�6� H�MFI�28Rate�equation� 9.2� 7.2 7.1 7.2 7.3� 7.3�A�(mol�h�1�kg�1)� 6�1012� 6�1014 3�1016 2�1016 2�1016� 1�1014
Ea��(kJ�mol�1)�
101±10� 121±3� 119±7� 121±7� 121±7� 121±11�
�Ha,DNHE��Ha,HeOH��(kJ�mol�1)�
� �56±23� 95±29� 68±19� 57±15� 89±58�
�Sa,DNHE��Sa,HeOH��(J/(mol�K))�
� �129±52� 217±65� 156±42� �131±34� 207±128�
�Ha,�H2O��Ha,HeOH��(kJ/mol)�
�147±47� � � �
�Sa,H2O��Sa,�HeOH��(J/mol�1�K�1)�
�330±104� � � �
�
Activation�energy�of�121±2�kJ�mol�1�was�reported�over�H�BEA�25�for�the�1�pentanol�
dehydration�to�DNPE�[44]�and�148±11�for�that�of�1�hexanol�to�DNHE�[47].�As� for�the�
adsorption� enthalpy� difference� between� alcohol� and� water,� it� is� shown� in� Table� 7.9�
that� 1�octanol� adsorption� over� H�FAU�30� would� be� more� exothermic� than� the�
adsorption�of�water.�On�the�contrary,�the�adsorption�of�water�in�H�BEA�25�seems�to�be�
more�exothermic�than�the�adsorption�of�1�hexanol�as�can�be�inferred�from�Table�7.10.�
As� for� DNHE� adsorption� enthalpy,� it� is� seen� that� 1�hexanol� adsorption� over� H�FAU�6�
and� H�MFI�28� would� be� more� exothermic� than� that� of� DNHE� whereas� on� H�FAU�30,�
DNHE�adsorption�is�more�exothermic�than�that�of�water.�Adsorption�entropy�followed�
the�same�trend�as�enthalpy.�
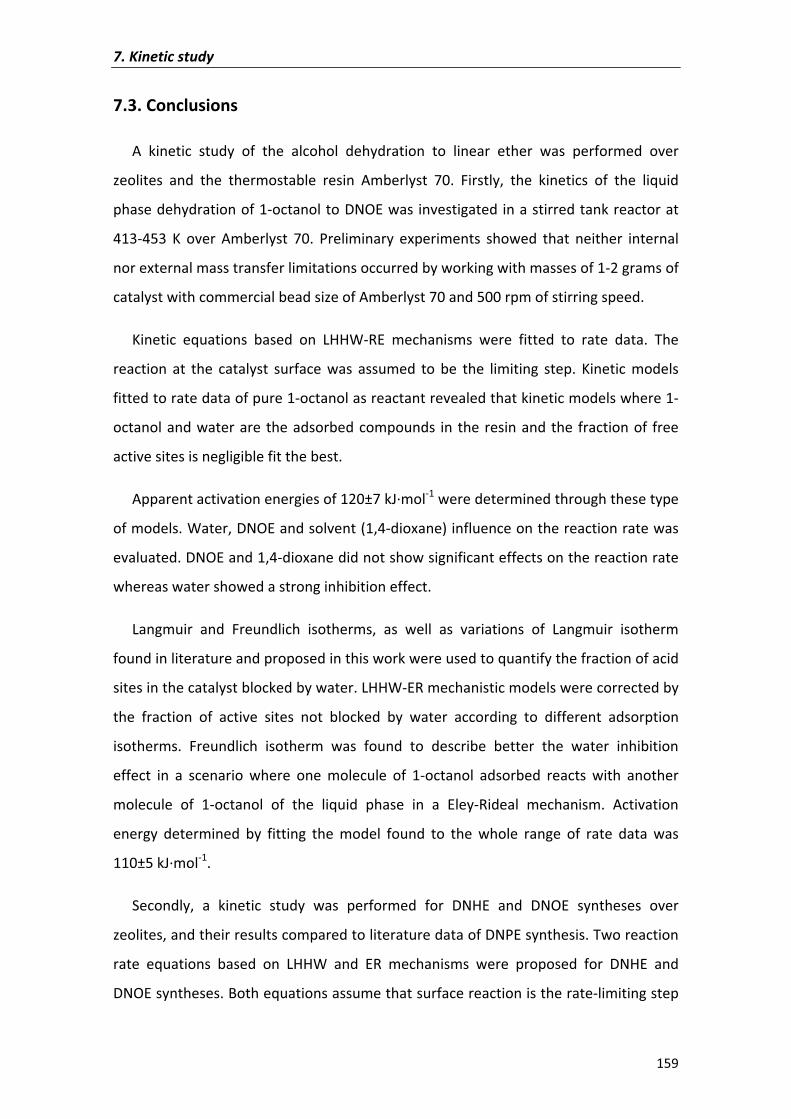
7.�Kinetic�study�
159�
7.3.�Conclusions�
A� kinetic� study� of� the� alcohol� dehydration� to� linear� ether� was� performed� over�
zeolites� and� the� thermostable� resin� Amberlyst� 70.� Firstly,� the� kinetics� of� the� liquid�
phase�dehydration�of�1�octanol�to�DNOE�was�investigated�in�a�stirred�tank�reactor�at�
413�453� K� over� Amberlyst� 70.� Preliminary� experiments� showed� that� neither� internal�
nor�external�mass�transfer�limitations�occurred�by�working�with�masses�of�1�2�grams�of�
catalyst�with�commercial�bead�size�of�Amberlyst�70�and�500�rpm�of�stirring�speed.�
Kinetic� equations� based� on� LHHW�RE� mechanisms� were� fitted� to� rate� data.� The�
reaction� at� the� catalyst� surface� was� assumed� to� be� the� limiting� step.� Kinetic� models�
fitted�to�rate�data�of�pure�1�octanol�as�reactant�revealed�that�kinetic�models�where�1�
octanol�and�water�are�the�adsorbed�compounds� in� the�resin�and�the� fraction�of� free�
active�sites�is�negligible�fit�the�best.��
Apparent�activation�energies�of�120±7�kJ�mol�1�were�determined�through�these�type�
of�models.�Water,�DNOE�and�solvent�(1,4�dioxane)�influence�on�the�reaction�rate�was�
evaluated.�DNOE�and�1,4�dioxane�did�not�show�significant�effects�on�the�reaction�rate�
whereas�water�showed�a�strong�inhibition�effect.��
Langmuir� and� Freundlich� isotherms,� as� well� as� variations� of� Langmuir� isotherm�
found�in�literature�and�proposed�in�this�work�were�used�to�quantify�the�fraction�of�acid�
sites�in�the�catalyst�blocked�by�water.�LHHW�ER�mechanistic�models�were�corrected�by�
the� fraction� of� active� sites� not� blocked� by� water� according� to� different� adsorption�
isotherms.� Freundlich� isotherm� was� found� to� describe� better� the� water� inhibition�
effect� in� a� scenario� where� one� molecule� of� 1�octanol� adsorbed� reacts� with� another�
molecule� of� 1�octanol� of� the� liquid� phase� in� a� Eley�Rideal� mechanism.� Activation�
energy� determined� by� fitting� the� model� found� to� the� whole� range� of� rate� data� was�
110±5�kJ�mol�1.�
Secondly,� a� kinetic� study� was� performed� for� DNHE� and� DNOE� syntheses� over�
zeolites,�and�their�results�compared�to�literature�data�of�DNPE�synthesis.�Two�reaction�
rate� equations� based� on� LHHW� and� ER� mechanisms� were� proposed� for� DNHE� and�
DNOE�syntheses.�Both�equations�assume�that�surface�reaction�is�the�rate�limiting�step�
7.�Kinetic�study�
160�
and� the� fraction� of� free� active� sites� is� negligible.� The� first� equation� assumes� that�
alcohol� and� ether� are� adsorbed� in� the� zeolite� surface,� in� agreement� with� kinetic�
equation�found�in�literature�for�DNPE�synthesis.�The�second�one�assumes�that�alcohol�
and�water�preferably�adsorb�through�the�reaction.�The�latter�was�found�for�DNHE�and�
DNOE�syntheses�only�over�H�BEA�25�and�H�FAU�30,� respectively.�Apparent�activation�
energy�of�100�120�kJ/mol�was�estimated�for�the�reactions�on�tested�zeolites.�
�
�
�
�
�
�
�

�
�
CHAPTER�8�
SUMMARY��
�
�
�
�
�
�
�
�
�
�
�
�
�
�
�
�

�
�
�
�
�
�
�
�
�
�
�
�
�
�
�
�
�
�
�
�
�
�
�
�
8.�Summary�
163�
Summary��
It� has� been� seen� that� diesel� combustion� in� a� diesel� engine� is� a� complex� process�
where�several�pollutants�are�emitted�in�the�engine�exhausts.�To�solve�this�problem�and�
at� the� same� time� accomplish� with� the� increasingly� stringent� regulations� for� diesel�
composition,�diesel�reformulation�with�oxygenate�compounds�is�proposed.��
Linear� symmetrical� ethers� with� more� than� 9� carbon� atoms� represent� a� group� of�
oxygenate� compounds� with� excellent� properties� as� diesel� additives.� Its� addition� in�
small�quantities� to�diesel�enhances� the�blending�cetane�number,� improves�cold� start�
performance� of� diesel� engine� and� dilutes� sulfur� and� other� non�desired� diesel�
components,� such�as�PAHs.�C10�C16� linear�ethers�such�as�DNPE,�DNHE�and�DNOE� are�
three� linear�symmetrical�ethers�with�excellent�properties� to�be�added�to�commercial�
diesel.�
This�work�proves�that�the�synthesis�of�DNOE�from�1�octanol�dehydration�over�acid�
catalysts�(acidic�zeolites�and�PS�DVB�ion�exchange�resins)� is�possible�at�413�473�K.�At�
the� same� time,� the� present� work� continues� with� the� series� of� synthesis� of� linear�
symmetrical�ethers�from�n�alcohols�started�with�DNPE�and�DNHE�in�previous�works.�
A� catalyst� screening� of� acidic� PS�DVB� ion� exchange� resins� showed� best�
performances� to� yield� DNPE,� DNHE� and� DNOE� selectively� on� low�crosslinked�
macroreticular�and�gel�type� resins�with�high�acid�capacity.�The�ability� to� swell� in� the�
reaction�media�of� low�crosslinked�and�gel�type� resins� can�be�proved�with� their�high�
volume�of� swollen� polymer� (Vsp)� values� characterized� with� the� ISEC� technique.� This�
way,� the�elastic�polymer�matrix�of� these�resins�allowed�the�diffusion�of�alcohols�and�
ethers�almost�equally�regardless�the�length�of�the�molecules.�
On�medium�and�large�pore�zeolites�synthesis�of�linear�symmetrical�ether�was�found�
to�be�strongly�related�to�the�zeolites�mesoporous�surface�and�the�acid�sites�number.�
Selectivity�to�linear�ether�generally�followed�the�trend:�|}~����}� { |�~������ { |���������which�
revealed� a� great� steric� hindrance� for� bulky� molecules.� Reaction� rates� of� alcohol�
consumption� doubled� their� values� each� 10� K� increase� but� selectivity� to� linear� ether�
8.�Summary�
164�
declined.�The�large�pore�zeolite�H�BEA�25�showed�the�best�yield�of�linear�ether�due�to�
the�combination�of�high�conversion�of�alcohol�and�high�selectivity�to�linear�ether.�
Thermodynamic� equilibrium� constants� of� 1�pentanol� and� 1�hexanol� dehydration�
reactions�to�DNPE�and�DNHE�respectively�were�determined�in�previous�works.� In�this�
work,� the� thermodynamic� equilibrium� constant� of� 1�octanol� dehydration� to� DNOE�
was� determined,� proving� that� dehydration� of� 1�octanol� to� DNOE� is� an� exothermic�
reaction� (�rH0� (298.15� K)� =� �13.6±1.7� kJ�mol�1).� The� study,� allowed� at� the� same� time�
improving�current�methods�to�estimate�molar�entropy�of�DNOE,�this�way�the�value�of�
658�±4�kJ�mol�1�K�1�was�proposed�for�molar�entropy�of�DNOE�at�298.15�K.�A�review�of�
the�literature�data�for�DNPE�and�DNHE�equilibrium�constants�showed�that�the�reaction�
enthalpy�change�tends�to�be�more�exothermic�as�the�ether�chain�gets�longer.�
A� kinetic� study� of� the� alcohol� dehydration� to� linear� ether� was� performed� over�
zeolites�and�the�thermostable�resin�Amberlyst�70.��
Over�Amberlyst� 70� a� series� of� kinetic� equations� based� on� LHHW�RE� mechanisms�
were� fitted� to� rate� data� of� 1�octanol� dehydration� to� DNOE.� Pure� 1�octanol�
experiments�revealed�that�kinetic�models�where�1�octanol�and�water�are�the�adsorbed�
compounds�in�the�resin�and�the�fraction�of�free�active�sites�is�negligible�fit�the�best.�In�
this�case�apparent�activation�energies�of�120�±�7�kJ�mol�1�were�determined.�Influence�
of�products�(water�and�DNOE)�and�solvent�(1,4�dioxane)�was�evaluated�which�revealed�
a�strong�inhibition�effect�of�water.�
Inhibition� effect� of� water� was� quantified� by� means� of� correction� factors� which�
described� the� fraction� of� active� sites� not� blocked� by� water� according� to� different�
adsorption� isotherms.� Freundlich� isotherm� was� found� to� better� describe� the� water�
inhibition�effect�in�an�scenario�where�one�molecule�of�1�octanol�adsorbed�reacts�with�
another� molecule� of� 1�octanol� of� the� liquid� phase� in� a� Rideal�Eley� mechanism.�
Activation�energy�determined�accounting�water�deactivation�was�110�±�5�kJ�mol�1.�
Over�zeolites,�a�kinetic�study�was�performed�for�DNHE�and�DNOE�synthesis�and�was�
compared�with�that�of�DNPE�in�the�literature.�LHHW�RE�kinetic�models�were�fitted�to�
rate�data�for�DNHE�and�DNOE�synthesis�showing�that�the�best�kinetic�models�assume�
8.�Summary�
165�
that� the� fraction� of� active� sites� is� negligible.� Within� these� models,� two� type� of�
equations�were�found�to�best�represent�rate�data,�one�assumes�that�alcohol�and�linear�
ether�are�adsorbed� in� the�zeolite�surface,�which�agreed�with�kinetic�equation� found�
for�DNPE�synthesis.�The�other�equation�assumes�that�alcohol�and�water�are�preferably�
adsorbed�through�the�reaction.�Apparent�activation�energy�of�100�120�kJ�mol�1�were�
estimated�for�the�reactions�on�tested�zeolites.�
�
�
�
�
�
�
�
�
�
�
�
�
�
�
�
�
�
�

�
�
�
�
�
�
�
�
�
�
�
�
�
�
�
�
�
�
�
�
�
�
�
�

�
�
CHAPTER�9�
References,�nomenclature,�list�of�tables,�equations�and�figures�
�
�
�
�
�
�
�
�
�
�
�
�

�
�
�
�
�
�
�
�
�
�
�
�
�
�
�
�
�
�
�
�
�
�
�
�
9.�References,�nomenclature,�list�of�tables,�equations�and�figures�
169�
9.1�References�
[1]� J.�P.�Wauquier.�Crude�oil,�Petroleum�Products,�Process�Flowsheets.�Paris:�
Technip,�1995.�
[2]� M.�Fahim,�T.�Al�Sahhaf,�A.�Elkilani.�Fundamentals�of�Petroleum�Refining.�
Elsevier,�2010.�
[3]� www.epicphysics.com�
[4]� www.springerimages.com�
[5]� I.�Ciria.�“Estudio�de�la�combustión�en�motores�diésel,”�
www.wearcheckibérica.es.�
[6]� M.J.Murphy,�J.D.�Taylor�and�R.L.�McCormick,�“Compendium�of�Experimental�
Cetane�Number�Data,”�National�Renewable�Energy�Laboratory,�2004.��
[7]� S.N.�Soid,�Z.A.�Zainal.�“Spray�and�combustion�characterization�for�internal�c
�ombustion�engines�using�optical�measuring�techniques��a�review,”�Energy,�vol.�
36,�pp.�724�741,�2011.�
[8]� EPA�web�site:�www.epa.org.�
[9]� EPA�technical�bulletin:�EPA�456/F�99�006R,�“Nitrogen�Oxides�(NOx),�Why�and�
How�They�are�Controlled,”�1999.�
[10]� EPA�technical�bulletin:�EPA�452/R�11�004a,�“Policy�Assessment�for�the�Review�
of�the�Secondary�National�Ambient�Air�Quality�Standards�for�Oxides�of�Nitrogen�
and�Oxides�of�Sulfur,”�2011.�
[11]� EPA�technical�bulletin:�EPA420�R�00�026,�“Regulatory�Impact�Analysis:�Heavy�
Duty�Engine�and�Vehicle�Standards�and�Highway�Diesel�Sulfur�Control�
Requirements,”�2000.�
[12]� EPA�technical�bulletin:�EPA420�P�01�001.�“Strategies�and�Issues�in�Correlating�
Diesel�Fuel�Properties�with�Emissions,”2001.�
[13]� N.�O.�Nylund,�P.�Aakko,�S.�Niemi,�T.�Paanu,�R.�Berg,�“Alcohols/Ethers�as�
�Oxygenates�in�Diesel�Fuel:�Properties�of�Blended�Fuels�and�Evaluation�of�
Practical�Experiences,”�Annex�XXVI�of�the�27th�Meeting�of�IEA�Implementing�
Agreement�on�Advanced�Motor�Fuels.�Report�TEC�3/2005,�2005.�
9.�References,�nomenclature,�list�of�tables,�equations�and�figures�
170�
[14]� R.�O.�Dunn,�“Effects�of�minor�constituents�on�cold�flow�properties�and�
performance�of�biodiesel,”�Prog.��Energy��Combust.�Sci.,�vol.�35,�pp.�481�489,�
2009.�
[15]� M.�Kozak,�J.�Merkisz,�“Some�considerations�on�the�oxygenated�fuels�for�diesel�
engines,”�TEKA�Kom.�Mot.�Energ.�Roln.��OL�PAN,�vol.�7,�pp.�129�136,�2007.�
[16]� H.G�Pöttering,�P.�Necas,�“Directive�2009/30/EC�of�the�European�parliament�and�
of� the� Council� of� 23� April� 2009� amending� Directive� 98/70/EC� as� regards� the�
specification�of�petrol,�diesel�and�gas�oil� introducing�a�mechanism�to�monitor�
and� reduce� greenhouse� gas� emissions� and� amending� Council� Directive�
1999/32/EC�as�regards�the�specification�of�fuel�used�by�inland�waterway�vessels�
and�repealing�Directive�93/12/EC,”�Off.�J.�Eur.�Union,�vol.�140,�88�112,�2009.��
[17]� B.C.�Dunn,�C.�Guenneau,�S.�A.�Hilton,�J.�Pahnke,�E.�M.�Eyring,�“Production�of�
diethyl�carbonate�from�ethanol�and�carbon�monoxide�over�a�heterogeneous�
catalyst,”�Energy�Fuels,�vol.�16,�pp.�177�181,�2002.�
[18]� Y.�Ren,�Z.�H.�Huang,�D.�M.�Jiang,�L.�X.�Liu,�K.�Zeng,�B.�Liu,�X.�B.�Wang,�“Engine�
performance�and�emission�characteristics�of�a�compression�ignition�engine�
fuelled�with�diesel/dimethoxymethane�blends,”J.�of�Autom.�Engin.,�vol.�219,�pp.�
905�914,�2005.�
[19]� International�Energy�Agency�web:�www.iea.org.��
[20]� P.�S.�Caro,�Z.�Mouloungui,�G.�Vaitilingom,�J.�C.�Berge,�“Interest�of�combining�an�
additive�with�diesel�ethanol�blends�for�use�in�diesel�engines,”�Fuel,�vol.�80,�pp.�
565�574,�2001.�
[21]� X.�Shi,�Y.�Yu,�H.�He,�S.�Shuai,�J.�Wang,�R.�Li,�“Emission�characteristics�using�
methyl�soyate�ethanol�diesel�fuel�blends�on�a�diesel�engine,"�Fuel,�vol.�84,�pp.�
1543�1549,�2005.�
[22]� A.C.�Hansen,�Q.�Zhang,�P.�Lyne,�“Ethanol�diesel�fuels�A�review,”�Bioresour.�
Technol.�vol.�96,�pp.�277�285,�2005.�
[23]� A.S.�Ramadhas,�S.�Jayaraj,�C.�Muraleedharan,�“Use�of�vegetable�oils�as�I.C.�
engine�fuels�–A�review,”�Renewable�Energy,�vol.�29,�pp.�727�742,�2004.�
[24]� M.�N.�Nabi,�M.�Akhter,�M.�Z.�Shahadat,�“Improvement�of�engine�emissions�with�
conventional�diesel�fuel�and�diesel�biodiesel�blends,”�Bioresour.�Technol.,�vol.�
97,�pp.�372�378,�2006.�
9.�References,�nomenclature,�list�of�tables,�equations�and�figures�
171�
[25]� D.C.�Drown,�K.�Harper,�E.�Frame,�“Screening�vegetable�oil�alcohol�esters�as�fuel�
lubricity�enhancers,”�J.�Am.�Oil�Chem.�Soc.,�vol.�78,�pp.�579�584,�2001.�
[26]� S.�Win�Lee,�T.�Herage,�B.�Young,�“Emission�reduction�potential�from�the�
combustion�of�soy�methyl�ester�fuel�blended�with�petroleum�distillate�fuel”,�
Fuel,�vol.�83,�pp.�1607�1613,�2004.�
[27]� D.�Altiparmak,�A.�Keskin,�A.�Koca,�M.�Gürü,�“Alternative�fuel�properties�of�tall�oil�
fatty�acid�methyl�ester�diesel�fuel�blends,”Bioresour.�Technol.,�vol.�98,�pp.�241�
246,�2007.�
[28]� L.A.�Johnson,�E.G.�Hammond,�US�Patent�5.520.708,�1996.�
[29]� G.�Knothe,�“Dependence�of�biodiesel�fuel�properties�on�the�structure�of�
structure�of�fatty�acid�alkyl�esters,”Fuel�Process.Technol,�vol.�86,�pp.�1059�1070,�
2005.�
[30]� Z.�H.�Huang,�D.M.�Jiang,�K.�Zeng,�B.�Liu�Z.�L.�Yang,�“Combustion�characteristics�
and�heat�release�analysis�of�a�direct�injection�compression�ignition�engine�
fuelled�with�diesel—dimethyl�carbonate�blends,”��J.�Automob.�Eng.,�vol.�217,�
pp.�595�605,�2003.��
[31]� J.�A.�Kenar,�G.�Knothe,�R.O.�Dunn,�T.�W.�Ryan,�A.�Matheaus,�“Physical�properties�
of�oleochemical�carbonates,”�J.�Am.�Oil�Chem.�Soc.,�vol.�82,�pp.�201�205,�2005.�
[32]� G.A.�Olah,�US�Patent�WO�95/25153,�1995.�
[33]� Z.�Huang,�H.�Wang,�H.�Chen,�L.�Zhou,�D.�Jiang,�“Study�of�combustion�
�characteristics�of�a�compression�ignition�engine�fuelled�with�dimethyl�ether,”�J.��
Automob.�Eng.,�vol.�213,�pp.�647�652,�1999.�
[34]� H.�Teng,�J.C.�McCandless,�J.B.�Schneyer,�“Thermochemical�Characteristics�of�
Dimethyl�Ether�–�An�alternative��Fuel�for�Compression�Ignition�Engines,”�SAE�
Technical�Paper�2001�01�0154,�2001,�doi:�10.4271/2001�01�0154.�
[35]� K.�Klepácova,�D.�Mravec,�A.�Kaszonyi,�M.�Bajus,�“Etherification�of�glycerol�and�
ethylene�glycol�by�isobutylene,”�Appl.�Catal.�A:�Gen.,�vol.�328,�pp.�1�13,�2007.�
[36]� C.�Beatrice,�C.�Bertoli,�N.D.�Giacomo,”New�findings�on�combustion�behavior�of�
oxygenated�synthetic�diesel�fuels,”�Combust.�Sci.�Technol.,�vol.�137,�pp.�31�50,�
1998.�
9.�References,�nomenclature,�list�of�tables,�equations�and�figures�
172�
[37]� T.�Dogu,�D.�Varisli,�Turk,�“Alcohols�as�Alternatives�to�Petroleum�for�
Environmentally�Clean�Fuels�and�Petrochemicals,”�J.�Chem.,�vol.�31,�pp.�551�
567,�2007.�
[38]� D.C.�Rakopoulos,�C.D.�Rakopoulos,�E.G.�Giakoumis,�A.M.�Dimaratos,�D.C.�
Kyritsis,�“Effects�of�butanol�diesel�blends�on�the�performance�and�emissions�of�
a�high�speed�DI�diesel�engine,”�Energy�Convers.�Manage.,�vol.�51,�pp.�1989�
1997,�2010.�
[39]� G.C.�Pecci,�M.G.�Clerici,�F.�Giavazzi,�F.�Ancillotti,�M.�Marchionna,�R.�Patrini,�
“Oxygenated�Diesel�Fuels.�Part�1�–�Structure�and�properties�correlation,”�ISAF,�
1993.�
[40]� G.�A.�Olah,��Cleaner�burning�and�cetane�enhancing�diesel� fuel�supplements,��
� U.S.�Patent�US�5520710,�1996.�
[41]� J.�Guilera,�R.�Bringué,�E.�Ramírez,�M.�Iborra,�J.�Tejero,�“Comparison�between�
ethanol�and�diethyl�carbonate�as�ethylating�agents�for�ethyl�octyl�ether�
synthesis�over�acidic�ion�exchange�resins,”�Ind.�Eng.�Chem.�Res.,�vol.�51,�pp.�
16525�16530,�2012.��
[42]� J.�Tejero,�F.�Cunill.�M.�Iborra,�J.F.�Izquierdo,�C.�Fité,�“Dehydration�of�1�pentanol�
to�di�n�pentyl�ether�over�ion�exchange�resin�catalysts,”�J.�Mol.�Catal.�A:�Chem.,�
vol.�182�183,�541�554,�2002.�
[43]� J.�Tejero,�C.�Fité,�M.�Iborra,�J.F.�Izquierdo,�F.�Cunill,�R.�Bringué,�“Liquid�phase�
dehydrocondensation�of�1�pentanol�to�di�n�pentyl�ether�(DNPE)�over�medium�
and�large�pore�acidic�zeolites,”��Microporous��Mesoporous.�Mater.,�vol.�117,�pp.�
650�660,�2009.�
[44]� R.�Bringué,�M.�Iborra,�J.�Tejero,�J.F.�Izquierdo,�F.�Cunill,�V.J.�Cruz,�“Thermally�
stable�ion�exchange�resins�as�catalysts�for�the�liquid�phase�dehydration�of�1�
pentanol�to�di�n�pentyl�ether�(DNPE),”�J.�Catal.,�vol.�244,�pp.�33�42,�2006.�
[45]� R.�Bringué,�J.�Tejero,�M.�Iborra,�J.F.�Izquierdo,�C.�Fité,�F.�Cunill,�“Experimental�
Study�of�the�Chemical�Equilibria�in�the�Liquid�Phase�Dehydration�of�1�Pentanol�
to�Di�n�pentyl�Ether,”�Ind.�Eng.�Chem.�Res.,�vol.�46,�pp.�6865�6872,�2007.�
[46]� R.�Bringué,�J.�Tejero,�M.�Iborra,�J.F.�Izquierdo,�C.�Fité,�F.�Cunill,�“Water�effect�on�
the�kinetics�of�1�pentanol�dehydration�to�di�n�pentyl�ether�(DNPE)�on�amberlyst�
70,”�Top.�Catal.,�vol.�45,�pp.�1�4,�2007.�
9.�References,�nomenclature,�list�of�tables,�equations�and�figures�
173�
[47]� R.�Bringué,�J.�Tejero,�M.�Iborra,�J.F.�Izquierdo,�C.�Fité,�F.�Cunill,�“Supported�
Nafion�catalyst�for�1�pentanol�dehydration�reaction�in�liquid�phase,”�Chem.�
Eng.�J.,�vol.�145,�pp.�135�141,�2008.�
[48]� E.�Medina,�R.�Bringué,�J.�Tejero,�M.�Iborra,�C.�Fité,�“Conversion�of�1�hexanol�to�
di�n�hexyl�ether�on�acidic�catalysts,”�App.�Catal.�A:�Gen.,�vol.�374,�pp.�41�47,�
2010.�
[49]� Fischer�Tropsch�Archive,�www.Fischer�Tropsch.org.�
[50]� D.P.�Krinkin,�D.M.�Rudkovskii,�A.G.�Trifel,�“Side�reactions�in�the�oxo�process,”�
Chem.�Technol.�Fuels�Oils,�vol.�1,�pp.�511–514,�1965.�
[51]� T.�Tsichida,�S.�Sakuma,�“Method�of�synthesizing�Higher�Molecular�Alcohol,”�US�
Patent�20070255079,�2007.�
[52] I.�Hoek,�T.A.�Nijhuis,�A.�I.�Stankiewicz,�J.�A.�Moulijn, “Kinetics�of�solid�acid�
catalysed�etherification�of�symmetrical�primary�alcohols:�zeolite�BEA�catalysed�
etherification�of�1�octanol,”�Appl.�Catal.�A:�Gen.,�vol.�266,�pp.�109�116,�2004.�
[53]� R.�J.�J.�Nel,�A.�de�Klerk,�“Dehydration�of�C5�C12�linear�1�alcohols�over���alumina�
to�fuel�ethers,”�Ind.�Eng.�Chem.�Res.,�vol.�48,�pp.�5230�5238,�2009.�
[54]� N.P.�Makgoba,�T.M.�Sakuneka,�J.G.�Koortzen,�C.�Van�Schalkwyk,�J.M�Botha,�C.P.�
Nicolaides,�“Silication�of���alumina�catalyst�during�the�dehydration�of�linear�
primary�alcohols,”�Appl.�Catal.�A:�Gen.,�vol.�297,�pp.�145�150,�2006.�
[55]� J.F.�Norris,�G.W.�Rigby,�“The�reactivity�of�atoms�and�groups�in�organic�
compounds,”�J.�Am.�Chem.�Soc.,�vol.�54,�pp.�2088�2100,�1932.�
[56]� A.�Corma�A,�H.�García,�“Crossing�the�borders�between�homogeneous�and�
heterogeneous�catalysis:�developing�recoverable�and�reusable�catalytic�
systems,”�Top.�Catal.,�vol.�48,�pp.�8�31,�2008.�
[57]� B.�Corain,�M.�Zecca,�K.�Je�ábek,�“Catalysis�and�polymer�networks�the�role�of�
morphology�and�molecular�accessibility,”�J.�Mol.�Catal.�A:�Chem.,�vol.�177,�pp.�
3�20,�2001.��
[58]� K.�Jerabek,�“Cross�evaluation�of�strategie,�size�exclusion�chromatography.�
(Inverse�steric�exclusion�chromatography�as�a�tool�for�morphology�
characterization),”�ACS�Symp.,�ser.�635,�pp.�211�224,�1996.�
[59]� IZA�web:�www.iza�structure.org.�
9.�References,�nomenclature,�list�of�tables,�equations�and�figures�
174�
[60]� J.F.�Izquierdo,�F.�Cunill,�J.�Tejero,�M.�Iborra,�C.�Fité.�Cinética�de�las�Reacciones�
Químicas.�Edicions�Universitat�de�Barcelona,�2004.�
[61]� P.K.� Kiviranta�Pääkkönen,� L.K.� Struckmann� (née� Rihko),� J.A.� Linnekoski,� A.O.I.�
Krause,� “Dehydration� of� the� alcohol� in� the� etherification� of� isoamylenes� with�
methanol�and�ethanol,”�Ind.�Eng.�Chem.�Res.,�vol.�37,�pp.�18�24,�1998.�
[62]� S.C.M.�dos�Reis,�E.R.�Lachter,�R.S.V.�Nascimento,� J.A.�Rodrigues� Jr.,�M.G.�Reid,�
“Transesterification�of�Brazilian�vegetable�oils�with�methanol�over�ion�exchange�
resins,”�J.�Am.�Oil�Chem.�Soc.,�vol.�82,�pp.�661�665,�2005.�
[63]� M.L.� Honkela,� A.� Root,� M.� Lindblad,� A.� Outi,� I.� Krause,� “Comparison� of� ion�
exchange�resin�catalysts� in� the�dimerization�of� isobutene,”�Appl.�Catal.�A,� vol.�
295,�pp.�216�223,�2005.�
[64]� Kapila�et�al.,�US�Patent�US2005/0137428A1�(2005).�
[65]� J.�Tejero,�A.�Zywert,�R.�Bringué,�S.�Kowalak,�E.�Janiszewska,�M.�Iborra,�“Zeolite�
catalysed�dehydration�of�alcohol�to�linear�ether,”�Stud.��Surf.�Sci.�Catal.,�vol.�174�
B,�pp.�1115�1118,�2008.�
[66]� S.� P.� Felix,� C,� Savill�Jovitt,� D.R.� Brown,� “Base� adsorption� calorimetry� for�
characterising� surface� acidity:� a� comparison� between� pulse� and� conventional�
“static”�techniques,”�Thermochimica�Acta,�vol.�433,�pp.�59�65,�2005.�
[67]� S.�Fischer,�R.�Kunin,�“Routine�exchange�capacity�determination�of�ion�exchange�
resins,”�Anal.�Chem.,�vol.�27,�pp.�1191,�1955.�
[68]� A.�Guyot,�D.C.�Sherrington,�in:�P.�Hodge�(Ed.).�Syntheses�and�Separations�Using�
Polymers�Supports.�Chichester�(UK):��Wiley,�1988.�
[69]� M.�Iborra,�J.�Tejero,�J.F.�Izquierdo,�F.�Cunill,�“Influence�of�resin�structure�on�the�
addition�of�ethanol�to�isobutene�in�the�vapor�phase,”�Br.�Polym.�J.,�vol.�23,�pp.�
117�127,�1990.�
[70]� G.� Leofanti,� M.� Padovan,� G.� Tozzola,� B.� Venturelli,� “Surface� area� and� pore�
texture�catalysts,”�Catal.�Today,�vol.�41,�pp.�207�219,�1998.�
[71]� R.� Kunin,� E.F.� Meitzner,� J.A.� Oline,� S.A.� Fischer,� N.� Frish,� “Characterization� of�
Amberlyst� 15.� Macroreticular� sulfonic� acid� cation� exchange� resin,”� Ind.� Eng.�
Chem.�Prod.�Res.�Dev.,�vol.�1,�pp.�140�144,�1962.�
9.�References,�nomenclature,�list�of�tables,�equations�and�figures�
175�
[72]� M.�Umar,�D.�Patel,�B.�Saha,�“Kinetic�studies�of�liquid�phase�ethyl�tert�butyl�ether�
(ETBE)�synthesis�using�macroporous�and�gelular�ion�exchange�resin�catalysts,”�
Chem.�Eng.�Sci.,�vol.�64,�pp.�4424�4432,�2009.�
[73]� K.�Sundmacher,�U.�Hoffmann,�“Macrokinetic�analysis�of�MTBE�synthesis�in�
chemical�potentials”,�Chem.�Eng.�Sci.,�vol.�49,�pp.�3077�3089,�1994.�
[74]� A.G.� Ogston,� “The� spaces� in� a� uniform� random� suspension� of� fibres,”� Trans.�
Faraday�Soc.,�vol.�54,�pp.�1754�1757,�1958.�
[75]� K.�Jerabek,�L.�Holub,�13th�International�IUPAC�Conference�on�Polymers�and�
Organic�Chemistry,�Montreal,�2009.�
[76]� A.J.�Lecloux,�Texture�of�Catalysts,�in�J.R.�Anderson,�M.�Boudart�(Eds.).�Catalysis�
Science�and�Technology.�Vol.�2.�Springer�Verlag,�1981.�
[77]� M.J.�Remy,�G.�Poncelet,�“A�new�approach�to�the�determination�of�the�external�
surface�and�micropore�volume�of�zeolites�from�the�nitrogen�adsorption�
isotherm�at�77�K,”�J.�Phys.�Chem.,�vol.�99,�pp.�773�779,�1995.�
[78]� E.P.�Barrett,�L.G.�Joyner,�P.P.�Halenda,�“The�determination�of�pore�volume�and�
area� distributions� in� porous� substances.� I.� Computations� from� nitrogen�
isotherms,”�J.�Am.�Chem.�Soc.,�vol.�73,�pp.�373�380,�1951.�
[79]� R.�Szostack.�Handbook�of�Molecular�Sieves.�New�York�:�Van�Nostrand�Reinhold,�
1992.�
[80]� M.�Kruk,�M.� Jaroniec,�A.�Sayari,� “Application�of� large�pore�MCM�41�molecular�
sieves�to�improve�pore�size�analysis�using�nitrogen�adsorption�measurements,”�
Langmuir,�vol.�13,�pp.�6267�6273,�1997.�
[81]� M.� Papajewska,� J.� Tejero,� E.� Medina,� R.� Bringué,� S.� Kowalak,� E.� Janiszewska,�
“Zeolites� as� catalysts� for� the� dehydration� reaction� of� 1�hexanol� to� di�n�hexyl�
ether�(DNHE),”�Proceedings�of�XIVth�Zeolite�Forum,�Kocierz,�pp.�287�292,�2007.�
[82]� A.� Zywert,� E.� Janiszewska,� R.� Bringué,� J.� F.� Izquierdo,� K.� Tejero,� S.� Kowalak,�
“Dehydration� of� alcohols� over� zeolite� catalysts,”� Proceedings� of� XVth� Zeolite�
Forum,��Kocierz,�pp.�221�226,�2008.��
[83]� A.A.� Nikolopoulos,� A.� Kogelbauer,� J.G.� Goodwin� Jr.,� G.� Marcelin,� “Effect� of�
dealumination� on� the� catalytic� activity� of� acid� zeolites� for� the� gas� phase�
synthesis�of�MTBE,”�Appl.�Catal.,�A,�vol.�119,�pp.�69�81,�1994.�
9.�References,�nomenclature,�list�of�tables,�equations�and�figures�
176�
[84]� S.� Ihm,� M.� Chung,� K.� Park,� “Activity� difference� between� the� internal� and�
external� sulfonic� groups� of� macroreticular� ion�exchange� resin� catalysts� in�
isobutylene�hydration�Ind,”�Eng.�Chem.�Res.,�vol.�27,�pp.�41�45,�1988.�
[85]� R.B.�Diemer�Jr.,�K.M.�Dooley,�B.C.�Gates,�R.L.�Albright,”Sulfonated�poly(styrene�
divinylbenzene)� catalysts:� III.� The� influence� of� polymer� physical� properties� on�
the�kinetics�of�methanol�dehydration,”�J.�Catal.,�vol.�74,�pp.�373�381,�1982.�
[86]� S.�Koujout,�B.M.�Kiernan,�D.R.�Brown,�H.G.M.�Edwards,�J.A.�Dale,�S.�Plant,�“The�
Nature� of� the� Internal� Acid� Solution� in� Sulfonated� Poly� (styrene�co�
divinylbenzene)�Resins,”�Catal.�Lett.,�vol.�85,�pp.�33�40,�2003.��
[87]� C.P.� Bezoukhanova,� Y.A.� Kalvachev,� “Alcohol� reactivity� on� zeolites� and�
molecular�sieves,”�Catal.�Rev.,�vol.�36,�pp.�125�143,�1994.�
[88] M.A.� Makarova,� E.A.� Paukshtis,� J.M.� Thomas,� C.� Williams,� K.I.� Zamaraev,�
“Dehydration�of�n�butanol�on�zeolite�H�ZSM�5�and�amorphous�aluminosilicate:�
Detailed�mechanistic�study�and�the�effect�of�pore�confinement,”�J.�Catal.,�vol.�
149,�pp.�36�51,�1994.�
[89]� M.A.�Makarova,�C.�Williams,�K.I.�Zamaraev,�J.M.�Thomas,�Mechanistic�study�of�
sec�butyl� alcohol� dehydration� on� zeolite� H�ZSM�5� and� amorphous�
aluminosilicate,”�J.�Chem.�Soc.,�Faraday�Trans.,�vol.�90,�pp.�2147�2153,�1994.�
[90]� K.J.�Balkus,�A.K.�Khanmamedova,�“Dehydration�of�methyl���hydroxybutyrate�
catalized�by�zeolites,”�J.�Catal.,�vol.�151,�pp.�10�16,�1995.�
[91]� T.�Barzetti,�E.�Selli,�D.�Moscotti,�L.�J.�Forni,�“Pyridine�and�ammonia�as�probes�for�
FTIR�analysis�of�solid�acid�catalysts,”�J.�Chem.�Soc.,�Faraday�Trans.,�vol.�92,�pp.�
1401�07,�1996.�
[92]� K.�Klier,�Q.�Sun,�O.C.�Feeley,�M.�Johansson,�R.G.�Herman,�“Coupling�of�alcohols�
to�ethers:�the�dominance�of�the�surface�SN2�reaction�pathway,”�Stud.�Surf.�Sci.�
Catal.,�vol.�101,�pp.�601�610,�1996.�
[93]� B.�Shi,�B.H.�Davis,�“Alcohol�dehydration:�mechanism�of�ether�formation�using�an�
alumina�catalyst,”�J.�Catal.,�vol.�157,�pp.�359�367,�1995.�
[94]� G.A.�Olah,�T.�Shamma,�G.K.�Surya�Prakash,�“Dehydration�of�alcohols� to�ethers�
over�Nafion�H,�a�solid�perfluoroalkanesulfonic�acid�resin�catalyst,”�Catal.�Lett.,�
vol.�46,�pp.�1�4,�1997.�
9.�References,�nomenclature,�list�of�tables,�equations�and�figures�
177�
[95]� I.�Halasz,�M.�Kornel,�“Pore�size�of�solids,”�Angew,�Chem.�Int.�Ed.�Engl.,�vol.�17,�
pp.�901�908,�1978.�
[96]� R.L.�Albright,�“Porous�polymers�as�an�anchor�for�catalysis,”�React.�Polym.,�vol.�4,�
pp.�155�174,�1986.�
[97]� A.� Thakur,� M.� Thakur,� P.V.� Khadikar,� C.T.� Supuran,� P.� Sudele,� “QSAR� study� on�
benzenesulphonamide� carbonic� anhydrase� inhibitors:� topological� approach�
using�Balaban�index,”�Bioorg.�Med.�Chem.,�vol.�12,�pp.�789�793,�2004.�
[98]� R.� Todeschini,� V.� Consonni.� Handbook� of� Molecular� Descriptors,� vol.� 11.�
Germany:�WILEY�VCH,�2000.�
[99]� S.� Kulprathipanja,� R.� B.� James.� Zeolites� in� Industrial� Separation� and� Catalysis.�
Germany:�Wiley�VCH,�2010.�
[100]� A.� Delion,� B.� Torck,� M.� Hellin,� “Equilibrium� Constant� for� the� Liquid�Phase�
Hydration� of� Isobutylene� over� Ion�Exchange� Resin,”� Ind.� Eng.� Chem.� Process�
Des.�Dev.,�vol.25,�pp.�889�893,�1986.�
[101]� R.� Bringué,� J.� Tejero,� M.� Iborra,� C.� Fité,� J.F.� Izquierdo,� F.� Cunill,� “Study� of� the�
Chemical�Equilibrium�of�the�Liquid�Phase�Dehydration�of�1�Hexanol�to�Dihexyl�
Ether,”�J.�Chem.�Eng.�Data,�vol.�53,�pp.�2854�2860,�2008.�
[102]� P.� Atkins,� J.� Paula,� Physical� Chemistry� for� the� life� sciences.� New� York:� W.H.�
Freeman�and�Company,�2006.�
[103]� R.�Witting,�J.�Lohmann,�“Vapor�Liquid�Equilibria�by�UNIFAC�Group�Contribution.�
6.�Revision�and�Extension,”Ind.�Eng.�Chem.�Res.,�vol.�42,�pp.�183�188,�2003.�
[104]� J.W.Kang,� V.� Diky,� R.D.� Chirico,� J.W.� Magee,� C.D.� Muzny,� I.� Abdulagatov,� A.F.�
Kazakov,� M.� Frenkel,”A� new� method� for� evaluation� of� UNIFAC� interaction�
parameters,”�Fluid�Phase�Equilibria,�vol.�309,�pp.�68�75,�2011.�
[105]� Saadet�Ulas.�Uncertainties� in�Chemicals�Biological�and�Molecular�Systems�and�
Optimal�Control.�ProQuest:�Michigan,�2007.�
[106]� J.M.� Smith,� H.C.� Van� Ness,� M.M.� Abbot.� Introduction� to� Chemical� Engineering�
Thermodynamics.�Ohio:�McGraw�Hill,�1996.�
[107]� R.C.�Reid,�J.M.�Prausnitz,�B.E.�Poling.�The�properties�of�Gases�and�Liquids.�New�
York:�McGraw�Hill,�1987.�
[108]� D.M.� Himmelblau.� Process� Analysis� by� Statistical� Methods.� New� York:� John�
Wiley�&�Sons,�1970.�
9.�References,�nomenclature,�list�of�tables,�equations�and�figures�
178�
[109]� D.R.� Stull,� E.F.,� Jr.� Westrum,� G.C.� Sinke.� The� Chemical� Thermodynamics� of�
Organic�Compounds.�New�York:�John�Wiley,�1969.�
[110]� C.L.�Yaws,�X.�Pan,�“Liquid�Heat�Capacity� for�Organics,”Chem.�Eng.,� vol.�99,�pp.�
130�134,�1992.�
[111]� J.� C.� van� Miltenburg,� H.� Gabrielova,� K.� Ruzicka,� “Heat� capacities� and� derived�
thermodynamic� functions� of� 1�hexanol,� 1�heptanol,� 1�octanol,� and� 1�decanol�
between�[5�K�and�390�K,”�J.�Chem.�Eng.�Data,�vol.�48,�pp.�1323�1331,�2003.��
[112]� D.R.�Lide.�Handbook�of�Chemistry�and�Physics.�Boca�Ratón:�CRC,�2009.�
[113]� S.P.� Verevkin,� “Improved� Benson� Increments� for� the� Estimation� of� Standard�
Enthalpies�of�Formation�and�Enthalpies�of�Vaporization�of�Alkyl�Ethers,�Acetals,�
Ketals,�and�Ortho�Esters,”�J.�Chem.�Eng.�Data,�vol.�47,�pp.�1071�1097,�2002.�
[114]� M.W.�Jr.�Chase,�“NIST�JANAF�Thermochemical�Tables,”�J.�Phys.�and�Chem.�Ref.�
Data,�vol.�9,�pp.�1�1951,�1998.�
[115]� I.N.�Levine.�FISICOQUIMICA�vol.�1.�Madrid:�McGraw�Hill,�1996.�
[116]� G.� Liessmann,� W.� Schmidt,� S.� Reiffarth,� “Recommended� Thermophysical� Data,�
”Data�compilation�of�the�Saechische�Olefinwerke�Boehlen,”pp.�11,�13,�1995.�
[117]� M.�Shacham,�N.�Brauner,�G.�St.�Cholakov,�R.�P.�Stateva,�“Property�Prediction�by�
Correlations�Based�on�Similarity�of�Molecular�Structures”,�AIChE�J.,�vol.�50,�pp.�
2481�2492,�2004.�
[118]� E.� du� Toit,� W.� Nicol.� “The� rate� inhibiting� effect� of� water� as� a� product� on�
reactions�catalysed�by�cation�exchange�resins:�formation�of�mesityl�oxide�from�
acetone�as�case�study,”�App.�Catal.�A:�Gen.,�vol.�277,�pp.�219�225,�2004.�
[119]� E.�du�Toit,�R.�Schwarzer,�W.�Nicol. Acetone�condensation�on�a�cation�exchange�
resin�catalyst:�the�pseudo�equilibrium�phenomenon�Chem.�Eng.�Sci.,�vol.�59,�pp.�
5545�5550,�2004.�
[120]� U.�Limbeck,�C.�Altwicker,�U.�Kunz,�U.�Hoffmann.�“Rate�expression�for�
THFsynthesis�on�acidic�ion�exchange�resin,”�Chem.�Eng.�Sci.,�vol.�56,�pp.�2171�
2178,�2001.�
[121]� B.�Yang,�M.�Maeda,�S.�Goto.�Kinetics�of�liquid�phase�synthesis�of�tert�amyl�
methyl�ether�from�tert�amyl�alcohol�and�methanol�catalyzed�by�ion�exchange�
resin,”�J.�Chem.�Kinet.,�vol.�30,�pp.�137�143,�1997.�
9.�References,�nomenclature,�list�of�tables,�equations�and�figures�
179�
[122]� B.� Yang,� S.� Yang,� R.� Yao.� “Synthesis� of� ethyl� tert�butyl� ether� from� tert�butyl�
alcohol� and� ethanol� on� strong� acid� cation�exchange� resins,”� React.� Funct.�
Polym.,�vol.�44,�pp.�167�175,�2000.�
[123]� R.� Bringué,� “Thermally� stable� ion�exchange� resins� as� catalysts� for� the� liquid�
phase�dehydration�of�1�pentanol�to�di�n�pentyl�ether”.�Phd�Thesis.�University�of�
Barcelona,�2007.�
�
9.2�Nomenclature�
Notation�
A�� � constant�A�(function�of�temperature)�
A�� � preexponential�term,�mol�h�1�kg�1�
a1� � first�parameter�of�constant�A�
a2�� � second�parameter�of�constant�A,�K�
aj�� � activity�of�compound�j�
aj� � activity�of�compound�j�
B�� � constant�B�(function�of�temperature)�
b1�� � first�parameter�of�constant�B�
b2�� � second�parameter�of�constant�B,�K�
C�� � constant�C�(function�of�temperature)�
c1�� � first�parameter�of�constant�C�
c2�� � second�parameter�of�constant�C,�K�
cj� � concentration�of�compound�j�(mol�L�1)�
W�� � concentration�of�compound�j�adsorbed�in�the�surface�(mol�L�1)�
W¥)«)��� � molar�heat�capacity�of�compound�j�(J�mol�1�K�1)�
WìÓ�� � concentration�of�vacant�active�sites�(mol�L�1)�
D�� � constant�D�(function�of�temperature)�
d1�� � first�parameter�of�constant�D�
9.�References,�nomenclature,�list�of�tables,�equations�and�figures�
180�
d2�� � second�parameter�of�constant�D,�K�
db� � bead�size�(mm)�
dp�� � particle�diameter�(mm)�
dpore� � pore�diameter�(nm)�
Ea� � activavion�energy�(kJ�mol�1)�
f�(aH2O)�� correction�factor�
J� � Balaban�Index�
K�� � chemical�equilibrium�constant�
³6�� � equilibrium�constant�of�surface�chemical�reaction��
g4%� � apparent�rate�constant�of�direct�reaction�at�the�surface,�mol�h�1�kg�1��
K0�� � true�rate�constant�of�direct�reaction,�mol�h�1�kg�1��
Ka,A� � adsorption�equilibrium�constant�of�A�
Ka,j�� � adsorption�constant�of�compound�j�
kd,A� � rate�constant�of�A�desorption�(m3�(g�s)�1)�
KH2O�� � adsorption�constant�of�water�
KH2O�(1)�� first�parameter�of�constant�KH2O�
KH2O�(2)�� second�parameter�of�constant�KH2O,�K�
Kx� � equilibrium�constant�as�a�function�of�molar�fractions�
³½� �� � Poynting�correction�factor�for�reaction�i�
K��� � Freundlich�parameter,�K�
K�� � equilibrium�constant�as�a�function�of�activity�coefficients�
Mw� � molecular�weight�(g�mol�1)�
\���� � initial�number�of�moles�of�j�(mol)�
n�� � number�of�active�centres�involved�in�the�chemical�reaction�
N�� � stirring�speed,�rpm�
nj�� � number�of�moles�of�j�(mol)�
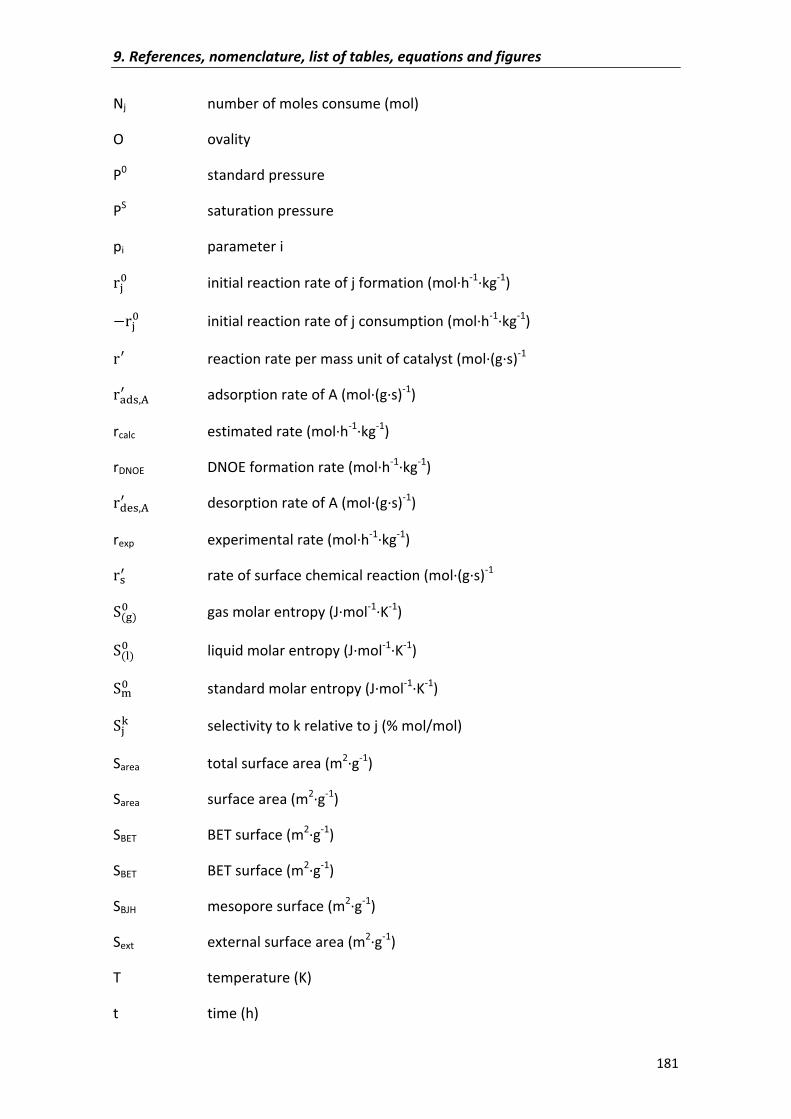
9.�References,�nomenclature,�list�of�tables,�equations�and�figures�
181�
Nj� � number�of�moles�consume�(mol)�
O� � ovality�
P0� � standard�pressure�
PS� � saturation�pressure�
pi�� � parameter�i�
Y���� � initial�reaction�rate�of�j�formation�(mol�h�1�kg�1)�
�Y���� � initial�reaction�rate�of�j�consumption�(mol�h�1�kg�1)�
Y7�� � reaction�rate�per�mass�unit�of�catalyst�(mol�(g�s)�1�
Y¢�±)¼7 �� � adsorption�rate�of�A�(mol�(g�s)�1)�
rcalc� � estimated�rate�(mol�h�1�kg�1)�
rDNOE�� � DNOE�formation�rate�(mol�h�1�kg�1)�
Y�r±)¼7 �� � desorption�rate�of�A�(mol�(g�s)�1)�
rexp� � experimental�rate�(mol�h�1�kg�1)�
Y±7 �� � rate�of�surface�chemical�reaction�(mol�(g�s)�1�
L��� �� � gas�molar�entropy�(J�mol�1�K�1)�
L�£�� �� � liquid�molar�entropy�(J�mol�1�K�1)�
L«� �� � standard�molar�entropy�(J�mol�1�K�1)�
L�� � selectivity�to�k�relative�to�j�(%�mol/mol)�
Sarea�� � total�surface�area�(m2�g�1)�
Sarea� � surface�area�(m2�g�1)�
SBET�� � BET�surface�(m2�g�1)�
SBET� � BET�surface�(m2�g�1)�
SBJH� � mesopore�surface�(m2�g�1)�
Sext� � external�surface�area�(m2�g�1)�
T�� � temperature�(K)�
t� � time�(h)�
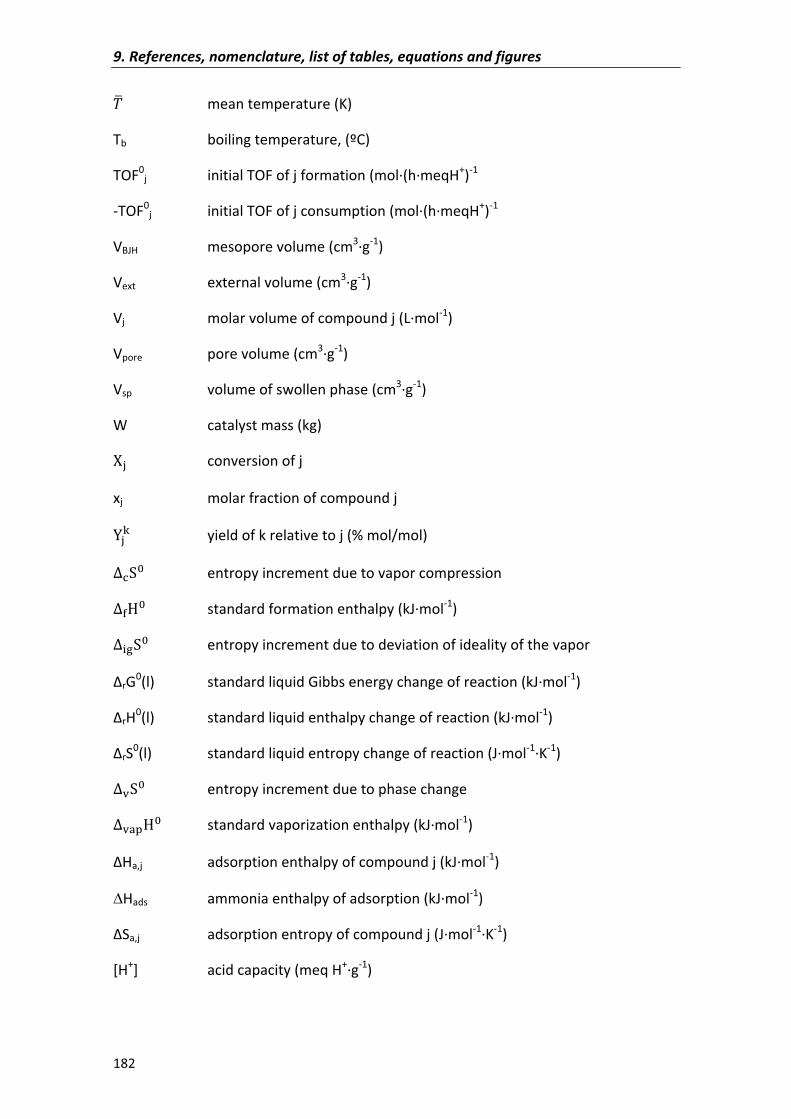
9.�References,�nomenclature,�list�of�tables,�equations�and�figures�
182�
ÅÌ �� � mean�temperature�(K)�
Tb� � boiling�temperature,�(ºC)�
TOF0j� � initial�TOF�of�j�formation�(mol�(h�meqH+)�1�
�TOF0j� � initial�TOF�of�j�consumption�(mol�(h�meqH+)�1�
VBJH�� � mesopore�volume�(cm3�g�1)�
Vext�� � external�volume�(cm3�g�1)�
Vj� � molar�volume�of�compound�j�(L�mol�1)�
Vpore�� � pore�volume�(cm3�g�1)�
Vsp� � volume�of�swollen�phase�(cm3�g�1)�
W�� � catalyst�mass�(kg)�
H��� � conversion�of�j�
xj� � molar�fraction�of�compound�j�
P�� � yield�of�k�relative�to�j�(%�mol/mol)�
Ï_L��� � entropy�increment�due�to�vapor�compression�
ÏÕl��� � standard�formation�enthalpy�(kJ�mol�1)�
Ï�ÔL��� � entropy�increment�due�to�deviation�of�ideality�of�the�vapor�
�rG0(l)� � standard�liquid�Gibbs�energy�change�of�reaction�(kJ�mol�1)�
�rH0(l)� � standard�liquid�enthalpy�change�of�reaction�(kJ�mol�1)�
�rS0(l)� � standard�liquid�entropy�change�of�reaction�(J�mol�1�K�1)�
ÏÓL��� � entropy�increment�due�to�phase�change�
ÏÓ¢¥l��� standard�vaporization�enthalpy�(kJ�mol�1)�
�Ha,j� � adsorption�enthalpy�of�compound�j�(kJ�mol�1)�
�Hads� � ammonia�enthalpy�of�adsorption�(kJ�mol�1)�
�Sa,j�� � adsorption�entropy�of�compound�j�(J�mol�1�K�1)�
[H+]� � acid�capacity�(meq�H+�g�1)�
�
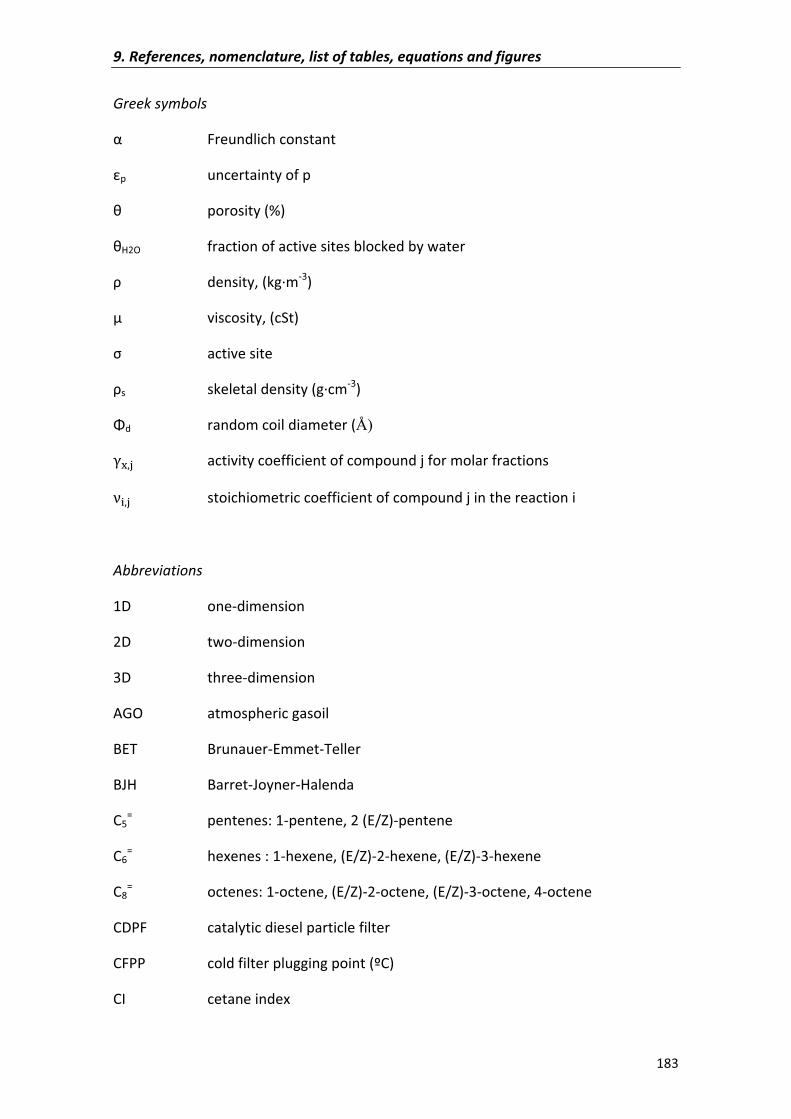
9.�References,�nomenclature,�list�of�tables,�equations�and�figures�
183�
Greek�symbols�
��� � Freundlich�constant�
�p�� � uncertainty�of�p�
��� � porosity�(%)��
�H2O�� � fraction�of�active�sites�blocked�by�water�
� � density,�(kg�m�3)�
μ� � viscosity,�(cSt)�
� � active�site�
s�� � skeletal�density�(g�cm�3)�
�d� � random�coil�diameter�(Å)
�¤)��� � activity�coefficient�of�compound�j�for�molar�fractions�
Á�)��� � stoichiometric�coefficient�of�compound�j�in�the�reaction�i�
�
Abbreviations�
1D� � one�dimension�
2D� � two�dimension�
3D� � three�dimension�
AGO� � atmospheric�gasoil�
BET�� � Brunauer�Emmet�Teller�
BJH� � Barret�Joyner�Halenda�
C5=�� � pentenes:�1�pentene,�2�(E/Z)�pentene�
C6=� � hexenes�:�1�hexene,�(E/Z)�2�hexene,�(E/Z)�3�hexene�
C8=� � octenes:�1�octene,�(E/Z)�2�octene,�(E/Z)�3�octene,�4�octene�
CDPF� � catalytic�diesel�particle�filter�
CFPP� � cold�filter�plugging�point�(ºC)�
CI� � cetane�index�
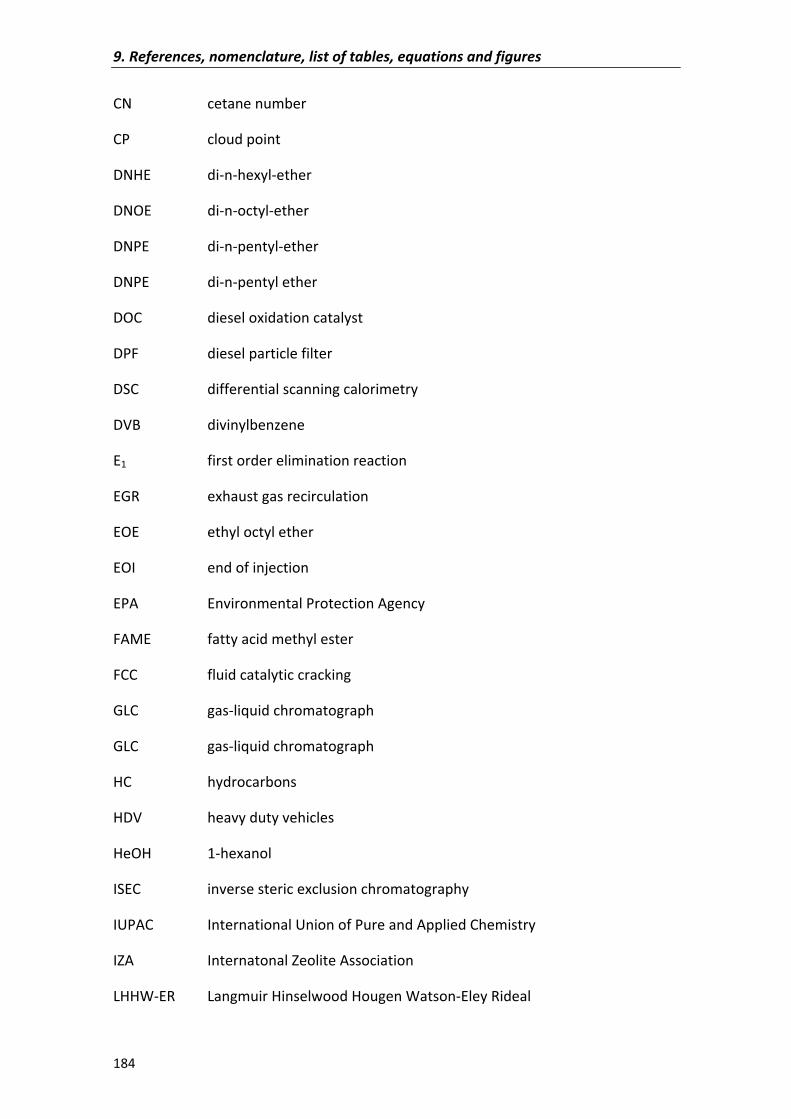
9.�References,�nomenclature,�list�of�tables,�equations�and�figures�
184�
CN� � cetane�number�
CP� � cloud�point�
DNHE�� � di�n�hexyl�ether�
DNOE�� � di�n�octyl�ether�
DNPE�� � di�n�pentyl�ether�
DNPE� � di�n�pentyl�ether�
DOC� � diesel�oxidation�catalyst�
DPF� � diesel�particle�filter�
DSC� � differential�scanning�calorimetry�
DVB� � divinylbenzene�
E1� � first�order�elimination�reaction�
EGR� � exhaust�gas�recirculation�
EOE� � ethyl�octyl�ether�
EOI� � end�of�injection�
EPA� � Environmental�Protection�Agency�
FAME� � fatty�acid�methyl�ester�
FCC� � fluid�catalytic�cracking�
GLC�� � gas�liquid�chromatograph�
GLC� � gas�liquid�chromatograph�
HC� � hydrocarbons�
HDV� � heavy�duty�vehicles�
HeOH� � 1�hexanol�
ISEC� � inverse�steric�exclusion�chromatography�
IUPAC� � International�Union�of�Pure�and�Applied�Chemistry�
IZA� � Internatonal�Zeolite�Association�
LHHW�ER� Langmuir�Hinselwood�Hougen�Watson�Eley�Rideal�
9.�References,�nomenclature,�list�of�tables,�equations�and�figures�
185�
MS� � mass�spectrometer�
OcOH� � 1�octanol�
PAHs� � polyaromatic�hydrocarbons�
PeOH� � 1�pentanol�
PM� � particulate�matter�
PP� � pour�point�(ºC)�
PS�DVB� polystyrene�divinylbenzene�
RSSQ� � residual�sum�of�squares�
RSSQRE� root�of�sum�of�squares�of�relative�errors�
SCR� � selective�catalytic�reduction�
SEM� � scanning�electronic�microscopy�
SN2� � Second�order�nucleophilic�substitution�reaction�
SOF� � soluble�organic�fraction�
SOI� � start�of�injection�
TCD� � thermal�conductivity�detector�
TG� � thermal�gravimetry��
TOF� � turn�over�frequency�
ULSD� � ultra�low�sulfur�diesel�
VGO� � vacuum�gasoil�
VOCs� � volatile�organic�compounds�
�
Subscripts�and�superscripts�
�
C=� � olefin�
C5=�� � pentenes:�1�pentene,�2�(E/Z)�pentene�
C6=� � hexenes�:�1�hexene,�(E/Z)�2�hexene,�(E/Z)�3�hexene�
9.�References,�nomenclature,�list�of�tables,�equations�and�figures�
186�
C8=� � octenes:�1�octene,�(E/Z)�2�octene,�(E/Z)�3�octene,�4�octene�
DNHE�� � di�n�hexyl�ether�
DNOE�� � di�n�octyl�ether�
DNPE�� � di�n�pentyl�ether�
DNPE� � di�n�pentyl�ether�
H2O� � water�
HeOH� � 1�hexanol�
HeOHe’� C12�branched�ethers:�2,2�oxybis�hexane,�1,2�oxybis�hexane.�
OcOH� � 1�octanol�
OcOOc’� C16�branched�ethers:�1,2�oxybis�octane,�1,3�oxybis�octane,�1,4�oxybis�octane�
PeOH� � 1�pentanol�
PeOPe’� �C10�branched�ethers:�1�(1�methylbutoxy)�pentane,�1�(2�methylbutoxy)�
pentane,�2�(1�methylbutoxy)�pentane,�2�(2�methylbutoxy)�pentane�
ROH� � alcohol�
ROR� � linear�symmetrical�ether�
ROR’� � branched�ether�
�
9.3�List�of�Tables�
CHAPTER�1� � �
Table�1.1� Most�representative�toxics�of�HDV�emissions� 22�
Table�1.2� Mandatory�diesel�properties�from�directive�2009/30/EC� 32�
Table�1.3� Effect�of�structure�and�oxygen�content�on�cetane�number�and�
cold�properties�
33�
Table�1.4� Properties�of�some�linear�ethers� 37�
CHAPTER�3� � �
Table�3.1� Purity�and�source�of�chemicals�used�in�this�work� 55�
9.�References,�nomenclature,�list�of�tables,�equations�and�figures�
187�
Table�3.2� Characteristics�of�tested�ion�exchange�resins� 56�
Table�3.3� Temperature�conditions�of�capillary�column�and�chemicals�
identified�
58�
Table�3.4� Physical�properties�of�tested�ion�exchange�resins� 62�
Table�3.5� Textural�parameters�of�tested�resins�in�dry�state�and�swollen�in�
water�
64�
Table�3.6� Volume�of�N2�adsorbed�at�77�K�for�Amberlyst�15� 65�
Table�3.7� Particle�diameter�of�some�resins�swollen�in�different�liquid�
media�
68�
Table�3.8� Physical�and�structural�properties�of�zeolites�and�MCM�materials�
tested�
69�
CHAPTER�4� � �
Table�4.1� Alcohol�conversion�and�acid�capacity�for�selected�resins� 78�
Table�4.2� Selectivity�to�DNOE�and�crosslinking�degree�for�selected�resin� 79�
Table�4.3� Alcohol�conversion,�selectivity�to�ether,�olefin�and�branched�
ethers�with�respect�of�alcohol,�and�yield�of�symmetrical�ether�
for�1�octanol,�1�hexanol�and�1�pentanol�dehydration�to�ether�at�
6�h�of�reaction�
80�
Table�4.4� Initial�rates�and�TOF�values�for�1�pentanol,�1�hexanol�and�1�
octanol�consumption�and�DNPE,�DNHE�and�DNOE�formation.�
84�
CHAPTER�5� � �
Table�5.1� Molecular�weights,�random�coil�diameters,�molecule�lengths,�
ovalities�and�Balaban�indexes�of�different�alcohol,�ether�and�
hydrocarbon�molecules�
98�
Table�5.2� Conversion�of�alcohol,�selectivity�to�linear�ether,�olefins�and�
branched�ethers�and�yield�of�linear�ether�
100�
Table�5.3� Response�surfaces�and�their�residual�sum�of�squares� 102�
Table�5.4� Values�of�parameters�of�equation�5.5�(a,b)�and�contribution�of�
mesoporous�and�microporous�surface�to�conversion�
103�
Table�5.5� Initial�reaction�rates�of�alcohol�consumption�and�their�
uncertainties�
108�
9.�References,�nomenclature,�list�of�tables,�equations�and�figures�
188�
Table�5.6� Initial�reaction�rates�of�linear�ether�formation�and�their�
uncertainties�
109�
CHAPTER�6� � �
Table�6.1� Mean�experimental�values�and�standard�uncertainties�of�the�
equilibrium�constant�of�the�different�reactions�at�the�range�of�
413�to�453.2�K�and�2.5�MPa�
119�
Table�6.2� Standard�Gibbs�energy,�enthalpy�and�entropy�changes�of�(I)�1�
octanol�dehydration�to�DNOE,�(II)�Intramolecular�dehydration�of�
1�octanol,�(III)�1�octene�isomerization�to�2�octene�at�298.15�K�
119�
Table�6.3� Thermochemical�data�of�1�octanol,�DNOE,�water,�1�octene�and�
(2E)�2�octene�
130�
Table�6.4� Standard�Gibbs�energy,�enthalpy�and�entropy�changes�of�DNPE,�
DNHE�and�DNOE�synthesis�reaction�in�the�liquid�phase�at�298.15�
K�
130�
CHAPTER�7� � �
Table�7.1� Kinetic�models�tested� 139�
Table�7.2� Temperature,�catalyst�mass�and�initial�concentrations�(w/w)�of�
kinetic�experiments�for�DNOE�synthesis�
143�
Table�7.3� Parameters,�residual�sum�of�squares�(RSSQ)�and�root�of�sum�of�
the�square�relative�errors�of�parameters�(RSSQRE)�for�type�7�and�
9�models�
146�
Table�7.4� Thermodynamic�data�for�type�7�and�9�models�� 147�
Table�7.5� Isotherms�and�correction�factors�to�represent�water�inhibiting�
effect�on�reaction�rate�
151�
Table�7.6� Parameters,�frequency�factors�(A),�activation�energies�(Ea)�and�
enthalpies�and�entropies�differences�for�model�9.1�and�model�
1.1�corrected�by�equations�CF3,�CF4�and�CF5�
153�
Table�7.7� Fitted�parameters�of�rate�equations�based�on�type�7�and�9�
models��
156�
Table�7.8� Best�rate�models�for�DNPE,�DNHE�and�DNOE�syntheses�over�
some�zeolites�
157�
9.�References,�nomenclature,�list�of�tables,�equations�and�figures�
189�
Table�7.9� Frequency�factors�(A),�apparent�activation�energies�(Ea)�and�
adsorption�enthalpy�and�entropy�differences�between�water�
and�1�octanol�
158�
Table�7.10� Frequency�factors�(A),�activation�energy�(Ea)�and�adsorption�
enthalpy�and�entropy�differences�between�DNHE�and�1�hexanol�
and�water�and�1�hexanol�
158�
�
9.4�List�of�equations�
CHAPTER�1� � �
Eq.1.1� Cetane�number� 27�
Eq.1.2� Cetane�index� 27�
Eq.1.3� Relation�between�cetane�number�and�cetane�index� 28�
Eq.1.4� Adsorption�equilibrium�of�A�in�an�active�site� 46�
Eq.1.5� Adsorption�rate�of�A�as�a�function�of�coverage,��A� 46�
Eq.1.6� Desorption�rate�of�A�as�a�function�of�coverage,��A� 47�
Eq.1.7� Langmuir�isotherm� 47�
Eq.1.8� Adsorption�rate�of�A�as�a�function�of�concentrations� 48�
Eq.1.9� Rate�of�surface�chemical�reaction�as�a�function�of�concentrations� 48�
Eq.1.10� Desorption�rate�of�P�as�a�function�of�concentrations� 48�
Eq.1.11� General�expression�for�rate�equations� 48�
CHAPTER�3� � �
Eq.3.1� Conversion�of�alcohol� 59�
Eq.3.2� Selectivity�to�linear�symmetrical�ether�with�respect�to�alcohol� 60�
Eq.3.3� Selectivity�to�olefins�with�respect�to�alcohol� 60�
Eq.3.4� Selectivity�to�branched�ethers�with�respect�to�alcohol� 60�
Eq.3.5� Yield�of�linear�symmetrical�ether�with�respect�to�alcohol� 60�
Eq.3.6� Initial�reaction�rate�of�linear�symmetrical�ether�formation� 60�
Eq.3.7� Initial�reaction�rate�of�alcohol�consumption� 60�
Eq.3.8� Initial�TOF�of�linear�symmetrical�ether�formation� 60�
Eq.3.9� Initial�TOF�of�alcohol�consumption� 60�
9.�References,�nomenclature,�list�of�tables,�equations�and�figures�
190�
Eq.3.10� Relationship�between�rate�of�linear�ether�formation�and�alcohol�
consumption�
60�
Eq.3.11� Relationship�between�TOF�of�linear�ether�formation�and�alcohol�
consumption�
60�
CHAPTER�5� � �
Eq.5.1� Random�coil�diameter� 96�
Eq.5.2� Balaban�Index� 96�
Eq.5.3� Ovality� 96�
Eq.5.4� Number�of�alcohol�moles�consumed� 101�
Eq.5.5� Response�surface�for�number�of�alcohol�moles�consumed� 103�
CHAPTER�6� � �
Eq.6.1� General�expression�of�the�thermodynamic�equilibrium�constant� 116�
Eq.6.2� Thermodynamic�equilibrium�constant�for�1�octanol�dehydration�
to�DNOE�
116�
Eq.6.3� Thermodynamic�equilibrium�constant�for�intramolecular�
dehydration�of�1�octanol�to�1�octene�
116�
Eq.6.4� Thermodynamic�equilibrium�constant�for�1�octene�isomerization�
to�2�octene�
116�
Eq.6.5� Poynting�correction�factor� 117�
Eq.6.6� Thermodynamic�equilibrium�constant�in�terms�of�entropy�and�
enthalpy�changes�of�reaction�
120�
Eq.6.7� Temperature�dependence�of�equilibrium�constant�for�1�octanol�
dehydration�to�DNOE�assuming�constant�the�reaction�enthalpy�
change��
121�
Eq.6.8� Temperature�dependence�of�equilibrium�constant�for�
intramolecular�dehydration�of�1�octanol�to�1�octene�assuming�
constant�the�reaction�enthalpy�change�
121�
Eq.6.9� Temperature�dependence�of�equilibrium�constant�for�1�octene�
isomerization�to�2�octene�assuming�constant�the�reaction�
enthalpy�change�
121�
Eq.6.10� Variance�ratio� 122�
9.�References,�nomenclature,�list�of�tables,�equations�and�figures�
191�
Eq.6.11� Contour�for�joint�confidence�region�for�the�parameters�of�lineal�
models�
122�
Eq.6.12� Kirchhoff�equation� 125�
Eq.6.13� van’t�Hoff�equation� 125�
Eq.6.14� Standard�enthalpy�change�of�reaction�as�a�function�of�T� 125�
Eq.6.15� Standard�entropy�change�of�reaction�as�a�function�of�T� 125�
Eq.6.16� Standard�Gibbs�energy�change�of�reaction�as�a�function�of�T� 125�
Eq.6.17� Thermodynamic�equilibrium�constant�as�a�function�of�T� 125�
Eq.6.18� Temperature�dependence�of�equilibrium�constant�for�1�octanol�
dehydration�to�DNOE�accounting�enthalpy�variation�with�
temperature��
126�
Eq.6.19� Temperature�dependence�of�equilibrium�constant�for�
intramolecular�dehydration�of�1�octanol�to�1�octene�accounting�
enthalpy�variation�with�temperature�
126�
Eq.6.20� Temperature�dependence�of�equilibrium�constant�for�1�octene�
isomerization�to�2�octene�accounting�enthalpy�variation�with�
temperature�
126�
Eq.6.21� General�expression�to�calculate�liquid�molar�entropy�proposed�by�
Stull�et�al.�
127�
Eq.6.22� Entropy�variation�due�to�phase�change�at�298.15�K� 127�
Eq.6.23� Entropy�variation�due�to�vapor�compression�from�Ps�to�P0� 127�
Eq.6.24� Entropy�variation�due�to�deviation�of�ideality�of�the�vapor�at�
298.15�K�and�P0�
127�
Eq.6.25� Formation�enthalpy�in�liquid�phase� 127�
CHAPTER�7� � �
Eq.7.1� Kinetic�model�for�mechanism�1� 136�
Eq.7.2� Kinetic�model�for�mechanism�2� 136�
Eq.7.3� Kinetic�model�for�mechanism�3� 137�
Eq.7.4� General�expression�of�kinetic�models�that�consider�the�fraction�of�
free�active�sites�
137�
� � �
9.�References,�nomenclature,�list�of�tables,�equations�and�figures�
192�
Eq.7.5� General�expression�of�kinetic�models�that�consider�negligible�the�
fraction�of�free�active�sites�
137�
Eq.7.6� Variation�of�constants�A,�B,�C�and�D�with�temperature� 138�
Eq.7.7� Variation�of�equilibrium�constant�for�1�pentanol�dehydration�to�
DNPE�with�temperature�
138�
Eq.�7.8� Variation�of�equilibrium�constant�for�1�hexanol�dehydration�to�
DNHE�with�temperature�
138�
Eq.�7.9� Variation�of�equilibrium�constant�for�1�octanol�dehydration�to�
DNOE�with�temperature�
138�
Eq.7.10� Expression�for�type�9�kinetic�models�of�1�octanol�dehydration�to�
DNOE�
144�
Eq.7.11� Expression�for�type�7�kinetic�models�of�1�octanol�dehydration�to�
DNOE�
145�
Eq.7.12� Constant�A�for�LHHW�mechanism�in�1�octanol�dehydration�to�
DNOE�
145�
Eq.7.13� Constant�A�for�RE�mechanisms�in�1�octanol�dehydration�to�DNOE� 145�
Eq.7.14� Constant�B�for�type�7�models�in�1�octanol�dehydration�to�DNOE� 145�
Eq.7.15� Constant�B�for�type�9�models�in�1�octanol�dehydration�to�DNOE� 145�
Eq.7.16� Residual�sum�of�squares�(RSSQ)� 145�
Eq.7.17� Root�of�sum�of�the�square�relative�errors� 145�
Eq.7.18� General�expression�for�correction�factors�in�kinetic�models� 151�
Eq.7.19� Variation�of�constant�KH2O�with�temperature� 151�
Eq.7.20� Variation�of�parameter���with�temperature� 151�
Eq.7.21� General�expression�of�the�kinetic�model�1.1�corrected�with�a�
Freundlich�isotherm�for�1�octanol�dehydration�to�DNOE�
154�
Eq.7.22� Final�expression�of�the�kinetic�model�1.1�corrected�with�a�
Freundlich�isotherm�for�1�octanol�dehydration�to�DNOE�
154�
Eq.7.23� Expression�for�type�7�kinetic�models�of�alcohol�dehydration�to�
linear�ether�
155�
Eq.7.24� Expression�for�type�9�kinetic�models�of�alcohol�dehydration�to�
linear�ether�
155�
�
9.�References,�nomenclature,�list�of�tables,�equations�and�figures�
193�
9.5�List�of�Figures�
CHAPTER�1� � �
Fig.1.1� Modern�refinery� 15�
Fig.1.2� Representation�of�a�diesel�engine� 16�
Fig.1.3� Thermodynamic�Diesel�cycle� 16�
Fig.1.4� Representation�of�fuel�spray�zones�in�diesel�injection� 17�
Fig.1.5� Overall�compression�ignition�process� 18�
Fig.1.6� Phases�in�diesel�combustion�process� 19�
Fig.1.7� Role�of�PAH�in�particle�formation� 24�
Fig.1.8� General�reaction�scheme�for�alcohol�dehydration�over�acid�
catalysts�
38�
Fig.1.9� Structure�of�a�sulfonated�PS�DVB�ion�exchange�resin� 40�
Fig.1.10� Small�beads�of�a�PS�DVB�resin� 41�
Fig.1.11� Schematic�representation�of�changes�in�the�morphology�of�gel�
type�bead�(A)�and�macroreticular�bead�(B)�during�swelling�
42�
Fig.1.12� Representation�of�swollen�state�morphology� 42�
Fig.1.13� Structure�and�channel�systems�of�MFI�(left)�and�FAU�(right)� 44�
Fig.1.14� Structure�and�channel�systems�of�FER�(left)�and�BEA�(right)� 44�
Fig.1.15� Representation�of�the�steps�in�the�catalytic�process� 46�
CHAPTER�3� � �
Fig.3.1� Scheme�of�the�experimental�set�up�employed� 57�
Fig.3.2� SEM�micrographs�of�Amberlyst�15.�(A)�General�view�of�beads.�(B)�
Surface�detail�of�a�bead��
63�
Fig.3.3� SEM�photomicrographs�of�CT�224�(A).�General�view�of�beads.�(B)�
Surface�detail�of�a�bead��
63�
Fig.3.4� Nitrogen�adsorption�isotherm�at�77�K�of�CT�276�and�A�15� 64�
Fig.3.5� Pore�size�distribution�from�desorption�N2�curve�and�from�ISEC�
data�of�A�15��and�CT�276��
65�
Fig.3.6� ISEC�pattern�displayed�by�resins�in�water.�(A)�Polymer�density�
distribution�of�gel�type�and�low�DVB%�macroreticular�resins.�(B)�
Id.�for�medium�and�high�DVB%�macroreticular�resins�
67�
9.�References,�nomenclature,�list�of�tables,�equations�and�figures�
194�
Fig.3.7� N2�adsorption�isotherms�of�H�BEA�25,H�FAU�6,�H�FAU�30,�H�MFI�
28,�H�MOR�20,�H�FER�20,�and�H�MCM�79�
70�
Fig.3.8� Pore�distribution�in�the�mesopore�range�of�H�BEA�25,�H�FAU�6,�H�
FAU�30,�H�MFI�28�and�H�FER�20�(A),�and�H�MCM�79�(B)�
71�
CHAPTER�4� � �
Fig.4.1� Variation�of�reaction�medium�composition�with�time,�1�octanol�
dehydration�to�DNOE�over�1�g�dry�A�39�at�423�K,�P=�2.5�MPa,�70�
cm3�1�octanol�
76�
�
Fig.4.2� Variation�of�1�octanol�conversion�and�selectivity�to�DNOE�with�
time�on�A�39�(W=�1�g,�T=�423�K,�P=�2.5�MPa,�70�cm3�1�octanol)�
77�
Fig.4.3� Reaction�scheme�for�dehydration�of�1�octanol�to�DNOE� 77�
Fig.4.4� Selectivity�to�DNOE,�C8�olefins�and�C16�branched�ethers�with�
respect�1�octanol�vs.�H+/Vsp�ratio�at�t=�6�h�(W=�1�g,�T=�423�K,�P=�
2.5�MPa,�70�cm3�1�octanol)�
82�
Fig.4.5� Comparison�of�1�pentanol,�1�hexanol�and�1�octanol�conversions�
on�tested�resins�at�t�=�6�h�(W�=�1�g,�T�=�423�K,�P�=�2.5�MPa,�70�cm3�
alcohol)�
87�
Fig.4.6� Influence�of�alcohol�length�and�sulfonation�type�on�alcohol�
conversion�at�t�=�6�h�(W�=�1�g,�T�=�423�K,�P�=�2.5�MPa,�70�cm3�
alcohol)�
87�
Fig.4.7� Selectivity�to�DNPE,�DNHE�and�DNOE��on�tested�resins�at�t�=�6�h�
(W�=�1�g,�T�=�423�K,�P�=�2.5�MPa,�70�cm3�alcohol)�
88�
Fig.4.8� Influence�of�Vsp�on�the�selectivity�to�linear�ether�(t�=�6�h,�W�=�1�g,�
T�=�423�K,�P�=�2.5�MPa,�70�cm3�alcohol)�
89�
Fig.4.9� Influence�of�crosslinking�degree�on�the�selectivity�to�DNPE,�DNHE�
and�DNOE�(W�=�1�g,�T�=�423�K,�P�=�2.5�MPa,�70�cm3�alcohol)�
90�
CHAPER�5� � �
Fig.5.1� (A)�Variation�of�ovality�with�Random�coil�diameter�of�molecules�of�
Table�5.1.�(B)�Variation�of�ovality�with�Balaban�index�of�molecules�
of�Table�5.1�
97�
� � �
9.�References,�nomenclature,�list�of�tables,�equations�and�figures�
195�
Fig.5.2� Experimental�(N�exp)�and�predicted�(N�calc)�number�of�alcohol�
moles�consumed�for�1�pentanol�(A),�1�hexanol�(B)�and�1�octanol�
(C)�
103�
Fig.5.3� Variation�of�selectivity�to�DNOE�and�conversion�of�1�octanol�with�
time.�H�FAU�30,�W�=�1�g,�T�=�453�K,�P�=�2.5�MPa�
104�
Fig.5.4� Graphic�summary�of�yield�to�linear�ether�and�mesoporous�surface�
(W�=�1�g,�T�=�453�K,�P�=�2.5�MPa,�70�cm3�alcohol,�t�=�6�h)�
107�
CHAPTER�6� � �
Fig.6.1� Equilibrium�reactions�studied.�(I)�Intermolecular�dehydration�of�1�
octanol�to�DNOE,�(II)�intramolecular�dehydration�of�1�octano,�(III)�
isomerization�of�1�octene�to�2�octene�
115�
Fig.6.2� Evolution�of�activities�during�an�experiment�at�453�K� 115�
Fig.6.3� Mean�experimental�values�of�ln�K�versus�1/T.�Predictive�linear�
model�and�0.95�level�of�confidence�loci�for�predicted�values.�(A)�
1�octanol�dehydration�to�DNOE,�(B)�intramolecular�dehydration�
of�1�octanol,�(C)�1�octene�isomerization�to�2�octene�
120�
Fig.6.4� Joint�0.95�level�of�confidence�region�for���and��7 .�(A)�1�octanol�
dehydration�to�DNOE,�(B)�intramolecular�dehydration�of�1�
octanol,�(C)�1�octene�isomerization�to�2�octene�
123�
Fig.6.5� Joint�0.95�level�of�confidence�region�for���and�� �in�1�octanol�
dehydration�to�DNOE�
124�
Fig.6.6� Mean�experimental�values�of�lnK+�f(T)�vs.�1/T.�(A)�1�octanol�
dehydration�to�DNOE,�(B)�intramolecular�dehydration�of�1�
octanol,�(C)�1�octene�isomerization�to�2�octene�
126�
�
CHAPTER�7� � �
Fig.7.1� Influence�of�catalyst�mass�on�conversion�of�1�octanol� 141�
Fig.7.2� Influence�of�bead�size�on�the�rate�of�DNOE�formation� 142�
Fig.7.3� Influence�of�stirring�speed�(N)�on�rate�of�DNOE�formation� 142�
Fig.�7.4� Experimental�reaction�rates�vs.�1�octanol�activity�at�different�
temperatures�
144�
Fig.7.5� rcalc�vs.�rexp�for�type�7�models� 146�
9.�References,�nomenclature,�list�of�tables,�equations�and�figures�
196�
Fig.7.6� rcalc�vs.�rexp�for�type�9�models� 146�
Fig.7.7� Influence�of�water�concentration�(w/w)�on�initial�reaction�rate�of�
DNOE�formation�
149�
Fig.7.8� Influence�of�DNOE�concentration�on�initial�reaction�rate�of�DNOE�
formation�
149�
Fig.7.9� Influence�of�1,4�dioxane�concentration�on�initial�reaction�rate�of�
DNOE�formation�at�423�K�
150�
Fig.7.10� Residual�sum�of�squares�for�model�9.1�and�models�1.1,�2.1,�2.2,�
2.3�and�7.1�with�deactivation�correction�factors�
152�
Fig.7.11� Residual�sum�of�squares�of�type�7�and�9�models�for�DNHE�
synthesis�
156�
Fig.7.12� Residual�sum�of�squares�of�type�7�and�9�models�for�DNOE�
synthesis�over�H�FAU�30�
156�
�
�
�
�
�
�
�
�
�
�
�
�

�
�
CHAPTER�10�
APPENDICES��
�
�
�
�
�
�
�
�
�
�
�
�
�
�
�
�

�
�
�
�
�
�
�
�
�
�
�
�
�
�
�
�
�
�
�
�
�
�
�
�
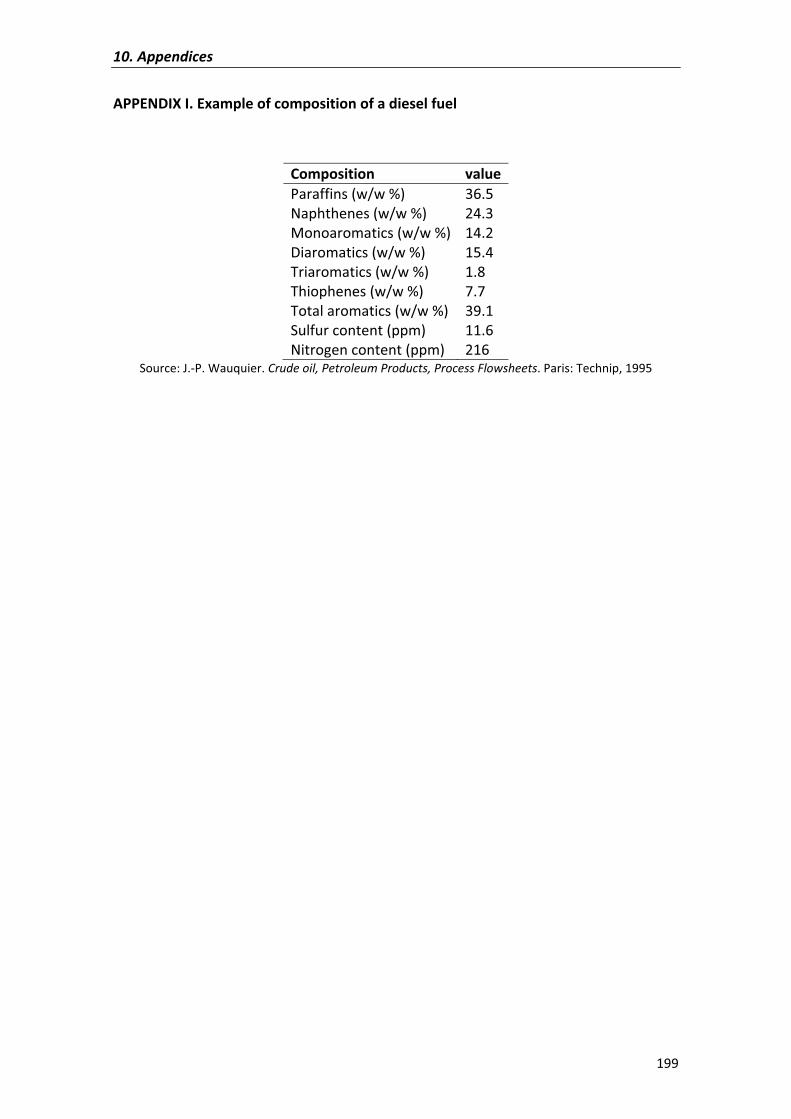
10.�Appendices�
199�
APPENDIX�I.�Example�of�composition�of�a�diesel�fuel�
�
Composition� valueParaffins�(w/w�%)� 36.5�Naphthenes�(w/w�%)� 24.3�Monoaromatics�(w/w�%) 14.2�Diaromatics�(w/w�%)� 15.4�Triaromatics�(w/w�%)� 1.8�Thiophenes�(w/w�%)� 7.7�Total�aromatics�(w/w�%)� 39.1�Sulfur�content�(ppm)� 11.6�Nitrogen�content�(ppm)� 216�
Source:�J.�P.�Wauquier.�Crude�oil,�Petroleum�Products,�Process�Flowsheets.�Paris:�Technip,�1995�
�
�
�
�
�
�
�
�
�
�
�
�
�
�
�
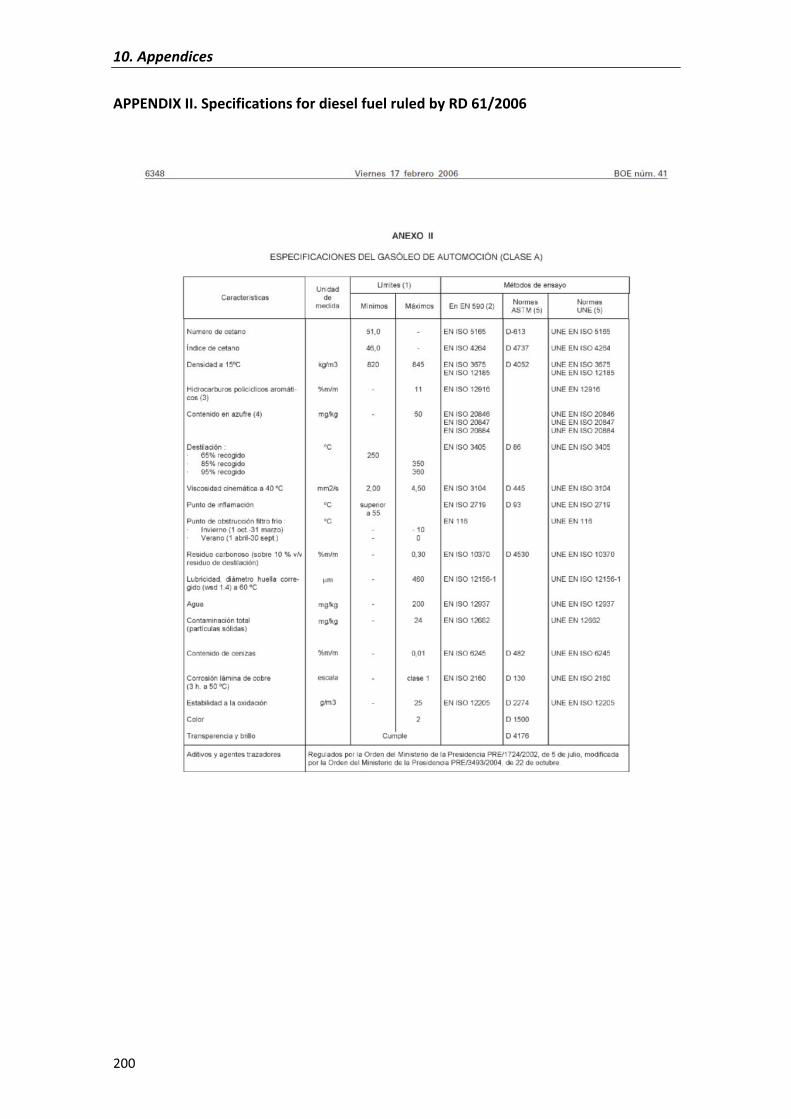
10.�Appendices�
200�
APPENDIX�II.�Specifications�for�diesel�fuel�ruled�by�RD�61/2006�
�
�
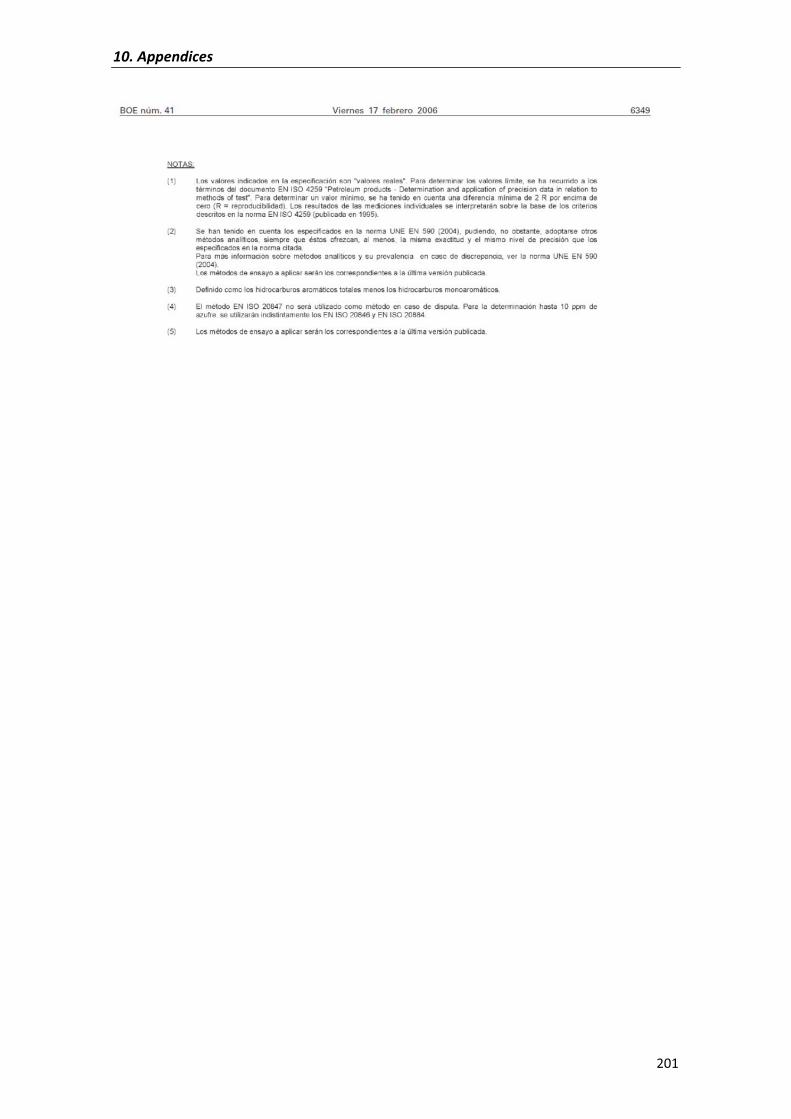
10.�Appendices�
201�
�
�
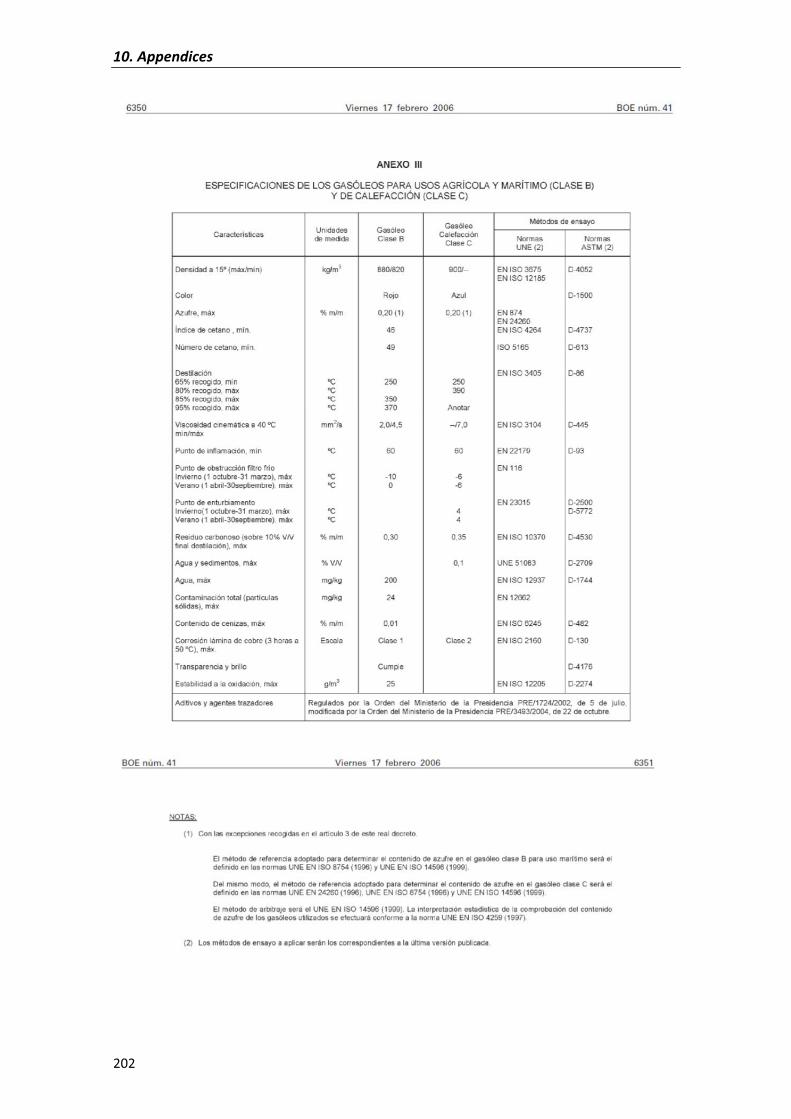
10.�Appendices�
202�
�
�
�
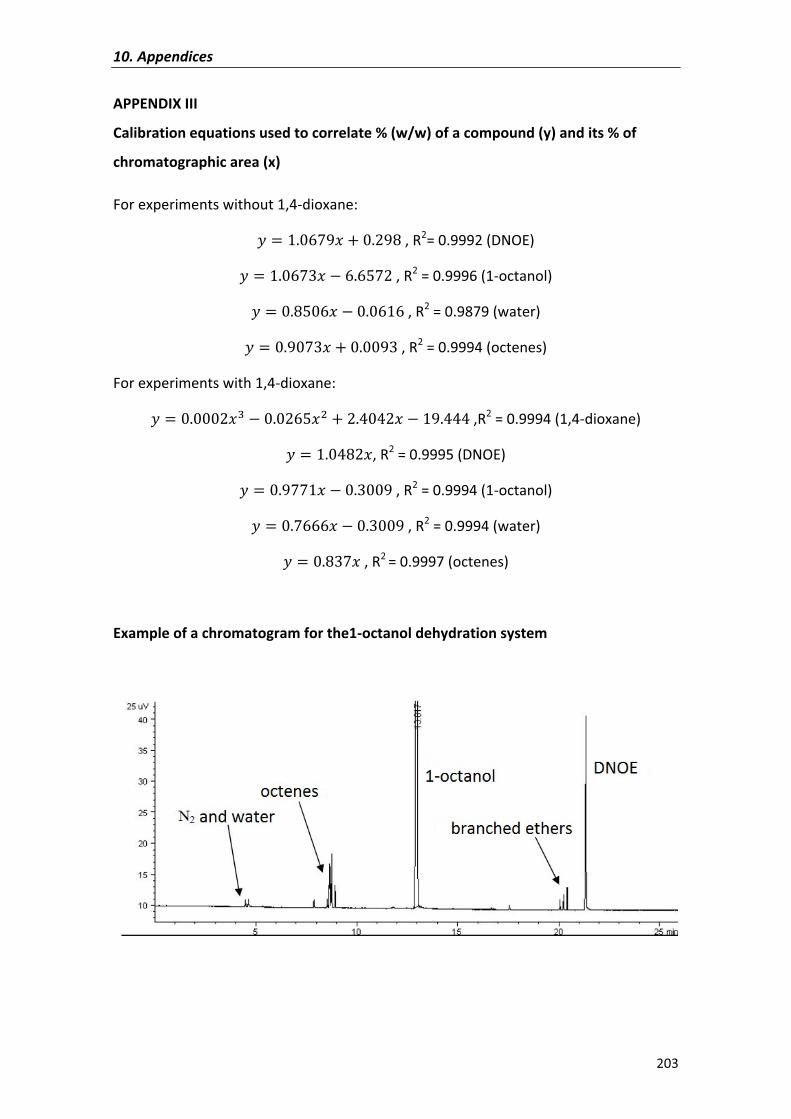
10.�Appendices�
203�
APPENDIX�III�
Calibration�equations�used�to�correlate�%�(w/w)�of�a�compound�(y)�and�its�%�of�
chromatographic�area�(x)��
For�experiments�without�1,4�dioxane:�
î � ���#�ï �����,�R2=�0.9992�(DNOE)�
î � ���#�ï � ����#��,�R2�=�0.9996�(1�octanol)�
î � ����ï � �����,�R2�=�0.9879�(water)�
î � ��#�ï ����,�R2�=�0.9994�(octenes)�
For�experiments�with�1,4�dioxane:�
î � ��ï� � ����ï" �����ï � �������,R2�=�0.9994�(1,4�dioxane)�
î � �����ï,�R2�=�0.9995�(DNOE)�
î � ��##�ï � ����,�R2�=�0.9994�(1�octanol)�
î � �#���ï � ����,�R2�=�0.9994�(water)�
î � ���#ï�,�R2�=�0.9997�(octenes)�
�
Example�of�a�chromatogram�for�the1�octanol�dehydration�system�
�
�
�
�
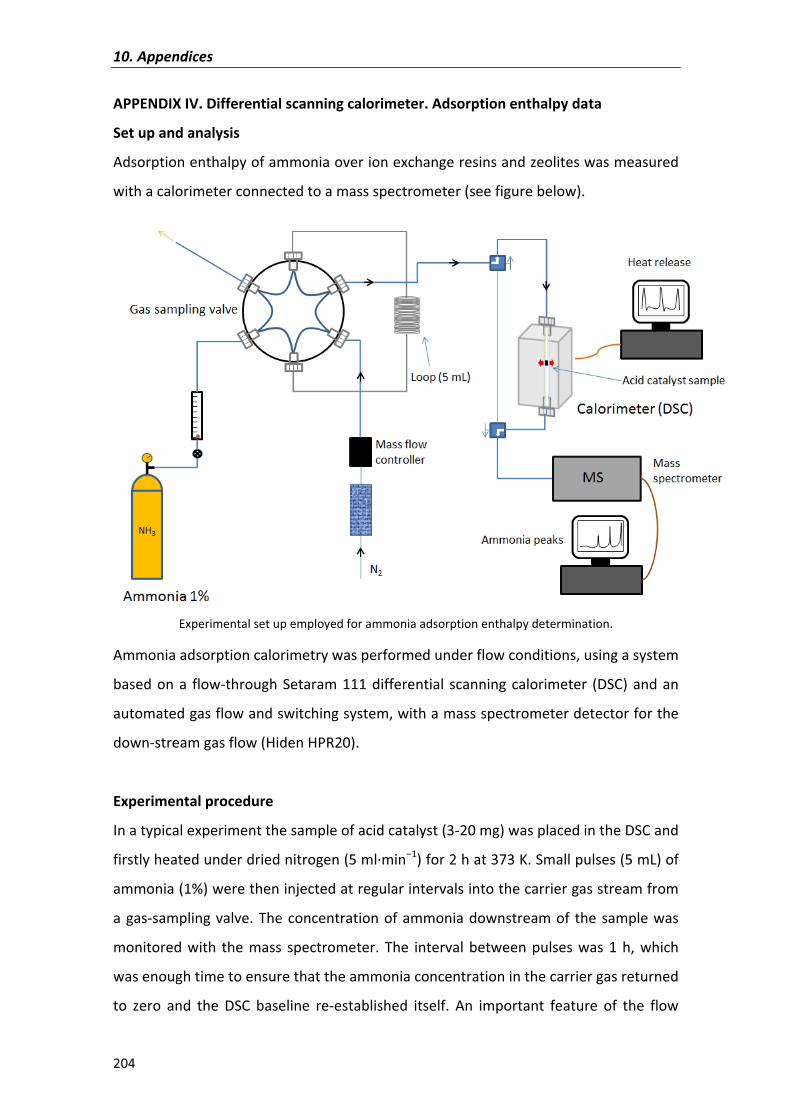
10.�Appendices�
204�
APPENDIX�IV.�Differential�scanning�calorimeter.�Adsorption�enthalpy�data�
Set�up�and�analysis�
Adsorption�enthalpy�of�ammonia�over�ion�exchange�resins�and�zeolites�was�measured�
with�a�calorimeter�connected�to�a�mass�spectrometer�(see�figure�below).��
�Experimental�set�up�employed�for�ammonia�adsorption�enthalpy�determination.�
Ammonia�adsorption�calorimetry�was�performed�under�flow�conditions,�using�a�system�
based�on�a� flow�through�Setaram�111�differential� scanning�calorimeter� (DSC)�and�an�
automated�gas�flow�and�switching�system,�with�a�mass�spectrometer�detector�for�the�
down�stream�gas�flow�(Hiden�HPR20).��
�
Experimental�procedure�
In�a�typical�experiment�the�sample�of�acid�catalyst�(3�20�mg)�was�placed�in�the�DSC�and�
firstly�heated�under�dried�nitrogen�(5�ml�min�1)�for�2�h�at�373�K.�Small�pulses�(5�mL)�of�
ammonia�(1%)�were�then�injected�at�regular�intervals�into�the�carrier�gas�stream�from�
a�gas�sampling�valve.�The�concentration�of�ammonia�downstream�of� the�sample�was�
monitored� with� the� mass� spectrometer.� The� interval� between� pulses� was� 1� h,� which�
was�enough�time�to�ensure�that�the�ammonia�concentration�in�the�carrier�gas�returned�
to� zero� and� the� DSC� baseline� re�established� itself.� An� important� feature� of� the� flow�
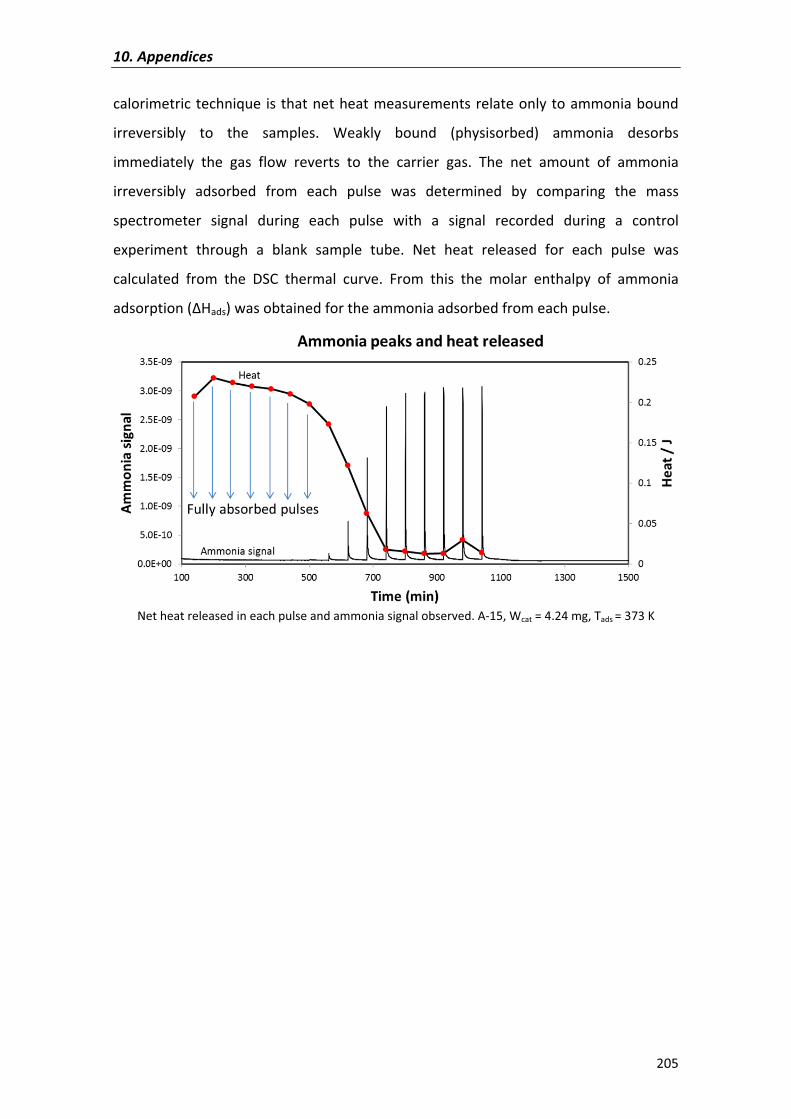
10.�Appendices�
205�
calorimetric�technique� is�that�net�heat�measurements�relate�only�to�ammonia�bound�
irreversibly� to� the� samples.� Weakly� bound� (physisorbed)� ammonia� desorbs�
immediately� the� gas� flow� reverts� to� the� carrier� gas.� The� net� amount� of� ammonia�
irreversibly� adsorbed� from� each� pulse� was� determined� by� comparing� the� mass�
spectrometer� signal� during� each� pulse� with� a� signal� recorded� during� a� control�
experiment� through� a� blank� sample� tube.� Net� heat� released� for� each� pulse� was�
calculated� from� the� DSC� thermal� curve.� From� this� the� molar� enthalpy� of� ammonia�
adsorption�(�Hads)�was�obtained�for�the�ammonia�adsorbed�from�each�pulse.�
�Net�heat�released�in�each�pulse�and�ammonia�signal�observed.�A�15,�Wcat�=�4.24�mg,�Tads�=�373�K�
�
�
�
�
�
�
�
�
�
�
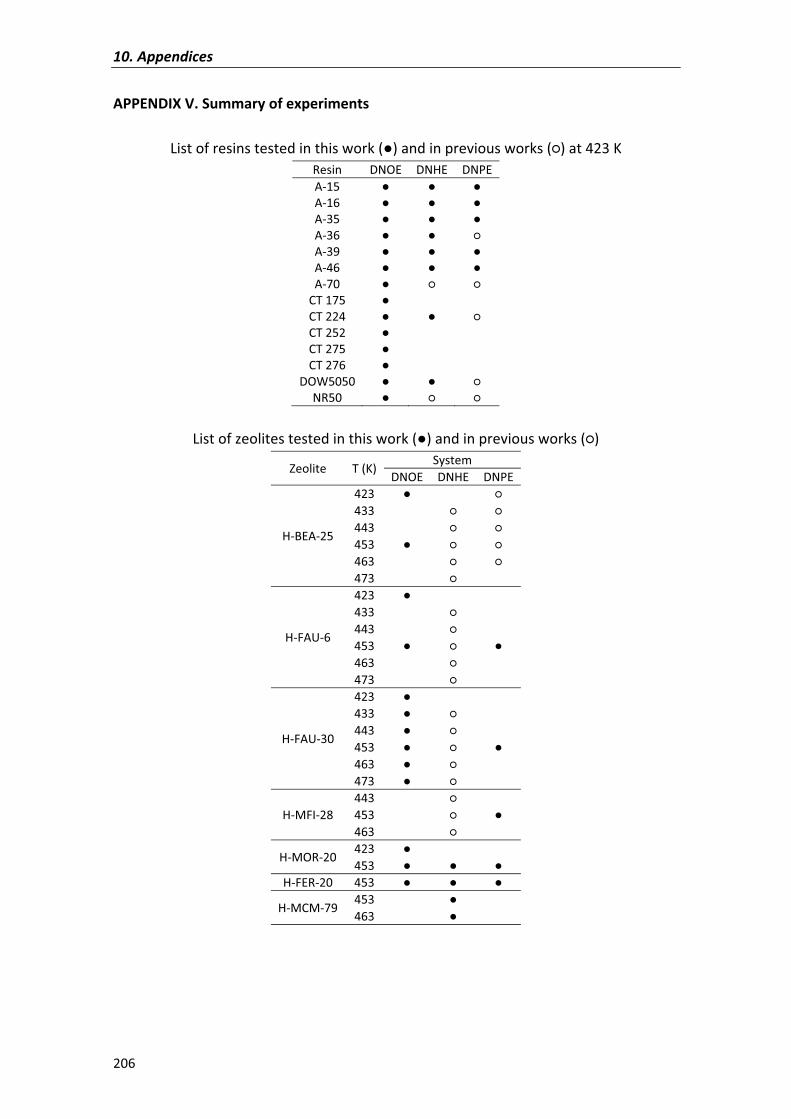
10.�Appendices�
206�
APPENDIX�V.�Summary�of�experiments��
List�of�resins�tested�in�this�work�(�)�and�in�previous�works�(�)�at�423�K�Resin DNOE DNHE DNPEA�15 � � �A�16 � � �A�35 � � �A�36 � � �A�39 � � �A�46 � � �A�70 � � �
CT�175 �CT�224 � � �CT�252 �CT�275 �CT�276 �
DOW5050 � � �NR50 � � �
�List�of�zeolites�tested�in�this�work�(�)�and�in�previous�works�(�)�
Zeolite� T�(K)�System
DNOE DNHE DNPE
H�BEA�25�
423 � �433 � �443 � �453 � � �463 � �473 �
H�FAU�6�
423 �433 �443 �453 � � �463 �473 �
H�FAU�30�
423 �433 � �443 � �453 � � �463 � �473 � �
H�MFI�28�443 �453 � �463 �
H�MOR�20�423 �453 � � �
H�FER�20 453 � � �
H�MCM�79�453 �463 �
��
�

10.�Appendices�
207�
APPENDIX�VI.RSSQ�and�RSSQRE�for�kinetic�models�on�Amberlyst�70�
RSSQ�and�RSSQRE�for�kinetic�models�fitted�to�DNOE�rates�of�pure�1�octanol�experiments�on�Amberlyst�70.�Models�crossed�out�are�thermodynamically�inconsistent.��
Model RSSQ RSSQRE1.1 1866 0.1701.2 5179 0.3711.3 1866 0.8842.1 385 3952.2 409 3282.3 368 3.21E+583.1 51153.2 55103.3 55674.14.24.35.1 47445.2 55465.3 55726.16.26.37.1 261 1547.2 278 11.37.3 300 4.1678.18.28.39.1 250 2.589.2 257 1.629.3 269 0.92910.110.210.311.1 474411.2 581911.3 623212.112.212.313.1 250 1.72E+10813.2 257 21513.3 269 25.214.114.214.3
�
�
�
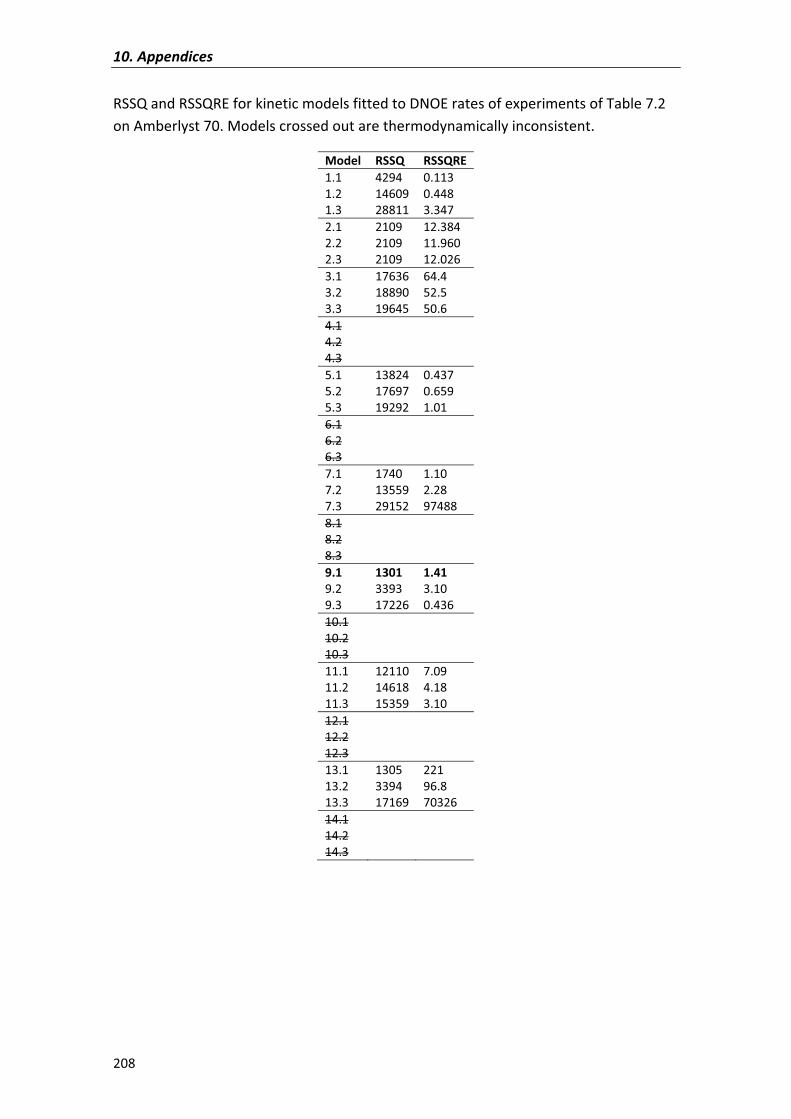
10.�Appendices�
208�
RSSQ�and�RSSQRE�for�kinetic�models�fitted�to�DNOE�rates�of�experiments�of�Table�7.2�on�Amberlyst�70.�Models�crossed�out�are�thermodynamically�inconsistent.��
Model RSSQ RSSQRE1.1 4294 0.1131.2 14609 0.4481.3 28811 3.3472.1 2109 12.3842.2 2109 11.9602.3 2109 12.0263.1 17636 64.43.2 18890 52.53.3 19645 50.64.14.24.35.1 13824 0.4375.2 17697 0.6595.3 19292 1.016.16.26.37.1 1740 1.107.2 13559 2.287.3 29152 974888.18.28.39.1 1301 1.419.2 3393 3.109.3 17226 0.43610.110.210.311.1 12110 7.0911.2 14618 4.1811.3 15359 3.1012.112.212.313.1 1305 22113.2 3394 96.813.3 17169 7032614.114.214.3
�
�
�
�
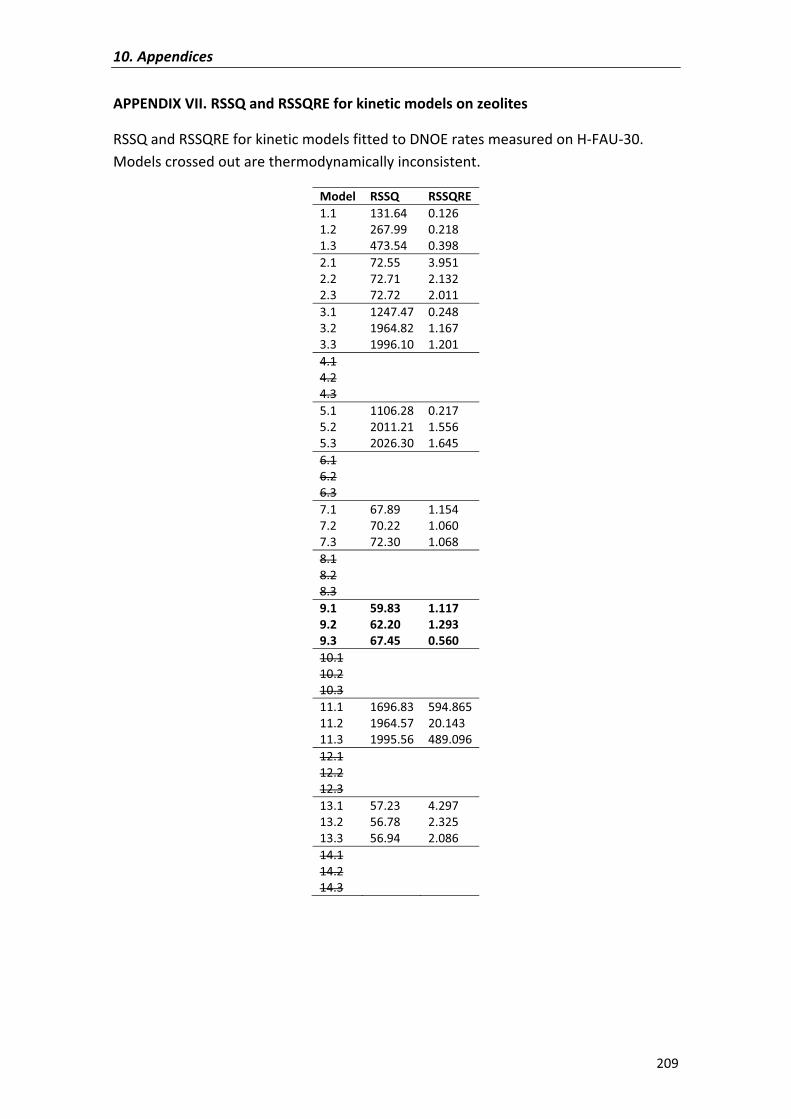
10.�Appendices�
209�
APPENDIX�VII.�RSSQ�and�RSSQRE�for�kinetic�models�on�zeolites��
RSSQ�and�RSSQRE�for�kinetic�models�fitted�to�DNOE�rates�measured�on�H�FAU�30.�Models�crossed�out�are�thermodynamically�inconsistent.��
Model RSSQ RSSQRE1.1 131.64 0.1261.2 267.99 0.2181.3 473.54 0.3982.1 72.55 3.9512.2 72.71 2.1322.3 72.72 2.0113.1 1247.47 0.2483.2 1964.82 1.1673.3 1996.10 1.2014.14.24.35.1 1106.28 0.2175.2 2011.21 1.5565.3 2026.30 1.6456.16.26.37.1 67.89 1.1547.2 70.22 1.0607.3 72.30 1.0688.18.28.39.1 59.83 1.1179.2 62.20 1.2939.3 67.45 0.56010.110.210.311.1 1696.83 594.86511.2 1964.57 20.14311.3 1995.56 489.09612.112.212.313.1 57.23 4.29713.2 56.78 2.32513.3 56.94 2.08614.114.214.3
�
�
�
�
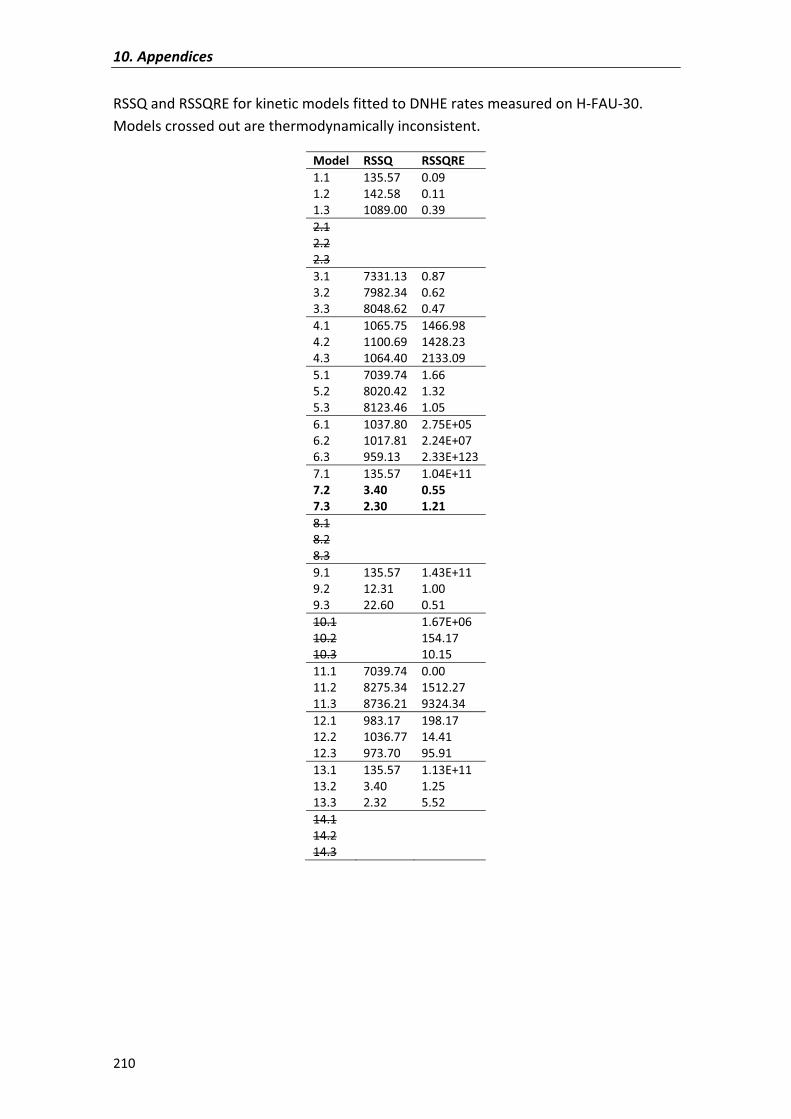
10.�Appendices�
210�
RSSQ�and�RSSQRE�for�kinetic�models�fitted�to�DNHE�rates�measured�on�H�FAU�30.�Models�crossed�out�are�thermodynamically�inconsistent.�
Model RSSQ RSSQRE1.1 135.57 0.091.2 142.58 0.111.3 1089.00 0.392.12.22.33.1 7331.13 0.873.2 7982.34 0.623.3 8048.62 0.474.1 1065.75 1466.984.2 1100.69 1428.234.3 1064.40 2133.095.1 7039.74 1.665.2 8020.42 1.325.3 8123.46 1.056.1 1037.80 2.75E+056.2 1017.81 2.24E+076.3 959.13 2.33E+1237.1 135.57 1.04E+117.2 3.40 0.557.3 2.30 1.218.18.28.39.1 135.57 1.43E+119.2 12.31 1.009.3 22.60 0.5110.1 1.67E+0610.2 154.1710.3 10.1511.1 7039.74 0.0011.2 8275.34 1512.2711.3 8736.21 9324.3412.1 983.17 198.1712.2 1036.77 14.4112.3 973.70 95.9113.1 135.57 1.13E+1113.2 3.40 1.2513.3 2.32 5.5214.114.214.3
�
�
�
�
�
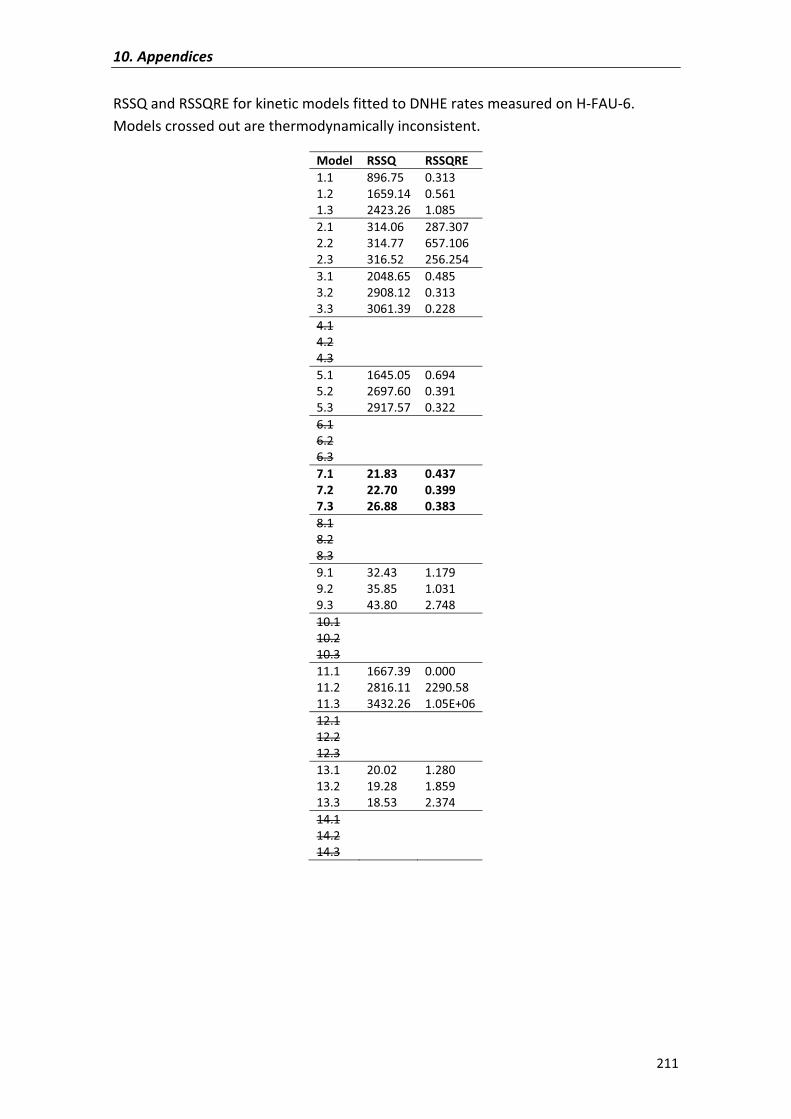
10.�Appendices�
211�
RSSQ�and�RSSQRE�for�kinetic�models�fitted�to�DNHE�rates�measured�on�H�FAU�6.�Models�crossed�out�are�thermodynamically�inconsistent.�
Model RSSQ RSSQRE1.1 896.75 0.3131.2 1659.14 0.5611.3 2423.26 1.0852.1 314.06 287.3072.2 314.77 657.1062.3 316.52 256.2543.1 2048.65 0.4853.2 2908.12 0.3133.3 3061.39 0.2284.14.24.35.1 1645.05 0.6945.2 2697.60 0.3915.3 2917.57 0.3226.16.26.37.1 21.83 0.4377.2 22.70 0.3997.3 26.88 0.3838.18.28.39.1 32.43 1.1799.2 35.85 1.0319.3 43.80 2.74810.110.210.311.1 1667.39 0.00011.2 2816.11 2290.5811.3 3432.26 1.05E+0612.112.212.313.1 20.02 1.28013.2 19.28 1.85913.3 18.53 2.37414.114.214.3
�
�
�
�
�
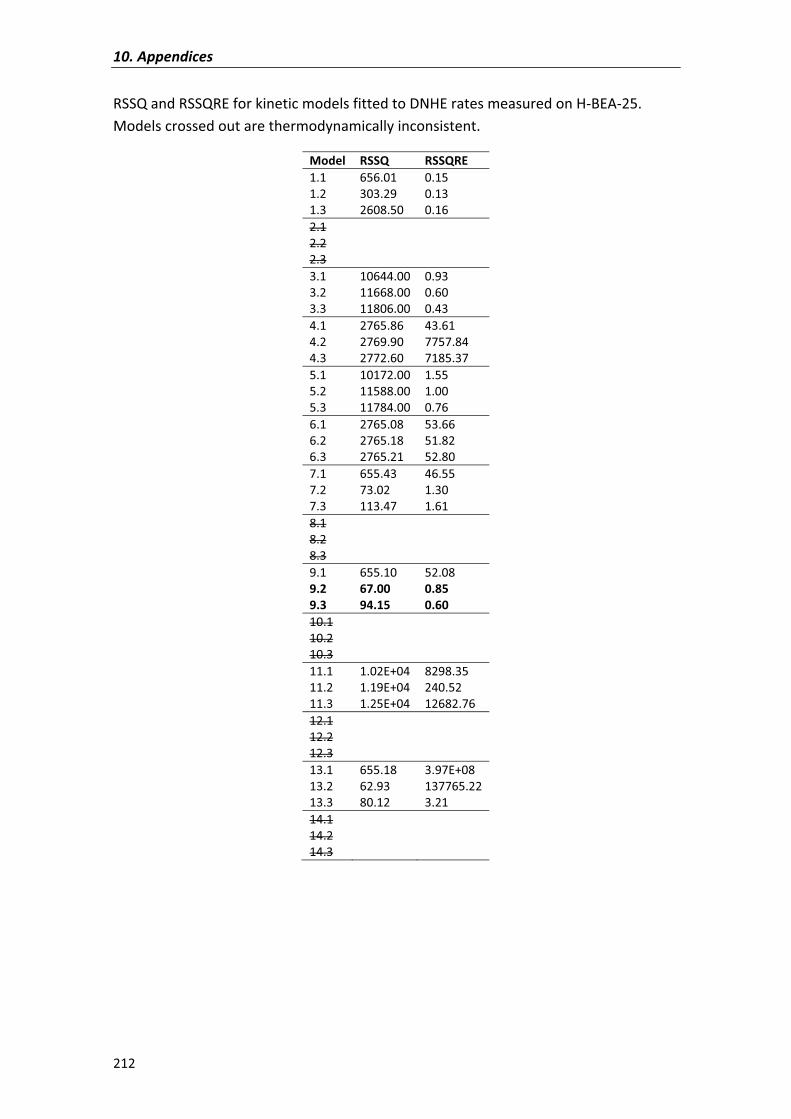
10.�Appendices�
212�
RSSQ�and�RSSQRE�for�kinetic�models�fitted�to�DNHE�rates�measured�on�H�BEA�25.�Models�crossed�out�are�thermodynamically�inconsistent.�
Model RSSQ RSSQRE1.1� 656.01 0.151.2� 303.29 0.131.3� 2608.50 0.162.1�2.2�2.3�3.1� 10644.00 0.933.2� 11668.00 0.603.3� 11806.00 0.434.1� 2765.86 43.614.2� 2769.90 7757.844.3� 2772.60 7185.375.1� 10172.00 1.555.2� 11588.00 1.005.3� 11784.00 0.766.1� 2765.08 53.666.2� 2765.18 51.826.3� 2765.21 52.807.1� 655.43 46.557.2� 73.02 1.307.3� 113.47 1.618.1�8.2�8.3�9.1� 655.10 52.089.2� 67.00 0.859.3� 94.15 0.6010.110.210.311.1 1.02E+04 8298.3511.2 1.19E+04 240.5211.3 1.25E+04 12682.7612.112.212.313.1 655.18 3.97E+0813.2 62.93 137765.2213.3 80.12 3.2114.114.214.3
�
�
�
�
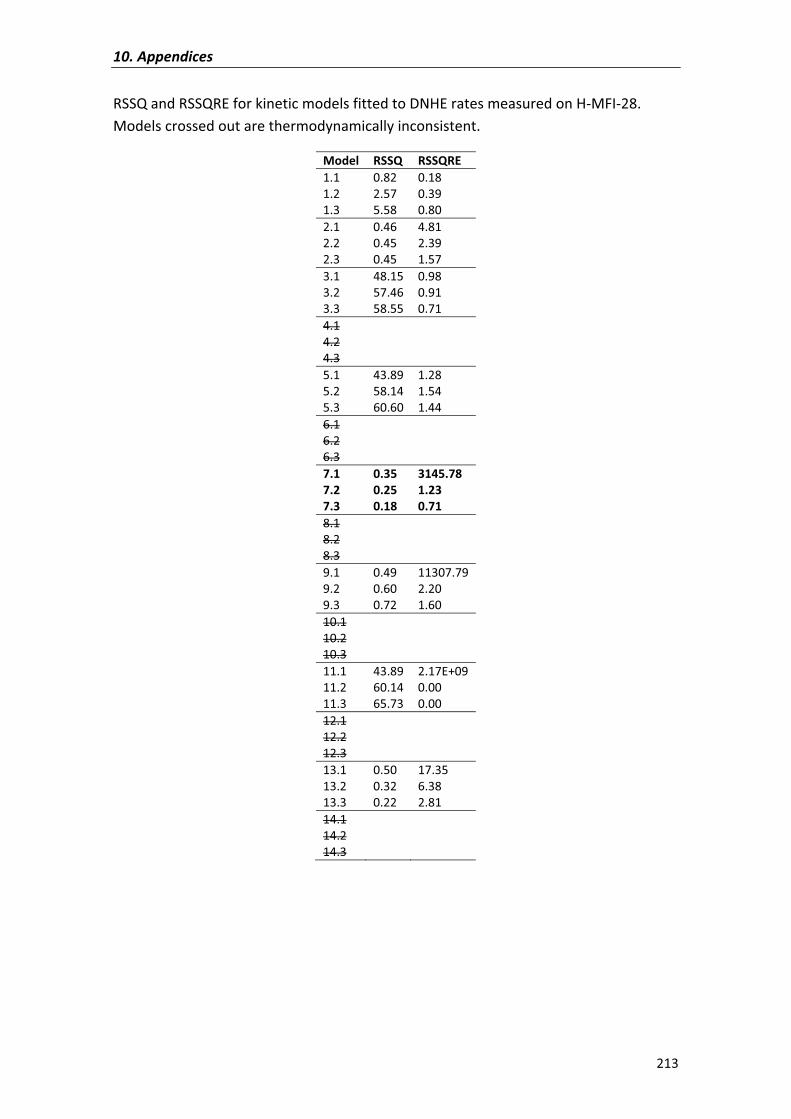
10.�Appendices�
213�
RSSQ�and�RSSQRE�for�kinetic�models�fitted�to�DNHE�rates�measured�on�H�MFI�28.�Models�crossed�out�are�thermodynamically�inconsistent.�
Model RSSQ RSSQRE1.1 0.82 0.181.2 2.57 0.391.3 5.58 0.802.1 0.46 4.812.2 0.45 2.392.3 0.45 1.573.1 48.15 0.983.2 57.46 0.913.3 58.55 0.714.14.24.35.1 43.89 1.285.2 58.14 1.545.3 60.60 1.446.16.26.37.1 0.35 3145.787.2 0.25 1.237.3 0.18 0.718.18.28.39.1 0.49 11307.799.2 0.60 2.209.3 0.72 1.6010.110.210.311.1 43.89 2.17E+0911.2 60.14 0.0011.3 65.73 0.0012.112.212.313.1 0.50 17.3513.2 0.32 6.3813.3 0.22 2.8114.114.214.3
�
�
�
�
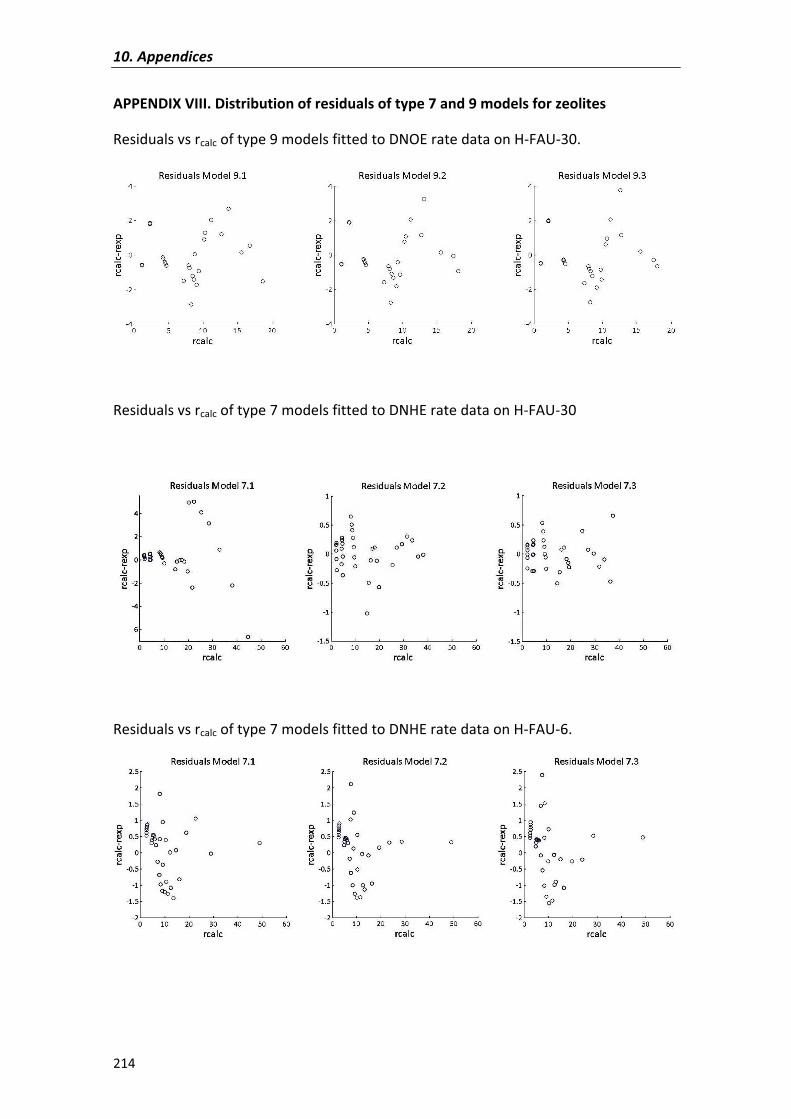
10.�Appendices�
214�
APPENDIX�VIII.�Distribution�of�residuals�of�type�7�and�9�models�for�zeolites�
Residuals�vs�rcalc�of�type�9�models�fitted�to�DNOE�rate�data�on�H�FAU�30.�
�
�
Residuals�vs�rcalc�of�type�7�models�fitted�to�DNHE�rate�data�on�H�FAU�30�
�
�
�
Residuals�vs�rcalc�of�type�7�models�fitted�to�DNHE�rate�data�on�H�FAU�6.�
�
�
�
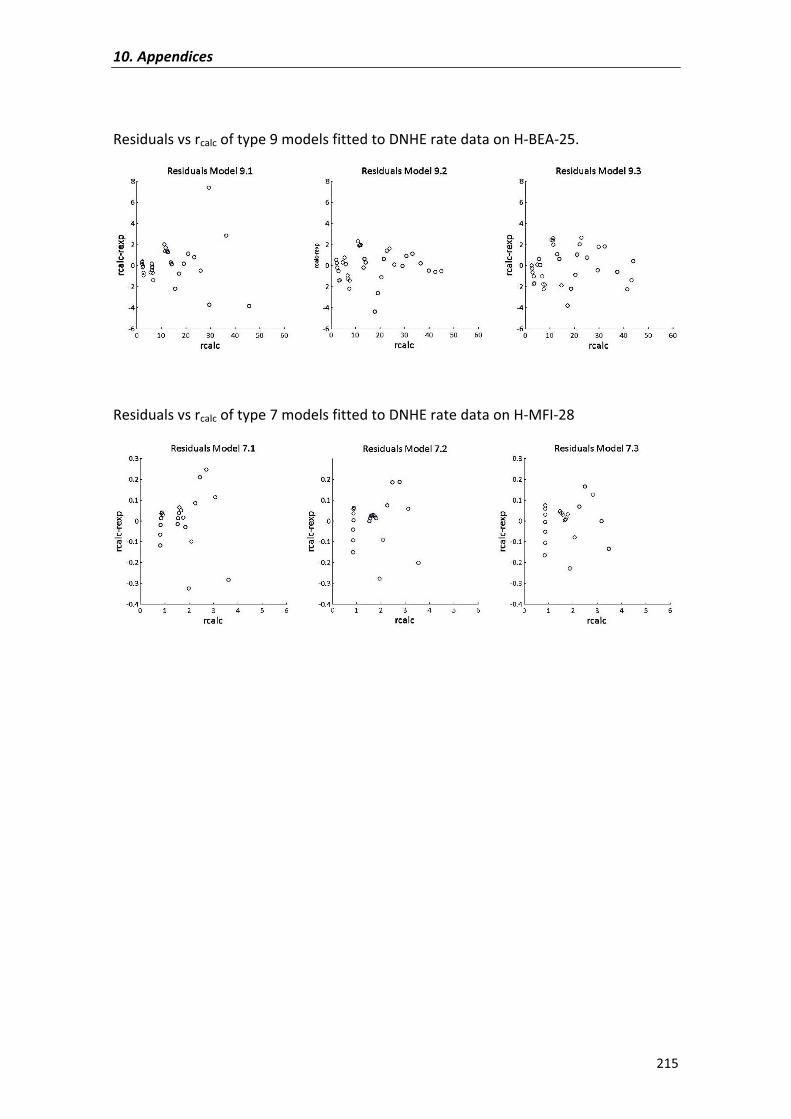
10.�Appendices�
215�
�
Residuals�vs�rcalc�of�type�9�models�fitted�to�DNHE�rate�data�on�H�BEA�25.�
�
�
Residuals�vs�rcalc�of�type�7�models�fitted�to�DNHE�rate�data�on�H�MFI�28�
�
�
�
�
�
�
�
�
�
�

�
�
�
�
�
�
�
�
�
�
�
�
�
�
�
�
�
�
�
�
�
�
�

�
�
CHAPTER�11�
RESUMEN�DEL�TRABAJO�(SPANISH)��
�
�
�
�
�
�
�
�
�
�
�
�
�
�
�

�
�
�
�
�
�
�
�
�
�
�
�
�
�
�
�
�
�
�
�
�
�
�
�
11.�Resumen�del�trabajo�(spanish)�
219�
Extracto�
En�esta�tesis�se�ha�estudiado�la�síntesis�de�éteres�lineales�simétricos�de�entre�10�y�
16� carbonos� a� partir� de� la� deshidratación� de� alcoholes� primarios� sobre� catalizadores�
ácidos.� Siguiendo� la� línea� de� investigación� empezada� con� trabajos� previos� sobre� la�
deshidratación� de� 1�pentanol� y� 1�hexanol� a� di�n�pentil� éter� (DNPE)� y� di�n�hexil� éter�
(DNHE)�respectivamente,�este�trabajo�continua�con�la�serie�de�éteres�simétricos�donde�
se� realiza� un� estudio� intensivo� de� la� reacción� de� deshidratación� de� 1�octanol� a� di�n�
octil�éter�y�se�amplían�los�estudios�sobre�las�síntesis�de�DNPE�y�DNHE.�
En� una� primera� etapa,� se� realiza� un� barrido� catalítico� con� resinas� de� intercambio�
iónico� ácidas� basadas� en� poliestireno� y� divinilbenceno� (PE�DVB)� donde� se� evalúan�
conversión� de� alcohol,� selectividad� y� rendimiento� en� éter� lineal� así� como� las�
velocidades� iniciales� para� determinar� qué� características� son� más� influyentes� para�
llevar� a� cabo� la� reacción� principal� (deshidratación� de� alcohol� a� éter� lineal)� y� las� que�
favorecen�las�reacciones�secundarias.�
De�la�misma�manera,� las�síntesis�de�DNPE,�DNHE�y�DNOE�se�llevaron�a�cabo�sobre�
distintas�zeolitas,�determinándose�qué�características�son�necesarias�para�maximizar�la�
el�rendimiento�en�éter�lineal�y�cómo�afectan�a�la�conversión�y�selectividad.�
En�el�presente�trabajo�se�lleva�a�cabo�también�el�estudio�del�equilibrio�químico�de�la�
reacción� de� deshidratación� de� 1�octanol� a� DNOE� sobre� la� resina� termoestable�
Amberlyst�70,�dando�así�continuidad�a�los�trabajos�previos�en�la�determinación�de�las�
constantes�de�equilibrio�del�DNPE�y�DNHE.�En�el�estudio�de�equilibrio�se�determina�la�
constante� de� equilibrio� así� como� el� carácter� térmico� de� la� reacción� a� la� vez� que� se�
cotejan� los� valores� de� entalpía� de� formación� del� DNOE� estimados� y� se� propone� un�
nuevo�valor�para�la�entropía�molar�del�DNOE.�
Por� último� se� realiza� un� estudio� cinético� de� las� síntesis� de� DNHE� y� DNOE� sobre�
zeolitas,� comparándose� con� el� estudio� cinético� para� la� síntesis� de� DNPE� de� la�
bibliografía.�Así�mismo�se�lleva�a�cabo�un�estudio�cinético�de�la�síntesis�de�DNOE�sobre�
la�resina�termoestable�Amberlyst�70.��
11.�Resumen�del�trabajo�(spanish)�
220�
En�referencia�a�la�síntesis�de�DNOE�sobre�Amberlyst�70,�se�llevan�a�cabo�una�serie�
de�estudios�preliminares�para�determinar�qué�condiciones�experimentales� (velocidad�
de� agitación,� diámetro� de� partícula� de� catalizador� y� masa� de� catalizador)� son�
necesarias�para�evitar�los�efectos�de�la�transferencia�de�materia�externa/interna�en�la�
velocidad� de� reacción� observada.� Los� datos� cinéticos� se� ajustan� a� modelos� cinéticos�
tipo� LHHW�RE� y� se� realiza� una� selección� y� discriminación� en� base� a� criterios� de�
coherencia�fisicoquímica�y�criterios�de�ajuste�matemático.�También�se�evalúa�el�efecto�
de�los�productos�de�la�reacción�(agua�y�DNOE)�así�como�el�disolvente�(1,4�dioxano)�en�
la� velocidad� de� reacción� y� se� proponen� y� evalúan� distintos� factores� para� corregir� el�
efecto�desactivador�del�agua�en�la�reacción�que�se�observa.�
Respecto� a� las� zeolitas,� análogamente� a� la� resina� Amberlyst� 70,� se� ajustaron�
modelos�cinéticos�LHHW�RE�a�los�datos�cinéticos�de�las�síntesis�de�DNHE�y�DNOE�y�se�
procedió�a�la�selección�del�modelo�cinético�con�los�mismos�criterios�fisicoquímicos�y�de�
ajuste�matemático.�Así�mismo�se�compararon�los�modelos�cinéticos�obtenidos�para�el�
DNHE�y�el�DNOE�con�el�modelo�para�el�DNPE�de�la�bibliografía.�
1.�Introducción�
El�motor�diésel�presenta�la�ventaja�de�su�mayor�eficiencia�térmica�respecto�a�otros�
motores� de� combustión� interna.� Sin� embargo,� la� combustión� del� diésel� genera�
contaminantes�como� las�partículas,�CO,�NOx,�SOx�e�hidrocarburos�no� quemados�que�
comprometen�la�calidad�del�aire�las�ciudades�europeas.�Para�resolver�el�problema�de�
las�emisiones�de� los�motores�diésel�existen�soluciones�que�pasan�por� la�modificación�
del�motor,�las�tecnologías�de�final�de�tubo�y�la�reformulación�del�combustible�diésel.��
La� reformulación� del� combustible� diésel� es� en� general� una� solución� que� afecta� a�
todo� tipo� de� motores.� Las� normativas� europeas� son� cada� vez� más� exigentes� en� las�
especificaciones� del� combustible� diésel,� estableciendo� índices� de� cetano� más� altos,�
densidades� más� bajas,� y� limitando� el� contenido� de� hidrocarburos� poliaromáticos,� y�
compuestos�de�azufre�[1].�
Dentro�de�la�variedad�de�posibles�aditivos�para�reformular�el�combustible�diésel,�los�
compuestos�oxigenados�y�más�concretamente�los�éteres�lineales�de�más�de�9�carbonos�
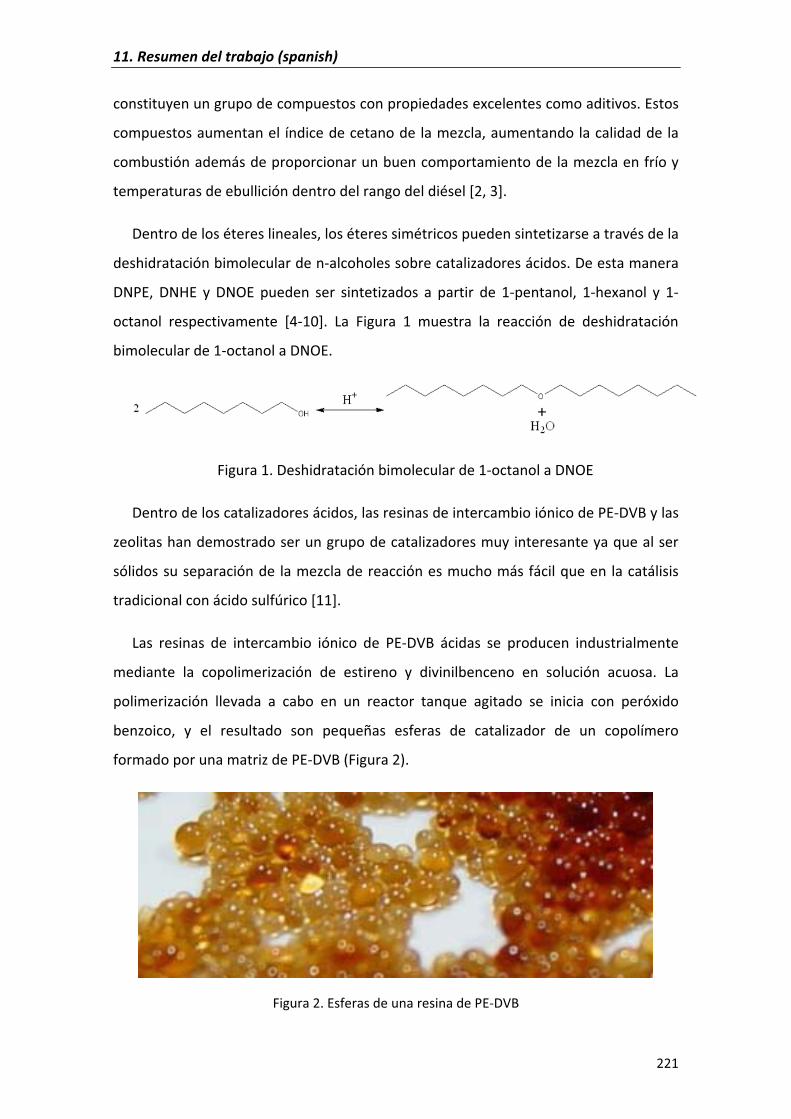
11.�Resumen�del�trabajo�(spanish)�
221�
constituyen�un�grupo�de�compuestos�con�propiedades�excelentes�como�aditivos.�Estos�
compuestos�aumentan�el� índice�de�cetano�de�la�mezcla,�aumentando�la�calidad�de�la�
combustión�además�de�proporcionar�un�buen�comportamiento�de�la�mezcla�en�frío�y�
temperaturas�de�ebullición�dentro�del�rango�del�diésel�[2,�3].�
Dentro�de�los�éteres�lineales,�los�éteres�simétricos�pueden�sintetizarse�a�través�de�la�
deshidratación�bimolecular�de�n�alcoholes�sobre�catalizadores�ácidos.�De�esta�manera�
DNPE,� DNHE� y� DNOE� pueden� ser� sintetizados� a� partir� de� 1�pentanol,� 1�hexanol� y� 1�
octanol� respectivamente� [4�10].� La� Figura� 1� muestra� la� reacción� de� deshidratación�
bimolecular�de�1�octanol�a�DNOE.�
�
Figura�1.�Deshidratación�bimolecular�de�1�octanol�a�DNOE�
Dentro�de�los�catalizadores�ácidos,�las�resinas�de�intercambio�iónico�de�PE�DVB�y�las�
zeolitas�han�demostrado�ser�un�grupo�de�catalizadores�muy�interesante�ya�que�al�ser�
sólidos�su�separación�de� la�mezcla�de�reacción�es�mucho�más�fácil�que�en� la�catálisis�
tradicional�con�ácido�sulfúrico�[11].��
Las� resinas� de� intercambio� iónico� de� PE�DVB� ácidas� se� producen� industrialmente�
mediante� la� copolimerización� de� estireno� y� divinilbenceno� en� solución� acuosa.� La�
polimerización� llevada� a� cabo� en� un� reactor� tanque� agitado� se� inicia� con� peróxido�
benzoico,� y� el� resultado� son� pequeñas� esferas� de� catalizador� de� un� copolímero�
formado�por�una�matriz�de�PE�DVB�(Figura�2).�
�
Figura�2.�Esferas�de�una�resina�de�PE�DVB�
11.�Resumen�del�trabajo�(spanish)�
222�
En� la� síntesis� de� las� resinas� de� PE�DVB� puede� incluirse� un� agente� porógeno� que�
genera�una�matriz�de�PE�DVB�macroreticular�con�porosidad�permanente.�Sin�embargo�
las� resinas� tipo� gel� se� sintetizan� en� ausencia� de� agente� porógeno� generando� una�
estructura�ausente�de�porosidad�en�estado�seco�pero�porosa�cuando�la�matriz�de�PE�
DVB�se�hincha�por�el�efecto�de�un�solvente�polar.�
Las� resinas� macroreticulares� contienen� porcentajes� de� DVB� altos� (8�20%� o� incluso�
más).� Su� estructura� es� más� resistente� físicamente� pero� su� matriz� polimérica� es� más�
rígida,� lo�que� les�confiere�menos�capacidad�de�hinchamiento�que� las�resinas�tipo�gel,�
con�porcentajes�de�DVB�más�bajos�(2�8%).�Las�resinas�de�PE�DVB�se�tratan�con�ácidos�
para�generar�los�centros�ácidos�en�su�estructura,�como�por�ejemplo�la�sulfonación�con�
ácido�sulfúrico,�que�genera�una�estructura�polimérica�con�grupos�sulfónicos�anclados�a�
los�anillos�bencénicos�de�la�matriz�de�PE�DVB.�
Las� zeolitas� son� aluminosilicatos� de� metales� del� grupo� I� y� II� de� la� tabla� periódica.�
Están� formadas� por� tetraedros� de� SiO44�� o� AlO4
5�� organizados� de� tal� manera� que�
generan� estructuras� con� microporos� de� tamaño� uniforme.� Es� posible� controlar� su�
composición,� tamaño� de� poro� y� topología,� generando� un� sinfín� de� estructuras.� Se�
pueden� sintetizar� hidrotermalmente� mediante� una� fuente� de� Si,� un� agente�
mineralizante� y� un� agente� director� de� estructura.� La� funcionalización� ácida� de� las�
zeolitas� se� lleva� a� cabo� mediante� sustitución� isomórfica,� sustituyendo� tetraedros� de�
SiO44��por�tetraedros�de�AlO4
5��y�así�generando�cargas�negativas�que�son�compensadas�
con�cationes�orgánicos�como�el�amonio.��
Para� que� la� deshidratación� de� alcoholes� a� éteres� lineales� se� lleve� a� cabo� en�
catalizadores�sólidos,�los�reactivos�deben�poder�acceder�desde�el�medio�de�reacción�a�
los� centros� ácidos� del� catalizador� y� los� productos� deben� poder� salir� de� los� centros�
ácidos�del�catalizador�y�llegar�al�medio�de�reacción.�
Los�pasos�de�un�proceso�catalizado�por�un�sólido�consisten�en�(Figura�3):�
A. Difusión�de�los�reactivos�desde�la�fase�fluida�a�la�película�externa�del�catalizador�
(transferencia�de�materia�externa).�
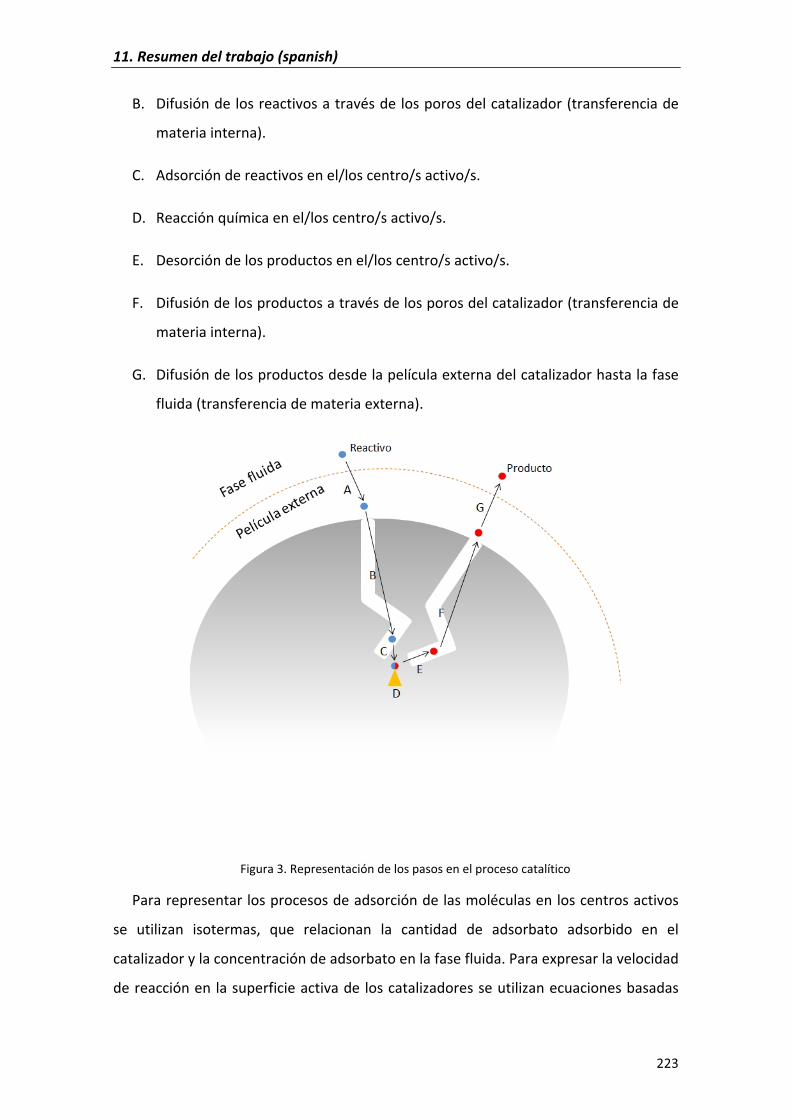
11.�Resumen�del�trabajo�(spanish)�
223�
B. Difusión�de�los�reactivos�a�través�de�los�poros�del�catalizador�(transferencia�de�
materia�interna).�
C. Adsorción�de�reactivos�en�el/los�centro/s�activo/s.�
D. Reacción�química�en�el/los�centro/s�activo/s.�
E. Desorción�de�los�productos�en�el/los�centro/s�activo/s.�
F. Difusión�de�los�productos�a�través�de�los�poros�del�catalizador�(transferencia�de�
materia�interna).�
G. Difusión�de�los�productos�desde�la�película�externa�del�catalizador�hasta�la�fase�
fluida�(transferencia�de�materia�externa).�
�
Figura�3.�Representación�de�los�pasos�en�el�proceso�catalítico�
Para�representar�los�procesos�de�adsorción�de�las�moléculas�en�los�centros�activos�
se� utilizan� isotermas,� que� relacionan� la� cantidad� de� adsorbato� adsorbido� en� el�
catalizador�y�la�concentración�de�adsorbato�en�la�fase�fluida.�Para�expresar�la�velocidad�
de�reacción�en�la�superficie�activa�de� los�catalizadores�se�utilizan�ecuaciones�basadas�
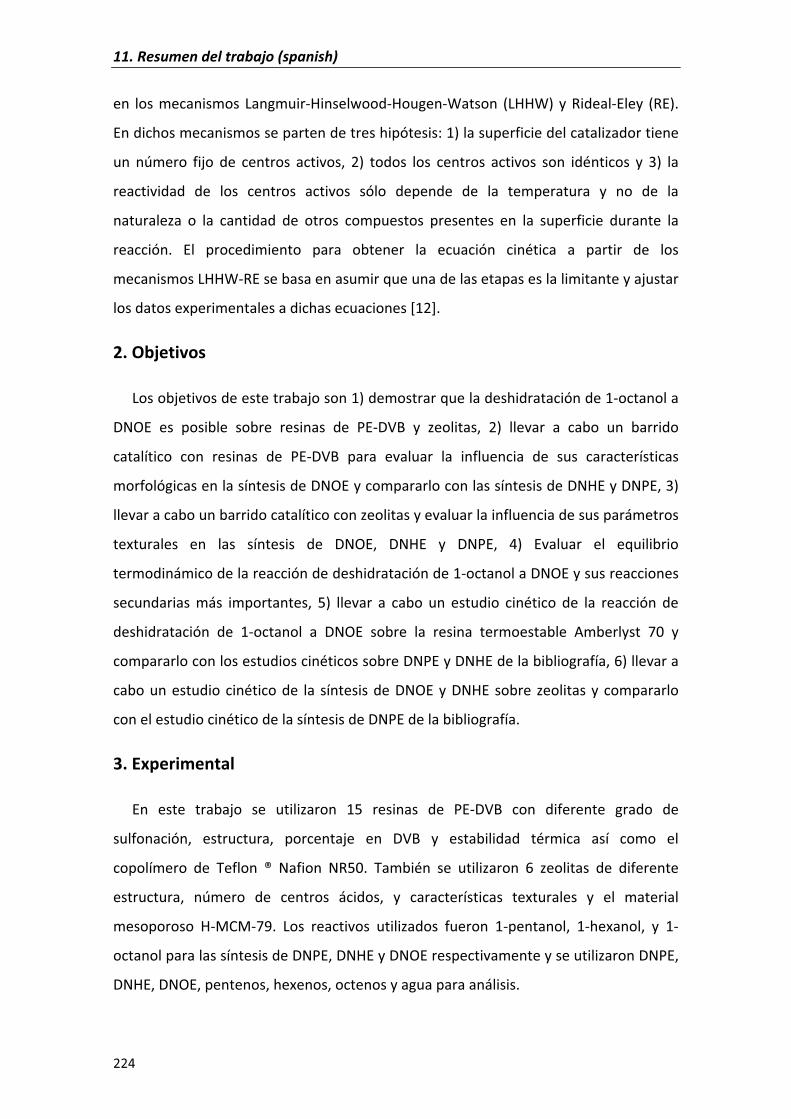
11.�Resumen�del�trabajo�(spanish)�
224�
en� los� mecanismos� Langmuir�Hinselwood�Hougen�Watson� (LHHW)� y� Rideal�Eley� (RE).�
En�dichos�mecanismos�se�parten�de�tres�hipótesis:�1)�la�superficie�del�catalizador�tiene�
un� número� fijo� de� centros� activos,� 2)� todos� los� centros� activos� son� idénticos� y� 3)� la�
reactividad� de� los� centros� activos� sólo� depende� de� la� temperatura� y� no� de� la�
naturaleza� o� la� cantidad� de� otros� compuestos� presentes� en� la� superficie� durante� la�
reacción.� El� procedimiento� para� obtener� la� ecuación� cinética� a� partir� de� los�
mecanismos�LHHW�RE�se�basa�en�asumir�que�una�de�las�etapas�es�la�limitante�y�ajustar�
los�datos�experimentales�a�dichas�ecuaciones�[12].��
2.�Objetivos�
Los�objetivos�de�este�trabajo�son�1)�demostrar�que�la�deshidratación�de�1�octanol�a�
DNOE� es� posible� sobre� resinas� de� PE�DVB� y� zeolitas,� 2)� llevar� a� cabo� un� barrido�
catalítico� con� resinas� de� PE�DVB� para� evaluar� la� influencia� de� sus� características�
morfológicas�en�la�síntesis�de�DNOE�y�compararlo�con�las�síntesis�de�DNHE�y�DNPE,�3)�
llevar�a�cabo�un�barrido�catalítico�con�zeolitas�y�evaluar�la�influencia�de�sus�parámetros�
texturales� en� las� síntesis� de� DNOE,� DNHE� y� DNPE,� 4)� Evaluar� el� equilibrio�
termodinámico�de�la�reacción�de�deshidratación�de�1�octanol�a�DNOE�y�sus�reacciones�
secundarias� más� importantes,� 5)� llevar� a� cabo� un� estudio� cinético� de� la� reacción� de�
deshidratación� de� 1�octanol� a� DNOE� sobre� la� resina� termoestable� Amberlyst� 70� y�
compararlo�con�los�estudios�cinéticos�sobre�DNPE�y�DNHE�de�la�bibliografía,�6)�llevar�a�
cabo�un�estudio�cinético�de� la� síntesis�de�DNOE�y�DNHE�sobre�zeolitas�y�compararlo�
con�el�estudio�cinético�de�la�síntesis�de�DNPE�de�la�bibliografía.�
3.�Experimental�
En� este� trabajo� se� utilizaron� 15� resinas� de� PE�DVB� con� diferente� grado� de�
sulfonación,� estructura,� porcentaje� en� DVB� y� estabilidad� térmica� así� como� el�
copolímero� de� Teflon� ®� Nafion� NR50.� También� se� utilizaron� 6� zeolitas� de� diferente�
estructura,� número� de� centros� ácidos,� y� características� texturales� y� el� material�
mesoporoso� H�MCM�79.� Los� reactivos� utilizados� fueron� 1�pentanol,� 1�hexanol,� y� 1�
octanol�para�las�síntesis�de�DNPE,�DNHE�y�DNOE�respectivamente�y�se�utilizaron�DNPE,�
DNHE,�DNOE,�pentenos,�hexenos,�octenos�y�agua�para�análisis.�
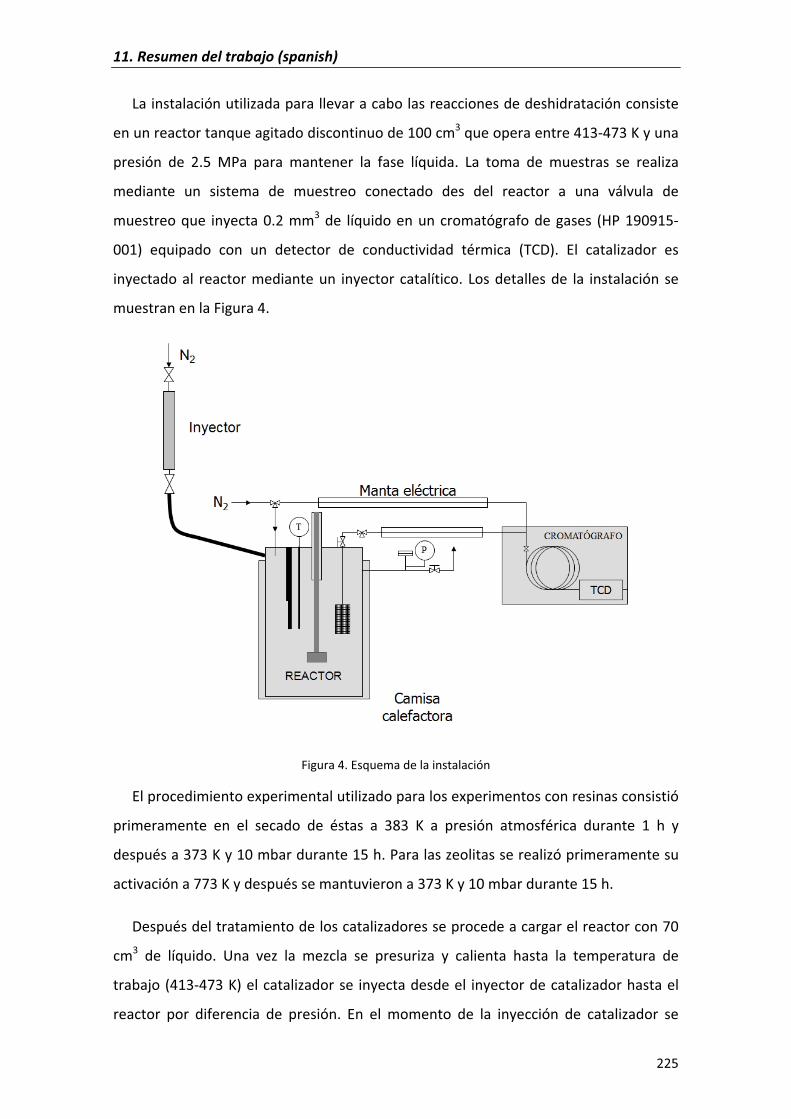
11.�Resumen�del�trabajo�(spanish)�
225�
La�instalación�utilizada�para�llevar�a�cabo�las�reacciones�de�deshidratación�consiste�
en�un�reactor�tanque�agitado�discontinuo�de�100�cm3�que�opera�entre�413�473�K�y�una�
presión� de� 2.5� MPa� para� mantener� la� fase� líquida.� La� toma� de� muestras� se� realiza�
mediante� un� sistema� de� muestreo� conectado� des� del� reactor� a� una� válvula� de�
muestreo�que� inyecta�0.2�mm3�de� líquido�en�un�cromatógrafo�de�gases� (HP�190915�
001)� equipado� con� un� detector� de� conductividad� térmica� (TCD).� El� catalizador� es�
inyectado�al� reactor�mediante�un� inyector�catalítico.� Los�detalles�de� la� instalación�se�
muestran�en�la�Figura�4.�
�
Figura�4.�Esquema�de�la�instalación��
El�procedimiento�experimental�utilizado�para�los�experimentos�con�resinas�consistió�
primeramente� en� el� secado� de� éstas� a� 383� K� a� presión� atmosférica� durante� 1� h� y�
después�a�373�K�y�10�mbar�durante�15�h.�Para�las�zeolitas�se�realizó�primeramente�su�
activación�a�773�K�y�después�se�mantuvieron�a�373�K�y�10�mbar�durante�15�h.��
Después�del�tratamiento�de�los�catalizadores�se�procede�a�cargar�el�reactor�con�70�
cm3� de� líquido.� Una� vez� la� mezcla� se� presuriza� y� calienta� hasta� la� temperatura� de�
trabajo�(413�473�K)�el�catalizador�se� inyecta�desde�el� inyector�de�catalizador�hasta�el�
reactor� por� diferencia� de� presión.� En� el� momento� de� la� inyección� de� catalizador� se�
11.�Resumen�del�trabajo�(spanish)�
226�
empieza�a� contar� el� tiempo� y� se� van� tomando� muestras� del� medio� de� reacción� cada�
hora�hasta�el�fin�del�experimento�(6�7�h�para�todos�los�experimentos�excepto�para�los�
experimentos�de�equilibrio�químico).�
4.�Resultados�y�discusión�
Del� estudio� sobre� la� deshidratación� de� 1�octanol� sobre� resinas� de� intercambio�
iónico� ácidas� se� concluyó� que� además� de� la� reacción� principal� de� eterificación� de� 1�
octanol� a� DNOE,� otras� reacciones� secundarias� también� tenían� lugar.� Las� reacciones�
secundarias� observadas� fueron� la� deshidratación� intramolecular� de� 1�octanol� a� 1�
octeno,� la� isomerización�de�1�octeno�a�2,3�y�4�octeno�y� la�reacción�entre�1�octanol�y�
octenos�para�producir�éteres�ramificados�de�16�carbonos.�En�la�Figura�5�se�muestra�el�
esquema�de�reacción�para�la�deshidratación�de�1�octanol.�
�
Figura�5.�Esquema�de�reacción�para�la�deshidratación�de�1�octanol�
�
Se�realizó�un�análisis�de�la�influencia�de�las�propiedades�de�las�resinas�en�la�reacción�
de� deshidratación� de� 1�octanol� a� DNOE.� Así� mismo,� este� análisis� se� extendió� a� las�
deshidrataciones� de� 1�pentanol� y� 1�hexanol� a� DNPE� y� DNHE� respectivamente,� con�
esquemas�de�reacción�análogos�al�mostrado�en�la�Figura�5.��
La� Figura� 6� muestra� la� conversión� de� alcohol� unificada� para� los� tres� sistemas�
(XROH�n0ROH/W)� en� varias� resinas.� Se� vio� que� la� conversión� de� alcohol� fue� mayor� en�
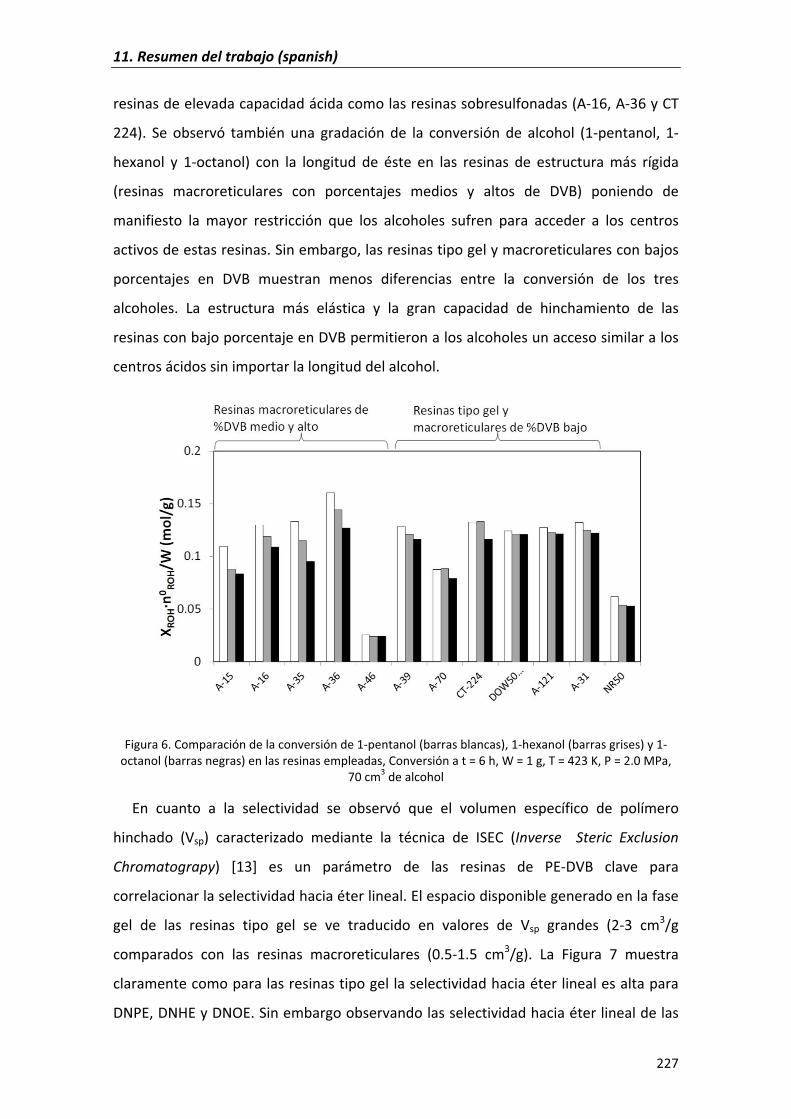
11.�Resumen�del�trabajo�(spanish)�
227�
resinas�de�elevada�capacidad�ácida�como�las�resinas�sobresulfonadas�(A�16,�A�36�y�CT�
224).� Se� observó� también� una� gradación� de� la� conversión� de� alcohol� (1�pentanol,� 1�
hexanol� y� 1�octanol)� con� la� longitud� de� éste� en� las� resinas� de� estructura� más� rígida�
(resinas� macroreticulares� con� porcentajes� medios� y� altos� de� DVB)� poniendo� de�
manifiesto� la� mayor� restricción� que� los� alcoholes� sufren� para� acceder� a� los� centros�
activos�de�estas�resinas.�Sin�embargo,�las�resinas�tipo�gel�y�macroreticulares�con�bajos�
porcentajes� en� DVB� muestran� menos� diferencias� entre� la� conversión� de� los� tres�
alcoholes.� La� estructura� más� elástica� y� la� gran� capacidad� de� hinchamiento� de� las�
resinas�con�bajo�porcentaje�en�DVB�permitieron�a�los�alcoholes�un�acceso�similar�a�los�
centros�ácidos�sin�importar�la�longitud�del�alcohol.�
�
Figura�6.�Comparación�de�la�conversión�de�1�pentanol�(barras�blancas),�1�hexanol�(barras�grises)�y�1�octanol�(barras�negras)�en�las�resinas�empleadas,�Conversión�a�t�=�6�h,�W�=�1�g,�T�=�423�K,�P�=�2.0�MPa,�
70�cm3�de�alcohol�
En� cuanto� a� la� selectividad� se� observó� que� el� volumen� específico� de� polímero�
hinchado� (Vsp)� caracterizado� mediante� la� técnica� de� ISEC� (Inverse� � Steric� Exclusion�
Chromatograpy)� [13]� es� un� parámetro� de� las� resinas� de� PE�DVB� clave� para�
correlacionar�la�selectividad�hacia�éter�lineal.�El�espacio�disponible�generado�en�la�fase�
gel� de� las� resinas� tipo� gel� se� ve� traducido� en� valores� de� Vsp� grandes� (2�3� cm3/g�
comparados� con� las� resinas� macroreticulares� (0.5�1.5� cm3/g).� La� Figura� 7� muestra�
claramente�como�para�las�resinas�tipo�gel�la�selectividad�hacia�éter�lineal�es�alta�para�
DNPE,�DNHE�y�DNOE.�Sin�embargo�observando�las�selectividad�hacia�éter�lineal�de�las�
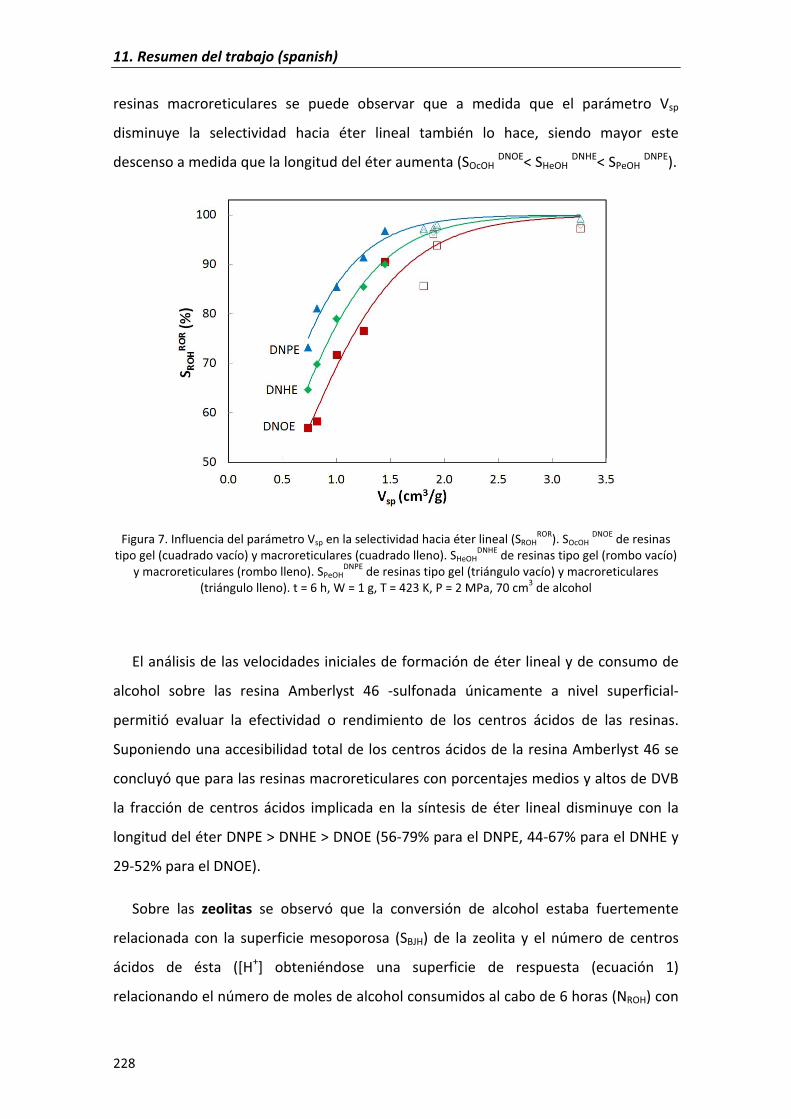
11.�Resumen�del�trabajo�(spanish)�
228�
resinas� macroreticulares� se� puede� observar� que� a� medida� que� el� parámetro� Vsp�
disminuye� la� selectividad� hacia� éter� lineal� también� lo� hace,� siendo� mayor� este�
descenso�a�medida�que�la�longitud�del�éter�aumenta�(SOcOH�DNOE<�SHeOH�DNHE<�SPeOH�DNPE).�
�
Figura�7.�Influencia�del�parámetro�Vsp�en�la�selectividad�hacia�éter�lineal�(SROHROR).�SOcOH�DNOE�de�resinas�
tipo�gel�(cuadrado�vacío)�y�macroreticulares�(cuadrado�lleno).�SHeOHDNHE�de�resinas�tipo�gel�(rombo�vacío)�
y�macroreticulares�(rombo�lleno).�SPeOHDNPE�de�resinas�tipo�gel�(triángulo�vacío)�y�macroreticulares�
(triángulo�lleno).�t�=�6�h,�W�=�1�g,�T�=�423�K,�P�=�2�MPa,�70�cm3�de�alcohol�
�
El�análisis�de�las�velocidades�iniciales�de�formación�de�éter�lineal�y�de�consumo�de�
alcohol� sobre� las� resina� Amberlyst� 46� �sulfonada� únicamente� a� nivel� superficial��
permitió� evaluar� la� efectividad� o� rendimiento� de� los� centros� ácidos� de� las� resinas.�
Suponiendo�una�accesibilidad�total�de�los�centros�ácidos�de�la�resina�Amberlyst�46�se�
concluyó�que�para�las�resinas�macroreticulares�con�porcentajes�medios�y�altos�de�DVB�
la� fracción� de� centros� ácidos� implicada� en� la� síntesis� de� éter� lineal� disminuye� con� la�
longitud�del�éter�DNPE�>�DNHE�>�DNOE�(56�79%�para�el�DNPE,�44�67%�para�el�DNHE�y�
29�52%�para�el�DNOE).��
Sobre� las� zeolitas� se� observó� que� la� conversión� de� alcohol� estaba� fuertemente�
relacionada� con� la� superficie� mesoporosa� (SBJH)� de� la� zeolita� y� el� número� de� centros�
ácidos� de� ésta� ([H+]� obteniéndose� una� superficie� de� respuesta� (ecuación� 1)�
relacionando�el�número�de�moles�de�alcohol�consumidos�al�cabo�de�6�horas�(NROH)�con�
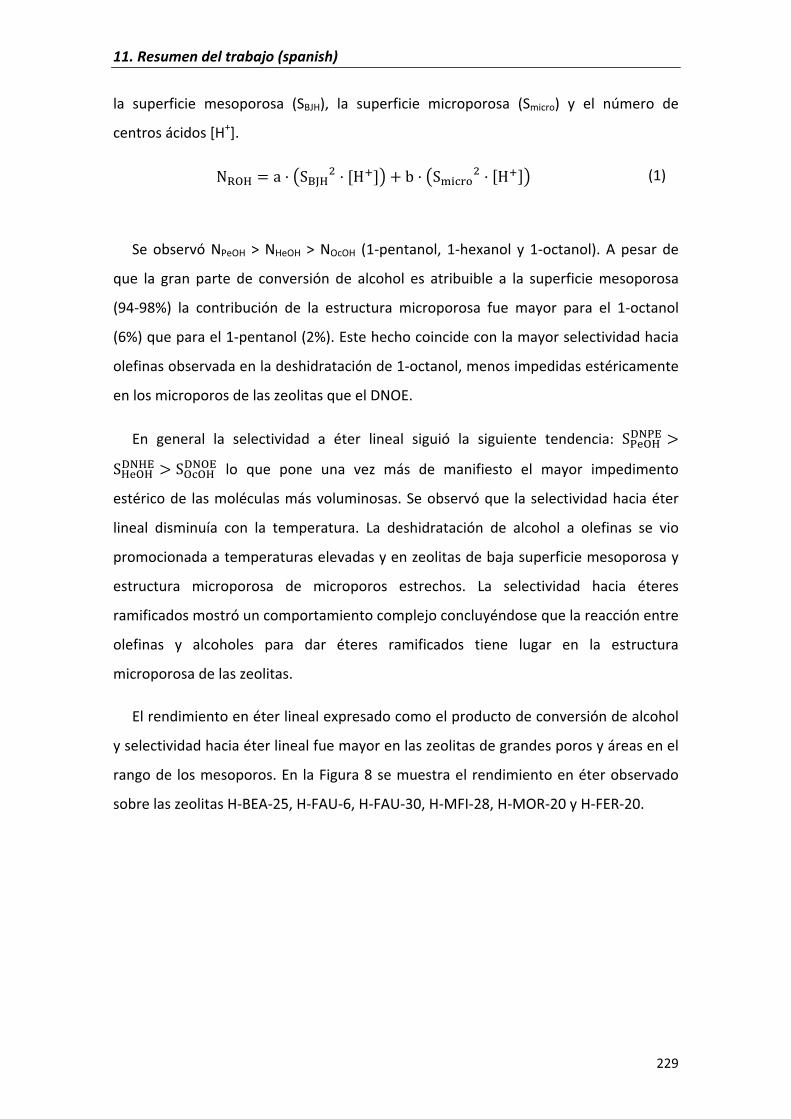
11.�Resumen�del�trabajo�(spanish)�
229�
la� superficie� mesoporosa� (SBJH),� la� superficie� microporosa� (Smicro)� y� el� número� de�
centros�ácidos�[H+].�
IJK � V ¡L§¨K" �lm�¦ ª ¡L«�_¬" �lm�¦� (1)�
�
Se� observó� NPeOH� >� NHeOH� >� NOcOH� (1�pentanol,� 1�hexanol� y� 1�octanol).� A� pesar� de�
que� la� gran� parte� de� conversión� de� alcohol� es� atribuible� a� la� superficie� mesoporosa�
(94�98%)� la� contribución� de� la� estructura� microporosa� fue� mayor� para� el� 1�octanol�
(6%)�que�para�el�1�pentanol�(2%).�Este�hecho�coincide�con�la�mayor�selectividad�hacia�
olefinas�observada�en�la�deshidratación�de�1�octanol,�menos�impedidas�estéricamente�
en�los�microporos�de�las�zeolitas�que�el�DNOE.��
En� general� la� selectividad� a� éter� lineal� siguió� la� siguiente� tendencia:� LsrJKnosp {LKrJKnoKp { LJ_JKnoJp� lo� que� pone� una� vez� más� de� manifiesto� el� mayor� impedimento�
estérico�de� las�moléculas�más�voluminosas.�Se�observó�que� la�selectividad�hacia�éter�
lineal� disminuía� con� la� temperatura.� La� deshidratación� de� alcohol� a� olefinas� se� vio�
promocionada�a�temperaturas�elevadas�y�en�zeolitas�de�baja�superficie�mesoporosa�y�
estructura� microporosa� de� microporos� estrechos.� La� selectividad� hacia� éteres�
ramificados�mostró�un�comportamiento�complejo�concluyéndose�que�la�reacción�entre�
olefinas� y� alcoholes� para� dar� éteres� ramificados� tiene� lugar� en� la� estructura�
microporosa�de�las�zeolitas.�
El�rendimiento�en�éter�lineal�expresado�como�el�producto�de�conversión�de�alcohol�
y�selectividad�hacia�éter�lineal�fue�mayor�en�las�zeolitas�de�grandes�poros�y�áreas�en�el�
rango�de� los�mesoporos.�En� la�Figura�8�se�muestra�el�rendimiento�en�éter�observado�
sobre�las�zeolitas�H�BEA�25,�H�FAU�6,�H�FAU�30,�H�MFI�28,�H�MOR�20�y�H�FER�20.�
11.�Resumen�del�trabajo�(spanish)�
230�
�
Figura�8.�Rendimiento�en�DNPE�(barras�blancas),�DNHE�(barras�grises)�y�DNOE�(barras�negras)�y�superficie�mesoporosa,�SBJH�(puntos).�Condiciones:�W�=�1g,�T�=453�K,�P�=�2.0�MPa,�70�cm3�alcohol,�t�=�6�h)�
�
En�el�estudio�de�equilibrio�de�la�reacción�de�deshidratación�de�1�octanol�a�DNOE�se�
determinaron� las� constantes� de� equilibrio� en� el� rango� de� temperaturas� 413�453� K�
sobre� la� resina� termoestable� Amberlyst� 70.� También� se� determinaron� las� constantes�
de�equilibrio�de�las�reacciones�secundarias�más�importantes.�
El� procedimiento� experimental� para� este� tipo� de� experimentos� consistió� en�
introducir� en� el� reactor� una� mezcla� de� reacción� próxima� al� equilibrio� junto� con� 4�
gramos� de� Amberlyst� 70,� calentar� la� mezcla� hasta� la� temperatura� de� trabajo� y� dejar�
evolucionar� la� mezcla� de� reacción� hasta� alcanzar� el� equilibrio.� Para� preparar� las�
mezclas�de�composición�cercana�al�equilibrio�se�utilizó�el�disolvente�1,4�dioxano,�que�
permitió� trabajar� con� mezclas� de� agua�1�octanol�DNOE� y� octenos� sin� problemas� de�
miscibilidad�entre� los�componentes� [REF�43,�99].�La� toma�de�muestras�se�realizaba�a�
diario�hasta�observar�que�el�valor�de�la�constante�de�equilibrio�experimental�calculada�
con�la�ecuación�2�no�variaba�significativamente�en�el�tiempo�(50�75�h).�
³ � ´�V��rµ¶·�f� � ´��¤)� ���rµ¶·
�f� � ´��¤)��rµ¶·�f� ´����rµ¶·
�f� � ³¸ ³¤� (2)�
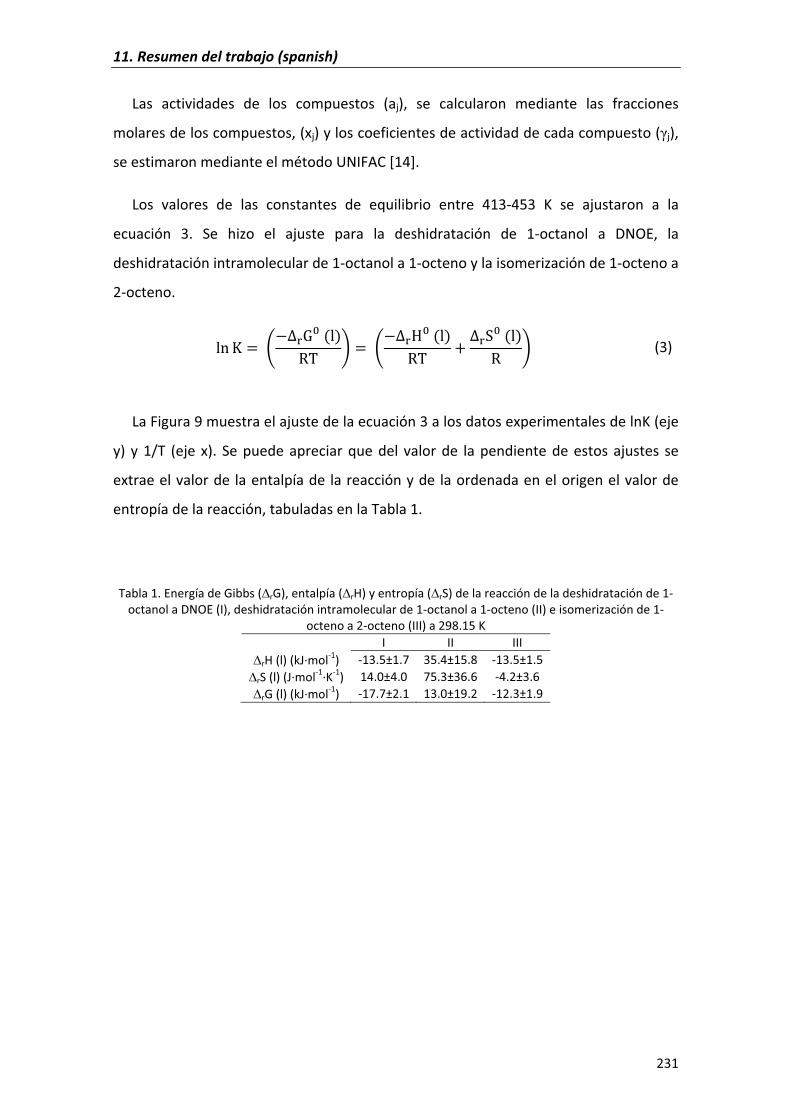
11.�Resumen�del�trabajo�(spanish)�
231�
Las� actividades� de� los� compuestos� (aj),� se� calcularon� mediante� las� fracciones�
molares�de�los�compuestos,�(xj)�y�los�coeficientes�de�actividad�de�cada�compuesto�(�j),�
se�estimaron�mediante�el�método�UNIFAC�[14].�
Los� valores� de� las� constantes� de� equilibrio� entre� 413�453� K� se� ajustaron� a� la�
ecuación� 3.� Se� hizo� el� ajuste� para� la� deshidratación� de� 1�octanol� a� DNOE,� la�
deshidratación�intramolecular�de�1�octanol�a�1�octeno�y�la�isomerización�de�1�octeno�a�
2�octeno.�
T\ ³ � ®�°¬Ã� �T�À� ¯ � ®�°¬l� �T�À� °¬L� �T�À ¯� (3)�
�
La�Figura�9�muestra�el�ajuste�de�la�ecuación�3�a�los�datos�experimentales�de�lnK�(eje�
y)� y� 1/T� (eje� x).� Se� puede� apreciar� que� del� valor� de� la� pendiente� de� estos� ajustes� se�
extrae�el�valor�de� la�entalpía�de� la�reacción�y�de� la�ordenada�en�el�origen�el�valor�de�
entropía�de�la�reacción,�tabuladas�en�la�Tabla�1.�
�
Tabla�1.�Energía�de�Gibbs�(�rG),�entalpía�(�rH)�y�entropía�(�rS)�de�la�reacción�de�la�deshidratación�de�1�octanol�a�DNOE�(I),�deshidratación�intramolecular�de�1�octanol�a�1�octeno�(II)�e�isomerización�de�1�
octeno�a�2�octeno�(III)�a�298.15�K�� I II III
�rH�(l)�(kJ�mol�1)� �13.5±1.7� 35.4±15.8� �13.5±1.5��rS�(l)�(J�mol�1�K�1)� 14.0±4.0� 75.3±36.6� �4.2±3.6��rG�(l)�(kJ�mol�1)� �17.7±2.1� 13.0±19.2� �12.3±1.9�
�
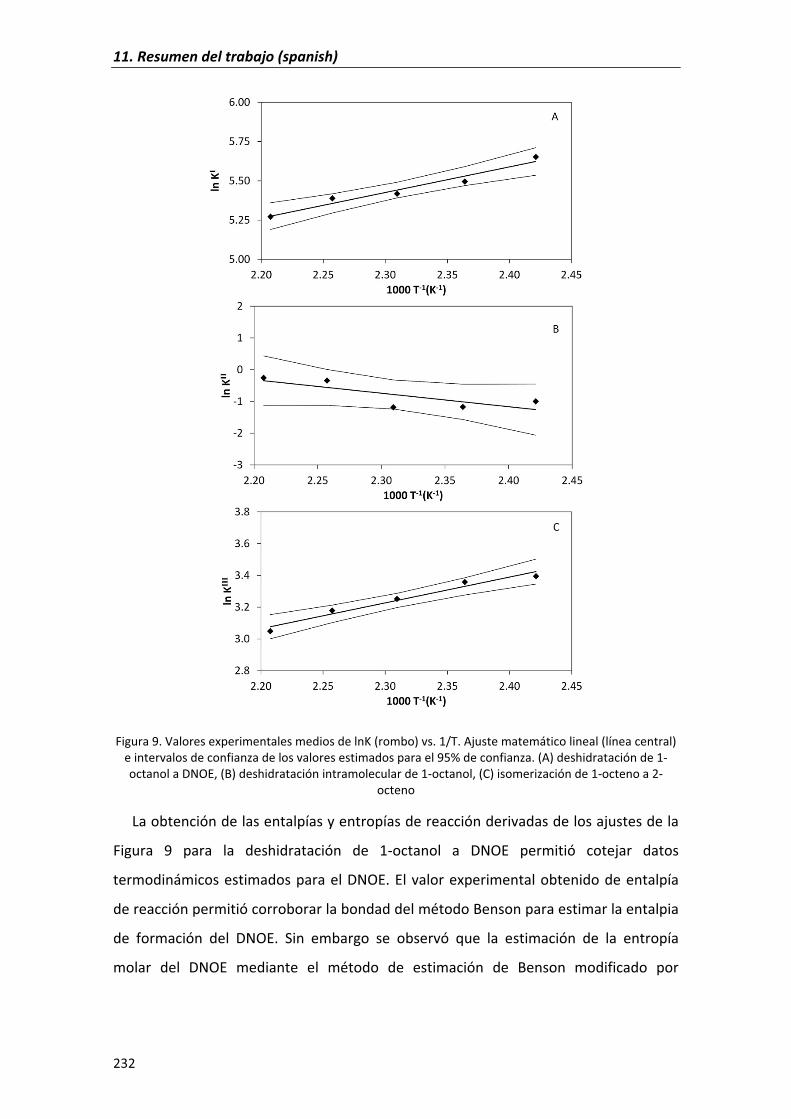
11.�Resumen�del�trabajo�(spanish)�
232�
�
Figura�9.�Valores�experimentales�medios�de�lnK�(rombo)�vs.�1/T.�Ajuste�matemático�lineal�(línea�central)�e�intervalos�de�confianza�de�los�valores�estimados�para�el�95%�de�confianza.�(A)�deshidratación�de�1�octanol�a�DNOE,�(B)�deshidratación�intramolecular�de�1�octanol,�(C)�isomerización�de�1�octeno�a�2�
octeno�
La�obtención�de�las�entalpías�y�entropías�de�reacción�derivadas�de�los�ajustes�de�la�
Figura� 9� para� la� deshidratación� de� 1�octanol� a� DNOE� permitió� cotejar� datos�
termodinámicos�estimados�para�el�DNOE.�El�valor�experimental�obtenido�de�entalpía�
de�reacción�permitió�corroborar�la�bondad�del�método�Benson�para�estimar�la�entalpia�
de� formación� del� DNOE.� Sin� embargo� se� observó� que� la� estimación� de� la� entropía�
molar� del� DNOE� mediante� el� método� de� estimación� de� Benson� modificado� por�
11.�Resumen�del�trabajo�(spanish)�
233�
Verevkin� [15]� no� coincidía� con� el� valor� deducido� mediante� la� entropía� de� reacción,�
proponiéndose�de�esta�manera�el�valor�de�658�±4�J�mol�1�K�1.�
Comparando� los� datos� termodinámicos� para� la� reacción� de� deshidratación� de� 1�
octanol� a� DNOE� con� los� datos� para� las� síntesis� de� DNHE� y� DNPE� se� observa� que� a�
medida�que�el�éter�lineal�es�más�grande�la�entalpía�y�energías�de�Gibbs�de�reacción�son�
más�negativas.�
Para� la� realización� del� estudio� cinético� de� la� reacción� de� deshidratación� de� 1�
octanol� a� DNOE� sobre� la� resina� termoestable�Amberlyst� 70� se� procede� inicialmente�
con�un�estudio�preliminar�para�determinar�qué�condiciones�del�reactor�(velocidad�de�
agitación,�masa�de�catalizador�y�diámetro�de�partícula)� son�necesarias�para�asegurar�
que� la� transferencia� de� materia� externa� e� interna� no� influyen� en� la� velocidad� de�
reacción.�De�este�estudio�inicial�se�concluyó�que�operando�con�masas�de�Amberlyst�70�
comercial�entre�1�y�2�g�y�agitando�a�una�velocidad�de�500�rpm�no�existe�influencia�de�
las�transferencias�de�materia�externa�e�interna�en�la�velocidad�de�reacción.�
En� una� primera� fase� del� estudio� cinético� se� procedió� a� medir� la� velocidad� de�
reacción� empleando� únicamente� 1�octanol� como� reactivo.� 42� modelos� cinéticos�
basadas� en� los� mecanismos� LHHW�RE� se� ajustaron� a� los� datos� de� velocidades� de�
reacción� experimentales.� Se� analizaron� los� ajustes,� descartando� inicialmente� los�
modelos� cuyas� constantes� de� adsorción� implicaban� entalpías� y/o� entropías� de�
adsorción� positivas� así� como� aquellos� modelos� con� energías� de� activación� negativas.�
Una�vez�seleccionados�los�modelos�con�coherencia�fisicoquímica�se�procedió�a�evaluar�
y�seleccionar�el�modelo�que�más�se�ajustaba�a� los�datos�experimentales�por�criterios�
matemáticos� de� ajuste,� como� la� suma� mínima� de� residuos� al� cuadrado� (RSSQ),� una�
distribución� aleatoria� de� los� residuos� y� el� valor� mínimo� de� la� raíz� de� la� suma� de�
cuadrados�de�los�errores�relativos�de�los�parámetros�(RSSQRE).�
Del� resultado� de� esta� discriminación� de� modelos,� 6� tipos� de� modelos� son� los� que�
mejor�explicaron�los�datos�cinéticos�referentes�al�1�octanol�como�reactivo�(ecuaciones�
4�y�5):�
�
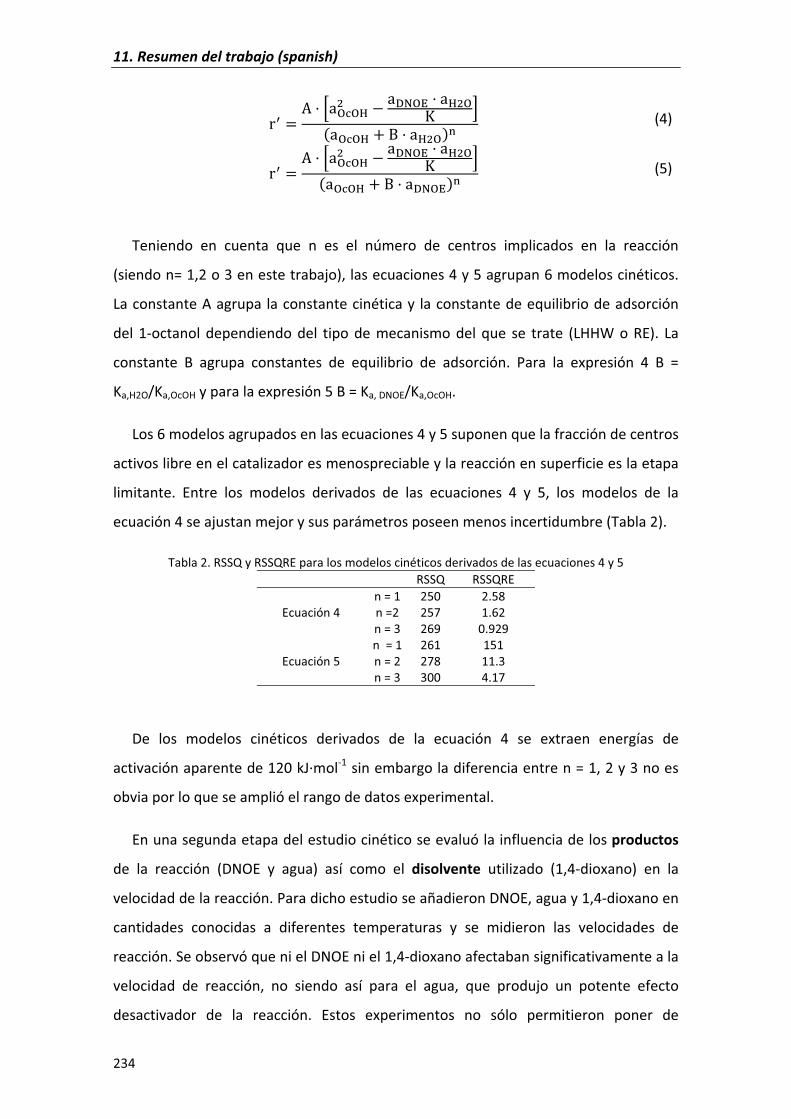
11.�Resumen�del�trabajo�(spanish)�
234�
Y7 � � ×VJ_JK" � VnoJp VK"J³ Ø�VJ_JK Ù VK"J�� � (4)�
Y7 � � ×VJ_JK" � VnoJp VK"J³ Ø�VJ_JK Ù VnoJp�� � (5)�
�
Teniendo� en� cuenta� que� n� es� el� número� de� centros� implicados� en� la� reacción�
(siendo�n=�1,2�o�3�en�este�trabajo),�las�ecuaciones�4�y�5�agrupan�6�modelos�cinéticos.�
La�constante�A�agrupa� la�constante�cinética�y� la�constante�de�equilibrio�de�adsorción�
del� 1�octanol� dependiendo� del� tipo� de� mecanismo� del� que� se� trate� (LHHW� o� RE).� La�
constante� B� agrupa� constantes� de� equilibrio� de� adsorción.� Para� la� expresión� 4� B� =�
Ka,H2O/Ka,OcOH�y�para�la�expresión�5�B�=�Ka,�DNOE/Ka,OcOH.�
Los�6�modelos�agrupados�en�las�ecuaciones�4�y�5�suponen�que�la�fracción�de�centros�
activos�libre�en�el�catalizador�es�menospreciable�y�la�reacción�en�superficie�es�la�etapa�
limitante.� Entre� los� modelos� derivados� de� las� ecuaciones� 4� y� 5,� los� modelos� de� la�
ecuación�4�se�ajustan�mejor�y�sus�parámetros�poseen�menos�incertidumbre�(Tabla�2).�
Tabla�2.�RSSQ�y�RSSQRE�para�los�modelos�cinéticos�derivados�de�las�ecuaciones�4�y�5�� RSSQ RSSQRE
Ecuación�4�n�=�1 250 2.58n�=2 257 1.62n�=�3 269 0.929
Ecuación�5�n��=�1 261 151n�=�2 278 11.3n�=�3 300 4.17
�
De� los� modelos� cinéticos� derivados� de� la� ecuación� 4� se� extraen� energías� de�
activación�aparente�de�120�kJ�mol�1�sin�embargo�la�diferencia�entre�n�=�1,�2�y�3�no�es�
obvia�por�lo�que�se�amplió�el�rango�de�datos�experimental.�
En�una�segunda�etapa�del�estudio�cinético�se�evaluó�la�influencia�de�los�productos�
de� la� reacción� (DNOE� y� agua)� así� como� el� disolvente� utilizado� (1,4�dioxano)� en� la�
velocidad�de�la�reacción.�Para�dicho�estudio�se�añadieron�DNOE,�agua�y�1,4�dioxano�en�
cantidades� conocidas� a� diferentes� temperaturas� y� se� midieron� las� velocidades� de�
reacción.�Se�observó�que�ni�el�DNOE�ni�el�1,4�dioxano�afectaban�significativamente�a�la�
velocidad� de� reacción,� no� siendo� así� para� el� agua,� que� produjo� un� potente� efecto�
desactivador� de� la� reacción.� Estos� experimentos� no� sólo� permitieron� poner� de�
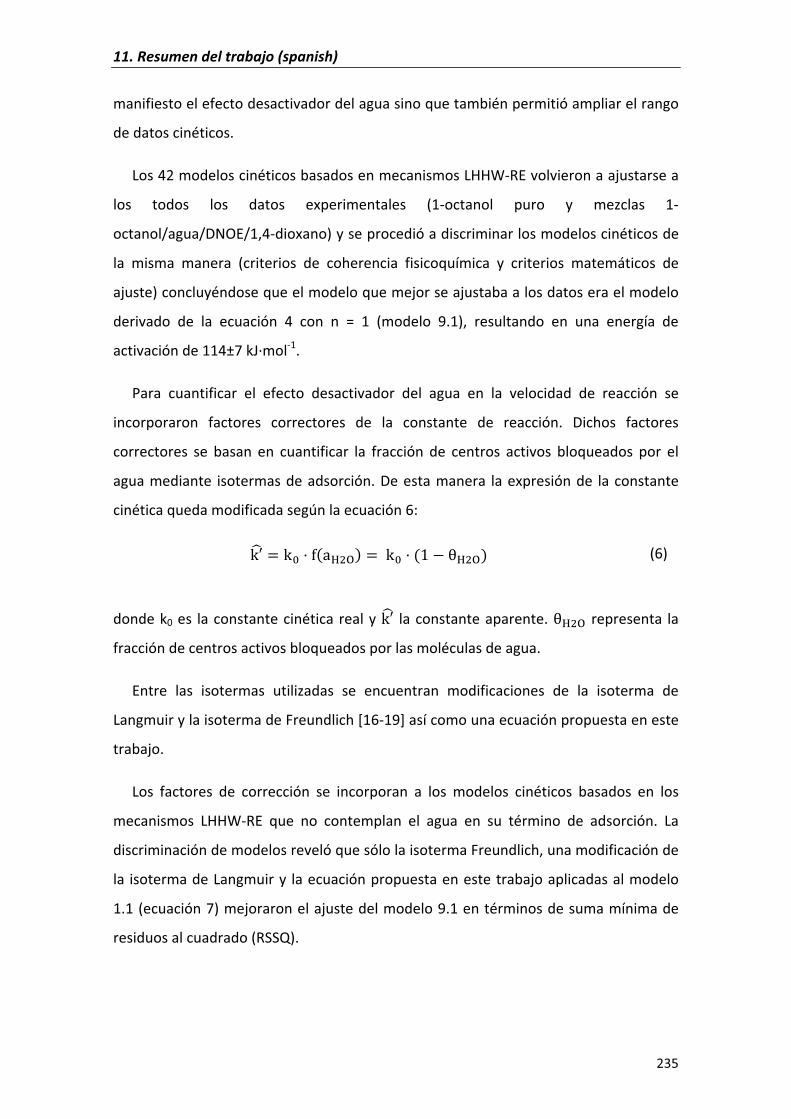
11.�Resumen�del�trabajo�(spanish)�
235�
manifiesto�el�efecto�desactivador�del�agua�sino�que�también�permitió�ampliar�el�rango�
de�datos�cinéticos.�
Los�42�modelos�cinéticos�basados�en�mecanismos�LHHW�RE�volvieron�a�ajustarse�a�
los� todos� los� datos� experimentales� (1�octanol� puro� y� mezclas� 1�
octanol/agua/DNOE/1,4�dioxano)�y�se�procedió�a�discriminar�los�modelos�cinéticos�de�
la� misma� manera� (criterios� de� coherencia� fisicoquímica� y� criterios� matemáticos� de�
ajuste)�concluyéndose�que�el�modelo�que�mejor�se�ajustaba�a�los�datos�era�el�modelo�
derivado� de� la� ecuación� 4� con� n� =� 1� (modelo� 9.1),� resultando� en� una� energía� de�
activación�de�114±7�kJ�mol�1.�
Para� cuantificar� el� efecto� desactivador� del� agua� en� la� velocidad� de� reacción� se�
incorporaron� factores� correctores� de� la� constante� de� reacción.� Dichos� factores�
correctores� se� basan� en� cuantificar� la� fracción� de� centros� activos� bloqueados� por� el�
agua�mediante� isotermas�de�adsorción.�De�esta�manera� la�expresión�de� la�constante�
cinética�queda�modificada�según�la�ecuación�6:�
g%6 � g� U�VK"J� � g� �� � äK"J� (6)��
donde�k0�es� la�constante�cinética�real�y�g%6 � la�constante�aparente.�äK"J� representa� la�
fracción�de�centros�activos�bloqueados�por�las�moléculas�de�agua.�
Entre� las� isotermas� utilizadas� se� encuentran� modificaciones� de� la� isoterma� de�
Langmuir�y�la�isoterma�de�Freundlich�[16�19]�así�como�una�ecuación�propuesta�en�este�
trabajo.��
Los� factores� de� corrección� se� incorporan� a� los� modelos� cinéticos� basados� en� los�
mecanismos� LHHW�RE� que� no� contemplan� el� agua� en� su� término� de� adsorción.� La�
discriminación�de�modelos�reveló�que�sólo�la�isoterma�Freundlich,�una�modificación�de�
la� isoterma�de�Langmuir�y� la�ecuación�propuesta�en�este�trabajo�aplicadas�al�modelo�
1.1�(ecuación�7)�mejoraron�el�ajuste�del�modelo�9.1�en�términos�de�suma�mínima�de�
residuos�al�cuadrado�(RSSQ).��
�
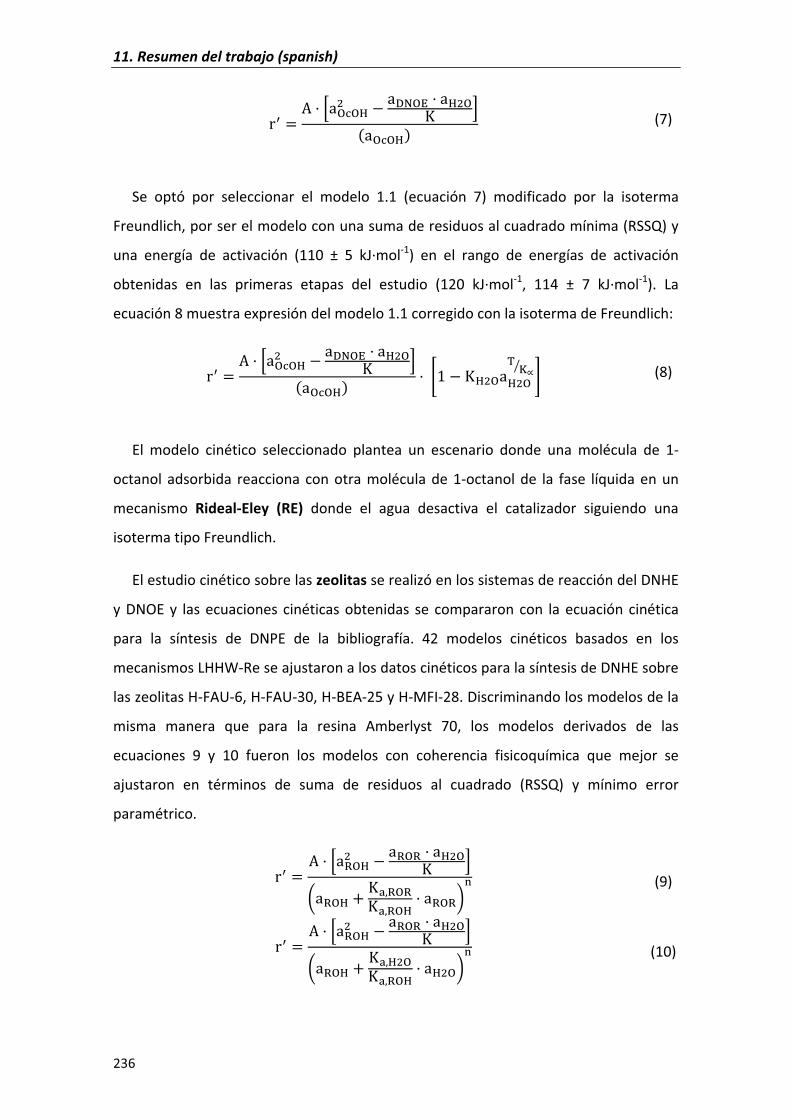
11.�Resumen�del�trabajo�(spanish)�
236�
Y7 � � ×VJ_JK" � VnoJp VK"J³ Ø�VJ_JK� � (7)�
�
Se� optó� por� seleccionar� el� modelo� 1.1� (ecuación� 7)� modificado� por� la� isoterma�
Freundlich,�por�ser�el�modelo�con�una�suma�de�residuos�al�cuadrado�mínima�(RSSQ)�y�
una� energía� de� activación� (110� ±� 5� kJ�mol�1)� en� el� rango� de� energías� de� activación�
obtenidas� en� las� primeras� etapas� del� estudio� (120� kJ�mol�1,� 114� ±� 7� kJ�mol�1).� La�
ecuación�8�muestra�expresión�del�modelo�1.1�corregido�con�la�isoterma�de�Freundlich:�
Y7 � � ×VJ_JK" � VnoJp VK"J³ Ø�VJ_JK� è� � ³K"JVK"J© Ñç� é� (8)�
�
El� modelo� cinético� seleccionado� plantea� un� escenario� donde� una� molécula� de� 1�
octanol� adsorbida� reacciona� con� otra� molécula� de� 1�octanol� de� la� fase� líquida� en� un�
mecanismo� Rideal�Eley� (RE)� donde� el� agua� desactiva� el� catalizador� siguiendo� una�
isoterma�tipo�Freundlich.�
El�estudio�cinético�sobre�las�zeolitas�se�realizó�en�los�sistemas�de�reacción�del�DNHE�
y� DNOE� y� las� ecuaciones� cinéticas� obtenidas� se� compararon� con� la� ecuación� cinética�
para� la� síntesis� de� DNPE� de� la� bibliografía.� 42� modelos� cinéticos� basados� en� los�
mecanismos�LHHW�Re�se�ajustaron�a�los�datos�cinéticos�para�la�síntesis�de�DNHE�sobre�
las�zeolitas�H�FAU�6,�H�FAU�30,�H�BEA�25�y�H�MFI�28.�Discriminando�los�modelos�de�la�
misma� manera� que� para� la� resina� Amberlyst� 70,� los� modelos� derivados� de� las�
ecuaciones� 9� y� 10� fueron� los� modelos� con� coherencia� fisicoquímica� que� mejor� se�
ajustaron� en� términos� de� suma� de� residuos� al� cuadrado� (RSSQ)� y� mínimo� error�
paramétrico.�
Y7 � � ×VIJK" � VIJI VK"J³ Ø0VIJK ³¢)IJI³¢)IJK VIJI3�� (9)�
Y7 � � ×VIJK" � VIJI VK"J³ Ø0VIJK ³¢)K"J³¢)IJK VK"J3�� (10)�
�
11.�Resumen�del�trabajo�(spanish)�
237�
En�las�ecuaciones�9�y�10,�ROR�representa�el�éter�lineal�(DNOE,�DNHE�o�DNPE)�y�ROH�
el�alcohol�(1�octano,�1�hexanol�y�1�pentanol).�
Para� las�zeolitas�H�FAU�6,�H�FAU�30�y�H�MFI�28� la�ecuación�9�obtuvo�mejor�ajuste�
(menor� RSSQ),� sin� embargo� sobre� la� zeolita� H�BEA�25� fue� la� ecuación� 10� la� que� se�
ajustó�mejor�a�los�datos�cinéticos�obtenidos�en�esta�zeolita.�
Para�la�síntesis�de�DNOE,�se�ajustaron�los�datos�cinéticos�sobre�la�zeolita�H�FAU�30�a�
los� mismos� 42� modelos� cinéticos� concluyéndose� que� los� modelos� descritos� por� la�
ecuación�10�predecían�mejor�los�datos�cinéticos.��
Tanto�para�la�síntesis�de�DNOE�como�de�DNHE�se�obtuvieron�valores�de�energía�de�
activación� aparente� comprendidos� entre� 100� y� 120� kJ�mol�1� sobre� todas� las� zeolitas�
probadas.�
Se�comprobó�que�los�modelos�cinéticos�para�la�síntesis�de�DNPE�sobre�H�BEA�25�de�
la�bibliografía�[20]�coincidían�con�los�modelos�cinéticos�obtenidos�en�este�trabajo.�
5.�Conclusiones�
Los�éteres�lineales�simétricos�DNOE,�DNHE�y�DNPE�pueden�obtenerse�a�partir�de�la�
deshidratación� bimolecular� de� 1�octanol,� 1�hexanol� y� 1�pentanol� respectivamente�
sobre�zeolitas�y�resinas�de�PE�DVB�de�intercambio�iónico.��
Las� resinas� de� PE�DVB� de� intercambio� iónico� con� bajos� porcentajes� de� agente�
reticulante� (DVB)� obtuvieron� selectividades� a� éter� lineal� y� conversiones� de� alcohol�
altas,�maximizando�el�rendimiento�en�éter�lineal.��
La�superficie�mesoporosa�de�las�zeolitas�en�combinación�con�el�número�de�centros�
ácidos�resultó�ser�clave�para� la�obtención�de�DNOE,�DNHE�y�DNPE.�Sobre�zeolitas�de�
baja� superficie� mesoporosa� se� favorecieron� las� reacciones� secundarias� con� menos�
requisitos�espaciales�como�la�deshidratación�intramolecular�a�olefinas.��
Del�estudio�de�equilibrio�de� la�reacción�de�deshidratación�de�1�octanol�a�DNOE�se�
concluye�que�la�reacción�de�síntesis�de�DNOE�es�una�reacción�exotérmica�(�rH�=��13.6�
±�1.7�kJ�mol�1�a�298.15�K)�permitiendo�cotejar�datos�termodinámicos�estimados�para�el�
11.�Resumen�del�trabajo�(spanish)�
238�
DNOE� y� proponer� el� valor� de� 658� ±4� J�mol�1�K�1� para� la� entropía� molar� de� DNOE� a�
298.15�K.�
En�el�estudio�cinético�de�la�síntesis�de�DNOE�sobre�la�resina�termoestable�Amberlyst�
70� se� propone� un� modelo� cinético� que� asume� la� reacción� química� como� etapa�
limitante�y�la�fracción�de�centros�activos�libre�menospreciable.�El�modelo�muestra�un�
escenario�donde�una�molécula�de�1�octanol�adsorbida�reacciona�con�otra�molécula�de�
1�octanol� adsorbida� en� un� mecanismo� Rideal�Eley� y� el� agua� desactiva� el� catalizador�
siguiendo�una�isoterma�tipo�Freundlich.��
Sobre�zeolitas,�los�modelos�cinéticos�propuestos�para�predecir�la�síntesis�de�DNOE�y�
DNHE� coinciden� con� los� modelos� de� la� bibliografía� para� la� síntesis� del� DNPE,� con�
energías�de�activación�comprendidas�entre�100�120�kJ�mol�1.�
6.�Bibliografía�
[1]�� H.G�Pöttering,�P.�Necas,�“Directive�2009/30/EC�of�the�European�parliament�and�
of� the� Council� of� 23� April� 2009� amending� Directive� 98/70/EC� as� regards� the�
specification�of�petrol,�diesel�and�gas�oil� introducing�a�mechanism�to�monitor�
and� reduce� greenhouse� gas� emissions� and� amending� Council� Directive�
1999/32/EC�as�regards�the�specification�of�fuel�used�by�inland�waterway�vessels�
and�repealing�Directive�93/12/EC,”�Off.�J.�Eur.�Union,�vol.�140,�88�112,�2009.��
[2]� G.C.� Pecci,� M.G.� Clerici,� F.� Giavazzi,� F.� Ancillotti,� M.� Marchionna,� R.� Patrini,�
“Oxygenated�Diesel�Fuels.�Part�1�–�Structure�and�properties�correlation,”�ISAF,�
1993.�
[3]� G.�A.�Olah,��Cleaner�burning�and�cetane�enhancing�diesel� fuel�supplements,��
U.S.�Patent�US�5520710,�1996.�
[4]� J.�Tejero,�F.�Cunill.�M.�Iborra,�J.F.�Izquierdo,�C.�Fité,�“Dehydration�of�1�pentanol�
to�di�n�pentyl�ether�over�ion�exchange�resin�catalysts,”�J.�Mol.�Catal.�A:�Chem.,�
vol.�182�183,�541�554,�2002.�
[5]� J.� Tejero,� C.� Fité,� M.� Iborra,� J.F.� Izquierdo,� F.� Cunill,� R.� Bringué,� “Liquid�phase�
dehydrocondensation�of�1�pentanol� to�di�n�pentyl�ether� (DNPE)�over�medium�
and�large�pore�acidic�zeolites,”��Microporous��Mesoporous.�Mater.,�vol.�117,�pp.�
650�660,�2009.�
11.�Resumen�del�trabajo�(spanish)�
239�
[6]� R.� Bringué,� M.� Iborra,� J.� Tejero,� J.F.� Izquierdo,� F.� Cunill,� V.J.� Cruz,� “Thermally�
stable� ion�exchange� resins� as� catalysts� for� the� liquid�phase� dehydration� of� 1�
pentanol�to�di�n�pentyl�ether�(DNPE),”�J.�Catal.,�vol.�244,�pp.�33�42,�2006.�
[7]� R.� Bringué,� J.� Tejero,� M.� Iborra,� J.F.� Izquierdo,� C.� Fité,� F.� Cunill,� “Experimental�
Study�of�the�Chemical�Equilibria�in�the�Liquid�Phase�Dehydration�of�1�Pentanol�
to�Di�n�pentyl�Ether,”�Ind.�Eng.�Chem.�Res.,�vol.�46,�pp.�6865�6872,�2007.�
[8]� R.�Bringué,�J.�Tejero,�M.�Iborra,�J.F.�Izquierdo,�C.�Fité,�F.�Cunill,�“Water�effect�on�
the�kinetics�of�1�pentanol�dehydration�to�di�n�pentyl�ether�(DNPE)�on�amberlyst�
70,”�Top.�Catal.,�vol.�45,�pp.�1�4,�2007.�
[9]� R.� Bringué,� J.� Tejero,� M.� Iborra,� J.F.� Izquierdo,� C.� Fité,� F.� Cunill,� “Supported�
Nafion� catalyst� for� 1�pentanol� dehydration� reaction� in� liquid� phase,”� Chem.�
Eng.�J.,�vol.�145,�pp.�135�141,�2008.�[10]� E.�Medina,�R.�Bringué,�J.�Tejero,�M.�Iborra,�C.�Fité,�“Conversion�of�1�hexanol�to�
di�n�hexyl� ether� on� acidic� catalysts,”� App.� Catal.� A:� Gen.,� vol.� 374,� pp.� 41�47,�
2010.�
[11]� A.� Corma� A,� H.� García,� “Crossing� the� borders� between� homogeneous� and�
heterogeneous� catalysis:� developing� recoverable� and� reusable� catalytic�
systems,”�Top.�Catal.,�vol.�48,�pp.�8�31,�2008.�
[12]� J.F.� Izquierdo,�F.�Cunill,� J.�Tejero,�M.� Iborra,�C.�Fité.�Cinética�de� las�Reacciones�
Químicas.�Edicions�Universitat�de�Barcelona,�2004.�
[13]� K.� Jerabek,� “Cross�evaluation� of� strategie,� size�exclusion� chromatography.�
(Inverse� steric� exclusion� chromatography� as� a� tool� for� morphology�
characterization),”�ACS�Symp.,�ser.�635,�pp.�211�224,�1996.�
[14]� R.�Witting,�J.�Lohmann,�“Vapor�Liquid�Equilibria�by�UNIFAC�Group�Contribution.�
6.�Revision�and�Extension,”Ind.�Eng.�Chem.�Res.,�vol.�42,�pp.�183�188,�2003.�
[15]� S.P.� Verevkin,� “Improved� Benson� Increments� for� the� Estimation� of� Standard�
Enthalpies�of�Formation�and�Enthalpies�of�Vaporization�of�Alkyl�Ethers,�Acetals,�
Ketals,�and�Ortho�Esters,”�J.�Chem.�Eng.�Data,�vol.�47,�pp.�1071�1097,�2002.�
[16]� E.�du�Toit,�R.�Schwarzer,�W.�Nicol. Acetone�condensation�on�a�cation�exchange�
resin�catalyst:�the�pseudo�equilibrium�phenomenon�Chem.�Eng.�Sci.,�vol.�59,�pp.�
5545�5550,�2004.�
11.�Resumen�del�trabajo�(spanish)�
240�
[17]� U.� Limbeck,� C.� Altwicker,� U.� Kunz,� U.� Hoffmann.� “Rate� expression� for�
THFsynthesis�on�acidic� ion�exchange�resin,”�Chem.�Eng.�Sci.,�vol.�56,�pp.�2171�
2178,�2001.�
[18]� B.� Yang,� M.� Maeda,� S.� Goto.� Kinetics� of� liquid� phase� synthesis� of� tert�amyl�
methyl�ether� from� tert�amyl� alcohol� and� methanol� catalyzed� by� ion� exchange�
resin,”�J.�Chem.�Kinet.,�vol.�30,�pp.�137�143,�1997.�
[19]� B.� Yang,� S.� Yang,� R.� Yao.� “Synthesis� of� ethyl� tert�butyl� ether� from� tert�butyl�
alcohol� and� ethanol� on� strong� acid� cation�exchange� resins,”� React.� Funct.�
Polym.,�vol.�44,�pp.�167�175,�2000.�
[20]� R.� Bringué,� “Thermally� stable� ion�exchange� resins� as� catalysts� for� the� liquid�
phase�dehydration�of�1�pentanol�to�di�n�pentyl�ether”.�Phd�Thesis.�University�of�
Barcelona,�2007.�
�
�
�
�
�
�
�
�
�
�
�
�
�
�
�
241�
Funding�statement�
This� work� has� been� economically� supported� by� the� State� Education,� Universities,�Research�&�Development�Office�of�Spain�(Projects�CTQ2007�60691/PPQ�and�CTQ2010�16047).�
Acknowledgements�
I�would�like�to�thank�my�supervisors,�Javier�Tejero�and�Montse�Iborra�for�the�guidance�
during�my�research�period.�They�introduced�me�in�the�world�of�research,�encouraged�
me�in�difficult�moments�and�made�this�work�possible.�I�would�like�to�thank�also�Fidel�
Cunill,� I� really� appreciate� the� opportunity� he� offered� me� when� I� joined� the� Group�of�
Applied�Kinetics�and�Catalysis.� I� am�also�grateful� to�my�co�authors�Carles,�and�Eliana�
for�all�the�help�they�offered�me�during�this�work.��
Further� thanks� to� Dr� Brown� and� Ahmed� for� the� help� during� my� short� stay� in� the�
University�of�Huddersfield.�
I� cannot� forget� Jordi� Guilera,� we� shared� a� lot� of� moments� and� work� in� our� thesis.� I�
would� like� to�specially� thank�Roger�Marta�and�Mari�Ángeles,� their�help�was�priceless�
and�discussing�with� them�about�work�and� life�was�always�a�pleasure.� I�would� like� to�
mention�my�lab�mates,�Jordi�Hug,�Rodrigo,�Madelin,�Xavi�and�Rafa,�we�shared�a�lot�of�
quotidian� moments� and� discussions� that� made� the� daily� research� very� gratifying.� I�
would� like�to�mention�Eduard�as�well,�as�a�student�he�contributed�to�this�work�and�I�
want�to�thank�him�for�his�implication�in�the�lab�and�for�the�nice�conversations�we�had.�
To�all�my�workmates�in�the�Chemical�Engineering�Department,�we�have�shared�a�lot�of�
moments�at�lunch�time�and�quickly�we�became�a�small�family…�
Por� último� me� gustaría� agradecer� a� mi� familia� por� apoyarme� al� decidir� hacer� un�
doctorado,� especialmente� a� mi� hermano� Jose,� que� siempre� me� ha� animado� en� mis�
proyectos.� Una� mención� muy� especial� a� Daniel,� por� los� consejos� más� allá� de� los�
números�y�fórmulas.�
“Si�buscas�resultados�distintos,�no�hagas�siempre�lo�mismo”�A.�Einstein�
�

�
�
�
�
�
�
�
�
�
�
�
�
�
�
�
�
�
�
�
�
�
�