synthesis of amylose and amylopectin brushes on silicon wafer surface
TRANSCRIPT
Prosiding Seminar Kimia Bersama UKM-ITB VIII
9-11 Jun 2009
269
SYNTHESIS OF AMYLOSE AND AMYLOPECTIN BRUSHES
ON SILICON WAFER SURFACE
PRADANTI MANDIRI VIDYAWARDHANI1, JEROEN VAN DER VLIST
2, KATJA LOOS
2,
SADIJAH ACHMAD1, DEANA WAHYUNINGRUM
1
1Chemistry Study Program, Faculty of Mathematics and Natural Sciences, Bandung Institute of
Technology, Indonesia
2Department of Polymer Chemistry. Zernike Institute for Advanced Materials. University of
Groningen. Nijenborgh 4. 9747 AG Groningen. The Netherlands
e-mail: [email protected]
ABSTRACT
Polysaccharides are polymer from nature that has attracted new interest as advanced materials due to
its biocompatibility, structure-forming capacity, and environmentally friendly property. One of its
application fields is to synthesis polymer brushes from amylose and amylopectin. Polymer brushes
can be obtained after three steps of reaction: modifying the surface of silicon wafers with (3-
aminopropyl)trimethoxysilane (APTMS), grafting maltoheptaose as a primer to silicon surface, and
enzymatic polymerization of the primer. To understand polymers property on silicon wafer surface,
three different glucose-1-phosphate (G1P) concentrations have been used. According to IR spectrum
and XPS data, amylose and amylopectin brushes have been successfully synthesized but cannot be
distinguished. The roughness of the layer on the surface was determined by using AFM but it still
cannot be concluded whether the concentration of G1P has an effect towards it. The thickness of the
layer on the surface has been calculated but can only be applied to amylose brushes. Kinetics
measurements showed that amylopectin wafers always grow faster than amylose wafers for every G1P
concentration used. Determination of surface density of the amine group concludes that the amount of
APTMS has been attached to silicon wafer was 1.86 molecule/nm2 meanwhile maltoheptaose gives
value of 0.45 molecule/nm2.
Keywords: amylose, amylopectin, polymer brushes, enzymatic polymerization.

Prosiding Seminar Kimia Bersama UKM-ITB VIII
9-11 Jun 2009
270
INTRODUCTION
Polysaccharides are polymer from nature that have attracted new interest as advanced materials due to
its biocompatibility, chirality, structure-forming capacity, and environmentally friendly property. Its
application field come from liquid crystalline polymers, selective membranes, sensor matrices, to
bioactive and biocompatible materials such as sugar based surfactant, drug delivery molecule, and
polymer brushes [1-5]. Synthesis of well-defined polysaccharides backbones in a molecule is difficult
because it needs perfect control of regio and stereochemistry in glycosylation reactions. One of the
alternative ways is to use enzyme as biocatalyst [6]. Enzymatic polymerization can be done by using
two enzyme: phosphorylase and glycogen branching enzyme. Linear polysaccharides such as amylose
can be synthesized using phosphorylase meanwhile branched polysaccharides like amylopectin can be
synthesized using both phosphorylase and branching enzyme. Amylose is a polymer which has long
linear α (14) linkages to join each glucose units while amylopectin also has α (16) linkages as
branching point where short amylose chains are connected together. The brushes were syntesis to
mimic glycocalyx, the external region of cell membrane dominated by glycosylated molecules.
Glycocalyx has non adhesive property that prevent undesirable non-specific adhesion of molecules
and cells [7]. This research was focused to synthesis amylose and amylopectin brushes on silicon
wafers surface with three different glucose-1-phosphate concentrations to understand polymer
properties on the surface such as layer thickness and roughness. This biomimetic glycocalix-like
surface can be used as coating agents on the surface of synthetic organ to prevent bacterial growth.
MATERIALS AND METHOD
Materials
Silicon wafers were purchased from Topsil. NaH2PO4.H2O, HCl, NaOH, p-xylene, ethanol, citric
buffer, 4 Ǻ molecular sieve, chloroform, H2SO4, H2O2, ammonium molybdate solution, acetate
solution were purchased from Merck. D2O, (3-aminopropyl)trimethoxysilane (APTMS), NaCNBH3
were purchased from Aldrich. Methanol and toluene for washing silicon surface were purchased from
Lab Scan. Glacial acetic acid was from Acros Organics and metol solution from Fluka. β-
cyclodextrin, MOPS buffer, α-D-glucose-1-phosphate disodium salt hydrate, and 9-anthraldehyde
were purchased from Sigma-Aldrich. Phosphorylase was isolated from potato and Deinococcus
geothermalis glycogen branching enzyme obtained from Center for Carbohydrate Bioengineering
RuG, The Netherlands. Deionized water was purified through a Milli-Q purification system and
distilled water purified by a reverse-osmosis system. DMSO, anhydrous toluene for synthesis of
amino functionalized silicon wafer, and anhydrous methanol for determination of surface density of
the amine group were all used after purification.

Prosiding Seminar Kimia Bersama UKM-ITB VIII
9-11 Jun 2009
271
Instrumentals
Ultraviolet/Visible (UV/Vis) absorbance data were obtained from a Pye Unicam SP8-200
spectrometer. Proton Nuclear Magnetic Resonace (1H NMR) spectrum was measured with a Varian
VXR-300 (300 MHz) spectrometer. Infra Red (IR) spectra were recorded on a Bruker IFS 66V/S
spectrometer. Atomic Force Microscopic (AFM) data were obtained using a Veeco Digital
Instruments EnviroScope spectrometer version 5.30. X-ray Photoelectronic Spectroscopy (XPS)
spectra were recorded using an SSX-100 (Surface Science Instruments) photoelectron spectrometer
with a monochromatic Al Kα X-ray source (hυ = 1486.6 eV). The base pressure in the spectrometer
was 1 x 10⁻⁹
Torr during the measurements.
Synthesis of Maltoheptaose from β-cyclodextrin
Maltoheptaose was synthesized via acid catalyzed ring cleavage of β-CD [8]. β-CD (477.70 g) was
dissolved in 1900 mL 0.01 M HCl and refluxed for 2 hours. The solution was neutralized by 19 mL 1
M NaOH indicated by color change from colorless to pale yellow, confirmed by pH paper showing
scale 7. The solution was stored in the refrigerator (4 ˚C) overnight. The regenerated β-CD was
collected by filtration and was saved for the next run. The remaining solution was saturated with the
excess of p-xylene and refluxed using heating mantle for 1.5 hours. β-CD/p-xylene complex crystals
were precipitated by storing the solution in the refrigerator overnight and then centrifuged for 30 min.
This step was repeated two times to make sure that β-CD/p-xylene complex has been removed
completely from the solution. The remaining solution was saturated by rotary evaporator and refluxed
with addition of p-xylene for 1 hour in oil bath. The remaining crystals of β-CD/p-xylene complex
were precipitated by storing the solution in the refrigerator overnight and separated by cold
centrifugation (5 ˚C) for 30 min. The solution was then precipitated drop wise in cold ethanol. The
resulting white powder of maltoheptaose was dried in the oven for several days and characterized by
1H NMR using D2O as a solvent.
Calibration Curve for Standard Solution of Phosphate
NaH2PO4.H2O (68.995 mg) was dissolved in 50 mL distilled water. Phosphate solution was added to
10 mL vials according to Table 1. Fiske and Subbarow method [9] was used to determine total amount
of phosphate in solutions. 0.5 mL metol solution and 1.0 mL ammonium molybdate solution were
added to these vials. The solutions were mixed with distilled water. After 10 minutes, 2 mL acetate
solution was added. Measurement of the solutions on UV-VIS apparatus at wavelength 716 nm was
done after 30 minutes.

Prosiding Seminar Kimia Bersama UKM-ITB VIII
9-11 Jun 2009
272
Table 1 Concentration and aliquot for standard solution of phosphate
Solution Concentration (mmol/L) Stock Solution (μL)
1 0 0
2 0,01 10
3 0,02 20
4 0,04 40
5 0,06 60
6 0,08 80
7 0,1 100
8 0,15 150
9 0,2 200
10 0,3 300
Si Surface Cleaning
This is based on Jeroen Luijten method with some modifications [10]. Si wafers were cut into slides
around 1.05 – 1.4 cm2. These wafers were sonicated in methanol and chloroform, each for 15 min
respectively, followed by immersion in piranha solution (H2SO4/H2O2 7:3 v/v). After 1 hour, the
wafers were rinsed with DI water several times and dried at room temperature.
Synthesis of Amino Functionalized Si Surface
The clean wafers were immersed into 5 mL anhydrous toluene containing APTMS (10% v/v) under
nitrogen atmosphere at 25 ˚C for 1 hour. APTMS molecules can make 1, 2, or 3 bonds with Si surface
and the reactions can not be controlled. After silanization, the wafers were washed with toluene,
methanol, and DI water respectively. Residual methoxy functionalities can be removed by immersion
of the wafers in DI water overnight at room temperature. Si wafers were then dried at room
temperature and characterized by IR and AFM [11].
Grafting of Maltoheptaose on Amino Functionalized Si Surface
The amino functionalized Si wafer was immersed into 5 mL distilled DMSO containing glacial acetic
acid (1% v/v), NaCNBH3 (50 mg), maltoheptaose (50 mg), and molecular sieves (4 Ǻ) in a vial. The
mixture was heated at 50 ˚C for 4 days. The resulting maltoheptaose functionalized wafer was then
rinsed with DI water several times followed by sonification in DI water for 2 min and dried at room
temperature. The wafers were characterized by IR and AFM.

Prosiding Seminar Kimia Bersama UKM-ITB VIII
9-11 Jun 2009
273
Enzymatic Polymerization of Maltoheptaose on Si Surface
Concentration of α-D-glucose-1-phosphate disodium salt hydrate (G1P) solution was diversified to
know its effect on layer thickness and roughness. Three different concentrations of G1P (0.029 g/mL,
0.23 g/mL, 0.425 g/mL) in 50 mM MOPS buffer pH 7 (20 mL) were mixed with 400 μL (34.4 U/mL)
potato phosphorylase. Each solution was divided to two parts. One part was used to synthesis amylose
functionalized Si wafers while the other part was used to synthesis amylopectin functionalized Si
wafers by adding 10 μL (700 U/mL) GBE. Maltoheptaose functionalized wafers were immersed into
the solutions at 37 ˚C. The progress of the reactions was observed with Fiske and Subbarow method
by sampling out the solution each time for 40 μL. After the reactions finished, the wafers were
washed with DI water several times, immersed in DI water overnight, and then dried at room
temperature. The wafers were characterized by IR, AFM, and XPS.
Determination of Surface Density of the Amine Group
Stock solution was made by disolving 0.4 mg 9-anthraldehyde in 1 L distilled water containing 0.8%
v/v acetic acid. Aliquots were then taken to 10 mL vials according to Table 2. and measured on UV-
VIS apparatus at wavelength 262 nm. Amino functionalized and maltoheptaose functionalized Si
wafers were immersed into anhydrous methanol (20 mL) containing 9-anthraldehyde (40 mg), glacial
acetic acid (10 μL), and 4 Ǻ molecular sieve under nitrogen atmosphere for 5 hour at 60 ˚C. Imine
groups were formed after the reaction. Si wafers were washed with methanol and sonicated in
methanol for 1 min. The wafers were then dried under N2 atmosphere. Hydrolysis of the imine groups
was performed in distilled water (5 mL) containing acetic acid (0.8% v/v). The solution was heated
for 30 min at 30 ˚C. UV measurement at 262 nm was done by sampling out the solution for 2 mL [12].
Table 2 Concentration and aliquot for standard solution of 9-anthraldehyde
Solution Concentration (mmol/L) Stock Solution (μL)
1 0 0
2 3.879 x 10⁻⁵
200
3 4.849 x 10⁻⁵
250
4 5.818 x 10⁻⁵
300
5 6.788 x 10⁻⁵
350
6 7.758 x 10⁻⁵
400
7 9.697 x 10⁻⁵
500
8 1.164 x 10⁻⁴
600
9 1.455 x 10⁻⁴
750
10 1.648 x10⁻⁴
850
11 1.842 x 10⁻⁴
950

Prosiding Seminar Kimia Bersama UKM-ITB VIII
9-11 Jun 2009
274
RESULTS AND DISCUSSION
Synthesis of Maltoheptaose from β-cyclodextrin
The yield of maltoheptaose that has been synthesized is 7% (33.184 g). The 1H NMR spectrum in
Figure 1 shows that it still contains impurities like β-CD and ethanol. β-CD impurity was expected to
be less because it has been complexed with p-xylene while impurity from ethanol can be removed by
heating maltoheptaose in the oven. The β-CD impurity must be avoided because it can inhibit potato
phosphorylase activity so that enzymatic polymerization cannot occur. To know whether enzymatic
polymerization still can occur, an experiment to determine degree of polymerization of maltoheptaose
from β-CD was conducted.
Figure 11H NMR Spectrum of maltoheptaose from β-cyclodextrin
Enzymatic Polymerization of Maltoheptaose from β-cyclodextrin
According to Figure 2, enzymatic polymerization of maltoheptaose from β-CD still can occur quite
well. Fiske and Subbarow method has been used to monitor reaction progress. Since the amount of
inorganic phosphates has been release during the reaction equals with the amount of glucose units
attached to primer, the degree of polymerization ( ) can also be obtained as described in Figure 2.
From this result, maltoheptaose that has been synthesized from β-CD can be used for the next steps
without further purification.

Prosiding Seminar Kimia Bersama UKM-ITB VIII
9-11 Jun 2009
275
Figure 2 Degree of polimerization of maltoheptaose from β-cyclodextrin
Infra Red Spectoscopy
IR spectroscopy was used to identify functional groups formed during the reactions. From Figure 3, it
can be concluded that amylose and amylopectin can not be distinguished by IR spectroscopy. This is
because they have the same functional groups such as: C – N stretching (m,w; 1250 cm-1
), N – H
bending (m,s; 1650 cm-1
), and free O – H groups (br; 3250 cm-1
). From the broad peak of the free O –
H groups, it still can be expected that there are some sugar attach on the surface.
Figure 3 Infra red spectrum of amylose and amylopectine wafer
X-ray Photoelectron Spectroscopy
XPS was used to know the elemental composition of the surface. It was expected that amylose and
amylopectin can be distinguish with XPS because of the difference in peak shiftness. From Figure 4 to
Figure 6, it can be seen that the peak shiftness between amylose and amylopectin are not very
different so these two compounds still can not be distinguished. These results are different from
comparison data as can be seen in Figure 7. In this comparison data, amylose and amylopectin are
distinguishable from its big peak shiftness. This difference might be caused by the less amount of

Prosiding Seminar Kimia Bersama UKM-ITB VIII
9-11 Jun 2009
276
amylose and amylopectin on the surface. To understand XPS result from amylose and amylopectin
brushes better, additional experimental need to be investigated further.
275 280 285 290 295
0
2000
4000
6000
8000
10000
12000
Inte
nsity (
a.u
.)
Energy (eV)
[0.029 g/mL], Amylose
[0.029 g/mL], Amylopectin
286.18, 11693.0056
286.00, 8292.3617
Figure 4 X-ray photoelectron spectroscopy spectrum for less concentrated G1P in solution
275 280 285 290 295
0
2000
4000
6000
8000
10000
12000
14000
16000
Inte
nsity (
a.u
.)
Energy (eV)
[0.23 g/mL], Amylose
[0.23 g/mL], Amylopectin
286.62, 14213.93
286.57, 8547.26
Figure 5 X-ray photoelectron spectroscopy spectrum for middle concentrated G1P in solution

Prosiding Seminar Kimia Bersama UKM-ITB VIII
9-11 Jun 2009
277
275 280 285 290 295
0
2000
4000
6000
8000
10000
12000
Inte
nsity (
a.u
.)
Energy (eV)
[0.425 g/mL], Amylose
[0.425 g/mL], Amylopectin
286.18, 11459.46
286.40 , 10693.2982
Figure 6 X-ray photoelectron spectroscopy spectrum for high concentrated G1P in solution
280285290
0
5000
10000
Maltoheptaose
Amylopectin, 5.9% branching
Amylopectin, 6.7% branching
Amylopectin, 9.5% branching
Amylopectin, 11% branching
Inte
nsi
ty (
a.u
.)
Binding Energy (eV)
Figure 7 Comparison data for x-ray photoelectron spectroscopy spectrum of amylose and amylopectin
Atomic Force Microscopy
AFM data was used to know the roughness of the surface. It is being proposed that amylose brushes
have more roughness than amylopectin brushes because it can not cover the surface homogeneously.
Amylopectin is able to cover the surface homogeneously due to its branching property. The
illustration of the surface roughness can be seen in Figure 8. From the AFM result in
Table , the theory of surface roughness between amylose and amylopectin still can not be proved
because there is no trend in the results. To understand surface property better, the thickness of the
layer that has been formed on the surface also must be determined. The thickness of the layer was
determined using AFM by scratching the surface and measuring its height difference between

Prosiding Seminar Kimia Bersama UKM-ITB VIII
9-11 Jun 2009
278
scratched and unscratched surface but further research is needed to interpret the results. The thickness
of the layer can also be calculated from data of kinetics and the amount of maltoheptaose on the
surface. The result is presented in Table 1. It is assumed that maltoheptaose on the surface has VH
polymorph form so it consists of six glucose residues for each turn and the average axial spacing per
turn is 0.805 nm. This calculation can not be applied to amylopectin brushes because it has branched
chain that should be considered. It is expected that concentration of G1P in solution has linear
correlation with surface layer thickness. If G1P concentration is high, the amount of glucose attach to
maltoheptaose will increase resulting very thick surface layer. This expectation can not be seen in the
result because the kinetics data from the very saturated G1P solution was not too good. It is proposed
that amylose chain has a tendency to grow lower than amylopectin. The linear chain of amylose might
lies flat on the surface while amylopectin grows higher because it has branched chains. The amount of
maltoheptaose molecules attached on the surface is low so the density of sugar chain is also low. This
can make amylopectin chain grows freely without interference from other chains. To understand this
surface property better, another information about chains alignment is needed.
Table 3 Mean roughness of amylose and amylopectin functionalized wafer
[G1P] g/mL Amylose (nm) Amylopectin (nm)
0.029 6.873 5.691
0.23 4.710 8.951
0.425 10.413 2.569
Table 4 Layer thickness for amylose functionalized wafer
[G1P] g/mL Amylose (cm)
0.029 0.0285
0.23 0.0525
0.425 0.0151
Figure 8 Proposed surface roughness of amylose and amylopectin brushes
Prosiding Seminar Kimia Bersama UKM-ITB VIII
9-11 Jun 2009
279
The layer thickness calculation results may not be very accurate because it is possible that secondary
amines on the surface are attached to another maltoheptaose so the thickness will become less than the
results. The chain length for every maltoheptaose chain might be different resulting inhomogeneity in
surface layer thickness. Ellipsometry method must be conducted to know the layer thickness more
precisely.
The Kinetics of Enzymatic Reaction on Silicon Wafer Surface
Kinetics of the reaction were determined using Fiske and Subbarow method. The color of the
solutions was observed before and after enzymatic polymerization. At the begining, all the solutions
were colorless but in the end it become milky with white solid precipitates. This unhomogenous white
milkysolution was tested using iodine reagent giving dark blue color. From this results, it can be
concluded that the solution was contaminated with amylose. This amylose was expected come from
the grafting step where some maltoheptaose might not be chemically attach to the surface and not be
completely removed after cleaning procedure. All results are similar for each solutions exept for
amylopectin wafer in less concentrated G1P solution (0.029 g/mL) which did not give blue color after
iodine test. This contamination might affect kinetics result and percentage of G1P converted during
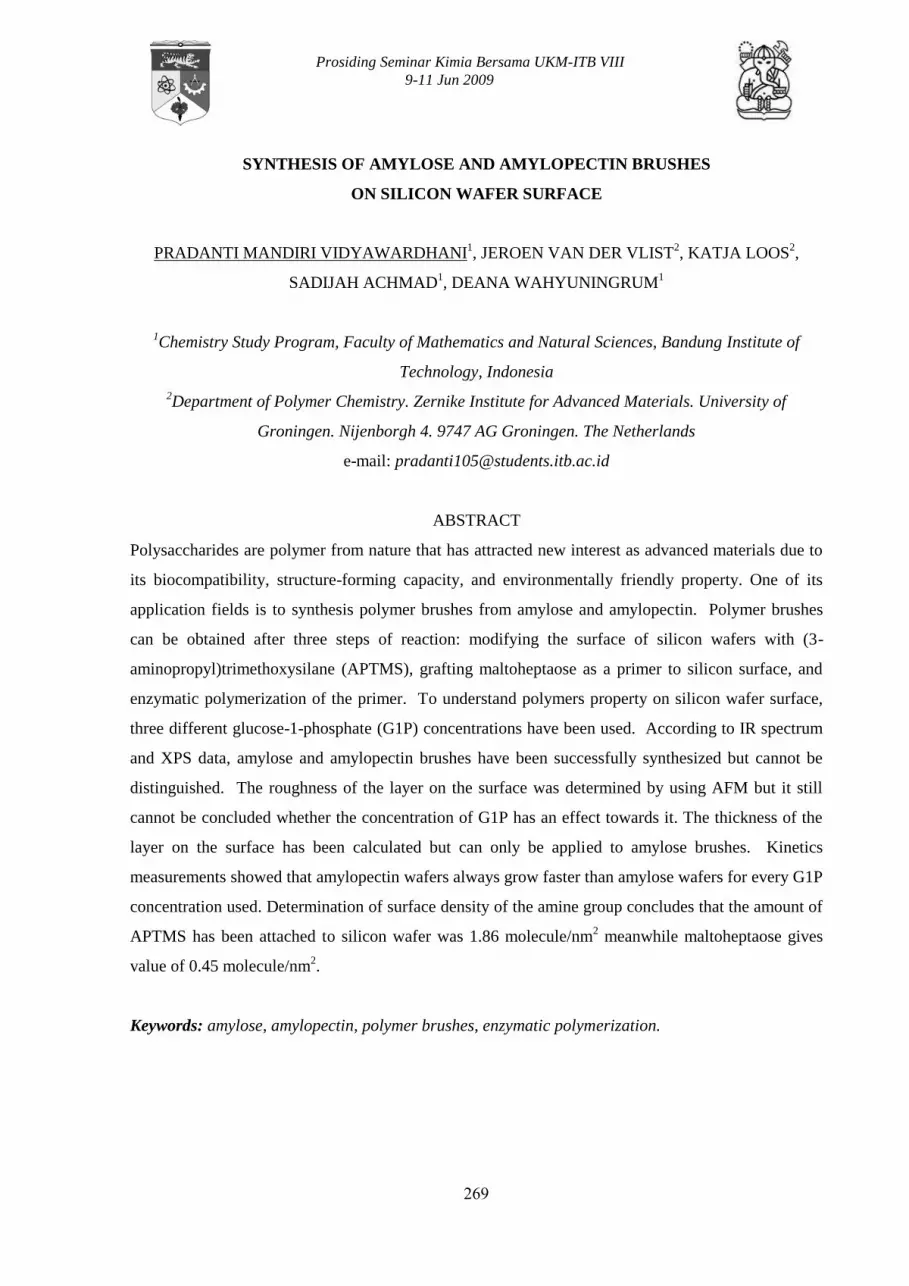
the reaction. From Figure 9, amylopectin functionalized wafers always grow faster for every G1P
concentration. This is because with branching enzyme, there will be more site for glucose unit from
G1P to attach on non reducing end of the primer. The higher concentration of G1P, the faster glucose
molecules attach to maltoheptaose so that the amount of phosphate that has been release will also
increase. For less concentrated G1P solution, the curves for amylose and amylopectin have a plateau
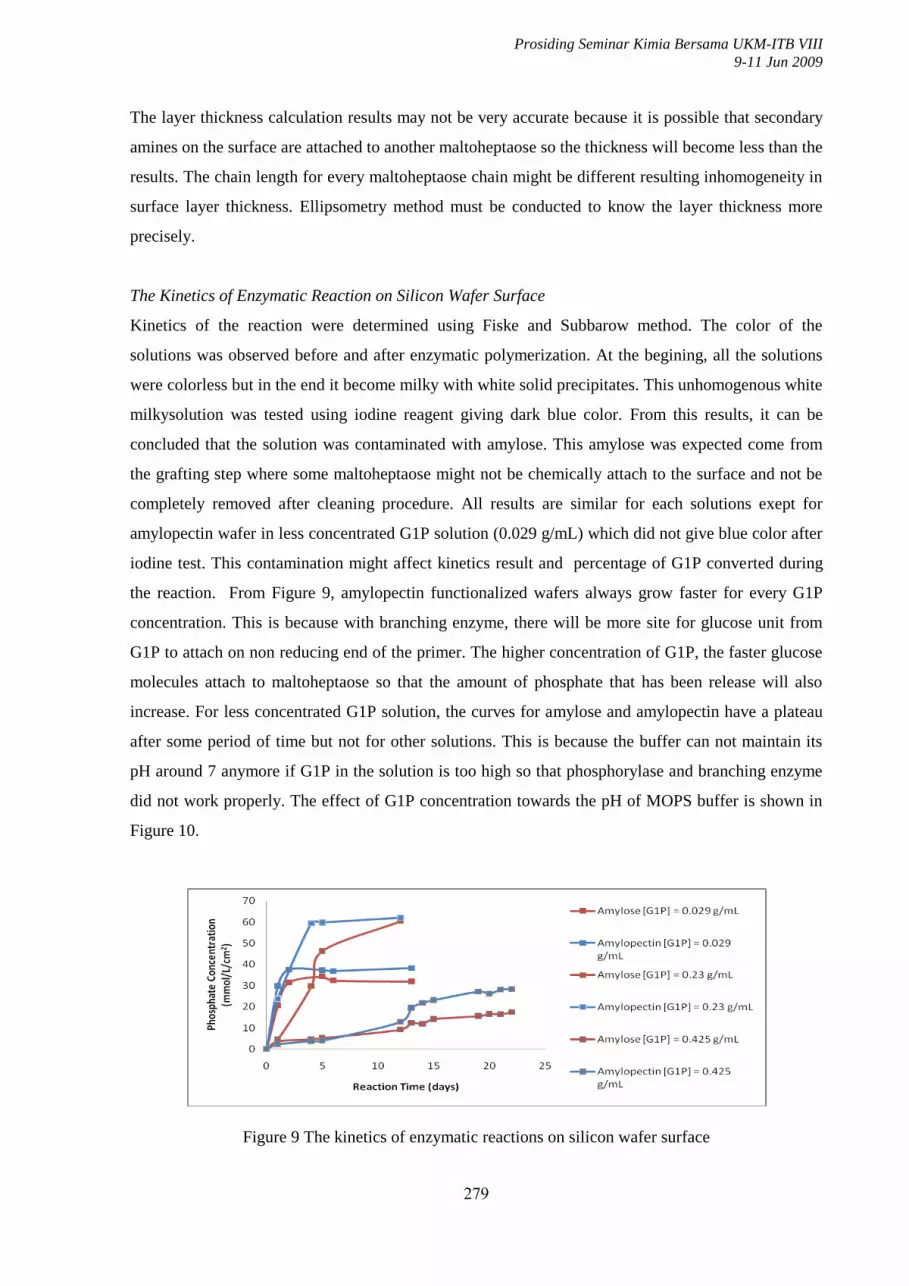
after some period of time but not for other solutions. This is because the buffer can not maintain its
pH around 7 anymore if G1P in the solution is too high so that phosphorylase and branching enzyme
did not work properly. The effect of G1P concentration towards the pH of MOPS buffer is shown in
Figure 10.
Figure 9 The kinetics of enzymatic reactions on silicon wafer surface
Prosiding Seminar Kimia Bersama UKM-ITB VIII
9-11 Jun 2009
280
Figure 10 The effect of G1P concentration to the ability of MOPS buffer to maintain its pH
Determination of Surface Density of the Amine Group
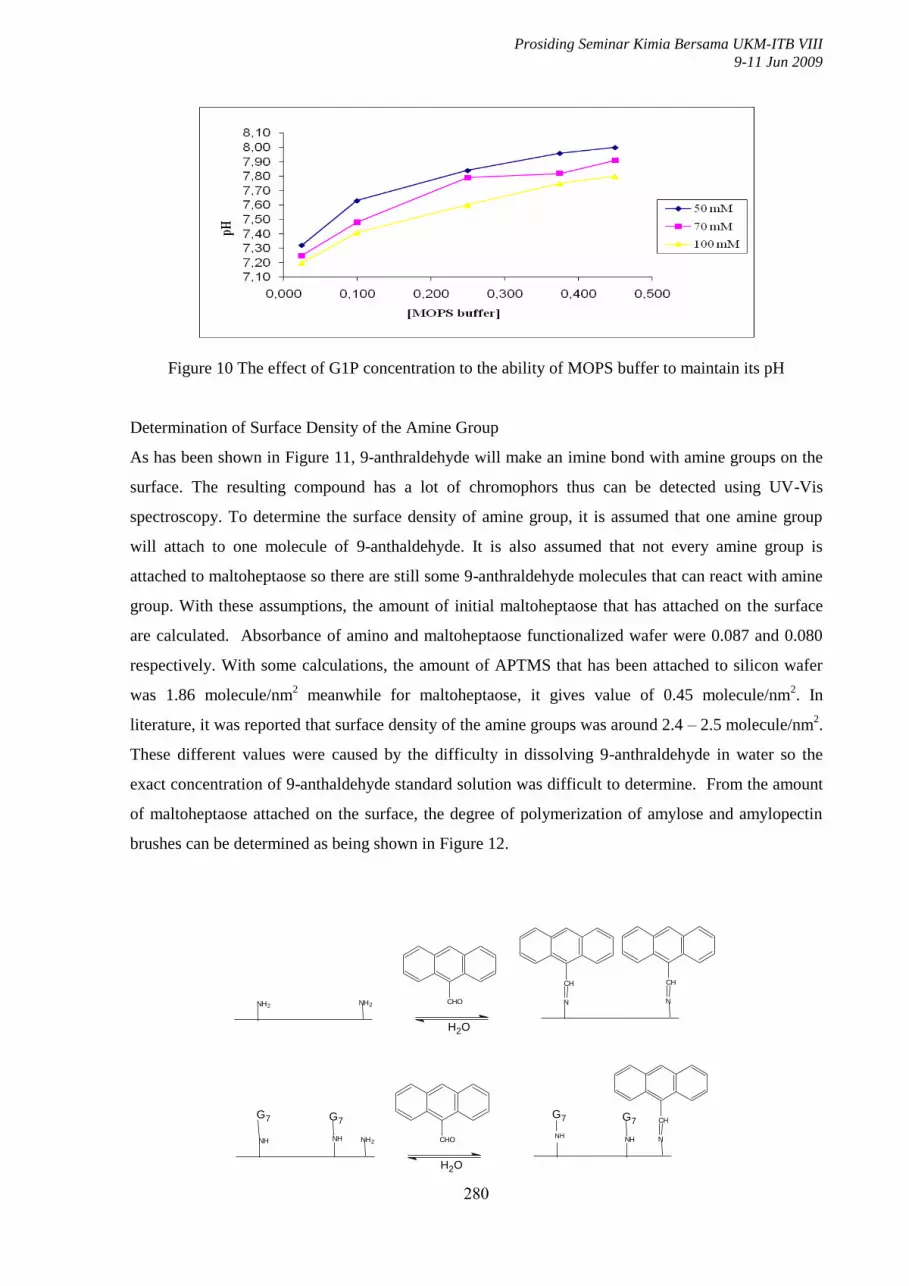
As has been shown in Figure 11, 9-anthraldehyde will make an imine bond with amine groups on the
surface. The resulting compound has a lot of chromophors thus can be detected using UV-Vis
spectroscopy. To determine the surface density of amine group, it is assumed that one amine group
will attach to one molecule of 9-anthaldehyde. It is also assumed that not every amine group is
attached to maltoheptaose so there are still some 9-anthraldehyde molecules that can react with amine
group. With these assumptions, the amount of initial maltoheptaose that has attached on the surface
are calculated. Absorbance of amino and maltoheptaose functionalized wafer were 0.087 and 0.080
respectively. With some calculations, the amount of APTMS that has been attached to silicon wafer
was 1.86 molecule/nm2 meanwhile for maltoheptaose, it gives value of 0.45 molecule/nm
2. In
literature, it was reported that surface density of the amine groups was around 2.4 – 2.5 molecule/nm2.
These different values were caused by the difficulty in dissolving 9-anthraldehyde in water so the
exact concentration of 9-anthaldehyde standard solution was difficult to determine. From the amount
of maltoheptaose attached on the surface, the degree of polymerization of amylose and amylopectin
brushes can be determined as being shown in Figure 12.
CH
N
CH
NNH2 NH2 CHO
H2O
NH NH2NH
G7 G7 CH
NNHCHO
H2O
G7
NH
G7

Prosiding Seminar Kimia Bersama UKM-ITB VIII
9-11 Jun 2009
281
Figure 11 Reaction scheme between 9-anthraldehyde and amine groups on the surface
Figure 12 Degree of polymerization amylose and amylopectin
CONCLUSION
The Synthesis of amylose and amylopectin brushes can be done via enzymatic polymerization by
using phosphorylase and branching enzyme. The roughness of the layer has been determined by using
AFM but it still can not be concluded whether the concentration of G1P has an effect towards it. The
thickness of the layer has been calculated but can only be applied to amylose brushes because
amylopectin brushes has branched chain that should be considered. Therefore G1P effect cannot be
determined. From kinetic measurement, amylopectin functionalized wafers seem to always grow
faster than amylose functionalized wafers for every G1P concentration. Determination of surface
density of the amine group concludes that the amount of APTMS has been attached to silicon wafer
was 1.86 molecule/nm2 meanwhile for maltoheptaose, it gives value of 0.45 molecule/nm
2.
ACKNOWLEDGMENTS
[1] DIKTI and ITB for the scholarship to do sandwich program in University of Groningen. The
Netherlands.
[2] Dr. Katja Loos. \Department of Polymer Chemistry. Zernike Institute for Advanced Materials.
University of Groningen. Nijenborgh 4. 9747 AG Groningen. The Netherlands
REFERENCES
[1] Hill, K., and Rhode, O. (1999), Sugar-based surfactants for consumer products and technical
applications, Lipid - Fett, 101, 25.
[2] Immel, S. (2005), Flexible and Rigid Non-glucose Cyclooligosaccharides: Synthesis, Structure,
and Properties, Doctoral Disertation, Technische Universität Darmstadt, 1, 4.

Prosiding Seminar Kimia Bersama UKM-ITB VIII
9-11 Jun 2009
282
[3] Kobayashi, S., Sakamoto, J., and Kimura, S. (2001a), In vitro synthesis of cellulose and related
polysaccharides, Progr Polym. Sci., 26, 1526 - 1527.
[4] von Rybinski, W., and Hill, K. (1998), Alkyl polyglycosides - properties and applications of a
new class of surfactants, Angew. Chem Int. Ed., 37, 1329.
[5] Zhao, B., and Brittain, W. J. (2000), Polymer brushes: surface-immobilized macromolecules,
Prog. Polym. Sci., 25, 678 - 680, 692 - 693.
[6] van der Vlist, J., Reixach, M. P., van der Maarel, M., Dijkhuizen, L., Schouten, A. J., and Loos,
K. (2008), Synthesis of Branched Polyglucans by the Tandem Action of Potato Phosphorylase
and Deinococcus geothermalis Glycogen Branching Enzyme, Macromol. Rapid Commun., 29,
1293.
[7] Holland, N. B., Qiu, Y., Ruegsegger, M., and Marchant, R. E. (1998), Biomimetic engineering of
non-adhesive glycocalyx-like surfaces using oligosaccharide surfactant polymers, Nature, 392,
799.
[8] von Braunmühl, V., Jones, G., and Stadler, R. (1995), Enzymatic grafting of amylose from
poly(dimethylsiloxanes), Macromolecules, 28, 17, 22.
[9] Fiske, C. H., and Subbarow, Y. (1925), The colorimetric determination of phosphorus, J. Biol.
Chem., 66, 375-400.
[10] Luijten, J., Vorenkamp, E. J., and Schouten, A. J. (2007), Reversible helix sense inversion in
surface-grafted poly(beta-phenethyl-L-aspartate) films, Langmuir, 23, 10772-10778.
[11] Howarter, J. A., and Youngblood, J. P. (2006), Optimization of silica silanization by 3-
aminopropyltriethoxysilane, Langmuir, 22, 11142-11147.
[12] Zhao, J., Li, Y., Guo, H., and Gao, L. (2006), Relative surface density and stability of the amines
on the biochip, Chin. J. of Anal. Chem., 34, 1235-1238.