sutil: intelligent ischemia monitoring system
TRANSCRIPT
International Journal of Medical Informatics 47 (1997) 193–214
SUTIL: Intelligent ischemia monitoring system
J. Vila a, J. Presedo a, M. Delgado a, S. Barro a,*, R. Ruiz b, F. Palacios c
a Departamento Electronica y Computacion, Facultad de Fisica, Uni6ersity of Santiago de Compostela, 15706,Santiago de Compostela, Spain
b Uni6ersity of Murcia, Cartagena, Spainc General Hospital of Elche, Elche, Spain
Received 3 July 1996; accepted 3 November 1997
Abstract
SUTIL is an intelligent monitoring system for intensive and exhaustive follow up of patients in coronary care units.This system processes electrocardiographic and hemodynamic signals in real time, with the main objective of detectingischemic episodes. In this paper, we describe the tasks included in SUTIL. In addition to basic tasks, those at higherlevels will also be presented. Some of these latter tasks attempt to mimic, to some extent, the way in which the humanexpert operates. © 1997 Elsevier Science Ireland Ltd.
Keywords: Ischemia detection; CCU patient monitoring; Signal processing; Intelligent monitoring; Real time
1. Introduction
The development of the health sciences andof information technology has resulted in alarge increase of the number of signals andthe amount of data and information that iscurrently evaluated in coronary care units(CCUs). As a result, the monitoring and thefollow up of patients in these units has be-come extremely complex.
Acute myocardial infarct (AMI) is fre-quently seen in CCU patients. AMI, or is-chemic necrosis of the left ventricle, is thefinal result of the irreversible reduction of theblood flow and hence, the provision of oxy-gen to the heart muscle. When an infarctoccurs the myocardial muscle evolves to-wards a situation of permanent instability. Inthis process, it goes through an ischemicphase in which the muscular mass affectedcan still be recovered as viable tissue.
One of the objectives of CCUs is to pre-vent an ischemic episode from evolving into
* Corresponding author. Tel.: +34 81 563100; fax: +34 81599412; e-mail: [email protected]
1386-5056/97/$17.00 © 1997 Elsevier Science Ireland Ltd. All rights reserved.
PII S 1 386 -5056 (97 )00095 -6
J. Vila et al. / International Journal of Medical Informatics 47 (1997) 193–214194
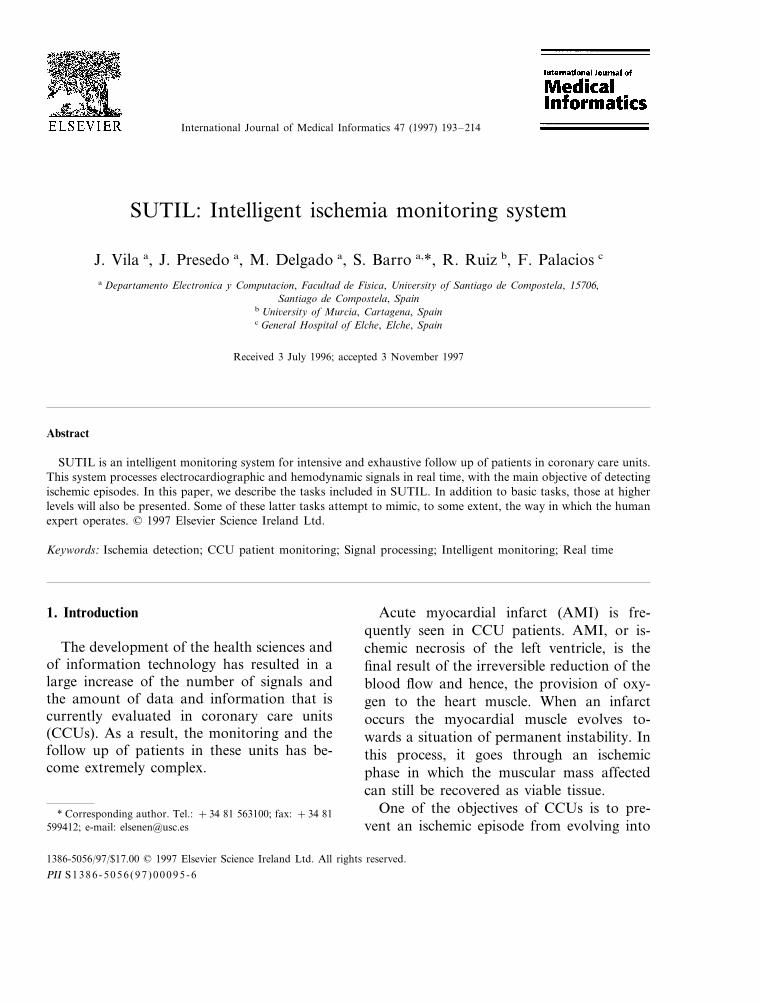
Fig. 1. (a) ECG signal for a normal patient; and (b) during an ischemic episode.
an irreversible necrosis situation (AMI).Physicians usually employ surface electrocar-diographic signals (ECG) as a monitoringsignal, as it is a non invasive signal that isrelatively easy to obtain and which, in gen-eral, displays notable changes when an is-chemic episode occurs. The effects of anischemic crisis appear as modifications in themorphology of the ST segment, the T waveor in both areas (Fig. 1). However, it is notalways possible to detect an ischemic episodepurely through the analysis of the ECG, asthe difference between a normal and an ab-normal ECG may be difficult to discern, evenfor specialists [1]. To model and handle thisimprecision in medical knowledge we havechosen an approach based on fuzzy set the-ory.
In general, current real time patient moni-toring systems carry out very poor processingof the ECG signal. In most cases they merelyextract a small number of significant vari-ables and display them in the form of trend
plots. At most, they establish alarms basedon the application of simple threshold criteria[2–4].
Taking these considerations into account,we have decided to develop an intelligentmonitoring system (SUTIL), aimed at moni-toring patients with ischemic cardiopathiesthat are confined to CCUs. This monitoringsystem processes three electrocardiographicleads and one invasive cardiovascular pres-sure signal in real time and its main objectiveis the detection of ischemic episodes in thepatient being monitored [5].
2. Hardware description
The current architecture of SUTIL consistsof two subsystems. The first—the signal pro-cessing subsystem—is aimed at low andmedium level signal processing tasks, whereasthe second—the user interaction subsys-tem—basically performs user-system interac-
J. Vila et al. / International Journal of Medical Informatics 47 (1997) 193–214 195
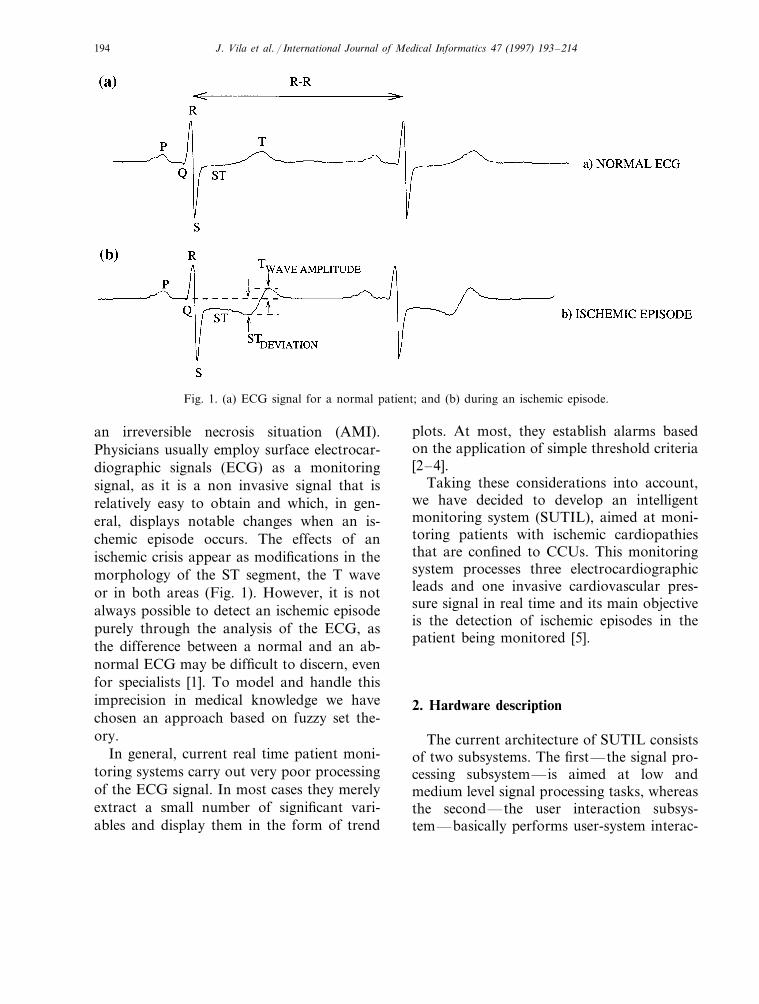
Fig. 2. Structure of SUTIL at the processing block level (the dashed arrows indicate situations where new routinesare triggered, '; or disabled, –$).
tion processes, massive information storageand medium and high level processing. Thesignal processing subsystem consists of a 12-bit A/D converter and a 32 bit 25 MHz68030 processor with a 68882 co-processor, 4Megabytes of RAM and an ethernet inter-face. These components are connectedthrough a VME bus [6]. The system runs theOS-9 real time operating system.
The user interaction subsystem is a SUNSparcStation 10 under UNIX, equipped with32 Megabytes of RAM memory, a 1.05 Giga-byte hard disk, a massive storage tape drive(hexabyte 8500) and a CDROM unit.
3. Software description
Our system can be broken down into tasks,among which there is a hierarchy imposed bythe frequency and the mode (synchronous or
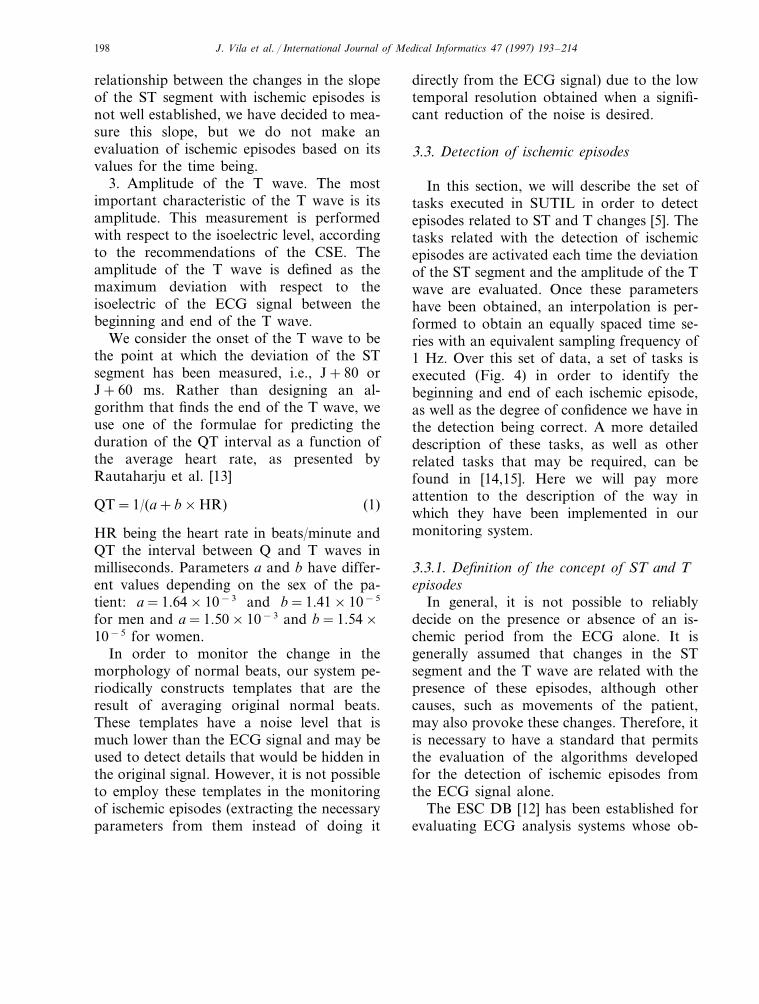
asynchronous) in which they are executed.From this point of view, we can classify thetasks of the signal processing subsystem intoone of the following categories (Fig. 2): sam-ple-by-sample and beat-by-beat.
3.1. Sample by sample
In this category we find all those tasks thatare executed with each new sample acquired.They are tasks whose execution is clearlysynchronous, as they are executed at preciseinstants of time. Within this category themain tasks are:
Acquisition. This task reads the data acqui-sition driver and stores the sampled signals incyclic buffers. The three ECG leads are sam-pled at a frequency of 500 Hz, as recom-mended by the American Heart Association[7]. Pressure signals are sampled at a rate of250 Hz.
J. Vila et al. / International Journal of Medical Informatics 47 (1997) 193–214196
Noise detection. We have opted for a de-sign of algorithms to detect different classesof noise (high frequency noise and noise dueto the saturation of the electrocardiographerand/or the analogue to digital converters).The signal intervals with a high level of con-tamination are not used in further analysissteps.
Beat detection. The performance of anECG processing system depends, to a greatextent, on the reliability of the detection ofthe cardiac cycles. The detection of a cardiaccycle in most monitoring systems (includingthis one) is carried out through the detectionof the QRS complex. We have chosen aclassical scheme based on a linear filtering ofthe signal and the application of an adaptivethreshold [8]. The purpose of the filter is toenhance QRS complexes in the signal and atthe same time attenuate the rest of the elec-trocardiographic signals. The position ofmaxima of the filtered signal that exceed theadaptive threshold indicate the fiducial marksin the QRS-complexes. The threshold valuewill depend on the maxima detected in previ-ous beats.
Although our QRS detector operates onlyon one channel it always selects that which apriori displays the best characteristics, i.e. theone that is free of noise and with a highervalue for the detection threshold.
3.2. Beat by beat
In this category we find all those tasks thatare executed for every newly detected beat.They are obviously asynchronous tasks, as abeat event may occur in any instant of time.Within this category we could place the fol-lowing tasks:
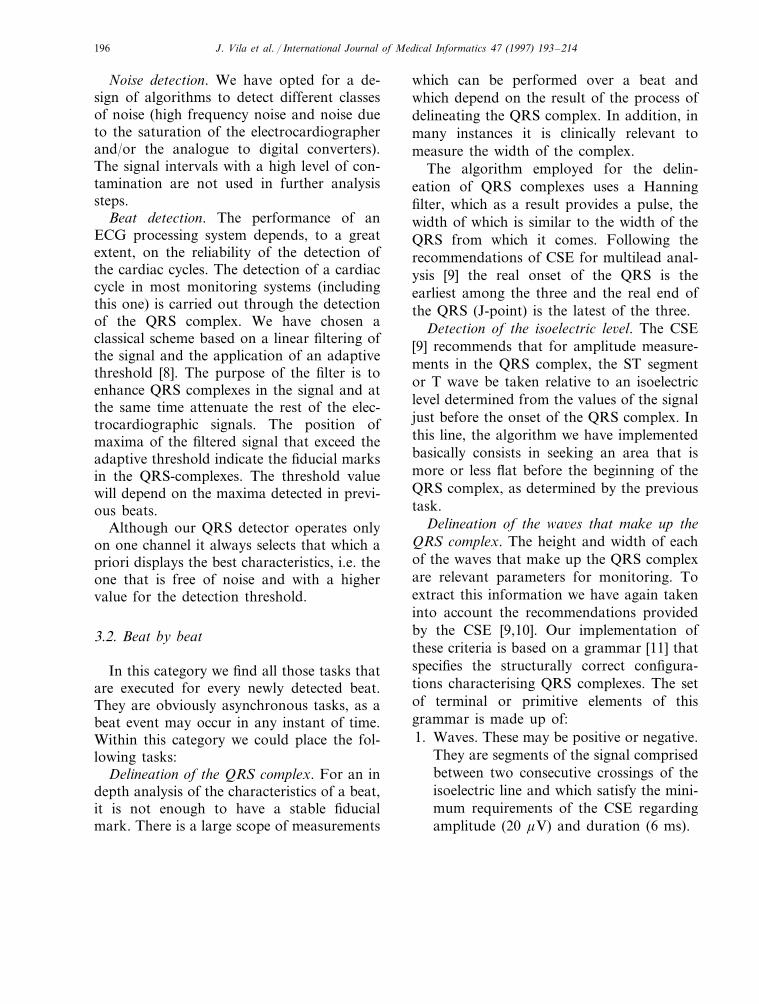
Delineation of the QRS complex. For an indepth analysis of the characteristics of a beat,it is not enough to have a stable fiducialmark. There is a large scope of measurements
which can be performed over a beat andwhich depend on the result of the process ofdelineating the QRS complex. In addition, inmany instances it is clinically relevant tomeasure the width of the complex.
The algorithm employed for the delin-eation of QRS complexes uses a Hanningfilter, which as a result provides a pulse, thewidth of which is similar to the width of theQRS from which it comes. Following therecommendations of CSE for multilead anal-ysis [9] the real onset of the QRS is theearliest among the three and the real end ofthe QRS (J-point) is the latest of the three.
Detection of the isoelectric le6el. The CSE[9] recommends that for amplitude measure-ments in the QRS complex, the ST segmentor T wave be taken relative to an isoelectriclevel determined from the values of the signaljust before the onset of the QRS complex. Inthis line, the algorithm we have implementedbasically consists in seeking an area that ismore or less flat before the beginning of theQRS complex, as determined by the previoustask.
Delineation of the wa6es that make up theQRS complex. The height and width of eachof the waves that make up the QRS complexare relevant parameters for monitoring. Toextract this information we have again takeninto account the recommendations providedby the CSE [9,10]. Our implementation ofthese criteria is based on a grammar [11] thatspecifies the structurally correct configura-tions characterising QRS complexes. The setof terminal or primitive elements of thisgrammar is made up of:1. Waves. These may be positive or negative.
They are segments of the signal comprisedbetween two consecutive crossings of theisoelectric line and which satisfy the mini-mum requirements of the CSE regardingamplitude (20 mV) and duration (6 ms).
J. Vila et al. / International Journal of Medical Informatics 47 (1997) 193–214 197
2. Segments. They are segments of the ECGsignal found between two consecutivecrossings of the isoelectric and which donot satisfy all of the minimum require-ments of the CSE for considering thesegment as a wave.
3. Final segment. This is a segment of thesignal between the end of the last wave ofthe complex and the point associated withthe end of the QRS complex.
In this model it is possible to define a set ofrewriting rules which enables us to assign toeach QRS complex a word belonging to analphabet (in our case, the set of possiblelabels that a QRS complex can be assigned asa function of the waves present) from itsprevious segmentation into its constitutingprimitives.
Morphological classification. Once the QRScomplexes have been correctly detected, it isnecessary to perform their classification inorder to successfully complete the rhythmidentification process.
Any ischemic process has effects on theECG, in particular on the ST segment and/orthe T wave of the cardiac complexes whoseorigin is the sinoauricular node (normalbeats). Therefore, a correct characterisationof the QRS complexes into two largegroups—normal and aberrant complexes—isnecessary. For the beats that are classified asnormal, characteristics are determined whichpermit a decision as to whether or not anischemic process is taking place.
The discrimination of normal beats hasmainly been based on their morphologicaland rhythmic normality. Morphological nor-mality is established through a process ofcomparing raw ECG signal, corresponding toQRS complex of each new beat detected toan adaptive template which evolves accordingto those normal QRS complexes which havebeen previously identified. We have chosenthis technique due to the fact that it does notrequire too much computational power.
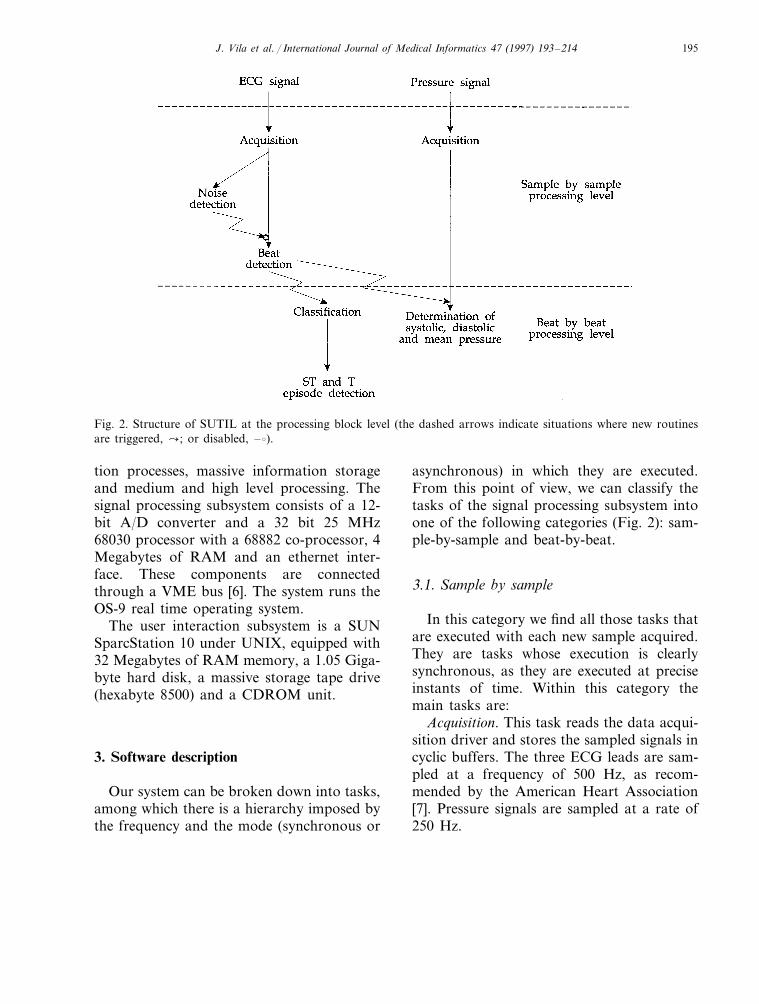
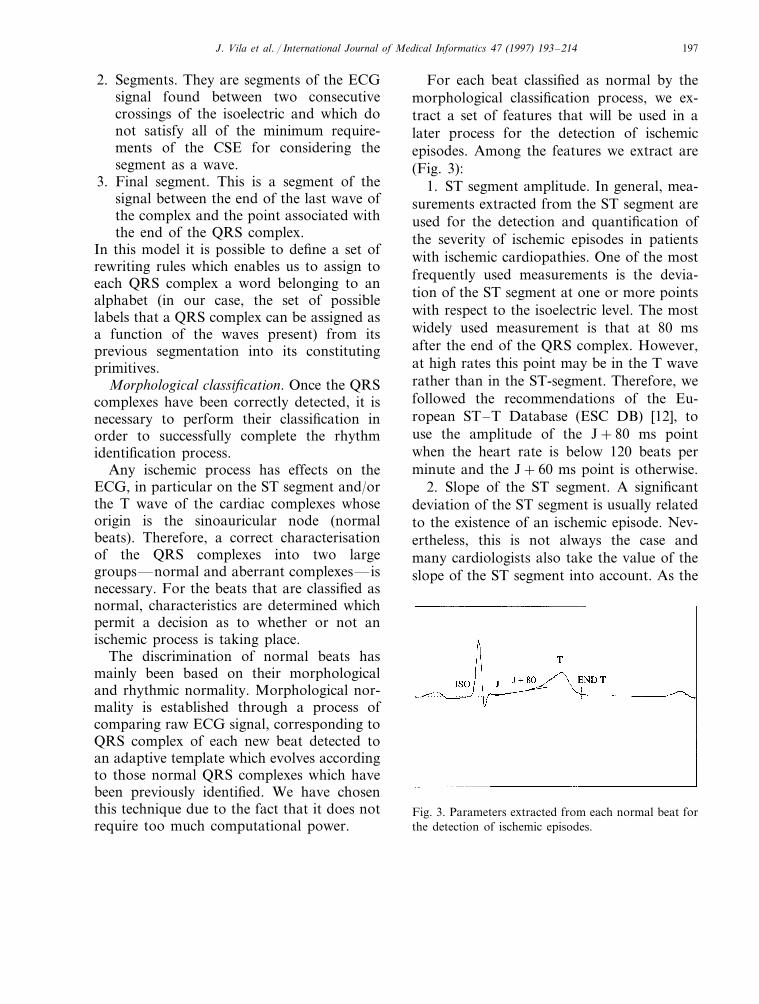
For each beat classified as normal by themorphological classification process, we ex-tract a set of features that will be used in alater process for the detection of ischemicepisodes. Among the features we extract are(Fig. 3):
1. ST segment amplitude. In general, mea-surements extracted from the ST segment areused for the detection and quantification ofthe severity of ischemic episodes in patientswith ischemic cardiopathies. One of the mostfrequently used measurements is the devia-tion of the ST segment at one or more pointswith respect to the isoelectric level. The mostwidely used measurement is that at 80 msafter the end of the QRS complex. However,at high rates this point may be in the T waverather than in the ST-segment. Therefore, wefollowed the recommendations of the Eu-ropean ST–T Database (ESC DB) [12], touse the amplitude of the J+80 ms pointwhen the heart rate is below 120 beats perminute and the J+60 ms point is otherwise.
2. Slope of the ST segment. A significantdeviation of the ST segment is usually relatedto the existence of an ischemic episode. Nev-ertheless, this is not always the case andmany cardiologists also take the value of theslope of the ST segment into account. As the
Fig. 3. Parameters extracted from each normal beat forthe detection of ischemic episodes.
J. Vila et al. / International Journal of Medical Informatics 47 (1997) 193–214198
relationship between the changes in the slopeof the ST segment with ischemic episodes isnot well established, we have decided to mea-sure this slope, but we do not make anevaluation of ischemic episodes based on itsvalues for the time being.
3. Amplitude of the T wave. The mostimportant characteristic of the T wave is itsamplitude. This measurement is performedwith respect to the isoelectric level, accordingto the recommendations of the CSE. Theamplitude of the T wave is defined as themaximum deviation with respect to theisoelectric of the ECG signal between thebeginning and end of the T wave.
We consider the onset of the T wave to bethe point at which the deviation of the STsegment has been measured, i.e., J+80 orJ+60 ms. Rather than designing an al-gorithm that finds the end of the T wave, weuse one of the formulae for predicting theduration of the QT interval as a function ofthe average heart rate, as presented byRautaharju et al. [13]
QT=1/(a+b×HR) (1)
HR being the heart rate in beats/minute andQT the interval between Q and T waves inmilliseconds. Parameters a and b have differ-ent values depending on the sex of the pa-tient: a=1.64×10⁻³ and b=1.41×10⁻⁵
for men and a=1.50×10⁻³ and b=1.54×10⁻⁵ for women.
In order to monitor the change in themorphology of normal beats, our system pe-riodically constructs templates that are theresult of averaging original normal beats.These templates have a noise level that ismuch lower than the ECG signal and may beused to detect details that would be hidden inthe original signal. However, it is not possibleto employ these templates in the monitoringof ischemic episodes (extracting the necessaryparameters from them instead of doing it
directly from the ECG signal) due to the lowtemporal resolution obtained when a signifi-cant reduction of the noise is desired.
3.3. Detection of ischemic episodes
In this section, we will describe the set oftasks executed in SUTIL in order to detectepisodes related to ST and T changes [5]. Thetasks related with the detection of ischemicepisodes are activated each time the deviationof the ST segment and the amplitude of the Twave are evaluated. Once these parametershave been obtained, an interpolation is per-formed to obtain an equally spaced time se-ries with an equivalent sampling frequency of1 Hz. Over this set of data, a set of tasks isexecuted (Fig. 4) in order to identify thebeginning and end of each ischemic episode,as well as the degree of confidence we have inthe detection being correct. A more detaileddescription of these tasks, as well as otherrelated tasks that may be required, can befound in [14,15]. Here we will pay moreattention to the description of the way inwhich they have been implemented in ourmonitoring system.
3.3.1. Definition of the concept of ST and Tepisodes
In general, it is not possible to reliablydecide on the presence or absence of an is-chemic period from the ECG alone. It isgenerally assumed that changes in the STsegment and the T wave are related with thepresence of these episodes, although othercauses, such as movements of the patient,may also provoke these changes. Therefore, itis necessary to have a standard that permitsthe evaluation of the algorithms developedfor the detection of ischemic episodes fromthe ECG signal alone.
The ESC DB [12] has been established forevaluating ECG analysis systems whose ob-
J. Vila et al. / International Journal of Medical Informatics 47 (1997) 193–214 199
Fig. 4. Stages of the ischemic episode detection process.
jective is the detection of ischemic episodes.This database contains 90 ECG recordings,each one 2 h long, which have been manuallyannotated by a group of expert cardiologists.
As has previously been mentioned, there isno universally accepted criterion for definingischemia using parameters from the ECGsignal alone. Instead of attempting to anno-tate all the ischemic episodes in these ECGs,it was decided to annotate only those signalevents which were sufficiently significant tobe considered as ischemic episodes.
The following significant events are defined(presumably related with ischemic episodes):
ST episode. For an episode to be consid-ered as an ST episode, the following condi-tions must be met:1. The absolute value of the ST segment
amplitude change relative to the referencevalue in baseline conditions must be more
than 1 mm (0.1 mV).2. This change must be maintained for at
least 30 s.3. For two episodes to be considered differ-
ent, the distance between them must be atleast 30 s.
T episode. The definition of a T episode iscompletely analogous to that of an STepisode, except for the fact that a thresholdof 0.2 mV is chosen. The absence of definitivecriteria leads us to use these criteria for thedetection of ischemic episodes with somereservations. A less strict application of thecriteria may, in our view, have a positiveeffect on the detection of ischemic episodes.We chose to fuzzify the thresholds in theabove definitions and to develop a fuzzy de-tection of ischemic episodes. Our fuzzy detec-tion algorithm is based on fuzzy set theory,introduced by Zadeh [16].
J.V
ilaet
al./International
Journalof
Medical
Informatics
47(1997)
193–
214200
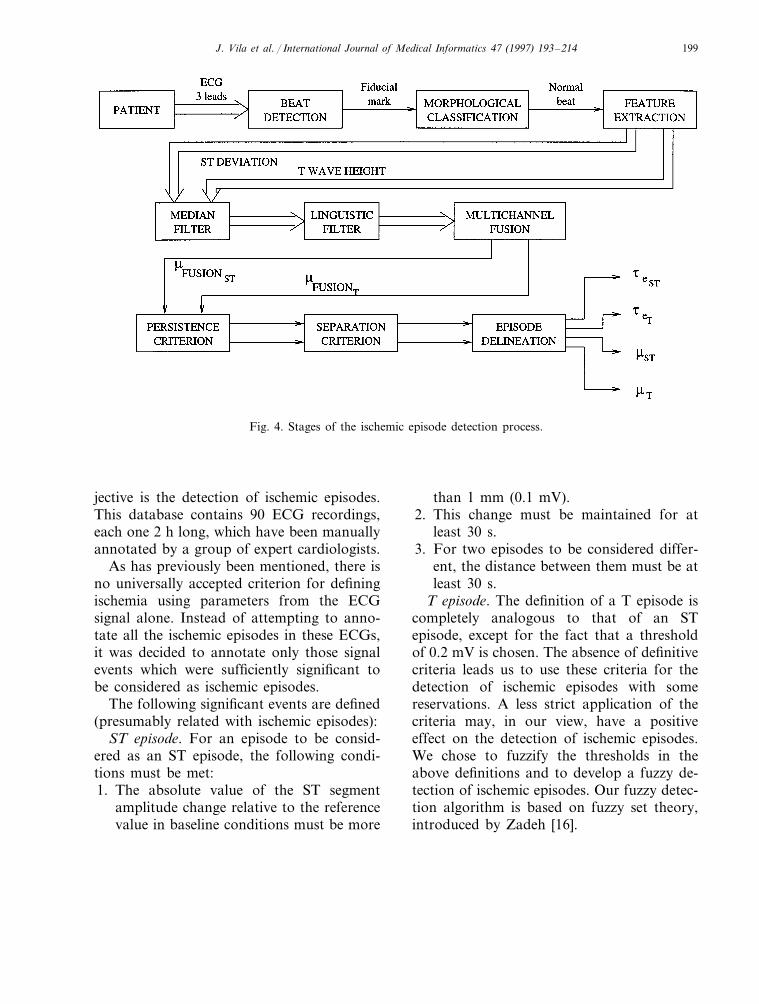
Fig. 5. Example of the transformation of the trend diagram of an ST segment amplitude by the application of the sucessive stages of our ischemicepisode detection algorithm (five squares are equivalent to 1 min). It can be appreciated that the patient suffers several ST episodes (extracted fromrecording eO113 of the European ST–T Database).
J. Vila et al. / International Journal of Medical Informatics 47 (1997) 193–214 201
3.3.2. Median filterThe measurements in the ST segment and
the T wave are taken for all normal beats.A large variability in the parameter valuesis expected due to noisy recordings. Toeliminate this noise—which in some casescould lead to false detection of ischemicepisodes—we make use of a median filter,similar to the one described in a paper byHeinonen and Neuvo [17]. This reduces thevariability in the trend diagrams for the STdeviation and the amplitude of the T wave.
The output of the filter at time t is thecentral value of the measured parametervalues in a 15 s window around time t. InFig. 5 we show the result of applying thisfilter to a trend diagram corresponding tothe deviation of the ST segment. Typicalbehaviour of a low pass filter can be ob-served, eliminating most of the variabilitypresent.
3.3.3. Linguistic filterAfter eliminating the trend diagram vari-
ability of the ST segment deviation and theT wave amplitude, the next step consists ofdetermining those areas in which we findsignificant deviations from a clinical pointof view. We use a linguistic filter to identifythese areas.
We consider that any numerical variableV, whose value at instant t�t is n(t)�U,has at least one representative in the do-main of the linguistic variables. This linguis-tic variable L, takes values from a set oflinguistic labels {l}, each of which is iden-tified with a fuzzy subset of U, whereml(u)� [0,1] represents the degree to whichu�U belongs to this fuzzy subset.
Linguistic filter. Given a temporal se-quence of values SV={n(ti), …, n(tj)} for avariable V, whose temporal definition do-main is represented by tSV
={ti, …, tj}, ap-plication of the linguistic filter associated to
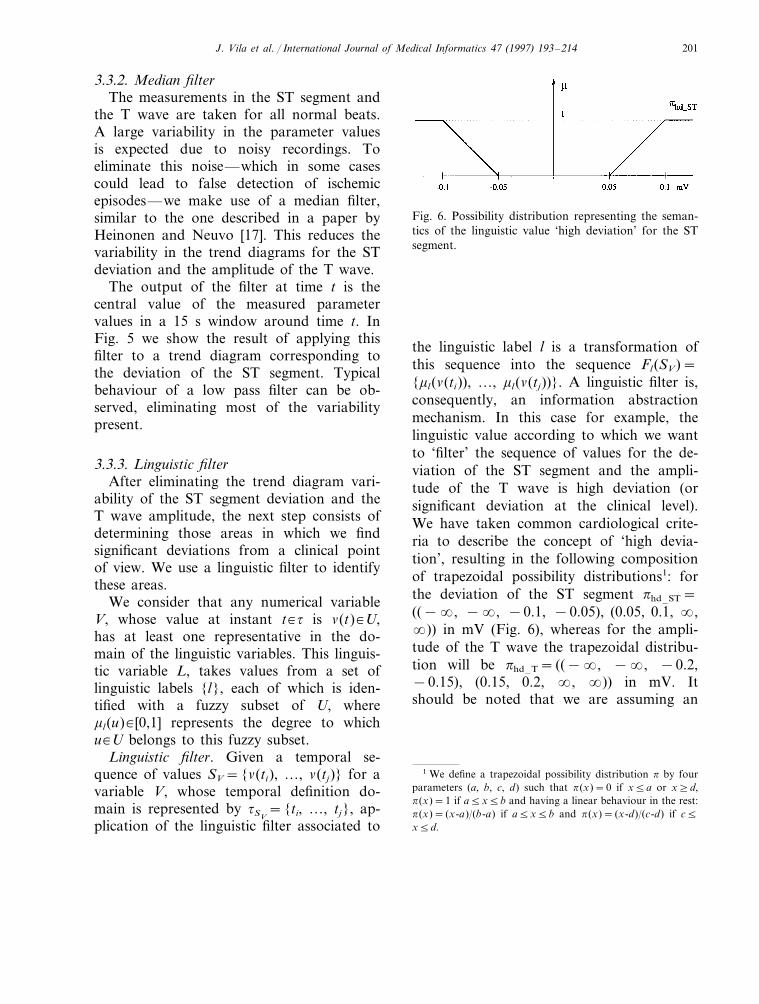
Fig. 6. Possibility distribution representing the seman-tics of the linguistic value ‘high deviation’ for the STsegment.
the linguistic label l is a transformation ofthis sequence into the sequence Fl(SV)={ml(n(ti)), …, ml(n(tj))}. A linguistic filter is,consequently, an information abstractionmechanism. In this case for example, thelinguistic value according to which we wantto ‘filter’ the sequence of values for the de-viation of the ST segment and the ampli-tude of the T wave is high deviation (orsignificant deviation at the clinical level).We have taken common cardiological crite-ria to describe the concept of ‘high devia-tion’, resulting in the following compositionof trapezoidal possibility distributions1: forthe deviation of the ST segment phd–ST=((−�, −�, −0.1, −0.05), (0.05, 0.1, �,�)) in mV (Fig. 6), whereas for the ampli-tude of the T wave the trapezoidal distribu-tion will be phd–T= ((−�, −�, −0.2,−0.15), (0.15, 0.2, �, �)) in mV. Itshould be noted that we are assuming an
1 We define a trapezoidal possibility distribution p by fourparameters (a, b, c, d) such that p(x)=0 if x5a or x]d,p(x)=1 if a5x5b and having a linear behaviour in the rest:p(x)= (x-a)/(b-a) if a5x5b and p(x)= (x-d)/(c-d) if c5x5d.
J. Vila et al. / International Journal of Medical Informatics 47 (1997) 193–214202
identity relation between possibility distribu-tions and membership functions (pl(x)=ml(x), Öx).
In Fig. 5 we display, as an example, theresult of applying a linguistic filter to afiltered trend diagram of the ST segmentdeviation.
3.3.4. Multichannel fusion of informationWhen more than one electrocardiographic
lead is monitored and we speak of the dura-tion of an ischemic episode, the temporalextension t={ti, …, tj} is generally referredto, such that Öt�t, indicating a significantepisode in one of the leads.
Consequently, before applying the dura-tion and separation between episodes criteria,a multichannel fusion process is carried outwith the information provided by the linguis-tic filter, with the aim of obtaining for eachinstant of time the degree of certainty ofbeing in a significant deviation of the STsegment or the T wave in any of the electro-cardiographic leads monitored. In our case,the degree of certainty associated with beingwithin an area having significant deviation inthe ST segment will be given by:
mFUSIONST(t)=max
imhd–ST(ST Leveli (t))
(2)
where hd–ST is the linguistic value associ-ated with the label ‘high deviation in the STsegment’ and ST Leveli(t) the value of thedeviation of the ST segment in lead i atinstant t. Similarly, it is possible to determinethe degree of certainty associated with beingwithin an area with significant deviation inthe T wave by applying the previous formulato the trend diagram corresponding to thedeviation of the T wave.
It must be pointed out that we have distin-guished between episodes caused as a conse-quence of a deviation of the ST segment andthose whose cause is a change in the ampli-
tude of the T wave, mainly because the firstcase is related to the concept of lesionwhereas the second one is related more to theconcept of ischemia. These two concepts havea different clinical value.
3.3.5. Persistence criterionOnce the possible ischemic episodes have
been determined, it is necessary to apply apersistence criterion to guarantee that theepisode has a duration of more than, orapproximately equal to, 30 s (taking intoaccount that a threshold relaxation process isbeing carried out). We consider that it isnecessary to formally describe some concepts:
Episode. Given a temporal sequence SV, anepisode el¤SV is the longest temporal sub-se-quence el={n(tm), …, n(tn)} for whichml(n(tk))\0, Ön(tk)�el.
Persistence criterion. An episode el={n(tm), …, n(tn)} constitutes a temporal con-text in which there is a non-null degree ofpersistence of the linguistic property of valuel. The degree with which n(t)�el is includedin a temporal context of duration m�I wherethe linguistic value l persists, is given by thefollowing expression:
Öm�I mel, m(t)=
maxm= tq− tr
tq, tr�tel
mint r5 t5 tq
{m l(n(t))}(3)
where telis the temporal domain where
episode el is defined.This equation defines the application of a
precise persistence criterion of value m. If thepersistence criterion applied was a precisetemporal extension (e.g. m]30 s), the previ-ous criterion would then be transformed intoa condition which would imply determiningthe maximum of mel,m
Öm�I such that m]30s. However, we are interested in applying afuzzy time extent [18] (larger or approxi-
J. Vila et al. / International Journal of Medical Informatics 47 (1997) 193–214 203
mately equal to 30 s) which in this case,corresponds to the distribution pp= (20, 30,�, �) in seconds.
In a case such as this, where we have adistribution pp associated with a given valueof persistence, the application of the previ-ous criterion is translated into the followingexpression:
mel, p(t)=maxm�I
min{mp(m), mel,m(t)} (4)
From this, it is easy to define the conceptof an ST or T episode (without taking intoaccount the episode separation criterion).For example, the degree of certainty of be-ing within a temporal context in which wehave the persistence required for the linguis-tic value hd–ST associated with a ‘large de-viation in the ST segment’ situation is givenby the following equation:
mst(t)=maxm�I
min{mp(m), maxm= tq− tr
tq, tr�te hd–ST
mintr5 t5 tq
{maxi
mhd–ST(ST Leveli(t))}}
(5)
Using the same method, it is possible todetermine the degree of certainty of beingwithin a T episode, just by using anotherlinguistic filter, this time over the trend dia-gram corresponding to the deviation of theT wave, obtaining as a result mt(t).
As an example, in Fig. 5 we present theapplication of the persistence criterion ex-pressed by the previous equation over atrend diagram corresponding to the devia-tion of the ST segment of a patient thathas experienced several ischemic events.
3.3.6. Separation criterionThe next step in the process of detecting
ischemic episodes consists of applying thecriterion for the separation between
episodes, so that episodes occurring closetogether are considered as a single episode.For this, the degree of certainty of beingoutside an ST episode is defined as:
mst=1−mst (6)
where testrepresents the temporal domain
associated with the absence of an STepisode. In the same way, we could definethe degree of certainty of being outside a Tepisode (mt being tet
, its associated temporaldomain).
Applying a criterion for the separationbetween episodes is equivalent to applying apersistence criterion over the condition ofabsence of an episode. In our case, thefuzzy time extent used is the trapezoidaldistribution ps= (30, 45, �, �) in seconds,so that the non null degree of certainty be-gins after 30 s, as could be expected fromthe definition of ischemic episodes given bythe ESC DB, becoming equal to one from45 s onwards. With this we are assumingthat when we find two episodes whichpresent a separation that is equal to orgreater than 45 s, we are completely certainthat they are different. Therefore, from afuzzy point of view, we could define theconcepts of ST and T episodes as follows:
Def. ST episode. We define ST episode asthe longest temporal sequence eST={STLevel(tm), …, ST Level(tn)} for which wehave mST(t)\0, Öt�te ST
, where mST is givenby the following expression:
mST(t)=
1−maxm�I
min{ms(m), maxm=tq−tr
tq, tr � te) st
mintr5t5tq
{mst(t)}}
(7)
Def. T episode. We define a T episode as thelongest temporal sequence eT={T Level(tm),
J. Vila et al. / International Journal of Medical Informatics 47 (1997) 193–214204
…, T Level(tn)} for which we have mT(t)\0, Öt�te T
, where mT is given by the follow-ing expression:
mT(t)=
1−maxm�I
min{ms(m), maxm=tq−tr
tq, tr � te) t
mintr5t5tq
{mt(t)}}
(8)
Once the ST (eST) and T (eT) episodes havebeen temporally bounded, that is, their tem-poral domain te ST
and te Thave been
defined in a precise manner, we will take asthe confidence degree associated with thedetection of these episodes the following:
me ST= max
t�te ST
{mST(t)} (9)
me T=max
t�te T
{mT(t)} (10)
These values, which convey the globalconfidence with which the presence of anST episode or a T episode can be assumed,are important parameters of the process ofpresenting information to the user of thesystem.
3.4. User interaction subsystem
The user-system interface in SUTIL is datadriven. The data comes from two mainsources:� Data from the signal processing subsys-
tem, received through the ethernet inter-face.
� Data from the user. Most of these datacome from the interaction of the user bymeans of the mouse, it rarely being nec-essary to use the keyboard. This facili-tates the learning and use of the system.On some occasions the user can request,by use of the keyboard or the mouse, themonitoring conditions to be modified.
These requests are transmitted to theVME system.The graphical interface provides the fol-
lowing output:� Graphic interaction. This is the most im-
portant output of the interface. It is car-ried out by means of events, accordingto the X11 protocol, processed by anXWindow server.
� Acoustical interaction for warnings andalarms.
� Information storage in a format compat-ible with the MIT-BIH database [19].
� Generation of printed reports.� Control of the signal processing subsystem
by means of sending requests through theethernet network, either initiated by theuser, or because of needs imposed by apossible high level processing block whichrequests this modification.The structure of the system itself led to the
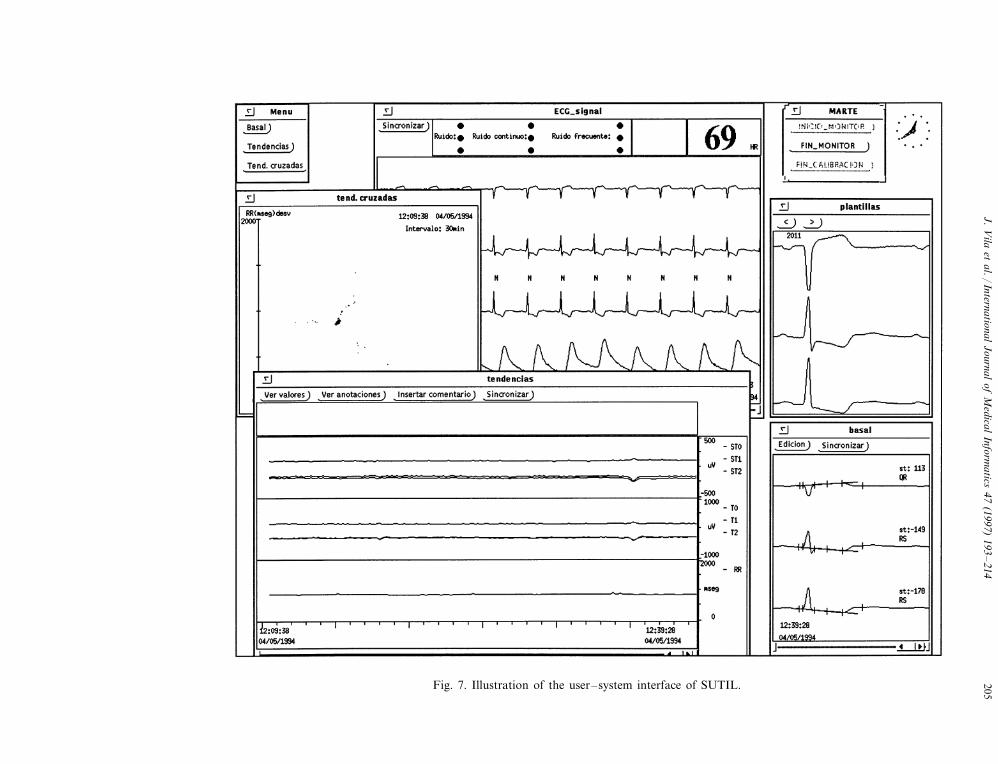
design of a multi-window user-system inter-face, in which the information is presented tothe user in a structured way, so that the useralways knows to which window he/she mustresort in order to obtain the informationhe/she requires. In Fig. 7 we present a view ofthis interface in which some of the mostrepresentative windows are open. The signalwindow (top centre), shows the ECG andcardiovascular pressure signals in real time,moving from right to left. On this window, itis also possible to view the signals at anyinstant during the last hour. The selection ofthe interval to be viewed may be carried outby explicitly referencing the time desired, orin an indirect way through the selection of anevent of interest detected by the system (abeat, an ischemic episode, etc). Other win-dows in Fig. 7 are: the basal window (lowerright), which permits viewing of the basalbeats and the results of the measurementscarried out over them; the trend window(lower left part) in which we represent the
J.V
ilaet
al./International
Journalof
Medical
Informatics
47(1997)
193–
214205Fig. 7. Illustration of the user–system interface of SUTIL.
J. Vila et al. / International Journal of Medical Informatics 47 (1997) 193–214206
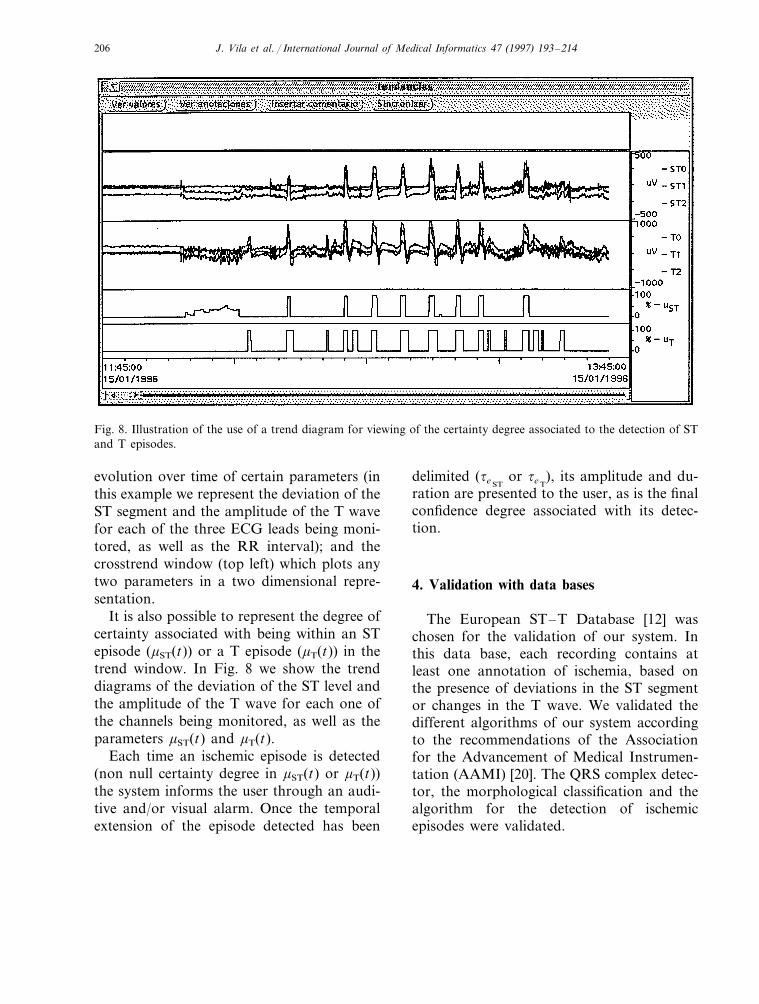
Fig. 8. Illustration of the use of a trend diagram for viewing of the certainty degree associated to the detection of STand T episodes.
evolution over time of certain parameters (inthis example we represent the deviation of theST segment and the amplitude of the T wavefor each of the three ECG leads being moni-tored, as well as the RR interval); and thecrosstrend window (top left) which plots anytwo parameters in a two dimensional repre-sentation.
It is also possible to represent the degree ofcertainty associated with being within an STepisode (mST(t)) or a T episode (mT(t)) in thetrend window. In Fig. 8 we show the trenddiagrams of the deviation of the ST level andthe amplitude of the T wave for each one ofthe channels being monitored, as well as theparameters mST(t) and mT(t).
Each time an ischemic episode is detected(non null certainty degree in mST(t) or mT(t))the system informs the user through an audi-tive and/or visual alarm. Once the temporalextension of the episode detected has been
delimited (te STor te T
), its amplitude and du-ration are presented to the user, as is the finalconfidence degree associated with its detec-tion.
4. Validation with data bases
The European ST–T Database [12] waschosen for the validation of our system. Inthis data base, each recording contains atleast one annotation of ischemia, based onthe presence of deviations in the ST segmentor changes in the T wave. We validated thedifferent algorithms of our system accordingto the recommendations of the Associationfor the Advancement of Medical Instrumen-tation (AAMI) [20]. The QRS complex detec-tor, the morphological classification and thealgorithm for the detection of ischemicepisodes were validated.
J. Vila et al. / International Journal of Medical Informatics 47 (1997) 193–214 207
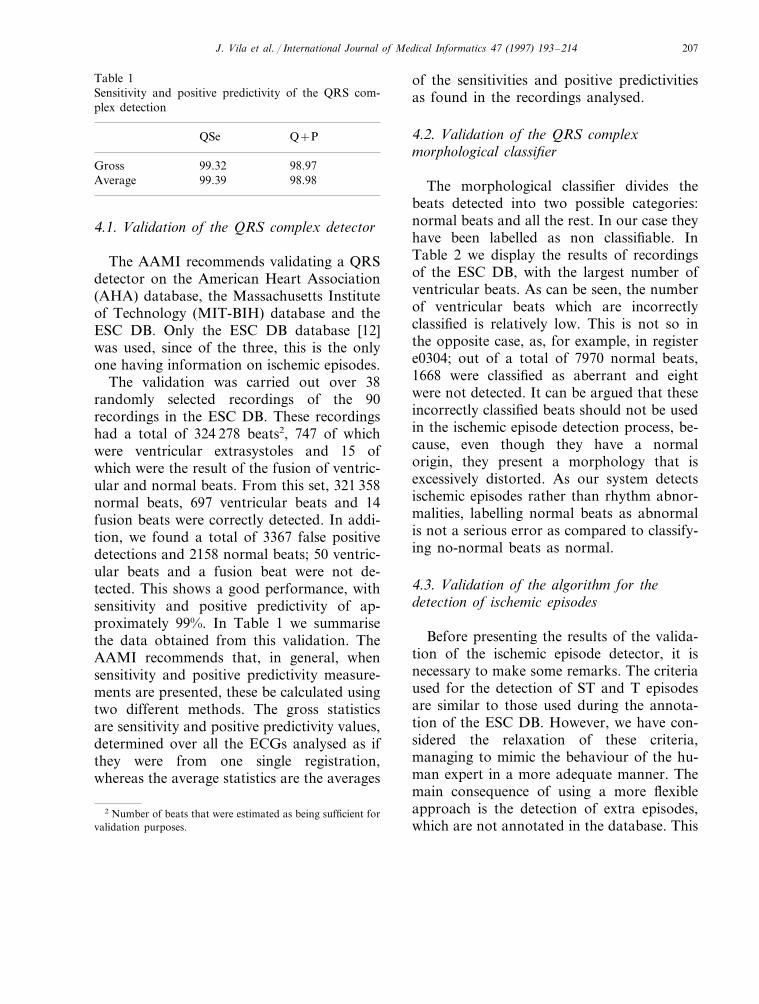
Table 1Sensitivity and positive predictivity of the QRS com-plex detection
QSe Q+P
98.97Gross 99.32Average 99.39 98.98
of the sensitivities and positive predictivitiesas found in the recordings analysed.
4.2. Validation of the QRS complexmorphological classifier
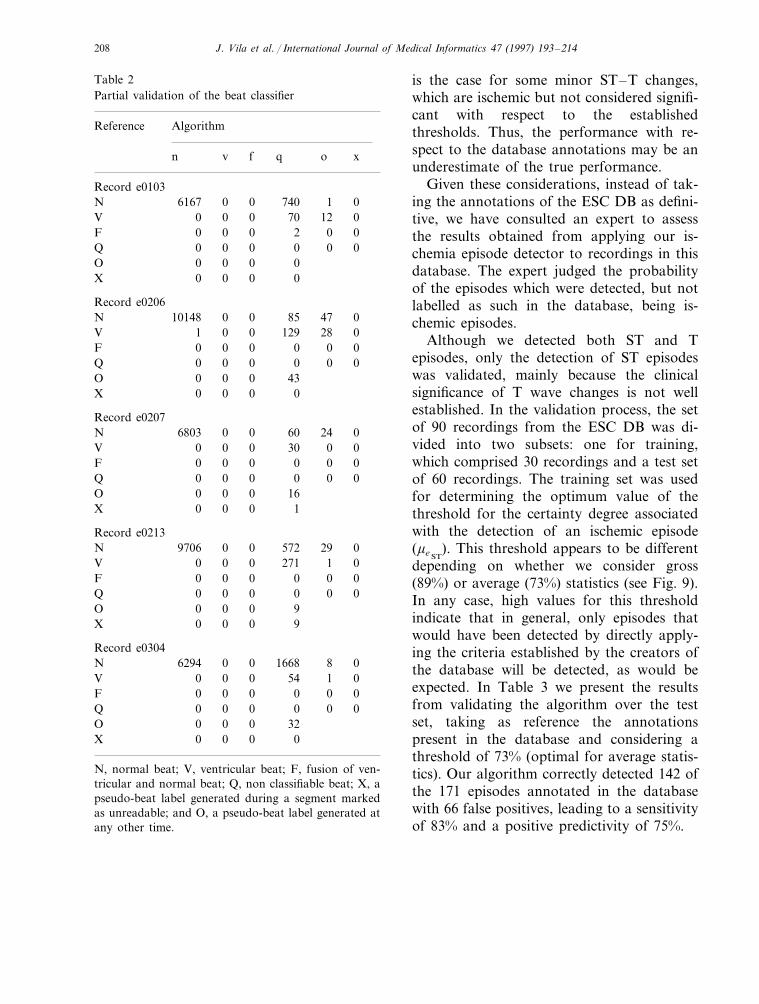
The morphological classifier divides thebeats detected into two possible categories:normal beats and all the rest. In our case theyhave been labelled as non classifiable. InTable 2 we display the results of recordingsof the ESC DB, with the largest number ofventricular beats. As can be seen, the numberof ventricular beats which are incorrectlyclassified is relatively low. This is not so inthe opposite case, as, for example, in registere0304; out of a total of 7970 normal beats,1668 were classified as aberrant and eightwere not detected. It can be argued that theseincorrectly classified beats should not be usedin the ischemic episode detection process, be-cause, even though they have a normalorigin, they present a morphology that isexcessively distorted. As our system detectsischemic episodes rather than rhythm abnor-malities, labelling normal beats as abnormalis not a serious error as compared to classify-ing no-normal beats as normal.
4.3. Validation of the algorithm for thedetection of ischemic episodes
Before presenting the results of the valida-tion of the ischemic episode detector, it isnecessary to make some remarks. The criteriaused for the detection of ST and T episodesare similar to those used during the annota-tion of the ESC DB. However, we have con-sidered the relaxation of these criteria,managing to mimic the behaviour of the hu-man expert in a more adequate manner. Themain consequence of using a more flexibleapproach is the detection of extra episodes,which are not annotated in the database. This
4.1. Validation of the QRS complex detector
The AAMI recommends validating a QRSdetector on the American Heart Association(AHA) database, the Massachusetts Instituteof Technology (MIT-BIH) database and theESC DB. Only the ESC DB database [12]was used, since of the three, this is the onlyone having information on ischemic episodes.
The validation was carried out over 38randomly selected recordings of the 90recordings in the ESC DB. These recordingshad a total of 324 278 beats2, 747 of whichwere ventricular extrasystoles and 15 ofwhich were the result of the fusion of ventric-ular and normal beats. From this set, 321 358normal beats, 697 ventricular beats and 14fusion beats were correctly detected. In addi-tion, we found a total of 3367 false positivedetections and 2158 normal beats; 50 ventric-ular beats and a fusion beat were not de-tected. This shows a good performance, withsensitivity and positive predictivity of ap-proximately 99%. In Table 1 we summarisethe data obtained from this validation. TheAAMI recommends that, in general, whensensitivity and positive predictivity measure-ments are presented, these be calculated usingtwo different methods. The gross statisticsare sensitivity and positive predictivity values,determined over all the ECGs analysed as ifthey were from one single registration,whereas the average statistics are the averages
2 Number of beats that were estimated as being sufficient forvalidation purposes.
J. Vila et al. / International Journal of Medical Informatics 47 (1997) 193–214208
Table 2Partial validation of the beat classifier
Reference Algorithm
xon v f q
Record e0103740 01N 06167 0
0 70 12V 00 0002F 00 000Q 0 0 0 0
O 0 0 0 00 0X 0 0
Record e02060 85 47 0N 10148 0
028129V 01 00 0F 0 0 0 00 0Q 0 0 0 0
43O 00 00 0X 0 0
Record e020760 024N 06803 0
0 30 0V 0 000 0F 0 0 0 0
00 0Q 00 0O 0 0 0 16
0 1X 0 0
Record e02130 572 29N 9706 00
271 1V 0 0 0 000 0F 00 0
0 0 0 0Q 0 09O 00 0
X 0 0 0 9
Record e03040 1668 8N 6294 00
1 054V 00 00 0F 0 0 00
000Q 00 0O 0 0 0 32X 0 0 0 0
N, normal beat; V, ventricular beat; F, fusion of ven-tricular and normal beat; Q, non classifiable beat; X, apseudo-beat label generated during a segment markedas unreadable; and O, a pseudo-beat label generated atany other time.
is the case for some minor ST–T changes,which are ischemic but not considered signifi-cant with respect to the establishedthresholds. Thus, the performance with re-spect to the database annotations may be anunderestimate of the true performance.
Given these considerations, instead of tak-ing the annotations of the ESC DB as defini-tive, we have consulted an expert to assessthe results obtained from applying our is-chemia episode detector to recordings in thisdatabase. The expert judged the probabilityof the episodes which were detected, but notlabelled as such in the database, being is-chemic episodes.
Although we detected both ST and Tepisodes, only the detection of ST episodeswas validated, mainly because the clinicalsignificance of T wave changes is not wellestablished. In the validation process, the setof 90 recordings from the ESC DB was di-vided into two subsets: one for training,which comprised 30 recordings and a test setof 60 recordings. The training set was usedfor determining the optimum value of thethreshold for the certainty degree associatedwith the detection of an ischemic episode(me ST
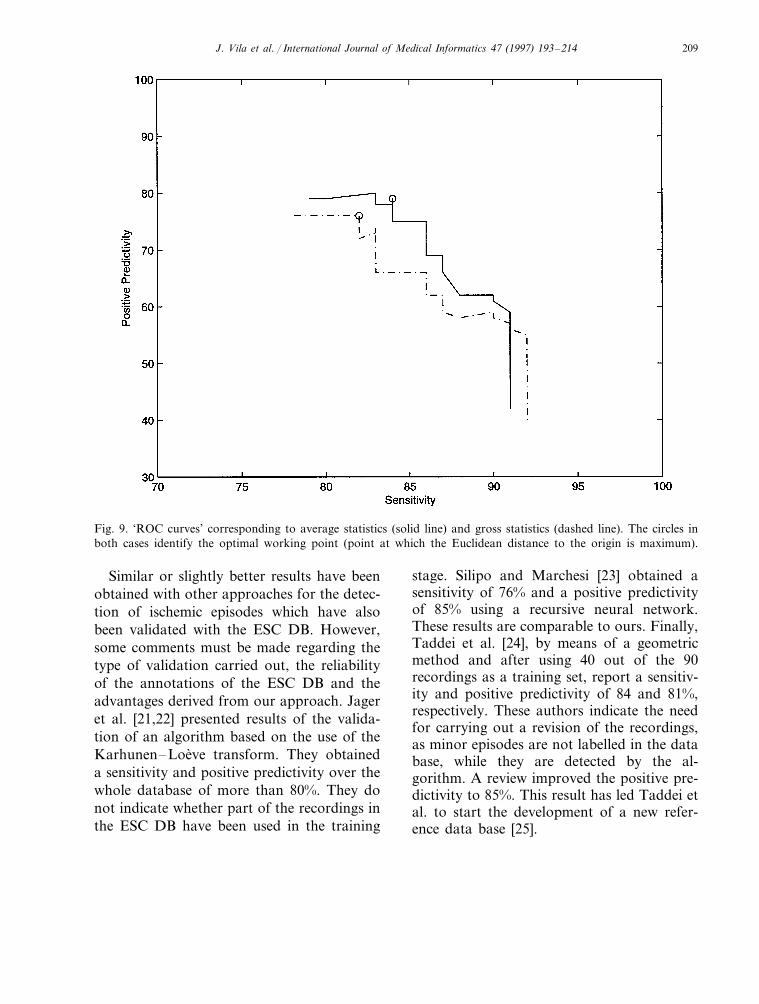
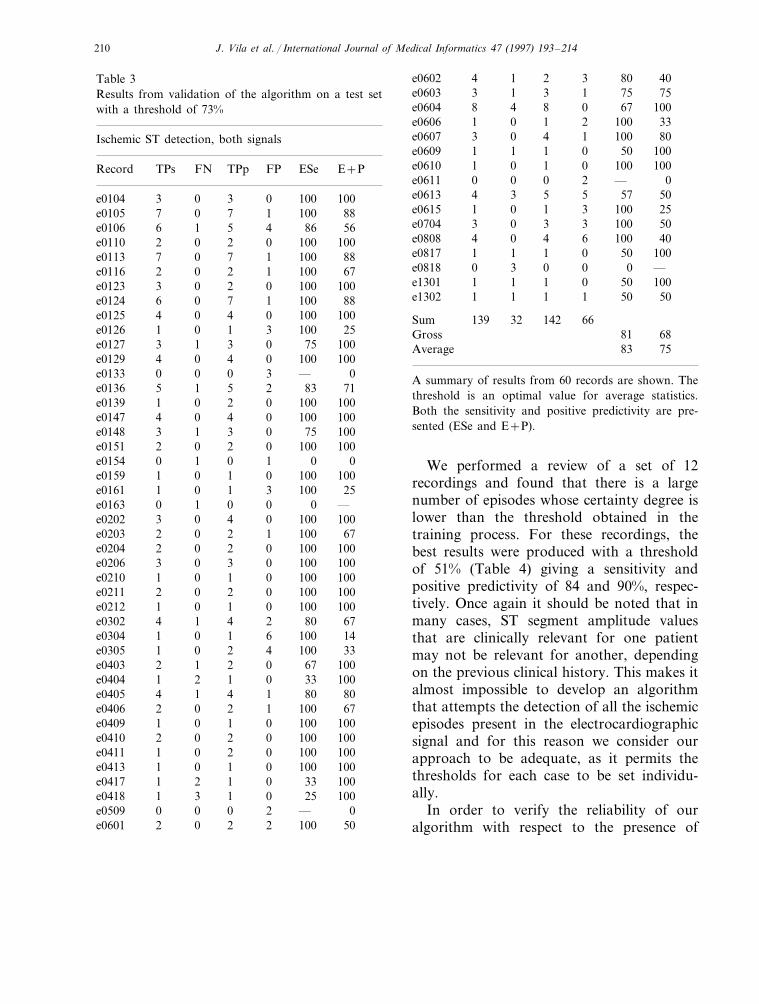
). This threshold appears to be differentdepending on whether we consider gross(89%) or average (73%) statistics (see Fig. 9).In any case, high values for this thresholdindicate that in general, only episodes thatwould have been detected by directly apply-ing the criteria established by the creators ofthe database will be detected, as would beexpected. In Table 3 we present the resultsfrom validating the algorithm over the testset, taking as reference the annotationspresent in the database and considering athreshold of 73% (optimal for average statis-tics). Our algorithm correctly detected 142 ofthe 171 episodes annotated in the databasewith 66 false positives, leading to a sensitivityof 83% and a positive predictivity of 75%.
J. Vila et al. / International Journal of Medical Informatics 47 (1997) 193–214 209
Fig. 9. ‘ROC curves’ corresponding to average statistics (solid line) and gross statistics (dashed line). The circles inboth cases identify the optimal working point (point at which the Euclidean distance to the origin is maximum).
Similar or slightly better results have beenobtained with other approaches for the detec-tion of ischemic episodes which have alsobeen validated with the ESC DB. However,some comments must be made regarding thetype of validation carried out, the reliabilityof the annotations of the ESC DB and theadvantages derived from our approach. Jageret al. [21,22] presented results of the valida-tion of an algorithm based on the use of theKarhunen–Loeve transform. They obtaineda sensitivity and positive predictivity over thewhole database of more than 80%. They donot indicate whether part of the recordings inthe ESC DB have been used in the training
stage. Silipo and Marchesi [23] obtained asensitivity of 76% and a positive predictivityof 85% using a recursive neural network.These results are comparable to ours. Finally,Taddei et al. [24], by means of a geometricmethod and after using 40 out of the 90recordings as a training set, report a sensitiv-ity and positive predictivity of 84 and 81%,respectively. These authors indicate the needfor carrying out a revision of the recordings,as minor episodes are not labelled in the database, while they are detected by the al-gorithm. A review improved the positive pre-dictivity to 85%. This result has led Taddei etal. to start the development of a new refer-ence data base [25].
J. Vila et al. / International Journal of Medical Informatics 47 (1997) 193–214210
Table 3Results from validation of the algorithm on a test setwith a threshold of 73%
Ischemic ST detection, both signals
E+PRecord FPTPs ESeFN TPp
100e0104 3 0 3 0 10088100e0105 7 10 7
86e0106 6 1 5 4 56100e0110 2 0 2 0 100100e0113 887 10 7
1 100e0116 2 670 2100100e0123 3 00 2
1 100e0124 886 0 7100e0125 1004 00 4
100e0126 1 0 1 3 2510075e0127 3 01 3
100e0129 4 0 4 0 100—e0133 0 0 0 3 083e0136 715 21 5
0 100e0139 1 1000 2100100e0147 4 00 4
0 75e0148 1003 1 3100e0151 1002 00 2
0e0154 0 1 0 1 0100100e0159 1 00 1
100e0161 1 0 1 3 250e0163 0 1 0 0 —
100e0202 1003 00 41 100e0203 672 0 2
100100e0204 2 00 20 100e0206 1003 0 3
100e0210 1001 00 1100e0211 2 0 2 0 100
100100e0212 1 00 180e0302 4 1 4 2 67
100e0304 1 0 1 6 14100e0305 331 40 2
0 67e0403 1002 1 210033e0404 1 02 1
1 80e0405 804 1 467e0406 1002 10 2
100e0409 1 0 1 0 100100100e0410 2 00 2
100e0411 1 0 2 0 100100e0413 1 0 1 0 10033e0417 1001 02 1
0 25e0418 1001 3 10—e0509 0 20 0
2 100e0601 502 0 2
40e0602 804 31 275e0603 3 1 3 1 75
10067e0604 8 04 8100e0606 1 0 1 2 33100e0607 3 0 4 1 8050e0609 1001 01 1
0 100 100e0610 1 0 10—e0611 0 20 0
5 57e0613 504 3 525e0615 1001 30 1
100e0704 3 0 3 3 5040100e0808 4 60 4
50e0817 1 1 1 0 1000e0818 0 3 0 0 —
50e1301 1001 01 11 50 50e1302 1 1 1
Sum 66139 32 14281Gross 6883Average 75
A summary of results from 60 records are shown. Thethreshold is an optimal value for average statistics.Both the sensitivity and positive predictivity are pre-sented (ESe and E+P).
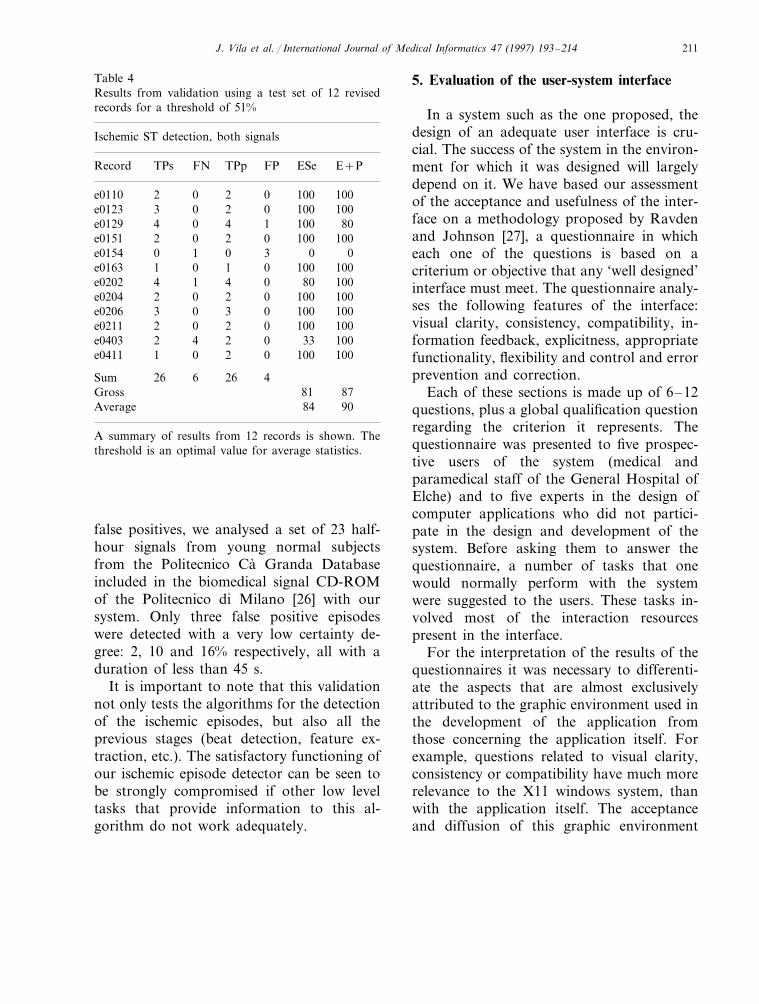
We performed a review of a set of 12recordings and found that there is a largenumber of episodes whose certainty degree islower than the threshold obtained in thetraining process. For these recordings, thebest results were produced with a thresholdof 51% (Table 4) giving a sensitivity andpositive predictivity of 84 and 90%, respec-tively. Once again it should be noted that inmany cases, ST segment amplitude valuesthat are clinically relevant for one patientmay not be relevant for another, dependingon the previous clinical history. This makes italmost impossible to develop an algorithmthat attempts the detection of all the ischemicepisodes present in the electrocardiographicsignal and for this reason we consider ourapproach to be adequate, as it permits thethresholds for each case to be set individu-ally.
In order to verify the reliability of ouralgorithm with respect to the presence of
J. Vila et al. / International Journal of Medical Informatics 47 (1997) 193–214 211
Table 4Results from validation using a test set of 12 revisedrecords for a threshold of 51%
Ischemic ST detection, both signals
ESe E+PRecord TPs FN TPp FP
100 100e0110 2 0 2 00 100e0123 3 0 2 100
1001 80e0129 44 02 0 100e0151 1002 0
3 0e0154 0 1 0 01000 100e0163 11 0
0 80e0202 4 1 4 1001001000e0204 22 0
3 0 100 100e0206 3 0100 1000e0211 22 0
0 33e0403 2 4 10021001002e0411 01 0
Sum 26 6 26 48781Gross
Average 84 90
A summary of results from 12 records is shown. Thethreshold is an optimal value for average statistics.
5. Evaluation of the user-system interface
In a system such as the one proposed, thedesign of an adequate user interface is cru-cial. The success of the system in the environ-ment for which it was designed will largelydepend on it. We have based our assessmentof the acceptance and usefulness of the inter-face on a methodology proposed by Ravdenand Johnson [27], a questionnaire in whicheach one of the questions is based on acriterium or objective that any ‘well designed’interface must meet. The questionnaire analy-ses the following features of the interface:visual clarity, consistency, compatibility, in-formation feedback, explicitness, appropriatefunctionality, flexibility and control and errorprevention and correction.
Each of these sections is made up of 6–12questions, plus a global qualification questionregarding the criterion it represents. Thequestionnaire was presented to five prospec-tive users of the system (medical andparamedical staff of the General Hospital ofElche) and to five experts in the design ofcomputer applications who did not partici-pate in the design and development of thesystem. Before asking them to answer thequestionnaire, a number of tasks that onewould normally perform with the systemwere suggested to the users. These tasks in-volved most of the interaction resourcespresent in the interface.
For the interpretation of the results of thequestionnaires it was necessary to differenti-ate the aspects that are almost exclusivelyattributed to the graphic environment used inthe development of the application fromthose concerning the application itself. Forexample, questions related to visual clarity,consistency or compatibility have much morerelevance to the X11 windows system, thanwith the application itself. The acceptanceand diffusion of this graphic environment
false positives, we analysed a set of 23 half-hour signals from young normal subjectsfrom the Politecnico Ca Granda Databaseincluded in the biomedical signal CD-ROMof the Politecnico di Milano [26] with oursystem. Only three false positive episodeswere detected with a very low certainty de-gree: 2, 10 and 16% respectively, all with aduration of less than 45 s.
It is important to note that this validationnot only tests the algorithms for the detectionof the ischemic episodes, but also all theprevious stages (beat detection, feature ex-traction, etc.). The satisfactory functioning ofour ischemic episode detector can be seen tobe strongly compromised if other low leveltasks that provide information to this al-gorithm do not work adequately.
J. Vila et al. / International Journal of Medical Informatics 47 (1997) 193–214212
guarantees good results in these criteria, whichreinforces our choice of interaction platform.
Since only a small number of peopleparticipated in this study, we present onlyglobal conclusions. On average, the users gavea moderately high score for the satisfactionindex. Somewhat surprisingly, the computerapplications experts were more critical thanthe clinical users of the system. The latter, ingeneral, evaluated the system more positively,which implies a better guarantee of acceptancein the environment where the system must beinstalled. These results lead us to install thesystem without modifications, which willhowever need to be carried out according tothe results after more intense use.
6. Conclusions
We have implemented a real time monitor-ing system aimed at the detection of ischemicepisodes in ECG recordings. It performs aseries of tasks, described in this paper, whichresult in a set of parameters such as, forexample, the deviation of the ST segment andthe amplitude of the T wave of the normalbeats present in the electrocardiographic sig-nal.
The evaluation of the system on the ESCDB database showed that our fuzzy approachfor the detection of ischemic episodes is ade-quate. One of the features most appreciatedby the cardiologists was the presence of agradation of the relative confidence in theresult, which emerges as a consequence of thedegree of imprecision in the knowledge. Inaddition, the fuzzy rule approach greatly fa-cilitates the redefinition of the criteria (evenin real time) by modifying the definition ofthe associated possibility distributions.
One of the important and particularly use-ful aspects of our approach is that its compu-tational complexity is not very high and thus
its real time implementation is feasible. Thereal time monitoring of patients with is-chemic cardiopathies clearly adds versatilityto the treatment of these cardiopathies whichcannot be obtained by using other off linemonitoring techniques such as, for example,Holter monitoring. Even though there areother techniques which offer a similar perfor-mance to that obtained by our system [28,29],they are not usually suitable for real timeimplementation, unless specific hardware isused.
The design of a good user interface is ofvital importance if the system is to be ac-cepted by the user community for which it isdesigned. For this reason, even though thegreatest emphasis was placed on signal pro-cessing, this aspect of the system was notforgotten. This is reflected in the very positiveevaluation of the user-system interface imple-mented.
Finally we observe several clear lines offuture developments. Until now we have nottaken into account the possibility that suddenchanges in the morphology of beats that orig-inate in the sinusal node are a consequence ofthe motion of the patient [28]. This is anaspect we will try to solve in the futurethrough a more sophisticated morphologicalclassification of the beats. It should detecteach new normal morphology, so that if achange of morphology coincides in time witha brusque change in the trend diagrams ofthe deviation of the ST segment or the heightof the T wave, it must not be interpreted asan ischemic episode.
Another interesting field of work consistsin trying to relate ischemic episodes with theappearance of particular previous cardiacarrhythmias. It will be necessary to imple-ment a module for the detection of arrhyth-mias that provides information to the modulefor the detection of ischemic episodes, mak-ing it possible to relate the presence of a new
J. Vila et al. / International Journal of Medical Informatics 47 (1997) 193–214 213
episode with the temporal closeness of a pre-vious arrhythmia.
Furthermore, the integration of informa-tion coming from signals other than ECGwould be interesting (for instance, invasivecardiovascular pressure signals). This integra-tion may aid the process of detecting andcharacterising ischemic episodes.
Acknowledgements
This work has been supported by theSpanish CICyT and Xunta de Galicia underprojects TIC95-0604 and XUGA 20602A97,respectively. We also wish to express ourthanks to the referees of this paper for theirdetailed comments.
References
[1] B. Surawicz, ST-segment, T-wave and U-wavechanges during myocardial ischemia and after my-ocardial infarction, Can. J. Cardiol. A (1986)71A–84A.
[2] Siemens, The Sirecust 960/961 system. User’s man-ual, Siemens.
[3] Marquette, Solar 7000/8000 patient monitor. Op-erator’s manual, Marquette Electronics, 1995.
[4] S. Nelwan, S. Meij, L. Lundstron, T. van Dam, P.Gilman P, M.L. Simoons, Continuous 12 lead STmonitoring, Comput. Cardiol. 23 (1996) 477–480.
[5] J. Presedo, Monitorizacion inteligente de isquemiaen SUTIL, Ph.D. Dissertation, Servicio de Publi-cacions e Intercambio Cientıfico, University ofSantiago de Compostela, ISBN: 84-8121-160-5,1994 (in Spanish).
[6] W. Fischer, IEEE P1014—A standard or the high-performance VME bus, IEEE Micro. 2 (1985)31–41.
[7] H.V. Pipberger, R.C. Arzbaecher, A.S. Berson,S.A. Briller, D.A. Brody, N.C. Flowers, D.B.Geselowitz, E. Lepeschkin, G.C. Oliver, O.H.Schmitt, M. Spach, Recommendations for stan-dardization of leads and of specifications for in-struments in electrocardiography andvectorcardiography, Report of the Committee on
Electrocardiography, Am. Heart Assoc. Circ. 52(1975) 11–31.
[8] O. Pahlm, L. Sornmo, Software QRS detection inambulatory monitoring—a review, Med. Biol.Eng. Comput. 22 (1984) 289–297.
[9] The CSE Working Party, Recommendations formeasurement standards in quantitative electrocar-diography, European Heart J. 6 (1985) 815–825.
[10] P. Laguna, R. Jane, P. Caminal, Automatic detec-tion of wave boundaries in multilead ECG signals:validation with the CSE database, Comp. Biomed.Res. 27 (1994) 45–60.
[11] J. Vila, J. Presedo, A. Bugarın, S. Barro, R. Ruiz,F. Palacios, Application of synctactic processing toECG analysis, 12th International Congress onMedical Informatics, MIE-94, 1994, 579–584.
[12] A. Taddei, G. Distante, M. Emdin, P. Pisani, G.B.Moody, C. Zeelenberg, C. Marchesi, The Eu-ropean ST–T Database: standard for evaluatingsystems for the analysis of ST–T changes in ambu-latory electrocardiography, Eur. Heart J. 13 (1992)1164–1172.
[13] P.M. Rautaharju, S.H. Zhou, S. Wong, R. Prineas,G.S. Berenson, Functional characteristics of QTprediction formulas. The concepts of QTmax andQT rate sensitivity, Comp. Biomed. Res. 26 (1993)188–204.
[14] J. Presedo, J. Vila, S. Barro, F. Palacios, R. Ruiz,A. Taddei, M. Emdin, Fuzzy modelling of theexpert’s knowledge in ECG-based ischaemia detec-tion, Fuzzy Sets Syst. 77 (1996) 63–75.
[15] J. Presedo, J. Vila, M. Delgado, S. Barro, P.Palacios, R. Ruiz, A proposal for the fuzzy evalua-tion of ischaemic episodes, Comput. Cardiol. 22(1995) 709–712.
[16] L.A. Zadeh, Fuzzy sets, Inf. Control 8 (1965)338–353.
[17] P. Heinonen, Y. Neuvo, FIR-median hybrid filters,IEEE Trans. Acoust. Speech Signal Process 35(1987) 832–838.
[18] S. Barro, R. Marin, J. Mira, A.R. Paton, A modeland a language for the fuzzy representation andhandling of time, Fuzzy Sets Syst. 61 (1994) 153–175.
[19] G.B. Moody, R.G. Mark, The MIT-BIH arrhyth-mia database on CDROM and software for usewith it, Comput. Cardiol. 17 (1990) 185–188.
[20] AAMI Recommended Practice, Testing and re-porting performance results of ventricular arrhyth-mia detection algorithms, Association for theAdvancement of Medical Instrumentation, 1987.
J. Vila et al. / International Journal of Medical Informatics 47 (1997) 193–214214
[21] F. Jager, G.B. Moody, A. Taddei, R.G. Mark,Performance measures for algorithms to detecttransient ischemic ST segment changes, Comput.Cardiol. 18 (1991) 369–372.
[22] F. Jager, R.G. Mark, G.B. Moody, S. Divjak,Analysis of transient ST segment changes duringambulatory monitoring using the Karhunen–Lo-eve transform, Comput. Cardiol. 19 (1992) 691–694.
[23] R. Silipo, C. Marchesi, Composite neural networkarchitecture for extensive long term ECG analysis,Comput. Cardiol. 23 (1996) 13–16.
[24] A. Taddei, G. Costantino, R. Silipo, M. Emdin, C.Marchesi, A system for the detection of ischemicepisodes in ambulatory ECG, Comput. Cardiol. 22(1995) 705–708.
[25] A. Taddei, M. Emdin, M. Varanini, G. Nassi, M.Bertinelli, C. Carpeggiani, E. Picano, C. Marchesi,
A new cardiovascular signal database for assesingmethods for analysis of ischemic heart disease,Comput. Cardiol. 23 (1996) 497–500.
[26] F. Pinciroli, R. Rossi, ECG and Resp from youngnormal subjects. A biomedical signals database onCD-ROM from the Politecnico di Milano.
[27] S.J. Ravden, G.I. Johnson, Evaluating Usability ofHuman–Computer Interfaces: A PracticalMethod, Ellis Hoorwood, Chichester, UK, 1989.
[28] A. Taddei, M. Varanini, A. Macerata, M. Emdin,C. Marchesi, Detection of ischemic episodesthrough principal component analysis, Bioteleme-try 12 (1992) 77–84.
[29] T. Stamkopoulos, M. Strintzis, C. Pappas, N.Maglaveras, One-lead ischemia detection using anew backpropagation algorithm and the EuropeanST–T Database, Comput. Cardiol. 19 (1992) 663–666.
.