sustainable utilization of waste oyster shell powders ... - mdpi
TRANSCRIPT
Citation: Liu, S.; Wang, Y.; Liu, B.;
Zou, Z.; Teng, Y.; Ji, Y.; Zhou, Y.;
Zhang, L.V.; Zhang, Y. Sustainable
Utilization of Waste Oyster Shell
Powders with Different Fineness
Levels in a Ternary Supplementary
Cementitious Material System.
Sustainability 2022, 14, 5981. https://
doi.org/10.3390/su14105981
Academic Editors: Elena Rada,
Marco Ragazzi, Ioannis Katsoyiannis,
Elena Magaril, Paolo Viotti, Hussain
H. Al-Kayiem, Marco Schiavon,
Gabriela Ionescu and Natalia Sliusar
Received: 21 March 2022
Accepted: 7 May 2022
Published: 14 May 2022
Publisher’s Note: MDPI stays neutral
with regard to jurisdictional claims in
published maps and institutional affil-
iations.
Copyright: © 2022 by the authors.
Licensee MDPI, Basel, Switzerland.
This article is an open access article
distributed under the terms and
conditions of the Creative Commons
Attribution (CC BY) license (https://
creativecommons.org/licenses/by/
4.0/).
sustainability
Article
Sustainable Utilization of Waste Oyster Shell Powders withDifferent Fineness Levels in a Ternary SupplementaryCementitious Material SystemShanglai Liu 1, Yuan Wang 1, Bonan Liu 2, Zhen Zou 2, Yina Teng 3, Yidi Ji 1, Yubo Zhou 2, Lei V. Zhang 4,*and Yannian Zhang 2,*
1 College of Fisheries and Life Science, Dalian Ocean University, Dalian 116023, China;[email protected] (S.L.); [email protected] (Y.W.); [email protected] (Y.J.)
2 School of Civil Engineering, Shenyang Jianzhu University, Shenyang 110168, China;[email protected] (B.L.); [email protected] (Z.Z.); [email protected] (Y.Z.)
3 Changxin International Art School, Yunnan University, Kunming 650031, China; [email protected] School of Civil and Transportation Engineering, Hebei University of Technology, 5340 Xiping Road,
Tianjin 300401, China* Correspondence: [email protected] (L.V.Z.); [email protected] (Y.Z.)
Abstract: As cement manufacturing accounts for 8% of global CO2 emissions, there is an urgentneed to tackle the environmental impacts of cement production and address the decarbonization ofconstruction materials. Adopting supplementary cementitious materials (SCMs), including fly ash,slag, silica fume, etc., can be used as a partial replacement for ordinary Portland cement (OPC) toreduce CO2 emissions related to the OPC industry, while providing benefits for waste valorization.This study aims to explore the sustainable utilization of a waste oyster shell powder (OSP)–lithiumslag (LS)–ground granulated blast furnace slag (GGBFS) ternary SCM system in green concrete. Theeffect of OSP fineness on compressive strength, hydration products, pore structure, and transportproperties in ternary SCM-based mortars was studied using a wide array of experimental techniques,including thermogravimetric analysis (TGA), scanning electron microscopy (SEM) analysis, Mercuryintrusion porosimetry (MIP), the water absorption test and the rapid chloride penetration test (RCPT).The results revealed that the concrete with the ternary SCMs showed equivalent compressive strengthcompared to reference specimens. The water absorption and chloride ion charge of the RCPT inthe concrete containing the ternary SCMs decreased by up to 30% and 81.4%, respectively. It wasobserved that the specimens incorporating the OSP with a mesh size of 3000 exhibited the highestcompressive strength and the most refined microstructure.
Keywords: oyster shell powders; compressive strength; permeability; coupling effect; supplementarycementitious materials
1. Introduction
Millions of tons of shell waste are produced and abandoned in landfills in China everyyear [1]. These landfilled shells leach heavy metals from the heap due to dense emissionsof land and air pollution during microbial decomposition and weathering. In some Africancountries, abandoned shells are difficult to handle, and millions of tons of abandoned shellspile up on shores and beaches each year. Open-air accumulation of abandoned shells isa potential habitat for microbes that attract organisms that are the carriers of potentialdiseases, causing public health problems [2]. The only effective solution to this problem isto recycle these shells as raw materials to develop new green building material [3]. In China,however, the utilization of discarded shells is less than 30%. Some scholars [4] have appliedwaste shells as concrete aggregate in the field of building materials. Whether they are usedas coarse aggregate or fine aggregate, it is difficult for the crushing indices of burned wasteshells to meet the standard of traditional sandstone, which greatly limits the application
Sustainability 2022, 14, 5981. https://doi.org/10.3390/su14105981 https://www.mdpi.com/journal/sustainability
Sustainability 2022, 14, 5981 2 of 13
of waste shells in the field of concrete. Shells contain a large amount of calcium oxideand calcium carbonate, which are two materials with a high recovery value [5]. Discardedshells are grinded into powder to treat highly acidic soils in agriculture [6]. In addition,calcium carbonate extracted from superfine OSP can be used to improve the properties ofrubber and plastics [7]. Barros et al. [8] proposed a method to extract high purity calciumoxide from OSP as early as 2008. High purity calcium oxide belongs to high quality mineralresources and building materials. Akella et al. [9] showed that calcite and nepheline are themost abundant mineral crystals in OSP.
The accumulation of abandoned shells is increasing year by year, so it is unnecessaryto worry about the shortage of raw materials. However, natural limestone belongs tothe category of mineral resources. The increase in limestone consumption in the field ofconstruction certainly means that a large number of mineral resources are mined. This hasled to a series of problems, including environmental pollution, mineral resource depletion,and a series of collapses, landslides, and other security risks [8]. Therefore, it is urgentlynecessary to replace natural limestone with abandoned shells, a solid waste rich in calciumoxide, as a building material. According to the current literature, waste OSP rich in highquality calcium oxide has been used in the field of cement products [9].
Bassam et al. [10,11] investigated the possibility of replacing cement by grinding andburning bivalve clam seashells. Their results showed that the 5% replacement mix is theoptimum percentage of replacement. However, these values are increased with higher levelsof replacement. Seashell ash generally reduces workability. The ash also reduces concretepermeability after long periods of curing. Soltanza et al. [12] assessed the potential of wasteshells as additives in mixed cement production, indicating that OSP can be used to developmixed cement and improve the performance of concrete. Ali et al. [13] studied the effects ofcalcined oyster OSP as an additive on the hardening and microstructure properties of largevolume slag cement. The results showed that the addition of calcined oyster OSP enhancesthe compressive strength of oyster shells at an early age, but excessive addition will lead toa decrease in their compressive strength. Abdelaziz et al. [14] conducted alkali activationtreatment on OSP and prepared a new type of alkali-activated shell waste (AASW) mortarwith a compressive strength of 22 MPa and a porosity of 16.5%. Hassan et al. [15] evaluatedthe effect of OSP on the chloride penetration of cement materials. OSP replacing partof cement can change the microstructure of materials and allow more ions to react withchloride through compaction, thereby reducing the corrosion risk of concrete reinforcement.From the existing research literature, it appears that waste OSP can be a perfect substitute fornatural limestone powder. Therefore, OSP has the potential to develop into a supplementarycementitious material (SCM) [16]. Pusit et al. [17] used OSP instead of cement to prepareplaster mortar. Compared with traditional cement, the compressive strength was reducedduring drying, but the shrinkage rate and thermal conductivity were lower. AlthoughOSP has the potential to be developed as a SCM, the compressive strength deterioratesgreatly with increases in the replacement rate. Therefore, OSP should be committed to thedevelopment of multiple cementitious systems.
Ground granulated blast furnace slag (GGBFS) and lithium slag (LS), two types ofwaste from the iron and lithium industries, are the most widely used types of slag to pro-duce green concrete. Ali Shah et al. [18] developed environmentally friendly geopolymersusing LS that showed better mechanical properties. He et al. [19] applied lithium slagto ultra-high performance concrete (UHPC). An appropriate LS content can improve theUHPC microstructure, and has a dense microstructure similar to the matrix in the interfacialtransition zone (ITZ). LS is a promising silica fume substitute for the preparation of UHPC.Adding LS can also improve the mechanical properties of ordinary concrete, including itscompressive strength, elastic modulus, drying shrinkage, and creep [20]. Granulated blastfurnace slag (GGBFS) has a long history as a traditional SCM, which is very useful in theproduction of mortar and concrete, and can solve various problems, such as the workability,strength, and durability of concrete [21]. GGBFS is a by-product of blast furnace ironmak-ing, which contains a large number of active vitreous components and is a good precursor
Sustainability 2022, 14, 5981 3 of 13
of silica [22]. At present, GGBFS is more committed to the development of alkali-activatedcementitious materials because of its water hardness [23]. Cao et al. [24] mixed GGBFSwith ferronickel slag (FNS) to produce alkali-activated cement (AAC). When the proportionof GGBFS was reduced, the mechanical strength was greatly reduced, and the autogenousshrinkage, total porosity, and autogenous shrinkage were increased.
Although OSP as an SCM has been a well-studied topic, and although the efficacy ofOSP in concrete is well documented and understood, there has been little research involvingthe effect of the fineness of OSP on the performance of SCM systems. Therefore, systematicstudies are needed to better understand the effect of OSP in concrete SCM systems andclarify its performance, so as to recycle resources, reduce carbon dioxide emissions andachieve sustainable construction.
According to the existing literature, LS and GGBFS can theoretically cooperate withOSP to develop a ternary cementitious system. Therefore, this paper studied the compres-sive strength and permeability of a SP–LS–GGBFS ternary system with different finenesslevels of OSP, and analyzed the influence mechanism of OSP fineness on the ternary system.In addition, the hydration degree and microstructure of the ternary system were studiedby TG and SEM, and the pore structure was detected by Mercury intrusion porosimetry.
2. Materials and Methods2.1. Raw Materials
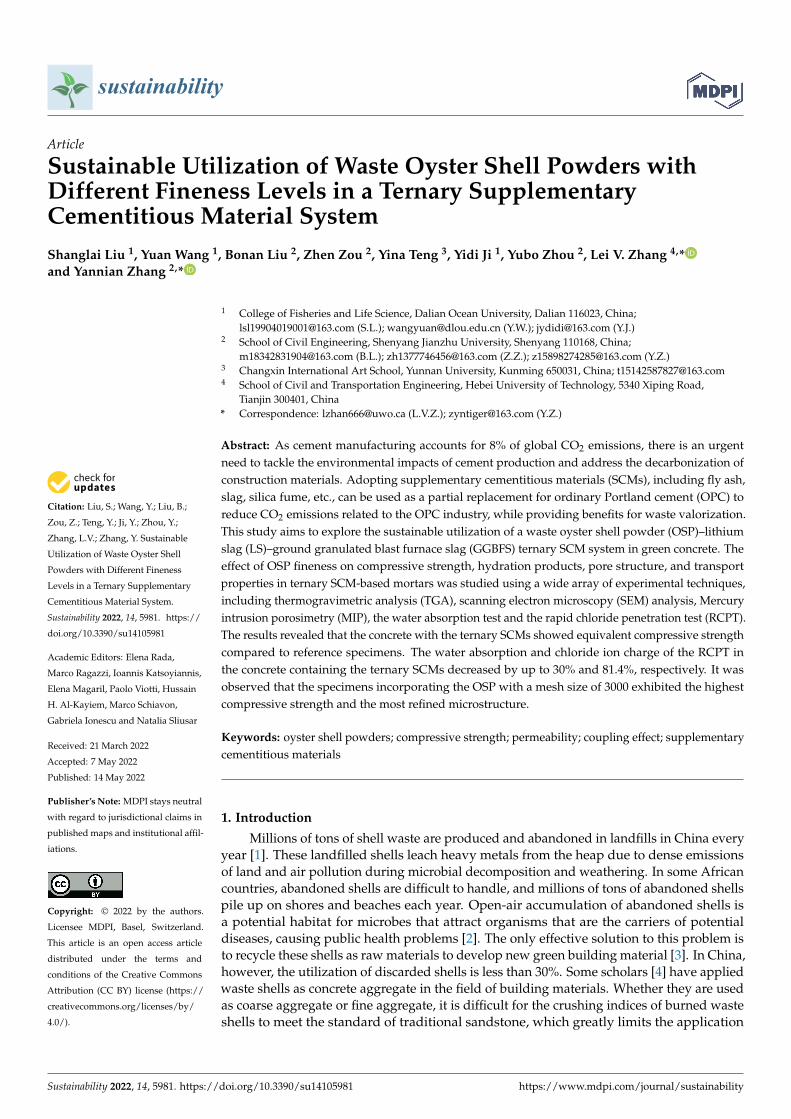
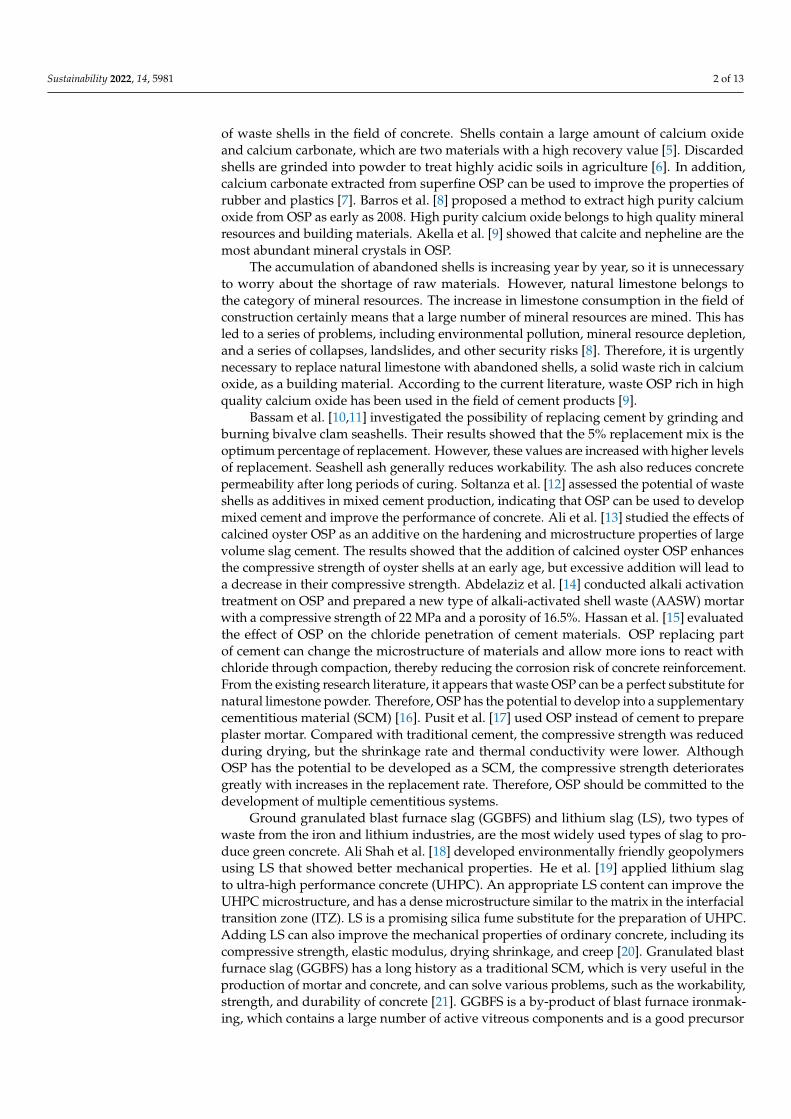
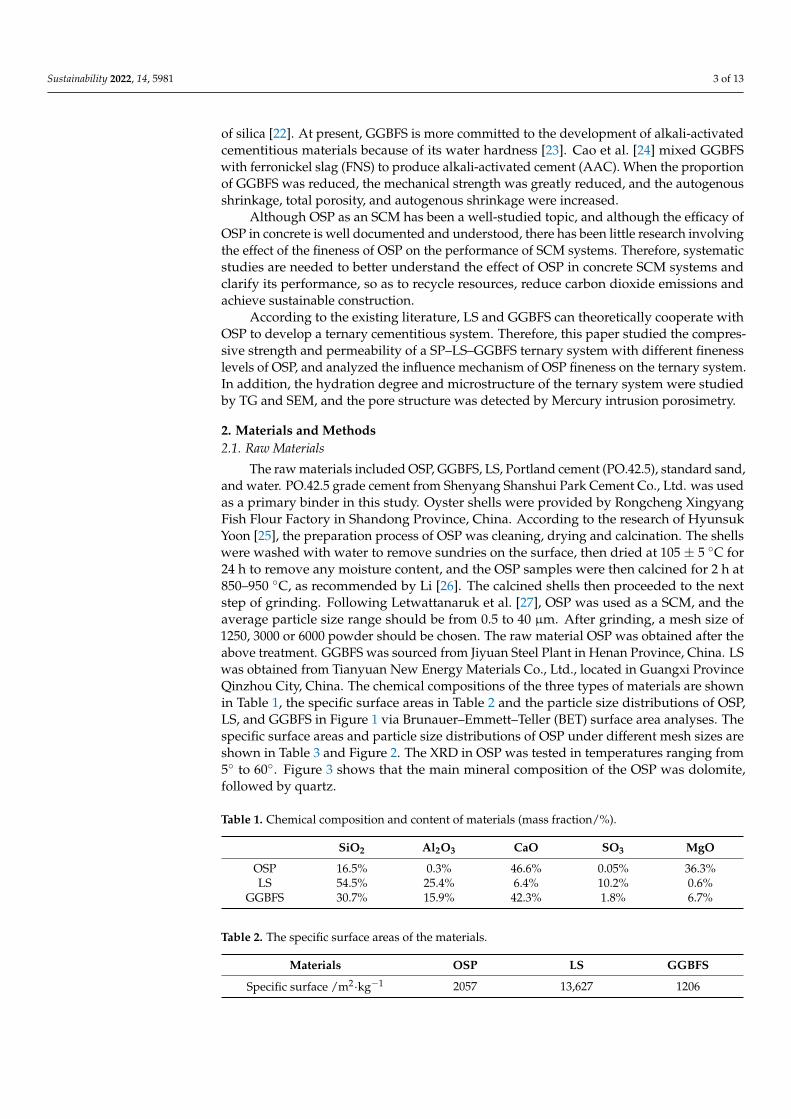
The raw materials included OSP, GGBFS, LS, Portland cement (PO.42.5), standard sand,and water. PO.42.5 grade cement from Shenyang Shanshui Park Cement Co., Ltd. was usedas a primary binder in this study. Oyster shells were provided by Rongcheng XingyangFish Flour Factory in Shandong Province, China. According to the research of HyunsukYoon [25], the preparation process of OSP was cleaning, drying and calcination. The shellswere washed with water to remove sundries on the surface, then dried at 105 ± 5 ◦C for24 h to remove any moisture content, and the OSP samples were then calcined for 2 h at850–950 ◦C, as recommended by Li [26]. The calcined shells then proceeded to the nextstep of grinding. Following Letwattanaruk et al. [27], OSP was used as a SCM, and theaverage particle size range should be from 0.5 to 40 µm. After grinding, a mesh size of1250, 3000 or 6000 powder should be chosen. The raw material OSP was obtained after theabove treatment. GGBFS was sourced from Jiyuan Steel Plant in Henan Province, China. LSwas obtained from Tianyuan New Energy Materials Co., Ltd., located in Guangxi ProvinceQinzhou City, China. The chemical compositions of the three types of materials are shownin Table 1, the specific surface areas in Table 2 and the particle size distributions of OSP,LS, and GGBFS in Figure 1 via Brunauer–Emmett–Teller (BET) surface area analyses. Thespecific surface areas and particle size distributions of OSP under different mesh sizes areshown in Table 3 and Figure 2. The XRD in OSP was tested in temperatures ranging from5◦ to 60◦. Figure 3 shows that the main mineral composition of the OSP was dolomite,followed by quartz.
Table 1. Chemical composition and content of materials (mass fraction/%).
SiO2 Al2O3 CaO SO3 MgO
OSP 16.5% 0.3% 46.6% 0.05% 36.3%LS 54.5% 25.4% 6.4% 10.2% 0.6%
GGBFS 30.7% 15.9% 42.3% 1.8% 6.7%
Table 2. The specific surface areas of the materials.
Materials OSP LS GGBFS
Specific surface /m2·kg−1 2057 13,627 1206
Sustainability 2022, 14, 5981 4 of 13
Sustainability 2022, 14, x FOR PEER REVIEW 4 of 13
Table 2. The specific surface areas of the materials.
Materials OSP LS GGBFS Specific surface /m2·kg−1 2057 13627 1206
Table 3. The specific surface areas of OSP under different mesh sizes.
Mesh size of OSP 1250 3000 6000 Specific surface /m2·kg−1 1624 2057 8479
0.01 0.1 1 10 100 10000
1
2
3
4
5
6
7
Bulk
den
sity/
%
Particle size/μm
SP LS GGBFS
Figure 1. Particle size distributions of materials.
0.01 0.1 1 10 100 10000
1
2
3
4
5
6
7
Bulk
den
sity/
%
Particle size/μm
mesh size 1250 mesh size 3000 mesh size 6000
Figure 2. Particle size distribution of OSP under different mesh sizes.
10 20 30 40 50 60
0
500
1000
1500
2000
2500
◇◇◇
◇
●
●●●
●
●★ ★ ◆
Inte
nsity
/(a.u
.)
2θ/degree
◆Dolomite★Quartz●MgCO3
◇Mg3Si4O10(OH)2
Figure 3. X-ray diffraction patterns of OSP.
2.2. Mix Design and Specimen Preparation Table 4 presents the mixed details of the specimens. The required raw materials were
poured into a JJ-5 planetary mixer to produce mortars as per China standard GB/T17671-1999 [28]. The mortars were placed in molds with a dimension of 40 mm × 40 mm × 160 mm and vibrated for 120 s. All specimens were demolded after 24 h and then cured in a standard curing room at 20 ± 2 °C with a relative humidity greater than 95%. Cubic 40-mm specimens were cast for measuring compressive strength. The purified slurry sam-ples were crushed and soaked in anhydrous ethanol for 3 days to terminate hydration.
Figure 1. Particle size distributions of materials.
Table 3. The specific surface areas of OSP under different mesh sizes.
Mesh size of OSP 1250 3000 6000
Specific surface /m2·kg−1 1624 2057 8479
Sustainability 2022, 14, x FOR PEER REVIEW 4 of 13
Table 2. The specific surface areas of the materials.
Materials OSP LS GGBFS Specific surface /m2·kg−1 2057 13627 1206
Table 3. The specific surface areas of OSP under different mesh sizes.
Mesh size of OSP 1250 3000 6000 Specific surface /m2·kg−1 1624 2057 8479
0.01 0.1 1 10 100 10000
1
2
3
4
5
6
7Bu
lk den
sity/
%
Particle size/μm
SP LS GGBFS
Figure 1. Particle size distributions of materials.
0.01 0.1 1 10 100 10000
1
2
3
4
5
6
7
Bulk
den
sity/
%
Particle size/μm
mesh size 1250 mesh size 3000 mesh size 6000
Figure 2. Particle size distribution of OSP under different mesh sizes.
10 20 30 40 50 60
0
500
1000
1500
2000
2500
◇◇◇
◇
●
●●●
●
●★ ★ ◆
Inte
nsity
/(a.u
.)
2θ/degree
◆Dolomite★Quartz●MgCO3
◇Mg3Si4O10(OH)2
Figure 3. X-ray diffraction patterns of OSP.
2.2. Mix Design and Specimen Preparation Table 4 presents the mixed details of the specimens. The required raw materials were
poured into a JJ-5 planetary mixer to produce mortars as per China standard GB/T17671-1999 [28]. The mortars were placed in molds with a dimension of 40 mm × 40 mm × 160 mm and vibrated for 120 s. All specimens were demolded after 24 h and then cured in a standard curing room at 20 ± 2 °C with a relative humidity greater than 95%. Cubic 40-mm specimens were cast for measuring compressive strength. The purified slurry sam-ples were crushed and soaked in anhydrous ethanol for 3 days to terminate hydration.
Figure 2. Particle size distribution of OSP under different mesh sizes.
Sustainability 2022, 14, x FOR PEER REVIEW 4 of 13
Table 2. The specific surface areas of the materials.
Materials OSP LS GGBFS Specific surface /m2·kg−1 2057 13627 1206
Table 3. The specific surface areas of OSP under different mesh sizes.
Mesh size of OSP 1250 3000 6000 Specific surface /m2·kg−1 1624 2057 8479
0.01 0.1 1 10 100 10000
1
2
3
4
5
6
7Bu
lk den
sity/
%
Particle size/μm
SP LS GGBFS
Figure 1. Particle size distributions of materials.
0.01 0.1 1 10 100 10000
1
2
3
4
5
6
7
Bulk
den
sity/
%
Particle size/μm
mesh size 1250 mesh size 3000 mesh size 6000
Figure 2. Particle size distribution of OSP under different mesh sizes.
10 20 30 40 50 60
0
500
1000
1500
2000
2500
◇◇◇
◇
●
●●●
●
●★ ★ ◆
Inte
nsity
/(a.u
.)
2θ/degree
◆Dolomite★Quartz●MgCO3
◇Mg3Si4O10(OH)2
Figure 3. X-ray diffraction patterns of OSP.
2.2. Mix Design and Specimen Preparation Table 4 presents the mixed details of the specimens. The required raw materials were
poured into a JJ-5 planetary mixer to produce mortars as per China standard GB/T17671-1999 [28]. The mortars were placed in molds with a dimension of 40 mm × 40 mm × 160 mm and vibrated for 120 s. All specimens were demolded after 24 h and then cured in a standard curing room at 20 ± 2 °C with a relative humidity greater than 95%. Cubic 40-mm specimens were cast for measuring compressive strength. The purified slurry sam-ples were crushed and soaked in anhydrous ethanol for 3 days to terminate hydration.
Figure 3. X-ray diffraction patterns of OSP.
2.2. Mix Design and Specimen Preparation
Table 4 presents the mixed details of the specimens. The required raw materials werepoured into a JJ-5 planetary mixer to produce mortars as per China standard GB/T17671-1999 [28]. The mortars were placed in molds with a dimension of 40 mm × 40 mm × 160 mmand vibrated for 120 s. All specimens were demolded after 24 h and then cured in a stan-dard curing room at 20 ± 2 ◦C with a relative humidity greater than 95%. Cubic 40-mmspecimens were cast for measuring compressive strength. The purified slurry sampleswere crushed and soaked in anhydrous ethanol for 3 days to terminate hydration. Thepurified slurry samples were then dried in a vacuum drying chamber at 50 ◦C and furthercharacterized. The P-1, P-2, and P-3 groups represented the fineness levels of differenttypes of OSP. The mesh sizes were 1250, 3000, and 6000.
Sustainability 2022, 14, 5981 5 of 13
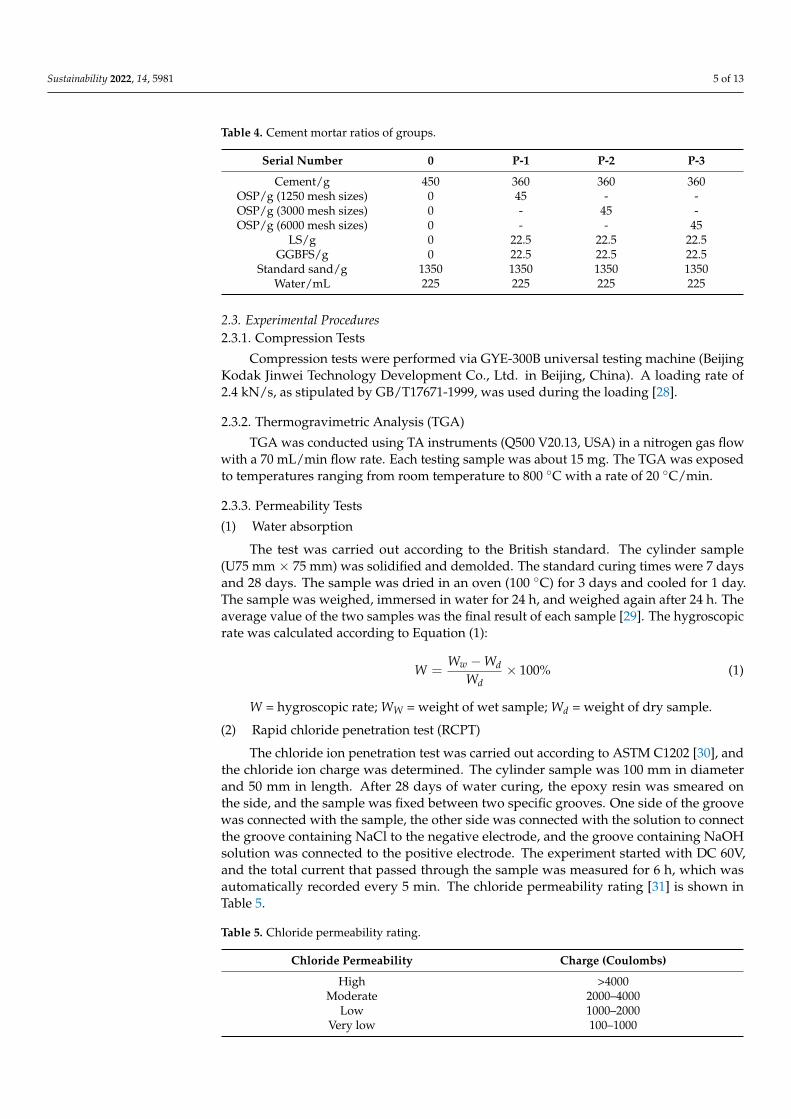
Table 4. Cement mortar ratios of groups.
Serial Number 0 P-1 P-2 P-3
Cement/g 450 360 360 360OSP/g (1250 mesh sizes) 0 45 - -OSP/g (3000 mesh sizes) 0 - 45 -OSP/g (6000 mesh sizes) 0 - - 45
LS/g 0 22.5 22.5 22.5GGBFS/g 0 22.5 22.5 22.5
Standard sand/g 1350 1350 1350 1350Water/mL 225 225 225 225
2.3. Experimental Procedures2.3.1. Compression Tests
Compression tests were performed via GYE-300B universal testing machine (BeijingKodak Jinwei Technology Development Co., Ltd. in Beijing, China). A loading rate of2.4 kN/s, as stipulated by GB/T17671-1999, was used during the loading [28].
2.3.2. Thermogravimetric Analysis (TGA)
TGA was conducted using TA instruments (Q500 V20.13, USA) in a nitrogen gas flowwith a 70 mL/min flow rate. Each testing sample was about 15 mg. The TGA was exposedto temperatures ranging from room temperature to 800 ◦C with a rate of 20 ◦C/min.
2.3.3. Permeability Tests
(1) Water absorption
The test was carried out according to the British standard. The cylinder sample(U75 mm × 75 mm) was solidified and demolded. The standard curing times were 7 daysand 28 days. The sample was dried in an oven (100 ◦C) for 3 days and cooled for 1 day.The sample was weighed, immersed in water for 24 h, and weighed again after 24 h. Theaverage value of the two samples was the final result of each sample [29]. The hygroscopicrate was calculated according to Equation (1):
W =Ww − Wd
Wd× 100% (1)
W = hygroscopic rate; WW = weight of wet sample; Wd = weight of dry sample.
(2) Rapid chloride penetration test (RCPT)
The chloride ion penetration test was carried out according to ASTM C1202 [30], andthe chloride ion charge was determined. The cylinder sample was 100 mm in diameterand 50 mm in length. After 28 days of water curing, the epoxy resin was smeared onthe side, and the sample was fixed between two specific grooves. One side of the groovewas connected with the sample, the other side was connected with the solution to connectthe groove containing NaCl to the negative electrode, and the groove containing NaOHsolution was connected to the positive electrode. The experiment started with DC 60V,and the total current that passed through the sample was measured for 6 h, which wasautomatically recorded every 5 min. The chloride permeability rating [31] is shown inTable 5.
Table 5. Chloride permeability rating.
Chloride Permeability Charge (Coulombs)
High >4000Moderate 2000–4000
Low 1000–2000Very low 100–1000
Sustainability 2022, 14, 5981 6 of 13
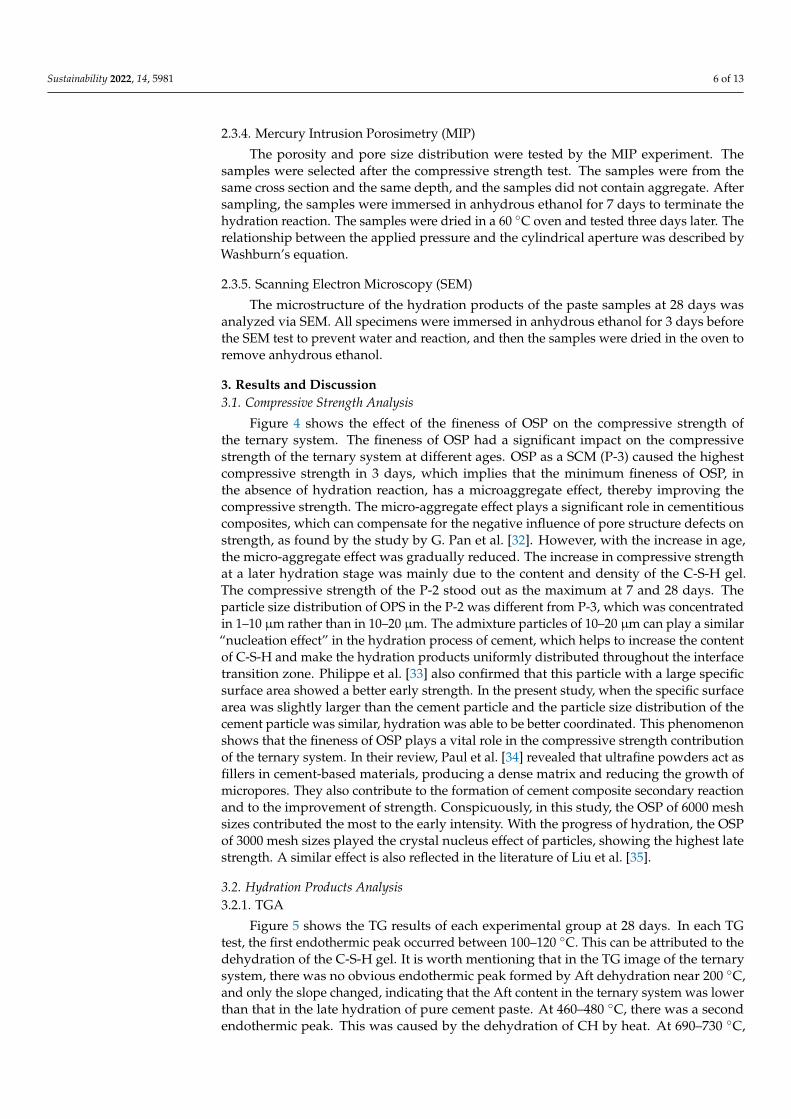
2.3.4. Mercury Intrusion Porosimetry (MIP)
The porosity and pore size distribution were tested by the MIP experiment. Thesamples were selected after the compressive strength test. The samples were from thesame cross section and the same depth, and the samples did not contain aggregate. Aftersampling, the samples were immersed in anhydrous ethanol for 7 days to terminate thehydration reaction. The samples were dried in a 60 ◦C oven and tested three days later. Therelationship between the applied pressure and the cylindrical aperture was described byWashburn’s equation.
2.3.5. Scanning Electron Microscopy (SEM)
The microstructure of the hydration products of the paste samples at 28 days wasanalyzed via SEM. All specimens were immersed in anhydrous ethanol for 3 days beforethe SEM test to prevent water and reaction, and then the samples were dried in the oven toremove anhydrous ethanol.
3. Results and Discussion3.1. Compressive Strength Analysis
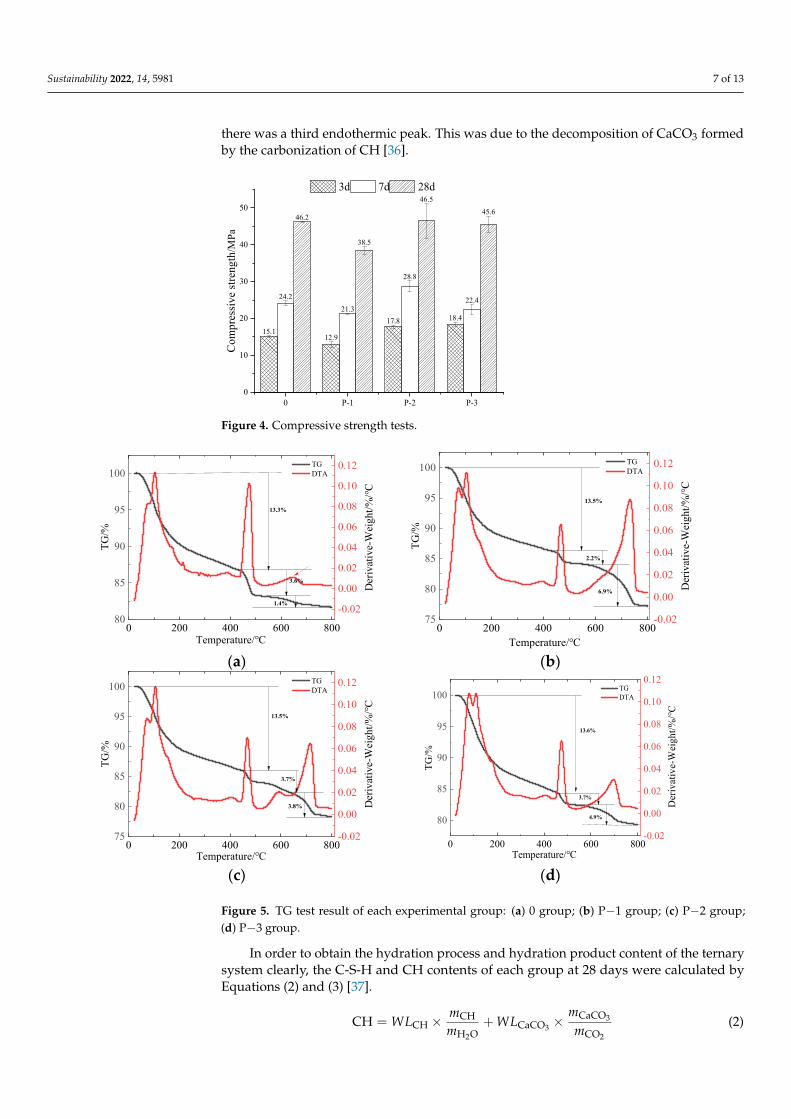
Figure 4 shows the effect of the fineness of OSP on the compressive strength ofthe ternary system. The fineness of OSP had a significant impact on the compressivestrength of the ternary system at different ages. OSP as a SCM (P-3) caused the highestcompressive strength in 3 days, which implies that the minimum fineness of OSP, inthe absence of hydration reaction, has a microaggregate effect, thereby improving thecompressive strength. The micro-aggregate effect plays a significant role in cementitiouscomposites, which can compensate for the negative influence of pore structure defects onstrength, as found by the study by G. Pan et al. [32]. However, with the increase in age,the micro-aggregate effect was gradually reduced. The increase in compressive strengthat a later hydration stage was mainly due to the content and density of the C-S-H gel.The compressive strength of the P-2 stood out as the maximum at 7 and 28 days. Theparticle size distribution of OPS in the P-2 was different from P-3, which was concentratedin 1–10 µm rather than in 10–20 µm. The admixture particles of 10–20 µm can play a similar“nucleation effect” in the hydration process of cement, which helps to increase the contentof C-S-H and make the hydration products uniformly distributed throughout the interfacetransition zone. Philippe et al. [33] also confirmed that this particle with a large specificsurface area showed a better early strength. In the present study, when the specific surfacearea was slightly larger than the cement particle and the particle size distribution of thecement particle was similar, hydration was able to be better coordinated. This phenomenonshows that the fineness of OSP plays a vital role in the compressive strength contributionof the ternary system. In their review, Paul et al. [34] revealed that ultrafine powders act asfillers in cement-based materials, producing a dense matrix and reducing the growth ofmicropores. They also contribute to the formation of cement composite secondary reactionand to the improvement of strength. Conspicuously, in this study, the OSP of 6000 meshsizes contributed the most to the early intensity. With the progress of hydration, the OSPof 3000 mesh sizes played the crystal nucleus effect of particles, showing the highest latestrength. A similar effect is also reflected in the literature of Liu et al. [35].
3.2. Hydration Products Analysis3.2.1. TGA
Figure 5 shows the TG results of each experimental group at 28 days. In each TGtest, the first endothermic peak occurred between 100–120 ◦C. This can be attributed to thedehydration of the C-S-H gel. It is worth mentioning that in the TG image of the ternarysystem, there was no obvious endothermic peak formed by Aft dehydration near 200 ◦C,and only the slope changed, indicating that the Aft content in the ternary system was lowerthan that in the late hydration of pure cement paste. At 460–480 ◦C, there was a secondendothermic peak. This was caused by the dehydration of CH by heat. At 690–730 ◦C,
Sustainability 2022, 14, 5981 7 of 13
there was a third endothermic peak. This was due to the decomposition of CaCO3 formedby the carbonization of CH [36].
Sustainability 2022, 14, x FOR PEER REVIEW 7 of 13
15.112.9
17.8 18.4
24.221.3
28.8
22.4
46.2
38.5
46.545.6
0 P-1 P-2 P-30
10
20
30
40
50
Com
pres
sive
stren
gth/
MPa
3d 7d 28d
Figure 4. Compressive strength tests.
3.2. Hydration Products Analysis 3.2.1. TGA
Figure 5 shows the TG results of each experimental group at 28 days. In each TG test, the first endothermic peak occurred between 100–120 °C. This can be attributed to the dehydration of the C-S-H gel. It is worth mentioning that in the TG image of the ternary system, there was no obvious endothermic peak formed by Aft dehydration near 200 °C, and only the slope changed, indicating that the Aft content in the ternary system was lower than that in the late hydration of pure cement paste. At 460–480 °C, there was a second endothermic peak. This was caused by the dehydration of CH by heat. At 690–730 °C, there was a third endothermic peak. This was due to the decomposition of CaCO3 formed by the carbonization of CH [36].
0 200 400 600 80080
85
90
95
100 TG DTA
Temperature/℃
TG/%
-0.02
0.00
0.02
0.04
0.06
0.08
0.10
0.12
Der
ivat
ive-
Wei
ght/%
/℃
13.3%
3.6%
1.4%
0 200 400 600 800
75
80
85
90
95
100 TG DTA
Temperature/℃
TG/%
-0.02
0.00
0.02
0.04
0.06
0.08
0.10
0.12
Der
ivat
ive-
Wei
ght/%
/℃
13.5%
2.2%
6.9%
(a) (b)
0 200 400 600 80075
80
85
90
95
100 TG DTA
Temperature/℃
TG/%
13.5%
3.7%
3.8%
-0.02
0.00
0.02
0.04
0.06
0.08
0.10
0.12
Der
ivat
ive-
Wei
ght/%
/℃
0 200 400 600 800
80
85
90
95
100 TG DTA
Temperature/℃
TG/%
-0.02
0.00
0.02
0.04
0.06
0.08
0.10
0.12
Der
ivat
ive-
Wei
ght/%
/℃
13.6%
3.7%
4.9%
(c) (d)
Figure 5. TG test result of each experimental group: (a) 0 group; (b) P−1 group; (c) P−2 group; (d) P−3 group.
Figure 4. Compressive strength tests.
Sustainability 2022, 14, x FOR PEER REVIEW 7 of 13
15.112.9
17.8 18.4
24.221.3
28.8
22.4
46.2
38.5
46.545.6
0 P-1 P-2 P-30
10
20
30
40
50
Com
pres
sive
stren
gth/
MPa
3d 7d 28d
Figure 4. Compressive strength tests.
3.2. Hydration Products Analysis 3.2.1. TGA
Figure 5 shows the TG results of each experimental group at 28 days. In each TG test, the first endothermic peak occurred between 100–120 °C. This can be attributed to the dehydration of the C-S-H gel. It is worth mentioning that in the TG image of the ternary system, there was no obvious endothermic peak formed by Aft dehydration near 200 °C, and only the slope changed, indicating that the Aft content in the ternary system was lower than that in the late hydration of pure cement paste. At 460–480 °C, there was a second endothermic peak. This was caused by the dehydration of CH by heat. At 690–730 °C, there was a third endothermic peak. This was due to the decomposition of CaCO3 formed by the carbonization of CH [36].
0 200 400 600 80080
85
90
95
100 TG DTA
Temperature/℃
TG/%
-0.02
0.00
0.02
0.04
0.06
0.08
0.10
0.12
Der
ivat
ive-
Wei
ght/%
/℃
13.3%
3.6%
1.4%
0 200 400 600 800
75
80
85
90
95
100 TG DTA
Temperature/℃
TG/%
-0.02
0.00
0.02
0.04
0.06
0.08
0.10
0.12
Der
ivat
ive-
Wei
ght/%
/℃
13.5%
2.2%
6.9%
(a) (b)
0 200 400 600 80075
80
85
90
95
100 TG DTA
Temperature/℃
TG/%
13.5%
3.7%
3.8%
-0.02
0.00
0.02
0.04
0.06
0.08
0.10
0.12
Der
ivat
ive-
Wei
ght/%
/℃
0 200 400 600 800
80
85
90
95
100 TG DTA
Temperature/℃
TG/%
-0.02
0.00
0.02
0.04
0.06
0.08
0.10
0.12 D
eriv
ativ
e-W
eigh
t/%/℃
13.6%
3.7%
4.9%
(c) (d)
Figure 5. TG test result of each experimental group: (a) 0 group; (b) P−1 group; (c) P−2 group; (d) P−3 group.
Figure 5. TG test result of each experimental group: (a) 0 group; (b) P−1 group; (c) P−2 group;(d) P−3 group.
In order to obtain the hydration process and hydration product content of the ternarysystem clearly, the C-S-H and CH contents of each group at 28 days were calculated byEquations (2) and (3) [37].
CH = WLCH × mCH
mH2O+ WLCaCO3 ×
mCaCO3
mCO2
(2)
Sustainability 2022, 14, 5981 8 of 13
H2O = WLC−S−H + WLCH + WLCaCO3 ×mH2O
mCO2
× 23
(3)
CH denotes the sample’s relative calcium hydroxide content; H2O is the sample’srelative water content; the mass loss of calcium carbonate caused by the removal of waterby TG is denoted by WLCH, %; WLCaCO3 denotes the mass loss of calcium carbonate dueto water removal by TG; WLC-S-H; the molar mass of calcium hydroxide is denoted bymCH; the molar mass of water is denoted by mH2O; mCaCO3 is the molar mass of calciumcarbonate; mCO2 is the molar mass of carbon dioxide.
CH = WLCH × 7418
+ WLCaCO3 ×10044
(4)
H2O = WLC−S−H + WLCH + WLCaCO3 ×622
(5)
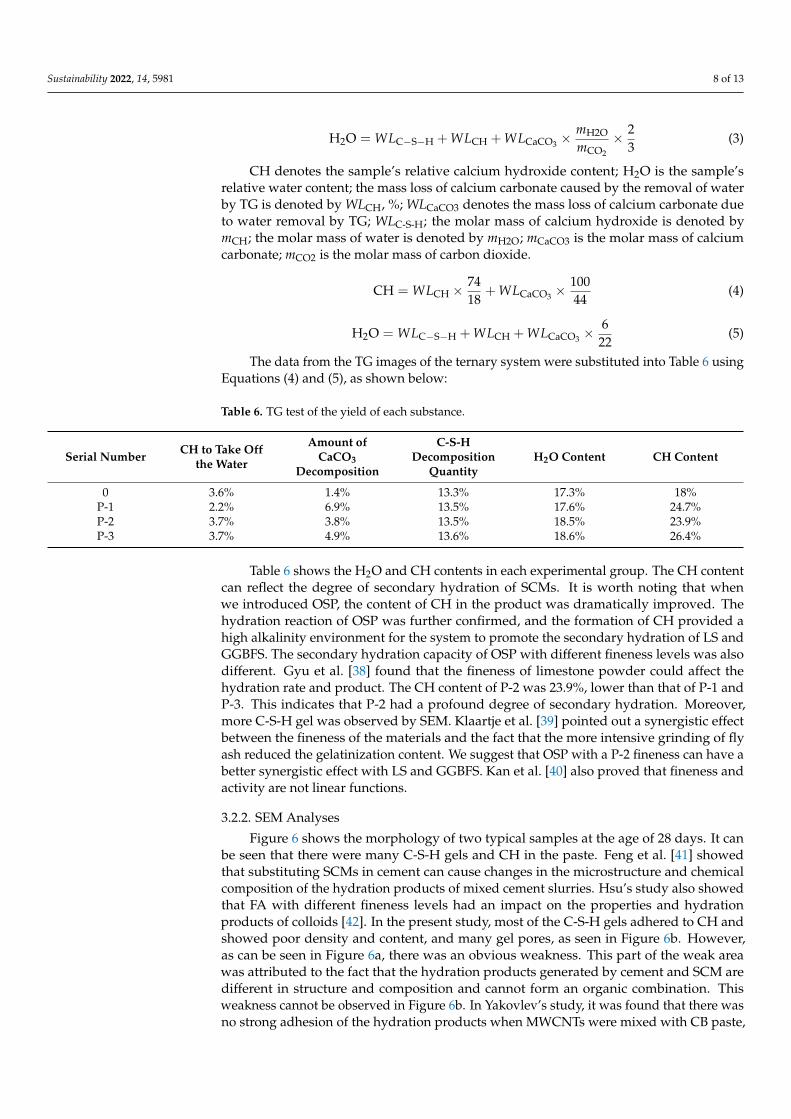
The data from the TG images of the ternary system were substituted into Table 6 usingEquations (4) and (5), as shown below:
Table 6. TG test of the yield of each substance.
Serial Number CH to Take Offthe Water
Amount ofCaCO3
Decomposition
C-S-HDecomposition
QuantityH2O Content CH Content
0 3.6% 1.4% 13.3% 17.3% 18%P-1 2.2% 6.9% 13.5% 17.6% 24.7%P-2 3.7% 3.8% 13.5% 18.5% 23.9%P-3 3.7% 4.9% 13.6% 18.6% 26.4%
Table 6 shows the H2O and CH contents in each experimental group. The CH contentcan reflect the degree of secondary hydration of SCMs. It is worth noting that whenwe introduced OSP, the content of CH in the product was dramatically improved. Thehydration reaction of OSP was further confirmed, and the formation of CH provided ahigh alkalinity environment for the system to promote the secondary hydration of LS andGGBFS. The secondary hydration capacity of OSP with different fineness levels was alsodifferent. Gyu et al. [38] found that the fineness of limestone powder could affect thehydration rate and product. The CH content of P-2 was 23.9%, lower than that of P-1 andP-3. This indicates that P-2 had a profound degree of secondary hydration. Moreover,more C-S-H gel was observed by SEM. Klaartje et al. [39] pointed out a synergistic effectbetween the fineness of the materials and the fact that the more intensive grinding of flyash reduced the gelatinization content. We suggest that OSP with a P-2 fineness can have abetter synergistic effect with LS and GGBFS. Kan et al. [40] also proved that fineness andactivity are not linear functions.
3.2.2. SEM Analyses
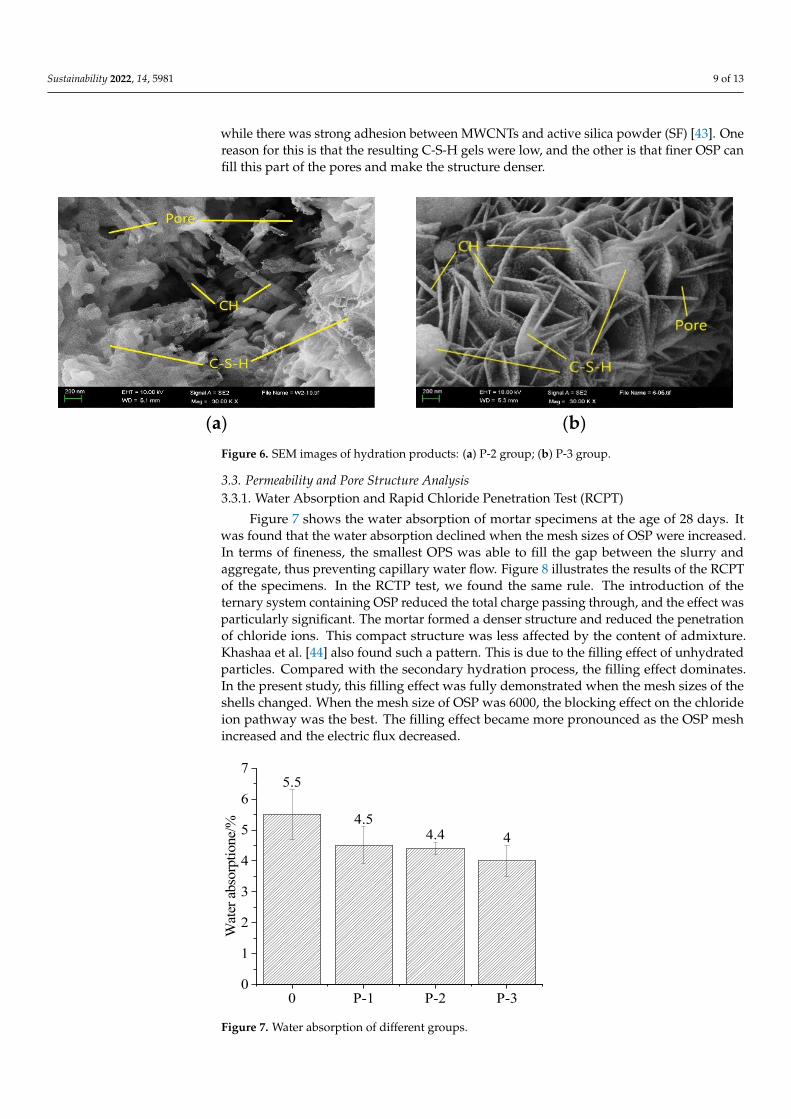
Figure 6 shows the morphology of two typical samples at the age of 28 days. It canbe seen that there were many C-S-H gels and CH in the paste. Feng et al. [41] showedthat substituting SCMs in cement can cause changes in the microstructure and chemicalcomposition of the hydration products of mixed cement slurries. Hsu’s study also showedthat FA with different fineness levels had an impact on the properties and hydrationproducts of colloids [42]. In the present study, most of the C-S-H gels adhered to CH andshowed poor density and content, and many gel pores, as seen in Figure 6b. However,as can be seen in Figure 6a, there was an obvious weakness. This part of the weak areawas attributed to the fact that the hydration products generated by cement and SCM aredifferent in structure and composition and cannot form an organic combination. Thisweakness cannot be observed in Figure 6b. In Yakovlev’s study, it was found that there wasno strong adhesion of the hydration products when MWCNTs were mixed with CB paste,
Sustainability 2022, 14, 5981 9 of 13
while there was strong adhesion between MWCNTs and active silica powder (SF) [43]. Onereason for this is that the resulting C-S-H gels were low, and the other is that finer OSP canfill this part of the pores and make the structure denser.
Sustainability 2022, 14, x FOR PEER REVIEW 9 of 13
seen in Figure 6a, there was an obvious weakness. This part of the weak area was at-tributed to the fact that the hydration products generated by cement and SCM are differ-ent in structure and composition and cannot form an organic combination. This weakness cannot be observed in Figure 6b. In Yakovlev’s study, it was found that there was no strong adhesion of the hydration products when MWCNTs were mixed with CB paste, while there was strong adhesion between MWCNTs and active silica powder (SF) [43]. One reason for this is that the resulting C-S-H gels were low, and the other is that finer OSP can fill this part of the pores and make the structure denser.
(a) (b)
Figure 6. SEM images of hydration products: (a) P-2 group; (b) P-3 group.
3.3. Permeability and Pore Structure Analysis 3.3.1. Water Absorption and Rapid Chloride Penetration Test (RCPT)
Figure 7 shows the water absorption of mortar specimens at the age of 28 days. It was found that the water absorption declined when the mesh sizes of OSP were increased. In terms of fineness, the smallest OPS was able to fill the gap between the slurry and aggre-gate, thus preventing capillary water flow. Figure 8 illustrates the results of the RCPT of the specimens. In the RCTP test, we found the same rule. The introduction of the ternary system containing OSP reduced the total charge passing through, and the effect was par-ticularly significant. The mortar formed a denser structure and reduced the penetration of chloride ions. This compact structure was less affected by the content of admixture. Khashaa et al. [44] also found such a pattern. This is due to the filling effect of unhydrated particles. Compared with the secondary hydration process, the filling effect dominates. In the present study, this filling effect was fully demonstrated when the mesh sizes of the shells changed. When the mesh size of OSP was 6000, the blocking effect on the chloride ion pathway was the best. The filling effect became more pronounced as the OSP mesh increased and the electric flux decreased.
5.5
4.54.4 4
0 P-1 P-2 P-30
1
2
3
4
5
6
7
Wat
er a
bsor
ptio
ne/%
Figure 7. Water absorption of different groups.
Figure 6. SEM images of hydration products: (a) P-2 group; (b) P-3 group.
3.3. Permeability and Pore Structure Analysis3.3.1. Water Absorption and Rapid Chloride Penetration Test (RCPT)
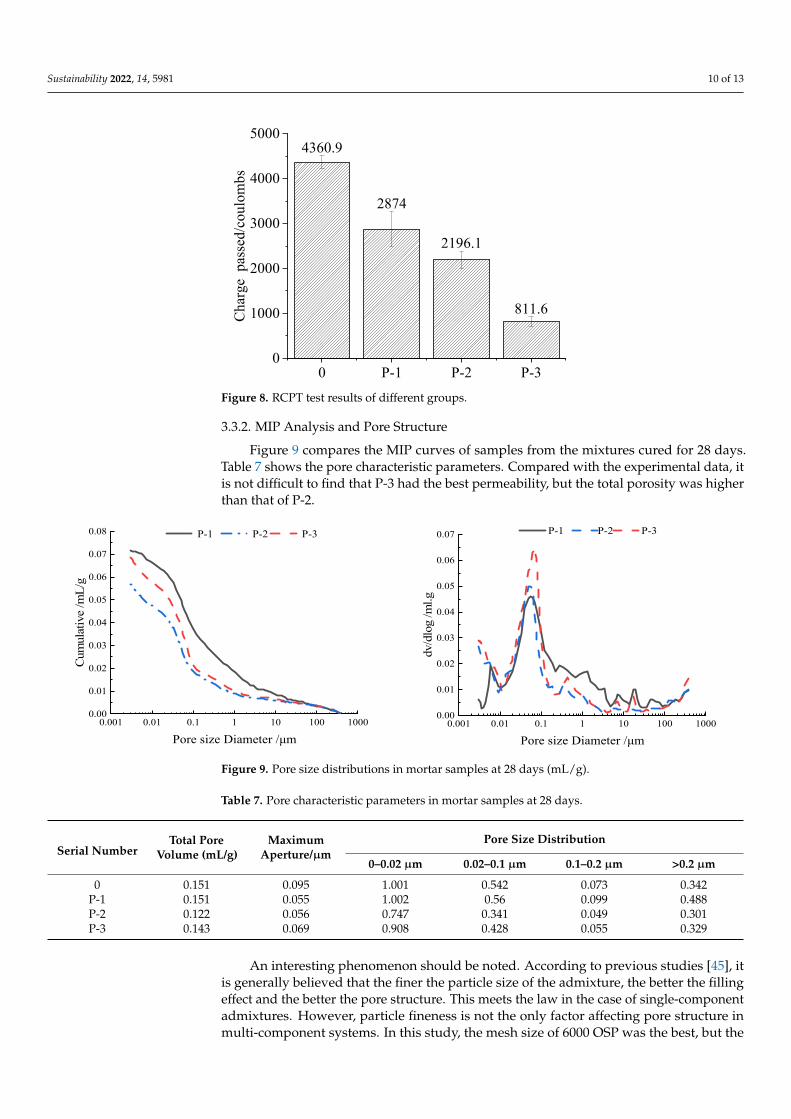
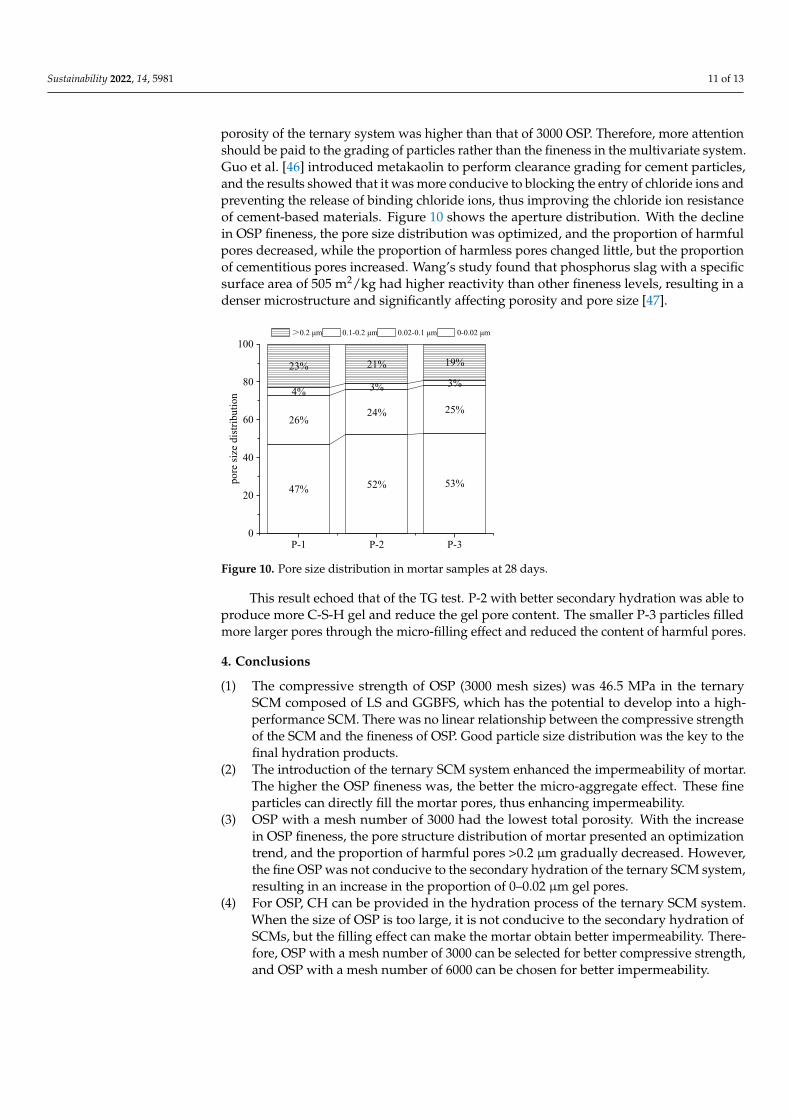
Figure 7 shows the water absorption of mortar specimens at the age of 28 days. Itwas found that the water absorption declined when the mesh sizes of OSP were increased.In terms of fineness, the smallest OPS was able to fill the gap between the slurry andaggregate, thus preventing capillary water flow. Figure 8 illustrates the results of the RCPTof the specimens. In the RCTP test, we found the same rule. The introduction of theternary system containing OSP reduced the total charge passing through, and the effect wasparticularly significant. The mortar formed a denser structure and reduced the penetrationof chloride ions. This compact structure was less affected by the content of admixture.Khashaa et al. [44] also found such a pattern. This is due to the filling effect of unhydratedparticles. Compared with the secondary hydration process, the filling effect dominates.In the present study, this filling effect was fully demonstrated when the mesh sizes of theshells changed. When the mesh size of OSP was 6000, the blocking effect on the chlorideion pathway was the best. The filling effect became more pronounced as the OSP meshincreased and the electric flux decreased.
Sustainability 2022, 14, x FOR PEER REVIEW 9 of 13
seen in Figure 6a, there was an obvious weakness. This part of the weak area was at-tributed to the fact that the hydration products generated by cement and SCM are differ-ent in structure and composition and cannot form an organic combination. This weakness cannot be observed in Figure 6b. In Yakovlev’s study, it was found that there was no strong adhesion of the hydration products when MWCNTs were mixed with CB paste, while there was strong adhesion between MWCNTs and active silica powder (SF) [43]. One reason for this is that the resulting C-S-H gels were low, and the other is that finer OSP can fill this part of the pores and make the structure denser.
(a) (b)
Figure 6. SEM images of hydration products: (a) P-2 group; (b) P-3 group.
3.3. Permeability and Pore Structure Analysis 3.3.1. Water Absorption and Rapid Chloride Penetration Test (RCPT)
Figure 7 shows the water absorption of mortar specimens at the age of 28 days. It was found that the water absorption declined when the mesh sizes of OSP were increased. In terms of fineness, the smallest OPS was able to fill the gap between the slurry and aggre-gate, thus preventing capillary water flow. Figure 8 illustrates the results of the RCPT of the specimens. In the RCTP test, we found the same rule. The introduction of the ternary system containing OSP reduced the total charge passing through, and the effect was par-ticularly significant. The mortar formed a denser structure and reduced the penetration of chloride ions. This compact structure was less affected by the content of admixture. Khashaa et al. [44] also found such a pattern. This is due to the filling effect of unhydrated particles. Compared with the secondary hydration process, the filling effect dominates. In the present study, this filling effect was fully demonstrated when the mesh sizes of the shells changed. When the mesh size of OSP was 6000, the blocking effect on the chloride ion pathway was the best. The filling effect became more pronounced as the OSP mesh increased and the electric flux decreased.
5.5
4.54.4 4
0 P-1 P-2 P-30
1
2
3
4
5
6
7
Wat
er a
bsor
ptio
ne/%
Figure 7. Water absorption of different groups. Figure 7. Water absorption of different groups.
Sustainability 2022, 14, 5981 10 of 13
Sustainability 2022, 14, x FOR PEER REVIEW 10 of 13
4360.9
2874
2196.1
811.6
0 P-1 P-2 P-30
1000
2000
3000
4000
5000
Char
ge p
asse
d/co
ulom
bs
Figure 8. RCPT test results of different groups.
3.3.2. MIP Analysis and Pore Structure Figure 9 compares the MIP curves of samples from the mixtures cured for 28 days.
Table 7 shows the pore characteristic parameters. Compared with the experimental data, it is not difficult to find that P-3 had the best permeability, but the total porosity was higher than that of P-2.
0.001 0.01 0.1 1 10 100 10000.00
0.01
0.02
0.03
0.04
0.05
0.06
0.07
0.08
Cum
ulat
ive
/mL/
g
Pore size Diameter /μm
P-1 P-2 P-3
0.001 0.01 0.1 1 10 100 1000
0.00
0.01
0.02
0.03
0.04
0.05
0.06
0.07
dv/d
log
/ml.g
Pore size Diameter /μm
P-1 P-2 P-3
Figure 9. Pore size distributions in mortar samples at 28 days (mL/g).
Table 7. Pore characteristic parameters in mortar samples at 28 days.
Serial Number Total Pore
Volume(mL/g)
Maximum Aperture/μm
Pore Size Distribution
0–0.02 μm 0.02–0.1 μm 0.1–0.2 μm >0.2 μm
0 0.151 0.095 1.001 0.542 0.073 0.342 P-1 0.151 0.055 1.002 0.56 0.099 0.488 P-2 0.122 0.056 0.747 0.341 0.049 0.301 P-3 0.143 0.069 0.908 0.428 0.055 0.329
An interesting phenomenon should be noted. According to previous studies [45], it is generally believed that the finer the particle size of the admixture, the better the filling effect and the better the pore structure. This meets the law in the case of single-component admixtures. However, particle fineness is not the only factor affecting pore structure in multi-component systems. In this study, the mesh size of 6000 OSP was the best, but the porosity of the ternary system was higher than that of 3000 OSP. Therefore, more attention should be paid to the grading of particles rather than the fineness in the multivariate sys-tem. Guo et al. [46] introduced metakaolin to perform clearance grading for cement parti-cles, and the results showed that it was more conducive to blocking the entry of chloride
Figure 8. RCPT test results of different groups.
3.3.2. MIP Analysis and Pore Structure
Figure 9 compares the MIP curves of samples from the mixtures cured for 28 days.Table 7 shows the pore characteristic parameters. Compared with the experimental data, itis not difficult to find that P-3 had the best permeability, but the total porosity was higherthan that of P-2.
Sustainability 2022, 14, x FOR PEER REVIEW 10 of 13
4360.9
2874
2196.1
811.6
0 P-1 P-2 P-30
1000
2000
3000
4000
5000
Char
ge p
asse
d/co
ulom
bs
Figure 8. RCPT test results of different groups.
3.3.2. MIP Analysis and Pore Structure Figure 9 compares the MIP curves of samples from the mixtures cured for 28 days.
Table 7 shows the pore characteristic parameters. Compared with the experimental data, it is not difficult to find that P-3 had the best permeability, but the total porosity was higher than that of P-2.
0.001 0.01 0.1 1 10 100 10000.00
0.01
0.02
0.03
0.04
0.05
0.06
0.07
0.08
Cum
ulat
ive
/mL/
g
Pore size Diameter /μm
P-1 P-2 P-3
0.001 0.01 0.1 1 10 100 1000
0.00
0.01
0.02
0.03
0.04
0.05
0.06
0.07
dv/d
log
/ml.g
Pore size Diameter /μm
P-1 P-2 P-3
Figure 9. Pore size distributions in mortar samples at 28 days (mL/g).
Table 7. Pore characteristic parameters in mortar samples at 28 days.
Serial Number Total Pore
Volume(mL/g)
Maximum Aperture/μm
Pore Size Distribution
0–0.02 μm 0.02–0.1 μm 0.1–0.2 μm >0.2 μm
0 0.151 0.095 1.001 0.542 0.073 0.342 P-1 0.151 0.055 1.002 0.56 0.099 0.488 P-2 0.122 0.056 0.747 0.341 0.049 0.301 P-3 0.143 0.069 0.908 0.428 0.055 0.329
An interesting phenomenon should be noted. According to previous studies [45], it is generally believed that the finer the particle size of the admixture, the better the filling effect and the better the pore structure. This meets the law in the case of single-component admixtures. However, particle fineness is not the only factor affecting pore structure in multi-component systems. In this study, the mesh size of 6000 OSP was the best, but the porosity of the ternary system was higher than that of 3000 OSP. Therefore, more attention should be paid to the grading of particles rather than the fineness in the multivariate sys-tem. Guo et al. [46] introduced metakaolin to perform clearance grading for cement parti-cles, and the results showed that it was more conducive to blocking the entry of chloride
Figure 9. Pore size distributions in mortar samples at 28 days (mL/g).
Table 7. Pore characteristic parameters in mortar samples at 28 days.
Serial NumberTotal Pore
Volume (mL/g)Maximum
Aperture/µmPore Size Distribution
0–0.02 µm 0.02–0.1 µm 0.1–0.2 µm >0.2 µm
0 0.151 0.095 1.001 0.542 0.073 0.342P-1 0.151 0.055 1.002 0.56 0.099 0.488P-2 0.122 0.056 0.747 0.341 0.049 0.301P-3 0.143 0.069 0.908 0.428 0.055 0.329
An interesting phenomenon should be noted. According to previous studies [45], itis generally believed that the finer the particle size of the admixture, the better the fillingeffect and the better the pore structure. This meets the law in the case of single-componentadmixtures. However, particle fineness is not the only factor affecting pore structure inmulti-component systems. In this study, the mesh size of 6000 OSP was the best, but the
Sustainability 2022, 14, 5981 11 of 13
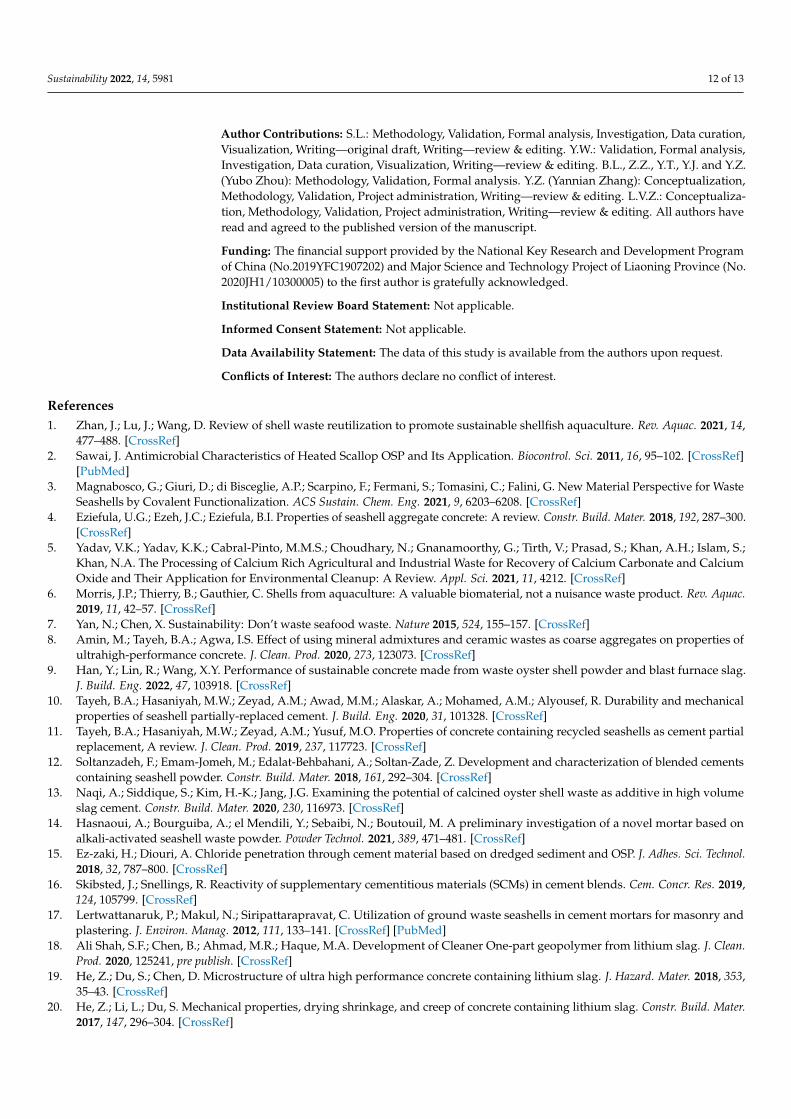
porosity of the ternary system was higher than that of 3000 OSP. Therefore, more attentionshould be paid to the grading of particles rather than the fineness in the multivariate system.Guo et al. [46] introduced metakaolin to perform clearance grading for cement particles,and the results showed that it was more conducive to blocking the entry of chloride ions andpreventing the release of binding chloride ions, thus improving the chloride ion resistanceof cement-based materials. Figure 10 shows the aperture distribution. With the declinein OSP fineness, the pore size distribution was optimized, and the proportion of harmfulpores decreased, while the proportion of harmless pores changed little, but the proportionof cementitious pores increased. Wang’s study found that phosphorus slag with a specificsurface area of 505 m2/kg had higher reactivity than other fineness levels, resulting in adenser microstructure and significantly affecting porosity and pore size [47].
Sustainability 2022, 14, x FOR PEER REVIEW 11 of 13
ions and preventing the release of binding chloride ions, thus improving the chloride ion resistance of cement-based materials. Figure 10 shows the aperture distribution. With the decline in OSP fineness, the pore size distribution was optimized, and the proportion of harmful pores decreased, while the proportion of harmless pores changed little, but the proportion of cementitious pores increased. Wang’s study found that phosphorus slag with a specific surface area of 505 m2/kg had higher reactivity than other fineness levels, resulting in a denser microstructure and significantly affecting porosity and pore size [47].
This result echoed that of the TG test. P-2 with better secondary hydration was able to produce more C-S-H gel and reduce the gel pore content. The smaller P-3 particles filled more larger pores through the micro-filling effect and reduced the content of harmful pores.
47% 52% 53%
26%24% 25%
4% 3% 3%23% 21% 19%
P-1 P-2 P-30
20
40
60
80
100
pore
size
dist
ribut
ion
>0.2 μm 0.1-0.2 μm 0.02-0.1 μm 0-0.02 μm
Figure 10. Pore size distribution in mortar samples at 28 days.
4. Conclusions (1) The compressive strength of OSP (3000 mesh sizes) was 46.5 MPa in the ternary SCM
composed of LS and GGBFS, which has the potential to develop into a high-performance SCM. There was no linear relationship between the compressive strength of the SCM and the fineness of OSP. Good particle size distribution was the key to the final hydration products.
(2) The introduction of the ternary SCM system enhanced the impermeability of mortar. The higher the OSP fineness was, the better the micro-aggregate effect. These fine particles can directly fill the mortar pores, thus enhancing impermeability.
(3) OSP with a mesh number of 3000 had the lowest total porosity. With the increase in OSP fineness, the pore structure distribution of mortar presented an optimization trend, and the proportion of harmful pores >0.2 μm gradually decreased. However, the fine OSP was not conducive to the secondary hydration of the ternary SCM system, resulting in an increase in the proportion of 0–0.02 μm gel pores.
(4) For OSP, CH can be provided in the hydration process of the ternary SCM system. When the size of OSP is too large, it is not conducive to the secondary hydration of SCMs, but the filling effect can make the mortar obtain better impermeability. Therefore, OSP with a mesh number of 3000 can be selected for better compressive strength, and OSP with a mesh number of 6000 can be chosen for better impermeability.
Author Contributions: S.L.: Methodology, Validation, Formal analysis, Investigation, Data cura-tion, Visualization, Writing—original draft, Writing—review & editing. Y.W.: Validation, Formal analysis, Investigation, Data curation, Visualization, Writing—review & editing. B.L., Z.Z., Y.T., Y.J. and Y.Z. (Yubo Zhou): Methodology, Validation, Formal analysis. Y.Z. (Yannian Zhang): Concep-tualization, Methodology, Validation, Project administration, Writing—review & editing. L.V.Z.:
Figure 10. Pore size distribution in mortar samples at 28 days.
This result echoed that of the TG test. P-2 with better secondary hydration was able toproduce more C-S-H gel and reduce the gel pore content. The smaller P-3 particles filledmore larger pores through the micro-filling effect and reduced the content of harmful pores.
4. Conclusions
(1) The compressive strength of OSP (3000 mesh sizes) was 46.5 MPa in the ternarySCM composed of LS and GGBFS, which has the potential to develop into a high-performance SCM. There was no linear relationship between the compressive strengthof the SCM and the fineness of OSP. Good particle size distribution was the key to thefinal hydration products.
(2) The introduction of the ternary SCM system enhanced the impermeability of mortar.The higher the OSP fineness was, the better the micro-aggregate effect. These fineparticles can directly fill the mortar pores, thus enhancing impermeability.
(3) OSP with a mesh number of 3000 had the lowest total porosity. With the increasein OSP fineness, the pore structure distribution of mortar presented an optimizationtrend, and the proportion of harmful pores >0.2 µm gradually decreased. However,the fine OSP was not conducive to the secondary hydration of the ternary SCM system,resulting in an increase in the proportion of 0–0.02 µm gel pores.
(4) For OSP, CH can be provided in the hydration process of the ternary SCM system.When the size of OSP is too large, it is not conducive to the secondary hydration ofSCMs, but the filling effect can make the mortar obtain better impermeability. There-fore, OSP with a mesh number of 3000 can be selected for better compressive strength,and OSP with a mesh number of 6000 can be chosen for better impermeability.
Sustainability 2022, 14, 5981 12 of 13
Author Contributions: S.L.: Methodology, Validation, Formal analysis, Investigation, Data curation,Visualization, Writing—original draft, Writing—review & editing. Y.W.: Validation, Formal analysis,Investigation, Data curation, Visualization, Writing—review & editing. B.L., Z.Z., Y.T., Y.J. and Y.Z.(Yubo Zhou): Methodology, Validation, Formal analysis. Y.Z. (Yannian Zhang): Conceptualization,Methodology, Validation, Project administration, Writing—review & editing. L.V.Z.: Conceptualiza-tion, Methodology, Validation, Project administration, Writing—review & editing. All authors haveread and agreed to the published version of the manuscript.
Funding: The financial support provided by the National Key Research and Development Programof China (No.2019YFC1907202) and Major Science and Technology Project of Liaoning Province (No.2020JH1/10300005) to the first author is gratefully acknowledged.
Institutional Review Board Statement: Not applicable.
Informed Consent Statement: Not applicable.
Data Availability Statement: The data of this study is available from the authors upon request.
Conflicts of Interest: The authors declare no conflict of interest.
References1. Zhan, J.; Lu, J.; Wang, D. Review of shell waste reutilization to promote sustainable shellfish aquaculture. Rev. Aquac. 2021, 14,
477–488. [CrossRef]2. Sawai, J. Antimicrobial Characteristics of Heated Scallop OSP and Its Application. Biocontrol. Sci. 2011, 16, 95–102. [CrossRef]
[PubMed]3. Magnabosco, G.; Giuri, D.; di Bisceglie, A.P.; Scarpino, F.; Fermani, S.; Tomasini, C.; Falini, G. New Material Perspective for Waste
Seashells by Covalent Functionalization. ACS Sustain. Chem. Eng. 2021, 9, 6203–6208. [CrossRef]4. Eziefula, U.G.; Ezeh, J.C.; Eziefula, B.I. Properties of seashell aggregate concrete: A review. Constr. Build. Mater. 2018, 192, 287–300.
[CrossRef]5. Yadav, V.K.; Yadav, K.K.; Cabral-Pinto, M.M.S.; Choudhary, N.; Gnanamoorthy, G.; Tirth, V.; Prasad, S.; Khan, A.H.; Islam, S.;
Khan, N.A. The Processing of Calcium Rich Agricultural and Industrial Waste for Recovery of Calcium Carbonate and CalciumOxide and Their Application for Environmental Cleanup: A Review. Appl. Sci. 2021, 11, 4212. [CrossRef]
6. Morris, J.P.; Thierry, B.; Gauthier, C. Shells from aquaculture: A valuable biomaterial, not a nuisance waste product. Rev. Aquac.2019, 11, 42–57. [CrossRef]
7. Yan, N.; Chen, X. Sustainability: Don’t waste seafood waste. Nature 2015, 524, 155–157. [CrossRef]8. Amin, M.; Tayeh, B.A.; Agwa, I.S. Effect of using mineral admixtures and ceramic wastes as coarse aggregates on properties of
ultrahigh-performance concrete. J. Clean. Prod. 2020, 273, 123073. [CrossRef]9. Han, Y.; Lin, R.; Wang, X.Y. Performance of sustainable concrete made from waste oyster shell powder and blast furnace slag.
J. Build. Eng. 2022, 47, 103918. [CrossRef]10. Tayeh, B.A.; Hasaniyah, M.W.; Zeyad, A.M.; Awad, M.M.; Alaskar, A.; Mohamed, A.M.; Alyousef, R. Durability and mechanical
properties of seashell partially-replaced cement. J. Build. Eng. 2020, 31, 101328. [CrossRef]11. Tayeh, B.A.; Hasaniyah, M.W.; Zeyad, A.M.; Yusuf, M.O. Properties of concrete containing recycled seashells as cement partial
replacement, A review. J. Clean. Prod. 2019, 237, 117723. [CrossRef]12. Soltanzadeh, F.; Emam-Jomeh, M.; Edalat-Behbahani, A.; Soltan-Zade, Z. Development and characterization of blended cements
containing seashell powder. Constr. Build. Mater. 2018, 161, 292–304. [CrossRef]13. Naqi, A.; Siddique, S.; Kim, H.-K.; Jang, J.G. Examining the potential of calcined oyster shell waste as additive in high volume
slag cement. Constr. Build. Mater. 2020, 230, 116973. [CrossRef]14. Hasnaoui, A.; Bourguiba, A.; el Mendili, Y.; Sebaibi, N.; Boutouil, M. A preliminary investigation of a novel mortar based on
alkali-activated seashell waste powder. Powder Technol. 2021, 389, 471–481. [CrossRef]15. Ez-zaki, H.; Diouri, A. Chloride penetration through cement material based on dredged sediment and OSP. J. Adhes. Sci. Technol.
2018, 32, 787–800. [CrossRef]16. Skibsted, J.; Snellings, R. Reactivity of supplementary cementitious materials (SCMs) in cement blends. Cem. Concr. Res. 2019,
124, 105799. [CrossRef]17. Lertwattanaruk, P.; Makul, N.; Siripattarapravat, C. Utilization of ground waste seashells in cement mortars for masonry and
plastering. J. Environ. Manag. 2012, 111, 133–141. [CrossRef] [PubMed]18. Ali Shah, S.F.; Chen, B.; Ahmad, M.R.; Haque, M.A. Development of Cleaner One-part geopolymer from lithium slag. J. Clean.
Prod. 2020, 125241, pre publish. [CrossRef]19. He, Z.; Du, S.; Chen, D. Microstructure of ultra high performance concrete containing lithium slag. J. Hazard. Mater. 2018, 353,
35–43. [CrossRef]20. He, Z.; Li, L.; Du, S. Mechanical properties, drying shrinkage, and creep of concrete containing lithium slag. Constr. Build. Mater.
2017, 147, 296–304. [CrossRef]
Sustainability 2022, 14, 5981 13 of 13
21. Özbay, E.; Erdemir, M.; Durmus, H.I. Utilization and efficiency of ground granulated blast furnace slag on concrete properties—Areview. Constr. Build. Mater. 2016, 105, 423–434. [CrossRef]
22. Zhang, W.; He, F.; Xiao, Y.; Xie, M.; Li, F.; Xie, J.; Yang, H.; Li, Z. Structure, viscosity, and crystallization of glass melt from moltenblast furnace slag. Int. J. Appl. Glass Sci. 2020, 11, 576–684. [CrossRef]
23. Aliabdo, A.A.; Abd Elmoaty, A.E.M.; Emam, M.A. Factors affecting the mechanical properties of alkali activated groundgranulated blast furnace slag concrete. Constr. Build. Mater. 2019, 197, 339–355. [CrossRef]
24. Cao, R.; Li, B.; You, N.; Zhang, Y.; Zhang, Z. Properties of alkali-activated ground granulated blast furnace slag blended withferronickel slag. Constr. Build. Mater. 2018, 192, 123–132. [CrossRef]
25. Yoon, H. Oyster Shell as Substitute for Aggregate in Mortar. Waste Manag. Res. 2004, 22, 158–170. [CrossRef]26. Li, G.; Xu, X.; Chen, E.; Fana, J.; Xiong, G. Properties of cement-based bricks with oyster-shells ash. J. Clean. Prod. 2015, 91,
279–287. [CrossRef]27. Chilakala, R.; Thannaree, C.; Shin, E.J.; Thenepalli, T.; Ahn, J.W. Sustainable Solutions for Oyster Shell Waste Recycling in Thailand
and the Philippines. Recycling 2019, 4, 35. [CrossRef]28. GB/T 17671-1999; Method of testing cements—Determination of Strength. State Bureau of Quality and Technical Supervision:
Beijing, China, 1999.29. Tayeh, B.A.; Bakar, B.H.A.; Johari, M.A.M.; Voo, Y.L. Mechanical and permeability properties of the interface between normal
concrete substrate and ultra high performance fiber concrete overlay. Constr. Build. Mater. 2012, 36, 538–548. [CrossRef]30. ASTM Standard C1202; Standard Test Method for Electrical Indication of Concrete’s Ability to Resist Chloride Ion Penetration.
ASTM International: West Conshohocken, PA, USA, 2009; p. 6.31. American Association of States Highway and Transportation Officials. Rapid Determination of the Chloride Permeability of Concrete,
Standard Specifications—Part II Tests; American Association of States Highway and Transportation Officials: Washington, DC, USA,1990.
32. Pan, G.; Sun, W.; Ding, D.; Zhang, Y. Experimental Study on the Micro-Aggregate Effect in High-Strength and Super-High-StrengthCementitious Composites 1 1 Communicated by D. M. Roy. Cem. Concr. Res. 1998, 28, 171–176. [CrossRef]
33. Lawrence, P.; Cyr, M.; Ringot, E. Mineral admixtures in mortars effect of type, amount and fineness of fine constituents oncompressive strength. Cem. Concr. Res. 2004, 35, 1092–1105. [CrossRef]
34. Paul, S.C.; van Rooyen, A.S.; van Zijl, G.P.A.G.; Petrik, L.F. Properties of cement-based composites using nanoparticles, Acomprehensive review. Constr. Build. Mater. 2018, 189, 1019–1034. [CrossRef]
35. Liu, S.; Zhang, T.; Guo, Y.; Wei, J.; Yu, Q. Effects of SCMs particles on the compressive strength of micro-structurally designedcement paste, Inherent characteristic effect, particle size refinement effect, and hydration effect. Powder Technol. 2018, 330, 1–11.[CrossRef]
36. Ai, P.C. The Activation Process and Mechanism of Iron Tailings Powder and Its Influence on Concrete Performance; China University ofMining and Technology: Beijing, China, 2017.
37. Cheng, Y.; Huang, F.; Li, W.; Liu, R.; Li, G.; Wei, J. Test research on the effects of mechanochemically activated iron tailings on thecompressive strength of concrete. Constr. Build. Mater. 2016, 118, 164–170. [CrossRef]
38. Moon, G.D.; Oh, S.; Jung, S.H.; Choi, Y.C. Effects of the fineness of limestone powder and cement on the hydration and strengthdevelopment of PLC concrete. Constr. Build. Mater. 2017, 135, 129–136. [CrossRef]
39. De Weerdt, K.; Sellevold, E.; Kjellsen, K.O.; Justnes, H. Fly ash–limestone ternary cements: Effect of component fineness. Adv.Cem. Res. 2011, 23, 203–214. [CrossRef]
40. Kan, L.; Shi, R.; Zhu, J. Effect of fineness and calcium content of fly ash on the mechanical properties of Engineered CementitiousComposites (ECC). Constr. Build. Mater. 2019, 209, 476–484. [CrossRef]
41. Yan, F.; Qinli, Z.; Qiusong, C.; Daolin, W.; Hongquan, G.; Lang, L.; Qixing, Y. Hydration and strength development in blendedcement with ultrafine granulated copper slag. PLoS ONE 2019, 14, e0216166.
42. Hsu, S.; Chi, M.; Huang, R. Effect of fineness and replacement ratio of ground fly ash on properties of blended cement mortar.Constr. Build. Mater. 2018, 176, 250–258. [CrossRef]
43. Grigory, Y.; Rostislav, D.; Gintautas, S.; Larisa, U.; Irina, P.; Igor, P.; Ekaterina, K.; Zarina, S.; Elrefai, A.E.M.M. Effect of UltrafineAdditives on the Morphology of Cement Hydration Products. Crystals 2021, 11, 1002.
44. Mohammed, M.; Dawson, A.; Thom, N.H. Macro/micro-pore structure characteristics and the chloride penetration of self-compacting concrete incorporating different types of filler and mineral admixture. Constr. Build. Mater. 2014, 72, 83–93.[CrossRef]
45. Hallet, V.; de Belie, N.; Pontikes, Y. The impact of slag fineness on the reactivity of blended cements with high-volume non-ferrousmetallurgy slag. Constr. Build. Mater. 2020, 257, 119400. [CrossRef]
46. Yiqun, G.; Tongsheng, Z.; Junpeng, D.; Wenli, T.; Aiguo, W.; Jiangxiong, W.; Qijun, Y. The chloride binding capacity and stabilityof gap-graded blended cement with calcined hydrotalcite and metakaolin. J. Build. Eng. 2022, 49, 104093.
47. Wang, L.; Luo, R.; Zhang, W.; Jin, M.; Tang, S. Effects of fineness and content of phosphorus slag on cement hydration, permeability,pore structure and fractal dimension of concrete. Fractals 2021, 29, 2140004. [CrossRef]