sustainability of the agri-food system's characterization with
TRANSCRIPT
Sustainability of the agri-food system's characterization with
food sovereignty framework and the evaluation approach of the
major threats
Adriana Ruiz Almeida
ADVERTIMENT La consulta d’aquesta tesi queda condicionada a l’acceptació de les següents condicions d'ús: La difusió d’aquesta tesi per mitjà del repositori institucional UPCommons (http://upcommons.upc.edu/tesis) i el repositori cooperatiu TDX ( h t t p : / / w w w . t d x . c a t / ) ha estat autoritzada pels titulars dels drets de propietat intel·lectual únicament per a usos privats emmarcats en activitats d’investigació i docència. No s’autoritza la seva reproducció amb finalitats de lucre ni la seva difusió i posada a disposició des d’un lloc aliè al servei UPCommons o TDX. No s’autoritza la presentació del seu contingut en una finestra o marc aliè a UPCommons (framing). Aquesta reserva de drets afecta tant al resum de presentació de la tesi com als seus continguts. En la utilització o cita de parts de la tesi és obligat indicar el nom de la persona autora. ADVERTENCIA La consulta de esta tesis queda condicionada a la aceptación de las siguientes condiciones de uso: La difusión de esta tesis por medio del repositorio institucional UPCommons (http://upcommons.upc.edu/tesis) y el repositorio cooperativo TDR (http://www.tdx.cat/?locale- attribute=es) ha sido autorizada por los titulares de los derechos de propiedad intelectual únicamente para usos privados enmarcados en actividades de investigación y docencia. No se autoriza su reproducción con finalidades de lucro ni su difusión y puesta a disposición desde un sitio ajeno al servicio UPCommons No se autoriza la presentación de su contenido en una ventana o marco ajeno a UPCommons (framing). Esta reserva de derechos afecta tanto al resumen de presentación de la tesis como a sus contenidos. En la utilización o cita de partes de la tesis es obligado indicar el nombre de la persona autora. WARNING On having consulted this thesis you’re accepting the following use conditions: Spreading this thesis by the institutional repository UPCommons (http://upcommons.upc.edu/tesis) and the cooperative repository TDX (http://www.tdx.cat/?locale- attribute=en) has been authorized by the titular of the intellectual property rights only for private uses placed in investigation and teaching activities. Reproduction with lucrative aims is not authorized neither its spreading nor availability from a site foreign to the UPCommons service. Introducing its content in a window or frame foreign to the UPCommons service is not authorized (framing). These rights affect to the presentation summary of the thesis as well as to its contents. In the using or citation of parts of the thesis it’s obliged to indicate the name of the author.
Sustainability of the Agri-food System's Characterization
with Food Sovereignty Framework and the Evaluation
Approach of the Major Threats.
Caracterización de la Sostenibilidad del Sistema Agroalimentario en el Marco de la Soberanía Alimentaria y Aproximación a la Evaluación de sus Principales Amenazas.
Caracterització de la Sostenibilitat del Sistema Agroalimentari en el Marc de la Sobirania Alimentària i Aproximació a l'Avaluació de les seves principals Amenaces.
Presented by:
Adriana Ruiz Almeida
A dissertation submitted in satisfaction of the requirements for the degree of
Doctor of Philosophy in Sustainability
in the
University Research Institute for Sustainability Science and Technology
of the
Universitat Politècnica de Catalunya
Advisors:
Marti Rosas Casals, PhD
Universitat Politècnica de Catalunya
Heat Engines Department
Sustainability Measurement and Modeling Lab (SUMMLab)
Marta G. Rivera Ferre, PhD
Universitat de Vic
Department of Agriculture and Environment
Inclusive Societies, Policies, and Communities (SoPCi)
Barcelona, Spain
November 2020

2
A mis chicos.
3
Table of Contents
GENERAL INTRODUCTION .......................................................................................................................... 5
Objectives ................................................................................................................................................ 15
References ............................................................................................................................................... 17
CHAPTER 1. INTERNATIONALLY‐BASED INDICATORS TO MEASURE AGRI‐FOOD SYSTEMS SUSTAINABILITY
USING FOOD SOVEREIGNTY AS A CONCEPTUAL FRAMEWORK ................................................................. 20
ABSTRACT ........................................................................................................................................................ 20
1 INTRODUCTION ........................................................................................................................................ 20
2 THE FOOD SOVEREIGNTY PROPOSAL ............................................................................................................. 24
Food sovereignty measurement .............................................................................................................. 25
3 METHODOLOGY ....................................................................................................................................... 26
Food sovereignty set of international indicators ..................................................................................... 26
4 RESULTS ................................................................................................................................................. 29
Definition of categories ............................................................................................................................ 29
Attributes within food sovereignty categories and selection of indicators .............................................. 30
5 DISCUSSION ............................................................................................................................................ 38
6 POTENTIAL APPLICATIONS OF THE DATABASE .................................................................................................. 42
7 CONCLUDING REMARKS ............................................................................................................................. 44
CHAPTER 2. FROM PRACTICE TO THEORY: FOOD SOVEREIGNTY AS A CONCEPT TO ASSESS THE
SUSTAINABILITY OF THE AGRI‐FOOD SYSTEM .......................................................................................... 55
ABSTRACT ........................................................................................................................................................ 55
1. INTRODUCTION ........................................................................................................................................ 55
8 BUILDING SUSTAINABLE AGRI‐FOOD SYSTEMS ................................................................................................. 57
Agri‐food systems' perspectives ............................................................................................................... 57
Methods ................................................................................................................................................... 60
9 ELEMENTS TO PURSUE SUSTAINABLE AGRI‐FOOD SYSTEMS ................................................................................ 61
10 SYSTEMS' OUTCOMES ........................................................................................................................... 63
Environmental Resilience ......................................................................................................................... 64
11 SOCIAL‐POLITICAL WELL‐BEING .............................................................................................................. 67
12 FROM PROCESSING DATA TO BUILDING THE FRAMEWORK ............................................................................. 68
13 SYNTHETIZING CONCEPTS INTO A THEORETICAL FRAMEWORK ........................................................................ 69
Methodology ........................................................................................................................................... 69
First Results .............................................................................................................................................. 70
4
14 NEXT STEPS ......................................................................................................................................... 73
CHAPTER 3. A SOCIAL‐ECOLOGICAL ANALYSIS OF THE GLOBAL AGRI‐FOOD SYSTEM: INSIGHTS FOR
ADVANCING SDG2 ................................................................................................................................... 77
ABSTRACT ........................................................................................................................................................ 77
1 INTRODUCTION ........................................................................................................................................ 78
2 RESULTS ................................................................................................................................................. 81
The state of food sovereignty: who is who in the global agri‐food system ............................................. 81
1. Landgrabbed and undernourished exporters ....................................................................................... 82
2. Intensive producers of permanent crops ............................................................................................. 85
3 Least ecologically wealthy and landgrabbers ....................................................................................... 86
4 Intensive food producers and exporters ............................................................................................... 86
5 Overnourished agricultural importers ................................................................................................... 87
3 DISCUSSION ............................................................................................................................................ 87
Winners and losers: agri‐food debt ......................................................................................................... 88
Nutritional and environmental contrasts in diets and food security between regions ............................ 89
International agri‐food trade, food security, and environmental sustainability ..................................... 89
The mismatch between regional biocapacity and food security .............................................................. 90
Limitations ............................................................................................................................................... 91
4 CONCLUSIONS ......................................................................................................................................... 91
5 MATERIALS AND METHODS ......................................................................................................................... 92
Data collection ......................................................................................................................................... 92
Indicator adjustments .............................................................................................................................. 92
World food sovereignty database ............................................................................................................ 95
The Debug Process ................................................................................................................................... 95
Selection of environmental sustainability and social wellbeing indicators .............................................. 96
Selection of other relevant indicators ...................................................................................................... 98
Data analyses ........................................................................................................................................ 101
Results .................................................................................................................................................... 101
CONCLUDING REMARKS ........................................................................................................................ 116
5
General Introduction
In 2015 the United Nations (UN) approved the Sustainable Development Goals (SDGs) consisting of
17 goals, composed of 169 targets that should be covered by the year 2030 – (see Box 1 below). Each
SDG focuses on a specific issue, but as a whole, they include a systemic view bases on the six
dimensions presented in an article published by Kates et al. (2005) people, economy, society to be
developed, natures, life support, and community.
The SDGs followed the Millennium Development Goals (MDGs), which consisted of eight objectives
aimed at addressing the world's poorest needs, and that the United Nations Organization (UN) set in
2000 to be reached by 2015. The first MDG required to eradicate extreme poverty1 and hunger; such
goal was broken down into three different targets:
I. To halve between 1990 and 2015, the proportion of people whose income is less
than one US dollar a day.
II. To achieve full and productive employment and decent work for all, including women
and young people.
III. To halve between 1990 and 2015 the proportion of people who suffer from hunger.
The first target was reached five years ahead of 2015, according to the MDGs webpage. On the
contrary, the second and the third were not achieve. By 2015 300 million workers were living below
de 1.25 USD poverty line, and the proportion of young women and men employed decrease from 5%
in 1991 to 4% in 2015. Regarding the third target, the portion of undernourished people decreased
from 23.3% between 1990-1992 to 12.6 % between 2014-2016 (UN, 2015).
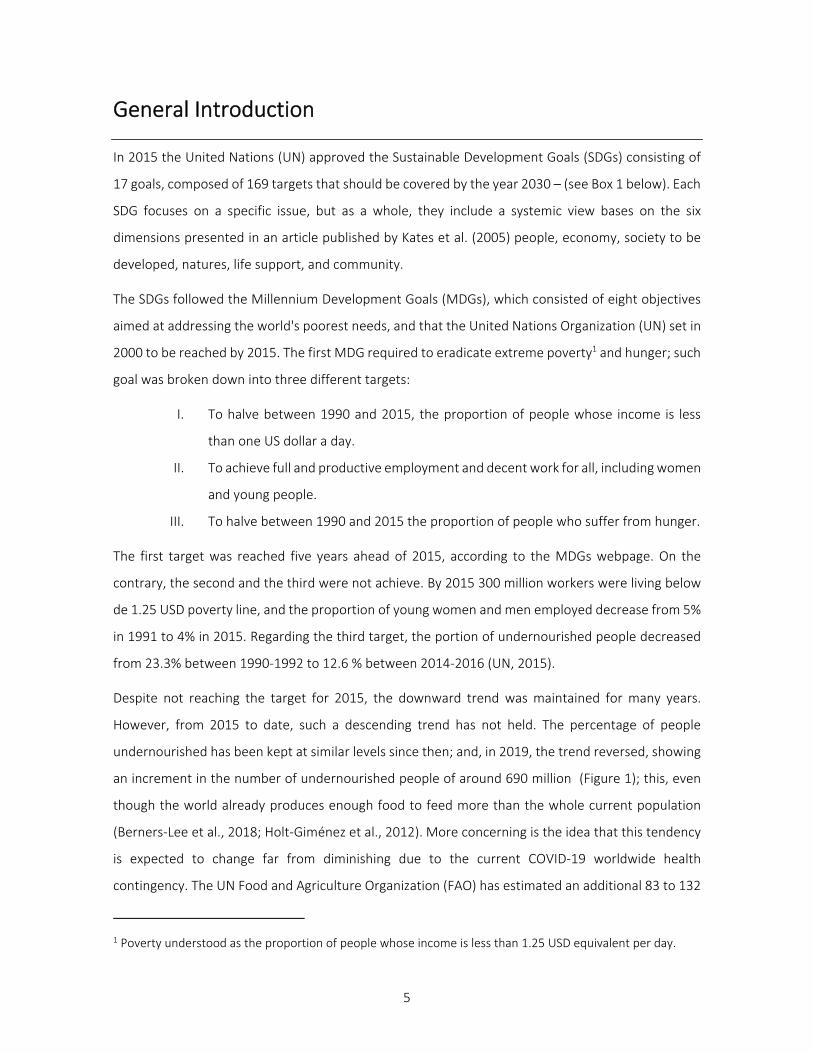
Despite not reaching the target for 2015, the downward trend was maintained for many years.
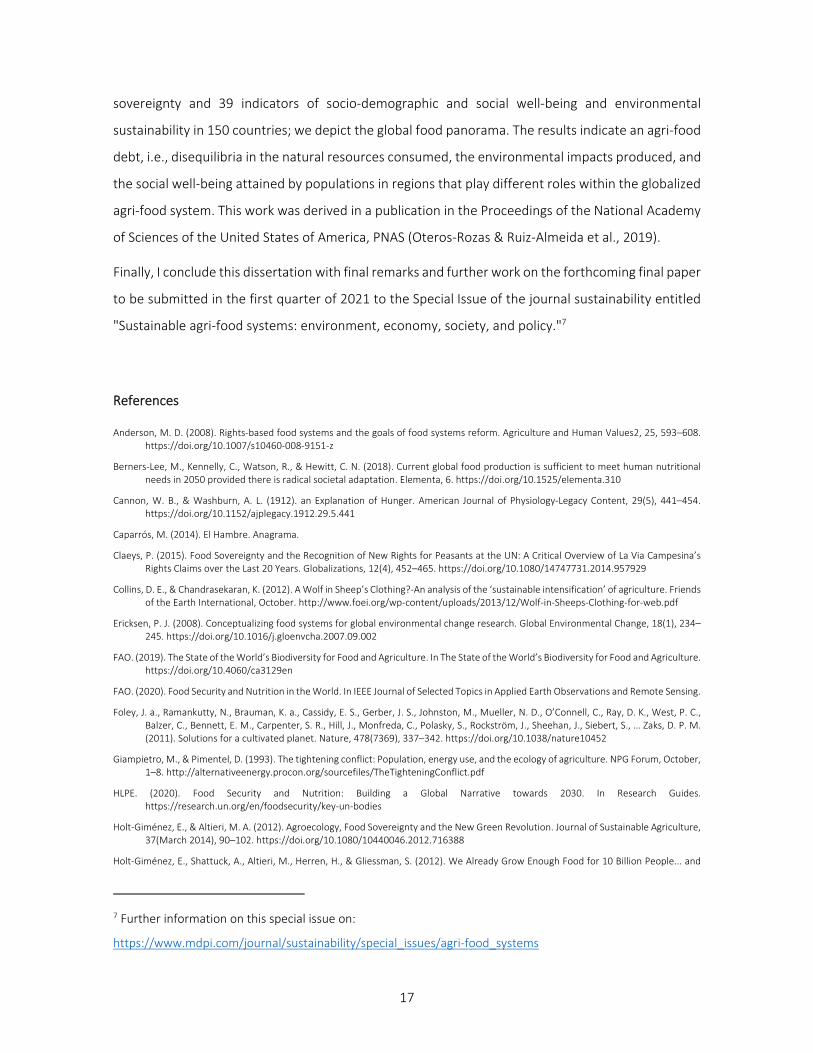
However, from 2015 to date, such a descending trend has not held. The percentage of people
undernourished has been kept at similar levels since then; and, in 2019, the trend reversed, showing
an increment in the number of undernourished people of around 690 million (Figure 1); this, even
though the world already produces enough food to feed more than the whole current population
(Berners-Lee et al., 2018; Holt-Giménez et al., 2012). More concerning is the idea that this tendency
is expected to change far from diminishing due to the current COVID-19 worldwide health
contingency. The UN Food and Agriculture Organization (FAO) has estimated an additional 83 to 132
1 Poverty understood as the proportion of people whose income is less than 1.25 USD equivalent per day.
6
million people undernourished in 2020 due to the pandemics and the associated socio-economic
crisis (FAO, 2020).
Figure 1 - People undernourished from 2000 to 2019
Source: FAOSTAT
Derived from the transition to SDGs, the new goal recognizes that a broader approach is needed to
end hunger since the SDG2 links the objectives of zero hunger, food security, and improved nutrition
to promote sustainable agriculture (Box 1).
SDG2 is the goal dedicated to reaching zero hunger by 2030. Nevertheless, what does hunger means?
Hunger is not an easy concept to define since it may include emotional and personal-physical
sensations (Cannon & Washburn, 1912); thus, it does not have a generally accepted definition.
Caparrós (2014) presents the duality of the term hunger. On one side, there is nothing more familiar
to us than hunger, as is expected that we feel it before a meal.
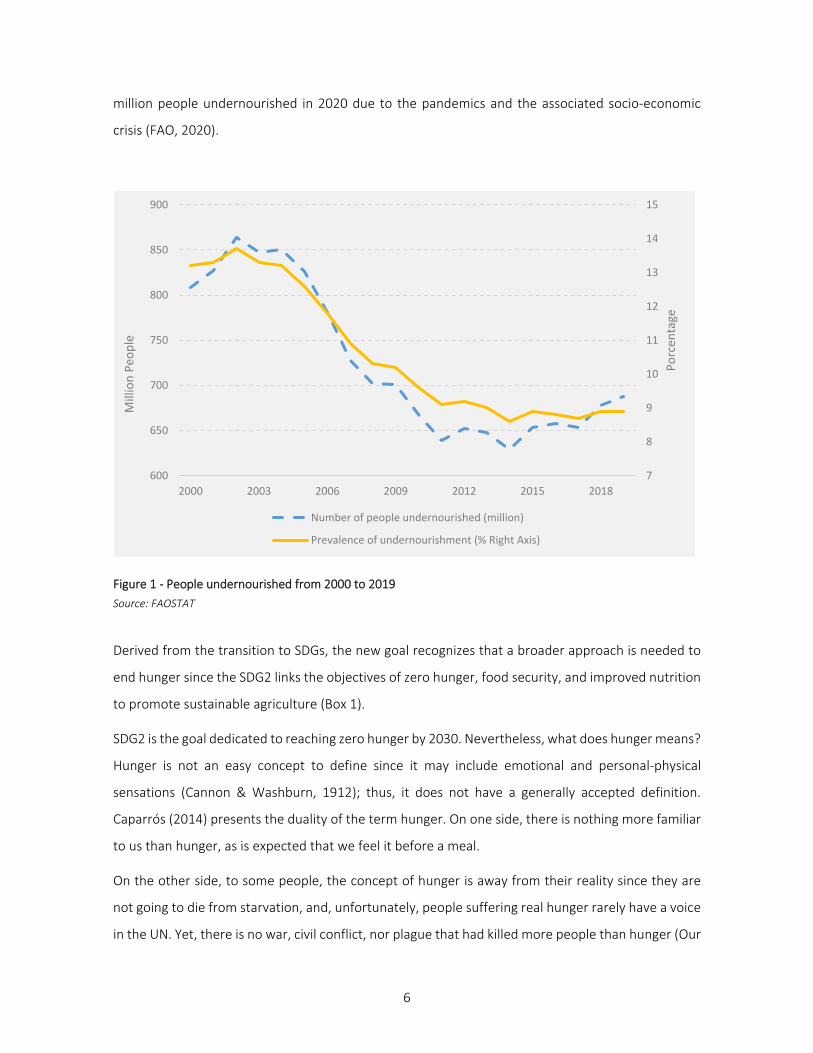
On the other side, to some people, the concept of hunger is away from their reality since they are
not going to die from starvation, and, unfortunately, people suffering real hunger rarely have a voice
in the UN. Yet, there is no war, civil conflict, nor plague that had killed more people than hunger (Our
7
8
9
10
11
12
13
14
15
600
650
700
750
800
850
900
2000 2003 2006 2009 2012 2015 2018
Porcen
tage
Million Peo
ple
Number of people undernourished (million)
Prevalence of undernourishment (% Right Axis)
7
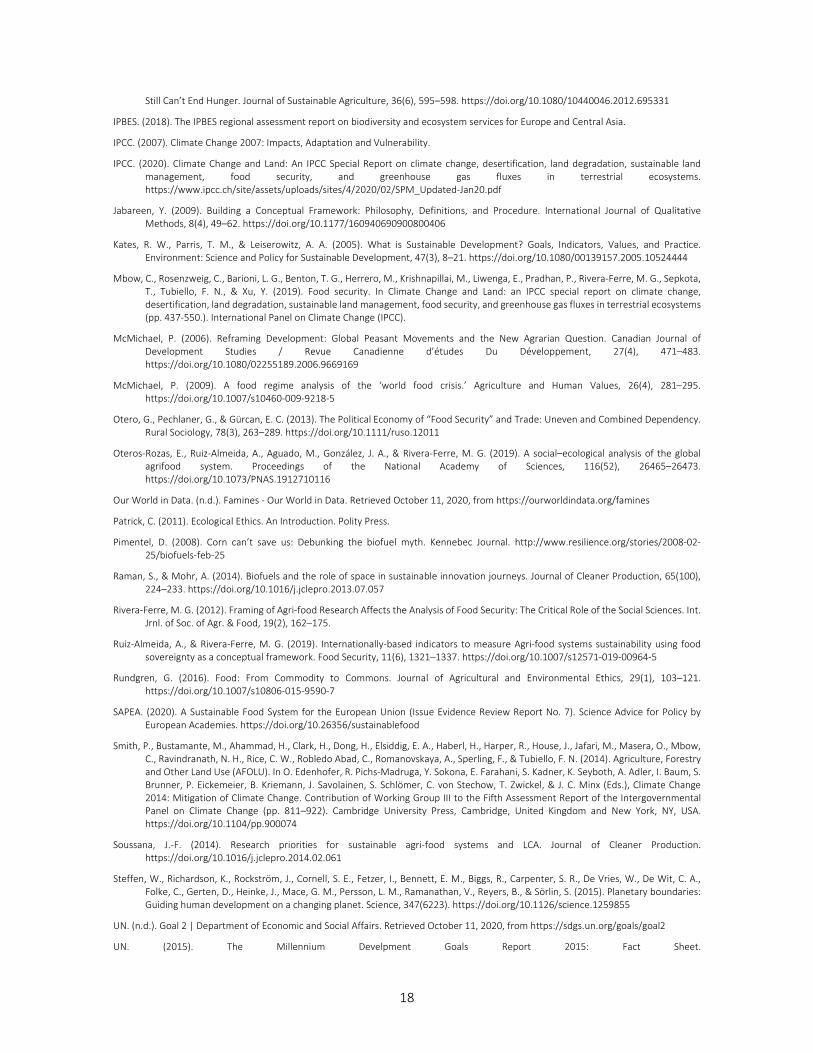
World in Data, n.d.). Around 45% of deaths among children under five years old are linked to
undernutrition (World Health Organization (WHO), n.d.) (Figure 2).
Figure 2 – Famine victims worldwide since the 1900s
Source: OurWorldinData.org with data as of 2016
Hunger and undernourishment are not the only problems that the current agri-food model faces. The
UN is looking deeply into some specific threats that can severely constraint the world's possibilities
to achieve the zero hunger goal: global environmental change, particularly climate shocks, social
conflicts worldwide, the locust crisis, and the recent CoVID-19 impacts (UN, n.d.).
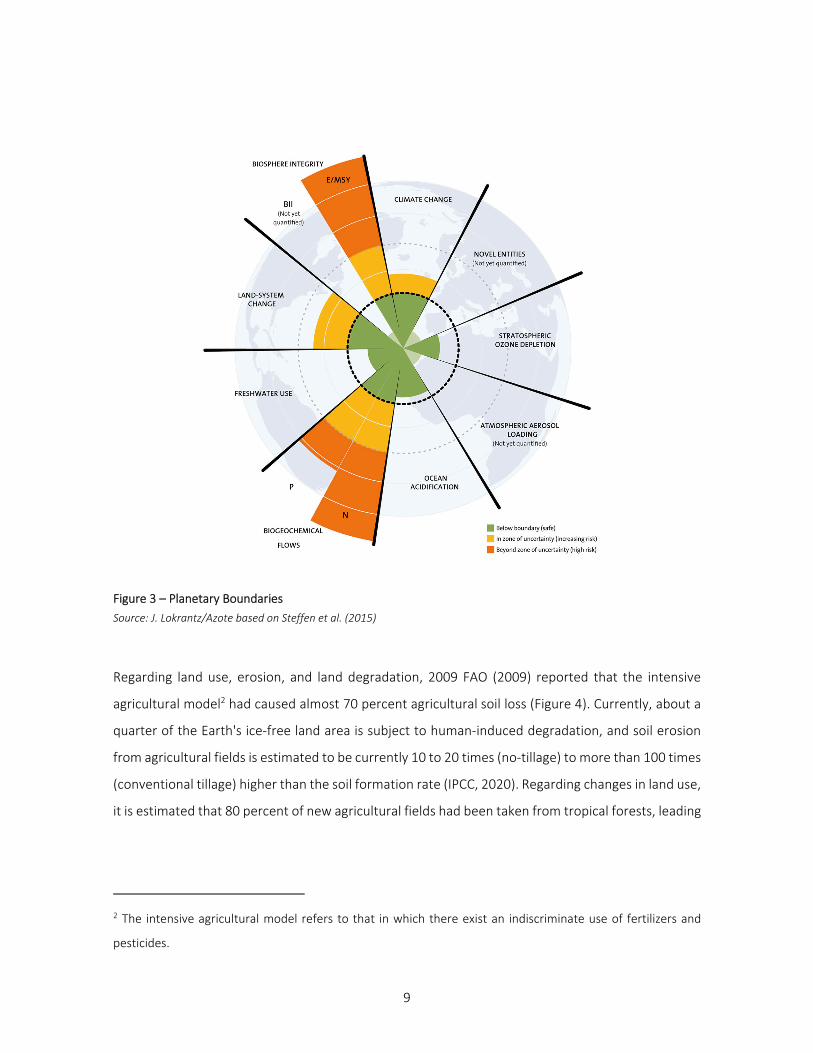
Environmental damage caused by agricultural activities is a constant threat, both for present needs
and for the system's sustainability in time, particularly under the uncertain consequences of climate
change. The planetary boundaries developed by Rockstrom et al. (2009) are very closely related to
agriculture. They identified a limit of nine biophysical processes in Earth that, if surpassed, the life for
humanity will be threatened. These processes are land use, climate change, biogeochemical flows,
water use, biodiversity loss, ocean acidification (Figure 3).
‐
2
4
6
8
10
12
14
16
18
20
1900s 1910s 1920s 1930s 1940s 1950s 1960s 1970s 1980s 1990s 2000s 2010s*
Millons
8
2.1
By 2030, end hunger and ensure access by all people, particularly the poor and people in vulnerable situations,
including infants, to safe, nutritious, and sufficient food all year round.
2.1.1. Prevalence of undernourishment
2.1.2. Prevalence of moderate or severe food insecurity in the population, based on the Food Insecurity Experience Scale (FIES)
2.2
By 2030, end all forms of malnutrition, including achieving, by 2025, the internationally agreed targets on stunting and
wasting in children under five years of age, and address adolescent girls' nutritional needs, pregnant and lactating
women, older persons.
2.2.1. Prevalence of stunting (height for age <‐ two standard deviations from the median of the World Health Organization (WHO)
Child Growth Standards) among children under five years of age
2.2.2. Prevalence of malnutrition (weight for height >+2 or <‐ two standard deviations from the median of the WHO Child Growth
Standards) among children under five years of age, by type (wasting and overweight)
2.3
By 2030, double the agricultural productivity and incomes of small‐scale food producers, in particular women,
indigenous peoples, family farmers, pastoralists, and fishers, including through secure and equal access to land, other
productive resources and inputs, knowledge, financial services, markets and opportunities for value addition and non‐
farm employment.
2.3.1. Volume of production per labor unit by classes of farming/pastoral/forestry enterprise size
2.3.2. Average income of small‐scale food producers, by sex and indigenous status
2.4
By 2030, ensure sustainable food production systems and implement resilient agricultural practices that increase
productivity and production, which help maintain ecosystems, strengthen capacity for adaptation to climate change,
extreme weather, drought, flooding, and other disasters, and that progressively improve land and soil quality.
2.4.1. Proportion of agricultural area under productive and sustainable agriculture
2.5
By 2020, maintain the genetic diversity of seeds, cultivated plants, and farmed and domesticated animals and their
related wild species, including through soundly managed and diversified seed and plant banks at the national, regional,
and international levels, and promote access to and fair and equitable sharing of benefits arising from the utilization
of genetic resources and associated traditional knowledge, as internationally agreed.
2.5.1. Number of plant and animal genetic resources for food and agriculture secured in either medium or long‐term conservation
facilities
2.5.2. Proportion of local breeds classified as being at risk, not‐at‐risk, or the unknown level of risk of extinction
2.a
Increase investment, including through enhanced international cooperation, in rural infrastructure, agricultural
research and extension services, technology development, and plant and livestock gene banks to enhance agricultural
productive capacity in developing countries, in particular, least developed countries.
2.a.1. The agriculture orientation index for government expenditures
2.a.2. Total official flows (official development assistance plus other official flows) to agriculture
2.b
Correct and prevent trade restrictions and distortions in world agricultural markets, including through the parallel
elimination of all forms of agricultural export subsidies and all export measures with equivalent effect, in accordance
with the mandate of the Doha Development Round.
2.b.1. Producer Support Estimate
2.b.2. Agricultural export subsidies
2.c
Adopt measures to ensure the proper functioning of food commodity markets and their derivatives and facilitate timely
access to market information, including food reserves, to help limit extreme food price volatility.
2.c.1. ‐indicator of food price anomalies
Box 1 – Targes for the Sustainable Development Goal Number 2 – End hunger, achieve food security and improved nutrition and promote sustainable agriculture.
Source: UN
9
Figure 3 – Planetary Boundaries
Source: J. Lokrantz/Azote based on Steffen et al. (2015)
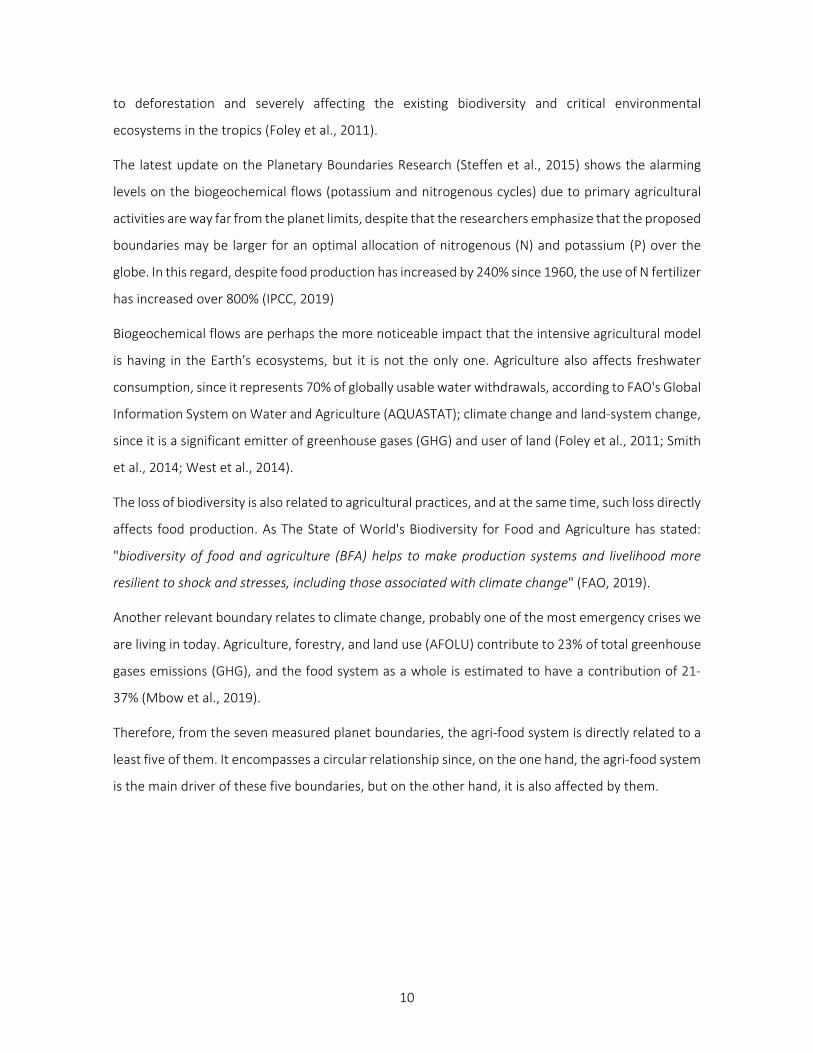
Regarding land use, erosion, and land degradation, 2009 FAO (2009) reported that the intensive
agricultural model2 had caused almost 70 percent agricultural soil loss (Figure 4). Currently, about a
quarter of the Earth's ice-free land area is subject to human-induced degradation, and soil erosion
from agricultural fields is estimated to be currently 10 to 20 times (no-tillage) to more than 100 times
(conventional tillage) higher than the soil formation rate (IPCC, 2020). Regarding changes in land use,
it is estimated that 80 percent of new agricultural fields had been taken from tropical forests, leading
2 The intensive agricultural model refers to that in which there exist an indiscriminate use of fertilizers and
pesticides.
10
to deforestation and severely affecting the existing biodiversity and critical environmental
ecosystems in the tropics (Foley et al., 2011).
The latest update on the Planetary Boundaries Research (Steffen et al., 2015) shows the alarming
levels on the biogeochemical flows (potassium and nitrogenous cycles) due to primary agricultural
activities are way far from the planet limits, despite that the researchers emphasize that the proposed
boundaries may be larger for an optimal allocation of nitrogenous (N) and potassium (P) over the
globe. In this regard, despite food production has increased by 240% since 1960, the use of N fertilizer
has increased over 800% (IPCC, 2019)
Biogeochemical flows are perhaps the more noticeable impact that the intensive agricultural model
is having in the Earth's ecosystems, but it is not the only one. Agriculture also affects freshwater
consumption, since it represents 70% of globally usable water withdrawals, according to FAO's Global
Information System on Water and Agriculture (AQUASTAT); climate change and land-system change,
since it is a significant emitter of greenhouse gases (GHG) and user of land (Foley et al., 2011; Smith
et al., 2014; West et al., 2014).
The loss of biodiversity is also related to agricultural practices, and at the same time, such loss directly
affects food production. As The State of World's Biodiversity for Food and Agriculture has stated:
"biodiversity of food and agriculture (BFA) helps to make production systems and livelihood more
resilient to shock and stresses, including those associated with climate change" (FAO, 2019).
Another relevant boundary relates to climate change, probably one of the most emergency crises we
are living in today. Agriculture, forestry, and land use (AFOLU) contribute to 23% of total greenhouse
gases emissions (GHG), and the food system as a whole is estimated to have a contribution of 21-
37% (Mbow et al., 2019).
Therefore, from the seven measured planet boundaries, the agri-food system is directly related to a
least five of them. It encompasses a circular relationship since, on the one hand, the agri-food system
is the main driver of these five boundaries, but on the other hand, it is also affected by them.
11
Figure 4 – Land degradation results in decreasing agricultural productivity
Source: (Zika & Erb, 2009)
Regardless of the stressful situation in which the soils find themselves, the global food production
model has continued to bet on producing more, even though the problem remains on the unequal
distribution of food and not on its scarcity (Collins & Chandrasekaran, 2012). The socio-political
dimension around the global agri-food system also plays a vital role in its performance, just as the
socio-ecological relations embedded in the agri-food systems do. To achieve SDG2, one should
undertake an in-depth analysis of such relationships and understand their drivers and consequences.
The agri-food system needs to be understood, analyzed and managed as a complex socio-ecological
system (Ericksen, 2008; Mbow et al., 2019; Rivera-Ferre, 2012).
From an anthropocentric point of view, the main objective of the agri-food systems must be to attain
food security for its population (Ericksen, 2008). This is to say that the system must ensure that "every
person, at all times, have physical, social and economic access to sufficient, safe and nutritious food
which meets their dietary needs and food preferences for an active and healthy life" (World Food
Summit, 1996).3 However, this must be done without harnessing the environment, as I have
presented above the close connections between food and environmental degradation production.
All the evidence gathered in the last decades regarding food systems have recently landed in need to
3 http://www.fao.org/organicag/oa-specialfeatures/oa-foodsecurity/en/
12
transform current food systems to build sustainable food systems. However, there are different
forms to build these food systems, which depend on the way food is framed (SAPEA, 2020).
SAPEA (2020) highlights three main framings: food as a commodity, food as a human right, and food
as a common good. Food as a commodity is usually the most used policy framing. This carries out a
conceptual problem from the origin, since such framing links food to global market needs rather than
by the local populations' necessities, hence increasing the risks for the proper fulfillment of the
original agri-food system goal. Alongside this conceptual framing of food as a commodity, also stand
out the use of food as an input for the production of energy (agrofuels4), the feeding of cattle, and
the generation of economic wealth through both regulated and unregulated (price speculation) food
markets. This perspective offers a plausible explanation of why in the world where food is produced
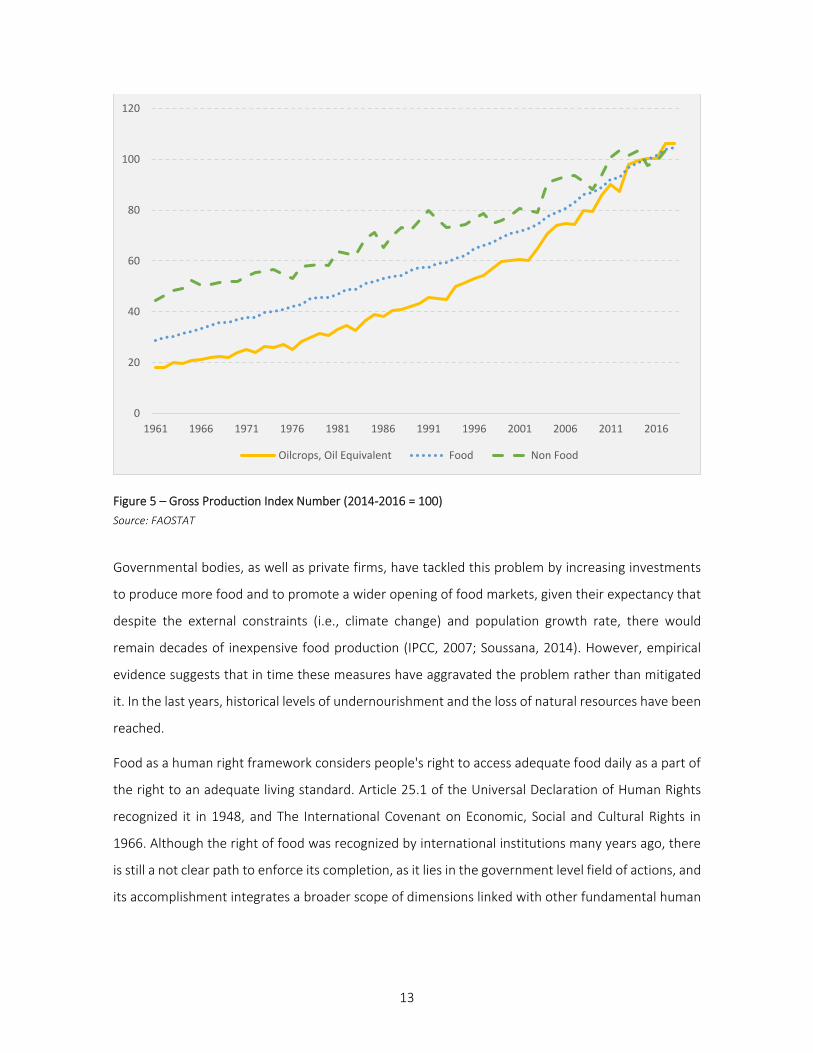
in abundance where the Gross Production Index Number for Food has continuously grown over the
past decades (Figure 5), hunger and undernourishment still affect one every nine people worldwide
every year.
4 Biofuels are fuels derived from biomass like wood, plants and manure, which have been used historically for
producing heat, light and electricity among other necessities. Agrofuels, particularly, are biofuels coming from
agricultural products like bioethanol or biodiesel, these fuels are now the center of two major debates: the first
relates to the ethical question on whether food, which could well shovel the problem of hunger in the world,
should be used to produce energy. The second refers to whether energy generation by means of biofuels is
indeed more sustainable and resource efficient than alternative sources of energy. Many authors have analyze
this (Giampietro & Pimentel, 1993; Patrick, 2011; Pimentel, 2008; Raman & Mohr, 2014)
13
Figure 5 – Gross Production Index Number (2014-2016 = 100)
Source: FAOSTAT
Governmental bodies, as well as private firms, have tackled this problem by increasing investments
to produce more food and to promote a wider opening of food markets, given their expectancy that
despite the external constraints (i.e., climate change) and population growth rate, there would
remain decades of inexpensive food production (IPCC, 2007; Soussana, 2014). However, empirical
evidence suggests that in time these measures have aggravated the problem rather than mitigated
it. In the last years, historical levels of undernourishment and the loss of natural resources have been
reached.
Food as a human right framework considers people's right to access adequate food daily as a part of
the right to an adequate living standard. Article 25.1 of the Universal Declaration of Human Rights
recognized it in 1948, and The International Covenant on Economic, Social and Cultural Rights in
1966. Although the right of food was recognized by international institutions many years ago, there
is still a not clear path to enforce its completion, as it lies in the government level field of actions, and
its accomplishment integrates a broader scope of dimensions linked with other fundamental human
0
20
40
60
80
100
120
1961 1966 1971 1976 1981 1986 1991 1996 2001 2006 2011 2016
Oilcrops, Oil Equivalent Food Non Food
14
rights. Anderson (2008) introduced the concept of rights-based agri-food systems and provided a six
criteria framework as a base for their development:
1. The first criteria consider the absence of human exploitation and absolute respect for every
human right.
2. The second empathize with the need for democratic participation in agri-food system choices
that impact all the system's stakeholders.
3. The third is to guarantee fair and transparent access to food production resources, including
knowledge sharing.
4. The fourth is to have multiple independent buyers and access to [local] markets.
5. The fifth is o guarantee the absence of resource exploitation.
6. Finally, the sixth mentioned that the system should not allow any impingement on people's
ability in other locales to meet these criteria (e.g., through trade relationships that
undermine decent wages, fair prices, environmental quality, and transparency of access to
information in other countries).
The High-Level Panel of Experts on Food Security and Nutrition of the Committee on World Food
Security (HLPE, 2020) recognized the "urgent need for strengthening and consolidating conceptual
thinking around food security and nutrition to prioritize the right of food" by articulating an
international legal framework for the right to food which comprises the growing local efforts done so
far to achieve the full realization of this fundamental human right. They call for a transformation of
the global narrative towards food as a human right.
Approaching food as a human right provides the basis for different food system framings such as food
sovereignty (Claeys, 2015; Wittman, 2011) or food as commons (Rundgren, 2016). It also provides a
moral basis for the idea of 'good food,' understood in terms of access to healthy, nutritious food and
the lively cultural values associated with food, such as identity, taste, and pleasure.
Finally, food framed as a common good puts sustainability at the center of the discussion since it
enhances the value of food accessibility rather than that of food production. This framework pushes
for the study of sustainability's social and environmental dimensions to identify the structures,
including governmental, public, and private sector institutions, required to facilitate food access. This
notion also considers a cultural dimension based on territorial diversity in soils, climate, ecosystems,
farming styles, and food cultures that shape diversity worldwide (SAPEA, 2020).
15
There is an ongoing debate in the agri-food system between those who want to strengthen what
McMichael (2009) characterizes as the corporate food regime5 and propose alternative production
routes linked to food's three conceptual framings. The former group is constituted by governmental
bodies, global institutions, monopolies of the agri-food industry, universities, think tanks, and
philanthropic organizations that proposed a so-called "green revolution"6 as a solution to hunger and
rural poverty. Their strategy is centered on producing more food to achieve food security, for which
they incentivize the use of biotechnology and genetically modified organisms (GMOs) and greater
exposure to global markets (Holt-Giménez & Altieri, 2012).
Conversely, the latter group is integrated by specific social, civil organizations (SCOs), farmers groups,
and non-governmental organizations (NGOs), which propose local perspective alternatives. This
means to focus production for farmers that are aimed at the sustainability of the agri-food system
itself. Some of these alternatives are intended to change the existing paradigm and return to the
traditional roots of farming and agricultural production by putting [small] farmers in the center of the
conversation recognizing their essential role within the system.
Objectives
The three frameworks exposed above are further analyzed in different stages of this work, as it is the
main objective of this work to adapt and establish key parameters that allow characterizing the
degree of sustainability of the global agri-food system following alternative framings of food, through
the study and analysis of its agents, interactions, main strengths, and vulnerabilities. Mainly, I focus
5 “A food regime is a temporally specific dynamic in the global political economy of food. It is characterized by
particular institutional structures, norms, and unwritten rules around agriculture and food that are
geographically and historically specific” (Otero et al., 2013). McMichael name the current dominant production
and consumption structure at global scale as de corporate food regime (Holt-Giménez & Altieri, 2012;
McMichael, 2006). The corporate food regime is “a relatively stable set of relationships privileging corporate
agriculture, in the service of capital accumulation on a world scale and at the expense of smallholder
agriculture, local ecologies and ‘redundant’ urban fringe-dwellers” (McMichael, 2009).
6 The term Green Revolution refers to the international movement promoted in by the mid of XX century, that
incorporates changes to the traditional agricultural model with the aim of increasing agricultural production.
Such changes are focused on the mass use of fertilizers, pesticides and herbicides, genetic modification,
implementation of artificial irrigation systems that allow intensive exploitation of soil, and the production at
large scale of a single crop.
16
on food as a human right to provide an alternative framework of the agri-food system's sustainability
as food sovereignty (Claeys, 2015; Wittman, 2011). Following Jabareen's (2009) methodology, I aim
to develop food sovereignty as a conceptual framework to achieve sustainable food systems.
The following secondary objectives will allow reaching the principal objective:
i) To propose a methodological analysis that incorporates and reviews previous
methodologies (Ruiz-Almeida & Rivera-Ferre, 2019).
ii) To propose a conceptual analysis of the main alternatives that foster the agri-food
system's sustainability (Ruiz-Almeida, Rivera-Ferre, and Rosas-Casals, forthcoming), and
iii) To validate the food sovereignty framework by creating a new concept, food debt (Oteros-
Rozas & Ruiz-Almeida et al., 2019).
This dissertation is structured as follows; the next chapter presents the database. Using food
sovereignty as a conceptual framework, we propose a quantitative methodology that analyzes food
systems' functioning at the international level. We present a database with 97 indicators distributed
into six categories: 1) access to resources; 2) productive models; 3) commercialization; 4) food
consumption and the right to food; 5) agrarian policies and civil society organization; and 6) gender.
We also present the limitations found in developing the database and its potential applications for a
wide variety of factors. This work derives from a publication on Food Security (Ruiz-Almeida & Rivera-
Ferre, 2019), but previous to its publication, this work was presented in the 3rd International
Conference on Global Food Security, which took place in Cape Town, South Africa in December 2017;
and in the VII International Agroecology Congress, held on Cordoba, Spain in June 2018. Besides, it
contributes to the IPBES regional assessment report on biodiversity and ecosystem services for
Europe and Central Asia (IPBES, 2018), where I am recognized as a contributing author.
In chapter two advances the concept of food sovereignty as a conceptual framework to analyze agri-
food systems' sustainability following the steps proposed by Jabareen (2009) to build conceptual
frameworks. In that work, we integrate similar concepts following the four agrarian questions
(agriculture, quality, environmental, emancipatory) and the three fundamental outcomes of
sustainable agri-food systems: food and nutrition security, environmental resilience, and social well-
being.
In chapter three, I use the database for analyzing the global agri-food system using a socio-ecological
approach. In a collaborative work among researchers from the University of Vic and Autonomous
University of Madrid, we conducted a quantitative multivariate assessment of 43 indicators of food
17
sovereignty and 39 indicators of socio-demographic and social well-being and environmental
sustainability in 150 countries; we depict the global food panorama. The results indicate an agri-food
debt, i.e., disequilibria in the natural resources consumed, the environmental impacts produced, and
the social well-being attained by populations in regions that play different roles within the globalized
agri-food system. This work was derived in a publication in the Proceedings of the National Academy
of Sciences of the United States of America, PNAS (Oteros-Rozas & Ruiz-Almeida et al., 2019).
Finally, I conclude this dissertation with final remarks and further work on the forthcoming final paper
to be submitted in the first quarter of 2021 to the Special Issue of the journal sustainability entitled
"Sustainable agri-food systems: environment, economy, society, and policy."7
References
Anderson, M. D. (2008). Rights-based food systems and the goals of food systems reform. Agriculture and Human Values2, 25, 593–608. https://doi.org/10.1007/s10460-008-9151-z
Berners-Lee, M., Kennelly, C., Watson, R., & Hewitt, C. N. (2018). Current global food production is sufficient to meet human nutritional needs in 2050 provided there is radical societal adaptation. Elementa, 6. https://doi.org/10.1525/elementa.310
Cannon, W. B., & Washburn, A. L. (1912). an Explanation of Hunger. American Journal of Physiology-Legacy Content, 29(5), 441–454. https://doi.org/10.1152/ajplegacy.1912.29.5.441
Caparrós, M. (2014). El Hambre. Anagrama.
Claeys, P. (2015). Food Sovereignty and the Recognition of New Rights for Peasants at the UN: A Critical Overview of La Via Campesina’s Rights Claims over the Last 20 Years. Globalizations, 12(4), 452–465. https://doi.org/10.1080/14747731.2014.957929
Collins, D. E., & Chandrasekaran, K. (2012). A Wolf in Sheep’s Clothing?-An analysis of the ‘sustainable intensification’ of agriculture. Friends of the Earth International, October. http://www.foei.org/wp-content/uploads/2013/12/Wolf-in-Sheeps-Clothing-for-web.pdf
Ericksen, P. J. (2008). Conceptualizing food systems for global environmental change research. Global Environmental Change, 18(1), 234–245. https://doi.org/10.1016/j.gloenvcha.2007.09.002
FAO. (2019). The State of the World’s Biodiversity for Food and Agriculture. In The State of the World’s Biodiversity for Food and Agriculture. https://doi.org/10.4060/ca3129en
FAO. (2020). Food Security and Nutrition in the World. In IEEE Journal of Selected Topics in Applied Earth Observations and Remote Sensing.
Foley, J. a., Ramankutty, N., Brauman, K. a., Cassidy, E. S., Gerber, J. S., Johnston, M., Mueller, N. D., O’Connell, C., Ray, D. K., West, P. C., Balzer, C., Bennett, E. M., Carpenter, S. R., Hill, J., Monfreda, C., Polasky, S., Rockström, J., Sheehan, J., Siebert, S., … Zaks, D. P. M. (2011). Solutions for a cultivated planet. Nature, 478(7369), 337–342. https://doi.org/10.1038/nature10452
Giampietro, M., & Pimentel, D. (1993). The tightening conflict: Population, energy use, and the ecology of agriculture. NPG Forum, October, 1–8. http://alternativeenergy.procon.org/sourcefiles/TheTighteningConflict.pdf
HLPE. (2020). Food Security and Nutrition: Building a Global Narrative towards 2030. In Research Guides. https://research.un.org/en/foodsecurity/key-un-bodies
Holt-Giménez, E., & Altieri, M. A. (2012). Agroecology, Food Sovereignty and the New Green Revolution. Journal of Sustainable Agriculture, 37(March 2014), 90–102. https://doi.org/10.1080/10440046.2012.716388
Holt-Giménez, E., Shattuck, A., Altieri, M., Herren, H., & Gliessman, S. (2012). We Already Grow Enough Food for 10 Billion People... and
7 Further information on this special issue on:
https://www.mdpi.com/journal/sustainability/special_issues/agri-food_systems
18
Still Can’t End Hunger. Journal of Sustainable Agriculture, 36(6), 595–598. https://doi.org/10.1080/10440046.2012.695331
IPBES. (2018). The IPBES regional assessment report on biodiversity and ecosystem services for Europe and Central Asia.
IPCC. (2007). Climate Change 2007: Impacts, Adaptation and Vulnerability.
IPCC. (2020). Climate Change and Land: An IPCC Special Report on climate change, desertification, land degradation, sustainable land management, food security, and greenhouse gas fluxes in terrestrial ecosystems. https://www.ipcc.ch/site/assets/uploads/sites/4/2020/02/SPM_Updated-Jan20.pdf
Jabareen, Y. (2009). Building a Conceptual Framework: Philosophy, Definitions, and Procedure. International Journal of Qualitative Methods, 8(4), 49–62. https://doi.org/10.1177/160940690900800406
Kates, R. W., Parris, T. M., & Leiserowitz, A. A. (2005). What is Sustainable Development? Goals, Indicators, Values, and Practice. Environment: Science and Policy for Sustainable Development, 47(3), 8–21. https://doi.org/10.1080/00139157.2005.10524444
Mbow, C., Rosenzweig, C., Barioni, L. G., Benton, T. G., Herrero, M., Krishnapillai, M., Liwenga, E., Pradhan, P., Rivera-Ferre, M. G., Sepkota, T., Tubiello, F. N., & Xu, Y. (2019). Food security. In Climate Change and Land: an IPCC special report on climate change, desertification, land degradation, sustainable land management, food security, and greenhouse gas fluxes in terrestrial ecosystems (pp. 437-550.). International Panel on Climate Change (IPCC).
McMichael, P. (2006). Reframing Development: Global Peasant Movements and the New Agrarian Question. Canadian Journal of Development Studies / Revue Canadienne d’études Du Développement, 27(4), 471–483. https://doi.org/10.1080/02255189.2006.9669169
McMichael, P. (2009). A food regime analysis of the ‘world food crisis.’ Agriculture and Human Values, 26(4), 281–295. https://doi.org/10.1007/s10460-009-9218-5
Otero, G., Pechlaner, G., & Gürcan, E. C. (2013). The Political Economy of “Food Security” and Trade: Uneven and Combined Dependency. Rural Sociology, 78(3), 263–289. https://doi.org/10.1111/ruso.12011
Oteros-Rozas, E., Ruiz-Almeida, A., Aguado, M., González, J. A., & Rivera-Ferre, M. G. (2019). A social–ecological analysis of the global agrifood system. Proceedings of the National Academy of Sciences, 116(52), 26465–26473. https://doi.org/10.1073/PNAS.1912710116
Our World in Data. (n.d.). Famines - Our World in Data. Retrieved October 11, 2020, from https://ourworldindata.org/famines
Patrick, C. (2011). Ecological Ethics. An Introduction. Polity Press.
Pimentel, D. (2008). Corn can’t save us: Debunking the biofuel myth. Kennebec Journal. http://www.resilience.org/stories/2008-02-25/biofuels-feb-25
Raman, S., & Mohr, A. (2014). Biofuels and the role of space in sustainable innovation journeys. Journal of Cleaner Production, 65(100), 224–233. https://doi.org/10.1016/j.jclepro.2013.07.057
Rivera-Ferre, M. G. (2012). Framing of Agri-food Research Affects the Analysis of Food Security: The Critical Role of the Social Sciences. Int. Jrnl. of Soc. of Agr. & Food, 19(2), 162–175.
Ruiz-Almeida, A., & Rivera-Ferre, M. G. (2019). Internationally-based indicators to measure Agri-food systems sustainability using food sovereignty as a conceptual framework. Food Security, 11(6), 1321–1337. https://doi.org/10.1007/s12571-019-00964-5
Rundgren, G. (2016). Food: From Commodity to Commons. Journal of Agricultural and Environmental Ethics, 29(1), 103–121. https://doi.org/10.1007/s10806-015-9590-7
SAPEA. (2020). A Sustainable Food System for the European Union (Issue Evidence Review Report No. 7). Science Advice for Policy by European Academies. https://doi.org/10.26356/sustainablefood
Smith, P., Bustamante, M., Ahammad, H., Clark, H., Dong, H., Elsiddig, E. A., Haberl, H., Harper, R., House, J., Jafari, M., Masera, O., Mbow, C., Ravindranath, N. H., Rice, C. W., Robledo Abad, C., Romanovskaya, A., Sperling, F., & Tubiello, F. N. (2014). Agriculture, Forestry and Other Land Use (AFOLU). In O. Edenhofer, R. Pichs-Madruga, Y. Sokona, E. Farahani, S. Kadner, K. Seyboth, A. Adler, I. Baum, S. Brunner, P. Eickemeier, B. Kriemann, J. Savolainen, S. Schlömer, C. von Stechow, T. Zwickel, & J. C. Minx (Eds.), Climate Change 2014: Mitigation of Climate Change. Contribution of Working Group III to the Fifth Assessment Report of the Intergovernmental Panel on Climate Change (pp. 811–922). Cambridge University Press, Cambridge, United Kingdom and New York, NY, USA. https://doi.org/10.1104/pp.900074
Soussana, J.-F. (2014). Research priorities for sustainable agri-food systems and LCA. Journal of Cleaner Production. https://doi.org/10.1016/j.jclepro.2014.02.061
Steffen, W., Richardson, K., Rockström, J., Cornell, S. E., Fetzer, I., Bennett, E. M., Biggs, R., Carpenter, S. R., De Vries, W., De Wit, C. A., Folke, C., Gerten, D., Heinke, J., Mace, G. M., Persson, L. M., Ramanathan, V., Reyers, B., & Sörlin, S. (2015). Planetary boundaries: Guiding human development on a changing planet. Science, 347(6223). https://doi.org/10.1126/science.1259855
UN. (n.d.). Goal 2 | Department of Economic and Social Affairs. Retrieved October 11, 2020, from https://sdgs.un.org/goals/goal2
UN. (2015). The Millennium Develpment Goals Report 2015: Fact Sheet.
19
https://www.un.org/millenniumgoals/2015_MDG_Report/pdf/MDG 2015 PR Key Facts Global.pdf
West, P. C., Gerber, J. S., Engstrom, P. M., Mueller, N. D., Brauman, K. A., Carlson, K. M., Cassidy, E. S., Johnston, M., MacDonald, G. K., Ray, D. K., & Siebert, S. (2014). Leverage points for improving global food security and the environment. Science, 345(6194), 325–328. https://doi.org/10.1126/science.1246067
Wittman, H. (2011). Food Sovereignty: A New Rights Framework for Food and Nature? Environment and Society: Advances in Research, 2(1), 87–105. https://doi.org/10.3167/ares.2011.020106
World Health Organization (WHO). (n.d.). Fact sheets - Malnutrition. Retrieved October 11, 2020, from https://www.who.int/news-room/fact-sheets/detail/malnutrition
Zika, M., & Erb, K.-H. (2009). The global loss of net primary production resulting from human-induced soil degradation in drylands. Ecological Economics, 69(2), 310–318. https://doi.org/10.1016/j.ecolecon.2009.06.014
20
Chapter 1. Internationally-based indicators to measure Agri-
food systems sustainability using food sovereignty as a
conceptual framework
Abstract
Agri‐food systems are essential in achieving food security and achieving both social and environmental
sustainability. Although different actors use different frameworks to define and assess food systems
sustainability, there is a growing consensus on approaching them from a complex socio‐ecological systems
perspective. However, existing frameworks often lack the political dimension in the analysis of food systems
outcomes. Food sovereignty has emerged as a proposal that centers the discussion in the entire system,
emphasizing food's political aspects. In this paper, using food sovereignty as a conceptual framework, we
propose a quantitative methodology that allows analysis of food systems' functioning at the international
level. We present a database with 97 indicators distributed into six categories: 1) access to resources; 2)
productive models; 3) commercialization; 4) food consumption and the right to food; 5) agrarian policies
and civil society organization; and 6) gender. We also present the limitations found in developing the
database as well as its potential applications for a wide variety of factors.
1 Introduction
Agri-food systems, through their multiple interactions with global environmental change, play a
significant role in human well-being (Ericksen, 2008). They are essential not only in achieving food
security but also in achieving both social and environmental sustainability. For instance, issues such
as land-grabbing, biodiversity depletion, soil degradation, water contamination, use of unsustainable
energy sources, habitat loss, global health, or poverty are all related to agri-food systems (McIntyre
et al., 2009). They are both greenhouse gas emitters (Smith et al., 2014) and one of the coupled
nature-human systems more vulnerable to climate change (Porter et al., 2014). Yet, it is
acknowledged that nowadays, agri-food systems do not fulfill their primary objective of providing
healthy and nutritious food to people without harnessing the environment. Thus, designing policies
to promote actions towards the sustainability of agri-food systems is imperative. However, designing
21
these policies is a complicated task given i) the relevant social, ecological, and economic impacts they
may have, ii) the multidimensional consequences of the decisions taken, and iii) the absence of a
standard and agreed definition of what is a sustainable agri-food system. Indeed, different actors
(e.g., retailers, governments, producers, civil society organizations) define sustainable agri-food
systems in different ways e.g. depending on the starting point of their analysis (Allen, 2013; Eakin et
al., 2017) and their narratives and scales (Rivera-Ferre, Ortega-Cerdà, et al., 2013; Thompson et al.,
2007). Indeed, food security has been defined as a wicked problem, where new governance
arrangements have a key role to play (Breeman et al., 2015; Candel, 2014).
In principle, it could be stated that policies for sustainable agri-food systems, which rely on eco-social
principles, should attend to the present needs and challenges regarding the production and provision
of safe and nutritious food without compromising the ability of future generations to meet their own
needs. The question is, how to achieve this goal? Despite the lack of consensus in defining a
sustainable agri-food system, eradicating hunger is one core objective of international policies aiming
to contribute to global sustainability, such as the Sustainable Development Goals (SDGs). In this
regard, international food policies have since the early 1970s centered on achieving food security as
the principal outcome of agri-food systems. However, despite several policy efforts since then, today,
there are still 815 million people suffering from hunger (FAO, 2017a), and the objective to reach the
zero hunger SDG2 for 2030 does not seem achievable. The evidence points that the current system
appears to be productive in terms of agricultural yields (De Ponti et al., 2012; Ponisio et al., 2014) and
that the world produces food for human consumption in abundance (Gustavsson & Cederberg, 2011),
but it fails to be inclusive and to distribute the benefits to the poor equitably and the hungered while
creating problems of overweight and obesity to more than 2 billion people in the world (WHO, 2018).
In time, food security has evolved to stand as a concept that seeks to address concerns related to
nourishment and public health (Maxwell, 1996). However, when intended as a unique outcome of
agri-food systems, food security often fails to contemplate alternative dimensions of sustainability,
such as environmental and social ones. The recurrent events of food crises, malnutrition, and famine
worldwide, together with the environmental impacts linked to agri-food systems, have evidenced the
failure of current food policies focused exclusively on a narrow definition of food security.
The problems related to food insecurity faced in the last decades have forced a paradigm change to
include different social and environmental variables as fundamental to reach food security
(Devereux, 2000; Patel, 2009). Some authors have proposed systemic approaches to study and
manage agri-food systems in their objective to achieve food and nutrition security while considering
22
both social and environmental aspects. Erickssen (2008) stated the relevance of analyzing "the food
system's interactions with global environmental change and evaluating the major societal outcomes
affected by these interactions: food security, ecosystem services, and social welfare." This approach
includes the social and environmental components as fundamental drivers that affect the potential
outcomes (food security), yet only from a technical perspective. Another interesting approach is
climate-smart food systems (Wheeler & von Braun, 2013) that proposes a systemic approach to the
"climate-smart agriculture" concept first launched by the Food and Agriculture Organization (FAO) in
2010. The proposal is centered on developing agri-food systems that are more resilient to climate
change, impacting food, and nutrition security. This concept skips the political dimension of food
systems and only addresses the environmental component of those elements linked to climate
change. A more political approach was proposed by Fullbrook (2010), who stated the need to address
food as security, which, according to him, would have positive consequences both to food security,
poverty, and the environment. Several authors have suggested developing policies to favor
sustainable agri-food systems; different frameworks are needed (McKenzie & Williams, 2015; Rivera-
Ferre, Pereira, et al., 2013). This hard task requires a paradigm shift that replaces the traditional
thought patterns in agriculture with a new concept that simultaneously addresses the key features
of complex agri-food systems, including its strong social and political component.
During the Thirty-Second Regional Conference for Latin America and the Caribbean (Buenos Aires,
March 2012), the FAO agreed to initiate discussions about alternative approaches to address hunger
and the unsustainability of food systems. One such approach was food sovereignty (Nicastro, 2012).
Food sovereignty was identified as a political concept that centers the discussion in the agri-food
system, suggesting that hunger is the result of the concentration of the means of production in a few
hands with the consequential exclusion of small producers, due to the worldwide generalization of
the corporate food regime based on industrialized systems and export-oriented agriculture
(McMichael, 2005) and the disenfranchisement of producers and consumers in the context of
consolidated global food supply chains (Macdonald, 2007). This concept conceptualizes food as a
human right, including its environmental and social aspects, which are viewed as drivers and
outcomes of food security. More interestingly, this concept focuses on small farmers who, according
to the proposal, have a central role to play. FAO's "State of Food and Agriculture" report (FAO, 2017a)
shows that "85 percent of the world's farms are smaller than 2 hectares" (p.54). In this sense,
Samberg et al. (2016) found that small farmers are crucial both in local and global food security
despite excluded from mainstream policies. They support the livelihood of many of the most
23
marginalized populations. Still, they also produce more than 70% of the food calories produced in
Latin America, sub-Saharan Africa, and Southeast Asia using only 30% of the agricultural land. Farmers
in these densely populated regions are responsible for more than half of the food calories produced
globally, and more than half of several major food crops' global production.
The food sovereignty proposal addresses food systems from a holistic perspective that encompasses
environmental, social, and economic aspects to find a political answer that guides the system towards
sustainability. From this perspective, sustainable agri-food systems are defined as systems capable of
ensuring all people's food security by making political efforts to address the root causes of hunger
and malnutrition while preserving the environment, putting at the center of policies those people
who produce food. This understanding of what a sustainable agri-food system is has a significant
challenge: the need to measure whether different approaches at the country level give or not result
in terms of food sovereignty and its expected outcomes (e.g., right to food, environmental
sustainability, social justice). Other proposals of sustainable agri-food systems have their own metrics
based on quantitative indicators. Still, food sovereignty has not, making it very difficult to elucidate
whether the proposal is capable of achieving its objectives or not. There have been initial efforts to
put forth a quantitative methodology that allows interested parties to measure and compare
progress in this line (Ortega-Cerdà & Rivera-Ferre, 2010). However, there is still no existing
framework that serves as a benchmark for comparisons among countries. The present paper
attempts to fill in this gap by setting up a revised collection of international country-based food
sovereignty indicators. Our objective is to operate as a benchmark to assess, in a standardized
manner, the sustainability of agri-food systems across countries through the lens of food sovereignty.
This paper is organized as follows. In the following section, we describe the food sovereignty proposal
and the initial efforts towards its measurement. Team two puts forth the methodology to define the
categories that integrate the country level's food sovereignty framework to select and organize the
indicators. Section three offers the resulting collection of indicators. In the last two quarters, we
discuss the results, present some potential applications of the database, and the conclusions.
24
2 The food sovereignty proposal
In April 1996, the international peasant movement organization La Via Campesina8 (LVC) developed
the concept of food sovereignty, considering it a prerequisite to achieving genuine food security.
Since its inception, the food sovereignty proposal has pursued to develop "just and sustainable agri-
food systems" (Rivera-Ferre, 2008). According to this broad proposal, a sustainable agri-food system
should aim at reducing poverty, promoting the development of rural areas and the sustainability of
the environment from the perspective of social justice and gender equity (Desmarais, 2003; Holt-
Giménez & Altieri, 2012; Patel, 2009; Rosset, 2011).
The most commonly used definition of food sovereignty is the one that emerged from the Declaration
of Nyéléni, the first Global Forum on Food Sovereignty, celebrated in Mali (February 2007) which
states that:
"Food sovereignty is the right of peoples to healthy and culturally appropriate food produced
through ecologically sound and sustainable methods, and their right to define their own food and
agriculture systems. It puts the aspirations and needs of those who produce, distribute, and
consume food at the heart of food systems (…). It defends the interests and inclusion of the next
generation. (…) Food sovereignty prioritizes local and national economies and markets and
empowers peasant and family farmer‐driven agriculture, artisanal fishing, pastoralist‐led
grazing, and food production, distribution, and consumption based on environmental, social and
economic sustainability."
Food sovereignty as a concept always refers to the right to food, which recognizes that people
worldwide must have access to safe, nutritious, and culturally appropriate food and the necessary
resources and mechanisms for its production and consumption to support themselves and their
societies. This last definition shows the shifting from an agrarian to a food system focus. Food
sovereignty currently adopts a systemic approach that also contemplates the environmental
sustainability of production and consumption methods (Dekeyser et al., 2018). Today, food
sovereignty is conceived by their supporters as a genuine precondition of food security (Patel, 2009)
8 La Via Campesina is an international movement that emerges in 1993 from the union of millions of farmers,
small producers, indigenous people and migrant workers. Currently it encompasses 164 local and national
organizations in 73 different countries representing around 200 million peasants worldwide.
25
The food sovereignty proposal has managed to stand itself as a potential alternative to the current
development model in the production, distribution, and consumption of food (Wittman, 2011).
Different Civil Society Organizations (CSOs), Non-Governmental Organizations (NGOs), multilateral
institutions (UNEP, Commissioner of the Right to Food, FAO) and Governments (Mali, Nepal,
Indonesia, Ecuador, Bolivia) have acknowledged its potential in the development of sustainable agri-
food systems.
Food sovereignty measurement
As the food sovereignty proposal has strengthened over the years, it has increasingly been the target
of several studies and critiques (Dekeyser et al., 2018). At a theoretical level, many scholars agreed
on its potential to reduce hunger and rural poverty (Altieri, 2009; Wittman, 2011), to pursue
sustainable development in rural areas (Rosset, 2009, 2011), and to promote gender equity
(Desmarais, 2003). Other authors raise influential critics to the proposal as it fails to be clear in how
to connect the individual activities of small farmers with the growing needs of a dynamic and changing
population (Agarwal, 2014; Bernstein, 2014), even suggesting that it could be better achieved with
top-down policies.
Despite all these studies, only a few have aimed at developing analytical tools for measuring the
outcomes of the proposal at different spatial scales (Binimelis et al., 2014). Thus, there is still a need
for an accepted international framework on which individuals and organizations can measure the
outcomes of different policies and actions in terms of food sovereignty, allowing comparisons at
various spatial and temporal scales.
A highly accepted tool to measure outcomes of policies and ecosystems' performance is indicators
since they simplify complex situations in a useful manner (Jackson et al., 2000). Developing indicators
have become central to the debate on sustainable development, with many national and
international organizations and academic institutions conducting significant research in the field
(Gasparatos et al., 2008). As a general rule, the elaboration or selection of a set of indicators to
measure specific actions' progress in a time frame requires first the establishment of the goals and
objectives. Niemeijer & de Groot (2008) stated that making explicit the selection process and the
framework used is essential in any process of indicators development since this determines which
indicators are considered and clarifies the conclusions of the analyses based on them. In assessing
agri-food systems from a food sovereignty perspective, the food sovereignty proposal is given the
framework. It needs to rely on indicators that assess whether the outcomes are acceptable and in
26
line with fulfilling the intended goals and objectives. Particularly, food sovereignty measurements
must determine whether the proposal stands as a valid alternative to the current agri-food
development model, for which no integrated and accurate data exist.
Defining the scale of analysis is also an essential step in defining the indicators. Since the analytical
framework to develop the indicators is in all cases given by the goals and objectives of the food
sovereignty proposal, categories and subcategories for allocating the indicators are similar regardless
of the scale (Binimelis et al., 2014). Yet defining the scale is important because the sources of
indicators and their objectives change depending on the context and the scale of analysis (global vs.
local). At the local level, Badal et al. (2010) developed a set of indicators to measure the level and
evolution of food sovereignty in Catalonia through participatory processes in the region. Vallejo-Rojas
et al. (2015), through the integration of socioecological systems and vulnerability frameworks,
developed their own set of indicators to measure outcomes of food sovereignty policies in local agri-
food systems in the Ecuadorian Andes. Islam and Berkes (2016) integrated the food sovereignty
approach with Sen's entitlement to analyze indigenous' people food security in Northern Canada
At the international level, Woodley et al. (2009) contributed with a set of indicators of indigenous
people's food and agro-ecological systems developed under the multi-stakeholder Sustainable
Agriculture and Rural Development Initiative. Simón Reardon and Pérez (2010) also proposed a
participatory process to develop indicators to measure agri-food systems sustainability through the
lens of food sovereignty in Cuba. Additionally, Ortega-Cerdà and Rivera-Ferre (2010), through a
participatory process with experts and stakeholders, provided an initial set of analytical tools that
facilitated the tracking and measurement of food sovereignty at national and international levels
aiming to assist the process of information gathering for policy recommendations. In their work, the
authors developed a pilot set of indicators to assess food sovereignty across countries, thus allowing
to define the status at the country level, as well as to evaluate the impact of diverse agricultural,
trade, and environmental policies in different countries. This set of indicators is the point of departure
of this work.
3 Methodology
Food sovereignty set of international indicators
The selection process of indicators determines whether they will succeed or fail to accomplish their
main task: to reduce a complex situation into a comprehensible one. Our point of departure was the
27
research conducted by Ortega-Cerdà and Rivera-Ferre (2010), who suggested a pyramidal structure
into categories, subcategories (attributes), and indicators. Such structure is similar to the one
proposed by other social sciences studies, like the Environmental Performance Index (Hsu et al.,
2013) on environmental issues and the Ibrahim Index of Governance (Rotberg & Gisselquist, 2007).
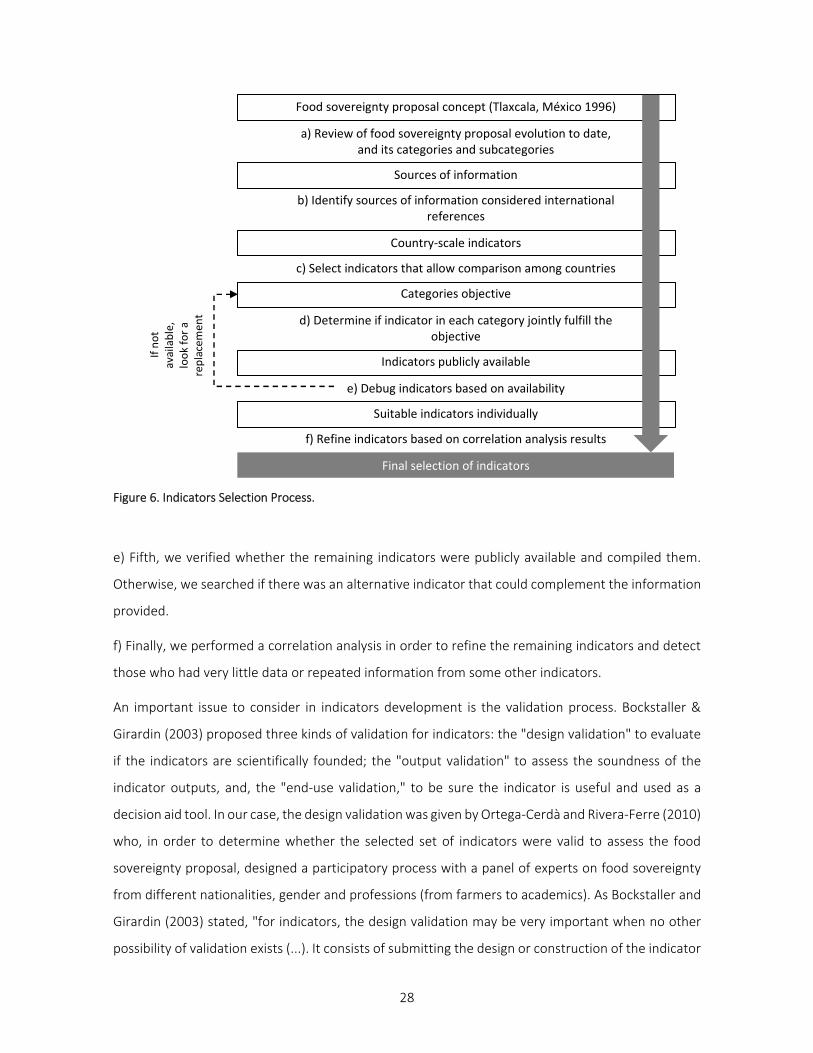
We analyzed and schematized our framework following a six steps methodology summarized in
Figure 1:
a) First, we reviewed how the food sovereignty proposal has conceptually evolved since 2009 to
identify whether the proposed five categories and corresponding subcategories proposed by Ortega-
Cerdà and Rivera-Ferre (2010) remained relevant to the proposal.
b) Second, we identified and selected those indicators that were already compiled by those
international organizations which are considered international benchmarks, such as institutions,
agencies and programs related to the United Nations Organization (FAO, UNDP, and UNEP);
international financial institutions (World Bank) and international economic organizations (OECD and
WTO).
c) Third, we revised if the indicators were valid at the country level to verify whether each of them
fulfilled the informational requirements for proper comparisons across countries and over time.
Indicators that only tracked individual performance were removed from the database.
d) Fourth, we determined if the selected indicators in each category jointly reflected the objective of
the whole category or whether there existed information gaps that needed to be fulfilled with
additional indicators.
28
Figure 6. Indicators Selection Process.
e) Fifth, we verified whether the remaining indicators were publicly available and compiled them.
Otherwise, we searched if there was an alternative indicator that could complement the information
provided.
f) Finally, we performed a correlation analysis in order to refine the remaining indicators and detect
those who had very little data or repeated information from some other indicators.
An important issue to consider in indicators development is the validation process. Bockstaller &
Girardin (2003) proposed three kinds of validation for indicators: the "design validation" to evaluate
if the indicators are scientifically founded; the "output validation" to assess the soundness of the
indicator outputs, and, the "end-use validation," to be sure the indicator is useful and used as a
decision aid tool. In our case, the design validation was given by Ortega-Cerdà and Rivera-Ferre (2010)
who, in order to determine whether the selected set of indicators were valid to assess the food
sovereignty proposal, designed a participatory process with a panel of experts on food sovereignty
from different nationalities, gender and professions (from farmers to academics). As Bockstaller and
Girardin (2003) stated, "for indicators, the design validation may be very important when no other
possibility of validation exists (...). It consists of submitting the design or construction of the indicator
Food sovereignty proposal concept (Tlaxcala, México 1996)
Country‐scale indicators
Sources of information
Categories objective
Indicators publicly available
e) Debug indicators based on availability
a) Review of food sovereignty proposal evolution to date, and its categories and subcategories
b) Identify sources of information considered international references
c) Select indicators that allow comparison among countries
d) Determine if indicator in each category jointly fulfill the objective
Final selection of indicators
f) Refine indicators based on correlation analysis results
Suitable indicators individually
If not
available,
look for a
replacemen
t
29
to a panel of experts". The output and end-use validation of the set of indicators proposed in this
article come from the source of indicators we have selected (databases from well-recognized
international institutions), which ensure both the soundness of the indicators output and their
potential use as a decision tool.
4 Results
Definition of categories
We set the first five food sovereignty's categories based on the five pillars proposed by Ortega-Cerdà
and Rivera-Ferre (2010) and García (2003), as follows:
Category One: Access to Resources
"Food Sovereignty attempts to foster and to support individual and community processes on access
and control over resources (land, seeds, credit, etc.) in a sustainable manner, respecting usage rights
of indigenous communities, particularly emphasizing women's access to resources."
Category Two: Production Models (includes processing and transformation)
"Food Sovereignty attempts to increase local and diversified domestic production, recovering,
validating, and divulging traditional models of agricultural production in an environmentally, socially,
and culturally sustainable manner. It supports endogenous agricultural development models and the
right to produce food."
Category Three: Commercialization
"Food Sovereignty protects the rights of farmers, landless rural workers, fishers, shepherds, and
indigenous counties to sell their products to feed their local population. Such action implies the
creation and support of local markets, and impulse of direct selling or at least with a minimum of
intermediaries, depending on the context."
Category Four: Food consumption and Right to Food
"Food Sovereignty protects citizens' right to consume healthy, nutritive, and culturally appropriated
food, which comes from local producers and is elaborated with agroecological techniques."
Category Five: Agrarian Policies and Civil Society Organization
"Food Sovereignty protects farmers' right to know, participate, and influence over the local public
policies related to Food Sovereignty."
30
While these categories cover fundamental components of the food sovereignty proposal and hence
stand as a good initial approach to measure it, in time, the proposal has included a strong call for
gender equity (Tayyib et al., 2013) being gender one of the new pillars of the proposal (Dekeyser et
al., 2018). Thus, the original categories left unattended a key component of food sovereignty: gender
equality; and hence fell short of providing a holistic picture of the system. As Sisto (2006) pointed
out: "addressing gender and socio‐economic concerns are key to promoting sustainable agricultural
development and natural resources management." The food sovereignty proposal contemplated
gender equality since its early beginnings as a transversal objective, but it started to become a central
issue as a result of peasant women participation in the organization and their efforts to introduce
feminist perspectives within the proposal (Desmarais, 2007; Garcia Forés, 2014; Siliprandi & Zuluaga,
2014). As Puleo (2009) suggests, "one of the most eloquent expressions of today's meeting between
the feminist viewpoint and ecology is the phenomenon of protest groups of women in the struggle for
food sovereignty." In that manner, gender issues have become central to the proposal, suggesting
the need to add a new category. Accordingly, we propose Gender as category six.
Attributes within food sovereignty categories and selection of indicators
The categories were divided into subcategories representing every attribute of the category's
objective (Figure 2). Once achieved a clear interpretation of the concept and the principles for each
category, we proceed to select the indicators (steps 3 to 6 in figure 1). In that sense, each of the
categories' objectives was assessed so that every indicator added unique information, ensuring that
the indicators jointly reflected the category's objective without redundancy. Ideally, every sub-
category should present at least one indicator. However, the lack of publicly available information in
many of them made it impossible to do so, resulting in some categories with no indicators. Blank sub-
categories are shown in Table 1 as empty sub-categories. The final collection consists of 97 indicators.
Almost every indicator has been standardized by dividing it with another variable to allow for
comparability across countries (e.g., agricultural tractors and capital stock in agriculture are divided
by agricultural area and agricultural income per capita respectively, see supplementary sources).
Resulting indicators were distributed among the sixth category and the corresponding sub-category,
as shown in Table 1.
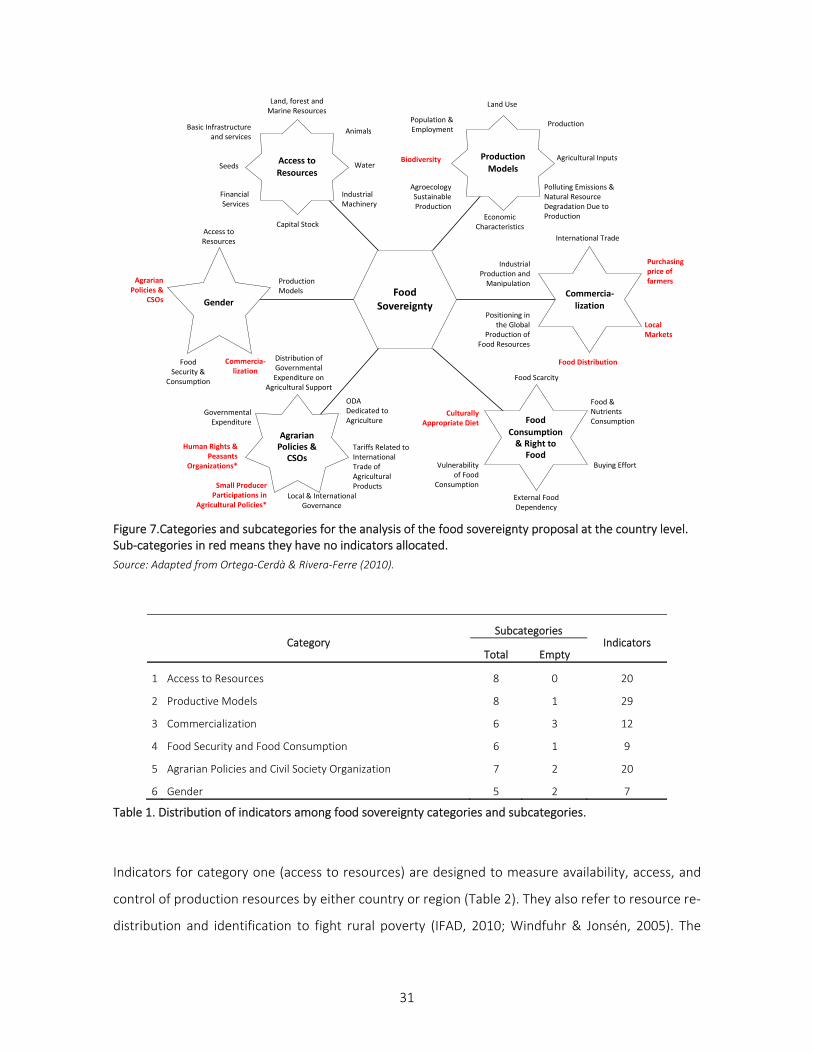
31
Figure 7.Categories and subcategories for the analysis of the food sovereignty proposal at the country level. Sub-categories in red means they have no indicators allocated.
Source: Adapted from Ortega‐Cerdà & Rivera‐Ferre (2010).
Category Subcategories
Indicators Total Empty
1 Access to Resources 8 0 20
2 Productive Models 8 1 29
3 Commercialization 6 3 12
4 Food Security and Food Consumption 6 1 9
5 Agrarian Policies and Civil Society Organization 7 2 20
6 Gender 5 2 7
Table 1. Distribution of indicators among food sovereignty categories and subcategories.
Indicators for category one (access to resources) are designed to measure availability, access, and
control of production resources by either country or region (Table 2). They also refer to resource re-
distribution and identification to fight rural poverty (IFAD, 2010; Windfuhr & Jonsén, 2005). The
Food Sovereignty
Basic Infrastructure and services
Land, forest and Marine Resources
Animals
Capital Stock
Water
Industrial Machinery
Financial Services
Seeds
Population & Employment
Land Use
Production
Economic Characteristics
Agricultural Inputs
Polluting Emissions & Natural Resource Degradation Due to Production
Agroecology Sustainable Production
Biodiversity
Industrial Production and Manipulation
International Trade
Purchasing price of farmers
Food Distribution
Local Markets
Positioning in the Global
Production of Food Resources
Culturally Appropriate Diet
Food Scarcity
Food & Nutrients Consumption
External Food Dependency
Buying EffortVulnerability of Food
Consumption
Access to
Resources
GenderCommercia‐lization
Food Consumption & Right to
Food
Agrarian Policies & CSOs
Production
Models
Distribution of Governmental Expenditure on
Agricultural Support
Governmental Expenditure
Local & International Governance
Tariffs Related to International Trade of Agricultural Products
Human Rights & Peasants
Organizations*
ODA Dedicated to Agriculture
Small Producer Participations in
Agricultural Policies*
Access to Resources
Production Models
Commercia‐lization
Food Security &
Consumption
Agrarian Policies &
CSOs
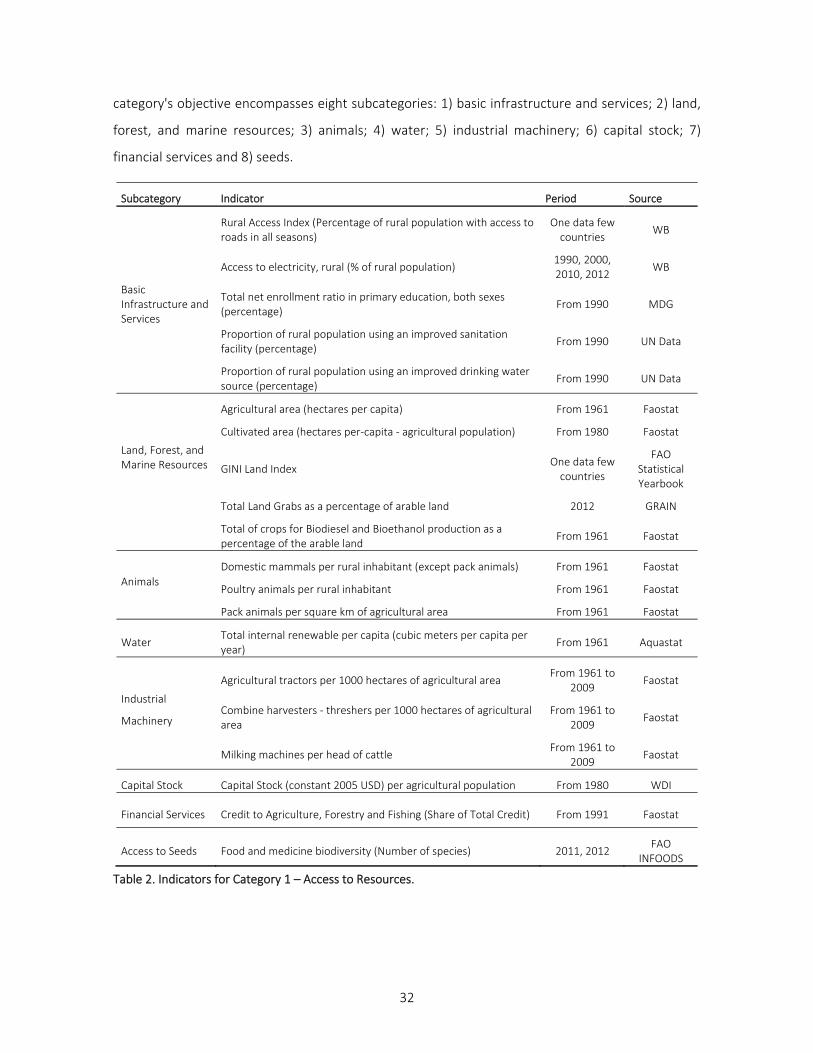
32
category's objective encompasses eight subcategories: 1) basic infrastructure and services; 2) land,
forest, and marine resources; 3) animals; 4) water; 5) industrial machinery; 6) capital stock; 7)
financial services and 8) seeds.
Subcategory Indicator Period Source
Basic Infrastructure and Services
Rural Access Index (Percentage of rural population with access to roads in all seasons)
One data few countries
WB
Access to electricity, rural (% of rural population) 1990, 2000, 2010, 2012
WB
Total net enrollment ratio in primary education, both sexes (percentage)
From 1990 MDG
Proportion of rural population using an improved sanitation facility (percentage)
From 1990 UN Data
Proportion of rural population using an improved drinking water source (percentage)
From 1990 UN Data
Land, Forest, and Marine Resources
Agricultural area (hectares per capita) From 1961 Faostat
Cultivated area (hectares per-capita - agricultural population) From 1980 Faostat
GINI Land Index One data few
countries
FAO Statistical Yearbook
Total Land Grabs as a percentage of arable land 2012 GRAIN
Total of crops for Biodiesel and Bioethanol production as a percentage of the arable land
From 1961 Faostat
Animals
Domestic mammals per rural inhabitant (except pack animals) From 1961 Faostat
Poultry animals per rural inhabitant From 1961 Faostat
Pack animals per square km of agricultural area From 1961 Faostat
Water Total internal renewable per capita (cubic meters per capita per year)
From 1961 Aquastat
Industrial
Machinery
Agricultural tractors per 1000 hectares of agricultural area From 1961 to
2009 Faostat
Combine harvesters - threshers per 1000 hectares of agricultural area
From 1961 to 2009
Faostat
Milking machines per head of cattle From 1961 to
2009 Faostat
Capital Stock Capital Stock (constant 2005 USD) per agricultural population From 1980 WDI
Financial Services Credit to Agriculture, Forestry and Fishing (Share of Total Credit) From 1991 Faostat
Access to Seeds Food and medicine biodiversity (Number of species) 2011, 2012 FAO
INFOODS
Table 2. Indicators for Category 1 – Access to Resources.
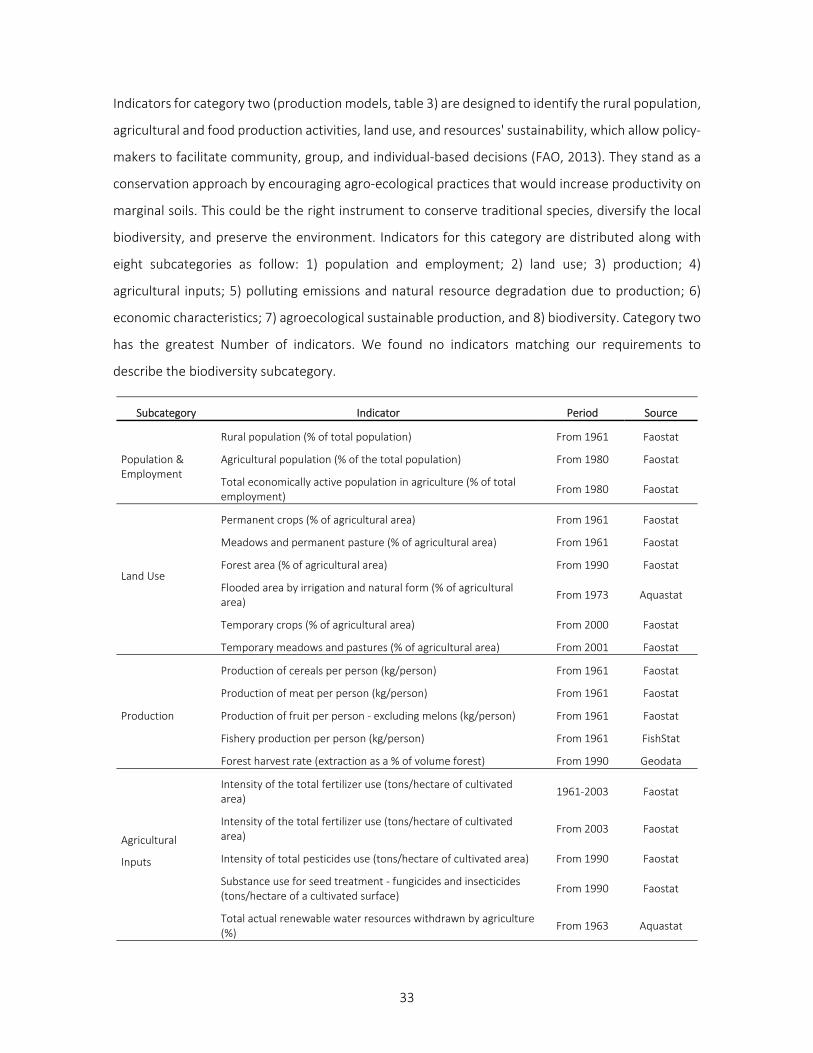
33
Indicators for category two (production models, table 3) are designed to identify the rural population,
agricultural and food production activities, land use, and resources' sustainability, which allow policy-
makers to facilitate community, group, and individual-based decisions (FAO, 2013). They stand as a
conservation approach by encouraging agro-ecological practices that would increase productivity on
marginal soils. This could be the right instrument to conserve traditional species, diversify the local
biodiversity, and preserve the environment. Indicators for this category are distributed along with
eight subcategories as follow: 1) population and employment; 2) land use; 3) production; 4)
agricultural inputs; 5) polluting emissions and natural resource degradation due to production; 6)
economic characteristics; 7) agroecological sustainable production, and 8) biodiversity. Category two
has the greatest Number of indicators. We found no indicators matching our requirements to
describe the biodiversity subcategory.
Subcategory Indicator Period Source
Population & Employment
Rural population (% of total population) From 1961 Faostat
Agricultural population (% of the total population) From 1980 Faostat
Total economically active population in agriculture (% of total employment)
From 1980 Faostat
Land Use
Permanent crops (% of agricultural area) From 1961 Faostat
Meadows and permanent pasture (% of agricultural area) From 1961 Faostat
Forest area (% of agricultural area) From 1990 Faostat
Flooded area by irrigation and natural form (% of agricultural area)
From 1973 Aquastat
Temporary crops (% of agricultural area) From 2000 Faostat
Temporary meadows and pastures (% of agricultural area) From 2001 Faostat
Production
Production of cereals per person (kg/person) From 1961 Faostat
Production of meat per person (kg/person) From 1961 Faostat
Production of fruit per person - excluding melons (kg/person) From 1961 Faostat
Fishery production per person (kg/person) From 1961 FishStat
Forest harvest rate (extraction as a % of volume forest) From 1990 Geodata
Agricultural
Inputs
Intensity of the total fertilizer use (tons/hectare of cultivated area)
1961-2003 Faostat
Intensity of the total fertilizer use (tons/hectare of cultivated area)
From 2003 Faostat
Intensity of total pesticides use (tons/hectare of cultivated area) From 1990 Faostat
Substance use for seed treatment - fungicides and insecticides (tons/hectare of a cultivated surface)
From 1990 Faostat
Total actual renewable water resources withdrawn by agriculture (%)
From 1963 Aquastat
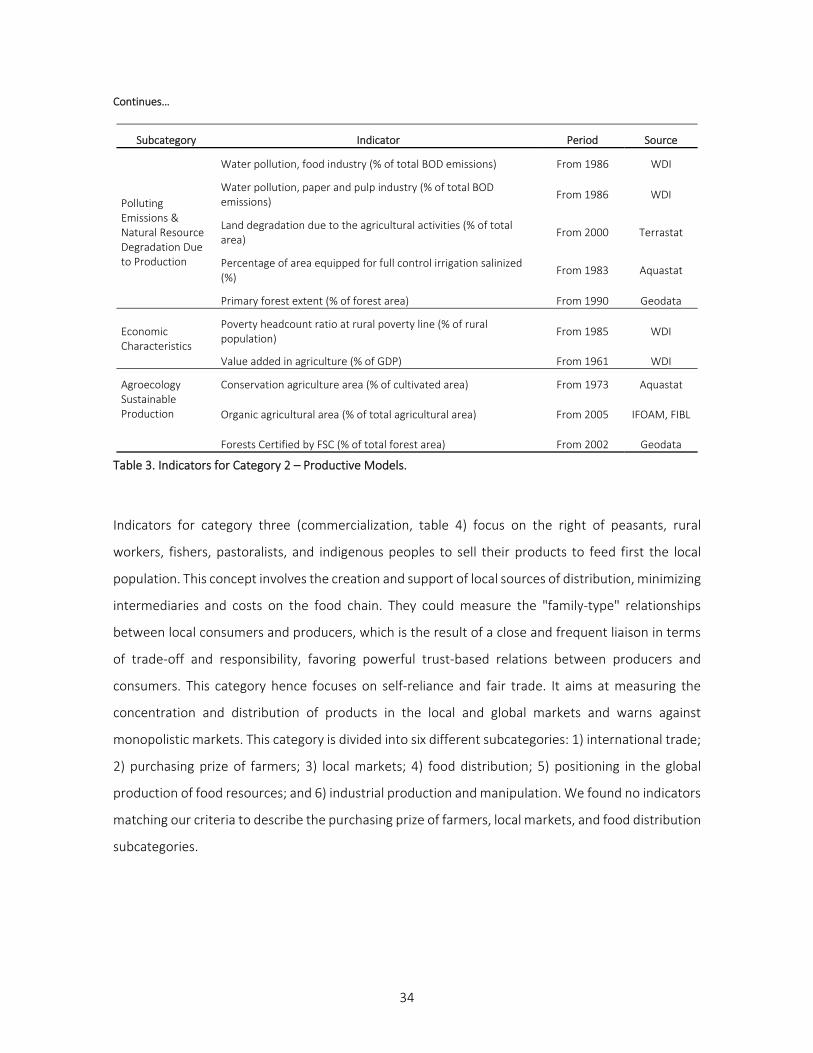
34
Continues…
Subcategory Indicator Period Source
Polluting Emissions & Natural Resource Degradation Due to Production
Water pollution, food industry (% of total BOD emissions) From 1986 WDI
Water pollution, paper and pulp industry (% of total BOD emissions)
From 1986 WDI
Land degradation due to the agricultural activities (% of total area)
From 2000 Terrastat
Percentage of area equipped for full control irrigation salinized (%)
From 1983 Aquastat
Primary forest extent (% of forest area) From 1990 Geodata
Economic Characteristics
Poverty headcount ratio at rural poverty line (% of rural population)
From 1985 WDI
Value added in agriculture (% of GDP) From 1961 WDI
Agroecology Sustainable Production
Conservation agriculture area (% of cultivated area) From 1973 Aquastat
Organic agricultural area (% of total agricultural area) From 2005 IFOAM, FIBL
Forests Certified by FSC (% of total forest area) From 2002 Geodata
Table 3. Indicators for Category 2 – Productive Models.
Indicators for category three (commercialization, table 4) focus on the right of peasants, rural
workers, fishers, pastoralists, and indigenous peoples to sell their products to feed first the local
population. This concept involves the creation and support of local sources of distribution, minimizing
intermediaries and costs on the food chain. They could measure the "family-type" relationships
between local consumers and producers, which is the result of a close and frequent liaison in terms
of trade-off and responsibility, favoring powerful trust-based relations between producers and
consumers. This category hence focuses on self-reliance and fair trade. It aims at measuring the
concentration and distribution of products in the local and global markets and warns against
monopolistic markets. This category is divided into six different subcategories: 1) international trade;
2) purchasing prize of farmers; 3) local markets; 4) food distribution; 5) positioning in the global
production of food resources; and 6) industrial production and manipulation. We found no indicators
matching our criteria to describe the purchasing prize of farmers, local markets, and food distribution
subcategories.
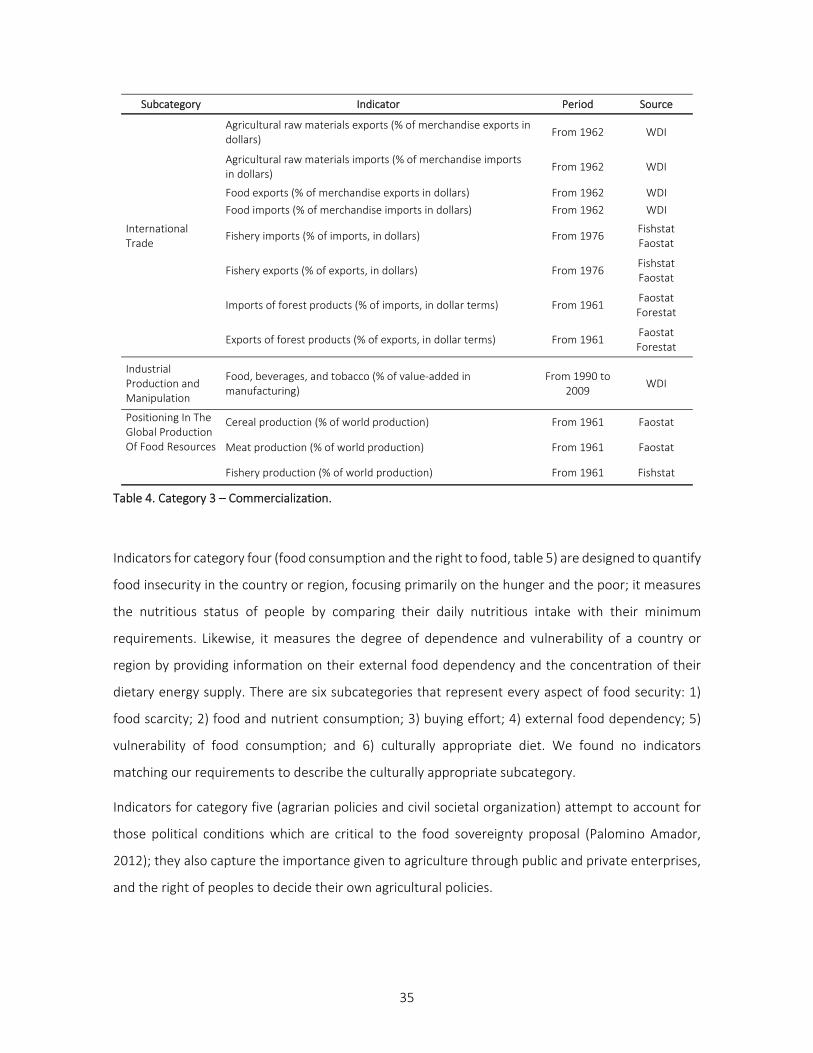
35
Subcategory Indicator Period Source
International Trade
Agricultural raw materials exports (% of merchandise exports in dollars)
From 1962 WDI
Agricultural raw materials imports (% of merchandise imports in dollars)
From 1962 WDI
Food exports (% of merchandise exports in dollars) From 1962 WDI
Food imports (% of merchandise imports in dollars) From 1962 WDI
Fishery imports (% of imports, in dollars) From 1976 Fishstat Faostat
Fishery exports (% of exports, in dollars) From 1976 Fishstat Faostat
Imports of forest products (% of imports, in dollar terms) From 1961 Faostat Forestat
Exports of forest products (% of exports, in dollar terms) From 1961 Faostat Forestat
Industrial Production and Manipulation
Food, beverages, and tobacco (% of value-added in manufacturing)
From 1990 to 2009
WDI
Positioning In The Global Production Of Food Resources
Cereal production (% of world production) From 1961 Faostat
Meat production (% of world production) From 1961 Faostat
Fishery production (% of world production) From 1961 Fishstat
Table 4. Category 3 – Commercialization.
Indicators for category four (food consumption and the right to food, table 5) are designed to quantify
food insecurity in the country or region, focusing primarily on the hunger and the poor; it measures
the nutritious status of people by comparing their daily nutritious intake with their minimum
requirements. Likewise, it measures the degree of dependence and vulnerability of a country or
region by providing information on their external food dependency and the concentration of their
dietary energy supply. There are six subcategories that represent every aspect of food security: 1)
food scarcity; 2) food and nutrient consumption; 3) buying effort; 4) external food dependency; 5)
vulnerability of food consumption; and 6) culturally appropriate diet. We found no indicators
matching our requirements to describe the culturally appropriate subcategory.
Indicators for category five (agrarian policies and civil societal organization) attempt to account for
those political conditions which are critical to the food sovereignty proposal (Palomino Amador,
2012); they also capture the importance given to agriculture through public and private enterprises,
and the right of peoples to decide their own agricultural policies.
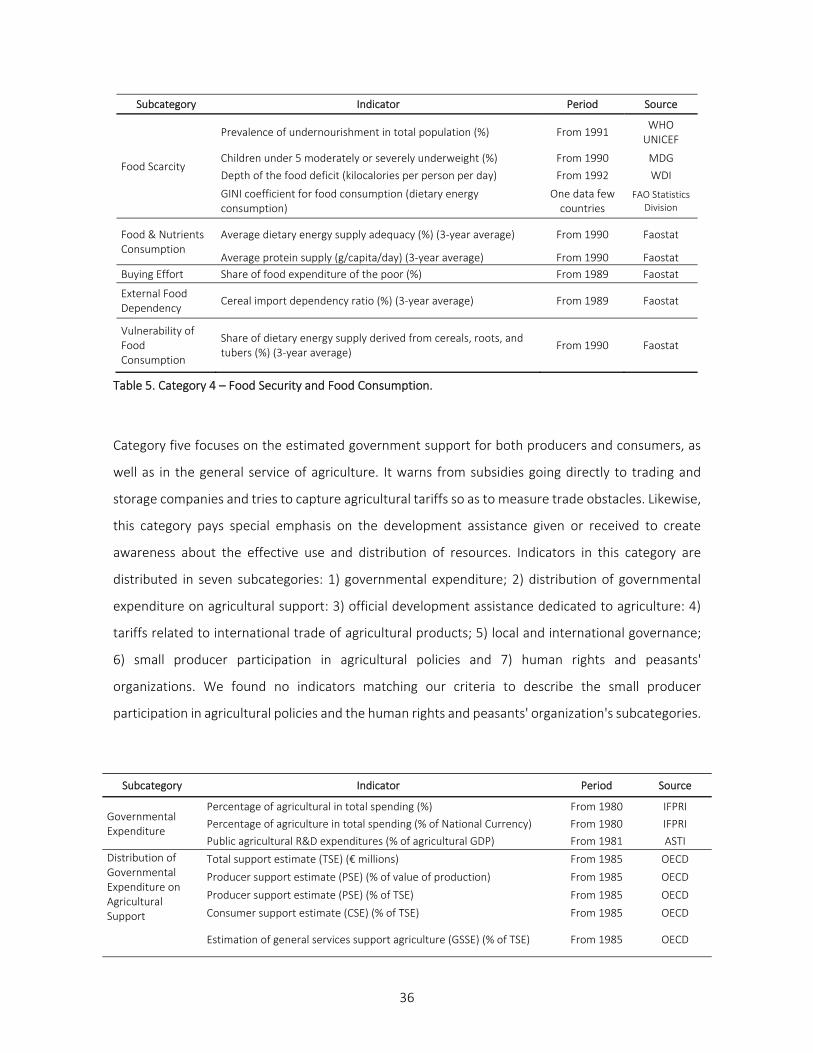
36
Subcategory Indicator Period Source
Food Scarcity
Prevalence of undernourishment in total population (%) From 1991 WHO
UNICEF
Children under 5 moderately or severely underweight (%) From 1990 MDG
Depth of the food deficit (kilocalories per person per day) From 1992 WDI
GINI coefficient for food consumption (dietary energy consumption)
One data few countries
FAO Statistics Division
Food & Nutrients Consumption
Average dietary energy supply adequacy (%) (3-year average) From 1990 Faostat
Average protein supply (g/capita/day) (3-year average) From 1990 Faostat
Buying Effort Share of food expenditure of the poor (%) From 1989 Faostat
External Food Dependency
Cereal import dependency ratio (%) (3-year average) From 1989 Faostat
Vulnerability of Food Consumption
Share of dietary energy supply derived from cereals, roots, and tubers (%) (3-year average)
From 1990 Faostat
Table 5. Category 4 – Food Security and Food Consumption.
Category five focuses on the estimated government support for both producers and consumers, as
well as in the general service of agriculture. It warns from subsidies going directly to trading and
storage companies and tries to capture agricultural tariffs so as to measure trade obstacles. Likewise,
this category pays special emphasis on the development assistance given or received to create
awareness about the effective use and distribution of resources. Indicators in this category are
distributed in seven subcategories: 1) governmental expenditure; 2) distribution of governmental
expenditure on agricultural support: 3) official development assistance dedicated to agriculture: 4)
tariffs related to international trade of agricultural products; 5) local and international governance;
6) small producer participation in agricultural policies and 7) human rights and peasants'
organizations. We found no indicators matching our criteria to describe the small producer
participation in agricultural policies and the human rights and peasants' organization's subcategories.
Subcategory Indicator Period Source
Governmental Expenditure
Percentage of agricultural in total spending (%) From 1980 IFPRI
Percentage of agriculture in total spending (% of National Currency) From 1980 IFPRI
Public agricultural R&D expenditures (% of agricultural GDP) From 1981 ASTI
Distribution of Governmental Expenditure on Agricultural Support
Total support estimate (TSE) (€ millions) From 1985 OECD
Producer support estimate (PSE) (% of value of production) From 1985 OECD
Producer support estimate (PSE) (% of TSE) From 1985 OECD
Consumer support estimate (CSE) (% of TSE) From 1985 OECD
Estimation of general services support agriculture (GSSE) (% of TSE) From 1985 OECD
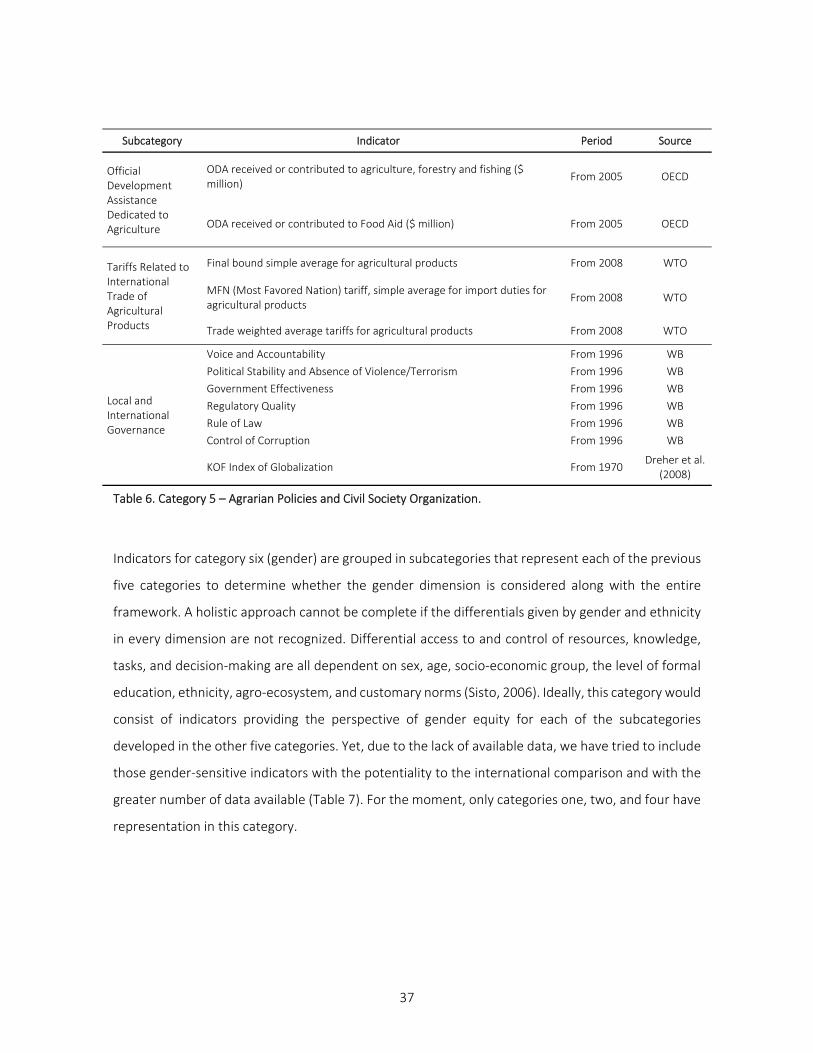
37
Subcategory Indicator Period Source
Official Development Assistance Dedicated to Agriculture
ODA received or contributed to agriculture, forestry and fishing ($ million)
From 2005 OECD
ODA received or contributed to Food Aid ($ million) From 2005 OECD
Tariffs Related to International Trade of Agricultural Products
Final bound simple average for agricultural products From 2008 WTO
MFN (Most Favored Nation) tariff, simple average for import duties for agricultural products
From 2008 WTO
Trade weighted average tariffs for agricultural products From 2008 WTO
Local and International Governance
Voice and Accountability From 1996 WB
Political Stability and Absence of Violence/Terrorism From 1996 WB
Government Effectiveness From 1996 WB
Regulatory Quality From 1996 WB
Rule of Law From 1996 WB
Control of Corruption From 1996 WB
KOF Index of Globalization From 1970 Dreher et al.
(2008)
Table 6. Category 5 – Agrarian Policies and Civil Society Organization.
Indicators for category six (gender) are grouped in subcategories that represent each of the previous
five categories to determine whether the gender dimension is considered along with the entire
framework. A holistic approach cannot be complete if the differentials given by gender and ethnicity
in every dimension are not recognized. Differential access to and control of resources, knowledge,
tasks, and decision-making are all dependent on sex, age, socio-economic group, the level of formal
education, ethnicity, agro-ecosystem, and customary norms (Sisto, 2006). Ideally, this category would
consist of indicators providing the perspective of gender equity for each of the subcategories
developed in the other five categories. Yet, due to the lack of available data, we have tried to include
those gender-sensitive indicators with the potentiality to the international comparison and with the
greater number of data available (Table 7). For the moment, only categories one, two, and four have
representation in this category.
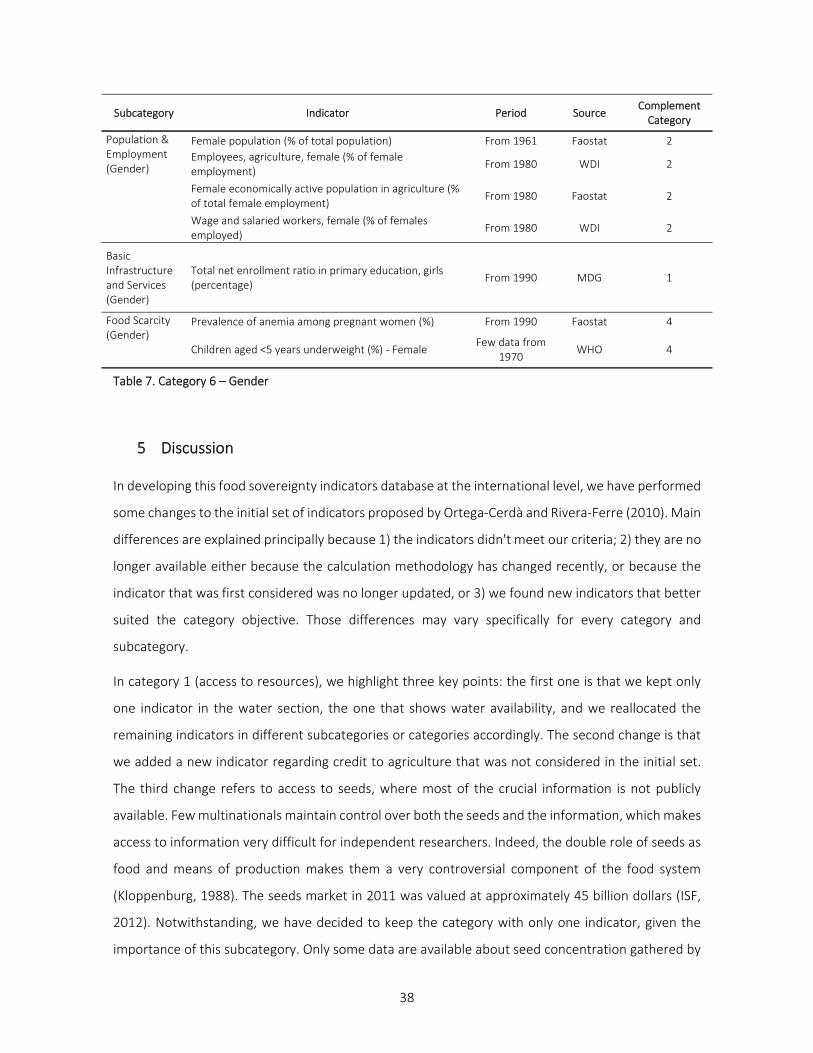
38
Subcategory Indicator Period Source Complement
Category
Population & Employment (Gender)
Female population (% of total population) From 1961 Faostat 2
Employees, agriculture, female (% of female employment)
From 1980 WDI 2
Female economically active population in agriculture (% of total female employment)
From 1980 Faostat 2
Wage and salaried workers, female (% of females employed)
From 1980 WDI 2
Basic Infrastructure and Services (Gender)
Total net enrollment ratio in primary education, girls (percentage)
From 1990 MDG 1
Food Scarcity (Gender)
Prevalence of anemia among pregnant women (%) From 1990 Faostat 4
Children aged <5 years underweight (%) - Female Few data from
1970 WHO 4
Table 7. Category 6 – Gender
5 Discussion
In developing this food sovereignty indicators database at the international level, we have performed
some changes to the initial set of indicators proposed by Ortega-Cerdà and Rivera-Ferre (2010). Main
differences are explained principally because 1) the indicators didn't meet our criteria; 2) they are no
longer available either because the calculation methodology has changed recently, or because the
indicator that was first considered was no longer updated, or 3) we found new indicators that better
suited the category objective. Those differences may vary specifically for every category and
subcategory.
In category 1 (access to resources), we highlight three key points: the first one is that we kept only
one indicator in the water section, the one that shows water availability, and we reallocated the
remaining indicators in different subcategories or categories accordingly. The second change is that
we added a new indicator regarding credit to agriculture that was not considered in the initial set.
The third change refers to access to seeds, where most of the crucial information is not publicly
available. Few multinationals maintain control over both the seeds and the information, which makes
access to information very difficult for independent researchers. Indeed, the double role of seeds as
food and means of production makes them a very controversial component of the food system
(Kloppenburg, 1988). The seeds market in 2011 was valued at approximately 45 billion dollars (ISF,
2012). Notwithstanding, we have decided to keep the category with only one indicator, given the
importance of this subcategory. Only some data are available about seed concentration gathered by
39
NGOs (see ETC (2012)), but the methodology used is not clearly explained, and so we have not
included their data in our database. Also, data about local seeds and the relevance for peasants do
not exist. Finally, despite the lack of data, we have maintained two important indicators that add
transcendental information to the category's objective: Rural Access Index and GINI land index. Both
of them show few data for some countries; in the case of the first one, it covers connectivity of rural
areas and is calculated once (between 1993 and 2004) for more than 200 countries and territories.
The later reflects the concentration of land ownership, and was calculated once for 184 countries
and territories, in years ranging from 1994 to 2002.
In category two, Ortega-Cerdà and Rivera-Ferre (2010) considered indicators in the subcategory
agricultural biodiversity and marine assessment, but we have removed them because they are not
available. Other indicators removed included those expressed as production indexes and those that
refer to companies' market share; both are important for individual analysis but do not allow for
country comparisons. Furthermore, we faced a major change in this category as a result of changes
in the main databases used: FAO changed the methodology to measure the use of fertilizers in 2003,
averting time analysis between databases, one from 1961 to 2003 and the other from 2003 to
present. We kept both databases as two different indicators.
The major challenge for category three (commercialization) was the lack of information concerning
local and national markets (Table 4). The indicators for this category focus on the analysis of the
international flow of food at the country level, making it difficult to know the specific problems for
each country. There are several specific studies that can be used for individual analysis, but we have
not identified an indicator that shows a comparison of internal food commerce. Another important
informational constraint attributable to this category is the lack of a specific indicator, comparable
across countries, on the purchasing price of farmers. Originally, we considered the "price paid to
farmers in terms of dollar per ton of the top five production goods in each country," but differences
in food production preferences for each country preclude an international comparison. Finally, the
subcategory of "food distribution" is also empty; we could not find a suitable indicator or group of
indicators that reflect distribution issues at the international level.
Category four (food consumption and the right to food, table 5) has suffered the most relevant
modifications in terms of the number of indicators. In 2011 FAOSTAT changed the Food Security
Database to improve the hunger estimates in a way that reflected the complexity of the problem. For
that reason, some indicators considered by Ortega-Cerdà and Rivera-Ferre, 2010) were left out of the
40
final database and replaced by new ones. For example, we had considered a subcategory
"vulnerability of food consumption" aimed at analyzing the country's dependency on the three food
groups to obtain daily requirements of energy, protein, and fat. However, indicators of food
consumption patterns were no longer available on FAO's databases, so the subcategory included a
single indicator "share of dietary energy supply derived from cereals, roots, and tubers (%)." The set
of indicators in this category missed the subcategory of "culturally appropriate diet" since it is a
qualitative analysis that has been done at regional levels but does not have a reliable quantitative
assessment at the international level that could be used for the purposes of this work. Finally, despite
the lack of data, we decided to keep the "GINI coefficient for food consumption" for its uniqueness
as it shows the inequality in the consumption of food.
Category five includes those indicators regarding the development of agricultural policies, one core
objective of the food sovereignty proposal, and governance aspects (Table 6). Category five did not
originally include indicators regarding civil society organizations because initially, food sovereignty
was mostly centered on the peasants' participation in the development of agricultural policies, and
thus, was focused on peasants' organizations. In time, however, and with the increased support of
new actors, the proposal has extended the need for participation across the whole society, stressing
the necessity to have not only strong peasants' organizations but also proactive civil society in general
(Calle Collado et al., 2011). The main challenge faced in this category was data availability since there
are limited data sources, and they do not entirely reflect the main objective of the category, which
are the evaluation of these policies and the involvement of producers in decision-making. Data
sources provide limited information; for example, the Organization for Economic Co-operation and
Development (OECD) contains only countries members and few other developing countries; and the
World Trade Organization (WTO) only published the last available data on their web page. Given the
emphasis given to direct democratic participation by the food sovereignty proposal, we considered
that social organization had to be a part of this category, so we included a new subcategory with a
set of indicators proposed in Palomino Amador (2012) to measure local and international
governance, which includes the World Bank's Governances indicators (Kaufmann et al., 2010) and
the KOF Index of Globalization (Dreher et al., 2008). Indicators for two subcategories are missing;
those reflecting small producers' participation in agricultural policies and those showing human rights
and peasant organizations in every country. Both categories are essential for the food sovereignty
proposal, but unfortunately, there is no information available at the international level.
41
With respect to category six, despite the efforts of some multilateral organizations to recognize the
importance of gender-sensitive indicators (GSI) with the aim of creating awareness of the different
impacts of a development intervention on men and women given their social-economic and cultural
differences, there is still very limited focus on GSIs on agricultural, food and nutrition statistics (Tayyib
et al., 2013) resulting in a lack of GSI at international level. Thus, there are not enough quantitative
gender studies related to food sovereignty to set a complete framework on the matter. There are
some projects that promise to fulfill this informational gap of information, such as the Women's
Empowerment in Agriculture Index (WEAI) developed by USAID for some countries since 2012. But
many of these efforts are still in progress and do not have any immediate result to be used in this
work.
As expected, there are a series of constraints for the consecution of the current research that
hindered the achievement of sufficient indicators in some of the categories. First, gathering indicators
of different nature (social, environmental, and economic) posits two main difficulties: (1) It may lead
to assume that the greater the number of indicators in the framework, the lower its individual
importance; and (2) despite the enormous amount of resulting indicators, there are certain aspects
of food sovereignty that cannot be tackled because of informational gaps (in other words, for certain
aspects the indicators do not clearly reflect the essence of food sovereignty as a whole, e.g., local
markets and GSI).
Second, there are many private interests in the agri-food system that make it difficult to access
information across countries. For example, we found that most databases offering information on
seeds were private. Similarly, countries that do not belong to international organisms of higher
organization level offer scarcer information in comparison to others, such as OECD countries, for
instance, offering more data than non-OECD.
Third, political instability obstructs to gather of consistent time series data. Plus, country information
should be based on detailed information collected at the field level by different government agencies;
for that reason, countries facing sociopolitical conflicts or with poor infrastructure often fail to report
accurate information to multilateral organizations. On the other hand, the geopolitical division of
many countries has changed over the past 50 years, particularly since the early 90s. Monitoring the
performance of the information beyond this date is a complicated task.
Finally, the lack of strong and stable gender-related databases, as well as the lack of a gender
perspective in data gathering at the international level, makes it very difficult to assess the gender
42
dimension on food sovereignty policies. Also, peasant women calling for food sovereignty does not
claim for a gender-focus of policies, but for a feminist focus, which also implies not only gathering GSI
but also looking for indicators that put at the center of the discussion both productive and
reproductive activities. The latest refers to those activities that sustain life (Pérez Orozco, 2014; Shiva
& Mies, 1998; Siliprandi & Zuluaga, 2014) which is considered probably the most important difference
between industrial agriculture (focused on growth and capital accumulation) and peasant agriculture
(focused on the reproduction of the system within the agroecological context) (Chayanov, 1991).
Despite these potential difficulties, some of which are inherent to the process of quantifying
qualitative factors, there are at least three target groups that can benefit from this work. First,
policymakers and non-governmental institutions could benefit from the adoption of an objective tool
that allows time comparison across regions or countries, and so facilitates the assessment of changes
in agricultural policies as well as the degree of sustainability of the food system from a food
sovereignty perspective. For instance, since one of the criteria for the eligibility of indicators is the
availability of publicly time series, these indicators can be used either jointly or individually (as
categories) as a reference to monitor specific public policy effects on time. Second, private
institutions and actors can use this set of indicators as a ground floor to establish specific action
niches for the various stakeholders (farmers, fishermen, consumers, policymakers, etc.), facilitating
comparability and decision-making. Finally, scholars, who can use the entire collection or a part of it
as instrumental variables for further statistical research, such as assessing how changes in any given
variable impact another variable with different nature; and in this manner, create connections
between economic variables and environmental or social ones in agri-food systems. To facilitate
access to the indicators, we have developed an on-line database publicly available
(https://foodsovereigntyindicators.uvic.cat/).
6 Potential applications of the database
There are many potential applications for this database. This may include the calculation of the status
of food sovereignty at regional (Çomak, 2012; Mohammed, 2012; Ruiz-Almeida, 2012) and world
level (Oteros-Rozas et al., forthcoming). The database could also be used to create a composed food
sovereignty index (FSvI). We have made some efforts in that direction (Comat, 2012), but we see
some problems in this particular regard. To develop a food sovereignty index, we have followed the
OECD Aggregated Environmental Indices (Goldberg, 2002), particularly synoptic indices, which claim
to give a comprehensive view of very complex things, such as food sovereignty. The food sovereignty
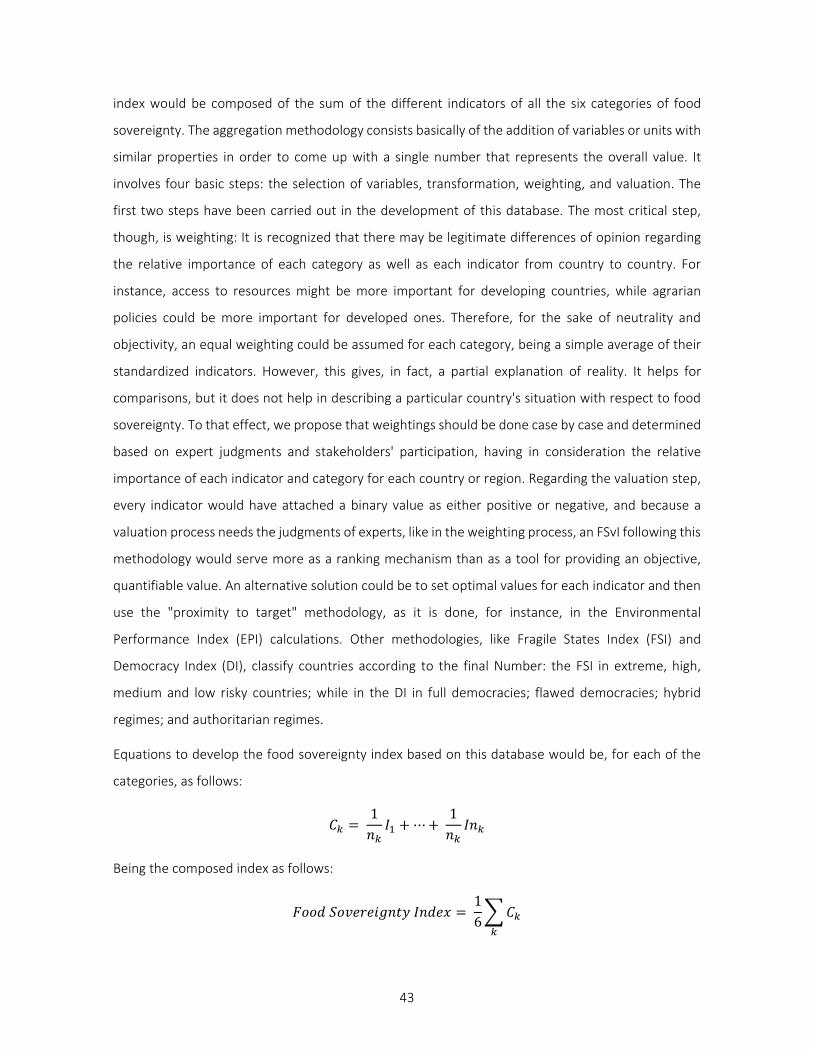
43
index would be composed of the sum of the different indicators of all the six categories of food
sovereignty. The aggregation methodology consists basically of the addition of variables or units with
similar properties in order to come up with a single number that represents the overall value. It
involves four basic steps: the selection of variables, transformation, weighting, and valuation. The
first two steps have been carried out in the development of this database. The most critical step,
though, is weighting: It is recognized that there may be legitimate differences of opinion regarding
the relative importance of each category as well as each indicator from country to country. For
instance, access to resources might be more important for developing countries, while agrarian
policies could be more important for developed ones. Therefore, for the sake of neutrality and
objectivity, an equal weighting could be assumed for each category, being a simple average of their
standardized indicators. However, this gives, in fact, a partial explanation of reality. It helps for
comparisons, but it does not help in describing a particular country's situation with respect to food
sovereignty. To that effect, we propose that weightings should be done case by case and determined
based on expert judgments and stakeholders' participation, having in consideration the relative
importance of each indicator and category for each country or region. Regarding the valuation step,
every indicator would have attached a binary value as either positive or negative, and because a
valuation process needs the judgments of experts, like in the weighting process, an FSvI following this
methodology would serve more as a ranking mechanism than as a tool for providing an objective,
quantifiable value. An alternative solution could be to set optimal values for each indicator and then
use the "proximity to target" methodology, as it is done, for instance, in the Environmental
Performance Index (EPI) calculations. Other methodologies, like Fragile States Index (FSI) and
Democracy Index (DI), classify countries according to the final Number: the FSI in extreme, high,
medium and low risky countries; while in the DI in full democracies; flawed democracies; hybrid
regimes; and authoritarian regimes.
Equations to develop the food sovereignty index based on this database would be, for each of the
categories, as follows:
𝐶 1𝑛𝐼 ⋯
1𝑛𝐼𝑛
Being the composed index as follows:
𝐹𝑜𝑜𝑑 𝑆𝑜𝑣𝑒𝑟𝑒𝑖𝑔𝑛𝑡𝑦 𝐼𝑛𝑑𝑒𝑥 16
𝐶
44
Where C refers to the categories and k=1,2…6 (the six categories) and Ink is the Number of indicators
in each category k.
Other uses of this database may include the analysis of food flows and its relationship with the
region's vulnerability to international markets change; correlation analysis among variables to
determine whether the six categories still stand in every region. The usefulness of this database is
also applicable to the assessment of the sustainability of the agri-food system as a complex socio-
ecological system, which can be done either through correlation analyses or network theory.
7 Concluding Remarks
Given the complexity of agri-food systems, which we understand as complex socio-ecological
systems, qualified with far-from-equilibrium states, co-evolution of system components, self-
organizing properties, non-linear dynamics, multivariable structure, high levels of uncertainty, control
of limiting factors, and cross-scale relationships in time and in space (Rivera-Ferre et al., 2013); the
quantitative analysis with regard to the sustainability of the agri-food system entails a number of
limitations that may discourage this kind of research. However, as Holling (2001) proposes, "we must
work in defining what is known, what is unknown and what is uncertain because we always stick to
the better judgment and not to the best certainty." Currently, there is a lack of consensus regarding
what specific characteristics a sustainable food system should have and how to define it. Thus,
different actors hold their own definitions. Small farmers have elaborated the food sovereignty
proposal as a potential option to develop their vision of how a sustainable food system should look
like.
The food sovereignty proposal offers a political framework to develop sustainable agri-food systems
from the perspective of small farmers. Nonetheless, to date, there are not enough quantitative
studies to analyze the efficiency of the proposal in achieving such an objective. The growing
acceptance of this concept as a robust and viable alternative to eradicate undernourishment,
promote rural development, and mitigate the environmental crisis, evidences the critical relevance
of this research.
The set of indicators here presented, hence, is motivated upon the adoption of food sovereignty
proposal in several countries, and by some multilateral organizations, and seeks to stand as
groundwork that contributes to the quantitative and qualitative analysis of the agri-food system as a
45
whole, with the aim to put forth tools that allow to measure and interpret the system functioning
and its degree of sustainability from a complex-systems perspective.
Throughout the development of this work, we faced difficulties in accessing information, either
because the information does not exist anymore or because it is in the hands of private entities that
constrain public access. These difficulties show how the measurement of a complex socio-ecological
system through indicators is not an easy task; indicators are continuously evolving and respond to
specific policy's needs and market interests. We are dealing with a dynamic set of indicators that
requires constant monitoring and update effort. By presenting a collection of indicators, we intend
to give flexibility for the application of this work since there are several ways in which these indicators
can be used.
The work here presented not only allows for further research aimed at measuring the sustainability
of the agri-food system from a food sovereignty perspective. It also emphasizes the need to analyze
agri-food systems holistically by advancing a set of indicators capable of adequately describing the
status of food systems at the country level and including the maximum amount of information
regarding various countries' agri-food systems description, with a standardized set of indicators as a
reference point.
References
Abubakar, M. S., & Attanda, M. L. (2013). The Concept of Sustainable Agriculture: Challenges and Prospects. IOP Conference Series: Materials Science and Engineering, 53, 012001. https://doi.org/10.1088/1757-899X/53/1/012001
Agarwal, B. (2014). Food sovereignty, food security, and democratic choice: critical contradictions, difficult conciliations. Journal of Peasant Studies, 41(6), 1247–1268. https://doi.org/10.1080/03066150.2013.876996
Allan, J. A. (1998). Virtual water: A strategic resource global solutions to regional deficits. In Ground Water (Vol. 36, Issue 4, pp. 545–546). https://doi.org/10.1111/j.1745-6584.1998.tb02825.x
Allen, P. (2013). Facing food security. Journal of Rural Studies, 29, 135–138. https://doi.org/10.1016/j.jrurstud.2012.12.002
Altieri, M. (2009). Agroecology, Small Farms, and Food Sovereignty. Monthly Review, 102–113. http://agroeco.org/wp-content/uploads/2010/09/Altieri-agroecoMR.pdf
Altieri, M. A. (1987). Agroecology: the scientific basis of alternative agriculture. In Agroecology: the scientific basis of alternative agriculture. Westview Press.
Altieri, M. A. (2009). Agroecology, Small Farms, and Food Sovereignty. Monthly Review, 102–113. http://agroeco.org/wp-content/uploads/2010/09/Altieri-agroecoMR.pdf
Altieri, M. A., & Nicholls, C. I. (2005). Agroecology and the Search for a Truly Sustainable Agriculture (First). United Nations Environment Programme.
Anderson, M. D. (2008). Rights-based food systems and the goals of food systems reform. Agriculture and Human Values2, 25, 593–608. https://doi.org/10.1007/s10460-008-9151-z
Anseeuw, W. (2013). The rush for land in Africa: Resource grabbing or green revolution? South African Journal of International Affairs, 20(1), 159–177. https://doi.org/10.1080/10220461.2013.780326
46
Badal, M., Binimelis, R., Gamboa, G., Heras, M., & Tendero, G. (2010). Arran de Terra. Indicadores participativos de Soberanía Alimentaria en Catalunya. http://www.ieeep.net/sobirania-alimentaria
Bajželj, B., Richards, K. S., Allwood, J. M., Smith, P., Dennis, J. S., Curmi, E., & Gilligan, C. A. (2014). Importance of food-demand management for climate mitigation. Nature Climate Change, 4(10), 924–929. https://doi.org/10.1038/nclimate2353
Batterbury, S., & Ndi, F. (2018). Land-grabbing in Africa Land-grabbing in Africa. January.
Béné, C., Oosterveer, P., Lamotte, L., Brouwer, I. D., de Haan, S., Prager, S. D., Talsma, E. F., & Khoury, C. K. (2019). When food systems meet sustainability – Current narratives and implications for actions. World Development, 113, 116–130. https://doi.org/10.1016/j.worlddev.2018.08.011
Bennett, E. M. (2017). Changing the agriculture and environment conversation. Nature Ecology and Evolution, 1(1), 1–2. https://doi.org/10.1038/s41559-016-0018
Berners-Lee, M., Kennelly, C., Watson, R., & Hewitt, C. N. (2018a). Current global food production is sufficient to meet human nutritional needs in 2050 provided there is radical societal adaptation. Elementa, 6. https://doi.org/10.1525/elementa.310
Berners-Lee, M., Kennelly, C., Watson, R., & Hewitt, C. N. (2018b). Current global food production is sufficient to meet human nutritional needs in 2050 provided there is radical societal adaptation. Elem Sci Anth, 6(1), 52. https://doi.org/10.1525/elementa.310
Bernstein, H. (2014). Food sovereignty via the ‘peasant way’: a sceptical view. Journal of Peasant Studies, 41(6), 1031–1063. https://doi.org/10.1080/03066150.2013.852082
Berry, E. M., Dernini, S., Burlingame, B., Meybeck, A., & Conforti, P. (2015). Food security and sustainability: Can one exist without the other? Public Health Nutrition, 18(13), 2293–2302. https://doi.org/10.1017/S136898001500021X
Binimelis, R., Rivera-Ferre, M. G., Tendero, G., Badal, M., Heras, M., Gamboa, G., & Ortega-Cerdà, M. (2014). Adapting established instruments to build useful food sovereignty indicators. Development Studies Research, 1(1), 324–339. https://doi.org/10.1080/21665095.2014.973527
Bockstaller, C., & Girardin, P. (2003). How to validate environmental indicators. Agricultural Systems, 76(2), 639–653. https://doi.org/10.1016/S0308-521X(02)00053-7
Breeman, G., Dijkman, J., & Termeer, C. (2015). Enhancing food security through a multi-stakeholder process: the global agenda for sustainable livestock. Food Security, 7(2), 425–435. https://doi.org/10.1007/s12571-015-0430-4
Burdock, R., & Ampt, P. (2017). Food Sovereignty: The Case and the Space for Community Led Agricultural Autonomy within the Global Strategic Framework for Food Security and Nutrition. Journal of Agricultural Science, 9(5), 1. https://doi.org/10.5539/jas.v9n5p1
Calle Collado, A., Soler Montiel, M., & Rivera-Ferre, M. G. (2011). Soberanía alimentaria y Agroecología Emergente: la democracia alimentaria. Democracia Radical: Entre Vínculos y Utopías, 213–238.
Campbell, B. M., Hansen, J., Rioux, J., Stirling, C. M., Twomlow, S., & Wollenberg, E. (Lini). (2018). Urgent action to combat climate change and its impacts (SDG 13): transforming agriculture and food systems. Current Opinion in Environmental Sustainability, 34(Sdg 13), 13–20. https://doi.org/10.1016/j.cosust.2018.06.005
Candel, J. J. L. (2014). Food security governance: A systematic literature review. Food Security, 6(4), 585–601. https://doi.org/10.1007/s12571-014-0364-2
Caparrós, M. (2014). El Hambre. Anagrama.
Carlsson, L., Callaghan, E., Morley, A., & Broman, G. (2017). Food system sustainability across scales: A proposed local-to-global approach to community planning and assessment. Sustainability (Switzerland), 9(6). https://doi.org/10.3390/su9061061
Chappell, M. J., & LaValle, L. A. (2011). Food security and biodiversity: Can we have both? An agroecological analysis. Agriculture and Human Values, 28(1), 3–26. https://doi.org/10.1007/s10460-009-9251-4
Chaudhary, A., & Brooks, T. M. (2017). National Consumption and Global Trade Impacts on Biodiversity. World Development. https://doi.org/10.1016/j.worlddev.2017.10.012
Chaudhary, A., Gustafson, D., & Mathys, A. (2018). Multi-indicator sustainability assessment of global food systems. Nature Communications, 9(1). https://doi.org/10.1038/s41467-018-03308-7
Chaudhary, A., & Kastner, T. (2016). Land use biodiversity impacts embodied in international food trade. Global Environmental Change, 38(May), 195–204. https://doi.org/10.1016/j.gloenvcha.2016.03.013
Chayanov, A. (1991). The Theory of Peasant Co-operatives. Ohio State University Press, USA.
Claeys, P. (2015a). Human Rights and the Food Sovereignty Movement: Reclaiming Control. Routledge.
Claeys, P. (2015b). Food Sovereignty and the Recognition of New Rights for Peasants at the UN: A Critical Overview of La Via Campesina’s Rights Claims over the Last 20 Years. Globalizations, 12(4), 452–465. https://doi.org/10.1080/14747731.2014.957929
Clark, W. C., van Kerkhoff, L., Lebel, L., & Gallopin, G. (2016). Crafting Usable Knowledge for Sustainable Development. Ssrn, 113(17), 4570–4578. https://doi.org/10.2139/ssrn.2782651
47
Collins, D. E., & Chandrasekaran, K. (2012). A Wolf in Sheep’s Clothing?-An analysis of the ‘sustainable intensification’ of agriculture. Friends of the Earth International, October. http://www.foei.org/wp-content/uploads/2013/12/Wolf-in-Sheeps-Clothing-for-web.pdf
Çomak, N. (2012). Food Sovereignty Indicators in Mediterranean Basin Countries and Comparative Analysis with other Indicators of Development and Sustainability. Universitat de Lleida.
Constance, D. H. (2008). The emancipatory question: The next step in the sociology of agrifood systems? Agriculture and Human Values, 25(2), 151–155. https://doi.org/10.1007/s10460-008-9114-4
Constance, D. H., Friedland, W. H., Renard, M.-C., & Rivera-Ferre, M. G. (2014). The Discourse on Alternative Agrifood Movements. 21, 3–46. https://doi.org/10.1108/S1057-192220140000021024
D’Odorico, P., Carr, J. A., Laio, F., Ridolfi, L., & Vandoni, S. (2014). Feeding humanity through global food trade Earth ’ s Future. Earth’s Future, 2, 458–469. https://doi.org/10.1002/2014EF000250
De Ponti, T., Rijk, B., & Van Ittersum, M. K. (2012). The crop yield gap between organic and conventional agriculture. Agricultural Systems, 108, 1–9. https://doi.org/10.1016/j.agsy.2011.12.004
De Schutter, O. (2014). Report of the Special Rapporteur on the right to food A/HRC/25/57. http://www.ohchr.org/EN/HRBodies/HRC/RegularSessions/Session25/Documents/A_HRC_25_57_ENG.DOC
DeClerck, F. A. J., Jones, S. K., Attwood, S., Bossio, D., Girvetz, E., Chaplin-Kramer, B., Enfors, E., Fremier, A. K., Gordon, L. J., Kizito, F., Lopez Noriega, I., Matthews, N., McCartney, M., Meacham, M., Noble, A., Quintero, M., Remans, R., Soppe, R., Willemen, L., … Zhang, W. (2016). Agricultural ecosystems and their services: the vanguard of sustainability? Current Opinion in Environmental Sustainability, 23, 92–99. https://doi.org/10.1016/j.cosust.2016.11.016
Dekeyser, K., Korsten, L., & Fioramonti, L. (2018). Food sovereignty : shifting debates on democratic food governance. Food Security, 10(1), 223–233. https://doi.org/10.1007/s12571-017-0763-2
Desmarais, A. A. (2003). The Via Campesina: Peasant Women at the Frontiers of Food Sovereignty. Canadian Woman Studies, 23(1), 140–145. http://pi.library.yorku.ca/ojs/index.php/cws/article/viewFile/6372/5560
Desmarais, A. A. (2007). La Via Campesina. Globalization and the power of the peasantry. Editorial Popular.
Devereux, S. (2000). Femine in the twentieth century (Vol. 1).
Dixon, J., Omwega, A. M., Friel, S., Burns, C., Donati, K., & Carlisle, R. (2007). The health equity dimensions of urban food systems. Journal of Urban Health, 84(SUPPL. 1), 118–129. https://doi.org/10.1007/s11524-007-9176-4
Dreher, A., Gaston, N., & Martens, P. (2008). Measuring Globalisation. Gauging Its Consequences. Springer. http://www.springer.com/de/book/9780387740676
Drewnowski, A., Rehm, C. D., Martin, A., Verger, E. O., Voinnesson, M., & Imbert, P. (2015). Energy and nutrient density of foods in relation to their carbon footprint. American Journal of Clinical Nutrition, 101(1), 184–191. https://doi.org/10.3945/ajcn.114.092486
Eakin, H., Connors, J. P., Wharton, C., Bertmann, F., Xiong, A., & Stoltzfus, J. (2017). Identifying attributes of food system sustainability: emerging themes and consensus. Agriculture and Human Values, 34(3), 757–773. https://doi.org/10.1007/s10460-016-9754-8
Easterly, W. (2015). The Trouble with the SDGs. Current History. http://www.currenthistory.com/Easterly_CurrentHistory.pdf
El Bilali, H. (2019). The multi-level perspective in research on sustainability transitions in agriculture and food systems: A systematic review. Agriculture (Switzerland), 9(4). https://doi.org/10.3390/agriculture9040074
Ericksen, P. J. (2008). Conceptualizing food systems for global environmental change research. Global Environmental Change, 18(1), 234–245. https://doi.org/10.1016/j.gloenvcha.2007.09.002
ETC. (2012). Just 3 companies control more than half (53%) of the global commercial market for seed. http://www.etcgroup.org/content/just-3-companies-control-more-half-53-global-commercial-market-seed
European Commission. (2020). A Farm to Fork Strategy for a fair, healthy and environmentally-friendly food system: Vol. COM(2020) (Issue 381). https://eur-lex.europa.eu/legal-content/EN/TXT/?qid=1590404602495&uri=CELEX%3A52020DC0381
FAO. (1996). Rome Declaration on World Food Security and World Food Summit Plan os Action. http://www.fao.org/docrep/003/w3613e/w3613e00.HTM
FAO. (2009). Global agriculture towards 2050. High Level Expert Forum-How to Feed the World 2050, 1–4. https://doi.org/http://www.fao.org/fileadmin/templates/wsfs/docs/Issues_papers/HLEF2050_Global_Agriculture.pdf
FAO. (2010). Climate-Smart Agriculture: Policies, Practices and Financing for Food Security, Adaptation and Mitigation. https://doi.org/10.1111/j.1467-6346.2009.02662.x
FAO. (2012). Thirty-second FAO Regional Conference for Latin America and the Caribbean (Issue March). http://www.fao.org/docrep/meeting/030/mj764e.pdf
FAO. (2013). El estado de la inseguridad alimentaria en el mundo. In Actividad Dietética. http://www.fao.org/docrep/019/i3434s/i3434s.pdf
48
FAO. (2017a). The State of Food and Agriculture - Leveraging Food Systems for Inclusive Rural Transformation (Vol. 2, Issue 7929). http://www.fao.org/3/a-I7658e.pdf%0Ahttp://www.ncbi.nlm.nih.gov/pubmed/24897208%5Cnhttp://www.ncbi.nlm.nih.gov/pmc/articles/PMC1319478/%0Ahttp://www.fao.org/3/a-i7658e.pdf
FAO. (2017b). The State of Food and Agriculture - Leveraging Food Systems for Inclusive Rural Transformation (Issue 7929). http://www.fao.org/3/a-I7658e.pdf%0Ahttp://www.ncbi.nlm.nih.gov/pubmed/24897208%5Cnhttp://www.ncbi.nlm.nih.gov/pmc/articles/PMC1319478/%0Ahttp://www.fao.org/3/a-i7658e.pdf
FAO. (2018). TRANSFORMING FOOD AND AGRICULTURE TO ACHIEVE THE SDGs. http://www.fao.org/3/I9900EN/i9900en.pdf
FAO. (2019). The State of the World’s Biodiversity for Food and Agriculture. In The State of the World’s Biodiversity for Food and Agriculture. https://doi.org/10.4060/ca3129en
FAO. (2020). Food Security and Nutrition in the World. In IEEE Journal of Selected Topics in Applied Earth Observations and Remote Sensing.
FAO, IFAD, UNICEF, WFP, & WHO. (2019). Review of The State of Food Security and Nutrition in the World 2019. Safeguarding against economic slowdowns and downturns. In World Nutrition (Vol. 10, Issue 3). https://doi.org/10.26596/wn.201910395-97
Foley, J. a., Ramankutty, N., Brauman, K. a., Cassidy, E. S., Gerber, J. S., Johnston, M., Mueller, N. D., O’Connell, C., Ray, D. K., West, P. C., Balzer, C., Bennett, E. M., Carpenter, S. R., Hill, J., Monfreda, C., Polasky, S., Rockström, J., Sheehan, J., Siebert, S., … Zaks, D. P. M. (2011). Solutions for a cultivated planet. Nature, 478(7369), 337–342. https://doi.org/10.1038/nature10452
Foley, J. A., Ramankutty, N., Brauman, K. A., Cassidy, E. S., Gerber, J. S., Johnston, M., Mueller, N. D., O ’connell, C., Ray, D. K., West, P. C., Balzer, C., Bennett, E. M., Carpenter, S. R., Hill, J., Monfreda, C., Polasky, S., Rockström, J., Sheehan, J., Siebert, S., … Zaks, D. P. M. (2011). Solutions for a cultivated planet. Nature, 478, 337–342. https://doi.org/10.1038/nature10452
Foran, T., Butler, J. R. A., Williams, L. J., Wanjura, W. J., Hall, A., Carter, L., & Carberry, P. S. (2014). Taking complexity in food systems seriously: An interdisciplinary analysis. World Development, 61, 85–101. https://doi.org/10.1016/j.worlddev.2014.03.023
Fullbrook, D. (2010). Food as Security. Food Security, 2(1), 5–20. https://doi.org/10.1007/s12571-009-0050-y
Galloway, J. N., Burke, M., Bradford, G. E., Naylor, R., Chapagain, A. K., Gaskell, J. C., Mccullough, E., Mooney, H. A., Oleson, L. L., Steinfeld, H., Wassenaar, T., Smil, V., Galloway, N., & Kirsten, L. L. (2007). Royal Swedish Academy of Sciences International Trade in Meat : The Tip of the Pork Chop International Pork Chop Trade in Meat : The Tip of the. International Trade in Meat: The Tip of the Pork Chop, 36(8), 622–629. file:///Users/dtgrassian/Dropbox/PhD/Resources/CORE%5Cntexts/2007-Galloway-Int’lMeatTrade.pdf
García, X. (2003). La Soberanía Alimentaria : un nuevo paradigma. Colección Soberanía Alimentaria de Veterinarios Sin Fronteras, 1–28.
Gasparatos, A., El-Haram, M., & Horner, M. (2008). A critical review of reductionist approaches for assessing the progress towards sustainability. Environmental Impact Assessment Review, 28(4–5), 286–311. https://doi.org/10.1016/j.eiar.2007.09.002
Giampietro, M., & Pimentel, D. (1993). The tightening conflict: Population, energy use, and the ecology of agriculture. NPG Forum, October, 1–8. http://alternativeenergy.procon.org/sourcefiles/TheTighteningConflict.pdf
Gliessman, S. R. (2002). Agroecología: Procesos Ecológicos en Agricultura Sostenible (E. Rodríguez, T. Benjamin, L. Rodríguez, & A. Cortés (eds.)). LITOCAT. http://academic.uprm.edu/dpesante/docs-apicultura/agroecologia-procesos ecologicos en agricultura sostenible.pdf
Gliessman, S. R. (2014). Agroecology: The Ecology of Sustainable Food Systems, Third Edition. CRC Press. http://books.google.com.mx/books?id=hoKfXwAACAAJ
Gliessman, S. R., Engles, E., & Krieger, R. (1998). Agroecology: ecological processes in sustainable agriculture. CRC Press.
Godfray, H. C. J., Beddington, J. R., Crute, I. R., Haddad, L., Lawrence, D., Muir, J. F., Pretty, J., Robinson, S., Thomas, S. M., & Toulmin, C. (2010). Food security: The challenge of feeding 9 billion people. Science, 327(5967), 812–818. https://doi.org/10.1126/science.1185383
Goeminne, G., & Paredis, E. (2010). The concept of ecological debt: Some steps towards an enriched sustainability paradigm. Environment, Development and Sustainability, 12(5), 691–712. https://doi.org/10.1007/s10668-009-9219-y
Goldberg, E. (2002). Aggregated Environmental Indices. Review of Aggregation Methodologies in Use. In Policy (ENV/EPOC/SE(2001)2/FINAL; Vol. 33, Issue October 2001).
Gomiero, T. (2019). Critical issues on Agri-food System Management: Addressing Complexity in Present and Future Challenges. Sustainability, 11(Special Issue). https://www.mdpi.com/journal/sustainability/special_issues/agrifood_system
Gustafson, D., Gutman, A., Leet, W., Drewnowski, A., Fanzo, J., & Ingram, J. (2016). Seven food system metrics of sustainable nutrition security. Sustainability (Switzerland), 8(3), 1–17. https://doi.org/10.3390/su8030196
Gustavsson, J., & Cederberg, C. (2011). Global food losses and food waste. In FAO. http://www.save-food.com/doc/Praesentation_Sonesson.pdf
49
HLPE. (2020). Food Security and Nutrition: Building a Global Narrative towards 2030. In Research Guides. https://research.un.org/en/foodsecurity/key-un-bodies
Holling, C. S. (2001). Understanding the Complexity of Economic, Ecological, and Social Systems. Ecosystems, 4(5), 390–405. https://doi.org/10.1007/s10021-001-0101-5
Holt-Giménez, E., & Altieri, M. A. (2012). Agroecology, Food Sovereignty and the New Green Revolution. Journal of Sustainable Agriculture, 37(March 2014), 90–102. https://doi.org/10.1080/10440046.2012.716388
Holt-Giménez, E., Shattuck, A., Altieri, M., Herren, H., & Gliessman, S. (2012). We Already Grow Enough Food for 10 Billion People... and Still Can’t End Hunger. Journal of Sustainable Agriculture, 36(6), 595–598. https://doi.org/10.1080/10440046.2012.695331
Hsu, A., Johnson, L. A., & Lloyd, A. (2013). Measuring Progress: A Practical Guide From the Developers of the Environmental Performance Index (EPI).
Hunter, M. C., Smith, R. G., Schipanski, M. E., Atwood, L. W., & Mortensen, D. A. (2017). Agriculture in 2050: Recalibrating targets for sustainable intensification. BioScience, 67(4), 386–391. https://doi.org/10.1093/biosci/bix010
ICSU, & ISSC. (2015). Review of Targets for the Sustainable Development Goals: The Science Perspective.
IFAD. (2010). Rural Poverty Report 2011. http://www.ifad.org/rpr2011/report/e/overview.pdf
IPBES. (2018). The IPBES regional assessment report on biodiversity and ecosystem services for Europe and Central Asia.
IPCC. (2007). Climate Change 2007: Impacts, Adaptation and Vulnerability.
iPES Food. (2015). The New Science of Sustainable Food Systems: Overcoming Barriers to Food Systems Reform. May, 20. http://www.ipes-food.org/first-report-from-ipes-food-who-shapes-food-systems-and-who-has-a-say-in-how-they-are-reformed
ISF. (2012). Domestic Market Value 2011 (Vol. 2011, Issue May).
Islam, D., & Berkes, F. (2016). Indigenous peoples’ fisheries and food security: a case from northern Canada. Food Security, 8(4), 815–826. https://doi.org/10.1007/s12571-016-0594-6
Jabareen, Y. (2009). Building a Conceptual Framework: Philosophy, Definitions, and Procedure. International Journal of Qualitative Methods, 8(4), 49–62. https://doi.org/10.1177/160940690900800406
Jackson, L. E., Kurtz, J. C., & Fisher, W. S. (2000). Evaluation guidelines for ecological indicators. EPA/620/R-99/005. In U.S. Environmental Protection Agency, Office of Research and Development. https://doi.org/10.1016/S1470-160X(01)00005-X
Jacobi, J., Mukhovi, S., Llanque, A., Augstburger, H., Käser, F., Pozo, C., Ngutu Peter, M., Delgado, J. M. F., Kiteme, B. P., Rist, S., & Ifejika Speranza, C. (2018). Operationalizing food system resilience: An indicator-based assessment in agroindustrial, smallholder farming, and agroecological contexts in Bolivia and Kenya. Land Use Policy, 79(September), 433–446. https://doi.org/10.1016/j.landusepol.2018.08.044
Kastner, T., Erb, K.-H., & Nonhebel, S. (2011). International wood trade and forest change: A global analysis. Global Environmental Change, 21(3), 947–956. https://doi.org/10.1016/j.gloenvcha.2011.05.003
Kastner, T., Schaffartzik, A., Eisenmenger, N., Erb, K. H., Haberl, H., & Krausmann, F. (2014). Cropland area embodied in international trade: Contradictory results from different approaches. Ecological Economics, 104, 140–144. https://doi.org/10.1016/j.ecolecon.2013.12.003
Kates, R. W., Parris, T. M., & Leiserowitz, A. A. (2005). What is Sustainable Development? Goals, Indicators, Values, and Practice. Environment: Science and Policy for Sustainable Development, 47(3), 8–21. https://doi.org/10.1080/00139157.2005.10524444
Kaufmann, D., Kraay, A., & Mastruzzi, M. (2010). The Worldwide Governance Indicators : A Summary of Methodology, Data and Analytical Issues. http://info.worldbank.org/governance/wgi/pdf/WGI.pdf
Khoury, C. K., Bjorkman, A. D., Dempewolf, H., Ramirez-Villegas, J., Guarino, L., Jarvis, A., Rieseberg, L. H., & Struik, P. C. (2014). Increasing homogeneity in global food supplies and the implications for food security. Proceedings of the National Academy of Sciences, 111(11), 4001–4006. https://doi.org/10.1073/pnas.1313490111
Kloppenburg, J. R. (1988). First the seed. The political economy of plant biotechnology, 1492-2000 (Second). The University of Wisconsin Press.
La Via Campesina. (1996). Food Sovereignty : A Future without Hunger. http://www.voiceoftheturtle.org/library/1996 Declaration of Food Sovereignty.pdf
La Via Campesina. (2007). II International Conference Of The Via Campesina Tlaxcala, Mexico, April 18-21. Tlaxcala Declaration of the Via Campesina. http://viacampesina.org/en/index.php/our-conferences-mainmenu-28/2-tlaxcala-1996-mainmenu-48/425-ii-international-conference-of-the-via-campesina-tlaxcala-mexico-april-18-21
Lang, T., & Barling, D. (2012). Food security and food sustainability: reformulating the debate. The Geographical Journal, 178(4), 313–326. https://doi.org/10.1111/j.1475-4959.2012.00480.x
50
Levidow, L., Pimbert, M., & Vanloqueren, G. (2014). Agroecological Research: Conforming—or Transforming the Dominant Agro-Food Regime? Agroecology and Sustainable Food Systems, 38(10), 1127–1155. https://doi.org/10.1080/21683565.2014.951459
Lim, M. M. L., Søgaard Jørgensen, P., & Wyborn, C. A. (2018). Reframing the sustainable development goals to achieve sustainable development in the anthropocene—a systems approach. Ecology and Society, 23(3). https://doi.org/10.5751/ES-10182-230322
Liu, J., Yang, W., & Li, S. (2016). Framing ecosystem services in the telecoupled Anthropocene. Frontiers in Ecology and the Environment, 14(1), 27–36. https://doi.org/10.1002/16-0188.1
Loos, J., Abson, D. J., Chappell, M. J., Hanspach, J., Mikulcak, F., Tichit, M., & Fischer, J. (2014). Putting meaning back into “sustainable intensification.” Frontiers in Ecology and the Environment, 12(6), 356–361. https://doi.org/10.1890/130157
MacDonald, G. K., Brauman, K. A., Sun, S., Carlson, K. M., Cassidy, E. S., Gerber, J. S., & West, P. C. (2015). Rethinking agricultural trade relationships in an era of globalization. BioScience, 65(3), 275–289. https://doi.org/10.1093/biosci/biu225
Macdonald, K. (2007). Globalising justice within coffee supply chains? Fair Trade, Starbucks and the transformation of supply chain governance. Third World Quarterly, 25(7), 793–812. https://doi.org/10.1080/01436590701336663
Maxwell, S. (1996). Food security : a post-modern perspective. Food Policy, 21(2), 155–170.
McIntyre, B. D., Herren, H. R., Wakhungu, J., & Watson, R. T. (2009). Agriculture at a Crossroads. : Synthesis Report (B. D. McIntyre, H. R. Herren, J. Wakhungu, & R. T. Watson (eds.)). Island Press. http://apps.unep.org/redirect.php?file=/publications/pmtdocuments/-Agriculture at a crossroads - Synthesis report-2009Agriculture_at_Crossroads_Synthesis_Report.pdf
McKenzie, F. C., & Williams, J. (2015). Sustainable food production: constraints, challenges and choices by 2050. Food Security, 7(2), 221–233. https://doi.org/10.1007/s12571-015-0441-1
McKeon, N. (n.d.). Food security governance : empowering communities, regulating corporations.
McMichael, P. (2005). Global Development and The Corporate Food Regime. In New Directions in the Sociology of Global Development (Vol. 11, pp. 269–303). Emerald Group Publishing Limited. https://doi.org/doi:10.1016/S1057-1922(05)11010-5
McMichael, P. (2006). Reframing Development: Global Peasant Movements and the New Agrarian Question. Canadian Journal of Development Studies / Revue Canadienne d’études Du Développement, 27(4), 471–483. https://doi.org/10.1080/02255189.2006.9669169
McMichael, P. (2009). A food regime analysis of the ‘world food crisis.’ Agriculture and Human Values, 26(4), 281–295. https://doi.org/10.1007/s10460-009-9218-5
Meyfroidt, P., Lambin, E. F., Erb, K. H., & Hertel, T. W. (2013). Globalization of land use: Distant drivers of land change and geographic displacement of land use. Current Opinion in Environmental Sustainability, 5(5), 438–444. https://doi.org/10.1016/j.cosust.2013.04.003
Mohammed, M. (2012). Pilot Food Sovereignty Index and Policy Recommendation to Alleviate Poverty, Hunger and Malnutrition in the Horn of Africa [Universitat Politècnica de Catalunya]. file:///Users/adrianaruizalmeida/Downloads/MOHAMMED%2525202012%252520Pilot%252520food%252520sovereignity%252520index%252520horn%252520of%252520Africa.pdf
Naghavi, M., Abajobir, A. A., Abbafati, C., Abbas, K. M., Abd-Allah, F., Abera, S. F., Aboyans, V., Adetokunboh, O., Ärnlöv, J., Afshin, A., Agrawal, A., Kiadaliri, A. A., Ahmadi, A., Ahmed, M. B., Aichour, A. N., Aichour, I., Aichour, M. T. E., Aiyar, S., Al-Eyadhy, A., … Murray, C. J. L. (2017). Global, regional, and national age-sex specifc mortality for 264 causes of death, 1980-2016: A systematic analysis for the Global Burden of Disease Study 2016. The Lancet, 390(10100), 1151–1210. https://doi.org/10.1016/S0140-6736(17)32152-9
Neher, D. (1992). Ecological sustainability in agricultural systems: definition and measurement. Journal of Sustainable Agriculture, 2, 51–61. http://www.tandfonline.com/doi/abs/10.1300/J064v02n03_05
Nelson, M. E., Hamm, M. W., Hu, F. B., Abrams, S. A., & Griffin, T. S. (2016). Alignment of Healthy Dietary Patterns and Environmental Sustainability : Advances in Nutrition, 7(3), 1005–1025. https://doi.org/10.3945/an.116.012567.rather
Nicastro, J. (2012, May 17). FAO accepts to debate food sovereignty. FAO, 1–2. http://lapress.org/articles.asp?art=6630
Niemeijer, D., & de Groot, R. S. (2008). A conceptual framework for selecting environmental indicator sets. Ecological Indicators, 8(1), 14–25. https://doi.org/10.1016/j.ecolind.2006.11.012
Nilsson, M., Chisholm, E., Griggs, D., Howden-Chapman, P., McCollum, D., Messerli, P., Neumann, B., Stevance, A. S., Visbeck, M., & Stafford-Smith, M. (2018). Mapping interactions between the sustainable development goals: lessons learned and ways forward. Sustainability Science, 13(6), 1–15. https://doi.org/10.1007/s11625-018-0604-z
Norman, D. W. (2002). The Farming Systems Approach: a Historical Perspective. 17th Symposium of the International Farming Systems Association, 13.
Ortega-Cerdà, M., & Rivera-Ferre, M. G. (2010). Indicadores internacionales de Soberanía Alimentaria . Nuevas herramientas para una nueva agricultura. Revista Iberoamericana, 14, 53–77. http://www.redibec.org/IVO/rev14_14.pdf
51
Ostrom, E. (2009). A general framework for analyzing sustainability of social-ecological systems. Science, 325(5939), 419–422. https://doi.org/10.1126/science.1172133
Otero, G., Pechlaner, G., & Gürcan, E. C. (2013). The Political Economy of “Food Security” and Trade: Uneven and Combined Dependency. Rural Sociology, 78(3), 263–289. https://doi.org/10.1111/ruso.12011
Oteros-Rozas, E., Ruiz-Almeida, A., Aguado, M., González, J. A., & Rivera-Ferre, M. G. (2019). A social–ecological analysis of the global agrifood system. Proceedings of the National Academy of Sciences, 116(52), 26465–26473. https://doi.org/10.1073/PNAS.1912710116
Our World in Data. (n.d.). Famines - Our World in Data. Retrieved October 11, 2020, from https://ourworldindata.org/famines
Palomino Amador, A. I. (2012). Evaluando el Estado de la Soberanía Alimentaria en el Mundo a través de Indicadores. Universidad Internacional de Andalucía.
Patel, R. (2009). Food sovereignty. Journal of Peasant Studies, 36(3), 663–706. https://doi.org/10.1080/03066150903143079
Patrick, C. (2011). Ecological Ethics. An Introduction. Polity Press.
Pérez Orozco, A. (2014). Subversión feminista de la economía. Traficante de Sueños. https://doi.org/M-15332-2014
Pimentel, D. (2008). Corn can’t save us: Debunking the biofuel myth. Kennebec Journal. http://www.resilience.org/stories/2008-02-25/biofuels-feb-25
Pittelkow, C. M., Liang, X., Linquist, B. A., Groenigen, L. J. Van, Lee, J., Lundy, M. E., Gestel, N. Van, Six, J., Venterea, R. T., & Kessel, C. Van. (2015). Productivity limits and potentials of the principles of conservation agriculture. Nature, 517(7534), 365–368. https://doi.org/10.1038/nature13809
Ponisio, L. C., M’Gonigle, L. K., Mace, K. C., Palomino, J., de Valpine, P., & Kremen, C. (2014). Diversification practices reduce organic to conventional yield gap. Proceedings of the Royal Society B: Biological Sciences, 282(1799), 20141396–20141396. https://doi.org/10.1098/rspb.2014.1396
Poore, J., & Nemecek, T. (2018). Reducing food’s environmental impacts through producers and consumers. Science, 360(6392), 987–992.
Porkka, M., Kummu, M., Siebert, S., & Varis, O. (2013). From food insufficiency towards trade dependency: A historical analysis of global food availability. PLoS ONE, 8(12). https://doi.org/10.1371/journal.pone.0082714
Porter, J. R., Xie, L., Challinor, A. J., Cochrane, K., Howden, S. M., Iqbal, M. M., Lobell, D. B., & Travasso, M. I. (2014). Food security and food production systems. Climate Change 2014: Impacts, Adaptation, and Vulnerability. Part A: Global and Sectoral Aspects. Contribution of Working Group II to the Fifth Assessment Report of the Intergovernmental Panel on Climate Change, 485–533. https://doi.org/10.1111/j.1728-4457.2009.00312.x
Pretty, J., Toulmin, C., & Williams, S. (2011). Sustainable intensification in African agriculture. International Journal of Agricultural Sustainability, 9(1), 5–24. https://doi.org/10.3763/ijas.2010.0583
Puleo, A. H. (2009). Ecofeminsmo.La perspectiva de género en la conscencia ecologista.pdf. In VV.AA. Claves del ecologismo social (pp. 169–172). Ecologistas en Acción. http://www.ecologistasalcalah.org/docs/ecof10.pdf
Raman, S., & Mohr, A. (2014). Biofuels and the role of space in sustainable innovation journeys. Journal of Cleaner Production, 65(100), 224–233. https://doi.org/10.1016/j.jclepro.2013.07.057
Raudsepp-Hearne, C., Peterson, G. D., Tengö, M., Bennett, E. M., Holland, T., Benessaiah, K., MacDonald, G. K., & Pfeifer, L. (2010). Untangling the Environmentalist’s Paradox: Why Is Human Well-being Increasing as Ecosystem Services Degrade? BioScience, 60(8), 576–589. https://doi.org/10.1525/bio.2010.60.8.4
Rivera-Ferre, M. G. (2008). The future of agriculture. EMBO Reports, 9(11), 1061–1066.
Rivera-Ferre, M. G. (2012). Framing of Agri-food Research Affects the Analysis of Food Security: The Critical Role of the Social Sciences. Int. Jrnl. of Soc. of Agr. & Food, 19(2), 162–175.
Rivera-Ferre, M. G., Ortega-Cerdà, M., & Baumgärtner, J. (2013). Rethinking Study and Management of Agricultural Systems for Policy Design. Sustainability, 5(9), 3858–3875. https://doi.org/10.3390/su5093858
Rivera-Ferre, M. G., Pereira, L., Karpouzoglou, T., Nicholas, A., Onzere, S., Waterlander, W., Mahomoodally, F., Vrieling, A., Babalola, F. D., Ummenhofer, C. C., Dogra, A., Conti, A. De, Baldermann, S., & Evoh, C. (2013). A vision for transdisciplinarity in Future Earth: Perspectives from young researchers. Journal of Agriculture, Food Systems and Community Development, 3(4), 249–260. https://doi.org/10.5304/jafscd.2013.034.031
Rockström, J., Steffen, W., Noone, K., Persson, Å., Chapin, F. S., Lambin, E., Lenton, T. M., Scheffer, M., Folke, C., Schellnhuber, H. J., Nykvist, B., de Wit, C. A., Hughes, T., van der Leeuw, S., Rodhe, H., Sörlin, S., Snyder, P. K., Costanza, R., Svedin, U., … Foley, J. (2009). Planetary boundaries: Exploring the safe operating space for humanity. Ecology and Society, 14(2). https://doi.org/10.5751/ES-03180-140232
Rosset, P. (2009). Fixing our Global Food System: Food Sovereignty and Redistributive Land Reform. Monthly Review, 61(3), 114. https://doi.org/10.14452/MR-061-03-2009-07_9
52
Rosset, P. (2011). Food Sovereignty and Alternative Paradigms to Confront Land Grabbing and the Food and Climate Crises. Development, 54(1), 21–30. http://dx.doi.org/10.1057/dev.2010.102
Rotberg, R., & Gisselquist, R. (2007). Ibrahim Index of African Governance. https://www.belfercenter.org/publication/ibrahim-index-african-governance
Ruiz-Almeida, A. (2012). Food Sovereignty in Latin America [Universitat Politècnica de Catalunya]. http://upcommons.upc.edu/bitstream/handle/2099.1/19268/TFM_RUIZ_ALMEIDA_ADRIANA.pdf?sequence=1&isAllowed=y
Ruiz-Almeida, A., & Rivera-Ferre, M. G. (n.d.). Internationally-based indicators to measure agri-food systems sustainability using food sovereignty as a conceptual framework. Food Systems.
Ruiz-Almeida, A., & Rivera-Ferre, M. G. (2019). Internationally-based indicators to measure Agri-food systems sustainability using food sovereignty as a conceptual framework. Food Security, 11(6), 1321–1337. https://doi.org/10.1007/s12571-019-00964-5
Samberg, L. H., Gerber, J. S., Ramankutty, N., Herrero, M., & West, P. C. (2016). Subnational distribution of average farm size and smallholder contributions to global food production. Environmental Research Letters, 11(12). https://doi.org/10.1088/1748-9326/11/12/124010
Sandhu, H., Müller, A., Sukhdev, P., Merrigan, K., Tenkouano, A., Kumar, P., Hussain, S., Zhang, W., Pengue, W., Gemmill-Herren, B., Hamm, M. W., Tirado von der Pahlen, M. C., Obst, C., Sharma, K., Gundimeda, H., Markandya, A., May, P., Platais, G., & Weigelt, J. (2019). The future of agriculture and food: Evaluating the holistic costs and benefits. Anthropocene Review, 6(3), 270–278. https://doi.org/10.1177/2053019619872808
SAPEA. (2020). A Sustainable Food System for the European Union (Issue Evidence Review Report No. 7). Science Advice for Policy by European Academies. https://doi.org/10.26356/sustainablefood
Schipanski, M. E., & Bennett, E. M. (2012). The Influence of Agricultural Trade and Livestock Production on the Global Phosphorus Cycle. Ecosystems, 15(2), 256–268. https://doi.org/10.1007/s10021-011-9507-x
Schipanski, M. E., MacDonald, G. K., Rosenzweig, S., Chappell, M. J., Bennett, E. M., Kerr, R. B., Blesh, J., Crews, T., Drinkwater, L., Lundgren, J. G., & Schnarr, C. (2016). Realizing resilient food systems. BioScience, 66(7), 600–610. https://doi.org/10.1093/biosci/biw052
Sen, A. (1981). Poverty and Famines: An Essay on Entitlement and Deprivation. In Economic Development and Cultural Change. Clarendon Press. https://doi.org/10.1086/451432
Shiva, V., & Mies, M. (1998). La práxis del ecofeminismo- Biotecnología, consumo, reproducción. Icaria Editorial.
Siliprandi, E., & Zuluaga, G. P. (2014). Género, Agroecología y Soberanía Alimentaria. Perspectivas Ecofeministas (E. Siliprandi & G. P. Zuluaga (eds.)). Icaria Editorial. http://www.icariaeditorial.com/pdf_libros/genero, agroecologia y seguridad alimentaria.pdf
Simón Reardon, J. A., & Pérez, R. A. (2010). Agroecology and the Development of Indicators of Food Sovereignty in Cuban Food Systems. Journal of Sustainable Agriculture, 34(8), 907–922. https://doi.org/10.1080/10440046.2010.519205
Sisto, I. (2006). Gender-sensitive indicators for natural resource management. In J. A. Sagardoy, A. Hamdy, G. Trisorio-Luizzi, N. Lamaddalena, R. Quagliariello, C. Bogliotti, & R. Guelloubi (Eds.), Institutional coordination and streamlining partners activities in the framework of GEWAMED project (pp. 49–56). CIHEAM. http://om.ciheam.org/article.php?IDPDF=800502
Smith, P., Bustamante, M., Ahammad, H., Clark, H., Dong, H., Elsiddig, E. A., Haberl, H., Harper, R., House, J., Jafari, M., Masera, O., Mbow, C., Ravindranath, N. H., Rice, C. W., Robledo Abad, C., Romanovskaya, A., Sperling, F., & Tubiello, F. N. (2014). Agriculture, Forestry and Other Land Use (AFOLU). In O. Edenhofer, R. Pichs-Madruga, Y. Sokona, E. Farahani, S. Kadner, K. Seyboth, A. Adler, I. Baum, S. Brunner, P. Eickemeier, B. Kriemann, J. Savolainen, S. Schlömer, C. von Stechow, T. Zwickel, & J. C. Minx (Eds.), Climate Change 2014: Mitigation of Climate Change. Contribution of Working Group III to the Fifth Assessment Report of the Intergovernmental Panel on Climate Change (pp. 811–922). Cambridge University Press, Cambridge, United Kingdom and New York, NY, USA. https://doi.org/10.1104/pp.900074
Soussana, J.-F. (2014). Research priorities for sustainable agri-food systems and LCA. Journal of Cleaner Production. https://doi.org/10.1016/j.jclepro.2014.02.061
Spaiser, V., Ranganathan, S., Swain, R. B., & Sumpter, D. J. T. (2017). The sustainable development oxymoron: quantifying and modelling the incompatibility of sustainable development goals. International Journal of Sustainable Development and World Ecology, 24(6), 457–470. https://doi.org/10.1080/13504509.2016.1235624
Springmann, M., Clark, M., Mason-D’croz, D., Wiebe, K., Leon Bodirsky, B., Lassaletta, L., Vries, W. de, Vermeulen, S. J., Herrero, M., Carlson, K. M., Jonell, M., Troell, M., DeClerck, F., Gordon, L. J., Zurak, R., Scarborough, P., Rayner, M., Loken, B., Fanzo, J., … Willett, W. (2018). Options for keeping the food system within environmental limits Agricultural Model Intercomparison and Improvement Project View project Smallholder System Innovations (SSI) View project. Article in Nature. https://doi.org/10.1038/s41586-018-0594-0
Springmann, M., Godfray, H. C. J., Rayner, M., & Scarborough, P. (2016). Analysis and valuation of the health and climate change cobenefits of dietary change. Proceedings of the National Academy of Sciences, 113(15), 4146–4151. https://doi.org/10.1073/pnas.1523119113
53
Steffen, W., Richardson, K., Rockström, J., Cornell, S. E., Fetzer, I., Bennett, E. M., Biggs, R., Carpenter, S. R., de Vries, W., de Wit, C. A., Folke, C., Gerten, D., Heinke, J., Mace, G. M., Persson, L. M., Ramanathan, V., Reyers, B., & Sörlin, S. (2015). Sustainability. Planetary boundaries: guiding human development on a changing planet. Science (New York, N.Y.), 347(6223), 1259855. https://doi.org/10.1126/science.1259855
Steffen, W., Richardson, K., Rockström, J., Cornell, S. E., Fetzer, I., Bennett, E. M., Biggs, R., Carpenter, S. R., De Vries, W., De Wit, C. A., Folke, C., Gerten, D., Heinke, J., Mace, G. M., Persson, L. M., Ramanathan, V., Reyers, B., & Sörlin, S. (2015). Planetary boundaries: Guiding human development on a changing planet. Science, 347(6223). https://doi.org/10.1126/science.1259855
Stern, D. I., Common, M. S., & Barbier, E. B. (1994). Econonmic growth and environmental degredation: A critique of the environmental Kuznets Curve. University of York, 44(0), 24. https://ageconsearch.umn.edu/record/263933/files/york-010.pdf
Sukhdev, P., May, P., & Müller, A. (2016). Fix food metrics. Nature, 540(7631), 33–34. https://doi.org/10.1038/540033a
Sun, J., Mooney, H., Wu, W., Tang, H., Tong, Y., Xu, Z., Huang, B., Cheng, Y., Yang, X., Wei, D., Zhang, F., & Liu, J. (2018). Importing food damages domestic environment: Evidence from global soybean trade. Proceedings of the National Academy of Sciences, 115(21), 5415–5419. https://doi.org/10.1073/pnas.1718153115
Swain, R. . (2018). A Critical Analysis of the Sustainable Development Goals. In W. L. Filho (Ed.), Handbook of Sustainability Science and Research (pp. 341–355). Springer. https://doi.org/https://doi.org/ 10.1007/978-3-319-63007-6
Tayyib, S., Rocca, V., & Bossanyi, Z. (2013). Core gender indicators for assessing the socio-economic status of agricultural and rural population. http://www.fao.org/fileadmin/user_upload/Europe/documents/WPW/gender_files/Gender_Indicators_en.pdf
Tester, M., & Langridge, P. (2010). Breeding technologies to increase crop production in a changing world. Science, 327(5967), 818–822. https://doi.org/10.1126/science.1183700
The Economics of Ecosystems and Biodiversity (TEEB). (2018). Measuring What Matters in Agriculture and Food Systems. http://teebweb.org/agrifood/measuring-what-matters-in-agriculture-and-food-systems/
Thompson, J., Millstone, E., Scooners, I., Ely, A., Marshall, F., Shah, E., & Stagl, S. (2007). Agri-Food System Dynamics: pathways to sustainability in an era of uncertainty (No. 4; STEPS Working Paper).
Tilman, D., Balzer, C., Hill, J., & Befort, B. L. (2011). From the Cover: Global food demand and the sustainable intensification of agriculture. Proceedings of the National Academy of Sciences, 108(50), 20260–20264. https://doi.org/10.1073/pnas.1116437108
Tomich, T. P., Brodt, S., Ferris, H., Galt, R., Horwath, W. R., Kebreab, E., Leveau, J. H. J., Liptzin, D., Lubell, M., Merel, P., Michelmore, R., Rosenstock, T., Scow, K., Six, J., Williams, N., & Yang, L. (2011). Agroecology: A Review from a Global-Change Perspective. Annual Review of Environment and Resources, 36(1), 193–222. https://doi.org/10.1146/annurev-environ-012110-121302
Tribaldos, T., Jacobi, J., & Rist, S. (2018). Linking sustainable diets to the concept of food system sustainability. Future of Food : Journal on Food, Agriculture and Society, 6(1), 71–84.
UN. (n.d.). Goal 2 | Department of Economic and Social Affairs. Retrieved October 11, 2020, from https://sdgs.un.org/goals/goal2
UN. (2015). The Millennium Develpment Goals Report 2015: Fact Sheet. https://www.un.org/millenniumgoals/2015_MDG_Report/pdf/MDG 2015 PR Key Facts Global.pdf
UN. (2016). Sustainable Development Goals. http://www.un.org/sustainabledevelopment/sustainable-development-goals/
Vallejo-Rojas, V., Ravera, F., & Rivera-Ferre, M. G. (2016). Developing an integrated framework to assess agri-food systems and its application in the Ecuadorian Andes. Regional Environmental Change, 16, 2171–2185.
Vallejo-Rojas, V., Ravera, F., & Rivera-Ferre, M. G. (2013). Developing tools to assess agri-food systems responses to food sovereignty policies: A conceptual and methodological approach through integration of SES and vulnerability frameworks. In Yale University & The Journal of Peasant Studies (Eds.), Food Sovereignty: A Critical Dialogue.
van Vuuren, D. P., Kok, M., Lucas, P. L., Prins, A. G., Alkemade, R., van den Berg, M., Bouwman, L., van der Esch, S., Jeuken, M., Kram, T., & Stehfest, E. (2015). Pathways to achieve a set of ambitious global sustainability objectives by 2050: Explorations using the IMAGE integrated assessment model. Technological Forecasting and Social Change, 98, 303–323. https://doi.org/10.1016/j.techfore.2015.03.005
Vermeulen, S. J., Campbell, B. M., & Ingram, J. S. I. (2012). Climate Change and Food Systems. Annu. Rev. Environ. Resour., 37, 195–222. https://doi.org/10.1146/annurev-environ-020411-130608
West, P. C., Gerber, J. S., Engstrom, P. M., Mueller, N. D., Brauman, K. A., Carlson, K. M., Cassidy, E. S., Johnston, M., MacDonald, G. K., Ray, D. K., & Siebert, S. (2014a). Leverage points for improving global food security and the environment. Science, 345(6194), 325–328. https://s3.amazonaws.com/academia.edu.documents/35407115/West-etal-2014-Leverage-Points-Food-Security-SCIENCE.pdf?AWSAccessKeyId=AKIAIWOWYYGZ2Y53UL3A&Expires=1510735501&Signature=GQhKjfmPcq1aKwGeLh8OKG0JAeE%3D&response-content-disposition=inline%3B filena
West, P. C., Gerber, J. S., Engstrom, P. M., Mueller, N. D., Brauman, K. A., Carlson, K. M., Cassidy, E. S., Johnston, M., MacDonald, G. K., Ray, D. K., & Siebert, S. (2014b). Leverage points for improving global food security and the environment. Science, 345(6194), 325–328. https://doi.org/10.1126/science.1246067
54
Westengen, O. T., & Banik, D. (2016). The State of Food Security: From Availability, Access and Rights to Food Systems Approaches. Forum for Development Studies, 43(1), 113–134. https://doi.org/10.1080/08039410.2015.1134644
Wheeler, T., & von Braun, J. (2013). Climate Change Impacts on Global Food Security. Science, 341(6145), 508–513. https://doi.org/10.1126/science.1239402
WHO. (2018). Obesity and overweight - Fact Sheet. http://www.who.int/mediacentre/factsheets/fs311/en/
Willett, W., Rockström, J., Loken, B., Springmann, M., Lang, T., Vermeulen, S., Garnett, T., Tilman, D., DeClerck, F., Wood, A., Jonell, M., Clark, M., Gordon, L. J., Fanzo, J., Hawkes, C., Zurayk, R., Rivera, J. A., De Vries, W., Majele Sibanda, L., … Murray, C. J. L. (2019a). Food in the Anthropocene: the EAT–Lancet Commission on healthy diets from sustainable food systems. The Lancet, 393(10170), 447–492. https://doi.org/10.1016/S0140-6736(18)31788-4
Willett, W., Rockström, J., Loken, B., Springmann, M., Lang, T., Vermeulen, S., Garnett, T., Tilman, D., DeClerck, F., Wood, A., Jonell, M., Clark, M., Gordon, L. J., Fanzo, J., Hawkes, C., Zurayk, R., Rivera, J. A., De Vries, W., Majele Sibanda, L., … Murray, C. J. L. (2019b). Food in the Anthropocene: the EAT–Lancet Commission on healthy diets from sustainable food systems. The Lancet, 393(10170), 447–492. https://doi.org/10.1016/S0140-6736(18)31788-4
Windfuhr, M., & Jonsén, J. (2005). Food Sovereignty: Towards democracy in localized food systems. In FIAN International (Ed.), World (First). ITDG Publishing.
Wittman, H. (2011). Food Sovereignty: A New Rights Framework for Food and Nature? Environment and Society: Advances in Research, 2(1), 87–105. https://doi.org/10.3167/ares.2011.020106
Woodley, E., Crowley, E., Pryck, J. D. De, & Carmen, A. (2009). Cultural indicators of Indigenous Peoples ’ food and agro-ecological systems * by. In SARD Initiative. ftp://ftp.fao.org/docrep/fao/011/ak243e/ak243e00.pdf
World Health Organization (WHO). (n.d.). Fact sheets - Malnutrition. Retrieved October 11, 2020, from https://www.who.int/news-room/fact-sheets/detail/malnutrition
Ziegler, J. (2013). Betting on Femine: Why the World Still Goes Hungry. New Press.
Zika, M., & Erb, K.-H. (2009). The global loss of net primary production resulting from human-induced soil degradation in drylands. Ecological Economics, 69(2), 310–318. https://doi.org/10.1016/j.ecolecon.2009.06.014
55
Chapter 2. From practice to theory: Food sovereignty as a
concept to assess the sustainability of the agri-food system
Abstract
In this work, we advance the concept of food sovereignty as a conceptual framework to analyze agri‐food
systems' sustainability following the steps proposed by Jabareen (2009) to build conceptual frameworks.
In previous work, we advanced the first four phases: identifying data, selecting, categorizing, and
processing such data, identifying and naming concepts, and the main attributes, characteristics,
assumptions, and roles. Here we complete the process with the other phases by integrating similar ideas
and synthesizing concepts into a theoretical framework, validating the conceptual framework, and
rethinking the conceptual framework as a dynamic phenomenon. To integrate similar concepts, we follow
the four agrarian questions (agriculture, quality, environmental, emancipatory) and the three fundamental
outcomes of sustainable agri‐food systems: Food and nutrition security, environmental resilience, and
social well‐being. Here, we analyze the interconnections among food sovereignty attributes and synthesize
them to create the conceptual framework. We conclude by offering the concept of "Food Sovereignty" as
a complete and valid framework to measure sustainability.
1. Introduction
Discussion around agri-food systems sustainability is at the center of global agreements and
initiatives such as the Sustainable Development Goals (SDGs), with several reports analyzing food
systems from an SDGs perspective. Just to mention a couple: the Economics of Ecosystems and
Biodiversity initiative relates the agri-food system with each SDG (TEEB, 2018)9, and the Transforming
Food and Agriculture to achieve the SDGs Report (FAO, 2018). The InterAcademy Partnership (IAP,
2018) and the European Academy of Sciences (SAPEA, 2020) have produced in-depth reports on
Food, and the recently approved farm to fork strategy also has the food system's sustainability at the
core of its objectives (European Commission, 2020). The latter is not surprising since the current
9 See http://www.teebweb.org/sdg-agrifood/annex-1/ (visited on: 26/04/2020)
56
global agri-food system has shown countless inconsistencies as proof of its unsustainability to feed
the growing population (IAP, 2018) equitably. A clear example is the still existence of 618 million
people with hunger, two billion overweighed people (FAO, 2019), of which around 700 million with
obesity by 2018, and about two billion people with some kind of micronutrient deficiency, in a world
where Food is produced in abundance (Holt-Giménez et al., 2012). In fact, as of this date, many
malnutrition factors are now considered the leading risk factors for deaths worldwide (FAO et al.,
2019; Naghavi et al., 2017).
An associated concern to these inconsistencies is that food distribution channels follow economic
incentives, leaving aside the human right perspective to pursue adequate Food and nutrients
worldwide. Eating is a fundamental human right, but paradoxically Food is one of the most traded
commodities in a global market based on competition10, leading to an inadequate distribution to the
final consumers (Berners-Lee et al., 2018; Sukhdev et al., 2016). Holt-Giménez et al. (2012), for
instance, accurately pointed out that the primary driver of hunger, and we would add of malnutrition
in general, has not been scarcity, but poverty and inequality.
These facts show the "inefficiencies" of the global food system around food security, the primary
food systems outcome. However, if we expand the perspective towards ecosystems or human
welfare, then the number of impacts grow all around the world, from the very local (e.g., soil
management) to global scales (e.g., globalization) (Gomiero, 2019).
Along with the current inefficiencies of the global agri-food system, there are a series of recent
phenomena that further challenge its performance: climate change and global warming effects,
growing demand as a consequence of population growth and concentration in urban areas, the
exponential loss of biodiversity, geopolitical issues, pandemics, among many others (IAP, 2018).
Not only do these events challenge its ability to reach the food security goal, but they also highlight
the need to implement a set of policies that encompasses the impacts that the global agri-food
system can exert at different scales.
Over the past years, some alternatives have emerged to assess agri-food systems' sustainability;
hence, potentially mitigating the aforementioned adverse effects and improving human well-being.
Those alternatives and methods emerge from many different perspectives. From a local-scale
10 See http://www.fao.org/waicent/faoinfo/economic/faodef/faodefe.htm for more detail in food commodities groups.
57
perspective, Carlsson et al. (2017) proposed a community-level process based on the Framework for
Strategic Sustainable Development (FSSD) that facilitates policy planning at that level, recognizing the
lack of tools to land global-scale conceptualizations into actions at the community level. DeClerck et
al. (2016) proposed a conservationist approach to agricultural landscape management from a
conservation perspective. Another interesting approach is those in Tribaldos et al. (2018), which adds
a usually obviated dimension, the link between diet and sustainability. The authors discussed what
the belief is the critical link: food security, the right to Food, reduction of poverty, and inequality,
environmental performance, and resilience.
Those perspectives are just a few examples of the many discussion streams that exist nowadays. Béné
et al. (2019) analyzed some of the main narratives around the food systems' unsustainability by
observing the various outcomes (e.g., malnourished people, rural poverty) as independent events;
thus, failing to provide adequate insight into the food systems' dynamics (Clapp, 2009), and letting
out of the scope the complexity of the system.
8 Building sustainable agri-food systems
To better understand sustainable agri-food systems, we must first define an agri-food system and
later analyze its elements and scope.
Agri-food systems' perspectives
The concept of food systems dates back to several decades (SAPEA, 2020). It has gained prominence
in recent years (Foran et al., 2014; Lang & Barling, 2012; Rivera-Ferre, 2012; Westengen & Banik,
2016) when leading experts started to approach the idea (IAASTD, 2009; iPES food 2015).
Traditionally, the bulk of studies was centered along the food supply chain, where scholars attempted
to develop simplistic theoretical models to find universal solutions on public policies that frequently
failed (Ostrom, 2009). More recently, some authors have proposed systemic approaches to study and
manage agri-food systems by contemplating and integrating variables that delve into details of
distribution, access, and utilization of Food (El Bilali, 2019; Nelson et al., 2016; Ruiz-Almeida, 2012;
Sandhu et al., 2019; Vallejo-Rojas et al., 2016).
Ericksen (2008) stated the relevance of analyzing "the food system's interactions with global
environmental change and evaluating the major societal outcomes affected by these interactions:
food security, ecosystem services, and social welfare." In her analysis, the system's leading emerging
property is Food and human nutrition across the bio-geophysical and social environments, which
58
define the relationship between the human being and its environment. All these interactions are
what Ostrom (2009) described as a complex socio-ecological system (SES), where multiple
subsystems and internal variables continuously interact, and through these interactions generate
consequences in the form of outcomes, which eventually could also feedback at the subsystems
levels. Therefore, to promote sustainability, we must analyze the systems' outcomes individually and
their interactions and the results of such dynamics.
In agri-food systems, interactions occur amongst agricultural, environmental, and socioeconomic
systems multidimensional in time and space (Vallejo-Rojas et al., 2013). To address this complexity,
Ericksen (2008) proposes a framework in which implicit recognition that such systems are managed,
either directly or indirectly, for the human benefit (i.e., ecosystem services). That one set of services
could be favored (e.g., food production) at the expense of another set (e.g., quality of water for fish);
hence these objectives can conflict with each other.
This framework contemplates four main activities that take place within the food system (): (i) food
production, which refers to all the processes that are intrinsically related to raw material production,
those related to agriculture and animal breeding; (ii) processing and packaging, which incorporates
those activities related to raw material transformation; (iii) distribution and sale, which considers
such activities through which Food is moved from a place to another, and (iv) consumption, which
refers to those activities that range from food selection to its cooking and final use.
This framework's final expected result would be a benchmark to measure food security in most FAO
dimensions except for "stability," which was added later11. Ericksen argues that those activities
contribute to achieving food security and the welfare of both the population and the environment.
Together, those outcomes can be understood as the agri-food system's sustainability since they
represent the three remarkable aspects of sustainability: economy, environment, and society.
Nonetheless, in this framework, these contributions are recognized as secondary results that may or
may not be achieved, being food security the primary outcome.
11 The Declaration of Rome on World Food Security define the three basic dimensions in 1996: access, availability and
utilization. Access would refer to the ability from a unit to get a hold of food in with the quality and quantity required.
Availability refers to the quantity, quality and type of food that a unit has at its disposal. Utilization, in turn, deals with the
household capacity to benefit from food consumption. Finally, in 2009 the concept of stability was included, since it brings
the time dimension to the concept and deals with the ability to withstand shocks to the food chain (Berry et al., 2015).
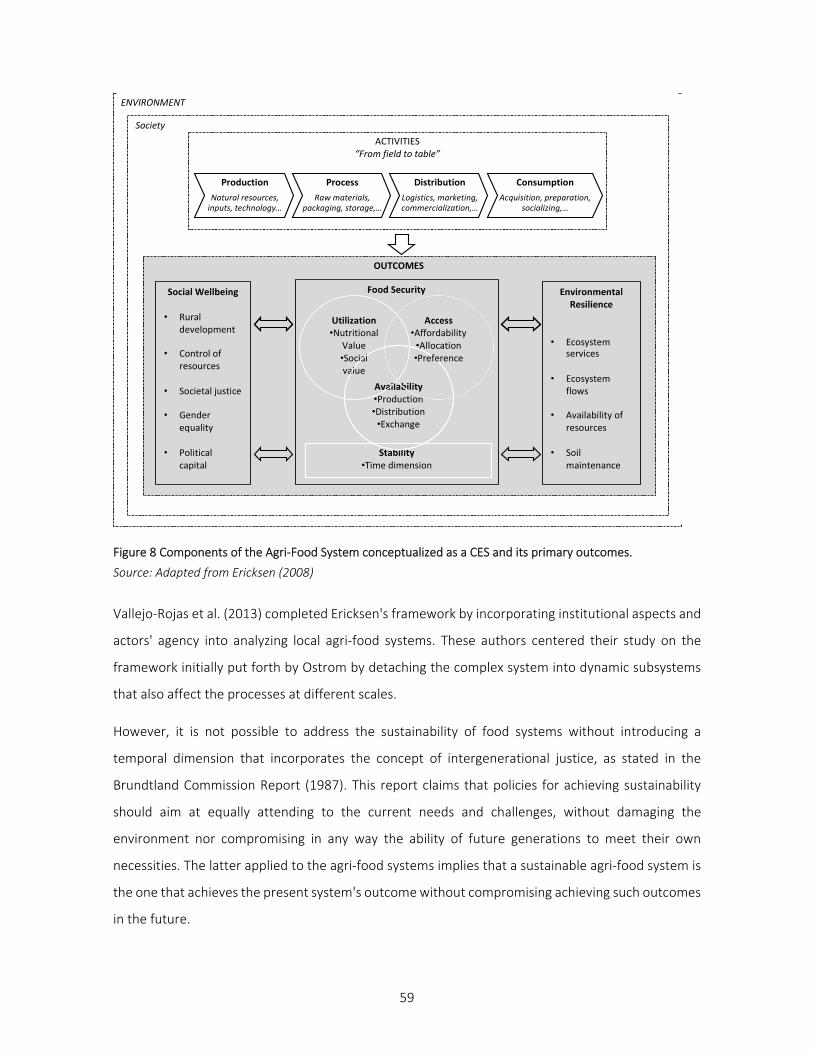
59
Figure 8 Components of the Agri-Food System conceptualized as a CES and its primary outcomes.
Source: Adapted from Ericksen (2008)
Vallejo-Rojas et al. (2013) completed Ericksen's framework by incorporating institutional aspects and
actors' agency into analyzing local agri-food systems. These authors centered their study on the
framework initially put forth by Ostrom by detaching the complex system into dynamic subsystems
that also affect the processes at different scales.
However, it is not possible to address the sustainability of food systems without introducing a
temporal dimension that incorporates the concept of intergenerational justice, as stated in the
Brundtland Commission Report (1987). This report claims that policies for achieving sustainability
should aim at equally attending to the current needs and challenges, without damaging the
environment nor compromising in any way the ability of future generations to meet their own
necessities. The latter applied to the agri-food systems implies that a sustainable agri-food system is
the one that achieves the present system's outcome without compromising achieving such outcomes
in the future.
OUTCOMES
Society
ENVIRONMENT
Stability•Time dimension
Availability•Production•Distribution•Exchange
Food Security
Utilization•Nutritional
Value•Social value
ACTIVITIES“From field to table”
Consumption
Acquisition, preparation,socializing,…
Distribution
Logistics, marketing, commercialization,…
Production
Natural resources, inputs, technology…
Social Wellbeing
• Rural development
• Control of resources
• Societal justice
• Gender equality
• Political capital
Environmental Resilience
• Ecosystemservices
• Ecosystemflows
• Availability of resources
• Soil maintenance
Access•Affordability•Allocation•Preference
Process
Raw materials, packaging, storage,…
60
The concept of intergenerational justice also puts forth the notion of interterritorial solidarity, which
implies that it is impossible to achieve sustainable food systems in one territory at the expense of
other regions' ecosystems (SAPEA, 2020). Thus, despite the growing number of studies and reports
addressing food systems' sustainability, there is no accepted definition of a sustainable agri-food
system or how it should be conceptualized.
Béné et al. (2019) explored the narratives around the "unsustainability" of the agri-food system. They
showed that researchers and analysts are still struggling to understand and apply sustainability
concepts to the agri-food systems. Its definition has been interpreted in different ways, some of them
based on relatively narrow applications. Many visions hold their meaning, sometimes contradicting
each other, according to their narratives and perspectives (Béné et al., 2019; Ruiz-Almeida & Rivera-
Ferre, 2019). To understand the scope and implications of agri-food systems, we should first embrace
their complexity and the fact that agri-food systems can be approached through diverse and often
divergent conceptual that derive from different mental models perspectives (Rivera-Ferre et al.,
2013; SAPEA, 2020). So, it would be useful to undertake a pluralist, interdisciplinary inquiry
concerning the meanings of and possibilities for improving the system's primary outcomes (Foran et
al., 2014; Rivera-Ferre, 2012).
In this chapter, based on the work of Ruiz-Almeida and Rivera-Ferre (2019), we build a conceptual
framework around the sustainability of the agri-food systems following the methodology offered by
Jabareen (2009), as a starting point and from the perspective of food sovereignty.
Methods
Jabareen (2009) proposes a methodology to build a conceptual framework by identifying the main
components to create a consistent concept. The author defines a conceptual framework as: "a
network of interlinked concepts that together provided a comprehensive understanding of a
phenomenon or phenomena" and stated eight phases (Table 1) to define a sound conceptual
framework.
Our phenomena of study are agri-food systems and the elements which define their sustainability.
The first five phases cover what Ruiz-Almeida and Rivera-Ferre (2019) presented in their research
"Internationally-based indicators to measure Agri-food systems sustainability using food sovereignty
as a conceptual framework." In their work, the authors mapped, identified, and categorized 97
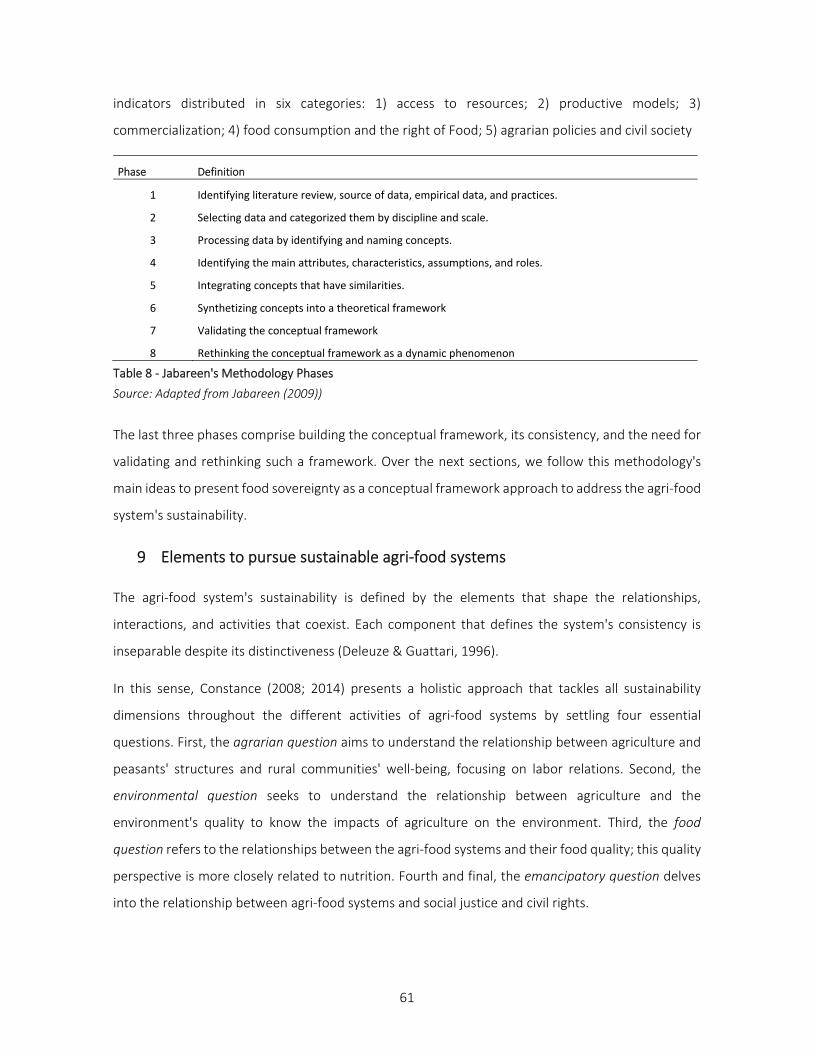
61
indicators distributed in six categories: 1) access to resources; 2) productive models; 3)
commercialization; 4) food consumption and the right of Food; 5) agrarian policies and civil society
Phase Definition
1 Identifying literature review, source of data, empirical data, and practices.
2 Selecting data and categorized them by discipline and scale.
3 Processing data by identifying and naming concepts.
4 Identifying the main attributes, characteristics, assumptions, and roles.
5 Integrating concepts that have similarities.
6 Synthetizing concepts into a theoretical framework
7 Validating the conceptual framework
8 Rethinking the conceptual framework as a dynamic phenomenon
Table 8 - Jabareen's Methodology Phases
Source: Adapted from Jabareen (2009))
The last three phases comprise building the conceptual framework, its consistency, and the need for
validating and rethinking such a framework. Over the next sections, we follow this methodology's
main ideas to present food sovereignty as a conceptual framework approach to address the agri-food
system's sustainability.
9 Elements to pursue sustainable agri-food systems
The agri-food system's sustainability is defined by the elements that shape the relationships,
interactions, and activities that coexist. Each component that defines the system's consistency is
inseparable despite its distinctiveness (Deleuze & Guattari, 1996).
In this sense, Constance (2008; 2014) presents a holistic approach that tackles all sustainability
dimensions throughout the different activities of agri-food systems by settling four essential
questions. First, the agrarian question aims to understand the relationship between agriculture and
peasants' structures and rural communities' well-being, focusing on labor relations. Second, the
environmental question seeks to understand the relationship between agriculture and the
environment's quality to know the impacts of agriculture on the environment. Third, the food
question refers to the relationships between the agri-food systems and their food quality; this quality
perspective is more closely related to nutrition. Fourth and final, the emancipatory question delves
into the relationship between agri-food systems and social justice and civil rights.
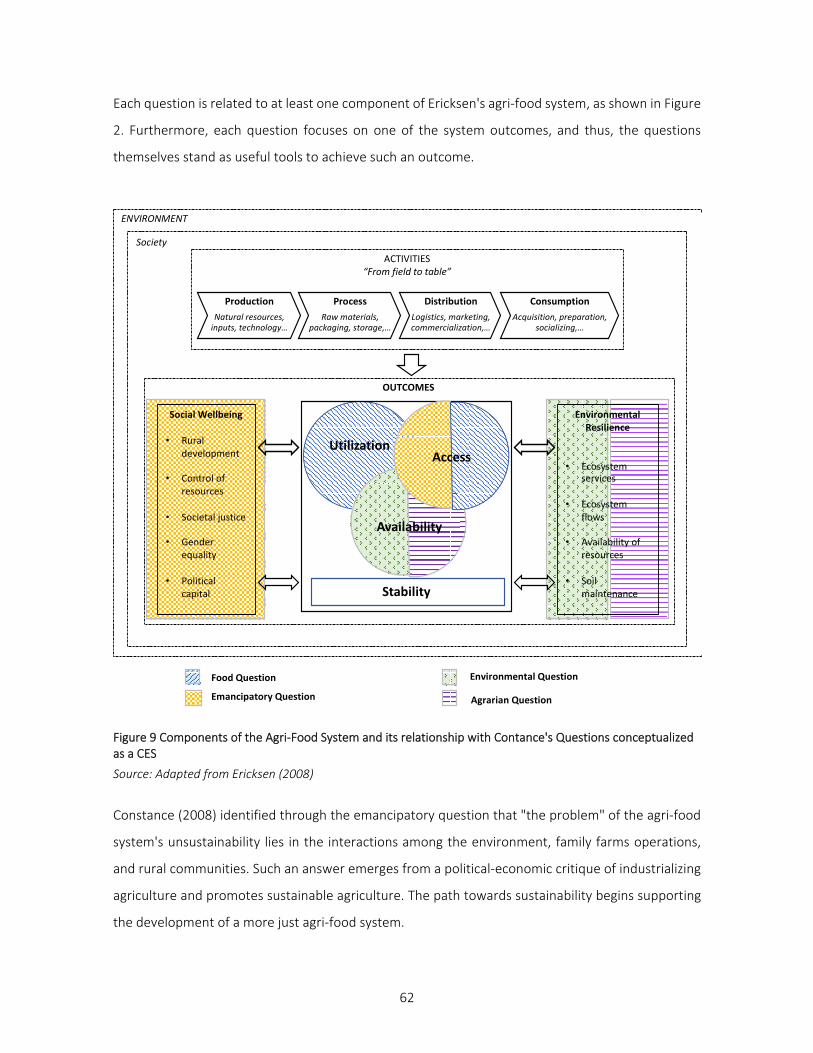
62
Each question is related to at least one component of Ericksen's agri-food system, as shown in Figure
2. Furthermore, each question focuses on one of the system outcomes, and thus, the questions
themselves stand as useful tools to achieve such an outcome.
Figure 9 Components of the Agri-Food System and its relationship with Contance's Questions conceptualized as a CES
Source: Adapted from Ericksen (2008)
Constance (2008) identified through the emancipatory question that "the problem" of the agri-food
system's unsustainability lies in the interactions among the environment, family farms operations,
and rural communities. Such an answer emerges from a political-economic critique of industrializing
agriculture and promotes sustainable agriculture. The path towards sustainability begins supporting
the development of a more just agri-food system.
OUTCOMES
Society
ENVIRONMENT
Utilization
Stability
Availability
ACTIVITIES“From field to table”
Consumption
Acquisition, preparation, socializing,…
Distribution
Logistics, marketing, commercialization,…
Production
Natural resources, inputs, technology…
Social Wellbeing
• Rural development
• Control of resources
• Societal justice
• Gender equality
• Political capital
Environmental Resilience
• Ecosystemservices
• Ecosystemflows
• Availability of resources
• Soil maintenance
Process
Raw materials, packaging, storage,…
Food Question Environmental Question
Emancipatory Question Agrarian Question
Access
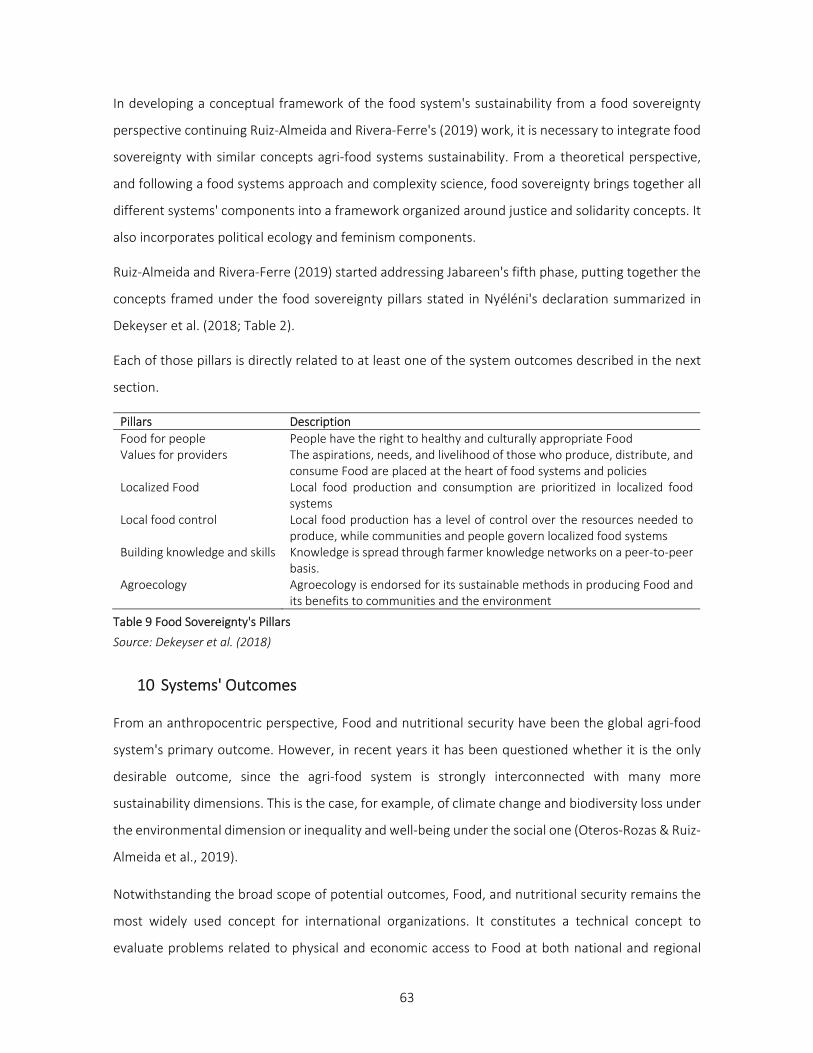
63
In developing a conceptual framework of the food system's sustainability from a food sovereignty
perspective continuing Ruiz-Almeida and Rivera-Ferre's (2019) work, it is necessary to integrate food
sovereignty with similar concepts agri-food systems sustainability. From a theoretical perspective,
and following a food systems approach and complexity science, food sovereignty brings together all
different systems' components into a framework organized around justice and solidarity concepts. It
also incorporates political ecology and feminism components.
Ruiz-Almeida and Rivera-Ferre (2019) started addressing Jabareen's fifth phase, putting together the
concepts framed under the food sovereignty pillars stated in Nyéléni's declaration summarized in
Dekeyser et al. (2018; Table 2).
Each of those pillars is directly related to at least one of the system outcomes described in the next
section.
Pillars Description
Food for people People have the right to healthy and culturally appropriate Food Values for providers The aspirations, needs, and livelihood of those who produce, distribute, and
consume Food are placed at the heart of food systems and policies Localized Food Local food production and consumption are prioritized in localized food
systems Local food control Local food production has a level of control over the resources needed to
produce, while communities and people govern localized food systems Building knowledge and skills Knowledge is spread through farmer knowledge networks on a peer-to-peer
basis. Agroecology Agroecology is endorsed for its sustainable methods in producing Food and
its benefits to communities and the environment
Table 9 Food Sovereignty's Pillars
Source: Dekeyser et al. (2018)
10 Systems' Outcomes
From an anthropocentric perspective, Food and nutritional security have been the global agri-food
system's primary outcome. However, in recent years it has been questioned whether it is the only
desirable outcome, since the agri-food system is strongly interconnected with many more
sustainability dimensions. This is the case, for example, of climate change and biodiversity loss under
the environmental dimension or inequality and well-being under the social one (Oteros-Rozas & Ruiz-
Almeida et al., 2019).
Notwithstanding the broad scope of potential outcomes, Food, and nutritional security remains the
most widely used concept for international organizations. It constitutes a technical concept to
evaluate problems related to physical and economic access to Food at both national and regional
64
scales. As defined in the World Food Summit of 1996, food security is reached whenever: "every
person has at every moment physical and economic access to enough nutritious food to satisfy their
food consumption necessities as well as their fundamental preferences and thus be able to carry out
a healthy and active life."
During the past century, human society has remained facing relevant problems related to food
insecurity. This matter forced a paradigm change to incorporate different social causes (like political
instability or marginalization) as underlying conditions to reach food security (Devereux, 2000).
Furthermore, some scholars have recognized the need to include an environmental analysis as an
integral part of food security (Patel, 2009). La Via Campesina12 considers food sovereignty,
considering it as a pre-requisite to achieving genuine food security.
Environmental Resilience
Environmental resilience is both an outcome and a precondition for building sustainable agri-food
systems (Jacobi et al., 2018). We understand it as an adaptative capacity of the ecosystems, i.e., their
ability to respond to unexpected, unpredictable shocks (Holling, 2001). The environmental resilience
of the ecosystems related to the agri-food systems has been measured in different ways; however, it
is recognized as a pre‐requisite for agriculture to reach its urgently needed potential in contributing
to multiple sustainability targets (DeClerck et al., 2016). One of them is sustainable agriculture.
Sustainable agriculture conception emerges from the necessity to synthesize agricultural practices
that differ from those that deviate from conventional production by emphasizing that the current
population's feeding needs and future generations are at stake (Neher, 1992). Because this paradigm
is mostly understood as a managerial philosophy, there is no explicit definition recognized. The
acceptance or rejection of a particular sense is related to each person's value system (Abubakar &
Attanda, 2013).
Sustainable agriculture programs often focus on environmental issues and neglect the social and
economic egalitarian matters that keep them in a relatively safe political territory (Constance, 2008).
12 La Via Campesina is an international movement that emerged in 1993 from the union of millions of farmers, small
producers, indigenous people and migrant workers. Currently it encompasses 164 local and national organizations in 73
different countries representing around 200 million peasants worldwide.
65
The lack of an explicit definition has caused researchers to use this term vaguely and with different
connotations across scientific journals, related news, speeches, marketing campaigns, etcetera,
further contributing to its ambiguity. The concept has also been adopted across a wide range of
scopes, from the intensive use of fertilizers (agricultural industry) to production within organic
farms.13
We have considered some definitions that have focused on an integral view of sustainability. The first
one, proposed by Neher (1992), stated that those definitions of sustainable agriculture contain four
main components: (i) environmental quality, (ii) ecologic robustness, (iii) productivity of flora and
fauna, and (iv) socioeconomic viability. As an example, the author presents sustainable agriculture as
a technique in which the quality of environmental and essential resources upon which agriculture
relies is enhanced; one that provides critical food and fiber needs; one that is economically viable and
improves the quality of life for farmers and society in general (Abubakar & Attanda, 2013).
This first definition of sustainable agriculture allows for a wide range of interpretations and uses. For
instance, it will enable the new green revolution to be part of the sustainable movement, with the
so-called "sustainable intensification," which presents simplistic solutions for complex problems. Due
to the vagueness in its definition, Sustainable agricultures have felt short in comprising a holistic
manner to understand environmental resilience.
The second definition stated that sustainable agriculture is the ability of an agroecosystem to
maintain its production in time from a systemic perspective (Altieri, 1987; Neher, 1992), in which
every interacting subsystem is affected or is prone to affect other subsystems. This vision is closer to
a holistic view, as is the farming systems research aimed at understanding partnerships, among
different stakeholders (peasants, scientists, farmers, and technicians), through realistic models that
show increasingly complex relationships (Norman, 2002). Here we focus on this second definition as
it tries to adapt to the complexity of the systems. We follow the agroecological approach to build
sustainable food systems
Agroecology applies all the ecological concepts and principles to the design and management of
sustainable agroecosystems (Gliessman et al., 1998)
13 The founder of “organic agriculture”, the American agricultural scientist Frankling Hiram King (1848-1911), visualizes a
farm as a sustainable unit, ecologically stable and self-contained.
66
Agroecology endorses food productions with techniques that benefit at the same time the
communities and the environment. Gliessman (2002) defines agroecology as the "guiding light in the
field of sustainable agriculture" since it seeks to meet the nutritional needs of the population at the
same time that conserves and restores natural resources in which agriculture depends on (e.g., soil,
seeds, water). Agroecology also links social equity to agri-food systems sustainability. An analysis of
the interrelatedness of agroecosystems components – ecological, social, and economic – is key to
building greater self-sufficiency and sustainability into these food systems (Altieri and Nicholls, 2005).
The agroecology concept encompasses the study of agroecosystems14by focusing on the form,
dynamics, and functions of all elements, interrelations, and processes in which they are involved.15
Traditional agriculture provided a cultural and ecological base for its further development as a science
(Altieri & Nicholls, 2005; Gliessman, 2014).
Like the case of sustainable agriculture, different versions have emerged for the concept of
agroecology. The first one attempts to appoint agroecology into the new green revolution16, arguing
that the framework has also motivated thinking about agroecosystems at higher levels and around
sustainable intensification (Foran et al., 2014; Pretty et al., 2011; Tomich et al., 2011). The second
one centers on agroecology within a politically transformative peasant movement for Food
Sovereignty. Holt-Giménez and Altieri (2012) argue that the livelihoods of smallholders, the
elimination of hunger, the restoration of the planet's agrobiodiversity, and agroecosystem resilience
would all be better served under the alliance between agroecologists and the Food Sovereignty
movement scenario.
In this matter, agroecology is at the same time a scientific approach to agroecosystems' and agri-food
systems' assessments, and a proposal for production technics and socio-political praxis around the
ecological administration of natural resources (Calle Collado et al., 2011). Agroecology is one of food
sovereignty's components regarding to the production of Food, also linked to the availability and
access dimensions of FNS, and the agrarian and environmental question of Constance et al. (2014).
14 Agroecosystems includes both the environmental and the human elements in their study.
15 Source: http://www.agroecology.org/
16 The so called “Green Revolution” is the set of agricultural practices that are intensive in chemical inputs
(fertilizers and pesticides) that increased agricultural production worldwide. These practices became popular
between 1950s and the late 1960s
67
11 Social-Political Well-Being
The relationships between people and Food take many forms—the various ways we have of relating
to Food directly impact the dynamics of the agri-food systems. The socio-political component of the
agri-food systems' outcomes tackles such relationships according to the scale and the context subject
to analysis. Thus, it cannot be left aside when analyzing agri-food systems.
As stated before, when analyzing food security as the unique outcome or the agri-food system, the
social control of the systems, particularly control of the means of production and resources, is not
directly considered. Therefore, reaching Food Security does not necessarily mean achieving social
well-being. The latter is the main argument of finding Food Sovereignty a precondition to genuinely
achieve food security (La Via Campesina, 1996).
Food Sovereignty "arises from the need to democratize production and consumption" to redistribute
power relations along the food chain (Calle Collado, Soler Montiel, and Rivera-Ferre, 2010). It results
from a collective effort of specific civil society organizations (CSOs), non-governmental organizations
(NGOs), and social movements to carry out an international debate around the agri-food systems.
The discussions contemplated a range of topics, from production problems to social concerns
regarding the agri-food system. The concept of Food Sovereignty appeared for the first time in April
1996 at the International Conference of La Via Campesina in Tlaxcala, México (La Via Campesina,
2007).
This concept has evolved as new actors take relevance of the scale of analysis and support the
proposal. Since its appearance in 1996, there has always been only one standing definition (i.e., more
than one explanation has never coexisted at the same time). Currently, Food Sovereignty is "the right
of peoples to healthy and culturally appropriate food produced through ecologically sound and
sustainable methods, and their right to define their food and agriculture systems" (Declaration of
Nyéléni, 2007)17.
Food Sovereignty recognizes that people worldwide must have access to safe nutrition and culturally
appropriate Food and the necessary resources and mechanisms for its production and consumption
to support people and their societies. The essence of the concept is that to achieve Food and nutrition
security, we require: (i) direct democratic participation; (ii) eradicate the usage of Food as an
17 Source: http://www.nyeleni.org/spip.php?page=forum&lang=en
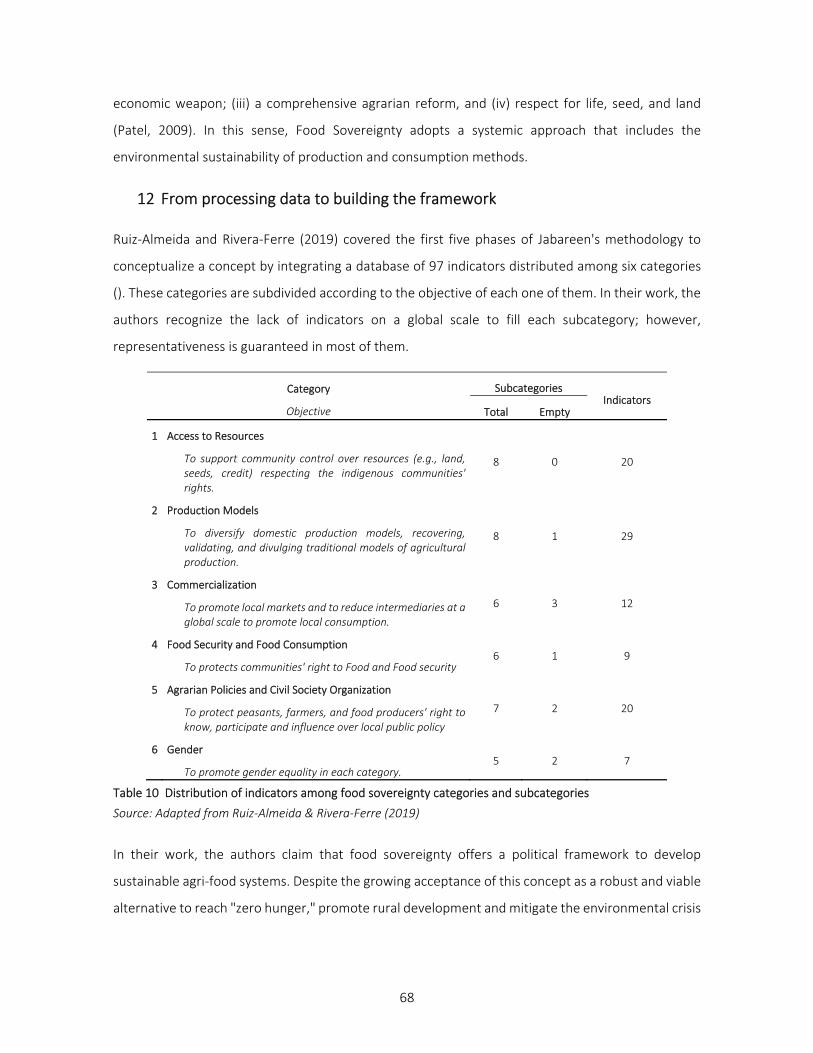
68
economic weapon; (iii) a comprehensive agrarian reform, and (iv) respect for life, seed, and land
(Patel, 2009). In this sense, Food Sovereignty adopts a systemic approach that includes the
environmental sustainability of production and consumption methods.
12 From processing data to building the framework
Ruiz-Almeida and Rivera-Ferre (2019) covered the first five phases of Jabareen's methodology to
conceptualize a concept by integrating a database of 97 indicators distributed among six categories
(). These categories are subdivided according to the objective of each one of them. In their work, the
authors recognize the lack of indicators on a global scale to fill each subcategory; however,
representativeness is guaranteed in most of them.
Category
Objective
Subcategories Indicators
Total Empty
1 Access to Resources
To support community control over resources (e.g., land, seeds, credit) respecting the indigenous communities' rights.
8 0 20
2 Production Models
To diversify domestic production models, recovering, validating, and divulging traditional models of agricultural production.
8 1 29
3 Commercialization
To promote local markets and to reduce intermediaries at a global scale to promote local consumption.
6 3 12
4 Food Security and Food Consumption
To protects communities' right to Food and Food security 6 1 9
5 Agrarian Policies and Civil Society Organization
To protect peasants, farmers, and food producers' right to know, participate and influence over local public policy
7 2 20
6 Gender
To promote gender equality in each category. 5 2 7
Table 10 Distribution of indicators among food sovereignty categories and subcategories
Source: Adapted from Ruiz‐Almeida & Rivera‐Ferre (2019)
In their work, the authors claim that food sovereignty offers a political framework to develop
sustainable agri-food systems. Despite the growing acceptance of this concept as a robust and viable
alternative to reach "zero hunger," promote rural development and mitigate the environmental crisis
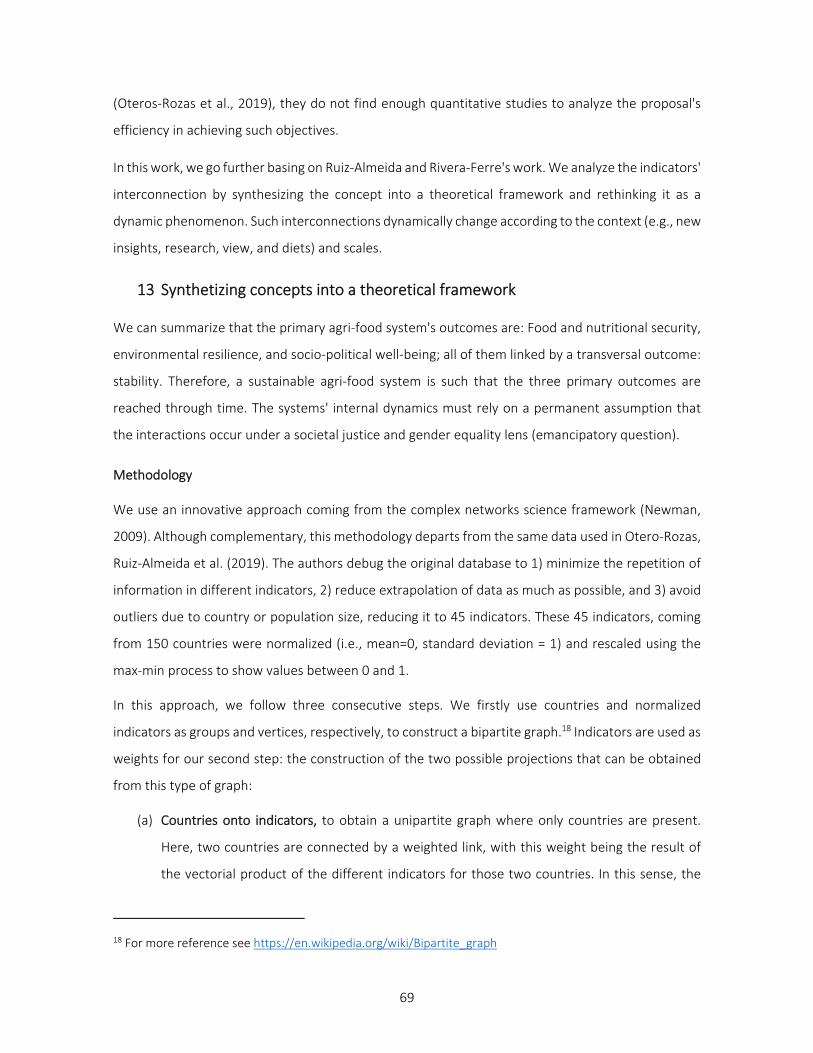
69
(Oteros-Rozas et al., 2019), they do not find enough quantitative studies to analyze the proposal's
efficiency in achieving such objectives.
In this work, we go further basing on Ruiz-Almeida and Rivera-Ferre's work. We analyze the indicators'
interconnection by synthesizing the concept into a theoretical framework and rethinking it as a
dynamic phenomenon. Such interconnections dynamically change according to the context (e.g., new
insights, research, view, and diets) and scales.
13 Synthetizing concepts into a theoretical framework
We can summarize that the primary agri-food system's outcomes are: Food and nutritional security,
environmental resilience, and socio-political well-being; all of them linked by a transversal outcome:
stability. Therefore, a sustainable agri-food system is such that the three primary outcomes are
reached through time. The systems' internal dynamics must rely on a permanent assumption that
the interactions occur under a societal justice and gender equality lens (emancipatory question).
Methodology
We use an innovative approach coming from the complex networks science framework (Newman,
2009). Although complementary, this methodology departs from the same data used in Otero-Rozas,
Ruiz-Almeida et al. (2019). The authors debug the original database to 1) minimize the repetition of
information in different indicators, 2) reduce extrapolation of data as much as possible, and 3) avoid
outliers due to country or population size, reducing it to 45 indicators. These 45 indicators, coming
from 150 countries were normalized (i.e., mean=0, standard deviation = 1) and rescaled using the
max-min process to show values between 0 and 1.
In this approach, we follow three consecutive steps. We firstly use countries and normalized
indicators as groups and vertices, respectively, to construct a bipartite graph.18 Indicators are used as
weights for our second step: the construction of the two possible projections that can be obtained
from this type of graph:
(a) Countries onto indicators, to obtain a unipartite graph where only countries are present.
Here, two countries are connected by a weighted link, with this weight being the result of
the vectorial product of the different indicators for those two countries. In this sense, the
18 For more reference see https://en.wikipedia.org/wiki/Bipartite_graph
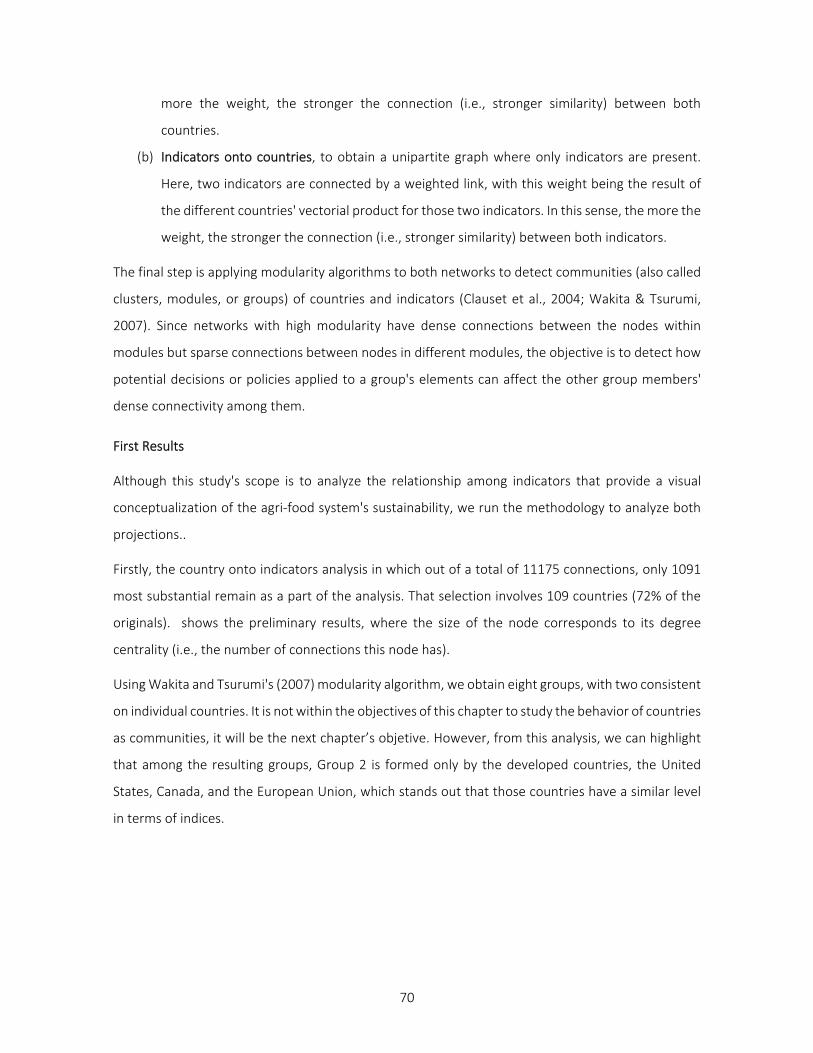
70
more the weight, the stronger the connection (i.e., stronger similarity) between both
countries.
(b) Indicators onto countries, to obtain a unipartite graph where only indicators are present.
Here, two indicators are connected by a weighted link, with this weight being the result of
the different countries' vectorial product for those two indicators. In this sense, the more the
weight, the stronger the connection (i.e., stronger similarity) between both indicators.
The final step is applying modularity algorithms to both networks to detect communities (also called
clusters, modules, or groups) of countries and indicators (Clauset et al., 2004; Wakita & Tsurumi,
2007). Since networks with high modularity have dense connections between the nodes within
modules but sparse connections between nodes in different modules, the objective is to detect how
potential decisions or policies applied to a group's elements can affect the other group members'
dense connectivity among them.
First Results
Although this study's scope is to analyze the relationship among indicators that provide a visual
conceptualization of the agri-food system's sustainability, we run the methodology to analyze both
projections..
Firstly, the country onto indicators analysis in which out of a total of 11175 connections, only 1091
most substantial remain as a part of the analysis. That selection involves 109 countries (72% of the
originals). shows the preliminary results, where the size of the node corresponds to its degree
centrality (i.e., the number of connections this node has).
Using Wakita and Tsurumi's (2007) modularity algorithm, we obtain eight groups, with two consistent
on individual countries. It is not within the objectives of this chapter to study the behavior of countries
as communities, it will be the next chapter’s objetive. However, from this analysis, we can highlight
that among the resulting groups, Group 2 is formed only by the developed countries, the United
States, Canada, and the European Union, which stands out that those countries have a similar level
in terms of indices.
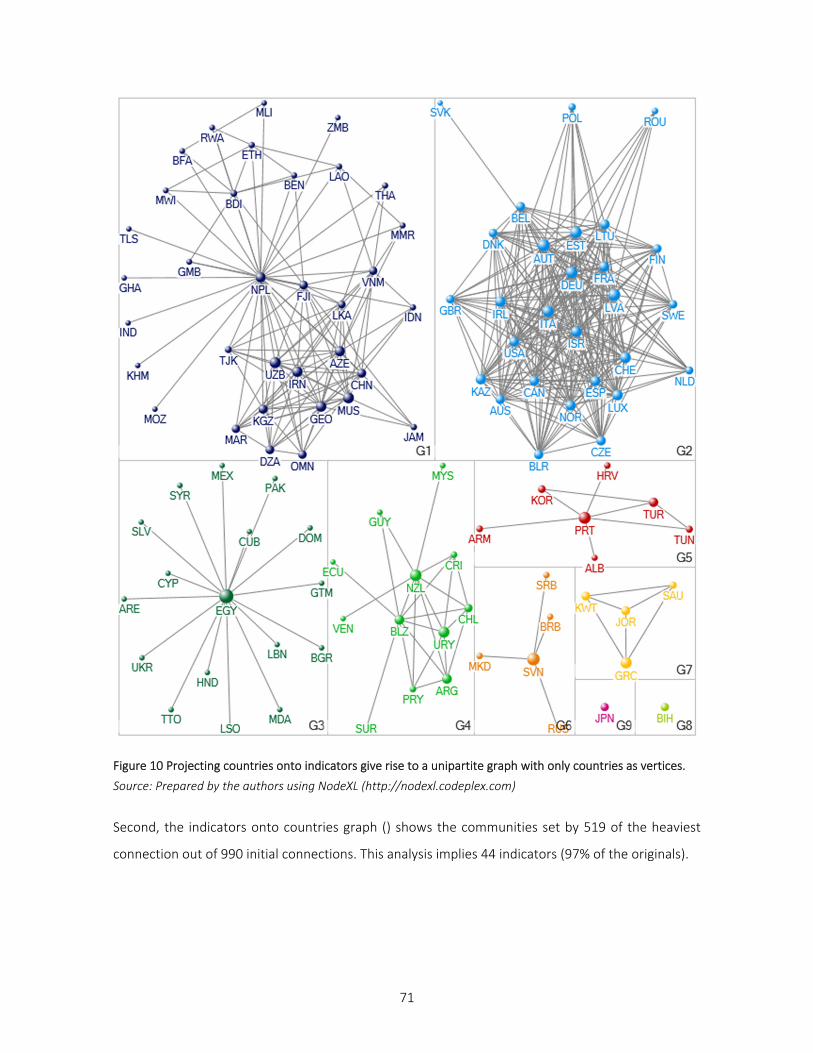
71
Figure 10 Projecting countries onto indicators give rise to a unipartite graph with only countries as vertices.
Source: Prepared by the authors using NodeXL (http://nodexl.codeplex.com)
Second, the indicators onto countries graph () shows the communities set by 519 of the heaviest
connection out of 990 initial connections. This analysis implies 44 indicators (97% of the originals).
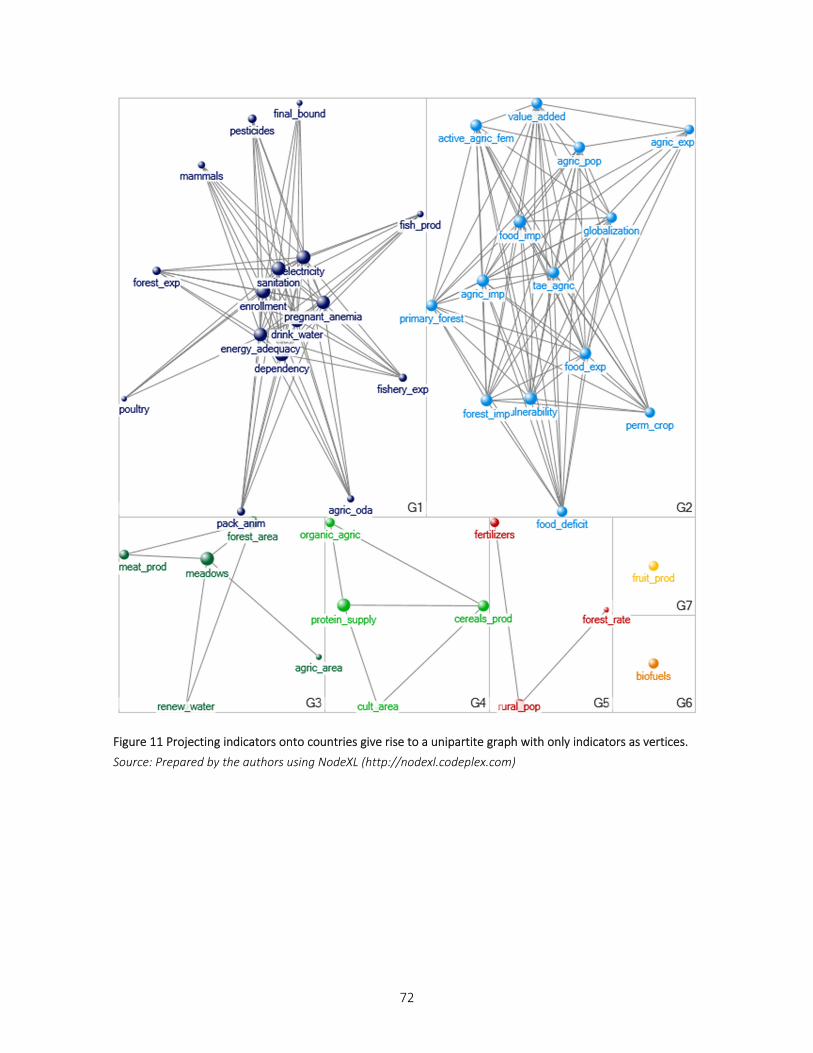
72
Figure 11 Projecting indicators onto countries give rise to a unipartite graph with only indicators as vertices.
Source: Prepared by the authors using NodeXL (http://nodexl.codeplex.com)
73
Again, using Wakita and Tsurumi's (2007) modularity algorithm, we obtain seven groups. The size of
the nodes corresponds to its degree centrality (i.e., the number of edges that connect it to other
indicators). From this graph, we can make the following preliminary remarks, although further study
is needed to understand the results better.
The first biggest group in terms of indicators (G1) contain indicators related to all of the six
food sovereignty pillars. Therefore, we need to go further in the analysis to determine which
strengthens the interactions since it seems to be relating dependency of food anemia with
access to resources (natural, economic and infrastructure resources).
The second biggest group (G2) suggests a relation with the international position (i.e., global
trade) with some of the main population characteristics and food vulnerability.
Groups G3 and G4 highlights the production of meat and cereals, respectively.
Group G5 relates the rural population with the uses of chemical inputs and deforestation.
Finally, groups G6 and G7 are single-indicators groups.
We expect to analyze in detail our results in the near term to be able to suggest possible explanations
to the relations between indicators and within each group.
14 Next steps
Final phases of Jabareen's methodology establish the need to clarify the interactions among the
different concepts around the agri-food system's sustainability and the need to validate the
conceptual framework. The latter point will be analyzed in the next chapter, but for now let's keep in
mind that a "theory of a theoretical framework representing a multidisciplinary phenomenon will
always be dynamic and may be revised according to new insights, comments, literature, and so on. As
the framework is multidisciplinary, the theory should make sense for those disciplines and enlarge
their theoretical perspective on the specific phenomenon in question".
By definition, the agri-food system is a dynamic complex system that will be continuously updated
concerning consumption preferences, food allocation, and food production. Therefore, the last
phase, Phase 8 Rethinking the conceptual framework, takes a significant relevance in this
assessment's continuity.
Here we present a set of indicators around the concept of food sovereignty as the "complete
framework" to measure sustainability. It is the closest framework to build a sustainable and resilient
74
agri-food system. Food sovereignty is often described as a political framework that focuses on the
food system's outcomes: food security, stability, ecosystem resilience, and socio-political well-being.
This work continues, thus any result herby presented is a preliminary assumption and will not be
necessary hold in the publication.
References
Abubakar, M. S., & Attanda, M. L. (2013). The Concept of Sustainable Agriculture: Challenges and Prospects. IOP Conference Series: Materials Science and Engineering, 53, 012001. https://doi.org/10.1088/1757-899X/53/1/012001
Altieri, M. A. (1987). Agroecology: the scientific basis of alternative agriculture. In Agroecology: the scientific basis of alternative agriculture. Westview Press.
Altieri, M. A., & Nicholls, C. I. (2005). Agroecology and the Search for a Truly Sustainable Agriculture (First). United Nations Environment Programme.
Béné, C., Oosterveer, P., Lamotte, L., Brouwer, I. D., de Haan, S., Prager, S. D., Talsma, E. F., & Khoury, C. K. (2019). When food systems meet sustainability – Current narratives and implications for actions. World Development, 113, 116–130. https://doi.org/10.1016/j.worlddev.2018.08.011
Berners-Lee, M., Kennelly, C., Watson, R., & Hewitt, C. N. (2018). Current global food production is sufficient to meet human nutritional needs in 2050 provided there is radical societal adaptation. Elementa, 6. https://doi.org/10.1525/elementa.310
Berry, E. M., Dernini, S., Burlingame, B., Meybeck, A., & Conforti, P. (2015). Food security and sustainability: Can one exist without the other? Public Health Nutrition, 18(13), 2293–2302. https://doi.org/10.1017/S136898001500021X
Calle Collado, A., Soler Montiel, M., & Rivera-Ferre, M. G. (2011). Soberanía alimentaria y Agroecología Emergente: la democracia alimentaria. Democracia Radical: Entre Vínculos y Utopías, 213–238.
Carlsson, L., Callaghan, E., Morley, A., & Broman, G. (2017). Food system sustainability across scales: A proposed local-to-global approach to community planning and assessment. Sustainability (Switzerland), 9(6). https://doi.org/10.3390/su9061061
Clauset, A., Newman, M. E. J., & Moore, C. (2004). Finding community structure in very large networks. Physical Review E, 70(0066111). https://journals-aps-org.recursos.biblioteca.upc.edu/pre/pdf/10.1103/PhysRevE.70.066111
Constance, D. H. (2008). The emancipatory question: The next step in the sociology of agri-foodd systems? Agriculture and Human Values, 25(2), 151–155. https://doi.org/10.1007/s10460-008-9114-4
Constance, D. H., Friedland, W. H., Renard, M.-C., & Rivera-Ferre, M. G. (2014). The Discourse on Alternative Agrifood Movements. 21, 3–46. https://doi.org/10.1108/S1057-192220140000021024
DeClerck, F. A. J., Jones, S. K., Attwood, S., Bossio, D., Girvetz, E., Chaplin-Kramer, B., Enfors, E., Fremier, A. K., Gordon, L. J., Kizito, F., Lopez Noriega, I., Matthews, N., McCartney, M., Meacham, M., Noble, A., Quintero, M., Remans, R., Soppe, R., Willemen, L., … Zhang, W. (2016). Agricultural ecosystems and their services: the vanguard of sustainability? Current Opinion in Environmental Sustainability, 23, 92–99. https://doi.org/10.1016/j.cosust.2016.11.016
Dekeyser, K., Korsten, L., & Fioramonti, L. (2018). Food sovereignty : shifting debates on democratic food governance. Food Security, 10(1), 223–233. https://doi.org/10.1007/s12571-017-0763-2
Deleuze, G., & Guattari, F. (1996). What Is Philosophy? Columbia University Press.
Devereux, S. (2000). Femine in the twentieth century (Vol. 1).
El Bilali, H. (2019). The multi-level perspective in research on sustainability transitions in agriculture and food systems: A systematic review. Agriculture (Switzerland), 9(4). https://doi.org/10.3390/agriculture9040074
Ericksen, P. J. (2008). Conceptualizing food systems for global environmental change research. Global Environmental Change, 18(1), 234–245. https://doi.org/10.1016/j.gloenvcha.2007.09.002
European Commission. (2020). A Farm to Fork Strategy for a fair, healthy and environmentally-friendly food system: Vol. COM(2020) (Issue 381). https://eur-lex.europa.eu/legal-content/EN/TXT/?qid=1590404602495&uri=CELEX%3A52020DC0381
FAO. (2018). TRANSFORMING FOOD AND AGRICULTURE TO ACHIEVE THE SDGs. http://www.fao.org/3/I9900EN/i9900en.pdf
75
FAO, IFAD, UNICEF, WFP, & WHO. (2019). Review of The State of Food Security and Nutrition in the World 2019. Safeguarding against economic slowdowns and downturns. In World Nutrition (Vol. 10, Issue 3). https://doi.org/10.26596/wn.201910395-97
Foran, T., Butler, J. R. A., Williams, L. J., Wanjura, W. J., Hall, A., Carter, L., & Carberry, P. S. (2014). Taking complexity in food systems seriously: An interdisciplinary analysis. World Development, 61, 85–101. https://doi.org/10.1016/j.worlddev.2014.03.023
Gliessman, S. R. (2002). Agroecología: Procesos Ecológicos en Agricultura Sostenible (E. Rodríguez, T. Benjamin, L. Rodríguez, & A. Cortés (eds.)). LITOCAT. http://academic.uprm.edu/dpesante/docs-apicultura/agroecologia-procesos ecologicos en agricultura sostenible.pdf
Gliessman, S. R. (2014). Agroecology: The Ecology of Sustainable Food Systems, Third Edition. CRC Press. http://books.google.com.mx/books?id=hoKfXwAACAAJ
Gliessman, S. R., Engles, E., & Krieger, R. (1998). Agroecology: ecological processes in sustainable agriculture. CRC Press.
Gomiero, T. (2019). Critical issues on Agri-food System Management: Addressing Complexity in Present and Future Challenges. Sustainability, 11(Special Issue). https://www.mdpi.com/journal/sustainability/special_issues/agrifood_system
Holling, C. S. (2001). Understanding the Complexity of Economic, Ecological, and Social Systems. Ecosystems, 4(5), 390–405. https://doi.org/10.1007/s10021-001-0101-5
Holt-Giménez, E., & Altieri, M. A. (2012). Agroecology, Food Sovereignty and the New Green Revolution. Journal of Sustainable Agriculture, 37(March 2014), 90–102. https://doi.org/10.1080/10440046.2012.716388
Holt-Giménez, E., Shattuck, A., Altieri, M., Herren, H., & Gliessman, S. (2012). We Already Grow Enough Food for 10 Billion People... and StillCan'tt Endhungerr. Journal of Sustainable Agriculture, 36(6), 595–598. https://doi.org/10.1080/10440046.2012.695331
iPES Food. (2015). The New Science of Sustainable Food Systems: Overcoming Barriers to Food Systems Reform. May, 20. http://www.ipes-food.org/first-report-from-ipes-food-who-shapes-food-systems-and-who-has-a-say-in-how-they-are-reformed
Jabareen, Y. (2009). Building a Conceptual Framework: Philosophy, Definitions, and Procedure. International Journal of Qualitative Methods, 8(4), 49–62. https://doi.org/10.1177/160940690900800406
Jacobi, J., Mukhovi, S., Llanque, A., Augstburger, H., Käser, F., Pozo, C., Ngutu Peter, M., Delgado, J. M. F., Kiteme, B. P., Rist, S., & Ifejika Speranza, C. (2018). Operationalizing food system resilience: An indicator-based assessment in agroindustrial, smallholder farming, and agroecological contexts in Bolivia and Kenya. Land Use Policy, 79(September), 433–446. https://doi.org/10.1016/j.landusepol.2018.08.044
La Via Campesina. (1996). Food Sovereignty : A Future without Hunger. http://www.voiceoftheturtle.org/library/1996 Declaration of Food Sovereignty.pdf
La Via Campesina. (2007). II International Conference Of The Via Campesina Tlaxcala, Mexico, April 18-21. Tlaxcala Declaration of the Via Campesina. http://viacampesina.org/en/index.php/our-conferences-mainmenu-28/2-tlaxcala-1996-mainmenu-48/425-ii-international-conference-of-the-via-campesina-tlaxcala-mexico-april-18-21
Lang, T., & Barling, D. (2012). Food security and food sustainability: reformulating the debate. The Geographical Journal, 178(4), 313–326. https://doi.org/10.1111/j.1475-4959.2012.00480.x
Naghavi, M., Abajobir, A. A., Abbafati, C., Abbas, K. M., Abd-Allah, F., Abera, S. F., Aboyans, V., Adetokunboh, O., Ärnlöv, J., Afshin, A., Agrawal, A., Kiadaliri, A. A., Ahmadi, A., Ahmed, M. B., Aichour, A. N., Aichour, I., Aichour, M. T. E., Aiyar, S., Al-Eyadhy, A., … Murray, C. J. L. (2017). Global, regional, and national age-sex specifc mortality for 264 causes of death, 1980-2016: A systematic analysis for the Global Burden of Disease Study 2016. The Lancet, 390(10100), 1151–1210. https://doi.org/10.1016/S0140-6736(17)32152-9
Neher, D. (1992). Ecological sustainability in agricultural systems: definition and measurement. Journal of Sustainable Agriculture, 2, 51–61. http://www.tandfonline.com/doi/abs/10.1300/J064v02n03_05
Nelson, M. E., Hamm, M. W., Hu, F. B., Abrams, S. A., & Griffin, T. S. (2016). Alignment of Healthy Dietary Patterns and Environmental Sustainability : Advances in Nutrition, 7(3), 1005–1025. https://doi.org/10.3945/an.116.012567.rather
Newman, M. E. J. (2009). Networks: An Introduction. Oxford University Press.
Norman, D. W. (2002). The Farming Systems Approach: a Historical Perspective. 17th Symposium of the International Farming Systems Association, 13.
Ostrom, E. (2009). A general framework for analyzing sustainability of social-ecological systems. Science, 325(5939), 419–422. https://doi.org/10.1126/science.1172133
Oteros-Rozas, E., Ruiz-Almeida, A., Aguado, M., González, J. A., & Rivera-Ferre, M. G. (2019). A social–ecological analysis of the global agrifood system. Proceedings of the National Academy of Sciences, 116(52), 26465–26473. https://doi.org/10.1073/PNAS.1912710116
Patel, R. (2009). Food sovereignty. Journal of Peasant Studies, 36(3), 663–706. https://doi.org/10.1080/03066150903143079
76
Pretty, J., Toulmin, C., & Williams, S. (2011). Sustainable intensification in African agriculture. International Journal of Agricultural Sustainability, 9(1), 5–24. https://doi.org/10.3763/ijas.2010.0583
Rivera-Ferre, M. G. (2012). Framing of Agri-food Research Affects the Analysis of Food Security: The Critical Role of the Social Sciences. Int. Jrnl. of Soc. of Agr. & Food, 19(2), 162–175.
Rivera-Ferre, M. G., Ortega-Cerdà, M., & Baumgärtner, J. (2013). Rethinking Study and Management of Agricultural Systems for Policy Design. Sustainability, 5(9), 3858–3875. https://doi.org/10.3390/su5093858
Ruiz-Almeida, A. (2012). Food Sovereignty in Latin America [Universitat Politècnica de Catalunya]. http://upcommons.upc.edu/bitstream/handle/2099.1/19268/TFM_RUIZ_ALMEIDA_ADRIANA.pdf?sequence=1&isAllowed=y
Ruiz-Almeida, A., & Rivera-Ferre, M. G. (2019). Internationally-based indicators to measure Agri-food systems sustainability using food sovereignty as a conceptual framework. Food Security, 11(6), 1321–1337. https://doi.org/10.1007/s12571-019-00964-5
Sandhu, H., Müller, A., Sukhdev, P., Merrigan, K., Tenkouano, A., Kumar, P., Hussain, S., Zhang, W., Pengue, W., Gemmill-Herren, B., Hamm, M. W., Tirado von der Pahlen, M. C., Obst, C., Sharma, K., Gundimeda, H., Markandya, A., May, P., Platais, G., & Weigelt, J. (2019). The future of agriculture and Food: Evaluating the holistic costs and benefits. Anthropocene Review, 6(3), 270–278. https://doi.org/10.1177/2053019619872808
SAPEA. (2020). A Sustainable Food System for the European Union (Issue Evidence Review Report No. 7). Science Advice for Policy by European Academies. https://doi.org/10.26356/sustainablefood
Sukhdev, P., May, P., & Müller, A. (2016). Fix food metrics. Nature, 540(7631), 33–34. https://doi.org/10.1038/540033a
The Economics of Ecosystems and Biodiversity (TEEB). (2018). Measuring What Matters in Agriculture and Food Systems. http://teebweb.org/agrifood/measuring-what-matters-in-agriculture-and-food-systems/
Tomich, T. P., Brodt, S., Ferris, H., Galt, R., Horwath, W. R., Kebreab, E., Leveau, J. H. J., Liptzin, D., Lubell, M., Merel, P., Michelmore, R., Rosenstock, T., Scow, K., Six, J., Williams, N., & Yang, L. (2011). Agroecology: A Review from a Global-Change Perspective. Annual Review of Environment and Resources, 36(1), 193–222. https://doi.org/10.1146/annurev-environ-012110-121302
Tribaldos, T., Jacobi, J., & Rist, S. (2018). Linking sustainable diets to the concept of food system sustainability. Future of Food : Journal on Food, Agriculture and Society, 6(1), 71–84.
Vallejo-Rojas, V., Ravera, F., & Rivera-Ferre, M. G. (2016). Developing an integrated framework to assessagri-foodd systems and its application in the Ecuadorian Andes. Regional Environmental Change, 16, 2171–2185.
Vallejo-Rojas, V., Ravera, F., & Rivera-Ferre, M. G. (2013). Developing tools to assessagri-foodd systems responses to food sovereignty policies: A conceptual and methodological approach through integration of SES and vulnerability frameworks. In Yale University & The Journal of Peasant Studies (Eds.), Food Sovereignty: A Critical Dialogue.
Wakita, K., & Tsurumi, T. (2007). Finding community structure in mega-scale social networks: [Extended abstract]. 16th International World Wide Web Conference, WWW2007, 1275–1276. https://doi.org/10.1145/1242572.1242805
Westengen, O. T., & Banik, D. (2016). The State of Food Security: From Availability, Access and Rights to Food Systems Approaches. Forum for Development Studies, 43(1), 113–134. https://doi.org/10.1080/08039410.2015.1134644
77
Chapter 3. A social-ecological analysis of the global agri-food
system: Insights for advancing SDG2
Abstract
The failure to eradicate world hunger – the aim of Sustainable Development Goal 2 – emphasizes the
need for a social‐ecological approach to agri‐food systems. An analysis of agri‐food systems from the
perspective of sustainability sciences can inform the path towards this goal. Through a quantitative
multivariate assessment of 43 indicators of food sovereignty and 39 indicators of socio‐demographic
and social wellbeing and environmental sustainability in 150 countries, we depict the global food
panorama. The results indicate an agri‐food debt, i.e., disequilibria in the natural resources consumed,
the environmental impacts produced, and the social wellbeing attained by populations in regions that
play different roles within the globalized agri‐food system. Three spotlights underpin this debt: (a) a
severe contrast in diets, and food security between regions; (b) concern about the role international
agri‐food trade is playing in regional food security; and (c) a mismatch between regional biocapacity
and food security. Our results contribute to broadening the debate beyond food security from a social‐
ecological perspective, incorporating environmental and social dimensions.
Significance Statement: The failure to end hunger and the environmental deterioration underpinning
food systems has prompted a paradigm shift around food security. We propose a social‐ecological
approach and carry out a quantitative analysis of 43 indicators of food sovereignty and 39 indicators
of the socio‐demographic, social wellbeing, and environmental sustainability situation in 150
countries. The results highlight the existence of an agri‐food debt among countries, i.e., disequilibria
in the natural resources consumed, the environmental impacts, and the social wellbeing in regions
that play different roles within the globalized agri‐food system. Three spotlights underpin this debt:
(a) inter‐regional contrasts in food security; (b) concern about the role of agri‐food trade; and (c) a
mismatch between regional biocapacity and food security.
78
1 Introduction
Agri-food systems, given their place among the most vulnerable coupled nature-human systems
(Porter et al., 2014; Rivera-Ferre, Ortega-Cerdà, et al., 2013), have multiple interactions with global
environmental change and play a major role in the present and future of humanity (Bennett, 2017;
Raudsepp-Hearne et al., 2010). They contemporarily sustain and challenge social wellbeing and
human life on the planet (Bennett, 2017) by providing food while contributing to global greenhouse
gas emissions, land degradation, eutrophication, and water quality depletion (J. A. Foley et al., 2011;
Smith et al., 2014; West et al., 2014a). Five of the seven planetary boundaries are directly linked to
agri-food systems (Rockström et al., 2009; Steffen, Richardson, Rockström, Cornell, Fetzer, Bennett,
Biggs, Carpenter, de Vries, et al., 2015). However, in a context in which enough calories are produced
to feed the entire human population (Chappell & LaValle, 2011), chronic hunger still affects one in
nine people in the world (FAO, 2017b). The evident failure of policies to end hunger and the
environmental deterioration underpinning agri-food systems has prompted a paradigm shift in the
way food security is approached, both scientifically and in policy terms: from being mostly focused
on the technical and agrarian aspects of food production (J. A. Foley et al., 2011; Godfray et al., 2010;
Porter et al., 2014; Tester & Langridge, 2010) to adopting a social-ecological systems approach
(Schipanski et al., 2016) and, more precisely, an agri-food system approach, including both
environmental sustainability and social wellbeing (Bennett, 2017; Chaudhary et al., 2018; Ericksen,
2008; Loos et al., 2014; Schipanski et al., 2016; Vallejo-Rojas et al., 2016; West et al., 2014a, 2014b).
This systemic perspective allows emphasis on the use of natural resources for primary production, as
well as food transformation, commercialization and consumption, therefore connecting pieces within
agri-food systems that previous analyses had studied separately.
Likewise, the multiple social and ecological dimensions of food security are transversal to 14 out of
the 17 United Nations’ 2030 Sustainable Development Goals (SDGs) (UN, 2016). The SDGs aim to
eradicate poverty, establish socioeconomic inclusion and protect the environment (Swain, 2018), so
the need for an integrative approach to address them has already been discussed (Lim et al., 2018).
However, critical studies have elicited an incompatibility between the environmental, social, and
economic aspirations of the SDGs (Spaiser et al., 2017).
While food security is commonly defined as the physical, social, and economic ability to access
sufficient, safe, and nutritious food (FAO, 1996), SDG2 implicitly recognizes that a broader approach
to food security is needed to end hunger. Indeed, for the first time, the SDG2 links the objectives of
79
zero hunger, food security, and improved nutrition (subgoal 1) with the need to promote sustainable
agriculture (subgoal 2; 20). It explicitly contributes to the global moral imperative to eradicate hunger
while respecting environmental sustainability. However, this entails controversy about the trade-offs
between achieving food security mainly through increasing food production (Hunter et al., 2017;
Tilman et al., 2011), addressing and minimizing the environmental impacts of agriculture and food
(West et al., 2014a) and adapting to climate change (Vermeulen et al., 2012). Therefore, actions
towards the transformation of agri-food systems need to account for the synergies and trade-offs
that exist between SDG2 and other SDGs (Campbell et al., 2018).
The international debate around the social-ecological sustainability of food systems is prolific, and
different authors have recently suggested a change from the land-sparing/sharing debate to a focus
on human wellbeing (Bennett, 2017); proposed “leverage points” for improving global food security
and environmental sustainability (West et al., 2014a); argued for sustainable healthy diets to keep
food systems within the planetary boundaries (Willett et al., 2019a); developed assessments of the
environmental impacts of food systems (Poore & Nemecek, 2018; Springmann et al., 2016); applied
metrics for the assessment of the sustainable nutrition outcomes of food systems (Gustafson et al.,
2016); and provided a valuable systemic analysis of global food systems (Chaudhary et al., 2018).
However, although it is widely acknowledged that the social and environmental costs and benefits
associated with environmental change are not distributed equally among actors and regions (Nilsson
et al., 2018), how this phenomenon occurs is still poorly understood because less than 6% of food
security publications in the past 25 years included equity or justice as part of their analysis (Schipanski
et al., 2016).
A tipping point in these international debates was the 2012 Thirty-Second Regional Conference for
Latin America and the Caribbean (FAO, 2012), where the United Nations Organization for Food and
Agriculture (FAO) agreed to initiate discussions about alternative approaches to address hunger and
the unsustainability of agri-food systems. One such approach was Food Sovereignty (FAO, 2012).
Food Sovereignty emerged in the late 1990s, arguing that hunger is not merely a matter of food
availability and quality but that equally or more critical issues are political aspects harnessing equity
and justice within food systems. Those may include agricultural trade liberalization, power relations
between different actors (from small producers to large transnational corporations and consumers),
a lack of wide social participation along the whole food chain, or access to the means of production
(Claeys, 2015a; Levidow et al., 2014). Food Sovereignty was coined by La Via Campesina, an
international movement of farmers, peasants, and landless workers, and has been developed and
80
discussed at large by civil society organizations, farmers’ trade unions, academia, governments, and
international institutions (De Schutter, 2014) to become a well-rooted concept (Patel, 2009). Within
this approach, food is framed as a human right, including its environmental and socio-cultural
aspects, which are viewed as both drivers and outcomes of food security and where small farmers
are considered to play a central role (Claeys, 2015a).
However, progress towards ending hunger needs to be measurable through indicators that aid
societies in assessing their performance (Swain, 2018). (Ruiz-Almeida & Rivera-Ferre, 2019)proposed
Food Sovereignty as a conceptual framework to analyze the food system’s sustainability and its
capacity to tackle hunger at the international level. They proposed a panel of 97 indicators that are
classified into six pillars explaining food systems from a food sovereignty perspective: (a) access to
resources, (b) production model, (c) commercialization, (d) food consumption and right to food, (e)
agri-food policies and civil society organization and (f) gender. Based on this set of indicators, we
analyze here the global agri-food system from a social-ecological sustainability perspective in order
to quantitatively assess at the international level the role that different countries play within the
system and the links with social wellbeing and environmental sustainability.
To do this, we carried out a Principal Component Analysis (PCA) of 43 indicators (variables) describing
the agri-food system (Tables SM.3 to SM.7) in 150 countries (observations). Using the standardized
coordinates of the most significant PCA factors, we performed a Hierarchical Cluster Analysis (HCA)
based on the Euclidean distance and Ward’s agglomerative method. Finally, we used Kruskal-Wallis
and Chi2 tests to characterize each cluster of countries according to its performance in terms of Food
Sovereignty, seven demographic and economic indicators, five social wellbeing indicators, and 17
environmental sustainability indicators (a more detailed description of statistical methods and results
can be found in the Supplementary Materials). This approach aims to contribute to other ongoing
efforts to provide indicators for monitoring SDG progress (see http://indicators.report).
In analyzing the relationship between Food Sovereignty, social wellbeing, and environmental
sustainability, we (a) identify world regions formed by countries under similar conditions of Food
Sovereignty; (b) relate the state of Food Sovereignty of the different regions with their state of social
wellbeing and environmental sustainability; and (c) critically reflect on the implications for SDG2 of
an agri-food debt between world regions that have been so far poorly addressed.
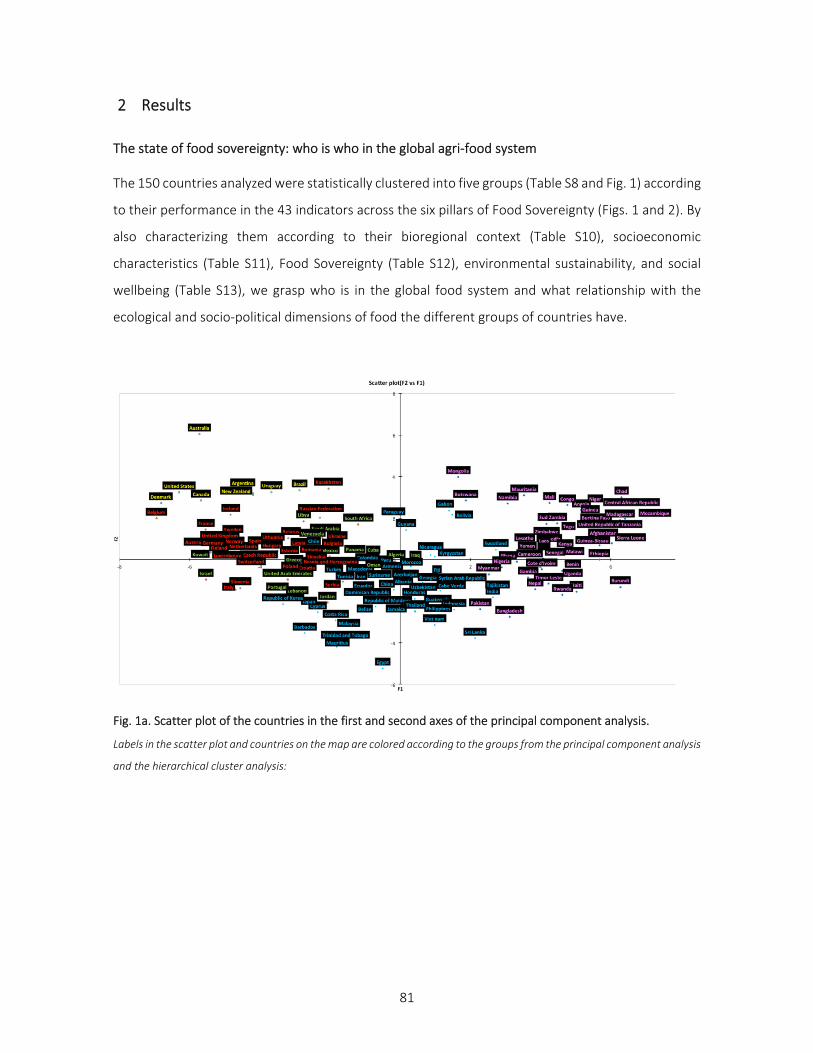
81
2 Results
The state of food sovereignty: who is who in the global agri-food system
The 150 countries analyzed were statistically clustered into five groups (Table S8 and Fig. 1) according
to their performance in the 43 indicators across the six pillars of Food Sovereignty (Figs. 1 and 2). By
also characterizing them according to their bioregional context (Table S10), socioeconomic
characteristics (Table S11), Food Sovereignty (Table S12), environmental sustainability, and social
wellbeing (Table S13), we grasp who is in the global food system and what relationship with the
ecological and socio-political dimensions of food the different groups of countries have.
Fig. 1a. Scatter plot of the countries in the first and second axes of the principal component analysis.
Labels in the scatter plot and countries on the map are colored according to the groups from the principal component analysis
and the hierarchical cluster analysis:
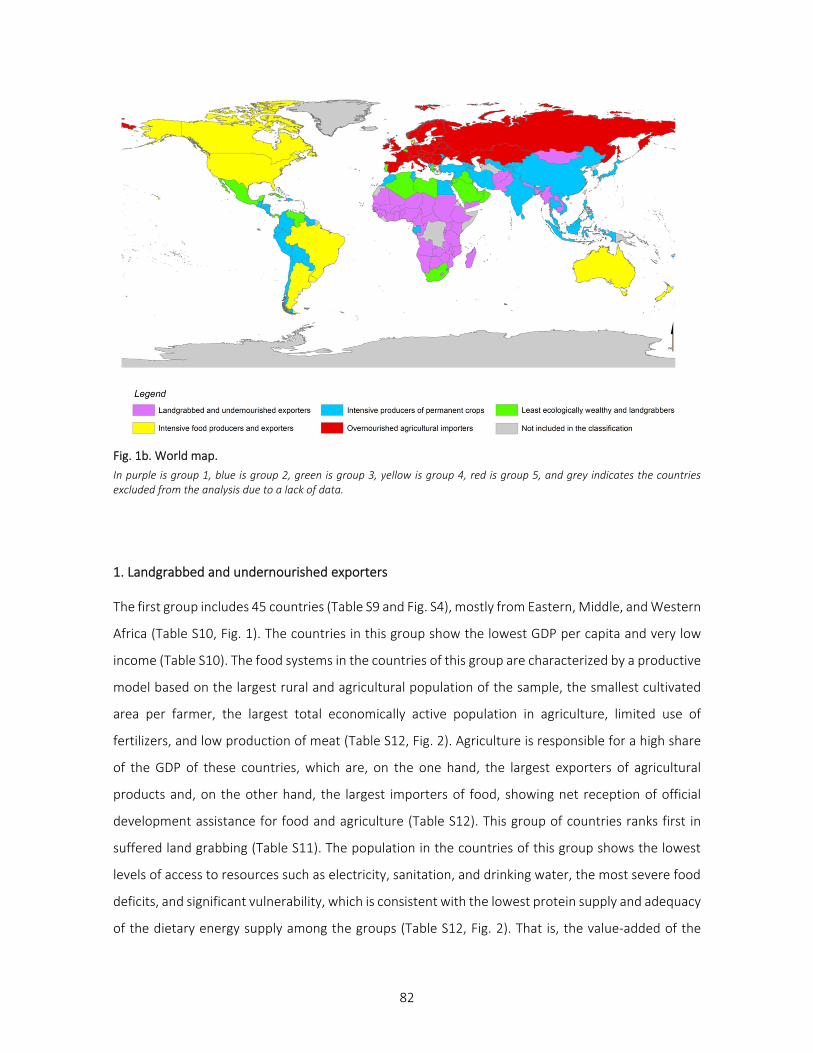
82
Fig. 1b. World map.
In purple is group 1, blue is group 2, green is group 3, yellow is group 4, red is group 5, and grey indicates the countries excluded from the analysis due to a lack of data.
1. Landgrabbed and undernourished exporters
The first group includes 45 countries (Table S9 and Fig. S4), mostly from Eastern, Middle, and Western
Africa (Table S10, Fig. 1). The countries in this group show the lowest GDP per capita and very low
income (Table S10). The food systems in the countries of this group are characterized by a productive
model based on the largest rural and agricultural population of the sample, the smallest cultivated
area per farmer, the largest total economically active population in agriculture, limited use of
fertilizers, and low production of meat (Table S12, Fig. 2). Agriculture is responsible for a high share
of the GDP of these countries, which are, on the one hand, the largest exporters of agricultural
products and, on the other hand, the largest importers of food, showing net reception of official
development assistance for food and agriculture (Table S12). This group of countries ranks first in
suffered land grabbing (Table S11). The population in the countries of this group shows the lowest
levels of access to resources such as electricity, sanitation, and drinking water, the most severe food
deficits, and significant vulnerability, which is consistent with the lowest protein supply and adequacy
of the dietary energy supply among the groups (Table S12, Fig. 2). That is, the value-added of the
83
agricultural products produced is not retained, exporting huge amounts of agricultural products while
failing to feed large shares of their population. These countries also show the lowest degree of
globalization. The indicators of social wellbeing are coherent with the former, as this group of
countries has the worst scores for all the indicators analyzed, including significantly shortest life
expectancy and worse life satisfaction (Table S13, Fig. 3). In terms of environmental sustainability,
these countries are associated with the lowest ecological footprint and low CO2 emissions, and water
withdrawal from agriculture (Table S13, Fig. 3).
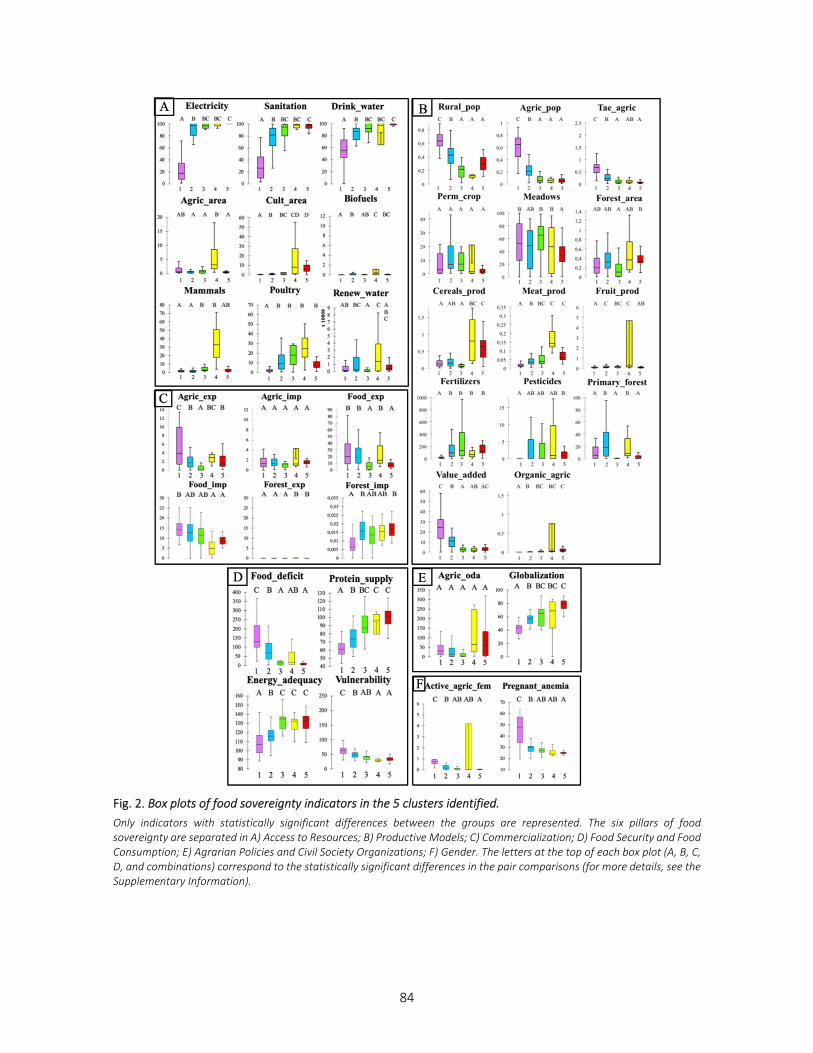
84
Fig. 2. Box plots of food sovereignty indicators in the 5 clusters identified.
Only indicators with statistically significant differences between the groups are represented. The six pillars of food sovereignty are separated in A) Access to Resources; B) Productive Models; C) Commercialization; D) Food Security and Food Consumption; E) Agrarian Policies and Civil Society Organizations; F) Gender. The letters at the top of each box plot (A, B, C, D, and combinations) correspond to the statistically significant differences in the pair comparisons (for more details, see the Supplementary Information).
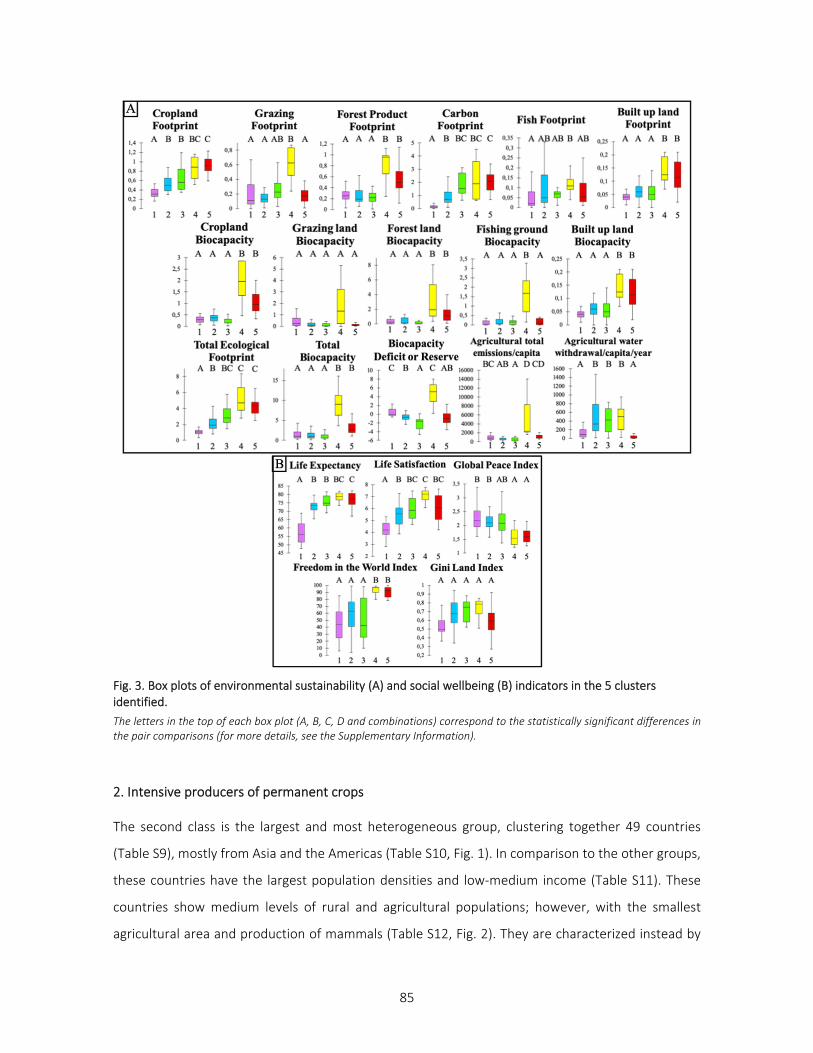
85
Fig. 3. Box plots of environmental sustainability (A) and social wellbeing (B) indicators in the 5 clusters identified.
The letters in the top of each box plot (A, B, C, D and combinations) correspond to the statistically significant differences in the pair comparisons (for more details, see the Supplementary Information).
2. Intensive producers of permanent crops
The second class is the largest and most heterogeneous group, clustering together 49 countries
(Table S9), mostly from Asia and the Americas (Table S10, Fig. 1). In comparison to the other groups,
these countries have the largest population densities and low-medium income (Table S11). These
countries show medium levels of rural and agricultural populations; however, with the smallest
agricultural area and production of mammals (Table S12, Fig. 2). They are characterized instead by
86
the vastest surfaces of permanent crops that are dedicated partly to fruit production and involve a
strong use of fertilizers and agricultural water withdrawal, which is potentially related to their large
food exports (Table S12, Figs. 2 and 3). Countries in this group are also characterized by the second-
highest food deficit, low energy and protein intake (Table S12, Fig. 2), and overall intermediate levels
of social wellbeing (Table S13, Fig. 3).
3 Least ecologically wealthy and landgrabbers
The 18 countries clustered in this class are not geographically or eco-regionally grouped (Tables S9
and S10, Fig. 1). They show medium population densities and GDP per capita (Table S11). Countries
in this group show a limited proportion of agricultural area and forests, as well as overall very little
cereal, meat, and fruit production but the greatest use of fertilizers (Table S12, Fig. 2). Little of the
population lives in rural areas or is dedicated to agriculture, and overall, the population in these
countries seems to have good access to all resources except renewable water (the group includes
several island states) (Table S12, Fig. 2). These countries have limited exports of agricultural products,
and they are net food importers, with limited value added to agriculture (Table S12, Fig. 2). Most of
these countries coincide with those in which the importance of food imports has increased in recent
years. They show an intermediate level of food security and consumption in comparison to the other
groups, in spite of limited subsidies invested in supporting agriculture (Table S12). Overall, they seem
to have a good situation in terms of social wellbeing (Table S13, Fig. 3). Two significant characteristics
of this group are the largest biocapacity deficit in comparison to the other four groups (Table S13,
Fig. 3) and the largest area of land grabbed abroad (Table S11).
4 Intensive food producers and exporters
The fourth group clusters eight vast countries from Oceania and the Americas with the largest intra-
group variance (Tables S9 and S10, Fig. 1). This group exhibits high income and the largest GDP per
capita alongside the smallest population densities (Table S11). Access to resources is high in these
countries, and the agri-food system is focused largely on a model of intensive production of cereals,
fruit, meat, and biofuels, dependent on large inputs of pesticides and with very low rural and
agricultural populations (Table S11, Fig. 2). However, organic agriculture scores high in this group due
to Uruguay and the United States. Countries in this group appear to be the “breadbasket of the
world”: they show a large share of food and agricultural exports while indicating limited food imports
(Table S12, Fig. 2). In fact, some of them, such as Australia, Argentina, Canada, the United States, and,
most recently, Brazil, dominate global food exports. This group also shows the largest financial
87
support for agriculture (Table S12, Fig. 2). Food deficit is quite low and the protein supply is high,
consistent with the high level of energy adequacy (Table S12, Fig. 2). Another common feature of
countries in this group is their large ecological footprints and agricultural CO2 emissions, as well as a
large biocapacity that sustains their large biocapacity reserves (Table S13, Fig. 3). Furthermore, they
have the best records for all social wellbeing indexes (Table S11, Fig. 3).
5 Overnourished agricultural importers
The fifth group is the most homogeneous group and includes 30 countries (Tables S9, Fig. S4), mostly
in Europe (Table S10, Fig. 1), and features the largest population densities, the second largest GDP
per capita, and high income (Table S11). Access to resources is satisfactory in these countries (Table
S12, Fig. 2). Agriculture is quite intensified, with little and masculinized rural and agricultural
populations and large use of fertilizers (Table S12, Fig. 2). These are the largest importers of
agricultural products, however, with little imports and exports of food (Table S12, Fig. 2). People in
these countries are overall food secure but have a diet largely based on a large consumption of
proteins (Table S12, Fig. 2). These countries are in a biocapacity deficit because of the ecological
footprint of the built-up land and the croplands, instead of showing the lowest grazing footprint and
agricultural water withdrawal but large CO2 agricultural emissions (Table S13, Fig. 3). These are the
countries with the largest degree of globalization and net contribution of official development
assistance for food and agriculture, as well as overall high levels of social wellbeing (Tables S12 and
S13; Figs. 2 and 3).
3 Discussion
The Food Sovereignty indicator framework (Ruiz-Almeida & Rivera-Ferre, 2019) used here to analyze
agri-food systems from a social-ecological systems perspective (Schipanski et al., 2016) contributes
to systematically and quantitatively assessing environmental, social, and economic relationships
between countries within a globalized world. It allows us to measure progress through periodical
monitoring: ideally, countries should not be so easily clustered, and if they are, the groups should not
show significant differences in terms of their socio-demographic characteristics, environmental
sustainability, and social wellbeing. The current clusters might help countries to (a) be conscious of
the impacts of their national agri-food policies in other countries and on their social-ecological
sustainability, (b) evaluate the dependence of their food security, social wellbeing, and environmental
88
sustainability on other countries, and therefore (c) allow governments to make sensible changes to
agri-food policies to contribute to SDG2.
Winners and losers: agri-food debt
The International Council for Science critically pointed towards the internal inconsistency between
ecological sustainability and socioeconomic progression in the SDG framework (ICSU & ISSC, 2015),
but there is limited quantitative evidence about the nature and extent of this incompatibility of
sustainability and development (ICSU & ISSC, 2015; Stern et al., 1994). Our results provide evidence
of the challenges to end hunger in a globalized agri-food system, which is far from equitable from
both socioeconomic and environmental perspectives. Certain countries, such as Australia, Brazil,
Argentina, and those in Europe and North America, hold a critical stake and should reduce over-
consumption, while other countries, such as most of Africa, would benefit from improving their self-
sufficiency. Our results show that intertwined and nested material flows in global agri-food systems
result in inter-regional social inequities in the distribution of both costs and benefits of producing,
trading and consuming food, hence affecting social wellbeing, unevenly distributing environmental
impacts and challenging environmental sustainability.
In line with the concept of “ecological debt,” which was coined by academics in 1992 and further
adopted and developed by civil society organizations and governments (Goeminne & Paredis, 2010),
the results presented here illustrate an agri-food debt, i.e., the inter-regional social-ecological
disequilibria in the natural resources consumed, the environmental impacts produced, and the social
wellbeing attained by populations in regions that play different roles within the globalized agri-food
system. Given that a substantial proportion of the world's 815 million people who are unable to meet
daily food needs are food producers, such as small-scale farmers and fishers (FAO, 2017b), our results
confirm that food security is largely a matter of redistribution, entitlements, food access, and access
to services and means of production (Sen, 1981; Spaiser et al., 2017). Globalization poses complex
trade-offs for food system resilience across scales due to high social, economic, and ecological
interconnectedness, trade-offs, and, hence, vulnerability (Schipanski et al., 2016). We suggest that
this agri-food debt, which has been poorly addressed to date, should be recognized, assessed, and
monitored through three spotlights: (a) a severe contrast in diets and food security between regions;
(b) concern about the role international agri-food trade is playing in regional food security, and (c) a
mismatch between regional biocapacity and food security.
89
Nutritional and environmental contrasts in diets and food security between regions
An unbalanced food system features a contrast between high rates of under-nutrition (group 1) vs.
over-nutrition (in groups 4 and 5), leading to increasing overweight and obesity (FAO, 2017b), which
highlights the need to promote dietary changes in many countries of the Global North (Chaudhary et
al., 2018; Dixon et al., 2007; Poore & Nemecek, 2018; Willett et al., 2019b). Divergences in diets are
reflected by the differences in carbon footprints between the groups: mean dietary carbon footprints
vary from ca. 0.7 kg CO2 eq. per capita per day for certain African countries (all in group 1), to 4 kg
CO2 eq. per capita per day for New Zealand, Australia, the United States, France, Austria, Argentina
and Brazil (all in groups 4 and 5) (Chaudhary et al., 2018). If current crop production used for animal
feed and other non-food uses such as biofuels (particularly in the United States, China, Western
Europe, and Brazil) were used for direct human consumption, ca. 70% more calories would be
available, potentially satisfying the basic needs of 4 billion people (Vermeulen et al., 2012). Our results
confirm that most countries with a high nutritional quality show high ecological footprints, so changes
in the diets in North America (group 4) and Europe (group 5) would entail the largest reductions in
environmental impacts of the global agri-food system (Bajželj et al., 2014; Berners-Lee et al., 2018b;
Chaudhary et al., 2018). However, concerns about nutrient density and public health must be
incorporated into considerations around the environmental impacts of food and consequently
integrated into agricultural policies (Chaudhary et al., 2018; Drewnowski et al., 2015; Schipanski et
al., 2016). The point at which the higher carbon footprint of some nutrient-dense foods is offset by
their higher nutritional value is a priority area for additional research.
Therefore, “doubling the agricultural productivity of small-scale food producers,” as stated by SDG2,
is, per se, not the way to eradicate hunger in a context where the world is already producing food to
feed 12 billion people (D’Odorico et al., 2014; Ziegler, 2013). On the contrary, it might be even
ecologically counterproductive unless other agri-food policies are adopted, such as the reduction of
the demand-side and particularly animal-sourced food in the diets of countries in groups 4 and 5 and
of some countries in group 3, the diminution of impacts of the supply chain, and the incentive of low-
impact and crop-diversifying farming systems (Bajželj et al., 2014; Berners-Lee et al., 2018b;
Chaudhary et al., 2018; Poore & Nemecek, 2018; Schipanski et al., 2016).
International agri-food trade, food security, and environmental sustainability
International trade plays an important role in food security (D’Odorico et al., 2014), and the
promotion and maintenance of certain lifestyles and diets rich in calories has been possible thanks to
90
the global food trade (Porkka et al., 2013); SDG2 states that “access to financial services, markets and
opportunities to value addition” is needed. However, unless regulated and complemented with other
policy instruments, the global agri-food trade entails trade-offs in terms of social equity and
environmental sustainability (Sun et al., 2018). In fact, securing the food supply through imports
occurs only in strong enough economies (Berners-Lee et al., 2018b; Porkka et al., 2013), and
international agri-food trade can contribute to increasing social inequality in the form of food
insecurity, with some groups of countries losing (groups 1 and 2) with respect to others (4 and 5).
The first group of countries (mostly in Africa) is a clear example of this: despite their large exports of
agricultural products and the largest imports of food, under-nutrition remains a critical limitation.
More than one-fifth of global calorie production is exported, mostly from countries in group 4 (the
United States, Canada, Brazil, and Argentina) (MacDonald et al., 2015). Industrialized countries with
high GDP per capita tend to be major net importers of biodiversity, while tropical countries such as
Argentina and Brazil suffer habitat degradation and biodiversity loss as a result of producing crops for
exports (Chaudhary & Kastner, 2016). Land use for export production is responsible for 25% of the
projected global extinctions and related biodiversity loss (Chaudhary & Brooks, 2017; Chaudhary &
Kastner, 2016), approximately 20% of global harvested cropland area is devoted to export production
(MacDonald et al., 2015), and most of the new cropland expansion is globally attributed to the
production of crops for export (Kastner et al., 2014). The international food trade has been related
to a virtual transfer of water (Allan, 1998), carbon (Schipanski & Bennett, 2012), nitrogen (Galloway
et al., 2007), and phosphorus (Kastner et al., 2011), while the environmental impacts of agricultural
production tend to remain in the producing countries (Meyfroidt et al., 2013).
The mismatch between regional biocapacity and food security
There has been a strong decoupling between regional biocapacity and food consumption. The global
tele-coupling (Liu et al., 2016) and increasing interdependence among countries in regard to
availability and access to food sources and the genetic resources supporting their production (Khoury
et al., 2014), result in the increasing reliance of some regions on social and natural resources from
other regions of the world, which also increases agri-food debt. A clear example of this phenomenon
is land grabbing, which is largely exerted by companies mostly from countries in groups 3 (Middle
East), 2 (e.g., China) and 5 (e.g., Europe) on countries from group 1 (e.g., Africa) (Anseeuw, 2013;
Batterbury & Ndi, 2018). For example, restrictions on agricultural production and changes in
bioenergy demand have nurtured the dependence of the EU (group 5) on the appropriation of
91
biological productivity outside its boundaries, with increasing reliance on Latin America as the main
supplier (Kastner et al., 2014). Additional evidence in that direction is related to food loss and waste:
industrialized Asia (China, India, and North Korea), Europe, North America, and Oceania have the
highest per capita carbon footprint of food loss and waste, while Sub-Saharan Africa has the lowest
(FAO, 2013).
Limitations
The intricacy and complexity of the currently globalized food system are impossible to fully
disentangle with a purely statistical exercise, like the one presented here. A participatory, qualitative
assessment with stakeholder collaboration could improve both the selection of indicators and the
interpretation of results, for example, be tailored at the national or regional levels, therefore also
improving the usability of the knowledge generated (Clark et al., 2016). Moreover, using the country
scale as a unit of analysis implies that internal environmental, social, and nutritional inequities cannot
be accounted for. For example, data on ethnic minorities, regional groups, indigenous populations,
slum dwellers, and women aged 50 and over are rarely collected (Swain, 2018). A further constraint
is the limited quality and/or availability of data: while data on economic indicators are widely available
for most countries, data on environmental and social indicators of contested phenomena (e.g., land
grabbing) are incomplete and of poor quality (Swain, 2018). However, providing quantitative agri-
food system metrics at the global scale using Food Sovereignty indicators together with other socio-
demographic, social wellbeing and environmental indicators allows the identification of trade-offs in
environmental and social justice within the global agri-food system, which is currently largely ignored
(van Vuuren et al., 2015) but needed in order to address SDGs.
4 Conclusions
In the last four decades, there has been an intense debate about the best policies needed to achieve
what is currently stated in SDG2. Between the mid-1960s and the early 2000s, food availability
improved globally, and global per capita exports of agricultural products almost doubled, but food
self-sufficiency did not change significantly (Porkka et al., 2013). The global population increased by
142% between 1961 and 2016, while calorie production increased by 217% by 2013 (McKeon, n.d.).
While the need to increase food production has been repeated like a mantra in many instances (FAO,
2009; West et al., 2014a), old policies focused on productivity, favoring agricultural industrialization,
trade liberalization, privatization, and deregulation, have failed to end hunger (Burdock & Ampt,
92
2017). As this study corroborates, under-nutrition is not only a matter of food availability and access
(Porkka et al., 2013; Schipanski et al., 2016). Instead, the eradication of hunger would be facilitated
by a redistribution of current consumption levels (Pittelkow et al., 2015). Furthermore, the challenges
and responsibility for achieving SDG2, as well as other SDGs, still within planetary boundaries, are not
evenly distributed across the globe (Easterly, 2015; Swain, 2018; West et al., 2014a). On a global
scale, agri-food debt shows that wealthy countries are exporting environmental degradation to
import cheap food that they largely waste and overeat: European and North American countries
(groups 4 and 5) currently hold an important stake.
There is no fundamental trade-off between eradicating hunger, achieving environmental
sustainability (van Vuuren et al., 2015), and social equity. However, for the achievement of SDG2
through transformational, socially fair, environmentally sustainable, and resilient food systems, our
results point to the following key wedges: biodiversity conservation through environmentally friendly
agri-food practices (M. Altieri, 2009), the reduction of agri-food waste (Schipanski et al., 2016), the
regionalization of food distribution (Schipanski et al., 2016) and the adoption of healthy and
sustainable diets (Vermeulen et al., 2012). We need to make these steps fast enough to advance
SDG2 while preserving environmental sustainability and social wellbeing.
5 Materials and methods
Data collection
We based the selection of our data collection on previous work by Ruiz-Almeida and Rivera-Ferre
(2019). They compiled 97 indicators for 223 regions (countries or officially recognized territories) to
analyze food sovereignty at a country level. The data collected ranged between 1961 and 2012, with
some indicators presenting complete time series but others presenting few sporadic data within this
timeframe.
Indicator adjustments
Nine indicators were selected to describe the pillar of “access to resources”, 16 for “productive
models”, 8 for “commercialization”, 5 for “food security and consumption”, 3 for “agrarian policies
and civil society organization”, and 2 for “gender”. Some indicators were originally published as
indexes or proportions while others needed to be transformed in relative terms with respect to
country area or population size in order to adjust magnitudes and allow comparison between
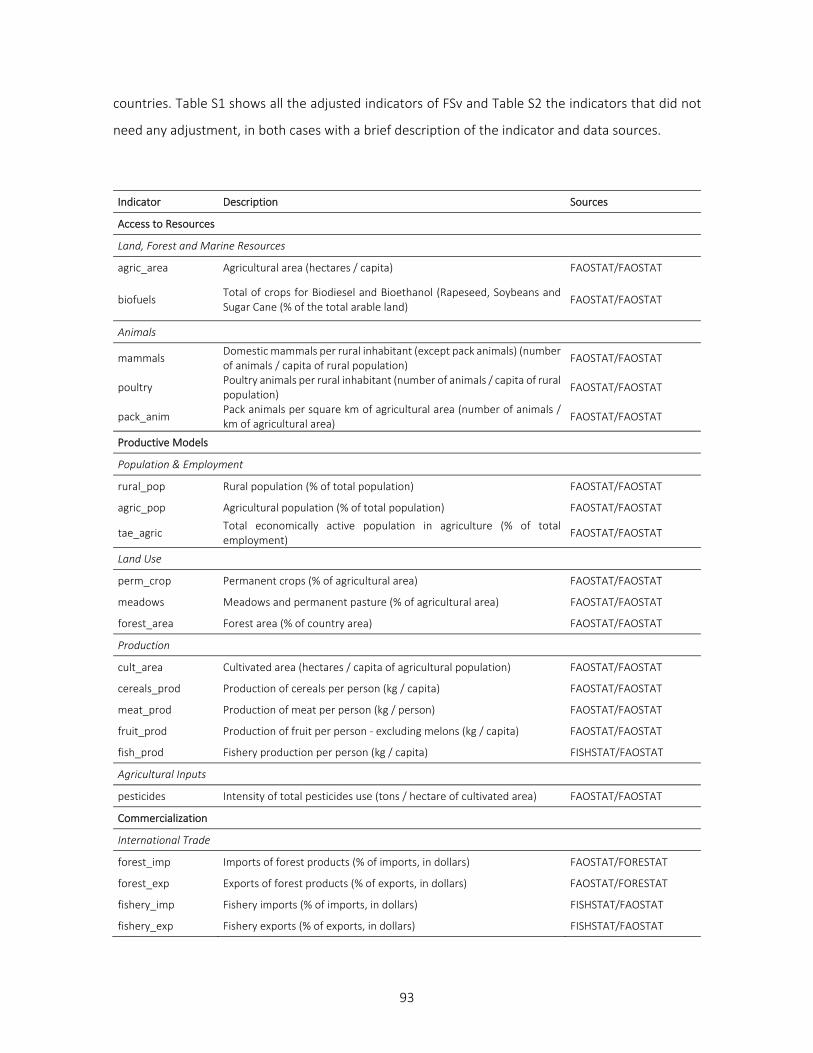
93
countries. Table S1 shows all the adjusted indicators of FSv and Table S2 the indicators that did not
need any adjustment, in both cases with a brief description of the indicator and data sources.
Indicator Description Sources
Access to Resources
Land, Forest and Marine Resources
agric_area Agricultural area (hectares / capita) FAOSTAT/FAOSTAT
biofuels Total of crops for Biodiesel and Bioethanol (Rapeseed, Soybeans and Sugar Cane (% of the total arable land)
FAOSTAT/FAOSTAT
Animals
mammals Domestic mammals per rural inhabitant (except pack animals) (number of animals / capita of rural population)
FAOSTAT/FAOSTAT
poultry Poultry animals per rural inhabitant (number of animals / capita of rural population)
FAOSTAT/FAOSTAT
pack_anim Pack animals per square km of agricultural area (number of animals / km of agricultural area)
FAOSTAT/FAOSTAT
Productive Models
Population & Employment
rural_pop Rural population (% of total population) FAOSTAT/FAOSTAT
agric_pop Agricultural population (% of total population) FAOSTAT/FAOSTAT
tae_agric Total economically active population in agriculture (% of total employment)
FAOSTAT/FAOSTAT
Land Use
perm_crop Permanent crops (% of agricultural area) FAOSTAT/FAOSTAT
meadows Meadows and permanent pasture (% of agricultural area) FAOSTAT/FAOSTAT
forest_area Forest area (% of country area) FAOSTAT/FAOSTAT
Production
cult_area Cultivated area (hectares / capita of agricultural population) FAOSTAT/FAOSTAT
cereals_prod Production of cereals per person (kg / capita) FAOSTAT/FAOSTAT
meat_prod Production of meat per person (kg / person) FAOSTAT/FAOSTAT
fruit_prod Production of fruit per person - excluding melons (kg / capita) FAOSTAT/FAOSTAT
fish_prod Fishery production per person (kg / capita) FISHSTAT/FAOSTAT
Agricultural Inputs
pesticides Intensity of total pesticides use (tons / hectare of cultivated area) FAOSTAT/FAOSTAT
Commercialization
International Trade
forest_imp Imports of forest products (% of imports, in dollars) FAOSTAT/FORESTAT
forest_exp Exports of forest products (% of exports, in dollars) FAOSTAT/FORESTAT
fishery_imp Fishery imports (% of imports, in dollars) FISHSTAT/FAOSTAT
fishery_exp Fishery exports (% of exports, in dollars) FISHSTAT/FAOSTAT
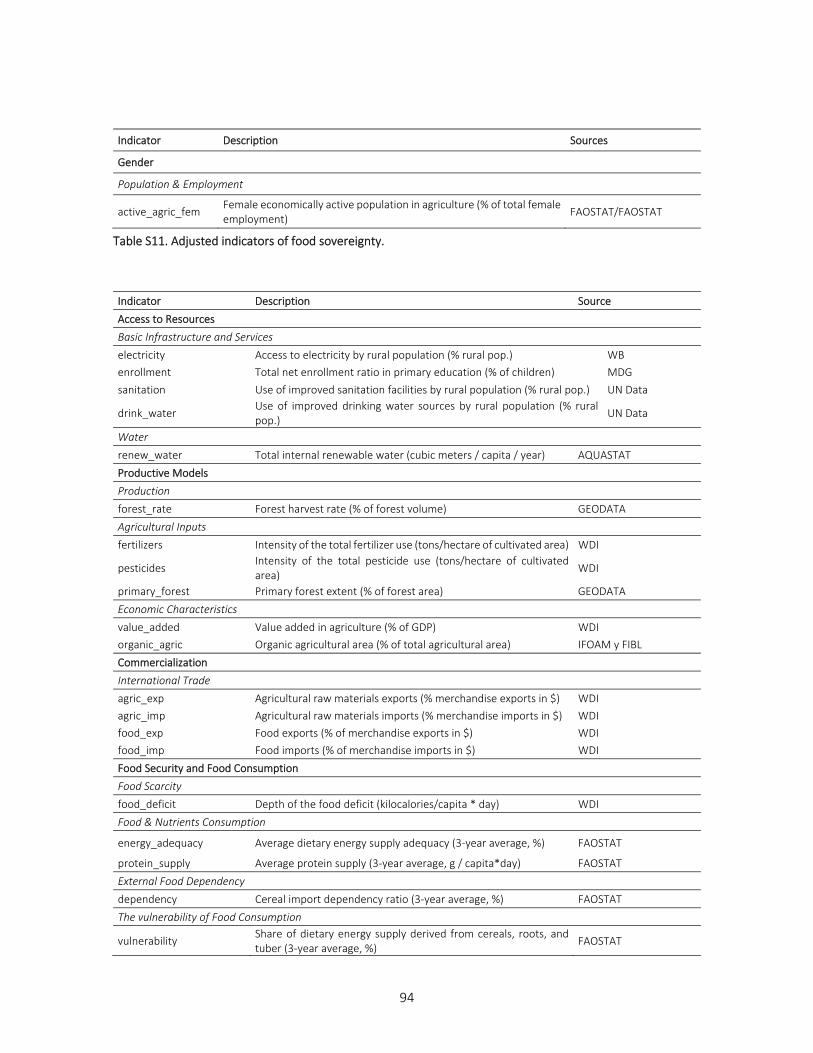
94
Indicator Description Sources
Gender
Population & Employment
active_agric_fem Female economically active population in agriculture (% of total female employment)
FAOSTAT/FAOSTAT
Table S11. Adjusted indicators of food sovereignty.
Indicator Description Source
Access to Resources
Basic Infrastructure and Services
electricity Access to electricity by rural population (% rural pop.) WB
enrollment Total net enrollment ratio in primary education (% of children) MDG
sanitation Use of improved sanitation facilities by rural population (% rural pop.) UN Data
drink_water Use of improved drinking water sources by rural population (% rural pop.)
UN Data
Water
renew_water Total internal renewable water (cubic meters / capita / year) AQUASTAT
Productive Models
Production
forest_rate Forest harvest rate (% of forest volume) GEODATA
Agricultural Inputs
fertilizers Intensity of the total fertilizer use (tons/hectare of cultivated area) WDI
pesticides Intensity of the total pesticide use (tons/hectare of cultivated area)
WDI
primary_forest Primary forest extent (% of forest area) GEODATA
Economic Characteristics
value_added Value added in agriculture (% of GDP) WDI
organic_agric Organic agricultural area (% of total agricultural area) IFOAM y FIBL
Commercialization
International Trade
agric_exp Agricultural raw materials exports (% merchandise exports in $) WDI
agric_imp Agricultural raw materials imports (% merchandise imports in $) WDI
food_exp Food exports (% of merchandise exports in $) WDI
food_imp Food imports (% of merchandise imports in $) WDI
Food Security and Food Consumption
Food Scarcity
food_deficit Depth of the food deficit (kilocalories/capita * day) WDI
Food & Nutrients Consumption
energy_adequacy Average dietary energy supply adequacy (3-year average, %) FAOSTAT
protein_supply Average protein supply (3-year average, g / capita*day) FAOSTAT
External Food Dependency
dependency Cereal import dependency ratio (3-year average, %) FAOSTAT
The vulnerability of Food Consumption
vulnerability Share of dietary energy supply derived from cereals, roots, and tuber (3-year average, %)
FAOSTAT
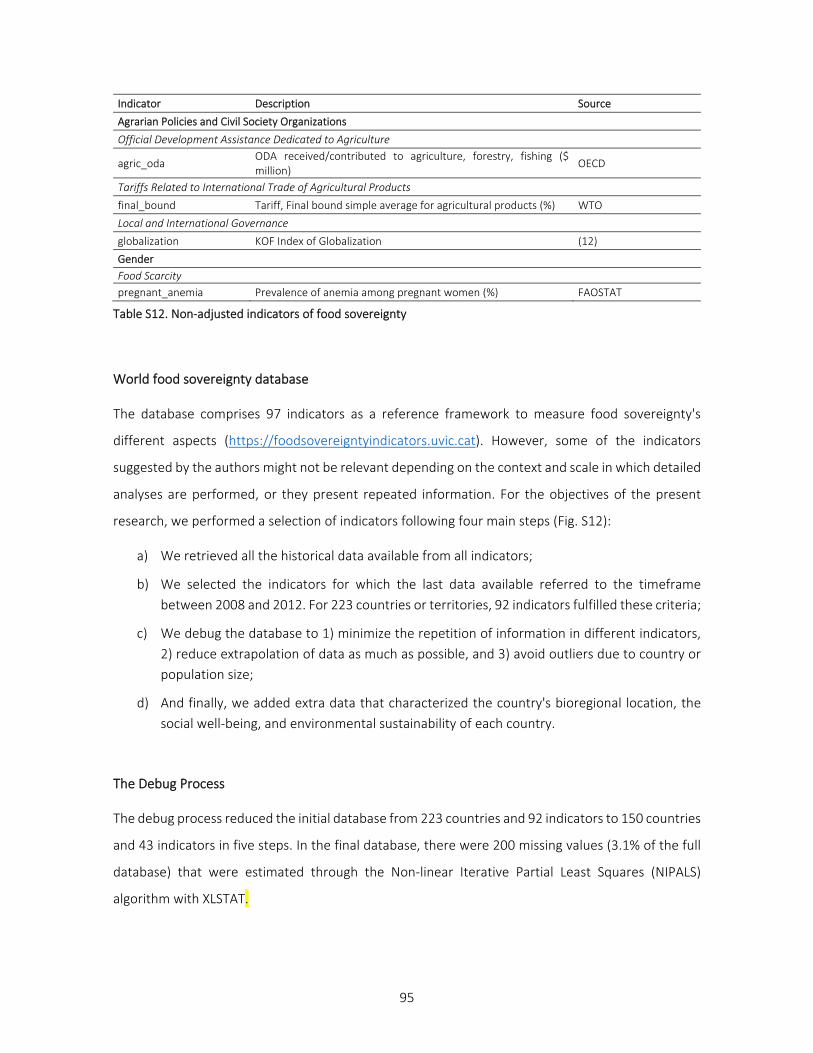
95
Indicator Description Source
Agrarian Policies and Civil Society Organizations
Official Development Assistance Dedicated to Agriculture
agric_oda ODA received/contributed to agriculture, forestry, fishing ($ million)
OECD
Tariffs Related to International Trade of Agricultural Products
final_bound Tariff, Final bound simple average for agricultural products (%) WTO
Local and International Governance
globalization KOF Index of Globalization (12)
Gender
Food Scarcity
pregnant_anemia Prevalence of anemia among pregnant women (%) FAOSTAT
Table S12. Non-adjusted indicators of food sovereignty
World food sovereignty database
The database comprises 97 indicators as a reference framework to measure food sovereignty's
different aspects (https://foodsovereigntyindicators.uvic.cat). However, some of the indicators
suggested by the authors might not be relevant depending on the context and scale in which detailed
analyses are performed, or they present repeated information. For the objectives of the present
research, we performed a selection of indicators following four main steps (Fig. S12):
a) We retrieved all the historical data available from all indicators;
b) We selected the indicators for which the last data available referred to the timeframe
between 2008 and 2012. For 223 countries or territories, 92 indicators fulfilled these criteria;
c) We debug the database to 1) minimize the repetition of information in different indicators,
2) reduce extrapolation of data as much as possible, and 3) avoid outliers due to country or
population size;
d) And finally, we added extra data that characterized the country's bioregional location, the
social well-being, and environmental sustainability of each country.
The Debug Process
The debug process reduced the initial database from 223 countries and 92 indicators to 150 countries
and 43 indicators in five steps. In the final database, there were 200 missing values (3.1% of the full
database) that were estimated through the Non-linear Iterative Partial Least Squares (NIPALS)
algorithm with XLSTAT.
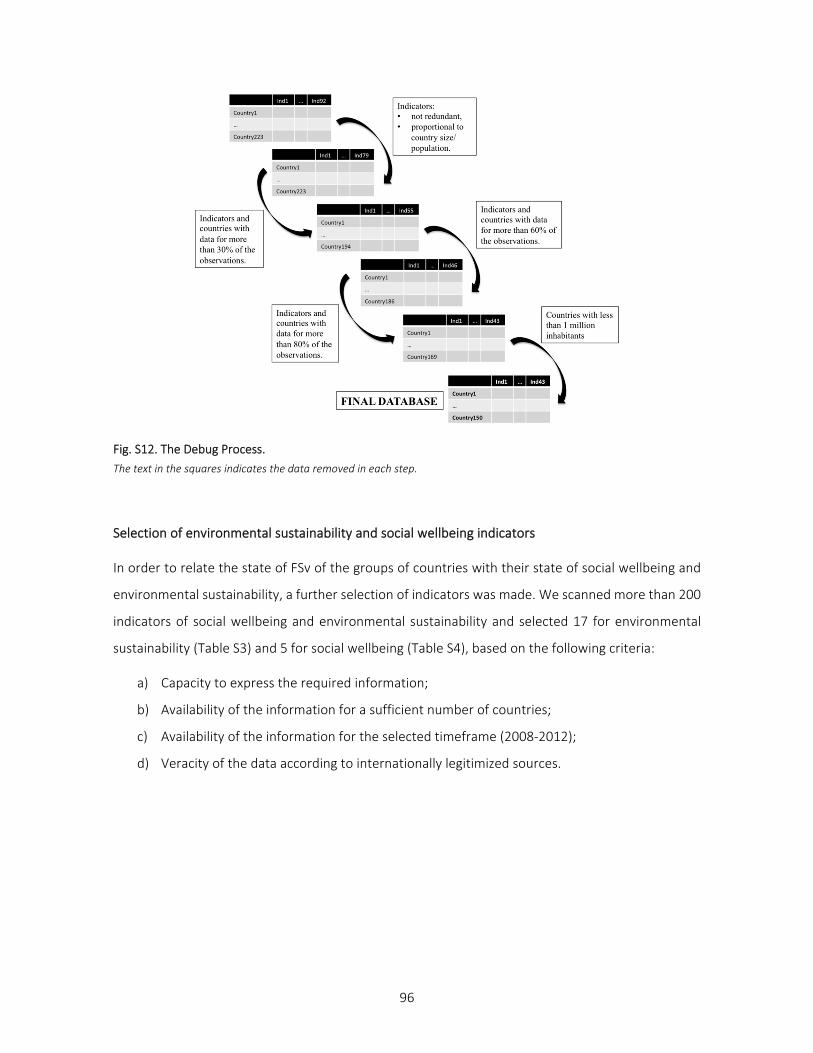
96
Fig. S12. The Debug Process.
The text in the squares indicates the data removed in each step.
Selection of environmental sustainability and social wellbeing indicators
In order to relate the state of FSv of the groups of countries with their state of social wellbeing and
environmental sustainability, a further selection of indicators was made. We scanned more than 200
indicators of social wellbeing and environmental sustainability and selected 17 for environmental
sustainability (Table S3) and 5 for social wellbeing (Table S4), based on the following criteria:
a) Capacity to express the required information;
b) Availability of the information for a sufficient number of countries;
c) Availability of the information for the selected timeframe (2008-2012);
d) Veracity of the data according to internationally legitimized sources.
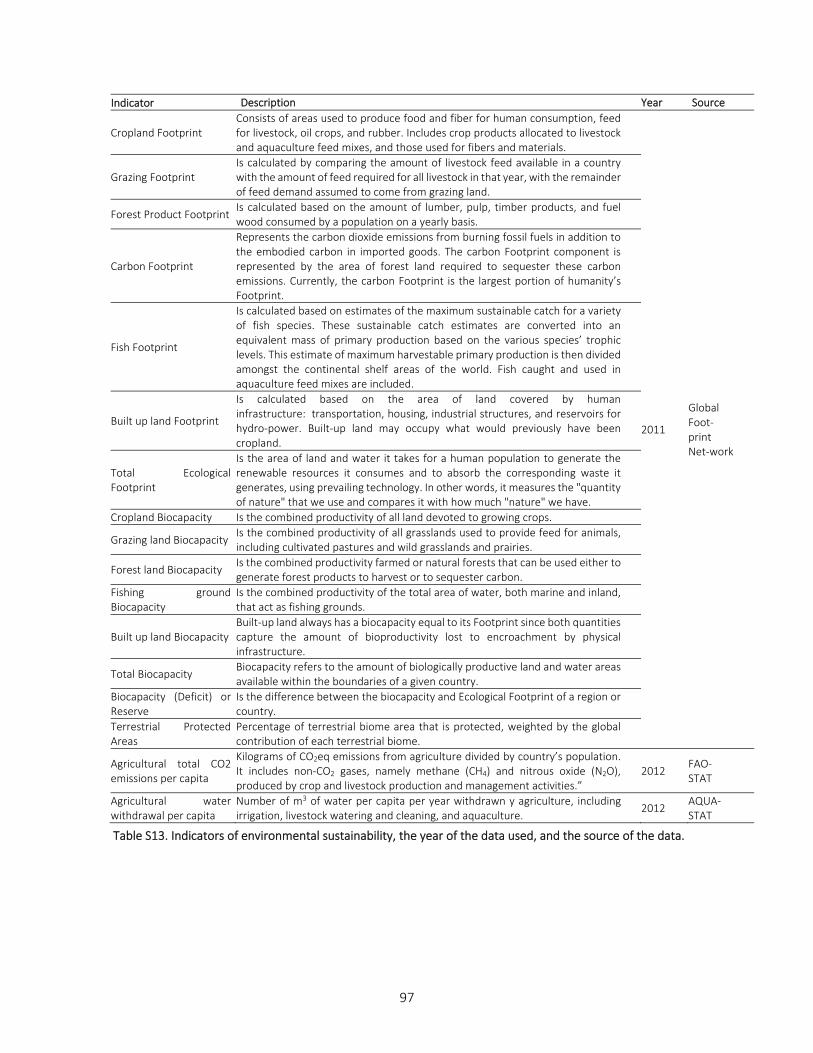
97
Indicator Description Year Source
Cropland Footprint Consists of areas used to produce food and fiber for human consumption, feed for livestock, oil crops, and rubber. Includes crop products allocated to livestock and aquaculture feed mixes, and those used for fibers and materials.
2011
Global Foot-print Net-work
Grazing Footprint Is calculated by comparing the amount of livestock feed available in a country with the amount of feed required for all livestock in that year, with the remainder of feed demand assumed to come from grazing land.
Forest Product Footprint Is calculated based on the amount of lumber, pulp, timber products, and fuel wood consumed by a population on a yearly basis.
Carbon Footprint
Represents the carbon dioxide emissions from burning fossil fuels in addition to the embodied carbon in imported goods. The carbon Footprint component is represented by the area of forest land required to sequester these carbon emissions. Currently, the carbon Footprint is the largest portion of humanity’s Footprint.
Fish Footprint
Is calculated based on estimates of the maximum sustainable catch for a variety of fish species. These sustainable catch estimates are converted into an equivalent mass of primary production based on the various species’ trophic levels. This estimate of maximum harvestable primary production is then divided amongst the continental shelf areas of the world. Fish caught and used in aquaculture feed mixes are included.
Built up land Footprint
Is calculated based on the area of land covered by human infrastructure: transportation, housing, industrial structures, and reservoirs for hydro-power. Built-up land may occupy what would previously have been cropland.
Total Ecological Footprint
Is the area of land and water it takes for a human population to generate the renewable resources it consumes and to absorb the corresponding waste it generates, using prevailing technology. In other words, it measures the "quantity of nature" that we use and compares it with how much "nature" we have.
Cropland Biocapacity Is the combined productivity of all land devoted to growing crops.
Grazing land Biocapacity Is the combined productivity of all grasslands used to provide feed for animals, including cultivated pastures and wild grasslands and prairies.
Forest land Biocapacity Is the combined productivity farmed or natural forests that can be used either to generate forest products to harvest or to sequester carbon.
Fishing ground Biocapacity
Is the combined productivity of the total area of water, both marine and inland, that act as fishing grounds.
Built up land Biocapacity Built-up land always has a biocapacity equal to its Footprint since both quantities capture the amount of bioproductivity lost to encroachment by physical infrastructure.
Total Biocapacity Biocapacity refers to the amount of biologically productive land and water areas available within the boundaries of a given country.
Biocapacity (Deficit) or Reserve
Is the difference between the biocapacity and Ecological Footprint of a region or country.
Terrestrial Protected Areas
Percentage of terrestrial biome area that is protected, weighted by the global contribution of each terrestrial biome.
Agricultural total CO2 emissions per capita
Kilograms of CO2eq emissions from agriculture divided by country’s population. It includes non-CO2 gases, namely methane (CH4) and nitrous oxide (N2O), produced by crop and livestock production and management activities.”
2012 FAO-STAT
Agricultural water withdrawal per capita
Number of m3 of water per capita per year withdrawn y agriculture, including irrigation, livestock watering and cleaning, and aquaculture.
2012 AQUA-STAT
Table S13. Indicators of environmental sustainability, the year of the data used, and the source of the data.
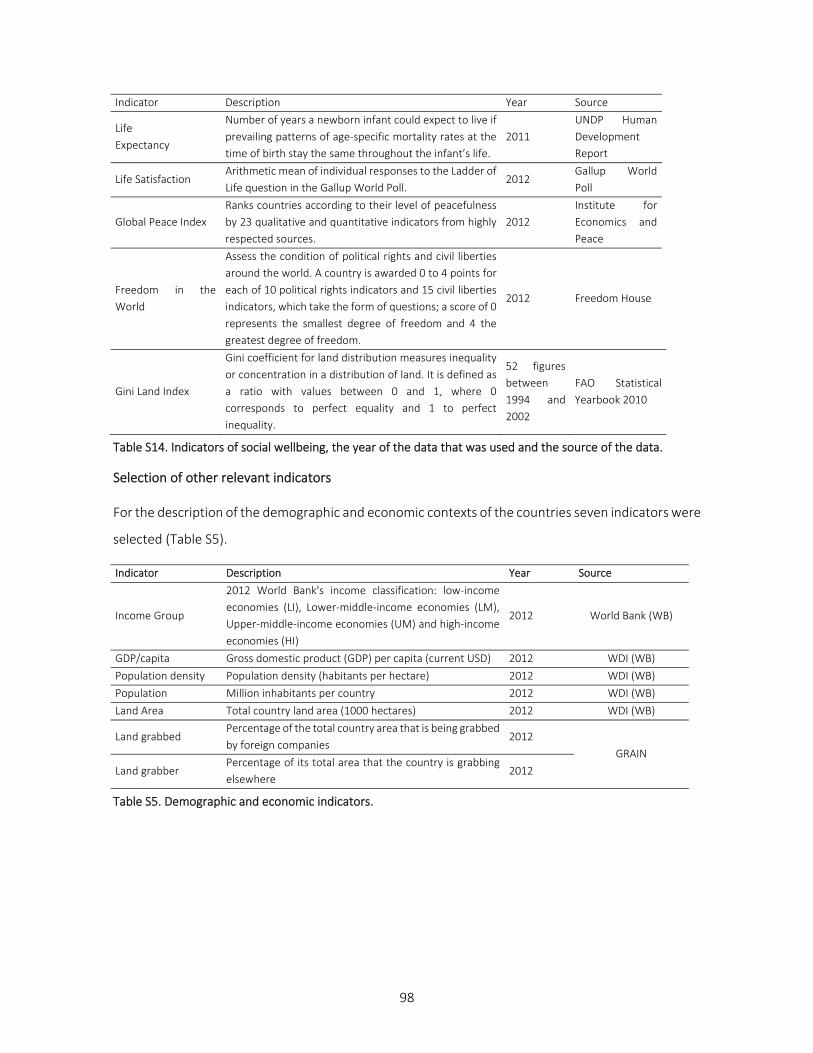
98
Indicator Description Year Source
Life
Expectancy
Number of years a newborn infant could expect to live if
prevailing patterns of age-specific mortality rates at the
time of birth stay the same throughout the infant’s life.
2011
UNDP Human
Development
Report
Life Satisfaction Arithmetic mean of individual responses to the Ladder of
Life question in the Gallup World Poll. 2012
Gallup World
Poll
Global Peace Index
Ranks countries according to their level of peacefulness
by 23 qualitative and quantitative indicators from highly
respected sources.
2012
Institute for
Economics and
Peace
Freedom in the
World
Assess the condition of political rights and civil liberties
around the world. A country is awarded 0 to 4 points for
each of 10 political rights indicators and 15 civil liberties
indicators, which take the form of questions; a score of 0
represents the smallest degree of freedom and 4 the
greatest degree of freedom.
2012 Freedom House
Gini Land Index
Gini coefficient for land distribution measures inequality
or concentration in a distribution of land. It is defined as
a ratio with values between 0 and 1, where 0
corresponds to perfect equality and 1 to perfect
inequality.
52 figures
between
1994 and
2002
FAO Statistical
Yearbook 2010
Table S14. Indicators of social wellbeing, the year of the data that was used and the source of the data.
Selection of other relevant indicators
For the description of the demographic and economic contexts of the countries seven indicators were
selected (Table S5).
Indicator Description Year Source
Income Group
2012 World Bank's income classification: low-income
economies (LI), Lower-middle-income economies (LM),
Upper-middle-income economies (UM) and high-income
economies (HI)
2012 World Bank (WB)
GDP/capita Gross domestic product (GDP) per capita (current USD) 2012 WDI (WB)
Population density Population density (habitants per hectare) 2012 WDI (WB)
Population Million inhabitants per country 2012 WDI (WB)
Land Area Total country land area (1000 hectares) 2012 WDI (WB)
Land grabbed Percentage of the total country area that is being grabbed
by foreign companies 2012
GRAIN
Land grabber Percentage of its total area that the country is grabbing
elsewhere 2012
Table S5. Demographic and economic indicators.
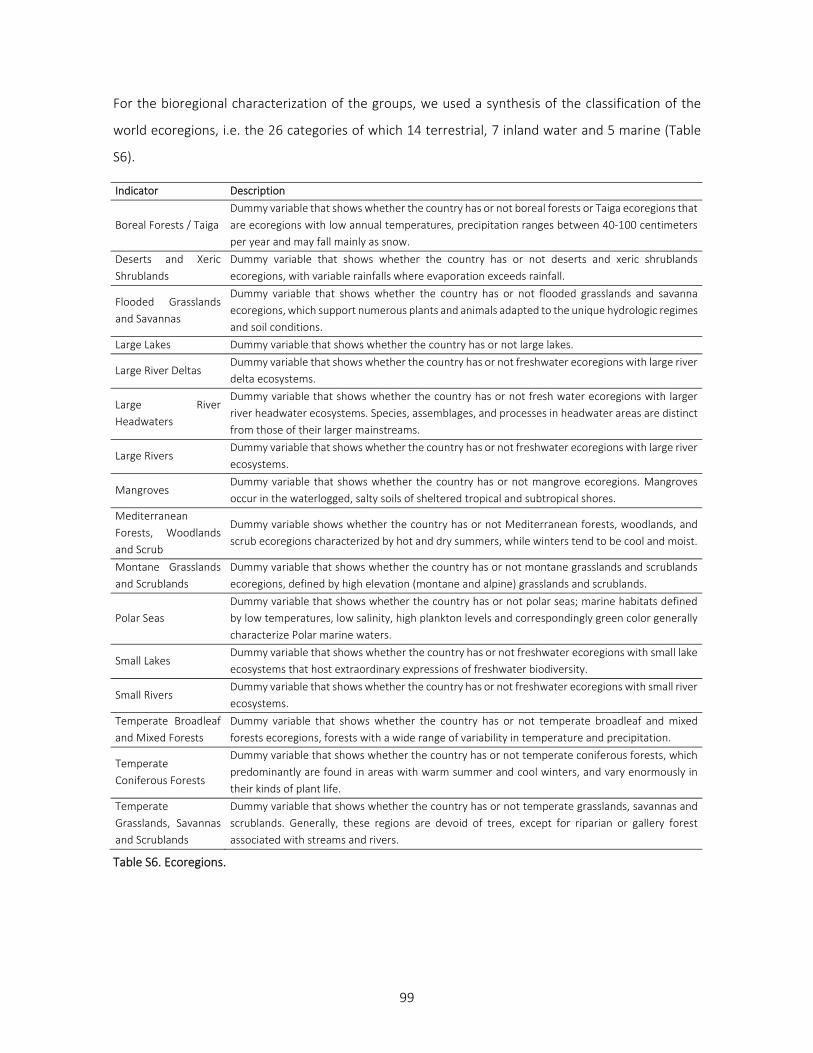
99
For the bioregional characterization of the groups, we used a synthesis of the classification of the
world ecoregions, i.e. the 26 categories of which 14 terrestrial, 7 inland water and 5 marine (Table
S6).
Indicator Description
Boreal Forests / Taiga
Dummy variable that shows whether the country has or not boreal forests or Taiga ecoregions that
are ecoregions with low annual temperatures, precipitation ranges between 40-100 centimeters
per year and may fall mainly as snow.
Deserts and Xeric
Shrublands
Dummy variable that shows whether the country has or not deserts and xeric shrublands
ecoregions, with variable rainfalls where evaporation exceeds rainfall.
Flooded Grasslands
and Savannas
Dummy variable that shows whether the country has or not flooded grasslands and savanna
ecoregions, which support numerous plants and animals adapted to the unique hydrologic regimes
and soil conditions.
Large Lakes Dummy variable that shows whether the country has or not large lakes.
Large River Deltas Dummy variable that shows whether the country has or not freshwater ecoregions with large river
delta ecosystems.
Large River
Headwaters
Dummy variable that shows whether the country has or not fresh water ecoregions with larger
river headwater ecosystems. Species, assemblages, and processes in headwater areas are distinct
from those of their larger mainstreams.
Large Rivers Dummy variable that shows whether the country has or not freshwater ecoregions with large river
ecosystems.
Mangroves Dummy variable that shows whether the country has or not mangrove ecoregions. Mangroves
occur in the waterlogged, salty soils of sheltered tropical and subtropical shores.
Mediterranean
Forests, Woodlands
and Scrub
Dummy variable shows whether the country has or not Mediterranean forests, woodlands, and
scrub ecoregions characterized by hot and dry summers, while winters tend to be cool and moist.
Montane Grasslands
and Scrublands
Dummy variable that shows whether the country has or not montane grasslands and scrublands
ecoregions, defined by high elevation (montane and alpine) grasslands and scrublands.
Polar Seas
Dummy variable that shows whether the country has or not polar seas; marine habitats defined
by low temperatures, low salinity, high plankton levels and correspondingly green color generally
characterize Polar marine waters.
Small Lakes Dummy variable that shows whether the country has or not freshwater ecoregions with small lake
ecosystems that host extraordinary expressions of freshwater biodiversity.
Small Rivers Dummy variable that shows whether the country has or not freshwater ecoregions with small river
ecosystems.
Temperate Broadleaf
and Mixed Forests
Dummy variable that shows whether the country has or not temperate broadleaf and mixed
forests ecoregions, forests with a wide range of variability in temperature and precipitation.
Temperate
Coniferous Forests
Dummy variable that shows whether the country has or not temperate coniferous forests, which
predominantly are found in areas with warm summer and cool winters, and vary enormously in
their kinds of plant life.
Temperate
Grasslands, Savannas
and Scrublands
Dummy variable that shows whether the country has or not temperate grasslands, savannas and
scrublands. Generally, these regions are devoid of trees, except for riparian or gallery forest
associated with streams and rivers.
Table S6. Ecoregions.
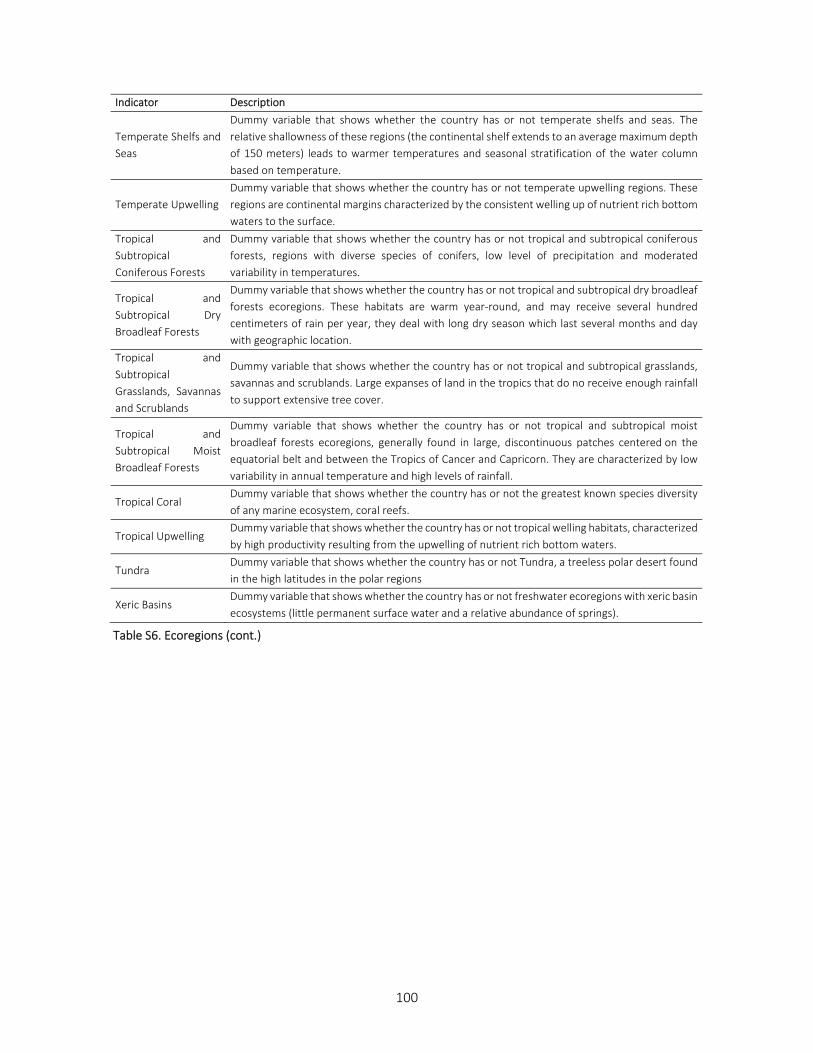
100
Indicator Description
Temperate Shelfs and
Seas
Dummy variable that shows whether the country has or not temperate shelfs and seas. The
relative shallowness of these regions (the continental shelf extends to an average maximum depth
of 150 meters) leads to warmer temperatures and seasonal stratification of the water column
based on temperature.
Temperate Upwelling
Dummy variable that shows whether the country has or not temperate upwelling regions. These
regions are continental margins characterized by the consistent welling up of nutrient rich bottom
waters to the surface.
Tropical and
Subtropical
Coniferous Forests
Dummy variable that shows whether the country has or not tropical and subtropical coniferous
forests, regions with diverse species of conifers, low level of precipitation and moderated
variability in temperatures.
Tropical and
Subtropical Dry
Broadleaf Forests
Dummy variable that shows whether the country has or not tropical and subtropical dry broadleaf
forests ecoregions. These habitats are warm year-round, and may receive several hundred
centimeters of rain per year, they deal with long dry season which last several months and day
with geographic location.
Tropical and
Subtropical
Grasslands, Savannas
and Scrublands
Dummy variable that shows whether the country has or not tropical and subtropical grasslands,
savannas and scrublands. Large expanses of land in the tropics that do no receive enough rainfall
to support extensive tree cover.
Tropical and
Subtropical Moist
Broadleaf Forests
Dummy variable that shows whether the country has or not tropical and subtropical moist
broadleaf forests ecoregions, generally found in large, discontinuous patches centered on the
equatorial belt and between the Tropics of Cancer and Capricorn. They are characterized by low
variability in annual temperature and high levels of rainfall.
Tropical Coral Dummy variable that shows whether the country has or not the greatest known species diversity
of any marine ecosystem, coral reefs.
Tropical Upwelling Dummy variable that shows whether the country has or not tropical welling habitats, characterized
by high productivity resulting from the upwelling of nutrient rich bottom waters.
Tundra Dummy variable that shows whether the country has or not Tundra, a treeless polar desert found
in the high latitudes in the polar regions
Xeric Basins Dummy variable that shows whether the country has or not freshwater ecoregions with xeric basin
ecosystems (little permanent surface water and a relative abundance of springs).
Table S6. Ecoregions (cont.)
101
Data analyses
Preparation of variables
Tests for normality of the distributions of all 43 indicators of FSv were performed. Only one indicator
proved to follow a normal distribution and was standardized (n-1). The indicators that did not follow
a normal distribution nor show negative values, were transformed through Ln(x), or Ln(x+1) when
the indicator (x) showed value equal to 0. The indicators that did not follow a normal distribution and
showed negative values were first rescaled (0-100) and then transformed through Ln(x+1).
Statistical analyses
For the identification of groups of countries we carried out a Principal Component Analysis (PCA,
covariance (n-1)) based on the matrix of countries (observations) and indicators (variables). We
followed the Kaiser criterion (eigenvalue >1) to determine the significant number of components. In
order to identify possible groups of countries with a similar values of FSv indicators, we carried out a
Hierarchical Cluster Analysis (HCA) based on the Euclidean distance (percentage of distance similarity
at a 95% level of confidence) and the Ward’s agglomerative method (16) using the standardized
coordinates of the most significant factors of the PCA. Finally, in order to characterize each group
resulting from the HCA in terms of ecoregions, socio-economic characteristics, FSv, social wellbeing
and environmental sustainability indicators we performed Kruskal-Wallis and Chi2 tests.
Results
Nine factors from the PCA showed an eigenvalue>1 and absorbed a total of 72% of variance. The
factors loadings of the countries in these factors were used to perform the HCA (Table S7).
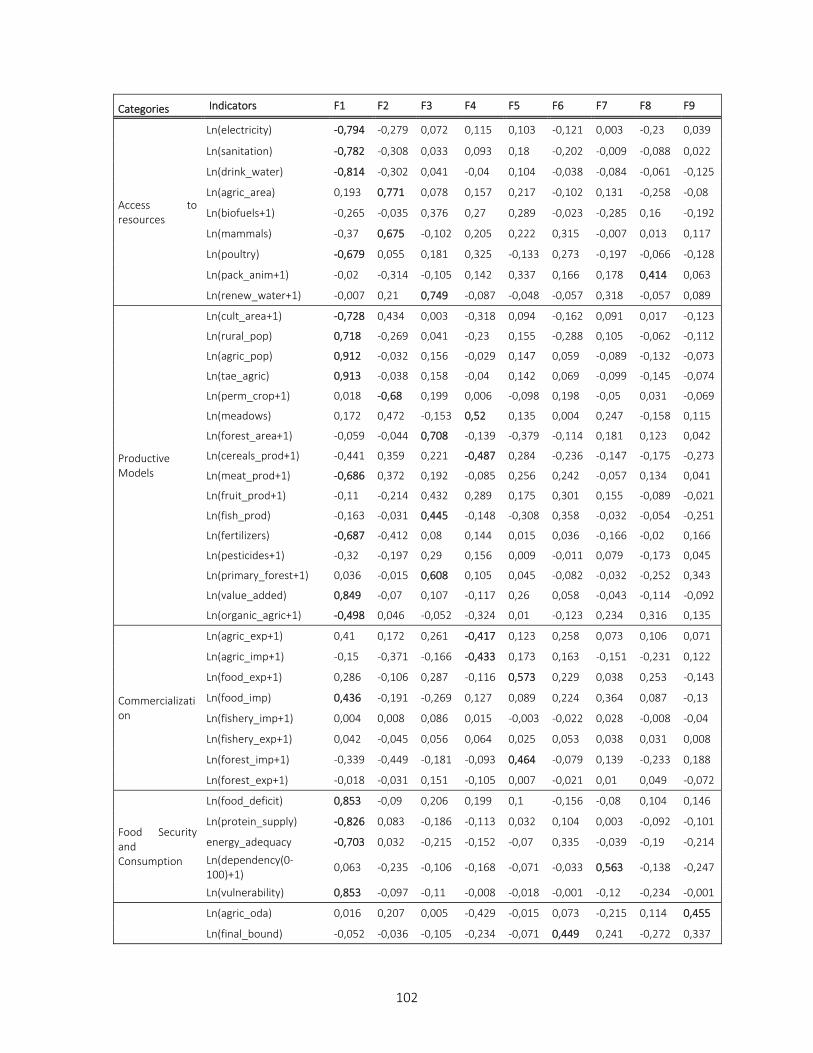
102
Categories Indicators F1 F2 F3 F4 F5 F6 F7 F8 F9
Access to resources
Ln(electricity) -0,794 -0,279 0,072 0,115 0,103 -0,121 0,003 -0,23 0,039
Ln(sanitation) -0,782 -0,308 0,033 0,093 0,18 -0,202 -0,009 -0,088 0,022
Ln(drink_water) -0,814 -0,302 0,041 -0,04 0,104 -0,038 -0,084 -0,061 -0,125
Ln(agric_area) 0,193 0,771 0,078 0,157 0,217 -0,102 0,131 -0,258 -0,08
Ln(biofuels+1) -0,265 -0,035 0,376 0,27 0,289 -0,023 -0,285 0,16 -0,192
Ln(mammals) -0,37 0,675 -0,102 0,205 0,222 0,315 -0,007 0,013 0,117
Ln(poultry) -0,679 0,055 0,181 0,325 -0,133 0,273 -0,197 -0,066 -0,128
Ln(pack_anim+1) -0,02 -0,314 -0,105 0,142 0,337 0,166 0,178 0,414 0,063
Ln(renew_water+1) -0,007 0,21 0,749 -0,087 -0,048 -0,057 0,318 -0,057 0,089
Productive Models
Ln(cult_area+1) -0,728 0,434 0,003 -0,318 0,094 -0,162 0,091 0,017 -0,123
Ln(rural_pop) 0,718 -0,269 0,041 -0,23 0,155 -0,288 0,105 -0,062 -0,112
Ln(agric_pop) 0,912 -0,032 0,156 -0,029 0,147 0,059 -0,089 -0,132 -0,073
Ln(tae_agric) 0,913 -0,038 0,158 -0,04 0,142 0,069 -0,099 -0,145 -0,074
Ln(perm_crop+1) 0,018 -0,68 0,199 0,006 -0,098 0,198 -0,05 0,031 -0,069
Ln(meadows) 0,172 0,472 -0,153 0,52 0,135 0,004 0,247 -0,158 0,115
Ln(forest_area+1) -0,059 -0,044 0,708 -0,139 -0,379 -0,114 0,181 0,123 0,042
Ln(cereals_prod+1) -0,441 0,359 0,221 -0,487 0,284 -0,236 -0,147 -0,175 -0,273
Ln(meat_prod+1) -0,686 0,372 0,192 -0,085 0,256 0,242 -0,057 0,134 0,041
Ln(fruit_prod+1) -0,11 -0,214 0,432 0,289 0,175 0,301 0,155 -0,089 -0,021
Ln(fish_prod) -0,163 -0,031 0,445 -0,148 -0,308 0,358 -0,032 -0,054 -0,251
Ln(fertilizers) -0,687 -0,412 0,08 0,144 0,015 0,036 -0,166 -0,02 0,166
Ln(pesticides+1) -0,32 -0,197 0,29 0,156 0,009 -0,011 0,079 -0,173 0,045
Ln(primary_forest+1) 0,036 -0,015 0,608 0,105 0,045 -0,082 -0,032 -0,252 0,343
Ln(value_added) 0,849 -0,07 0,107 -0,117 0,26 0,058 -0,043 -0,114 -0,092
Ln(organic_agric+1) -0,498 0,046 -0,052 -0,324 0,01 -0,123 0,234 0,316 0,135
Commercialization
Ln(agric_exp+1) 0,41 0,172 0,261 -0,417 0,123 0,258 0,073 0,106 0,071
Ln(agric_imp+1) -0,15 -0,371 -0,166 -0,433 0,173 0,163 -0,151 -0,231 0,122
Ln(food_exp+1) 0,286 -0,106 0,287 -0,116 0,573 0,229 0,038 0,253 -0,143
Ln(food_imp) 0,436 -0,191 -0,269 0,127 0,089 0,224 0,364 0,087 -0,13
Ln(fishery_imp+1) 0,004 0,008 0,086 0,015 -0,003 -0,022 0,028 -0,008 -0,04
Ln(fishery_exp+1) 0,042 -0,045 0,056 0,064 0,025 0,053 0,038 0,031 0,008
Ln(forest_imp+1) -0,339 -0,449 -0,181 -0,093 0,464 -0,079 0,139 -0,233 0,188
Ln(forest_exp+1) -0,018 -0,031 0,151 -0,105 0,007 -0,021 0,01 0,049 -0,072
Food Security and Consumption
Ln(food_deficit) 0,853 -0,09 0,206 0,199 0,1 -0,156 -0,08 0,104 0,146
Ln(protein_supply) -0,826 0,083 -0,186 -0,113 0,032 0,104 0,003 -0,092 -0,101
energy_adequacy -0,703 0,032 -0,215 -0,152 -0,07 0,335 -0,039 -0,19 -0,214
Ln(dependency(0-100)+1)
0,063 -0,235 -0,106 -0,168 -0,071 -0,033 0,563 -0,138 -0,247
Ln(vulnerability) 0,853 -0,097 -0,11 -0,008 -0,018 -0,001 -0,12 -0,234 -0,001
Ln(agric_oda) 0,016 0,207 0,005 -0,429 -0,015 0,073 -0,215 0,114 0,455
Ln(final_bound) -0,052 -0,036 -0,105 -0,234 -0,071 0,449 0,241 -0,272 0,337
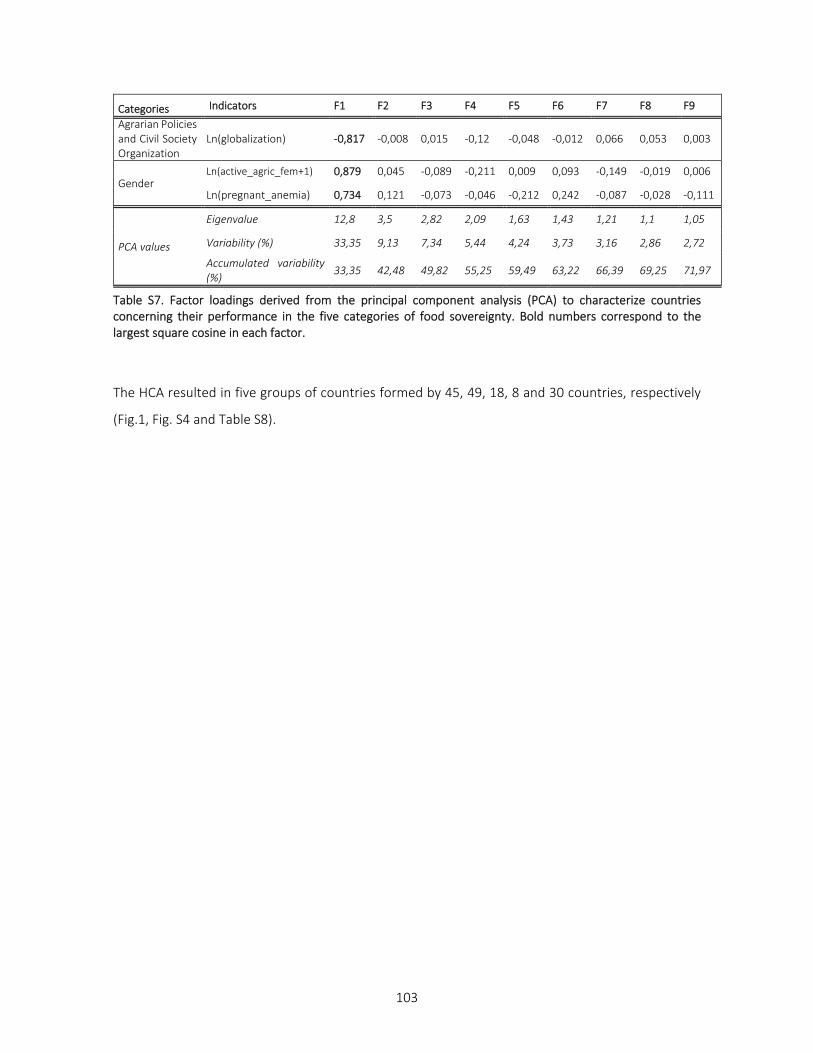
103
Categories Indicators F1 F2 F3 F4 F5 F6 F7 F8 F9
Agrarian Policies and Civil Society Organization
Ln(globalization) -0,817 -0,008 0,015 -0,12 -0,048 -0,012 0,066 0,053 0,003
Gender Ln(active_agric_fem+1) 0,879 0,045 -0,089 -0,211 0,009 0,093 -0,149 -0,019 0,006
Ln(pregnant_anemia) 0,734 0,121 -0,073 -0,046 -0,212 0,242 -0,087 -0,028 -0,111
PCA values
Eigenvalue 12,8 3,5 2,82 2,09 1,63 1,43 1,21 1,1 1,05
Variability (%) 33,35 9,13 7,34 5,44 4,24 3,73 3,16 2,86 2,72
Accumulated variability (%)
33,35 42,48 49,82 55,25 59,49 63,22 66,39 69,25 71,97
Table S7. Factor loadings derived from the principal component analysis (PCA) to characterize countries concerning their performance in the five categories of food sovereignty. Bold numbers correspond to the largest square cosine in each factor.
The HCA resulted in five groups of countries formed by 45, 49, 18, 8 and 30 countries, respectively
(Fig.1, Fig. S4 and Table S8).
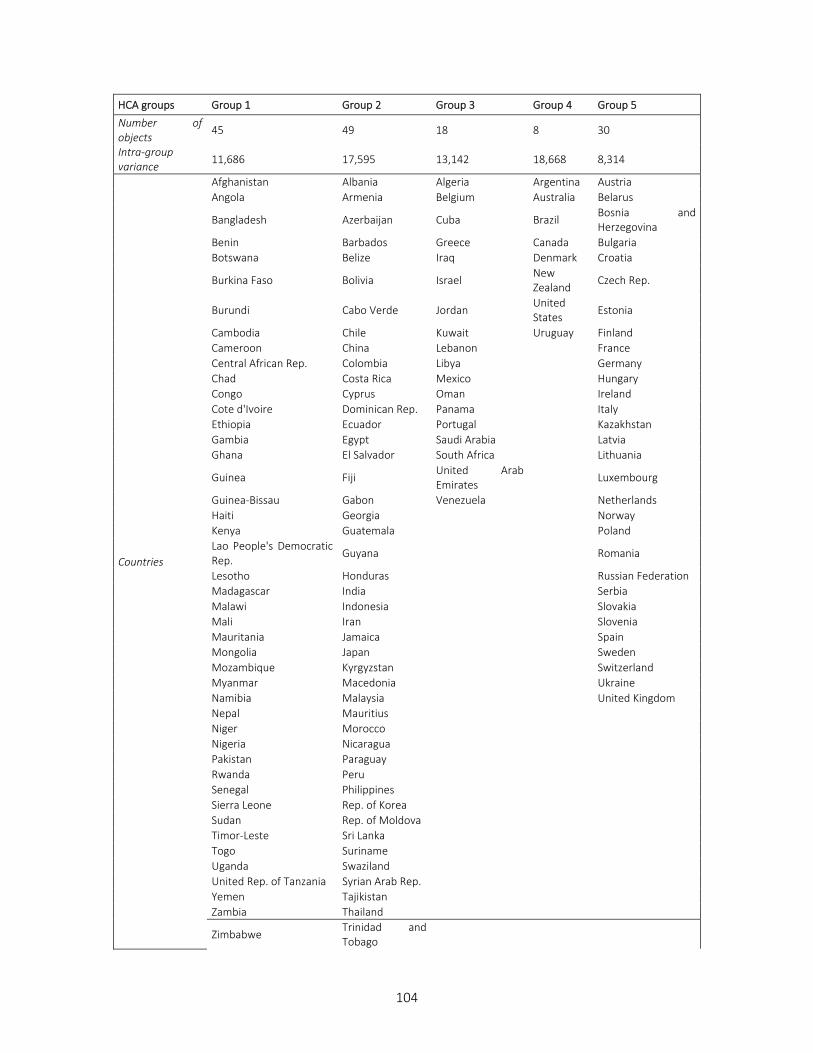
104
HCA groups Group 1 Group 2 Group 3 Group 4 Group 5
Number of objects
45 49 18 8 30
Intra‐group variance
11,686 17,595 13,142 18,668 8,314
Countries
Afghanistan Albania Algeria Argentina Austria
Angola Armenia Belgium Australia Belarus
Bangladesh Azerbaijan Cuba Brazil Bosnia and Herzegovina
Benin Barbados Greece Canada Bulgaria
Botswana Belize Iraq Denmark Croatia
Burkina Faso Bolivia Israel New Zealand
Czech Rep.
Burundi Cabo Verde Jordan United States
Estonia
Cambodia Chile Kuwait Uruguay Finland
Cameroon China Lebanon France
Central African Rep. Colombia Libya Germany
Chad Costa Rica Mexico Hungary
Congo Cyprus Oman Ireland
Cote d'Ivoire Dominican Rep. Panama Italy
Ethiopia Ecuador Portugal Kazakhstan
Gambia Egypt Saudi Arabia Latvia
Ghana El Salvador South Africa Lithuania
Guinea Fiji United Arab Emirates
Luxembourg
Guinea-Bissau Gabon Venezuela Netherlands
Haiti Georgia Norway
Kenya Guatemala Poland
Lao People's Democratic Rep.
Guyana Romania
Lesotho Honduras Russian Federation
Madagascar India Serbia
Malawi Indonesia Slovakia
Mali Iran Slovenia
Mauritania Jamaica Spain
Mongolia Japan Sweden
Mozambique Kyrgyzstan Switzerland
Myanmar Macedonia Ukraine
Namibia Malaysia United Kingdom
Nepal Mauritius
Niger Morocco
Nigeria Nicaragua
Pakistan Paraguay
Rwanda Peru
Senegal Philippines
Sierra Leone Rep. of Korea
Sudan Rep. of Moldova
Timor-Leste Sri Lanka
Togo Suriname
Uganda Swaziland
United Rep. of Tanzania Syrian Arab Rep.
Yemen Tajikistan
Zambia Thailand
Zimbabwe Trinidad and Tobago
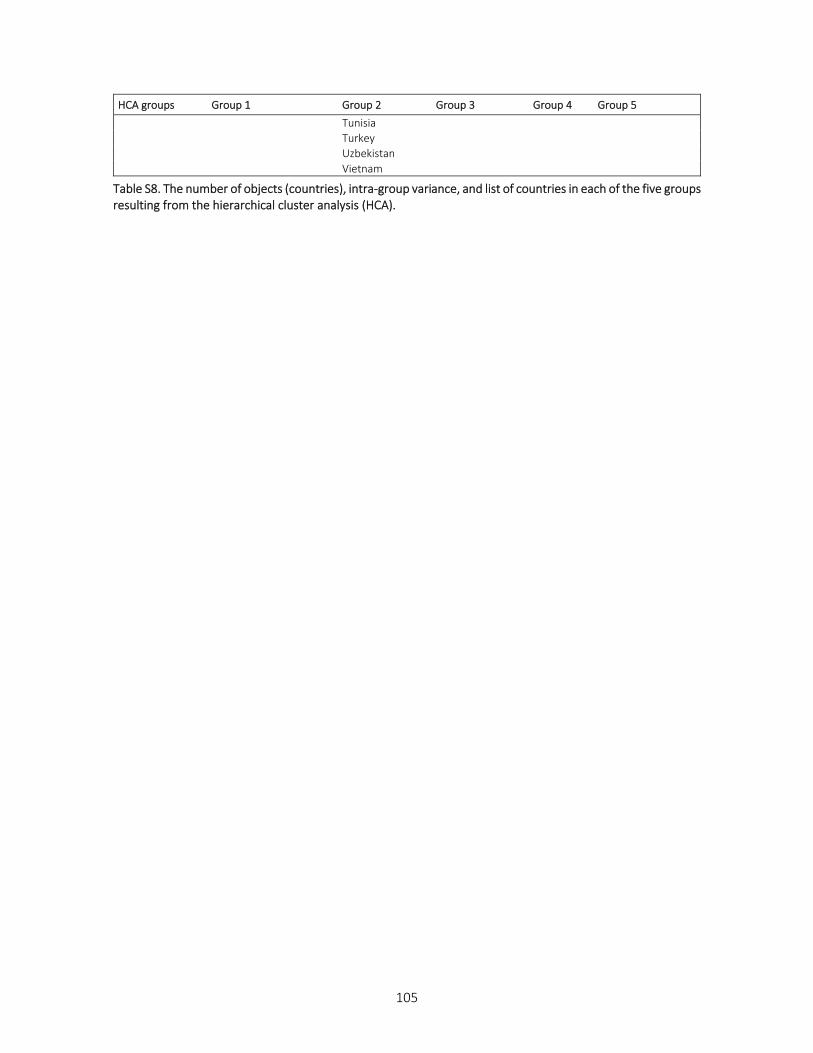
105
HCA groups Group 1 Group 2 Group 3 Group 4 Group 5 Tunisia Turkey Uzbekistan
Vietnam
Table S8. The number of objects (countries), intra-group variance, and list of countries in each of the five groups resulting from the hierarchical cluster analysis (HCA).
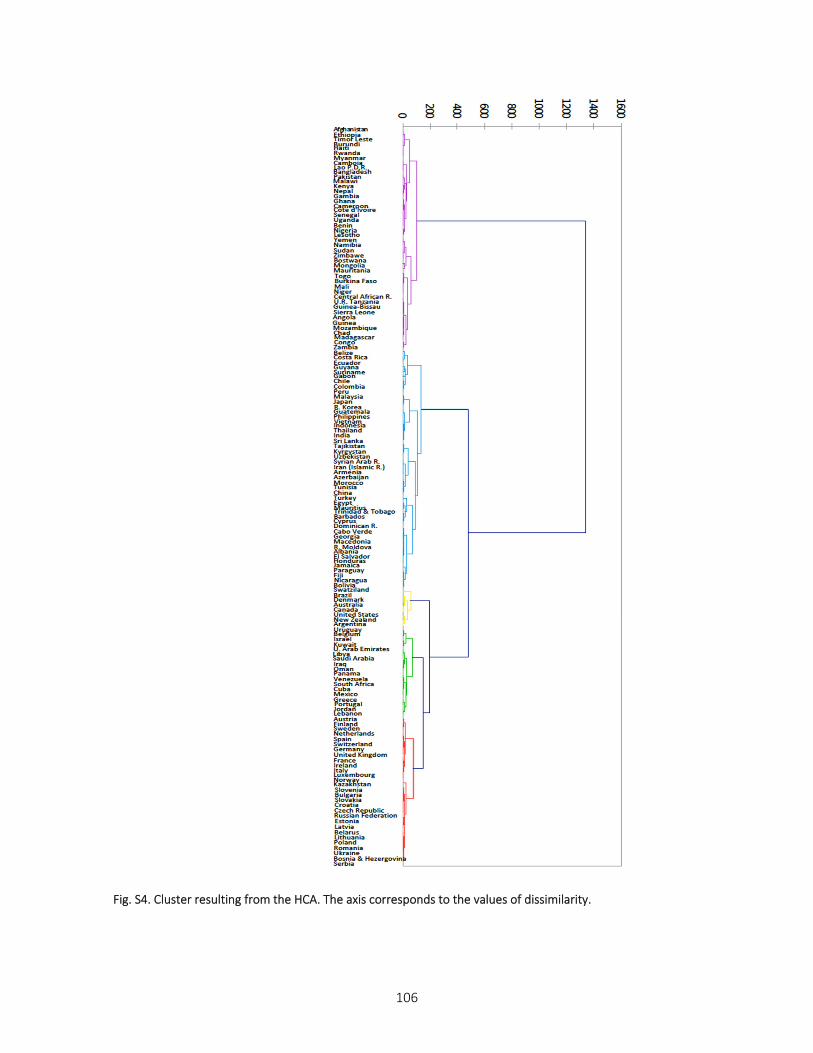
106
Fig. S4. Cluster resulting from the HCA. The axis corresponds to the values of dissimilarity.
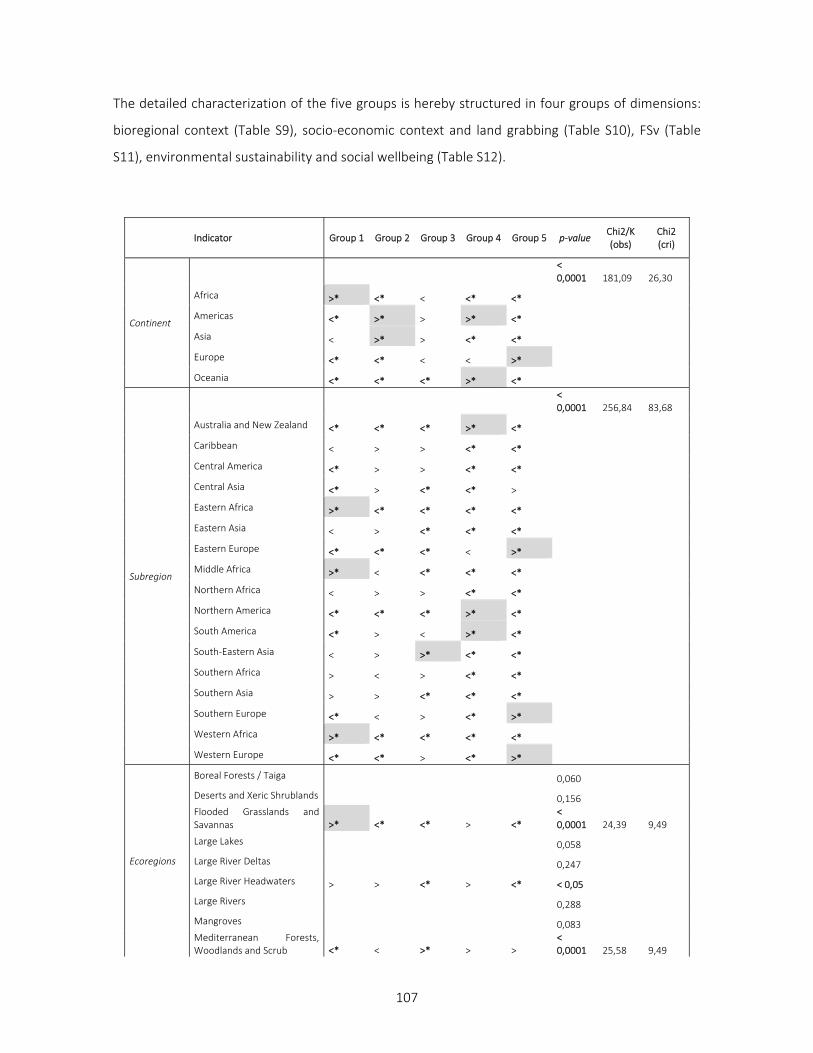
107
The detailed characterization of the five groups is hereby structured in four groups of dimensions:
bioregional context (Table S9), socio-economic context and land grabbing (Table S10), FSv (Table
S11), environmental sustainability and social wellbeing (Table S12).
Indicator Group 1 Group 2 Group 3 Group 4 Group 5 p‐value Chi2/K (obs)
Chi2 (cri)
Continent
< 0,0001 181,09 26,30
Africa >* <* < <* <*
Americas <* >* > >* <*
Asia < >* > <* <*
Europe <* <* < < >*
Oceania <* <* <* >* <*
Subregion
< 0,0001 256,84 83,68
Australia and New Zealand <* <* <* >* <*
Caribbean < > > <* <*
Central America <* > > <* <*
Central Asia <* > <* <* >
Eastern Africa >* <* <* <* <*
Eastern Asia < > <* <* <*
Eastern Europe <* <* <* < >*
Middle Africa >* < <* <* <*
Northern Africa < > > <* <*
Northern America <* <* <* >* <*
South America <* > < >* <*
South-Eastern Asia < > >* <* <*
Southern Africa > < > <* <*
Southern Asia > > <* <* <*
Southern Europe <* < > <* >*
Western Africa >* <* <* <* <*
Western Europe <* <* > <* >*
Ecoregions
Boreal Forests / Taiga 0,060
Deserts and Xeric Shrublands 0,156
Flooded Grasslands and Savannas >* <* <* > <*
< 0,0001 24,39 9,49
Large Lakes 0,058
Large River Deltas 0,247
Large River Headwaters > > <* > <* < 0,05
Large Rivers 0,288
Mangroves 0,083
Mediterranean Forests, Woodlands and Scrub <* < >* > >
< 0,0001 25,58 9,49
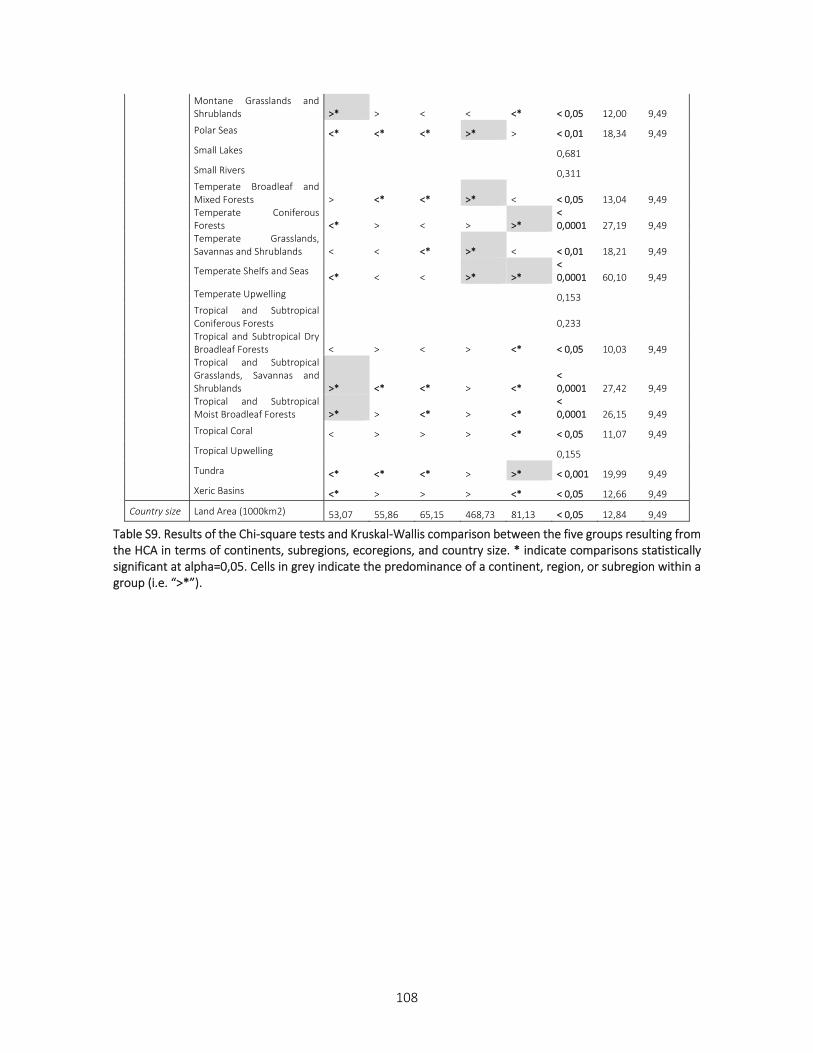
108
Montane Grasslands and Shrublands >* > < < <* < 0,05 12,00 9,49
Polar Seas <* <* <* >* > < 0,01 18,34 9,49
Small Lakes 0,681
Small Rivers 0,311
Temperate Broadleaf and Mixed Forests > <* <* >* < < 0,05 13,04 9,49 Temperate Coniferous Forests <* > < > >*
< 0,0001 27,19 9,49
Temperate Grasslands, Savannas and Shrublands < < <* >* < < 0,01 18,21 9,49
Temperate Shelfs and Seas <* < < >* >*
< 0,0001 60,10 9,49
Temperate Upwelling 0,153
Tropical and Subtropical Coniferous Forests 0,233 Tropical and Subtropical Dry Broadleaf Forests < > < > <* < 0,05 10,03 9,49 Tropical and Subtropical Grasslands, Savannas and Shrublands >* <* <* > <*
< 0,0001 27,42 9,49
Tropical and Subtropical Moist Broadleaf Forests >* > <* > <*
< 0,0001 26,15 9,49
Tropical Coral < > > > <* < 0,05 11,07 9,49
Tropical Upwelling 0,155
Tundra <* <* <* > >* < 0,001 19,99 9,49
Xeric Basins <* > > > <* < 0,05 12,66 9,49
Country size Land Area (1000km2) 53,07 55,86 65,15 468,73 81,13 < 0,05 12,84 9,49
Table S9. Results of the Chi-square tests and Kruskal-Wallis comparison between the five groups resulting from the HCA in terms of continents, subregions, ecoregions, and country size. * indicate comparisons statistically significant at alpha=0,05. Cells in grey indicate the predominance of a continent, region, or subregion within a group (i.e. “>*”).
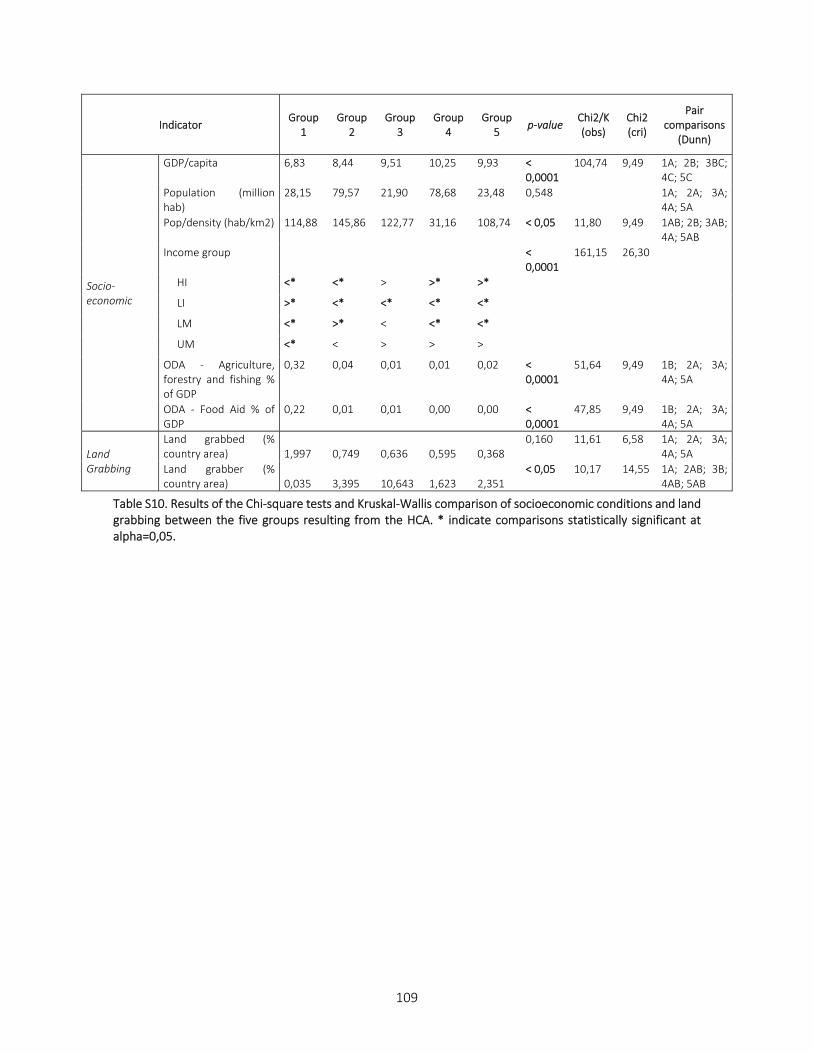
109
Indicator Group
1 Group
2 Group
3 Group
4 Group
5 p‐value
Chi2/K (obs)
Chi2 (cri)
Pair comparisons
(Dunn)
Socio‐economic
GDP/capita 6,83 8,44 9,51 10,25 9,93 < 0,0001
104,74 9,49 1A; 2B; 3BC; 4C; 5C
Population (million hab)
28,15 79,57 21,90 78,68 23,48 0,548
1A; 2A; 3A; 4A; 5A
Pop/density (hab/km2) 114,88 145,86 122,77 31,16 108,74 < 0,05 11,80 9,49 1AB; 2B; 3AB; 4A; 5AB
Income group
< 0,0001
161,15 26,30
HI <* <* > >* >*
LI >* <* <* <* <*
LM <* >* < <* <*
UM <* < > > >
ODA - Agriculture, forestry and fishing % of GDP
0,32 0,04 0,01 0,01 0,02 < 0,0001
51,64 9,49 1B; 2A; 3A; 4A; 5A
ODA - Food Aid % of GDP
0,22 0,01 0,01 0,00 0,00 < 0,0001
47,85 9,49 1B; 2A; 3A; 4A; 5A
Land Grabbing
Land grabbed (% country area) 1,997 0,749 0,636 0,595 0,368
0,160 11,61 6,58 1A; 2A; 3A; 4A; 5A
Land grabber (% country area) 0,035 3,395 10,643 1,623 2,351
< 0,05 10,17 14,55 1A; 2AB; 3B; 4AB; 5AB
Table S10. Results of the Chi-square tests and Kruskal-Wallis comparison of socioeconomic conditions and land grabbing between the five groups resulting from the HCA. * indicate comparisons statistically significant at alpha=0,05.
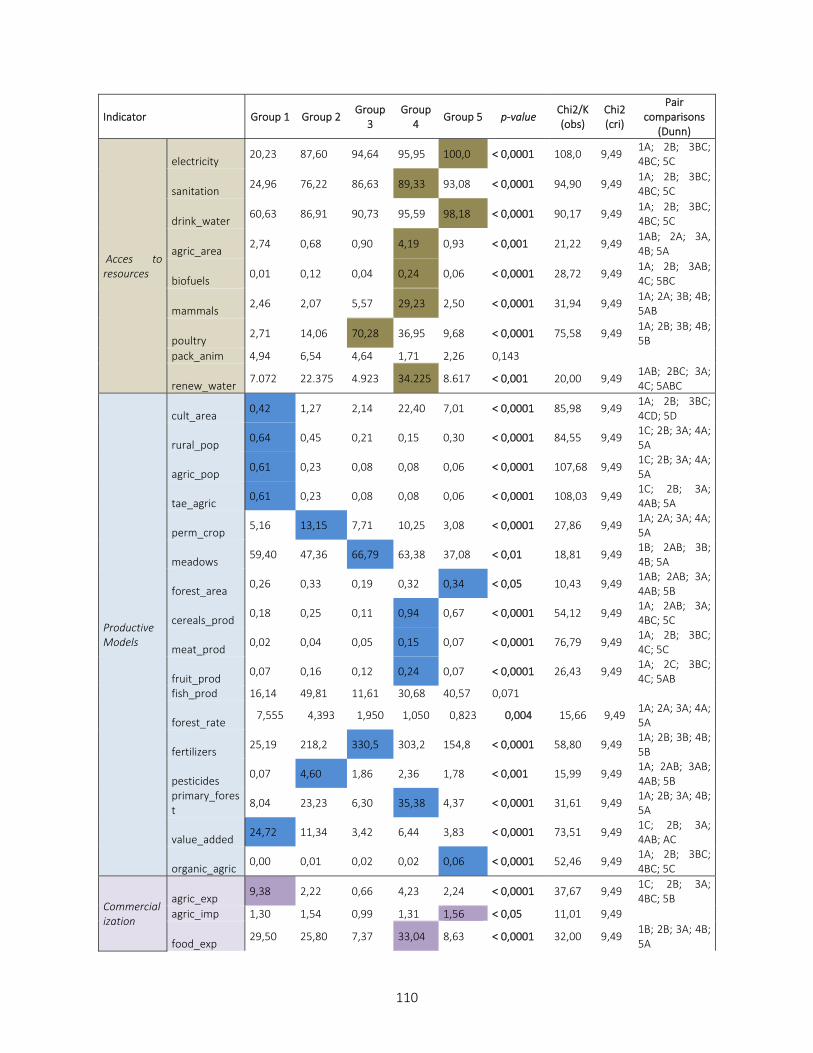
110
Indicator Group 1 Group 2 Group
3 Group
4 Group 5 p‐value
Chi2/K (obs)
Chi2 (cri)
Pair comparisons
(Dunn)
Acces to resources
electricity 20,23 87,60 94,64 95,95 100,0 < 0,0001 108,0 9,49
1A; 2B; 3BC; 4BC; 5C
sanitation 24,96 76,22 86,63 89,33 93,08 < 0,0001 94,90 9,49
1A; 2B; 3BC; 4BC; 5C
drink_water 60,63 86,91 90,73 95,59 98,18 < 0,0001 90,17 9,49
1A; 2B; 3BC; 4BC; 5C
agric_area 2,74 0,68 0,90 4,19 0,93 < 0,001 21,22 9,49
1AB; 2A; 3A, 4B; 5A
biofuels 0,01 0,12 0,04 0,24 0,06 < 0,0001 28,72 9,49
1A; 2B; 3AB; 4C; 5BC
mammals 2,46 2,07 5,57 29,23 2,50 < 0,0001 31,94 9,49
1A; 2A; 3B; 4B; 5AB
poultry 2,71 14,06 70,28 36,95 9,68 < 0,0001 75,58 9,49
1A; 2B; 3B; 4B; 5B
pack_anim 4,94 6,54 4,64 1,71 2,26 0,143
renew_water 7.072 22.375 4.923 34.225 8.617 < 0,001 20,00 9,49
1AB; 2BC; 3A; 4C; 5ABC
Productive Models
cult_area 0,42 1,27 2,14 22,40 7,01 < 0,0001 85,98 9,49
1A; 2B; 3BC; 4CD; 5D
rural_pop 0,64 0,45 0,21 0,15 0,30 < 0,0001 84,55 9,49
1C; 2B; 3A; 4A; 5A
agric_pop 0,61 0,23 0,08 0,08 0,06 < 0,0001 107,68 9,49
1C; 2B; 3A; 4A; 5A
tae_agric 0,61 0,23 0,08 0,08 0,06 < 0,0001 108,03 9,49
1C; 2B; 3A; 4AB; 5A
perm_crop 5,16 13,15 7,71 10,25 3,08 < 0,0001 27,86 9,49
1A; 2A; 3A; 4A; 5A
meadows 59,40 47,36 66,79 63,38 37,08 < 0,01 18,81 9,49
1B; 2AB; 3B; 4B; 5A
forest_area 0,26 0,33 0,19 0,32 0,34 < 0,05 10,43 9,49
1AB; 2AB; 3A; 4AB; 5B
cereals_prod 0,18 0,25 0,11 0,94 0,67 < 0,0001 54,12 9,49
1A; 2AB; 3A; 4BC; 5C
meat_prod 0,02 0,04 0,05 0,15 0,07 < 0,0001 76,79 9,49
1A; 2B; 3BC; 4C; 5C
fruit_prod 0,07 0,16 0,12 0,24 0,07 < 0,0001 26,43 9,49
1A; 2C; 3BC; 4C; 5AB
fish_prod 16,14 49,81 11,61 30,68 40,57 0,071
forest_rate 7,555 4,393 1,950 1,050 0,823 0,004 15,66 9,49
1A; 2A; 3A; 4A; 5A
fertilizers 25,19 218,2 330,5 303,2 154,8 < 0,0001 58,80 9,49
1A; 2B; 3B; 4B; 5B
pesticides 0,07 4,60 1,86 2,36 1,78 < 0,001 15,99 9,49
1A; 2AB; 3AB; 4AB; 5B
primary_forest
8,04 23,23 6,30 35,38 4,37 < 0,0001 31,61 9,49 1A; 2B; 3A; 4B; 5A
value_added 24,72 11,34 3,42 6,44 3,83 < 0,0001 73,51 9,49
1C; 2B; 3A; 4AB; AC
organic_agric 0,00 0,01 0,02 0,02 0,06 < 0,0001 52,46 9,49
1A; 2B; 3BC; 4BC; 5C
Commercialization
agric_exp 9,38 2,22 0,66 4,23 2,24 < 0,0001 37,67 9,49
1C; 2B; 3A; 4BC; 5B
agric_imp 1,30 1,54 0,99 1,31 1,56 < 0,05 11,01 9,49
food_exp 29,50 25,80 7,37 33,04 8,63 < 0,0001 32,00 9,49
1B; 2B; 3A; 4B; 5A
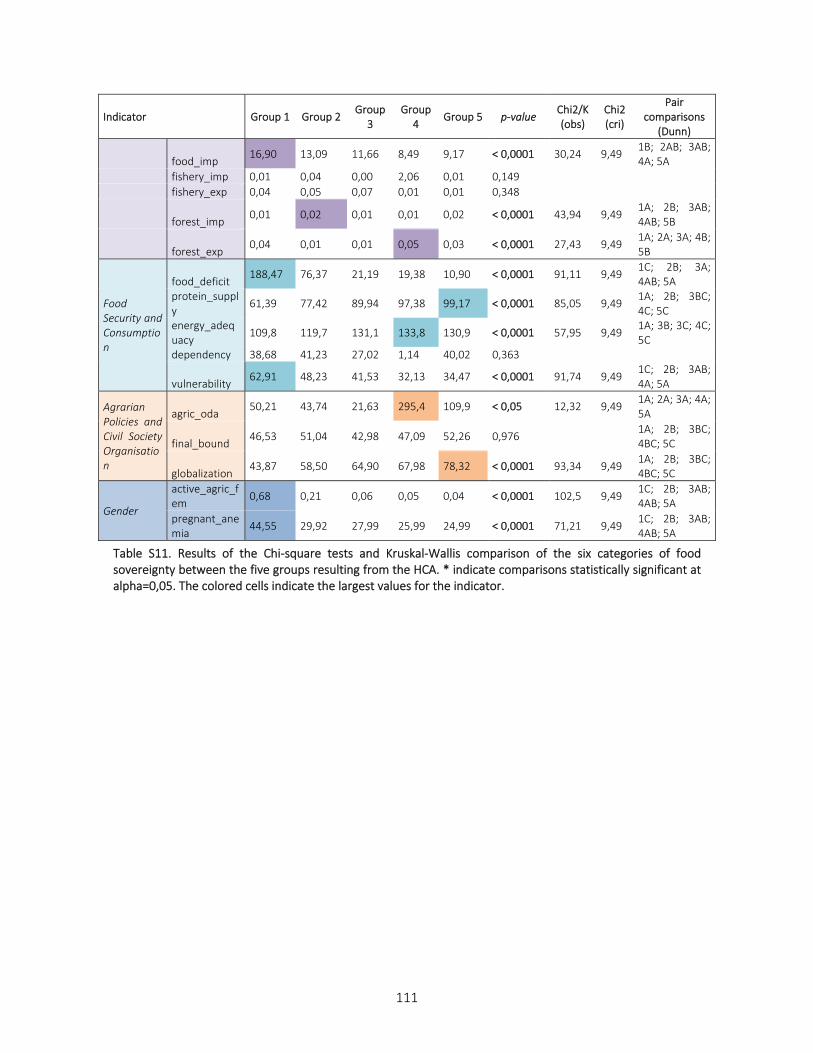
111
Indicator Group 1 Group 2 Group
3 Group
4 Group 5 p‐value
Chi2/K (obs)
Chi2 (cri)
Pair comparisons
(Dunn)
food_imp 16,90 13,09 11,66 8,49 9,17 < 0,0001 30,24 9,49
1B; 2AB; 3AB; 4A; 5A
fishery_imp 0,01 0,04 0,00 2,06 0,01 0,149
fishery_exp 0,04 0,05 0,07 0,01 0,01 0,348
forest_imp 0,01 0,02 0,01 0,01 0,02 < 0,0001 43,94 9,49
1A; 2B; 3AB; 4AB; 5B
forest_exp 0,04 0,01 0,01 0,05 0,03 < 0,0001 27,43 9,49
1A; 2A; 3A; 4B; 5B
Food Security and Consumption
food_deficit 188,47 76,37 21,19 19,38 10,90 < 0,0001 91,11 9,49
1C; 2B; 3A; 4AB; 5A
protein_supply
61,39 77,42 89,94 97,38 99,17 < 0,0001 85,05 9,49 1A; 2B; 3BC; 4C; 5C
energy_adequacy
109,8 119,7 131,1 133,8 130,9 < 0,0001 57,95 9,49 1A; 3B; 3C; 4C; 5C
dependency 38,68 41,23 27,02 1,14 40,02 0,363
vulnerability 62,91 48,23 41,53 32,13 34,47 < 0,0001 91,74 9,49
1C; 2B; 3AB; 4A; 5A
Agrarian Policies and Civil Society Organisation
agric_oda 50,21 43,74 21,63 295,4 109,9 < 0,05 12,32 9,49
1A; 2A; 3A; 4A; 5A
final_bound 46,53 51,04 42,98 47,09 52,26 0,976 1A; 2B; 3BC;
4BC; 5C
globalization 43,87 58,50 64,90 67,98 78,32 < 0,0001 93,34 9,49
1A; 2B; 3BC; 4BC; 5C
Gender
active_agric_fem
0,68 0,21 0,06 0,05 0,04 < 0,0001 102,5 9,49 1C; 2B; 3AB; 4AB; 5A
pregnant_anemia
44,55 29,92 27,99 25,99 24,99 < 0,0001 71,21 9,49 1C; 2B; 3AB; 4AB; 5A
Table S11. Results of the Chi-square tests and Kruskal-Wallis comparison of the six categories of food sovereignty between the five groups resulting from the HCA. * indicate comparisons statistically significant at alpha=0,05. The colored cells indicate the largest values for the indicator.
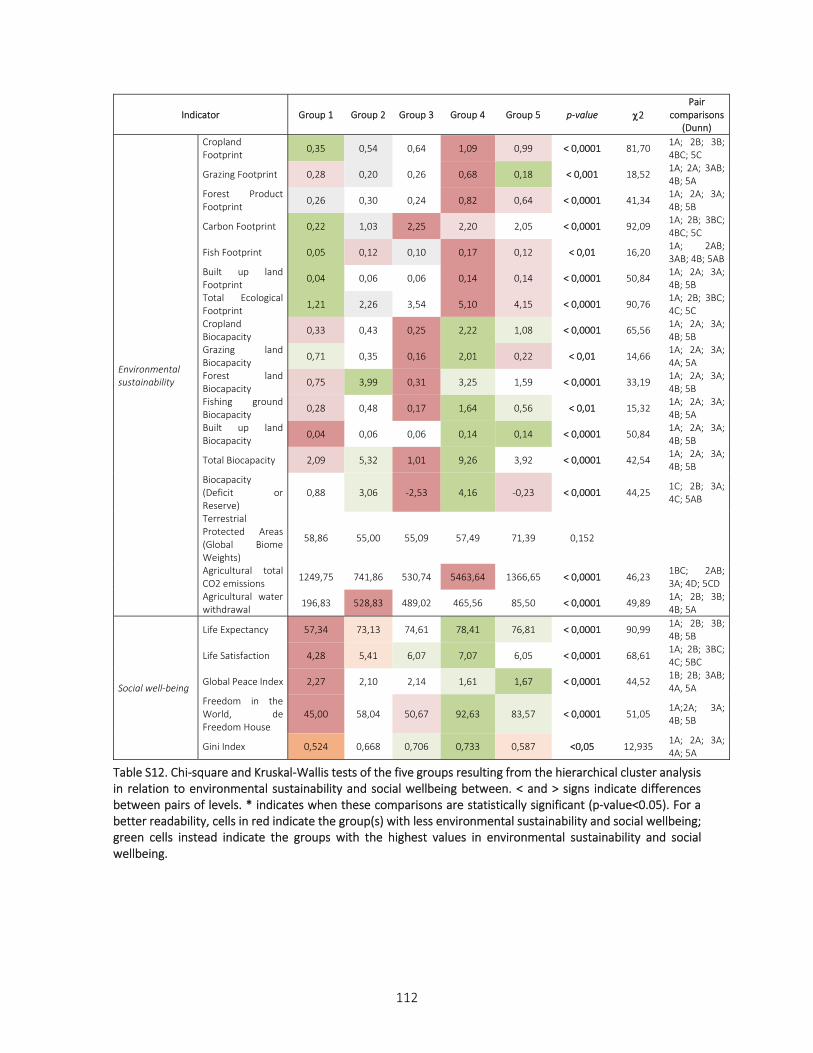
112
Indicator Group 1 Group 2 Group 3 Group 4 Group 5 p‐value 2 Pair
comparisons (Dunn)
Environmental sustainability
Cropland Footprint
0,35 0,54 0,64 1,09 0,99 < 0,0001 81,70 1A; 2B; 3B; 4BC; 5C
Grazing Footprint 0,28 0,20 0,26 0,68 0,18 < 0,001 18,52 1A; 2A; 3AB; 4B; 5A
Forest Product Footprint
0,26 0,30 0,24 0,82 0,64 < 0,0001 41,34 1A; 2A; 3A; 4B; 5B
Carbon Footprint 0,22 1,03 2,25 2,20 2,05 < 0,0001 92,09 1A; 2B; 3BC; 4BC; 5C
Fish Footprint 0,05 0,12 0,10 0,17 0,12 < 0,01 16,20 1A; 2AB; 3AB; 4B; 5AB
Built up land Footprint
0,04 0,06 0,06 0,14 0,14 < 0,0001 50,84 1A; 2A; 3A; 4B; 5B
Total Ecological Footprint
1,21 2,26 3,54 5,10 4,15 < 0,0001 90,76 1A; 2B; 3BC; 4C; 5C
Cropland Biocapacity
0,33 0,43 0,25 2,22 1,08 < 0,0001 65,56 1A; 2A; 3A; 4B; 5B
Grazing land Biocapacity
0,71 0,35 0,16 2,01 0,22 < 0,01 14,66 1A; 2A; 3A; 4A; 5A
Forest land Biocapacity
0,75 3,99 0,31 3,25 1,59 < 0,0001 33,19 1A; 2A; 3A; 4B; 5B
Fishing ground Biocapacity
0,28 0,48 0,17 1,64 0,56 < 0,01 15,32 1A; 2A; 3A; 4B; 5A
Built up land Biocapacity
0,04 0,06 0,06 0,14 0,14 < 0,0001 50,84 1A; 2A; 3A; 4B; 5B
Total Biocapacity 2,09 5,32 1,01 9,26 3,92 < 0,0001 42,54 1A; 2A; 3A; 4B; 5B
Biocapacity (Deficit or Reserve)
0,88 3,06 -2,53 4,16 -0,23 < 0,0001 44,25 1C; 2B; 3A; 4C; 5AB
Terrestrial Protected Areas (Global Biome Weights)
58,86 55,00 55,09 57,49 71,39 0,152
Agricultural total CO2 emissions
1249,75 741,86 530,74 5463,64 1366,65 < 0,0001 46,23 1BC; 2AB; 3A; 4D; 5CD
Agricultural water withdrawal
196,83 528,83 489,02 465,56 85,50 < 0,0001 49,89 1A; 2B; 3B; 4B; 5A
Social well‐being
Life Expectancy 57,34 73,13 74,61 78,41 76,81 < 0,0001 90,99 1A; 2B; 3B; 4B; 5B
Life Satisfaction 4,28 5,41 6,07 7,07 6,05 < 0,0001 68,61 1A; 2B; 3BC; 4C; 5BC
Global Peace Index 2,27 2,10 2,14 1,61 1,67 < 0,0001 44,52 1B; 2B; 3AB; 4A, 5A
Freedom in the World, de Freedom House
45,00 58,04 50,67 92,63 83,57 < 0,0001 51,05 1A;2A; 3A; 4B; 5B
Gini Index 0,524 0,668 0,706 0,733 0,587 <0,05 12,935 1A; 2A; 3A; 4A; 5A
Table S12. Chi-square and Kruskal-Wallis tests of the five groups resulting from the hierarchical cluster analysis in relation to environmental sustainability and social wellbeing between. < and > signs indicate differences between pairs of levels. * indicates when these comparisons are statistically significant (p-value<0.05). For a better readability, cells in red indicate the group(s) with less environmental sustainability and social wellbeing; green cells instead indicate the groups with the highest values in environmental sustainability and social wellbeing.
113
References
Porter JR, et al. (2014) Food security and food production systems. Clim Chang 2014 Impacts, Adapt Vulnerability Part A Glob Sect Asp Contrib Work Gr II to Fifth Assess Rep Intergov Panel Clim Chang:485–533.
Rivera-Ferre MG, Ortega-Cerdà M, Baumgärtner J (2013) Rethinking Study and Management of Agricultural Systems for Policy Design. Sustainability 5(9):3858–3875.
Raudsepp-Hearne C, et al. (2010) Untangling the Environmentalist’s Paradox: Why Is Human Well-being Increasing as Ecosystem Services Degrade? Bioscience 60(8):576–589.
Bennett EM (2017) Changing the agriculture and environment conversation. Nat Ecol Evol 1(1):1–2.
Foley JA, et al. (2011) Solutions for a cultivated planet. Nature 478:337–342.
West PC, et al. (2014) Leverage points for improving global food security and the environment. Science (80- ) 345(6194):325–328.
Smith P, et al. (2014) Agriculture, Forestry and Other Land Use (AFOLU). Climate Change 2014: Mitigation of Climate Change. Contribution of Working Group III to the Fifth Assessment Report of the Intergovernmental Panel on Climate Change, eds Edenhofer O, et al. (Cambridge University Press, Cambridge, United Kingdom and New York, NY, USA), pp 811–922.
Rockström J, et al. (2009) Planetary boundaries: Exploring the safe operating space for humanity. Ecol Soc 14(2). doi:10.5751/ES-03180-140232.
Steffen W, et al. (2015) Sustainability. Planetary boundaries: guiding human development on a changing planet. Science 347(6223):1259855.
Chappell MJ, LaValle LA (2011) Food security and biodiversity: Can we have both? An agroecological analysis. Agric Human Values 28(1):3–26.
FAO (2017) The State of Food and Agriculture - Leveraging Food Systems for Inclusive Rural Transformation Available at: http://www.fao.org/3/a-I7658e.pdf%0Ahttp://www.ncbi.nlm.nih.gov/pubmed/24897208%5Cnhttp://www.ncbi.nlm.nih.gov/pmc/articles/PMC1319478/%0Ahttp://www.fao.org/3/a-i7658e.pdf.
Tester M, Langridge P (2010) Breeding technologies to increase crop production in a changing world. Science (80- ) 327(5967):818–822.
Godfray HCJ, et al. (2010) Food security: The challenge of feeding 9 billion people. Science (80- ) 327(5967):812–818.
Schipanski ME, et al. (2016) Realizing resilient food systems. Bioscience 66(7):600–610.
Ericksen PJ (2008) Conceptualizing food systems for global environmental change research. Glob Environ Chang 18(1):234–245.
Vallejo-Rojas V, Ravera F, Rivera-Ferre MG (2016) Developing an integrated framework to assess agri-food systems and its application in the Ecuadorian Andes. Reg Environ Chang 16:2171–2185.
West PC, et al. (2014) Leverage points for improving global food security and the environment. Science (80- ) 345(6194):325–328.
Loos J, et al. (2014) Putting meaning back into “sustainable intensification.” Front Ecol Environ 12(6):356–361.
Chaudhary A, Gustafson D, Mathys A (2018) Multi-indicator sustainability assessment of global food systems. Nat Commun 9(1). doi:10.1038/s41467-018-03308-7.
UN (2016) Sustainable Development Goals. Available at: http://www.un.org/sustainabledevelopment/sustainable-development-goals/ [Accessed April 8, 2016].
Swain R. (2018) A Critical Analysis of the Sustainable Development Goals. Handbook of Sustainability Science and Research, ed Filho WL (Springer), pp 341–355.
Lim MML, Søgaard Jørgensen P, Wyborn CA (2018) Reframing the sustainable development goals to achieve sustainable development in the anthropocene—a systems approach. Ecol Soc 23(3). doi:10.5751/ES-10182-230322.
Spaiser V, Ranganathan S, Swain RB, Sumpter DJT (2017) The sustainable development oxymoron: quantifying and modelling the incompatibility of sustainable development goals. Int J Sustain Dev World Ecol 24(6):457–470.
FAO (1996) Rome Declaration on World Food Security and World Food Summit Plan os Action (Rome, Italy) Available at: http://www.fao.org/docrep/003/w3613e/w3613e00.HTM.
Tilman D, Balzer C, Hill J, Befort BL (2011) From the Cover: Global food demand and the sustainable intensification of agriculture. Proc Natl Acad Sci 108(50):20260–20264.
114
Hunter MC, Smith RG, Schipanski ME, Atwood LW, Mortensen DA (2017) Agriculture in 2050: Recalibrating targets for sustainable intensification. Bioscience 67(4):386–391.
Vermeulen SJ, Campbell BM, Ingram JSI (2012) Climate Change and Food Systems. Annu Rev Environ Resour 37:195–222.
Campbell BM, et al. (2018) Urgent action to combat climate change and its impacts (SDG 13): transforming agriculture and food systems. Curr Opin Environ Sustain 34(Sdg 13):13–20.
Willett W, et al. (2019) Food in the Anthropocene: the EAT–Lancet Commission on healthy diets from sustainable food systems. Lancet 393(10170):447–492.
Poore J, Nemecek T (2018) Reducing food’s environmental impacts through producers and consumers. Science (80- ) 360(6392):987–992.
Springmann M, Godfray HCJ, Rayner M, Scarborough P (2016) Analysis and valuation of the health and climate change cobenefits of dietary change. Proc Natl Acad Sci 113(15):4146–4151.
Gustafson D, et al. (2016) Seven food system metrics of sustainable nutrition security. Sustain 8(3):1–17.
Nilsson M, et al. (2018) Mapping interactions between the sustainable development goals: lessons learned and ways forward. Sustain Sci 13(6):1–15.
FAO (2012) Thirty-second FAO Regional Conference for Latin America and the Caribbean (Buenos Aires, Argentina) Available at: http://www.fao.org/docrep/meeting/030/mj764e.pdf.
Claeys P (2015) Human Rights and the Food Sovereignty Movement: Reclaiming Control (Routledge, London and New York).
Levidow L, Pimbert M, Vanloqueren G (2014) Agroecological Research: Conforming—or Transforming the Dominant Agro-Food Regime? Agroecol Sustain Food Syst 38(10):1127–1155.
De Schutter O (2014) Report of the Special Rapporteur on the right to food A/HRC/25/57 (New York, U.S.A.) Available at: http://www.ohchr.org/EN/HRBodies/HRC/RegularSessions/Session25/Documents/A_HRC_25_57_ENG.DOC.
Patel R (2009) Food sovereignty. J Peasant Stud 36(3):663–706.
Ruiz-Almeida A, Rivera-Ferre MG Internationally-based indicators to measure agri-food systems sustainability using food sovereignty as a conceptual framework. Food Syst.
ICSU, ISSC (2015) Review of Targets for the Sustainable Development Goals: The Science Perspective.
Stern DI, Common MS, Barbier EB (1994) Econonmic growth and environmental degredation: A critique of the environmental Kuznets Curve. Univ York 44(0):24.
Goeminne G, Paredis E (2010) The concept of ecological debt: Some steps towards an enriched sustainability paradigm. Environ Dev Sustain 12(5):691–712.
Sen A (1981) Poverty and Famines: An Essay on Entitlement and Deprivation (Clarendon Press, Oxford) doi:10.1086/451432.
Dixon J, et al. (2007) The health equity dimensions of urban food systems. J Urban Heal 84(SUPPL. 1):118–129.
Bajželj B, et al. (2014) Importance of food-demand management for climate mitigation. Nat Clim Chang 4(10):924–929.
Berners-Lee M, Kennelly C, Watson R, Hewitt CN (2018) Current global food production is sufficient to meet human nutritional needs in 2050 provided there is radical societal adaptation. Elem Sci Anth 6(1):52.
Drewnowski A, et al. (2015) Energy and nutrient density of foods in relation to their carbon footprint. Am J Clin Nutr 101(1):184–191.
D’Odorico P, Carr JA, Laio F, Ridolfi L, Vandoni S (2014) Feeding humanity through global food trade Earth ’ s Future. Earth’s Futur 2:458–469.
Ziegler J (2013) Betting on Femine: Why the World Still Goes Hungry (New Press, New York, U.S.A.).
Porkka M, Kummu M, Siebert S, Varis O (2013) From food insufficiency towards trade dependency: A historical analysis of global food availability. PLoS One 8(12). doi:10.1371/journal.pone.0082714.
Sun J, et al. (2018) Importing food damages domestic environment: Evidence from global soybean trade. Proc Natl Acad Sci 115(21):5415–5419.
MacDonald GK, et al. (2015) Rethinking agricultural trade relationships in an era of globalization. Bioscience 65(3):275–289.
Chaudhary A, Kastner T (2016) Land use biodiversity impacts embodied in international food trade. Glob Environ Chang 38(May):195–204.
Chaudhary A, Brooks TM (2017) National Consumption and Global Trade Impacts on Biodiversity. World Dev. doi:10.1016/j.worlddev.2017.10.012.
115
Kastner T, et al. (2014) Cropland area embodied in international trade: Contradictory results from different approaches. Ecol Econ 104:140–144.
Allan JA (1998) Virtual water: A strategic resource global solutions to regional deficits. Ground Water 36(4):545–546.
Schipanski ME, Bennett EM (2012) The Influence of Agricultural Trade and Livestock Production on the Global Phosphorus Cycle. Ecosystems 15(2):256–268.
Galloway JN, et al. (2007) Royal Swedish Academy of Sciences International Trade in Meat : The Tip of the Pork Chop International Pork Chop Trade in Meat : The Tip of the. Int Trade Meat Tip Pork Chop 36(8):622–629.
Kastner T, Erb K-H, Nonhebel S (2011) International wood trade and forest change: A global analysis. Glob Environ Chang 21(3):947–956.
Meyfroidt P, Lambin EF, Erb KH, Hertel TW (2013) Globalization of land use: Distant drivers of land change and geographic displacement of land use. Curr Opin Environ Sustain 5(5):438–444.
Liu J, Yang W, Li S (2016) Framing ecosystem services in the telecoupled Anthropocene. Front Ecol Environ 14(1):27–36.
Khoury CK, et al. (2014) Increasing homogeneity in global food supplies and the implications for food security. Proc Natl Acad Sci 111(11):4001–4006.
Anseeuw W (2013) The rush for land in Africa: Resource grabbing or green revolution? South African J Int Aff 20(1):159–177.
Batterbury S, Ndi F (2018) Land-grabbing in Africa Land-grabbing in Africa. (January).
Clark WC, van Kerkhoff L, Lebel L, Gallopin G (2016) Crafting Usable Knowledge for Sustainable Development. Ssrn 113(17):4570–4578.
van Vuuren DP, et al. (2015) Pathways to achieve a set of ambitious global sustainability objectives by 2050: Explorations using the IMAGE integrated assessment model. Technol Forecast Soc Change 98:303–323.
McKeon N Food security governance : empowering communities, regulating corporations.
FAO (2009) Global agriculture towards 2050. High Lev Expert Forum-How to Feed world 2050:1–4.
Burdock R, Ampt P (2017) Food Sovereignty: The Case and the Space for Community Led Agricultural Autonomy within the Global Strategic Framework for Food Security and Nutrition. J Agric Sci 9(5):1.
Pittelkow CM, et al. (2015) Productivity limits and potentials of the principles of conservation agriculture. Nature 517(7534):365–368.
Easterly W (2015) The Trouble with the SDGs. Curr Hist. Available at: http://www.currenthistory.com/Easterly_CurrentHistory.pdf.
Altieri M (2009) Agroecology, Small Farms, and Food Sovereignty. Mon Rev:102–113.
116
Concluding Remarks
Through the SDGs approach, the UN recognizes the importance of analyzing the various complex
problems from a holistic perspective. Although there are specific indicators in each one of the
objectives, many of them are intercorrelated. The agri-food system is a perfect example for that, in
the way that to meet the zero hunger objective (SDG2), we do need a broader approach to food
security given that the old policies focused only on productivity have failed to end hunger.
The food sovereignty framework encompasses all dimensions of sustainability while focusing its
analysis on the producer rights approach. From this perspective, it offers a holistic political framework
to develop sustainable agri-food systems. Nonetheless, the broader approach has not enough
quantitative studies to analyze its efficiency in achieving such an objective to date.
The work presented in this thesis contributes to the complex analysis around the problem of the
unsustainability of the agri-food systems. It contributes by offering quantitative and qualitative
analysis of the entire system, intending to put forth tools that measure and interpret the system's
functioning and degree of sustainability from a complex-systems perspective. In this line, the past
chapters present three different works that support the fulfillment of the main objective of my
doctoral studies: to adapt and establish critical parameters that allow characterizing the degree of
sustainability of the global agri-food system following alternative framings of food, through the
research and analysis of its agents, interactions, main strengths, and vulnerabilities
I highlight three main contributions of my doctoral work. The first one is the database that was a
continuation of my final master's work. The base aroused great interest in the research community,
which reflected the need for a multidisciplinary base of these characteristics. We have been
contacted on several occasions and derived from this publication, and the data has contributed to
other research works, apart from those mentioned here.
The second contribution of my thesis is the emergence of a new concept: agri-food debt. Agri-food
debt is defined as "the inter‐regional social‐ecological disequilibria in the natural resources consumed,
the environmental impacts produced, and the social well‐being attained by populations in regions that
play different roles within the globalized agri‐food system." This new concept emerges from analyzing
clusters of countries using the food sovereignty framework.
The third main contribution is the latest research that will be published in 2021. Using Jabareen's
steps to construct the agri-food systems sustainability concept, we apply a complex networks
117
methodology to analyze how indicators interact among them and communities. Our objective is to
detect how potential decisions or policies applied to a group's elements can affect the other group
members' dense connectivity among them. Within this last work scope, we will be covering the
previous phases of the methodology since the final stages establish the need to clarify the
interactions among the different concepts around the agri-food system's sustainability and the need
to validate the conceptual framework.
As a climate change activist, I considered a lack in this work to investigate the major agri-food systems
threats. However, despite not having achieved research in this area, I believed that my active
participation in an international social movement aiming to fight climate change and build sustainable
cities covers that lack. I have been since 2017 perusing a persona project related to the valorization
of organic waste, one of the main threats to the agri-food system; with agencies the size of the United
Nations, the organization of sustainable cities C40, and local governments (Mexico City and San
Francisco).
Finally, besides the further work that we are in, analysis of other perspectives is needed to
continue on our path to building sustainable agri-food systems. The new approach to system
evaluation based on human rights and ecosystem regeneration will play an essential role in
developing these new strategies. From my perspective, food sovereignty will always be based
on these new analyzes as a grouping element of the dimensions of sustainability.
118
Acknowledgments
The work presented in this dissertation constitutes too many years of work, collaborating with
different research groups but always under the guidance of Doctor Marta G. Rivera Ferré, to whom I
will be forever grateful. Thanks, Marta, for transmitting your passion for this topic, your knowledge,
and for being practically the only one who never doubted that I would achieve it. I'm also thankful for
my co-Director Marti Rosas Casals. Graciès Marti! for your unlimited support, clear vision, and calm.
The first part of this research has its roots in the research project made in collaboration with Miquel
Ortega-Cerdà, Neşat Çomak, and Mahmud Mohammed. The second was done in a collaborative
experience with Dr. Elisa Otero Rozas, Dr. José González, and Dr. Mateo Aguado, co-authors of my
second article. I recognized their valuable participation, and gratefully acknowledged their work and
dedication.
Since begin my Doctoral studies, I also thank the Mexican Government by holding a grant from the
Mexican National Council of Science and Technology (CONACYT).
Finally, thanks to all my closest friends and family, my community, for their endless support, cheers
and understanding. Jumis, Paqui, Chumis, Adrián, Javiera, Olga, and Ioanna ¡Gracias!