survey of period variations of superhumps in su uma-type dwarf novae. ii the second year (2009-2010)
TRANSCRIPT

arX
iv:1
507.
0561
0v1
[as
tro-
ph.S
R]
20
Jul 2
015
PASJ: Publ. Astron. Soc. Japan , 1–??,c© 2015. Astronomical Society of Japan.
Survey of Period Variations of Superhumps in SU UMa-Type DwarfNovae. VII: The Seventh Year (2014–2015)
Taichi Kato,1* Franz-Josef Hambsch,2,3,4 Pavol A. Dubovsky,5 Igor Kudzej,5 Berto Monard,6,7 Ian Miller,8
Hiroshi Itoh,9 Seiichiro Kiyota,10 Kazunari Masumoto,11 Daiki Fukushima,11 Hiroki Kinoshita,11
Kazuki Maeda,11 Jyunya Mikami,11 Risa Matsuda,11 Naoto Kojiguchi,11 Miho Kawabata,11
Megumi Takenaka,11 Katsura Matsumoto,11 Enrique de Miguel,12,13 Yutaka Maeda,14 Tomohito Ohshima,1
Keisuke Isogai,1 Roger D. Pickard,15,16 Arne Henden,17 Stella Kafka,17 Hidehiko Akazawa,18
Noritoshi Otani,18 Sakiko Ishibashi,18 Minako Ogi,18 Kenji Tanabe,18 Kazuyoshi Imamura,18 William Stein,19
Kiyoshi Kasai,20 Tonny Vanmunster,21 Peter Starr,22 Arto Oksanen,23 Elena P. Pavlenko,24
Oksana I. Antonyuk,24 Kirill A. Antonyuk,24 Aleksei A. Sosnovskij,24 Nikolaj V. Pit,24 Julia V. Babina,24
Aleksandr Sklyanov,26 Rudolf Novák,25 Shawn Dvorak,27 Raúl Michel,28 Gianluca Masi,29
Colin Littlefield,30 Joseph Ulowetz,31 Sergey Yu. Shugarov,32,33 Polina Yu. Golysheva,32
Drahomir Chochol,33 Viktoriia Krushevska,34 Javier Ruiz,35,36,37 Tamás Tordai,38 Etienne Morelle,39
Richard Sabo,40 Hiroyuki Maehara,41 Michael Richmond,42 Natalia Katysheva,32 Kenji Hirosawa,43
William N. Goff,44 Franky Dubois,45 Ludwig Logie,46 Steve Rau,47 Irina B. Voloshina,32
Maksim V. Andreev,48,49 Kazuhiko Shiokawa,50 Vitaly V. Neustroev,51 George Sjoberg,52,17
Sergey Zharikov,28 Nick James,53 Greg Bolt,54 Tim Crawford,55 Denis Buczynski,56 Lewis M. Cook,57
Christopher S. Kochanek,58 Benjamin Shappee,58 Krzysztof Z. Stanek,58 José L. Prieto,59,60
Denis Denisenko,61 Hideo Nishimura,62 Masaru Mukai,63 Shizuo Kaneko,64 Seiji Ueda,65 Rod Stubbings,66
Masayuki Moriyama,67 Patrick Schmeer,68 Eddy Muyllaert,69 Jeremy Shears,70,15 Robert J. Modic,71
Kevin B. Paxson,721 Department of Astronomy, Kyoto University, Kyoto 606-8502, Japan
∗[email protected] Groupe Européen d’Observations Stellaires (GEOS), 23 Parc de Levesville, 28300 Bailleau l’Evêque, France
3 Bundesdeutsche Arbeitsgemeinschaft für Veränderliche Sterne (BAV), Munsterdamm 90, 12169 Berlin, Germany4 Vereniging Voor Sterrenkunde (VVS), Oude Bleken 12, 2400 Mol, Belgium
5 Vihorlat Observatory, Mierova 4, Humenne, Slovakia6 Bronberg Observatory, Center for Backyard Astrophysics Pretoria, PO Box 11426, Tiegerpoort 0056, South Africa
7 Kleinkaroo Observatory, Center for Backyard Astrophysics Kleinkaroo, Sint Helena 1B, PO Box 281, Calitzdorp 6660, South
Africa8 Furzehill House, Ilston, Swansea, SA2 7LE, UK
9 Variable Star Observers League in Japan (VSOLJ), 1001-105 Nishiterakata, Hachioji, Tokyo 192-0153, Japan10 VSOLJ, 7-1 Kitahatsutomi, Kamagaya, Chiba 273-0126, Japan
11 Osaka Kyoiku University, 4-698-1 Asahigaoka, Osaka 582-8582, Japan12 Departamento de Física Aplicada, Facultad de Ciencias Experimentales, Universidad de Huelva, 21071 Huelva, Spain
13 Center for Backyard Astrophysics, Observatorio del CIECEM, Parque Dunar, Matalascañas, 21760 Almonte, Huelva, Spain14 Kaminishiyamamachi 12-14, Nagasaki, Nagasaki 850-0006, Japan
15 The British Astronomical Association, Variable Star Section (BAA VSS), Burlington House, Piccadilly, London, W1J
0DU, UK16 3 The Birches, Shobdon, Leominster, Herefordshire, HR6 9NG, UK
17 American Association of Variable Star Observers, 49 Bay State Rd., Cambridge, MA 02138, USA18 Department of Biosphere-Geosphere System Science, Faculty of Informatics, Okayama University of Science, 1-1 Ridai-cho,
Okayama, Okayama 700-0005, Japan19 6025 Calle Paraiso, Las Cruces, New Mexico 88012, USA
20 Baselstrasse 133D, CH-4132 Muttenz, Switzerland21 Center for Backyard Astrophysics Belgium, Walhostraat 1A, B-3401 Landen, Belgium
22 Warrumbungle Observatory, Tenby, 841 Timor Rd, Coonabarabran NSW 2357, Australia23 Hankasalmi observatory, Jyvaskylan Sirius ry, Vertaalantie 419, FI-40270 Palokka, Finland
24 Crimean Astrophysical Observatory, p/o Naychny, 298409, Republic of Crimea25 Research Centre for Toxic Compounds in the Environment, Faculty of Science, Masaryk University, Kamenice 3, 625 00
Brno, Czech Republic26 Kazan Federal University, Kremlevskaya str., 18, Kazan, 420008, Russia
27 Rolling Hills Observatory, 1643 Nightfall Drive, Clermont, Florida 34711, USA28 Instituto de Astronomía UNAM, Apartado Postal 877, 22800 Ensenada B.C., México29 The Virtual Telescope Project, Via Madonna del Loco 47, 03023 Ceccano (FR), Italy

2 T. Kato et al. [Vol. ,
30 Department of Physics, University of Notre Dame, Notre Dame, Indiana 46556, USA31 Center for Backyard Astrophysics Illinois, Northbrook Meadow Observatory, 855 Fair Ln, Northbrook, Illinois 60062, USA32 Sternberg Astronomical Institute, Lomonosov Moscow State University, Universitetsky Ave., 13, Moscow 119992, Russia
33 Astronomical Institute of the Slovak Academy of Sciences, 05960, Tatranska Lomnica, the Slovak Republic34 Main astronomical observatory of the National Academy of Sciences of Ukraine, 27 Akademika Zabolotnoho ave., 03680
Kyiv, Ukraine35 Observatorio de Cántabria, Ctra. de Rocamundo s/n, Valderredible, Cantabria, Spain
36 Instituto de Física de Cantabria (CSIC-UC), Avenida Los Castros s/n, E-39005 Santander, Cantabria, Spain37 Agrupación Astronómica Cántabria, Apartado 573, 39080, Santander, Spain
38 Polaris Observatory, Hungarian Astronomical Association, Laborc utca 2/c, 1037 Budapest, Hungary39 9 rue Vasco de GAMA, 59553 Lauwin Planque, France40 2336 Trailcrest Dr., Bozeman, Montana 59718, USA
41 Okayama Astrophysical Observatory, National Astronomical Observatory of Japan, Asakuchi, Okayama 719-0232, Japan42 Physics Department, Rochester Institute of Technology, Rochester, New York 14623, USA
43 216-4 Maeda, Inazawa-cho, Inazawa-shi, Aichi 492-8217, Japan44 13508 Monitor Ln., Sutter Creek, California 95685, USA45 Astrolab team, Poelkapellestraat 57 Langemark, Belgium
46 Astrolab team, Gezellestraat 9, 8908 Vlamertinge, Belgium47 Astrolab team, Veldstraat 6, 8400 Oostende, Belgium
48 Institute of Astronomy, Russian Academy of Sciences, 361605 Peak Terskol, Kabardino-Balkaria, Russia49 International Center for Astronomical, Medical and Ecological Research of NASU, Ukraine 27 Akademika Zabolotnoho Str.
03680 Kyiv, Ukraine50 Moriyama 810, Komoro, Nagano 384-0085, Japan
51 Astronomy and Space Physics, PO Box 3000, FIN-90014 University of Oulu, Finland52 The George-Elma Observatory, 9 Contentment Crest, #182, Mayhill, New Mexico 88339, USA
53 11 Tavistock Road, Chelmsford, Essex CM1 6JL, UK54 Camberwarra Drive, Craigie, Western Australia 6025, Australia
55 Arch Cape Observatory, 79916 W. Beach Road, Arch Cape, Oregon 97102, USA56 Conder Brow Observatory, Fell Acre, Conder Brow, Little Fell Lane, Scotforth, Lancs LA2 0RQ, England
57 Center for Backyard Astrophysics Concord, 1730 Helix Ct. Concord, California 94518, USA58 Department of Astronomy, the Ohio State University, Columbia, OH 43210, USA
59 Núcleo de Astronomía de la Facultad de Ingeniería, Universidad Diego Portales, Av. Ejército 441, Santiago, Chile60 Department of Astrophysical Sciences, Princeton University, NJ 08544, USA
61 Space Research Institute (IKI), Russian Academy of Sciences, Moscow, Russia62 Miyawaki 302-6, Kakegawa, Shizuoka 436-0086, Japan
63 JCPM Kagoshima Station, Kagoshima City, Kagoshima 892-0871, Japan64 14-7 Kami-Yashiki, Kakegawa, Shizuoka 436-0049, Japan
65 6-23-9 Syowa-Minami, Kushiro City, Hokkaido 084-0909, Japan66 Tetoora Observatory, Tetoora Road, Victoria, Australia67 290-383, Ogata-cho, Sasebo, Nagasaki 858-0926, Japan
68 Bischmisheim, Am Probstbaum 10, 66132 Saarbrücken, Germany69 Vereniging Voor Sterrenkunde (VVS), Moffelstraat 13 3370 Boutersem, Belgium
70 “Pemberton”, School Lane, Bunbury, Tarporley, Cheshire, CW6 9NR, UK71 351 Fairlawn Dr., Richmond Heights, Ohio 44143, USA
72 20219 Eden Pines, Spring, Texas 77379, USA
(Received 201 0; accepted 201 0)
Abstract
Continuing the project described by Kato et al. (2009), we collected times of superhump maxima for102 SU UMa-type dwarf novae observed mainly during the 2014–2015 season and characterized theseobjects. Our project has greatly improved the statistics of the distribution of orbital periods, which is agood approximation of the distribution of cataclysmic variables at the terminal evolutionary stage, andconfirmed the presence of a period minimum at a period of 0.053 d and a period spike just above this period.The number density monotonically decreased toward the longer period and there was no strong indicationof a period gap. We detected possible negative superhumps in Z Cha. It is possible that normal outburstsare also suppressed by the presence of a disk tilt in this system. There was no indication of enhanced orbitalhumps just preceding the superoutburst, and this result favors the thermal-tidal disk instability as the originof superoutbursts. We detected superhumpsin three AM CVn-type dwarf novae. Our observations and

No. ] Period Variations in SU UMa-Type Dwarf Novae VII 3
recent other detections suggest that 8% of objects showing dwarf nova-type outbursts are AM CVn-typeobjects. AM CVn-type objects and EI Psc-type object may be more abundant than previously recognized.OT J213806, a WZ Sge-type object, exhibited a remarkably different feature between the 2010 and 2014superoutbursts. Although the 2014 superoutburst was much fainter the plateau phase was shorter than the2010 one, the course of the rebrightening phase was similar. This object indicates that the O−C diagramsof superhumps can be indeed variable at least in WZ Sge-type objects. Four deeply eclipsing SU UMa-type dwarf novae (ASASSN-13cx, ASASSN-14ag, ASASSN-15bu, NSV 4618) were identified. We studiedlong-term trends in supercycles in MM Hya and CY UMa and found systematic variations of supercyclesof ∼20%.
Key words: accretion, accretion disks — stars: novae, cataclysmic variables — stars: dwarf novae
1. Introduction
Cataclysmic variables (CVs) are close binary systemstransferring matter from a low-mass dwarf secondary toa white dwarf. The transferred matter forms an accre-tion disk. Thermal instability od the disk caused by par-tial ionization of hydrogen results outbursts in dwarf no-vae (DNe), a subclass of CVs. Tidal instability of thedisk caused by the 3:1 resonance with the orbiting sec-ondary is considered to develop an eccentric (or flexing)disk in SU UMa-type dwarf novae, a subclass of DNe.This eccentric disk is responsible for superhumps, whichhave periods a few percent longer than the orbital period[see e.g. Whitehurst (1988); Hirose, Osaki (1990); Lubow(1991)]. The enhanced mass accretion by tidal instabilitycauses long-lasting superoutbursts [thermal tidal instabil-ity (TTI) model: Osaki (1989); Osaki (1996)]. Althoughthere had been intensive discussions whether superout-bursts are a result of tidal instability or an enhanced mass-transfer from the secondary [e.g. Smak (1991), Smak(2004), Smak (2008)], recent detailed analyses of high-precision Kepler observations have favored the TTI modelas the only viable model for ordinary SU UMa-type dwarfnovae (Osaki, Kato 2013a; Osaki, Kato 2013b; Osaki,Kato 2014). [For general information of CVs, DNe, SUUMa-type dwarf novae and superhumps, see e.g. Warner(1995)].
This paper is one of series of papers Kato et al. (2009),Kato et al. (2010), Kato et al. (2012a), Kato et al. (2013a),Kato et al. (2014b) and Kato et al. (2014a). These pa-pers originally intended to clarify the period variations ofsuperhumps in SU UMa-type dwarf novae and first suc-ceeded in identifying superhump stages (stages A, B andC) in Kato et al. (2009). Among them, stage A super-humps have recently been identified to be reflect the pre-cession of the eccentric disk at the radius of the 3:1 reso-nance, and have been one of the most promising tools indetermining the mass-ratios in SU UMa-type dwarf no-vae and in following the terminal evolution of CVs (Kato,Osaki 2013b).
Continuing this project, we report observations of su-perhumps and associated phenomena in SU UMa-typedwarf novae whose superoutbursts were observed in 2014–2015. In this paper, we report basic observational ma-terials and discussions in relation to individual objects.General discussion related to WZ Sge-type dwarf novae,which are a subclass of SU UMa-type dwarf novae with
infrequent, large amplitude superoutbursts, will be givenas in a planned summary paper by Kato (2015).
Starting from Kato et al. (2014a), we have been intend-ing these series of papers to be also a source of compiledinformation, including historical, of individual dwarf no-vae since there have been no compiled publication sinceGlasby (1970).
The material and methods of analysis are given in sec-tion 2, observations and analysis of individual objects aregiven in section 3, including some discussions particularto the objects, the general discussion is given in section 4and the summary is given in section 5.
2. Observation and Analysis
2.1. General Procedure
The data were obtained under campaigns led by theVSNET Collaboration (Kato et al. 2004c). For someobjects, we used the public data from the AAVSOInternational Database1.
The majority of the data were acquired by time-resolvedCCD photometry by using 30cm-class telescopes locatedworld-wide, whose observational details will be presentedin future papers dealing with analysis and discussion onindividual objects of interest. The list of outbursts andobservers is summarized in table 1. The data analysiswas performed just in the same way described in Katoet al. (2009) and Kato et al. (2014a) and we mainlyused R software2 for data analysis. In de-trending thedata, we used both lower (1–5th order) polynomial fittingand locally-weighted polynomial regression (LOWESS:Cleveland 1979). The times of superhumps maxima weredetermined by the template fitting method as describedin Kato et al. (2009). The times of all observations areexpressed in barycentric Julian Days (BJD).
The abbreviations used in this paper are the sameas in Kato et al. (2014a): Porb means the orbital pe-riod and ε ≡ PSH/Porb − 1 for the fractional superhumpexcess. Following Osaki, Kato (2013a), the alternativefractional superhump excess in the frequency unit ε∗ ≡
1−Porb/PSH− 1 = ε/(1+ ε) has been introduced becausethis fractional superhump excess can be directly comparedto the precession rate. We therefore used ε∗ in referringthe precession rate.
1 <http://www.aavso.org/data-download>.2 The R Foundation for Statistical Computing:
<http://cran.r-project.org/>.

4 T. Kato et al. [Vol. ,
We used phase dispersion minimization (PDM;Stellingwerf 1978) for period analysis and 1σ errors forthe PDM analysis was estimated by the methods of Fernie(1989) and Kato et al. (2010). We present evidence for anSU UMa-type dwarf nova by presenting period analysisand averaged superhump profile if the paper provides thefirst solid presentation of individual objects as such.
The resultant PSH, Pdot and other parameters are listedin table 2 in same format as in Kato et al. (2009). Thedefinitions of parameters P1,P2,E1,E2 and Pdot are thesame as in Kato et al. (2009).3 Comparisons of O−C dia-grams between different superoutbursts are also presentedwhenever available, since this comparison was one of themain motivations in of these series papers (cf. Uemuraet al. 2005). Combined O−C diagrams also help iden-tifying superhump stages particularly when observationsare insufficient. In drawing combined O −C diagrams,we usually used E = 0 for the start of the superoutburst,which usually refers to the first positive detection of theoutburst. This epoch usually has an accuracy of ∼1 dfor well-observed objects, and if the outburst was notsufficiently observed, we mentioned in the figure captionhow to estimate E in such an outburst. We also presentO−C diagrams and light curves especially for WZ Sge-type dwarf novae, which are not expected to undergo out-bursts in the near future. In all figures, the binned magni-tudes and O−C values are accompanied by 1σ error bars,which are omitted when the error is smaller than the plotmark.
We used the same terminology of superhumps summa-rized in Kato et al. (2012a). We especially call attention tothe term “late superhumps”. Although this term has beenused to refer to various phenomena, we only used the con-cept of “traditional” late superhumps when an ∼0.5 phaseshift is detected [Vogt (1983); see also table 1 in Kato et al.(2012a) for various types of superhumps], since we suspectthat many of the past claims of detections of “late super-humps” were likely stage C superhumps [cf. Kato et al.(2009); note that the Kepler observation of V585 Lyr alsodemonstrated this persistent stage C superhumps withouta phase shift (Kato, Osaki 2013a), and most recently it isconfirmed in another Kepler CV by Brown et al. (2015)].
Early superhumps are double-wave humps seen duringthe early stages of WZ Sge-type dwarf novae, and haveperiod close to the orbital periods (Kato et al. 1996; Kato2002; Osaki, Meyer 2002). We are going to discuss thisphenomenon in the planned paper (Kato 2015). We usedthe period of early superhumps as approximate orbitalperiod (Kato et al. 2014a).
As in Kato et al. (2009), we have used coordinate-based optical transient (OT) designations for some ob-jects, such as apparent dwarf nova candidates reported inthe Transient Objects Confirmation Page of the CentralBureau for Astronomical Telegrams4 and listed the orig-inal identifiers in table 1. For objects detected in the
3 The intervals (E1 and E2) for the stages B and C given in thetable sometimes overlap because of occasional observational am-biguity in determining the stages.
4 <http://www.cbat.eps.harvard.edu/unconf/tocp.html>.
Catalina Real-time Transient Survey (CRTS; Drake et al.2009)5 transients, we preferably used the names providedin Drake et al. (2014). If these names are not yet available,we used the International Astronomical Union (IAU)-format names provided by the CRTS team in the publicdata release6
Since ASAS-SN detectors have relatively poor angu-lar resolutions (7.5 arcsec/pixel), we provided coordinatesfrom our own astrometry and astrometric catalogs forASAS-SN CVs. We used SDSS, the Initial Gaia SourceList (IGSL, Smart 2013) and Guide Star Catalog 2.3.2.The coordinates used in this paper are J2000.0.
2.2. Period Selection
Questions have been raised to our surveys how to selectthe periods among the aliases and what is the uncertainty.Such question are natural if one only sees PDM diagrams.We should note that PDM (and most of other period find-ing algorithms) assumes “uncorrelated” (in time) observa-tions and defines the statistics. The actual data have moreinformation, such as the superhump timing data. Evenif the PDM result shows strong aliases, we can resolvethe alias problem if we have sufficiently long continuousobservations (continuous data produce no aliases). Ourperiod selection is mostly based on this principle, whenalias selection is inconclusive by the PDM analysis only.The second approach is to examine the trends of O−Cvalues against the trial periods. A period longer thanthe actual one produces systematically decreasing O−Cvalues within each night, and our measurements of the su-perhump maxima have typical errors of 0.001 d, which isusually sufficient to select one-day aliases when multiplesuperhumps were detected each night. If the case is not,we describe the uncertainty of the selection.
We show an example how our method works by usingthe data of FI Cet (subsection 3.6). A PDM analysisover a wider range of periods (figure 1) gives an impres-sion that there are many period candidates and a periodof 0.057 d and 0.060 d are equally acceptable. If we relyon statistics assuming temporarily “uncorrelated” observa-tions, this would give equal significance to these periods.An example for FI Cet is shown in figure 2. Scatter inthe O−C values and systematic trends within each nightare apparent for trial period 0.06033 d, which is rejected.Although we do not show similar figures for other objectsdue to the limitation of space, we made similar analysisfor objects when ambiguities in period selection remained.
Readers may be interested in the result of least absoluteshrinkage and selection operator (Lasso) (Tibshirani 1996;Kato, Uemura 2012) analysis, which has been proven tobe very effective in detecting rapidly varying periods inunevenly sampled data (e.g. Kato, Maehara 2013; Osaki,Kato 2013b; Kato, Osaki 2013a; Ohshima et al. 2014).The result is shown in figure 3, and the impression is sodifferent from the PDM result (figure 1). However, we
5 <http://nesssi.cacr.caltech.edu/catalina/>. For theinformation of the individual Catalina CVs, see<http://nesssi.cacr.caltech.edu/catalina/AllCV.html>.
6 <http://nesssi.cacr.caltech.edu/DataRelease/>.

No. ] Period Variations in SU UMa-Type Dwarf Novae VII 5
0.045 0.050 0.055 0.060 0.065 0.070 0.075
0.8
0.9
1.0
(d)
θ
Fig. 1. PDM analysis of FI Cet (see subsection 3.6) in awider period range.
0 20 40 60 80 100−0.02
−0.01
0.00
0.01
trial period=0.05690 d
trial period=0.06033 d
Fig. 2. O − C diagrams assuming two trial periods (twoaliases in figure 1). Scatter in the O − C values and sys-tematic trends within each night are apparent for trial period0.06033 d, which is rejected.
didn’t widely used this method in selecting the aliasessince our model used in Lasso analysis also assumed tem-porarily uncorrelated observations, and the suppression ofthe aliases is simply a result of highly non-linear charac-teristics of compressed sensing. This figure (if comparedto classical figures) would give misleading impression thatthere is no possibility for aliases and we have not used thistype of figure in this paper.
3. Individual Objects
3.1. KX Aquilae
For the history of KX Aql, see Kato et al. (2010) andKato et al. (2014b). The 2014 outburst was detected byC. Chiselbrook at a visual magnitude of 12.8 on December15 (cf. BAAVSS alert 3897). The outburst was con-firmed to be a superoutburst by the presence of a su-perhump and long outburst duration (vsnet-alert 18083,
0.045 0.050 0.055 0.060 0.065 0.070 0.075
0.000
0.001
0.002
0.003
Fig. 3. Lasso period analysis of FI Cet. The period of 0.057 dis strongly selected.
18090).7 Only one superhump maximum was obtained:BJD 2457011.2633(15) (N=38).
3.2. NN Camelopardalis
NN Cam = NSV 1485 was recognized as a dwarf novaby Khruslov (2005). The object was given a GCVS des-ignation in Kazarovets et al. (2008).8 The first superout-burst was detected in 2007 (Kato et al. 2009). The orbitalperiod was reported to be 0.0717 d (vsnet-alert 9557).
The 2014 superoutburst was detected by M. Moriyamaon February 19 (vsnet-alert 16934). The times of super-hump maxima are listed in table 3. The observation cov-ered the later stage of the superoutburst. A comparisonof the O−C diagrams (figure 4) suggests that we mainlyobserved stage C superhumps.
A list of recent outbursts is given in table 4. A linearregression to the epochs of superoutbursts yielded a meansupercycle of 386(6) d. The value of supercycle may behalved since this object is not well observed around solarconjunctions.
3.3. V342 Camelopardalis
For the history of this object (=1RXS J042332+745300=HS 0417+7445), see Kato et al. (2014a). The 2014 su-peroutburst was detected on December 28 by E. Muyllaert(vsnet-alert 18128). Time-series observations started on2015 January 3 and detected superhumps (vsnet-alert18149, 18157, 18171). The times of superhump maximaare listed in table 5. Since the observation covered thefinal part of the superoutburst, we likely observed onlystage C superhumps, which is also supported by a com-parison of the O−C diagrams (figure 5).
7 VSNET alert message can be accessed at<http://ooruri.kusastro.kyoto-u.ac.jp/pipermail/vsnet-alert/>.
8 The object is unofficially called “Samus’s star”, since thename can be read N. N. Samus, the editor in chiefof the GCVS, in Russian spelling. <http://www.ka-dar.ru/forum/index.php/topic,1040.15.html>.

6 T. Kato et al. [Vol. ,
Table 1. List of Superoutbursts.
Subsection Object Year Observers or references∗ ID†
3.1 KX Aql 2014 RPc3.2 NN Cam 2014 DPV3.3 V342 Cam 2014 OKU, Kis, Ioh3.5 OY Car 2014 SPE
2015 SPE3.6 FI Cet 2014 HaC3.7 Z Cha 2014 HaC3.8 YZ Cnc 2014b AAVSO3.9 V337 Cyg 2014 IMi3.10 V503 Cyg 2014 Kis, DPV
2014b RPc3.11 BC Dor 2015 HaC, COO3.12 V660 Her 2014 Ioh3.13 CT Hya 2015 SPE, Kis3.14 LY Hya 2014 HaC3.15 MM Hya 2014 Mdy, Ioh3.16 RZ LMi 2014 Mic3.18 AY Lyr 2014 OUS, Aka3.19 V453 Nor 2014 HaC3.20 DT Oct 2014 HaC3.21 UV Per 2014 Ioh, DPV, IMi, Mdy, Kis,
Nov, RPc3.22 HY Psc 2014 OKU, Ioh, IMi, Kis
∗Key to observers: Aka (H. Akazawa, OUS), Buc (D. Buczynski), COO (L. Cook), CRI (Crimean Astrophys. Obs.),CTX†(T. Crawford), deM (E. de Miguel), DKS‡(S. Dvorak), DPV (P. Dubovsky), Dub (F. Dubois team), GBo (G.Bolt), GFB‡(W. Goff), HaC (F.-J. Hambsch, remote obs. in Chile), Ham (F.-J. Hambsch), Han (Hankasalmi Obs.,by A. Oksanen), Hsk (K. Hirosawa), IMi‡(I. Miller), Ioh (H. Itoh), Kai (K. Kasai), Kis (S. Kiyota), KU (Kyoto U.,campus obs.), LCO (C. Littlefield), MEV‡(E. Morelle), MLF (B. Monard), Mas (G. Masi), Mdy (Y. Maeda), Mhh(H. Maehara), Mic (R. Michel-Murillo team), NDJ (N. James), Neu (V. Neustroev team), NKa (N. Katysheva andS. Shugarov), Nov (R. Novák), OKU (Osaya Kyoiku U.), OUS (Okayama U. of Science), OkC‡(A. Oksanen, remoteobs. in Chile), RIT (M. Richmond), RPc‡(R. Pickard), Rui (J. Ruiz), SPE‡(P. Starr), SRI‡(R. Sabo), SWI‡(W.Stein), Shu (S. Shugarov team), Siz (K. Shiokawa), Ter (Terskol Obs.), Trt (T. Tordai), UJH‡(J. Ulowetz), Van (T.Vanmunster), Vol (I. Voloshina), AAVSO (AAVSO database)†Original identifications, discoverers or data source.‡Inclusive of observations from the AAVSO database.
Table 3. Superhump maxima of NN Cam (2014)
E max∗ error O−C† N ‡
0 56713.2745 0.0005 −0.0017 761 56713.3519 0.0005 0.0018 752 56713.4233 0.0005 −0.0006 763 56713.4984 0.0034 0.0005 9
68 56718.3037 0.0005 0.0013 4769 56718.3740 0.0004 −0.0023 7270 56718.4512 0.0005 0.0010 58∗BJD−2400000.†Against max = 2456713.2761+ 0.073916E.‡Number of points used to determine the maximum.
Table 5. Superhump maxima of V342 Cam (2014)
E max∗ error O−C† N ‡
0 57026.0470 0.0003 0.0012 1211 57026.1237 0.0003 −0.0001 168
14 57027.1454 0.0016 0.0067 8515 57027.2134 0.0003 −0.0032 16240 57029.1706 0.0029 0.0023 3052 57030.0992 0.0033 −0.0058 16253 57030.1831 0.0009 0.0000 16254 57030.2536 0.0027 −0.0075 13789 57032.9963 0.0183 0.0030 6890 57033.0748 0.0021 0.0034 112∗BJD−2400000.†Against max = 2457026.0457+ 0.078063E.‡Number of points used to determine the maximum.

No. ] Period Variations in SU UMa-Type Dwarf Novae VII 7
Table 1. List of Superoutbursts (continued).
Subsection Object Year Observers or references∗ ID†
– CC Scl 2014 Kato et al. (2015)3.23 QW Ser 2014 DPV3.24 V418 Ser 2014 CRI, AAVSO, LCO, SWI, KU, GFB,
2014 Mdy, deM, UJH, Ioh, SRI, DPV3.25 V701 Tau 2015 RPc, Kai, Trt3.26 SU UMa 2014 Kis, Nov, Dub, AAVSO3.27 CY UMa 2014 Nov, Aka, Kis, DPV, Mdy, Ham, Han3.29 NSV 1436 2014 IMi, DPV, Aka, NKa, KU, Hsk3.30 NSV 4618 2015 Ioh, HaC, SWI, Ter3.31 1RXS J185310 2014 IMi, LCO, Mdy, Ioh 1RXS J185310.0+5945093.32 1RXS J231935 2014 Kai, OKU, CRI, Mdy, IMi, DPV 1RXS J231935.0+3647053.33 2QZ J130441 2014 HaC, Mdy 2QZ J130441.7+0103303.34 ASASSN-13cx 2014 deM, IMi, Han, OkC, Rui,
RPc, SWI, Mdy, Ham3.35 ASASSN-14ag 2014 Mas, Kai, HaC, deM, Kis3.36 ASASSN-14aj 2014 HaC3.37 ASASSN-14au 2014 deM3.38 ASASSN-14aw 2014 deM3.39 ASASSN-14bh 2014 MLF3.40 ASASSN-14cl 2014 OkC, CRI, SWI, AAVSO, IMi, HaC,
OKU, DPV, RIT, LCO, NDJ, Kai,DKS, SPE, CTX, UJH, deM
3.41 ASASSN-14cq 2014 MLF, HaC— ASASSN-14cv 2014 C. Nakata et al. in preparation
3.42 ASASSN-14dm 2014 MLF3.43 ASASSN-14do 2014 MLF, HaC3.44 ASASSN-14dw 2014 HaC3.45 ASASSN-14eh 2014 HaC, Ioh3.46 ASASSN-14eq 2014 MLF3.47 ASASSN-14fr 2014 MLF3.48 ASASSN-14gd 2014 MLF3.49 ASASSN-14gq 2014 MLF3.50 ASASSN-14gx 2014 MLF, AAVSO, HaC, OKU3.51 ASASSN-14hk 2014 Ioh, OKU3.52 ASASSN-14hl 2014 MLF3.53 ASASSN-14hs 2014 MLF, HaC, Ioh
3.4. SY Capriconi
SY Cap was originally discovered as a long-period vari-able star with a photographic range of 12.6 to fainter than14.5 (=56.1927, Beljawsky 1927). The variable was inde-pendently discovered at a photographic magnitude of 11on 1915 September 9 by Ross (1928) (Ross 328). Kholopovet al. (1985) listed this star as a possible Mira-type vari-able. Noting that there is no bright 2MASS counterpart,T. Kato identified this object as a dwarf nova (likely SUUMa-type one) using ASAS-3 (Pojmański 2002) observa-tions (vsnet-alert 10025). D. Denisenko confirmed thisidentification (vsnet-alert 10027).
Soon after this re-classification, an outburst was de-tected by ASAS-3 on 2008 August 18 (vsnet-outburst9336). The outburst turned out to be a superout-burst by the detection of superhumps (Kato et al. 2009).Thorstensen, Skinner (2012) made spectroscopic confir-
mation as a CV.9 Another superoutburst was observed in2011 August–September (Kato et al. 2013a).
The 2014 superoutburst was detected by R. Stubbingsat a visual magnitude of 12.8 on September 18 (vsnet-alert 17747). Subsequent observations detected super-humps (vsnet-alert 17750, 17764, 17769). The times ofsuperhump maxima are listed in table 6. We most likelyobserved stage C superhump between E=24 and E=89and the value in table 2 is based on this identification (fig-ure 6). The maxima for E ≥ 119 were post-superoutburstsuperhumps.
Recent outbursts of SY Cap are listed in table 7. Thetypical cycle length of normal outbursts is estimated tobe ∼30 d. The three shortest intervals between super-outbursts were 187, 220 and 235 d. The intervals between
9 Although the object is given CRTS designation in Thorstensen,Skinner (2012), we should note that the object was already rec-ognized as a known dwarf nova at the time of CRTS detection.

8 T. Kato et al. [Vol. ,
Table 1. List of Superoutbursts (continued).
Subsection Object Year Observers or references∗ ID†
3.54 ASASSN-14ia 2014 OKU3.55 ASASSN-14id 2014 IMi, OKU, KU3.56 ASASSN-14it 2014 KU3.57 ASASSN-14iv 2014 Mdy, HaC3.58 ASASSN-14je 2014 MLF3.59 ASASSN-14jf 2014 HaC3.60 ASASSN-14jq 2014 LCO, DPV, KU, Kis, IMi,
deM, Kai, Ioh3.61 ASASSN-14jv 2014 SWI, OUS, Van, DPV, AAVSO,
CRI, OKU, Dub, Mdy, Buc,Aka, deM, Kis, DKS
3.62 ASASSN-14kf 2014 MLF3.63 ASASSN-14kk 2014 MLF3.64 ASASSN-14ku 2014 MLF, HaC3.65 ASASSN-14lk 2014 MLF3.66 ASASSN-14mc 2014 MLF, HaC3.67 ASASSN-14md 2014 MLF, HaC3.68 ASASSN-14mh 2014 HaC, Ioh3.69 ASASSN-14mj 2014 Kis, Shu, Ioh, IMi, DPV3.70 ASASSN-15ah 2015 MLF, HaC, Ioh3.71 ASASSN-15ap 2015 MLF3.72 ASASSN-15aq 2015 MLF, HaC3.73 ASASSN-15aw 2015 Van3.74 ASASSN-15bg 2015 MLF, HaC3.75 ASASSN-15bp 2015 Kis, deM, SPE, DKS, Ioh,
OKU, HaC, AAVSO, DPV, UJH,OUS, SWI, IMi, Van, Neu,
Trt, CRI, Aka3.76 ASASSN-15bu 2015 deM, SWI, SRI, DPV, UJH3.77 ASASSN-15bv 2015 MLF3.78 ASASSN-15dq 2015 Van, HaC, Kai3.79 CRTS J081936 2013 Han CRTS J081936.1+1915403.80 CRTS J172038 2014 Mic CRTS J172038.7+1838023.82 CRTS J202731 2014 HaC, OKU CRTS J202731.2−2240023.83 CRTS J214738 2014 Kai, KU, Kis, DPV CRTS J214738.4+2445543.81 CSS J174033 2014 AAVSO, GFB, DPV, SRI, Mas, CSS J174033.5+414756
IMi, Nov, RPc, Ioh, RIT
superoutburst clustered around 317–353 d (six occasions).The cycle lengths of superoutbursts (supercycles) may beeither bimodally distributed (187–235 d and 317–353 d)or the recorded longer supercycles represent two super-cycles. If the latter is the case, the supercycle may bearound 180 d.
3.5. OY Carinae
OY Car was discovered as a dwarf nova by Hoffmeister(1963). The object has been monitored by amateur as-tronomers (notably the Variable Star Section of the RoyalAstronomical Society of New Zealand, VSS RASNZ) since1963 and many outbursts were recorded. Warner (1976)listed the object as an SU UMa-type dwarf nova with asupercycle (called as super-period then) of ∼300 d basedon observations by the VSS RASNZ. The object receivedspecial attention after the discovery of the eclipsing na-
ture (Vogt 1979; Vogt et al. 1981). The object has beenintensively studied since then (e.g. Ritter 1980; Bailey,Ward 1981; Sherrington et al. 1982; Schoembs, Hartmann1983; Vogt 1983). Superhumps were first detected duringthe 1980 outburst (Krzeminski, Vogt 1985). Despite thatthe object is one of the best known SU UMa-type dwarfnovae, no systematic study of superhumps has been re-ported. Since Kato et al. (2009), it has been establishedthat objects with short superhumps periods almost alwaysshow positive Pdot. Although Kato et al. (2009) suggesteda positive Pdot for the 1980 data by Krzeminski, Vogt(1985), a historical analysis by Patterson et al. (1993) sug-gested a negative Pdot. New observations of OY Car havetherefore been desired.
A Markov-Chain Monte Carlo (MCMC) analysis (Katoet al. 2013a) of the eclipse observations of in theAAVSO database (2009–2015) yielded the following or-

No. ] Period Variations in SU UMa-Type Dwarf Novae VII 9
Table 1. List of Superoutbursts (continued).
Subsection Object Year Observers or references∗ ID†
3.84 MASTER J031600 2014 Van MASTER OT J031600.08+175824.43.85 MASTER J043915 2014 OKU MASTER OT J043915.60+424232.33.86 MASTER J055845 2014 IMi MASTER OT J055845.55+391533.43.87 MASTER J085854 2015 SPE, Kis, GBo, MLF MASTER OT J085854.16−274030.73.88 MASTER J105545 2014 DPV, IMi MASTER OT J105545.20+573109.73.89 OT J030929 2014 DPV, OKU, Mdy, deM, Kis, PNV J03093063+2638031
Ioh, Mas, Mic, Siz, Kai,MEV, Van, SPE
— OT J060009 2014 C. Nakata et al. in preparation PNV J06000985+14261523.90 OT J064833 2014 OKU, HaC, Mdy, DPV, IMi, PNV J06483343+0656236
Ioh, Van, Kis, Kai, Aka, NKa3.91 OT J213806 2014 OKU, DPV, Trt, Aka, Vol, OT J213806.6+261957
RPc, DKS, HaC, Kis, AAVSO,MEV, Han, Hsk
3.92 OT J230523 2014 OKU, Kis, Mas PNV J23052314−0225455— PNV J171442 2014 C. Nakata et al. in preparation PNV J17144255−2943481
3.93 PNV J172929 2014 Kis, OKU, Mdy, HaC, Shu, PNV J17292916+0054043Ioh, DPV, Mhh, deM, Aka, Rui
3.94 PTF1 J071912 2014 IMi, DPV PTF1 J071912.13+485834.03.95 SDSS J033449 2014 Mdy SDSS J033449.86−071047.83.96 SDSS J081408 2014 Mic, IMi, Rui, RPc SDSS J081408.42+090759.13.97 SDSS J090221 2014 SWI, deM, DPV, AAVSO, IMi, SDSS J090221.35+381941.9
KU, CRI, OKU, LCO, Han,Ioh, Mas, RPc, DKS, Kis,UJH, Mdy, Mic, Shu, Nov
(Kato et al. 2014c)3.98 SDSS J120231 2014 MEV, deM, IMi SDSS J120231.01+450349.13.99 SDSS J140037 2015 IMi, SWI, DPV, RPc SDSS J140037.99+572341.33.100 SDSS J172325 2014 OKU, CRI, RPc, IMi, DPV SDSS J172325.99+330414.1
=ASASSN-14gz3.101 SDSS J173047 2014 deM, SWI, DKS, Nov, RPc, Mhh, DPV, Ham SDSS J173047.59+554518.53.102 TCP J160548 2014 DPV, OKU, Van, AAVSO TCP J16054809+2405338
bital ephemeris:
Min(BJD) = 2456502.09846(1)+ 0.0631209050(6)E.(1)
The epoch of this ephemeris corresponds to the meanepoch of the observations. The decrease from the pe-riod in Greenhill et al. (2006) has been confirmed. Therate of secular decrease was about a half (−0.7× 10⁻¹³)of that reported in Greenhill et al. (2006). This valueagrees with the one reported by Han et al. (2015) withina factor of two. The value corresponds to the time-scaleof Porb/Porb of ∼ 2× 10⁹ yr. This times scale is simi-lar to what is expected for angular momentum loss onlyby the gravitational wave radiation [1.1× 10⁹ yr, fromequations 9.5b and 9.20 in Warner (1995) assuming con-servative mass-transfer; the binary parameters are fromRKcat 7.21 (Ritter, Kolb 2003)] One should be carefulin interpreting secular period variations in CVs, however,since the same method is known to give much differenttimes scales of variation, the well-known case being Z Cha(Cook, Warner 1981). We used this modern ephemeris inanalyzing the data.
We observed two superoutbursts in 2014 and 2015.Although the initiation of the 2014 superoutburst was notrecorded, the time-resolved observations started withintwo days of the start of the superoutburst. This super-outburst was followed by a post-superoutburst rebright-ening. The 2015 superoutburst started with a precursoroutburst (vsnet-alert 18313, 18325) and the early stageof the superoutburst was observed. This superoutburstwas also followed by a post-superoutburst rebrightening(vsnet-alert 18408). The times of superhump maxima arelisted in tables 8 and 9, respectively. Although the 2015observations recorded stage A superhumps, the times ofsuperhump maxima in this stage were not well determinedbecause they happened to be close to eclipses. The cyclecount between E=18 and E=137 for the 2015 data is un-certain. Note that the superhump period for the 2014 su-peroutburst listed in table 2 only refers to the initial partof stage B and it is expected to be significantly shorterthan the mean period of stage B superhumps.
As shown in the comparison of O−C diagrams (figure7), the present observations were limited in coverage than

10 T. Kato et al. [Vol. ,
Table 2. Superhump Periods and Period Derivatives
Object Year P1 (d)∗ err E1† Pdot
‡ err‡ P2 (d)∗ err E2† Porb (d)§ Q‖
NN Cam 2014 – – – – – – 0.073916 0.000019 0 70 0.0717 CV342 Cam 2014 – – – – – – 0.078063 0.000047 0 90 0.07531 CSY Cap 2014 – – – – – – 0.063414 0.000029 24 89 – COY Car 2014 0.064595 0.000042 0 140 6.9 5.5 – – – – 0.063121 CMOY Car 2015 0.064464 0.000063 137 153 – – – – – – 0.063121 CFI Cet 2014 0.056911 0.000028 18 106 9.7 2.1 – – – – 0.05594 BEZ Cha 2014 0.077360 0.000082 25 65 – – 0.076948 0.000023 64 143 0.074499 B
YZ Cnc 2014b 0.090707 0.000127 0 21 – – – – – – 0.0868 CV337 Cyg 2014 0.070190 0.000034 0 14 – – – – – – – CV503 Cyg 2014 0.081215 0.000209 0 17 – – – – – – 0.077759 CBC Dor 2003 0.068048 0.000036 44 145 – – – – – – – CBC Dor 2015 0.068026 0.000024 53 141 – – – – – – – CLY Hya 2014 – – – – – – 0.076973 0.000025 – – 0.0748 CMM Hya 2014 0.058851 0.000030 0 119 −1.0 4.6 – – – – 0.057590 CGBR Lup 2014 0.082241 0.000037 23 97 1.1 4.5 0.081816 0.000090 96 145 0.07948 B
V453 Nor 2014 0.064977 0.000045 16 94 16.4 3.5 0.064590 0.000017 108 232 0.063381 BDT Oct 2014b 0.074667 0.000043 0 67 −7.1 5.5 – – – – 0.072707 CGUV Per 2014 0.066750 0.000039 46 112 6.1 5.3 0.066124 0.000054 135 198 0.06489 CHY Psc 2014 0.079942 0.000021 0 74 – – – – – – 0.0767 C
∗P1 and P2 are mean periods of stage B and C superhumps, respectively.†Interval used for calculating the period (corresponding to E in the individual tables in section 3).‡Pdot = P /P for stage B superhumps, unit 10−5.§References: NN Cam (Denisenko, D. 2007, vsnet-alert 9557), V342 Cam (Shears et al. 2011b), Z Cha (Dai et al.2009), YZ Cnc (Shafter, Hessman 1988), V503 Cyg (Kato et al. 2014b), LY Hya (Still et al. 1994), MM Hya(Patterson et al. 2003), BR Lup (this work based in Mennickent, Sterken 1998, see text), V453 Nor (Imada,Monard 2006), DT Oct (Kato et al. 2014a), UV Per (Thorstensen, Taylor 1997), HY Psc Dillon et al. cited inGänsicke et al. (2009), CC Scl (Kato et al. 2015), SU UMa (Thorstensen et al. 1986), CY UMa (Thorstensen et al.1996), QZ Vir (Shafter, Szkody 1984), CRTS J214738 (Kato et al. 2013a), CSS J174033 (T. Ohshima et al. inpreparation), OT J213806 (Kato et al. 2010), ASASSN-14cv, PNV J171442 (C. Nakata et al. in preparation), PTF1J071912 (Levitan et al. 2011), SDSS J090221 (Rau et al. 2010), FI Cet, ASASSN-13cx, ASASSN-14ag, ASASSN-14cl, ASASSN-14cq, ASASSN-14gx, ASASSN-14id, ASASSN-14jf, ASASSN-14jv, ASASSN-15bp, OT J030929, OTJ230523, PNV J172929 (this work)‖Data quality and comments. A: excellent, B: partial coverage or slightly low quality, C: insufficient coverage orobservations with large scatter, G: Pdot denotes global Pdot, M: observational gap in middle stage, 2: late-stagecoverage, the listed period may refer to P2, E: Porb refers to the period of early superhumps, P: Porb refers to ashorter stable periodicity recorded in outburst.
the 1980 one and the result was not conclusive. We hopewe have a better luck next time to record the full evolutionof superhumps.
3.6. FI Ceti
FI Cet was originally discovered as a transient ROTSE3J015118.59−022300.1 on 2001 October 13 by ROTSE-IIIatelescope. The object was detected at 14.71 mag andfaded by two magnitudes over 13 days. The object wasoriginally suspected to be a nova based on the large am-plitude, but it was also suspected to be either a recurrentnova or a WZ Sge-type dwarf nova (Smith et al. 2002).The object was named FI Cet in Kazarovets et al. (2006),which classified it as a possible dwarf nova.
Although amateur observers recognized that the ob-ject is most likely a larger-amplitude dwarf nova andstarted monitoring since 2002, no secure outburst had
been detected until the detection on 2014 June 27 by theASAS-SN team (Davis et al. 2015) at V =14.4 (vsnet-alert17423).
Subsequent observations initially did not detect super-humps (vsnet-alert 17428, 17436). The object startedshowing superhumps on July 2 and the amplitudes fur-ther grew over two days (vsnet-alert 17440, 17453; figure8). The times of superhump maxima are listed in table10. The period identification is based on the O−C anal-ysis on individual nights. The adopted period among thecandidates only give acceptably small O − C variationswithin the same nights. A stage A-B transition and stageB with a positive Pdot can be well recognized. Due to thefaintness of the object, the times of superhump maximacould not be measured in the later part of the superout-burst. The light curve, however, showed a brighteningtrend around July 13. Since such a trend in the light curve

No. ] Period Variations in SU UMa-Type Dwarf Novae VII 11
Table 2. Superhump Periods and Period Derivatives (continued)
Object Year P1 err E1 Pdot err P2 err E2 Porb QCC Scl 2014 0.05998 0.00002 – – – – 0.059523 0.000006 – – 0.058567 C
V418 Ser 2014 0.044669 0.000013 0 83 6.1 2.6 0.044408 0.000007 106 311 – BV701 Tau 2015 0.068838 0.000141 13 72 – – – – – – – CSU UMa 2014 0.079252 0.000037 0 25 – – – – – – 0.07635 CGCY UMa 2014 0.072202 0.000018 5 35 −17.8 5.1 0.072017 0.000022 43 103 0.06957 BQZ Vir 2014 0.060368 0.000015 20 126 8.9 1.1 0.059980 0.000086 125 170 0.05882 B
NSV 1436 2014 0.072843 0.000014 12 84 3.7 2.0 0.072403 0.000048 109 150 – BNSV 4618 2015 – – – – – – 0.067506 0.000242 0 31 0.065769 C
1RXS J185310 2014 0.059521 0.000032 0 65 – – – – – – – C1RXS J231935 2014 0.066105 0.000059 0 51 – – 0.065387 0.000059 81 140 – C2QZ J130441 2014 – – – – – – 0.058069 0.000061 0 72 – CASASSN-13cx 2014 0.083098 0.000042 7 52 – – 0.082647 0.000035 48 133 0.079650 BASASSN-14ag 2014 0.062059 0.000055 0 38 – – – – – – 0.060311 CASASSN-14aj 2014 0.082028 0.000041 0 90 −3.0 5.2 – – – – – C2ASASSN-14au 2014 0.082486 0.000084 0 37 – – – – – – – CASASSN-14aw 2014 0.097586 0.000154 0 31 – – – – – – – CASASSN-14bh 2014 – – – – – – 0.061368 0.000065 0 35 – CASASSN-14cl 2014 0.060008 0.000013 27 174 8.5 0.4 0.059738 0.000014 174 249 0.05838 AEASASSN-14cq 2014 0.057354 0.000011 34 194 4.6 0.4 – – – – 0.05660 BEASASSN-14cv 2014 0.060413 0.000007 109 227 0.9 0.9 – – – – 0.059917 AEASASSN-14dm 2014 0.068335 0.000042 0 76 – – 0.068160 0.000130 73 104 – CASASSN-14do 2014 0.056528 0.000032 14 105 4.6 3.2 – – – – – CASASSN-14dw 2014 0.075630 0.000045 0 54 – – 0.075195 0.000029 53 94 – CASASSN-14eh 2014 0.062907 0.000027 0 96 6.0 3.0 – – – – – CASASSN-14eq 2014 0.079467 0.000069 0 52 −40.2 10.0 – – – – – CGASASSN-14gd 2014 0.078957 0.000054 0 14 – – – – – – – CASASSN-14gx 2014 0.056088 0.000016 18 194 5.1 0.6 – – – – 0.05488 BEASASSN-14hk 2014 0.060001 0.000019 0 135 2.8 2.1 – – – – – CGASASSN-14hs 2014 0.093660 0.000059 10 102 −3.4 4.9 – – – – – C2ASASSN-14id 2014 0.079366 0.000028 0 137 −2.2 1.7 – – – – 0.076857 CGASASSN-14iv 2014 0.069192 0.000051 0 22 – – – – – – – CASASSN-14je 2014 – – – – – – 0.069070 0.000054 0 74 – C
is usually associated with development of stage C super-humps, superhumps after this epoch were likely stage Csuperhumps. Although we were not able to measure theperiod of stage A superhumps, an analysis of the first twonights yielded a period of 0.05594(3) d, which we tenta-tively identified to be the period of early superhumps (fig-ure 9). Note that this identification of the period is notconclusive and awaits determination of the orbital periodin quiescence. All the pieces of evidence support the WZSge-type classification as originally proposed. The largepositive Pdot suggests that this object is not an extremeWZ Sge-type dwarf nova.
3.7. Z Chameleontis
3.7.1. Superhumps during the 2014 superoutburst
Z Cha is one of the best known SU UMa-type dwarfnovae since the early history of research of SU UMa-typedwarf novae (e.g. Warner 1974; Bailey 1979; Vogt 1980).Its deep eclipses has provided us wealth of informationabout the structure of the accretion disk and its variationover the course of outburst and superoutburst (e.g. Vogt1982; Horne 1984). Despite its importance, the object
was mostly observed in the era of photoelectric photome-try and no publicly available data for superoutbursts arepublished. This has been an obstacle to compare the clas-sical knowledge in SU UMa-type dwarf novae with the onewith the modern CCD observations. In order to improvethe situation, we undertook a campaign in 2013–2014 tocover a full supercycle. Since such a long-term campaignrequires enormous effort, we did not attempt to recordhigh time-resolution observations to resolve eclipses, in-stead we focused on longer-term (orbital modulations andsuperhumps) variations. The entire data are now publiclyavailable in the AAVSO database.
As in the rest of this paper, we first deal with the su-peroutburst which occurred in 2014 April. The rise tothe outburst was detected on April 15, and the objectstayed the precursor part for three days, during which su-perhumps evolved (see bottom panel of figure 10). OnApril 20, fully grown superhumps were recorded associ-ated with an increase of the brightness by ∼0.2 mag. Theobject entered the post-superoutburst stage on April 30.The general behavior is in good agreement with the mod-ern knowledge: a superoutburst is triggered by a normal

12 T. Kato et al. [Vol. ,
Table 2. Superhump Periods and Period Derivatives (continued)
Object Year P1 err E1 Pdot err P2 err E2 Porb QASASSN-14jf 2014 0.055949 0.000005 54 341 1.1 0.2 – – – – 0.05539 BEASASSN-14jq 2014 0.055178 0.000013 0 142 4.3 1.2 – – – – – CASASSN-14jv 2014 0.055102 0.000013 59 210 4.9 0.7 – – – – 0.05442 BEASASSN-14kf 2014 0.072095 0.000038 13 70 – – – – – – – CASASSN-14kk 2014 0.056361 0.000060 0 89 – – – – – – – CASASSN-14ku 2014 0.079066 0.000079 0 54 – – – – – – – C2ASASSN-14lk 2014 0.061432 0.000030 0 130 −2.7 3.5 – – – – – CGASASSN-14mc 2014 0.055463 0.000017 18 127 1.7 2.1 – – – – – CASASSN-14md 2014 0.066878 0.000074 28 74 – – – – – – – CASASSN-14mh 2014 0.062754 0.000018 16 144 1.2 1.6 – – – – – CASASSN-14mj 2014 0.060262 0.000032 18 63 – – – – – – – CASASSN-15ah 2015 0.055469 0.000032 35 145 6.2 3.2 – – – – – CASASSN-15ap 2015 0.091340 0.000042 0 67 −5.5 6.0 – – – – – CASASSN-15aq 2015 0.072297 0.000064 0 80 6.6 7.3 0.071842 0.000035 80 139 – CASASSN-15aw 2015 0.0615 0.0003 0 3 – – – – – – – CASASSN-15bg 2015 0.065669 0.000071 0 32 – – – – – – – CASASSN-15bp 2015 0.056702 0.000009 35 256 4.5 0.3 0.056656 0.000013 269 396 0.05563 AEASASSN-15bu 2015 0.080049 0.000039 0 80 −8.3 4.8 – – – – 0.076819 CGASASSN-15dq 2015 0.082062 0.000037 0 47 2.3 7.4 – – – – – CCRTS J214738 2014 0.096770 0.000137 41 80 – – – – – – 0.09273 CCRTS J202731 2014 0.071499 0.000064 0 78 – – 0.071237 0.000050 78 164 – CCSS J174033 2014 0.045591 0.000003 0 166 2.0 0.3 0.045526 0.000008 59 332 0.045048 A
MASTER J043915 2014 0.062452 0.000047 0 48 – – – – – – – CMASTER J055845 2014 – – – – – – 0.056300 0.000400 0 3 – CMASTER J085854 2015 0.055560 0.000019 0 124 8.1 1.0 – – – – – BMASTER J105545 2014 0.066937 0.000052 0 46 −10.8 10.3 – – – – – CG
OT J030929 2014 0.057437 0.000015 35 199 6.8 0.5 0.057076 0.000022 190 264 0.05615 BEOT J060009 2014 0.063311 0.000007 116 275 −1.2 0.6 – – – – – AOT J064833 2014 0.100326 0.000056 38 75 33.4 7.5 – – – – – BOT J213806 2014 0.055046 0.000011 16 174 6.5 0.5 0.054905 0.000040 190 228 0.054523 APOT J230523 2014 0.055595 0.000023 34 125 8.2 1.3 – – – – 0.05456 CE
PNV J171442 2014 0.060092 0.000009 67 188 4.4 0.7 – – – – 0.059558 AE
Table 2. Superhump Periods and Period Derivatives (continued)
Object Year P1 err E1 Pdot err P2 err E2 Porb QPNV J172929 2014 0.060282 0.000015 32 173 2.6 1.2 – – – – 0.05973 BEPTF1 J071912 2014 0.018808 0.000011 0 159 – – – – – – 0.01859 CSDSS J081408 2014 0.100929 0.000112 0 27 −40.8 10.9 – – – – – CGSDSS J090221 2014 0.033714 0.000005 0 140 1.5 0.8 0.033593 0.000009 150 246 0.03355 ASDSS J120231 2014 0.059801 0.000042 0 134 9.0 1.3 0.059577 0.000024 134 202 – BSDSS J140037 2015 0.063954 0.000021 0 125 – – – – – – – CSDSS J172325 2014 0.059200 0.000021 6 110 5.3 2.6 – – – – – CSDSS J173047 2014 0.024609 0.000006 0 166 −0.7 0.9 – – – – – BGTCP J160548 2014 0.054989 0.000017 0 316 1.6 0.2 – – – – – C

No. ] Period Variations in SU UMa-Type Dwarf Novae VII 13
Table 4. List of recent outbursts of NN Cam.
Year Month max∗ magnitude type source2007 9 54354 12.6 precursor + super vsnet-alert 9557; Kato et al. (2009); Shears et al. (2011a)2008 3 54535 12.5 ? AAVSO2008 10 54758 13.2 super vsnet-alert 10588; Shears et al. (2011a)2009 11 55137 13.0 super BAAVSS alert 2130; Kato et al. (2010); Shears et al. (2011a)2011 12 55905 12.4 super vsnet-alert 13937; Kato et al. (2013a)2012 11 56241 12.7 super cvnet-outburst 5039; Kato et al. (2014b)2013 9 56563 13.1 normal AAVSO2014 2 56708 12.8 super this paper∗JD−2400000.
Table 7. List of recent outbursts of SY Cap.
Year Month max∗ magnitude type source2001 5 52040 13.2 super ASAS-32002 4 52390 13.1 super ASAS-32002 8 52502 13.7 normal?† ASAS-32003 4 52741 13.5 normal?† ASAS-32003 4 52756 14.3 normal?† ASAS-32003 11 52945 13.6 super ASAS-32004 6 53165 13.1 super ASAS-32005 4 53467 13.0 super ASAS-32005 7 53568 14.1 normal?† ASAS-32005 9 53644 13.0 super ASAS-32006 6 53914 14.7 normal? ASAS-32007 4 54194 13.3 super?† ASAS-32007 9 54344 13.2 super ASAS-32008 4 54560 13.6 ? ASAS-32008 8 54697 13.1 super ASAS-3, Kato et al. (2009)2008 9 54725 13.9 normal† ASAS-32008 10 54760 13.6 normal ASAS-3, vsnet-outburst 95672009 4 54951 13.0 normal? vsnet-outburst 10221, ASAS-32009 7 55014 12.9 super ASAS-32009 7 55038 13.4 normal vsnet-outburst 104082009 8 55060 14.1 normal vsnet-outburst 104642009 10 56113 13.1 normal vsnet-outburst 106112010 5 55340 14.1 normal vsnet-outburst 112352010 7 55390 13.2 normal? vsnet-outburst 113792010 10 55497 15.4 normal vsnet-outburst 117202011 6 55742 13.1 normal vsnet-outburst 129882011 8 55776 13.4 normal cvnet-outburst 42522011 8 55799 13.0 super Kato et al. (2013a)2011 9 55827 14.1 normal vsnet-outburst 132352011 10 55861 15.1 normal vsnet-outburst 133632011 11 55890 15.0 normal vsnet-outburst 134782012 7 56127 13.0 super vsnet-outburst 144812013 5 56434 13.2 normal? vsnet-outburst 15436∗JD−2400000.†Single detection.

14 T. Kato et al. [Vol. ,
Table 7. List of recent outbursts of SY Cap (continued).
Year Month max∗ magnitude type source2013 7 56500 13.2 normal? vsnet-outburst 157212013 8 56532 13.6 normal vsnet-alert 162962013 9 56560 13.0 normal vsnet-outburst 160272013 10 56584 13.1 super vsnet-alert 165502014 4 56753 13.0 normal? vsnet-outburst 167492014 6 56817 13.4 normal? vsnet-outburst 169702014 9 56819 12.8 super this paper2014 10 56847 13.2 normal this paper2014 11 56982 13.5 normal this paper∗JD−2400000.†Single detection.
0 20 40 60 80 100 120 140 160
−0.04
−0.02
0.00
0.02
2007200920112014
Fig. 4. Comparison of O−C diagrams of NN Cam betweendifferent superoutbursts. A period of 0.07430 d was used todraw this figure. Approximate cycle counts (E) after the startof the superoutburst were used.
outburst, which appears as a precursor, followed by devel-opment of superhumps (cf. Osaki, Kato 2013a).
The times of superhump maxima were determined dur-ing the superoutburst after subtracting the mean orbitalvariation (mostly eclipses) and template fitting as in othersystems. This simple method assumes the constancy ofthe orbital light curve, which is obviously wrong becausethe orbital and superhump variations interact each otherto produce a beat phenomenon. We used, however, thismethod since there is no other suitable method to deter-mine times of superhumps. Readers should be careful ininterpreting the resultant values (they should contain sys-tematic errors dur to this simple treatment other thanthe nominal errors given in the tables) in such a high-inclination system.
The result clearly indicates the presence of stage A(E ≤ 14) and stage B to C transition around E =64. TheO−C diagram for stage B superhumps is not as smoothas other non-eclipsing objects due to the strong beat phe-
0 50 100 150
−0.04
−0.02
0.00
0.02
2008201020132014
Fig. 5. Comparison of O−C diagrams of V342 Cam betweendifferent superoutbursts. A period of 0.07830 d was used todraw this figure. Approximate cycle counts (E) after the startof the superoutburst were used. Since the start of the 2013superoutburst was not well constrained, we shifted the O−C
diagram to best fit the others.
nomenon. The measured periods of stage B and C su-perhumps are in good agreement with the previous valuesfrom re-identification of the published epochs in the lit-erature (Kato et al. 2009) and analysis of recent limiteddata (Kato et al. 2010).
The three growing superhumps (E≤ 14) during the pre-cursor phase (stage A superhumps) unfortunately hap-pened around the phase of eclipses, and the times of max-ima could not be determined around their peaks. Thetimes of these superhump maxima should therefore con-tain considerable errors. Although the period of stage Asuperhumps can be measured as 0.08017(3) d, this valueshould be treated with caution. The fractional superhumpexcess corresponds to q = 0.22(1). We hope observationsin the future, when times of stage A superhumps do notoverlap with eclipses, could provide a more reliable q valuedirectly comparable to the one from eclipse observations.

No. ] Period Variations in SU UMa-Type Dwarf Novae VII 15
0 20 40 60 80 100 120 140 160 180 200−0.08
−0.06
−0.04
−0.02
0.00
0.02
200820112014
Fig. 6. Comparison of O−C diagrams of SY Cap betweendifferent superoutbursts. A period of 0.06376 d was used todraw this figure. Approximate cycle counts (E) after the startof the superoutburst were used. The 2014 superoutburst wasshifted by 60 cycles to best match the others.
Table 6. Superhump maxima of SY Cap (2014)
E max∗ error O−C† N ‡
0 56920.9768 0.0053 −0.0268 271 56921.0554 0.0005 −0.0116 73
24 56922.5255 0.0007 0.0031 2025 56922.5864 0.0008 0.0007 1826 56922.6523 0.0015 0.0033 1740 56923.5379 0.0012 0.0030 1641 56923.6014 0.0008 0.0032 1842 56923.6654 0.0007 0.0039 1956 56924.5544 0.0009 0.0069 1557 56924.6140 0.0007 0.0032 1658 56924.6795 0.0010 0.0055 1372 56925.5659 0.0021 0.0059 1673 56925.6306 0.0042 0.0073 1674 56925.6945 0.0037 0.0080 787 56926.5148 0.0026 0.0056 1288 56926.5827 0.0019 0.0102 1689 56926.6525 0.0036 0.0168 17
103 56927.5275 0.0083 0.0058 10104 56927.5861 0.0030 0.0012 16119 56928.5204 0.0022 −0.0138 14120 56928.5768 0.0026 −0.0207 16121 56928.6402 0.0026 −0.0206 16∗BJD−2400000.†Against max = 2456921.0037+ 0.063282E.‡Number of points used to determine the maximum.
0 50 100 150 200 250−0.04
−0.02
0.00
0.02
198020142015
Fig. 7. Comparison of O−C diagrams of OY Car betweendifferent superoutbursts. A period of 0.06465 d was used todraw this figure. Approximate cycle counts (E) after thestarts of outbursts were used. The 2015 superoutburst with aseparate precursor outburst was shifted by 15 cycles to bestmatch the others.
Table 8. Superhump maxima of OY Car (2014)
E max∗ error O−C† phase‡ N §
0 56818.0448 0.0009 0.0064 0.41 4615 56819.0076 0.0008 −0.0003 0.67 3716 56819.0706 0.0011 −0.0020 0.67 3630 56819.9778 0.0010 0.0003 0.04 3631 56820.0436 0.0027 0.0014 0.08 34
109 56825.0834 0.0012 −0.0004 0.92 34123 56825.9778 0.0019 −0.0109 0.09 50124 56826.0417 0.0031 −0.0117 0.11 54140 56827.0958 0.0120 0.0083 0.81 28185 56830.0051 0.0020 0.0089 0.90 28∗BJD−2400000.†Against max = 2456818.0384+ 0.064636E.‡Orbital phase.§Number of points used to determine the maximum.

16 T. Kato et al. [Vol. ,
Table 9. Superhump maxima of OY Car (2015)
E max∗ error O−C† phase‡ N §
0 57067.0848 0.0077 0.0024 0.86 532 57067.2121 0.0050 0.0001 0.88 533 57067.2846 0.0028 0.0078 0.02 24
18 57068.2361 0.0009 −0.0121 0.10 43137 57075.9570 0.0010 0.0026 0.42 51138 57076.0220 0.0013 0.0028 0.45 63152 57076.9232 0.0017 −0.0026 0.73 23153 57076.9895 0.0006 −0.0010 0.78 45∗BJD−2400000.†Against max = 2457067.0825+ 0.064759E.‡Orbital phase.§Number of points used to determine the maximum.
0.054 0.055 0.056 0.057 0.058 0.059 0.060
0.8
0.9
1.0
(d)
θ
P=0.05702
−0.5 0.0 0.5 1.0 1.5
−0.10
−0.05
0.00
0.05
0.10
Fig. 8. Superhumps in FI Cet (2014). (Upper): PDM anal-ysis. (Lower): Phase-averaged profile.
0.054 0.055 0.056 0.057 0.058 0.059 0.060
0.6
0.8
1.0
1.2
(d)
θ
P=0.05594
−0.5 0.0 0.5 1.0 1.5
−0.04
−0.02
0.00
0.02
0.04
Fig. 9. Possible early superhumps in FI Cet (2014). (Upper):PDM analysis. (Lower): Phase-averaged profile.
Table 10. Superhump maxima of FI Cet (2014)
E max∗ error O−C† N ‡
0 56840.8397 0.0023 −0.0018 151 56840.8939 0.0022 −0.0046 19
18 56841.8724 0.0005 0.0054 1935 56842.8382 0.0010 0.0027 1636 56842.8945 0.0004 0.0020 1971 56844.8847 0.0013 −0.0017 1988 56845.8534 0.0010 −0.0015 1789 56845.9094 0.0011 −0.0025 17
106 56846.8825 0.0020 0.0021 19∗BJD−2400000.†Against max = 2456840.8415+ 0.056971E.‡Number of points used to determine the maximum.

No. ] Period Variations in SU UMa-Type Dwarf Novae VII 17
−200 −100 0 100 200 300 400 500
−0.10
−0.05
0.00
760 770 780 790 800 810
12
14
16
763 764 765 766 767 768 769 770 771
12
13
14
Fig. 10. O − C diagram of superhumps in Z Cha (2014).(Upper): O−C. We used a period of 0.07736 d for calcu-lating the O−C residuals. (Middle): Light curve. The datawere binned to 0.0077 d. (Lower): Enlarged light curve ofshowing the precursor and evolution of superhumps. Afterthe full growth of superhumps, strong beat phenomena werepresent.
The superhumps persisted in the post-superoutburstphase (table 12), whose times were also determined af-ter subtracting the mean orbital modulation. The periodwas similar to that of stage C superhumps. This super-hump signal could be traced to BJD 2456790 with thePDM method, but became unclear after this.
A comparison of the O−C diagrams between differentsuperoutbursts is shown in figure 11. The 1982 superout-burst had a separate precursor outburst and we neededto shift 50 cycles for this superoutburst to make a matchwith the others. This indicates that superhumps startedto grow 50 cycles (about 4 d) before the start of the mainoutburst. This value implies that superhumps started todevelop 1 d after the precursor outburst, since it took fivedays before the main outburst occurs.3.7.2. Search for negative superhumps
Our entire observation covered one complete su-percycle consisting of the 2013 August superoutburst(BJD 2456524), three normal outbursts (BJD 2456572,2456624, 2456676) and the 2014 April superoutburst (BJD2456764).
0 20 40 60 80 100 120 140 160 180 200−0.06
−0.04
−0.02
0.00
0.02
0.04
1982201020132014
Fig. 11. Comparison of O−C diagrams of Z Cha betweendifferent superoutbursts. A period of 0.07736 d was used todraw this figure. Approximate cycle counts (E) after thestarts of outbursts were used. The 1982 superoutburst had aseparate precursor outburst and the start of the outburst wasdefined as the start of the main outburst. The 1982 super-outburst was shifted by 50 cycles to best match the others.
Table 11. Superhump maxima of Z Cha (2014)
E max∗ error O−C† phase‡ N §
0 56765.5347 0.0034 −0.0410 0.10 2612 56766.4992 0.0018 −0.0027 0.04 2813 56766.5749 0.0016 −0.0042 0.06 3325 56767.5060 0.0004 0.0006 0.56 9126 56767.5842 0.0005 0.0016 0.61 14727 56767.6660 0.0016 0.0062 0.71 3838 56768.5195 0.0010 0.0107 0.16 13339 56768.5987 0.0008 0.0128 0.23 14751 56769.5181 0.0006 0.0059 0.57 12252 56769.5966 0.0008 0.0072 0.62 14764 56770.5277 0.0008 0.0121 0.12 14865 56770.6028 0.0006 0.0099 0.13 14077 56771.5247 0.0007 0.0056 0.50 14278 56771.6014 0.0008 0.0050 0.53 148
103 56773.5268 0.0017 0.0008 0.38 41104 56773.6025 0.0035 −0.0007 0.39 33116 56774.5258 0.0013 −0.0036 0.79 40117 56774.6002 0.0018 −0.0064 0.78 32129 56775.5311 0.0066 −0.0018 0.28 34142 56776.5283 0.0042 −0.0080 0.66 33143 56776.6035 0.0043 −0.0100 0.67 21∗BJD−2400000.†Against max = 2456765.5757+0.077187E.‡Orbital phase.§Number of points used to determine the maximum.

18 T. Kato et al. [Vol. ,
Table 12. Superhump maxima of Z Cha (2014) (post-super-outburst)
E max∗ error O−C† phase‡ N §
0 56777.5343 0.0062 0.0047 0.17 3226 56779.5207 0.0052 −0.0088 0.83 3027 56779.5949 0.0062 −0.0115 0.83 2440 56780.5991 0.0169 −0.0073 0.31 1752 56781.5310 0.0034 0.0016 0.82 2853 56781.6249 0.0011 0.0185 0.08 978 56783.5447 0.0025 0.0152 0.85 2891 56784.5274 0.0127 −0.0020 0.04 28
117 56786.5314 0.0018 0.0020 0.94 80118 56786.5938 0.0048 −0.0125 0.77 27∗BJD−2400000.†Against max = 2456777.5295+ 0.076922E.‡Orbital phase.§Number of points used to determine the maximum.
We searched for possible negative superhumps. Afterdividing the quiescent data into 10–20 d bins (depend-ing on the gaps in observations and the goodness of cov-erage), we subtracted the mean orbital variation andapplied the PDM analysis. We detected possible sig-nal of negative superhumps in the following three bins:BJD 2456610–2456623 (before the second normal out-burst), period 0.07342(4) d and amplitude 0.05 mag;BJD 2456651–2456662 (before the third normal outburst),period of 0.07352(8) d and amplitude 0.05 mag; BJD2456663–2456675 (after the third normal outburst), pe-riod of 0.07314(4) d and amplitude 0.04 mag. Althoughthese possible detections were close to the detection limitand may have been affected by (probably variable) strongorbital modulations and uneven sampling of observations,these negative superhumps may have indeed transientlyexisted.
It may be noteworthy that the interval of the third nor-mal outburst and the second superoutburst was relativelylong (88 d). In VW Hyi, there exists “L” (long intervals ofnormal outbursts) and “S” (short intervals) type supercy-cles (Smak 1985), and it has been recently established byKepler observations of that L-type and S-type supercyclesare related to negative superhumps, which are consideredto be a result of the tilted disk (Osaki, Kato 2013a). Asimilar suggestion was reported in VW Hyi (Kato et al.2014a). The relatively long interval of outbursts after thethird normal outburst in Z Cha might be also related tothe existence of transient negative superhumps.3.7.3. Secular brightness variation
van Amerongen et al. (1987) and van Amerongen et al.(1990) studied secular variation of the brightness of VWHyi and Z Cha, respectively. Although van Amerongenet al. (1990) could not yield convincing results, our muchimproved and homogeneous data are expected to providea better clue to understanding the quiescent disk. As invan Amerongen et al. (1987), we used phase 0.20 segmentto represent the mean magnitude. Since Z Cha has anmaximum of the quiescent orbital humps at around the
500 550 600 650 700 750 800
12
13
14
15
16
Fig. 12. Brightness variation of Z Cha outside orbital humps(orbital phase 0.26–0.46). Each dot represent 2-d average.
orbital phase 0.86, we used phase 0.36±0.10 for this pur-pose.
The result clearly shows that the mean magnitude isvariable in quiescence (figure 12). The mean magnitude inquiescence clearly monotonically faded between the thirdnormal outburst and the second superoutburst. The situ-ation is somewhat different in the quiescence between thesecond and third normal outburst, and there was a secularfading trend followed by a rising trend before the thirdnormal outburst. It appears that the mean magnitudein quiescence shows a secular fading trend in a supercy-cle. The mean magnitude after the second superoutburstis much brighter than before the superoutburst, but thistrend was not so evident in the first superoutburst. In anycase, an explanation for such a trend is a future task forthe disk instability model.
The variation of the orbital humps in quiescence wasalso examined (figure 13). The amplitude is defined herebetween magnitudes of orbital phase 0.76–0.96 and or-bital phase 0.26–0.46. The amplitude of orbital humps in-creases during quiescence between normal outbursts. Thismost likely reflect the increased release of the gravitationalpotential energy as the disk shrinks in quiescence. Therewas no indication of enhanced orbital humps before anyoutburst, which severely constrain the mass-transfer in-stability model.
3.8. YZ Cancri
YZ Cnc is a well-known active SU UMa-type dwarfnova (e.g. Szkody, Mattei 1984). See Kato et al. (2014a)for more history. In 2014, another superoutburst inNovember–December was observed. The times of su-perhump maxima are listed in table 13. According tothe AAVSO observations, there was an outburst (BJD2456977.7, November 16) 5 d before the start of the su-peroutburst. Since the object did not reach the ordinaryquiescent level after this outburst, it was likely that thisoutburst was a separate precursor outburst. Although the

No. ] Period Variations in SU UMa-Type Dwarf Novae VII 19
500 550 600 650 700 750 8000.0
0.1
0.2
0.3
0.4
0.5
Fig. 13. Amplitude of orbital humps in Z Cha in quiescence(difference between orbital phase 0.76–0.96 and orbital phase0.26–0.46). Each dot represent 2-d average.
0 50 100 150 200 250 300
−0.04
−0.02
0.00
0.02
0.04200720112014
2014b
Fig. 14. Comparison of O−C diagrams of YZ Cnc betweendifferent superoutbursts. A period of 0.09050 d was used todraw this figure. Approximate cycle counts (E) after the startof the superoutburst were used (in the case of YZ Cnc, thisrefers to the precursor outburst). Since the start of the 2014superoutburst was not well constrained, we shifted the O−C
diagram to best fit the others. The figure was drawn based onan assumption that the preceding outburst before the 2014bsuperoutburst was a precursor outburst. The superhumps ap-parently appeared immediately following this precursor out-burst.
superhump observations started only ∼24 cycles after thefinal rise to the superoutburst, there was no hint of stage Asuperhumps. It was most likely that stage A superhumpsappeared following the separate precursor outburst. Thissuggestion was supported by a comparison of O−C dia-grams (figure 14).
Table 13. Superhump maxima of YZ Cnc (2014b)
E max∗ error O−C† N ‡
0 56985.9582 0.0002 −0.0009 7210 56986.8680 0.0005 0.0019 16920 56987.7712 0.0003 −0.0020 18421 56987.8649 0.0004 0.0010 179∗BJD−2400000.†Against max = 2456985.9591+ 0.090707E.‡Number of points used to determine the maximum.
Table 14. Superhump maxima of V337 Cyg (2014)
E max∗ error O−C† N ‡
0 56840.5108 0.0003 −0.0003 751 56840.5817 0.0006 0.0003 43
14 56841.4932 0.0005 −0.0000 67∗BJD−2400000.†Against max = 2456840.5112+ 0.070150E.‡Number of points used to determine the maximum.
3.9. V337 Cygni
V337 Cyg was discovered as a long-period variable (AN101.1928) with a range of 14.2 to fainter than 16.4 (Baade1928). Guthnick, Prager (1933) suggested that this objectis likely a dwarf nova. The object had been long lost sincethen, and both Bruch et al. (1987) and Downes, Shara(1993) could not identify the object. In 1996, J. Manekidentified three outbursts of this object in the Sonnebergarchive (vsnet 775). J. Manek further supplied the datesof six outbursts (vsnet 782). In 2006 May, a new outburstwas detected and subsequent observations confirmed theSU UMa-type nature of this object (Boyd et al. 2007; Katoet al. 2009). Kato et al. (2010) further studied the 2010superoutburst.
The 2014 superoutburst was detected by J. Shears onJune 29 (BAAVSS alert 3728; vsnet-alert 17427). Time-series observations were undertaken on two nights and thethree times of superhump maxima were measured (table14). A PDM analysis yielded a period of 0.07019(3) d. Weprobably observed stage B superhumps as judged from acomparison with the 2007 and 2010 data.
3.10. V503 Cygni
For this famous SU UMa-type dwarf nova, see Katoet al. (2014a) for a description. The 2014 July super-outburst was observed. On the initial two nights (BJD2456864–2456865), typical superhumps were recorded.After BJD 2456867, the superhumps became double-humped. Since we could not distinguish which maximacorrespond to the smooth continuation of the earlier su-perhump maxima, we listed both hump maxima in table15. The value given in table 2 refers to the initial partonly. Similar variation in the superhump profile can befound in Harvey et al. (1995).
Another superoutburst occurred in 2014 October

20 T. Kato et al. [Vol. ,
Table 15. Superhump maxima of V503 Cyg (2014)
E max∗ error O−C† N ‡
0 56864.0992 0.0006 0.0031 1331 56864.1776 0.0007 0.0000 142
12 56865.0712 0.0010 −0.0020 14013 56865.1530 0.0008 −0.0017 14214 56865.2391 0.0018 0.0030 4516 56865.3917 0.0012 −0.0072 6417 56865.4815 0.0007 0.0011 8140 56867.3698 0.0017 0.0166 7941 56867.4216 0.0009 −0.0129 7465 56869.4034 0.0015 0.0146 7466 56869.4532 0.0029 −0.0170 6966 56869.4928 0.0018 0.0226 7267 56869.5314 0.0036 −0.0202 65∗BJD−2400000.†Against max = 2456864.0961+ 0.081425E.‡Number of points used to determine the maximum.
(vsnet-alert 17827; 2014b outburst in table 1). Time-seriesobservations were obtained only on two nights and two su-perhumps maxima were obtained: BJD 2456942.4363(7)(N=68) and 2456952.4321(10) (N=90).
3.11. BC Doradus
This object was originally designated as CAL 86 inthe direction of the Large Megellanic Cloud (LMC). Thisstar was originally selected as an Einstein X-ray source.Cowley et al. (1984) provided an optical identification.Schmidtke et al. (2002) reported the detection of a short(0.066 d) orbital period and at least five outbursts in theMACHO observations. Some of these outbursts reachedV =14. Kato et al. (2004a) confirmed the SU UMa-typenature by the detection of superhumps during the 2003outburst.
The 2015 superoutburst was visually detected by R.Stubbings on February 20 (vsnet-alert 18315). The out-burst was also detected by ASAS-SN (vsnet-alert 18316).There was a gap in the observation in the early part ofthe superoutburst. The times of superhump maxima arelisted in table 16. After a comparison with the 2003 re-sult (figure 15), we noticed that the stage identificationsfor the 2003 superhumps were incorrect. We provide anupdated result in table 2.
3.12. V660 Herculis
For the explanation of the history of this object, seeKato et al. (2014b). The 2014 superoutburst was de-tected by M. Moriyama at an unfiltered CCD magnitudeof 14.4 on September 13 (vsnet-alert 17724). Only one su-perhump maximum was obtained: BJD 2456915.0538(8)(N=97).
3.13. CT Hydrae
For history of CT Hya, refer to Kato et al. (2014a). The2015 superoutburst was visually detected by R. Stubbings(vsnet-alert 18285). The outburst was apparently de-
0 50 100 150 200
−0.08
−0.06
−0.04
−0.02
0.00
0.02
20032015
Fig. 15. Comparison of O−C diagrams of BC Dor betweendifferent superoutbursts. A period of 0.06806 d was used todraw this figure. Approximate cycle counts (E) after the max-imum of the superoutburst were used.
Table 16. Superhump maxima of BC Dor (2015)
E max∗ error O−C† N ‡
0 57076.9685 0.0014 −0.0049 2453 57080.5915 0.0012 0.0068 1696 57083.5175 0.0092 0.0029 1097 57083.5841 0.0012 0.0014 17
111 57084.5356 0.0023 −0.0009 16112 57084.6042 0.0020 −0.0006 12126 57085.5549 0.0019 −0.0038 17141 57086.5797 0.0076 −0.0010 17∗BJD−2400000.†Against max = 2457076.9734+ 0.068137E.‡Number of points used to determine the maximum.
tected during the rising phase by P. Starr one night beforeStubbings’ detection. The times of superhump maximaare listed in table 17. A comparison of O−C diagramsindicates that we observed stage B and C superhumps,although observations were not sufficient to determine in-dividual periods.
3.14. LY Hydrae
LY Hya (=1329−294) was originally discovered as aCV selected for blue color (Echevarria et al. 1983).Double-peak emission lines suggested a high orbital in-clination (Echevarria et al. 1983). Although Kubiak,Krzeminski (1989) reported a photometric period of 3.8 hrand Kubiak, Krzeminski (1992) reported photometric andspectroscopic observations indicating an orbital period of0.13688 d, these observations were not confirmed. Stillet al. (1994) obtained an orbital period of 0.0748(5) d andthe Doppler tomogram suggested that the object likely

No. ] Period Variations in SU UMa-Type Dwarf Novae VII 21
0 50 100 150 200
−0.02
−0.01
0.00
0.01
0.02
199519992000
2002a2002b2009201020142015
Fig. 16. Comparison of O−C diagrams of CT Hya betweendifferent superoutbursts. A period of 0.06650 d was used todraw this figure. Approximate cycle counts (E) after the max-imum of the superoutburst were used. Since the start of the2014 superoutburst was not well constrained, we shifted theO−C diagram to best fit the others.
Table 17. Superhump maxima of CT Hya (2015)
E max∗ error O−C† N ‡
0 57067.0221 0.0010 −0.0024 5129 57068.9599 0.0005 0.0045 6530 57069.0257 0.0011 0.0037 20831 57069.0872 0.0008 −0.0015 17745 57070.0166 0.0015 −0.0043 50∗BJD−2400000.†Against max = 2457067.0244+ 0.066587E.‡Number of points used to determine the maximum.
belong SU UMa-type dwarf novae.There was a report by T. Vanmunster that S. Howell
observed an outburst in 1996 around V =14.4 (cf. vsnet-obs 2047). The details of this observation are not known.It was only in 1998 April when a fresh outburst wasdetected by R. Stubbings (vsnet-alert 1707). The ob-ject rapidly faded during this outburst (vsnet-alert 1713,1714). In 2000 April, another brightening at 16.0 magwas reported by P. Schmeer (vsnet-alert 4559). This out-burst also quickly faded (vsnet-alert 4563). Another out-burst at 14.0 mag was reported visually vy R. Stubbingsin 2000 September (vsnet-outburst 462) but no further ob-servation was available for this outburst. In 2009 May, R.Stubbings detected another outburst (vsnet-alert 11233)but it again faded rapidly (vsnet-alert 11236). Afteranother faint outburst in 2011 February (vsnet-outburst12296), there was a bright outburst reaching 13.1 mag in2012 February (vsnet-alert 14206). No time-series obser-vations were, however, obtained during this outburst.
The 2014 superoutburst was the first one during which
0.074 0.076 0.078 0.080
0.2
0.4
0.6
0.8
1.0
1.2
(d)
θ
P=0.07697
−0.5 0.0 0.5 1.0 1.5
−0.2
−0.1
0.0
0.1
Fig. 17. Superhumps in LY Hya (2014). (Upper): PDManalysis. (Lower): Phase-averaged profile.
time-series observations were obtained. This outburst wasdetected at V =13.25 by the ASAS-SN team on August9 (vsnet-alert 17632). Superhumps were finally detected(vsnet-alert 17640, 17644, 17653). Due to the unfa-vorable seasonal condition, observations were limited toshort evening windows. Despite that individual super-hump maxima were never recorded, a combined lightcurve yielded an unmistakable superhump signal (figure17). Since we observed only the later part of the super-outburst until the rapid fading, we likely recorded stageC superhumps. In table 2, we list this identification.
3.15. MM Hydrae
MM Hya was originally selected as a CV by thePalomer-Green survey (Green et al. 1982). AlthoughMisselt, Shafter (1995) suggested it to be a WZ Sge-typedwarf nova based on the very short orbital period, theobject has been recognized as a rather ordinary SU UMa-type dwarf nova Patterson et al. (2003). Past superhumpobservations were given in Kato et al. (2009), Kato et al.(2012a), Kato et al. (2013a) and Kato et al. (2014b).
The 2014 superoutburst was detected by R. Stubbingson April 27 during its rising stage (vsnet-alert 17267).Six days later, time-resolved observations detected super-humps (vsnet-alert 17279). The times of superhump max-

22 T. Kato et al. [Vol. ,
0.057580 0.057590 0.057600
0.90
0.95
1.00
1.05
(d)
θ
0.0575901
−0.5 0.0 0.5 1.0 1.5
−0.4
−0.2
0.0
0.2
0.4
Fig. 18. Orbital variation of MM Hya in quiescence us-ing the CRTS data. (Upper): PDM analysis. (Lower):Phase-averaged profile.
ima are listed in table 18. A comparison of the O −Cdiagrams between different superoutbursts suggests thatwe observed stage B–C superhumps during the 2014 su-peroutburst (figure 19).
We have also refined the orbital period to be0.0575901(1) using the quiescent CRTS data (figure 18;BJD 2453705–2456441).
We have also examined the recent outbursts of MM Hya(table 18). The O−C diagram indicates that the super-cycle was long [386(3) d] between 1998 and 2003, but itdecreased to 330(2) d. Superoutbursts were not detectedbetween 2007 and 2011 probably because superoutburstsoccurred around solar conjunctions since the supercycleis close to one year. Although the shorter supercycle[347(8) d] was also recorded between 2011 and 2013, itagain became longer in 2014. The number of normal out-bursts has been rather small, although many of them mayhave escaped detection due to the faintness, particularlyfor visual observations.
3.16. RZ Leonis Minoris
This object is one of the ER UMa-type dwarf novae,and is renowned for its short supercycle length (19 d;cf. Robertson et al. 1995; Nogami et al. 1995). Two su-
0 50 100 150 200 250
−0.03
−0.02
−0.01
0.00
0.01
1998200120122014
Fig. 19. Comparison of O−C diagrams of MM Hya betweendifferent superoutbursts. A period of 0.05892 d was used todraw this figure. Approximate cycle counts (E) after the ap-pearance of superhumps were used.
0 5 10 15 20−200
−100
0
100
200
Fig. 20. O−C diagram of superoutbursts in MM Hya. Theephemeris used was Max(JD)= 2451001 +337.5E.
Table 18. Superhump maxima of MM Hya (2014)
E max∗ error O−C† N ‡
0 56780.9808 0.0018 0.0026 1221 56781.0340 0.0008 −0.0031 122
52 56784.0393 0.0006 0.0008 108119 56787.9812 0.0029 −0.0003 58∗BJD−2400000.†Against max = 2456780.9782+ 0.058851E.‡Number of points used to determine the maximum.

No. ] Period Variations in SU UMa-Type Dwarf Novae VII 23
Table 19. List of recent outbursts of MM Hya.
Year Month max∗ magnitude type source1998 3 50881 13.7 super J. Kemp, AAVSO; Patterson et al. (2003); Kato et al. (2009)1999 4 51277 13.0 super vsnet-alert 2842, AAVSO2000 4 51636 13.0 super vsnet-obs 27068, vsnet-alert 4565, AAVSO2001 5 52044 13.0 super AAVSO; Kato et al. (2009)2002 11 52594 15.1† normal AAVSO2003 5 52816 13.2 super AAVSO, ASAS-32004 1 53036 13.8 normal AAVSO, ASAS-32004 7 53191 14.0‡ ? vsnet-outburst 6354, AAVSO2004 11 53320 14.1† normal AAVSO2005 5 53482 13.9 super ASAS-3, VSOLJ, AAVSO2006 3 53805 13.0 super AAVSO2006 10 54040 14.2 normal AAVSO, VSOLJ2011 4 55659 13.1 super vsnet-alert 13113, AAVSO; Kato et al. (2012a)2012 3 55992 13.4 super AAVSO; Kato et al. (2013a)2012 5 56055 15.1† normal AAVSO2013 3 56353 13.3 super vsnet-alert 15487, AAVSO; Kato et al. (2014b)2014 4 56775 13.1 super vsnet-alert 17267; this paper∗JD−2400000.†CCD single detection.‡Single visual detection and single positive detection by ASAS-3 5 d before.
perhump maxima were obtained: BJD 2456725.7181(2)(N = 58) and 2456725.7800(7) (N = 31).
3.17. BR Lupi
This object (=HV 4889) was discovered as a dwarf nova(although it was referred to as an SS Cyg-type, therewas no distinction of subtypes at the time of this dis-covery) by Swope, Caldwell (1930) with a photographicrange of 13.5 to fainter than 16.0 in the table. Swope,Caldwell (1930) reported ten outbursts and the photo-graphic range was corrected to 13.1 to fainter than 16.4in Prager, Shapley (1941). Walker, Olmsted (1958) pro-vided a finding chart. Vogt, Bateson (1982) also provideda detailed finding chart.
O’Donoghue (1987) reported on the detection of su-perhumps during the 1986 outburst, establishing the SUUMa-type nature. Munari, Zwitter (1998) confirmed theCV nature by spectroscopy. Mennickent, Sterken (1998)reported a radial-velocity study and photometry in quies-cence and during a superoutburst.
We conducted a time-series photometry in quiescenceand superoutburst starting on 2014 July 31. The timesof superhump maxima are listed in table 20. After BJD2456878, the profile became double-humped. The two dis-tinct hump maxima at E = 194 and E = 218 may be tra-ditional late superhumps after an ∼0.5 phase jump. Thesuperhumps up to E = 24 correspond to stage A super-humps with growing amplitudes.
A comparison of O−C diagrams between different su-peroutbursts is shown in figure 21. The trends were thesame except the late part of the superoutburst, when su-perhump profiles became less regular or doubly humped.Since the mass-transfer rate is expected to be large to ac-
count for the short supercycle (140 d), the appearance oftraditional late superhumps reflecting the bright hot spotis not a surprise.
The orbital period of this system has not been well-established. The period in the literature was 0.0795(5) din Mennickent, Sterken (1998). We observed this objectin quiescence to determine the orbital period (figure 22).The orbital signal was rather weak in contrast to the re-ported 0.4-mag variation in Mennickent, Sterken (1998).We adopted here a period of 0.07948(2) d because it iscloser to the value by Mennickent, Sterken (1998) andthe estimated orbital period (0.0795 d) based on the up-dated relation between the orbital and superhump peri-ods (equation 6 in Kato et al. 2012a). There remainsa possibility of 0.07904(2) d. The exact orbital periodneeds to be confirmed by further observations. This or-bital period gives ǫ∗=0.0488(12) for stage A superhumpsand q=0.142(4). This value needs to be established byconfirming the orbital period.
3.18. AY Lyrae
The 2014 October superoutburst of this well-known SUUMa-type dwarf nova was observed on two nights. Threesuperhump maxima were recorded: BJD 2456947.9590(7)(N=51), 2456948.0347(7) (N=56) and 2456954.9360(10)(N=96).
3.19. V453 Normae
This object (=ASAS J160048−4846.2) was discoveredas a dwarf nova in 2005 June by Pojmanski (2005). Earlyobservations of superhumps was reported by Monard,Africa (2005). Imada, Monard (2006) reported the possi-ble detection of early superhumps and classified this ob-

24 T. Kato et al. [Vol. ,
0 50 100 150 200
−0.04
−0.02
0.00
0.02
200320042014
Fig. 21. Comparison of O−C diagrams of BR Lup betweendifferent superoutbursts. A period of 0.08228 d was used todraw this figure. Approximate cycle counts (E) after the ap-pearance of superhumps were used.
0.0785 0.0790 0.0795 0.0800 0.0805
0.98
0.99
1.00
1.01
(d)
θ
P=0.07948
−0.5 0.0 0.5 1.0 1.5
−0.10
−0.05
0.00
0.05
0.10
Fig. 22. Period analysis of BR Lup in quiescence (BJD2456835–2456864). (Upper): PDM analysis. (Lower):Phase-averaged profile.
Table 20. Superhump maxima of BR Lup (2014)
E max∗ error O−C† N ‡
0 56869.5644 0.0030 −0.0242 1511 56870.4835 0.0008 −0.0101 1112 56870.5714 0.0006 −0.0045 1423 56871.4865 0.0007 0.0058 1524 56871.5707 0.0007 0.0076 1635 56872.4672 0.0034 −0.0007 636 56872.5589 0.0007 0.0087 1947 56873.4543 0.0049 −0.0008 648 56873.5466 0.0006 0.0092 1960 56874.5308 0.0017 0.0062 1561 56874.6103 0.0031 0.0035 672 56875.5162 0.0012 0.0045 1473 56875.5992 0.0016 0.0052 884 56876.5013 0.0018 0.0024 1485 56876.5852 0.0031 0.0040 1196 56877.4937 0.0098 0.0077 1197 56877.5690 0.0025 0.0007 10
121 56879.5336 0.0017 −0.0091 14145 56881.5000 0.0030 −0.0170 15194 56885.5536 0.0023 0.0056 20218 56887.5178 0.0021 −0.0046 20∗BJD−2400000.†Against max = 2456869.5887+ 0.082265E.‡Number of points used to determine the maximum.
ject as a WZ Sge-type dwarf nova. Soejima et al. (2009)provided the detailed analysis of the superhumps, and de-tected an increase in the superhump period which waslater associated with the increase of the amplitude. Katoet al. (2009) made an extended analysis after combina-tion with the AAVSO data, which generally confirmed thefinding by Imada, Monard (2006).
After the 2005 superoutburst, there have been two de-tections of apparent normal outbursts: 2006 May 20 (14.2mag) and 2009 January 5 (13.8), both detected by R.Stubbings.
The next superoutburst was detected on 2014 April 23at 12.4 mag by R. Stubbings (vsnet-alert 17254). Growingsuperhumps were detected on April 25 and 26 (vsnet-alert17262).
The times of superhump maxima are listed in table 21.This table includes superhumps observed after the rapidfading from the superoutburst. Although the end phaseof stage A was probably observed on April 25 (E = 1 andE = 2), the period of stage A superhumps could not bedetermined. The Pdot of stage B superhumps was strik-ingly positive [+16.4(3.5)×10−5], similar to the 2005 value[+11.1(0.8)×10−5]. A very clear stage B-C transition wasrecorded (cf. figure 23). There was no phase jump duringthe rapid fading phase, and a single period (stage C su-perhumps) well explained the superhumps during the latecourse of the plateau phase and the post-superoutburstphase. An analysis of observations after the rebrighten-ing (BJD 2456789.7–2456796) yielded weak modulations

No. ] Period Variations in SU UMa-Type Dwarf Novae VII 25
0 50 100 150 200 250
−0.06
−0.04
−0.02
0.00
0.02
20052014
Fig. 23. Comparison of O−C diagrams of V453 Nor betweendifferent superoutbursts. A period of 0.06497 d was used todraw this figure. Approximate cycle counts (E) after the ap-pearance of superhumps were used. The 2014 superoutburstwas shifted by 10 cycles to best match the 2005 one.
(0.05 mag) with period of 0.06416(13) d, which may bedecaying superhumps.
The overall O−C diagrams were very similar between2005 and 2014 (figure 23) except the appearance of humpswith different phases during the rebrightening in 2005 [seealso discussion in Kato et al. 2009].
3.20. DT Octantis
For the history of this object, see Kato et al. (2014a).The 2014 December superoutburst was detected by R.Stubbings and the ASAS-SN team (vsnet-alert 18079).The times of superhump maxima are listed in table 22.The period listed in table 2 is probably a mixture of stageB and C superhumps (figure 24).
3.21. UV Persei
UV Per is a famous dwarf nova known more than fora century. The object was discovered as a nova or a newvariable star (87.1911) in 1911 November by D’Esterre(1912). Since the object was initially suspected to be anova, Wolf (1912) studied the counterpart and found thatthe object is a southern component of the close pair. Thisfinding was confirmed by D’Esterre (1913). Nijland (1914)detected an outburst in 1914 June lasting 14 d and con-cluded that the object must be a U Gem-type variable.Hartwig (1915) recorded an outburst in 1915 September,which faded quickly. This outburst was also recorded byNijland (1915), who confirmed the shortness of the out-burst. Hartwig (1917) recorded a long outburst in 1916December. Hartwig (1917) suggested that the intervalsof three outbursts were 442 and 473 d. Nijland (1918)and Hartwig (1920) detected further outbursts in 1918May and 1920 October, respectively. In the meantime,Harvard College Observatory reported the intervals of out-
Table 21. Superhump maxima of V453 Nor (2014)
E max∗ error O−C† N ‡
0 56772.8084 0.0006 −0.0138 301 56772.8724 0.0005 −0.0146 37
16 56773.8538 0.0003 −0.0046 3517 56773.9205 0.0010 −0.0027 1531 56774.8258 0.0005 −0.0041 2232 56774.8905 0.0004 −0.0041 3547 56775.8614 0.0005 −0.0047 3548 56775.9295 0.0013 −0.0013 1062 56776.8366 0.0005 −0.0009 3363 56776.9018 0.0005 −0.0005 2977 56777.8112 0.0051 0.0023 1078 56777.8778 0.0008 0.0041 3593 56778.8555 0.0006 0.0104 3594 56778.9285 0.0016 0.0186 12
108 56779.8272 0.0007 0.0106 33109 56779.8931 0.0006 0.0117 35123 56780.8004 0.0095 0.0124 16124 56780.8619 0.0015 0.0092 35125 56780.9273 0.0019 0.0098 15139 56781.8290 0.0010 0.0048 35140 56781.8939 0.0014 0.0049 35170 56783.8319 0.0009 0.0001 31171 56783.8975 0.0010 0.0009 29186 56784.8632 0.0032 −0.0048 30201 56785.8326 0.0017 −0.0068 27202 56785.8960 0.0031 −0.0082 27216 56786.8008 0.0027 −0.0101 27217 56786.8680 0.0020 −0.0076 27231 56787.7727 0.0009 −0.0097 16232 56787.8457 0.0037 −0.0014 19∗BJD−2400000.†Against max = 2456772.8222+ 0.064762E.‡Number of points used to determine the maximum.
Table 22. Superhump maxima of DT Oct (2014b)
E max∗ error O−C† N ‡
0 57012.5406 0.0010 −0.0031 2414 57013.5926 0.0020 0.0035 1127 57014.5603 0.0013 0.0005 2640 57015.5309 0.0023 0.0005 1854 57016.5750 0.0022 −0.0007 1667 57017.5458 0.0035 −0.0007 25∗BJD−2400000.†Against max = 2457012.5437+ 0.074667E.‡Number of points used to determine the maximum.

26 T. Kato et al. [Vol. ,
0 20 40 60 80 100 120 140 160 180−0.06
−0.04
−0.02
0.00
0.02
20032003b20082014
2014b
Fig. 24. Comparison of O−C diagrams of DT Oct betweendifferent superoutbursts. A period of 0.07485 d was used todraw this figure. Approximate cycle counts (E) after the startof the superoutburst were used. Since the start of the 2014and 2014b superoutbursts was not well constrained, we shiftedthe O−C diagrams to best fit the others.
bursts to be 214 and 299 d, suggesting the irregularity.Nijland (1924) summarized nine known outbursts (five ofthem were long outbursts) and suggested that the inter-vals could be expressed by the basic period of 131.48 d.
Since then, the object has long been monitored by am-ateur observers (e.g. Petit, Brun 1956; Hornby 1975).Petit, Brun (1956) analyzed the outbursts in detail andobtained a mean interval of 359.8 d. Petit, Brun (1956)also classified outbursts into two types: type I lasting for12 d and type II lasting for 4 d. Mayall (1966) was an-other summary article and reported a list of 32 outburstsbetween 1928 and 1966. The existence of long and shortoutbursts was clear from these data. Howarth (1978) alsopresented a list of 63 outbursts (dating back to Pickering’sobservation in 1896) and discussed outburst statistics.Howarth (1978) estimated the mean cycle length of 320 d.
The long cycle length of UV Per received attention,and the object was considered to be a good candidatefor an SU UMa-type dwarf nova. It was only in 1989when Udalski (1989) succeeded in detecting superhumps.Kato (1990) reported photometry in quiescence. Udalski,Pych (1992) reported both during the 1989 superoutburstand in quiescence. The orbital period was first reliablymeasured to be 0.06489(11) d by radial-velocity study byThorstensen, Taylor (1997). The 1989 superoutburst wasalso notable that this was one of the first superoutburstsof SU UMa-type dwarf novae followed by a rebrighten-ing.10 This rebrightening was best recorded by the VSOLJmembers [although there were several detections in thepresent AAVSO data, they were not shown in Udalski,
10 The first documented record of a rebrightening was VY Aqr byR. McNaught (Perez, McNaught 1986) in 1986, which was laterpublished (Patterson et al. 1993).
0 50 100 150 200
−0.04
−0.02
0.00
200020032007199120102014
Fig. 25. Comparison of O−C diagrams of UV Per betweendifferent superoutbursts. A period of 0.06665 d was used todraw this figure. Approximate cycle counts (E) after the ap-pearance of superhumps were used. The superoutbursts be-fore 2014 was shifted by 10 cycles against the figure in Katoet al. (2010) to best match the start of the 2014 one.
Pych (1992)].Although a number of superoutbursts were detected,
there have not been many papers. Price et al. (2003) wasthe only publication before Kato et al. (2009) and dealtwith the 2003 superoutburst. Kato et al. (2009) reportedon the 2000, 2003 and 2007 superoutbursts and Kato et al.(2010) reported on the 2010 superoutburst. None of su-peroutbursts were better observed than the 2003 one.
The 2014 superoutburst was visually detected by C.Chiselbrook (cf. vsnet-alert 18000). Since the detection ofthe outburst was early enough to record the appearance ofsuperhumps (vsnet-alert 18008, 18022). There was a sin-gle post-superoutburst rebrightening (vsnet-alert 18061).
The times of superhump maxima are listed in table 23.Stages B and C can be recognized. Although the maximafor E≤ 7 correspond to stage A superhumps, the period ofstage A superhumps could not be determined. Since theearly phase of stage B superhumps were not observed, thevalue of Pdot in table 2 is not as reliable as the 2003 onein Kato et al. (2009). A comparison of O−C diagramsbetween different superoutbursts is given in figure 25.
3.22. HY Piscium
This object (=SDSSp J230351.64+010651.0) was origi-nally selected as a CV by the SDSS (Szkody et al. 2002).Szkody et al. (2002) identified this object as a dwarf novaby obtaining spectra both in outburst and quiescence. Aradial-velocity study by Szkody et al. (2002) yielded anorbital period of 100±14 min. The first secure outburstsince the discovery was detected on 2006 August 29 of 14.5mag (magnitudes are unfiltered CCD ones for this object)by I. Miller (cvnet-outburst 1327). Although this outburstquickly faded, modulations with a period of 0.07 d were

No. ] Period Variations in SU UMa-Type Dwarf Novae VII 27
Table 23. Superhump maxima of UV Per (2014)
E max∗ error O−C† N ‡
0 56984.9961 0.0008 −0.0253 791 56985.0576 0.0013 −0.0303 737 56985.4729 0.0012 −0.0142 229
46 56988.0813 0.0003 −0.0005 13347 56988.1428 0.0004 −0.0056 13460 56989.0158 0.0059 0.0026 2161 56989.0772 0.0034 −0.0026 2380 56990.3448 0.0004 0.0010 6981 56990.4123 0.0003 0.0019 6682 56990.4777 0.0004 0.0008 6883 56990.5468 0.0005 0.0034 6484 56990.6107 0.0005 0.0008 6985 56990.6892 0.0007 0.0126 1488 56990.8709 0.0039 −0.0052 2589 56990.9457 0.0002 0.0030 24890 56991.0118 0.0002 0.0026 24891 56991.0820 0.0002 0.0063 24992 56991.1485 0.0006 0.0062 5593 56991.2148 0.0006 0.0060 6894 56991.2836 0.0005 0.0083 6995 56991.3484 0.0003 0.0066 19196 56991.4150 0.0004 0.0066 6997 56991.4808 0.0005 0.0059 6698 56991.5494 0.0004 0.0080 6799 56991.6165 0.0005 0.0086 69
100 56991.6883 0.0005 0.0138 24109 56992.2829 0.0003 0.0096 107110 56992.3510 0.0003 0.0112 200111 56992.4167 0.0003 0.0104 154112 56992.4823 0.0004 0.0095 66135 56994.0082 0.0005 0.0052 84139 56994.2853 0.0007 0.0162 86∗BJD−2400000.†Against max = 2456985.0214+ 0.066531E.‡Number of points used to determine the maximum.
Table 23. Superhump maxima of UV Per (2014) (continued)
E max∗ error O−C† N ‡
140 56994.3377 0.0003 0.0020 132141 56994.4057 0.0003 0.0034 111168 56996.1959 0.0008 −0.0026 122169 56996.2606 0.0008 −0.0045 144170 56996.3341 0.0010 0.0025 137181 56997.0521 0.0008 −0.0114 86182 56997.1194 0.0005 −0.0106 215183 56997.1858 0.0007 −0.0108 202196 56998.0429 0.0010 −0.0185 65197 56998.1092 0.0008 −0.0188 62198 56998.1802 0.0017 −0.0143 49∗BJD−2400000.†Against max = 2456985.0214+ 0.066531E.‡Number of points used to determine the maximum.
0.077 0.078 0.079 0.080 0.081 0.082
0.6
0.8
1.0
(d)
θ
P=0.07994
−0.5 0.0 0.5 1.0 1.5
−0.10
−0.05
0.00
0.05
0.10
Fig. 26. Superhumps in HY Psc (2014) before BJD 2456873.(Upper): PDM analysis. (Lower): Phase-averaged profile.
reported during the declining branch (vsnet-alert 9004).In Gänsicke et al. (2009), there was an orbital period of110.51(24) min [0.07674(17) d] by Dillon et al., but thisobservation has not yet been published. On 2010 January3, J. Shears detected a bright outburst at 13.6 mag (cvnet-outburst 3532). Although this outburst was a long one,superhumps were not confidently detected.
The 2014 outburst was detected by the ASAS-SN team(vsnet-alert 17560) at V =13.27 on July 28. Although su-perhumps were securely detected, the limited observationtime in the morning sky did not enable an unique selec-tion of the superhump period (vsnet-alert 17577, 17602).Based on the best observed part of the data (BJD before2456873), two periods of 0.07994(2) d and 0.07788(2) d re-mained viable. Since the period 0.080 d better expressednightly observations, we list the times of maxima basedon this selection of the period (table 24). Both periods,however, give anomalous ǫ if assume an orbital period of0.07674(17) d. Both the orbital and superhump periodsneed to be confirmed by further observations. The laterpart of the data (BJD after 2456873) gave a period of0.07981(2) d with a more irregular profile. We are notconfident whether this period corresponds to stage C su-perhump due to the lack of observations.

28 T. Kato et al. [Vol. ,
Table 24. Superhump maxima of HY Psc (2014)
E max∗ error O−C† N ‡
0 56869.1790 0.0003 −0.0022 1091 56869.2615 0.0002 0.0004 171
38 56872.2221 0.0004 0.0036 14574 56875.0941 0.0011 −0.0019 40∗BJD−2400000.†Against max = 2456869.1811+ 0.079930E.‡Number of points used to determine the maximum.
3.23. QW Serpentis
This object was identified as an SU UMa-type dwarfnova in 2003 (Patterson et al. 2003; Olech et al. 2003;Nogami et al. 2004). See Kato et al. (2014b) for morehistory.
The 2014 superoutburst was detected by MASTER-Tunka on February 25 (vsnet-alert 16951). The obser-vations on March 2 detected superhumps. Only twotimes of superhumps were obtained: BJD 2456718.5235(9)(N = 79), 2456718.5991(15) (N = 77).
3.24. V418 Serpentis
This object (=ROTSE3 J151453.6+020934.2) was dis-covered as a dwarf nova (Rykoff et al. 2004). Althoughthe variable star designation was given in Kazarovetset al. (2011), only little had been known until the out-burst detection by CRTS on 2014 May 21 (cf. vsnet-alert 17320). Subsequent time-resolved photometry indi-cated that this object is an SU UMa-type dwarf nova be-low the period minimum by the detection of superhumps(vsnet-alert 17321, 17322; figure 27). The times of super-hump maxima are listed in table 25. A very clear stageB-C transition was recorded (vsnet-alert 17349, 17358).Spectroscopic observation clarified that this object con-tains hydrogen, ruling out the possibility of an AM CVn-type object (Garnavich et al. 2014). The spectroscopicappearance was very similar to SBS 1108+574 (Littlefieldet al. 2013; Carter et al. 2013b) making this object a newmember of EI Psc-type objects.
Among EI Psc-type objects, SBS 1108+574 was the firstin which distinct stages B and C were recorded (Katoet al. 2013a). Another well-established object is CSSJ174033.5+414756 (T. Ohshima et al. in preparation;subsection 3.81). V418 Ser is the third object in this classof objects in which distinct stages B and C are recorded(figure 28). It was likely the early phase of stage B was notobserved. There was an apparent increase in the super-hump period after the stage B-C transition, a phenomenonsimilar to what is observed in hydrogen-rich CVs (Katoet al. 2009) and in SBS 1108+574 (Kato et al. 2013a). Thefractional decrease of the superhump period (∼0.5%) be-tween stage B and C was also similar to those in hydrogen-rich CVs (Kato et al. 2009). A comparison of these threeobjects has shown that the stage transition in EI Psc-typeobjects are similar to ordinary hydrogen-rich CVs.
In the AAVSO database, one observer detected a rise to
0.0430 0.0435 0.0440 0.0445 0.0450 0.0455 0.0460
0.97
0.98
0.99
1.00
(d)
θ
P=0.04464
−0.5 0.0 0.5 1.0 1.5
−0.04
−0.02
0.00
0.02
0.04
Fig. 27. Superhumps in V418 Ser (2014). (Upper): PDManalysis. (Lower): Phase-averaged profile.
V =16.02 on May 16. The entire duration of the superout-burst was 20–21 d, somewhat shorter than the one in SBS1108+574 (Kato et al. 2013a) and CSS J174033.5+414756(T. Ohshima et al. in preparation).
3.25. V701 Tauri
V701 Tau was discovered by Erastova (1973) as an erup-tive object. Since this “eruption” lasted more than tendays, the object was considered to be a dwarf nova and hasbeen monitored by amateur observers. The initial super-outburst was recorded in 1995 December (vsnet-alert 303).Shears, Boyd (2007) further reported the 2005 superout-burst and obtained a superhump period of 0.0690(2) d.The 1995 superoutburst was analyzed in (Kato et al. 2009)as well as the 2005 superoutburst. Although there wasalso a well-recorded superoutburst in 2007 March (e.g.vsnet-outburst 7535), superhumps were not sufficientlyobserved.
The 2015 superoutburst was detected by K. Paxson onFebruary 16 (vsnet-alert 18301). This is the first securesuperoutburst since 2007. Subsequent observations de-tected superhumps (vsnet-alert 18308, 18312). The timesof superhump maxima are listed in table 26. AlthoughE = 0 appears to be a stage A superhump (figure 29), theperiod of stage A superhumps could not be determined.

No. ] Period Variations in SU UMa-Type Dwarf Novae VII 29
−200 −100 0 100 200 300 400 500 600 700 800
−0.06
−0.04
−0.02
0.00
0.02
0.00
0.05
0.10
0.15
0.20
800 810 820 830
16
17
18
19
20
Fig. 28. O−C diagram of superhumps in V418 Ser (2014).(Upper:) O − C diagram. We used a period of 0.04467 dfor calculating the O − C residuals. (Middle:) Amplitudesof superhumps. There was a slight tendency of regrowth ofsuperhumps after the stage B–C transition. (Lower:) Lightcurve. The data were binned to 0.015 d. The detection of anoutburst on BJD 2456794 appears to be secure. The seem-ingly rebrightening on BJD 2456833 may not be real sincethis magnitude was similar to the pre-outburst observationsof the same observer.
3.26. SU Ursae Majoris
This famous dwarf nova (=5.1908) was discovered byCeraski (1908). Hoffmeister identified this object to be aU Gem-type object with cycle lengths of 10–20 d. Elvey,Babcock (1943) observed the object in outburst and ob-tained a spectrum B5 with Hα emission. Petit (1960)reported a summary of outbursts and identified long andshort outbursts. According to this literature, Brun andPetit considered a class of SU UMa-type variables and in-troduced a concept of supermaxima in 1952. Isles (1974)also reported historical variations in 1926–1954 and pro-posed a mean cycle length between long outbursts to be170 d. Thorstensen et al. (1986) determined the orbitalperiod by a radial-velocity study. Although the objecthad long been proposed to be the prototype of SU UMa-type dwarf novae, it was only in 1989 when superhumpswere detected during a superoutburst Udalski (1990), af-ter unsuccessful reports before a superoutburst (Barwig,Schoembs 1981) and during a normal outburst (Udalski
Table 25. Superhump maxima of V418 Ser (2014)
E max∗ error O−C† N ‡
0 56800.0447 0.0079 −0.0051 411 56800.0854 0.0009 −0.0089 752 56800.1356 0.0008 −0.0032 784 56800.2196 0.0006 −0.0082 568 56800.3992 0.0004 −0.0065 529 56800.4420 0.0005 −0.0082 55
10 56800.4900 0.0005 −0.0048 5111 56800.5322 0.0005 −0.0071 4812 56800.5784 0.0006 −0.0053 4813 56800.6223 0.0006 −0.0059 10014 56800.6673 0.0008 −0.0054 7815 56800.7137 0.0012 −0.0036 7816 56800.7575 0.0021 −0.0043 6417 56800.7999 0.0016 −0.0064 7423 56801.0669 0.0016 −0.0063 4824 56801.1151 0.0011 −0.0027 9025 56801.1637 0.0026 0.0014 5226 56801.1986 0.0024 −0.0081 5727 56801.2503 0.0015 −0.0009 9128 56801.2911 0.0144 −0.0047 3930 56801.3824 0.0008 −0.0023 3532 56801.4692 0.0008 −0.0046 3536 56801.6513 0.0014 −0.0004 7837 56801.6927 0.0017 −0.0035 12038 56801.7381 0.0009 −0.0026 12039 56801.7844 0.0014 −0.0009 8340 56801.8266 0.0022 −0.0032 3743 56801.9581 0.0007 −0.0051 4444 56802.0059 0.0009 −0.0018 3745 56802.0544 0.0010 0.0022 4446 56802.0955 0.0004 −0.0012 4247 56802.1400 0.0006 −0.0012 4448 56802.1858 0.0007 0.0001 43∗BJD−2400000.†Against max = 2456800.0498+ 0.044498E.‡Number of points used to determine the maximum.
1988). This delay of detection of superhumps was partlycaused by the decrease of frequency of superoutbursts be-tween 1980 and 1989, which prevented scheduled observa-tional campaigns (cf. Udalski 1990).
We reported observations of the 1999, 2010 and 2013superoutbursts in Kato et al. (2009), Kato et al. (2010)and Kato et al. (2014a), respectively.
The rise to the 2014–2015 superoutburst took place on2014 December 27 according to the AAVSO data. Theoutburst was a precursor outburst and the final rise tothe superoutburst was on 2015 January 1–2 (vsnet-alert18142; figure 30). There was a post-superoutburst re-brightening on January 18–19 (figure 30). Time-resolvedphotometry was obtained rather fragmentarily. Althoughthere were also observations in the late stage of the plateauphase, superhumps became unclear. Only the times of su-perhump maxima in the earlier stage of the superoutburst

30 T. Kato et al. [Vol. ,
Table 25. Superhump maxima of V418 Ser (2014) (contin-ued)
E max∗ error O−C† N ‡
53 56802.4078 0.0003 −0.0004 13154 56802.4523 0.0003 −0.0004 10265 56802.9447 0.0007 0.0025 4066 56802.9894 0.0010 0.0027 4367 56803.0329 0.0016 0.0017 4368 56803.0799 0.0009 0.0043 4269 56803.1233 0.0017 0.0032 4170 56803.1669 0.0013 0.0022 4171 56803.2104 0.0023 0.0012 3973 56803.3098 0.0007 0.0117 12974 56803.3458 0.0005 0.0032 13275 56803.3935 0.0005 0.0064 13276 56803.4412 0.0007 0.0095 13377 56803.4803 0.0004 0.0042 13078 56803.5231 0.0004 0.0024 13281 56803.6626 0.0038 0.0085 7682 56803.7077 0.0018 0.0090 7783 56803.7501 0.0038 0.0070 64
106 56804.7752 0.0010 0.0086 41118 56805.3066 0.0002 0.0061 91127 56805.7060 0.0023 0.0049 30128 56805.7524 0.0007 0.0068 47129 56805.8006 0.0006 0.0105 29130 56805.8421 0.0012 0.0076 43131 56805.8860 0.0020 0.0070 35132 56805.9324 0.0006 0.0088 56133 56805.9744 0.0012 0.0064 91134 56806.0209 0.0007 0.0084 137135 56806.0642 0.0010 0.0072 93136 56806.1089 0.0006 0.0074 42137 56806.1524 0.0004 0.0063 34152 56806.8214 0.0011 0.0079 35∗BJD−2400000.†Against max = 2456800.0498+ 0.044498E.‡Number of points used to determine the maximum.
are listed in table 27. A comparison of O−C diagramssuggests that the superhumps started to grow around themaximum of the precursor outburst in the 2014 superout-burst (figure 31).
3.27. CY Ursae Majoris
This object was identified as an SU UMa-type dwarfnova in 1988 (Kato et al. 1988; Kato 1997b). The correctsuperhump period was established by Harvey, Patterson(1995). See Kato et al. (2014b) for more history.
The 2014 superoutburst was detected by H. Maehara(vsnet-alert 16967), which stared as a separate precursoroutburst on March 3. The object once faded, but was de-tected in outburst again after six days (vsnet-alert 16998).This outburst turned out to be a genuine superoutburst.Such a separate precursor was first observed in CY UMa.
The times of superhump maxima are listed in table 28.Although E = 0 corresponded to the growing stage of su-
Table 25. Superhump maxima of V418 Ser (2014) (contin-ued)
E max∗ error O−C† N ‡
153 56806.8648 0.0009 0.0068 40154 56806.9084 0.0009 0.0059 41173 56807.7517 0.0009 0.0037 35174 56807.7947 0.0023 0.0023 32175 56807.8394 0.0013 0.0025 41195 56808.7290 0.0013 0.0021 66196 56808.7696 0.0011 −0.0019 83197 56808.8140 0.0026 −0.0019 68198 56808.8614 0.0021 0.0010 55199 56808.9026 0.0023 −0.0024 32240 56810.7254 0.0008 −0.0040 74241 56810.7674 0.0010 −0.0065 107242 56810.8111 0.0008 −0.0072 88243 56810.8602 0.0014 −0.0027 79263 56811.7443 0.0024 −0.0085 16264 56811.7873 0.0043 −0.0100 28307 56813.7021 0.0018 −0.0086 31308 56813.7478 0.0020 −0.0075 32309 56813.7892 0.0019 −0.0105 32310 56813.8414 0.0033 −0.0028 32311 56813.8844 0.0016 −0.0043 32∗BJD−2400000.†Against max = 2456800.0498+ 0.044498E.‡Number of points used to determine the maximum.
0 50 100 150 200
−0.04
−0.02
0.00
0.02
199520052015
Fig. 29. Comparison of O − C diagrams of V701 Tau be-tween different superoutbursts. A period of 0.06899 d wasused to draw this figure. Approximate cycle counts (E) afterthe start of the superoutburst were used. We assumed thatthe 2015 superoutburst was detected soon after the maximumand shifted other superoutbursts to get the best fit.

No. ] Period Variations in SU UMa-Type Dwarf Novae VII 31
Table 26. Superhump maxima of V701 Tau (2015)
E max∗ error O−C† N ‡
0 57070.3621 0.0038 −0.0147 6813 57071.2927 0.0050 0.0186 4114 57071.3462 0.0008 0.0031 7556 57074.2327 0.0028 −0.0097 2757 57074.3101 0.0005 −0.0014 7758 57074.3771 0.0010 −0.0034 7771 57075.2865 0.0030 0.0086 3772 57075.3459 0.0006 −0.0010 67∗BJD−2400000.†Against max = 2457070.3768+ 0.069030E.‡Number of points used to determine the maximum.
−200 −150 −100 −50 0 50 100 150 200 250 300
−0.02
0.00
0.02
1010 1015 1020 1025 1030 1035 1040 1045
10
12
14
16
Fig. 30. O−C diagram of superhumps in SU UMa (2014).(Upper): O −C diagram. A period of 0.07918 d was usedto draw this figure. (Lower): Light curve. The observationswere binned to 0.01 d. A precursor outburst and a post-su-peroutburst rebrightening were clearly recorded.
Table 27. Superhump maxima of SU UMa (2014)
E max∗ error O−C† N ‡
0 57025.5893 0.0006 −0.0001 3622 57027.3341 0.0010 0.0011 16623 57027.4115 0.0005 −0.0006 14624 57027.4913 0.0006 −0.0001 16025 57027.5704 0.0017 −0.0003 49∗BJD−2400000.†Against max = 2457025.5894+ 0.079252E.‡Number of points used to determine the maximum.
0 50 100 150 200 250
−0.04
−0.02
0.00
0.02
1989199920102014
Fig. 31. Comparison of O−C diagrams of SU UMa betweendifferent superoutbursts. A period of 0.07918 d was used todraw this figure. Approximate cycle counts (E) after the startof the superoutburst were used. For the 2014 superoutburst,the cycle count from the maximum of the precursor outburstwas used. The two epochs in the 2010 data may be traditionallate superhumps.
perhumps (during the final rise to the superoutburst), theperiod of stage A superhumps was not meaningfully de-termined. The transition from stage B to C was rathersmooth in this object and the distinction between thesestages is rather ambiguous. The epochs for E ≥ 125 cor-respond to the rapid fading phase and post-superoutburstphase. Since the observations were rather fragmentary inthese phases, we did not attempt to determine the periodafter the superoutburst.
A comparison of the O−C diagrams (figure 32) indi-cates that the O−C diagram of the 2014 superoutburstwell matched the others if we assume that superhumpsstarted to grow 22 cycles before E =0. It implies that theduration of stage A was 2.0 d (up to E = 5), and it is evi-dent that superhumps started to grow after the precursoroutburst.
Since there is no published statistics of outbursts of CYUMa, we summarized the list of outbursts from the read-ily available data (table 29). It has become evident thatnormal outbursts were more frequently recorded in thelate 1980s to early 1990s. Most of superoutbursts weredetected except two between 1989 and 1991, one between2006 and 2008 and likely three between 2010 and 2013.These outburst detections heavily relied on a few expertobservers, and the variation of the activity of these ob-servers strongly affected the detections. The lack of su-peroutburst between 2010 and 2013 was probably a resultof the decrease of visual observers regularly watching thisobject. This decrease has been partly compensated byCCD monitoring, but it is not still sufficient particularlyaround solar conjunctions. It has also become evidentthat supercycle length has experienced a dramatic change

32 T. Kato et al. [Vol. ,
0 50 100 150 200−0.03
−0.02
−0.01
0.00
0.01
19951998199920092014
Fig. 32. Comparison of O−C diagrams of CY UMa betweendifferent superoutbursts. A period of 0.07212 d was used todraw this figure. Approximate cycle counts (E) after the startof the superoutburst were used. The 2014 superoutburst wasshifted by 22 cycles to best match the others.
0 5 10 15 20 25 30−400
−200
0
200
Fig. 33. O−C diagram of superoutbursts in CY UMa. Theephemeris used was Max(JD)= 2447824 + 327.0E. In 2003,the supercycle suddenly decreased from 362 d to 290 d.
around 2003 (figure 33). Before 2003 (JD 2452545), themean supercycle was 362(3) d. After this, the value de-creased to 290(1) d. Since this change was not apparentlyassociated with the increase of normal outbursts, it is lesslikely to be a result of an increased mass-transfer rate. Itwould be interesting to see the evolution of the supercyclelength in future.
Table 28. Superhump maxima of CY UMa (2014)
E max∗ error O−C† N ‡
0 56726.1519 0.0006 0.0080 1315 56726.5052 0.0002 0.0003 1016 56726.5776 0.0002 0.0006 1587 56726.6495 0.0002 0.0003 137
11 56726.9405 0.0005 0.0026 7112 56727.0107 0.0005 0.0007 7913 56727.0836 0.0003 0.0014 15514 56727.1567 0.0002 0.0022 17715 56727.2280 0.0002 0.0014 22016 56727.3015 0.0002 0.0027 23817 56727.3730 0.0002 0.0021 15518 56727.4459 0.0002 0.0028 14919 56727.5167 0.0002 0.0014 15320 56727.5897 0.0003 0.0022 15421 56727.6623 0.0005 0.0026 6727 56728.0953 0.0004 0.0026 12728 56728.1664 0.0005 0.0015 23329 56728.2387 0.0006 0.0016 20530 56728.3119 0.0004 0.0026 23131 56728.3830 0.0003 0.0017 12732 56728.4552 0.0002 0.0016 18933 56728.5268 0.0003 0.0010 19934 56728.5987 0.0004 0.0008 15535 56728.6728 0.0006 0.0027 4644 56729.3219 0.0007 0.0022 9945 56729.3942 0.0004 0.0024 11646 56729.4637 0.0003 −0.0003 17447 56729.5387 0.0003 0.0025 16148 56729.6112 0.0003 0.0029 14457 56730.2575 0.0007 −0.0004 13758 56730.3292 0.0005 −0.0009 14859 56730.4011 0.0003 −0.0012 120∗BJD−2400000.†Against max = 2456726.1440+ 0.072174E.‡Number of points used to determine the maximum.
3.28. QZ Virginis
QZ Vir (former T Leo) is the second dwarf nova discov-ered in the history. See Kato (1997a) for a summary ofthe history. In recent years, this object has shown super-outbursts approximately once a year.
The 2014 superoutburst was detected by R. Modicin relatively early phase (vsnet-alert 17291). After fur-ther brightening (vsnet-alert 17296), evolving superhumpswere observed (vsnet-alert 17301). This part was laterfound to be a precursor part of a superoutburst andfully developed superhumps were recorded near the peakbrightness. The times of superhump maxima during thesuperoutburst plateau are listed in table 30. All stagesA–C were recorded (see also figure 34). After the plateauphase, superhumps were also continuously observed (ta-ble 31). The superhumps in the post-superoutburst phasewere on a smooth continuation of stage C superhumps,and there was no phase ∼0.5 jump as expected for “tradi-

No. ] Period Variations in SU UMa-Type Dwarf Novae VII 33
Table 29. List of recent outbursts of CY UMa.
Year Month max∗ magnitude type source1988 1 47167 12.3 super VSOLJ; Kato et al. (1988); Kato (1997b)1988 5 47299 12.5 normal VSOLJ; Watanabe et al. (1989)1988 10 47464 12.2 normal VSOLJ; Watanabe et al. (1989)1989 1 47528 12.9 normal VSOLJ; Watanabe et al. (1989)1989 3 47614 12.3 super P. Schmeer; Watanabe et al. (1989)1989 6 47679 12.8 normal VSOLJ1990 1 47915 12.5 normal VSOLJ1990 4 47986 12.9 normal VSOLJ, AAVSO1990 9 48156 12.3 normal VSOLJ, AAVSO1990 12 48252 13.3 normal Schmeer1991 3 48335 13.3 normal VSOLJ, AAVSO1991 12 48610 12.8 super VSOLJ, AAVSO; Kato (1995)1993 2 49042 12.2 super VSOLJ, AAVSO1993 6 49155 12.9 normal AAVSO1994 3 49441 11.7 super VSOLJ, AAVSO1995 3 49795 12.1 super VSOLJ, AAVSO; Harvey, Patterson (1995); Kato et al. (2009)1995 5 49859 13.0 normal AAVSO1995 7 49915 13.3 normal AAVSO1996 3 50164 12.2 super AAVSO, VSOLJ1996 6 50245 13.4 normal AAVSO1996 12 50442 12.9 normal AAVSO1997 3 50516 14.1 ?† AAVSO1997 3 50520 13.7 ?‡ AAVSO1997 4 50559 12.6 precursor?† AAVSO1997 4 50568 12.3 super AAVSO, VSOLJ1997 10 50726 12.6 normal AAVSO1998 3 50882 12.4 super AAVSO, VSOLJ; Kato et al. (2009)1998 5 50948 l3.8 normal AAVSO1998 12 51167 13.2 normal§ VSOLJ1999 2 51220 l2.5 super AAVSO, VSOLJ; Kato, Matsumoto (1999); Kato et al. (2009)1999 6 51335 12.8 normal AAVSO1999 12 51539 12.5 super AAVSO, VSOLJ2000 2 51600 13.0 normal AAVSO2000 4 51654 13.2 normal AAVSO∗JD−2400000.†CCD single detection.‡Detection by two visual observers, but contradict a CCD observation two hours later.§Single visual detection.

34 T. Kato et al. [Vol. ,
Table 29. List of recent outbursts of CY UMa (continued).
Year Month max∗ magnitude type source2000 6 51716 13.1 normal AAVSO2000 12 51893 12.5 super AAVSO, VSOLJ2001 6 52064 13.1 normal AAVSO2001 11 52234 12.3 super AAVSO2002 1 52300 13.9 normal AAVSO2002 5 52422 12.9 normal AAVSO2002 11 52601 12.9 normal† AAVSO2003 1 52645 12.4 super AAVSO, VSOLJ2003 3 52717 12.7 normal AAVSO2003 6 52818 12.9 normal† AAVSO2003 10 52929 12.3 super AAVSO2003 12 52998 14.4§ normal AAVSO2004 2 53055 13.0 normal AAVSO, VSOLJ2004 4 53122 12.9 normal AAVSO2004 7 53203 12.3 super AAVSO2004 11 53315 12.3 normal AAVSO2005 1 53398 12.9 normal AAVSO2005 4 53478 12.5 super AAVSO, VSOLJ2005 11 53676 12.5 normal AAVSO2006 2 53788 12.8 super AAVSO2006 6 53802 13.8 normal AAVSO2006 11 54062 12.4 super vsnet-alert 9148; AAVSO2007 4 54195 13.0 normal AAVSO2008 6 54643 l2.5 super AAVSO2009 3 54916 12.6 super vsnet-alert 11127; AAVSO; Kato et al. (2009)2009 5 54972 12.6 normal AAVSO2010 2 55234 12.3 super vsnet-alert 11811; AAVSO2010 4 55302 13.2 normal† AAVSO2010 5 55330 15.1 normal† AAVSO2010 12 55558 13.5 normal AAVSO2011 2 55615 13.3 normal AAVSO2012 1 55944 14.6 normal† AAVSO2012 2 55986 13.1 normal† AAVSO2012 5 56078 13.7 normal§ AAVSO2013 4 56389 12.5 super vsnet-alert 15596; AAVSO2014 3 56720 12.6 precursor + super vsnet-alert 16967; this paper∗JD−2400000.†CCD single detection.‡Detection by two visual observers, but contradict a CCD observation two hours later.§Single visual detection.

No. ] Period Variations in SU UMa-Type Dwarf Novae VII 35
Table 28. Superhump maxima of CY UMa (2014) (contin-ued)
E max∗ error O−C† N ‡
60 56730.4731 0.0004 −0.0014 15161 56730.5464 0.0003 −0.0002 15562 56730.6196 0.0004 0.0008 10468 56731.0542 0.0014 0.0024 4169 56731.1180 0.0024 −0.0060 2770 56731.1937 0.0004 −0.0025 23571 56731.2663 0.0004 −0.0021 24472 56731.3382 0.0003 −0.0023 23073 56731.4104 0.0007 −0.0023 7974 56731.4815 0.0014 −0.0034 5775 56731.5539 0.0011 −0.0032 6881 56731.9899 0.0012 −0.0002 5482 56732.0587 0.0014 −0.0035 5483 56732.1359 0.0025 0.0014 12784 56732.2025 0.0009 −0.0042 21585 56732.2751 0.0019 −0.0037 7197 56733.1400 0.0011 −0.0048 13898 56733.2069 0.0009 −0.0102 16799 56733.2786 0.0004 −0.0107 133
101 56733.4276 0.0015 −0.0060 18102 56733.5014 0.0021 −0.0043 34103 56733.5697 0.0021 −0.0082 35125 56735.1419 0.0007 −0.0239 68126 56735.2084 0.0013 −0.0296 110156 56737.4295 0.0014 0.0263 36170 56738.4478 0.0008 0.0342 38181 56739.2186 0.0006 0.0111 73182 56739.2815 0.0011 0.0018 76∗BJD−2400000.†Against max = 2456726.1440+ 0.072174E.‡Number of points used to determine the maximum.
tional” late superhumps. This finding confirmed the ear-lier finding (Kato et al. 2009).
Although stage A superhumps were detected, the cov-erage of the 2014 observation was not good enough to de-termine the period sufficiently. An analysis of the O−Cdata suggested a period of 0.0625(3) d, which correspondsto q=0.18(2). However, since the baseline is only 1 d andthe coverage was not so good, we should not heavily relyon this value. The absence of stage A superhumps dur-ing the 1993 superoutburst still remains a mystery (Kato1997a; Kato et al. 2009). If we can shift the O−C dia-gram of the 1993 superoutburst by 50 cycles, the resultantO−C diagram appears to fit the others (figure 34; thisfigure used the data in Ohshima et al. 2011). This im-plies that superhumps started to grow 3 d earlier thanthe precursor outburst. If superhumps had already grownat the time of the precursor outburst, the lack of stage Asuperhumps may be reconciled, although such early devel-opment of superhumps may be a challenge to the standardthermal-tidal disk instability model.
0 100 200 300 400 500 600
−0.10
−0.05
0.00
790 795 800 805 810 815 820 825
10
12
14
16
Fig. 34. O − C diagram of superhumps in QZ Vir (2014).(Upper): O −C diagram. A period of 0.06038 d was usedto draw this figure. (Lower): Light curve. The observationswere binned to 0.01 d.
0 50 100 150 200 250 300 350
−0.06
−0.04
−0.02
0.00
0.02
0.04
199320052007200820092014
Fig. 35. Comparison of O−C diagrams of QZ Vir betweendifferent superoutbursts. A period of 0.06032 d was used todraw this figure. Approximate cycle counts (E) after thestarts of outbursts were used. Since the starts of the 2005,2007 and 2008 superoutbursts were not well constrained, weshifted the O−C diagrams to best fit the others. The 1993superoutburst was shifted by 50 cycles, which implies thatsuperhumps started to grow 3 d before the precursor.

36 T. Kato et al. [Vol. ,
Table 30. Superhump maxima of QZ Vir (2014)
E max∗ error O−C† N ‡
0 56791.4075 0.0038 −0.0334 271 56791.4677 0.0030 −0.0335 235 56791.7308 0.0090 −0.0120 836 56791.7991 0.0078 −0.0041 78
16 56792.4093 0.0017 0.0024 5617 56792.4858 0.0041 0.0185 2618 56792.5345 0.0005 0.0069 3219 56792.5978 0.0005 0.0097 1920 56792.6565 0.0018 0.0080 632 56793.3739 0.0038 0.0010 2233 56793.4402 0.0008 0.0068 2834 56793.4985 0.0004 0.0048 2235 56793.5575 0.0006 0.0034 3136 56793.6197 0.0006 0.0052 2542 56793.9811 0.0005 0.0044 43743 56794.0410 0.0001 0.0039 123544 56794.1013 0.0002 0.0038 124845 56794.1621 0.0008 0.0043 13749 56794.3999 0.0011 0.0005 2951 56794.5217 0.0007 0.0016 3252 56794.5799 0.0003 −0.0006 8253 56794.6406 0.0004 −0.0003 10054 56794.7017 0.0002 0.0005 15959 56795.0025 0.0003 −0.0007 33960 56795.0637 0.0002 0.0002 32661 56795.1248 0.0003 0.0009 47466 56795.4274 0.0003 0.0016 24267 56795.4929 0.0009 0.0067 2568 56795.5448 0.0009 −0.0018 4969 56795.6053 0.0004 −0.0016 11070 56795.6654 0.0005 −0.0019 8671 56795.7278 0.0027 0.0001 2675 56795.9682 0.0018 −0.0009 10176 56796.0294 0.0002 −0.0002 450∗BJD−2400000.†Against max = 2456791.4409+ 0.060377E.‡Number of points used to determine the maximum.
3.29. NSV 1436
NSV 1436 was one of variable stars (Ross 4) reported inRoss (1925). Although Ross (1925) gave a photographicrange of 12–16 mag, the variability type was not known.T. Kato pointed out in 2000 that the object can be iden-tified with an ROSAT X-ray source (vsnet-chat 3326).11
Starting from 2000, a search for outburst started mostlyby visual observers. This attempt had been unsuccessfulup to 2010. In Brown et al. (2010), studied the histori-cal photographic material and characterized two outburstsin 1904 and 1948. The object was mostly in faint statefainter than 15.8 mag and occasionally observed in out-burst. Brown et al. (2010) suggested that the object mightbe a recurrent nova.
11 Brown et al. (2010) incorrectly gave the first reference of theROSAT identification of this object.
Table 30. Superhump maxima of QZ Vir (2014) (continued)
E max∗ error O−C† N ‡
77 56796.0906 0.0002 0.0006 51378 56796.1479 0.0009 −0.0024 25985 56796.5748 0.0017 0.0019 2686 56796.6339 0.0006 0.0006 8387 56796.6941 0.0011 0.0004 8192 56796.9947 0.0009 −0.0009 14293 56797.0566 0.0003 0.0006 48594 56797.1136 0.0007 −0.0027 39499 56797.4179 0.0034 −0.0004 18
100 56797.4793 0.0083 0.0007 10101 56797.5386 0.0016 −0.0004 41102 56797.6002 0.0006 0.0008 100115 56798.3891 0.0006 0.0048 132117 56798.5095 0.0016 0.0044 29118 56798.5702 0.0008 0.0048 84119 56798.6319 0.0005 0.0061 93125 56798.9941 0.0007 0.0060 65126 56799.0529 0.0006 0.0044 64127 56799.1133 0.0009 0.0045 39135 56799.5940 0.0003 0.0022 85136 56799.6529 0.0005 0.0007 88141 56799.9689 0.0016 0.0148 48142 56800.0139 0.0006 −0.0005 76143 56800.0733 0.0006 −0.0015 79148 56800.3726 0.0006 −0.0041 114149 56800.4375 0.0012 0.0004 63151 56800.5648 0.0014 0.0070 55152 56800.6114 0.0007 −0.0068 82153 56800.6743 0.0007 −0.0043 82158 56800.9699 0.0012 −0.0106 64159 56801.0339 0.0010 −0.0069 104160 56801.0975 0.0012 −0.0038 26168 56801.5729 0.0008 −0.0114 67170 56801.6922 0.0010 −0.0128 54∗BJD−2400000.†Against max = 2456791.4409+ 0.060377E.‡Number of points used to determine the maximum.
In 2011, a fresh outburst was reported by E. Muyllaertat an unfiltered CCD magnitude of 13.49 on March 28,and the outburst was confirmed by M. Linnolt a visualmagnitude of 12.8. There was a suspected fainter out-burst on March 9 (Templeton 2011). Despite an intensiveobserving campaign, the object rapidly faded. Osborneet al. (2011) observed this outburst with Swift satelliteand found that the X-ray properties were not those of arecurrent nova. The optical light variation suggested thedwarf nova classification (Osborne et al. 2011).
A total of 14 outbursts were recorded between 2011 and2014 March, and the object was found to undergo out-bursts more frequently than supposed. Pagnotta, Schaefer(2014) also listed this object as an ordinary dwarf nova.
In 2014 September, a bright outburst of thie object wasvisually detected by P. Schmeer (11.8 mag on September15, vsnet-alert 17729). Subsequent observations finally

No. ] Period Variations in SU UMa-Type Dwarf Novae VII 37
Table 31. Superhump maxima of QZ Vir (2014) (post-su-peroutburst)
E max∗ error O−C† N ‡
0 56803.0126 0.0002 0.0059 2406 56803.3689 0.0005 0.0022 1319 56803.5494 0.0007 0.0028 28
10 56803.6099 0.0007 0.0033 1925 56804.5049 0.0010 −0.0015 2726 56804.5652 0.0011 −0.0013 2733 56804.9830 0.0042 −0.0034 2234 56805.0355 0.0004 −0.0109 33135 56805.1058 0.0005 −0.0006 26642 56805.5330 0.0019 0.0067 2843 56805.5830 0.0015 −0.0033 2651 56806.0630 0.0012 −0.0033 6052 56806.1163 0.0021 −0.0099 3559 56806.5468 0.0015 0.0007 2766 56806.9676 0.0031 0.0015 4467 56807.0307 0.0011 0.0047 6475 56807.5072 0.0015 0.0012 29
109 56809.5370 0.0014 −0.0086 27142 56811.5514 0.0061 0.0261 24176 56813.5537 0.0017 −0.0112 19259 56818.5430 0.0012 −0.0011 23∗BJD−2400000.†Against max = 2456803.0067+ 0.059990E.‡Number of points used to determine the maximum.
revealed the emergence of superhumps after a rise from aprecursor outburst (figure 36; vsnet-alert 17736). Furtherobservations confirmed superhump (vsnet-alert 17754,17770; figure 37).
The times of superhump maxima are listed in table 32.The maxima for E≤ 2 were likely the final part of stage A.Although there were observations on the preceding night,the amplitudes were too small to determine the periodof stage A superhumps. As is usual for an object withthis moderate superhump period, the transition betweenstages was not very sharp. We could, however, identifystages B and C. The resultant behavior was typical for anSU UMa-type dwarf nova.
3.30. NSV 4618
NSV 4618 was discovered by Luyten (1938) as a vari-able object. A photographic range of 14.0 to fainter than16 was reported. Although the identity of the object hadlong been unknown, CRTS Siding Spring Survey (SSS)detected an outburst on 2013 April 13 (cf. vsnet-alert15611). The object was recorded in outburst several timesin ASAS-3 data. The brightest outburst reached V =13.3.The eclipsing nature of this object was inferred (vsnet-alert 15612, 15613, 15614). Using the CRTS data, an or-bital period was determined (vsnet-alert 15615) and theobject was recognized as a candidate eclipsing SU UMa-type dwarf nova. The 2015 outburst was detected onFebruary 14 by the ASAS-SN team (vsnet-alert 18297).Subsequent observations detected deep eclipses and super-
915 920 925 930 935 940
12
14
16
Fig. 36. Light curve of the superoutburst of NSV 1436(2014). The data were binned to 0.01 d. The initial precursorpart of the outburst and subsequent rise to the superoutburstmaximum are clearly depicted. The widths of the light curvemainly reflect the amplitudes of superhumps.
0.070 0.071 0.072 0.073 0.074 0.075 0.076
0.4
0.6
0.8
1.0
(d)
θ
P=0.07275
−0.5 0.0 0.5 1.0 1.5
−0.10
−0.05
0.00
0.05
0.10
Fig. 37. Superhumps in NSV 1436 during the superout-burst plateau (2014). (Upper): PDM analysis. (Lower):Phase-averaged profile.

38 T. Kato et al. [Vol. ,
Table 32. Superhump maxima of NSV 1436 (2014)
E max∗ error O−C† N ‡
0 56917.5356 0.0004 −0.0071 711 56917.6102 0.0003 −0.0053 772 56917.6816 0.0004 −0.0065 63
12 56918.4124 0.0003 −0.0030 8013 56918.4862 0.0003 −0.0019 10914 56918.5589 0.0003 −0.0019 10915 56918.6323 0.0003 −0.0013 15426 56919.4332 0.0004 −0.0002 11327 56919.5075 0.0003 0.0014 10628 56919.5782 0.0003 −0.0007 9529 56919.6517 0.0057 0.0001 2949 56921.1041 0.0005 −0.0019 12750 56921.1796 0.0005 0.0010 14251 56921.2519 0.0017 0.0005 5052 56921.3246 0.0009 0.0005 5668 56922.4948 0.0015 0.0071 5369 56922.5628 0.0007 0.0025 7670 56922.6393 0.0007 0.0062 7677 56923.1497 0.0007 0.0076 5378 56923.2208 0.0007 0.0060 5579 56923.2940 0.0005 0.0065 5482 56923.5114 0.0005 0.0058 7783 56923.5856 0.0003 0.0072 7884 56923.6569 0.0008 0.0058 77
109 56925.4690 0.0005 −0.0001 66110 56925.5404 0.0006 −0.0014 78111 56925.6123 0.0004 −0.0022 75112 56925.6895 0.0016 0.0023 36119 56926.1949 0.0008 −0.0014 53120 56926.2684 0.0007 −0.0005 53149 56928.3673 0.0008 −0.0105 80150 56928.4361 0.0009 −0.0144 76∗BJD−2400000.†Against max = 2456917.5428+ 0.072719E.‡Number of points used to determine the maximum.
humps (vsnet-alert 18305, 18306; figures 39, figure 38).An MCMC analysis of both the CRTS data and the
present data in outburst yielded the following orbitalephemeris:
Min(BJD) = 2454884.13441(2)+ 0.0657692860(6)E.(2)
The times of superhump maxima outside the eclipsesare listed in table 33. Since the object faded three daysafter the initial observation, it was likely we only observedthe terminal stage of the superoutburst.
3.31. 1RXS J185310.0+594509
This object (hereafter 1RXS J185310) was originallyselected as a variable optical counterpart of an ROSATX-ray source (Denisenko, Sokolovsky 2011). The desig-nation DDE 14 was also given (Denisenko 2011).12 The
12 For a list of DDE variables, see<http://hea.iki.rssi.ru/∼denis/VarDDE.html>.
0.064 0.066 0.068 0.070 0.072
0.6
0.7
0.8
0.9
1.0
(d)
θ
P=0.06756
−0.5 0.0 0.5 1.0 1.5
−0.2
−0.1
0.0
0.1
0.2
Fig. 38. Superhumps in NSV 4618 outside the eclipses(2015). Due to the limited data segment, the error is rel-atively large. Post-superoutburst observations were not in-cluded in the analysis. (Upper): PDM analysis. (Lower):Phase-averaged profile.
Table 33. Superhump maxima of NSV 4618 (2015)
E max∗ error O−C† phase‡ N §
0 57070.5565 0.0014 −0.0080 0.82 171 57070.6404 0.0020 0.0084 0.09 24
15 57071.5842 0.0128 0.0071 0.44 1718 57071.7727 0.0005 −0.0069 0.31 5619 57071.8445 0.0006 −0.0027 0.40 4930 57072.5944 0.0212 0.0047 0.80 1931 57072.6545 0.0036 −0.0027 0.72 18∗BJD−2400000.†Against max = 2457070.5645+ 0.067506E.‡Orbital phase.§Number of points used to determine the maximum.

No. ] Period Variations in SU UMa-Type Dwarf Novae VII 39
0.50 0.55 0.60 0.65 0.70 0.75 0.80 0.85 0.90
15
16
17
18
19
1.50 1.55 1.60 1.65 1.70 1.75 1.80 1.85
15
16
17
18
19
Fig. 39. Sample light curve of NSV 4618 in superoutburst.Superposition of superhumps and eclipse are well visible.
object was found in outburst on Palomar Observatory SkySurvey II infrared plate on 1992 June 28. On 2011 May8, J. Shears detected an outburst at an unfiltered CCDmagnitude of 15.9 (all magnitudes are unfiltered for thisobject unless otherwise noted; cvnet-outburst 4145). On2011 November 22, J. Shears also detected an outburstat a magnitude of 15.1 (cvnet-outburst 4405). Duringthis outburst, J. Shears detected superhump-like modula-tions, but it was not confirmed because the observationswere obtained only for a night. Two further outburstswere recorded on 2012 December 5-11 (peak brightnessat 15.16 on December 9) and 2013 August 16 (16.6 mag)by J. Shears. The 2013 August outburst was recordedby the ASAS-SN team at V =15.18 on August 15 (vsnet-alert 16247). Two faint outbursts in 2014 were detectedby MASTER network (vsnet-alert 17500).
The 2014 July outburst was detected by J. Shears ata magnitude of 14.8 on July 16 (vsnet-outburst 17115).Subsequent observations detected superhumps (vsnet-alert 17514, 17532; figure 40).
The times of superhump maxima are listed in table 34.Although the superhump stage was not identified, thesesuperhumps were likely stage B superhumps as judgedfrom the large amplitudes.
The two long outbursts in 2011 November and 2012December must have been superoutbursts. The intervalbetween these two superoutburst was 379 d. The intervalbetween the 2012 and current superoutbursts was 590 d.
0.057 0.058 0.059 0.060 0.061 0.062
0.4
0.6
0.8
1.0
(d)
θ
P=0.05955
−0.5 0.0 0.5 1.0 1.5
−0.10
−0.05
0.00
0.05
0.10
Fig. 40. Superhumps in 1RXS J185310 (2014). (Upper):PDM analysis. (Lower): Phase-averaged profile.
The supercycle may be around 190 d, which needs to beconfirmed by further observations.
3.32. 1RXS J231935.0+364705
This object (=DDE 8, hereafter 1RXS J231935) was se-lected as a likely dwarf nova during the course of identifica-tion of the ROSAT sources (Denisenko, Sokolovsky 2011).The 2011 outburst was a superoutburst during which su-perhumps were detected (Kato et al. 2013a). The 2013outburst also a superoutburst (Kato et al. 2014a). The2005 outburst was also most likely a superoutburst whichwas recorded by CRTS. The 2010 May outburst was alsobright (CRTS data) but only single night observation wasavailable.
The 2014 outburst was detected by D. Denisenko atan unfiltered CCD magnitude of 13.9 (vsnet-alert 17701).Subsequent observations detected superhumps (vsnet-alert 17703, 17717, 17739). The times of superhump max-ima are listed in table 35. Although observations were notdense enough in the middle part of the outburst, stagesB and C were recorded. The O−C diagrams were verysimilar between the 2011 and 2014 superoutbursts (figure41).
The known outburst of this object is listed in table36. The shortest interval between outbursts was 74 d.

40 T. Kato et al. [Vol. ,
Table 34. Superhump maxima of 1RXS J185310 (2014)
E max∗ error O−C† N ‡
0 56857.6878 0.0020 0.0016 541 56857.7458 0.0003 0.0001 1042 56857.8060 0.0004 0.0008 1043 56857.8639 0.0005 −0.0009 104
14 56858.5174 0.0004 −0.0021 6415 56858.5863 0.0009 0.0073 2023 56859.0538 0.0008 −0.0014 2224 56859.1098 0.0033 −0.0050 4925 56859.1747 0.0012 0.0005 9530 56859.4746 0.0028 0.0027 2931 56859.5276 0.0004 −0.0037 6432 56859.5879 0.0006 −0.0029 6257 56861.0800 0.0009 0.0011 5758 56861.1392 0.0012 0.0008 5859 56861.1978 0.0011 −0.0001 1964 56861.4936 0.0024 −0.0019 4465 56861.5583 0.0010 0.0033 63∗BJD−2400000.†Against max = 2456857.6862+ 0.059521E.‡Number of points used to determine the maximum.
−20 0 20 40 60 80 100 120 140 160 180
−0.04
−0.02
0.00
0.02
20112014
Fig. 41. Comparison of O −C diagrams of 1RXS J231935between different superoutbursts. A period of 0.06600 d wasused to draw this figure. Approximate cycle counts (E) afterthe start of observations were used. The 2014 superoutburstwas shifted by 10 cycles to best match the 2011 one.
Although supercycle was not well determined, the short-est known interval between superoutbursts was ∼420 d.
3.33. 2QZ J130441.7+010330
This object (hereafter 2QZ J130441) was identified as aCV during the course of the 2dF QSO Redshift Survey(Croom et al. 2004). Although little had been knownabout this object, Kato et al. (2012b) estimated the or-bital period to be 0.064–0.069 d from the SDSS colors,
Table 35. Superhump maxima of 1RXS J231935 (2014)
E max∗ error O−C† N ‡
0 56908.0625 0.0002 −0.0035 734 56908.3262 0.0003 −0.0030 1005 56908.3934 0.0003 −0.0015 1336 56908.4591 0.0003 −0.0017 1317 56908.5179 0.0008 −0.0086 1118 56908.5905 0.0003 −0.0018 2079 56908.6555 0.0004 −0.0026 192
15 56909.0529 0.0005 −0.0001 13016 56909.1174 0.0004 −0.0013 17117 56909.1886 0.0011 0.0041 5251 56911.4325 0.0009 0.0109 4681 56913.4047 0.0004 0.0092 7182 56913.4690 0.0008 0.0077 5094 56914.2622 0.0029 0.0114 3695 56914.3222 0.0004 0.0056 99
108 56915.1778 0.0021 0.0058 39109 56915.2369 0.0007 −0.0009 48127 56916.4156 0.0015 −0.0065 24128 56916.4809 0.0016 −0.0070 25140 56917.2614 0.0010 −0.0161 49∗BJD−2400000.†Against max = 2456908.0660+ 0.065796E.‡Number of points used to determine the maximum.
suggesting an SU UMa-type dwarf nova. ASAS-SN teamdetected this object in outburst on 2014 March 20 at 15.65mag.
Subsequent observation detected superhumps (vsnet-alert 17079, 17087; figure 42). The times of superhumpmaxima are listed in table 37. Since the object startedfading rapidly on the fifth night of the observation, weprobably observed only stage C superhumps.
3.34. ASASSN-13cx
This object was detected as a transient at V =15.47. on2013 September 14 by ASAS-SN team. The coordinatesare 00h02m22.s34, +42◦42′13.′′4 (the Initial Gaia SourceList). CRTS data detected six past outbursts. This objectwas detected in outburst again by E. Muyllaert on 2014August 31 (cvnet-outburst 6073). Noting that there weretwo faint measurements in the CRTS data, an observa-tional campaign started to verify possible eclipses (vsnet-alert 17682). The object immediately turned out to be anSU UMa-type dwarf nova with deep eclipses (vsnet-alert17684; figure 44).
An MCMC analysis of both the CRTS data and thepresent data in outburst yielded the following orbitalephemeris (vsnet-alert 17691):
Min(BJD) = 2456901.69823(5)+ 0.079650075(5)E. (3)
The orbital light curve in quiescence based on thisephemeris is in figure 43. Orbital humps before eclipseswere present.
The times of superhump maxima are listed in table 38.Stages B and C can be identified. Although E ≤ 2 ap-
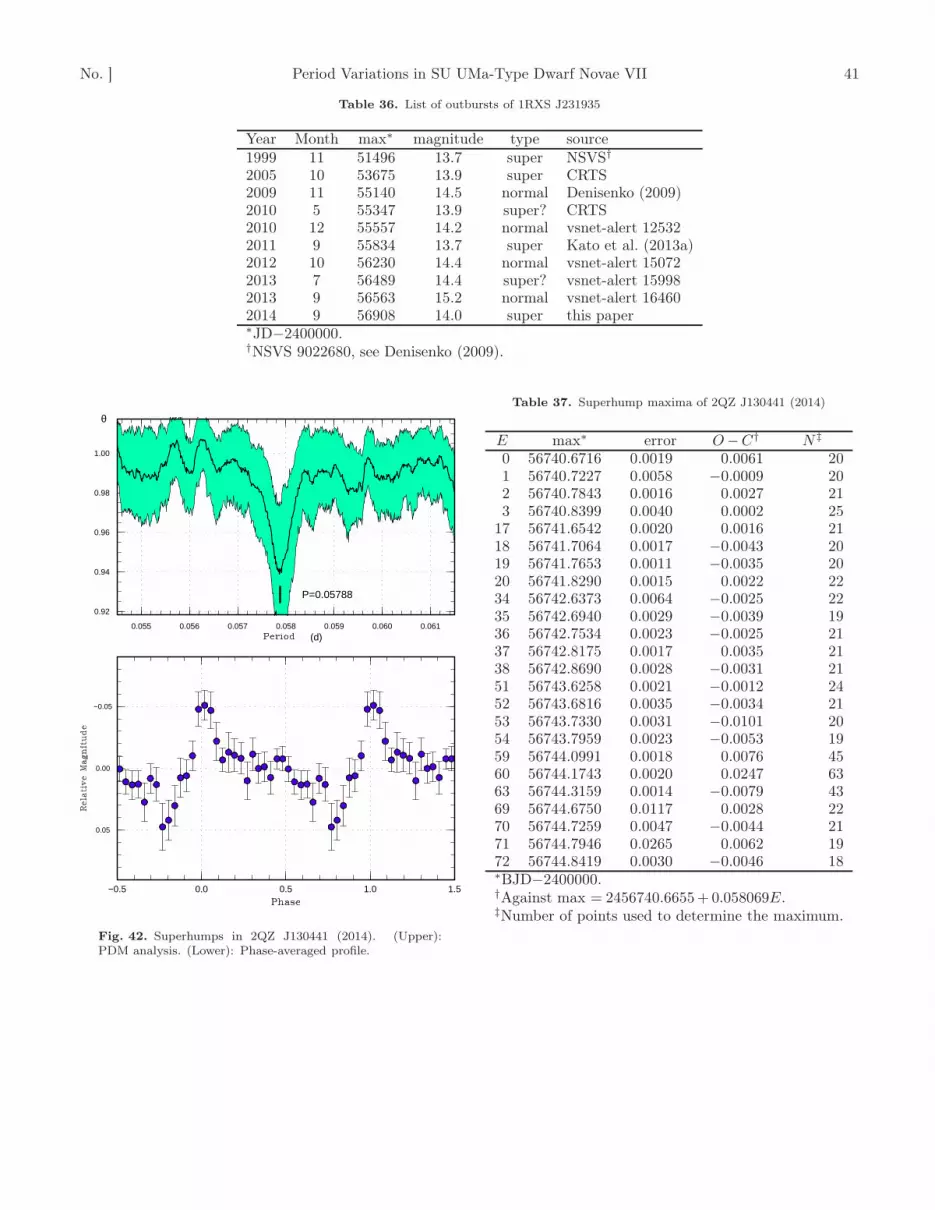
No. ] Period Variations in SU UMa-Type Dwarf Novae VII 41
Table 36. List of outbursts of 1RXS J231935
Year Month max∗ magnitude type source1999 11 51496 13.7 super NSVS†
2005 10 53675 13.9 super CRTS2009 11 55140 14.5 normal Denisenko (2009)2010 5 55347 13.9 super? CRTS2010 12 55557 14.2 normal vsnet-alert 125322011 9 55834 13.7 super Kato et al. (2013a)2012 10 56230 14.4 normal vsnet-alert 150722013 7 56489 14.4 super? vsnet-alert 159982013 9 56563 15.2 normal vsnet-alert 164602014 9 56908 14.0 super this paper∗JD−2400000.†NSVS 9022680, see Denisenko (2009).
0.055 0.056 0.057 0.058 0.059 0.060 0.061
0.92
0.94
0.96
0.98
1.00
(d)
θ
P=0.05788
−0.5 0.0 0.5 1.0 1.5
−0.05
0.00
0.05
Fig. 42. Superhumps in 2QZ J130441 (2014). (Upper):PDM analysis. (Lower): Phase-averaged profile.
Table 37. Superhump maxima of 2QZ J130441 (2014)
E max∗ error O−C† N ‡
0 56740.6716 0.0019 0.0061 201 56740.7227 0.0058 −0.0009 202 56740.7843 0.0016 0.0027 213 56740.8399 0.0040 0.0002 25
17 56741.6542 0.0020 0.0016 2118 56741.7064 0.0017 −0.0043 2019 56741.7653 0.0011 −0.0035 2020 56741.8290 0.0015 0.0022 2234 56742.6373 0.0064 −0.0025 2235 56742.6940 0.0029 −0.0039 1936 56742.7534 0.0023 −0.0025 2137 56742.8175 0.0017 0.0035 2138 56742.8690 0.0028 −0.0031 2151 56743.6258 0.0021 −0.0012 2452 56743.6816 0.0035 −0.0034 2153 56743.7330 0.0031 −0.0101 2054 56743.7959 0.0023 −0.0053 1959 56744.0991 0.0018 0.0076 4560 56744.1743 0.0020 0.0247 6363 56744.3159 0.0014 −0.0079 4369 56744.6750 0.0117 0.0028 2270 56744.7259 0.0047 −0.0044 2171 56744.7946 0.0265 0.0062 1972 56744.8419 0.0030 −0.0046 18∗BJD−2400000.†Against max = 2456740.6655+ 0.058069E.‡Number of points used to determine the maximum.

42 T. Kato et al. [Vol. ,
−0.4 −0.2 0.0 0.2 0.4 0.6 0.8 1.0 1.2 1.4
−1
0
1
2
Fig. 43. Orbital light curve of ASASSN-13cx in the CRTSdata.
1.0 1.2 1.4 1.6 1.8
14.5
15.0
15.5
16.0
16.5
2.0 2.2 2.4 2.6 2.8
14.5
15.0
15.5
16.0
16.5
Fig. 44. Sample light curve of ASASSN-13cx in superout-burst. Superposition of superhumps and eclipse are well visi-ble.
pears to corresponds to stage A superhumps, the periodof stage A superhumps could not be determined. Themean superhump profile outside the eclipses is shown infigure 45.
Since the 2013 outburst was likely a superoutburst asjudged from the magnitude, the supercycle can be esti-mated to be ∼350 d or possibly its half.
0.079 0.080 0.081 0.082 0.083 0.084 0.085 0.086
0.6
0.8
1.0
(d)
θ
P=0.08303
−0.5 0.0 0.5 1.0 1.5
−0.2
−0.1
0.0
0.1
Fig. 45. Superhumps in ASASSN-13cx outside the eclipses(2014). (Upper): PDM analysis. (Lower): Phase-averagedprofile.
3.35. ASASSN-14ag
This object was detected as a transient at V =13.5.on 2014 March 14 by ASAS-SN team. The coordinatesare 08h13m18.s51, −01◦03′28.′′5 (2MASS position). CRTSrecorded five more outbursts in the past data. One of theauthors (TK) noticed that the CRTS light curve showedevidence of eclipses, and obtained a period below theperiod gap (vsnet-alert 17036; figure 46). This sugges-tion was confirmed by photometry in outburst (vsnet-alert17041, 17042; figure 47). An MCMC analysis of both theCRTS data and the present data in outburst yielded thefollowing orbital ephemeris:
Min(BJD) = 2454413.99168(7)+ 0.060310651(2)E. (4)
There was a strong beat phenomenon between the su-perhump period and the orbital period (figure 47). Themean profile of superhumps outside the eclipses is shownin figure 48. The times of superhump maxima determinedoutside the eclipses are listed in table 39.
The relatively low outburst amplitude (2–3 mag in theCRTS data; the outburst data in ASAS-SN data appearto be brighter than the real magnitude by ∼1 mag) isprobably due to the high orbital inclination. Since sucha bright, deeply eclipsing SU UMa-type dwarf nova with

No. ] Period Variations in SU UMa-Type Dwarf Novae VII 43
Table 38. Superhump maxima of ASASSN-13cx (2014)
E max∗ error O−C† phase‡ N §
0 56901.5524 0.0006 −0.0069 0.17 1331 56901.6357 0.0004 −0.0064 0.22 1362 56901.7257 0.0012 0.0007 0.35 197 56902.1313 0.0005 −0.0079 0.44 808 56902.2185 0.0005 −0.0035 0.53 64
10 56902.3819 0.0003 −0.0059 0.58 8011 56902.4646 0.0004 −0.0060 0.62 9112 56902.5500 0.0005 −0.0034 0.69 12313 56902.6340 0.0008 −0.0023 0.75 10214 56902.7172 0.0004 −0.0019 0.79 7315 56902.8031 0.0009 0.0012 0.87 7134 56904.3712 0.0041 −0.0047 0.56 2635 56904.4609 0.0004 0.0021 0.68 8536 56904.5450 0.0005 0.0034 0.74 8738 56904.7142 0.0075 0.0069 0.87 1847 56905.4597 0.0009 0.0068 0.23 21548 56905.5433 0.0008 0.0076 0.27 21149 56905.6253 0.0004 0.0068 0.30 8650 56905.7075 0.0006 0.0061 0.34 5752 56905.8692 0.0007 0.0021 0.37 7158 56906.3684 0.0012 0.0043 0.63 4359 56906.4487 0.0008 0.0018 0.64 5460 56906.5305 0.0013 0.0007 0.67 6461 56906.6176 0.0013 0.0049 0.76 5463 56906.7817 0.0006 0.0034 0.82 9364 56906.8728 0.0015 0.0116 0.97 8072 56907.5217 0.0018 −0.0022 0.11 13073 56907.6051 0.0014 −0.0016 0.16 11683 56908.4406 0.0024 0.0054 0.65 6384 56908.5243 0.0024 0.0062 0.70 53
118 56911.3291 0.0027 −0.0055 0.92 46130 56912.3164 0.0042 −0.0124 0.31 39133 56912.5658 0.0077 −0.0115 0.44 33∗BJD−2400000.†Against max = 2456901.5593+ 0.082842E.‡Orbital phase.§Number of points used to determine the maximum.
a short orbital period is rare, further detailed study willbe promising in resolving the superhump light source indifferent stages.
3.36. ASASSN-14aj
This object was detected as a transient at V =15.1on 2014 March 27 by ASAS-SN team (vsnet-alert17101). The coordinates are 17h36m15.s09, +07◦16′56.′′0(SDSS g = 21.7 counterpart). This object was alsoindependently discovered on the same day as TCPJ17361506+0716560.13 There were also two past out-bursts (vsnet-alert 17130).
Subsequent observation detected superhumps (vsnet-alert 17119, 17128, 17131). The times of superhump max-
13 <http://www.cbat.eps.harvard.edu/unconf/followups/J17361506+0716560.html>.
−0.4 −0.2 0.0 0.2 0.4 0.6 0.8 1.0 1.2 1.4
−0.5
0.0
0.5
1.0
1.5
Fig. 46. Orbital light curve of ASASSN-14ag in the CRTSdata.
4.0 4.1 4.2 4.3 4.4 4.5 4.6 4.7
14
15
16
17
5.0 5.1 5.2 5.3 5.4 5.5 5.6 5.7
14
15
16
17
Fig. 47. Sample light curve of ASASSN-14ag in superout-burst. Superposition of superhumps and eclipse are well visi-ble.

44 T. Kato et al. [Vol. ,
0.059 0.060 0.061 0.062 0.063 0.064 0.065
0.7
0.8
0.9
1.0
(d)
θ
P=0.06209
−0.5 0.0 0.5 1.0 1.5
−0.2
−0.1
0.0
0.1
Fig. 48. Superhumps in ASASSN-14ag outside the eclipses(2014). (Upper): PDM analysis. (Lower): Phase-averagedprofile.
ima are listed in table 40. Although we only observed thelate phase of the superoutburst, we left the stage clas-sification as an open question since the stages tend tobecome unclear for long-Porb systems. If there were dis-tinct stage transitions in this system, we may have onlyobserved stage C superhumps.
3.37. ASASSN-14au
This object was detected as a transient at V =16.4. on2014 May 8 by ASAS-SN team (vsnet-alert 17290). Thecoordinates are 18h17m52.s54, +67◦08′08.′′0. There is aGALEX counterpart with an NUV magnitude of 21.6.Subsequent observations detected superhumps (vsnet-alert 17295; figure 50). The times of superhump maximaare listed in table 41.
3.38. ASASSN-14aw
This object was detected as a transient at V =15.8. on2014 May 10 by ASAS-SN team (vsnet-alert 17290). Thecoordinates are 18h47m02.s57, +53◦00′30.′′6. Subsequentobservations detected superhumps (vsnet-alert 17295; fig-ure 51). The times of superhump maxima are listed intable 42. The superhump period indicates that this ob-ject is located in the period gap.
Table 39. Superhump maxima of ASASSN-14ag (2014)
E max∗ error O−C† phase‡ N §
0 56734.0403 0.0025 −0.0027 0.31 851 56734.0969 0.0025 −0.0081 0.25 194 56734.2909 0.0008 −0.0003 0.46 1665 56734.3530 0.0011 −0.0003 0.49 2016 56734.4172 0.0012 0.0018 0.56 2227 56734.4788 0.0011 0.0014 0.58 2078 56734.5431 0.0042 0.0036 0.64 30
10 56734.6670 0.0004 0.0034 0.70 9616 56735.0392 0.0004 0.0033 0.87 7717 56735.0983 0.0011 0.0003 0.85 8820 56735.2854 0.0004 0.0012 0.95 7921 56735.3453 0.0007 −0.0009 0.95 11722 56735.4083 0.0014 −0.0000 0.99 13223 56735.4706 0.0009 0.0003 0.02 5624 56735.5349 0.0014 0.0025 0.09 8025 56735.5946 0.0006 0.0001 0.08 9636 56736.2739 0.0012 −0.0032 0.34 10037 56736.3379 0.0008 −0.0013 0.40 10038 56736.4001 0.0054 −0.0011 0.43 111∗BJD−2400000.†Against max = 2456734.0430+ 0.062059E.‡Orbital phase.§Number of points used to determine the maximum.
Table 40. Superhump maxima of ASASSN-14aj (2014)
E max∗ error O−C† N ‡
0 56746.7697 0.0017 −0.0057 151 56746.8528 0.0009 −0.0046 21
12 56747.7625 0.0023 0.0036 1613 56747.8434 0.0011 0.0025 2725 56748.8266 0.0012 0.0022 2737 56749.8076 0.0010 −0.0003 2638 56749.8930 0.0022 0.0031 1149 56750.7932 0.0016 0.0018 2550 56750.8692 0.0020 −0.0042 1961 56751.7750 0.0013 0.0000 2562 56751.8612 0.0013 0.0043 2473 56752.7631 0.0040 0.0047 2298 56754.8000 0.0058 −0.0074 26∗BJD−2400000.†Against max = 2456746.7754+ 0.081959E.‡Number of points used to determine the maximum.
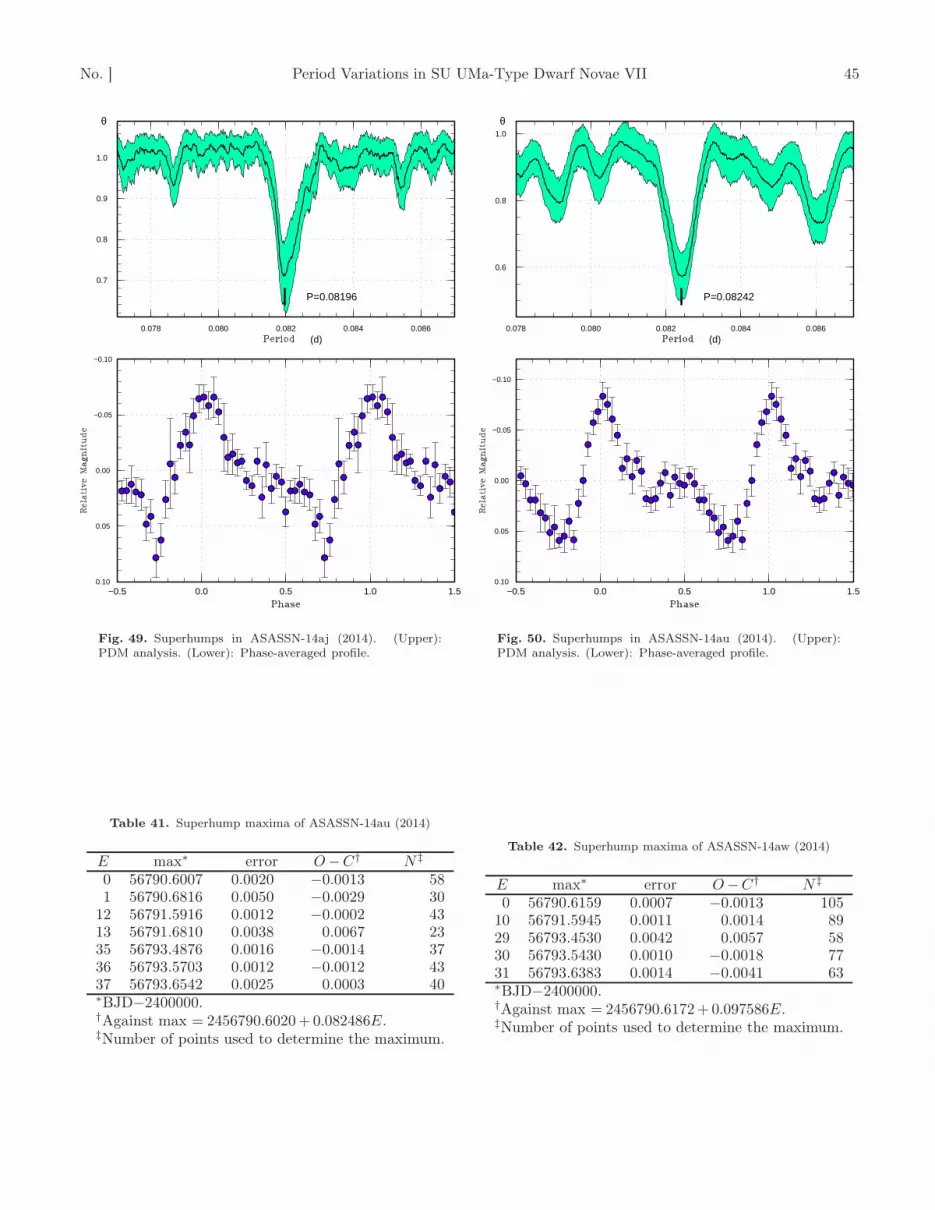
No. ] Period Variations in SU UMa-Type Dwarf Novae VII 45
0.078 0.080 0.082 0.084 0.086
0.7
0.8
0.9
1.0
(d)
θ
P=0.08196
−0.5 0.0 0.5 1.0 1.5
−0.10
−0.05
0.00
0.05
0.10
Fig. 49. Superhumps in ASASSN-14aj (2014). (Upper):PDM analysis. (Lower): Phase-averaged profile.
Table 41. Superhump maxima of ASASSN-14au (2014)
E max∗ error O−C† N ‡
0 56790.6007 0.0020 −0.0013 581 56790.6816 0.0050 −0.0029 30
12 56791.5916 0.0012 −0.0002 4313 56791.6810 0.0038 0.0067 2335 56793.4876 0.0016 −0.0014 3736 56793.5703 0.0012 −0.0012 4337 56793.6542 0.0025 0.0003 40∗BJD−2400000.†Against max = 2456790.6020+ 0.082486E.‡Number of points used to determine the maximum.
0.078 0.080 0.082 0.084 0.086
0.6
0.8
1.0
(d)
θ
P=0.08242
−0.5 0.0 0.5 1.0 1.5
−0.10
−0.05
0.00
0.05
0.10
Fig. 50. Superhumps in ASASSN-14au (2014). (Upper):PDM analysis. (Lower): Phase-averaged profile.
Table 42. Superhump maxima of ASASSN-14aw (2014)
E max∗ error O−C† N ‡
0 56790.6159 0.0007 −0.0013 10510 56791.5945 0.0011 0.0014 8929 56793.4530 0.0042 0.0057 5830 56793.5430 0.0010 −0.0018 7731 56793.6383 0.0014 −0.0041 63∗BJD−2400000.†Against max = 2456790.6172+ 0.097586E.‡Number of points used to determine the maximum.

46 T. Kato et al. [Vol. ,
0.092 0.094 0.096 0.098 0.100 0.102
0.4
0.6
0.8
1.0
(d)
θ
P=0.09754
−0.5 0.0 0.5 1.0 1.5
−0.10
−0.05
0.00
0.05
0.10
Fig. 51. Superhumps in ASASSN-14aw (2014). (Upper):PDM analysis. (Lower): Phase-averaged profile.
3.39. ASASSN-14bh
This object was detected as a transient at V =14.66. on2014 May 21 by ASAS-SN team (vsnet-alert 17334). Thecoordinates given by the ASAS-SN team are 13h24m40.s0,−19◦51′31.′′4, which is 3′′ distant from a 20.4 mag (blueplate) USNO B1.0 object. Subsequent observations de-tected superhumps (vsnet-alert 17359; figure 52). Thetimes of superhump maxima are listed in table 43. Theobject started fading rapidly five nights after the startof this observation. We only observed the final part ofthe superoutburst, and we most likely observed stage Csuperhumps.
3.40. ASASSN-14cl
This object was detected as a bright transient atV =10.66. on 2014 June 14 by ASAS-SN team (Staneket al. 2014a; vsnet-alert 17376). The coordinates are21h54m57.s70, +26◦41′12.′′9 (vsnet-alert 17429). The qui-escent counterpart in SDSS was a g = 18.8 star. No pre-vious outbursts are known. The SDSS colors expected ashort orbital period of 0.066 d by using the neural net-work analysis (Kato et al. 2012b). The large outburstamplitude suggested a WZ Sge-type dwarf nova caught inthe early stage (vsnet-alert 17377). Teyssier (2014) spec-troscopically confirmed that this object is an outbursting
0.058 0.059 0.060 0.061 0.062 0.063 0.064 0.065
0.80
0.85
0.90
0.95
1.00
(d)
θ
P=0.06136
−0.5 0.0 0.5 1.0 1.5
−0.05
0.00
0.05
Fig. 52. Superhumps in ASASSN-14bh (2014). (Upper):PDM analysis. (Lower): Phase-averaged profile.
Table 43. Superhump maxima of ASASSN-14bh (2014)
E max∗ error O−C† N ‡
0 56808.2910 0.0007 −0.0035 1391 56808.3567 0.0009 0.0009 1412 56808.4156 0.0011 −0.0016 135
16 56809.2791 0.0014 0.0027 13617 56809.3420 0.0015 0.0043 4618 56809.4007 0.0014 0.0016 12832 56810.2569 0.0018 −0.0013 14033 56810.3189 0.0031 −0.0008 13634 56810.3773 0.0020 −0.0037 14035 56810.4438 0.0023 0.0015 140∗BJD−2400000.†Against max = 2456808.2945+ 0.061368E.‡Number of points used to determine the maximum.

No. ] Period Variations in SU UMa-Type Dwarf Novae VII 47
0.055 0.056 0.057 0.058 0.059 0.060 0.061 0.062
0.95
0.96
0.97
0.98
0.99
1.00
(d)
θ
P=0.05838
−0.5 0.0 0.5 1.0 1.5
−0.02
−0.01
0.00
0.01
0.02
Fig. 53. Early superhumps in ASASSN-14cl (2014).(Upper): PDM analysis. (Lower): Phase-averaged profile
.
dwarf nova. The spectrum was characterized by broadBalmer absorption lines with an emission core in Hα. TheHeii line was recorded in emission, which is known to be afrequent signature of a WZ Sge-type dwarf nova (cf. Babaet al. 2002).
Soon after the discovery, possible early superhumpswere detected (vsnet-alert 17383, 17384, 17387; figure 53).The object then started to show ordinary superhumps(vsnet-alert 17392, 17398, 17413; figure 54).
The times of superhump maxima during the superout-burst plateau are listed in table 44. The O −C valuesshowed very prominent stages A–C with a definitely pos-itive Pdot for stage B. The times of superhumps in thepost-superoutburst stage are listed in table 45. The post-superoutburst superhumps were on very good extensionof stage C superhumps (figure 55).
The presence of distinct stage B with a definitelypositive Pdot, the presence of stage C and the persis-tence of stage C superhumps after the rapid fading fromthe plateau phase indicate that ASASSN-14cl resemblesa rather ordinary large-amplitude SU UMat-type dwarfnova rather than an extreme WZ Sge-type object.
0.0580 0.0585 0.0590 0.0595 0.0600 0.0605 0.0610 0.0615 0.0620
0.6
0.8
1.0
(d)
θ
P=0.05999
−0.5 0.0 0.5 1.0 1.5
−0.05
0.00
0.05
Fig. 54. Ordinary superhumps in ASASSN-14cl (2014) dur-ing the plateau phase (BJD 2456829–2456843). (Upper):PDM analysis. (Lower): Phase-averaged profile
.
−100 0 100 200 300 400 500 600 700 800
−0.10
−0.08
−0.06
−0.04
−0.02
0.00
0.02
820 830 840 850 860 870
10
12
14
16
18
Fig. 55. O − C diagram of superhumps in ASASSN-14cl(2014). (Upper): O − C diagram. A period of 0.06001 dwas used to draw this figure. (Lower): Light curve. Theobservations were binned to 0.012 d.

48 T. Kato et al. [Vol. ,
Table 44. Superhump maxima of ASASSN-14cl (2014)
E max∗ error O−C† N ‡
0 56828.8437 0.0013 −0.0122 2071 56828.9019 0.0006 −0.0139 1878 56829.3319 0.0007 −0.0039 99
11 56829.5177 0.0007 0.0020 6812 56829.5750 0.0004 −0.0007 6315 56829.7567 0.0017 0.0010 3216 56829.8167 0.0001 0.0011 35817 56829.8748 0.0001 −0.0009 44818 56829.9367 0.0001 0.0010 25027 56830.4819 0.0004 0.0064 3728 56830.5417 0.0002 0.0062 5231 56830.7230 0.0002 0.0075 14232 56830.7815 0.0001 0.0061 27733 56830.8402 0.0001 0.0048 22434 56830.9001 0.0001 0.0047 21435 56830.9594 0.0002 0.0040 4644 56831.4970 0.0002 0.0017 11045 56831.5571 0.0003 0.0018 8946 56831.6170 0.0003 0.0018 8547 56831.6766 0.0012 0.0014 1948 56831.7368 0.0002 0.0016 9249 56831.7966 0.0001 0.0014 28450 56831.8553 0.0001 0.0002 29151 56831.9150 0.0001 −0.0002 24452 56831.9747 0.0006 −0.0005 4959 56832.3944 0.0002 −0.0007 5860 56832.4537 0.0002 −0.0014 8461 56832.5134 0.0002 −0.0017 15362 56832.5728 0.0002 −0.0022 11165 56832.7494 0.0034 −0.0055 1166 56832.8112 0.0006 −0.0037 1867 56832.8713 0.0006 −0.0036 2672 56833.1700 0.0003 −0.0049 125∗BJD−2400000.†Against max = 2456828.8559+ 0.059986E.‡Number of points used to determine the maximum.
3.41. ASASSN-14cq
This object was detected as a transient at V =13.72 on2014 June 18 by ASAS-SN team (vsnet-alert 17386). Thecoordinates are 15h32m00.s29, −28◦33′57.′′2 (vsnet-alert17429).
Subsequent observations recorded prominent early su-perhumps (vsnet-alert 17403, 17405; figure 56). Althoughordinary superhumps (figure 57) started to be observedon June 26 (vsnet-alert 17426), the early phase of thedevelopment of superhumps fell in the 1.8-d gap in theobservation. The times of superhump maxima are listedin table 46. Although there were short gaps in the ob-servation in the late stage of the superoutburst, the timesof maxima for 34 ≤ E ≤ 194 appear to be expressed by asingle, positive Pdot. We identified this part as stage B.There was some hint of stage C superhump after E =194,but the stage was not well observed because the object
Table 44. Superhump maxima of ASASSN-14cl (2014) (con-tinued)
E max∗ error O−C† N ‡
73 56833.2306 0.0002 −0.0042 12593 56834.4293 0.0024 −0.0053 6994 56834.4895 0.0002 −0.0051 22999 56834.7877 0.0006 −0.0068 224
100 56834.8494 0.0003 −0.0051 245101 56834.9094 0.0002 −0.0050 228102 56834.9730 0.0005 −0.0014 51105 56835.1470 0.0007 −0.0074 88106 56835.2094 0.0002 −0.0049 147107 56835.2689 0.0002 −0.0054 138111 56835.5163 0.0004 0.0020 116116 56835.8102 0.0004 −0.0040 193117 56835.8710 0.0005 −0.0032 137123 56836.2322 0.0004 −0.0019 121124 56836.2929 0.0006 −0.0012 115125 56836.3510 0.0032 −0.0031 53126 56836.4134 0.0005 −0.0007 62127 56836.4709 0.0005 −0.0032 60128 56836.5351 0.0019 0.0011 19131 56836.7108 0.0006 −0.0032 55132 56836.7737 0.0004 −0.0003 258133 56836.8364 0.0004 0.0025 216134 56836.8928 0.0003 −0.0012 263135 56836.9534 0.0003 −0.0006 94142 56837.3770 0.0010 0.0031 97143 56837.4341 0.0005 0.0002 119144 56837.4965 0.0006 0.0027 107145 56837.5545 0.0010 0.0006 32149 56837.7976 0.0007 0.0039 137150 56837.8581 0.0006 0.0043 129151 56837.9160 0.0006 0.0023 132159 56838.4023 0.0008 0.0087 91160 56838.4626 0.0032 0.0090 82∗BJD−2400000.†Against max = 2456828.8559+ 0.059986E.‡Number of points used to determine the maximum.
became too faint. Although E = 0 corresponds to one ofstage A superhumps, the period of stage A superhumps(and q) could not be estimated.
3.42. ASASSN-14dm
This object was detected as a transient at V =15.02 on2014 July 1 by ASAS-SN team (vsnet-alert 17434). Thecoordinates are 14h09m32.s07, −29◦17′04.′′5. (GSC 2.3.2position). The object has a GALEX UV counterpart withan NUV magnitude of 20.6. Subsequent observations de-tected superhumps (vsnet-alert 17452; figure 58). Thetimes of superhump maxima are listed in table 47. TheO−C values suggest that we recorded stage B-C transi-tion around E = 75.

No. ] Period Variations in SU UMa-Type Dwarf Novae VII 49
Table 44. Superhump maxima of ASASSN-14cl (2014) (con-tinued)
E max∗ error O−C† N ‡
161 56838.5214 0.0007 0.0078 160162 56838.5808 0.0014 0.0072 44165 56838.7602 0.0011 0.0067 23166 56838.8212 0.0013 0.0077 19167 56838.8831 0.0016 0.0096 16173 56839.2429 0.0004 0.0095 129174 56839.3030 0.0006 0.0096 35178 56839.5420 0.0004 0.0086 120179 56839.6004 0.0003 0.0071 86182 56839.7801 0.0003 0.0069 119183 56839.8402 0.0003 0.0070 117184 56839.8985 0.0003 0.0053 116193 56840.4343 0.0006 0.0012 123194 56840.4954 0.0003 0.0023 252195 56840.5544 0.0003 0.0014 228198 56840.7333 0.0012 0.0002 28199 56840.7980 0.0007 0.0050 62200 56840.8559 0.0007 0.0029 102201 56840.9131 0.0005 0.0001 85210 56841.4517 0.0017 −0.0012 26215 56841.7509 0.0013 −0.0019 34216 56841.8130 0.0020 0.0002 29217 56841.8722 0.0023 −0.0006 20222 56842.1720 0.0017 −0.0007 45223 56842.2298 0.0015 −0.0029 27226 56842.4076 0.0008 −0.0051 99227 56842.4685 0.0005 −0.0041 153228 56842.5281 0.0008 −0.0045 128229 56842.5895 0.0007 −0.0031 48232 56842.7678 0.0012 −0.0047 75233 56842.8276 0.0006 −0.0049 128234 56842.8859 0.0008 −0.0066 131242 56843.3644 0.0036 −0.0080 45243 56843.4207 0.0012 −0.0117 61249 56843.7805 0.0021 −0.0119 86∗BJD−2400000.†Against max = 2456828.8559+ 0.059986E.‡Number of points used to determine the maximum.
Table 45. Superhump maxima of ASASSN-14cl (2014)(post-superoutburst)
E max∗ error O−C† N ‡
0 56844.4338 0.0116 0.0034 145 56844.7257 0.0021 −0.0034 816 56844.7822 0.0048 −0.0067 1087 56844.8478 0.0018 −0.0009 768 56844.9039 0.0026 −0.0045 64
17 56845.4379 0.0015 −0.0082 4218 56845.5115 0.0007 0.0056 4422 56845.7499 0.0053 0.0050 1425 56845.9245 0.0073 0.0003 3334 56846.4600 0.0019 −0.0020 2735 56846.5312 0.0010 0.0094 2741 56846.8836 0.0023 0.0034 4547 56847.2415 0.0035 0.0027 5848 56847.2989 0.0032 0.0004 5653 56847.5945 0.0012 −0.0027 3954 56847.6675 0.0089 0.0104 956 56847.7838 0.0070 0.0072 4258 56847.8976 0.0067 0.0016 5172 56848.7209 0.0078 −0.0117 1873 56848.7837 0.0018 −0.0086 4974 56848.8551 0.0027 0.0030 7179 56849.1549 0.0044 0.0041 16
122 56851.7239 0.0082 0.0037 17123 56851.7772 0.0179 −0.0028 15124 56851.8371 0.0026 −0.0027 14131 56852.2519 0.0036 −0.0061 55155 56853.6934 0.0037 0.0013 14157 56853.8115 0.0132 −0.0001 15189 56855.7162 0.0024 −0.0075 19280 56861.1663 0.0018 0.0051 58281 56861.2220 0.0049 0.0010 40∗BJD−2400000.†Against max = 2456844.4304+ 0.059753E.‡Number of points used to determine the maximum.
3.43. ASASSN-14do
This object was detected as a transient at V =15.08 on2014 July 1 by ASAS-SN team (vsnet-alert 17447). Thecoordinates are 20h37m06.s79, −30◦12′21.′′7. The objecthas been spectroscopically confirmed to be a CV (Prietoet al. 2014b).
Although initial observations did not show strong su-perhumps (vsnet-alert 17464), the object soon developedsuperhumps (vsnet-alert 17467, 17476, 17506; figure 59).The times of superhump maxima are listed in table 48.Although E = 0 corresponds to stage A superhumps, theperiod of stage A superhumps could not have been deter-mined.
3.44. ASASSN-14dw
This object was detected as a transient at V =14.23 on2014 July 10 by ASAS-SN team (vsnet-alert 17487). Thecoordinates are 13h43m37.s18, −44◦26′42.′′0 (2MASS po-

50 T. Kato et al. [Vol. ,
0.054 0.055 0.056 0.057 0.058 0.059
0.7
0.8
0.9
1.0
(d)
θ
P=0.05660
−0.5 0.0 0.5 1.0 1.5
−0.04
−0.02
0.00
0.02
0.04
Fig. 56. Early superhumps in ASASSN-14cq (2014).(Upper): PDM analysis. (Lower): Phase-averaged profile
.
sition). The object further brightened to V =13.4 on July12 in the ASAS-SN data. Time-resolved photometry de-tected superhumps (vsnet-alert 17495, 17498; figure 60).The times of superhump maxima are listed in table 49.Both stages B and C can be identified. The object startedfading rapidly on July 22. The duration of the superout-burst was ∼12 d, which was not particularly long as inobjects with similar PSH, such as TT Boo (Olech et al.2004). During the post-superoutburst period, the objectstayed around 17 mag for at least eight days. Although in-dividual superhump maxima were not measured, an anal-ysis of the entire post-superoutburst data yielded a strongperiod of 0.07498(6) d. A PDM analysis of the com-bined data of stage C during the superoutburst plateauand post-superoutburst yielded a period of 0.07491(3) d.This period can express well both observations of stage Cduring the superoutburst plateau and post-superoutburstwithout a phase shift. It is most likely that there was nophase jump around the termination of the superoutburst.
3.45. ASASSN-14eh
This object was detected as a transient at V =16.7 on2014 July 21 by ASAS-SN team (vsnet-alert 17533). Thecoordinates are 20h32m37.s49, +03◦05′25.′′3 (GSC 2.3.2
0.055 0.056 0.057 0.058 0.059 0.060
0.96
0.98
1.00
(d)
θ
P=0.05733
−0.5 0.0 0.5 1.0 1.5
−0.10
−0.05
0.00
0.05
0.10
Fig. 57. Ordinary superhumps in ASASSN-14cq (2014).(Upper): PDM analysis. (Lower): Phase-averaged profile
.
position). The object has a GALEX UV counterpart withan NUV magnitude of 22.4. The object further brightenedto V =14.94 on July 23. On July 28, the object started toshow prominent superhumps (vsnet-alert 17568; figure 61)accompanied by a slight rise of the brightness. The timesof superhump maxima are listed in table 50. Althoughthere was possibility of early superhumps or stage A su-perhumps before July 28, we could not detect variationssecurely due to the limited observational coverage. Thesuperoutburst lasted at least 13 d.
3.46. ASASSN-14eq
This object was detected as a transient at V =13.53on 2014 July 28 by ASAS-SN team (vsnet-alert 17561).The coordinates are 00h21m30.s92, −57◦19′22.′′0 (2MASSposition). The object has a GALEX UV counterpartwith an NUV magnitude of 18.1. ASAS-3 data indi-cated at least five past outbursts and at least one ofthem (2005 November-December one) looked like a super-outburst. Subsequent observations detected superhumps(vsnet-alert 17576; figure 62). The times of superhumpmaxima are listed in table 51. The large negative Pdot forthe entire observation appears to be a result of a stagetransition. We could not distinguish whether it was stage
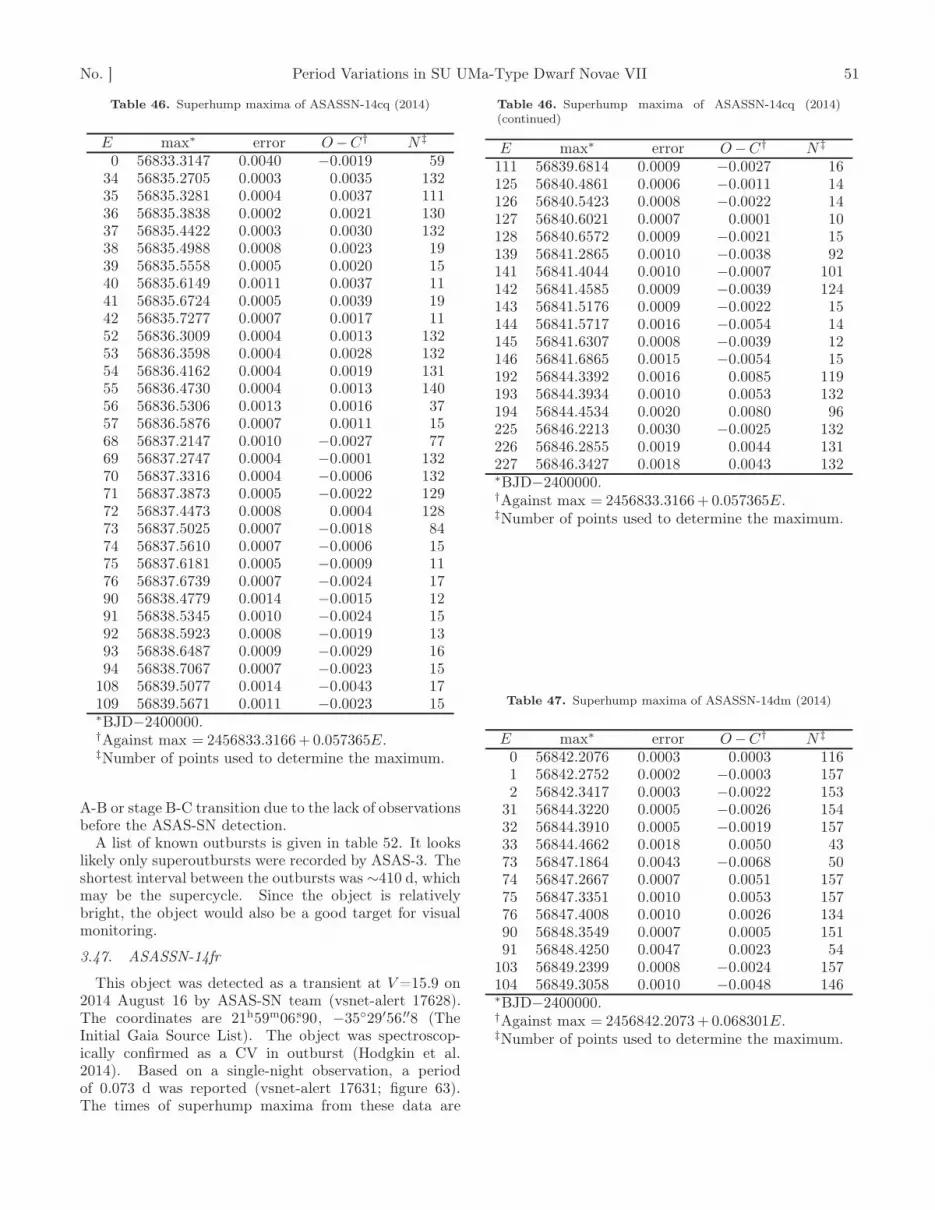
No. ] Period Variations in SU UMa-Type Dwarf Novae VII 51
Table 46. Superhump maxima of ASASSN-14cq (2014)
E max∗ error O−C† N ‡
0 56833.3147 0.0040 −0.0019 5934 56835.2705 0.0003 0.0035 13235 56835.3281 0.0004 0.0037 11136 56835.3838 0.0002 0.0021 13037 56835.4422 0.0003 0.0030 13238 56835.4988 0.0008 0.0023 1939 56835.5558 0.0005 0.0020 1540 56835.6149 0.0011 0.0037 1141 56835.6724 0.0005 0.0039 1942 56835.7277 0.0007 0.0017 1152 56836.3009 0.0004 0.0013 13253 56836.3598 0.0004 0.0028 13254 56836.4162 0.0004 0.0019 13155 56836.4730 0.0004 0.0013 14056 56836.5306 0.0013 0.0016 3757 56836.5876 0.0007 0.0011 1568 56837.2147 0.0010 −0.0027 7769 56837.2747 0.0004 −0.0001 13270 56837.3316 0.0004 −0.0006 13271 56837.3873 0.0005 −0.0022 12972 56837.4473 0.0008 0.0004 12873 56837.5025 0.0007 −0.0018 8474 56837.5610 0.0007 −0.0006 1575 56837.6181 0.0005 −0.0009 1176 56837.6739 0.0007 −0.0024 1790 56838.4779 0.0014 −0.0015 1291 56838.5345 0.0010 −0.0024 1592 56838.5923 0.0008 −0.0019 1393 56838.6487 0.0009 −0.0029 1694 56838.7067 0.0007 −0.0023 15
108 56839.5077 0.0014 −0.0043 17109 56839.5671 0.0011 −0.0023 15∗BJD−2400000.†Against max = 2456833.3166+ 0.057365E.‡Number of points used to determine the maximum.
A-B or stage B-C transition due to the lack of observationsbefore the ASAS-SN detection.
A list of known outbursts is given in table 52. It lookslikely only superoutbursts were recorded by ASAS-3. Theshortest interval between the outbursts was ∼410 d, whichmay be the supercycle. Since the object is relativelybright, the object would also be a good target for visualmonitoring.
3.47. ASASSN-14fr
This object was detected as a transient at V =15.9 on2014 August 16 by ASAS-SN team (vsnet-alert 17628).The coordinates are 21h59m06.s90, −35◦29′56.′′8 (TheInitial Gaia Source List). The object was spectroscop-ically confirmed as a CV in outburst (Hodgkin et al.2014). Based on a single-night observation, a periodof 0.073 d was reported (vsnet-alert 17631; figure 63).The times of superhump maxima from these data are
Table 46. Superhump maxima of ASASSN-14cq (2014)(continued)
E max∗ error O−C† N ‡
111 56839.6814 0.0009 −0.0027 16125 56840.4861 0.0006 −0.0011 14126 56840.5423 0.0008 −0.0022 14127 56840.6021 0.0007 0.0001 10128 56840.6572 0.0009 −0.0021 15139 56841.2865 0.0010 −0.0038 92141 56841.4044 0.0010 −0.0007 101142 56841.4585 0.0009 −0.0039 124143 56841.5176 0.0009 −0.0022 15144 56841.5717 0.0016 −0.0054 14145 56841.6307 0.0008 −0.0039 12146 56841.6865 0.0015 −0.0054 15192 56844.3392 0.0016 0.0085 119193 56844.3934 0.0010 0.0053 132194 56844.4534 0.0020 0.0080 96225 56846.2213 0.0030 −0.0025 132226 56846.2855 0.0019 0.0044 131227 56846.3427 0.0018 0.0043 132∗BJD−2400000.†Against max = 2456833.3166+ 0.057365E.‡Number of points used to determine the maximum.
Table 47. Superhump maxima of ASASSN-14dm (2014)
E max∗ error O−C† N ‡
0 56842.2076 0.0003 0.0003 1161 56842.2752 0.0002 −0.0003 1572 56842.3417 0.0003 −0.0022 153
31 56844.3220 0.0005 −0.0026 15432 56844.3910 0.0005 −0.0019 15733 56844.4662 0.0018 0.0050 4373 56847.1864 0.0043 −0.0068 5074 56847.2667 0.0007 0.0051 15775 56847.3351 0.0010 0.0053 15776 56847.4008 0.0010 0.0026 13490 56848.3549 0.0007 0.0005 15191 56848.4250 0.0047 0.0023 54
103 56849.2399 0.0008 −0.0024 157104 56849.3058 0.0010 −0.0048 146∗BJD−2400000.†Against max = 2456842.2073+ 0.068301E.‡Number of points used to determine the maximum.

52 T. Kato et al. [Vol. ,
Table 48. Superhump maxima of ASASSN-14do (2014)
E max∗ error O−C† N ‡
0 56845.7565 0.0029 −0.0083 1914 56846.5539 0.0005 −0.0028 13015 56846.6156 0.0005 0.0023 13017 56846.7277 0.0016 0.0013 1918 56846.7866 0.0016 0.0036 1719 56846.8439 0.0013 0.0043 830 56847.4636 0.0005 0.0018 13131 56847.5202 0.0005 0.0019 13132 56847.5770 0.0005 0.0021 13033 56847.6333 0.0005 0.0018 13034 56847.6920 0.0008 0.0039 9047 56848.4187 0.0058 −0.0047 6048 56848.4764 0.0010 −0.0036 13049 56848.5365 0.0006 −0.0001 13050 56848.5938 0.0006 0.0007 13151 56848.6498 0.0062 0.0001 4552 56848.7094 0.0010 0.0032 1253 56848.7601 0.0017 −0.0028 1654 56848.8136 0.0027 −0.0058 15
105 56851.7056 0.0029 0.0012 14∗BJD−2400000.†Against max = 2456845.7648+ 0.056568E.‡Number of points used to determine the maximum.
Table 49. Superhump maxima of ASASSN-14dw (2014)
E max∗ error O−C† N ‡
0 56852.4711 0.0011 −0.0080 101 56852.5542 0.0022 −0.0003 14
14 56853.5352 0.0013 −0.0003 1715 56853.6093 0.0011 −0.0016 1727 56854.5197 0.0013 0.0034 1628 56854.5943 0.0006 0.0025 1653 56856.4832 0.0009 0.0051 1454 56856.5588 0.0012 0.0053 1667 56857.5379 0.0010 0.0035 1668 56857.6115 0.0012 0.0017 1480 56858.5150 0.0019 −0.0002 1781 56858.5899 0.0021 −0.0008 1793 56859.4895 0.0025 −0.0066 1594 56859.5679 0.0053 −0.0036 17∗BJD−2400000.†Against max = 2456852.4791+ 0.075451E.‡Number of points used to determine the maximum.
0.066 0.067 0.068 0.069 0.070 0.071
0.4
0.6
0.8
1.0
(d)
θ
P=0.06833
−0.5 0.0 0.5 1.0 1.5
−0.10
−0.05
0.00
0.05
0.10
Fig. 58. Superhumps in ASASSN-14dm (2014). (Upper):PDM analysis. (Lower): Phase-averaged profile
.
Table 50. Superhump maxima of ASASSN-14eh (2014)
E max∗ error O−C† N ‡
0 56866.6506 0.0011 0.0001 71 56866.7139 0.0007 0.0005 12
16 56867.6592 0.0005 0.0022 1017 56867.7214 0.0013 0.0015 1033 56868.7278 0.0017 0.0014 748 56869.6684 0.0012 −0.0016 1249 56869.7314 0.0034 −0.0015 964 56870.6711 0.0022 −0.0055 1365 56870.7339 0.0017 −0.0056 780 56871.6850 0.0024 0.0019 1486 56872.0644 0.0020 0.0039 7187 56872.1225 0.0030 −0.0009 6696 56872.6933 0.0026 0.0037 12∗BJD−2400000.†Against max = 2456866.6505+ 0.062907E.‡Number of points used to determine the maximum.

No. ] Period Variations in SU UMa-Type Dwarf Novae VII 53
0.053 0.054 0.055 0.056 0.057 0.058 0.059 0.060
0.6
0.7
0.8
0.9
1.0
(d)
θ
P=0.05659
−0.5 0.0 0.5 1.0 1.5
−0.10
−0.05
0.00
0.05
0.10
Fig. 59. Superhumps in ASASSN-14do (2014). (Upper):PDM analysis. (Lower): Phase-averaged profile
.
Table 51. Superhump maxima of ASASSN-14eq (2014)
E max∗ error O−C† N ‡
0 56868.5150 0.0040 −0.0050 641 56868.5970 0.0005 −0.0025 1852 56868.6762 0.0005 −0.0027 148
12 56869.4779 0.0003 0.0043 18313 56869.5612 0.0004 0.0082 18414 56869.6333 0.0004 0.0008 18450 56872.4948 0.0007 0.0015 18351 56872.5706 0.0007 −0.0022 18452 56872.6499 0.0008 −0.0024 164∗BJD−2400000.†Against max = 2456868.5200+ 0.079467E.‡Number of points used to determine the maximum.
0.072 0.073 0.074 0.075 0.076 0.077 0.078 0.079
0.6
0.8
1.0
(d)
θ
P=0.07550
−0.5 0.0 0.5 1.0 1.5
−0.10
−0.05
0.00
0.05
Fig. 60. Superhumps in ASASSN-14dw during the super-outburst plateau (2014). (Upper): PDM analysis. (Lower):Phase-averaged profile
.
Table 52. List of known outbursts of ASASSN-14eq.
Year Month max∗ magnitude type source2001 9 52168 14.0 ? ASAS-32002 10 52578 13.3 ? ASAS-32004 1 53005 13.6 ? ASAS-32005 11 53702 13.5 super ASAS-32007 5 54231 13.5: super? ASAS-32014 7 56867 13.5 super ASAS-SN∗JD−2400000.

54 T. Kato et al. [Vol. ,
0.060 0.061 0.062 0.063 0.064 0.065 0.066
0.8
0.9
1.0
(d)
θ
P=0.06297
−0.5 0.0 0.5 1.0 1.5
−0.1
0.0
0.1
Fig. 61. Superhumps in ASASSN-14eh (2014). (Upper):PDM analysis. (Lower): Phase-averaged profile
.
BJD 2456886.5052(18) (N=169) and 2456886.6289(26)(N=169). The observation was not long enough to con-strain the period better than the initial report.
3.48. ASASSN-14gd
This object was detected as a transient at V =16.23 on2014 August 23 by ASAS-SN team (vsnet-alert 17670).The coordinates are 19h26m08.s92, −65◦26′21.′′0 (GSC2.3.2 position). There is a GALEX counterpart with anNUV magnitude of 21.9. Superhumps were detected inobservations on two nights (vsnet-alert 17669; figure 64).The times of superhump maxima are listed in table 53.The superhump period in table 2 was obtained by thePDM method.
3.49. ASASSN-14gq
This object was detected as a transient at V =13.92 on2014 September 4 by ASAS-SN team (vsnet-alert 17695).The coordinates are 19h27m10.s15, −48◦47′52.′′3 (2MASSposition). At least six past outbursts were recordedby CRTS. Superhumps with a period of ∼0.072 d wererecorded (vsnet-alert 17731; figure 65x). Two superhumpmaxima were recorded: BJD 2456908.2970(7) (N=164)and 2456908.3687(8) (N=166). Although there were ob-
0.076 0.077 0.078 0.079 0.080 0.081 0.082 0.083
0.4
0.6
0.8
1.0
(d)
θ
P=0.07942
−0.5 0.0 0.5 1.0 1.5
−0.1
0.0
0.1
Fig. 62. Superhumps in ASASSN-14eq (2014). (Upper):PDM analysis. (Lower): Phase-averaged profile
.
0.45 0.50 0.55 0.60 0.65
−0.2
−0.1
0.0
0.1
0.2
Fig. 63. Superhumps in ASASSN-14fr (2014). The datawere binned to 0.0025 d.
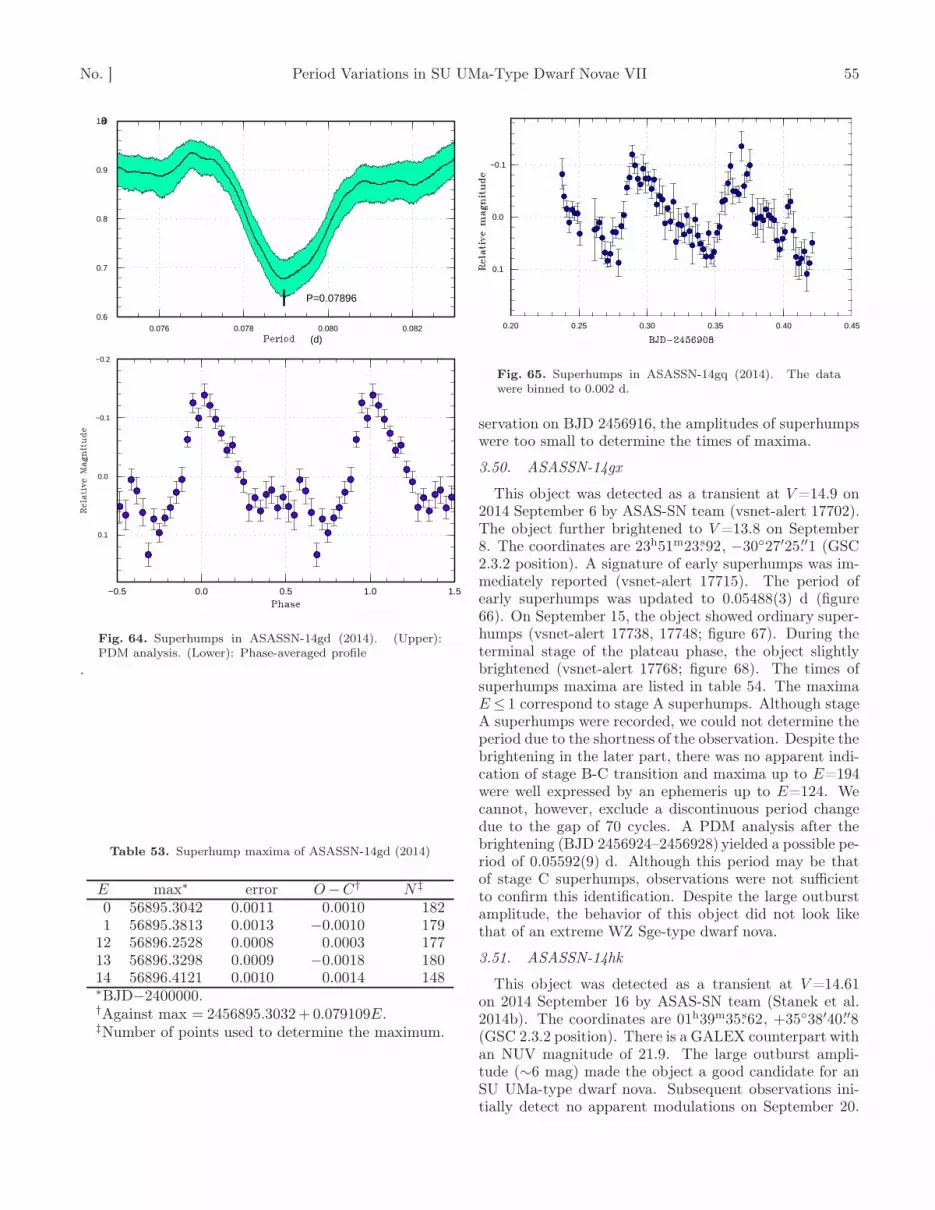
No. ] Period Variations in SU UMa-Type Dwarf Novae VII 55
0.076 0.078 0.080 0.0820.6
0.7
0.8
0.9
1.0
(d)
θ
P=0.07896
−0.5 0.0 0.5 1.0 1.5
−0.2
−0.1
0.0
0.1
Fig. 64. Superhumps in ASASSN-14gd (2014). (Upper):PDM analysis. (Lower): Phase-averaged profile
.
Table 53. Superhump maxima of ASASSN-14gd (2014)
E max∗ error O−C† N ‡
0 56895.3042 0.0011 0.0010 1821 56895.3813 0.0013 −0.0010 179
12 56896.2528 0.0008 0.0003 17713 56896.3298 0.0009 −0.0018 18014 56896.4121 0.0010 0.0014 148∗BJD−2400000.†Against max = 2456895.3032+ 0.079109E.‡Number of points used to determine the maximum.
0.20 0.25 0.30 0.35 0.40 0.45
−0.1
0.0
0.1
Fig. 65. Superhumps in ASASSN-14gq (2014). The datawere binned to 0.002 d.
servation on BJD 2456916, the amplitudes of superhumpswere too small to determine the times of maxima.
3.50. ASASSN-14gx
This object was detected as a transient at V =14.9 on2014 September 6 by ASAS-SN team (vsnet-alert 17702).The object further brightened to V =13.8 on September8. The coordinates are 23h51m23.s92, −30◦27′25.′′1 (GSC2.3.2 position). A signature of early superhumps was im-mediately reported (vsnet-alert 17715). The period ofearly superhumps was updated to 0.05488(3) d (figure66). On September 15, the object showed ordinary super-humps (vsnet-alert 17738, 17748; figure 67). During theterminal stage of the plateau phase, the object slightlybrightened (vsnet-alert 17768; figure 68). The times ofsuperhumps maxima are listed in table 54. The maximaE ≤ 1 correspond to stage A superhumps. Although stageA superhumps were recorded, we could not determine theperiod due to the shortness of the observation. Despite thebrightening in the later part, there was no apparent indi-cation of stage B-C transition and maxima up to E=194were well expressed by an ephemeris up to E=124. Wecannot, however, exclude a discontinuous period changedue to the gap of 70 cycles. A PDM analysis after thebrightening (BJD 2456924–2456928) yielded a possible pe-riod of 0.05592(9) d. Although this period may be thatof stage C superhumps, observations were not sufficientto confirm this identification. Despite the large outburstamplitude, the behavior of this object did not look likethat of an extreme WZ Sge-type dwarf nova.
3.51. ASASSN-14hk
This object was detected as a transient at V =14.61on 2014 September 16 by ASAS-SN team (Stanek et al.2014b). The coordinates are 01h39m35.s62, +35◦38′40.′′8(GSC 2.3.2 position). There is a GALEX counterpart withan NUV magnitude of 21.9. The large outburst ampli-tude (∼6 mag) made the object a good candidate for anSU UMa-type dwarf nova. Subsequent observations ini-tially detect no apparent modulations on September 20.

56 T. Kato et al. [Vol. ,
Table 54. Superhump maxima of ASASSN-14gx (2014)
E max∗ error O−C† N ‡
0 56914.6027 0.0050 −0.0065 1441 56914.6627 0.0008 −0.0026 14
18 56915.6259 0.0011 0.0070 1419 56915.6821 0.0005 0.0070 1531 56916.3527 0.0006 0.0044 10132 56916.4078 0.0006 0.0035 9033 56916.4642 0.0008 0.0038 9034 56916.5184 0.0007 0.0019 9135 56916.5763 0.0007 0.0037 13136 56916.6319 0.0018 0.0032 6437 56916.6878 0.0010 0.0030 1541 56916.9112 0.0002 0.0021 4742 56916.9670 0.0003 0.0017 5543 56917.0286 0.0010 0.0072 2145 56917.1327 0.0009 −0.0009 4246 56917.1875 0.0009 −0.0022 4153 56917.5819 0.0012 −0.0004 1554 56917.6370 0.0013 −0.0014 1455 56917.6919 0.0014 −0.0026 1559 56917.9178 0.0005 −0.0011 5560 56917.9717 0.0004 −0.0034 5661 56918.0324 0.0023 0.0013 1377 56918.9229 0.0005 −0.0058 5678 56918.9798 0.0005 −0.0050 5689 56919.6021 0.0025 0.0003 1590 56919.6493 0.0017 −0.0086 1495 56919.9324 0.0007 −0.0060 5696 56919.9901 0.0006 −0.0044 56
107 56920.6047 0.0022 −0.0068 14113 56920.9405 0.0012 −0.0076 51114 56921.0000 0.0006 −0.0041 46∗BJD−2400000.†Against max = 2456914.6092+ 0.056096E.‡Number of points used to determine the maximum.
Table 54. Superhump maxima of ASASSN-14gx (2014)(continued)
E max∗ error O−C† N ‡
120 56921.3467 0.0055 0.0059 76121 56921.3951 0.0013 −0.0018 127123 56921.5067 0.0019 −0.0023 129124 56921.5638 0.0030 −0.0013 141192 56925.3855 0.0013 0.0058 129193 56925.4436 0.0017 0.0078 129194 56925.4971 0.0021 0.0052 136∗BJD−2400000.†Against max = 2456914.6092+ 0.056096E.‡Number of points used to determine the maximum.
0.053 0.054 0.055 0.056 0.057
0.96
0.98
1.00
(d)
θ
P=0.05488
−0.5 0.0 0.5 1.0 1.5
−0.02
0.00
0.02
Fig. 66. Early superhumps in ASASSN-14gx (2014).(Upper): PDM analysis. (Lower): Phase-averaged profile
.
Table 55. Superhump maxima of ASASSN-14hk (2014)
E max∗ error O−C† N ‡
0 56921.0890 0.0035 0.0026 511 56921.1463 0.0026 −0.0002 712 56921.2101 0.0026 0.0037 1203 56921.2638 0.0016 −0.0026 128
36 56923.2428 0.0010 −0.0036 4537 56923.3049 0.0008 −0.0016 45
118 56928.1686 0.0050 0.0021 61135 56929.1861 0.0018 −0.0005 27∗BJD−2400000.†Against max = 2456921.0864+ 0.060001E.‡Number of points used to determine the maximum.
Superhumps were present on September 22 (BJD 2456921,vsnet-alert 17773). The superhumps took 4–6 d to de-velop. Although there remained some ambiguity in periodselection, we selected the superhump period to best matchthe result from the long single-night observation on BJD2456921 (figure 69). The times of superhump maxima arelisted in table 55. The epochs for E ≤ 118 were not verycertain due to the low signal-to-noise ratio.

No. ] Period Variations in SU UMa-Type Dwarf Novae VII 57
0.054 0.055 0.056 0.057 0.058
0.90
0.95
1.00
(d)
θ
P=0.05610
−0.5 0.0 0.5 1.0 1.5
−0.10
−0.05
0.00
0.05
0.10
Fig. 67. Ordinary superhumps in ASASSN-14gx during theplateau phase (2014). (Upper): PDM analysis. (Lower):Phase-averaged profile
.
−100 0 100 200 300 400
−0.02
−0.01
0.00
0.01
0.02
910 915 920 925 930 935
14
16
18
20
Fig. 68. O − C diagram of superhumps in ASASSN-14gx(2014). (Upper): O − C diagram. A period of 0.05609 dwas used to draw this figure. (Lower): Light curve. Theobservations were binned to 0.011 d.
0.057 0.058 0.059 0.060 0.061 0.062 0.063
0.94
0.96
0.98
1.00
(d)
θ
P=0.06000
−0.5 0.0 0.5 1.0 1.5
−0.05
0.00
0.05
Fig. 69. Superhumps in ASASSN-14hk after BJD 2456923(2014). (Upper): PDM analysis. (Lower): Phase-averagedprofile
.
3.52. ASASSN-14hl
This object was detected as a transient at V =15.42 on2014 September 18 by ASAS-SN team (vsnet-alert 17746).The coordinates are 23h49m55.s12, −60◦54′17.′′1 (theInitial Gaia Source List). Two superhumps were detectedfrom a single-night observation (vsnet-alert 17772, figure70): BJD 2456925.3196(6) (N=157) and 2456925.3885(7)(N=158). The superhump period is 0.0685(5) d.
3.53. ASASSN-14hs
This object was detected as a transient at V =13.99on 2014 September 26 by ASAS-SN team (vsnet-alert17777). The coordinates are 22h42m58.s04, −19◦45′51.′′5(the Initial Gaia Source List). There is a GALEX coun-terpart with an NUV magnitude of 20.0. Subsequent ob-servations detected superhumps (vsnet-alert 17785, 17802,17809; figure 71). The period suggests that the object islocated in the lower edge of the period gap. The times ofsuperhumps maxima are listed in table 56. Except E ≤ 1,the maxima could be expressed by a relatively constantperiod. The last two epochs correspond to the rapidlyfading part. Since O−C variations in long-Porb systemsstrongly depends on object, we could not identify the su-

58 T. Kato et al. [Vol. ,
0.28 0.30 0.32 0.34 0.36 0.38 0.40 0.42 0.44
−0.2
0.0
0.2
Fig. 70. Superhumps in ASASSN-14hl (2014). The datawere binned to 0.0018 d.
0.090 0.092 0.094 0.096 0.098
0.8
0.9
1.0
(d)
θ
P=0.09374
−0.5 0.0 0.5 1.0 1.5
−0.2
−0.1
0.0
0.1
Fig. 71. Superhumps in ASASSN-14hs (2014). (Upper):PDM analysis. (Lower): Phase-averaged profile
.
perhump stage confidently in this system.
3.54. ASASSN-14ia
This object was first detected as a transient at V =14.3on 2014 September 19 by ASAS-SN team but was rec-ognized at V =15.6 on September 24 (vsnet-alert 17786).
Table 56. Superhump maxima of ASASSN-14hs (2014)
E max∗ error O−C† N ‡
0 56929.0606 0.0005 −0.0092 971 56929.1540 0.0005 −0.0096 118
10 56930.0118 0.0020 0.0047 5111 56930.1008 0.0069 −0.0001 926 56931.5084 0.0118 0.0016 827 56931.6067 0.0009 0.0062 1827 56931.6071 0.0010 0.0065 1837 56932.5417 0.0006 0.0039 2238 56932.6277 0.0065 −0.0038 1055 56934.2313 0.0069 0.0064 9756 56934.3167 0.0005 −0.0020 19357 56934.4112 0.0021 −0.0012 6566 56935.2541 0.0008 −0.0019 16267 56935.3500 0.0011 0.0003 19569 56935.5386 0.0014 0.0014 3970 56935.6408 0.0018 0.0099 4180 56936.5526 0.0027 −0.0156 4781 56936.6670 0.0070 0.0050 2288 56937.3185 0.0025 0.0005 21690 56937.5213 0.0080 0.0158 30
101 56938.5340 0.0027 −0.0026 29102 56938.6143 0.0032 −0.0160 50∗BJD−2400000.†Against max = 2456929.0698+ 0.093730E.‡Number of points used to determine the maximum.
The coordinates are 06h40m20.s89, +44◦21′26.′′4 (theInitial Gaia Source List). Only rather fragmentary ob-servations on two nights were obtained. The resultantsuperhump maxima were BJD 2456930.2213(29) (N=15),2456930.2910(6) (N=24) and 2456932.2452(9) (N=19).The superhump period was not very well constrained. Infigure 72, we selected one of the possible aliases.
3.55. ASASSN-14id
This object was detected as a transient at V =14.3 on2014 September 29 by ASAS-SN team (vsnet-alert 17791).The coordinates are 07h26m37.s23, +83◦32′18.′′6 (SDSSg=20.8 counterpart). Subsequent observations detectedlarge-amplitude superhumps (vsnet-alert 17814, 17826;figures 73, 74). The times superhumps maxima are listedin table 57. Although the PDM figure is not so clear, it isprobably a result of beat modulation because this objectis eclipsing (as shown later). The period selection is se-cure from the O−C analysis of the best observed segmentof E ≤ 24. The superhump stage was not clear from theseobservations.
On BJD 2456942 and 2456952, shallow eclipses (∼0.3mag) were observed. Since superhumps were strongly seenon BJD 2456942, we subtracted the superhump signal.After combining with the data on BJD 2456952, we ap-plied an MCMC analysis (cf. Kato et al. 2013a) to deter-mine the eclipse ephemeris. The result was
Min(BJD) = 2456942.3720(5)+ 0.076857(4)E. (5)

No. ] Period Variations in SU UMa-Type Dwarf Novae VII 59
0.064 0.065 0.066 0.067 0.068 0.069 0.070
0.0
0.5
1.0
(d)
θ
P=0.06741
−0.5 0.0 0.5 1.0 1.5
−0.1
0.0
0.1
Fig. 72. Superhumps in ASASSN-14ia (2014). (Upper):PDM analysis. (Lower): Phase-averaged profile
.
Although there were several possibilities of the orbital pe-riod due to the long gap between two nights, this periodwas selected because it gives a reasonably acceptable ǫ of0.033. This period selection is confirmed by the detectionof shallow eclipse-like features at zero orbital phase on ear-lier nights (figure 74). Since the eclipse profile was likelyaffected by superhumps, this ephemeris is not intended forlong-term prediction of eclipse times. The observed largesuperhump amplitudes on the initial two nights were mostlikely a result of a high orbital inclination.
3.56. ASASSN-14it
This object was detected as a transient at V =15.6 on2014 October 10 by ASAS-SN team. The coordinates are20h11m09.s13, +53◦39′01.′′7 (R. Nesci, vsnet-alert 17840).The absence of a quiescent counterpart in past catalogssuggested a large (≥6 mag) outburst amplitude. Only ashort run on a single night was obtained. Although possi-ble superhumps were detected (figure 75), the period wasdifficult to estimate due to the shortness of the observa-tion.
0.076 0.077 0.078 0.079 0.080 0.081 0.082 0.083
0.96
0.98
1.00
(d)
θ
P=0.07929
−0.5 0.0 0.5 1.0 1.5
−0.4
−0.2
0.0
0.2
0.4
Fig. 73. Superhumps in ASASSN-14id (2014). (Upper):PDM analysis. A weak signal near 0.0769 d is likely the or-bital one. (Lower): Phase-averaged profile
.
Table 57. Superhump maxima of ASASSN-14id (2014)
E max∗ error O−C† phase‡ N §
0 56935.3475 0.0003 −0.0012 0.60 751 56935.4267 0.0002 −0.0014 0.63 1032 56935.5066 0.0002 −0.0009 0.67 77
24 56937.2530 0.0003 −0.0006 0.40 5225 56937.3256 0.0008 −0.0074 0.34 3636 56938.2071 0.0016 0.0012 0.81 4637 56938.2945 0.0005 0.0092 0.95 4648 56939.1624 0.0038 0.0041 0.24 3188 56942.3328 0.0007 −0.0002 0.49 4089 56942.4127 0.0005 0.0004 0.53 5490 56942.4908 0.0006 −0.0009 0.55 40
137 56946.2196 0.0024 −0.0023 0.06 26∗BJD−2400000.†Against max = 2456935.3488+0.079366E.‡Orbital phase.§Number of points used to determine the maximum.

60 T. Kato et al. [Vol. ,
0.0 0.5 1.0 1.5 2.0 2.5 3.0 3.5
0
1
2
3
2456935
2456937
2456938
2456942
2456952
Fig. 74. Superhumps and eclipses in ASASSN-14id (2014).The orbital phase refers to equation (5). Shallow signaturesof eclipses were also detected in all observations. The datawere binned to 0.0025 d.
0.88 0.90 0.92 0.94 0.96 0.98 1.00
−0.1
0.0
0.1
Fig. 75. Possible superhumps in ASASSN-14it (2014). Thedata were binned to 0.0035 d.
0.066 0.068 0.070 0.072 0.074
0.6
0.8
1.0
(d)
θ
P=0.06919
−0.5 0.0 0.5 1.0 1.5
−0.2
−0.1
0.0
0.1
Fig. 76. Superhumps in ASASSN-14iv (2014). (Upper):PDM analysis. The selection of the alias was based on O−C
analysis. (Lower): Phase-averaged profile
.
Table 58. Superhump maxima of ASASSN-14iv (2014)
E max∗ error O−C† N ‡
0 56944.5019 0.0255 −0.0073 91 56944.5829 0.0019 0.0042 332 56944.6516 0.0030 0.0035 15
21 56945.9698 0.0010 0.0028 7222 56946.0333 0.0018 −0.0031 71∗BJD−2400000.†Against max = 2456944.5092+ 0.069418E.‡Number of points used to determine the maximum.
3.57. ASASSN-14iv
This object was detected as a transient at V =15.6on 2014 October 10 by ASAS-SN team. The coordi-nates are 20h35m09.s75, +09◦20′46.′′4 (SDSS g=20.7 coun-terpart). Subsequent observations detected superhumps(vsnet-alert 17844, 17850; figure 76). The times of super-hump maxima are listed in table 58.

No. ] Period Variations in SU UMa-Type Dwarf Novae VII 61
0.066 0.067 0.068 0.069 0.070 0.071 0.072
0.96
0.98
1.00
(d)
θ
P=0.06914
−0.5 0.0 0.5 1.0 1.5
−0.1
0.0
0.1
Fig. 77. Superhumps in ASASSN-14je (2014). (Upper):PDM analysis. (Lower): Phase-averaged profile
.
3.58. ASASSN-14je
This object was detected as a transient at V =14.26 on2014 October 20 by ASAS-SN team (vsnet-alert 17880).The coordinates are 06h32m27.s68, −56◦38′52.′′6 (theInitial Gaia Source List). Subsequent observations de-tected superhumps (vsnet-alert 17883, 17889; figure 77).The times of superhumps maxima are listed in table 59.The maxima for E ≥ 73 correspond to the rapid fadingphase. Since the object started fading rapidly within fivedays of the start of our outburst, the superhumps we ob-served were most likely stage C superhumps.
3.59. ASASSN-14jf
This object was detected as a transient at V =13.3on 2014 October 22 by ASAS-SN team Simonian et al.(2014). The coordinates are 06h06m02.s61, −60◦39′41.′′5(the Initial Gaia Source List). There is a GALEX counter-part with an NUV magnitude of 20.9. The large outburstamplitude (∼7.9 mag) suggested a WZ Sge-type dwarfnova. Subsequent observations indeed detected early su-perhumps (vsnet-alert 17897, 17898, 17901, 17923; figure78). Nine days after the outburst detection, this objectstarted to show ordinary superhumps (vsnet-alert 17928,17930, 17938, 17960; figure 79). The times of superhump
Table 59. Superhump maxima of ASASSN-14je (2014)
E max∗ error O−C† N ‡
0 56952.4237 0.0037 −0.0029 851 56952.4958 0.0003 0.0002 1592 56952.5637 0.0004 −0.0010 1603 56952.6372 0.0013 0.0035 33
14 56953.3908 0.0037 −0.0027 8415 56953.4654 0.0004 0.0028 16016 56953.5328 0.0005 0.0011 16017 56953.6002 0.0012 −0.0005 7673 56957.4603 0.0025 −0.0083 15974 56957.5456 0.0057 0.0079 160∗BJD−2400000.†Against max = 2456952.4266+ 0.069070E.‡Number of points used to determine the maximum.
0.053 0.054 0.055 0.056 0.057
0.7
0.8
0.9
1.0
(d)
θ
P=0.05539
−0.5 0.0 0.5 1.0 1.5
−0.06
−0.04
−0.02
0.00
0.02
0.04
0.06
Fig. 78. Early superhumps in ASASSN-14jf (2014).(Upper): PDM analysis. (Lower): Phase-averaged profile
.
maxima are listed in table 60. Stages A and B can beclearly identified (figure 80). There was no evidence oftransition to stage C superhumps during the superout-burst plateau, as is usual the case in WZ Sge-type dwarfnovae. The period of stage A superhumps corresponds toǫ∗=0.026(2) and q=0.070(5).

62 T. Kato et al. [Vol. ,
0.054 0.055 0.056 0.057 0.058
0.7
0.8
0.9
1.0
(d)
θ
P=0.05596
−0.5 0.0 0.5 1.0 1.5
−0.05
0.00
0.05
Fig. 79. Ordinary superhumps in ASASSN-14jf (2014).(Upper): PDM analysis. (Lower): Phase-averaged profile
.
−100 0 100 200 300 400−0.06
−0.04
−0.02
0.00
0.02
955 960 965 970 975 980 985
14
15
16
17
Fig. 80. O − C diagram of superhumps in ASASSN-14jf(2014). (Upper): O − C diagram. A period of 0.05595 dwas used to draw this figure. (Lower): Light curve. Theobservations were binned to 0.011 d.
Table 60. Superhump maxima of ASASSN-14jf (2014)
E max∗ error O−C† N ‡
0 56962.6916 0.0045 −0.0347 161 56962.7577 0.0039 −0.0245 162 56962.8192 0.0018 −0.0190 20
18 56963.7221 0.0019 −0.0121 1619 56963.7800 0.0011 −0.0102 1720 56963.8370 0.0015 −0.0093 1435 56964.6877 0.0010 0.0014 1736 56964.7466 0.0010 0.0043 1637 56964.8049 0.0007 0.0067 1954 56965.7621 0.0008 0.0118 1655 56965.8189 0.0005 0.0126 2170 56966.6562 0.0042 0.0100 1071 56966.7127 0.0009 0.0105 1772 56966.7687 0.0010 0.0104 1673 56966.8267 0.0005 0.0125 1989 56967.7196 0.0014 0.0093 1990 56967.7731 0.0009 0.0068 1991 56967.8299 0.0010 0.0077 17
106 56968.6677 0.0027 0.0055 11107 56968.7221 0.0010 0.0039 19108 56968.7772 0.0018 0.0030 19109 56968.8362 0.0016 0.0060 14124 56969.6750 0.0011 0.0047 17125 56969.7321 0.0012 0.0058 20126 56969.7846 0.0020 0.0023 20127 56969.8421 0.0020 0.0038 6141 56970.6254 0.0019 0.0032 18142 56970.6828 0.0015 0.0045 16143 56970.7379 0.0030 0.0037 17144 56970.7917 0.0009 0.0015 20160 56971.6890 0.0024 0.0027 17161 56971.7509 0.0018 0.0087 17162 56971.8001 0.0017 0.0018 17∗BJD−2400000.†Against max = 2456962.7263+ 0.056000E.‡Number of points used to determine the maximum.
3.60. ASASSN-14jq
This object was detected as a transient at V =13.74 on2014 November 6 by ASAS-SN team (vsnet-alert 17943).The coordinates are 02h21m02.s78, +73◦22′45.′′2 (SDSSg=20.5 counterpart). Subsequent observations detectedsuperhumps (vsnet-alert 17957, 17974; figure 81). Theobject then faded after the plateau phase (a dip aroundBJD 2456979, vsnet-alert 17978). The object faded again(BJD 2456982) and a long rebrightening followed, whichlasted more than 5 d (vsnet-alert 17997, 18010; figure 82).During this rebrightening, the superhumps grew again(figure 83).
The times of superhump maxima during the superout-burst plateau are listed in table 62. During the dip, thesuperhump signal became very weak (See the middle panelof figure 82. The amplitudes are shown in magnitudes andthe pulsed flux during the dip remarkably decreased). The

No. ] Period Variations in SU UMa-Type Dwarf Novae VII 63
Table 61. Superhump maxima of ASASSN-14jf (2014) (con-tinued)
E max∗ error O−C† N ‡
178 56972.6979 0.0016 0.0036 16179 56972.7506 0.0019 0.0003 16180 56972.8081 0.0017 0.0018 17196 56973.7025 0.0011 0.0002 17197 56973.7567 0.0021 −0.0016 16198 56973.8121 0.0018 −0.0022 14214 56974.7063 0.0022 −0.0040 16215 56974.7641 0.0023 −0.0021 15216 56974.8203 0.0014 −0.0019 10231 56975.6545 0.0030 −0.0078 11232 56975.7133 0.0015 −0.0050 17233 56975.7701 0.0025 −0.0041 15234 56975.8260 0.0029 −0.0043 9249 56976.6631 0.0015 −0.0072 15250 56976.7256 0.0019 −0.0007 17251 56976.7780 0.0014 −0.0043 16252 56976.8400 0.0016 0.0017 5267 56977.6790 0.0043 0.0007 16268 56977.7331 0.0019 −0.0012 17269 56977.7848 0.0033 −0.0054 16303 56979.6958 0.0027 0.0015 16304 56979.7469 0.0027 −0.0034 15321 56980.7005 0.0023 −0.0018 17322 56980.7578 0.0023 −0.0005 16339 56981.7111 0.0020 0.0008 16340 56981.7646 0.0038 −0.0016 16341 56981.8158 0.0014 −0.0065 10∗BJD−2400000.†Against max = 2456962.7263+ 0.056000E.‡Number of points used to determine the maximum.
times of superhump maxima during the dip and the re-brightening are listed in table 63. The maxima for E ≤ 4correspond to maxima observed during the dip and therising phase from the dip. There was no marked periodvariation compared to the superhumps observed duringthe superoutburst plateau (figure 83). The O −C val-ues between the plateau and the rebrightening showed ajump by a phase ∼0.3 (figure 82). Since the periods werealmost the same between the plateau and the rebrighten-ing, it was unlikely a continuous period change gave riseto this shift. Since the amplitudes of superhumps grewagain during the rebrightening, it is most likely these su-perhumps were newly excited during the rebrightening.
The last ASAS-SN observation was 25 d before the out-burst detection, and it was very likely the true maximumwas missed. Although early superhump were not recorded,we consider that the object is likely a WZ Sge-type dwarfnova because it showed a dip and a long rebrightening,characteristic to WZ Sge-type dwarf novae (type-A re-brightening, cf. Imada et al. 2006; Kato et al. 2009).
There has been an attempt to explain WZ Sge-typerebrightenings by an enhanced mass-transfer (originallyproposed by Patterson et al. 2002 and modeled by Buat-
0.052 0.053 0.054 0.055 0.056 0.057 0.058
0.6
0.8
1.0
(d)
θ
P=0.05515
−0.5 0.0 0.5 1.0 1.5
−0.05
0.00
0.05
Fig. 81. Ordinary superhumps in ASASSN-14jq during thesuperoutburst plateau (2014). (Upper): PDM analysis.(Lower): Phase-averaged profile
.
Ménard, Hameury 2002). This model predicts the shrink-age of the disk radius (see figure 5 in Buat-Ménard,Hameury 2002) by an addition of matter with low-angularmomentum. The present observation did not detect no-ticeable period variation, indicating that the disk radiuswas almost constant (we consider that we can reasonablyneglect the pressure effect since the amplitudes of super-humps were very small around the dip and during therebrightening). This observation does not favor the en-hanced mass-transfer model.
3.61. ASASSN-14jv
This object was detected as a transient at V =11.3on 2014 November 9 by ASAS-SN team Shappee et al.(2014b). The coordinates are 18h53m28.s81, +42◦03′43.′′3(the Initial Gaia Source List). Berardi (2014) spec-troscopically confirmed the object to be an outburstingdwarf nova. Early superhumps were immediately re-ported (vsnet-alert 17950, 17953, 17956, 17966; figure84). Following this phase, ordinary superhumps appeared(vsnet-alert 17973, 17985, 18015; figure 85).
The times of superhump maxima are listed in table 64.Both stages A and B were clearly recorded. Instead ofstage C superhumps, either a phase shift or a large de-

64 T. Kato et al. [Vol. ,
Table 62. Superhump maxima of ASASSN-14jq during theplateau phase (2014)
E max∗ error O−C† N ‡
0 56969.7257 0.0001 0.0041 5691 56969.7802 0.0002 0.0034 1652 56969.8356 0.0002 0.0037 4003 56969.8907 0.0001 0.0036 5694 56969.9474 0.0003 0.0051 320
29 56971.3191 0.0007 −0.0027 5030 56971.3755 0.0014 −0.0014 6131 56971.4303 0.0006 −0.0018 6532 56971.4876 0.0007 0.0003 6333 56971.5396 0.0006 −0.0028 6434 56971.5964 0.0009 −0.0013 5036 56971.7069 0.0001 −0.0011 56837 56971.7606 0.0002 −0.0026 43050 56972.4765 0.0003 −0.0040 15051 56972.5320 0.0005 −0.0037 12152 56972.5871 0.0007 −0.0037 12353 56972.6441 0.0018 −0.0019 5187 56974.5186 0.0007 −0.0034 6088 56974.5758 0.0010 −0.0014 31
115 56976.0632 0.0015 −0.0039 115116 56976.1212 0.0007 −0.0010 116117 56976.1830 0.0029 0.0056 137118 56976.2308 0.0011 −0.0018 145119 56976.2969 0.0019 0.0091 87120 56976.3423 0.0021 −0.0006 65121 56976.3966 0.0009 −0.0015 57135 56977.1656 0.0007 −0.0050 40136 56977.2225 0.0016 −0.0033 148137 56977.2885 0.0014 0.0076 106138 56977.3346 0.0008 −0.0016 109139 56977.3982 0.0010 0.0069 53140 56977.4446 0.0007 −0.0019 57141 56977.5047 0.0013 0.0030 57142 56977.5566 0.0010 −0.0003 54∗BJD−2400000.†Against max = 2456969.7216+ 0.055178E.‡Number of points used to determine the maximum.
−50 0 50 100 150 200 250 300 350
−0.02
0.00
0.02
0.04
0.0
0.1
0.2
0.3
970 975 980 985 990
13
14
15
16
17
18
Fig. 82. O − C diagram of superhumps in ASASSN-14jq(2014). (Upper:) O − C diagram. We used a period of0.05518 d for calculating the O − C residuals. (Middle:)Amplitudes of superhumps. (Lower:) Light curve. The datawere binned to 0.011 d.
crease in the period was recorded during the rapid fadingphase (figure 86). This phenomenon appears similar towhat was observed in FL Psc and GW Lib (Kato et al.2009).
The period of early superhumps was determined to be0.054417(15) d. The period of stage A superhumps corre-sponds to ǫ∗=0.0278(9) and q=0.074(3).
3.62. ASASSN-14kf
This object was detected as a transient at V =15.36on 2014 November 11 by ASAS-SN team (vsnet-alert17880). The coordinates are 05h13m06.s59, −26◦19′52.′′0(the Initial Gaia Source List). Superhumps were immedi-ately detected (vsnet-alert 17992; figure 87). The times ofsuperhump maxima are listed in table 65. Although E=0corresponds to stage A superhump, the period of stage Asuperhumps could not be determined.
3.63. ASASSN-14kk
This object was detected as a transient at V =16.17 on2014 November 12 by ASAS-SN team (vsnet-alert 17988).The coordinates are 01h32m02.s77, −10◦43′57.′′8 (SDSSg=20.8 counterpart). The object brightened to V =15.87
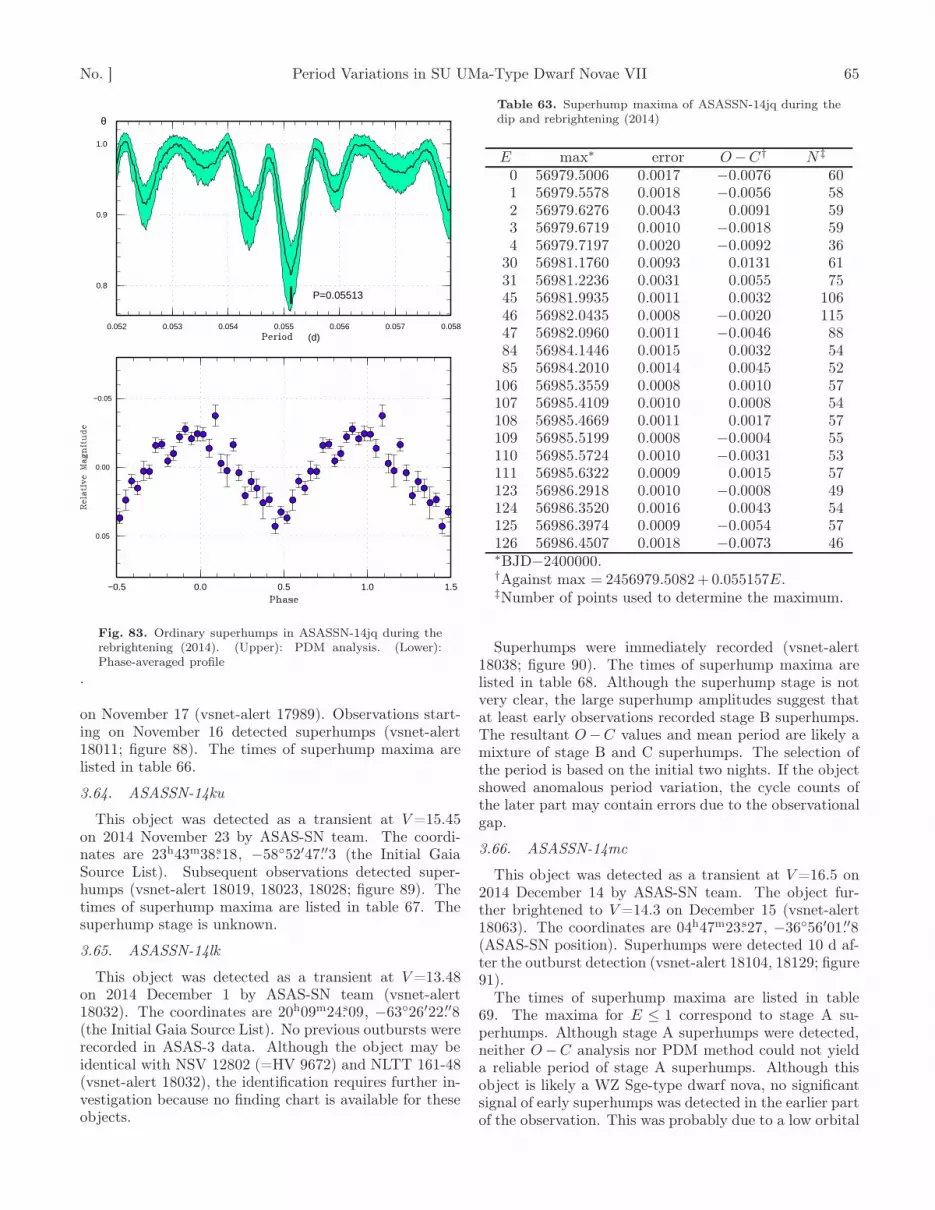
No. ] Period Variations in SU UMa-Type Dwarf Novae VII 65
0.052 0.053 0.054 0.055 0.056 0.057 0.058
0.8
0.9
1.0
(d)
θ
P=0.05513
−0.5 0.0 0.5 1.0 1.5
−0.05
0.00
0.05
Fig. 83. Ordinary superhumps in ASASSN-14jq during therebrightening (2014). (Upper): PDM analysis. (Lower):Phase-averaged profile
.
on November 17 (vsnet-alert 17989). Observations start-ing on November 16 detected superhumps (vsnet-alert18011; figure 88). The times of superhump maxima arelisted in table 66.
3.64. ASASSN-14ku
This object was detected as a transient at V =15.45on 2014 November 23 by ASAS-SN team. The coordi-nates are 23h43m38.s18, −58◦52′47.′′3 (the Initial GaiaSource List). Subsequent observations detected super-humps (vsnet-alert 18019, 18023, 18028; figure 89). Thetimes of superhump maxima are listed in table 67. Thesuperhump stage is unknown.
3.65. ASASSN-14lk
This object was detected as a transient at V =13.48on 2014 December 1 by ASAS-SN team (vsnet-alert18032). The coordinates are 20h09m24.s09, −63◦26′22.′′8(the Initial Gaia Source List). No previous outbursts wererecorded in ASAS-3 data. Although the object may beidentical with NSV 12802 (=HV 9672) and NLTT 161-48(vsnet-alert 18032), the identification requires further in-vestigation because no finding chart is available for theseobjects.
Table 63. Superhump maxima of ASASSN-14jq during thedip and rebrightening (2014)
E max∗ error O−C† N ‡
0 56979.5006 0.0017 −0.0076 601 56979.5578 0.0018 −0.0056 582 56979.6276 0.0043 0.0091 593 56979.6719 0.0010 −0.0018 594 56979.7197 0.0020 −0.0092 36
30 56981.1760 0.0093 0.0131 6131 56981.2236 0.0031 0.0055 7545 56981.9935 0.0011 0.0032 10646 56982.0435 0.0008 −0.0020 11547 56982.0960 0.0011 −0.0046 8884 56984.1446 0.0015 0.0032 5485 56984.2010 0.0014 0.0045 52
106 56985.3559 0.0008 0.0010 57107 56985.4109 0.0010 0.0008 54108 56985.4669 0.0011 0.0017 57109 56985.5199 0.0008 −0.0004 55110 56985.5724 0.0010 −0.0031 53111 56985.6322 0.0009 0.0015 57123 56986.2918 0.0010 −0.0008 49124 56986.3520 0.0016 0.0043 54125 56986.3974 0.0009 −0.0054 57126 56986.4507 0.0018 −0.0073 46∗BJD−2400000.†Against max = 2456979.5082+ 0.055157E.‡Number of points used to determine the maximum.
Superhumps were immediately recorded (vsnet-alert18038; figure 90). The times of superhump maxima arelisted in table 68. Although the superhump stage is notvery clear, the large superhump amplitudes suggest thatat least early observations recorded stage B superhumps.The resultant O−C values and mean period are likely amixture of stage B and C superhumps. The selection ofthe period is based on the initial two nights. If the objectshowed anomalous period variation, the cycle counts ofthe later part may contain errors due to the observationalgap.
3.66. ASASSN-14mc
This object was detected as a transient at V =16.5 on2014 December 14 by ASAS-SN team. The object fur-ther brightened to V =14.3 on December 15 (vsnet-alert18063). The coordinates are 04h47m23.s27, −36◦56′01.′′8(ASAS-SN position). Superhumps were detected 10 d af-ter the outburst detection (vsnet-alert 18104, 18129; figure91).
The times of superhump maxima are listed in table69. The maxima for E ≤ 1 correspond to stage A su-perhumps. Although stage A superhumps were detected,neither O−C analysis nor PDM method could not yielda reliable period of stage A superhumps. Although thisobject is likely a WZ Sge-type dwarf nova, no significantsignal of early superhumps was detected in the earlier partof the observation. This was probably due to a low orbital

66 T. Kato et al. [Vol. ,
Table 64. Superhump maxima of ASASSN-14jv (2014)
E max∗ error O−C† N ‡
0 56978.5970 0.0017 −0.0281 1821 56978.6539 0.0015 −0.0263 185
18 56979.6121 0.0005 −0.0052 10318 56979.6124 0.0005 −0.0048 10323 56979.8903 0.0004 −0.0026 8024 56979.9435 0.0004 −0.0044 10325 56979.9957 0.0004 −0.0074 9635 56980.5600 0.0003 0.0058 9636 56980.6147 0.0001 0.0053 10837 56980.6722 0.0004 0.0076 5242 56980.9484 0.0002 0.0083 11643 56981.0050 0.0003 0.0097 6959 56981.8863 0.0003 0.0091 13860 56981.9404 0.0003 0.0081 16561 56981.9948 0.0003 0.0074 15567 56982.3249 0.0002 0.0068 7868 56982.3767 0.0003 0.0035 6869 56982.4327 0.0004 0.0044 8771 56982.5427 0.0005 0.0042 6072 56982.5997 0.0002 0.0060 10773 56982.6535 0.0003 0.0047 9084 56983.2515 0.0001 −0.0036 8385 56983.3131 0.0005 0.0029 32
108 56984.5794 0.0003 0.0014 103109 56984.6345 0.0003 0.0014 108114 56984.9090 0.0013 0.0003 92137 56986.1774 0.0003 0.0009 75138 56986.2312 0.0003 −0.0004 181139 56986.2871 0.0008 0.0004 140140 56986.3414 0.0003 −0.0004 90141 56986.3965 0.0005 −0.0005 57∗BJD−2400000.†Against max = 2456978.6251+ 0.055119E.‡Number of points used to determine the maximum.
Table 64. Superhump maxima of ASASSN-14jv (2014)(continued)
E max∗ error O−C† N ‡
162 56987.5553 0.0004 0.0008 97163 56987.6108 0.0004 0.0012 107164 56987.6667 0.0014 0.0020 45175 56988.2757 0.0004 0.0047 25180 56988.5527 0.0008 0.0061 60181 56988.6063 0.0006 0.0046 68182 56988.6595 0.0012 0.0027 37210 56990.2070 0.0009 0.0069 35229 56991.2396 0.0016 −0.0078 103230 56991.2874 0.0013 −0.0151 124231 56991.3369 0.0025 −0.0207 49∗BJD−2400000.†Against max = 2456978.6251+ 0.055119E.‡Number of points used to determine the maximum.
0.052 0.053 0.054 0.055 0.056 0.057 0.058
0.96
0.98
1.00
(d)
θ
P=0.05442
−0.5 0.0 0.5 1.0 1.5
−0.02
−0.01
0.00
0.01
0.02
Fig. 84. Early superhumps in ASASSN-14jv (2014).(Upper): PDM analysis. (Lower): Phase-averaged profile
.
Table 65. Superhump maxima of ASASSN-14kf (2014)
E max∗ error O−C† N ‡
0 56978.5438 0.0009 −0.0030 15813 56979.4857 0.0009 0.0013 16714 56979.5566 0.0008 0.0000 16727 56980.4963 0.0010 0.0021 16628 56980.5662 0.0011 −0.0001 16654 56982.4440 0.0039 0.0024 14555 56982.5161 0.0017 0.0024 16556 56982.5836 0.0018 −0.0022 13969 56983.5252 0.0025 0.0017 16670 56983.5910 0.0042 −0.0046 126∗BJD−2400000.†Against max = 2456978.5468+ 0.072127E.‡Number of points used to determine the maximum.

No. ] Period Variations in SU UMa-Type Dwarf Novae VII 67
0.052 0.053 0.054 0.055 0.056 0.057 0.058
0.6
0.7
0.8
0.9
1.0
(d)
θ
P=0.05508
−0.5 0.0 0.5 1.0 1.5
−0.05
0.00
0.05
Fig. 85. Ordinary superhumps in ASASSN-14jv during thesuperoutburst plateau (2014). (Upper): PDM analysis.(Lower): Phase-averaged profile
.
−150 −100 −50 0 50 100 150 200 250 300−0.06
−0.04
−0.02
0.00
0.02
970 975 980 985 990 995
12
14
16
18
Fig. 86. O − C diagram of superhumps in ASASSN-14jv(2014). (Upper): O − C diagram. A period of 0.05510 dwas used to draw this figure. (Lower): Light curve. Theobservations were binned to 0.011 d.
0.069 0.070 0.071 0.072 0.073 0.074 0.075
0.85
0.90
0.95
1.00
(d)
θ
P=0.07212
−0.5 0.0 0.5 1.0 1.5
−0.10
−0.05
0.00
0.05
0.10
Fig. 87. Superhumps in ASASSN-14kf (2014). (Upper):PDM analysis. (Lower): Phase-averaged profile
.
Table 66. Superhump maxima of ASASSN-14kk (2014)
E max∗ error O−C† N ‡
0 56978.4042 0.0009 −0.0071 801 56978.4650 0.0006 −0.0026 129
16 56979.3286 0.0041 0.0156 13017 56979.3704 0.0030 0.0010 12918 56979.4197 0.0021 −0.0060 7769 56982.3067 0.0014 0.0065 8470 56982.3501 0.0009 −0.0065 12871 56982.4164 0.0032 0.0035 7487 56983.3139 0.0063 −0.0007 4788 56983.3692 0.0012 −0.0019 12989 56983.4254 0.0015 −0.0020 124∗BJD−2400000.†Against max = 2456978.4112+ 0.056361E.‡Number of points used to determine the maximum.

68 T. Kato et al. [Vol. ,
0.053 0.054 0.055 0.056 0.057 0.058 0.059 0.060
0.7
0.8
0.9
1.0
(d)
θ
P=0.05634
−0.5 0.0 0.5 1.0 1.5
−0.10
−0.05
0.00
0.05
0.10
Fig. 88. Superhumps in ASASSN-14kk (2014). (Upper):PDM analysis. (Lower): Phase-averaged profile
.
Table 67. Superhump maxima of ASASSN-14ku (2014)
E max∗ error O−C† N ‡
0 56988.3239 0.0022 0.0021 1331 56988.3986 0.0017 −0.0022 1833 56988.5632 0.0024 0.0042 29
13 56989.3492 0.0016 −0.0005 18214 56989.4234 0.0021 −0.0053 14016 56989.5877 0.0038 0.0009 2825 56990.3036 0.0073 0.0052 8226 56990.3772 0.0040 −0.0003 13528 56990.5300 0.0145 −0.0056 1529 56990.6175 0.0048 0.0028 2238 56991.3279 0.0083 0.0017 14241 56991.5551 0.0059 −0.0083 2754 56992.5967 0.0059 0.0053 29∗BJD−2400000.†Against max = 2456988.3218+ 0.079066E.‡Number of points used to determine the maximum.
0.076 0.077 0.078 0.079 0.080 0.081 0.082
0.92
0.94
0.96
0.98
1.00
(d)
θ
P=0.07907
−0.5 0.0 0.5 1.0 1.5
−0.1
0.0
0.1
Fig. 89. Superhumps in ASASSN-14ku (2014). (Upper):PDM analysis. (Lower): Phase-averaged profile
.
Table 68. Superhump maxima of ASASSN-14lk (2014)
E max∗ error O−C† N ‡
0 56997.3080 0.0003 0.0018 13716 56998.2864 0.0004 −0.0027 12217 56998.3494 0.0005 −0.0012 13481 57002.2863 0.0013 0.0041 58
130 57005.2903 0.0026 −0.0021 94∗BJD−2400000.†Against max = 2456997.3062+ 0.061432E.‡Number of points used to determine the maximum.

No. ] Period Variations in SU UMa-Type Dwarf Novae VII 69
0.059 0.060 0.061 0.062 0.063 0.064
0.4
0.6
0.8
1.0
(d)
θ
P=0.06143
−0.5 0.0 0.5 1.0 1.5
−0.1
0.0
0.1
Fig. 90. Superhumps in ASASSN-14lk (2014). (Upper):PDM analysis. (Lower): Phase-averaged profile
.
inclination.
3.67. ASASSN-14md
This object was detected as a transient at V =15.7 on2014 December 15 by ASAS-SN team (vsnet-alert 18074).The coordinates are 04h43m45.s41, −21◦08′34.′′1 (refinedastrometry, vsnet-alert 18078). Superhumps appeared ac-companied by brightening of the brightness of the object(vsnet-alert 18095, 18099, 18105, 18130; figure 92). Thetimes of superhump maxima are listed in table 70. StagesA and B can be clearly recognized. Since the object isvery faint (V ∼ 17), no secure superhumps were detectedin the later part of the superoutburst. The alias selec-tion was made to express the O−C values for the bestobserved data on BJD 2457014 and 2457015.
3.68. ASASSN-14mh
This object was detected as a transient at V =15.1on 2014 December 20 by ASAS-SN team (vsnet-alert18074). The coordinates are 11h27m25.s99, −28◦22′11.′′8(the Initial Gaia Source List). The object initiallyshowed rapid fading and subsequent brightening (vsnet-alert 18094), which turned out to be a precursor outburstand rise to a superoutburst accompanied by superhumps
0.053 0.054 0.055 0.056 0.057 0.058
0.8
0.9
1.0
(d)
θ
P=0.05552
−0.5 0.0 0.5 1.0 1.5
−0.1
0.0
0.1
Fig. 91. Superhumps in ASASSN-14mc (2014). (Upper):PDM analysis. (Lower): Phase-averaged profile
.
Table 69. Superhump maxima of ASASSN-14mc (2014)
E max∗ error O−C† N ‡
0 57015.6156 0.0035 −0.0074 281 57015.6675 0.0035 −0.0110 30
18 57016.6291 0.0009 0.0062 3019 57016.6841 0.0009 0.0057 2636 57017.6277 0.0018 0.0049 3037 57017.6828 0.0021 0.0044 2555 57018.6826 0.0012 0.0042 2173 57019.6801 0.0027 0.0017 2191 57020.6747 0.0014 −0.0036 22
109 57021.6741 0.0022 −0.0042 19127 57022.6774 0.0035 −0.0009 25∗BJD−2400000.†Against max = 2457015.6229+ 0.055554E.‡Number of points used to determine the maximum.
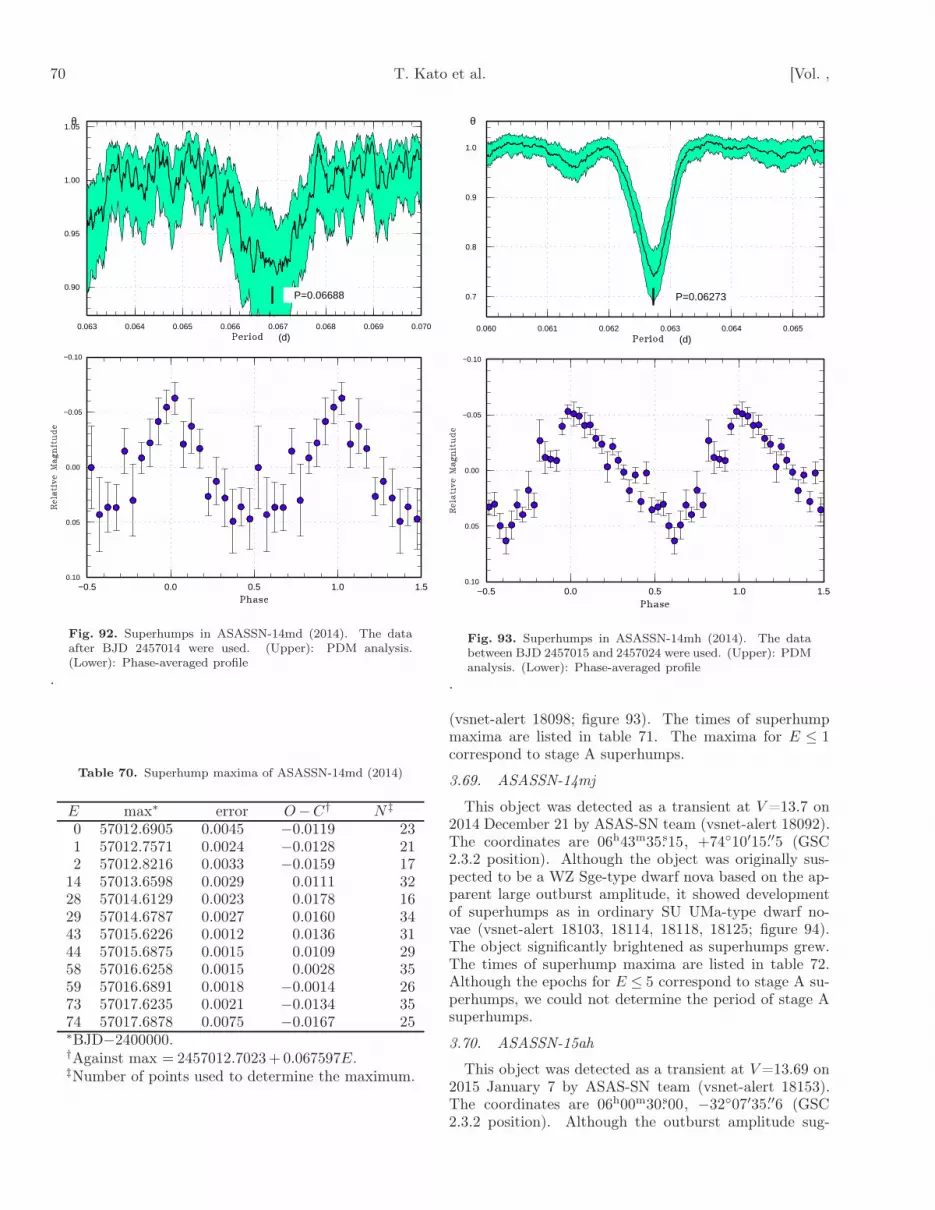
70 T. Kato et al. [Vol. ,
0.063 0.064 0.065 0.066 0.067 0.068 0.069 0.070
0.90
0.95
1.00
1.05
(d)
θ
P=0.06688
−0.5 0.0 0.5 1.0 1.5
−0.10
−0.05
0.00
0.05
0.10
Fig. 92. Superhumps in ASASSN-14md (2014). The dataafter BJD 2457014 were used. (Upper): PDM analysis.(Lower): Phase-averaged profile
.
Table 70. Superhump maxima of ASASSN-14md (2014)
E max∗ error O−C† N ‡
0 57012.6905 0.0045 −0.0119 231 57012.7571 0.0024 −0.0128 212 57012.8216 0.0033 −0.0159 17
14 57013.6598 0.0029 0.0111 3228 57014.6129 0.0023 0.0178 1629 57014.6787 0.0027 0.0160 3443 57015.6226 0.0012 0.0136 3144 57015.6875 0.0015 0.0109 2958 57016.6258 0.0015 0.0028 3559 57016.6891 0.0018 −0.0014 2673 57017.6235 0.0021 −0.0134 3574 57017.6878 0.0075 −0.0167 25∗BJD−2400000.†Against max = 2457012.7023+ 0.067597E.‡Number of points used to determine the maximum.
0.060 0.061 0.062 0.063 0.064 0.065
0.7
0.8
0.9
1.0
(d)
θ
P=0.06273
−0.5 0.0 0.5 1.0 1.5
−0.10
−0.05
0.00
0.05
0.10
Fig. 93. Superhumps in ASASSN-14mh (2014). The databetween BJD 2457015 and 2457024 were used. (Upper): PDManalysis. (Lower): Phase-averaged profile
.
(vsnet-alert 18098; figure 93). The times of superhumpmaxima are listed in table 71. The maxima for E ≤ 1correspond to stage A superhumps.
3.69. ASASSN-14mj
This object was detected as a transient at V =13.7 on2014 December 21 by ASAS-SN team (vsnet-alert 18092).The coordinates are 06h43m35.s15, +74◦10′15.′′5 (GSC2.3.2 position). Although the object was originally sus-pected to be a WZ Sge-type dwarf nova based on the ap-parent large outburst amplitude, it showed developmentof superhumps as in ordinary SU UMa-type dwarf no-vae (vsnet-alert 18103, 18114, 18118, 18125; figure 94).The object significantly brightened as superhumps grew.The times of superhump maxima are listed in table 72.Although the epochs for E ≤ 5 correspond to stage A su-perhumps, we could not determine the period of stage Asuperhumps.
3.70. ASASSN-15ah
This object was detected as a transient at V =13.69 on2015 January 7 by ASAS-SN team (vsnet-alert 18153).The coordinates are 06h00m30.s00, −32◦07′35.′′6 (GSC2.3.2 position). Although the outburst amplitude sug-

No. ] Period Variations in SU UMa-Type Dwarf Novae VII 71
Table 71. Superhump maxima of ASASSN-14mh (2014)
E max∗ error O−C† N ‡
0 57014.7329 0.0020 −0.0029 281 57014.7916 0.0017 −0.0070 28
16 57015.7409 0.0005 0.0007 2817 57015.8051 0.0006 0.0021 2732 57016.7468 0.0008 0.0020 2833 57016.8087 0.0006 0.0012 2847 57017.6909 0.0051 0.0045 1148 57017.7507 0.0008 0.0015 2849 57017.8125 0.0008 0.0006 2856 57018.2584 0.0068 0.0070 4357 57018.3187 0.0018 0.0045 6465 57018.8100 0.0021 −0.0064 2373 57019.3181 0.0021 −0.0005 5479 57019.6931 0.0054 −0.0022 1680 57019.7568 0.0018 −0.0013 2896 57020.7613 0.0013 −0.0013 27
111 57021.7051 0.0017 0.0009 25112 57021.7623 0.0010 −0.0047 27128 57022.7724 0.0023 0.0009 15143 57023.7155 0.0076 0.0023 15144 57023.7741 0.0050 −0.0019 13∗BJD−2400000.†Against max = 2457014.7358+ 0.062779E.‡Number of points used to determine the maximum.
Table 72. Superhump maxima of ASASSN-14mj (2014)
E max∗ error O−C† N ‡
0 57019.1881 0.0029 −0.0094 1994 57019.4351 0.0013 −0.0041 565 57019.4915 0.0010 −0.0082 61
18 57020.2919 0.0003 0.0063 5419 57020.3512 0.0002 0.0053 6320 57020.4123 0.0002 0.0059 6521 57020.4718 0.0003 0.0050 6422 57020.5326 0.0003 0.0053 4533 57021.1948 0.0006 0.0026 5934 57021.2538 0.0005 0.0011 5935 57021.3153 0.0006 0.0022 5845 57021.9209 0.0012 0.0034 12251 57022.2796 0.0005 −0.0006 10252 57022.3397 0.0006 −0.0009 11753 57022.3997 0.0003 −0.0014 6154 57022.4588 0.0004 −0.0027 5955 57022.5208 0.0003 −0.0012 6256 57022.5808 0.0002 −0.0016 6157 57022.6404 0.0003 −0.0025 6258 57022.6994 0.0024 −0.0039 2262 57022.9399 0.0040 −0.0052 4763 57023.0103 0.0018 0.0047 44∗BJD−2400000.†Against max = 2457019.1975+ 0.060445E.‡Number of points used to determine the maximum.
0.057 0.058 0.059 0.060 0.061 0.062 0.063
0.85
0.90
0.95
1.00
(d)
θ
P=0.06035
−0.5 0.0 0.5 1.0 1.5
−0.10
−0.05
0.00
0.05
Fig. 94. Superhumps in ASASSN-14mj (2014). The dataafter BJD 2457019 were used. (Upper): PDM analysis.(Lower): Phase-averaged profile
.
gested a WZ Sge-type dwarf nova, no evident early super-humps were detected. Eight days after the detection, thisobject started to show ordinary superhumps (vsnet-alert18189, 18200; figure 95). The times of superhump maximaare listed in table 73. The epochs for E ≤ 2 correspond tostage A superhumps. Despite the large outburst ampli-tude, the shortness of the segment before the appearanceof ordinary superhumps suggests that ASASSN-15ah isnot an extreme WZ Sge-type dwarf nova.
3.71. ASASSN-15ap
This object was detected as a transient at V =17.0on 2015 January 8 by ASAS-SN team. The bright-ened to V =15.55 on January 11. The coordinates are06h37m47.s51, −25◦41′20.′′1 (the Initial Gaia Source List).Superhumps were observed since our initial observationon January 17 (vsnet-alert 18198, 18222; figure 96). Thetimes of superhump maxima are listed in table 74. Thesuperhump stage is not known. The superhump periodwas relatively constant for this long-PSH system.
3.72. ASASSN-15aq
This object was detected as a transient at V =14.2 on2015 January 13 by ASAS-SN team (vsnet-alert 18175).

72 T. Kato et al. [Vol. ,
0.052 0.053 0.054 0.055 0.056 0.057 0.058
0.90
0.95
1.00
(d)
θ
P=0.05544
−0.5 0.0 0.5 1.0 1.5
−0.05
0.00
0.05
Fig. 95. Superhumps in ASASSN-15ah (2015). The dataafter BJD 2457038 were used. (Upper): PDM analysis.(Lower): Phase-averaged profile
.
Table 73. Superhump maxima of ASASSN-15ah (2015)
E max∗ error O−C† N ‡
0 57038.3679 0.0006 −0.0028 1281 57038.4223 0.0006 −0.0040 1282 57038.4741 0.0033 −0.0077 33
35 57040.3212 0.0003 0.0069 12736 57040.3760 0.0002 0.0061 12737 57040.4306 0.0003 0.0052 12738 57040.4873 0.0003 0.0064 12885 57043.0859 0.0035 −0.0049 7089 57043.3102 0.0004 −0.0027 12790 57043.3662 0.0003 −0.0023 127
107 57044.3073 0.0007 −0.0052 95108 57044.3739 0.0021 0.0059 78109 57044.4210 0.0013 −0.0026 56139 57046.0969 0.0033 0.0075 54144 57046.3651 0.0008 −0.0020 128145 57046.4185 0.0007 −0.0041 127∗BJD−2400000.†Against max = 2457038.3708+ 0.055530E.‡Number of points used to determine the maximum.
0.088 0.089 0.090 0.091 0.092 0.093 0.094 0.095
0.2
0.4
0.6
0.8
1.0
(d)
θ
P=0.09134
−0.5 0.0 0.5 1.0 1.5
−0.1
0.0
0.1
Fig. 96. Superhumps in ASASSN-15ap (2015). (Upper):PDM analysis. (Lower): Phase-averaged profile
.
Table 74. Superhump maxima of ASASSN-15ap (2015)
E max∗ error O−C† N ‡
0 57038.4067 0.0010 −0.0058 1221 57038.5068 0.0042 0.0031 28
22 57040.4233 0.0008 0.0014 12423 57040.5166 0.0004 0.0034 21155 57043.4353 0.0004 −0.0009 16656 57043.5259 0.0005 −0.0016 21166 57044.4410 0.0006 0.0001 16667 57044.5326 0.0006 0.0004 210∗BJD−2400000.†Against max = 2457038.4125+ 0.091340E.‡Number of points used to determine the maximum.

No. ] Period Variations in SU UMa-Type Dwarf Novae VII 73
0.069 0.070 0.071 0.072 0.073 0.074 0.075
0.6
0.8
1.0
(d)
θ
P=0.07227
−0.5 0.0 0.5 1.0 1.5
−0.10
−0.05
0.00
0.05
Fig. 97. Superhumps in ASASSN-15aq during the plateauphase (2015). (Upper): PDM analysis. (Lower):Phase-averaged profile
.
The coordinates are 00h42m14.s24, −56◦09′19.′′9 (2MASSposition). There were several outbursts in the ASAS-3.The 2007 outburst looked like superoutbursts (vsnet-alert18175). Superhumps were immediately detected (vsnet-alert 18186, 18199; figure 97). The times of superhumpmaxima are listed in table 75. Both stages B and C canbe recognized. It was likely that the outburst detectionwas not early enough to detect stage A superhumps.
3.73. ASASSN-15aw
This object was detected as a transient at V =15.8on 2015 January 15 by ASAS-SN team. The coordi-nates are 01h57m46.s13, +51◦10′24.′′1 (The Initial GaiaSource List). There is a GALEX counterpart with anNUV magnitude of 21.1. MASTER team also detectedthis object (MASTER OT J015746.16+511023.2) threedays later (Balanutsa et al. 2015b). Superhumps wererecorded in single-night observations (vsnet-alert 18203;figure 98). Three superhump maxima were recorded: BJD2457044.3558(18) (N=39), 2457044.4104(9) (N=42) and2457044.4720(10) (N=43). The superhump period deter-mined by the PDM method is listed in table 2.
Table 75. Superhump maxima of ASASSN-15aq (2015)
E max∗ error O−C† N ‡
0 57037.5159 0.0076 −0.0110 91 57037.6044 0.0028 0.0054 9
11 57038.3208 0.0003 0.0001 16712 57038.3946 0.0005 0.0017 8014 57038.5341 0.0015 −0.0032 1539 57040.3398 0.0004 −0.0016 16640 57040.4175 0.0010 0.0039 5942 57040.5562 0.0007 −0.0017 3756 57041.5701 0.0021 0.0018 2680 57043.3113 0.0005 0.0110 167
108 57045.3254 0.0004 0.0044 167125 57046.5455 0.0016 −0.0024 23139 57047.5499 0.0030 −0.0084 24∗BJD−2400000.†Against max = 2457037.5269+ 0.072168E.‡Number of points used to determine the maximum.
0.25 0.30 0.35 0.40 0.45 0.50 0.55
−0.2
−0.1
0.0
0.1
0.2
Fig. 98. Superhumps in ASASSN-15aw (2015).
3.74. ASASSN-15bg
This object was detected as a transient at V =15.6on 2015 January 20 by ASAS-SN team. The coordi-nates are 01h27m54.s61, −58◦17′16.′′8 (the Initial GaiaSource List). Subsequent observations detected super-humps (vsnet-alert 18223; figure 99). The times of su-perhump maxima are listed in table 76.
3.75. ASASSN-15bp
This object was detected as a transient at V =11.9 on2015 January 23 by ASAS-SN team (Simonian et al. 2015).The coordinates are 12h12m40.s43, +04◦16′55.′′8 (SDSSg=20.5 counterpart). There is a GALEX counterpart witha NUV magnitude of 20.9. The object was spectroscop-ically confirmed as an outbursting CV (Williams et al.2015). The object was immediately identified as a WZSge-type dwarf nova by the detection of early superhumps(vsnet-alert 18219, 18325, 18241; figure 100). The objectthen started to show ordinary superhumps (vsnet-alert

74 T. Kato et al. [Vol. ,
0.063 0.064 0.065 0.066 0.067 0.068
0.80
0.85
0.90
0.95
1.00
(d)
θ
P=0.06579
−0.5 0.0 0.5 1.0 1.5
−0.1
0.0
0.1
Fig. 99. Superhumps in ASASSN-15bg (2015). (Upper):PDM analysis. (Lower): Phase-averaged profile
.
Table 76. Superhump maxima of ASASSN-15bg (2015)
E max∗ error O−C† N ‡
0 57044.3073 0.0022 −0.0019 731 57044.3782 0.0013 0.0034 104
15 57045.2932 0.0041 −0.0011 10816 57045.3583 0.0014 −0.0016 14831 57046.3456 0.0010 0.0006 15132 57046.4112 0.0019 0.0006 103∗BJD−2400000.†Against max = 2457044.3092+ 0.065669E.‡Number of points used to determine the maximum.
18250, 18255, 18262, 18269, 18277, 18300, 18311; figure101). The object then started fading rapidly on February23 (31 d after the outburst detection, vsnet-alert 18331).Although there was some hint of post-superoutburst re-brightenings (figure 102), they were not confirmed by in-dependent observers.
The times of superhump maxima during the plateauphase are listed in table 77. The times E ≤ 35 are clearlygrowing superhumps (cf. figure 102). Using the data forE ≤ 33 (BJD 2457054–2457056), we could determine theperiod of stage A superhumps as 0.05731(3) d with thePDM method. The maxima for 35 ≤ E ≤ 256 representcharacteristic stage B superhumps with a small positivePdot. As is usual for a WZ Sge-type dwarf nova, this objectdid not show a smooth transition to stage C superhumps.There was an apparent phase jump after E=256. Thisjump corresponds to the later part of the plateau phase,and it looks like the superhumps observed after this phasejump appear to be on a smooth extension of early stage Bsuperhumps (figure 102), just as seen in GW Lib duringthe 2007 superoutburst (figure 33 in Kato et al. 2009).There is difference, however, in that this jump occurredduring the rapid fading in GW Lib while it occurred dur-ing the plateau phase in ASASSN-15bp. The superhumpperiod after E = 256 (BJD 2457069–2457076.8) was de-termined to be 0.05666(1) d by the PDM method. Welisted this period as stage C superhumps in table 2. Thetimes of superhump maxima in the post-superoutburststage are listed in table 78. The period was determinedas 0.05651(2) d with the PDM method.
The variation of the superhump period is also well vi-sualized in two-dimensional period analysis (figure 103)using Lasso.
The period of stage A superhumps corresponds toǫ∗=0.0293(6) and q=0.079(2). Following the formulationin Kato, Osaki (2013b), the period of superhump in thepost-superoutburst phase is found to correspond to a diskradius of 0.355(5)A, where A is the binary separation.This value is close to those recorded in WZ Sge-typedwarf novae without multiple rebrightenings (Kato, Osaki2013b).
3.76. ASASSN-15bu
This object was detected as a transient at V =15.8 on2015 January 22 by ASAS-SN team. The coordinates are02h54m43.s77, +22◦44′01.′′9 (2MASS position). There isa GALEX counterpart with a NUV magnitude of 19.7.The object was suspected to be an eclipsing SU UMa-typedwarf nova based on apparent eclipses in the CRTS data(vsnet-alert 18228). Although the outburst amplitude wassmall, the outburst turned out to be a superoutburst withsuperhumps (vsnet-alert 18234, 18242; figure 104).
An MCMC analysis of both the CRTS data and thepresent data in outburst yielded the following orbitalephemeris:
Min(BJD) = 2455129.74232(3)+ 0.076819040(1)E. (6)
Like ASASSN-14ag, the object showed a strong beatphenomenon between the superhump period and the or-

No. ] Period Variations in SU UMa-Type Dwarf Novae VII 75
0.054 0.055 0.056 0.057 0.058
0.96
0.97
0.98
0.99
1.00
(d)
θ
P=0.05563
−0.5 0.0 0.5 1.0 1.5
−0.01
0.00
0.01
Fig. 100. Early superhumps in ASASSN-15bp (2015).(Upper): PDM analysis. (Lower): Phase-averaged profile
.
bital period (figure 105).The times of superhump maxima outside the eclipses
are listed in table 79. Since the object started fadingrapidly ∼9 d after the ASAS-SN detection, it was likelythat we observed the only the later part of the super-outburst. The superhumps were possibly mostly stage Csuperhumps although the superhump amplitudes (some-times reaching 0.6 mag) were much larger than those oftypical stage C superhumps in non-eclipsing systems.
3.77. ASASSN-15bv
This object was detected as a transient at V =15.5 on2015 January 22 by ASAS-SN team. The coordinatesare 06h25m01.s75, −02◦47′58.′′6 (the Initial Gaia SourceList). A single-night observations detected likely super-humps (vsnet-alert 18244, figure 106). Although a periodof 0.101(1) d can be determined, the reality of superhumpsneeds to be confirmed by future observations.
3.78. ASASSN-15dq
This object was detected as a transient at V =14.5 on2015 February 22 by ASAS-SN team. The coordinates are09h46m06.s91, −00◦56′01.′′6 (SDSS g=20.4 counterpart).CRTS also detected the object four days later (cf. vsnet-
0.055 0.056 0.057 0.058 0.059
0.85
0.90
0.95
1.00
(d)
θ
P=0.05659
−0.5 0.0 0.5 1.0 1.5
−0.06
−0.04
−0.02
0.00
0.02
0.04
0.06
Fig. 101. Ordinary superhumps in ASASSN-15bp (2015).The data for BJD 2457056–2457069 were used. (Upper):PDM analysis. (Lower): Phase-averaged profile
.
alert 18348). The SDSS colors suggested an SU UMa-typedwarf nova (vsnet-alert 18329). Superhumps were imme-diately detected (vsnet-alert 18333, 18352, 18362; figure107). The times of superhump maxima are listed in table80. Although superhump stage is now known, no strongperiod variation was detected except E ≥ 61. The objectrapidly faded on March 7, 13 d after the outburst detec-tion.
3.79. CRTS J081936.1+191540
This object (hereafter CRTS J081936) was origi-nally detected as a CV by CRTS on 2010 February 2(=CSS100202:081936+191540). Although it was a faint(17.35 mag), there was another brighter outburst (16.33mag) on 2011 February 4. The object was given a CRTSdesignation in Drake et al. (2014). The 2013 bright (15.02mag) outburst was by MASTER network (vsnet-alert15562). Subsequent observations detected superhumps(vsnet-alert 15565, 15574; figure 108). The times of su-perhump maxima are listed in table 81. The superhumpstage is unknown.

76 T. Kato et al. [Vol. ,
−100 0 100 200 300 400 500 600 700
−0.06
−0.04
−0.02
0.00
0.02
0.0
0.1
0.2
0.3
0.4
50 60 70 80 90
12
14
16
18
Fig. 102. O −C diagram of superhumps in ASASSN-15bp(2015). (Upper:) O − C diagram. We used a period of0.05670 d for calculating the O − C residuals. (Middle:)Amplitudes of superhumps. (Lower:) Light curve. The datawere binned to 0.018 d.
3.80. CRTS J172038.7+183802
This object (hereafter CRTS J172038) was originallydetected as a CV by CRTS on 2009 September 29(=CSS090929:172039+183802). The object was given aCRTS designation in Drake et al. (2014). MASTER net-work detected a new outburst on 2014 April 3 (vsnet-alert17148). Subsequent observations detected superhumps(vsnet-alert 17154). Only single-night observation was ob-tained (figure 109) and only an approximate superhumpperiod of 0.06 d was obtained.
3.81. CSS J174033.5+414756
3.81.1. IntroductionThis object (=CSS130418:174033+414756, hereafter
CSS J174033) was discovered by the CRTS team in 2013April (cf. vsnet-alert 15629). The object was also detectedby the ASAS-SN team (ASASSN-13ad: Prieto et al. 2013;Nesci et al. 2013). The 2013 outburst showed a sequenceof early superhumps and ordinary superhumps. The ob-ject was identified as a WZ Sge-type object having a pe-riod below the period minimum. The details of the 2013outburst is reported in T. Ohshima et al. in preparation.
12
14
16
18
34.0
34.5
35.0
35.5
36.0Porb/2
57050 57060 57070 5708017.0
17.2
17.4
17.6
17.8
18.0Porb
Fig. 103. Lasso period analysis of ASASSN-15bp (2015).(Upper:) Light curve. The data were were binned to 0.018 d.(Middle:) First harmonics of the superhump and orbital sig-nals. (Lower:) Fundamental of the superhump and orbitalsignal. The orbital signal was only weakly detected dur-ing the earliest stage (early superhumps). The signal ofpositive superhumps with variable frequency (around 17.6c/d) was recorded during the superoutburst plateau post–superoutburst stage. It is obvious that the frequency de-creased between BJD 2457055 and 2457059, the increased,in agreement with the O−C analysis. Superhump signals be-fore BJD 2457055 were noisy due to rapidly variable periodsand contamination of early superhumps in analyzed windows.logλ =−7.8 was used. The width of the sliding window andthe time step used are 6 d and 0.3 d, respectively.
3.81.2. 2014 Outburst
The 2014 outburst was detected by C. Chiselbrook onAugust 6 (vsnet-alert 17610). Since there was a 6 d gapin observation before this detection and since the bright-ness was fainter by 0.7 mag than the peak brightness ofthe 2013 outburst, it was likely the peak of the 2013 out-burst was missed for several days. It was a surprise thatan object showing a WZ Sge-type outburst repeated a su-peroutburst less than 500 d after the previous outburst(vsnet-alert 17610).
As in the 2013 outburst, there was a deep dip followingthe plateau (BJD 2456886–2456889; figure 110. After thisdip, the object showed a plateau-type rebrightening as inAL Com in 1995 (Patterson et al. 1996; Howell et al. 1996;Nogami et al. 1997) and 2001 (Ishioka et al. 2002). Sucha dip was recorded in a WZ Sge-type dwarf nova IK Leo(=OT J102146.4+234926; Uemura et al. 2008, Golovinet al. 2007, Kato et al. 2009), which was regarded as atemporary dip in a plateau rather than a dip precedinga rebrightening. After this dip, the plateau continued for

No. ] Period Variations in SU UMa-Type Dwarf Novae VII 77
Table 77. Superhump maxima of ASASSN-15bp (2015)
E max∗ error O−C† N ‡
0 57054.2881 0.0013 −0.0233 1961 57054.3453 0.0032 −0.0228 3245 57054.5734 0.0010 −0.0211 606 57054.6295 0.0012 −0.0216 667 57054.6930 0.0022 −0.0148 62
14 57055.1072 0.0030 0.0030 6515 57055.1528 0.0010 −0.0081 21416 57055.2121 0.0010 −0.0053 27817 57055.2729 0.0008 −0.0013 19218 57055.3294 0.0008 −0.0013 12122 57055.5572 0.0006 −0.0000 7023 57055.6133 0.0004 −0.0006 7324 57055.6711 0.0004 0.0006 6025 57055.7278 0.0006 0.0007 6926 57055.7827 0.0006 −0.0011 10227 57055.8424 0.0004 0.0020 17228 57055.9020 0.0003 0.0049 10533 57056.1867 0.0003 0.0065 11834 57056.2433 0.0002 0.0065 13135 57056.3013 0.0002 0.0079 12336 57056.3544 0.0006 0.0043 9243 57056.7520 0.0003 0.0055 4544 57056.8083 0.0003 0.0052 4545 57056.8658 0.0004 0.0060 4546 57056.9222 0.0005 0.0058 4060 57057.7204 0.0019 0.0112 1861 57057.7629 0.0012 −0.0029 1962 57057.8235 0.0006 0.0010 2263 57057.8798 0.0026 0.0007 1167 57058.1057 0.0015 0.0001 1868 57058.1624 0.0010 0.0002 3569 57058.2163 0.0011 −0.0026 30∗BJD−2400000.†Against max = 2457054.3114+ 0.056629E.‡Number of points used to determine the maximum.
15 d. There was a short dip (BJD 2456902) before thetermination of the entire plateau. Such a dip was recordedin KK Cnc (=OT J080714.2+113812; Kato et al. 2009).3.81.3. Superhumps
The times of superhumps before the initial dip are listedin table 82. As in the 2013 superoutburst, there werestage B superhumps (E ≤ 166) with a positive Pdot of+2.0(0.3)× 10−5. The value was similar to the 2013 one[+1.6(0.1)× 10−5]. The phases of early superhumps andstage A superhumps were not covered by the present ob-servation since the detection was apparently several daysafter the peak brightness.
Before entering the dip, the superhump signal decreasedand another period appeared (E ≤ 176). The new periodis 0.04505(6) d, which is identical to the orbital periodwithin errors. We consider that the orbital signal wassomehow enhanced during the decline branch to the dipminimum.
Table 77. Superhump maxima of ASASSN-15bp (2015)(continued)
E max∗ error O−C† N ‡
70 57058.2766 0.0009 0.0011 2975 57058.5569 0.0003 −0.0018 8176 57058.6145 0.0002 −0.0008 9277 57058.6701 0.0002 −0.0018 9078 57058.7275 0.0002 −0.0010 8379 57058.7846 0.0006 −0.0006 6080 57058.8404 0.0007 −0.0014 6481 57058.8969 0.0005 −0.0015 6282 57058.9560 0.0025 0.0010 2496 57059.7438 0.0006 −0.0041 4297 57059.8028 0.0007 −0.0017 9498 57059.8574 0.0012 −0.0037 10599 57059.9154 0.0007 −0.0024 44
102 57060.0822 0.0020 −0.0055 28103 57060.1404 0.0006 −0.0039 179104 57060.1982 0.0009 −0.0027 191105 57060.2532 0.0007 −0.0044 257106 57060.3128 0.0007 −0.0014 152107 57060.3687 0.0011 −0.0021 80130 57061.6722 0.0012 −0.0011 87142 57062.3474 0.0004 −0.0054 62147 57062.6320 0.0005 −0.0040 15156 57063.1501 0.0009 0.0045 119157 57063.1999 0.0007 −0.0024 145158 57063.2557 0.0012 −0.0033 148159 57063.3162 0.0014 0.0006 109167 57063.7720 0.0016 0.0034 59168 57063.8259 0.0004 0.0007 167169 57063.8843 0.0012 0.0025 18170 57063.9392 0.0003 0.0007 110173 57064.1107 0.0016 0.0023 31174 57064.1654 0.0010 0.0004 119175 57064.2232 0.0008 0.0015 125∗BJD−2400000.†Against max = 2457054.3114+ 0.056629E.‡Number of points used to determine the maximum.
The times of superhump after tis dip are listed in table83. After the dip, the period was almost constant andslightly shorter than the period of stage B superhumps.The situation is clear in figure 110 that superhumps af-ter the dip are on a smooth continuation of superhumpsbefore the dip. Since the period was almost constant andshorter, we identified this period as that of stage C super-humps. The cycle counts listed in table 2 refer to table83. Although these superhumps were phenomenologicallyidentified as stage C superhumps, the variation of the pe-riod from stage B to C was smaller (0.14%) compared to∼0.5% in ordinary hydrogen-rich SU UMa-type dwarf no-vae (Kato et al. 2009). This phenomenon may be differentfrom stage C superhumps in ordinary hydrogen-rich SUUMa-type dwarf novae. Although the entire light curveis similar to long-lasting rebrightenings in WZ Sge-typedwarf novae (such as AL Com, figure 13 in Kato et al.

78 T. Kato et al. [Vol. ,
Table 77. Superhump maxima of ASASSN-15bp (2015)(continued)
E max∗ error O−C† N ‡
176 57064.2829 0.0011 0.0047 120184 57064.7324 0.0009 0.0011 58185 57064.7911 0.0010 0.0031 65186 57064.8465 0.0010 0.0019 65187 57064.9067 0.0012 0.0055 28193 57065.2485 0.0048 0.0075 27199 57065.5886 0.0007 0.0079 58200 57065.6431 0.0008 0.0057 58202 57065.7584 0.0009 0.0078 48203 57065.8148 0.0010 0.0075 58204 57065.8739 0.0013 0.0100 60206 57065.9841 0.0010 0.0069 45212 57066.3245 0.0034 0.0076 43213 57066.3867 0.0029 0.0132 21221 57066.8366 0.0021 0.0100 70222 57066.8953 0.0028 0.0120 19228 57067.2368 0.0025 0.0138 78238 57067.8018 0.0016 0.0124 30244 57068.1456 0.0045 0.0165 77247 57068.3096 0.0026 0.0106 177250 57068.4923 0.0029 0.0234 59251 57068.5458 0.0017 0.0203 56252 57068.6080 0.0023 0.0259 56253 57068.6577 0.0023 0.0189 59254 57068.7128 0.0028 0.0174 24256 57068.8299 0.0028 0.0213 71269 57069.5345 0.0009 −0.0103 46271 57069.6489 0.0013 −0.0092 59280 57070.1633 0.0026 −0.0045 35287 57070.5605 0.0011 −0.0037 118∗BJD−2400000.†Against max = 2457054.3114+ 0.056629E.‡Number of points used to determine the maximum.
2014a), the O−C behavior is different and resembles thoseof SU UMa-type dwarf novae with stage B-C transition.This difference needs to be further examined.3.81.4. Comparison of superoutbursts
In figure 111, three known (super)outbursts are com-pared. The zero point in abscissa refers to the CRTSdetection for the 2013 outburst. The object was at 14.0mag in this detection, and the outburst was most likelydetected during its rising phase. We therefore considerthat zero point for the 2013 outburst refers to the startof the outburst within an error of 1 d. The 2007 out-burst was detected at a much brighter magnitude (12.7).We consider that the 2007 outburst was detected near itspeak brightness since the light curves well agree with the2013 one following this assumption. The situation for the2014 outburst is less clear. Although there was a negativeobservation 7 d before the initial detection by the sameobserver (there were four negative observations startingfrom 11 d before the initial detection). Since all theseobservations were visual observations and the detection
Table 77. Superhump maxima of ASASSN-15bp (2015)(continued)
E max∗ error O−C† N ‡
288 57070.6128 0.0019 −0.0080 112294 57070.9516 0.0012 −0.0090 60295 57071.0033 0.0013 −0.0140 63296 57071.0648 0.0015 −0.0091 81305 57071.5740 0.0016 −0.0096 121323 57072.5970 0.0012 −0.0059 116324 57072.6486 0.0011 −0.0109 150325 57072.7151 0.0015 −0.0010 145327 57072.8294 0.0013 0.0000 77328 57072.8821 0.0017 −0.0039 101329 57072.9370 0.0013 −0.0056 103330 57072.9839 0.0028 −0.0154 64341 57073.6151 0.0016 −0.0071 37342 57073.6704 0.0018 −0.0085 37344 57073.7885 0.0031 −0.0036 32345 57073.8327 0.0020 −0.0160 86346 57073.8918 0.0019 −0.0136 98347 57073.9529 0.0027 −0.0091 74362 57074.8081 0.0025 −0.0033 61363 57074.8591 0.0016 −0.0090 58367 57075.0893 0.0035 −0.0053 45368 57075.1358 0.0030 −0.0154 44376 57075.6047 0.0005 0.0005 154379 57075.7585 0.0025 −0.0156 35380 57075.8186 0.0015 −0.0122 24381 57075.8804 0.0021 −0.0070 17395 57076.6799 0.0034 −0.0004 27396 57076.7610 0.0035 0.0241 21∗BJD−2400000.†Against max = 2457054.3114+ 0.056629E.‡Number of points used to determine the maximum.
limit was close to the magnitude of the initial detection,we consider that there was a chance that the early part ofthe outburst was not detected by visual observations. Ifwe consider that the actual outburst started 14 d beforethe initial detection, the magnitude, the epoch of the dipand the final fading agree with the 2013 ones. We adoptedthis assumption in figure 111. If this assumption is cor-rect, the outburst light curves in CSS J174033 are highlyreproducible.
3.82. CRTS J202731.2−224002
This object (=SSS110515:202731−224002, hereafterCRTS J202731) is a dwarf nova discovered by CRTSin 2011 May (Breedt et al. 2014). The 2014 outburstwas detected by the ASAS-SN team (vsnet-alert 17857).Nine past outbursts were detected by ASAS-3 and thebrightest outburst reached V =12.2 (vsnet-alert 17858,17859). Subsequent observations detected superhumps(vsnet-alert 17861, 17868, 17877; figure 112). The timesof superhump maxima are listed in table 84. The val-ues for E≤191 represent post-superoutburst observations.Although stage B was not very clearly identified, a sharp

No. ] Period Variations in SU UMa-Type Dwarf Novae VII 79
Table 78. Superhump maxima of ASASSN-15bp (2015)(post-superoutburst)
E max∗ error O−C† N ‡
0 57078.2673 0.0025 0.0022 155 57078.5479 0.0009 0.0002 516 57078.6048 0.0009 0.0007 437 57078.6596 0.0008 −0.0011 458 57078.7157 0.0014 −0.0015 44
23 57079.5645 0.0013 −0.0005 4224 57079.6252 0.0029 0.0037 4125 57079.6767 0.0017 −0.0014 5026 57079.7346 0.0019 −0.0001 2828 57079.8436 0.0029 −0.0041 1429 57079.9005 0.0037 −0.0037 1242 57080.6398 0.0073 0.0008 1043 57080.6990 0.0011 0.0035 4894 57083.5838 0.0021 0.0057 3795 57083.6352 0.0024 0.0005 4096 57083.6926 0.0016 0.0014 40
112 57084.5893 0.0066 −0.0063 20∗BJD−2400000.†Against max = 2457078.2650+ 0.056523E.‡Number of points used to determine the maximum.
0.077 0.078 0.079 0.080 0.081 0.082 0.083
0.6
0.7
0.8
0.9
1.0
(d)
θ
P=0.08002
−0.5 0.0 0.5 1.0 1.5
−0.2
−0.1
0.0
0.1
Fig. 104. Superhumps in ASASSN-15bu outside the eclipses(2015). (Upper): PDM analysis. (Lower): Phase-averagedprofile.
9.3 9.4 9.5 9.6 9.7
14
15
16
17
18
10.3 10.4 10.5 10.6 10.7
14
15
16
17
18
Fig. 105. Sample light curve of ASASSN-15bu in superout-burst. Superposition of superhumps and eclipse are well visi-ble.
0.30 0.35 0.40 0.45 0.50
15.6
15.8
16.0
Fig. 106. Likely superhumps in ASASSN-15bv (2015).

80 T. Kato et al. [Vol. ,
Table 79. Superhump maxima of ASASSN-15bu (2015)
E max∗ error O−C† phase‡ N §
0 57049.3319 0.0006 −0.0021 0.46 881 57049.4138 0.0005 −0.0003 0.53 923 57049.5672 0.0015 −0.0070 0.52 394 57049.6540 0.0004 −0.0002 0.65 605 57049.7334 0.0016 −0.0008 0.69 30
12 57050.2921 0.0020 −0.0025 0.96 2313 57050.3811 0.0008 0.0065 0.12 7414 57050.4557 0.0017 0.0010 0.09 4115 57050.5329 0.0096 −0.0019 0.09 2216 57050.6134 0.0011 −0.0013 0.14 7417 57050.7007 0.0014 0.0059 0.28 6626 57051.4174 0.0005 0.0021 0.61 8428 57051.5777 0.0006 0.0024 0.70 9329 57051.6536 0.0008 −0.0019 0.68 7653 57053.5811 0.0046 0.0045 0.78 7155 57053.7416 0.0022 0.0049 0.87 6064 57054.4507 0.0033 −0.0064 0.10 3876 57055.4257 0.0015 0.0080 0.79 6679 57055.6572 0.0005 −0.0007 0.80 6680 57055.7278 0.0007 −0.0101 0.72 52∗BJD−2400000.†Against max = 2457049.3340+ 0.080049E.‡Orbital phase.§Number of points used to determine the maximum.
Table 80. Superhump maxima of ASASSN-15dq (2015)
E max∗ error O−C† N ‡
0 57078.5776 0.0003 −0.0031 7613 57079.6433 0.0009 −0.0020 2225 57080.6286 0.0007 0.0006 1836 57081.5292 0.0005 0.0004 7337 57081.6157 0.0012 0.0050 3146 57082.3530 0.0008 0.0054 9147 57082.4331 0.0038 0.0036 3561 57083.5670 0.0040 −0.0090 962 57083.6569 0.0022 −0.0009 19∗BJD−2400000.†Against max = 2457078.5807+ 0.081889E.‡Number of points used to determine the maximum.
Table 81. Superhump maxima of CRTS J081936 (2013)
E max∗ error O−C† N ‡
0 56384.4396 0.0005 0.0008 891 56384.5141 0.0014 −0.0009 81
13 56385.4304 0.0007 −0.0001 9014 56385.5069 0.0012 0.0001 87∗BJD−2400000.†Against max = 2456384.4387+ 0.076285E.‡Number of points used to determine the maximum.
0.078 0.079 0.080 0.081 0.082 0.083 0.084 0.085
0.6
0.8
1.0
(d)
θ
P=0.08206
−0.5 0.0 0.5 1.0 1.5
−0.2
−0.1
0.0
0.1
Fig. 107. Superhumps in ASASSN-15dq during the super-outburst plateau (2015). (Upper): PDM analysis. (Lower):Phase-averaged profile
.
variation in the O −C values signified stage B-C tran-sition around E = 78. The post-superoutburst data didnot yield a significant signal of superhumps except for theinitial two nights.
A list of recent outbursts is given in table 85. Theintervals of known superoutburst were 473 d, 415 d and619 d. Given the relatively frequent normal outbursts, thetrue supercycle appears to be 206–237 d.
3.83. CRTS J214738.4+244554
This object (=CSS111004:214738+244554, hereafterCRTS J214738) is a dwarf nova discovered by CRTS(Breedt et al. 2014). The 2011 superoutburst was rela-tively well observed and a positive Pdot for stage B super-humps was recorded in spite of the long superhump period(Kato et al. 2013a).
The 2014 superoutburst was detected by the ASAS-SNteam at V =12.81 on September 11 (vsnet-alert 17728).On September 14, low-amplitude superhumps were de-tected despite that already ∼3 d had passed since theoutburst detection (vsnet-alert 17752). The superhumpsfurther evolved ∼4 d later (vsnet-alert 17751, 17766). Thetimes of superhump maxima are listed in table 86. We as-signed negative O−C for E ≤ 2 assuming that they are

No. ] Period Variations in SU UMa-Type Dwarf Novae VII 81
Table 85. List of recent outbursts of CRTS J202731
Year Month max∗ magnitude type source2001 5 52053 13.0 super ASAS-32001 9 52157 13.4 normal?† ASAS-32002 9 52526 12.2 super ASAS-32003 5 52770 12.8 normal?† ASAS-32003 10 52941 12.7 super ASAS-32005 7 53560 12.2 super ASAS-32007 11 54409 13.0 normal?† ASAS-32008 8 54686 13.0 normal ASAS-32009 5 54976 13.0 normal ASAS-32011 5 55697 13.0 normal? CRTS2014 10 56949 12.5 super this paper∗JD−2400000.†Single detection.
0.073 0.074 0.075 0.076 0.077 0.078 0.079
0.6
0.8
1.0
(d)
θ
P=0.07628
−0.5 0.0 0.5 1.0 1.5
−0.2
−0.1
0.0
0.1
Fig. 108. Superhumps in CRTS J081936 during the super-outburst plateau (2014). (Upper): PDM analysis. (Lower):Phase-averaged profile
.
0.80 0.82 0.84 0.86 0.88 0.90 0.92
−0.1
0.0
0.1
Fig. 109. Superhumps in CRTS J172038 (2014).
−100 0 100 200 300 400 500 600 700
−0.06
−0.04
−0.02
0.00
875 880 885 890 895 900 905 910
14
16
18
Fig. 110. O − C diagram of superhumps in CSS J174033(2014). (Upper:) O − C diagram. We used a period of0.045592 d for calculating the O − C residuals. (Middle:)Amplitudes of superhumps. (Lower:) Light curve. The datawere binned to 0.009 d.

82 T. Kato et al. [Vol. ,
0 10 20 30 40 50 60
10
15
20
2014
2013 (−2.5)
2007 (−5)
Fig. 111. Comparison of superoutbursts of CSS J174033.The data were binned to 1 d and shifted in magnitude. Thedashed lines are added to aid recognizing the variation. Thedata for the 2013 superoutburst were from T. Ohshima et al.in preparationThe data for the 2007 superoutburst were fromthe CRTS public data.
0.068 0.069 0.070 0.071 0.072 0.073 0.074 0.075
0.8
0.9
1.0
(d)
θ
P=0.07162
−0.5 0.0 0.5 1.0 1.5
−0.05
0.00
0.05
Fig. 112. Superhumps in CRTS J202731 during the super-outburst plateau (2014). (Upper): PDM analysis. (Lower):Phase-averaged profile
.
Table 82. Superhump maxima of CSS J174033 (2014)
E max∗ error O−C† N ‡
0 56878.3516 0.0002 −0.0003 931 56878.3977 0.0004 0.0003 1752 56878.4419 0.0004 −0.0011 1803 56878.4896 0.0006 0.0010 1654 56878.5339 0.0009 −0.0002 525 56878.5790 0.0007 −0.0007 716 56878.6249 0.0005 −0.0003 937 56878.6720 0.0006 0.0013 998 56878.7159 0.0005 −0.0004 2169 56878.7612 0.0004 −0.0007 185
10 56878.8081 0.0006 0.0006 15011 56878.8528 0.0005 −0.0002 15212 56878.8972 0.0009 −0.0014 12513 56878.9432 0.0010 −0.0010 6422 56879.3533 0.0004 −0.0009 2423 56879.3991 0.0014 −0.0006 7324 56879.4444 0.0008 −0.0009 4825 56879.4895 0.0007 −0.0014 4926 56879.5352 0.0015 −0.0012 4830 56879.7167 0.0006 −0.0019 14531 56879.7633 0.0005 −0.0009 14532 56879.8087 0.0006 −0.0010 13633 56879.8537 0.0011 −0.0016 11935 56879.9458 0.0018 −0.0006 3245 56880.4008 0.0014 −0.0013 9646 56880.4463 0.0009 −0.0014 9547 56880.4916 0.0009 −0.0016 5848 56880.5370 0.0006 −0.0017 5949 56880.5851 0.0008 0.0007 10450 56880.6287 0.0007 −0.0012 8051 56880.6745 0.0009 −0.0010 17252 56880.7199 0.0007 −0.0011 185∗BJD−2400000.†Against max = 2456878.3519+ 0.045560E.‡Number of points used to determine the maximum.
stage A superhumps. These counts may be in error byone cycle.
Although the observations were not sufficient, there wasa suggestion of slow evolution of superhumps both in 2011superoutburst (stage A lasting for more than 21 cycles)and the 2014 one. This indication appears to have beenconfirmed by a comparison of O−C diagrams (figure 113).Such a slow evolution with long stage A was hypothesizedfor objects in the period gap as a consequence of nearlycritical condition of tidal instability (Kato et al. 2014a).CRTS J214738 may be another example supporting thisinterpretation.
3.84. MASTER OT J031600.08+175824.4
This optical transient (hereafter MASTER J031600)was detected on 2014 December 26 at a magnitude of 15.1(Shumkov et al. 2014). The outburst was detected in theearly stage and subsequent development of superhumps

No. ] Period Variations in SU UMa-Type Dwarf Novae VII 83
Table 82. Superhump maxima of CSS J174033 (2014) (con-tinued)
E max∗ error O−C† N ‡
53 56880.7659 0.0025 −0.0006 6967 56881.4027 0.0005 −0.0017 4868 56881.4495 0.0004 −0.0005 4869 56881.4943 0.0006 −0.0012 4970 56881.5394 0.0005 −0.0017 4871 56881.5870 0.0013 0.0003 2791 56882.4978 0.0007 −0.0000 8892 56882.5440 0.0006 0.0006 8793 56882.5903 0.0007 0.0014 67
111 56883.4093 0.0005 0.0003 47112 56883.4559 0.0007 0.0013 47113 56883.5012 0.0006 0.0010 46114 56883.5476 0.0026 0.0019 17117 56883.6836 0.0011 0.0011 31118 56883.7292 0.0013 0.0013 40119 56883.7745 0.0031 0.0010 41120 56883.8219 0.0016 0.0028 40121 56883.8683 0.0017 0.0036 40140 56884.7274 0.0018 −0.0029 32141 56884.7803 0.0020 0.0044 31142 56884.8235 0.0038 0.0021 10143 56884.8703 0.0022 0.0033 10155 56885.4175 0.0008 0.0038 49156 56885.4629 0.0006 0.0037 49157 56885.5096 0.0007 0.0048 46158 56885.5548 0.0008 0.0044 48161 56885.6922 0.0012 0.0051 78162 56885.7375 0.0013 0.0049 86163 56885.7853 0.0031 0.0071 57166 56885.9213 0.0019 0.0064 53176 56886.3750 0.0034 0.0045 23177 56886.4216 0.0008 0.0055 44∗BJD−2400000.†Against max = 2456878.3519+ 0.045560E.‡Number of points used to determine the maximum.
was recorded (vsnet-alert 18112, 18138). On December28, there were only small-amplitude variations. On 2015January 2, fully developed superhumps were observed (fig-ure 114). The times of superhump maxima are listed intable 87. The O−C data suggest that we observed theearly phase of stage B superhumps.
3.85. MASTER OT J043915.60+424232.3
This optical transient (hereafter MASTER J043915)was detected on 2014 January 21 at a magnitude of 15.7(Balanutsa et al. 2014). The second outburst was de-tected also by the D. Denisenko on 2014 December 26 ata magnitude of 15.7 (vsnet-alert 18106). Subsequent ob-servations detected superhumps (vsnet-alert 18127, 18140;figure 115). The alias selection was based on the period[0.0625(4) d] derived from the continuous observation onthe first night. The times of superhump maxima are listedin table 88. The superhump stage is unknown. The mag-
Table 82. Superhump maxima of CSS J174033 (2014) (con-tinued)
E max∗ error O−C† N ‡
178 56886.4671 0.0011 0.0055 49179 56886.5126 0.0011 0.0055 48180 56886.5550 0.0053 0.0023 48184 56886.7385 0.0031 0.0036 67185 56886.7836 0.0023 0.0031 66186 56886.8264 0.0027 0.0004 46187 56886.8767 0.0044 0.0051 28201 56887.4968 0.0021 −0.0127 114205 56887.6838 0.0018 −0.0080 63206 56887.7262 0.0011 −0.0111 79207 56887.7745 0.0034 −0.0084 75208 56887.8158 0.0017 −0.0126 72209 56887.8615 0.0036 −0.0125 53210 56887.9141 0.0017 −0.0055 35∗BJD−2400000.†Against max = 2456878.3519+ 0.045560E.‡Number of points used to determine the maximum.
0 20 40 60 80 100 120 140−0.08
−0.06
−0.04
−0.02
0.00
0.02
20112014
Fig. 113. Comparison of O−C diagrams of CRTS J214738between different superoutbursts. A period of 0.09723 d wasused to draw this figure. Approximate cycle counts (E) afterthe start of the superoutburst were used. We have shifted the2011 O−C diagram by 10 cycles to best match the 2014 one.This shift suggests that the 2011 superoutburst started 1 dearlier than the CRTS detection.

84 T. Kato et al. [Vol. ,
Table 83. Superhump maxima of CSS J174033 (2014) (afterdip)
E max∗ error O−C† N ‡
0 56888.6903 0.0017 −0.0020 731 56888.7412 0.0016 0.0033 942 56888.7857 0.0012 0.0023 81
59 56891.3669 0.0027 −0.0108 2560 56891.4196 0.0010 −0.0036 2461 56891.4613 0.0017 −0.0074 2467 56891.7511 0.0102 0.0093 2181 56892.3770 0.0013 −0.0020 6882 56892.4205 0.0019 −0.0041 7684 56892.5095 0.0020 −0.0061 7189 56892.7381 0.0098 −0.0051 2190 56892.7886 0.0028 −0.0001 21
103 56893.3771 0.0030 −0.0033 59106 56893.5190 0.0060 0.0021 46109 56893.6588 0.0027 0.0054 12110 56893.7037 0.0025 0.0047 22112 56893.7831 0.0026 −0.0068 21125 56894.3853 0.0028 0.0036 48126 56894.4273 0.0011 0.0002 72127 56894.4706 0.0019 −0.0021 70128 56894.5194 0.0013 0.0012 57146 56895.3354 0.0007 −0.0020 23147 56895.3850 0.0016 0.0020 62148 56895.4271 0.0013 −0.0014 70149 56895.4748 0.0016 0.0008 62150 56895.5199 0.0017 0.0004 43169 56896.3838 0.0018 −0.0004 45176 56896.7041 0.0017 0.0013 32177 56896.7527 0.0013 0.0043 45178 56896.7969 0.0010 0.0030 42179 56896.8435 0.0014 0.0041 46∗BJD−2400000.†Against max = 2456888.6924+ 0.045514E.‡Number of points used to determine the maximum.
nitude on 2014 January 21 would suggest a superoutburst.If this is the case, the supercycle is around 340 d.
3.86. MASTER OT J055845.55+391533.4
This optical transient (hereafter MASTER J055845)was detected on 2014 February 19 at a magnitude of 14.4(Yecheistov et al. 2014). A retrospective examination ofthe MASTER data indicated that the object was alreadybright at 13.9 mag on February 13. There were also twooutbursts (2011 November 28 and 2012 November 19)recorded in the MASTER data. Single-night observationson February 28 detected superhumps (vsnet-alert 16955;figure 116). The best superhump period using the PDMmethod was 0.0563(4) d. The times of superhump max-ima are listed in table 89. Since the object had been inoutburst already at least for 15 d, this observation mostlikely recorded stage C superhumps. If the three outburstswere all superoutbursts, the supercycle would be an orderof 360–450 d.
Table 83. Superhump maxima of CSS J174033 (2014) (afterdip, continued)
E max∗ error O−C† N ‡
191 56897.3892 0.0013 0.0036 44192 56897.4337 0.0010 0.0026 29193 56897.4795 0.0008 0.0029 48194 56897.5259 0.0014 0.0038 43211 56898.3013 0.0006 0.0054 25212 56898.3438 0.0016 0.0024 32213 56898.3925 0.0010 0.0056 63214 56898.4322 0.0017 −0.0002 62219 56898.6628 0.0012 0.0028 19221 56898.7552 0.0018 0.0041 66222 56898.7893 0.0042 −0.0073 53233 56899.2998 0.0016 0.0026 25264 56900.7068 0.0010 −0.0014 18266 56900.7965 0.0032 −0.0027 22307 56902.6661 0.0036 0.0009 20308 56902.7106 0.0027 −0.0001 22329 56903.6670 0.0025 0.0005 62330 56903.7090 0.0039 −0.0031 68332 56903.8034 0.0036 0.0003 60374 56905.7012 0.0059 −0.0135 45395 56906.6647 0.0027 −0.0058 20417 56907.6716 0.0020 −0.0002 20439 56908.6801 0.0031 0.0070 43440 56908.7178 0.0019 −0.0009 40∗BJD−2400000.†Against max = 2456888.6924+ 0.045514E.‡Number of points used to determine the maximum.
3.87. MASTER OT J085854.16−274030.7
This optical transient (hereafter MASTER J085854)was detected on 2015 January 17 at a magnitude of 13.7(Balanutsa et al. 2015a). Four days after the detec-tion, the object started to show short-period superhumps(vsnet-alert 18210, 18220; figure 118). After the superout-burst plateau ended, the object showed two rebrightenings(vsnet-alert 18254, 18266; figure 117).
The times of superhumps during the plateau phase arelisted in table 90. Although observations started relativelyearly, we could not confidently detect stage A superhumps.The resultant Pdot for stage B superhumps was relativelylarge.
WZ Sge-type dwarf novae with multiple rebrighten-ings have been recently systematically studied by Nakataet al. (2013), C. Nakata et al. in preparation. Mrozet al. (2013) also reported two new objects (OGLE-GD-DN-001, OGLE-GD-DN-014) with multiple rebrighten-ings. All these objects were known to have orbital periods(or superhump periods) longer than >
∼0.06 d. MASTERJ085854 is the only known system showing multiple re-brightenings and with a very short superhump period.
C. Nakata et al. in preparation suggest that WZ Sge-type dwarf novae with multiple rebrightenings have highermass ratios than period bouncers, which also appear tobe consistent with the shortness of stage A, i.e. super-

No. ] Period Variations in SU UMa-Type Dwarf Novae VII 85
Table 84. Superhump maxima of CRTS J202731 (2014)
E max∗ error O−C† N ‡
0 56948.9418 0.0002 −0.0129 781 56949.0140 0.0005 −0.0121 538 56949.5127 0.0044 −0.0126 109 56949.5858 0.0008 −0.0108 19
23 56950.5865 0.0006 −0.0085 2136 56951.5151 0.0055 −0.0071 1337 56951.5860 0.0034 −0.0075 1942 56951.9434 0.0071 −0.0067 1170 56953.9357 0.0012 −0.0112 1878 56954.5287 0.0016 0.0113 1983 56954.8765 0.0019 0.0025 2384 56954.9597 0.0005 0.0144 7892 56955.5259 0.0013 0.0101 2993 56955.6000 0.0005 0.0128 4794 56955.6715 0.0011 0.0130 22
106 56956.5225 0.0015 0.0082 29107 56956.5951 0.0006 0.0095 47108 56956.6672 0.0021 0.0102 25121 56957.5938 0.0006 0.0098 47122 56957.6638 0.0028 0.0085 26126 56957.9572 0.0010 0.0165 53127 56958.0132 0.0010 0.0013 41135 56958.5920 0.0009 0.0095 45136 56958.6630 0.0028 0.0092 26139 56958.8925 0.0021 0.0247 40140 56958.9507 0.0008 0.0116 52149 56959.5872 0.0009 0.0063 48150 56959.6540 0.0011 0.0018 24163 56960.5779 0.0010 −0.0014 49164 56960.6500 0.0013 −0.0006 29191 56962.5409 0.0029 −0.0353 45192 56962.6166 0.0038 −0.0309 38205 56963.5409 0.0020 −0.0337 36∗BJD−2400000.†Against max = 2456948.9548+ 0.071316E.‡Number of points used to determine the maximum.
Table 86. Superhump maxima of CRTS J214738 (2014)
E max∗ error O−C† N ‡
0 56915.3175 0.0009 −0.0071 1871 56915.4071 0.0013 −0.0156 1862 56915.5089 0.0009 −0.0118 125
41 56919.3734 0.0003 0.0306 9242 56919.4730 0.0007 0.0321 3759 56921.1116 0.0043 0.0047 3260 56921.2180 0.0013 0.0131 7978 56922.9466 0.0023 −0.0224 7179 56923.0577 0.0005 −0.0092 20080 56923.1507 0.0006 −0.0143 181∗BJD−2400000.†Against max = 2456915.3247+ 0.098004E.‡Number of points used to determine the maximum.
0.070 0.071 0.072 0.073 0.074 0.075 0.076 0.077
0.6
0.8
1.0
(d)
θ
P=0.07343
−0.5 0.0 0.5 1.0 1.5
−0.1
0.0
0.1
Fig. 114. Superhumps in MASTER J031600 (2014).(Upper): PDM analysis. (Lower): Phase-averaged profile
.
Table 87. Superhump maxima of MASTER J031600 (2014)
E max∗ error O−C† N ‡
0 57025.2070 0.0023 −0.0034 361 57025.2844 0.0008 0.0006 732 57025.3578 0.0009 0.0005 49
30 57027.4221 0.0032 0.0086 4831 57027.4852 0.0025 −0.0018 7542 57028.2964 0.0014 0.0017 7643 57028.3730 0.0012 0.0048 6744 57028.4308 0.0024 −0.0109 76∗BJD−2400000.†Against max = 2457025.2104+ 0.073438E.‡Number of points used to determine the maximum.

86 T. Kato et al. [Vol. ,
0.059 0.060 0.061 0.062 0.063 0.064 0.065 0.066
0.85
0.90
0.95
1.00
(d)
θ
P=0.06253
−0.5 0.0 0.5 1.0 1.5
−0.05
0.00
0.05
Fig. 115. Superhumps in MASTER J043915 (2014).(Upper): PDM analysis. (Lower): Phase-averaged profile
.
Table 88. Superhump maxima of MASTER J043915 (2014)
E max∗ error O−C† N ‡
0 57019.0953 0.0018 0.0017 471 57019.1564 0.0010 0.0003 462 57019.2164 0.0017 −0.0021 27
48 57022.0914 0.0045 0.0001 45∗BJD−2400000.†Against max = 2457019.0936+ 0.062452E.‡Number of points used to determine the maximum.
Table 89. Superhump maxima of MASTER J055845 (2014)
E max∗ error O−C† N ‡
0 56717.3638 0.0016 −0.0005 551 56717.4203 0.0019 −0.0005 542 56717.4796 0.0011 0.0024 543 56717.5322 0.0017 −0.0015 57∗BJD−2400000.†Against max = 2456717.3643+ 0.056443E.‡Number of points used to determine the maximum.
0.30 0.35 0.40 0.45 0.50 0.55
−0.1
0.0
0.1
Fig. 116. Superhumps in MASTER J055845 (2014).
−100 0 100 200 300 400 500
−0.01
0.00
0.01
1040 1045 1050 1055 1060 1065 1070 1075
14
16
18
Fig. 117. O − C diagram of superhumps in MASTERJ085854 (2015). (Upper:) O−C diagram. We used a periodof 0.05556 d for calculating the O − C residuals. (Lower:)Light curve. The data were binned to 0.011 d.
humps quickly grow. This also likely applies to MASTERJ085854 as judged from the quick appearance of stage Bsuperhumps. Since there was possibly a past outburst inthe CRTS data (Balanutsa et al. 2015a), continued moni-toring of this object will clarify the supercycle length andwhere there is a phase of early superhumps.
3.88. MASTER OT J105545.20+573109.7
This optical transient (hereafter MASTER J105545)was detected on 2014 March 4 at a magnitude of 15.5(Vladimirov et al. 2014). Subsequent observations de-tected superhumps (vsnet-alert 17007, 17018; figure 119).The times of superhump maxima are listed in table 91.Although the stage of the superoutburst was unknown,the small amplitudes of superhumps may suggest that weobserved the later stage of the superoutburst.

No. ] Period Variations in SU UMa-Type Dwarf Novae VII 87
Table 90. Superhump maxima of MASTER J085854 (2015)
E max∗ error O−C† N ‡
0 57044.1262 0.0003 0.0042 891 57044.1813 0.0002 0.0037 1152 57044.2372 0.0002 0.0040 98
17 57045.0685 0.0007 0.0020 4318 57045.1246 0.0004 0.0024 10019 57045.1783 0.0002 0.0006 11720 57045.2330 0.0003 −0.0002 11721 57045.2858 0.0021 −0.0029 2223 57045.4003 0.0004 0.0004 7924 57045.4565 0.0002 0.0010 12825 57045.5117 0.0002 0.0007 12826 57045.5663 0.0002 −0.0003 12727 57045.6229 0.0005 0.0008 7033 57045.9552 0.0004 −0.0003 4634 57046.0111 0.0010 0.0001 3835 57046.0662 0.0004 −0.0004 21236 57046.1196 0.0004 −0.0026 24837 57046.1759 0.0006 −0.0018 23638 57046.2306 0.0003 −0.0027 15339 57046.2852 0.0004 −0.0036 12940 57046.3413 0.0005 −0.0031 8452 57047.0067 0.0013 −0.0044 5371 57048.0601 0.0009 −0.0066 35
107 57050.0659 0.0007 −0.0010 95123 57050.9638 0.0019 0.0079 57124 57051.0138 0.0007 0.0023 58∗BJD−2400000.†Against max = 2457044.1220+ 0.055560E.‡Number of points used to determine the maximum.
Table 91. Superhump maxima of MASTER J105545 (2014)
E max∗ error O−C† N ‡
0 56726.4942 0.0010 −0.0024 7214 56727.4377 0.0016 0.0040 1915 56727.5009 0.0006 0.0002 3316 56727.5645 0.0007 −0.0031 6017 56727.6369 0.0011 0.0024 9418 56727.7015 0.0008 0.0001 6529 56728.4369 0.0016 −0.0009 6030 56728.5070 0.0013 0.0022 7331 56728.5703 0.0016 −0.0014 3545 56729.5094 0.0119 0.0006 2646 56729.5741 0.0026 −0.0016 33∗BJD−2400000.†Against max = 2456726.4966+ 0.066937E.‡Number of points used to determine the maximum.
0.053 0.054 0.055 0.056 0.057 0.058
0.6
0.8
1.0
(d)
θ
P=0.05554
−0.5 0.0 0.5 1.0 1.5
−0.10
−0.05
0.00
0.05
0.10
Fig. 118. Superhumps in MASTER J085854 during theplateau phase (2015). (Upper): PDM analysis. (Lower):Phase-averaged profile
.
3.89. OT J030929.8+263804
This object (=PNV J03093063+2638031, hereafter OTJ030929) was announced as a possible nova detected byS. Ueda.14 Based on the presence of a blue counterpartand the relatively small outburst amplitude, the objectwas considered to be a WZ Sge-type dwarf nova ratherthan a nova (vsnet-alert 17907, 17908). Spectroscopic ob-servations also indicated a dwarf nova (vsnet-alert 17912,17919). Soon after the announcement, early superhumpswere detected (vsnet-alert 17918, 17920, 17926, 17931; fig-ure 120). The period was determined to be 0.05615(2) d.The object then showed ordinary superhumps (vsnet-alert17934, 17959, 17972; figure 121).
The times of superhump maxima during the outburstplateau are listed in table 92. Although stage A super-humps were recorded (E≤ 36), there was an observationalgap in the early stage B. There was a clear stage B-C tran-sition around E=197. The period of stage A superhumpscorresponds to ǫ∗=0.0291(3) and q=0.078(1).
Superhumps after the rapid fading became less clear.
14 <http://www.cbat.eps.harvard.edu/unconf/followups/J03093063+2638031.html>. Also note that the re-ported coordinates were somewhat different from the final values.

88 T. Kato et al. [Vol. ,
0.064 0.065 0.066 0.067 0.068 0.069 0.070
0.7
0.8
0.9
1.0
(d)
θ
P=0.06706
−0.5 0.0 0.5 1.0 1.5
−0.04
−0.02
0.00
0.02
0.04
Fig. 119. Superhumps in MASTER J105545 (2014).(Upper): PDM analysis. (Lower): Phase-averaged profile
.
The times before BJD 2456987 are listed in table 93.These post-superoutburst superhumps were on a smoothextension of stage C superhumps (figure 122). After this,the profile of superhumps became double-humped (figure123). The secondary humps even became stronger thanthe original superhumps. Although this phenomenon boresome resemblance to traditional late superhumps, thischange in the profile occurred more than ∼4 d after therapid decline, which is not the usual case in traditionallate superhumps.
The relatively large Pdot of stage B superhumps andthe transition to stage C superhumps during the plateauphase were similar to SU UMa-type dwarf novae ratherthan extreme WZ Sge-type dwarf novae. The object mayhave intermediate properties between WZ Sge-type dwarfnovae and ordinary SU UMa-type dwarf novae.
3.90. OT J064833.4+065624
This object (=PNV J06483343+0656236, hereafter OTJ064833) was announced as a possible nova detected at anunfiltered CCD magnitude of 11.6 on 2014 November 22by S. Kaneko.15 The presence of a relatively bright quies-
15 <http://www.cbat.eps.harvard.edu/unconf/followups/J06483343+0656236.html>.
0.053 0.054 0.055 0.056 0.057 0.058 0.059
0.92
0.94
0.96
0.98
1.00
(d)
θ
P=0.05615
−0.5 0.0 0.5 1.0 1.5
−0.02
−0.01
0.00
0.01
0.02
Fig. 120. Early superhumps in OT J030929 (2014).(Upper): PDM analysis. (Lower): Phase-averaged profile
.
cent counterpart made the object a good candidate for adwarf nova (vsnet-alert 18001). Spectroscopic observationby M. Fujii indeed confirmed the dwarf nova-type nature(vsnet-alert 18004).
Subsequent observations detected growing superhumpswith a long period (vsnet-alert 18012, 18014, 18018,18027; figure 124). The times of superhump maxima arelisted in table 94. Stage A superhumps are clearly de-tected (E ≤ 15; figure 125). The epochs after E = 84 arepost-superoutburst superhumps, and they are not used todetermine the periods in table 2. There was no indicationof a phase jump at the end of the superoutburst plateau.
The most notable feature of this object is the long-lasting stage A despite the long superhump period, whichmakes this object as a dwarf nova in the period gap. InKato et al. (2014a), we have argued that in some long-Porb
dwarf novae, the condition of tidal instability is criticallyreached and it may take longer time to develop super-humps. This object appears to fit this interpretation.
The object also showed a rebrightening (vsnet-alert18040; figure 125), which is relatively rare in long-Porb
systems. Well-documented rebrightenings in long-Porb
systems include V725 Aql (Uemura et al. 2001) and QZSer (T. Ohshima et al. in preparation, vsnet-alert 15567,

No. ] Period Variations in SU UMa-Type Dwarf Novae VII 89
0.054 0.055 0.056 0.057 0.058 0.059 0.060
0.8
0.9
1.0
(d)
θ
P=0.05739
−0.5 0.0 0.5 1.0 1.5
−0.04
−0.02
0.00
0.02
0.04
Fig. 121. Ordinary superhumps in OT J030929 (2014).(Upper): PDM analysis. (Lower): Phase-averaged profile
.
15620). The 1997 superoutburst of EF Peg may have alsobeen accompanied by a rebrightening (vsnet-alert 1344).All these objects are known to have long recurrence timesand are hence considered to have low mass-transfer rates.Given the lack of past detections of outbursts in OTJ064833, this object also likely have a low mass-transferrate. The features resembling short-Porb (rebrightenings,positive Pdot and absence of phase jump at the end of su-peroutburst) may be a result of low mass-transfer ratesand await future theoretical investigation.
Since the object has a bright quiescent counterpart (15.9mag in J), it is a promising candidate to detect the sec-ondary. Accurate measurement of the orbital period willlead to determination of q by using the stage A super-hump method and would clarify the evolutionary state ofthis object.
3.91. OT J213806.6+261957
3.91.1. IntroductionThis object (OT J213806) was discovered as a possi-
ble nova independently by D.-A. Yi (Yamaoka 2010) andS. Kaneko (Nakano 2010) in 2010. Spectroscopic obser-vations demonstrated that the dwarf nova-type nature ofthe object (Graham et al. 2010 Tovmassian et al. 2010,
−100 0 100 200 300 400 500
−0.06
−0.04
−0.02
0.00
0.02
0.0
0.1
0.2
0.3
960 965 970 975 980 985 990
10
12
14
16
18
Fig. 122. O − C diagram of superhumps in OT J030929(2014). (Upper:) O − C diagram. We used a period of0.05736 d for calculating the O − C residuals. (Middle:)Amplitudes of superhumps. (Lower:) Light curve. The datawere binned to 0.011 d.
−0.5 0.0 0.5 1.0 1.5
−0.10
−0.05
0.00
0.05
0.10
Fig. 123. Late-stage post-superoutburst superhumps in OTJ030929 (2014). The data after BJD 2456987 were used. Thephase corresponds to the times of maxima in table 93.

90 T. Kato et al. [Vol. ,
Table 92. Superhump maxima of OT J030929 (2014)
E max∗ error O−C† N ‡
0 56966.1342 0.0009 0.0003 2021 56966.1851 0.0009 −0.0062 2912 56966.2441 0.0008 −0.0046 2903 56966.3042 0.0005 −0.0018 2094 56966.3534 0.0008 −0.0100 1026 56966.4792 0.0009 0.0011 1027 56966.5250 0.0014 −0.0105 1058 56966.5879 0.0010 −0.0050 1089 56966.6461 0.0008 −0.0042 82
17 56967.1094 0.0016 0.0001 8918 56967.1622 0.0009 −0.0045 7119 56967.2176 0.0011 −0.0065 8520 56967.2857 0.0009 0.0043 17721 56967.3366 0.0006 −0.0022 19322 56967.3980 0.0007 0.0018 20123 56967.4541 0.0007 0.0005 20824 56967.5175 0.0004 0.0065 13925 56967.5742 0.0006 0.0059 10326 56967.6308 0.0006 0.0051 10327 56967.6906 0.0006 0.0076 9635 56968.1546 0.0001 0.0125 12136 56968.2114 0.0001 0.0119 11586 56971.0653 0.0009 −0.0030 4087 56971.1242 0.0003 −0.0016 11988 56971.1812 0.0003 −0.0019 11089 56971.2398 0.0006 −0.0006 10390 56971.2937 0.0011 −0.0041 9493 56971.4687 0.0003 −0.0013 6694 56971.5248 0.0002 −0.0025 6295 56971.5826 0.0003 −0.0021 6796 56971.6398 0.0003 −0.0023 6697 56971.6974 0.0005 −0.0020 49∗BJD−2400000.†Against max = 2456966.1339+ 0.057377E.‡Number of points used to determine the maximum.
vsnet-alert 11987). There was a known outburst in 1942(Hudec 2010). The object has a bright X-ray counterpart(1RXS J213807.1+261958) and has a close visual com-panion (Yamaoka 2010) which dominates when the ob-ject is near quiescence. Although the 2010 superoutburstwas well observed, the phase of early superhumps was notvery well covered by observations (Kato et al. 2010). The2010 superoutburst was also analyzed by Chochol et al.(2012) and Zemko, Kato (2013). Although the orbitalperiod is not well determined yet, a possible period of(0.054523 d) was reported (Kato et al. 2010). Chocholet al. (2012) reported a period of 0.05435 d after the ob-ject started fading. Mitrofanova et al. (2014) reported adetailed spectroscopic study in quiescence and obtainedDoppler tomograms. Mitrofanova et al. (2014) did notobtain the orbital period but assumed a period reportedby Chochol et al. (2012).
Table 92. Superhump maxima of OT J030929 (2014) (con-tinued)
E max∗ error O−C† N ‡
101 56971.9272 0.0005 −0.0018 43102 56971.9858 0.0005 −0.0006 31104 56972.0983 0.0003 −0.0028 95105 56972.1562 0.0002 −0.0023 109106 56972.2127 0.0002 −0.0031 112109 56972.3860 0.0012 −0.0021 51110 56972.4418 0.0002 −0.0036 101111 56972.4995 0.0002 −0.0033 112112 56972.5582 0.0003 −0.0020 119113 56972.6147 0.0006 −0.0028 36137 56973.9939 0.0005 −0.0007 51138 56974.0513 0.0008 −0.0007 149139 56974.1065 0.0007 −0.0029 150140 56974.1674 0.0006 0.0007 83141 56974.2251 0.0035 0.0010 10155 56975.0294 0.0009 0.0020 94156 56975.0843 0.0008 −0.0004 96172 56976.0070 0.0009 0.0042 94173 56976.0645 0.0011 0.0043 95174 56976.1297 0.0007 0.0121 75175 56976.1801 0.0009 0.0051 106176 56976.2379 0.0006 0.0056 120190 56977.0444 0.0008 0.0088 167191 56977.1021 0.0003 0.0091 298192 56977.1588 0.0003 0.0084 348193 56977.2161 0.0003 0.0084 271194 56977.2712 0.0006 0.0061 113196 56977.3885 0.0006 0.0087 57197 56977.4467 0.0005 0.0094 60198 56977.5032 0.0006 0.0086 60199 56977.5598 0.0005 0.0079 46210 56978.1878 0.0003 0.0047 122211 56978.2443 0.0004 0.0038 120∗BJD−2400000.†Against max = 2456966.1339+ 0.057377E.‡Number of points used to determine the maximum.
3.91.2. 2014 SuperoutburstThe 2014 superoutburst occurred only four years af-
ter the 2010 one, and the interval was surprisingly shortfor a WZ Sge-type dwarf nova. The outburst was de-tected visually by C. Chiselbrook at a magnitude of 9.7 onOctober 22. The same observed reported that the objectwas fainter than 13.8 on the night before (AAVSO obser-vations). Approximately 1.5 d after this detection, initialCCD observations started. The object already showed or-dinary superhumps (vsnet-alert 17891, 17893).
The times of superhump maxima during the super-outburst plateau are listed in table 95. As in the2010 superoutburst, stages A-B-C were clearly present.The present observation recorded stage A superhumpsmuch better than in the 2010 one. A PDM analysisbefore BJD 2456954.7 yielded a period of 0.0568(3) d,which is adopted in table 2. This period corresponds to

No. ] Period Variations in SU UMa-Type Dwarf Novae VII 91
Table 92. Superhump maxima of OT J030929 (2014) (con-tinued)
E max∗ error O−C† N ‡
226 56979.1033 0.0007 0.0021 103227 56979.1625 0.0010 0.0039 142228 56979.2170 0.0032 0.0010 68229 56979.2712 0.0010 −0.0021 123243 56980.0699 0.0019 −0.0067 67244 56980.1325 0.0007 −0.0014 150245 56980.1888 0.0003 −0.0026 244246 56980.2460 0.0004 −0.0027 212247 56980.3040 0.0007 −0.0021 101260 56981.0376 0.0015 −0.0144 82262 56981.1530 0.0013 −0.0138 106263 56981.2101 0.0024 −0.0140 69264 56981.2637 0.0025 −0.0178 30∗BJD−2400000.†Against max = 2456966.1339+ 0.057377E.‡Number of points used to determine the maximum.
Table 93. Superhump maxima of OT J030929 (2014) (post–superoutburst)
E max∗ error O−C† N ‡
0 56982.1744 0.0008 −0.0020 631 56982.2380 0.0005 0.0045 63
17 56983.1453 0.0024 −0.0011 5535 56984.1737 0.0016 0.0002 5836 56984.2319 0.0012 0.0014 6356 56985.3608 0.0019 −0.0110 5957 56985.4281 0.0015 −0.0007 4567 56986.0030 0.0006 0.0035 1073 56986.3438 0.0010 0.0020 5974 56986.4019 0.0009 0.0031 54∗BJD−2400000.†Against max = 2456982.1764+ 0.057060E.‡Number of points used to determine the maximum.
ǫ∗=0.041(4) and q=0.12(2) assuming the orbital period of0.054523 d. The values are 0.044(4) and 0.13(2), respec-tively, if we adopt the period of 0.05435 d.3.91.3. Object classification
The 2014 observation indicated that the duration ofearly superhumps was less than 1 d, indicating that the2014 superoutburst was of an ordinary SU UMa-typedwarf nova rather than a WZ Sge-type dwarf nova. Sincethe peak brightness of the 2014 superoutburst was fainterthan the 2010 one at least by 1.0 mag, it may be thatthe 2014 superoutburst was much less powerful as in the2010 one, and that the 2:1 resonance was not reached dur-ing this superoutburst. The 2010 superoutburst, however,was not very well observed before the appearance of ordi-nary superhumps, and the existence of early superhumpswas not very certain. It may be that the 2010 superout-burst did not show early superhumps at all, as was likelyin the 2014 one. If it is the case, the object should be
0.096 0.098 0.100 0.102 0.104 0.106
0.6
0.7
0.8
0.9
1.0
(d)
θ
P=0.10071
−0.5 0.0 0.5 1.0 1.5
−0.10
−0.05
0.00
0.05
0.10
Fig. 124. Superhumps in OT J064833 during the superout-burst plateau (2014). (Upper): PDM analysis. (Lower):Phase-averaged profile
.
better classified as an SU UMa-type dwarf nova ratherthan a WZ Sge-type one. The large q value (although thisvalue has a large uncertainty), the short outburst recur-rence time, the large positive Pdot of stage B superhumps,the short evolutionary time of stage A superhumps andthe presence of stage C superhumps are better reconciledwith this interpretation. We probably need to wait an-other bright outburst as in 2010 to test the presence ofearly superhumps.3.91.4. Comparison of 2010 and 2014 superoutbursts
A comparison of O−C diagrams (figure 126) indicatesthat the duration of stage B was different between thesesuperoutbursts: stage B was longer in a brighter super-outburst in 2010. The behavior after transition to stageC was also different. Such features was not observed inother SU UMa-type dwarf novae and this result and wouldprovide a clue in understanding the origin of superhumpsin different stages.
The duration of the superoutburst was different (fig-ure 127). The magnitudes during the linearly fading part,which corresponds to stage B superhumps, were almostsimilar between these superoutbursts despite the differ-ence of the peak brightness.

92 T. Kato et al. [Vol. ,
0 50 100 150 200
−0.10
−0.05
0.00
0.0
0.2
0.4
0.6
985 990 995 1000 1005
12
14
16
18
Fig. 125. O − C diagram of superhumps in OT J064833(2014). (Upper:) O − C diagram. We used a period of0.01005 d for calculating the O − C residuals. (Middle:)Amplitudes of superhumps. (Lower:) Light curve. The datawere binned to 0.020 d.
3.92. OT J230523.1−022546
This object (=PNV J23052314−0225455, hereafter OTJ230523) was discovered as a transient at an unfilteredCCD magnitude of 12.3 on 2014 July 19 by M. Mukai.16
Since there was a 19.7-mag (g) SDSS blue counterpart(see also vsnet-alert 17512), the object was immediatelyconsidered as a dwarf nova. G. Masi also obtained low-resolution spectrum which did not indicate strong an Hαemission line. Subsequent observations detected early su-perhumps (vsnet-alert 17513, 17528, 17571; figure 128),indicating that the object is a WZ Sge-type dwarf nova.On July 25, the object started to show growing ordi-nary superhumps (vsnet-alert 17550). The period of fullygrown superhumps turned out to be very short (vsnet-alert 17566). The mean profile of stage B superhumps isshown in figure 129.
The times of superhump maxima are listed in table 96.There was clear stage A for E≤ 17. Although superhumpsafter E = 213 were likely stage C superhumps, the epochwhen stage B-C transition occurred was not determined
16 <http://www.cbat.eps.harvard.edu/unconf/followups/J23052314−0225455.html>.
0 100 200 300 400 500 600 700
−0.10
−0.05
0.00
20102014
Fig. 126. Comparison of O−C diagrams of OT J213806 be-tween different superoutbursts. A period of 0.05513 d wasused to draw this figure. Approximate cycle counts (E) afterthe appearance of superhumps were used. The 2014 super-outburst was shifted by 20 cycles to best match the 2010 one.The 2014 superoutburst was artificially shifted by 0.01 d toavoid excessive overlaps with the 2010 diagram.
0 10 20 30 40 50
8
10
12
14
2010
2014
Fig. 127. Comparison of superoutbursts of OT J213806.The data were binned to 1 d and shifted in magnitude. Thedashed lines are added to aid recognizing the variation. Theduration of the 2014 superoutburst was shorter than the 2010one although the magnitudes were almost similar during thelinearly fading part, which corresponds to the phase of stageB superhumps.

No. ] Period Variations in SU UMa-Type Dwarf Novae VII 93
Table 94. Superhump maxima of OT J064833 (2014)
E max∗ error O−C† N ‡
0 56985.2170 0.0011 −0.0538 4191 56985.3043 0.0029 −0.0672 2533 56985.5302 0.0007 −0.0430 3534 56985.6411 0.0004 −0.0329 308
12 56986.4763 0.0006 −0.0042 14313 56986.5802 0.0002 −0.0012 22014 56986.6841 0.0002 0.0019 27915 56986.7881 0.0006 0.0051 4624 56987.7048 0.0008 0.0145 2725 56987.8069 0.0007 0.0158 3129 56988.2136 0.0002 0.0192 41530 56988.3147 0.0004 0.0195 28538 56989.1224 0.0002 0.0206 42939 56989.2218 0.0002 0.0193 23441 56989.4205 0.0006 0.0163 6242 56989.5239 0.0002 0.0189 8743 56989.6208 0.0004 0.0150 8344 56989.7234 0.0008 0.0168 2745 56989.8235 0.0009 0.0161 2651 56990.4248 0.0006 0.0125 6252 56990.5265 0.0003 0.0133 20853 56990.6227 0.0003 0.0087 20254 56990.7256 0.0005 0.0108 13655 56990.8215 0.0007 0.0058 2758 56991.1227 0.0009 0.0047 6759 56991.2239 0.0004 0.0050 32460 56991.3238 0.0003 0.0042 34961 56991.4206 0.0023 0.0001 2962 56991.5265 0.0005 0.0052 11363 56991.6263 0.0007 0.0042 11264 56991.7261 0.0011 0.0032 2765 56991.8287 0.0016 0.0050 23∗BJD−2400000.†Against max = 2456985.2707+ 0.100816E.‡Number of points used to determine the maximum.
due to the gap in the observation (see figure 130).The period of stage A superhumps [0.05663(4) d] corre-
sponds to ǫ∗ of 0.037. This value gives q=0.102(2), whichis relatively large for a WZ Sge-type dwarf nova. The rela-tively large Pdot of stage B superhumps [+8.2(1.3)×10−5],the presence of stage C and relatively short duration ofstage A indicate that OT J230523 is not an extreme WZSge-type and but an object close to ordinary SU UMa-type dwarf novae. Thus identification is consistent with arelatively large q.
3.93. PNV J17292916+0054043
This object (hereafter PNV J172929) was discovered asa possible nova on May 22 at an unfiltered CCD mag-nitude of 12.1 by H. Nishimura.17 S. Kiyota reportedthat the blue color suggested a dwarf nova-type outburst.
17 <http://www.cbat.eps.harvard.edu/unconf/followups/J17292916+0054043.html>.
Table 94. Superhump maxima of OT J064833 (2014) (con-tinued)
E max∗ error O−C† N ‡
72 56992.5346 0.0006 0.0051 28173 56992.6298 0.0008 −0.0005 13174 56992.7379 0.0023 0.0068 2875 56992.8364 0.0021 0.0044 1884 56993.7412 0.0038 0.0019 2788 56994.1479 0.0013 0.0053 14394 56994.7537 0.0013 0.0063 40
103 56995.6573 0.0025 0.0025 18104 56995.7595 0.0010 0.0039 41114 56996.7539 0.0033 −0.0098 28119 56997.2567 0.0008 −0.0111 107120 56997.3582 0.0012 −0.0104 97124 56997.7471 0.0030 −0.0248 37129 56998.2483 0.0009 −0.0277 98130 56998.3458 0.0009 −0.0310 79∗BJD−2400000.†Against max = 2456985.2707+ 0.100816E.‡Number of points used to determine the maximum.
0.0530 0.0535 0.0540 0.0545 0.0550 0.0555 0.0560
0.6
0.8
1.0
(d)
θ
P=0.05456
−0.5 0.0 0.5 1.0 1.5
−0.04
−0.02
0.00
0.02
0.04
Fig. 128. Early superhumps in OT J230523 (2014).(Upper): PDM analysis. (Lower): Phase-averaged profile.

94 T. Kato et al. [Vol. ,
Table 95. Superhump maxima of OT J213806 (2014)
E max∗ error O−C† N ‡
0 56954.0563 0.0005 −0.0076 1601 56954.1018 0.0003 −0.0171 3053 56954.2249 0.0016 −0.0042 534 56954.2854 0.0004 0.0012 1505 56954.3403 0.0008 0.0011 1506 56954.3942 0.0003 −0.0002 597 56954.4505 0.0005 0.0010 609 56954.5633 0.0006 0.0037 22
16 56954.9512 0.0002 0.0059 10217 56955.0067 0.0002 0.0064 16018 56955.0642 0.0001 0.0088 39119 56955.1173 0.0001 0.0069 53720 56955.1711 0.0001 0.0056 43024 56955.3927 0.0009 0.0068 8625 56955.4466 0.0002 0.0055 15726 56955.5015 0.0003 0.0054 14227 56955.5582 0.0003 0.0070 3928 56955.6114 0.0005 0.0051 2834 56955.9398 0.0005 0.0030 11535 56955.9964 0.0004 0.0045 17136 56956.0501 0.0002 0.0031 25737 56956.1054 0.0001 0.0033 34538 56956.1589 0.0004 0.0018 22639 56956.2150 0.0007 0.0027 21140 56956.2706 0.0005 0.0032 37641 56956.3237 0.0006 0.0013 35742 56956.3822 0.0008 0.0047 28443 56956.4382 0.0007 0.0057 10144 56956.4913 0.0008 0.0036 1045 56956.5447 0.0003 0.0019 12746 56956.5995 0.0003 0.0016 12247 56956.6551 0.0003 0.0022 124∗BJD−2400000.†Against max = 2456954.0638+ 0.055087E.‡Number of points used to determine the maximum.
There was also a faint (g=21.5) SDSS counterpart (vsnet-alert 17325). Spectroscopic observation by K. Ayani in-dicated the dwarf nova-type spectrum showing narrowemission lines of Hα, Hβ and Heii 4686 on a blue contin-uum (see above URL). The amplitude and the presenceof Heii emission line suggested the WZ Sge-type classifi-cation (vsnet-alert 17327).
Subsequent observations detected possible early super-humps (vsnet-alert 17337; figure 131). The object devel-oped ordinary superhumps 12 d after the discovery (vsnet-alert 17365; figure 132). The times of maxima of ordinarysuperhumps are listed in table 97. After a relatively longstage A (E ≤ 28), stage B appeared (figure 133). Therewas no strong hint of transition to stage C superhumpsduring the superoutburst plateau.
The signal of early superhump was weak and the datawere not sufficient to uniquely determine the period.Although a signal around 0.0586 d was slightly stronger,
Table 95. Superhump maxima of OT J213806 (2014) (con-tinued)
E max∗ error O−C† N ‡
48 56956.7089 0.0005 0.0009 8358 56957.2593 0.0004 0.0004 4459 56957.3137 0.0005 −0.0002 5260 56957.3738 0.0021 0.0047 11461 56957.4226 0.0004 −0.0016 5762 56957.4778 0.0003 −0.0014 6663 56957.5331 0.0003 −0.0012 11064 56957.5868 0.0003 −0.0027 13265 56957.6411 0.0003 −0.0034 7466 56957.6960 0.0003 −0.0035 6571 56957.9724 0.0003 −0.0026 5972 56958.0281 0.0003 −0.0020 6073 56958.0811 0.0003 −0.0041 5674 56958.1363 0.0007 −0.0039 3775 56958.1982 0.0009 0.0028 6576 56958.2477 0.0003 −0.0028 24777 56958.3006 0.0004 −0.0050 37978 56958.3559 0.0006 −0.0047 20279 56958.4126 0.0006 −0.0031 18080 56958.4698 0.0004 −0.0010 2681 56958.5201 0.0005 −0.0058 9882 56958.5790 0.0004 −0.0020 4183 56958.6311 0.0005 −0.0050 6584 56958.6858 0.0004 −0.0054 6589 56958.9627 0.0003 −0.0039 5790 56959.0181 0.0003 −0.0035 14291 56959.0703 0.0003 −0.0064 33792 56959.1256 0.0002 −0.0062 35193 56959.1812 0.0024 −0.0057 20994 56959.2368 0.0004 −0.0052 21295 56959.2950 0.0004 −0.0021 11196 56959.3489 0.0005 −0.0033 56∗BJD−2400000.†Against max = 2456954.0638+ 0.055087E.‡Number of points used to determine the maximum.
we have selected a period of 0.05973(3) d because thisvalue gave a more reasonable value of ǫ∗. The periodof stage A superhumps corresponds to ǫ∗=0.0273(5) andq=0.073(2).
The orbital period is apparently longer than the periodminimum and the system parameters resemble those ofperiod bouncers although q is not so extreme. This ob-ject appears to be similar to recently identified objectswith superhump periods of 0.058–0.061 d having proper-ties intermediate between ordinary hydrogen-rich dwarfnovae and period bouncers (C. Nakata et al. in prepara-tion). There was no indication of rebrightenings in PNVJ172929, which makes a difference from the objects men-tioned in C. Nakata et al. in preparation.
3.94. PTF1 J071912.13+485834.0
This object (hereafter PTF1 J071912) is an AM CVn-type object detected in outburst by Palomar Transient

No. ] Period Variations in SU UMa-Type Dwarf Novae VII 95
Table 95. Superhump maxima of OT J213806 (2014) (con-tinued)
E max∗ error O−C† N ‡
97 56959.4047 0.0008 −0.0026 6398 56959.4588 0.0014 −0.0036 3699 56959.5082 0.0042 −0.0093 43
100 56959.5675 0.0006 −0.0050 100101 56959.6258 0.0004 −0.0018 118102 56959.6788 0.0003 −0.0039 148103 56959.7335 0.0004 −0.0043 82107 56959.9549 0.0068 −0.0032 13108 56960.0138 0.0006 0.0006 106109 56960.0656 0.0006 −0.0027 121112 56960.2335 0.0007 −0.0000 66113 56960.2890 0.0010 0.0003 161118 56960.5642 0.0013 0.0001 127119 56960.6147 0.0030 −0.0045 40126 56961.0007 0.0012 −0.0041 59130 56961.2246 0.0020 −0.0006 203131 56961.2783 0.0011 −0.0020 442132 56961.3362 0.0008 0.0009 249133 56961.3872 0.0017 −0.0032 222134 56961.4392 0.0012 −0.0063 57136 56961.5544 0.0027 −0.0013 38137 56961.6126 0.0020 0.0019 11148 56962.2208 0.0006 0.0040 246149 56962.2678 0.0010 −0.0040 175155 56962.6089 0.0013 0.0065 104156 56962.6621 0.0028 0.0046 25173 56963.5994 0.0008 0.0055 128174 56963.6542 0.0022 0.0052 87190 56964.5360 0.0018 0.0056 22191 56964.5912 0.0012 0.0057 24197 56964.9195 0.0004 0.0035 128199 56965.0290 0.0007 0.0029 173200 56965.0864 0.0006 0.0051 143∗BJD−2400000.†Against max = 2456954.0638+ 0.055087E.‡Number of points used to determine the maximum.
Factory (PTF) (Levitan et al. 2011). Levitan et al. (2011)identified the orbital period of 26.77(2) min [0.01859(1) d]and reported superoutbursts recurring with intervalslonger than 65 d together with normal outbursts. Levitanet al. (2011) recorded superhumps with amplitudes of ∼0.1mag. Due to the shortness of the observation, the only ap-proximated period of 26–27 min was obtained.
The 2014 outburst was detected by the ASAS-SN teamon August 31 at V =15.57 (vsnet-alert 17685). Subsequentobservations detected superhumps (vsnet-alert 17688).This single-night observation determined the period of0.0186(3) d, better than in Levitan et al. (2011). Weobtained time-resolved observations three nights later.Although there was a long gap, we have selected a pe-riod of 0.01881(1) d among alias periods based on theknowledge that superhump periods of AM CVn-typeobjects are 0.67–2.18% longer than the orbital periods
Table 95. Superhump maxima of OT J213806 (2014) (con-tinued)
E max∗ error O−C† N ‡
202 56965.1918 0.0016 0.0003 155203 56965.2516 0.0005 0.0051 247204 56965.3037 0.0006 0.0021 245205 56965.3605 0.0007 0.0038 247206 56965.4143 0.0011 0.0025 242216 56965.9631 0.0003 0.0005 317217 56966.0187 0.0003 0.0009 367218 56966.0730 0.0004 0.0002 316221 56966.2406 0.0017 0.0025 173222 56966.2965 0.0014 0.0033 277223 56966.3476 0.0008 −0.0006 279224 56966.3966 0.0008 −0.0067 140227 56966.5671 0.0008 −0.0015 125228 56966.6231 0.0008 −0.0006 99234 56966.9540 0.0009 −0.0002 61235 56967.0064 0.0006 −0.0029 61236 56967.0610 0.0032 −0.0034 21239 56967.2223 0.0004 −0.0073 102240 56967.4001 0.0019 0.1154 121241 56967.3257 0.0029 −0.0141 176242 56967.3753 0.0019 −0.0196 105245 56967.5483 0.0040 −0.0119 24253 56967.9857 0.0019 −0.0152 36254 56968.0372 0.0031 −0.0188 41255 56968.0921 0.0018 −0.0189 33∗BJD−2400000.†Against max = 2456954.0638+ 0.055087E.‡Number of points used to determine the maximum.
(Pearson 2007)18, corresponding to 0.01871–0.01900 d inthe present case. figure 134). Table 98 is based on thisidentification.
3.95. SDSS J033449.86−071047.8
This object (hereafter SDSS J033449) was selected asa CV during the course of the SDSS (Szkody et al.2007). The 2009 superoutburst was reported in Katoet al. (2009). The 2014 superoutburst was detectedby the ASAS-SN team (vsnet-alert 17711). Single-night observation was available and the following su-perhump maxima were obtained: BJD 2456909.1948(33)(N=69), 2456909.2738(4) (N=143) and 2456909.3576(11)(N=57). Two other outbursts (likely normal outbursts)were recorded on 2013 February 16 (15.5 mag, unfilteredCCD, vsnet-outburst 15132) and 2014 March 26 (16.6mag, unfiltered CCD, AAVSO data).
3.96. SDSS J081408.42+090759.1
This object (hereafter SDSS J081408) was selected asa CV by its variability by Wils et al. (2010). Kato et al.(2012b) estimated the orbital period to be 0.11–0.14 d
18 The superhump period in Pearson (2007) was an old value. Amore updated period 0.018728 d (Kato et al. 2004b) correspondsto 1.3%.
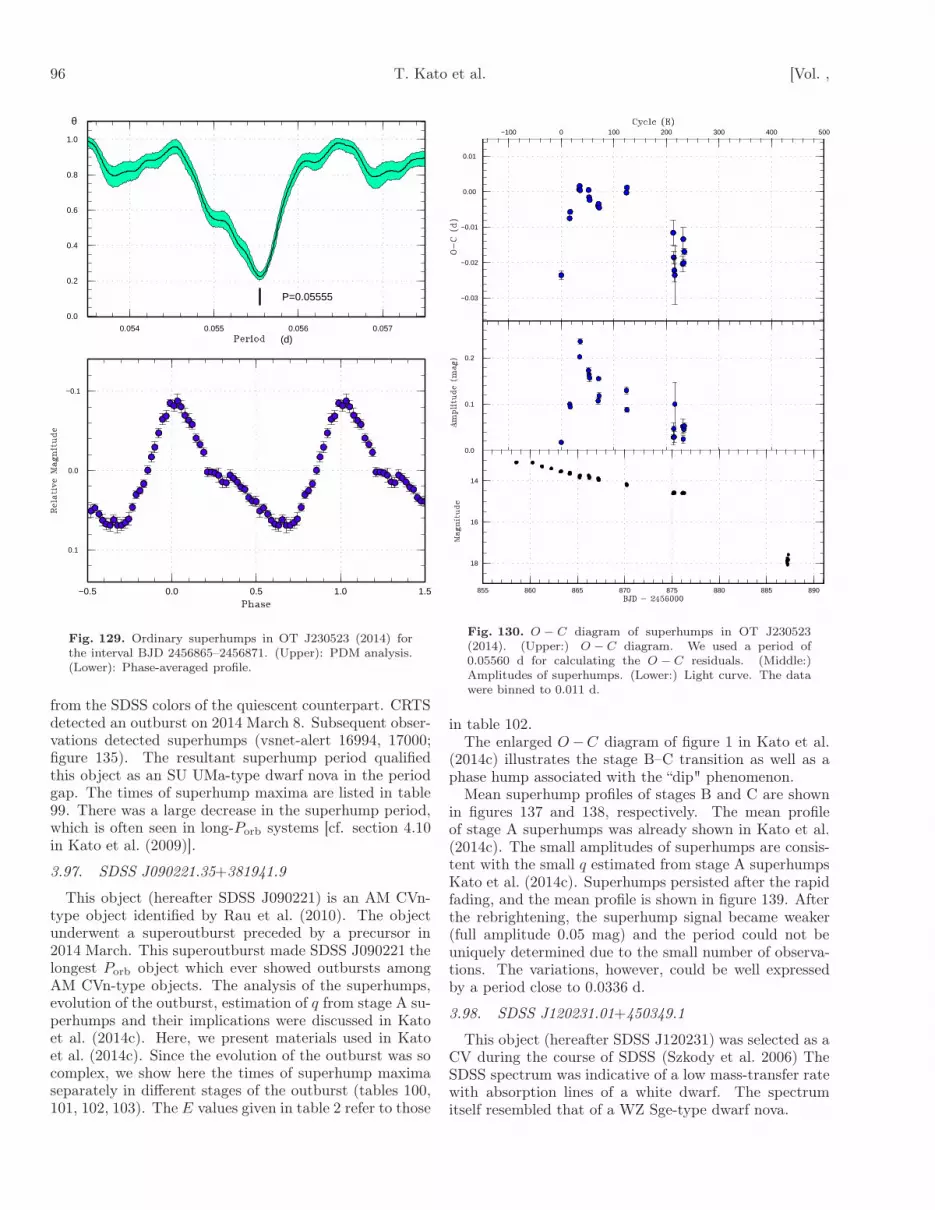
96 T. Kato et al. [Vol. ,
0.054 0.055 0.056 0.057
0.0
0.2
0.4
0.6
0.8
1.0
(d)
θ
P=0.05555
−0.5 0.0 0.5 1.0 1.5
−0.1
0.0
0.1
Fig. 129. Ordinary superhumps in OT J230523 (2014) forthe interval BJD 2456865–2456871. (Upper): PDM analysis.(Lower): Phase-averaged profile.
from the SDSS colors of the quiescent counterpart. CRTSdetected an outburst on 2014 March 8. Subsequent obser-vations detected superhumps (vsnet-alert 16994, 17000;figure 135). The resultant superhump period qualifiedthis object as an SU UMa-type dwarf nova in the periodgap. The times of superhump maxima are listed in table99. There was a large decrease in the superhump period,which is often seen in long-Porb systems [cf. section 4.10in Kato et al. (2009)].
3.97. SDSS J090221.35+381941.9
This object (hereafter SDSS J090221) is an AM CVn-type object identified by Rau et al. (2010). The objectunderwent a superoutburst preceded by a precursor in2014 March. This superoutburst made SDSS J090221 thelongest Porb object which ever showed outbursts amongAM CVn-type objects. The analysis of the superhumps,evolution of the outburst, estimation of q from stage A su-perhumps and their implications were discussed in Katoet al. (2014c). Here, we present materials used in Katoet al. (2014c). Since the evolution of the outburst was socomplex, we show here the times of superhump maximaseparately in different stages of the outburst (tables 100,101, 102, 103). The E values given in table 2 refer to those
−100 0 100 200 300 400 500
−0.03
−0.02
−0.01
0.00
0.01
0.0
0.1
0.2
855 860 865 870 875 880 885 890
14
16
18
Fig. 130. O − C diagram of superhumps in OT J230523(2014). (Upper:) O − C diagram. We used a period of0.05560 d for calculating the O − C residuals. (Middle:)Amplitudes of superhumps. (Lower:) Light curve. The datawere binned to 0.011 d.
in table 102.The enlarged O−C diagram of figure 1 in Kato et al.
(2014c) illustrates the stage B–C transition as well as aphase hump associated with the “dip" phenomenon.
Mean superhump profiles of stages B and C are shownin figures 137 and 138, respectively. The mean profileof stage A superhumps was already shown in Kato et al.(2014c). The small amplitudes of superhumps are consis-tent with the small q estimated from stage A superhumpsKato et al. (2014c). Superhumps persisted after the rapidfading, and the mean profile is shown in figure 139. Afterthe rebrightening, the superhump signal became weaker(full amplitude 0.05 mag) and the period could not beuniquely determined due to the small number of observa-tions. The variations, however, could be well expressedby a period close to 0.0336 d.
3.98. SDSS J120231.01+450349.1
This object (hereafter SDSS J120231) was selected as aCV during the course of SDSS (Szkody et al. 2006) TheSDSS spectrum was indicative of a low mass-transfer ratewith absorption lines of a white dwarf. The spectrumitself resembled that of a WZ Sge-type dwarf nova.

No. ] Period Variations in SU UMa-Type Dwarf Novae VII 97
Table 96. Superhump maxima of OT J230523 (2014)
E max∗ error O−C† N ‡
0 56863.2644 0.0011 −0.0226 11716 56864.1701 0.0002 −0.0054 11817 56864.2275 0.0002 −0.0036 11934 56865.1791 0.0007 0.0039 2835 56865.2356 0.0002 0.0050 11936 56865.2900 0.0001 0.0039 9752 56866.1797 0.0003 0.0050 3953 56866.2332 0.0002 0.0030 6154 56866.2880 0.0003 0.0023 5770 56867.1760 0.0006 0.0017 4071 56867.2322 0.0002 0.0024 6172 56867.2867 0.0004 0.0014 58
124 56870.1821 0.0005 0.0092 29125 56870.2392 0.0004 0.0107 41213 56875.1192 0.0036 0.0039 94214 56875.1679 0.0018 −0.0030 95215 56875.2198 0.0033 −0.0066 79216 56875.2741 0.0082 −0.0078 44231 56876.1113 0.0022 −0.0036 88232 56876.1738 0.0033 0.0034 130233 56876.2227 0.0010 −0.0032 185234 56876.2815 0.0009 0.0000 199∗BJD−2400000.†Against max = 2456863.2870+ 0.055532E.‡Number of points used to determine the maximum.
Quimby, Mondol (2006) detected an outburst on 2006March 21.15 UT at 13.4 mag with ROTSE-IIIb telescope.This outburst faded to 14.8 mag over the ten days. Thequiescent SDSS colors also suggested a short (0.056 d)orbital period (Kato et al. 2012b).
The 2014 outburst was detected by ASAS-SN on May27 at V =13.88. The object was not detected in outburston May 25 (vsnet-alert 17341).
Subsequent observations recorded well-developed super-humps (vsnet-alert 17348). Considering that the outburstdetection was made sufficiently early, the lack of a stagewith early superhumps indicates that this object is an or-dinary SU UMa-type dwarf nova rather than a WZ Sge-type object as suggested from spectroscopy.
The times of superhump maxima are listed in table 104.Although there was a gap in the observation, the entireobservation can be well interpreted by stage B with a largepositive Pdot and a transition to stage C. The Pdot of+9.0(1.3)× 10−5 in stage B is typical for this PSH. Theprofiles of superhumps are given separately for stages Aand B (figures 140, 141) since the large change in theperiod, which is supposed to be present in the later partof stage B but was not covered by observation, caused asplit in the superhump signal if the combined data areused. It would be worth mentioning that the superhumpperiods of early stage B and stage C are almost the same(as described in Kato et al. 2009).
0.057 0.058 0.059 0.060 0.061 0.062
0.97
0.98
0.99
1.00
(d)
θ
P=0.05973
−0.5 0.0 0.5 1.0 1.5
−0.02
−0.01
0.00
0.01
0.02
Fig. 131. Early superhumps in PNV J172929 (2014).(Upper): PDM analysis. The selection of the period wasbased on comparison with the period of ordinary superhumps.(Lower): Phase-averaged profile.
3.99. SDSS J140037.99+572341.3
This object (hereafter SDSS J140037) was selected fromSDSS and spectroscopically confirmed as a CV by Carteret al. (2013a). No previous outburst was known. The 2015outburst was detected by the ASAS-SN team on February2 (vsnet-alert 18257). Superhumps were immediately de-tected (vsnet-alert 18263, 18265; figure 142). The times ofsuperhump maxima are listed in table 105. There remainsambiguity in cycle count between E = 8 and E = 123.Among the possible aliases (see figure 142), we have se-lected the most likely period based on the period deter-mined by the PDM method from the observations on thefirst night was 0.0639(2) d. This selection, however, maynot be true if there were significant variations in the pe-riod during the 8 d gap. The object already faded fromthe superoutburst on February 17, 15 d after the initialdetection.
3.100. SDSS J172325.99+330414.1
This object (hereafter SDSS J172325) was reported inoutburst by the ASAS-SN team (=ASASSN-14gz, Daviset al. 2014) at V =14.2 on 2014 September 9. Since thespectrum in quiescence was already obtained in the SDSS

98 T. Kato et al. [Vol. ,
0.058 0.059 0.060 0.061 0.062
0.85
0.90
0.95
1.00
(d)
θ
P=0.06032
−0.5 0.0 0.5 1.0 1.5
−0.10
−0.05
0.00
0.05
0.10
Fig. 132. Ordinary superhumps in PNV J172929 (2014).(Upper): PDM analysis. (Lower): Phase-averaged profile.
archive and was clearly recognized as a CV, we call thisobject by the SDSS name. The large outburst amplitude(7.7 mag) was suggestive of a WZ Sge-type dwarf nova(Davis et al. 2014). On September 16, this object startedto show ordinary superhumps (vsnet-alert 17737, 17755,17800; figure 143). The times of superhump maxima arelisted in table 106. Although E ≤ 1 most likely corre-sponded to stage A superhumps as judged from the grow-ing amplitude, the period of stage A superhumps was notdetermined due to the lack of the data.
After fading to V =16.6 on September 26, the object un-derwent a rebrightening to V =15.8 on October 4 (vsnet-alert 17824) and remained at this level at least untilOctober 24 (figure 144).
There was no convincing signal of early superhumpsbefore the appearance of ordinary superhumps.
3.101. SDSS J173047.59+554518.5
This object (hereafter SDSS J173047) was selected asan AM CVn-type object from the SDSS photometric cat-alog by Carter et al. (2014). Carter et al. (2014) ob-tained time-resolved spectroscopy and found an orbitalperiod of 35.2(2) min, possibly allowing one-day aliases.Although the emission lines showed double peaks, Carteret al. (2014) suggested a low orbital inclination since the
−200 −100 0 100 200 300
−0.04
−0.02
0.00
0.0
0.1
0.2
800 805 810 815 820 825 830 835
12
14
16
18
20
Fig. 133. O − C diagram of superhumps in PNV J172929(2014). (Upper): O − C diagram. A period of 0.06028 dwas used to draw this figure. (Lower): Light curve. Theobservations were binned to 0.012 d.
lines were narrow. A single outburst was detected in thepast CRTS data.
The 2014 outburst was detected by CRTS on April 2at 14.5 mag (cvnet-outburst 5889). On the first nightof the observation, there were no significant modulations(vsnet-alert 17143). On April 6, the object was foundto show prominent superhumps (vsnet-alert 17160; figure145). These superhumps developed somewhere betweenApril 4 and 6, and we probably missed stage A super-humps. The object started fading rapidly on April 10(lower panel of figure 146). The object was again observedbright on April 15, accompanied by rapid fading.
The times of superhump are listed in table 107. Duringthe rebrightening, superhumps were still strongly seen.The epochs E ≥ 367 in table 107 represent these su-perhumps during the rebrightening, although the conti-nuity of the phase or the cycle count between E = 166and E = 367 is unclear. The mean superhump periodof 0.024597(6) d confirmed the alias selection in Carteret al. (2014). The fractional superhump excess is 0.006(6),where the source of the error is mostly due to the uncer-tainty of the orbital period. Future refinement of the or-bital period is desired to estimate q from the fractionalsuperhump excess.

No. ] Period Variations in SU UMa-Type Dwarf Novae VII 99
Table 97. Superhump maxima of PNV J172929 (2014)
E max∗ error O−C† N ‡
0 56811.7769 0.0030 −0.0283 141 56811.8452 0.0025 −0.0203 14
16 56812.7661 0.0050 −0.0048 1517 56812.8231 0.0023 −0.0082 1626 56813.3774 0.0004 0.0029 7527 56813.4382 0.0003 0.0034 8328 56813.4995 0.0003 0.0044 6832 56813.7437 0.0010 0.0072 1633 56813.8042 0.0006 0.0073 2534 56813.8638 0.0009 0.0065 2238 56814.1077 0.0006 0.0090 4339 56814.1653 0.0016 0.0063 1649 56814.7703 0.0009 0.0077 1750 56814.8274 0.0011 0.0045 3055 56815.1294 0.0010 0.0047 7757 56815.2391 0.0016 −0.0063 8558 56815.3213 0.0024 0.0155 3767 56815.8505 0.0015 0.0016 2872 56816.1550 0.0018 0.0043 10173 56816.2111 0.0044 −0.0000 11581 56816.7010 0.0025 0.0071 1382 56816.7578 0.0019 0.0035 1683 56816.8198 0.0014 0.0051 2994 56817.4800 0.0004 0.0015 4795 56817.5404 0.0003 0.0016 4798 56817.7192 0.0011 −0.0007 1899 56817.7811 0.0011 0.0008 18
100 56817.8373 0.0019 −0.0034 17110 56818.4428 0.0007 −0.0014 33114 56818.6861 0.0052 0.0005 11115 56818.7400 0.0029 −0.0059 19116 56818.8018 0.0019 −0.0045 17∗BJD−2400000.†Against max = 2456811.8052+ 0.060354E.‡Number of points used to determine the maximum.
The outburst behavior of SDSS J173047 is character-ized by the short duration of the plateau phase, con-sisting only 5±1 d after the appearance of superhumps.This behavior is similar to another AM CVn-type ob-ject, SDSS J012940.05+384210.4 (Kato et al. 2010; Shearset al. 2012).
3.102. TCP J16054809+2405338
This object (hereafter TCP J160548) is a transient dis-covered by H. Nishimura at an unfiltered CCD magnitudeof 12.6 on 2014 December 20. The object was not detectedon December 2 and 3.19 The object was readily identifiedwith a blue SDSS object and a GALEX source (vsnet-alert 18085). The object was also detected in outburstby ASAS-SN survey (vsnet-alert 18107, 18109). The ob-ject was also selected as a candidate for an AM CVn-type
19 <http://www.cbat.eps.harvard.edu/unconf/followups/J16054809+2405338.html>.
Table 97. Superhump maxima of PNV J172929 (2014) (con-tinued)
E max∗ error O−C† N ‡
131 56819.7059 0.0026 −0.0057 18132 56819.7742 0.0025 0.0022 18133 56819.8270 0.0037 −0.0054 18142 56820.3754 0.0012 −0.0002 30143 56820.4349 0.0007 −0.0010 31144 56820.4932 0.0010 −0.0031 32145 56820.5574 0.0028 0.0008 11147 56820.6772 0.0069 −0.0001 10148 56820.7309 0.0030 −0.0068 18165 56821.7638 0.0026 0.0001 18171 56822.1253 0.0022 −0.0005 216172 56822.1885 0.0031 0.0023 97173 56822.2422 0.0033 −0.0043 98∗BJD−2400000.†Against max = 2456811.8052+ 0.060354E.‡Number of points used to determine the maximum.
0.0185 0.0190 0.0195
0.8
0.9
1.0
(d)
θ
P=0.01881
−0.5 0.0 0.5 1.0 1.5
−0.05
0.00
0.05
Fig. 134. Superhumps in PTF1 J071912 (2014). (Upper):PDM analysis. (Lower): Phase-averaged profile.

100 T. Kato et al. [Vol. ,
Table 98. Superhump maxima of PTF1 J071912 (2014)
E max∗ error O−C† N ‡
0 56902.6058 0.0006 0.0010 321 56902.6244 0.0008 0.0009 362 56902.6423 0.0006 −0.0000 363 56902.6593 0.0012 −0.0019 33
153 56905.4829 0.0019 −0.0009 9155 56905.5218 0.0014 0.0004 9158 56905.5772 0.0018 −0.0007 10159 56905.5979 0.0006 0.0012 7∗BJD−2400000.†Against max = 2456902.6047+ 0.018818E.‡Number of points used to determine the maximum.
0.094 0.096 0.098 0.100 0.102 0.104 0.106 0.108 0.110
0.0
0.2
0.4
0.6
0.8
1.0
(d)
θ
P=0.10098
−0.5 0.0 0.5 1.0 1.5
−0.2
−0.1
0.0
0.1
Fig. 135. Superhumps in SDSS J081408 (2014). (Upper):PDM analysis. (Lower): Phase-averaged profile.
150 200 250 300 350 400 450 500
−0.02
−0.01
0.00
0.01
B C
736 738 740 742 744 746
13
14
15
16
17
Fig. 136. O−C diagram of superhumps in SDSS J090221(2014) showing the stage B–C transition. (Upper): O −C
diagram. A period of 0.03372 d was used to draw this figure.(Lower): Light curve. The observations were binned to 0.01 d.
0.032 0.033 0.034 0.035 0.036
0.80
0.85
0.90
0.95
1.00
(d)
θ
P=0.03371
−0.5 0.0 0.5 1.0 1.5
−0.04
−0.02
0.00
0.02
0.04
Fig. 137. Stage B superhumps in SDSS J090221 (2014).(Upper): PDM analysis. (Lower): Phase-averaged profile.

No. ] Period Variations in SU UMa-Type Dwarf Novae VII 101
Table 99. Superhump maxima of SDSS J081408 (2014)
E max∗ error O−C† N ‡
0 56724.7195 0.0003 −0.0022 10111 56725.8337 0.0003 0.0018 9716 56726.3384 0.0007 0.0019 8817 56726.4390 0.0004 0.0015 11318 56726.5377 0.0008 −0.0007 9627 56727.4444 0.0007 −0.0023 58∗BJD−2400000.†Against max = 2456724.7217+ 0.100929E.‡Number of points used to determine the maximum.
0.032 0.033 0.034 0.035 0.036
0.8
0.9
1.0
(d)
θ
P=0.03361
−0.5 0.0 0.5 1.0 1.5
−0.05
0.00
0.05
Fig. 138. Stage C superhumps in SDSS J090221 (2014).(Upper): PDM analysis. (Lower): Phase-averaged profile.
0.032 0.033 0.034 0.035 0.036
0.97
0.98
0.99
1.00
(d)
θ
P=0.03368
−0.5 0.0 0.5 1.0 1.5
−0.10
−0.05
0.00
0.05
0.10
Fig. 139. Superhumps in the post-superoutburst stage be-fore the rebrightening in SDSS J090221 (2014). (Upper):PDM analysis. (Lower): Phase-averaged profile.
object from SDSS colors (Carter et al. 2013a). Althoughthe object received attention, the difficult visibility in themorning sky and unstable weather hindered early obser-vations. On December 21, apparent large-amplitude vari-ations were recorded (vsnet-alert 18102). Although short-term variations were recorded on December 26 and 27(vsnet-alert 18126), the nature of the variation was un-clear. It was only on 2015 January 1, when clear su-perhumps were detected (vsnet-alert 18131, 18134; fig-ure 147). Although the data were rather fragmentaryand with long gaps, a period of 0.05501 d was found toexpress observations after BJD 2457019 (December 27).The times of superhump maxima based on this periodare listed in table 108. Although there was a possibilityof stage A superhumps or early superhumps before BJD2457019, this could not be confirmed due to the lack ofobservations.
4. Discussion
4.1. Statistics of Objects
Up to Kato et al. (2009), a large fraction of objects stud-ied in our survey were known variable stars in the GeneralCatalog of Variable Stars (GCVS: Kholopov et al. 1985).Since 2007, the CRTS started to produce new transients,

102 T. Kato et al. [Vol. ,
Table 100. Superhump maxima of SDSS J090221 (2014)(slow rising part)
E max∗ error O−C† N ‡
0 56729.2778 0.0059 0.0016 181 56729.3088 0.0015 −0.0016 182 56729.3462 0.0014 0.0018 123 56729.3805 0.0009 0.0019 185 56729.4408 0.0027 −0.0061 14
29 56730.2652 0.0012 −0.0005 1730 56730.2994 0.0011 −0.0004 1831 56730.3356 0.0021 0.0016 1632 56730.3661 0.0010 −0.0020 2533 56730.4020 0.0012 −0.0002 2734 56730.4373 0.0018 0.0010 1635 56730.4716 0.0011 0.0011 2136 56730.5050 0.0016 0.0004 3137 56730.5415 0.0028 0.0028 2538 56730.5742 0.0016 0.0014 1858 56731.2540 0.0011 −0.0012 1959 56731.2894 0.0010 0.0000 1760 56731.3215 0.0013 −0.0019 1161 56731.3570 0.0010 −0.0005 1664 56731.4581 0.0013 −0.0018 1390 56732.3503 0.0011 0.0033 3991 56732.3852 0.0012 0.0041 4092 56732.4176 0.0008 0.0024 4093 56732.4518 0.0015 0.0024 2794 56732.4836 0.0009 0.0001 2795 56732.5165 0.0016 −0.0012 2396 56732.5524 0.0013 0.0007 6097 56732.5858 0.0006 −0.0001 11598 56732.6193 0.0009 −0.0007 7399 56732.6537 0.0009 −0.0004 80
100 56732.6862 0.0014 −0.0020 23101 56732.7183 0.0021 −0.0040 15102 56732.7545 0.0011 −0.0020 14∗BJD−2400000.†Against max = 2456729.2763+ 0.034120E.‡Number of points used to determine the maximum.
most of which were initially supernovae. The first CRTSCV studied in our survey was CRTS J021110.2+171624in 2008 (Djorgovski et al. 2008). The CRTS then becamethe dominant source of new CVs for the subsequent fiveyears (figure 148). Since the main targets of the CRTSare moving Solar system objects, the observation strategy(approximately once in 10 d) was not necessarily suitablefor detecting CV outbursts in the early phase. Startingfrom 2012, the MASTER network started to produce newtransients. The first MASTER CV studied in our surveywas MASTER OT J072948.66+593824.4 (Balanutsa et al.2012). Since the observation strategy was more suitablefor early detection of CV outbursts, the contribution ofoutburst detections by the MASTER network increasedup to 2013. A large number of newly discovered WZ Sge-type dwarf novae was a remarkable product of this survey(e.g. Kato et al. 2013a; Kato et al. 2014b; Nakata et al.
Table 101. Superhump maxima of SDSS J090221 (2014)(rise to superoutburst)
E max∗ error O−C† N ‡
0 56733.3333 0.0018 0.0026 321 56733.3633 0.0006 −0.0012 653 56733.4342 0.0015 0.0022 654 56733.4672 0.0010 0.0013 655 56733.4996 0.0014 −0.0001 616 56733.5372 0.0036 0.0037 407 56733.5660 0.0005 −0.0013 30
10 56733.6707 0.0041 0.0021 3111 56733.7031 0.0021 0.0007 3712 56733.7366 0.0011 0.0004 9314 56733.8041 0.0014 0.0003 10915 56733.8406 0.0037 0.0030 10630 56734.3442 0.0011 −0.0004 3731 56734.3748 0.0017 −0.0036 6432 56734.4096 0.0015 −0.0026 6534 56734.4771 0.0017 −0.0027 5236 56734.5451 0.0014 −0.0023 7437 56734.5773 0.0015 −0.0039 6938 56734.6188 0.0012 0.0038 6439 56734.6447 0.0012 −0.0041 6940 56734.6834 0.0033 0.0008 9141 56734.7148 0.0008 −0.0016 7942 56734.7510 0.0008 0.0009 5943 56734.7811 0.0007 −0.0029 7544 56734.8151 0.0009 −0.0026 6145 56734.8481 0.0020 −0.0034 3946 56734.8837 0.0009 −0.0016 3858 56735.2898 0.0002 −0.0011 13959 56735.3252 0.0003 0.0005 19860 56735.3585 0.0003 −0.0000 20661 56735.3921 0.0005 −0.0002 23662 56735.4278 0.0004 0.0017 9863 56735.4608 0.0004 0.0009 190∗BJD−2400000.†Against max = 2456733.3307+ 0.033797E.‡Number of points used to determine the maximum.
2013). Starting from 2013, the ASAS-SN system (Shappeeet al. 2014a) started to produce new transients. The firstASAS-SN CV we studied was ASASSN-13cf and the num-ber of ASAS-SN CVs rapidly increased thanks to the highfrequency of observations (observations up to every night)and large sky coverage up to 15000 square degrees. As aresult, the fraction of ASAS-SN CVs and detections of CVoutbursts by the ASAS-SN team dramatically increased.If we restrict the objects to those studied in our series ofpapers, the number of objects designated by the ASAS-SN survey has already surpassed the number registeredin the GCVS. It is likely that the majority of CVs withinthe reach of small telescopes have ASAS-SN names (cur-rently 452 at the time of writing in 2015 June) in thenear future unless the GCVS names (currently 581, in-cluding NSV) are given more quickly. The ASAS-SN tran-sients are mostly not very faint as in the CRTS ones and

No. ] Period Variations in SU UMa-Type Dwarf Novae VII 103
Table 101. Superhump maxima of SDSS J090221 (2014)(rise to superoutburst, continued)
E max∗ error O−C† N ‡
64 56735.4953 0.0006 0.0016 15265 56735.5277 0.0009 0.0002 13666 56735.5628 0.0010 0.0015 5267 56735.5941 0.0005 −0.0010 5068 56735.6298 0.0008 0.0009 4569 56735.6639 0.0009 0.0012 5670 56735.6957 0.0006 −0.0007 8071 56735.7304 0.0007 0.0002 4172 56735.7636 0.0011 −0.0005 3973 56735.8017 0.0008 0.0038 3974 56735.8322 0.0012 0.0005 4375 56735.8668 0.0010 0.0014 4376 56735.9014 0.0008 0.0021 21∗BJD−2400000.†Against max = 2456733.3307+ 0.033797E.‡Number of points used to determine the maximum.
0.057 0.058 0.059 0.060 0.061 0.062
0.2
0.4
0.6
0.8
1.0
(d)
θ
P=0.05956
−0.5 0.0 0.5 1.0 1.5
−0.10
−0.05
0.00
0.05
0.10
Fig. 140. Superhumps in SDSS J120231 (2014, stage B).(Upper): PDM analysis. (Lower): Phase-averaged profile.
Table 102. Superhump maxima of SDSS J090221 (2014)(superoutburst plateau)
E max∗ error O−C† N ‡
0 56736.2800 0.0006 −0.0048 1091 56736.3150 0.0007 −0.0035 1112 56736.3479 0.0008 −0.0042 1453 56736.3818 0.0012 −0.0040 1114 56736.4180 0.0006 −0.0016 345 56736.4515 0.0007 −0.0017 476 56736.4855 0.0008 −0.0013 367 56736.5173 0.0006 −0.0032 428 56736.5531 0.0006 −0.0010 1019 56736.5864 0.0007 −0.0015 96
10 56736.6191 0.0008 −0.0024 7911 56736.6507 0.0011 −0.0045 13512 56736.6879 0.0005 −0.0010 16613 56736.7207 0.0007 −0.0018 16414 56736.7549 0.0005 −0.0013 16715 56736.7898 0.0005 −0.0001 16616 56736.8224 0.0004 −0.0011 13517 56736.8537 0.0006 −0.0036 12618 56736.8901 0.0005 −0.0008 10229 56737.2598 0.0004 −0.0015 3731 56737.3240 0.0010 −0.0045 3732 56737.3595 0.0022 −0.0028 7533 56737.3921 0.0022 −0.0038 7534 56737.4292 0.0007 −0.0004 12035 56737.4628 0.0010 −0.0005 14236 56737.4961 0.0007 −0.0008 13937 56737.5316 0.0007 0.0010 13538 56737.5635 0.0007 −0.0008 13739 56737.5998 0.0008 0.0018 16440 56737.6307 0.0012 −0.0009 5741 56737.6656 0.0008 0.0003 19642 56737.6993 0.0006 0.0004 18243 56737.7332 0.0019 0.0006 203∗BJD−2400000.†Against max = 2456736.2848+ 0.033669E.‡Number of points used to determine the maximum.
are reachable by relatively small telescopes. This presentstatistics would provide a clue for strategy of surveys inmaximizing the scientific gain for small telescopes.
4.2. Period Distribution
In figure 149, we give distribution of superhump and es-timated orbital periods, greatly updated since Kato et al.(2009). Since most of non-magnetic CVs below the periodgap are SU UMa-type dwarf novae, this figure is expectedto well represent the distribution of superhump periodsof non-magnetic CVs. It is quite noticeable that there isa sharp cut-off at a period of 0.053 d (the objects belowthis period are either AM CVn-type systems and EI Psc-type objects). This finding has strengthened the modernobservational identification of the period minimum (e.g.Knigge 2006; Gänsicke et al. 2009; Knigge et al. 2011)and there is no indication of systems below this period,

104 T. Kato et al. [Vol. ,
Table 102. Superhump maxima of SDSS J090221 (2014)(superoutburst plateau, continued)
E max∗ error O−C† N ‡
44 56737.7673 0.0037 0.0010 4851 56738.0029 0.0010 0.0010 1953 56738.0696 0.0006 0.0003 2554 56738.1041 0.0009 0.0011 2155 56738.1321 0.0019 −0.0046 1559 56738.2687 0.0005 −0.0026 3660 56738.3060 0.0004 0.0010 3762 56738.3740 0.0013 0.0017 11163 56738.4052 0.0014 −0.0008 10664 56738.4384 0.0014 −0.0013 7265 56738.4734 0.0009 0.0001 7366 56738.5073 0.0007 0.0003 6767 56738.5390 0.0005 −0.0017 7368 56738.5732 0.0006 −0.0012 3672 56738.7107 0.0007 0.0017 6673 56738.7433 0.0004 0.0006 7574 56738.7752 0.0005 −0.0011 7575 56738.8091 0.0009 −0.0009 7576 56738.8437 0.0007 0.0000 7577 56738.8814 0.0021 0.0040 7078 56738.9115 0.0009 0.0004 7579 56738.9411 0.0023 −0.0037 7480 56738.9779 0.0009 −0.0005 2481 56739.0132 0.0005 0.0012 7482 56739.0454 0.0006 −0.0003 8583 56739.0802 0.0004 0.0008 7484 56739.1132 0.0005 0.0001 6985 56739.1473 0.0006 0.0005 6891 56739.3496 0.0012 0.0008 7392 56739.3842 0.0009 0.0018 7593 56739.4166 0.0005 0.0005 9494 56739.4512 0.0006 0.0015 10195 56739.4855 0.0007 0.0021 101∗BJD−2400000.†Against max = 2456736.2848+ 0.033669E.‡Number of points used to determine the maximum.
contrary to what was suggested by Uemura et al. (2010).Since there have been a sizeable number of genuine candi-dates for period bouncers (Kato et al. 2013b; Kato, Osaki2013b; Nakata et al. 2014), it is unlikely that the mass-transfer rate quickly decreases as systems approach theperiod minimum and this identification of the period min-imum appears to be secure.
There is a peak of distribution just above the pe-riod minimum and it is compatible with the period spike(Gänsicke et al. 2009). The distribution monotonicallydecreases towards the longer period, and, rather surpris-ingly, there is no clear indication of a sudden decreaseof the number at the supposed lower edge of the periodgap. This tendency is the same as reported in Pavlenkoet al. (2014). This result may even cast a doubt againstthe presence of the period gap, at least for SU UMa-typedwarf novae and the lower edge of the gap (we should
Table 102. Superhump maxima of SDSS J090221 (2014)(superoutburst plateau, continued)
E max∗ error O−C† N ‡
96 56739.5188 0.0008 0.0018 10297 56739.5516 0.0009 0.0008 3598 56739.5828 0.0007 −0.0016 22
101 56739.6849 0.0010 −0.0005 81102 56739.7203 0.0010 0.0012 78103 56739.7558 0.0010 0.0030 84104 56739.7893 0.0007 0.0029 85105 56739.8232 0.0008 0.0031 78106 56739.8538 0.0009 0.0000 84107 56739.8910 0.0015 0.0036 75108 56739.9184 0.0012 −0.0027 136109 56739.9556 0.0011 0.0008 160110 56739.9841 0.0012 −0.0044 172111 56740.0277 0.0021 0.0056 219112 56740.0533 0.0014 −0.0025 183113 56740.0941 0.0016 0.0046 196114 56740.1224 0.0013 −0.0007 215115 56740.1598 0.0012 0.0029 164116 56740.1875 0.0020 −0.0030 122117 56740.2206 0.0011 −0.0035 122121 56740.3571 0.0027 −0.0017 98122 56740.3955 0.0011 0.0030 114123 56740.4294 0.0007 0.0033 180124 56740.4641 0.0007 0.0043 175125 56740.4998 0.0013 0.0063 195126 56740.5300 0.0007 0.0028 206127 56740.5662 0.0009 0.0054 207128 56740.6001 0.0008 0.0056 238129 56740.6322 0.0018 0.0040 108130 56740.6670 0.0006 0.0051 211131 56740.6960 0.0010 0.0005 309132 56740.7359 0.0010 0.0067 300133 56740.7680 0.0005 0.0052 249∗BJD−2400000.†Against max = 2456736.2848+ 0.033669E.‡Number of points used to determine the maximum.
note, our surveys of superhumps systems are not sensitiveto the upper edge of the period gap, above which almostall dwarf novae are not SU UMa-type stars).
4.3. Period Derivatives during Stage B
Figure 150 represents updated relation between Pdot forstage B versus Porb. The objects studied in this paperare heavily concentrated in the region of Porb < 0.065 d,and most of the object showed positive Pdot as in earlierstudies. The longer-period systems studied in this workgenerally followed the trend shown in previous works. OTJ064833 showed an exceptionally large Pdot. As discussedin subsection 3.90, this object has features common toshort-Porb systems and warrants further study.

No. ] Period Variations in SU UMa-Type Dwarf Novae VII 105
0.06 0.07 0.08 0.09 0.10 0.11
−10
0
10
20
30
Fig. 150. Pdot for stage B versus Porb. Filled circles, filled diamonds, filled triangles, filled squares, filled lower-pointed triangles,open square and filled stars represent samples in Kato et al. (2009), Kato et al. (2010), Kato et al. (2012a), Kato et al. (2013a),Kato et al. (2014b), Kato et al. (2014a) and this paper, respectively. The curve represents the spline-smoothed global trend.
4.4. Mass Ratios from Stage A Superhumps
We have proposed that the precession rate of stageA superhumps represents the dynamical precession rateof at the 3:1 resonance, thereby enabling estimation ofmass ratios without experimental calibration (Kato, Osaki2013b). We list new estimates for the binary mass ratiofrom stage A superhumps in table 109. This table includestwo objects in C. Nakata et al. in preparation. In table110, we list stage A superhumps recorded in the presentstudy.
A updated distribution of mass ratios is shown in fig-ure 151. The Kepler DNe shown in this figures areV516 Lyr (Kato, Osaki 2013a), KIC 7524178 (Kato,Osaki 2013c) and the unusual short-Porb object GALEXJ194419.33+491257.0 in the field of KIC 11412044 (Kato,Osaki 2014) (located at Porb=0.05282 d, q=0.14). Thepresent study has strengthened the concentration of WZSge-type dwarf novae around q = 0.07 just above the pe-riod minimum.
4.5. Development of Superhumps Following PrecursorOutburst
In Kato et al. (2012a), we showed from the Kepler dataof V1504 Cyg and V344 Lyr that superhumps start to de-velop following precursor outbursts. This finding was ex-amined in more detail using the Kepler data of the sameobjects in Osaki, Kato (2013a), Osaki, Kato (2013b). Thesame phenomenon was also confirmed in the Kepler dataof the background dwarf nova of KIC 4378554 and V516Lyr (Kato, Osaki 2013a). These findings have strength-ened the universal application of the TTI model to variousSU UMa-type dwarf novae.
In this paper, we have observed similar evolution ofsuperhumps following the precursor outburst in Z Cha.Although only one superhump was recorded, superhumpslikely started to grow just before the final rise to the mainsuperoutburst also in CY UMa. An O − C analysis ofSU UMa also suggested that superhumps likely started toappear around the maximum of the precursor outburst.All of these findings are in good agreement with what theTTI model predicts (cf. Osaki, Kato 2013a).

106 T. Kato et al. [Vol. ,
0.05 0.06 0.07 0.08 0.09 0.10 0.110.0
0.1
0.2
0.3
Kato and Osaki (2013b) & Nakata et al. (2013) &Kato et al. (2014) &Kato et al. (2015)
eclipse, radial velocityKepler DNe
this work
Fig. 151. Mass ratio versus orbital period. The dashed and solid curves represent the standard and optimal evolutionary tracks inKnigge et al. (2011), respectively. The filled circles, filled squares, filled stars, filled diamonds represent q values from a combinationof the estimates from stage A superhumps published in four preceding sources (Kato, Osaki 2013b; Nakata et al. 2013; Kato et al.2014b; Kato et al. 2014a), known q values from quiescent eclipses or radial-velocity study (see Kato, Osaki 2013b for the data source),q estimated in this work and dwarf novae in the Kepler data (see text for the complete reference), respectively. The objects in “thiswork” includes two objects in C. Nakata et al. in preparation
4.6. AM CVn-Type Objects and Related Objects
In recent years, an increasing number of AM CVn-type objects [for recent reviews of AM CVn-type ob-jects, see e.g. Nelemans (2005); Solheim (2010)] havebeen recorded in outbursts and superhumps were de-tected during outbursts: CR Boo (observation in atyp-ical state in Patterson et al. 1997, more regular su-peroutburst in Kato et al. 2001); V803 Cen (observa-tion in atypical state in Patterson et al. 2000); KL Dra(Wood et al. 2002); V406 Hya (Nogami et al. 2004);SDSS J012940.05+384210.4 (Kato et al. 2010; Shearset al. 2012); YZ LMi (partial coverage in Copperwheatet al. 2011); PTF1 J071912.13+485834.0 (Levitan et al.2011); CP Eri (Armstrong et al. 2012; Kato et al. 2014a);SDSS J172102.48+273301.2 (Kato et al. 2013a); CSSJ045019.7−093113 (Woudt et al. 2013).
In Kato et al. (2013a), we also studied superhumps andoutburst patterns in an AM CVn star CR Boo and foundthat the basic O−C variation of superhumps in AM CVn-type superoutburst is the same as in hydrogen-rich sys-tems. K. Isogai et al. in preparation also detected stage
A superhumps in CR Boo, first time in AM CVn-typeobjects with typical supercycles.
In this paper, we added new examples of AM CVn-type systems PTF1 J071912, SDSS J090221 (see also Katoet al. 2014c) and SDSS J173047. During the present sur-vey, two further objects ASASSN-14ei and ASASSN-14mvhave been identified as AM CVn-type objects showing su-peroutbursts and multiple rebrightenings (K. Isogai et al.in preparation; for spectroscopic identifications, see Prietoet al. 2014a, see also vsnet-alert 18160). ASASSN-14cnwas also found to be an eclipsing AM CVn-type objectin outburst (vsnet-alert 17879; superhumps are yet to bedetected). ASASSN-14fv was also found to be an out-bursting AM CVn-type object (Wagner et al. 2014 forspectroscopic identification; superhumps are yet to be de-tected). These data suggest that about 8% of objectsshowing dwarf nova-type outbursts are AM CVn-type ob-jects. This fraction is much larger than the hitherto knownstatistics (about 1% in RKcat Edition 7.21 Ritter, Kolb2003). AM CVn-type objects may be more populous thanhave been considered.
There have also been an increasing number of EI Psc-

No. ] Period Variations in SU UMa-Type Dwarf Novae VII 107
Table 102. Superhump maxima of SDSS J090221 (2014)(superoutburst plateau, continued)
E max∗ error O−C† N ‡
134 56740.7992 0.0006 0.0027 233135 56740.8353 0.0011 0.0051 216136 56740.8691 0.0011 0.0053 189138 56740.9382 0.0027 0.0070 72140 56741.0040 0.0013 0.0055 49150 56741.3340 0.0004 −0.0013 76151 56741.3718 0.0009 0.0029 97152 56741.4002 0.0014 −0.0023 117153 56741.4425 0.0012 0.0062 85158 56741.6078 0.0007 0.0032 117159 56741.6434 0.0015 0.0051 84161 56741.7113 0.0005 0.0057 104162 56741.7436 0.0007 0.0043 104163 56741.7785 0.0005 0.0056 102164 56741.8097 0.0007 0.0031 102165 56741.8420 0.0010 0.0017 102166 56741.8774 0.0011 0.0034 102180 56742.3457 0.0008 0.0004 41181 56742.3798 0.0012 0.0008 54183 56742.4423 0.0024 −0.0041 39185 56742.5159 0.0011 0.0022 25187 56742.5833 0.0012 0.0023 34190 56742.6828 0.0009 0.0008 64191 56742.7163 0.0008 0.0006 62192 56742.7506 0.0017 0.0012 64193 56742.7844 0.0024 0.0014 32206 56743.2179 0.0019 −0.0028 17207 56743.2549 0.0050 0.0005 13208 56743.2851 0.0010 −0.0029 32209 56743.3204 0.0010 −0.0014 30210 56743.3553 0.0012 −0.0001 30211 56743.3861 0.0006 −0.0030 71212 56743.4204 0.0004 −0.0024 93∗BJD−2400000.†Against max = 2456736.2848+ 0.033669E.‡Number of points used to determine the maximum.
type objects (CVs containing but depleted hydrogen withorbital period below the period minimum): V485 Cen(Augusteijn 1995; Olech 1997); EI Psc (Thorstensen et al.2002; Uemura et al. 2002; Skillman et al. 2002); CRTSJ102842.9−081927 (Kato et al. 2009; Kato et al. 2013a;Kato et al. 2014b); CRTS J112253.3−111037 (Kato et al.2010); SBS 1108+574 (Kato et al. 2013a; Littlefield et al.2013; Carter et al. 2013b); CSS J174033.5+414756 (T.Ohshima et al. in preparation). Candidate systems in-clude CRTS J233313.0−155744 (Woudt, Warner 2011).
We have added another object of this class, V418 Ser,in this paper. In all well-observed cases, the developmentof superhumps in these systems follow the same pattern asin hydrogen-rich systems. Although the number of theseobjects is smaller than AM CVn-type objects, these objectmay be more abundant than have been considered.
Table 102. Superhump maxima of SDSS J090221 (2014)(superoutburst plateau, continued)
E max∗ error O−C† N ‡
213 56743.4542 0.0004 −0.0022 97214 56743.4871 0.0005 −0.0030 92215 56743.5234 0.0005 −0.0003 89216 56743.5553 0.0004 −0.0021 37217 56743.5880 0.0006 −0.0030 22219 56743.6570 0.0004 −0.0014 70220 56743.6898 0.0002 −0.0023 64221 56743.7238 0.0005 −0.0020 66222 56743.7582 0.0003 −0.0013 72223 56743.7922 0.0003 −0.0009 70224 56743.8253 0.0004 −0.0015 72225 56743.8571 0.0003 −0.0033 54226 56743.8906 0.0005 −0.0035 72228 56743.9550 0.0027 −0.0064 15229 56743.9935 0.0005 −0.0016 39230 56744.0288 0.0012 0.0000 83231 56744.0560 0.0019 −0.0065 95232 56744.0946 0.0012 −0.0015 92239 56744.3287 0.0006 −0.0031 45240 56744.3619 0.0007 −0.0036 72241 56744.3956 0.0011 −0.0035 97242 56744.4293 0.0006 −0.0035 99243 56744.4638 0.0012 −0.0026 63244 56744.4960 0.0008 −0.0041 45245 56744.5309 0.0013 −0.0029 35246 56744.5659 0.0006 −0.0016 24∗BJD−2400000.†Against max = 2456736.2848+ 0.033669E.‡Number of points used to determine the maximum.
4.7. Long-Term Variation of Supercycles
In this paper, we studied long-term variation of super-cycles in MM Hya (subsection 3.15) and CY UMa (sub-section 3.27). In MM Hya, variations of the supercyclein the range of 330 d and 386 d were recorded. In CYUMa, a sudden decrease of the supercycle from 362(3) dto 290(1) d was observed in 2003. In both systems, thesupercycle tended to be constant for several to ten years,and there was a tendency of a sudden switch to a differentperiod.
Similar systematic variations of cycle lengths were stud-ied in SS Cyg-type dwarf novae [cf. AR And, UU Aql,RU Peg: Andronov, Shakun (1990)]. Andronov, Shakun(1990) suggested the Solar-type activity as a possiblecause, but the phenomenon still remained a puzzle. Inrecent years, Zemko et al. (2013) recorded variations ofsupercycles from 43.6 to 59.2 d in ER UMa. The vari-ations of the supercycle in ER UMa was an order sim-ilar to those in the two systems studied in this paper.Although there was a possibility that a disk tilt, which issupposed to produce negative superhumps (Wood, Burke2007; Montgomery 2012), could affect the outburst prop-erties, Zemko et al. (2013) could not find a correlationbetween the appearance of negative superhumps and the

108 T. Kato et al. [Vol. ,
Table 103. Superhump maxima of SDSS J090221 (2014)(rapid fading)
E max∗ error O−C† N ‡
0 56754.9713 0.0008 −0.0009 641 56755.0049 0.0007 −0.0011 642 56755.0385 0.0009 −0.0014 653 56755.0758 0.0013 0.0021 654 56755.1058 0.0028 −0.0017 239 56755.2813 0.0007 0.0046 32
10 56755.3099 0.0010 −0.0007 4511 56755.3451 0.0007 0.0007 7012 56755.3784 0.0006 0.0002 7213 56755.4114 0.0012 −0.0007 8714 56755.4461 0.0007 0.0002 7415 56755.4803 0.0008 0.0005 6116 56755.5134 0.0010 −0.0002 3922 56755.7168 0.0007 0.0002 7223 56755.7495 0.0004 −0.0009 7224 56755.7831 0.0008 −0.0011 7022 56755.7169 0.0007 0.0003 70∗BJD−2400000.†Against max = 2456754.9722+ 0.033836E.‡Number of points used to determine the maximum.
0.057 0.058 0.059 0.060 0.061 0.062
0.4
0.6
0.8
1.0
(d)
θ
P=0.05960
−0.5 0.0 0.5 1.0 1.5
−0.10
−0.05
0.00
0.05
Fig. 141. Superhumps in SDSS J120231 (2014, stage C).(Upper): PDM analysis. (Lower): Phase-averaged profile.
Table 104. Superhump maxima of SDSS J120231 (2014)
E max∗ error O−C† N ‡
0 56806.4104 0.0002 0.0022 941 56806.4700 0.0002 0.0020 922 56806.5297 0.0003 0.0019 68
16 56807.3663 0.0004 0.0013 6217 56807.4272 0.0002 0.0024 14318 56807.4826 0.0003 −0.0021 12419 56807.5441 0.0005 −0.0004 8751 56809.4493 0.0003 −0.0088 4752 56809.5098 0.0002 −0.0081 6153 56809.5711 0.0008 −0.0065 33
134 56814.4280 0.0004 0.0066 49135 56814.4894 0.0005 0.0081 53150 56815.3838 0.0006 0.0055 36151 56815.4452 0.0006 0.0071 52152 56815.5047 0.0004 0.0068 41167 56816.3978 0.0009 0.0029 20168 56816.4560 0.0009 0.0013 53169 56816.5139 0.0018 −0.0006 31184 56817.4124 0.0006 0.0009 52185 56817.4698 0.0007 −0.0015 54200 56818.3587 0.0010 −0.0096 19201 56818.4223 0.0018 −0.0058 28202 56818.4822 0.0013 −0.0057 21∗BJD−2400000.†Against max = 2456806.4082+ 0.059800E.‡Number of points used to determine the maximum.
Table 105. Superhump maxima of SDSS J140037 (2015)
E max∗ error O−C† N ‡
0 57057.4814 0.0013 0.0005 731 57057.5429 0.0015 −0.0018 992 57057.6082 0.0010 −0.0006 815 57057.8007 0.0006 0.0001 486 57057.8627 0.0005 −0.0019 677 57057.9250 0.0008 −0.0035 618 57057.9998 0.0009 0.0073 19
123 57065.3426 0.0023 −0.0046 37124 57065.4116 0.0018 0.0005 35125 57065.4789 0.0014 0.0039 35∗BJD−2400000.†Against max = 2457057.4808+ 0.063954E.‡Number of points used to determine the maximum.

No. ] Period Variations in SU UMa-Type Dwarf Novae VII 109
0.061 0.062 0.063 0.064 0.065 0.066 0.067
0.6
0.7
0.8
0.9
1.0
(d)
θ
P=0.06396
−0.5 0.0 0.5 1.0 1.5
−0.10
−0.05
0.00
0.05
0.10
Fig. 142. Superhumps in SDSS J140037 during the plateauphase (2015). (Upper): PDM analysis. The shown periodis one of possible aliases, which has been selected basedon the long, continuous data on the first night. (Lower):Phase-averaged profile.
Table 106. Superhump maxima of SDSS J172325 (2014)
E max∗ error O−C† N ‡
0 56916.9409 0.0005 −0.0018 661 56917.0029 0.0018 0.0009 196 56917.2979 0.0008 −0.0001 377 56917.3568 0.0004 −0.0004 618 56917.4193 0.0005 0.0029 899 56917.4757 0.0005 0.0001 51
22 56918.2486 0.0036 0.0034 3123 56918.3057 0.0014 0.0013 3439 56919.2531 0.0017 0.0014 4940 56919.3062 0.0007 −0.0047 5841 56919.3666 0.0005 −0.0035 2492 56922.3873 0.0013 −0.0020 6293 56922.4451 0.0022 −0.0035 60
109 56923.3976 0.0017 0.0018 40110 56923.4591 0.0037 0.0041 29∗BJD−2400000.†Against max = 2456916.9428+ 0.059202E.‡Number of points used to determine the maximum.
0.056 0.057 0.058 0.059 0.060 0.061 0.062
0.8
0.9
1.0
(d)
θ
P=0.05903
−0.5 0.0 0.5 1.0 1.5
−0.10
−0.05
0.00
0.05
0.10
Fig. 143. Superhumps in SDSS J172325 (2014). Thedata between BJD 2456916.5 and BJD 2456928 were used.(Upper): PDM analysis. (Lower): Phase-averaged profile.
−100 0 100 200 300 400 500 600 700
−0.01
0.00
0.01
910 920 930 940 950
14
15
16
17
Fig. 144. O−C diagram of superhumps in SDSS J172325(2014). (Upper): O − C diagram. A period of 0.05920 dwas used to draw this figure. (Lower): Light curve. Theobservations were binned to 0.011 d.
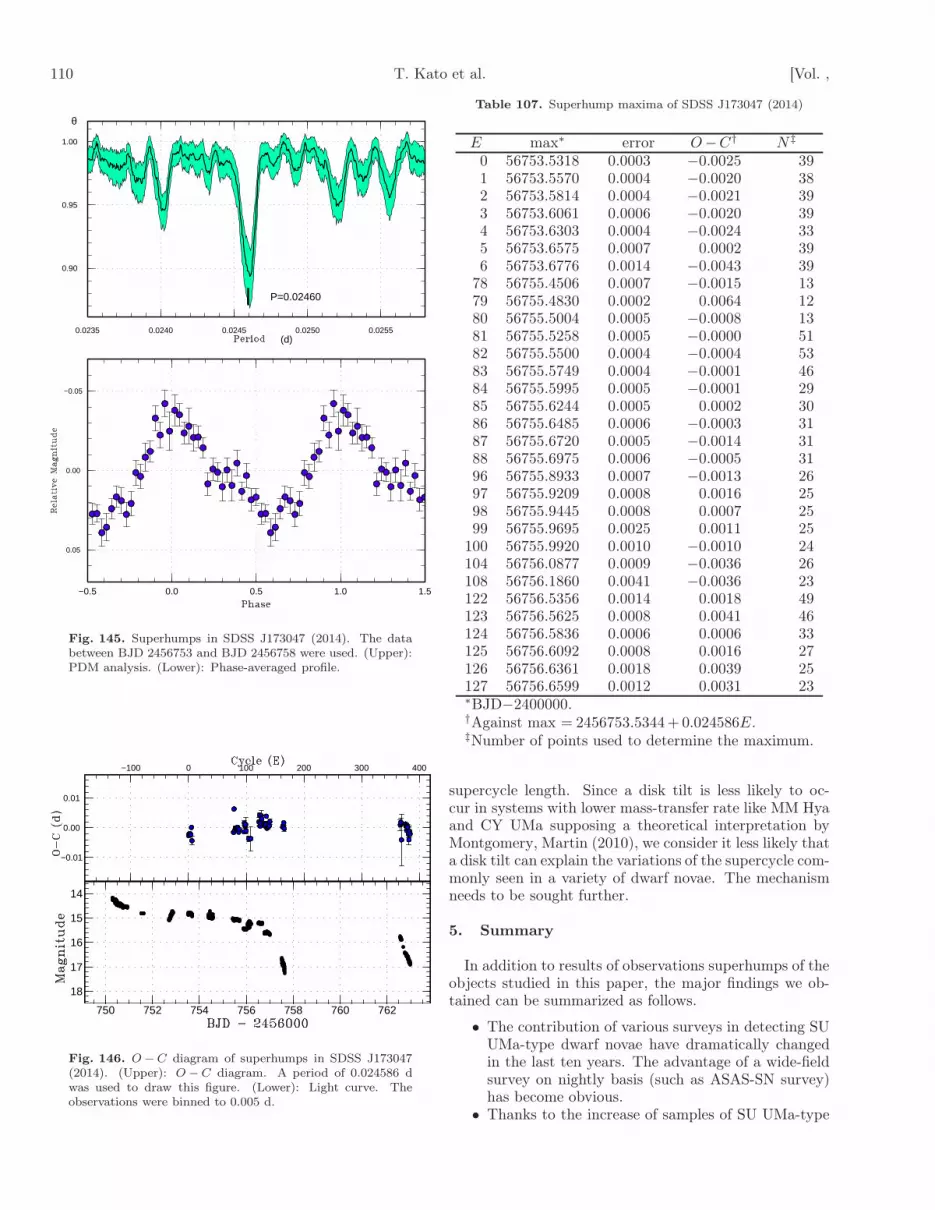
110 T. Kato et al. [Vol. ,
0.0235 0.0240 0.0245 0.0250 0.0255
0.90
0.95
1.00
(d)
θ
P=0.02460
−0.5 0.0 0.5 1.0 1.5
−0.05
0.00
0.05
Fig. 145. Superhumps in SDSS J173047 (2014). The databetween BJD 2456753 and BJD 2456758 were used. (Upper):PDM analysis. (Lower): Phase-averaged profile.
−100 0 100 200 300 400
−0.01
0.00
0.01
750 752 754 756 758 760 762
14
15
16
17
18
Fig. 146. O −C diagram of superhumps in SDSS J173047(2014). (Upper): O − C diagram. A period of 0.024586 dwas used to draw this figure. (Lower): Light curve. Theobservations were binned to 0.005 d.
Table 107. Superhump maxima of SDSS J173047 (2014)
E max∗ error O−C† N ‡
0 56753.5318 0.0003 −0.0025 391 56753.5570 0.0004 −0.0020 382 56753.5814 0.0004 −0.0021 393 56753.6061 0.0006 −0.0020 394 56753.6303 0.0004 −0.0024 335 56753.6575 0.0007 0.0002 396 56753.6776 0.0014 −0.0043 39
78 56755.4506 0.0007 −0.0015 1379 56755.4830 0.0002 0.0064 1280 56755.5004 0.0005 −0.0008 1381 56755.5258 0.0005 −0.0000 5182 56755.5500 0.0004 −0.0004 5383 56755.5749 0.0004 −0.0001 4684 56755.5995 0.0005 −0.0001 2985 56755.6244 0.0005 0.0002 3086 56755.6485 0.0006 −0.0003 3187 56755.6720 0.0005 −0.0014 3188 56755.6975 0.0006 −0.0005 3196 56755.8933 0.0007 −0.0013 2697 56755.9209 0.0008 0.0016 2598 56755.9445 0.0008 0.0007 2599 56755.9695 0.0025 0.0011 25
100 56755.9920 0.0010 −0.0010 24104 56756.0877 0.0009 −0.0036 26108 56756.1860 0.0041 −0.0036 23122 56756.5356 0.0014 0.0018 49123 56756.5625 0.0008 0.0041 46124 56756.5836 0.0006 0.0006 33125 56756.6092 0.0008 0.0016 27126 56756.6361 0.0018 0.0039 25127 56756.6599 0.0012 0.0031 23∗BJD−2400000.†Against max = 2456753.5344+ 0.024586E.‡Number of points used to determine the maximum.
supercycle length. Since a disk tilt is less likely to oc-cur in systems with lower mass-transfer rate like MM Hyaand CY UMa supposing a theoretical interpretation byMontgomery, Martin (2010), we consider it less likely thata disk tilt can explain the variations of the supercycle com-monly seen in a variety of dwarf novae. The mechanismneeds to be sought further.
5. Summary
In addition to results of observations superhumps of theobjects studied in this paper, the major findings we ob-tained can be summarized as follows.
• The contribution of various surveys in detecting SUUMa-type dwarf novae have dramatically changedin the last ten years. The advantage of a wide-fieldsurvey on nightly basis (such as ASAS-SN survey)has become obvious.
• Thanks to the increase of samples of SU UMa-type

No. ] Period Variations in SU UMa-Type Dwarf Novae VII 111
Table 107. Superhump maxima of SDSS J173047 (2014)(continued)
E max∗ error O−C† N ‡
132 56756.7805 0.0005 0.0008 26133 56756.8058 0.0006 0.0015 25134 56756.8300 0.0012 0.0011 23135 56756.8574 0.0007 0.0040 26136 56756.8780 0.0006 −0.0001 26137 56756.9027 0.0006 0.0000 25138 56756.9274 0.0007 0.0001 26139 56756.9525 0.0006 0.0006 25140 56756.9771 0.0006 0.0007 25141 56757.0031 0.0009 0.0021 6163 56757.5421 0.0010 0.0002 24164 56757.5671 0.0010 0.0007 27165 56757.5927 0.0011 0.0017 23166 56757.6152 0.0015 −0.0004 27367 56762.5584 0.0018 0.0010 18368 56762.5839 0.0013 0.0019 31369 56762.6026 0.0087 −0.0040 22376 56762.7800 0.0006 0.0014 25377 56762.8039 0.0012 0.0006 22378 56762.8270 0.0007 −0.0008 26379 56762.8533 0.0004 0.0008 26380 56762.8772 0.0009 0.0002 26381 56762.8996 0.0013 −0.0020 26382 56762.9222 0.0017 −0.0040 24383 56762.9496 0.0018 −0.0012 26384 56762.9734 0.0006 −0.0020 25∗BJD−2400000.†Against max = 2456753.5344+ 0.024586E.‡Number of points used to determine the maximum.
Table 108. Superhump maxima of TCP J160548 (2014)
E max∗ error O−C† N ‡
0 57019.3296 0.0009 0.0087 2979 57023.6644 0.0007 −0.0006 7080 57023.7192 0.0003 −0.0009 10181 57023.7720 0.0016 −0.0030 32
187 57029.6010 0.0010 −0.0029 54188 57029.6547 0.0008 −0.0042 56189 57029.7077 0.0029 −0.0062 45315 57036.6494 0.0015 0.0068 42316 57036.6998 0.0012 0.0023 41∗BJD−2400000.†Against max = 2457019.3209+ 0.054989E.‡Number of points used to determine the maximum.
0.0535 0.0540 0.0545 0.0550 0.0555 0.0560 0.0565 0.0570
0.7
0.8
0.9
1.0
(d)
θ
P=0.05501
−0.5 0.0 0.5 1.0 1.5
−0.05
0.00
0.05
0.10
Fig. 147. Superhumps in SDSS J173047 (2014). The dataafter BJD 2457019 were used. (Upper): PDM analysis.(Lower): Phase-averaged profile.
Table 109. New estimates for the binary mass ratio fromstage A superhumps
Object ε∗ (stage A) q from stage AZ Cha 0.0707(4) 0.22(1)
BR Lup 0.0488(12) 0.142(4)QZ Vir 0.059(5) 0.18(2)
ASASSN-14cv 0.0286(3) 0.077(1)ASASSN-14jf 0.026(2) 0.070(5)ASASSN-14jv 0.0278(9) 0.074(3)ASASSN-15bp 0.0293(6) 0.079(2)OT J030929 0.0291(3) 0.078(1)OT J213806 0.041(4) 0.12(2)OT J230523 0.0366(7) 0.102(2)
PNV J171442 0.0284(3) 0.076(1)PNV J172929 0.0273(5) 0.073(2)

112 T. Kato et al. [Vol. ,
1992 1995 1998 2001 2004 2007 2010 2013
othersASAS−SNMASTERCRTSGCVS
Year
Num
ber
020
4060
8010
0
Fig. 148. Object categories in our survey. Superoutburstswith measured superhump periods are included. The yearrepresents the year of outburst. The year 1992 representsoutbursts up to 1992 and the year 2014 includes the out-bursts in 2015, respectively. The category GCVS includesthe objects named in the General Catalog of Variable StarsKholopov et al. (1985) in the latest version and objects namedin New Catalog of Suspected Variable Stars (NSV). The cat-egories CRTS, MASTER, ASAS-SN represent objects whichwere discovered in respective surveys. A small fraction of ob-jects discovered by the CRTS are already named in GCVSand are included in the category GCVS.
Table 110. Superhump Periods during Stage A
Object Year period (d) errZ Cha 2014 0.08017 0.00031
BR Lup 2014 0.08357 0.00011QZ Vir 2014 0.06248 0.00034
ASASSN-14cl 2014 0.06082 0.00014ASASSN-14cv 2014 0.06168 0.00002ASASSN-14jf 2014 0.05687 0.00009ASASSN-14jv 2014 0.05597 0.00006ASASSN-14md 2014 0.06943 0.00035ASASSN-15bp 2015 0.05731 0.00003OT J030929 2014 0.05783 0.00008OT J060009 2014 0.06458 0.00005OT J064833 2014 0.10519 0.00040OT J213806 2014 0.05684 0.00026OT J230523 2014 0.05663 0.00004
PNV J171442 2014 0.06130 0.00002PNV J172929 2014 0.06141 0.00009SDSS J090221 2014 0.03409 0.00001
Psh (d)
Fre
quen
cy
0.02 0.04 0.06 0.08 0.10 0.12
010
2030
40
Porb (d)
Fre
quen
cy
0.02 0.04 0.06 0.08 0.10 0.12
010
2030
40
Fig. 149. Distribution of superhump periods in this survey.The data are from Kato et al. (2009), Kato et al. (2010),Kato et al. (2012a), Kato et al. (2013a), Kato et al. (2014b),Kato et al. (2014a) and this paper. The mean values are usedwhen multiple superoutbursts were observed. (Upper) distri-bution of superhump periods. (Lower) distribution of orbitalperiods. For objects with superhump periods shorter than0.053 d, the orbital periods were assumed to be 1% shorterthan superhump periods. For objects with superhump peri-ods longer than 0.053 d, we used the new calibration in Katoet al. (2012a) to estimate orbital periods.
dwarf novae, we could clarify the distribution of or-bital periods in SU UMa-type dwarf novae, whichapproximate the CV population with short orbitalperiods. There is a sharp cut-off at a period of0.053 d, which is considered to be the period min-imum. There is a high concentration of objectsjust above the period minimum, which can be in-terpreted as the “period spike”. The distributionmonotonically decreases towards the longer period,and there is little indication of the period gap.
• We observed a precursor outburst in Z Cha andfound that superhumps developed just following theprecursor outburst. O−C analyses in CY UMa andYZ Cnc also support this finding. The agreementof the time of growing superhumps with the risingbranch following the precursor outburst has beenconfirmed in all SU UMa-type systems so far stud-ied. This finding provides a strong support to thethermal-tidal disk instability model which predictsthat a superoutburst develops as a result of the de-

No. ] Period Variations in SU UMa-Type Dwarf Novae VII 113
velopment of superhumps.• We detected possible negative superhumps in Z Cha.
During the phase of negative superhumps, the out-burst cycle apparently lengthened. This findingseems to support a suggestion that a disk tilt sup-presses normal outbursts.
• We studied secular variations of the quiescentbrightness and the amplitude of orbital humpsthroughout one supercycle in Z Cha. The quiescentbrightness decreased as the system approached thenext superoutburst. There was no enhanced orbitalhumps just before the superoutburst.
• We studied long-term trends in supercycles in MMHya and CY UMa and found systematic variationsof supercycles of ∼20%. This degree and character-istics os variations are similar to those recorded inother SS Cyg-type dwarf novae and the SU UMa-type system ER UMa. A disk tilt is unlikely a com-mon source of this variation.
• The WZ Sge-type object ASASSN-15bp showed aphase jump of superhumps during the plateau phase.
• A sizable number of AM CVn-type objects (PTF1J071912, SDSS J090221, SDSS J173047) were stud-ied in this paper and four more AM CVn-type ob-jects (ASASSN-14cn, ASASSN-14ei, ASASSN-14fvand ASASSN-14mv) were found in this period. Thisnumber suggests that about 8% of objects showingdwarf nova-type outbursts are AM CVn-type ob-jects.
• We have added another EI Psc-type object V418 Serin this paper. These object may be more abundantthan have been considered.
• CSS J174033, an EI Psc-type object, showed a sim-ilar type of superoutbursts in 2012 and 2014, com-prising of a dip and the second plateau phase. Thisfinding suggests that the same type of superout-bursts tend to be reproduced in EI Psc-type objectsas in hydrogen-rich systems.
• OT J213806, a WZ Sge-type object, exhibited a re-markably different peak brightness and O−C dia-grams between the 2010 and 2014 superoutbursts.The fainter superoutburst in 2014 was shorter andthe difference was most striking in the later part ofthe plateau phase.
• MASTER J085854 showed two post-superoutburstrebrightenings. This object had a rather excep-tionally short superhump period among the objectsshowing multiple rebrightenings.
• Four deeply eclipsing SU UMa-type dwarf no-vae were identified (ASASSN-13cx, ASASSN-14ag,ASASSN-15bu, NSV 4618). ASASSN-14id alsoshowed shallow eclipses.
Acknowledgements
This work was supported by the Grant-in-Aid“Initiative for High-Dimensional Data-Driven Sciencethrough Deepening of Sparse Modeling” (25120007) fromthe Ministry of Education, Culture, Sports, Science and
Technology (MEXT) of Japan. The authors are grate-ful to observers of VSNET Collaboration and VSOLJ ob-servers who supplied vital data. We acknowledge withthanks the variable star observations from the AAVSOInternational Database contributed by observers world-wide and used in this research. We are also grateful tothe VSOLJ database. This work is deeply indebted tooutburst detections and announcement by a number ofvariable star observers worldwide, including participantsof CVNET and BAA VSS alert. The CCD operationof the Bronberg Observatory is partly sponsored by theCenter for Backyard Astrophysics. We are grateful tothe Catalina Real-time Transient Survey team for makingtheir real-time detection of transient objects available tothe public. R. Modic acknowledge the Bradford RoboticTelescope for the detection of the 2014 outburst of QZ Vir.The work by A. Sklyanov is partially performed accord-ing to the Russian Government Program of CompetitiveGrowth of Kazan Federal University.
References
Andronov, I. L., & Shakun, L. I. 1990, Ap&SS, 169, 237Armstrong, E., Patterson, J., & Kemp, J. 2012, MNRAS, 421,
2310Augusteijn, T. 1995, in Cataclysmic Variables, ed. A.
Bianchini, M. della Valle, & M. Orio (Dordrecht: KluwerAcademic Publishers), p. 129
Baade, W. 1928, Astron. Nachr., 232, 65Baba, H., et al. 2002, PASJ, 54, L7Bailey, J. 1979, MNRAS, 187, 645Bailey, J., & Ward, M. 1981, MNRAS, 194, 17Balanutsa, P., et al. 2014, Astron. Telegram, 5787Balanutsa, P., et al. 2015a, Astron. Telegram, 6946Balanutsa, P., et al. 2015b, Astron. Telegram, 6967Balanutsa, P., et al. 2012, Astron. Telegram, 3935Barwig, H., & Schoembs, R. 1981, IBVS, 1989Beljawsky, S. 1927, Astron. Nachr., 230, 349Berardi, P. 2014, Astron. Telegram, 6684Boyd, D., Kracji, T., Shears, J., & Poyner, G. 2007, J. Br.
Astron. Assoc., 117, 198Breedt, E., et al. 2014, MNRAS, 443, 3174Brown, A., et al. 2015, AJ, 149, 67Brown, S. J., Mills, O. F., Osborn, W., & Hoette, V. 2010, J.
American Assoc. Variable Star Obs., 38, 176Bruch, A., Fischer, F.-J., & Wilmsen, U. 1987, A&AS, 70, 481Buat-Ménard, V., & Hameury, J.-M. 2002, A&A, 386, 891Carter, P. J., et al. 2013a, MNRAS, 429, 2143Carter, P. J., et al. 2013b, MNRAS, 431, 372Carter, P. J., Steeghs, D., Marsh, T. R., Kupfer, T.,
Copperwheat, C. M., Groot, P. J., & Nelemans, G. 2014,MNRAS, 437, 2894
Ceraski, W. 1908, Astron. Nachr., 177, 173Chochol, D., Katysheva, N. A., Shugarov, S. Y., Zemko, P. O.,
& Andreev, M. V. 2012, Contr. of the Astron. Obs. SkalnatéPleso, 42, 39
Cleveland, W. S. 1979, J. Amer. Statist. Assoc., 74, 829Cook, M. C., & Warner, B. 1981, MNRAS, 196, 55PCopperwheat, C. M., et al. 2011, MNRAS, 410, 1113Cowley, A. P., Crampton, D., Hutchings, J. B., Helfand, D. J.,
Hamilton, T. T., Thorstensen, J. R., & Charles, P. A. 1984,ApJ, 286, 196

114 T. Kato et al. [Vol. ,
Croom, S. M., Smith, R. J., Boyle, B. J., Shanks, T., Miller,L., Outram, P. J., & Loaring, N. S. 2004, MNRAS, 349,1397
Dai, Z., Qian, S., & Fernández Lajús, E. 2009, ApJ, 703, 109Davis, A. B., Shappee, B. J., Archer Shappee, B., & ASAS-
SN 2015, American Astron. Soc. Meeting Abstracts, 225,#344.02
Davis, A. B., et al. 2014, Astron. Telegram, 6455Denisenko, D. 2011, Perem. Zvezdy, 31, 3Denisenko, D. V. 2009, Astron. Telegram, 2282Denisenko, D. V., & Sokolovsky, K. V. 2011, Astron. Lett., 37,
91D’Esterre, C. R. 1912, Astron. Nachr., 190, 163D’Esterre, C. R. 1913, Astron. Nachr., 193, 281Djorgovski, S. G. ., et al. 2008, Astron. Telegram, 1416Downes, R. A., & Shara, M. M. 1993, PASP, 105, 127Drake, A. J., et al. 2009, ApJ, 696, 870Drake, A. J., et al. 2014, MNRAS, 441, 1186Echevarria, J., Pocock, A. S., Penston, M. V., & Blades, J. C.
1983, MNRAS, 205, 559Elvey, C. T., & Babcock, H. W. 1943, ApJ, 97, 412Erastova, L. K. 1973, Astron. Tsirk., 774, 5Fernie, J. D. 1989, PASP, 101, 225Gänsicke, B. T., et al. 2009, MNRAS, 397, 2170Garnavich, P., Littlefield, C., Terndrup, D., & Adams, S. 2014,
Astron. Telegram, 6287Glasby, J. S. 1970, The Dwarf Novae (London: Constable)Golovin, A., et al. 2007, IBVS, 5763Graham, M. L., Broekhoven-Fiene, H., Parker, A. H., Sadavoy,
S., Maxwell, A. J., Hsiao, E. Y., & Balam 2010, Cent. Bur.Electron. Telegrams, 2275, 6
Green, R. F., Ferguson, D. H., Liebert, J., & Schmidt, M. 1982,PASP, 94, 560
Greenhill, J. G., Hill, K. M., Dieters, S., Fienberg, K., Howlett,M., Meijers, A., Munro, A., & Senkbeil, C. 2006, MNRAS,372, 1129
Guthnick, P., & Prager, R. 1933, Astron. Nachr., 249, 253Han, Z.-T., Qian, S.-B., Fernández Lajús, E., Liao, W.-P., &
Zhang, J. 2015, New Astron., 34, 1Hartwig, E. 1915, Astron. Nachr., 201, 287Hartwig, E. 1917, Astron. Nachr., 204, 11Hartwig, E. 1920, Astron. Nachr., 212, 79Harvey, D., Skillman, D. R., Patterson, J., & Ringwald, F. A.
1995, PASP, 107, 551Harvey, D. A., & Patterson, J. 1995, PASP, 107, 1055Hirose, M., & Osaki, Y. 1990, PASJ, 42, 135Hodgkin, S. T., et al. 2014, Astron. Telegram, 6407Hoffmeister, C. 1963, Veröff. Sternw. Sonneberg, 6, 1Hornby, P. W. 1975, J. Br. Astron. Assoc., 85, 528Horne, K. 1984, Nature, 312, 348Howarth, I. D. 1978, J. Br. Astron. Assoc., 89, 47Howell, S. B., De Young, J., Mattei, J. A., Foster, G., Szkody,
P., Cannizzo, J. K., Walker, G., & Fierce, E. 1996, AJ, 111,2367
Hudec, R. 2010, Astron. Telegram, 2619Imada, A., Kubota, K., Kato, T., Nogami, D., Maehara, H.,
Nakajima, K., Uemura, M., & Ishioka, R. 2006, PASJ, 58,L23
Imada, A., & Monard, L. A. G. B. 2006, PASJ, 58, L19Ishioka, R., et al. 2002, A&A, 381, L41Isles, J. E. 1974, J. Br. Astron. Assoc., 84, 365Kato, T. 1990, IBVS, 3522Kato, T. 1995, IBVS, 4236Kato, T. 1997a, PASJ, 49, 583
Kato, T. 1997b, VSOLJ Variable Star Bull., 25, 2Kato, T. 2002, PASJ, 54, L11Kato, T. 2015, PASJ, submittedKato, T., et al. 2014a, PASJ, 66, 90Kato, T., Fujino, S., Iida, M., Makiguchi, N., & Koshiro, S.
1988, VSOLJ Variable Star Bull., 5, 18Kato, T., et al. 2013a, PASJ, 65, 23Kato, T., et al. 2014b, PASJ, 66, 30Kato, T., Hambsch, F.-J., Oksanen, A., Starr, P., & Henden,
A. 2015, PASJ, 67, 3Kato, T., et al. 2009, PASJ, 61, S395Kato, T., & Maehara, H. 2013, PASJ, 65, 76Kato, T., et al. 2012a, PASJ, 64, 21Kato, T., Maehara, H., & Uemura, M. 2012b, PASJ, 64, 62Kato, T., et al. 2010, PASJ, 62, 1525Kato, T., & Matsumoto, K. 1999, IBVS, 4763Kato, T., Monard, B., Hambsch, F.-J., Kiyota, S., & Maehara,
H. 2013b, PASJ, 65, L11Kato, T., et al. 2004a, MNRAS, 347, 861Kato, T., Nogami, D., Baba, H., Matsumoto, K., Arimoto, J.,
Tanabe, K., & Ishikawa, K. 1996, PASJ, 48, L21Kato, T., et al. 2014c, PASJ, 66, L7Kato, T., & Osaki, Y. 2013a, PASJ, 65, 97Kato, T., & Osaki, Y. 2013b, PASJ, 65, 115Kato, T., & Osaki, Y. 2013c, PASJ, 65, L13Kato, T., & Osaki, Y. 2014, PASJ, 66, L5Kato, T., et al. 2001, IBVS, 5120, 1Kato, T., Stubbings, R., Monard, B., Butterworth, N. D., Bolt,
G., & Richards, T. 2004b, PASJ, 56, S89Kato, T., & Uemura, M. 2012, PASJ, 64, 122Kato, T., Uemura, M., Ishioka, R., Nogami, D., Kunjaya, C.,
Baba, H., & Yamaoka, H. 2004c, PASJ, 56, S1Kazarovets, E. V., Samus, N. N., Durlevich, O. V., Kireeva,
N. N., & Pastukhova, E. N. 2006, IBVS, 5721Kazarovets, E. V., Samus, N. N., Durlevich, O. V., Kireeva,
N. N., & Pastukhova, E. N. 2008, IBVS, 5863, 1Kazarovets, E. V., Samus, N. N., Durlevich, O. V., Kireeva,
N. N., & Pastukhova, E. N. 2011, IBVS, 6008, 1Kholopov, P. N., et al. 1985, General Catalogue of Variable
Stars, fourth edition (Moscow: Nauka Publishing House)Khruslov, A. V. 2005, Perem. Zvezdy, Prilozh., 5, 4Knigge, C. 2006, MNRAS, 373, 484Knigge, C., Baraffe, I., & Patterson, J. 2011, ApJS, 194, 28Krzeminski, W., & Vogt, N. 1985, A&A, 144, 124Kubiak, M., & Krzeminski, W. 1989, PASP, 101, 667Kubiak, M., & Krzeminski, W. 1992, Acta Astron., 42, 177Levitan, D., et al. 2011, ApJ, 739, 68Littlefield, C., et al. 2013, AJ, 145, 145Lubow, S. H. 1991, ApJ, 381, 259Luyten, W. J. 1938, Publ. of the Astron. Obs. Univ. of
Minnesota, 6, 1Mayall, M. W. 1966, JRASC, 60, 301Mennickent, R. E., & Sterken, C. 1998, PASP, 110, 1032Misselt, K. A., & Shafter, A. W. 1995, AJ, 109, 1757Mitrofanova, A. A., Borisov, N. V., & Shimansky, V. V. 2014,
Astrophys. Bull., 69, 82Monard, L. A. G., & Africa, S. 2005, IAU Circ., 8540, 3Montgomery, M. M. 2012, ApJ, 745, L25Montgomery, M. M., & Martin, E. L. 2010, ApJ, 722, 989Mroz, P., et al. 2013, Acta Astron., 63, 135Munari, U., & Zwitter, T. 1998, A&AS, 128, 277Nakano, S. 2010, Cent. Bur. Electron. Telegrams, 2275, 2Nakata, C., et al. 2014, PASJ, 66, 116Nakata, C., et al. 2013, PASJ, 65, 117

No. ] Period Variations in SU UMa-Type Dwarf Novae VII 115
Nelemans, G. 2005, in ASP Conf. Ser. 330, The Astrophysicsof Cataclysmic Variables and Related Objects, ed. J.-M.Hameury, & J.-P. Lasota (San Francisco: ASP), p. 27
Nesci, R., Caravano, A., Falasca, V., & Villani, L. 2013, IBVS,6059
Nijland, A. A. 1914, Astron. Nachr., 199, 131Nijland, A. A. 1915, Astron. Nachr., 201, 347Nijland, A. A. 1918, Astron. Nachr., 206, 223Nijland, A. A. 1924, Astron. Nachr., 221, 243Nogami, D., Kato, T., Baba, H., Matsumoto, K., Arimoto, J.,
Tanabe, K., & Ishikawa, K. 1997, ApJ, 490, 840Nogami, D., Kato, T., Masuda, S., Hirata, R., Matsumoto, K.,
Tanabe, K., & Yokoo, T. 1995, PASJ, 47, 897Nogami, D., Monard, B., Retter, A., Liu, A., Uemura, M.,
Ishioka, R., Imada, A., & Kato, T. 2004, PASJ, 56, L39Nogami, D., et al. 2004, PASJ, 56, S99O’Donoghue, D. 1987, Ap&SS, 136, 247Ohshima, T., et al. 2014, PASJ, 66, 67Ohshima, T., et al. 2011, PASJ, submittedOlech, A. 1997, Acta Astron., 47, 281Olech, A., Cook, L. M., Złoczewski, K., Mularczyk, K.,
Kêdzierski, P., Udalski, A., & Wisniewski, M. 2004, ActaAstron., 54, 233
Olech, A., Kedzierski, P., Złoczewski, K., Mularczyk, K., &Wiśniewski, M. 2003, A&A, 411, 483
Osaki, Y. 1989, PASJ, 41, 1005Osaki, Y. 1996, PASP, 108, 39Osaki, Y., & Kato, T. 2013a, PASJ, 65, 50Osaki, Y., & Kato, T. 2013b, PASJ, 65, 95Osaki, Y., & Kato, T. 2014, PASJ, 66, 15Osaki, Y., & Meyer, F. 2002, A&A, 383, 574Osborne, J. P., et al. 2011, A&A, 533, A41Pagnotta, A., & Schaefer, B. E. 2014, ApJ, 788, 164Patterson, J., Augusteijn, T., Harvey, D. A., Skillman, D. R.,
Abbott, T. M. C., & Thorstensen, J. 1996, PASP, 108, 748Patterson, J., Bond, H. E., Grauer, A. D., Shafter, A. W., &
Mattei, J. A. 1993, PASP, 105, 69Patterson, J., et al. 1997, PASP, 109, 1100Patterson, J., et al. 2002, PASP, 114, 721Patterson, J., et al. 2003, PASP, 115, 1308Patterson, J., Walker, S., Kemp, J., O’Donoghue, D., Bos, M.,
& Stubbings, R. 2000, PASP, 112, 625Pavlenko, E. P., et al. 2014, PASJ, 66, 111Pearson, K. J. 2007, MNRAS, 379, 183Perez, A., & McNaught, R. H. 1986, IAU Circ., 4222, 2Petit, M. 1960, Journal des Observateurs, 43, 33Petit, M., & Brun, A. 1956, Journal des Observateurs, 39, 37Pojmański, G. 2002, Acta Astron., 52, 397Pojmanski, G. 2005, IAU Circ., 8539, 3Prager, R., & Shapley, H. 1941, Annals of the Astron. Obs. of
Harvard Coll. 111, 1Price, A., et al. 2003, IBVS, 5488Prieto, J. L., et al. 2013, Astron. Telegram, 4999Prieto, J. L., et al. 2014a, Astron. Telegram, 6475, 1Prieto, J. L., et al. 2014b, Astron. Telegram, 6293Quimby, R., & Mondol, P. 2006, Astron. Telegram, 787Rau, A., Roelofs, G. H. A., Groot, P. J., Marsh, T. R.,
Nelemans, G., Steeghs, D., Salvato, M., & Kasliwal, M. M.2010, ApJ, 708, 456
Ritter, H. 1980, A&A, 85, 362Ritter, H., & Kolb, U. 2003, A&A, 404, 301Robertson, J. W., Honeycutt, R. K., & Turner, G. W. 1995,
PASP, 107, 443Ross, F. E. 1925, AJ, 36, 99
Ross, F. E. 1928, AJ, 38, 144Rykoff, E. S., et al. 2004, IBVS, 5559Schmidtke, P. C., Cowley, A. P., Hutchings, J. B., &
Crampton, D. 2002, AJ, 123, 3210Schoembs, R., & Hartmann, K. 1983, A&A, 128, 37Shafter, A. W., & Hessman, F. V. 1988, AJ, 95, 178Shafter, A. W., & Szkody, P. 1984, ApJ, 276, 305Shappee, B. J., et al. 2014a, ApJ, 788, 48Shappee, B. J., et al. 2014b, Astron. Telegram, 6676Shears, J., & Boyd, D. 2007, J. Br. Astron. Assoc., 117, 25Shears, J., Brady, S., Koff, R., Goff, W., & Boyd, D. 2012, J.
Br. Astron. Assoc., 122, 49Shears, J., et al. 2011a, J. Br. Astron. Assoc., 121, 355Shears, J. H., Gaensicke, B. T., Brady, S., Dubovsky, P.,
Miller, I., & Staels, B. 2011b, New Astron., 16, 311Sherrington, M. R., Jameson, R. F., Bailey, J., & Giles, A. B.
1982, MNRAS, 200, 861Shumkov, V., et al. 2014, Astron. Telegram, 6851Simonian, G., et al. 2015, Astron. Telegram, 6981Simonian, G., et al. 2014, Astron. Telegram, 6608Skillman, D. R., et al. 2002, PASP, 114, 630Smak, J. 1985, Acta Astron., 35, 357Smak, J. 2004, Acta Astron., 54, 221Smak, J. 2008, Acta Astron., 58, 55Smak, J. I. 1991, Acta Astron., 41, 269Smart, R. L. 2013, VizieR Online Data Catalog, 1324Smith, D. A., et al. 2002, IBVS, 5226Soejima, Y., Imada, A., Nogami, D., Kato, T., & Monard,
L. A. G. 2009, PASJ, 61, 395Solheim, J.-E. 2010, PASP, 122, 1133Stanek, K. Z., et al. 2014a, Astron. Telegram, 6233Stanek, K. Z., et al. 2014b, Astron. Telegram, 6479Stellingwerf, R. F. 1978, ApJ, 224, 953Still, M. D., Marsh, T. R., Dhillon, V. S., & Horne, K. 1994,
MNRAS, 267, 957Swope, H. H., & Caldwell, I. W. 1930, Harvard Coll. Obs.
Bull., 879Szkody, P., et al. 2002, AJ, 123, 430Szkody, P., et al. 2006, AJ, 131, 973Szkody, P., et al. 2007, AJ, 134, 185Szkody, P., & Mattei, J. A. 1984, PASP, 96, 988Templeton, M. R. 2011, AAVSO Alert Notice, 434Teyssier, F. 2014, Astron. Telegram, 6235Thorstensen, J. R., Fenton, W. H., Patterson, J. O., Kemp, J.,
Krajci, T., & Baraffe, I. 2002, ApJ, 567, L49Thorstensen, J. R., Patterson, J. O., Shambrook, A., &
Thomas, G. 1996, PASP, 108, 73Thorstensen, J. R., & Skinner, J. N. 2012, AJ, 144, 81Thorstensen, J. R., & Taylor, C. J. 1997, PASP, 109, 1359Thorstensen, J. R., Wade, R. A., & Oke, J. B. 1986, ApJ, 309,
721Tibshirani, R. 1996, J. R. Statistical Soc. Ser. B, 58, 267Tovmassian, G., Clark, D., & Zharikov, S. 2010, Cent. Bur.
Electron. Telegrams, 2283, 1Udalski, A. 1988, IBVS, 3239Udalski, A. 1989, IAU Circ., 4885Udalski, A. 1990, AJ, 100, 226Udalski, A., & Pych, W. 1992, Acta Astron., 42, 285Uemura, M., et al. 2008, PASJ, 60, 227Uemura, M., et al. 2002, PASJ, 54, L15Uemura, M., Kato, T., Nogami, D., & Ohsugi, T. 2010, PASJ,
62, 613Uemura, M., Kato, T., Pavlenko, E., Baklanov, A., & Pietz,
J. 2001, PASJ, 53, 539

116 T. Kato et al. [Vol. ,
Uemura, M., et al. 2005, A&A, 432, 261van Amerongen, S., Bovenschen, H., & van Paradijs, J. 1987,
MNRAS, 229, 245van Amerongen, S., Kuulkers, E., & van Paradijs, J. 1990,
MNRAS, 242, 522Vladimirov, V., et al. 2014, Astron. Telegram, 5950Vogt, N. 1979, IAU Circ., 3375Vogt, N. 1980, A&A, 88, 66Vogt, N. 1982, ApJ, 252, 653Vogt, N. 1983, A&A, 128, 29Vogt, N. 1983, A&A, 118, 95Vogt, N., & Bateson, F. M. 1982, A&AS, 48, 383Vogt, N., Schoembs, R., Krzeminski, W., & Pedersen, H. 1981,
A&A, 94, L29Wagner, R. M., et al. 2014, Astron. Telegram, 6669Walker, A. D., & Olmsted, M. 1958, PASP, 70, 495Warner, B. 1974, MNRAS, 168, 235Warner, B. 1976, in IAU Colloq. 29, Multiple Periodic Variable
Stars, ed. W. S. Fitch (Dordrecht: D. Reidel PublishingCompany), p. 247
Warner, B. 1995, Cataclysmic Variable Stars (Cambridge:Cambridge University Press)
Watanabe, M., Hirosawa, K., Kato, T., & Narumi, H. 1989,VSOLJ Variable Star Bull., 10, 40
Whitehurst, R. 1988, MNRAS, 232, 35Williams, S. C., Darnley, M. J., Bode, M. F., & Copperwheat,
C. M. 2015, Astron. Telegram, 6992Wils, P., Gänsicke, B. T., Drake, A. J., & Southworth, J. 2010,
MNRAS, 402, 436Wolf, M. 1912, Astron. Nachr., 192, 7Wood, M. A., & Burke, C. J. 2007, ApJ, 661, 1042Wood, M. A., Casey, M. J., Garnavich, P. M., & Haag, B.
2002, MNRAS, 334, 87Woudt, P. A., & Warner, B. 2011, Astron. Telegram, 3705Woudt, P. A., Warner, B., & Motsoaledi, M. 2013, Astron.
Telegram, 4726Yamaoka, H. 2010, Cent. Bur. Electron. Telegrams, 2273Yecheistov, V., et al. 2014, Astron. Telegram, 5905Zemko, P., Kato, T., & Shugarov, S. 2013, PASJ, 65, 54Zemko, P. O., & Kato, T. 2013, Astrophysics, 56, 203