supporting report-b
TRANSCRIPT

G-i
SUPPORTING REPORT-B
Chapter 1 Socio-economic Condition ...............................................G1-1 1.1 National and Regional Economy .............................................................. G1-1
1.1.1 Social Condition and National Economy .........................................G1-1 1.1.2 Social Condition and Regional Economy.........................................G1-2
1.2 Methodology of Social Survey .................................................................. G1-3 1.2.1 Rapid Rural Appraisal (RRA)...........................................................G1-3 1.2.2 Household Survey.............................................................................G1-4
1.3 Results of Rapid Rural Appraisal ............................................................ G1-6 1.3.1 Population and Projection of Population..........................................G1-6 1.3.2 Household Size .................................................................................G1-7 1.3.3 Ethnic Groups ...................................................................................G1-8 1.3.4 Migration and Settlement .................................................................G1-8 1.3.5 Water Resource...............................................................................G1-10 1.3.6 Water Quality and Quantity............................................................G1-13 1.3.7 Poverty............................................................................................G1-13 1.3.8 Gender ............................................................................................G1-15 1.3.9 Mass Organization ..........................................................................G1-16 1.3.10 Rural Infrastructure.........................................................................G1-18
1.4 Results of Household Survey .................................................................. G1-20 1.4.1 Interviewee .....................................................................................G1-20 1.4.2 Household Size ...............................................................................G1-20 1.4.3 Household Structure .......................................................................G1-20 1.4.4 Ethnic Group...................................................................................G1-22 1.4.5 Migration ........................................................................................G1-22 1.4.6 Occupation......................................................................................G1-22 1.4.7 Responsibility in Family.................................................................G1-26 1.4.8 Education........................................................................................G1-26 1.4.9 Water Related Issues.......................................................................G1-29 1.4.10 Living Condition.............................................................................G1-34 1.4.11 Agriculture......................................................................................G1-37

G-ii
Chapter 2 Design of Water Supply System ......................................G2-1 2.1 Framework of Water Supply Master Plan.............................................. G2-1
2.1.1 Purposes............................................................................................G2-1 2.1.2 Strategy .............................................................................................G2-1 2.1.3 Level of Service................................................................................G2-2
2.2 Water Demand Projections and Choice of Technology .......................... G2-2 2.2.1 Projection of Populations..................................................................G2-2 2.2.2 Projection of Water Demands...........................................................G2-3 2.2.3 Choice of Technology.......................................................................G2-4
2.3 Groundwater Development Plan.............................................................. G2-9 2.3.1 Present Groundwater Resources.......................................................G2-9 2.3.2 Necessary Groundwater Development ...........................................G2-10 2.3.3 Drilling Method ..............................................................................G2-11 2.3.4 Water Quality and Necessary Treatment ........................................G2-13
2.4 Design for Piped Schemes ....................................................................... G2-15 2.4.1 Design Principles ............................................................................G2-15 2.4.2 Design Criteria................................................................................G2-15 2.4.3 Alternatives for the 21 Piped Schemes...........................................G2-17 2.4.4 Water Supply Drawings ..................................................................G2-19 2.4.5 Hydraulic Calculations ...................................................................G2-22
2.5 Standard Designs of Water Supply Facilities ........................................ G2-24 2.5.1 Well Head .......................................................................................G2-25 2.5.2 Iron and Manganese Removal ........................................................G2-25 2.5.3 Surface Water Treatment ................................................................G2-26 2.5.4 Chlorination ....................................................................................G2-27 2.5.5 Sand Washing Basins (Alternative 3 and K4.1) .............................G2-28 2.5.6 Reservoirs .......................................................................................G2-28 2.5.7 Pumping Stations ............................................................................G2-28 2.5.8 Pipelines..........................................................................................G2-30 2.5.9 Valve Chambers ..............................................................................G2-31 2.5.10 Public Taps......................................................................................G2-32 2.5.11 Water Meters...................................................................................G2-32

G-iii
Chapter 3 Pilot Models Construction...............................................G3-1 3.1 Purposes of Pilot Models........................................................................... G3-1 3.2 Background Information .......................................................................... G3-2
3.2.1 Dak Ui Commune (K3-1) .................................................................G3-2 3.2.2 Nhon Hoa Commune (G2) ...............................................................G3-3
3.3 Overall Progress of Pilot Model ............................................................... G3-4 3.3.1 General..............................................................................................G3-4 3.3.2 Construction Works ..........................................................................G3-5 3.3.3 Water Tariff and Financial Sustainability .........................................G3-8 3.3.4 Water Supply Management Unit ......................................................G3-9 3.3.5 On-going IEC Activities .................................................................G3-10
3.4 Percentage of House Connections ...........................................................G3-11 3.5 Local Construction Skills and Materials................................................G3-11 3.6 Necessary Monitoring Items................................................................... G3-12 3.7 Results of the Monitoring of O&M ........................................................ G3-13
3.7.1 Purpose and Methodology ..............................................................G3-13 3.7.2 Progress and Status .........................................................................G3-13
3.8 Lessons Learned ...................................................................................... G3-16 3.8.1 Institutional Aspects .......................................................................G3-16 3.8.2 Financial Aspects............................................................................G3-17 3.8.3 Technical Aspects ...........................................................................G3-17
Chapter 4 Cost Estimation and Implementation Plan....................G4-1 4.1 Project Cost ................................................................................................ G4-1
4.1.1 Conditions and Assumptions for Cost Estimate ...............................G4-1 4.1.2 Construction Cost .............................................................................G4-3 4.1.3 Cost for Soft Components ................................................................G4-6 4.1.4 Procurement for Equipment..............................................................G4-6 4.1.5 Total Project Cost excluding the Soft Components..........................G4-7
4.2 Implementation Plan ................................................................................. G4-8 4.2.1 Introduction ......................................................................................G4-8 4.2.2 Development Schemes .....................................................................G4-8 4.2.3 Implementation Schedule ...............................................................G4-10
4.3 Mode of Implementation......................................................................... G4-10 4.3.1 Soft Components ............................................................................G4-10

G-iv
4.3.2 Construction....................................................................................G4-11 4.3.3 Implementation Schedule ...............................................................G4-13 4.3.4 Funding / Finance ...........................................................................G4-14 4.3.5 Organization for Implementation ...................................................G4-14
Chapter 5 Operation and Management ...........................................G5-1 5.1 Organization of Operation and Maintenance ......................................... G5-1
5.1.1 Principles ..........................................................................................G5-1 5.1.2 Organization of O&M.......................................................................G5-1 5.1.3 Guideline for Operation and Maintenance .....................................G5-10
5.2 Strengthening of Implementing Organizations..................................... G5-12 5.2.1 Principles ........................................................................................G5-12 5.2.2 National and Provincial Level ........................................................G5-13 5.2.3 District and Commune/Town Level Organizations ........................G5-14 5.2.4 Coordination with Relevant Donors ...............................................G5-16
5.3 Economic Evaluation of the Priority Systems....................................... G5-19 5.3.1 General Principles...........................................................................G5-19
5.4 Estimation of Operation and Maintenance, and Re-Investment Costs .......................................................................................................... G5-20 5.4.1 Ability of Payment for Estimated Tariff .........................................G5-22 5.4.2 Financial Cash Flow Analysis ........................................................G5-26
5.5 Economic Evaluation............................................................................... G5-28 5.5.1 Identification of Economic Benefits and Demerits ........................G5-28 5.5.2 Economic Cash Flow Analysis .......................................................G5-29 5.5.3 Socio-economic Considerations .....................................................G5-32
5.6 Conclusion ................................................................................................ G5-34
Chapter 6 Approach to Information, Education and Communication (IEC) .....................................................G6-1
6.1 IEC and Hygiene Promotion..................................................................... G6-1 6.2 Parties Responsible for IEC...................................................................... G6-1
6.2.1 Necessary Information for IEC.........................................................G6-2 6.3 IEC Campaigns.......................................................................................... G6-5
6.3.1 Formal Meeting ................................................................................G6-5

G-v
6.3.2 Face-to-face Communication ...........................................................G6-6 6.3.3 Local media ......................................................................................G6-6
6.4 Staffing for IEC.......................................................................................... G6-6
Appendices Appendix 1 Standard Well Design (type-1 and type-2) Appendix 2 Spread Sheet on Plan and Design for Rural Water Supply Appendix 3 Standard Designs of Water Supply Facilities Appendix 4 Technical Specifications Appendix 5 Comparison of Power Cost between Existing Line Use and
Generator Driven Pump Appendix 6 Cost Estimates for Feasibility StudyAppendix 7 Summary of Price for Well Drilling Equipment, Supporting
Equipment, Mobile Workshop Equipment & Spare Parts Appendix 8-1 General Regulations of Services for Piped Water Supply Appendix 8-2 Application for a Connection to Piped Water Supply Appendix 9 Contractor for Water Supply between the User and the WSU Appendix 10 Daily Operations Record Appendix 11 O&M Costs for Each Target Communes

G-vi
List of Tables
Table 1.1 Monthly Income per Capita by Income Source and Region in 1999 .....G1-2 Table 1.2 Monthly Income per Capita by Income Source in the Central
Highlands................................................................................................G1-2 Table 1.3 Monthly Income per Capita by Income Source in Central
Highlands................................................................................................G1-3 Table 1.4 Projection of population .........................................................................G1-6 Table 1.5 Detailed numbers of Villages, Households, Population in the
Target Area..............................................................................................G1-7 Table 1.6 Water Source in Target Area.................................................................G1-10 Table 1.7 Classification and Definition of Poverty by MOLISA.........................G1-14 Table 1.8 Poverty situation in the Target Area .....................................................G1-15 Table 1.9 Household with Electrification .............................................................G1-19 Table 1.10 Population of Children and Adults .......................................................G1-20 Table 1.11 Responsibility on Family Issue by Sex.................................................G1-26 Table 1.12 Ownership of dug well .........................................................................G1-29 Table 1.13 Requests for Improvement to the Present Water Supply ......................G1-31 Table 1.14 House Holder Expectations on Organizational responsibility for
water supply O&M ...............................................................................G1-31 Table 1.15 Willingness to Pay and Ability to Pay ..................................................G1-32 Table 1.16 Average Expenditure by Expenses Items .............................................G1-34 Table 1.17 Power Source for Domestic Use...........................................................G1-36 Table 1.18 Definitions of House Type....................................................................G1-36 Table 1.19 Cultivated Area in Interviewed Households .........................................G1-37
Table 2.1 Projected Populations .............................................................................G2-3 Table 2.2 Calculation of necessary water supply quantity: Gia Lai
Province..................................................................................................G2-4 Table 2.3 Water Supply Plan ..................................................................................G2-9 Table 2.4 Safe Well Yields of Explored Wells........................................................G2-9 Table 2.5 Number of Required Wells ...................................................................G2-10 Table 2.6 Casing and Screen Pipes.......................................................................G2-12 Table 2.7 Recommended Treatment .....................................................................G2-14 Table 2.8 Design Criteria......................................................................................G2-16 Table 2.9 Overview of Proposed Water Supply Systems .....................................G2-19

G-vii
Table 3.1 Daily operation record ..........................................................................G3-18 Table 3.2(1/4) Daily operation record of G2 .............................................................G3-19 Table 3.3(2/4) Daily operation record of G2 .............................................................G3-20 Table 3.4(3/4) Daily operation record of G2 .............................................................G3-21 Table 3.5(4/4) Daily operation record of G2 .............................................................G3-22
Table 4.1 Composition of Project Cost...................................................................G4-1 Table 4.2 Unit Cost for Major Items with Foreign and Local Currency
Portion ....................................................................................................G4-2 Table 4.3 Cost for the 21 Systems by 4-step Implementation................................G4-4 Table 4.4 Alternative Cost Study by Phasing Implementation in Phase1 ..............G4-4 Table 4.5 Summary of Project Cost Divided FC and LC in Phase 1(to
2010).......................................................................................................G4-5 Table 4.6 Cost for the 21 Systems by 4-step Implementation................................G4-5 Table 4.7 Cost for the 21 Systems by 2-step Implementation................................G4-6 Table 4.8 Soft Components ....................................................................................G4-6 Table 4.9 Summary of Project Cost........................................................................G4-7 Table 4.10 Grouping for Implementation Priority....................................................G4-9 Table 4.11 Phasing Plan of Implementation for 21 Systems..................................G4-10 Table 4.12 Evaluation of Facilities Construction Capability by Alternative
Implementation Method .......................................................................G4-12 Table 4.13 Technical and Financial Soundness of Alternatives 1 and 2.................G4-12 Table 4.14 Summary of Implementation Schedule ................................................G4-13 Table 4.15 Construction Schedule Plan..................................................................G4-13
Table 5.1 Staffing Requirements ............................................................................G5-9 Table 5.2 Annual costs MVND/a .........................................................................G5-24 Table 5.3 Annual costs per cubic meter and annual water use.............................G5-26 Table 5.4 Financial Cash Flow Analysis ..............................................................G5-27 Table 5.5 EIRR Cash Flow...................................................................................G5-31 Table 5.6 Construction Cost Per Capita ...............................................................G5-33 Table 5.7 Cost for the 14-System for the Implementation in 2004-2005 .............G5-34
Table 6.1 Tentative schedule for IEC activities ..........................................................G6-7 Table 6.2 Necessary Activities for Target Communes................................................G6-8

G-viii
List of Figures
Figure 1.1 Housing Size.........................................................................................G1-21 Figure 1.2 Main Interviewee by Sex ......................................................................G1-21 Figure 1.3 Population by Age and Sex in Dac Lac ................................................G1-21 Figure 1.4 Population by Age and Sex in Gia Lai .................................................G1-21 Figure 1.5 Population by Age and Sex in Kon Tum ..............................................G1-21 Figure 1.6 Distribution of Ethnic Minority ............................................................G1-23 Figure 1.7 Migration ..............................................................................................G1-24 Figure 1.8 Occupation by Sex................................................................................G1-25 Figure 1.9 Educational System in Vietnam............................................................G1-27 Figure 1.10 Education Level....................................................................................G1-28 Figure 1.11 Present Water Sources ..........................................................................G1-30 Figure 1.12 Satisfaction Ratio for Present Water Sources .......................................G1-30 Figure 1.13 Ability of Willingness to Pay................................................................G1-33 Figure 1.14 Needs for Water Quantity ....................................................................G1-35 Figure 1.15 Monthly Income per Capita ..................................................................G1-35 Figure 1.16 Expenditures by Expense Items............................................................G1-35 Figure 1.17 Power Sources ......................................................................................G1-38 Figure 1.18 Type of House and Income ...................................................................G1-38 Figure 1.19 Owned Commodity...............................................................................G1-38 Figure 1.20 Main Agriculture Products....................................................................G1-39
Figure 3.1 Schedule of Model Plants Construction in Dak Ui (K3-1) and Nhon Hoa (G2) Communes ..................................................................G3-23
Figure 4.1 Organization Structure Plan for Implementation of Rural Water Supply Project in the Central Highlands ..............................................G4-15
Figure 5.1 Organization for piped water supply ......................................................G5-2 Figure 5.2 Concept Paper for Coordination...........................................................G5-18
Figure 6.1 Information Flow at Town Meeting for Well-off Communities...............G6-9

G1-1
Chapter 1 Socio-economic Condition
1.1 National and Regional Economy
1.1.1 Social Condition and National Economy
The population of Vietnam was estimated at 76.3 million in 1999 (statistics in 1999), and 118 million in 2025 (World Development Report: 1996). The total area of Vietnam is 332,000 km2. The land is administratively divided into 57 provinces and 4 central control cities (Hanoi, Ho Chi Minh, Hyphone and Danang) in November 1996. The people of 20 % are living in urban area and the rest people are in rural area. More than 60 ethnic peoples are identified. They are Kinh (majority: 87 %), and the minorities of Thai, Muong, Taie, Nue, Meo and so on. The Zao, Ede and Bana minority peoples are living in the north. The Gia Lai people is in the Highland. The Cham and Khmel peoples are in the south.
Since 1986, Vietnam has experienced a transition from a centrally planned economy to a market economy called as “Doi-Noi”. Over the last ten years, the economy has achieved a high growth rate at 9 % per year. Industry output growth has averaged 13.5 %. In spite of this significant growth, Vietnam remains still one of poor countries in the world, whose GNP per capita is estimated as US$ 250 (World Development Report 1996).
Vietnam is a poor, densely populated country that has had to recover from the ravages of war, the loss of financial support from the old Soviet Bloc, and the rigidity of a centrally planned economy. Substantial progress has been achieved over the past 10 years in moving forward from an extremely low starting point, though the regional downturn is now limiting that progress. GDP growth of 8.5 % in 1997 fell to 4 % in 1998. These numbers masked some major difficulties that are emerging in economic performance.
Since 1997, the economic situation in Vietnam was rather complicated due to the influence of the financial crisis in the Asian region and losses to agricultural production caused by floods in the central coast area. The GDP still increased at an average rate of 6.1 % for the period 1996-1999.
According to the Results of the household Living Standards and Economic Condition Survey in 1999, income increased for both the poor and the rich, but the results also indicated the gap between the poor and the rich is widening.

G1-2
1.1.2 Social Condition and Regional Economy
Table 1.1 shows monthly income per capita by income source in seven regions.
North East South region contains Ho Chi Minh City and surrounding provinces and has achieved outstandingly in most sectors. Central Highlands has the second highest per capita income among the 7 regions. Agriculture sector in Central Highlands contributes the highest regional sector income in the country, and supports about 55 % of total income of the region. Central highlands are famous for industrial export crops, such as coffee and rubber. However, since the year 2000, the international price of coffee has dropped dramatically, and has effected coffee farmers in the region.
Table 1.1 Monthly Income per Capita by Income Source and Region in 1999
Unit: 1,000 VND
Region Total Salary &
wage
Agriculture Forestry &
Fishery
Industry & construction
Service activities
Others
North West and North East 210.00 34.70 117.00 12.00 24.20 22.10 Red River Delta 280.30 75.70 93.30 23.00 42.30 46.00 North Central Coast 212.40 40.40 88.10 21.20 29.50 33.20 South Central Coast 252.80 70.50 83.90 13.70 54.10 30.60 Central Highlands 344.70 54.50 189.20 15.90 59.60 25.50 North East South 527.80 191.60 111.40 54.40 117.70 52.70 Mekong River Delta 342.10 69.40 164.90 17.10 57.50 33.20
Source: Results of the Households’ Living Standards and Economic Condition Survey in 1999
Table 1.2 Monthly Income per Capita by Income Source in the Central Highlands
Year Total Salary & wage
Agriculture, Forestry &
Fishery
Industry & construction
Service activities Others
1995 241.14 35.40 136.39 9.86 39.31 20.18 1996 265.60 39.20 146.50 13.00 45.60 21.30 1999 344.70 54.50 189.20 15.90 59.60 25.50
Source: Results of the households’ Living Standards and Economic Condition Survey in 1999
Gia Lai province Agriculture is dominant in Gia Lai province. Proportion of agriculture in total has increased about 5%, while Service activity has decreased. Coffee and rubber are grown in 45,000 ha and 50,000 ha respectively, while rice is cultivated in 97,000 ha. Table 1.3 presents income per capita by income source

G1-3
in each province. Dac Lac is the richest of the three provinces. The main income source is agriculture, especially coffee production.
Table 1.3 Monthly Income per Capita by Income Source in Central Highlands
Unit: %
Total (1000VND)
Salary & wage
Agriculture. Forestry &
Fishery
Industry & construction
Service activities Others
Gia Lai 1996 168.96 20.64 47.79 5.39 16.06 10.12 1999 229.40 21.88 53.18 6.06 11.94 6.94
Source: Results of the households’ Living Standards and Economic Condition Survey in 1999
Coffee is planted in about 250,000 ha in the province. Agriculture accounts for a high proportion of income, but the proportion has slightly decreased from 59.69% in 1996 to 57.31% in 1999, while salary and wages has increased.
1.2 Methodology of Social Survey
The survey on socio-economic condition was divided into three parts, secondary data collection (official statistics), household survey (questionnaire survey) and key informant survey (Rapid Rural Appraisal). Secondary data collection and household survey were conducted mainly for quantitative data collection, while key informant survey was carried out for qualitative data collection.
1.2.1 Rapid Rural Appraisal (RRA)
Purpose
Purpose of this RRA is better to understood the socio-economic condition in target communes in terms of present water sources, water use practice, poverty, electrification, etc. The team focused on
To collect general information of each commune, and
To share information among stakeholders on present condition of water use, problems and needs of villagers through the study.

G1-4
Methods and Tools
ey informant interview and semi-structured interviewing The survey was carried out through key informant interview using a semi- structured checklist. In the survey, representatives from People’s Committee, People’s Council, villages, mass organization, Health Service and schoolteachers participated in interviews. Instead of formal, prepared questions, semi-structured interviewing uses a “checklist” to guide the interviewers through the topics the team wishes to address. Once the interviewers start interviewing on a certain topic, the issue is probed by asking related questions (sub-questions), in order to deepen the interviewers’ understanding.
Mapping Mapping is one of the tools of RAA. The expert would draw a map, which showed roads, public facilities, dwelling location of each village, ethnic groups, number of households, population, poverty, water sources, power supply, etc. The map drawn by informants effectively introduced the team to the general spatial layout of the area. It is helpful to start RRA by mapping because it helps to break the ice as well as orienting the team to its surroundings.
Historical profile Historical profile shows not just what happens over one year, but what the important events in the life of the area, commune or village have been. Such items as disease outbreak and natural disasters, such as drought and flood, are important information for the planning.
Seasonal calendar In this study, the seasonal calendar was used for identifying rainfall pattern, the quality and quantity of water sources and disease patterns through the year. This can show correlation between rainfall and other items such as, quality and quantity of water sources, and disease incidence. It can be referred to more effective planning of disease prevention because the calendars show when and how long diseases break out in the area.
1.2.2 Household Survey
uestionnaire
Questionnaires were prepared by experts in charge of sanitary and environment,

G1-5
institution, operation and maintenance, and social and economic conditions. The questionnaires were also examined by an expert of DANIDA in charge of a water supply program in Dac Lac province. The questionnaire consisted of the following questions;
on family structure: member, age, sex, education, occupation, income, and responsibility for family finance, education and health care
on present water use practice: source, ownership, quality and quantity, consumption, O&M of facility and problems
on future water supply: willingness and amount to pay, and responsibility on construction, management and O&M
on living level: house type, commodities, electricity, expenditure
Health and sanitation: personnel and organization concerned, health worker, mass media, sanitation practice, latrine, and disease, and
on agriculture: land, crop, livestock, and yield and selling price.
Sampling Design
Sampling size Based on estimates of expected sampling errors, a sample size of 210 households was selected. Thirty households from each of 7 commune/towns were selected by a manner described as follows.
Selection methodology and sampling probability The total number of households in the commune/town was divided by the number of households to be selected (30) to calculate the skip interval used in selection of households.
A random number is selected to start; succeeding site numbers are identified by formula: Xi=X+i.k; in which i=1,2,3… and the series is stopped when 30 samples are identified. The procedure is repeated for each commune.
Training of interviewers
All interviewers had previous experience conducting questionnaire surveys. For the purpose of confirming protocol and their skills, i.e. introduction and greetings, location/interview placement, interview management and time, two days training was held in Dac Lac province before starting the interview survey. One day was

G1-6
allocated to understanding all the questions and another day was allocated to a field trial. All interviewers experienced actual household survey with the questionnaire in the field trial. After the field trial, the interview team discussed the meaning of questions, ways of asking, revision of questions, etc.
Data input
Collected row data from all questionnaires was input and transformed into digital data by a sub-contracted company. The data was then checked and analyzed by the expert.
1.3 Results of Rapid Rural Appraisal
1.3.1 Population and Projection of Population
Population and growth rate data were collected as much as possible. However, as the growth rate in some communes is not available, the neighboring data was assumed for population projection for the year 2005, 2010, 2015 and 2020. Table 1.4 shows the estimated results.
Table 1.4 Projection of population
GrowthRate (%)*
GrowthRate (%)* Population Projection Commune No. of
Villages No. of
Household 2001-2005 2006-2020 2000 2001 2005 2010 2020
Gia Lai province G1:Kong Tang 11 1163 2.30 2.30 5567 5695 6237 6988 8773 G2: Nhon Hoa 15 1906 2.20 2.20 11084 11328 12358 13779 17128 G3: Chu Ty 8 1481 1.90 1.90 6377 6498 7006 7698 9292 G4-1: Thang Hung 5 858 1.70 1.70 4292 4365 4669 5080 6013 G4-2: Thang Hung 1 51 1.70 1.70 249 253 271 295 349 G4-3: Thang Hung 1 66 1.70 1.70 325 331 354 385 455 G4-4: Thang Hung 3 338 1.70 1.70 1472 1497 1601 1742 2062 G5-1: Ngia Hoa 5 696 2.00 2.00 3288 3354 3630 4008 4886 G5-2: Ngia Hoa 1 66 2.00 2.00 362 369 400 441 538 G6-1: Ia Rsion 9 710 2.00 2.00 3843 3920 4243 4685 5710 G6-2: Ia Rsion 2 134 2.00 2.00 688 702 760 839 1022 G7-1: Kong Yang 5 374 2.00 2.00 1507 1537 1664 1837 2239 G7-2: Kong Yang 1 48 2.00 2.00 212 216 234 258 315 G7-3: Kong Yang 1 26 2.00 2.00 132 135 146 161 196 G7-4: Kong Yang 2 109 2.00 2.00 547 558 604 667 813 G7-5: Kong Yang 1 50 2.00 2.00 128 131 141 156 190
Population growth through migration was assumed only until the year 2005 due to unknown factors of political decisions for migration and limited land area.
Table 1.5 shows detailed numbers of villages/wards and households, population,

G1-7
average household size and population growth rate in each target commune/town. The total numbers of households and population at present in the target area are 24,191 and 118,617 persons. Of which, Dac Lac province shares more than half of them, 12,588 households. Size of commune/town ranges from 325 households (1,530 people) in Sa Nghia commune in Kon Tum province to 2,961 in Ea Drang town in Dac Lac province.
Table 1.5 Detailed numbers of Villages, Households, Population in the Target Area
Town/ Commune No. of village
No. of Household (household)
Population Average householdsize (persons/household)
Population growth rate*)(%)
Gia Lai province Kong Tang T. 12 1,163 5,567 4.8 2.3 Nhon Hoa C. 14 1,906 11,084 5.8 2.2 Chu Ty T. 7 1,481 6,377 4.3 1.9 Thang Hung C. 7 1,313 6,338 4.8 1.7 Nghia Hoa C. 6 762 3,650 4.8 2.0 Ia Rsiom C. 9 844 4,531 5.4 2.0 Kong Yang C. 10 607 2,526 4.2 2.0 Province total 65 8,076 40,073 5.0
Source: RRA results *): Population growth rate consists of both natural and mechanical growth
1.3.2 Household Size
The RRA results show that the average household size in the target towns/communes varies from 4.2 persons per household to 5.8 persons. At the village/ward level, Village No.4 in Kong Yang commune of Gia Lai province has the smallest household size, 2.2 persons per household, and Ward No.8 in Krong Nang town has the biggest household size, 5.8 persons per household. In the target area of the 3 provinces, there are 210 villages/wards in total. Of which, 103 villages/wards are classified under 4.9 persons (average household size of target area), while 107 wards/villages are classified as 4.9 persons or more. Proportions of Kinh household in these wards/villages are 59% of 103 and 22% of 107 respectively. These figures show that the average household size is larger in villages/wards with a high proportion of ethnic minority (EM) groups. There are two reasons that influence the household size; number of children and adults who live together in one household. Household survey results also support this as mentioned below.

G1-8
1.3.3 Ethnic Groups
Official figures show that there are in total 54 ethnic groups in Vietnam. The majority of the population in the country belongs to the Kinh group. In the target area, 20 ethnic groups were identified Ethnic minorities (EM) such as E De, Gia Rai, Ba Na, Xe Dang, Xo Dra, Ca Dong, Mnong, Gie, Mang, Brau and Romam originate from the central highland area. According to the study results, Gia Rai and Ba Na are spread in both Gia Lai and Kon Tum province. Other ethnic groups including Kinh, Tay, Nung, Thai, Tho, Lao, Muong, Hoa and Dao, have settled from north and surrounding provinces. Kinh, Tay and Nung are distributed throughout the whole target area. According to RRA results, proportions of Kinh households in the target area are estimated as 52% in Gia Lai.
It is observed that the locations of most original EM communities are far from main road in communes/towns and close to mountainous area. They had practiced slash- and-burn cultivation, shifting cultivation, and relied on forest products, but most of them have stopped shifting cultivation, apart from a few minority groups. Some recently settled Kinh people live in remote area because they could not find land around the center of town/commune.
In general, each ethnic group, especially original EMs, tends to keep its own community, which often shaped village/ward.
1.3.4 Migration and Settlement
There are two kinds of migration pattern. One is government sponsored resettlement program (New Economic Zone). The Government has supported New Economic Zone program, in order to move people from high population density areas to sparsely populated areas. In this program, the Government prepares social and economic infrastructure and some institutional supporting systems for these settlers, so that migrants can start their lives smoothly.
Another is free migration where people move into unused area and start cultivation. Even though they are free migrants, they have a right to receive social services, such as education and health service just the same as legal dwellers. After several years, the town or commune where they live judges their behavior and, if there are no serious problems and troubles with them, they can be registered as a legal

G1-9
dweller. The considerable difference between legal dweller and illegal dweller is whether they have land use certification. It is necessary to borrow money from official banks. In case of free migration, seasonal migration was sometimes observed whereby those from another province come to the central highlands to reclaim forest area and cultivate cash crops every season. After selling the harvested crops they return to their main place of residence.
Capricious Migraqtion
Migration of Kinh and the other ethnic minorities peoples are sometime capriciously migrating without government control. The population growth ratio is included such capricious influences. The growth ratio of 2-3% in the Central Highlands is therefore, higher value than the average growth ratio of approximately 2% in the whole country.

G1-10
1.3.5 Water Resource
Water resource map in all target communes were drawn with the help of key informants (Data Book Chapter 1, Figure K1-2 K1-7). The water resources are classified into dug well, shallow borehole with a hand pump (UNICEF), deep well, river, stream, spring, and rain water (rainy season only). The same household often has several sources for different domestic purposes. They need to keep plural water sources which can be accessed through a year, even in the driest year.
Table 1.6 Water Source in Target Area
Province Commune Dug well Spring Borehole River Stream Vendor Gia Lai Kong Tang O O
Nhon Hoa O O Chu Ty Town O Thang Hung O O Nghia Hoa O O O Ia Siom O O O Kong Yang O O
Dug well includes UNICEF shallow borehole, Borehole: private use only
Dug wells Dug wells are the most popular water source in the target area. Most Kinh people and some EMs, who follow the Kinh practice, use dug well. The depth of a dug well varies from 5-6 m to 30 m and more. People use bucket with rope, bucket with pulley, hand pump or electric pump to lift water from well. Dug well water is used for drinking, cooking, bathing, washing and/or plant watering.
Most households using a dug well have their own dug well except EMs. If a household does not have a well or sufficient water in their well, water is collected from neighbors without payment. This is from mutual help custom. However, when a well is equipped with an electric pump, the owner charges a electricity fee to users who regularly use the pump.

G1-11
Left: EM woman washing cloths and girls collecting water at Kong Yang commune in Gia Lai province. Right: EM woman pouring water into a gourd at Kong Yang commune in Gia Lai province.
The Government has issued instructions to boil water for drinking purpose through local institutions such as health services and schools. At school level, when a school has a dug well and enough water, schools prepare drinking water tanks for children. If a school does not have a well or sufficient water in their well, teachers instruct children to bring boiled water from home.
Springs, Streams and Rivers Springs, streams and rivers have been used for a long time as water sources, mainly by EM in the area. Before rapid migration started in the central highlands, a large number of springs were located in mountainous area as well as rivers and streams. Mass migration caused deforestation for reclamation of agricultural and residential lands and pollution of these water resources by agricultural chemicals and human waste. Consequently, many springs have disappeared as water source or the quantity of water has decreased, and quality of these water sources has become worse.
Generally, water collection is done mainly by women including girls among ethnic minorities. Gourd bottles and plastic PET bottles are used for water collection. These bottles are carried by women in a bamboo basket on their back. Collected water is used for drinking and / or cooking. When women collect water from a spring, stream or river, they usually wash cloths and take baths as well, while men take baths during vacancy of women or at another water source. Most of these water collection points are kept a certain distance from the residential area, and cannot be seen from outside easily.

G1-12
Left: Spring at Chu Hreng commune in Kon Tum province. Right: Spring at Krong Nang town in Dak Lak province
These water collection points have another important role. They provide a public space for communication, where women can exchange various kinds of information on their economic activities and lives.
Deep boreholes Deep boreholes are not popular in the residential area, but are observed at official facilities in some communes/towns. Water from those deep boreholes are for office use only and are not utilized within private households.
Piped water Piped water is not common in the target area. At Chu Ty town of Gia Lai province, a piped water supply system was installed at the center of town and used by people, but since widening of the main road and construction of drainage system started, plastic pipes were destroyed and the water supply was often stopped. Now water is supplied for 2 hours in the morning and people use dug wells at other times.
Bamboo piped system was observed at Dak Ui commune in Kon Tum province. A spring is located at the middle of a mountain which is at a higher elevation than the villages. In the 1970’s people started construction of a gravity type water supply piped system using bamboo from the forest. Recently they put PVC pipe inside the bamboo pipe for reinforcement of the facility. Users purchase materials and maintain the facility by themselves.

G1-13
Left: Public piped water supply system is made of bamboo and woods at Dac Ui commune in Kon Tum province. A board and a stone are used for washing cloths. PVC pipe is recently used for reinforcement. Right: Water intake at spring
1.3.6 Water Quality and Quantity
Change of water quality and quantity were also clarified in cooperation with key informant. Results are shown in with rainfall pattern. It cannot be compared with other communes, because these figures were subjectively made by informants. The results, however, indicate changes of water quality and quantity through the year. It is necessary to combine these data with scientific examination conducted by the team, then the water condition in each communes/towns can be forecasted in detail.
The rainy season in the target area starts in March or April and ends in October to January. One or two months after the start of the rainy season, the quantity of water in all sources begins to increase, while quality begins to decrease. Meanwhile, there are areas, like Kong Tang town and Nonh Hoa commune in Gia Lai province, where it takes 5 months for the rain water to effect the water level of sources.
1.3.7 Poverty
Several definitions measuring poverty are available in Vietnam. The study team used the definition of Ministry of Labor, Invalids and Social Affairs (MOLISA), which is prevalent in rural administrative offices of target area. MOLISA uses rice as a measurement of income, and it can be converted to a money equivalent. Table 1.7 shows the poverty definition published by MOLISA in May 1997. The definition would be valid for 1998, but local administrations in the target area still use this definition.

G1-14
Table 1.7 Classification and Definition of Poverty by MOLISA
Classification Definition - Very poor Income less than 13kg rice capita/month, equivalent to
VND 45,000 - Poor in rural
mountainous and islands Income less than 15kg rice capita/month, equivalent to VND 55,000
- Poor in rural, delta and midland areas
Income less than 20kg rice capita/month, equivalent to VND 70,000
- Poor in urban areas Income less than 25kg rice capita/month, equivalent to VND 90,000
Source: Ministry of Labor, Invalids and Social Affairs
Poverty situation from the results of key informant interview is shown in Table 1.8. Of the three provinces it can be seen that Gia Rai province province has rather high proportions of poverty. Towns commonly have less than 15% poverty rate, which is low compared to communes.
Ia Rsiom commune in Gia Lai province is the poorest (46%, 393 households) commune in the target area. There are two Gia Lai villages, Fung Ang village and Fung Dy village, located far from the center of the commune. The poverty rate of these villages is remarkably high, 85% and 90%, even through their villages are sited on a main road. First priority of their needs is easier access to health service, second priority is clean water supply, followed by draught animals and electricity supply. According to key informants in these communes, the main reason of poverty is low agricultural production, especially cash crop production. Cash crops such as coffee, pepper and rubber, which are cultivated in other areas, cannot be grown in this area because of poor soil fertility. They grow cashew, maize, beans and sesame. A similar situation was observed in Kong Yang commune in Gia Lai province (32% poverty in 178 households).
Among communes/towns, it tends that villages that are located in remote area have a high concentration of poor households. The situation of social and economic infrastructure is very poor.

G1-15
Table 1.8 Poverty situation in the Target Area
Town/ Commune No. of
Household (household)
Population Poverty1)
(household) Poverty
(%)
G1:Kong Tang T. 1,163 5,567 1282) 12%G2:Nhon Hoa C. 1,906 11,084 492 28% G3:Chu Ty T. 1,481 6,377 149 11% G4:Thang Hung C. 1,313 6,338 215 26% G5:Nghia Hoa C. 762 3,650 210 30% G6:Ia Rsiom C. 844 4,531 393 46% G7:Kong Yang C. 607 2,526 178 32% Province total 8,076 40,073 1,765 25%
Area total 25,672 128,343 4,430 18% Source: RRA results 1) Poverty includes very poor and poor households by MOLISA definition 2) There is no very poor households
According to the key informants, characteristics of poverty are;
Households of illegal migrants Households with invalids by disease or accident Households with numerous children Households with insufficient land and capital to invest Households without modern cultivation technology
1.3.8 Gender
Among Kinh people (majority), male and female share the housework such as water lifting, cooking, cleaning, washing cloths and taking care of children. Among EM, some EM groups share the housework, but some do not. It is difficult to say that certain ethnic groups do one way or the other because even in the same ethnic group, various customs and traditions apply.
According to the results of household survey, responsibilities for finance, education and health in the family are shared between women and men, and there is no difference among different ethnic groups. Even though these responsibilities are shared among family members, final decision is prevalently made by men. When a family must make a decision on some important issues, the husband discusses it with his wife, and sometimes other family members or friends, then the husband makes the final decision after the discussion.

G1-16
1.3.9 Mass Organization
In all target communes/towns, several community organizations are established, such as Farmer’s Union, Women’s Union, Youth Union, Elder’s Union and Red Cross. Most of these organizations were established to spread government propaganda, but now they also have important roles of economical and social activity. All organizations take care of not only legal dwellers, but also illegal immigrant in their activities as the Government does. The main problem in all organizations is the shortage of budget for activities.
Women’s Union Over 20-year-old women except elders can be a member of the Union. The union was originally established as a political organization to extend the Government propaganda and Party policies to members. Beside these main activities, social and economical activities are now a major role of the organization. The union is well organized by women from central level to community level. Budget is allocated by the commune/town People’s Committee. However, since the budget is limited, some unions collect money from members to fund activities.
At the commune level, the Union is composed of the president, the vice president, board member and ordinary member. The board members hold a chief of a village at once. The president and the vice president are elected by the members directly. Following activities are common in all Women’s Union.
To introduce agricultural techniques for women, on garden planting and livestock breeding To extend primary health care, mother and child health care, family planning, and disease prevention in cooperation with public health services.
Some Unions have established a fund for individual economic activity. A member can borrow money from the fund at lower interest rate than from banks. The money is invested in economic activities such as agricultural input, but not for medical care and educational purpose. The purpose of the loan is to help women from poor households. Members contribute a small amount of money every year to expand the fund. They also support women to borrow money from VBARD (Vietnamese Bank for Agriculture and Rural Development)by providing a recommendation letter.

G1-17
The Union in Nghia Hoa commune of Gia Lai province has a plan of night class cooperating with DPC to increase the literacy rate of adults. WU encourages villagers to attend the class.
In addition to internal activities, they also have a close relationship with other Women’s Unions in the area. They often invite Chairwomen from other communes to the regular meeting.
Farmer’s Union All farmers, male and female, rich and poor, are members. They carry out agriculture extension service and introduction of new crop and livestock. The Union cooperates with Division of Agriculture and Rural Development of the District to carry out their activities. CPC or TPC allocates budget for the Union.
Youth Union The Union consists of teenagers (high school students and above), and young people in this 20’s and 30’s. The Main purpose of the Union is to educate the young generation on policies of the party. They carry out charitable activities and sports events. Besides these, they also coordinate with THS to promote environment and sanitation program. They work with WU, FU, VU and Red Cross in the same activities if needed. Awareness of people about sanitation in community has improved. TPC allocates budget for their activities. Some of their activities are sponsored by small entrepreneurs.
Elder’s Union Over 60 years old people can be a member. Purposes of the union are to keep elders’ life healthy and enjoyable. This is a kind of volunteer group.
Red Cross Members of Red Cross are selected from relatively wealthy households. They carry out charitable activities such as supporting victims of disasters, fire, and accidents with money and commodities (foods, furniture, blanket, mosquito net etc.). When the number of victims is small, members contribute money and/or commodities, but ask the Government in the case of large-scale disasters.

G1-18
1.3.10 Rural Infrastructure
Education All communes/towns have primary schools. There is one primary school at the center of commune/town to teach from grades 1 to 5 as compulsory education. There are also many primary schools with one or two classrooms in remote areas which can teach from grade 1 to grade 2 or 4. Classes are carried out in two shifts, morning class and afternoon class, because of the shortage of classrooms. Towns usually have lower secondary and/or upper secondary school as well.
The drop out rate is quite low (less than 5%) according to teachers in all interviewed primary schools, while the household survey suggested it is higher. Teachers insisted that some students drop out in spite of their great effort. When a student almost drops out, or after the student dropped out, teachers visit the students and her/him parents to encourage them to stay or return to school.
Health The health service is located in all communes/towns, called Commune/Town Health Service (CHS and THS). More than two staff, at least physicians are stationed in each health service. Most health services are equipped with beds, treatment tools and medicines. CHS/THS is in charge of simple treatment for sickness and injury, delivery of babies, basic data collection and campaigns for improvement of health condition. Patients in serious cases are transferred to an upper level health service or hospital, such as District Health Service (DHS) and Provincial Hospital. Village health worker (VHW) system started in 2000. DHS appoints health workers and pays an allowance (about 40,000 VND/month). VHW have to inform the CHS/THS about disease cases and cooperate in campaigns organized by CHS/THS.
Road and bridge All communes/towns have or will soon have a main asphalt road passing through the center of the commune/town, but roads and bridges inside commune/town are in poor condition. Access to remote villages is difficult to even in the dry season.

G1-19
Electricity Electricity distribution in each commune/town is shown in Table 1.9. Electricity is installed in all target communes/towns, but not to all villages and households. Villages in remote area and poor households cannot install electricity, because of economical difficulty. Users must contribute for installation of village power line as well as house connection. It costs between 1 million and 3 million VND depending on the distance from the main line, while a house connection costs 0.6-0.8 million VND per 100 m from the village line.
Electricity tariffs vary between 400 VND/kwh and 800 VND/kwh depending on commune/town. Tariff is categorized as private use, commercial use and official use, and agricultural use sometimes. The tariffs for official use and agricultural use are set about 100 VND/kwh higher than it of private use, and tariff of commercial use is set at almost twice that of private use. In Ia Rsiom commune, Gia Lai province, a lower tariff (500 VND/kwh) is specially set for poor households than normal tariff (700 VND/kwh). In Kong Tang town, Gia Lai province, an upper limit (100 kwh/household) is set, and when power consumption exceeds the upper limit, the tariff doubles.
CPC, TPC or DPC (in case of towns) have electricity management units for management, operation and maintenance. They usually have 3 or 4 staff for metering making bills, collection of charges and payment to the electric company. Before they pay the electric company, their salary and O&M cost are deducted.
Table 1.9 Household with Electrification
Gia Lai Province Households (%) Kong Tang T. 90% Nhon Hoa C. 80% Chu Ty T. 99% Thang Hung C. 92% Nghia Hoa C. 70% Ia Rsiom C. 69% Kong Yang C. 38%
Source: RRA results

G1-20
1.4 Results of Household Survey
1.4.1 Interviewee
To obtain accurate data from each household, an interviewer could speak to any family member. The interviewee means the person who mainly answered the questionnaire. Figure 1.1 shows sex ratio of the interviewees. Twenty percent (180) of the main interviewees were female in total. 10 percent of the interviewees were female in Gia Lai province.
1.4.2 Household Size
The average household size in all provinces was 5.24 persons per household. There is little difference in average household sizes among provinces. Average household sizes in Gia Lai province is 5.40 persons per household as seen in Figure 1.1. Proportion of children (under 15 years) and adult by province and ethnic group is shown in Table 1.10 The number of children is not higher for EM than it is for Kinh, but the number of adults in EM is higher than it is for Kinh in whole area.
Table 1.10 Population of Children and Adults Unit: persons
Province Children Average per household Adult Average per household
Target area All 1,174 1.96 1,967 3.28 Kinh 657 1.77 1,186 3.19 EMs 517 2.27 781 3.43
Gia Lai All 370 1.76 764 3.64 Kinh 308 1.78 610 3.53 EMs 62 1.68 154 4.16
Source: Household survey results
1.4.3 Household Structure
The distribution of population by age and sex in each province is shown in Figure 1.3 – 1.5. As can be seen from these figures, in each province, the population of the 20-24 years age group is sharply lowers than the age group under 20 years. This may be considered to be due to the wars from 1946 to 1975. Regarding the number of children, it is high for the age group 15-19 years, but has tended to decline in the past five years. Overall the sex ratio is 51 percent female and 49 percent male, and there is no significant difference between provinces.

G1-21
Figure 1.1 Housing Size Figure 1.2 Main Interviewee by Sex
Figure 1.3 Population by Age and Sex in Dac Lac Figure 1.4 Population by Age and Sex in Gia Lai Figure 1.5 Population by Age and Sex in Kon Tum
0%10%20%30%40%50%60%70%80%90%
100%
Dac Lac Gia Lai Kon Tum Total
Female Male
0
10
20
30
40
50
60
1 2 3 4 5 6 7 8 9 10
Household Size (persons/household)
Hou
seho
lds Dac Lac
Gia LaiKon Tum
0 50 100 150 200
0-4
10-14
20-24
30-34
40-44
50-54
60-64
70-74
80-84
90-94
Dac Lac F
Dac Lac M
0 50 100 150 200
0-4
10-14
20-24
30-34
40-44
50-54
60-64
70-74
80-84
90-94
Gia Lai FGia Lai M
0 50 100 150 200
0-4
10-14
20-24
30-34
40-44
50-54
60-64
70-74
80-84
90-94
Kon Tum F
Kon Tum M

G1-22
1.4.4 Ethnic Group
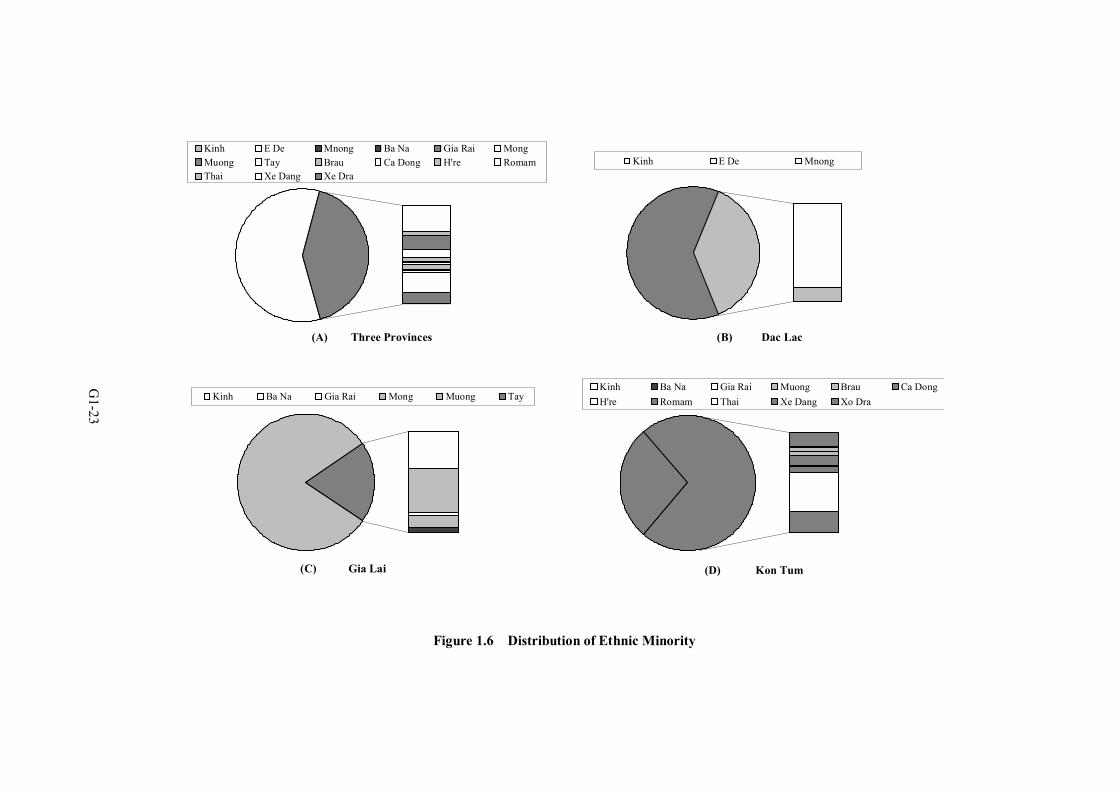
Proportions of ethnic groups are shown in Figure 1.6. Total proportion of Kinh in households interviewed was 59 percent. Kinh is a major ethnic group in the country. The proportion of Kinh households in Gia Lai province is 81 percent. In Gia Lai province, Ba Na and Gia Rai are the most abundant EMs.
1.4.5 Migration
Results of the household interview survey (Figure 1.7) shows that 64 percent of households interviewed were the migrants. Of these, 71 percent had settled in last two decades and 92 percent were Kinh. In Gia Lai province, 81 percent of households were immigrant with 66 percent arrives after 1980. The proportion of migrants in Kon Tum province is lower than in the other two provinces. In Gia Lai province, the proportion of migrants after 1990 is lower than in the 1980’s.
1.4.6 Occupation
The occupation of family members by sex in the interviewed households is shown in Figure 1.8. As stated above, agriculture is a major income source in the central highlands. The occupation distribution also reflects this. The majority of workers are involved in agriculture. Beside agriculture, there are some small business, such as retail trading, restaurant, milling factory and workshops are observed in the area. The percentage of females working in retail trade or as teachers is higher than males.
G1-23
(B) Dac Lac
Kinh E De Mnong
(C) Gia Lai
Kinh Ba Na Gia Rai Mong Muong Tay
(D) Kon Tum
Kinh Ba Na Gia Rai Muong Brau Ca DongH're Romam Thai Xe Dang Xo Dra
(A) Three Provinces
Kinh E De Mnong Ba Na Gia Rai MongMuong Tay Brau Ca Dong H're RomamThai Xe Dang Xe Dra
Figure 1.6 Distribution of Ethnic Minority

G1-24
(A) Three Provinces
37% 64%
32%
39%
15%
14%
Origin Migration after 1990Migratoin in 1980's Migration in 1970'sMigration before 1969
(B) Dac Lac
33% 66%
7%
17%
43%
33%
Origin Migration after 1990Migratoin in 1980's Migration in 1970'sMigration before 1969
(C) Gia Lai
19% 81%
24%
10%
40%
26%
Origin Migration after 1990Migratoin in 1980's Migration in 1970'sMigration before 1969
(D) Kon Tum
61% 39%
3%
23%
31%
44%
Origin Migration after 1990Migratoin in 1980's Migration in 1970'sMigration before 1969
Figure 1.7 Migration

G1-25
(A) Kon Tum
0% 10% 20% 30% 40% 50% 60%
FarmerRetail traderSkilled labor
HirelingHousewife
OfficerDoctorNurse
TeacherStudentRetired
Not stated
FemaleMale
(C) Dac Lac
0% 10% 20% 30% 40% 50% 60%
FarmerRetail traderSkilled labor
HirelingHousewife
OfficerDoctorNurse
TeacherStudentRetired
Not stated
FemaleMale
(B) Gia Lai
0% 10% 20% 30% 40% 50% 60%
FarmerRetail traderSkilled labor
HirelingHousewife
OfficerDoctorNurse
TeacherStudentRetired
Not stated
FemaleMale
Figure 1.8 Occupation by Sex

G1-26
1.4.7 Responsibility in Family
Table 1.11 shows the sex ratio for responsibility for family issues. Issues selected were family finance, education of children and health of family members. There is no difference between female and male in responsibilities for the family. As mentioned earlier, the final decision is generally made by the male rather than female, even though responsibilities are shared between female and male.
Table 1.11 Responsibility on Family Issue by Sex
Unit: persons (%) Finance Education Health
Gia Lai province Female 291(50 %) 215(51 %) 214 (51 %)Male 291(50 %) 206(49 %) 205(49 %)
Source: Household survey results
1.4.8 Education
Figure 1.9 presents the proportion of uneducated population by age group in the interviewed households. The percentage of population that is uneducated decreases as the age group becomes younger. Difference between female and male has been improved as well.
Education system in Vietnam is shown in Figure 1.9. Compulsory education period is 5 years from grade 1 to grade 5 in primary school.

G1-27
Grade Age
17 22
16 21
15 20
14 19
University College
13 18
12 17
11 16
Upper Secondary
School
Technical School
Vocational school
10 15
9 14
8 13
7 12 Vocational School
6 11
Lower secondary school
5 10
4 9
3 8
2 7
1 6
Primary school
5
4
3
Kindergarten Preschool education
Figure 1.9 Educational System in Vietnam
Highest education level by sex and each age group is shown in Figure 1.10. Highest education level increase as age group becomes younger. However, many people dropped out in both primary and secondary education at present. A difference between female and male can be seen even for primary level education. Females tend to stop studying at an early stage of education.

G1-28
Figure 1.10 Education Level
(A) Education Level by Sex (age group 7-19)
0% 10% 20% 30% 40%
1
3
5
7
9
11
Over 12
Grade
16-19 Female 16-19 Male
(B) Education Level by Sex (age group 20's)
0% 10% 20% 30% 40%
1
3
5
7
9
11 Over 12
Grade
20's Female20's Male
(C) Education Level by Sex (age group 30's)
0% 10% 20% 30% 40%
1
3
5
7
9
11
Over 12
Grade
30's Female 30's Male
(D) Education Level by Sex (age group 40's)
0% 10% 20% 30% 40%
1
3
5
7
9
11
Over 12
Grade
Percentage
40's Female40's Male
(E) Education Level by Sex (age group 50's)
0% 10% 20% 30% 40%
1
3
5
7
9
11
Over 12
Grade
Percentage
50's Female50's Male
(F) Education Level by Sex (age group over 60)
0% 10% 20% 30% 40%
1
3
5
7
9
11
Over 12
Grade
Percentage
> 60 Female > 60 Male

G1-29
1.4.9 Water Related Issues
Water source Main water sources of interviewed households are presented in Figure 1.11. Dug well, borehole, spring and river are used for water sources. Dug well is common in interviewed households of all communes/towns. Ea Wer commune has a public water supply facility with deep borehole, and one village located by Srepok river relies on river water.
Ownership of water source Spring, stream and river are public water sources. Only wells can be owned privately. Table 1.12 shows the proportion of dug wells as water source and ownership status. There is quite a low percentage people that own a dug well in Kon Tum province. This is related to income because construction of the dug well costs money and owners must incur O&M cost every year for the well.
Table 1.12 Ownership of dug well
Proportion of dug well user Of which, own well Gia Lai 99 % 83 %
Source: Household survey results
Quality Figure 1.12 shows the quality of water by use and season. Fifty percent of households in Ea Wer commune in Dac Lac province are not satisfied with water quality in dry season. A small change, the answer changed from satisfied to acceptable in Krong Buk commune in Dac Lac province, was observed in other provinces.
Quantity Figure 1.12 shows the quantity of water by use and season. There is little change throughout the year in Dac Lac province.
Request for present water condition Table 1.13 shows points of dissatisfaction with the present water supply. Interviewees answered “Distance” do not have their own water source which explains the high percentage of interviewees providing this answers in Kon Tum province.

G1-30
(A) Pre se n t W ate r S ou rce for Drin k in g
0%
20%
40%
60%
80%
1 00%
D1 D2 D3 D4 D5 D6 D7 G1 G2 G3 G4 G5 G6 G7 K1 K2 K3 K4 K5 K6
Du g well Sp ring Bo reho le River Vender
(B) Pre se n t W ate r S ou rce for Dom e sti c
0%
20%
40%
60%
80%
100%
D1 D2 D3 D4 D5 D6 D7 G1 G2 G3 G4 G5 G6 G7 K1 K2 K3 K4 K5 K6
Dug we ll Spring Bore hole River Ve nder St re am
Figure 1.11 Present Water Sources
(C) Q uality of drinking water in dryseason
0%
20%
40%
60%
80%
100%
D1 D2 D3 D4 D5 D6 D7 G1 G2 G3 G4 G5 G6 G7 K1 K2 K3 K4 K5 K6Co mm une/town
Sufficient Fair In sufficien t
(A) Q u an ti ty o f dom e s ti c wate r indry se as on
0%
20%
40%
60%
80%
100%
D1 D2 D3 D4 D5 D6 D7 G1 G2 G3 G4 G5 G6 G7 K1 K2 K3 K4 K5 K6
Sufficient Fair In sufficient
(B ) Q ua nti ty of dom e s ti c wate r inrain s e as on
0%
20%
40%
60%
80%
100%
D1 D2 D3 D4 D5 D6 D7 G1 G2 G3 G4 G5 G6 G7 K1 K2 K3 K4 K5 K6
Sufficient Fair Insufficient
(D) Q u al i ty of drin k in g wate r in ra inse as on
0%
20%
40%
60%
80%
100%
D1 D2 D3 D4 D5 D6 D7 G1 G2 G3 G4 G5 G6 G7 K1 K2 K3 K4 K5 K6Com mune/town
Suff icient Fair Insufficient
Figure 1.12 Satisfaction Ratio for Present Water Sources

G1-31
Fifty-five percent of interviewed households answered “Equipment” as a dissatisfied point. Of these 54% use a bucket for lifting water. Households that use a bucket generally seek to upgrade to a motor pump. Some people that presently use a motor pump also responded “Equipment”. It is not clear whether they want a higher quality or quantity pump.
Households that answered “Quantity” account for 48% of total interviewed households. It is observed in all kinds of water source users.
Table 1.13 Requests for Improvement to the Present Water Supply
Distance Equipment Quantity Quality Gia Lai 6% 56% 60% 81%
Total 25% 55% 48% 60%
Source: Household survey results
Sixty percent of those interviewed answered “Quality” to be improved. In Gia Lai province, quite a high percentage (4 out of 5 households) of people need better quality water in terms of mainly odor and color.
Operation and maintenance At present, people, who own a dug well maintain (i.e. dredging mud in the bottom of a well) the well by themselves. When a dug well needs to be deepened, however, an owner asks a specialist. Most households responded that they want CPC or DPC to manage the water supply system as well as the electricity supply system (Table 1.14). It is considered that this is because most have never experienced using a borehole before. Even though people have used water from the borehole, they have never operated the borehole because CPC or DPC has carried out all O&M and paid for them.
Table 1.14 House Holder Expectations on Organizational responsibility
for water supply O&M Activitiy
Construction of Facility
O&M Of Facility
Money collection
Management auditing
Tariff setting
Gia Lai CPC 46 % 56 % 59 % 57 % 49 % DPC 46 % 36 % 32 % 34 % 43 % PCERWASS 6 % 7 % 7 % 7 % 6 % Village 0 % 0 % 0 % 0 % 0 % User 2 % 0 % 2 % 2 % 2 % Source: Household survey results

G1-32
Ability and Willingness to Pay Willingness to Pay (WTP) for individual piped system is similar to or exceeds that for public water supply system in all communes/towns (Figure 1.13). WTP for both individual piped and public water supply system in Gia Lai province is higher than the other two provinces. The average WTP for public water supply system in Gia Lai province is 96%. On the other hand, average WTP for individual piped system are quite high 98% in Gia Lai province.
According to National Rural Potable Water Supply and Sanitation Strategy to 2020, an average household spends less than 1 percent of its annual income on water supply and sanitation, and the strategy assumes that an average rural household could pay between 3 percent and 5 percent of its total annual income for potable water and sanitation in the future.
Table 1.15 is a rough estimation of WTP (payment) and Ability to Pay (ATP) calculated from present income. At present, people are ready to pay more than 1% of their income for piped water supply in all communes/towns. Table 1.15 also describes ATP calculated by percentage in accordance with NRWSS. If income stays at present levels the, amount stated in Table 1.15 can be spent by users for both water supply and sanitation. The difference between the present WTP and ATP should be reduced through the Information, Education and Communication activity of the project.
Table 1.15 Willingness to Pay and Ability to Pay
Unit VND
Town/ Commune Average annual
income per capita
Willingness To Pay for piped system (VND, %)
3% of income
5% of income
Gia Lai provinceKong Tang T. 2,973,520 64,600 2.2% 89,206 148,676 Nhon Hoa C. 5,350,492 55,700 1.0% 160,515 267,525 Chu Ty T. 4,403,992 47,300 1.1% 132,120 220,200 Thang Hung C. 1,960,873 81,700 4.2% 58,826 98,044 Nghia Hoa C. 3,253,095 63,700 2.0% 97,593 162,655 Ia Rsiom C. 2,527,044 63,100 2.5% 75,811 126,352 Kong Yang C. 2,635,858 94,100 3.6% 79,076 131,793 Kien Duc T. 4,668,492 209,500 4.5% 140,055 233,425 Krong Kmar T. 3,287,566 62,900 1.9% 98,627 164,378
Source: Household survey results

G1-33
(A) Wi llingnes s to Pay by Kinds of Sys tem
0
20
40
60
80
100
120
< 1000
1000 < 2000
2000 < 3000
3000 < 4000
4000 < 5000
5000 < 6000
6000 < 7000
7000 < 8000
8000 < 9000
9000 < 10000
> 10000
VN D /month-cap ita
No.
of H
ouse
olds
Public
Pip ed
(B ) Willingne ss to Pay for Public Wate r Supply by Prov ince
0
10
2030
40
50
< 1000
1000 < 2000
2000 < 3000
3000 < 4000
4000 < 5000
5000 < 6000
6000 < 7000
7000 < 8000
8000 < 9000
9000 < 10000
> 10000
VN D/month-capita
No.
of
Hou
seho
lds
Dac Lac Gia Lai Kon Tum
(C) Willingne ss to Pay for Piped Water Supply by Prov ince
0
10
20
30
40
50
< 1000
1000 < 2000
2000 < 3000
3000 < 4000
4000 < 5000
5000 < 6000
6000 < 7000
7000 < 8000
8000 < 9000
9000 < 10000
> 10000
VN D/month-capita
No.
of H
ouse
hold
s
Dac Lac Gia Lai Kon Tum
Figure 1.13 Ability of Willingness to Pay

G1-34
Future water needs Future water needs for domestic use, gardening, and livestock are presented in Figure 1.14. For domestic use including drinking, 80 percent of households respond that they need from 20 to 120 liters per day per person. Households that answered from 40 to 60 liters per day-person are 32 percent of total households. Meanwhile, for gardening and livestock, 54 percent of households need less than 120 liters per day, while 22 percent answered that it is unnecessary.
1.4.10 Living Condition
Income and Expenditure Figure 1.15 shows monthly income per capita. Ratio of income less than 100,000 VND/month-capita in Kon Tum province is quite high (almost three times) compared to the other two provinces. The main reason is lower income from agriculture production. Production of industrial crops is very low in Kon Tum province, while food crop production is high. Details are described in the chapter on agriculture.
Table 1.16 Average Expenditure by Expenses Items
Food Cloths House Water Electricity Fuel Education Medical service
Agriculture Other Total
Kon Tum 3,434,382 545,810 0 16,668 220,272 87,996 239,303 295,612 1,048,426 305,125 6,193,594Gia Lai 5,763,432 634,152 1,273,104 566,568 408,216 570,600 822,165 459,320 4,912,450 830,398 16,240,405Dac Lac 5,249,148 574,082 132,864 55,560 559,692 298,740 1,180,000 477,273 1,845,856 154,796 10,528,011
Source: Household survey results
Table 1.16 shows expenditure by expenses items in interviewed households. Average expenditure of interviewed households is 15,410,000 VND/year in Gia Lai province. Figure 1.16 shows proportion of each item against total expenditure. Expenses for water is high (3.5%) in Gia Lai province, while only 0.5% in Dac Lac and 0.3% in Kon Tum province.

G1-35
Figure 1.14 Needs for Water Quantity
Figure 1.15 Monthly Income per Capita Figure 1.16 Expenditures by Expense Items
(A) Need for Drinking and Domestic Use
0%
10%
20%
30%
40%
50%
< 20
41 -60
81-100
121 - 140
161 - 180
201 - 220
ober 240
Liters/person-day
(B) Need for Gardening and Livestock
0%
10%
20%
30%
40%
50%
0 41-80
121-160
201-300
401-500
> 1000
0% 20% 40% 60% 80% 100%
Kon T um
Gia Lai
Dac Lac
<100,000 100,000-200,000 200,000-300,000 300,000-400,000
400,000-500,000 500,000-600,000 >600,000
(C) Dac Lac(A) Kon Tum (B) Gia Lai
Food ClothsHouse WaterElectricity FuelEducation Medical serviceAgriculture Other

G1-36
Electricity Eighty-eight percent of total interviewed households use electricity (including batteries). Most users access the power line, while a few households in Gia Lai province use batteries. More details about access to the electricity in whole area are described in the result of RRA.
Table 1.17 Power Source for Domestic Use
Power line Battery Generator None Gia Lai 87% 3% 0% 10% Total (3 provinces) 86% 2% 0% 12%
Source: Household survey results
As Figure 1.17 shows, wood and charcoal are still the dominant source of heat for cooking, even in electrified area. About 80 percent of household that use gas for cooking are not farm households.
Type of Housing In the household survey, definitions of house type are shown in Table 1.18 and were obtained from the 1999 Population and Housing Census. Figure 1.18 shows a relationship between type of house and income.
Table 1.18 Definitions of House Type
Classification Definition - Permanent type Brick wall, ceramic roof and cement floor - Semi-permanent type Wood wall, ceramic roof, and cement floor or ground - Temporary type Any type other than above
Permanent and semi-permanent houses are common in the high-income group, while temporary types are common for the low-income group. Because people must buy housing materials in case of permanent and semi-permanent type houses, these results are directly linked to income level. It is not clear whether the difference between rates of permanent type and semi-permanent type house is related to income.
Commodity Ownership Figure 1.19 presents commodity ownership in the interviewed households.
Private transportation methods are important in terms of accessing information and interacting with people in other areas. More than half of the households

G1-37
interviewed have a motorcycle. Households that do not have either a bicycle or motorcycle account for 7% in Gia Lai province.
Having electric products is related not only to income level, but also to the situation of power supply in the residential area concerned.
Watching TV program or video is a common source of enjoyment in the lives of householders. Televisions account for the highest rate of ownership among electric products. TVs also have an important role as an information source in terms of activities of campaign and promotion.
Telephone is not yet prevalent in the interviewed households. This is also condition of infrastructure is related to expansion of user.
1.4.11 Agriculture
Agriculture is the main income source in the central highlands. Following Table 1.19 shows cultivated area and number of farmers in the interviewed households. As can be seen, households have about 2.5 ha of farmland in Gia Lai province. Farmland per farmer in Gia Lai province is 0.86 ha. This is two times of that of Kon Tum province. Agricultural production is mainly cash crops like coffee, pepper and cashew.
Table 1.19 Cultivated Area in Interviewed Households
Total farmland
(Ha)
Farm households
(Households)
Average farmland per household
(Ha/household)
Number of farmers
(Persons)
Average farmland per farmer
(Ha/farmer)
Gia Lai 493.55 198 2.49 527 0.94
Source: Household survey result

G1-38
Figure 1.17 Power Sources
Figure 1.18 Type of House and Income
Figure 1.19 Owned Commodity
(A) Power Sou rce for Cook in g
0
5
10
15
20
25
30
D1
D3
D5
D7
G1
G3
G5
G7
K1
K3
K5
Hou
seho
lds
W ood, charcol Kerosene Gas Electricity
(B) Power S ource for Ligh tin g
0
5
10
15
20
25
30
D1 D2 D3 D4 D5 D6 D7 G1 G2 G3 G4 G5 G6 G7 K1 K2 K3 K4 K5 K6
Hou
seho
lds
Kerosene Electricity
0
5
10
15
20
25
30
D1 D2 D3 D4 D5 D6 D7 G1 G2 G3 G4 G5 G6 G7 K1 K2 K3 K4 K5 K6
Hou
seho
lds
0
5
10
15
20
25
30
Inco
me
per c
apita
(VN
D/y
ear)Permanent Semi-permanent Temporary Income per capita
0%
20%
40%
60%
80%
100%
Dac Lac Gia Lai Kon T um
Hou
seho
lds
Motorcycle
Bicycle
T V
Video
Line t elephone
Mobile t elephone
Wind fan
Air conditioner
Refrigerator

G1-39
Figure 1.20 Main Agriculture Products
(A) Coffee Production (B) Pepper Production (C) Cashew Production
(D) Rice Production (F) Maize Production
(E) Cassava Production
Dac Lac Gia Lai Kon Tum

G2-1
Chapter 2 Design of Water Supply System
2.1 Framework of Water Supply Master Plan
2.1.1 Purposes
The purposes of water supply master plan is the find the best solutions for rural water supply in the study area in accordance with the National Rural Clean Water Supply and Sanitation Strategy up to year 2020 (NRWSS). As a result the selected 21 priority water supply out of all the 46 systems were planned by a centralized piped water supply network. The 21 systems are recommended to implement in the earliest stage. The water supply master plan was updated during the F/S phase for the following items:
projections of population and water demand in every system in the study area, groundwater development plan, identification of necessary treatment systems for the priority systems, preliminary drawings for the priority systems, hydraulic calculations to check pressures in the piped systems, standard designs of water supply facilities that can be used with detailed design, and cost estimates for the piped supply systems.
2.1.2 Strategy
The NRWSS gives clear targets to be achieved up to the year 2010 (phase 1) and the year 2020 (phase 2), and this study follows the same targets of the NRWSS. The NRWSS emphasizes the need for the demand responsible approaches with applying appropriate technological options, and for enabling the users to make an informed choice for the selection of the water supply system. The present study aims a groundwater development which points towards a centralized piped water supply system for the prioritized systems. Alternative options are given for the systems, where piped water supply method is insuitable. In this study the three options of water supply system are identified by the rural condition of Central Highlands. Each option was examined advantages and

G2-2
disadvantages. This is based on the effectiveness of each system for bringing clean drinking water to users, capital cost, cost and complexity of operation and maintenance, appropriate level of operation and maintenance, availability of spare parts, and economic evaluation with taking into account of the social equity and political situations.
2.1.3 Level of Service
According to the NRWSS, the users should decide the “level of service”. Service items mean:
method of supply, user demand,
service hours, and service pressure.
Level of service is described as follows:
Service item Level of Service
Supply method A: House connection by piped supply B: Public taps by piped supply C: Individual household systems such as private dug well.
Water demand NRWSS is described the demand of 60 l c d for years 2010 and 2020. Service hours Basically 24 hours.Service pressure 40 m head (4 bar) at maximum, and more than 4 m head in peak hours.
The centralized piped water supply systems will provide the opportunity for local residents to choose house connections (supply method A) and public taps (supply method B). Individual households shall be taken the simplest method for the improvement of the existing dug wells (supply method C) with the help of the user’s contribution, UNICEF and the local governments.
2.2 Water Demand Projections and Choice of Technology
2.2.1 Projection of Populations
The population was projected for the years 2005, 2010, 2015 and 2020 for all 46 systems in the study area to cover the all villages and hamlets. The population and population growth rates were collected from the 20 target communes with breakdown for each village so as to make the best planning by grouping for systems. It was collected during the 1st field investigation period, and updated at the F/S

G2-3
stage. When population growth rate is not certain by various reasons, the population growth rate is assumed to be the same as nearby commune/village. As the abnormally high growth rates of these communes will be terminated soon by the limited land space to receive migration. They are expected to continue up to 2005 and falling down to the regional average (about 2.0%) after probably 2006.
Table 2.1 Projected Populations Growth
Rate (%)Growth
Rate (%)Population Projection Commune No. of
Villages No. of
Household 2001-2005 2006-2020 2000 2001 2005 2010 2020 Gia Lai province G1:Kong Tang 11 1163 2.30 2.30 5567 5695 6237 6988 8773 G2: Nhon Hoa 15 1906 2.20 2.20 11084 11328 12358 13779 17128 G3: Chu Ty 8 1481 1.90 1.90 6377 6498 7006 7698 9292 G4-1: Thang Hung 5 858 1.70 1.70 4292 4365 4669 5080 6013 G4-2: Thang Hung 1 51 1.70 1.70 249 253 271 295 349 G4-3: Thang Hung 1 66 1.70 1.70 325 331 354 385 455 G4-4: Thang Hung 3 338 1.70 1.70 1472 1497 1601 1742 2062 G5-1: Ngia Hoa 5 696 2.00 2.00 3288 3354 3630 4008 4886 G5-2: Ngia Hoa 1 66 2.00 2.00 362 369 400 441 538 G6-1: Ia Rsion 9 710 2.00 2.00 3843 3920 4243 4685 5710 G6-2: Ia Rsion 2 134 2.00 2.00 688 702 760 839 1022 G7-1: Kong Yang 5 374 2.00 2.00 1507 1537 1664 1837 2239 G7-2: Kong Yang 1 48 2.00 2.00 212 216 234 258 315 G7-3: Kong Yang 1 26 2.00 2.00 132 135 146 161 196 G7-4: Kong Yang 2 109 2.00 2.00 547 558 604 667 813 G7-5: Kong Yang 1 50 2.00 2.00 128 131 141 156 190
*The shaded parts in the table show that rapid population growth will follow the development plan up to 2005, and will scale down (about 2.0%) after 2006 through 2020. The population projections for the other communes/towns apply the same growth rates.
2.2.2 Projection of Water Demands
The water demand projections were made based on the projected population, coverage and demand per capita (q) as followings:
Year 2001 2005 2010 2020Coverage (%) 1 25 50 85 100 Demand (q) (l c d) 2 30 30 60 60
*1: Coverage means population served as percentage of total population *2: l/c/d means litter per capita per day ** NRWSS targets
The necessary water supply quantities are calculated for setting of design factors such as, 1) daverage day demand (Qav), 2) maximum daily demand (Qmax), and 3) maximum hourly demand (qmax). The formula to calculate necessary water supply quantity are shown in the following tables. These calculated results are to be used for the design of the water supply facilities in each system.

G2-4
Necessary water supply quantity
Definitions
Average Day Demand (Q av)
Qav = capita * q * 1.2 20% is added here for leakage.
This will require a very efficient O&M planning, otherwise the leakage will be higher.
Maximum daily Demand (Q max)
Qmax = Qav * 1.3 coeffi cient value (1.3) is applied referring Japanese standard of 1.28. Qmax is used to determine:
Number of required wells (depending on yield), Dimensions of raw water pipes, Dimensions of treatment plants, Dimensions of elevated tanks, and Dimensions of reservoir tanks.
Maximum Hourly Demand (qmax)
qmax = Qmax *2.0/24 =1.3 *2.0 Qav /24 coeffi cient value (2.0) is applied referring Japanese standard for rather small piped system in rural area.
qmax is used to determine dimensions of transmission and distribution pipes.
Table 2.2 Calculation of necessary water supply quantity Gia Lai Province Qav: Daily average supply (m3/day) Qmax: Daily maximum supply (m3/day) qmax: Daily maximu m hourly supply (m3/hour)
Year 2001 2005 2010 2020 Community Qav Qmax qmax Qav Qmax qmax Qav Qmax qmax Qav Qmax qmax
G1 Kong Tang 51.3 66.6 5.55 112.3 146.0 12.16 427.7 556.0 46.33 631.6 821.1 68.43G2 Nhon Hoa 102.0 132.5 11.04 222.4 289.2 24.10 843.3 1096.2 91.35 1233.2 1603.2 133.60G3 Chu Ty 58.5 76.0 6.34 126.1 163.9 13.66 471.1 612.4 51.04 669.0 869.7 72.48G4-1 Thang Hung 39.3 51.1 4.26 84.0 109.3 9.11 310.9 404.2 33.68 432.9 562.8 46.90G4-2 Thang Hung 2.3 3.0 0.25 4.9 6.3 0.53 18.0 23.4 1.95 25.1 32.7 2.72G4-3 Thang Hung 3.0 3.9 0.32 6.4 8.3 0.69 23.5 30.6 2.55 32.8 42.6 3.55G4-4 Thang Hung 13.5 17.5 1.46 28.8 37.5 3.12 106.6 138.6 11.55 148.5 193.0 16.09G5-1 Ngia Hoa 30.2 39.2 3.27 65.3 84.9 7.08 245.3 318.9 26.57 351.8 457.3 38.11G5-2 Ngia Hoa 3.3 4.3 0.36 7.2 9.4 0.78 27.0 35.1 2.93 38.7 50.3 4.20G6-1 Ia Rsion 35.3 45.9 3.82 76.4 99.3 8.27 286.7 372.7 31.06 411.2 534.5 44.54G6-2 Ia Rsion 6.3 8.2 0.63 13.7 17.8 1.37 51.3 66.7 5.13 73.6 95.7 4.42G7-1 Kong Yang 13.8 18.0 1.50 29.9 38.9 3.24 112.4 146.2 12.18 161.2 209.6 17.47G7-2 Kong Yang 1.9 2.5 0.21 4.2 5.5 0.46 15.8 20.6 1.71 22.7 29.5 2.46G7-3 Kong Yang 1.2 1.6 0.13 2.6 3.4 0.28 9.8 12.8 1.07 14.1 18.4 1.53G7-4 Kong Yang 5.0 6.5 0.54 10.9 14.1 1.18 40.8 53.0 4.42 58.5 76.1 6.34G7-5 Kong Yang 1.2 1.5 0.13 2.5 3.3 0.28 9.5 12.4 1.03 13.7 17.8 1.48
2.2.3 Choice of Technology
The NRWSS stresses the need for appropriate technology, easy operation and maintenance, low cost and sustainability. This section is described the three main technical options that may be suitable for the selection of the system in the study area: 1) centralized piped network, 2) small piped network, and 3) household system.

G2-5
(1) Option 1 Centralized Piped Network Centralized piped supply is applicable for the 21 systems prioritized in the previous chapter to meet immediate catch up the NRWSS target by its large size water supply. A piped system enables all (or most) of households to be connected to a piped water supply system. General descriptions of this option is as follows:
Densely populated areas are feasible for this solution. The water source will be a deep well for most communities, although some communities may be supplied from a surface water source. This option can centralize more complicated processes such as water treatment and pump operation. A single operation and maintenance organization will be needed. Relatively long supply pipelines will be needed if the housing density is not high enough (e.g. as the systems in Kon Tum province). Long lines place a higher demand on maintenance in order to avoid high leakage rates (up to 50 % or more). As the users will have to pay for the connection themselves, it may be a problem for poor households. In areas with high poverty rates there could also be a number of public taps. Public taps are furthermore included for kindergartens, schools, health clinics, hospitals and other public utilities.
Photo 1 shows the central of D6 (Kien Duc town). This is a semi-urban area with little resemblance to a rural area. A centralized piped water supply system is feasible.
(2) Option 2 Small Scale Piped Network In the small scale piped network option, each (or a few) village has its own small piped network. General descriptions of this option are as follows:
This option is suitable for small communities/hamlets located in remote areas far from the main communities and with small number of households (from 2-100). A shallow well with a sufficient yield is needed to use for this option for all the communities. A treatment plant have to be constructed in each community (if needed). The construction cost per capita of this option may become high.

G2-6
Photo 2 shows a remote area in G4-2, with long distance between houses in the villages. This option will actually appoints after examining the location of water sources and the degree of treatment requirement.
(3) Option 3 Household System Dug wells often get polluted and they have risk for drying up in the dry season. The polluted water of the dug wells can be solved by improvement of the shallow wells e.g. covering apron, installation of hand pump and possibly lining of the well. General descriptions of this option are as follows:
Simple filters to remove iron and to some extent bacteriologic contamination may be needed. This option is relatively inexpensive and requires little operation and maintenance. Improved sanitary and hygienic practices are important.
Photo 3 shows a dug well in D3-3. It is well constructed with apron and raised side. It might be improved with a hand pump or possibly a small electric pump, thereby reducing the risk of contamination and making operation easier.

G2-7
Photo 1 Semi-urban area (D6). Well suited for piped water supply (Option1)
Photo 2 Thinly populated area (G4). Long pipelines increase cost and risk of leakage (Option 2)
Photo 3 Dug well. Well constructed with apron and raised sides.
This type could be improved with a handpump or small electric pump (Option 3)

G2-8
The plan includes two phases (phases 1 and 2) in accordance with the NRWSS. The following shows the consequences of each phase:
Phase Water supply Supply by centralized piped water network is implemented in larger, densely populated 21 systems prioritized for piped supply systems. Water supply is improved in other areas by improving household systems, mostly shallow dug wells. Extending the distribution pipes of the already established network continues the improvement of the supply. New piped networks are constructed in such systems for high population growth areas.
The summary of the selection of the options is shown in the table below, and the water supply plan to be used option for a total of 46 systems is shown in Table 2.3.
Phase Option Number of systems Total Remarks
Kon Tum:5 Gia Lai: 7 Option 1 DacLac: 9
21 systems Priority projects for option 1 were further investigated at the F/S stage and described herewith.
Option 2 No system - No system is recommended for a small piped system at phase 1.
Kon Tum:13 Gia Lai:9
Phase 1
Option 3 Dac Lac: 3
25 systems
Improvement of the existing dug wells, and construction of dug wells are realistic for remote areas. No groundwater sources were identified in K5 and K6.
Kon Tum:9 Gia Lai: 7
Option 1 DacLac: 10
26 systems
Distribution pipes of the firstly prioritized systems will be extended, and connected to some neighboring systems. Systems in K4-3, K4-4, K5, K6, D3-3 may be included in piped network if enough financial and water resources are promised.
Kon Tum:3 Gia Lai: 0 Option 2 DacLac: 0
3 systems 3 systems with a population more than 1,000 may be appropriate for small piped systems at phase 2 if fund is available.
Kon Tum:6 Gia Lai 9
Phase 2
Option 3 DacLac 2
17 systems Systems with a population less than 1,000 even at phase 2 are not suitable for piped systems.
Note: Phase 1 means the period of 2003 – 2010, and Phase 2 means the period of 2010 –2020.

G2-9
Table 2.3 Water Supply Plan Population System
2000 2010 2020 Phase 1
(2003-2010) Phase 2
(2010-2020) GIA LAI G1 Kong Tang 5567 6988 8773 Option 1 Extension of distribution pipes G2 Nhon Hoa 11084 13779 17128 Option 1 Extension of distribution pipes G3 Chu Ty 6377 7698 9292 Option 1 Extension of distribution pipes G4-1 Thang Hung 4292 5080 6013 Option 1 Extension of distribution pipes G4-2 249 295 349 Option 3 Option 3 G4-3 325 385 455 Option 3 Option 3 G4-4 1472 1742 2062 Option 3 Option 3 G5-1 Nghia Hoa 3288 4008 4886 Option 1 Extension of distribution pipes G5-2 362 441 538 Option 3 Option 3 G6-1 Ia Rsion 3843 4685 5710 Option 1 Extension of distribution pipes G6-2 688 839 1022 Option 3 Option 3 G7.1 Kong Yang 1507 1837 2239 Option 1 Extension of distribution pipes G7-2 212 258 315 Option 3 Option 3 G7-3 132 161 196 Option 3 Option 3 G7-4 547 667 813 Option 3 Option 3 G7-5 128 156 190 Option 3 Option 3
Note: The areas with shaded mark are correspondent with the priority systems.
2.3 Groundwater Development Plan
2.3.1 Present Groundwater Resources
Out of the 21 priority systems, the water sources have been identified for 19 systems: the groundwater resources for 17 systems. The safe well yields for the 7 wells explored by the study team and the 2 existing wells to be integrated are shown below.
Table 2.4 Safe Well Yields of Explored Wells
Prioritized System Safe well yield
(m3 day) (liter sec)
Geology Remarks
Gia Lai province G1 Kong Tang 322 3.7 Basalt ( N2-Q1) Conf ined aquifer G2 Nhon Hoa 173 2.0 Basalt ( N2-Q1) Conf ined aquifer G3 Chu Ty 317 3.7 Basalt ( N2-Q1) Conf ined aquifer G4-1 Thang
Hung 259 3.0 Basalt ( N2-Q1) Conf ined aquifer
G5-1 Nghia Hoa 173 2.0 Basalt ( N2-Q1) Conf ined aquifer G6-1 Ia Rsiom 406 4.7 Quaternary sediment (Q),
Jurassic sandstone (N) Conf ined aquifer
G7-1 Kong Yang 432 5.0 Basalt ( N2-Q1) Conf ined aquifer
* Based on the pumping test of the existing boreholes for D2 and D6
Basalt covers most of the communes/towns in Gai Lai and Dac Lac provinces, except for the target communes of Kon Tum province, G-6 (Ia Rsiom commune).

G2-10
The 7 wells explored by the study team have enough quantity of water for the initiation of the piped supply systems. However, in a number of systems the quantity of water will be insufficient.
2.3.2 Necessary Groundwater Development
The following table shows the numbers of wells which will be required by 2010 and 2020 based on the water supply plans and safe well yields of the wells used for piped supply. The number of necessary wells in 2010 and 2020 were calculated based on the before described maximum daily demand (Qmax) and safe well yield obtained by groundwater investigation. The present quantity of water in the wells of K1-1, G2, and D2 will not satisfy the future water demand even in 2005. In K1-1 there is a need to explore 7 more wells up to 2010, and 6 more in D2, 5 more in G2 and 3 more in D6. The explored wells in K2-1, K3-1, G6-1, and G7-1, have enough water for water supply plans and will not require any additional wells up to 2010.
Table 2.5 Number of Required Wells
Water supply plan (m3/day) Required wells Prioriti zed system
Safe well yield
(m3/day) 2001 2005 2010 2020 2010 2020 G1 Kong Tang 322 66.6 146.0 556.0 821.1 1 1 G2 Nhon Hoa 173 132.5 289.2 1096.2 1603.2 6 3 G3 Chu Ty 317 76.0 163.9 612.4 869.7 1 1 G4-1 Thang Hung 259 51.1 109.3 404.2 562.8 1 1 G5-1 Ngia Hoa 173 39.2 84.9 318.9 457.3 1 1 G6-1 Ia Rsion 406 45.9 99.3 372.7 534.5 0 1 G7-1 Kong Yang 432 18.0 38.9 146.2 209.6 0 0
The necessary drilling points in future are shown with the shadow zones in the figures in the Supporting Report-A labeled “Groundwater potential and the most promising drilling area”. The exact locations shall be decided through the discussion with the people’s committee and PCERWASS to avoid private land. The location of well to be constructed shall also be decided considering well interval of 300m or over, distance from latrine (shall be 50m apart from latrine) or to prevent noise pollution (shall be 20m apart from house). For the purpose of selecting of potential groundwater areas in the study area, geophysical prospecting by electrical and electromagnetic sounding was carried out in the first field investigation stage The resistivity of weathered or fractured saturated rocks and sedimentary rocks becomes lower. Water along faults and fractures in the rock will demonstrate low resistivity anomalies against the compact

G2-11
and fresh rock. Very low resistivity - less than 10 ohm-m - possibly indicates existence of a high content of clay. The resistivity of promising zones, that could be an aquifer, ranges from 30 to 100 ohm-m, reflecting the drilling experience of this study. The successful ratio by the 20 drilling was 90% (17 wells were constructed). The sites for the future production wells could be close to the successed exploratory wells because the hydrogeological data and the results from the electrical sounding and electro-magnetic survey in the first investigation are available to analyze the suitable location for drilling. In this case, further geological and hydrogeological investigations can be avoided.
2.3.3 Drilling Method
After identifying potential groundwater areas, drilling will be carried out by the following order: 1) drilling work, 2) geophysical logging, 3) reaming of holes, 4) installation of casing and screen pipes, and 5) gravel packing and grout sealing.
(1) Drilling Work Core drilling was performed by a hydraulic driven rotary machine in the first field work. Considering the difficulty of drilling and enormous time for reaming work by old rotary machines in Vietnam for hard basalt layers, it is recommendable to employ down-the-hole (DTH) method which is the latest type of drilling rig to be provided. Typical well design is shown in Appendix 1. Water level shall be measured and recorded during drilling work. When a portion of outstanding loss of drilling water or spring-up of groundwater is encountered, the depth of the portion shall be recorded with the discharge rate.
(2) Geophysical Logging Immediately after the completion of drilling work, electrical logging will be made using logging devices of the latest model of real time recording system at site to be provided. The logging record will be used in the casing and screen program to be installed in the drilled hole.

G2-12
(3) Reaming of the Pilot Hole After completion of geophysical logging, reaming work is conducted to make a hole wider, if the old type of drilling machine is employed in future work. The latest drilling rig will not require such reaming work when the procurement of machine is possible. Enormous amounts of time can be saved by deducting the reaming work by the latest rig.
(4) Installation of Casing and Screen Pipes The following table shows the specifications of the necessary casing and screen pipes for future well construction. The following pipes which were provided by JICA remain at the sites after drilling and constructing the 20 exploratory wells. It is recommended that the remaining pipes be used to minimize the construction cost with high quality wells. In total, 1,188m of the remaining pipes shall be approximately equivalent to 12 wells 100 m deep on average. However, the material of pipes may not be Fiber Reinforced Polymer (FRP) for the local construction when the remaining pipes are thoroughly consumed.
Table 2.6 Casing and Screen Pipes Type of Pipes Material of Pipes Size of Pipe Remaining Q’ty
FRP 150mm (dia.) x 4m (L) 1,096m ScreenFRP 150mm (dia.) x 2m (L) 476m FRP 150mm (dia.) x 4m (L) 380m Casing FRP 150mm (dia.) x 2m (L) 4m
Bottom Plug FRP 150mm (dia.) 74 pieces Centerizer Made by copper 150mm (dia.) 39 pieces
FRPM 150mm (dia.) x 2m (L) 4m ScreenFRPM 150mm (dia.) x 4m (L) 52m FRPM 150mm (dia.) x 4m (L) 340m Casing FRPM 150mm (dia.) x 2m (L) 4m
Bottom Plug FRPM 150mm (dia.) 1 piece Centerizer Made by copper 150mm (dia.) 53 pieces
The drilled hole shall be vertical and straight enough to install the casing and screen pipes, and to allow the packing of the homogeneous gravel in the space between the casing and screen pipes and the drilled hole. On the basis of the lithological and logging records, the casing program shall be formulated for each well. In accordance with the casing program, bottom plug, screen and blank casings shall be installed in the center of the drilled hole. The centralizers shall be attached to the said pipes at every six (6) meters interval from the bottom.

G2-13
(5) Gravel Packing and Grout Sealing Immediately after the casing installation completed, gravel packing shall be carried out into the annular space between the pipes installed and the hole. The packing gravel shall be composed of round shaped siliceous materials and selected gradation. Gravel shall be dropped at an equal rate, not so as to occur sticking and bridging of gravel at the space. Drill-cut or impervious materials may be packed at the blank casing portion near the surface. Finally, the annular space between the hole and casing pipes at the upper-most ten (10) meter portion of all the holes shall be sealed perfectly by cement grouting to avoid the infiltration of surface water.
2.3.4 Water Quality and Necessary Treatment
(1) Review of Water Quality Analysis Water quality analysis was carried out for 23 items shown in Chapter 2 in the first investigation and for 3 items (coliform, nitrate, and nitrite) in the F/S period. Necessary treatment is decided based on the result of the water quality analysis of the exploratory wells and in accordance with Standard 505 of the MOH for separate systems and rural areas. The standard is somewhat more lenient than the WHO standard for some parameters, e.g. an iron content of 0.5 mg/l is allowed. The following general observations are made:
The iron content of groundwater was high in G1, G6-1, and G7-1. Iron and manganese in the water do not pose a health risk, but they leave colored deposits in installations or stains on clothes, and unpleasant taste.
Some manganese content is found in G2, G4-1 and G7-1. Low pH means that the water is corrosive and may corrode house installations and pipes made out of metal. Aeration facility is recommended to adjust pH value.
The water is generally soft. Some of the groundwater samples have a certain level of coliform. Water taken from G7-1 has unpleasant smell. No treatment is necessary for arsenic and fluoride. Dioxin was not detected in the 3 analyzed samples (G3).

G2-14
(2) Recommendations for Treatment The following preliminary recommendations on treatment can be made, and an overview is seen in the following table.
pH adjustment can be done by neutralizing the corrosiveness by adding chemicals (usually lime). This complicates the operation of the systems and it will only be recommended for the larger systems, if the analysis from the deep wells shows that it is necessary. Level of pH could be adjusted by aeration, but this effect shall be checked through the monitoring of the pilot model plants. Chlorination may be avoided for small systems as it complicates the operation and maintenance with high cost of O&M. However it cannot totally be avoided if coliform is still found. For the larger systems, a chlorinator should principally be installed. Iron removal may be necessary in the systems of G1, G6-1, and G7-1. Manganese removal may be required in the communes G2, G4-1, and G7- 1. For the system of K4-1, surface (river) water is often subject to bacteriological contamination. In the rainy season the water often becomes turbid, which complicates the treatment. In addition, the river water contains a high content of iron. The water should consequently be treated for removal of turbidity and the water should be disinfected. A simple technology option has been recommended for treatment of surface water. The need for treatment should be reconfirmed by repeated water quality analysis before the detailed design.
Table 2.7 Recommended Treatment Treatment
System Source Problem Filtration pH adjust. Recommended Disinfection
G1 Deep well Iron Aeration + Slow sand filter No Chlorination
G2 Deep well Mangan. Aeration + Slow sand filter No Chlorination
G3 Deep well None No treatment No Chlorination
G4-1 Deep well Mangan. Aeration + Slow sand filter No Chlorination
G5-1 Deep well None No treatment No Chlorination
G6-1 Deep well Iron Aeration + Slow sand filter No Chlorination
G7-1 Deep well Iron
Mangan. Smell
Aeration + Slow sand filter No Chlorination

G2-15
2.4 Design for Piped Schemes
2.4.1 Design Principles
“Appropriate technology” or even “low technology” should not necessarily mean
“low cost”. Even though less advanced methods are recommended, the materials
used should be good. The following are the basic recommendations for the design
principles of the piped supply systems.
Simple (or manual) pump controls are recommended.
As far as possible gravity will be used for transport of water.
Local materials should preferably be used for construction in order to
ensure the availability of spare parts.
Pipe material and fittings should be of good quality in order to minimize
pipe bursts and leakage.
Water meters are delicate equipment and only good quality meters should be used, otherwise they will quickly break down or the accuracy
will degrade. Only dry-dial meters should be used, as even the allowed iron
content of 0.5 mg/l may be harmful to wet-dial meters.
Pumps with good efficiency should be used in order to save operating
costs.
Installations should be properly performed. Poor pipe work will certainly
increase leakage rates.
2.4.2 Design Criteria
This section includes the Vietnamese design criteria “TCXD 33 (1985)” for water
supply external networks and facilities design standard. This master plan follows
this design criteria, and the following table shows the design items and design
criteria.

G2-16
Table 2.8 Design Criteria Design Item Design Criteria
Service hours Basically 24 hours. Submersible
Pumps Submersible pumps are dimensioned to deliver the maximum daily supply (Qmax) in 2020 around 20 hours pumping (4 hours is considered for sudden public power drop and maintenance).
Booster pumps Booster pumps pumping to elevated tanks should deliver the maximum hourly supply (qmax).
Distribution Pipe Dimensions
The distribution pipe dimensions will be calculated so as to deliver the required servi ce pressure in the maximum hourly supply (qmax) for 2020.
Treatment Plants Treatment plants will be dimensioned for delivering the maximum daily supply (Qmax) within 20 hours in 2010 and less (corresponding to the demand) before that.
Reservoirs Reservoir size will be constructed to balance the fluctuating demand from the distribution system against the output from the raw water supply, and to act as a safeguard for the continuation of the supply should there be any breakdown or stop by maintenance at the sources. The dimension is as 8 times the average hourly demand in the maximum daily supply (Qmax) for 2010.
Elevated Tanks Elevated tanks are set for the accumulation of water pressure, and usually are located at the highest locations close to reservoirs. Elevated tank size is determined by the consumption in the average hourly demand in the maximum daily supply (Qmax) for 2020.
Service Pressure Pressure at user should be: Maximum: 40 m (4 bar). Higher pressure (up to 6 bar) can be accepted in some areas if no other source is available. Pressure reducing installations should be considered. Minimum: 6 m (0.6 bar). In the peak situation 4 m may be accepted in small areas if the achi evement of higher pressure will be costly.
Public Taps Public taps will be installed at all public buildings, e.g. peoples committee offi ces, schools, kindergartens, health centers etc. The communities may decide on more public taps to be installed.
Bulk Water Meters
Bulk water meters are to monitor water production and consequently unaccounted-for water, in various areas of the water supply system. Bulk water meter shall be installed in the front of each village/hamlet and/or diverging point from main distribution pipeline to secondary pipeline.

G2-17
2.4.3 Alternatives for the 21 Piped Schemes
The 21 prioritized systems are varying with regard to elevations and pressure, and
the locations of the water supply facilities should be efficient. This section prepares
the six main alternatives for economical centralized piped supply as described
below:
(1) Alternative 1 This solution is proposed in systems with small variations in ground elevation.
For example, where it is not possible to position a reservoir on high ground,
and supply the distribution system by gravity. It can also be proposed in areas
where there is no need for water treatment (excepting chlorination).
Water is pumped directly from a deep well submersible pump to a ground level
reservoir for storage. From this reservoir, the booster pumps transfer water to
an elevated tank (8 to 10 meters in height). From the elevated tank the water
flows by gravity to the piped distribution network.
(2) Alternative 2 This solution is proposed where simple water treatment is necessary, which
basically involves removal of excess contents of iron and manganese.
Chlorination after slow sand filtration may require when a long retention time
is expected by large scale reservoir.
The deep well submersible pumps transfer water through a treatment plant
(aeration tower and slow sand filtration) to a ground level reservoir. Booster
pumps then transfer water to an elevated tower, from where the water flows by
gravity to the distribution network.
(3) Alternative 2a This variation of Alternative 2 is proposed where the topography allows for a
treatment plant and reservoir to be placed at relatively high ground. There is no
need for booster pumps or an elevated tower (example: K3-1).
The main problem of this alternative is to locate a suitable position for the
treatment plant at a relatively high ground level, while considering that there
will also be the need for proper access to the treatment plant (the requirement
for access to a reservoir only is less critical). Optional chlorination at filtration.

G2-18
(4) Alternative 2b This variation of alternative 2 is proposed where it is not possible to find a
suitable location for a treatment plant for iron or manganese removal at a high
position. Consequently, the treatment plant may be placed near the deep well,
and the water boosted to a reservoir site. From the reservoir, the water flows by
gravity to the distribution network.
This solution introduces the need for secondary booster pumps, however, an
advantage is that the treatment plants can be more conveniently positioned with
easy access.
(5) Alternative 3 This solution is proposed for the treatment of surface water. The intake consists
of a concrete inlet chamber along river cource. Simple treatment plant which
consists of a roughing filter (pre-filter) will be installed in front of raw water
pipeline. The treatment facility and reservoir of slow sand filter and
chlorination shall be planned by gravity system. From there the water pumps
up to elevated tower reservoir.
In order to reduce the power cost a gravity system of the treatment plant, the
topographic survey was carried out for the upstream of conceivable treatment
plant. The intake is selected 1 km upstream of the treatment plant. Therefore, a
raw water pipe of at least 1 km in length would be necessary.
(6) Alternative 4 This is the proposed simple solution in areas where there is no need for water
treatment (apart from optional chlorination), and where the topography allows
for a ground level reservoir to be placed at a site of high ground elevation.
Direct pumping from a deep well to a reservoir located on a high ground.
Table 2.9 shows the overview of proposed water supply systems, summarized
in.

G2-19
Table 2.9 Overview of Proposed Water Supply Systems Prioriti zed
System Alternative Description and Comments
GIA LAI G1 Kong Tang
2 Water pumped directly from deep wells through the treatment plant to the ground level reservoir (both placed at the highest point of the villages). Iron removal treatment by aeration and slow sand filtration. Treated water is boosted to an elevated reservoir and gravitates to the villages.
G2 Nhon Hoa
2a Water is pumped directly from deep wells through the treatment plant to the ground level reservoir (both placed at the highest point of the villages). Treatment: manganese removal by aeration and slow filtration. Treated water is boosted to an elevated reservoir and gravitates to the villages. Note: the content of manganese is to be confirmed.
G3 Chu Ty
4 Water is pumped directly from the deep well to the ground level reservoi r placed at high location. Water gravitates to the network.
G4-1 Thang Hung
2 Water is pumped directly from deep wells through the treatment plant to the ground level reservoir. Treatment: manganese removal by aeration and slow sand filtration. Treated water is boosted to an el evated reservoir (placed at the highest point in the villages) and gravitates to the villages. Note: the content of manganese is to be confirmed
G5-1 Nghia Hoa
1 Water is pumped directly from the deep well to the ground level reservoi r. Water is boosted to an elevated tower from where the water gravitat es to the villages.
G6-1 Ia Rsion
2 Water is pumped directly from deep wells through the treatment plant to the ground level reservoir. Treatment: iron and manganese removal by aeration and slow sand filtration. Treated water is boosted to an el evated reservoir (placed at the highest point in the villages) and gravitates to the villages.
G7-1 Kong Yang
2 Water is pumped directly from deep wells through the treatment plant to the ground level reservoir. Treatment: iron and manganese removal by aeration and slow sand filtration. Treated water is boosted to an el evated reservoir (placed at the highest point in the villages) and gravitates to the villages.
2.4.4 Water Supply Drawings
The diagrams in attached in the last of this Chapter 2 (“Layout Drawings of Water
Supply System”) detail the final proposed water supply networks for each of the
systems. This section provides a general description of the contents of the drawings
as well as comments on particular details and restraints.
The layout drawings in attached in the last of this Chapter 2 have been updated
where necessary, of which the changes and additions by the updated results are:

G2-20
Newly decided intake location and raw water pipe line route,
Addition of some main distribution pipes,
Change in pipe lengths and diameters of several main distribution pipes,
The proposed location of water treatment plants,
Change of location of elevated reservoirs (K4-1 and G4),
Inclusion of water supply network diagram for D3-2.
(1) Deep Wells The locations of the wells drilled by the study team are shown in the drawings.
There are also existing deep wells in D2 and D6, which are planned to be
incorporated into the water supply systems in future. Although more than one
deep well is required for most systems in order to cover the user demand at
phase 1, the final location of these wells shall be confirmed in detailed design
phase.
(2) Target Area and Water Supply Plan The layout drawings indicate the main areas proposed to be supplied with
piped water, i.e. the names and locations of villages. Areas of future
development are also shown in the drawings, where plans for such
development were informed (e.g. for G1, D1, D6 and D7).
The maximum hourly supply for year 2020 is shown for all villages in the
layout drawings. The maximum hourly supply for year 2000 is the basis for the
design of pipelines.
(3) Raw Water Pipes Proposed routing and diameters of raw water pipelines are shown in the
drawings. The routing was chosen so that the pipelines would always run
alongside roads for easy identification and maintenance, and simpler location.
For the raw water pipes from new deep wells, which have not been identified, a
length of 1,500 meters for these raw water pipes has been conservatively
estimated and included in the design and cost estimates considering the present
conditions.
(4) Main Distribution Pipes The main distribution pipes are shown in the drawings with diameter and
approximate length indicated. The diameters of the pipes were designed for
year 2020, based on hydraulic calculations described in the next section.
The main distribution pipes can supply all main areas with water at sufficient
pressure, such that the secondary network (which will be designed during the

G2-21
detailed design phase) can supply all households. Main distribution pipes are
normally of diameter 75 mm to 200 mm.
Distribution pipes should preferably be constructed along roadside shoulders
for easy access and maintenance, however this installation may not always be
possible.
The systems in D6 and D7 have an existing, limited, piped water network and
these are included in the design.
(5) Secondary Distribution Pipelines For most systems many of the houses were concentrated along the main roads.
Thus, one main distribution pipeline along each side of the main road where
the residential people request it could supply most of the households. There are
some houses located away from the concentrated area along the roads, so
several secondary pipes are necessary to enable water supply to these areas.
Secondary pipelines are normally of diameter 25 to 65 mm.
Secondary pipes will be designed during the detailed design phase, such that
water supply pipelines are located near all households and thereby enabling
them to connect to the system. Secondary pipelines are generally not shown in
the drawings of this report, however the required quantities to supply all houses
in the villages have been estimated.
The quantity of secondary pipes needed was estimated following the criteria
below:
An estimate of the length of the village,
The need for one or two pipes along the road to the village,
Interconnection pipes were added.
(6) Proposed location of Treatment Plants and Reservoirs The proposed location of treatment plants and reservoirs were determined
taking into account the following:
Water should be directly transferred by submersible pumps to treatment
plants, and flow by gravity to the reservoirs, in order to avoid secondary
pumping. This may not always be possible because the location of
treatment plants (e.g. on hilltops) may be unfavorable, with regards to site
access.
If possible, reservoirs should be located at high locations, so that the water
can gravitate to the system.

G2-22
♦ Space for the construction of treatment plants and reservoirs should be readily available.
♦ The water works should preferably be placed on public ground, in order to avoid compensation to private landowners.
(7) Public Buildings Public buildings (e.g. CPC, TPC, Schools, Kindergartens and health clinics) are shown in the drawings. Public taps should be installed in the vicinity of all public buildings.
2.4.5 Hydraulic Calculations
The proposed water supply schemes have been analyzed using a computer aided hydraulic calculation software package for piped networks, specifically “Epanet”. The “Darcy-Weiss” equation was the basic calculation process for the analysis.
(1) Analysis Guidelines The following guidelines were applied for the analysis: ♦ Pipe dimensions listed in the tables are internal diameters. ♦ The maximum hourly supply in year 2020 was used for dimensioning the
pipes. This provided a conservative calculation for the design in all periods up to year 2020.
♦ A number of the systems were further analyzed in order to determine and view how flow and pressure varied during the course of an average day.
♦ A pipe roughness factor of 0.1 mm was used. This is a conservative value, which takes into account the possibility of deposits on the pipe wall over time (a typical value for new pipes is 0.01 to 0.05).
♦ All main distribution pipelines in the system were included in the analysis. Some secondary pipelines were also included for several systems.
♦ Pumping mains were generally not included in the analysis as the design of a single pumping pipe is relatively simple and does not require computer analysis. Design of pumping mains with multiple pumps networked together may be more complicated, however as the locations and details on future deep wells are not yet known, the multiple pump case cannot be analyzed at this stage.
♦ Water supply quantities were distributed amongst network nodes on the basis of water demands and knowledge gained from inspections during the field surveys. The supply quantities were distributed in a conservative

G2-23
manner by, for example, placing half (or a third) of the consumption at the
farthest point of the pipe.
The criterion for minimum pipe pressure was 6 meters head at all locations,
but preferably up to 7 meters, so as to take into account friction losses in
secondary pipes.
Alternatively, it is sound practice to maintain minimum flow velocities in
the pipes (preferably above 0.2 m/s). This is in order to avoid stagnant
water and to achieve a self-cleaning effect within the pipes.
Accurate pipe invert levels are of high importance towards accurate results
of the analysis. Surface levels have been obtained during the field visits
with the use of altimeters and by the study of topographic maps (1:50.000).
Several critical lines were subject to carry out a topographic survey, in
order to confirm the levels of the main areas for supply. However,
elevations of some secondary pipe routes may still not be sufficiently
accurate and should be confirmed during detailed design.
(2) The Results of the Analysis The results of the analysis is included in Dat aBook, together with print outs of
the results in the form of network maps. The results are graphically shown on
the maps, featuring pressures for the nodes and flow velocities for the pipes
(values are shown underneath the respective nodes and pipes, with node
numbers and pipe numbers also shown). Tables of the analysis results are
included after each network map, detailing complete information on the water
supply system flows and pressures.
Tables specify elevations, supply quantity and pressures for the nodes; and
lengths, dimensions, velocities and head losses (per km) for the pipes.
The following significant results of the analysis can be seen:
Generally, there were no problems in achieving the required pressures
throughout most areas in the network. However, there were isolated areas
where it was difficult to reach sufficient pressure during maximum hourly
supply times. During times outside the maximum hourly supply periods
(usually lasting only a few hours per day) there was no difficulty for all
areas in obtaining sufficient pressure.
A maximum height limit for elevated reservoirs of 10 meters was used in
the analysis. Higher pressures can be achieved by increasing the height of
these towers.

G2-24
Water Supply networks can be adjusted to optimal pressures and supply
flows with the aid of computer software calculations. The resulting output
often lists many different pipe dimensions and numerous changes in
dimensions along pipes. Some such results are not desirable with regards to
operations and maintenance, so repeated changes to pipe dimensions were
subsequently avoided and the results altered accordingly.
One particular result of the computer analysis was that the outskirts of
systems only required very small pipe diameters. However, allowing for
future water supply system expansion, these very small dimensions (below
65 mm) were avoided at pipe ends in most networks.
The analysis results formed, in part, the basis for the estimation of pipe
quantities. However, most secondary pipes will only be correctly evaluated
after detailed survey maps are completed and detailed design has been
performed. At this stage, lengths of such secondary pipes have been only
approximately estimated from information gathered during site visits.
2.5 Standard Designs of Water Supply Facilities The main components of each proposed network system are outlined in Appendix 2
(“Spreadsheet on Design of Water Supply Facilities”). Typical designs of the water
supply works have been prepared and the drawings are included in Appendix 3
(“Standard Designs of Water Supply Facilities”).
A general summary of specifications for water supply works is presented below.
The designs have been detailed to an extent that they can easily be modified to the
single communes with regard to dimensions.
The following Standard Drawings are included:
Typical deep well structure,
Typical design of well head and well house building,
Typical iron and manganese removal plant (aeration tower, reaction tank, and
slow sand filter),
Typical surface water treatment plant (horizontal roughing filter and slow sand
filter),
Chlorination system,
Sludge basins and sand washing basins,
Typical reservoirs,
Pumping stations,
Pipelines,

G2-25
Typical public taps - Alternative 1 to 3, and
Water meters.
2.5.1 Well Head
The proposed assembly of a wellhead consists of: air valve, pressure gauge (0 to 10
bar), non-return valve, gate valves, water meter, pipework, and anti-waterhammer
protection (optional).
None of the wellheads included in the study required pipes greater than 100 mm in
diameter, and most wells shall only require 80 mm diameter pipeworks. Pipework
may be fabricated from galvanized iron.
Pump house should be equipped with a tripod with crane for the well house
buildings for easy installation and removal of the submersible pumps.
Waterhammer analysis should be carried out on in detailed design stage all
pumping mains and protection against waterhammer pressure surges should be
installed at pump stations as needed.
2.5.2 Iron and Manganese Removal
The designs illustrate a typical Vietnamese standard design for iron removal plants,
which is considered appropriate, considering the water quality test results in the
study area. The following are the important points concerning iron and manganese
removal:
Manganese removal can be performed by means of aeration and slow sand filtration. This process requires very effective aeration and careful
operation of the filter, which should never become dry and should preferably
receive a constant flow of water.
The purpose of aeration is to provide sufficient time for the iron and
manganese oxidization reaction processes to complete. The hydraulic retention
time should be approximately 40 minutes.
The aeration system consists of a series of small water pipes (25 mm dia.)
perforated with outlet holes (3 - 5 mm dia. at approximately 50 mm spacing),
from where the outflow of water falls down upon a series of plates in turn, and
finally on to the surface of the reaction tank. Some maintenance is necessary
because the pipe outlet holes may become blocked with iron deposits over
time.

G2-26
Proper ventilation is necessary to enable the supply of sufficient oxygen, as
well as assisting in the removal of possible dissolved gases in the water, such
as hydrogen sulphide.
Removing the products created during the iron and manganese oxidization
processes is achieved by the use of a filter, consisting of several sand layers of
differing particle size. The maximum hydraulic filter speed should be 5 m/day
for slow sand filtration.
Iron removal can be performed by means of aeration and slow sand filtration.
The periodical washing or replace of the surface layer (10cm) in slow sand
filter is approximately 3 to 6 months intervals, depending upon its water
treated volume and size of sand filtration.
2.5.3 Surface Water Treatment
Treatment of surface water is more complicated than for groundwater for several
reasons, such as rivers and streams becoming more turbid during the rainy season.
More significantly, it is possible that upstream areas of river and stream intakes are
used for bathing, washing clothes and defecating, and may therefore be biologically
contaminated.
The following is the main points of surface water treatment:
The process of surface water treatment follows roughing filter, followed by
slow sand filter.
Complete removal of turbidity may present a problem during the rainy season,
however this can only be verified after testing the water quality following
heavy rain.
The water quality analysis showed that the surface water had high iron content.
The roughing and slow sand filters are together able to remove the iron.
The purpose of the roughing filter is to remove the bulk of the turbidity content
and also some of the iron content contained in the raw water. The filter shall be
equipped with drains. From the roughing filter the water flows by gravity to the
slow sand filter.
The slow sand filter is a simpler alternative to the slow sand filter, and contains
very fine sand, requiring a larger filter area.
Slow sand filters do not require backwashing or the operation of backwash
pumps, however the filter sand needs to be periodically removed, washed and

G2-27
replaced. Washing of the filters should be performed every 3 months, however
washing may need to be more frequent during the rainy season.
In order to guarantee the fulfillment of all water supply quality standards, it
may be necessary to employ flocculation, sedimentation and filtration processes
followed by disinfection. Such full-scale treatment complicates the operation
and maintenance procedures and increases the costs.
2.5.4 Chlorination
Deep groundwater does not normally require a disinfection process by chlorination,
provided that the deep well and installation works were properly installed and
constructed, and the required safety zone has been established around the deep well.
The need for disinfection will also depend on how well the deep aquifer has been
protected from possible seepage from upper aquifers. For several systems there
exists this risk of contamination of the unconfined aquifer from above (e.g. K1-1,
K3-1, D5, and D7).
However, there is always the risk of pollution of treated water, while stored in
reservoirs for long retention time or through breaks in damaged pipes. The points to
be highlighted for chlorination are as follows:
As an option, the chlorination equipment of chlorine gas shall be installed
where a large reservoir tank and long retention time are expecting and/or
shallow groundwater sources. For smaller rural villages in case of a few hours
retention time, chlorination can be installed later during phase 2 (2010 –
2020).
Surface water that has been treated by roughing filter and slow sand filter
normally also becomes bacteriological clean, however this cannot be
guaranteed. Therefore, the water should, in theory, be disinfected by
chlorination.
The disadvantages of the chlorination process are that it complicates the
treatment process; particularly in the way the chlorine should be continually
and correctly dosed against measured water flow, and should be well mixed,
which is sometimes difficult to achieve. The efficiency of disinfection also
depends on the content of other substances in the water.
The cost of delivering chlorine to the plant needs to be added to the overall
operations and maintenance cost. Chlorine is also a dangerous chemical
substance that requires careful handling and storage.

G2-28
An alternative chlorination system is presently being used in treatment plants
for several water schemes in Vietnam. This particular disinfection process
produces chlorine from salt (Na Cl) through electrolysis. This eliminates the
risk of handling and storing chlorine, however the risk of the system breaking
down and requiring spare parts is increased.
2.5.5 Sand Washing Basins (Alternative 3 and K4.1)
The purpose of sand washing basins is to facilitate washing of the filter sand media
to a clean efficient procedure. The basins are simple structures where the sand can
be placed securely for washing, enabling the water to drain away, and all the sand
remain for drying.
Following this settlement, the overlying water can be drained away to a stream or
river.
The following points are highlighted for sludge basin and sand washing basins:
The sand-washing basins can be constructed as simple concrete boxes. The size
shall be decided in detailed design stage depending on the availability of land
use condition.
2.5.6 Reservoirs
The purpose of reservoirs is to balance the varying supply quantity (up to
maximum hourly supply) against the relatively steady production flows of the
water works, with the use of water storage.
Reservoirs shall be constructed in reinforced concrete, and shall be equipped
with overflows large enough to accommodate the maximum expected flows
from inlet pipes.
The reservoir shall be equipped with sufficient ventilation in order to empty the
reservoir of air, when filling with water.
The reservoir shall have a piped washout installed at its base.
All openings shall be covered with screening in order to prevent birds, rats, etc.
from entering the reservoirs.
2.5.7 Pumping Stations
Two kinds of pumps are used in the systems: submersible pumps and booster
pumps

G2-29
Submersible pumps These are the most commonly used, for pumping from the deep wells to surface
reservoirs or treatment plants.
The submersible pumps proposed fall within a relatively narrow range for flow
yields and lifting heads. The maximum proposed yields vary between 6 m3/hr
and 22 m3/hr.
The lifting heads vary between 60 and 110 meters.
Most pumps could be operated from power supplied from a one-phase power
grid.
Only in perhaps 0 to 3 instances would 3 –phase power supply be required.
Booster Pumps Where elevated tanks are constructed it becomes necessary to pump water from
ground reservoirs to elevated tanks using booster pumps.
Booster pumps are also necessary in the case of secondary pumping
requirements from low elevation treatment plants to reservoirs located at higher
levels.
Booster pumping to elevated towers typically only provides small lift, e.g.15 to
20 m. Booster pumping from treatment plants to reservoirs may need to lift 40
to 50 m.
Pumps should be carefully designed to operate near optimum efficiencies, based
on the design parameters of flow and head.
If the pump operates outside (above or below optimum flows) its optimum
efficiency, this means that the power consumption becomes higher for each m3
lifted, resulting in increased costs to water production or distribution.
Control of Pumping Control of pumping is proposed to be manual to the highest extent possible. For
example, a pump may be started manually in order to fill up a reservoir, and
stopped manually when full.
A pumping schedule should be prepared from the experience gained during
operation, and by considering the water consumption.
Another simple way of controlling start and stop operations of pumps is by
using float control switches in the reservoirs. When the reservoir is full, the
float lever becomes horizontal and trips a switch that signals the pump to stop.
After the water level drops, the float lever will hang vertically, tripping a switch
that signals for the pump to start. This method may require the installation of
cables over relatively long distances to carry signals from the float control

G2-30
switch to the deep well pump panel, which results in the risk of possible
damage to cabling.
Motor Protection Motor control panels, as recommended by the pump supplier, shall be included
in the installation of pumps.
Control panels shall include necessary pump protection devices to protect
against, e.g.: dry running, voltage surge, under/over voltage, lightning transient
surge protection, thermal overload protection, phase failure protection shall be
included for three phase pumps.
2.5.8 Pipelines
Most of the proposed water supply schemes are relatively small and with pipe
dimensions below 100 mm diameter. Only a few main distribution lines may be of
larger diameters up to 125 mm, 150 mm or 200 mm. Detailed specifications for
water supply pipes are included in Appendix 4 (Technical Specifications).
Raw Water Pipelines Raw water mains are proposed to consist of galvanized iron pipes.
Mains passing through farmland should principally be installed in trenches deep
enough to cover the pipes with minimum 1000 mm of soil, in order to avoid
damage resulting from the planting of coffee, and other crops, shrubs and trees.
Distribution Pipelines Galvanized iron (GI) pipes have traditionally been used for water distribution
mains in Vietnam. In places where it may be necessary to construct the mains
either above ground or at shallow depths, GI pipes should be used.
However, high density polyethylene (HDPE) and unplasticized polyvinyl
chloride (uPVC) pipes are now also widely used. Such plastic pipes are less
costly and do not corrode, once buried.
uPVC pipes may become brittle if they are subjected to sunlight, thus should be
stored accordingly.
It is proposed to use uPVC Class 6 bar pressure for pipes 100 mm diameter and
above, and HDPE for pipes below 100 mm diameter. In areas where heavy
external forces may be exerted on the pipe, e.g. road crossings, GI pipes should
be used or the plastic pipe should be housed within a protective steel sleeving.
Concrete encasement should not be used for plastic pipes.

G2-31
Several areas have large differences in elevation. In such cases, Class 10 bar
pressure pipes should be used, or if hydraulic calculations result in maximum
operating pressures exceeding 60 metres.
A minimum soil cover of 600 mm is recommended for distribution pipes within
footpath areas for protection against normal loads and to provide nominal
protection towards obstructing access for illegally made connections. A
minimum cover of 1000 mm is recommended in roads to avoid damage from
vehicles, trucks, road works and other works.
Pressure Testing All water supply mains shall be pressure tested with the pipe joints uncovered.
The pipes should be tested to 1.5 times the working pressure, and the pressure
loss should be measured at each end of the section of main being tested.
Disinfection All mains shall be flushed with clean water, until the water emerging from the
flushing operation is visibly clear. Following the flushing procedure, and before
commissioning and handing over of water mains or plant, all parts that will be
in contact with the water supply shall then be disinfected.
The disinfection process provides that all such sections of the pipeline be
immersed with a 50 mg/l chlorine solution for 24 hours. If the concentration of
chlorine after the test is less than 25 mg/l, the testing shall be repeated based on
international guideline.
Following disinfection, the system shall be thoroughly flushed until the residual
chlorine content is below 1 mg/l.
2.5.9 Valve Chambers
Isolation Valves The purpose of isolation valves is to provide the possibility of carrying out
repairs on sections of the water supply network, without causing supply to be
cut-off to other areas of the village.
A number of valves have been included in the estimates in order to facilitate the
above procedures. Isolation valves are proposed to be resilient wedge soft-
seated gate valves.
All gate valves should be installed in watertight lockable valve chambers.

G2-32
Air Valves, Washouts and Thrust Blocks Generally, it is not considered necessary to install air valves on distribution
lines as house connections will act to release air. It was estimated that there will
be a few points where air valves will be necessary along the raw water mains,
which will be determined during the detailed design.
Washouts should be installed on main distribution pipes at low points by
installing a flanged branch off-take with valve.
Thrust blocks should be constructed at all points of change in direction (bends
and tees), changes in diameter and dead ends, on all raw water mains and
distribution mains (100 mm diameter and larger). Thrust blocks consist of a
concrete block with the pipe adequately embedded to transfer the forces. The
surface area of the thrust block bearing against the undisturbed soil surface
shall be sufficient for the particular type of soil to support such force.
2.5.10 Public Taps
Three types of public taps have been included as standard designs in the drawings:
Alternative 1 uses a tap for dispensing water directly from the distribution main.
The tap is installed on a concrete slab, with a slight slope for drainage.
Alternative 2 uses 3 taps for dispensing water, and a small storage volume (1
m3) as a back-up supply, during periods of the maximum amount served, times
of power failure or during reduced pumping times. There is a single tap on a
sloping concrete slab.
Alternative3 includes a small storage as a back-up supplying, bathing rooms for
men and for women, with 3 taps for supplying water. This type is suited to very
poor villages.
Pipes and taps shall be manufactured from metal, such as GI or bronze. Plastic
pipes must not be used to prevent damages by hunging the water vessels on the
pipe.
2.5.11 Water Meters
Bulk Water Meters Bulk water meters are important for monitoring overall water production and
Unaccounted-For Water (UFW) through district meters throughout the water
supply system.

G2-33
Location to be installed the meter are in front of each village/hamlet of the main
distribution pipeline, and/or in front of branch (secondary) pipeline.
Raw Water Meters: Equipped at all Deep wells in order to record water
production.
Clean Water Meters are recommended installed at all reservoir outlets.
If necessary bulk water meters could be equipped together with an upstream
screening filter in order to avoid larger particles in the water flow from
damaging the meter rotor mechanism. If necessary, a by-pass could be installed
at the meter in order to facilitate the cleaning of the screen and maintenance of
the meter.
The diameter of the water meter should be designed according to the range of
flows and the manufacturer’s specifications.
Household Meters Household meters installed in house connections are for the accurate collection
of water tariffs.
The theoretical lifetime of a user household water meter should be at least 10
years, however, this depends on the quality of the meter, water quality and the
general maintenance carried out on the meter. Unless the standards of these are
high, the life span of the meter becomes much less.
Meters should be calibrated regularly (internationally every 3 to 5 years
depending on the meter quality and maintenance level). This requires that
reliable meter calibrating facilities are available in the province (or neighboring
provinces) and that spare parts are readily available.
If users discover that the meters are inaccurate, they will eventually lose faith
that they are paying a “fair” price for the water supplied. A common problem is
that users will then attempt to “cheat” the meters, by manipulating them in
various ways. The user may possibly go as far as sabotaging the meter.
Metering each of the households increases the administrative workload. Meters
need to be read and recorded regularly by trained staff. The recorded data needs
to be processed, with water bills sent out to users and money collected.
Policies for metering should be decided by water supply unit (WSU) and the
board who are to operate the systems. Possible solutions should be presented to
each village in order for them to make well-informed choices.
The water meter installation is important for quantitative control for whole
water supply to manage proper consumption and to establish fair water charge
collection system.