supply chain losses of vegetables in central philippines
TRANSCRIPT
Acta Hortic. 1103. ISHS 2015. DOI 10.17660/ActaHortic.2015.1103.1 XXIX IHC – Proc. XVII Int. Symp. on Horticultural Economics & Management and V Int. Symp. on Improving the Performance of Supply Chains in the Trans. Economies Ed.: P.J. Batt
1
Supply chain losses of vegetables in Central Philippines A.Acedo1, L.M.Gonzales2, A. Valida3, A. Salabao3,M.Benitez3, E. Sudaria3, F.R. Rivera3 andJ.Ekman41AVRDC - The World Vegetable Center, India; 2Capiz State University, Philippines; 3Visayas State University,Philippines;4AppliedHorticulturalResearch,Australia.Abstract
Thisstudywasdesigned tobenchmark interventionson freshvegetable lossesthroughkey informant interviews,adetailedsurveytodeterminepracticesand lossestimates,andactual lossmeasurement.ThestudyusedcabbageasamodelsystemandtrackedproductfromtheleadingvegetablegrowingareainCebu,Philippinestoretailers 100 km away. Both wet markets (traditional chain) and supermarkets(modern chain) were studied. Traditional and modern retail chains had similarplayers: farmers,commissionagents,wholesalersand retailers.The total losses forcabbages were estimated at 26 to 27% in both chains. However, farmers in themodern chain incurred higher losses (13%) than farmers in the traditional chain(10%) due to more stringent quality requirements. In contrast, retailers in thetraditional chain incurred higher losses (10%) than in supermarkets (7%).Wholesalers inbothchainshad lossesof6 to7%.Lossesweremainlydue to insectdamageandrottingatthefarmlevel,withweightlossandphysicaldamagethemajorissuesatthewholesaleandretaillevel.Muchofthislosswasduetopoorpackagingandhandlingtechniques.Thetotallossofediblematerialwascalculatedbasedonthesum of weight loss and trimming of damaged, wilted and/or rotten parts. Thisrevealedmuchhigherlossesof34%inthetraditionalchain.Nearlyhalfofthis(16%)occurredduringretail,whichcouldtake3daysatambienttemperatures.Incontrast,only 9% loss occurred during retail in themodern chain. In both cases, transportresulted in12%of total loss.Partlybecauseof these losses,wholesalepriceswereabout40%higherthan farmgateprice inbothchains,withretailpricesabout60%and 190% higher than farm gate prices in the traditional and modern chain,respectively. Based on these results, technological improvements for testing andorganizationalinterventionsarerecommended.
Keywords:cabbage,postharvestloss,traditionalchain,modernchainINTRODUCTIONCabbageisconsideredoneofthetoptwentyvegetablesinthePhilippines.Itisthefifthleadingvegetableandthenumberoneleafyvegetablewithproductionapproaching125,310tonnes from an area of 8,550 hectares (BAS, 2013). However, cabbages have to betransported over long distances from the production areas to the market. Poor handlingconsequently results in significant product losses. The high perishability of cabbageexacerbatestheproblem.Theextremelyperishablenatureofvegetablesresultsintheinabilityofproducerstomanagesupplyintheassemblingmarkets.Furthermore,thelongdistancesthatseparatetheproduction area and markets, and poor postharvest management contribute to the hugepostharvestlossesofvegetableswhichareestimatedtoexceed30to40%.To effectively reduce postharvest losses, it is recommended that a supply chainapproachbeadopted, inwhichthewholesupplychainmustbeconsideredindeterminingappropriateinterventions,ratherthanapiecemealapproachinwhichonlyonestageinthechain is targeted for intervention. The supply chain starts from the collection of theharvested produce at the farm gate, through processing or preparation, distribution and
2
finallydisplayforretailsaletoconsumers(BattandCadilhon,2007).Inmanydevelopingcountries,thefreshproduceindustryishamperedbythelackofefficient and effective supply chains. In these countries, supply chains are generallyfragmented,unorganizedandlossesinproductqualityandquantityareusuallyhigh.Theselossesaremostoftenabsorbedby farmersasreduced farmgatepricesandbyconsumersthroughanincreasedpurchaseprice(Acedo,2010;RapusasandRolle,2009).For cabbages produced in Mantalongon, Dalaguete, Cebu, traditional and modernsupplychainshavenotbeenassessed.Thisstudywasconductedtomapthetraditionalandmodern supply chains for locally produced cabbage and to assess postharvest losses intraditionalandmodernchainsinCebu.MATERIALSANDMETHODSAnupstreamapproach(fromretailerstofarmers)wasemployed(Genovaetal.,2006).The selectedmarketswere the Carbonmarket, the biggestwholesale-retailmarket in theVisayas for the traditional chain, and selected supermarkets for themodern chain. A keyinformant survey using reliable reference points (agricultural technicians and keytraders/wholesalers, retailers and farmers) was conducted to construct the supply chainmap.Adetailed interviewwasthenconductedusingapretestedstructuredquestionnaire.Thisapproachenabledthecollectionofqualitativeandquantitativedata(Prinsloo,2000).Following the sample size principle (Van Der Vorst, 2000), 35 respondents (15farmers, 5 collectors, 5 wholesalers and 10 retailers) were randomly selected for thetraditionalchainand28respondents(15farmers,5traders/collectors,5wholesalersand3supermarkets)forthemodernchain(farmtosupermarkets).Survey results were analyzed using the STAR program and reported as frequenciesandaverages.Productlosseswereestimatedateachstageofthesupplychain.RESULTSANDDISCUSSIONS
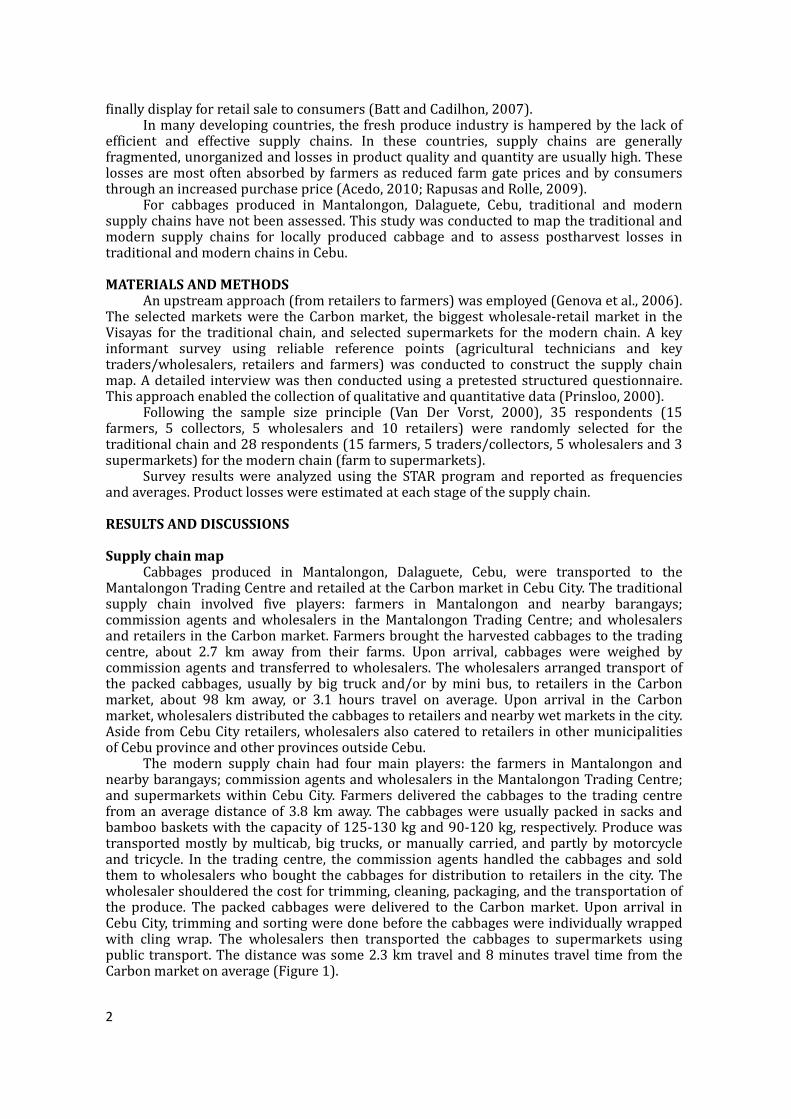
SupplychainmapCabbages produced in Mantalongon, Dalaguete, Cebu, were transported to theMantalongonTradingCentreandretailedattheCarbonmarketinCebuCity.Thetraditionalsupply chain involved five players: farmers in Mantalongon and nearby barangays;commission agents andwholesalers in theMantalongon Trading Centre; andwholesalersandretailersintheCarbonmarket.Farmersbroughttheharvestedcabbagestothetradingcentre, about 2.7 km away from their farms. Upon arrival, cabbages were weighed bycommissionagentsand transferred towholesalers.Thewholesalersarranged transportofthe packed cabbages, usually by big truck and/or bymini bus, to retailers in the Carbonmarket, about 98 km away, or 3.1 hours travel on average. Upon arrival in the Carbonmarket,wholesalersdistributedthecabbagestoretailersandnearbywetmarketsinthecity.AsidefromCebuCityretailers,wholesalersalsocateredtoretailersinothermunicipalitiesofCebuprovinceandotherprovincesoutsideCebu.The modern supply chain had four main players: the farmers in Mantalongon andnearbybarangays;commissionagentsandwholesalersintheMantalongonTradingCentre;and supermarketswithinCebuCity. Farmers delivered the cabbages to the trading centrefromanaveragedistanceof3.8kmaway.Thecabbageswereusuallypacked in sacksandbamboobasketswiththecapacityof125-130kgand90-120kg,respectively.Producewastransportedmostlybymulticab,big trucks, ormanually carried, andpartlybymotorcycleand tricycle. In the trading centre, the commission agents handled the cabbages and soldthem towholesalerswhobought the cabbages fordistribution to retailers in the city.Thewholesalershoulderedthecostfortrimming,cleaning,packaging,andthetransportationofthe produce. The packed cabbages were delivered to the Carbonmarket. Upon arrival inCebuCity,trimmingandsortingweredonebeforethecabbageswereindividuallywrappedwith cling wrap. The wholesalers then transported the cabbages to supermarkets usingpublic transport.Thedistancewassome2.3kmtraveland8minutestravel time fromtheCarbonmarketonaverage(Figure1).
3
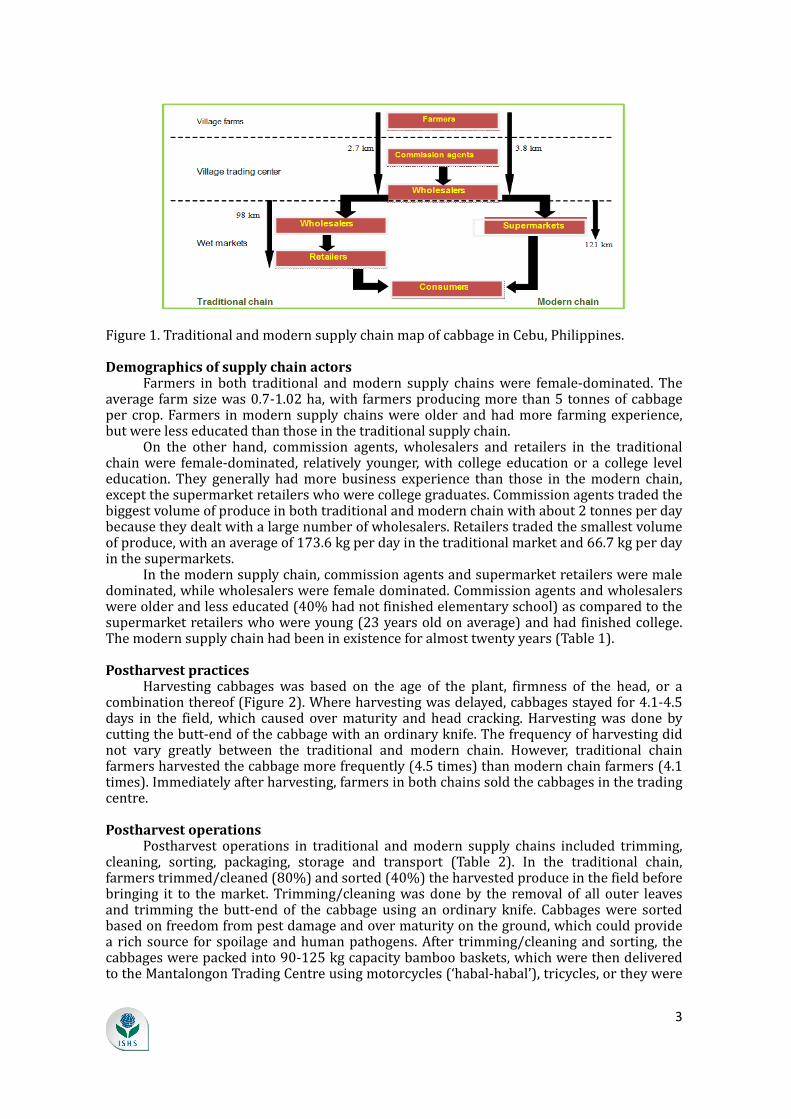
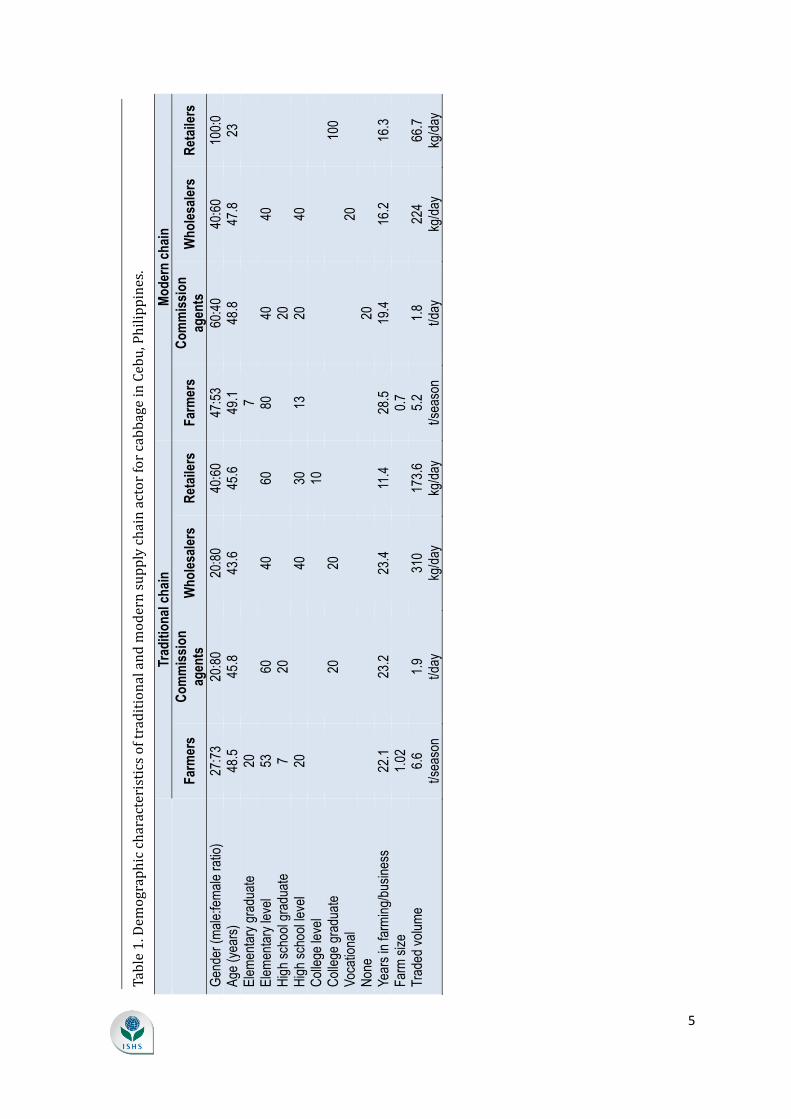
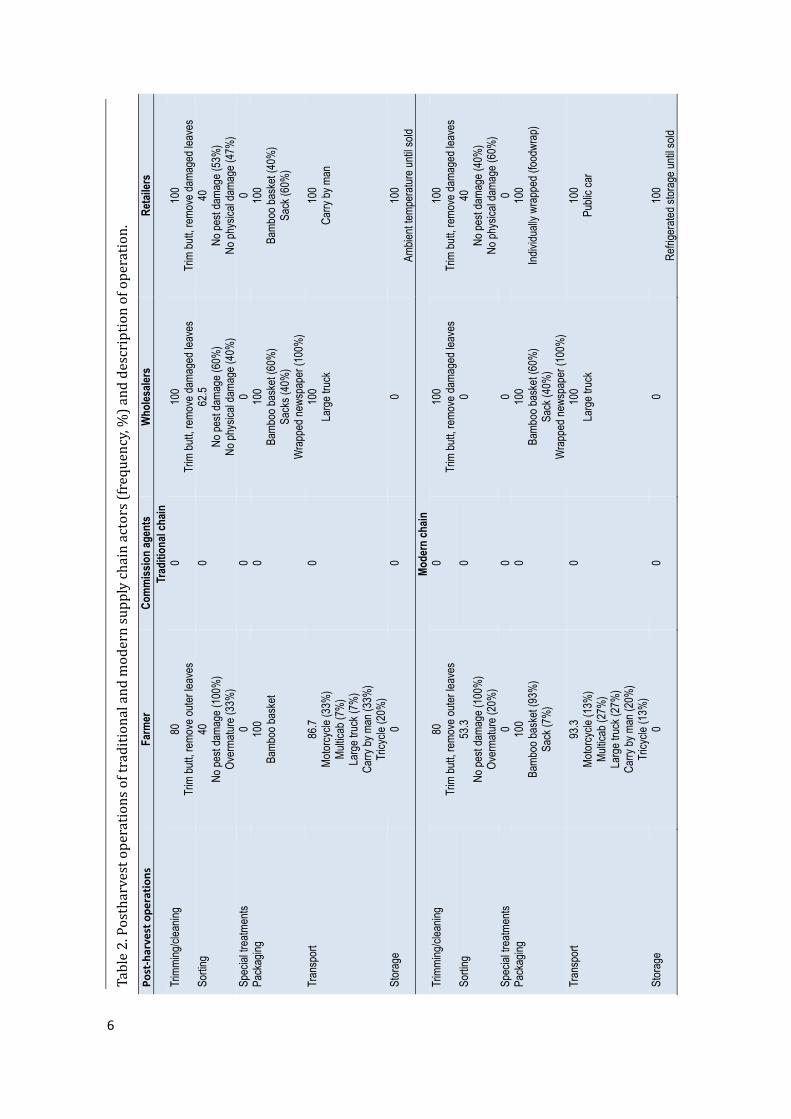
Figure1.TraditionalandmodernsupplychainmapofcabbageinCebu,Philippines.DemographicsofsupplychainactorsFarmers in both traditional andmodern supply chainswere female-dominated. Theaveragefarmsizewas0.7-1.02ha,withfarmersproducingmorethan5tonnesofcabbageper crop.Farmers inmodernsupply chainswereolderandhadmore farmingexperience,butwerelesseducatedthanthoseinthetraditionalsupplychain.On the other hand, commission agents, wholesalers and retailers in the traditionalchainwere female-dominated, relatively younger,with collegeeducationor a college leveleducation. They generally hadmore business experience than those in themodern chain,exceptthesupermarketretailerswhowerecollegegraduates.Commissionagentstradedthebiggestvolumeofproduceinbothtraditionalandmodernchainwithabout2tonnesperdaybecausetheydealtwithalargenumberofwholesalers.Retailerstradedthesmallestvolumeofproduce,withanaverageof173.6kgperdayinthetraditionalmarketand66.7kgperdayinthesupermarkets.Inthemodernsupplychain,commissionagentsandsupermarketretailersweremaledominated,whilewholesalerswerefemaledominated.Commissionagentsandwholesalerswereolderandlesseducated(40%hadnotfinishedelementaryschool)ascomparedtothesupermarketretailerswhowereyoung(23yearsoldonaverage)andhadfinishedcollege.Themodernsupplychainhadbeeninexistenceforalmosttwentyyears(Table1).PostharvestpracticesHarvesting cabbages was based on the age of the plant, firmness of the head, or acombinationthereof(Figure2).Whereharvestingwasdelayed,cabbagesstayedfor4.1-4.5days in the field,which caused overmaturity andhead cracking.Harvestingwasdone bycuttingthebutt-endofthecabbagewithanordinaryknife.Thefrequencyofharvestingdidnot vary greatly between the traditional and modern chain. However, traditional chainfarmersharvestedthecabbagemorefrequently(4.5times)thanmodernchainfarmers(4.1times).Immediatelyafterharvesting,farmersinbothchainssoldthecabbagesinthetradingcentre.PostharvestoperationsPostharvest operations in traditional andmodern supply chains included trimming,cleaning, sorting, packaging, storage and transport (Table 2). In the traditional chain,farmerstrimmed/cleaned(80%)andsorted(40%)theharvestedproduceinthefieldbeforebringing it to themarket.Trimming/cleaningwasdoneby the removal of all outer leavesand trimming the butt-endof the cabbageusing an ordinary knife. Cabbageswere sortedbasedonfreedomfrompestdamageandovermaturityontheground,whichcouldprovidearichsource forspoilageandhumanpathogens.After trimming/cleaningandsorting, thecabbageswerepackedinto90-125kgcapacitybamboobaskets,whichwerethendeliveredtotheMantalongonTradingCentreusingmotorcycles(‘habal-habal’),tricycles,ortheywere
4
manually carried. No refrigerated vehicle was used to transport the produce in bothtraditional and modern chains. Upon arrival, the packed cabbages were weighed, whichserved as the basis of payment to farmers. Commission agents then sold the produce towholesalers.Therewasnopostharvestoperationatthecommissionagentlevel.Uponreceipt,wholesalersre-trimmedthecabbagesbyremovingdamagedleavesandany protruding butt, and sorted them visually based on freedom from pest damage andphysical damage. After trimming and sorting, cabbages were individually wrapped withnewsprint, placed in bamboo baskets or sacks, and transported to the Carbonmarket bytruck(‘trakdekarga’).UponarrivalintheCarbonmarket,wholesalerseitherdistributedthecabbagesbyhiredlabourtoadjacentretailers,usuallyjustafewmetresfromtheirstall,orretailers purchased the cabbages from wholesalers and brought the produce to theirrespective selling area. In the retail market, cabbages were re-trimmed, packed usingbamboobasketsandsacks,andstoredunderambientconditionswhilewaitingforbuyers.
Figure 2. Postharvest practices of farmers in traditional and modern supply chains ofcabbage(frequency,%).
5
Table1.Demo
graphiccharac
teristicsoftra
ditionalandm
odernsupplyc
hainactorfor
cabbageinCe
bu,Philippine
s.
Trad
ition
al ch
ainMo
dern
chain
Fa
rmer
s Co
mm
issio
n ag
ents
Who
lesale
rs
Reta
ilers
Fa
rmer
s Co
mm
issio
n ag
ents
Who
lesale
rs
Reta
ilers
Ge
nder
(male
:fema
le ra
tio)
27:73
20:80
20:80
40:60
47:53
60:40
40:60
100:0
Ag
e (ye
ars)
48.5
45.8
43.6
45.6
49.1
48.8
47.8
23
Elem
entar
y gra
duate
20
7
El
emen
tary l
evel
5360
4060
80
4040
Hi
gh sc
hool
grad
uate
720
20
High
scho
ol lev
el20
40
30
1320
40
Colle
ge le
vel
10
Co
llege
grad
uate
20
20
10
0 Vo
catio
nal
20
None
20
Ye
ars i
n far
ming
/busin
ess
22.1
23.2
23.4
11.4
28.5
19.4
16.2
16.3
Farm
size
1.02
0.7
Tr
aded
volum
e6.6
t/s
easo
n1.9
t/d
ay31
0 kg
/day
173.6
kg
/day
5.2
t/sea
son
1.8
t/day
224
kg/da
y66
.7 kg
/day
5
6 Table2
.Postharvest
operationsof
traditionalan
dmodernsupp
lychainactors
(frequency,%
)anddescript
ionofoperatio
n.Po
st-h
arve
st o
pera
tions
Fa
rmer
Co
mm
issio
n ag
ents
W
holes
alers
Re
taile
rs
Trad
ition
al ch
ain
Trim
ming
/clea
ning
80Tr
im bu
tt, re
move
outer
leav
es0
100
Trim
butt,
remo
ve da
mage
d lea
ves
100
Trim
butt,
remo
ve da
mage
d lea
ves
Sortin
g 40
No pe
st da
mage
(100
%)
Over
matur
e (33
%)
0 62
.5No
pest
dama
ge (6
0%)
No ph
ysica
l dam
age (
40%
)
40No
pest
dama
ge (5
3%)
No ph
ysica
l dam
age (
47%
) Sp
ecial
trea
tmen
ts0
00
0Pa
ckag
ing
100
Bamb
oo ba
sket
0 10
0Ba
mboo
bask
et (6
0%)
Sack
s (40
%)
Wra
pped
news
pape
r (10
0%)
100
Bamb
oo ba
sket
(40%
) Sa
ck (6
0%)
Tran
spor
t 86
.7Mo
torcy
cle (3
3%)
Multic
ab (7
%)
Larg
e tru
ck (7
%)
Carry
by m
an (3
3%)
Tricy
cle (2
0%)
0 10
0La
rge t
ruck
10
0Ca
rry by
man
Stor
age
0 0
0 10
0Am
bient
tempe
ratur
e unti
l sold
Mo
dern
chain
Tr
immi
ng/cl
eanin
g 80
Trim
butt,
remo
ve ou
ter le
aves
0 10
0Tr
im bu
tt, re
move
dama
ged l
eave
s10
0Tr
im bu
tt, re
move
dama
ged l
eave
s So
rting
53.3
No pe
st da
mage
(100
%)
Over
matur
e (20
%)
0 0
40No
pest
dama
ge (4
0%)
No ph
ysica
l dam
age (
60%
) Sp
ecial
trea
tmen
ts0
00
0Pa
ckag
ing
100
Bamb
oo ba
sket
(93%
) Sa
ck (7
%)
0 10
0Ba
mboo
bask
et (6
0%)
Sack
(40%
) W
rapp
ed ne
wspa
per (
100%
)
100
Indivi
duall
y wra
pped
(foo
dwra
p)
Tran
spor
t 93
.3Mo
torcy
cle (1
3%)
Multic
ab (2
7%)
Larg
e tru
ck (2
7%)
Carry
by m
an (2
0%)
Tricy
cle (1
3%)
0 10
0La
rge t
ruck
10
0Pu
blic c
ar
Stor
age
0 0
0 10
0Re
friger
ated s
torag
e unti
l sold
6
7
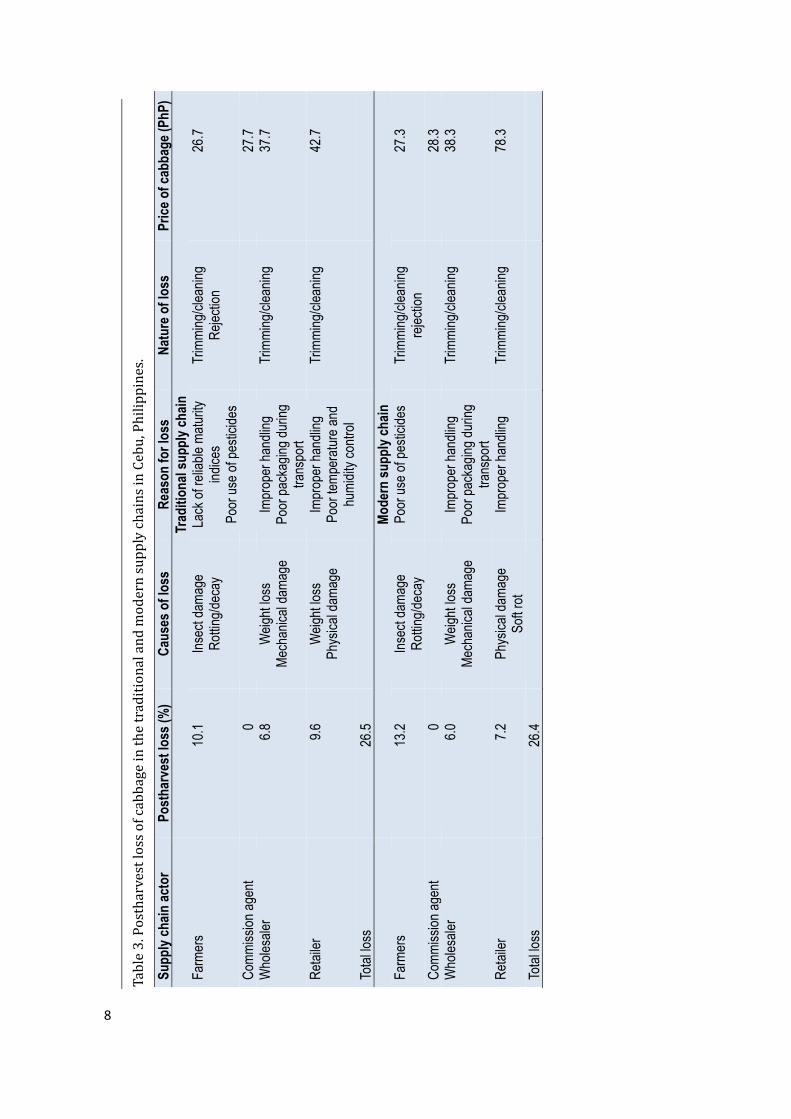
In themodern supply chain, the samepostharvestoperationswereperformedas inthetraditionalchain:thebuttwastrimmedandallouterleaveswereremoved;sortingwasbasedonfreedomfrompestdamageandovermaturity;andtheheadswerepackedmostlyinto bamboobaskets and in a few cases into sacks. Theproducewas then transported toMantalongonTradingCentrebymulti-cab,truckormanuallycarried(Table2).Uponarrival,thecabbageswereweighed.Afterthecommissionagentsandwholesalershadagreedonaprice, thewholesalers re-trimmed the cabbageswhichwere thenwrapped individually innewsprint before packing in bamboo baskets or sacks. The packed cabbages were thentransportedtotheCarbonmarketbytruck.Refrigeratedtransportwasabsent.Neither the traditional nor the modern supply chain had any special treatment tocontrolbacterialsoftrot. IntheCarbonmarket,wholesalersre-trimmed,re-sortedandre-packedthecabbagesusingindividualshrinkwrapbeforedeliverytosupermarkets,usuallyby public transport. In the supermarkets, cabbages were displayed for sale underrefrigeratedconditions.Cabbage prices were dictated by commissioners, wholesalers and retailers in bothchains.Pricingwasbasedonwhether thecabbageswereofgoodqualitywithnodamage,wilted and/or rotten parts, insect damage and physical damage. In transporting thecabbages, both traditional andmodern chains employed big trucks, which contributed tohigh losses due to mechanical damage, weight loss and the build-up of micro-organismsinside the package due to high temperatures and humid conditions. A major marketingconstraintwasthepoorinfrastructurethatcontributedtohugelossesofproduce.PostharvestlossThe total loss of cabbagewas similar in both traditional andmodern supply chains(26%)(Table3).However,farmersinmodernsupplychainsincurredahigherlossof13%compared to traditional chain farmerswhohad a10% loss. Losseswereprimarilydue topre-harvestorigin, including insectdamageand rotting/decaydue to rain.No losseswererecordedatthecommissionagent’slevel,fornopostharvestoperationwasperformed:thecabbagesweremerelytransferredfromthefarmerstothewholesalersatthetradingpost.Losses at the wholesaler and retailer level differed with the supply chain. In thetraditionalchain,wholesalersincurreda7%lossduetoweightlossandmechanicaldamageas a result of improper handling and poor packaging during transportation. Retailersincurreda9.6%lossonaverage,muchhighercomparedtothewholesaler’s,duetophysicaldamage andweight loss resulting from the improper handling of fresh produce and poortemperatureandhumiditycontrol.Lossoccurredintheformoftrimmingsorwholecabbagerejection at the farmer level, while at the wholesaler and retailer levels, trimmingcontributedmoretolosses.In the modern chain, wholesalers incurred an average loss of 6% and retailers anaveragelossof7.2%(Table3).Poortransportwasthemaincontributoryfactortothelossinbothchains.Lossesatthewholesalerlevelwereduetoweightlossandmechanicaldamageasaresultofimproperhandlingandpoorpackagingduringtransportation.Physicaldamageandsoftrotwereamongthemaincausesoflossattheretailerlevel.Cabbagepricesalongthechainvariedgreatly.Thefarmgatepricewasslightlyhigherin the modern chain (PhP 27.3 kg-1) than in the traditional chain (PhP 26.7 kg-1).Commission agents in both chains received a PhP 1.0 kg-1 commission for facilitating thetransactionbetweengrowersandwholesalers.Nopostharvestoperationswereperformed.WholesalersinbothchainsaddedaboutPhP11kg-1tothepricegiventocommissionagents,however,theyshoulderedthecostsofpostharvestoperationsandtransporttoretailers.Thebiggest discrepancy in price was obtained at the retail level, where the price in thetraditionalchain(PhP42.7kg-1)washalfthatinthemodernchain(PhP78.3kg-1).
8 Table3
.Postharvest
lossofcabbag
einthetraditi
onalandmode
rnsupplychain
sinCebu,Phili
ppines.
Supp
ly ch
ain ac
tor
Post
harv
est l
oss (
%)
Caus
es o
f los
s Re
ason
for l
oss
Natu
re o
f los
s Pr
ice o
f cab
bage
(PhP
)
Trad
ition
al su
pply
chain
Fa
rmer
s 10
.1 Ins
ect d
amag
e Ro
tting/d
ecay
La
ck of
relia
ble m
aturity
ind
ices
Poor
use o
f pes
ticide
s
Trim
ming
/clea
ning
Rejec
tion
26.7
Comm
ission
agen
t 0
27
.7 W
holes
aler
6.8
Weig
ht los
s Me
chan
ical d
amag
e Im
prop
er ha
ndlin
g Po
or pa
ckag
ing du
ring
trans
port
Trim
ming
/clea
ning
37.7
Retai
ler
9.6
Weig
ht los
s Ph
ysica
l dam
age
Impr
oper
hand
ling
Poor
temp
eratu
re an
d hu
midit
y con
trol
Trim
ming
/clea
ning
42.7
Total
loss
26
.5
Mode
rn su
pply
chain
Fa
rmer
s 13
.2 Ins
ect d
amag
e Ro
tting/d
ecay
Po
or us
e of p
estic
ides
Trim
ming
/clea
ning
rejec
tion
27.3
Comm
ission
agen
t 0
28
.3 W
holes
aler
6.0
Weig
ht los
s Me
chan
ical d
amag
e Im
prop
er ha
ndlin
g Po
or pa
ckag
ing du
ring
trans
port
Trim
ming
/clea
ning
38.3
Retai
ler
7.2
Phys
ical d
amag
e So
ft rot
Impr
oper
hand
ling
Trim
ming
/clea
ning
78.3
Total
loss
26
.4
8
9
CONCLUSIONFarmersreceivedthelowestprofitinbothchains.Postharvestlossesofcabbageswereaboutonequarterofthetotalvolume.Theselosseswerepassedontofarmersintheformoflow farm gate prices and onto consumers in the form of a high retail price. Appropriatetechnologicalinterventionstoreducelossesshouldtranslatetohigherfarmgatepriceswithincreasedfinancialreturnsoffarmers.The traditional chain was more complex than the modern chain. Nevertheless,practices in both chains were far from desirable. Postharvest losses did not differ muchbetween the two chains, but the modern chain hadmore stringent quality requirementswitharetailpricealmosttwotimeshigherthanthetraditionalchain.LiteraturecitedAcedo, A.L. (2010). Postharvest Technology for Leafy Vegetables. AVRDC-ADB Postharvest Projects RETA6208/6376.AVRDCPublicationNo.10-733(Taiwan:AVRDC-TheWorldVegetableCenter),pp.67.BAS. (2013). Bureau of Agricultural Statistics. Other Crops: Volume of Production. Country STAT Philippines2006-2013.http://countrystat.bas.gov.ph/selection.asp(AccessedJanuary15,2013).Batt, P.J., andCadilhon, J.J. (2007). Freshproduce supply chainmanagement: overviewof theproceedings andpolicy recommendations. Paper presented at International Symposium on Fresh Produce Supply ChainManagement, Publication No. 2007/21 (Bangkok, Thailand: Food and Agriculture Organization of the UnitedNations-RegionalOfficeforAsiaandthePacific(FAO-RAP)).Genova,C.,Weinberger,K.,Sokhom,S.,Vanndy,M.,Koh,K.,andYarith,E.(2006).Postharvestlossinthesupplychain for vegetables – The Case of Tomato, Yardlong Bean, Cucumber and Chinese Kale in Cambodia. AVRDCPublicationNo.06-683,WorkingPaperNo.16(Shanhua,Taiwan:AVRDC-TheWorldVegetableCenter).Prinsloo,C.H.(2000).Methodologyissuesinpersonalityassessmentresearch.IndustrialPsychologyConference(Pretoria,SouthAfrica).Rapusas,R.S.,andRolle,R.S.(2009).ManagementofReusablePlasticCratesinFreshProduceSupplyChains.ATechnicalGuide.FoodandAgricultureOrganizationof theUnitedNations(Bangkok,Thailand: RegionalOfficeforAsiaandthePacific).Van Der Vorst, G.A.J. (2000). Effective food supply chains; generating, modelling and evaluating supply chainscenarios.PhDThesis(TheNetherlands:WageningenUniv.).

10
Acta Hortic. 1205. ISHS 2018. DOI 10.17660/ActaHortic.2018.1205.46 Proc. International Symposia on Tropical and Temperate Horticulture Ed.: R. Drew
393
Efficacy of guava and mangosteen extracts in reducing soft rot (Pectobacterium carotovorum) in harvested Chinese cabbage K.B.Barbin1,L.B.Secretaria1,E.R.V.Bayogan1,a,A.T.Lacap1andJ.H.Ekman21Universityof thePhilippinesMindanao,Mintal,TugbokDistrictDavaoCity,Philippines; 2AppliedHorticulturalResearch, Suite 352, Biomedical Building, 1 Central Avenue, AustralianTechnology Park, Eveleigh,NSW2015,Australia.Abstract
Theeffectofmatureguavaleafandmangosteenrindextractswasevaluatedinsoft rot (Pectobacterium carotovorum)-inoculated butt-ends of Chinese cabbageheads. Chemical extraction (with methanol and ethanol) exhibited higherantibacterial properties in the bioassay compared to the mechanically producedextracts.Theinhibitionzonesobservedwithfiveconcentrations(100,250,500,750and1000µgmL-1)ofguavaleafandmangosteenrindextractsdidnotvarybutweresignificantlybetterthandistilledwater.Newly-trimmedChinesecabbageheadswereinoculatedwith thesoftrotorganism24,48and72h followedbyair-drying for30min before treatment with 10% alum (positive control); distilled water (negativecontrol);andextractsfrommatureguavaleaf(1000µgmL-1)ormangosteenrind(500µLL-1). Inthebioassay,themangosteenrindextractexhibitedagreaterdiameterofinhibition than theguavaextractbut thiswas lesser invitro.The twoextractsveryslightly extended shelf life of heads held under ambient conditions (26.2±0.30°C,84.8±2.0%RH)byoneday.Ontheotherhand,the10%alumtreatmentextendedshelflife to twice that of the control. Delaying inoculation on butt-ends trimmed 72 hearlierdelayedonsetofdiseasebyoneday.Thisstudyconfirmsefficacyof10%alumin reducing soft rot inChinese cabbagebutt-ends.Furtherassessment isneeded toevaluateotherconcentrationsofthetwoplantextracts.
Keywords:alum,guavaleaves,mangosteenrind,Pectobacteriumcarotovorum,softrotINTRODUCTIONChinesecabbage(Brassicarapasubsp.pekinensis) isanannualandcool-seasoncrop(Stephens,2015). It isconsideredasoneof themostvaluablecrops inEastAsia includingPhilippines,asitisknowntobeagoodsourceofnutrients.InthePhilippines,itcontributedaroundP1.08Brevenuetolocaleconomy(PCAARRD,2003).Various problemsmay arise during postharvest operations, one ofwhich is soft rotinfection. Soft rot is a disease commonly caused by the bacterium Pectobacteriumcarotovorum(Nazerianetal.,2011).Infectionoccurswhenconditionsbecomefavorableforbacterialgrowth,suchashighrelativehumidity,hightemperatureandawetenvironment.Pectobacteriumcarotovorum,formerlyknownasErwiniacarotovorum,caneffectivelyinducecellularmacerationbyreleasingenzymesthatcandegradethecellwalls(Davidssonetal.,2013).Natural agentswith antibacterial properties to inhibit infection could be a practicalway to mitigate this postharvest disease. Two potential agents are guava leaf andmangosteen rind extracts. The use of these natural plant extracts as an alternativeantibacterialcontrolmaysatisfyconsumerdemandforfoodnutrition(Tiwarietal.,2009).Guava (Psidium guajava) leaf extract is known to exhibit antibacterial activity (Gnan andDemello,1999;Biswasetal.,2013).Onecomponentthatprovidesthispropertyofguavaleafis tannin. Tannins are known to have antiseptic properties that can inhibit the growth of aE-mail: [email protected]
394
disease-causing microorganisms (Godstime et al., 2014). On the other hand, mangosteen(Garciniamangostana)hasbroad-spectrumantibacterialcomponentssuchasα-mangostinandxanthones,whichareknowntoexertpotentantimicrobialactivityinhumanpathogens(Torrungruangetal.,2007;Priyaetal.,2010).Amongplantextracts,onlylemongrass,garlic,Aloe vera, neem (leaf, bark seed) are commonly studied in controlling plant pathogens(Simeon and Abubakar, 2014; Nweke and Ibiam, 2012; Bdliya and Dahiru, 2006).Mangosteen leaf extracts were reported to display antibacterial activity against plantpathogenssuchasX.oryzaeandP.syringae(Alsultanetal.,2016).Theextractsoftheguavaleafandmangosteenrindextractsarenotwellreportedasabiocontroltoplantpathogens.The antibacterial properties of the two extracts could be used as potential bioagents incontrollingplantpathogens.Hence,inthisstudy,guavaleafandmangosteenrindextractswereassessedfortheircontrolofsoftrotinChinesecabbagecomparedwithpostharvestalumtreatment.Theeffectoftimeofinoculationofthesoftrotorganismfollowedbydryingandapplicationofextractsafter24,48and72hfromharvestonsoftrotdevelopmentintheChinesecabbagebutt-endwasevaluated.MATERIALSANDMETHODChinesecabbageheadsandmangosteenfruitwereobtainedfromBankerohanPublicMarket, while the guava leaves of the native variety were picked from ALCON Farm, LosAmigos, Tugbok District, Davao City. For the mechanical extraction, an HA100W HuromMasticatingSlowJuicerwasused tomechanicallyextractguava leafandmangosteenrind.Theextractswereeachdilutedwithwatertoproducevariousconcentrations(10,25,50,75and100%).Forthechemicalextraction,matureguavaleaves(130.5to191.0mmlong,darkgreen),andmangosteenrindfromreddishpurplefruitwerewashedseparatelywithwater,driedandpowdered.ASoxhletapparatusandarotaryevaporatorwereusedtoobtainthecrudeextractspriortothepreparationofdilutionstoproduceconcentrationsof100,250,500,750and1000µgmL-1.Methanolandethanolwereusedassolventsfortheguavaleafandthemangosteenrind,respectively.An assay for antibacterial activity was performed on the extracts at eachconcentration. A bacterial suspension of P. carotovorum was prepared using the methoddescribedbyD’AmatoandHochstein(1982).Discdiffusionassay,themethodofMurrayetal. (1995)was employed. The diameters of inhibitionweremeasured and compared. Theconcentrations with higher inhibitory action were tested next on butt-ends of Chinesecabbageheads.Seventy-twoChinesecabbageheadsofuniformqualityandsizewereselected.Afterharvest, three to four leaves of Chinese cabbage were trimmed to remove senescing ordamaged outer leaves. Butt-ends were uniformly trimmed prior to the experiment. Thesamples were divided into three groups, for the three periods (24, 48 and 72 h) ofinoculation followed by application of extracts. At each period (24, 48 and 72 h afterharvest)thebutt-endswereinoculatedwiththe24-holdP.carotovorum.Thiswasfollowedby treatmentwithextracts30minafter inoculation.Tenpercent alumanddistilledwaterservedas controls.Theconcentrationsused forguavaandmangosteen rindextractswere1000and500µgmL-1,respectively.TheChinesecabbagesampleswerestoredforeightdaysat25.5-26.6°Cand76.3-88.7%relativehumidity.TheChinesecabbageleavesandbutt-endwereseparatelyassesseddailyonfourparameters:thedegreeofdecay(DoD)scale,where1=no infection,2=1-10%infection(slight),3=11-25%infection(moderate),4=26-50%infection (moderately severe), and 5 = more than 50% infection (severe); days to initialoccurrenceofdecay;visualqualityusingthescale:1=excellent(fresh),2=verygood(slightdefects), 3 = good (limit of saleability, defects progressing), 4 = fair (useable but notsaleable),and5=poor;andshelflife,wherethesamplewasterminatedwhenthebutt-endor leavesreachedavisualqualityratingof4.Theexperimentwas laidout inacompletelyrandomized design (CRD)with six replications. The datawere analysed using analysis ofvariance(ANOVA)andleastsignificantdifference(LSD)testforcomparisonofmeans.
395
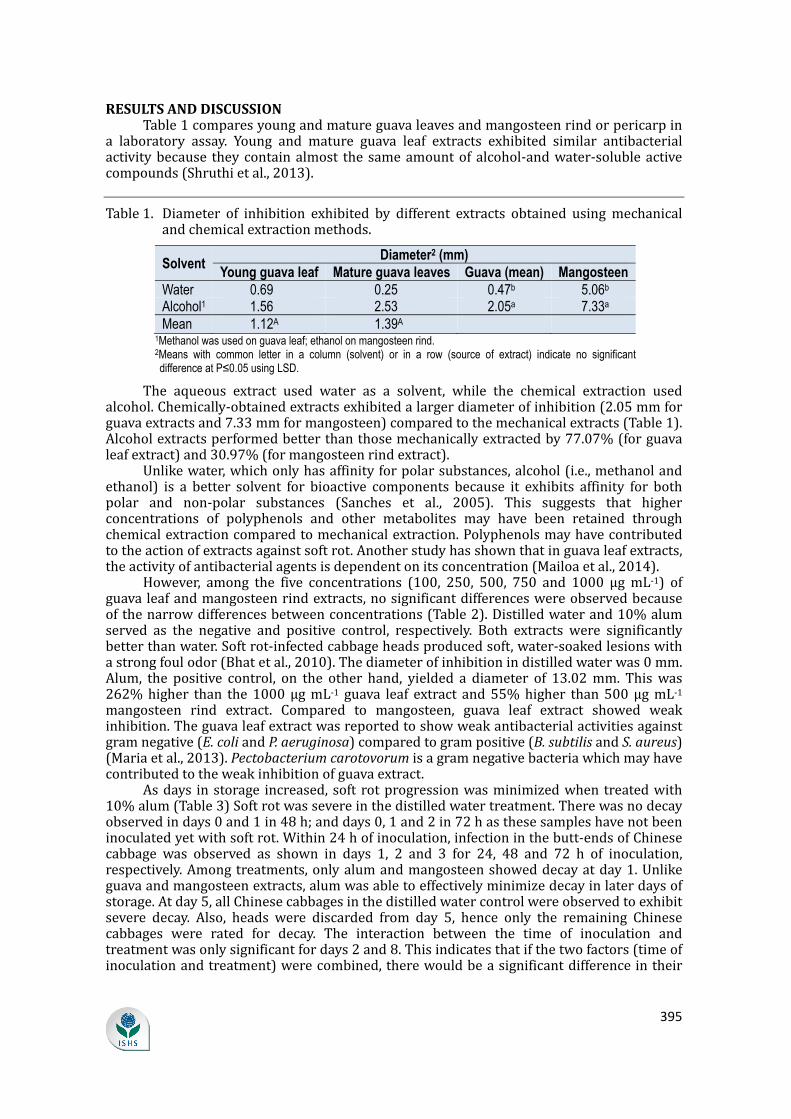
RESULTSANDDISCUSSIONTable1comparesyoungandmatureguavaleavesandmangosteenrindorpericarpina laboratory assay. Young and mature guava leaf extracts exhibited similar antibacterialactivitybecause theycontainalmost the sameamountof alcohol-andwater-solubleactivecompounds(Shruthietal.,2013).Table1. Diameter of inhibition exhibited by different extracts obtained usingmechanicalandchemicalextractionmethods.Solvent
Diameter2 (mm) Young guava leaf Mature guava leaves Guava (mean) Mangosteen
Water 0.69 0.25 0.47b 5.06bAlcohol1 1.56 2.53 2.05a 7.33aMean 1.12A 1.39A
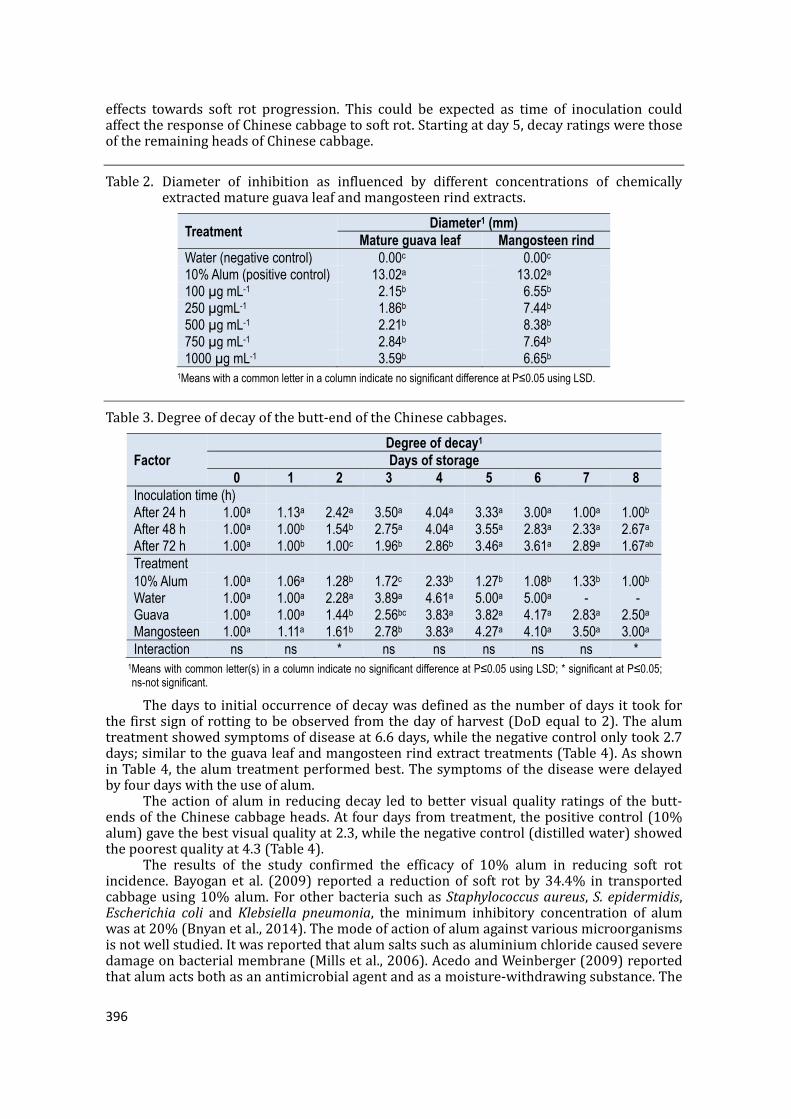
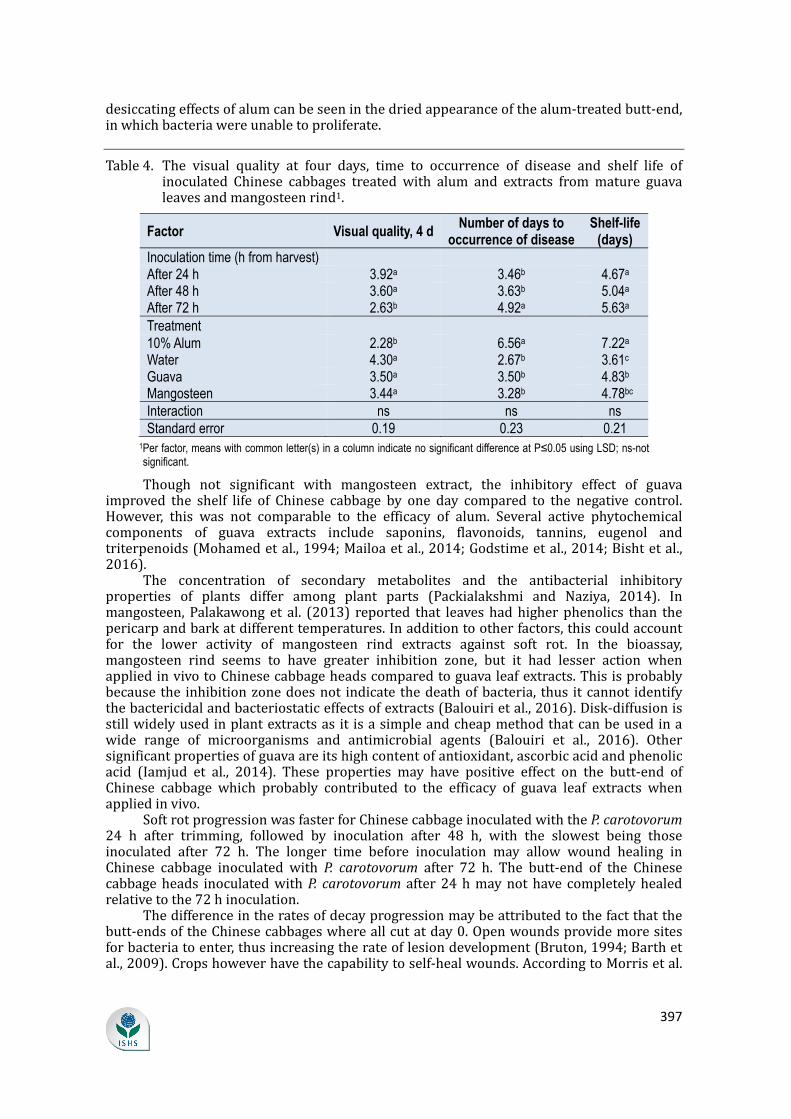
1Methanol was used on guava leaf; ethanol on mangosteen rind. 2Means with common letter in a column (solvent) or in a row (source of extract) indicate no significant difference at P≤0.05 using LSD. The aqueous extract used water as a solvent, while the chemical extraction usedalcohol.Chemically-obtainedextractsexhibitedalargerdiameterofinhibition(2.05mmforguavaextractsand7.33mmformangosteen)comparedtothemechanicalextracts(Table1).Alcoholextractsperformedbetterthanthosemechanicallyextractedby77.07%(forguavaleafextract)and30.97%(formangosteenrindextract).Unlikewater,whichonlyhasaffinityforpolarsubstances,alcohol(i.e.,methanolandethanol) is a better solvent for bioactive components because it exhibits affinity for bothpolar and non-polar substances (Sanches et al., 2005). This suggests that higherconcentrations of polyphenols and other metabolites may have been retained throughchemicalextractioncomparedtomechanicalextraction.Polyphenolsmayhavecontributedtotheactionofextractsagainstsoftrot.Anotherstudyhasshownthatinguavaleafextracts,theactivityofantibacterialagentsisdependentonitsconcentration(Mailoaetal.,2014).However, among the five concentrations (100, 250, 500, 750 and 1000 µgmL-1) ofguavaleafandmangosteenrindextracts,nosignificantdifferenceswereobservedbecauseofthenarrowdifferencesbetweenconcentrations(Table2).Distilledwaterand10%alumserved as the negative and positive control, respectively. Both extracts were significantlybetterthanwater.Softrot-infectedcabbageheadsproducedsoft,water-soakedlesionswithastrongfoulodor(Bhatetal.,2010).Thediameterofinhibitionindistilledwaterwas0mm.Alum, the positive control, on the other hand, yielded a diameter of 13.02mm. Thiswas262%higher than the 1000µgmL-1 guava leaf extract and55%higher than500µgmL-1mangosteen rind extract. Compared to mangosteen, guava leaf extract showed weakinhibition.Theguavaleafextractwasreportedtoshowweakantibacterialactivitiesagainstgramnegative(E.coliandP.aeruginosa)comparedtogrampositive(B.subtilisandS.aureus)(Mariaetal.,2013).Pectobacteriumcarotovorumisagramnegativebacteriawhichmayhavecontributedtotheweakinhibitionofguavaextract.Asdays instorage increased,soft rotprogressionwasminimizedwhentreatedwith10%alum(Table3)Softrotwassevereinthedistilledwatertreatment.Therewasnodecayobservedindays0and1in48h;anddays0,1and2in72hasthesesampleshavenotbeeninoculatedyetwithsoftrot.Within24hofinoculation,infectioninthebutt-endsofChinesecabbage was observed as shown in days 1, 2 and 3 for 24, 48 and 72 h of inoculation,respectively.Amongtreatments,onlyalumandmangosteenshoweddecayatday1.Unlikeguavaandmangosteenextracts,alumwasabletoeffectivelyminimizedecayinlaterdaysofstorage.Atday5,allChinesecabbagesinthedistilledwatercontrolwereobservedtoexhibitsevere decay. Also, heads were discarded from day 5, hence only the remaining Chinesecabbages were rated for decay. The interaction between the time of inoculation andtreatmentwasonlysignificantfordays2and8.Thisindicatesthatifthetwofactors(timeofinoculationandtreatment)werecombined,therewouldbeasignificantdifferenceintheir
396
effects towards soft rot progression. This could be expected as time of inoculation couldaffecttheresponseofChinesecabbagetosoftrot.Startingatday5,decayratingswerethoseoftheremainingheadsofChinesecabbage.Table2. Diameter of inhibition as influenced by different concentrations of chemicallyextractedmatureguavaleafandmangosteenrindextracts.Treatment
Diameter1 (mm) Mature guava leaf Mangosteen rind
Water (negative control) 0.00c 0.00c
10% Alum (positive control) 13.02a 13.02a100 µg mL-1 2.15b 6.55b
250 µgmL-1 1.86b 7.44b
500 µg mL-1 2.21b 8.38b
750 µg mL-1 2.84b 7.64b
1000 µg mL-1 3.59b 6.65b
1Means with a common letter in a column indicate no significant difference at P≤0.05 using LSD. Table3.Degreeofdecayofthebutt-endoftheChinesecabbages.Factor
Degree of decay1 Days of storage
0 1 2 3 4 5 6 7 8Inoculation time (h) After 24 h 1.00a 1.13a 2.42a 3.50a 4.04a 3.33a 3.00a 1.00a 1.00bAfter 48 h 1.00a 1.00b 1.54b 2.75a 4.04a 3.55a 2.83a 2.33a 2.67aAfter 72 h 1.00a 1.00b 1.00c 1.96b 2.86b 3.46a 3.61a 2.89a 1.67abTreatment 10% Alum 1.00a 1.06a 1.28b 1.72c 2.33b 1.27b 1.08b 1.33b 1.00bWater 1.00a 1.00a 2.28a 3.89a 4.61a 5.00a 5.00a - -Guava 1.00a 1.00a 1.44b 2.56bc 3.83a 3.82a 4.17a 2.83a 2.50aMangosteen 1.00a 1.11a 1.61b 2.78b 3.83a 4.27a 4.10a 3.50a 3.00aInteraction ns ns * ns ns ns ns ns *
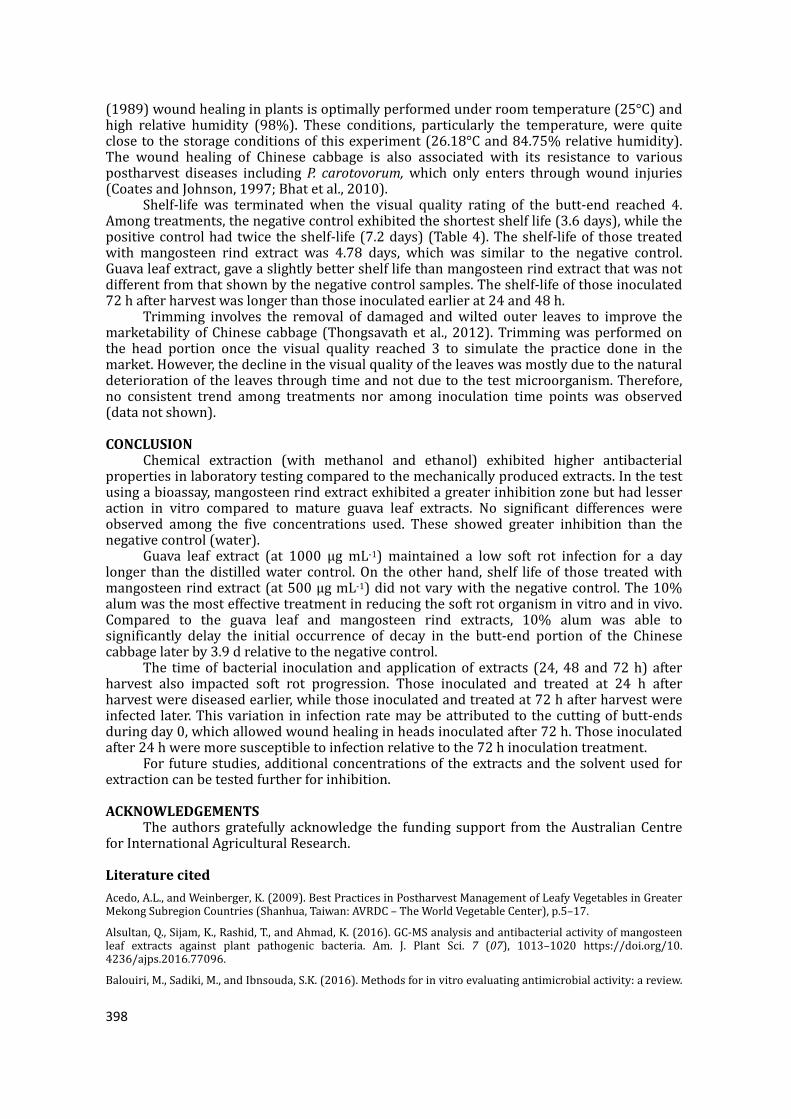
1Means with common letter(s) in a column indicate no significant difference at P≤0.05 using LSD; * significant at P≤0.05; ns-not significant. Thedaystoinitialoccurrenceofdecaywasdefinedasthenumberofdaysittookforthefirstsignofrottingtobeobservedfromthedayofharvest(DoDequalto2).Thealumtreatmentshowedsymptomsofdiseaseat6.6days,whilethenegativecontrolonlytook2.7days;similartotheguavaleafandmangosteenrindextracttreatments(Table4).AsshowninTable4,thealumtreatmentperformedbest.Thesymptomsofthediseaseweredelayedbyfourdayswiththeuseofalum.Theactionofalum in reducingdecay led tobettervisualquality ratingsof thebutt-endsoftheChinesecabbageheads.Atfourdaysfromtreatment,thepositivecontrol(10%alum)gavethebestvisualqualityat2.3,whilethenegativecontrol(distilledwater)showedthepoorestqualityat4.3(Table4).The results of the study confirmed the efficacy of 10% alum in reducing soft rotincidence.Bayogan et al. (2009) reported a reductionof soft rot by34.4% in transportedcabbageusing10%alum.Forotherbacteria suchasStaphylococcusaureus,S.epidermidis,
Escherichia coli andKlebsiella pneumonia, the minimum inhibitory concentration of alumwasat20%(Bnyanetal.,2014).Themodeofactionofalumagainstvariousmicroorganismsisnotwellstudied.Itwasreportedthatalumsaltssuchasaluminiumchloridecausedseveredamageonbacterialmembrane(Millsetal.,2006).AcedoandWeinberger(2009)reportedthatalumactsbothasanantimicrobialagentandasamoisture-withdrawingsubstance.The
397
desiccatingeffectsofalumcanbeseeninthedriedappearanceofthealum-treatedbutt-end,inwhichbacteriawereunabletoproliferate.Table4. The visual quality at four days, time to occurrence of disease and shelf life ofinoculated Chinese cabbages treated with alum and extracts frommature guavaleavesandmangosteenrind1.Factor Visual quality, 4 d
Number of days to occurrence of disease
Shelf-life (days)
Inoculation time (h from harvest) After 24 h 3.92a 3.46b 4.67aAfter 48 h 3.60a 3.63b 5.04aAfter 72 h 2.63b 4.92a 5.63aTreatment 10% Alum 2.28b 6.56a 7.22aWater 4.30a 2.67b 3.61cGuava 3.50a 3.50b 4.83bMangosteen 3.44a 3.28b 4.78bcInteraction ns ns nsStandard error 0.19 0.23 0.21
1Per factor, means with common letter(s) in a column indicate no significant difference at P≤0.05 using LSD; ns-not significant. Though not significant with mangosteen extract, the inhibitory effect of guavaimproved the shelf life of Chinese cabbage by one day compared to the negative control.However, this was not comparable to the efficacy of alum. Several active phytochemicalcomponents of guava extracts include saponins, flavonoids, tannins, eugenol andtriterpenoids(Mohamedetal.,1994;Mailoaetal.,2014;Godstimeetal.,2014;Bishtetal.,2016).The concentration of secondary metabolites and the antibacterial inhibitoryproperties of plants differ among plant parts (Packialakshmi and Naziya, 2014). Inmangosteen, Palakawonget al. (2013) reported that leaveshadhigherphenolics than thepericarpandbarkatdifferenttemperatures.Inadditiontootherfactors,thiscouldaccountfor the lower activity of mangosteen rind extracts against soft rot. In the bioassay,mangosteen rind seems to have greater inhibition zone, but it had lesser action whenappliedinvivotoChinesecabbageheadscomparedtoguavaleafextracts.Thisisprobablybecausethe inhibitionzonedoesnot indicate thedeathofbacteria, thus itcannot identifythebactericidalandbacteriostaticeffectsofextracts(Balouirietal.,2016).Disk-diffusionisstillwidelyusedinplantextractsas it isasimpleandcheapmethodthatcanbeusedinawide range of microorganisms and antimicrobial agents (Balouiri et al., 2016). Othersignificantpropertiesofguavaareitshighcontentofantioxidant,ascorbicacidandphenolicacid (Iamjud et al., 2014). These properties may have positive effect on the butt-end ofChinese cabbage which probably contributed to the efficacy of guava leaf extracts whenappliedinvivo.SoftrotprogressionwasfasterforChinesecabbageinoculatedwiththeP.carotovorum24 h after trimming, followed by inoculation after 48 h, with the slowest being thoseinoculated after 72 h. The longer time before inoculation may allow wound healing inChinese cabbage inoculated with P. carotovorum after 72 h. The butt-end of the Chinesecabbageheads inoculatedwithP.carotovorum after24hmaynothave completelyhealedrelativetothe72hinoculation.Thedifferenceintheratesofdecayprogressionmaybeattributedtothefactthatthebutt-endsoftheChinesecabbageswhereallcutatday0.Openwoundsprovidemoresitesforbacteriatoenter,thusincreasingtherateoflesiondevelopment(Bruton,1994;Barthetal.,2009).Cropshoweverhavethecapabilitytoself-healwounds.AccordingtoMorrisetal.
398
(1989)woundhealinginplantsisoptimallyperformedunderroomtemperature(25°C)andhigh relative humidity (98%). These conditions, particularly the temperature, were quiteclosetothestorageconditionsofthisexperiment(26.18°Cand84.75%relativehumidity).The wound healing of Chinese cabbage is also associated with its resistance to variouspostharvest diseases includingP. carotovorum, which only enters throughwound injuries(CoatesandJohnson,1997;Bhatetal.,2010).Shelf-life was terminated when the visual quality rating of the butt-end reached 4.Amongtreatments,thenegativecontrolexhibitedtheshortestshelflife(3.6days),whilethepositivecontrolhadtwice theshelf-life(7.2days)(Table4).Theshelf-lifeof thosetreatedwith mangosteen rind extract was 4.78 days, which was similar to the negative control.Guavaleafextract,gaveaslightlybettershelflifethanmangosteenrindextractthatwasnotdifferentfromthatshownbythenegativecontrolsamples.Theshelf-lifeofthoseinoculated72hafterharvestwaslongerthanthoseinoculatedearlierat24and48h.Trimming involves the removal of damaged andwilted outer leaves to improve themarketabilityofChinese cabbage (Thongsavathet al., 2012).Trimmingwasperformedonthe head portion once the visual quality reached 3 to simulate the practice done in themarket.However,thedeclineinthevisualqualityoftheleaveswasmostlyduetothenaturaldeteriorationoftheleavesthroughtimeandnotduetothetestmicroorganism.Therefore,no consistent trend among treatments nor among inoculation time points was observed(datanotshown).CONCLUSIONChemical extraction (with methanol and ethanol) exhibited higher antibacterialpropertiesinlaboratorytestingcomparedtothemechanicallyproducedextracts.Inthetestusingabioassay,mangosteenrindextractexhibitedagreaterinhibitionzonebuthadlesseraction in vitro compared to mature guava leaf extracts. No significant differences wereobserved among the five concentrations used. These showed greater inhibition than thenegativecontrol(water).Guava leaf extract (at 1000 µg mL-1) maintained a low soft rot infection for a daylonger than thedistilledwater control.On theotherhand, shelf life of those treatedwithmangosteenrindextract(at500µgmL-1)didnotvarywiththenegativecontrol.The10%alumwasthemosteffectivetreatmentinreducingthesoftrotorganisminvitroandinvivo.Compared to the guava leaf and mangosteen rind extracts, 10% alum was able tosignificantly delay the initial occurrence of decay in the butt-end portion of the Chinesecabbagelaterby3.9drelativetothenegativecontrol.The timeof bacterial inoculation andapplicationof extracts (24,48 and72h) afterharvest also impacted soft rot progression. Those inoculated and treated at 24 h afterharvestwerediseasedearlier,whilethoseinoculatedandtreatedat72hafterharvestwereinfected later.Thisvariation in infectionratemaybeattributedto thecuttingofbutt-endsduringday0,whichallowedwoundhealinginheadsinoculatedafter72h.Thoseinoculatedafter24hweremoresusceptibletoinfectionrelativetothe72hinoculationtreatment.For futurestudies,additionalconcentrationsof theextractsandthesolventused forextractioncanbetestedfurtherforinhibition.ACKNOWLEDGEMENTSThe authors gratefully acknowledge the funding support from theAustralianCentreforInternationalAgriculturalResearch.LiteraturecitedAcedo,A.L.,andWeinberger,K.(2009).BestPracticesinPostharvestManagementofLeafyVegetablesinGreaterMekongSubregionCountries(Shanhua,Taiwan:AVRDC–TheWorldVegetableCenter),p.5–17.Alsultan,Q.,Sijam,K.,Rashid,T.,andAhmad,K.(2016).GC-MSanalysisandantibacterialactivityofmangosteenleaf extracts against plant pathogenic bacteria. Am. J. Plant Sci. 7 (07), 1013–1020 https://doi.org/10.4236/ajps.2016.77096.Balouiri,M.,Sadiki,M.,andIbnsouda,S.K.(2016).Methodsforinvitroevaluatingantimicrobialactivity:areview.
399
JPharmAnal6(2),71–79https://doi.org/10.1016/j.jpha.2015.11.005.PubMedBarth,M.,Hankinson,T.R.,Zhuang,H.,andBreidt,F.(2009).Microbiologicalspoilageoffruitsandvegetables.InCompendiumoftheMicrobiologicalSpoilageofFoodsandBeverages,FoodMicrobiologyandFoodSafety,W.H.Sperber,andM.P.Doyle,eds.(SpringerScienceBusinessMedia),p.134–183http://dx.doi.org/183.10.1007/978-1-4419-0826-1_6.Bayogan,E.V.,Jimenez,E.F.,Boteng,J.D.,Bautista,O.K.,andMacario,C.B.(2009).Improvingpostharvestcabbage(BrassicaoleraceaL.var.capitata)qualityusingalumandnewspaperwrap.Banwa.6(2),76–86.Bdliya,B.S.,andDahiru,B.(2006).EfficacyofsomeplantextractsonthecontrolofpotatotubersoftrotcausedbyErwiniacarotovorassp.carotovora.J.PlantProt.Res.46(3),285–294.Bhat,K.A.,Masood,S.D.,Bhat,N.A.,Bhat,M.A.,Razvi,S.M.,Mir,M.R.,Akhtar,S.,Wani,N.,andHabib,M. (2010).Currentstatusofpostharvestsoftrotinvegetables:areview.AsianJ.PlantSci.9(4),200–208https://doi.org/10.3923/ajps.2010.200.208.Bisht, R., Chanyal, S., and Agrawal, P.K. (2016). Antimicrobial and phytochemical analysis of leaf extract ofmedicinalfruitplants.AsianJ.Pharm.Clin.Res.9(4),131–136.Biswas,B.,Rogers,K.,McLaughlin,F.,Daniels,D.,andYadav,A.(2013).Antimicrobialactivitiesofleafextractsofguava (Psidium guajava L.) on two gram-negative and gram-positive bacteria. Int J Microbiol 2013, 746165https://doi.org/10.1155/2013/746165.PubMedBnyan, I.A., Alta’ee, A.H., and Kadhum, N.H. (2014). Antibacterial activity of aluminum potassium sulfate andsyzygiumaromaticumextractagainstpathogenicmicroorganisms.J.Nat.Sci.Res.4(15),11–14.Bruton, B.D. (1994).Mechanical injury and latent infections leading to postharvest decay. HortScience29 (7),747–750.Coates,L.M.,andJohnson,G.I.(1997).Postharvestdiseasesoffruitandvegetables.InPlantPathogensandPlantdiseases,J.F.BrownandH.J.Ogle,eds.(Cambridge,UK:RockvalePublications),p.533–547.D’Amato,R.F.,andHochstein,L.(1982).Evaluationofarapidinoculumpreparationmethodforagardiskdiffusionsusceptibilitytesting.J.Clin.Microbiol.15(2),282–285.PubMedDavidsson, P.R., Kariola, T., Niemi, O., and Palva, E.T. (2013). Pathogenicity of and plant immunity to soft rotpectobacteria.FrontPlantSci4(191),191.PubMedGnan, S.O., and Demello, M.T. (1999). Inhibition of Staphylococcus aureus by aqueous Goiaba extracts. JEthnopharmacol68(1-3),103–108https://doi.org/10.1016/S0378-8741(99)00048-3.PubMedGodstime, O., Felix, E., Augustina, J., and Christopher, E. (2014). Mechanisms of antimicrobial actions ofphytochemicalsagainstentericpathogens–areview.J.Pharm.Chem.Biol.Sci.2(2),77–85.Iamjud,K.,Banyen,N.,Boonprakob,U.,andThaipong,K. (2014).Ascorbicacid, totalphenolicsandantioxidantactivityofguavaleafextracts.ActaHortic.1024,367–372https://doi.org/10.17660/ActaHortic.2014.1024.50.Mailoa,M.N.,Mahendradatta,M.,Laga,A.,andDjide,N. (2014).Antimicrobialactivitiesof tanninsextract fromguavaleaves(PsidiumguajavaL.)onpathogensmicrobial.Int.J.Sci.Technol.Res.3(1),236–241.Maria, L.D., Lacuna, G., Carmona, M., Amparado, B.L., Daclan, M.A.F., and Ranido, L.A. (2013). Antimicrobialactivityofsupercritical fluidextractsof twoPhilippinemedicinalplants,Psidiumguajava andEuphorbiahirta:implicationstocommunityhealth.AABBioflux5(1),1–12.Mills,A.A.S.,Platt,H.W.,andHurta,R.A.R.(2006).SensitivityofErwiniaspp.tosaltcompoundsinvitroandtheireffect on the development of soft rot in potato tubers in storage. Postharvest Biol. Technol. 41, 208–214https://doi.org/10.1016/j.postharvbio.2006.03.015.Mohamed,S.,Hassan,Z.,andAbdHamid,N.(1994).Antimicrobialactivityofsometropicalfruitwastes(guava,starfruit,banana,papaya,passionfruit,langsat,duku,rambutanandrambai).Pertanika,J.Trop.Agric.Sci.17(3),219–227.Morris,S.C.,Forbes-Smith,M.R.,andScriven,F.M.(1989).Determinationofoptimumconditionsforsuberization,woundperidermformation,cellulardesiccationandpathogenresistanceinwoundedSolanumtuberosumtubers.Physiol.Mol.PlantPathol.35(2),177–190https://doi.org/10.1016/0885-5765(89)90087-8.Murray,P.R.,Baron,E.J.,Pfaller,M.A.,Tenover,F.C.,andYolke,R.H.(1995).ManualofClinicalMicrobiology,6thedn(Washington,DC:ASM).Nazerian, E., Sijam,K.,MiorAhmad, Z.A., andVadamalai, G. (2011). First report of cabbage soft rot causedbyPectobacterium carotovorum subsp. carotovorum in Malaysia. Plant Dis. 95 (4), 491–491 https://doi.org/10.1094/PDIS-09-10-0683.Nweke,C.N.,andIbiam,O.F.A.(2012).Effectofextractsfromleaves,barkandrootofAzadiratchaindicaL.onthe
400
vegetativegrowthofColletrichumgloeosporoides: fieldsoftrotpathogenofsoursop(AnnonamuricataL.) fruit.Agric.Biol.J.N.Am.3(13),481–485https://doi.org/10.5251/abjna.2012.3.12.481.485.Packialakshmi,N.,andNaziya,S. (2014).Phytochemicalandantibacterialscreeningof thepolarandnon-polarsolventstemextractofCallalumafimbriyata.Int.J.PureApp.Biosci.2(4),32–37.Palakawong,C.,Sophanodora,P.,Toivonen,P.,andDelaquis,P.(2013).Optimizedextractionandcharacterizationof antimicrobial phenolic compounds from mangosteen (Garciniamangostana L.) cultivation and processingwaste.J.Sci.FoodAgric.93(15),3792–3800https://doi.org/10.1002/jsfa.6277.PubMedPhilippine Council for Agriculture, Aquatic and Natural Resources Research and Development (PCAARRD).(2003). Chinese Cabbage: Industry Status. http://www.pcaarrd.dost.gov.ph/home/joomla/index.php?option=com_content&task=view&id=828&Itemid=582.Priya,V.V.,Jainu,M.,Mohan,S.K.,Saraswathi,P.,andGopan,C.S.(2010).AntimicrobialactivityofpericarpextractofGarciniamangostana.Linn.Int.J.Pharm.Sci.Res.1(8),278–281.Sanches,N.R., Garcia Cortez,D.A., Schiavini,M.S., Nakamura, C.V., andDias Filho, B.P. (2005). An evaluation ofantibacterialactivitiesofPsidiumguajavaL.Braz.Arch.Biol.Technol.48(3),429–436https://doi.org/10.1590/S1516-89132005000300014.Shruthi,S.D.,Roshan,A.,Timilsina,S.S.,andSunita,S.(2013).AreviewonthemedicinalplantPsidiumguajavaLinn.(Myrtaceae).J.DrugDeliv.Ther.3(2),162–168https://doi.org/10.1590/S1516-89132005000300014.Simeon, A.U., and Abubakar. (2014). Evaluation of some plant extracts for the control of bacterial soft rot oftubers.Am.J.Exp.Agric.4(12),1869–1876https://doi.org/10.9734/AJEA/2014/12309.Stephens, J.M. (2015). Cabbage, Chinese – Brassica campestris L. (Pekinensis group), Brassica campestris L.(Chinensis group). Publication No. HS569 (University of Florida, Institute of Food and Agricultural SciencesExtensionService),http://edis.ifas.ufl.edu/mv036.Thongsavath,C.,Varit,S.,Thananya,W.,Sirichai,K.,andAntonio,A.,Jr.(2012).CabbagesupplychainmappingandpostharvestlossinthedomesticandexporttradeinLaoPDR.Int.FoodRes.J.19(4),1615–1620.Tiwari, B.K., Valdramidis, V.P., O’Donnell, C.P., Muthukumarappan, K., Bourke, P., and Cullen, P.J. (2009).Applicationofnaturalantimicrobialsforfoodpreservation.J.Agric.FoodChem.57(14),5987–6000https://doi.org/10.1021/jf900668n.PubMedTorrungruang,K.,Vichienroj,P., andChutimaworapan, S. (2007).Antibacterial activityofmangosteenpericarpextractagainstcariogenicStreptococcusmutans.CUDentJ.30,1–10.
Acta Hortic. 1179. ISHS 2017. DOI 10.17660/ActaHortic.2017.1179.15 Proc. III Southeast Asia Symp. on Quality Management in Postharvest Systems Eds.: A.L. Acedo Jr. et al.
101
Physicochemical quality of sweet pepper (Capsicum annuum ‘Smooth Cayenne’) treated with 1-methylcyclopropene
E.V. Bayogan and A.T. Lacap University of the Philippines Mindanao, Mintal, Tugbok District, Davao City 8000, Philippines.
Abstract Four concentrations (0, 0.1, 1 or 10 µL L-1) of 1-methylcyclopropene (1-MCP)
were applied to sweet pepper (Capsicum annuum L. ‘Smooth Cayenne’) fruit that was then stored for 10 days under ambient conditions (27.4±0.7°C, 82.0±10.1% RH). Treated sweet pepper consistently maintained better visual quality and reduced shriveling starting from 4 days after treatment (DAT). Ripening was delayed best by 10 µL L-1 1-MCP, followed by 1 µL L-1 1-MCP, as exhibited by lower a* (greenness) and chroma (intensity) during the initial period of storage. Later, skin lightness (L*) and b* (yellowness) were higher in treated fruit. Vitamin C content and total soluble solids were only slightly affected at 4 and 6 DAT, respectively. Shriveling and decay were reduced in treated fruit. Weight loss did not vary with treatment. There was delayed ripening and better postharvest quality maintenance of sweet pepper under ambient conditions using 10 µL L-1 1-MCP for 12 h.
Keywords: Capsicum annuum L., visual quality, shriveling, color, vitamin C
INTRODUCTION Sweet pepper is an economically important crop that is grown throughout tropical,
subtropical and temperate regions by small, medium and large producers (Pickersgill, 1997). It is an important food ingredient, and it is consumed fresh or processed (Costa et al., 2009). The major postharvest factor limiting marketing of sweet pepper is its short shelf life (Ilić et al., 2011). Rapid deterioration due to poor handling and storage is the main cause of postharvest losses in sweet pepper (Nyanjage et al., 2005). Green sweet pepper can better withstand transport stresses because of its thick pericarp wall, and therefore has a longer postharvest life than fully ripe fruit (Cao et al., 2012; Ilić et al., 2011). After sweet peppers are detached from the plant, the fruit undergoes several postharvest processes that lead to its rapid decline in quality, such as rapid senescence, loss of nutritive components, water loss and pathological decay (Du et al., 2007). Thus, it has been a challenge to maintain the quality of sweet peppers in the fresh produce industry (Xie et al., 2004).
1-Methylcyclopropene (1-MCP) is widely used to extend the shelf life of many fruits and vegetables. 1-MCP is an ethylene blocker, preventing ethylene-dependent processes such as ripening, senescence, yellowing and softening in many crops (Li et al., 2011). 1-MCP is effective in delaying senescence and retaining the quality of sweet pepper by reducing ethylene production and maintaining firmness and acidity (Ilić et al., 2009, 2011; Li et al., 2011). In this study, the effect of 1-MCP in maintaining quality and delaying the ripening of ‘Smooth Cayenne’ sweet pepper was investigated.
MATERIALS AND METHODS The experiment was conducted at the Postharvest Biology Laboratory of the
University of the Philippines Mindanao. Three hundred and sixty newly harvested mature green (L*=43.79; a*=1.41; b*=18.51) ‘Smooth Cayenne’ sweet peppers of uniform quality (mean weight 47.8 g) that were grown on a farm 54 km away were purchased from Bankerohan Public Market in Davao City, Philippines. From the market, samples were transported to the laboratory in an air-conditioned vehicle, washed briefly with tap water, soaked in 500 ppm bleach solution (5.25% NaOCl) for 2 min, laid on paper towels and air-
102
dried before treatment. The samples were treated with 0, 0.1, 1 and 10 µL L-1 1-MCP for 12 h and then stored under ambient room conditions (26.8-28.1°C, 71.95-92.1% RH) for 10 days.
The following data were gathered at 2-day intervals: weight loss; skin color (using a Minolta CR-400 Chromameter) by determining L* (lightness; black = -100; white = 100), a* (green or red; - = green; + = red), b* (blue or yellow; - = blue; + = yellow), chroma and hue angle; visual quality (1, excellent; 3, good, limit of salability; 5, poor); shriveling (1, no shriveling; 3, moderate, 16-30% of the surface area shriveled; 5, extreme, 50% or more of the surface area shriveled); decay (1, no decay; 3, moderate, 6-10% of the surface area decayed; 5, extreme, 16% or more); total soluble solids (TSS) using an Atago Pocket Refractometer PAL-1; vitamin C (redox titration using iodine solution); and decay incidence (%). The experiment followed a completely randomized design (CRD) with three replications at six fruits per replicate. Data were analyzed using analysis of variance (ANOVA) and differences between treatment means were compared using least significant difference (LSD) at 5% level of significance.
RESULTS
Physical evaluation
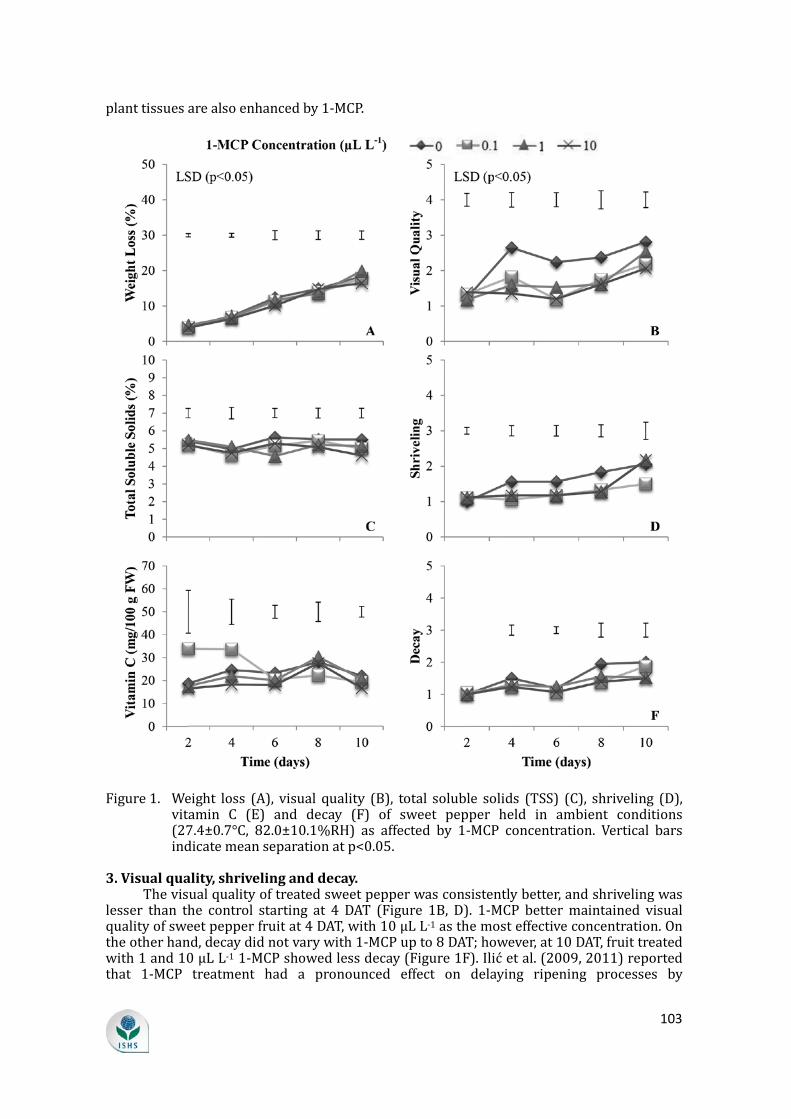
1. Weight loss. Weight loss in both control and treated fruit increased during storage, but it did not
vary with 1-MCP concentration (Figure 1A). This is in contrast to 1-MCP at 450 nL L-1, which reduced weight loss and decay incidence and inhibited color development in treated Capsicum annuum ‘Silica’ and ‘H1530’ sweet peppers (Ilić et al., 2009). Cultivar could have influenced this response to 1-MCP.
2. Skin color. Color represents a major external characteristic of a fruit vegetable like sweet pepper,
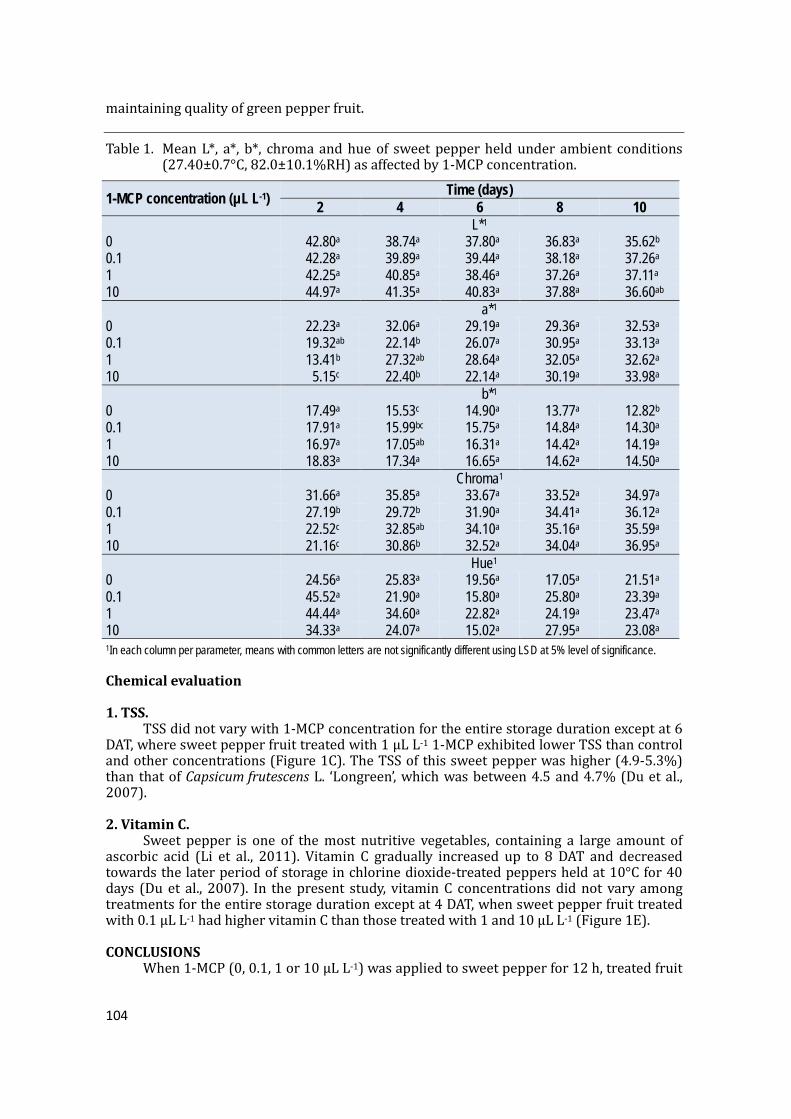
and is therefore a crucial consideration in determining its quality (Jiménez León et al., 2013). Color change as an indication of ripening was delayed by up to 4 days after treatment (DAT) in treated sweet pepper as depicted by lower a* (greenness) (Table 1). At 2 DAT, samples treated with 10 µL L-1 1-MCP had the lowest a*, or the most delayed ripening, followed by those treated with 1 µL L-1 1-MCP. In a study by Cao et al. (2012), 1-MCP at 1 µL L-1 was most effective in delaying senescence of green bell pepper fruit. Lightness of sweet pepper skin color, L*, was not affected by 1-MCP concentration up to 8 DAT; however, treated samples had lighter skin color (L*) at 10 DAT. Yellowness, positive b*, was not affected by 1-MCP at 2, 6 and 8 DAT, but was higher in samples treated with 1 and 10 µL L-1 1-MCP at 4 DAT. At 8 DAT, 1-MCP-treated sweet pepper also seemed to be more yellow than the control. Compared with the control, 1-MCP also prevented the increase in skin chroma (saturation) up to 4 DAT. The higher concentrations, 1 and 10 µL L-1 1-MCP, had the lowest chroma values, followed by 0.1 µL L-1. According to Jiménez León et al. (2013), the green chromaticity value decreases because of the disappearance of chlorophyll and the gradual increase of polyphenol compounds. Hue did not vary among treatments.
1-MCP manifested an effect on delaying ripening processes, as shown by inhibited color development from mature green stage. Similar studies also reported a positive effect of 1-MCP on senescence and quality maintenance of green bell pepper fruit as evidenced by delayed color change and softening (Huang et al., 2003; Ilić et al., 2009, 2011). 1-MCP inhibits ripening by irreversibly occupying ethylene-binding sites, so that ethylene cannot bind and stimulate subsignal transduction and translation in the ripening process (Serek et al., 1994).
According to Cao et al. (2012), the mechanism of the delay of ripening process and senescence of green sweet pepper by 1-MCP is attributed to enhanced antioxidant enzyme activities that destroy reactive oxygen species (ROS), which cause damage to cellular macromolecules, and these lead to plant senescence. Further, polyamine contents that are known to be associated with cell division and growth and act as antisenescence agents in
103
plant tissues are also enhanced by 1-MCP.
Figure 1. Weight loss (A), visual quality (B), total soluble solids (TSS) (C), shriveling (D), vitamin C (E) and decay (F) of sweet pepper held in ambient conditions (27.4±0.7°C, 82.0±10.1%RH) as affected by 1-MCP concentration. Vertical bars indicate mean separation at p<0.05.
3. Visual quality, shriveling and decay. The visual quality of treated sweet pepper was consistently better, and shriveling was
lesser than the control starting at 4 DAT (Figure 1B, D). 1-MCP better maintained visual quality of sweet pepper fruit at 4 DAT, with 10 µL L-1 as the most effective concentration. On the other hand, decay did not vary with 1-MCP up to 8 DAT; however, at 10 DAT, fruit treated with 1 and 10 µL L-1 1-MCP showed less decay (Figure 1F). Ilić et al. (2009, 2011) reported that 1-MCP treatment had a pronounced effect on delaying ripening processes by
104
maintaining quality of green pepper fruit.
Table 1. Mean L*, a*, b*, chroma and hue of sweet pepper held under ambient conditions (27.40±0.7°C, 82.0±10.1%RH) as affected by 1-MCP concentration.
1-MCP concentration (µL L-1) Time (days) 2 4 6 8 10
L*1
0 42.80a 38.74a 37.80a 36.83a 35.62b
0.1 42.28a 39.89a 39.44a 38.18a 37.26a
1 42.25a 40.85a 38.46a 37.26a 37.11a
10 44.97a 41.35a 40.83a 37.88a 36.60ab
a*1
0 22.23a 32.06a 29.19a 29.36a 32.53a
0.1 19.32ab 22.14b 26.07a 30.95a 33.13a
1 13.41b 27.32ab 28.64a 32.05a 32.62a
10 5.15c 22.40b 22.14a 30.19a 33.98a
b*1
0 17.49a 15.53c 14.90a 13.77a 12.82b
0.1 17.91a 15.99bc 15.75a 14.84a 14.30a
1 16.97a 17.05ab 16.31a 14.42a 14.19a
10 18.83a 17.34a 16.65a 14.62a 14.50a
Chroma1
0 31.66a 35.85a 33.67a 33.52a 34.97a
0.1 27.19b 29.72b 31.90a 34.41a 36.12a
1 22.52c 32.85ab 34.10a 35.16a 35.59a
10 21.16c 30.86b 32.52a 34.04a 36.95a
Hue1
0 24.56a 25.83a 19.56a 17.05a 21.51a
0.1 45.52a 21.90a 15.80a 25.80a 23.39a
1 44.44a 34.60a 22.82a 24.19a 23.47a
10 34.33a 24.07a 15.02a 27.95a 23.08a
1In each column per parameter, means with common letters are not significantly different using LSD at 5% level of significance.
Chemical evaluation
1. TSS. TSS did not vary with 1-MCP concentration for the entire storage duration except at 6
DAT, where sweet pepper fruit treated with 1 µL L-1 1-MCP exhibited lower TSS than control and other concentrations (Figure 1C). The TSS of this sweet pepper was higher (4.9-5.3%) than that of Capsicum frutescens L. ‘Longreen’, which was between 4.5 and 4.7% (Du et al., 2007).
2. Vitamin C. Sweet pepper is one of the most nutritive vegetables, containing a large amount of
ascorbic acid (Li et al., 2011). Vitamin C gradually increased up to 8 DAT and decreased towards the later period of storage in chlorine dioxide-treated peppers held at 10°C for 40 days (Du et al., 2007). In the present study, vitamin C concentrations did not vary among treatments for the entire storage duration except at 4 DAT, when sweet pepper fruit treated with 0.1 µL L-1 had higher vitamin C than those treated with 1 and 10 µL L-1 (Figure 1E).
CONCLUSIONS When 1-MCP (0, 0.1, 1 or 10 µL L-1) was applied to sweet pepper for 12 h, treated fruit
105
consistently maintained better visual quality and reduced shriveling starting from 4 DAT. Further, 1-MCP treatment was effective in delaying ripening of sweet pepper up to 4 DAT by restraining color change, as indicated by higher skin lightness (L*) and lower greenness (a*) and chroma. Visual quality was best in the lot treated with 10 µL L-1 1-MCP. Weight loss and decay incidence did not vary with 1-MCP concentration, while TSS and vitamin C were only slightly affected. These results suggest that delayed senescence by 1-MCP is associated with delayed color changes up to 4 DAT and better visual quality due to lesser shriveling up to 8 DAT. Ripening was delayed and postharvest quality of sweet pepper held under ambient conditions was better maintained using 10 µL L-1 1-MCP applied for 12 h.
ACKNOWLEDGMENTS The authors thank the Australian Centre for International Agricultural Research for
research funds.
Literature cited Cao, S., Yang, Z., and Zheng, Y. (2012). Effect of 1-methylcyclopropene on senescence and quality maintenance of green bell pepper fruit during storage at 20°C. Postharvest Biol. Technol. 70, 1–6 https://doi.org/10.1016/j.postharvbio.2012.03.005.
Costa, L.V., Lopes, R., Lopes, M.T.G., de Figueiredo, A.F., Barros, W.S., and Alves, S.R.M. (2009). Cross compatibility of domesticated hot pepper and cultivated sweet pepper. Crop Breed. Appl. Biotechnol. 9 (1), 37–44 https://doi.org/10.12702/1984-7033.v09n01a06.
Du, J., Fu, M., Li, M., and Xia, W. (2007). Effects of chlorine dioxide gas on postharvest physiology and storage quality of green bell pepper (Capsicum frutescens L. var. Longrum). Agric. Sci. China 6 (2), 214–219 https://doi.org/10.1016/S1671-2927(07)60037-6.
Huang, X., Zhang, Z., and Duan, X. (2003). Effect of 1-methylcyclopropene on storage quality of pepper at room temperature. Zhongguo Shucai 1 (1), 9–11.
Ilić, Z., Aharon, Z., Perzelan, Y., Alkalai-Tuvia, S., and Fallik, E. (2009). The influence of 1-MCP on chlorophyll, antioxidants activity and quality changes in "Ever-Green" and red pepper fruits after harvest. Acta Hortic. 830, 643–650 https://doi.org/10.17660/ActaHortic.2009.830.93.
Ilić, Z.S., Trajkovic, R., Perzelan, Y., Alkalai-Tuvia, S., and Fallik, E. (2012). Influence of 1-methylcyclopropene (1-MCP) on postharvest storage quality in green bell pepper fruit. Food Bioprocess Technol. 5 (7), 2758–2767 https://doi.org/10.1007/s11947-011-0614-7.
Jiménez León, J., López Elías, J., Huez López, M.A., García López, A.M., Soto Ortiz, R., and Escoboza García, L.F. (2013). Postharvest quality and shelf life of green pepper (Capsicum annuum L.) grown under open-field and greenhouse conditions. Idesia 31 (4), 35–41 https://doi.org/10.4067/S0718-34292013000400005.
Li, X., Yun, J., Fan, X., Xing, Y., and Tang, Y. (2011). Effect of 1-methylcyclopropene and modified atmosphere packaging on chilling injury and antioxidative defensive mechanism of sweet pepper. Afr. J. Biotechnol. 10 (34), 6581–6589.
Nyanjage, M.O., Nyalala, S.P.O., Illa, A.O., Mugo, B.W., Limbe, A.E., and Vulimu, E.M. (2005). Extending postharvest life of sweet pepper (Capsicum annuum L. ‘California Wonder’) with modified atmosphere packaging and storage temperature. Agric. Trop. Subtrop. 38 (2), 28–34.
Pickersgill, B. (1997). Genetic resources and breeding of Capsicum spp. Euphytica 96 (1), 129–133 https://doi.org/10.1023/A:1002913228101.
Serek, M., Sisler, E.C., and Reid, M.S. (1994). Novel gaseous ethylene binding inhibitor prevents ethylene effects in potted flowering plants. J. Am. Soc. Hortic. Sci. 119, 1230–1233.
Xie, M.H., Zhu, J.M., and Xie, J.M. (2004). Effect factors on storage of green pepper. J. Gansu Agric. Univ. 3, 300–305.

106
Acta Hortic. 1179. ISHS 2017. DOI 10.17660/ActaHortic.2017.1179.33 Proc. III Southeast Asia Symp. on Quality Management in Postharvest Systems Eds.: A.L. Acedo Jr. et al.
213
Quality changes in sweet pepper (Capsicum annuum L. ‘Smooth Cayenne’) under simulated retail conditions
E.V. Bayogan1, A.T. Lacap1 and J.H. Ekman2 1University of the Philippines Mindanao Mintal, Tugbok District, Davao City 8022, Philippines; 2Applied Horticultural Research, Suite 352, Biomedical Building, Central Avenue, Australian Tech. Park, Eveleigh, New South Wales 2015, Australia.
Abstract The handling chain of ‘Smooth Cayenne’ sweet pepper produced in Digos City,
southern Philippines, was tracked from harvest to wholesale. Quality was evaluated after transit at wholesale and at simulated retail for 15 days. Farmers harvested fruit at different maturities, but with more green fruit. There was an increase in light and full-red sweet peppers after a total of 25 h from harvest. Upon receipt at the retail level, losses at each section (i.e., top, middle, bottom) of the polypropylene sack were determined and quantified. Damage found at the bottom section included bruised (3.8%), cracked/split (48.1%), detached pedicel (23.1%), disease and rots (23.1%) and combination of damage (1.9%). The quality of sweet pepper during the simulated retail as affected by maturity (i.e., green, breaker, turning, orange and red) and container section was also evaluated. Those packed in the upper third of the sack had the fewest cracks and least weight loss, shriveling and decay relative to fruit from the middle and bottom portions. Further, fruit in the upper third also exhibited the slowest ripening and best visual quality. Mature green fruit had slower color change than the other maturity stages, as depicted by lower color index, a* value (green or red on surface) and chroma. Visual quality was better in turning and orange fruit until 9 d, while shriveling was less at 15 d. Overall, sweet pepper located in the upper portion of the polypropylene sack and green fruit had better quality after 15 d of simulated ambient retail conditions compared with fruit in lower portions of the container and later maturity stages, respectively.
Keywords: Capsicum annuum, harvest maturity, handling chain, postharvest loss
INTRODUCTION Sweet pepper (Capsicum annuum L.) is an important food ingredients all over the
world. It is an excellent source of ascorbic acid and a fair source of provitamin A carotenoids, which make it an object of attention for its potential in prevention of certain types of cancer and cardiovascular diseases (Rao et al., 2011; Simonne et al., 1997). The postharvest quality of fresh pepper fruit is influenced by physiological and pathological factors (Smith et al., 2006). Like any other crop, sweet pepper undergoes a wide range of environmental shocks along the supply chain that contribute to high losses upon reaching the wholesale and retail levels. Players in the supply chain, especially consumers, consider color, freshness, firmness, freedom from defects and diseases as well as shelf-life as important attributes during handling and storage (Nyanjage et al., 2005; Sigge et al., 2001). Further, most retailers keep their produce under ambient conditions, and could only reach up to 3-4 d shelf-life. This study determined and quantified the losses at each section (i.e., top, middle, bottom) of the package upon receipt at the retail level, and evaluated the quality of sweet pepper during simulated retail as affected by package section and maturity (i.e., green, breaker, turning, orange and red).
MATERIALS AND METHODS
Loss assessments in the supply chain Freshly harvested ‘Smooth Cayenne’ sweet pepper fruit were obtained from a farm
214
(3107 m2) in Kapatagan, Digos City, in the southern Philippines. The harvest was sorted into marketable and non-marketable produce and then packed in unused polypropylene sacks, covered on top with a plastic mesh and sewed on the edge with polypropylene string. A Hobo temperature logger (UX100-001) was placed inside each sack after packing was completed, and left in until final transit. Three sacks of marketable produce (mean 46 kg) were tracked from harvest to the wholesale level. The sacks were transported by horse from the farm to the consolidation area (20 min, 25.9±0.7°C), remaining there before being carried onto a truck for transport (5 h, 25.8±0.4°C), transported to the wholesaler in Davao City (3 h, 26.2±0.1°C) and, lastly, to the laboratory in an air-conditioned vehicle (1 h, 26.5±0.3°C). After transport, each sack was opened and divided into three sections: top, middle and bottom. Fifty random samples from each section were assessed according to their maturity at harvest (i.e., green, breaker, turning, orange, light red and full red). Further, at the wholesale level, all rejects (those with defects and damage that materially detracted from acceptable quality) from each section of the three sample sacks and causes of rejection were assessed.
Simulated retail Postharvest evaluation was conducted at the Postharvest Biology Laboratory of the
University of the Philippines Mindanao. A total of 900 newly harvested sweet pepper fruit of uniform size and quality from three sections of each of the three sacks were used in the study. The samples were first wiped with a clean damp cloth and then wiped with a cloth moistened with 500 ppm bleach (5.25% NaOCl) and air-dried. Three replications with 25 samples each for different maturity stages (green, breaker, turning and orange) from different sections (top, middle and bottom) were held under ambient conditions (26.4±0.9°C, 83.96±5.7% RH). A Hobo logger (UX100-003) was used to monitor temperature and RH.
The following data were gathered every 3 days for 15 days: weight loss; skin color (using a Minolta CR-400 Chromameter) by determining a*, green or red (- = green; + = red) and chroma; color index [(no. of green samples × 1) + (no. of breaker stage samples × 2) + (no. of turning samples × 3) + (no. of orange samples × 4) + (no. of light red samples × 5) + (no. of full red samples × 6)/total no. of samples]; firmness (using a Fruit Pressure Tester model FT 327); visual quality (1, excellent; 3, good, limit of salability; 5, poor); shriveling (1, no shriveling; 3, moderate, 16-30% of the surface area shriveled; 5, extreme, ≥50% of the surface area shriveled); and decay (1, no decay; 3, moderate, 6-10% of the surface area decayed; 5, severe, ≥16% surface area decayed); and postharvest losses by determining the percentage of unusable fruit per replicate.
The study was laid in a completely randomized design (CRD) with section in packaging and maturity as the factors. Data were analyzed using analysis of variance (ANOVA) and differences between treatment means were detected using least significant difference (LSD) at 5% level of significance.
RESULTS AND DISCUSSION
Temperature changes during transport Proper temperature management is the most efficient method for prolonging the
shelf-life of fresh horticultural produce. In sweet pepper, the temperature increased by almost 2°C from packing to transport (Figure 1). This increase in temperature inside the sweet pepper container could also raise the rate of water loss, while further fluctuations in temperature could increase vapor pressure deficit between the tissue and its micro-environment air, leading to enhancement of transpiration and thereby causing weight loss (Nyanjage et al., 2005). After 14 h of transport, sweet pepper showed a weight loss of 0.93%. Cooling peppers as soon as possible after harvest has been shown to extend their shelf-life (Jiménez León et al., 2013).
215
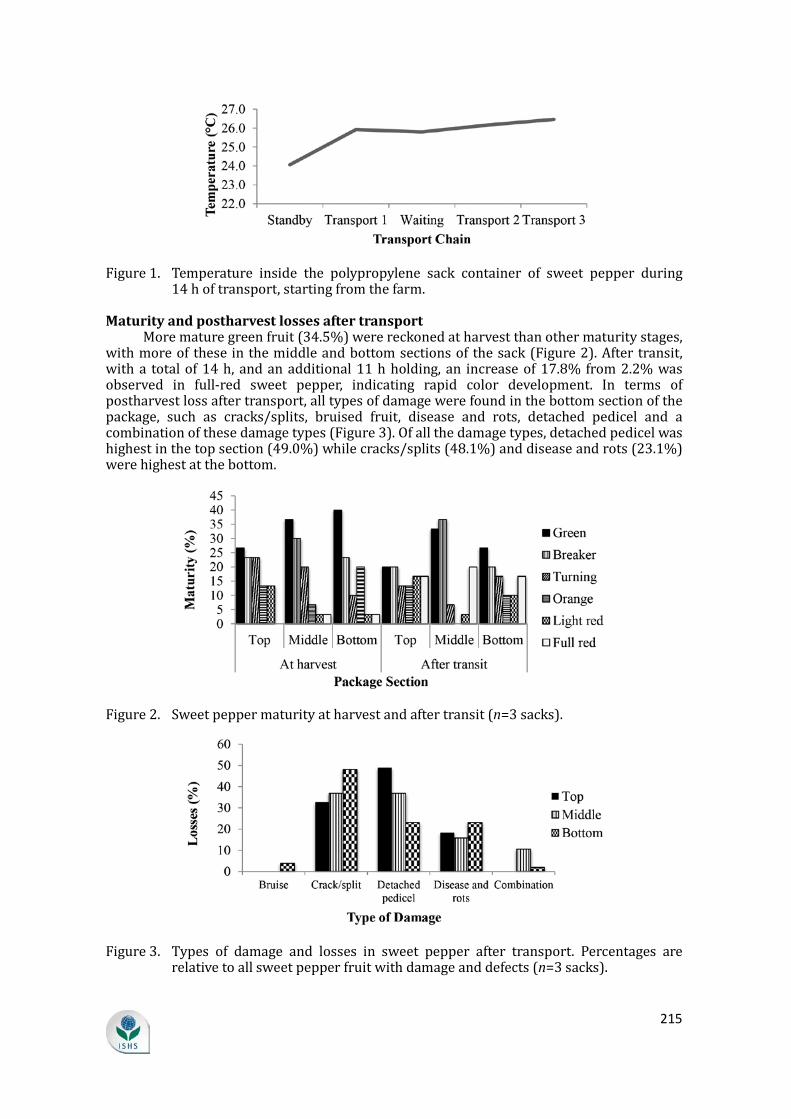
Figure 1. Temperature inside the polypropylene sack container of sweet pepper during 14 h of transport, starting from the farm.
Maturity and postharvest losses after transport More mature green fruit (34.5%) were reckoned at harvest than other maturity stages,
with more of these in the middle and bottom sections of the sack (Figure 2). After transit, with a total of 14 h, and an additional 11 h holding, an increase of 17.8% from 2.2% was observed in full-red sweet pepper, indicating rapid color development. In terms of postharvest loss after transport, all types of damage were found in the bottom section of the package, such as cracks/splits, bruised fruit, disease and rots, detached pedicel and a combination of these damage types (Figure 3). Of all the damage types, detached pedicel was highest in the top section (49.0%) while cracks/splits (48.1%) and disease and rots (23.1%) were highest at the bottom.
Figure 2. Sweet pepper maturity at harvest and after transit (n=3 sacks).
Figure 3. Types of damage and losses in sweet pepper after transport. Percentages are relative to all sweet pepper fruit with damage and defects (n=3 sacks).
216
Physical evaluation
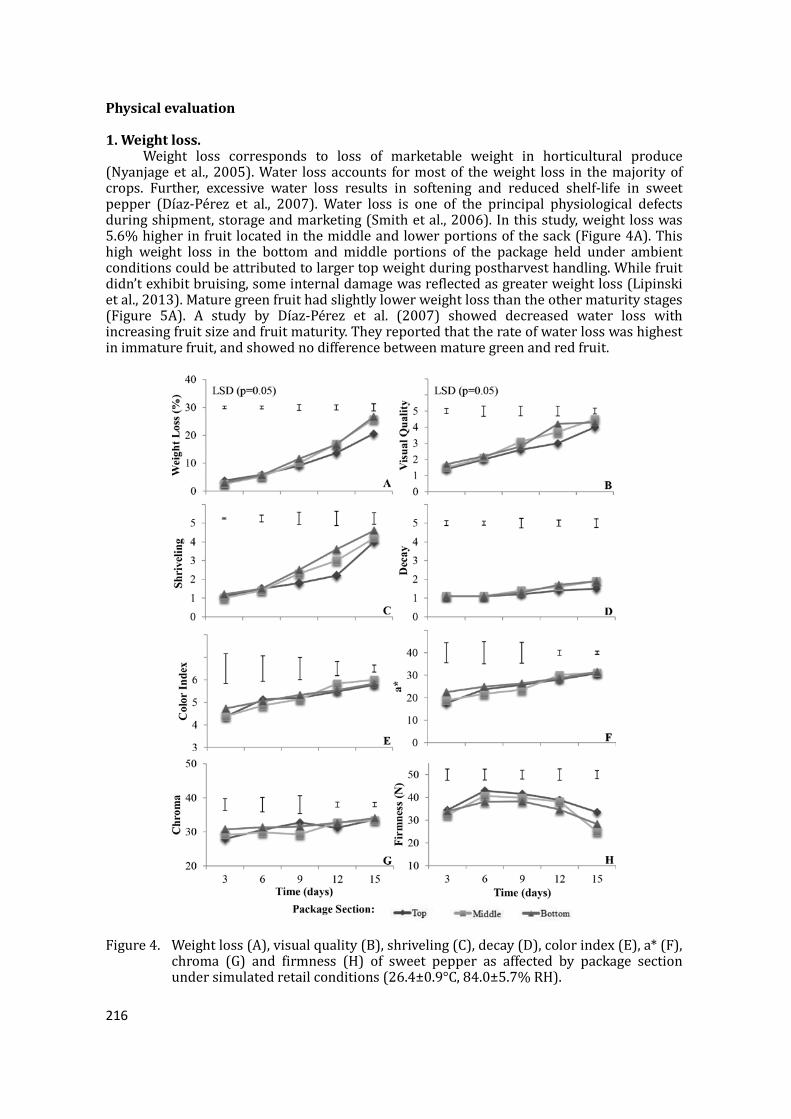
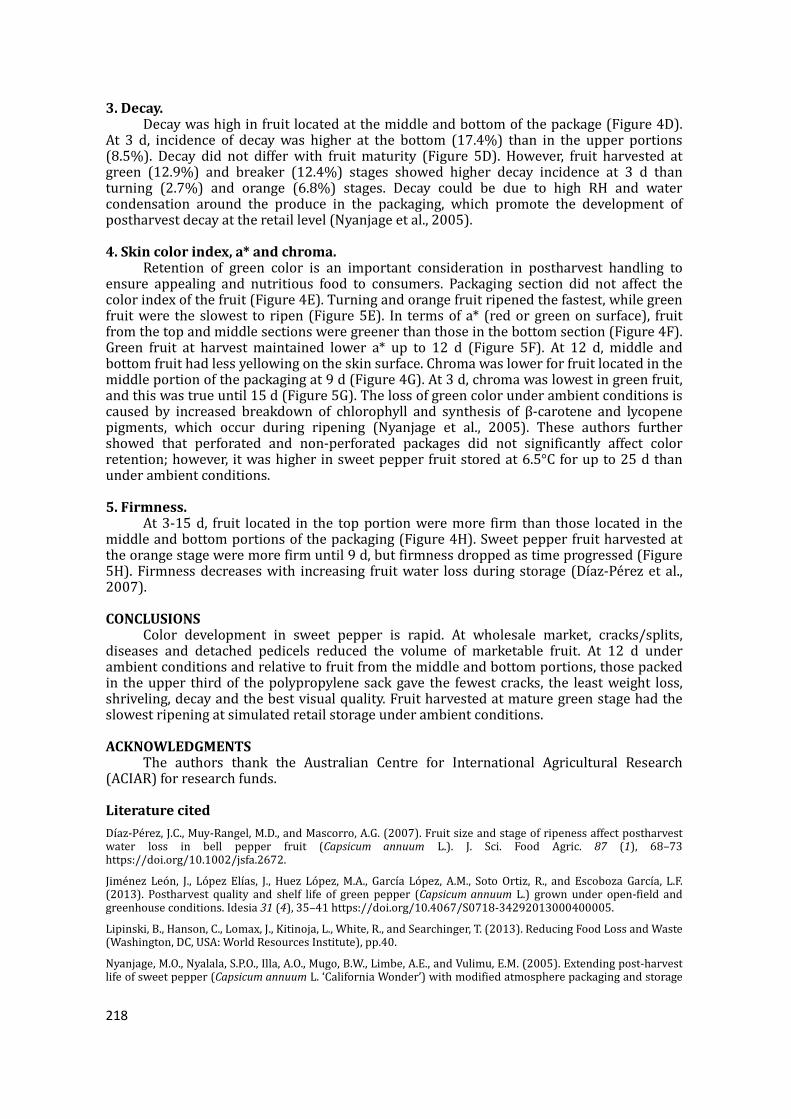
1. Weight loss. Weight loss corresponds to loss of marketable weight in horticultural produce
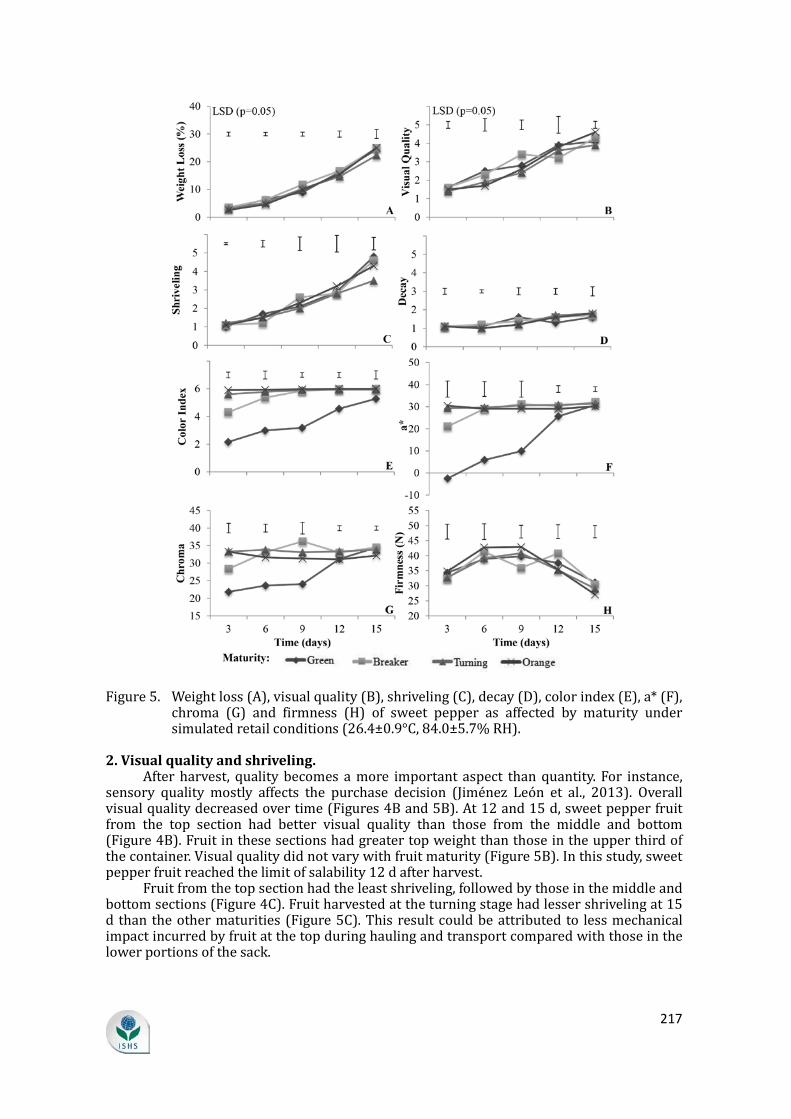
(Nyanjage et al., 2005). Water loss accounts for most of the weight loss in the majority of crops. Further, excessive water loss results in softening and reduced shelf-life in sweet pepper (Díaz-Pérez et al., 2007). Water loss is one of the principal physiological defects during shipment, storage and marketing (Smith et al., 2006). In this study, weight loss was 5.6% higher in fruit located in the middle and lower portions of the sack (Figure 4A). This high weight loss in the bottom and middle portions of the package held under ambient conditions could be attributed to larger top weight during postharvest handling. While fruit didn’t exhibit bruising, some internal damage was reflected as greater weight loss (Lipinski et al., 2013). Mature green fruit had slightly lower weight loss than the other maturity stages (Figure 5A). A study by Díaz-Pérez et al. (2007) showed decreased water loss with increasing fruit size and fruit maturity. They reported that the rate of water loss was highest in immature fruit, and showed no difference between mature green and red fruit.
Figure 4. Weight loss (A), visual quality (B), shriveling (C), decay (D), color index (E), a* (F), chroma (G) and firmness (H) of sweet pepper as affected by package section under simulated retail conditions (26.4±0.9°C, 84.0±5.7% RH).
217
Figure 5. Weight loss (A), visual quality (B), shriveling (C), decay (D), color index (E), a* (F), chroma (G) and firmness (H) of sweet pepper as affected by maturity under simulated retail conditions (26.4±0.9°C, 84.0±5.7% RH).
2. Visual quality and shriveling. After harvest, quality becomes a more important aspect than quantity. For instance,
sensory quality mostly affects the purchase decision (Jiménez León et al., 2013). Overall visual quality decreased over time (Figures 4B and 5B). At 12 and 15 d, sweet pepper fruit from the top section had better visual quality than those from the middle and bottom (Figure 4B). Fruit in these sections had greater top weight than those in the upper third of the container. Visual quality did not vary with fruit maturity (Figure 5B). In this study, sweet pepper fruit reached the limit of salability 12 d after harvest.
Fruit from the top section had the least shriveling, followed by those in the middle and bottom sections (Figure 4C). Fruit harvested at the turning stage had lesser shriveling at 15 d than the other maturities (Figure 5C). This result could be attributed to less mechanical impact incurred by fruit at the top during hauling and transport compared with those in the lower portions of the sack.
218
3. Decay. Decay was high in fruit located at the middle and bottom of the package (Figure 4D).
At 3 d, incidence of decay was higher at the bottom (17.4%) than in the upper portions (8.5%). Decay did not differ with fruit maturity (Figure 5D). However, fruit harvested at green (12.9%) and breaker (12.4%) stages showed higher decay incidence at 3 d than turning (2.7%) and orange (6.8%) stages. Decay could be due to high RH and water condensation around the produce in the packaging, which promote the development of postharvest decay at the retail level (Nyanjage et al., 2005).
4. Skin color index, a* and chroma. Retention of green color is an important consideration in postharvest handling to
ensure appealing and nutritious food to consumers. Packaging section did not affect the color index of the fruit (Figure 4E). Turning and orange fruit ripened the fastest, while green fruit were the slowest to ripen (Figure 5E). In terms of a* (red or green on surface), fruit from the top and middle sections were greener than those in the bottom section (Figure 4F). Green fruit at harvest maintained lower a* up to 12 d (Figure 5F). At 12 d, middle and bottom fruit had less yellowing on the skin surface. Chroma was lower for fruit located in the middle portion of the packaging at 9 d (Figure 4G). At 3 d, chroma was lowest in green fruit, and this was true until 15 d (Figure 5G). The loss of green color under ambient conditions is caused by increased breakdown of chlorophyll and synthesis of β-carotene and lycopene pigments, which occur during ripening (Nyanjage et al., 2005). These authors further showed that perforated and non-perforated packages did not significantly affect color retention; however, it was higher in sweet pepper fruit stored at 6.5°C for up to 25 d than under ambient conditions.
5. Firmness. At 3-15 d, fruit located in the top portion were more firm than those located in the
middle and bottom portions of the packaging (Figure 4H). Sweet pepper fruit harvested at the orange stage were more firm until 9 d, but firmness dropped as time progressed (Figure 5H). Firmness decreases with increasing fruit water loss during storage (Díaz-Pérez et al., 2007).
CONCLUSIONS Color development in sweet pepper is rapid. At wholesale market, cracks/splits,
diseases and detached pedicels reduced the volume of marketable fruit. At 12 d under ambient conditions and relative to fruit from the middle and bottom portions, those packed in the upper third of the polypropylene sack gave the fewest cracks, the least weight loss, shriveling, decay and the best visual quality. Fruit harvested at mature green stage had the slowest ripening at simulated retail storage under ambient conditions.
ACKNOWLEDGMENTS The authors thank the Australian Centre for International Agricultural Research
(ACIAR) for research funds.
Literature cited Díaz-Pérez, J.C., Muy-Rangel, M.D., and Mascorro, A.G. (2007). Fruit size and stage of ripeness affect postharvest water loss in bell pepper fruit (Capsicum annuum L.). J. Sci. Food Agric. 87 (1), 68–73 https://doi.org/10.1002/jsfa.2672.
Jiménez León, J., López Elías, J., Huez López, M.A., García López, A.M., Soto Ortiz, R., and Escoboza García, L.F. (2013). Postharvest quality and shelf life of green pepper (Capsicum annuum L.) grown under open-field and greenhouse conditions. Idesia 31 (4), 35–41 https://doi.org/10.4067/S0718-34292013000400005.
Lipinski, B., Hanson, C., Lomax, J., Kitinoja, L., White, R., and Searchinger, T. (2013). Reducing Food Loss and Waste (Washington, DC, USA: World Resources Institute), pp.40.
Nyanjage, M.O., Nyalala, S.P.O., Illa, A.O., Mugo, B.W., Limbe, A.E., and Vulimu, E.M. (2005). Extending post-harvest life of sweet pepper (Capsicum annuum L. ‘California Wonder’) with modified atmosphere packaging and storage
219
temperature. Agric. Trop. Subtrop. 38 (2), 28–34.
Rao, R.T.V., Gol, N.B., and Shah, K.K. (2011). Effect of postharvest treatments and storage temperatures on the quality and shelf life of sweet pepper (Capsicum annuum L.). Sci. Hortic. (Amsterdam) 132, 18–26 https://doi.org/10.1016/j.scienta.2011.09.032.
Sigge, G.O., Hansmann, C.F., and Joubert, E. (2001). Effects of storage conditions, packaging material and metabisulphite treatment on the colour of dehydrated green bell pepper (Capsicum annuum L.). J. Food Qual. 24 (3), 205–218 https://doi.org/10.1111/j.1745-4557.2001.tb00603.x.
Simonne, A.H., Simonne, E.H., Eitenmiller, R.R., Mills, H.A., and Green, N.R. (1997). Ascorbic acid and provitamin A contents in unusually colored bell peppers (Capsicum annuum L.). J. Food Compos. Anal. 10 (4), 299–311 https://doi.org/10.1006/jfca.1997.0544.
Smith, D.L., Stommel, J.R., Fung, R.W.M., Wang, C.Y., and Whitaker, B.D. (2006). Influence of cultivar and harvest method on postharvest storage quality of pepper (Capsicum annuum L.) fruit. Postharvest Biol. Technol. 42 (3), 243–247 https://doi.org/10.1016/j.postharvbio.2006.06.013.

220
South Western Journal of Vol.8, No.1, 2017 Horticulture, Biology and Environment pp.1-15 P-Issn: 2067- 9874, E-Issn: 2068-7958 Art.no. e17101
SHELF LIFE OF TWO SWEET PEPPER (Capsicum annuum) CULTIVARS STORED AT AMBIENT AND EVAPORATIVE
COOLING CONDITIONS
Emma Ruth BAYOGAN*, Roelene SALVILLA, Ana Maria Carmela MAJOMOT and Joseph ACOSTA
College of Science and Mathematics, University of the Philippines Mindanao,
Mintal, Tugbok District, Davao City, Philippines Corresponding author, E.V. Bayogan, E-mail: [email protected]
ABSTRACT. Sweet pepper (Capsicum annuum L.) is one of the most commercially important horticultural crops developed in temperate and tropical regions. This crop is highly perishable and high postharvest losses often result if handled poorly or stored in unfavorable conditions. An alternative non-refrigerated storage that can potentially maintain quality longer is the use of evaporative coolers. In this study, the effects of evaporative cooling (23.91±3.85°C, 93.84±9.33% RH, 1.79kPa VPD) on the shelf life and physico-chemical characteristics of two sweet pepper cultivars (‘Smooth Cayenne’ and ‘Sultan’) were evaluated and compared with those stored under ambient conditions (28.74±0.94°C, 65.68±7.43% RH, 13.62kPa VPD). Cultivar and storage conditions had significant effect (P ≤ 0.05) on the shelf life of the sweet peppers. Storage of sweet pepper in the evaporative cooler (EC) resulted in reduced weight loss (9.65% and 28.86% for ‘Sweet Cayenne’ and ‘Sultan’, respectively), slower decline in moisture content and longer retention of acceptable visual quality and firmness due to lesser color change and shriveling, respectively, for both cultivars. There were rapid changes in total soluble solids and titratable acidity in both cultivars stored at ambient condition indicative of ripening. Decay can however reduce benefits from EC thus moisture control is essential. The shelf life of ‘Smooth Cayenne’ was at 9 and 18 days when stored in ambient and EC conditions, respectively, while this was at 7 and 15 days for ‘Sultan’. The shelf life of these sweet peppers was prolonged by eight days in the present burlap-walled EC.
KEY WORDS: sweet pepper, ‘Smooth Cayenne’, ‘Sultan’, evaporative cooler, shelf life.
E.R. Bayogan et al.
2
INTRODUCTION Sweet pepper (Capsicum annuum L.) is an economically important crop for both local and export market (Shehata et al. 2013). It is known for its antioxidant properties as it is a good source of vitamins A and C as well as phenolic compounds (Shotorbani et al. 2013). With its nutritional contribution, it is believed to prevent certain types of cardiovascular diseases, atherosclerosis, cancer, and haemorrhage (Marin et al. 2004).
Unlike dried grains and legumes, fresh fruits and vegetables such as peppers have an extremely low level of natural protection against biochemical and physiological deterioration in warm and humid places (FAO 1981). During prolonged storage, the main factors for the quality degradation of sweet pepper include poor external appearance, decay development, shriveling associated with water loss and its high susceptibility to chilling injury (Shehata et al. 2013).
Temperature management during storage period is the most effective tool in maintaining the quality and extending the shelf life of fresh horticultural crops such as sweet pepper (Leon et al. 2013). However, refrigeration requires high initial cost and power sources which cannot be afforded by most small-scale farmers, retailers and wholesalers in developing countries (Basediya et al. 2013) such as the Philippines. Evaporative cooling is a postharvest treatment that is usually done in rural areas. It is a physical process wherein evaporation of a liquid cools an object in contact with it. It is far less expensive than the usual refrigeration cooling. Bautista et al. (2007) explained that the heat of respiration of the produce evaporates the water that is applied to its immediate surroundings. When it is windy or when air movement is greater, there is also faster evaporation. Compared to the surroundings, it maintains a lower temperature and a higher relative humidity in the storage chamber (Dadhich et al. 2008).
Studies have shown the efficiency of evaporative coolers as a good postharvest treatment for fresh crops. Awole et al. (2011) conducted a study on the yield and storability of hot peppers harvested mature green and stored in two storage conditions (ambient and evaporative cooling). After 16 days of storage, nearly all pepper fruit stored at ambient condition were found to be unmarketable. On the other hand, those that were stored in the evaporative cooler chamber were kept up to 28 days. In another study conducted by Vanndy et al. (2008) using a brick-walled evaporative
Shelf life of two sweet pepper cultivars
3
cooler (EC), reddening of chili was hastened but weight loss was lower regardless of variety and initial ripeness stage. Weight loss reduction is one of the primary effects of EC as a result of the humid condition in the storage chamber (Acedo 1997; Acedo et al. 2009).
The shelf life and quality of different chili cultivars were examined by Acedo et al. (2009) using three storage conditions: (1) ambient, (2) polypropylene bag as modified atmosphere package (MAP), and (3) simple EC. Chili quality deteriorated rapidly at ambient due to weight loss and shriveling although inhibited in MAP and EC. Decay incidence was very high in MAP due to moisture condensation inside the plastic bag which favored rot development. EC created a more humid and cooler environment, causing reductions in weight loss and shriveling but at lower magnitude than MAP.
The effectivity of evaporative cooling was further validated in Nigeria by Olosunde et al. (2016) who developed a solar-powered evaporative cooler (SPECSS) to help smallholder rural farmers improve the shelf life of their produce. The mangoes, tomatoes, bananas and carrots that were stored in the SPECSS had shelf lives of 14, 21, 17, and 28 days, respectively, while those that were stored in ambient condition lasted for 5-8 days only. This present study assessed the effect of ambient and evaporative cooling on the shelf life and physico-chemical characteristics of two cultivars of sweet peppers. MATERIALS AND METHODS Sample preparation Freshly harvested, mature green, uniformly-sized and blemish-free ‘Smooth Cayenne’ and ‘Sultan’ sweet pepper fruit were procured from Bangkerohan, Davao City, Philippines. Samples were wiped with soft cloth moistened with distilled water to remove dirt and then surface-sterilized by soaking in 200 mg·L-1 sodium hypochlorite for 2 min. There were three replicates of 35 fruit samples each per storage condition per cultivar for a 21-day evaluation done at three day intervals. Treatments The sweet pepper samples were kept in two storage conditions: ambient and evaporative cooler (EC). The EC was covered with two layers of jute sack (burlap) as walls of the EC cabinet. The sack wall was constantly bathed with water from a
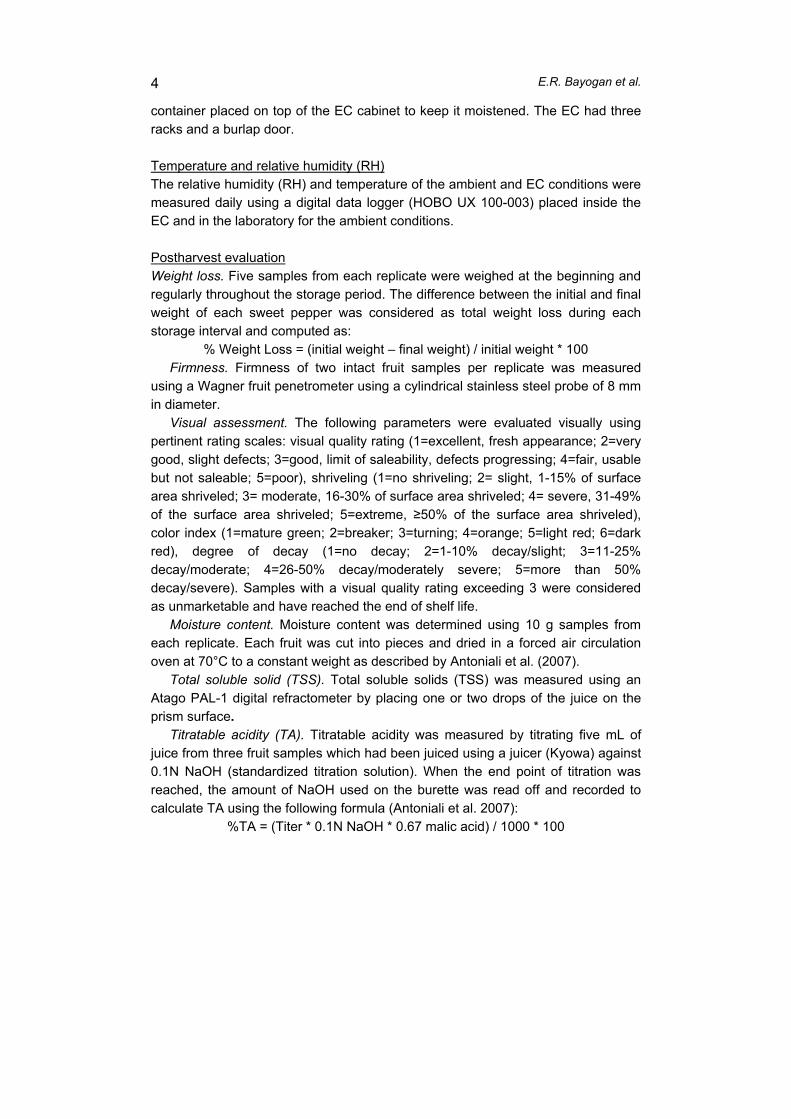
E.R. Bayogan et al.
4
container placed on top of the EC cabinet to keep it moistened. The EC had three racks and a burlap door. Temperature and relative humidity (RH) The relative humidity (RH) and temperature of the ambient and EC conditions were measured daily using a digital data logger (HOBO UX 100-003) placed inside the EC and in the laboratory for the ambient conditions. Postharvest evaluation Weight loss. Five samples from each replicate were weighed at the beginning and regularly throughout the storage period. The difference between the initial and final weight of each sweet pepper was considered as total weight loss during each storage interval and computed as:
% Weight Loss = (initial weight – final weight) / initial weight * 100 Firmness. Firmness of two intact fruit samples per replicate was measured
using a Wagner fruit penetrometer using a cylindrical stainless steel probe of 8 mm in diameter.
Visual assessment. The following parameters were evaluated visually using pertinent rating scales: visual quality rating (1=excellent, fresh appearance; 2=very good, slight defects; 3=good, limit of saleability, defects progressing; 4=fair, usable but not saleable; 5=poor), shriveling (1=no shriveling; 2= slight, 1-15% of surface area shriveled; 3= moderate, 16-30% of surface area shriveled; 4= severe, 31-49% of the surface area shriveled; 5=extreme, ≥50% of the surface area shriveled), color index (1=mature green; 2=breaker; 3=turning; 4=orange; 5=light red; 6=dark red), degree of decay (1=no decay; 2=1-10% decay/slight; 3=11-25% decay/moderate; 4=26-50% decay/moderately severe; 5=more than 50% decay/severe). Samples with a visual quality rating exceeding 3 were considered as unmarketable and have reached the end of shelf life.
Moisture content. Moisture content was determined using 10 g samples from each replicate. Each fruit was cut into pieces and dried in a forced air circulation oven at 70°C to a constant weight as described by Antoniali et al. (2007).
Total soluble solid (TSS). Total soluble solids (TSS) was measured using an Atago PAL-1 digital refractometer by placing one or two drops of the juice on the prism surface.
Titratable acidity (TA). Titratable acidity was measured by titrating five mL of juice from three fruit samples which had been juiced using a juicer (Kyowa) against 0.1N NaOH (standardized titration solution). When the end point of titration was reached, the amount of NaOH used on the burette was read off and recorded to calculate TA using the following formula (Antoniali et al. 2007):
%TA = (Titer * 0.1N NaOH * 0.67 malic acid) / 1000 * 100
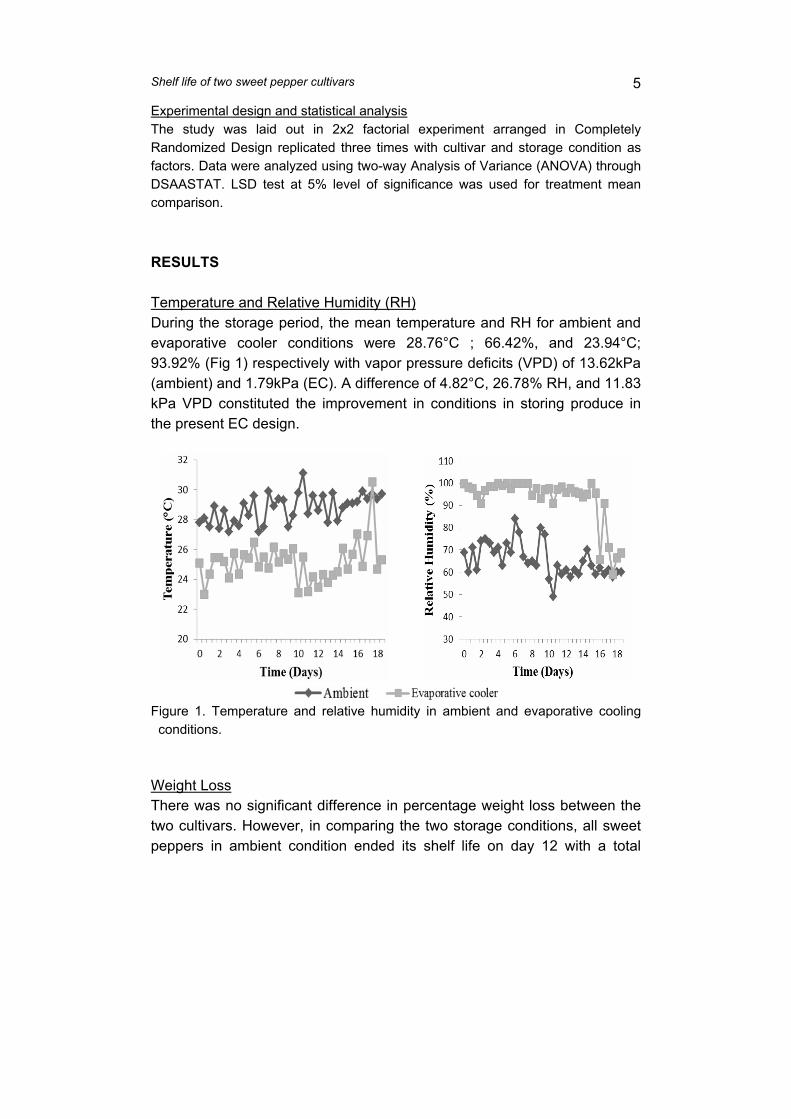
Shelf life of two sweet pepper cultivars
5
Experimental design and statistical analysis The study was laid out in 2x2 factorial experiment arranged in Completely Randomized Design replicated three times with cultivar and storage condition as factors. Data were analyzed using two-way Analysis of Variance (ANOVA) through DSAASTAT. LSD test at 5% level of significance was used for treatment mean comparison.
RESULTS Temperature and Relative Humidity (RH) During the storage period, the mean temperature and RH for ambient and evaporative cooler conditions were 28.76°C ; 66.42%, and 23.94°C; 93.92% (Fig 1) respectively with vapor pressure deficits (VPD) of 13.62kPa (ambient) and 1.79kPa (EC). A difference of 4.82°C, 26.78% RH, and 11.83 kPa VPD constituted the improvement in conditions in storing produce in the present EC design.
Figure 1. Temperature and relative humidity in ambient and evaporative cooling conditions.
Weight Loss There was no significant difference in percentage weight loss between the two cultivars. However, in comparing the two storage conditions, all sweet peppers in ambient condition ended its shelf life on day 12 with a total
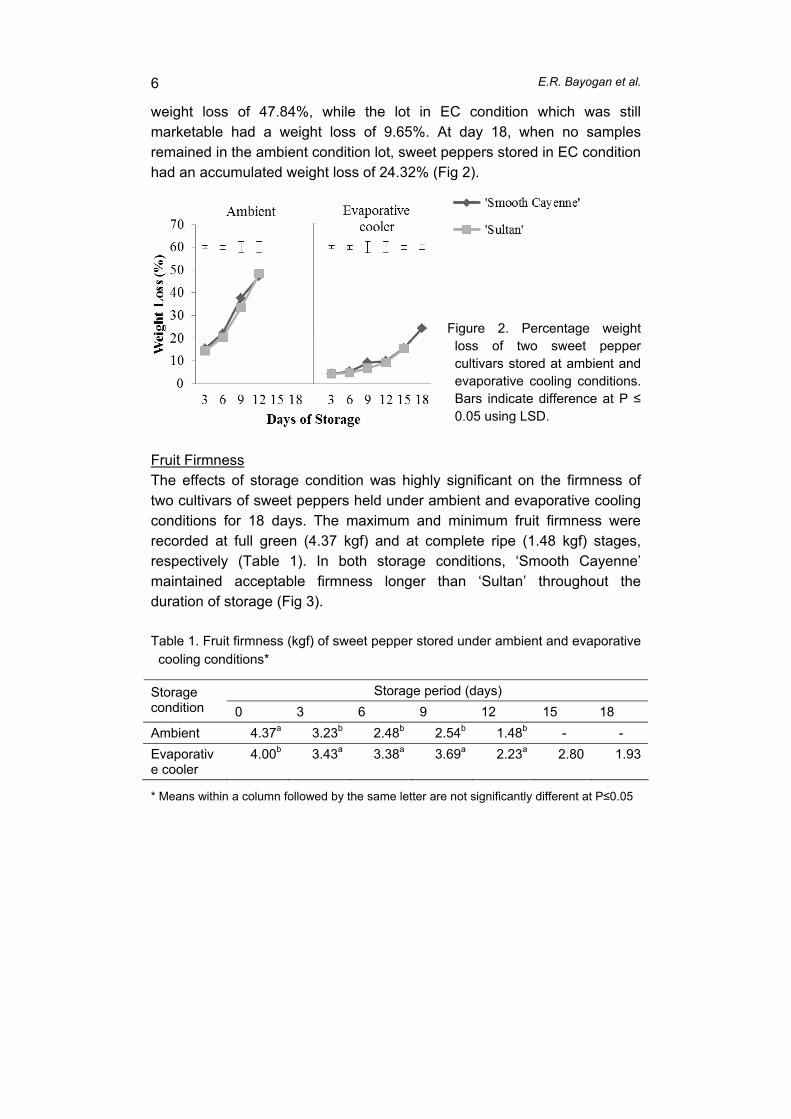
E.R. Bayogan et al.
6
weight loss of 47.84%, while the lot in EC condition which was still marketable had a weight loss of 9.65%. At day 18, when no samples remained in the ambient condition lot, sweet peppers stored in EC condition had an accumulated weight loss of 24.32% (Fig 2).
Fruit Firmness The effects of storage condition was highly significant on the firmness of two cultivars of sweet peppers held under ambient and evaporative cooling conditions for 18 days. The maximum and minimum fruit firmness were recorded at full green (4.37 kgf) and at complete ripe (1.48 kgf) stages, respectively (Table 1). In both storage conditions, ‘Smooth Cayenne’ maintained acceptable firmness longer than ‘Sultan’ throughout the duration of storage (Fig 3). Table 1. Fruit firmness (kgf) of sweet pepper stored under ambient and evaporative
cooling conditions*
Storage period (days) Storage condition 0 3 6 9 12 15 18
Ambient 4.37a 3.23b 2.48b 2.54b 1.48b - -
Evaporative cooler
4.00b 3.43a 3.38a 3.69a 2.23a 2.80 1.93
* Means within a column followed by the same letter are not significantly different at P≤0.05
Figure 2. Percentage weight loss of two sweet pepper cultivars stored at ambient and evaporative cooling conditions. Bars indicate difference at P ≤ 0.05 using LSD.
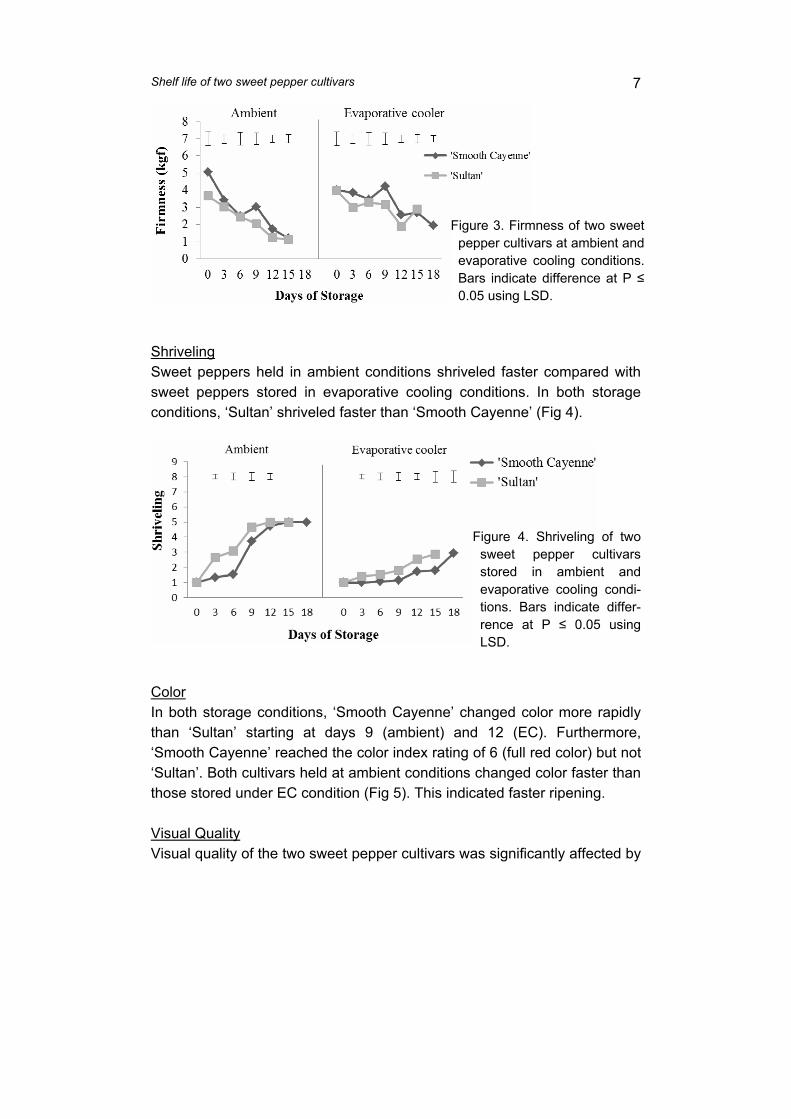
Shelf life of two sweet pepper cultivars
7
Shriveling Sweet peppers held in ambient conditions shriveled faster compared with sweet peppers stored in evaporative cooling conditions. In both storage conditions, ‘Sultan’ shriveled faster than ‘Smooth Cayenne’ (Fig 4).
Color In both storage conditions, ‘Smooth Cayenne’ changed color more rapidly than ‘Sultan’ starting at days 9 (ambient) and 12 (EC). Furthermore, ‘Smooth Cayenne’ reached the color index rating of 6 (full red color) but not ‘Sultan’. Both cultivars held at ambient conditions changed color faster than those stored under EC condition (Fig 5). This indicated faster ripening. Visual Quality Visual quality of the two sweet pepper cultivars was significantly affected by
Figure 3. Firmness of two sweet pepper cultivars at ambient and evaporative cooling conditions. Bars indicate difference at P ≤ 0.05 using LSD.
Figure 4. Shriveling of two sweet pepper cultivars stored in ambient and evaporative cooling condi-tions. Bars indicate differ-rence at P ≤ 0.05 using LSD.
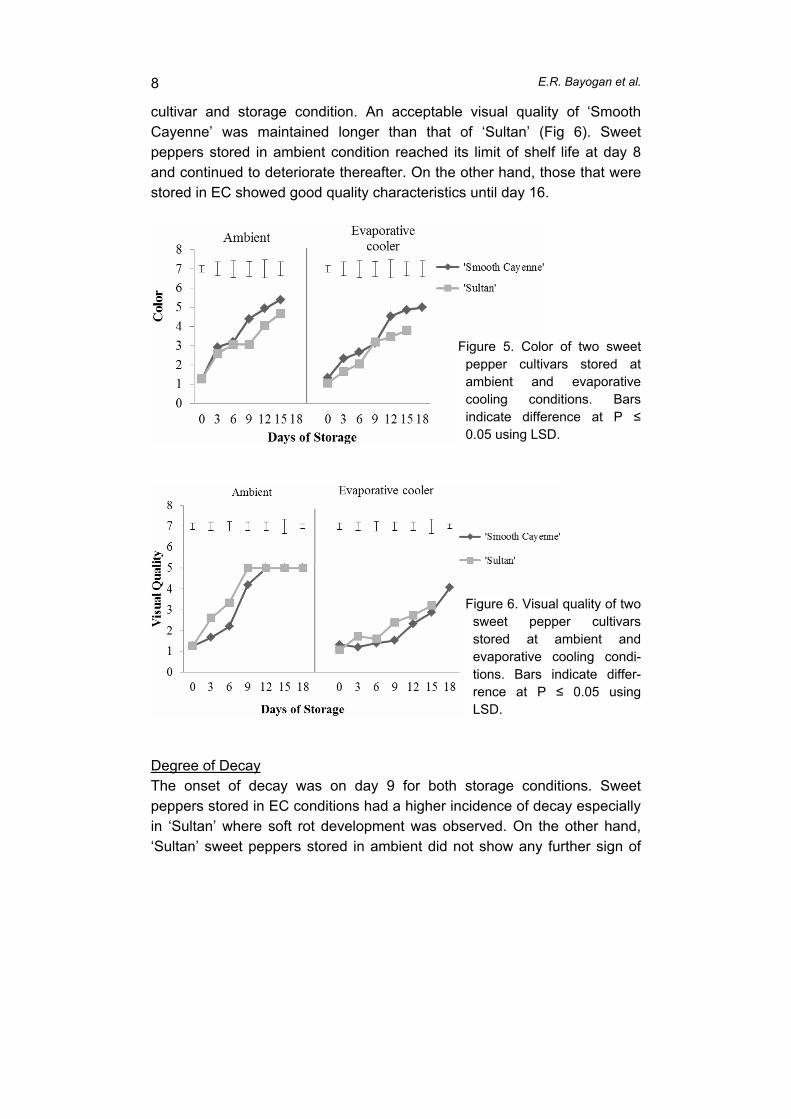
E.R. Bayogan et al.
8
cultivar and storage condition. An acceptable visual quality of ‘Smooth Cayenne’ was maintained longer than that of ‘Sultan’ (Fig 6). Sweet peppers stored in ambient condition reached its limit of shelf life at day 8 and continued to deteriorate thereafter. On the other hand, those that were stored in EC showed good quality characteristics until day 16.
Degree of Decay The onset of decay was on day 9 for both storage conditions. Sweet peppers stored in EC conditions had a higher incidence of decay especially in ‘Sultan’ where soft rot development was observed. On the other hand, ‘Sultan’ sweet peppers stored in ambient did not show any further sign of
Figure 5. Color of two sweet pepper cultivars stored at ambient and evaporative cooling conditions. Bars indicate difference at P ≤ 0.05 using LSD.
Figure 6. Visual quality of two sweet pepper cultivars stored at ambient and evaporative cooling condi-tions. Bars indicate differ-rence at P ≤ 0.05 using LSD.
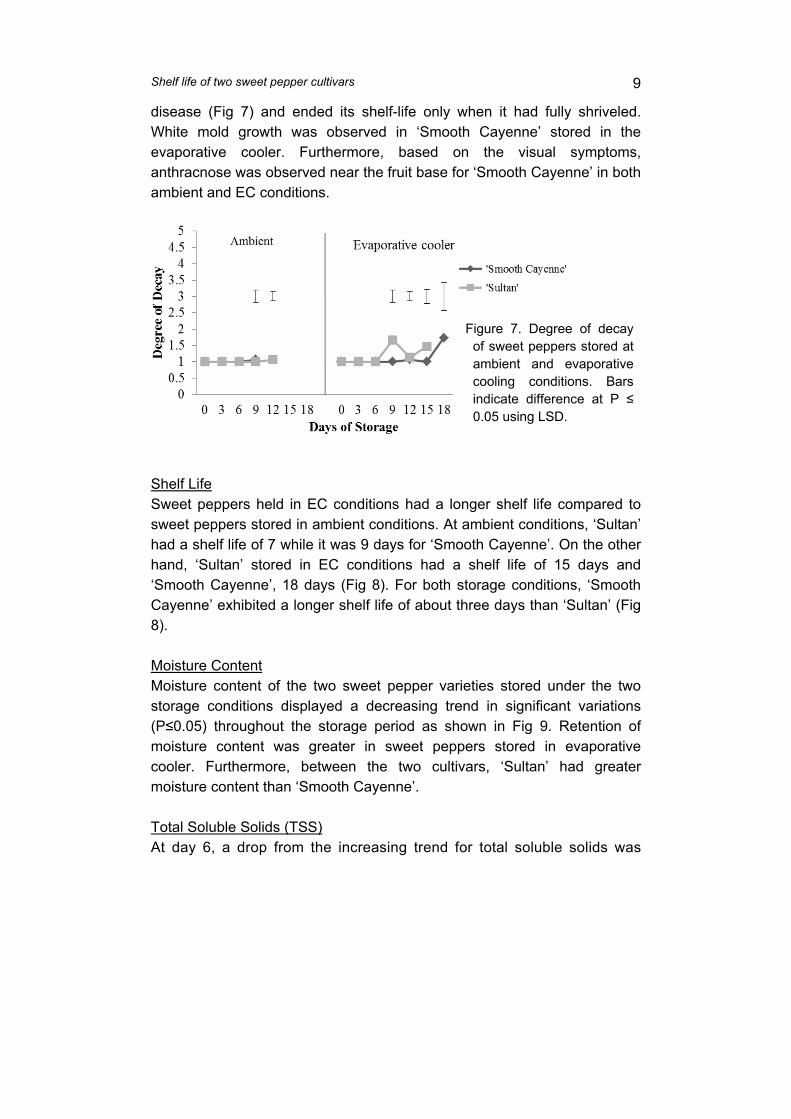
Shelf life of two sweet pepper cultivars
9
disease (Fig 7) and ended its shelf-life only when it had fully shriveled. White mold growth was observed in ‘Smooth Cayenne’ stored in the evaporative cooler. Furthermore, based on the visual symptoms, anthracnose was observed near the fruit base for ‘Smooth Cayenne’ in both ambient and EC conditions.
Shelf Life Sweet peppers held in EC conditions had a longer shelf life compared to sweet peppers stored in ambient conditions. At ambient conditions, ‘Sultan’ had a shelf life of 7 while it was 9 days for ‘Smooth Cayenne’. On the other hand, ‘Sultan’ stored in EC conditions had a shelf life of 15 days and ‘Smooth Cayenne’, 18 days (Fig 8). For both storage conditions, ‘Smooth Cayenne’ exhibited a longer shelf life of about three days than ‘Sultan’ (Fig 8). Moisture Content Moisture content of the two sweet pepper varieties stored under the two storage conditions displayed a decreasing trend in significant variations (P≤0.05) throughout the storage period as shown in Fig 9. Retention of moisture content was greater in sweet peppers stored in evaporative cooler. Furthermore, between the two cultivars, ‘Sultan’ had greater moisture content than ‘Smooth Cayenne’. Total Soluble Solids (TSS) At day 6, a drop from the increasing trend for total soluble solids was
Figure 7. Degree of decay of sweet peppers stored at ambient and evaporative cooling conditions. Bars indicate difference at P ≤ 0.05 using LSD.
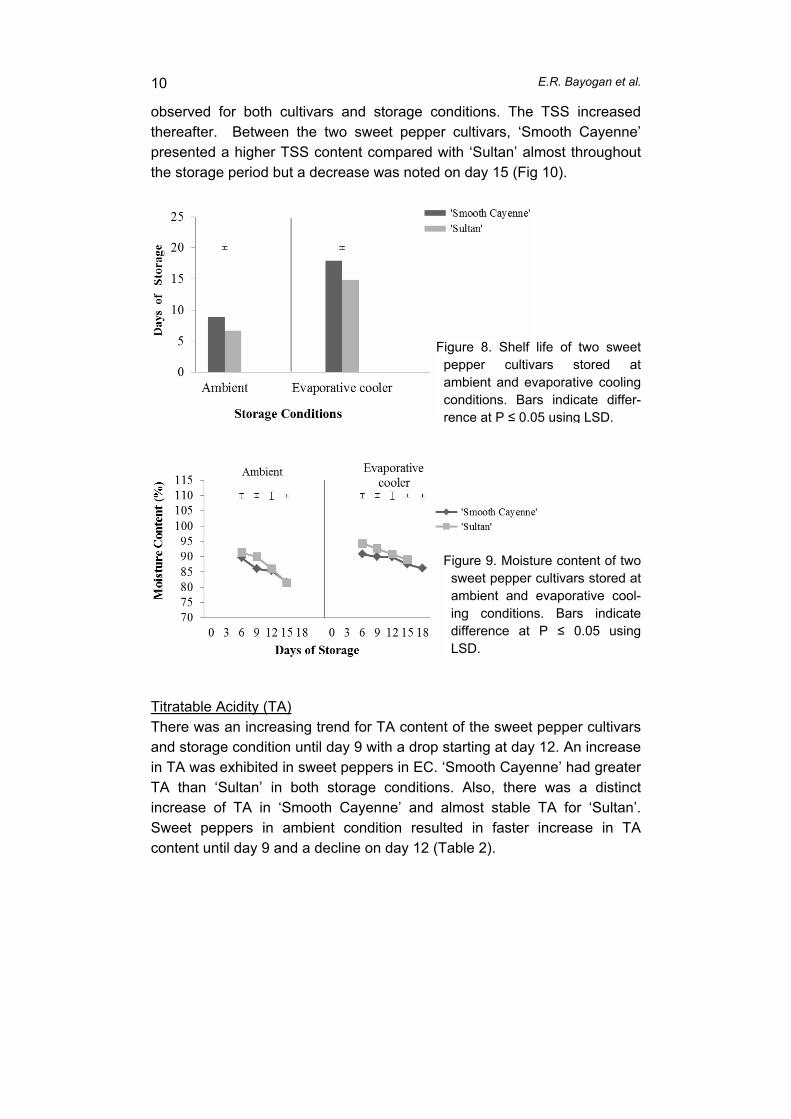
E.R. Bayogan et al.
10
observed for both cultivars and storage conditions. The TSS increased thereafter. Between the two sweet pepper cultivars, ‘Smooth Cayenne’ presented a higher TSS content compared with ‘Sultan’ almost throughout the storage period but a decrease was noted on day 15 (Fig 10).
Titratable Acidity (TA) There was an increasing trend for TA content of the sweet pepper cultivars and storage condition until day 9 with a drop starting at day 12. An increase in TA was exhibited in sweet peppers in EC. ‘Smooth Cayenne’ had greater TA than ‘Sultan’ in both storage conditions. Also, there was a distinct increase of TA in ‘Smooth Cayenne’ and almost stable TA for ‘Sultan’. Sweet peppers in ambient condition resulted in faster increase in TA content until day 9 and a decline on day 12 (Table 2).
Figure 8. Shelf life of two sweet pepper cultivars stored at ambient and evaporative cooling conditions. Bars indicate differ-rence at P ≤ 0.05 using LSD.
Figure 9. Moisture content of two sweet pepper cultivars stored at ambient and evaporative cool-ing conditions. Bars indicate difference at P ≤ 0.05 using LSD.
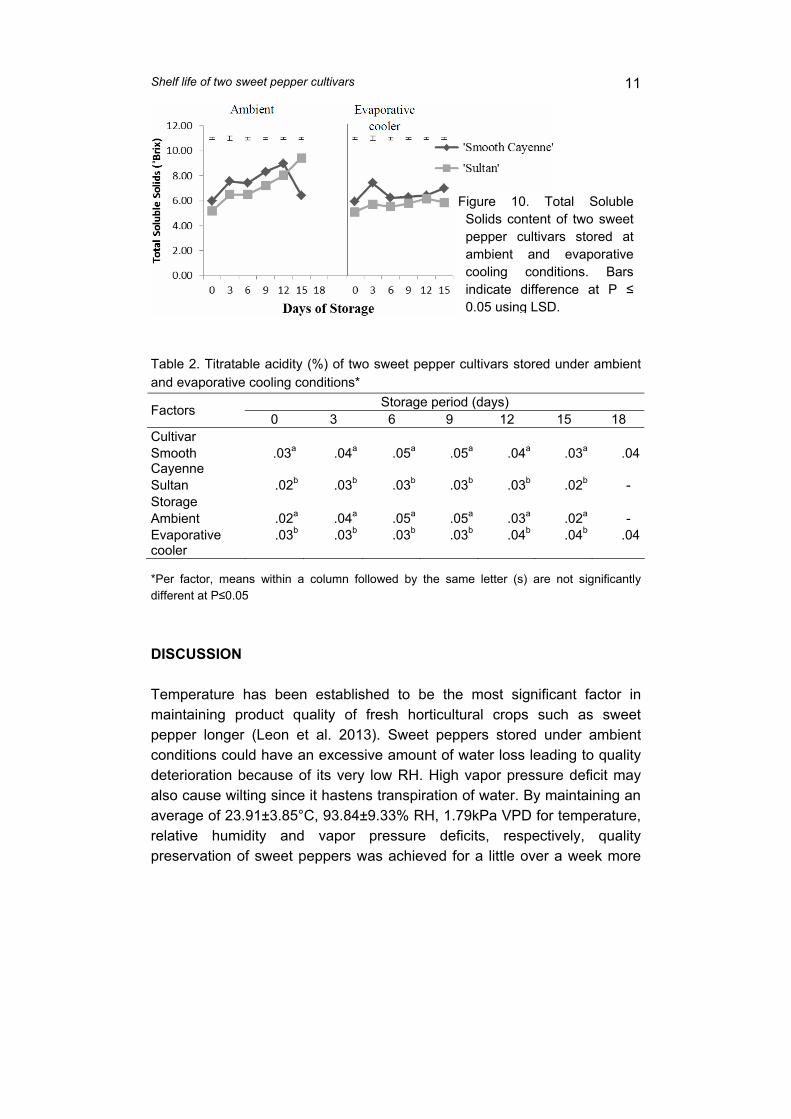
Shelf life of two sweet pepper cultivars
11
Table 2. Titratable acidity (%) of two sweet pepper cultivars stored under ambient and evaporative cooling conditions*
Storage period (days) Factors
0 3 6 9 12 15 18 Cultivar Smooth Cayenne
.03a .04a .05a .05a .04a .03a .04
Sultan .02b .03b .03b .03b .03b .02b - Storage Ambient .02a .04a .05a .05a .03a .02a - Evaporative cooler
.03b .03b .03b .03b .04b .04b .04
*Per factor, means within a column followed by the same letter (s) are not significantly different at P≤0.05
DISCUSSION Temperature has been established to be the most significant factor in maintaining product quality of fresh horticultural crops such as sweet pepper longer (Leon et al. 2013). Sweet peppers stored under ambient conditions could have an excessive amount of water loss leading to quality deterioration because of its very low RH. High vapor pressure deficit may also cause wilting since it hastens transpiration of water. By maintaining an average of 23.91±3.85°C, 93.84±9.33% RH, 1.79kPa VPD for temperature, relative humidity and vapor pressure deficits, respectively, quality preservation of sweet peppers was achieved for a little over a week more
Figure 10. Total Soluble Solids content of two sweet pepper cultivars stored at ambient and evaporative cooling conditions. Bars indicate difference at P ≤ 0.05 using LSD.
E.R. Bayogan et al.
12
(16 days in EC, 8 days in ambient) by storing the samples in the burlap-walled evaporative cooler (EC).
Water loss is a primary physiological factor that impacts on sweet pepper fruit quality during shipment, storage and marketing (Dumville & Fry 2000). Sweet peppers stored under ambient conditions displayed a significantly higher percentage of weight losses compared to those stored under EC condition. The higher RH and reduced temperature and VPD values given by the EC relative to ambient conditions allowed the former to sustain reduced produce weight losses and at the same time slowed down the rate of shriveling. Furthermore, although there was a decline in firmness on the sweet peppers in both storage conditions, this physical characteristic was better maintained by storing the samples in the EC. The difference in average weight loss percentages between the two sweet pepper cultivars could be due to the varying morpho-anatomical characteristics, surface types and underlying tissues of the cultivar that affect the rate of water loss (Bondada & Keller 2012; Wills et al. 1998).
The ripening rates of peppers are highly variable especially among cultivars (Samira et al. 2013). This explains why the two cultivars in this study differ in their rate of color change. Furthermore, as ripening is often signaled by changes in fruit color, it can be concluded that storing sweet peppers in EC could slow done the rate of ripening. This allows farmers, retailers, and other handlers to store a fraction of their harvest for some time instead of exposing these crops to the harsh environment of the marketplace which poses a higher risk for contamination and mechanical damages.
One of the visual aspects that totally eliminate a crop from being accepted by the consumers is decay. Due to observed diseases on sweet peppers, it can be implied that the sanitizing agent (e.g. NaOCl) used may not have been sufficient to eradicate the decay-causing organism. In addition, the development of anthracnose on ‘Sweet Cayenne’ may have been favored by the environment inside the EC since Colletotrichum sp. thrives on warm wet weather at an optimum temperature and RH of 27ºC and 80%, respectively (Ali et al. 2016). There was also surface moisture in the storage walls of the EC that sometimes flowed to the shelves where the trays were placed.
Sweet peppers stored in evaporative cooling condition showed greater moisture content than sweet peppers stored in ambient condition from days 6 to 18. Furthermore, reduced respiration might have taken place because
Shelf life of two sweet pepper cultivars
13
of the low temperature in the evaporative cooler which resulted in delayed fruit ripening and consequently reduced moisture loss (Atta-Aly & Brecht 1995). The percentage of decrease in moisture content was greater in sweet peppers stored at ambient condition. This was due to transpiration as well as ripening during the storage period. Ripening of sweet pepper makes variations in the permeability of cell membranes that makes them more subtle to water loss (Samira et al. 2013).
The increase in TSS content for all the sweet peppers throughout the storage in both EC and ambient conditions indicate continuous metabolic conversion of sugars from starch (Samira et al. 2013). The lower TSS content in evaporative cooling condition might be due to its high RH which reduces water loss; hence, slowing the conversion of sugars from starch which decreases the amount of soluble solids.
Change in TA content comes along with the changes in different organic acids like ascorbic acid (Salisbury & Ross 1994). Results indicate that TA in sweet peppers increases as these ripen. The decline of TA in ambient conditions might be due to high temperature which promoted high respiration that used up titratable acids as a substrate. On the other hand, the lower temperature in EC reduced the rate of respiration, decreasing the use of titratable acids (Getenit et al. 2008).
Shelf life was ended when the fruit exceeded a visual quality rating of 3 (good, limit of saleability, defects progressing). Sweet peppers stored under EC condition was kept up to 16 days of storage while those stored in ambient was 8 days. CONCLUSIONS This study has verified the efficiency of the evaporative cooler (EC) in prolonging the shelf life of a highly perishable crop like sweet pepper. As compared to ambient condition, the EC was able to provide a storage environment with lower temperature, lower vapor pressure deficit and a higher relative humidity. Weight loss was effectively reduced in EC as well as the extent and rate of moisture loss. Results also showed that physical characteristics of sweet pepper in terms of visual quality, color, firmness, and shriveling were maintained better when stored under EC condition. The rate of the chemical changes for total soluble solids and titratable acidity for sweet peppers stored in EC condition were slowed down contributing to its
E.R. Bayogan et al.
14
extended shelf life. Furthermore, samples in EC condition exhibited a longer shelf life of a maximum of 9 more days than those stored in ambient. Decay, however, can reduce the benefits gained from the use of the EC. Controlling the amount of moisture may reduce disease occurrence in the produce. In addition, between the two cultivars, ‘Smooth Cayenne’ exhibited better visual quality characteristics and longer shelf life. Hence, selecting a good cultivar of sweet pepper paired with storage in EC could lengthen the shelf life of sweet peppers. ACKNOWLEDGMENT. The authors thank the Commission on Higher Education (CHED) for their financial support. REFERENCES Acedo, A.L. Jr. (1997): Storage life of vegetables in simple evaporative coolers. Tropical
Science 37: 169-175. Acedo, A. Jr., Vanndy, M., Buntong, B., Weinberger, K. (2009): Postharvest life of three chili
(Capsicum annuum L.) cultivars as affected by fruit stalk removal and storage condition. Acta Horticulture 837: 171-176.
Ali, A., Bordoh, P.K., Singh, A., Siddiqui, Y., Droby, S. (2016): Post-harvest development of anthracnose in pepper (Capsicum spp.): etiology and management strategies. Crop Protection 90: 132-141.
Antoniali, S., Leal, P.M., Magalhaes, A.M., Fuziki, R.T., Sanches, J. (2007): Physico-chemical characterization of ‘Zarco HS’ yellow bell pepper for different ripeness stages. Scientia Agricola 64: 19-22.
Atta-Aly, M.A., Brecht, J.K. (1995): Effect of postharvest high temperature on tomato fruit ripening and quality. pp. 250-256. In: International Symposium "Postharvest Physiology, Pathology and Technologies for Horticultural Commodities: Recent Advances".
Awole, S., Woldetsadik, K., Workneh, T.S. (2011): Yield and storability of green fruits from hot pepper cultivars (Capsicum spp.). African Journal of Biotechnology 10(56): 12662-12670.
Basediya, A.M., Samuel, D.V.K., Beera, V. (2013): Evaporative cooling system for storage of fruits and vegetables – a review. Journal of Food Science Technology 50(3): 429-442.
Bautista, O.K., Flor, N.B., Yaptenco, K.F. (2007). Alternatives to refrigerated transport and storage. pp. 300-308. In: Bautista, O.K., Esguerra, E.B. (eds.), Postharvest Technology for Southeast Asian Perishable Crops. (University of the Philippines Los Baños and Department of Agriculture-Bureau of Agricultural Research.
Shelf life of two sweet pepper cultivars
15
Bondada, B., Keller, M. (2012): Not all shrivels are created equal - morphoanatomical and compositional characteristics vary among different shrivel forms that develop during ripening of grape (Vitis vinifera L.) berries. American Journal of Plant Science 12: 13-16.
Dadhich, S.M., Dadhich, H., Verma, R.C. (2008): Comparative study on storage of fruits and vegetables in evaporative cool chamber and in ambient. International Journal of Food Engineering 4(1): 1–11.
Dumville, J.C., Fry, S.C. (2000): Uronic acid-containing oligosaccharins: their biosynthesis, degradation and signaling roles in non-diseased plant tissues. Plant Physiology and Biochemistry 38: 125–140.
Food and Agriculture Organization (FAO). (1981): Food loss prevention in perishable crops. FAO Agricultural Service Bulletin 43, United Nations Food and Agriculture Organization, Rome, Italy.
Getenit, H., Seyoum, T., Woldetsdik, K. (2008) .The effect of cultivar, maturity stage and storage environment on quality of tomatoes. Journal of Food Engineering 87: 467–498.
Leon, J.J., Elias, J.L., Huez Lopez, M.A., Garcia Lopez, A.M., Ortiz, R.S., Escoboza Garcia, L.F. (2013): Postharvest quality and shelf life of green pepper (Capsicum annuum L.) grown under open-field and greenhouse conditions. IDESIA (Chile) 3(4): 35-41.
Marin, A., Ferreres, F., Tomas-Barberan, F., Gil, M.I. (2004): Characterization and quantitation of antioxidant constituents of sweet pepper (Capsicum annuum L.). Journal of Agricultural and Food Chemistry 52: 3861-3869.
Olosunde, W.A., Aremu, K.A., Onwude, D.I. (2016): Development of a solar powered evaporative cooling storage system for tropical fruits and vegetables. Journal of Food Engineering 40(2): 279-290.
Salisbury, F.B., Ross, C.W. (1994): Physiology Vegetable Group Editorial. Mexico, pp. 71- 441.
Samira, A., Woldetsadik, K., Workneh, T.S. (2013): Postharvest quality and shelf life of some hot pepper varieties. Journal of Food Science and Technology 50(5): 842-855.
Shehata, S.A., Ibrahim, M.I.A., El-Mogy, M.M. El-Gawad, K.F.A. (2013): Effect of hot water dips and modified atmosphere packaging on extending the shelf life of bell pepper fruits. Wulfenia Journal 20(3): 315-328.
Shotorbani, N.M., Jamei, R., Heidari, R. (2013): Antioxidant activities of two sweet pepper Capsicum annuum L. varieties phenolic extracts and the effects of thermal treatment. Avicenna Journal of Phytomedicine 3(1): 25-34.
Vanndy, M., Buntong B., Acedo, Jr. A., Weinberger, K. (2008): Improving postharvest reddening and shelf life of fresh chili (Capsicum annuum) using simple evaporative cooler. Acta Horticulture 804: 561-564.
Wills, R., McGlasson, B., Graham, D., Joyce, D. (1998): Postharvest: An Introduction to the Physiology and Handling of Fruit, Vegetables and Ornamentals. Hyde Park Press, Adelaide, Australia. p.262.

Acta Hortic. 1205. ISHS 2018. DOI 10.17660/ActaHortic.2018.1205.48 Proc. International Symposia on Tropical and Temperate Horticulture Ed.: R. Drew
411
Trimming losses in Chinese cabbage E.R.V.Bayogan1,L.B.Secretaria1,C.D.S.Lubaton1,K.B.Barbin1,M.S.Luayon1andJ.H.Ekman21University of the Philippines Mindanao, Mintal, Tugbok District, Davao City 8022, Philippines; 2AppliedHorticulturalResearch,Suite352,BiomedicalBldg.,AustralianTechnologyPark,EveleighNSW2015,Australia.Abstract
Trimming inChinese cabbageheads removeswrapper leaves andotherpartsthatdetractfromagoodappearance,thusimprovingmarketability.Trimminglosseswerequantifiedinvariousassessmentsatthewholesaleandretail(asinfluencedbysackposition,coldstorageandalum)levels.Trimminglossesof43.9%byweightweremeasured inChinesecabbage forproductgrown inKapatagan,DavaodelSurat thewholesalemarket inBankerohan,DavaoCity.The trimming losswas less,28.5%byweight, forChinesecabbagegrown inLantapan,Bukidnon,at theBulua,CagayandeOroCitywholesalemarkets.HeadsprocuredfromBankerohanmarketshowed11.1%more trimming losses in the drier conditions of cold storage (at 21.1±1.3°C and49.8±9.8% relativehumidity (RH)) after twodays, comparedwith ambient storage(27.0±0.6°Cand69.6±6.1%relativehumidity).However, theoppositeoccurredaftersix days of storage, due to accelerated decay at ambient temperatures. Withinpolypropylenesacksections(top,middleandbottom),trimming lossesweresimilarin all positions. Under ambient conditions, where no control heads remained, allalum-treatedheadswerestilluseableatsixdays,buttrimminglossreached70%.
Keywords:alum,postharvestlosses,wholesalemarket,wrapperleaves,leafremovalINTRODUCTIONChinese cabbage, a widely cultivated crop in Asia, is a hardy, shallow-rooted, cool-season crop with an optimal temperature range of 13-21°C. This leafy vegetable crop isgrown in the Philippines, contributing about PhP 1.08 B to the local economy in 2006(PCAARRD, 2006). In the southern Philippines, production areas of this crop include theprovinces of Zamboanga del Norte, Bukidnon, Camiguin, Misamis Occidental, MisamisOriental,DavaodelSur,CompostellaValley,NorthCotabato,Sarangani,SouthCotabatoandSultanKudarat(CountrySTATPhilippines,2015).TwomaindomesticmarketsarelocatedinDavao City and Cagayan de Oro City – both big cities in Mindanao. Crops produced anydistance from these domestic markets are potentially vulnerable to different kinds ofmechanicalstressduringtransport.Mechanicalstressesareevidentindamaged,crushedortornleaves,whichreduceitsvisualappealanduseablebiomass.Ifthecroplossesitsquality,thenitsmarketabilityisalsoreduced.Trimmingisdoneinordertomaintaintheappearanceofqualityandincreasemarketability.Trimmingispracticedonfarmduringharvestandbywholesalersandretailers.Thispostharvest practice involves the removal of the outer (wrapper leaves), other leaves andparts of the butt-end of Chinese cabbage heads. This crop has the high surface area tovolumeratiothatischaracteristicofaleafyvegetable.Wilting,yellowinganddamageduetoethylene exposure, high temperature conditions or decay caused by soft rot bacteria(Pectobacteriumcarotovorum)are themainreasons for trimmingChinesecabbage (AcedoandWeinberger,2009;JiangandPearce,2005).Whilsttrimmingcouldmaintainthequalityof thecrop, itcouldalsoreducethemarketableweightthatcanbesold inthemarketanddelay the onset of soft rot. Thus, excessive trimming causes postharvest loss for farmers,traders,wholesalersandretailers.AnassessmentoftrimminglossesinChinesecabbageinthemarketwasneededwiththeaimofimprovingpostharvesthandling.Inthisstudy,trimminglosseswereevaluatedinthe wholesale market; and the effects of position in the package, storage conditions andalumtreatmentwereevaluated.
412
MATERIALSANDMETHODS
WholesaletrimminglossassessmentChinesecabbagetrimminglosswasevaluatedattheBankerohanmarketinDavaoCityas well as at Bulua, Westbound, Cagayan de Oro where both wholesale and retailtransactions takeplaceA totalof51 sacksand20 individualChinese cabbageheadswereassessedfortrimminglossattheBankerohanmarket.Thefirstevaluationfortrimminglosswas done at Bankerohan market, wherein the overall weight of the trimmed leaves wasdeductedfromthetotalweightof51sacks.ThesecondevaluationforBankerohanmarketinvolved the trimming loss of individual Chinese cabbage heads. For the trimming loss inCagayandeOromarket,threecartonboxes(75kgbox-1)ofChinesecabbagewereevaluated.ThedamagedwrapperandouterleavesoftheChinesecabbageheadsweretrimmeduntilanacceptable marketable quality was attained. Chinese cabbages assessed from theBankerohanmarketweregrowninthehighlandareaofKapatagan,DavaodelSurwhereasthose fromCagayandeOrowereproduced inLantapan,Bukidnon.TheKapataganarea isconsideredtobecoolerandthusallowthistemperatevegetablecroptothrivebetterthanLantapan.Trimmingloss(%)wascalculatedbysubtractingtheweightaftertrimmingfromtheweightbeforetrimming/weightbeforetrimming×100(Klieberetal.,2001).TrimminglossatsimulatedretailconditionsasaffectedbypackagesectionChinese cabbage transported from the farm to wet market was evaluated underlaboratoryconditionssimulatingretail.Trimminglossofthesamplesasaffectedbylocationwithin the sack (top, middle, and bottom) was assessed at the Postharvest BiologyLaboratory. Three sacks of newly harvested Chinese cabbage were procured fromKapatagan, Davao del Sur. Upon arrival in the laboratory, the samples were grouped intothreetreatmentsbasedontheirposition(top,middle,andbottom)insidethepolypropylenesacks andwere trimmed to amarketable retail standard.Trimmingkniveswere sanitizedwith 200 ppm sodium hypochlorite. The evaluation was carried out in a completelyrandomized design. Samples were then held for 15 days at ambient conditions(26.46±1.01°C, 84.23±7.18% RH) as Chinese cabbage heads would be retailed in localmarket stalls minus the use of electric fans by retailers. Trimming was done repeatedlyduring the evaluation period at three day intervals. Trimming loss was calculated asindicated earlier (Klieber et al., 2001) except that initialweight before trimmingwas theweightjustbeforetrimmingateachevaluationperiod.TrimminglossintwostorageconditionsChinese cabbage heads procured from Bankerohan Public Market, Davao City werestored unpacked in ambient (27.0±0.6°C, 69.6±6.1% RH) or cool storage (21.1±1.3°C,49.8±9.8%RH)conditions.Trimminglosswasevaluatedaftertwoandsixdaysofstorage.TrimminglossinChinesecabbageheadsinoculatedwithPectobacterium carotovorumfollowedbyalumtreatmentNewly-harvestedChinese cabbageheads fromKapatagan,DigosCitywereprocured.Uponarrivalat thepostharvest laboratory,eachof theheadswerechecked fordamageordisease. Prior to treatment and to simulate retail conditions, three to fivewrapper leavesweretrimmed,includingdamagedleaves,whilethebutt-endwasre-cut.Thesampleswereinoculatedwith soft rot bacteria,Pectobacteriumcarotovorumwithin24hof harvest. TheinoculationwasdonebyprickingthebuttendoftheChinesecabbageoncetoadepthof1mmandapplying a singledropof inoculumwith the concentrationof 10-8 CFUmL-1.Onehourlater,eachsamplewasgroupedaccordingtotreatment(distilledwaterand10%alumsolution)andeachheadsprayeduntildrippingwet.TheChinesecabbageheadswereheldinambient storage (26.2±0.3°C, 84.8±2.0% RH) for 8 days and trimming was repeated asnecessary.Trimmingwasdonesolelyontheleavesandnotonthebutt-endoftheheads.
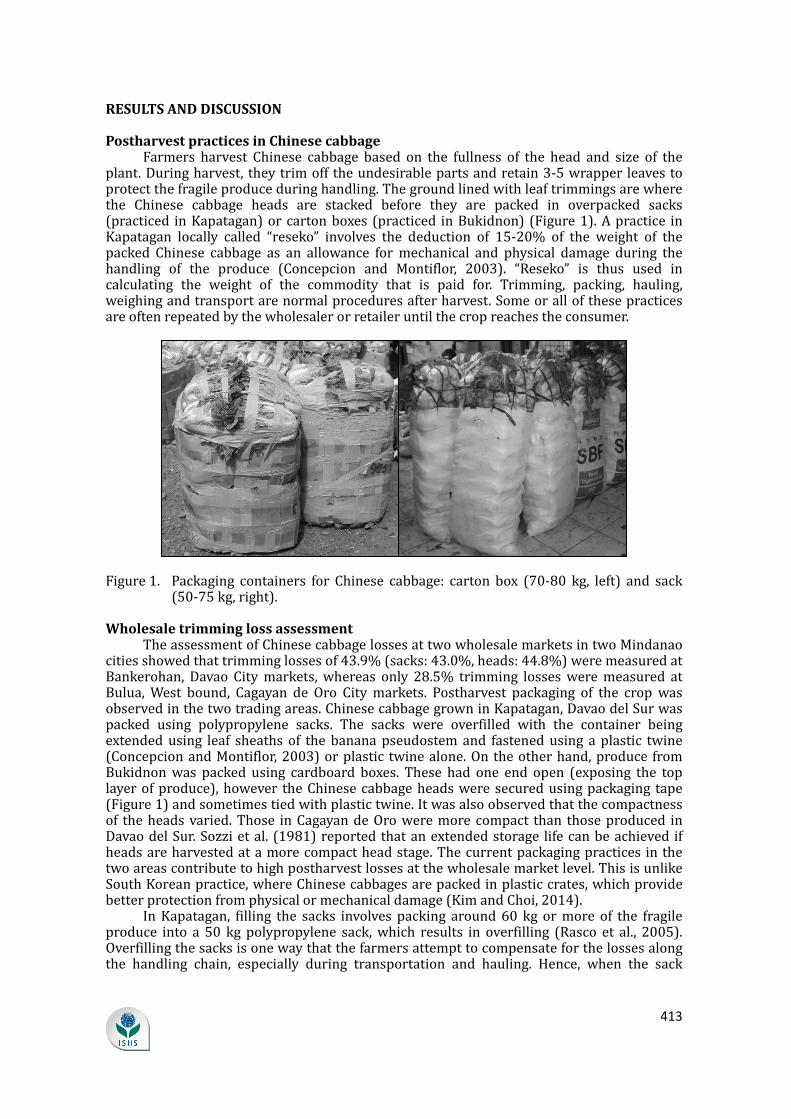
413
RESULTSANDDISCUSSION
PostharvestpracticesinChinesecabbageFarmers harvest Chinese cabbage based on the fullness of the head and size of theplant.Duringharvest, theytrimofftheundesirablepartsandretain3-5wrapperleavestoprotectthefragileproduceduringhandling.Thegroundlinedwithleaftrimmingsarewherethe Chinese cabbage heads are stacked before they are packed in overpacked sacks(practiced inKapatagan)orcartonboxes(practiced inBukidnon)(Figure1).Apractice inKapatagan locally called “reseko” involves the deduction of 15-20% of the weight of thepacked Chinese cabbage as an allowance formechanical and physical damage during thehandling of the produce (Concepcion and Montiflor, 2003). “Reseko” is thus used incalculating the weight of the commodity that is paid for. Trimming, packing, hauling,weighingandtransportarenormalproceduresafterharvest.Someorallofthesepracticesareoftenrepeatedbythewholesalerorretaileruntilthecropreachestheconsumer.
Figure1. Packaging containers for Chinese cabbage: carton box (70-80 kg, left) and sack(50-75kg,right).WholesaletrimminglossassessmentTheassessmentofChinesecabbagelossesattwowholesalemarketsintwoMindanaocitiesshowedthattrimminglossesof43.9%(sacks:43.0%,heads:44.8%)weremeasuredatBankerohan, Davao Citymarkets,whereas only 28.5% trimming lossesweremeasured atBulua,West bound, Cagayan de Oro Citymarkets. Postharvest packaging of the cropwasobservedinthetwotradingareas.ChinesecabbagegrowninKapatagan,DavaodelSurwaspacked using polypropylene sacks. The sacks were overfilled with the container beingextendedusing leaf sheathsof thebananapseudostemand fastenedusing aplastic twine(ConcepcionandMontiflor,2003)orplastic twinealone.Ontheotherhand,produce fromBukidnonwas packed using cardboard boxes. These had one end open (exposing the toplayerofproduce),however theChinesecabbageheadsweresecuredusingpackaging tape(Figure1)andsometimestiedwithplastictwine.Itwasalsoobservedthatthecompactnessof theheadsvaried.Those inCagayandeOroweremorecompact than thoseproduced inDavaodelSur.Sozzietal. (1981)reportedthatanextendedstorage lifecanbeachievedifheadsareharvestedatamorecompactheadstage.Thecurrentpackagingpractices inthetwoareascontributetohighpostharvestlossesatthewholesalemarketlevel.ThisisunlikeSouthKoreanpractice,whereChinesecabbagesarepackedinplasticcrates,whichprovidebetterprotectionfromphysicalormechanicaldamage(KimandChoi,2014).InKapatagan, filling the sacks involves packing around60 kg ormore of the fragileproduce into a 50 kg polypropylene sack,which results in overfilling (Rasco et al., 2005).Overfillingthesacksisonewaythatthefarmersattempttocompensateforthelossesalongthe handling chain, especially during transportation and hauling. Hence, when the sack
414
reaches market, a substantial amount of the crop still remains. Due to this practice, thequality of the harvested produce is compromised. The oversized carton box used in theBuluawholesalemarketisslightlymorerigidcomparedtothesack.Thepackagingmaterialwas not the only reason for a greater percentage trimming loss in Chinese cabbage inBankerohan. Since the Chinese cabbage in the two markets is from different productionsources, thecultivarusedandon-farmqualitycouldalsobe factors in the losses incurred.Thelossesmayalsodependontheperceptionofthemarketintermediary,sincetheydothetrimming and selling of the crop in themarket. Over-trimming is a cause of postharvestlossesatthewholesalemarket.In a study by Concepcion andMontiflor (2003), farmers perceived that mechanicalinjuries are not important, while the market intermediaries are concerned about it. ThereasonforgreatertrimminglossesatBankerohanwholesalemarketwasnotlimitedtoonefactor.Trimminglossescouldbeduetothepackagingmaterialused,thehandlingpracticesof farmers or the perception of quality by market intermediaries as the produce goesthrough the handling chain (Concepcion andMontiflor, 2003;Manalili, 2003; Rasco et al.,2005).TrimminglossatsimulatedretailconditionasaffectedbylocationinpackageThe producewas handled as growers and traderswould until the crop reached themarket, thus simulating the handling conditions from the farm to market. Samples werefurther observed in the laboratory and showed that Chinese cabbage trimming losses foreach location (top,middle, and bottom)within the sackwas similar (Table 1). Kapataganfarmers tend to overfill the polypropylene sack when they pack Chinese cabbage heads.Furthermore, sacks are handled roughly as they are hauled and piled onto vehicles withotherfarmproductsfortransport.Polypropylenesacksarenon-rigidcontainersanddonotaffordadequateprotectiontothepackedproduce.Eachsectionofthesackwassubjectedtothe same degree of injury, such as compression, which led to similar percentages oftrimmingloss.ThehigherpercentageoftrimminglossonDay3canbeattributedtoremovalofwrapper,torn,brokenandwiltedleaves,aswellasinsectdamagedleaves.Table1. Mean trimming loss (%) of Chinese cabbage held at ambient conditions(26.46±1.01°C,84.23±7.18%RH)asaffectedbylocationinthepolypropylenesack.
Packaging sectionTrimming loss1
Time (days) 3 6 9 12 15
Top 52.82a 22.74a 14.84a 24.29a 12.49abMiddle 52.46a 21.87a 14.30a 21.48a 11.09bBottom 50.21a 18.71a 16.54a 17.92a 17.48a
1Means in a column with common letters are not significantly different using LSD at 5% level of significance.
TrimminglossintwostorageconditionsAftertwodaysofstorageinacoolroom(21.1±1.3°C,49.8±9.8%RH)Chinesecabbagehad11%more trimming loss thanproduct in ambient conditions (27.0±0.6°C, 69.6±6.1%RH) (Figure 2). The higher trimming loss in the cool room was attributed to the drierconditionscomparedwithambienthumidity.Waterfromtheairandfromthevegetablesisdrawnoutby the air conditionerduringdefrost cycles,which results in lowerpercentagerelativehumidity(GovernmentofWesternAustralia,2016).Thisinturncausedmorewiltingof leaves, which contributed to a greater trimming loss. However, at six days Chinesecabbageheads stored at ambient conditions exhibited higher trimming loss than those incoldstorage.Ambientconditions,particularlythehighertemperature(adifferenceof5.9°C),increased the incidence of decay. In lower temperature conditions in the cool room, thegrowthofmicroorganismswasdelayed,reducingtrimmingloss.AccordingtoKramchoteetal. (2012), a temperature of 0°C and a relative humidity of 90% are ideal conditions to
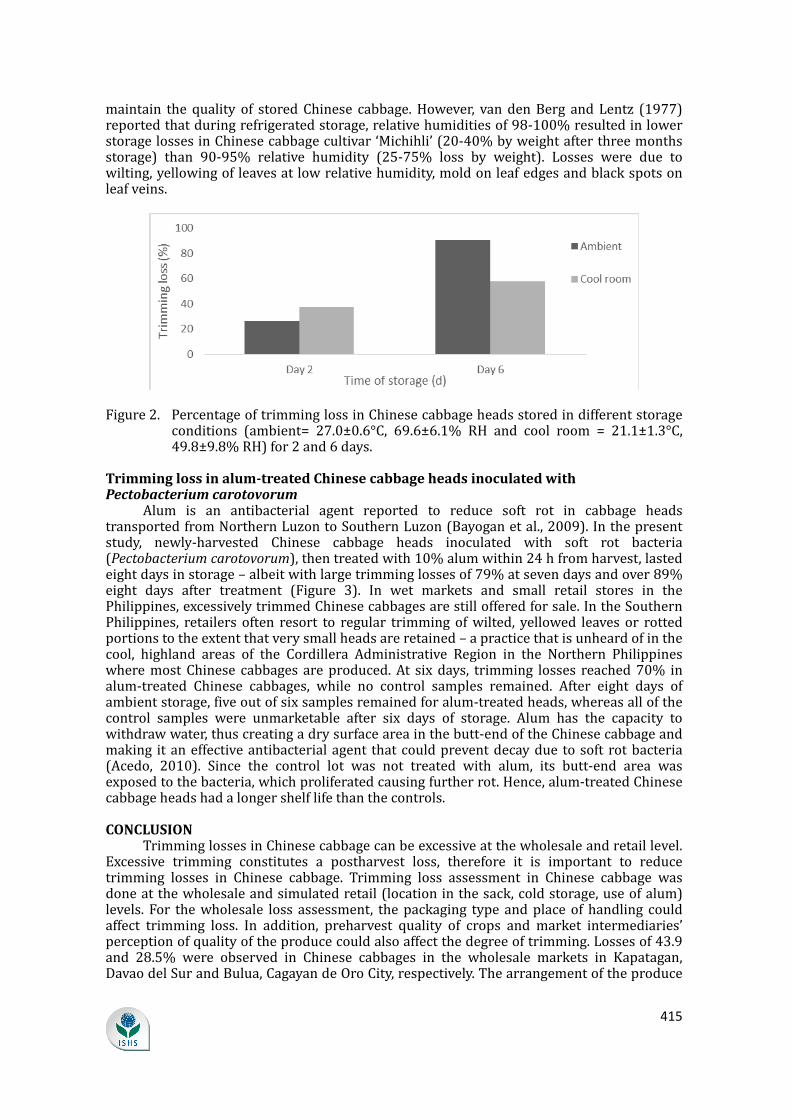
415
maintain the quality of storedChinese cabbage.However, vandenBerg andLentz (1977)reportedthatduringrefrigeratedstorage,relativehumiditiesof98-100%resultedinlowerstoragelossesinChinesecabbagecultivar‘Michihli’(20-40%byweightafterthreemonthsstorage) than 90-95% relative humidity (25-75% loss by weight). Losses were due towilting,yellowingofleavesatlowrelativehumidity,moldonleafedgesandblackspotsonleafveins.
Figure2. PercentageoftrimminglossinChinesecabbageheadsstoredindifferentstorageconditions (ambient= 27.0±0.6°C, 69.6±6.1% RH and cool room = 21.1±1.3°C,49.8±9.8%RH)for2and6days.Trimminglossinalum-treatedChinesecabbageheadsinoculatedwithPectobacterium carotovorumAlum is an antibacterial agent reported to reduce soft rot in cabbage headstransportedfromNorthernLuzontoSouthernLuzon(Bayoganetal.,2009).Inthepresentstudy, newly-harvested Chinese cabbage heads inoculated with soft rot bacteria(Pectobacteriumcarotovorum),thentreatedwith10%alumwithin24hfromharvest,lastedeightdaysinstorage–albeitwithlargetrimminglossesof79%atsevendaysandover89%eight days after treatment (Figure 3). In wet markets and small retail stores in thePhilippines,excessivelytrimmedChinesecabbagesarestillofferedforsale.IntheSouthernPhilippines, retailers often resort to regular trimmingofwilted, yellowed leavesor rottedportionstotheextentthatverysmallheadsareretained–apracticethatisunheardofinthecool, highland areas of the Cordillera Administrative Region in the Northern Philippineswheremost Chinese cabbages areproduced.At sixdays, trimming losses reached70% inalum-treated Chinese cabbages, while no control samples remained. After eight days ofambientstorage,fiveoutofsixsamplesremainedforalum-treatedheads,whereasallofthecontrol samples were unmarketable after six days of storage. Alum has the capacity towithdrawwater,thuscreatingadrysurfaceareainthebutt-endoftheChinesecabbageandmaking itaneffectiveantibacterialagent thatcouldpreventdecaydue tosoft rotbacteria(Acedo, 2010). Since the control lot was not treated with alum, its butt-end area wasexposedtothebacteria,whichproliferatedcausingfurtherrot.Hence,alum-treatedChinesecabbageheadshadalongershelflifethanthecontrols.CONCLUSIONTrimminglossesinChinesecabbagecanbeexcessiveatthewholesaleandretaillevel.Excessive trimming constitutes a postharvest loss, therefore it is important to reducetrimming losses in Chinese cabbage. Trimming loss assessment in Chinese cabbage wasdoneatthewholesaleandsimulatedretail(locationinthesack,coldstorage,useofalum)levels. For thewholesale loss assessment, thepackaging type andplaceof handling couldaffect trimming loss. In addition, preharvest quality of crops and market intermediaries’perceptionofqualityoftheproducecouldalsoaffectthedegreeoftrimming.Lossesof43.9and 28.5% were observed in Chinese cabbages in the wholesale markets in Kapatagan,DavaodelSurandBulua,CagayandeOroCity,respectively.Thearrangementoftheproduce
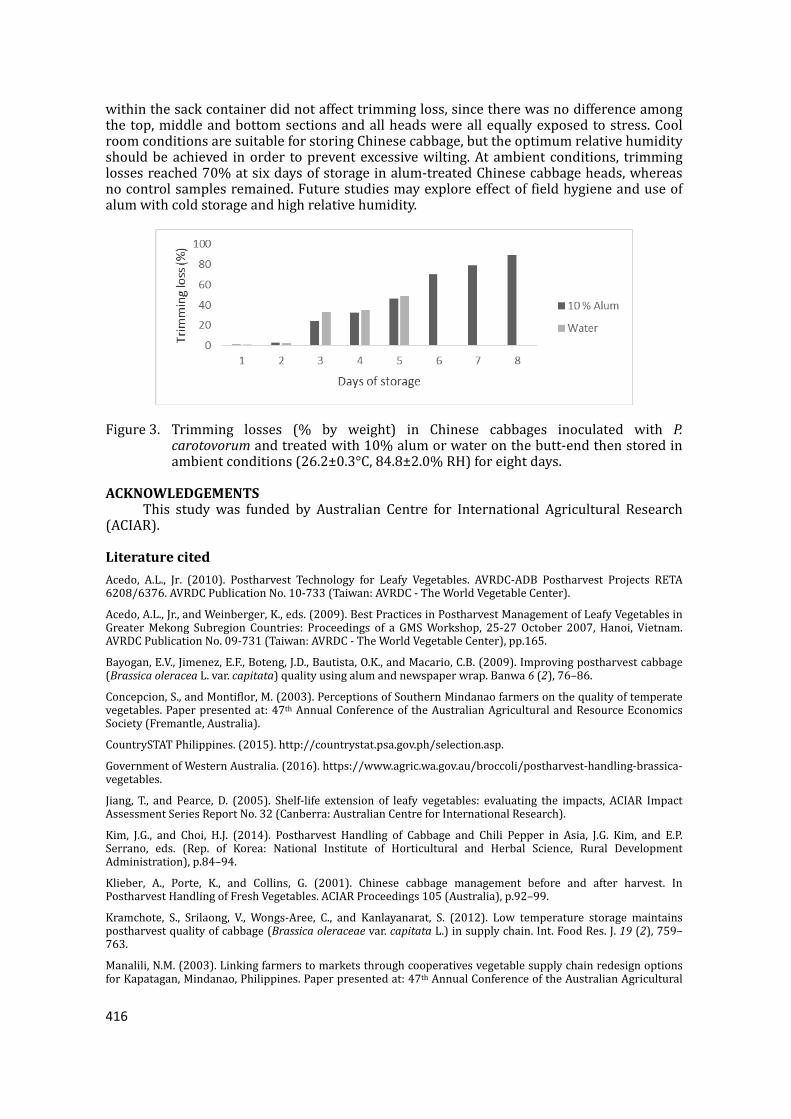
416
withinthesackcontainerdidnotaffecttrimmingloss,sincetherewasnodifferenceamongthetop,middleandbottomsectionsandallheadswereallequallyexposedtostress.CoolroomconditionsaresuitableforstoringChinesecabbage,buttheoptimumrelativehumidityshouldbeachieved inorder topreventexcessivewilting.Atambientconditions, trimminglossesreached70%atsixdaysofstorageinalum-treatedChinesecabbageheads,whereasnocontrolsamplesremained.Futurestudiesmayexploreeffectoffieldhygieneanduseofalumwithcoldstorageandhighrelativehumidity.
Figure3. Trimming losses (% by weight) in Chinese cabbages inoculated with P.carotovorumandtreatedwith10%alumorwateronthebutt-endthenstoredinambientconditions(26.2±0.3°C,84.8±2.0%RH)foreightdays.
ACKNOWLEDGEMENTSThis studywas funded by Australian Centre for International Agricultural Research(ACIAR).LiteraturecitedAcedo, A.L., Jr. (2010). Postharvest Technology for Leafy Vegetables. AVRDC-ADB Postharvest Projects RETA6208/6376.AVRDCPublicationNo.10-733(Taiwan:AVRDC-TheWorldVegetableCenter).Acedo,A.L.,Jr.,andWeinberger,K.,eds.(2009).BestPracticesinPostharvestManagementofLeafyVegetablesinGreaterMekong Subregion Countries: Proceedings of a GMSWorkshop, 25-27October 2007, Hanoi, Vietnam.AVRDCPublicationNo.09-731(Taiwan:AVRDC-TheWorldVegetableCenter),pp.165.Bayogan,E.V.,Jimenez,E.F.,Boteng,J.D.,Bautista,O.K.,andMacario,C.B.(2009).Improvingpostharvestcabbage(BrassicaoleraceaL.var.capitata)qualityusingalumandnewspaperwrap.Banwa6(2),76–86.Concepcion,S.,andMontiflor,M.(2003).PerceptionsofSouthernMindanaofarmersonthequalityoftemperatevegetables.Paperpresentedat:47thAnnualConferenceof theAustralianAgriculturalandResourceEconomicsSociety(Fremantle,Australia).CountrySTATPhilippines.(2015).http://countrystat.psa.gov.ph/selection.asp.GovernmentofWesternAustralia.(2016).https://www.agric.wa.gov.au/broccoli/postharvest-handling-brassica-vegetables.Jiang, T., and Pearce, D. (2005). Shelf-life extension of leafy vegetables: evaluating the impacts, ACIAR ImpactAssessmentSeriesReportNo.32(Canberra:AustralianCentreforInternationalResearch).Kim, J.G., and Choi, H.J. (2014). Postharvest Handling of Cabbage and Chili Pepper in Asia, J.G. Kim, and E.P.Serrano, eds. (Rep. of Korea: National Institute of Horticultural and Herbal Science, Rural DevelopmentAdministration),p.84–94.Klieber, A., Porte, K., and Collins, G. (2001). Chinese cabbage management before and after harvest. InPostharvestHandlingofFreshVegetables.ACIARProceedings105(Australia),p.92–99.Kramchote, S., Srilaong, V., Wongs-Aree, C., and Kanlayanarat, S. (2012). Low temperature storage maintainspostharvestqualityofcabbage(Brassicaoleraceaevar.capitataL.)insupplychain.Int.FoodRes.J.19(2),759–763.Manalili,N.M.(2003).LinkingfarmerstomarketsthroughcooperativesvegetablesupplychainredesignoptionsforKapatagan,Mindanao,Philippines.Paperpresentedat:47thAnnualConferenceoftheAustralianAgricultural
417
andResourceEconomicsSociety(Fremantle,Australia).Philippine Council for Agriculture, Aquatic and Natural Resources Research and Development (PCAARRD).(2006). http://www.pcaarrd.dost.gov.ph/home/joomla/index.php?option=com_content&task=view&id=828&Itemid=582.Rasco,E.T.,Jr.,Maquilan,M.D.,Mendoza,M.A.,Migalbin,L.,Hualda,L.T.,Concepcion,S.B.,Digal,L.N.,Moran,A.G.,Murray-Prior,R.B.,Batt,P.,etal.(2005).SustainabilityofvegetablefarminginSouthernMindanao,Philippines2.Yieldandprofitabilityofgrowingsixmajorcrops.Philipp.Agric.Sci.88(1),19–34.Sozzi,A.,Gorini,F.L.,andUncini,L.(1981).StoragesuitabilityoftheChinesecabbageasaffectedbylining.ActaHortic.116,157–162https://doi.org/10.17660/ActaHortic.1981.116.19.vandenBerg,L.,andLentz,C.P.(1977).Effectofrelativehumidityonstoragelifeofvegetables.ActaHortic.62,197–208https://doi.org/10.17660/ActaHortic.1977.62.20.

418
261
Postharvest Quality and Antioxidant Content of Organic Eggplant (Solanum melongena L.) in Modified Atmosphere Packaging M.M. Benitez, R.J.S. Zapanta and E.D. Briones Department of Horticulture, CAFS Visayas State University Visca, Baybay City, Leyte Philippines Keywords: organic agriculture, vermicompost, total antioxidant content Abstract
Organic farming is increasingly adopted to add value to vegetable production and marketing. This study was conducted to determine the effects of preharvest vermicompost application and postharvest modified atmosphere packaging (MAP) on the quality, shelf life and total antioxidant activity of eggplant fruits. Vermicompost was applied at 2.5 kg/plant at planting and compared with inorganic fertilizer application (farmer’s practice) and without fertilizer applied. Harvested fruits were individually packed in 0.02 mm thick low density polyethylene (PE) bag or 0.05 mm thick polypropylene (PP) bag and stored at ambient; unpacked fruit served as control. Fertilizer application using vermicompost or inorganic material reduced weight loss and shrivelling of the fruit. Modified atmosphere packaging (MAP) was very effective in delaying shrivelling, reducing weight loss, improving visual quality, and extending shelflife of fruits. Fruit antioxidant activity was generally higher with vermicompost application than with chemical fertilizer application. Fruit browning, respiration rate and decay incidence did not differ with treatment after seven days of ambient storage. INTRODUCTION
Eggplant (Solanum melongena L.) is a nightshade vegetable and known as purple pears which belong to the family Solanaceae. It is one of the most important vegetables nowadays due to many beneficial effects in human health and nutrition. It is a culturally important vegetable commonly consumed in South and South East Asia. It is grown for its fruits which are utilized as vegetables to contribute to the essential nutrients in our diet (Nafiu et al., 2011). While many fruits and vegetables are important for good health, eggplant appears to play a special role in the treatment and prevention of a number of very serious conditions. The nutritional value of this vegetable may not be high, however, it still contains some very essential nutrients and even some medicinal properties that are highly beneficial for the human body (http://www.buzzle.com/article/eggplant-nutritional-value.html). Eggplant is ranked as one of the top ten vegetables in terms of oxygen radical scavenging capacity due to the fruits phenolic constituents. Flavonoid is a large group of phytonutrients that are water-soluble pigments, considered to have antioxidant and anti-inflammatory properties. It protects the body against cardiovascular disease as they are able to reduce the oxidation of low density lipoprotein (Razak, 2012). For countless generations, anthocyanins, which belong to the parent class molecule of flavonoids, have also been consumed by man without an apparent ill effect to health. Anthocyanin can reduce coronary heart disease, improved visual activity; possess antioxidant and anticancer activities (Fuentes, 2002). Moreover, Ghosh and Konishi (2007) showed that high dietary intake of foods rich in flavonoids, including anthocyanin is associated with low prevalence of some diseases such as cancer and cardiovascular diseases as evidenced from epidemiological studies. Takamura et al. (1994), cited by Pino (2011), also reported that anthocyanin acts as a powerful antioxidant.
There is a research on the antioxidant activity carried out by a systematic examination on a phenolic acid content of the flesh fruit that is found on seven commercial cultivars of eggplant (Eun Ju Jung et al., 2011). A number of observations as
Proc. IInd Southeast Asia Symp. on Quality Management in Postharvest Systems Eds.: A.L. Acedo Jr. and S. Kanlayanarat Acta Hort. 1088, ISHS 2015
262
well as accumulated research findings had supported to claim that eggplant contains an array of health benefits (Sterling, 2001, cited by Racquel, 2006). Considering the medicinal benefits and the potential market demand of eggplant, techniques in management and production should be given much attention. Vermicompost constitutes a promising alternative to inorganic fertilizers in enhancing plant growth. Vermicompost is a microbiologically-active, nutrient-rich, peat-like material, which when added to plant growing media may influence plant growth directly or indirectly through different chemical, physical and biological mechanisms (Lazcano and Dominguez, 2011). Moreover, it provides better P nutrition from different organic waste (Ghosh et al., 1999). In addition, benefit of using vermicast is the presence of plant hormone compound which can enhance cell growth and plant metabolism. Studies on the production of important vegetable crop like eggplant have yielded good results by the use of vermicompost, but no scientific findings on postharvest quality and antioxidant content of organic eggplant (Solanum melongena L.) in modified atmosphere packaging. MATERIALS AND METHODS
Newly harvested eggplant cultivar ‘Morena F1’ at commercial maturity stage produced by a farmers’ farm in Sta. Cruz, Baybay, Leyte and Eco-Farmi VSU, Baybay, Leyte was collected and brought to the Postharvest Technology Laboratory, Department of Horticulture, Visayas State University, Visca, Baybay, Leyte. On arrival, the fruits were sorted out and only those with more or less uniform size and no damage were used as samples. Nine were used for each treatment; three samples per treatment per replication were placed in cooled water to remove the field heat before placing in polyethylene bags. The experiment was laid out in 3×3 factorial experiments in Completely Randomized Design (CRD). The treatments were replicated three times: Factor A – fertilizer treatment: without fertilizer; inorganic fertilizer (farmers’ practice); T3 – vermicompost application (2.5 kg/per plant). Factor B – Modified atmospheric packaging: M1 – open; M2 – polyethylene bag (PE) (0.02 mm thick); M3 – polypropylene bag (PP) (0.05 mm thick). Data gathered (weight loss, shriveling, visual quality rating, lightness, respiration rate and antioxidant content were subjected to analysis of variance using the Statistical Analysis System software. Significant differences (P<0.05) among treatments were identified by means of the least significant difference (LSD) test. RESULTS AND DISCUSSION Weight Loss and Shriveling
No significant interaction effect between organic fertilizer and modified atmosphere treatments was obtained for weight loss and shriveling. Weight loss in eggplant did not vary when eggplant fruits were stored from the first day of storage (Fig. 1). No differences were observed for all the fertilizer treatments and these values were significantly higher than the control. Among MAP, the open-stored fruits rapidly increased in weight loss and shriveling throughout storage. MAP using polymeric films might be considered to be beneficial to maintain high humidity essential for prevention of water loss. It creates a humid atmosphere by trapping the transpirational water within the package thereby decreasing the vapor pressure deficit which is driving force of water loss. Visual Quality Rating and Shelf life
The visual quality of eggplant fruits was significantly affected by the interaction between the two types of modified atmosphere packages (PE and PP) where the fruits were stored and the fertilizer treatments (Fig. 2). Fruit in MAP had higher visual quality rating than in open-stored fruit. The fruit appeared fresh and defect free during the first 3-4 days of storage specifically in MAP; thereafter, visual quality decreased.
The shelf life in eggplant fruits was significantly affected by the interaction between the two types of modified atmosphere packages (PE and PP) and the fertilizer treatments (Fig. 2). Fruit held in PE and PP had longer shelf life than fruit held in open,
263
which had shorter shelf life. Rapid shriveling and loss of turgidity were the main factors to limit the shelf life of fruit in open condition. MAP treatments were rated to be more desirable and marketable which reached the limit of shelf life and also effective in inhibiting shriveling which consequently resulted to increased shelf life.
Browning incidence, lightness (L* value) and respiration rate were not affected by the application of vermicompost and inorganic fertilizers and between the two types of packages (PE and PP) after seven days of storage (Table 1). Total Antioxidant Content
The total antioxidant content in eggplant fruits in response to the vermicompost and inorganic fertilizer treatments and stored in modified atmosphere package under ambient condition were determined when the fruit sample reached to VQR 5. Based on the analysis of variance, there were significant interaction effects between fertilizer treatments and the two types of packages (MAP) where the eggplants were stored under ambient condition (Table 2). Based on the results, the level of antioxidants was generally higher in eggplant fruits fertilized with vermicompost compared with those applied with inorganic fertilizer. The antioxidant levels of eggplant from open-stored fertilized with vermicompost were at par with those obtained from the control (without fertilizer) stored in PP. Fruits gathered from plants applied with the inorganic fertilizer had the lowest amount of this compound. Findings of this study were in agreement with the recent researches that provide evidence for the relatively higher antioxidant contents of organically-grown crops than those treated with inorganic fertilizer. In basil plants raised from organic and bioorganic fertilization exhibited higher antioxidant activity (Taie et al., 2010). Similarly, one of the compounds of antioxidant content (vitamin C) of strawberry fruits (Mahadeen, 2009) and sweet pepper (Ghoname and Shafeek, 2005) was significantly increased with the application of organic fertilizer consisting of poultry manure and a combination of organic manure, mineral and Bio-N fertilizer, respectively. CONCLUSIONS
The pre-harvest vermicompost application eggplant fruits effectively maintained the quality during storage. MAP (PE and PP) effectively delayed the shriveling, reduced weight loss and prolonged shelf life of fruits. Fruit antioxidant activity was generally higher with vermicompost application than with chemical fertilizer application. Literature Cited Enaya, I.P. Jr. 2012. Modified atmosphere packaging of bitter gourd using commercial
polymeric films. Undergrad. Thesis. Visayas State University, Leyte. 32p. Eun, Ju Jung, Myung, Suk-Bae, Eun-Kyung, J.O., Young Hong, J.O. and Seung, Cheol
Lee. 2011. Antioxidant activity of different parts of eggplant. Journal of Medicinal Plants Research 5(18):4610-4615.
Fuentes, R. 2002. Anthocyanin content of Codiaeum variegatum and Coleus blumei leaf extract. Undergraduate Thesis. Leyte State University, Visca, Baybay, Leyte. 66p.
Ghoname, A. and Shafeek, M.R. 2005. Growth and productivity of sweet pepper (Capsicum annum L.) grown in plastic house as affected by organic, mineral and Bio-N fertilizers. J. Agron. 4(4):369-372.
Ghosh, D. and Konishi, T. 2007. Anthocyanins and anthocyanin-rich extracts: role in diabetes and eye function. Asia Pac. J. Clin. Nutr. 16(2):200-208.
Haard, N.F. and Salunkhe, D.K. 1975. Symposium: Postharvest Biology and Handling of Fruits and Vegetables. Avi Pub. Co. (Westport, Conn.). Institute of Food Technologists, Miami, Florida. 193p.
Khan, A. 2011. Chemical nutrient analysis of different composts (Vermicompost and Pitcompost) and their effect on the growth of a vegetative crop Pisum sativum. Asian Journal of Plant Science and Research 1(1):116-130.
Kurubar, A. 2007. Studies on integrated nutrient and postharvest management of fig (Ficus carica L.). Ph. D. Thesis. Univ. Agric. Sci., Dharwad, India.
264
Lazcano, C. and Dominguez, J. 2011. The use of vermicompost in sustainable agriculture: impact on plant growth and soil fertility. Soil Nutrients 10:1-23. ISBN 978-1-61324-785-3.
Liu, F.W. 1988. Postharvest Handling of Tropical and Subtropical Fruit Crops. Shutter Printing Co., Ltd. Taiwan.
Mahadeen, A.Y. 2009. Influence of organic and chemical fertilization on fruit yield and quality of plastic-house grown strawberry. Jordan J. Agric. Sci. 5(2):167-176.
Nafiu K.A., Togun, A.O., Abiodun, M.O. and Chude, V.O. 2011. Effects of NPK fertilizer on growth, dry matter production and yield of eggplant in southwestern Nigeria. Agriculture and Biology Journal of North America 2(7):2151-7517.
Narkhede, S.D., Attarde, S.B. and Iingle, S.T. 2011. Study on effect of chemical fertilizer and vermicompost on growth of chilli pepper plant (Capsicum annum). J. Appl. Sci. Envl. Sanit. 6(3):327-332.
Pino, D. 2011. Anthocyanin content of sweet potato (Ipomoea batatas L.) NSIC sp 25 root extract. Undergraduate Thesis. Visayas State University, Leyte. 53p.
Raquel, S.D.P. 2006. Anthocyanin content of pili pulp (Canarium ovatum L.). Undergraduate Thesis. Leyte State University, Visca, Baybay, Leyte. 46p.
Razak, N.F. 2012. A comparative study on antioxidant properties of different varieties of eggplant (Solanum melongena L.). http://ir.uitm.edu.my/4982/1/NURUL_FASIHAH_ BINTI_RAZAK_12_24.pdf. (January 2013)
Schlimme, D.V. 1995. Marketing highly processed fruit and vegetables. HortSci. 30:15-17.
Segunto, E.C Jr. 2005. Effect of modified atmosphere packaging and genotype on postharvest life of rambutan fruits (Nephelium lappaceum Linn.). Undergraduate Thesis. Leyte State University, Visca, Baybay, Leyte. 54p.
Taie, H.A., Salams, Z.A.E. and Radwan, S. 2010. Potential activity of basil plants as a source of antioxidants and anticancer agents as affected by organic and bio-organic fertilization. Not. Bot. Hort. Agrobot. 38(1):119-127.
Velioglu, Y.S., Mazza, G., Gao, L. and Oomah, B.D. 1998. Anthocyanin activity and total phenolics in selected fruits, vegetables and grain products. Journal of Agriculture Food and Chemistry 46:4113-4117.
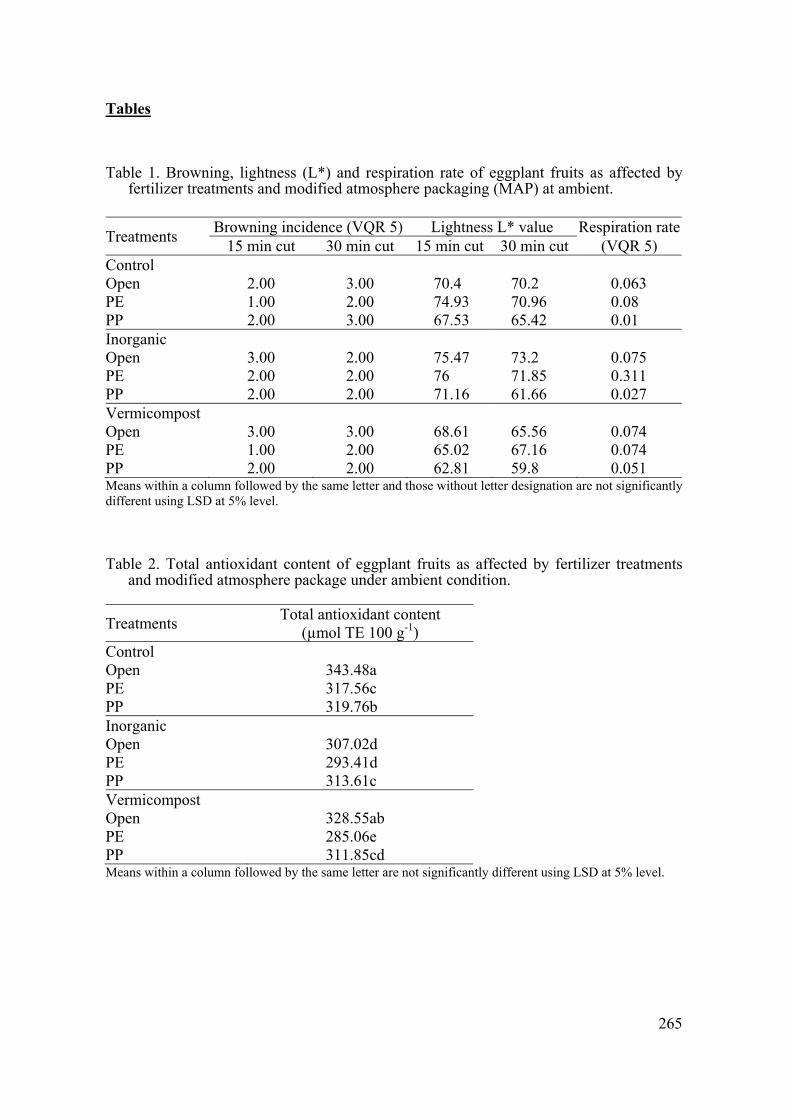
265
Tables Table 1. Browning, lightness (L*) and respiration rate of eggplant fruits as affected by
fertilizer treatments and modified atmosphere packaging (MAP) at ambient.
Treatments Browning incidence (VQR 5) Lightness L* value Respiration rate15 min cut 30 min cut 15 min cut 30 min cut (VQR 5)
Control Open 2.00 3.00 70.4 70.2 0.063 PE 1.00 2.00 74.93 70.96 0.08 PP 2.00 3.00 67.53 65.42 0.01 Inorganic Open 3.00 2.00 75.47 73.2 0.075 PE 2.00 2.00 76 71.85 0.311 PP 2.00 2.00 71.16 61.66 0.027 Vermicompost Open 3.00 3.00 68.61 65.56 0.074 PE 1.00 2.00 65.02 67.16 0.074 PP 2.00 2.00 62.81 59.8 0.051 Means within a column followed by the same letter and those without letter designation are not significantly different using LSD at 5% level. Table 2. Total antioxidant content of eggplant fruits as affected by fertilizer treatments
and modified atmosphere package under ambient condition.
Treatments Total antioxidant content (µmol TE 100 g-1)
Control Open 343.48a PE 317.56c PP 319.76b Inorganic Open 307.02d PE 293.41d PP 313.61c Vermicompost Open 328.55ab PE 285.06e PP 311.85cd Means within a column followed by the same letter are not significantly different using LSD at 5% level.
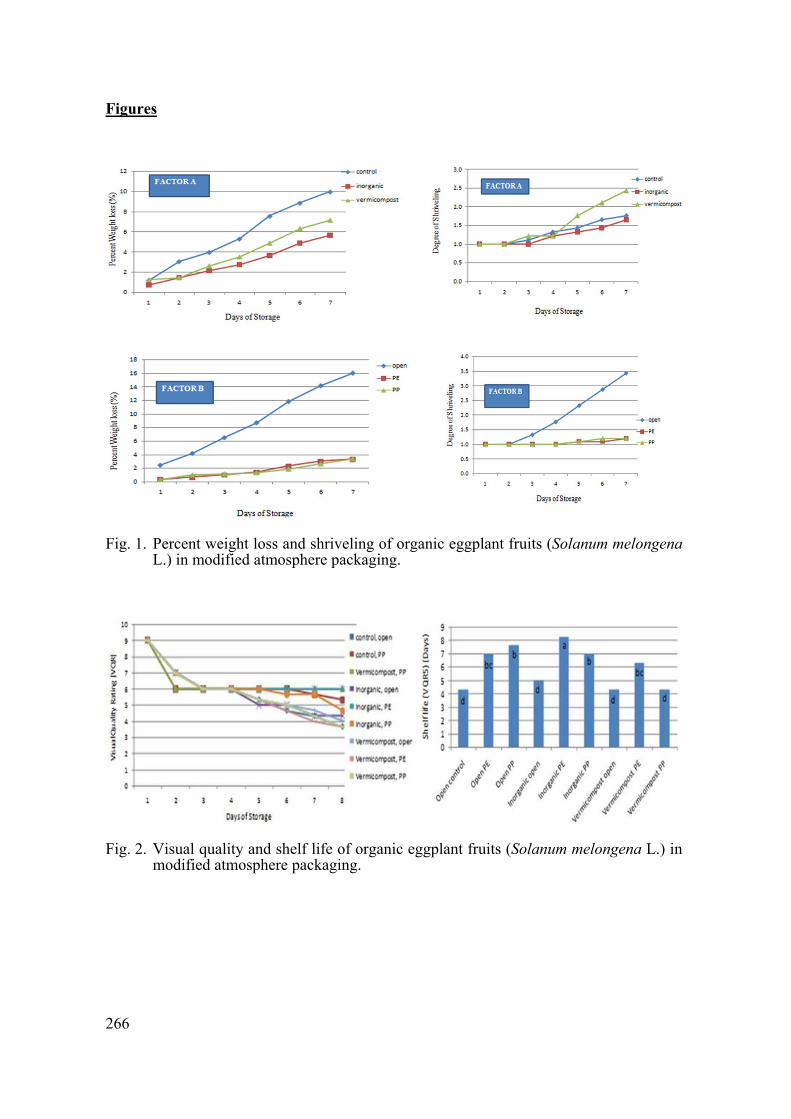
266
Figures
Fig. 1. Percent weight loss and shriveling of organic eggplant fruits (Solanum melongena
L.) in modified atmosphere packaging.
Fig. 2. Visual quality and shelf life of organic eggplant fruits (Solanum melongena L.) in
modified atmosphere packaging.
See discussions, stats, and author profiles for this publication at: https://www.researchgate.net/publication/326028887
Asia-Pacific Journal of Food Safety and Security
Article · June 2018
CITATIONS
0READS
38
1 author:
Some of the authors of this publication are also working on these related projects:
Improved Postharvest Management of Fruit and Vegetables in the Southern Philippines and Australia View project
Michael adonis Sudaria
northwest samar state university, calbayog, philippines
4 PUBLICATIONS 1 CITATION
SEE PROFILE
All content following this page was uploaded by Michael adonis Sudaria on 28 June 2018.
The user has requested enhancement of the downloaded file.
Asia-Pacific Journal of Food Safety and Security
ISSN 2422-9555 Volume 2, Issue 2 (http://apjfss.wix.com/apjfss)
15 | P a g e A P J F S S 0 4 2 0 1 6 - 0 9
OPEN ACCESS
Theme: Global Food Safety and Security
Research Paper
Effects of Polyvinyl chloride film on bitter gourd quality under various storage conditions
Marilou Benitez1, Aljay Valida
1, Fatima Rose Rivera
1, Michael Adonis Sudaria
1, Analita
Salabao1, Eutiquio Sudaria
1, Antonio Acedo Jr.
2 , Emma Winley
3 and Jenny Ekman
3
1Postharvest Technology Division, Department of Horticulture, Visayas
State University, Leyte, Philippines 2AVRDC-The World Vegetable Center, South Asia Regional Office,
ICRISAT Campus, Patancheru 502 324, Hyderabad, India 3Applied Horticultural Research, Suite 352, Biomedical Building,
1 Central Avenue, Australian Technology Park, Eveleigh NSW 2015, Australia
Corresponding author email addresses: [email protected]
Received: June 13, 2016 / Revised: July 31, 2016/ Accepted: August 19, 2016 / Published online: September 28, 2016
To cite this article: Benitez, M.M., Valida, A., Rivera, F.R., Sudaria, M.A., Salabao, A., Sudaria, E., Acedo Jr, A., Winley, E., and Ekman, J.
(2016). Effects of Polyvinyl chloride film on bitter gourd quality under various storage conditions. Asia-Pacific Journal
of Food Safety and Security, 2(2): 15-19.
Abstract
Good packaging during transport and storage are important factors for bitter gourd because of their
high perishability. The study evaluated the effects of polyvinyl chloride film and storage conditions
to improve bitter gourd marketability. A 2 x 3 factorial experiment was laid out in Completely Ran-
domized Design (CRD) with 6 treatments and 3 replications. Thirty (30) bitter gourd fruit samples
per replication were used. The treatments were: Factor A- MAP (W1- control, W2- with polyvinyl
chloride film) Factor B-Storage Conditions (S1-Ambient room, S2-Refrigerated, S3-Evaporative
Cooler). Polyvinyl chloride film was applied by wrapping the whole fruit. Ambient storage was done
by keeping the fruits at 25oC, Evaporative storage using a box-type evaporative cooler while refrig-
erated storage was done using a chiller with temperature maintained at 7-10oC. Results demonstrated
that bitter gourd treated with polyvinyl chloride film wrapping were similar in terms of weight loss,
total soluble solids, titratable acidity and shelf-life relative to the control. Meanwhile, Bitter gourd
under refrigerated storage prolonged the shelf life with the highest value of 12 days compared to 7.4
and 7.8 days for ambient and evaporative storage, respectively. Weight loss was higher for both am-
bient and evaporative storage. Soluble solid content and titratable acidity did not differ among stor-
age treatments which ranged from 5.2-6.3°Brix and 0.18-0.24% citric acid, respectively. The prelim-
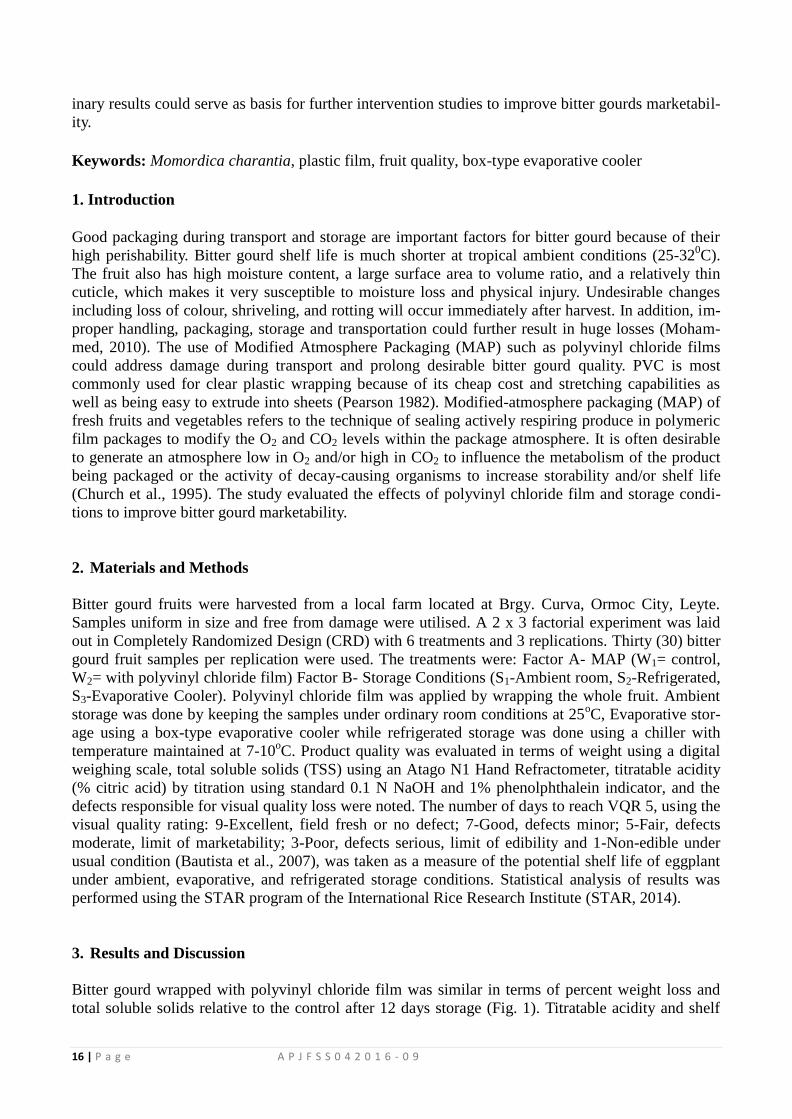
16 | P a g e A P J F S S 0 4 2 0 1 6 - 0 9
inary results could serve as basis for further intervention studies to improve bitter gourds marketabil-
ity.
Keywords: Momordica charantia, plastic film, fruit quality, box-type evaporative cooler
1. Introduction
Good packaging during transport and storage are important factors for bitter gourd because of their
high perishability. Bitter gourd shelf life is much shorter at tropical ambient conditions (25-320C).
The fruit also has high moisture content, a large surface area to volume ratio, and a relatively thin
cuticle, which makes it very susceptible to moisture loss and physical injury. Undesirable changes
including loss of colour, shriveling, and rotting will occur immediately after harvest. In addition, im-
proper handling, packaging, storage and transportation could further result in huge losses (Moham-
med, 2010). The use of Modified Atmosphere Packaging (MAP) such as polyvinyl chloride films
could address damage during transport and prolong desirable bitter gourd quality. PVC is most
commonly used for clear plastic wrapping because of its cheap cost and stretching capabilities as
well as being easy to extrude into sheets (Pearson 1982). Modified-atmosphere packaging (MAP) of
fresh fruits and vegetables refers to the technique of sealing actively respiring produce in polymeric
film packages to modify the O2 and CO2 levels within the package atmosphere. It is often desirable
to generate an atmosphere low in O2 and/or high in CO2 to influence the metabolism of the product
being packaged or the activity of decay-causing organisms to increase storability and/or shelf life
(Church et al., 1995). The study evaluated the effects of polyvinyl chloride film and storage condi-
tions to improve bitter gourd marketability.
2. Materials and Methods
Bitter gourd fruits were harvested from a local farm located at Brgy. Curva, Ormoc City, Leyte.
Samples uniform in size and free from damage were utilised. A 2 x 3 factorial experiment was laid
out in Completely Randomized Design (CRD) with 6 treatments and 3 replications. Thirty (30) bitter
gourd fruit samples per replication were used. The treatments were: Factor A- MAP (W1= control,
W2= with polyvinyl chloride film) Factor B- Storage Conditions (S1-Ambient room, S2-Refrigerated,
S3-Evaporative Cooler). Polyvinyl chloride film was applied by wrapping the whole fruit. Ambient
storage was done by keeping the samples under ordinary room conditions at 25oC, Evaporative stor-
age using a box-type evaporative cooler while refrigerated storage was done using a chiller with
temperature maintained at 7-10oC. Product quality was evaluated in terms of weight using a digital
weighing scale, total soluble solids (TSS) using an Atago N1 Hand Refractometer, titratable acidity
(% citric acid) by titration using standard 0.1 N NaOH and 1% phenolphthalein indicator, and the
defects responsible for visual quality loss were noted. The number of days to reach VQR 5, using the
visual quality rating: 9-Excellent, field fresh or no defect; 7-Good, defects minor; 5-Fair, defects
moderate, limit of marketability; 3-Poor, defects serious, limit of edibility and 1-Non-edible under
usual condition (Bautista et al., 2007), was taken as a measure of the potential shelf life of eggplant
under ambient, evaporative, and refrigerated storage conditions. Statistical analysis of results was
performed using the STAR program of the International Rice Research Institute (STAR, 2014).
3. Results and Discussion
Bitter gourd wrapped with polyvinyl chloride film was similar in terms of percent weight loss and
total soluble solids relative to the control after 12 days storage (Fig. 1). Titratable acidity and shelf
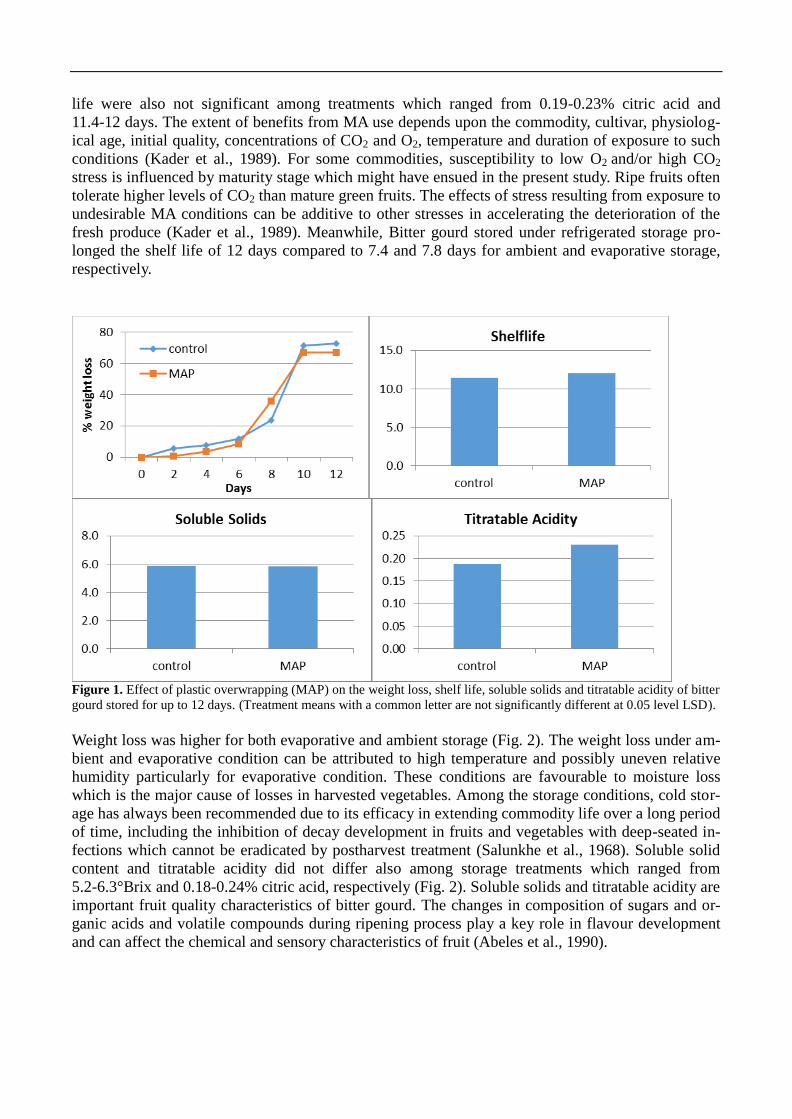
life were also not significant among treatments which ranged from 0.19-0.23% citric acid and
11.4-12 days. The extent of benefits from MA use depends upon the commodity, cultivar, physiolog-
ical age, initial quality, concentrations of CO2 and O2, temperature and duration of exposure to such
conditions (Kader et al., 1989). For some commodities, susceptibility to low O2 and/or high CO2
stress is influenced by maturity stage which might have ensued in the present study. Ripe fruits often
tolerate higher levels of CO2 than mature green fruits. The effects of stress resulting from exposure to
undesirable MA conditions can be additive to other stresses in accelerating the deterioration of the
fresh produce (Kader et al., 1989). Meanwhile, Bitter gourd stored under refrigerated storage pro-
longed the shelf life of 12 days compared to 7.4 and 7.8 days for ambient and evaporative storage,
respectively.
Figure 1. Effect of plastic overwrapping (MAP) on the weight loss, shelf life, soluble solids and titratable acidity of bitter
gourd stored for up to 12 days. (Treatment means with a common letter are not significantly different at 0.05 level LSD).
Weight loss was higher for both evaporative and ambient storage (Fig. 2). The weight loss under am-
bient and evaporative condition can be attributed to high temperature and possibly uneven relative
humidity particularly for evaporative condition. These conditions are favourable to moisture loss
which is the major cause of losses in harvested vegetables. Among the storage conditions, cold stor-
age has always been recommended due to its efficacy in extending commodity life over a long period
of time, including the inhibition of decay development in fruits and vegetables with deep-seated in-
fections which cannot be eradicated by postharvest treatment (Salunkhe et al., 1968). Soluble solid
content and titratable acidity did not differ also among storage treatments which ranged from
5.2-6.3°Brix and 0.18-0.24% citric acid, respectively (Fig. 2). Soluble solids and titratable acidity are
important fruit quality characteristics of bitter gourd. The changes in composition of sugars and or-
ganic acids and volatile compounds during ripening process play a key role in flavour development
and can affect the chemical and sensory characteristics of fruit (Abeles et al., 1990).
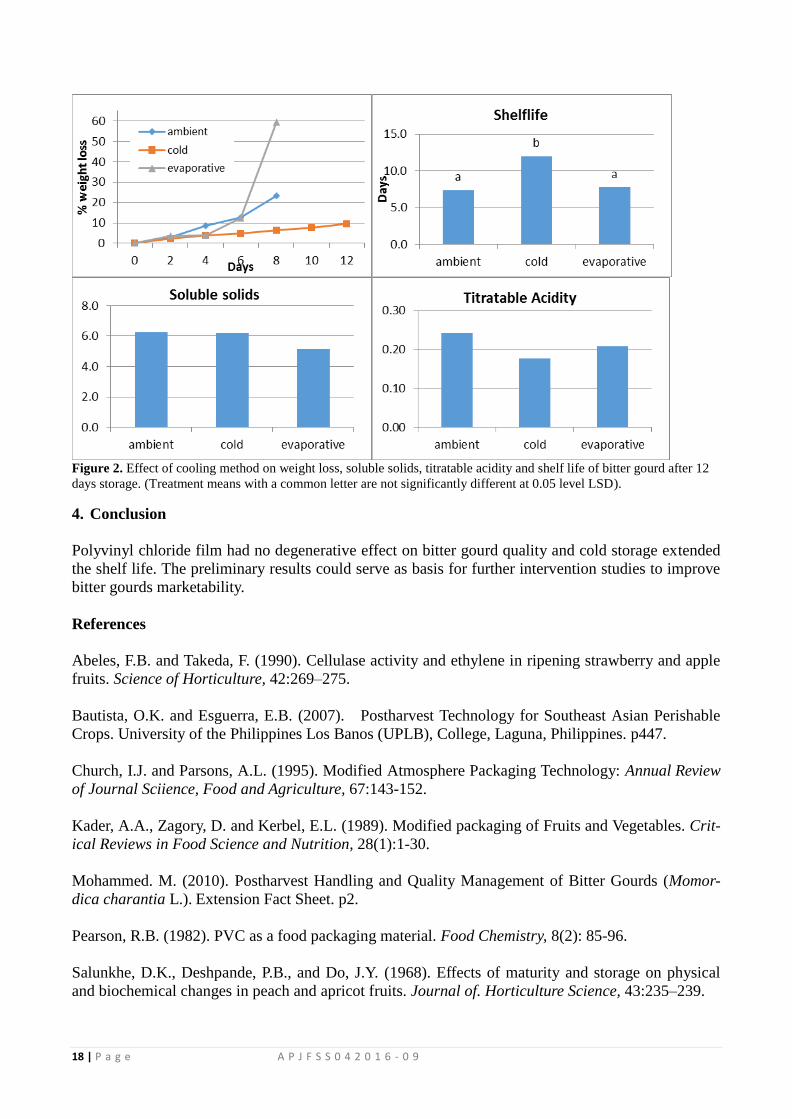
18 | P a g e A P J F S S 0 4 2 0 1 6 - 0 9
Figure 2. Effect of cooling method on weight loss, soluble solids, titratable acidity and shelf life of bitter gourd after 12
days storage. (Treatment means with a common letter are not significantly different at 0.05 level LSD).
4. Conclusion
Polyvinyl chloride film had no degenerative effect on bitter gourd quality and cold storage extended
the shelf life. The preliminary results could serve as basis for further intervention studies to improve
bitter gourds marketability.
References
Abeles, F.B. and Takeda, F. (1990). Cellulase activity and ethylene in ripening strawberry and apple
fruits. Science of Horticulture, 42:269–275.
Bautista, O.K. and Esguerra, E.B. (2007). Postharvest Technology for Southeast Asian Perishable
Crops. University of the Philippines Los Banos (UPLB), College, Laguna, Philippines. p447.
Church, I.J. and Parsons, A.L. (1995). Modified Atmosphere Packaging Technology: Annual Review
of Journal Sciience, Food and Agriculture, 67:143-152.
Kader, A.A., Zagory, D. and Kerbel, E.L. (1989). Modified packaging of Fruits and Vegetables. Crit-
ical Reviews in Food Science and Nutrition, 28(1):1-30.
Mohammed. M. (2010). Postharvest Handling and Quality Management of Bitter Gourds (Momor-
dica charantia L.). Extension Fact Sheet. p2.
Pearson, R.B. (1982). PVC as a food packaging material. Food Chemistry, 8(2): 85-96.
Salunkhe, D.K., Deshpande, P.B., and Do, J.Y. (1968). Effects of maturity and storage on physical
and biochemical changes in peach and apricot fruits. Journal of. Horticulture Science, 43:235–239.

STAR, version 2.0.1 (2014). Biometrics and Breeding Informatics, PBGB Division, International
Rice Research Institute, Los Baños, Laguna.
© 2016 by the authors; licensee 2050Science Publishers, Christchurch, New Zealand. This is an open access
article distributed under the Creative Commons Attribution License, which permits unrestricted use, distribu-
tion, and reproduction in any medium, provided the original work is properly cited.
View publication statsView publication stats
Acta Hortic. 1111. ISHS 2016. DOI 10.17660/ActaHortic.2016.1111.55 XXIX IHC – Proc. Int. Symp. on Papaya, Pineapple and Mango Eds.: R. Drew et al.
385
Postharvest treatment effects on ‘B74’ mango fruit lenticel discolouration after irradiation
G.Q.Li1,2,M.Gupta1,A.T.San1,D.C.Joyce1,2,P.J.Hofman3,A.J.Macnish3andJ.Marques3
1School of Agriculture and Food Sciences, The University of Queensland, Gatton, Queensland, Australia;2Department of Agriculture, Fisheries and Forestry, Dutton Park, Queensland, Australia; 3Department ofAgriculture,FisheriesandForestry,Nambour,Queensland,Australia.
Abstract Lenticel discolouration (LD) is a common disorder of mango fruit around the
world. It results in poor appearance and disappointment of consumers. LD is exacerbated by treatment of mango fruit with gamma irradiation for insect disinfestation. The issue is problematic on the relatively new mango cultivar ‘B74’ and may represent an oxidative browning process. With a view to reducing irradiation-induced LD on ‘B74’, postharvest wax (one and three layers; 75% carnauba wax) and antioxidant (100 mM ascorbic acid, 100 mM calcium chloride, 10, 50 and 100 mM calcium ascorbate) dip treatments were investigated. Treatment of green mature fruit with three layers of wax prior to exposure to 557 Gy gamma irradiation reduced LD by 40% relative to the non-waxed control. However, the fruit failed to ripen properly as evidenced by delayed skin colour change, retarded softening and increased skin browning as compared to the controls and fruit coated with one layer of wax. Treatment with one layer of wax did not reduce LD. Mechanistically, the responses suggest that air exchange plays a pivotal role in LD. A lowered oxygen concentration in the lenticels may reduce the disorder after irradiation treatment. Postharvest treatments with the various antioxidants failed to reduce LD. Rather, all antioxidant treatments at the test concentrations, except calcium chloride, significantly increased skin browning.
Keywords:antioxidants, 75%carnaubawax, lenticeldiscolouration, skin colour, firmness,skinbrowning
INTRODUCTION Lenticelsaremacroscopicporesinplanttissuesthatregulategasexchange(Kaderand
Saltveit,2003).Discolourationoflenticelsonsomefruitsuchasmango,appleandavocadoisa cosmetic defect that reduces their appearance quality (Everett et al., 2008; Joyce et al.,2011;Grimmetal.,2012).Thisdiscolourationistypicallymanifestedasredorbrown‘halos’surroundinglenticelswith/withoutablackorbrowncenter(Hofmanetal.,2010).Lenticeldiscolourationwasreportedtobeassociatedwithcorkcambiumandcellsinthelenticelsof‘TommyAtkins’mangofruit(Bezuidenhoutetal.,2005).LDhasbeensuggestedasadefencemechanism(Plooyetal.,2006).Exposuretorain,waterduringpostharvesthandlingandhotwaterincreasedarkbrownLDonmangofruit(JacobiandWong,1989;O’Hareetal.,1996,MitchamandYahia,2009).Exposureofmangofruitγ‐irradiationasaninsectdisinfestationtreatmentalsoincreasesLD(Hofmanetal.,2010).
‘B74’(Calypso™)isarelativelynewcultivarofmangodevelopedinAustralia(Whiley,2000). This cultivar has an attractive appearance, fibre‐free flesh and small seed to fleshratio. It has been successfully commercialised in Australia and is exported to othercountries;e.g.,NewZealand,China(Dillonetal.,2013).
In order to eliminate insect infestation during storage and transport, phytosanitarytreatment with γ‐irradiation is applied to ‘B74’ mango fruit prior to export (AustralianMango Industry Association, 2014). However, ‘B74’ fruit are relatively sensitive toirradiation‐inducedLDandgenerallyloweredskinappearancequality(Hofmanetal.,2010).LDinmangomayreflectanoxidativeenzymatictissuebrowningprocess.
Inthepresentstudywetestedtheefficacyofcoating‘B74’mangofruitwithcarnauba
386
waxpriortoirradiationtreatmenttoreduceLDbyrestrictingfruitgasexchange(O2,CO2).Wealsoevaluatedthecapacityofpre‐treatingfruitwithsolutionsofvariousantioxidantstoreducethedisorderbydirectlyinhibitingoxidativeenzymeactivity.
MATERIALS AND METHODS
Plant material ‘B74’ mango (Mangifera indica) fruit was grown under standard commercial
conditionsatanorchardnearChilders(25°17’S,152°17’E)inQueensland,Australia.Greenmature fruit were harvested in January 2013 with a dry matter content of 13.6±0.21%(n=10).Theywerede‐sappedinacommercialmangowashsolution.Thefruitwerepassedthroughacommercialpackinglinewhereintheywerewashed,treatedwithafungicideandinsecticide,brushedandgradedforuniformity.Theywerethenpackedintosinglelayertraycardboard trays and transportedby car to theMaroochyResearch Facility nearNambour,Queensland within 4 h. The fruit were maintained at 20°C and randomly allocated totreatmentsonthefollowingday.
Chemicals Carnauba wax (Natural Shine™ TFC 210, Pace international Pty Ltd, Australia) was
dissolvedindistilledwatertoafinalconcentrationof75%(v/v).Stocksolutionsofascorbicacid(BDHAustraliaPtyLtd,Australia),calciumchloride(BDHAustraliaPtyLtd,Australia)and calcium ascorbate (Melrose Laboratories Pty Ltd, Australia) were also prepared indistilledwater.
Experiment 1 Entirefruitweredippedinto75%carnaubawaxsolutionfor10sandthenair‐dried
at room temperature (ca. 26°C) for 1 h. Additional fruitwere dipped in thewax solutionthree times to increase thewax coating thickness. Fruit dipped into distilledwater (DW)werecontrols.Thefruitwerethenexposedtoγ‐irradiationtreatmentasdescribedbelow.
Experiment 2 Entire fruitweredipped into solutionsof either of 100mMascorbic acid (AA), 100
mMcalciumchloride(CC)or10,50,100mMcalciumascorbate(CA)for10min.Theywerethen air‐dried as per experiment 1. Additional control fruitwere dipped inDW. The fruitwerethenexposedtoγ‐irradiationasdescribedbelow.
Irradiation treatment Fruit were packed into cardboard trays in a completely randomized fashion and
transportedtoacommercial irradiationfacility(Steritec,Narangba,Queensland,Australia)within1h.Thefruitwereexposedtoanaveragedoseof557Gy(min‐max524‐587Gyofγ‐irradiation fromacobalt‐60source.The fruitwere then transportedback to theResearchFacilityandmaintainedat20°Cand90‐100%relativehumidityintheabsenceofexogenousethyleneuntilripe.Fifteenindividualreplicatefruitwereusedpertreatment.
Quality assessments Fruitwereassessed forvariousqualityparametersondays0,4,8,11and14of the
experiments.LDwasassessedusingthescale(Hofmanetal.,2010):0=nolenticelspotting;1= light spotson less than25%ordense,pronouncedspotson less than5%of skin,notstar‐shaped or cracked; 2 = light spots on less than 50% or dense, pronounced spots onmore than 5% and less than 10% of skin, not star‐shaped or cracked; 3 = scatteredpronouncedspotsonlessthan50%ordense,pronouncedspotsonmorethan10%andlessthan25%of skin,not star‐shapedor cracked;4=dense,pronouncedspotsonmore than25% and less than 50% of skin, star‐shaped or cracked; 5 = dense, pronounced spots onmore than50%of skin, star‐shapedorcracked. Skincolourassessmentwasbasedon theproportion of the non‐blushed area with yellow skin colour using the scale: 1 = 0‐10%
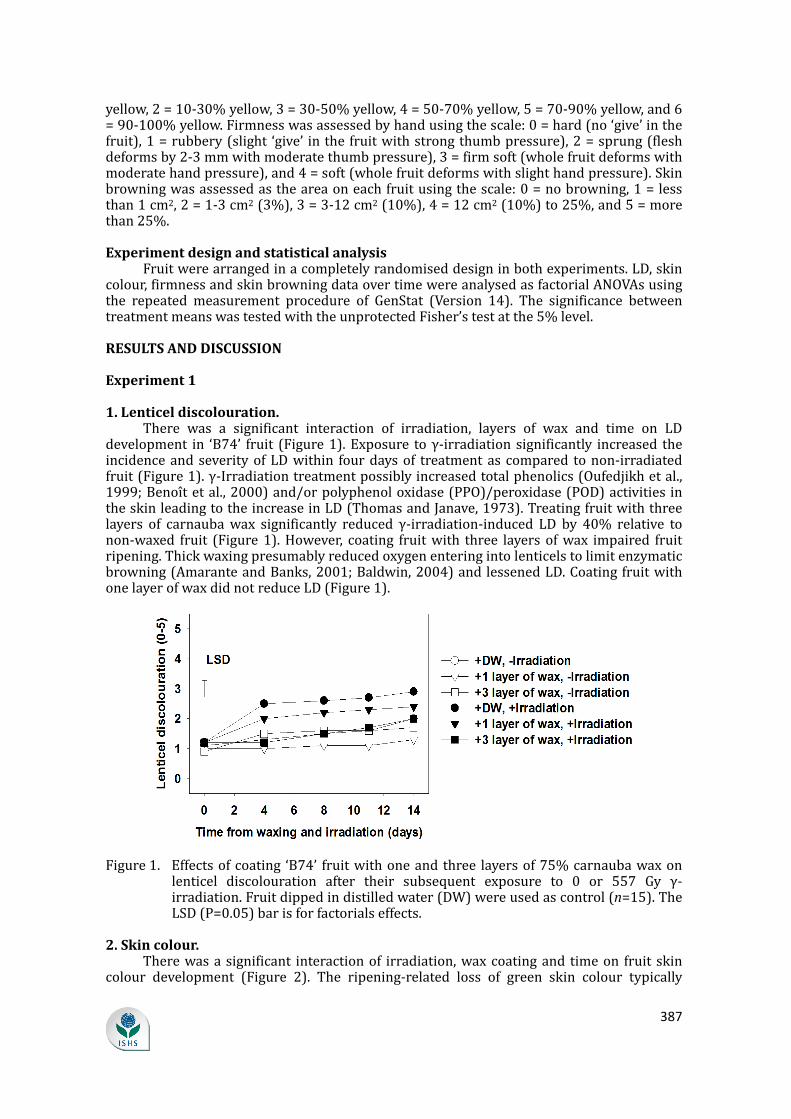
387
yellow,2=10‐30%yellow,3=30‐50%yellow,4=50‐70%yellow,5=70‐90%yellow,and6=90‐100%yellow.Firmnesswasassessedbyhandusingthescale:0=hard(no‘give’inthefruit),1=rubbery(slight ‘give’ inthefruitwithstrongthumbpressure),2=sprung(fleshdeformsby2‐3mmwithmoderatethumbpressure),3=firmsoft(wholefruitdeformswithmoderatehandpressure),and4=soft(wholefruitdeformswithslighthandpressure).Skinbrowningwasassessedastheareaoneachfruitusingthescale:0=nobrowning,1=lessthan1cm2,2=1‐3cm2(3%),3=3‐12cm2(10%),4=12cm2(10%)to25%,and5=morethan25%.
Experiment design and statistical analysis Fruitwerearrangedinacompletelyrandomiseddesigninbothexperiments.LD,skin
colour,firmnessandskinbrowningdataovertimewereanalysedasfactorialANOVAsusingthe repeated measurement procedure of GenStat (Version 14). The significance betweentreatmentmeanswastestedwiththeunprotectedFisher’stestatthe5%level.
RESULTS AND DISCUSSION
Experiment 1
1. Lenticel discolouration. There was a significant interaction of irradiation, layers of wax and time on LD
development in ‘B74’ fruit (Figure1).Exposure toγ‐irradiationsignificantly increased theincidenceandseverityofLDwithin fourdaysof treatmentascompared tonon‐irradiatedfruit(Figure1).γ‐Irradiationtreatmentpossiblyincreasedtotalphenolics(Oufedjikhetal.,1999;Benoıtetal.,2000)and/orpolyphenoloxidase(PPO)/peroxidase(POD)activities intheskinleadingtotheincreaseinLD(ThomasandJanave,1973).Treatingfruitwiththreelayers of carnaubawax significantly reduced γ‐irradiation‐induced LD by 40% relative tonon‐waxed fruit (Figure1).However, coating fruitwith three layersofwax impaired fruitripening.Thickwaxingpresumablyreducedoxygenenteringintolenticelstolimitenzymaticbrowning(AmaranteandBanks,2001;Baldwin,2004)andlessenedLD.CoatingfruitwithonelayerofwaxdidnotreduceLD(Figure1).
Figure1. Effectsofcoating ‘B74’ fruitwithoneandthree layersof75%carnaubawaxonlenticel discolouration after their subsequent exposure to 0 or 557 Gy γ‐irradiation.Fruitdippedindistilledwater(DW)wereusedascontrol(n=15).TheLSD(P=0.05)barisforfactorialseffects.
2. Skin colour. Therewasasignificant interactionof irradiation,waxcoatingand timeon fruit skin
colour development (Figure 2). The ripening‐related loss of green skin colour typically
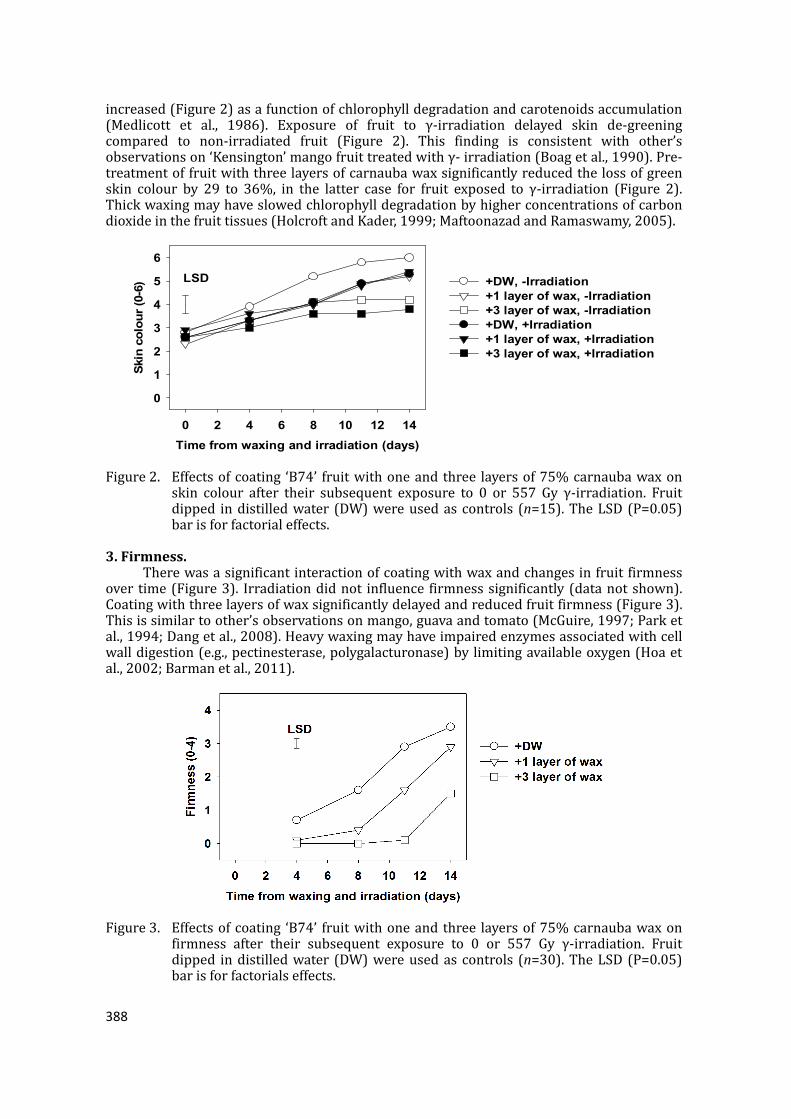
388
increased(Figure2)asafunctionofchlorophylldegradationandcarotenoidsaccumulation(Medlicott et al., 1986). Exposure of fruit to γ‐irradiation delayed skin de‐greeningcompared to non‐irradiated fruit (Figure 2). This finding is consistent with other’sobservationson‘Kensington’mangofruittreatedwithγ‐irradiation(Boagetal.,1990).Pre‐treatmentoffruitwiththreelayersofcarnaubawaxsignificantlyreducedthelossofgreenskin colour by 29 to 36%, in the latter case for fruit exposed to γ‐irradiation (Figure 2).Thickwaxingmayhaveslowedchlorophylldegradationbyhigherconcentrationsofcarbondioxideinthefruittissues(HolcroftandKader,1999;MaftoonazadandRamaswamy,2005).
Time from waxing and irradiation (days)
0 2 4 6 8 10 12 14
Ski
n c
olo
ur
(0-6
)
0
1
2
3
4
5
6
+DW, -Irradiation +1 layer of wax, -Irradiation +3 layer of wax, -Irradiation +DW, +Irradiation +1 layer of wax, +Irradiation +3 layer of wax, +Irradiation
LSD
Figure2. Effectsofcoating ‘B74’ fruitwithoneandthree layersof75%carnaubawaxonskin colour after their subsequent exposure to 0 or 557 Gy γ‐irradiation. Fruitdipped indistilledwater (DW)wereusedascontrols (n=15).TheLSD(P=0.05)barisforfactorialeffects.
3. Firmness. Therewasasignificantinteractionofcoatingwithwaxandchangesinfruitfirmness
over time(Figure3). Irradiationdidnot influence firmnesssignificantly(datanotshown).Coatingwiththreelayersofwaxsignificantlydelayedandreducedfruitfirmness(Figure3).Thisissimilartoother’sobservationsonmango,guavaandtomato(McGuire,1997;Parketal.,1994;Dangetal.,2008).Heavywaxingmayhaveimpairedenzymesassociatedwithcellwalldigestion(e.g.,pectinesterase,polygalacturonase)bylimitingavailableoxygen(Hoaetal.,2002;Barmanetal.,2011).
Figure3. Effectsofcoating ‘B74’ fruitwithoneandthree layersof75%carnaubawaxonfirmness after their subsequent exposure to 0 or 557 Gy γ‐irradiation. Fruitdipped indistilledwater (DW)wereusedascontrols (n=30).TheLSD(P=0.05)barisforfactorialseffects.
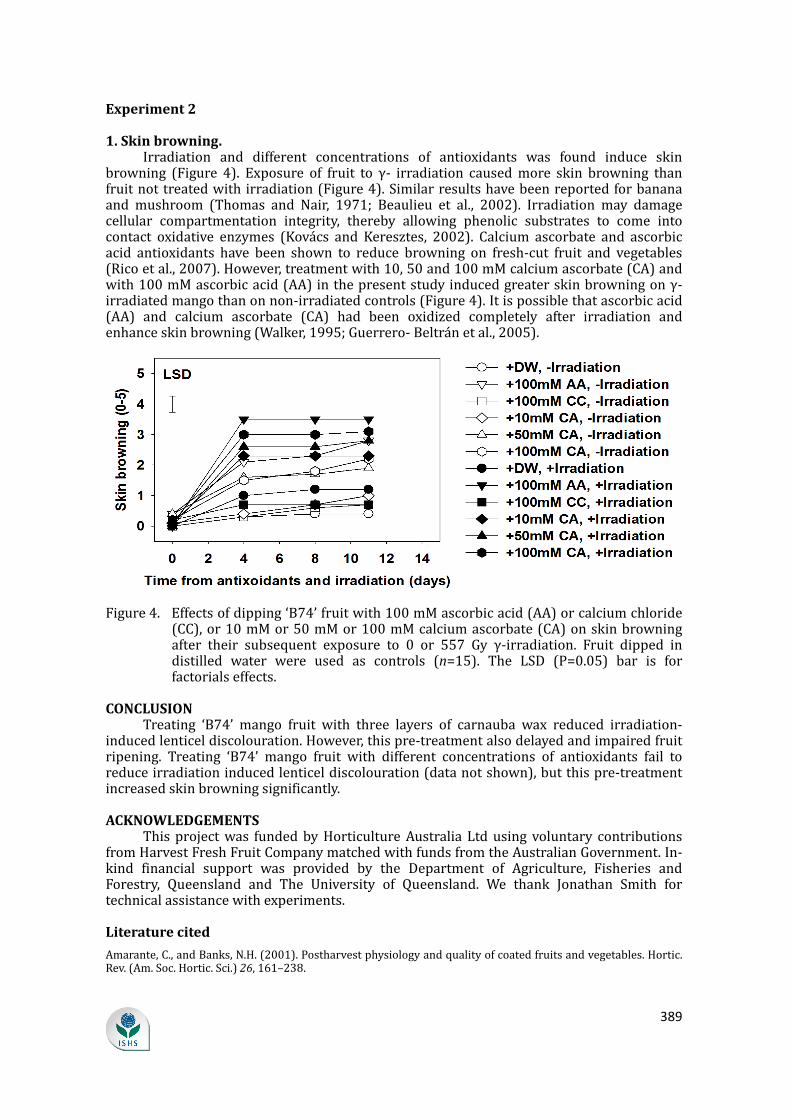
389
Experiment 2
1. Skin browning. Irradiation and different concentrations of antioxidants was found induce skin
browning (Figure 4). Exposure of fruit to γ‐ irradiation causedmore skin browning thanfruitnottreatedwithirradiation(Figure4).Similarresultshavebeenreportedforbananaand mushroom (Thomas and Nair, 1971; Beaulieu et al., 2002). Irradiation may damagecellular compartmentation integrity, thereby allowing phenolic substrates to come intocontact oxidative enzymes (Kovacs and Keresztes, 2002). Calcium ascorbate and ascorbicacid antioxidants have been shown to reduce browning on fresh‐cut fruit and vegetables(Ricoetal.,2007).However,treatmentwith10,50and100mMcalciumascorbate(CA)andwith100mMascorbicacid(AA)inthepresentstudyinducedgreaterskinbrowningonγ‐irradiatedmangothanonnon‐irradiatedcontrols(Figure4).Itispossiblethatascorbicacid(AA) and calcium ascorbate (CA) had been oxidized completely after irradiation andenhanceskinbrowning(Walker,1995;Guerrero‐Beltranetal.,2005).
Figure4. Effectsofdipping‘B74’fruitwith100mMascorbicacid(AA)orcalciumchloride(CC),or10mMor50mMor100mMcalciumascorbate(CA)onskinbrowningafter their subsequent exposure to 0 or 557 Gy γ‐irradiation. Fruit dipped indistilled water were used as controls (n=15). The LSD (P=0.05) bar is forfactorialseffects.
CONCLUSION Treating ‘B74’ mango fruit with three layers of carnauba wax reduced irradiation‐
inducedlenticeldiscolouration.However,thispre‐treatmentalsodelayedandimpairedfruitripening. Treating ‘B74’ mango fruit with different concentrations of antioxidants fail toreduceirradiationinducedlenticeldiscolouration(datanotshown),butthispre‐treatmentincreasedskinbrowningsignificantly.
ACKNOWLEDGEMENTS Thisprojectwas fundedbyHorticultureAustralia Ltdusing voluntary contributions
fromHarvestFreshFruitCompanymatchedwithfundsfromtheAustralianGovernment.In‐kind financial support was provided by the Department of Agriculture, Fisheries andForestry, Queensland and The University of Queensland. We thank Jonathan Smith fortechnicalassistancewithexperiments.
Literature cited
Amarante,C.,andBanks,N.H.(2001).Postharvestphysiologyandqualityofcoatedfruitsandvegetables.Hortic.Rev.(Am.Soc.Hortic.Sci.)26,161–238.

390
AustralianMangoIndustryAssociation.(2014).http://industry.mangoes.net.au/?PageID=112
Baldwin,E.A.(2004).Ediblecoatings.InEnvironmentallyFriendlyTechnologiesforAgriculturalProduceQuality,S.Ben‐Yehoshua,ed.(BocaRaton,Florida,USA:CRCPress/TaylorandFrancis),p.301–314.
Barman,K.,Asrey,R.,andPal,R.K.(2011).Putrescineandcarnaubawaxpretreatmentsalleviatechillinginjury,enhanceshelflifeandpreservepomegranatefruitqualityduringcoldstorage.Sci.Hortic.(Amsterdam)130(4),795–800http://dx.doi.org/10.1016/j.scienta.2011.09.005.
Beaulieu,M.,D’Aprano,G.,andLacroix,M.(2002).Effectofdoserateofgammairradiationonbiochemicalqualityand browning of mushrooms Agaricus bisporus. Radiat. Phys. Chem. 63 (3-6), 311–315http://dx.doi.org/10.1016/S0969‐806X(01)00518‐7.
Benoıt,M.A.,D’Aprano,G.,andLacroix,M.(2000).Effectofγ‐irradiationonphenylalanineammonia‐lyaseactivity,total phenolic content, and respirationofmushrooms (Agaricus bisporus). J.Agric. FoodChem.48 (12), 6312–6316http://dx.doi.org/10.1021/jf000543s.PubMed
Bezuidenhout, J., Robbertse, P., and Kaiser, C. (2005). Anatomical investigation of lenticel development andsubsequent discolouration of ‘Tommy Atkins’ and ‘Keitt’ mango (Mangifera indica L.) fruit. J. Hortic. Sci.Biotechnol.80,18–22.
Boag,T.S.,Johnson,G.I.,Izard,M.,Murray,C.,andFitzsimmons,K.C.(1990).Physiologicalresponsesofmangoescv.KensingtonPridetogammairradiationtreatmentasaffectedbyfruitmaturityandripeness.Ann.Appl.Biol.116(1),177–187http://dx.doi.org/10.1111/j.1744‐7348.1990.tb06597.x.
Dang, K.T., Singh, Z., and Swinny, E.E. (2008). Edible coatings influence fruit ripening, quality, and aromabiosynthesis in mango fruit. J. Agric. Food Chem. 56 (4), 1361–1370 http://dx.doi.org/10.1021/jf072208a.PubMed
Dillon, N.L., Bally, I.S., Wright, C.L., Hucks, L., Innes, D.J., and Dietzgen, R.G. (2013). Genetic diversity of theAustralian National Mango Genebank. Sci. Hortic. (Amsterdam) 150, 213–226http://dx.doi.org/10.1016/j.scienta.2012.11.003.
Everett,K.R.,Hallett, I.C.,Rees‐George, J., Chynoweth,R.W., andPak,H.A. (2008).Avocado lenticeldamage: thecause and the effect on fruit quality. Postharvest Biol. Technol. 48 (3), 383–390http://dx.doi.org/10.1016/j.postharvbio.2007.09.008.
Grimm, E., Khanal, B.P.,Winkler, A., Knoche, M., and Kopcke, D. (2012). Structural and physiological changesassociated with the skin spot disorder in apple. Postharvest Biol. Technol. 64 (1), 111–118http://dx.doi.org/10.1016/j.postharvbio.2011.10.004.
Guerrero‐Beltran, J.A., Swanson, B.G., and Barbosa‐Canovas, G.V. (2005). Inhibition of polyphenoloxidase inmangopureewith4‐hexylresorcinol,cysteineandascorbicacid.PostharvestBiol.Technol.38,625–630.
Hoa,T.T.,Ducamp,M.N.,Lebrun,M.,andBaldwin,E.A.(2002).Effectofdifferentcoatingtreatmentsonthequalityofmangofruit.J.FoodQual.25(6),471–486http://dx.doi.org/10.1111/j.1745‐4557.2002.tb01041.x.
Hofman,P.,Marques,J.,Taylor,L.,Stubbings,B.,Ledger,S.,andJordan,R.(2010).Skindamagetotwonewmangocultivars during irradiation and cold storage. Acta Hortic. 877, 475–481http://dx.doi.org/10.17660/ActaHortic.2010.877.61.
Holcroft,D.M., andKader,A.A. (1999). Carbondioxide–inducedchanges in color andanthocyanin synthesis ofstoredstrawberryfruit.HortScience34,1244–1248.
Jacobi,K.,andWong,L.(1989).TheinjuriesandchangesinripeningbehaviourcausedtoKensingtonmangobyhotwatertreatments.ActaHortic.291,372–378.http://dx.doi.org/10.17660/ActaHortic.1991.291.42.
Joyce,D.C.,Hofman,P.J.,Marques,R.,Nguyen,T.M.,andGupta,M.L.(2011).Lenticeldamageon‘Calypso’mango.Paperpresentedat:ConferenceonHorticulturefortheFuture.
Kader,A.A.,andSaltveit,M.E.(2003).Respirationandgasexchangeofvegetables.InPostharvestPhysiologyandPathologyofVegetables,J.A.Kader,andJ.K.Brecht,eds(NewYork,USA:MarcelDekker),p.7–29.
Kovacs,E.,andKeresztes,A.(2002).EffectofgammaandUV‐B/Cradiationonplantcells.Micron33(2),199–210http://dx.doi.org/10.1016/S0968‐4328(01)00012‐9.PubMed
Maftoonazad, N., and Ramaswamy, H.S. (2005). Postharvest shelf‐life extension of avocados using methylcellulose‐basedcoating.LWT‐.FoodSci.Technol.(Campinas)38,617–624.
McGuire,R.G.(1997).Marketqualityofguavasafterhot‐waterquarantinetreatmentandapplicationofcarnaubawaxcoating.HortScience32,271–274.
Medlicott, A.P.,Bhogal,M., andReynolds, S.B. (1986). Changes in peel pigmentationduring ripening ofmangofruit(Mangifera indicavar.TommyAtkins).Ann.Appl.Biol.109(3),651–656http://dx.doi.org/10.1111/j.1744‐7348.1986.tb03222.x.
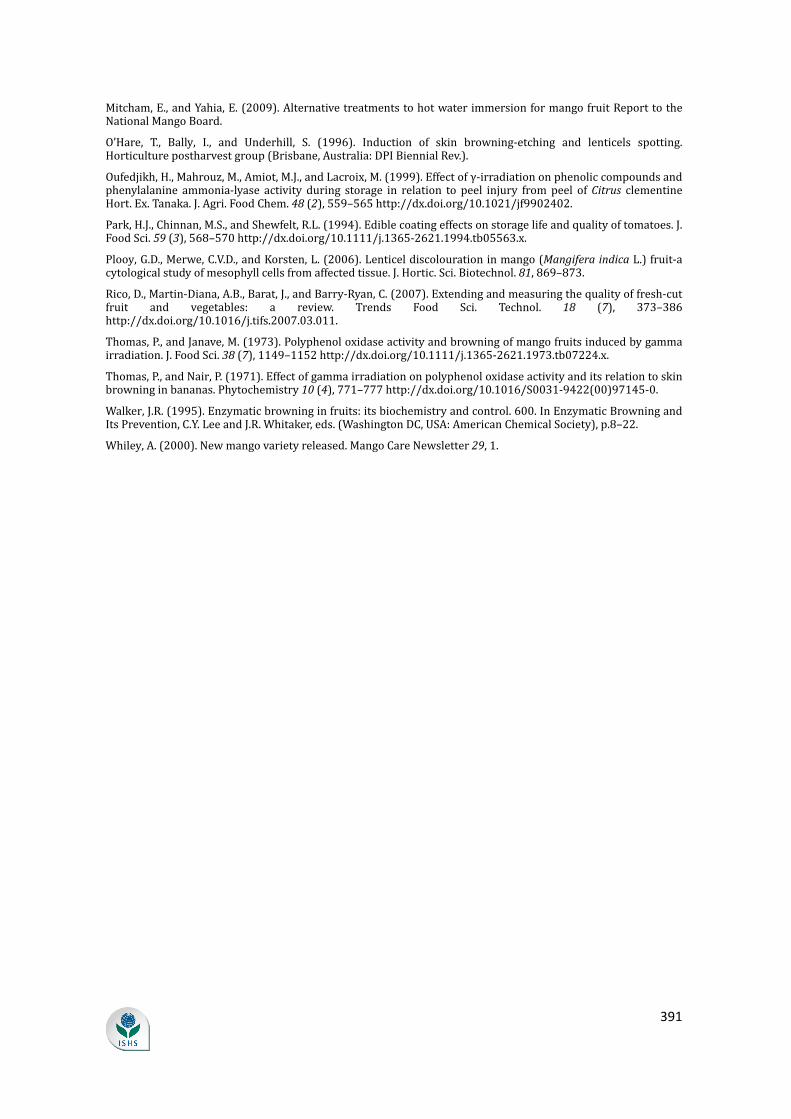
391
Mitcham,E.,andYahia,E.(2009).AlternativetreatmentstohotwaterimmersionformangofruitReporttotheNationalMangoBoard.
O’Hare, T., Bally, I., and Underhill, S. (1996). Induction of skin browning‐etching and lenticels spotting.Horticulturepostharvestgroup(Brisbane,Australia:DPIBiennialRev.).
Oufedjikh,H.,Mahrouz,M.,Amiot,M.J.,andLacroix,M.(1999).Effectofγ‐irradiationonphenoliccompoundsandphenylalanine ammonia‐lyase activity during storage in relation to peel injury frompeel ofCitrus clementineHort.Ex.Tanaka.J.Agri.FoodChem.48(2),559–565http://dx.doi.org/10.1021/jf9902402.
Park,H.J.,Chinnan,M.S.,andShewfelt,R.L.(1994).Ediblecoatingeffectsonstoragelifeandqualityoftomatoes.J.FoodSci.59(3),568–570http://dx.doi.org/10.1111/j.1365‐2621.1994.tb05563.x.
Plooy,G.D.,Merwe,C.V.D.,andKorsten,L.(2006).Lenticeldiscolourationinmango(Mangifera indicaL.)fruit‐acytologicalstudyofmesophyllcellsfromaffectedtissue.J.Hortic.Sci.Biotechnol.81,869–873.
Rico,D.,Martin‐Diana,A.B.,Barat,J.,andBarry‐Ryan,C.(2007).Extendingandmeasuringthequalityoffresh‐cutfruit and vegetables: a review. Trends Food Sci. Technol. 18 (7), 373–386http://dx.doi.org/10.1016/j.tifs.2007.03.011.
Thomas,P.,andJanave,M.(1973).Polyphenoloxidaseactivityandbrowningofmangofruitsinducedbygammairradiation.J.FoodSci.38(7),1149–1152http://dx.doi.org/10.1111/j.1365‐2621.1973.tb07224.x.
Thomas,P.,andNair,P.(1971).Effectofgammairradiationonpolyphenoloxidaseactivityanditsrelationtoskinbrowninginbananas.Phytochemistry10(4),771–777http://dx.doi.org/10.1016/S0031‐9422(00)97145‐0.
Walker,J.R.(1995).Enzymaticbrowninginfruits:itsbiochemistryandcontrol.600.InEnzymaticBrowningandItsPrevention,C.Y.LeeandJ.R.Whitaker,eds.(WashingtonDC,USA:AmericanChemicalSociety),p.8–22.
Whiley,A.(2000).Newmangovarietyreleased.MangoCareNewsletter29,1.

392
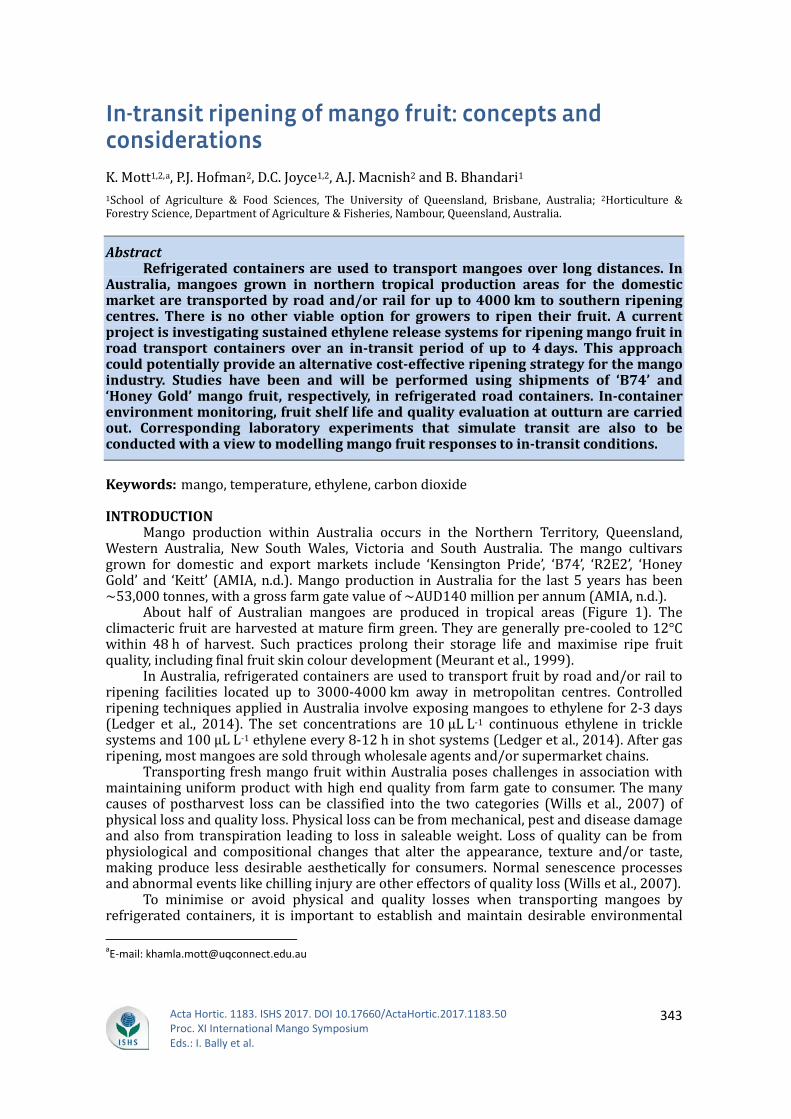
Acta Hortic. 1183. ISHS 2017. DOI 10.17660/ActaHortic.2017.1183.50 Proc. XI International Mango Symposium Eds.: I. Bally et al.
343
In-transit ripening of mango fruit: concepts and considerations
K. Mott1,2,a, P.J. Hofman2, D.C. Joyce1,2, A.J. Macnish2 and B. Bhandari1 1School of Agriculture & Food Sciences, The University of Queensland, Brisbane, Australia; 2Horticulture & Forestry Science, Department of Agriculture & Fisheries, Nambour, Queensland, Australia.
Abstract Refrigerated containers are used to transport mangoes over long distances. In
Australia, mangoes grown in northern tropical production areas for the domestic market are transported by road and/or rail for up to 4000 km to southern ripening centres. There is no other viable option for growers to ripen their fruit. A current project is investigating sustained ethylene release systems for ripening mango fruit in road transport containers over an in-transit period of up to 4 days. This approach could potentially provide an alternative cost-effective ripening strategy for the mango industry. Studies have been and will be performed using shipments of ‘B74’ and ‘Honey Gold’ mango fruit, respectively, in refrigerated road containers. In-container environment monitoring, fruit shelf life and quality evaluation at outturn are carried out. Corresponding laboratory experiments that simulate transit are also to be conducted with a view to modelling mango fruit responses to in-transit conditions.
Keywords: mango, temperature, ethylene, carbon dioxide
INTRODUCTION Mango production within Australia occurs in the Northern Territory, Queensland,
Western Australia, New South Wales, Victoria and South Australia. The mango cultivars grown for domestic and export markets include ‘Kensington Pride’, ‘B74’, ‘R2E2’, ‘Honey Gold’ and ‘Keitt’ (AMIA, n.d.). Mango production in Australia for the last 5 years has been ~53,000 tonnes, with a gross farm gate value of ~AUD140 million per annum (AMIA, n.d.).
About half of Australian mangoes are produced in tropical areas (Figure 1). The climacteric fruit are harvested at mature firm green. They are generally pre-cooled to 12°C within 48 h of harvest. Such practices prolong their storage life and maximise ripe fruit quality, including final fruit skin colour development (Meurant et al., 1999).
In Australia, refrigerated containers are used to transport fruit by road and/or rail to ripening facilities located up to 3000-4000 km away in metropolitan centres. Controlled ripening techniques applied in Australia involve exposing mangoes to ethylene for 2-3 days (Ledger et al., 2014). The set concentrations are 10 µL L-1 continuous ethylene in trickle systems and 100 µL L-1 ethylene every 8-12 h in shot systems (Ledger et al., 2014). After gas ripening, most mangoes are sold through wholesale agents and/or supermarket chains.
Transporting fresh mango fruit within Australia poses challenges in association with maintaining uniform product with high end quality from farm gate to consumer. The many causes of postharvest loss can be classified into the two categories (Wills et al., 2007) of physical loss and quality loss. Physical loss can be from mechanical, pest and disease damage and also from transpiration leading to loss in saleable weight. Loss of quality can be from physiological and compositional changes that alter the appearance, texture and/or taste, making produce less desirable aesthetically for consumers. Normal senescence processes and abnormal events like chilling injury are other effectors of quality loss (Wills et al., 2007).
To minimise or avoid physical and quality losses when transporting mangoes by refrigerated containers, it is important to establish and maintain desirable environmental aE-mail: [email protected]
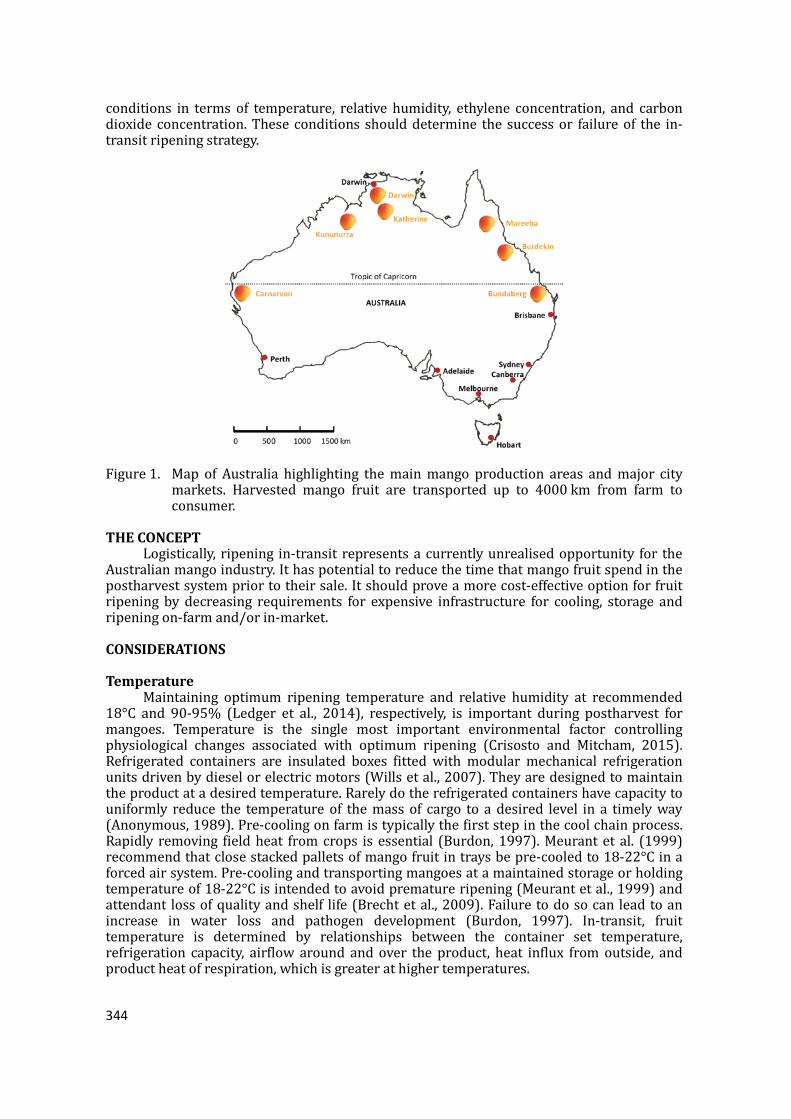
344
conditions in terms of temperature, relative humidity, ethylene concentration, and carbon dioxide concentration. These conditions should determine the success or failure of the in-transit ripening strategy.
Figure 1. Map of Australia highlighting the main mango production areas and major city markets. Harvested mango fruit are transported up to 4000 km from farm to consumer.
THE CONCEPT Logistically, ripening in-transit represents a currently unrealised opportunity for the
Australian mango industry. It has potential to reduce the time that mango fruit spend in the postharvest system prior to their sale. It should prove a more cost-effective option for fruit ripening by decreasing requirements for expensive infrastructure for cooling, storage and ripening on-farm and/or in-market.
CONSIDERATIONS
Temperature Maintaining optimum ripening temperature and relative humidity at recommended
18°C and 90-95% (Ledger et al., 2014), respectively, is important during postharvest for mangoes. Temperature is the single most important environmental factor controlling physiological changes associated with optimum ripening (Crisosto and Mitcham, 2015). Refrigerated containers are insulated boxes fitted with modular mechanical refrigeration units driven by diesel or electric motors (Wills et al., 2007). They are designed to maintain the product at a desired temperature. Rarely do the refrigerated containers have capacity to uniformly reduce the temperature of the mass of cargo to a desired level in a timely way (Anonymous, 1989). Pre-cooling on farm is typically the first step in the cool chain process. Rapidly removing field heat from crops is essential (Burdon, 1997). Meurant et al. (1999) recommend that close stacked pallets of mango fruit in trays be pre-cooled to 18-22°C in a forced air system. Pre-cooling and transporting mangoes at a maintained storage or holding temperature of 18-22°C is intended to avoid premature ripening (Meurant et al., 1999) and attendant loss of quality and shelf life (Brecht et al., 2009). Failure to do so can lead to an increase in water loss and pathogen development (Burdon, 1997). In-transit, fruit temperature is determined by relationships between the container set temperature, refrigeration capacity, airflow around and over the product, heat influx from outside, and product heat of respiration, which is greater at higher temperatures.
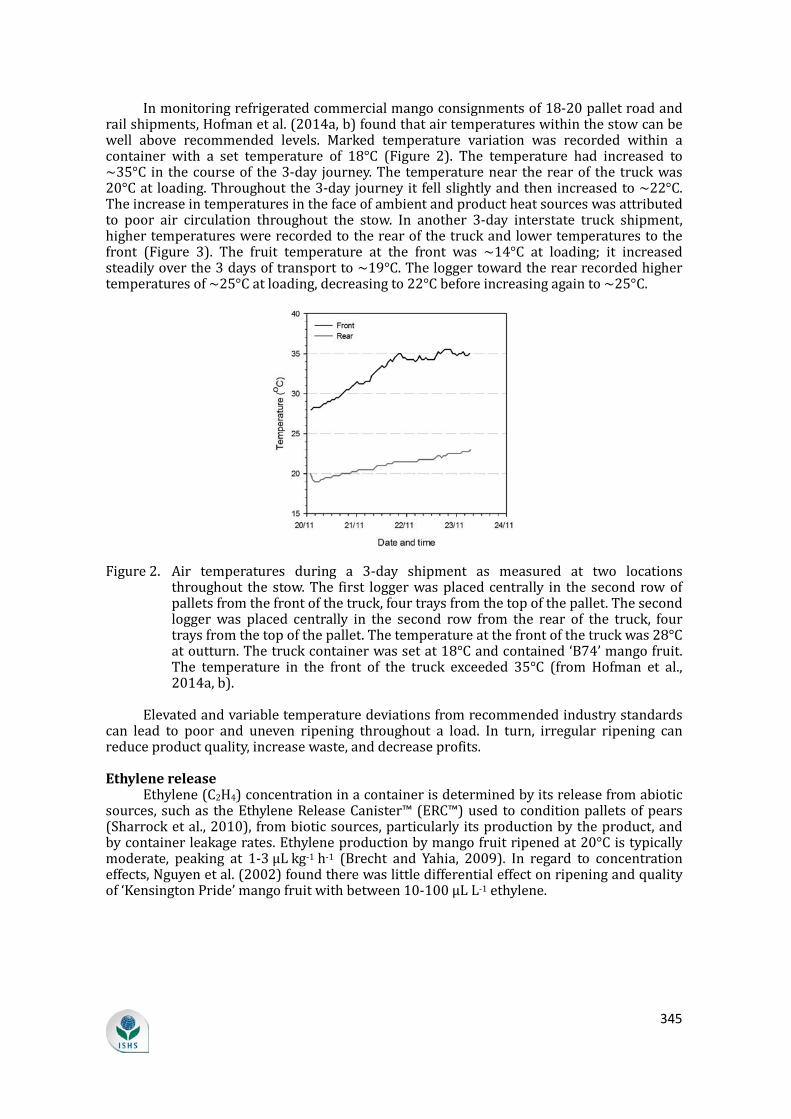
345
In monitoring refrigerated commercial mango consignments of 18-20 pallet road and rail shipments, Hofman et al. (2014a, b) found that air temperatures within the stow can be well above recommended levels. Marked temperature variation was recorded within a container with a set temperature of 18°C (Figure 2). The temperature had increased to ~35°C in the course of the 3-day journey. The temperature near the rear of the truck was 20°C at loading. Throughout the 3-day journey it fell slightly and then increased to ~22°C. The increase in temperatures in the face of ambient and product heat sources was attributed to poor air circulation throughout the stow. In another 3-day interstate truck shipment, higher temperatures were recorded to the rear of the truck and lower temperatures to the front (Figure 3). The fruit temperature at the front was ~14°C at loading; it increased steadily over the 3 days of transport to ~19°C. The logger toward the rear recorded higher temperatures of ~25°C at loading, decreasing to 22°C before increasing again to ~25°C.
Figure 2. Air temperatures during a 3-day shipment as measured at two locations throughout the stow. The first logger was placed centrally in the second row of pallets from the front of the truck, four trays from the top of the pallet. The second logger was placed centrally in the second row from the rear of the truck, four trays from the top of the pallet. The temperature at the front of the truck was 28°C at outturn. The truck container was set at 18°C and contained ‘B74’ mango fruit. The temperature in the front of the truck exceeded 35°C (from Hofman et al., 2014a, b).
Elevated and variable temperature deviations from recommended industry standards can lead to poor and uneven ripening throughout a load. In turn, irregular ripening can reduce product quality, increase waste, and decrease profits.
Ethylene release Ethylene (C2H4) concentration in a container is determined by its release from abiotic
sources, such as the Ethylene Release Canister™ (ERC™) used to condition pallets of pears (Sharrock et al., 2010), from biotic sources, particularly its production by the product, and by container leakage rates. Ethylene production by mango fruit ripened at 20°C is typically moderate, peaking at 1-3 µL kg-1 h-1 (Brecht and Yahia, 2009). In regard to concentration effects, Nguyen et al. (2002) found there was little differential effect on ripening and quality of ‘Kensington Pride’ mango fruit with between 10-100 µL L-1 ethylene.
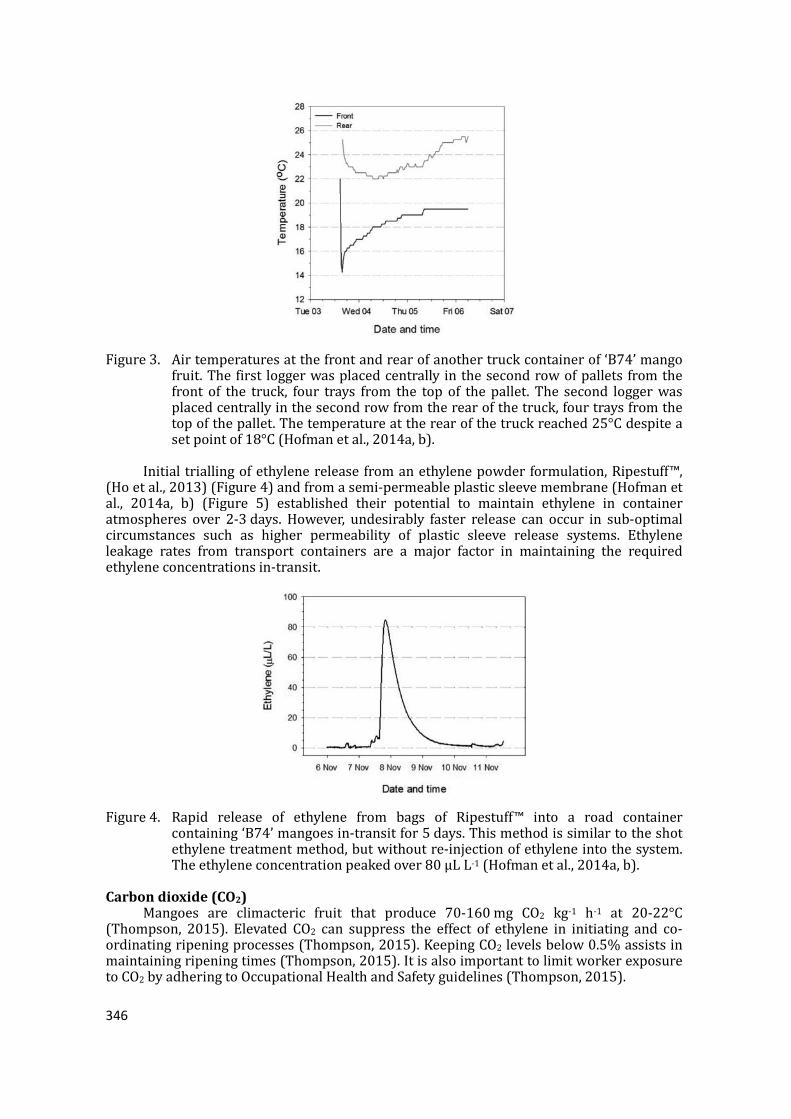
346
Figure 3. Air temperatures at the front and rear of another truck container of ‘B74’ mango fruit. The first logger was placed centrally in the second row of pallets from the front of the truck, four trays from the top of the pallet. The second logger was placed centrally in the second row from the rear of the truck, four trays from the top of the pallet. The temperature at the rear of the truck reached 25°C despite a set point of 18°C (Hofman et al., 2014a, b).
Initial trialling of ethylene release from an ethylene powder formulation, Ripestuff™, (Ho et al., 2013) (Figure 4) and from a semi-permeable plastic sleeve membrane (Hofman et al., 2014a, b) (Figure 5) established their potential to maintain ethylene in container atmospheres over 2-3 days. However, undesirably faster release can occur in sub-optimal circumstances such as higher permeability of plastic sleeve release systems. Ethylene leakage rates from transport containers are a major factor in maintaining the required ethylene concentrations in-transit.
Figure 4. Rapid release of ethylene from bags of Ripestuff™ into a road container containing ‘B74’ mangoes in-transit for 5 days. This method is similar to the shot ethylene treatment method, but without re-injection of ethylene into the system. The ethylene concentration peaked over 80 µL L-1 (Hofman et al., 2014a, b).
Carbon dioxide (CO2) Mangoes are climacteric fruit that produce 70-160 mg CO2 kg-1 h-1 at 20-22°C
(Thompson, 2015). Elevated CO2 can suppress the effect of ethylene in initiating and co-ordinating ripening processes (Thompson, 2015). Keeping CO2 levels below 0.5% assists in maintaining ripening times (Thompson, 2015). It is also important to limit worker exposure to CO2 by adhering to Occupational Health and Safety guidelines (Thompson, 2015).
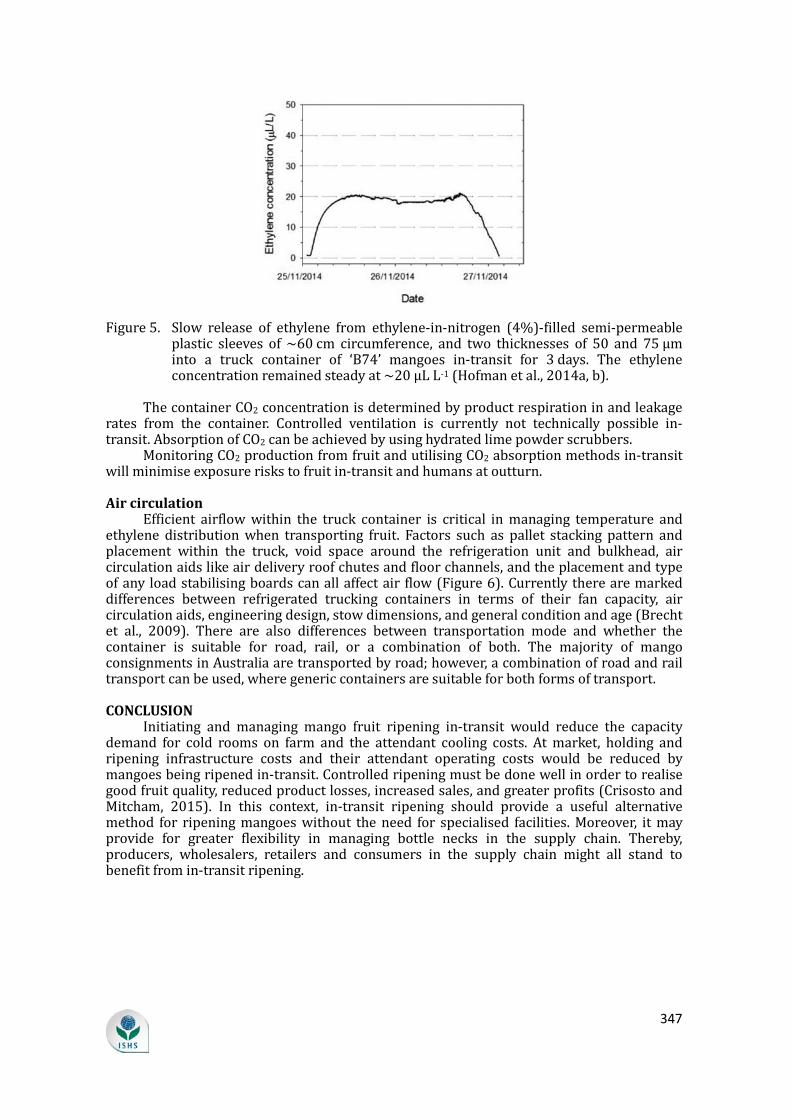
347
Figure 5. Slow release of ethylene from ethylene-in-nitrogen (4%)-filled semi-permeable plastic sleeves of ~60 cm circumference, and two thicknesses of 50 and 75 µm into a truck container of ‘B74’ mangoes in-transit for 3 days. The ethylene concentration remained steady at ~20 µL L-1 (Hofman et al., 2014a, b).
The container CO2 concentration is determined by product respiration in and leakage rates from the container. Controlled ventilation is currently not technically possible in-transit. Absorption of CO2 can be achieved by using hydrated lime powder scrubbers.
Monitoring CO2 production from fruit and utilising CO2 absorption methods in-transit will minimise exposure risks to fruit in-transit and humans at outturn.
Air circulation Efficient airflow within the truck container is critical in managing temperature and
ethylene distribution when transporting fruit. Factors such as pallet stacking pattern and placement within the truck, void space around the refrigeration unit and bulkhead, air circulation aids like air delivery roof chutes and floor channels, and the placement and type of any load stabilising boards can all affect air flow (Figure 6). Currently there are marked differences between refrigerated trucking containers in terms of their fan capacity, air circulation aids, engineering design, stow dimensions, and general condition and age (Brecht et al., 2009). There are also differences between transportation mode and whether the container is suitable for road, rail, or a combination of both. The majority of mango consignments in Australia are transported by road; however, a combination of road and rail transport can be used, where generic containers are suitable for both forms of transport.
CONCLUSION Initiating and managing mango fruit ripening in-transit would reduce the capacity
demand for cold rooms on farm and the attendant cooling costs. At market, holding and ripening infrastructure costs and their attendant operating costs would be reduced by mangoes being ripened in-transit. Controlled ripening must be done well in order to realise good fruit quality, reduced product losses, increased sales, and greater profits (Crisosto and Mitcham, 2015). In this context, in-transit ripening should provide a useful alternative method for ripening mangoes without the need for specialised facilities. Moreover, it may provide for greater flexibility in managing bottle necks in the supply chain. Thereby, producers, wholesalers, retailers and consumers in the supply chain might all stand to benefit from in-transit ripening.
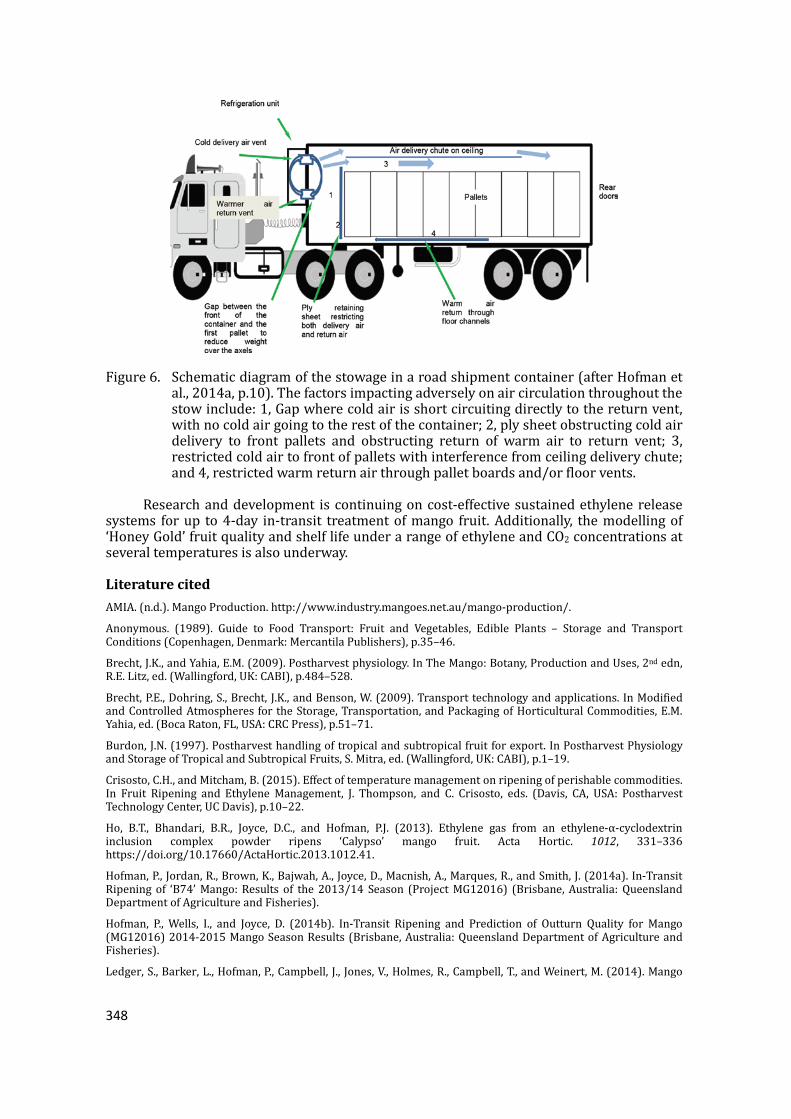
348
Figure 6. Schematic diagram of the stowage in a road shipment container (after Hofman et al., 2014a, p.10). The factors impacting adversely on air circulation throughout the stow include: 1, Gap where cold air is short circuiting directly to the return vent, with no cold air going to the rest of the container; 2, ply sheet obstructing cold air delivery to front pallets and obstructing return of warm air to return vent; 3, restricted cold air to front of pallets with interference from ceiling delivery chute; and 4, restricted warm return air through pallet boards and/or floor vents.
Research and development is continuing on cost-effective sustained ethylene release systems for up to 4-day in-transit treatment of mango fruit. Additionally, the modelling of ‘Honey Gold’ fruit quality and shelf life under a range of ethylene and CO2 concentrations at several temperatures is also underway.
Literature cited AMIA. (n.d.). Mango Production. http://www.industry.mangoes.net.au/mango-production/.
Anonymous. (1989). Guide to Food Transport: Fruit and Vegetables, Edible Plants – Storage and Transport Conditions (Copenhagen, Denmark: Mercantila Publishers), p.35–46.
Brecht, J.K., and Yahia, E.M. (2009). Postharvest physiology. In The Mango: Botany, Production and Uses, 2nd edn, R.E. Litz, ed. (Wallingford, UK: CABI), p.484–528.
Brecht, P.E., Dohring, S., Brecht, J.K., and Benson, W. (2009). Transport technology and applications. In Modified and Controlled Atmospheres for the Storage, Transportation, and Packaging of Horticultural Commodities, E.M. Yahia, ed. (Boca Raton, FL, USA: CRC Press), p.51–71.
Burdon, J.N. (1997). Postharvest handling of tropical and subtropical fruit for export. In Postharvest Physiology and Storage of Tropical and Subtropical Fruits, S. Mitra, ed. (Wallingford, UK: CABI), p.1–19.
Crisosto, C.H., and Mitcham, B. (2015). Effect of temperature management on ripening of perishable commodities. In Fruit Ripening and Ethylene Management, J. Thompson, and C. Crisosto, eds. (Davis, CA, USA: Postharvest Technology Center, UC Davis), p.10–22.
Ho, B.T., Bhandari, B.R., Joyce, D.C., and Hofman, P.J. (2013). Ethylene gas from an ethylene-α-cyclodextrin inclusion complex powder ripens ‘Calypso’ mango fruit. Acta Hortic. 1012, 331–336 https://doi.org/10.17660/ActaHortic.2013.1012.41.
Hofman, P., Jordan, R., Brown, K., Bajwah, A., Joyce, D., Macnish, A., Marques, R., and Smith, J. (2014a). In-Transit Ripening of ‘B74’ Mango: Results of the 2013/14 Season (Project MG12016) (Brisbane, Australia: Queensland Department of Agriculture and Fisheries).
Hofman, P., Wells, I., and Joyce, D. (2014b). In-Transit Ripening and Prediction of Outturn Quality for Mango (MG12016) 2014-2015 Mango Season Results (Brisbane, Australia: Queensland Department of Agriculture and Fisheries).
Ledger, S., Barker, L., Hofman, P., Campbell, J., Jones, V., Holmes, R., Campbell, T., and Weinert, M. (2014). Mango
349
Ripening Manual (Brisbane, Australia: Queensland Department of Agriculture and Fisheries).
Meurant, N., Holmes, R., MacLeod, N., Fullelove, G., Bally, I., and Kernot, I. (1999). Mango Information Kit, Agrilink, Your Growing Guide to Better Farming Guide (Brisbane, Australia: Department of Primary Industries, Queensland Horticulture Institute).
Nguyen, H., McConchie, R., Hofman, P., Smith, L., Stubbings, B., and Adkins, M. (2002). Effect of ethylene and ripening temperatures on the skin colour and flesh characteristics of ripe ‘Kensington Pride’ mango fruit. Acta Hortic. 575, 635–642 https://doi.org/10.17660/ActaHortic.2002.575.74.
Sharrock, K.R., Clark, C.J., Henzell, R.F., and Barker, D.A. (2010). Ethylene ripening of pears by unconventional means: use of an Ethylene Release Canister™ within covered pallets. Acta Hortic. 880, 331–338 https://doi.org/10.17660/ActaHortic.2010.880.39.
Thompson, J.F. (2015). Ripening facilities. In Fruit Ripening and Ethylene Management, J. Thompson, and C. Crisosto, eds. (Davis, CA, USA: Postharvest Technology Center, UC Davis), p.23–27.
Wills, R.B.H., McGlasson, W.B., Graham, D., and Joyce, D.C. (2007). Technology of Storage. In Postharvest: an Introduction to the Physiology and Handling of Fruit, Vegetables and Ornamentals, 5th edn (Sydney, Australia: University of New South Wales Press), p.100–116.

350
145
Effects of Wood Vinegar on Tomato Fruit Quality and Shelf Life at Ambient and Low Temperatures F.R. Rivera, A.D. Valida and A.L. Acedo Jr. Postharvest Technology Division, Department of Horticulture Visayas State University Baybay City, Leyte Philippines Keywords: Solanum lycopersicum Mill., pyroligneous acid, postharvest dip Abstract
Wood vinegar (pyroligneous acid or pyrolysis oil), a liquid produced through natural carbonization of plant refuse, has several potential benefits to agriculture and human health and has been reported to improve harvest quality and shelf life of fruits and vegetables but may also promote ethylene production. In this study, we used wood vinegar derived from citrus tree refuse and corn stover and applied on breaker tomato ‘Diamante’ at dilutions with distilled water of 1:10 or 1:5 (10 and 20%) as postharvest dip for 3 min before storage at ambient (25-30°C) or refrigerated condition (8-10°C) for 2 weeks. No remarkable effects of wood vinegar on quality changes were noted except in terms of weight loss and reddening (a* values). Fruit stored at ambient and pretreated with 10-20% wood vinegar from corn stover or 20% wood vinegar from citrus refuse had lower weight loss than the control (water dip). Fruit reddening was favored at low temperature than at ambient. Sensory quality, soluble solids content, acidity and fruit decay incidence were not affected. INTRODUCTION
Revival of wood vinegar (pyroligneous acid) application in agriculture and human health was prompted by the drive to develop organic and environment-friendly production systems and natural medicines. Pyroligneous acid has been used for ages as sterilizing agent, deodorizer, fertilizer and antimicrobial (Souza et al., 2012). The strong antimicrobial activity of pyroligneous acid was correlated to its high contents of organic acids and phenolic substances. Pyroligneous acid also exhibits antioxidant activity and was found to have superior free radical scavenging activity (Loo et al., 2007). The strong antioxidant activity is due to its high content of phenols. Wood vinegar consists of more than 200 water soluble compounds comprising of organic acids, phenolic, alkane, alcohol and ester compounds (Wei et al., 2010). Wood vinegar has many uses; in agriculture it is used in pest and disease control, improving yield and quality, increasing fruit size, weight and sweetness, and extending shelf life of fruit and vegetables (Mohan et al., 2006; Oramahi and Yoshimura, 2013; Tuntika et al., 2013; Zulkarami et al., 2011). This study explored the use of wood vinegar from citrus tree refuse and corn stover on the quality and shelf life of tomato fruit. MATERIALS AND METHODS
Freshly harvested, uniformly sized and defect-free breaker tomatoes ‘Diamante’ (East-West Seed Co.) were treated with wood vinegar derived from slow pyrolysis of citrus tree refuse and corn stover at dilutions of 1:10 or 1:5 (10 and 20%) as 3 min dip. Fruit dipped in distilled water for 3 min served as control. The fruits were then stored at ambient (25-30°C) or refrigerated condition (8-10°C) for 2 weeks. Peel color reddening was measured as a* values using a Minolta colorimeter CR-13; weight loss as percent of the initial weight; total soluble solids (TSS) using Atago handhled refractometer, percent acidity by the titrimetric method, and sensory appearance by 15 trained panelists using a rating scale of 9-1 in which 9 – excellent, defect-free, 7 – good, defects minor, 5 – fair, defects moderate, 3 – poor, defects serious, limit of marketability, 2 – limit of edibility,
Proc. IInd Southeast Asia Symp. on Quality Management in Postharvest Systems Eds.: A.L. Acedo Jr. and S. Kanlayanarat Acta Hort. 1088, ISHS 2015
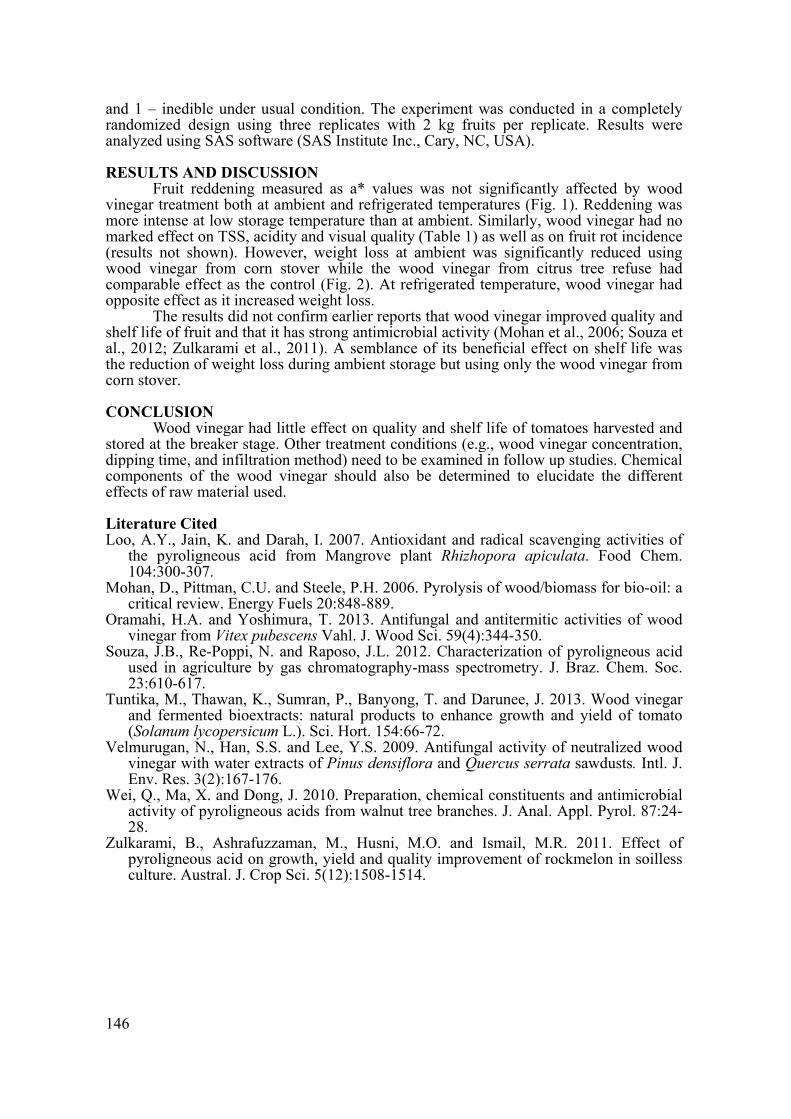
146
and 1 – inedible under usual condition. The experiment was conducted in a completely randomized design using three replicates with 2 kg fruits per replicate. Results were analyzed using SAS software (SAS Institute Inc., Cary, NC, USA). RESULTS AND DISCUSSION
Fruit reddening measured as a* values was not significantly affected by wood vinegar treatment both at ambient and refrigerated temperatures (Fig. 1). Reddening was more intense at low storage temperature than at ambient. Similarly, wood vinegar had no marked effect on TSS, acidity and visual quality (Table 1) as well as on fruit rot incidence (results not shown). However, weight loss at ambient was significantly reduced using wood vinegar from corn stover while the wood vinegar from citrus tree refuse had comparable effect as the control (Fig. 2). At refrigerated temperature, wood vinegar had opposite effect as it increased weight loss.
The results did not confirm earlier reports that wood vinegar improved quality and shelf life of fruit and that it has strong antimicrobial activity (Mohan et al., 2006; Souza et al., 2012; Zulkarami et al., 2011). A semblance of its beneficial effect on shelf life was the reduction of weight loss during ambient storage but using only the wood vinegar from corn stover. CONCLUSION
Wood vinegar had little effect on quality and shelf life of tomatoes harvested and stored at the breaker stage. Other treatment conditions (e.g., wood vinegar concentration, dipping time, and infiltration method) need to be examined in follow up studies. Chemical components of the wood vinegar should also be determined to elucidate the different effects of raw material used. Literature Cited Loo, A.Y., Jain, K. and Darah, I. 2007. Antioxidant and radical scavenging activities of
the pyroligneous acid from Mangrove plant Rhizhopora apiculata. Food Chem. 104:300-307.
Mohan, D., Pittman, C.U. and Steele, P.H. 2006. Pyrolysis of wood/biomass for bio-oil: a critical review. Energy Fuels 20:848-889.
Oramahi, H.A. and Yoshimura, T. 2013. Antifungal and antitermitic activities of wood vinegar from Vitex pubescens Vahl. J. Wood Sci. 59(4):344-350.
Souza, J.B., Re-Poppi, N. and Raposo, J.L. 2012. Characterization of pyroligneous acid used in agriculture by gas chromatography-mass spectrometry. J. Braz. Chem. Soc. 23:610-617.
Tuntika, M., Thawan, K., Sumran, P., Banyong, T. and Darunee, J. 2013. Wood vinegar and fermented bioextracts: natural products to enhance growth and yield of tomato (Solanum lycopersicum L.). Sci. Hort. 154:66-72.
Velmurugan, N., Han, S.S. and Lee, Y.S. 2009. Antifungal activity of neutralized wood vinegar with water extracts of Pinus densiflora and Quercus serrata sawdusts. Intl. J. Env. Res. 3(2):167-176.
Wei, Q., Ma, X. and Dong, J. 2010. Preparation, chemical constituents and antimicrobial activity of pyroligneous acids from walnut tree branches. J. Anal. Appl. Pyrol. 87:24-28.
Zulkarami, B., Ashrafuzzaman, M., Husni, M.O. and Ismail, M.R. 2011. Effect of pyroligneous acid on growth, yield and quality improvement of rockmelon in soilless culture. Austral. J. Crop Sci. 5(12):1508-1514.
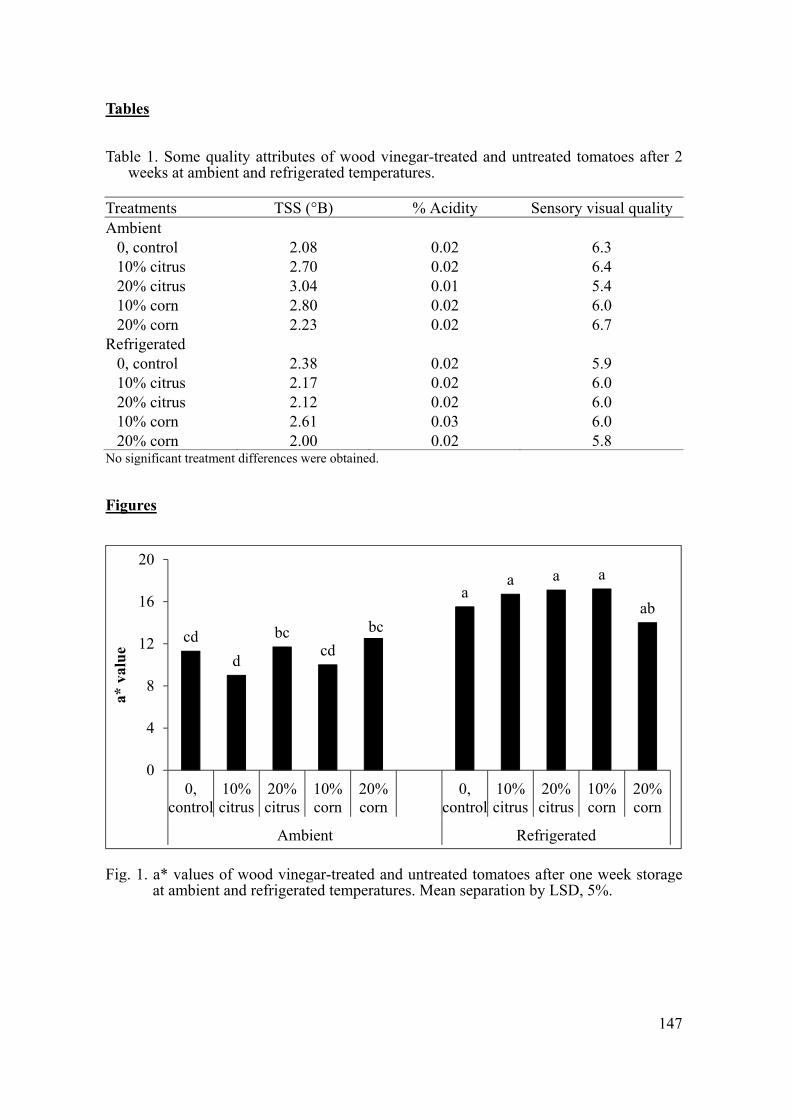
147
Tables Table 1. Some quality attributes of wood vinegar-treated and untreated tomatoes after 2
weeks at ambient and refrigerated temperatures. Treatments TSS (°B) % Acidity Sensory visual quality Ambient
0, control 2.08 0.02 6.3 10% citrus 2.70 0.02 6.4 20% citrus 3.04 0.01 5.4 10% corn 2.80 0.02 6.0 20% corn 2.23 0.02 6.7
Refrigerated 0, control 2.38 0.02 5.9 10% citrus 2.17 0.02 6.0 20% citrus 2.12 0.02 6.0 10% corn 2.61 0.03 6.0 20% corn 2.00 0.02 5.8
No significant treatment differences were obtained. Figures
Fig. 1. a* values of wood vinegar-treated and untreated tomatoes after one week storage
at ambient and refrigerated temperatures. Mean separation by LSD, 5%.
cdd
bccd
bc
aa a a
ab
0
4
8
12
16
20
0,control
10%citrus
20%citrus
10%corn
20%corn
0,control
10%citrus
20%citrus
10%corn
20%corn
Ambient Refrigerated
a* v
alue
148
Fig. 2. Weight loss of wood vinegar-treated and untreated tomatoes after one week
storage at ambient or refrigerated conditions. Mean separation by LSD, 5%.
a aab
cdde
e
bccd
ab
de
00,5
11,5
22,5
33,5
0,control
10%citrus
20%citrus
10%corn
20%corn
0,control
10%citrus
20%citrus
10%corn
20%corn
Ambient Refrigerated
Wei
ght l
oss,
Acta Hortic. 1111. ISHS 2016. DOI 10.17660/ActaHortic.2016.1111.56 XXIX IHC – Proc. Int. Symp. on Papaya, Pineapple and Mango Eds.: R. Drew et al.
393
γ-Irradiation effects on appearance and aroma of ‘Kensington Pride’ mango fruit
A.T.San1,H.E.Smyth1,D.C.Joyce1,R.Webb1,G.Q.Li1,P.J.Hofman2andA.J.Macnish2
1The University of Queensland, Coopers Plains, Gatton and St Lucia, Australia; 2Department of Agriculture,FisheriesandForestry,Nambour,Queensland,Australia.
Abstract γ‐Irradiation doses of 0.5 (target) and 1.0 (high) kGy were applied as insect
disinfestation treatments to ‘Kensington Pride’ mango fruit. The effects of these treatments on fruit physicochemical properties and aroma volatile production were investigated and compared to non-irradiated controls. There were no significant effects of the irradiation treatments on flesh total soluble solids content. However, the loss of green skin colour usually associated with fruit ripening was inhibited by irradiation at both 0.5 and 1.0 kGy by approximately 32 and 52%, respectively, relative to non-irradiated fruit. Fruit exposed to 0.5 and 1.0 kGy exhibited a 58 and 80% reduction in emission of α-terpinolene volatiles, respectively. Thus, γ-irradiation at 0.5 and 1.0 kGy can have an adverse effect on ‘Kensington Pride’ mango fruit aroma volatile production and skin colouration.
Keywords:lenticeldiscolouration,Mangifera indica,skincolour,volatileproduction
INTRODUCTION Mango(Mangifera indicaL.)isconsidered“TheKingofFruits”andisoneofthemain
fruitcropsinthetropicsandsubtropics.Mangofruitarehighlynutritiousandarichsourceof amino acids, carbohydrates, fatty acids,minerals, organic acids, proteins, vitamins andantioxidants.Mangofruitaresusceptibletovariousinsectpestsofquarantinesignificance;e.g., fruit fly and mango seed weevil. Susceptible fruit require appropriate preventativemeasuresandpostharvestdisinfestation treatments tominimise theriskofpest incursionintoimportingcountries.Exposuretosourcesofionisingradiation,suchasgamma(γ)rays,isaneffectivepostharvestquarantine/phytosanitarytreatmenttominimisequarantinepestpresenceintradedfoods(Bustosetal.,2004).
Disinfestationtreatments,andparticularlyphysicaltreatments,oftenrepresentafinebalance between delivering adequate insect mortality and not damaging the product. γ‐Irradiationofmangofruitcanprovidequarantinesecurity.However,itcanalsoreduceripefruit skinqualityby increasing lenticeldiscolourationanddecreasing therateof ripening‐related green colour loss (McLauchlan et al., 1989). In addition to affecting fruit skinpigmentation, treatmentwithγ‐irradiationmaypotentially affect theproductionof aromavolatiles. For example, exposure of ‘Chok Anan’ mango fruit to 0.3 kGy γ‐irradiationsignificantly reduced rates of terpene production as compared to non‐treated samples(Laohakunjitetal.,2006).
In the present study, we investigated the effects of γ‐irradiation on thephysicochemical properties of ‘Kensington Pride’ mango fruit, a commercially importantcultivarinAustralia.Anexperimentwascompletedwithaviewtoimprovingunderstandingofmangoskinde‐greeningandaromasynthesisresponses.
MATERIALS AND METHODS
Material ‘Kensington Pride’ mango fruit were harvested at commercial maturity from an
orchard near Childers, Queensland, Australia (‐25.237° S, 152.278° E). The fruitwere de‐stemmedinMangoWash®,treatedwithapostharvestfungicideandinsecticideandgraded
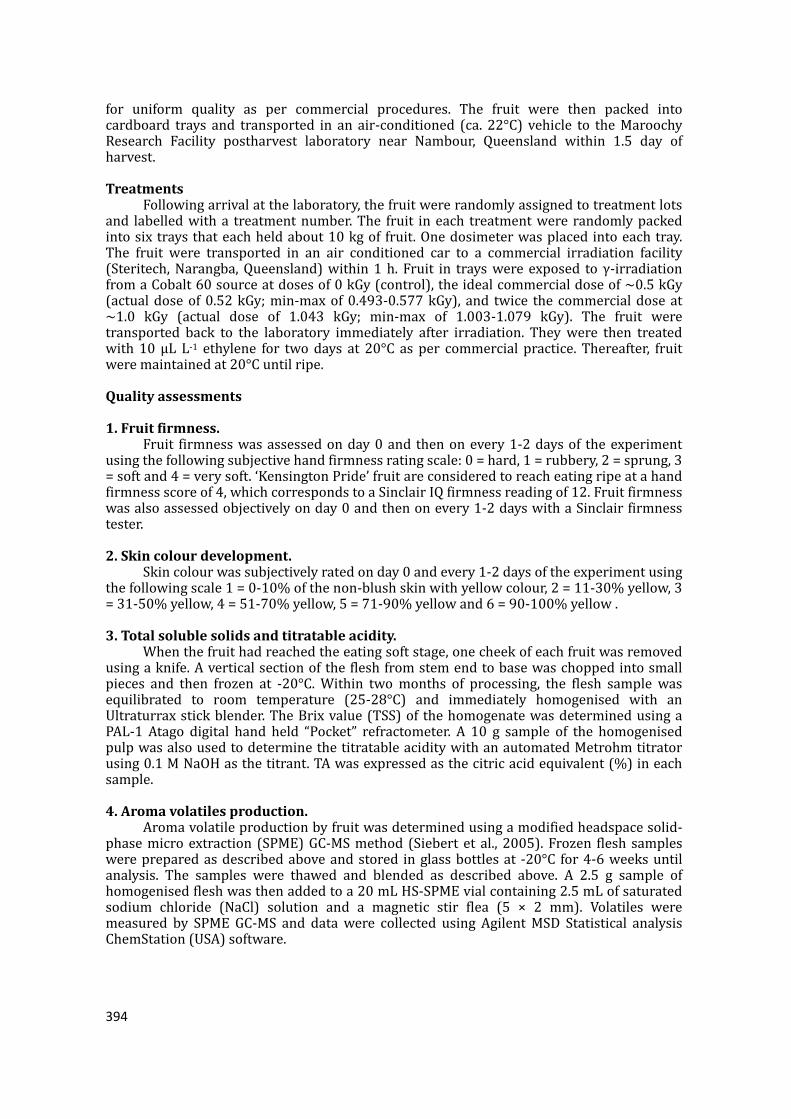
394
for uniform quality as per commercial procedures. The fruit were then packed intocardboard trays and transported in an air‐conditioned (ca. 22°C) vehicle to theMaroochyResearch Facility postharvest laboratory near Nambour, Queensland within 1.5 day ofharvest.
Treatments Followingarrivalatthelaboratory,thefruitwererandomlyassignedtotreatmentlots
and labelledwitha treatmentnumber.The fruit ineach treatmentwererandomlypackedintosixtraysthateachheldabout10kgof fruit.Onedosimeterwasplacedintoeachtray.The fruit were transported in an air conditioned car to a commercial irradiation facility(Steritech,Narangba,Queensland)within1h. Fruit in trayswereexposed toγ‐irradiationfromaCobalt60sourceatdosesof0kGy(control),theidealcommercialdoseof~0.5kGy(actualdoseof0.52kGy;min‐maxof0.493‐0.577kGy), and twice the commercialdoseat~1.0 kGy (actual dose of 1.043 kGy; min‐max of 1.003‐1.079 kGy). The fruit weretransported back to the laboratory immediately after irradiation. Theywere then treatedwith 10µL L‐1 ethylene for twodays at 20°C as per commercial practice. Thereafter, fruitweremaintainedat20°Cuntilripe.
Quality assessments
1. Fruit firmness. Fruit firmnesswasassessedonday0and thenonevery1‐2daysof theexperiment
usingthefollowingsubjectivehandfirmnessratingscale:0=hard,1=rubbery,2=sprung,3=softand4=verysoft.‘KensingtonPride’fruitareconsideredtoreacheatingripeatahandfirmnessscoreof4,whichcorrespondstoaSinclairIQfirmnessreadingof12.Fruitfirmnesswasalsoassessedobjectivelyonday0andthenonevery1‐2dayswithaSinclairfirmnesstester.
2. Skin colour development. Skincolourwassubjectivelyratedonday0andevery1‐2daysoftheexperimentusing
thefollowingscale1=0‐10%ofthenon‐blushskinwithyellowcolour,2=11‐30%yellow,3=31‐50%yellow,4=51‐70%yellow,5=71‐90%yellowand6=90‐100%yellow.
3. Total soluble solids and titratable acidity. Whenthefruithadreachedtheeatingsoftstage,onecheekofeachfruitwasremoved
usingaknife.Averticalsectionofthefleshfromstemendtobasewaschoppedintosmallpieces and then frozen at ‐20°C.Within twomonths of processing, the flesh sample wasequilibrated to room temperature (25‐28°C) and immediately homogenised with anUltraturraxstickblender.TheBrixvalue(TSS)of thehomogenatewasdeterminedusingaPAL‐1 Atago digital hand held “Pocket” refractometer. A 10 g sample of the homogenisedpulpwasalsousedtodeterminethetitratableaciditywithanautomatedMetrohmtitratorusing0.1MNaOHasthetitrant.TAwasexpressedasthecitricacidequivalent(%)ineachsample.
4. Aroma volatiles production. Aromavolatileproductionbyfruitwasdeterminedusingamodifiedheadspacesolid‐
phasemicroextraction (SPME)GC‐MSmethod (Siebertet al., 2005).Frozen flesh sampleswerepreparedasdescribedaboveandstored inglassbottlesat ‐20°C for4‐6weeksuntilanalysis. The samples were thawed and blended as described above. A 2.5 g sample ofhomogenisedfleshwasthenaddedtoa20mLHS‐SPMEvialcontaining2.5mLofsaturatedsodium chloride (NaCl) solution and a magnetic stir flea (5 × 2 mm). Volatiles weremeasured by SPME GC‐MS and datawere collected using AgilentMSD Statistical analysisChemStation(USA)software.
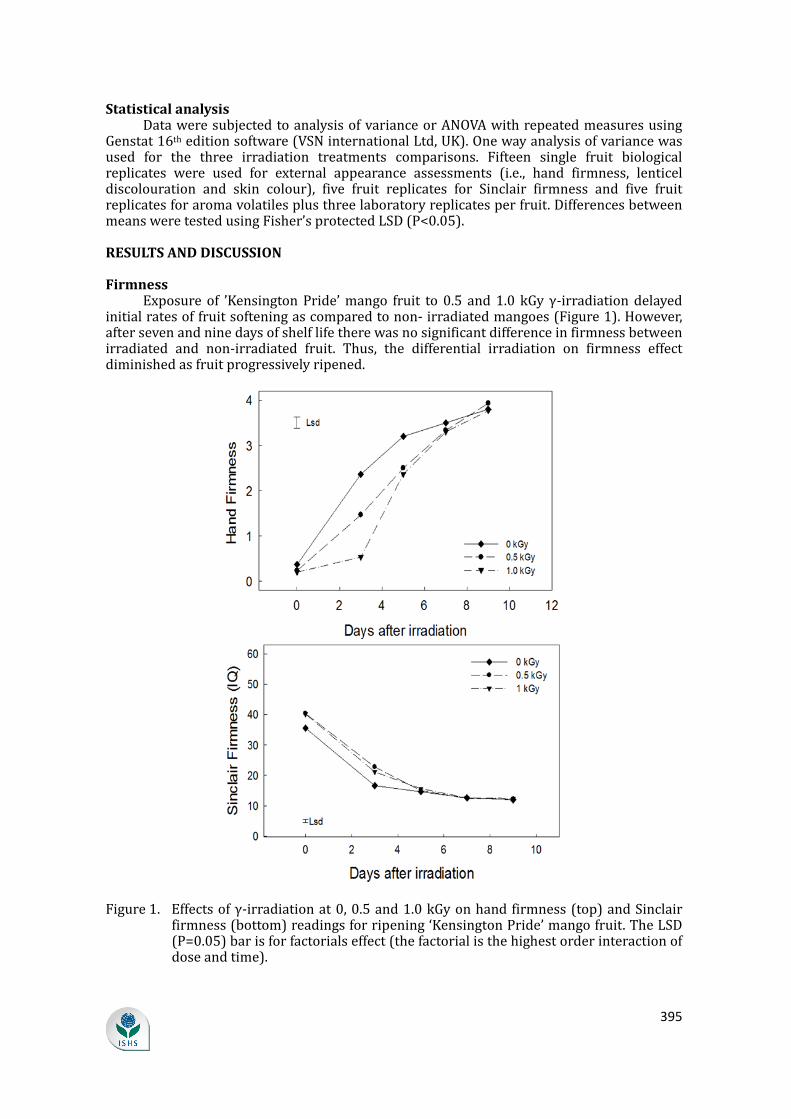
395
Statistical analysis DataweresubjectedtoanalysisofvarianceorANOVAwithrepeatedmeasuresusing
Genstat16theditionsoftware(VSNinternationalLtd,UK).Onewayanalysisofvariancewasused for the three irradiation treatments comparisons. Fifteen single fruit biologicalreplicates were used for external appearance assessments (i.e., hand firmness, lenticeldiscolouration and skin colour), five fruit replicates for Sinclair firmness and five fruitreplicatesforaromavolatilesplusthreelaboratoryreplicatesperfruit.DifferencesbetweenmeansweretestedusingFisher’sprotectedLSD(P<0.05).
RESULTS AND DISCUSSION
Firmness Exposureof ’KensingtonPride’mango fruit to 0.5 and1.0 kGyγ‐irradiationdelayed
initialratesoffruitsofteningascomparedtonon‐irradiatedmangoes(Figure1).However,aftersevenandninedaysofshelflifetherewasnosignificantdifferenceinfirmnessbetweenirradiated and non‐irradiated fruit. Thus, the differential irradiation on firmness effectdiminishedasfruitprogressivelyripened.
Figure1. Effectsofγ‐irradiationat0,0.5and1.0kGyonhandfirmness(top)andSinclairfirmness(bottom)readingsforripening‘KensingtonPride’mangofruit.TheLSD(P=0.05)barisforfactorialseffect(thefactorialisthehighestorderinteractionofdoseandtime).
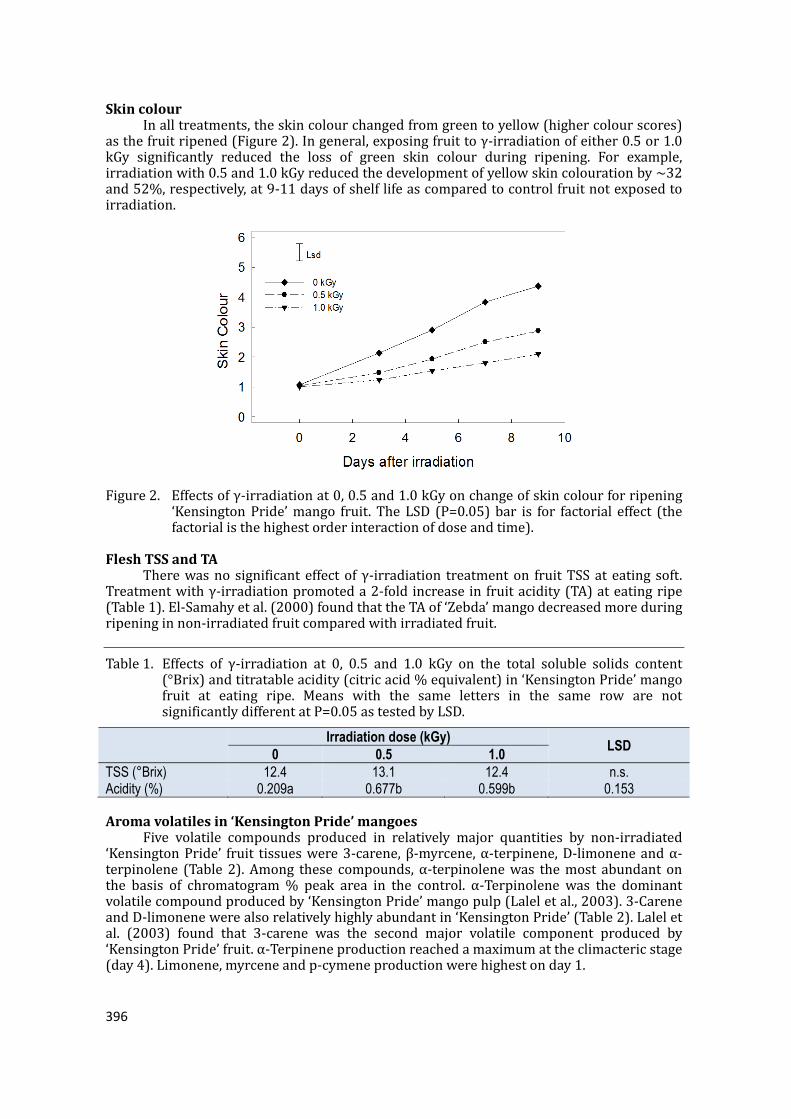
396
Skin colour Inalltreatments,theskincolourchangedfromgreentoyellow(highercolourscores)
asthefruitripened(Figure2).Ingeneral,exposingfruittoγ‐irradiationofeither0.5or1.0kGy significantly reduced the loss of green skin colour during ripening. For example,irradiationwith0.5and1.0kGyreducedthedevelopmentofyellowskincolourationby~32and52%,respectively,at9‐11daysofshelflifeascomparedtocontrolfruitnotexposedtoirradiation.
Figure2. Effectsofγ‐irradiationat0,0.5and1.0kGyonchangeofskincolourforripening‘KensingtonPride’mango fruit. The LSD (P=0.05)bar is for factorial effect (thefactorialisthehighestorderinteractionofdoseandtime).
Flesh TSS and TA Therewasno significanteffectofγ‐irradiation treatmenton fruitTSSat eating soft.
Treatmentwithγ‐irradiationpromoteda2‐foldincreasein fruitacidity(TA)ateatingripe(Table1).El‐Samahyetal.(2000)foundthattheTAof‘Zebda’mangodecreasedmoreduringripeninginnon‐irradiatedfruitcomparedwithirradiatedfruit.
Table1. Effects of γ‐irradiation at 0, 0.5 and 1.0 kGy on the total soluble solids content(°Brix)andtitratableacidity(citricacid%equivalent)in‘KensingtonPride’mangofruit at eating ripe. Means with the same letters in the same row are notsignificantlydifferentatP=0.05astestedbyLSD.
Irradiation dose (kGy) LSD
0 0.5 1.0 TSS (°Brix) 12.4 13.1 12.4 n.s. Acidity (%) 0.209a 0.677b 0.599b 0.153
Aroma volatiles in ‘Kensington Pride’ mangoes Five volatile compounds produced in relatively major quantities by non‐irradiated
‘KensingtonPride’ fruit tissueswere3‐carene,β‐myrcene,α‐terpinene,D‐limoneneandα‐terpinolene (Table 2).Among these compounds, α‐terpinolenewas themost abundant onthe basis of chromatogram% peak area in the control. α‐Terpinolene was the dominantvolatilecompoundproducedby‘KensingtonPride’mangopulp(Laleletal.,2003).3‐CareneandD‐limonenewerealsorelativelyhighlyabundantin‘KensingtonPride’(Table2).Laleletal. (2003) found that 3‐carene was the second major volatile component produced by‘KensingtonPride’fruit.α‐Terpineneproductionreachedamaximumattheclimactericstage(day4).Limonene,myrceneandp‐cymeneproductionwerehighestonday1.
397
Table2. Relative abundance of major volatile compounds from non‐irradiated ripened‘KensingtonPride’mangofruit.
Peak Compound Retention time %
(min) max. 1 3-Carene 6.74 5.18% 2 β-Myrcene 7.07 3.92% 3 α-Terpinene 7.35 5.27% 4 D-Limonene 7.74 2.69% 5 α-Terpinolene 9.76 100.00%
Fruit exposed to 0.5 and 1.0 kGy γ‐irradiation produced significantly lowerconcentrations of α‐terpinolene as compared to the control samples (Figure 3). Thepronounced reduction suggests that irradiation has a significant effect of suppressing theflavourprofileof‘KensingtonPride’mango.
Figure3. Effectsofγ‐irradiationat0,0.5and1.0kGyonα‐terpinolenevolatileproductionby ripened ‘KensingtonPride’mango fruit.Meanswith the same lettersarenotsignificantlydifferentatP=0.05astestedbyLSD.
CONCLUSIONS Ourstudyconfirmsthatexposureofgreenmature ‘KensingtonPride’mango fruit to
typical commercial γ‐irradiation disinfestation doses of 0.5 and 1.0 kGy can significantlyreducetheexternalappearancequality.Lossofgreenskincolourduringripeningisretardedevenat0.5kGy, resulting inundesirablemoregreenskin colourat eating soft. In general,fruitfirmnesschangeswerenotsignificantlyaffectedbyirradiation.Nonetheless,theremayinitially be unwanted slightly slower firmness loss. γ‐Irradiation also reduced volatilesproduction by the ripened fruit. In concert with a relative increase in TA of ‘KensingtonPride’ in association with irradiation, a reduction in volatiles indicates an unacceptableeffect of irradiation on fruit flavour. ‘Kensington Pride’ mangoes are susceptible toirradiation‐relateddamage at commercial doses of 0.5‐1.0 kGy.While lowerdosesof 0.15kGymightkillfruitflyandnotdamagethefruitasmuch,therealityisthatthehigherdoses(e.g., 0.4+ kGy) are required to kill other insect pests and meet market requirements. Itsuggests that the formulation of postharvest practices should be studied to optimise thequalityofirradiatedfruit.
ACKNOWLEDGEMENTS ThisresearchwasfundedbyHorticultureAustraliaLtdusingvoluntarycontributions
fromOneHarvestmatchedbyfundsfromtheAustralianGovernment.In‐kindandfinancialsupportswere also providedby theQueenslandDepartment ofAgriculture, Fisheries andForestry (DAFF) and The University of Queensland. We acknowledge the Queensland
398
Alliance forAgriculture&Food InnovationandDAFF for theuseof specialised laboratoryfacilitiesandassistance.WethankScottLedger,JonathanSmithandRobertoMarquesforthefruit supply and collection and Steve Fuller for GC‐MS technical advice. Finally, ATSacknowledges the ACIAR John Allwright Fellowship for financial support of PhD study inAustralia.
Literature cited
Bustos,M.E., Enkerlin,W., Reyes, J., andToledo, J. (2004). Irradiation ofmangoes as a postharvest quarantinetreatment for fruit flies (Diptera: tephritidae). J. Econ. Entomol. 97 (2), 286–292http://dx.doi.org/10.1093/jee/97.2.286.PubMed
El‐Samahy,S.K.,Youssef,B.M.,Askar,A.A.,andSwailam,H.M.M.(2000).Microbiologicalandchemicalpropertiesofirradiatedmango.J.FoodSaf.20(3),139–156http://dx.doi.org/10.1111/j.1745‐4565.2000.tb00294.x.
Lalel,H.J.D.,Singh,Z.,andTan,S.C.(2003).Aromavolatilesproductionduringfruitripeningof‘KensingtonPride’mango.PostharvestBiol.Technol.27(3),323–336http://dx.doi.org/10.1016/S0925‐5214(02)00117‐5.
Laohakunjit,N.,Uthairatakij,A.,Kerdchoechuen,O.,Chatpaisarn,A.,andPhotchanachai,S.(2006).Identificationof changes in volatile compound in γ‐irradiated mango during storage. Paper presented at: Intl. Symp. NewFrontierofIrradiatedFoodandNon‐FoodProducts(Bangkok,Thailand:ISNF).
McLauchlan,R.,Johnson,G.,Mitchell,G.,andWills,P.(1989).IrradiationofKensingtonpridemangoes.Symp.onTropicalFruitinIntl.Trade.269,469–476.
Siebert,T.E.,Smyth,H.E.,Capone,D.L.,Neuwohner,C.,Pardon,K.H.,Skouroumounis,G.K.,Herderich,M.J.,Sefton,M.A.,andPollnitz,A.P.(2005).StableisotopedilutionanalysisofwinefermentationproductsbyHS‐SPME‐GC‐MS.Analytical and Bioanalytical Chemistry 381 (4), 937–947 http://dx.doi.org/10.1007/s00216‐004‐2992‐4.PubMed
Acta Hortic. 1183. ISHS 2017. DOI 10.17660/ActaHortic.2017.1183.48 Proc. XI International Mango Symposium Eds.: I. Bally et al.
331
Anatomy of skin disorders afflicting Australian mangoes
A.T. San1,2,a, R.I. Webb3, D.C. Joyce1,4, P.J. Hofman4, A.J. Macnish4 and H.E. Smyth2 1School of Agriculture and Food Sciences, The University of Queensland, Queensland, Australia; 2Queensland Alliance for Agriculture and Food Innovation, The University of Queensland, Queensland, Australia; 3Centre for Microscopy and Microanalysis, The University of Queensland, Queensland, Australia; 4Horticulture and Forestry Science, Department of Agriculture and Fisheries, Queensland, Australia.
Abstract Lenticel discoloration (LD), under-skin browning (USB) and resin canal disorder
(RCD) are three important fruit skin disorders of concern to the Australian mango industry. They result in downgrading of fruit quality and loss of market confidence. LD is confined to the discoloration of lenticels on the fruit skin. USB is a sub-surface spreading grey-brown lesion that may only become evident in the marketplace. RCD is a dark brown discoloration of the finely branched pattern of ramifying sub-surface resin canals. These three browning disorders were compared and contrasted at the cellular level by light microscopy after free-hand sectioning. Discoloured lenticels on the surface of ‘Honey Gold’ mango fruit typically appeared as small round spots comprised of a dark brown centre surrounded by a white corona. Non-coloured lenticels were visible as small round spots surrounded by a white corona. In cross-section, there was browning of cells surrounding the cavity of discoloured lenticels. Nonetheless, there was no such browning in non-coloured lenticels. USB symptoms in ‘Honey Gold’ fruit were evident as dark-brown cells in the tissue surrounding the resin ducts. In contrast, RCD, which was evident in ‘Kensington Pride’ mango fruit, was characterised by browning of the lumen of resin ducts. Accordingly, LD, USB and RCD involve different browning biology processes at the cell and tissue levels. A greater understanding of symptom development and expression could aid in informed management of these physiological disorders.
Keywords: Mangifera indica, lenticel discoloration, resin canal disorder, under-skin browning
INTRODUCTION Skin physiological disorders are of major concern to the Australian mango industry.
They lead to downgrading of fruit quality and to loss of market confidence (Rymbai et al., 2012). Lenticel discoloration (LD), under-skin browning (USB) and resin canal disorder (RCD) have emerged in recent years as serious economic issues.
Lenticels are macroscopic openings on the fruit skin. They contribute to gaseous exchange and transpiration. Bally (1999) found that lenticel formation in ‘Kensington Pride’ fruit was due to rupturing of stomata. Rymbai et al. (2012) confirmed that lenticels in mango derive from stomata and enlarge during fruit growth, largely due to stretching of the fruit surface. Several studies on mechanisms of mango LD have been conducted. Wang et al. (2012) observed that discoloration occurred in the form of light purple areas due to pigment accumulation in the vacuoles of sub-lenticel cells. Thus, LD involves vacuolar deposition of phenolics in cells surrounding the lenticel cavity. It is associated with the increased reddening and eventual brown to black darkening of lenticels (Du Plooy et al., 2009).
USB mainly affects ‘Honey Gold’ mango fruit. It is manifest under the epidermis as a diffuse grey-brown discoloration with no damage to the flesh (Hofman et al., 2010). The
aE-mail: [email protected]
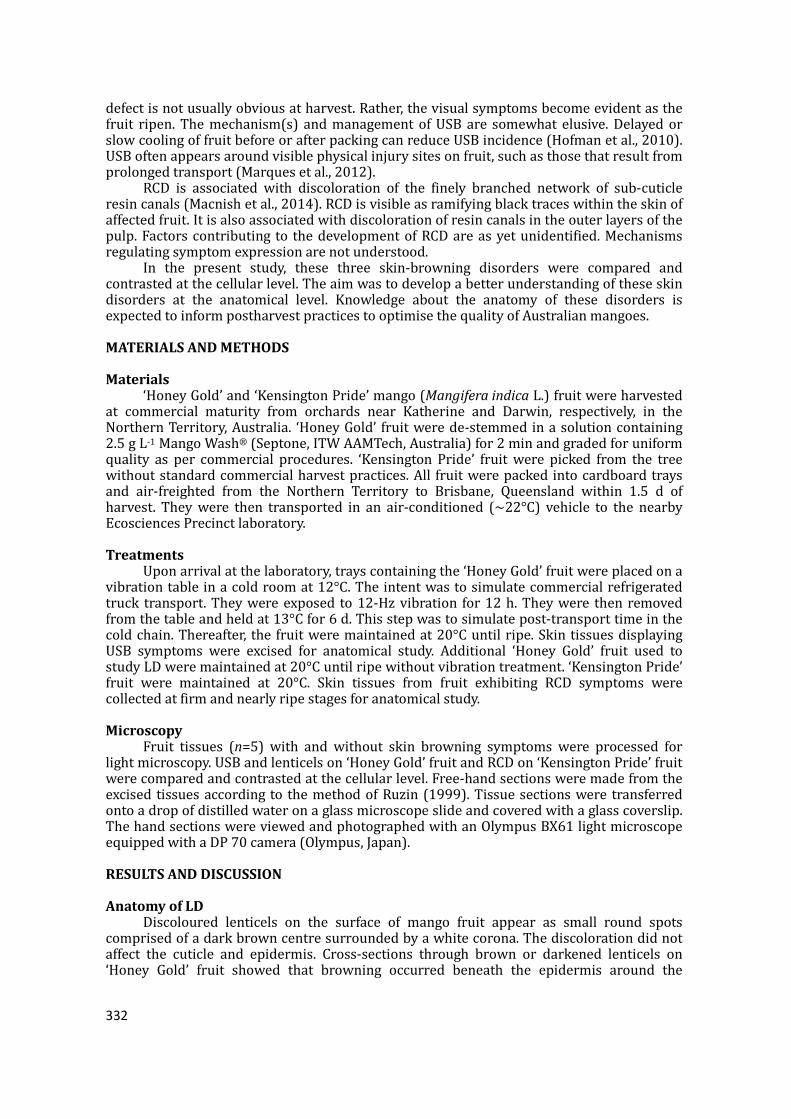
332
defect is not usually obvious at harvest. Rather, the visual symptoms become evident as the fruit ripen. The mechanism(s) and management of USB are somewhat elusive. Delayed or slow cooling of fruit before or after packing can reduce USB incidence (Hofman et al., 2010). USB often appears around visible physical injury sites on fruit, such as those that result from prolonged transport (Marques et al., 2012).
RCD is associated with discoloration of the finely branched network of sub-cuticle resin canals (Macnish et al., 2014). RCD is visible as ramifying black traces within the skin of affected fruit. It is also associated with discoloration of resin canals in the outer layers of the pulp. Factors contributing to the development of RCD are as yet unidentified. Mechanisms regulating symptom expression are not understood.
In the present study, these three skin-browning disorders were compared and contrasted at the cellular level. The aim was to develop a better understanding of these skin disorders at the anatomical level. Knowledge about the anatomy of these disorders is expected to inform postharvest practices to optimise the quality of Australian mangoes.
MATERIALS AND METHODS
Materials ‘Honey Gold’ and ‘Kensington Pride’ mango (Mangifera indica L.) fruit were harvested
at commercial maturity from orchards near Katherine and Darwin, respectively, in the Northern Territory, Australia. ‘Honey Gold’ fruit were de-stemmed in a solution containing 2.5 g L-1 Mango Wash® (Septone, ITW AAMTech, Australia) for 2 min and graded for uniform quality as per commercial procedures. ‘Kensington Pride’ fruit were picked from the tree without standard commercial harvest practices. All fruit were packed into cardboard trays and air-freighted from the Northern Territory to Brisbane, Queensland within 1.5 d of harvest. They were then transported in an air-conditioned (~22°C) vehicle to the nearby Ecosciences Precinct laboratory.
Treatments Upon arrival at the laboratory, trays containing the ‘Honey Gold’ fruit were placed on a
vibration table in a cold room at 12°C. The intent was to simulate commercial refrigerated truck transport. They were exposed to 12-Hz vibration for 12 h. They were then removed from the table and held at 13°C for 6 d. This step was to simulate post-transport time in the cold chain. Thereafter, the fruit were maintained at 20°C until ripe. Skin tissues displaying USB symptoms were excised for anatomical study. Additional ‘Honey Gold’ fruit used to study LD were maintained at 20°C until ripe without vibration treatment. ‘Kensington Pride’ fruit were maintained at 20°C. Skin tissues from fruit exhibiting RCD symptoms were collected at firm and nearly ripe stages for anatomical study.
Microscopy Fruit tissues (n=5) with and without skin browning symptoms were processed for
light microscopy. USB and lenticels on ‘Honey Gold’ fruit and RCD on ‘Kensington Pride’ fruit were compared and contrasted at the cellular level. Free-hand sections were made from the excised tissues according to the method of Ruzin (1999). Tissue sections were transferred onto a drop of distilled water on a glass microscope slide and covered with a glass coverslip. The hand sections were viewed and photographed with an Olympus BX61 light microscope equipped with a DP 70 camera (Olympus, Japan).
RESULTS AND DISCUSSION
Anatomy of LD Discoloured lenticels on the surface of mango fruit appear as small round spots
comprised of a dark brown centre surrounded by a white corona. The discoloration did not affect the cuticle and epidermis. Cross-sections through brown or darkened lenticels on ‘Honey Gold’ fruit showed that browning occurred beneath the epidermis around the
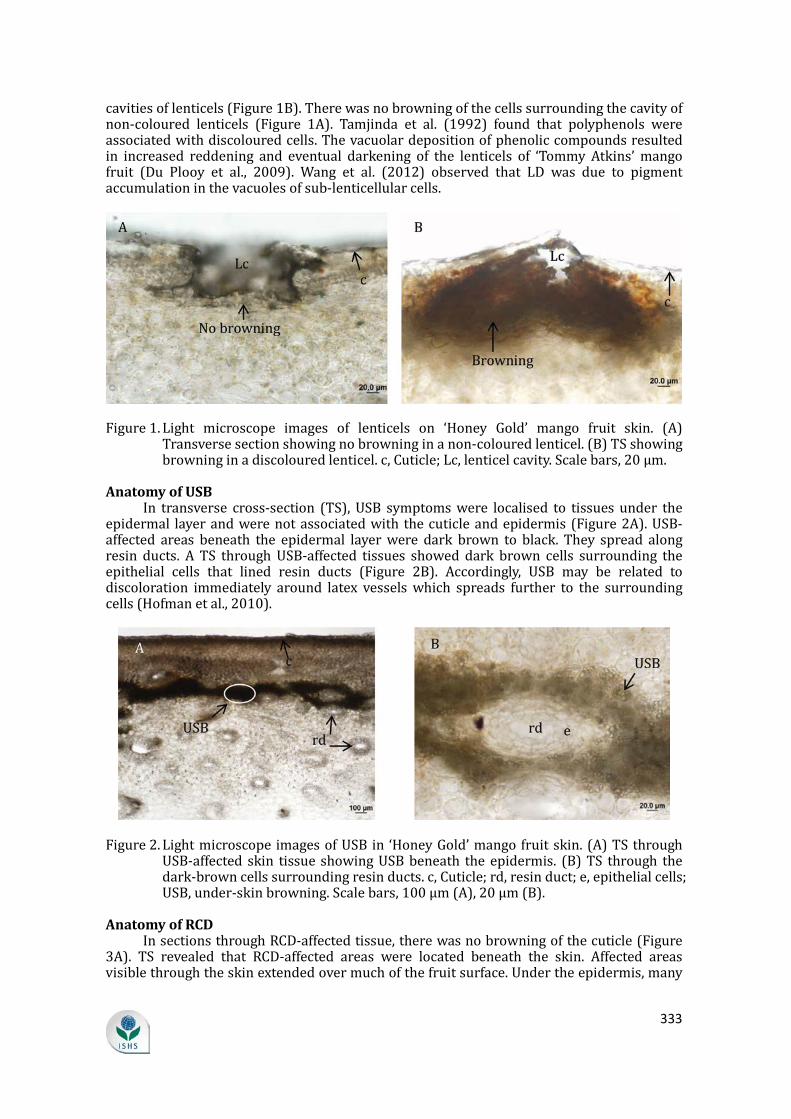
333
cavities of lenticels (Figure 1B). There was no browning of the cells surrounding the cavity of non-coloured lenticels (Figure 1A). Tamjinda et al. (1992) found that polyphenols were associated with discoloured cells. The vacuolar deposition of phenolic compounds resulted in increased reddening and eventual darkening of the lenticels of ‘Tommy Atkins’ mango fruit (Du Plooy et al., 2009). Wang et al. (2012) observed that LD was due to pigment accumulation in the vacuoles of sub-lenticellular cells.
Figure 1. Light microscope images of lenticels on ‘Honey Gold’ mango fruit skin. (A) Transverse section showing no browning in a non-coloured lenticel. (B) TS showing browning in a discoloured lenticel. c, Cuticle; Lc, lenticel cavity. Scale bars, 20 μm.
Anatomy of USB In transverse cross-section (TS), USB symptoms were localised to tissues under the
epidermal layer and were not associated with the cuticle and epidermis (Figure 2A). USB-affected areas beneath the epidermal layer were dark brown to black. They spread along resin ducts. A TS through USB-affected tissues showed dark brown cells surrounding the epithelial cells that lined resin ducts (Figure 2B). Accordingly, USB may be related to discoloration immediately around latex vessels which spreads further to the surrounding cells (Hofman et al., 2010).
Figure 2. Light microscope images of USB in ‘Honey Gold’ mango fruit skin. (A) TS through USB-affected skin tissue showing USB beneath the epidermis. (B) TS through the dark-brown cells surrounding resin ducts. c, Cuticle; rd, resin duct; e, epithelial cells; USB, under-skin browning. Scale bars, 100 μm (A), 20 μm (B).
Anatomy of RCD In sections through RCD-affected tissue, there was no browning of the cuticle (Figure
3A). TS revealed that RCD-affected areas were located beneath the skin. Affected areas visible through the skin extended over much of the fruit surface. Under the epidermis, many
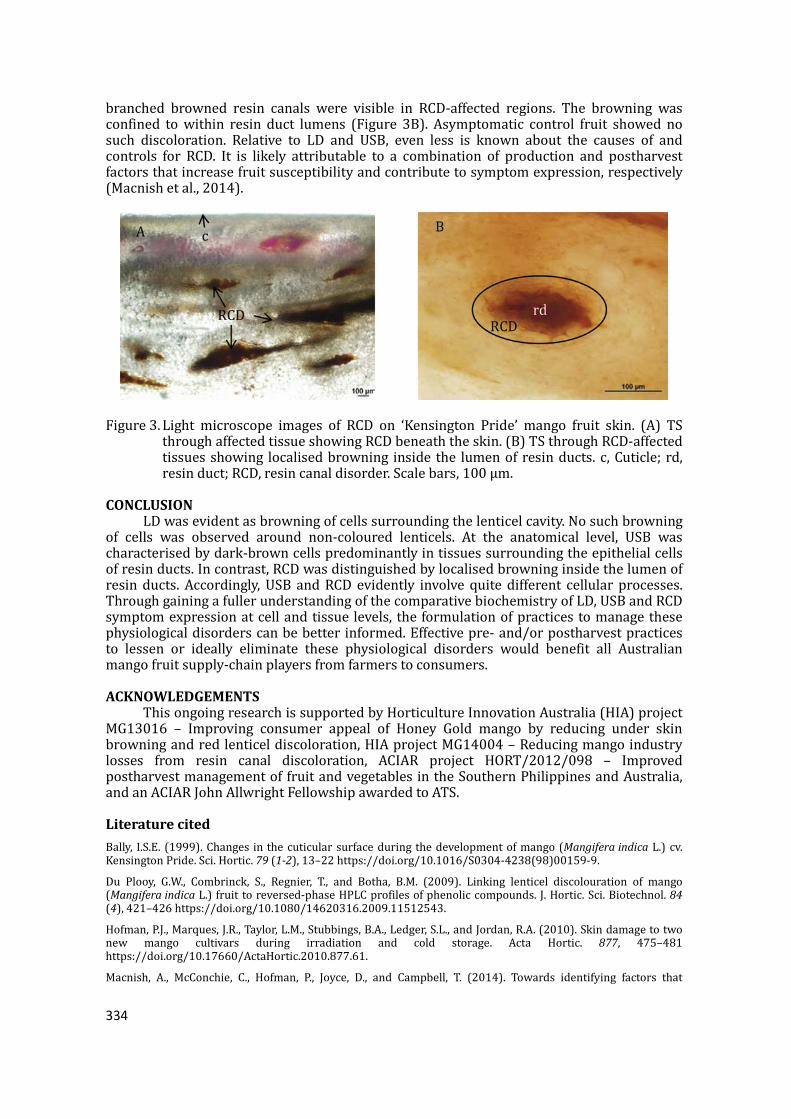
334
branched browned resin canals were visible in RCD-affected regions. The browning was confined to within resin duct lumens (Figure 3B). Asymptomatic control fruit showed no such discoloration. Relative to LD and USB, even less is known about the causes of and controls for RCD. It is likely attributable to a combination of production and postharvest factors that increase fruit susceptibility and contribute to symptom expression, respectively (Macnish et al., 2014).
Figure 3. Light microscope images of RCD on ‘Kensington Pride’ mango fruit skin. (A) TS through affected tissue showing RCD beneath the skin. (B) TS through RCD-affected tissues showing localised browning inside the lumen of resin ducts. c, Cuticle; rd, resin duct; RCD, resin canal disorder. Scale bars, 100 μm.
CONCLUSION LD was evident as browning of cells surrounding the lenticel cavity. No such browning
of cells was observed around non-coloured lenticels. At the anatomical level, USB was characterised by dark-brown cells predominantly in tissues surrounding the epithelial cells of resin ducts. In contrast, RCD was distinguished by localised browning inside the lumen of resin ducts. Accordingly, USB and RCD evidently involve quite different cellular processes. Through gaining a fuller understanding of the comparative biochemistry of LD, USB and RCD symptom expression at cell and tissue levels, the formulation of practices to manage these physiological disorders can be better informed. Effective pre- and/or postharvest practices to lessen or ideally eliminate these physiological disorders would benefit all Australian mango fruit supply-chain players from farmers to consumers.
ACKNOWLEDGEMENTS This ongoing research is supported by Horticulture Innovation Australia (HIA) project
MG13016 – Improving consumer appeal of Honey Gold mango by reducing under skin browning and red lenticel discoloration, HIA project MG14004 – Reducing mango industry losses from resin canal discoloration, ACIAR project HORT/2012/098 – Improved postharvest management of fruit and vegetables in the Southern Philippines and Australia, and an ACIAR John Allwright Fellowship awarded to ATS.
Literature cited Bally, I.S.E. (1999). Changes in the cuticular surface during the development of mango (Mangifera indica L.) cv. Kensington Pride. Sci. Hortic. 79 (1-2), 13–22 https://doi.org/10.1016/S0304-4238(98)00159-9.
Du Plooy, G.W., Combrinck, S., Regnier, T., and Botha, B.M. (2009). Linking lenticel discolouration of mango (Mangifera indica L.) fruit to reversed-phase HPLC profiles of phenolic compounds. J. Hortic. Sci. Biotechnol. 84 (4), 421–426 https://doi.org/10.1080/14620316.2009.11512543.
Hofman, P.J., Marques, J.R., Taylor, L.M., Stubbings, B.A., Ledger, S.L., and Jordan, R.A. (2010). Skin damage to two new mango cultivars during irradiation and cold storage. Acta Hortic. 877, 475–481 https://doi.org/10.17660/ActaHortic.2010.877.61.
Macnish, A., McConchie, C., Hofman, P., Joyce, D., and Campbell, T. (2014). Towards identifying factors that
335
contribute to mango resin canal discolouration. Mango Matters 14, 9–12.
Marques, J.R., Hofman, P.J., Giles, J.E., and Campbell, P.R. (2012). Reducing the incidence of under-skin browning in ‘Honey Gold’ mango (Mangifera indica L.) fruit. J. Hortic. Sci. Biotechnol. 87 (4), 341–346 https://doi.org/10.1080/14620316.2012.11512874.
Ruzin, S.E. (1999). Plant Microtechnique and Microscopy (New York, NY, USA: Oxford University Press), p.121–122.
Rymbai, H., Srivastav, M., Sharma, R.R., and Singh, S.K. (2012). Lenticels on mango fruit: origin, development, discoloration and prevention of their discoloration. Sci. Hortic. (Amsterdam) 135, 164–170 https://doi.org/10.1016/j.scienta.2011.11.018.
Tamjinda, B., Sirphanich, J., and Nobuchi, T. (1992). Anatomy of lenticels and the occurrence of their discoloration in mangoes (Mangifera indica cv. Namdokmai). Witthayasan Kasetsat Witthayasat 26, 57–64.
Wang, G., Zhang, Z., Kong, D., Liu, Q., and Zhao, G. (2012). Programmed cell death is responsible for replaceable bud senescence in chestnut (Castanea mollissima BL.). Plant Cell Rep. 31 (9), 1603–1610 https://doi.org/10.1007/s00299-012-1274-4. PubMed

336
i
LENTICEL DISCOLOURATION, UNDER-SKIN
BROWNING AND RESIN CANAL DISORDER IN
AUSTRALIAN MANGO FRUIT CULTIVARS
Anh Tram San
B.Sc Biotechnology
M.Sc Genetics
A thesis submitted for the degree of Doctor of Philosophy at
The University of Queensland in 2017
School of Agriculture and Food Sciences
ii
Abstract
Lenticel discolouration (LD), under-skin browning (USB), and resin canal disorder (RCD) are three
fruit skin disorders of concern to the Australian mango industry. LD is confined to lenticels on the
fruit skin. It was suspected that irradiation may differentially induce LD on cvs. ‘B74’, ‘Honey
Gold’, ‘Kensington Pride’, and ‘R2E2’ fruit. Irradiation at 0.5 kGy significantly (P≤0.05) increased
LD and delayed the loss of green skin colour of all four cultivars. There was generally no
significant differences (P>0.05) between 0.5 (‘commercial’ dose) and 1.0 kGy (‘upper limit’ dose).
The least pronounced effect was on cv. ‘Honey Gold’. Irradiation also diminished aroma volatiles
production by cvs. ‘Kensington Pride’ and ‘R2E2’. Examination of the morphology of LD showed
it in tissue sections as browning of sub-lenticellular cells around lenticel cavities. No such browning
was evident in sub-lenticellular cells around non-coloured lenticel cavities. Coloured polymerised
phenolic compounds appeared accumulate in the cell wall and in the cytoplasm of sub-lenticellular
cells around the cavities of discoloured lenticels.
USB is a physiological disorder evident as spreading grey-brown sub-surface lesions in cv. ‘Honey
Gold’ mango fruit. In contrast, RCD in cv. ‘Kensington Pride’ mango fruit is evident as ramifying
dark brown sub-surface resin canals. These two largely cv. specific browning disorders were
compared and contrasted at the cellular level. USB was characterised by dark brown surrounding
parenchyma cells around the epithelial cells that line resin ducts. This disorder involves starch
retention as well as deposition of phenolic compounds in parenchyma cells surrounding the
epithelial cells of resin ducts. In contrast, RCD was distinguished by localised browning inside resin
duct lumens. The browning process evidently involved accumulation of polymerised phenolics.
Polyphenol oxidase and peroxidase enzymes were determined by tissue printing to be associated
with both USB and RCD browning.
The effect of harvest time over the diurnal cycle was investigated with regard to the propensity of
cv. ‘Honey Gold’ fruit to develop USB. USB expressed in postharvest is related to the cumulative
interaction of physical (viz., vibration) and physiological (viz., chilling) stresses. Fruit harvested
during the day were relatively more susceptible to developing USB than were those picked at night.
The higher USB incidence in the afternoon harvest was related to temporally variable sap
phytoxicity. An important contributory factor to greater afternoon sap phytoxicity was concomitant
increases in the concentrations of volatiles in the sap and, especially, in the non-aqueous sap phase.
Changing from day to night and early morning harvesting afforded reduced incidence and severity
of USB on cv. ‘Honey Gold’ fruit.
iii
Declaration by author
This thesis is composed of my original work and contains no material previously published or
written by another person except where due reference has been made in the text. I have clearly
stated the contribution by others to jointly-authored works that I have included in my thesis.
I have clearly stated the contribution of others to my thesis as a whole, including statistical
assistance, survey design, data analysis, significant technical procedures, professional editorial
advice, and any other original research work used or reported in my thesis. The content of my thesis
is the result of work I have carried out since the commencement of my research higher degree
candidature and does not include a substantial part of work that has been submitted to qualify for
the award of any other degree or diploma in any university or other tertiary institution. I have
clearly stated which parts of my thesis, if any, have been submitted to qualify for another award.
I acknowledge that an electronic copy of my thesis must be lodged with the University Library and,
subject to the policy and procedures of The University of Queensland, the thesis be made available
for research and study in accordance with the Copyright Act 1968 unless a period of embargo has
been approved by the Dean of the Graduate School.
I acknowledge that copyright of all material contained in my thesis resides with the copyright
holder(s) of that material. Where appropriate I have obtained copyright permission from the
copyright holder to reproduce material in this thesis.
iv
Publications during candidature
Conferences
San, A.T., Smyth, H.E., Joyce, D.C., Webb, R., Li, G.Q., Hofman, P.J., Macnish, A.J, 2014. Mango
quality and skin disorders. In ‘QAAFI Annual Research Meeting’, Brisbane, Australia. (Poster
presentation).
San, A.T., Webb, R., Smyth, H.E., Joyce, D., Hofman, P., Macnish, A.J, 2015. A convenient
sample preparation protocol for scanning electron microscope examination of mango skin disorders.
2015. In ‘Tropical Agricultural Conference 2015’, pp. 65 66 Brisbane, Australia. (Poster
presentation).
San, A.T., Webb, R., Joyce, D.C., Hofman, P.J., Macnish, A.J, and Smyth, H.E., 2015. Anatomy of
skin disorders afflicting Australian mango fruit. In XI International Mango Symposium. (Poster
presentation).
Li, G.Q., Gupta, M., San, A.T., Joyce, D.C., Hofman, P.J., Macnish, A.J., Marques, J., 2014. Post-
harvest treatments effects on ‘B74’ mango fruit lenticel discolouration after irradiation. 2014. In
‘XXIX International Horticultural Congress on Horticulture: Sustaining Lives, Livelihoods and
Landscapes (IHC2014)’, pp. 17 22. Brisbane, Australia. (Oral presentation)
San, A.T., Smyth, H.E., Joyce, D.C., Webb, R., Li, G.Q., Hofman, P.J., Macnish, A.J., 2014. -
Irradiation effects on appearance and aroma of 'Kensington Pride' mango fruit. In ‘XXIX
International Horticultural Congress on Horticulture: Sustaining Lives, Livelihoods and Landscapes
(IHC2014)’, Brisbane, Australia. (Oral presentation)
Proceeding and journal publications
San, A.T., Joyce, D.C., Hofman, P.J., Macnish, A.J., Webb, R.I., Matovic, N.J., Williams, C.M., De
Voss, J.J., Wong, S.H., Smyth, H.E., 2017. Stable isotope dilution assay (SIDA) and HS-SPME-
GCMS quantification of key aroma volatiles for fruit and sap of Australian mango cultivars. Food
Chemistry 221, 613-619.
San, A.T., Smyth, H.E., Joyce, D.C., Webb, R., Li, G.Q., Hofman, P.J., Macnish, A.J., 2016. -
Irradiation effects on appearance and aroma of 'Kensington Pride' mango fruit. Acta Horticulturae
(ISHS) 1111, pp. 393-398.
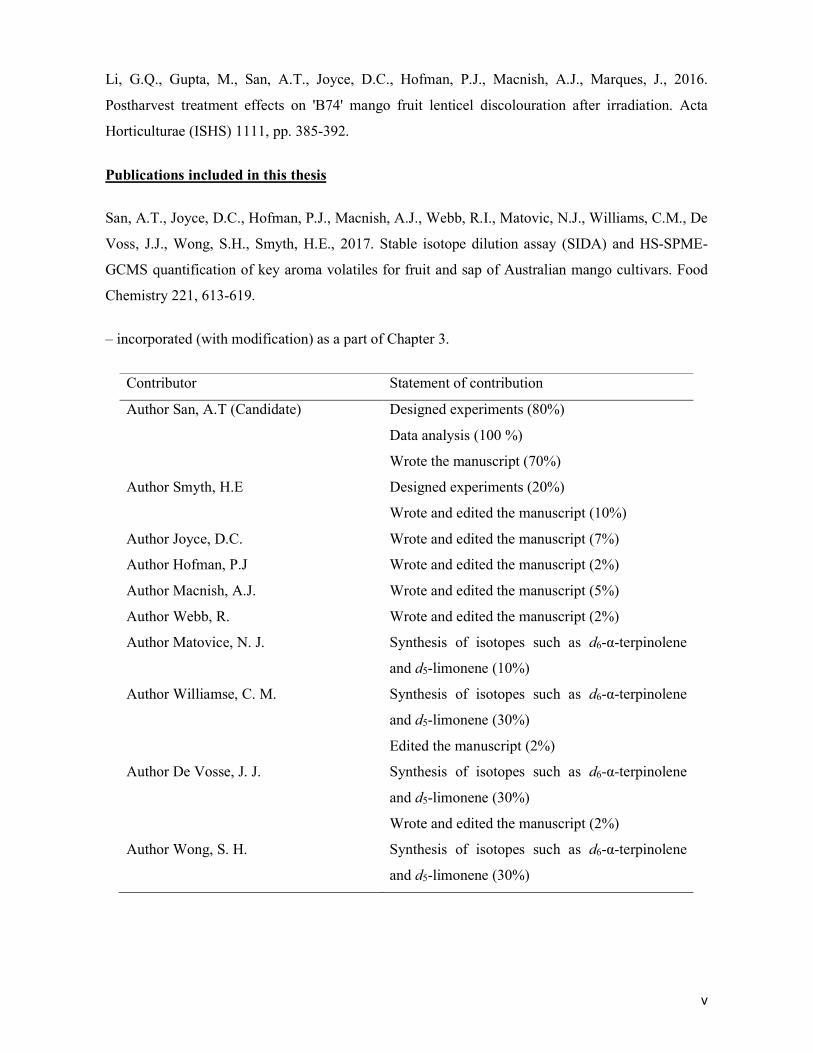
v
Li, G.Q., Gupta, M., San, A.T., Joyce, D.C., Hofman, P.J., Macnish, A.J., Marques, J., 2016.
Postharvest treatment effects on 'B74' mango fruit lenticel discolouration after irradiation. Acta
Horticulturae (ISHS) 1111, pp. 385-392.
Publications included in this thesis
San, A.T., Joyce, D.C., Hofman, P.J., Macnish, A.J., Webb, R.I., Matovic, N.J., Williams, C.M., De
Voss, J.J., Wong, S.H., Smyth, H.E., 2017. Stable isotope dilution assay (SIDA) and HS-SPME-
GCMS quantification of key aroma volatiles for fruit and sap of Australian mango cultivars. Food
Chemistry 221, 613-619.
– incorporated (with modification) as a part of Chapter 3.
Contributor Statement of contribution
Author San, A.T (Candidate) Designed experiments (80%)
Data analysis (100 %)
Wrote the manuscript (70%)
Author Smyth, H.E Designed experiments (20%)
Wrote and edited the manuscript (10%)
Author Joyce, D.C. Wrote and edited the manuscript (7%)
Author Hofman, P.J Wrote and edited the manuscript (2%)
Author Macnish, A.J. Wrote and edited the manuscript (5%)
Author Webb, R. Wrote and edited the manuscript (2%)
Author Matovice, N. J. Synthesis of isotopes such as d6-α-terpinolene
and d5-limonene (10%)
Author Williamse, C. M. Synthesis of isotopes such as d6-α-terpinolene
and d5-limonene (30%)
Edited the manuscript (2%)
Author De Vosse, J. J. Synthesis of isotopes such as d6-α-terpinolene
and d5-limonene (30%)
Wrote and edited the manuscript (2%)
Author Wong, S. H. Synthesis of isotopes such as d6-α-terpinolene
and d5-limonene (30%)
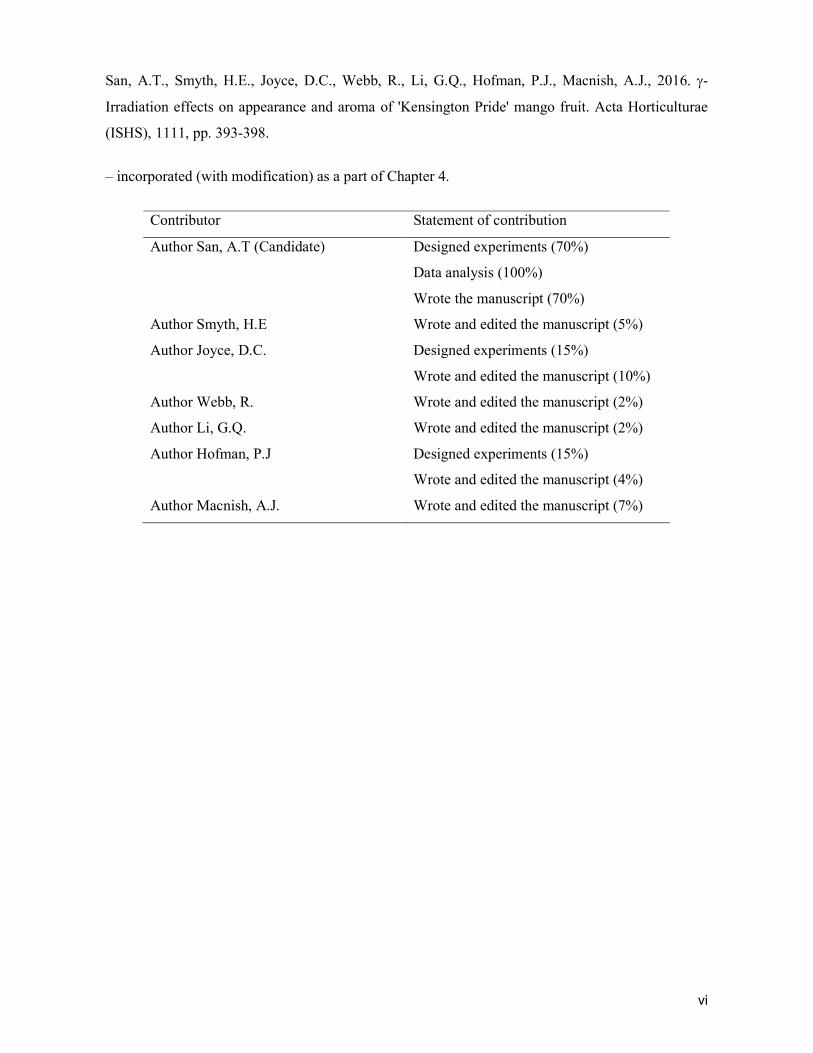
vi
San, A.T., Smyth, H.E., Joyce, D.C., Webb, R., Li, G.Q., Hofman, P.J., Macnish, A.J., 2016. -
Irradiation effects on appearance and aroma of 'Kensington Pride' mango fruit. Acta Horticulturae
(ISHS), 1111, pp. 393-398.
– incorporated (with modification) as a part of Chapter 4.
Contributor Statement of contribution
Author San, A.T (Candidate) Designed experiments (70%)
Data analysis (100%)
Wrote the manuscript (70%)
Author Smyth, H.E Wrote and edited the manuscript (5%)
Author Joyce, D.C. Designed experiments (15%)
Wrote and edited the manuscript (10%)
Author Webb, R. Wrote and edited the manuscript (2%)
Author Li, G.Q. Wrote and edited the manuscript (2%)
Author Hofman, P.J Designed experiments (15%)
Wrote and edited the manuscript (4%)
Author Macnish, A.J. Wrote and edited the manuscript (7%)
vii
Contributions by others to the thesis
1. Daryl C. Joyce (Principal Thesis Advisor; UQ Professor): Advising on experimental design and
critically revising drafts of chapters as to contribute to interpretation.
2. Heather Smyth (Thesis Advisor; UQ Senior Research Fellow): Advising on GC-MS analysis and
critically revising drafts of aroma volatile results.
3. Richard Webb (Thesis Advisor; UQ Lab Manager): Training on hand sectioning technique and
scanning electron microscopy. Advising on experimental results and revising drafts of the TEM
work.
4. Peter J. Hofman (Thesis Advisor; Senior Principal Horticulturist – Postharvest; Queensland
Department of Agriculture, Fisheries and Forestry): Advising on experimental design and critically
revising drafts of the work so as to contribute to interpretation.
5. Andrew Macnish (Thesis Advisor; Horticultural Scientist - Postharvest Queensland Department
of Agriculture, Fisheries and Forestry): Advising on experiments and critically revising drafts of the
work so as to contribute to interpretation.
5. Kerri Chandra (nee Dawson, Biometrician; Queensland Department of Agriculture, Fisheries and
Forestry): Advising on experimental design and data analyses.
6. Clare McGrory (Biometrician; School of Mathematics and Physics, UQ): Advising on data
analyses.
7. Robyn Webb (Lab technician; Centre for Microscopy and Microanalysis, UQ): Helping with
TEM training and the operation of serial block-face scanning electron microscopy for lenticel
imaging.
8. Rachel Templin (Lab technician; Centre for Microscopy and Microanalysis, UQ): Re-slicing of
image stacks of 3D datasets and building up the movie sequence through a stack of block-face
images from lenticel tissue.
9. Christy Macnish (Editor, UQ): Professional English editing for thesis chapters.
10. Nicolas J. Matovic (Uniquest, UQ): Supporting the synthesis of deuterium labelled internal
standards d6-α-terpinolene and d5-limonene in-house (Chapter 3).
viii
11. Craig M. Williams, (School of Chemistry and Molecular Biosciences, UQ): Supporting the
synthesis of deuterium labelled internal standards d6-α-terpinolene and d5-limonene in-house
(Chapter 3).
12. James J. De Voss, (School of Chemistry and Molecular Biosciences, UQ): Supporting the
synthesis of deuterium labelled internal standards d6-α-terpinolene and d5-limonene in-house
(Chapter 3).
13. Siew H. Wong (School of Chemistry and Molecular Biosciences, UQ): Supporting the synthesis
of deuterium labelled internal standards d6-α-terpinolene and d5-limonene in-house (Chapter 3).
Statement of parts of the thesis submitted to qualify for the award of another degree
None.
ix
Acknowledgements
I would like to express my sincere gratitude to my principal supervisor Professor Daryl Joyce for
his patience, broad knowledge guidance in research, and valuable advice for my PhD study. His
guidance helped me throughout my research to achieve successful results for this thesis. I would
like to thank Dr Peter Hofman for his advice and support in the project experiments. I would like to
give special gratitude to Dr Andrew Macnish for his patience in his detailed advice on experimental
results, thesis writing and revision. I would like too to thank Dr Heather Smyth for her expert
advice on volatile analysis and the revision of this manuscript. My sincere thanks also go to Richard
Webb for his extraordinary support in the anatomical work and thesis revision.
I am grateful to Robert Nissen, a former CARD project leader, who introduced me to the current
advisor team and encouraged me to apply for the John Allwright Fellowship. I am indebted to Dr
Allan McKay and Duc Duy Nguyen, former ACIAR project leaders, who also supported me
applying for the John Allwright Fellowship. Special thanks go to the former staff members of DAF
Supply Chain Innovation Team, including Barbara Stubbings, Roberto Marques, Jonathan Smith,
Christine Nolan and Ian Wells for their technical support. I would like to thank Kent Fanning,
David Edwards, Sharon Pun and Steve Fuller for the kind support during the time I worked in the
laboratory of DAF in Coopers Plains. I sincerely thank Robyn Webb and Rachel Templin for their
expert support in the training, sample examination and movie construction. Statistical advice from
Kerri Chandra and Clare McGrory are greatly appreciated. My special thanks go to Christy Macnish
for her welcome effort and time in my thesis editing. I would like to thank Sharon Harvey at
ACIAR, Kaye Hunt at School of Agriculture and Food Sciences and Catherine Fitzgerald at UQ
International Scholarship for their kind support during my PhD.
I gratefully acknowledge the receipt of an ACIAR John Allwright Fellowship for financial support
of my PhD study in Australia. My study would have been impossible without the support of ACIAR
project HORT 2012/098 and projects MG10008, MG10009 and MG13016 funded by Horticulture
Australia Ltd using voluntary contributions from Harvest Fresh Fruit Company and Piñata Farms
matched by funds from the Australian Government. In-kind and financial support was also provided
by the Queensland Department of Agriculture and Fisheries (DAF) and The University of
Queensland (UQ). We acknowledge the Queensland Alliance for Agriculture & Food Innovation
(QAAFI) and DAF for the use of specialised laboratory facilities and assistance.
I sincerely thank my fellow postgraduate students Guoqin Li, Tuan Minh Nguyen, Muhammad
Sohail Mazhar, Khamla Mott, Chi Nguyen Ngo, Vilayphone Sourideth, Sharmin Afroz, Sungbo
x
Cho, Yunru Lai and Wenny-Bekti Sunarharum for their friendship during my study. My special
thanks go to my beloved husband Long Hoang Phan and my little son An Thien Hoang Phan who
have given me their love, encouragement and moral support. Last but not least, I would like to
express my deep gratitude to my parents who have always given me their inspiration, drive and
endless love to support all the dreams in my life.
xi
Keywords
Anatomy, diurnal harvest cycle, enzymatic browning, light microscopy, Mangifera indica L., serial
block-face scanning electron microscopy, transmission electron microscopy, tissue printing.
Australian and New Zealand Standard Research Classifications (ANZSRC)
070605 Post Harvest Horticultural Technologies 30%
060705 Plant Physiology 40%
060799 Plant Biology 30%
Fields of Research (FoR) Classification
0706 Horticultural Production 30%
0607 Plant Biology 70%
xii
TABLE OF CONTENTS
TABLE OF CONTENTS .............................................................................................................. xii
LIST OF FIGURES ..................................................................................................................... xix
LIST OF TABLES .................................................................................................................... xxxii
LIST OF ABBREVIATIONS .................................................................................................. xxxvi
CHAPTER 1. GENERAL INTRODUCTION ................................................................................. 1
1.1 Research background ............................................................................................................. 1
1.2 Research approach ................................................................................................................. 3
1.3 Thesis structure ...................................................................................................................... 5
References ................................................................................................................................... 6
CHAPTER 2. LITERATURE REVIEW ......................................................................................... 9
2.1 Introduction ........................................................................................................................... 9
2.2 Quality of mango fruit ........................................................................................................... 9
2.3 Mango ripening physiology ................................................................................................. 11
2.3.1 Respiration .................................................................................................................... 11
2.3.2 Ethylene production and the ripening process ................................................................ 11
2.4 Metabolic and compositional changes during ripening ......................................................... 12
2.4.1 Cell wall and structural polysaccharides and texture ...................................................... 12
2.4.2 Organic acids ................................................................................................................ 12
2.4.3 Soluble sugars ............................................................................................................... 12
2.4.4 Colour and pigments ..................................................................................................... 13
xiii
2.4.5 Flavour (taste, aroma) .................................................................................................... 14
2.5 Mango skin disorders ........................................................................................................... 17
2.5.1 Lenticel discolouration .................................................................................................. 17
2.5.2 Under-skin browning ..................................................................................................... 19
2.5.3 Resin canal discolouration ............................................................................................. 20
2.6 Pre-harvest management ...................................................................................................... 21
2.6.1 Cultivar ......................................................................................................................... 21
2.6.2 Moisture ........................................................................................................................ 21
2.6.3 Nutrition ........................................................................................................................ 22
2.6.4 Fruit bagging ................................................................................................................. 22
2.7 Irradiation of mango fruit ..................................................................................................... 22
2.7.1 Sources ......................................................................................................................... 23
2.7.2 -Irradiation and mango fruit ......................................................................................... 23
2.8 Conclusions and perspectives............................................................................................... 24
References ................................................................................................................................. 25
CHAPTER 3. STABLE ISOTOPE DILUTION ASSAY (SIDA) AND HS-SPME-GCMS
QUANTIFICATION OF KEY AROMA VOLATILES FOR FRUIT AND SAP OF AUSTRALIAN
MANGO CULTIVARS ................................................................................................................ 37
Abstract ..................................................................................................................................... 37
3.1 Introduction ......................................................................................................................... 37
3.2 Materials and methods ......................................................................................................... 40
3.2.1 Materials ....................................................................................................................... 40
xiv
3.2.2 Synthesis of isotopes ..................................................................................................... 40
3.2.3 Mango fruit ................................................................................................................... 41
3.2.4 Mango sap ..................................................................................................................... 42
3.2.5 Calibration and validation of method ............................................................................. 42
3.2.6 Headspace sampling of volatiles for analysis ................................................................. 43
3.2.7 Instrumental analysis of volatiles ................................................................................... 43
3.3 Results and Discussion ........................................................................................................ 44
3.3.1 Isotope synthesis ........................................................................................................... 44
3.3.2 Mango volatile analysis method and validation .............................................................. 45
3.3.3 Analysis of key aroma volatiles in mango fruits............................................................. 48
3.3.4 Analysis of key aroma volatiles in mango sap................................................................ 51
3.4 Conclusion........................................................................................................................... 52
References ................................................................................................................................. 52
CHAPTER 4. -IRRADIATION EFFECTS ON APPEARANCE, PHYSICO-CHEMICAL
PROPERTIES AND AROMA OF FOUR AUSTRALIAN MANGO FRUIT CULTIVARS ......... 58
Abstract ..................................................................................................................................... 58
4.1 Introduction ......................................................................................................................... 58
4.2 Materials and methods ......................................................................................................... 60
4.2.1 Plant material ................................................................................................................ 60
4.2.2 Treatments .................................................................................................................... 61
4.2.3 Quality assessments ....................................................................................................... 63
xv
4.2.4 Statistical analysis ......................................................................................................... 66
4.3 Results ................................................................................................................................. 66
4.3.1 External appearance and physical properties during ripening ......................................... 66
4.3.2. Taste and chemical properties of ripe fruit .................................................................... 82
4.4 Discussion ........................................................................................................................... 96
4.5 Conclusion........................................................................................................................... 99
References ................................................................................................................................. 99
CHAPTER 5. ANATOMICAL OBSERVATIONS OF LENTICEL DISCOLOURATION IN
AUSTRALIAN MANGO FRUIT SKIN ..................................................................................... 105
Abstract ................................................................................................................................... 105
5.1 Introduction ....................................................................................................................... 105
5.2 Materials and methods ....................................................................................................... 107
5.2.1 Materials ..................................................................................................................... 107
5.2.2 Binocular microscope observations ............................................................................. 107
5.2.3 Free-hand sectioning ................................................................................................... 107
5.2.4 Light microscopy ........................................................................................................ 108
5.2.5 SBF-SEM .................................................................................................................... 108
5.3 Results ............................................................................................................................... 109
5.3.1 Binocular microscope observations ............................................................................. 109
5.3.2 Free-hand section observations .................................................................................... 109
5.3.3 Light microscopy observations .................................................................................... 110
5.3.4 SBF-SEM observations ............................................................................................... 113
xvi
5.4 Discussion ......................................................................................................................... 117
5.5 Conclusion......................................................................................................................... 120
References ............................................................................................................................... 120
CHAPTER 6. DIURNAL HARVEST CYCLE AND SAP COMPONENTS AFFECT THE
DEVELOPMENT OF UNDER-SKIN BROWNING IN ‘HONEY GOLD’ MANGO FRUIT ..... 122
Abstract ................................................................................................................................... 122
6.1 Introduction ....................................................................................................................... 122
6.2 Materials and methods ....................................................................................................... 124
6.2.1 Experiment 1: Effect of diurnal harvest cycle on USB development ............................ 124
6.2.2 Experiment 2: Effect of sap components on USB development .................................... 126
6.2.3 Assessment of USB, induced USB symptoms, and sapburn severity and incidence ...... 126
6.2.4 Determination of sap volume and composition ............................................................ 127
6.2.5 Anatomy of natural USB, induced USB symptoms and sapburn .................................. 127
6.2.6 Experimental design and statistical analysis ................................................................. 127
6.3 Results ............................................................................................................................... 128
6.3.1 Experiment 1: Effect of diurnal harvest cycle on USB development ............................ 128
6.3.2 Experiment 2: Effect of sap components on USB incidence ......................................... 142
6.3.3 Anatomical observations ............................................................................................. 144
6.4 Discussion ......................................................................................................................... 147
6.5 Conclusion......................................................................................................................... 149
References ............................................................................................................................... 150
xvii
CHAPTER 7. COMPARATIVE ANATOMY AND ENZYMATIC BROWNING OF UNDER-
SKIN BROWNING AND RESIN CANAL DISORDER ............................................................ 153
Abstract ................................................................................................................................... 153
7.1 Introduction ....................................................................................................................... 153
7.2 Materials and methods ....................................................................................................... 155
7.2.1 Materials ..................................................................................................................... 155
7.2.2 Treatments .................................................................................................................. 155
7.2.3 Comparative anatomy of USB and RCD ...................................................................... 156
7.2.4 Effects of non-aqueous fraction of sap on USB development ....................................... 158
7.2.5 Localisation of polyphenol oxidase (PPO) and peroxidase (POD) in USB and RCD
browning .............................................................................................................................. 159
7.3 Results ............................................................................................................................... 159
7.3.1Comparative anatomy of USB and RCD ....................................................................... 159
7.3.2 Effects of the non-aqueous sap fraction on USB development ..................................... 172
7.3.3 Localisation of PPO and POD by tissue printing .......................................................... 177
7.4 Discussion ......................................................................................................................... 180
7.4.1 Anatomy and histochemistry of USB ........................................................................... 180
7.4.2 Anatomy and histochemistry of RCD .......................................................................... 181
7.4.3 Effects of non-aqueous fraction of sap on USB development ....................................... 182
7.4.4 Localisation of PPO and POD on USB and RCD browning ......................................... 184
7.5 Conclusion......................................................................................................................... 185
References ............................................................................................................................... 185
xviii
CHAPTER 8. GENERAL DISCUSSION AND CONCLUSIONS .............................................. 189
8.1 Method development for quantification of key aroma volatiles for mango fruit and sap ..... 189
8.2 LD and other mango quality attributes ............................................................................... 190
8.2.1 Effects of irradiation on LD and other mango quality attributes ................................... 190
8.2.2 Anatomy of LD ........................................................................................................... 191
8.3 USB on ‘Honey Gold’ mango and RCD on ‘Kensington Pride’ mango .............................. 193
8.3.1 Comparative anatomy of USB and RCD ...................................................................... 193
8.3.2 Mechanism of USB development ................................................................................ 194
8.3.3 Comparative enzymatic browning of USB and RCD ................................................... 196
8.4 Conclusions and suggested future directions ...................................................................... 196
References ............................................................................................................................... 198
APPENDICES ............................................................................................................................ 201
Appendix 1 .............................................................................................................................. 201
Appendix 2. Scanning electron microscopy (SEM) .................................................................. 202
A 2.1 SEM protocol ............................................................................................................. 202
A 2.2 SEM observations....................................................................................................... 202
Appendix 3. Dry matter ........................................................................................................... 203
xix
LIST OF FIGURES
Figure 1.1 Typical symptoms of LD on ‘B74’ (A) , USB (B) on ‘Honey Gold’ and RCD on
‘Kensington Pride’(B) mango fruit. Arrows point to affected regions. ............................................. 3
Figure 2.1 Biosynthesis pathways of major volatile compounds in fruits (from Defilippi et al.,
2009). Abbreviations: LOX, lipoxygenase; HPL, fatty acid hydroperoxide lyase; ADH, alcohol
dehydrogenase; AAT, alcohol acyl transferase; PDC, pyruvate decarboxylase; THMF, 3-ketoacyl-
CoA thiolase; CCD, carotenoid cleavage dioxygenase; MTS, monoterpene synthase; TPS, terpene
synthase; and, Acetyl CoA, acetyl coenzyme A. ............................................................................ 17
Figure 2.2 Vacuolar accumulation of pigmentation in sub-lenticellular cells of mature ‘Tommy
Atkins’ mango fruit stained with Safranin A (from Bezuidenhout et al., 2005). ............................. 19
Figure 2.3 Damaged resin duct adjacent to discoloured lenticels of ‘Keitt’ mango exocarp (from
Bezuidenhout et al., 2005). Ep, epithelial cells; rd , resin duct. ...................................................... 19
Figure 2.4 Retention or accumulation of starch granules revealed in starch-iodine stained USB-
affected tissue (from Marques et al., 2012). C, cuticle; RC, resin canal; SL, starch layer; DCL,
discoloured cell layer. Scale bars = 0.1 mm. .................................................................................. 20
Figure 2.5 Resin canal disorder symptom in ‘Kensington Pride’ mango fruit...................................20
Figure 3.1 Mass spectra and possible fragmentations of the internal standard compounds d6-α-
terpinolene (A) and d5-limonene (B) as synthesised in-house and commercial d12-hexanal (C) and
d15-ethyl octanoate (D). ................................................................................................................. 44
Figure 4.1 Effect of irradiation (0, 0.5, 1.0 kGy) on hand firmness of ‘B74’, ‘Honey Gold’,
‘Kensington Pride’ and ‘R2E2’ mango fruit (n = 15) during shelf life at 20 oC. Green mature fruit
were harvested from north Queensland (NQ) and south east Queensland (SEQ) in the 2012/2013
season and exposed to -irradiation. Fruit were treated with 10 µl/l ethylene for 2 d at 20 ºC inside a
ripening room and maintained at 20 ºC and 90 - 100% RH until ripe. The LSD (P = 0.05) bars are
for factorial effect of dose and time. .............................................................................................. 67
Figure 4.2 Effect of irradiation (0, 0.5, 1.0 kGy) on hand firmness of ‘B74’, ‘Honey Gold’,
‘Kensington Pride’ and ‘R2E2’ mango fruit (n = 15) during shelf life at 20 oC. Green mature fruit
were harvested from north Queensland (NQ) and south east Queensland (SEQ) in the 2013/2014
season and exposed to -irradiation. Fruit were treated with 10 µl/l ethylene for 2 d at 20 ºC inside a
xx
ripening room and maintained at 20 ºC and 90 - 100% RH until ripe. The LSD (P = 0.05) bars are
for factorial effect of dose and time. .............................................................................................. 68
Figure 4.3 Effect of irradiation (0, 0.5, 1.0 kGy) on Sinclair IQ firmness tester assessments of
‘B74’, ‘Honey Gold’, ‘Kensington Pride’ and ‘R2E2’ mango fruit (n = 5) during shelf life at 20oC.
Green mature fruit were harvested from north Queensland (NQ) and south east Queensland (SEQ)
in the 2013/2014 season and exposed to -irradiation. Fruit were treated with 10 µl/l ethylene for 2
d at 20 ºC inside a ripening room and maintained at 20 ºC and 90 - 100% RH until ripe. The LSD (P
= 0.05) bars are for factorial effect of dose and time. .................................................................... 69
Figure 4.4 Effect of irradiation (0, 0.5, 1.0 kGy) on skin colour of ‘B74’, ‘Honey Gold’,
‘Kensington Pride’ and ‘R2E2’ mango fruit (n = 15) during shelf life at 20 ºC. Green mature fruit
were harvested from north Queensland (NQ) and south east Queensland (SEQ) in the 2012/2013
season and exposed to -irradiation. Fruit were treated with 10 µl/l ethylene for 2 d at 20 ºC inside a
ripening room and maintained at 20 ºC and 90 - 100% RH until ripe. The LSD (P = 0.05) bars are
for factorial effect of dose and time. .............................................................................................. 71
Figure 4.5 Effect of irradiation (0, 0.5, 1.0 kGy) on skin colour of ‘B74’, ‘Honey Gold’,
‘Kensington Pride’ and ‘R2E2’ mango fruit (n = 15) during shelf life at 20 ºC. Green mature fruit
were harvested from north Queensland (NQ) and south east Queensland (SEQ) in the 2013/2014
season and exposed to -irradiation. Fruit were treated with 10 µl/l ethylene for 2 d at 20 ºC inside a
ripening room and maintained at 20 ºC and 90 - 100% RH until ripe. The LSD (P = 0.05) bars are
for factorial effect of dose and time. .............................................................................................. 72
Figure 4.6 Effect of irradiation (0, 0.5, 1.0 kGy) on L of ‘B74’, ‘Honey Gold’, ‘Kensington Pride’
and ‘R2E2’ mango fruit during shelf life at 20 ºC. Green mature fruit were harvested from north
Queensland (NQ)1 and south east Queensland (SEQ)2 in the 2012/2013 season and exposed to -
irradiation. Fruit were treated with 10 µl/l ethylene for 2 d at 20 ºC inside a ripening room and
maintained at 20 ºC and 90 - 100% RH until ripe. The LSD (P = 0.05) bars are for factorial effect
of dose and time. (1n = 15 and 2n = 10). ......................................................................................... 73
Figure 4.7 Effect of irradiation (0, 0.5, 1.0 kGy) on C of ‘B74’, ‘Honey Gold’, ‘Kensington Pride’
and ‘R2E2’ mango fruit during shelf life at 20 ºC. Green mature fruit were harvested from north
Queensland (NQ)1 and south east Queensland (SEQ)2 in the 2012/2013 season and exposed to -
irradiation. Fruit were treated with 10 µl/l ethylene for 2 d at 20 ºC inside a ripening room and
xxi
maintained at 20 ºC and 90 - 100% RH until ripe. The LSD (P = 0.05) bars are for factorial effect
of dose and time. (1n = 15 and 2n = 10). ......................................................................................... 74
Figure 4.8 Effect of irradiation (0, 0.5, 1.0 kGy) on ho of ‘B74’, ‘Honey Gold’, ‘Kensington Pride’
and ‘R2E2’ mango fruit during shelf life at 20 ºC. Green mature fruit were harvested from north
Queensland (NQ)1 and south east Queensland (SEQ)2 in the 2012/2013 season and exposed to -
irradiation. Fruit were treated with 10 µl/l ethylene for 2 d at 20 ºC inside a ripening room and
maintained at 20 ºC and 90 - 100% RH until ripe. The LSD (P = 0.05) bars are for factorial effect
of dose and time. (1n = 15 and 2n = 10). ......................................................................................... 75
Figure 4.9 Effect of irradiation (0, 0.5, 1.0 kGy) on L of ‘B74’, ‘Honey Gold’, ‘Kensington Pride’
and ‘R2E2’ mango fruit (n = 10) during shelf life at 20 ºC. Green mature fruit were harvested from
north Queensland (NQ) and south east Queensland (SEQ) in the 2013/2014 season and exposed to
-irradiation. Fruit were treated with 10 µl/l ethylene for 2 d at 20 ºC inside a ripening room and
maintained at 20 ºC and 90 - 100% RH until ripe. The LSD (P = 0.05) bars are for factorial effect
of dose and time. ........................................................................................................................... 76
Figure 4.10 Effect of irradiation (0, 0.5, 1.0 kGy) on C of ‘B74’, ‘Honey Gold’, ‘Kensington Pride’
and ‘R2E2’ mango fruit (n = 10) during shelf life at 20 ºC. Green mature fruit were harvested from
north Queensland (NQ) and south east Queensland (SEQ) in the 2013/2014 season and exposed to
-irradiation. Fruit were treated with 10 µl/l ethylene for 2 d at 20 ºC inside a ripening room and
maintained at 20 ºC and 90 - 100% RH until ripe. The LSD (P = 0.05) bars are for factorial effect
of dose and time. ........................................................................................................................... 77
Figure 4.11 Effect of irradiation (0, 0.5, 1.0 kGy) on ho of ‘B74’, ‘Honey Gold’, ‘Kensington Pride’
and ‘R2E2’ mango fruit (n = 10) during shelf life at 20 ºC. Green mature fruit were harvested from
north Queensland (NQ) and south east Queensland (SEQ) in the 2013/2014 season and exposed to
-irradiation. Fruit were treated with 10 µl/l ethylene for 2 d at 20 ºC inside a ripening room and
maintained at 20 ºC and 90 - 100% RH until ripe. The LSD (P = 0.05) bars are for factorial effect
of dose and time. ........................................................................................................................... 78
Figure 4.12 Typical symptoms of skin browning on ‘Kensington Pride’ (B) and ‘R2E2’ (D) mango
fruit exposed to 1.0 kGy as compared to non-irradiated ‘Kensington Pride’ (A) and ‘R2E2’ (C)
mango fruit. Arrows point to affected regions. .............................................................................. 79
Figure 4.13 Effect of irradiation (0, 0.5, 1.0 kGy) on lenticel discolouration of ‘B74’, ‘Honey Gold’,
‘Kensington Pride’ and ‘R2E2’ mango fruit (n = 10) during shelf life at 20 ºC. Green mature fruit
xxii
were harvested from north Queensland (NQ) and south east Queensland (SEQ) in the 2012/2013
season and exposed to -irradiation. Fruit were treated with 10 µl/l ethylene for 2 d at 20 ºC inside a
ripening room and maintained at 20 ºC and 90 - 100% RH until ripe. The LSD (P = 0.05) bars are
for factorial effect of dose and time. .............................................................................................. 80
Figure 4.14 Effect of irradiation (0, 0.5, 1.0 kGy) on lenticel discolouration of ‘B74’, ‘Honey Gold’,
‘Kensington Pride’ and ‘R2E2’ mango fruit (n = 15) during shelf life at 20 ºC. Green mature fruit
were harvested from north Queensland (NQ) and south east Queensland (SEQ) in the 2013/2014
season and exposed to -irradiation. Fruit were treated with 10 µl/l ethylene for 2 d at 20 ºC inside a
ripening room and maintained at 20 ºC and 90 - 100% RH until ripe. The LSD (P = 0.05) bars are
for factorial effect of dose and time. .............................................................................................. 81
Figure 4.15 A diagrammatic model of γ-irradiation effects on appearance, physico-chemical
properties and aroma of four Australian mango fruit cultivars based on currently findings (this
chapter) and published work (Defilippi et al., 2009; Schwab et al., 2008; Winterhalter and Rouseff,
2002). Chls, chlorophylls; blue slashes, suppressed; red slashes, suppressed. ................................ 98
Figure 5.1 Symptom of LD on ‘B74’ mango fruit. (A) External feature of LD on fruit. (B) Arrows
point (panel B) to each of characteristic non-coloured (n) and discoloured (d) lenticels. (C) Arrow
point to non-coloured lenticel (B) Arrow point to discoloured lenticel. Scale bars = C, D, 50 μm. n,
non-coloured lenticel; di, discoloured lenticel. ............................................................................ 110
Figure 5.2 Light photomicrographs of lenticels on ‘B74’ (A, B), ‘Honey Gold’ (C, D), ‘Kensington
Pride’ (E, F) and ‘R2E2’ (G, H) mango fruit. (A, C, E and G) Transverse sections (TS) showing no
browning in non-coloured ‘control’ lenticels. (B, D, F and H) TS showing browning in discoloured
lenticels. c, cuticle; Ep, epidermal cells; Lc, lenticel cavity; B, browning. (A-H) Scale bars = 20
μm………………………………………………………………………………………………….111
Figure 5.3 Light microscope images of lenticels on ‘B74’ (A, B), ‘Honey Gold’ (C, D), ‘Kensington
Pride’ (E, F) and ‘R2E2’ (G, H) mango fruit. The transverse 5 μm-thick sections were examined
using the paraffin wax embedding method and stained with metachromatic Toluidine Blue O. (A, C,
E and G) TS showing phenolics are absent as purple staining colour in non-coloured lenticels. (B,
D, F and H) TS showing phenolics are present as green staining colour in discoloured lenticels. c,
cuticle; Ep, epidermal cells; GC, stomatal guard cells; P, phenolics; rd, resin duct; Lc, lenticel
cavity. Scale bars = A-C, E-H, 20 μm; D, 50 μm. ........................................................................ 112
xxiii
Figure 5.4. Four image slices from 3D datasets of non-coloured lenticel of ‘B74’ mango fruit.
Images A, B, C and D are sections 1, 216, 725 and 1501, respectively, of a total stack of 2,000
sections at 100 nm thickness. These images of a non-coloured lenticel show minimal evidence of
electron-dense material accumulation in cells. c, cuticle; Ep, epidermal cells; Lc, lenticel cavity; P1
- P3, three types of phenolics; Si, silver conductive paint layer. Scale bars = 25 µm. ................... 114
Figure 5.5. Four image slices from 3D datasets of discoloured lenticel of ‘B74’ mango fruit. Images
A, B, C and D are sections 776, 1,121, 1680 and 2,800, respectively, of a total stack of 3,259
sections at 100 nm thickness. These images of a discoloured lenticel illustrate the evidence of
pronounced electron-dense material accumulation in cells. c, cuticle; Ep, epidermal cells; Lc,
lenticel cavity; P1 - P3, three types of phenolics; Si, silver conductive paint layer. Scale bars = 25
µm. ............................................................................................................................................. 115
Figure 5.6. Images taken from SBF-SEM movie sequences of non-coloured and discoloured of
‘B74’ mango fruit lenticels. (A, C, E) Images showing minimal evidence of electron-dense material
in a non-coloured lenticel. (B, D, F) Images showing evidence of more extensive electron-dense
material in a discoloured lenticel. c, cuticle; Ep, epidermal cells; GC, stomatal guard cells; Lc,
lenticel cavity; P1 - P3, three types of phenolics; rd, resin duct. ................................................... 116
Figure 5.7. A comparative diagrammatic model of LD in mango fruit is based on current findings
(this chapter) and published work (Bezuidenhout et al., 2005; Du Plooy et al., 2009; Du Plooy et al.,
2006). LD is visible as browning in the sub-lenticellular cells surrounding the lenticel cavity. This
browning was asscociated with phenolic deposition in the sub-lenticellular cells surrounding the
cavity. There was three different types of phenolic deposition as polymerised electron-dense
phenolic depositions in the cell walls and cytoplasm and a discrete deposit of phenolics in the
cytoplasm of sub-lenticellular cells. Lc, lenticel cavity; LD, lenticel discolouration; P1 - P3, three
types of phenolics; SLC, the sub-lenticellular cells. ..................................................................... 119
Figure 6.1 Collecting sap on a de-sapping rack (A) and USB abrasion test as applied with an orbital
finishing sander (B). .................................................................................................................... 125
Figure 6.2 Field temperatures (A) and relative humidity (B) over a diurnal harvest cycle in the
2013/2014 season. Field temperature and relative humidity during the harvest periods were
recorded using a Tinytag Ultra 2 logger....................................................................................... 129
Figure 6.3 Field temperatures (A) and RH (B) over a diurnal harvest cycle in the 2014/2015
season……………………………………………………………………………………………...129
xxiv
Figure 6.4 Under skin browning (USB) induced by the abrasion test in 2013/2014. (A) The
incidence of USB from the diurnal harvest cycle. (B) The average severity of USB from the diurnal
harvest cycle. The LSD (P = 0.05) bars are for comparison between harvest times. If the difference
between means is less than the vertical bar, then there is no statistically significant difference
between those means (P>0.05). n.s. indicates no significant difference (P>0.05). n = 4 replications
each comprised of 10 individual fruit on each of which four sub-samples were taken. ................. 131
Figure 6.5 Under skin browning (USB) induced by the abrasion test in 2014/2015. (A) The
incidence of USB from the diurnal harvest cycle. (B) The average severity of USB from the diurnal
harvest cycle. The LSD (P = 0.05) bar on graph A is for comparison between harvest time and on
graph B for the interaction between harvest time and delay treatments. Fruit were placed in the cold
room after 1 d of abrasion (termed ‘1 d delay’) and fruit were placed in the cold room within 2 h of
abrasion (termed ‘no delay’). If the difference between means is less than the vertical bar, then there
is no statistically significant difference between those means (P>0.05). n = 4 replications each
comprised of 10 individual fruit on each of which four sub-samples were taken. ......................... 132
Figure 6.6. USB associated with the abrasion test on fruit harvested at 1400 h (A) and 2200 h
(B).....................................................................................................................................................133
Figure 6.7 USB not associated with the abrasion test (i.e. natural USB) in 2014/2015. (A) The
incidence of USB over the diurnal harvest cycle. (B) The average severity of USB over the diurnal
harvest cycle. The LSD (P = 0.05) bars are for the interaction between harvest time and delay
treatments. Fruit were either placed in the cold room after 1 d of abrasion (‘1 d delay’) or within 2 h
of abrasion (‘no delay’). If the difference between means is less than the vertical bar, then there is
no statistically significant difference between those means (P>0.05). n = 4 replications each
comprised of 10 individual fruit on each of which four sub-samples were taken. ......................... 133
Figure 6.8 Changes in the volume of whole sap (A), non-aqueous phase (B), aqueous phase (C) and
the relative proportions of non-aqueous phase and aqueous phase (E) over the diurnal harvest cycle
in the 2013/2014 season. The LSD (P = 0.05) bars are for comparison of means between harvest
times. n = 4 replications. ............................................................................................................. 134
Figure 6.9 Changes in the volume of whole sap (A), non-aqueous phase (B), aqueous phase (C) and
the relative proportions of non-aqueous phase and aqueous phase (E) over the diurnal harvest cycle
in the 2014/2015 season. The LSD (P = 0.05) bars are for comparison of means between harvest
times. n.s. indicates no significant difference (P>0.05). n = 4 replications. .................................. 135
xxv
Figure 6.10 Changes in the concentrations of aroma volatiles, including 2-carene (A), 3-carene (B),
p-cymene (C), -terpinene (D), limonene (E) and –terpinolene (F), in the whole sap over the
diurnal harvest cycle in the 2013/2014 season. The LSD (P = 0.05) bars are for comparison of
means between harvest times. n.s. indicates no significant difference (P>0.05). n = 4 sap
replications plus two laboratory replicates per replication. ........................................................... 136
Figure 6.11 Changes in the concentrations of aroma volatiles, including 2-carene (A), 3-carene (B),
p-cymene (C), -terpinene (D), limonene (E) and –terpinolene (F), in the non-aqueous phase over
the diurnal harvest cycle in the 2013/2014 season. The LSD (P = 0.05) bars are for comparison of
means between harvest times. n.s. indicates no significant difference (P>0.05). n = 4 sap
replications plus two laboratory replicates per replication. ........................................................... 137
Figure 6.12 Changes in the concentration of aroma volatiles of the aqueous phase including 2-
carene (A), 3-carene (B), p-cymene (C), -terpinene (D), limonene (E) and –terpinolene (F) over
the diurnal harvest cycle in the 2013/2014 season. The LSD (P = 0.05) bars are for comparison of
means between harvest times. n = 4 sap replications plus two laboratory replicates per
replication.........................................................................................................................................138
Figure 6.13 Changes in the concentrations of aroma volatiles of the whole sap, including 2-carene
(A), 3-carene (B), p-cymene (C), -terpinene (D), limonene (E) and –terpinolene (F), over the
diurnal harvest cycle in the 2014/2015 season. The LSD (P = 0.05) bars are for comparison of
means between harvest times. n = 4 sap replications plus two laboratory replicates per replication
..........................................................................................................................................................139
Figure 6.14 Changes in the concentrations of aroma volatiles of the non-aqueous phase, including 2-
carene (A), 3-carene (B), p-cymene (C), -terpinene (D), limonene (E) and –terpinolene (F), over
the diurnal harvest cycle in the 2014/2015 season. The LSD (P = 0.05) bars are for comparison of
means between harvest times. n = 4 sap replications plus two laboratory replicates per
replication……………………………………………………………………………………….....140
Figure 6.15 Changes in the concentration of aroma volatiles of the aqueous phase, including 2-
carene (A), 3-carene (B), p-cymene (C), -terpinene (D), limonene (E) and –terpinolene (F), over
the diurnal harvest cycle in the 2014/2015 season. The LSD (P = 0.05) bars are for comparison of
means between harvest times. n = 4 sap replications plus two laboratory replicates per
replication…... ............................................................................................................................ 141
xxvi
Figure 6.16 Symptoms of USB in the afternoon-harvested (1400 h) fruit caused by abrasion test as
applied with an orbital finishing sander (A), sap-burn browning due to topical sap application (B),
induced USB symptoms by topical terpinolene (C), limonene (D) and 2-carene (E) applications, and
control sample treated with distilled water (F). MB, mild skin browning; NB, no browning; SB,
severe skin browning; USB, under-skin browning. ...................................................................... 144
Figure 6.17 Hand sections of natural USB (A, B), browning due to topical spurt sap application (C,
D), induced USB symptoms by topical terpinolene (E, F) and limonene (G, H) versus control
(distilled water) applications (I, J) in ‘Honey Gold’ mango fruit. (A) Transverse section (TS)
through USB-affected skin tissue showing browning beneath the epidermis. (B) TS through USB-
affected skin tissue showing dark-brown cells surrounding resin ducts. (C, D) TS through browning
due to topical spurt sap application showed mild browning was appeared slightly in the epidermis.
(E) TS through induced USB-affected skin tissue by topical terpinolene showing browning beneath
the epidermis. (F) TS through induced USB by topical terpinolene showing dark-brown cells
surrounding resin ducts. (G) TS through induced USB-affected skin tissue by topical limonene
showing browning beneath the epidermis. (H) TS through induced USB by topical limonene
showing dark-brown cells surrounding resin ducts. (I) TS through control tissue showing no
browning beneath the epidermis. (J) TS through control tissue showing no browning around resin
ducts. Scale bars = A, C, 100 μm; B, D, 20 μm. c, cuticle; rd, resin duct; Ep, epidermal cells; e,
epithelial cells; USB, under-skin browning; B, browning; Scale bars = A, C, E, G, I, 100 μm; B, D,
F, H, J, 50 μm. ............................................................................................................................ 145
Figure 6.18 A model representing the effects of diurnal harvest cycle and sap components on USB
development in ‘Honey Gold’ mango fruit. The arrows mean ‘related with’. ............................... 149
Figure 7.1 Natural USB symptoms on a ‘Honey Gold’ mango fruit. ............................................ 160
Figure 7.2 Symptoms of RCD on a ‘Kensington Pride’ mango fruit. (A, C) Dark traces of finely
branched resin canals in the skin. (B, D) Discoloured resin canals (RC) in the outer flesh layers.
RC, resin canal; RCD, resin canal disorder......................................................................................160
Figure 7.3 Comparative cross-sections of USB on ‘Honey Gold’ (A) and RCD on ‘Kensington
Pride’ mango fruit (B). USB, under-skin browning; RCD, resin canal disorder. Scale bars = 200
μm………………………………………………………………………………………………..161
Figure 7.4 Hand sections of control and USB-affected tissues in ‘Honey Gold’ mango fruit skin. (A)
Transverse section (TS) through control tissue showing no browning beneath the epidermis. (B) TS
xxvii
through control tissue showing no browning around resin ducts. (C) TS through USB-affected skin
tissue showing discolouration beneath the epidermis. (D) TS through dark-brown cells surrounding
resin ducts. c, cuticle; rd, resin duct; e, epithelial cells; USB, under-skin browning. Scale bars = A,
C, 100 μm; B, D, 20 μm. ............................................................................................................. 161
Figure 7.5 Hand sections of control and RCD-affected tissues in ‘Kensington Pride’ mango fruit
skin. (A) Transverse section (TS) through control tissue showing no browning beneath the
epidermis. (B) TS through control tissue showing no browning of the lumen of resin ducts. (C) TS
through RCD-affected tissue showing discolouration beneath the skin. (D) TS through RCD-
affected tissues showing browning localised to the lumen of resin ducts. c, cuticle; rd, resin duct;
RCD, resin canal disorder. Scale bars = A, 50 μm; B, D, 20 μm; C, 100 μm. ............................... 162
Figure 7.6 Paraffin wax embedded sections of control and USB-affected tissues in ‘Honey Gold’
mango fruit skin as stained by TBO. (A) Stained TS through a resin duct in a control tissue showing
wherein no granules are present in epithelial cells that line the resin ducts. (B) Stained TS through a
resin duct in USB-affected skin tissue showing granules inside the cells immediately surrounding
the epithelial cells of resin ducts. rd, resin duct; e, epithelial cells; Gra, granules. Scale bars = A, B,
20 μm. ......................................................................................................................................... 163
Figure 7.7 Histochemical images of control (A, C, E and G) and USB-affected tissues (B, D, F and
H) in ‘Honey Gold’ mango fruit skin. (A, B) Staining of starch using IKI. (A) IKI stained control
tissue showing no starch granules in cells surrounding the epithelial cells that bound the resin duct.
(B) IKI stained USB-affected tissues showing starch granules stained purple in cells around the
epithelial cells that line the resin duct. (C, D) Staining of cuticle or lipids using Sudan IV showing
the cuticle stained red. The control and USB-affected sections did not otherwise stain with Sudan
IV. (E, F) Staining of lipids using Sudan Black. Neither control nor USB-affected sections stained
with Sudan Black. (G, H) Staining for phenolics using Vanillin - HCl. Control tissue sections did
not stain with Vanillin - HCl. It is likely that USB-affected sections stained slightly with Vanillin -
HCl. c, cuticle; e, epithelial cells; Ep, epidermis, Li, lipid; rd, resin duct; Sta, starch granules; USB,
under-skin browning. Scale bars = A, B, C, E, F, 20 μm; D, G, H, 50 μm. ................................... 164
Figure 7.8 Paraffin wax embedded sections of control and RCD-affected tissues in ‘Kensington
Pride’ mango fruit skin. (A) Stained TS through resin ducts of control tissue showing no phenolics
inside the resin duct lumen. (B) Stained TS through RCD-affected tissues showing phenolics
present inside the lumen of resin ducts. c, cuticle; e, epithelial cells; P, phenolics; rd, resin duct;
RCD, resin canal disorder. Scale bars = A, B, 50 μm. .................................................................. 165
xxviii
Figure 7.9 Histochemistry of control (A, C, E and G) and RCD-affected tissues (B, D, F and H) in
‘Kensington Pride’ mango fruit skin. (A, B) Staining of starch using IKI. The control and USB-
affected sections did not stain with IKI. (C, D) Staining of cuticle or lipids using Sudan IV. The
cuticle stained red with Sudan IV. The control and USB-affected sections did not stain with Sudan
IV. (E, F) Staining of lipids using Sudan Black. The control and USB-affected sections did not stain
with Sudan Black. (G, H) Staining of phenolics using Vanillin - HCl. (G) Vanillin - HCl stained
control sample showing phenolics are absent in the resin duct lumen. (H) Vanillin - HCl staining of
RCD-affected tissues showing phenolics present inside lumen of resin ducts. rd, resin duct; RCD,
resin canal disorder; e, epithelial cells; Gra, granules. Scale bars = A, B, C, E, F, 20 μm; D, G, H, 50
μm. ............................................................................................................................................. 166
Figure 7.10 TEM of healthy green mature (A, B), ripe control (C, E) and ripe USB-affected cells
(D, F) in ‘Honey Gold’ mango fruit skin. (A) A normal cell showing organelles in the cytoplasm
(B). A control cell wherein no starch granules are present in the cytoplasm. (C) A control cell
wherein no starch retention and phenolic deposition are present. (D) Starch retention and phenolic
deposition present in USB-affected cell. Starch granules were partly degraded and present around
epithelial cells. (E) No such electron-dense material in the cell wall in the control. (F) Electron-
dense material evident in the cell wall of USB-affected cells. The phenolics were diffuse. cw, cell
wall; c, cuticle; Cyt, cytoplasm; de sta, degraded starch; ED, electron-dense material; e, epithelial
cells; P, phenolics; rd, resin duct; Sta, starch granules. Scale bars = A, B, 5 μm; C, D, 2 μm; E, F, 1
μm. ............................................................................................................................................. 168
Figure 7.11 TEM of resin ducts of ripe control (A, C and E) and ripe USB-affected regions (B, D
and F) in ‘Honey Gold’ mango fruit skin. (A) A control resin duct showing no phenolic deposition
in the epithelial cells. (B) The resin duct of USB-affected region showing phenolic deposition in the
epithelial cells. (C) No such electron-dense materials were found in the junction between two
epithelial cells of control tissue sections (D) Electron-dense materials were present in the junctions
between two epithelial cells of USB-affected region. (E) No such electron-dense material was found
in the cell wall of epithelial cells in the control tissue sections. (F) There was electron-dense
material in the cell wall of epithelial cells in the USB-affected region. cw, cell wall; ED, electron-
dense material; e, epithelial cells; j, junction between two epithelial cells; P, phenolics; rd, resin
duct. Scale bars = A, B, 2 μm; C, D, F, 500 nm; E, 200 nm............................................................169
Figure 7.12 TEM of cells of control (A, C and E) and RCD-affected tissues (B, D and F) in
‘Kensington Pride’ mango fruit skin. (A) A normal tissue showing no phenolic deposition inside the
lumen of resin ducts. (B) USB-affected region showing phenolic deposition inside the lumen of a
xxix
resin duct. (C) A normal tissue showing no phenolic deposition inside the lumen of a resin duct and
no dense materials in the junction of epithelial cells. (D) USB-affected region showing polymerised
phenolic deposition inside the lumen and dense materials in the epithelial cells. (E) The control
lumens showing phenolics were absent. (F) The lumen of the RCD-affected region showing
polymerised phenolics was present. cw, cell wall; e, epithelial cells; IM, impenetrable materials; P,
phenolics; PPD, polymerised phenolic deposition; rd, resin duct. Scale bars = A, B, 5 μm; C, D, 2
μm; E, F, 200 nm.. ...................................................................................................................... 171
Figure 7.13 LM images of control (A), natural USB (B) and induced USB symptoms by terpinolene
(C) and limonene (D) in ‘Honey Gold’ mango fruit skin stained by IKI. (A) IKI stained control
showing no starch granules present surrounding resin duct epithelial cells. (B) IKI stained USB-
affected tissues showing starch granules that stained purple in cells around resin duct epithelial
cells. (C) IKI stained induced USB symptoms induced by terpinolene injection showing starch
granules that stained purple in cells around the epithelial cells that line the resin duct. (D) IKI
stained induced USB symptoms induced by limonene injection showing starch granules in cells
surrounding resin duct epithelial cells. rd, resin duct; Sta, starch granules; USB, under-skin
browning. Scale bars = A, B, C, E, F, 20 μm; D, G, H, 50 μm. .................................................... 172
Figure 7.14 LM images of control (A), natural USB (B), induced USB symptoms by terpinolene (C)
and limonene (D) in ‘Honey Gold’ mango fruit skin stained by TBO. (A) TBO stained control
tissue showing no granules was present in the epithelial cells that line the resin duct. (B) TBO
stained natural USB-affected tissues with bright white and dark granules present around the resin
duct epithelial cells. (C) TBO stained induced USB symptoms induced by terpinolene injection
showing that bright white granules were visible surrounding the epithelial cells that line the resin
duct. (D) TBO stained induced USB symptoms induced by limonene injection showing bright white
granules were present surrounding the epithelial cells. bg, bright granules; dg, dark granules; e,
epithelial cells; rd, resin duct; USB, under-skin browning. Scale bars = A, B, C, E, F, 20 μm; D, G,
H, 50 μm. .................................................................................................................................... 173
Figure 7.15 TEM of control (A, B), natural USB (C, D) and induced USB symptoms by terpinolene
(E, F) and limonene (G, H) on ‘Honey Gold’ mango fruit. (A, B) A normal cell wherein no starch
retention and phenolic deposition are present. (C, D) A natural USB-affected cell showing starch
retention and phenolic deposition inside the cytoplasm. Starch granules were partly degraded. (E)
An induced USB-affected cell by terpinolene showing only the starch retention in the cytoplasm.
No phenolic deposition was found in the induced USB-affected cell. (F) Presence of electron-dense
material in the cell wall of induced USB-affected cell by terpinolene. (G) An induced USB-affected
xxx
cell by limonene showing starch retention only in the cytoplasm. (H) Presence of electron-dense
material in the cell wall of induced USB-affected cell by limonene. cw, cell wall; Cyt, cytoplasm;
de sta, degraded starch; ED, electron-dense material; P, phenolics; rd, resin duct; Sta, starch
granules. Scale bars = A, C, E, G, 5 μm; B, D, F, H, 2 μm..............................................................174
Figure 7.16 TEM of cell wall of control (A), natural USB (B), induced USB symptoms by
terpinolene (C) and limonene (D) on ‘Honey Gold’ mango fruit. (A) A control cell showing no
electron-dense material in the cell wall. (B) A natural USB-affected cell showing the indication of
electron-dense material in the cell wall. (C) An induced USB-affected cell by terpinolene showing
the presence of electron-dense material in the cell wall. (D) Similar electron-dense material was
found in the cell wall of the induced USB-affected cell by limonene. cw, cell wall; ED, electron-
dense material. Scale bars = A, B, C, D, G, 500 nm. .................................................................... 176
Figure 7.17 PPO localisation in control (A), natural USB (B), and induced USB-affected tissue
sections by terpinolene (C) and limonene (D) on ‘Honey Gold’ mango fruit. (A) A control tissue
section showing bright pink staining. (B) A natural USB tissue section stained pink colour. The
bright pink colour is due to the presence of PPO. (C) An induced USB section by terpinolene
showing the PPO activity. (D) An induced USB tissue section by limonene showing the PPO
activity. Ep, epidermis, rd, resin duct. Scale bars = A, B, C, D, 200 μm. ...................................... 177
Figure 7.18 POD localisation in control (A), natural USB (B), induced USB-affected tissue sections
by terpinolene (C) and limonene (D) on ‘Honey Gold’ mango fruit. (A) A control tissue section
showing no visible evidence of POD activity. (B, C) A natural USB-affected tissue section stained
dark purple. The dark purple is due to the presence of POD. (D) An induced USB-affected section
by terpinolene showing no POD activity was present in the affected region. (E) An induced USB-
affected section by limonene showing no POD activity was present in the affected region. Ep,
epidermis, rd, resin duct; POD, peroxidase. Scale bars = A, B, C, D, E, 200 μm. ........................ 178
Figure 7.19 PPO and POD localisation in control (A, B) and RCD-affected tissue sections (C-H) on
‘Kensington Pride’ mango fruit skin. (A) A control tissue section showing no visible evidence of
PPO activity. (B) A control tissue section showing no visible evidence of POD activity. (C, E) A
RCD-affected tissue section stained dark pink around the resin ducts and the affected region
indicating the presence of PPO. (D, F) A RCD-affected tissue section stained dark purple
surrounding the resin ducts. The dark purple indicated the presence of POD. (G, H) A RCD-affected
tissue section wherein the localisation of both PPO and POD activity surrounding the resin ducts
xxxi
presents. Ep, epidermis, rd, resin duct; POD, peroxidase; PPO, Polyphenol oxidase. Scale bars = A,
B, C, D, E, 200 μm. ..................................................................................................................... 179
Figure 7.20 A comparative diagrammatic model of USB and RCD development mechanisms. USB
symptoms are visible as browning in cell layers surrounding the epithelial cells. In contrast, RCD is
visible as browning inside resin duct lumen. The USB model in ‘Honey Gold’ mango fruit is based
on current findings (this chapter) and published work by Gong et al., 2001; Nakano and Asada,
1981; Prasad et al., 1995; Toivonen and Brummell, 2008. Host tissue stress-induced
decompartmentalisation likely occurs along with newly synthesised phenolics being added to those
that are constitutively present. Damaged membranes of cell compartments release enzymes (e.g.
PPOs in vacuoles and plastids, PODs in chloroplasts and mitochondria) and perhaps starch granules
from amyloplasts into the cytoplasm. Browning enzymes are then free to oxidise phenolic substrates
to yield brown polyphenols. The RCD model for ‘Kensington Pride’ mango fruit is based on current
findings (this chapter). The browning is presumably polymerised phenolics inside the resin duct
lumen (Figure 7.8). PPO and POD are evidently involved in RCD development (Figure 7.19). POD
activity was mainly distributed in cells surrounding the lumen (Figure 7.19). Red slash, membrane
disruption; POD, peroxidase; and, PPO, polyphenol oxidase. ...................................................... 183
Figure 8.1 A model representing the effects of -irradiation on different Australian mango cultivars
(‘B74’, ‘Honey Gold’, ‘Kensington Pride’ and ‘R2E2’) in terms of LD and other quality attributes.
The upward arrows mean ‘increase’ and the downward arrows mean ‘decline’. .......................... 192
Figure 8.2 A model representing the comparative anatomy and enzymatic browning of USB on
‘Honey Gold’ fruit and RCD on ‘Kensington Pride’ fruit and factors affecting USB development.
The black arrows mean ‘related with’ and the red arrow means ‘did not affect’. .......................... 195
Figure A 2.1 Scanning electron micrographs showing the surface of discoloured lenticels of green
‘Kensington Pride’ (A) and ‘B74’ (B), mango fruit. Lc, lenticel cavity. Scale bars = A, B, 100
μm….. ......................................................................................................................................... 202
xxxii
LIST OF TABLES
Table 2.1 Odour threshold and odour quality description of major aroma compounds in ‘B74’ and
‘Kensington Pride’ mangoes. Odour threshold is defined as the minimum concentration of odour
compound perceived by human sense of smell (Van Gemert, 2003). ............................................. 15
Table 2.2 Effects of irradiation on insect pests and spoilage organisms. ........................................ 24
Table 3.1 Analysis parameters for determination using SIM of eight important aroma volatiles. ... 45
Table 3.2 Summary of calibration and main validation parameters for eight mango volatiles in
water, mango flesh and mango sap matrices. ................................................................................. 47
Table 3.3 Recoveries and relative standard deviation (RSD) of compounds spiked into a mango
fruit. .............................................................................................................................................. 48
Table 3.4. Aroma compounds concentrations in ripe ‘B74’ and ‘Kensington Pride’ mango fruits. . 49
Table 3.5 Odour activity values in ripe ‘B74’ and ‘Kensington Pride’ mango fruits (n = 30). ........ 50
Table 3.6. Aroma compounds concentrations in ‘Honey Gold’ mango sap. ................................... 51
Table 4.1 Harvest location and dry matter content of green mature ‘B74’, ‘Honey Gold’,
‘Kensington Pride’ and ‘R2E2’ mango fruit. Fruit were harvested from north Queensland (NQ) and
south east Queensland (SEQ) in the 2012/2013 season. n = 10 except ‘R2E2’ from SEQ (n = 6). .. 61
Table 4.2 Harvest location and dry matter content of green mature ‘B74’, ‘Honey Gold’,
‘Kensington Pride’ and ‘R2E2’ mango fruit (n = 7). The fruit were harvested from north
Queensland (NQ) and south east Queensland (SEQ) in the 2013/2014 season. .............................. 61
Table 4.3 The average and minimum (min) and maximum (max) doses recorded for green mature
fruit (n = 15) harvested from north Queensland (NQ) and south east Queensland (SEQ) in the
2012/2013 season and exposed to -irradiation at 0.5 (commercial dose) and 1.0 kGy (twice the
commercial dose). ......................................................................................................................... 62
Table 4.4 The average and minimum (min) and maximum (max) doses recorded for green mature
fruit (n = 15) harvested from north Queensland (NQ) and south east Queensland (SEQ) in the
2013/2014 season and exposed to -irradiation at 0.5 (commercial dose) and 1.0 kGy (twice the
commercial dose). ......................................................................................................................... 63
xxxiii
Table 4.5 Effect of -irradiation (0, 0.5, 1.0 kGy) on total soluble solids (TSS), titrable acidity (TA)
and TSS/TA ratio of ripe ‘B74’, ‘Honey Gold’, ‘Kensington Pride’ and ‘R2E2’ mango fruit (n =
10). Green mature fruit were harvested from north Queensland (NQ) and south east Queensland
(SEQ) in the 2012/2013 season and exposed to -irradiation. Fruit were treated with 10 µl/l ethylene
for 2 d at 20 ºC inside a ripening room and maintained at 20 ºC and 90 - 100% RH until ripe. ....... 82
Table 4.6 Effect of irradiation (0, 0.5, 1.0 kGy) on total soluble solids (TSS), titrable acidity (TA)
and TSS/TA ratio of ripe ‘B74’, ‘Honey Gold’, ‘Kensington Pride’ and ‘R2E2’ mango fruit (n = 5).
Green mature fruit were harvested from north Queensland (NQ) and south east Queensland (SEQ)
in the 2013/2014 season and exposed to -irradiation. Fruit were treated with 10 µl/l ethylene for 2
d at 20 ºC inside a ripening room and maintained at 20 ºC and 90 - 100% RH until ripe. ............... 84
Table 4.7 Effect of irradiation (0, 0.5, 1.0 kGy) on Chl a, Chl b, total Chls and carotenoid
concentrations of ripened ‘B74’, ‘Honey Gold’, ‘Kensington Pride’ and ‘R2E2’ mango skin. Green
mature fruit were harvested from south east Queensland (SEQ) in the 2012/2013 season and
exposed to -irradiation. Fruit were treated with 10 µl/l ethylene for 2 d at 20 ºC inside a ripening
room and maintained at 20 ºC and 90 - 100% RH until ripe. The skin was collected from non-blush
area using a fruit peeler. ................................................................................................................ 86
Table 4.8 Effect of irradiation (0, 0.5, 1.0 kGy) on Chl a, Chl b, total Chls and carotenoid
concentrations of ripened ‘B74’, ‘Honey Gold’, ‘Kensington Pride’ and ‘R2E2’ mango skin. Green
mature fruit were harvested from north Queensland (NQ) in the 2013/2014 season and exposed to -
irradiation. Fruit were treated with 10 µl/l ethylene for 2 d at 20 ºC inside a ripening room and
maintained at 20 ºC and 90 - 100% RH until ripe. The skin was collected from non-blush area using
a fruit peeler. ................................................................................................................................. 87
Table 4.9 Effect of irradiation (0, 0.5, 1.0 kGy) on Chl a, Chl b, total Chls and carotenoid
concentrations of ripened ‘B74’, ‘Honey Gold’, ‘Kensington Pride’ and ‘R2E2’ mango skin. Green
mature fruit were harvested from south east Queensland (SEQ) in the 2013/2014 season and
exposed to -irradiation. Fruit were treated with 10 µl/l ethylene for 2 d at 20 ºC inside a ripening
room and maintained at 20 ºC and 90 - 100% RH until ripe. The skin was collected from non-blush
area using a fruit peeler. ................................................................................................................ 88
Table 4.10 Effect of irradiation (0, 0.5, 1.0 kGy) on Chl a, Chl b, total Chls and carotenoid
concentrations of ripened ‘B74’, ‘Honey Gold’, ‘Kensington Pride’ and ‘R2E2’ mango flesh. Green
mature fruit were harvested from north Queensland (NQ) in the 2013/2014 season and exposed to -
xxxiv
irradiation. Fruit were treated with 10 µl/l ethylene for 2 d at 20 ºC inside a ripening room and
maintained at 20 ºC and 90 - 100% RH until ripe. ......................................................................... 89
Table 4.11 Effect of irradiation (0, 0.5, 1.0 kGy) on Chl a, Chl b, total Chls and carotenoid
concentrations of ripened ‘B74’, ‘Honey Gold’, ‘Kensington Pride’ and ‘R2E2’ mango flesh. Green
mature fruit were harvested from south east Queensland (SEQ) in the 2013/2014 season and
exposed to -irradiation. Fruit were treated with 10 µl/l ethylene for 2 d at 20 ºC inside a ripening
room and maintained at 20 ºC and 90 - 100% RH until ripe. .......................................................... 90
Table 4.12 Effect of irradiation (0, 0.5, 1.0 kGy) on the aroma production of ripened ‘B74’, ‘Honey
Gold’, ‘Kensington Pride’ and ‘R2E2’ mango flesh. Green mature fruit were harvested from north
Queensland (NQ) in the 2013/2014 season and exposed to -irradiation. Fruit were treated with 10
µl/l ethylene for 2 d at 20 ºC inside a ripening room and maintained at 20 ºC and 90 - 100% RH
until ripe. ...................................................................................................................................... 92
Table 4.13 Effect of irradiation (0, 0.5, 1.0 kGy) on the aroma production of ripened ‘B74’, ‘Honey
Gold’, ‘Kensington Pride’ and ‘R2E2’ mango flesh. Green mature fruit were harvested from south
east Queensland (SEQ) in the 2013/2014 season and exposed to -irradiation. Fruit were treated
with 10 µl/l ethylene for 2 d at 20 ºC inside a ripening room and maintained at 20 ºC and 90 - 100%
RH until ripe. ................................................................................................................................ 94
Table 6.1 Effects of sap components on the response of fruit harvested at different times on USB
development. To test the hypothesis that USB diurnal responses were at least partly due to sap
characteristics, an aliquot of 0.1 ml of either spurt or ooze sap, of whole sap from additional ‘Honey
Gold’ fruit harvested in the morning (0600 h) and afternoon (1400 h) in the 2014/2015 season or of
distilled water was placed onto the abraded surface of morning- (0600 h) and afternoon-harvested
(1400 h) fruit. The fruit were then held at 12 ± 1 ºC for 6 d, road-freighted to Brisbane under
commercial conditions in a standard 20-pallet 40-foot refrigerated trailer at about 14 ºC to
Wamuran in Queensland. Then the fruit were transported in an air-conditioned vehicle at ca. 22 oC
to the lab in Brisbane and ripened in a ripening room at 20 °C and 90 - 100% RH. ...................... 142
Table 6.2 Effect of main oil fraction ingredients including terpinoline, 2-carene and limonene to
induce USB symptoms in ‘Honey Gold’ mango fruit skin. An aliquot of 0.1 ml of pure terpinolene,
limonene, 2-carene and distilled water were placed onto abraded surface of morning- (0600 h) and
afternoon-harvested (1400 h) fruit. The fruit were then held at 12 ± 1 ºC for 6 d, road-freighted to
Brisbane under commercial conditions in a standard 20-pallet 40-foot refrigerated trailer at about 14
xxxv
ºC to Wamuran in Queensland. Then the fruit were transported in an air-conditioned vehicle at ca.
22 oC to the Eco-Science Precinct, Department of Agriculture and Fisheries and ripened in a
ripening room at 20 °C and 90 - 100% RH. ................................................................................. 143
xxxvi
LIST OF ABBREVIATIONS
o Degree
% Percent
± Plus or minus
® Registered trademark
Gamma
AAT Alcohol acyl transferase
Acetyl CoA Acetyl coenzyme A
ACS Aminocyclopropane-1-carboxylic acid synthase
ACO Aminocyclopropane-1-carboxylic acid oxidase
ADH Alcohol dehydrogenase
ANOVA Analysis of variance
AVG Aminoethoxyvinylglycine
B Browning
bg Bright granules
C Cuticle
Ca Calcium
CCD Carotenoid cleavage dioxygenase
Chls Total chlorophyll
Chl a Chlorophyll a
Chl b Chlorophyll b
C Chroma
Co Cobalt
CV Coefficient of variation
cw Cell wall
Cyt Cytoplasm
d Day
DCL Discoloured cell layer
de sta Degraded starch
dg Dark granules
di Discoloured lenticel
DM Dry matter
DMF N,N-dimethylformamide
DVB/CAR/PDMS Divinylbenzene/carboxen/polymethylsiloxane
xxxvii
e Epithelial cells
ED Electron-dense material
e.g. For example
Ep Epidermis
et al. And others
FAA solution Solution comprised of 50 ml 95% ethanol, 5 ml glacial acetic acid, 10 ml 37-
40% formalin formaldehyde and 35 ml distilled water
j Junction between two epithelial cells
ho Hue angle
GC Stomatal guard cells
GCMS Gas-chromatography mass spectrometry
Gra Granules
Gy Gray
h Hour
HS Headspace
HPL Hydroperoxide lyase
IM Impenetrable materials
kg Kilogram
kGy Kilo Gray
kV Kilovolts
Gy Gray
l Litre
L Lightness
Lc Lenticel cavity
LD Lenticel discolouration
Li Lipid
LM Light microscopy
LOX Lipoxygenase
LOD Limit of detection
LOQ Limit of quantification
LSD Least significant difference
Max Maximum
MB Mild skin browning
MBTH 3-Methyl-2-benzo-thiazolinone hydrazone
MTS Monoterpene synthase
xxxviii
1-MCP 1-Methylcyclopropane
ml Millilitre
mm Millimetre
MS Mass spectrometry
mg Milligram
min Minute
Min Minimum
mM mmol/l
n Non-coloured lenticel
N Nitrogen
n.a Not available
NaCl Sodium chloride
NB No browning
n.d. Not detected
NMR Nuclear magnetic resonance
NQ North Queensland
n.s No significant difference (P>0.05)
OAV Odour activity value
P Phenolics
P1 First type of phenolics
P2 Second type of phenolics
P3 Third type of phenolics
PDC Pyruvate decarboxylase
POD Peroxidase
PPD Polymerised phenolic deposition
PPO Polyphenol oxidase
PPARs Peroxisome proliferator-activated receptor isoforms
PTV Programmable Temperature Vaporizing
R2 Determination coefficients
RC Resin canal
RCD Resin canal disorder
rd Resin duct
RH Relative humidity
RSD Relative standard deviation
s Second
xxxix
SB Severe skin browning
SBF-SEM Serial block-face scanning electron microscopy
S.D. Standard deviation
SEM Scanning electron microscopy
SEQ South east Queensland
Sta Starch granules
Si Silver paint layer
SIDA Stable isotope dilution analysis
SIM Selective ion monitoring
SL Starch layer
SLC Sub-lenticellular cells.
SPME Solid-phase microextraction
SPS Sucrose phosphate synthase
TA Titratable acidity
TEM Transmission electron microscopy
THMF 3-Ketoacyl-CoA thiolase
tRa Retention time
TS Transverse section
TSS Total soluble solids
TPS Terpene synthase
USB Under-skin browning
UHQ Ultra-high quality water
Viz. Namely
β
Beta
μ Micro
μg Microgram
μl Microliter
1
CHAPTER 1. GENERAL INTRODUCTION
1.1 Research background
Mango (Mangifera indica L.) is one of the world’s most popular tropical fruits (Tharanathan et al.,
2006). World mango production increased from 25 million tonnes in 2000 (Galán Saúco, 2004) to
43 million tonnes in 2013 (Statista, 2016). Australia produces ca. 50,000 tonnes of mango fruit for
domestic and export markets annually (AMIA, 2016). ‘B74’ (traded as CalypsoTM), ‘Honey Gold’,
‘Kensington Pride’ and ‘R2E2’ are the main cultivars grown commercially in Australia (Dillon et
al., 2013). Although these cultivars are not widely grown overseas, they are in high demand both
domestically and as premium products in export markets. Other cultivars such as ‘Keitt’, ‘Kent’,
‘Palmer’, ‘Pearl’ and ‘Brooks’ are also cultivated in relatively small volumes (AMIA, 2016).
‘Kensington Pride’ mango is the most widely planted cultivar in Australia, consisting of 65% of
production (AMIA, 2016; Bally et al., 1999b). The parentage of ‘Kensington Pride’ is not clear.
Johnson (2000) suggested that ‘Kensington Pride’ originated from an Indian cultivar and a South
East Asian parent. ‘Kensington Pride’ is desirable due to its unique flavour (MacLeod et al., 1988).
However, inconstant fruit bearing as well as unfavourable colour and size are the disadvantages of
this cultivar (Johnson and Parr, 2000). Bally et al. (1999a) studied cross-breeding of ‘Kensington
Pride’ with other cultivars to expand genetic diversity and enhance fruit quality attributes. Many
hybrids of ‘Kensington Pride’ and other maternal parents including ‘Delta R2E2’, ‘A67’, ‘B74’,
‘Honey Gold’, ‘NMBP 1243’, ‘NMBP 1201’, and ‘NMBP 4069’ have been introduced in the past
few years (Dillon et al., 2013).
R2E2 has been cultivated commercially since 1991 (Anonymous, 2014). ‘R2E2’ is a seedling from
‘Kensington Pride’ and ‘Kent’ parents (Dillon et al., 2013). ‘R2E2’ showed 20% dissimilarity
RAPD molecular analysis compared to ‘Kensington Pride’ parents (Bally et al., 1996). ‘R2E2’ is
characterised by large-sized (>600 g) highly-coloured fruit and accounts for 6 % of production in
Australia (AMIA, 2016; Bally et al., 1999b).
Increased market share is being gained by ‘B74’ (20%) and Honey Gold (4%) (AMIA, 2016). ‘B74’
(CalypsoTM) was released in 2000 and is a hybrid of ‘Kensington Pride’ and ‘Sensation’ (Whiley
and Dorrian, 2007). ‘B74’ has a small seed and fibreless flesh. ‘Honey Gold’ is a relatively newly
released cultivar in 2002 that originates from ‘Kensington Pride’ and an unknown parent tree
(Dillon et al., 2013). ‘Honey Gold’ is attractive with a juicy, fiber-free flesh and favourable essence
(Marques et al., 2012).
2
Mango fruit are appreciated by consumers for their external appearance, unique flavour and other
health-contributing qualities such as vitamin C, β-carotene and minerals (Tharanathan et al., 2006).
External appearance, including size, shape, skin colour and blemishes, is critical to consumer intent
to purchase, especially for first-time buyers. Skin blemishes can result from field marks (e.g.
rubbing against branches and twigs), insect damage (e.g. russetting and fruit fly), pre- and
postharvest diseases, harvest and postharvest physical damage, and physiological disorders
(Sivakumar et al., 2011). Skin physiological disorders are of real concern to the Australian mango
industry (Macnish et al., 2014; Marques et al., 2012). They lead to downgrading of fruit quality
attributes and to loss of market confidence (Hofman et al., 2010; Rymbai et al., 2012). Lenticel
discolouration (LD), ‘under-skin browning’ (USB) and ‘resin canal damage’ (RCD) (Figure 1.1)
have emerged in recent years as serious problems in terms of poor fruit appearance that reduce the
economic value of fruit.
LD has an adverse effect on fruit appearance and economic value and consequently is a major
concern to the mango industry (Hofman et al., 2010). LD affects many mango cultivars around the
world (Bezuidenhout and Robbertse, 2005; Self et al., 2006), including Australian genotypes
(Hofman et al., 2010; Li et al., 2016; Marques et al., 2016). LD is confined to lenticels on the fruit
skin and is characterised byf red or black darkening associated with pigment accumulation in the
vacuoles of sub-lenticel cells (Bezuidenhout et al., 2005; Self et al., 2006). LD is exacerbated by
exposure to quarantine or phytosanitary treatments, such as irradiation. For example, irradiation of
‘Kensington Pride’ mango with 300 or 600 Gy delayed the ripening process and increased levels of
LD (McLauchlan et al., 1989). Hofman et al. ( 2010) reported that irradiation increased the
incidence of LD on ‘B74’ mango. Marques et al. (2016) showed that either irradiation at 441 - 610
Gy or harvesting and postharvest handling increased LD on ‘B74’ mango fruit.
USB is one of important skin browning disorders of ‘Honey Gold’ mango fruit (Hofman et al.,
2010; Holmes, 1999) due to the resulting downgrading of fruit quality and loss of market
confidence. USB visible on the surface of ‘Honey Gold’ fruit predominantly affects this cultivar
(Marques et al., 2012). It manifests under the epidermis as a superficial bruise-like injury with no
damage to the flesh (Hofman et al., 2010). The defect is usually not obvious at harvest. Rather,
visual symptoms become pronounced at around 4 days after harvest. Limited published information
is available on the mechanism and control of USB development. Hofman et al. (2010) showed that
delayed or slow cooling of fruit before or after packing was effective in diminishing USB incidence.
Marques et al. (2012) reported that, in combination with holding of ‘Honey Gold’ fruit at less than
14 - 16 ºC, USB is associated with physical damage after harvest.
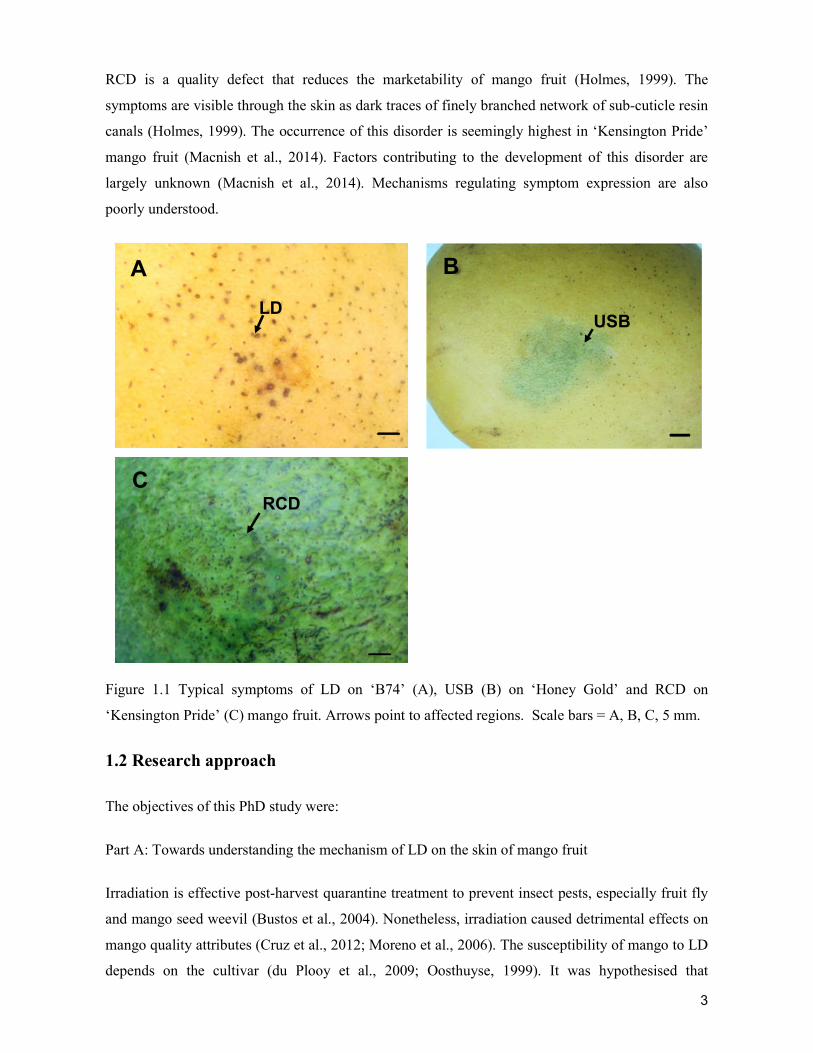
3
RCD is a quality defect that reduces the marketability of mango fruit (Holmes, 1999). The
symptoms are visible through the skin as dark traces of finely branched network of sub-cuticle resin
canals (Holmes, 1999). The occurrence of this disorder is seemingly highest in ‘Kensington Pride’
mango fruit (Macnish et al., 2014). Factors contributing to the development of this disorder are
largely unknown (Macnish et al., 2014). Mechanisms regulating symptom expression are also
poorly understood.
Figure 1.1 Typical symptoms of LD on ‘B74’ (A), USB (B) on ‘Honey Gold’ and RCD on
‘Kensington Pride’ (C) mango fruit. Arrows point to affected regions. Scale bars = A, B, C, 5 mm.
1.2 Research approach
The objectives of this PhD study were:
Part A: Towards understanding the mechanism of LD on the skin of mango fruit
Irradiation is effective post-harvest quarantine treatment to prevent insect pests, especially fruit fly
and mango seed weevil (Bustos et al., 2004). Nonetheless, irradiation caused detrimental effects on
mango quality attributes (Cruz et al., 2012; Moreno et al., 2006). The susceptibility of mango to LD
depends on the cultivar (du Plooy et al., 2009; Oosthuyse, 1999). It was hypothesised that
B A
C RCD
LD USB
4
irradiation would differentially induce LD on different Australian mango cultivars. In addition, it
was proposed that irradiation would inhibit skin degreening in mango. Furthermore, it was proposed
that other ripening parameters, including aroma volatile production and fruit eating quality, would
be adversely affected.
LD was characterised as light purple areas due to pigment accumulation in the vacuoles of sub-
lenticellular cells (Bezuidenhout et al., 2005). Polyphenols were also related to discoloured lenticels
(Tamjinda et al., 1992). LM or SEM imaging revealed parts of lenticel structure.
Specific aims were:
(1) To investigate the effects of -irradiation on LD and other physical chemical properties,
especially aroma volatiles, in the Australian mango cultivars including ‘B74’, ‘Honey Gold’,
‘Kensington Pride’ and ‘R2E2’ mangoes.
(2) To investigate the general morphology of LD in these cultivars in terms of histological
features and the overall structure of non-coloured and discoloured lenticels in ‘B74’ mango fruit.
Part B: Towards addressing ‘under-skin browning’ (USB) on ‘Honey Gold’ and ‘resin canal
damage’ (RCD) on ‘Kensington Pride’ mango fruit
USB on Honey Gold mango and RCD of Kensington Pride mango are two important fruit skin-
browning disorders concerning the Australian mango industry in recent years. However, there is
limited published information about the mechanisms and anatomies of these disorders. Increased
understanding of these disorders should help in their improved management. Symptomology
suggest that USB and RCD involve different cell biology processes.
The specific aims were:
(1) To inform better understanding of these skin disorders at the anatomical level. Therefore,
USB and RCD were compared and contrasted at the cellular level using light microscopy and
transmission electron microscopy.
(2) To understand at the cellular level the potential roles of polyphenol oxidase (PPO) and
peroxidase (POD) in tissue browning associated with of USB and RCD.
5
It was envisaged that, through gaining a fuller understanding of the comparative biochemistry of
USB and RCD symptom expression at cell and tissue levels, future development and testing of
treatments to manage these physiological disorders would be better informed.
Also examined was the hypothesis that USB incidence is higher in fruit harvested in the afternoon,
particularly in combination with physical. A diurnal effect was proposed to be associated with
varying sap components. It is likely that USB expression is a defence system against stress. Putative
differences in USB incidence at different harvest times were considered to likely be due to temporal
differences in sensitivity of mango fruit skin tissue to the concentrations of aroma volatiles in sap.
In this regard, additional experiments focused on understanding the mechanism underpinning USB
symptom expression. In general, it was envisaged that better understanding the USB mechanism
would offered informed management of the problem.
The specific aims were:
(1) To investigate the postulated effect of harvest time over the diurnal cycle with regard to
the varying temporal propensity of ‘Honey Gold’ fruit to develop USB.
(2) To characterise the putative effects of sap components and changes in the volatile
composition on USB induction in ‘Honey Gold’ fruit.
1.3 Thesis structure
The current chapter (Chapter 1) provides a general introduction to the research focus and objectives.
Chapter 2 reviews the literature on mango fruit quality attributes and mango skin disorders. Chapter
3 reports the development of a high throughput precise analytical method to quantify key volatiles
produced by Australian mango fruit and sap. The novel method utilises a combination of Stable
Isotope Dilution Analysis (SIDA) and Head-space Solid phase microextraction (HS-SPME) in
combination with gas chromatography mass spectrometry (-GC-MS). Chapter 4 examines the
effects of -irradiation on LD, physical-chemical properties and aroma volatiles in four Australian
mango cultivars. Chapter 5 presents the anatomical features of LD with special emphasis on an
integrated ultrastructural visualisation of non-coloured and discoloured lenticels to deliver a better
understanding of LD. Chapter 6 reports on the effects of diurnal harvest time on USB susceptibility
and possible relationships to the chemical composition of fruit sap. Chapter 7 describes anatomical
and histological disparities between USB and RCD and investigates the potential spatial
involvement of PPO and POD activities in these disorders. Chapter 8 presents the final discussion
6
and conclusions for the research chapters described above and proffers future directions to inform
better management of these disorders.
References
AMIA, 2016. Mango production http://www.industry.mangoes.net.au/mango-production/ (accessed
on 19.05.16).
Anonymous, 2014. R2E2. Department of Agriculture and Fisheries,
https://www.daf.qld.gov.au/plants/fruit-and-vegetables/fruit-and-nuts/mangoes/mango-
varieties/r2e2 (accessed on 19.10.16).
Bally, I., Harris, M., Kulkarni, V., Hamilton, D., Johnson, P., Robinson, D., Leonardi, J., 1999a.
The Australian national mango breeding project, VI International Symposium on Mango 509, pp.
225-232.
Bally, I.S., Johnson, P., Kulkarni, V., 1999b. Mango production in Australia, VI International
Symposium on Mango 509, pp. 59-68.
Bally, I.S.E., Graham, G.C., Henry, R.J., 1996. Genetic diversity of Kensington mango in Australia.
Australian Journal of Experimental Agriculture 36, 243-247.
Bezuidenhout, J.L., Robbertse, H., 2005. Lenticel development and discoloration of some mango
[Mangifera indica (L.)] cultivars. HortScience 40, 995-995.
Bezuidenhout, J.L.J., Robbertse, P.J., Kaiser, C., 2005. Anatomical investigation of lenticel
development and subsequent discolouration of 'Tommy Atkins' and 'Keitt' mango (Mangifera indica
L.) fruit. Journal of Horticultural Science & Biotechnology 80, 18-22.
Bustos, M.E., Enkerlin, W., Reyes, J., Toledo, J., 2004. Irradiation of mangoes as a postharvest
quarantine treatment for fruit flies (Diptera: Tephritidae). Journal of Economic Entomology 97,
286-286.
Cruz, J.N., Soares, C.A., Fabbri, A.D.T., Cordenunsi, B.R., Sabato, S.F., 2012. Effect of quarantine
treatments on the carbohydrate and organic acid content of mangoes (cv. Tommy Atkins). Radiation
Physics and Chemistry 81, 1059-1063.
7
Dillon, N.L., Bally, I.S.E., Wright, C.L., Hucks, L., Innes, D.J., Dietzgen, R.G., 2013. Genetic
diversity of the Australian national mango genebank. Scientia Horticulturae 150, 213-226.
Du Plooy, G.W., Combrinck, S., Botha, B., van der Merwe, C.F., Regnier, T., 2009. Development
of discolouration in mango lenticels. Acta Horticulturae 820, 665-672.
Galán Saúco, V., 2004. Mango production and world market: current situation and future prospects.
Acta Horticulturae 645, 107-116.
Hofman, P.J., Marques, J.R., Taylor, L.M., Stubbings, B.A., Ledger, S.N., Jordan, R.A., 2010. Skin
damage to two new mango cultivars during irradiation and cold storage. Acta Horticulturae 877,
475-481.
Holmes, R.J., 1999. Mango skin browning. Horticultural Research and Development Corporation,
Gordon, N.S.W.
Johnson, G.I., 2000. Introduction of the mango to Australia. Proceedings of the Royal Society of
Queensland, 109, 83-90.
Johnson, P., Parr, D., 2000. Mango growing in Western Australia. Department of Agriculture and
Food, Western Australia.
Li, G.Q., Gupta, M., San, A.T., Joyce, D.C., Hofman, P.J., Macnish, A.J., Marques, J., 2016.
Postharvest treatment effects on 'B74' mango fruit lenticel discolouration after irradiation, XXIX
International Horticultural Congress on Horticulture: Sustaining Lives, Livelihoods and Landscapes
(IHC2014). Acta Horticulturae, pp. 385-392.
MacLeod, A.J., Macleod, G., Snyder, C.H., 1988. Volatile aroma constituents of mango (cv
Kensington). Phytochemistry 27, 2189-2193.
Macnish, A., McConchie, C., Hofman, P., Joyce, D.C., T., 2014. Towards identifying factors that
contribute to mango resin canal discolouration. Mango Matters 14, 9-12.
Marques, J., Hofman, P., Macnish, A., 2016. Postharvest handling practices and irradiation increase
lenticel discolouration in ‘B74’ mango fruit. The Journal of Horticultural Science and
Biotechnology, 1-7.
8
Marques, J.R., Hofman, P.J., Giles, J.E., Campbell, P.R., 2012. Reducing the incidence of under-
skin browning in 'Honey Gold' mango (Mangifera indica L.) fruit. The Journal of Horticultural
Science and Biotechnology 87, 341-346.
McLauchlan, R., Johnson, G., Mitchell, G., Wills, P., 1989. Irradiation of Kensington Pride
mangoes, Symposium on Tropical Fruit in International Trade 269, pp. 469-476.
Moreno, M., Castell‐Perez, M.E., Gomes, C., Da Silva, P.F., Moreira, R.G., 2006. Effects of
electron beam irradiation on physical, textural, and microstructural properties of “Tommy Atkins”
mangoes (Mangifera indica L.). Journal of Food Science 71, E80-E86.
Oosthuyse, S.A., 1999. Effects of each of the stages in the pack-line on the incidence of lenticel
damage in Keitt and Tommy Atkins mango. South African Mango Growers' Association Yearbook
19, 37-39.
Rymbai, H., Srivastav, M., Sharma, R.R., Singh, S.K., 2012. Lenticels on mango fruit: Origin,
development, discoloration and prevention of their discoloration. Scientia Horticulturae 135, 164-
170.
Self, G., de Assis, J.S., Caron, V.C., 2006. Effects of postharvest handling on lenticel spotting of
´Tommy Atkins´ mangoes from Northeast Brazil. Acta Horticulturae 712, 543-550.
Sivakumar, D., Jiang, Y., Yahia, E.M., 2011. Maintaining mango (Mangifera indica L.) fruit quality
during the export chain. Food Research International 44, 1254-1263.
Statista, 2016. Global fruit production in 2013, by variety (in million metric tons). The Statistics
Portal, https://www.statista.com/statistics/264001/worldwide-production-of-fruit-by-variety/
(accessed on 18.10.16).
Tamjinda, B., Sirphanich, J., Nobuchi, T., 1992. Anatomy of lenticels and the occurrence of their
discoloration in mangoes (Mangifera indica cv. Namdokmai). Kasetsart Journal, Natural Sciences
26, 57-64.
Tharanathan, R.N., Yashoda, H.M., Prabha, T.N., 2006. Mango (Mangifera indica L.), the king of
fruits an overview. Food Reviews International 22, 95-123.
Whiley, A.W., Dorrian, J.W., 2007. Mango tree named ‘B74’. U.S. Patent No. PP17, 770, 2007.
9
CHAPTER 2. LITERATURE REVIEW
2.1 Introduction
The attractive appearance of fruit is critical to a consumer’s decision to purchase, especially for
first-time buyers. In addition to size, the main external characteristics of fruit typically include
shape, colour and blemishes. Consumers often equate blemishes to poor quality, including off
flavours and limited useable flesh. Accordingly, they can be intolerant of blemishes. Skin blemishes
can result from field marks (e.g. wind rub), harvest and postharvest physical damage, insect
damage, pre- and postharvest diseases, and physiological disorders. Skin physiological disorders are
of major concerns to the Australian mango industry due to the resultant downgrading of the fruit
appearance and quality attributes (Hofman et al., 2010; Marques et al., 2016). Pre-harvest
conditions are important factors affecting mango skin disorders (Bally, 2007). Besides pre-harvest
factors, post-harvest treatment, especially irradiation, should be emphasized (Marques et al., 2016).
In this chapter, the general background of mango quality attributes and their metabolic and
compositional changes during ripening are presented to provide a better overview and
understanding of the potential contribution to metabolism and nutrition. The mechanisms and
factors associated with skin browning disorders including ‘lenticel discolouration’ (LD), ‘under-
skin browning’ (USB) and ‘resin canal damage’ (RCD) are reviewed. In addition, pre-harvest
management and postharvest factors such as irradiation affecting skin browning disorders are also
discussed. Finally, general prospects and hypothesis for the development of these disorders should
be given due consideration.
2.2 Quality of mango fruit
2.2.1 External quality
Consumer acceptance is dependent on fruit quality attributes, including appearance, blemish marks,
colour, texture, eating experience, ripeness levels, etc. Appearance is the first factor easily
perceived by the consumer in the process of making a decision to purchase a particular type of fruit
or its products, with colour being the vital appearance attribute (Akhtar et al., 2009). Consumers
prioritize colour as it is perceived best in providing information on ripeness level. Consumer
acceptance is higher for mangoes free from external damage, including bruises, latex or sap injury
and decay, along with uniform weight, colour and shape (Sivakumar et al., 2011).

10
2.2.2 Internal quality
Valente et al. (2011) reported that texture is a good indicator for establishing the eating quality and
the freshness of fruit, making it a major index in determining product acceptability. Internal
attributes such as pulp fibrousness, sweetness, and aroma are important for a full perception of fruit
quality (Araújo and Garcia, 2012).
2.2.3 Nutritional contributions
Mangoes play a role in human nutrition and health as they provide a rich source of antioxidants
including ascorbic acid, carotenoids and phenolic compounds (Brecht and Yahia, 2009). Mangoes
are also regarded as a source of bioactive compounds with human health-promoting properties.
Wilkinson et al. (2008) reported that mango components and metabolites may contribute to health
because activations of transcription factors in human diseases, such as peroxisome proliferator-
activated receptor isoforms (PPARs), are inhibited by quercetin and norathyriol.
Different values of vitamin C content were shown mong mango cultivars, maturity stages and
postharvest handling. For example, ascorbic acid contents in the fruit of nine Indian cultivars were
different from 14 mg/100 g to 57 mg/100 g (Kohli et al., 1987). Total ascorbic acid concentrations
in ‘Tommy Atkins’ and ‘Ubá’ were 10 and 78 mg/100 g, respectively. Vitamin C concentration in
the flesh decreased substantially from 88 to 22 mg/100 g between 5 weeks after fruit set up to
maturity in ‘Amini’, ‘Mullgoa’, ‘Pico’, and ‘Turpentine’ mangoes (Spencer et al., 1956).
‘Haden’,‘Irwin’ and ‘Keitt’ showed a general loss in vitamin C content from 16 to 23% during
ripening at different storage temperatures, whereas ‘Kent’ showed a steady increase (Vazquez-
Salinas and Lakshminarayana, 1985). Postharvest disease control treatments and nitric oxide
fumigation did not significantly influence the concentration of ascorbic acid in ‘Kensington Pride’
mangoes (Dang et al., 2008; Zaharah and Singh, 2011).
In addition, mango fruit contain many valuable antioxidant compounds, such as carotenoids and
phenolics (Ornelas-Paz et al., 2007; Rocha-Ribeiro et al., 2007). Main phenolics in mango are
leucocyanidin, catechin, epicatechin, chlorogenic acid, quercitrin and quercetin (Berardini et al.,
2005; Schieber et al., 2000). Some carotenoids function as provitamin A as expressed as Retinol
Activity Equivalents (RAE) (Rocha Ribeiro et al., 2007). RAE values were 74; 51; 55 and 185
µg/100 g respectively in ‘Haden’, ‘Tommy Atkins’, ‘Palmer’ and ‘Ubá’ cultivars.
11
2.3 Mango ripening physiology
2.3.1 Respiration
Mango fruit show a climacteric pattern in which the respiration increased during the ripening (Aina
and Oladunjoye, 1993; Akamine and Goo, 1973). In the ripening of ‘Kensington Pride’ mangoes,
the climacteric rate gained a peak at day 4 (Lalel et al., 2003a). Fruit maturity affected the
respiration rate in which only hard mature green stage showed the climacteric pattern (Lalel et al.,
2003c). Mitcham and McDonald (1993) reported that heat treatment at 46 °C and 48 °C enhanced
the respiration of mature green fruit. Moreover, the respiration of ‘Kensington Pride’ fruit was
inhibited by aminoethoxyvinylglycine (AVG) and 1-methylcyclopropane (1-MCP), while
exogenous ethephon enhanced it (Lalel et al., 2003d).
2.3.2 Ethylene production and the ripening process
Ethylene is important in triggering the ripening process of mango (Medlicott et al., 1987). Mangoes
are climacteric fruit in which ethylene production facilitates the ripening process (Brecht and Yahia,
2009). According to Burdon et al. (1996), the mango ripening process was associated with
increased ethylene production. Lalel et al. (2003c) showed ethylene production of ‘Kensington
Pride’ mango fruit harvested at the hard mature green stage followed a typical climacteric rise
during ripening. However, there was no increase at the half ripe or ripe stage as they were post-
climacteric at the time of harvest. Lalel et al. (2004) reported that an increase in ripening
temperature from 15 to 30 oC enhanced ethylene production in green mature mango fruit. In
contrast, ripening at 35 oC lowered ethylene production slightly due evidently to temperature
sensitivity of aminocyclopropane-1-carboxylic acid synthase (ACS) and aminocyclopropane-1-
carboxylic acid oxidase (ACO).
It is important to modulate ethylene production because the increase in ethylene production during
mango fruit ripening coordinates the ripening process (Burdon et al., 1996). Monitoring ethylene
production has been recorded in many studies. Application of ethephon to green mature
‘Kensington Pride’ mangoes stimulated ethylene production during ripening. Conversely,
aminoethoxyvinylglycine (AVG) at 500 and 1000 mg/l or 1-methylcyclopropane (1-MCP) at 1, 10
and 25 µl/l significantly inhibited ethylene biosynthesis (Lalel et al., 2003d). Additionally, Burdon
et al. (1996) suggested increased ethylene production may be suppressed by acetaldehyde through
inhibition of ACO.
12
2.4 Metabolic and compositional changes during ripening
2.4.1 Cell wall and structural polysaccharides and texture
Mango fruit softening is an important indicator of ripe and ready to eat fruit. Mango texture is
mainly related to changes in cell wall composition, including degradation of pectin (Muda et al.,
1995; Roe and Bruemmer, 1981). During ripening of ‘Ngowe’ mangoes, Brinson et al. (1988)
showed that degradation of pectin involved marked declines in arabinose, galactose and
galacturonic acid contents of mesocarp cell walls. Muda et al. (1995) examined changes in cell wall
polymers during ripening of ‘Tommy Atkins’ mangoes. An overall reduction of galactosyl and
deoxyhexosyl residues during ripening process was associated with degradation of pectin
components.
The pectolytic enzymes polygalacturonase, pectin methyl esterase, galactanase, arabinanase and β-
galactosidase are involved in ‘Alphonso’ mango ripening (Prasanna et al., 2003). The increase in
polygalacturonase and cellulase activities was associated with softening and ripening of ‘Keitt’
mangoes (Roe and Bruemmer, 1981). Also, cell wall degrading glycanases and glycosidases in
combination with decreased mannose content may contribute to textural softening during the
ripening process (Yashoda et al., 2007).
2.4.2 Organic acids
During mango ripening, there is a substantial decrease in organic acids mainly due to the loss of
citric acid (Medlicott and Thompson, 1985) that has important impact on palatability. Lalel et al.
(2003c) reported that the acid content in ‘Kensington Pride’ ripe fruit, harvested at hard green
mature stage was significantly higher than those in fruit collected at later stages of maturity.
2.4.3 Soluble sugars
Yashoda et al. (2006) reported the total soluble solids content of ‘Alphonso’ mango fruit increased
from 7% to 20% over the unripe to ripe stage. Medlicott and Thompson (1985) reported that there
was an increase in the contents of glucose, fructose and sucrose during ripening of ‘Keitt’. Sucrose
is predominant throughout ripening, with fructose being the major reducing sugar. Castrillo et al.
(1992) found that sucrose phosphate synthase (SPS) may be involved in the regulation of sucrose
metabolism during ripening. Similarly, Wongmetha et al. (2012) found that sucrose accumulation
was associated with a decrease in SPS.
13
Soluble sugars that contribute mango sweetness are accumulated through carbon supplied by both
photosynthesis and starch degradation during ripening (Peroni et al., 2008; Silva et al., 2008).
Peroni et al. (2008) showed that starch was converted into sucrose, the most abundant sugar of the
‘Keitt’ ripe fruits, by α- and β-amylases. According to Lalel et al. (2003c), maturity stage at harvest
has no considerable effect on the contents of non-reducing sugars when fruit ripen. However,
markedly lower concentrations of reducing and total sugar were found in ripe fruit harvested at the
hard mature green as compared to other later stages of maturity.
2.4.4 Colour and pigments
2.4.4.1 Skin colour changes
Mango skin colour change, typically from green to yellow, is an important indicator to consumers
of fruit ripeness level. The change from green to yellow or orange is often augmented by red blush,
depending on the variety (Medlicott et al., 1986). Peel colour in ‘Tommy Atkins’ and ‘Keitt’ mango
cultivars has a stronger red blush than in green or yellow-skinned mangoes. ‘Tommy Atkins’
mangoes develop more red and yellow pigmentation in peel than ‘Keitt’ mangoes (Mitcham and
McDonald, 1992). Ornelas-Paz et al. (2008) characterized gradual changes in epidermis
pigmentation from green to yellow in ‘Manila’ and ‘Ataulfo’ mango cultivars during ripening.
Mango peel ground colour changes during ripening are due to the degradation of chlorophyll and
the accumulation of carotenoid (Medlicott et al., 1986). Ketsa et al. (1999) observed that the
breakdown of chlorophyll was catalysed by chlorophyllase and peroxidase. Lalel et al. (2003c)
established that ‘Kensington Pride' ripe fruit harvested at the hard mature green stage had lower a*
value than those harvested at other later maturity stages.
2.4.4.2 Flesh colour changes
The development of yellow-orange colouration in the mesocarp during ripening of most mango
cultivars is due to carotenoid accumulation (Vásquez-Caicedo et al., 2005). A range of carotenoids
have been detected in fruit of different mango cultivars, but only a few constitute large portions
(Chen et al., 2004b; Mercadante et al., 1997; Ornelas-Paz et al., 2008). Mercadante et al. (1997)
found that all-trans-violaxanthin, all-trans-β-carotene and 9-cisviolaxanthin are major carotenoids
in ‘Keitt’ mango pulp. In ‘Manila’ and ‘Ataulfo’ fruit mesocarp, all-trans-β-carotene and the
dibutyrates of all-trans-violaxanthin and 9-cis-violaxanthin were the predominant carotenoids
(Ornelas-Paz et al., 2008). There was an increase of total carotenoid contents from the mature-green
to the ripe stage of ‘Keitt’ and ‘Tommy Atkins’ mango fruit (Mercadante and Rodriguez-Amaya,
14
1998). In ‘Kensington Pride’, there was no significant effect of fruit maturity stage at harvest in
carotenoid concentration (Lalel et al., 2003c).
2.4.5 Flavour (taste, aroma)
2.4.5.1 Flavour components
Flavour is a complex attribute of quality because it encapsulates taste, mouthfeel, and aroma
properties. Taste includes ‘sweetness, sourness, bitterness, saltiness, and aroma’ (Baldwin, 2002).
Mouthfeel is all ‘tactile (feel) properties’ perceived from the food’s physical and chemical
interaction in the mouth (Guinard and Mazzucchelli, 1996). Fruit aroma is defined as ‘a complex
mixture of a large number of volatile compounds including alcohols, aldehydes, and esters’
(Defilippi et al., 2009).
Differences in the composition of aroma volatile compounds among different mango cultivars have
been found (Lalel et al., 2003a). ‘Kensington Pride’ mangoes produced 61 volatile components, of
which 35 compounds had not been shown in previous studies (Lalel et al., 2003a). Three hundred
and seventy-two volatile compounds have been identified that contributed to the volatile profiles of
20 Cuban mango cultivars (Pino et al., 2005). Although ripe mangoes contain more than 300
volatile compounds, only some are odour-active as key odourants which contribute significantly to
aroma (Brecht and Yahia, 2009).
Esters together with some lactones contribute to peach flavour in ‘Kensington Pride’ (MacLeod et
al., 1988). In sensory evaluation, ‘Kensington Pride’ was scored highly for terpene, fermented,
buttery, tropical, and floral scent (Table 2.1). ‘R2E2’ had some fermented and buttery aroma notes,
and was also high in melon scent (Smyth et al., 2008). MacLeod and Snyder (1985) reported that
while α-terpinolene was described as contributing floral, scented and sweet (fragrant) scents, car-3-
ene contributed pungent and mango leaf-like aromas in ‘Willard’ and ‘Parrot’ mangoes.
Terpene hydrocarbons represent the most abundant class of volatiles for most mango cultivars
studied (Defilippi et al., 2009; Lalel and Singh, 2006; Lalel et al., 2003a; MacLeod and de Troconis,
1982; MacLeod et al., 1988; Pino et al., 2005). Monoterpenes was the major group among terpene
hydrocarbons, contributing ca 49%, 50%, and 54% of total volatiles, respectively, in ‘Kensington
Pride’(MacLeod et al., 1988), ‘R2E2’ (Lalel and Singh, 2006) and Venezuelan mangoes (MacLeod
and de Troconis, 1982). In comparison, sequiterpene hydrocarbons were represented in lower
concentration of 14% of total volatiles in Venezuelan mangoes (MacLeod and de Troconis, 1982).
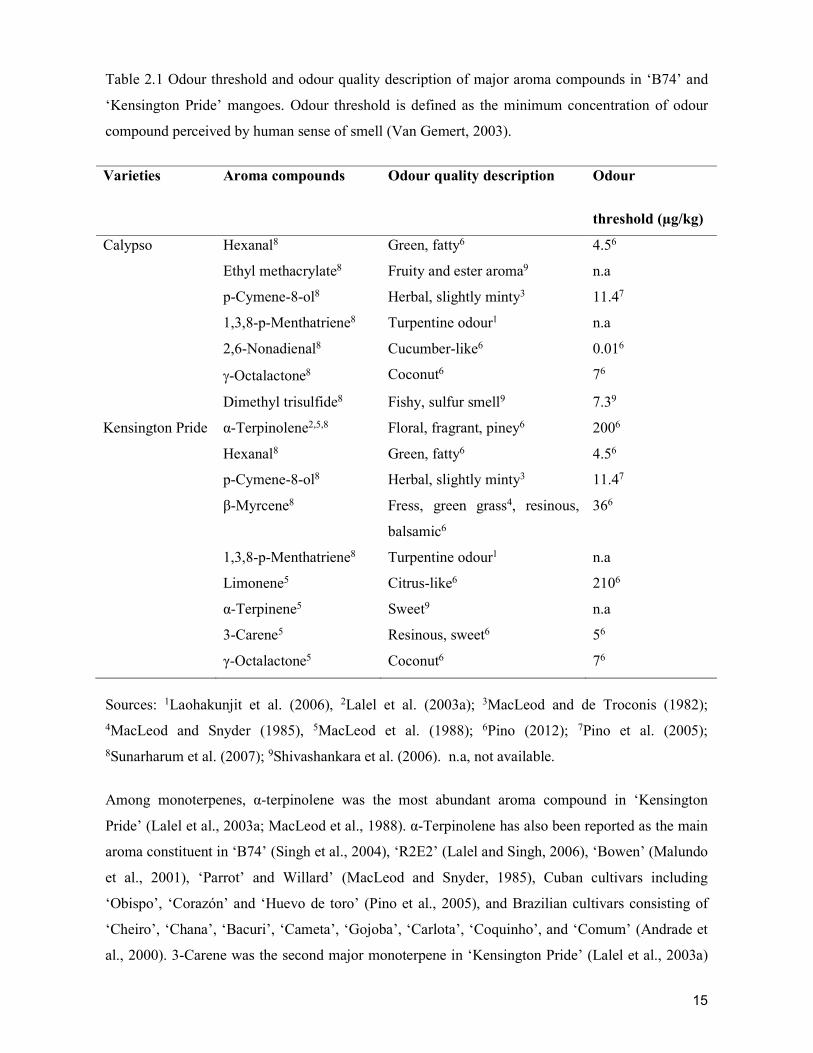
15
Table 2.1 Odour threshold and odour quality description of major aroma compounds in ‘B74’ and
‘Kensington Pride’ mangoes. Odour threshold is defined as the minimum concentration of odour
compound perceived by human sense of smell (Van Gemert, 2003).
Varieties Aroma compounds Odour quality description Odour
threshold (µg/kg)
Calypso Hexanal8 Green, fatty6 4.56
Ethyl methacrylate8 Fruity and ester aroma9 n.a
p-Cymene-8-ol8 Herbal, slightly minty3 11.47
1,3,8-p-Menthatriene8 Turpentine odour1 n.a
2,6-Nonadienal8 Cucumber-like6 0.016
-Octalactone8 Coconut6 76
Dimethyl trisulfide8 Fishy, sulfur smell9 7.39
Kensington Pride α-Terpinolene2,5,8 Floral, fragrant, piney6 2006
Hexanal8 Green, fatty6 4.56
p-Cymene-8-ol8 Herbal, slightly minty3 11.47
β-Myrcene8 Fress, green grass4, resinous,
balsamic6
366
1,3,8-p-Menthatriene8 Turpentine odour1 n.a
Limonene5 Citrus-like6 2106
α-Terpinene5 Sweet9 n.a
3-Carene5 Resinous, sweet6 56
γ-Octalactone5 Coconut6 76
Sources: 1Laohakunjit et al. (2006), 2Lalel et al. (2003a); 3MacLeod and de Troconis (1982);
4MacLeod and Snyder (1985), 5MacLeod et al. (1988); 6Pino (2012); 7Pino et al. (2005);
8Sunarharum et al. (2007); 9Shivashankara et al. (2006). n.a, not available.
Among monoterpenes, α-terpinolene was the most abundant aroma compound in ‘Kensington
Pride’ (Lalel et al., 2003a; MacLeod et al., 1988). α-Terpinolene has also been reported as the main
aroma constituent in ‘B74’ (Singh et al., 2004), ‘R2E2’ (Lalel and Singh, 2006), ‘Bowen’ (Malundo
et al., 2001), ‘Parrot’ and Willard’ (MacLeod and Snyder, 1985), Cuban cultivars including
‘Obispo’, ‘Corazón’ and ‘Huevo de toro’ (Pino et al., 2005), and Brazilian cultivars consisting of
‘Cheiro’, ‘Chana’, ‘Bacuri’, ‘Cameta’, ‘Gojoba’, ‘Carlota’, ‘Coquinho’, and ‘Comum’ (Andrade et
al., 2000). 3-Carene was the second major monoterpene in ‘Kensington Pride’ (Lalel et al., 2003a)
16
and ‘R2E2’ (Lalel and Singh, 2006).-3-Carene was reported as the most abundant volatile in
‘Haden’, ‘Manga Amarilla’, ‘Macho’, ‘Manga Blanca’, ‘San Diego’, ‘Manzano’, ‘Smith’, ‘Florida’,
‘Keitt’, and ‘Kent’ cultivars (Pino and Mesa, 2006; Pino et al., 2005). Besides terpenes, esters
represented an important class of volatiles in ‘Kensington Pride’ (Lalel et al., 2003a).
The variability in mango volatile compounds depends on many other factors including cultivar (i.e.,
genetics), maturity stage at harvest (Lalel et al., 2003c), part of the fruit (Lalel et al., 2003b), and
ripening temperature (Lalel et al., 2004). Lalel et al. (2003c) suggested that harvesting at sprung
green stage can result in greater production of aroma volatiles in ripe ‘Kensington Pride’ fruit. Lalel
et al. (2003b) showed aroma volatiles presented more abundantly in the top mesocarp and outer
parts of ripe ‘Kensington Pride’ mango fruit consisting of skin and outer mesocarp. Lalel et al.
(2004) suggested that ripening temperature is a key factor directly affecting the biosynthesis of
aroma volatile compounds in green mature ‘Kensington Pride’ mangoes. Twenty oC was found to
be optimum for fruit ripening and aroma volatile biosynthesis in ‘Kensington Pride.
2.4.5.2 Volatiles metabolism
Aroma compounds are derived from many different pathways in fatty acid, amino acid, phenolic,
and terpenoid metabolism (Baldwin, 2002) (Figure 2.1). Through β-oxidation and the lipoxygenase
(LOX) pathway (Sanz et al., 1997), fatty acids have been considered precursors of many aroma
volatile compounds of fruit, including terpenes, aldehydes, acids, alcohols, and esters (Bartley et al.,
1985; Lalel et al., 2004; Tressl and Drawert, 1973). During ripening, there was an increase in fatty
acid production in ‘Kensington Pride’ mango fruit (Lalel et al., 2003a). The biosynthesis of esters
may be related with the biosynthesis of fatty acids in ‘Kensington Pride’ mangoes (Lalel et al.,
2003a). Lalel et al. (2003d) reported that the biosynthesis of fatty acids seemed to be catalyzed by
ethylene in ‘Kensington Pride’. Higher ripening temperature up to 30 oC increased the level of all
fatty acids, except palmitic, palmitoleic, and linolenic acids (Lalel et al., 2004).
Sanz et al. (1997) reported that only a few classes of aroma components were created directly from
carbohydrate metabolism. The biosynthetic synthesis of monoterpenes and sesquiterpenes
diterpenes is reported to be catalyzed by terpene synthases (Chen et al., 2004a; Nieuwenhuizen et
al., 2009). Norterpenoids or norisoprenoids are aroma compounds which originated from
carotenoids (Defilippi et al., 2009; Winterhalter and Rouseff, 2002). Cleavage of the carotenoid
chain was catalyzed by carotenoid cleavage dioxygenases (CCD) (Booker et al., 2004; Kato et al.,
2006). Pott et al. (2003) suggested that the expression of ccd4 played the major role in the
accumulation of carotenoids and carotenoid-derived volatiles in peach fruit flesh.
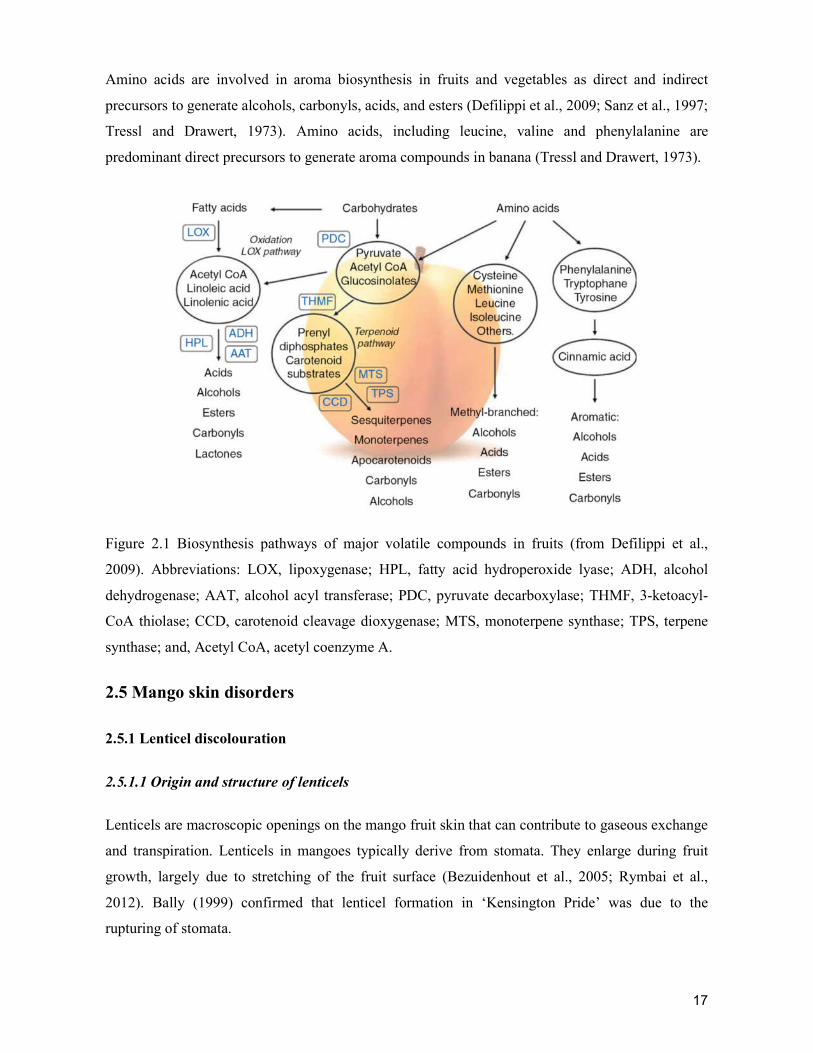
17
Amino acids are involved in aroma biosynthesis in fruits and vegetables as direct and indirect
precursors to generate alcohols, carbonyls, acids, and esters (Defilippi et al., 2009; Sanz et al., 1997;
Tressl and Drawert, 1973). Amino acids, including leucine, valine and phenylalanine are
predominant direct precursors to generate aroma compounds in banana (Tressl and Drawert, 1973).
Figure 2.1 Biosynthesis pathways of major volatile compounds in fruits (from Defilippi et al.,
2009). Abbreviations: LOX, lipoxygenase; HPL, fatty acid hydroperoxide lyase; ADH, alcohol
dehydrogenase; AAT, alcohol acyl transferase; PDC, pyruvate decarboxylase; THMF, 3-ketoacyl-
CoA thiolase; CCD, carotenoid cleavage dioxygenase; MTS, monoterpene synthase; TPS, terpene
synthase; and, Acetyl CoA, acetyl coenzyme A.
2.5 Mango skin disorders
2.5.1 Lenticel discolouration
2.5.1.1 Origin and structure of lenticels
Lenticels are macroscopic openings on the mango fruit skin that can contribute to gaseous exchange
and transpiration. Lenticels in mangoes typically derive from stomata. They enlarge during fruit
growth, largely due to stretching of the fruit surface (Bezuidenhout et al., 2005; Rymbai et al.,
2012). Bally (1999) confirmed that lenticel formation in ‘Kensington Pride’ was due to the
rupturing of stomata.
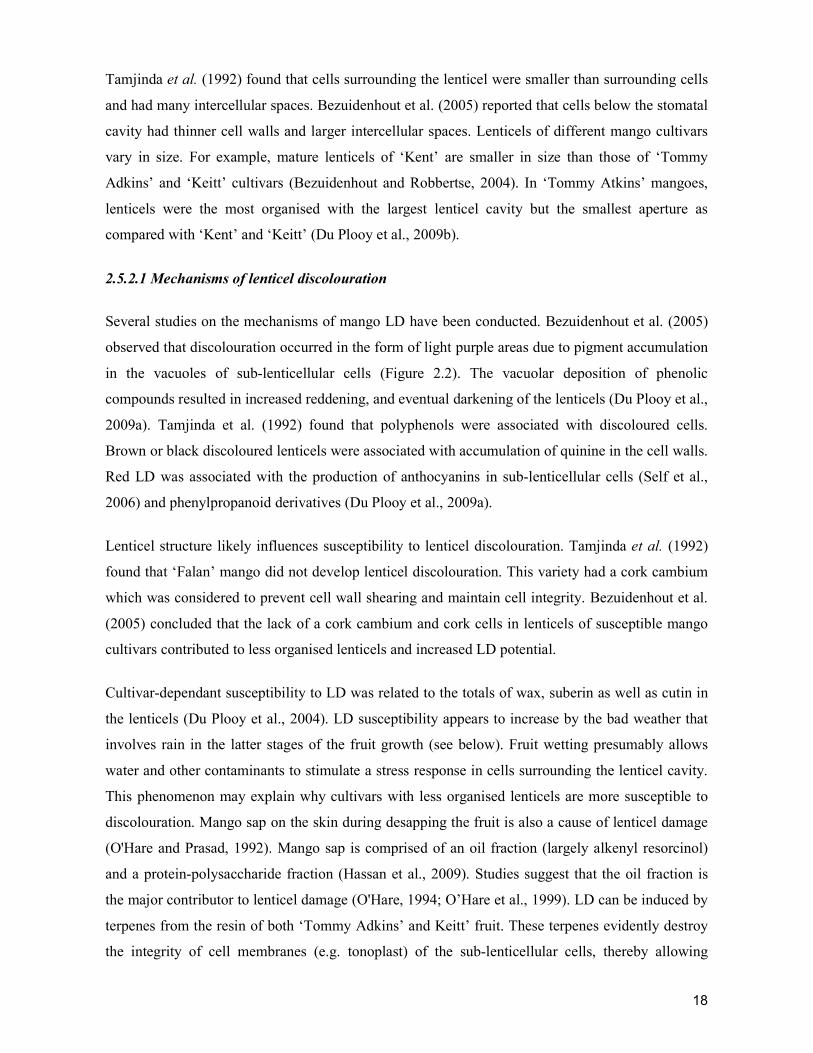
18
Tamjinda et al. (1992) found that cells surrounding the lenticel were smaller than surrounding cells
and had many intercellular spaces. Bezuidenhout et al. (2005) reported that cells below the stomatal
cavity had thinner cell walls and larger intercellular spaces. Lenticels of different mango cultivars
vary in size. For example, mature lenticels of ‘Kent’ are smaller in size than those of ‘Tommy
Adkins’ and ‘Keitt’ cultivars (Bezuidenhout and Robbertse, 2004). In ‘Tommy Atkins’ mangoes,
lenticels were the most organised with the largest lenticel cavity but the smallest aperture as
compared with ‘Kent’ and ‘Keitt’ (Du Plooy et al., 2009b).
2.5.2.1 Mechanisms of lenticel discolouration
Several studies on the mechanisms of mango LD have been conducted. Bezuidenhout et al. (2005)
observed that discolouration occurred in the form of light purple areas due to pigment accumulation
in the vacuoles of sub-lenticellular cells (Figure 2.2). The vacuolar deposition of phenolic
compounds resulted in increased reddening, and eventual darkening of the lenticels (Du Plooy et al.,
2009a). Tamjinda et al. (1992) found that polyphenols were associated with discoloured cells.
Brown or black discoloured lenticels were associated with accumulation of quinine in the cell walls.
Red LD was associated with the production of anthocyanins in sub-lenticellular cells (Self et al.,
2006) and phenylpropanoid derivatives (Du Plooy et al., 2009a).
Lenticel structure likely influences susceptibility to lenticel discolouration. Tamjinda et al. (1992)
found that ‘Falan’ mango did not develop lenticel discolouration. This variety had a cork cambium
which was considered to prevent cell wall shearing and maintain cell integrity. Bezuidenhout et al.
(2005) concluded that the lack of a cork cambium and cork cells in lenticels of susceptible mango
cultivars contributed to less organised lenticels and increased LD potential.
Cultivar-dependant susceptibility to LD was related to the totals of wax, suberin as well as cutin in
the lenticels (Du Plooy et al., 2004). LD susceptibility appears to increase by the bad weather that
involves rain in the latter stages of the fruit growth (see below). Fruit wetting presumably allows
water and other contaminants to stimulate a stress response in cells surrounding the lenticel cavity.
This phenomenon may explain why cultivars with less organised lenticels are more susceptible to
discolouration. Mango sap on the skin during desapping the fruit is also a cause of lenticel damage
(O'Hare and Prasad, 1992). Mango sap is comprised of an oil fraction (largely alkenyl resorcinol)
and a protein-polysaccharide fraction (Hassan et al., 2009). Studies suggest that the oil fraction is
the major contributor to lenticel damage (O'Hare, 1994; O’Hare et al., 1999). LD can be induced by
terpenes from the resin of both ‘Tommy Adkins’ and Keitt’ fruit. These terpenes evidently destroy
the integrity of cell membranes (e.g. tonoplast) of the sub-lenticellular cells, thereby allowing
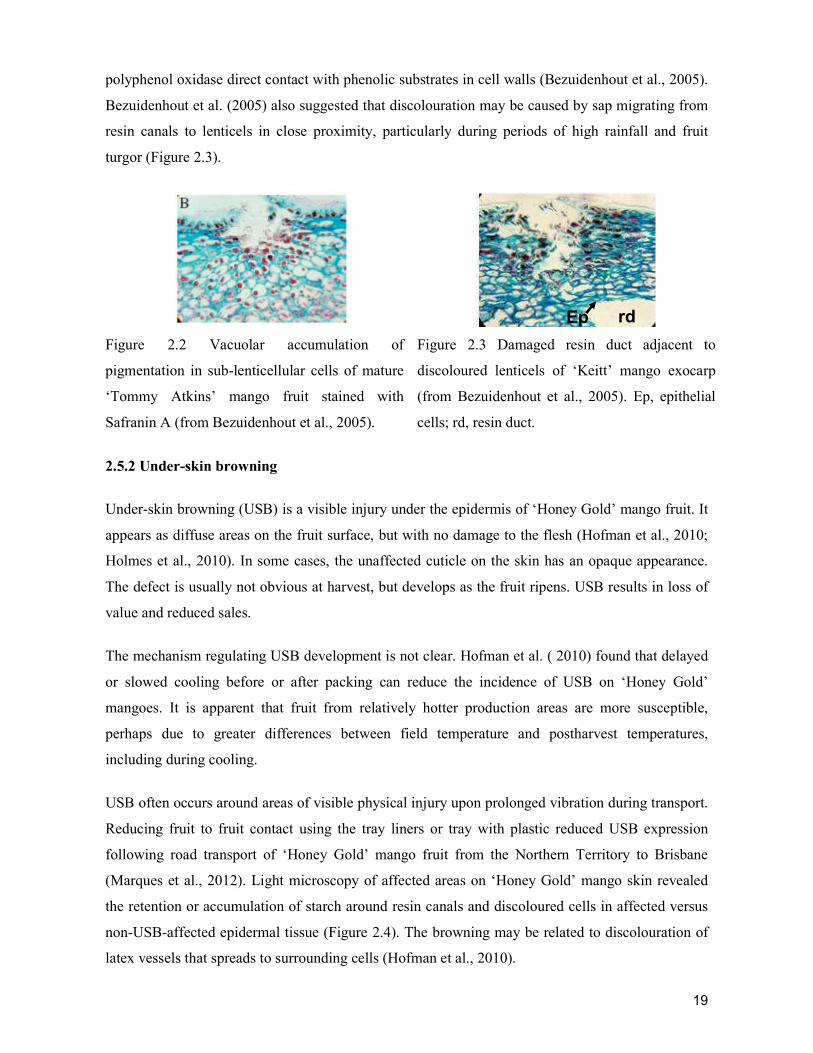
19
polyphenol oxidase direct contact with phenolic substrates in cell walls (Bezuidenhout et al., 2005).
Bezuidenhout et al. (2005) also suggested that discolouration may be caused by sap migrating from
resin canals to lenticels in close proximity, particularly during periods of high rainfall and fruit
turgor (Figure 2.3).
Figure 2.2 Vacuolar accumulation of
pigmentation in sub-lenticellular cells of mature
‘Tommy Atkins’ mango fruit stained with
Safranin A (from Bezuidenhout et al., 2005).
Figure 2.3 Damaged resin duct adjacent to
discoloured lenticels of ‘Keitt’ mango exocarp
(from Bezuidenhout et al., 2005). Ep, epithelial
cells; rd, resin duct.
2.5.2 Under-skin browning
Under-skin browning (USB) is a visible injury under the epidermis of ‘Honey Gold’ mango fruit. It
appears as diffuse areas on the fruit surface, but with no damage to the flesh (Hofman et al., 2010;
Holmes et al., 2010). In some cases, the unaffected cuticle on the skin has an opaque appearance.
The defect is usually not obvious at harvest, but develops as the fruit ripens. USB results in loss of
value and reduced sales.
The mechanism regulating USB development is not clear. Hofman et al. ( 2010) found that delayed
or slowed cooling before or after packing can reduce the incidence of USB on ‘Honey Gold’
mangoes. It is apparent that fruit from relatively hotter production areas are more susceptible,
perhaps due to greater differences between field temperature and postharvest temperatures,
including during cooling.
USB often occurs around areas of visible physical injury upon prolonged vibration during transport.
Reducing fruit to fruit contact using the tray liners or tray with plastic reduced USB expression
following road transport of ‘Honey Gold’ mango fruit from the Northern Territory to Brisbane
(Marques et al., 2012). Light microscopy of affected areas on ‘Honey Gold’ mango skin revealed
the retention or accumulation of starch around resin canals and discoloured cells in affected versus
non-USB-affected epidermal tissue (Figure 2.4). The browning may be related to discolouration of
latex vessels that spreads to surrounding cells (Hofman et al., 2010).
rd Ep
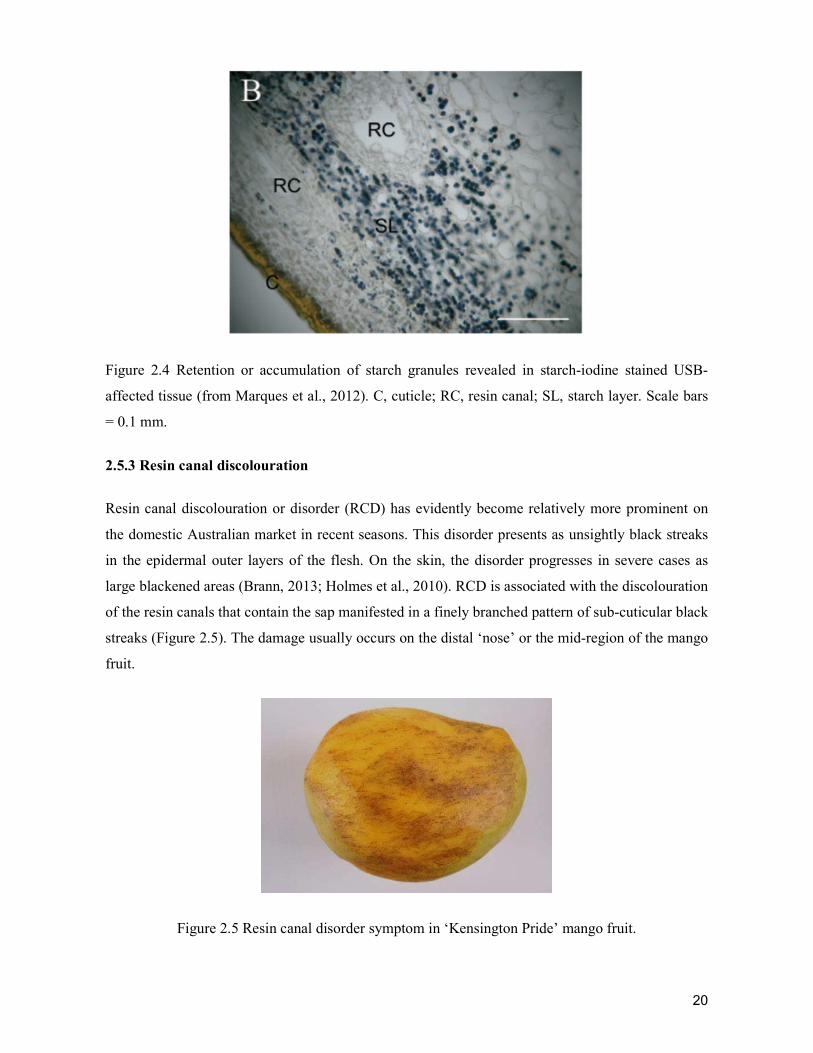
20
Figure 2.4 Retention or accumulation of starch granules revealed in starch-iodine stained USB-
affected tissue (from Marques et al., 2012). C, cuticle; RC, resin canal; SL, starch layer. Scale bars
= 0.1 mm.
2.5.3 Resin canal discolouration
Resin canal discolouration or disorder (RCD) has evidently become relatively more prominent on
the domestic Australian market in recent seasons. This disorder presents as unsightly black streaks
in the epidermal outer layers of the flesh. On the skin, the disorder progresses in severe cases as
large blackened areas (Brann, 2013; Holmes et al., 2010). RCD is associated with the discolouration
of the resin canals that contain the sap manifested in a finely branched pattern of sub-cuticular black
streaks (Figure 2.5). The damage usually occurs on the distal ‘nose’ or the mid-region of the mango
fruit.
Figure 2.5 Resin canal disorder symptom in ‘Kensington Pride’ mango fruit.
21
The causes are unknown, but are likely a combination of production factors increasing fruit
susceptibility and postharvest factors causing fruit stress that contribute to disorder expression in
these more susceptible fruit.
2.6 Pre-harvest management
Most postharvest skin defects/disorders are not obvious at harvest, but become so from several days
after harvest to near ripe. Pre-harvest factors that can potentially influence skin disorders include
cultivar, climate, soil, nutrition, and water stress. Relatively little has been published on these
interactions, except for lenticel discolouration.
2.6.1 Cultivar
Cultivar plays an important role in susceptibility to disorders. According to Hofman et al. (2010),
USB mainly occurs on ‘Honey Gold’ while RCD is often more obvious on ‘Kensington Pride’. The
susceptibility of mango to LD is also cultivar-dependant (Du Plooy et al., 2009b; Oosthuyse, 1999).
For example, ‘Tommy Atkins’ and ‘Keitt’ are generally more susceptible to LD as compared with
‘Kent’ (Bezuidenhout and Robbertse, 2004; Oosthuyse, 1998). Also, LD is generally least
noticeable on ‘Honey Gold’ as compared with ‘Kensington Pride’, ‘R2E2’, and ‘B74’ (authors
observations). Relative cultivar susceptibility appears to be influenced by the degree of
disorganisation of the cells around the lenticel cavity and also the presence and extent of
suberisation and cutinisation on the cells lining the cavity (Du Plooy et al., 2004).
2.6.2 Moisture
Moisture can have a significant influence on fruit appearance, especially skin and flesh disorders.
Duvenhage (1993) showed that LD in avocado was more severe when fruit were picked wet as
compared to dry-harvested fruit. Also, wet-harvested fruit had higher incidence of black cold
damage which was related to the response to low temperature. Hofman et al. (1997) reported that
mango fruit from cooler growing locations and harvested in the rain were more susceptible to
chilling injury.
The influence of both excess and deficit water stress on skin disorders depends on the timing and
extent of water stress. Excess water in soil during fruit growth is one of main causes of translucent
flesh disorder and gamboge disorder in mangosteen fruit (Sayan and Rawee, 2005). Incidence of
both disorders can be reduced by controlling soil water potential at about -70 kPa. Simmons et al.
(1998) reported that withholding irrigation for 12 weeks after flowering and from 7 weeks before
22
harvest significantly reduced lenticel spotting in ‘Kensington Pride’ mango, possibly by minimising
stretching of the skin during fruit growth. In ‘Keitt’ and ‘Tommy Atkins’, LD decreased
significantly as soil water potential decreased to –50 to –70 kPa (Cronje, 2009). Thus, reducing soil
water potential in orchards with a history of LD can help reduce LD.
2.6.3 Nutrition
Nutrient balance influences many physiological disorders. Calcium (Ca) is an important mineral in
the physiological and biochemical processes in plants and is particularly important in fruit disorders
(Hewett, 2006), including skin disorders. For example, Dong et al. (2014) reported that Ca2+
deficiency can lead to the increased incidence of skin browning spot in ‘Huangguan’ pear fruit.
There is limited information on nutrient effects on mango skin disorders, but nutrient effects on
flesh disorders such as soft nose and jelly seed are well documented (Cracknell Torres et al., 2002;
Johnson and Hofman, 2009). In general, higher calcium and lower N treatments are associated with
lessening of disorder severity. Disorders are also lessened by other factors that can influence the
water, carbohydrate and mineral balance in the fruit, such as excess vegetative growth and water
supply (Beverly et al., 1993). It is possible these factors also influence fruit susceptibility to USB.
2.6.4 Fruit bagging
Pre-harvest bagging can reduce disease and blemish. Chonhenchob et al. (2011) observed that
bagging significantly reduced the severity of mango physical damage, skin browning, insect
damage, and disease defects. Bagging ‘Sensation’ mango reduced fruit blemish (Shorter et al.,
1997). Bagging with paper bags 70 days after flowering reduced the incidence of lenticel and
browning blemish of ‘Apple’ mango (Mathooko et al., 2009). It is not known if bagging would
affect USB development. It suggests that bagging treatment should be tested on ‘Honey Gold’
mango fruit to evaluate its potential effects on USB prevention.
2.7 Irradiation of mango fruit
Irradiation is recommended as an effective quarantine or phytosanitary treatment. The purpose of
irradiation is to prevent the spread of regulated pests or diseases as it can kill or sterilize
microorganisms or insects by damaging their DNA (FAO, 2008). In 1986, the U.S. Food and Drug
Administration was amended to permit irradiation at specific doses to delay maturation, inhibit
growth, and control disinfect foods, including vegetables and spices (FDA, 1986).
23
2.7.1 Sources
Sources of ionizing radiation include radioactive isotopes viz., ‘cobalt-60 or caesium-137’, ‘high-
energy electrons from machine’, and ‘X-rays’ (FAO, 2008; Kilcast, 1995). Gray (Gy), which is the
amount of ionizing radiation energy absorbed by the irradiated material in joules per kilogram of
material, is the measurement unit (Huda, 1997). Hallman (2000) reported that X-ray radiation and
gamma () ray from isotopes can be used for pallet-loads. Additionally, electron beam radiation is
limited to small products as it penetrates only a thin surface to just a few centimetres.
2.7.2 -Irradiation and mango fruit
The effectiveness of -irradiation in eliminating insect pests and controlling postharvest spoilage
organisms on mangoes is reported in Table 2.2. For instance, Bustos et al. (2004) found that a dose
of 150 Gy was sufficient to assure quarantine security against the infestation of fruit fly in
‘Ataulfo’, ‘Kent’, and ‘Keitt cultivars. Heather et al. (1991) determined that irradiation treatment
with 74 - 101 Gy of ‘Kensington Pride’ mangoes was effective to inactivate eggs or larvae of
Bactrocera tryoni (Froggatt) and B. jarvisi (Tryon). A dose of 100 Gy was sufficient to disinfest
mango seed weevil in ‘Haden’ mangoes (Follett, 2001). Santos et al. (2010) showed that -radiation
at 0.45 kGy inhibited the development of 'Tommy Atkins' mango rot caused by Fusicoccum
incidence. A combination of dipping ‘Zebda’ mangoes in hot water (55 oC/5 min) with irradiation
up to 1 kGy was an appropriate treatment for shelf life extension (El-Samahy et al., 2000).
For mangoes, irradiation has variable effects on quality characteristics. Moreno et al. (2006) found
that irradiation at up to 1.0 kGy retained overall fruit quality attributes and extended the shelf life of
‘Tommy Atkins’ mangoes. Irradiations at medium (1.5 kGy) and high (3.1 kGy) dose levels were
compromised by potential change to fruit texture; viz., softening. Sensory panelists indicated
unacceptable overall quality, colour, texture, and aroma for fruit treated with 3.1 kGy. According to
Cruz et al. (2012), starch degradation in Tommy Atkins mangoes was affected by irradiation. For
example, fruit exposed to 0.4 and 1.0 kGy showed higher rates of starch hydrolysis than for non-
irradiated fruit. However, there were no significant differences in total sugar content between
treated and control fruit. Mitchell et al. (1990) found no significant effects on the carotene content
in ‘Kensington Pride’ mango fruit irradiated at 0.75, 0.3 and 0.6 kGy.
24
Table 2.2 Effects of irradiation on insect pests and spoilage organisms.
Dose (Gy) Variety Effectiveness Ref.
150 Ataulfo, Kent
and Keitt
prevent adult emergence of Mexican fruit
fly (Anastrepha ludens), West Indies
fruit fly (A. obliqua), sapote fruit fly (A.
serpentina), and Mediterranean fruit fly
(Ceratitis capitata)
Bustos et al.
(2004)
74 - 101 Kensington inactivate eggs or larvae of Bactrocera
tryoni and B. jarvisi
Heather et al.
(1991)
100 Haden disinfest of mango seed weevil Follett (2001)
450 Tommy Atkins inhibit mango rot by Fusicoccum Santos et al.
(2010)
1000
+ hot water
treatment
Zebda shelf life extension from 1 week to 2
weeks
El-Samahy et
al. (2000)
2.8 Conclusions and perspectives
Although Australian mango production is not significant as compared to the world scale (AAG,
2006), mango is one of the major horticultural crops in Australia (AMIA, 2016). -Irradiation is an
effective and approved post-harvest quarantine treatment in mango (Ducamp Collin et al., 2007;
Follett, 2004). LD is the real issue facing by many cultivars in the world including Australian
mango genotypes. Irradiation induced the development of LD in mango (Marques et al., 2016).
However, limited study has been conducted on the effects of irradiation in term of appearance and
internal quality attributes on importantly commercial Australian mango cultivars. Based on the
literature review, the cultivar-dependant susceptibility of important Australian mangoes to LD
should be evaluated in order to illustrate a better understanding the cultivar response to irradiation
in terms of LD. In addition, the impact of irradiation on other ripening parameters, including
external appearance attributes and flavour is an additional interest. Better visualization of the
discolouration of entire lenticels provides a detailed understanding of morphology differences in
LD.
The mechanism of the development of USB and RCD are still unclear. It is likely USB and RCD
development may be related to different cell biology processes. USB is thought to be associated
with the release of sap from resin canals (laticifers) within the exocarp. USB symptoms can develop
25
in response to physical stress (e.g. abrasion) and low temperature (e.g. < 12 - 14 C) exposure
during postharvest handling. Pre-harvest variables may also influence the occurrence of USB. In
the context of this thesis, a postulated effect of harvest time over the diurnal cycle should be
evaluated in regard to the propensity of fruit to develop USB. More importantly, the comparative
anatomy of these browning disorders should be examined to receive a fuller understanding of the
comparative biochemistry of these symptom expressions.
References
AAG, 2006. Market overview – The Australian mango industry, Australian Agribusiness Group.
Aina, J.O., Oladunjoye, O.O., 1993. Respiration, pectolytic activity and textural changes in ripening
African mango (Irvingia gabonensis) fruits. Journal of the Science of Food and Agriculture 63, 451-
454.
Akamine, E.K., Goo, T., 1973. Respiration and ethylene production during ontogeny of fruit.
Journal of the American Society for Horticultural Science 98, 381-383.
Akhtar, S., Mahmood, S., Naz, S., Nasir, M., Sultan, M., 2009. Sensory evaluation of mangoes
(Mangifera indica L.) grown in different regions of Pakistan. Pakistan Journal of Botany 41, 2821-
2829.
AMIA, 2016. Mango production http://www.industry.mangoes.net.au/mango-production/ (accessed
on 19.05.16).
Andrade, E.H.A., Maia, J.G.S., Zoghbi, M.d.G.B., 2000. Aroma volatile constituents of Brazilian
varieties of mango fruit. Journal of Food Composition and Analysis 13, 27-33.
Araújo, J.L.P., Garcia, J.L.L., 2012. A study of the mango market in the European union. Banco do
Nordeste 43, 282-296.
Baldwin, E.A., 2002. Fruit flavor, volatile metabolism and consumer perceptions, In: Knee, M.
(Ed.), Fruit quality and its biological basis. Sheffield Academic Press, Sheffield, pp. 89-106.
Bally, I.S.E., 1999. Changes in the cuticular surface during the development of mango (Mangifera
indica L.) cv. Kensington Pride. Scientia Horticulturae 79, 13-22.
26
Bally, I.S.E., 2007. The effect of preharvest nutrition and crop load on fruit quality and postharvest
disease in mango (Mangifera indica L.). University of Queensland, Brisbane.
Bartley, I.M., Stoker, P.G., Martin, A.D., Hatfield, S.G., Knee, M., 1985. Synthesis of aroma
compounds by apples supplied with alcohols and methyl esters of fatty acids. Journal of the Science
of Food and Agriculture 36, 567-574.
Beverly, R.B., Latimer, J.G., Smittle, D.A., 1993. Preharvest physiological and cultural effects on
postharvest quality., In: Shewfelt, R., Prussia, S. (Eds.), Postharvest Handling: A Systems
Approach. Academic Press, San Diego, USA, pp. 74-93.
Bezuidenhout, J.L.J., Robbertse, P.J., 2004. Relation between lenticel discoloration, resin
composition and structure of lenticels in some mango cultivars. Research Journal - South African
Mango Growers' Association 24, 38-42.
Bezuidenhout, J.L.J., Robbertse, P.J., Kaiser, C., 2005. Anatomical investigation of lenticel
development and subsequent discolouration of 'Tommy Atkins' and 'Keitt' mango (Mangifera indica
L.) fruit. Journal of Horticultural Science & Biotechnology 80, 18-22.
Booker, J., Auldridge, M., Wills, S., McCarty, D., Klee, H., Leyser, O., 2004. MAX3/CCD7 is a
carotenoid cleavage dioxygenase required for the synthesis of a novel plant signaling molecule.
Current Biology 14, 1232-1238.
Brann, M., 2013. Mango industry baffled by mystery disorder. http://www.abc.net.au/site-
archive/rural/news/content/201302/s3683453.htm (accessed on 05.02.13).
Brecht, J.K., Yahia, E.M., 2009. Postharvest physiology, In: Litz, R.E. (Ed.), The mango: botany,
production and uses, 2nd ed. CAB International, Cambridge, MA, pp. 484-516.
Brinson, K., Dey, P.M., John, M.A., Pridham, J.B., 1988. Post-harvest changes in Mangifera indica
mesocarp cell walls and cytoplasmic polysaccharides. Phytochemistry 27, 719-723.
Burdon, J., Dori, S., Marinansky, R., Pesis, E., 1996. Acetaldehyde inhibition of ethylene
biosynthesis in mango fruit. Postharvest Biology and Technology 8, 153-161.
Bustos, M.E., Enkerlin, W., Reyes, J., Toledo, J., 2004. Irradiation of mangoes as a postharvest
quarantine treatment for fruit flies (Diptera: Tephritidae). Journal of Economic Entomology 97,
286-286.
27
Castrillo, M., Kruger, N.J., Whatley, F.R., 1992. Sucrose metabolism in mango fruit during
ripening. Plant Science 84, 45-51.
Chen, F., Ro, D., Petri, J., Gershenzon, J., Bohlmann, J., Pichersky, E., Tholl, D., 2004a.
Characterization of a root-specific Arabidopsis terpene synthase responsible for the formation of the
volatile monoterpene 1, 8-cineole. Plant Physiology 135, 1956-1966.
Chen, J.P., Tai, C.Y., Chen, B.H., 2004b. Improved liquid chromatographic method for
determination of carotenoids in Taiwanese mango (Mangifera indica L.). Journal of
Chromatography A 1054, 261-268.
Chonhenchob, V., Kamhangwong, D., Kruenate, J., Khongrat, K., Tangchantra, N., Wichai, U.,
Singh, S.P., 2011. Preharvest bagging with wavelength-selective materials enhances development
and quality of mango (Mangifera indica L.) cv. Nam Dok Mai #4. Journal of the Science of Food
and Agriculture 91, 664-671.
Cracknell Torres, A., Cid Ballarín, M., Socorro Monzon, A., Fernández Galván, D., Rosell García,
P., Galán Saúco, V., 2002. Effects of nitrogen and calcium supply on the incidence of internal fruit
breakdown in Tommy Atkins mangoes (Mangifera Indica L.) grown in a soilless system, VII
International Mango Symposium 645, pp. 387-393.
Cronje, R.B., 2009. Effect of harvesting practices and pre-packing storage on lenticel discolouration
of mangoes. Acta Horticulturae 820, 653-664.
Cruz, J.N., Soares, C.A., Fabbri, A.D.T., Cordenunsi, B.R., Sabato, S.F., 2012. Effect of quarantine
treatments on the carbohydrate and organic acid content of mangoes (cv. Tommy Atkins). Radiation
Physics and Chemistry 81, 1059-1063.
Dang, K.T.H., Singh, Z., Swinny, E.E., 2008. Impact of postharvest disease control methods and
cold storage on volatiles, color development and fruit quality in ripe ‘Kensington Pride’ mangoes.
Journal of Agricultural and Food Chemistry 56, 10667-10674.
Defilippi, B.G., Manríquez, D., Luengwilai, K., González-Agüero, M., 2009. Chapter 1 Aroma
volatiles: biosynthesis and mechanisms of modulation during fruit ripening, In: Jean-Claude, K.,
Michel, D. (Eds.), Advances in Botanical Research. Academic Press, pp. 1-37.
Dong, Y., Guan, J., Ma, S., Liu, L., Feng, Y., Cheng, Y., 2014. Calcium content and its correlated
distribution with skin browning spot in bagged Huangguan pear. Protoplasma, 1-7.
28
Du Plooy, G.W., Combrinck, S., Regnier, T., Botha, B.M., 2009a. Linking lenticel discolouration of
mango (Mangifera indica L.) fruit to reversed-phase HPLC profiles of phenolic compounds. Journal
of Horticultural Science & Biotechnology 84, 421-426.
Du Plooy, W., Combrinck, S., Botha, B., Van Der Merwe, C., Regnier, T., 2009b. Development of
discolouration in mango lenticels. Acta Horticulturae 820, 665-671.
Du Plooy, W.d., Merwe, C., Korsten, L., 2004. Differences in the surface structures of three mango
cultivars and the effect of kaolin on these structures. Research Journal-South African Mango
Growers' Association 24, 29-36.
Ducamp Collin, M., Arnaud, C., Kagy, V., Didier, C., 2007. Fruit flies: disinfestation, techniques
used, possible application to mango. Fruits 62, 223-236.
Duvenhage, J.A., 1993. The influence of wet picking on postharvest diseases and disorders of
avocado fruit. South African Avocado Growers' Association Yearbook 16, 77-79.
El-Samahy, S.K., Youssef, B.M., Askar, A.A., Swailam, H.M.M., 2000. Microbiological and
chemical properties of irradiated mango. Journal of Food Safety 20, 139-156.
FAO, 2008. International standards for phytosanitary measures - Guidelines for the use of
irradiation as a phytosanitary measure. FAO, Rome.
FDA, 1986. History of food irradiation. http://www.epa.gov/rpdweb00/sources/food_history.html
(accessed 07.09.10).
Follett, P.A., 2001. Irradiation as a quarantine treatment for mango seed weevil, Proceedings of the
Hawaiian Entomological Society, pp. 85–90.
Follett, P.A., 2004. Irradiation to control insects in fruits and vegetables for export from Hawaii.
Radiation Physics and Chemistry 71, 163-166.
Guinard, J., Mazzucchelli, R., 1996. The sensory perception of texture and mouthfeel. Trends in
Food Science & Technology 7, 213-219.
Hallman, G.J., 2000. Expanding radiation quarantine treatments beyond fruit flies. Agricultural and
Forest Entomology 2, 85-95.

29
Hassan, M.K., Irving, D.E., Dann, E.K., Coates, L.M., Hofman, P.J., 2009. Sap properties and
alk(en)ylresorcinol concentrations in Australian-grown mangoes. Annals of Applied Biology 154,
419-419.
Heather, N.W., Corcoran, R.J., Banos, C., 1991. Disinfestation of mangoes with gamma-irradiation
against 2 Australian fruit-flies (Diptera, Tephritidae). Journal of Economic Entomology 84, 1304-
1307.
Hewett, E., 2006. An overview of preharvest factors influencing postharvest quality of horticultural
products. International Journal of Postharvest Technology and Innovation 1, 4-15.
Hofman, P.J., Marques, J.R., Taylor, L.M., Stubbings, B.A., Ledger, S.N., Jordan, R.A., 2010. Skin
damage to two new mango cultivars during irradiation and cold storage. Acta Horticulturae 877,
475-481.
Hofman, P.J., Smith, L.G., Meiburg, G.F., Giles, J.E., 1997. Production locality affects mango fruit
quality. Australian Journal of Experimental Agriculture 37, 801-808.
Holmes, R., Hofman, P., Barker, L., 2010. Mango quality assessment manual. Department of
Employment, Economic Development and Innovation, Brisbane.
Huda, W., 1997. Radiation dosimetry in diagnostic radiology. AJR. American journal of
roentgenology 169, 1487-1488.
Johnson, G.I., Hofman, P.J., 2009. Postharvest technology and quarantine treatments, In: Litz, R.E.
(Ed.), The Mango: 2nd Edition - Botany, Production and Uses, 2nd ed. CAB International Press,
Wallingford, UK, pp. 529-605.
Kato, M., Matsumoto, H., Ikoma, Y., Okuda, H., Yano, M., 2006. The role of carotenoid cleavage
dioxygenases in the regulation of carotenoid profiles during maturation in citrus fruit. Journal of
Experimental Botany 57, 2153-2164.
Ketsa, S., Phakawatmongkol, W., Subhadrabhandhu, S., 1999. Peel enzymatic activity and colour
changes in ripening mango fruit. Journal of Plant Physiology 154, 363-366.
Kilcast, D., 1995. Food irradiation: Current problems and future potential. International
Biodeterioration & Biodegradation 36, 279-296.
30
Kohli, K., Qadry, J.S., Ali, M., 1987. Protein, amino acids and ascorbic acid in some cultivars of
mango. Journal of the Science of Food and Agriculture 39, 247-252.
Lalel, H.J.D., Singh, Z., 2006. Controlled atmosphere storage of 'Delta R2E2' mango fruit affects
production of aroma volatile compounds. Journal of Horticultural Science & Biotechnology 81,
449-457.
Lalel, H.J.D., Singh, Z., Tan, S.C., 2003a. Aroma volatiles production during fruit ripening of
‘Kensington Pride’ mango. Postharvest Biology and Technology 27, 323-336.
Lalel, H.J.D., Singh, Z., Tan, S.C., 2003b. Distribution of aroma volatile compounds in different
parts of mango fruit. Journal of Horticultural Science & Biotechnology 78, 131-138.
Lalel, H.J.D., Singh, Z., Tan, S.C., 2003c. Maturity stage at harvest affects fruit ripening, quality
and biosynthesis of aroma volatile compounds in 'Kensington Pride' mango. Journal of Horticultural
Science & Biotechnology 78, 225-233.
Lalel, H.J.D., Singh, Z., Tan, S.C., 2003d. The role of ethylene in mango fruit aroma volatiles
biosynthesis. Journal of Horticultural Science & Biotechnology 78, 485-496.
Lalel, H.J.D., Singh, Z., Tan, S.C., 2004. Ripening temperatures influence biosynthesis of aroma
volatile compounds in 'Kensington Pride' mango fruit. Journal of Horticultural Science &
Biotechnology 79, 146-157.
Laohakunjit, N., Uthairatakij, A., Kerdchoechuen, O., Chatpaisarn, A., Photchanachai, S., 2006.
Identification of changes in volatile compound in γ-irradiated mango during storage, International
Symposium “New Frontier of Irradiated food and Non-Food Products”. ISNF, Bangkok, Thailand
MacLeod, A.J., de Troconis, N.G., 1982. Volatile flavour components of mango fruit.
Phytochemistry 21, 2523-2526.
MacLeod, A.J., Macleod, G., Snyder, C.H., 1988. Volatile aroma constituents of mango (cv
Kensington). Phytochemistry 27, 2189-2193.
MacLeod, A.J., Snyder, C.H., 1985. Volatile components of two cultivars of mango from Florida.
Journal of Agricultural and Food Chemistry 33, 380-384.
31
Malundo, T.M.M., Shewfelt, R.L., Ware, G.O., Baldwin, E.A., 2001. Sugars and acids influence
flavor properties of mango (Mangifera indica). Journal of the American Society for Horticultural
Science 126, 115-121.
Marques, J., Hofman, P., Macnish, A., 2016. Postharvest handling practices and irradiation increase
lenticel discolouration in ‘B74’ mango fruit. The Journal of Horticultural Science and
Biotechnology, 1-7.
Marques, J.R., Hofman, P.J., Giles, J.E., Campbell, P.R., 2012. Reducing the incidence of under-
skin browning in 'Honey Gold' mango (Mangifera indica L.) fruit. Journal of Horticultural Science
& Biotechnology, 87, 341-346.
Mathooko, F., Kahangi, E., Runkuab, J., Onyangob, C., Owinob, W., 2009. Preharvest mango
(Mangifera indica L.'Apple') fruit bagging controls lenticel discolouration and improves postharvest
quality, International Conference on Postharvest and Quality Management of Horticultural Products
of Interest for Tropical Regions 906, pp. 55-62.
Medlicott, A.P., Bhogal, M., Reynolds, S.B., 1986. Changes in peel pigmentation during ripening of
mango fruit (Mangifera indica var. Tommy Atkins). Annals of Applied Biology 109, 651-656.
Medlicott, A.P., Sigrist, J.M.M., Reynolds, S.B., Thompson, A.K., 1987. Effects of ethylene and
acetylene on mango fruit ripening. Annals of Applied Biology 111, 439-444.
Medlicott, A.P., Thompson, A.K., 1985. Analysis of sugars and organic acids in ripening mango
fruits (Mangifera indica L. var Keitt) by high performance liquid chromatography. Journal of the
Science of Food and Agriculture 36, 561-566.
Mercadante, A.Z., Rodriguez-Amaya, D.B., 1998. Effects of ripening, cultivar differences, and
processing on the carotenoid composition of mango. Journal of Agricultural and Food Chemistry
46, 128-130.
Mercadante, A.Z., RodriguezAmaya, D.B., Britton, G., 1997. HPLC and mass spectrometric
analysis of carotenoids from mango. Journal of Agricultural and Food Chemistry 45, 120-123.
Mitcham, E.J., McDonald, R.E., 1992. Cell wall modification during ripening of 'Keitt' and 'Tommy
Atkins' mango fruit. Journal of the American Society for Horticultural Science 117, 919-924.
32
Mitcham, E.J., McDonald, R.E., 1993. Respiration rate, internal atmosphere, and ethanol and
acetaldehyde accumulation in heat-treated mango fruit. Postharvest Biology and Technology 3, 77-
86.
Mitchell, G.E., McLauchlan, R.L., Beattie, T.R., Banos, C., Gillen, A.A., 1990. Effect of gamma
irradiation on the carotene content of mangos and red capsicums. Journal of Food Science 55, 1185-
1186.
Moreno, M., Castell‐Perez, M.E., Gomes, C., Da Silva, P.F., Moreira, R.G., 2006. Effects of
electron beam irradiation on physical, textural, and microstructural properties of ‘Tommy Atkins’
mangoes (Mangifera indica L.). Journal of Food Science 71, E80-E86.
Muda, P., Seymour, G.B., Errington, N., Tucker, G.A., 1995. Compositional changes in cell wall
polymers during mango fruit ripening. Carbohydrate Polymers 26, 255-260.
Nieuwenhuizen, N.J., Wang, M.Y., Matich, A.J., Green, S.A., Chen, X., Yauk, Y., Beuning, L.L.,
Nagegowda, D.A., Dudareva, N., Atkinson, R.G., 2009. Two terpene synthases are responsible for
the major sesquiterpenes emitted from the flowers of kiwifruit (Actinidia deliciosa). Journal of
Experimental Botany 60, 3203-3219.
O'Hare, T., 1994. The susceptibility of Thai and Australian mango cultivars to sap injury and
possible means of control, In: Johnson, G.I., Highley, E. (Eds.), Development of Postharvest
Handling Technology for Tropical Tree Fruits. Australian Centre for International Agricultural
Research, Bangkok, Thailand, pp. 21-24.
O'Hare, T.J., Prasad, A., 1992. The alleviation of sap-induced skin-injury by calcium hydroxide.
Acta Horticulturae 321, 372-381.
O’Hare, T.J., Bally, I.S.E., Dahler, J.M., Saks, Y., Underhill, S.J.R., 1999. Characterisation and
induction of ‘etch’ browning in the skin of mango fruit. Postharvest Biology and Technology 16,
269-277.
Oosthuyse, S.A., 1998. Effect of environmental conditions at harvest on the incidence of lenticel
damage in mango. South African Mango Growers' Association Yearbook 18, 15-17.
Oosthuyse, S.A., 1999. Effects of each of the stages in the pack-line on the incidence of lenticel
damage in Keitt and Tommy Atkins mango. South African Mango Growers' Association Yearbook
19, 37-39.
33
Ornelas-Paz, J.d.J., Yahia, E.M., Gardea, A.A., 2008. Changes in external and internal color during
postharvest ripening of ‘Manila’ and ‘Ataulfo’ mango fruit and relationship with carotenoid content
determined by liquid chromatography–APcI+-time-of-flight mass spectrometry. Postharvest Biology
and Technology 50, 145-152.
Peroni, F.H.G., Koike, C., Louro, R.P., Purgatto, E., do Nascimento, J.R.O., Lajolo, F.M.,
Cordenunsi, B.R., 2008. Mango starch degradation. II. The binding of alpha-amylase and beta-
amylase to the starch granule. Journal of Agricultural and Food Chemistry 56, 7416-7421.
Pino, J.A., Mesa, J., 2006. Contribution of volatile compounds to mango (Mangifera indica L.)
aroma. Flavour and Fragrance Journal 21, 207-213.
Pino, J.A., Mesa, J., Muñoz, Y., Martí, M.P., Marbot, R., 2005. Volatile components from mango
(Mangifera indica L.) cultivars. Journal of Agricultural and Food Chemistry 53, 2213-2223.
Pott, I., Breithaupt, D.E., Carle, R., 2003. Detection of unusual carotenoid esters in fresh mango
(Mangifera indica L. cv. ‘Kent’). Phytochemistry 64, 825-829.
Prasanna, V., Yashoda, H.M., Prabha, T.N., Tharanathan, R.N., 2003. Pectic polysaccharides during
ripening of mango (Mangifera indica L). Journal of the Science of Food and Agriculture 83, 1182-
1186.
Rocha Ribeiro, S.M., Queiroz, J.H., Lopes Ribeiro de Queiroz, M.E., Campos, F.M., Pinheiro
Sant’Ana, H.M., 2007. Antioxidant in mango (Mangifera indica L.) pulp. Plant Foods for Human
Nutrition 62, 13-17.
Roe, B., Bruemmer, J.H., 1981. Changes in pectic substances and enzymes during ripening and
storage of "Keitt" mangos. Journal of Food Science 46, 186-189.
Rymbai, H., Srivastav, M., Sharma, R.R., Singh, S.K., 2012. Lenticels on mango fruit: origin,
development, discoloration and prevention of their discoloration. Scientia Horticulturae 135, 164-
170.
Santos, A.M.G., de Oliveira, S.M.A., da Silva, J.M., Terao, D., 2010. Fusicoccum rot in mangoes
submitted to low doses of gamma irradiation. Pesquisa Agropecuaria Brasileira 45, 1066-1072.
34
Sanz, C., Olias, J.M., Perez, A.G., 1997. Aroma biochemistry of fruits and vegetables, In: Tomás-
Barberán, F.A., Robins, R.J. (Eds.), Phytochemistry of fruit and vegetables. Oxford University
Press, Oxford, pp. 125–155.
Sayan, S., Rawee, C., 2005. Regulating irrigation during pre-harvest to avoid the incidence of
translucent flesh disorder and gamboge disorder of mangosteen fruits. Songklanakarin Journal of
Science and Technology 27, 957-965.
Self, G., de Assis, J.S., Caron, V.C., 2006. Effects of postharvest handling on lenticel spotting of
'Tommy Atkins' mangoes from Northeast Brazil. Acta Horticulturae 712, 543-550.
Shivashankara, K.S., Isobe, S., Horita, H., Takenaka, M., Shiina, T., 2006. Volatile aromatic
constituents of tree ripened and mature green 'Irwin' mango fruits during low temperature storage.
Journal of the Japanese Society for Horticultural Science 75, 209-212.
Shorter, A.J., Beasley, D.R., Joyce, D.C., 1997. Effect of preharvest bagging on fruit calcium
levels,and storage and ripening characteristics of ‘Sensation’ mangoes Australian Journal of
Experimental Agriculture 37, 383-389.
Silva, A.P.F.B., Nascimento, J.R.O.D.O., Lajolo, F.M., Cordenunsi, B.R., 2008. Starch
mobilization and sucrose accumulation in the pulp of Keitt mangoes during postharvest ripening.
Journal of Food Biochemistry 32, 384-395.
Simmons, S.L., Hofman, P.J., Whiley, A.W., Hetherington, S.E., 1998. Effects of preharvest
calcium sprays and fertilizers, leaf: fruit ratios, and water stress on mango fruit quality, In: Coates,
L.M., Hofman, P.J., Johnson, G.I. (Eds.), Disease Control and Storage Life Extension in Fruit.
ACIAR Proceedings 81, Chiang Mai, Thailand, pp. 19-26.
Singh, Z., Lalel, H.J., Nair, S., 2004. A review of mango fruit aroma volatile compounds-state of
the art research, VII International Mango Symposium 645, pp. 519-527.
Sivakumar, D., Jiang, Y., Yahia, E.M., 2011. Maintaining mango (Mangifera indica L.) fruit quality
during the export chain. Food Research International 44, 1254-1263.
Smyth, H., Kirchhoff, S., Fuller, S., Abberlonl, K., Davis, C., Bally, I., Dietzgen, R., 2008. Tropical
flavours to tempt consumers, Proceedings of the tropical fruits in human nutrition and health
conference, pp. 126-132.
35
Spencer, J.L., Morris, M.P., Kennard, W.C., 1956. Vitamin C concentration in developing and
mature fruits of mango (Mangifera indica L.). Plant Physiology 31, 79-80.
Sunarharum, W., Kravchuk, O., D’Arcy, B., Smyth, H., 2007. Key aroma-contributing compounds
of mango, The Amistar 6th Australian Mango Conference, The Business of Mangoes, Gold Coast.
Tamjinda, B., Sirphanich, J., Nobuchi, T., 1992. Anatomy of lenticels and the occurrence of their
discoloration in mangoes (Mangifera indica cv. Namdokmai). Kasetsart Journal, Natural Sciences
26, 57-64.
Tressl, R., Drawert, F., 1973. Biogenesis of banana volatiles. Journal of Agricultural and Food
Chemistry 21, 560-565.
Valente, M., Ribeyre, F., Self, G.U.Y., Berthiot, L., Assemat, S., 2011. Instrumental and sensory
characterization of mango fruit texture. Journal of Food Quality 34, 413-424.
Van Gemert, L., 2003. Flavour thresholds. Compilations of flavour threshold values in water and
other media. Oliemans Punter & Partners BV, Utrecht, the Netherlands.
Vásquez-Caicedo, A.L., Sruamsiri, P., Carle, R., Neidhart, S., 2005. Accumulation of all-trans-beta-
carotene and its 9-cis and 13-cis stereoisomers during postharvest ripening of nine Thai mango
cultivars. Journal of Agricultural and Food Chemistry 53, 4827-4835.
Vazquez-Salinas, C., Lakshminarayana, S., 1985. Compositional changes in mango fruit during
ripening at different storage temperatures. Journal of Food Science 50, 1646-1648.
Wilkinson, A.S., Monteith, G.R., Shaw, P.N., Lin, C., Gidley, M.J., Roberts-Thomson, S.J., 2008.
Effects of the mango components mangiferin and quercetin and the putative mangiferin metabolite
norathyriol on the transactivation of peroxisome proliferator-activated receptor isoforms. Journal of
Agricultural and Food Chemistry 56, 3037-3042.
Winterhalter, P., Rouseff, R., 2002. Carotenoid-derived aroma compounds: An introduction In:
Winterhalter, P., Rouseff, R. (Eds.), Carotenoid-derived aroma compounds. American Chemical
Society, Cary, NC, pp. 1-17.
Wongmetha, O., Ke, L., Liang, Y., 2012. Sucrose metabolism and physiological changes during
mango cv. Irwin growth and development. Horticulture, Environment, and Biotechnology 53, 373-
377.
36
Yashoda, H.M., Prabha, T.N., Tharanathan, R.N., 2006. Mango ripening: changes in cell wall
constituents in relation to textural softening. Journal of the Science of Food and Agriculture 86,
713-721.
Yashoda, H.M., Prabha, T.N., Tharanathan, R.N., 2007. Mango ripening – Role of carbohydrases in
tissue softening. Food Chemistry 102, 691-698.
Zaharah, S.S., Singh, Z., 2011. Postharvest nitric oxide fumigation alleviates chilling injury, delays
fruit ripening and maintains quality in cold-stored ‘Kensington Pride’ mango. Postharvest Biology
and Technology 60, 202-210.
37
CHAPTER 3. STABLE ISOTOPE DILUTION ASSAY (SIDA) AND HS-SPME-
GCMS QUANTIFICATION OF KEY AROMA VOLATILES FOR FRUIT
AND SAP OF AUSTRALIAN MANGO CULTIVARS
Abstract
Reported herein is a high throughput method to quantify in a single analysis the key volatiles that
contribute to the aroma of commercially significant mango cultivars grown in Australia. The
method constitutes stable isotope dilution analysis (SIDA) in conjunction with headspace (HS)
solid-phase microextraction (SPME) coupled with gas-chromatography mass spectrometry
(GCMS). Deuterium labelled analogues of the target analytes were either purchased commercially
or synthesised for use as internal standards. Eight volatiles, hexanal, 2-carene, 3-carene, α-
terpinene, p-cymene, limonene, α-terpinolene and ethyl octanoate, were targeted. The resulting
calibration functions had determination coefficients (R2) ranging from 0.93775 to 0.99741. High
recovery efficiencies for spiked mango samples were also achieved. The method was applied to
identify the key aroma volatile compounds produced by ‘Kensington Pride and ‘B74’ mango fruit
and by ‘Honey Gold’ mango sap. This method represents a marked improvement over current
methods for detecting and measuring concentrations of mango fruit and sap volatiles.
3.1 Introduction
Mango fruits are highly desired by consumers because of their distinctive and evocative flavour as a
function of their aroma and taste. Australia produces ca. 50,000 tonnes of mango fruit for domestic
and export markets annually (AMIA, 2016). ‘Kensington Pride’, ‘B74’, ‘Honey Gold’ and ‘R2E2’
are the main cultivars grown commercially (Dillon et al., 2013). These Australian varieties are not
grown widely overseas. Nonetheless, they are in high demand both domestically and as premium
products in export markets due to their distinctive fruit odour profiles. The intense flavour of the
fruit of Australian mango cultivars has been reported to be a crucial attribute that drives repeat
purchases by consumers (Florkowski et al., 2014a). The mango industry has responded to this
driver by focusing horticultural research on optimising agronomic and postharvest handling
practices to maximise flavour production by fruit; for example, a ‘guaranteed sweet’ program
(Florkowski et al., 2014a).
Several hundred volatile compounds have been identified in mango fruits (Andrade et al., 2000;
Lalel and Singh, 2006; Lalel et al., 2003; MacLeod and de Troconis, 1982; MacLeod et al., 1988;
MacLeod and Snyder, 1985; Pino et al., 2005; Shivashankara et al., 2006). The volatile profile
38
varies considerably among different mango cultivars. The selection of the eight targeted compounds
was based on their presence in the headspace analysis and their contribution to the flavour of mango
fruit. For example, α-terpinolene is considered a key aroma volatile responsible for the
characteristic flavour of ‘Kensington Pride’, the most commonly grown cultivar in Australia (Lalel
et al., 2003). It was also shown to be present in relatively high abundance in ‘Cheiro’, ‘Chana’,
‘Bacuri’, ‘Cametá’, ‘Gojoba’, ‘Carlota’, ‘Coquinho’ and ‘Comum’ mango fruits (Andrade et al.,
2000). Other volatile compounds, including hexanal, 3-carene and limonene, are also considered
important as they have been found in mango fruits at concentrations above their sensory thresholds
(Pino, 2012). 3-Carene has a sweet and pungent odour and quantitatively represented the second
main volatile compound produced by ‘Kensington Pride’ mango fruit (2003). In ‘Kensington Pride’
mango, α-terpinene was present as the major volatile component at the climacteric stage, while the
highest concentrations of limonene and p-cymene were found during the pre-climacteric stage. 2-
Carene was also highest among other monoterpenes at the over-ripe stage. Ethyl octanoate replaces
-terpinolene in dominance after fruit reach the fully ripe stage. Ethyl octanoate has a low odour
activity value. Nonetheless, it is important in the aromatic equilibrium phase as the most abundant
constituent, and is a potential indicator of ‘Kensington Pride’ mango fruit senescence.
Mango sap has two phases including an oily upper non-aqueous phase and a milky lower aqueous
phase. It is interesting to note that the non-aqueous phase, which is rich in terpenoids, plays an
important role in the plant’s defence against bacteria and fungus (Negi et al., 2002). In this study,
limonene was reported as the dominant terpenoid compound. Moreover, a ‘sapburn’ browning
injury was largely due to sap exudation on the mango fruit surface (Loveys et al., 1992). This
blemish reduces the visual quality of fruit and leads to the loss of market confidence. Terpinolene
was abundant in the non-aqueous phase of ‘Kensington Pride’ mango sap that is evidently related
with this browning (Loveys et al., 1992).
The purpose of the present study was to develop a rapid, accurate and precise analytical method
utilising a combination of Stable Isotope Dilution Analysis (SIDA) and Head-space Solid phase
microextraction (HS-SPME) in combination with gas chromatography mass spectrometry (GC-MS)
to quantify characteristic aroma volatiles produced by fruits and sap of Australian mango cultivars
to assist flavour optimisation research. This analytical work was conducted towards better
understanding the role of sap components in antimicrobial activities and sapburn injury. Eight key
aroma volatile compounds, hexanal, 2-carene, 3-carene, α-terpinene, p-cymene, limonene, α-
terpinolene, ethyl octanoate, were targeted for ripe ‘Kensington Pride’ and ‘B74’ mango fruit and
for ‘Honey Gold’ mango sap.
39
HS-SPME coupled with GC-MS is a relatively simple, rapid, inexpensive, and solvent-free
technique for quantifying volatiles (Butkhup et al., 2011; Sánchez-Palomo et al., 2005). However,
matrix effects and other potential sources of variation (e.g. MS detector, ionic strength and other
matrices) can considerably impact the quantification of results, particularly their accuracy and
precision (Yuan et al., 2013). SIDA provides an alternative approach to eliminate variability related
to sample preparation and matrix effects and to improve the recovery of the analytes (Maraval et al.,
2010). The combined analytical method of SIDA and HS-SPME-GC-MS is considered more
accurate, precise, rapid and sensitive than other quantitative techniques, such as liquid–liquid
extraction, especially for low volatile and polar odorants (Siebert et al., 2005).
Quantification methods have been developed previously for the analysis of volatiles in mango. The
common examples are where analytical methods have been applied either to compare the most
abundant aroma compounds between mango cultivars (Munafo et al., 2014; Nicola and Fontana,
2014; Pandit et al., 2009a; Pino et al., 2005), to measure differences in volatile aroma components
between ripened and mature green mango fruits (Lalel et al., 2003; Pandit et al., 2009b;
Shivashankara et al., 2006) or to quantify the major aroma-active compounds in tree-ripened mango
fruit (Munafo et al., 2016). These methods only provide definite and accurate quantification results
if recovery rates and response factors are measured for each compound against a suitable internal
standard. Some studies (Loveys et al., 1992; John et al., 1999) demonstrate only the percentage
composition of sap and not the quantitative concentrations of aroma volatiles in sap. Musharraf et
al. (2016) quantified the volatile concentration of different Pakistani mango sap using gas
chromatography triple quadrupole mass spectrometry. However, limited information is given
regarding the effect of the sap matrix on the quantification. In most cases, such rigor in analytical
method development has not been employed for the analysis of mango volatiles.
Ideally, in analytical methods development, the response of analytes should be calibrated to an
internal standard that behaves very similarly both chemically and physically to the analyte in a
given matrix. This is particularly important where SPME is employed due to variation in the
adsorption properties of different analytes to the fibre. Techniques that overcome these challenges
use either deuterium or carbon-13 labelled analogues of target analytes as internal standards.
Deuterium labelled standards are commonly applied as they are readily accessible (Florkowski et
al., 2014b) and relatively inexpensive as compared to 13C-labeled standards. This technique known
as SIDA has been applied in combination with SPME for the analysis of volatiles in rice (Maraval
et al., 2010), freeze-dried Cheonggukjang (Park et al., 2007), olive oil (Dierkes et al., 2012), juice
and wine (Kotseridis et al., 2008), for which target analytes are successfully measured in
concentrations ranging from µg/l down to ng/l. To date, however, the combination of SIDA and
40
HS-SPME-GC-MS has not been proven for quantitative analysis of key aroma volatiles in mango
fruit and sap, which inspired our method development in this space.
3.2 Materials and methods
3.2.1 Materials
All solvents were HPLC grade and all reagents were purchased from Sigma-Aldrich, Australia. The
standards used included hexanal (Sigma-Aldrich, Australia), 2-carene (Sigma-Aldrich, Australia),
3-carene (Sigma-Aldrich, Australia), α-terpinene (Sigma-Aldrich, Australia), p-cymene (Sigma-
Aldrich, Australia), limonene (Sigma-Aldrich, Australia), α-terpinolene (Fluka, Australia) and ethyl
octanoate (Sigma-Aldrich, Australia). d15-Ethyl octanoate and d12-hexanal were purchased from
CDN Isotopes (CDN, Canada). Deuterium labelled internal standards d6-α-terpinolene and d5-
limonene were synthesised in-house, as they were not commercially available.
3.2.2 Synthesis of isotopes
The commercially available methyl 4-methyl-cyclohex-3-ene-1-carboxylate was reacted with an
excess of d3-methyl magnesium iodide to provide d6-terpineol (Ketter and Herrmann, 1990).
Phosphoryl chloride mediated elimination of water (procedure for unlabelled terpineol given below)
produced a mixture of d6-terpinolene and d5-limonene (Korstanje et al., 2012; Rudloff, 1961). Both
compounds were partially separated by column chromatography on silver impregnated silica gel
(Mander and Williams, 2016; Williams and Mander, 2001) to give 9:1 and 1:1 fractions of d6-
terpinolene and d5-limonene. The fractions were characterised by high field 1H and 13C NMR as
well as by Bruker AV400MHz mass spectrometry. For 1H NMR, residual CHCl3 in CDCl3 was
referenced at 7.26 ppm. For 13C NMR, the central peak of the CDCl3 triplet (77.0 ppm) was used
to reference chemical shifts. GC/MS was performed using a Shimadzu-17A GC equipped with
J&W Scientific DB5 column (internal diameter 0.2mm; 30m) coupled to a Shimadzu QP5000 Mass
Spectrometer (70eV).
d6-α-Terpinolene (Zou et al., 2008):
1H NMR (CDCl3, 400 MHz): δ 1.65 (s, 3H, H3-7), 1.99 (m, 2H), 2.30 (t, J = 6.4 Hz, 2H), 2.71 (m,
2H), 5.35 (m, 1H, H-2).
13C NMR (CDCl3, 125 MHz): δ 23.4, 26.6, 29.5, 31.5, 120.8, 121.3, 127.6, 134.2.
d5-Limonene (Guo et al., 2016):
41
1H NMR (CDCl3, 400 MHz): δ 1.49 (m, 1H), 1.64 (br s, 3H, H3-7), 1.73 – 2.12 (m, 4H), 2.30 (m,
1H), 2.71 (sextet, J = 2 Hz, 1H, H-4), 5.35 (m, 1H, H-2).
13C NMR (CDCl3, 125 MHz): δ 23.4, 27.9, 30.6, 30.8, 41.0, 120.7, 133.8, 150.0.
Elimination of water from terpineol: A solution of α-terpineol (1.0 g, 6.5 mmol) in anhydrous
pyridine (10 ml) was added in phosphoryl chloride (1.2 ml, 13.0 mmol) under a N2 atmosphere at
0 °C. The reaction mixture was gradually warmed up to room temperature and stirred for 20 h. The
reaction mixture was then added to cold water and extracted with petroleum spirit (2 × 10 ml). The
organic phases were washed with a saturated solution of copper sulfate, dried over anhydrous
magnesium sulfate and concentrated to give a yellow oil (0.75 g, 85%) consisting of terpinolene and
limonene (1:1 by GC-MS) along with a small amount of chlorinated side product (8% by GC-MS).
3.2.3 Mango fruit
‘B74’ mango fruit were collected at commercial maturity (dry matter contents of 13.9, and 13.6%)
from orchards near Dimbulah, Queensland, Australia (-17.149 oS, 145.111 oE) and Goodwood,
Queensland, Australia (-25.10 oS, 152.37 oE), respectively. ‘Kensington Pride’ mango fruit were
harvested at commercial maturity (dry matter contents of 13.1 and 13.6%) from orchards near
Mareeba, Queensland, Australia (-16.992 ºS, 145.422 ºE) and Childers, Queensland, Australia (-
25.17 oS, 152.17 oE), respectively. The dry matter of mango fruit was analysed destructively as
described in Appendix 3. Thirty biological fruit replicates with three technical replicates per
biological replicate were used for each ‘B74’ mangoes and ‘Kensington Pride’ mangoes. All fruit
were de-stemmed in Mango Wash® (Septone, ITW AAMTech, Australia) for 2 min and graded for
uniform quality as per commercial procedures. ‘Nam Dok Mai’ mango fruit for method validation
were collected from the major commercial market at Rocklea near Brisbane, Queensland, Australia
(-27.28 oS, 153.03 oE). The fruit were packed as a single layer into cardboard trays with plastic
liners and transported within 24 h by airplane and / or car to the Maroochy Research Facility
postharvest laboratory near Nambour, Queensland, Australia. They were then treated with 10 µl/l
ethylene for 2 d at 20 ºC to trigger ripening as per commercial practice. Thereafter, the fruit were
maintained at 20 ºC until ripe. The flesh of one cheek of each fruit was then removed using a sharp
knife. A vertical section of flesh from the proximal stem end to the distal fruit tip was diced into
small pieces and stored in glass bottles at -20 ºC for 2 - 3 months pending analysis. Prior to
instrumental analysis, samples were thawed and blended with an Ultra-Turrax® (IKA, Germany)
stick blender ready for sampling directly into headspace vials.
42
3.2.4 Mango sap
‘Honey Gold’ mango fruit were harvested at commercial maturity from an orchard near Katherine,
Northern Territory, Australia (14.28 °S, 132.16 °E). Fruit with a 2-5 cm-long pedicel attached were
carefully transported to a nearby packing shed. The pedicel was broken at the abscission zone and
the fruit inverted to allow the sap to drain over 4 - 5 min. The sap was collected into glass vials. The
sap from 20 fruit was collected for each replication. The vial opening was covered with a piece of
aluminium foil and closed with an aluminium screw-on cap. The collected sap was stored at -20 oC
pending analysis. The aqueous phase of sap (lower phase) was separated using a 5810 R centrifuge
(Eppendorf, Germany) at 3000 rpm for 10 min and used in the validation.
Aliquots of 0.1 g of sap, either whole sap or aqueous sap lower phase, were dissolved in 10 ml of
distilled water. The diluted samples were mixed well using a ball mill MM400 (Retsch GmbH,
Germany) for 30s and then diluted a further 50 times with distilled water. A volume of 2.5 ml
diluted sap was then added to a 20 ml HS-SPME vial (Merck, Australia) containing 2.5 ml of
saturated sodium chloride (NaCl) solution and a magnetic stir flea (5 x 2 mm) for aroma analysis.
Five biological replicates with two technical replicates per biological replicate were prepared for
analysis.
3.2.5 Calibration and validation of method
The calibration and validation of method were determined using the method of Siebert et al. (2005)
with some modifications. Standard solutions were prepared using analytical reagent grade
chemicals. A combined stock solution which contained each of the target analytes (viz., hexanal, 2-
carene, 3-carene, α-terpinene, p-cymene, limonene, α-terpinolene and ethyl octanoate) in ethanol
(Merck, Australia) was also prepared. Solutions were always made in duplicate from separately
weighed reagents to ensure precision in their preparation. The stock concentration of target analytes
were approximately 0.5 g/l (hexanal and p-cymene), 0.5 g/l (2-carene), 2 g/l (3-carene and α-
terpinene), 10 g/l (limonene) and 20 g/l (α-terpinolene).
In duplicate, water, mango flesh and aqueous sap lower phase were spiked with increasing levels of
the combined stock solution of analytes so that the resulting concentrations in water were
approximately 0, 1.5, 3, 6, 15, 30, 60, 150, 300 and 600 µg/l for hexanal and p-cymene, 0, 0.5, 1, 2,
5, 20, 50, 100, 200 and 400 for 2-carene, 0, 5, 10, 20, 50, 100, 200, 500, 1000 and 2000 µg/l for 3-
carene, α-terpinene and ethyl octanoate, 0, 25, 50, 100, 250, 500, 1000, 1500, 5 000 and 10 000 µg/l
for limonene, and 0, 50, 100, 200, 500, 1000, 2000, 5000, 10 000 and 20 000 µg/l for α-terpinolene.
A dilution of mango flesh of 1:400 was spiked with different amounts of α-terpinolene (0, 50, 100,
43
200, 500, 1000, 2000, 5000, 10 000 and 20 000 µg/l) in order to have a low α-terpinolene
concentration for optimising the MS signal of α-terpinolene. The solutions were prepared in SPME
vials for analysis (n = 10 x 2). The concentrations of analytes in the samples were calculated from
the peak area ratios for the unlabelled and labelled compounds versus the concentration ratio.
Validation parameters including the calibration relative standard deviation (RSD) and recovery
were calculated in spiked concentration levels of each standard compound. The limit of detection
(LOD) and limit of quantification (LOQ) were calculated on the basis of 3.3/S and 10/S,
respectively (Musharraf et al., 2016). is the standard deviation of the y-intercepts and S is the
slope of the calibration curve.
3.2.6 Headspace sampling of volatiles for analysis
A sample of either 2.5 g homogenized mango flesh or 2.5 ml aqueous solution of standards was
added to a 20 ml SPME vial (Merck, Australia) containing 2.5 ml of saturated sodium chloride
(NaCl) solution and a magnetic stirrer flea (5 x 2 mm). Vials were immediately sealed with a screw
cap fitted with a silicone/PTFE septum. Subsequently, 100 μl of combined internal standard
solution was injected through the septum and the vial was shaken well. The deuterated internal
standards were added at concentrations of 30 µg/l for d12-hexanal, 50 µg/l for d15-ethyl octanoate
and 106 µg/l for both d6-α-terpinolene and d5-limonene as equivalent to the amount of mango flesh
in the vial. The vial and its contents were heated to 40 °C with stirring at 250 rpm for 2 min
followed by extraction with a divinylbenzene/carboxen/polymethylsiloxane (DVB/CAR/PDMS,
'grey', 1 cm) 50/30 μm fibre (Supelco, USA) which was exposed to the headspace for 30 min. The
SPME fibre was injected into the Programmable Temperature Vaporizing (PTV) inlet (Gerstel,
Germany) set at 200 °C in splitless mode and the fibre was desorbed for 8 min.
3.2.7 Instrumental analysis of volatiles
An Agilent 6890 gas chromatograph (Agilent Technologies, USA) equipped with a Gerstel
MPS2XL multi-purpose sampler and coupled to a 5975N mass selective detector was used for the
analysis of samples. The instrument was controlled by and the data analysed with MSD
Chemstation E. 02. 02. 1431software (Agilent). The gas chromatograph was fitted with a ~30 m x
0.25 mm fused silica capillary ZB-5ms column (Phenomenex, Australia) with 0.25μm film
thickness. Helium carrier gas (BOC Gas) using a linear velocity of 44 cm/s with a constant flow rate
of 1.5 ml/min was used. The pressure was 75.7 kPa and total flow was 70.5 ml/min. The oven had
an initial temperature of 40°C that was held for 2 min, increased to 80 °C at 2 °C/min and then to
220 °C at 40 °C/min and held for 5 min. The PTV inlet was fitted with a 0.75 mm borosilicate glass
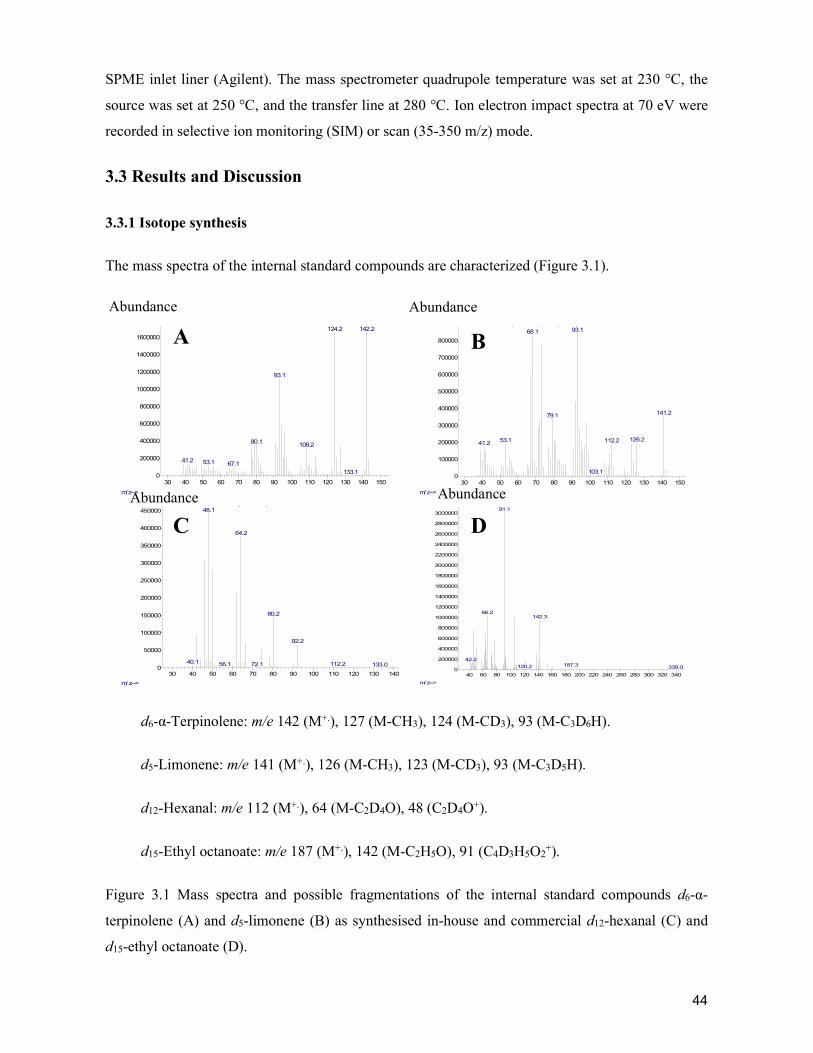
44
SPME inlet liner (Agilent). The mass spectrometer quadrupole temperature was set at 230 °C, the
source was set at 250 °C, and the transfer line at 280 °C. Ion electron impact spectra at 70 eV were
recorded in selective ion monitoring (SIM) or scan (35-350 m/z) mode.
3.3 Results and Discussion
3.3.1 Isotope synthesis
The mass spectra of the internal standard compounds are characterized (Figure 3.1).
d6-α-Terpinolene: m/e 142 (M+.), 127 (M-CH3), 124 (M-CD3), 93 (M-C3D6H).
d5-Limonene: m/e 141 (M+.), 126 (M-CH3), 123 (M-CD3), 93 (M-C3D5H).
d12-Hexanal: m/e 112 (M+.), 64 (M-C2D4O), 48 (C2D4O+).
d15-Ethyl octanoate: m/e 187 (M+.), 142 (M-C2H5O), 91 (C4D3H5O2+).
Figure 3.1 Mass spectra and possible fragmentations of the internal standard compounds d6-α-
terpinolene (A) and d5-limonene (B) as synthesised in-house and commercial d12-hexanal (C) and
d15-ethyl octanoate (D).
30 40 50 60 70 80 90 100 110 120 130 140 1500
200000
400000
600000
800000
1000000
1200000
1400000
1600000
m/z-->
142.2124.2
93.1
80.1108.2
41.2 53.1 67.1
133.1
30 40 50 60 70 80 90 100 110 120 130 140 1500
100000
200000
300000
400000
500000
600000
700000
800000
m/z-->
Scan 3533 (17.327 min): d5 alpha-terpinolene D Limonene 1.D\data.ms93.168.1
141.279.1
126.253.1 112.241.2
103.1
30 40 50 60 70 80 90 100 110 120 130 1400
50000
100000
150000
200000
250000
300000
350000
400000
450000
m/z-->
Scan 374 (5.485 min): d12-hexanal new 1.D\data.ms48.1
64.2
80.2
92.2
40.1 112.256.1 72.1 133.0
40 60 80 100 120 140 160 180 200 220 240 260 280 300 320 3400
200000
400000
600000
800000
1000000
1200000
1400000
1600000
1800000
2000000
2200000
2400000
2600000
2800000
3000000
m/z-->
91.1
66.2142.3
42.2187.3120.2 339.0
Abundance Abundance
A B
C D
Abundance Abundance
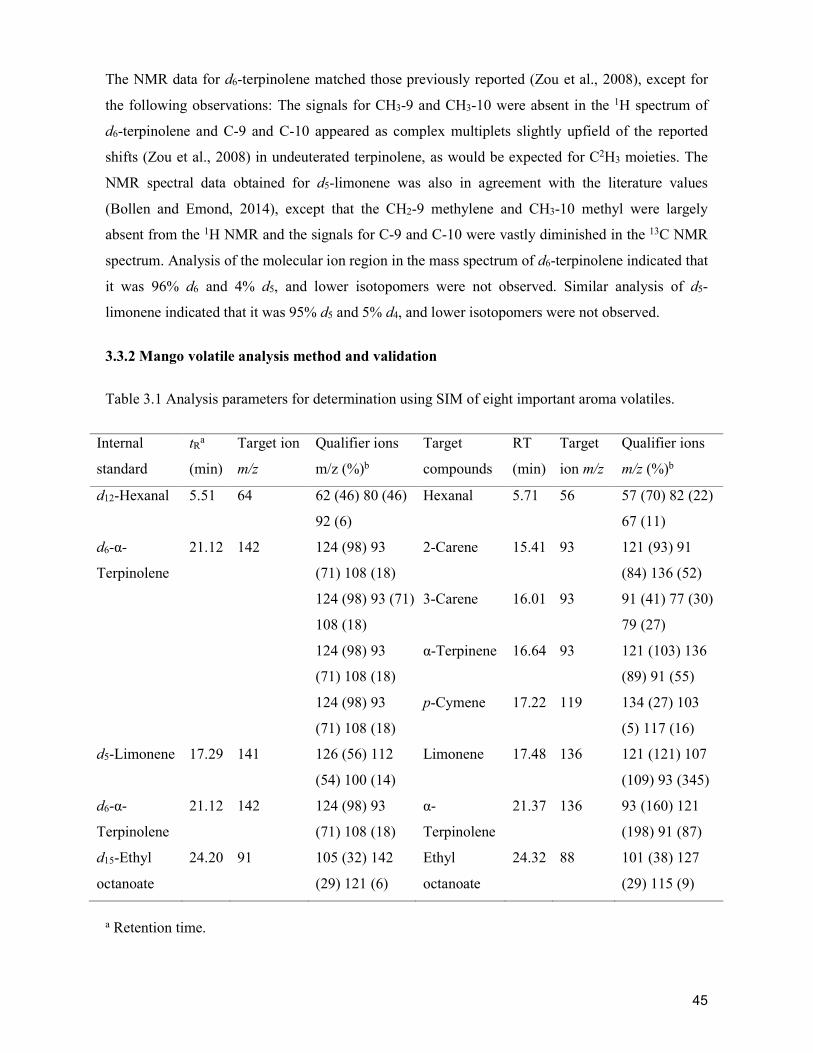
45
The NMR data for d6-terpinolene matched those previously reported (Zou et al., 2008), except for
the following observations: The signals for CH3-9 and CH3-10 were absent in the 1H spectrum of
d6-terpinolene and C-9 and C-10 appeared as complex multiplets slightly upfield of the reported
shifts (Zou et al., 2008) in undeuterated terpinolene, as would be expected for C2H3 moieties. The
NMR spectral data obtained for d5-limonene was also in agreement with the literature values
(Bollen and Emond, 2014), except that the CH2-9 methylene and CH3-10 methyl were largely
absent from the 1H NMR and the signals for C-9 and C-10 were vastly diminished in the 13C NMR
spectrum. Analysis of the molecular ion region in the mass spectrum of d6-terpinolene indicated that
it was 96% d6 and 4% d5, and lower isotopomers were not observed. Similar analysis of d5-
limonene indicated that it was 95% d5 and 5% d4, and lower isotopomers were not observed.
3.3.2 Mango volatile analysis method and validation
Table 3.1 Analysis parameters for determination using SIM of eight important aroma volatiles.
Internal
standard
tRa
(min)
Target ion
m/z
Qualifier ions
m/z (%)b
Target
compounds
RT
(min)
Target
ion m/z
Qualifier ions
m/z (%)b
d12-Hexanal 5.51 64 62 (46) 80 (46)
92 (6)
Hexanal 5.71 56 57 (70) 82 (22)
67 (11)
d6-α-
Terpinolene
21.12 142 124 (98) 93
(71) 108 (18)
2-Carene 15.41 93 121 (93) 91
(84) 136 (52)
124 (98) 93 (71)
108 (18)
3-Carene 16.01 93 91 (41) 77 (30)
79 (27)
124 (98) 93
(71) 108 (18)
α-Terpinene 16.64 93 121 (103) 136
(89) 91 (55)
124 (98) 93
(71) 108 (18)
p-Cymene 17.22 119 134 (27) 103
(5) 117 (16)
d5-Limonene 17.29 141 126 (56) 112
(54) 100 (14)
Limonene 17.48 136 121 (121) 107
(109) 93 (345)
d6-α-
Terpinolene
21.12 142 124 (98) 93
(71) 108 (18)
α-
Terpinolene
21.37 136 93 (160) 121
(198) 91 (87)
d15-Ethyl
octanoate
24.20 91 105 (32) 142
(29) 121 (6)
Ethyl
octanoate
24.32 88 101 (38) 127
(29) 115 (9)
a Retention time.
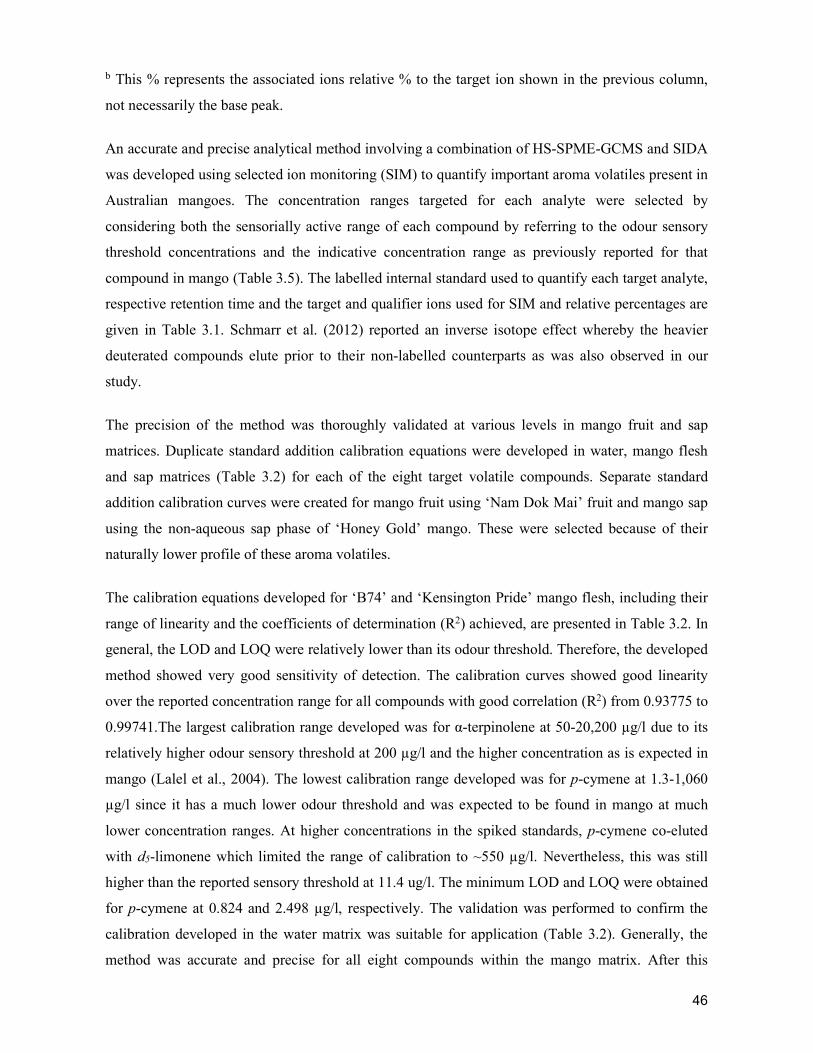
46
b This % represents the associated ions relative % to the target ion shown in the previous column,
not necessarily the base peak.
An accurate and precise analytical method involving a combination of HS-SPME-GCMS and SIDA
was developed using selected ion monitoring (SIM) to quantify important aroma volatiles present in
Australian mangoes. The concentration ranges targeted for each analyte were selected by
considering both the sensorially active range of each compound by referring to the odour sensory
threshold concentrations and the indicative concentration range as previously reported for that
compound in mango (Table 3.5). The labelled internal standard used to quantify each target analyte,
respective retention time and the target and qualifier ions used for SIM and relative percentages are
given in Table 3.1. Schmarr et al. (2012) reported an inverse isotope effect whereby the heavier
deuterated compounds elute prior to their non-labelled counterparts as was also observed in our
study.
The precision of the method was thoroughly validated at various levels in mango fruit and sap
matrices. Duplicate standard addition calibration equations were developed in water, mango flesh
and sap matrices (Table 3.2) for each of the eight target volatile compounds. Separate standard
addition calibration curves were created for mango fruit using ‘Nam Dok Mai’ fruit and mango sap
using the non-aqueous sap phase of ‘Honey Gold’ mango. These were selected because of their
naturally lower profile of these aroma volatiles.
The calibration equations developed for ‘B74’ and ‘Kensington Pride’ mango flesh, including their
range of linearity and the coefficients of determination (R2) achieved, are presented in Table 3.2. In
general, the LOD and LOQ were relatively lower than its odour threshold. Therefore, the developed
method showed very good sensitivity of detection. The calibration curves showed good linearity
over the reported concentration range for all compounds with good correlation (R2) from 0.93775 to
0.99741.The largest calibration range developed was for α-terpinolene at 50-20,200 µg/l due to its
relatively higher odour sensory threshold at 200 µg/l and the higher concentration as is expected in
mango (Lalel et al., 2004). The lowest calibration range developed was for p-cymene at 1.3-1,060
µg/l since it has a much lower odour threshold and was expected to be found in mango at much
lower concentration ranges. At higher concentrations in the spiked standards, p-cymene co-eluted
with d5-limonene which limited the range of calibration to ~550 µg/l. Nevertheless, this was still
higher than the reported sensory threshold at 11.4 ug/l. The minimum LOD and LOQ were obtained
for p-cymene at 0.824 and 2.498 µg/l, respectively. The validation was performed to confirm the
calibration developed in the water matrix was suitable for application (Table 3.2). Generally, the
method was accurate and precise for all eight compounds within the mango matrix. After this
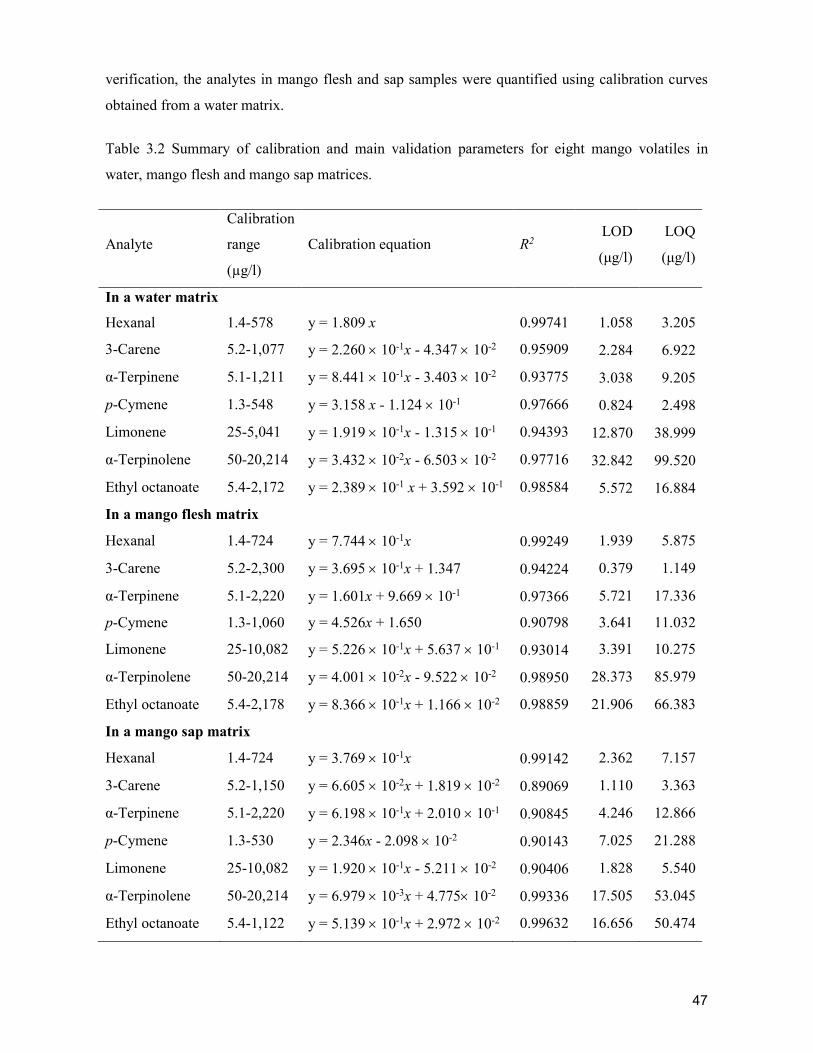
47
verification, the analytes in mango flesh and sap samples were quantified using calibration curves
obtained from a water matrix.
Table 3.2 Summary of calibration and main validation parameters for eight mango volatiles in
water, mango flesh and mango sap matrices.
Analyte
Calibration
range
(µg/l)
Calibration equation R2 LOD
(μg/l)
LOQ
(μg/l)
In a water matrix
Hexanal 1.4-578 y = 1.809 x 0.99741 1.058 3.205
3-Carene 5.2-1,077 y = 2.260 10-1x - 4.347 10-2 0.95909 2.284 6.922
α-Terpinene 5.1-1,211 y = 8.441 10-1x - 3.403 10-2 0.93775 3.038 9.205
p-Cymene 1.3-548 y = 3.158 x - 1.124 10-1 0.97666 0.824 2.498
Limonene 25-5,041 y = 1.919 10-1x - 1.315 10-1 0.94393 12.870 38.999
α-Terpinolene 50-20,214 y = 3.432 10-2x - 6.503 10-2 0.97716 32.842 99.520
Ethyl octanoate 5.4-2,172 y = 2.389 10-1 x + 3.592 10-1 0.98584 5.572 16.884
In a mango flesh matrix
Hexanal 1.4-724 y = 7.744 10-1x 0.99249 1.939 5.875
3-Carene 5.2-2,300 y = 3.695 10-1x + 1.347 0.94224 0.379 1.149
α-Terpinene 5.1-2,220 y = 1.601x + 9.669 10-1 0.97366 5.721 17.336
p-Cymene 1.3-1,060 y = 4.526x + 1.650 0.90798 3.641 11.032
Limonene 25-10,082 y = 5.226 10-1x + 5.637 10-1 0.93014 3.391 10.275
α-Terpinolene 50-20,214 y = 4.001 10-2x - 9.522 10-2 0.98950 28.373 85.979
Ethyl octanoate 5.4-2,178 y = 8.366 10-1x + 1.166 10-2 0.98859 21.906 66.383
In a mango sap matrix
Hexanal 1.4-724 y = 3.769 10-1x 0.99142 2.362 7.157
3-Carene 5.2-1,150 y = 6.605 10-2x + 1.819 10-2 0.89069 1.110 3.363
α-Terpinene 5.1-2,220 y = 6.198 10-1x + 2.010 10-1 0.90845 4.246 12.866
p-Cymene 1.3-530 y = 2.346x - 2.098 10-2 0.90143 7.025 21.288
Limonene 25-10,082 y = 1.920 10-1x - 5.211 10-2 0.90406 1.828 5.540
α-Terpinolene 50-20,214 y = 6.979 10-3x + 4.775 10-2 0.99336 17.505 53.045
Ethyl octanoate 5.4-1,122 y = 5.139 10-1x + 2.972 10-2 0.99632 16.656 50.474
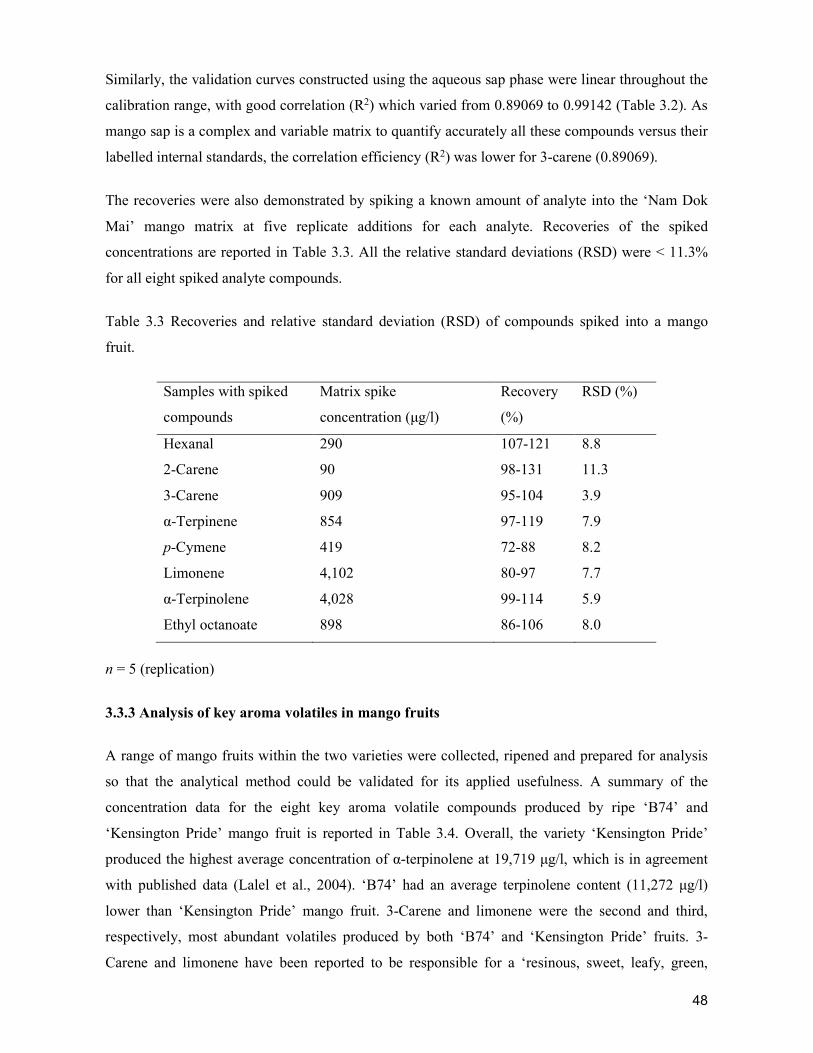
48
Similarly, the validation curves constructed using the aqueous sap phase were linear throughout the
calibration range, with good correlation (R2) which varied from 0.89069 to 0.99142 (Table 3.2). As
mango sap is a complex and variable matrix to quantify accurately all these compounds versus their
labelled internal standards, the correlation efficiency (R2) was lower for 3-carene (0.89069).
The recoveries were also demonstrated by spiking a known amount of analyte into the ‘Nam Dok
Mai’ mango matrix at five replicate additions for each analyte. Recoveries of the spiked
concentrations are reported in Table 3.3. All the relative standard deviations (RSD) were < 11.3%
for all eight spiked analyte compounds.
Table 3.3 Recoveries and relative standard deviation (RSD) of compounds spiked into a mango
fruit.
Samples with spiked
compounds
Matrix spike
concentration (μg/l)
Recovery
(%)
RSD (%)
Hexanal 290 107-121 8.8
2-Carene 90 98-131 11.3
3-Carene 909 95-104 3.9
α-Terpinene 854 97-119 7.9
p-Cymene 419 72-88 8.2
Limonene 4,102 80-97 7.7
α-Terpinolene 4,028 99-114 5.9
Ethyl octanoate 898 86-106 8.0
n = 5 (replication)
3.3.3 Analysis of key aroma volatiles in mango fruits
A range of mango fruits within the two varieties were collected, ripened and prepared for analysis
so that the analytical method could be validated for its applied usefulness. A summary of the
concentration data for the eight key aroma volatile compounds produced by ripe ‘B74’ and
‘Kensington Pride’ mango fruit is reported in Table 3.4. Overall, the variety ‘Kensington Pride’
produced the highest average concentration of α-terpinolene at 19,719 μg/l, which is in agreement
with published data (Lalel et al., 2004). ‘B74’ had an average terpinolene content (11,272 μg/l)
lower than ‘Kensington Pride’ mango fruit. 3-Carene and limonene were the second and third,
respectively, most abundant volatiles produced by both ‘B74’ and ‘Kensington Pride’ fruits. 3-
Carene and limonene have been reported to be responsible for a ‘resinous, sweet, leafy, green,
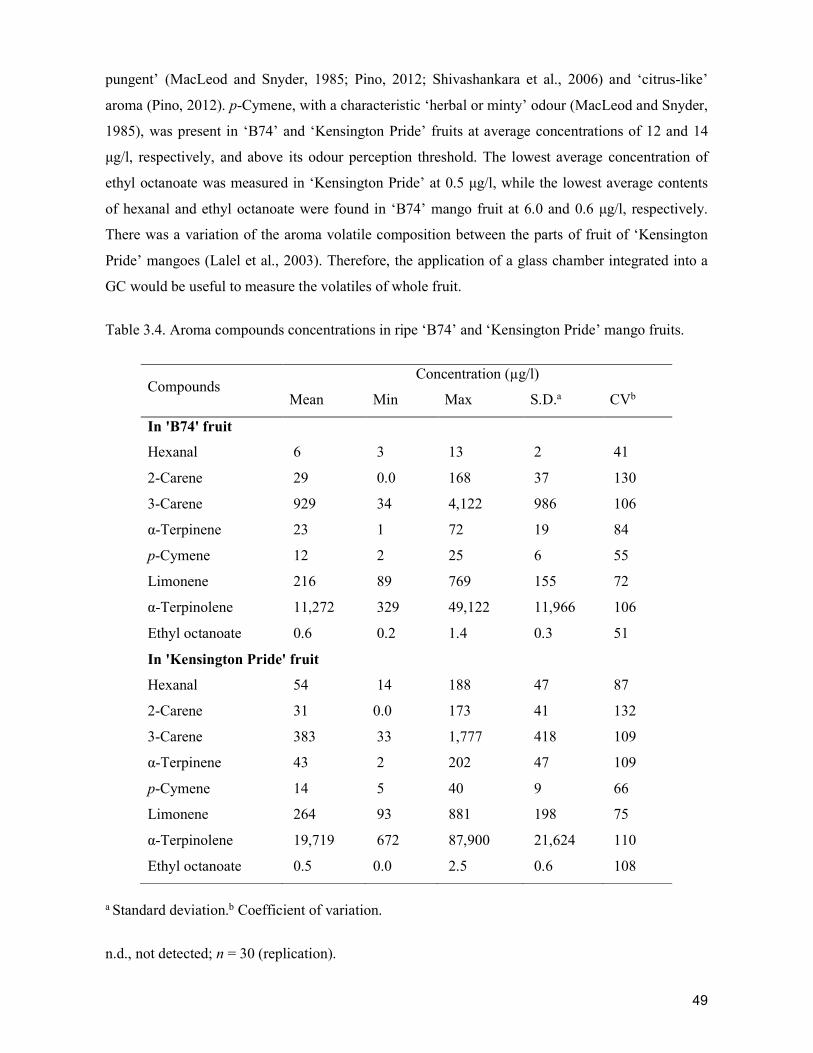
49
pungent’ (MacLeod and Snyder, 1985; Pino, 2012; Shivashankara et al., 2006) and ‘citrus-like’
aroma (Pino, 2012). p-Cymene, with a characteristic ‘herbal or minty’ odour (MacLeod and Snyder,
1985), was present in ‘B74’ and ‘Kensington Pride’ fruits at average concentrations of 12 and 14
μg/l, respectively, and above its odour perception threshold. The lowest average concentration of
ethyl octanoate was measured in ‘Kensington Pride’ at 0.5 μg/l, while the lowest average contents
of hexanal and ethyl octanoate were found in ‘B74’ mango fruit at 6.0 and 0.6 μg/l, respectively.
There was a variation of the aroma volatile composition between the parts of fruit of ‘Kensington
Pride’ mangoes (Lalel et al., 2003). Therefore, the application of a glass chamber integrated into a
GC would be useful to measure the volatiles of whole fruit.
Table 3.4. Aroma compounds concentrations in ripe ‘B74’ and ‘Kensington Pride’ mango fruits.
Compounds Concentration (µg/l)
Mean Min Max S.D.a CVb
In 'B74' fruit
Hexanal 6 3 13 2 41
2-Carene 29 0.0 168 37 130
3-Carene 929 34 4,122 986 106
α-Terpinene 23 1 72 19 84
p-Cymene 12 2 25 6 55
Limonene 216 89 769 155 72
α-Terpinolene 11,272 329 49,122 11,966 106
Ethyl octanoate 0.6 0.2 1.4 0.3 51
In 'Kensington Pride' fruit
Hexanal 54 14 188 47 87
2-Carene 31 0.0 173 41 132
3-Carene 383 33 1,777 418 109
α-Terpinene 43 2 202 47 109
p-Cymene 14 5 40 9 66
Limonene 264 93 881 198 75
α-Terpinolene 19,719 672 87,900 21,624 110
Ethyl octanoate 0.5 0.0 2.5 0.6 108
a Standard deviation.b Coefficient of variation.
n.d., not detected; n = 30 (replication).
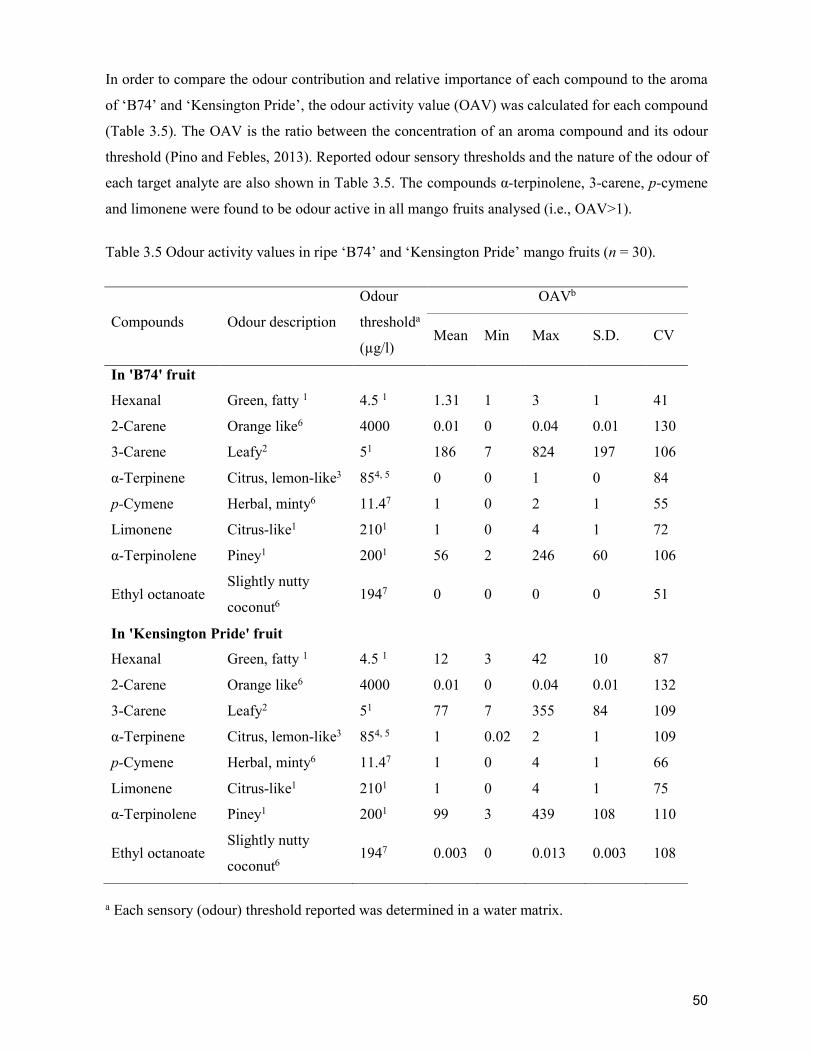
50
In order to compare the odour contribution and relative importance of each compound to the aroma
of ‘B74’ and ‘Kensington Pride’, the odour activity value (OAV) was calculated for each compound
(Table 3.5). The OAV is the ratio between the concentration of an aroma compound and its odour
threshold (Pino and Febles, 2013). Reported odour sensory thresholds and the nature of the odour of
each target analyte are also shown in Table 3.5. The compounds α-terpinolene, 3-carene, p-cymene
and limonene were found to be odour active in all mango fruits analysed (i.e., OAV>1).
Table 3.5 Odour activity values in ripe ‘B74’ and ‘Kensington Pride’ mango fruits (n = 30).
Compounds Odour description
Odour
thresholda
(µg/l)
OAVb
Mean Min Max S.D. CV
In 'B74' fruit
Hexanal Green, fatty 1 4.5 1 1.31 1 3 1 41
2-Carene Orange like6 4000 0.01 0 0.04 0.01 130
3-Carene Leafy2 51 186 7 824 197 106
α-Terpinene Citrus, lemon-like3 854, 5 0 0 1 0 84
p-Cymene Herbal, minty6 11.47 1 0 2 1 55
Limonene Citrus-like1 2101 1 0 4 1 72
α-Terpinolene Piney1 2001 56 2 246 60 106
Ethyl octanoate Slightly nutty
coconut6 1947 0 0 0 0 51
In 'Kensington Pride' fruit
Hexanal Green, fatty 1 4.5 1 12 3 42 10 87
2-Carene Orange like6 4000 0.01 0 0.04 0.01 132
3-Carene Leafy2 51 77 7 355 84 109
α-Terpinene Citrus, lemon-like3 854, 5 1 0.02 2 1 109
p-Cymene Herbal, minty6 11.47 1 0 4 1 66
Limonene Citrus-like1 2101 1 0 4 1 75
α-Terpinolene Piney1 2001 99 3 439 108 110
Ethyl octanoate Slightly nutty
coconut6 1947 0.003 0 0.013 0.003 108
a Each sensory (odour) threshold reported was determined in a water matrix.
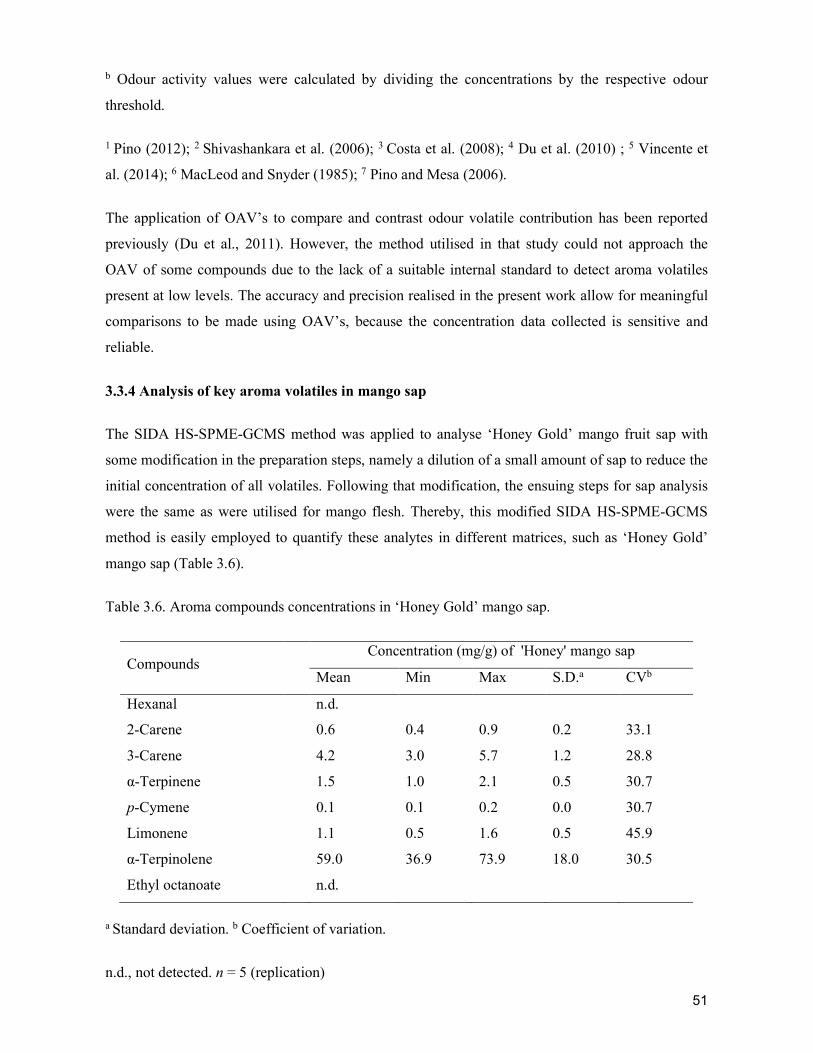
51
b Odour activity values were calculated by dividing the concentrations by the respective odour
threshold.
1 Pino (2012); 2 Shivashankara et al. (2006); 3 Costa et al. (2008); 4 Du et al. (2010) ; 5 Vincente et
al. (2014); 6 MacLeod and Snyder (1985); 7 Pino and Mesa (2006).
The application of OAV’s to compare and contrast odour volatile contribution has been reported
previously (Du et al., 2011). However, the method utilised in that study could not approach the
OAV of some compounds due to the lack of a suitable internal standard to detect aroma volatiles
present at low levels. The accuracy and precision realised in the present work allow for meaningful
comparisons to be made using OAV’s, because the concentration data collected is sensitive and
reliable.
3.3.4 Analysis of key aroma volatiles in mango sap
The SIDA HS-SPME-GCMS method was applied to analyse ‘Honey Gold’ mango fruit sap with
some modification in the preparation steps, namely a dilution of a small amount of sap to reduce the
initial concentration of all volatiles. Following that modification, the ensuing steps for sap analysis
were the same as were utilised for mango flesh. Thereby, this modified SIDA HS-SPME-GCMS
method is easily employed to quantify these analytes in different matrices, such as ‘Honey Gold’
mango sap (Table 3.6).
Table 3.6. Aroma compounds concentrations in ‘Honey Gold’ mango sap.
Compounds Concentration (mg/g) of 'Honey' mango sap
Mean Min Max S.D.a CVb
Hexanal n.d.
2-Carene 0.6 0.4 0.9 0.2 33.1
3-Carene 4.2 3.0 5.7 1.2 28.8
α-Terpinene 1.5 1.0 2.1 0.5 30.7
p-Cymene 0.1 0.1 0.2 0.0 30.7
Limonene 1.1 0.5 1.6 0.5 45.9
α-Terpinolene 59.0 36.9 73.9 18.0 30.5
Ethyl octanoate n.d.
a Standard deviation. b Coefficient of variation.
n.d., not detected. n = 5 (replication)
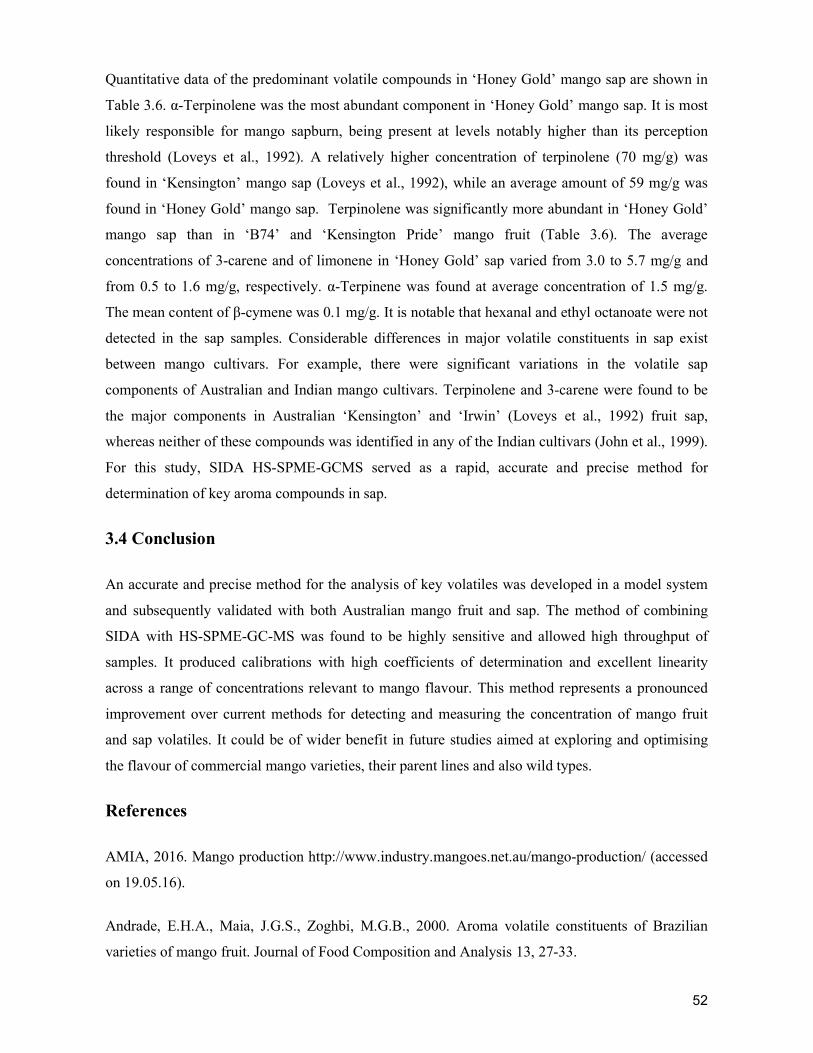
52
Quantitative data of the predominant volatile compounds in ‘Honey Gold’ mango sap are shown in
Table 3.6. α-Terpinolene was the most abundant component in ‘Honey Gold’ mango sap. It is most
likely responsible for mango sapburn, being present at levels notably higher than its perception
threshold (Loveys et al., 1992). A relatively higher concentration of terpinolene (70 mg/g) was
found in ‘Kensington’ mango sap (Loveys et al., 1992), while an average amount of 59 mg/g was
found in ‘Honey Gold’ mango sap. Terpinolene was significantly more abundant in ‘Honey Gold’
mango sap than in ‘B74’ and ‘Kensington Pride’ mango fruit (Table 3.6). The average
concentrations of 3-carene and of limonene in ‘Honey Gold’ sap varied from 3.0 to 5.7 mg/g and
from 0.5 to 1.6 mg/g, respectively. α-Terpinene was found at average concentration of 1.5 mg/g.
The mean content of β-cymene was 0.1 mg/g. It is notable that hexanal and ethyl octanoate were not
detected in the sap samples. Considerable differences in major volatile constituents in sap exist
between mango cultivars. For example, there were significant variations in the volatile sap
components of Australian and Indian mango cultivars. Terpinolene and 3-carene were found to be
the major components in Australian ‘Kensington’ and ‘Irwin’ (Loveys et al., 1992) fruit sap,
whereas neither of these compounds was identified in any of the Indian cultivars (John et al., 1999).
For this study, SIDA HS-SPME-GCMS served as a rapid, accurate and precise method for
determination of key aroma compounds in sap.
3.4 Conclusion
An accurate and precise method for the analysis of key volatiles was developed in a model system
and subsequently validated with both Australian mango fruit and sap. The method of combining
SIDA with HS-SPME-GC-MS was found to be highly sensitive and allowed high throughput of
samples. It produced calibrations with high coefficients of determination and excellent linearity
across a range of concentrations relevant to mango flavour. This method represents a pronounced
improvement over current methods for detecting and measuring the concentration of mango fruit
and sap volatiles. It could be of wider benefit in future studies aimed at exploring and optimising
the flavour of commercial mango varieties, their parent lines and also wild types.
References
AMIA, 2016. Mango production http://www.industry.mangoes.net.au/mango-production/ (accessed
on 19.05.16).
Andrade, E.H.A., Maia, J.G.S., Zoghbi, M.G.B., 2000. Aroma volatile constituents of Brazilian
varieties of mango fruit. Journal of Food Composition and Analysis 13, 27-33.
53
Bollen, A.F., Emond, J.P., 2014. Chapter 17 - Traceability in postharvest systems, In: Shewfelt,
R.L., Brueckner, B., Prussia, S.E. (Eds.), Postharvest Handling (Third Edition). Academic Press,
San Diego, pp. 485-504.
Butkhup, L., Jeenphakdee, M., Jorjong, S., Samappito, S., Samappito, W., Chowtivannakul, S.,
2011. HS-SPME-GC-MS analysis of volatile aromatic compounds in alcohol related beverages
made with mulberry fruits. Food Science and Biotechnology 20, 1021-1032.
Costa, R., Zellner, B.D., Crupi, M.L., De Fina, M.R., Valentino, M.R., Dugo, P., Dugo, G.,
Mondello, L., 2008. GC-MS, GC-O and enantio-GC investigation of the essential oil of
Tarchonanthus camphoratus L. Flavour and Fragrance Journal 23, 40-48.
Dierkes, G., Bongartz, A., Guth, H., Hayen, H., 2012. Quality evaluation of olive oil by statistical
analysis of multicomponent stable isotope dilution assay data of aroma active compounds. Journal
of Agricultural and Food Chemistry 60, 394-401.
Dillon, N.L., Bally, I.S.E., Wright, C.L., Hucks, L., Innes, D.J., Dietzgen, R.G., 2013. Genetic
diversity of the Australian national mango genebank. Scientia Horticulturae 150, 213-226.
Du, X., Finn, C.E., Qian, M.C., 2010. Volatile composition and odour-activity value of thornless
‘Black Diamond’ and ‘Marion’ blackberries. Food Chemistry 119, 1127-1134.
Du, X., Plotto, A., Baldwin, E., Rouseff, R., 2011. Evaluation of volatiles from two subtropical
strawberry cultivars using GC–olfactometry, GC-MS odor activity values, and sensory analysis.
Journal of Agricultural and Food Chemistry 59, 12569-12577.
Florkowski, W.J., Klepacka, A.M., Nambiar, P.M., Meng, T., Fu, S., Sheremenko, G., Sarpong,
D.B., 2014a. Chapter 7 - Consumer expenditures on fresh fruit and vegetables, In: Florkowski,
W.J., Shewfelt, R.L., Brueckner, B., Prussia, S.E. (Eds.), Postharvest Handling (Third Edition).
Academic Press, San Diego, pp. 147-166.
Florkowski, W.J., Shewfelt, R.L., Brueckner, B., Prussia, S.E., 2014b. Chapter 20 - Challenges in
postharvest handling, In: Florkowski, W.J., Shewfelt, R.L., Brueckner, B., Prussia, S.E. (Eds.),
Postharvest Handling (Third Edition). Academic Press, San Diego, pp. 543-547.
Guo, S., Zhang, W., Liang, J., You, C., Geng, Z., Wang, C., Du, S., 2016. Contact and repellent
activities of the essential oil from Juniperus Formosana against two stored product insects.
Molecules 21, 504.
54
John, K.S., Bhat, S., Rao, L.J.M., Rao, U.P., 1999. Characterization of aroma components of sap
from different Indian mango varieties. Phytochemistry 52, 891-894.
Ketter, A., Herrmann, R., 1990. Chiral Lewis acids as enantioselective catalysts in the Diels-Alder
reaction and the allylic addition to aldehydes. Zeitschrift für Naturforschung B 45, 1684-1688.
Korstanje, T.J., de Waard, E.F., Jastrzebski, J.T., Klein Gebbink, R.J., 2012. Rhenium-catalyzed
dehydration of nonbenzylic and terpene alcohols to olefins. ACS catalysis 2, 2173-2181.
Kotseridis, Y.S., Spink, M., Brindle, I.D., Blake, A.J., Sears, M., Chen, X., Soleas, G., Inglis, D.,
Pickering, G.J., 2008. Quantitative analysis of 3-alkyl-2-methoxypyrazines in juice and wine using
stable isotope labelled internal standard assay. Journal of Chromatography A 1190, 294-301.
Lalel, H.J.D., Singh, Z., 2006. Controlled atmosphere storage of 'Delta R2E2' mango fruit affects
production of aroma volatile compounds. Journal of Horticultural Science & Biotechnology 81,
449-457.
Lalel, H.J.D., Singh, Z., Tan, S.C., 2003. Aroma volatiles production during fruit ripening of
‘Kensington Pride’ mango. Postharvest Biology and Technology 27, 323-336.
Lalel, H.J.D., Singh, Z., Tan, S.C., 2004. Ripening temperatures influence biosynthesis of aroma
volatile compounds in 'Kensington Pride' mango fruit. Journal of Horticultural Science &
Biotechnology 79, 146-157.
Loveys, B.R., Robinson, S.P., Brophy, J.J., Chacko, E.K., 1992. Mango sapburn - components of
fruit sap and their role in causing skin damage. Australian Journal of Plant Physiology 19, 449-457.
MacLeod, A.J., de Troconis, N.G., 1982. Volatile flavour components of mango fruit.
Phytochemistry 21, 2523-2526.
MacLeod, A.J., Macleod, G., Snyder, C.H., 1988. Volatile aroma constituents of mango (cv
Kensington). Phytochemistry 27, 2189-2193.
MacLeod, A.J., Snyder, C.H., 1985. Volatile components of two cultivars of mango from Florida.
Journal of Agricultural and Food Chemistry 33, 380-384.
Mander, L.N., Williams, C.M., 2016. Chromatography with silver nitrate: part 2. Tetrahedron 72,
1133-1150.
55
Maraval, I., Sen, K., Agrebi, A., Menut, C., Morere, A., Boulanger, R., Gay, F., Mestres, C.,
Gunata, Z., 2010. Quantification of 2-acetyl-1-pyrroline in rice by stable isotope dilution assay
through headspace solid-phase microextraction coupled to gas chromatography-tandem mass
spectrometry. Analytica Chimica Acta 675, 148-155.
Munafo, J.P., Didzbalis, J., Schnell, R.J., Schieberle, P., Steinhaus, M., 2014. Characterization of
the major aroma-active compounds in mango (Mangifera indica L.) cultivars Haden, White
Alfonso, Praya Sowoy, Royal Special, and Malindi by application of a comparative aroma extract
dilution analysis. Journal of Agricultural and Food Chemistry 62, 4544-4551.
Munafo, J.P., Didzbalis, J., Schnell, R.J., Steinhaus, M., 2016. Insights into the key aroma
compounds in mango (Mangifera indica L.'Haden') fruits by stable isotope dilution quantitation and
aroma simulation experiments. Journal of Agricultural and Food Chemistry 64, 4312–4318.
Musharraf, S.G., Uddin, J., Siddiqui, A.J., Akram, M.I., 2016. Quantification of aroma constituents
of mango sap from different Pakistan mango cultivars using gas chromatography triple quadrupole
mass spectrometry. Food Chemistry 196, 1355-1360.
Negi, P., John, S., Rao, P., 2002. Antimicrobial activity of mango sap. European Food Research and
Technology 214, 327-330.
Nicola, S., Fontana, E., 2014. Chapter 9 - Fresh-cut produce quality: Implications for a systems
approach, In: Florkowski, W.J., Shewfelt, R.L., Brueckner, B., Prussia, S.E. (Eds.), Postharvest
Handling (Third Edition). Academic Press, San Diego, pp. 217-273.
Pandit, S.S., Chidley, H.G., Kulkarni, R.S., Pujari, K.H., Giri, A.P., Gupta, V.S., 2009a. Cultivar
relationships in mango based on fruit volatile profiles. Food Chemistry 114, 363-372.
Pandit, S.S., Kulkarni, R.S., Chidley, H.G., Giri, A.P., Pujari, K.H., Köllner, T.G., Degenhardt, J.,
Gershenzon, J., Gupta, V.S., 2009b. Changes in volatile composition during fruit development and
ripening of ‘Alphonso’ mango. Journal of the Science of Food and Agriculture 89, 2071-2081.
Park, M.K., Choi, H., Kwon, D., Kim, Y., 2007. Study of volatile organic acids in freeze-dried
Cheonggukjang formed during fermentation using SPME and stable-isotope dilution assay (SIDA).
Food Chemistry 105, 1276-1280.
Pino, J.A., 2012. Odour‐active compounds in mango (Mangifera indica L. cv. Corazón).
International Journal of Food Science & Technology 47, 1944-1950.
56
Pino, J.A., Febles, Y., 2013. Odour-active compounds in banana fruit cv. Giant Cavendish. Food
Chemistry 141, 795-801.
Pino, J.A., Mesa, J., 2006. Contribution of volatile compounds to mango (Mangifera indica L.)
aroma. Flavour and Fragrance Journal 21, 207-213.
Pino, J.A., Mesa, J., Muñoz, Y., Martí, M.P., Marbot, R., 2005. Volatile components from mango
(Mangifera indica L.) cultivars. Journal of Agricultural and Food Chemistry 53, 2213-2223.
Rudloff, E.V., 1961. A simple reagent for the specific dehydration of terpene alcohols. Canadian
Journal of Chemistry 39, 1860-1864.
Sánchez-Palomo, E., Díaz-Maroto, M.C., Pérez-Coello, M.S., 2005. Rapid determination of volatile
compounds in grapes by HS-SPME coupled with GC–MS. Talanta 66, 1152-1157.
Schmarr, H., Slabizki, P., Müntnich, S., Metzger, C., Gracia-Moreno, E., 2012. Ionic liquids as
novel stationary phases in gas liquid chromatography: Inverse or normal isotope effect? Journal of
Chromatography A 1270, 310-317.
Shivashankara, K.S., Isobe, S., Horita, H., Takenaka, M., Shiina, T., 2006. Volatile aromatic
constituents of tree ripened and mature green 'Irwin' mango fruits during low temperature storage.
Journal of the Japanese Society for Horticultural Science 75, 209-212.
Siebert, T.E., Smyth, H.E., Capone, D.L., Neuwöhner, C., Pardon, K.H., Skouroumounis, G.K.,
Herderich, M.J., Sefton, M.A., Pollnitz, A.P., 2005. Stable isotope dilution analysis of wine
fermentation products by HS-SPME-GC-MS. Analytical and Bioanalytical Chemistry 381, 937-
947.
Vincente, A.R., Manganaris, G.A., Ortiz, C.M., Sozzi, G.O., Crisosto, C.H., 2014. Chapter 5 -
Nutritional quality of fruits and vegetables, In: Prussia, W.J., Florkowski, R.L., Shewfelt, B.,
Brueckner, S.E. (Eds.), Postharvest Handling (Third Edition). Academic Press, San Diego, pp. 69-
122.
Williams, C.M., Mander, L.N., 2001. Chromatography with silver nitrate. Tetrahedron 57, 425-447.
Yuan, B., Li, F., Xu, D., Fu, M., 2013. Comparison of two methods for the determination of
geosmin and 2-methylisoborneol in algae samples by stable isotope dilution assay through purge-
57
and-trap or headspace solid-phase microextraction combined with GC/MS. Analytical Methods 5,
1739-1746.
Zou, Y., Wang, Q., Goeke, A., 2008. Organocatalytic multicomponent alpha-methylenation/Diels-
Alder reactions: a versatile route to substituted cyclohexenecarbaldehyde derivatives. Chemistry 14,
5335-5345.
58
CHAPTER 4. -IRRADIATION EFFECTS ON APPEARANCE, PHYSICO-
CHEMICAL PROPERTIES AND AROMA OF FOUR AUSTRALIAN MANGO
FRUIT CULTIVARS
Abstract
-Irradiation is recommended as an effective quarantine or phytosanitary treatment. This study
determined the response of four Australian cultivars (‘B74’, ‘Honey Gold’, ‘Kensington Pride’ and
‘R2E2’) to -irradiation. Fruit were harvested from north and south east Queensland during the
2012/2013 and 2013/2014 seasons. In both seasons, -irradiation of green mature fruit at 0.5
(commercial dose) and 1.0 kGy (twice the commercial dose) generally retarded softening in the early
stages of ripening, but had little effect after 7 - 9 d of shelf life. -Irradiation also retarded the loss of
green colour that is typically associated with ripening, resulting in both seasons in ripe fruit with less
yellow skin colour. ‘Honey Gold’ was the least affected by irradiation, with ‘Kensington Pride’
generally having the least yellow colour at ripe. Irradiation at 0.5 kGy significantly (P≤0.05)
increased lenticel discolouration (LD), with generally little increase between 0.5 and 1.0 kGy.
‘Honey Gold’ had the least LD in both seasons. Irradiation did not affect total soluble solids (TSS) at
ripe, but reduced the titratable acidity (TA) decrease during ripening. There were significant
reductions (P≤0.05) of the concentrations of all of the measured volatiles in ‘Kensington Pride’ and
‘R2E2’ exposed 0.5 kGy and 1.0 kGy as compared to no irradiation, while there were no
considerable effects (P>0.05) of irradiation on the volatile contents of ‘B74’ and ‘Honey Gold’. It is
possible that irradiation may also diminish the flavour of ‘Kensington Pride’ and ‘R2E2’ by
increasing titratable acidity and reducing volatiles concentrations at ripe.
4.1 Introduction
Mango (Mangifera indica L.) is one of the most popular tropical fruits in the world, second only to
banana (AAG, 2006). In Australia, mango is an economically significant domestic horticultural crop.
The average production between 2011 and 2016 was 53,500 tonnes (AMIA, 2016). ‘B74’, ‘Honey
Gold’, ‘Kensington Pride’ and ‘R2E2’ are the major commercial cultivars in Australia (Dillon et al.,
2013). Other cultivars cultivated in Australia include ‘Brook’, ‘Haden’, ‘Irwin’, ‘Kent’, ‘Keitt’ and
‘Palmer’ (AMIA, 2014; Bally et al., 2000).
59
Many countries impose strict regulatory and physical barriers to the importation of fruit that are
susceptible to infestation by economically important quarantined insect pests (Follett, 2009).
Exposure to relatively low doses of gamma () irradiation can be an effective postharvest treatment
against pest presence (Ducamp Collin et al., 2007; Follett, 2004). -Irradiation of ‘Ataulfo’, ‘Kent’
and ‘Keitt mango fruits at up to 0.15 kGy can provide quarantine security against fruit flies such as
Anastrepha obliqua, Anastrepha serpentina, Anastrepha ludens and Ceratitis capitata (Bustos et al.,
2004). Similarly, a minimum dose of 228 Gy can disinfest ‘Red Fuji’ apple fruit of peach fruit moth
(Carposina sasakii) (Zhan et al., 2014). The mango seed weevil (Cryptorhynchus mangiferae F.) can
be eliminated upon application of -irradiation at 0.1 kGy (Follett, 2001). Also, Santos et al. (2015)
reported that low dose irradiation (0.45 kGy) of ‘Tommy Atkins’ mango reduced the incidence of rot
caused by Lasiodiplodia theobromae.
While -irradiation can be an effective quarantine treatment, there is concern by mango packers and
shippers about potential negative effects on fruit appearance and eating quality. ‘Tommy Atkins’
mangoes treated with the relatively high dose of 3.1 kGy were rated by a sensory panel to exhibit
unacceptable general visual quality, colour, texture and aroma as compared to non-treated control
fruit (Moreno et al., 2006). Reyes and Cisneros-Zevallos (2007) reported that ‘Tommy Atkins’
mango fruit irradiated at high doses (≥1.5 kGy) expressed higher levels of peel scalding and void
formations as compared to non-irradiated control fruit. -Irradiation at 1.0 kGy initiated pulp
browning and softer texture of ‘Tommy Atkins’ mango fruit (Sabato et al., 2009). Exposure to -
irradiation from 0.3 up to 10kGy reduced the loss of green peel colour during ripening and gave a
relatively lighter pulp colour to Indian mango fruit cvs. ‘Dushehri’ and ‘Fazli’ after storage (Mahto
and Das, 2013).
Although the effects of irradiation on fruit physicochemical properties and quality have been
extensively studied (Lacroix et al., 1992; Lacroix et al., 1993; McLauchlan et al., 1989; Thomas and
Janave, 1975), there is limited published information on the response of Australian mango cultivars
to -irradiation on appearance in terms of LD and skin degreening. For example, ‘B74’ mango fruit
showed a significant increase (P≤0.05) in LD incidence after exposure to 0.543 kGy (Hofman et al.,
2010c). According to McLauchlan et al. (1989), irradiation at 0.3 and 0.6 kGy increased LD and
decreased the rate of ripening-related green skin colour loss in ‘Kensington Pride’ mango fruit as
compared to the control.
60
Aroma is an important fruit quality attribute. Nonetheless, the effects of irradiation on aroma
volatiles have been studied on only a few mango cultivars (Blakesley et al., 1979; Gholap et al.,
1990; Laohakunjit et al., 2006). Irradiation of ‘Alphonso’ mangoes at 0.25 kGy and ‘Kent’ mango
fruit at 0.75 kGy did not affect the aroma volatile profile (Blakesley et al., 1979; Gholap et al., 1990).
In contrast, irradiation of applied chitosan or non-chitosan ‘Chok Anan’ mango fruit at 0.3 kGy
decreased terpene production after 30 d of storage at 13 °C as compared to the non-irradiated control
(Laohakunjit et al., 2006). There has been no published work on the effects of irradiation on aroma
production by Australian mango cultivars. Among Australian cultivars, there are relatively different
aroma descriptions (Smyth et al., 2008; Sunarharum et al., 2007).
The aim of the present study was to investigate the effects of -irradiation on the appearance,
physicochemical properties and aroma volatile production of four (‘B74’, ‘Kensington Pride’,
‘Honey Gold’, ‘R2E2’) commercially important mango cultivars in Australia. We hypothesised that
irradiation would differentially induce LD, delay the loss of green skin colour, and diminish aroma
volatile production among these four cultivars (Dillon et al., 2013). The effects of -irradiation at 0.5
(commercial dose) and 1.0 kGy (twice the commercial dose) were evaluated using fruit harvested
from north Queensland and south east Queensland over two seasons.
4.2 Materials and methods
4.2.1 Plant material
The fruit of four mango (Mangifera indica L.) cultivars (‘B74’, ‘Honey Gold’, ‘Kensington Pride’,
‘R2E2’) were harvested on day 0 (designated) at commercial maturity (dry matter content: 13 - 19%)
from orchards in north Queensland (NQ) and south east Queensland (SEQ), Australia over two
seasons 2012/13 and 2013/2014 (Table 4.1 and 4.2). Fifty-five fruit of each cultivar were harvested
to provide 15 replicate fruit per irradiation treatment and ten fruit for dry matter measurement.
Immediately after harvest, all fruit were de-stemmed in 2.5 g/l Mango Wash® (Septone, ITW
AAMTech, Australia) solution for 2 min. They were taken to a nearby commercial packing house
and passed over a packing line under standard commercial conditions that included fungicide
treatment (0.55 ml/l Sportak®, a.i. prochloraz, Bayer Crop Science, Australia), brushing, drying, and
sorting (Hofman et al., 2010b). The fruit were then graded for uniform quality and size as per
commercial procedures. They were packed into single layer cardboard trays with polyethylene liners.
NQ fruit were air-freighted to Brisbane from NQ in 2 h and then transported from Brisbane airport
61
by car (ca. 22 oC) to the Ecosciences Precinct laboratory in Brisbane, Queensland, Australia (27.49
°S, 153.03 °E) in 1 - 2 h. Fruit harvested in SEQ were transported in an air-conditioned vehicle (ca.
22 oC) to the lab in 3 - 4 h.
Table 4.1 Harvest location and dry matter content of green mature ‘B74’, ‘Honey Gold’, ‘Kensington
Pride’ and ‘R2E2’ mango fruit. Fruit were harvested from north Queensland (NQ) and south east
Queensland (SEQ) in the 2012/2013 season. n = 10 except ‘R2E2’ from SEQ (n = 6).
Cultivar Location Dry matter (%)
‘B74’ Orchard 1, Dimbulah, NQ (7.149 oS, 145.111 oE) 13.5 ± 1.2
Orchard 2, Childers, SEQ (25.17 oS, 152.17 oE) 13.8 ± 0.7
‘Honey Gold’ Orchard 3, Mareeba, NQ (16.992 ºS, 145.422 ºE) 19.6 ± 1.6
Orchard 4, Childers, SEQ (25.17 oS, 152.17 oE) 19.0 ± 1.4
‘Kensington Pride’ Orchard 5, Mareeba, NQ (16.992 ºS, 145.422 ºE) 16.1 ± 1.6
Orchard 6, Childers, SEQ (25.17 ºS, 152.17 oE) 13.5 ± 1.2
‘R2E2’ Orchard 7, Dimbulah, NQ (17.149 oS, 145.111 oE) 17.4 ± 1.6
Orchard 6, Childers, SEQ (25.17 ºS, 152.17 oE) 15.3 ± 1.2
Table 4.2 Harvest location and dry matter content of green mature ‘B74’, ‘Honey Gold’, ‘Kensington
Pride’ and ‘R2E2’ mango fruit (n = 7). The fruit were harvested from north Queensland (NQ) and
south east Queensland (SEQ) in the 2013/2014 season.
Cultivar Location Dry matter (%)
‘B74’ Orchard 1, Dimbulah, NQ (17.149 oS, 145.111 oE) 13.9 ± 1.7
Goodwood, SEQ (25.10 ºS, 152.37 oE) 13.6 ± 1.2
‘Honey Gold’ Orchard 2, Dimbulah, NQ (17.149 oS, 145.111 oE) 18.2 ± 0.4
Electra, SEQ (24.98 ºS, 152.11 oE) 20.8 ± 1.2
‘Kensington Pride’ Mareeba, NQ (16.992 ºS, 145.422 ºE) 13.1 ± 0.4
Childers, SEQ (25.17 ºS, 152.17 oE) 14.2 ± 1.1
‘R2E2’ Orchard 2, Dimbulah, NQ (17.149 oS, 145.111 oE) 16.6 ± 0.8
Childers, SEQ (25.17 ºS, 152.17 oE) 15.3 ± 0.8
4.2.2 Treatments
At the laboratory, fruit were randomly assigned to treatment lots and labelled with a treatment
number. Fruit of the different cultivars and for the various treatments were randomly assigned to
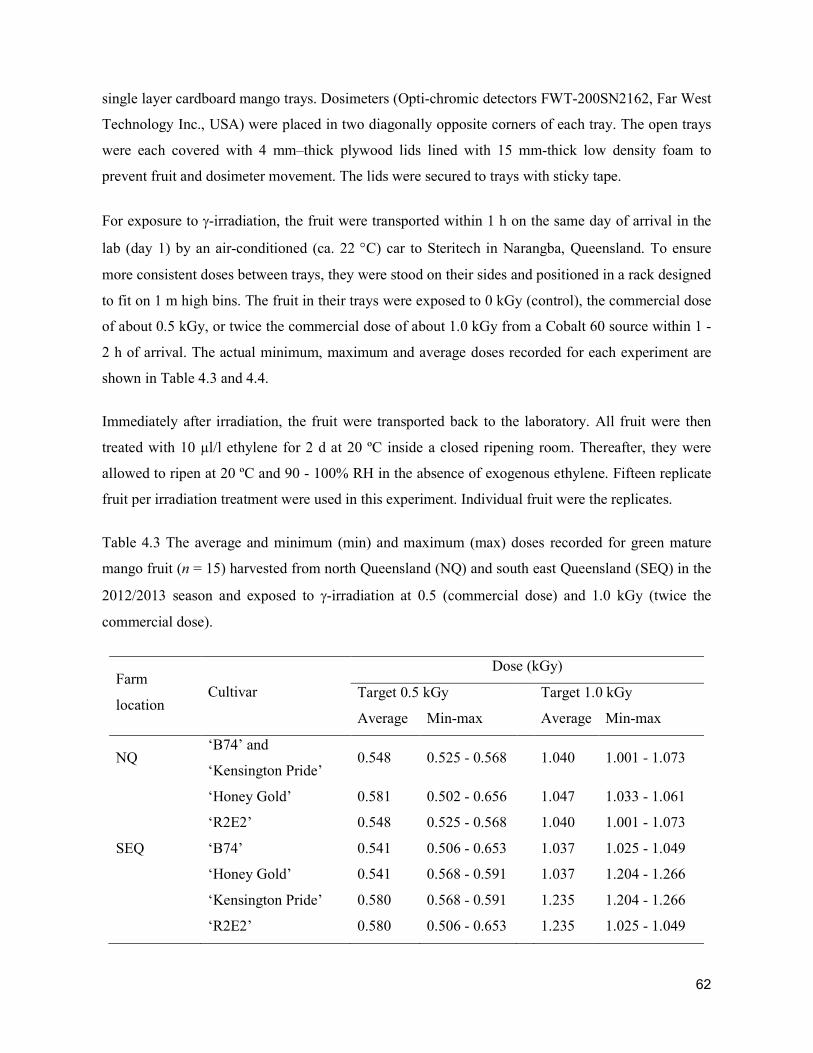
62
single layer cardboard mango trays. Dosimeters (Opti-chromic detectors FWT-200SN2162, Far West
Technology Inc., USA) were placed in two diagonally opposite corners of each tray. The open trays
were each covered with 4 mm–thick plywood lids lined with 15 mm-thick low density foam to
prevent fruit and dosimeter movement. The lids were secured to trays with sticky tape.
For exposure to -irradiation, the fruit were transported within 1 h on the same day of arrival in the
lab (day 1) by an air-conditioned (ca. 22 C) car to Steritech in Narangba, Queensland. To ensure
more consistent doses between trays, they were stood on their sides and positioned in a rack designed
to fit on 1 m high bins. The fruit in their trays were exposed to 0 kGy (control), the commercial dose
of about 0.5 kGy, or twice the commercial dose of about 1.0 kGy from a Cobalt 60 source within 1 -
2 h of arrival. The actual minimum, maximum and average doses recorded for each experiment are
shown in Table 4.3 and 4.4.
Immediately after irradiation, the fruit were transported back to the laboratory. All fruit were then
treated with 10 µl/l ethylene for 2 d at 20 ºC inside a closed ripening room. Thereafter, they were
allowed to ripen at 20 ºC and 90 - 100% RH in the absence of exogenous ethylene. Fifteen replicate
fruit per irradiation treatment were used in this experiment. Individual fruit were the replicates.
Table 4.3 The average and minimum (min) and maximum (max) doses recorded for green mature
mango fruit (n = 15) harvested from north Queensland (NQ) and south east Queensland (SEQ) in the
2012/2013 season and exposed to -irradiation at 0.5 (commercial dose) and 1.0 kGy (twice the
commercial dose).
Farm
location Cultivar
Dose (kGy)
Target 0.5 kGy Target 1.0 kGy
Average Min-max Average Min-max
NQ ‘B74’ and
‘Kensington Pride’ 0.548 0.525 - 0.568 1.040 1.001 - 1.073
‘Honey Gold’ 0.581 0.502 - 0.656 1.047 1.033 - 1.061
‘R2E2’ 0.548 0.525 - 0.568 1.040 1.001 - 1.073
SEQ ‘B74’ 0.541 0.506 - 0.653 1.037 1.025 - 1.049
‘Honey Gold’ 0.541 0.568 - 0.591 1.037 1.204 - 1.266
‘Kensington Pride’ 0.580 0.568 - 0.591 1.235 1.204 - 1.266
‘R2E2’ 0.580 0.506 - 0.653 1.235 1.025 - 1.049
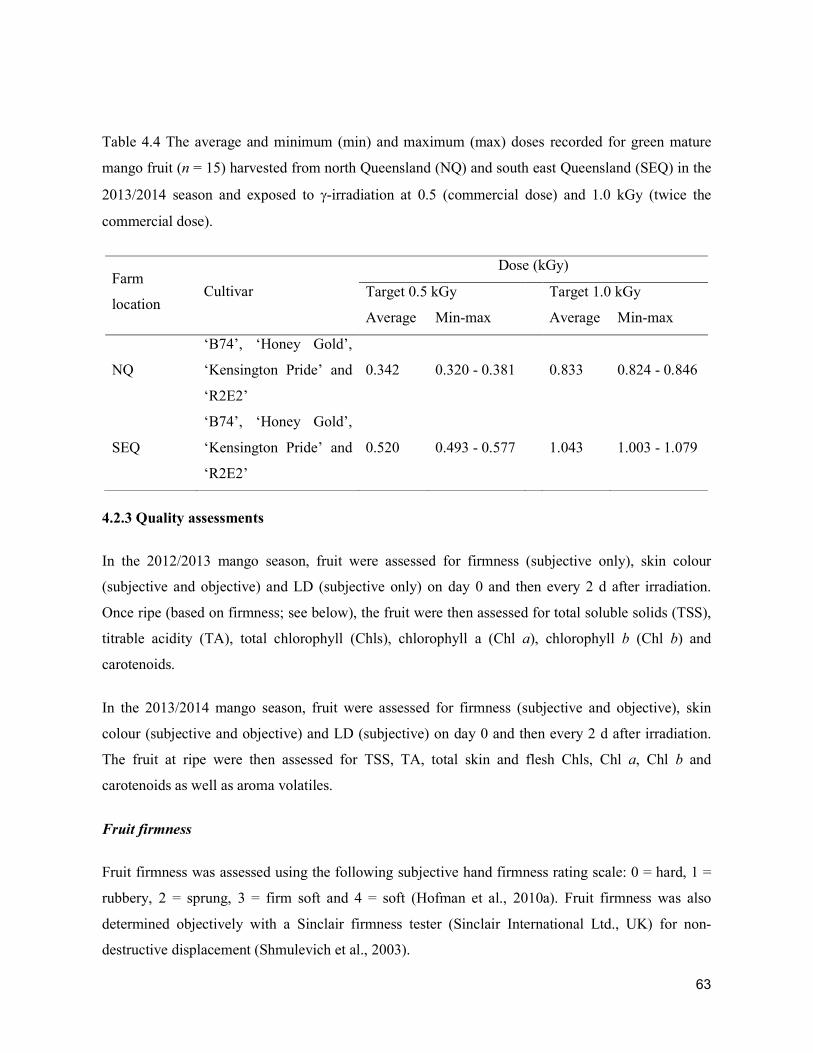
63
Table 4.4 The average and minimum (min) and maximum (max) doses recorded for green mature
mango fruit (n = 15) harvested from north Queensland (NQ) and south east Queensland (SEQ) in the
2013/2014 season and exposed to -irradiation at 0.5 (commercial dose) and 1.0 kGy (twice the
commercial dose).
Farm
location Cultivar
Dose (kGy)
Target 0.5 kGy Target 1.0 kGy
Average Min-max Average Min-max
NQ
‘B74’, ‘Honey Gold’,
‘Kensington Pride’ and
‘R2E2’
0.342 0.320 - 0.381 0.833 0.824 - 0.846
SEQ
‘B74’, ‘Honey Gold’,
‘Kensington Pride’ and
‘R2E2’
0.520 0.493 - 0.577 1.043 1.003 - 1.079
4.2.3 Quality assessments
In the 2012/2013 mango season, fruit were assessed for firmness (subjective only), skin colour
(subjective and objective) and LD (subjective only) on day 0 and then every 2 d after irradiation.
Once ripe (based on firmness; see below), the fruit were then assessed for total soluble solids (TSS),
titrable acidity (TA), total chlorophyll (Chls), chlorophyll a (Chl a), chlorophyll b (Chl b) and
carotenoids.
In the 2013/2014 mango season, fruit were assessed for firmness (subjective and objective), skin
colour (subjective and objective) and LD (subjective) on day 0 and then every 2 d after irradiation.
The fruit at ripe were then assessed for TSS, TA, total skin and flesh Chls, Chl a, Chl b and
carotenoids as well as aroma volatiles.
Fruit firmness
Fruit firmness was assessed using the following subjective hand firmness rating scale: 0 = hard, 1 =
rubbery, 2 = sprung, 3 = firm soft and 4 = soft (Hofman et al., 2010a). Fruit firmness was also
determined objectively with a Sinclair firmness tester (Sinclair International Ltd., UK) for non-
destructive displacement (Shmulevich et al., 2003).
64
Skin colour development
Skin colour was objectively measured using a CR 400 Chroma Meter (Konica Minolta, Japan).
Colour was determined with two measurements per fruit (stem end and central region) and repeated
every second day at the same position. Values were obtained for lightness (L) and chroma (C) and
hue angle (ho) as calculated using ‘a’ and ‘b’ values by LabLchConversions (Semba et al., 2002). L
value represents the lightness of the colour with 0 for black and 100 for white. C data represents
colour saturation for h° representing colour space chroma position where red-purple is an angle of
0°, yellow is 90°, bluish-green is 180°, and blue is 270° (McGuire, 1992; Semba et al., 2002).
Skin colour was also subjectively rated using the following scale: 1 = 0 - 10% of the non-blushed
skin with yellow colour, 2 = 11 - 30% yellow, 3 = 31 - 50% yellow, 4 = 51 - 70% yellow, 5 = 71 -
90% yellow and 6 = 91 - 100% yellow (Hofman et al., 2010a).
Lenticel discolouration (LD)
LD on each fruit was determined using the following rating scale (Hofman et al., 2010a): 0 = no
lenticels discoloured, 1 = light spots on not more than 25% of the surface or dense pronounced spots
on not more than 5% of the surface, 2 = light spots on not more than 50% of the surface or dense
pronounced spots on not more than 10% of the surface, 3 = scattered pronounced spots on not more
than 50% of the surface or dense pronounced spots on not more than 25% of the surface, 4 = dense
pronounced spots on not more than 50% of the surface, and, 5 = dense pronounced spots on more
than 50% of the surface.
TSS
When the fruit were ripe, the two ‘cheeks’ from each were removed using a knife. A vertical section
of the flesh from the proximal stem end to the distal base was chopped into small pieces and frozen
at -20 °C. Prior to instrumental analysis, the samples were thawed and squeezed through two layers
of cheesecloth to extract the juice. The TSS (oBrix) of juice samples was determined at room
temperature using a PAL-1 digital hand-held “Pocket” refractometer (Atago, Japan).
TA
Flesh samples were collected and stored as above. Prior to instrumental analysis, they were thawed
and blended with a stick blender. TA of 10 g samples of the homogenised pulp in 50 ml distilled
65
water and then determined with an automatic titrator (Metrohm, Switzerland) using 0.1 M NaOH
(Melrose Laboratories Pty Ltd, Australia) as the titrant. TA was expressed as the citric acid
equivalent (%) in each sample.
Chls and carotenoids in mango skin
The Chls and carotenoid concentration were determined using the method of Ketsa et al. (1999) with
minor modification. Peel samples on the non-blushed area of each fruit were sampled with a
vegetable peeler when fruit reached ripe. They were frozen in liquid nitrogen and stored at -20 ºC for
2 - 4 weeks and then at -80 ºC for 3 months.
About 3 g of the frozen mango peel was ground to a powder in liquid nitrogen. A 0.2 - 0.3 g sub-
sample of the powdered peel was extracted and diluted 100-fold with 80% cold (4 oC) acetone for
2012/2013 fruit samples and 100% cold acetone for 2013/2014 fruit samples. A solvent of 100%
acetone was used in the second season in order to inhibit the conversion of chlorophyll into
chlorophyllide (Hu et al., 2013). The extracts were transferred to 50 ml falcon tubes and kept in the
dark overnight in a cool room at 4 oC. The sample extracts were clarified by centrifugation at 4000
rpm in a refrigerated centrifuge (Eppendorf, Germany) for 15 min at -9 ºC. The absorbance of
supernatant samples was measured at 662, 645 and 710 nm using a DU 530 UV Vis
spectrophotometer (Beckman Coulter, USA). Chl a, Chl b, total Chls and carotenoids were expressed
as µg/g fresh weight (Hartmut, 1983). Five fruit from 15 individual mango fruit were analysed per
treatment for each cultivar in both locations.
Chls and carotenoids in mango flesh
To examine the effects of irradiation on Chls and carotenoids in mango flesh, the Chls and
carotenoid concentration were determined using the method of (Ketsa et al., 1999) with modification.
Flesh samples of each fruit were excised when fruit reached ripe as per the TSS section above and
frozen in liquid nitrogen. They were stored at -20 ºC for 2 - 4 weeks, then at -80 ºC for 3 months.
Approximately 4 g of mango flesh (2013/2014) was ground to in 100% 4 oC cold acetone (Hu et al.,
2013). The extract was diluted 100-times with 100% 4 oC cold acetone and transferred to a 50 ml
falcon tube. Then the samples were kept in the dark in the cool room at 4 oC and processed as
described in the mango skin section above.
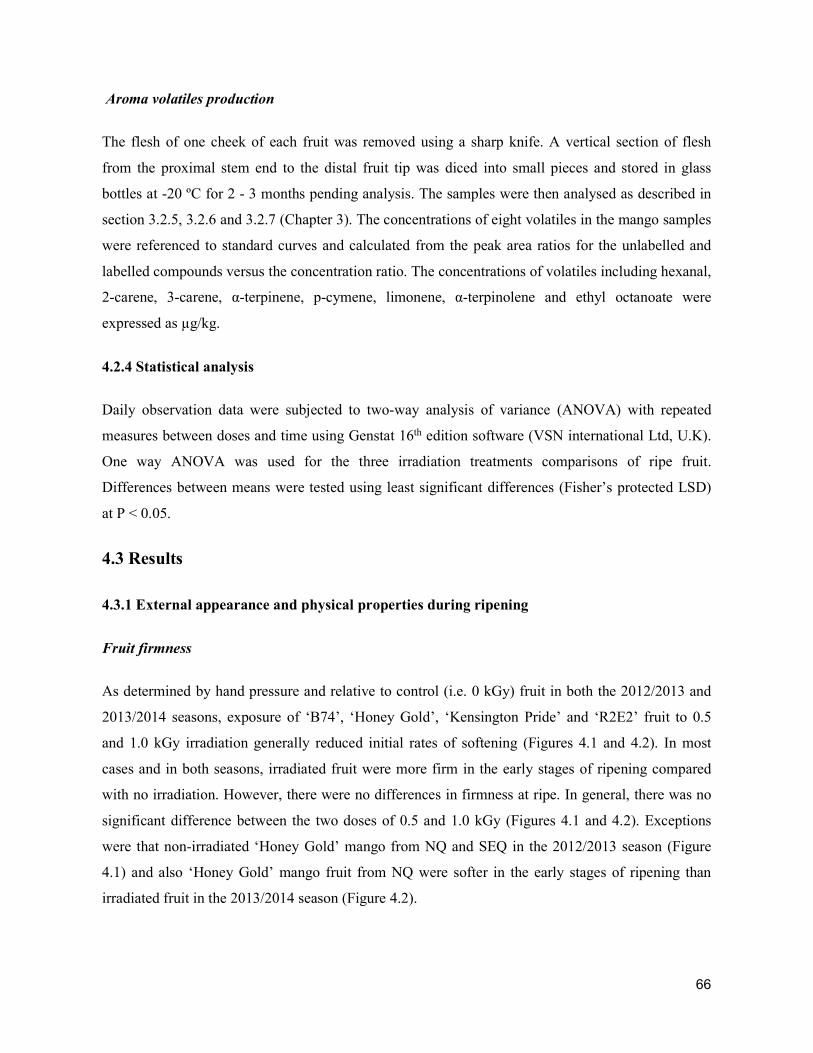
66
Aroma volatiles production
The flesh of one cheek of each fruit was removed using a sharp knife. A vertical section of flesh
from the proximal stem end to the distal fruit tip was diced into small pieces and stored in glass
bottles at -20 ºC for 2 - 3 months pending analysis. The samples were then analysed as described in
section 3.2.5, 3.2.6 and 3.2.7 (Chapter 3). The concentrations of eight volatiles in the mango samples
were referenced to standard curves and calculated from the peak area ratios for the unlabelled and
labelled compounds versus the concentration ratio. The concentrations of volatiles including hexanal,
2-carene, 3-carene, α-terpinene, p-cymene, limonene, α-terpinolene and ethyl octanoate were
expressed as µg/kg.
4.2.4 Statistical analysis
Daily observation data were subjected to two-way analysis of variance (ANOVA) with repeated
measures between doses and time using Genstat 16th edition software (VSN international Ltd, U.K).
One way ANOVA was used for the three irradiation treatments comparisons of ripe fruit.
Differences between means were tested using least significant differences (Fisher’s protected LSD)
at P < 0.05.
4.3 Results
4.3.1 External appearance and physical properties during ripening
Fruit firmness
As determined by hand pressure and relative to control (i.e. 0 kGy) fruit in both the 2012/2013 and
2013/2014 seasons, exposure of ‘B74’, ‘Honey Gold’, ‘Kensington Pride’ and ‘R2E2’ fruit to 0.5
and 1.0 kGy irradiation generally reduced initial rates of softening (Figures 4.1 and 4.2). In most
cases and in both seasons, irradiated fruit were more firm in the early stages of ripening compared
with no irradiation. However, there were no differences in firmness at ripe. In general, there was no
significant difference between the two doses of 0.5 and 1.0 kGy (Figures 4.1 and 4.2). Exceptions
were that non-irradiated ‘Honey Gold’ mango from NQ and SEQ in the 2012/2013 season (Figure
4.1) and also ‘Honey Gold’ mango fruit from NQ were softer in the early stages of ripening than
irradiated fruit in the 2013/2014 season (Figure 4.2).
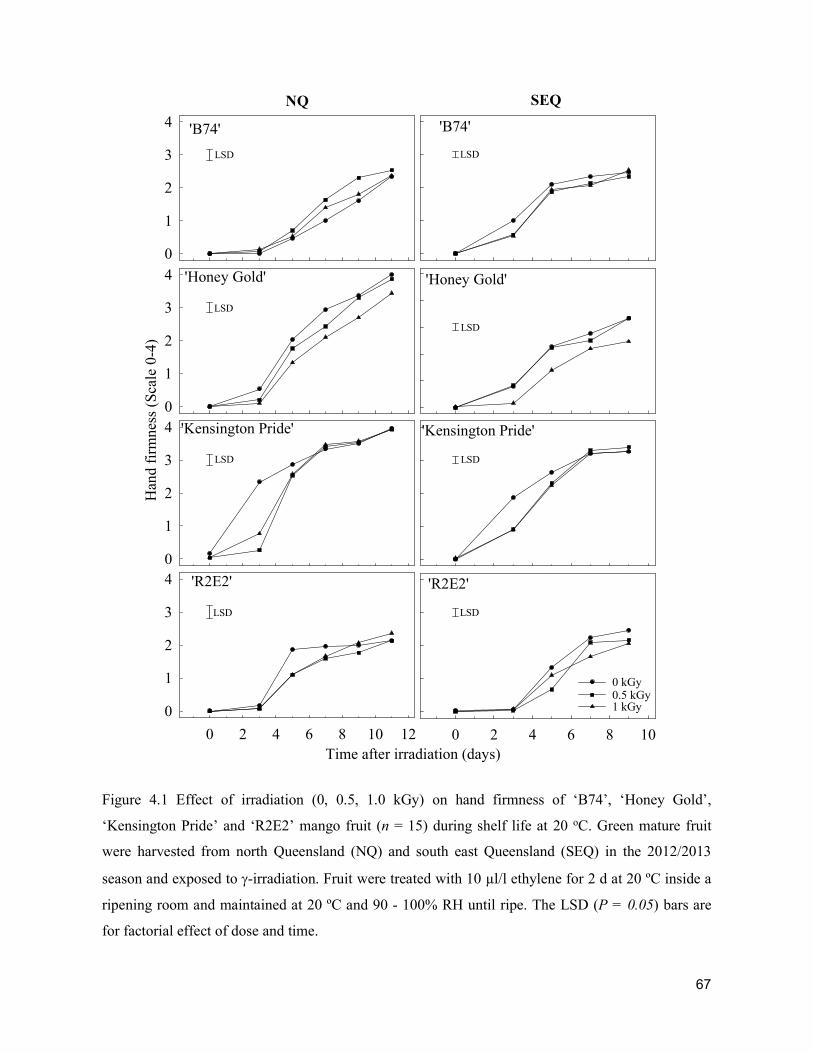
67
Figure 4.1 Effect of irradiation (0, 0.5, 1.0 kGy) on hand firmness of ‘B74’, ‘Honey Gold’,
‘Kensington Pride’ and ‘R2E2’ mango fruit (n = 15) during shelf life at 20 oC. Green mature fruit
were harvested from north Queensland (NQ) and south east Queensland (SEQ) in the 2012/2013
season and exposed to -irradiation. Fruit were treated with 10 µl/l ethylene for 2 d at 20 ºC inside a
ripening room and maintained at 20 ºC and 90 - 100% RH until ripe. The LSD (P = 0.05) bars are
for factorial effect of dose and time.
NQ
'Honey Gold'
Time after irradiation (days)
0
1
2
3
4
'B74'
Han
d f
irm
nes
s (S
cale
0-4
)
0
1
2
3
4
'Kensington Pride'
0
1
2
3
4
'R2E2'
0 2 4 6 8 10 12
0
1
2
3
4
LSD
LSD
LSD
LSD
'Honey Gold'
'B74'
'Kensington Pride'
'R2E2'
0 2 4 6 8 10
LSD
LSD
LSD
LSD
SEQ
0 kGy0.5 kGy1 kGy
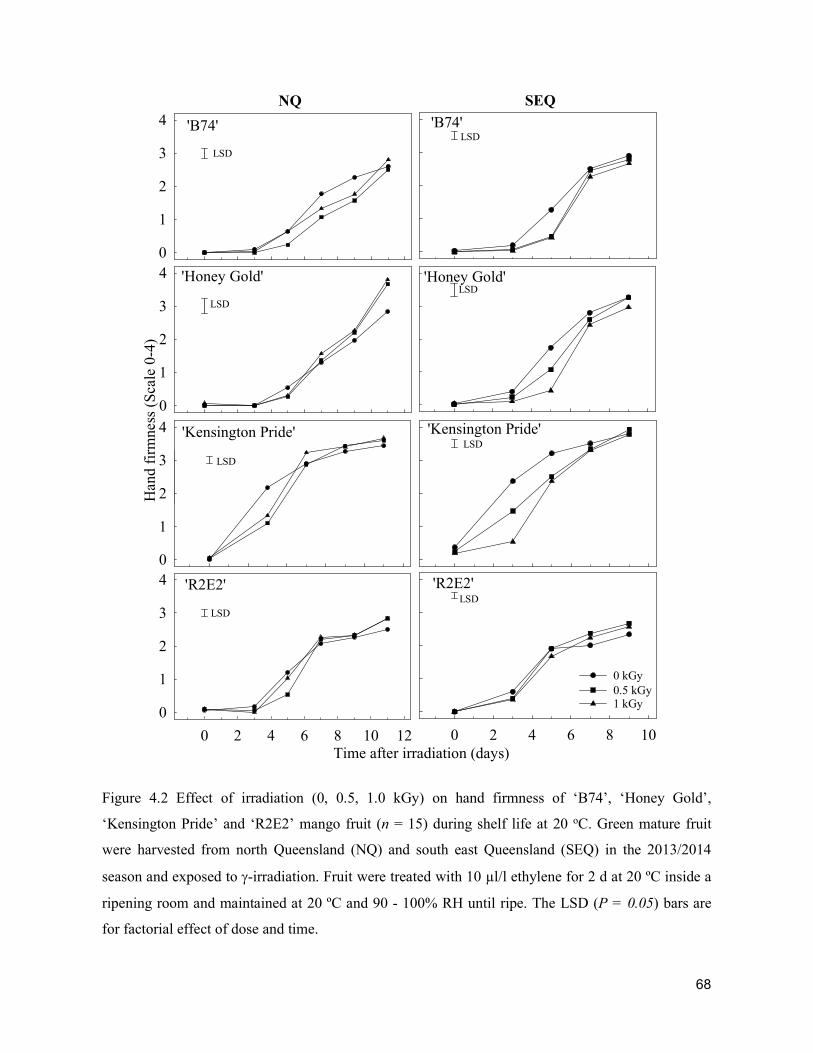
68
Figure 4.2 Effect of irradiation (0, 0.5, 1.0 kGy) on hand firmness of ‘B74’, ‘Honey Gold’,
‘Kensington Pride’ and ‘R2E2’ mango fruit (n = 15) during shelf life at 20 oC. Green mature fruit
were harvested from north Queensland (NQ) and south east Queensland (SEQ) in the 2013/2014
season and exposed to -irradiation. Fruit were treated with 10 µl/l ethylene for 2 d at 20 ºC inside a
ripening room and maintained at 20 ºC and 90 - 100% RH until ripe. The LSD (P = 0.05) bars are
for factorial effect of dose and time.
'R2E2'
0 2 4 6 8 10
'Honey Gold'
0
1
2
3
4
Time vs HG1
Time vs HG2 Time vs HG3 Time vs Col 18
'B74'
Han
d fi
rmne
ss (
Sca
le 0
-4)
0
1
2
3
4
'Kensington Pride'
0
1
2
3
4
'R2E2'
0 2 4 6 8 10 12
0
1
2
3
4
LSD
LSD
LSD
LSD
NQ SEQ
'Honey Gold'
Time after irradiation (days)
'B74'
'Kensington Pride'
0 kGy0.5 kGy1 kGy
LSD
LSD
LSD
LSD
69
Figure 4.3 Effect of irradiation (0, 0.5, 1.0 kGy) on Sinclair IQ firmness tester assessments of ‘B74’,
‘Honey Gold’, ‘Kensington Pride’ and ‘R2E2’ mango fruit (n = 5) during shelf life at 20oC. Green
mature fruit were harvested from north Queensland (NQ) and south east Queensland (SEQ) in the
2013/2014 season and exposed to -irradiation. Fruit were treated with 10 µl/l ethylene for 2 d at 20
ºC inside a ripening room and maintained at 20 ºC and 90 - 100% RH until ripe. The LSD (P = 0.05)
bars are for factorial effect of dose and time.
'R2E2'
0 2 4 6 8 10 12
NQ SEQ'B74''B74'
Sin
clai
r fi
rmne
ss (
IQ)
0
10
20
30
40
50
60
'Kensington Pride'
0
10
20
30
40
50
60
'R2E2'
0 2 4 6 8 10 120
10
20
30
40
50
60
'Honey Gold'
Time after irradiation (days)
0
10
20
30
40
50
60
LSD
LSD
LSD
LSD
'Honey Gold'
'Kensington Pride'
LSD
LSD
LSD
0 kGy0.5 kGy1 kGy
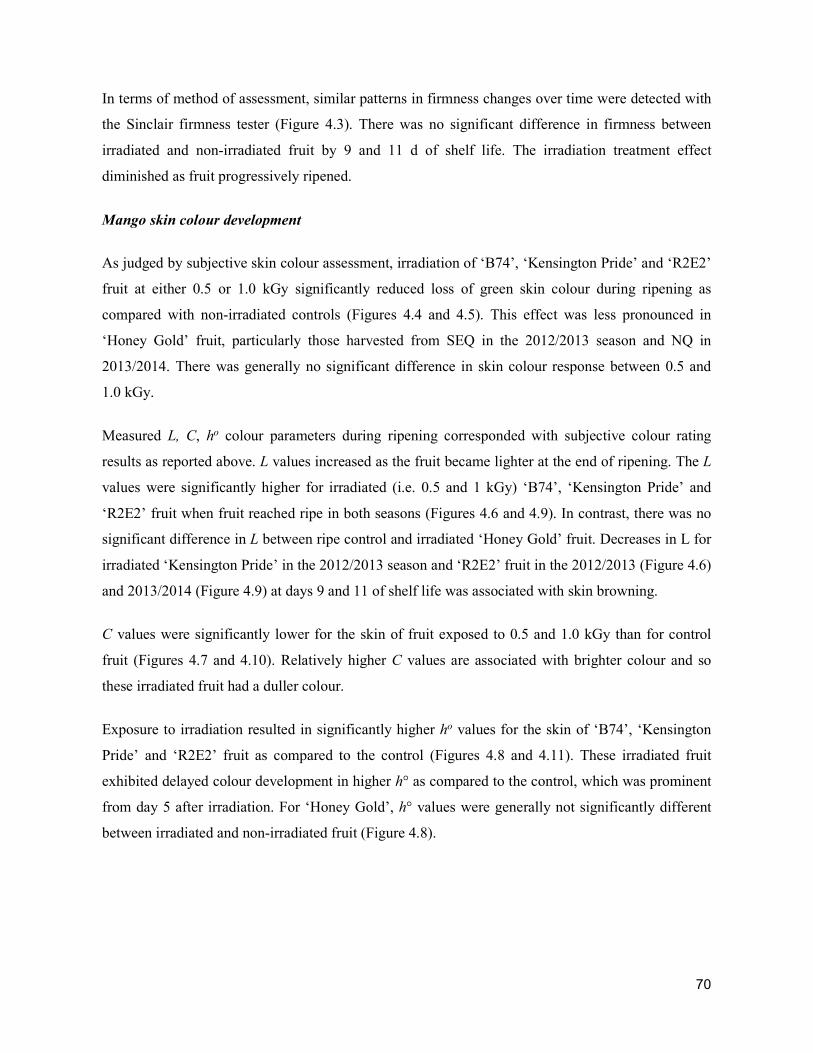
70
In terms of method of assessment, similar patterns in firmness changes over time were detected with
the Sinclair firmness tester (Figure 4.3). There was no significant difference in firmness between
irradiated and non-irradiated fruit by 9 and 11 d of shelf life. The irradiation treatment effect
diminished as fruit progressively ripened.
Mango skin colour development
As judged by subjective skin colour assessment, irradiation of ‘B74’, ‘Kensington Pride’ and ‘R2E2’
fruit at either 0.5 or 1.0 kGy significantly reduced loss of green skin colour during ripening as
compared with non-irradiated controls (Figures 4.4 and 4.5). This effect was less pronounced in
‘Honey Gold’ fruit, particularly those harvested from SEQ in the 2012/2013 season and NQ in
2013/2014. There was generally no significant difference in skin colour response between 0.5 and
1.0 kGy.
Measured L, C, ho colour parameters during ripening corresponded with subjective colour rating
results as reported above. L values increased as the fruit became lighter at the end of ripening. The L
values were significantly higher for irradiated (i.e. 0.5 and 1 kGy) ‘B74’, ‘Kensington Pride’ and
‘R2E2’ fruit when fruit reached ripe in both seasons (Figures 4.6 and 4.9). In contrast, there was no
significant difference in L between ripe control and irradiated ‘Honey Gold’ fruit. Decreases in L for
irradiated ‘Kensington Pride’ in the 2012/2013 season and ‘R2E2’ fruit in the 2012/2013 (Figure 4.6)
and 2013/2014 (Figure 4.9) at days 9 and 11 of shelf life was associated with skin browning.
C values were significantly lower for the skin of fruit exposed to 0.5 and 1.0 kGy than for control
fruit (Figures 4.7 and 4.10). Relatively higher C values are associated with brighter colour and so
these irradiated fruit had a duller colour.
Exposure to irradiation resulted in significantly higher ho values for the skin of ‘B74’, ‘Kensington
Pride’ and ‘R2E2’ fruit as compared to the control (Figures 4.8 and 4.11). These irradiated fruit
exhibited delayed colour development in higher h° as compared to the control, which was prominent
from day 5 after irradiation. For ‘Honey Gold’, h° values were generally not significantly different
between irradiated and non-irradiated fruit (Figure 4.8).
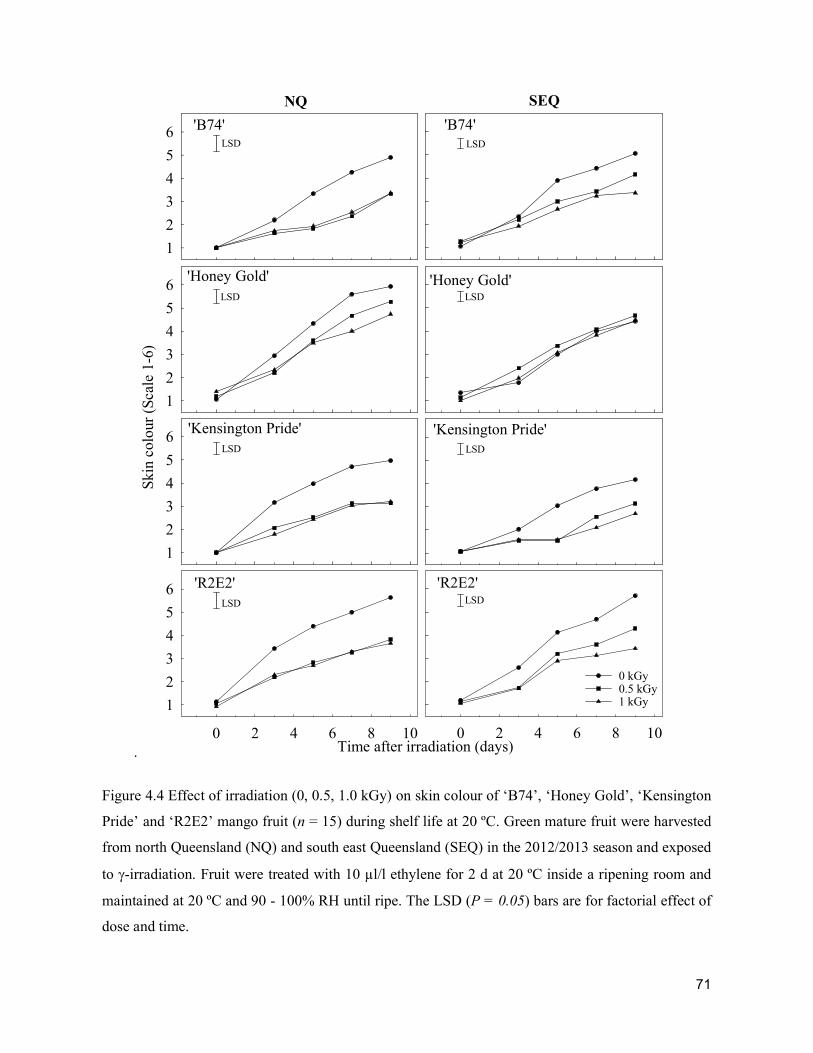
71
.
Figure 4.4 Effect of irradiation (0, 0.5, 1.0 kGy) on skin colour of ‘B74’, ‘Honey Gold’, ‘Kensington
Pride’ and ‘R2E2’ mango fruit (n = 15) during shelf life at 20 ºC. Green mature fruit were harvested
from north Queensland (NQ) and south east Queensland (SEQ) in the 2012/2013 season and exposed
to -irradiation. Fruit were treated with 10 µl/l ethylene for 2 d at 20 ºC inside a ripening room and
maintained at 20 ºC and 90 - 100% RH until ripe. The LSD (P = 0.05) bars are for factorial effect of
dose and time.
'Kensington Pride'
1
2
3
4
5
6
'B74'
Skin
colo
ur
(Sca
le 1
-6)
1
2
3
4
5
6 'Honey Gold'
Time after irradiation (days)
1
2
3
4
5
6
'R2E2'
0 2 4 6 8 10
1
2
3
4
5
6
LSD
LSDLSD
LSD
NQ
'Kensington Pride'
'B74'
'Honey Gold'
'R2E2'
0 2 4 6 8 10
LSD
LSD
LSD
LSD
SEQ
'Honey Gold'LSD
LSD
0 kGy0.5 kGy1 kGy
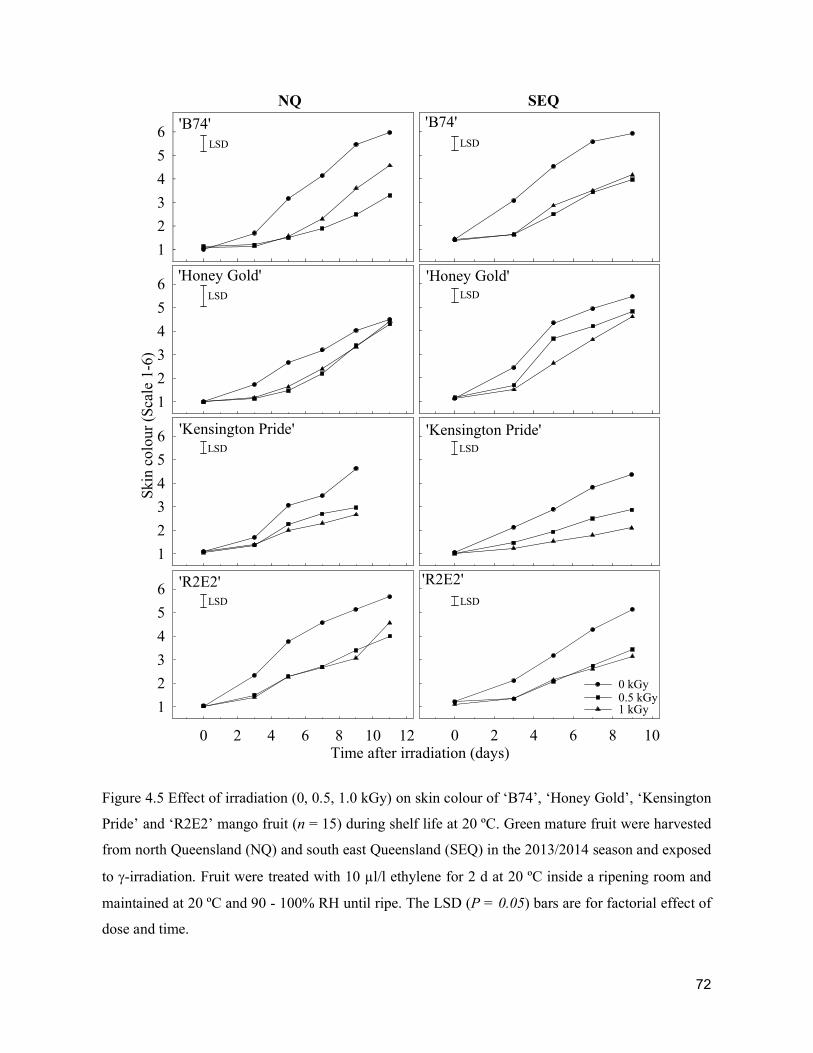
72
Figure 4.5 Effect of irradiation (0, 0.5, 1.0 kGy) on skin colour of ‘B74’, ‘Honey Gold’, ‘Kensington
Pride’ and ‘R2E2’ mango fruit (n = 15) during shelf life at 20 ºC. Green mature fruit were harvested
from north Queensland (NQ) and south east Queensland (SEQ) in the 2013/2014 season and exposed
to -irradiation. Fruit were treated with 10 µl/l ethylene for 2 d at 20 ºC inside a ripening room and
maintained at 20 ºC and 90 - 100% RH until ripe. The LSD (P = 0.05) bars are for factorial effect of
dose and time.
'Honey Gold'
Days after Irradiation
1
2
3
4
5
6
NQ
'Kensington Pride'
1
2
3
4
5
6
'B74'
Ski
n co
lour
(S
cale
1-6
)
1
2
3
4
5
6
'R2E2'
0 2 4 6 8 10 12
1
2
3
4
5
6
LSD
LSD
LSD
LSD
'Kensington Pride'
'B74'
'Honey Gold'
Time after irradiation (days)
'R2E2'
0 2 4 6 8 10
LSD
LSD
LSD
LSD
SEQ
0 kGy0.5 kGy1 kGy
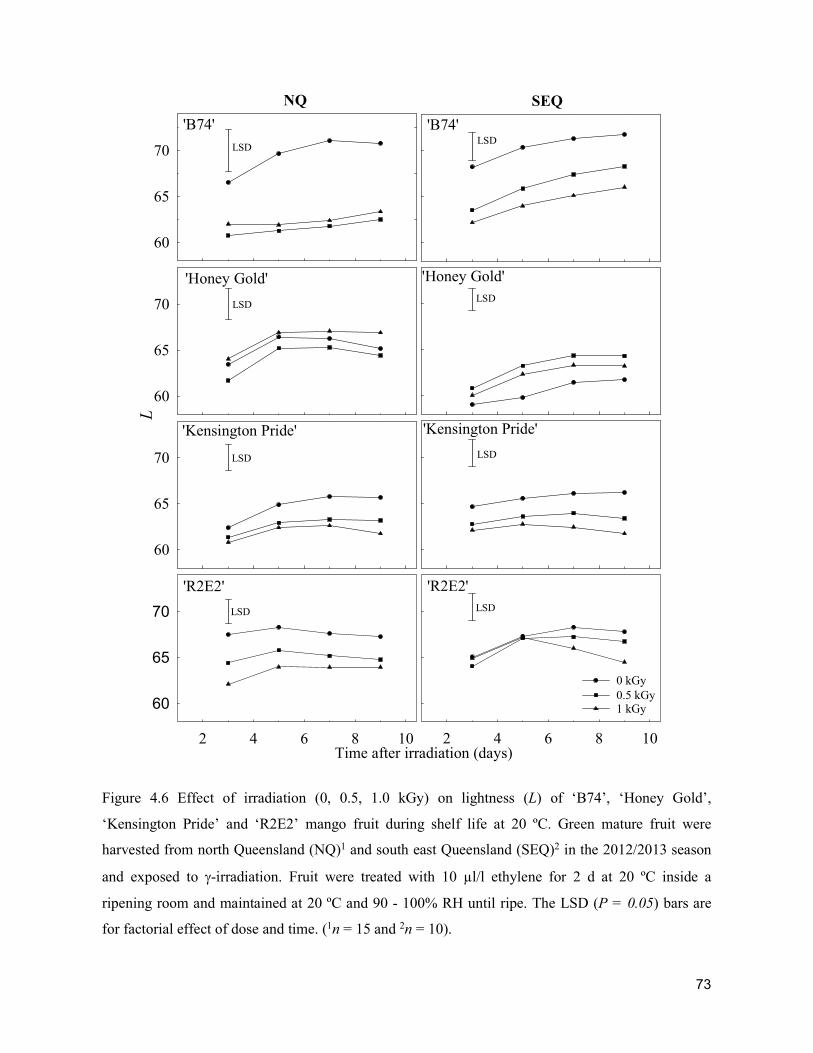
73
Figure 4.6 Effect of irradiation (0, 0.5, 1.0 kGy) on lightness (L) of ‘B74’, ‘Honey Gold’,
‘Kensington Pride’ and ‘R2E2’ mango fruit during shelf life at 20 ºC. Green mature fruit were
harvested from north Queensland (NQ)1 and south east Queensland (SEQ)2 in the 2012/2013 season
and exposed to -irradiation. Fruit were treated with 10 µl/l ethylene for 2 d at 20 ºC inside a
ripening room and maintained at 20 ºC and 90 - 100% RH until ripe. The LSD (P = 0.05) bars are
for factorial effect of dose and time. (1n = 15 and 2n = 10).
'R2E2'
2 4 6 8 10
'Honey Gold'
2 4 6 8 10
60
65
70
NQ
'Kensington Pride'
60
65
70
'B74'
L
60
65
70
'R2E2'
2 4 6 8 10
60
65
70
LSD
LSD
LSD
LSD
'Honey Gold'
Time after irradiation (days)
SEQ
'Kensington Pride'
'B74'
0 kGy0.5 kGy1 kGy
LSD
LSD
LSD
LSD
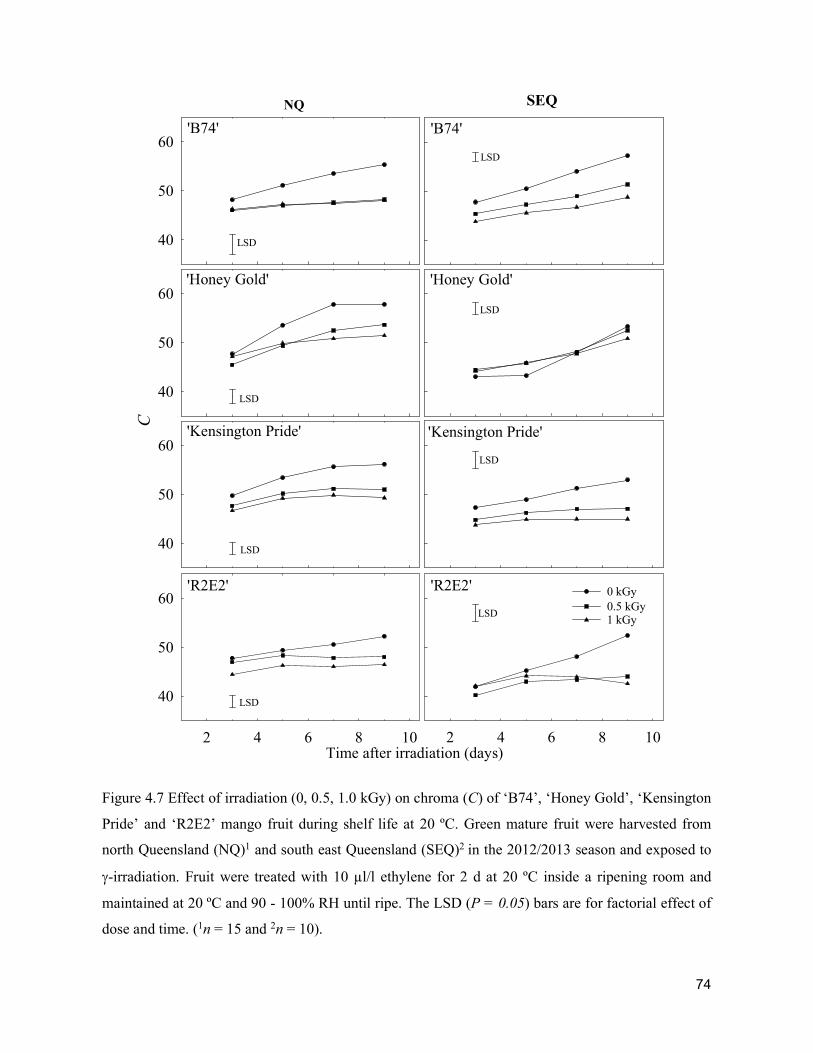
74
Figure 4.7 Effect of irradiation (0, 0.5, 1.0 kGy) on chroma (C) of ‘B74’, ‘Honey Gold’, ‘Kensington
Pride’ and ‘R2E2’ mango fruit during shelf life at 20 ºC. Green mature fruit were harvested from
north Queensland (NQ)1 and south east Queensland (SEQ)2 in the 2012/2013 season and exposed to
-irradiation. Fruit were treated with 10 µl/l ethylene for 2 d at 20 ºC inside a ripening room and
maintained at 20 ºC and 90 - 100% RH until ripe. The LSD (P = 0.05) bars are for factorial effect of
dose and time. (1n = 15 and 2n = 10).
'R2E2'
2 4 6 8 10
'Honey Gold'
Time after irradiation (days)
40
50
60
NQ
'Kensington Pride'
40
50
60
'B74'C
40
50
60
'R2E2'
2 4 6 8 10
40
50
60
LSD
LSD
LSD
LSD
'Honey Gold'
SEQ
'Kensington Pride'
'B74'
0 kGy0.5 kGy1 kGy
LSD
LSD
LSD
LSD
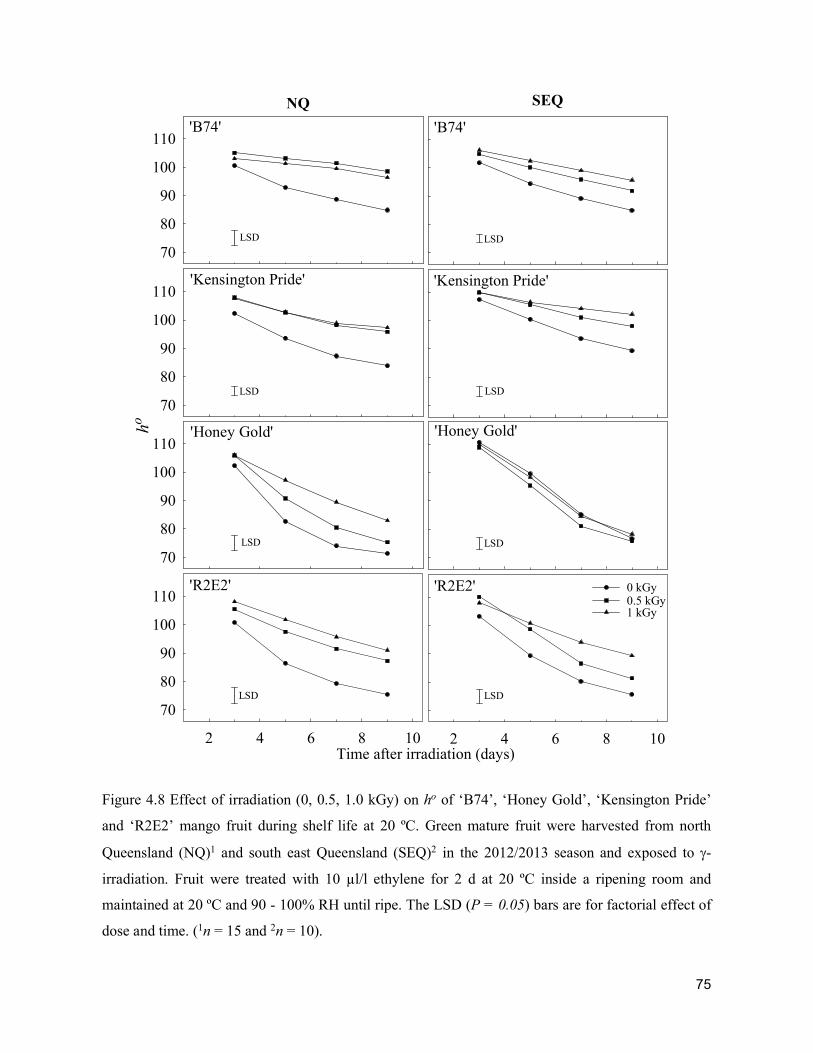
75
Figure 4.8 Effect of irradiation (0, 0.5, 1.0 kGy) on ho of ‘B74’, ‘Honey Gold’, ‘Kensington Pride’
and ‘R2E2’ mango fruit during shelf life at 20 ºC. Green mature fruit were harvested from north
Queensland (NQ)1 and south east Queensland (SEQ)2 in the 2012/2013 season and exposed to -
irradiation. Fruit were treated with 10 µl/l ethylene for 2 d at 20 ºC inside a ripening room and
maintained at 20 ºC and 90 - 100% RH until ripe. The LSD (P = 0.05) bars are for factorial effect of
dose and time. (1n = 15 and 2n = 10).
'Honey Gold'
Time after irradiation (days)
70
80
90
100
110
NQ
'Kensington Pride'
70
80
90
100
110
'B74'h
o
70
80
90
100
110
'R2E2'
2 4 6 8 10
70
80
90
100
110
LSD
LSD
LSD
LSD
'Honey Gold'
'Kensington Pride'
'B74'
'R2E2'
2 4 6 8 10
LSD
LSD
LSD
LSD
SEQ
0 kGy0.5 kGy1 kGy
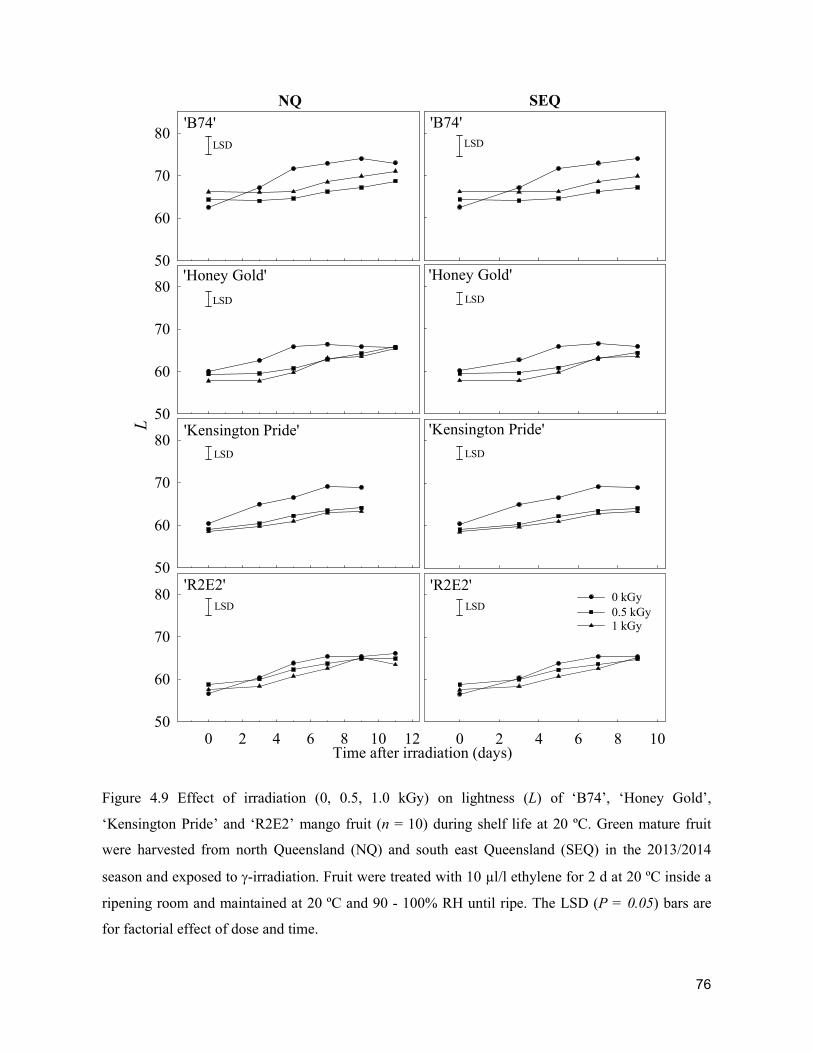
76
Figure 4.9 Effect of irradiation (0, 0.5, 1.0 kGy) on lightness (L) of ‘B74’, ‘Honey Gold’,
‘Kensington Pride’ and ‘R2E2’ mango fruit (n = 10) during shelf life at 20 ºC. Green mature fruit
were harvested from north Queensland (NQ) and south east Queensland (SEQ) in the 2013/2014
season and exposed to -irradiation. Fruit were treated with 10 µl/l ethylene for 2 d at 20 ºC inside a
ripening room and maintained at 20 ºC and 90 - 100% RH until ripe. The LSD (P = 0.05) bars are
for factorial effect of dose and time.
'R2E2'
0 2 4 6 8 10
'Honey Gold'
Time after irradiation (days)
50
60
70
80
NQ
'Kensington Pride'
50
60
70
80
'B74'L
50
60
70
80
'R2E2'
0 2 4 6 8 10 1250
60
70
80
LSD
LSD
LSD
LSD
'Honey Gold'
SEQ
'Kensington Pride'
'B74'
0 kGy0.5 kGy1 kGy
LSD
LSD
LSD
LSD
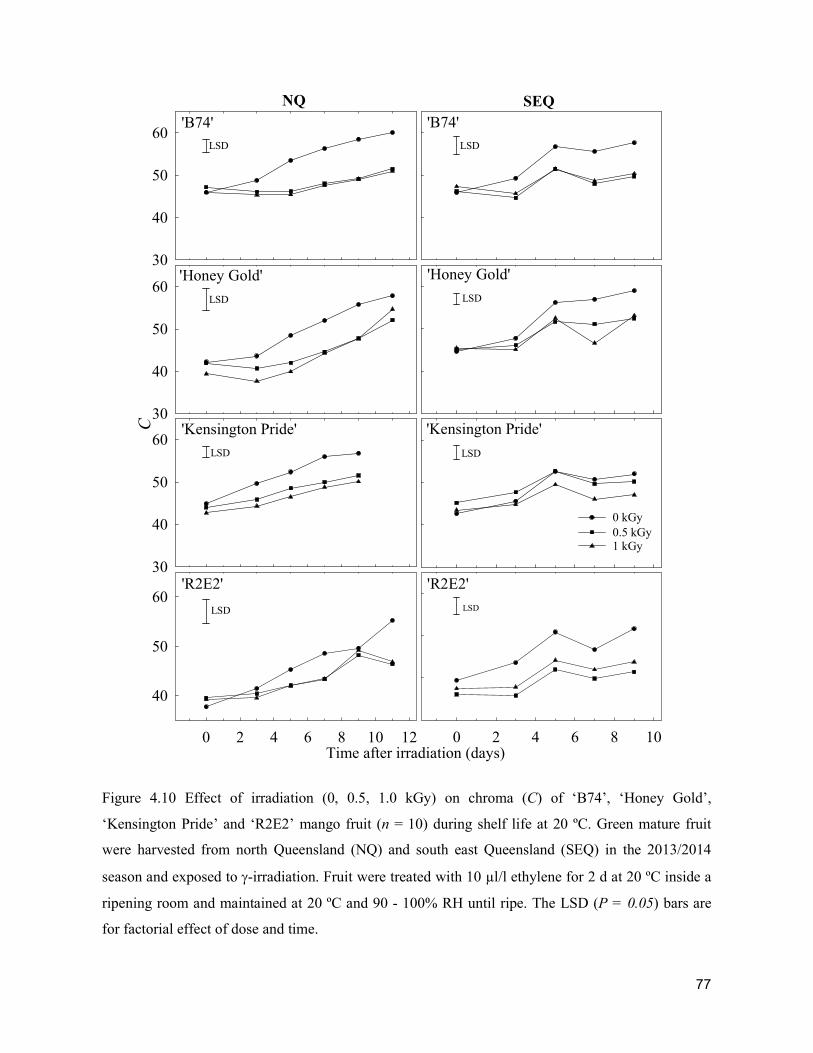
77
Figure 4.10 Effect of irradiation (0, 0.5, 1.0 kGy) on chroma (C) of ‘B74’, ‘Honey Gold’,
‘Kensington Pride’ and ‘R2E2’ mango fruit (n = 10) during shelf life at 20 ºC. Green mature fruit
were harvested from north Queensland (NQ) and south east Queensland (SEQ) in the 2013/2014
season and exposed to -irradiation. Fruit were treated with 10 µl/l ethylene for 2 d at 20 ºC inside a
ripening room and maintained at 20 ºC and 90 - 100% RH until ripe. The LSD (P = 0.05) bars are
for factorial effect of dose and time.
'Honey Gold'
Time after irradiation (days)
30
40
50
60
NQ
'Kensington Pride'
30
40
50
60
'B74'
C
30
40
50
60
'R2E2'
0 2 4 6 8 10 12
40
50
60
LSD
LSD
LSD
LSD
'Honey Gold'
SEQ
'Kensington Pride'
'B74'
0 kGy0.5 kGy1 kGy
'R2E2'
0 2 4 6 8 10
LSD
LSD
LSD
LSD
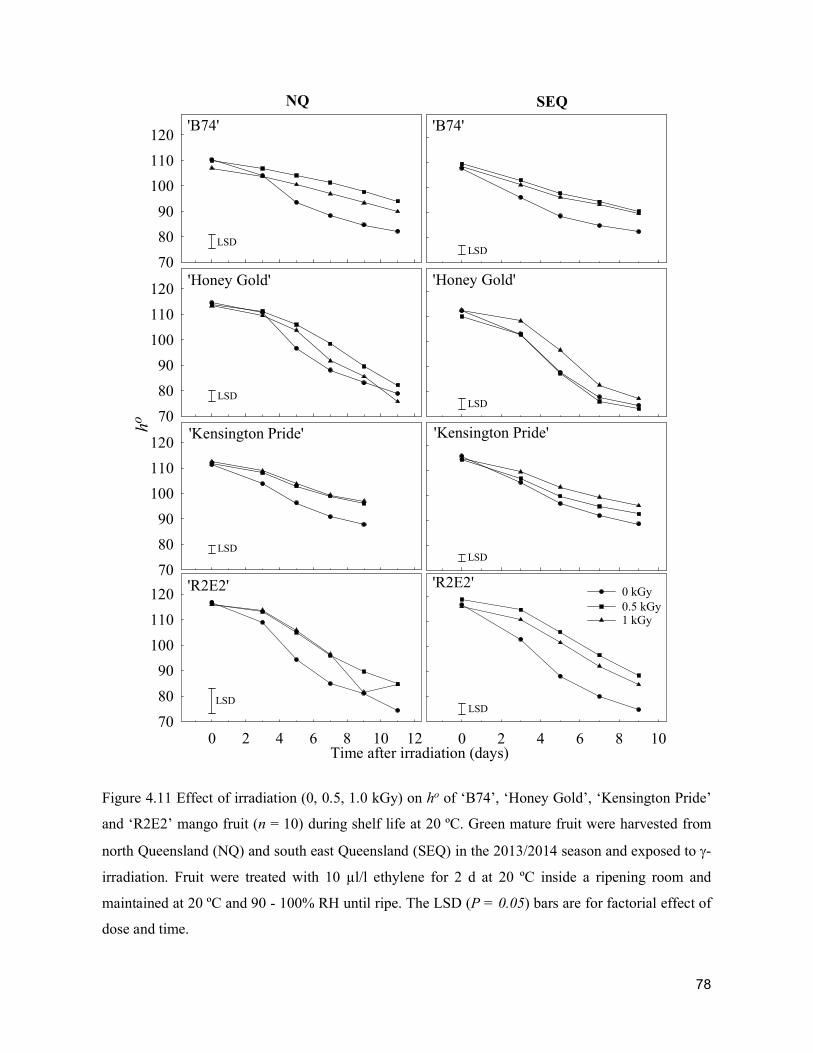
78
Figure 4.11 Effect of irradiation (0, 0.5, 1.0 kGy) on ho of ‘B74’, ‘Honey Gold’, ‘Kensington Pride’
and ‘R2E2’ mango fruit (n = 10) during shelf life at 20 ºC. Green mature fruit were harvested from
north Queensland (NQ) and south east Queensland (SEQ) in the 2013/2014 season and exposed to -
irradiation. Fruit were treated with 10 µl/l ethylene for 2 d at 20 ºC inside a ripening room and
maintained at 20 ºC and 90 - 100% RH until ripe. The LSD (P = 0.05) bars are for factorial effect of
dose and time.
'R2E2'
0 2 4 6 8 10
'Honey Gold'
Time after irradiation (days)
70
80
90
100
110
120
NQ
'Kensington Pride'
70
80
90
100
110
120
'B74'ho
70
80
90
100
110
120
'R2E2'
0 2 4 6 8 10 1270
80
90
100
110
120
LSD
LSD
LSD
LSD
'Honey Gold'
SEQ
'Kensington Pride'
'B74'
0 kGy0.5 kGy1 kGy
LSD
LSD
LSD
LSD
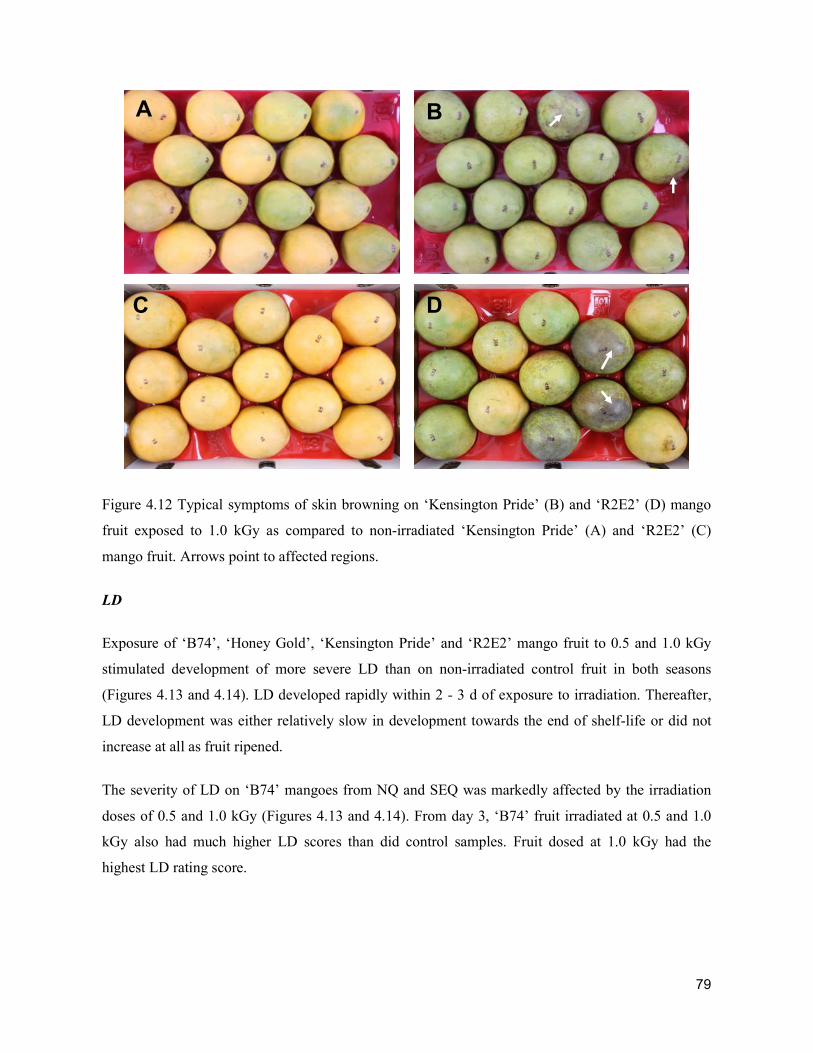
79
Figure 4.12 Typical symptoms of skin browning on ‘Kensington Pride’ (B) and ‘R2E2’ (D) mango
fruit exposed to 1.0 kGy as compared to non-irradiated ‘Kensington Pride’ (A) and ‘R2E2’ (C)
mango fruit. Arrows point to affected regions.
LD
Exposure of ‘B74’, ‘Honey Gold’, ‘Kensington Pride’ and ‘R2E2’ mango fruit to 0.5 and 1.0 kGy
stimulated development of more severe LD than on non-irradiated control fruit in both seasons
(Figures 4.13 and 4.14). LD developed rapidly within 2 - 3 d of exposure to irradiation. Thereafter,
LD development was either relatively slow in development towards the end of shelf-life or did not
increase at all as fruit ripened.
The severity of LD on ‘B74’ mangoes from NQ and SEQ was markedly affected by the irradiation
doses of 0.5 and 1.0 kGy (Figures 4.13 and 4.14). From day 3, ‘B74’ fruit irradiated at 0.5 and 1.0
kGy also had much higher LD scores than did control samples. Fruit dosed at 1.0 kGy had the
highest LD rating score.
A B
D C
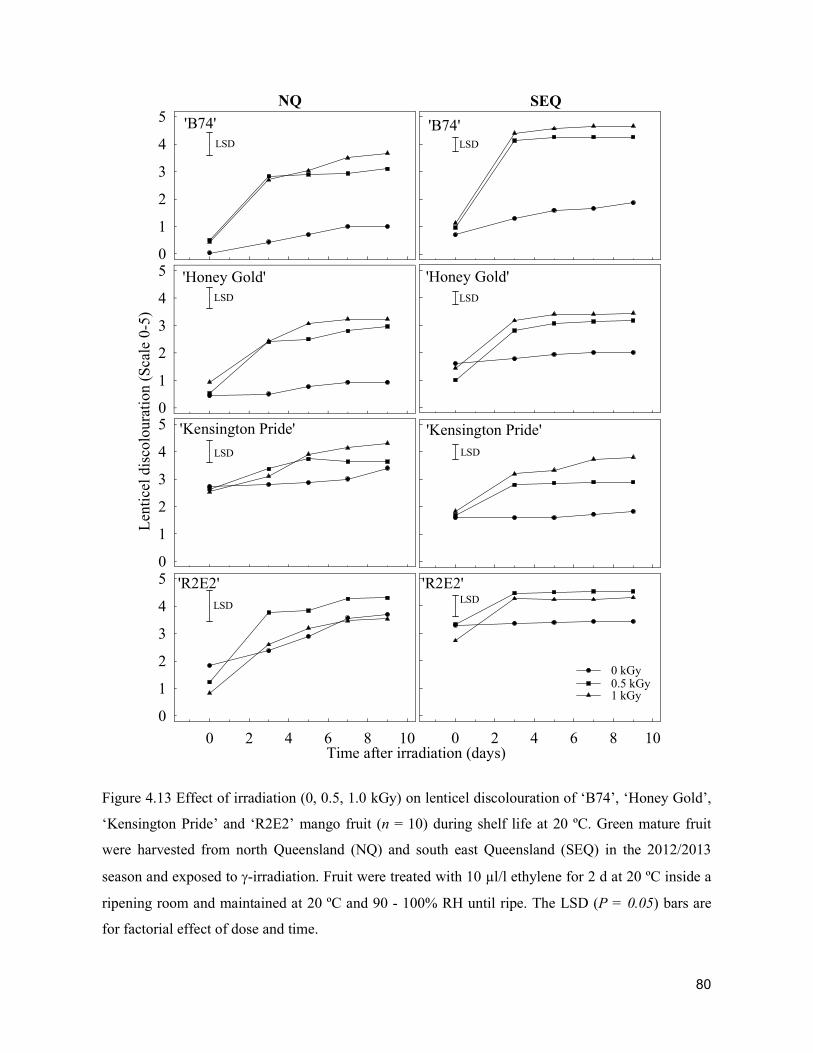
80
Figure 4.13 Effect of irradiation (0, 0.5, 1.0 kGy) on lenticel discolouration of ‘B74’, ‘Honey Gold’,
‘Kensington Pride’ and ‘R2E2’ mango fruit (n = 10) during shelf life at 20 ºC. Green mature fruit
were harvested from north Queensland (NQ) and south east Queensland (SEQ) in the 2012/2013
season and exposed to -irradiation. Fruit were treated with 10 µl/l ethylene for 2 d at 20 ºC inside a
ripening room and maintained at 20 ºC and 90 - 100% RH until ripe. The LSD (P = 0.05) bars are
for factorial effect of dose and time.
NQ
'Honey Gold'
Time after irradiation (days)
0
1
2
3
4
5
'B74'
Len
tice
l di
scol
oura
tion
(S
cale
0-5
)
0
1
2
3
4
5
'Kensington Pride'
0
1
2
3
4
5
'R2E2'
0 2 4 6 8 10
0
1
2
3
4
5
LSD
LSD
LSD
LSD
'R2E2'
0 2 4 6 8 10
'Honey Gold'
'B74'
'Kensington Pride'
0 kGy0.5 kGy1 kGy
LSD
LSD
LSD
LSD
SEQ
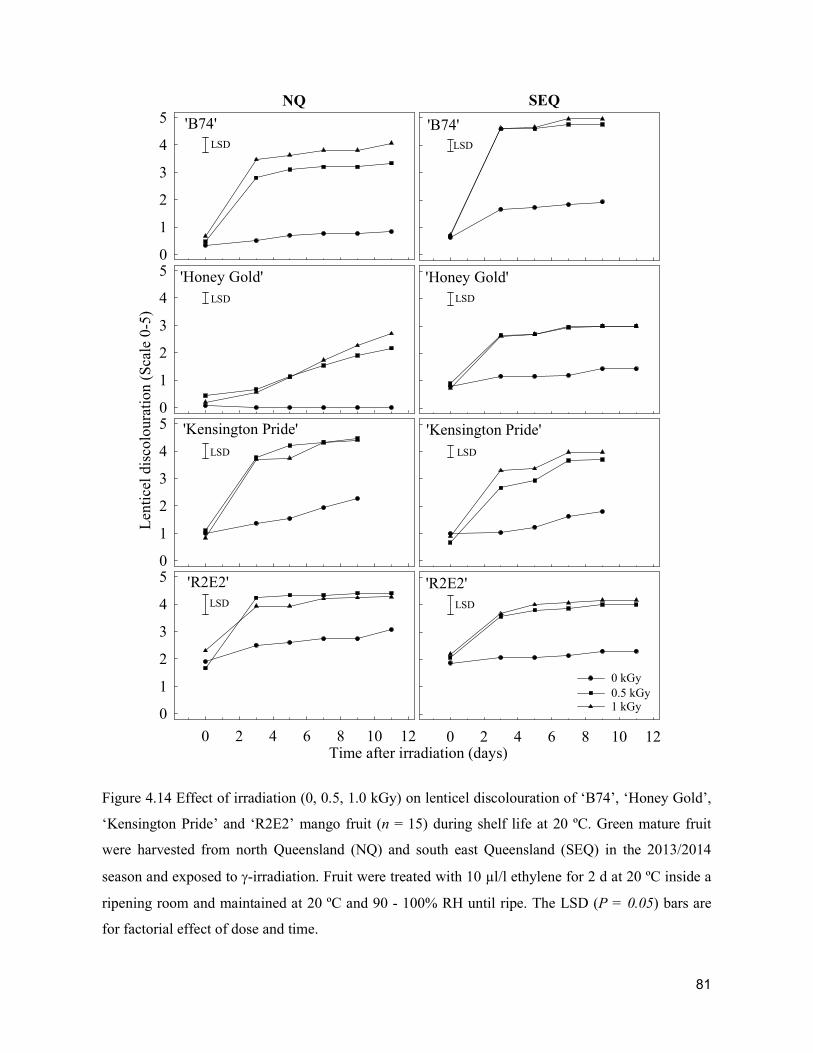
81
Figure 4.14 Effect of irradiation (0, 0.5, 1.0 kGy) on lenticel discolouration of ‘B74’, ‘Honey Gold’,
‘Kensington Pride’ and ‘R2E2’ mango fruit (n = 15) during shelf life at 20 ºC. Green mature fruit
were harvested from north Queensland (NQ) and south east Queensland (SEQ) in the 2013/2014
season and exposed to -irradiation. Fruit were treated with 10 µl/l ethylene for 2 d at 20 ºC inside a
ripening room and maintained at 20 ºC and 90 - 100% RH until ripe. The LSD (P = 0.05) bars are
for factorial effect of dose and time.
'R2E2'
0 2 4 6 8 10 12
'Honey Gold'
Time after irradiation (days)
0
1
2
3
4
5
'B74'
Len
tice
l di
scol
oura
tion
(S
cale
0-5
)
0
1
2
3
4
5
'Kensington Pride'
0
1
2
3
4
5
'R2E2'
0 2 4 6 8 10 12
0
1
2
3
4
5
LSD
LSD
LSD
LSD
NQ
'Honey Gold'
'B74'
'Kensington Pride'
0 kGy0.5 kGy1 kGy
LSD
LSD
LSD
LSD
SEQ
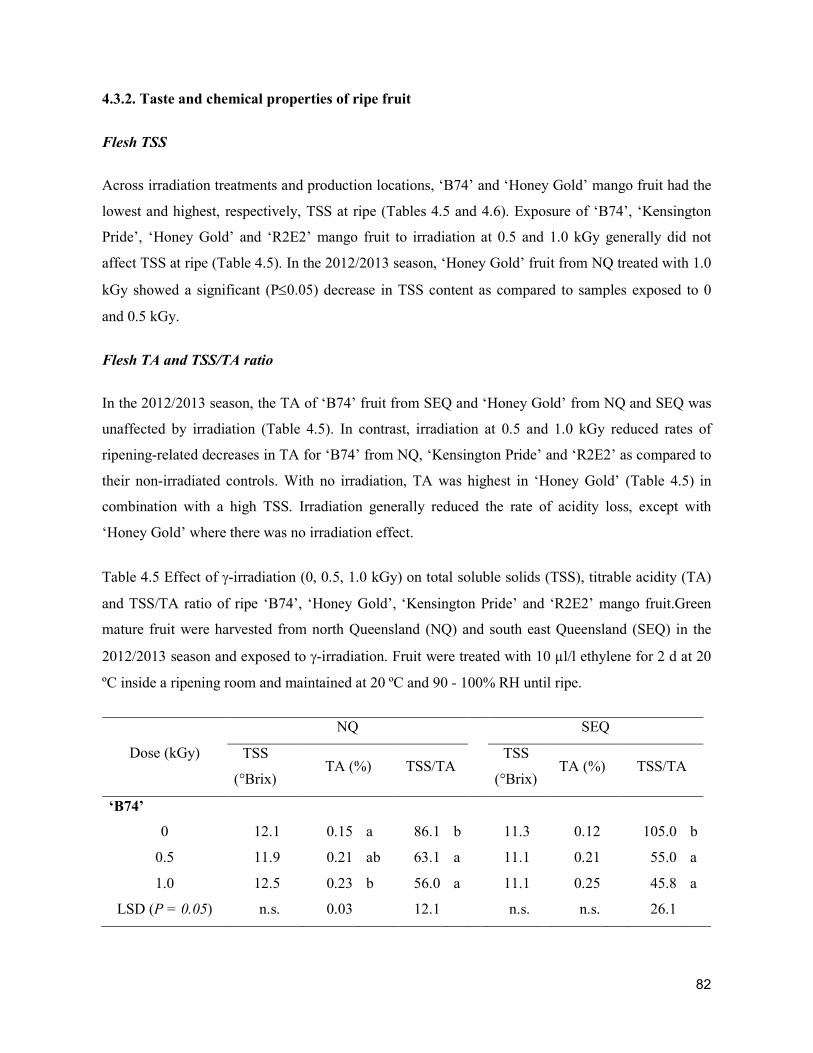
82
4.3.2. Taste and chemical properties of ripe fruit
Flesh TSS
Across irradiation treatments and production locations, ‘B74’ and ‘Honey Gold’ mango fruit had the
lowest and highest, respectively, TSS at ripe (Tables 4.5 and 4.6). Exposure of ‘B74’, ‘Kensington
Pride’, ‘Honey Gold’ and ‘R2E2’ mango fruit to irradiation at 0.5 and 1.0 kGy generally did not
affect TSS at ripe (Table 4.5). In the 2012/2013 season, ‘Honey Gold’ fruit from NQ treated with 1.0
kGy showed a significant (P0.05) decrease in TSS content as compared to samples exposed to 0
and 0.5 kGy.
Flesh TA and TSS/TA ratio
In the 2012/2013 season, the TA of ‘B74’ fruit from SEQ and ‘Honey Gold’ from NQ and SEQ was
unaffected by irradiation (Table 4.5). In contrast, irradiation at 0.5 and 1.0 kGy reduced rates of
ripening-related decreases in TA for ‘B74’ from NQ, ‘Kensington Pride’ and ‘R2E2’ as compared to
their non-irradiated controls. With no irradiation, TA was highest in ‘Honey Gold’ (Table 4.5) in
combination with a high TSS. Irradiation generally reduced the rate of acidity loss, except with
‘Honey Gold’ where there was no irradiation effect.
Table 4.5 Effect of -irradiation (0, 0.5, 1.0 kGy) on total soluble solids (TSS), titrable acidity (TA)
and TSS/TA ratio of ripe ‘B74’, ‘Honey Gold’, ‘Kensington Pride’ and ‘R2E2’ mango fruit.Green
mature fruit were harvested from north Queensland (NQ) and south east Queensland (SEQ) in the
2012/2013 season and exposed to -irradiation. Fruit were treated with 10 µl/l ethylene for 2 d at 20
ºC inside a ripening room and maintained at 20 ºC and 90 - 100% RH until ripe.
Dose (kGy)
NQ SEQ
TSS
(°Brix) TA (%) TSS/TA
TSS
(°Brix) TA (%) TSS/TA
‘B74’
0 12.1
0.15 a 86.1 b
11.3
0.12
105.0 b
0.5 11.9
0.21 ab 63.1 a
11.1
0.21
55.0 a
1.0 12.5
0.23 b 56.0 a
11.1
0.25
45.8 a
LSD (P = 0.05) n.s.
0.03
12.1
n.s.
n.s. 26.1
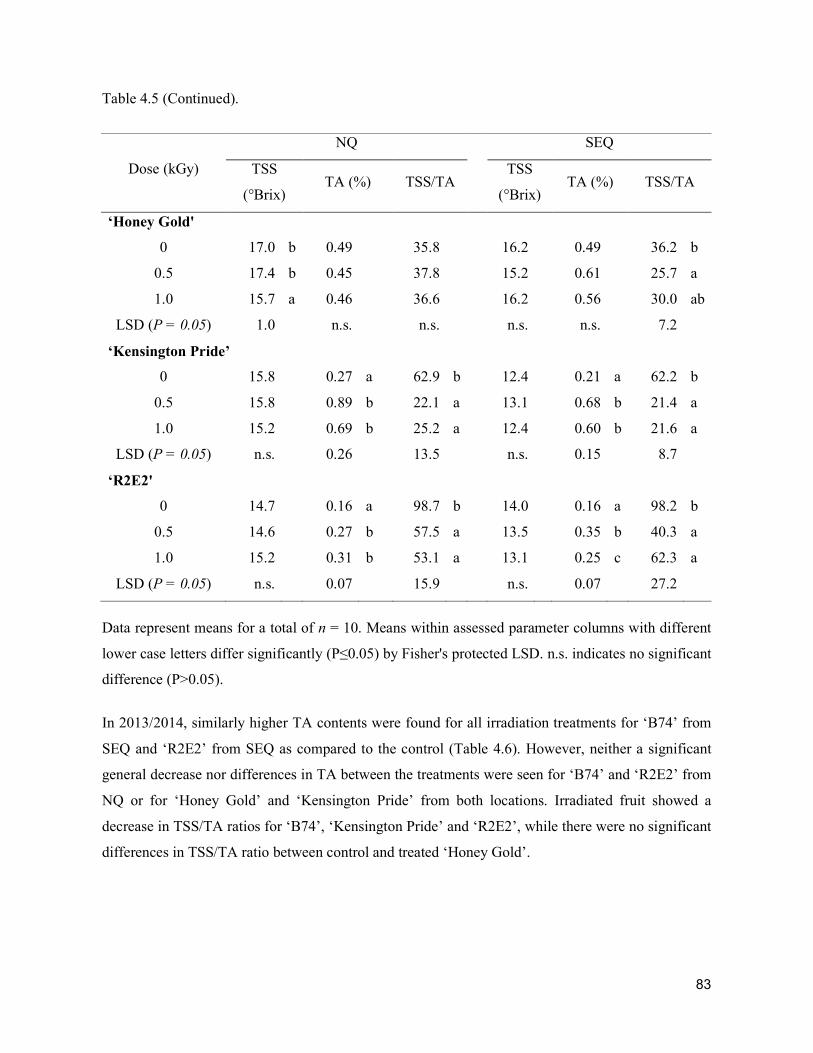
83
Table 4.5 (Continued).
Dose (kGy)
NQ SEQ
TSS
(°Brix) TA (%) TSS/TA
TSS
(°Brix) TA (%) TSS/TA
‘Honey Gold'
0 17.0 b 0.49 35.8 16.2 0.49 36.2 b
0.5 17.4 b 0.45 37.8 15.2 0.61 25.7 a
1.0 15.7 a 0.46 36.6 16.2 0.56 30.0 ab
LSD (P = 0.05) 1.0 n.s. n.s. n.s. n.s. 7.2
‘Kensington Pride’
0 15.8
0.27 a 62.9 b
12.4
0.21 a 62.2 b
0.5 15.8
0.89 b 22.1 a
13.1
0.68 b 21.4 a
1.0 15.2
0.69 b 25.2 a
12.4
0.60 b 21.6 a
LSD (P = 0.05) n.s.
0.26
13.5
n.s.
0.15 8.7
‘R2E2'
0 14.7
0.16 a 98.7 b
14.0
0.16 a 98.2 b
0.5 14.6
0.27 b 57.5 a
13.5
0.35 b 40.3 a
1.0 15.2
0.31 b 53.1 a
13.1
0.25 c 62.3 a
LSD (P = 0.05) n.s.
0.07
15.9
n.s.
0.07 27.2
Data represent means for a total of n = 10. Means within assessed parameter columns with different
lower case letters differ significantly (P≤0.05) by Fisher's protected LSD. n.s. indicates no significant
difference (P>0.05).
In 2013/2014, similarly higher TA contents were found for all irradiation treatments for ‘B74’ from
SEQ and ‘R2E2’ from SEQ as compared to the control (Table 4.6). However, neither a significant
general decrease nor differences in TA between the treatments were seen for ‘B74’ and ‘R2E2’ from
NQ or for ‘Honey Gold’ and ‘Kensington Pride’ from both locations. Irradiated fruit showed a
decrease in TSS/TA ratios for ‘B74’, ‘Kensington Pride’ and ‘R2E2’, while there were no significant
differences in TSS/TA ratio between control and treated ‘Honey Gold’.

84
Table 4.6 Effect of irradiation (0, 0.5, 1.0 kGy) on total soluble solids (TSS), titrable acidity (TA)
and TSS/TA ratio of ripe ‘B74’, ‘Honey Gold’, ‘Kensington Pride’ and ‘R2E2’ mango fruit. Green
mature fruit were harvested from north Queensland (NQ) and south east Queensland (SEQ) in the
2013/2014 season and exposed to -irradiation. Fruit were treated with 10 µl/l ethylene for 2 d at 20
ºC inside a ripening room and maintained at 20 ºC and 90 - 100% RH until ripe.
Dose (kGy)
NQ
SEQ
TSS
(°Brix)
TA
(%) TSS/TA
TSS
(°Brix) TA (%) TSS/TA
‘B74’
0 12.9 0.2 65.5 12.9 0.2 a 73.8 b
0.5 12.5 0.2 54.4 12.9 0.3 b 49.8 a
1.0 12.9 0.2 55.8 12.7 0.3 b 49.9 a
LSD (P = 0.05) n.s n.s n.s n.s 0.04 8.5
‘Honey Gold’
0 15.7 1.06 22.4 18.5 0.46 42
0.5 15.7 1.84 13.6 18.7 0.79 35
1.0 15.4 2.16 7.3 18.2 0.96 28
LSD (P = 0.05) n.s. n.s. n.s. n.s. n.s. n.s.
‘Kensington Pride’
0 12.6 0.2 a 69.4 b 13.1 0.3 a 40.2 b
0.5 13.2 1.7 b 11.5 a 13.9 1.1 b 14.4 a
1.0 12.2 1.8 b 13.4 a 13.4 1.1 b 13.7 a
LSD (P = 0.05) n.s 1.3 15.9 n.s 0.5 7.1
‘R2E2'
0 14.4 0.38 59.6
14.4 0.15 a 104.7 b
0.5 15.4 0.29 55.7
13.8 0.31 c 46.3 a
1.0 14.6 0.28 54.4
13.9 0.24 b 58.0 a
LSD (P = 0.05) n.s. n.s. n.s.
n.s. n.s.
37.1
Data represent means for a total of n = 5. Means within assessed parameter columns with different
lower case letters differ significantly (P≤0.05) by Fisher's protected LSD. n.s. indicates no significant
difference (P>0.05).
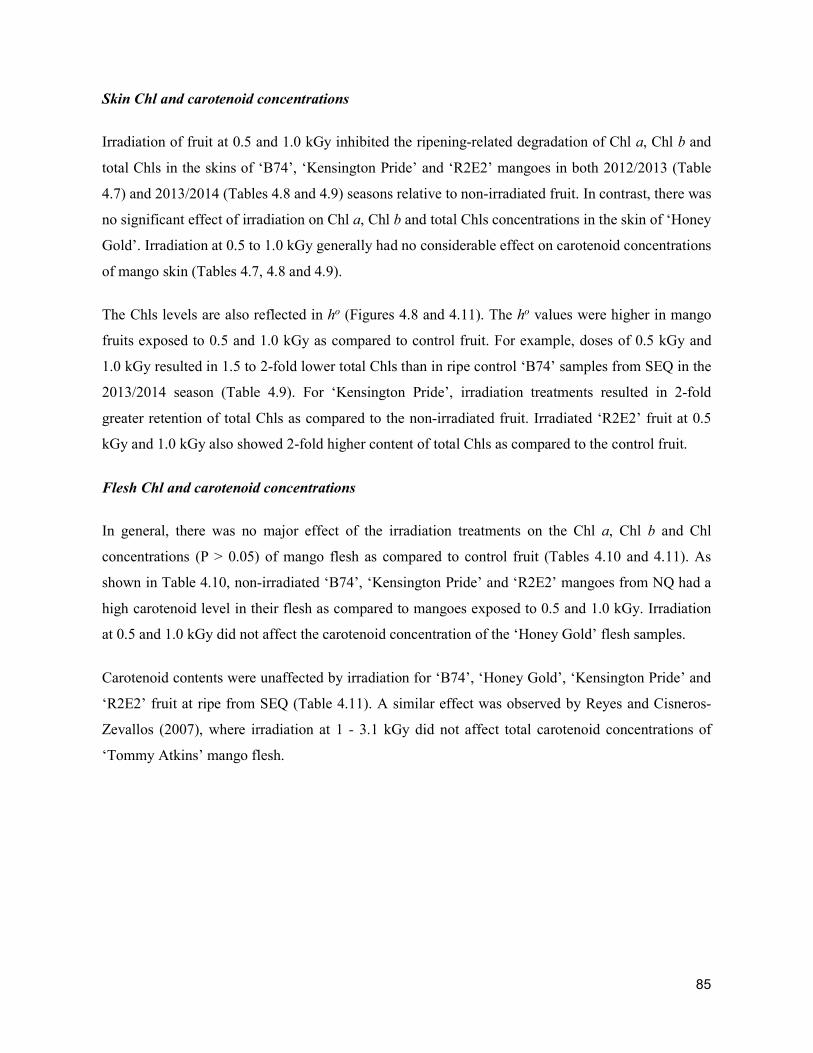
85
Skin Chl and carotenoid concentrations
Irradiation of fruit at 0.5 and 1.0 kGy inhibited the ripening-related degradation of Chl a, Chl b and
total Chls in the skins of ‘B74’, ‘Kensington Pride’ and ‘R2E2’ mangoes in both 2012/2013 (Table
4.7) and 2013/2014 (Tables 4.8 and 4.9) seasons relative to non-irradiated fruit. In contrast, there was
no significant effect of irradiation on Chl a, Chl b and total Chls concentrations in the skin of ‘Honey
Gold’. Irradiation at 0.5 to 1.0 kGy generally had no considerable effect on carotenoid concentrations
of mango skin (Tables 4.7, 4.8 and 4.9).
The Chls levels are also reflected in ho (Figures 4.8 and 4.11). The ho values were higher in mango
fruits exposed to 0.5 and 1.0 kGy as compared to control fruit. For example, doses of 0.5 kGy and
1.0 kGy resulted in 1.5 to 2-fold lower total Chls than in ripe control ‘B74’ samples from SEQ in the
2013/2014 season (Table 4.9). For ‘Kensington Pride’, irradiation treatments resulted in 2-fold
greater retention of total Chls as compared to the non-irradiated fruit. Irradiated ‘R2E2’ fruit at 0.5
kGy and 1.0 kGy also showed 2-fold higher content of total Chls as compared to the control fruit.
Flesh Chl and carotenoid concentrations
In general, there was no major effect of the irradiation treatments on the Chl a, Chl b and Chl
concentrations (P > 0.05) of mango flesh as compared to control fruit (Tables 4.10 and 4.11). As
shown in Table 4.10, non-irradiated ‘B74’, ‘Kensington Pride’ and ‘R2E2’ mangoes from NQ had a
high carotenoid level in their flesh as compared to mangoes exposed to 0.5 and 1.0 kGy. Irradiation
at 0.5 and 1.0 kGy did not affect the carotenoid concentration of the ‘Honey Gold’ flesh samples.
Carotenoid contents were unaffected by irradiation for ‘B74’, ‘Honey Gold’, ‘Kensington Pride’ and
‘R2E2’ fruit at ripe from SEQ (Table 4.11). A similar effect was observed by Reyes and Cisneros-
Zevallos (2007), where irradiation at 1 - 3.1 kGy did not affect total carotenoid concentrations of
‘Tommy Atkins’ mango flesh.
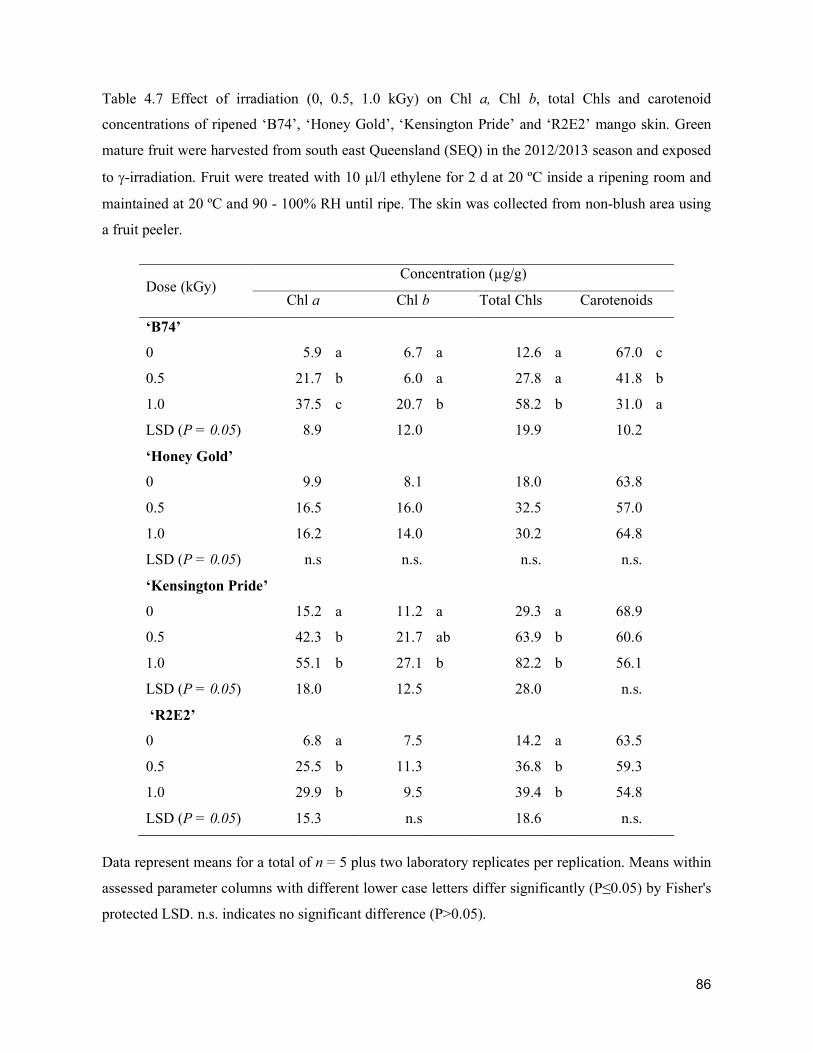
86
Table 4.7 Effect of irradiation (0, 0.5, 1.0 kGy) on Chl a, Chl b, total Chls and carotenoid
concentrations of ripened ‘B74’, ‘Honey Gold’, ‘Kensington Pride’ and ‘R2E2’ mango skin. Green
mature fruit were harvested from south east Queensland (SEQ) in the 2012/2013 season and exposed
to -irradiation. Fruit were treated with 10 µl/l ethylene for 2 d at 20 ºC inside a ripening room and
maintained at 20 ºC and 90 - 100% RH until ripe. The skin was collected from non-blush area using
a fruit peeler.
Dose (kGy) Concentration (µg/g)
Chl a Chl b Total Chls Carotenoids
‘B74’
0 5.9 a 6.7 a 12.6 a 67.0 c
0.5 21.7 b 6.0 a 27.8 a 41.8 b
1.0 37.5 c 20.7 b 58.2 b 31.0 a
LSD (P = 0.05) 8.9
12.0
19.9
10.2
‘Honey Gold’
0 9.9 8.1 18.0 63.8
0.5 16.5 16.0 32.5 57.0
1.0 16.2 14.0 30.2 64.8
LSD (P = 0.05) n.s n.s. n.s. n.s.
‘Kensington Pride’
0 15.2 a 11.2 a 29.3 a 68.9
0.5 42.3 b 21.7 ab 63.9 b 60.6
1.0 55.1 b 27.1 b 82.2 b 56.1
LSD (P = 0.05) 18.0
12.5
28.0
n.s.
‘R2E2’
0 6.8 a 7.5
14.2 a 63.5
0.5 25.5 b 11.3
36.8 b 59.3
1.0 29.9 b 9.5
39.4 b 54.8
LSD (P = 0.05) 15.3
n.s
18.6
n.s.
Data represent means for a total of n = 5 plus two laboratory replicates per replication. Means within
assessed parameter columns with different lower case letters differ significantly (P≤0.05) by Fisher's
protected LSD. n.s. indicates no significant difference (P>0.05).
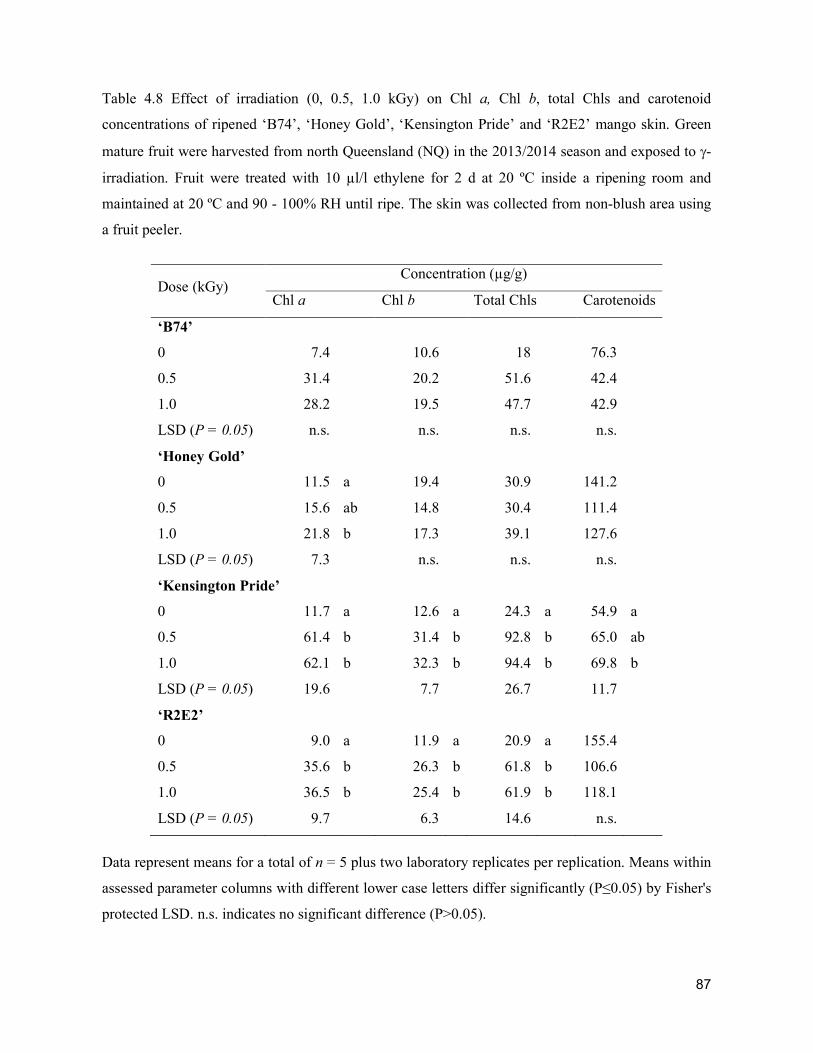
87
Table 4.8 Effect of irradiation (0, 0.5, 1.0 kGy) on Chl a, Chl b, total Chls and carotenoid
concentrations of ripened ‘B74’, ‘Honey Gold’, ‘Kensington Pride’ and ‘R2E2’ mango skin. Green
mature fruit were harvested from north Queensland (NQ) in the 2013/2014 season and exposed to -
irradiation. Fruit were treated with 10 µl/l ethylene for 2 d at 20 ºC inside a ripening room and
maintained at 20 ºC and 90 - 100% RH until ripe. The skin was collected from non-blush area using
a fruit peeler.
Dose (kGy) Concentration (µg/g)
Chl a Chl b Total Chls Carotenoids
‘B74’
0 7.4
10.6
18
76.3
0.5 31.4
20.2
51.6
42.4
1.0 28.2
19.5
47.7
42.9
LSD (P = 0.05) n.s.
n.s.
n.s.
n.s.
‘Honey Gold’
0 11.5 a 19.4 30.9 141.2
0.5 15.6 ab 14.8 30.4 111.4
1.0 21.8 b 17.3 39.1 127.6
LSD (P = 0.05) 7.3 n.s. n.s. n.s.
‘Kensington Pride’
0 11.7 a 12.6 a 24.3 a 54.9 a
0.5 61.4 b 31.4 b 92.8 b 65.0 ab
1.0 62.1 b 32.3 b 94.4 b 69.8 b
LSD (P = 0.05) 19.6
7.7
26.7
11.7
‘R2E2’
0 9.0 a 11.9 a 20.9 a 155.4
0.5 35.6 b 26.3 b 61.8 b 106.6
1.0 36.5 b 25.4 b 61.9 b 118.1
LSD (P = 0.05) 9.7
6.3
14.6
n.s.
Data represent means for a total of n = 5 plus two laboratory replicates per replication. Means within
assessed parameter columns with different lower case letters differ significantly (P≤0.05) by Fisher's
protected LSD. n.s. indicates no significant difference (P>0.05).
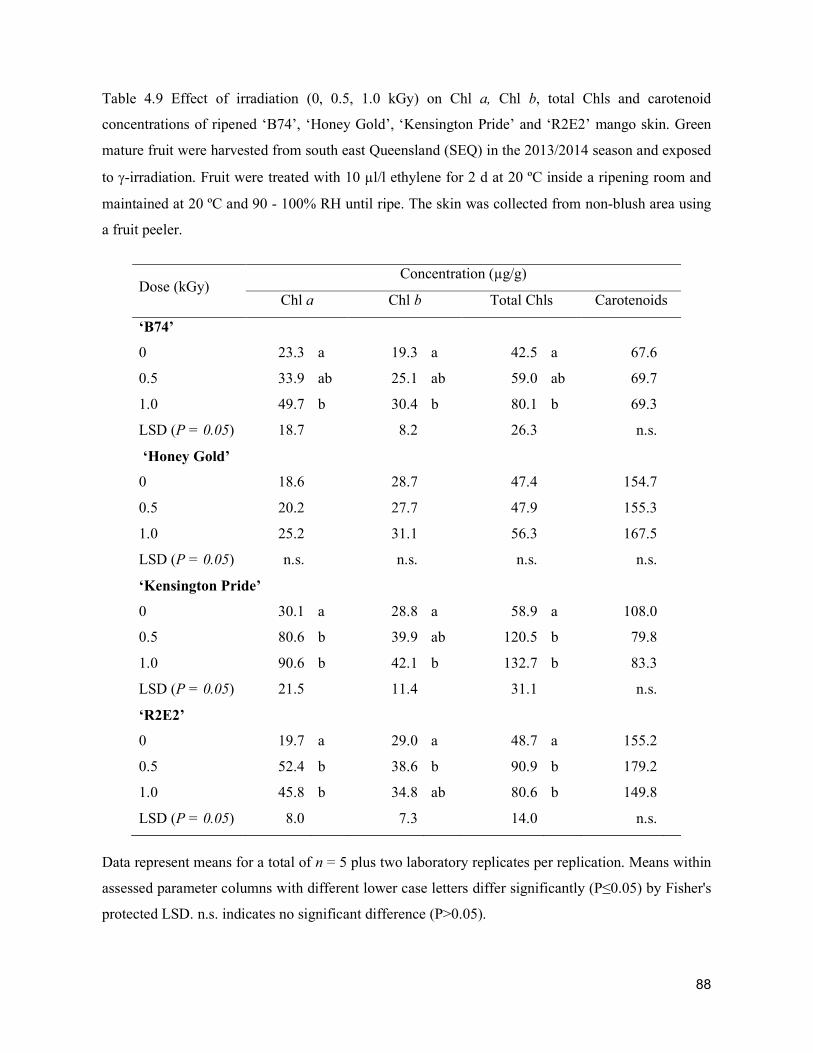
88
Table 4.9 Effect of irradiation (0, 0.5, 1.0 kGy) on Chl a, Chl b, total Chls and carotenoid
concentrations of ripened ‘B74’, ‘Honey Gold’, ‘Kensington Pride’ and ‘R2E2’ mango skin. Green
mature fruit were harvested from south east Queensland (SEQ) in the 2013/2014 season and exposed
to -irradiation. Fruit were treated with 10 µl/l ethylene for 2 d at 20 ºC inside a ripening room and
maintained at 20 ºC and 90 - 100% RH until ripe. The skin was collected from non-blush area using
a fruit peeler.
Dose (kGy) Concentration (µg/g)
Chl a Chl b Total Chls Carotenoids
‘B74’
0 23.3 a 19.3 a 42.5 a 67.6
0.5 33.9 ab 25.1 ab 59.0 ab 69.7
1.0 49.7 b 30.4 b 80.1 b 69.3
LSD (P = 0.05) 18.7
8.2
26.3
n.s.
‘Honey Gold’
0 18.6 28.7 47.4 154.7
0.5 20.2 27.7 47.9 155.3
1.0 25.2 31.1 56.3 167.5
LSD (P = 0.05) n.s. n.s. n.s. n.s.
‘Kensington Pride’
0 30.1 a 28.8 a 58.9 a 108.0
0.5 80.6 b 39.9 ab 120.5 b 79.8
1.0 90.6 b 42.1 b 132.7 b 83.3
LSD (P = 0.05) 21.5
11.4
31.1
n.s.
‘R2E2’
0 19.7 a 29.0 a 48.7 a 155.2
0.5 52.4 b 38.6 b 90.9 b 179.2
1.0 45.8 b 34.8 ab 80.6 b 149.8
LSD (P = 0.05) 8.0
7.3
14.0
n.s.
Data represent means for a total of n = 5 plus two laboratory replicates per replication. Means within
assessed parameter columns with different lower case letters differ significantly (P≤0.05) by Fisher's
protected LSD. n.s. indicates no significant difference (P>0.05).
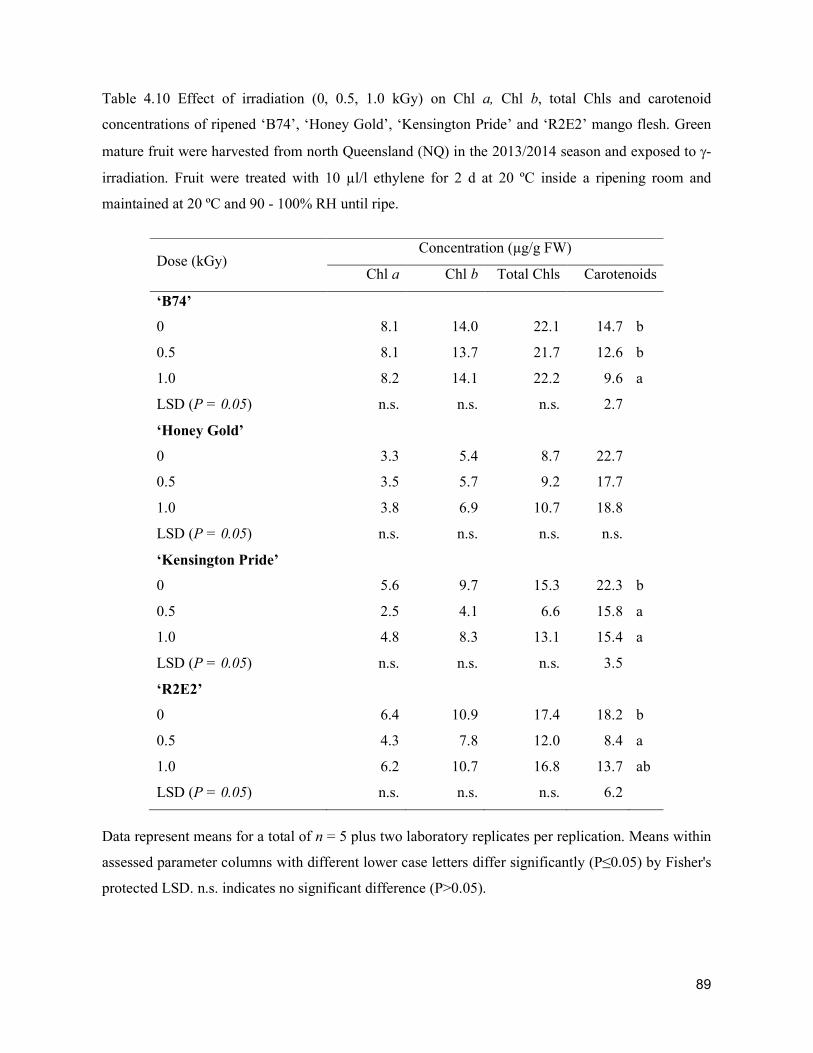
89
Table 4.10 Effect of irradiation (0, 0.5, 1.0 kGy) on Chl a, Chl b, total Chls and carotenoid
concentrations of ripened ‘B74’, ‘Honey Gold’, ‘Kensington Pride’ and ‘R2E2’ mango flesh. Green
mature fruit were harvested from north Queensland (NQ) in the 2013/2014 season and exposed to -
irradiation. Fruit were treated with 10 µl/l ethylene for 2 d at 20 ºC inside a ripening room and
maintained at 20 ºC and 90 - 100% RH until ripe.
Dose (kGy) Concentration (µg/g FW)
Chl a Chl b Total Chls Carotenoids
‘B74’
0 8.1 14.0 22.1 14.7 b
0.5 8.1 13.7 21.7 12.6 b
1.0 8.2 14.1 22.2 9.6 a
LSD (P = 0.05) n.s. n.s. n.s. 2.7
‘Honey Gold’
0 3.3 5.4 8.7 22.7
0.5 3.5 5.7 9.2 17.7
1.0 3.8 6.9 10.7 18.8
LSD (P = 0.05) n.s. n.s. n.s. n.s.
‘Kensington Pride’
0 5.6 9.7 15.3 22.3 b
0.5 2.5 4.1 6.6 15.8 a
1.0 4.8 8.3 13.1 15.4 a
LSD (P = 0.05) n.s. n.s. n.s. 3.5
‘R2E2’
0 6.4 10.9 17.4 18.2 b
0.5 4.3 7.8 12.0 8.4 a
1.0 6.2 10.7 16.8 13.7 ab
LSD (P = 0.05) n.s. n.s. n.s. 6.2
Data represent means for a total of n = 5 plus two laboratory replicates per replication. Means within
assessed parameter columns with different lower case letters differ significantly (P≤0.05) by Fisher's
protected LSD. n.s. indicates no significant difference (P>0.05).
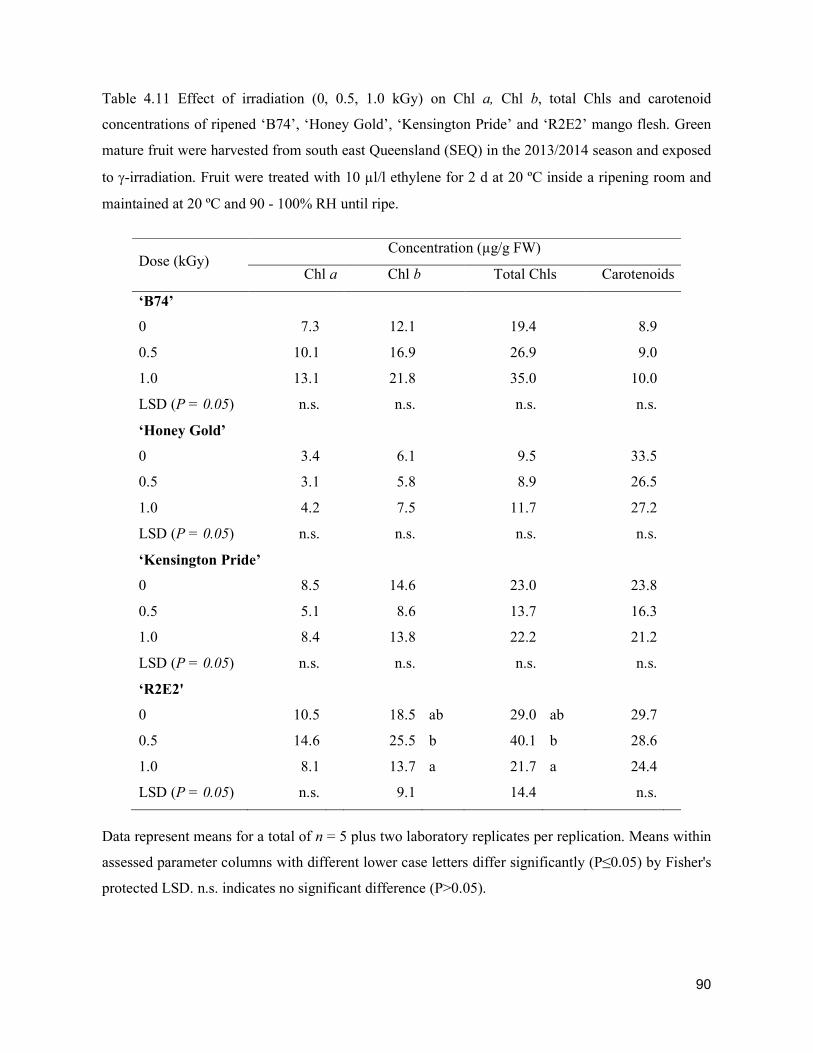
90
Table 4.11 Effect of irradiation (0, 0.5, 1.0 kGy) on Chl a, Chl b, total Chls and carotenoid
concentrations of ripened ‘B74’, ‘Honey Gold’, ‘Kensington Pride’ and ‘R2E2’ mango flesh. Green
mature fruit were harvested from south east Queensland (SEQ) in the 2013/2014 season and exposed
to -irradiation. Fruit were treated with 10 µl/l ethylene for 2 d at 20 ºC inside a ripening room and
maintained at 20 ºC and 90 - 100% RH until ripe.
Dose (kGy) Concentration (µg/g FW)
Chl a Chl b Total Chls Carotenoids
‘B74’
0 7.3
12.1
19.4
8.9
0.5 10.1
16.9
26.9
9.0
1.0 13.1
21.8
35.0
10.0
LSD (P = 0.05) n.s. n.s. n.s. n.s.
‘Honey Gold’
0 3.4 6.1 9.5 33.5
0.5 3.1 5.8 8.9 26.5
1.0 4.2 7.5 11.7 27.2
LSD (P = 0.05) n.s. n.s. n.s. n.s.
‘Kensington Pride’
0 8.5
14.6
23.0
23.8
0.5 5.1
8.6
13.7
16.3
1.0 8.4
13.8
22.2
21.2
LSD (P = 0.05) n.s. n.s. n.s. n.s.
‘R2E2'
0 10.5
18.5 ab 29.0 ab 29.7
0.5 14.6
25.5 b 40.1 b 28.6
1.0 8.1
13.7 a 21.7 a 24.4
LSD (P = 0.05) n.s.
9.1
14.4
n.s.
Data represent means for a total of n = 5 plus two laboratory replicates per replication. Means within
assessed parameter columns with different lower case letters differ significantly (P≤0.05) by Fisher's
protected LSD. n.s. indicates no significant difference (P>0.05).
91
Aroma volatiles
Exposure of green mature fruit to irradiation generally reduced biosynthesis rates of the important
aroma volatile 2-carene, 3-carene, α-terpinene, p-cymene, limonene, α-terpinolene, and ethyl
octanoate in the ripened pulp of ‘Kensington Pride’ and ‘R2E2’ mango fruit from NQ, except
hexanal (Table 4.12). For example, irradiation of ‘Kensington Pride' mango fruit at 0.5 and 1.0 kGy
reduced the production of α-terpinolene, the most abundant compound in the mango pulp, by
approximately 66% and 76%, respectively, as compared to the control (i.e. 0 kGy) fruit. Production
of 3-carene, the second major volatile component in ripe ‘Kensington Pride’, was reduced by 53%
for 0.5 kGy and about 77% for 1.0 kGy in irradiated fruit relative to controls. There was significant
reduction in limonene production in ‘Kensington Pride’ mango fruit exposed to the commercial dose
(0.5kGy) and high dose (1.0kGy). α–Terpinene concentration in the pulp of ‘Kensington Pride’ fruit
with doses up to 1.0 kGy was lower than that in the control fruit. Similar decreases at the two
irradiation doses were found, for example, in the aromatics 2-carene, β-cymene and ethyl octanoate
(Table 4.12).
Similarly, the pulp of ‘R2E2’ mango fruit irradiated at 0.5 and 1.0 kGy exhibited significantly
reduced production of aroma volatiles (i.e., 2-carene, 3-carene, α-terpinene, p-cymene, limonene, α-
terpinolene) in the pulp of the ripe fruit as compared to the control, except for hexanal and ethyl
octanoate. There was no significant effect of irradiation on ethyl octanoate production. Ethyl
octanoate concentration was minor as compared to other compounds analysed in ‘R2E2’. The
concentration of α-terpinolene in irradiated (0.5 and 1.0 kGy) ‘R2E2’ mango fruit was 0.6–0.8-fold
lower than in the control fruit. In contrast, irradiation with 0.5 and 1.0 kGy did not affect the
concentration of the aroma volatiles hexanal, 2-carene, 3-carene, α-terpinene, β-cymene, limonene,
α-terpinolene and ethyl octanoate as produced by ripe ‘B74’ and ‘Honey Gold’ cultivars from NQ.
In SEQ, similar findings were found in ‘Kensington Pride’ and ‘R2E2’ responses to irradiation
treatment (Table 4.13). Irradiation had a negative impact on aroma production by the pulp with
marked decreases of aroma concentrations while maintaining minor hexanal concentrations. The
content of α-terpinolene was significantly lower by 58 and 80% less, respectively, in ‘Kensington
Pride’ fruit subjected to 0.5 and 1.0 kGy as compared with the non-irradiated fruit. α-Terpinolene
also decreased by 63% for 0.5 kGy and 75% for 1.0 kGy in ‘R2E2’ fruit relative to their controls.
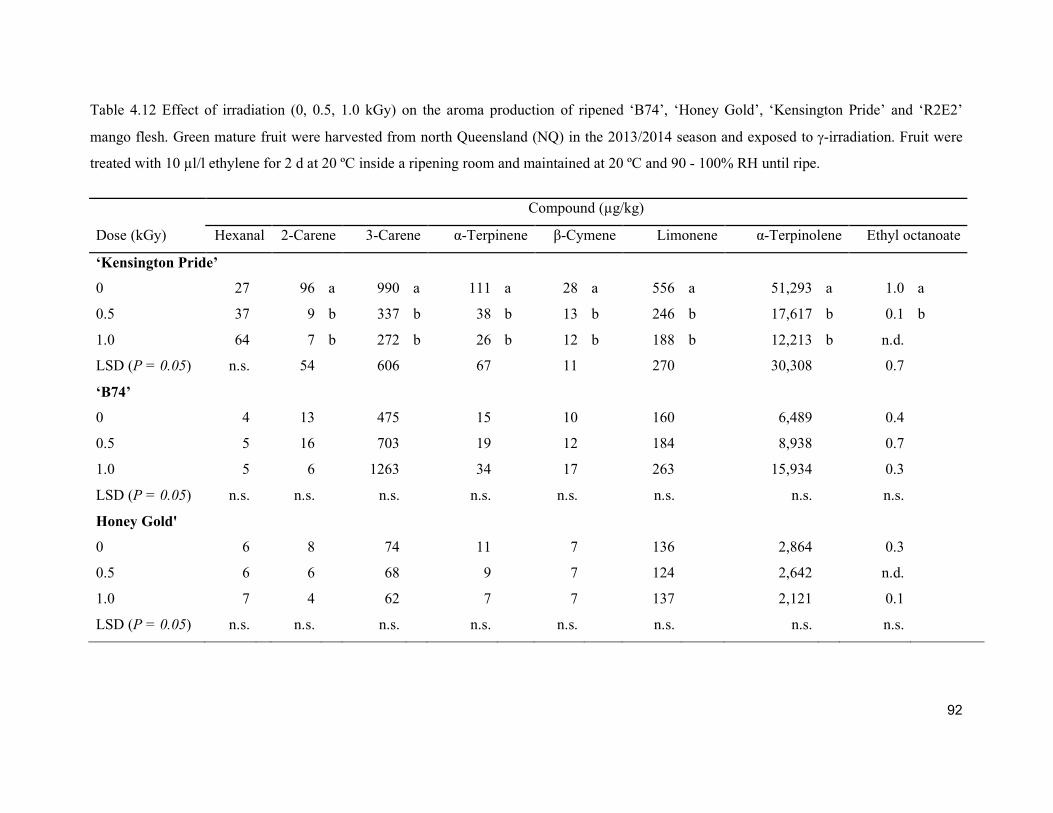
92
Table 4.12 Effect of irradiation (0, 0.5, 1.0 kGy) on the aroma production of ripened ‘B74’, ‘Honey Gold’, ‘Kensington Pride’ and ‘R2E2’
mango flesh. Green mature fruit were harvested from north Queensland (NQ) in the 2013/2014 season and exposed to -irradiation. Fruit were
treated with 10 µl/l ethylene for 2 d at 20 ºC inside a ripening room and maintained at 20 ºC and 90 - 100% RH until ripe.
Compound (µg/kg)
Dose (kGy) Hexanal 2-Carene 3-Carene α-Terpinene β-Cymene Limonene α-Terpinolene Ethyl octanoate
‘Kensington Pride’
0 27
96 a 990 a 111 a 28 a 556 a 51,293 a 1.0 a
0.5 37
9 b 337 b 38 b 13 b 246 b 17,617 b 0.1 b
1.0 64
7 b 272 b 26 b 12 b 188 b 12,213 b n.d.
LSD (P = 0.05) n.s.
54
606
67
11
270
30,308
0.7
‘B74’
0 4
13
475
15
10
160
6,489
0.4
0.5 5
16
703
19
12
184
8,938
0.7
1.0 5
6
1263
34
17
263
15,934
0.3
LSD (P = 0.05) n.s.
n.s.
n.s.
n.s.
n.s.
n.s.
n.s.
n.s.
Honey Gold'
0 6
8
74
11
7
136
2,864
0.3
0.5 6
6
68
9
7
124
2,642
n.d.
1.0 7
4
62
7
7
137
2,121
0.1
LSD (P = 0.05) n.s.
n.s.
n.s.
n.s.
n.s.
n.s.
n.s.
n.s.
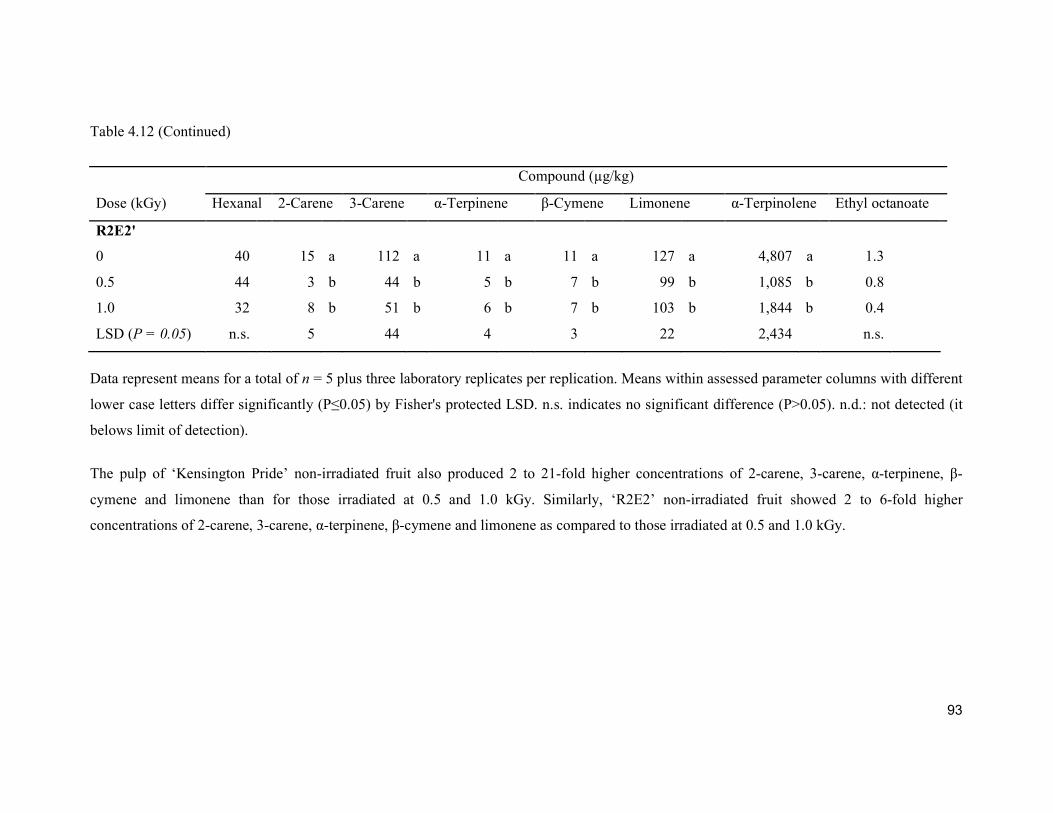
93
Table 4.12 (Continued)
Compound (µg/kg)
Dose (kGy) Hexanal 2-Carene 3-Carene α-Terpinene β-Cymene Limonene α-Terpinolene Ethyl octanoate
R2E2'
0 40
15 a 112 a 11 a 11 a 127 a 4,807 a 1.3
0.5 44
3 b 44 b 5 b 7 b 99 b 1,085 b 0.8
1.0 32
8 b 51 b 6 b 7 b 103 b 1,844 b 0.4
LSD (P = 0.05) n.s.
5
44
4
3
22
2,434
n.s.
Data represent means for a total of n = 5 plus three laboratory replicates per replication. Means within assessed parameter columns with different
lower case letters differ significantly (P≤0.05) by Fisher's protected LSD. n.s. indicates no significant difference (P>0.05). n.d.: not detected (it
belows limit of detection).
The pulp of ‘Kensington Pride’ non-irradiated fruit also produced 2 to 21-fold higher concentrations of 2-carene, 3-carene, α-terpinene, β-
cymene and limonene than for those irradiated at 0.5 and 1.0 kGy. Similarly, ‘R2E2’ non-irradiated fruit showed 2 to 6-fold higher
concentrations of 2-carene, 3-carene, α-terpinene, β-cymene and limonene as compared to those irradiated at 0.5 and 1.0 kGy.
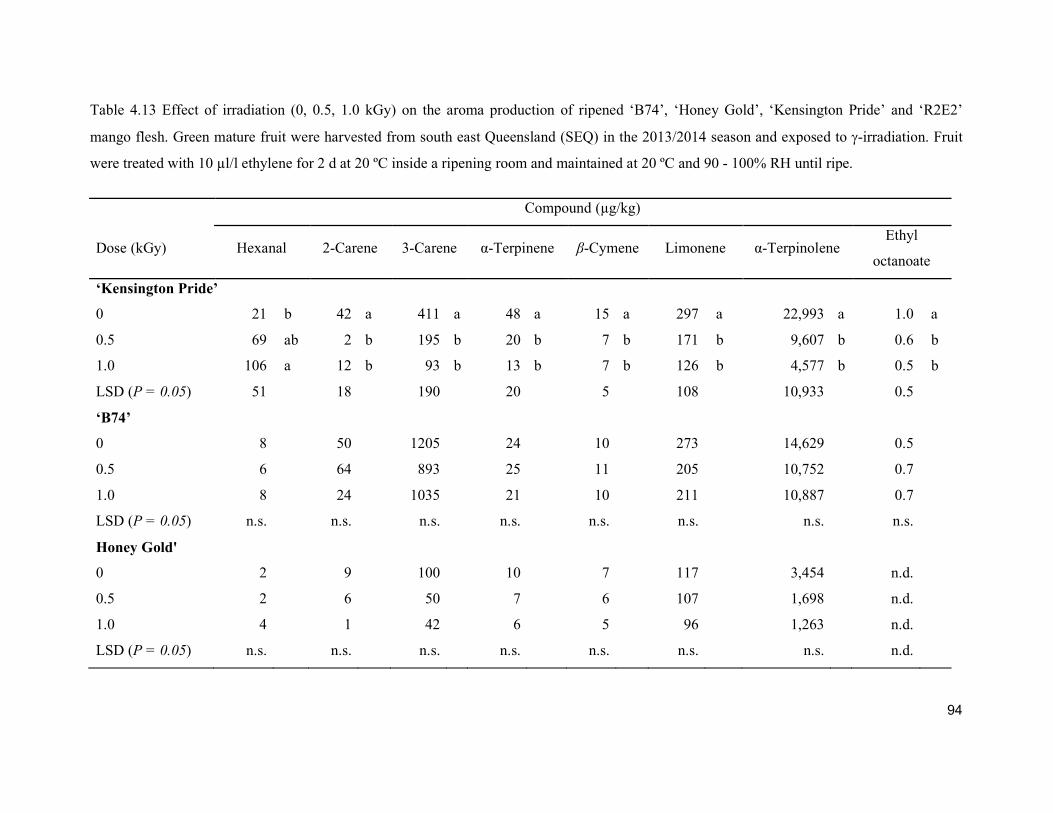
94
Table 4.13 Effect of irradiation (0, 0.5, 1.0 kGy) on the aroma production of ripened ‘B74’, ‘Honey Gold’, ‘Kensington Pride’ and ‘R2E2’
mango flesh. Green mature fruit were harvested from south east Queensland (SEQ) in the 2013/2014 season and exposed to -irradiation. Fruit
were treated with 10 µl/l ethylene for 2 d at 20 ºC inside a ripening room and maintained at 20 ºC and 90 - 100% RH until ripe.
Compound (µg/kg)
Dose (kGy) Hexanal 2-Carene 3-Carene α-Terpinene β-Cymene Limonene α-Terpinolene Ethyl
octanoate
‘Kensington Pride’
0 21 b 42 a 411 a 48 a 15 a 297 a 22,993 a 1.0 a
0.5 69 ab 2 b 195 b 20 b 7 b 171 b 9,607 b 0.6 b
1.0 106 a 12 b 93 b 13 b 7 b 126 b 4,577 b 0.5 b
LSD (P = 0.05) 51
18
190
20
5
108
10,933
0.5
‘B74’
0 8
50
1205
24
10
273
14,629
0.5
0.5 6
64
893
25
11
205
10,752
0.7
1.0 8
24
1035
21
10
211
10,887
0.7
LSD (P = 0.05) n.s.
n.s.
n.s.
n.s.
n.s.
n.s.
n.s.
n.s.
Honey Gold'
0 2 9 100 10 7 117 3,454 n.d.
0.5 2 6 50 7 6 107 1,698 n.d.
1.0 4 1 42 6 5 96 1,263 n.d.
LSD (P = 0.05) n.s. n.s. n.s. n.s. n.s. n.s. n.s. n.d.
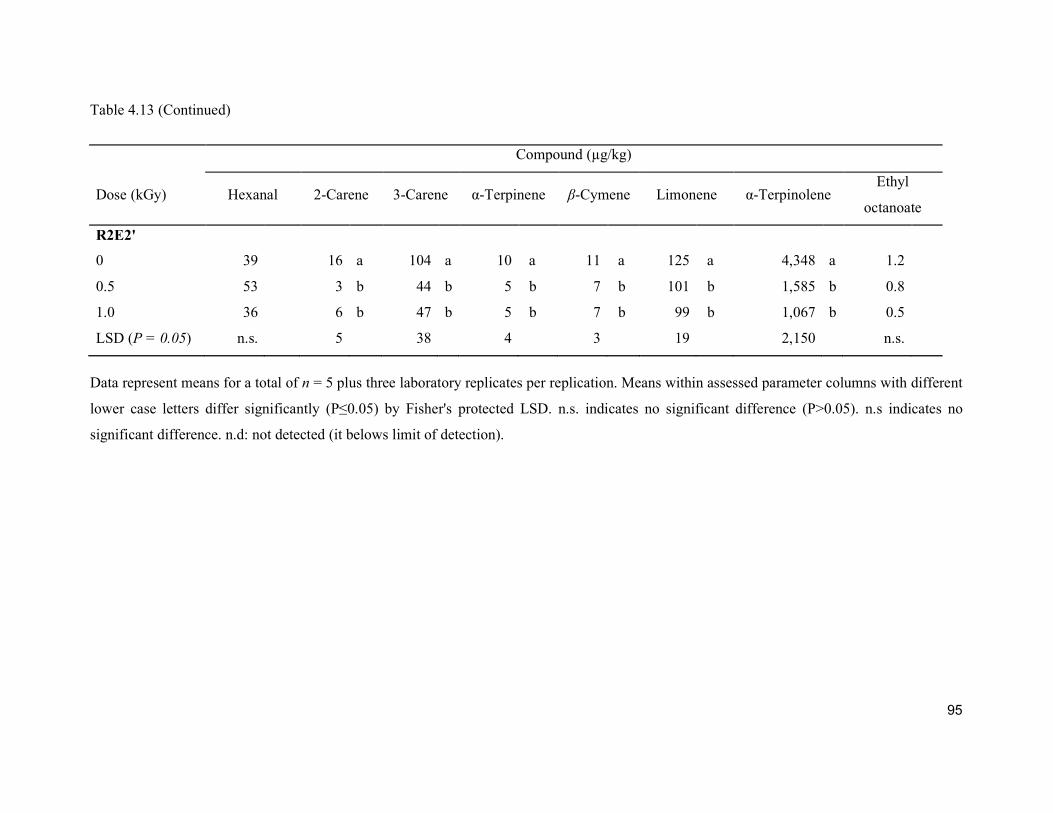
95
Table 4.13 (Continued)
Compound (µg/kg)
Dose (kGy) Hexanal 2-Carene 3-Carene α-Terpinene β-Cymene Limonene α-Terpinolene Ethyl
octanoate
R2E2'
0 39
16 a 104 a 10 a 11 a 125 a 4,348 a 1.2
0.5 53
3 b 44 b 5 b 7 b 101 b 1,585 b 0.8
1.0 36
6 b 47 b 5 b 7 b 99 b 1,067 b 0.5
LSD (P = 0.05) n.s. 5
38 4 3 19 2,150 n.s.
Data represent means for a total of n = 5 plus three laboratory replicates per replication. Means within assessed parameter columns with different
lower case letters differ significantly (P≤0.05) by Fisher's protected LSD. n.s. indicates no significant difference (P>0.05). n.s indicates no
significant difference. n.d: not detected (it belows limit of detection).
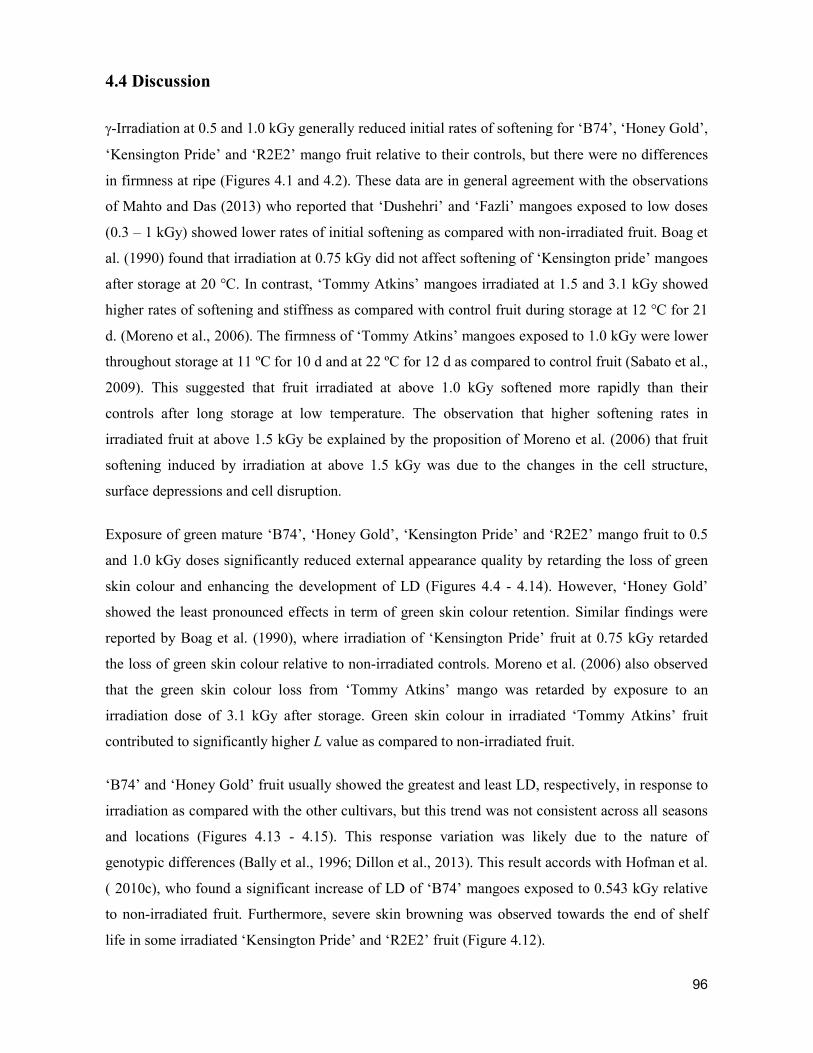
96
4.4 Discussion
-Irradiation at 0.5 and 1.0 kGy generally reduced initial rates of softening for ‘B74’, ‘Honey Gold’,
‘Kensington Pride’ and ‘R2E2’ mango fruit relative to their controls, but there were no differences
in firmness at ripe (Figures 4.1 and 4.2). These data are in general agreement with the observations
of Mahto and Das (2013) who reported that ‘Dushehri’ and ‘Fazli’ mangoes exposed to low doses
(0.3 – 1 kGy) showed lower rates of initial softening as compared with non-irradiated fruit. Boag et
al. (1990) found that irradiation at 0.75 kGy did not affect softening of ‘Kensington pride’ mangoes
after storage at 20 °C. In contrast, ‘Tommy Atkins’ mangoes irradiated at 1.5 and 3.1 kGy showed
higher rates of softening and stiffness as compared with control fruit during storage at 12 °C for 21
d. (Moreno et al., 2006). The firmness of ‘Tommy Atkins’ mangoes exposed to 1.0 kGy were lower
throughout storage at 11 ºC for 10 d and at 22 ºC for 12 d as compared to control fruit (Sabato et al.,
2009). This suggested that fruit irradiated at above 1.0 kGy softened more rapidly than their
controls after long storage at low temperature. The observation that higher softening rates in
irradiated fruit at above 1.5 kGy be explained by the proposition of Moreno et al. (2006) that fruit
softening induced by irradiation at above 1.5 kGy was due to the changes in the cell structure,
surface depressions and cell disruption.
Exposure of green mature ‘B74’, ‘Honey Gold’, ‘Kensington Pride’ and ‘R2E2’ mango fruit to 0.5
and 1.0 kGy doses significantly reduced external appearance quality by retarding the loss of green
skin colour and enhancing the development of LD (Figures 4.4 - 4.14). However, ‘Honey Gold’
showed the least pronounced effects in term of green skin colour retention. Similar findings were
reported by Boag et al. (1990), where irradiation of ‘Kensington Pride’ fruit at 0.75 kGy retarded
the loss of green skin colour relative to non-irradiated controls. Moreno et al. (2006) also observed
that the green skin colour loss from ‘Tommy Atkins’ mango was retarded by exposure to an
irradiation dose of 3.1 kGy after storage. Green skin colour in irradiated ‘Tommy Atkins’ fruit
contributed to significantly higher L value as compared to non-irradiated fruit.
‘B74’ and ‘Honey Gold’ fruit usually showed the greatest and least LD, respectively, in response to
irradiation as compared with the other cultivars, but this trend was not consistent across all seasons
and locations (Figures 4.13 - 4.15). This response variation was likely due to the nature of
genotypic differences (Bally et al., 1996; Dillon et al., 2013). This result accords with Hofman et al.
( 2010c), who found a significant increase of LD of ‘B74’ mangoes exposed to 0.543 kGy relative
to non-irradiated fruit. Furthermore, severe skin browning was observed towards the end of shelf
life in some irradiated ‘Kensington Pride’ and ‘R2E2’ fruit (Figure 4.12).
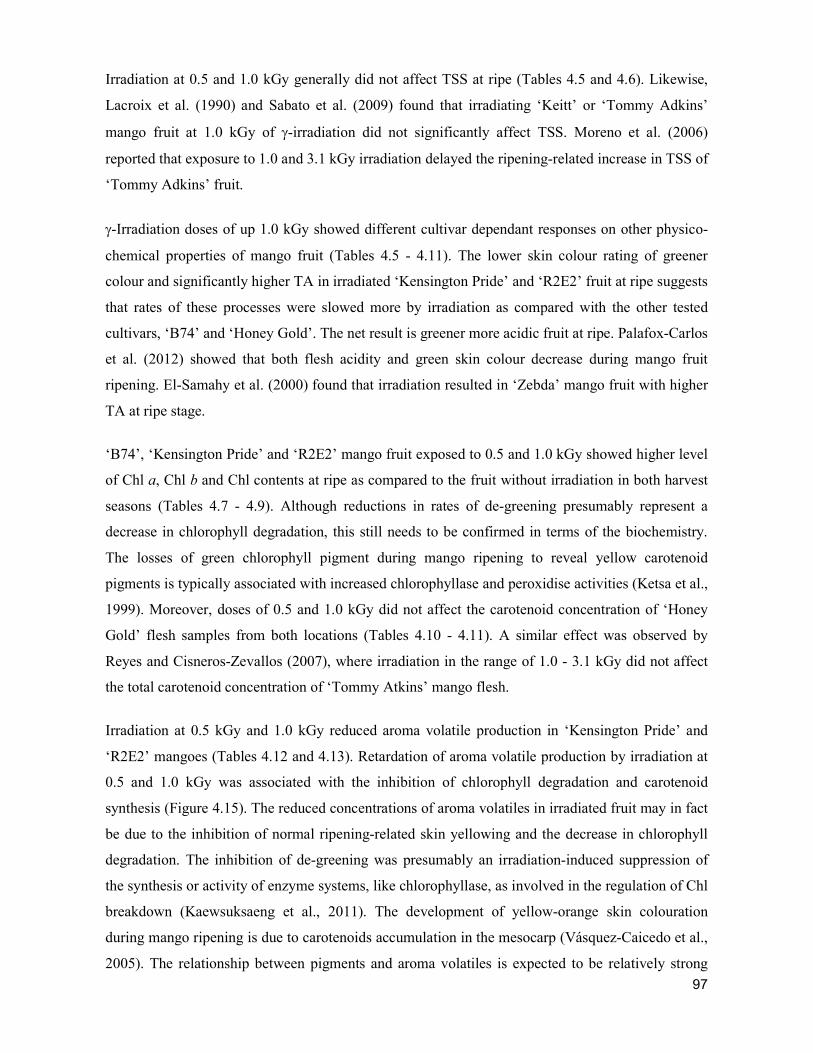
97
Irradiation at 0.5 and 1.0 kGy generally did not affect TSS at ripe (Tables 4.5 and 4.6). Likewise,
Lacroix et al. (1990) and Sabato et al. (2009) found that irradiating ‘Keitt’ or ‘Tommy Adkins’
mango fruit at 1.0 kGy of -irradiation did not significantly affect TSS. Moreno et al. (2006)
reported that exposure to 1.0 and 3.1 kGy irradiation delayed the ripening-related increase in TSS of
‘Tommy Adkins’ fruit.
-Irradiation doses of up 1.0 kGy showed different cultivar dependant responses on other physico-
chemical properties of mango fruit (Tables 4.5 - 4.11). The lower skin colour rating of greener
colour and significantly higher TA in irradiated ‘Kensington Pride’ and ‘R2E2’ fruit at ripe suggests
that rates of these processes were slowed more by irradiation as compared with the other tested
cultivars, ‘B74’ and ‘Honey Gold’. The net result is greener more acidic fruit at ripe. Palafox-Carlos
et al. (2012) showed that both flesh acidity and green skin colour decrease during mango fruit
ripening. El-Samahy et al. (2000) found that irradiation resulted in ‘Zebda’ mango fruit with higher
TA at ripe stage.
‘B74’, ‘Kensington Pride’ and ‘R2E2’ mango fruit exposed to 0.5 and 1.0 kGy showed higher level
of Chl a, Chl b and Chl contents at ripe as compared to the fruit without irradiation in both harvest
seasons (Tables 4.7 - 4.9). Although reductions in rates of de-greening presumably represent a
decrease in chlorophyll degradation, this still needs to be confirmed in terms of the biochemistry.
The losses of green chlorophyll pigment during mango ripening to reveal yellow carotenoid
pigments is typically associated with increased chlorophyllase and peroxidise activities (Ketsa et al.,
1999). Moreover, doses of 0.5 and 1.0 kGy did not affect the carotenoid concentration of ‘Honey
Gold’ flesh samples from both locations (Tables 4.10 - 4.11). A similar effect was observed by
Reyes and Cisneros-Zevallos (2007), where irradiation in the range of 1.0 - 3.1 kGy did not affect
the total carotenoid concentration of ‘Tommy Atkins’ mango flesh.
Irradiation at 0.5 kGy and 1.0 kGy reduced aroma volatile production in ‘Kensington Pride’ and
‘R2E2’ mangoes (Tables 4.12 and 4.13). Retardation of aroma volatile production by irradiation at
0.5 and 1.0 kGy was associated with the inhibition of chlorophyll degradation and carotenoid
synthesis (Figure 4.15). The reduced concentrations of aroma volatiles in irradiated fruit may in fact
be due to the inhibition of normal ripening-related skin yellowing and the decrease in chlorophyll
degradation. The inhibition of de-greening was presumably an irradiation-induced suppression of
the synthesis or activity of enzyme systems, like chlorophyllase, as involved in the regulation of Chl
breakdown (Kaewsuksaeng et al., 2011). The development of yellow-orange skin colouration
during mango ripening is due to carotenoids accumulation in the mesocarp (Vásquez-Caicedo et al.,
2005). The relationship between pigments and aroma volatiles is expected to be relatively strong
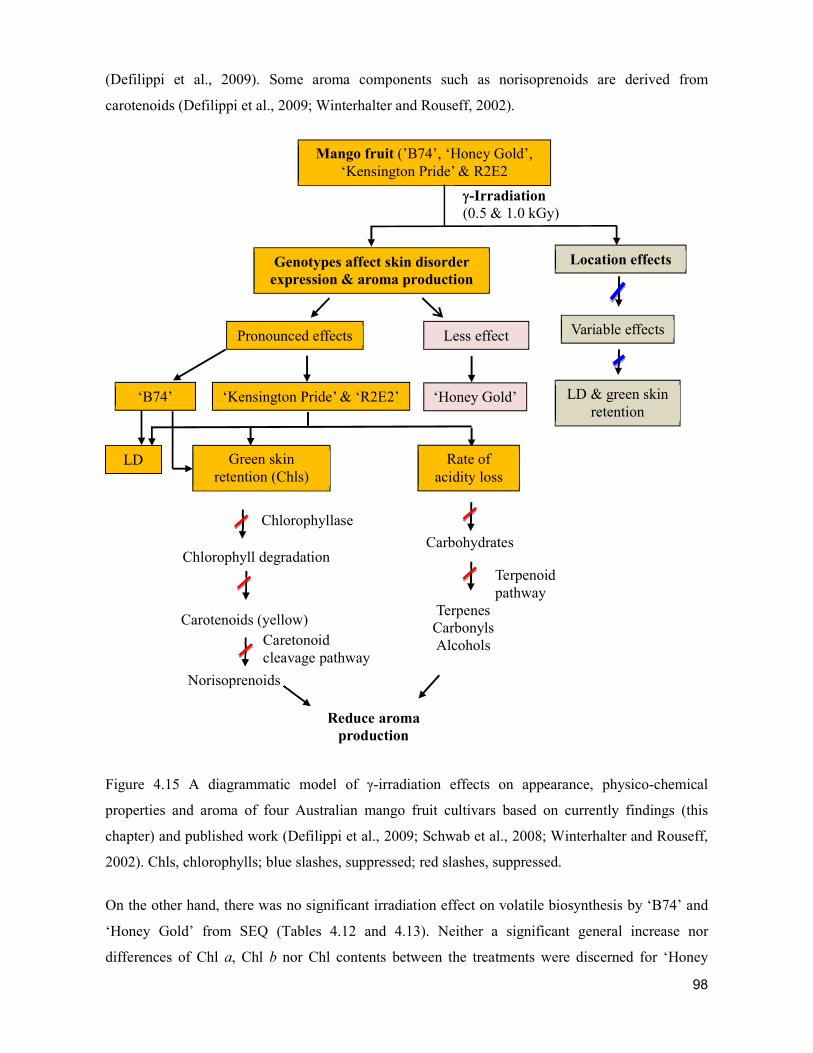
98
(Defilippi et al., 2009). Some aroma components such as norisoprenoids are derived from
carotenoids (Defilippi et al., 2009; Winterhalter and Rouseff, 2002).
Figure 4.15 A diagrammatic model of γ-irradiation effects on appearance, physico-chemical
properties and aroma of four Australian mango fruit cultivars based on currently findings (this
chapter) and published work (Defilippi et al., 2009; Schwab et al., 2008; Winterhalter and Rouseff,
2002). Chls, chlorophylls; blue slashes, suppressed; red slashes, suppressed.
On the other hand, there was no significant irradiation effect on volatile biosynthesis by ‘B74’ and
‘Honey Gold’ from SEQ (Tables 4.12 and 4.13). Neither a significant general increase nor
differences of Chl a, Chl b nor Chl contents between the treatments were discerned for ‘Honey
Mango fruit (’B74’, ‘Honey Gold’, ‘Kensington Pride’ & R2E2
Genotypes affect skin disorder expression & aroma production
Location effects
Variable effects
-Irradiation (0.5 & 1.0 kGy)
Reduce aroma production
Carbohydrates
Terpenes Carbonyls Alcohols
Terpenoid pathway
Caretonoid cleavage pathway
Carotenoids (yellow)
Chlorophyll degradation
Norisoprenoids
Chlorophyllase
LD Green skin retention (Chls)
Rate of acidity loss
Pronounced effects
‘Kensington Pride’ & ‘R2E2’ ‘B74’ ‘Honey Gold’
Less effect
LD & green skin retention
99
Gold’ mango skin (Tables 4.7 - 4.9). These findings suggest that ‘B74’ and ‘Honey Gold’ are
relatively less sensitive to irradiation-induced reduction in rates of volatile production. It is possible
that irradiation has a more dramatic impact on fruit that are typically higher in volatile components
to begin with. Conversely, irradiation may have little or impact on fruits that typically have low
volatiles composition. It suggests that the use of irradiation as a disinfestation treatment should be
manipulated by further post-harvest practices (suitable fruit ripeness stage for irradiation or proper
coatings) to optimise the irradiation procedure and deliver high-quality fruit to the market. In future
refinement of this work, complimentary sensory evaluation is recommended towards fully
understanding the impacts of irradiation-induced changes in, for example, TA and aroma on
consumer satisfaction.
4.5 Conclusion
In order to sterilise insect pests and meet quarantine requirements, irradiation doses of 0.4+ kGy are
applied in the horticultural industry. However, -irradiation at mature green for both the
recommended commercial level of 0.5 and higher for research purposes (viz. positive control) at 1.0
kGy generally reduced the visual appearance quality of ‘B74’, ‘Honey Gold’, ‘Kensington Pride’
and ‘R2E2’ mango fruit, particularly by inhibiting chlorophyll degradation and by increasing LD at
ripe. -Irradiation at 0.5 and 1.0 kGy elicited different cultivar dependant responses in the physico-
chemical properties of the fruit. Increased TA and retarded chlorophyll degradation of irradiated
and ripened ‘Kensington Pride’ and ‘R2E2’ fruit at 0.5 kGy coupled with reduction in volatiles with
a higher dose at 1.0 kGy may translate into diminished flavour. In contrast, there were no notable
effects of irradiation treatment at 0.5 and 1.0 kGy on the ‘Honey Gold’ cultivar. Knowing the
relative susceptibility to irradiation damage in terms of appearance and physical-chemical
properties for various mango cultivars, in this case Australian, represents opportunity for the mango
industry to assure the quality of irradiated fruit. Moreover, understanding irradiation effects on
mango fruit appearance (e.g. LD, skin de-greening), taste (e.g. TSS, TA) and flavour (e.g. aroma
synthesis) responses should inform postharvest practices to optimise the overall quality of irradiated
fruit.
References
AAG, 2006. Market overview – The Australian mango industry, Australian Agribusiness Group.
AMIA, 2014. Industry advisory committee annual report 2013/2014. Australian Mango Industry
Association.
100
AMIA, 2016. Mango production http://www.industry.mangoes.net.au/mango-production/ (accessed
on 19.05.16).
Bally, I.S.E., Graham, G.C., Henry, R.J., 1996. Genetic diversity of Kensington mango in Australia.
Australian Journal of Experimental Agriculture 36, 243-247.
Bally, I.S.E., Johnson, P.R., Kulkarni, V.J., 2000. Mango production in Australia. Acta
Horticulturae 509, 59-68.
Blakesley, C.N., Loots, J.G., Du Plessis, L., De Bruyn, G., 1979. Gamma irradiation of subtropical
fruits. 2. Volatile components, lipids and amino acids of mango, papaya, and strawberry pulp.
Journal of Agricultural and Food Chemistry 27, 42-48.
Boag, T.S., Johnson, G.I., Izard, M., Murray, C., Fitzsimmons, K.C., 1990. Physiological responses
of mangoes cv. Kensington Pride to gamma irradiation treatment as affected by fruit maturity and
ripeness. Annals of Applied Biology 116, 177-187.
Bustos, M.E., Enkerlin, W., Reyes, J., Toledo, J., 2004. Irradiation of mangoes as a postharvest
quarantine treatment for fruit flies (Diptera: Tephritidae). Journal of Economic Entomology 97,
286-286.
Defilippi, B.G., Manríquez, D., Luengwilai, K., González-Agüero, M., 2009. Chapter 1 Aroma
volatiles: biosynthesis and mechanisms of modulation during fruit ripening, In: Jean-Claude, K.,
Michel, D. (Eds.), Advances in Botanical Research. Academic Press, pp. 1-37.
Dillon, N.L., Bally, I.S.E., Wright, C.L., Hucks, L., Innes, D.J., Dietzgen, R.G., 2013. Genetic
diversity of the Australian national mango genebank. Scientia Horticulturae 150, 213-226.
Ducamp Collin, M.-N., Arnaud, C., Kagy, V., Didier, C., 2007. Fruit flies: disinfestation,
techniques used, possible application to mango. Fruits 62, 223-236.
El-Samahy, S.K., Youssef, B.M., Askar, A.A., Swailam, H.M.M., 2000. Microbiological and
chemical properties of irradiated mango. Journal of Food Safety 20, 139-156.
Follett, P.A., 2001. Irradiation as a quarantine treatment for mango seed weevil, Proceedings of the
Hawaiian Entomological Society, pp. 85–90.
101
Follett, P.A., 2004. Irradiation to control insects in fruits and vegetables for export from Hawaii.
Radiation Physics and Chemistry 71, 163-166.
Follett, P.A., 2009. Generic radiation quarantine treatments: the next steps. Journal of Economic
Entomology 102, 1399-1406.
Gholap, A.S., Bandyopadhyay, C., Nair, P.M., 1990. Lipid-composition and flavor changes in
irradiated mango (var.Alphonso). Journal of Food Science 55, 1579-1579.
Hartmut, K., 1983. Determinations of total carotenoids and chlorophylls b of leaf extracts in
different solvents. Analysis (Peach, K & Tracey, MV, eds) 4, 142-196.
Hofman, P.J., Holmes, R., Barker, L., 2010a. B74 mango quality assessment manual : A guide to
assessing the post-harvest quality of B74 mangoes Dept. of Employment, Economic Development
and Innovation, [Brisbane].
Hofman, P.J., Marques, J.R., Taylor, A.H., Stubbings, B.A., Ledger, S.N., Jordan, R.A., 2010b.
Development of best practice pre- and postharvest of 'B74‘ mango fruit: Phase II. Final report
MG06005, Horticulture Australia Ltd., Sydney, Australia.
Hofman, P.J., Marques, J.R., Taylor, L.M., Stubbings, B.A., Ledger, S.N., Jordan, R.A., 2010c.
Skin damage to two new mango cultivars during irradiation and cold storage. Acta Horticulturae
877, 475-481.
Hu, X., Tanaka, A., Tanaka, R., 2013. Simple extraction methods that prevent the artifactual
conversion of chlorophyll to chlorophyllide during pigment isolation from leaf samples. Plant
Methods 9, 19-19.
Kaewsuksaeng, S., Urano, Y., Aiamla-or, S., Shigyo, M., Yamauchi, N., 2011. Effect of UV-B
irradiation on chlorophyll-degrading enzyme activities and postharvest quality in stored lime
(Citrus latifolia Tan.) fruit. Postharvest Biology and Technology 61, 124-130.
Ketsa, S., Phakawatmongkol, W., Subhadrabhandhu, S., 1999. Peel enzymatic activity and colour
changes in ripening mango fruit. Journal of Plant Physiology 154, 363-366.
Lacroix, M., Bernard, L., Jobin, M., Milot, S., Gagnon, M., 1990. Effect of irradiation on the
biochemical and organoleptic changes during the ripening of papaya and mango fruits. International
102
Journal of Radiation Applications & Instrumentation. Part C, Radiation Physics & Chemistry 35,
296-300.
Lacroix, M., Jobin, M., Gagnon, M., 1992. Irradiation and storage effects on sensory and physical
characteristics of Keitt mangoes (Mangifera-Indica L) quality of irradiated mangoes. Sciences Des
Aliments 12, 63-81.
Lacroix, M., Lettre, J., Grad, B., Gagnon, M., Pringsulaka, V., Jobin, M., Latreille, B.,
Nouchpramool, K., Prachasitthisak, Y., Charoen, S., Adulyatham, P., 1993. Effect of gamma
irradiation with or without hot water dip and transportation from Thailand to Canada on nutritional
qualities, ripening index and sensorial characteristics of Thai mangoes (Nahng Glahng Wahn
variety). Radiation Physics and Chemistry 42, 273-277.
Laohakunjit, N., Uthairatakij, A., Kerdchoechuen, O., Chatpaisarn, A., Photchanachai, S., 2006.
Identification of changes in volatile compound in γ-irradiated mango during storage, International
Symposium “New Frontier of Irradiated Food and Non-Food Products”. ISNF, Bangkok, Thailand
Mahto, R., Das, M., 2013. Effect of gamma irradiation on the physico-chemical and visual
properties of mango (Mangifera indica L.), cv. 'Dushehri' and 'Fazli' stored at 20°C. Postharvest
Biology and Technology 86, 447-455.
McGuire, R.G., 1992. Reporting of objective color measurements. Hortscience 27, 1254-1255.
McLauchlan, R., Johnson, G., Mitchell, G., Wills, P., 1989. Irradiation of Kensington Pride
mangoes, Symposium on Tropical Fruit in International Trade 269, pp. 469-476.
Moreno, M., Castell‐Perez, M.E., Gomes, C., Da Silva, P.F., Moreira, R.G., 2006. Effects of
electron beam irradiation on physical, textural, and microstructural properties of “Tommy Atkins”
mangoes (Mangifera indica L.). Journal of Food Science 71, E80-E86.
Palafox-Carlos, H., Yahia, E., Islas-Osuna, M.A., Gutierrez-Martinez, P., Robles-Sánchez, M.,
González-Aguilar, G.A., 2012. Effect of ripeness stage of mango fruit (Mangifera indica L., cv.
Ataulfo) on physiological parameters and antioxidant activity. Scientia Horticulturae 135, 7-13.
Reyes, L.F., Cisneros-Zevallos, L., 2007. Electron-beam ionizing radiation stress effects on mango
fruit (Mangifera indica L.) antioxidant constituents before and during postharvest storage. Journal
of Agricultural and Food Chemistry 55, 6132-6139.
103
Sabato, S.F., Silva, J.M.d., Cruz, J.N.d., Salmieri, S., Rela, P.R., Lacroix, M., 2009. Study of
physical–chemical and sensorial properties of irradiated Tommy Atkins mangoes (Mangifera indica
L.) in an international consignment. Food Control 20, 284-288.
Santos, A.M.G., Lins, S.R.O., Silva, J.M.d., Oliveira, S.M.A.d., 2015. Low doses of gamma
radiation in the management of postharvest Lasiodiplodia theobromae in mangos. Brazilian Journal
of Microbiology 46, 841-847.
Schwab, W., Davidovich-Rikanati, R., Lewinsohn, E., 2008. Biosynthesis of plant-derived flavor
compounds. The Plant Journal 54, 712-732.
Semba, S., Shimizu, M., Suzuki, S., Murashita, K., 2002. Color data converting method. U.S. Patent
No 6, 373, 595, 2002.
Shmulevich, I., Galili, N., Howarth, M.S., 2003. Nondestructive dynamic testing of apples for
firmness evaluation. Postharvest Biology and Technology 29, 287-299.
Smyth, H., Kirchhoff, S., Fuller, S., Abberlonl, K., Davis, C., Bally, I., Dietzgen, R., 2008. Tropical
flavours to tempt consumers, Proceedings of the Tropical Fruits in Human Nutrition and Health
Conference, pp. 126-132.
Sunarharum, W., Kravchuk, O., D’Arcy, B., Smyth, H., 2007. Key aroma-contributing compounds
of mango, The Amistar 6th Australian Mango Conference, The Business of Mangoes, Gold Coast.
Thomas, P., Janave, M.T., 1975. Effects of gamma irradiation and storage temperature on
carotenoids and ascorbic acid content of mangoes on ripening. Journal of the Science of Food and
Agriculture 26, 1503-1512.
Vásquez-Caicedo, A.L., Sruamsiri, P., Carle, R., Neidhart, S., 2005. Accumulation of all-trans-beta-
carotene and its 9-cis and 13-cis stereoisomers during postharvest ripening of nine Thai mango
cultivars. Journal of Agricultural and Food Chemistry 53, 4827-4835.
Winterhalter, P., Rouseff, R., 2002. Carotenoid-derived aroma compounds: An introduction In:
Winterhalter, P., Rouseff, R. (Eds.), Carotenoid-derived aroma compounds. American Chemical
Society, Cary, NC, pp. 1-17.
104
Zhan, G., Li, B., Gao, M., Liu, B., Wang, Y., Liu, T., Ren, L., 2014. Phytosanitary irradiation of
peach fruit moth (Lepidoptera: Carposinidae) in apple fruits. Radiation Physics and Chemistry 103,
153-157.
105
CHAPTER 5. ANATOMICAL OBSERVATIONS OF LENTICEL
DISCOLOURATION IN AUSTRALIAN MANGO FRUIT SKIN
Abstract
Lenticel discolouration (LD) is a disorder of concern to the mango industry. The disorder is
typically characterised by brown to black lenticels on the surface of mango fruit visible as small
round spots sometimes comprised of a bordered centre surrounded by a white corona. To describe
anatomical features of non-coloured and discoloured lenticels towards better understanding the
mechanisms of LD in the Australian mango fruit cultivars including ‘B74’, ‘Honey Gold’,
‘Kensington Pride’ and ‘R2E2, binocular microscope observations, free-hand sectioning, light
microscopy (LM) and serial block-face scanning electron microscopy (SBF-SEM) were employed.
There was no pronounced difference in the morphology of lenticels between these four cultivars.
Morphological examination with LM showed LD clearly evident as browning in the cell wall of
sub-lenticellular cells around the cavity. No such cell browning was observed in non-discoloured
lenticels. Based on SBF-SEM results, the browning was related to phenolic deposition in the cell
walls and of cytoplasm of sub-lenticellular cells surrounding the lenticel cavity. Three different
types of phenolic deposition were evident as polymerised electron-dense phenolic depositions in the
cell walls and cytoplasm and a discrete deposit of phenolics in the cytoplasm of sub-lenticellular
cells surrounding the cavity of discoloured lenticels. Only a discrete deposit of phenolics
characterised by spherical dark granules was observed in the non-coloured lenticel. Greater
knowledge of exterior, central and periphery regions of the lenticels and detailed ultrastructural
changes in the partitioning of phenolics as associated with LD has contributed to an improved
understanding of the mechanism of LD.
5.1 Introduction
Skin appearance is an important quality criterion for fresh fruit. Surface defects can reduce
perceived quality with undesirable effects on customers’ value decisions to purchase. Lenticel
discolouration (LD) is an important mango fruit skin disorder in terms of reduction in fruit
appearance and economic value (Bezuidenhout et al., 2005).
Lenticels in mango fruit are macroscopic pits on the skin (peel) that contribute or contributed to
gaseous exchange and transpiration. Lenticels in mango can derive from stomata (Bally, 1999).
They enlarge during fruit growth due largely to stretching of the fruit surface; i.e. epidermis
(Bezuidenhout et al., 2005; Rymbai et al., 2012). LD on mango skin produces brown, black or red
106
discoloured spots in and around lenticels. The brown and black discolouration involves vacuolar
deposition of phenolic compounds in cells surrounding the lenticel cavity (Du Plooy et al., 2009).
Brown or black lenticels were also associated with accumulation of quinine in cell walls
(Bezuidenhout and Robbertse, 2005). Red lenticel spotting was related to production of
anthocyanins in sub-lenticel cells (Self et al., 2006).
Micro-structural properties of typical lenticels have been described for some mango cultivars. For
instance, lenticel development and subsequent discolouration in ‘Tommy Atkins’ and ‘Keitt’ mango
fruit were studied using LM by Bezuidenhout et al. (2005). The discoloured lenticels were
associated with natural pigment deposition such as quinine in the cell walls (Bezuidenhout et al.,
2005; Tamjinda et al., 1992). In terms of discolouration, differences of LD localisation and
chemical changes in ‘Tommy Atkins’ mango fruit were characterised by Du Plooy et al. (2006)
using transmission electron microscopy (TEM). In this study, LD was associated with the
deposition of electron-dense materials from the cell wall to the inside of cells.
Physicochemical, including micro-structural properties of LD on Australian mango cultivars are
largely undescribed. This is perhaps in part because key micro-morphological methodology (viz.,
LM, SEM, TEM, etc.) is an intricate and expensive approach to gaining structural functional
information on biological tissues (Fowke et al., 1994). In this light, SBF-SEM offers a relatively
new cost-effective method to align stacks of serial images, including gaining insight in three-
dimensional (3D) structure (Feng et al., 2016). Accordingly, comparative visualisation of non-
discoloured and coloured lenticels using SBF-SEM could contribute to better understanding the
physiochemistry of LD.
To better understand the physicochemical mechanism of LD on fruit of the Australian mango
cultivars ‘B74’, ‘Honey Gold’, ‘Kensington Pride’ and ‘R2E2’, this study sought to: (1)
comparatively describe the general features of non-discoloured and coloured lenticels on a
microscopic scale; and, (2) comparatively describe ultrastructural properties in the morphology of
the non-coloured and discoloured lenticels of ‘B74’ mango fruit. In due course, it is anticipated that
this basic information will help to inform commercial practices to mitigate post-harvest losses due
to this disorder.
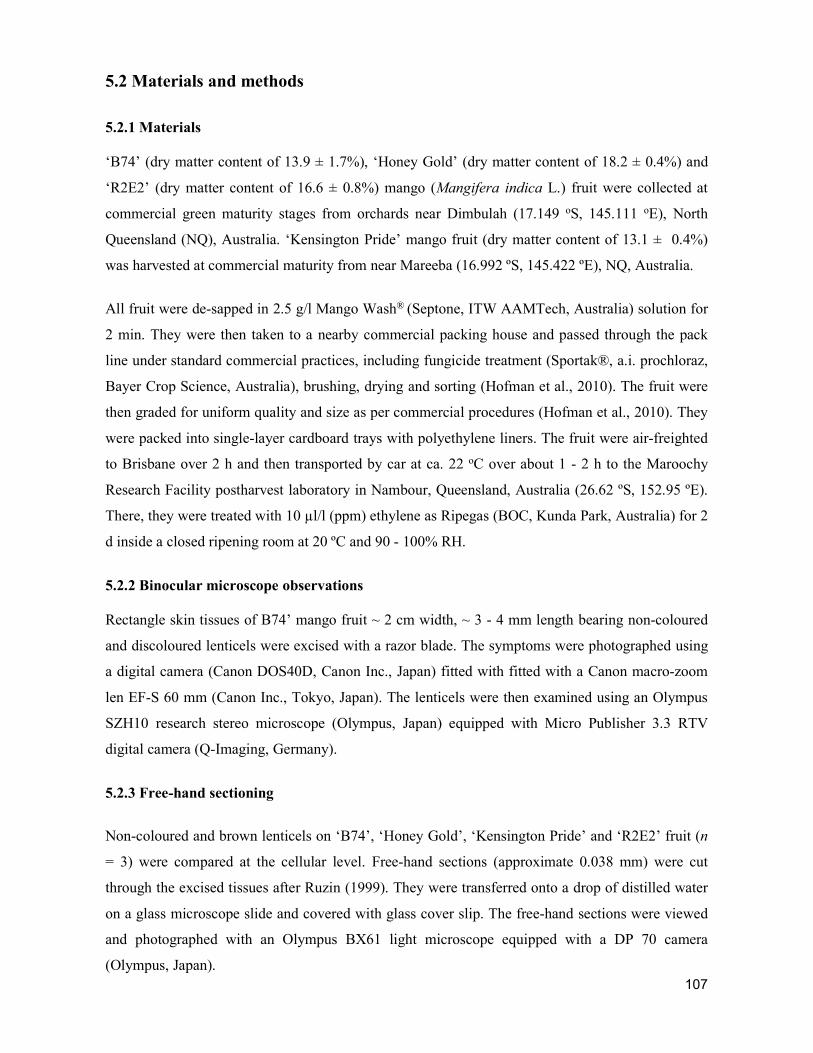
107
5.2 Materials and methods
5.2.1 Materials
‘B74’ (dry matter content of 13.9 ± 1.7%), ‘Honey Gold’ (dry matter content of 18.2 ± 0.4%) and
‘R2E2’ (dry matter content of 16.6 ± 0.8%) mango (Mangifera indica L.) fruit were collected at
commercial green maturity stages from orchards near Dimbulah (17.149 oS, 145.111 oE), North
Queensland (NQ), Australia. ‘Kensington Pride’ mango fruit (dry matter content of 13.1 ± 0.4%)
was harvested at commercial maturity from near Mareeba (16.992 ºS, 145.422 ºE), NQ, Australia.
All fruit were de-sapped in 2.5 g/l Mango Wash® (Septone, ITW AAMTech, Australia) solution for
2 min. They were then taken to a nearby commercial packing house and passed through the pack
line under standard commercial practices, including fungicide treatment (Sportak®, a.i. prochloraz,
Bayer Crop Science, Australia), brushing, drying and sorting (Hofman et al., 2010). The fruit were
then graded for uniform quality and size as per commercial procedures (Hofman et al., 2010). They
were packed into single-layer cardboard trays with polyethylene liners. The fruit were air-freighted
to Brisbane over 2 h and then transported by car at ca. 22 oC over about 1 - 2 h to the Maroochy
Research Facility postharvest laboratory in Nambour, Queensland, Australia (26.62 ºS, 152.95 ºE).
There, they were treated with 10 µl/l (ppm) ethylene as Ripegas (BOC, Kunda Park, Australia) for 2
d inside a closed ripening room at 20 ºC and 90 - 100% RH.
5.2.2 Binocular microscope observations
Rectangle skin tissues of B74’ mango fruit ~ 2 cm width, ~ 3 - 4 mm length bearing non-coloured
and discoloured lenticels were excised with a razor blade. The symptoms were photographed using
a digital camera (Canon DOS40D, Canon Inc., Japan) fitted with fitted with a Canon macro-zoom
len EF-S 60 mm (Canon Inc., Tokyo, Japan). The lenticels were then examined using an Olympus
SZH10 research stereo microscope (Olympus, Japan) equipped with Micro Publisher 3.3 RTV
digital camera (Q-Imaging, Germany).
5.2.3 Free-hand sectioning
Non-coloured and brown lenticels on ‘B74’, ‘Honey Gold’, ‘Kensington Pride’ and ‘R2E2’ fruit (n
= 3) were compared at the cellular level. Free-hand sections (approximate 0.038 mm) were cut
through the excised tissues after Ruzin (1999). They were transferred onto a drop of distilled water
on a glass microscope slide and covered with glass cover slip. The free-hand sections were viewed
and photographed with an Olympus BX61 light microscope equipped with a DP 70 camera
(Olympus, Japan).
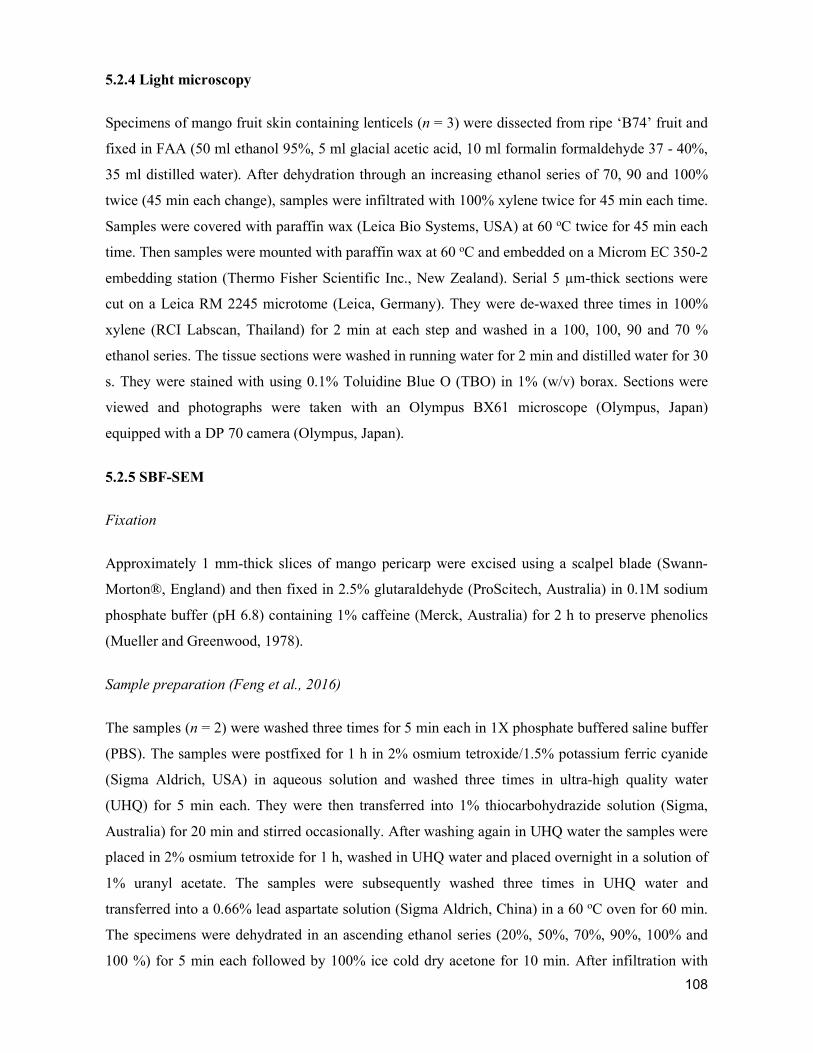
108
5.2.4 Light microscopy
Specimens of mango fruit skin containing lenticels (n = 3) were dissected from ripe ‘B74’ fruit and
fixed in FAA (50 ml ethanol 95%, 5 ml glacial acetic acid, 10 ml formalin formaldehyde 37 - 40%,
35 ml distilled water). After dehydration through an increasing ethanol series of 70, 90 and 100%
twice (45 min each change), samples were infiltrated with 100% xylene twice for 45 min each time.
Samples were covered with paraffin wax (Leica Bio Systems, USA) at 60 oC twice for 45 min each
time. Then samples were mounted with paraffin wax at 60 oC and embedded on a Microm EC 350-2
embedding station (Thermo Fisher Scientific Inc., New Zealand). Serial 5 µm-thick sections were
cut on a Leica RM 2245 microtome (Leica, Germany). They were de-waxed three times in 100%
xylene (RCI Labscan, Thailand) for 2 min at each step and washed in a 100, 100, 90 and 70 %
ethanol series. The tissue sections were washed in running water for 2 min and distilled water for 30
s. They were stained with using 0.1% Toluidine Blue O (TBO) in 1% (w/v) borax. Sections were
viewed and photographs were taken with an Olympus BX61 microscope (Olympus, Japan)
equipped with a DP 70 camera (Olympus, Japan).
5.2.5 SBF-SEM
Fixation
Approximately 1 mm-thick slices of mango pericarp were excised using a scalpel blade (Swann-
Morton®, England) and then fixed in 2.5% glutaraldehyde (ProScitech, Australia) in 0.1M sodium
phosphate buffer (pH 6.8) containing 1% caffeine (Merck, Australia) for 2 h to preserve phenolics
(Mueller and Greenwood, 1978).
Sample preparation (Feng et al., 2016)
The samples (n = 2) were washed three times for 5 min each in 1X phosphate buffered saline buffer
(PBS). The samples were postfixed for 1 h in 2% osmium tetroxide/1.5% potassium ferric cyanide
(Sigma Aldrich, USA) in aqueous solution and washed three times in ultra-high quality water
(UHQ) for 5 min each. They were then transferred into 1% thiocarbohydrazide solution (Sigma,
Australia) for 20 min and stirred occasionally. After washing again in UHQ water the samples were
placed in 2% osmium tetroxide for 1 h, washed in UHQ water and placed overnight in a solution of
1% uranyl acetate. The samples were subsequently washed three times in UHQ water and
transferred into a 0.66% lead aspartate solution (Sigma Aldrich, China) in a 60 oC oven for 60 min.
The specimens were dehydrated in an ascending ethanol series (20%, 50%, 70%, 90%, 100% and
100 %) for 5 min each followed by 100% ice cold dry acetone for 10 min. After infiltration with
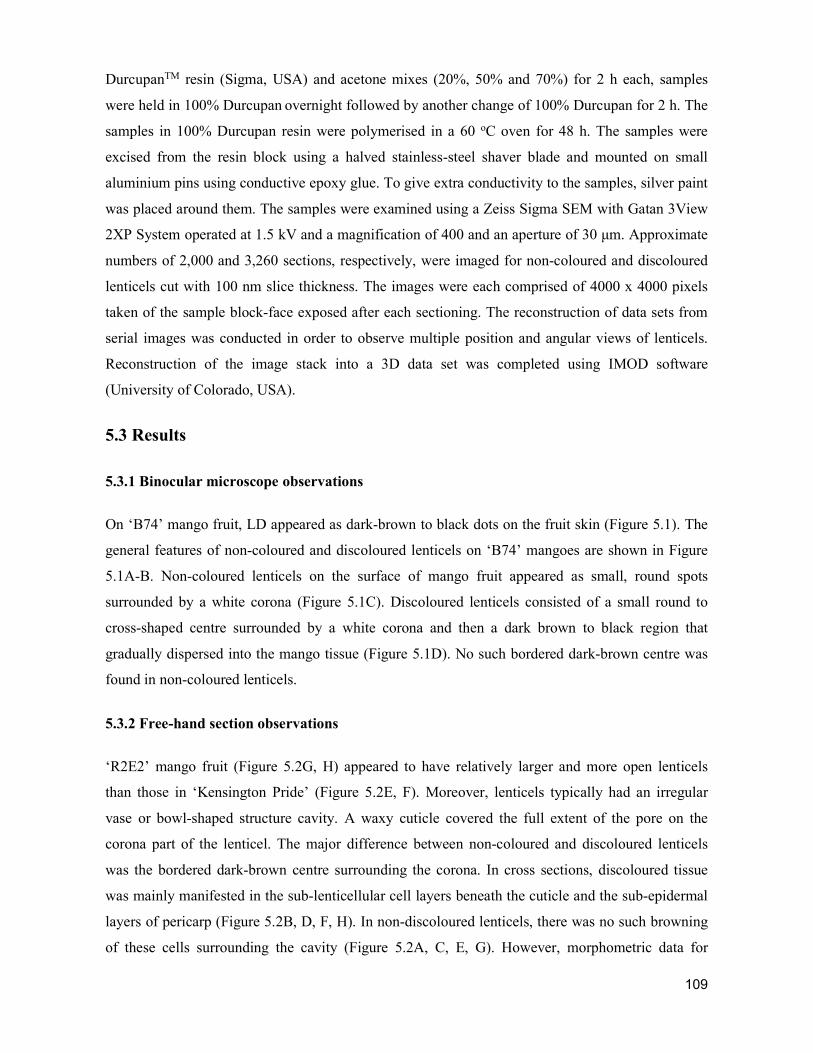
109
DurcupanTM resin (Sigma, USA) and acetone mixes (20%, 50% and 70%) for 2 h each, samples
were held in 100% Durcupan overnight followed by another change of 100% Durcupan for 2 h. The
samples in 100% Durcupan resin were polymerised in a 60 oC oven for 48 h. The samples were
excised from the resin block using a halved stainless-steel shaver blade and mounted on small
aluminium pins using conductive epoxy glue. To give extra conductivity to the samples, silver paint
was placed around them. The samples were examined using a Zeiss Sigma SEM with Gatan 3View
2XP System operated at 1.5 kV and a magnification of 400 and an aperture of 30 μm. Approximate
numbers of 2,000 and 3,260 sections, respectively, were imaged for non-coloured and discoloured
lenticels cut with 100 nm slice thickness. The images were each comprised of 4000 x 4000 pixels
taken of the sample block-face exposed after each sectioning. The reconstruction of data sets from
serial images was conducted in order to observe multiple position and angular views of lenticels.
Reconstruction of the image stack into a 3D data set was completed using IMOD software
(University of Colorado, USA).
5.3 Results
5.3.1 Binocular microscope observations
On ‘B74’ mango fruit, LD appeared as dark-brown to black dots on the fruit skin (Figure 5.1). The
general features of non-coloured and discoloured lenticels on ‘B74’ mangoes are shown in Figure
5.1A-B. Non-coloured lenticels on the surface of mango fruit appeared as small, round spots
surrounded by a white corona (Figure 5.1C). Discoloured lenticels consisted of a small round to
cross-shaped centre surrounded by a white corona and then a dark brown to black region that
gradually dispersed into the mango tissue (Figure 5.1D). No such bordered dark-brown centre was
found in non-coloured lenticels.
5.3.2 Free-hand section observations
‘R2E2’ mango fruit (Figure 5.2G, H) appeared to have relatively larger and more open lenticels
than those in ‘Kensington Pride’ (Figure 5.2E, F). Moreover, lenticels typically had an irregular
vase or bowl-shaped structure cavity. A waxy cuticle covered the full extent of the pore on the
corona part of the lenticel. The major difference between non-coloured and discoloured lenticels
was the bordered dark-brown centre surrounding the corona. In cross sections, discoloured tissue
was mainly manifested in the sub-lenticellular cell layers beneath the cuticle and the sub-epidermal
layers of pericarp (Figure 5.2B, D, F, H). In non-discoloured lenticels, there was no such browning
of these cells surrounding the cavity (Figure 5.2A, C, E, G). However, morphometric data for
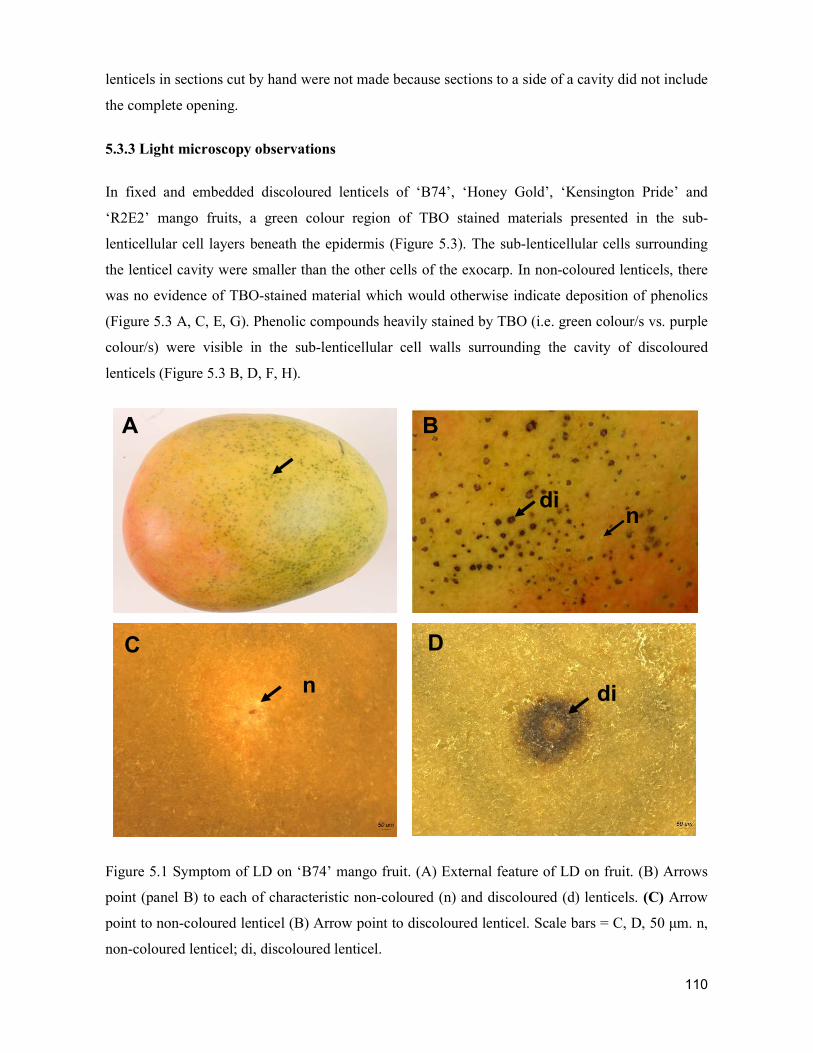
110
lenticels in sections cut by hand were not made because sections to a side of a cavity did not include
the complete opening.
5.3.3 Light microscopy observations
In fixed and embedded discoloured lenticels of ‘B74’, ‘Honey Gold’, ‘Kensington Pride’ and
‘R2E2’ mango fruits, a green colour region of TBO stained materials presented in the sub-
lenticellular cell layers beneath the epidermis (Figure 5.3). The sub-lenticellular cells surrounding
the lenticel cavity were smaller than the other cells of the exocarp. In non-coloured lenticels, there
was no evidence of TBO-stained material which would otherwise indicate deposition of phenolics
(Figure 5.3 A, C, E, G). Phenolic compounds heavily stained by TBO (i.e. green colour/s vs. purple
colour/s) were visible in the sub-lenticellular cell walls surrounding the cavity of discoloured
lenticels (Figure 5.3 B, D, F, H).
Figure 5.1 Symptom of LD on ‘B74’ mango fruit. (A) External feature of LD on fruit. (B) Arrows
point (panel B) to each of characteristic non-coloured (n) and discoloured (d) lenticels. (C) Arrow
point to non-coloured lenticel (B) Arrow point to discoloured lenticel. Scale bars = C, D, 50 μm. n,
non-coloured lenticel; di, discoloured lenticel.
A B
di n
C D
di n
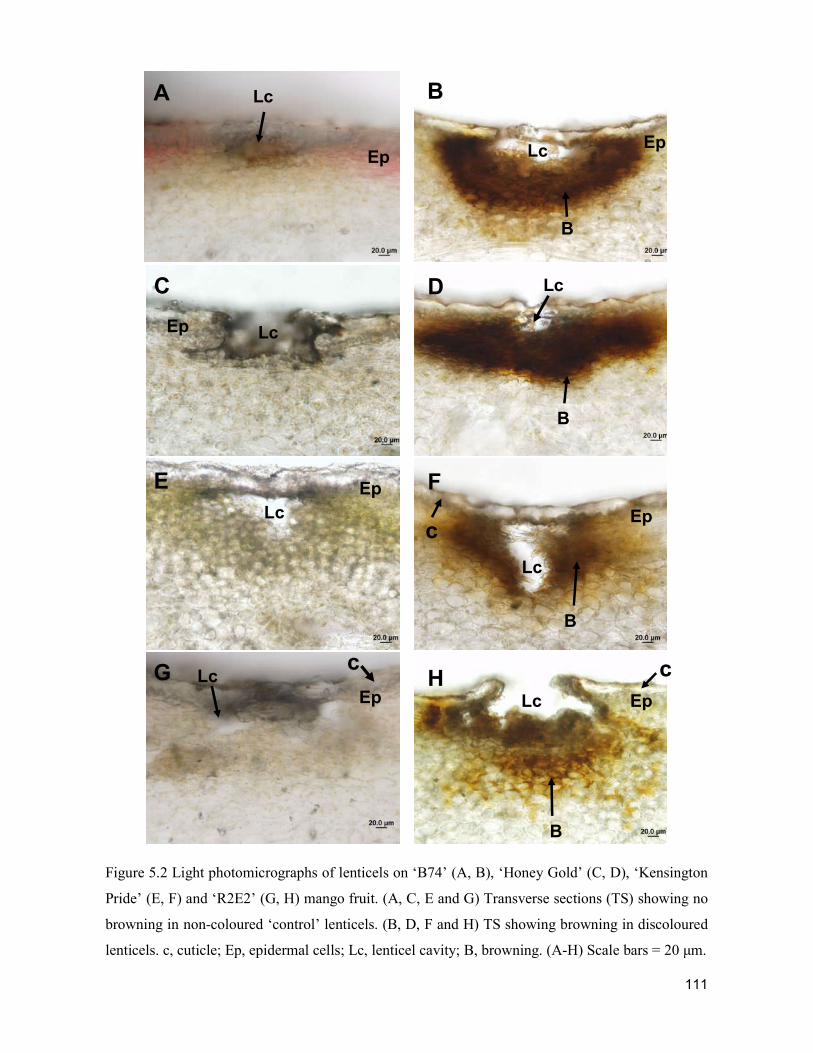
111
Figure 5.2 Light photomicrographs of lenticels on ‘B74’ (A, B), ‘Honey Gold’ (C, D), ‘Kensington
Pride’ (E, F) and ‘R2E2’ (G, H) mango fruit. (A, C, E and G) Transverse sections (TS) showing no
browning in non-coloured ‘control’ lenticels. (B, D, F and H) TS showing browning in discoloured
lenticels. c, cuticle; Ep, epidermal cells; Lc, lenticel cavity; B, browning. (A-H) Scale bars = 20 μm.
A
B
B
C D
E F
Lc area
Lc area
Lc area
Lc area
Lc area
Lc are
Ep are
B
B
Ep are
Ep ar Ep
Ep ar
c
G H Lc area
c c
Lc area
B
Ep ar
Ep are
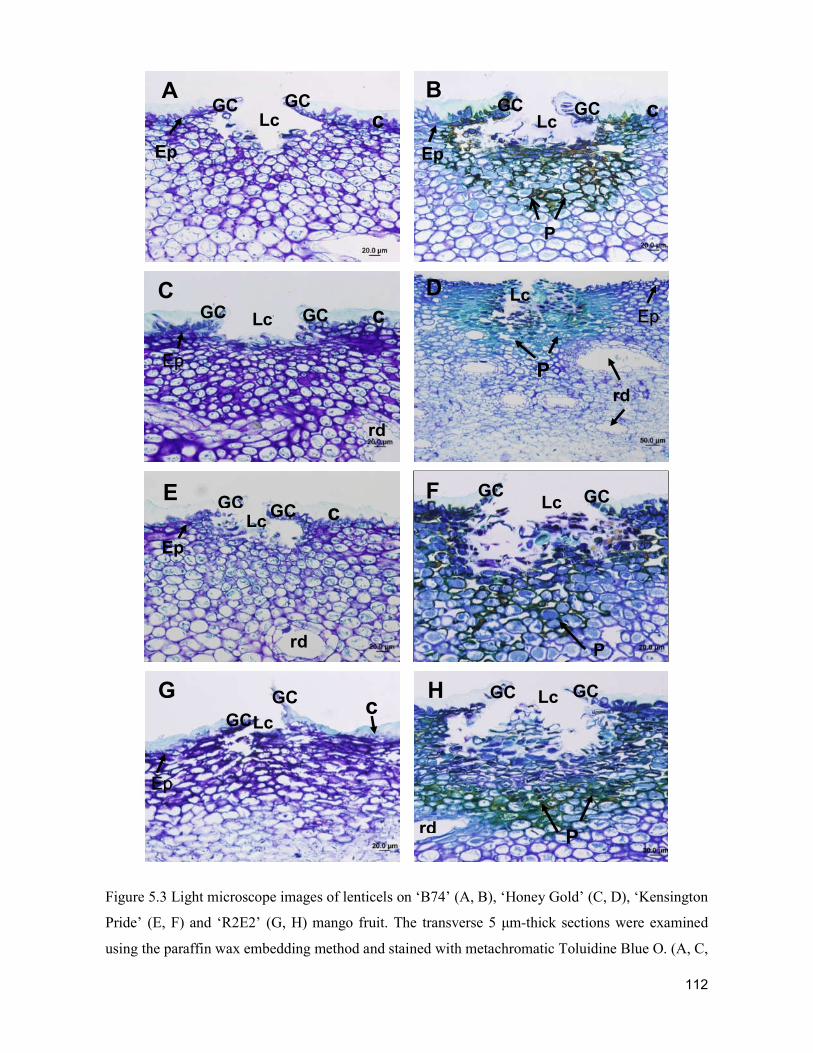
112
Figure 5.3 Light microscope images of lenticels on ‘B74’ (A, B), ‘Honey Gold’ (C, D), ‘Kensington
Pride’ (E, F) and ‘R2E2’ (G, H) mango fruit. The transverse 5 μm-thick sections were examined
using the paraffin wax embedding method and stained with metachromatic Toluidine Blue O. (A, C,
G H GC
GC
GC GC Lc areLc
rd P
c
Ep
P
B
D
GC are
GC area Lc
are
Lc ar
c
Ep
rd
P
Ep
GC GC areLc
are
C GC are
GC area
Lc are
c
rd
A
Ep
c
Ep
Lc
E GC c
Ep
GC F Lc are
GC GC
P rd
113
E and G) TS showing phenolics are absent as purple staining colour in non-coloured lenticels. (B,
D, F and H) TS showing phenolics are present as green staining colour in discoloured lenticels. c,
cuticle; Ep, epidermal cells; GC, stomatal guard cells; P, phenolics; rd, resin duct; Lc, lenticel
cavity. Scale bars = A-C, E-H, 20 μm; D, 50 μm.
5.3.4 SBF-SEM observations
SBF-SEM study of non-coloured versus discoloured ‘B74’ mango fruit lenticels was undertaken to
explore their 3D architecture. That is, SBF-SEM was used to better understand and potentially
differentiate non-coloured and discoloured complete architecture of lenticels at the cellular level.
By reconstruction of data sets from serial images it is possible to show multiple positions and
angular views of lenticels.
Some individual sections illustrated detailed ultrastructural information. The electron-dense
granular layer above the cuticle in Figure 5.4 is conductive silver paint as applied to the samples to
reduce charging potential artifacts. The technique enabled clear visualisation of exterior (Figure 5.4
A-D), central (Figure 5.4 E-F) and periphery (Figure 5.4 G-H) regions of the lenticels. At a cellular
level, the discoloured lenticel showed extensive accumulation of electron-dense materials in
hypodermis under the cuticle and sub-lenticellular cells surrounding the cavity. The electron-dense
materials are most likely polymerised phenolics (Du Plooy et al., 2006; Ramsey and Berlin, 1976).
SBF-SEM imaging involved relatively massive data collection for 3D space capturing complete or
almost complete lenticels at relatively high resolution. The image stacks acquired for ‘B74’ mango
fruit consisted of 2,000 continuous aligned sections for a non-coloured lenticel (Movie 5.1a-b) and
3,259 sections for a discoloured lenticel (Movie 5.2). The image stacks illustrated the changes from
the outer cell layers to inner cell layers surrounding the lenticel cavity of lenticels.
In Movie 5.1a-b, image stacks consisting of 2,000 aligned sections illustrating the structural features
of a non-coloured lenticel of ‘B74’ mango fruit are presented. (Electronic files ‘Movie 5.1a non-
coloured lenticel stack’ and ‘Movie 5.1b non-coloured lenticel stack’ attached in the external hard
drive). Viewing the SBF-SEM sequence, a progressive change was distinguished in the interior of
non-coloured lenticel due to degenerated guard cells and cuticle rupture into the disclosed cavity (in
Movie 5.1 and 5.2). In Movie 5.2, the image stack consisting of 3,259 aligned sections illustrates
the structural features of a discoloured lenticel of ‘B74’ mango fruit. (Electronic file ‘Movie 5.2
discoloured lenticel stack’ attached in the external hard drive). The stack started with a section at
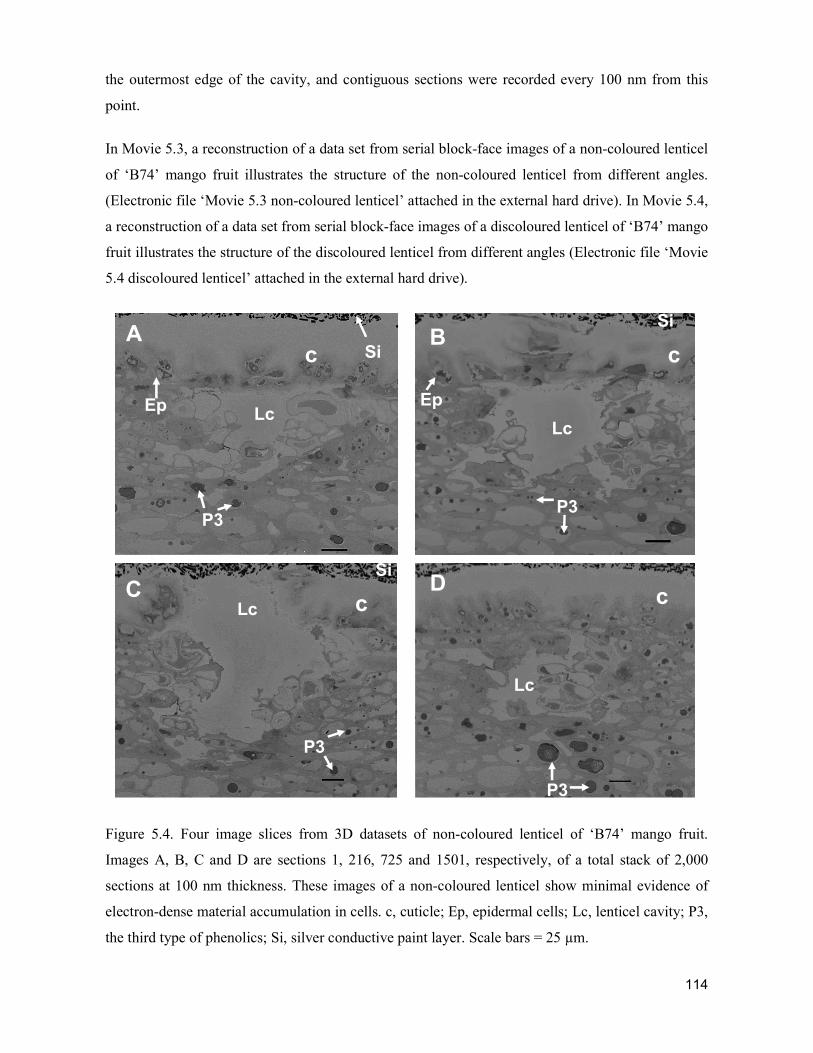
114
the outermost edge of the cavity, and contiguous sections were recorded every 100 nm from this
point.
In Movie 5.3, a reconstruction of a data set from serial block-face images of a non-coloured lenticel
of ‘B74’ mango fruit illustrates the structure of the non-coloured lenticel from different angles.
(Electronic file ‘Movie 5.3 non-coloured lenticel’ attached in the external hard drive). In Movie 5.4,
a reconstruction of a data set from serial block-face images of a discoloured lenticel of ‘B74’ mango
fruit illustrates the structure of the discoloured lenticel from different angles (Electronic file ‘Movie
5.4 discoloured lenticel’ attached in the external hard drive).
Figure 5.4. Four image slices from 3D datasets of non-coloured lenticel of ‘B74’ mango fruit.
Images A, B, C and D are sections 1, 216, 725 and 1501, respectively, of a total stack of 2,000
sections at 100 nm thickness. These images of a non-coloured lenticel show minimal evidence of
electron-dense material accumulation in cells. c, cuticle; Ep, epidermal cells; Lc, lenticel cavity; P3,
the third type of phenolics; Si, silver conductive paint layer. Scale bars = 25 µm.
Lc c
P3
A
Lc Ep are
Si ar
P3
B c
Ep
Si are
P3
c
Lc area
C Si
D
Lc
c
P3
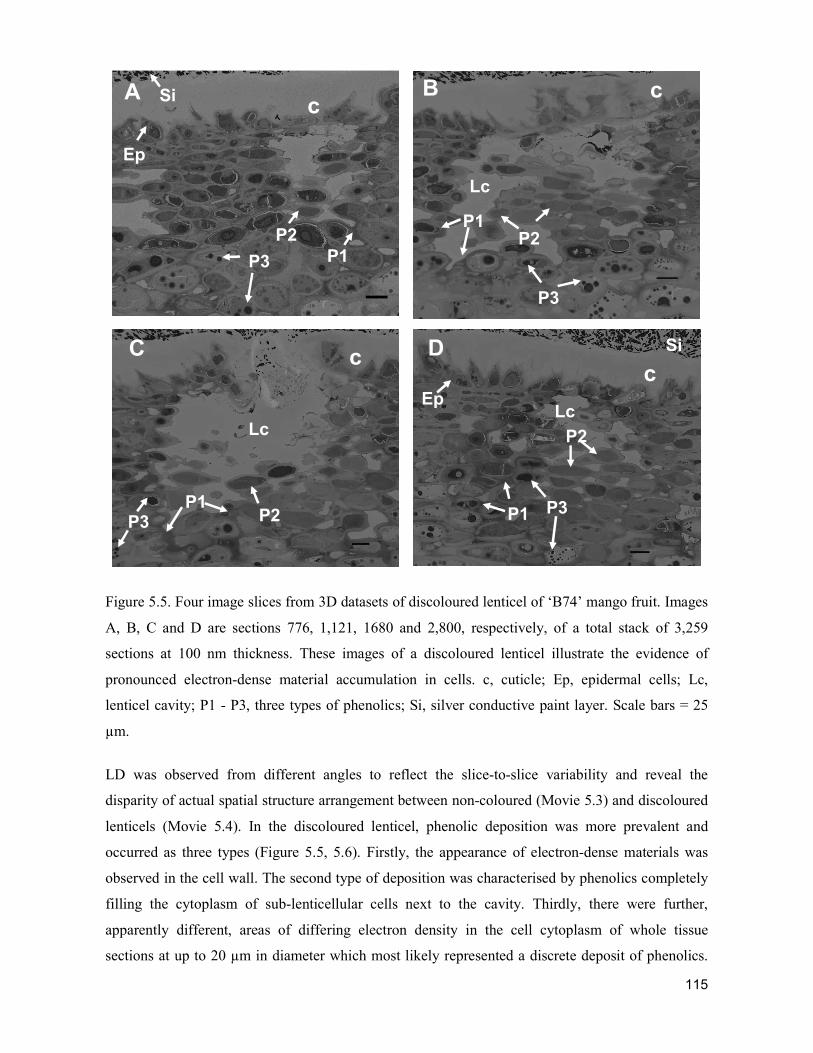
115
Figure 5.5. Four image slices from 3D datasets of discoloured lenticel of ‘B74’ mango fruit. Images
A, B, C and D are sections 776, 1,121, 1680 and 2,800, respectively, of a total stack of 3,259
sections at 100 nm thickness. These images of a discoloured lenticel illustrate the evidence of
pronounced electron-dense material accumulation in cells. c, cuticle; Ep, epidermal cells; Lc,
lenticel cavity; P1 - P3, three types of phenolics; Si, silver conductive paint layer. Scale bars = 25
µm.
LD was observed from different angles to reflect the slice-to-slice variability and reveal the
disparity of actual spatial structure arrangement between non-coloured (Movie 5.3) and discoloured
lenticels (Movie 5.4). In the discoloured lenticel, phenolic deposition was more prevalent and
occurred as three types (Figure 5.5, 5.6). Firstly, the appearance of electron-dense materials was
observed in the cell wall. The second type of deposition was characterised by phenolics completely
filling the cytoplasm of sub-lenticellular cells next to the cavity. Thirdly, there were further,
apparently different, areas of differing electron density in the cell cytoplasm of whole tissue
sections at up to 20 µm in diameter which most likely represented a discrete deposit of phenolics.
A c
Ep area
P1
Si ar
P3
P2
B
Lc are
c
P3
P2 P1
C
Lc
c
P2 P3 P1
D
Lc are
c
P3
Ep are
Si
P1
P2
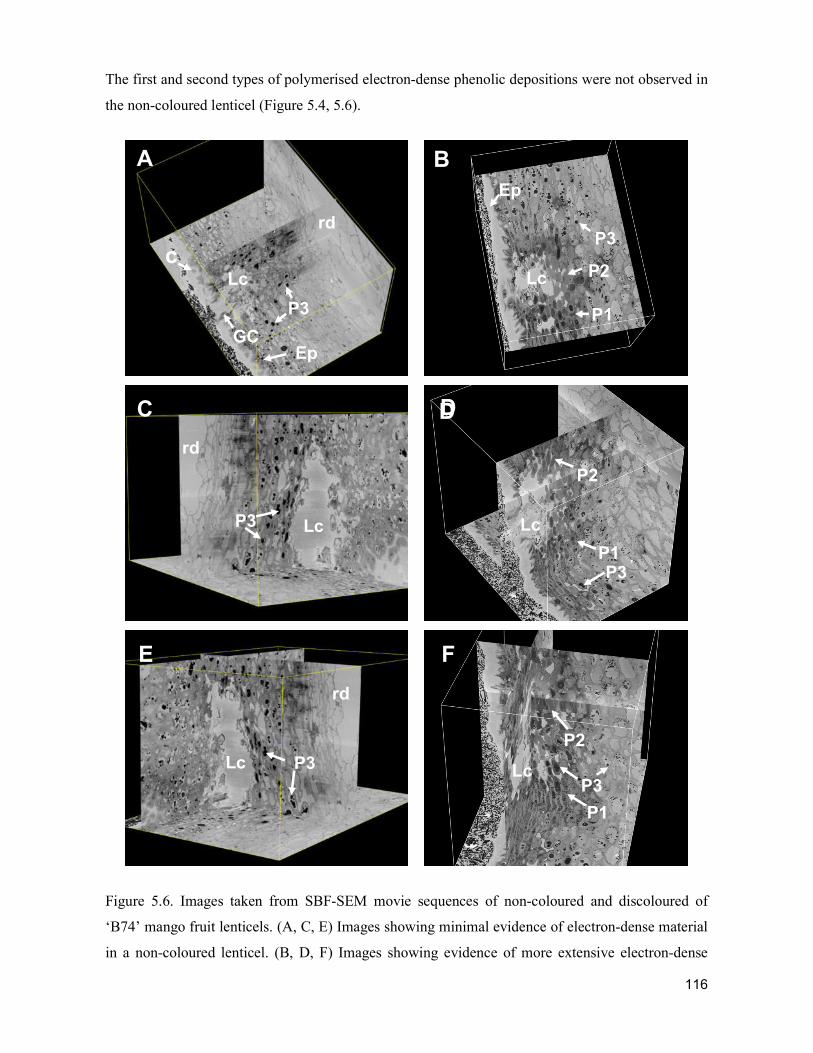
116
The first and second types of polymerised electron-dense phenolic depositions were not observed in
the non-coloured lenticel (Figure 5.4, 5.6).
Figure 5.6. Images taken from SBF-SEM movie sequences of non-coloured and discoloured of
‘B74’ mango fruit lenticels. (A, C, E) Images showing minimal evidence of electron-dense material
in a non-coloured lenticel. (B, D, F) Images showing evidence of more extensive electron-dense
B A
D
Lc c
GC
rd
Ep
Lc are
Ep
P1
P3
P2
P3
C
E F
Lc are
Lc area
Lc are
rd
rd
Lc are
P3
P1
P2
P1
P2
P3
P3
P3
D
117
material in a discoloured lenticel. c, cuticle; Ep, epidermal cells; GC, stomatal guard cells; Lc,
lenticel cavity; P1 - P3, three types of phenolics; rd, resin duct.
5.4 Discussion
LD is a physicochemical process characterised by darkened tissues around the cavities of lenticels.
LD can also be evident as a brown to black-coloured blemish surrounding lenticels (Du Plooy et al.,
2006). LD can reduce fruit visual appeal and lead to loss of market confidence, including consumer
appeal (Self et al., 2006).
In the present study, no marked difference in the morphology of lenticels between the ‘B74’,
‘Honey Gold’, ‘Kensington Pride’ and ‘R2E2’ cultivars were discerned. Nevertheless, there was in
the anatomy of individual lenticels in all cultivars (Figure 5.3). LM imaging showed that the shape
of lenticels was typically irregularly oval-shaped (Figure 5.3). LD was evident as browning of sub-
lenticellular cells surrounding the lenticel cavity (Figure 5.2). Based on the evidence of phenolics
heavily stained by TBO (i.e. green colour/s vs. purple colour/s), this browning was associated with
polymerised phenolic deposition in sub-lenticellular cells surrounding the lenticel cavity (Figure
5.3). Bezuidenhout et al. (2005) observed that such discolouration in the lenticel of ‘Tommy
Atkins’ mango fruit was due to pigment accumulation in the vacuoles of sub-lenticellular cells. Du
Plooy et al. (2009) considered that the blackening development of lenticels was due to vacuolar
deposition of phenolics. In the current research, the location of the phenolics within the cells could
not be clearly observed under LM. Further examination by SBF-SEM was carried out to observe the
intracellular partitioning of phenolics.
Resin ducts were visible close to both discoloured and non-coloured lenticels (Figure 5.4). This
suggests that proximity of canals close to lenticels is not likely to be a factor in the development of
LD in ‘B74’, ‘Honey Gold’, ‘Kensington Pride’ and ‘R2E2’cultivars. This is in contrast to the
previous suggestion by Bezuidenhout et al. (2005) that for ‘Tommy Atkins’ and ‘Keitt’ cultivars a
relationship between resin ducts and LD may exist. Tamjinda et al. (1992) reported that ‘Falan’
mango cultivar did not develop LD due to the presence of a cork cambium. Bezuidenhout et al.
(2005) indicated some mango cultivars were more susceptible to LD, a possible result of the
absence of a cork cambium and cork cells in lenticels. The cambium was not observed in ‘B74’,
‘Honey Gold’, ‘Kensington Pride’ and ‘R2E2’ mango samples, which means that these cultivars are
more likely to get LD.
118
SBF-SEM made it possible to derive 3D anatomy at the ultrastructure level of mango fruit skin
lenticels. This structure was the same for both coloured and non-discoloured lenticels, with a similar
change observed in the discoloured lenticel (in Movie 5.1 and 5.2). Single 50 nm sections observed
in the TEM only showed a part of lenticel structure. SBF-SEM image stacks provided additional
information to differentiate between the architecture of non-coloured (in Movie 5.3) and
discoloured lenticels (in Movie 5.4) at the cellular level.
In general, both non-coloured and discoloured lenticels of ‘B74’ mango fruit did not vary
significantly in their structure (Figure 5.6). The lenticels had an irregular oval-like shape. On the
outer surface of the lenticel, a waxy cuticle covered the epidermis, penetrating into the exposed
cavity without the waxy cuticle of inner lenticel. Discolouration of the lenticel was apparent
beneath the cuticle in the sub-lenticellular cells of the pericarp (Figure 5.3 - 5.7). Electron-dense
phenolic materials were found in the cell wall and cytoplasm of sub-lenticellular cells surrounding
the cavity (Figure 5.7). These electron-dense phenolic materials were more prevalent in the
discoloured lenticel than in non-coloured lenticel.
SBF-SEM provided detailed ultra-structure of LD. Three different types of phenolic deposition
could be identified in the tissues of a discoloured lenticel (Figure 5.5, 5.7). The first type was
deposition in the cell wall of sub-lenticellular cells surrounding the cavity. The second type was
distinguished by phenolics completely filling the cytoplasm of sub-lenticellular cells next to the
cavity. Thirdly, dark granules of various sizes were distributed randomly in the vacuoles of sub-
lenticellular cells in the region adjacent to the lenticel cavity. However, only the third type of
phenolic deposition was observed in the non-coloured lenticel (Figure 5.4). Bezuidenhout et al.
(2005) reported LD only associated with phenolic deposition in the vacuolar contents of sub-
lenticellular cells surrounding the lenticel cavity.
SBF-SEM has been used to study 3D structure of the thylakoids of Arabidopsis thaliana Nicotiana
tabacum and Spinacia oleracea (Austin and Staehelin, 2011) and the meristematic cell of
Arabidopsis root (Kittelmann et al., 2016). In the present study, this technique is applied for the first
time to study mango LD. It was beneficial to reveal aspects of the 3D nature of the lenticels. In this
context, the method was superior to LM and traditional SEM. Using TEM, Du Plooy et al. (2006)
associated LD with electron-dense deposition spreading from the cell wall (i.e. apoplast) towards
the cytoplasm (i.e. symplast) of the cells.
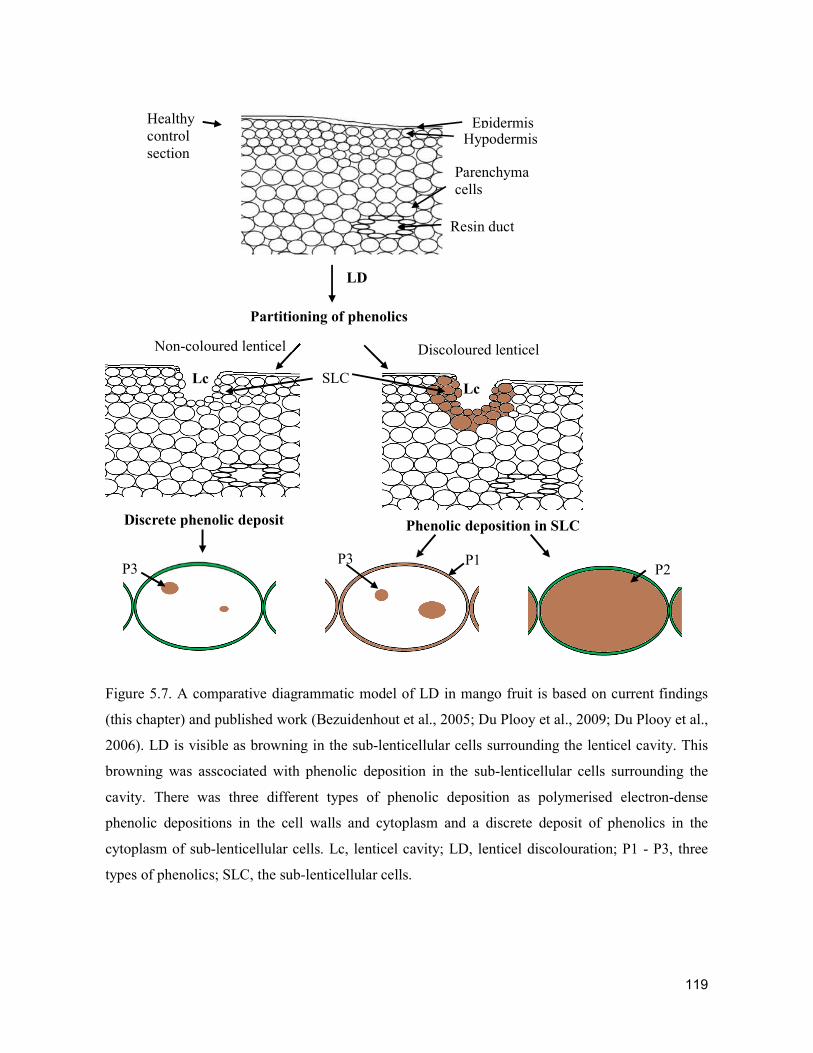
119
Figure 5.7. A comparative diagrammatic model of LD in mango fruit is based on current findings
(this chapter) and published work (Bezuidenhout et al., 2005; Du Plooy et al., 2009; Du Plooy et al.,
2006). LD is visible as browning in the sub-lenticellular cells surrounding the lenticel cavity. This
browning was asscociated with phenolic deposition in the sub-lenticellular cells surrounding the
cavity. There was three different types of phenolic deposition as polymerised electron-dense
phenolic depositions in the cell walls and cytoplasm and a discrete deposit of phenolics in the
cytoplasm of sub-lenticellular cells. Lc, lenticel cavity; LD, lenticel discolouration; P1 - P3, three
types of phenolics; SLC, the sub-lenticellular cells.
Healthy control section
Epidermis Hypodermis
Resin duct
Parenchyma cells
LD
Non-coloured lenticel Discoloured lenticel
P3 P3 P1
P2
Partitioning of phenolics
Phenolic deposition in SLC Discrete phenolic deposit olic deposition
SLC Lc Lc
120
5.5 Conclusion
This study characterised the ultrastructural differences of LD in mango fruit. Correlative imaging of
LD with LM, and SBF-SEM were employed to study the structure of lenticels at different scales.
SBF-SEM in particular revealed something of the 3D structure of both discoloured and non-
discoloured lenticels. This approach showed relatively detailed ultrastructural changes in the
partitioning of phenolics as associated with LD. Namely, polymerised electron-dense phenolic
depositions in the cell wall and cytoplasm of sub-lenticellular cells surrounding the cavity were
revealed for the first time. This work has progressed knowledge regarding the functional
microstructure of LD. In due course, it will contribute to greater understanding of the mechanism of
LD.
References
Austin, J.R., Staehelin, L.A., 2011. Three-dimensional architecture of grana and stroma thylakoids
of higher plants as determined by electron tomography. Plant Physiology 155, 1601-1611.
Bally, I.S.E., 1999. Changes in the cuticular surface during the development of mango (Mangifera
indica L.) cv. Kensington Pride. Scientia Horticulturae 79, 13-22.
Bezuidenhout, J.L.J., Robbertse, P.J., Kaiser, C., 2005. Anatomical investigation of lenticel
development and subsequent discolouration of 'Tommy Atkins' and 'Keitt' mango (Mangifera indica
L.) fruit. Journal of Horticultural Science & Biotechnology 80, 18-22.
Du Plooy, G.W., Combrinck, S., Regnier, T., Botha, B.M., 2009. Linking lenticel discolouration of
mango (Mangifera indica L.) fruit to reversed-phase HPLC profiles of phenolic compounds. Journal
of Horticultural Science & Biotechnology 84, 421-426.
Du Plooy, G.W., Van Der Merwe, C.F., Korsten, L., 2006. Lenticel discolouration in mango
(Mangifera indica L.) fruit - a cytological study of mesophyll cells from affected tissue. Journal of
Horticultural Science & Biotechnology 81, 869-873.
Feng, T., Paterson, B.D., Webb, R., Johnston, S.D., 2016. Three-dimensional reconstruction of
black tiger prawn (Penaeus monodon) spermatozoa using serial block-face scanning electron
microscopy. Journal of Morphology 277, 565-574.
121
Fowke, L.C., Attree, S.M., Rennie, P.J., 1994. Scanning electron microscopy of hydrated and
desiccated mature somatic embryos and zygotic embryos of white spruce (Picea glauca [Moench]
Voss.). Plant Cell Reports 13, 612-618.
Hofman, P.J., Marques, J.R., Taylor, A.H., Stubbings, B.A., Ledger, S.N., Jordan, R.A., 2010.
Development of best practice pre- and postharvest of 'B74‘ mango fruit: Phase II. Final report
MG06005, Horticulture Australia Ltd., Sydney, Australia.
Kittelmann, M., Hawes, C., Hughes, L., 2016. Serial block face scanning electron microscopy and
the reconstruction of plant cell membrane systems. Journal of Microscopy 263, 200-211.
Mueller, W., Greenwood, A., 1978. The ultrastructure of phenolic-storing cells fixed with caffeine.
Journal of Experimental Botany 29, 757-764.
Ramsey, J.C., Berlin, J.D., 1976. Ultrastructure of early stages of cotton fiber differentiation.
Botanical Gazette 137, 11-19.
Ruzin, S.E., 1999. Chapter 10 Microtechnique notes and problem solving, Plant microtechnique
and microscopy. Oxford University Press, New York, pp. 137-143.
Rymbai, H., Srivastav, M., Sharma, R.R., Singh, S.K., 2012. Lenticels on mango fruit: origin,
development, discoloration and prevention of their discoloration. Scientia Horticulturae 135, 164-
170.
Self, G., de Assis, J.S., Caron, V.C., 2006. Effects of postharvest handling on lenticel spotting of
´Tommy Atkins´ mangoes from Northeast Brazil. Acta Horticulturae 712, 543-550.
Tamjinda, B., Sirphanich, J., Nobuchi, T., 1992. Anatomy of lenticels and the occurrence of their
discoloration in mangoes (Mangifera indica cv. Namdokmai). Kasetsart Journal, Natural Sciences
26, 57-64.
122
CHAPTER 6. DIURNAL HARVEST CYCLE AND SAP COMPONENTS
AFFECT THE DEVELOPMENT OF UNDER-SKIN BROWNING IN ‘HONEY
GOLD’ MANGO FRUIT
Abstract
Under-skin browning (USB) is a physiological disorder that affects harvested ‘Honey Gold’ mango
fruit. USB is thought to be associated with the sap release from resin canals (laticifers) within the
exocarp. USB symptoms can develop in response to physical stress (e.g. abrasion) and low
temperature exposure (e.g. < 10 - 12 °C) during postharvest handling. A postulated effect of harvest
time over the diurnal cycle regarding the propensity of fruit to develop USB was evaluated. This
was tested by lightly abrading fruit from over the diurnal cycle to simulate vibration damage in
transport. The fruit were then held at 10 - 12 °C for 6 d in line with commercial handling. In
complementary work, sap extracts were applied to skin abrasion points on additional fruit. Naturally
expressing USB was compared with induced USB symptoms at the cellular level. Fruit harvested at
1000 h, 1400 h and 1800 h showed 3 to 5-fold higher USB incidence levels than did those picked at
2200 h, 0200 h and 0600 h. The concentrations of key aroma volatile compounds (2-carene, 3-
carene, α-terpinene, p-cymene, limonene, α-terpinolene) in the fruit sap were significantly higher
(P≤0.05) at 1400 h as compared to other harvest times. Treatment with spurt sap collected from fruit
picked at 1400 h caused up to 15-fold higher browning incidence and 29-fold higher browning
severity as compared to treatment with spurt sap from fruit picked at 0600 h. Fruit harvested in the
afternoon were more prone to developing USB than those picked at night and early morning. The
diurnal variation in sensitivity was attributed to changes in the concentration of fruit sap volatiles.
Night and early morning harvesting evidently afforded an opportunity to reduce the incidence and
severity of USB on ‘Honey Gold’ mangoes. To this end, ‘Honey Gold’ growers have changed their
harvest practices and enhanced the quality of fruit on offer to consumers.
6.1 Introduction
The ‘Honey Gold’ mango (Mangifera indica L.) is a relatively new Australian cultivar. It has juicy,
fibre-free flesh and a pleasant flavour (Marques et al., 2012). However, an unsightly physiological
skin disorder termed ‘Under-Skin Browning’ (USB) can cause economic loss in the marketplace
due to poor fruit appearance (Hofman et al., 2010b). USB is visible beneath the epidermis as diffuse
discoloured areas. There is, however, no damage to the flesh (Marques et al., 2012). Sometimes the
skin and cuticle can also take on an opaque appearance. ‘Honey Gold’ mango is most susceptible
123
among the common Australian mango cultivars to USB. The physicochemical mechanisms of USB
and its control are largely unknown. They evidently reflect discolouration of latex vessels and
surrounding cells (Marques et al., 2012). Delayed or slow cooling of fruit before or after packing
can reduce the incidence of USB. This is especially so if combined with soft packaging options,
such as use of foam liners that may reduce vibration damage during transport (Marques et al., 2016;
Marques et al., 2012).
Mango fruit and stems, including pedicle and peduncle, are characterised by an internal longitudinal
multilayered network of branching resin ducts (Joel, 1980). The extensive laticifer system consists
of sap that stores and can emit resinous secretions (Joel and Fahn, 1980). Turgor pressure in the
ducts is maintained because the sap contains large amounts of non-dialysable and non-starchy
carbohydrate (John et al., 2003). These osmolytic compounds allow high water status to be
maintained in the laticifers, even under tree water deficit stress conditions (Pongsomboon et al.,
1991). Thus, sap or latex in the ducts is generally under high turgor pressure while the fruit is
connected to the peduncle. When the peduncle is broken, the resin ducts are severed and sap spurts
and / or oozes out.
Visually, mango sap is a viscous clear or slightly milky liquid. It typically separates into two
phases, an oily yellow-brown non-aqueous phase and a milky viscous aqueous phase (Loveys et al.,
1992). The non-aqueous phase contains mono-terpenes (John et al., 1999) and alk(en)ylresorcinols
(Hassan et al., 2009). The aqueous phase has high polyphenol oxidase (PPO) and peroxidase (POD)
activities (John et al., 2003).
Contact of the fruit surface with the sap exudate can lead to skin injury termed ‘sapburn’ (Loveys et
al., 1992). De-sapping of mangoes in lime and Mango Wash®, a commercial detergent combining
alkaline salts, phosphates and a biodegradable surfactant, is an important approach to reduce the
incidence of sapburn (Amin et al., 2008). John et al. (2002) reported that treatment of ‘Badami’,
‘Malgoa’, ‘Mallika’ and ‘Totapuri’ mango fruit with either whole sap or the non-aqueous phase
caused sapburn. No skin injury was associated with treatment of fruit with the aqueous phase. The
sapburn is likely due to terpenoids in sap and PPO and POD in the peel (John et al., 2002). The sap
terpenoid composition varies considerably among different mango cultivars (John et al., 1999;
Loveys et al., 1992). Thus, it seems likely that a range of terpenoids may be responsible for sapburn
in different mango cultivars. For example, limonene, ocimene, -myrcene and -pinene caused
sapburn in Indian mango cultivars (John et al., 2002). Terpinolene was strongly associated with
sapburn in ‘Kensington Pride’ fruit (Loveys et al., 1992).
124
Differences in sapburn on fruit harvested at different times of the day have been noted. They were
suggested to be due to varying sensitivity of the mango fruit skin (Maqbool et al., 2007). The
severity of sapburn injury was reported to be considerably less for ‘Samar Bahisht Chaunsa’ fruit
harvested in the morning (e.g. 7 AM) as compared to those harvested other times of the day. It was
highest among fruit collected at noon (12 PM) (Amin et al., 2008).
In the present research, we investigated the effects of diurnal fruit harvest time and sap components
on the propensity of ‘Honey Gold’ mango fruit to develop USB. We hypothesised that ‘Honey
Gold’ mango fruit harvested in the morning and night would be more resistant to USB than those
harvested in the afternoon. Moreover, we considered that this response may be related to varying
characteristics of the sap at different harvest times. To test that, we harvested fruit at several times,
determined USB susceptibility, and quantified the concentration of aroma volatiles in the sap from
the diurnal harvest cycle by GC-MS. We also examined the anatomy of USB and induced USB
symptoms. In general, it was proposed that better understanding of the mechanisms involved in the
putative diurnal effect, including any differences in sap composition, may provide deeper insight
into measures to minimise USB incidence in commercial consignments.
6.2 Materials and methods
6.2.1 Experiment 1: Effect of diurnal harvest cycle on USB development
‘Honey Gold’ mango fruit of uniform size were harvested at commercial maturity (dry matter
content of 16.8 ± 1.0%) from a commercial orchard near Katherine, Northern Territory, Australia
(14.28 °S, 132.16 °E). Trees were grown under standard commercial practices (Johnson and
Hofman, 2009; Kernot et al., 1999). Field temperature and relative humidity during the harvest
periods were recorded using a Tinytag Ultra 2 logger (Hasting Data Loggers, Australia).
The fruit (n = 80) were harvested every 4 - 6 h in the 2013/2014 season (viz., 1000, 1400, 1800,
2400, 0600 and 1400 h) and every 4 h in the 2014/2015 season (viz. 0600, 1000, 1400, 1800, 2200
and 0200 h) fruiting seasons. Fruit with 2-5 cm-long pedicels attached were carefully transported to
a nearby packing shed. On a de-sapping rack (Figure 6.1A), the pedicel was broken off at the
abscission zone and fruit inverted to allow sap to drain over 4 - 5 min. Where required, spurt sap
(0600 and 1400 h) was collected from extra fruit (60 fruit) in the first 10 - 15 s after stem removal
for experiment 2. Ooze sap was collected from then on. The sap was collected into glass vials. The
sap from 20 fruit was collected for each of four replications comprising a total of 80 fruit per
harvest time. The vial opening was then covered with a piece of aluminium foil and closed with an
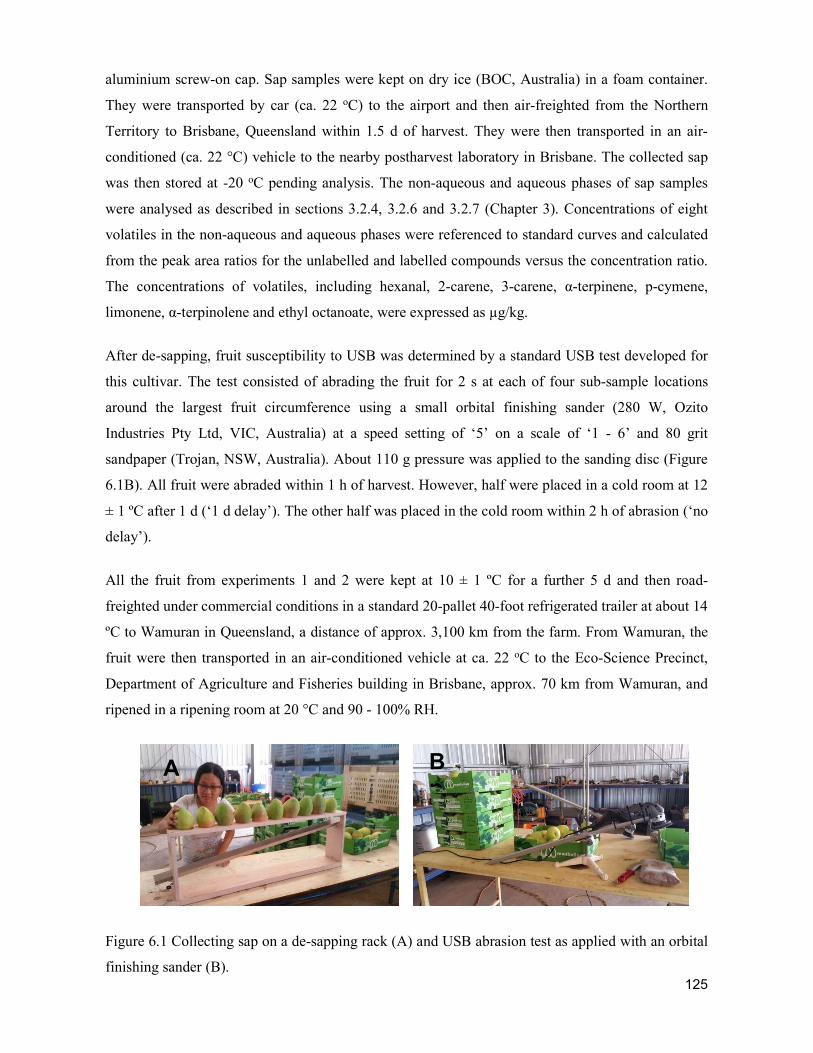
125
aluminium screw-on cap. Sap samples were kept on dry ice (BOC, Australia) in a foam container.
They were transported by car (ca. 22 oC) to the airport and then air-freighted from the Northern
Territory to Brisbane, Queensland within 1.5 d of harvest. They were then transported in an air-
conditioned (ca. 22 °C) vehicle to the nearby postharvest laboratory in Brisbane. The collected sap
was then stored at -20 oC pending analysis. The non-aqueous and aqueous phases of sap samples
were analysed as described in sections 3.2.4, 3.2.6 and 3.2.7 (Chapter 3). Concentrations of eight
volatiles in the non-aqueous and aqueous phases were referenced to standard curves and calculated
from the peak area ratios for the unlabelled and labelled compounds versus the concentration ratio.
The concentrations of volatiles, including hexanal, 2-carene, 3-carene, α-terpinene, p-cymene,
limonene, α-terpinolene and ethyl octanoate, were expressed as µg/kg.
After de-sapping, fruit susceptibility to USB was determined by a standard USB test developed for
this cultivar. The test consisted of abrading the fruit for 2 s at each of four sub-sample locations
around the largest fruit circumference using a small orbital finishing sander (280 W, Ozito
Industries Pty Ltd, VIC, Australia) at a speed setting of ‘5’ on a scale of ‘1 - 6’ and 80 grit
sandpaper (Trojan, NSW, Australia). About 110 g pressure was applied to the sanding disc (Figure
6.1B). All fruit were abraded within 1 h of harvest. However, half were placed in a cold room at 12
± 1 ºC after 1 d (‘1 d delay’). The other half was placed in the cold room within 2 h of abrasion (‘no
delay’).
All the fruit from experiments 1 and 2 were kept at 10 ± 1 ºC for a further 5 d and then road-
freighted under commercial conditions in a standard 20-pallet 40-foot refrigerated trailer at about 14
ºC to Wamuran in Queensland, a distance of approx. 3,100 km from the farm. From Wamuran, the
fruit were then transported in an air-conditioned vehicle at ca. 22 oC to the Eco-Science Precinct,
Department of Agriculture and Fisheries building in Brisbane, approx. 70 km from Wamuran, and
ripened in a ripening room at 20 °C and 90 - 100% RH.
Figure 6.1 Collecting sap on a de-sapping rack (A) and USB abrasion test as applied with an orbital
finishing sander (B).
Bp
A
126
6.2.2 Experiment 2: Effect of sap components on USB development
To test the hypothesis that USB diurnal responses were at least partly due to sap characteristics,
either whole sap or its component spurt or ooze sap were collected from additional ‘Honey Gold’
fruit harvested in the morning (0600 h, n = 40) and afternoon (1400 h, n = 40) in the 2014/2015
season, as described above. An aliquot of 0.1 ml of either spurt or ooze sap, of whole sap or of
distilled water was placed onto the abraded surface of morning- (0600 h) and afternoon-harvested
(1400 h) fruit as mentioned in section 6.2.1 in experiment 1. To affirm effects of main oil fraction
ingredients in mango fruit sap, 0.1 ml of pure terpinolene (Sigma-Aldrich), limonene (Aldrich), 2-
carene (Aldrich) and distilled water were placed onto 1 cm2 rectangular filter papers. The filter
papers were then covered with pieces of aluminium foil (~ 35 - 40 cm2) with plastic tape to reduce
vaporisation. The fruit were then held at 12 ± 1 ºC for 6 d, road-freighted to Brisbane under
commercial conditions as described above and ripened in a ripening room at 20 °C and and 90 -
100% RH before being assessed for damage areas around abrasion sites, as described below.
6.2.3 Assessment of USB, induced USB symptoms, and sapburn severity and incidence
The severity of USB, induced USB and sap burn around the abrasion site on each fruit was rated
according to the following scale (Hofman et al., 2010a): 0 = nil; 1 = < 3% (1 cm2) of skin surface
affected; 2 = ~ 3% (1 – 3 cm2); 3 = ~ 10% (3 – 12 cm2); 4 = 10% – 25% (12 - 25 cm²); and 5 = >
25% of skin surface affected. Placing sap onto abraded fruit often resulted in slight brown-coloured
damage to the surrounding skin. This symptom is referred to as sapburn. Injection of terpinolene
and limonene as described in section 6.2.2 caused significant brown-coloured damage to the
surrounding skin, similar to natural USB symptoms. This symptom is referred to as induced USB
symptoms.
The incidence of USB within each replication was calculated as the proportion (%) of fruit or
abrasion sites that developed USB relative to the total number of fruit or abrasion sites. The severity
of USB lesions not associated with abrasion treatment (i.e., those which developed on other areas of
the fruit) were also recorded. The severity of USB and induced USB symptoms induced by
terpinolene and limonene and also of sapburn were calculated as the average severity rating of those
fruit as affected by USB, induced USB or sapburn symptoms in each treatment, excluding the non-
affected fruit.
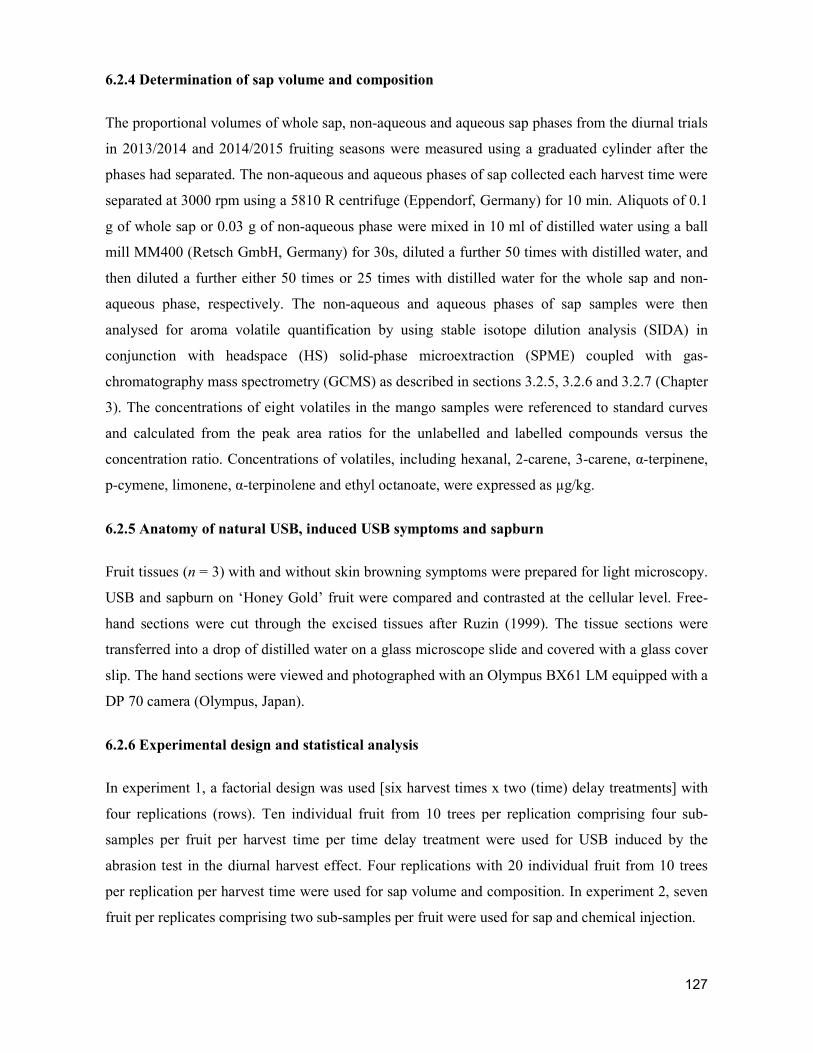
127
6.2.4 Determination of sap volume and composition
The proportional volumes of whole sap, non-aqueous and aqueous sap phases from the diurnal trials
in 2013/2014 and 2014/2015 fruiting seasons were measured using a graduated cylinder after the
phases had separated. The non-aqueous and aqueous phases of sap collected each harvest time were
separated at 3000 rpm using a 5810 R centrifuge (Eppendorf, Germany) for 10 min. Aliquots of 0.1
g of whole sap or 0.03 g of non-aqueous phase were mixed in 10 ml of distilled water using a ball
mill MM400 (Retsch GmbH, Germany) for 30s, diluted a further 50 times with distilled water, and
then diluted a further either 50 times or 25 times with distilled water for the whole sap and non-
aqueous phase, respectively. The non-aqueous and aqueous phases of sap samples were then
analysed for aroma volatile quantification by using stable isotope dilution analysis (SIDA) in
conjunction with headspace (HS) solid-phase microextraction (SPME) coupled with gas-
chromatography mass spectrometry (GCMS) as described in sections 3.2.5, 3.2.6 and 3.2.7 (Chapter
3). The concentrations of eight volatiles in the mango samples were referenced to standard curves
and calculated from the peak area ratios for the unlabelled and labelled compounds versus the
concentration ratio. Concentrations of volatiles, including hexanal, 2-carene, 3-carene, α-terpinene,
p-cymene, limonene, α-terpinolene and ethyl octanoate, were expressed as µg/kg.
6.2.5 Anatomy of natural USB, induced USB symptoms and sapburn
Fruit tissues (n = 3) with and without skin browning symptoms were prepared for light microscopy.
USB and sapburn on ‘Honey Gold’ fruit were compared and contrasted at the cellular level. Free-
hand sections were cut through the excised tissues after Ruzin (1999). The tissue sections were
transferred into a drop of distilled water on a glass microscope slide and covered with a glass cover
slip. The hand sections were viewed and photographed with an Olympus BX61 LM equipped with a
DP 70 camera (Olympus, Japan).
6.2.6 Experimental design and statistical analysis
In experiment 1, a factorial design was used [six harvest times x two (time) delay treatments] with
four replications (rows). Ten individual fruit from 10 trees per replication comprising four sub-
samples per fruit per harvest time per time delay treatment were used for USB induced by the
abrasion test in the diurnal harvest effect. Four replications with 20 individual fruit from 10 trees
per replication per harvest time were used for sap volume and composition. In experiment 2, seven
fruit per replicates comprising two sub-samples per fruit were used for sap and chemical injection.
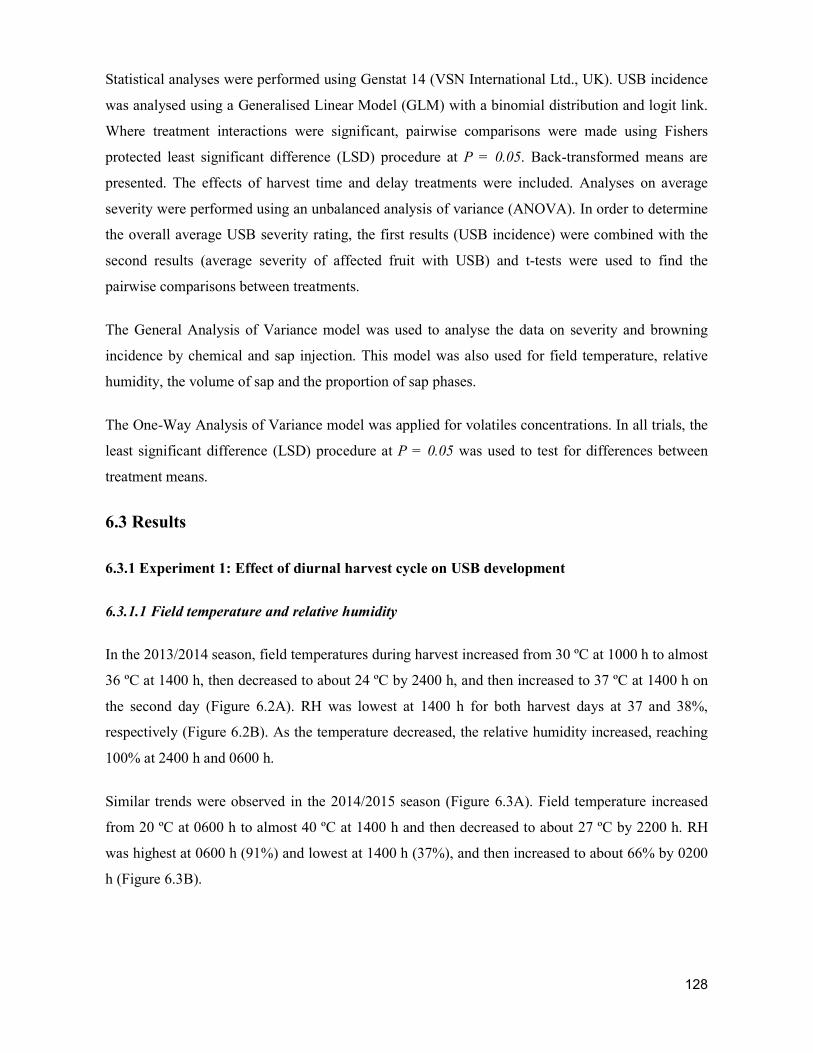
128
Statistical analyses were performed using Genstat 14 (VSN International Ltd., UK). USB incidence
was analysed using a Generalised Linear Model (GLM) with a binomial distribution and logit link.
Where treatment interactions were significant, pairwise comparisons were made using Fishers
protected least significant difference (LSD) procedure at P = 0.05. Back-transformed means are
presented. The effects of harvest time and delay treatments were included. Analyses on average
severity were performed using an unbalanced analysis of variance (ANOVA). In order to determine
the overall average USB severity rating, the first results (USB incidence) were combined with the
second results (average severity of affected fruit with USB) and t-tests were used to find the
pairwise comparisons between treatments.
The General Analysis of Variance model was used to analyse the data on severity and browning
incidence by chemical and sap injection. This model was also used for field temperature, relative
humidity, the volume of sap and the proportion of sap phases.
The One-Way Analysis of Variance model was applied for volatiles concentrations. In all trials, the
least significant difference (LSD) procedure at P = 0.05 was used to test for differences between
treatment means.
6.3 Results
6.3.1 Experiment 1: Effect of diurnal harvest cycle on USB development
6.3.1.1 Field temperature and relative humidity
In the 2013/2014 season, field temperatures during harvest increased from 30 ºC at 1000 h to almost
36 ºC at 1400 h, then decreased to about 24 ºC by 2400 h, and then increased to 37 ºC at 1400 h on
the second day (Figure 6.2A). RH was lowest at 1400 h for both harvest days at 37 and 38%,
respectively (Figure 6.2B). As the temperature decreased, the relative humidity increased, reaching
100% at 2400 h and 0600 h.
Similar trends were observed in the 2014/2015 season (Figure 6.3A). Field temperature increased
from 20 ºC at 0600 h to almost 40 ºC at 1400 h and then decreased to about 27 ºC by 2200 h. RH
was highest at 0600 h (91%) and lowest at 1400 h (37%), and then increased to about 66% by 0200
h (Figure 6.3B).
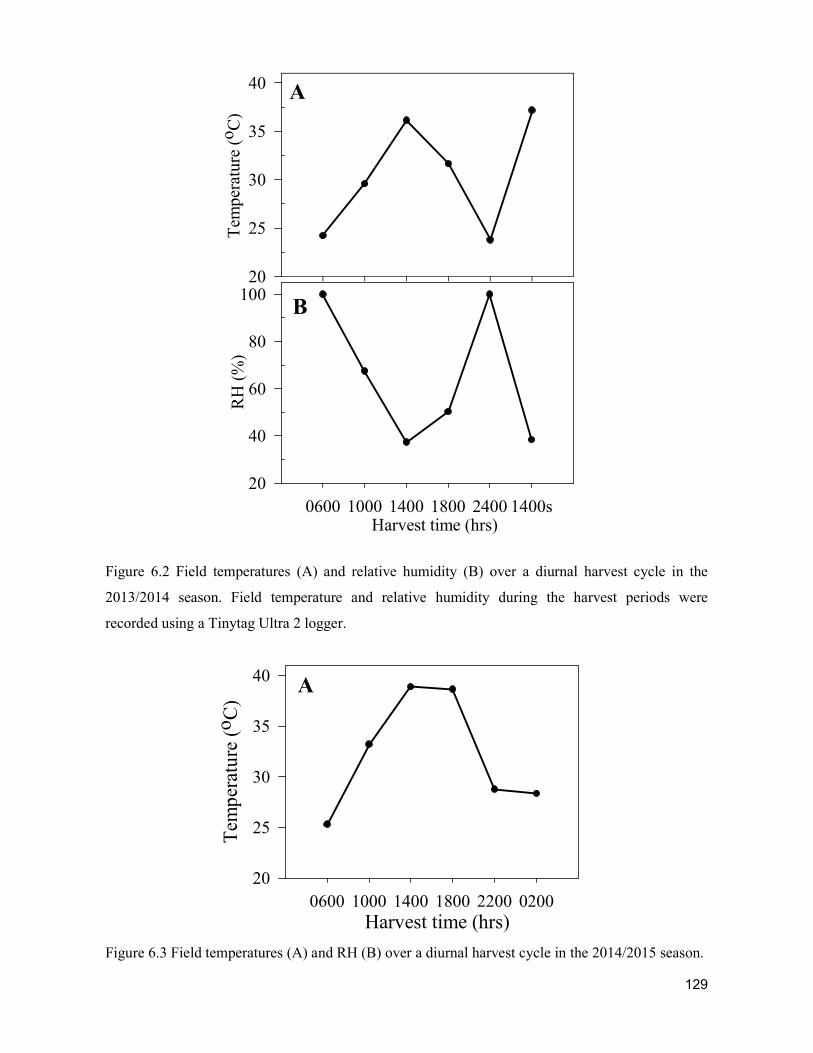
129
Figure 6.2 Field temperatures (A) and relative humidity (B) over a diurnal harvest cycle in the
2013/2014 season. Field temperature and relative humidity during the harvest periods were
recorded using a Tinytag Ultra 2 logger.
Figure 6.3 Field temperatures (A) and RH (B) over a diurnal harvest cycle in the 2014/2015 season.
Tem
pera
ture
(o
C)
20
25
30
35
40
Harvest time (hrs)0600 1000 1400 1800 2400 1400s
RH
(%
)
20
40
60
80
100
A
B
0600 1000 1400 1800 2200 0200
Tem
per
atu
re (
oC
)
20
25
30
35
40 A
Harvest time (hrs)
130
Field temperature and relative humidity during the harvest periods were recorded using a Tinytag
Ultra 2 logger.
Figure 6.3 (Continued).
6.3.1.2 Diurnal harvest effect
In the 2013/2014 season, USB incidence was highest on fruit harvested at 1400 h and 1800 h for
both harvest days (Figure 6.4A). Similarly, fruit harvested at 1400 h and 1800 h showed higher
USB severity than for all other harvest times (Figure 6.4B). However, there was no significant
interaction between harvest time and delay (P>0.05) on USB incidence and severity at abraded
sites.
The results in 2014/2015 were similar regarding USB incidence (Figure 6.5A). It was significantly
different (P≤0.05) between harvest times (Figure 6.5A, 6). USB incidence was lowest in fruit
harvested at 2200, 0200 and 0600 h and the highest in fruit harvested at 1400 h and 1800 h. There
was no significant (P>0.05) difference in USB incidence between fruit placed in the cold room
immediately after abrasion and those that were held for 1 d before cooling. Opposite patterns were
observed for the average severity of USB (Figure 6.5B). That is, there was significant interaction
between harvest time and delay (P≤0.05) on USB severity at abraded sites. There was little diurnal
effect on USB severity if fruit were placed in the cold room 24 h after abrasion.
USB lesions were also observed on areas of the skin that had not been abraded, presumably as a
result of physical damage during handling and transport. These USB lesions from non-abraded
regions would likely reflect natural USB occurring under commercial conditions. The results for
Harvest time (hrs)0600 1000 1400 1800 2200 0200
RH
(%
)
20
40
60
80
100B
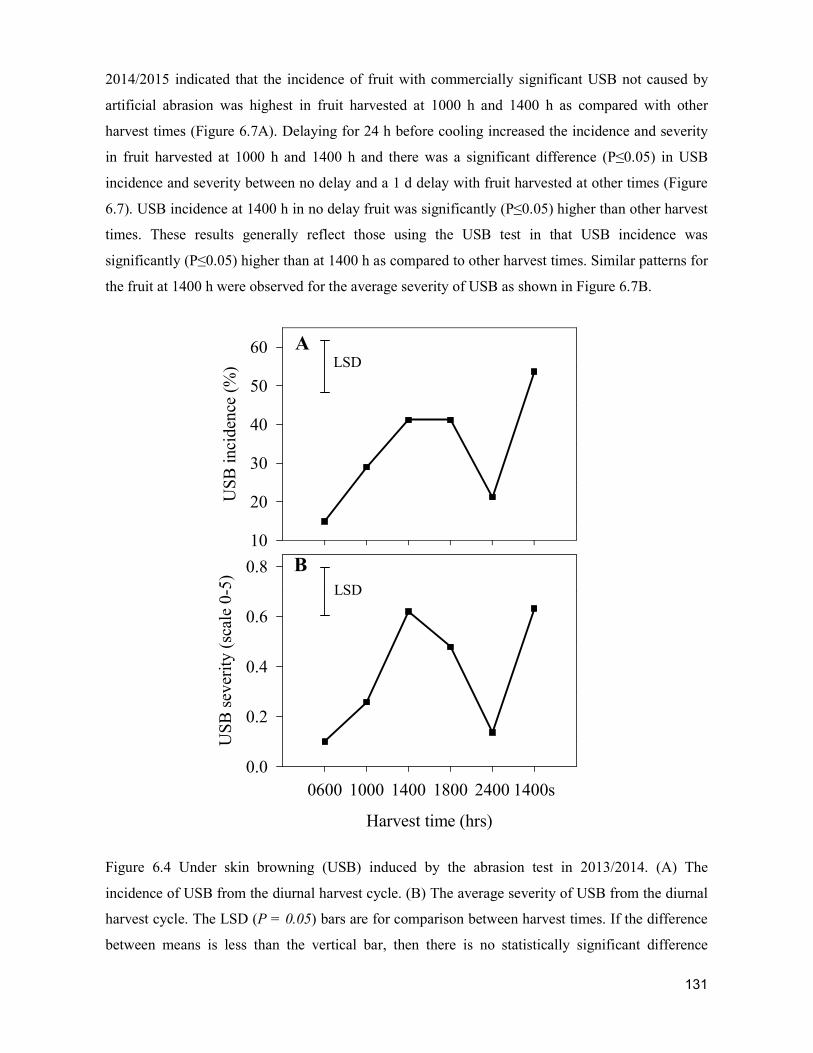
131
2014/2015 indicated that the incidence of fruit with commercially significant USB not caused by
artificial abrasion was highest in fruit harvested at 1000 h and 1400 h as compared with other
harvest times (Figure 6.7A). Delaying for 24 h before cooling increased the incidence and severity
in fruit harvested at 1000 h and 1400 h and there was a significant difference (P≤0.05) in USB
incidence and severity between no delay and a 1 d delay with fruit harvested at other times (Figure
6.7). USB incidence at 1400 h in no delay fruit was significantly (P≤0.05) higher than other harvest
times. These results generally reflect those using the USB test in that USB incidence was
significantly (P≤0.05) higher than at 1400 h as compared to other harvest times. Similar patterns for
the fruit at 1400 h were observed for the average severity of USB as shown in Figure 6.7B.
Figure 6.4 Under skin browning (USB) induced by the abrasion test in 2013/2014. (A) The
incidence of USB from the diurnal harvest cycle. (B) The average severity of USB from the diurnal
harvest cycle. The LSD (P = 0.05) bars are for comparison between harvest times. If the difference
between means is less than the vertical bar, then there is no statistically significant difference
US
B i
ncid
ence
(%
)
10
20
30
40
50
60
Harvest time (hrs)
0600 1000 1400 1800 2400 1400s
US
B s
ever
ity
(sca
le 0
-5)
0.0
0.2
0.4
0.6
0.8
LSD
LSD
A
B

132
between those means (P>0.05). n.s. indicates no significant difference (P>0.05). n = 4 replications
each comprised of 10 individual fruit on each of which four sub-samples were taken.
Figure 6.5 Under skin browning (USB) induced by the abrasion test in 2014/2015. (A) The
incidence of USB from the diurnal harvest cycle. (B) The average severity of USB from the diurnal
harvest cycle. The LSD (P = 0.05) bar on graph A is for comparison between harvest time and on
graph B for the interaction between harvest time and delay treatments. Fruit were placed in the cold
room after 1 d of abrasion (termed ‘1 d delay’) and fruit were placed in the cold room within 2 h of
abrasion (termed ‘no delay’). If the difference between means is less than the vertical bar, then there
is no statistically significant difference between those means (P>0.05). n = 4 replications each
comprised of 10 individual fruit on each of which four sub-samples were taken.
US
B i
ncid
ence
(%
)
10
20
30
40
50
60
70
Harvest time (hrs)
0600 1000 1400 1800 2200 0200
US
B s
ever
ity
(sca
le 0
-5)
0.0
0.5
1.0
1.5
LSD
LSD
A
B
Incidence
1 day delayNo delay
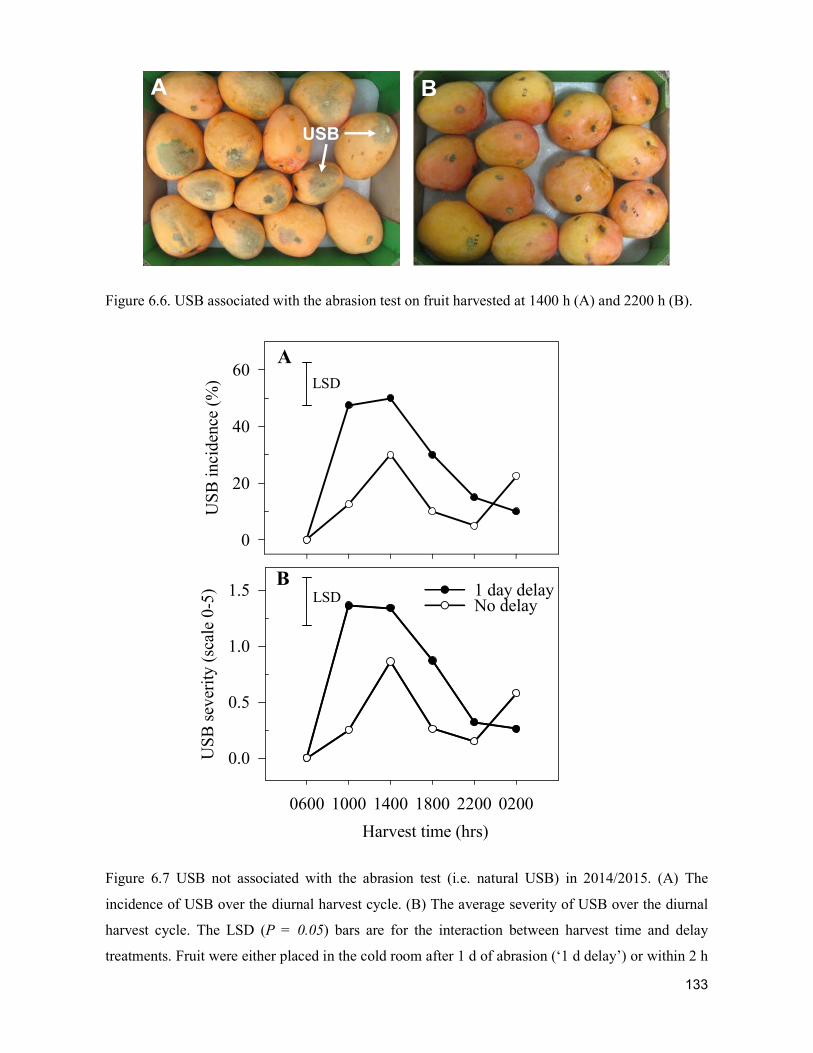
133
Figure 6.6. USB associated with the abrasion test on fruit harvested at 1400 h (A) and 2200 h (B).
Figure 6.7 USB not associated with the abrasion test (i.e. natural USB) in 2014/2015. (A) The
incidence of USB over the diurnal harvest cycle. (B) The average severity of USB over the diurnal
harvest cycle. The LSD (P = 0.05) bars are for the interaction between harvest time and delay
treatments. Fruit were either placed in the cold room after 1 d of abrasion (‘1 d delay’) or within 2 h
US
B i
nci
den
ce (
%)
0
20
40
60
Harvest time (hrs)
0600 1000 1400 1800 2200 0200
US
B s
ever
ity
(sca
le 0
-5)
0.0
0.5
1.0
1.5
LSD
LSD
A
B1 day delay No delay
A B
USB
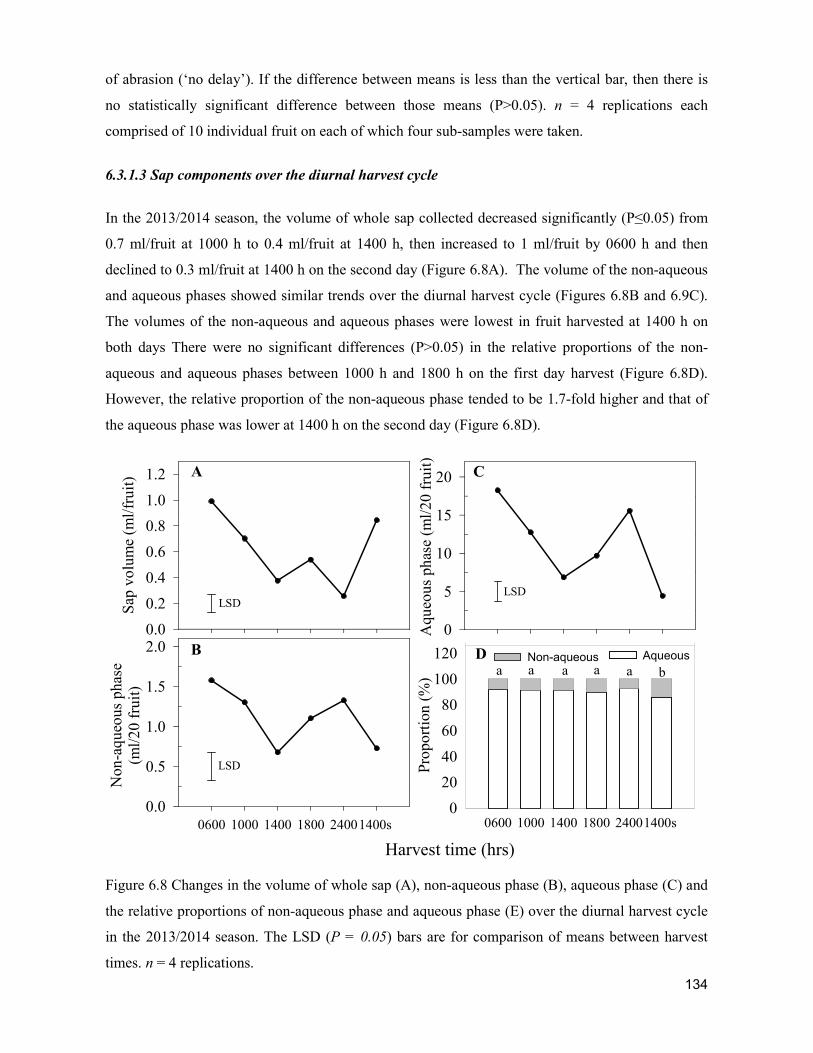
134
of abrasion (‘no delay’). If the difference between means is less than the vertical bar, then there is
no statistically significant difference between those means (P>0.05). n = 4 replications each
comprised of 10 individual fruit on each of which four sub-samples were taken.
6.3.1.3 Sap components over the diurnal harvest cycle
In the 2013/2014 season, the volume of whole sap collected decreased significantly (P≤0.05) from
0.7 ml/fruit at 1000 h to 0.4 ml/fruit at 1400 h, then increased to 1 ml/fruit by 0600 h and then
declined to 0.3 ml/fruit at 1400 h on the second day (Figure 6.8A). The volume of the non-aqueous
and aqueous phases showed similar trends over the diurnal harvest cycle (Figures 6.8B and 6.9C).
The volumes of the non-aqueous and aqueous phases were lowest in fruit harvested at 1400 h on
both days There were no significant differences (P>0.05) in the relative proportions of the non-
aqueous and aqueous phases between 1000 h and 1800 h on the first day harvest (Figure 6.8D).
However, the relative proportion of the non-aqueous phase tended to be 1.7-fold higher and that of
the aqueous phase was lower at 1400 h on the second day (Figure 6.8D).
Figure 6.8 Changes in the volume of whole sap (A), non-aqueous phase (B), aqueous phase (C) and
the relative proportions of non-aqueous phase and aqueous phase (E) over the diurnal harvest cycle
in the 2013/2014 season. The LSD (P = 0.05) bars are for comparison of means between harvest
times. n = 4 replications.
Sap
vo
lum
e (m
l/fr
uit
)
0.0
0.2
0.4
0.6
0.8
1.0
1.2
0600 1000 1400 1800 24001400s
Non
-aq
ueo
us
phas
e (m
l/2
0 f
ruit
)
0.0
0.5
1.0
1.5
2.0
Harvest time (hrs)
Aqu
eou
s ph
ase
(ml/
20
fru
it)
0
5
10
15
20
LSD
LSD
LSD
A
B
C
0600 1000 1400 1800 24001400s
Pro
po
rtio
n (
%)
0
20
40
60
80
100
120baaaaa
D AqueousNon-aqueous
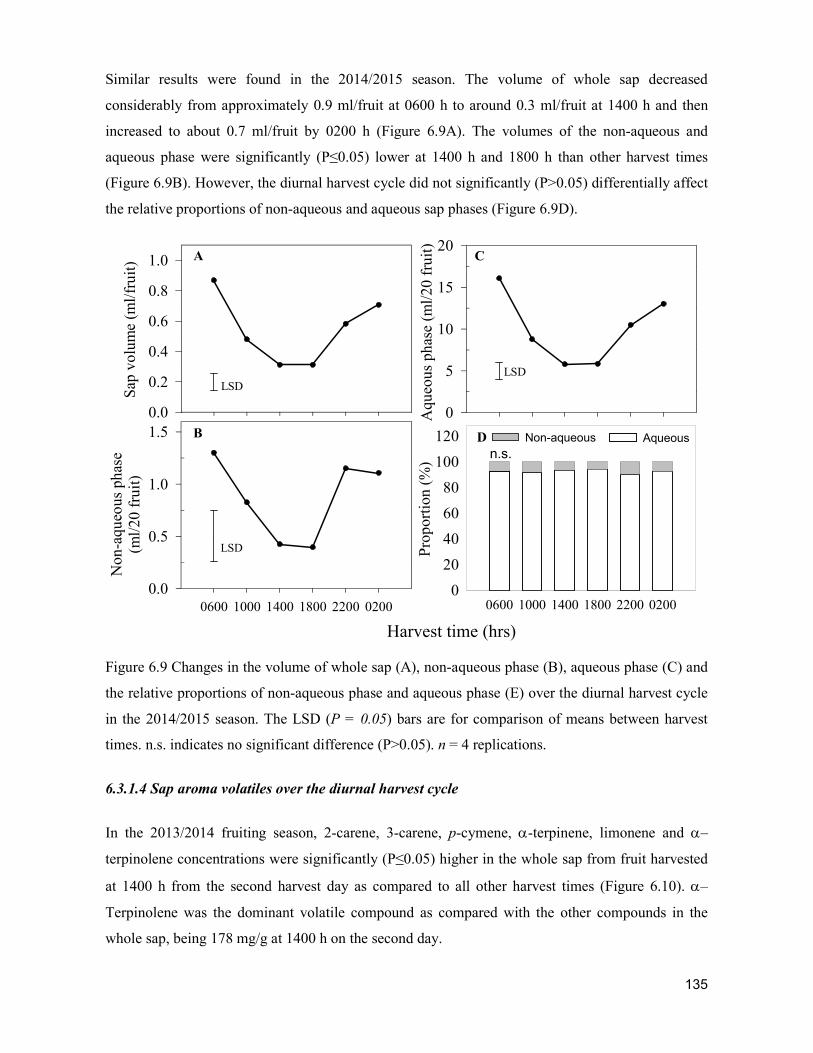
135
Similar results were found in the 2014/2015 season. The volume of whole sap decreased
considerably from approximately 0.9 ml/fruit at 0600 h to around 0.3 ml/fruit at 1400 h and then
increased to about 0.7 ml/fruit by 0200 h (Figure 6.9A). The volumes of the non-aqueous and
aqueous phase were significantly (P≤0.05) lower at 1400 h and 1800 h than other harvest times
(Figure 6.9B). However, the diurnal harvest cycle did not significantly (P>0.05) differentially affect
the relative proportions of non-aqueous and aqueous sap phases (Figure 6.9D).
Figure 6.9 Changes in the volume of whole sap (A), non-aqueous phase (B), aqueous phase (C) and
the relative proportions of non-aqueous phase and aqueous phase (E) over the diurnal harvest cycle
in the 2014/2015 season. The LSD (P = 0.05) bars are for comparison of means between harvest
times. n.s. indicates no significant difference (P>0.05). n = 4 replications.
6.3.1.4 Sap aroma volatiles over the diurnal harvest cycle
In the 2013/2014 fruiting season, 2-carene, 3-carene, p-cymene, -terpinene, limonene and –
terpinolene concentrations were significantly (P≤0.05) higher in the whole sap from fruit harvested
at 1400 h from the second harvest day as compared to all other harvest times (Figure 6.10). –
Terpinolene was the dominant volatile compound as compared with the other compounds in the
whole sap, being 178 mg/g at 1400 h on the second day.
Sap
vo
lum
e (m
l/fr
uit
)
0.0
0.2
0.4
0.6
0.8
1.0
0600 1000 1400 1800 2200 0200
Non
-aqu
eou
s ph
ase
(ml/
20 f
ruit
)
0.0
0.5
1.0
1.5
Harvest time (hrs)
Aqu
eou
s ph
ase
(ml/
20 f
ruit
) 0
5
10
15
20
LSD
LSD
LSD
A
B
C
0600 1000 1400 1800 2200 0200
Pro
por
tion
(%
)
0
20
40
60
80
100
120 D AqueousNon-aqueous
n.s.
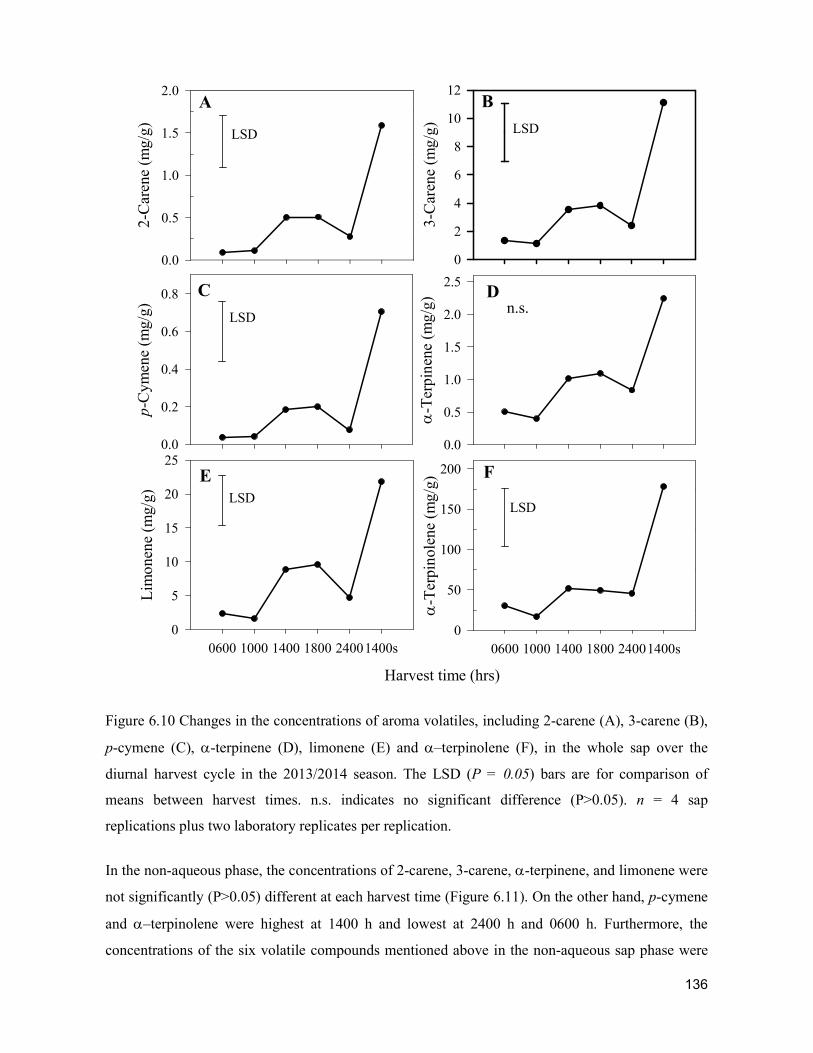
136
Figure 6.10 Changes in the concentrations of aroma volatiles, including 2-carene (A), 3-carene (B),
p-cymene (C), -terpinene (D), limonene (E) and –terpinolene (F), in the whole sap over the
diurnal harvest cycle in the 2013/2014 season. The LSD (P = 0.05) bars are for comparison of
means between harvest times. n.s. indicates no significant difference (P>0.05). n = 4 sap
replications plus two laboratory replicates per replication.
In the non-aqueous phase, the concentrations of 2-carene, 3-carene, -terpinene, and limonene were
not significantly (P>0.05) different at each harvest time (Figure 6.11). On the other hand, p-cymene
and –terpinolene were highest at 1400 h and lowest at 2400 h and 0600 h. Furthermore, the
concentrations of the six volatile compounds mentioned above in the non-aqueous sap phase were
2-C
aren
e (m
g/g
)
0.0
0.5
1.0
1.5
2.0
3-C
aren
e (m
g/g
)
0
2
4
6
8
10
12
-T
erpi
nen
e (m
g/g
)0.0
0.5
1.0
1.5
2.0
2.5
p-C
ymen
e (m
g/g
)
0.0
0.2
0.4
0.6
0.8
0600 1000 1400 1800 24001400s
Lim
one
ne
(mg/
g)
0
5
10
15
20
25
Harvest time (hrs)
0600 1000 1400 1800 24001400s
-T
erpi
nol
ene
(mg
/g)
0
50
100
150
200
LSD LSD
A B
C
LSDn.s.
D
E F
LSDLSD
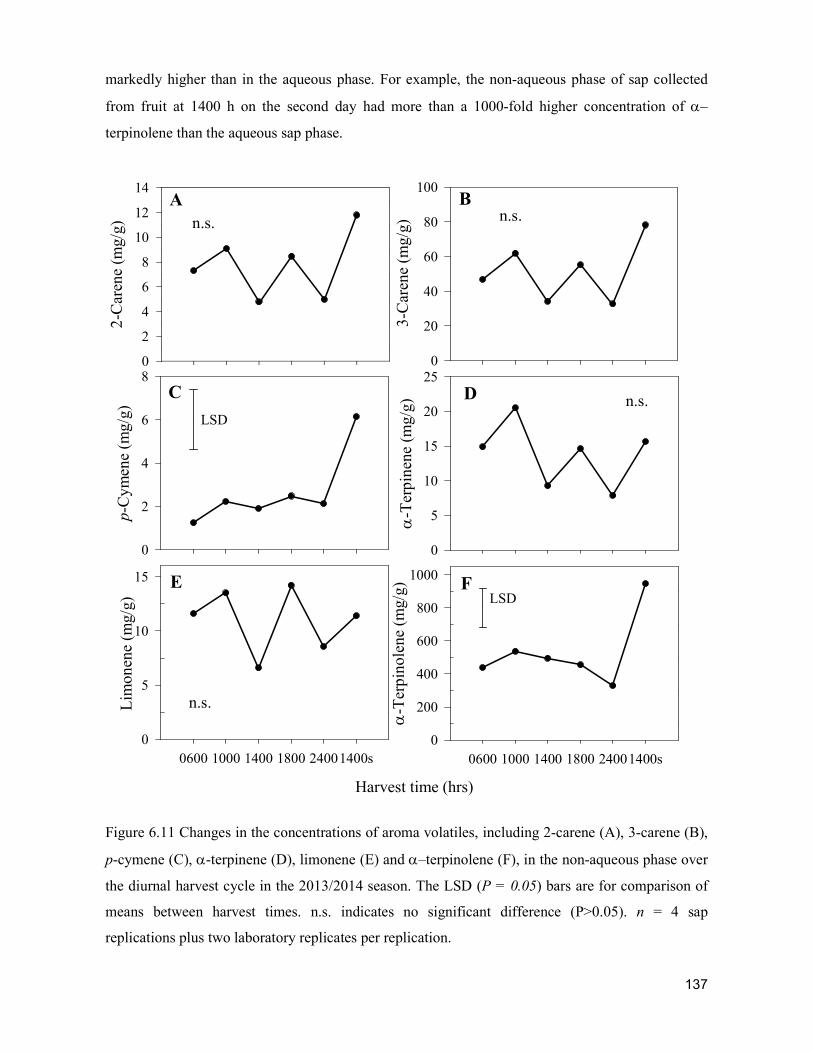
137
markedly higher than in the aqueous phase. For example, the non-aqueous phase of sap collected
from fruit at 1400 h on the second day had more than a 1000-fold higher concentration of –
terpinolene than the aqueous sap phase.
Figure 6.11 Changes in the concentrations of aroma volatiles, including 2-carene (A), 3-carene (B),
p-cymene (C), -terpinene (D), limonene (E) and –terpinolene (F), in the non-aqueous phase over
the diurnal harvest cycle in the 2013/2014 season. The LSD (P = 0.05) bars are for comparison of
means between harvest times. n.s. indicates no significant difference (P>0.05). n = 4 sap
replications plus two laboratory replicates per replication.
2-C
aren
e (m
g/g)
0
2
4
6
8
10
12
14
3-C
aren
e (m
g/g)
0
20
40
60
80
100
-T
erp
inen
e (m
g/g)
0
5
10
15
20
25
p-C
ymen
e (m
g/g)
0
2
4
6
8
0600 1000 1400 1800 24001400s
Lim
onen
e (m
g/g)
0
5
10
15
Harvest time (hrs)
0600 1000 1400 1800 24001400s
-T
erp
inol
ene
(mg/
g)
0
200
400
600
800
1000
n.s. n.s.A B
C
LSD
n.s.D
E F
n.s.
LSD
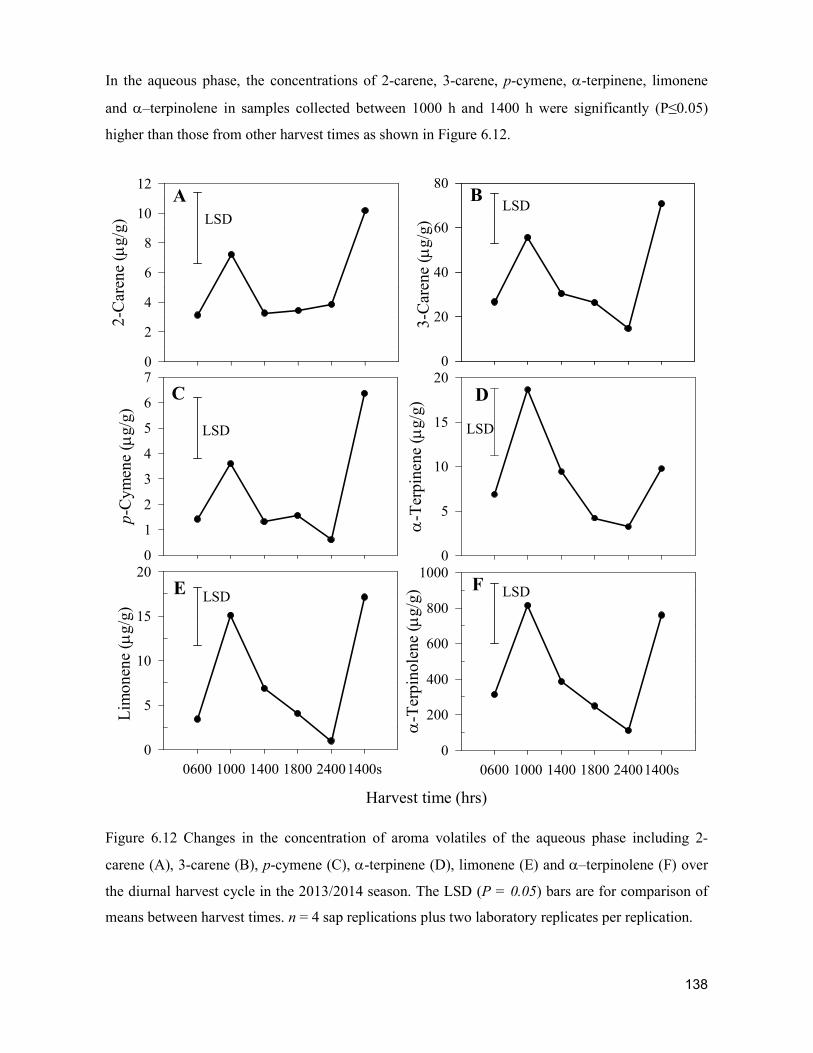
138
In the aqueous phase, the concentrations of 2-carene, 3-carene, p-cymene, -terpinene, limonene
and –terpinolene in samples collected between 1000 h and 1400 h were significantly (P≤0.05)
higher than those from other harvest times as shown in Figure 6.12.
Figure 6.12 Changes in the concentration of aroma volatiles of the aqueous phase including 2-
carene (A), 3-carene (B), p-cymene (C), -terpinene (D), limonene (E) and –terpinolene (F) over
the diurnal harvest cycle in the 2013/2014 season. The LSD (P = 0.05) bars are for comparison of
means between harvest times. n = 4 sap replications plus two laboratory replicates per replication.
2-C
aren
e (
g/g
)
0
2
4
6
8
10
12
3-C
aren
e (
g/g
)
0
20
40
60
80
-T
erp
inen
e (
g/g
)
0
5
10
15
20
p-C
ymen
e (
g/g
)
0
1
2
3
4
5
6
7
0600 1000 1400 1800 24001400s
Lim
on
ene
(g
/g)
0
5
10
15
20
Harvest time (hrs)
0600 1000 1400 1800 24001400s
-T
erp
inol
ene
(g
/g)
0
200
400
600
800
1000
A B
C
LSD
D
E F LSD
LSDLSD
LSD
LSD
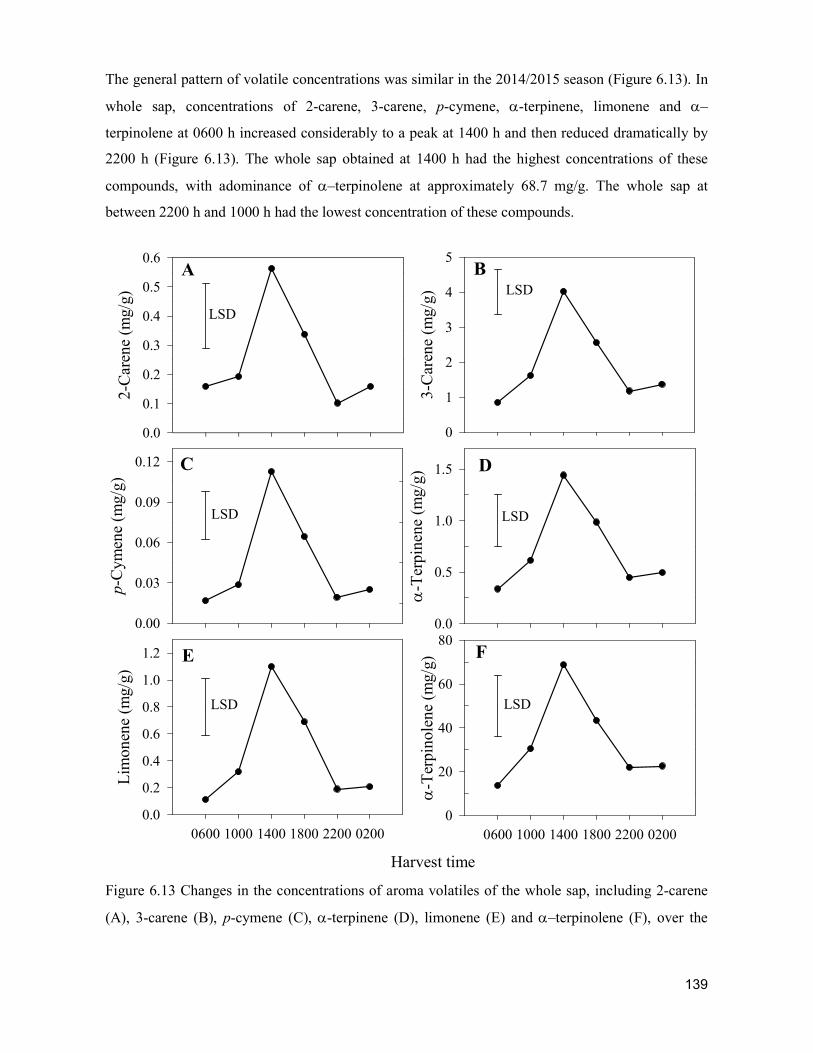
139
The general pattern of volatile concentrations was similar in the 2014/2015 season (Figure 6.13). In
whole sap, concentrations of 2-carene, 3-carene, p-cymene, -terpinene, limonene and –
terpinolene at 0600 h increased considerably to a peak at 1400 h and then reduced dramatically by
2200 h (Figure 6.13). The whole sap obtained at 1400 h had the highest concentrations of these
compounds, with adominance of –terpinolene at approximately 68.7 mg/g. The whole sap at
between 2200 h and 1000 h had the lowest concentration of these compounds.
Figure 6.13 Changes in the concentrations of aroma volatiles of the whole sap, including 2-carene
(A), 3-carene (B), p-cymene (C), -terpinene (D), limonene (E) and –terpinolene (F), over the
2-C
aren
e (m
g/g)
0.0
0.1
0.2
0.3
0.4
0.5
0.6
3-C
aren
e (m
g/g)
0
1
2
3
4
5
-T
erpi
nene
(m
g/g)
0.0
0.5
1.0
1.5
p-C
ymen
e (m
g/g
)
0.00
0.03
0.06
0.09
0.12
0600 1000 1400 1800 2200 0200
Lim
onen
e (m
g/g)
0.0
0.2
0.4
0.6
0.8
1.0
1.2
Harvest time
0600 1000 1400 1800 2200 0200
-T
erpi
nol
ene
(mg/
g)
0
20
40
60
80
LSD
LSD
A B
C
LSD
D
E F
LSD LSD
LSD
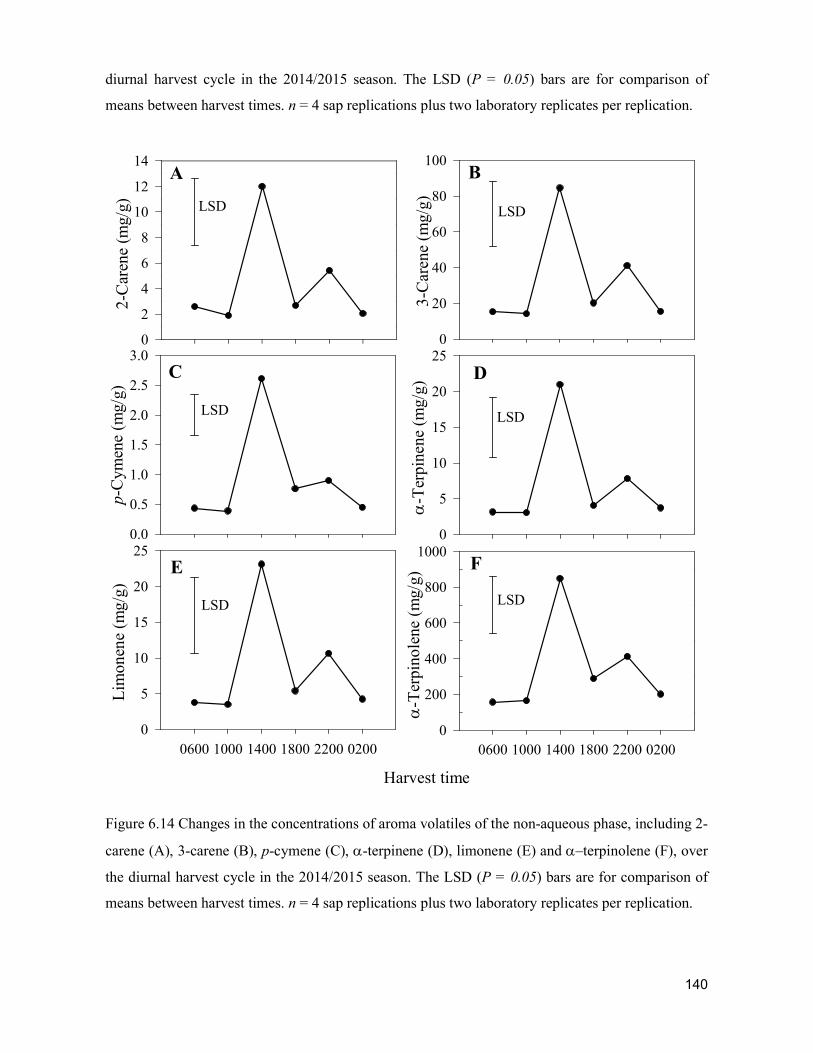
140
diurnal harvest cycle in the 2014/2015 season. The LSD (P = 0.05) bars are for comparison of
means between harvest times. n = 4 sap replications plus two laboratory replicates per replication.
Figure 6.14 Changes in the concentrations of aroma volatiles of the non-aqueous phase, including 2-
carene (A), 3-carene (B), p-cymene (C), -terpinene (D), limonene (E) and –terpinolene (F), over
the diurnal harvest cycle in the 2014/2015 season. The LSD (P = 0.05) bars are for comparison of
means between harvest times. n = 4 sap replications plus two laboratory replicates per replication.
2-C
aren
e (m
g/g)
0
2
4
6
8
10
12
14
3-C
aren
e (m
g/g)
0
20
40
60
80
100
-T
erpi
nene
(m
g/g)
0
5
10
15
20
25
p-C
ymen
e (m
g/g)
0.0
0.5
1.0
1.5
2.0
2.5
3.0
0600 1000 1400 1800 2200 0200
Lim
onen
e (m
g/g
)
0
5
10
15
20
25
Harvest time
0600 1000 1400 1800 2200 0200
-T
erpi
nole
ne (
mg/
g)
0
200
400
600
800
1000
LSD LSD
A B
C
LSD
D
E F
LSD LSD
LSD
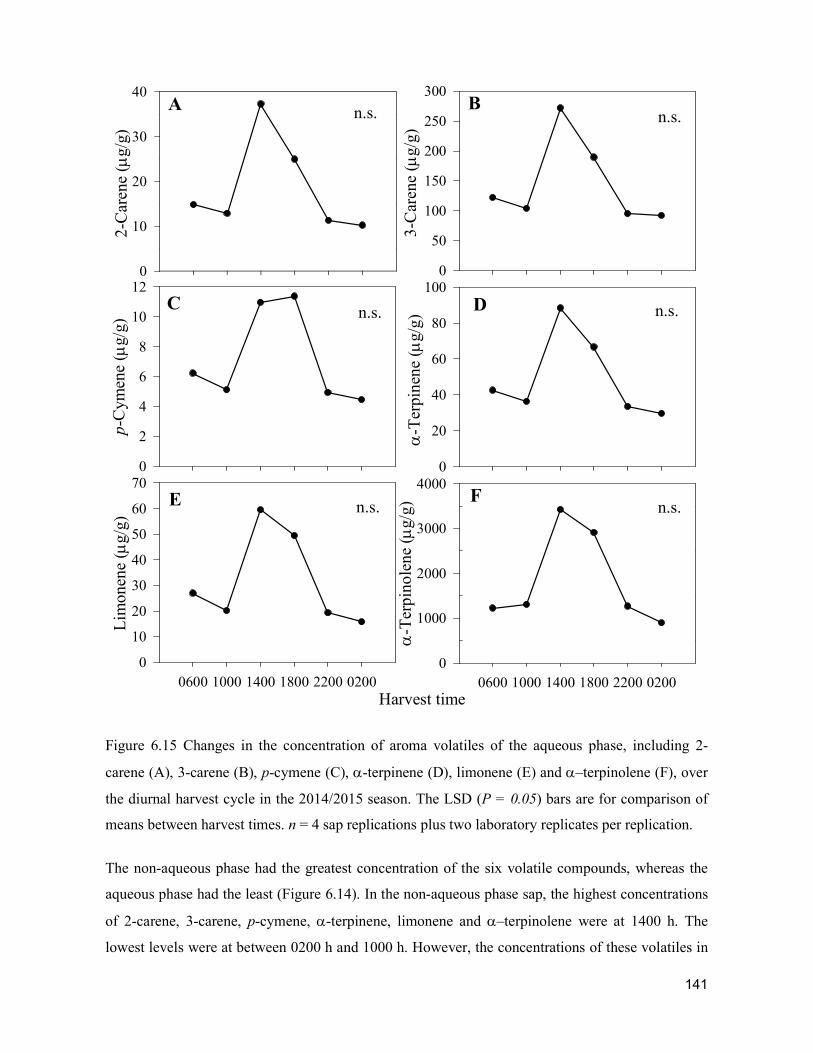
141
Figure 6.15 Changes in the concentration of aroma volatiles of the aqueous phase, including 2-
carene (A), 3-carene (B), p-cymene (C), -terpinene (D), limonene (E) and –terpinolene (F), over
the diurnal harvest cycle in the 2014/2015 season. The LSD (P = 0.05) bars are for comparison of
means between harvest times. n = 4 sap replications plus two laboratory replicates per replication.
The non-aqueous phase had the greatest concentration of the six volatile compounds, whereas the
aqueous phase had the least (Figure 6.14). In the non-aqueous phase sap, the highest concentrations
of 2-carene, 3-carene, p-cymene, -terpinene, limonene and –terpinolene were at 1400 h. The
lowest levels were at between 0200 h and 1000 h. However, the concentrations of these volatiles in
2-C
aren
e (
g/g
)
0
10
20
30
40
3-C
aren
e (
g/g)
0
50
100
150
200
250
300
-T
erpi
nen
e (
g/g
)
0
20
40
60
80
100
p-C
ymen
e (
g/g)
0
2
4
6
8
10
12
0600 1000 1400 1800 2200 0200
Lim
onen
e (
g/g
)
0
10
20
30
40
50
60
70
Harvest time0600 1000 1400 1800 2200 0200
-T
erp
ino
lene
(
g/g)
0
1000
2000
3000
4000
A B
C D
E F
n.s. n.s.
n.s. n.s.
n.s. n.s.
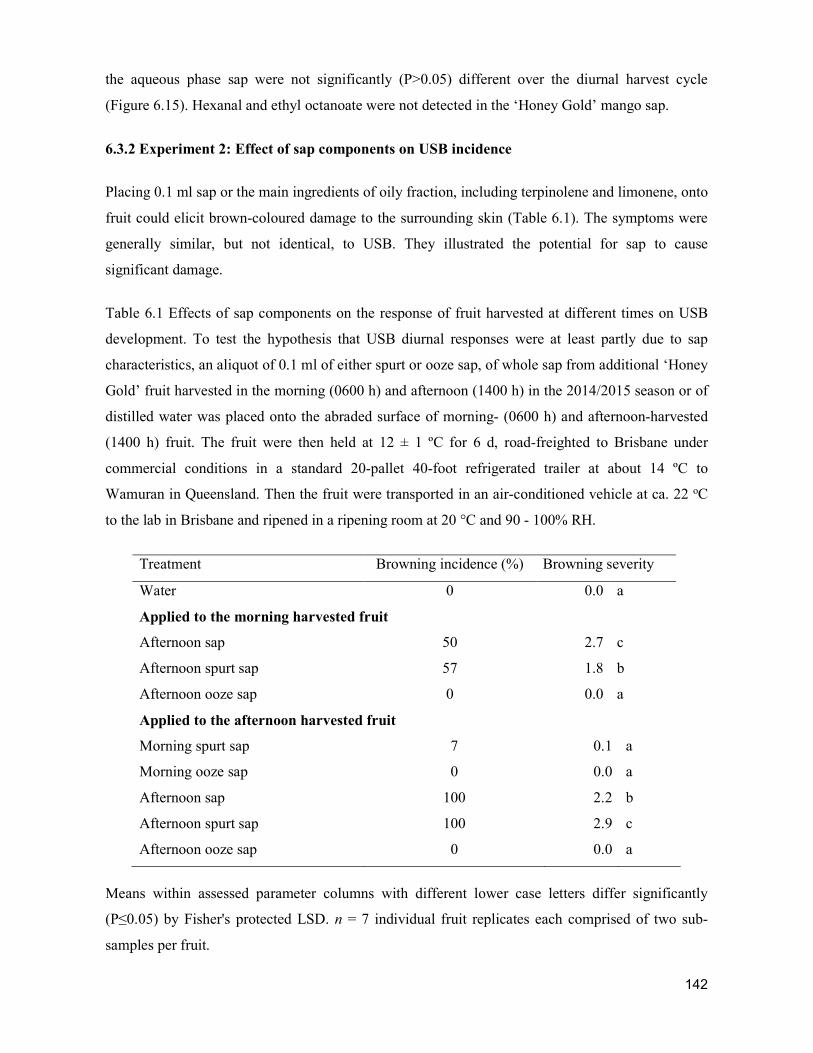
142
the aqueous phase sap were not significantly (P>0.05) different over the diurnal harvest cycle
(Figure 6.15). Hexanal and ethyl octanoate were not detected in the ‘Honey Gold’ mango sap.
6.3.2 Experiment 2: Effect of sap components on USB incidence
Placing 0.1 ml sap or the main ingredients of oily fraction, including terpinolene and limonene, onto
fruit could elicit brown-coloured damage to the surrounding skin (Table 6.1). The symptoms were
generally similar, but not identical, to USB. They illustrated the potential for sap to cause
significant damage.
Table 6.1 Effects of sap components on the response of fruit harvested at different times on USB
development. To test the hypothesis that USB diurnal responses were at least partly due to sap
characteristics, an aliquot of 0.1 ml of either spurt or ooze sap, of whole sap from additional ‘Honey
Gold’ fruit harvested in the morning (0600 h) and afternoon (1400 h) in the 2014/2015 season or of
distilled water was placed onto the abraded surface of morning- (0600 h) and afternoon-harvested
(1400 h) fruit. The fruit were then held at 12 ± 1 ºC for 6 d, road-freighted to Brisbane under
commercial conditions in a standard 20-pallet 40-foot refrigerated trailer at about 14 ºC to
Wamuran in Queensland. Then the fruit were transported in an air-conditioned vehicle at ca. 22 oC
to the lab in Brisbane and ripened in a ripening room at 20 °C and 90 - 100% RH.
Treatment Browning incidence (%) Browning severity
Water 0 0.0 a
Applied to the morning harvested fruit
Afternoon sap 50 2.7 c
Afternoon spurt sap 57 1.8 b
Afternoon ooze sap 0 0.0 a
Applied to the afternoon harvested fruit
Morning spurt sap 7 0.1 a
Morning ooze sap 0 0.0 a
Afternoon sap 100 2.2 b
Afternoon spurt sap 100 2.9 c
Afternoon ooze sap 0 0.0 a
Means within assessed parameter columns with different lower case letters differ significantly
(P≤0.05) by Fisher's protected LSD. n = 7 individual fruit replicates each comprised of two sub-
samples per fruit.
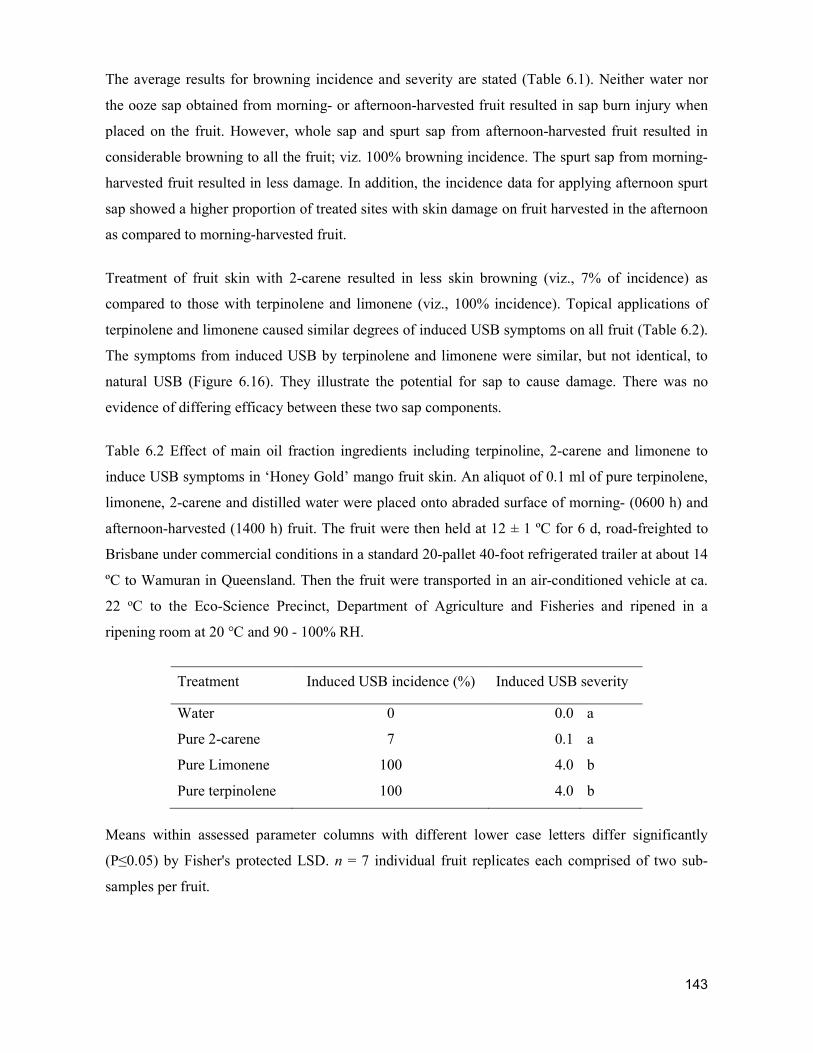
143
The average results for browning incidence and severity are stated (Table 6.1). Neither water nor
the ooze sap obtained from morning- or afternoon-harvested fruit resulted in sap burn injury when
placed on the fruit. However, whole sap and spurt sap from afternoon-harvested fruit resulted in
considerable browning to all the fruit; viz. 100% browning incidence. The spurt sap from morning-
harvested fruit resulted in less damage. In addition, the incidence data for applying afternoon spurt
sap showed a higher proportion of treated sites with skin damage on fruit harvested in the afternoon
as compared to morning-harvested fruit.
Treatment of fruit skin with 2-carene resulted in less skin browning (viz., 7% of incidence) as
compared to those with terpinolene and limonene (viz., 100% incidence). Topical applications of
terpinolene and limonene caused similar degrees of induced USB symptoms on all fruit (Table 6.2).
The symptoms from induced USB by terpinolene and limonene were similar, but not identical, to
natural USB (Figure 6.16). They illustrate the potential for sap to cause damage. There was no
evidence of differing efficacy between these two sap components.
Table 6.2 Effect of main oil fraction ingredients including terpinoline, 2-carene and limonene to
induce USB symptoms in ‘Honey Gold’ mango fruit skin. An aliquot of 0.1 ml of pure terpinolene,
limonene, 2-carene and distilled water were placed onto abraded surface of morning- (0600 h) and
afternoon-harvested (1400 h) fruit. The fruit were then held at 12 ± 1 ºC for 6 d, road-freighted to
Brisbane under commercial conditions in a standard 20-pallet 40-foot refrigerated trailer at about 14
ºC to Wamuran in Queensland. Then the fruit were transported in an air-conditioned vehicle at ca.
22 oC to the Eco-Science Precinct, Department of Agriculture and Fisheries and ripened in a
ripening room at 20 °C and 90 - 100% RH.
Treatment Induced USB incidence (%) Induced USB severity
Water 0 0.0 a
Pure 2-carene 7 0.1 a
Pure Limonene 100 4.0 b
Pure terpinolene 100 4.0 b
Means within assessed parameter columns with different lower case letters differ significantly
(P≤0.05) by Fisher's protected LSD. n = 7 individual fruit replicates each comprised of two sub-
samples per fruit.
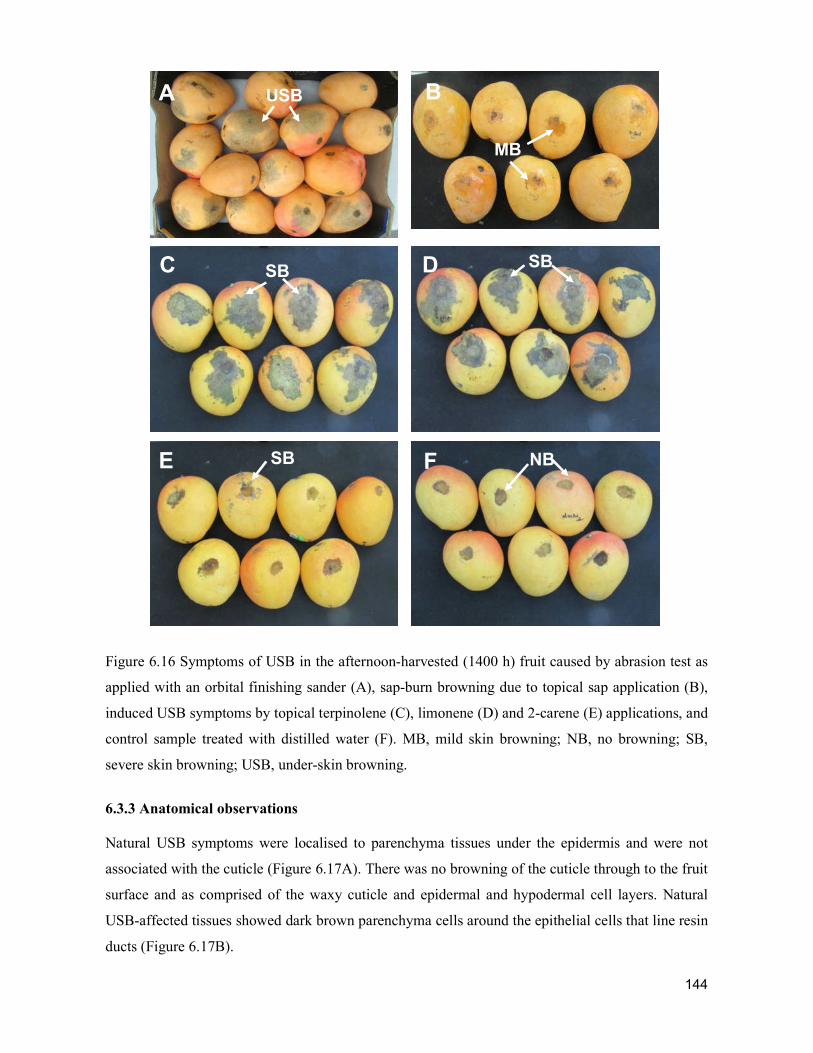
144
Figure 6.16 Symptoms of USB in the afternoon-harvested (1400 h) fruit caused by abrasion test as
applied with an orbital finishing sander (A), sap-burn browning due to topical sap application (B),
induced USB symptoms by topical terpinolene (C), limonene (D) and 2-carene (E) applications, and
control sample treated with distilled water (F). MB, mild skin browning; NB, no browning; SB,
severe skin browning; USB, under-skin browning.
6.3.3 Anatomical observations
Natural USB symptoms were localised to parenchyma tissues under the epidermis and were not
associated with the cuticle (Figure 6.17A). There was no browning of the cuticle through to the fruit
surface and as comprised of the waxy cuticle and epidermal and hypodermal cell layers. Natural
USB-affected tissues showed dark brown parenchyma cells around the epithelial cells that line resin
ducts (Figure 6.17B).
B A
E F
D C
USB
MB
SB SB
SB NB
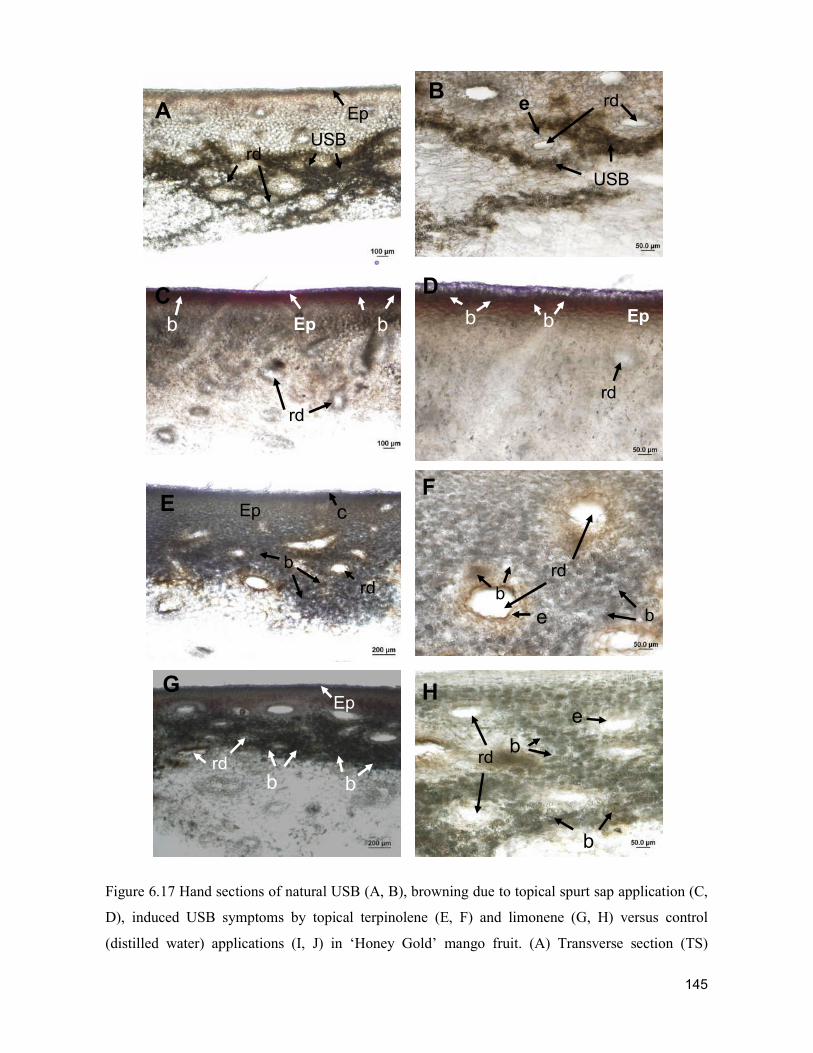
145
Figure 6.17 Hand sections of natural USB (A, B), browning due to topical spurt sap application (C,
D), induced USB symptoms by topical terpinolene (E, F) and limonene (G, H) versus control
(distilled water) applications (I, J) in ‘Honey Gold’ mango fruit. (A) Transverse section (TS)
H G
rd b b
b
rd b
e Ep
A B
USB
USB
rd Ep
rd
e
C D
E F
c
Ep
Ep
rd
rd
b b b b Ep
rd
rd
b b e
b
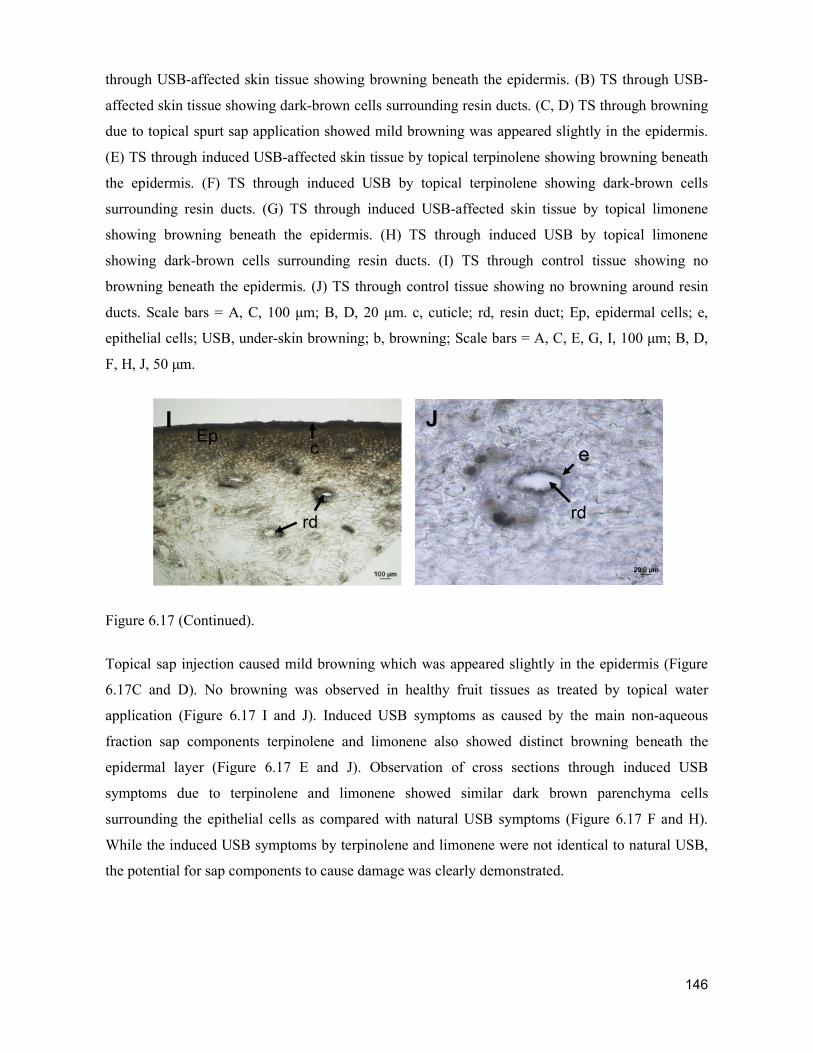
146
through USB-affected skin tissue showing browning beneath the epidermis. (B) TS through USB-
affected skin tissue showing dark-brown cells surrounding resin ducts. (C, D) TS through browning
due to topical spurt sap application showed mild browning was appeared slightly in the epidermis.
(E) TS through induced USB-affected skin tissue by topical terpinolene showing browning beneath
the epidermis. (F) TS through induced USB by topical terpinolene showing dark-brown cells
surrounding resin ducts. (G) TS through induced USB-affected skin tissue by topical limonene
showing browning beneath the epidermis. (H) TS through induced USB by topical limonene
showing dark-brown cells surrounding resin ducts. (I) TS through control tissue showing no
browning beneath the epidermis. (J) TS through control tissue showing no browning around resin
ducts. Scale bars = A, C, 100 μm; B, D, 20 μm. c, cuticle; rd, resin duct; Ep, epidermal cells; e,
epithelial cells; USB, under-skin browning; b, browning; Scale bars = A, C, E, G, I, 100 μm; B, D,
F, H, J, 50 μm.
Figure 6.17 (Continued).
Topical sap injection caused mild browning which was appeared slightly in the epidermis (Figure
6.17C and D). No browning was observed in healthy fruit tissues as treated by topical water
application (Figure 6.17 I and J). Induced USB symptoms as caused by the main non-aqueous
fraction sap components terpinolene and limonene also showed distinct browning beneath the
epidermal layer (Figure 6.17 E and J). Observation of cross sections through induced USB
symptoms due to terpinolene and limonene showed similar dark brown parenchyma cells
surrounding the epithelial cells as compared with natural USB symptoms (Figure 6.17 F and H).
While the induced USB symptoms by terpinolene and limonene were not identical to natural USB,
the potential for sap components to cause damage was clearly demonstrated.
I J c
Ep
rd
e
rd
147
6.4 Discussion
There was a strong association between harvest time and USB incidence and severity. ‘Honey
Gold’ fruit harvested at night and in the early morning were less sensitive to USB as induced by a
‘standardised test’ comprised of light skin abrasion followed by storage at 10 - 12 ºC for 6 d before
fruit ripening and assessment. The results affirmed a strong consistent effect of harvest time.
‘Honey Gold’ mango fruit harvested at 1400 h and 1800 h under high temperature (37 - 40 oC) and
low RH (38 - 40%) developed much higher USB incidence (i.e. 50 - 70%) and severity (i.e. 5 to 8-
fold higher) as compared to fruit harvested at either 2200 h or 0200 h or 0600 h. Thus, ‘Honey
Gold’ fruit harvested at night and in the early morning are ‘commercially’ less susceptible to USB.
The higher USB incidence in the afternoon harvest could be a stress response related to physical
damage (viz., abrasion) and temporal harvest time (viz. concentrated volatile concentrations). In the
experiments, natural USB was observed on areas of the fruit that had not been abraded. It is likely
that physical damage during road freight from the Northern Territory to south-east Queensland was
contributory. Natural USB incidence and severity on these non-abraded areas was characteristically
less on fruit harvested at night and in the early morning as compared with those harvested in the
afternoon (Figure 6.7). Marques et al. (2012) similarly determined that USB often appeared around
visible physical injury sites on fruit, such as those from prolonged transport (Marques et al., 2012).
Likewise, the severity of sap burn injury was higher on fruit harvested at noon and in the afternoon
than on those harvested at other times (Amin et al., 2008). Thus, afternoon-harvest combined with
physical damage probably involving disruption of cellular integrity upon abrasion leads to more
USB damage.
Based on largely anecdotal evidence, it was hypothesised that the incidence and severity of USB on
‘Honey Gold’ mango were at least partly due to effects of sap. It was considered likely that
differences in USB incidence and severity of mango fruit across the diurnal harvest cycle could be
associated with putative differences in sensitivity of the mango fruit skin and / or the changes in
composition of potentially phytotoxic sap. Sap collected from afternoon-harvested fruit proved to
cause more damage to abraded skin than sap from morning-harvested fruit, which actually caused
no damage (Table 6.1). It was possible that higher concentrations of phytotoxic components were
present in afternoon sap. Moreover, it was clear that spurt sap and the non-aqueous sap phase (oil
fraction) was responsible for the damage. Thus, afternoon sap, especially afternoon spurt sap
evidently contributes to the higher sensitivity of afternoon-harvested fruit to USB. This conclusion
is in general agreement with sap burn studies, which showed that skin damage was mainly due to
the upper non-aqueous phase (Loveys et al., 1992). Similarly, Maqbool et al. (2007) reported that
148
spurt sap exuded within first 15 s after removing the pedicel of fruit was the most injurious to the
skin of fruit.
The phytotoxic response is evidently related to individual sap components, especially
concentrations of volatiles including terpinolene and limonene. Topical application to the fruit skin
of terpinolene and limonene, both major components of the oil fraction, resulted in USB-like
browning damage. In contrast, topical applications of carene and distilled water did not (Table 6.2).
While the symptoms were not identical to USB (Figure 6.16), the potential for sap components to
cause damage was clearly demonstrated. Terpinolene and sap upper phase also caused tissue
damage in ‘Kensington’ mangoes, with associated subsequent enzymic browning (Loveys et al.,
1992). Anatomically, both natural (Figure 6.17 A and B) and induced USB symptoms (Figure 6.17
E, F, G and H) featured browning around the epithelial cells that lined resin ducts, while sap
injection gave slight browning in the epidermis (Figure 6.17 C and D). Terpenoid components of
spurt sap are no doubt mainly responsible for the damage manifested as browning. Further work is
required to characterise the anatomy of natural versus induced USB symptoms, such as are caused
by sap volatiles components, and the enzymology of the browning process.
Volumes of ‘Honey Gold’ whole sap ranged from 0.3 to 0.9 ml/fruit over the diurnal harvest cycle.
By comparison, O'Hare (1994) estimated sap volumes exuded from ‘Kensington Pride’ fruit of
around 1.67 ml/fruit. The volumes of the non-aqueous and aqueous phases at 1400 h and 1800 h
were considerably (P≤0.05) lower than were those collected at other harvest times. In an earlier
study, Maqbool et al. (2007) also reported lower sap volumes related to afternoon harvest.
However, there was no significant difference (P>0.05) in relative proportions of non-aqueous and
aqueous sap phases over the diurnal harvest cycle (Figure 6.9). This means that both phases became
more concentrated at the same time.
Harvest time also affected the concentrations of aroma volatile compounds in mango fruit sap. Key
aroma volatile compounds, including 2-carene, 3-carene, α-terpinene, p-cymene, limonene and α-
terpinolene were more concentrated in sap from fruit at 1400 h as compared with sap from early
morning and night harvests (Figures 6.10 and 6.13). Terpinolene was the most abundant compound
in the whole sap and non-aqueous phase of ‘Honey Gold’ fruit. Terpinolene in non-aqueous sap was
4-6 times higher in fruit harvested in the afternoon than in those picked at other harvest times
(Figure 6.14). This ‘peaking’ was associated with the higher USB susceptibility of fruit harvested at
1400 h. Under high temperatures and low RH, it is likely that all cells of the afternoon-harvested
fruit decreased in water content (Link et al., 1998; Schroeder and Wieland, 1956). This response
would concentrate aroma compounds within the sap. The apoplasmic water potential gradient is
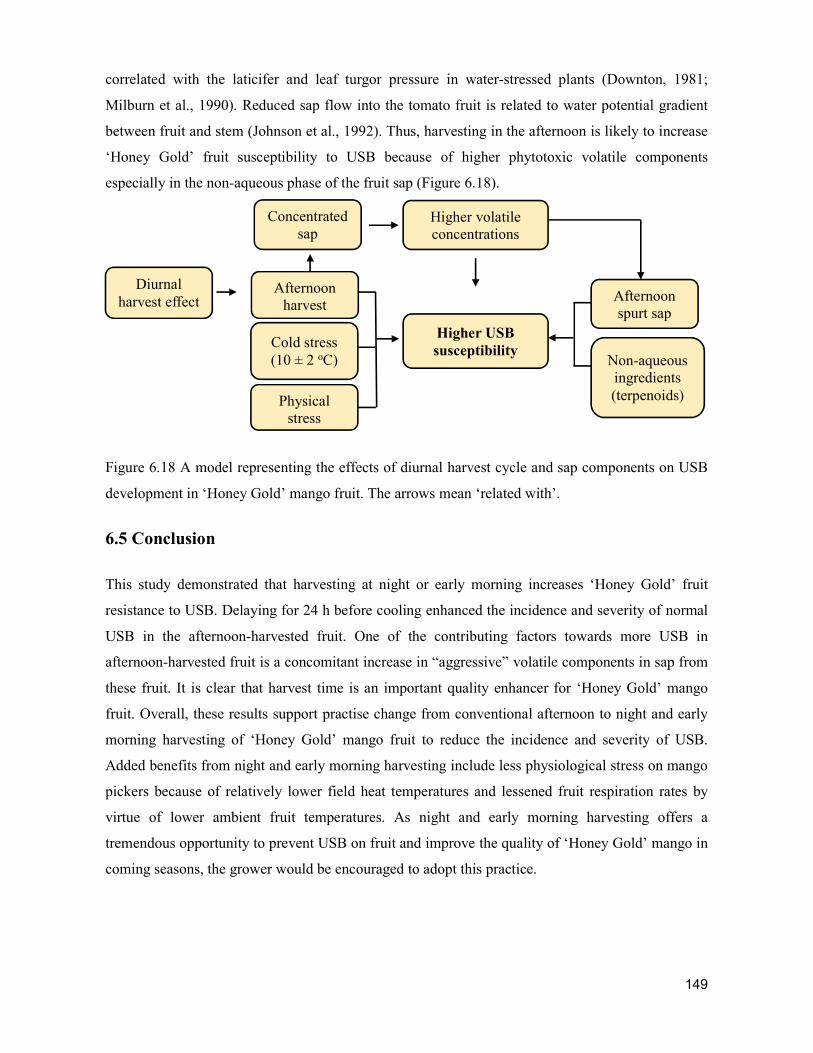
149
correlated with the laticifer and leaf turgor pressure in water-stressed plants (Downton, 1981;
Milburn et al., 1990). Reduced sap flow into the tomato fruit is related to water potential gradient
between fruit and stem (Johnson et al., 1992). Thus, harvesting in the afternoon is likely to increase
‘Honey Gold’ fruit susceptibility to USB because of higher phytotoxic volatile components
especially in the non-aqueous phase of the fruit sap (Figure 6.18).
Figure 6.18 A model representing the effects of diurnal harvest cycle and sap components on USB
development in ‘Honey Gold’ mango fruit. The arrows mean ‘related with’.
6.5 Conclusion
This study demonstrated that harvesting at night or early morning increases ‘Honey Gold’ fruit
resistance to USB. Delaying for 24 h before cooling enhanced the incidence and severity of normal
USB in the afternoon-harvested fruit. One of the contributing factors towards more USB in
afternoon-harvested fruit is a concomitant increase in “aggressive” volatile components in sap from
these fruit. It is clear that harvest time is an important quality enhancer for ‘Honey Gold’ mango
fruit. Overall, these results support practise change from conventional afternoon to night and early
morning harvesting of ‘Honey Gold’ mango fruit to reduce the incidence and severity of USB.
Added benefits from night and early morning harvesting include less physiological stress on mango
pickers because of relatively lower field heat temperatures and lessened fruit respiration rates by
virtue of lower ambient fruit temperatures. As night and early morning harvesting offers a
tremendous opportunity to prevent USB on fruit and improve the quality of ‘Honey Gold’ mango in
coming seasons, the grower would be encouraged to adopt this practice.
Higher volatile concentrations
Higher USB susceptibility
Physical stress
Cold stress (10 ± 2 oC)
Afternoon harvest
Diurnal harvest effect
Concentrated sap
Non-aqueous ingredients (terpenoids)
Afternoon spurt sap
150
References
Amin, M., Malik, A.U., Mazhar, M.S., Din, I.U., Khalid, M.S., Ahmad, S., 2008. Mango fruit
desapping in relation to time of harvesting. Pakistan Journal of Botany 40, 1587-1593.
Downton, W., 1981. Water relations of laticifers in Nerium oleander. Functional Plant Biology 8,
329-334.
Hassan, M.K., Irving, D.E., Dann, E.K., Coates, L.M., Hofman, P.J., 2009. Sap properties and
alk(en)ylresorcinol concentrations in Australian-grown mangoes. Annals of Applied Biology 154,
419-419.
Hofman, P.J., Holmes, R., Barker, L., 2010a. B74 mango quality assessment manual : A guide to
assessing the post-harvest quality of B74 mangoes Department of Employment, Economic
Development and Innovation, [Brisbane].
Hofman, P.J., Marques, J.R., Taylor, L.M., Stubbings, B.A., Ledger, S.N., Jordan, R.A., 2010b.
Skin damage to two new mango cultivars during irradiation and cold storage. Acta Horticulturae
877, 475-481.
Joel, D.M., 1980. Resin ducts in the mango fruit: A defence system. Journal of Experimental
Botany 31, 1707-1718.
Joel, D.M., Fahn, A., 1980. Ultrastructure of the resin ducts of Mangifera indica L.
(Anacardiaceae). 3. Secretion of the protein-polysaccharide mucilage in the fruit. Annals of Botany
46, 785-790.
John, K.S., Bhat, S., Rao, L.J.M., Rao, U.P., 1999. Characterization of aroma components of sap
from different Indian mango varieties. Phytochemistry 52, 891-894.
John, K.S., Bhat, S., Rao, U.P., 2002. Involvement of peroxidase and polyphenol oxidase in mango
sap‐injury. Journal of Food Biochemistry 26, 403-414.
John, K.S., Bhat, S., Rao, U.P., 2003. Biochemical characterization of sap (latex) of a few Indian
mango varieties. Phytochemistry 62, 13-19.
Johnson, G.I., Hofman, P.J., 2009. Postharvest technology and quarantine treatments. CABI,
Wallingford, UK, pp. 529-605.
151
Johnson, R., Dixon, M., Lee, D., 1992. Water relations of the tomato during fruit growth. Plant,
Cell & Environment 15, 947-953.
Kernot, I., Meurant, N., Holmes, R., MacLeod, N., Fullelove, G., Bally, I., 1999. Mango
information kit. Queensland Department of Primary Industries and Fisheries, Brisbane.
Link, S., Thiede, M., Van Bavel, M., 1998. An improved strain-gauge device for continuous field
measurement of stem and fruit diameter. Journal of Experimental Botany 49, 1583-1587.
Loveys, B.R., Robinson, S.P., Brophy, J.J., Chacko, E.K., 1992. Mango sapburn - components of
fruit sap and their role in causing skin damage. Australian Journal of Plant Physiology 19, 449-457.
Maqbool, M., Malik, A.U., Jabbar, A., 2007. Sap dynamics and its management in commercial
mango cultivars of Pakistan. Pakistan Journal of Botany 39, 1565-1574.
Marques, J., Hofman, P., Macnish, A., 2016. Postharvest handling practices and irradiation increase
lenticel discolouration in ‘B74’ mango fruit. The Journal of Horticultural Science and
Biotechnology, 1-7.
Marques, J.R., Hofman, P.J., Giles, J.E., Campbell, P.R., 2012. Reducing the incidence of under-
skin browning in 'Honey Gold' mango (Mangifera indica L.) fruit. The Journal of Horticultural
Science and Biotechnology 87, 341-346.
Milburn, J., Kallarackal, J., Baker, D., 1990. Water relations of the banana. I. Predicting the water
relations of the field-grown banana using the exuding latex. Functional Plant Biology 17, 57-68.
O'Hare, T., 1994. The susceptibility of Thai and Australian mango cultivars to sap injury and
possible means of control, In: Johnson, G.I., Highley, E. (Eds.), Development of Postharvest
Handling Technology for Tropical Tree Fruits. Australian Centre for International Agricultural
Research, Bangkok, Thailand, pp. 21-24.
Pongsomboon, W., Whiley, A., Stephenson, R., Subhadrabandhu, S., 1991. Development of water
stress and stomatal closure in juvenile mango (Mangifera indica L.) stress. Frontier in Tropical
Fruit Research 321, 496-503.
Ruzin, S.E., 1999. Chapter 10 Microtechnique notes and problem solving, Plant microtechnique
and microscopy. Oxford University Press, New York, pp. 137-143.

152
Schroeder, C., Wieland, P., 1956. Diurnal fluctuation in size in various parts of the avocado tree and
fruit, Proceedings of the American Society for Horticultural Science, p. 13.
153
CHAPTER 7. COMPARATIVE ANATOMY AND ENZYMATIC BROWNING
OF UNDER-SKIN BROWNING AND RESIN CANAL DISORDER
Abstract
Under-skin browning (USB) and resin canal disorder (RCD) are two fruit browning disorders of
concern to the Australian mango industry. USB is a sub-surface spreading grey-brown lesion that
may only become evident in the marketplace. RCD is a dark brown discolouration of the finely
branched pattern of ramifying sub-surface resin canals. These two browning disorders were
compared and contrasted at the macroscopic and microscopic levels. USB symptoms were evident
as dark-brown cells in the tissue surrounding the resin ducts. In contrast, RCD was characterised by
browning of the lumen of resin ducts. Accordingly, USB and RCD involve distinctly different cell
biology processes at cell and tissue levels as evidence by means of light microscopy and
transmission electron microscopy. Five different stains including iodine - potassium iodide, Sudan
IV, Sudan Black, Vanillin - HCl and Toluidine Blue O were used to characterise the histochemistry
of these disorders. Naturally occurring USB was distinguished by starch retention and phenolic
deposition in cell layers surrounding the epithelial cells of resin ducts. However, only starch
retention was observed in tissues from fruit in which USB had been induced by treatment with
terpinolene and limonene. USB was evidently related to host defence against stress. RCD was
distinguished by deposition of polymerised phenolics inside laticifer lumens. PPO and POD
activities were associated with both natural USB and RCD browning. However, POD was located
differently in both natural USB and RCD browning. Nevertheless, POD was not detected in tissue
prints from fruit in which USB had been induced by terpinolene and limonene. The comparative
anatomy and enzymatic expression provides better understanding of browning mechanism of USB
and RCD expression. This knowledge would contribute to management of these disorders.
7.1 Introduction
USB is visible through the surface of ‘Honey Gold’ mango fruit. It occurs under the epidermis as a
grey-brown ‘bruise-like’ injury with no damage to the flesh (Hofman et al., 2010b). The defect is
not usually obvious at harvest. Rather, visual symptoms become pronounced as the fruit ripen.
Expression of symptoms is reportedly associated with starch retention in affected tissues (Marques
et al. 2012). The mechanism of and controls for USB development are unclear. USB incidence and
severity can be diminished by delayed or slow cooling of fruit to ≥ 14 - 16 C before or after
packing (Hofman et al., 2010b). USB often appears around visible physical injury sites on fruit,
154
such as those that result from vibration in prolonged transport (Marques et al., 2012). Thus, USB
development is related to mechanical damage after harvest in combination with low temperatures at
just below 14 - 16 ºC.
The occurrence of RCD has seemingly been on the rise in the domestic Australian mango industry
in recent seasons. The disorder primarily affects the ‘Kensington Pride’ cultivar and involves
discolouration of the finely branched network of sub-cuticle resin canals (Holmes, 1999). It usually
expresses itself on the distal tip and /or around the mid-region of the fruit (Holmes, 1999). Causal
factors and mechanisms of symptom expression are as yet unknown (Macnish et al., 2014). Unlike
with USB, there is no evidence of suppression of starch hydrolysis (Holmes, 1999).
Mangoes contain a branching network of resin ducts distributed throughout fruit (Joel, 1980). This
extensive duct system stores or emits resinous secretions (Joel and Fahn, 1980). Turgor pressure in
the ducts is maintained due to the presence of large amounts of non-dialysable and non-starchy
carbohydrate in sap (John et al., 2003). Sap in the fruit ducts is under high turgor pressure and when
the pedicel is removed, sap initially spurts and then oozes out from the severed surface.
Mango sap includes two phases; an oily yellow-brown non-aqueous phase and a milky aqueous
phase (Loveys et al., 1992). Mono-terpenes (John et al., 1999) and alk(en)ylresorcinols are the main
constituents of the non-aqueous phase (Hassan et al., 2009). The aqueous phase contains high
amounts of polyphenol oxidase (PPO) and peroxidase (POD) (John et al., 2003). The non-aqueous
phase, which is abundant with terpenoids, has been proposed to contribute to plant defence against
insect attacks, such as those from fruit flies (Joel, 1980) and prevent the fruit from bacterial and
fungal infection (Negi et al., 2002).
Browning processes in fruit typically involve PPO and / or POD enzymes oxidising phenolic
substrates with the presence of oxygen (Franck et al., 2007; Jiang et al., 2004). Anthocyanins are
substrates in the oxidation process for PPO in litchi browning (Jiang et al., 2004). PPOs are mainly
present in vacuoles and plastids (Murata et al., 1997). PODs are mostly located in chloroplasts
(Nakano and Asada, 1981), mitochondria (Prasad et al., 1995; Toivonen and Brummell, 2008) and
plant cell plasma membranes (Vianello and Macri, 1991). PPO and POD are active in mango skin
and sap (John et al., 2002; Robinson et al., 1993). Robinson et al. (1993) reported that PPO in the
skin of ‘Kensington’ mango fruit was responsible for the browning associated with sapburn injury.
John et al. (2002) showed that PPO and POD activities in the skin of mango fruit were associated
with sap-burn injury.
155
There is relatively limited information on the histochemistry and enzymatic browning of USB and
RCD disorders. USB and RCD are hypothesised to be enzymatic browning processes which are
related to PPO and POD activities. The aim of this study was to gain more understanding of the
comparative cellular biology of USB and RCD symptom expression in Australian mango cultivars
at cell and tissue levels, including in relation to PPO and POD activities. In this chapter, the
anatomy and histochemistry of USB and RCD were compared by means of binocular microscope
observation, free-hand sectioning, light microscopy (LM) and transmission electron microscopy
(TEM). Further anatomical comparison of natural USB and artificially induced USB was examined
using LM and TEM. Localisation of PPO and POD in natural USB, artificially induced USB-
affected tissue and RCD was determined using tissue printing. A better understanding of the
underlying biology of USB and RCD should help inform and improve management of these
physiological disorders.
7.2 Materials and methods
7.2.1 Materials
‘Honey Gold’ (dry matter content of 16.9 ± 1.4%) and ‘Kensington Pride’ (dry matter content of
16.8 ± 1%) mango fruit were harvested at commercial maturity from orchards near Katherine and
Darwin (14.28 °S, 132.16 °E), respectively, in the Northern Territory, Australia. ‘Honey Gold’ fruit
were de-stemmed in a solution containing 2.5 g/l Mango Wash® (Septone, ITW AAMTech,
Australia) for 2 min. They were then taken to a nearby commercial packing house and run over a
pack line under standard conditions, including fungicide treatment (Sportak®, a.i. prochloraz, Bayer
Crop Science, Australia), brushing, drying and sorting (Hofman et al., 2010a). Next the fruit were
graded for uniform quality and size as per commercial procedures. The fruit were packed as a single
layer in cardboard trays with semi-rigid plastic inserts. ‘Kensington Pride’ fruit were picked from
the tree and de-stemmed without standard commercial harvest practices. They were packed directly
into cardboard trays. All fruit were transported by car (ca. 22 oC) to the Darwin airport and then air-
freighted from the Northern Territory to Brisbane, Queensland within 1.5 d of harvest. They were
then transported in an air-conditioned (ca. 22 °C) vehicle to the nearby postharvest laboratories in
Brisbane or to Gatton for postharvest treatments.
7.2.2 Treatments
At the laboratory, trays containing ‘Honey Gold’ fruit were randomised in cardboard trays and
placed on an EQ 21857 vibration table (RL Windsor & Son Pty Ltd., Australia) in a cold room at 12
156
± 1 C. The fruit were exposed to 12 Hz vibration for 12 h at 12 °C and 90 - 100% RH. They were
then removed from the table and held at 12 ± 1 C for 6 d. Thereafter, the fruit were maintained at
20 °C and 90 - 100% RH until ripe. These treatments are to simulate commercial handling and
transport. Skin tissues displaying USB symptoms were excised for anatomical study. Additional
‘Honey Gold’ fruit for the control treatment were maintained at 12 C without vibration for 6.5 d
and ripened at 20 C and 90 - 100% RH until ripe without vibration treatment. The ‘Kensington
Pride’ fruit were also maintained under standard shelf life conditions at 20 C and 90 - 100% RH.
Flesh and skin tissues from fruit exhibiting RCD symptoms were collected at firm (at hand firmness
scale 1) and ripe stages for anatomical study.
7.2.3 Comparative anatomy of USB and RCD
7.2.3.1 Binocular microscope observation
Rectangle skin tissues ~ 2 cm width, ~ 3 - 4 cm length displaying USB and RCD symptoms were
removed using a sharp knife. Briefly, a cross section through a USB lesion was excised with a
single-edge stainless-steel blade (Proscitech, Australia). For tissues affected by RCD ~ 3 - 4 mm
depth, the underlying pulp under the skin was removed using its blunt edge of blade. These
symptomatic tissues were photographed using a digital camera (Canon DOS40D, Canon Inc.,
Japan), and with a SZH10 research stereo microscope (Olympus, Japan) equipped with Micro
Publisher 3.3 RTV camera (Q-Imaging, Germany).
7.2.3.2 Free-hand sectioning
Fruit tissues (n = 5) with and without skin browning symptoms were processed for light
microscopy. USB on ‘Honey Gold’ fruit and RCD on ‘Kensington Pride’ fruit were compared and
contrasted at the cellular level. Free-hand sections were cut through the excised tissues following
the methods of Ruzin (1999a). The tissue sections were transferred onto a drop of distilled water on
a glass microscope slide, and covered with a glass cover slip. The hand sections were viewed and
photographed with an Olympus BX61 LM equipped with a DP 70 camera (Olympus, Japan).
In order to better understand the histology, free-hand sections were stained with five different
stains:
Iodine - potassium iodide (Biolab Australia Ltd, Australia) to stain starch after Ruzin
(1999b): Sections were stained for 5 min with 1 g potassium iodine and 1 g iodine in 100 ml
distilled water.
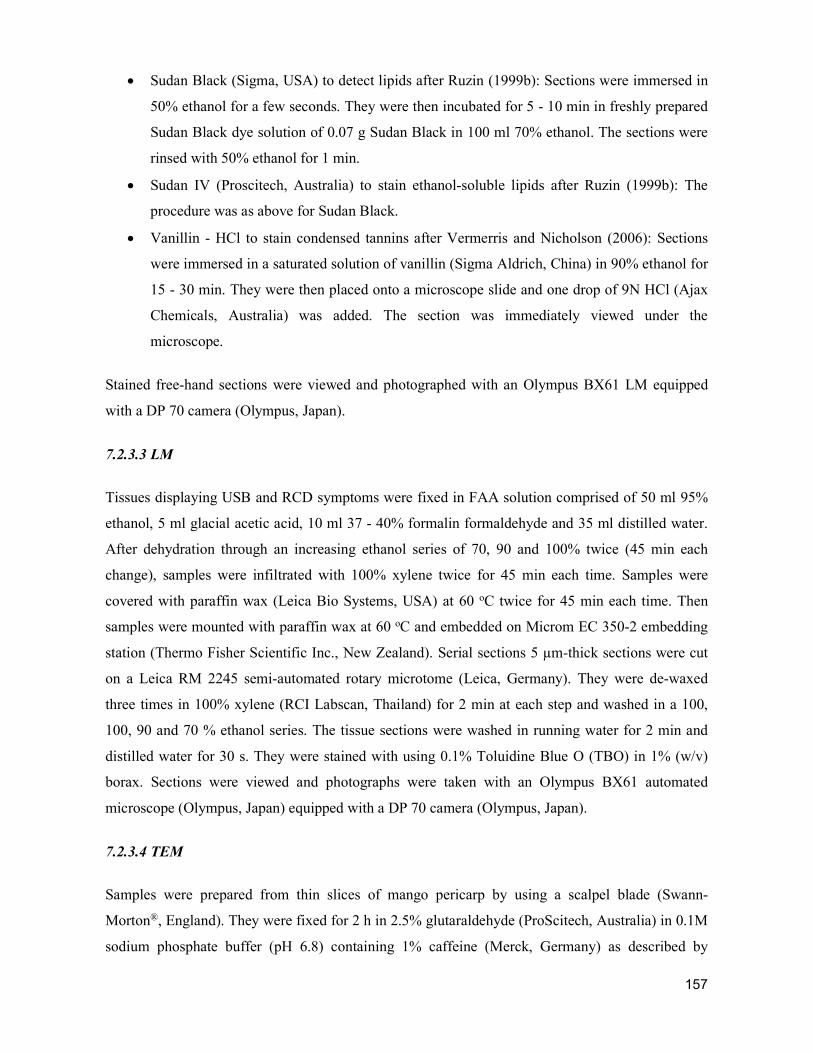
157
Sudan Black (Sigma, USA) to detect lipids after Ruzin (1999b): Sections were immersed in
50% ethanol for a few seconds. They were then incubated for 5 - 10 min in freshly prepared
Sudan Black dye solution of 0.07 g Sudan Black in 100 ml 70% ethanol. The sections were
rinsed with 50% ethanol for 1 min.
Sudan IV (Proscitech, Australia) to stain ethanol-soluble lipids after Ruzin (1999b): The
procedure was as above for Sudan Black.
Vanillin - HCl to stain condensed tannins after Vermerris and Nicholson (2006): Sections
were immersed in a saturated solution of vanillin (Sigma Aldrich, China) in 90% ethanol for
15 - 30 min. They were then placed onto a microscope slide and one drop of 9N HCl (Ajax
Chemicals, Australia) was added. The section was immediately viewed under the
microscope.
Stained free-hand sections were viewed and photographed with an Olympus BX61 LM equipped
with a DP 70 camera (Olympus, Japan).
7.2.3.3 LM
Tissues displaying USB and RCD symptoms were fixed in FAA solution comprised of 50 ml 95%
ethanol, 5 ml glacial acetic acid, 10 ml 37 - 40% formalin formaldehyde and 35 ml distilled water.
After dehydration through an increasing ethanol series of 70, 90 and 100% twice (45 min each
change), samples were infiltrated with 100% xylene twice for 45 min each time. Samples were
covered with paraffin wax (Leica Bio Systems, USA) at 60 oC twice for 45 min each time. Then
samples were mounted with paraffin wax at 60 oC and embedded on Microm EC 350-2 embedding
station (Thermo Fisher Scientific Inc., New Zealand). Serial sections 5 µm-thick sections were cut
on a Leica RM 2245 semi-automated rotary microtome (Leica, Germany). They were de-waxed
three times in 100% xylene (RCI Labscan, Thailand) for 2 min at each step and washed in a 100,
100, 90 and 70 % ethanol series. The tissue sections were washed in running water for 2 min and
distilled water for 30 s. They were stained with using 0.1% Toluidine Blue O (TBO) in 1% (w/v)
borax. Sections were viewed and photographs were taken with an Olympus BX61 automated
microscope (Olympus, Japan) equipped with a DP 70 camera (Olympus, Japan).
7.2.3.4 TEM
Samples were prepared from thin slices of mango pericarp by using a scalpel blade (Swann-
Morton®, England). They were fixed for 2 h in 2.5% glutaraldehyde (ProScitech, Australia) in 0.1M
sodium phosphate buffer (pH 6.8) containing 1% caffeine (Merck, Germany) as described by
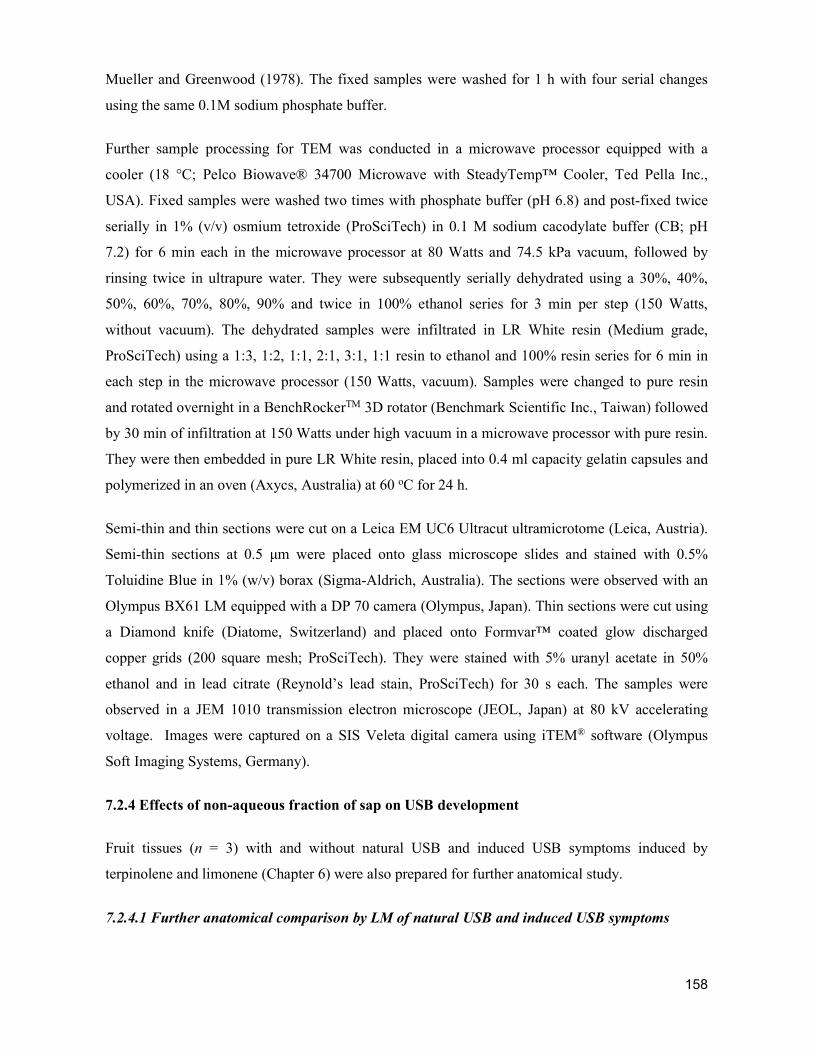
158
Mueller and Greenwood (1978). The fixed samples were washed for 1 h with four serial changes
using the same 0.1M sodium phosphate buffer.
Further sample processing for TEM was conducted in a microwave processor equipped with a
cooler (18 °C; Pelco Biowave® 34700 Microwave with SteadyTemp™ Cooler, Ted Pella Inc.,
USA). Fixed samples were washed two times with phosphate buffer (pH 6.8) and post-fixed twice
serially in 1% (v/v) osmium tetroxide (ProSciTech) in 0.1 M sodium cacodylate buffer (CB; pH
7.2) for 6 min each in the microwave processor at 80 Watts and 74.5 kPa vacuum, followed by
rinsing twice in ultrapure water. They were subsequently serially dehydrated using a 30%, 40%,
50%, 60%, 70%, 80%, 90% and twice in 100% ethanol series for 3 min per step (150 Watts,
without vacuum). The dehydrated samples were infiltrated in LR White resin (Medium grade,
ProSciTech) using a 1:3, 1:2, 1:1, 2:1, 3:1, 1:1 resin to ethanol and 100% resin series for 6 min in
each step in the microwave processor (150 Watts, vacuum). Samples were changed to pure resin
and rotated overnight in a BenchRockerTM 3D rotator (Benchmark Scientific Inc., Taiwan) followed
by 30 min of infiltration at 150 Watts under high vacuum in a microwave processor with pure resin.
They were then embedded in pure LR White resin, placed into 0.4 ml capacity gelatin capsules and
polymerized in an oven (Axycs, Australia) at 60 oC for 24 h.
Semi-thin and thin sections were cut on a Leica EM UC6 Ultracut ultramicrotome (Leica, Austria).
Semi-thin sections at 0.5 μm were placed onto glass microscope slides and stained with 0.5%
Toluidine Blue in 1% (w/v) borax (Sigma-Aldrich, Australia). The sections were observed with an
Olympus BX61 LM equipped with a DP 70 camera (Olympus, Japan). Thin sections were cut using
a Diamond knife (Diatome, Switzerland) and placed onto Formvar™ coated glow discharged
copper grids (200 square mesh; ProSciTech). They were stained with 5% uranyl acetate in 50%
ethanol and in lead citrate (Reynold’s lead stain, ProSciTech) for 30 s each. The samples were
observed in a JEM 1010 transmission electron microscope (JEOL, Japan) at 80 kV accelerating
voltage. Images were captured on a SIS Veleta digital camera using iTEM® software (Olympus
Soft Imaging Systems, Germany).
7.2.4 Effects of non-aqueous fraction of sap on USB development
Fruit tissues (n = 3) with and without natural USB and induced USB symptoms induced by
terpinolene and limonene (Chapter 6) were also prepared for further anatomical study.
7.2.4.1 Further anatomical comparison by LM of natural USB and induced USB symptoms
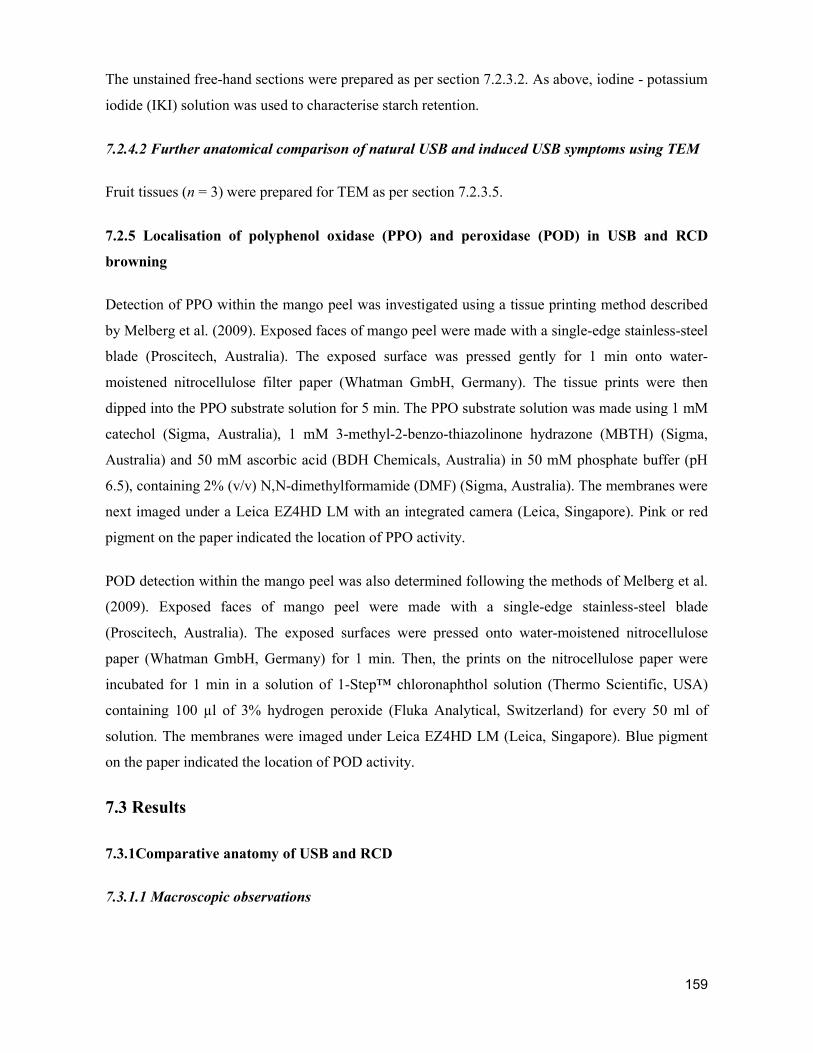
159
The unstained free-hand sections were prepared as per section 7.2.3.2. As above, iodine - potassium
iodide (IKI) solution was used to characterise starch retention.
7.2.4.2 Further anatomical comparison of natural USB and induced USB symptoms using TEM
Fruit tissues (n = 3) were prepared for TEM as per section 7.2.3.5.
7.2.5 Localisation of polyphenol oxidase (PPO) and peroxidase (POD) in USB and RCD
browning
Detection of PPO within the mango peel was investigated using a tissue printing method described
by Melberg et al. (2009). Exposed faces of mango peel were made with a single-edge stainless-steel
blade (Proscitech, Australia). The exposed surface was pressed gently for 1 min onto water-
moistened nitrocellulose filter paper (Whatman GmbH, Germany). The tissue prints were then
dipped into the PPO substrate solution for 5 min. The PPO substrate solution was made using 1 mM
catechol (Sigma, Australia), 1 mM 3-methyl-2-benzo-thiazolinone hydrazone (MBTH) (Sigma,
Australia) and 50 mM ascorbic acid (BDH Chemicals, Australia) in 50 mM phosphate buffer (pH
6.5), containing 2% (v/v) N,N-dimethylformamide (DMF) (Sigma, Australia). The membranes were
next imaged under a Leica EZ4HD LM with an integrated camera (Leica, Singapore). Pink or red
pigment on the paper indicated the location of PPO activity.
POD detection within the mango peel was also determined following the methods of Melberg et al.
(2009). Exposed faces of mango peel were made with a single-edge stainless-steel blade
(Proscitech, Australia). The exposed surfaces were pressed onto water-moistened nitrocellulose
paper (Whatman GmbH, Germany) for 1 min. Then, the prints on the nitrocellulose paper were
incubated for 1 min in a solution of 1-Step™ chloronaphthol solution (Thermo Scientific, USA)
containing 100 µl of 3% hydrogen peroxide (Fluka Analytical, Switzerland) for every 50 ml of
solution. The membranes were imaged under Leica EZ4HD LM (Leica, Singapore). Blue pigment
on the paper indicated the location of POD activity.
7.3 Results
7.3.1Comparative anatomy of USB and RCD
7.3.1.1 Macroscopic observations
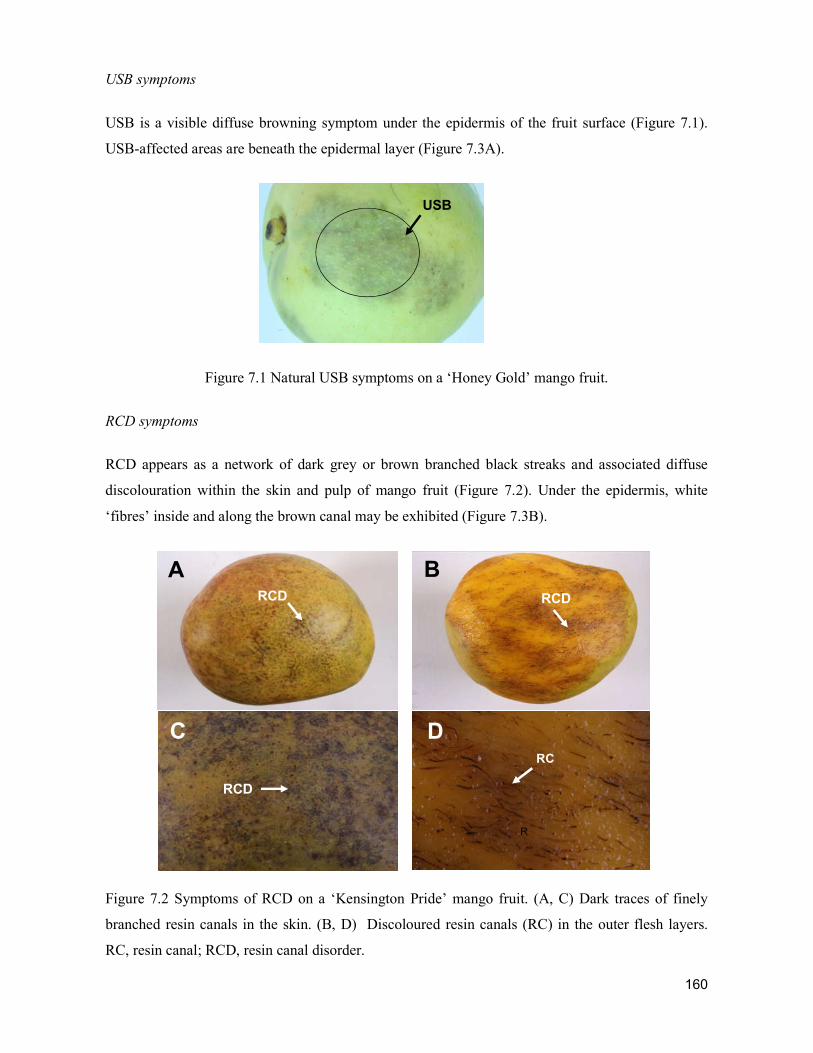
160
USB symptoms
USB is a visible diffuse browning symptom under the epidermis of the fruit surface (Figure 7.1).
USB-affected areas are beneath the epidermal layer (Figure 7.3A).
Figure 7.1 Natural USB symptoms on a ‘Honey Gold’ mango fruit.
RCD symptoms
RCD appears as a network of dark grey or brown branched black streaks and associated diffuse
discolouration within the skin and pulp of mango fruit (Figure 7.2). Under the epidermis, white
‘fibres’ inside and along the brown canal may be exhibited (Figure 7.3B).
Figure 7.2 Symptoms of RCD on a ‘Kensington Pride’ mango fruit. (A, C) Dark traces of finely
branched resin canals in the skin. (B, D) Discoloured resin canals (RC) in the outer flesh layers.
RC, resin canal; RCD, resin canal disorder.
USB
R
C D
RCD
RC
A B RCD RCD
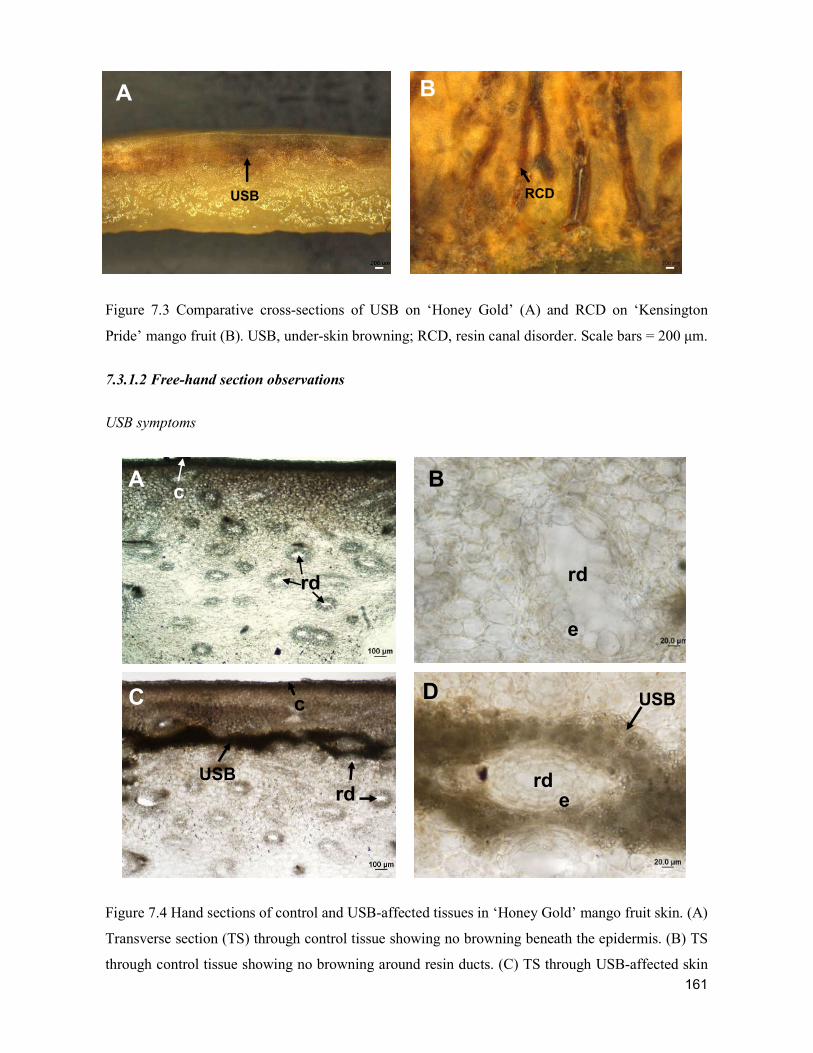
161
Figure 7.3 Comparative cross-sections of USB on ‘Honey Gold’ (A) and RCD on ‘Kensington
Pride’ mango fruit (B). USB, under-skin browning; RCD, resin canal disorder. Scale bars = 200 μm.
7.3.1.2 Free-hand section observations
USB symptoms
Figure 7.4 Hand sections of control and USB-affected tissues in ‘Honey Gold’ mango fruit skin. (A)
Transverse section (TS) through control tissue showing no browning beneath the epidermis. (B) TS
through control tissue showing no browning around resin ducts. (C) TS through USB-affected skin
USB RCD
B A
A B
rd
c
rd
e
D
rd
c
USB rd e
USB C
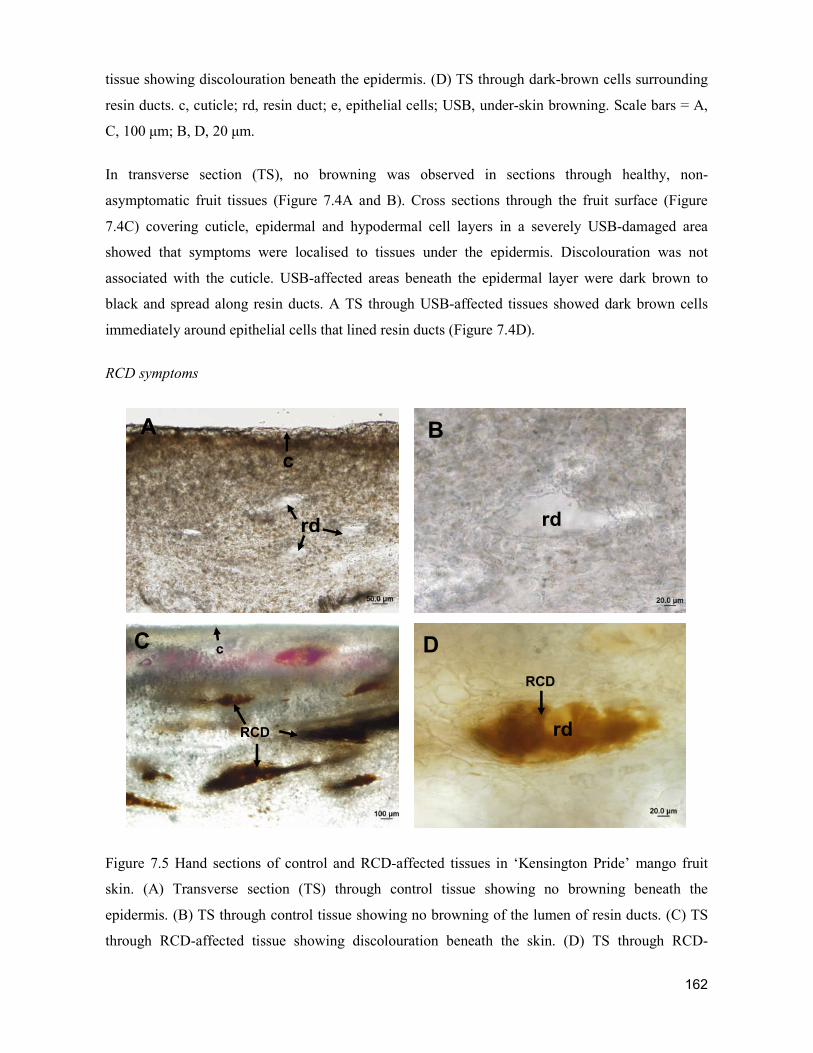
162
tissue showing discolouration beneath the epidermis. (D) TS through dark-brown cells surrounding
resin ducts. c, cuticle; rd, resin duct; e, epithelial cells; USB, under-skin browning. Scale bars = A,
C, 100 μm; B, D, 20 μm.
In transverse section (TS), no browning was observed in sections through healthy, non-
asymptomatic fruit tissues (Figure 7.4A and B). Cross sections through the fruit surface (Figure
7.4C) covering cuticle, epidermal and hypodermal cell layers in a severely USB-damaged area
showed that symptoms were localised to tissues under the epidermis. Discolouration was not
associated with the cuticle. USB-affected areas beneath the epidermal layer were dark brown to
black and spread along resin ducts. A TS through USB-affected tissues showed dark brown cells
immediately around epithelial cells that lined resin ducts (Figure 7.4D).
RCD symptoms
Figure 7.5 Hand sections of control and RCD-affected tissues in ‘Kensington Pride’ mango fruit
skin. (A) Transverse section (TS) through control tissue showing no browning beneath the
epidermis. (B) TS through control tissue showing no browning of the lumen of resin ducts. (C) TS
through RCD-affected tissue showing discolouration beneath the skin. (D) TS through RCD-
A B
rd rd
c
D C
rd
c
RCD
RCD
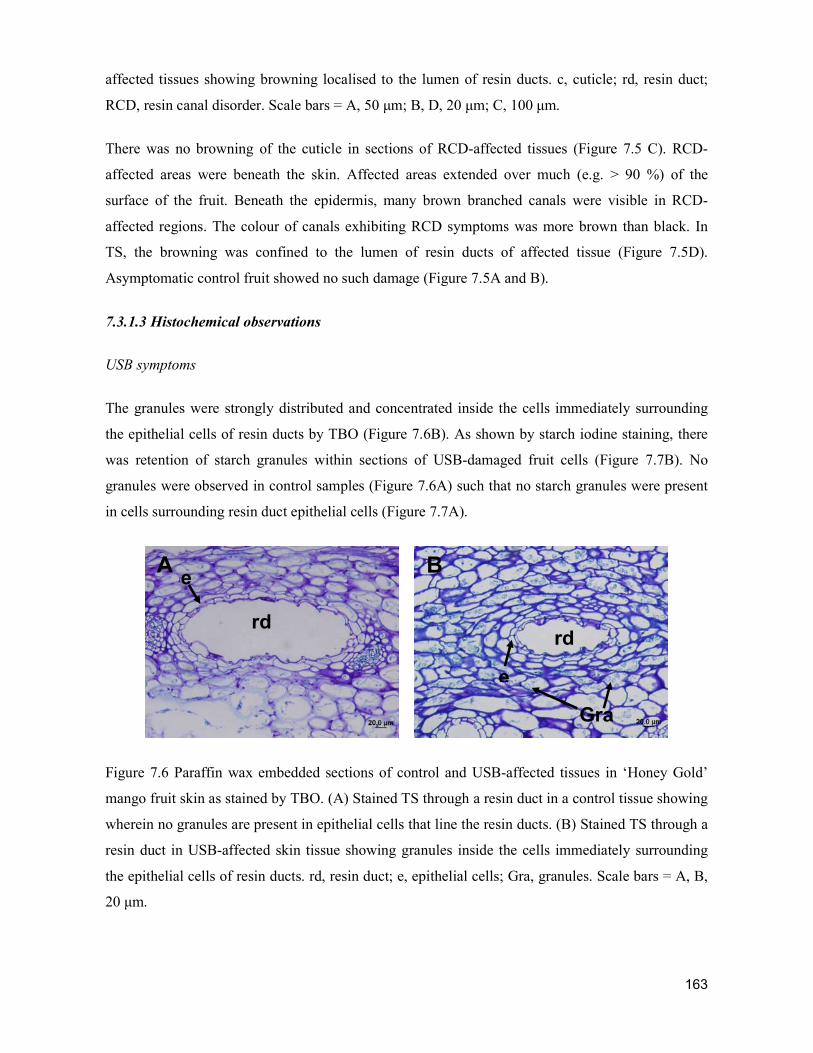
163
affected tissues showing browning localised to the lumen of resin ducts. c, cuticle; rd, resin duct;
RCD, resin canal disorder. Scale bars = A, 50 μm; B, D, 20 μm; C, 100 μm.
There was no browning of the cuticle in sections of RCD-affected tissues (Figure 7.5 C). RCD-
affected areas were beneath the skin. Affected areas extended over much (e.g. > 90 %) of the
surface of the fruit. Beneath the epidermis, many brown branched canals were visible in RCD-
affected regions. The colour of canals exhibiting RCD symptoms was more brown than black. In
TS, the browning was confined to the lumen of resin ducts of affected tissue (Figure 7.5D).
Asymptomatic control fruit showed no such damage (Figure 7.5A and B).
7.3.1.3 Histochemical observations
USB symptoms
The granules were strongly distributed and concentrated inside the cells immediately surrounding
the epithelial cells of resin ducts by TBO (Figure 7.6B). As shown by starch iodine staining, there
was retention of starch granules within sections of USB-damaged fruit cells (Figure 7.7B). No
granules were observed in control samples (Figure 7.6A) such that no starch granules were present
in cells surrounding resin duct epithelial cells (Figure 7.7A).
Figure 7.6 Paraffin wax embedded sections of control and USB-affected tissues in ‘Honey Gold’
mango fruit skin as stained by TBO. (A) Stained TS through a resin duct in a control tissue showing
wherein no granules are present in epithelial cells that line the resin ducts. (B) Stained TS through a
resin duct in USB-affected skin tissue showing granules inside the cells immediately surrounding
the epithelial cells of resin ducts. rd, resin duct; e, epithelial cells; Gra, granules. Scale bars = A, B,
20 μm.
A B
rd rd
e
e
Gra
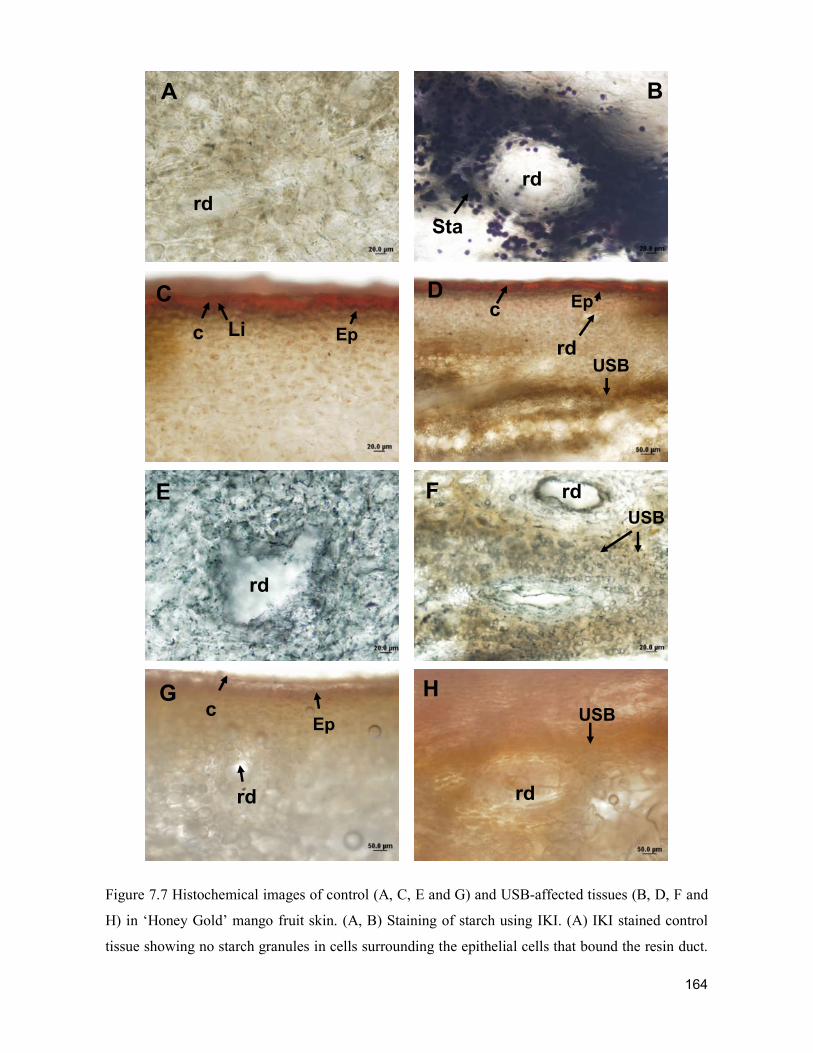
164
Figure 7.7 Histochemical images of control (A, C, E and G) and USB-affected tissues (B, D, F and
H) in ‘Honey Gold’ mango fruit skin. (A, B) Staining of starch using IKI. (A) IKI stained control
tissue showing no starch granules in cells surrounding the epithelial cells that bound the resin duct.
E
G H
A
F
B
c
rd
rd
rd
rd
Sta
rd
USB
USB Ep
rd
C D
c c
USB rd
Li Ep
Ep
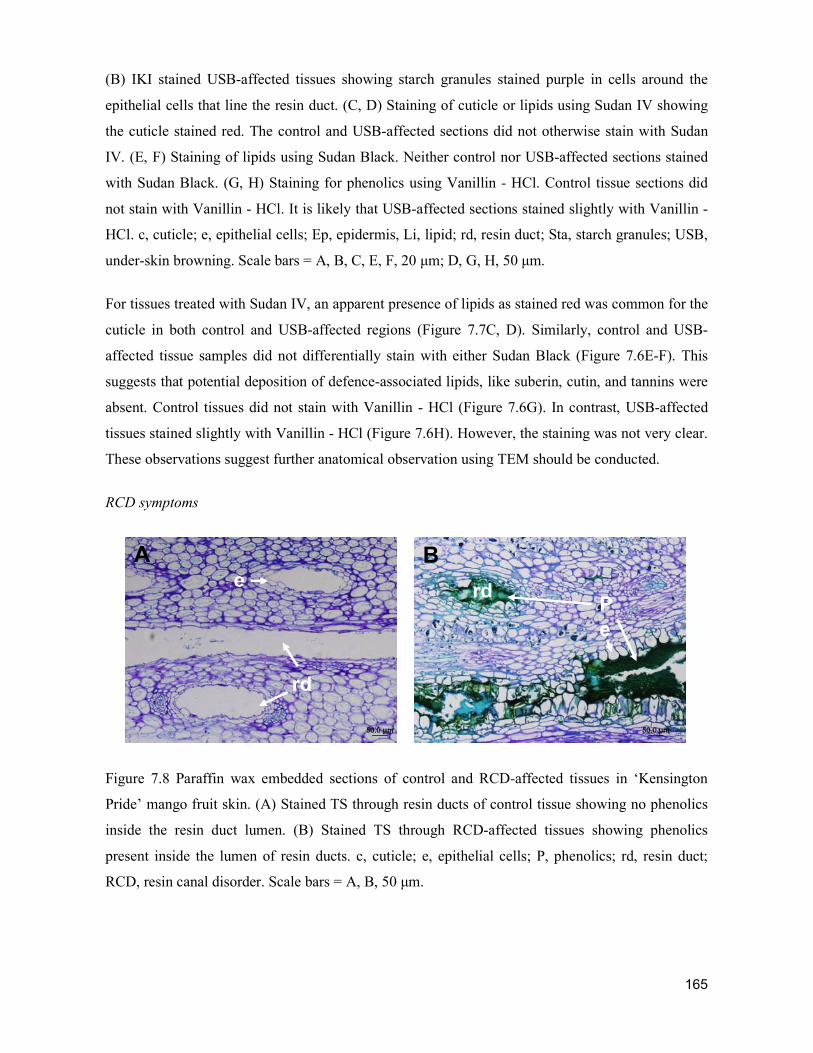
165
(B) IKI stained USB-affected tissues showing starch granules stained purple in cells around the
epithelial cells that line the resin duct. (C, D) Staining of cuticle or lipids using Sudan IV showing
the cuticle stained red. The control and USB-affected sections did not otherwise stain with Sudan
IV. (E, F) Staining of lipids using Sudan Black. Neither control nor USB-affected sections stained
with Sudan Black. (G, H) Staining for phenolics using Vanillin - HCl. Control tissue sections did
not stain with Vanillin - HCl. It is likely that USB-affected sections stained slightly with Vanillin -
HCl. c, cuticle; e, epithelial cells; Ep, epidermis, Li, lipid; rd, resin duct; Sta, starch granules; USB,
under-skin browning. Scale bars = A, B, C, E, F, 20 μm; D, G, H, 50 μm.
For tissues treated with Sudan IV, an apparent presence of lipids as stained red was common for the
cuticle in both control and USB-affected regions (Figure 7.7C, D). Similarly, control and USB-
affected tissue samples did not differentially stain with either Sudan Black (Figure 7.6E-F). This
suggests that potential deposition of defence-associated lipids, like suberin, cutin, and tannins were
absent. Control tissues did not stain with Vanillin - HCl (Figure 7.6G). In contrast, USB-affected
tissues stained slightly with Vanillin - HCl (Figure 7.6H). However, the staining was not very clear.
These observations suggest further anatomical observation using TEM should be conducted.
RCD symptoms
Figure 7.8 Paraffin wax embedded sections of control and RCD-affected tissues in ‘Kensington
Pride’ mango fruit skin. (A) Stained TS through resin ducts of control tissue showing no phenolics
inside the resin duct lumen. (B) Stained TS through RCD-affected tissues showing phenolics
present inside the lumen of resin ducts. c, cuticle; e, epithelial cells; P, phenolics; rd, resin duct;
RCD, resin canal disorder. Scale bars = A, B, 50 μm.
B A
rd
rd P
e
e
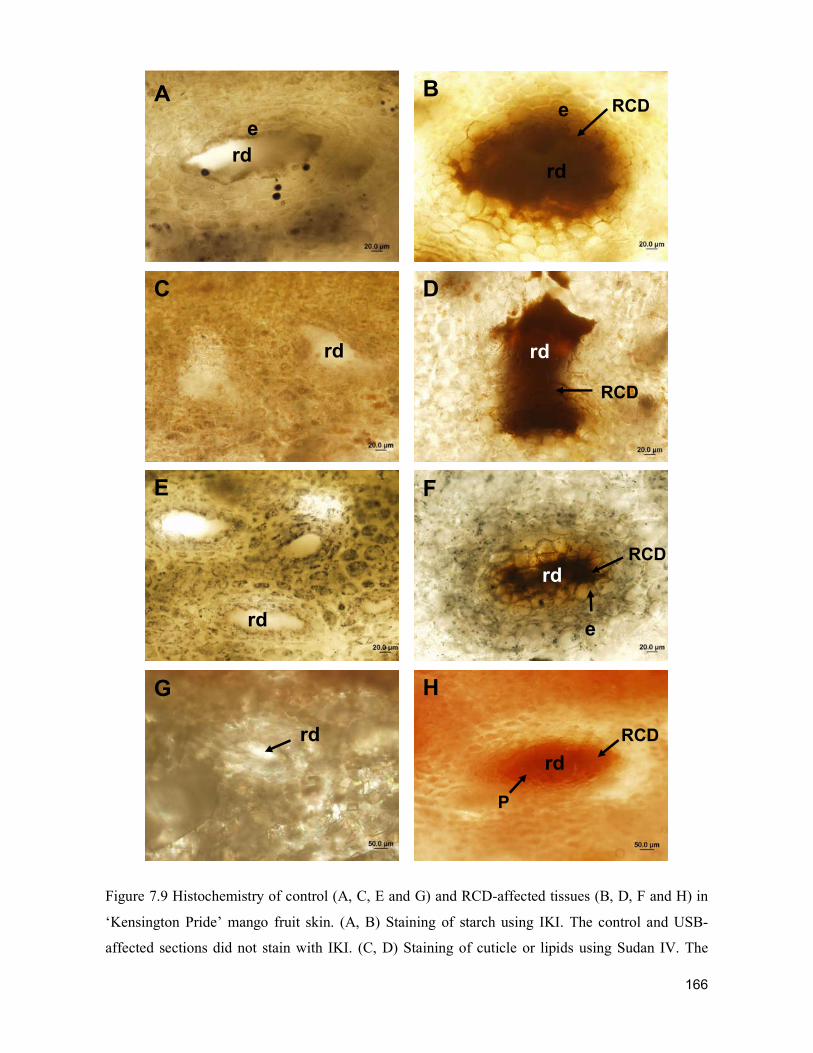
166
Figure 7.9 Histochemistry of control (A, C, E and G) and RCD-affected tissues (B, D, F and H) in
‘Kensington Pride’ mango fruit skin. (A, B) Staining of starch using IKI. The control and USB-
affected sections did not stain with IKI. (C, D) Staining of cuticle or lipids using Sudan IV. The
A B
rd rd
e e
RCD
E F
G H
rd
rd
RCD
e rd
rd
RCD
P
C D
RCD
rd rd
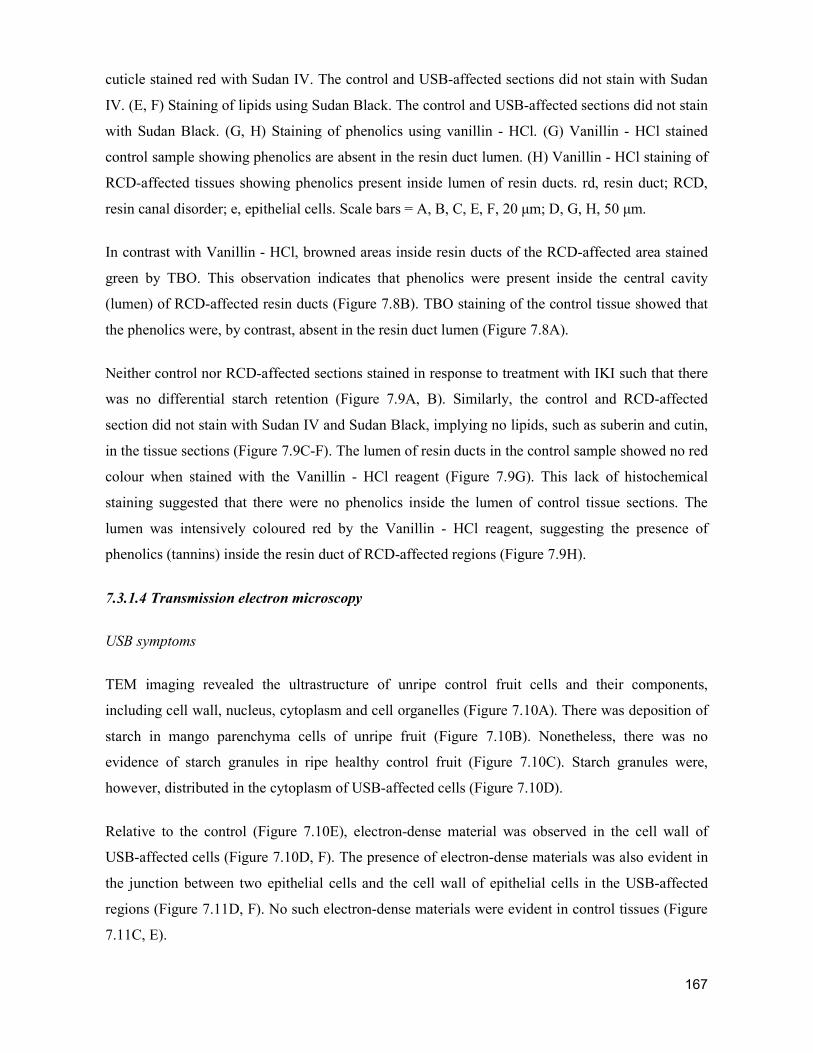
167
cuticle stained red with Sudan IV. The control and USB-affected sections did not stain with Sudan
IV. (E, F) Staining of lipids using Sudan Black. The control and USB-affected sections did not stain
with Sudan Black. (G, H) Staining of phenolics using vanillin - HCl. (G) Vanillin - HCl stained
control sample showing phenolics are absent in the resin duct lumen. (H) Vanillin - HCl staining of
RCD-affected tissues showing phenolics present inside lumen of resin ducts. rd, resin duct; RCD,
resin canal disorder; e, epithelial cells. Scale bars = A, B, C, E, F, 20 μm; D, G, H, 50 μm.
In contrast with Vanillin - HCl, browned areas inside resin ducts of the RCD-affected area stained
green by TBO. This observation indicates that phenolics were present inside the central cavity
(lumen) of RCD-affected resin ducts (Figure 7.8B). TBO staining of the control tissue showed that
the phenolics were, by contrast, absent in the resin duct lumen (Figure 7.8A).
Neither control nor RCD-affected sections stained in response to treatment with IKI such that there
was no differential starch retention (Figure 7.9A, B). Similarly, the control and RCD-affected
section did not stain with Sudan IV and Sudan Black, implying no lipids, such as suberin and cutin,
in the tissue sections (Figure 7.9C-F). The lumen of resin ducts in the control sample showed no red
colour when stained with the Vanillin - HCl reagent (Figure 7.9G). This lack of histochemical
staining suggested that there were no phenolics inside the lumen of control tissue sections. The
lumen was intensively coloured red by the Vanillin - HCl reagent, suggesting the presence of
phenolics (tannins) inside the resin duct of RCD-affected regions (Figure 7.9H).
7.3.1.4 Transmission electron microscopy
USB symptoms
TEM imaging revealed the ultrastructure of unripe control fruit cells and their components,
including cell wall, nucleus, cytoplasm and cell organelles (Figure 7.10A). There was deposition of
starch in mango parenchyma cells of unripe fruit (Figure 7.10B). Nonetheless, there was no
evidence of starch granules in ripe healthy control fruit (Figure 7.10C). Starch granules were,
however, distributed in the cytoplasm of USB-affected cells (Figure 7.10D).
Relative to the control (Figure 7.10E), electron-dense material was observed in the cell wall of
USB-affected cells (Figure 7.10D, F). The presence of electron-dense materials was also evident in
the junction between two epithelial cells and the cell wall of epithelial cells in the USB-affected
regions (Figure 7.11D, F). No such electron-dense materials were evident in control tissues (Figure
7.11C, E).
168
Figure 7.10 TEM of healthy green mature (A, B), ripe control (C, E) and ripe USB-affected cells
(D, F) in ‘Honey Gold’ mango fruit skin. (A) A normal cell showing organelles in the cytoplasm
(B). A control cell wherein no starch granules are present in the cytoplasm. (C) A control cell
wherein no starch retention and phenolic deposition are present. (D) Starch retention and phenolic
deposition present in USB-affected cell. Starch granules were partly degraded and present around
epithelial cells. (E) No such electron-dense material in the cell wall in the control. (F) Electron-
dense material evident in the cell wall of USB-affected cells. The phenolics were diffuse. cw, cell
wall; c, cuticle; Cyt, cytoplasm; de sta, degraded starch; ED, electron-dense material; e, epithelial
A B
cw
Nu
Sta
Sta cw
Cyt
Cyt
E F
cw
cw
P ED
C D
cw
Sta
de sta
cw
P Cyt
Cyt
ED
A
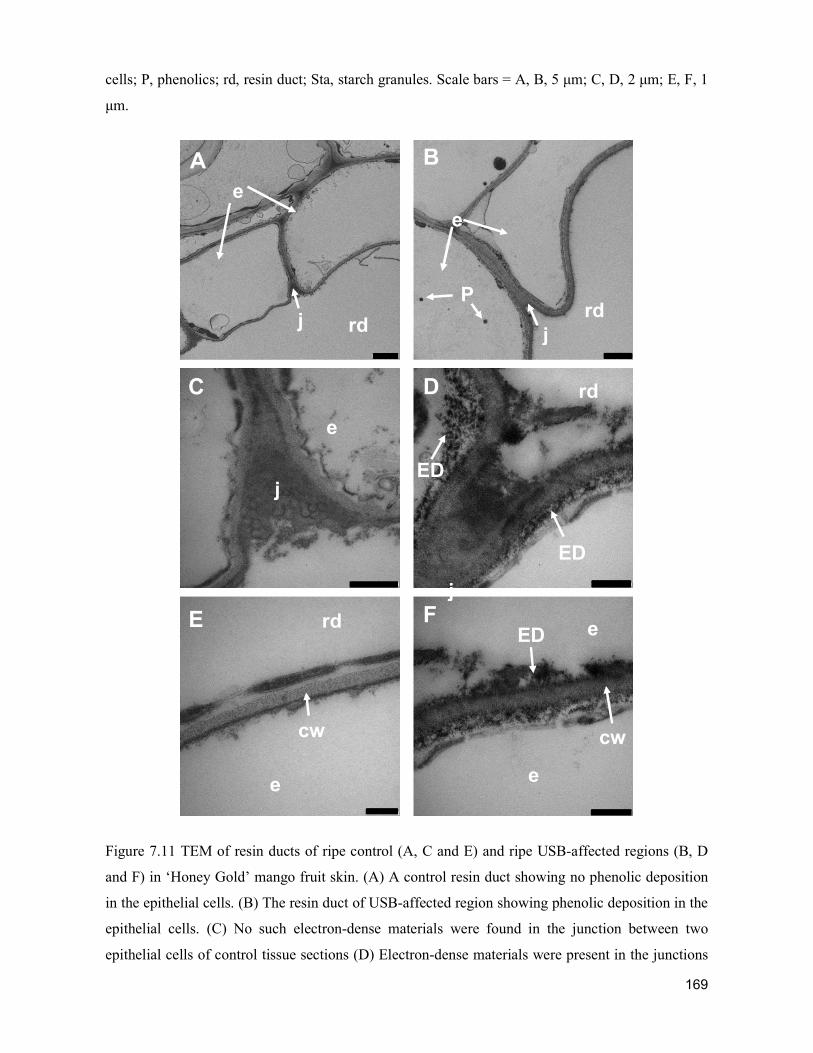
169
cells; P, phenolics; rd, resin duct; Sta, starch granules. Scale bars = A, B, 5 μm; C, D, 2 μm; E, F, 1
μm.
Figure 7.11 TEM of resin ducts of ripe control (A, C and E) and ripe USB-affected regions (B, D
and F) in ‘Honey Gold’ mango fruit skin. (A) A control resin duct showing no phenolic deposition
in the epithelial cells. (B) The resin duct of USB-affected region showing phenolic deposition in the
epithelial cells. (C) No such electron-dense materials were found in the junction between two
epithelial cells of control tissue sections (D) Electron-dense materials were present in the junctions
A B
C D
e
rd
rd
e
rd
rd
ED
ED
j
e
e
j
j
j
P
E F ED
e e
cw cw
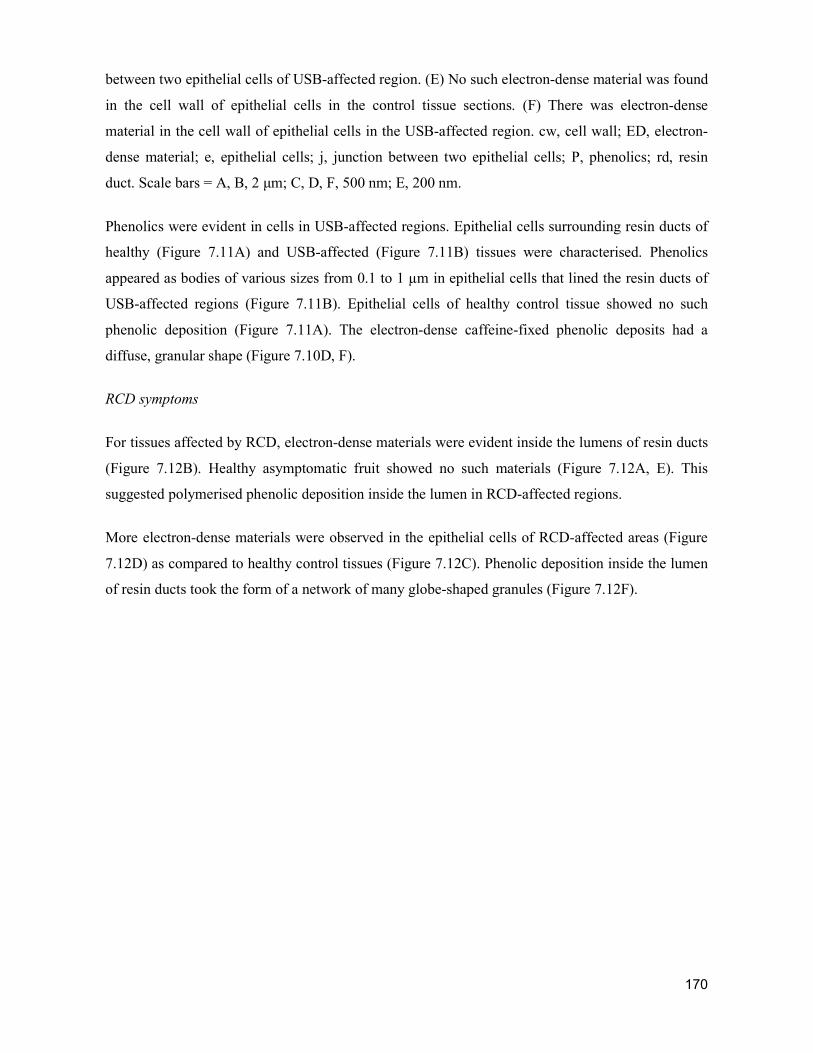
170
between two epithelial cells of USB-affected region. (E) No such electron-dense material was found
in the cell wall of epithelial cells in the control tissue sections. (F) There was electron-dense
material in the cell wall of epithelial cells in the USB-affected region. cw, cell wall; ED, electron-
dense material; e, epithelial cells; j, junction between two epithelial cells; P, phenolics; rd, resin
duct. Scale bars = A, B, 2 μm; C, D, F, 500 nm; E, 200 nm.
Phenolics were evident in cells in USB-affected regions. Epithelial cells surrounding resin ducts of
healthy (Figure 7.11A) and USB-affected (Figure 7.11B) tissues were characterised. Phenolics
appeared as bodies of various sizes from 0.1 to 1 µm in epithelial cells that lined the resin ducts of
USB-affected regions (Figure 7.11B). Epithelial cells of healthy control tissue showed no such
phenolic deposition (Figure 7.11A). The electron-dense caffeine-fixed phenolic deposits had a
diffuse, granular shape (Figure 7.10D, F).
RCD symptoms
For tissues affected by RCD, electron-dense materials were evident inside the lumens of resin ducts
(Figure 7.12B). Healthy asymptomatic fruit showed no such materials (Figure 7.12A, E). This
suggested polymerised phenolic deposition inside the lumen in RCD-affected regions.
More electron-dense materials were observed in the epithelial cells of RCD-affected areas (Figure
7.12D) as compared to healthy control tissues (Figure 7.12C). Phenolic deposition inside the lumen
of resin ducts took the form of a network of many globe-shaped granules (Figure 7.12F).
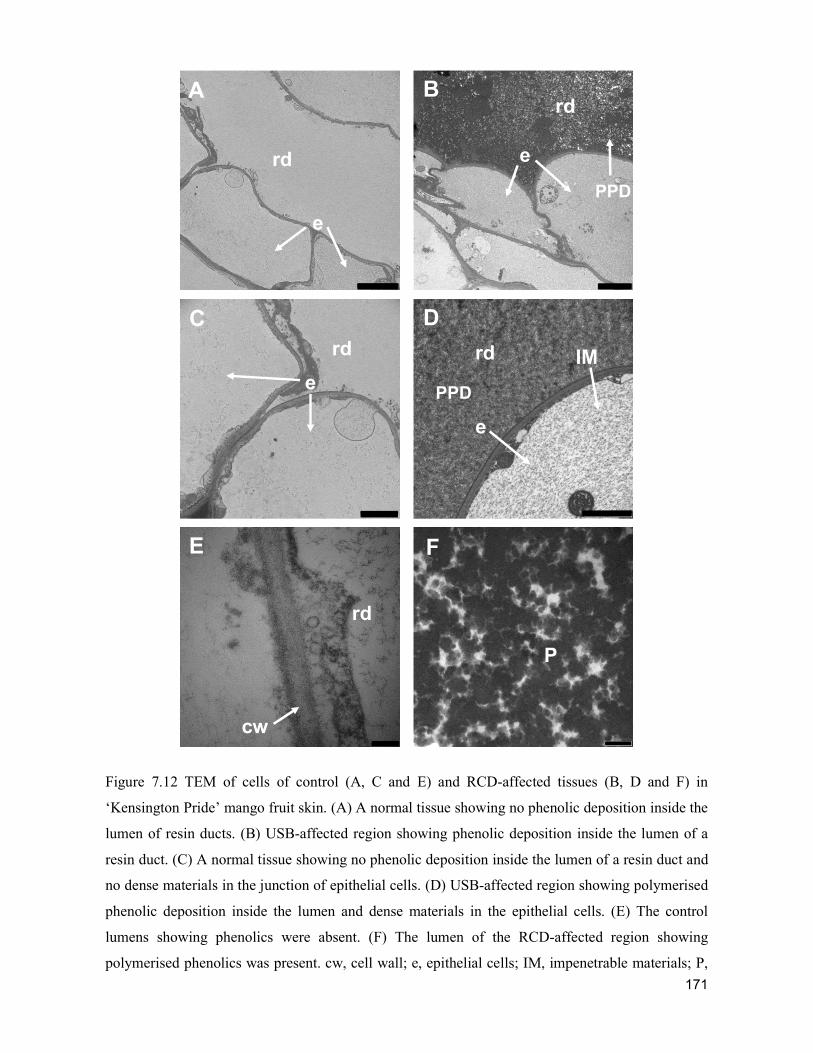
171
Figure 7.12 TEM of cells of control (A, C and E) and RCD-affected tissues (B, D and F) in
‘Kensington Pride’ mango fruit skin. (A) A normal tissue showing no phenolic deposition inside the
lumen of resin ducts. (B) USB-affected region showing phenolic deposition inside the lumen of a
resin duct. (C) A normal tissue showing no phenolic deposition inside the lumen of a resin duct and
no dense materials in the junction of epithelial cells. (D) USB-affected region showing polymerised
phenolic deposition inside the lumen and dense materials in the epithelial cells. (E) The control
lumens showing phenolics were absent. (F) The lumen of the RCD-affected region showing
polymerised phenolics was present. cw, cell wall; e, epithelial cells; IM, impenetrable materials; P,
E F
rd
e
cw
P
C D
rd
e
e
rd IM
A B
rd
rd
e
e
PPD
PPD
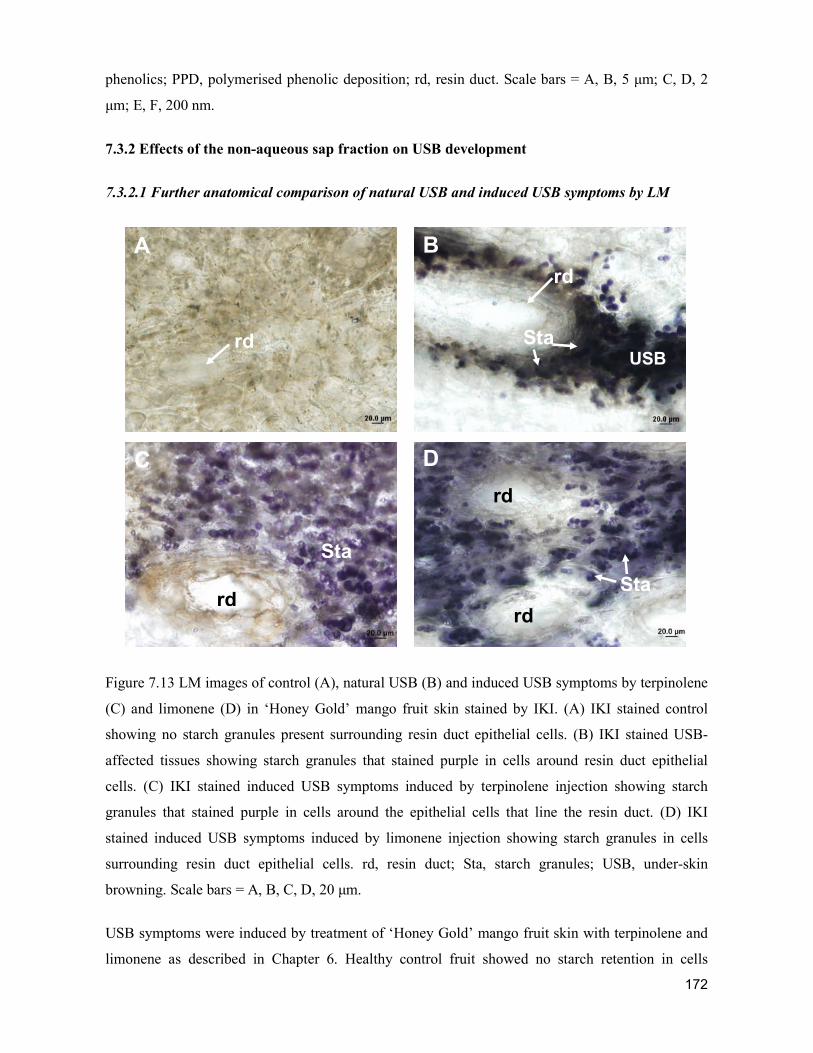
172
phenolics; PPD, polymerised phenolic deposition; rd, resin duct. Scale bars = A, B, 5 μm; C, D, 2
μm; E, F, 200 nm.
7.3.2 Effects of the non-aqueous sap fraction on USB development
7.3.2.1 Further anatomical comparison of natural USB and induced USB symptoms by LM
Figure 7.13 LM images of control (A), natural USB (B) and induced USB symptoms by terpinolene
(C) and limonene (D) in ‘Honey Gold’ mango fruit skin stained by IKI. (A) IKI stained control
showing no starch granules present surrounding resin duct epithelial cells. (B) IKI stained USB-
affected tissues showing starch granules that stained purple in cells around resin duct epithelial
cells. (C) IKI stained induced USB symptoms induced by terpinolene injection showing starch
granules that stained purple in cells around the epithelial cells that line the resin duct. (D) IKI
stained induced USB symptoms induced by limonene injection showing starch granules in cells
surrounding resin duct epithelial cells. rd, resin duct; Sta, starch granules; USB, under-skin
browning. Scale bars = A, B, C, D, 20 μm.
USB symptoms were induced by treatment of ‘Honey Gold’ mango fruit skin with terpinolene and
limonene as described in Chapter 6. Healthy control fruit showed no starch retention in cells
A
rd
rd
Sta
C
rd
Sta
D
Sta
rd
rd
B
USB
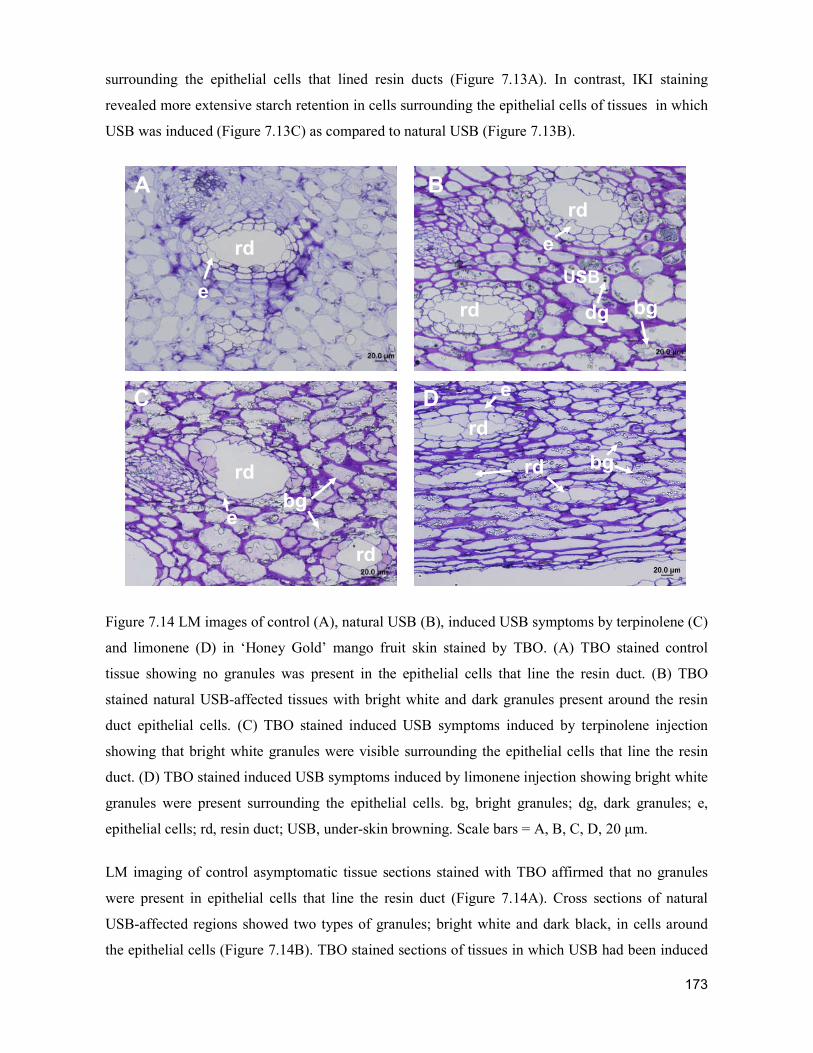
173
surrounding the epithelial cells that lined resin ducts (Figure 7.13A). In contrast, IKI staining
revealed more extensive starch retention in cells surrounding the epithelial cells of tissues in which
USB was induced (Figure 7.13C) as compared to natural USB (Figure 7.13B).
Figure 7.14 LM images of control (A), natural USB (B), induced USB symptoms by terpinolene (C)
and limonene (D) in ‘Honey Gold’ mango fruit skin stained by TBO. (A) TBO stained control
tissue showing no granules was present in the epithelial cells that line the resin duct. (B) TBO
stained natural USB-affected tissues with bright white and dark granules present around the resin
duct epithelial cells. (C) TBO stained induced USB symptoms induced by terpinolene injection
showing that bright white granules were visible surrounding the epithelial cells that line the resin
duct. (D) TBO stained induced USB symptoms induced by limonene injection showing bright white
granules were present surrounding the epithelial cells. bg, bright granules; dg, dark granules; e,
epithelial cells; rd, resin duct; USB, under-skin browning. Scale bars = A, B, C, D, 20 μm.
LM imaging of control asymptomatic tissue sections stained with TBO affirmed that no granules
were present in epithelial cells that line the resin duct (Figure 7.14A). Cross sections of natural
USB-affected regions showed two types of granules; bright white and dark black, in cells around
the epithelial cells (Figure 7.14B). TBO stained sections of tissues in which USB had been induced
A B
C D
rd
rd
rd
rd
rd
rd
rd
e
dg
bg
bg
e
e
e
USB
bg
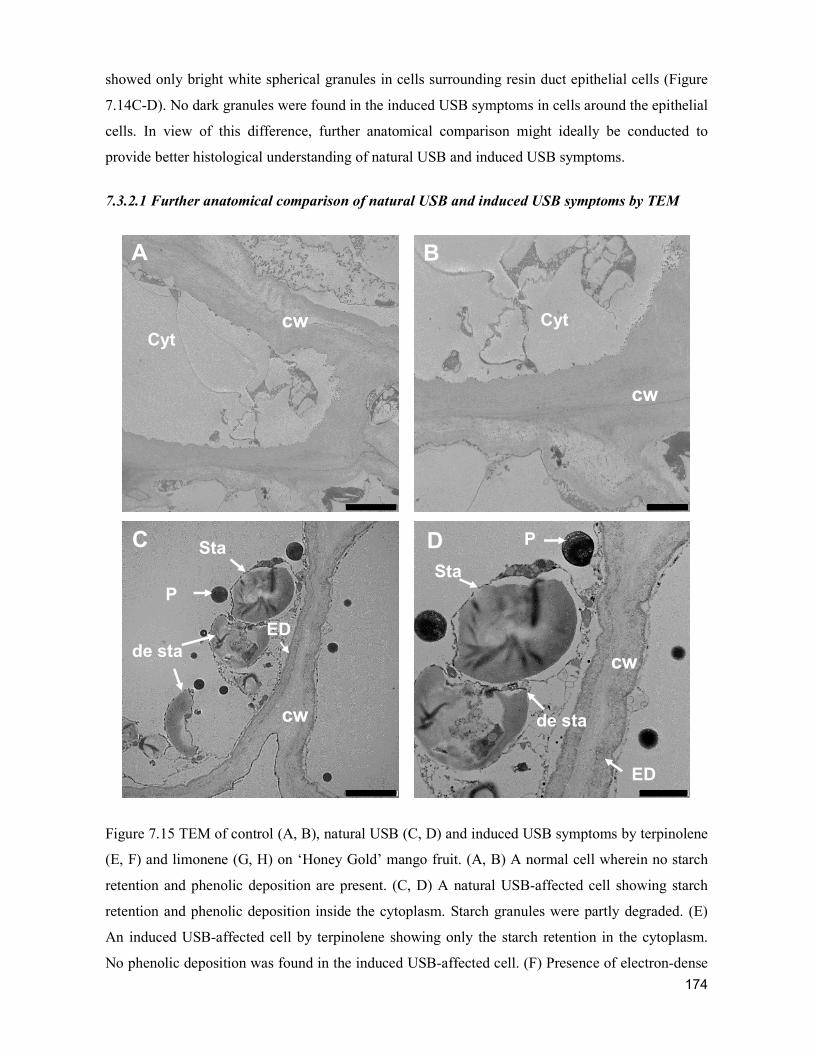
174
showed only bright white spherical granules in cells surrounding resin duct epithelial cells (Figure
7.14C-D). No dark granules were found in the induced USB symptoms in cells around the epithelial
cells. In view of this difference, further anatomical comparison might ideally be conducted to
provide better histological understanding of natural USB and induced USB symptoms.
7.3.2.1 Further anatomical comparison of natural USB and induced USB symptoms by TEM
Figure 7.15 TEM of control (A, B), natural USB (C, D) and induced USB symptoms by terpinolene
(E, F) and limonene (G, H) on ‘Honey Gold’ mango fruit. (A, B) A normal cell wherein no starch
retention and phenolic deposition are present. (C, D) A natural USB-affected cell showing starch
retention and phenolic deposition inside the cytoplasm. Starch granules were partly degraded. (E)
An induced USB-affected cell by terpinolene showing only the starch retention in the cytoplasm.
No phenolic deposition was found in the induced USB-affected cell. (F) Presence of electron-dense
A B
cw
cw
Cyt Cyt
C D
cw
cw
ED
Sta
Sta P
de sta
P
de sta
ED
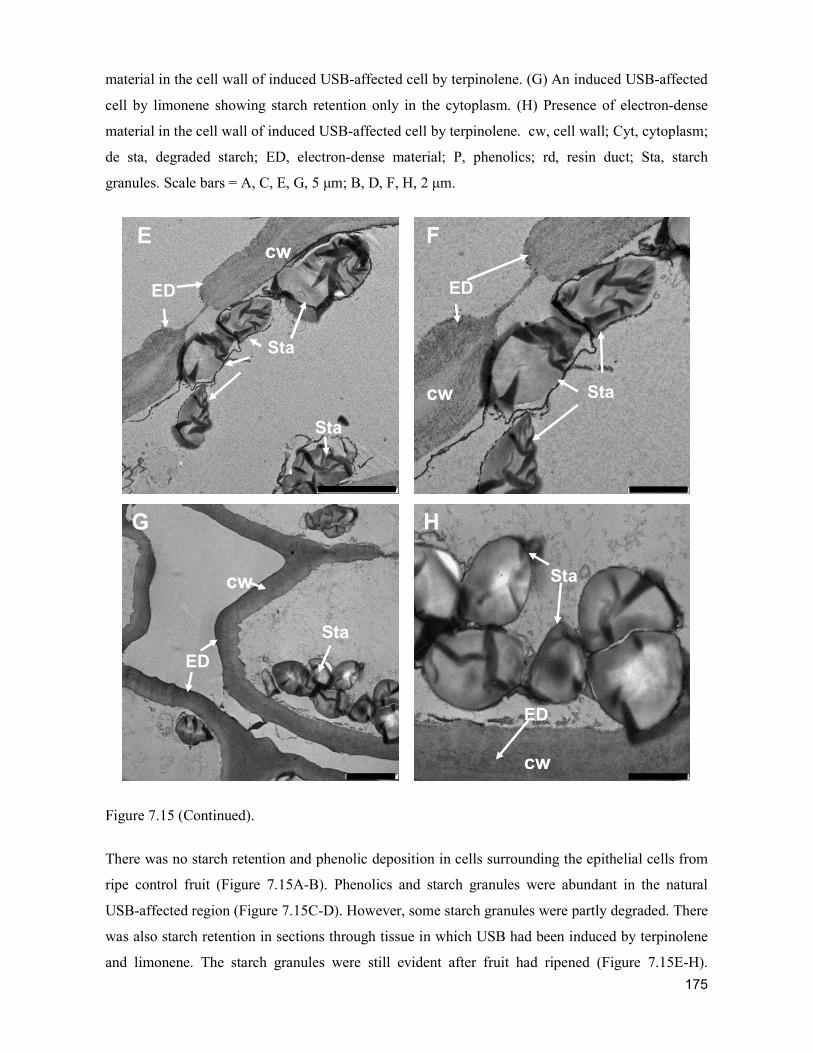
175
material in the cell wall of induced USB-affected cell by terpinolene. (G) An induced USB-affected
cell by limonene showing starch retention only in the cytoplasm. (H) Presence of electron-dense
material in the cell wall of induced USB-affected cell by terpinolene. cw, cell wall; Cyt, cytoplasm;
de sta, degraded starch; ED, electron-dense material; P, phenolics; rd, resin duct; Sta, starch
granules. Scale bars = A, C, E, G, 5 μm; B, D, F, H, 2 μm.
Figure 7.15 (Continued).
There was no starch retention and phenolic deposition in cells surrounding the epithelial cells from
ripe control fruit (Figure 7.15A-B). Phenolics and starch granules were abundant in the natural
USB-affected region (Figure 7.15C-D). However, some starch granules were partly degraded. There
was also starch retention in sections through tissue in which USB had been induced by terpinolene
and limonene. The starch granules were still evident after fruit had ripened (Figure 7.15E-H).
E F cw
cw Sta
Sta
Sta
ED ED
G H
cw
cw
ED
Sta
Sta
ED
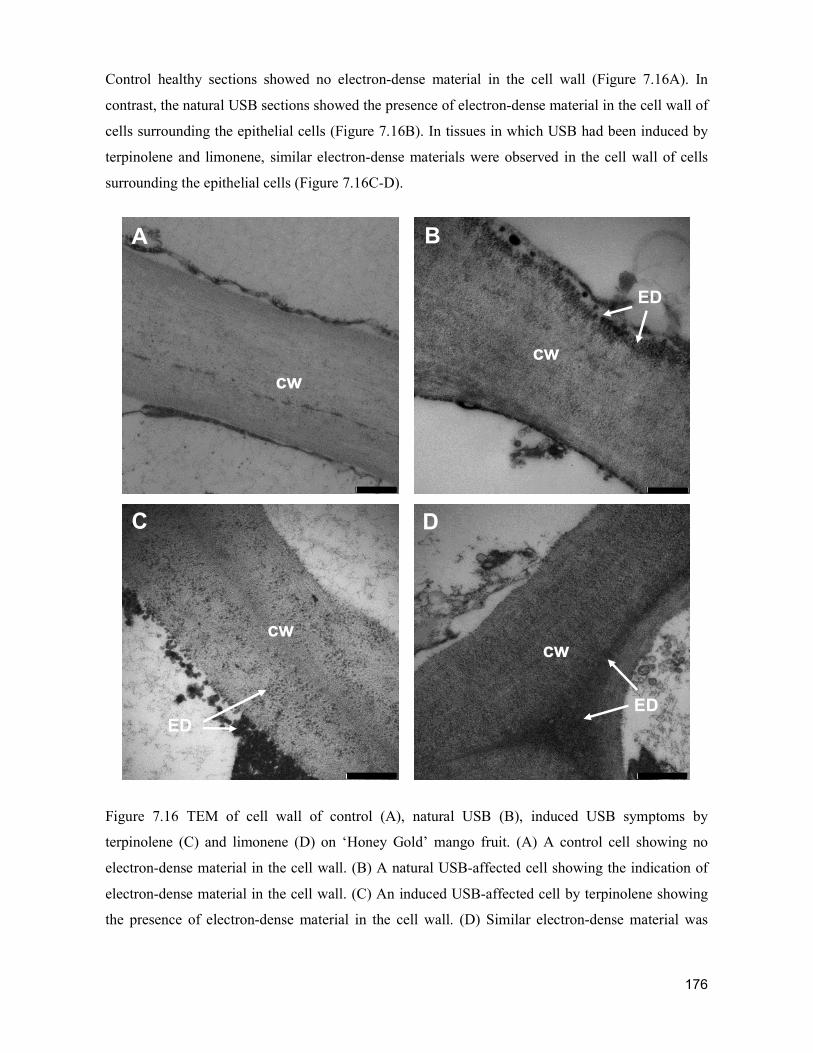
176
Control healthy sections showed no electron-dense material in the cell wall (Figure 7.16A). In
contrast, the natural USB sections showed the presence of electron-dense material in the cell wall of
cells surrounding the epithelial cells (Figure 7.16B). In tissues in which USB had been induced by
terpinolene and limonene, similar electron-dense materials were observed in the cell wall of cells
surrounding the epithelial cells (Figure 7.16C-D).
Figure 7.16 TEM of cell wall of control (A), natural USB (B), induced USB symptoms by
terpinolene (C) and limonene (D) on ‘Honey Gold’ mango fruit. (A) A control cell showing no
electron-dense material in the cell wall. (B) A natural USB-affected cell showing the indication of
electron-dense material in the cell wall. (C) An induced USB-affected cell by terpinolene showing
the presence of electron-dense material in the cell wall. (D) Similar electron-dense material was
A B
C D
cw cw
cw
cw
ED
ED ED
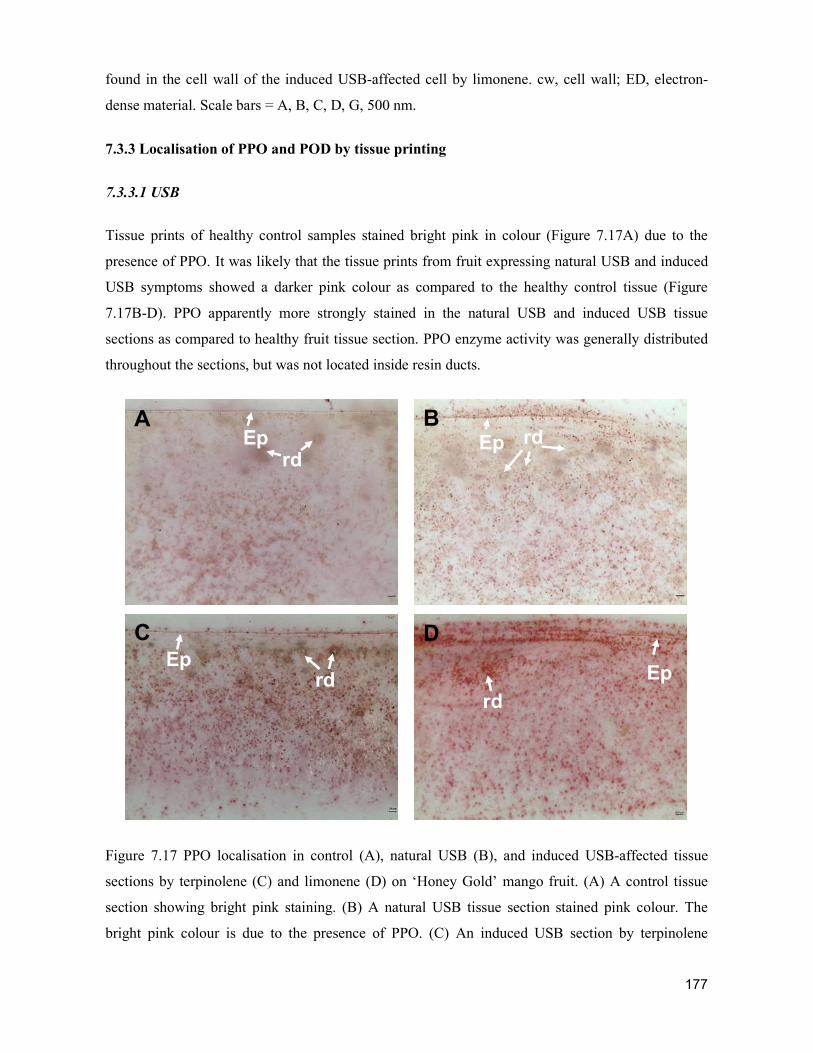
177
found in the cell wall of the induced USB-affected cell by limonene. cw, cell wall; ED, electron-
dense material. Scale bars = A, B, C, D, G, 500 nm.
7.3.3 Localisation of PPO and POD by tissue printing
7.3.3.1 USB
Tissue prints of healthy control samples stained bright pink in colour (Figure 7.17A) due to the
presence of PPO. It was likely that the tissue prints from fruit expressing natural USB and induced
USB symptoms showed a darker pink colour as compared to the healthy control tissue (Figure
7.17B-D). PPO apparently more strongly stained in the natural USB and induced USB tissue
sections as compared to healthy fruit tissue section. PPO enzyme activity was generally distributed
throughout the sections, but was not located inside resin ducts.
Figure 7.17 PPO localisation in control (A), natural USB (B), and induced USB-affected tissue
sections by terpinolene (C) and limonene (D) on ‘Honey Gold’ mango fruit. (A) A control tissue
section showing bright pink staining. (B) A natural USB tissue section stained pink colour. The
bright pink colour is due to the presence of PPO. (C) An induced USB section by terpinolene
A B
C D
Ep Ep
Ep Ep
rd rd
rd rd
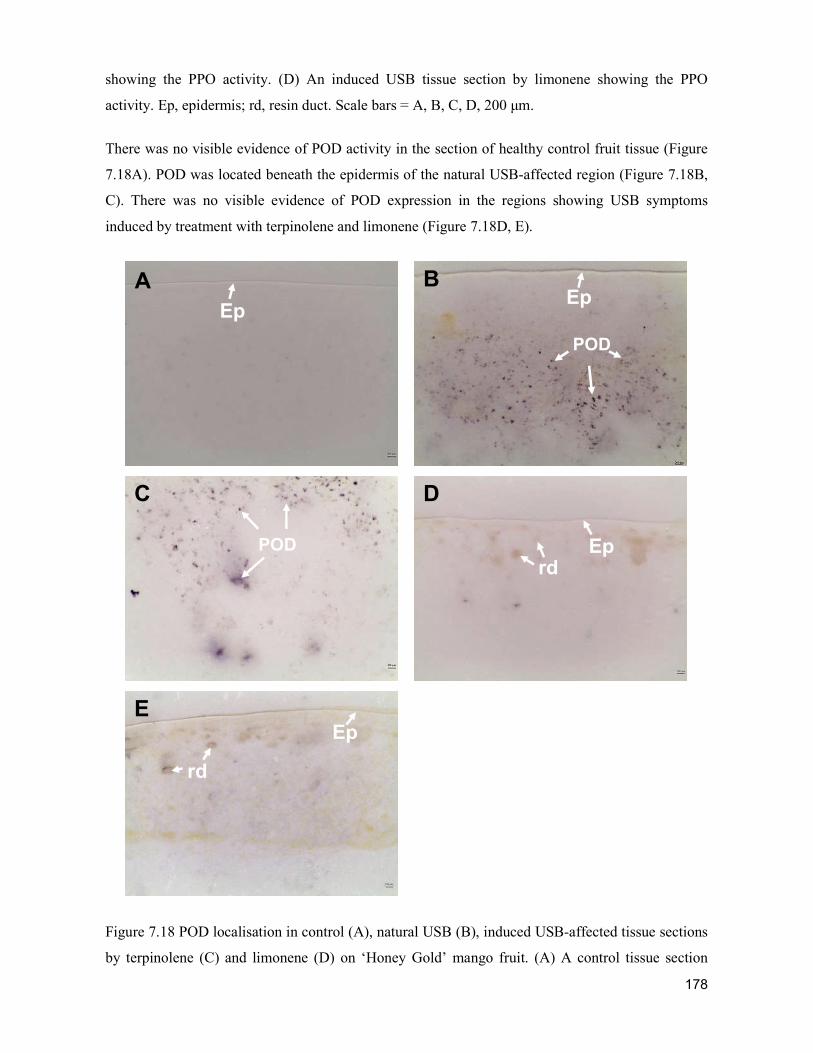
178
showing the PPO activity. (D) An induced USB tissue section by limonene showing the PPO
activity. Ep, epidermis; rd, resin duct. Scale bars = A, B, C, D, 200 μm.
There was no visible evidence of POD activity in the section of healthy control fruit tissue (Figure
7.18A). POD was located beneath the epidermis of the natural USB-affected region (Figure 7.18B,
C). There was no visible evidence of POD expression in the regions showing USB symptoms
induced by treatment with terpinolene and limonene (Figure 7.18D, E).
Figure 7.18 POD localisation in control (A), natural USB (B), induced USB-affected tissue sections
by terpinolene (C) and limonene (D) on ‘Honey Gold’ mango fruit. (A) A control tissue section
A B
C D
E
Ep Ep
POD
POD
Ep
Ep
rd
rd
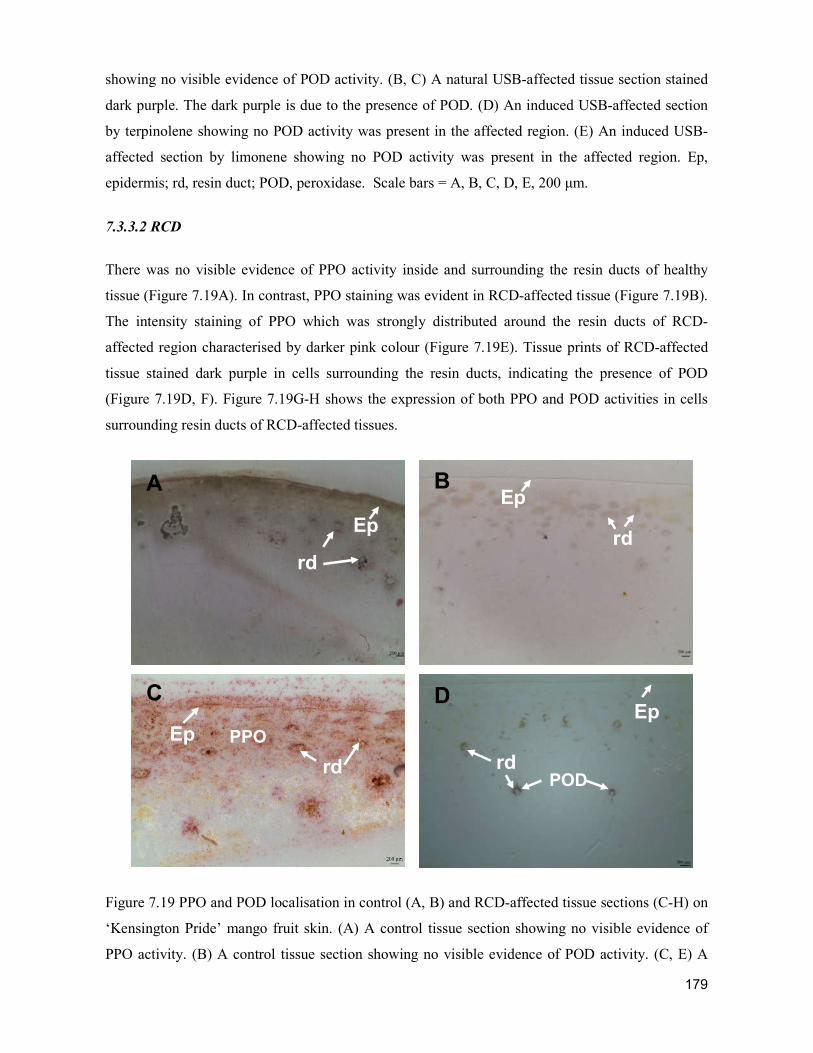
179
showing no visible evidence of POD activity. (B, C) A natural USB-affected tissue section stained
dark purple. The dark purple is due to the presence of POD. (D) An induced USB-affected section
by terpinolene showing no POD activity was present in the affected region. (E) An induced USB-
affected section by limonene showing no POD activity was present in the affected region. Ep,
epidermis; rd, resin duct; POD, peroxidase. Scale bars = A, B, C, D, E, 200 μm.
7.3.3.2 RCD
There was no visible evidence of PPO activity inside and surrounding the resin ducts of healthy
tissue (Figure 7.19A). In contrast, PPO staining was evident in RCD-affected tissue (Figure 7.19B).
The intensity staining of PPO which was strongly distributed around the resin ducts of RCD-
affected region characterised by darker pink colour (Figure 7.19E). Tissue prints of RCD-affected
tissue stained dark purple in cells surrounding the resin ducts, indicating the presence of POD
(Figure 7.19D, F). Figure 7.19G-H shows the expression of both PPO and POD activities in cells
surrounding resin ducts of RCD-affected tissues.
Figure 7.19 PPO and POD localisation in control (A, B) and RCD-affected tissue sections (C-H) on
‘Kensington Pride’ mango fruit skin. (A) A control tissue section showing no visible evidence of
PPO activity. (B) A control tissue section showing no visible evidence of POD activity. (C, E) A
D
B
C
A Ep
Ep rd
rd
Ep
rd
Ep
rd POD
PPO
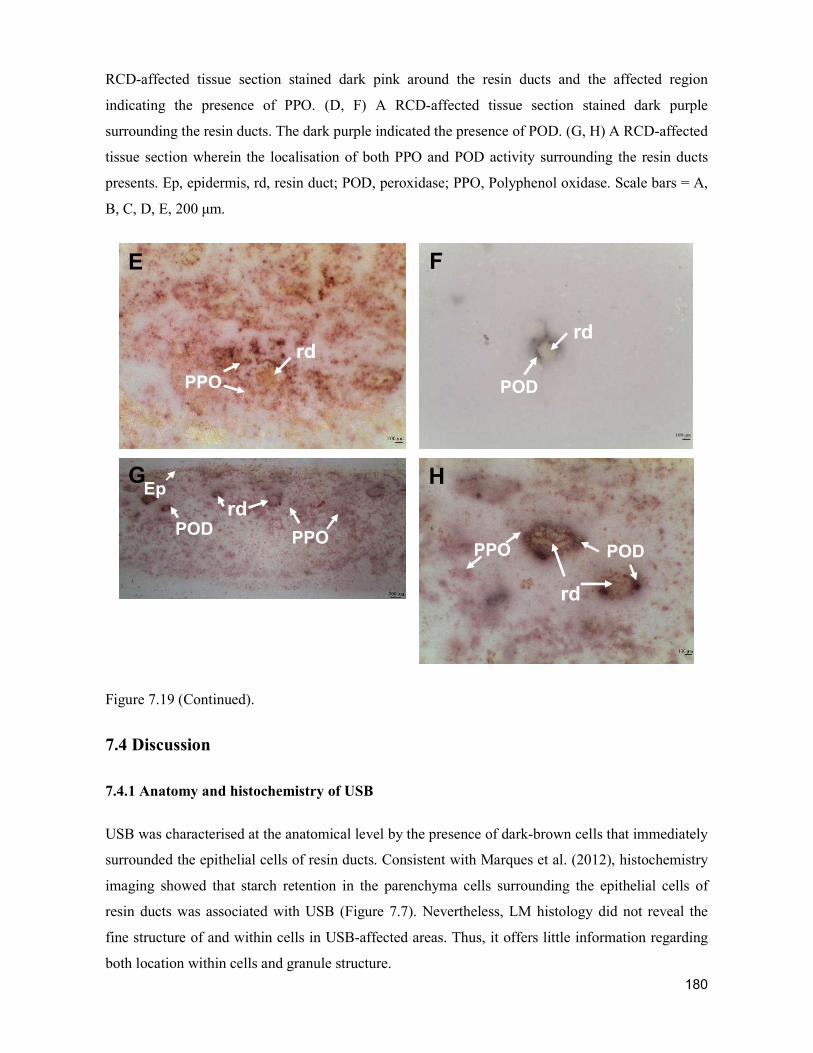
180
RCD-affected tissue section stained dark pink around the resin ducts and the affected region
indicating the presence of PPO. (D, F) A RCD-affected tissue section stained dark purple
surrounding the resin ducts. The dark purple indicated the presence of POD. (G, H) A RCD-affected
tissue section wherein the localisation of both PPO and POD activity surrounding the resin ducts
presents. Ep, epidermis, rd, resin duct; POD, peroxidase; PPO, Polyphenol oxidase. Scale bars = A,
B, C, D, E, 200 μm.
Figure 7.19 (Continued).
7.4 Discussion
7.4.1 Anatomy and histochemistry of USB
USB was characterised at the anatomical level by the presence of dark-brown cells that immediately
surrounded the epithelial cells of resin ducts. Consistent with Marques et al. (2012), histochemistry
imaging showed that starch retention in the parenchyma cells surrounding the epithelial cells of
resin ducts was associated with USB (Figure 7.7). Nevertheless, LM histology did not reveal the
fine structure of and within cells in USB-affected areas. Thus, it offers little information regarding
both location within cells and granule structure.
E F
G H
POD
rd rd
PPO
rd
rd
POD PPO
Ep
POD PPO
181
TEM observations affirmed that the parenchyma cells of unripe fruit contained starch in the form of
granules which otherwise would be converted into sugars during ripening (Figure 7.10B). Simão et
al. (2008) reported the retention of starch in cells of unripe ‘Keitt’ mango fruit. Espinosa-Solis et al.
(2009) showed that starch granules of ‘Tommy Atkins’ mango fruit had spherical dome shapes
using SEM. Based on TEM imaging, the starch granules observed in ‘Honey Gold’ fruit in the
current study were partially degraded (Figure 7.10D) in USB-affected tissues at the ripe stage. By
contrast, starch granules were intact in the parenchyma cells of fruit tissue at green mature stage
(Figure 7.10B). Somewhat similarly, Jacobi and Gowanlock (1995) reported that starch granules
were located in the mesocarp of heat-treated ripe ‘Kensington’ mango fruit due to the prevention of
enzyme activities related to carbohydrate metabolism. No starch granules were observed in the
epithelial cells within both control and natural USB-affected tissues at the ripe stage such that there
was no starch retention in the epithelial cells of mature-green fruit.
In addition, phenolics were present as granular bodies of various sizes ranging from 0.1 to 1 µm
surrounding the epithelial cells of USB-affected tissue (Figure 7.11B). Electron-dense phenolic
materialwas found in the boundaries of the junctions and cell wall of epithelial cells in the USB-
affected areas (Figure 7.11D, F). No such electron-dense materials were observed in this region of
control tissue sections (Figure 7.11C, E). This suggested that there was an apoplast in the cell wall.
Jacobi and Gowanlock (1995) also noted that heat treatments of ‘Kensington Pride’ mango fruit
caused phenolic as well as starch retention in mesocarp parenchyma cells. Similarly, traumatic resin
ducts in conifers with parenchyma cells in the phloem contained starch granules and phenolics
(Krokene et al., 2008). These TEM results supported the idea that the inhibition of starch
degradation and phenolic deposition in USB were related to the self-defence to an external stress.
7.4.2 Anatomy and histochemistry of RCD
In contrast to USB, RCD was distinguished by localised browning of the lumen of resin ducts.
Histological examination revealed phenolics (tannins) inside the lumen of resin ducts in RCD-
affected epidermal tissue. TEM imaging confirmed the presence of polymerised phenolics inside
resin duct lumen. Polyphenolic parenchyma cells containing phenolics and starch granules are
associated with defence in many conifers (Krokene et al., 2008). Resin, produced in resin ducts, is a
prominent defence constituent in many conifer families (Phillips and Croteau, 1999; Ruel et al.,
1998). Resin or exudate gum, synthesised in secretory ducts in cashew trees, can inhibit the
development of some bacteria, fungi and insects (Marques et al., 1992; Miranda, 2009) It is likely
that a combination of production factors contribute to fruit susceptibility, along with a combination
182
of postharvest factors that generate symptom expression (Macnish et al., 2014). Like USB, natural
defence mechanisms seem to be associated with RCD development.
7.4.3 Effects of non-aqueous fraction of sap on USB development
The histology of LM sections from fruit in which USB had been induced by two major components
of non-aqueous fraction (terpinolene and limonene) revealed no apparent differences as compared
to fruit with natural USB symptoms (Figure 7.13). Nonetheless, starch granules were present
relatively more densely in cells surrounding the epithelial cells and also distributed further from the
resin ducts in tissues in which USB had been induced as compared to in natural USB sections.
Preservation of starch grains in USB-affected tissue in ripe fruit was apparently due to the inhibition
of starch degradation (Figure 7.10D). Moreover, two different types of granules, bright white and
dark, were present in cells surrounding the epithelial cells of natural USB (Figure 7.14B). In
contrast, there were only spherical granules in cell layers surrounding the epithelial cells of induced
USB symptoms (Figure 7.14C-D). Further anatomical comparison by TEM should be conducted to
provide better histological understanding of natural versus induced USB symptoms.
TEM imaging revealed phenolics and starch granules in tissues showing natural USB (Figure
7.15C, D). However, only starch granules were retained in the sections of tissues in which USB
had been induced USB. Starch grains in the induced USB tissue sections remained intact and were
not degraded during fruit ripening (Figure 7.15E-H). Thus, high amounts of terpinolene and
limonene (100 µl) resulted in the inhibition of starch degradation. Terpenoid compounds including
terpinolene, 3-carene and limonene are major components of the non-aqueous fraction of mango sap
(Loveys et al., 1992). Terpinolene and limonene possibly interfered with and/or damaged cell
membranes leading to cell decompartmentalisation. Regarding a putative role in defence, Martin et
al. (2002) reported that terpenoids accumulated upon induction of traumatic resin ducts using
methyl jasmonate treatment.
USB is seemingly a discolouration of the latex vessels, which spreads to surrounding tissues
(Hofman et al., 2010b). It is possible that terpenoids diffuse from affected resin ducts into their
surrounding epithelial cells and thence onto cell layers surrounding the epithelial cells. The
reactions quite evidently retarded the starch degradation and promoted phenolic accumulation in
parenchyma cells surrounding the epithelial cells that line resin ducts in USB-affected regions.
(Krokene et al., 2008) considered the presence of starch granules and phenolics in parenchyma cells
of traumatic resin ducts in conifers as defense responses against biotic or abiotic stress. Electron-
dense regions were observed in the walls of cells surrounding epithelial cells of USB and induced
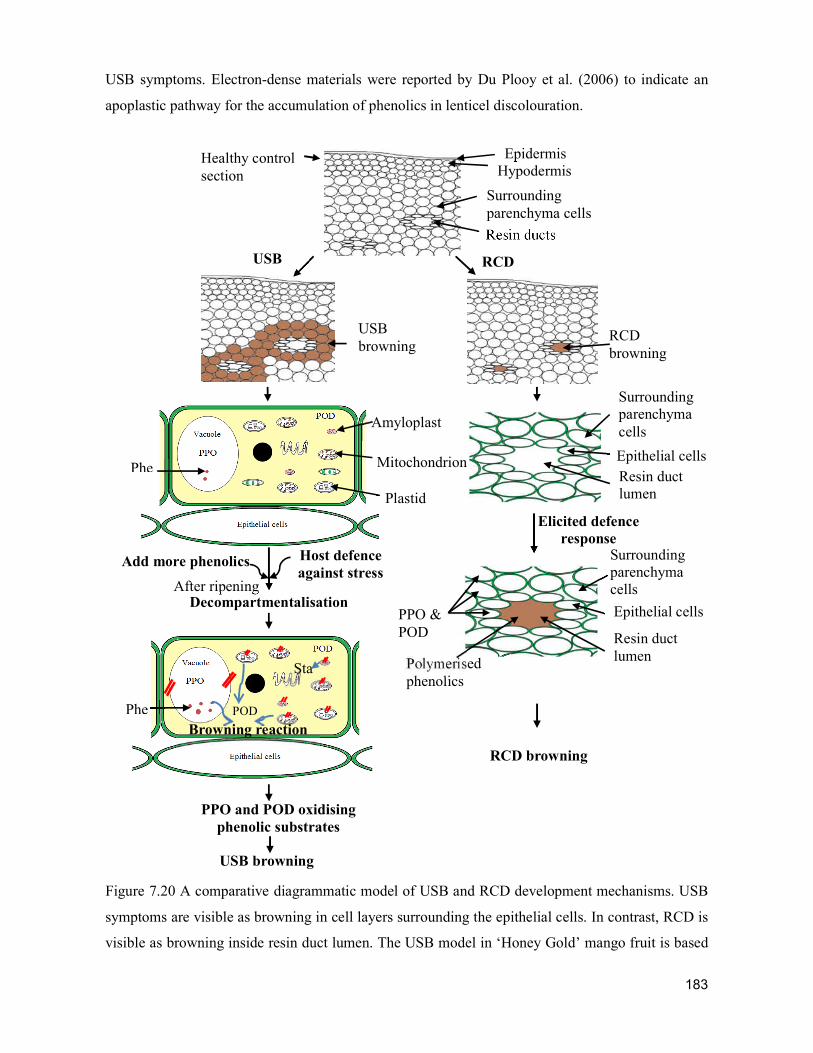
183
USB symptoms. Electron-dense materials were reported by Du Plooy et al. (2006) to indicate an
apoplastic pathway for the accumulation of phenolics in lenticel discolouration.
Figure 7.20 A comparative diagrammatic model of USB and RCD development mechanisms. USB
symptoms are visible as browning in cell layers surrounding the epithelial cells. In contrast, RCD is
visible as browning inside resin duct lumen. The USB model in ‘Honey Gold’ mango fruit is based
Host defence against stress
After ripening
Add more phenolics
Decompartmentalisation
Mitochondrion
Plastid
Amyloplast
Phe
PPO and POD oxidising phenolic substrates
USB browning
Browning reaction
Phe
Sta
POD
Elicited defence response
Epithelial cells
Resin duct lumen
Surrounding parenchyma cells
Resin duct lumen
Epithelial cells
Surrounding parenchyma cells
Polymerised phenolics
PPO & POD
Healthy control section
USB RCD
Epidermis Hypodermis
Resin ducts
Surrounding parenchyma cells
USB browning
RCD browning
RCD browning
184
on current findings (this chapter) and published work by Gong et al., 2001; Nakano and Asada,
1981; Prasad et al., 1995; Toivonen and Brummell, 2008. Host tissue stress-induced
decompartmentalisation likely occurs along with newly synthesised phenolics being added to those
that are constitutively present. Damaged membranes of cell compartments release enzymes (e.g.
PPOs in vacuoles and plastids, PODs in chloroplasts and mitochondria) and perhaps starch granules
from amyloplasts into the cytoplasm. Browning enzymes are then free to oxidise phenolic substrates
to yield brown polyphenols. The RCD model for ‘Kensington Pride’ mango fruit is based on current
findings (this chapter). The browning is presumably polymerised phenolics inside the resin duct
lumen (Figure 7.8). PPO and POD are evidently involved in RCD development (Figure 7.19). POD
activity was mainly distributed in cells surrounding the lumen (Figure 7.19). Red slash, membrane
disruption; POD, peroxidase; and, PPO, polyphenol oxidase.
7.4.4 Localisation of PPO and POD on USB and RCD browning
Tissue printing showed higher PPO levels in tissues from fruit with natural and induced USB
symptoms as compared to the controls (Figure 7.17). Thus, involvement of PPO activity was
attributed to development of USB symptoms. However, POD activity was only detected in fruit
with natural USB. It appeared beneath the epidermis of the natural USB-affected regions. No POD
activity was detected by tissue printing in tissues in which USB had been induced USB-affected
tissue. A possible explanation is that host defence against stress-induced decompartmentalisation
process increased phenolics in affected tissues (Figure 7.20). PPOs are mainly distributed in
vacuoles and plastids (Murata et al., 1997). PODs are mostly found in chloroplasts (Nakano and
Asada, 1981), mitochondria (Prasad et al., 1995; Toivonen and Brummell, 2008) and plant cell
plasma membranes (Vianello and Macri, 1991). It was likely that the membranes of cell
components such as vacuoles, plastids, chloroplasts and mitochondria were damaged through the
physical and cold stress, so these PPOs and PODs were released in the cytoplasm. PPO and / or
POD enzymes could then oxidise phenolic substrates to induce the browning.
PPO and POD activities were evidently associated with RCD browning in ‘Kensington Pride’
mangoes (Figure 7.19B). POD activity was mainly distributed in cell layers and epithelial cells
surrounding the lumen of resin ducts (Figure 7.20). Somewhat similarly, John et al. (2002) found
PPO and POD in the peel as the primary enzymes involved in browning that was associated with
mango sap-burn injury. Thipyapong et al. (2004) reported increased PPO activity was correlated
with the stress defence reaction in tomato. Accordingly, increased PPO and POD activities likely
contributed to stress-related defence response browning of USB and RCD.
185
7.5 Conclusion
In short, USB and RCD evidently involve different cell biology processes. USB was associated
with the starch retention and phenolic deposition in cells surrounding the epithelial cells of resin
ducts through the apoplast in the cell wall. RCD involved polymerised phenolic deposition inside
the lumen of resin ducts. Both PPO and POD activities contributed to oxidative browning in USB
and RCD. This comparative study at the anatomical level contributes to better understanding of the
browning mechanism for USB and RCD symptom expression. This improved knowledge should
inform formulation of pre- and /or postharvest practices to lessen and ideally eliminate these
disorders.
References
Du Plooy, G.W., Van Der Merwe, C.F., Korsten, L., 2006. Lenticel discolouration in mango
(Mangifera indica L.) fruit - a cytological study of mesophyll cells from affected tissue. Journal of
Horticultural Science & Biotechnology 81, 869-873.
Espinosa-Solis, V., Jane, J., Bello-Perez, L., 2009. Physicochemical characteristics of starches from
unripe fruits of mango and banana. Starch - Stärke 61, 291-299.
Franck, C., Lammertyn, J., Ho, Q.T., Verboven, P., Verlinden, B., Nicolaï, B.M., 2007. Browning
disorders in pear fruit. Postharvest Biology and Technology 43, 1-13.
Hassan, M.K., Irving, D.E., Dann, E.K., Coates, L.M., Hofman, P.J., 2009. Sap properties and
alk(en)ylresorcinol concentrations in Australian-grown mangoes. Annals of Applied Biology 154,
419-419.
Hofman, P.J., Marques, J.R., Taylor, A.H., Stubbings, B.A., Ledger, S.N., Jordan, R.A., 2010a.
Development of best practice pre- and postharvest of 'B74‘ mango fruit: Phase II. Final report
MG06005, Horticulture Australia Ltd., Sydney, Australia.
Hofman, P.J., Marques, J.R., Taylor, L.M., Stubbings, B.A., Ledger, S.L., Jordan, R.A., 2010b.
Skin damage to two new mango cultivars during irradiation and cold storage. Acta Horticulturae
877, 475-481.
Holmes, R.J., 1999. Mango skin browning. Horticultural Research and Development Corporation,
Gordon, N.S.W.
186
Jacobi, K.K., Gowanlock, D., 1995. Ultrastructural studies of 'Kensington' mango (Mangifera
indica Linn.) heat injuries. HortScience 30, 102-103.
Jiang, Y., Duan, X., Joyce, D., Zhang, Z., Li, J., 2004. Advances in understanding of enzymatic
browning in harvested litchi fruit. Food Chemistry 88, 443-446.
Joel, D.M., 1980. Resin ducts in the mango fruit: A defence system. Journal of Experimental
Botany 31, 1707-1718.
Joel, D.M., Fahn, A., 1980. Ultrastructure of the resin ducts of Mangifera indica L.
(Anacardiaceae). 3. Secretion of the protein-polysaccharide mucilage in the fruit. Annals of Botany
46, 785-790.
John, K.S., Bhat, S., Rao, U.P., 2002. Involvement of peroxidase and polyphenol oxidase in mango
sap‐injury. Journal of Food Biochemistry 26, 403-414.
John, K.S., Bhat, S., Rao, U.P., 2003. Biochemical characterization of sap (latex) of a few Indian
mango varieties. Phytochemistry 62, 13-19.
Krokene, P., Nagy, N., Krekling, T., 2008. Traumatic resin ducts and polyphenolic parenchyma
cells in conifers, In: Schaller, A. (Ed.), Induced Plant Resistance to Herbivory. Springer
Netherlands, pp. 147-169.
Loveys, B.R., Robinson, S.P., Brophy, J.J., Chacko, E.K., 1992. Mango sapburn - components of
fruit sap and their role in causing skin damage. Australian Journal of Plant Physiology 19, 449-457.
Macnish, A., McConchie, C., Hofman, P., Joyce, D.C., T., 2014. Towards identifying factors that
contribute to mango resin canal discolouration. Mango Matters 14, 9-12.
Marques, J.R., Hofman, P.J., Giles, J.E., Campbell, P.R., 2012. Reducing the incidence of under-
skin browning in 'Honey Gold' mango (Mangifera indica L.) fruit. The Journal of Horticultural
Science and Biotechnology 87, 341-346.
Marques, M.R., Albuquerque, L.M.B., Xavier-Filho, J., 1992. Antimicrobial and insecticidal
activities of cashew tree gum exudate. Annals of Applied Biology 121, 371-377.
187
Martin, D., Tholl, D., Gershenzon, J., Bohlmann, J., 2002. Methyl jasmonate induces traumatic
resin ducts, terpenoid resin biosynthesis, and terpenoid accumulation in developing xylem of
Norway spruce stems. Plant Physiology 129, 1003-1018.
Melberg, A.R., Flurkey, W.H., Inlow, J.K., 2009. Tissue printing to visualize polyphenol oxidase
and peroxidase in vegetables, fruits, and mushrooms. Biochemistry and Molecular Biology
Education 37, 92-98.
Miranda, R.L., 2009. Cashew tree bark secretion–perspectives for its use in protein isolation
strategies. Open Glycoscience 2, 16-19.
Mueller, W., Greenwood, A., 1978. The ultrastructure of phenolic-storing cells fixed with caffeine.
Journal of Experimental Botany 29, 757-764.
Murata, M., Tsurutani, M., Hagiwara, S., Homma, S., 1997. Subcellular location of polyphenol
oxidase in apples. Bioscience, Biotechnology, and Biochemistry 61, 1495-1499.
Nakano, Y., Asada, K., 1981. Hydrogen peroxide is scavenged by ascorbate-specific peroxidase in
spinach chloroplasts. Plant and Cell Physiology 22, 867-880.
Negi, P., John, S., Rao, P., 2002. Antimicrobial activity of mango sap. European Food Research and
Technology 214, 327-330.
Phillips, M.A., Croteau, R.B., 1999. Resin-based defenses in conifers. Trends in Plant Science 4,
184-190.
Prasad, T.K., Anderson, M.D., Stewart, C.R., 1995. Localization and characterization of
peroxidases in the mitochondria of chilling-acclimated maize seedlings. Plant Physiology 108,
1597-1605.
Robinson, S.P., Loveys, B.R., Chacko, E.K., 1993. Polyphenol oxidase enzymes in the sap and skin
of mango fruit. Australian Journal of Plant Physiology 20, 99-107.
Ruel, J.J., Ayres, M.P., Lorio, J., Peter L, 1998. Loblolly pine responds to mechanical wounding
with increased resin flow. Canadian Journal of Forest Research 28, 596-602.
Ruzin, S.E., 1999a. Chapter 10 Microtechnique notes and problem solving, Plant microtechnique
and microscopy. Oxford University Press, New York, pp. 137-143.
188
Ruzin, S.E., 1999b. Chapter 11 Histochemistry and cytochemistry, Plant microtechnique and
microscopy. Oxford University Press New York, pp. 145-176.
John, K.S., Jagan Mohan Rao, L., Bhat, S.G., Prasada Rao, U.J.S., 1999. Characterization of aroma
components of sap from different Indian mango varieties. Phytochemistry 52, 891-894.
Simão, R.A., Silva, A.P.F.B., Peroni, F.H.G., do Nascimento, J.R.O., Louro, R.P., Lajolo, F.M.,
Cordenunsi, B.R., 2008. Mango starch degradation. I. A microscopic view of the granule during
ripening. Journal of Agricultural and Food Chemistry 56, 7410-7415.
Thipyapong, P., Melkonian, J., Wolfe, D.W., Steffens, J.C., 2004. Suppression of polyphenol
oxidases increases stress tolerance in tomato. Plant Science 167, 693-703.
Toivonen, P.M.A., Brummell, D.A., 2008. Biochemical bases of appearance and texture changes in
fresh-cut fruit and vegetables. Postharvest Biology and Technology 48, 1-14.
Vermerris, W., Nicholson, R., 2006. Isolation and identification of phenolic compounds, Phenolic
Compound Biochemistry. Springer Netherlands, Dordrecht, pp. 151-196.
Vianello, A., Macri, F., 1991. Generation of superoxide anion and hydrogen peroxide at the surface
of plant cells. Journal of Bioenergetics and Biomembranes 23, 409-423.
189
CHAPTER 8. GENERAL DISCUSSION AND CONCLUSIONS
Mango is an economically important crop in Australia (Johnson and Parr, 2000). ‘B74’, ‘Honey
Gold’, ‘Kensington Pride’ and ‘R2E2’ are the major cultivars produced in Australia (Dillon et al.,
2013). However, the visual appeal and marketability of these cultivars can be limited by
physiological skin disorders.
Lenticel discolouration (LD), under-skin browning (USB) and resin canal disorder (RCD) are three
important skin browning disorders affecting the Australian mango industry (Hofman et al., 2010;
Macnish et al., 2014; Marques et al., 2016). LD is evident as brown-black spots on the fruit surface.
It reduces the appearance attribute of many mango cultivars in the world (Bezuidenhout and
Robbertse, 2005; Self et al., 2006) including those cultivated in Australia (Hofman et al., 2010; Li
et al., 2016; Marques et al., 2016). USB is an emerging important disorder that mainly occurs in
‘Honey Gold’ mango fruit. It develops under the epidermis and is visible as a diffuse brown region.
Although no damage is caused to the flesh, the unattractive appearance of the fruit skin decreases
consumer’s decision to purchase. RCD is visible as darkened outlines of the finely branched
network of resin ducts under the skin and/or in the flesh. This disorder predominantly affects the
‘Kensington Pride’ cultivar. These three physiological disorders are of great concern to mango
marketers because consumers often equate external blemishes to poor internal quality, including
limited useable flesh and off flavours.
8.1 Method development for quantification of key aroma volatiles for mango
fruit and sap
A high throughput and precise analytical method was developed to quantify characteristic aroma
volatiles produced by fruits and sap of Australian mango cultivars (Chapter 3). This method utilises
stable isotope dilution analysis (SIDA) in conjunction with headspace (HS) solid-phase
microextraction (SPME) coupled with gas-chromatography mass spectrometry (GCMS).
More specifically, the combination of SIDA together with HS-SPME-GC-MS produced a highly
sensitive and precise analytical tool for key volatiles released by Australian mango fruit and sap
(Chapter 3, Table 3.2). The importance and impact of the technique is found in the ability to now
eliminate variability related to sample preparation and matrix effects (i.e. improves recovery of the
analytes), which has not previously been possible for quantitative analysis of key aroma volatiles in
mango fruit and sap (Chapter 3). To highlight this further, in previous studies, the odour activity
value of some compounds could not be resolved due to the lack of a suitable internal standard to
190
detect aroma volatiles at low levels. The accuracy and precision realised in the present work
facilitates meaningful comparisons to be made using odour activity values, as the concentration data
collected are sensitive and reliable (Chapter 3, Table 3.5).
Moreover, it has been applied to studies aimed at exploring and optimising the flavour of other
mango varieties including ‘B74’, ‘Kensington Pride’, ‘Honey Gold’, ‘R2E2’ in other studies
(Chapter 4) and those yet to be instigated. Accordingly, this method is of value to those in the
community that measure key aroma volatiles produced by mango sap accurately and precisely in
support of current research into the field of mango physiological disorder studies (in Chapter 6).
8.2 LD and other mango quality attributes
8.2.1 Effects of irradiation on LD and other mango quality attributes
-Irradiation is an effective post-harvest quarantine treatment. However, -irradiation at 0.5
(commercial dose) and 1.0 kGy (twice the commercial dose) reduced the appearance quality of
‘B74’, ‘Kensington Pride’ and ‘R2E2’ mango fruit by inhibiting the loss of green skin colour and
stimulating development of severe LD during ripening (Chapter 4). Decreased rates of green skin
colour loss presumably reflected a reduction in chlorophyll degradation. This finding was consistent
with Hofman et al. (2010) who reported a significant increase in LD development on ‘B74’
mangoes irradiated at 0.543 kGy relative to non-irradiated fruit. In general, there was no difference
in the severity of LD for fruit exposed to 0.5 or 1.0 kGy (Chapter 4). The -irradiation-induced LD
was usually evident within 2-4 d of treatment and increased slowly towards the end of shelf-life or
not at all as fruit ripened.
‘Honey Gold’ fruit were the least sensitive in response to irradiation in terms of LD and the loss of
green skin colour as compared to other three tested cultivars (Figure 8.1). This variation in response
to irradiation was likely largely due to the nature of their genotypic dissimilarity to the other
cultivars. ‘B74’, ‘Honey Gold’ and ‘R2E2’ are hybrids of ‘Kensington Pride’ mangoes with
different maternal parents (Dillon et al., 2013). In particular, the different cultivar-dependant
susceptibility to LD may be due to compositional disparity of lenticel surface structure (Du Plooy et
al., 2004). Marques et al. (2016) indicated that water contact and infiltration into lenticels during
post-harvest handling can enhance LD development.
Exposure to 0.5 and 1.0 kGy -irradiation reduced initial rates of fruit softening in all ‘B74’, ‘Honey
Gold’, ‘Kensington Pride’, ‘R2E2’ cultivars. Fruit softening in irradiated ‘Tommy Atkins’ fruit has
191
previously been reported to be due to the disintegration of the cells (Moreno et al., 2006). There
was, however, no significant difference in firmness between irradiated and non-irradiated fruit by
the end of ripening. It is possible that the effect of irradiation was lessened as fruit progressively
ripened.
In general, -irradiation up to 1.0 kGy did not affect the TSS and carotenoid concentration in the
skin of the four tested cultivars although this varied with cultivar. -Irradiation doses of up 1.0 kGy
showed different responses which are cultivar dependant on the other chemical properties and
volatile production of mango fruit. Exposure to 0.5 and 1.0 kGy significantly (P≤0.05) reduced
biosynthesis rates of the important aroma volatile 2-carene, 3-carene, α-terpinene, p-cymene,
limonene, α-terpinolene, and ethyl octanoate in the ripened pulp of ‘Kensington Pride’ and ‘R2E2’
mango fruit. However, there was no significant (P>0.05) effects of -irradiation at 0.5 and 1.0 kGy
on volatile production of ‘B74’ and ‘Honey Gold’ mangoes. The irradiation-associated reduction in
the rates of ripening-related decreases in TA and chlorophyll degradation during ripening of
‘Kensington Pride’ and ‘R2E2’ fruit, in combination with a decline in volatile production at higher
doses, may translate into diminished flavour. In contrast, there was no major effect of irradiation
treatment on the ‘Honey Gold’ cultivar (Chapter 4, Figure 8.1). Understanding the response of
different Australian mango cultivars to irradiation in terms of appearance acceptability and
physical-chemical properties is essential and meaningful for the mango industry to maximise the
quality of treated fruit. Further post-harvest research should be undertaken to optimise the
irradiation dose with a view to reducing the negative impacts of this phytosanitary treatment and
delivering high-quality fruit to consumers.
8.2.2 Anatomy of LD
In Chapter 5, the anatomical features of LD in ‘B74’ mango fruit was illustrated using binocular
microscope observation, light microscopy (LM) and serial block face scanning electron microscopy
(SBF-SEM). LD is a physiological discolouration process that is visible as a dark brown to black
region surrounding a white corona of the lenticel. LM imaging highlighted that LD was
characterised by browning of sub-lenticellular cells around the lenticel cavity (Chapter 5). This
browning was related to the phenolic deposition. It was likely that there was the phenolic deposition
in cell walls (Chapter 5, section 5.3.3) and vacuoles (Du Plooy et al., 2009) of discoloured lenticels.
However, this possible process was not very clearly demonstrated by LM, so SBF-SEM was
employed to clarify.
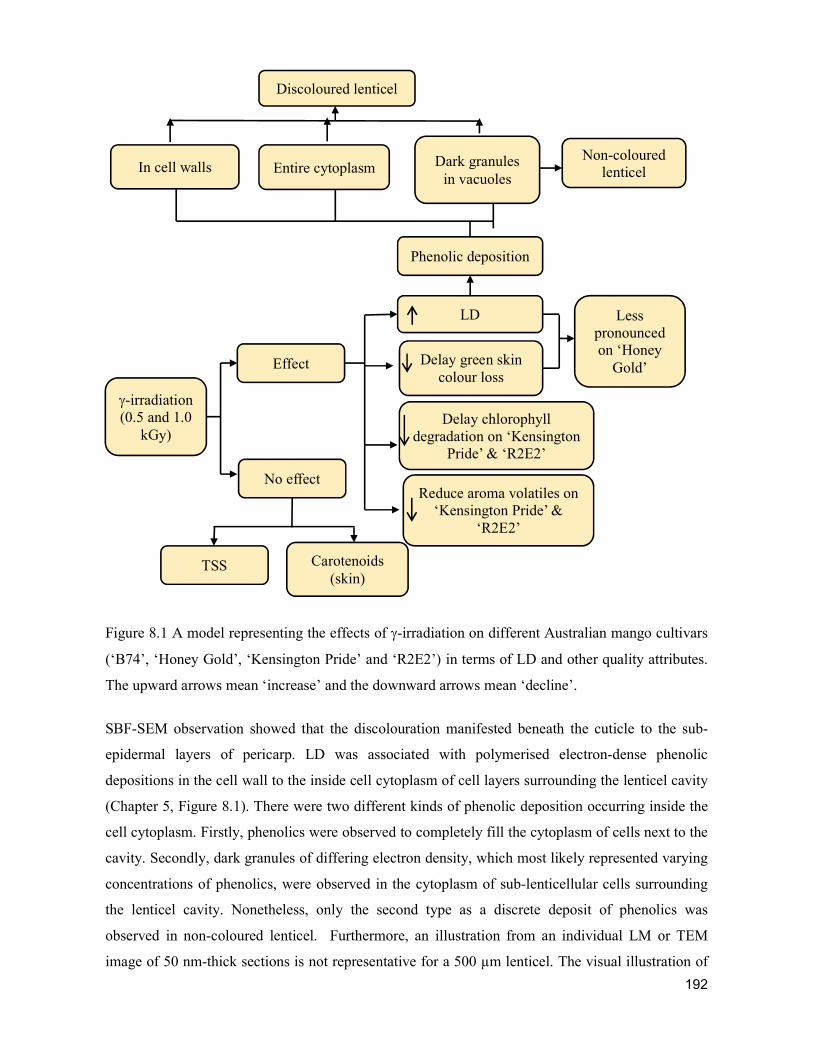
192
Figure 8.1 A model representing the effects of -irradiation on different Australian mango cultivars
(‘B74’, ‘Honey Gold’, ‘Kensington Pride’ and ‘R2E2’) in terms of LD and other quality attributes.
The upward arrows mean ‘increase’ and the downward arrows mean ‘decline’.
SBF-SEM observation showed that the discolouration manifested beneath the cuticle to the sub-
epidermal layers of pericarp. LD was associated with polymerised electron-dense phenolic
depositions in the cell wall to the inside cell cytoplasm of cell layers surrounding the lenticel cavity
(Chapter 5, Figure 8.1). There were two different kinds of phenolic deposition occurring inside the
cell cytoplasm. Firstly, phenolics were observed to completely fill the cytoplasm of cells next to the
cavity. Secondly, dark granules of differing electron density, which most likely represented varying
concentrations of phenolics, were observed in the cytoplasm of sub-lenticellular cells surrounding
the lenticel cavity. Nonetheless, only the second type as a discrete deposit of phenolics was
observed in non-coloured lenticel. Furthermore, an illustration from an individual LM or TEM
image of 50 nm-thick sections is not representative for a 500 µm lenticel. The visual illustration of
-irradiation (0.5 and 1.0
kGy)
LD
Delay green skin colour loss
Delay chlorophyll degradation on ‘Kensington
Pride’ & ‘R2E2’
Carotenoids (skin)
Reduce aroma volatiles on ‘Kensington Pride’ &
‘R2E2’
TSS
No effect
Effect
Less pronounced on ‘Honey
Gold’
Entire cytoplasm
Phenolic deposition
Non-coloured lenticel
Dark granules in vacuoles
Discoloured lenticel
In cell walls
193
structural changes in detail and internal structural continuity of entire lenticel during discolouration
using SBF-SEM provides a better understanding of the functional microstructure and potentially the
mechanism of LD.
8.3 USB on ‘Honey Gold’ mango and RCD on ‘Kensington Pride’ mango
USB is often associated with physical injury damage and exposure to low temperature during
extended transport and delivery (Marques et al., 2012a). Exposure of ‘Honey Gold’ mango fruit to
physical damage by abrasion with sand paper and storage at low temperature (12 °C) can mimic
these conditions and induce USB development (Hofman et al., 2010). Reducing fruit-to-fruit
contact may reduce USB that otherwise expresses after long distance road transport (Li, 2015;
Marques et al., 2012b). However, there is limited published information about the mechanism and
control of USB development.
RCD is associated with discolouration of the finely branched network of sub-cuticle resin canals.
Relative to USB, even less is known about the cause and prevention of RCD. This quality defect is
likely attributable to a combination of production factors that contribute to increase fruit
susceptibility and postharvest factors that contribute to fruit stress and symptom expression
(Macnish et al., 2014).
8.3.1 Comparative anatomy of USB and RCD
At the anatomical level, USB was characterised by dark-brown cells predominantly in the cells
surrounding the epithelial cells of resin ducts (Chapter 6). In contrast, RCD was distinguished by
localised browning of the lumen of resin ducts. Accordingly, different cell biology processes
hypothesised to be behind the development of USB and RCD at the cell and tissue levels. USB was
associated with starch retention and phenolic deposition in the cell layers surrounding the resin
ducts. TEM observation illustrated that the starch granules were only partly degraded in USB-
affected regions of ripe ‘Honey Gold’ fruit tissue. In control fruit, starch was completed converted
to sugars (Chapter 7, Figure 7.15). This finding implies that starch degradation in USB-affected
regions was suppressed during fruit ripening. These results suggest that USB might be associated
with self-defence to external stress (Chapter 7).
In contrast with USB, the browning of resin ducts in RCD-affected tissues was only related to
polymerised phenolic deposition inside the lumen (Chapter 6, Figure 8.2). Polyphenolic
parenchyma cells associated with phenolic and starch deposition were related to the defence
response of many conifers (Krokene et al., 2008). Resin was major defence component in the resin
194
duct system of many conifer families (Phillips and Croteau, 1999; Ruel et al., 1998). Taken
together, these findings suggest that the defensive mechanism may contribute to RCD development
and expression.
8.3.2 Mechanism of USB development
8.3.2.1 Effect of diurnal harvest cycle on USB development
In Chapter 6, a postulated effect of harvest time over the diurnal cycle was evaluated in regard to
the propensity of abraded fruit to develop USB at low temperature (e.g. < 10 - 12°C) exposure.
USB incidence was markedly less in night- and early morning-harvested fruit than in post-midday-
harvested ‘Honey Gold’ fruit (Chapter 6). USB was also observed on areas of the fruit that had not
been abraded, most likely because of physical damage caused during road freight from the Northern
Territory to south-east Queensland for evaluation. USB incidence on these non-abraded regions was
also significantly less in fruit harvested at night and in the early morning compared with those
harvested in the afternoon. Delayed cooling increased the incidence and severity of normal USB in
the afternoon-harvested fruit. The higher USB incidence was related to a stress response to elevated
physical damage (e.g. abrasion or transport) and/ or cold storage in combination with the afternoon
harvest time (Figure 8.2). This result is consistent with the study by Marques et al. (2012) that
physical injury from transport and delivery was a major factor inducing USB development
(Marques et al., 2012b). Likewise, the severity of sap burn injury to the fruit skin was reported by
Amin et al., 2008 to be significantly higher in ‘Samar Bahisht Chaunsa’ mango fruit harvested at
noon and in the afternoon relative to those harvested at morning (7 AM).
The concentration of key aroma volatile compounds (2-carene, 3-carene, α-terpinene, p-cymene,
limonene and α-terpinolene) in ‘Honey Gold’ fruit sap was significantly higher at 1400 h as
compared to all other harvest times (0600 h, 1000 h, 1800 h, 2200 h, 2400 h and 0200 h). This
diurnal variation in USB sensitivity was concomitant with changes in the concentration of fruit sap
volatiles. The sap was more concentrated in the afternoon versus the morning as the water content
of sap presumably decreases during the day (Chapter 6). This decrease in water content is because
the plant pulls back water from organs into the tree via the resin canal system (Downton, 1981;
Milburn et al., 1990).
8.2.2.2 Effect of sap components on USB incidence
Spurt sap or the non-aqueous phase (oil fraction) of the sap was responsible for inducing browning
damage. These observations suggest that two factors played a role in increasing the sensitivity of
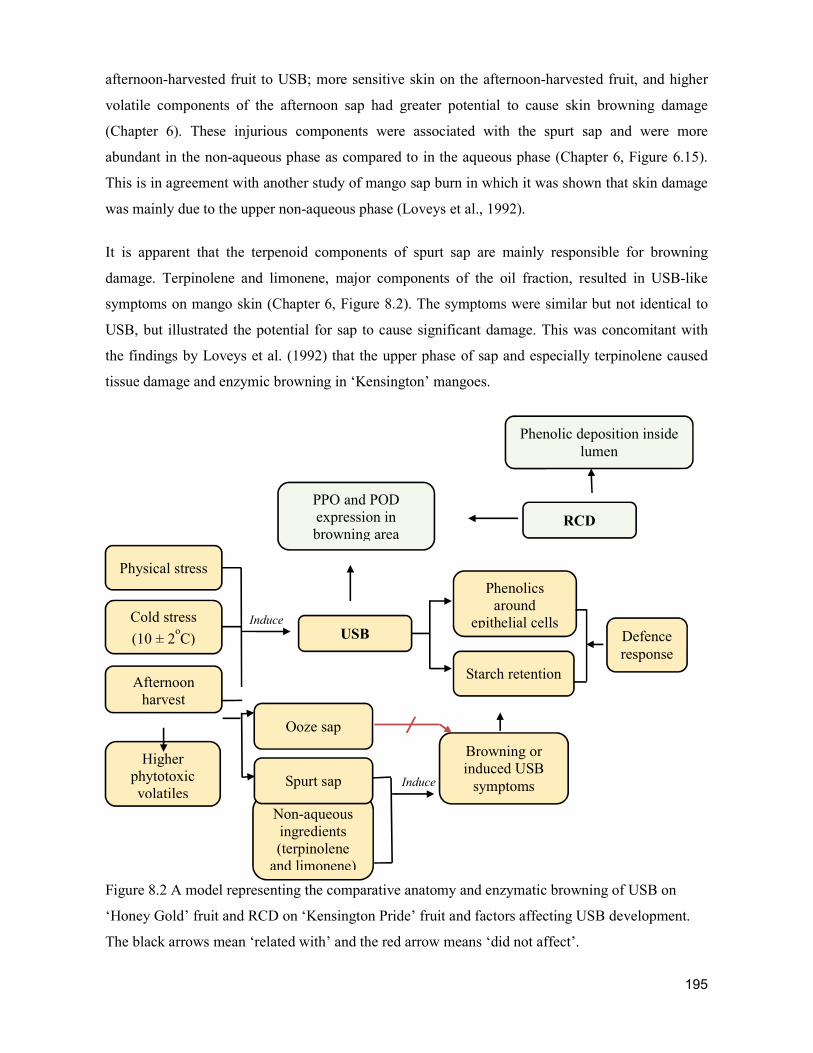
195
afternoon-harvested fruit to USB; more sensitive skin on the afternoon-harvested fruit, and higher
volatile components of the afternoon sap had greater potential to cause skin browning damage
(Chapter 6). These injurious components were associated with the spurt sap and were more
abundant in the non-aqueous phase as compared to in the aqueous phase (Chapter 6, Figure 6.15).
This is in agreement with another study of mango sap burn in which it was shown that skin damage
was mainly due to the upper non-aqueous phase (Loveys et al., 1992).
It is apparent that the terpenoid components of spurt sap are mainly responsible for browning
damage. Terpinolene and limonene, major components of the oil fraction, resulted in USB-like
symptoms on mango skin (Chapter 6, Figure 8.2). The symptoms were similar but not identical to
USB, but illustrated the potential for sap to cause significant damage. This was concomitant with
the findings by Loveys et al. (1992) that the upper phase of sap and especially terpinolene caused
tissue damage and enzymic browning in ‘Kensington’ mangoes.
Figure 8.2 A model representing the comparative anatomy and enzymatic browning of USB on
‘Honey Gold’ fruit and RCD on ‘Kensington Pride’ fruit and factors affecting USB development.
The black arrows mean ‘related with’ and the red arrow means ‘did not affect’.
USB
Starch retention
Physical stress
Cold stress
(10 ± 2oC)
PPO and POD expression in browning area
Non-aqueous ingredients (terpinolene
and limonene)
Afternoon harvest
Higher phytotoxic volatiles
Induce
Phenolic deposition inside lumen
RCD
Phenolics around
epithelial cells
Ooze sap
Browning or induced USB
symptoms
Defence response
Induce Spurt sap
196
USB in ‘Honey Gold’ mango was also associated with phenolic deposition and the inhibition of
starch degradation surrounding the epithelial cells of resin ducts through the apoplastic pathway
(Chapter 6, Figure 8.2). Some starch granules were partly degraded in USB-affected tissues as fruit
ripened. Parenchyma cells surrounding traumatic resin ducts were also reported to contain starch
granules and phenolics (Krokene et al., 2008). This was due to the defensive response against biotic
or abiotic stress in conifers. Likewise, it is possible that USB is associated to stress-related self-
defence response.
Induced USB symptoms by treatment of fruit with terpinolene and limonene were also associated
with starch retention (Figure 8.2). In these induced USB regions, starch granules were intact after
the ripening process indicating the starch degradation process was completely suppressed by
chemical-defence response to high concentration of terpenoids. It indicated that terpenoids like
terpinolene and limonene were the browning inducers related to chemical defence response. It was
possible that the terpenoids were dispersed from the resin duct into the epithelial cells and the cell
layers surrounding the epithelial cells. Then they inhibited the starch degradation and accumulated
phenolics surrounding the epithelial cells as the defence response.
8.3.3 Comparative enzymatic browning of USB and RCD
PPO and POD activities were responsible for the browning symptoms associated with USB and
RCD (Chapter 7). PPO was evidently involved the browning of natural USB, induced USB
symptoms and RCD. POD activity appeared to contribute to the enzymatic browning of natural
USB and RCD. No such POD existence was illustrated in the induced USB symptoms. POD
activity was localised to different tissues of natural USB and RCD-affected regions. Specifically,
POD activity appeared all over the natural USB-affected regions, whilst it was mainly localised to
the resin ducts of RCD-affected areas. Similarly, John et al. (2002) found that PPO and POD in the
peel were the key enzymes involved in the skin browning reactions associated with mango sap-burn
injury. Thipyapong et al. (2004) reported that PPO activity was correlated with a stress defence
reaction in tomato. Collectively, the findings from the current study support the working hypothesis
that increased PPO levels as well as the presence of POD contribute to tissue browning in USB and
RCD disorders in Australian mango cultivars as a general stress-related defence response.
8.4 Conclusions and suggested future directions
Overall, a combination of SIDA and HS-SPME-GC-MS represents a marked improvement over
current methods for detecting and measuring the concentration of key volatiles released by
197
Australian mango fruit and sap. This method has contributed to explore the flavour of Australian
mango varieties affected by irradiation and the field of mango physiological disorder studies like
under-skin browning. New techniques and methods in this area are highly sought after not only for
the Australian market, but the many other countries that produce mango fruit for consumption. It
could be beneficial in future mango flavour optimisation studies of other commercial cultivars, their
parent lines and also wild types.
The present study highlighted genotypic variation of ‘B74’, ‘Kensington Pride’, ‘Honey Gold’,
‘R2E2’ cultivars in their tolerance to -irradiation in terms of LD, skin colour development and
volatile production. ‘Honey Gold’ fruit were typically the most tolerant of irradiation while
‘Kensington Pride’ and ‘R2E2’ were the least tolerant. The genotypic dissimilarity and /or different
composition of lenticel surface structure (Du Plooy et al., 2004) may contribute to this variable
response to -irradiation. These findings underscore the importance of screening different cultivars
for their response to commercial irradiation treatments with a view to devising/optimising handling
and treatment protocols that minimise fruit quality loss. The results also highlight an opportunity to
further study and quantify possible relationships between different cultivar sensitivity to irradiation-
induced LD and lenticel anatomy and biochemistry. Moreover, sensory evaluation would be
recommended to evaluate whether the irradiation-induced decrease in TA and aroma are discernible
by consumers. It would be interesting to study the effect of irradiation on ‘shared’ pigment and
aroma biochemical pathways.
The current research also contributed to a greater understanding of USB and RCD disorders by
distinguishing their uniquely different cell biology processes at the cell and tissue levels. USB was
associated with starch retention and phenolic deposition in the cell layers surrounding the resin
ducts. USB development was likely due to a natural defence response to an external stress through
the apoplast in the cell wall. RCD was characterised by polymerised phenolic deposition inside the
resin duct lumen. An increase in PPO and POD activities contributed to the tissue-specific
browning of these physiological disorders. A greater understanding of PPO and POD gene
expression and the activation of the plant defence system should aid in the management of these
physiological disorders. At present, there is limited information on the mechanism of RCD. It is
unclear whether the existence of RCD occurs in the stem before the stem removal as a self-defence
response to external stress factors. Another possibility is that bacteria could contribute to RCD
symptoms. It is not known if the spurt resin contains bacteria or if the removal of the stem transmits
infection. Determining the potential role of bacteria in RCD could be analysed by a molecular
marker approach such as quantitative real-time PCR.
198
Stress response to elevated physical damage (e.g. abrasion or transport) and/ or cold storage in
combination with afternoon-harvest were shown to be key contributing factors that induce USB
development. One of the contributing factors towards higher USB sensitivity in afternoon-harvested
fruit is a concomitant increase in ‘aggressive’ terpenoid volatile constituents in sap from these fruit.
Overall, these results support practise change from conventional afternoon picking to night and
early morning harvesting of ‘Honey Gold’ mango fruit to reduce the incidence and severity of USB.
Night and early morning harvesting offers tremendous opportunities to prevent USB on fruit and
reduces physiological stress on mango pickers. In order to improve the quality of ‘Honey Gold’
mango in coming seasons, growers of susceptible fruit are encouraged to adopt this practice.
References
Bezuidenhout, J.L., Robbertse, H., 2005. Lenticel development and discoloration of some mango
[Mangiferaindica (L.)] cultivars. HortScience 40, 995-995.
Dillon, N.L., Bally, I.S.E., Wright, C.L., Hucks, L., Innes, D.J., Dietzgen, R.G., 2013. Genetic
diversity of the Australian national mango genebank. Scientia Horticulturae 150, 213-226.
Downton, W., 1981. Water relations of laticifers in Nerium oleander. Functional Plant Biology 8,
329-334.
Du Plooy, G.W., Combrinck, S., Regnier, T., Botha, B.M., 2009. Linking lenticel discolouration of
mango (Mangifera indica L.) fruit to reversed-phase HPLC profiles of phenolic compounds. Journal
of Horticultural Science & Biotechnology 84, 421-426.
Du Plooy, W.d., Merwe, C., Korsten, L., 2004. Differences in the surface structures of three mango
cultivars and the effect of kaolin on these structures. Research Journal-South African Mango
Growers' Association 24, 29-36.
Hofman, P.J., Marques, J.R., Taylor, L.M., Stubbings, B.A., Ledger, S.N., Jordan, R.A., 2010. Skin
damage to two new mango cultivars during irradiation and cold storage. Acta Horticulturae 877,
475-481.
John, K.S., Bhat, S., Rao, U.P., 2002. Involvement of peroxidase and polyphenol oxidase in mango
sap‐injury. Journal of Food Biochemistry 26, 403-414.
Johnson, P., Parr, D., 2000. Mango growing in Western Australia. Department of Agriculture and
Food, Western Australia.
199
Krokene, P., Nagy, N., Krekling, T., 2008. Traumatic resin ducts and polyphenolic parenchyma
cells in conifers, In: Schaller, A. (Ed.), Induced plant resistance to herbivory. Springer Netherlands,
pp. 147-169.
Li, G., 2015. Lenticel discolouration on 'B74' mango fruit and under-skin browning on 'Honey
Gold' mango fruit. The University of Queensland, School of Agriculture and Food Sciences.
Li, G.Q., Gupta, M., San, A.T., Joyce, D.C., Hofman, P.J., Macnish, A.J., Marques, J., 2016.
Postharvest treatment effects on 'B74' mango fruit lenticel discolouration after irradiation, XXIX
International Horticultural Congress on Horticulture: Sustaining Lives, Livelihoods and Landscapes
(IHC2014). Acta Horticulturae, pp. 385-392.
Loveys, B.R., Robinson, S.P., Brophy, J.J., Chacko, E.K., 1992. Mango sapburn - components of
fruit sap and their role in causing skin damage. Australian Journal of Plant Physiology 19, 449-457.
Macnish, A., McConchie, C., Hofman, P., Joyce, D.C., T., 2014. Towards identifying factors that
contribute to mango resin canal discolouration. Mango Matters 14, 9-12.
Marques, J., Hofman, P., Macnish, A., 2016. Postharvest handling practices and irradiation increase
lenticel discolouration in ‘B74’ mango fruit. The Journal of Horticultural Science and
Biotechnology, 1-7.
Marques, J.R., Hofman, P.J., Giles, J.E., Campbell, P.R., 2012a. Reducing the incidence of under-
skin browning in 'Honey Gold' mango (Mangifera indica L.) fruit. Journal of Horticultural Science
& Biotechnology 87, 341-346.
Marques, J.R., Hofman, P.J., Giles, J.E., Campbell, P.R., 2012b. Reducing the incidence of under-
skin browning in 'Honey Gold' mango (Mangifera indica L.) fruit. The Journal of Horticultural
Science and Biotechnology 87, 341-346.
Milburn, J., Kallarackal, J., Baker, D., 1990. Water relations of the banana. I. Predicting the water
relations of the field-grown banana using the exuding latex. Functional Plant Biology 17, 57-68.
Moreno, M., Castell‐Perez, M.E., Gomes, C., Da Silva, P.F., Moreira, R.G., 2006. Effects of
electron beam irradiation on physical, textural, and microstructural properties of “Tommy Atkins”
mangoes (Mangifera indica L.). Journal of Food Science 71, E80-E86.
200
Phillips, M.A., Croteau, R.B., 1999. Resin-based defenses in conifers. Trends in Plant Science 4,
184-190.
Ruel, J.J., Ayres, M.P., Lorio, J., Peter L, 1998. Loblolly pine responds to mechanical wounding
with increased resin flow. Canadian Journal of Forest Research 28, 596-602.
Self, G., de Assis, J.S., Caron, V.C., 2006. Effects of postharvest handling on lenticel spotting of
´Tommy Atkins´ mangoes from Northeast Brazil. Acta Horticulturae 712, 543-550.
Thipyapong, P., Melkonian, J., Wolfe, D.W., Steffens, J.C., 2004. Suppression of polyphenol
oxidases increases stress tolerance in tomato. Plant Science 167, 693-703.
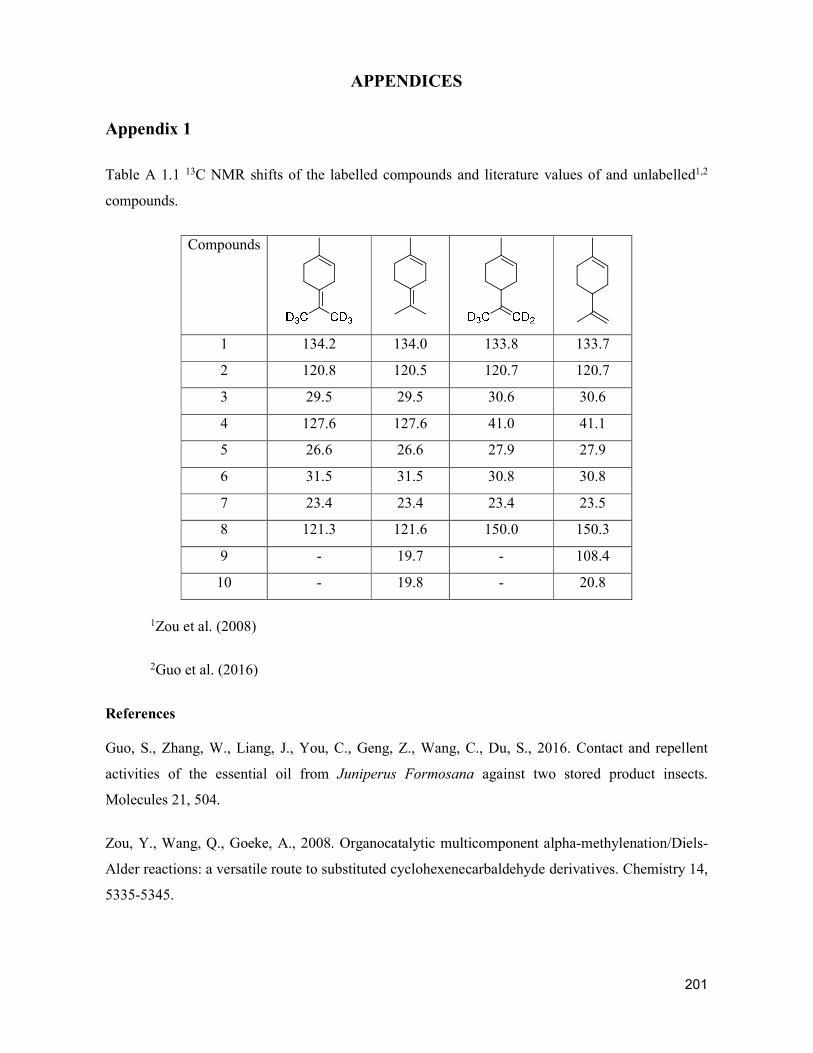
201
APPENDICES
Appendix 1
Table A 1.1 13C NMR shifts of the labelled compounds and literature values of and unlabelled1,2
compounds.
Compounds
1 134.2 134.0 133.8 133.7
2 120.8 120.5 120.7 120.7
3 29.5 29.5 30.6 30.6
4 127.6 127.6 41.0 41.1
5 26.6 26.6 27.9 27.9
6 31.5 31.5 30.8 30.8
7 23.4 23.4 23.4 23.5
8 121.3 121.6 150.0 150.3
9 - 19.7 - 108.4
10 - 19.8 - 20.8
1Zou et al. (2008)
2Guo et al. (2016)
References
Guo, S., Zhang, W., Liang, J., You, C., Geng, Z., Wang, C., Du, S., 2016. Contact and repellent
activities of the essential oil from Juniperus Formosana against two stored product insects.
Molecules 21, 504.
Zou, Y., Wang, Q., Goeke, A., 2008. Organocatalytic multicomponent alpha-methylenation/Diels-
Alder reactions: a versatile route to substituted cyclohexenecarbaldehyde derivatives. Chemistry 14,
5335-5345.
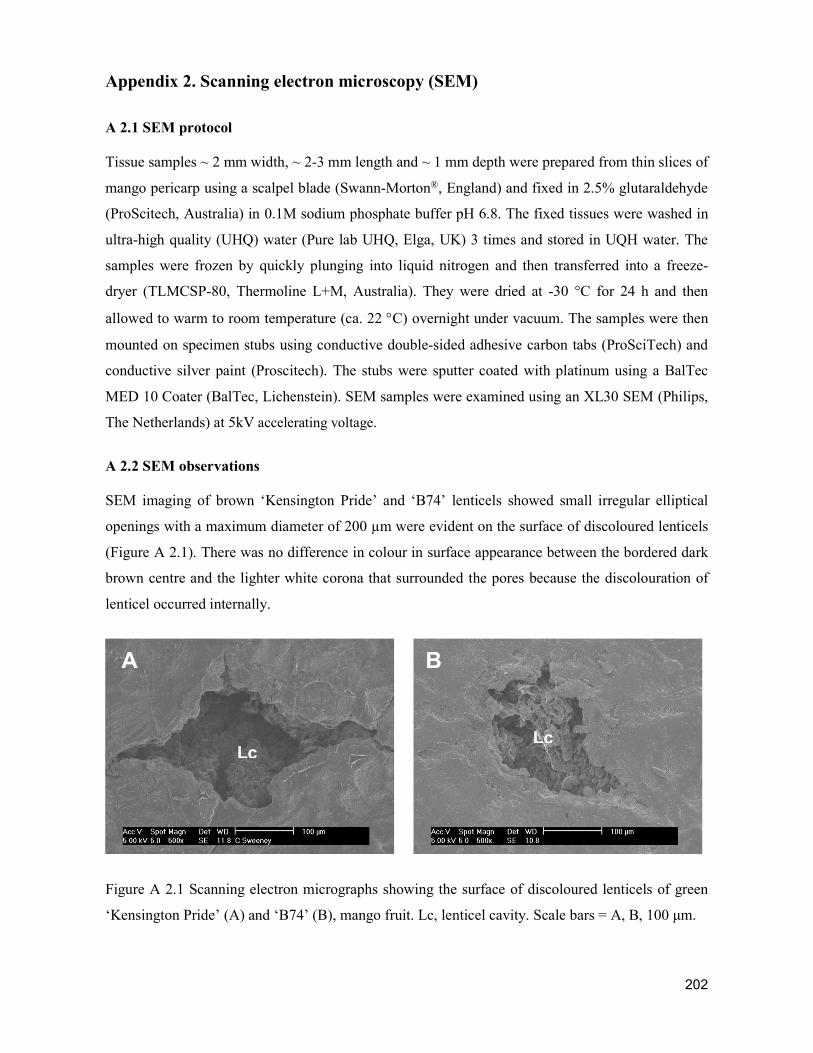
202
Appendix 2. Scanning electron microscopy (SEM)
A 2.1 SEM protocol
Tissue samples ~ 2 mm width, ~ 2-3 mm length and ~ 1 mm depth were prepared from thin slices of
mango pericarp using a scalpel blade (Swann-Morton®, England) and fixed in 2.5% glutaraldehyde
(ProScitech, Australia) in 0.1M sodium phosphate buffer pH 6.8. The fixed tissues were washed in
ultra-high quality (UHQ) water (Pure lab UHQ, Elga, UK) 3 times and stored in UQH water. The
samples were frozen by quickly plunging into liquid nitrogen and then transferred into a freeze-
dryer (TLMCSP-80, Thermoline L+M, Australia). They were dried at -30 °C for 24 h and then
allowed to warm to room temperature (ca. 22 C) overnight under vacuum. The samples were then
mounted on specimen stubs using conductive double-sided adhesive carbon tabs (ProSciTech) and
conductive silver paint (Proscitech). The stubs were sputter coated with platinum using a BalTec
MED 10 Coater (BalTec, Lichenstein). SEM samples were examined using an XL30 SEM (Philips,
The Netherlands) at 5kV accelerating voltage.
A 2.2 SEM observations
SEM imaging of brown ‘Kensington Pride’ and ‘B74’ lenticels showed small irregular elliptical
openings with a maximum diameter of 200 µm were evident on the surface of discoloured lenticels
(Figure A 2.1). There was no difference in colour in surface appearance between the bordered dark
brown centre and the lighter white corona that surrounded the pores because the discolouration of
lenticel occurred internally.
Figure A 2.1 Scanning electron micrographs showing the surface of discoloured lenticels of green
‘Kensington Pride’ (A) and ‘B74’ (B), mango fruit. Lc, lenticel cavity. Scale bars = A, B, 100 μm.
A B
Lc Lc
203
Appendix 3. Dry matter
The dry matter (%) was determined using the method of Hassan et al. (2007) with minor
modification. Individual fruit was taken as the replicate. The flesh of one cheek of each fruit was
removed using a sharp knife. A vertical section of flesh from the proximal stem end to the distal
fruit tip was diced into small pieces. A sample of approximate 20 g mango flesh was added to a
plastic cup and dried at 65 °C to constant weight.
References
Hassan, M.K., Dann, E.K., Irving, D.E., Coates, L.M., 2007. Concentrations of alk(en)ylresorcinols
in mango peel and their relationship to natural resistance to postharvest anthracnose. Physiological
and Molecular Plant Pathology 71, 158–165.

Food Chemistry 221 (2017) 613–619
Contents lists available at ScienceDirect
Food Chemistry
journal homepage: www.elsevier .com/locate / foodchem
Analytical Methods
Stable isotope dilution assay (SIDA) and HS-SPME-GCMS quantificationof key aroma volatiles for fruit and sap of Australian mango cultivars
http://dx.doi.org/10.1016/j.foodchem.2016.11.1300308-8146/� 2016 Elsevier Ltd. All rights reserved.
⇑ Corresponding author.E-mail addresses: [email protected] (A.T. San), [email protected] (H.E.
Smyth).
Anh T. San a,b, Daryl C. Joyce b,c, Peter J. Hofman c, Andrew J. Macnish c, Richard I. Webb d, Nicolas J. Matovic e,Craig M. Williams e, James J. De Voss e, Siew H. Wong e, Heather E. Smyth a,⇑aQueensland Alliance for Agriculture & Food Innovation, The University of Queensland, Coopers Plains, Queensland, Australiab School of Agriculture & Food Sciences, The University of Queensland, Gatton & St Lucia, Queensland, AustraliacDepartment of Agriculture and Forestry, Brisbane and Nambour, Queensland, AustraliadCentre for Microscopy & Microanalysis, The University of Queensland, St Lucia, Queensland, Australiae School of Chemistry and Molecular Biosciences, The University of Queensland, Brisbane, Queensland, Australia
a r t i c l e i n f o
Article history:Received 27 June 2016Received in revised form 22 November 2016Accepted 23 November 2016Available online 24 November 2016
Keywords:Gas chromatography–mass spectrometry(GC–MS)Mangifera indicaMango fruitSolid-phase microextraction (SPME)Stable-isotope dilution assay (SIDA)Volatiles
a b s t r a c t
Reported herein is a high throughput method to quantify in a single analysis the key volatiles that con-tribute to the aroma of commercially significant mango cultivars grown in Australia. The method consti-tutes stable isotope dilution analysis (SIDA) in conjunction with headspace (HS) solid-phasemicroextraction (SPME) coupled with gas-chromatography mass spectrometry (GCMS). Deuteriumlabelled analogues of the target analytes were either purchased commercially or synthesised for use asinternal standards. Seven volatiles, hexanal, 3-carene, a-terpinene, p-cymene, limonene, a-terpinoleneand ethyl octanoate, were targeted. The resulting calibration functions had determination coefficients(R2) ranging from 0.93775 to 0.99741. High recovery efficiencies for spiked mango samples were alsoachieved. The method was applied to identify the key aroma volatile compounds produced by‘Kensington Pride’ and ‘B74’ mango fruit and by ‘Honey Gold’ mango sap. This method represents amarked improvement over current methods for detecting and measuring concentrations of mango fruitand sap volatiles.
� 2016 Elsevier Ltd. All rights reserved.
1. Introduction
Mango fruits are highly desired by consumers because of theirdistinctive and evocative flavour as a function of their aroma andtaste. Australia produces ca. 50,000 ton of mango fruit for domesticand export markets annually (AMIA, 2016). ‘Kensington Pride’,‘B74’, ‘Honey Gold’ and ‘R2E2’ are the main cultivars grown com-mercially (Dillon et al., 2013). These Australian varieties are notgrown widely overseas. Nonetheless, they are in high demand bothdomestically and as premium products in export markets due totheir distinctive fruit odour profiles. The intense flavour of the fruitof Australian mango cultivars has been reported to be a crucialattribute that drives repeat purchases by consumers (Florkowskiet al., 2014). The mango industry has responded to this driver byfocusing horticultural research into optimising agronomic andpostharvest handling practices to maximise flavour production
by fruit; for example, a ‘guaranteed sweet’ program (Florkowskiet al., 2014).
Several hundred volatile compounds have been identified inmango fruits (Andrade, Maia, & Zoghbi, 2000; Lalel & Singh,2006; Lalel, Singh, & Tan, 2003; MacLeod & de Troconis, 1982;MacLeod, Macleod, & Snyder, 1988; MacLeod & Snyder, 1985;Pino, Mesa, Muñoz, Martí, & Marbot, 2005; Shivashankara, Isobe,Horita, Takenaka, & Shiina, 2006). The volatile profile varies consid-erably among different mango cultivars. The selection of the seventargeted compounds was based on their presence in the headspaceanalysis and their contribution to the flavour of mango fruit. Forexample, a-terpinolene is considered a key aroma volatile respon-sible for the characteristic flavour of ‘Kensington Pride’, the mostcommonly grown cultivar in Australia (Lalel et al., 2003). It wasalso shown to be present in relatively high abundance in ‘Cheiro’,‘Chana’, ‘Bacuri’, ‘Cametá’, ‘Gojoba’, ‘Carlota’, ‘Coquinho’ and‘Comum’ mango fruits (Andrade et al., 2000). Other volatile com-pounds, including hexanal, 3-carene and limonene, are also consid-ered important as they have been found in mango fruits atconcentrations above their sensory thresholds (Pino, 2012). 3-Carene has a sweet and pungent odour and quantitatively
614 A.T. San et al. / Food Chemistry 221 (2017) 613–619
represented the second main volatile compound produced by‘Kensington Pride’ mango fruit (2003). In ‘Kensington Pride’ mango,a-terpinene was present as the major volatile component at theclimacteric stage, while the highest concentrations of limoneneand p-cymene were found during the pre-climacteric stage. Ethyloctanoate replaces a-terpinolene in dominance after fruit reachthe fully ripe stage. Ethyl octanoate has a low odour activity value.Nonetheless, it is important in the aromatic equilibrium phase asthe most abundant constituent, and is a potential indicator of‘Kensington Pride’ mango fruit senescence.
Mango sap has two phases including an oily upper non-aqueousphase and a milky lower aqueous phase. It is interesting to notethat the non-aqueous phase, which is rich in terpenoids, plays animportant role in the plants defence against bacteria and fungus(Negi, John, & Rao, 2002). In this study, limonene was reported asthe dominant terpenoid compound. Moreover, a ‘sapburn’ brown-ing injury was largely due to sap exudation on the mango fruit sur-face (Loveys, Robinson, Brophy, & Chacko, 1992). This blemishreduces the visual quality of fruit and leads to the loss of marketconfidence. Terpinolene was abundant in the non-aqueous phaseof ‘Kensington Pride’ mango sap that is evidently related with thisbrowning (Loveys et al., 1992).
The purpose of the present study was to develop a rapid, accu-rate and precise analytical method utilising a combination ofStable Isotope Dilution Analysis (SIDA) and Head-space Solid phasemicroextraction (HS-SPME) in combination with gas chromatogra-phy mass spectrometry (GC–MS) to quantify characteristic aromavolatiles produced by fruits and sap of Australian mango cultivarsto assist flavour optimisation research. This analytical work wasconducted towards better understanding the role of sap compo-nents in antimicrobial activities and sapburn injury. Seven keyaroma volatile compounds, hexanal, 3-carene, a-terpinene, p-cymene, limonene, a-terpinolene, ethyl octanoate, were targetedfor ripe ‘Kensington Pride’ and ‘B74’ mango fruit and for ‘HoneyGold’ mango sap.
HS-SPME coupled with GC–MS is a relatively simple, rapid,inexpensive, and solvent-free technique for quantifying volatiles(Butkhup et al., 2011; Sánchez-Palomo, Díaz-Maroto, & Pérez-Coello, 2005). However, matrix effects and other potential sourcesof variation (e.g. MS detector, ionic strength and other matrices)can considerably impact on the quantification of results, particu-larly their accuracy and precision (Yuan, Li, Xu, & Fu, 2013). SIDAprovides an alternative approach to eliminate variability relatedto sample preparation and matrix effects and to improve the recov-ery of the analytes (Maraval et al., 2010). The combined analyticalmethod of SIDA and HS-SPME-GC-MS is considered more accurate,precise, rapid and sensitive than other quantitative techniques,such as liquid–liquid extraction, especially for low volatile andpolar odorants (Siebert et al., 2005).
Quantification methods have been developed previously for theanalysis of volatiles in mango. The common examples are whereanalytical methods have been applied either to compare the mostabundant aroma compounds between mango cultivars (Munafo,Didzbalis, Schnell, Schieberle, & Steinhaus, 2014; Nicola &Fontana, 2014; Pandit, Chidley et al., 2009; Pino et al., 2005), tomeasure differences in volatile aroma components betweenripened and mature green mango fruits (Lalel et al., 2003; Pandit,Kulkarni et al., 2009; Shivashankara et al., 2006) or to quantifythe major aroma-active compounds in tree-ripened mango fruit(Munafo, Didzbalis, Schnell, & Steinhaus, 2016). These methodsonly provide definite and accurate quantification results if recoveryrates and response factors are measured for each compoundagainst a suitable internal standard. Some studies (Loveys et al.,1992; Saby John, Jagan Mohan Rao, Bhat, & Prasada Rao, 1999)demonstrate only the percentage composition of sap and not thequantitative concentrations of aroma volatiles in sap. Musharraf,
Uddin, Siddiqui, and Akram (2016) quantified the volatile concen-tration of different Pakistan mango sap using gas chromatographytriple quadrupole mass spectrometry. However, limited informa-tion is given regarding the effect of the sap matrix on the quantifi-cation. In most cases, such rigor in analytical method developmenthas not been employed for the analysis of mango volatiles.
Ideally in analytical methods development, the response of ana-lytes should be calibrated to an internal standard that behaves verysimilarly both chemically and physically to the analyte in a givenmatrix. This is particularly important where SPME is employeddue to variation in the adsorption properties of different analytesto the fibre. Techniques that overcome these challenges use eitherdeuterium or carbon-13 labelled analogues of target analytes asinternal standards. Deuterium labelled standards are commonlyapplied as they are readily accessible (Florkowski, Shewfelt,Brueckner, & Prussia, 2014) and relatively inexpensive as com-pared to 13C-labelled standards. This technique known as SIDAhas been applied in combination with SPME for the analysis ofvolatiles in rice (Maraval et al., 2010), freeze-dried Cheonggukjang(Park, Choi, Kwon, & Kim, 2007), olive oil (Dierkes, Bongartz, Guth,& Hayen, 2012), juice and wine (Kotseridis et al., 2008), for whichtarget analytes are successfully measured in concentrations rang-ing from lg/l down to ng/l. To date, however, the combination ofSIDA and HS-SPME-GC-MS has not been proven for quantitativeanalysis of key aroma volatiles in mango fruit and sap, whichinspired our method development in this space.
2. Materials and methods
2.1. Materials
All solvents were HPLC grade and all reagents were purchasedfrom Sigma-Aldrich, Australia. The standards used includedhexanal (Sigma-Aldrich, Australia), 3-carene (Sigma-Aldrich,Australia), a-terpinene (Sigma-Aldrich, Australia), p-cymene(Sigma-Aldrich, Australia), limonene (Sigma-Aldrich, Australia),a-terpinolene (Fluka, Australia) and ethyl octanoate (Sigma-Aldrich, Australia). d15-Ethyl octanoate and d12-hexanal werepurchased from CDN Isotopes (CDN, Canada). Deuterium labelledinternal standards d6-a-terpinolene and d5-limonene were synthe-sised in-house, as they were not commercially available.
2.2. Synthesis of isotopes
The commercially available methyl 4-methyl-cyclohex-3-ene-1-carboxylate was reacted with an excess of d3-methyl magnesiumiodide to provide d6-terpineol (Ketter & Herrmann, 1990). Phos-phoryl chloride mediated elimination of water (procedure for unla-belled terpineol given below) produced a mixture of d6-terpinoleneand d5-limonene (Korstanje, de Waard, Jastrzebski, & KleinGebbink, 2012; Rudloff, 1961). Both compounds were partiallyseparated by column chromatography on silver impregnated silicagel (Mander & Williams, 2016; Williams & Mander, 2001) to give9:1 and 1:1 fractions of d6-terpinolene and d5-limonene. The frac-tions were characterised by high field 1H and 13C NMR as well as byBruker AV400MHz mass spectrometry. For 1H NMR, residual CHCl3in CDCl3 was referenced at d 7.26 ppm. For 13C NMR, the centralpeak of the CDCl3 triplet (d77.0 ppm) was used to reference chem-ical shifts. GC/MS was performed using a Shimadzu-17A GCequipped with J&W Scientific DB5 column (internal diameter0.2 mm; 30 m) coupled to a Shimadzu QP5000 Mass Spectrometer(70 eV).
d6-a-Terpinolene (Zou, Wang, & Goeke, 2008)
1H NMR (CDCl3, 400 MHz): d 1.65 (s, 3H, H3-7), 1.99 (m, 2H),2.30 (t, J = 6.4 Hz, 2H), 2.71 (m, 2H), 5.35 (m, 1H, H-2).
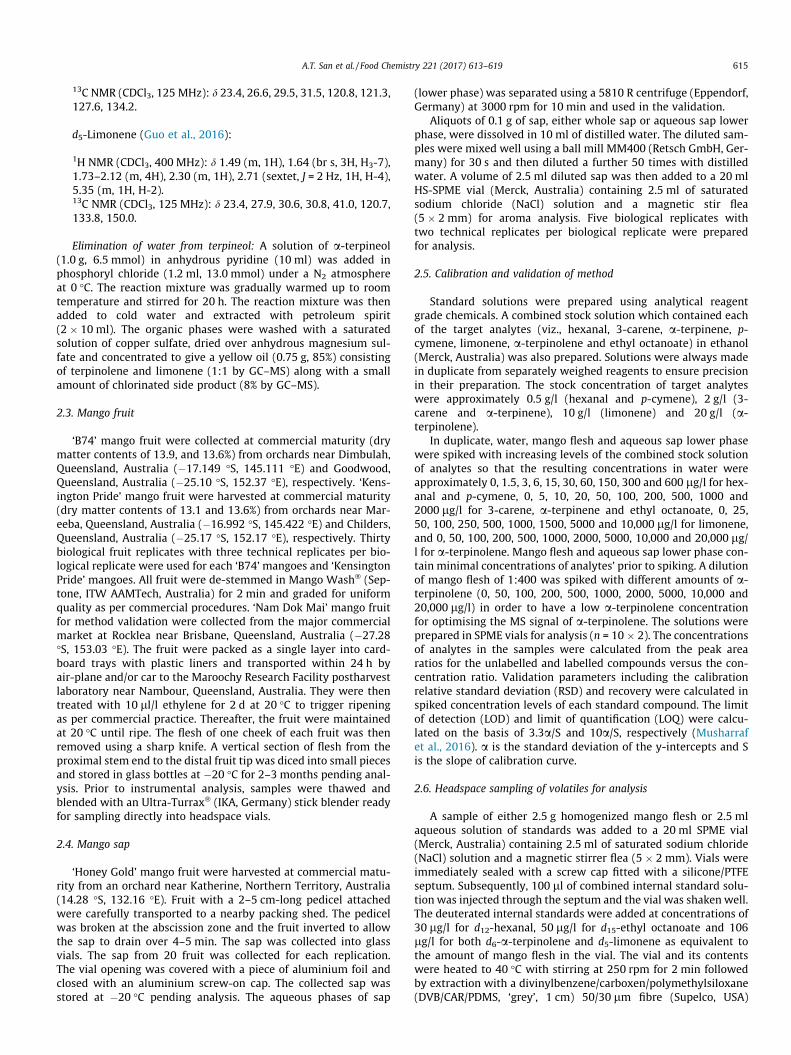
A.T. San et al. / Food Chemistry 221 (2017) 613–619 615
13C NMR (CDCl3, 125 MHz): d 23.4, 26.6, 29.5, 31.5, 120.8, 121.3,127.6, 134.2.
d5-Limonene (Guo et al., 2016):
1H NMR (CDCl3, 400 MHz): d 1.49 (m, 1H), 1.64 (br s, 3H, H3-7),1.73–2.12 (m, 4H), 2.30 (m, 1H), 2.71 (sextet, J = 2 Hz, 1H, H-4),5.35 (m, 1H, H-2).13C NMR (CDCl3, 125 MHz): d 23.4, 27.9, 30.6, 30.8, 41.0, 120.7,133.8, 150.0.
Elimination of water from terpineol: A solution of a-terpineol(1.0 g, 6.5 mmol) in anhydrous pyridine (10 ml) was added inphosphoryl chloride (1.2 ml, 13.0 mmol) under a N2 atmosphereat 0 �C. The reaction mixture was gradually warmed up to roomtemperature and stirred for 20 h. The reaction mixture was thenadded to cold water and extracted with petroleum spirit(2 � 10 ml). The organic phases were washed with a saturatedsolution of copper sulfate, dried over anhydrous magnesium sul-fate and concentrated to give a yellow oil (0.75 g, 85%) consistingof terpinolene and limonene (1:1 by GC–MS) along with a smallamount of chlorinated side product (8% by GC–MS).
2.3. Mango fruit
‘B74’ mango fruit were collected at commercial maturity (drymatter contents of 13.9, and 13.6%) from orchards near Dimbulah,Queensland, Australia (�17.149 �S, 145.111 �E) and Goodwood,Queensland, Australia (�25.10 �S, 152.37 �E), respectively. ‘Kens-ington Pride’ mango fruit were harvested at commercial maturity(dry matter contents of 13.1 and 13.6%) from orchards near Mar-eeba, Queensland, Australia (�16.992 �S, 145.422 �E) and Childers,Queensland, Australia (�25.17 �S, 152.17 �E), respectively. Thirtybiological fruit replicates with three technical replicates per bio-logical replicate were used for each ‘B74’ mangoes and ‘KensingtonPride’ mangoes. All fruit were de-stemmed in Mango Wash� (Sep-tone, ITW AAMTech, Australia) for 2 min and graded for uniformquality as per commercial procedures. ‘Nam Dok Mai’ mango fruitfor method validation were collected from the major commercialmarket at Rocklea near Brisbane, Queensland, Australia (�27.28�S, 153.03 �E). The fruit were packed as a single layer into card-board trays with plastic liners and transported within 24 h byair-plane and/or car to the Maroochy Research Facility postharvestlaboratory near Nambour, Queensland, Australia. They were thentreated with 10 ll/l ethylene for 2 d at 20 �C to trigger ripeningas per commercial practice. Thereafter, the fruit were maintainedat 20 �C until ripe. The flesh of one cheek of each fruit was thenremoved using a sharp knife. A vertical section of flesh from theproximal stem end to the distal fruit tip was diced into small piecesand stored in glass bottles at �20 �C for 2–3 months pending anal-ysis. Prior to instrumental analysis, samples were thawed andblended with an Ultra-Turrax� (IKA, Germany) stick blender readyfor sampling directly into headspace vials.
2.4. Mango sap
‘Honey Gold’ mango fruit were harvested at commercial matu-rity from an orchard near Katherine, Northern Territory, Australia(14.28 �S, 132.16 �E). Fruit with a 2–5 cm-long pedicel attachedwere carefully transported to a nearby packing shed. The pedicelwas broken at the abscission zone and the fruit inverted to allowthe sap to drain over 4–5 min. The sap was collected into glassvials. The sap from 20 fruit was collected for each replication.The vial opening was covered with a piece of aluminium foil andclosed with an aluminium screw-on cap. The collected sap wasstored at �20 �C pending analysis. The aqueous phases of sap
(lower phase) was separated using a 5810 R centrifuge (Eppendorf,Germany) at 3000 rpm for 10 min and used in the validation.
Aliquots of 0.1 g of sap, either whole sap or aqueous sap lowerphase, were dissolved in 10 ml of distilled water. The diluted sam-ples were mixed well using a ball mill MM400 (Retsch GmbH, Ger-many) for 30 s and then diluted a further 50 times with distilledwater. A volume of 2.5 ml diluted sap was then added to a 20 mlHS-SPME vial (Merck, Australia) containing 2.5 ml of saturatedsodium chloride (NaCl) solution and a magnetic stir flea(5 � 2 mm) for aroma analysis. Five biological replicates withtwo technical replicates per biological replicate were preparedfor analysis.
2.5. Calibration and validation of method
Standard solutions were prepared using analytical reagentgrade chemicals. A combined stock solution which contained eachof the target analytes (viz., hexanal, 3-carene, a-terpinene, p-cymene, limonene, a-terpinolene and ethyl octanoate) in ethanol(Merck, Australia) was also prepared. Solutions were always madein duplicate from separately weighed reagents to ensure precisionin their preparation. The stock concentration of target analyteswere approximately 0.5 g/l (hexanal and p-cymene), 2 g/l (3-carene and a-terpinene), 10 g/l (limonene) and 20 g/l (a-terpinolene).
In duplicate, water, mango flesh and aqueous sap lower phasewere spiked with increasing levels of the combined stock solutionof analytes so that the resulting concentrations in water wereapproximately 0, 1.5, 3, 6, 15, 30, 60, 150, 300 and 600 lg/l for hex-anal and p-cymene, 0, 5, 10, 20, 50, 100, 200, 500, 1000 and2000 lg/l for 3-carene, a-terpinene and ethyl octanoate, 0, 25,50, 100, 250, 500, 1000, 1500, 5000 and 10,000 lg/l for limonene,and 0, 50, 100, 200, 500, 1000, 2000, 5000, 10,000 and 20,000 lg/l for a-terpinolene. Mango flesh and aqueous sap lower phase con-tain minimal concentrations of analytes’ prior to spiking. A dilutionof mango flesh of 1:400 was spiked with different amounts of a-terpinolene (0, 50, 100, 200, 500, 1000, 2000, 5000, 10,000 and20,000 lg/l) in order to have a low a-terpinolene concentrationfor optimising the MS signal of a-terpinolene. The solutions wereprepared in SPME vials for analysis (n = 10 � 2). The concentrationsof analytes in the samples were calculated from the peak arearatios for the unlabelled and labelled compounds versus the con-centration ratio. Validation parameters including the calibrationrelative standard deviation (RSD) and recovery were calculated inspiked concentration levels of each standard compound. The limitof detection (LOD) and limit of quantification (LOQ) were calcu-lated on the basis of 3.3a/S and 10a/S, respectively (Musharrafet al., 2016). a is the standard deviation of the y-intercepts and Sis the slope of calibration curve.
2.6. Headspace sampling of volatiles for analysis
A sample of either 2.5 g homogenized mango flesh or 2.5 mlaqueous solution of standards was added to a 20 ml SPME vial(Merck, Australia) containing 2.5 ml of saturated sodium chloride(NaCl) solution and a magnetic stirrer flea (5 � 2 mm). Vials wereimmediately sealed with a screw cap fitted with a silicone/PTFEseptum. Subsequently, 100 ll of combined internal standard solu-tion was injected through the septum and the vial was shaken well.The deuterated internal standards were added at concentrations of30 lg/l for d12-hexanal, 50 lg/l for d15-ethyl octanoate and 106lg/l for both d6-a-terpinolene and d5-limonene as equivalent tothe amount of mango flesh in the vial. The vial and its contentswere heated to 40 �C with stirring at 250 rpm for 2 min followedby extraction with a divinylbenzene/carboxen/polymethylsiloxane(DVB/CAR/PDMS, ‘grey’, 1 cm) 50/30 lm fibre (Supelco, USA)
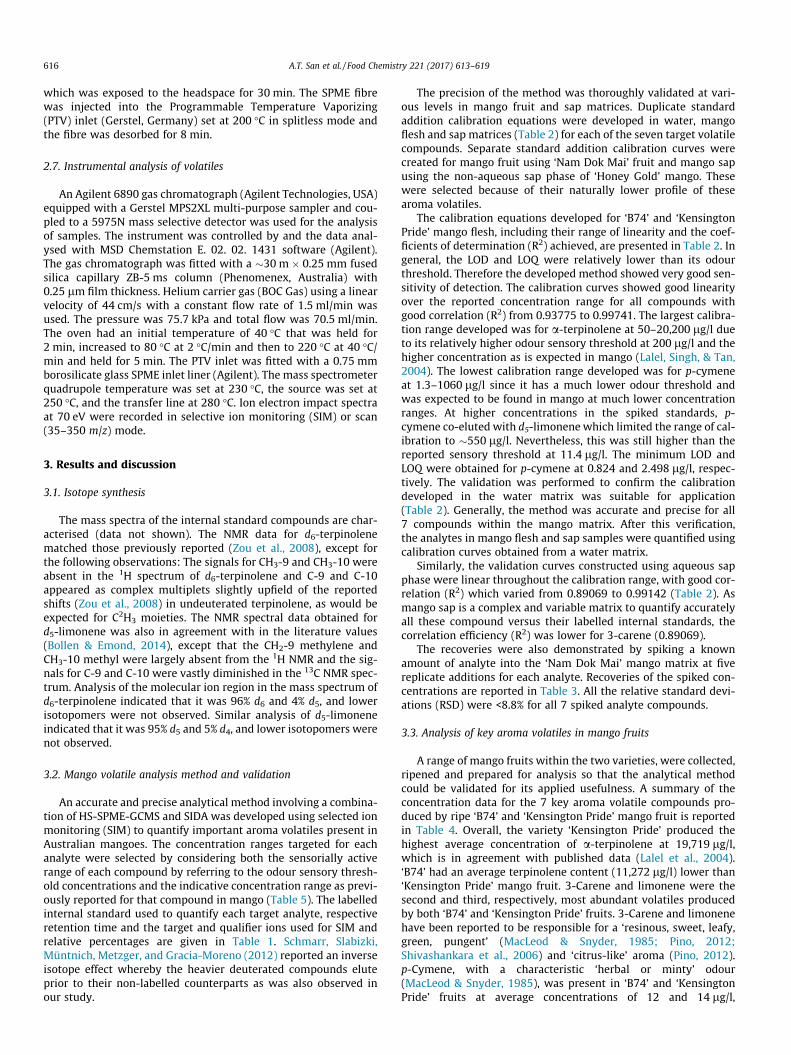
616 A.T. San et al. / Food Chemistry 221 (2017) 613–619
which was exposed to the headspace for 30 min. The SPME fibrewas injected into the Programmable Temperature Vaporizing(PTV) inlet (Gerstel, Germany) set at 200 �C in splitless mode andthe fibre was desorbed for 8 min.
2.7. Instrumental analysis of volatiles
An Agilent 6890 gas chromatograph (Agilent Technologies, USA)equipped with a Gerstel MPS2XL multi-purpose sampler and cou-pled to a 5975N mass selective detector was used for the analysisof samples. The instrument was controlled by and the data anal-ysed with MSD Chemstation E. 02. 02. 1431 software (Agilent).The gas chromatograph was fitted with a �30 m � 0.25 mm fusedsilica capillary ZB-5 ms column (Phenomenex, Australia) with0.25 lm film thickness. Helium carrier gas (BOC Gas) using a linearvelocity of 44 cm/s with a constant flow rate of 1.5 ml/min wasused. The pressure was 75.7 kPa and total flow was 70.5 ml/min.The oven had an initial temperature of 40 �C that was held for2 min, increased to 80 �C at 2 �C/min and then to 220 �C at 40 �C/min and held for 5 min. The PTV inlet was fitted with a 0.75 mmborosilicate glass SPME inlet liner (Agilent). The mass spectrometerquadrupole temperature was set at 230 �C, the source was set at250 �C, and the transfer line at 280 �C. Ion electron impact spectraat 70 eV were recorded in selective ion monitoring (SIM) or scan(35–350 m/z) mode.
3. Results and discussion
3.1. Isotope synthesis
The mass spectra of the internal standard compounds are char-acterised (data not shown). The NMR data for d6-terpinolenematched those previously reported (Zou et al., 2008), except forthe following observations: The signals for CH3-9 and CH3-10 wereabsent in the 1H spectrum of d6-terpinolene and C-9 and C-10appeared as complex multiplets slightly upfield of the reportedshifts (Zou et al., 2008) in undeuterated terpinolene, as would beexpected for C2H3 moieties. The NMR spectral data obtained ford5-limonene was also in agreement with in the literature values(Bollen & Emond, 2014), except that the CH2-9 methylene andCH3-10 methyl were largely absent from the 1H NMR and the sig-nals for C-9 and C-10 were vastly diminished in the 13C NMR spec-trum. Analysis of the molecular ion region in the mass spectrum ofd6-terpinolene indicated that it was 96% d6 and 4% d5, and lowerisotopomers were not observed. Similar analysis of d5-limoneneindicated that it was 95% d5 and 5% d4, and lower isotopomers werenot observed.
3.2. Mango volatile analysis method and validation
An accurate and precise analytical method involving a combina-tion of HS-SPME-GCMS and SIDA was developed using selected ionmonitoring (SIM) to quantify important aroma volatiles present inAustralian mangoes. The concentration ranges targeted for eachanalyte were selected by considering both the sensorially activerange of each compound by referring to the odour sensory thresh-old concentrations and the indicative concentration range as previ-ously reported for that compound in mango (Table 5). The labelledinternal standard used to quantify each target analyte, respectiveretention time and the target and qualifier ions used for SIM andrelative percentages are given in Table 1. Schmarr, Slabizki,Müntnich, Metzger, and Gracia-Moreno (2012) reported an inverseisotope effect whereby the heavier deuterated compounds eluteprior to their non-labelled counterparts as was also observed inour study.
The precision of the method was thoroughly validated at vari-ous levels in mango fruit and sap matrices. Duplicate standardaddition calibration equations were developed in water, mangoflesh and sap matrices (Table 2) for each of the seven target volatilecompounds. Separate standard addition calibration curves werecreated for mango fruit using ‘Nam Dok Mai’ fruit and mango sapusing the non-aqueous sap phase of ‘Honey Gold’ mango. Thesewere selected because of their naturally lower profile of thesearoma volatiles.
The calibration equations developed for ‘B74’ and ‘KensingtonPride’ mango flesh, including their range of linearity and the coef-ficients of determination (R2) achieved, are presented in Table 2. Ingeneral, the LOD and LOQ were relatively lower than its odourthreshold. Therefore the developed method showed very good sen-sitivity of detection. The calibration curves showed good linearityover the reported concentration range for all compounds withgood correlation (R2) from 0.93775 to 0.99741. The largest calibra-tion range developed was for a-terpinolene at 50–20,200 lg/l dueto its relatively higher odour sensory threshold at 200 lg/l and thehigher concentration as is expected in mango (Lalel, Singh, & Tan,2004). The lowest calibration range developed was for p-cymeneat 1.3–1060 lg/l since it has a much lower odour threshold andwas expected to be found in mango at much lower concentrationranges. At higher concentrations in the spiked standards, p-cymene co-eluted with d5-limonene which limited the range of cal-ibration to �550 lg/l. Nevertheless, this was still higher than thereported sensory threshold at 11.4 lg/l. The minimum LOD andLOQ were obtained for p-cymene at 0.824 and 2.498 lg/l, respec-tively. The validation was performed to confirm the calibrationdeveloped in the water matrix was suitable for application(Table 2). Generally, the method was accurate and precise for all7 compounds within the mango matrix. After this verification,the analytes in mango flesh and sap samples were quantified usingcalibration curves obtained from a water matrix.
Similarly, the validation curves constructed using aqueous sapphase were linear throughout the calibration range, with good cor-relation (R2) which varied from 0.89069 to 0.99142 (Table 2). Asmango sap is a complex and variable matrix to quantify accuratelyall these compound versus their labelled internal standards, thecorrelation efficiency (R2) was lower for 3-carene (0.89069).
The recoveries were also demonstrated by spiking a knownamount of analyte into the ‘Nam Dok Mai’ mango matrix at fivereplicate additions for each analyte. Recoveries of the spiked con-centrations are reported in Table 3. All the relative standard devi-ations (RSD) were <8.8% for all 7 spiked analyte compounds.
3.3. Analysis of key aroma volatiles in mango fruits
A range of mango fruits within the two varieties, were collected,ripened and prepared for analysis so that the analytical methodcould be validated for its applied usefulness. A summary of theconcentration data for the 7 key aroma volatile compounds pro-duced by ripe ‘B74’ and ‘Kensington Pride’ mango fruit is reportedin Table 4. Overall, the variety ‘Kensington Pride’ produced thehighest average concentration of a-terpinolene at 19,719 lg/l,which is in agreement with published data (Lalel et al., 2004).‘B74’ had an average terpinolene content (11,272 lg/l) lower than‘Kensington Pride’ mango fruit. 3-Carene and limonene were thesecond and third, respectively, most abundant volatiles producedby both ‘B74’ and ‘Kensington Pride’ fruits. 3-Carene and limonenehave been reported to be responsible for a ‘resinous, sweet, leafy,green, pungent’ (MacLeod & Snyder, 1985; Pino, 2012;Shivashankara et al., 2006) and ‘citrus-like’ aroma (Pino, 2012).p-Cymene, with a characteristic ‘herbal or minty’ odour(MacLeod & Snyder, 1985), was present in ‘B74’ and ‘KensingtonPride’ fruits at average concentrations of 12 and 14 lg/l,
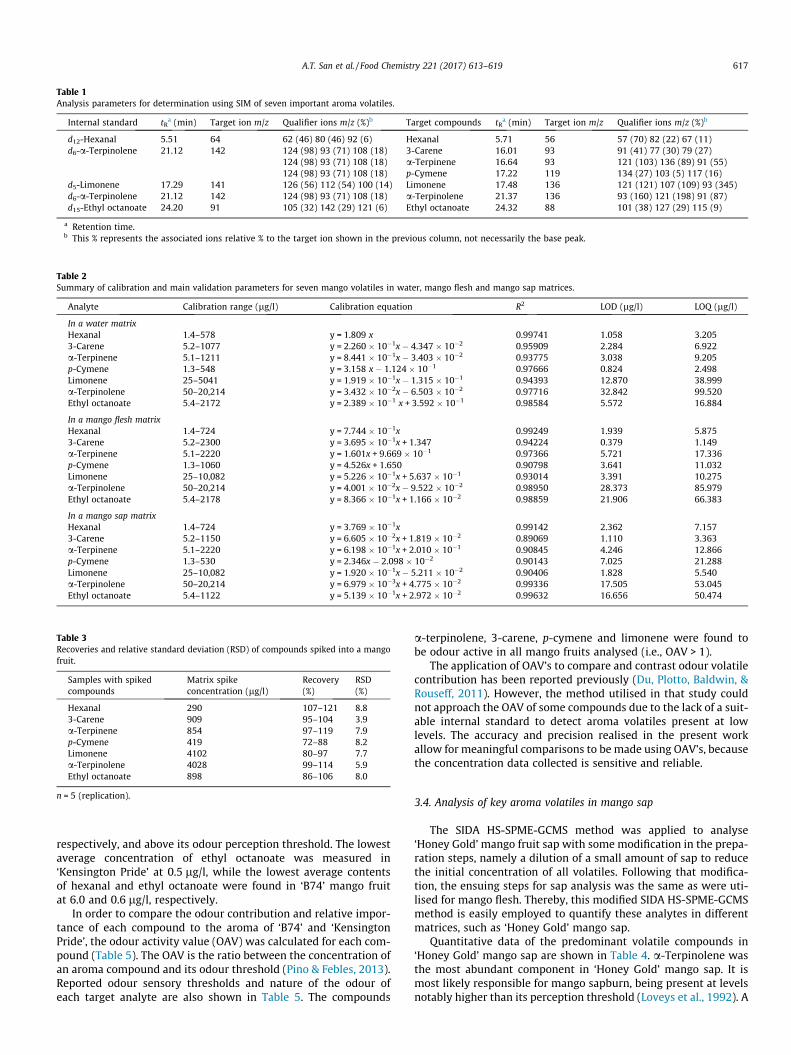
Table 1Analysis parameters for determination using SIM of seven important aroma volatiles.
Internal standard tRa (min) Target ion m/z Qualifier ions m/z (%)b Target compounds tR
a (min) Target ion m/z Qualifier ions m/z (%)b
d12-Hexanal 5.51 64 62 (46) 80 (46) 92 (6) Hexanal 5.71 56 57 (70) 82 (22) 67 (11)d6-a-Terpinolene 21.12 142 124 (98) 93 (71) 108 (18) 3-Carene 16.01 93 91 (41) 77 (30) 79 (27)
124 (98) 93 (71) 108 (18) a-Terpinene 16.64 93 121 (103) 136 (89) 91 (55)124 (98) 93 (71) 108 (18) p-Cymene 17.22 119 134 (27) 103 (5) 117 (16)
d5-Limonene 17.29 141 126 (56) 112 (54) 100 (14) Limonene 17.48 136 121 (121) 107 (109) 93 (345)d6-a-Terpinolene 21.12 142 124 (98) 93 (71) 108 (18) a-Terpinolene 21.37 136 93 (160) 121 (198) 91 (87)d15-Ethyl octanoate 24.20 91 105 (32) 142 (29) 121 (6) Ethyl octanoate 24.32 88 101 (38) 127 (29) 115 (9)
a Retention time.b This % represents the associated ions relative % to the target ion shown in the previous column, not necessarily the base peak.
Table 2Summary of calibration and main validation parameters for seven mango volatiles in water, mango flesh and mango sap matrices.
Analyte Calibration range (lg/l) Calibration equation R2 LOD (lg/l) LOQ (lg/l)
In a water matrixHexanal 1.4–578 y = 1.809 x 0.99741 1.058 3.2053-Carene 5.2–1077 y = 2.260 � 10�1x � 4.347 � 10�2 0.95909 2.284 6.922a-Terpinene 5.1–1211 y = 8.441 � 10�1x � 3.403 � 10�2 0.93775 3.038 9.205p-Cymene 1.3–548 y = 3.158 x � 1.124 � 10�1 0.97666 0.824 2.498Limonene 25–5041 y = 1.919 � 10�1x � 1.315 � 10�1 0.94393 12.870 38.999a-Terpinolene 50–20,214 y = 3.432 � 10�2x � 6.503 � 10�2 0.97716 32.842 99.520Ethyl octanoate 5.4–2172 y = 2.389 � 10�1 x + 3.592 � 10�1 0.98584 5.572 16.884
In a mango flesh matrixHexanal 1.4–724 y = 7.744 � 10�1x 0.99249 1.939 5.8753-Carene 5.2–2300 y = 3.695 � 10�1x + 1.347 0.94224 0.379 1.149a-Terpinene 5.1–2220 y = 1.601x + 9.669 � 10�1 0.97366 5.721 17.336p-Cymene 1.3–1060 y = 4.526x + 1.650 0.90798 3.641 11.032Limonene 25–10,082 y = 5.226 � 10�1x + 5.637 � 10�1 0.93014 3.391 10.275a-Terpinolene 50–20,214 y = 4.001 � 10�2x � 9.522 � 10�2 0.98950 28.373 85.979Ethyl octanoate 5.4–2178 y = 8.366 � 10�1x + 1.166 � 10�2 0.98859 21.906 66.383
In a mango sap matrixHexanal 1.4–724 y = 3.769 � 10�1x 0.99142 2.362 7.1573-Carene 5.2–1150 y = 6.605 � 10�2x + 1.819 � 10�2 0.89069 1.110 3.363a-Terpinene 5.1–2220 y = 6.198 � 10�1x + 2.010 � 10�1 0.90845 4.246 12.866p-Cymene 1.3–530 y = 2.346x � 2.098 � 10�2 0.90143 7.025 21.288Limonene 25–10,082 y = 1.920 � 10�1x � 5.211 � 10�2 0.90406 1.828 5.540a-Terpinolene 50–20,214 y = 6.979 � 10�3x + 4.775 � 10�2 0.99336 17.505 53.045Ethyl octanoate 5.4–1122 y = 5.139 � 10�1x + 2.972 � 10�2 0.99632 16.656 50.474
Table 3Recoveries and relative standard deviation (RSD) of compounds spiked into a mangofruit.
Samples with spikedcompounds
Matrix spikeconcentration (lg/l)
Recovery(%)
RSD(%)
Hexanal 290 107–121 8.83-Carene 909 95–104 3.9a-Terpinene 854 97–119 7.9p-Cymene 419 72–88 8.2Limonene 4102 80–97 7.7a-Terpinolene 4028 99–114 5.9Ethyl octanoate 898 86–106 8.0
n = 5 (replication).
A.T. San et al. / Food Chemistry 221 (2017) 613–619 617
respectively, and above its odour perception threshold. The lowestaverage concentration of ethyl octanoate was measured in‘Kensington Pride’ at 0.5 lg/l, while the lowest average contentsof hexanal and ethyl octanoate were found in ‘B74’ mango fruitat 6.0 and 0.6 lg/l, respectively.
In order to compare the odour contribution and relative impor-tance of each compound to the aroma of ‘B74’ and ‘KensingtonPride’, the odour activity value (OAV) was calculated for each com-pound (Table 5). The OAV is the ratio between the concentration ofan aroma compound and its odour threshold (Pino & Febles, 2013).Reported odour sensory thresholds and nature of the odour ofeach target analyte are also shown in Table 5. The compounds
a-terpinolene, 3-carene, p-cymene and limonene were found tobe odour active in all mango fruits analysed (i.e., OAV > 1).
The application of OAV’s to compare and contrast odour volatilecontribution has been reported previously (Du, Plotto, Baldwin, &Rouseff, 2011). However, the method utilised in that study couldnot approach the OAV of some compounds due to the lack of a suit-able internal standard to detect aroma volatiles present at lowlevels. The accuracy and precision realised in the present workallow for meaningful comparisons to be made using OAV’s, becausethe concentration data collected is sensitive and reliable.
3.4. Analysis of key aroma volatiles in mango sap
The SIDA HS-SPME-GCMS method was applied to analyse‘Honey Gold’ mango fruit sap with some modification in the prepa-ration steps, namely a dilution of a small amount of sap to reducethe initial concentration of all volatiles. Following that modifica-tion, the ensuing steps for sap analysis was the same as were uti-lised for mango flesh. Thereby, this modified SIDA HS-SPME-GCMSmethod is easily employed to quantify these analytes in differentmatrices, such as ‘Honey Gold’ mango sap.
Quantitative data of the predominant volatile compounds in‘Honey Gold’ mango sap are shown in Table 4. a-Terpinolene wasthe most abundant component in ‘Honey Gold’ mango sap. It ismost likely responsible for mango sapburn, being present at levelsnotably higher than its perception threshold (Loveys et al., 1992). A
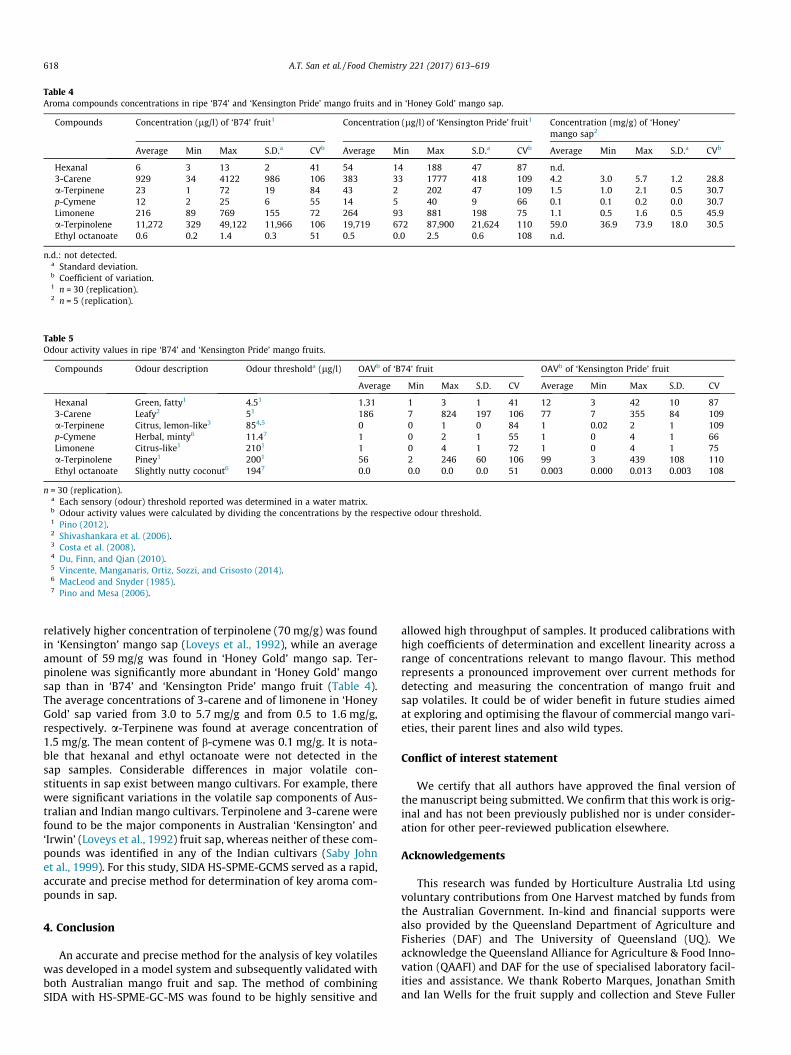
Table 4Aroma compounds concentrations in ripe ‘B74’ and ‘Kensington Pride’ mango fruits and in ‘Honey Gold’ mango sap.
Compounds Concentration (lg/l) of ‘B74’ fruit1 Concentration (lg/l) of ‘Kensington Pride’ fruit1 Concentration (mg/g) of ‘Honey’mango sap2
Average Min Max S.D.a CVb Average Min Max S.D.a CVb Average Min Max S.D.a CVb
Hexanal 6 3 13 2 41 54 14 188 47 87 n.d.3-Carene 929 34 4122 986 106 383 33 1777 418 109 4.2 3.0 5.7 1.2 28.8a-Terpinene 23 1 72 19 84 43 2 202 47 109 1.5 1.0 2.1 0.5 30.7p-Cymene 12 2 25 6 55 14 5 40 9 66 0.1 0.1 0.2 0.0 30.7Limonene 216 89 769 155 72 264 93 881 198 75 1.1 0.5 1.6 0.5 45.9a-Terpinolene 11,272 329 49,122 11,966 106 19,719 672 87,900 21,624 110 59.0 36.9 73.9 18.0 30.5Ethyl octanoate 0.6 0.2 1.4 0.3 51 0.5 0.0 2.5 0.6 108 n.d.
n.d.: not detected.a Standard deviation.b Coefficient of variation.1 n = 30 (replication).2 n = 5 (replication).
Table 5Odour activity values in ripe ‘B74’ and ‘Kensington Pride’ mango fruits.
Compounds Odour description Odour thresholda (lg/l) OAVb of ‘B74’ fruit OAVb of ‘Kensington Pride’ fruit
Average Min Max S.D. CV Average Min Max S.D. CV
Hexanal Green, fatty1 4.51 1.31 1 3 1 41 12 3 42 10 873-Carene Leafy2 51 186 7 824 197 106 77 7 355 84 109a-Terpinene Citrus, lemon-like3 854,5 0 0 1 0 84 1 0.02 2 1 109p-Cymene Herbal, minty6 11.47 1 0 2 1 55 1 0 4 1 66Limonene Citrus-like1 2101 1 0 4 1 72 1 0 4 1 75a-Terpinolene Piney1 2001 56 2 246 60 106 99 3 439 108 110Ethyl octanoate Slightly nutty coconut6 1947 0.0 0.0 0.0 0.0 51 0.003 0.000 0.013 0.003 108
n = 30 (replication).a Each sensory (odour) threshold reported was determined in a water matrix.b Odour activity values were calculated by dividing the concentrations by the respective odour threshold.1 Pino (2012).2 Shivashankara et al. (2006).3 Costa et al. (2008).4 Du, Finn, and Qian (2010).5 Vincente, Manganaris, Ortiz, Sozzi, and Crisosto (2014).6 MacLeod and Snyder (1985).7 Pino and Mesa (2006).
618 A.T. San et al. / Food Chemistry 221 (2017) 613–619
relatively higher concentration of terpinolene (70 mg/g) was foundin ‘Kensington’ mango sap (Loveys et al., 1992), while an averageamount of 59 mg/g was found in ‘Honey Gold’ mango sap. Ter-pinolene was significantly more abundant in ‘Honey Gold’ mangosap than in ‘B74’ and ‘Kensington Pride’ mango fruit (Table 4).The average concentrations of 3-carene and of limonene in ‘HoneyGold’ sap varied from 3.0 to 5.7 mg/g and from 0.5 to 1.6 mg/g,respectively. a-Terpinene was found at average concentration of1.5 mg/g. The mean content of b-cymene was 0.1 mg/g. It is nota-ble that hexanal and ethyl octanoate were not detected in thesap samples. Considerable differences in major volatile con-stituents in sap exist between mango cultivars. For example, therewere significant variations in the volatile sap components of Aus-tralian and Indian mango cultivars. Terpinolene and 3-carene werefound to be the major components in Australian ‘Kensington’ and‘Irwin’ (Loveys et al., 1992) fruit sap, whereas neither of these com-pounds was identified in any of the Indian cultivars (Saby Johnet al., 1999). For this study, SIDA HS-SPME-GCMS served as a rapid,accurate and precise method for determination of key aroma com-pounds in sap.
4. Conclusion
An accurate and precise method for the analysis of key volatileswas developed in a model system and subsequently validated withboth Australian mango fruit and sap. The method of combiningSIDA with HS-SPME-GC-MS was found to be highly sensitive and
allowed high throughput of samples. It produced calibrations withhigh coefficients of determination and excellent linearity across arange of concentrations relevant to mango flavour. This methodrepresents a pronounced improvement over current methods fordetecting and measuring the concentration of mango fruit andsap volatiles. It could be of wider benefit in future studies aimedat exploring and optimising the flavour of commercial mango vari-eties, their parent lines and also wild types.
Conflict of interest statement
We certify that all authors have approved the final version ofthe manuscript being submitted. We confirm that this work is orig-inal and has not been previously published nor is under consider-ation for other peer-reviewed publication elsewhere.
Acknowledgements
This research was funded by Horticulture Australia Ltd usingvoluntary contributions from One Harvest matched by funds fromthe Australian Government. In-kind and financial supports werealso provided by the Queensland Department of Agriculture andFisheries (DAF) and The University of Queensland (UQ). Weacknowledge the Queensland Alliance for Agriculture & Food Inno-vation (QAAFI) and DAF for the use of specialised laboratory facil-ities and assistance. We thank Roberto Marques, Jonathan Smithand Ian Wells for the fruit supply and collection and Steve Fuller
A.T. San et al. / Food Chemistry 221 (2017) 613–619 619
for GC-MS technical support. Finally, ATS gratefully acknowledgesthe receipt of an ACIAR John Allwright Fellowship for financial sup-port of her PhD study in Australia and participation in ACIAR pro-ject HORT 2012/098 – Improved postharvest management of fruitand vegetables in the Southern Philippines and Australia.
Appendix A. Supplementary data
Supplementary data associated with this article can be found, inthe online version, at http://dx.doi.org/10.1016/j.foodchem.2016.11.130.
References
AMIA. Mango production. (2016). http://www.industry.mangoes.net.au/mango-production/ Accessed 19.05.16.
Andrade, E. H. A., Maia, J. G. S., & Zoghbi, M. d. G. B. (2000). Aroma volatileconstituents of Brazilian varieties of mango fruit. Journal of Food Compositionand Analysis, 13(1), 27–33.
Bollen, A. F., & Emond, J. P. (2014). Chapter 17 – Traceability in postharvest systems.In R. L. Shewfelt, B. Brueckner, & S. E. Prussia (Eds.), Postharvest handling (thirded., pp. 485–504). San Diego: Academic Press.
Butkhup, L., Jeenphakdee, M., Jorjong, S., Samappito, S., Samappito, W., &Chowtivannakul, S. (2011). HS-SPME-GC-MS analysis of volatile aromaticcompounds in alcohol related beverages made with mulberry fruits. FoodScience and Biotechnology, 20(4), 1021–1032.
Costa, R., Zellner, B. D., Crupi, M. L., De Fina, M. R., Valentino, M. R., Dugo, P., et al.(2008). GC-MS, GC-O and enantio-GC investigation of the essential oil ofTarchonanthus camphoratus L.. Flavour and Fragrance Journal, 23(1), 40–48.
Dierkes, G., Bongartz, A., Guth, H., & Hayen, H. (2012). Quality evaluation of olive oilby statistical analysis of multicomponent stable isotope dilution assay data ofaroma active compounds. Journal of Agricultural and Food Chemistry, 60(1),394–401.
Dillon, N. L., Bally, I. S. E., Wright, C. L., Hucks, L., Innes, D. J., & Dietzgen, R. G. (2013).Genetic diversity of the Australian national mango genebank. ScientiaHorticulturae, 150, 213–226.
Du, X., Finn, C. E., & Qian, M. C. (2010). Volatile composition and odour-activityvalue of thornless ‘Black Diamond’ and ‘Marion’ blackberries. Food Chemistry,119(3), 1127–1134.
Du, X., Plotto, A., Baldwin, E., & Rouseff, R. (2011). Evaluation of volatiles from twosubtropical strawberry cultivars using GC–Olfactometry, GC–MS odor activityvalues, and sensory analysis. Journal of Agricultural and Food Chemistry, 59(23),12569–12577.
Florkowski, W. J., Klepacka, A. M., Nambiar, P. M., Meng, T., Fu, S., Sheremenko, G.,et al. (2014). Chapter 7 – Consumer expenditures on fresh fruit and vegetables.In W. J. Florkowski, R. L. Shewfelt, B. Brueckner, & S. E. Prussia (Eds.), Postharvesthandling (third ed., pp. 147–166). San Diego: Academic Press.
Florkowski, W. J., Shewfelt, R. L., Brueckner, B., & Prussia, S. E. (2014). Chapter 20 –Challenges in postharvest handling. In W. J. Florkowski, R. L. Shewfelt, B.Brueckner, & S. E. Prussia (Eds.), Postharvest handling (third ed., pp. 543–547).San Diego: Academic Press.
Guo, S., Zhang, W., Liang, J., You, C., Geng, Z., Wang, C., et al. (2016). Contact andrepellent activities of the essential oil from juniperus formosana against twostored product insects. Molecules, 21(4), 504.
Ketter, A., & Herrmann, R. (1990). Chiral lewis acids as enantioselective catalysts inthe diels-alder reaction and the allylic addition to aldehydes. Zeitschrift fürNaturforschung B, 45(12), 1684–1688.
Korstanje, T. J., de Waard, E. F., Jastrzebski, J. T., & Klein Gebbink, R. J. (2012).Rhenium-catalyzed dehydration of nonbenzylic and terpene alcohols to olefins.ACS Catalysis, 2(10), 2173–2181.
Kotseridis, Y. S., Spink, M., Brindle, I. D., Blake, A. J., Sears, M., Chen, X., et al. (2008).Quantitative analysis of 3-alkyl-2-methoxypyrazines in juice and wine usingstable isotope labelled internal standard assay. Journal of Chromatography A,1190(1–2), 294–301.
Lalel, H. J. D., & Singh, Z. (2006). Controlled atmosphere storage of ‘Delta R2E2’mango fruit affects production of aroma volatile compounds. Journal ofHorticultural Science & Biotechnology, 81(3), 449–457.
Lalel, H. J. D., Singh, Z., & Tan, S. C. (2003). Aroma volatiles production during fruitripening of ‘Kensington Pride’ mango. Postharvest Biology and Technology, 27(3),323–336.
Lalel, H. J. D., Singh, Z., & Tan, S. C. (2004). Ripening temperatures influencebiosynthesis of aroma volatile compounds in ‘Kensington Pride’ mango fruit.Journal of Horticultural Science & Biotechnology, 79(1), 146–157.
Loveys, B. R., Robinson, S. P., Brophy, J. J., & Chacko, E. K. (1992). Mango sapburn –components of fruit sap and their role in causing skin damage. Australian Journalof Plan Physiology, 19(5), 449–457.
MacLeod, A. J., & de Troconis, N. G. (1982). Volatile flavour components of mangofruit. Phytochemistry, 21(10), 2523–2526.
MacLeod, A. J., Macleod, G., & Snyder, C. H. (1988). Volatile aroma constituents ofmango (cv Kensington). Phytochemistry, 27(7), 2189–2193.
MacLeod, A. J., & Snyder, C. H. (1985). Volatile components of two cultivars ofmango from Florida. Journal of Agricultural and Food Chemistry, 33(3), 380–384.
Mander, L. N., & Williams, C. M. (2016). Chromatography with silver nitrate: Part 2.Tetrahedron, 72(9), 1133–1150.
Maraval, I., Sen, K., Agrebi, A., Menut, C., Morere, A., Boulanger, R., et al. (2010).Quantification of 2-acetyl-1-pyrroline in rice by stable isotope dilution assaythrough headspace solid-phase microextraction coupled to gaschromatography-tandem mass spectrometry. Analytica Chimica Acta, 675(2),148–155.
Munafo, J. P., Didzbalis, J., Schnell, R. J., Schieberle, P., & Steinhaus, M. (2014).Characterization of the major aroma-active compounds in mango (Mangiferaindica L.) cultivars Haden, White Alfonso, Praya Sowoy, Royal Special, andMalindi by application of a comparative aroma extract dilution analysis. Journalof Agricultural and Food Chemistry, 62(20), 4544–4551.
Munafo, J. P., Didzbalis, J., Schnell, R. J., & Steinhaus, M. (2016). Insights into the keyaroma compounds in mango (Mangifera indica L. ‘Haden’) fruits by stableisotope dilution quantitation and aroma simulation experiments. Journal ofAgricultural and Food Chemistry.
Musharraf, S. G., Uddin, J., Siddiqui, A. J., & Akram, M. I. (2016). Quantification ofaroma constituents of mango sap from different Pakistan mango cultivars usinggas chromatography triple quadrupole mass spectrometry. Food Chemistry, 196,1355–1360.
Negi, P., John, S., & Rao, P. (2002). Antimicrobial activity of mango sap. EuropeanFood Research and Technology, 214(4), 327–330.
Nicola, S., & Fontana, E. (2014). Chapter 9 – Fresh-cut produce quality: Implicationsfor a systems approach. In W. J. Florkowski, R. L. Shewfelt, B. Brueckner, & S. E.Prussia (Eds.), Postharvest handling (third ed., pp. 217–273). San Diego:Academic Press.
Pandit, S. S., Chidley, H. G., Kulkarni, R. S., Pujari, K. H., Giri, A. P., & Gupta, V. S.(2009). Cultivar relationships in mango based on fruit volatile profiles. FoodChemistry, 114(1), 363–372.
Pandit, S. S., Kulkarni, R. S., Chidley, H. G., Giri, A. P., Pujari, K. H., Köllner, T. G., et al.(2009b). Changes in volatile composition during fruit development andripening of ‘Alphonso’ mango. Journal of the Science of Food and Agriculture, 89(12), 2071–2081.
Park, M. K., Choi, H.-K., Kwon, D.-Y., & Kim, Y.-S. (2007). Study of volatile organicacids in freeze-dried Cheonggukjang formed during fermentation using SPMEand stable-isotope dilution assay (SIDA). Food Chemistry, 105(3), 1276–1280.
Pino, J. A. (2012). Odour-active compounds in mango (Mangifera indica L. cv.Corazón). International Journal of Food Science & Technology, 47(9), 1944–1950.
Pino, J. A., & Febles, Y. (2013). Odour-active compounds in banana fruit cv. GiantCavendish. Food Chemistry, 141(2), 795–801.
Pino, J. A., & Mesa, J. (2006). Contribution of volatile compounds to mango(Mangifera indica L.) aroma. Flavour and Fragrance Journal, 21(2), 207–213.
Pino, J. A., Mesa, J., Muñoz, Y., Martí, M. P., & Marbot, R. (2005). Volatile componentsfrom mango (Mangifera indica L.) cultivars. Journal of Agricultural and FoodChemistry, 53(6), 2213–2223.
Rudloff, E. V. (1961). A simple reagent for the specific dehydration of terpenealcohols. Canadian Journal of Chemistry, 39(9), 1860–1864.
Saby John, K., Jagan Mohan Rao, L., Bhat, S. G., & Prasada Rao, U. J. S. (1999).Characterization of aroma components of sap from different Indian mangovarieties. Phytochemistry, 52(5), 891–894.
Sánchez-Palomo, E., Díaz-Maroto, M. C., & Pérez-Coello, M. S. (2005). Rapiddetermination of volatile compounds in grapes by HS-SPME coupled withGC–MS. Talanta, 66(5), 1152–1157.
Schmarr, H.-G., Slabizki, P., Müntnich, S., Metzger, C., & Gracia-Moreno, E. (2012).Ionic liquids as novel stationary phases in gas liquid chromatography: Inverseor normal isotope effect? Journal of Chromatography A, 1270, 310–317.
Shivashankara, K. S., Isobe, S., Horita, H., Takenaka, M., & Shiina, T. (2006). Volatilearomatic constituents of tree ripened and mature green ‘Irwin’ mango fruitsduring low temperature storage. Journal of the Japanese Society for HorticulturalScience, 75(3), 209–212.
Siebert, T. E., Smyth, H. E., Capone, D. L., Neuwöhner, C., Pardon, K. H.,Skouroumounis, G. K., et al. (2005). Stable isotope dilution analysis of winefermentation products by HS-SPME-GC-MS. Analytical and BioanalyticalChemistry, 381(4), 937–947.
Vincente, A. R., Manganaris, G. A., Ortiz, C. M., Sozzi, G. O., & Crisosto, C. H. (2014).Chapter 5 – Nutritional quality of fruits and vegetables. In W. J. F. L. S. B. E.Prussia (Ed.), Postharvest handling (third ed., pp. 69–122). San Diego: AcademicPress.
Williams, C. M., & Mander, L. N. (2001). Chromatography with silver nitrate.Tetrahedron, 57(3), 425–447.
Yuan, B., Li, F., Xu, D., & Fu, M.-L. (2013). Comparison of two methods for thedetermination of geosmin and 2-methylisoborneol in algae samples by stableisotope dilution assay through purge-and-trap or headspace solid-phasemicroextraction combined with GC/MS. Analytical Methods, 5(7), 1739–1746.
Zou, Y., Wang, Q., & Goeke, A. (2008). Organocatalytic multicomponent a-methylenation/diels–alder reactions: A versatile route to substitutedcyclohexenecarbaldehyde derivatives. Chemistry – A European Journal, 14(17),5335–5345.
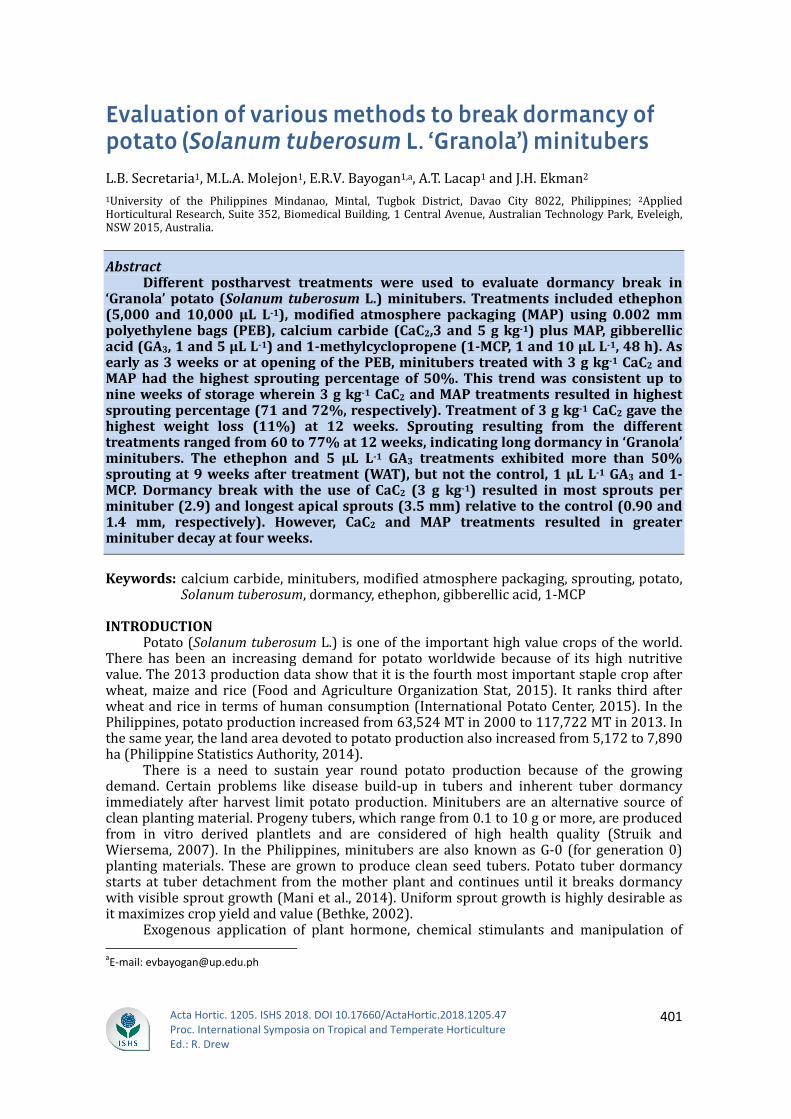
Acta Hortic. 1205. ISHS 2018. DOI 10.17660/ActaHortic.2018.1205.47 Proc. International Symposia on Tropical and Temperate Horticulture Ed.: R. Drew
401
Evaluation of various methods to break dormancy of potato (Solanum tuberosum L. ‘Granola’) minitubers L.B.Secretaria1,M.L.A.Molejon1,E.R.V.Bayogan1,a,A.T.Lacap1andJ.H.Ekman21University of the Philippines Mindanao, Mintal, Tugbok District, Davao City 8022, Philippines; 2AppliedHorticulturalResearch,Suite352,BiomedicalBuilding,1CentralAvenue,AustralianTechnologyPark,Eveleigh,NSW2015,Australia.Abstract
Different postharvest treatments were used to evaluate dormancy break in‘Granola’potato (Solanum tuberosumL.)minitubers.Treatments includedethephon(5,000 and 10,000µL L-1),modified atmospherepackaging (MAP)using 0.002mmpolyethylenebags (PEB),calciumcarbide (CaC2,3and5gkg-1)plusMAP,gibberellicacid(GA3,1and5µLL-1)and1-methylcyclopropene(1-MCP,1and10µLL-1,48h).Asearlyas3weeksoratopeningofthePEB,minituberstreatedwith3gkg-1CaC2andMAPhad thehighest sproutingpercentageof50%.This trendwasconsistentup tonineweeksofstoragewherein3gkg-1CaC2andMAPtreatmentsresulted inhighestsproutingpercentage(71and72%,respectively).Treatmentof3gkg-1CaC2gavethehighest weight loss (11%) at 12 weeks. Sprouting resulting from the differenttreatmentsrangedfrom60to77%at12weeks,indicatinglongdormancyin‘Granola’minitubers. The ethephon and 5 µL L-1 GA3 treatments exhibitedmore than 50%sproutingat9weeksaftertreatment(WAT),butnotthecontrol,1µLL-1GA3and1-MCP.Dormancy breakwith the use of CaC2 (3 g kg-1) resulted inmost sproutsperminituber(2.9)andlongestapicalsprouts(3.5mm)relativetothecontrol(0.90and1.4 mm, respectively). However, CaC2 and MAP treatments resulted in greaterminituberdecayatfourweeks.
Keywords:calciumcarbide,minitubers,modifiedatmospherepackaging,sprouting,potato,Solanumtuberosum,dormancy,ethephon,gibberellicacid,1-MCP
INTRODUCTIONPotato(SolanumtuberosumL.)isoneoftheimportanthighvaluecropsoftheworld.There has been an increasing demand for potatoworldwide because of its high nutritivevalue.The2013productiondatashowthatitisthefourthmostimportantstaplecropafterwheat,maizeand rice (FoodandAgricultureOrganizationStat, 2015). It ranks thirdafterwheatandrice intermsofhumanconsumption(InternationalPotatoCenter,2015). InthePhilippines,potatoproductionincreasedfrom63,524MTin2000to117,722MTin2013.Inthesameyear,thelandareadevotedtopotatoproductionalsoincreasedfrom5,172to7,890ha(PhilippineStatisticsAuthority,2014).There is a need to sustain year round potato production because of the growingdemand. Certain problems like disease build-up in tubers and inherent tuber dormancyimmediately afterharvest limitpotatoproduction.Minitubers are analternative sourceofcleanplantingmaterial.Progenytubers,whichrangefrom0.1to10gormore,areproducedfrom in vitro derived plantlets and are considered of high health quality (Struik andWiersema, 2007). In thePhilippines,minitubers are alsoknownasG-0 (for generation0)plantingmaterials.Thesearegrown toproducecleanseed tubers.Potato tuberdormancystartsat tuberdetachment fromthemotherplantandcontinuesuntil itbreaksdormancywithvisiblesproutgrowth(Manietal.,2014).Uniformsproutgrowthishighlydesirableasitmaximizescropyieldandvalue(Bethke,2002).Exogenous application of plant hormone, chemical stimulants and manipulation of aE-mail: [email protected]
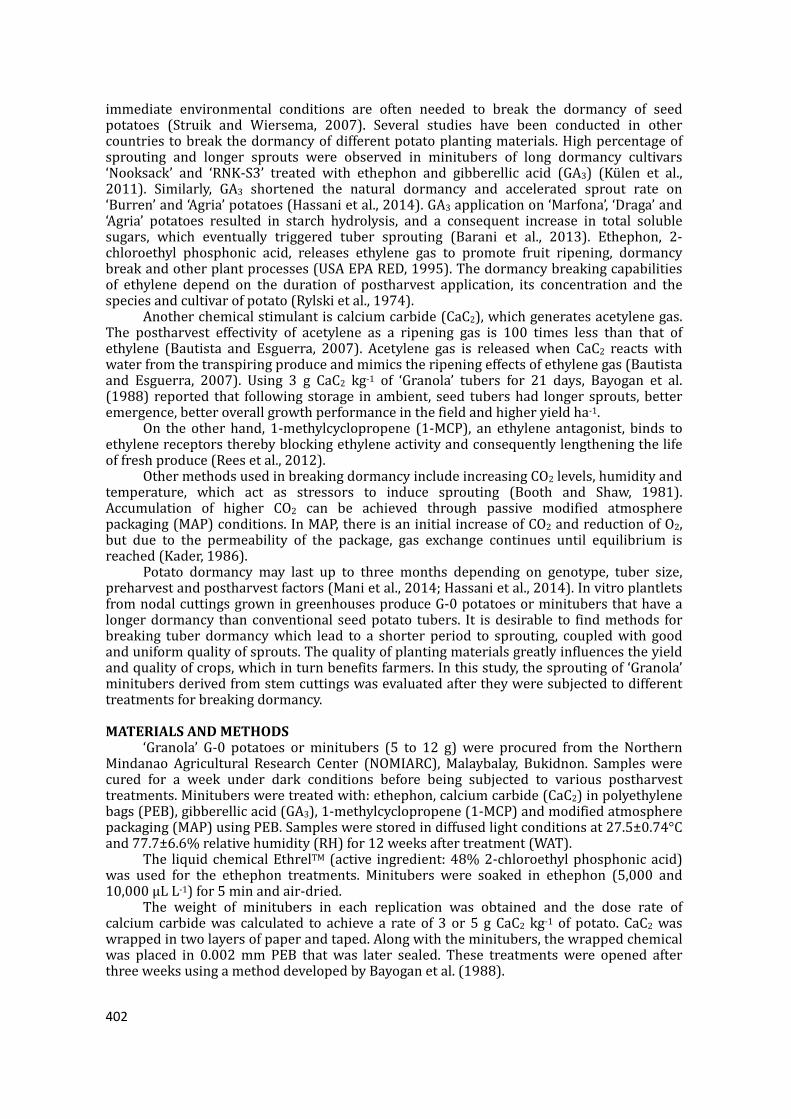
402
immediate environmental conditions are often needed to break the dormancy of seedpotatoes (Struik and Wiersema, 2007). Several studies have been conducted in othercountriestobreakthedormancyofdifferentpotatoplantingmaterials.Highpercentageofsprouting and longer sprouts were observed in minitubers of long dormancy cultivars‘Nooksack’ and ‘RNK-S3’ treated with ethephon and gibberellic acid (GA3) (Kulen et al.,2011). Similarly, GA3 shortened the natural dormancy and accelerated sprout rate on‘Burren’and‘Agria’potatoes(Hassanietal.,2014).GA3applicationon‘Marfona’,‘Draga’and‘Agria’ potatoes resulted in starch hydrolysis, and a consequent increase in total solublesugars, which eventually triggered tuber sprouting (Barani et al., 2013). Ethephon, 2-chloroethyl phosphonic acid, releases ethylene gas to promote fruit ripening, dormancybreakandotherplantprocesses(USAEPARED,1995).Thedormancybreakingcapabilitiesof ethylene depend on the duration of postharvest application, its concentration and thespeciesandcultivarofpotato(Rylskietal.,1974).Anotherchemicalstimulantiscalciumcarbide(CaC2),whichgeneratesacetylenegas.The postharvest effectivity of acetylene as a ripening gas is 100 times less than that ofethylene (Bautista and Esguerra, 2007). Acetylene gas is releasedwhen CaC2 reacts withwaterfromthetranspiringproduceandmimicstheripeningeffectsofethylenegas(Bautistaand Esguerra, 2007). Using 3 g CaC2 kg-1 of ‘Granola’ tubers for 21 days, Bayogan et al.(1988) reported that following storage in ambient, seed tubershad longer sprouts, betteremergence,betteroverallgrowthperformanceinthefieldandhigheryieldha-1.On the other hand, 1-methylcyclopropene (1-MCP), an ethylene antagonist, binds toethylenereceptorstherebyblockingethyleneactivityandconsequentlylengtheningthelifeoffreshproduce(Reesetal.,2012).OthermethodsusedinbreakingdormancyincludeincreasingCO2levels,humidityandtemperature, which act as stressors to induce sprouting (Booth and Shaw, 1981).Accumulation of higher CO2 can be achieved through passive modified atmospherepackaging(MAP)conditions.InMAP,thereisaninitialincreaseofCO2andreductionofO2,but due to the permeability of the package, gas exchange continues until equilibrium isreached(Kader,1986).Potato dormancy may last up to three months depending on genotype, tuber size,preharvestandpostharvestfactors(Manietal.,2014;Hassanietal.,2014).InvitroplantletsfromnodalcuttingsgrowningreenhousesproduceG-0potatoesorminitubersthathavealongerdormancy thanconventional seedpotato tubers. It isdesirable to findmethods forbreaking tuber dormancywhich lead to a shorter period to sprouting, coupledwith goodanduniformqualityofsprouts.Thequalityofplantingmaterialsgreatlyinfluencestheyieldandqualityofcrops,whichinturnbenefitsfarmers.Inthisstudy,thesproutingof‘Granola’minitubersderivedfromstemcuttingswasevaluatedaftertheyweresubjectedtodifferenttreatmentsforbreakingdormancy.MATERIALSANDMETHODS‘Granola’ G-0 potatoes orminitubers (5 to 12 g)were procured from the NorthernMindanao Agricultural Research Center (NOMIARC),Malaybalay, Bukidnon. Sampleswerecured for a week under dark conditions before being subjected to various postharvesttreatments.Minitubersweretreatedwith:ethephon,calciumcarbide(CaC2)inpolyethylenebags(PEB),gibberellicacid(GA3),1-methylcyclopropene(1-MCP)andmodifiedatmospherepackaging(MAP)usingPEB.Sampleswerestoredindiffusedlightconditionsat27.5±0.74°Cand77.7±6.6%relativehumidity(RH)for12weeksaftertreatment(WAT).The liquidchemicalEthrelTM (active ingredient:48%2-chloroethylphosphonicacid)was used for the ethephon treatments. Minitubers were soaked in ethephon (5,000 and10,000μLL-1)for5minandair-dried.The weight of minitubers in each replication was obtained and the dose rate ofcalciumcarbidewas calculated to achieve a rate of 3 or5 g CaC2 kg-1 of potato. CaC2waswrappedintwolayersofpaperandtaped.Alongwiththeminitubers,thewrappedchemicalwas placed in 0.002mm PEB thatwas later sealed. These treatmentswere opened afterthreeweeksusingamethoddevelopedbyBayoganetal.(1988).
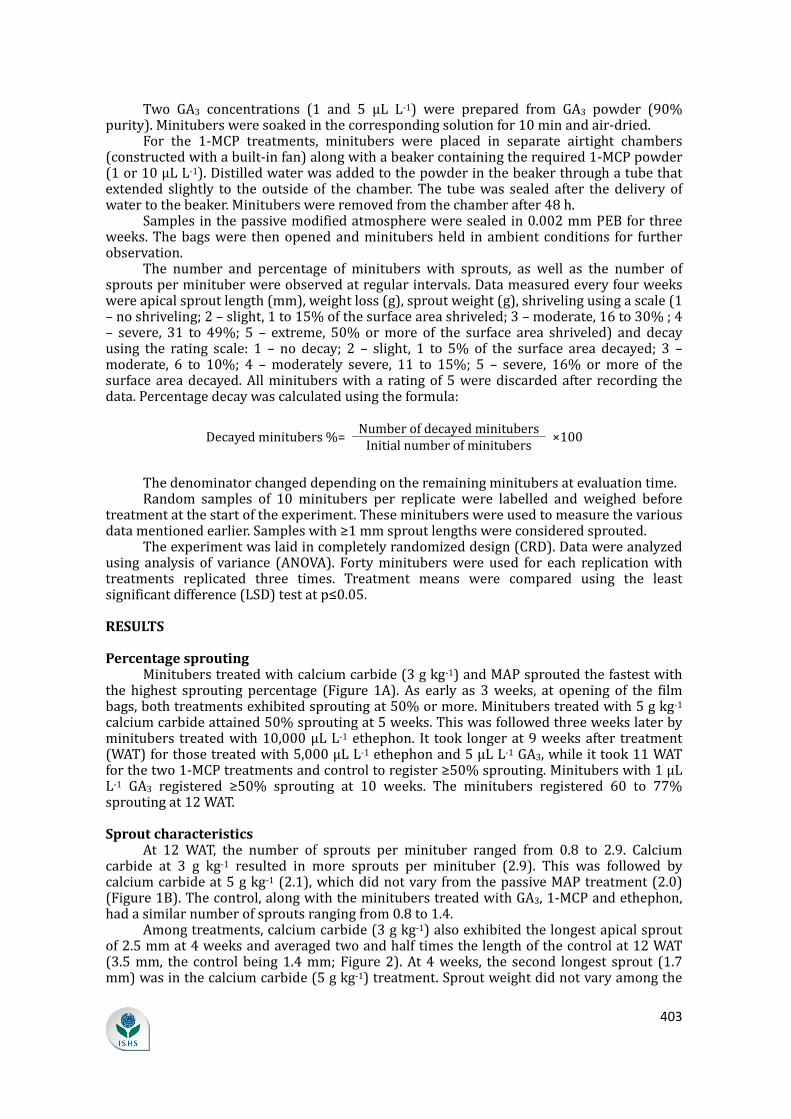
403
Two GA3 concentrations (1 and 5 μL L-1) were prepared from GA3 powder (90%purity).Minitubersweresoakedinthecorrespondingsolutionfor10minandair-dried.For the 1-MCP treatments, minitubers were placed in separate airtight chambers(constructedwithabuilt-infan)alongwithabeakercontainingtherequired1-MCPpowder(1or10μLL-1).Distilledwaterwasaddedtothepowderinthebeakerthroughatubethatextended slightly to the outsideof the chamber.The tubewas sealed after thedeliveryofwatertothebeaker.Minituberswereremovedfromthechamberafter48h.Samplesinthepassivemodifiedatmosphereweresealedin0.002mmPEBforthreeweeks.Thebagswere thenopenedandminitubersheld inambientconditions for furtherobservation.The number and percentage of minitubers with sprouts, as well as the number ofsproutsperminituberwereobservedatregularintervals.Datameasuredeveryfourweekswereapicalsproutlength(mm),weightloss(g),sproutweight(g),shrivelingusingascale(1–noshriveling;2–slight,1to15%ofthesurfaceareashriveled;3–moderate,16to30%;4– severe, 31 to 49%; 5 – extreme, 50%ormore of the surface area shriveled) and decayusing the rating scale: 1 – no decay; 2 – slight, 1 to 5% of the surface area decayed; 3 –moderate, 6 to 10%; 4 –moderately severe, 11 to 15%; 5 – severe, 16% ormore of thesurfaceareadecayed.Allminituberswitha ratingof5werediscardedafter recording thedata.Percentagedecaywascalculatedusingtheformula:Decayedminitubers%= Numberofdecayedminitubers ×100Initialnumberofminitubers Thedenominatorchangeddependingontheremainingminitubersatevaluationtime.Random samples of 10 minitubers per replicate were labelled and weighed beforetreatmentatthestartoftheexperiment.Theseminituberswereusedtomeasurethevariousdatamentionedearlier.Sampleswith≥1mmsproutlengthswereconsideredsprouted.Theexperimentwaslaidincompletelyrandomizeddesign(CRD).Datawereanalyzedusing analysis of variance (ANOVA). Fortyminituberswereused for each replicationwithtreatments replicated three times. Treatment means were compared using the leastsignificantdifference(LSD)testatp≤0.05.
RESULTS
PercentagesproutingMinituberstreatedwithcalciumcarbide(3gkg-1)andMAPsproutedthefastestwiththe highest sprouting percentage (Figure 1A). As early as 3weeks, at opening of the filmbags,bothtreatmentsexhibitedsproutingat50%ormore.Minituberstreatedwith5gkg-1calciumcarbideattained50%sproutingat5weeks.Thiswasfollowedthreeweekslaterbyminitubers treatedwith10,000μLL-1ethephon. It took longerat9weeksafter treatment(WAT)forthosetreatedwith5,000μLL-1ethephonand5μLL-1GA3,whileittook11WATforthetwo1-MCPtreatmentsandcontroltoregister≥50%sprouting.Minituberswith1μLL-1 GA3 registered ≥50% sprouting at 10 weeks. The minitubers registered 60 to 77%sproutingat12WAT.SproutcharacteristicsAt 12 WAT, the number of sprouts per minituber ranged from 0.8 to 2.9. Calciumcarbide at 3 g kg-1 resulted in more sprouts per minituber (2.9). This was followed bycalciumcarbideat5gkg-1(2.1),whichdidnotvaryfromthepassiveMAPtreatment(2.0)(Figure1B).Thecontrol,alongwiththeminituberstreatedwithGA3,1-MCPandethephon,hadasimilarnumberofsproutsrangingfrom0.8to1.4.Amongtreatments,calciumcarbide(3gkg-1)alsoexhibitedthelongestapicalsproutof2.5mmat4weeksandaveragedtwoandhalftimesthelengthofthecontrolat12WAT(3.5mm, the control being1.4mm;Figure2).At4weeks, the second longest sprout (1.7mm)wasinthecalciumcarbide(5gkg-1)treatment.Sproutweightdidnotvaryamongthe
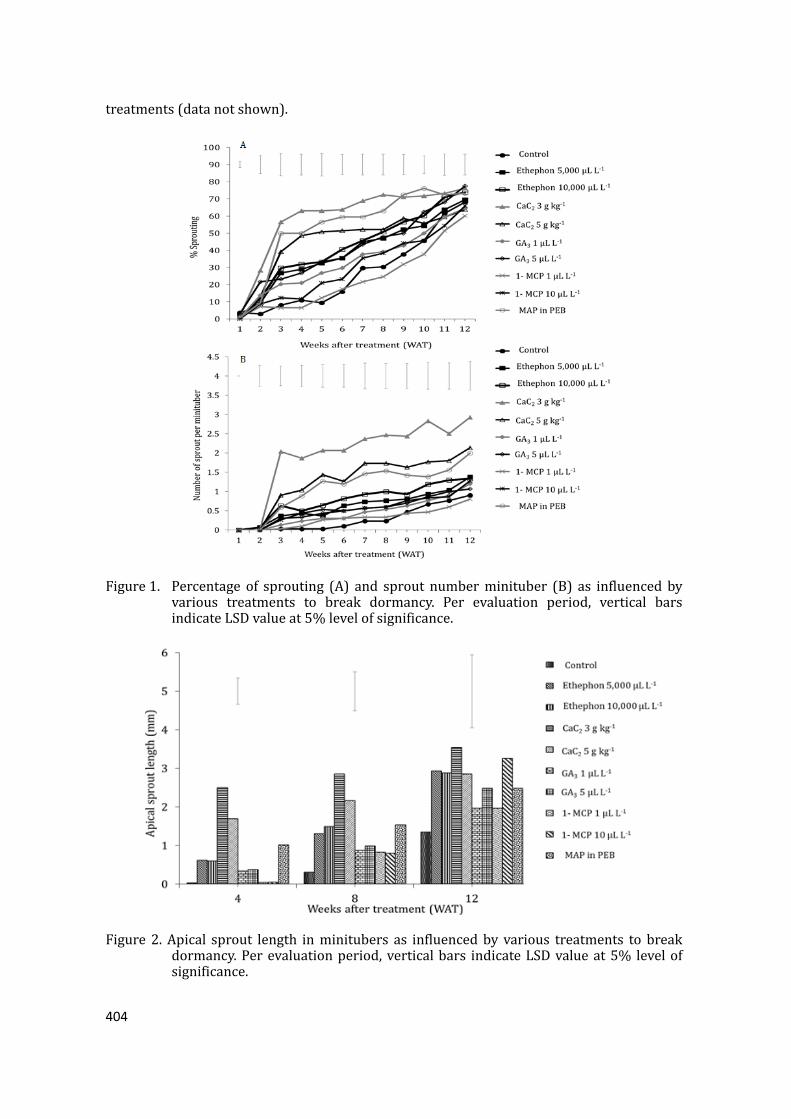
404
treatments(datanotshown).
Figure1. Percentage of sprouting (A) and sprout numberminituber (B) as influenced byvarious treatments to break dormancy. Per evaluation period, vertical barsindicateLSDvalueat5%levelofsignificance.
Figure 2.Apical sprout length inminitubers as influencedby various treatments to breakdormancy.Perevaluationperiod,verticalbars indicateLSDvalueat5% levelofsignificance.
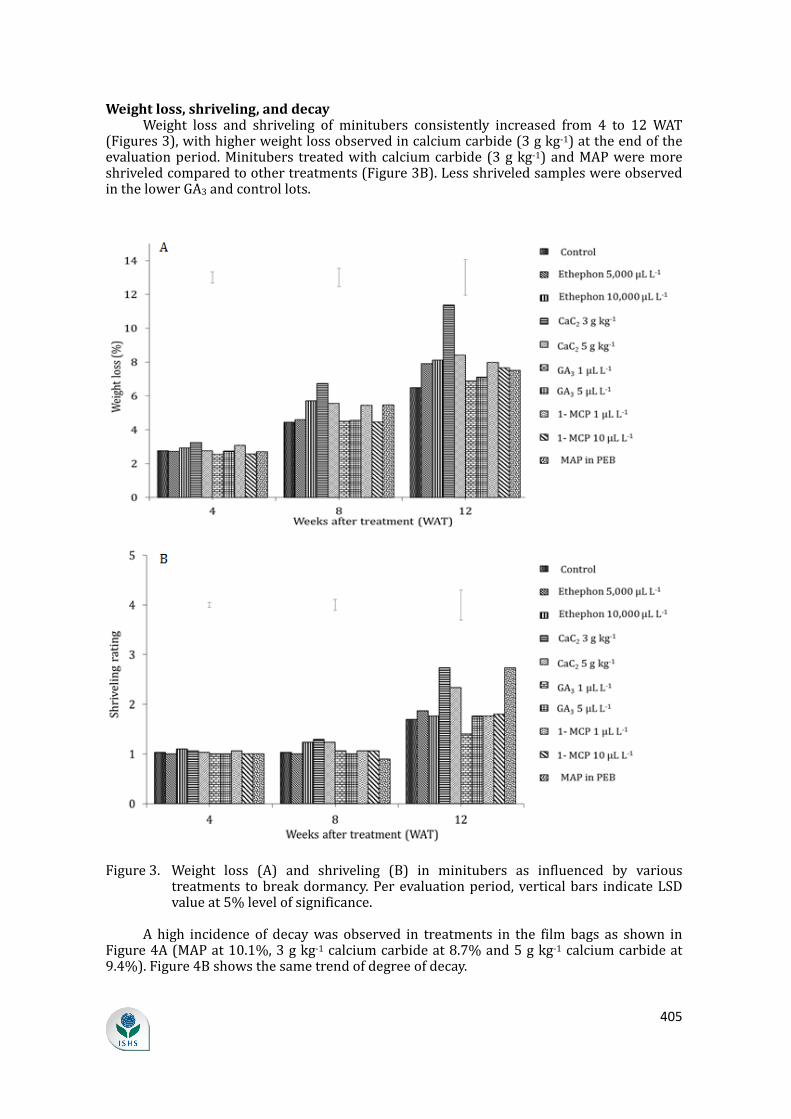
405
Weightloss,shriveling,anddecayWeight loss and shriveling of minitubers consistently increased from 4 to 12 WAT(Figures3),withhigherweightlossobservedincalciumcarbide(3gkg-1)attheendoftheevaluationperiod.Minitubers treatedwithcalciumcarbide (3gkg-1)andMAPweremoreshriveledcomparedtoothertreatments(Figure3B).LessshriveledsampleswereobservedinthelowerGA3andcontrollots.
Figure3. Weight loss (A) and shriveling (B) in minitubers as influenced by varioustreatments tobreakdormancy.Perevaluationperiod,verticalbars indicateLSDvalueat5%levelofsignificance.A high incidence of decaywas observed in treatments in the filmbags as shown inFigure4A(MAPat10.1%,3gkg-1calciumcarbideat8.7%and5gkg-1calciumcarbideat9.4%).Figure4Bshowsthesametrendofdegreeofdecay.
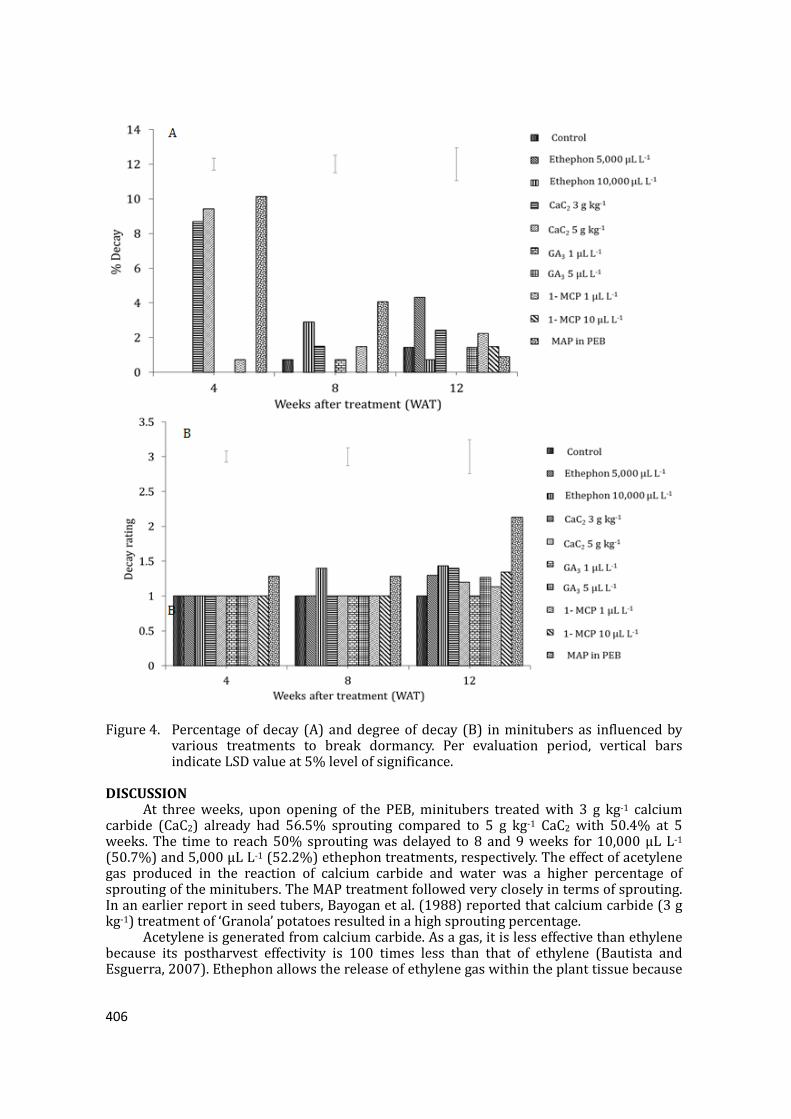
406
Figure4. Percentageofdecay (A)anddegreeofdecay (B) inminitubersas influencedbyvarious treatments to break dormancy. Per evaluation period, vertical barsindicateLSDvalueat5%levelofsignificance.DISCUSSIONAt threeweeks, upon opening of the PEB,minitubers treatedwith 3 g kg-1 calciumcarbide (CaC2) already had 56.5% sprouting compared to 5 g kg-1 CaC2 with 50.4% at 5weeks.The time to reach50%sproutingwasdelayed to8 and9weeks for10,000µLL-1(50.7%)and5,000µLL-1(52.2%)ethephontreatments,respectively.Theeffectofacetylenegas produced in the reaction of calcium carbide and water was a higher percentage ofsproutingoftheminitubers.TheMAPtreatmentfollowedverycloselyintermsofsprouting.Inanearlierreportinseedtubers,Bayoganetal.(1988)reportedthatcalciumcarbide(3gkg-1)treatmentof‘Granola’potatoesresultedinahighsproutingpercentage.Acetyleneisgeneratedfromcalciumcarbide.Asagas,itislesseffectivethanethylenebecause its postharvest effectivity is 100 times less than that of ethylene (Bautista andEsguerra,2007).Ethephonallowsthereleaseofethylenegaswithintheplanttissuebecause
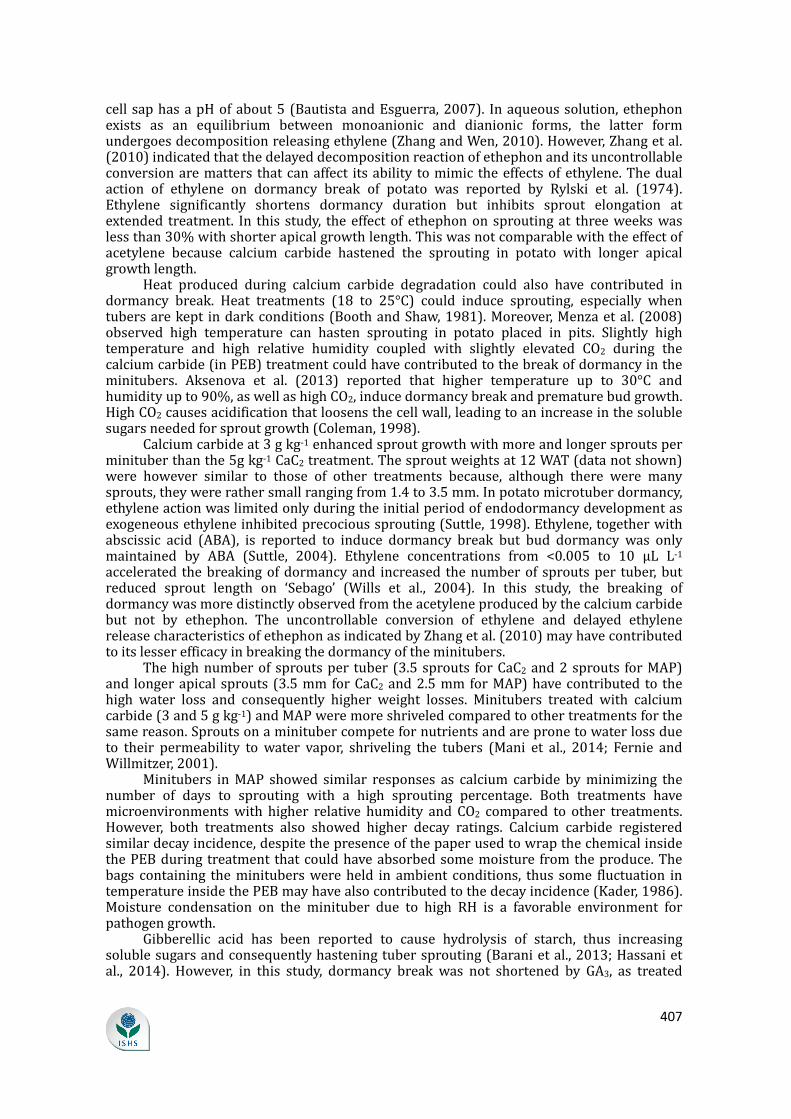
407
cellsaphasapHofabout5(BautistaandEsguerra,2007). Inaqueoussolution,ethephonexists as an equilibrium between monoanionic and dianionic forms, the latter formundergoesdecompositionreleasingethylene(ZhangandWen,2010).However,Zhangetal.(2010)indicatedthatthedelayeddecompositionreactionofethephonanditsuncontrollableconversionarematters thatcanaffect itsability tomimic theeffectsofethylene.Thedualaction of ethylene on dormancy break of potato was reported by Rylski et al. (1974).Ethylene significantly shortens dormancy duration but inhibits sprout elongation atextended treatment. In this study, theeffectof ethephononsproutingat threeweekswaslessthan30%withshorterapicalgrowthlength.Thiswasnotcomparablewiththeeffectofacetylene because calcium carbide hastened the sprouting in potato with longer apicalgrowthlength.Heat produced during calcium carbide degradation could also have contributed indormancy break. Heat treatments (18 to 25°C) could induce sprouting, especially whentubersarekept indarkconditions(BoothandShaw,1981).Moreover,Menzaetal. (2008)observed high temperature can hasten sprouting in potato placed in pits. Slightly hightemperature and high relative humidity coupled with slightly elevated CO2 during thecalciumcarbide(inPEB)treatmentcouldhavecontributedtothebreakofdormancyintheminitubers. Aksenova et al. (2013) reported that higher temperature up to 30°C andhumidityupto90%,aswellashighСО2,inducedormancybreakandprematurebudgrowth.HighCO2causesacidificationthatloosensthecellwall,leadingtoanincreaseinthesolublesugarsneededforsproutgrowth(Coleman,1998).Calciumcarbideat3gkg-1enhancedsproutgrowthwithmoreandlongersproutsperminituberthanthe5gkg-1CaC2treatment.Thesproutweightsat12WAT(datanotshown)were however similar to those of other treatments because, although there were manysprouts,theywererathersmallrangingfrom1.4to3.5mm.Inpotatomicrotuberdormancy,ethyleneactionwaslimitedonlyduringtheinitialperiodofendodormancydevelopmentasexogeneousethyleneinhibitedprecocioussprouting(Suttle,1998).Ethylene,togetherwithabscissic acid (ABA), is reported to induce dormancy break but bud dormancy was onlymaintained by ABA (Suttle, 2004). Ethylene concentrations from <0.005 to 10 µL L-1accelerated thebreakingofdormancyand increased thenumberof sproutsper tuber,butreduced sprout length on ‘Sebago’ (Wills et al., 2004). In this study, the breaking ofdormancywasmoredistinctlyobservedfromtheacetyleneproducedbythecalciumcarbidebut not by ethephon. The uncontrollable conversion of ethylene and delayed ethylenereleasecharacteristicsofethephonasindicatedbyZhangetal.(2010)mayhavecontributedtoitslesserefficacyinbreakingthedormancyoftheminitubers.Thehighnumberofsproutsper tuber(3.5sprouts forCaC2and2sprouts forMAP)and longerapicalsprouts (3.5mmforCaC2and2.5mmforMAP)havecontributed to thehigh water loss and consequently higher weight losses. Minitubers treated with calciumcarbide(3and5gkg-1)andMAPweremoreshriveledcomparedtoothertreatmentsforthesamereason.Sproutsonaminitubercompetefornutrientsandarepronetowaterlossdueto their permeability to water vapor, shriveling the tubers (Mani et al., 2014; Fernie andWillmitzer,2001).Minitubers inMAP showed similar responses as calcium carbide byminimizing thenumber of days to sprouting with a high sprouting percentage. Both treatments havemicroenvironmentswith higher relative humidity and CO2 compared to other treatments.However, both treatments also showed higher decay ratings. Calcium carbide registeredsimilardecayincidence,despitethepresenceofthepaperusedtowrapthechemicalinsidethePEBduringtreatment thatcouldhaveabsorbedsomemoisture fromtheproduce.Thebags containing theminituberswereheld in ambient conditions, thus some fluctuation intemperatureinsidethePEBmayhavealsocontributedtothedecayincidence(Kader,1986).Moisture condensation on the minituber due to high RH is a favorable environment forpathogengrowth.Gibberellic acid has been reported to cause hydrolysis of starch, thus increasingsolublesugarsandconsequentlyhasteningtubersprouting(Baranietal.,2013;Hassanietal., 2014). However, in this study, dormancy break was not shortened by GA3, as treated
408
minitubersreached50%sproutingafter9and10weeksofstoragecomparedto3weeksinminitubers treated with 3 g kg-1 calcium carbide. Lesser and shorter sprouts were alsoobserved in GA3 treatments leading to lowerweight loss and shriveling. Dormancy breakwasnothastenedbyGA3,probablybecauseendogenousGAhasnoroleindormancyrelease,butonlyinsproutgrowth(Suttle,2004).Inthisstudy,after12weeks,sproutingpercentageswere similar in GA3 (77.54%) and 3 g kg-1 calcium carbide (76.09%) treatments. Calciumcarbideconferredtheadvantagesofearliersproutingandbettersproutgrowth,asindicatedbymoresproutswithgreaterlength.The control samples slowly sprouted with over 50% of the minitubers sproutingbefore11weeks–thetimeinwhichminitubersmayhavereachedthephysiologicalagefordormancy break (Bethke, 2002). As an ethylene antagonist, 1-MCP can bind to ethylenereceptors to inhibit sprouting.Plants can lessen their sensitivity to ethylenebymodifyingtheirethylenereceptorgenes(Foukarakietal.,2012).Minitubers treatedwith1-MCPat1and10µLL-1reached≥50%sproutingat11weeks.Atthistime,newethylenereceptorsmayhavebeenformedtherebyallowingsproutingtotakeplace.Likewise,applicationof1μLL-11-MCP for 24 h did not affect the sprout number in potato tubers but it suppressed theactionofethyleneinsugaraccumulation(Foukarakietal.,2012).Overall, breaking of dormancy in minitubers was slow. Even at 12 weeks, themaximum percentage of sprouting was only 77.5% in 5 µL L-1 GA3, followed by 3 g kg-1calcium carbide at 76.1%. Someminituberswere unsprouted at 12weeks. Thiswas alsocompoundedwiththeincidenceofdecay.Comparedtofarmer’sseedtubers,minitubersarereportedtoexhibitalongdormancyperiod,whichwasseeninthe‘Granola’minitubersusedinthisstudy.Hosseinietal.(2011)reportedthatittookmoretime,approximately75to78days,foruntreatedpotatominituberstoobtain80%sproutingcomparedtothiourea-treatedminitubers.At12WAT,%sproutingamongtreatmentsrangingfrom60to77%didnotvary.After the rapid sprouting shown by calcium carbide- and MAP-treated minitubers, thetreatments also sustained better sprout growth. It is possible that freshly harvestedminitubersweremoreresponsivethanthosetreatedoneweekafterharvest(Hosseinietal.,2011). In this study, samples used were one week old minitubers which were cured foranotherweekbeforetreatment.CONCLUSIONThis study aimed to breakdormancy of potatominituberswith early sprouting anduniformsproutgrowth.‘Granola’potatominitubersweresubjectedtovarioustreatmentstobreak dormancy, such as calcium carbide plus MAP, ethephon, gibberellic acid (GA3), 1-methylcyclopropene (1-MCP) at different concentrations and modified atmospherepackaging (MAP) in polyethylene bags (PEB). 70% sprouting was attained in ‘Granola’minitubersat10-12weeksaftertreatment.AsearlyasthreeweeksoratopeningofthePEB,minitubers treated with 3 g kg-1 calcium carbide and MAP had the highest sproutingpercentage.Thistrendwasconsistentuptonineweeksofstorage. Italsogavethehighestweight loss at 12 weeks. At 12 weeks, sprouting resulting from the different treatmentsranged from60 to 77%, indicating longdormancy in ‘Granola’minitubers.Atnineweeks,ethephon treatments and 5 µL L-1 GA3 exhibited more than 50% sprouting, but not thecontrol,1µLL-1GA3and1-MCP.Dormancybreakwiththeuseofcalciumcarbide(3gkg-1)resultedinmostsproutsperminituber(2.9)andthelongestapicalsprouts(3.5mm)relativeto the control (0.90 and 1.4 mm, respectively). Sprout weights were similar across alltreatments.However,CaC2andMAPtreatmentsresultedinlessthan10%minituberdecayatfourweeks.Theuseofcalciumcarbidecanhastendormancybreakinminituberspotato,butmethodsareneededtosustainbettersproutgrowthandreducedecay.ACKNOWLEDGEMENTSThe authors gratefully acknowledge funding support from the Australian Centre forInternationalAgriculturalResearch.
409
LiteraturecitedAksenova, N.P., Sergeeva, L.I., Konstantinova, T.N., Golyanovskaya, S.A., Kolachevskaya, O.O., and Romanov, G.A.(2013). Regulation of potato tuber dormancy and sprouting. Russ. J. Plant Physiol. 60 (3), 301–319https://doi.org/10.1134/S1021443713030023.Barani,M.,Akbari,N.,andAhmadi,H.(2013).Theeffectofgibberellicacid(GA3)onseedsizeandsproutingofpotatotubers(SolanumtuberosumL.).Afr.J.Agric.Res.8,3898–3903.Bautista,O.K.,andEsguerra,E.B.(2007).PostharvestTechnologyforSoutheastAsianPerishableCrops(QuezonCity,Philippines:UniversityofthePhilippinesLosBanos,LagunaandDepartmentofAgriculture).Bayogan, E.V., Salda, V.B., and Ticguingan, E.B. (1988). Alternative methods of breaking dormancy in seedpotatoes. Paperpresentedat:PotatoPostharvestTechnologyWorkshop (Kunming,China: InternationalPotatoCenter).Bethke,P.(2002).Potatotuberdormancy.Paperpresentedat:Wisconsin’sAnnualPotatoMeetings(UniversityofWisconsin-Madison, College of Agricultural and Life Sciences Research Division, Wisconsin AgriculturalExperimentStation).Booth,R.H.,andShaw,R.(1981).PrinciplesofPotatoStorage(Lima,Peru:InternationalPotatoCenter).Coleman,W.K.(1998).Carbondioxide,oxygenandethyleneeffectsonpotatotuberdormancyreleaseandsproutgrowth.Ann.Bot.82(1),21–27https://doi.org/10.1006/anbo.1998.0645.Fernie,A.R., andWillmitzer,L. (2001).Molecularandbiochemical triggersofpotato tuberdevelopment.PlantPhysiol.127(4),1459–1465https://doi.org/10.1104/pp.010764.PubMedFood and Agriculture Organization Stat. (2015). Production Crops. Production Quantities by Country. USA.http://faostat3.fao.org/browse/Q/QC/E(June15,2015).Foukaraki, S.G., Chope, G.A., and Terry, L.A. (2012). 1-MCP application before continuous ethylene storagesuppresses sugar accumulation in the UK-grown potato cultivar ‘Marfona’. Acta Hortic. 945, 291–296https://doi.org/10.17660/ActaHortic.2012.945.38.Hassani,F.,Zareian,A.,andRezvani,E.(2014).Effectsofchemicaltreatmentsondormancybreakingandsomesproutingcharacteristicsoftwopotatocultivarsindifferenttubersizes.Eur.J.Exp.Biol.4,98–102.Hosseini,M.B.,Afshari,R.T.,andSalimi,K.(2011).Breakingdormancyofpotatominituberswiththiourea.PotatoJ.38(1),9–12.InternationalPotatoCenter(IPC).(2015).Potato.http://cipotato.org/potato-2/(accessedJuly30,2015).Kader,A.A.(1986).Modifiedatmospherepackagingoffreshproduce.OutlookAgric.13(2),9–10.Kulen,O.,Stushnoff,C.R.,Davidson,R.,andHolm,D.(2011).Gibberellicacidandethephonalterminituberbuddormancy and improve seed tuber yield.Am. J. PotatoRes.88 (2), 167–174https://doi.org/10.1007/s12230-010-9178-8.Mani, F., Doudech, N., and Hannachi, C. (2014). Physiological mechanisms for potato dormancy release andsprouting:areview.Afr.CropSci.J.22,155–174.Menza,M.K.,Shibairo,S.I.,Nyankanga,R.O.,Demo,P.,Kabira,J.N.,andGildermacher,P.(2008).EffectsofPit,Darkand Cold Pre-Storage Treatments and Their Duration on Dormancy Breaking and Sprouting of Seed PotatoTubers (Solanum tuberosum L.) (Thika, Kenya: Kenya Agricultural Research Institute, National HorticulturalResearchCenter).Philippine Statistics Authority (PSA). (2014). Rootcrops: Supply Utilization Accounts (Bureau of AgriculturalStatistics),www.bas.gov.ph(accessedJune15,2015).Rees, D., Farrell, G., and Orchard, J. (2012). Introduction. In Crop Post-Harvest: Science and Technology –Perishables,1stedn(Pondicherry,India:JohnWileyandSonsLtd.),p.1–4.Rylski,I.,Rappaport,L.,andPratt,H.K.(1974).Dualeffectsofethyleneonpotatodormancyandsproutgrowth.PlantPhysiol.53(4),658–662https://doi.org/10.1104/pp.53.4.658.PubMedStruik, P.C., and Wiersema, S.G. (2007). Seed Potato Technology (Wageningen, The Netherlands: WageningenPers),pp.383.Suttle, J.C. (1998). Involvement of ethylene in potato microtuber dormancy. Plant Physiol. 118 (3), 843–848https://doi.org/10.1104/pp.118.3.843.PubMedSuttle,J.C.(2004).Involvementofendogenousgibberellinsinpotatotuberdormancyandearlysproutgrowth:acriticalassessment.J.PlantPhysiol.161(2),157–164https://doi.org/10.1078/0176-1617-01222.PubMedUnited States Environmental Protection Agency. (US EPA) Registration Eligibility Decision (RED). (1995).

410
Ethephon–USEPAArchiveDocument.https://archive.epa.gov/pesticides/reregistration/web/pdf/0382fact.pdf(accessedJuly30,2015).Wills, R.B.H., Warton, M.A., and Kim, J.K. (2004). Effect of low levels of ethylene on sprouting of potatoes instorage.HortScience39,136–137.Zhang,W.,andWen,C.K.(2010).Preparationofethylenegasandcomparisonofethyleneresponsesinducedbyethylene, ACC, and ethephon. Plant Physiol. Biochem. 48 (1), 45–53 https://doi.org/10.1016/j.plaphy.2009.10.002.PubMedZhang,W.,Hu,W.,andWen,C.K.(2010).Ethylenepreparationanditsapplicationtophysiologicalexperiments.PlantSignalBehav5(4),453–457https://doi.org/10.4161/psb.5.4.10875.PubMed
409
Effects of Organic Acids on Quality of Freshcut Cucumber A.D. Valida and A.L. Acedo Jr. Postharvest Technology Division, Department of Horticulture Visayas State University Leyte Philippines Keywords: Cucumis sativus, ascorbic acid, lactic acid, antimicrobials, postharvest quality Abstract
Enhancing quality and food safety of freshcut products is a great challenge in the fresh produce industry as consumers are increasingly patronizing ready-to-eat fruits and vegetables. This study was conducted to evaluate the antimicrobial efficacy of ascorbic and lactic acids and evaluate the physicochemical and sensory qualities of cucumber slices. Ascorbic and lactic acids were applied at 1.5-2.5% as 2-min dip, with 150 ppm chlorine and distilled water as control treatments. The product samples were packed in sterile resealable 50 μm-thick polyethylene bag and stored at 7-10°C for five days. Both organic acids were ineffective against bacterial load but markedly reduced yeast and mold population, with 1.5% level being sufficient. In most cases, the antimicrobial activities of organic acids were either comparable to or better than that of chlorine. These antimicrobial agents had also no remarkable effects on the physicochemical and sensory qualities after five days of cold storage. INTRODUCTION
Cucumber is usually eaten raw or uncooked and is subject to contamination by spoilage and pathogenic microorganisms if no antimicrobial treatment is employed. Use of natural antioxidants such as organic acids has been singled out as emerging technologies where research should focus in order to develop safer and sustainable antimicrobial systems (Mastromatteo et al., 2009; Oliu et al., 2010; Vandekinderen et al., 2009). Limited information is available on the use of organic acids as antimicrobial treatment for freshcut products in the Philippines. Recently, the use of 1.5% ascorbic acid in freshcut jackfruit was found effective as antimicrobial agent but the efficacy was not sustained during subsequent cold storage (Acedo et al., 2011). This study evaluated the efficacy of ascorbic and lactic acids in maintaining quality of freshcut cucumber. MATERIALS AND METHODS
Commercially mature defect-free cucumber fruits were sourced locally and under sanitary conditions, were washed, peeled, and cut into 7 mm thick slices. About 200 g fruit slices were applied with L-ascorbic acid and lactic acid (Hanna Chemicals) at 1.5-2.5% as 2-min dip, with 150 ppm chlorine and distilled water as control. Three replicates were used per treatment. After the immersion treatment, excess solution was removed using a commercial salad spinner. Samples were packed in sterile resealable 50 μm-thick polyethylene bag and stored at 7-10°C for five days. Microbial analysis was performed after 3 h from treatment and after five days of storage using plate count agar (total aerobic bacteria), violet red bile agar (coliform) and potato dextrose agar (yeast and mold) following US-FDA (2003) methods; microbial counts were expressed as log colony-forming units (CFU/ml). Produce quality was evaluated in terms of color using a Minolta CR-13 colorimeter, total soluble solids (TSS) using an Atago N1 Hand Refractometer, pH using an Orion pH meter model 210 A+, titratable acidity (% citric acid) by titration using standard 0.1 N NaOH and 1% phenolphthalein indicator, and sensory quality (color, aroma, taste, texture, and aftertaste) using 15 trained panelists and 1-5 rating scale describing the variation in each attribute and 9-point Hedonic scale for acceptability of each attribute; the general acceptability was also evaluated using a 9-point Hedonic scale.
Proc. IInd Southeast Asia Symp. on Quality Management in Postharvest Systems Eds.: A.L. Acedo Jr. and S. Kanlayanarat Acta Hort. 1088, ISHS 2015
410
Statistical analysis of results used the CROPSTAT version 7.2 program of the International Rice Research Institute. RESULTS AND DISCUSSION
Ascorbic and lactic acids were ineffective against bacterial load but effectively reduced yeast and mold population with 1.5% level being sufficient (Figs. 1 and 2). Lactic acid, as produced by LAB or as additive to foods, is recognized as a bio-preservative with GRAS (generally regarded as safe) status, and numerous applications for decontamination using lactic acid have been described (Alakomi et al., 2000). They acidify the cells interior by being lipophilic and penetrating the plasma membrane (Akbas et al., 2007); reduce internal cellular pH, and disrupt membrane transport and/or permeability (Barry-Ryan et al., 2007).
In most cases, the antimicrobial activities of organic acids were either comparable to or better than that of chlorine. These antimicrobial agents had also no remarkable adverse effects on the physicochemical and sensory qualities of freshcut cucumber after five days of cold storage (Table 1). CONCLUSION
Ascorbic and lactic acids can be considered as possible alternatives to chlorine or water as antimicrobial agents to ensuring food safety in sync that these treatments have no remarkable adverse effects on the physicochemical and sensory qualities of freshcut cucumber after five days of cold storage. Literature Cited Acedo, J.Z., Varron, D.A.C., Emnace, I.C., Lauzon, R.D. and Acedo, A.L. 2011.
Antimicrobeffects of ascorbic acid and calcium lactate in freshcut jackfruit (Artocarpus heterophyllus Lam.). Acta Hort. 989:199-208.
Akbas, M.Y. and Ölmez, H. 2007. Inactivating of Escherichia coli and Listeria monocytogeneson iceberg lettuce by dip wash treatments with organic acids. Letters in Applied Microbiology 44:619-624.
Alakomi, H.L., Skytta, E., Saarela, M., Mattila-Sandholm, T., Latva-Kala, K. and Helander, I.M. 2000. Lactic acid permeabilizes gram-negative bacteria by disrupting the outer membrane. Applied Environmental Microbiology 66(5):2001-2005.
Barry-Ryan, C., Martin-Diana, A., Rico, D. and Barat, J. 2007. Extending and measuring the quality of fresh-cut fruit and vegetables: a review. Trends in Food Science and Technology 18:373-386.
Mastromatteo, M., Conte, A. and Del Nobile, M.A. 2009. Preservation of fresh-cut produce using natural compounds. Stewart Postharvest Review 5:1-7.
Oliu, G.O., Grau, A.R., Gonzales, L.A., Varela, P., Fortuny, R.S., Hernando, I.H., Munuera, I.P., Fiszman, S. and Belloso, O.M. 2010. Recent approaches using chemical ttreatments to preserve quality of fresh-cut fruit: a review. Postharvest Biology and Technology 57:139-148.
US-FDA (US-Food and Drug Administration) 2003. Bacteriological Analytical Manual (revised edition).
Vandekinderen, I., Devlieghere, F., De Meulenaer, B., Ragaert, P. and Van Camp, J. 2009. Decontamination strategies for fresh-cut produce. Stewart Postharvest Review 5(4):1-8.
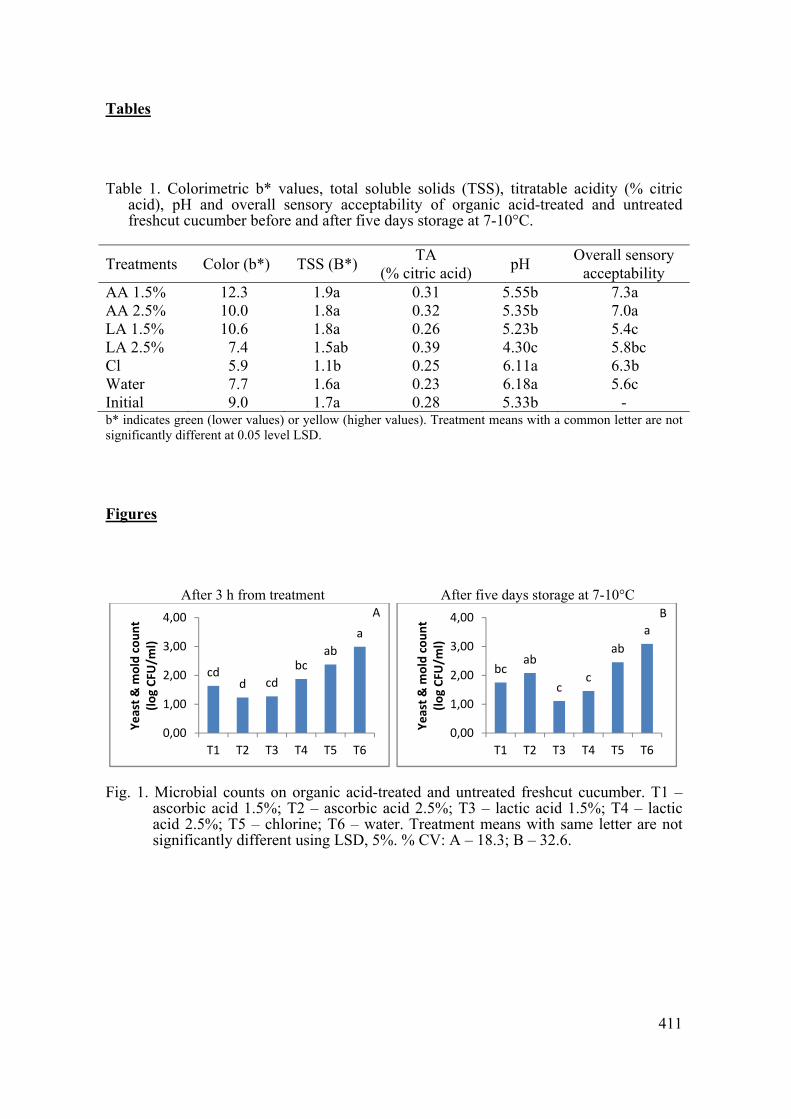
411
Tables Table 1. Colorimetric b* values, total soluble solids (TSS), titratable acidity (% citric
acid), pH and overall sensory acceptability of organic acid-treated and untreated freshcut cucumber before and after five days storage at 7-10°C.
Treatments Color (b*) TSS (B*) TA (% citric acid) pH Overall sensory
acceptability AA 1.5% 12.3 1.9a 0.31 5.55b 7.3a AA 2.5% 10.0 1.8a 0.32 5.35b 7.0a LA 1.5% 10.6 1.8a 0.26 5.23b 5.4c LA 2.5% 7.4 1.5ab 0.39 4.30c 5.8bc Cl 5.9 1.1b 0.25 6.11a 6.3b Water 7.7 1.6a 0.23 6.18a 5.6c Initial 9.0 1.7a 0.28 5.33b - b* indicates green (lower values) or yellow (higher values). Treatment means with a common letter are not significantly different at 0.05 level LSD. Figures
After 3 h from treatment After five days storage at 7-10°C
Fig. 1. Microbial counts on organic acid-treated and untreated freshcut cucumber. T1 –
ascorbic acid 1.5%; T2 – ascorbic acid 2.5%; T3 – lactic acid 1.5%; T4 – lactic acid 2.5%; T5 – chlorine; T6 – water. Treatment means with same letter are not significantly different using LSD, 5%. % CV: A – 18.3; B – 32.6.
cdd cd
bcab
a
0,00
1,00
2,00
3,00
4,00
T1 T2 T3 T4 T5 T6
Yeas
t & m
old
coun
t (lo
g CF
U/m
l)
bcab
cc
ab
a
0,00
1,00
2,00
3,00
4,00
T1 T2 T3 T4 T5 T6
Yeas
t & m
old
coun
t (lo
g CF
U/m
l)
A B
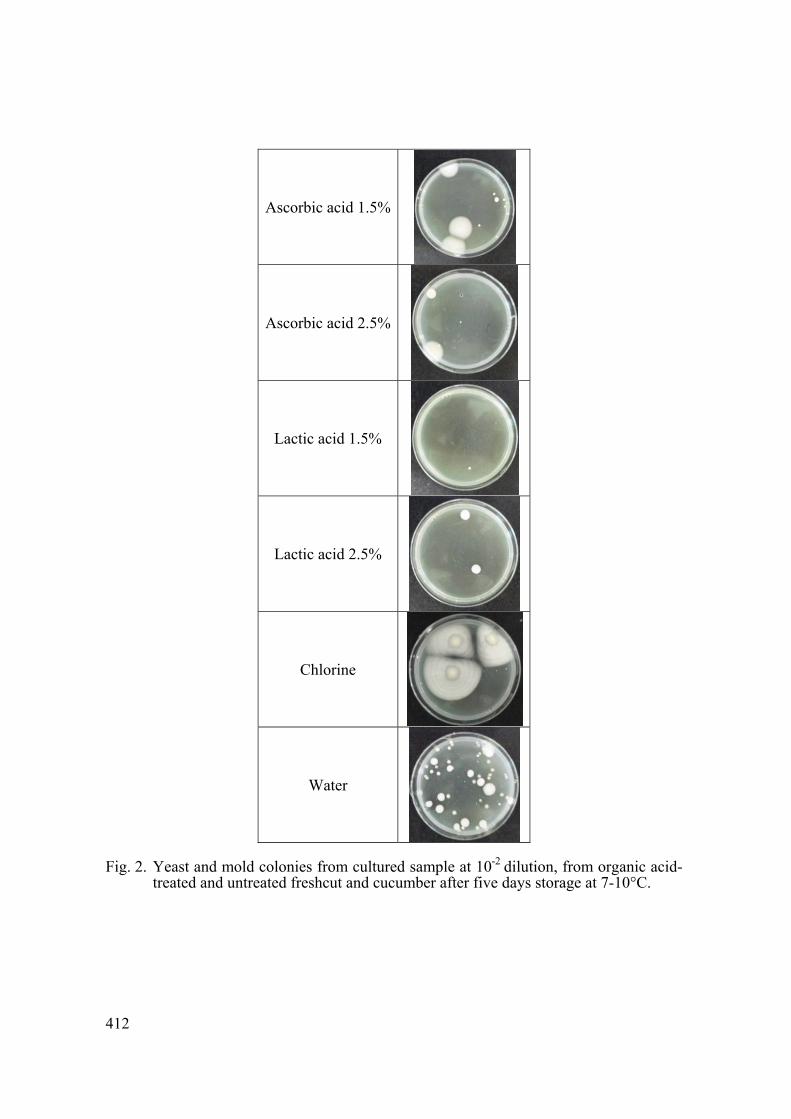
412
Ascorbic acid 1.5%
Ascorbic acid 2.5%
Lactic acid 1.5%
Lactic acid 2.5%
Chlorine
Water
Fig. 2. Yeast and mold colonies from cultured sample at 10-2 dilution, from organic acid-
treated and untreated freshcut and cucumber after five days storage at 7-10°C.
401
Quality of Freshcut Tomato and Cucumber Treated with Probiotic Lactic Acid Bacteria A.D. Valida and A.L. Acedo Jr. Postharvest Technology Division, Department of Horticulture Visayas State University Leyte Philippines Keywords: Solanum lycopersicum, Cucumis sativus, Lactobacillus plantarum,
bioprotectant, postharvest quality Abstract
Assuring food safety is vital to cater to consumer demand for quality and safe produce and improve the market competitiveness of fruit and vegetable industries. In an attempt to develop safe antimicrobial treatment, this study was conducted to optimize the application of probiotic Lactobacillus plantarum and evaluate the physicochemical and sensory qualities of tomato and cucumber slices. Lb. plantarum at 109 CFU/ml was applied at 1-3% (v/w) as protective culture. Control treatments included 150 ppm chlorine and distilled water as 2-min dip. The product samples were packed in sterile resealable 50 μm-thick polyethylene bag and stored at 7-10°C for five days. Lb. plantarum inhibited coliform and aerobic bacteria and was consistently most effective at 3% on both tomato and cucumber. It also reduced yeast and mold population but only in tomato. In most cases, the antimicrobial activities of Lb. plantarum were either comparable to or better than that of chlorine. Lb. plantarum had no remarkable effects on the physicochemical and sensory qualities of the freshcut products after five days of cold storage. INTRODUCTION
Lactic acid bacteria (LAB) are probiotics that could contain microbial contaminants of food products particularly in freshcut produce where microbial load and rates of deterioration are high (Makarova and Koonin, 2007). LAB carry out their reactions, i.e., conversion of carbohydrate to lactic acid, carbon dioxide, and other organic acids without the need for oxygen hence, they do not cause drastic changes in the composition of the food. Lactobacillus acidophilus, Lb. bulgaricus, and Lb. plantarum are examples of LAB routinely used as starter cultures in the manufacture of fruit, vegetable, meat, dairy, and bakery products (Abee et al., 1995). Probiotics are safe to humans, regulating the body’s microenvironment to prevent dominance by harmful microorganisms. The use of Lb. acidophilus or Lb. plantarum (109 CFU/ml cell suspensions) as 1% (v/w) protective culture in freshcut jackfruit was explored (Acedo et al., 2011). This study optimized the efficacy of Lb. plantarum in maintaining quality of freshcut tomato and cucumber. MATERIALS AND METHODS
Tomato fruits were washed and sliced circularly (7 mm thick) while cucumber fruits were washed and peeled before cutting into 7 mm thick slices. A small portion of pure culture of Lb. plantarum was aseptically transferred onto 50 ml of sterile Lactobacillus MRS broth to produce about 109 CFU/ml cell suspension. After 24 h of ordinary room incubation (26-33°C), product samples were applied with the cell suspension at 1, 2 or 3% (v/w) or 2, 4 or 6 ml per 200 g sample in sterile resealable 50 μm-thick polyethylene bag and stored at 7-10°C for five days. Distilled water and 150 ppm chlorine served as control. Microbial analysis was performed after 3 h from treatment and after five days of storage using plate count agar (total aerobic bacteria), violet red bile agar (coliform) and potato dextrose agar (yeast and mold) following US-FDA (2003) methods; microbial counts were expressed as log colony-forming units
Proc. IInd Southeast Asia Symp. on Quality Management in Postharvest Systems Eds.: A.L. Acedo Jr. and S. Kanlayanarat Acta Hort. 1088, ISHS 2015
402
(CFU/ml). Produce quality was evaluated in terms of color using a Minolta CR-13 colorimeter, total soluble solids (TSS) using an Atago N1 Hand Refractometer, pH using an Orion pH meter model 210 A+, titratable acidity (% citric acid) by titration using standard 0.1 N NaOH and 1% phenolphthalein indicator, and sensory quality (color, aroma, taste, texture, and aftertaste) using 15 trained panelists and 1-5 rating scale describing the variation in each attribute and 9-point Hedonic scale for acceptability of each attribute; the general acceptability was also evaluated using a 9-point Hedonic scale. Statistical analysis of results was performed using the CROPSTAT version 7.2 program of the International Rice Research Institute. RESULTS AND DISCUSSION Effects of Probiotics LAB on Microbial Load
Lb. plantarum inhibited coliform and aerobic bacteria on both tomato and cucumber and was consistently most effective at 3%. It also reduced yeast and mold counts on tomato but not on cucumber (Figs. 1 and 2). It has been reported that Lb. plantarum is a Gram-positive aero tolerant bacterium that produces both isomers of lactic acid (D and L) and has the capacity to lower the pH in the surrounding media, thereby creating a hostile environment for the undesirable microflora. This species and related lactobacilli are unusual because they can respire with oxygen but have no respiratory chain or cytochromes. The consumed oxygen ultimately ends up as hydrogen peroxide which acts as a weapon to exclude competing bacteria on the food source. Furthermore, Lb. plantarum is commonly found in many fermented food products and when directly added to food, shelf life could be enhanced by competing with other microflora (both bacterial and fungal) for food and by producing antimicrobial metabolites such as lactic acid, hydrogen peroxide, and bacteriocins. The high levels of LAB in food make it an ideal candidate for the development of probiotics for human health promotion. Physicochemical and Sensory Quality
In most cases, the antimicrobial activities of Lb. plantarum were either comparable to or better than that of chlorine. These antimicrobial agents had also no remarkable adverse effects on the physicochemical and sensory qualities of freshcut tomato and cucumber after five days of cold storage (Tables 1 and 2). CONCLUSIONS
Lb. plantarum at 3% minimized microbial population on both freshcut tomato and cucumber. Probiotic treatments had no dramatic effects on the physicochemical and sensory qualities of freshcut tomato and cucumber. Hence, these treatments can be considered as possible alternatives to chlorine or water as antimicrobial agents to ensuring food safety in sync that these treatments have no remarkable adverse effects on the physicochemical and sensory qualities of freshcut tomato and cucumber after five days of cold storage. Literature Cited Abee, T L., Krockel and Hill, C. 1995. Bacteriocins: modes of action and potentials in
food preservation and control of food poisoning. International Journal of Food Microbiology 28:169-185.
Acedo, J.Z., Varron, D.A.C., Emnace, I.C., Lauzon, R.D. and Acedo, A.L. 2011. Antimicrobial effects of ascorbic acid and calcium lactate in freshcut jackfruit (Artocarpus heterophyllus Lam.) Acta Hort. 989:199-208.
Makarova, K.S. and Koonin, E. V. 2007. Evolutionary genomics of lactic acid bacteria. Journal of Bacteriology 189:1199-1208.
US-FDA (US-Food and Drug Administration) 2003. Bacteriological Analytical Manual (revised edition).
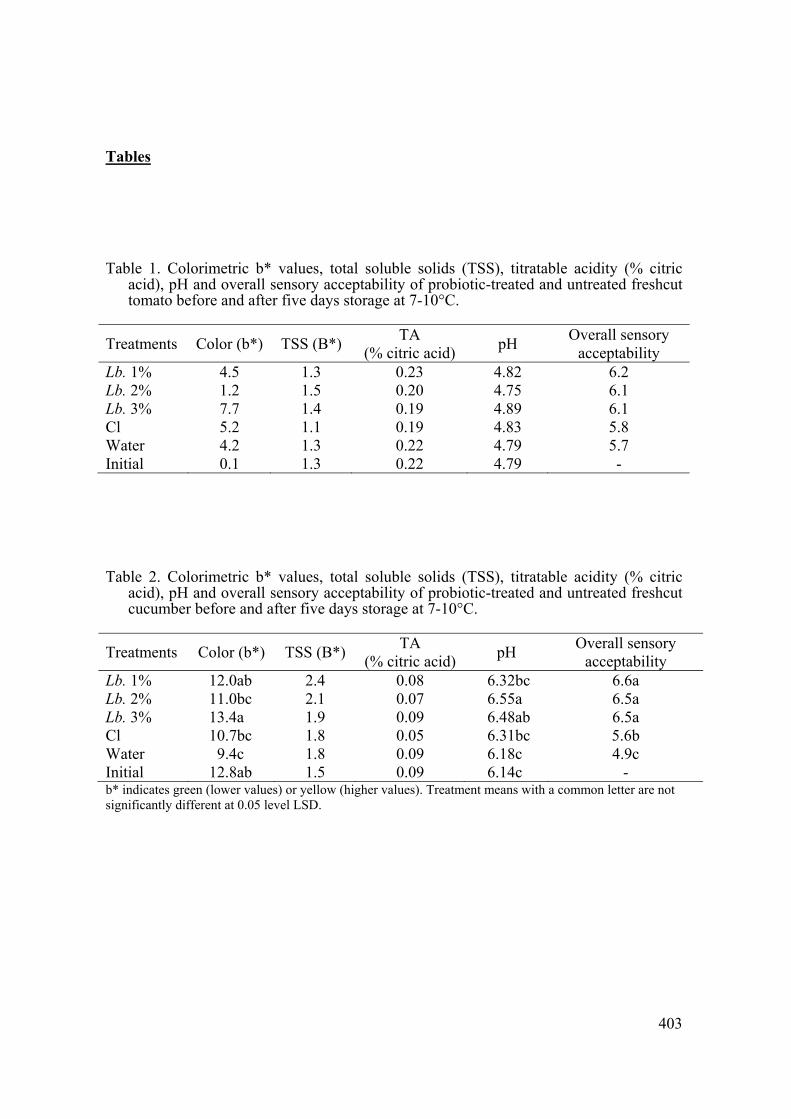
403
Tables Table 1. Colorimetric b* values, total soluble solids (TSS), titratable acidity (% citric
acid), pH and overall sensory acceptability of probiotic-treated and untreated freshcut tomato before and after five days storage at 7-10°C.
Treatments Color (b*) TSS (B*) TA (% citric acid) pH Overall sensory
acceptability Lb. 1% 4.5 1.3 0.23 4.82 6.2 Lb. 2% 1.2 1.5 0.20 4.75 6.1 Lb. 3% 7.7 1.4 0.19 4.89 6.1 Cl 5.2 1.1 0.19 4.83 5.8 Water 4.2 1.3 0.22 4.79 5.7 Initial 0.1 1.3 0.22 4.79 - Table 2. Colorimetric b* values, total soluble solids (TSS), titratable acidity (% citric
acid), pH and overall sensory acceptability of probiotic-treated and untreated freshcut cucumber before and after five days storage at 7-10°C.
Treatments Color (b*) TSS (B*) TA (% citric acid) pH Overall sensory
acceptability Lb. 1% 12.0ab 2.4 0.08 6.32bc 6.6a Lb. 2% 11.0bc 2.1 0.07 6.55a 6.5a Lb. 3% 13.4a 1.9 0.09 6.48ab 6.5a Cl 10.7bc 1.8 0.05 6.31bc 5.6b Water 9.4c 1.8 0.09 6.18c 4.9c Initial 12.8ab 1.5 0.09 6.14c - b* indicates green (lower values) or yellow (higher values). Treatment means with a common letter are not significantly different at 0.05 level LSD.
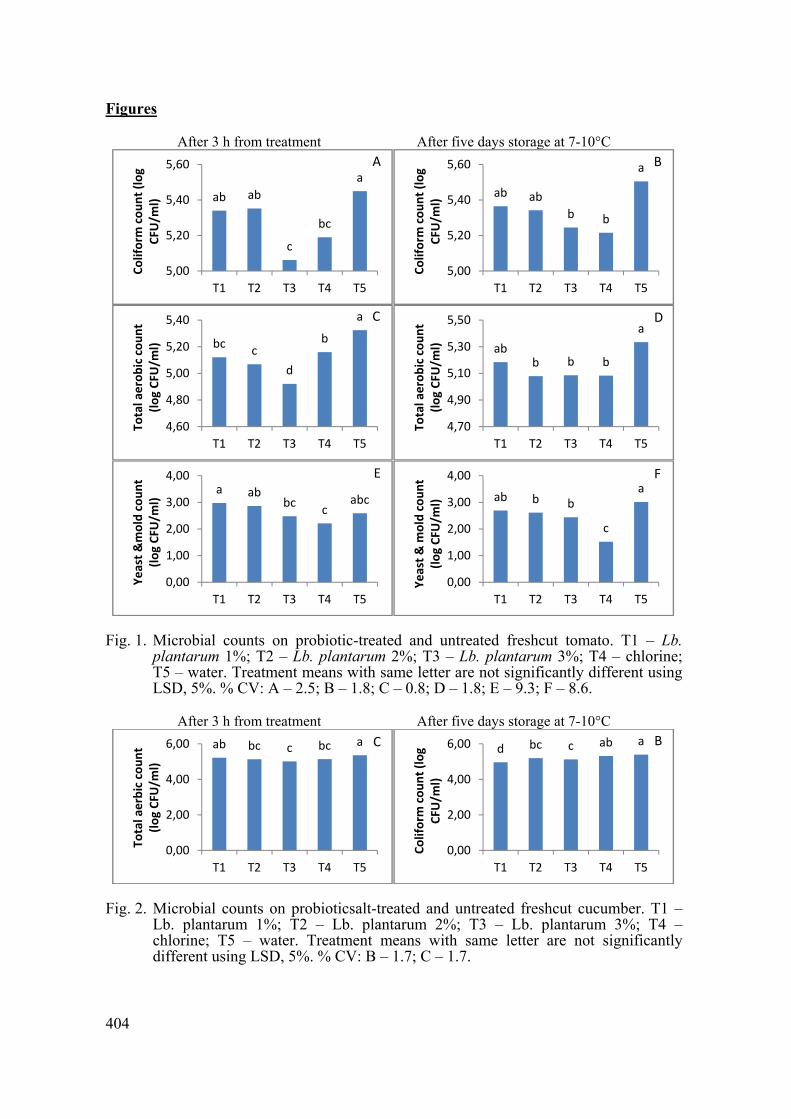
404
Figures
After 3 h from treatment After five days storage at 7-10°C
Fig. 1. Microbial counts on probiotic-treated and untreated freshcut tomato. T1 – Lb.
plantarum 1%; T2 – Lb. plantarum 2%; T3 – Lb. plantarum 3%; T4 – chlorine; T5 – water. Treatment means with same letter are not significantly different using LSD, 5%. % CV: A – 2.5; B – 1.8; C – 0.8; D – 1.8; E – 9.3; F – 8.6.
After 3 h from treatment After five days storage at 7-10°C
Fig. 2. Microbial counts on probioticsalt-treated and untreated freshcut cucumber. T1 –
Lb. plantarum 1%; T2 – Lb. plantarum 2%; T3 – Lb. plantarum 3%; T4 – chlorine; T5 – water. Treatment means with same letter are not significantly different using LSD, 5%. % CV: B – 1.7; C – 1.7.
ab ab
c
bc
a
5,00
5,20
5,40
5,60
T1 T2 T3 T4 T5
Colif
orm
cou
nt (l
og
CFU
/ml)
ab ab
b b
a
5,00
5,20
5,40
5,60
T1 T2 T3 T4 T5
Colif
orm
cou
nt (l
og
CFU
/ml)
bcc
d
b
a
4,60
4,80
5,00
5,20
5,40
T1 T2 T3 T4 T5
Tota
l aer
obic
cou
nt
(log
CFU
/ml) ab
b b b
a
4,70
4,90
5,10
5,30
5,50
T1 T2 T3 T4 T5
Tota
l aer
obic
cou
nt
(log
CFU
/ml)
a abbc
cabc
0,00
1,00
2,00
3,00
4,00
T1 T2 T3 T4 T5
Yeas
t &m
old
coun
t (lo
g CF
U/m
l) ab b b
c
a
0,00
1,00
2,00
3,00
4,00
T1 T2 T3 T4 T5
Yeas
t & m
old
coun
t (lo
g CF
U/m
l)
ab bc c bc a
0,00
2,00
4,00
6,00
T1 T2 T3 T4 T5
Tota
l aer
bic
coun
t (lo
g CF
U/m
l)
d bc c ab a
0,00
2,00
4,00
6,00
T1 T2 T3 T4 T5
Colif
orm
cou
nt (l
og
CFU
/ml)
BA
DC
FE
C B
Acta Hortic. 1213. ISHS 2018. DOI 10.17660/ActaHortic.2018.1213.42 Proc. III Asia Pacific Symposium on Postharvest Research, Education and Extension Eds.: R.E. Roberts et al.
293
Bitter gourd (Momordica charantia) quality grading at two storage temperatures
A.Valida1,F.R.Rivera1,A.Salabao1,M.Benitez1,E.Sudaria1,A.AcedoJr.2andJ.Ekman3
1Postharvest Technology Division, Department of Horticulture, Visayas State University, Leyte, Philippines;2AVRDC ‐ The World Vegetable Center, South Asia Regional Office, ICRISAT Campus, Patancheru 502 324,Hyderabad,India;3AppliedHorticulturalResearch,Suite352,BiomedicalBuilding,1CentralAvenue,AustralianTechnologyPark,EveleighN.S.W.2015,Australia.
Abstract This study characterized the fruit quality attributes of commercially mature
bitter gourd (Momordica charantia L. ‘Galaxy F1’) from harvest to end of shelf life during storage at 7-10 and 21-25°C to develop quality grading standards for research, education and industry use. Quality at harvest was mainly determined by shape, size, uniformity of green surface color, and absence of defects that included yellowing (overmaturity) and preharvest damage due to insect pests, diseases and mechanical injury. During postharvest storage, loss in quality was due to yellowing, water loss that resulted in turgidity loss measured as weight loss and degree of shrivelling and softening, and/or soft rot. These quality changes occurred more rapidly at 21-25°C resulting in much shorter shelf life than at 7-10°C. Overall, the quality attributes were characterized using a scale for visual quality which was evaluated by a consumer panel. The results provide valuable information for establishing a system of grade standardization and classification along the production-marketing continuum.
Keywords:qualitystandards,gradeclassification,temperatureeffects
INTRODUCTION Bittergourd(Momordica charantiaL.)isamemberoftheCucurbitaceaefamilyandis
alsocalled,dependingonthecountrywhereitiscultivated,bittermelon,Africancucumber,karela,carille,artpumpkin,balsampear,maidenappleorkoe(Mohammed,2010).Perhapsbetterknown for theuseof the leaf, rootand fruit formedicinaluses, thecommodityhasgreatpotentialasafoodsourceinbothdevelopingandindustrializedcountriesandisrichiniron, phosphorus and ascorbic acid. The fruit is intensely bitter, green and warty inappearance,andishighlyfragileandperishable(Mohammed,2010).Theperishablenatureofbittergourdtoagreatextentleadstomixedvariabilityinqualitywhichdoesn’tcoincidewith consumer requirement. This study evaluated the fruit quality attributes ofcommerciallymaturebittergourd(Momordica charantiaL.‘GalaxyF1’)fromharvesttoendof shelf life during storage at 7‐10 and 21‐25°C to develop grading scale for research,educationandindustryuse.
MATERIAL AND METHODS Bittergourd (Momordica charantiaL. ‘GalaxyF1’)at commercialmaturity stagewas
harvestedatacommercialfarmatBrgy.Cabintan,OrmocCity.Rightafterharvest,thefruitswere sorted for shape, size, uniformityof green surface color, and absenceof defects thatincludedyellowing(overmaturity)andpreharvestdamageduetoinsectpests,diseasesandmechanical injury. Each fruit was individually wrapped with soft paper and packed incartonsbeforeshipmenttoPostharvestTechnologyLaboratory,DepartmentofHorticulture,VSU,andweretakenoutfromtheboxandallowedtoequilibrateatambientforabout2hbefore the application of the storage treatments. Ten fruits were used as samples perreplicateoratotalof30fruitspertreatment.Thesampleswerethenplacedinplastictrays(40×30 cm) each representing a replicate. All samples were stored at 7‐10°C using arefrigerator compartment to simulate prolonged refrigerated holding, and ambient roomtemperature at 21‐25°C. Photomicrographs were taken daily for firmness/softening,
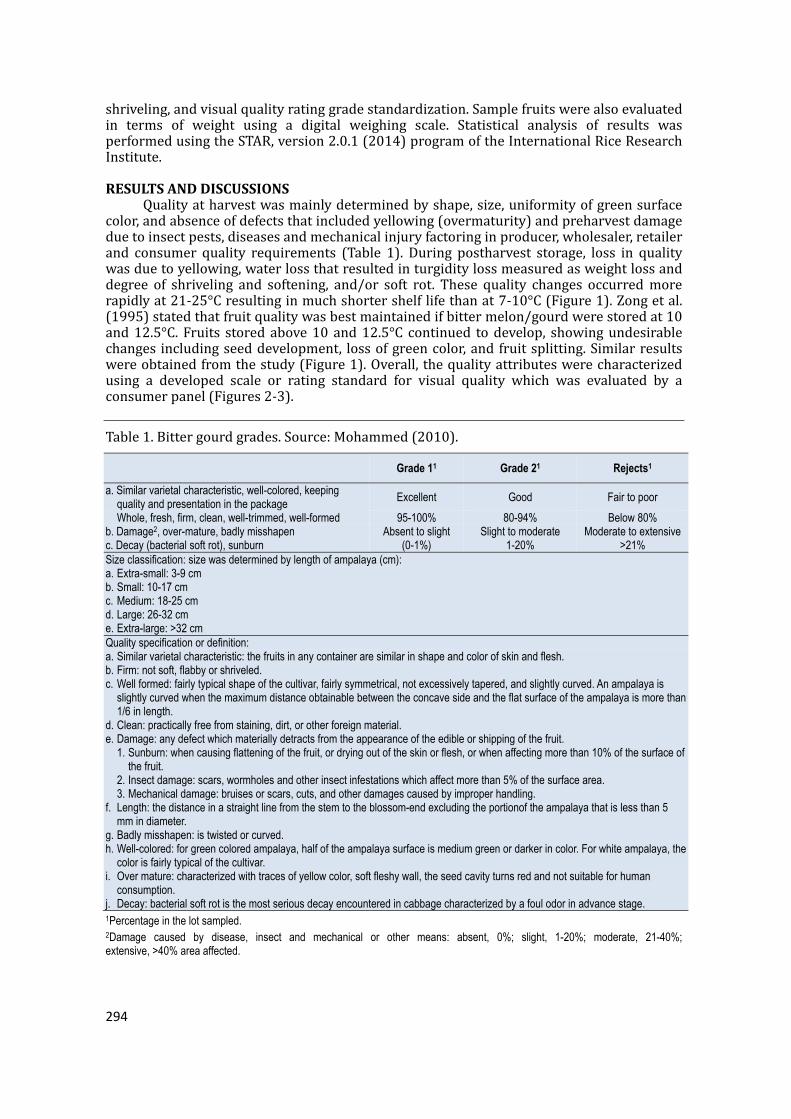
294
shriveling,andvisualqualityratinggradestandardization.Samplefruitswerealsoevaluatedin terms of weight using a digital weighing scale. Statistical analysis of results wasperformedusingtheSTAR,version2.0.1(2014)programoftheInternationalRiceResearchInstitute.
RESULTS AND DISCUSSIONS Qualityatharvestwasmainlydeterminedbyshape,size,uniformityofgreensurface
color,andabsenceofdefectsthatincludedyellowing(overmaturity)andpreharvestdamageduetoinsectpests,diseasesandmechanicalinjuryfactoringinproducer,wholesaler,retailerand consumer quality requirements (Table 1). During postharvest storage, loss in qualitywasduetoyellowing,waterlossthatresultedinturgiditylossmeasuredasweightlossanddegree of shriveling and softening, and/or soft rot. These quality changes occurredmorerapidlyat21‐25°Cresultinginmuchshortershelflifethanat7‐10°C(Figure1).Zongetal.(1995)statedthatfruitqualitywasbestmaintainedifbittermelon/gourdwerestoredat10and12.5°C. Fruits storedabove10 and12.5°C continued todevelop, showingundesirablechanges includingseeddevelopment, lossofgreencolor,andfruitsplitting.Similarresultswereobtainedfromthestudy(Figure1).Overall,thequalityattributeswerecharacterizedusing a developed scale or rating standard for visual quality which was evaluated by aconsumerpanel(Figures2‐3).
Table1.Bittergourdgrades.Source:Mohammed(2010).
Grade 11 Grade 21 Rejects1
a. Similar varietal characteristic, well-colored, keeping quality and presentation in the package
Excellent Good Fair to poor
Whole, fresh, firm, clean, well-trimmed, well-formed 95-100% 80-94% Below 80% b. Damage2, over-mature, badly misshapen Absent to slight Slight to moderate Moderate to extensive c. Decay (bacterial soft rot), sunburn (0-1%) 1-20% >21% Size classification: size was determined by length of ampalaya (cm): a. Extra-small: 3-9 cm b. Small: 10-17 cm c. Medium: 18-25 cm d. Large: 26-32 cm e. Extra-large: >32 cm Quality specification or definition: a. Similar varietal characteristic: the fruits in any container are similar in shape and color of skin and flesh. b. Firm: not soft, flabby or shriveled. c. Well formed: fairly typical shape of the cultivar, fairly symmetrical, not excessively tapered, and slightly curved. An ampalaya is
slightly curved when the maximum distance obtainable between the concave side and the flat surface of the ampalaya is more than 1/6 in length.
d. Clean: practically free from staining, dirt, or other foreign material. e. Damage: any defect which materially detracts from the appearance of the edible or shipping of the fruit.
1. Sunburn: when causing flattening of the fruit, or drying out of the skin or flesh, or when affecting more than 10% of the surface of the fruit.
2. Insect damage: scars, wormholes and other insect infestations which affect more than 5% of the surface area. 3. Mechanical damage: bruises or scars, cuts, and other damages caused by improper handling.
f. Length: the distance in a straight line from the stem to the blossom-end excluding the portionof the ampalaya that is less than 5 mm in diameter.
g. Badly misshapen: is twisted or curved. h. Well-colored: for green colored ampalaya, half of the ampalaya surface is medium green or darker in color. For white ampalaya, the
color is fairly typical of the cultivar. i. Over mature: characterized with traces of yellow color, soft fleshy wall, the seed cavity turns red and not suitable for human
consumption. j. Decay: bacterial soft rot is the most serious decay encountered in cabbage characterized by a foul odor in advance stage. 1Percentage in the lot sampled. 2Damage caused by disease, insect and mechanical or other means: absent, 0%; slight, 1-20%; moderate, 21-40%; extensive, >40% area affected.
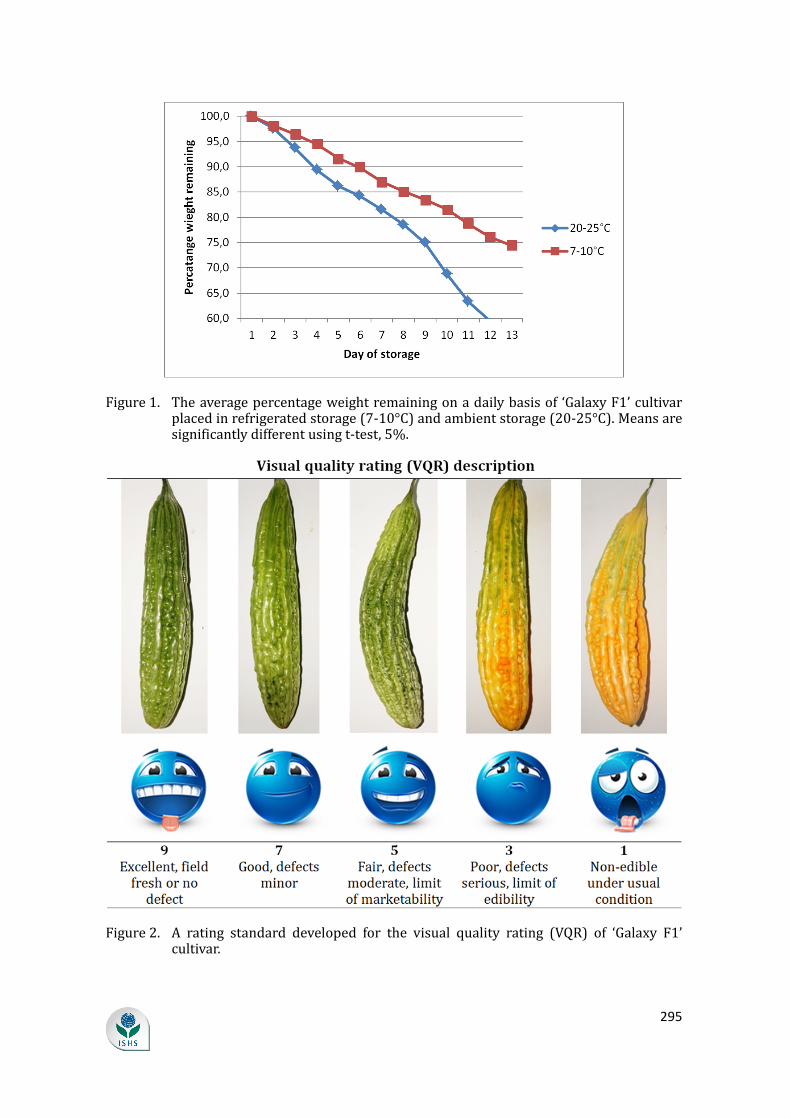
295
Figure1. Theaveragepercentageweightremainingonadailybasisof ‘GalaxyF1’cultivarplacedinrefrigeratedstorage(7‐10°C)andambientstorage(20‐25°C).Meansaresignificantlydifferentusingt‐test,5%.
Figure2. A rating standard developed for the visual quality rating (VQR) of ‘Galaxy F1’cultivar.
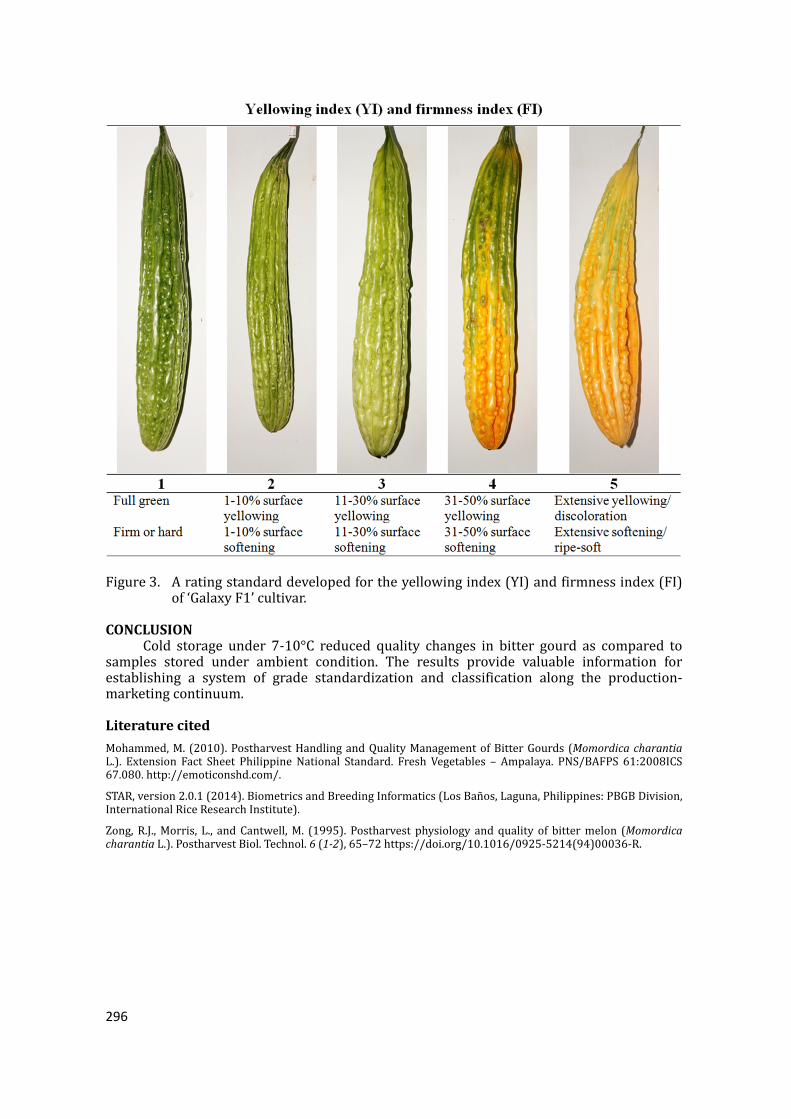
296
Figure3. Aratingstandarddevelopedfortheyellowingindex(YI)andfirmnessindex(FI)of‘GalaxyF1’cultivar.
CONCLUSION Cold storage under 7‐10°C reduced quality changes in bitter gourd as compared to
samples stored under ambient condition. The results provide valuable information forestablishing a system of grade standardization and classification along the production‐marketingcontinuum.
Literature cited
Mohammed,M. (2010).PostharvestHandlingandQualityManagementofBitterGourds(Momordica charantiaL.). Extension Fact Sheet PhilippineNational Standard. Fresh Vegetables – Ampalaya. PNS/BAFPS 61:2008ICS67.080.http://emoticonshd.com/.
STAR,version2.0.1(2014).BiometricsandBreedingInformatics(LosBanos,Laguna,Philippines:PBGBDivision,InternationalRiceResearchInstitute).
Zong,R.J.,Morris, L., andCantwell,M. (1995). Postharvest physiology andquality of bittermelon (Momordica charantiaL.).PostharvestBiol.Technol.6(1-2),65–72https://doi.org/10.1016/0925‐5214(94)00036‐R.
Acta Hortic. 1213. ISHS 2018. DOI 10.17660/ActaHortic.2018.1213.17 Proc. III Asia Pacific Symposium on Postharvest Research, Education and Extension Eds.: R.E. Roberts et al.
129
Cabbage (Brassica oleraceae var. capitata) quality grading at two storage temperatures
A.Valida1,F.R.Rivera1,A.Salabao1,M.Benitez1,E.Sudaria1,A.AcedoJr.2andJ.Ekman3
1Postharvest Technology Division, Department of Horticulture, Visayas State University, Leyte, Philippines;2AVRDC‐The World Vegetable Center, South Asia Regional Office, ICRISAT Campus, Patancheru 502 324,Hyderabad,India;3AppliedHorticulturalResearch,Suite352,BiomedicalBuilding,1CentralAvenue,AustralianTechnologyPark,EveleighN.S.W.2015,Australia.
Abstract Common cabbage (Brassica oleraceae var. capitata) is the leading leafy vegetable
in the Philippines. Quality grading is vital to establish a system of grade standardization and classification that can be used as research, education and industry standards. This study evaluated the quality attributes of head cabbage at commercial mature stage and their changes during storage at 7-10 and 21-25°C. Quality at harvest was mainly determined by head solidity, size, weight, and absence of defects that included yellowing of outer leaves, insect damage particularly by the Diamond back moth, bacterial soft rot, immaturity (puffy heads) and mechanical injury. During postharvest storage, loss in quality was due to yellowing and wilting of outer leaves and bacterial soft rot that usually started at the cut butt end, which necessitated trimming of affected parts. Trimming loss and weight loss increased with storage at a faster rate at 21-25°C resulting in much shorter shelf life than at 7-10°C. Yellowing and wilting of outer leaves limited the shelf at both storage temperatures; additionally at 21-25°C, bacterial soft rot contributed to quality deterioration.
Keywords:qualitystandards,gradeclassification,temperatureeffects
INTRODUCTION Cabbage’s1stquarter’sproductionwas23.42MT,5.0%higherthanthe2013levelof
22.29MT(http://www.bas.gov.ph/?ids=vegetablessituation).It’sthefifthleadingvegetableandthenumberoneleafywithproductionof125,309.48metrictfromanareaof8,549.63ha(BAS,2013).Cabbageishighlyseasonalwithanoversupplyduringproductionpeaksandundersupply during lean season resulting in highly fluctuating prices aside from varyingwholesaler, retailer and consumer requirements. Consumer preference which is adetermining factor on cabbage quality must be integrated in standards or grades. Thesequality requirements are market information that should be effectively and efficientlytransmitted from downstream to upstream industries. In short, requirements of ultimateconsumersofvegetablesshouldbeknown to farmersandall theplayers in themarketingsystem so that production can accurately respond to market signals (Digal and Hualda,2003).Recently, the formulationof thePNS/BAFPS17:2005,PhilippineNationalStandardfor Vegetables – Cabbage (Brassica oleracea var. capitata L.) – Grading and Classification,wasinitiallydraftedbytheBureauofAgricultureandFisheriesProductStandards(BAFPS).Thisstudyevaluatedthequalityattributesofheadcabbageatcommercialmaturestageandtheir changes during storage at 7‐10 and 21‐25°C and developed a local gradestandardizationandclassificationthatcouldserveasacommongroundfordeterminingandharmonizingmarketplayerandconsumerpreferences.
MATERIAL AND METHODS Commoncabbage(Brassica oleraceaevar.capitata)atcommercialmaturitystagewas
harvestedatacommercialfarmatBrgy.Cabintan,OrmocCity,Leyte,Philippines.Rightafterharvest,thefruitsweresortedforsolidity,size,weightandabsenceofdefects.Eachproducewas individually wrapped with soft paper and packed in cartons before shipment toPostharvest Technology Laboratory, Department ofHorticulture, VSU, andwere taken out
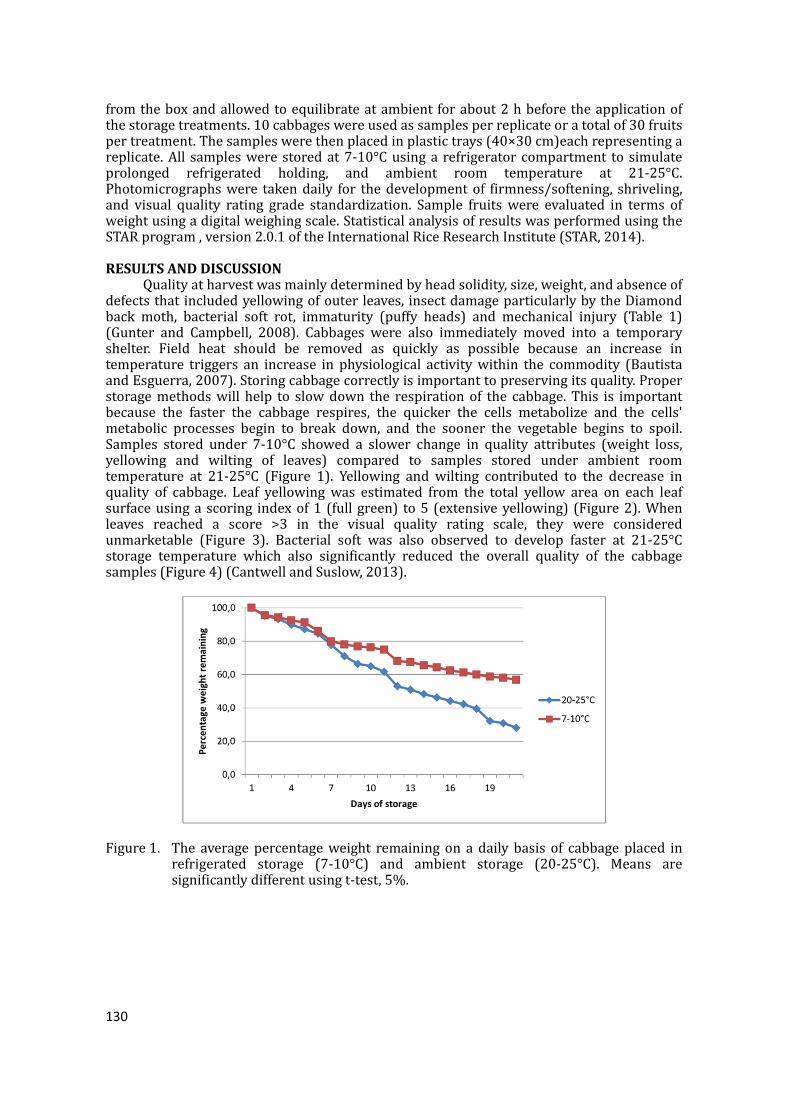
130
fromtheboxandallowedtoequilibrateatambient forabout2hbeforetheapplicationofthestoragetreatments.10cabbageswereusedassamplesperreplicateoratotalof30fruitspertreatment.Thesampleswerethenplacedinplastictrays(40×30cm)eachrepresentingareplicate.All sampleswerestoredat7‐10°Cusinga refrigeratorcompartment tosimulateprolonged refrigerated holding, and ambient room temperature at 21‐25°C.Photomicrographswere takendaily for thedevelopmentof firmness/softening, shriveling,and visual quality rating grade standardization. Sample fruitswere evaluated in terms ofweightusingadigitalweighingscale.StatisticalanalysisofresultswasperformedusingtheSTARprogram,version2.0.1oftheInternationalRiceResearchInstitute(STAR,2014).
RESULTS AND DISCUSSION Qualityatharvestwasmainlydeterminedbyheadsolidity,size,weight,andabsenceof
defectsthat includedyellowingofouterleaves, insectdamageparticularlybytheDiamondback moth, bacterial soft rot, immaturity (puffy heads) and mechanical injury (Table 1)(Gunter and Campbell, 2008). Cabbages were also immediately moved into a temporaryshelter. Field heat should be removed as quickly as possible because an increase intemperature triggers an increase in physiological activitywithin the commodity (BautistaandEsguerra,2007).Storingcabbagecorrectlyisimportanttopreservingitsquality.Properstoragemethodswill help to slowdown the respirationof the cabbage. This is importantbecause the faster the cabbage respires, the quicker the cells metabolize and the cells'metabolic processes begin to break down, and the sooner the vegetable begins to spoil.Samples stored under 7‐10°C showed a slower change in quality attributes (weight loss,yellowing and wilting of leaves) compared to samples stored under ambient roomtemperature at 21‐25°C (Figure 1). Yellowing and wilting contributed to the decrease inquality of cabbage. Leaf yellowingwas estimated from the total yellow area on each leafsurfaceusingascoring indexof1 (fullgreen) to5 (extensiveyellowing) (Figure2).Whenleaves reached a score >3 in the visual quality rating scale, they were consideredunmarketable (Figure 3). Bacterial soft was also observed to develop faster at 21‐25°Cstorage temperature which also significantly reduced the overall quality of the cabbagesamples(Figure4)(CantwellandSuslow,2013).
Figure1. The averagepercentageweight remainingon adaily basis of cabbageplaced inrefrigerated storage (7‐10°C) and ambient storage (20‐25°C). Means aresignificantlydifferentusingt‐test,5%.
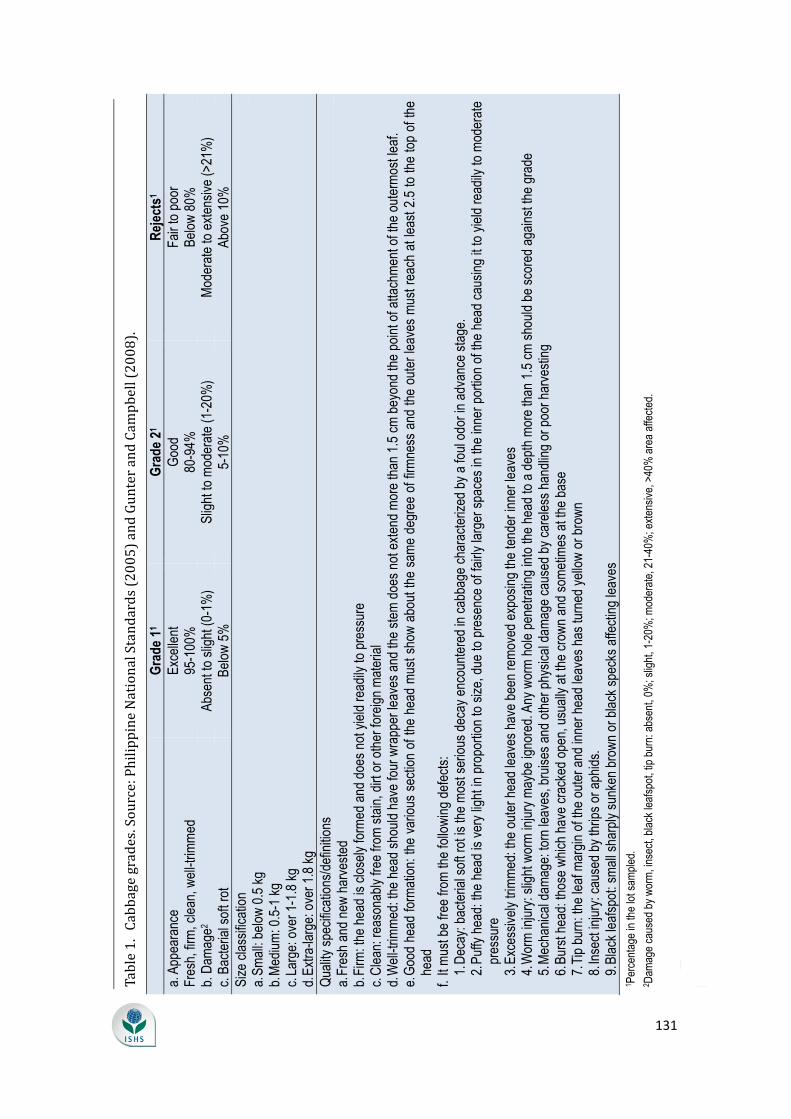
13
1
Table1.Cabbagegrades.Source:PhilippineNationalStandards(2005)andGunterandCam
pbell(2008).
G
rade
11
Gra
de 2
1 R
ejec
ts1
a. A
ppea
ranc
e Ex
celle
nt
Goo
d Fa
ir to
poo
r Fr
esh,
firm
, cle
an, w
ell-t
rimm
ed
95-1
00%
80
-94%
Be
low
80%
b.
Dam
age2
Abse
nt to
slig
ht (0
-1%
) Sl
ight
to m
oder
ate
(1-2
0%)
Mod
erat
e to
ext
ensi
ve (>
21%
) c.
Bac
teria
l sof
t rot
Be
low
5%
5-
10%
Ab
ove
10%
Si
ze c
lass
ifica
tion
a. S
mal
l: be
low
0.5
kg
b. M
ediu
m: 0
.5-1
kg
c. L
arge
: ove
r 1-1
.8 k
g d.
Ext
ra-la
rge:
ove
r 1.8
kg
Qua
lity
spec
ifica
tions
/def
initi
ons
a. F
resh
and
new
har
vest
ed
b. F
irm: t
he h
ead
is c
lose
ly fo
rmed
and
doe
s no
t yie
ld re
adily
to p
ress
ure
c. C
lean
: rea
sona
bly
free
from
sta
in, d
irt o
r oth
er fo
reig
n m
ater
ial
d. W
ell-t
rimm
ed: t
he h
ead
shou
ld h
ave
four
wra
pper
leav
es a
nd th
e st
em d
oes
not e
xten
d m
ore
than
1.5
cm
bey
ond
the
poin
t of a
ttach
men
t of t
he o
uter
mos
t lea
f. e.
Goo
d he
ad fo
rmat
ion:
the
vario
us s
ectio
n of
the
head
mus
t sho
w a
bout
the
sam
e de
gree
of f
irmne
ss a
nd th
e ou
ter l
eave
s m
ust r
each
at l
east
2.5
to th
e to
p of
the
head
f.
It m
ust b
e fre
e fro
m th
e fo
llow
ing
defe
cts:
1.
Dec
ay: b
acte
rial s
oft r
ot is
the
mos
t ser
ious
dec
ay e
ncou
nter
ed in
cab
bage
cha
ract
eriz
ed b
y a
foul
odo
r in
adva
nce
stag
e.
2. P
uffy
hea
d: th
e he
ad is
ver
y lig
ht in
pro
porti
on to
siz
e, d
ue to
pre
senc
e of
fairl
y la
rger
spa
ces
in th
e in
ner p
ortio
n of
the
head
cau
sing
it to
yie
ld re
adily
to m
oder
ate
pres
sure
3.
Exc
essi
vely
trim
med
: the
out
er h
ead
leav
es h
ave
been
rem
oved
exp
osin
g th
e te
nder
inne
r lea
ves
4. W
orm
inju
ry: s
light
wor
m in
jury
may
be ig
nore
d. A
ny w
orm
hol
e pe
netra
ting
into
the
head
to a
dep
th m
ore
than
1.5
cm
sho
uld
be s
core
d ag
ains
t the
gra
de
5. M
echa
nica
l dam
age:
torn
leav
es, b
ruis
es a
nd o
ther
phy
sica
l dam
age
caus
ed b
y ca
rele
ss h
andl
ing
or p
oor h
arve
stin
g 6.
Bur
st h
ead:
thos
e w
hich
hav
e cr
acke
d op
en, u
sual
ly a
t the
cro
wn
and
som
etim
es a
t the
bas
e 7.
Tip
bur
n: th
e le
af m
argi
n of
the
oute
r and
inne
r hea
d le
aves
has
turn
ed y
ello
w o
r bro
wn
8. In
sect
inju
ry: c
ause
d by
thrip
s or
aph
ids.
9.
Bla
ck le
afsp
ot: s
mal
l sha
rply
sun
ken
brow
n or
bla
ck s
peck
s af
fect
ing
leav
es
1 Per
cent
age
in th
e lo
t sam
pled
. 2 D
amag
e ca
used
by
wor
m, i
nsec
t, bl
ack
leaf
spot
, tip
bur
n: a
bsen
t, 0%
; slig
ht, 1
-20%
; mod
erat
e, 2
1-40
%; e
xten
sive
, >40
% a
rea
affe
cted
.
131
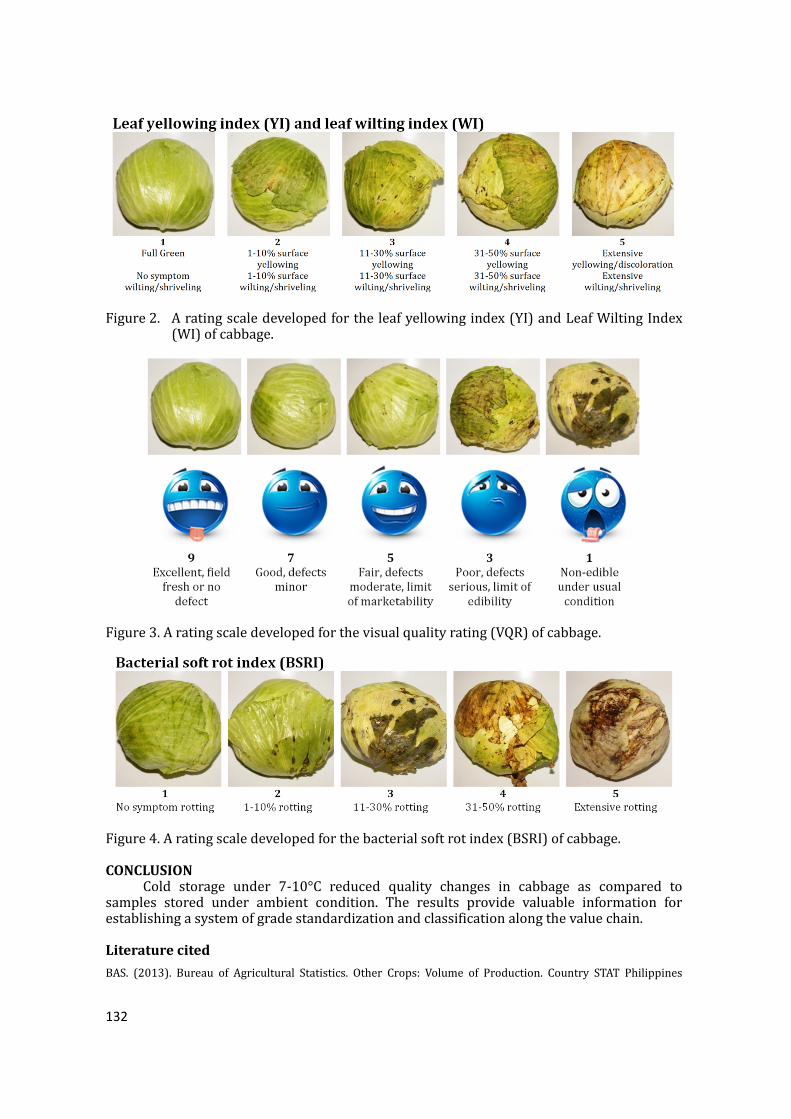
132
Figure2. Aratingscaledevelopedfortheleafyellowingindex(YI)andLeafWiltingIndex(WI)ofcabbage.
Figure3.Aratingscaledevelopedforthevisualqualityrating(VQR)ofcabbage.
Figure4.Aratingscaledevelopedforthebacterialsoftrotindex(BSRI)ofcabbage.
CONCLUSION Cold storage under 7‐10°C reduced quality changes in cabbage as compared to
samples stored under ambient condition. The results provide valuable information forestablishingasystemofgradestandardizationandclassificationalongthevaluechain.
Literature cited
BAS. (2013). Bureau of Agricultural Statistics. Other Crops: Volume of Production. Country STAT Philippines
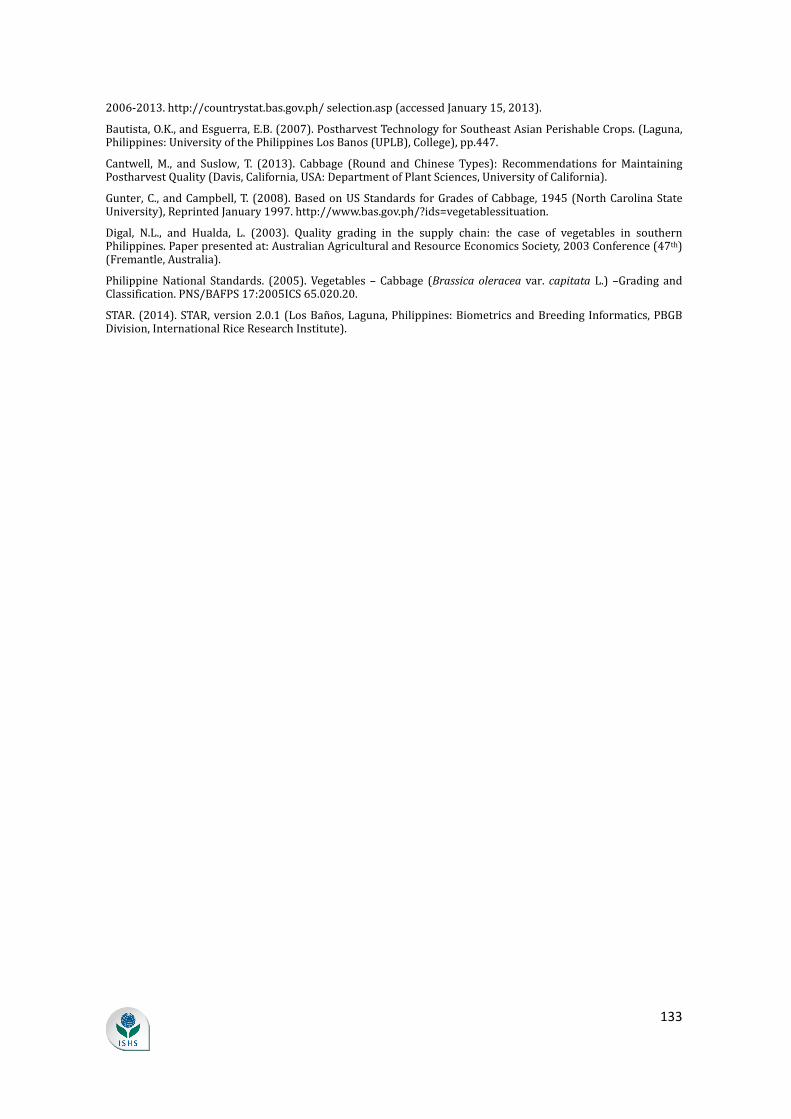
133
2006‐2013.http://countrystat.bas.gov.ph/selection.asp(accessedJanuary15,2013).
Bautista,O.K.,andEsguerra,E.B.(2007).PostharvestTechnologyforSoutheastAsianPerishableCrops.(Laguna,Philippines:UniversityofthePhilippinesLosBanos(UPLB),College),pp.447.
Cantwell, M., and Suslow, T. (2013). Cabbage (Round and Chinese Types): Recommendations forMaintainingPostharvestQuality(Davis,California,USA:DepartmentofPlantSciences,UniversityofCalifornia).
Gunter,C.,andCampbell,T. (2008).BasedonUSStandards forGradesofCabbage,1945(NorthCarolinaStateUniversity),ReprintedJanuary1997.http://www.bas.gov.ph/?ids=vegetablessituation.
Digal, N.L., and Hualda, L. (2003). Quality grading in the supply chain: the case of vegetables in southernPhilippines.Paperpresentedat:AustralianAgriculturalandResourceEconomicsSociety,2003Conference(47th)(Fremantle,Australia).
PhilippineNational Standards. (2005). Vegetables – Cabbage (Brassica oleracea var. capitata L.) –Grading andClassification.PNS/BAFPS17:2005ICS65.020.20.
STAR.(2014).STAR,version2.0.1(LosBanos,Laguna,Philippines:BiometricsandBreedingInformatics,PBGBDivision,InternationalRiceResearchInstitute).

134
Acta Hortic. 1213. ISHS 2018. DOI 10.17660/ActaHortic.2018.1213.38 Proc. III Asia Pacific Symposium on Postharvest Research, Education and Extension Eds.: R.E. Roberts et al.
269
Tomato (Solanum lycopersicum) quality grading at two storage temperatures
A.Valida1,F.R.Rivera1,A.Salabao1,M.Benitez1,E.Sudaria1,A.AcedoJr.2andJ.Ekman3
1Postharvest Technology Division, Department of Horticulture, Visayas State University, Leyte, Philippines;2AVRDC ‐ The World Vegetable Center, South Asia Regional Office, ICRISAT Campus, Patancheru 502 324,Hyderabad,India;3AppliedHorticulturalResearch,Suite352,BiomedicalBuilding,1CentralAvenue,AustralianTechnologyPark,EveleighN.S.W.2015,Australia.
Abstract The study was conducted to evaluate the quality and shelflife of tomato
(Solanum lycopersicon ‘Diamante Max’) at 7-10°C and 21-25°C and develop grading scale for research, education and industry use. Fruit quality at harvest was determined by maturity and absence of defects including deformation, blossom-end rot, and insect damage. During storage, quality changes were a result of the ripening process, with water loss and rotting as secondary factors. Storage at 7-10°C expectedly and more effectively delayed ripening, reduced weight loss, and prolonged shelf life of tomato fruits than at 21-25°C. Overall, the quality attributes were characterized using a scale for visual quality which was evaluated by a consumer panel. The results provide valuable information for establishing a system of grade standardization and classification along the production-marketing continuum.
Keywords:qualitystandards,gradeclassification,temperatureeffects
INTRODUCTION The cultivated tomato (Solanum lycopersicum L.) is the second most commonly
consumedvegetablecropafterpotato(Solanum tuberosumL.)intheworld(FAOSTAT,2008).Dependingonthemarket,cultivarandproductionarea,tomatoesareharvestedatstagesofmaturity ranging from physiological maturity (mature‐green stage) through full‐ripe.Immaturetomatoesareavailableforcertainregionaldishes.Thisdenotesacertaindegreeofvarying fruit quality which may not coincide with consumer quality requirements at aspecificperiodwithoutproperstandardization.Recently,theformulationofthisPhilippineNationalStandardforTomatoes,PNS/BAFPS26:2006wasinitiallydraftedbytheBureauofAgricultureandFisheriesProductStandards(BAFPS).Thestudywasconductedtoevaluatethequalityandshelflifeoftomato(Solanum lycopersicon‘DiamanteMax’)at7‐10°Cand21‐25°Canddevelopalocalgradingscaletobridgethegapbetweenproducersandend‐usertofacilitateresearch,educationandmainlyindustryuse.
MATERIAL AND METHODS Tomato (Solanum lycopersicon ‘Diamante Max’) at commercial maturity stage was
harvestedatacommercialfarmatBrgy.Cabintan,OrmocCity.Rightafterharvest,thefruitswere sorted by maturity (size and shape) and absence of defects including deformation,blossom‐end rot, and insect damage. Each fruitwas individuallywrappedwith soft paperandpackedincartonsbeforeshipmenttoPostharvestTechnologyLaboratory,DepartmentofHorticulture,VSU,andweretakenoutfromtheboxandallowedtoequilibrateatambientfor about 2 h before the application of the storage treatments. Ten fruits were used assamplesper replicateor a total of30 fruitsper treatment.The sampleswere thenplacedplastic trays (40×30 cm) each representing a replicate.All sampleswere stored at 7‐10°Cusingarefrigeratorcompartmenttosimulateprolongedrefrigeratedholding,andambientroom temperature at 21‐25°C. Photomicrographs were taken daily for color change,firmness/softening, shrivelling, and visual quality rating grade standardization (Table 1;Figures1‐3).Samplefruitswereevaluatedintermsofweightusingadigitalweighingscale.StatisticalanalysisofresultswasperformedusingtheSTAR,version2.0.1(2014)programof
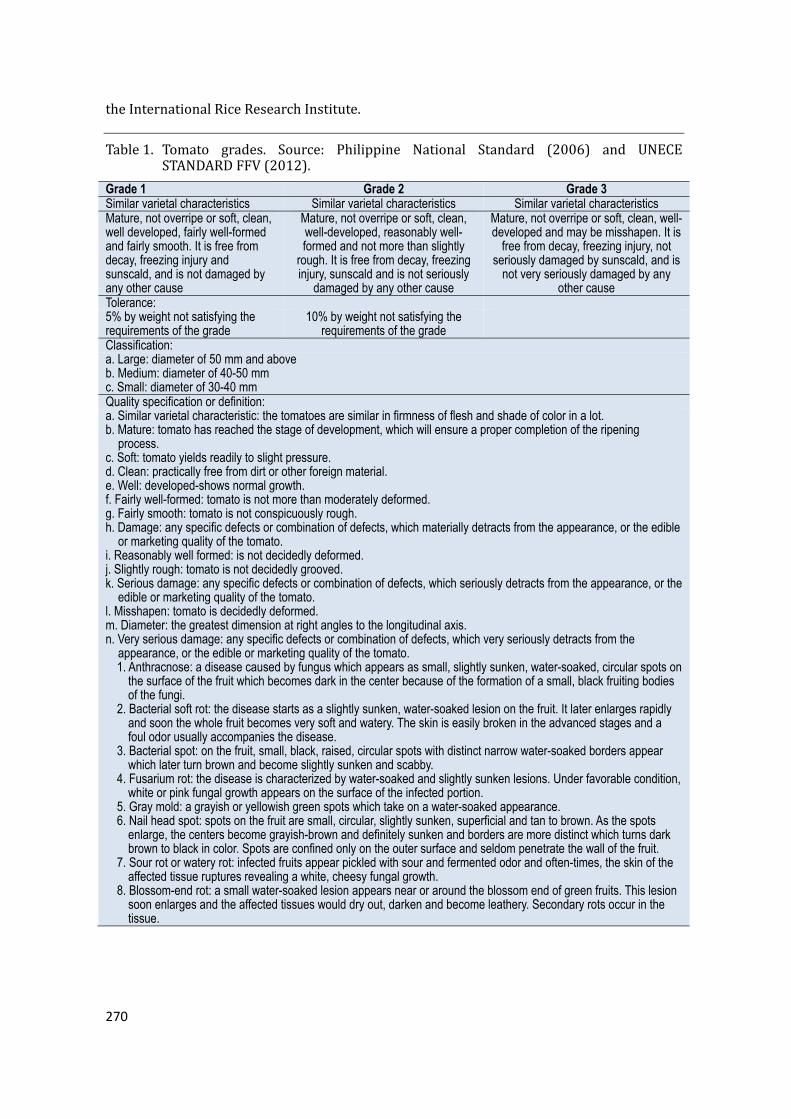
270
theInternationalRiceResearchInstitute.
Table1. Tomato grades. Source: Philippine National Standard (2006) and UNECESTANDARDFFV(2012).
Grade 1 Grade 2 Grade 3 Similar varietal characteristics Similar varietal characteristics Similar varietal characteristics Mature, not overripe or soft, clean, well developed, fairly well-formed and fairly smooth. It is free from decay, freezing injury and sunscald, and is not damaged by any other cause
Mature, not overripe or soft, clean, well-developed, reasonably well-formed and not more than slightly
rough. It is free from decay, freezing injury, sunscald and is not seriously
damaged by any other cause
Mature, not overripe or soft, clean, well-developed and may be misshapen. It is
free from decay, freezing injury, not seriously damaged by sunscald, and is
not very seriously damaged by any other cause
Tolerance: 5% by weight not satisfying the requirements of the grade
10% by weight not satisfying the requirements of the grade
Classification: a. Large: diameter of 50 mm and above b. Medium: diameter of 40-50 mm c. Small: diameter of 30-40 mm Quality specification or definition: a. Similar varietal characteristic: the tomatoes are similar in firmness of flesh and shade of color in a lot. b. Mature: tomato has reached the stage of development, which will ensure a proper completion of the ripening
process. c. Soft: tomato yields readily to slight pressure. d. Clean: practically free from dirt or other foreign material. e. Well: developed-shows normal growth. f. Fairly well-formed: tomato is not more than moderately deformed. g. Fairly smooth: tomato is not conspicuously rough. h. Damage: any specific defects or combination of defects, which materially detracts from the appearance, or the edible
or marketing quality of the tomato. i. Reasonably well formed: is not decidedly deformed. j. Slightly rough: tomato is not decidedly grooved. k. Serious damage: any specific defects or combination of defects, which seriously detracts from the appearance, or the
edible or marketing quality of the tomato. l. Misshapen: tomato is decidedly deformed. m. Diameter: the greatest dimension at right angles to the longitudinal axis. n. Very serious damage: any specific defects or combination of defects, which very seriously detracts from the
appearance, or the edible or marketing quality of the tomato. 1. Anthracnose: a disease caused by fungus which appears as small, slightly sunken, water-soaked, circular spots on
the surface of the fruit which becomes dark in the center because of the formation of a small, black fruiting bodies of the fungi.
2. Bacterial soft rot: the disease starts as a slightly sunken, water-soaked lesion on the fruit. It later enlarges rapidly and soon the whole fruit becomes very soft and watery. The skin is easily broken in the advanced stages and a foul odor usually accompanies the disease.
3. Bacterial spot: on the fruit, small, black, raised, circular spots with distinct narrow water-soaked borders appear which later turn brown and become slightly sunken and scabby.
4. Fusarium rot: the disease is characterized by water-soaked and slightly sunken lesions. Under favorable condition, white or pink fungal growth appears on the surface of the infected portion.
5. Gray mold: a grayish or yellowish green spots which take on a water-soaked appearance. 6. Nail head spot: spots on the fruit are small, circular, slightly sunken, superficial and tan to brown. As the spots
enlarge, the centers become grayish-brown and definitely sunken and borders are more distinct which turns dark brown to black in color. Spots are confined only on the outer surface and seldom penetrate the wall of the fruit.
7. Sour rot or watery rot: infected fruits appear pickled with sour and fermented odor and often-times, the skin of the affected tissue ruptures revealing a white, cheesy fungal growth.
8. Blossom-end rot: a small water-soaked lesion appears near or around the blossom end of green fruits. This lesion soon enlarges and the affected tissues would dry out, darken and become leathery. Secondary rots occur in the tissue.
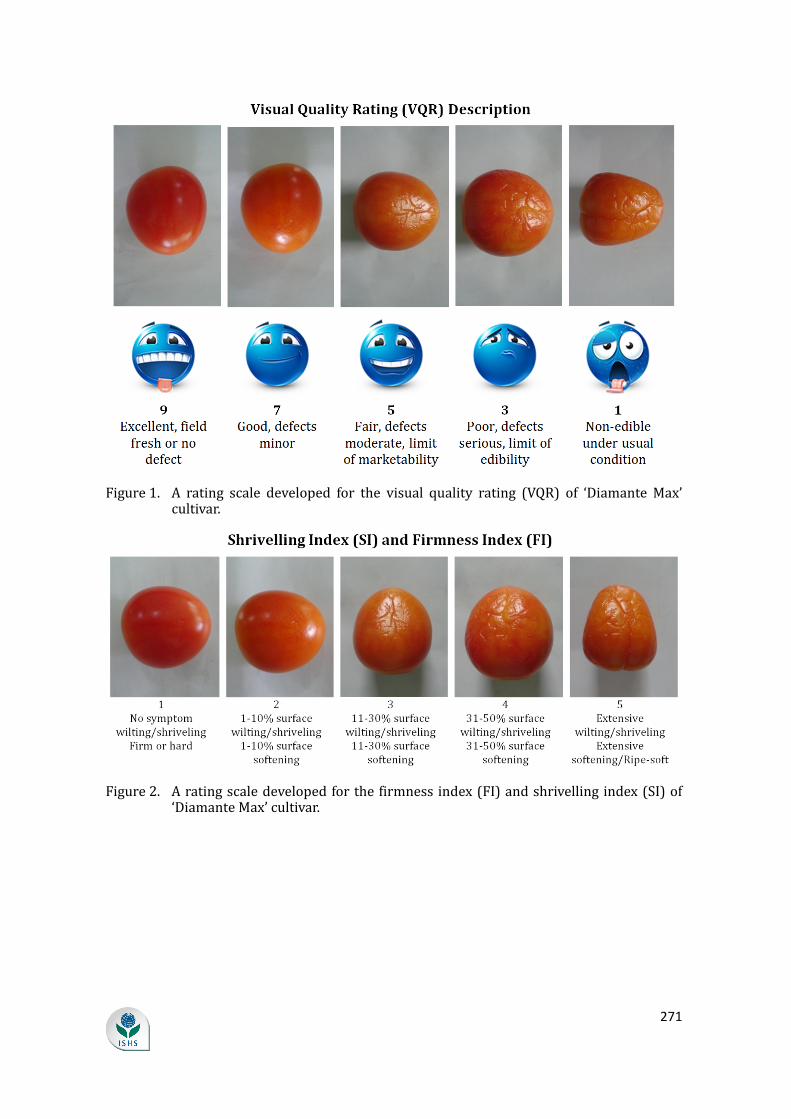
271
Figure1. A rating scale developed for the visual quality rating (VQR) of ‘DiamanteMax’cultivar.
Figure2. Aratingscaledevelopedforthefirmnessindex(FI)andshrivellingindex(SI)of‘DiamanteMax’cultivar.
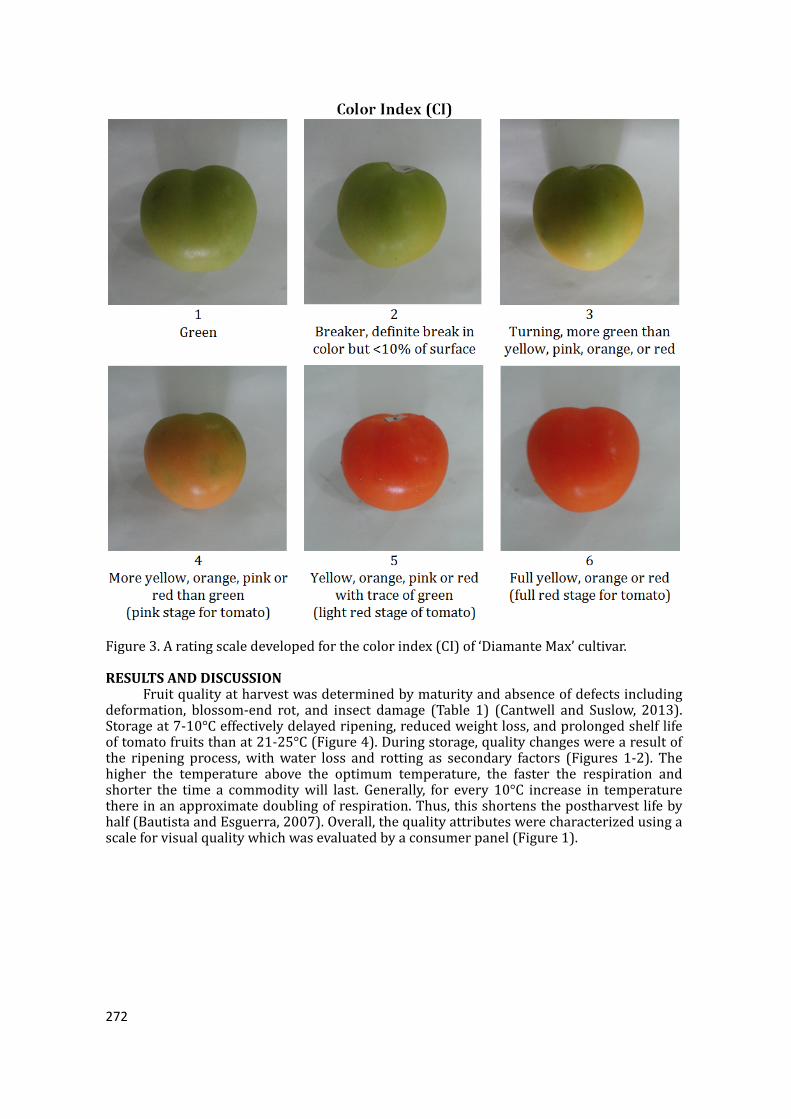
272
Figure3.Aratingscaledevelopedforthecolorindex(CI)of‘DiamanteMax’cultivar.
RESULTS AND DISCUSSION Fruitqualityatharvestwasdeterminedbymaturityandabsenceofdefectsincluding
deformation, blossom‐end rot, and insect damage (Table 1) (Cantwell and Suslow, 2013).Storageat7‐10°Ceffectivelydelayedripening,reducedweightloss,andprolongedshelflifeoftomatofruitsthanat21‐25°C(Figure4).Duringstorage,qualitychangeswerearesultofthe ripening process,withwater loss and rotting as secondary factors (Figures 1‐2). Thehigher the temperature above the optimum temperature, the faster the respiration andshorter the time a commoditywill last. Generally, for every 10°C increase in temperaturethereinanapproximatedoublingofrespiration.Thus,thisshortensthepostharvestlifebyhalf(BautistaandEsguerra,2007).Overall,thequalityattributeswerecharacterizedusingascaleforvisualqualitywhichwasevaluatedbyaconsumerpanel(Figure1).
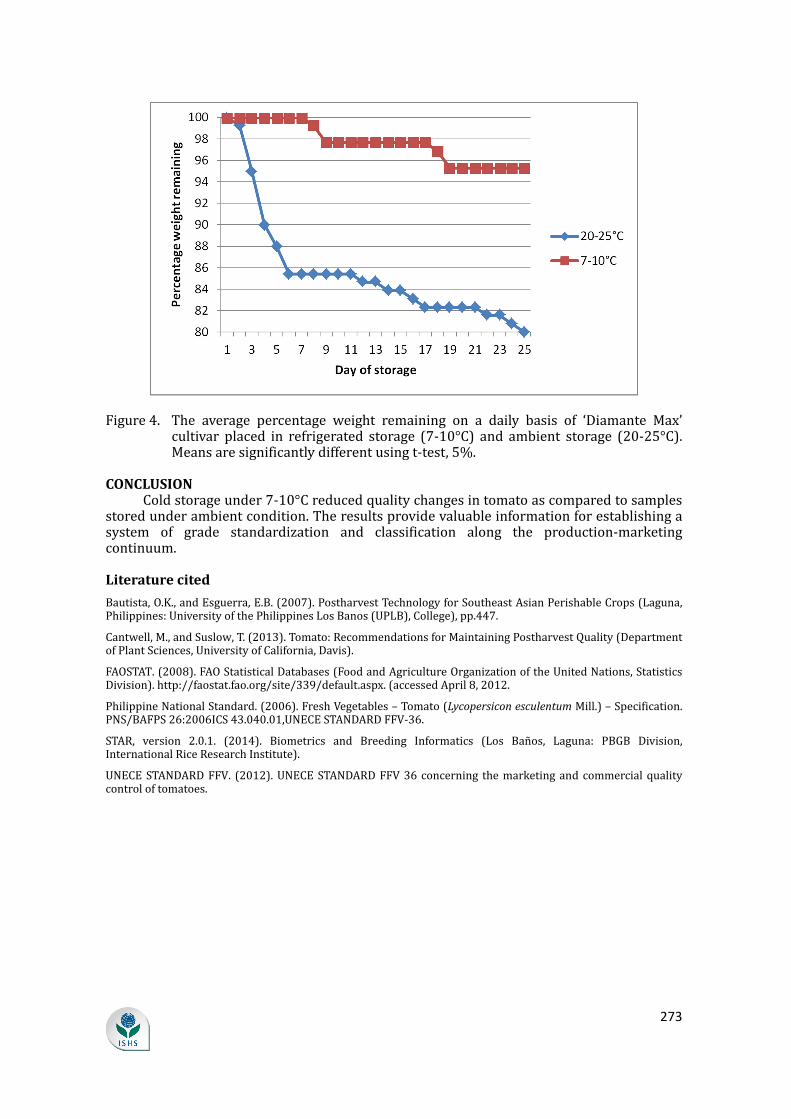
273
Figure4. The average percentage weight remaining on a daily basis of ‘Diamante Max’cultivar placed in refrigerated storage (7‐10°C) and ambient storage (20‐25°C).Meansaresignificantlydifferentusingt‐test,5%.
CONCLUSION Coldstorageunder7‐10°Creducedqualitychangesintomatoascomparedtosamples
storedunderambientcondition.Theresultsprovidevaluableinformationforestablishingasystem of grade standardization and classification along the production‐marketingcontinuum.
Literature cited
Bautista,O.K.,andEsguerra,E.B.(2007).PostharvestTechnologyforSoutheastAsianPerishableCrops(Laguna,Philippines:UniversityofthePhilippinesLosBanos(UPLB),College),pp.447.
Cantwell,M.,andSuslow,T.(2013).Tomato:RecommendationsforMaintainingPostharvestQuality(DepartmentofPlantSciences,UniversityofCalifornia,Davis).
FAOSTAT.(2008).FAOStatisticalDatabases(FoodandAgricultureOrganizationoftheUnitedNations,StatisticsDivision).http://faostat.fao.org/site/339/default.aspx.(accessedApril8,2012.
PhilippineNationalStandard.(2006).FreshVegetables–Tomato(Lycopersicon esculentumMill.)–Specification.PNS/BAFPS26:2006ICS43.040.01,UNECESTANDARDFFV‐36.
STAR, version 2.0.1. (2014). Biometrics and Breeding Informatics (Los Banos, Laguna: PBGB Division,InternationalRiceResearchInstitute).
UNECESTANDARDFFV. (2012).UNECESTANDARDFFV36concerning themarketingandcommercialqualitycontroloftomatoes.

274