suitability of the vegetation types in mexico's tamaulipas state for the siting of hazardous...
TRANSCRIPT
Suitability of the vegetation types in Mexico’s Tamaulipas state
for the siting of hazardous waste treatment plants
Silke Cram a,*, Irene Sommer a, Luis-Miguel Morales a, Oralia Oropeza a,
Estela Carmona a, Francisco Gonzalez-Medrano b
a Institute of Geography, Universidad Nacional Autonoma de Mexico (UNAM), Aptdo. Postal 20-850, Mexico 01000, D.F., Mexicob Department of Botany, Institute of Biology, UNAM, Circuito de la Investigacion Cientıfica, C.U., Mexico 04510, Mexico
Received 17 September 2004; received in revised form 8 August 2005; accepted 10 August 2005
Available online 20 December 2005
Abstract
A land suitability study was carried out by applying a multiple-criteria technique to 12 different vegetation types in Mexico’s Tamaulipas state
to help select potentially suitable sites for hazardous waste treatment plants. Species richness, spatial distribution, and uniqueness were selected as
the criteria for estimating a vegetation type’s suitability. Using the analytical hierarchy process, we ranked and mapped vegetation types, then
compared the results with rankings of the same vegetation types based only on their number of endemic species. The suitabilities of the various
vegetation types were ordered in more or less the same way by both methods, except in two cases for which the results were very different. The
method proved to be a useful tool despite the availability of only partial (mostly qualitative) information; under such circumstances, expert
experience can be incorporated in the evaluation process to a limited degree. The technique described in this paper has a high potential to aid
decisions when many opinions and options must be considered simultaneously.
q 2005 Elsevier Ltd. All rights reserved.
Keywords: Multiple-criteria techniques; Land suitability; Ranking of vegetation types
1. Introduction
It is very important to accurately select locations for
hazardous waste-treatment plants because of their potential to
contaminate both air and water, with corresponding effects on
land use and public health (SEDESOL-INE, 1994; Randall
et al., 2004).
Techniques for land-use suitability analysis have evolved
rapidly during the last century, and especially computer-based
techniques assisted by Geographic Information Systems (GIS).
Collins et al. (2001) recognized two main research directions
during the 1990s: The first involves the evaluation of Boolean
logic to handle spatial boundaries in a GIS-based analysis,
combined with fuzzy-set theory to allow determination of
degrees of belonging, thereby making the inclusion of a land
0301-4797/$ - see front matter q 2005 Elsevier Ltd. All rights reserved.
doi:10.1016/j.jenvman.2005.08.013
* Corresponding author. Tel.: C55 56 22 43 36; fax: C55 56 22 43 52/4.
E-mail addresses: [email protected] (S. Cram), irenes@igiris.
igeograf.unam.mx (I. Sommer), [email protected] (L.-
M. Morales), [email protected] (O. Oropeza), ecj@igiris.
igeograf.mx (E. Carmona), [email protected] (F. Gonzalez-
Medrano).
unit in various classes a more flexible (less binary) matter. The
second research direction is concerned with incorporating the
preferences of stakeholders in site selection. This idea gave rise
to multiple-criteria evaluations for analyzing multiple-objec-
tive decisions. In the 1970s Banai-Kashani proposed the use of
the Analytical Hierarchy Process (AHP) within a GIS
environment as a mathematical method for estimating the
value of a function based on various pairwise comparisons, and
subsequently using the function to rank the alternatives. This
method was further developed by Saaty (1980) as a scenario-
based approach, which nowadays is integrated in some GIS soft
wares such as IDRISI.
Due to the fact that judgments of this type generally require
specific standards of comparison that are seldom available,
Saaty (1987) suggested the use of ‘structural dependency’, in
which the relative weights of alternative sites are derived based
upon paired comparisons.
Considering this feature AHP has become a common tool in
land evaluation because of its advantages over other methods.
The AHP method has been intensively applied since its
creation, alone or in combination with other methods. Its
versatility allows a wide range of applications like land
suitability for different purposes (Aras et al., 2004; Basnet
et al., 2001; Dey, 2002; Hokey, 1994; Siddiqui et al., 1996;
Journal of Environmental Management 80 (2006) 13–24
www.elsevier.com/locate/jenvman
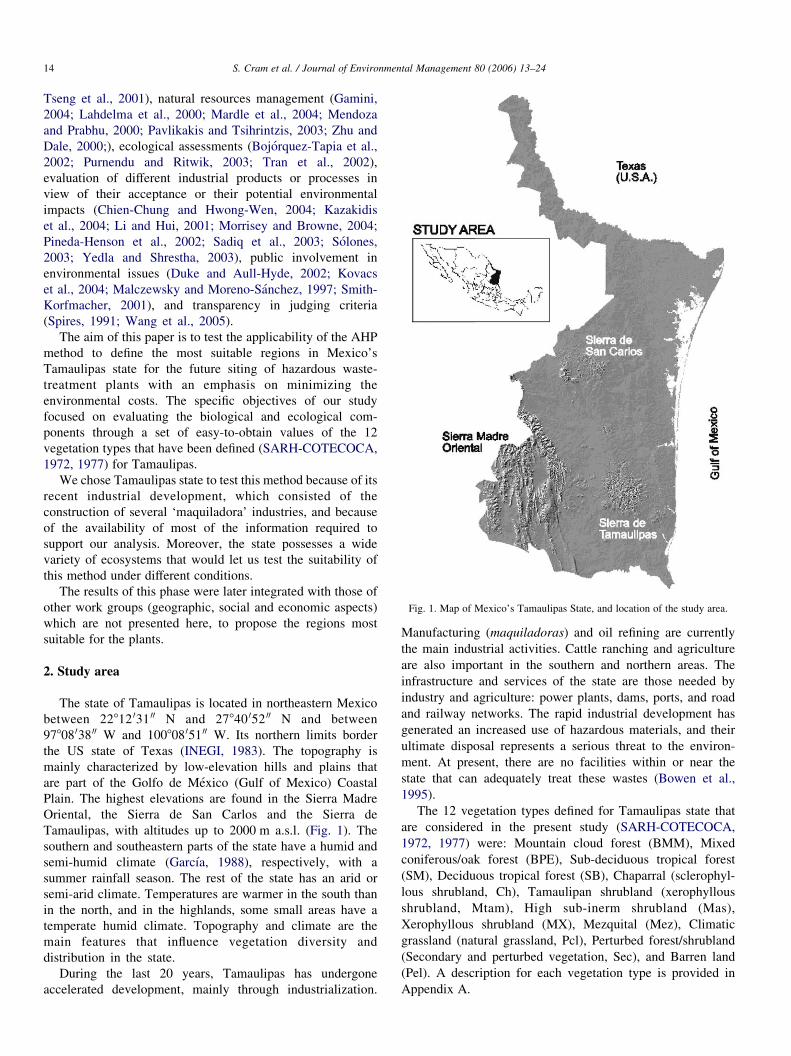
Fig. 1. Map of Mexico’s Tamaulipas State, and location of the study area.
S. Cram et al. / Journal of Environmental Management 80 (2006) 13–2414
Tseng et al., 2001), natural resources management (Gamini,
2004; Lahdelma et al., 2000; Mardle et al., 2004; Mendoza
and Prabhu, 2000; Pavlikakis and Tsihrintzis, 2003; Zhu and
Dale, 2000;), ecological assessments (Bojorquez-Tapia et al.,
2002; Purnendu and Ritwik, 2003; Tran et al., 2002),
evaluation of different industrial products or processes in
view of their acceptance or their potential environmental
impacts (Chien-Chung and Hwong-Wen, 2004; Kazakidis
et al., 2004; Li and Hui, 2001; Morrisey and Browne, 2004;
Pineda-Henson et al., 2002; Sadiq et al., 2003; Solones,
2003; Yedla and Shrestha, 2003), public involvement in
environmental issues (Duke and Aull-Hyde, 2002; Kovacs
et al., 2004; Malczewsky and Moreno-Sanchez, 1997; Smith-
Korfmacher, 2001), and transparency in judging criteria
(Spires, 1991; Wang et al., 2005).
The aim of this paper is to test the applicability of the AHP
method to define the most suitable regions in Mexico’s
Tamaulipas state for the future siting of hazardous waste-
treatment plants with an emphasis on minimizing the
environmental costs. The specific objectives of our study
focused on evaluating the biological and ecological com-
ponents through a set of easy-to-obtain values of the 12
vegetation types that have been defined (SARH-COTECOCA,
1972, 1977) for Tamaulipas.
We chose Tamaulipas state to test this method because of its
recent industrial development, which consisted of the
construction of several ‘maquiladora’ industries, and because
of the availability of most of the information required to
support our analysis. Moreover, the state possesses a wide
variety of ecosystems that would let us test the suitability of
this method under different conditions.
The results of this phase were later integrated with those of
other work groups (geographic, social and economic aspects)
which are not presented here, to propose the regions most
suitable for the plants.
2. Study area
The state of Tamaulipas is located in northeastern Mexico
between 22812 031 00 N and 27840 052 00 N and between
97808 038 00 W and 100808 051 00 W. Its northern limits border
the US state of Texas (INEGI, 1983). The topography is
mainly characterized by low-elevation hills and plains that
are part of the Golfo de Mexico (Gulf of Mexico) Coastal
Plain. The highest elevations are found in the Sierra Madre
Oriental, the Sierra de San Carlos and the Sierra de
Tamaulipas, with altitudes up to 2000 m a.s.l. (Fig. 1). The
southern and southeastern parts of the state have a humid and
semi-humid climate (Garcıa, 1988), respectively, with a
summer rainfall season. The rest of the state has an arid or
semi-arid climate. Temperatures are warmer in the south than
in the north, and in the highlands, some small areas have a
temperate humid climate. Topography and climate are the
main features that influence vegetation diversity and
distribution in the state.
During the last 20 years, Tamaulipas has undergone
accelerated development, mainly through industrialization.
Manufacturing (maquiladoras) and oil refining are currently
the main industrial activities. Cattle ranching and agriculture
are also important in the southern and northern areas. The
infrastructure and services of the state are those needed by
industry and agriculture: power plants, dams, ports, and road
and railway networks. The rapid industrial development has
generated an increased use of hazardous materials, and their
ultimate disposal represents a serious threat to the environ-
ment. At present, there are no facilities within or near the
state that can adequately treat these wastes (Bowen et al.,
1995).
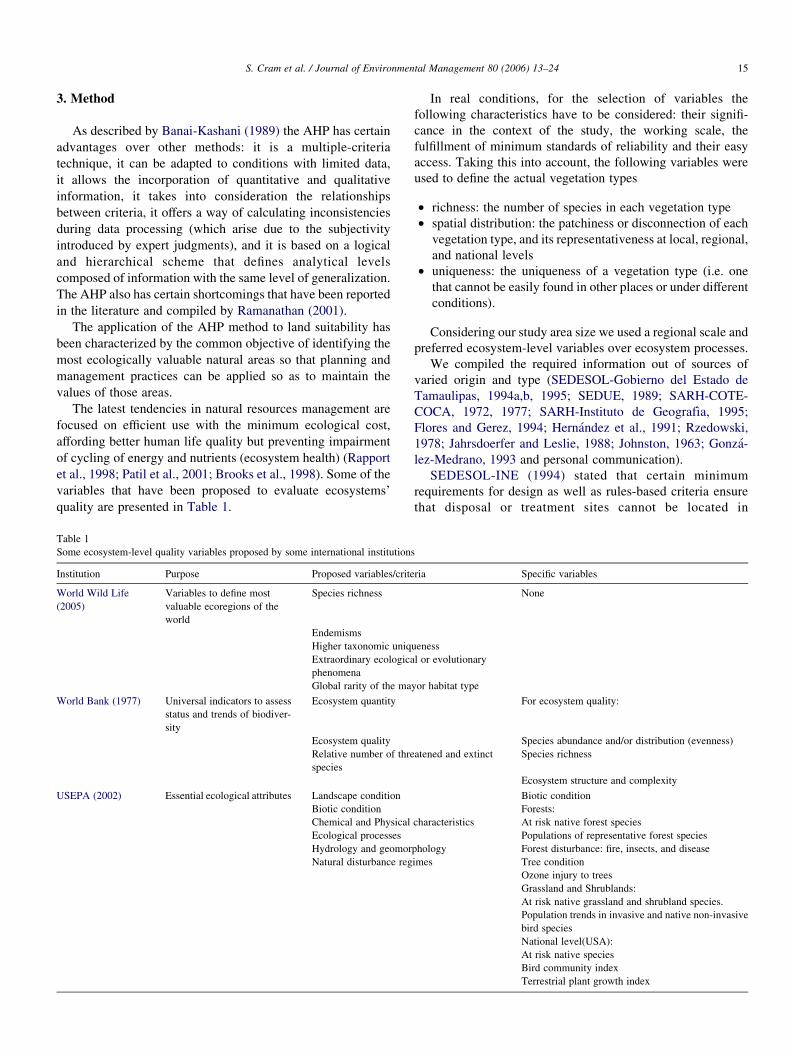
The 12 vegetation types defined for Tamaulipas state that
are considered in the present study (SARH-COTECOCA,
1972, 1977) were: Mountain cloud forest (BMM), Mixed
coniferous/oak forest (BPE), Sub-deciduous tropical forest
(SM), Deciduous tropical forest (SB), Chaparral (sclerophyl-
lous shrubland, Ch), Tamaulipan shrubland (xerophyllous
shrubland, Mtam), High sub-inerm shrubland (Mas),
Xerophyllous shrubland (MX), Mezquital (Mez), Climatic
grassland (natural grassland, Pcl), Perturbed forest/shrubland
(Secondary and perturbed vegetation, Sec), and Barren land
(Pel). A description for each vegetation type is provided in
Appendix A.
S. Cram et al. / Journal of Environmental Management 80 (2006) 13–24 15
3. Method
As described by Banai-Kashani (1989) the AHP has certain
advantages over other methods: it is a multiple-criteria
technique, it can be adapted to conditions with limited data,
it allows the incorporation of quantitative and qualitative
information, it takes into consideration the relationships
between criteria, it offers a way of calculating inconsistencies
during data processing (which arise due to the subjectivity
introduced by expert judgments), and it is based on a logical
and hierarchical scheme that defines analytical levels
composed of information with the same level of generalization.
The AHP also has certain shortcomings that have been reported
in the literature and compiled by Ramanathan (2001).
The application of the AHP method to land suitability has
been characterized by the common objective of identifying the
most ecologically valuable natural areas so that planning and
management practices can be applied so as to maintain the
values of those areas.
The latest tendencies in natural resources management are
focused on efficient use with the minimum ecological cost,
affording better human life quality but preventing impairment
of cycling of energy and nutrients (ecosystem health) (Rapport
et al., 1998; Patil et al., 2001; Brooks et al., 1998). Some of the
variables that have been proposed to evaluate ecosystems’
quality are presented in Table 1.
Table 1
Some ecosystem-level quality variables proposed by some international institutions
Institution Purpose Proposed variables/crite
World Wild Life
(2005)
Variables to define most
valuable ecoregions of the
world
Species richness
Endemisms
Higher taxonomic uniq
Extraordinary ecologica
phenomena
Global rarity of the ma
World Bank (1977) Universal indicators to assess
status and trends of biodiver-
sity
Ecosystem quantity
Ecosystem quality
Relative number of thre
species
USEPA (2002) Essential ecological attributes Landscape condition
Biotic condition
Chemical and Physical
Ecological processes
Hydrology and geomor
Natural disturbance reg
In real conditions, for the selection of variables the
following characteristics have to be considered: their signifi-
cance in the context of the study, the working scale, the
fulfillment of minimum standards of reliability and their easy
access. Taking this into account, the following variables were
used to define the actual vegetation types
† richness: the number of species in each vegetation type
† spatial distribution: the patchiness or disconnection of each
vegetation type, and its representativeness at local, regional,
and national levels
† uniqueness: the uniqueness of a vegetation type (i.e. one
that cannot be easily found in other places or under different
conditions).
Considering our study area size we used a regional scale and
preferred ecosystem-level variables over ecosystem processes.
We compiled the required information out of sources of
varied origin and type (SEDESOL-Gobierno del Estado de
Tamaulipas, 1994a,b, 1995; SEDUE, 1989; SARH-COTE-
COCA, 1972, 1977; SARH-Instituto de Geografıa, 1995;
Flores and Gerez, 1994; Hernandez et al., 1991; Rzedowski,
1978; Jahrsdoerfer and Leslie, 1988; Johnston, 1963; Gonza-
lez-Medrano, 1993 and personal communication).
SEDESOL-INE (1994) stated that certain minimum
requirements for design as well as rules-based criteria ensure
that disposal or treatment sites cannot be located in
ria Specific variables
None
ueness
l or evolutionary
yor habitat type
For ecosystem quality:
Species abundance and/or distribution (evenness)
atened and extinct Species richness
Ecosystem structure and complexity
Biotic condition
Forests:
characteristics At risk native forest species
Populations of representative forest species
phology Forest disturbance: fire, insects, and disease
imes Tree condition
Ozone injury to trees
Grassland and Shrublands:
At risk native grassland and shrubland species.
Population trends in invasive and native non-invasive
bird species
National level(USA):
At risk native species
Bird community index
Terrestrial plant growth index
S. Cram et al. / Journal of Environmental Management 80 (2006) 13–2416
environmentally sensitive areas, including wetlands, 100-year
flood-plains (i.e. any area that is predicted to be flooded at least
once during a century), permafrost areas, habitats of
endangered species, and recharge zones for aquifers. Accord-
ing to this, some vegetation types were excluded from the
beginning because they are strongly associated with land types
that are permanently or commonly submerged (i.e. wetlands),
that are highly unstable (i.e. dunes) or previously assigned to
incompatible land uses (i.e. urban, agricultural). We also
Fig. 2. Distribution of the main vegetatio
excluded those lands declared or projected as protected areas
by both federal and state authorities. The distribution of the
main vegetation types is shown in Fig. 2.
Once appropriate variables have been selected, they must be
translated into criteria, which are categories with well-defined
limits (i.e. the highest and lowest permissible values) that allow
alternative sites to be judged (accepted or rejected) according
to the objectives that are being pursued. We established that no
vegetation type would be 100% suitable for this use, so we
n types in Tamaulipas State, Mexico.
S. Cram et al. / Journal of Environmental Management 80 (2006) 13–24 17
canceled this possibility; and because the final score for the 12
vegetation types would be expressed as a percentage, a value of
8.3% (100/12) would be assigned to each vegetation type if
they were all equally suitable. Our assessment used the
following criteria: ‘suitable with restrictions’ if the final
score was less than 8.3%, and ‘unsuitable’ if the final score
was greater than 8.3%.
We applied the AHP as follows (Ramanathan, 2001):
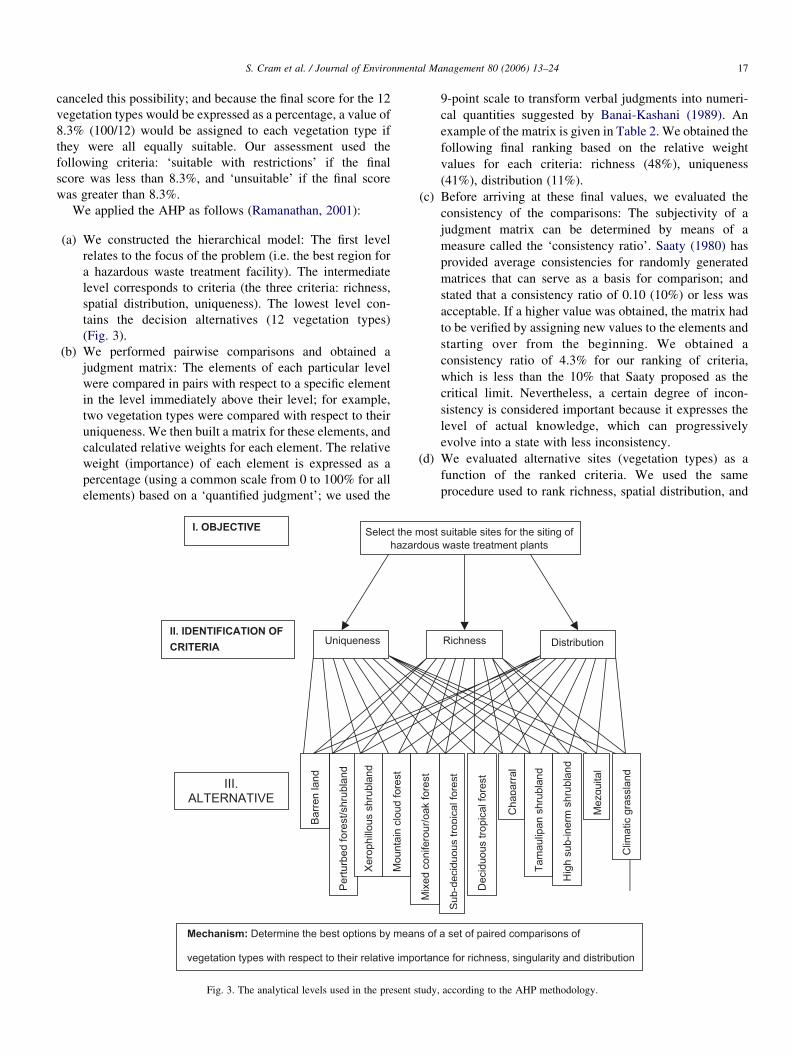
(a) We constructed the hierarchical model: The first level
relates to the focus of the problem (i.e. the best region for
a hazardous waste treatment facility). The intermediate
level corresponds to criteria (the three criteria: richness,
spatial distribution, uniqueness). The lowest level con-
tains the decision alternatives (12 vegetation types)
(Fig. 3).
(b) We performed pairwise comparisons and obtained a
judgment matrix: The elements of each particular level
were compared in pairs with respect to a specific element
in the level immediately above their level; for example,
two vegetation types were compared with respect to their
uniqueness. We then built a matrix for these elements, and
calculated relative weights for each element. The relative
weight (importance) of each element is expressed as a
percentage (using a common scale from 0 to 100% for all
elements) based on a ‘quantified judgment’; we used the
Fig. 3. The analytical levels used in the present
9-point scale to transform verbal judgments into numeri-
cal quantities suggested by Banai-Kashani (1989). An
example of the matrix is given in Table 2. We obtained the
following final ranking based on the relative weight
values for each criteria: richness (48%), uniqueness
(41%), distribution (11%).
(c) Before arriving at these final values, we evaluated the
consistency of the comparisons: The subjectivity of a
judgment matrix can be determined by means of a
measure called the ‘consistency ratio’. Saaty (1980) has
provided average consistencies for randomly generated
matrices that can serve as a basis for comparison; and
stated that a consistency ratio of 0.10 (10%) or less was
acceptable. If a higher value was obtained, the matrix had
to be verified by assigning new values to the elements and
starting over from the beginning. We obtained a
consistency ratio of 4.3% for our ranking of criteria,
which is less than the 10% that Saaty proposed as the
critical limit. Nevertheless, a certain degree of incon-
sistency is considered important because it expresses the
level of actual knowledge, which can progressively
evolve into a state with less inconsistency.
(d) We evaluated alternative sites (vegetation types) as a
function of the ranked criteria. We used the same
procedure used to rank richness, spatial distribution, and
study, according to the AHP methodology.
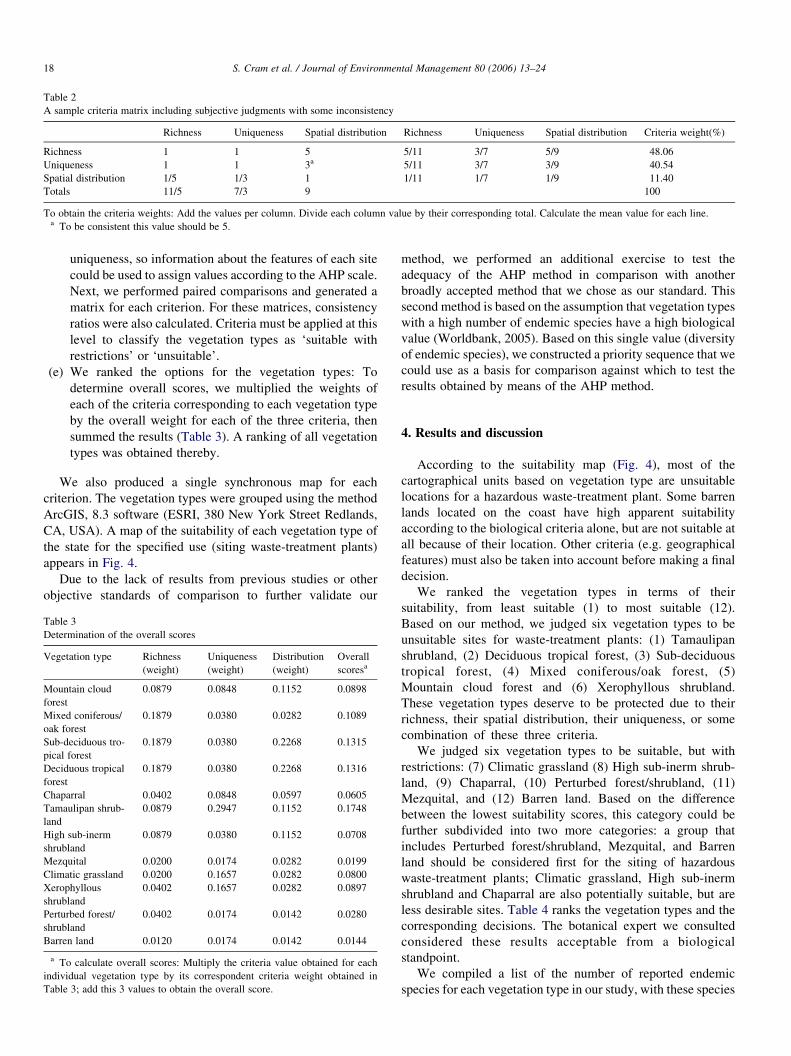
Table 2
A sample criteria matrix including subjective judgments with some inconsistency
Richness Uniqueness Spatial distribution Richness Uniqueness Spatial distribution Criteria weight(%)
Richness 1 1 5 5/11 3/7 5/9 48.06
Uniqueness 1 1 3a 5/11 3/7 3/9 40.54
Spatial distribution 1/5 1/3 1 1/11 1/7 1/9 11.40
Totals 11/5 7/3 9 100
To obtain the criteria weights: Add the values per column. Divide each column value by their corresponding total. Calculate the mean value for each line.a To be consistent this value should be 5.
S. Cram et al. / Journal of Environmental Management 80 (2006) 13–2418
uniqueness, so information about the features of each site
could be used to assign values according to the AHP scale.
Next, we performed paired comparisons and generated a
matrix for each criterion. For these matrices, consistency
ratios were also calculated. Criteria must be applied at this
level to classify the vegetation types as ‘suitable with
restrictions’ or ‘unsuitable’.
(e) We ranked the options for the vegetation types: To
determine overall scores, we multiplied the weights of
each of the criteria corresponding to each vegetation type
by the overall weight for each of the three criteria, then
summed the results (Table 3). A ranking of all vegetation
types was obtained thereby.
We also produced a single synchronous map for each
criterion. The vegetation types were grouped using the method
ArcGIS, 8.3 software (ESRI, 380 New York Street Redlands,
CA, USA). A map of the suitability of each vegetation type of
the state for the specified use (siting waste-treatment plants)
appears in Fig. 4.
Due to the lack of results from previous studies or other
objective standards of comparison to further validate our
Table 3
Determination of the overall scores
Vegetation type Richness
(weight)
Uniqueness
(weight)
Distribution
(weight)
Overall
scoresa
Mountain cloud
forest
0.0879 0.0848 0.1152 0.0898
Mixed coniferous/
oak forest
0.1879 0.0380 0.0282 0.1089
Sub-deciduous tro-
pical forest
0.1879 0.0380 0.2268 0.1315
Deciduous tropical
forest
0.1879 0.0380 0.2268 0.1316
Chaparral 0.0402 0.0848 0.0597 0.0605
Tamaulipan shrub-
land
0.0879 0.2947 0.1152 0.1748
High sub-inerm
shrubland
0.0879 0.0380 0.1152 0.0708
Mezquital 0.0200 0.0174 0.0282 0.0199
Climatic grassland 0.0200 0.1657 0.0282 0.0800
Xerophyllous
shrubland
0.0402 0.1657 0.0282 0.0897
Perturbed forest/
shrubland
0.0402 0.0174 0.0142 0.0280
Barren land 0.0120 0.0174 0.0142 0.0144
a To calculate overall scores: Multiply the criteria value obtained for each
individual vegetation type by its correspondent criteria weight obtained in
Table 3; add this 3 values to obtain the overall score.
method, we performed an additional exercise to test the
adequacy of the AHP method in comparison with another
broadly accepted method that we chose as our standard. This
second method is based on the assumption that vegetation types
with a high number of endemic species have a high biological
value (Worldbank, 2005). Based on this single value (diversity
of endemic species), we constructed a priority sequence that we
could use as a basis for comparison against which to test the
results obtained by means of the AHP method.
4. Results and discussion
According to the suitability map (Fig. 4), most of the
cartographical units based on vegetation type are unsuitable
locations for a hazardous waste-treatment plant. Some barren
lands located on the coast have high apparent suitability
according to the biological criteria alone, but are not suitable at
all because of their location. Other criteria (e.g. geographical
features) must also be taken into account before making a final
decision.
We ranked the vegetation types in terms of their
suitability, from least suitable (1) to most suitable (12).
Based on our method, we judged six vegetation types to be
unsuitable sites for waste-treatment plants: (1) Tamaulipan
shrubland, (2) Deciduous tropical forest, (3) Sub-deciduous
tropical forest, (4) Mixed coniferous/oak forest, (5)
Mountain cloud forest and (6) Xerophyllous shrubland.
These vegetation types deserve to be protected due to their
richness, their spatial distribution, their uniqueness, or some
combination of these three criteria.
We judged six vegetation types to be suitable, but with
restrictions: (7) Climatic grassland (8) High sub-inerm shrub-
land, (9) Chaparral, (10) Perturbed forest/shrubland, (11)
Mezquital, and (12) Barren land. Based on the difference
between the lowest suitability scores, this category could be
further subdivided into two more categories: a group that
includes Perturbed forest/shrubland, Mezquital, and Barren
land should be considered first for the siting of hazardous
waste-treatment plants; Climatic grassland, High sub-inerm
shrubland and Chaparral are also potentially suitable, but are
less desirable sites. Table 4 ranks the vegetation types and the
corresponding decisions. The botanical expert we consulted
considered these results acceptable from a biological
standpoint.
We compiled a list of the number of reported endemic
species for each vegetation type in our study, with these species
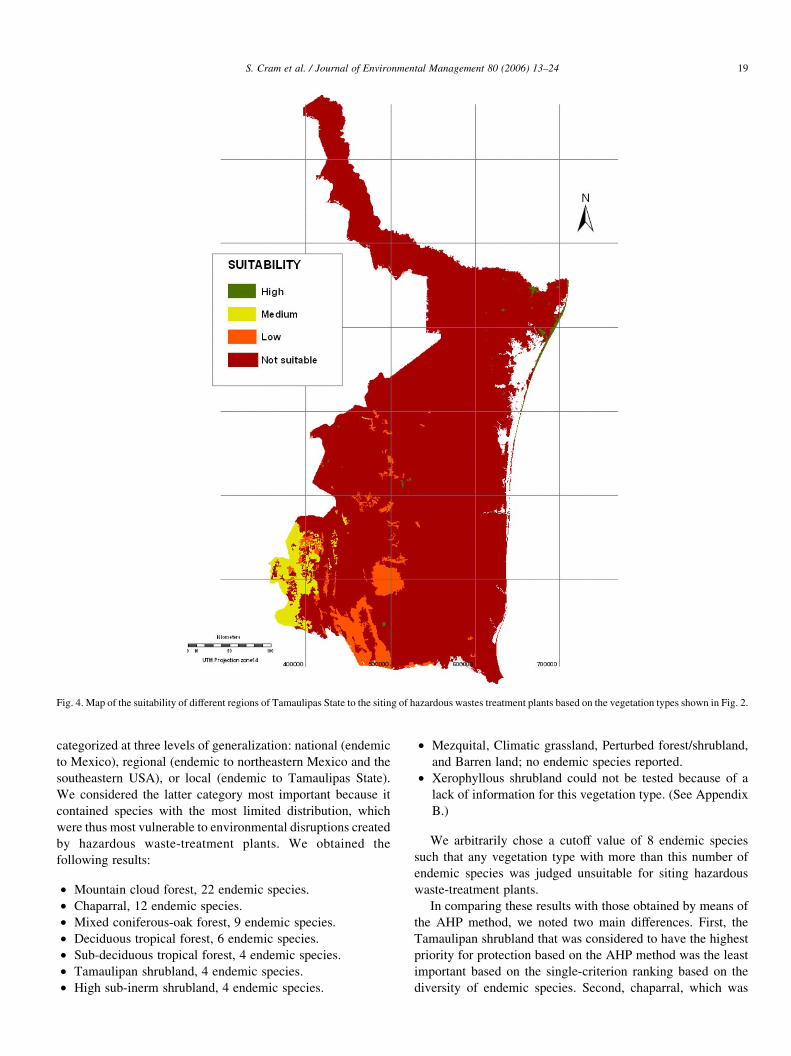
Fig. 4. Map of the suitability of different regions of Tamaulipas State to the siting of hazardous wastes treatment plants based on the vegetation types shown in Fig. 2.
S. Cram et al. / Journal of Environmental Management 80 (2006) 13–24 19
categorized at three levels of generalization: national (endemic
to Mexico), regional (endemic to northeastern Mexico and the
southeastern USA), or local (endemic to Tamaulipas State).
We considered the latter category most important because it
contained species with the most limited distribution, which
were thus most vulnerable to environmental disruptions created
by hazardous waste-treatment plants. We obtained the
following results:
† Mountain cloud forest, 22 endemic species.
† Chaparral, 12 endemic species.
† Mixed coniferous-oak forest, 9 endemic species.
† Deciduous tropical forest, 6 endemic species.
† Sub-deciduous tropical forest, 4 endemic species.
† Tamaulipan shrubland, 4 endemic species.
† High sub-inerm shrubland, 4 endemic species.
† Mezquital, Climatic grassland, Perturbed forest/shrubland,
and Barren land; no endemic species reported.
† Xerophyllous shrubland could not be tested because of a
lack of information for this vegetation type. (See Appendix
B.)
We arbitrarily chose a cutoff value of 8 endemic species
such that any vegetation type with more than this number of
endemic species was judged unsuitable for siting hazardous
waste-treatment plants.
In comparing these results with those obtained by means of
the AHP method, we noted two main differences. First, the
Tamaulipan shrubland that was considered to have the highest
priority for protection based on the AHP method was the least
important based on the single-criterion ranking based on the
diversity of endemic species. Second, chaparral, which was
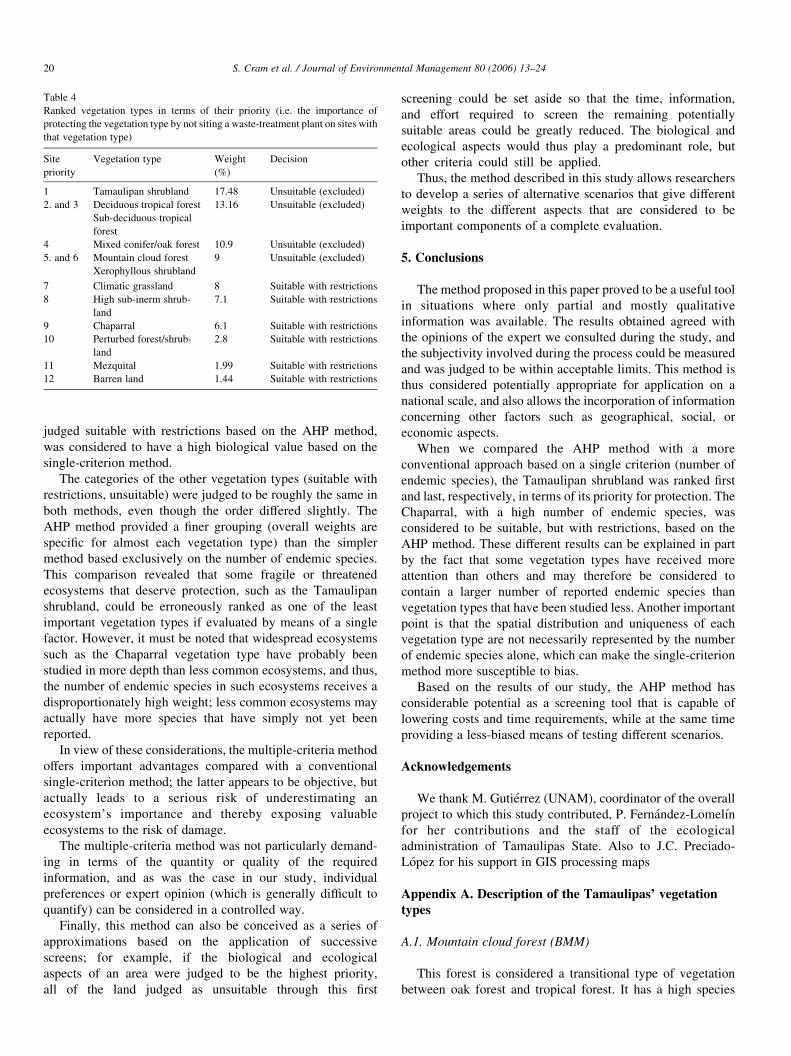
Table 4
Ranked vegetation types in terms of their priority (i.e. the importance of
protecting the vegetation type by not siting a waste-treatment plant on sites with
that vegetation type)
Site
priority
Vegetation type Weight
(%)
Decision
1 Tamaulipan shrubland 17.48 Unsuitable (excluded)
2. and 3 Deciduous tropical forest 13.16 Unsuitable (excluded)
Sub-deciduous tropical
forest
4 Mixed conifer/oak forest 10.9 Unsuitable (excluded)
5. and 6 Mountain cloud forest 9 Unsuitable (excluded)
Xerophyllous shrubland
7 Climatic grassland 8 Suitable with restrictions
8 High sub-inerm shrub-
land
7.1 Suitable with restrictions
9 Chaparral 6.1 Suitable with restrictions
10 Perturbed forest/shrub-
land
2.8 Suitable with restrictions
11 Mezquital 1.99 Suitable with restrictions
12 Barren land 1.44 Suitable with restrictions
S. Cram et al. / Journal of Environmental Management 80 (2006) 13–2420
judged suitable with restrictions based on the AHP method,
was considered to have a high biological value based on the
single-criterion method.
The categories of the other vegetation types (suitable with
restrictions, unsuitable) were judged to be roughly the same in
both methods, even though the order differed slightly. The
AHP method provided a finer grouping (overall weights are
specific for almost each vegetation type) than the simpler
method based exclusively on the number of endemic species.
This comparison revealed that some fragile or threatened
ecosystems that deserve protection, such as the Tamaulipan
shrubland, could be erroneously ranked as one of the least
important vegetation types if evaluated by means of a single
factor. However, it must be noted that widespread ecosystems
such as the Chaparral vegetation type have probably been
studied in more depth than less common ecosystems, and thus,
the number of endemic species in such ecosystems receives a
disproportionately high weight; less common ecosystems may
actually have more species that have simply not yet been
reported.
In view of these considerations, the multiple-criteria method
offers important advantages compared with a conventional
single-criterion method; the latter appears to be objective, but
actually leads to a serious risk of underestimating an
ecosystem’s importance and thereby exposing valuable
ecosystems to the risk of damage.
The multiple-criteria method was not particularly demand-
ing in terms of the quantity or quality of the required
information, and as was the case in our study, individual
preferences or expert opinion (which is generally difficult to
quantify) can be considered in a controlled way.
Finally, this method can also be conceived as a series of
approximations based on the application of successive
screens; for example, if the biological and ecological
aspects of an area were judged to be the highest priority,
all of the land judged as unsuitable through this first
screening could be set aside so that the time, information,
and effort required to screen the remaining potentially
suitable areas could be greatly reduced. The biological and
ecological aspects would thus play a predominant role, but
other criteria could still be applied.
Thus, the method described in this study allows researchers
to develop a series of alternative scenarios that give different
weights to the different aspects that are considered to be
important components of a complete evaluation.
5. Conclusions
The method proposed in this paper proved to be a useful tool
in situations where only partial and mostly qualitative
information was available. The results obtained agreed with
the opinions of the expert we consulted during the study, and
the subjectivity involved during the process could be measured
and was judged to be within acceptable limits. This method is
thus considered potentially appropriate for application on a
national scale, and also allows the incorporation of information
concerning other factors such as geographical, social, or
economic aspects.
When we compared the AHP method with a more
conventional approach based on a single criterion (number of
endemic species), the Tamaulipan shrubland was ranked first
and last, respectively, in terms of its priority for protection. The
Chaparral, with a high number of endemic species, was
considered to be suitable, but with restrictions, based on the
AHP method. These different results can be explained in part
by the fact that some vegetation types have received more
attention than others and may therefore be considered to
contain a larger number of reported endemic species than
vegetation types that have been studied less. Another important
point is that the spatial distribution and uniqueness of each
vegetation type are not necessarily represented by the number
of endemic species alone, which can make the single-criterion
method more susceptible to bias.
Based on the results of our study, the AHP method has
considerable potential as a screening tool that is capable of
lowering costs and time requirements, while at the same time
providing a less-biased means of testing different scenarios.
Acknowledgements
We thank M. Gutierrez (UNAM), coordinator of the overall
project to which this study contributed, P. Fernandez-Lomelın
for her contributions and the staff of the ecological
administration of Tamaulipas State. Also to J.C. Preciado-
Lopez for his support in GIS processing maps
Appendix A. Description of the Tamaulipas’ vegetation
types
A.1. Mountain cloud forest (BMM)
This forest is considered a transitional type of vegetation
between oak forest and tropical forest. It has a high species
S. Cram et al. / Journal of Environmental Management 80 (2006) 13–24 21
richness; a characteristic species is Liquidambar styraciflua,
together with species in the Quercus, Magnolia, Cornus,
and Styrax genera. Some of its species, such as Fagus
mexicana (Flores and Gerez, 1994), are considered as relict.
Crataegus uniflora is endemic to Tamaulipas, and other
species such as Magnolia tamaulipana, Acer grandidenta-
tum, and Beschorneria septentrionalis are endemic to the
northern part of Mexico. On a national scale, its distribution
is restricted to a few localities, mainly to mountain slopes
with high humidity. This type of forest covers only 1% of
the national area but hosts almost 10% of the Mexican flora
(Rzedowski, 1978). Tamaulipas represents the northern limit
of this vegetation type’s national distribution. The mountain
cloud forest is the habitat of 69 endemic species of
Mesoamerican fauna, two of which are restricted to
Tamaulipas (Flores and Gerez, 1994).
A.2. Mixed coniferous/oak forest (BPE)
This type of vegetation includes pine forest, oak forest,
and pine-oak (Pinus spp.—Quercus spp.) forest. It has a
high species richness due to its patchy distribution. In
Mexico, it hosts a high percentage of the endemic species
(25%) and is home to a large number of associated
vertebrates (127 vertebrate species are endemic to Mesoa-
merica, and 5 of them are restricted to Tamaulipas) (Flores
and Gerez, 1994).
A.3. Sub-deciduous tropical forest (SM)
Tropical forests reach their northern limit (along the
Atlantic coast) in Tamaulipas state. Sub-deciduous tropical
forests are considered one of the richest and more complex
plant communities (typical species include Brosimum
alicastrum, Mirandaceltis monoica, Wimmeria concolor,
Bursera simaruba, Archras zapota, Lysiloma sp., Ficus
spp., and Enterolobium cyclocarpum). They form an
important refuge for plants and animals of Neotropical
origin. This forest is organized into three spatial layers
characterized by the presence of climbing species, and 103
endemic species of Mesoamerican fauna are associated with
this type of vegetation (Flores and Gerez, 1994).
A.4. Deciduous tropical forest (SB)
The principal characteristic of this forest is the fall of
leaves during 5 to 8 months of the year. It has a high
species richness. Two types of this vegetation have been
reported (Rzedowski, 1978) for the Sierra de Tamaulipas,
one dominated by Bursera simaruba and Lysiloma divar-
icata and the other by Phoebe tampicensis and Pithecello-
bium ebano, with some Esenbeckia runyonii. Like the sub-
deciduous tropical forest, it also forms an important refuge
for plants and animals of Neotropical origin. Deciduous
tropical forests are the habitat of six endemic species of
Mexican feline (Flores and Gerez, 1994).
A.5. Chaparral (sclerophyllous shrubland) (Ch)
This vegetation type is a dense community of small oaks
and other species such as Arctostaphylos spp. Species
richness is not particularly high, but a great number of relict
species are included. Its distribution is quite restricted on a
national level and therefore its situation in the study area
should be considered critical (Rzedowski, 1978).
A.6. Tamaulipan shrubland (xerophyllous shrubland) (Mtam)
The species richness of this vegetation type is classified
(Jahrsdoerfer and Leslie, 1988) as moderate to high (typical
species include Prosopis grandulosa, Celtis pallida, Randia
aculeata, Bumelia angustifolia, Castela texana, and Con-
dalia obovata). It is a unique vegetation type because its
distribution is restricted to the northeastern part of Mexico
and the southeastern part of the USA. It is a transitional
type of vegetation (between desertic shrubland and sub-
mountain shrubland), and hosts 54 endangered species and
127 others reported (Jahrsdoerfer and Leslie, 1988) in a
watch-list for the northern border. This shrubland has
undergone intensive changes in land use, with only 5% of
its original distribution remaining in the USA (Jahrsdoerfer
and Leslie, 1988). Consequently, it presents a patchy
distribution.
A.7. High sub-inerm shrubland (Mas)
This vegetation type includes sub-mountain and moun-
tain-foot shrubland, it has the highest species richness
among shrublands (Gonzalez-Medrano, 1993) (typical
species include Helietta parvifolia, Acacia rigidula, Leuco-
phyllum frutescens, Acacia berlandieri, Cordia boissieri,
and Viguieria stenoloba). Extensive cattle ranching has
significantly decreased the total area once occupied by this
vegetation type.
A.8. Xerophyllous shrubland (MX)
This vegetation type is represented mostly by cactaceous
plants and others with a slow growth rate, long life cycle,
and long reproductive periods (with reproduction by means
of seeds). It is therefore considered very vulnerable to
disturbance. Many endangered species are found in this type
of shrubland, and it should consequently be protected
(Gonzalez-Medrano, 1993).
A.9. Mezquital (Mez)
This vegetation type is a special kind of xerophyllous
shrubland. Its species richness ranges from medium to low
(typical species include Prosopis grandulosa, Condalia
obovata, Lycium berlandieri, Acacia rigidula, and Leuco-
phyllum frutescens). It has undergone a rapid change in land
use due to agricultural development, therefore its
S. Cram et al. / Journal of Environmental Management 80 (2006) 13–2422
distribution has become restricted and fragmented (Gonza-
lez-Medrano, 1993).
A.10. Climatic grassland (Pcl)
Species richness ranges from medium to low (typical species
include Calliandra conferta, Krameria ramosissima, Cassia
greggii, and a wide variety of grasses). Some species are
reported as endangered (e.g. Asclepias prostata and Boerhavia
mathisiana) and some native species are considered to have a
high genetic potential (e.g. Manihot walkerae, a very rare
species of very restricted distribution) (Gonzalez-Medrano,
1993). This type of vegetation has been severely impacted by
grazing, and is now restricted to small patches.
A.11. Perturbed forest/shrubland (Sec)
Species richness can be high in some cases. This vegetation
type has no singular or relevant features apart from its origins in
a disturbance of some kind. Its distribution is thus widespread
due to cattle ranching and the expansion of sorghum (Sorghum
bicolor) production in Tamaulipas.
Barren land (Pel). Natural desert zones and eroded areas are
included in this category.
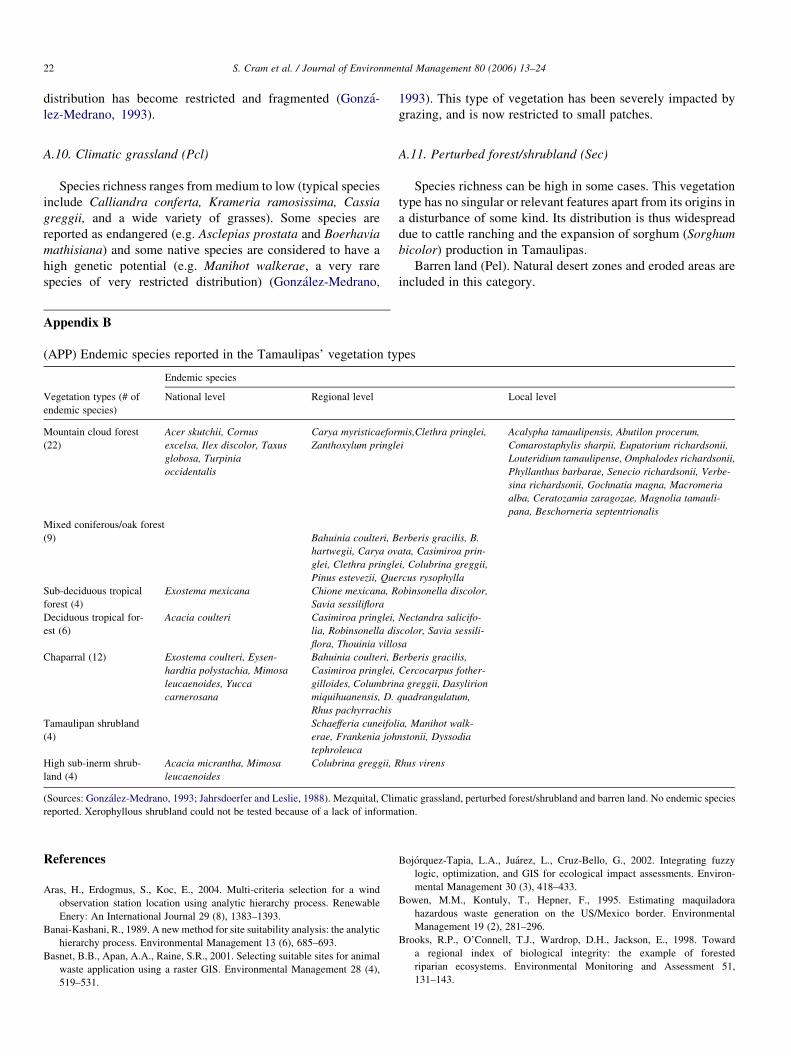
Appendix B
(APP) Endemic species reported in the Tamaulipas’ vegetation types
Endemic species
Vegetation types (# of
endemic species)
National level Regional level Local level
Mountain cloud forest
(22)
Acer skutchii, Cornus
excelsa, Ilex discolor, Taxus
globosa, Turpinia
occidentalis
Carya myristicaeformis,Clethra pringlei,
Zanthoxylum pringlei
Acalypha tamaulipensis, Abutilon procerum,
Comarostaphylis sharpii, Eupatorium richardsonii,
Louteridium tamaulipense, Omphalodes richardsonii,
Phyllanthus barbarae, Senecio richardsonii, Verbe-
sina richardsonii, Gochnatia magna, Macromeria
alba, Ceratozamia zaragozae, Magnolia tamauli-
pana, Beschorneria septentrionalis
Mixed coniferous/oak forest
(9) Bahuinia coulteri, Berberis gracilis, B.
hartwegii, Carya ovata, Casimiroa prin-
glei, Clethra pringlei, Colubrina greggii,
Pinus estevezii, Quercus rysophylla
Sub-deciduous tropical
forest (4)
Exostema mexicana Chione mexicana, Robinsonella discolor,
Savia sessiliflora
Deciduous tropical for-
est (6)
Acacia coulteri Casimiroa pringlei, Nectandra salicifo-
lia, Robinsonella discolor, Savia sessili-
flora, Thouinia villosa
Chaparral (12) Exostema coulteri, Eysen-
hardtia polystachia, Mimosa
leucaenoides, Yucca
carnerosana
Bahuinia coulteri, Berberis gracilis,
Casimiroa pringlei, Cercocarpus fother-
gilloides, Columbrina greggii, Dasylirion
miquihuanensis, D. quadrangulatum,
Rhus pachyrrachis
Tamaulipan shrubland
(4)
Schaefferia cuneifolia, Manihot walk-
erae, Frankenia johnstonii, Dyssodia
tephroleuca
High sub-inerm shrub-
land (4)
Acacia micrantha, Mimosa
leucaenoides
Colubrina greggii, Rhus virens
(Sources: Gonzalez-Medrano, 1993; Jahrsdoerfer and Leslie, 1988). Mezquital, Climatic grassland, perturbed forest/shrubland and barren land. No endemic species
reported. Xerophyllous shrubland could not be tested because of a lack of information.
References
Aras, H., Erdogmus, S., Koc, E., 2004. Multi-criteria selection for a wind
observation station location using analytic hierarchy process. Renewable
Enery: An International Journal 29 (8), 1383–1393.
Banai-Kashani, R., 1989. A new method for site suitability analysis: the analytic
hierarchy process. Environmental Management 13 (6), 685–693.
Basnet, B.B., Apan, A.A., Raine, S.R., 2001. Selecting suitable sites for animal
waste application using a raster GIS. Environmental Management 28 (4),
519–531.
Bojorquez-Tapia, L.A., Juarez, L., Cruz-Bello, G., 2002. Integrating fuzzy
logic, optimization, and GIS for ecological impact assessments. Environ-
mental Management 30 (3), 418–433.
Bowen, M.M., Kontuly, T., Hepner, F., 1995. Estimating maquiladora
hazardous waste generation on the US/Mexico border. Environmental
Management 19 (2), 281–296.
Brooks, R.P., O’Connell, T.J., Wardrop, D.H., Jackson, E., 1998. Toward
a regional index of biological integrity: the example of forested
riparian ecosystems. Environmental Monitoring and Assessment 51,
131–143.
S. Cram et al. / Journal of Environmental Management 80 (2006) 13–24 23
Chien-Chung, H., Hwong-Wen, M., 2004. A multidimensional environmental
evaluation of packaging materials. Science of the Total Environment 324
(1–3), 161–173.
Collins, M.G., Steiner, F.R., Rushman, M.J., 2001. Land-use suitability
analysis in the United States: historical development and promising
technological achievements. Environmental Management 28 (6), 11–
621.
Dey, P.K., 2002. An integrated assessment model for cross-country pipelines.
Environmental Impact Assessment Review 22 (6), 703–721.
Duke, J.M., Aull-Hyde, R., 2002. Identifying public preferences for land
preservation using the analytic hierarchy process. Ecological Economics 42
(1/2), 131–146.
Flores, O., Gerez, P., 1994. Biodiversidad y conservacion en Mexico:
vertebrados, vegetacion y uso del suelo. Ed. INIREB, Mexico, 302 pp.
Gamini, H., 2004. Incorporating community objectives in improved wetland
management: the use of the analytic hierarchy process. Journal of
Environmental Management 70 (3), 263–274.
Garcıa, E., 1988. Modificaciones al sistema de clasificacion climatica de
Koppen, Instituto de Geografıa. UNAM, Mexico.
Gonzalez-Medrano, F., 1993. Areas protegidas de Mexico. Reserva de la
biosfera El Cielo, Tamaulipas. Report for the World Bank (Internal
report).
Hernandez, S.L., Gonzalez, R.C., Gonzalez, Y.F.M., 1991. Plantas utiles de
Tamaulipas, Mexico. Anales del Instituto de Biologıa. Universidad
Nacional Autonoma de Mexico, Serie Botanica 62 (1), 1–38.
Hokey, M., 1994. Location planning of airport facilities using an
analytic hierarchy process. Logistics and Transportation Review 30
(1), 79–95.
INEGI, 1983. Sıntesis geografica del estado de Tamaulipas. SPP, Mexico D.F.,
(Instituto Nacional de Estadıstica, Geografıa e Informatica) 158 pp.
Jahrsdoerfer, S.E., Leslie, D.M., 1988. Tamaulipan shrubland of the lower
Rio Grande Valley of South Texas: description, human impacts, and
management options. US Fish & Wildlife Service. Biological Report 88
(36), 63.
Johnston, M.C., 1963. Past and present grasslands of southern Texas and
northeastern Mexico. Ecology 44 (3), 456–466.
Kazakidis, V.N., Mayer, Z., Scoble, J., 2004. Decision making using the
analytic hierarchy process in mining engineering. Mining Technology:
Transactions of the Institute of Mining & Metallurgy Section A 113 (1), 30–
43.
Kovacs, J.M., Malczewski, J., Flores-Verdugo, F., 2004. Examining local
ecological knowledge of hurricane impacts in a mangrove forest using an
analytical hierarchy process (AHP) approach. Journal of Coastal Research
20 (3), 792–8001.
Lahdelma, R., Salminen, P., Hokkanen, J., 2000. Using multicriteria methods in
environmental planning and management. Environmental Management 26
(6), 595–605.
Li, C.P., Hui, I.K., 2001. Environmental impact evaluation model for industrial
processes. Environmental Management 27 (5), 729–737.
Malczewski, J., Moreno-Sanchez, R., 1997. Multicriteria group decision-
making model for environmental conflict analysis. Journal of Environmen-
tal Planning & Management 40 (3), 349–375.
Mardle, S., Pascoe, S., Herrero, I., 2004. Management objective importance in
fisheries: an evaluation using the analytic hierarchy process (AHP).
Environmental Management 33 (1), 1–11.
Mendoza, G.A., Prabhu, R., 2000. Development of a methodology for selecting
criteria and indicators of sustainable forest management: a case study on
participatory assessment. Environmental Management 26 (6), 659–673.
Morrissey, A.J., Browne, J., 2004. Waste management models and their
application to sustainable waste management. Waste Management 24 (3),
297–309.
Patil, G.P., Brooks, R.P., Myers, W.L., Rapport, D.J., Taillie, C.H., 2001.
Ecosystem health and its measurement at landscape scale: towards
the next generation of quantitative assessments. Ecosystem Health 7 (4),
307–316.
Pavlikakis, G.E., Tsihrintzis, A., 2003. A quantitative method for accounting
human opinion, preferences and perceptions in ecosystem management.
Journal of Environmental Management 68 (2), 193–207.
Pineda_Henson, R., Culaba, A.B., Mendoza, A., 2002. Evaluating environ-
mental performance of pulp and paper manufacturing using the analytic
hierarchy process and life-cycle assessment. Journal of Industrial Ecology 6
(1), 15–29.
Purnendu, B., Ritwik, C.H., 2003. Application of optimized multi-criteria
decision-making in an environmental impact assessment study. Civil
Engineering & Environmental Systems 20 (1), 31–49.
Randall, P., Brown, L., Deschaine, L., Dimarzio, J., Kaiser, G., Vierow, J.,
2004. Application of the analytic hierarchy process to compare alternatives
for the long-term management of surplus mercury. Journal of Environ-
mental Management 71, 35–43.
Ramanathan, R., 2001. A note on the use of the analytic hierarchy process for
environmental impact assessment. Journal of Environmental Management
63, 27–35.
Rapport, D.J., Gaudet, C., Karr, J.R., Baron, J.S., Bohlen, C., Jackson, W.,
Jones, B., Naiman, R.J., Norton, B., Pollock, M.M., 1998. Evaluating
landscape health: integrating societal goals and biophysical process.
Journal of Environmental Management 53, 1–15.
Rzedowski, J., 1978. Vegetacion de Mexico. Limusa, Mexico. 432 pp.
Saaty, R.W., 1987. The analytic hierarchy process — what it is and how it is
used. Mathematical Modelling 9 (3-5), 161–176.
Saaty, T.L., 1980. The Analytical Hierarchy Process. McGraw-Hill, New York.
287 pp.
Sadiq, R., Husain, T., Veitch, B., Bose, N., 2003. Evaluation of generic types of
drilling fluid using a risk-based analytic hierarchy process. Environmental
Management 32 (6), 778–787.
SARH-COTECOCA, 1972. Tipos de vegetacion en el Estado de Tamaulipas
con diferenciacion de sitios de productividad forrajera. 1:1,000,000 scale.
Mexico. (Secretarıa de Agricultura y Recursos Hidraulicos-Comision
Tecnico Consultiva para la determinacion de los Coeficientes de
Agostadero).
SARH-COTECOCA, 1977. Situacion actual de los recursos naturales
renovables en el Estado de Tamaulipas. 1:500,000 scale. Mexico.
(Secretarıa de Agricultura y Recursos Hidraulicos-Comision
Tecnico Consultiva para la determinacion de los Coeficientes de
Agostadero).
SARH-Instituto de Geografıa, 1995. Inventario nacional forestal. 1:
250,000 scale. Mexico. (Secretarıa de Agricultura y Recursos
Hidraulicos).
SEDESOL, 1994a. Gobierno del Estado de Tamaulipas. Diagnostico ambiental
y plan de accion del Estado de Tamaulipas 1995. Programa ambiental de la
frontera norte fortalecimiento a la gestion ambiental. Cd. Victoria,
Tamaulipas. Mexico. (Secretarıa de Desarrollo Social) 65 pp.
SEDESOL, 1994b. Gobierno del Estado de Tamaulipas, Reserva de la biosfera
“El Cielo”. Plan de manejo integral. Mexico. (Secretarıa de Desarrollo
Social) 120 pp.
SEDESOL, 1995. Gobierno del Estado de Tamaulipas, Propuesta para un
sistema estatal de areas naturales protegidas de Tamaulipas. Internal
report. Depto. de Ecologıa, SEDESOL, Cd. Victoria, Tamaulipas,
Mexico, s/p (without page numbering). (Secretarıa de Desarrollo
Social).
SEDESOL-INE, 1994. Bases para una polıtica nacional de residuos peligrosos.
Mexico. (Secretarıa de Desarrollo Social-Instituto Nacional de Ecologıa)
38 pp.
SEDUE, 1989. Informacion basica sobre las areas naturales protegidas
de Mexico. Mexico. (Secretarıa de Desarrollo Urbano y Ecologıa)
67 pp.
Siddiqui, M.Z., Everett, J.W., Vieux, E., 1996. Landfill siting using geographic
information systems: a demonstration. Journal of Environmental Engin-
eering 122 (6), 515–524.
Smith-Korfmacher, K., 2001. The politics of participation in watershed
modeling. Environmental Mangement 27 (2), 161–176.
Solones, J., 2003. Environmental quality indexing of large development
alternatives using AHP. Environmental Impact Assessment Review 23 (3),
283–303.
Spires, E.E., 1991. Using the analytic hierarchy process to analyze
multiattribute decisions. Multivariate Behavioral Research 26 (2), 345–
362.

S. Cram et al. / Journal of Environmental Management 80 (2006) 13–2424
Tran, L.T., Knight, C.G., O’Neill, R.V., Smith, E.R., Ritters, K.H., Wickham,
J., 2002. Fuzzy decision analysis for integrated environmental vulnerability
assessment of the Mid-Atlantic region. Environmental Management 29 (6),
845–859.
Tseng, C.H., Chen, S.H., Huang, C.H., Liu, C.H., 2001. GIS-assisted site
selection for artificial reefs. Fisheries Science 67 (6), 1015–1023.
USEPA, 2002. www.epa.gov/indicators/roe/pdf/tdEco5-1.pdf.
Wang, K., Wang, C.K., Chun, H.U., 2005. Analytic hierarchy process with
fuzzy scoring in evaluating multidisciplinary R&D projects in China. IEEE
Transactions on Engineering Management 52 (1), 119–130.
World Bank, 1977. http://lnweb18.worldbank.org.
Worldwildlife, 2005. http://worldwildlife.org/bsp/publications/lac./regionala-
nalysis/regional.htmlhttp://www.panda.org/about_wwf/where_we_work/
ecoregions/global2000/pages/method.html.
Yedla, S., Shrestha, R.M., 2003. Multi-criteria approach for the selection of
alternative options for environmentally sustainable transport system in
Delhi. Transportation Research: Part A 37 (8), 717–730.
Zhu, X., Dale, A.P., 2000. Identifying opportunities for decision support
systems in support of regional resource use planning: an approach through
soft systems methodology. Environmental Management 26 (4), 371–384.