suggett et al 2007 jphyc43
TRANSCRIPT
DIFFERENT STRATEGIES OF PHOTOACCLIMATION BY TWO STRAINS OFEMILIANIA HUXLEYI (HAPTOPHYTA)1
David J. Suggett,2 Emilie Le Floc’H, Gayle N. Harris, Nikos Leonardos, and Richard J. Geider
Department of Biological Sciences, University of Essex, Colchester CO4 3SQ, Essex, UK
Photoacclimation involves the modification ofcomponents of the light and dark reactions to opti-mize photosynthesis following changes in availablelight. All of the energy required for photosynthesiscomes from linear electron transport through PSIIand PSI and is dependent upon the amount of lightharvested by PSII relative to PSI (a*PSII and a*PSI).The amount of light harvested is determined by theeffective absorption cross-sections (rPSII, rPSI) andcellular contents of the PSII and PSI reaction centercomplexes (RCII, RCI). Here, we examine theeffective absorption cross-sections and reaction cen-ter contents for calcifying (B11) and noncalcifying(B92) strains of the globally important coccolitho-phorid Emiliania huxleyi (Lohmann) W. H. Hay etH. Mohler when grown under various photon fluxdensities (PFDs). The two strains displayed different‘‘strategies’’ of acclimation. As growth PFDincreased, B11 preferentially changed r and the cel-lular content of chl a per cell over PSU ‘‘size’’ (thetotal cellular chl a content associated with the reac-tion center complexes); strain B92 preferentiallychanged PSU size over the cellular content of reac-tion complexes. Neither strategy was specificallyconsistent with the majority of previous studiesfrom other microalgal species. For both strains, cel-lular light absorption for PSII and PSI was main-tained close to unity across the range of growthPFDs since changes of rPSII and rPSI were recipro-cated by those of RCIIs and RCIs per cell. Ourresults demonstrate a significant adaptive flexibilityof E. huxleyi to photoacclimate. Finally, we calcu-lated the amount of chl a associated with eitherphotosystem to consider our interpretations ofphotoacclimation based on conventional determina-tions of PSU size.
Key index words: absorption; chlorophyll a; Emil-iania huxleyi; fast repetition rate fluorescence;P680; P700; photoacclimation; photosyntheticunit; reaction center complex
Abbreviations: FRR, fast repetition rate; PAM,pulse amplitude modulation; PET, photosyntheticelectron transport; PFD, photosynthetically activephoton flux density; PS, photosystem; PSU, pho-
tosynthetic unit; RC, reaction center; ST, singleturnover
Background. All of the energy required for photo-autotrophic growth is generated by the photosyn-thetic electron transfer (PET) chain and associatedlight-harvesting pigments (Falkowski and Raven1997). The PET is organized around two photosys-tems, PSI and PSII (Falkowski and Raven 1997, Nel-son and Yocum 2006). For Emiliania huxleyi, as withall other microalgae, these photosystems consist ofpigment-protein complexes that are coupled to reac-tion center complexes. Pigment-protein complexesabsorb photons and funnel the excitation energy ofthe absorbed photons to the reaction centers.Within the reaction center complexes, excitationenergy is then converted to electrochemical energythat drives PET (Minagawa and Takahashi 2004,Melkozernov et al. 2006).
Linear PET requires that PSII and PSI work inseries to evolve O2, produce NADPH, and generatethe proton gradient that is used to power ATP syn-thesis. In addition to linear PET, microalgae employcyclic electron transfer around PSI to generate addi-tional ATP. Importantly, this process does notinvolve PSII, O2 evolution, or the generation ofreductant. NADPH and ATP produced by the lightreactions are consumed in the dark reactions of theCalvin cycle during CO2 fixation. In addition, bothNADPH and ATP provide the energy for other cel-lular growth and maintenance processes, nitratereduction, sulfate reduction, and reductive biosyn-thesis (Falkowski and Raven 1997, Melkozernovet al. 2006).
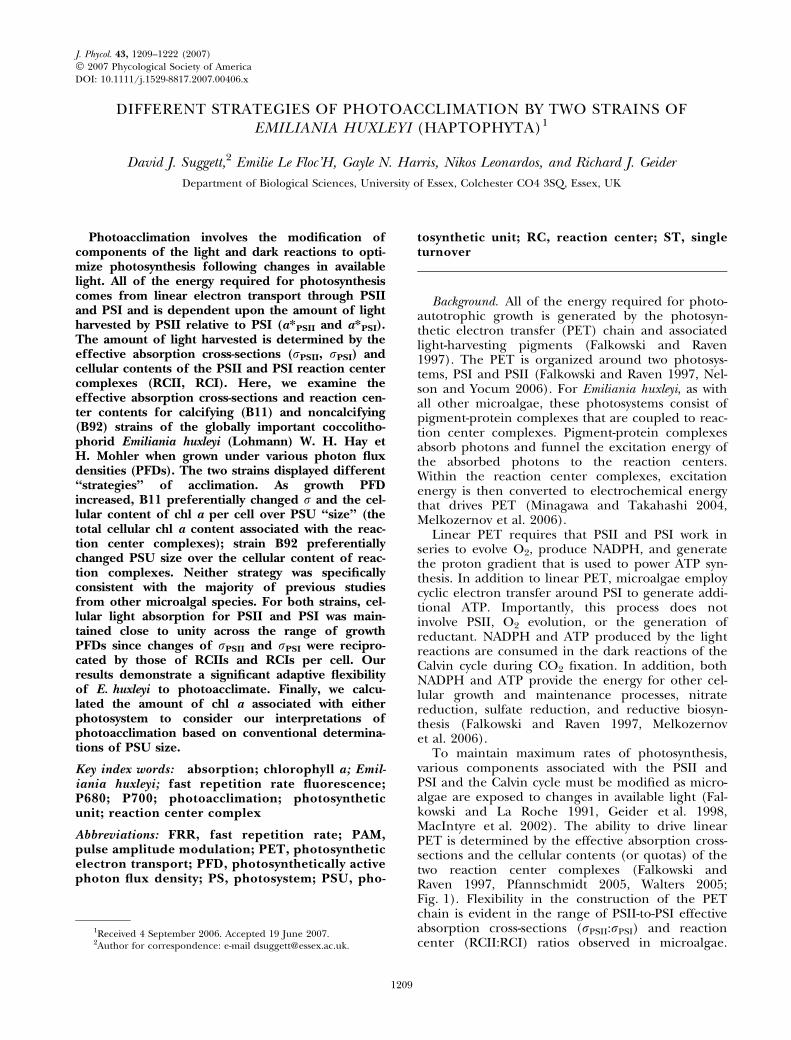
To maintain maximum rates of photosynthesis,various components associated with the PSII andPSI and the Calvin cycle must be modified as micro-algae are exposed to changes in available light (Fal-kowski and La Roche 1991, Geider et al. 1998,MacIntyre et al. 2002). The ability to drive linearPET is determined by the effective absorption cross-sections and the cellular contents (or quotas) of thetwo reaction center complexes (Falkowski andRaven 1997, Pfannschmidt 2005, Walters 2005;Fig. 1). Flexibility in the construction of the PETchain is evident in the range of PSII-to-PSI effectiveabsorption cross-sections (rPSII:rPSI) and reactioncenter (RCII:RCI) ratios observed in microalgae.
1Received 4 September 2006. Accepted 19 June 2007.2Author for correspondence: e-mail [email protected].
J. Phycol. 43, 1209–1222 (2007)� 2007 Phycological Society of AmericaDOI: 10.1111/j.1529-8817.2007.00406.x
1209
Both rPSII:rPSI (Mauzerall and Greenbaum 1989,Berges et al. 1996) and RCII:RCI (Falkowski et al.1981, Dubinsky et al. 1986, Herzig and Dubinsky1992, Berges et al. 1996, Fisher et al. 1998) varyamong taxa and ⁄ or with growth conditions.
Examination of acclimation for PET was improvedconsiderably with the development of the pump-and-probe (Mauzerall 1972) and later the fast repeti-tion rate (FRR) fluorescence protocols (Kolber et al.1998). These techniques allow the effective cross-section of PSII, rPSII, to be determined via the fluo-rescence signature of the O2-evolving complex, PSII.Cross-sections derived from conventional O2 evolu-tion measurements are similar to rPSII (Falkowskiet al. 1988). Thus, combining O2-based measure-ments of the PSII reaction center content (Falkowskiet al. 1981) with the FRR fluorescence-based rPSII
enables direct assessment of PSII acclimation. Addi-tional knowledge of PSI reaction center concentra-tion and rPSI further enables identification of thespecific ‘‘strategy’’ of photoacclimation with whichthe PET is balanced to meet cellular metabolicrequirements. However, to date such an approachhas not been made.
In a previous paper, Leonardos and Harris(2006) described acclimation of the pigment con-tent of calcifying (B11) and noncalcifying (B92,CCMP 379) strains of the coccolithophore Emilianiahuxleyi to photon flux density (PFD). The strainsdiffered in accessory pigment compliment but
showed the same pattern of response of cellular chla content to PFD. Here we describe photoacclima-tion of the PSII and PSI reaction center content,the PSII effective cross-section, and the chl a–spe-cific absorption coefficient. From these data, weconsider the proportion of chl a and of lightabsorption associated with the two photosystemsand thus the strategy inherent to E. huxleyi strainsB11 and B92 as PET is balanced across differentgrowth PFDs.
Theoretical considerations of the photosyntheticunit. Introduction of methods for measuring RCIIand RCI content to oceanography stimulated a newinterest in describing photoacclimation of PET formicroalgae (Richardson et al. 1983). Two basic pat-terns or, in the terminology used at the time, strate-gies of photoacclimation were described: changes inthe ‘‘size’’ of the photosynthetic unit (PSU) orchanges in the number of PSUs per cell (Falkowskiand La Roche 1991).
Gaffron and Wohl (1936) originally defined theterm ‘‘photosynthetic unit’’ as ‘‘the mechanism thatmust undergo the photochemical reaction to pro-duce one molecule of oxygen or reduce one mole-cule of carbon dioxide’’ (p. 87). Thus, the PSU wasconceived as a mechanism rather than an entity forevolving O2 (Falkowski and Raven 1997). Operation-ally, PSU size is defined as the ratio of the concen-tration of chl a molecules to either RCI or RCII(Falkowski et al. 1981, Mauzerall and Greenbaum1989; Fig. 1). RCI is typically assessed from measure-ments of the oxidized minus reduced difference inabsorption of the RCI chl a molecule, P700 (Mau-zerall and Greenbaum 1989, Klughammer andSchreiber 1998), while RCII is typically assessedfrom the O2 flash yield, a method introduced byEmerson and Arnold (1932). Given that a range ofRCII-to-RCI ratios has been observed for differenttaxa and growth conditions, it would be fortuitous ifthe two measures of PSU size based on chl a:RCIIor chl a:RCI were ever exactly equal.
Earlier papers by Falkowski and Owens (1980)and Falkowski et al. (1981) showed that photoaccli-mation in the chlorophyte Dunaliella tertiolectaButcher was characterized by changes in PSUs percell. In contrast, photoacclimation of the diatomSkeletonema costatum (Grev.) Cleve was from changesin PSU size. The most common pattern of acclima-tion to high light by eukaryotic microalgae consistsof large decreases in PSU number per cell and smalldecreases in the PSU size (Falkowski and Owens1980, Falkowski et al. 1981, Perry et al. 1981, Dubin-sky et al. 1996, Sukenik et al. 1987, Herzig andDubinsky 1992, Iglesias-Prieto and Trench 1994,Fisher et al. 1996). A notable exception to this pat-tern is observed for the haptophyte Isochrysis galbanaParke (Dubinsky et al. 1986, Herzig and Dubinsky1992). Evidence from natural microalgal popula-tions growing at different depths within a verticallight gradient also suggests larger changes in PSU
Fig. 1. Simplified schematic of the photosynthetic apparatusrelated to photoacclimation and definition of PSU ‘‘size.’’ PSI andPSII are each composed of a pool of reactions centers (RCIIs Æcell)1 and RCIs Æ cell)1), which are each bound to an intrinsicpool of chl a molecules—P680 in PSII (chl aPSII Æ cell)1) and P700in PSI (chl aPSI Æ cell)1). Coupled to these chl a molecules is aperipheral antennae complex of additional light-harvesting chland carotenoid molecules. The total amount of light-harvestingpigment and its arrangement gives an effective absorption cross-section for light absorption relative to the RC pool for both PSIIand PSI (rPSII and rPSI, m2 Æ mol photon)1). Photoacclimationdescribes optimization of linear electron transport through PSIIand PSI and can be described through modification of the RCsand r. Traditionally, two photoacclimation ‘‘strategies’’ of RC con-tent exist: changes of PSU size (amount of chl a Æ RC)1) or of PSUconcentration (RCs Æ cell)1). The conventional definition ofPSU size accounts for the total cellular chl a [i.e., PSU sizes forPSII and PSI = (chl aPSII Æ cell)1 + chl aPSI Æ cell )1) · eitherRCII Æ cell)1 or RCI Æ cell)1]. To strictly calculate the PSU size asthe amount of chl a associated with either RC, these calculationsare more appropriately = (chl aPSII Æ cell)1 · RCII Æ cell)1) and(chl aPSI Æ cell)1 · RCI Æ cell)1) for PSII and PSI, respectively.Importantly, this simplified schematic assumes no energy sharingbetween photosystems.
1210 DAVID J. SUGGETT ET AL.
per cell than in PSU size (Moore et al. 2006).Importantly, this variability of PSU size results insome conceptual ambiguity in the exact definitionof a PSU and hence an operational ambiguity in themeasurement of PSU size.
Describing photoacclimation in terms of changesof chl a per RCII and ⁄ or per RCI does not provideinformation on the partitioning of chl a into com-ponents that can be associated unambiguously withPSII or PSI (Falkowski et al. 1981, Mauzerall andGreenbaum 1989). Consequently, conventional mea-surements of PSU size do not reflect the actualinvestment of chl a per unit reaction center (thesize) that is coupled to the light-harvesting antennafor either PSII or PSI (see Fig. 1). In our descrip-tion of photoacclimation of the PSII and PSI reac-tion center content for E. huxleyi strains B11 andB92, we consider changes of both PSU size andnumber for photosystems I and II. However, we willexamine these changes with regard to the originalconcept of PSU size (mol chl a Æ mol RC)1) by addi-tionally estimating the amount of chl a associatedwith each photosystem.
MATERIALS AND METHODS
Growth. Unialgal turbidostat-cyclostat cultures of two strainsof E. huxleyi (PML-B11, calcifying, and PML-92A, noncalcify-ing) were grown at 15�C on 14:10 light:dark (L:D) cycles atPFDs of 25 to 600 lmol photons Æ m)2 Æ s)1 as describedpreviously (Leonardos and Harris 2006). Using this approachensured that cells were in balanced exponential growth whenharvested. An aliquot of 300–400 mL was collected onto47 mm diameter polycarbonate filters of 3 lm pore size andresuspended in �10 mL of filtrate to provide concentratedalgal suspensions for all subsequent measurements. Chl acontent of each concentrated sample was determined usingHPLC analyses (Leonardos and Harris 2006).
Photosynthetic unit size. Single turnover (ST) flash yields ofO2 evolution were obtained using a custom-made LED flashsystem described previously (Suggett et al. 2003, 2006). TheEmerson and Arnold number is the photosynthetic unit size forO2 evolution and was calculated as the chl a concentrationnormalized to the O2 flash yield, designated PSUO2
(mol chl a Æ mol O2)1; see Suggett et al. 2006). PSUO2 was
multiplied by a factor of 0.25 to provide the PSU size for PSII(mol chl a Æ mol RCII)1, Table S1 in the supplementarymaterial) under the assumption that four electron transferevents, and thus four RCIIs, are required for each O2 evolved.
The PSU size for PSI, designated PSU700 (mol chl a Æ molRCI)1, Table S1), was determined from redox changes in thefar-red region of peak absorption by the P700+ cation radicalfollowing an approach modified from Klughammer andSchreiber (1998). A pulse-amplitude-modulation (PAM) fluo-rometer, model PAM 101, was coupled with a Dual-WavelengthEmitter-Detector Unit ED-P700DW and an actinic light sourcevia fiber-optic cables to an ED-101US housing (Walz GmbH,Effeltrich, Germany). An aliquot of 1.5 mL of each concentratewas dispensed into a cuvette mirrored on one side and placedwithin the ED-101US housing. DCMU [3-(3,4-dichlorophenyl)-1,1-dimethylurea] was added to each sample to yield a finalconcentration of 30 mM (<1% ethanol). The mirrored face ofthe cuvette was oriented opposite the fiber-optic connected tothe emitter-detector to provide a doubling of the signal pathlength. P700+ was determined from absorption at 810 nmrelative to an 870 nm reference. Each sample was initially
calibrated by inducing a 0.1% change of absorption at 810 nm.Measurements of absorption were then made in the presenceand absence of saturating actinic light. PSU700 (mol chl a Æ molRCI)1) was calculated using the following equations:
PSU700 ¼ lAL�ADð Þ=A0:1%�0:001�2:303
h i�0:064� chl a
892:5ð1Þ
where AL, AD, and A0.1& are transmission of the absorptance at810 nm relative to 870 nm under actinic light, in darkness, andat the 0.1% calibration; l is the path length (cm); and chl a isthe chl a concentration (mg Æ m)3). For our measurements, thepath length was 2 cm. The factors 0.001, 2.303, 0.064, and892.5 account for normalization of transmittance (A) to 0.1%,conversion of A in log units to A in ln units, the differentialextinction coefficient for P700 (lM)1 Æ cm)1; Nakamura et al.2003) and conversion of mg chl a Æ m)3 to lM Æ chl a, respec-tively. Calibrations and measurements were repeated five timesfor each sample.
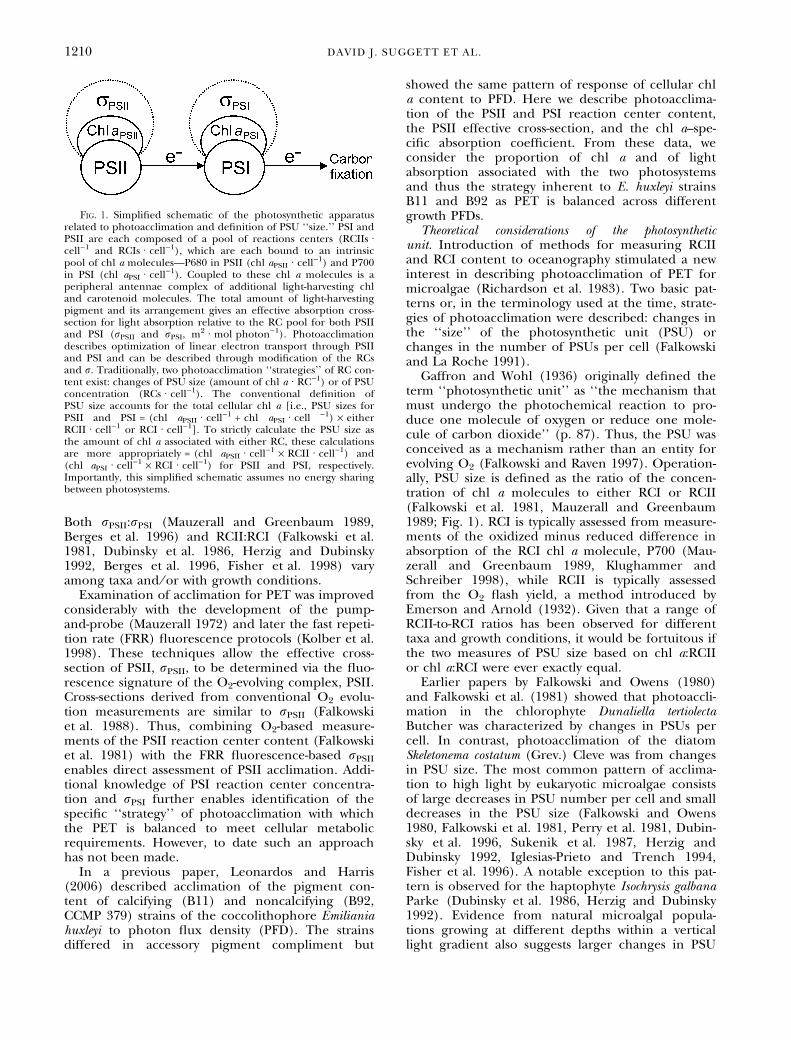
Light absorption and spectrofluorescence. Optical density ofeach concentrate was measured using a U-3000 spectropho-tometer fitted with a /-60 integrating sphere (Hitachi HighTechnologies, Wokingham, UK) as described by Suggett et al.(2004). Absorption was calculated from the optical density aftercorrecting for path length and residual scattering at 750 nm.To compensate for additional scattering by coccoliths from theB11 calcifying strain, a scattering correction was applied asfollows. The apparent absorption between 750 and 800 nm wasassumed to be due to scattering since light absorption by cellmaterial, including pigment-protein complexes, is negligible inthis spectral region (Fig. 2A). Scattering was assumed toincrease linearly with decreasing wavelength, and the gradientobserved between 750 and 800 nm was extrapolated to 400 nmto provide a scattering baseline. This scattering baseline wassubtracted from the measured absorption spectrum to yield thecorrected absorption spectrum. Each spectrum was normalizedto the chl a concentration to yield the chl a–specific absorptioncoefficient, a* (m2 Æ mg chl a)1).
A fluorescence excitation spectrum, with the monochroma-tor on the detector set to 730 nm emission, was measured foreach concentrate using a Perkin-Elmer LS50B (Perkin-Elmer,Waltham, MA, USA) following Suggett et al. (2004). Sampleswere treated with DCMU and preilluminated for 5 min to allowthe DCMU to bind to and close all PSII reaction centers. Aswith a*, each fluorescence spectrum was normalized to the chla concentration to yield the chl a–specific fluorescenceexcitation at 730 nm, F* (Instrument Units, IU Æ mg chl a)1).
FRR fluorometry. Separate fluorescence measurements weremade from aliquots taken directly from the turbidostats priorto concentration. Aliquots were taken immediately prior to thelight period of the L:D growth cycle to ensure the material wasin a fully dark-adapted state. A Chelsea Instruments FASTtracka
FRR fluorometer (Chelsea Technology Group, West Molesey,UK) was used to acquire ST fluorescence transients fordetermination of minimum (Fo) and maximum (Fm) fluores-cence yields, PSII effective absorption (rPSII) as described bySuggett et al. (2004, 2006). All measurements were correctedfor nonlinearity of the instrument response and fluorescenceblanks. PSII photochemical efficiency was determined as (Fm–Fo) ⁄ Fm (=Fv ⁄ Fm). Triplicate measurements were taken fromeach aliquot.
Fluorescence-light response curves were measured to assessthe extent of photochemical and nonphotochemical dissipa-tion of excitation energy following an approach modifiedfrom Suggett et al. (2003). FRR fluorescence transients werecollected at 2 s intervals. Actinic light was provided from ablock of blue light-emitting diodes (LEDs) controlled via a PCinterface (Suggett et al. 2003). Actinic light levels between 0and 700 lmol photons Æ m)2 Æ s)1 were delivered for 3.5 min
PHOTOACCLIMATION IN EMILIANIA HUXLEYI 1211
periods, each separated by a 20 s dark interval. Each experi-ment was performed at the growth temperature within atemperature-controlled room. PFDs delivered by the LEDswere adjusted to account for spectral differences between theLEDs and the lights used for growth as described by Suggettet al. (2003, 2006). Coefficients for the PSII operatingefficiency, Fq¢ ⁄ Fv¢, and nonphotochemical quenching in theantennae bed, rPSII¢ ⁄ rPSII, were subsequently calculated foreach actinic light level. Extents of photochemical andnonphotochemical quenching were calculated as 1–(Fq¢ ⁄ Fv¢)and 1–(rPSII¢ ⁄ rPSII), respectively. Only the quenching coeffi-cients from the actinic PFD within each fluorescence-lightcurve corresponding to the PFD used for growth arepresented.
RESULTS
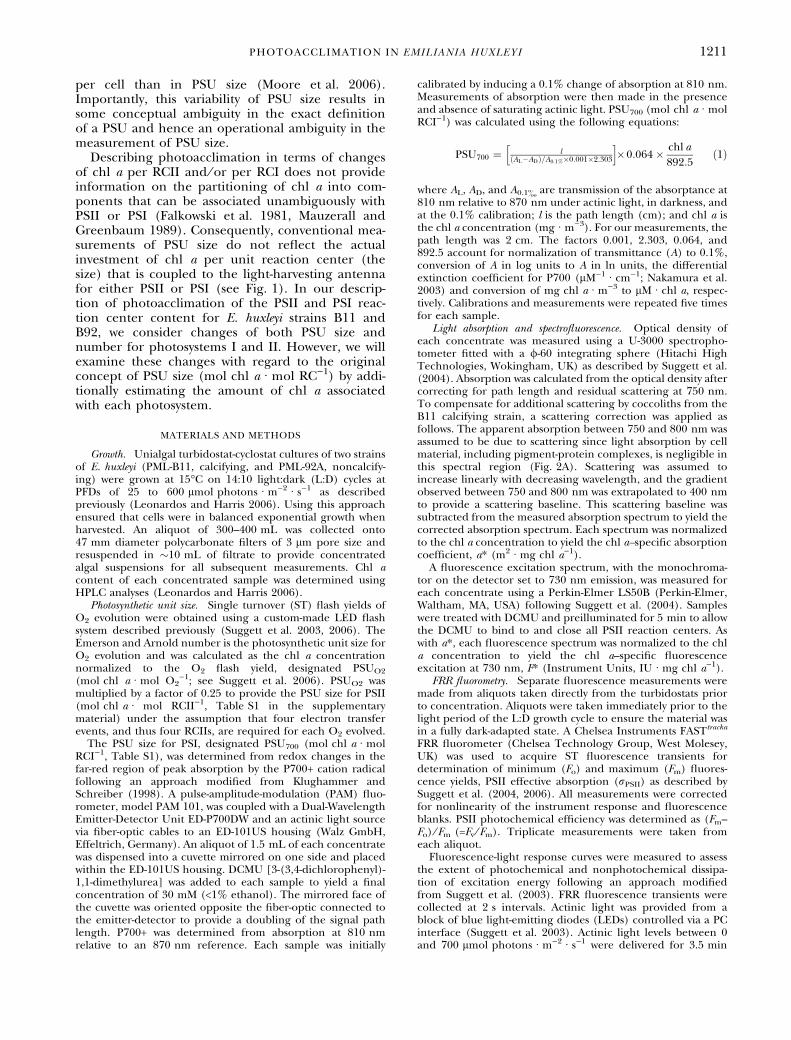
PSU size and concentration. Conventionally definedphotosynthetic unit sizes for PSII and PSI, chl a ÆRCII)1 and chl a Æ RCI)1 (mol Æ mol)1), decreasedwith increasing growth PFD (Table 1). Chl a Æ RCII)1
Fig. 2. (A) Chl a–specific optical absorption spectra, a*(m2 Æ mg chl a)1), uncorrected (uncorr) and corrected (corr) forscattering by coccoliths as described in the main text. (B) Chl a–normalized absorption spectra measured optically and correctedfor coccolith scattering, a* (m2 Æ mg chl a)1), and the chl a–specificabsorption associated with PSII, a*PSII (m2 Æ mg chl a)1), as deter-mined from measurements of F* spectra, rPSII, mol chl a Æ molRCII)1 and Fv ⁄ Fm (eq. 4). The chl a–specific absorption associ-ated with PSI, a*PSI (m2 Æ mg chl a)1), is determined from the dif-ference between a*PSII and a* for any given wavelength (eq. 5).(C) The proportion of total light absorption associated with PSII,a*PSII ⁄ a* (dimensionless). All examples are Emiliania huxleyi calci-fying strain B11 grown under 75 lmol photons Æ m)2 Æ s)1.
Table
1.
Mea
nva
lues
for
chl
ap
erce
ll(f
gch
la
Æcel
l)1),
Em
erso
nan
dA
rno
ldn
um
ber
(PSU
O2,
mo
lch
la
Æmo
lO
2)
1)
and
PSI
Ian
dP
SIp
ho
tosy
nth
etic
un
it‘‘
size
’’(m
ol
chl
aÆR
CII
)1,
mo
lch
la
ÆR
CI)
1),
con
cen
trat
ion
(RC
IIÆc
ell)
1,
RC
IÆc
ell)
1),
and
reac
tio
nce
nte
rst
oic
hio
met
ries
(mo
lR
CII
Æmo
lR
CI)
1)
for
calc
ifyi
ng
(B11
)an
dn
on
calc
ifyi
ng
(B92
)st
rain
so
fE
mil
ian
iahu
xley
ifo
rea
chgr
ow
thp
ho
ton
flu
xd
ensi
ty(P
FD
).
Gro
wth
PF
DC
hl
a:ce
ll(f
gÆ
cell
)1)
PSU
O2
(mo
lch
la
Æm
ol
O2)
1)
Ch
la:
RC
II(m
olÆ
mo
l)1)
PSU
700
(mo
lch
la
Æm
ol
RC
I)1)
RC
II:c
ell
(10)
19
mo
lÆ
cell
)1)
RC
I:ce
ll(1
0)19
mo
lÆ
cell
)1)
RC
II:R
CI
(mo
lÆ
mo
l)1)
B1
125
133
(4)a
2660
(48)
a66
5(1
2)a
1418
(39)
a2.
24(0
.08)
a1.
05(0
.26)
2.15
(0.1
1)50
132
(4)a
2504
(72)
a62
6(1
8)a
1430
(33)
a2.
36(0
.10)
a1.
03(0
.18)
2.28
(0.1
8)15
097
(3)b
2200
(59)
b55
0(1
5)b
1164
(36)
b1.
98(0
.06)
b0.
93(0
.14)
2.12
(0.1
4)30
085
(2)c
2016
(99)
b50
4(2
5)b
970
(41)
c1.
89(0
.12)
b0.
98(0
.20)
1.93
(0.1
8)60
067
(10)
d19
52(6
2)b
488
(15)
b95
9(2
8)c
1.54
(0.1
4)c
0.78
(0.2
6)1.
97(0
.25)
B9
225
208
(7)a
2880
(123
)a72
0(3
1)a
1422
(35)
a3.
24(0
.17)
a1.
64(0
.19)
a2.
15(0
.18)
a
5021
0(1
3)a
2708
(73)
a67
7(1
8)a
1382
(36)
a3.
48(0
.11)
a1.
71(0
.22)
a2.
20(0
.22)
a
150
197
(17)
a23
40(1
04)b
585
(26)
b11
11(3
3)b
3.77
(0.2
2)b
1.98
(0.2
8)a
2.02
(0.2
3)a
300
189
(12)
a21
80(3
9)b
545
(10)
b82
2(3
0)c
3.88
(0.1
3)b
2.57
(0.3
9)b
1.64
(0.2
1)b
600
155
(10)
b21
12(5
5)b
528
(14)
b70
5(3
8)d
3.92
(0.2
6)b
2.46
(0.4
4)b
1.59
(0.2
6)b
Ad
dit
ion
al(±
stan
dar
der
ror)
valu
esar
ein
clu
ded
wh
ere
rep
lica
tem
easu
rem
ents
fro
mea
chsa
mp
lew
ere
mad
e.In
thes
eca
ses,
anan
alys
iso
fva
rian
ce(A
NO
VA
)an
dsu
bse
-q
uen
tT
uke
y’s
test
wer
ep
erfo
rmed
bet
wee
nP
FD
for
eith
erst
rain
.Su
per
scri
pt
lett
ers
ind
icat
esi
gnifi
can
tly
dif
fere
nt
dat
agr
ou
pin
gsfr
om
Tu
key’
ste
st;
no
lett
erin
dic
ates
that
the
AN
OV
Ate
stw
asn
ot
sign
ifica
nt.
1212 DAVID J. SUGGETT ET AL.
decreased by a similar amount (27%) in both strainB11 and strain B92, while chl a Æ RCI)1 declinedmore in B92 (50%) than in B11 (33%). Values of chla Æ RCII)1 were smaller for B11 than B92 at all growthPFDs. In contrast, values of chl a Æ RCI)1 were typi-cally larger for B11 than B92, in particular, at the twohighest growth PFDs (Table 1).
The ratio of RCII to RCI, RCII:RCI (mol Æ mol)1),was similar for both strains, 2.09 ± 0.066 and1.92 ± 0.138 (mean ± standard error for all growthPFDs) for B11 and B92, respectively. RCII:RCIdecreased with increasing growth PFD by 8% forB11 but by 26% for B92, as indicated by the greaterdecrease in chl a Æ RCI)1 relative to chl a Æ RCII)1
for the latter strain. This decrease for B11 was notstatistically significant.
The two strains displayed markedly differentresponses of PSU number, RCII Æ cell)1 and RCI Æcell)1, with growth PFD (Table 1). B11 displayed asignificant decrease in RCII Æ cell)1 (31%) but notin RCI Æ cell)1 with increasing PFD. In contrast, B92displayed a significant increase in both RCII Æ cell)1
(21%) and RCI Æ cell)1 (50%) from the lowest tothe highest growth PFD. Despite these differencesbetween strains, RCII Æ cell)1 and RCI Æ cell)1
remained higher for B92 than B11 at all growthPFDs.
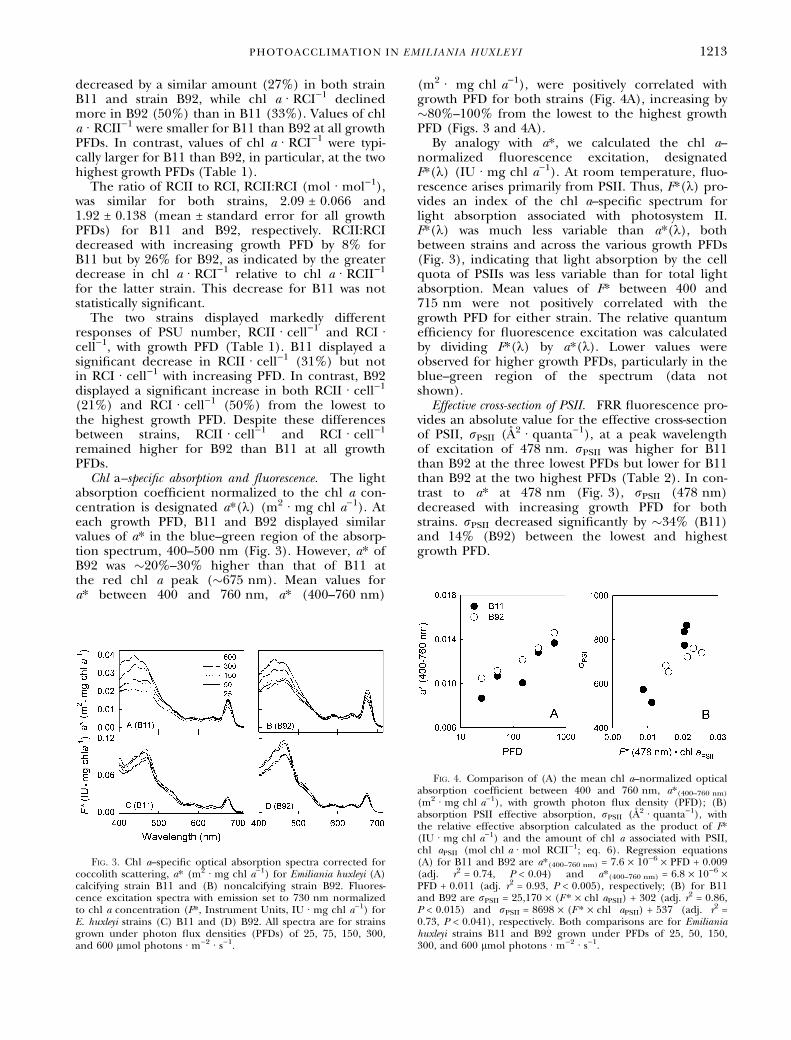
Chl a–specific absorption and fluorescence. The lightabsorption coefficient normalized to the chl a con-centration is designated a*(k) (m2 Æ mg chl a)1). Ateach growth PFD, B11 and B92 displayed similarvalues of a* in the blue–green region of the absorp-tion spectrum, 400–500 nm (Fig. 3). However, a* ofB92 was �20%–30% higher than that of B11 atthe red chl a peak (�675 nm). Mean values fora* between 400 and 760 nm, a* (400–760 nm)
(m2 Æ mg chl a)1), were positively correlated withgrowth PFD for both strains (Fig. 4A), increasing by�80%–100% from the lowest to the highest growthPFD (Figs. 3 and 4A).
By analogy with a*, we calculated the chl a–normalized fluorescence excitation, designatedF*(k) (IU Æ mg chl a)1). At room temperature, fluo-rescence arises primarily from PSII. Thus, F*(k) pro-vides an index of the chl a–specific spectrum forlight absorption associated with photosystem II.F*(k) was much less variable than a*(k), bothbetween strains and across the various growth PFDs(Fig. 3), indicating that light absorption by the cellquota of PSIIs was less variable than for total lightabsorption. Mean values of F* between 400 and715 nm were not positively correlated with thegrowth PFD for either strain. The relative quantumefficiency for fluorescence excitation was calculatedby dividing F*(k) by a*(k). Lower values wereobserved for higher growth PFDs, particularly in theblue–green region of the spectrum (data notshown).
Effective cross-section of PSII. FRR fluorescence pro-vides an absolute value for the effective cross-sectionof PSII, rPSII (A2 Æ quanta)1), at a peak wavelengthof excitation of 478 nm. rPSII was higher for B11than B92 at the three lowest PFDs but lower for B11than B92 at the two highest PFDs (Table 2). In con-trast to a* at 478 nm (Fig. 3), rPSII (478 nm)decreased with increasing growth PFD for bothstrains. rPSII decreased significantly by �34% (B11)and 14% (B92) between the lowest and highestgrowth PFD.
Fig. 3. Chl a–specific optical absorption spectra corrected forcoccolith scattering, a* (m2 Æ mg chl a)1) for Emiliania huxleyi (A)calcifying strain B11 and (B) noncalcifying strain B92. Fluores-cence excitation spectra with emission set to 730 nm normalizedto chl a concentration (F*, Instrument Units, IU Æ mg chl a)1) forE. huxleyi strains (C) B11 and (D) B92. All spectra are for strainsgrown under photon flux densities (PFDs) of 25, 75, 150, 300,and 600 lmol photons Æ m)2 Æ s)1.
Fig. 4. Comparison of (A) the mean chl a–normalized opticalabsorption coefficient between 400 and 760 nm, a*(400–760 nm)
(m2 Æ mg chl a)1), with growth photon flux density (PFD); (B)absorption PSII effective absorption, rPSII (A2 Æ quanta)1), withthe relative effective absorption calculated as the product of F*(IU Æ mg chl a)1) and the amount of chl a associated with PSII,chl aPSII (mol chl a Æ mol RCII)1; eq. 6). Regression equations(A) for B11 and B92 are a*(400–760 nm) = 7.6 · 10)6 · PFD + 0.009(adj. r2 = 0.74, P < 0.04) and a*(400–760 nm) = 6.8 · 10)6 ·PFD + 0.011 (adj. r2 = 0.93, P < 0.005), respectively; (B) for B11and B92 are rPSII = 25,170 · (F * · chl aPSII) + 302 (adj. r2 = 0.86,P < 0.015) and rPSII = 8698 · (F * · chl aPSII) + 537 (adj. r2 =0.73, P < 0.041), respectively. Both comparisons are for Emilianiahuxleyi strains B11 and B92 grown under PFDs of 25, 50, 150,300, and 600 lmol photons Æ m)2 Æ s)1.
PHOTOACCLIMATION IN EMILIANIA HUXLEYI 1213
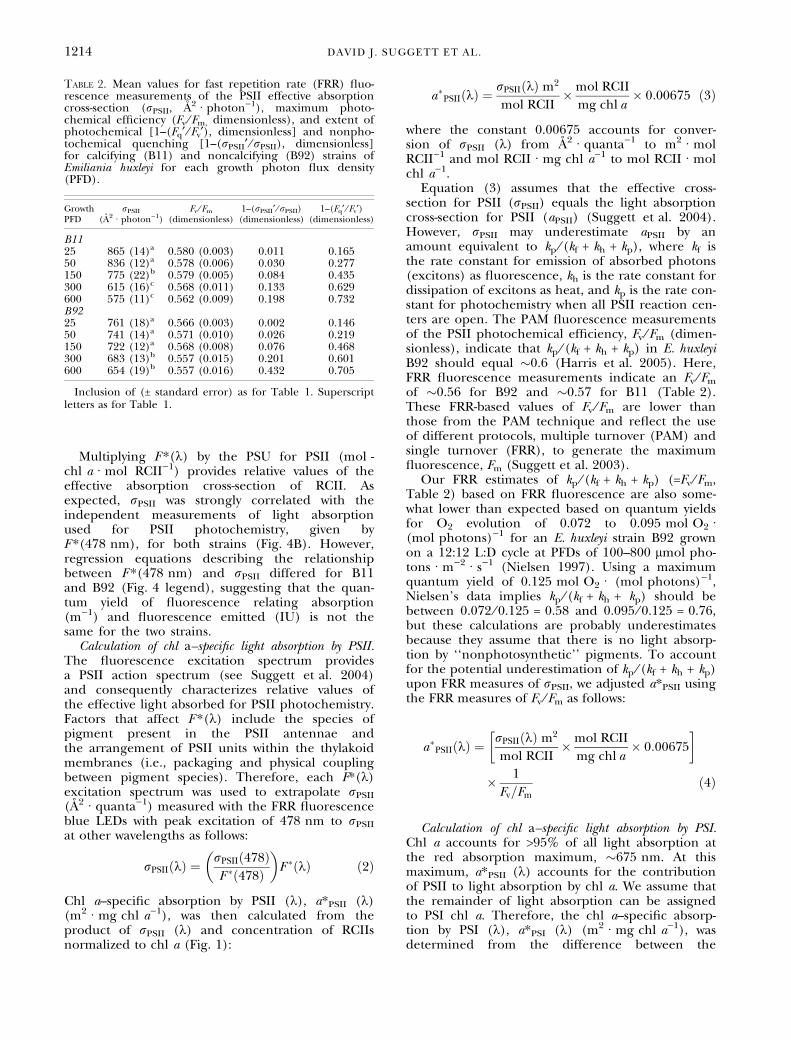
Multiplying F *(k) by the PSU for PSII (mol -chl a Æ mol RCII)1) provides relative values of theeffective absorption cross-section of RCII. Asexpected, rPSII was strongly correlated with theindependent measurements of light absorptionused for PSII photochemistry, given byF *(478 nm), for both strains (Fig. 4B). However,regression equations describing the relationshipbetween F *(478 nm) and rPSII differed for B11and B92 (Fig. 4 legend), suggesting that the quan-tum yield of fluorescence relating absorption(m)1) and fluorescence emitted (IU) is not thesame for the two strains.
Calculation of chl a–specific light absorption by PSII.The fluorescence excitation spectrum providesa PSII action spectrum (see Suggett et al. 2004)and consequently characterizes relative values ofthe effective light absorbed for PSII photochemistry.Factors that affect F *(k) include the species ofpigment present in the PSII antennae andthe arrangement of PSII units within the thylakoidmembranes (i.e., packaging and physical couplingbetween pigment species). Therefore, each F*(k)excitation spectrum was used to extrapolate rPSII
(A2 Æ quanta)1) measured with the FRR fluorescenceblue LEDs with peak excitation of 478 nm to rPSII
at other wavelengths as follows:
rPSII kð Þ ¼ rPSII 478ð ÞF � 478ð Þ
� �F � kð Þ ð2Þ
Chl a–specific absorption by PSII (k), a*PSII (k)(m2 Æ mg chl a)1), was then calculated from theproduct of rPSII (k) and concentration of RCIIsnormalized to chl a (Fig. 1):
a�PSII kð Þ ¼ rPSII kð Þ m2
mol RCII�mol RCII
mg chl a� 0:00675 ð3Þ
where the constant 0.00675 accounts for conver-sion of rPSII (k) from A2 Æ quanta)1 to m2 Æ molRCII)1 and mol RCII Æ mg chl a)1 to mol RCII Æ molchl a)1.
Equation (3) assumes that the effective cross-section for PSII (rPSII) equals the light absorptioncross-section for PSII (aPSII) (Suggett et al. 2004).However, rPSII may underestimate aPSII by anamount equivalent to kp ⁄ (kf + kh + kp), where kf isthe rate constant for emission of absorbed photons(excitons) as fluorescence, kh is the rate constant fordissipation of excitons as heat, and kp is the rate con-stant for photochemistry when all PSII reaction cen-ters are open. The PAM fluorescence measurementsof the PSII photochemical efficiency, Fv ⁄ Fm (dimen-sionless), indicate that kp ⁄ (kf + kh + kp) in E. huxleyiB92 should equal �0.6 (Harris et al. 2005). Here,FRR fluorescence measurements indicate an Fv ⁄ Fm
of �0.56 for B92 and �0.57 for B11 (Table 2).These FRR-based values of Fv ⁄ Fm are lower thanthose from the PAM technique and reflect the useof different protocols, multiple turnover (PAM) andsingle turnover (FRR), to generate the maximumfluorescence, Fm (Suggett et al. 2003).
Our FRR estimates of kp ⁄ (kf + kh + kp) (=Fv ⁄ Fm,Table 2) based on FRR fluorescence are also some-what lower than expected based on quantum yieldsfor O2 evolution of 0.072 to 0.095 mol O2 Æ(mol photons))1 for an E. huxleyi strain B92 grownon a 12:12 L:D cycle at PFDs of 100–800 lmol pho-tons Æ m)2 Æ s)1 (Nielsen 1997). Using a maximumquantum yield of 0.125 mol O2 Æ (mol photons))1,Nielsen’s data implies kp ⁄ (kf + kh + kp) should bebetween 0.072 ⁄ 0.125 = 0.58 and 0.095 ⁄ 0.125 = 0.76,but these calculations are probably underestimatesbecause they assume that there is no light absorp-tion by ‘‘nonphotosynthetic’’ pigments. To accountfor the potential underestimation of kp ⁄ (kf + kh + kp)upon FRR measures of rPSII, we adjusted a*PSII usingthe FRR measures of Fv ⁄ Fm as follows:
a�PSII kð Þ ¼ rPSII kð Þ m2
mol RCII�mol RCII
mg chl a� 0:00675
� �
� 1
Fv=Fmð4Þ
Calculation of chl a–specific light absorption by PSI.Chl a accounts for >95% of all light absorption atthe red absorption maximum, �675 nm. At thismaximum, a*PSII (k) accounts for the contributionof PSII to light absorption by chl a. We assume thatthe remainder of light absorption can be assignedto PSI chl a. Therefore, the chl a–specific absorp-tion by PSI (k), a*PSI (k) (m2 Æ mg chl a)1), wasdetermined from the difference between the
Table 2. Mean values for fast repetition rate (FRR) fluo-rescence measurements of the PSII effective absorptioncross-section (rPSII, A2 Æ photon)1), maximum photo-chemical efficiency (Fv ⁄ Fm, dimensionless), and extent ofphotochemical [1–(Fq¢ ⁄ Fv¢), dimensionless] and nonpho-tochemical quenching [1–(rPSII¢ ⁄ rPSII), dimensionless]for calcifying (B11) and noncalcifying (B92) strains ofEmiliania huxleyi for each growth photon flux density(PFD).
GrowthPFD
rPSII
(A2 Æ photon)1)Fv ⁄ Fm
(dimensionless)1–(rPSII¢ ⁄ rPSII)
(dimensionless)1–(Fq¢ ⁄ Fv¢)
(dimensionless)
B1125 865 (14)a 0.580 (0.003) 0.011 0.16550 836 (12)a 0.578 (0.006) 0.030 0.277150 775 (22)b 0.579 (0.005) 0.084 0.435300 615 (16)c 0.568 (0.011) 0.133 0.629600 575 (11)c 0.562 (0.009) 0.198 0.732B9225 761 (18)a 0.566 (0.003) 0.002 0.14650 741 (14)a 0.571 (0.010) 0.026 0.219150 722 (12)a 0.568 (0.008) 0.076 0.468300 683 (13)b 0.557 (0.015) 0.201 0.601600 654 (19)b 0.557 (0.016) 0.432 0.705
Inclusion of (± standard error) as for Table 1. Superscriptletters as for Table 1.
1214 DAVID J. SUGGETT ET AL.
chl a–specific light absorption coefficient (a*) andchl a–specific light absorption by PSII (a*PSII) inthe following equation:
a�PSI ð675 nmÞ ¼ a� ð675 nmÞ � a�PSI ð675 nmÞð5Þ
Since chl a accounts for essentially all of the lightabsorption at this wavelength, the percentage oftotal light absorbed by chl a associated with PSIIwas thus calculated as (a*PSII ⁄ a*) · 100 (k =675 nm) (Fig. 1C). If we assume that there is no dif-ference in the package effect between pigmentsassociated with PSII and PSI, we can calculate thechl a associated specifically with the pool of reactioncenters for each photosystem, chl aPSII (mol chl a Æmol RCII)1) and chl aPSI (mol chl a Æ mol RCI)1),as follows:
chl aPSII ¼a�PSII
a�
� �ð675 nmÞ � 0:25molO2
molRCII
� PSUO2
ð6Þ
chl aPSI ¼a�PSI
a�
� �ð675 nmÞ � PSU700 ð7Þ
Consequently, chl aPSII and chl aPSI define abso-lute PSU sizes for PSII and PSI. However, to avoidconfusion with the original conceptual definitionof PSU size, we simply define chl aPSII and chl aPSI
as the amount of chl a associated with PSII andPSI.
Chl a associated with PSI and PSII. The percentageof total light absorption by chl a associated withPSII, (a*PSII ⁄ a*) · 100 at 676 nm (eq. 4; Fig. 1C),
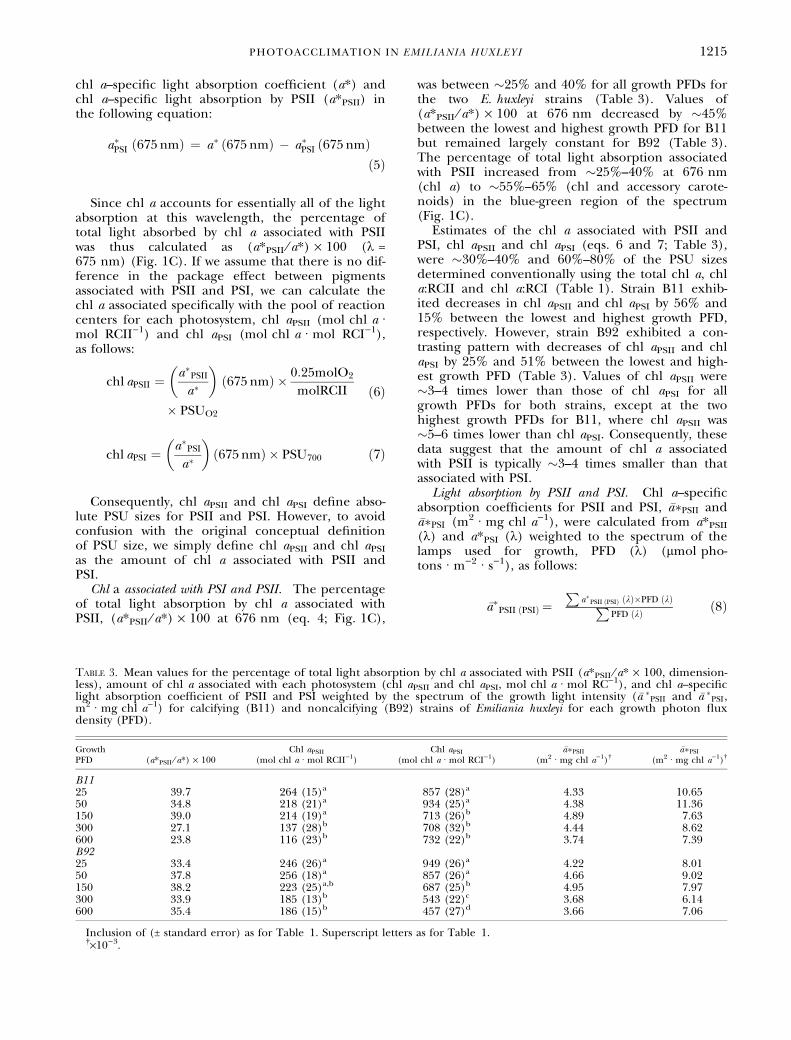
was between �25% and 40% for all growth PFDs forthe two E. huxleyi strains (Table 3). Values of(a*PSII ⁄ a*) · 100 at 676 nm decreased by �45%between the lowest and highest growth PFD for B11but remained largely constant for B92 (Table 3).The percentage of total light absorption associatedwith PSII increased from �25%–40% at 676 nm(chl a) to �55%–65% (chl and accessory carote-noids) in the blue-green region of the spectrum(Fig. 1C).
Estimates of the chl a associated with PSII andPSI, chl aPSII and chl aPSI (eqs. 6 and 7; Table 3),were �30%–40% and 60%–80% of the PSU sizesdetermined conventionally using the total chl a, chla:RCII and chl a:RCI (Table 1). Strain B11 exhib-ited decreases in chl aPSII and chl aPSI by 56% and15% between the lowest and highest growth PFD,respectively. However, strain B92 exhibited a con-trasting pattern with decreases of chl aPSII and chlaPSI by 25% and 51% between the lowest and high-est growth PFD (Table 3). Values of chl aPSII were�3–4 times lower than those of chl aPSI for allgrowth PFDs for both strains, except at the twohighest growth PFDs for B11, where chl aPSII was�5–6 times lower than chl aPSI. Consequently, thesedata suggest that the amount of chl a associatedwith PSII is typically �3–4 times smaller than thatassociated with PSI.
Light absorption by PSII and PSI. Chl a–specificabsorption coefficients for PSII and PSI, �a�PSII and�a�PSI (m2 Æ mg chl a)1), were calculated from a*PSII
(k) and a*PSI (k) weighted to the spectrum of thelamps used for growth, PFD (k) (lmol pho-tons Æ m)2 Æ s)1), as follows:
�a�PSII ðPSIÞ ¼P
a�PSII ðPSIÞ kð Þ�PFD kð ÞPPFD kð Þ ð8Þ
Table 3. Mean values for the percentage of total light absorption by chl a associated with PSII (a*PSII ⁄ a* · 100, dimension-less), amount of chl a associated with each photosystem (chl aPSII and chl aPSI, mol chl a Æ mol RC)1), and chl a–specificlight absorption coefficient of PSII and PSI weighted by the spectrum of the growth light intensity (�a �PSII and �a �PSI,m2 Æ mg chl a)1) for calcifying (B11) and noncalcifying (B92) strains of Emiliania huxleyi for each growth photon fluxdensity (PFD).
GrowthPFD (a*PSII ⁄ a*) · 100
Chl aPSII
(mol chl a Æ mol RCII)1)Chl aPSI
(mol chl a Æ mol RCI)1)�a�PSII
(m2 Æ mg chl a)1)��a�PSI
(m2 Æ mg chl a)1)�
B1125 39.7 264 (15)a 857 (28)a 4.33 10.6550 34.8 218 (21)a 934 (25)a 4.38 11.36150 39.0 214 (19)a 713 (26)b 4.89 7.63300 27.1 137 (28)b 708 (32)b 4.44 8.62600 23.8 116 (23)b 732 (22)b 3.74 7.39B9225 33.4 246 (26)a 949 (26)a 4.22 8.0150 37.8 256 (18)a 857 (26)a 4.66 9.02150 38.2 223 (25)a,b 687 (25)b 4.95 7.97300 33.9 185 (13)b 543 (22)c 3.68 6.14600 35.4 186 (15)b 457 (27)d 3.66 7.06
Inclusion of (± standard error) as for Table 1. Superscript letters as for Table 1.�·10)3.
PHOTOACCLIMATION IN EMILIANIA HUXLEYI 1215
Values of �a�PSII were �1.5–2.5 times lowerthan those of �a�PSI (Table 3). Both strains exhib-ited a 15% decrease of �a�PSII between the lowestand highest growth PFD. �a�PSI also decreasedby 15% for B92; however, �a�PSI decreased by 30%for B11, between the lowest and highest growthPFD.
DISCUSSION
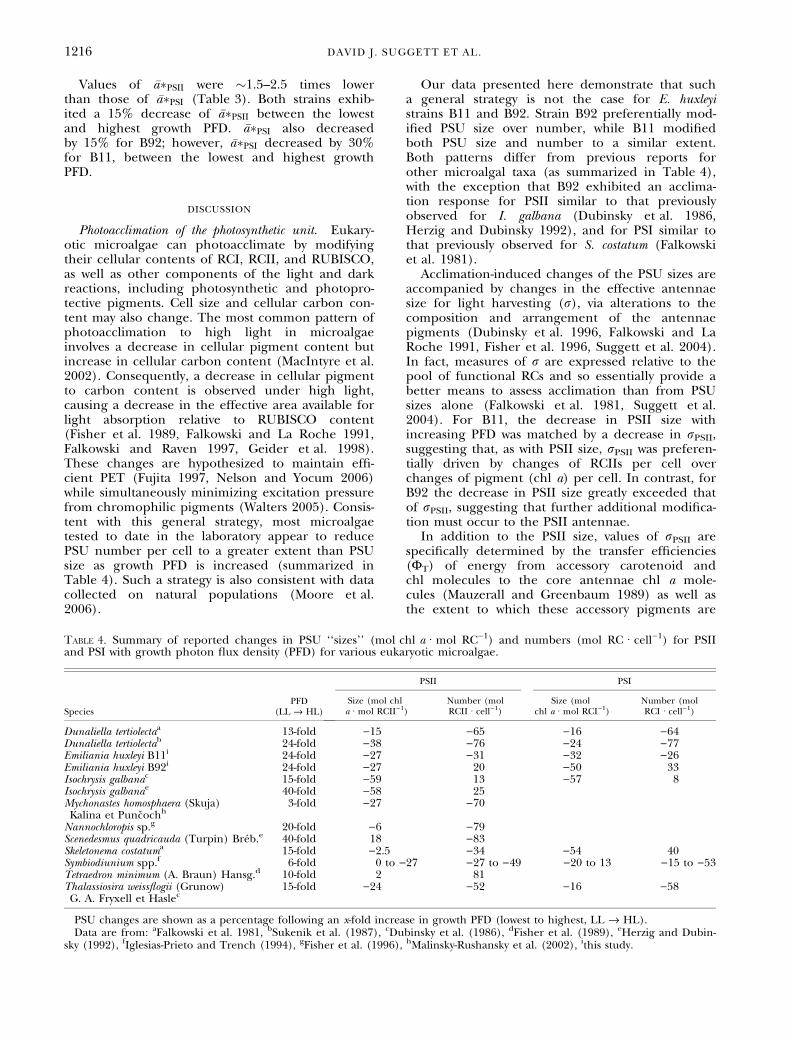
Photoacclimation of the photosynthetic unit. Eukary-otic microalgae can photoacclimate by modifyingtheir cellular contents of RCI, RCII, and RUBISCO,as well as other components of the light and darkreactions, including photosynthetic and photopro-tective pigments. Cell size and cellular carbon con-tent may also change. The most common pattern ofphotoacclimation to high light in microalgaeinvolves a decrease in cellular pigment content butincrease in cellular carbon content (MacIntyre et al.2002). Consequently, a decrease in cellular pigmentto carbon content is observed under high light,causing a decrease in the effective area available forlight absorption relative to RUBISCO content(Fisher et al. 1989, Falkowski and La Roche 1991,Falkowski and Raven 1997, Geider et al. 1998).These changes are hypothesized to maintain effi-cient PET (Fujita 1997, Nelson and Yocum 2006)while simultaneously minimizing excitation pressurefrom chromophilic pigments (Walters 2005). Consis-tent with this general strategy, most microalgaetested to date in the laboratory appear to reducePSU number per cell to a greater extent than PSUsize as growth PFD is increased (summarized inTable 4). Such a strategy is also consistent with datacollected on natural populations (Moore et al.2006).
Our data presented here demonstrate that sucha general strategy is not the case for E. huxleyistrains B11 and B92. Strain B92 preferentially mod-ified PSU size over number, while B11 modifiedboth PSU size and number to a similar extent.Both patterns differ from previous reports forother microalgal taxa (as summarized in Table 4),with the exception that B92 exhibited an acclima-tion response for PSII similar to that previouslyobserved for I. galbana (Dubinsky et al. 1986,Herzig and Dubinsky 1992), and for PSI similar tothat previously observed for S. costatum (Falkowskiet al. 1981).
Acclimation-induced changes of the PSU sizes areaccompanied by changes in the effective antennaesize for light harvesting (r), via alterations to thecomposition and arrangement of the antennaepigments (Dubinsky et al. 1996, Falkowski and LaRoche 1991, Fisher et al. 1996, Suggett et al. 2004).In fact, measures of r are expressed relative to thepool of functional RCs and so essentially provide abetter means to assess acclimation than from PSUsizes alone (Falkowski et al. 1981, Suggett et al.2004). For B11, the decrease in PSII size withincreasing PFD was matched by a decrease in rPSII,suggesting that, as with PSII size, rPSII was preferen-tially driven by changes of RCIIs per cell overchanges of pigment (chl a) per cell. In contrast, forB92 the decrease in PSII size greatly exceeded thatof rPSII, suggesting that further additional modifica-tion must occur to the PSII antennae.
In addition to the PSII size, values of rPSII arespecifically determined by the transfer efficiencies(FT) of energy from accessory carotenoid andchl molecules to the core antennae chl a mole-cules (Mauzerall and Greenbaum 1989) as well asthe extent to which these accessory pigments are
Table 4. Summary of reported changes in PSU ‘‘sizes’’ (mol chl a Æ mol RC)1) and numbers (mol RC Æ cell)1) for PSIIand PSI with growth photon flux density (PFD) for various eukaryotic microalgae.
SpeciesPFD
(LL fi HL)
PSII PSI
Size (mol chla Æ mol RCII)1)
Number (molRCII Æ cell)1)
Size (molchl a Æ mol RCI)1)
Number (molRCI Æ cell)1)
Dunaliella tertiolectaa 13-fold )15 )65 )16 )64Dunaliella tertiolectab 24-fold )38 )76 )24 )77Emiliania huxleyi B11i 24-fold )27 )31 )32 )26Emiliania huxleyi B92i 24-fold )27 20 )50 33Isochrysis galbanac 15-fold )59 13 )57 8Isochrysis galbanae 40-fold )58 25Mychonastes homosphaera (Skuja)Kalina et Puncochh
3-fold )27 )70
Nannochloropis sp.g 20-fold )6 )79Scenedesmus quadricauda (Turpin) Breb.e 40-fold 18 )83Skeletonema costatuma 15-fold )2.5 )34 )54 40Symbiodiunium spp.f 6-fold 0 to )27 )27 to )49 )20 to 13 )15 to )53Tetraedron minimum (A. Braun) Hansg.d 10-fold 2 81Thalassiosira weissflogii (Grunow)G. A. Fryxell et Haslec
15-fold )24 )52 )16 )58
PSU changes are shown as a percentage following an x-fold increase in growth PFD (lowest to highest, LL fi HL).Data are from: aFalkowski et al. 1981, bSukenik et al. (1987), cDubinsky et al. (1986), dFisher et al. (1989), eHerzig and Dubin-
sky (1992), fIglesias-Prieto and Trench (1994), gFisher et al. (1996), hMalinsky-Rushansky et al. (2002), ithis study.
1216 DAVID J. SUGGETT ET AL.
packaged (Falkowski and Raven 1997). FT repre-sents the extent to which excitation energy ispassed from one pigment molecule to another asa result of the energy and lifetime of the excited(S1 and S2) state of each molecule (Papagiannakiset al. 2005). Consequently, values for FT varybetween pigment ‘‘types’’ of different biomolecularstructure (Frank et al. 1997). Algal pigments arecommonly referred to as photosynthetic (PS) ornonphotosynthetic (NPS), to denote pigments witha relatively high or low FT, respectively. During E.huxleyi photoacclimation, the ratio of PS (=chlc + 19¢ hexanoyloxyfucoxanthin [19¢ hex] + fuco-xanthin) to NPS (=diatoxanthin + diadinoxan-thin + b-carotene) pigments within the antennae isdecreased to reduce the amount of excitationenergy cascading into the RCs (Harris et al. 2005).In our study, both E. huxleyi strains decreasedPS:NPS by �30% between the lowest and highestgrowth PFD (see Leonardos and Harris 2006).However, strains B11 and B92 also exhibited differ-ent PS stoichiometries, such that chl c:fucoxan-thin + 19¢ hex decreased more for B11 (20%)than B92 (7.5%) between the lowest and highestgrowth PFD (Leonardos and Harris 2006). Chl ctransfers energy to chl a with �100% efficiency,while fucoxanthin, and presumably 19¢ hex, isless efficient (Frank et al. 1997, Papagiannakiset al. 2005). Consequently, the decrease in rPSII
with increasing growth PFD may be partly con-strained for B92 via a more efficient PS pigmentcomplex.
Pigment packaging, Q* (dimensionless, <1), wasdetermined following Morel and Bricaud (1981)from knowledge of a* at 478 nm (to coincide withpeak FRR excitation used to measure rPSII) and thechl a concentration and mean cellular diameter forcultures in steady state (Leonardos and Harris2006). Values of Q* were high (0.85–0.92) for bothstrains and showed no statistical difference betweengrowth irradiances (not shown). Consequently, pig-ment packaging was not a significant physiologicalfeature to these strains of E. huxleyi throughoutexperimentation.
Evidence from cultures suggests that manymicroalgal species increase both cell volume andcarbon content with increasing growth PFD(Thompson et al. 1991, Fisher et al. 1998, MacIn-tyre et al. 2002). As such, cellular decreases in RCcontent that are observed with increasing PFDmay not be evident if RCs are expressed per unitcell volume per unit cell carbon (Falkowski andRaven 1997, MacIntyre et al. 2002). Consequently,changes in RC content simply reflect the increas-ing number or size of organelles associated withthe net cellular metabolism as more light becomesavailable (Sukenik et al. 1987, Falkowski and LaRoche 1991, Fisher et al. 1998). Unfortunately,data of cell volume and of total cell carbon con-tent were not collected for our experiments.
Observations from independent B11 cultures showthat cell volume increases from 63 to 86 lm3
between growth PFDs of 25 and 600 lmol pho-tons Æ m)2 Æ s)1 (N. Leonardos, unpublished data).If applied to our data (Table 1), we would esti-mate only a small decrease (�10%) in RCII Æ lm3
cell volume and a constant RCI Æ lm3 between thelowest and highest growth PFDs. Therefore, thequota of photosystem reaction centers per unitcell volume would remain more or less constantas B11 acclimates. We cannot apply the samereasoning to B92. However, the increases inRCI Æ cell)1 and RCII Æ cell)1 with growth PFD forB92 would have to be matched by a decrease in�20%–50% of cell volume to match the patternfor B11. Evidence from other species tested todate suggests that this would be unlikely (Fisheret al. 1998).
Photoacclimation of the PSU size for E. huxleyistrain B92 followed patterns that had been previ-ously reported for the chromophytes I. galbana andS. costatum; however, it is not clear from our lim-ited data set why this is the case. Compared toB92, the calcifying strain B11 appears to exhibitphysiological characteristics that are more consis-tent with I. galbana, such as the relatively low chla Æ cell)1 content but high fucoxanthin:19¢ hex(Dubinsky et al. 1986, Herzig and Dubinsky 1992).A calcifying strain of E. huxleyi has also been shownto exhibit patterns of acclimation and photosynthe-sis that are highly similar to those for S. costatumunder similar growth conditions (Juneau andHarrison 2005). Different acclimation strategies ofr versus PSU are apparent among genetic variantsof microalgae (e.g., the dinoflagellate Symbiodiniumspp.; Iglesias-Prieto and Trench 1994, D. Suggett,S. Hennige, M. Warner, and D. Smith, unpublisheddata). However, placing our results in the contextof other studies is not easy given possible differ-ences of growth conditions, in particular tempera-ture and pH. For example, Suggett et al. (2004)have also assessed PSII acclimation of another non-calcifying E. huxleyi strain (CCAP 920 ⁄ 6 = PLYB92D) and observed changes of PSII size and rPSII
that followed neither pattern exhibited by strainsB11 and B92. Despite such potential limitations,significant flexibility of acclimation strategies is evi-dent among E. huxleyi strains.
Modulation of light-harvesting and photosystem stoichi-ometry. Photoacclimation characteristics of PSIImust also be inherently tied to modification of PSI.The amount of light harvested by each photosystem,which is the product of the light absorption and RCconcentration, determines the electron transportrate (ETR) that must provide ATP and NADPH forall cellular energetic demands. When RCII:RCI iscompared with the ratio of light absorption byPSII:PSI, �a �PSII:�a �PSI, it is clear that changes in RCstoichiometry correspond with changes in �a�PSII:�a �PSI (i.e., the points are largely clustered) across all
PHOTOACCLIMATION IN EMILIANIA HUXLEYI 1217
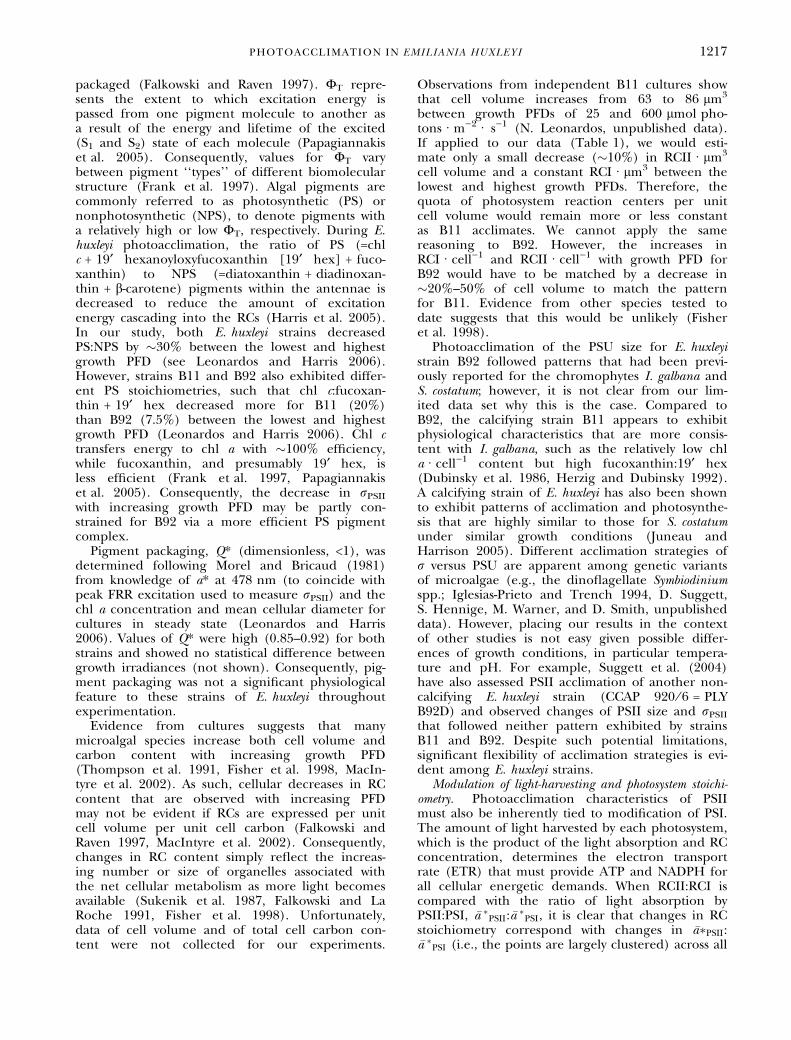
growth PFDs, in particular for B92 (Fig. 5A). Fur-ther expressing the proportion of light absorptionbetween PSII and PSI for the entire cell,[�a �PSII · (RCII Æ cell)1)] ⁄ [�a �PSI · (RCI Æ cell)1)]demonstrates that very little variability (± �10%)around unity is observed for either strain for themajority of growth PFDs (Fig. 5B). Therefore, thechanges in RCII:RCI with growth PFD effectivelymaintain a relatively constant balance of excitationpressure between photosystems. Such a strategy isexpected where the algae are in nutrient-replete,steady-state growth.
Reaction center stoichiometry for eukaryoticalgae typically varies between �1.5 and 2 RCII:RCIunder nutrient-replete growth conditions (Falkowskiet al. 1981, Dubinsky et al. 1986, Iglesias-Prieto andTrench 1994). However, an exceptionally high valueof RCII:RCI of �10:1 has been observed in iron-replete Thalassiosira oceanica Hasle (Strzepek andHarrison 2004). Consistent with the majority of pre-vious observations, both E. huxleyi strains containedabout twice as many RCIIs Æ cell)1 as RCIs Æ cell)1
(Table 1). Strain B92 exhibited some reduction inthe RCII:RCI at the highest two growth PFDs as aresult of a greater change in RCI Æ cell)1 than inRCII Æ cell)1. Consequently, our results suggest thatrPSI should typically be 1.5–2 times higher than rPSII
to maintain equal and balanced excitation pressureon either PSII or PSI.
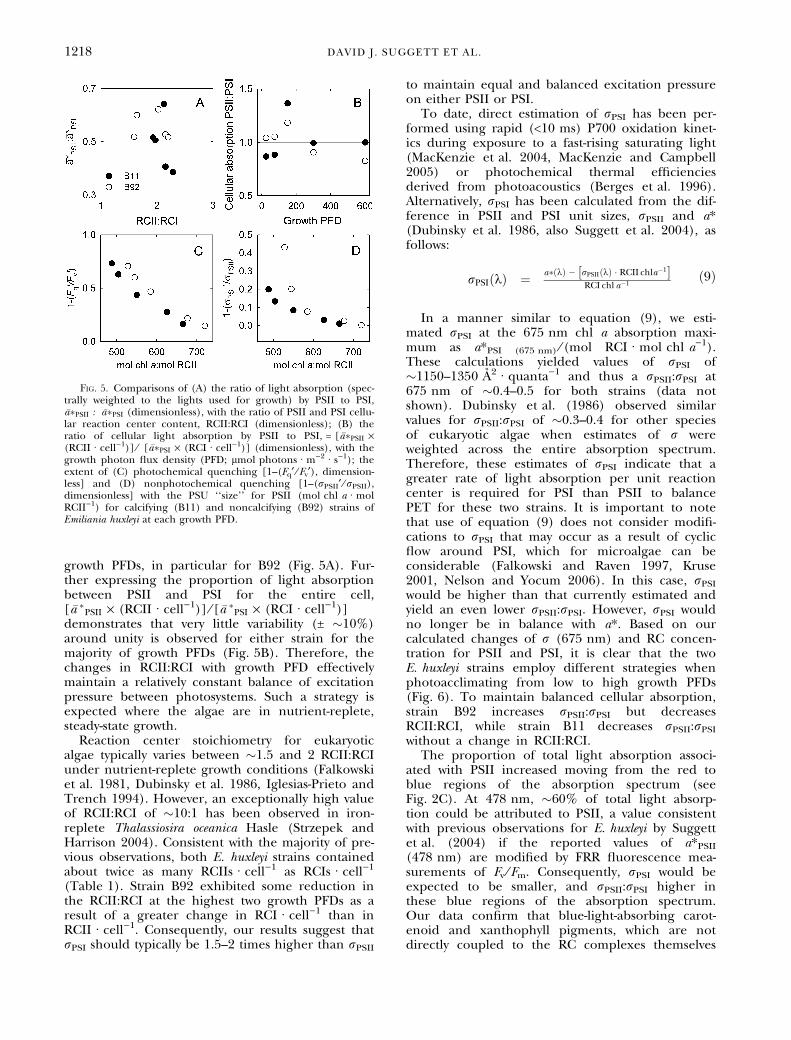
To date, direct estimation of rPSI has been per-formed using rapid (<10 ms) P700 oxidation kinet-ics during exposure to a fast-rising saturating light(MacKenzie et al. 2004, MacKenzie and Campbell2005) or photochemical thermal efficienciesderived from photoacoustics (Berges et al. 1996).Alternatively, rPSI has been calculated from the dif-ference in PSII and PSI unit sizes, rPSII and a*(Dubinsky et al. 1986, also Suggett et al. 2004), asfollows:
rPSI kð Þ ¼ a� kð Þ � rPSII kð Þ � RCII chla�1½ �RCI chl a�1
ð9Þ
In a manner similar to equation (9), we esti-mated rPSI at the 675 nm chl a absorption maxi-mum as a*PSI (675 nm) ⁄ (mol RCI Æ mol chl a)1).These calculations yielded values of rPSI of�1150–1350 A2 Æ quanta)1 and thus a rPSII:rPSI at675 nm of �0.4–0.5 for both strains (data notshown). Dubinsky et al. (1986) observed similarvalues for rPSII:rPSI of �0.3–0.4 for other speciesof eukaryotic algae when estimates of r wereweighted across the entire absorption spectrum.Therefore, these estimates of rPSI indicate that agreater rate of light absorption per unit reactioncenter is required for PSI than PSII to balancePET for these two strains. It is important to notethat use of equation (9) does not consider modifi-cations to rPSI that may occur as a result of cyclicflow around PSI, which for microalgae can beconsiderable (Falkowski and Raven 1997, Kruse2001, Nelson and Yocum 2006). In this case, rPSI
would be higher than that currently estimated andyield an even lower rPSII:rPSI. However, rPSI wouldno longer be in balance with a*. Based on ourcalculated changes of r (675 nm) and RC concen-tration for PSII and PSI, it is clear that the twoE. huxleyi strains employ different strategies whenphotoacclimating from low to high growth PFDs(Fig. 6). To maintain balanced cellular absorption,strain B92 increases rPSII:rPSI but decreasesRCII:RCI, while strain B11 decreases rPSII:rPSI
without a change in RCII:RCI.The proportion of total light absorption associ-
ated with PSII increased moving from the red toblue regions of the absorption spectrum (seeFig. 2C). At 478 nm, �60% of total light absorp-tion could be attributed to PSII, a value consistentwith previous observations for E. huxleyi by Suggettet al. (2004) if the reported values of a*PSII
(478 nm) are modified by FRR fluorescence mea-surements of Fv ⁄ Fm. Consequently, rPSI would beexpected to be smaller, and rPSII:rPSI higher inthese blue regions of the absorption spectrum.Our data confirm that blue-light-absorbing carot-enoid and xanthophyll pigments, which are notdirectly coupled to the RC complexes themselves
Fig. 5. Comparisons of (A) the ratio of light absorption (spec-trally weighted to the lights used for growth) by PSII to PSI,�a�PSII : �a�PSI (dimensionless), with the ratio of PSII and PSI cellu-lar reaction center content, RCII:RCI (dimensionless); (B) theratio of cellular light absorption by PSII to PSI, = [�a�PSII ·(RCII Æ cell)1)] ⁄ [�a�PSI · (RCI Æ cell)1)] (dimensionless), with thegrowth photon flux density (PFD; lmol photons Æ m)2 Æ s)1); theextent of (C) photochemical quenching [1–(Fq¢ ⁄ Fv¢), dimension-less] and (D) nonphotochemical quenching [1–(rPSII¢ ⁄ rPSII),dimensionless] with the PSU ‘‘size’’ for PSII (mol chl a Æ molRCII)1) for calcifying (B11) and noncalcifying (B92) strains ofEmiliania huxleyi at each growth PFD.
1218 DAVID J. SUGGETT ET AL.
but are located within the peripheral antenna, ofPSII are an important component of acclimationfor E. huxleyi in terms of modification of r and a*stoichiometries between PSII and PSI (see alsoMacIntyre et al. 2002). Therefore, as has beenobserved for other microalgae, pigmentation (PSand NPS pigments) other than chl a must be con-sidered when interpreting photoacclimation basedon changes to the photosynthetic unit alone.
In addition to the changes of RCII:RCI andrPSII:rPSI across a wide range of growth PFDs, itshould be noted that under ambient light, rPSII
may decline relative to rPSI as xanthophylls withinthe antennae bed are converted to forms thatquench excitation energy nonphotochemically
(MacIntyre et al. 2002, Walters 2005), or as mobilelight-harvesting antenna pigment-protein com-plexes migrate from RCII to RCI, termed a statetransition (Fujita 1997, Kruse 2001). Similarly,high light exposure may cause RCII complexes tobecome inactive for photochemistry but stillenable some excitation energy to be dissipated asheat (Krause and Weis 1991). Consequently,knowledge of the acclimation ‘‘poise’’ (i.e., thebalance between light harvesting and RUBISCOcontent achieved under steady state) alone maynot be sufficient to understand the physiologicalbasis for the stoichiometry of light absorptionbetween PSII and PSI, and thus maintenance ofan efficient PET.
Cyanobacteria have been shown to have much oftheir chl a associated with PSI (Nelson and Yocum2006). Consequently, these microalgae have low val-ues of RCII:RCI of 0.2–0.4 (Mauzerall and Green-baum 1989, Murakami and Fujita 1991, Miskiewiczet al. 2002, MacKenzie et al. 2004) compared witheukaryotic microalgae. To maintain an efficientPET, cyanobacteria employ a highly mobile state-transition system via the phycobilin pool to modu-late light harvested by PSII and PSI (Falkowski andRaven 1997, Fujita 1997).
Fluorescence measurements under actinic lightindicated that photochemical quenching of excita-tion energy (=1–Fq¢ ⁄ Fv¢) increased with growth PFDin a manner similar for both E. huxleyi strains(Table 2). However, this increase was not propor-tional with growth PFD, an observation alsoreported for another E. huxleyi B92 strain usingPAM fluorometry (Harris et al. 2005). Instead,1–Fq¢ ⁄ Fv¢ increased proportionally with the decreasein PSU size for PSII (Fig. 5C), confirming that reg-ulation of photochemical excitation is ultimatelydetermined by the maximum achievable turnoverdownstream of PSI (Sukenik et al. 1987, MacIntyreet al. 2002). In contrast, the extent of nonphoto-chemical quenching (=1–rPSII¢ ⁄ rPSII) changed pro-portionally with PFD (Table 2) but not with thePSU size for PSII (Fig. 5D). At the highest growthPFDs (smallest PSU sizes), quenching of heat bythe antennae for B92 far exceeded that for B11.Both strains exhibit the same % decrease inPS:NPS pigments with increasing growth PFD andthus cannot provide an explanation. While ourobservations presumably relate to the differentadaptive properties of the two strains, we cannotexplicitly assign the mechanism(s) responsible fromthis data set alone.
Toward a true photosynthetic unit size. The conceptof the PSU describes the mechanism of photochem-istry. Conventionally, the size of each photosystem isexpressed as the inverse of reaction center contentrelative to the total chl a, regardless of whether thechl a is associated with PSII or PSI. The value ofsuch an expression is seen when using PSUs to con-vert PET by each reaction center into a measure of
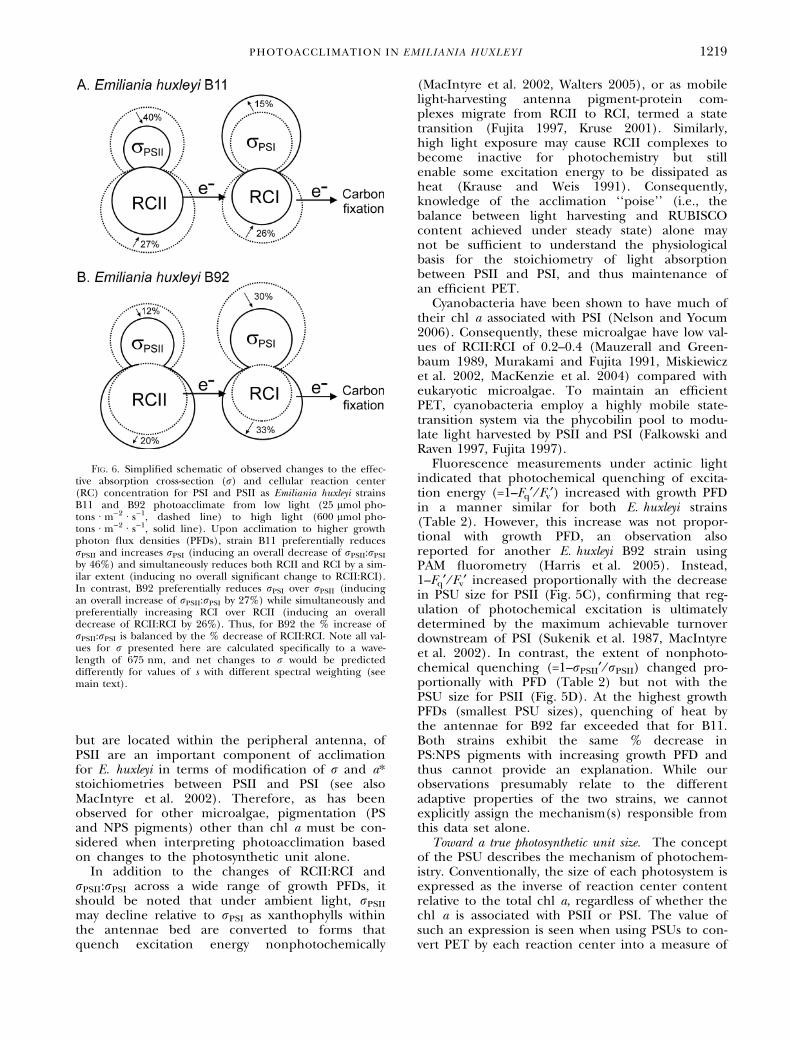
Fig. 6. Simplified schematic of observed changes to the effec-tive absorption cross-section (r) and cellular reaction center(RC) concentration for PSI and PSII as Emiliania huxleyi strainsB11 and B92 photoacclimate from low light (25 lmol pho-tons Æ m)2 Æ s)1, dashed line) to high light (600 lmol pho-tons Æ m)2 Æ s)1, solid line). Upon acclimation to higher growthphoton flux densities (PFDs), strain B11 preferentially reducesrPSII and increases rPSI (inducing an overall decrease of rPSII:rPSI
by 46%) and simultaneously reduces both RCII and RCI by a sim-ilar extent (inducing no overall significant change to RCII:RCI).In contrast, B92 preferentially reduces rPSI over rPSII (inducingan overall increase of rPSII:rPSI by 27%) while simultaneously andpreferentially increasing RCI over RCII (inducing an overalldecrease of RCII:RCI by 26%). Thus, for B92 the % increase ofrPSII:rPSI is balanced by the % decrease of RCII:RCI. Note all val-ues for r presented here are calculated specifically to a wave-length of 675 nm, and net changes to r would be predicteddifferently for values of s with different spectral weighting (seemain text).
PHOTOACCLIMATION IN EMILIANIA HUXLEYI 1219
productivity per unit total chl a (i.e., a measure ofproductivity with units of ecological relevance; Sugg-ett et al. 2003, 2006, MacKenzie and Campbell2005).
To understand the true PSU size, it is moreappropriate to quantify the distribution of chl abetween PSII and PSI (Falkowski et al. 1981, Mau-zerall and Greenbaum 1989), designated here as chlaPSII and chl aPSI, respectively. Molecular analysesindicate that 36 and 96 chl a molecules are associ-ated with the PSII and PSI monomers, respectively(i.e., �75% of the total chl a is associated with thePSI monomer; Nelson and Yocum 2006). These val-ues appear highly conservative for PSII but not PSIin cyanobacteria and higher plants. Furthermore,they demonstrate that more chl a is associated withPSI than can be ascertained from observationsbased on PSU size (MacKenzie and Campbell 2005,Nelson and Yocum 2006). From chl aPSII and chlaPSI, we calculated that as much as �80% of thetotal chl a was associated with PSI for both strainsof E. huxleyi.
Conventional measures of PSU size simplyreflect alterations to the RC stoichiometry relativeto the total chl a for each cell. Typically, and asobserved here for both strains of E. huxleyi,RCII:RCI was between 1.5:1 and 2:1, resulting inmarked differences in PSU sizes, mol chl a Æ molRC)1, for both PSII and PSI. Falkowski et al.(1981) implied that this phenomenon relates to afaster turnover time of P700 than of P680,enabling the same excitation event of PSII todrive more than one event for PSI. More impor-tantly, this phenomenon will be determined bythe amount of excitons entering the PET as aresult of the extent of (i) connectivity betweenreaction centers of PSII and of PSI, (ii) quench-ing of excitation energy that is inherent to PSIIbut not PSI, and (iii) the requirement for cyclicelectron flow around both PSII and PSI (Falkow-ski and Raven 1997, Kruse 2001, Nelson andYocum 2006)—in other words, processes that actto alter the effective absorption between the twophotosystems.
Different allocation of light harvesting betweenthe two photosystems may also reflect requirementsfor maintaining intermediary electron carriersbetween PSII and PSI at any given redox poise(Fujita 1997, Kovacs et al. 2000; see also Miskiewiczet al. 2002, Strzepek and Harrison 2004). Specifi-cally, the reoxidation rate of PSII reaction centerswill be affected by the concentration and bindingconstants for quinone, Fe-S protein, cytochrome,and Cu-protein plastocyanin molecules that funnelelectrons from PSII to PSI. However, availability ofboth macronutrients and trace metals (Falkowskiand Raven 1997, Strzepek and Harrison 2004)places constraints on the quantity of these mole-cules that can be synthesized. A similar argumentshould be applicable to the phylloquinones, Fe-S
center, and ferrodoxin molecules that transportelectrons from RCIs. Consequently, it is perhaps notsurprising that genetic constraints upon the photo-synthetic architecture, for example, up-regulation ofthe RCI genes psaA and psaB (Pfannschmidt 2005),down-regulation of chl-binding light-harvesting pig-ments (Escoubas et al. 1995, Walters 2005), or evenDI protein inactivation (Fujita 1997), play a signifi-cant role in the strategy utilized, or that is available,for acclimation.
Summary. While the photosynthetic unit size pro-vides some information as to the modification ofcellular constituents associated with photosynthesis,a better descriptor of photoacclimation is achievedthrough consideration of r and RC stoichiometries.Here we have provided a novel approach to explorethe modification of the light-harvesting apparatusvia r and RC measurements. Two strains of E. hux-leyi, calcifying (B11) and noncalcifying (B92), exhib-ited different strategies of r and RC modification tomaintain a relatively constant balance of absorbedexcitation energy between photosystems I and II forPET as the growth PFD was increased.
Neither strategy for the two strains of E. huxleyiexamined here was consistent with the majority ofprevious studies performed using other microalgalspecies. It is likely that the contrasting photoaccli-mation strategies of B11 and B92 reflect underly-ing genetic variability in laying down thephotosynthetic architecture as a result of lifestyle(calcifying versus noncalcifying) and evolutionaryhistory. However, to confirm the nature with whichmicroalgae employ different acclimation strategies,a wider synthesis of information beyond the scopeof this current data set is required. It is also clearthat to understand the mechanisms behind differ-ent acclimation strategies, better knowledge of thestoichiometry of many components inherent toPET, for example the plastoquinone (PQ) pool,cytochrome complexes, and r (transfer efficienciesand pigment mobilization), is needed. Taking suchfundamental steps will be crucial if we are to sig-nificantly develop physiologically based models ofacclimation and photosynthesis for globally impor-tant phytoplankton taxa.
The authors wish to thank Phil Davey and Kevin Oxbor-ough for technical support. Earlier versions of the manu-script were improved by insightful comments from C. MarkMoore (University of Essex) and two anonymous reviewers.This work was funded through a NERC postdoctoral fellow-ship to D. J. S. and NERC grant NERE ⁄ A ⁄ S ⁄ 2003 ⁄ 00441 toR. J. G.
Berges, J. A., Charlebois, D. O., Mauzerall, D. C. & Falkowski, P. G.1996. Differential effects of nitrogen limitation on photosyn-thetic efficiency of photosystems I and II in microalgae. PlantPhysiol. 110:689–96.
Dubinsky, Z., Falkowski, P. G. & Wyman, K. 1986. Light harvestingand utilisation by phytoplankton. Plant Cell Physiol. 27:1335–49.
Emerson, R. & Arnold, W. 1932. The photochemical reaction inphotosynthesis. J. Gen. Physiol. 16:191–205.
1220 DAVID J. SUGGETT ET AL.
Escoubas, J. M., Lomas, M., La Roche, J. & Falkowski, P. G. 1995.Light intensity regulation of cab gene transcription is signaledby the redox state of the plastoquinone pool. Proc. Natl. Acad.Sci. U. S. A. 92:10237–41.
Falkowski, P. G., Kolber, Z. S. & Fujita, Y. 1988. Effect of redoxstate on the dynamics of photosystem II during steady-statephotosynthesis in eukaryotic algae. Biochim. Biophys. Acta933:432–43.
Falkowski, P. G. & La Roche, J. 1991. Acclimation to spectral irra-diance in algae. J. Phycol. 27:8–14.
Falkowski, P. G. & Owens, T. G. 1980. Light-shade adaptation: twostrategies in marine phytoplankton. Plant Physiol. 66:592–5.
Falkowski, P. G., Owens, T. G., Ley, A. C. & Mauzerall, D. C. 1981.Effects of growth irradiance levels on the ratio of reactioncentres in two species of marine phytoplankton. Plant Physiol.68:969–73.
Falkowski, P. G. & Raven, J. A. 1997. Aquatic Photosynthesis. BlackwellScientific, Oxford, UK, 375 pp.
Fisher, T., Berner, T., Lluz, D. & Dubinsky, Z. 1998. The kinetics ofthe photoacclimation response of Nannochloropsis sp. (Eustig-matophyceae): a study of changes in ultrastructure and PSUdensity. J. Phycol. 34:818–24.
Fisher, T., Minnaard, J. & Dubinsky, Z. 1996. Photoacclimation inthe marine alga Nannochloropsis sp. (Eustigmatophyte): akinetic study. J. Plankton. Res. 18:1797–818.
Fisher, T., Shurtz-Swirski, R., Gepstein, S. & Dubinsky, Z. 1989.Changes in the levels of ribulose-1,5-biphosphate carbo-xylase ⁄ oxygenase (Rubisco) in Tetraedon minimum (Chloro-phyta) during light and shade adaptation. Plant Cell Physiol.30:221–8.
Frank, H. A., Chynwat, V., Desamero, R. Z. B., Farhoosh, R.,Erickson, J. & Bautista, J. 1997. On the photophysics andphotochemical properties of carotenoids and their role aslight harvesting pigments in photosynthesis. Pure Appl. Chem.69:2117–24.
Fujita, Y. 1997. A study on the dynamic features of photosystemstoichiometry: accomplishments and problems for futurestudies. Photosynth. Res. 53:83–93.
Gaffron, H. & Wohl, K. 1936. Zur Theorie der Assimilation.Naturwissenschaften 24:81–92.
Geider, R. J., MacIntyre, H. L. & Kana, T. M. 1998. A dynamicregulatory model of phytoplanktonic acclimation to light,nutrients, and temperature. Limnol. Oceanogr. 43:679–94.
Harris, G. N., Scanlan, D. J. & Geider, R. J. 2005. Acclimation ofEmiliania huxleyi to photon flux density. J. Phycol. 41:851–62.
Herzig, R. & Dubinsky, Z. 1992. Photoacclimation, photosynthesisand growth in phytoplankton. Isr. J. Bot. 41:199–211.
Iglesias-Prieto, R. & Trench, R. K. 1994. Acclimation and adapta-tion to irradiance in symbiotic dinoflagellates. I. Responses ofthe photosynthetic unit to changes in photon flux density.Mar. Ecol. Prog. Ser. 113:163–75.
Juneau, P. & Harrison, P. J. 2005. Comparison by PAM fluorom-etry of photosynthetic activity of nine marine phytoplanktongrown under identical conditions. Photochem. Photobiol. 81:649–53.
Klughammer, C. & Schreiber, U. 1998. Measuring P700 absorbancechanges in the near infrared spectral region with a dualwavelength pulse modulation system. In Garab, G. [Ed.] Pho-tosynthesis: Mechanisms and Effects, Vol. V. Kluwer AcademicPublishers, Dordrecht, the Netherlands, pp. 4357–60.
Kolber, Z. S., Prasil, O. & Falkowski, P. G. 1998. Measurements ofvariable chlorophyll fluorescence using fast repetition ratetechniques: defining methodology and experimental proto-cols. Biochim. Biophys. Acta 1367:88–106.
Kovacs, L., Wiessner, W., Kis, M., Nagy, F., Mende, D. & Demeter, S.2000. Short- and long-term redox regulation of photosyntheticlight energy distribution and photosystem stoichiometry byacetate metabolism in the green alga, Chlamydobotrys stellata.Photosynth. Res. 65:231–47.
Krause, G. H. & Weis, E. 1991. Chlorophyll fluorescence andphotosynthesis: the basics. Annu. Rev. Plant Physiol. Plant Mol.Biol. 42:313–49.
Kruse, O. 2001. Light-induced short-term adaptation mechanismsunder redox control in the PSII-LHCII supercomplex: LHCIIstate transitions and the PSII repair cycle. Naturwissenschaften88:284–92.
Leonardos, N. & Harris, G. N. 2006. Comparative effects of lighton pigments of two strains of Emiliania huxleyi (Haptophyta).J. Phycol. 42:1217–24.
MacIntyre, H. L., Anning, T., Kana, T. M. & Geider, R. J. 2002.Photoacclimation of photosynthesis-irradiance responsecurves and photosynthetic pigments in microalgae andcyanobacteria. J. Phycol. 38:17–38.
MacKenzie, T. D. B., Burns, R. A. & Campbell, D. A. 2004. Carbonstatus constrains light acclimation in the cyanobacteriumSynechococcus elongates. Plant Physiol. 136:3301–12.
MacKenzie, T. D. B. & Campbell, D. A. 2005. Cyanobacterialacclimation to fluctuating light is constrained by inorganiccarbon status. J. Phycol. 41:801–11.
Malinsky-Rushansky, N., Berman, T., Berner, T., Yacobi, Y. Z. &Dubinsky, Z. 2002. Physiological characteristics of picophyto-plankton, isolated from Lake Kinneret: responses to light andtemperature. J. Plankton Res. 24:1173–83.
Mauzerall, D. 1972. Light-induced changes in Chlorella, and theprimary photoreaction for the production of oxygen. Proc.Natl. Acad. Sci. U. S. A. 69:1358–62.
Mauzerall, D. & Greenbaum, N. L. 1989. The absolute size of aphotosynthetic unit. Biochim. Biophys. Acta 974:119–40.
Melkozernov, A. N., Barber, J. & Blakenship, R. E. 2006. Lightharvesting in photosystem I supercomplexes. Biochemistry45:331–45.
Minagawa, J. & Takahashi, Y. 2004. Structure, function andassembly of photosystem II and its light-harvesting proteins.Photosynth. Res. 82:241–63.
Miskiewicz, E., Ivanov, A. G. & Huner, N. P. A. 2002. Stoichiometryof the photosynthetic apparatus and phycobilisome structureof the cyanobacterium Plectonema boryanum UTEX 485 areregulated by both light and temperature. Plant Physiol.130:1414–25.
Moore, C. M., Suggett, D. J., Hickman, A. E., Kim, Y. N., Tweddle,J. F., Sharples, J., Geider, R. J. & Holligan, P. M. 2006. Phyto-plankton photoacclimation and photoadaptation in responseto environmental gradients in a shelf sea. Limnol. Oceanogr.51:936–49.
Morel, A. & Bricaud, A. 1981. Theoretical results concerninglight absorption in a discrete medium, and application tospecific absorption of phytoplankton. Deep-Sea Res. 28:1375–93.
Murakami, A. & Fujita, Y. 1991. Regulation of photosystem stoi-chiometry in the photosynthetic system of the cyanophyteSynechocystis PCC 6714 in response to light-intensity. Plant CellPhysiol. 32:223–30.
Nakamura, A., Akai, M., Taki, T. & Watanabe, T. 2003. Reversed-phase HPLC determination of chlorophyll a¢ and phylloqui-none in photosystem I of oxygenic photosynthetic organisms:universal existence of one chlorophyll a¢ molecule in photo-system I. Eur. J. Biochem. 270:2446–58.
Nelson, N. & Yocum, C. F. 2006. Structure and functions ofphotosystems I and II. Annu. Rev. Plant Biol. 57:512–65.
Nielsen, M. V. 1997. Growth, dark respiration and photosyntheticparameters of the coccolithophorid Emiliania huxleyi (Prym-nesiophyceae) acclimated to different day length-irradiancecombinations. J. Phycol. 33:818–22.
Papagiannakis, E., van Stokkum, I. H. M., Fey, H., Buchel, C. & vanGrondelle, R. 2005. Spectroscopic characterization of theexcitation energy transfer in the fucoxanthin–chlorophyllprotein of diatoms. Photosynth. Res. 86:241–50.
Perry, M., Talbot, M. & Alberte, R. 1981. Photoadaptation in mar-ine phytoplankton: response of the photosynthetic unit. Mar.Biol. 62:91–101.
Pfannschmidt, T. 2005. Acclimation to varying light qualities:towards the functional relationship of state transitions andadjustment of photosystem stoichiometry. J. Phycol. 41:723–5.
PHOTOACCLIMATION IN EMILIANIA HUXLEYI 1221
Richardson, K., Beardall, J. & Raven, J. A. 1983. Adaptation ofunicellular algae to irradiance: an analysis of strategies. NewPhytol. 93:157–91.
Strzepek, R. F. & Harrison, P. J. 2004. Photosynthetic archi-tecture differs in coastal and oceanic diatoms. Nature431:689–92.
Suggett, D. J., Maberly, S. C. & Geider, R. J. 2006. Gross photo-synthesis and lake community metabolism during the springphytoplankton bloom. Limnol. Oceanogr. 51:2064–76.
Suggett, D. J., MacIntyre, H. L. & Geider, R. J. 2004. Evaluation ofbiophysical and optical determinations of light absorption byphotosystem II in phytoplankton. Limnol. Oceanogr. Methods2:316–32.
Suggett, D. J., Oxborough, K., Baker, N. R., MacIntyre, H. L., Kana,T. M. & Geider, R. J. 2003. Fast repetition rate and pulseamplitude modulation chlorophyll a fluorescence measure-ments for assessment of photosynthetic electron transport inmarine phytoplankton. Eur. J. Phycol 38:371–84.
Sukenik, A., Bennet, J. & Falkowski, P. G. 1987. Light-saturatedphotosynthesis: limitation by electron transport or carbonfixation? Biochim. Biophys. Acta 891:205–15.
Thompson, P. A., Harrison, P. J. & Parslow, J. S. 1991. Influence ofirradiance on cell volume and carbon quota for ten species ofmarine phytoplankton. J. Phycol. 27:351–60.
Walters, R. G. 2005. Towards an understanding of photosyntheticacclimation. J. Exp. Bot. 56:435–47.
Supplementary Material
The following supplementary material is avail-able for this article:
Table S1. Terms and definitions. Fluorescenceparameters follow Suggett et al. (2003, 2004,2006).
This material is available as part of the onlinearticle from: http://www.blackwell-synergy.com/doi/abs/10.1111/j.1529-8817.2007.00406.x.
(This link will take you to the article abstract.)
Please note: Blackwell Publishing is notresponsible for the content or functionality ofany supplementary materials supplied by theauthors. Any queries (other than missing mate-rial) should be directed to the correspondingauthor for the article.
1222 DAVID J. SUGGETT ET AL.