study on dynamic characteristics of residual char of cfb
TRANSCRIPT
energies
Article
Study on Dynamic Characteristics of Residual Char ofCFB Boiler Based on CPFD Method
Xin Shen 1, Li Jia 1, Yanlin Wang 1, Baihe Guo 1, Haodong Fan 1, Xiaolei Qiao 1, Man Zhang 2 andYan Jin 1,*
1 College of Electrical and Power Engineering, Taiyuan University of Technology, Taiyuan 030024, China;[email protected] (X.S.); [email protected] (L.J.); [email protected] (Y.W.);[email protected] (B.G.); [email protected] (H.F.); [email protected] (X.Q.)
2 State Key Lab of Power Systems, Tsinghua University, Beijing 100083, China; [email protected]* Correspondence: [email protected]; Tel.: +86-139-3463-0502
Received: 18 September 2020; Accepted: 10 November 2020; Published: 11 November 2020 �����������������
Abstract: When the load of Circulating Fluidized Bed (CFB) boiler changes dynamically, theaccumulation and consumption of residual char causes a large inertia and hysteresis in the boilercombustion system. Therefore, accurate estimation of the residual char in the boiler is of greatsignificance to the control system and improve the combustion efficiency. Based on the ComputationalParticles Fluid Dynamics (CPFD) method, a numerical simulation of the variable load process of CFBboiler was carried out, and the dynamic changes of the residual char inventory were analyzed bycombining the coal feed, ash discharge, and furnace calorific value. The results showed that after CFBboiler reached stable operation, the residual char fluctuated from 11,000 kg to 16,000 kg, accountingfor about 3.7% of the total bed material, and the residual char was in a dynamic balance. Duringthe load-up phase, the average residual char was 17,500 kg, and during the load-down phase, theaverage residual char was 15,000 kg. In the process of load dynamic change, reasonable residual charstock can ensure the boiler load from one steady state to another steady state rapid transition.
Keywords: CPFD method; CFB boiler; residual char; load change; dynamic analysis
1. Introduction
Circulating Fluidized Bed (CFB) power generation technology is one of the clean coal powergeneration technologies developed in the past 30 years [1]. This technology offers wide fuel adaptability,high combustion efficiency, high efficiency desulfurization, low nitrogen oxide emissions, a wide rangeof load regulation, and other superior performances [2,3]. CFB technology has paved the way for thelarge-scale utilization of inferior coal and coal washing wastes [4]. CFB has become the best methodfor the large-scale utilization of low-calorific value fuels in China, and it is suitable for the currentultra-low emissions and thermal power peak shaving requirements. The power generation efficiencyof supercritical units has been greatly improved. Under the same power generation, coal consumptionfor power generation is low, and pollutant emissions are low [5]. Therefore, the development of CFBcombustion technology with supercritical parameter is the only way for the development of CFB boilers.In recent years, China has made breakthroughs in supercritical CFB power generation technology,leading the world in this field. To date, one 600 MW and twenty-six 350 MW supercritical CFBboilers have been put into commercial operation, and two 660 MW and twelve 350 MW supercriticalCFB boilers have entered the adjusting stage, with the largest scale in the world [6,7]. The 350 MWsupercritical CFB boiler is the most widely used supercritical CFB boiler.
With the intelligent development of the national power grid, in order to ensure the power qualityand safety of the power grid, grid-connected units must invest in AGC (Automatic Generation Control)
Energies 2020, 13, 5883; doi:10.3390/en13225883 www.mdpi.com/journal/energies
Energies 2020, 13, 5883 2 of 24
to participate in deep peak shaving of the power grid. In AGC mode, the unit load command changesirregularly in a sawtooth wave, that is, the macro-complex grid factors cause the grid-connected AGCunit load to always be in a frequent dynamic change adjustment state, so it is necessary that thegenerator set has a rapid response ability to respond to changes in power load. When CFB unit raisesand lowers the load, there is a large amount of bed material, incompletely burned residual char in thecoal particles and incompletely reacted calcium-based desulfurizer in the furnace. Therefore, the flow,combustion (pollutant generation and reduction), and heat transfer processes all have a large systeminertia, and the primary and secondary air ratio is a time-varying, nonlinear, multivariable couplingcontrol object in the process of variable working conditions, and important parameters, such as steamparameters, bed temperature, oxygen content, and furnace negative pressure, are interdependent.Because it is difficult for the ratio of various reactants to respond quickly when the power generationload changes, they are out of balance with each other and cannot be quickly matched, which not onlyaffects the load change rate of the boiler, but also affects the combustion status in the furnace and thepollutants in the combustion [8]. The generation and emission lead to the deviation of pollutant controlfrom the optimal value, and the pollutant may even exceed the limits, which makes CFB power plantface the dual pressure of ultra-low emission and AGC assessment.
In the circulating fluidized bed unit rapid load change process, due to the large amount of bedmaterial in the furnace, the incomplete combustion of residual char will affect the load change rate aswell as the pollutant emissions. Therefore, the rational use of the residual char stock in the boiler hasan important role in improving the heat release rate and the load response rate. The main differencebetween he CFB boiler and pulverized coal (PC) boiler is the different combustion mechanism [9].Gao et al. [10,11] suggested that the combustion of residual char stored in the CFB furnace is thedominant factor in the calorific value of the instantaneous combustion, and the residual char is also themain reason for the CFB combustion response lagging behind the PC furnace. The obvious differencesbetween the CFB boiler and PC boiler are presented in the coal–heat module. Different from the PCboiler, the combustion heat released in the CFB boiler mainly comes from the combustion of “residualchar” in bed material [12,13]. Bidwe et al. [14] experimentally studied the effect of bed material wear onthe bed inventory and found that the actual bed material height is often greater than the height obtainedfrom the operating parameters. Therefore, it is believed that the total bed inventory should includethe transition of the free fall zone in the furnace. Chourasia et al. [15] found that, as the fluidizationvelocity and the amount of bed material increase, the degree of wear increases, the surface of the bedmaterial is more easily broken, the formation and elutriation of fine particles are more obvious, andthe wear changes the particle size distribution of the bed material. The surface morphology of theparticles also affects the fluidization state and operating conditions. Based on theoretical analysis andexperimental verification, Yang et al. [16] studied the effect of bed pressure drop and bed inventory onCFB performance, and found that as the bed pressure drop decreases, the height of the dense phasezone at the bottom of the furnace decreases, and the char content in fly ash decreases. There is anoptimal value for the bed pressure drop, which can maximize the combustion efficiency and minimizethe wear of the heated surface and the power consumption of the fan. Park et al. [17] discussed theinstantaneous change of char concentration and the reaction rate to the instantaneous temperature withbed mass equilibrium. The current research basically takes the bed material in the furnace as a wholeand does not consider the changing law of the residual char in the bed material or its influence on thecombustion, heat transfer, and load change rate in the furnace. These studies are in the preliminaryanalysis stage of the start-stop process of the boiler and have not yet involved the analysis in theprocess of rapid dynamic changes of the lifting load.
At present, the amount of residual char is a variable that cannot be measured by instruments,which creates challenges in the adjustment and control of the circulating fluidized bed combustionsystem. Many furnace shutdown accidents caused by the unstable CFB combustion system are due tounstable bed temperature or bed pressure. Accurately estimating the amount of residual char in the
Energies 2020, 13, 5883 3 of 24
boiler is very important for the control system and the combustion efficiency. Therefore, it is of greatpractical significance to study the dynamic characteristics of residual char of the CFB boiler.
2. Boiler Characteristic Analysis
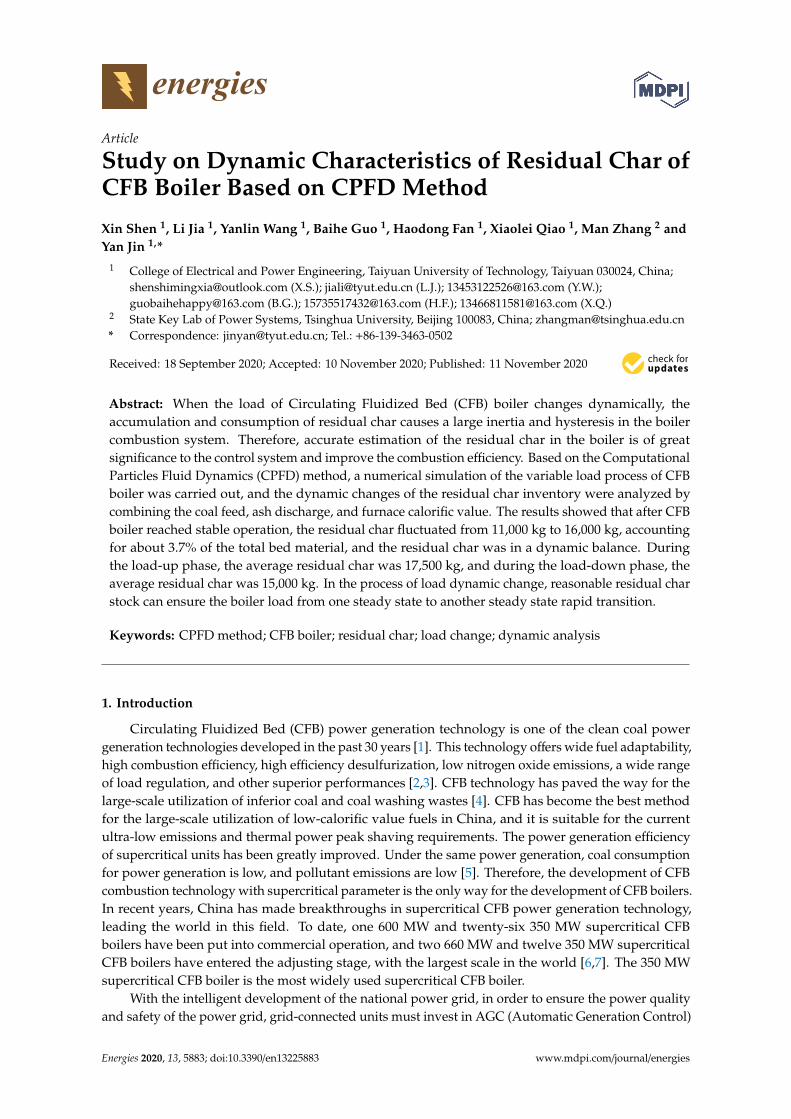
The 350 MW supercritical CFB boiler is a Direct Current (DC) furnace with supercritical parametersand variable pressure operation. The boiler type is SG-1208/25.4-M4605. It adopts a circulating fluidizedbed combustion mode; single-chamber, steam-cooled cyclone gas-solid separator; primary intermediatereheating; balanced ventilation; and solid slag discharge. The boiler is mainly composed of a suspendedfull-film water-cooled wall furnace, steam-cooled cyclone separator, returning system, and convectiveheating surface of the backpass channel. The geometric dimensions of the main components are shownin Table 1. The return valve is one of the key components of the CFB boiler. Figure 1 is a schematicdiagram of the return valve, where us and ur are separately the velocities of the loose air and return air.
Table 1. Geometric dimensions of main components of the boiler.
The Main Components Geometric Size (m)
Furnace width × depth 32 × 10Furnace height (to air distribution board) 48
Cyclone separator diameter ø 10Rear chimney width × depth 22 × 9
Energies 2020, 13, x FOR PEER REVIEW 3 of 26
the boiler is very important for the control system and the combustion efficiency. Therefore, it is of great practical significance to study the dynamic characteristics of residual char of the CFB boiler.
2. Boiler Characteristic Analysis
The 350 MW supercritical CFB boiler is a Direct Current (DC) furnace with supercritical parameters and variable pressure operation. The boiler type is SG-1208/25.4-M4605. It adopts a circulating fluidized bed combustion mode; single-chamber, steam-cooled cyclone gas-solid separator; primary intermediate reheating; balanced ventilation; and solid slag discharge. The boiler is mainly composed of a suspended full-film water-cooled wall furnace, steam-cooled cyclone separator, returning system, and convective heating surface of the backpass channel. The geometric dimensions of the main components are shown in Table 1. The return valve is one of the key components of the CFB boiler. Figure 1 is a schematic diagram of the return valve, where us and ur are separately the velocities of the loose air and return air.
Table 1. Geometric dimensions of main components of the boiler.
The Main Components Geometric Size(m) Furnace width × depth 32 × 10
Furnace height (to air distribution board) 48 Cyclone separator diameter ø 10 Rear chimney width × depth 22 × 9
1- Downcomer, 2- Moving packed bed, 3- Return bed
Figure 1. Return valve of the supercritical the Circulating Fluidized Bed (CFB) boiler.
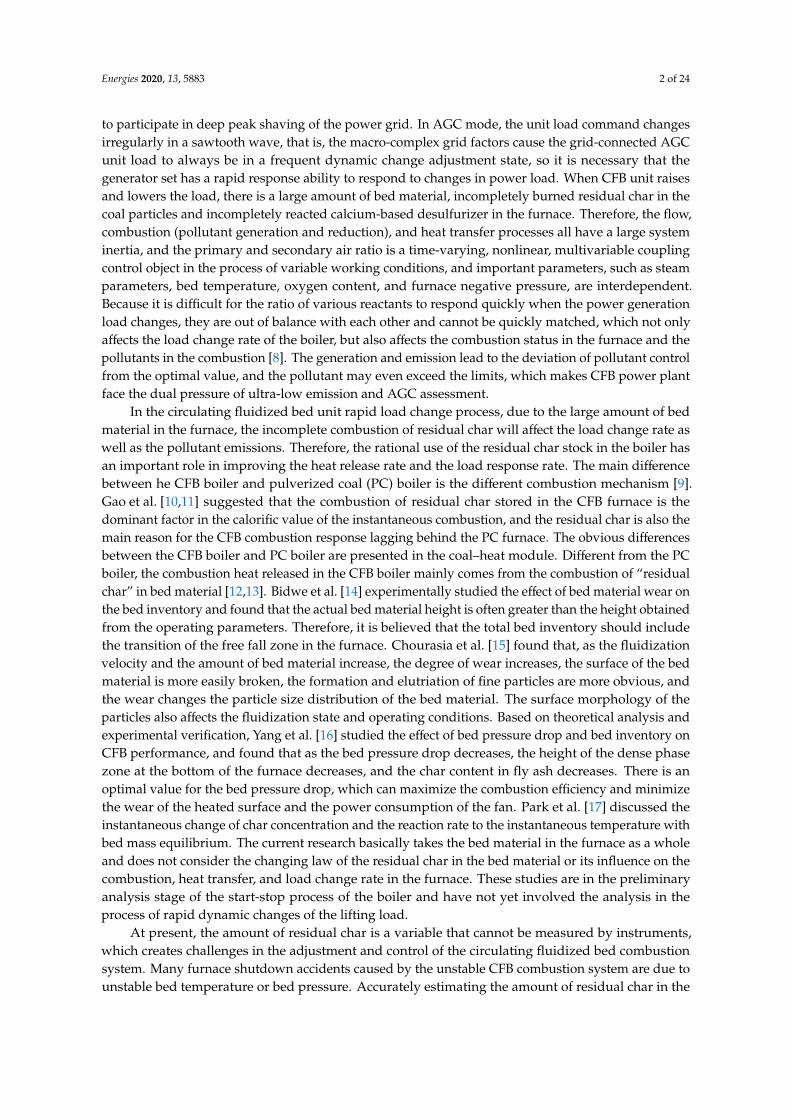
In the 350 MW supercritical CFB boiler, in addition to the arrangement of flue gas temperature, pressure, and sampling measurement points, a large number of measurement points of furnace pressure difference, bed temperature, fluidized air pressure and air volume are set to provide necessary monitoring means and protection measures to ensure the safe operation of the boiler. According to the actual position of pressure measurement points, the same pressure measurement points were set in the CPFD model. The pressure measurement point distribution is shown in Figure 2, in which Pa is the average value of 7–9, Pb is the average value of 10–12, Pc is the average value of 13–15, Pd is the average value of 16–18, Pe is the average value of 19–21, Pf is the average value of 22–27, and Pg is the average value of 28–33.
Figure 1. Return valve of the supercritical the Circulating Fluidized Bed (CFB) boiler.
In the 350 MW supercritical CFB boiler, in addition to the arrangement of flue gas temperature,pressure, and sampling measurement points, a large number of measurement points of furnacepressure difference, bed temperature, fluidized air pressure and air volume are set to provide necessarymonitoring means and protection measures to ensure the safe operation of the boiler. According to theactual position of pressure measurement points, the same pressure measurement points were set inthe CPFD model. The pressure measurement point distribution is shown in Figure 2, in which Pa isthe average value of 7–9, Pb is the average value of 10–12, Pc is the average value of 13–15, Pd is theaverage value of 16–18, Pe is the average value of 19–21, Pf is the average value of 22–27, and Pg is theaverage value of 28–33.
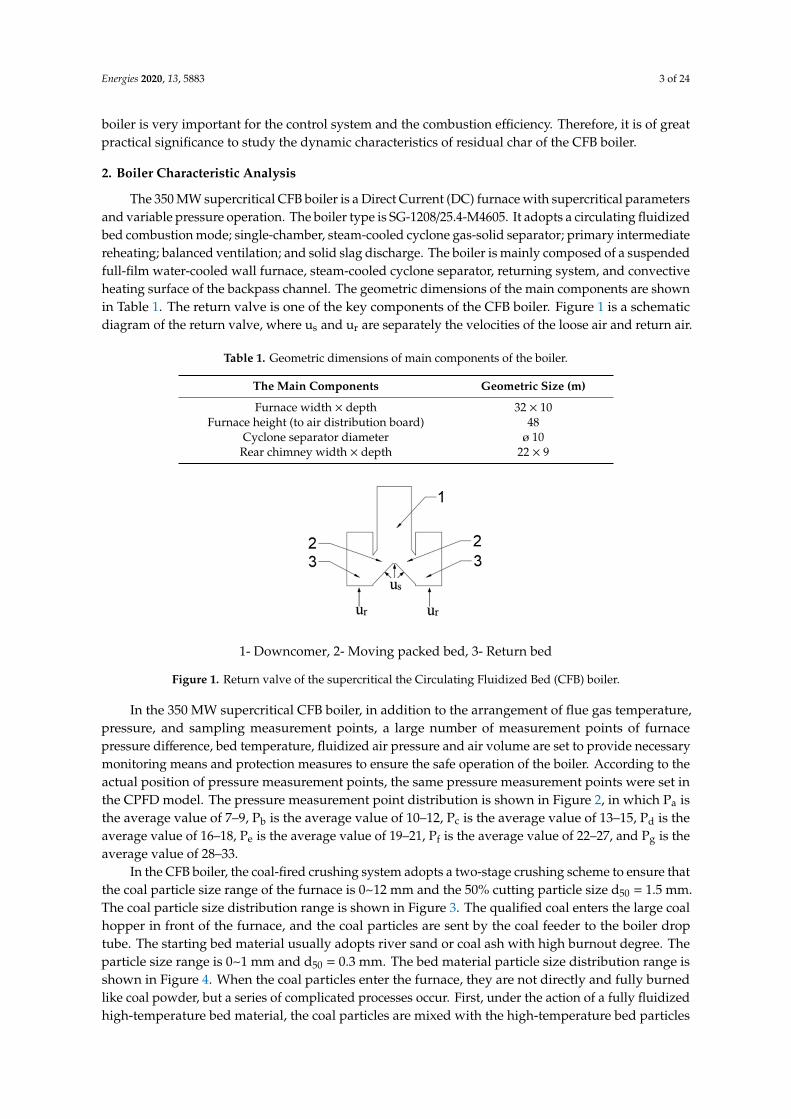
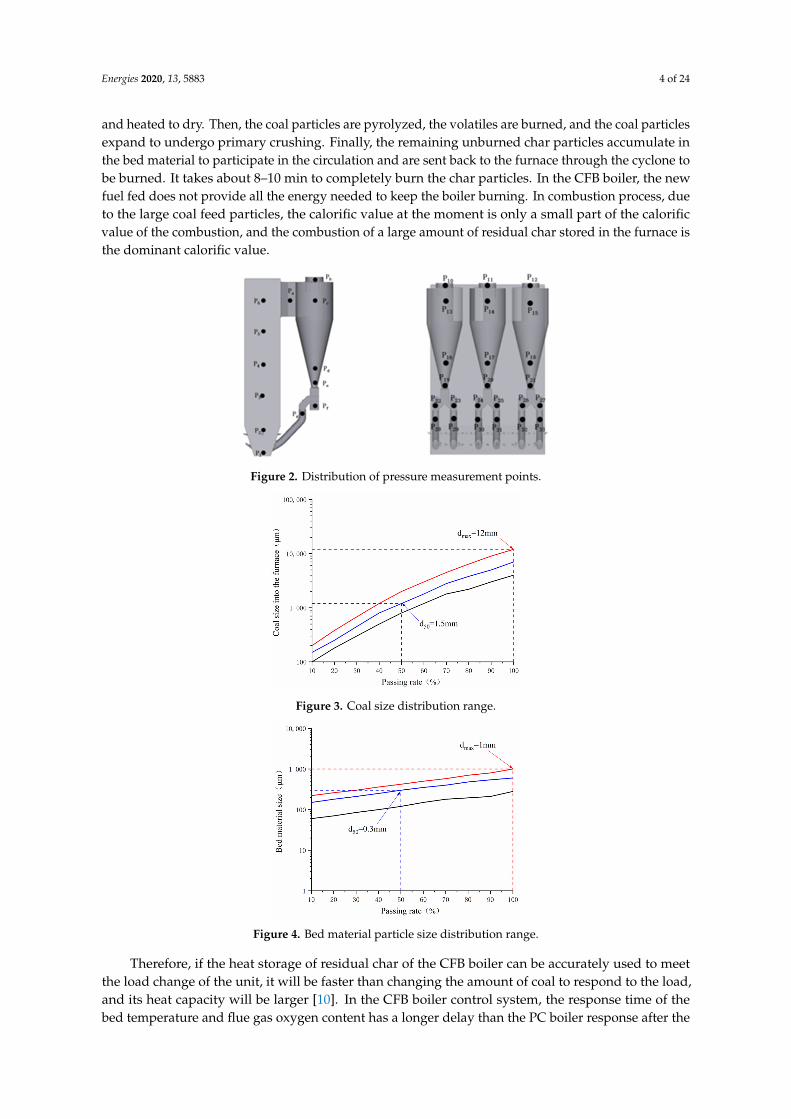
In the CFB boiler, the coal-fired crushing system adopts a two-stage crushing scheme to ensure thatthe coal particle size range of the furnace is 0~12 mm and the 50% cutting particle size d50 = 1.5 mm.The coal particle size distribution range is shown in Figure 3. The qualified coal enters the large coalhopper in front of the furnace, and the coal particles are sent by the coal feeder to the boiler droptube. The starting bed material usually adopts river sand or coal ash with high burnout degree. Theparticle size range is 0~1 mm and d50 = 0.3 mm. The bed material particle size distribution range isshown in Figure 4. When the coal particles enter the furnace, they are not directly and fully burnedlike coal powder, but a series of complicated processes occur. First, under the action of a fully fluidizedhigh-temperature bed material, the coal particles are mixed with the high-temperature bed particles
Energies 2020, 13, 5883 4 of 24
and heated to dry. Then, the coal particles are pyrolyzed, the volatiles are burned, and the coal particlesexpand to undergo primary crushing. Finally, the remaining unburned char particles accumulate inthe bed material to participate in the circulation and are sent back to the furnace through the cyclone tobe burned. It takes about 8–10 min to completely burn the char particles. In the CFB boiler, the newfuel fed does not provide all the energy needed to keep the boiler burning. In combustion process, dueto the large coal feed particles, the calorific value at the moment is only a small part of the calorificvalue of the combustion, and the combustion of a large amount of residual char stored in the furnace isthe dominant calorific value.
Energies 2020, 13, x FOR PEER REVIEW 4 of 26
Figure 2. Distribution of pressure measurement points.
In the CFB boiler, the coal-fired crushing system adopts a two-stage crushing scheme to ensure that the coal particle size range of the furnace is 0~12 mm and the 50% cutting particle size d50 = 1.5 mm. The coal particle size distribution range is shown in Figure 3. The qualified coal enters the large coal hopper in front of the furnace, and the coal particles are sent by the coal feeder to the boiler drop tube. The starting bed material usually adopts river sand or coal ash with high burnout degree. The particle size range is 0~1 mm and d50 = 0.3 mm. The bed material particle size distribution range is shown in Figure 4. When the coal particles enter the furnace, they are not directly and fully burned like coal powder, but a series of complicated processes occur. First, under the action of a fully fluidized high-temperature bed material, the coal particles are mixed with the high-temperature bed particles and heated to dry. Then, the coal particles are pyrolyzed, the volatiles are burned, and the coal particles expand to undergo primary crushing. Finally, the remaining unburned char particles accumulate in the bed material to participate in the circulation and are sent back to the furnace through the cyclone to be burned. It takes about 8–10 min to completely burn the char particles. In the CFB boiler, the new fuel fed does not provide all the energy needed to keep the boiler burning. In combustion process, due to the large coal feed particles, the calorific value at the moment is only a small part of the calorific value of the combustion, and the combustion of a large amount of residual char stored in the furnace is the dominant calorific value.
Figure 3. Coal size distribution range.
Figure 2. Distribution of pressure measurement points.
Energies 2020, 13, x FOR PEER REVIEW 4 of 26
Figure 2. Distribution of pressure measurement points.
In the CFB boiler, the coal-fired crushing system adopts a two-stage crushing scheme to ensure that the coal particle size range of the furnace is 0~12 mm and the 50% cutting particle size d50 = 1.5 mm. The coal particle size distribution range is shown in Figure 3. The qualified coal enters the large coal hopper in front of the furnace, and the coal particles are sent by the coal feeder to the boiler drop tube. The starting bed material usually adopts river sand or coal ash with high burnout degree. The particle size range is 0~1 mm and d50 = 0.3 mm. The bed material particle size distribution range is shown in Figure 4. When the coal particles enter the furnace, they are not directly and fully burned like coal powder, but a series of complicated processes occur. First, under the action of a fully fluidized high-temperature bed material, the coal particles are mixed with the high-temperature bed particles and heated to dry. Then, the coal particles are pyrolyzed, the volatiles are burned, and the coal particles expand to undergo primary crushing. Finally, the remaining unburned char particles accumulate in the bed material to participate in the circulation and are sent back to the furnace through the cyclone to be burned. It takes about 8–10 min to completely burn the char particles. In the CFB boiler, the new fuel fed does not provide all the energy needed to keep the boiler burning. In combustion process, due to the large coal feed particles, the calorific value at the moment is only a small part of the calorific value of the combustion, and the combustion of a large amount of residual char stored in the furnace is the dominant calorific value.
Figure 3. Coal size distribution range.
Figure 3. Coal size distribution range.
Energies 2020, 13, x FOR PEER REVIEW 5 of 26
Figure 4. Bed material particle size distribution range.
Therefore, if the heat storage of residual char of the CFB boiler can be accurately used to meet the load change of the unit, it will be faster than changing the amount of coal to respond to the load, and its heat capacity will be larger [10]. In the CFB boiler control system, the response time of the bed temperature and flue gas oxygen content has a longer delay than the PC boiler response after the coal feed step increase. The bed temperature and flue gas oxygen content respond very quickly to the stepwise increase in air volume. Reasonable use of the combustion characteristics will improve the stability of the unit and the response rate to the load command [11–13].
3. Model Construction
Barracuda is a commercial software based on Computational Particles Fluid Dynamics (CPFD) method. CPFD method simulates granular multiphase flow based on Euler–Lagrangian framework. CPFD technology draws on the multiphase particle-in-cell (MP-PIC) method to double-treat the particle phase. The particle is considered as a continuous medium and as a discrete body.
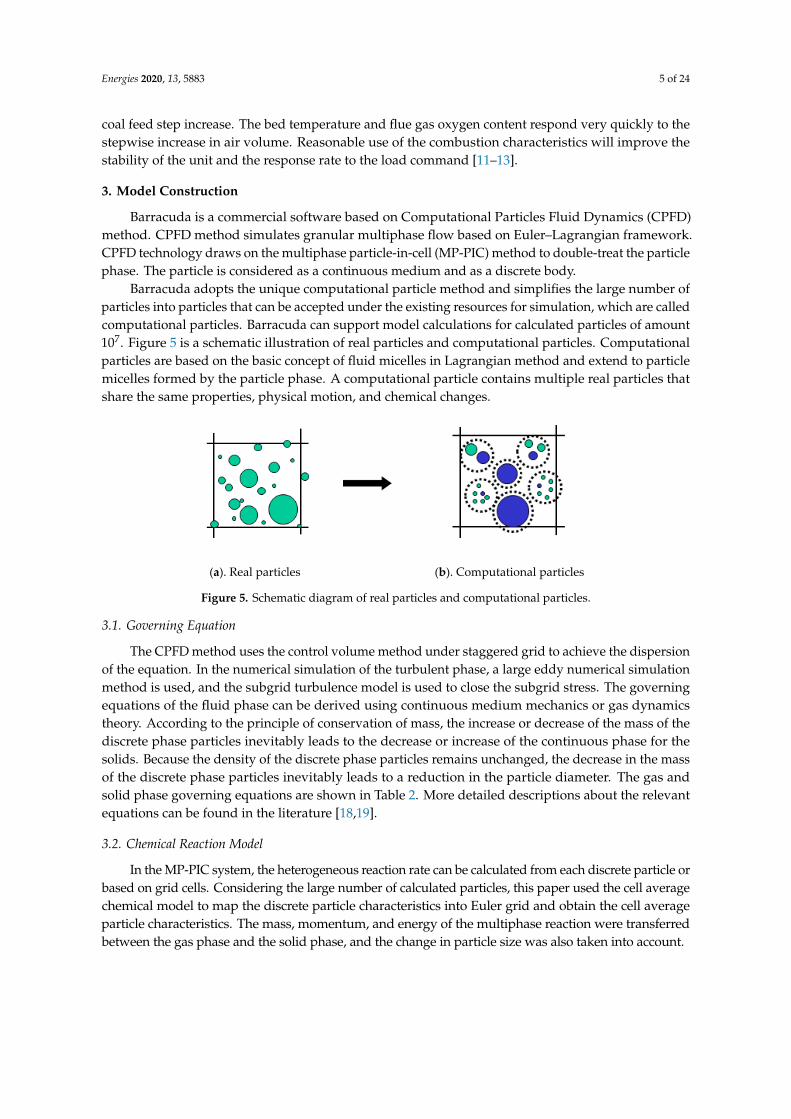
Barracuda adopts the unique computational particle method and simplifies the large number of particles into particles that can be accepted under the existing resources for simulation, which are called computational particles. Barracuda can support model calculations for calculated particles of amount 107. Figure 5 is a schematic illustration of real particles and computational particles. Computational particles are based on the basic concept of fluid micelles in Lagrangian method and extend to particle micelles formed by the particle phase. A computational particle contains multiple real particles that share the same properties, physical motion, and chemical changes.
(a). Real particles (b). Computational particles
Figure 5. Schematic diagram of real particles and computational particles.
3.1. Governing Equation
The CPFD method uses the control volume method under staggered grid to achieve the dispersion of the equation. In the numerical simulation of the turbulent phase, a large eddy numerical simulation method is used, and the subgrid turbulence model is used to close the subgrid stress. The
Figure 4. Bed material particle size distribution range.
Therefore, if the heat storage of residual char of the CFB boiler can be accurately used to meetthe load change of the unit, it will be faster than changing the amount of coal to respond to the load,and its heat capacity will be larger [10]. In the CFB boiler control system, the response time of thebed temperature and flue gas oxygen content has a longer delay than the PC boiler response after the
Energies 2020, 13, 5883 5 of 24
coal feed step increase. The bed temperature and flue gas oxygen content respond very quickly to thestepwise increase in air volume. Reasonable use of the combustion characteristics will improve thestability of the unit and the response rate to the load command [11–13].
3. Model Construction
Barracuda is a commercial software based on Computational Particles Fluid Dynamics (CPFD)method. CPFD method simulates granular multiphase flow based on Euler–Lagrangian framework.CPFD technology draws on the multiphase particle-in-cell (MP-PIC) method to double-treat the particlephase. The particle is considered as a continuous medium and as a discrete body.
Barracuda adopts the unique computational particle method and simplifies the large number ofparticles into particles that can be accepted under the existing resources for simulation, which are calledcomputational particles. Barracuda can support model calculations for calculated particles of amount107. Figure 5 is a schematic illustration of real particles and computational particles. Computationalparticles are based on the basic concept of fluid micelles in Lagrangian method and extend to particlemicelles formed by the particle phase. A computational particle contains multiple real particles thatshare the same properties, physical motion, and chemical changes.
Energies 2020, 13, x FOR PEER REVIEW 5 of 26
Figure 4. Bed material particle size distribution range.
Therefore, if the heat storage of residual char of the CFB boiler can be accurately used to meet the load change of the unit, it will be faster than changing the amount of coal to respond to the load, and its heat capacity will be larger [10]. In the CFB boiler control system, the response time of the bed temperature and flue gas oxygen content has a longer delay than the PC boiler response after the coal feed step increase. The bed temperature and flue gas oxygen content respond very quickly to the stepwise increase in air volume. Reasonable use of the combustion characteristics will improve the stability of the unit and the response rate to the load command [11–13].
3. Model Construction
Barracuda is a commercial software based on Computational Particles Fluid Dynamics (CPFD) method. CPFD method simulates granular multiphase flow based on Euler–Lagrangian framework. CPFD technology draws on the multiphase particle-in-cell (MP-PIC) method to double-treat the particle phase. The particle is considered as a continuous medium and as a discrete body.
Barracuda adopts the unique computational particle method and simplifies the large number of particles into particles that can be accepted under the existing resources for simulation, which are called computational particles. Barracuda can support model calculations for calculated particles of amount 107. Figure 5 is a schematic illustration of real particles and computational particles. Computational particles are based on the basic concept of fluid micelles in Lagrangian method and extend to particle micelles formed by the particle phase. A computational particle contains multiple real particles that share the same properties, physical motion, and chemical changes.
(a). Real particles (b). Computational particles
Figure 5. Schematic diagram of real particles and computational particles.
3.1. Governing Equation
The CPFD method uses the control volume method under staggered grid to achieve the dispersion of the equation. In the numerical simulation of the turbulent phase, a large eddy numerical simulation method is used, and the subgrid turbulence model is used to close the subgrid stress. The
Figure 5. Schematic diagram of real particles and computational particles.
3.1. Governing Equation
The CPFD method uses the control volume method under staggered grid to achieve the dispersionof the equation. In the numerical simulation of the turbulent phase, a large eddy numerical simulationmethod is used, and the subgrid turbulence model is used to close the subgrid stress. The governingequations of the fluid phase can be derived using continuous medium mechanics or gas dynamicstheory. According to the principle of conservation of mass, the increase or decrease of the mass of thediscrete phase particles inevitably leads to the decrease or increase of the continuous phase for thesolids. Because the density of the discrete phase particles remains unchanged, the decrease in the massof the discrete phase particles inevitably leads to a reduction in the particle diameter. The gas andsolid phase governing equations are shown in Table 2. More detailed descriptions about the relevantequations can be found in the literature [18,19].
3.2. Chemical Reaction Model
In the MP-PIC system, the heterogeneous reaction rate can be calculated from each discrete particle orbased on grid cells. Considering the large number of calculated particles, this paper used the cell averagechemical model to map the discrete particle characteristics into Euler grid and obtain the cell averageparticle characteristics. The mass, momentum, and energy of the multiphase reaction were transferredbetween the gas phase and the solid phase, and the change in particle size was also taken into account.
Energies 2020, 13, 5883 6 of 24
Table 2. Governing equations for gas and solid phases.
Items Control Equations
Gas-phase massconservative equation
∂(θgρg)∂t +∇·
(θgρgug
)= δms
Gas-phase momentum conservation equation ∂(θgρgug)∂t +∇·
(θgρgugug
)= −θg∇p+F + θgρgg+∇·
(θgτg
)Species conservation
equation for the gas phase∂(θgρgYg,i)
∂t +∇·(θgρgYg,iug
)= ∇·
(ρgDθg∇Yg,i
)+δmi,chem
Gas-phase energyconservation equation
∂∂t
(θgρghg
)+∇·(θgρghgug
)= θg
(∂p∂t +ug·∇p
)+ϕ−∇·
(θgq)+ Q + Sh+qD
Transport equation forparticle distribution function
∂f∂t +
∂(fu)∂x +
∂(fA)∂u = 0
Equation for particle acceleration a =dup
dt= Dp(ug − up) −
1ρp∇p− 1
θpρp∇τp + g +
u−up
2τD+ Fs
Equation for particlecontact normal stress τp =
Ppθβp
max[(θcp−θp),ε(1−θp)]Lumped-heat equation
for the particle CvdTp
dt = 1mp
λgNug,p
2rpAp(Tg−Tp
)+ 1
mpAwXwcewcσ
(T4
w−T4c
)Mass exchange rate δmp= −
tf
dmp
dt dmpdupdTp
Interphase momentum transfer F = −t
f{mp
[Dp
(ug−up −
∇pρp
)]+up
dmp
dt
}dmpdupdTp
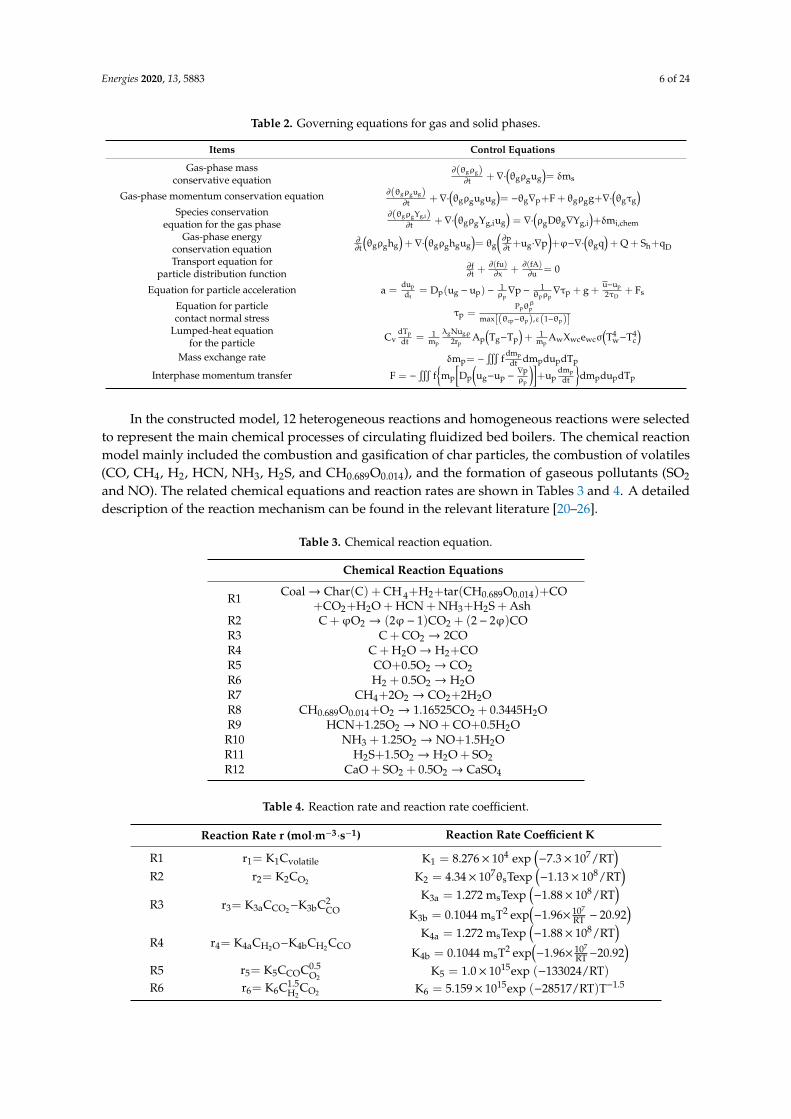
In the constructed model, 12 heterogeneous reactions and homogeneous reactions were selectedto represent the main chemical processes of circulating fluidized bed boilers. The chemical reactionmodel mainly included the combustion and gasification of char particles, the combustion of volatiles(CO, CH4, H2, HCN, NH3, H2S, and CH0.689O0.014), and the formation of gaseous pollutants (SO2
and NO). The related chemical equations and reaction rates are shown in Tables 3 and 4. A detaileddescription of the reaction mechanism can be found in the relevant literature [20–26].
Table 3. Chemical reaction equation.
Chemical Reaction Equations
R1 Coal→ Char(C) + CH 4+H2+tar(CH0.689O0.014)+CO+CO2+H2O + HCN + NH3+H2S + Ash
R2 C +ϕO2 → (2ϕ− 1)CO2 + (2− 2ϕ)COR3 C + CO2 → 2COR4 C + H2O→ H2+COR5 CO+0.5O2 → CO2R6 H2 + 0.5O2 → H2OR7 CH4+2O2 → CO2+2H2OR8 CH0.689O0.014+O2 → 1.16525CO2 + 0.3445H2OR9 HCN+1.25O2 → NO + CO+0.5H2O
R10 NH3 + 1.25O2 → NO+1.5H2OR11 H2S+1.5O2 → H2O + SO2R12 CaO + SO2 + 0.5O2 → CaSO4
Table 4. Reaction rate and reaction rate coefficient.
Reaction Rate r (mol·m−3·s−1) Reaction Rate Coefficient K
R1 r1= K1Cvolatile K1 = 8.276× 10⁴ exp(−7.3× 10⁷/RT
)R2 r2= K2CO2 K2 = 4.34× 10⁷θsTexp
(−1.13× 10⁸/RT
)R3 r3= K3aCCO2−K3bC2
CO
K3a = 1.272 msTexp(−1.88× 10⁸/RT
)K3b = 0.1044 msT2 exp
(−1.96× 10⁷
RT − 20.92)
R4 r4= K4aCH2O−K4bCH2 CCOK4a = 1.272 msTexp
(−1.88× 10⁸/RT
)K4b = 0.1044 msT2 exp
(−1.96× 10⁷
RT −20.92)
R5 r5= K5CCOC0.5O2
K5 = 1.0× 10¹⁵exp (−133024/RT)R6 r6= K6C1.5
H2CO2 K6 = 5.159× 10¹⁵exp (−28517/RT)T−1.5
Energies 2020, 13, 5883 7 of 24
Table 4. Cont.
Reaction Rate r (mol·m−3·s−1) Reaction Rate Coefficient K
R7 r7= K7CCH4 CO2 K7 = 3.552× 10¹⁴exp (−130530/RT)T−1
R8 r8= K8CtarCO2 K8 = 3.8× 10⁷exp(−0.555× 10⁸/RT
)R9 r9= K9CHCNCO2 K9 = 2.14× 10⁸exp
(−8.314× 10⁷/RT
)R10 r10= K10CNH3 CO2 K10 = 3.1× 10⁸exp
(−8.314× 10⁷/RT
)R11 r11= K11CH2SCO2 K11 = 5.2× 10⁸exp (−19300/RT)R12 r12= K12CSO2 CO2 K12 = 1.1× 10⁶exp
(−0.595× 10⁸/RT
)3.3. Simulation Condition Setting
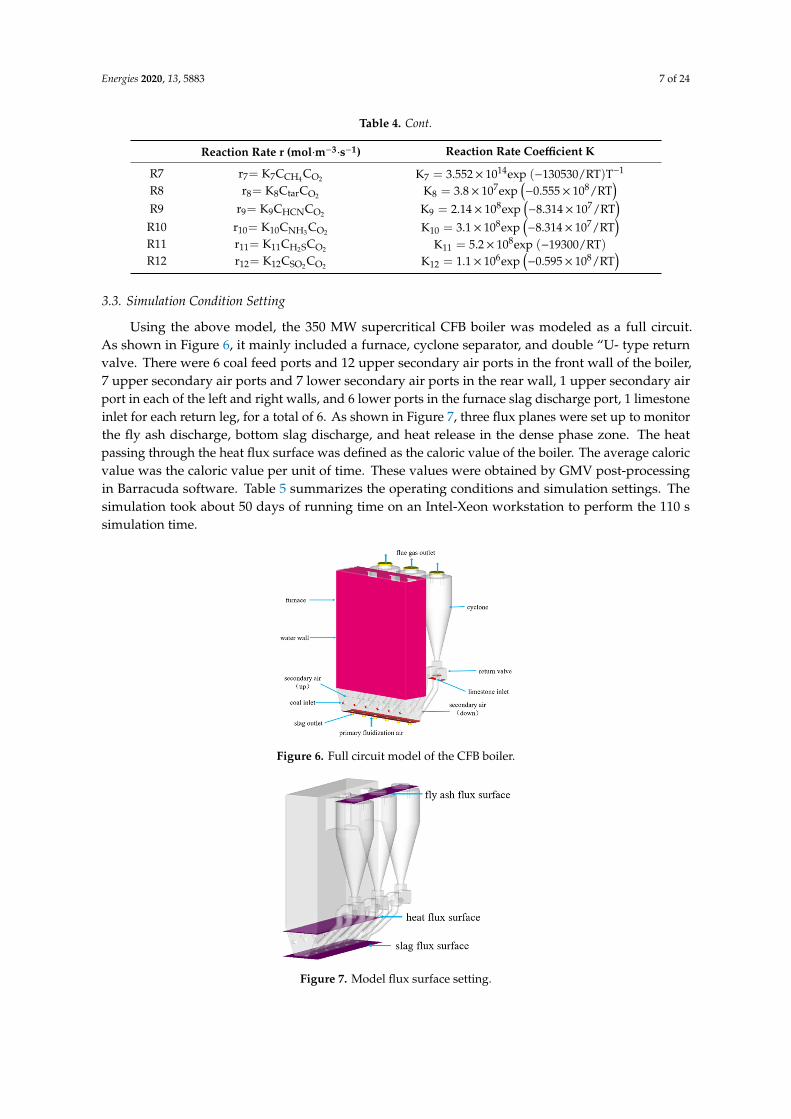
Using the above model, the 350 MW supercritical CFB boiler was modeled as a full circuit.As shown in Figure 6, it mainly included a furnace, cyclone separator, and double “U- type returnvalve. There were 6 coal feed ports and 12 upper secondary air ports in the front wall of the boiler,7 upper secondary air ports and 7 lower secondary air ports in the rear wall, 1 upper secondary airport in each of the left and right walls, and 6 lower ports in the furnace slag discharge port, 1 limestoneinlet for each return leg, for a total of 6. As shown in Figure 7, three flux planes were set up to monitorthe fly ash discharge, bottom slag discharge, and heat release in the dense phase zone. The heatpassing through the heat flux surface was defined as the caloric value of the boiler. The average caloricvalue was the caloric value per unit of time. These values were obtained by GMV post-processingin Barracuda software. Table 5 summarizes the operating conditions and simulation settings. Thesimulation took about 50 days of running time on an Intel-Xeon workstation to perform the 110 ssimulation time.Energies 2020, 13, x FOR PEER REVIEW 8 of 26
Figure 6. Full circuit model of the CFB boiler.
Figure 7. Model flux surface setting.
Table 5. Input parameters for the simulations.
Item Number load change (MW) 250 300 350
coal inlet flowrate (kg/s) 55 65 75 primary air inlet flowrate (kg/s) 110 125 140
secondary air (up/down) inlet flowrate (kg/s) 55/25 65/35 75/45 slag outlet pressure (Pa) 98,000 98,000 98,000
flue gas outlet pressure (Pa) 120,000 120,000 120,000 water wall temperature (K) 800 820 850
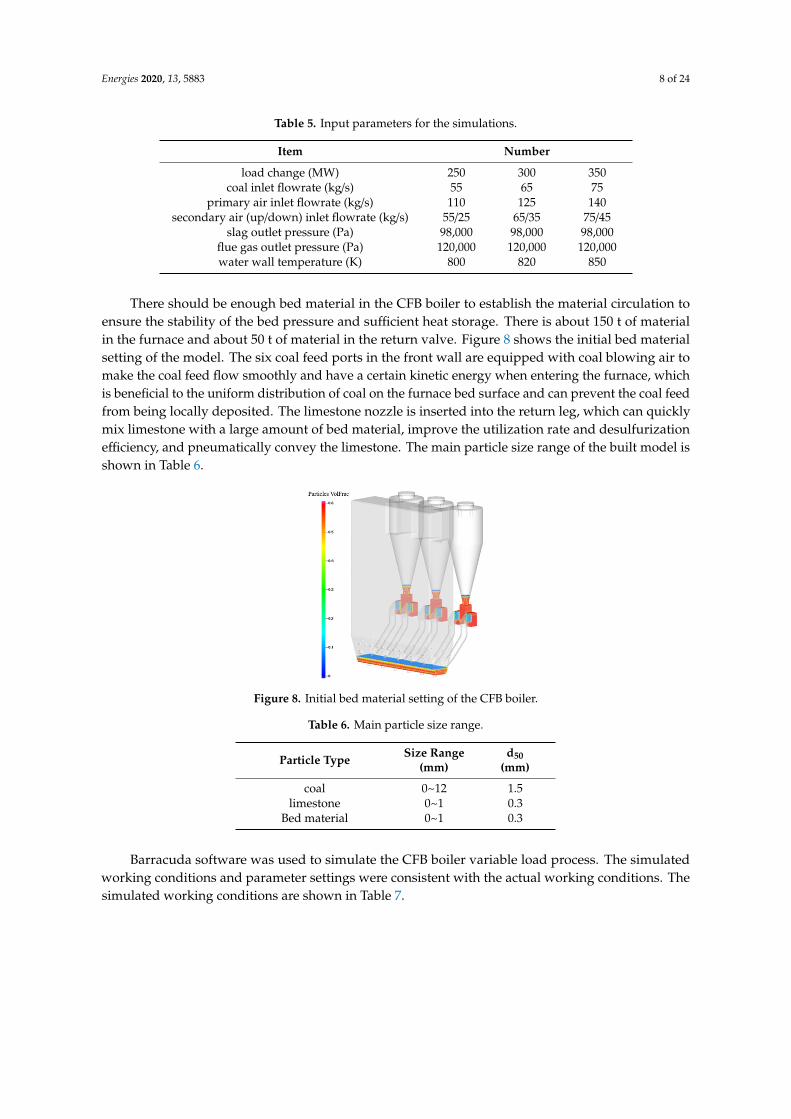
There should be enough bed material in the CFB boiler to establish the material circulation to ensure the stability of the bed pressure and sufficient heat storage. There is about 150 t of material in the furnace and about 50 t of material in the return valve. Figure 8 shows the initial bed material setting of the model. The six coal feed ports in the front wall are equipped with coal blowing air to make the coal feed flow smoothly and have a certain kinetic energy when entering the furnace, which is beneficial to the uniform distribution of coal on the furnace bed surface and can prevent the coal feed from being locally deposited. The limestone nozzle is inserted into the return leg, which can quickly mix limestone with a large amount of bed material, improve the utilization rate and desulfurization efficiency, and pneumatically convey the limestone. The main particle size range of the built model is shown in Table 6.
Figure 6. Full circuit model of the CFB boiler.
Energies 2020, 13, x FOR PEER REVIEW 8 of 26
Figure 6. Full circuit model of the CFB boiler.
Figure 7. Model flux surface setting.
Table 5. Input parameters for the simulations.
Item Number load change (MW) 250 300 350
coal inlet flowrate (kg/s) 55 65 75 primary air inlet flowrate (kg/s) 110 125 140
secondary air (up/down) inlet flowrate (kg/s) 55/25 65/35 75/45 slag outlet pressure (Pa) 98,000 98,000 98,000
flue gas outlet pressure (Pa) 120,000 120,000 120,000 water wall temperature (K) 800 820 850
There should be enough bed material in the CFB boiler to establish the material circulation to ensure the stability of the bed pressure and sufficient heat storage. There is about 150 t of material in the furnace and about 50 t of material in the return valve. Figure 8 shows the initial bed material setting of the model. The six coal feed ports in the front wall are equipped with coal blowing air to make the coal feed flow smoothly and have a certain kinetic energy when entering the furnace, which is beneficial to the uniform distribution of coal on the furnace bed surface and can prevent the coal feed from being locally deposited. The limestone nozzle is inserted into the return leg, which can quickly mix limestone with a large amount of bed material, improve the utilization rate and desulfurization efficiency, and pneumatically convey the limestone. The main particle size range of the built model is shown in Table 6.
Figure 7. Model flux surface setting.
Energies 2020, 13, 5883 8 of 24
Table 5. Input parameters for the simulations.
Item Number
load change (MW) 250 300 350coal inlet flowrate (kg/s) 55 65 75
primary air inlet flowrate (kg/s) 110 125 140secondary air (up/down) inlet flowrate (kg/s) 55/25 65/35 75/45
slag outlet pressure (Pa) 98,000 98,000 98,000flue gas outlet pressure (Pa) 120,000 120,000 120,000water wall temperature (K) 800 820 850
There should be enough bed material in the CFB boiler to establish the material circulation toensure the stability of the bed pressure and sufficient heat storage. There is about 150 t of materialin the furnace and about 50 t of material in the return valve. Figure 8 shows the initial bed materialsetting of the model. The six coal feed ports in the front wall are equipped with coal blowing air tomake the coal feed flow smoothly and have a certain kinetic energy when entering the furnace, whichis beneficial to the uniform distribution of coal on the furnace bed surface and can prevent the coal feedfrom being locally deposited. The limestone nozzle is inserted into the return leg, which can quicklymix limestone with a large amount of bed material, improve the utilization rate and desulfurizationefficiency, and pneumatically convey the limestone. The main particle size range of the built model isshown in Table 6.Energies 2020, 13, x FOR PEER REVIEW 9 of 26
Figure 8. Initial bed material setting of the CFB boiler.
Table 6. Main particle size range.
Particle Type Size Range (mm)
d50 (mm)
coal 0~12 1.5 limestone 0~1 0.3
Bed material 0~1 0.3
Barracuda software was used to simulate the CFB boiler variable load process. The simulated working conditions and parameter settings were consistent with the actual working conditions. The simulated working conditions are shown in Table 7.
Table 7. Load dynamic simulation conditions of the CFB boiler.
Simulation Phase Simulation Time(s) Load Change (MW) start up 0~30 0→250
Load up 30~50 250→300 50~70 300→350
Load down 70~90 350→300 90~110 300→250
4. Results and Discussion
4.1. Simulation Parameter Determination
4.1.1. Determination of Particle Packing Limit
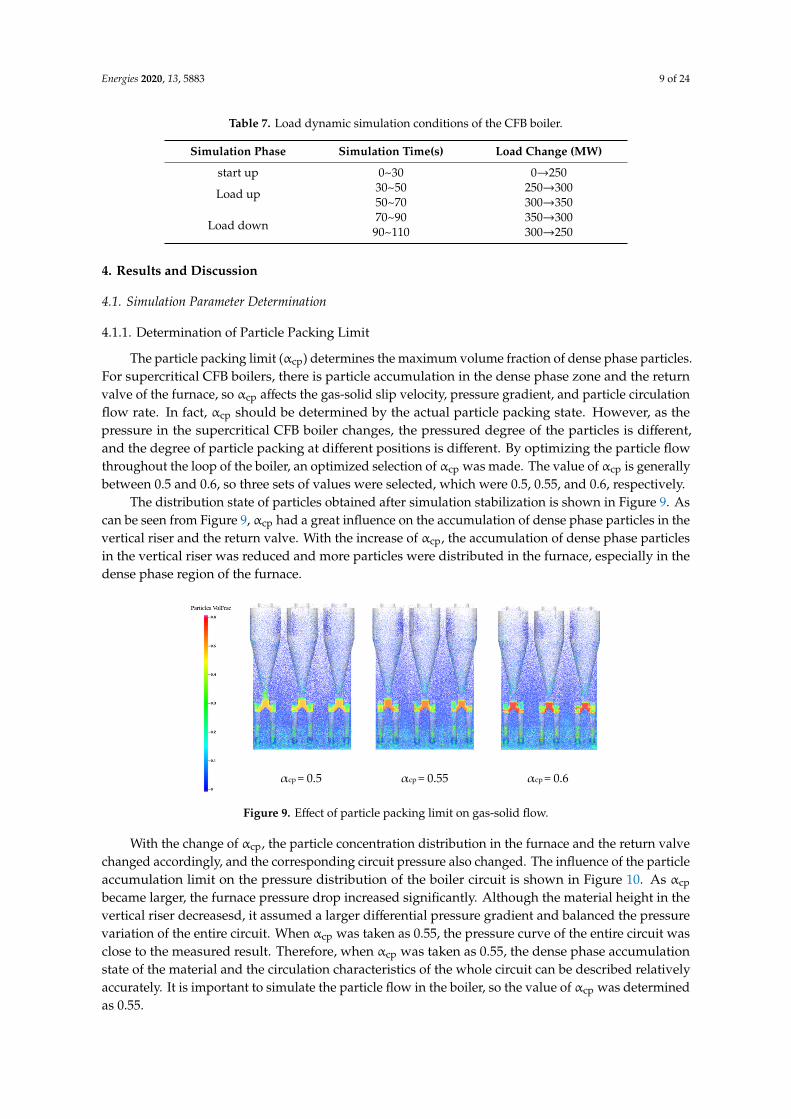
The particle packing limit (αcp) determines the maximum volume fraction of dense phase particles. For supercritical CFB boilers, there is particle accumulation in the dense phase zone and the return valve of the furnace, so αcp affects the gas-solid slip velocity, pressure gradient, and particle circulation flow rate. In fact, αcp should be determined by the actual particle packing state. However, as the pressure in the supercritical CFB boiler changes, the pressured degree of the particles is different, and the degree of particle packing at different positions is different. By optimizing the particle flow throughout the loop of the boiler, an optimized selection of αcp was made. The value of αcp is generally between 0.5 and 0.6, so three sets of values were selected, which were 0.5, 0.55, and 0.6, respectively.
The distribution state of particles obtained after simulation stabilization is shown in Figure 9. As can be seen from Figure 9, αcp had a great influence on the accumulation of dense phase particles in the vertical riser and the return valve. With the increase of αcp, the accumulation of dense phase particles in the vertical riser was reduced and more particles were distributed in the furnace, especially in the dense phase region of the furnace.
Figure 8. Initial bed material setting of the CFB boiler.
Table 6. Main particle size range.
Particle Type Size Range(mm)
d50(mm)
coal 0~12 1.5limestone 0~1 0.3
Bed material 0~1 0.3
Barracuda software was used to simulate the CFB boiler variable load process. The simulatedworking conditions and parameter settings were consistent with the actual working conditions. Thesimulated working conditions are shown in Table 7.
Energies 2020, 13, 5883 9 of 24
Table 7. Load dynamic simulation conditions of the CFB boiler.
Simulation Phase Simulation Time(s) Load Change (MW)
start up 0~30 0→250
Load up 30~50 250→30050~70 300→350
Load down70~90 350→30090~110 300→250
4. Results and Discussion
4.1. Simulation Parameter Determination
4.1.1. Determination of Particle Packing Limit
The particle packing limit (αcp) determines the maximum volume fraction of dense phase particles.For supercritical CFB boilers, there is particle accumulation in the dense phase zone and the returnvalve of the furnace, so αcp affects the gas-solid slip velocity, pressure gradient, and particle circulationflow rate. In fact, αcp should be determined by the actual particle packing state. However, as thepressure in the supercritical CFB boiler changes, the pressured degree of the particles is different,and the degree of particle packing at different positions is different. By optimizing the particle flowthroughout the loop of the boiler, an optimized selection of αcp was made. The value of αcp is generallybetween 0.5 and 0.6, so three sets of values were selected, which were 0.5, 0.55, and 0.6, respectively.
The distribution state of particles obtained after simulation stabilization is shown in Figure 9. Ascan be seen from Figure 9, αcp had a great influence on the accumulation of dense phase particles in thevertical riser and the return valve. With the increase of αcp, the accumulation of dense phase particlesin the vertical riser was reduced and more particles were distributed in the furnace, especially in thedense phase region of the furnace.Energies 2020, 13, x FOR PEER REVIEW 10 of 26
αcp = 0.5 αcp = 0.55 αcp = 0.6
Figure 9. Effect of particle packing limit on gas-solid flow.
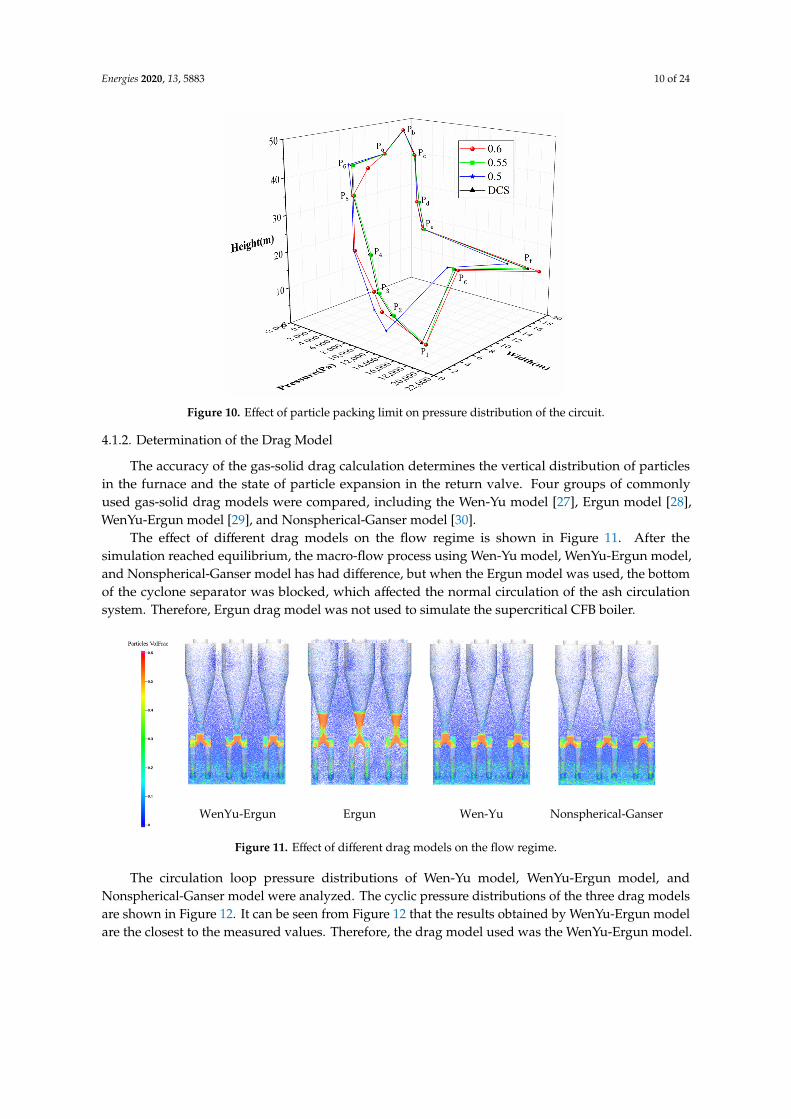
With the change of αcp, the particle concentration distribution in the furnace and the return valve changed accordingly, and the corresponding circuit pressure also changed. The influence of the particle accumulation limit on the pressure distribution of the boiler circuit is shown in Figure 10. As αcp became larger, the furnace pressure drop increased significantly. Although the material height in the vertical riser decreasesd, it assumed a larger differential pressure gradient and balanced the pressure variation of the entire circuit. When αcp was taken as 0.55, the pressure curve of the entire circuit was close to the measured result. Therefore, when αcp was taken as 0.55, the dense phase accumulation state of the material and the circulation characteristics of the whole circuit can be described relatively accurately. It is important to simulate the particle flow in the boiler, so the value of αcp was determined as 0.55.
Figure 10. Effect of particle packing limit on pressure distribution of the circuit.
4.1.2. Determination of the Drag Model
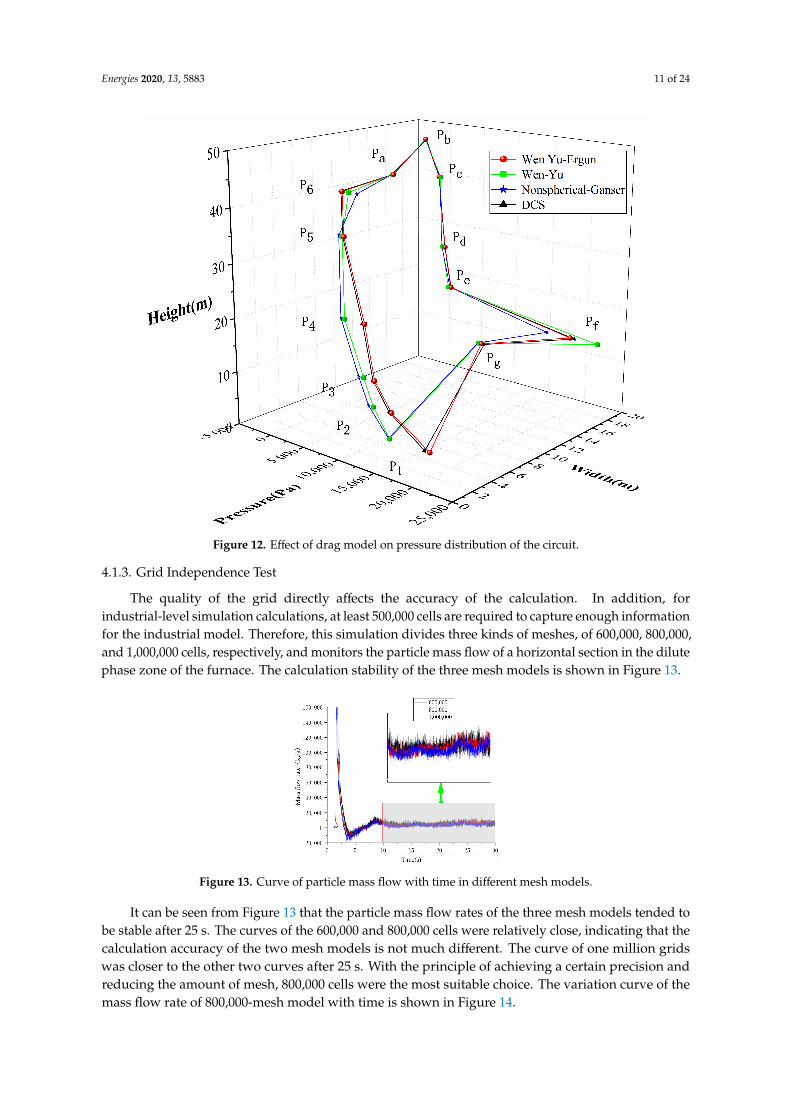
The accuracy of the gas-solid drag calculation determines the vertical distribution of particles in the furnace and the state of particle expansion in the return valve. Four groups of commonly used gas-solid drag models were compared, including the Wen-Yu model [27], Ergun model [28], WenYu-Ergun model [29], and Nonspherical-Ganser model [30].
The effect of different drag models on the flow regime is shown in Figure 11. After the simulation reached equilibrium, the macro-flow process using Wen-Yu model, WenYu-Ergun model, and Nonspherical-Ganser model has had difference, but when the Ergun model was used, the bottom of
Figure 9. Effect of particle packing limit on gas-solid flow.
With the change of αcp, the particle concentration distribution in the furnace and the return valvechanged accordingly, and the corresponding circuit pressure also changed. The influence of the particleaccumulation limit on the pressure distribution of the boiler circuit is shown in Figure 10. As αcp
became larger, the furnace pressure drop increased significantly. Although the material height in thevertical riser decreasesd, it assumed a larger differential pressure gradient and balanced the pressurevariation of the entire circuit. When αcp was taken as 0.55, the pressure curve of the entire circuit wasclose to the measured result. Therefore, when αcp was taken as 0.55, the dense phase accumulationstate of the material and the circulation characteristics of the whole circuit can be described relativelyaccurately. It is important to simulate the particle flow in the boiler, so the value of αcp was determinedas 0.55.
Energies 2020, 13, 5883 10 of 24
Energies 2020, 13, x FOR PEER REVIEW 10 of 26
αcp = 0.5 αcp = 0.55 αcp = 0.6
Figure 9. Effect of particle packing limit on gas-solid flow.
With the change of αcp, the particle concentration distribution in the furnace and the return valve changed accordingly, and the corresponding circuit pressure also changed. The influence of the particle accumulation limit on the pressure distribution of the boiler circuit is shown in Figure 10. As αcp became larger, the furnace pressure drop increased significantly. Although the material height in the vertical riser decreasesd, it assumed a larger differential pressure gradient and balanced the pressure variation of the entire circuit. When αcp was taken as 0.55, the pressure curve of the entire circuit was close to the measured result. Therefore, when αcp was taken as 0.55, the dense phase accumulation state of the material and the circulation characteristics of the whole circuit can be described relatively accurately. It is important to simulate the particle flow in the boiler, so the value of αcp was determined as 0.55.
Figure 10. Effect of particle packing limit on pressure distribution of the circuit.
4.1.2. Determination of the Drag Model
The accuracy of the gas-solid drag calculation determines the vertical distribution of particles in the furnace and the state of particle expansion in the return valve. Four groups of commonly used gas-solid drag models were compared, including the Wen-Yu model [27], Ergun model [28], WenYu-Ergun model [29], and Nonspherical-Ganser model [30].
The effect of different drag models on the flow regime is shown in Figure 11. After the simulation reached equilibrium, the macro-flow process using Wen-Yu model, WenYu-Ergun model, and Nonspherical-Ganser model has had difference, but when the Ergun model was used, the bottom of
Figure 10. Effect of particle packing limit on pressure distribution of the circuit.
4.1.2. Determination of the Drag Model
The accuracy of the gas-solid drag calculation determines the vertical distribution of particlesin the furnace and the state of particle expansion in the return valve. Four groups of commonlyused gas-solid drag models were compared, including the Wen-Yu model [27], Ergun model [28],WenYu-Ergun model [29], and Nonspherical-Ganser model [30].
The effect of different drag models on the flow regime is shown in Figure 11. After thesimulation reached equilibrium, the macro-flow process using Wen-Yu model, WenYu-Ergun model,and Nonspherical-Ganser model has had difference, but when the Ergun model was used, the bottomof the cyclone separator was blocked, which affected the normal circulation of the ash circulationsystem. Therefore, Ergun drag model was not used to simulate the supercritical CFB boiler.
Energies 2020, 13, x FOR PEER REVIEW 11 of 26
the cyclone separator was blocked, which affected the normal circulation of the ash circulation system. Therefore, Ergun drag model was not used to simulate the supercritical CFB boiler.
WenYu-Ergun Ergun Wen-Yu Nonspherical-Ganser
Figure 11. Effect of different drag models on the flow regime.
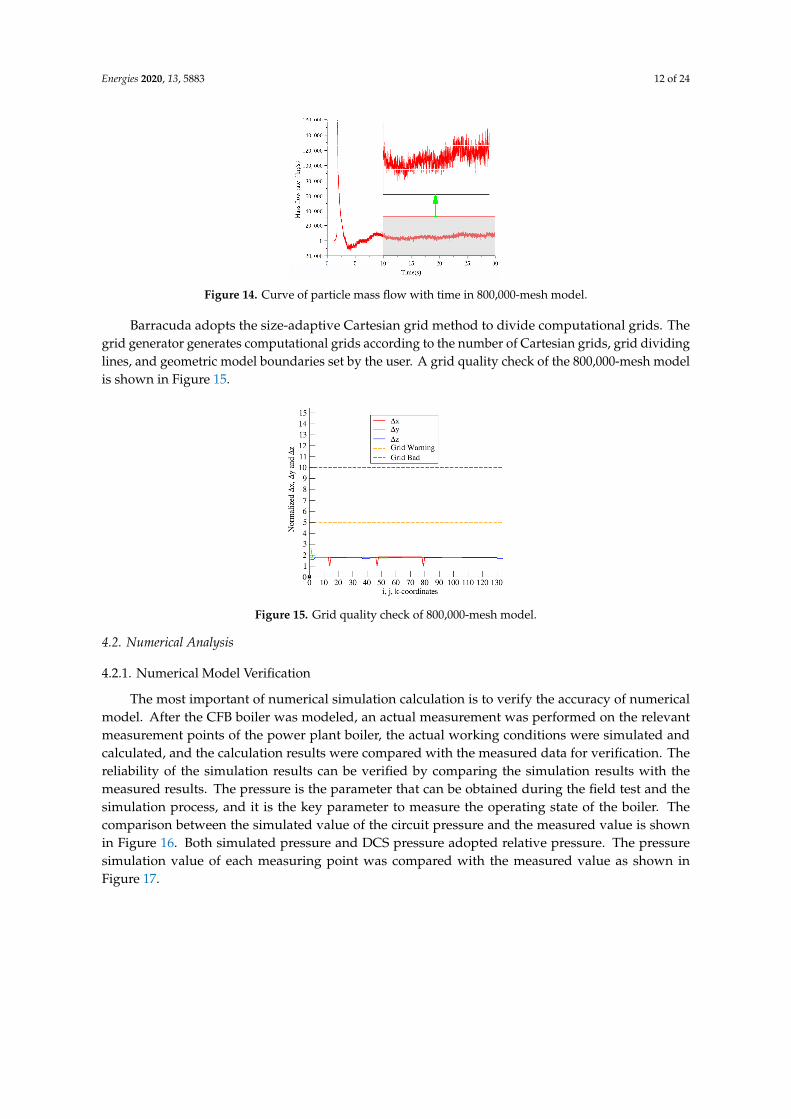
The circulation loop pressure distributions of Wen-Yu model, WenYu-Ergun model, and Nonspherical-Ganser model were analyzed. The cyclic pressure distributions of the three drag models are shown in Figure 12. It can be seen from Figure 12 that the results obtained by WenYu-Ergun model are the closest to the measured values. Therefore, the drag model used was the WenYu-Ergun model.
Figure 12. Effect of drag model on pressure distribution of the circuit.
4.1.3. Grid Independence Test
The quality of the grid directly affects the accuracy of the calculation. In addition, for industrial-level simulation calculations, at least 500,000 cells are required to capture enough information for the
Figure 11. Effect of different drag models on the flow regime.
The circulation loop pressure distributions of Wen-Yu model, WenYu-Ergun model, andNonspherical-Ganser model were analyzed. The cyclic pressure distributions of the three drag modelsare shown in Figure 12. It can be seen from Figure 12 that the results obtained by WenYu-Ergun modelare the closest to the measured values. Therefore, the drag model used was the WenYu-Ergun model.
Energies 2020, 13, 5883 11 of 24
Energies 2020, 13, x FOR PEER REVIEW 11 of 26
the cyclone separator was blocked, which affected the normal circulation of the ash circulation system. Therefore, Ergun drag model was not used to simulate the supercritical CFB boiler.
WenYu-Ergun Ergun Wen-Yu Nonspherical-Ganser
Figure 11. Effect of different drag models on the flow regime.
The circulation loop pressure distributions of Wen-Yu model, WenYu-Ergun model, and Nonspherical-Ganser model were analyzed. The cyclic pressure distributions of the three drag models are shown in Figure 12. It can be seen from Figure 12 that the results obtained by WenYu-Ergun model are the closest to the measured values. Therefore, the drag model used was the WenYu-Ergun model.
Figure 12. Effect of drag model on pressure distribution of the circuit.
4.1.3. Grid Independence Test
The quality of the grid directly affects the accuracy of the calculation. In addition, for industrial-level simulation calculations, at least 500,000 cells are required to capture enough information for the
Figure 12. Effect of drag model on pressure distribution of the circuit.
4.1.3. Grid Independence Test
The quality of the grid directly affects the accuracy of the calculation. In addition, forindustrial-level simulation calculations, at least 500,000 cells are required to capture enough informationfor the industrial model. Therefore, this simulation divides three kinds of meshes, of 600,000, 800,000,and 1,000,000 cells, respectively, and monitors the particle mass flow of a horizontal section in the dilutephase zone of the furnace. The calculation stability of the three mesh models is shown in Figure 13.
Energies 2020, 13, x FOR PEER REVIEW 12 of 26
industrial model. Therefore, this simulation divides three kinds of meshes, of 600,000, 800,000, and 1,000,000 cells, respectively, and monitors the particle mass flow of a horizontal section in the dilute phase zone of the furnace. The calculation stability of the three mesh models is shown in Figure 13.
Figure 13. Curve of particle mass flow with time in different mesh models.
It can be seen from Figure 13 that the particle mass flow rates of the three mesh models tended to be stable after 25 s. The curves of the 600,000 and 800,000 cells were relatively close, indicating that the calculation accuracy of the two mesh models is not much different. The curve of one million grids was closer to the other two curves after 25 s. With the principle of achieving a certain precision and reducing the amount of mesh, 800,000 cells were the most suitable choice. The variation curve of the mass flow rate of 800,000-mesh model with time is shown in Figure 14.
Figure 14. Curve of particle mass flow with time in 800,000-mesh model.
Barracuda adopts the size-adaptive Cartesian grid method to divide computational grids. The grid generator generates computational grids according to the number of Cartesian grids, grid dividing lines, and geometric model boundaries set by the user. A grid quality check of the 800,000-mesh model is shown in Figure 15.
Figure 13. Curve of particle mass flow with time in different mesh models.
It can be seen from Figure 13 that the particle mass flow rates of the three mesh models tended tobe stable after 25 s. The curves of the 600,000 and 800,000 cells were relatively close, indicating that thecalculation accuracy of the two mesh models is not much different. The curve of one million gridswas closer to the other two curves after 25 s. With the principle of achieving a certain precision andreducing the amount of mesh, 800,000 cells were the most suitable choice. The variation curve of themass flow rate of 800,000-mesh model with time is shown in Figure 14.
Energies 2020, 13, 5883 12 of 24
Energies 2020, 13, x FOR PEER REVIEW 12 of 26
industrial model. Therefore, this simulation divides three kinds of meshes, of 600,000, 800,000, and 1,000,000 cells, respectively, and monitors the particle mass flow of a horizontal section in the dilute phase zone of the furnace. The calculation stability of the three mesh models is shown in Figure 13.
Figure 13. Curve of particle mass flow with time in different mesh models.
It can be seen from Figure 13 that the particle mass flow rates of the three mesh models tended to be stable after 25 s. The curves of the 600,000 and 800,000 cells were relatively close, indicating that the calculation accuracy of the two mesh models is not much different. The curve of one million grids was closer to the other two curves after 25 s. With the principle of achieving a certain precision and reducing the amount of mesh, 800,000 cells were the most suitable choice. The variation curve of the mass flow rate of 800,000-mesh model with time is shown in Figure 14.
Figure 14. Curve of particle mass flow with time in 800,000-mesh model.
Barracuda adopts the size-adaptive Cartesian grid method to divide computational grids. The grid generator generates computational grids according to the number of Cartesian grids, grid dividing lines, and geometric model boundaries set by the user. A grid quality check of the 800,000-mesh model is shown in Figure 15.
Figure 14. Curve of particle mass flow with time in 800,000-mesh model.
Barracuda adopts the size-adaptive Cartesian grid method to divide computational grids. Thegrid generator generates computational grids according to the number of Cartesian grids, grid dividinglines, and geometric model boundaries set by the user. A grid quality check of the 800,000-mesh modelis shown in Figure 15.
Energies 2020, 13, x FOR PEER REVIEW 12 of 26
industrial model. Therefore, this simulation divides three kinds of meshes, of 600,000, 800,000, and 1,000,000 cells, respectively, and monitors the particle mass flow of a horizontal section in the dilute phase zone of the furnace. The calculation stability of the three mesh models is shown in Figure 13.
Figure 13. Curve of particle mass flow with time in different mesh models.
It can be seen from Figure 13 that the particle mass flow rates of the three mesh models tended to be stable after 25 s. The curves of the 600,000 and 800,000 cells were relatively close, indicating that the calculation accuracy of the two mesh models is not much different. The curve of one million grids was closer to the other two curves after 25 s. With the principle of achieving a certain precision and reducing the amount of mesh, 800,000 cells were the most suitable choice. The variation curve of the mass flow rate of 800,000-mesh model with time is shown in Figure 14.
Figure 14. Curve of particle mass flow with time in 800,000-mesh model.
Barracuda adopts the size-adaptive Cartesian grid method to divide computational grids. The grid generator generates computational grids according to the number of Cartesian grids, grid dividing lines, and geometric model boundaries set by the user. A grid quality check of the 800,000-mesh model is shown in Figure 15.
Figure 15. Grid quality check of 800,000-mesh model.
4.2. Numerical Analysis
4.2.1. Numerical Model Verification
The most important of numerical simulation calculation is to verify the accuracy of numericalmodel. After the CFB boiler was modeled, an actual measurement was performed on the relevantmeasurement points of the power plant boiler, the actual working conditions were simulated andcalculated, and the calculation results were compared with the measured data for verification. Thereliability of the simulation results can be verified by comparing the simulation results with themeasured results. The pressure is the parameter that can be obtained during the field test and thesimulation process, and it is the key parameter to measure the operating state of the boiler. Thecomparison between the simulated value of the circuit pressure and the measured value is shownin Figure 16. Both simulated pressure and DCS pressure adopted relative pressure. The pressuresimulation value of each measuring point was compared with the measured value as shown inFigure 17.
Energies 2020, 13, 5883 13 of 24
Energies 2020, 13, x FOR PEER REVIEW 13 of 26
Figure 15. Grid quality check of 800,000-mesh model.
4.2. Numerical Analysis
4.2.1. Numerical Model Verification
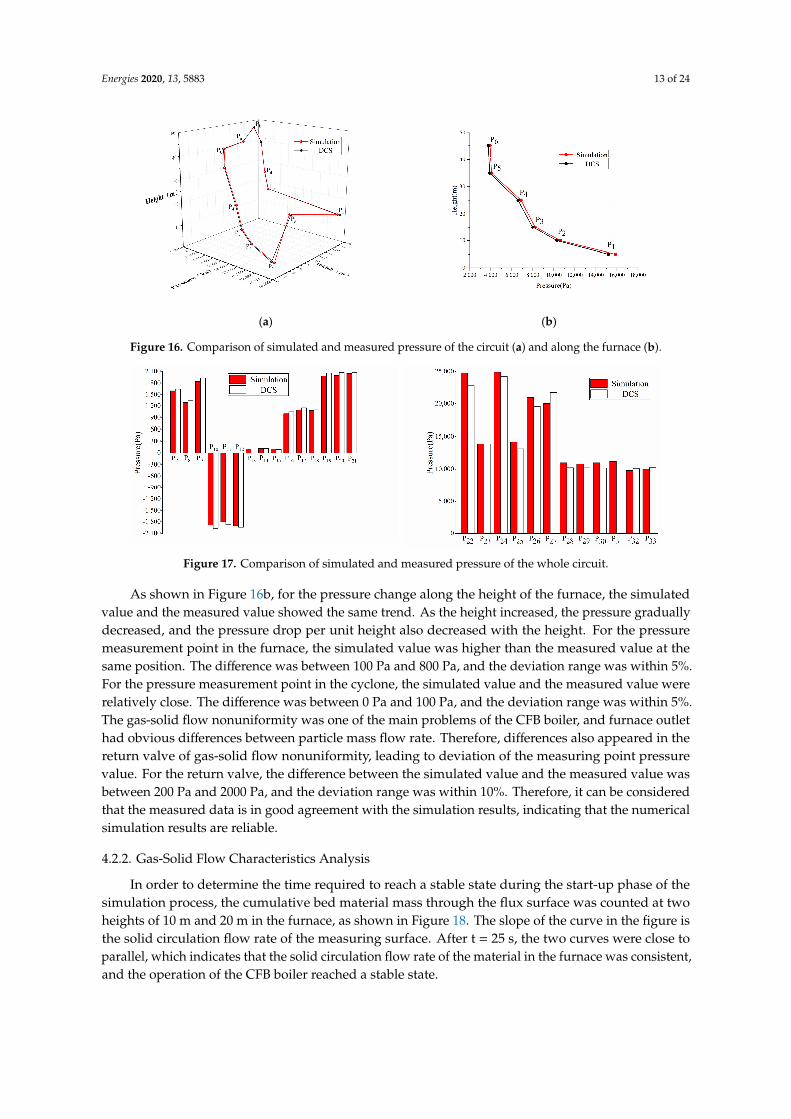
The most important of numerical simulation calculation is to verify the accuracy of numerical model. After the CFB boiler was modeled, an actual measurement was performed on the relevant measurement points of the power plant boiler, the actual working conditions were simulated and calculated, and the calculation results were compared with the measured data for verification. The reliability of the simulation results can be verified by comparing the simulation results with the measured results. The pressure is the parameter that can be obtained during the field test and the simulation process, and it is the key parameter to measure the operating state of the boiler. The comparison between the simulated value of the circuit pressure and the measured value is shown in Figure 16. Both simulated pressure and DCS pressure adopted relative pressure. The pressure simulation value of each measuring point was compared with the measured value as shown in Figure 17.
(a) (b)
Figure 16. Comparison of simulated and measured pressure of the circuit (a) and along the furnace (b).
Figure 17. Comparison of simulated and measured pressure of the whole circuit.
As shown in Figure 16b, for the pressure change along the height of the furnace, the simulated value and the measured value showed the same trend. As the height increased, the pressure gradually decreased, and the pressure drop per unit height also decreased with the height. For the pressure measurement point in the furnace, the simulated value was higher than the measured value
Figure 16. Comparison of simulated and measured pressure of the circuit (a) and along the furnace (b).
Energies 2020, 13, x FOR PEER REVIEW 13 of 26
Figure 15. Grid quality check of 800,000-mesh model.
4.2. Numerical Analysis
4.2.1. Numerical Model Verification
The most important of numerical simulation calculation is to verify the accuracy of numerical model. After the CFB boiler was modeled, an actual measurement was performed on the relevant measurement points of the power plant boiler, the actual working conditions were simulated and calculated, and the calculation results were compared with the measured data for verification. The reliability of the simulation results can be verified by comparing the simulation results with the measured results. The pressure is the parameter that can be obtained during the field test and the simulation process, and it is the key parameter to measure the operating state of the boiler. The comparison between the simulated value of the circuit pressure and the measured value is shown in Figure 16. Both simulated pressure and DCS pressure adopted relative pressure. The pressure simulation value of each measuring point was compared with the measured value as shown in Figure 17.
(a) (b)
Figure 16. Comparison of simulated and measured pressure of the circuit (a) and along the furnace (b).
Figure 17. Comparison of simulated and measured pressure of the whole circuit.
As shown in Figure 16b, for the pressure change along the height of the furnace, the simulated value and the measured value showed the same trend. As the height increased, the pressure gradually decreased, and the pressure drop per unit height also decreased with the height. For the pressure measurement point in the furnace, the simulated value was higher than the measured value
Figure 17. Comparison of simulated and measured pressure of the whole circuit.
As shown in Figure 16b, for the pressure change along the height of the furnace, the simulatedvalue and the measured value showed the same trend. As the height increased, the pressure graduallydecreased, and the pressure drop per unit height also decreased with the height. For the pressuremeasurement point in the furnace, the simulated value was higher than the measured value at thesame position. The difference was between 100 Pa and 800 Pa, and the deviation range was within 5%.For the pressure measurement point in the cyclone, the simulated value and the measured value wererelatively close. The difference was between 0 Pa and 100 Pa, and the deviation range was within 5%.The gas-solid flow nonuniformity was one of the main problems of the CFB boiler, and furnace outlethad obvious differences between particle mass flow rate. Therefore, differences also appeared in thereturn valve of gas-solid flow nonuniformity, leading to deviation of the measuring point pressurevalue. For the return valve, the difference between the simulated value and the measured value wasbetween 200 Pa and 2000 Pa, and the deviation range was within 10%. Therefore, it can be consideredthat the measured data is in good agreement with the simulation results, indicating that the numericalsimulation results are reliable.
4.2.2. Gas-Solid Flow Characteristics Analysis
In order to determine the time required to reach a stable state during the start-up phase of thesimulation process, the cumulative bed material mass through the flux surface was counted at twoheights of 10 m and 20 m in the furnace, as shown in Figure 18. The slope of the curve in the figure isthe solid circulation flow rate of the measuring surface. After t = 25 s, the two curves were close toparallel, which indicates that the solid circulation flow rate of the material in the furnace was consistent,and the operation of the CFB boiler reached a stable state.
Energies 2020, 13, 5883 14 of 24
Energies 2020, 13, x FOR PEER REVIEW 14 of 26
at the same position. The difference was between 100 Pa and 800 Pa, and the deviation range was within 5%. For the pressure measurement point in the cyclone, the simulated value and the measured value were relatively close. The difference was between 0 Pa and 100 Pa, and the deviation range was within 5%. The gas-solid flow nonuniformity was one of the main problems of the CFB boiler, and furnace outlet had obvious differences between particle mass flow rate. Therefore, differences also appeared in the return valve of gas-solid flow nonuniformity, leading to deviation of the measuring point pressure value. For the return valve, the difference between the simulated value and the measured value was between 200 Pa and 2000 Pa, and the deviation range was within 10%. Therefore, it can be considered that the measured data is in good agreement with the simulation results, indicating that the numerical simulation results are reliable.
4.2.2. Gas-Solid Flow Characteristics Analysis
In order to determine the time required to reach a stable state during the start-up phase of the simulation process, the cumulative bed material mass through the flux surface was counted at two heights of 10 m and 20 m in the furnace, as shown in Figure 18. The slope of the curve in the figure is the solid circulation flow rate of the measuring surface. After t = 25 s, the two curves were close to parallel, which indicates that the solid circulation flow rate of the material in the furnace was consistent, and the operation of the CFB boiler reached a stable state.
Figure 18. Variation curve of cumulative bed material mass of different sections (0~30 s).
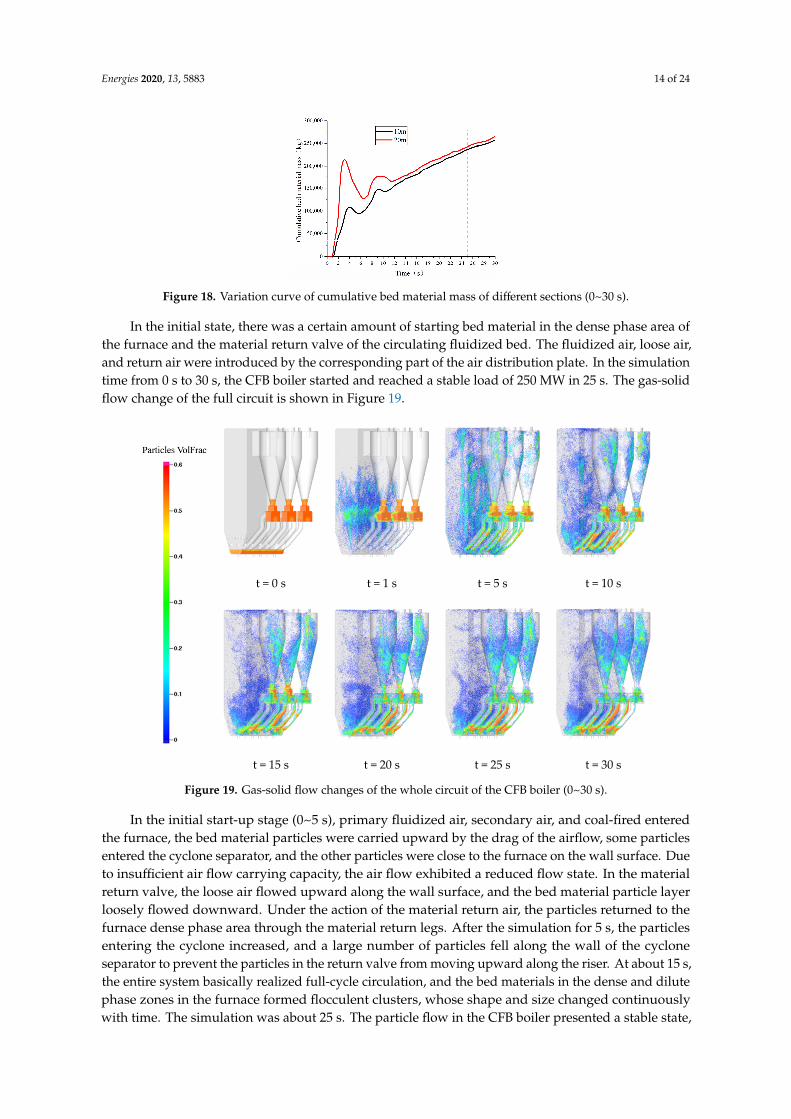
In the initial state, there was a certain amount of starting bed material in the dense phase area of the furnace and the material return valve of the circulating fluidized bed. The fluidized air, loose air, and return air were introduced by the corresponding part of the air distribution plate. In the simulation time from 0 s to 30 s, the CFB boiler started and reached a stable load of 250 MW in 25 s. The gas-solid flow change of the full circuit is shown in Figure 19.
Figure 18. Variation curve of cumulative bed material mass of different sections (0~30 s).
In the initial state, there was a certain amount of starting bed material in the dense phase area ofthe furnace and the material return valve of the circulating fluidized bed. The fluidized air, loose air,and return air were introduced by the corresponding part of the air distribution plate. In the simulationtime from 0 s to 30 s, the CFB boiler started and reached a stable load of 250 MW in 25 s. The gas-solidflow change of the full circuit is shown in Figure 19.
Energies 2020, 13, x FOR PEER REVIEW 15 of 26
t = 0 s t = 1 s t = 5 s t = 10 s
t = 15 s t = 20 s t = 25 s t = 30 s
Figure 19. Gas-solid flow changes of the whole circuit of the CFB boiler (0~30s).
In the initial start-up stage (0~5 s), primary fluidized air, secondary air, and coal-fired entered the furnace, the bed material particles were carried upward by the drag of the airflow, some particles entered the cyclone separator, and the other particles were close to the furnace on the wall surface. Due to insufficient air flow carrying capacity, the air flow exhibited a reduced flow state. In the material return valve, the loose air flowed upward along the wall surface, and the bed material particle layer loosely flowed downward. Under the action of the material return air, the particles returned to the furnace dense phase area through the material return legs. After the simulation for 5 s, the particles entering the cyclone increased, and a large number of particles fell along the wall of the cyclone separator to prevent the particles in the return valve from moving upward along the riser. At about 15 s, the entire system basically realized full-cycle circulation, and the bed materials in the dense and dilute phase zones in the furnace formed flocculent clusters, whose shape and size changed continuously with time. The simulation was about 25 s. The particle flow in the CFB boiler presented a stable state, and the particle volume fraction of the dense phase zone, the dilute phase zone, the cyclone separator, and the return valve were basically stable. The cone section of the furnace formed a dense phase zone, which was close to the height of the dense phase zone monitored in the actual furnace. The average particle volume fraction was 0.06. The dilute phase zone was less affected by the return material and the bed material was more evenly distributed than the dense phase zone. The particle volume fraction was 0.005.
In the load-up phase of the boiler (30~70 s), the load varied from 250 MW to 350 MW, and the coal mass flow rate and air mass flow rate increased accordingly. Among them, the coal mass flow rate changed from 55 kg/s to 75 kg/s and the total air mass flow rate changed from 195 kg/s to 255 kg/s. The flow field and temperature field distribution of the boiler during the load increase process are shown in Figure 20. As the load increased, the volume fraction of particles in the dense phase zone of the furnace increased and the temperature rose. This was mainly due to the increase in the amount of coal feed and air flow, which caused more coal to burn in the dense phase zone to release heat. The amount of residual char increased, and the amount of heat generated per unit time rose, which led to an increase in the amount of material from the return legs and an increase in the temperature in the dense phase zone. As the boiler load increased, the temperature in the dilute phase
Figure 19. Gas-solid flow changes of the whole circuit of the CFB boiler (0~30 s).
In the initial start-up stage (0~5 s), primary fluidized air, secondary air, and coal-fired enteredthe furnace, the bed material particles were carried upward by the drag of the airflow, some particlesentered the cyclone separator, and the other particles were close to the furnace on the wall surface. Dueto insufficient air flow carrying capacity, the air flow exhibited a reduced flow state. In the materialreturn valve, the loose air flowed upward along the wall surface, and the bed material particle layerloosely flowed downward. Under the action of the material return air, the particles returned to thefurnace dense phase area through the material return legs. After the simulation for 5 s, the particlesentering the cyclone increased, and a large number of particles fell along the wall of the cycloneseparator to prevent the particles in the return valve from moving upward along the riser. At about 15 s,the entire system basically realized full-cycle circulation, and the bed materials in the dense and dilutephase zones in the furnace formed flocculent clusters, whose shape and size changed continuouslywith time. The simulation was about 25 s. The particle flow in the CFB boiler presented a stable state,
Energies 2020, 13, 5883 15 of 24
and the particle volume fraction of the dense phase zone, the dilute phase zone, the cyclone separator,and the return valve were basically stable. The cone section of the furnace formed a dense phase zone,which was close to the height of the dense phase zone monitored in the actual furnace. The averageparticle volume fraction was 0.06. The dilute phase zone was less affected by the return material andthe bed material was more evenly distributed than the dense phase zone. The particle volume fractionwas 0.005.
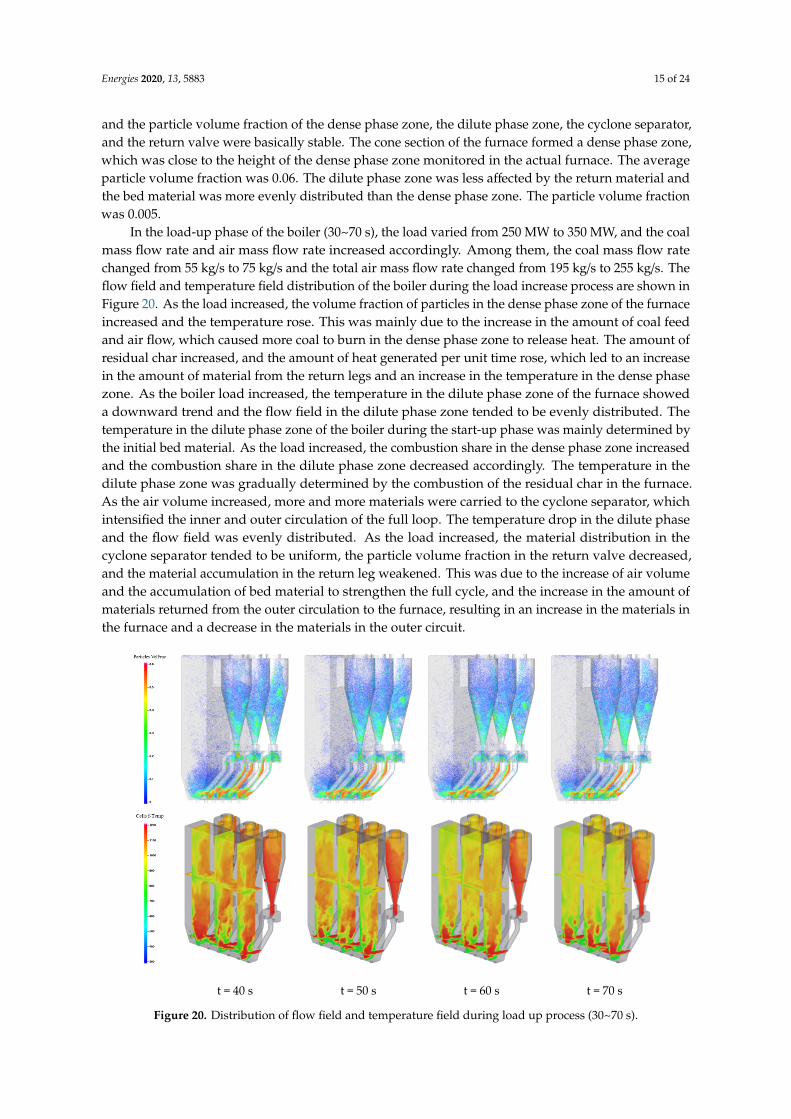
In the load-up phase of the boiler (30~70 s), the load varied from 250 MW to 350 MW, and the coalmass flow rate and air mass flow rate increased accordingly. Among them, the coal mass flow ratechanged from 55 kg/s to 75 kg/s and the total air mass flow rate changed from 195 kg/s to 255 kg/s. Theflow field and temperature field distribution of the boiler during the load increase process are shown inFigure 20. As the load increased, the volume fraction of particles in the dense phase zone of the furnaceincreased and the temperature rose. This was mainly due to the increase in the amount of coal feedand air flow, which caused more coal to burn in the dense phase zone to release heat. The amount ofresidual char increased, and the amount of heat generated per unit time rose, which led to an increasein the amount of material from the return legs and an increase in the temperature in the dense phasezone. As the boiler load increased, the temperature in the dilute phase zone of the furnace showeda downward trend and the flow field in the dilute phase zone tended to be evenly distributed. Thetemperature in the dilute phase zone of the boiler during the start-up phase was mainly determined bythe initial bed material. As the load increased, the combustion share in the dense phase zone increasedand the combustion share in the dilute phase zone decreased accordingly. The temperature in thedilute phase zone was gradually determined by the combustion of the residual char in the furnace.As the air volume increased, more and more materials were carried to the cyclone separator, whichintensified the inner and outer circulation of the full loop. The temperature drop in the dilute phaseand the flow field was evenly distributed. As the load increased, the material distribution in thecyclone separator tended to be uniform, the particle volume fraction in the return valve decreased,and the material accumulation in the return leg weakened. This was due to the increase of air volumeand the accumulation of bed material to strengthen the full cycle, and the increase in the amount ofmaterials returned from the outer circulation to the furnace, resulting in an increase in the materials inthe furnace and a decrease in the materials in the outer circuit.
Energies 2020, 13, x FOR PEER REVIEW 16 of 26
zone of the furnace showed a downward trend and the flow field in the dilute phase zone tended to be evenly distributed. The temperature in the dilute phase zone of the boiler during the start-up phase was mainly determined by the initial bed material. As the load increased, the combustion share in the dense phase zone increased and the combustion share in the dilute phase zone decreased accordingly. The temperature in the dilute phase zone was gradually determined by the combustion of the residual char in the furnace. As the air volume increased, more and more materials were carried to the cyclone separator, which intensified the inner and outer circulation of the full loop. The temperature drop in the dilute phase and the flow field was evenly distributed. As the load increased, the material distribution in the cyclone separator tended to be uniform, the particle volume fraction in the return valve decreased, and the material accumulation in the return leg weakened. This was due to the increase of air volume and the accumulation of bed material to strengthen the full cycle, and the increase in the amount of materials returned from the outer circulation to the furnace, resulting in an increase in the materials in the furnace and a decrease in the materials in the outer circuit.
t = 40 s t = 50 s t = 60 s t = 70 s
Figure 20. Distribution of flow field and temperature field during load up process (30~70 s).
In the boiler load-down stage (70~110 s), the load varied from 350 MW to 250 MW, and the coal mass flow rate and air mass flow rate were reduced accordingly. Among them, the coal mass flow rate changed from 75 kg/s to 55 kg/s and the total air mass flow rate changed from 255 kg/s to 195 kg/s. The flow field and temperature field distribution of the boiler during load-down are shown in Figure 21. In the initial stage of load reduction, due to the inertia of the boiler system, the bed material distribution in the furnace was mainly affected by the material leg return. Whereas the coal feed rate had little effect on the bed material distribution, the furnace temperature did not change much, and the flow field distribution in the dilute phase zone was uniform, with stable heat transfer in the furnace. With the continuous reduction of coal feed and air volume, the inventory of circulating materials decreased, the volume fraction of particles in both the dense phase zone and the dilute phase zone decreased, and the phenomenon of particle agglomeration decreased. Due to the influence of material inventory and heat absorption of the water-cooled wall, the temperature in the dilute phase zone was reduced, and the temperature field was unevenly distributed. The temperature of the rear wall of the furnace was higher than that of the front wall. As the load decreased, the heat absorption effect of the secondary air was obvious. In addition, due to the negative pressure of the
Figure 20. Distribution of flow field and temperature field during load up process (30~70 s).
Energies 2020, 13, 5883 16 of 24
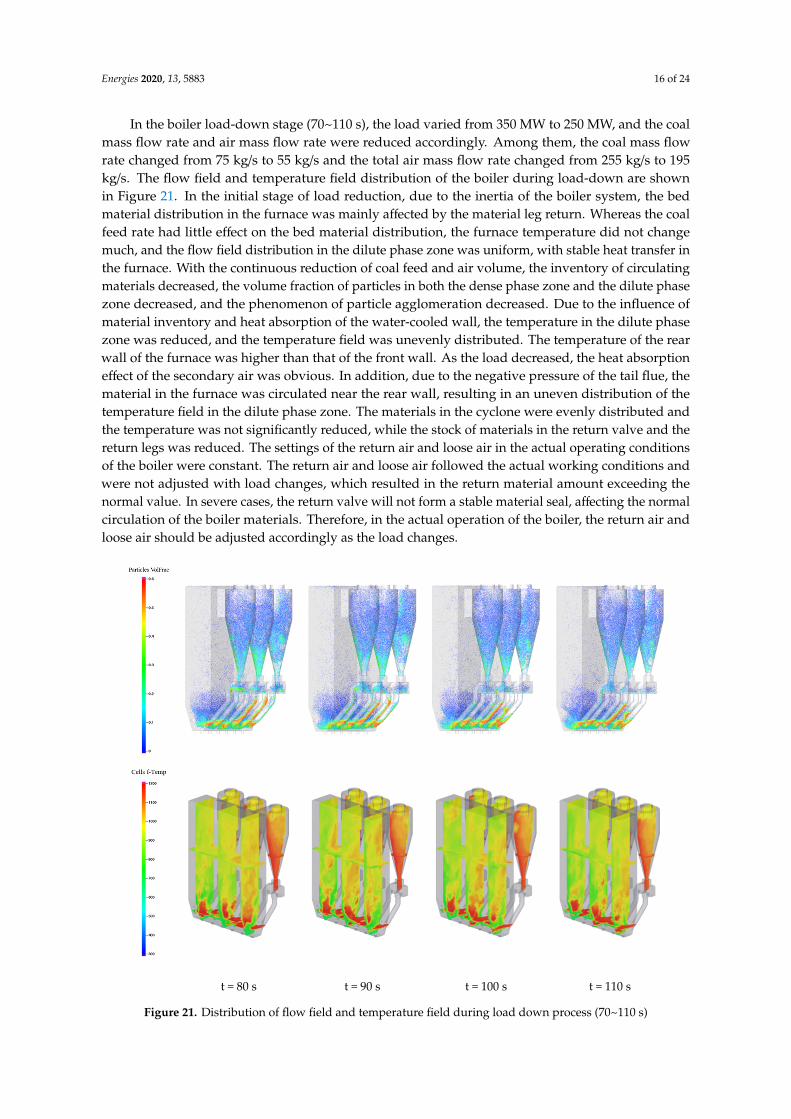
In the boiler load-down stage (70~110 s), the load varied from 350 MW to 250 MW, and the coalmass flow rate and air mass flow rate were reduced accordingly. Among them, the coal mass flowrate changed from 75 kg/s to 55 kg/s and the total air mass flow rate changed from 255 kg/s to 195kg/s. The flow field and temperature field distribution of the boiler during load-down are shownin Figure 21. In the initial stage of load reduction, due to the inertia of the boiler system, the bedmaterial distribution in the furnace was mainly affected by the material leg return. Whereas the coalfeed rate had little effect on the bed material distribution, the furnace temperature did not changemuch, and the flow field distribution in the dilute phase zone was uniform, with stable heat transfer inthe furnace. With the continuous reduction of coal feed and air volume, the inventory of circulatingmaterials decreased, the volume fraction of particles in both the dense phase zone and the dilute phasezone decreased, and the phenomenon of particle agglomeration decreased. Due to the influence ofmaterial inventory and heat absorption of the water-cooled wall, the temperature in the dilute phasezone was reduced, and the temperature field was unevenly distributed. The temperature of the rearwall of the furnace was higher than that of the front wall. As the load decreased, the heat absorptioneffect of the secondary air was obvious. In addition, due to the negative pressure of the tail flue, thematerial in the furnace was circulated near the rear wall, resulting in an uneven distribution of thetemperature field in the dilute phase zone. The materials in the cyclone were evenly distributed andthe temperature was not significantly reduced, while the stock of materials in the return valve and thereturn legs was reduced. The settings of the return air and loose air in the actual operating conditionsof the boiler were constant. The return air and loose air followed the actual working conditions andwere not adjusted with load changes, which resulted in the return material amount exceeding thenormal value. In severe cases, the return valve will not form a stable material seal, affecting the normalcirculation of the boiler materials. Therefore, in the actual operation of the boiler, the return air andloose air should be adjusted accordingly as the load changes.
Energies 2020, 13, x FOR PEER REVIEW 17 of 26
tail flue, the material in the furnace was circulated near the rear wall, resulting in an uneven distribution of the temperature field in the dilute phase zone. The materials in the cyclone were evenly distributed and the temperature was not significantly reduced, while the stock of materials in the return valve and the return legs was reduced. The settings of the return air and loose air in the actual operating conditions of the boiler were constant. The return air and loose air followed the actual working conditions and were not adjusted with load changes, which resulted in the return material amount exceeding the normal value. In severe cases, the return valve will not form a stable material seal, affecting the normal circulation of the boiler materials. Therefore, in the actual operation of the boiler, the return air and loose air should be adjusted accordingly as the load changes.
t = 80 s t = 90 s t = 100 s t = 110 s
Figure 21. Distribution of flow field and temperature field during load down process (70~110 s)
4.2.3. Analysis of Dynamic Characteristics of Residual Char
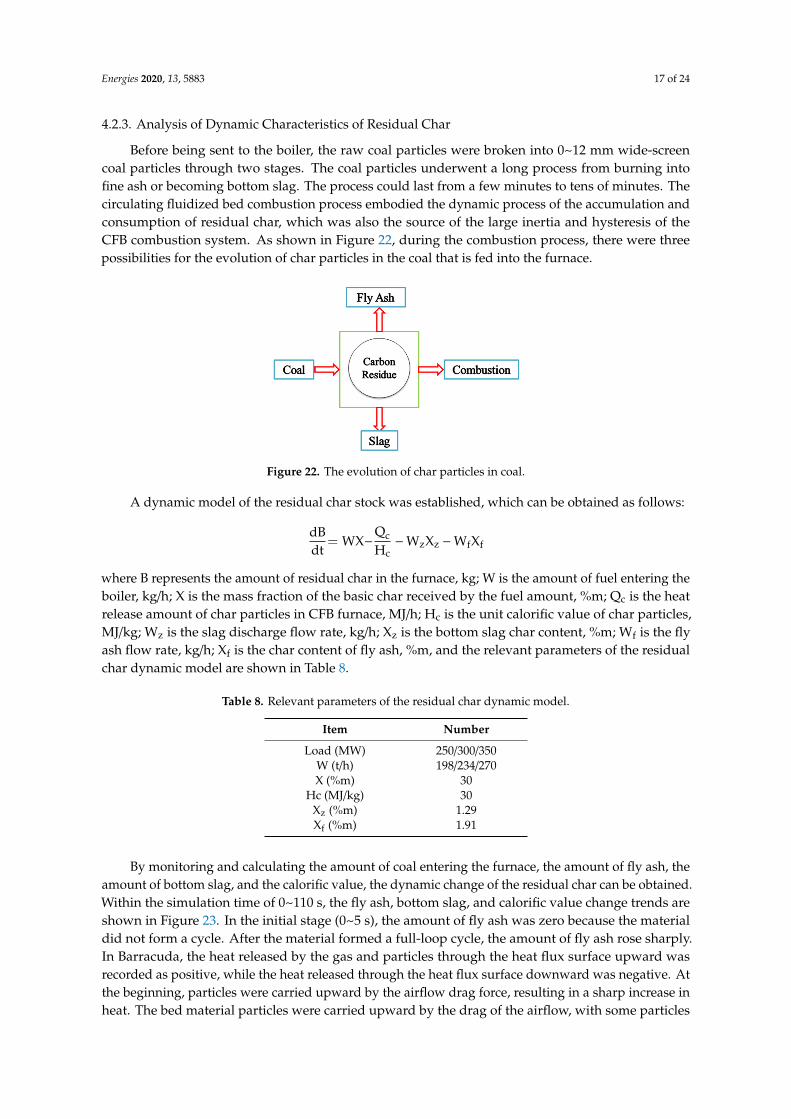
Before being sent to the boiler, the raw coal particles were broken into 0~12 mm wide-screen coal particles through two stages. The coal particles underwent a long process from burning into fine ash or becoming bottom slag. The process could last from a few minutes to tens of minutes. The circulating fluidized bed combustion process embodied the dynamic process of the accumulation and consumption of residual char, which was also the source of the large inertia and hysteresis of the CFB combustion system. As shown in Figure 22, during the combustion process, there were three possibilities for the evolution of char particles in the coal that is fed into the furnace.
Figure 21. Distribution of flow field and temperature field during load down process (70~110 s)
Energies 2020, 13, 5883 17 of 24
4.2.3. Analysis of Dynamic Characteristics of Residual Char
Before being sent to the boiler, the raw coal particles were broken into 0~12 mm wide-screencoal particles through two stages. The coal particles underwent a long process from burning intofine ash or becoming bottom slag. The process could last from a few minutes to tens of minutes. Thecirculating fluidized bed combustion process embodied the dynamic process of the accumulation andconsumption of residual char, which was also the source of the large inertia and hysteresis of theCFB combustion system. As shown in Figure 22, during the combustion process, there were threepossibilities for the evolution of char particles in the coal that is fed into the furnace.Energies 2020, 13, x FOR PEER REVIEW 18 of 26
Figure 22. The evolution of char particles in coal.
A dynamic model of the residual char stock was established, which can be obtained as follows:
dBdt = WX - Qc
Hc - WzXz - WfXf
where B represents the amount of residual char in the furnace, kg; W is the amount of fuel entering the boiler, kg/h; X is the mass fraction of the basic char received by the fuel amount, %m; Qc is the heat release amount of char particles in CFB furnace, MJ/h; Hc is the unit calorific value of char particles, MJ/kg; Wz is the slag discharge flow rate, kg/h; Xz is the bottom slag char content, %m; Wf is the fly ash flow rate, kg/h; Xf is the char content of fly ash, %m, and the relevant parameters of the residual char dynamic model are shown in Table 8.
Table 8. Relevant parameters of the residual char dynamic model.
Item Number Load (MW) 250/300/350
W (t/h) 198/234/270 X (%m) 30
Hc (MJ/kg) 30 Xz (%m) 1.29 Xf (%m) 1.91
By monitoring and calculating the amount of coal entering the furnace, the amount of fly ash, the amount of bottom slag, and the calorific value, the dynamic change of the residual char can be obtained. Within the simulation time of 0~110 s, the fly ash, bottom slag, and calorific value change trends are shown in Figure 23. In the initial stage (0~5 s), the amount of fly ash was zero because the material did not form a cycle. After the material formed a full-loop cycle, the amount of fly ash rose sharply. In Barracuda, the heat released by the gas and particles through the heat flux surface upward was recorded as positive, while the heat released through the heat flux surface downward was negative. At the beginning, particles were carried upward by the airflow drag force, resulting in a sharp increase in heat. The bed material particles were carried upward by the drag of the airflow, with some particles entering the cyclone separator, and the other particles falling along the furnace wall. Since the external circulation had not yet formed, the falling particles exceeded the rising particles, resulting in a drop in heat. When the boiler was stable, the increment of fly ash per unit time was stable. In the stable stage (25~30 s), the average displacement of fly ash was 15 kg. The pressure of the slag outlet was set to 20 kPa. When the material pressure in the dense phase area exceeded the set value, the bottom slag was discharged through the slag discharge port. The total amount of bottom slag discharge rose stepwise with time. After the boiler ran under a stable operation, the average displacement of slag was 24 kg. In the initial stage, the heat generated by the boiler was mainly generated by the initial bed material. After the boiler was started for 5 s, because the coal absorbed part of the heat for volatile, and the primary air and secondary air were heated, the monitoring heat showed a downward trend. After stable operation, the calorific value was mainly
Figure 22. The evolution of char particles in coal.
A dynamic model of the residual char stock was established, which can be obtained as follows:
dBdt
= WX−Qc
Hc−WzXz −WfXf
where B represents the amount of residual char in the furnace, kg; W is the amount of fuel entering theboiler, kg/h; X is the mass fraction of the basic char received by the fuel amount, %m; Qc is the heatrelease amount of char particles in CFB furnace, MJ/h; Hc is the unit calorific value of char particles,MJ/kg; Wz is the slag discharge flow rate, kg/h; Xz is the bottom slag char content, %m; Wf is the flyash flow rate, kg/h; Xf is the char content of fly ash, %m, and the relevant parameters of the residualchar dynamic model are shown in Table 8.
Table 8. Relevant parameters of the residual char dynamic model.
Item Number
Load (MW) 250/300/350W (t/h) 198/234/270X (%m) 30
Hc (MJ/kg) 30Xz (%m) 1.29Xf (%m) 1.91
By monitoring and calculating the amount of coal entering the furnace, the amount of fly ash, theamount of bottom slag, and the calorific value, the dynamic change of the residual char can be obtained.Within the simulation time of 0~110 s, the fly ash, bottom slag, and calorific value change trends areshown in Figure 23. In the initial stage (0~5 s), the amount of fly ash was zero because the materialdid not form a cycle. After the material formed a full-loop cycle, the amount of fly ash rose sharply.In Barracuda, the heat released by the gas and particles through the heat flux surface upward wasrecorded as positive, while the heat released through the heat flux surface downward was negative. Atthe beginning, particles were carried upward by the airflow drag force, resulting in a sharp increase inheat. The bed material particles were carried upward by the drag of the airflow, with some particles
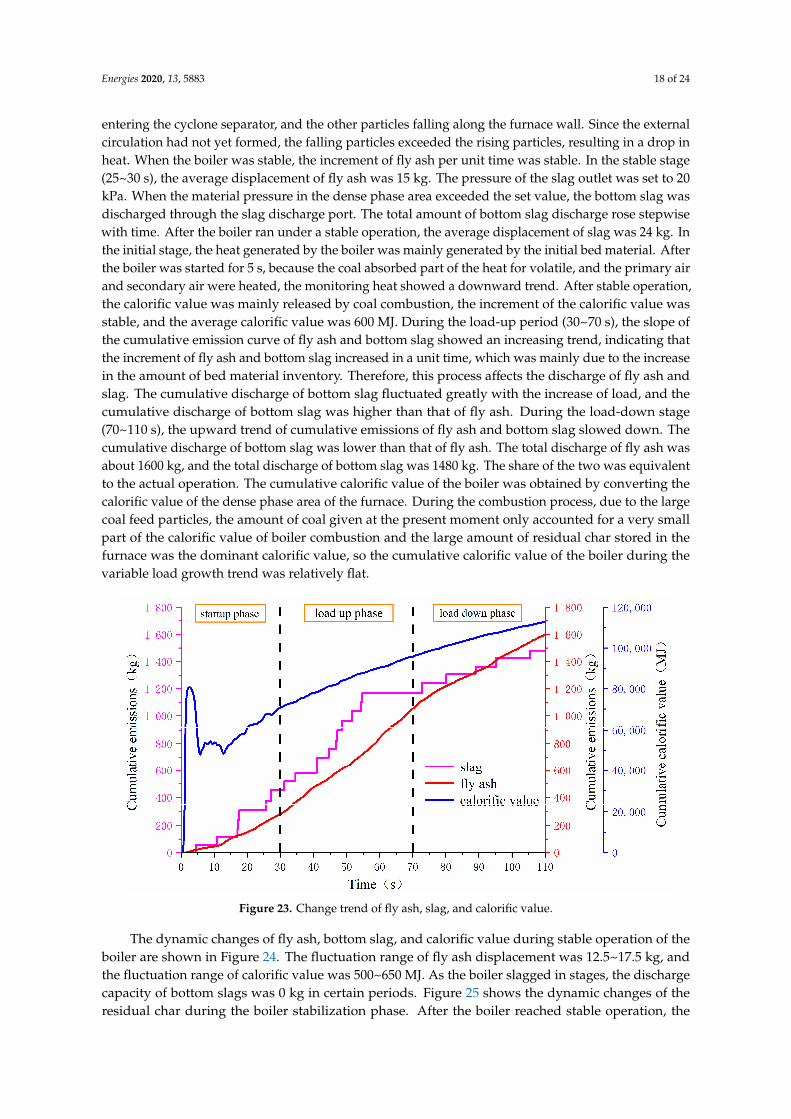
Energies 2020, 13, 5883 18 of 24
entering the cyclone separator, and the other particles falling along the furnace wall. Since the externalcirculation had not yet formed, the falling particles exceeded the rising particles, resulting in a drop inheat. When the boiler was stable, the increment of fly ash per unit time was stable. In the stable stage(25~30 s), the average displacement of fly ash was 15 kg. The pressure of the slag outlet was set to 20kPa. When the material pressure in the dense phase area exceeded the set value, the bottom slag wasdischarged through the slag discharge port. The total amount of bottom slag discharge rose stepwisewith time. After the boiler ran under a stable operation, the average displacement of slag was 24 kg. Inthe initial stage, the heat generated by the boiler was mainly generated by the initial bed material. Afterthe boiler was started for 5 s, because the coal absorbed part of the heat for volatile, and the primary airand secondary air were heated, the monitoring heat showed a downward trend. After stable operation,the calorific value was mainly released by coal combustion, the increment of the calorific value wasstable, and the average calorific value was 600 MJ. During the load-up period (30~70 s), the slope ofthe cumulative emission curve of fly ash and bottom slag showed an increasing trend, indicating thatthe increment of fly ash and bottom slag increased in a unit time, which was mainly due to the increasein the amount of bed material inventory. Therefore, this process affects the discharge of fly ash andslag. The cumulative discharge of bottom slag fluctuated greatly with the increase of load, and thecumulative discharge of bottom slag was higher than that of fly ash. During the load-down stage(70~110 s), the upward trend of cumulative emissions of fly ash and bottom slag slowed down. Thecumulative discharge of bottom slag was lower than that of fly ash. The total discharge of fly ash wasabout 1600 kg, and the total discharge of bottom slag was 1480 kg. The share of the two was equivalentto the actual operation. The cumulative calorific value of the boiler was obtained by converting thecalorific value of the dense phase area of the furnace. During the combustion process, due to the largecoal feed particles, the amount of coal given at the present moment only accounted for a very smallpart of the calorific value of boiler combustion and the large amount of residual char stored in thefurnace was the dominant calorific value, so the cumulative calorific value of the boiler during thevariable load growth trend was relatively flat.
Energies 2020, 13, x FOR PEER REVIEW 19 of 26
released by coal combustion, the increment of the calorific value was stable, and the average calorific value was 600 MJ. During the load-up period (30~70 s), the slope of the cumulative emission curve of fly ash and bottom slag showed an increasing trend, indicating that the increment of fly ash and bottom slag increased in a unit time, which was mainly due to the increase in the amount of bed material inventory. Therefore, this process affects the discharge of fly ash and slag. The cumulative discharge of bottom slag fluctuated greatly with the increase of load, and the cumulative discharge of bottom slag was higher than that of fly ash. During the load-down stage (70~110 s), the upward trend of cumulative emissions of fly ash and bottom slag slowed down. The cumulative discharge of bottom slag was lower than that of fly ash. The total discharge of fly ash was about 1600 kg, and the total discharge of bottom slag was 1480 kg. The share of the two was equivalent to the actual operation. The cumulative calorific value of the boiler was obtained by converting the calorific value of the dense phase area of the furnace. During the combustion process, due to the large coal feed particles, the amount of coal given at the present moment only accounted for a very small part of the calorific value of boiler combustion and the large amount of residual char stored in the furnace was the dominant calorific value, so the cumulative calorific value of the boiler during the variable load growth trend was relatively flat.
Figure 23. Change trend of fly ash, slag, and calorific value.
The dynamic changes of fly ash, bottom slag, and calorific value during stable operation of the boiler are shown in Figure 24. The fluctuation range of fly ash displacement was 12.5~17.5 kg, and the fluctuation range of calorific value was 500~650 MJ. As the boiler slagged in stages, the discharge capacity of bottom slags was 0 kg in certain periods. Figure 25 shows the dynamic changes of the residual char during the boiler stabilization phase. After the boiler reached stable operation, the residual char fluctuated in the range of 11,000 kg to 16,000 kg, accounting for approximately 3.7% of the total bed material. In CFB boiler, the current combustion calorific value is not determined by the current coal feed, but by the amount of residual char stored in the furnace. Under stable operating conditions, the burning rate of residual char was the same as the coal feed rate. Except for a small number of fine particles and volatiles, the remaining coal burned into new residual char after being broken and worn out. The quality was equivalent to the amount of residual char burned at this time. Therefore, under stable operating conditions, the residual char stock did not change much and was in a dynamic balance.
Figure 23. Change trend of fly ash, slag, and calorific value.
The dynamic changes of fly ash, bottom slag, and calorific value during stable operation of theboiler are shown in Figure 24. The fluctuation range of fly ash displacement was 12.5~17.5 kg, andthe fluctuation range of calorific value was 500~650 MJ. As the boiler slagged in stages, the dischargecapacity of bottom slags was 0 kg in certain periods. Figure 25 shows the dynamic changes of theresidual char during the boiler stabilization phase. After the boiler reached stable operation, the
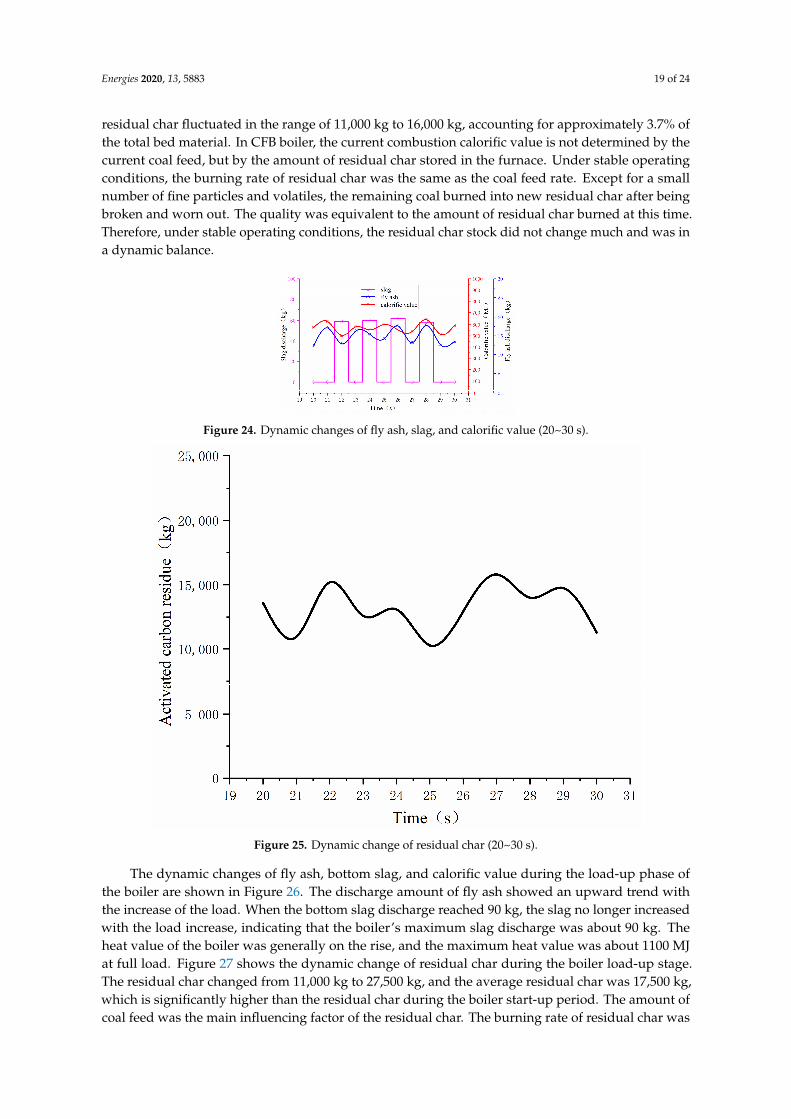
Energies 2020, 13, 5883 19 of 24
residual char fluctuated in the range of 11,000 kg to 16,000 kg, accounting for approximately 3.7% ofthe total bed material. In CFB boiler, the current combustion calorific value is not determined by thecurrent coal feed, but by the amount of residual char stored in the furnace. Under stable operatingconditions, the burning rate of residual char was the same as the coal feed rate. Except for a smallnumber of fine particles and volatiles, the remaining coal burned into new residual char after beingbroken and worn out. The quality was equivalent to the amount of residual char burned at this time.Therefore, under stable operating conditions, the residual char stock did not change much and was ina dynamic balance.
Energies 2020, 13, x FOR PEER REVIEW 20 of 26
Figure 24. Dynamic changes of fly ash, slag, and calorific value (20~30 s).
Figure 25. Dynamic change of residual char (20~30 s).
The dynamic changes of fly ash, bottom slag, and calorific value during the load-up phase of the boiler are shown in Figure 26. The discharge amount of fly ash showed an upward trend with the increase of the load. When the bottom slag discharge reached 90 kg, the slag no longer increased with the load increase, indicating that the boiler’s maximum slag discharge was about 90 kg. The heat value of the boiler was generally on the rise, and the maximum heat value was about 1100 MJ at full load. Figure 27 shows the dynamic change of residual char during the boiler load-up stage. The residual char changed from 11,000 kg to 27,500 kg, and the average residual char was 17,500 kg, which is significantly higher than the residual char during the boiler start-up period. The amount of coal feed was the main influencing factor of the residual char. The burning rate of residual char was lower than the coal feed rate. It can be seen that it was not reasonable to adjust the total air volume by the coal feed when the boiler load changed. The total air volume should be adjusted according to the air volume required for combustion of residual char, so that the burning rate of residual char is comparable to the coal feed rate, eliminating the impact of load changes on the residual char stock.
Figure 24. Dynamic changes of fly ash, slag, and calorific value (20~30 s).
Energies 2020, 13, x FOR PEER REVIEW 20 of 26
Figure 24. Dynamic changes of fly ash, slag, and calorific value (20~30 s).
Figure 25. Dynamic change of residual char (20~30 s).
The dynamic changes of fly ash, bottom slag, and calorific value during the load-up phase of the boiler are shown in Figure 26. The discharge amount of fly ash showed an upward trend with the increase of the load. When the bottom slag discharge reached 90 kg, the slag no longer increased with the load increase, indicating that the boiler’s maximum slag discharge was about 90 kg. The heat value of the boiler was generally on the rise, and the maximum heat value was about 1100 MJ at full load. Figure 27 shows the dynamic change of residual char during the boiler load-up stage. The residual char changed from 11,000 kg to 27,500 kg, and the average residual char was 17,500 kg, which is significantly higher than the residual char during the boiler start-up period. The amount of coal feed was the main influencing factor of the residual char. The burning rate of residual char was lower than the coal feed rate. It can be seen that it was not reasonable to adjust the total air volume by the coal feed when the boiler load changed. The total air volume should be adjusted according to the air volume required for combustion of residual char, so that the burning rate of residual char is comparable to the coal feed rate, eliminating the impact of load changes on the residual char stock.
Figure 25. Dynamic change of residual char (20~30 s).
The dynamic changes of fly ash, bottom slag, and calorific value during the load-up phase ofthe boiler are shown in Figure 26. The discharge amount of fly ash showed an upward trend withthe increase of the load. When the bottom slag discharge reached 90 kg, the slag no longer increasedwith the load increase, indicating that the boiler’s maximum slag discharge was about 90 kg. Theheat value of the boiler was generally on the rise, and the maximum heat value was about 1100 MJat full load. Figure 27 shows the dynamic change of residual char during the boiler load-up stage.The residual char changed from 11,000 kg to 27,500 kg, and the average residual char was 17,500 kg,which is significantly higher than the residual char during the boiler start-up period. The amount ofcoal feed was the main influencing factor of the residual char. The burning rate of residual char was
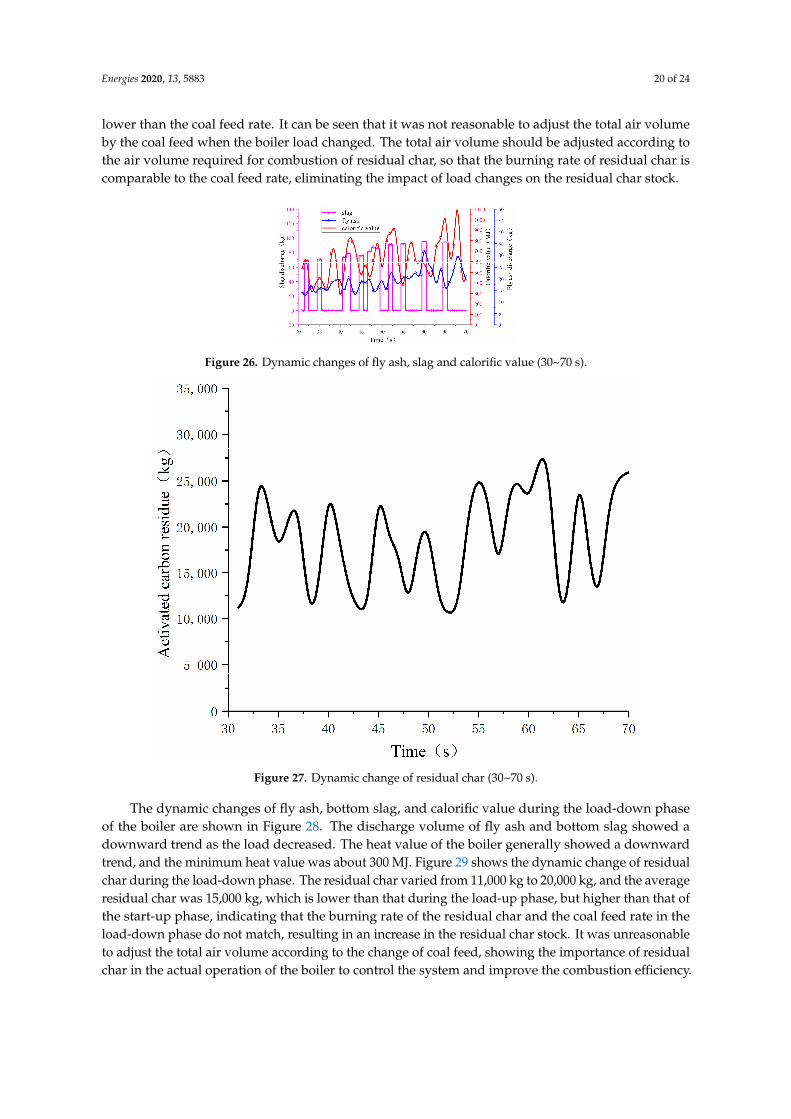
Energies 2020, 13, 5883 20 of 24
lower than the coal feed rate. It can be seen that it was not reasonable to adjust the total air volumeby the coal feed when the boiler load changed. The total air volume should be adjusted according tothe air volume required for combustion of residual char, so that the burning rate of residual char iscomparable to the coal feed rate, eliminating the impact of load changes on the residual char stock.
Energies 2020, 13, x FOR PEER REVIEW 21 of 26
Figure 26. Dynamic changes of fly ash, slag and calorific value (30~70 s).
Figure 27. Dynamic change of residual char (30~70 s).
The dynamic changes of fly ash, bottom slag, and calorific value during the load-down phase of the boiler are shown in Figure 28. The discharge volume of fly ash and bottom slag showed a downward trend as the load decreased. The heat value of the boiler generally showed a downward trend, and the minimum heat value was about 300 MJ. Figure 29 shows the dynamic change of residual char during the load-down phase. The residual char varied from 11,000 kg to 20,000 kg, and the average residual char was 15,000 kg, which is lower than that during the load-up phase, but higher than that of the start-up phase, indicating that the burning rate of the residual char and the coal feed rate in the load-down phase do not match, resulting in an increase in the residual char stock. It was unreasonable to adjust the total air volume according to the change of coal feed, showing the importance of residual char in the actual operation of the boiler to control the system and improve the combustion efficiency.
Figure 26. Dynamic changes of fly ash, slag and calorific value (30~70 s).
Energies 2020, 13, x FOR PEER REVIEW 21 of 26
Figure 26. Dynamic changes of fly ash, slag and calorific value (30~70 s).
Figure 27. Dynamic change of residual char (30~70 s).
The dynamic changes of fly ash, bottom slag, and calorific value during the load-down phase of the boiler are shown in Figure 28. The discharge volume of fly ash and bottom slag showed a downward trend as the load decreased. The heat value of the boiler generally showed a downward trend, and the minimum heat value was about 300 MJ. Figure 29 shows the dynamic change of residual char during the load-down phase. The residual char varied from 11,000 kg to 20,000 kg, and the average residual char was 15,000 kg, which is lower than that during the load-up phase, but higher than that of the start-up phase, indicating that the burning rate of the residual char and the coal feed rate in the load-down phase do not match, resulting in an increase in the residual char stock. It was unreasonable to adjust the total air volume according to the change of coal feed, showing the importance of residual char in the actual operation of the boiler to control the system and improve the combustion efficiency.
Figure 27. Dynamic change of residual char (30~70 s).
The dynamic changes of fly ash, bottom slag, and calorific value during the load-down phaseof the boiler are shown in Figure 28. The discharge volume of fly ash and bottom slag showed adownward trend as the load decreased. The heat value of the boiler generally showed a downwardtrend, and the minimum heat value was about 300 MJ. Figure 29 shows the dynamic change of residualchar during the load-down phase. The residual char varied from 11,000 kg to 20,000 kg, and the averageresidual char was 15,000 kg, which is lower than that during the load-up phase, but higher than that ofthe start-up phase, indicating that the burning rate of the residual char and the coal feed rate in theload-down phase do not match, resulting in an increase in the residual char stock. It was unreasonableto adjust the total air volume according to the change of coal feed, showing the importance of residualchar in the actual operation of the boiler to control the system and improve the combustion efficiency.
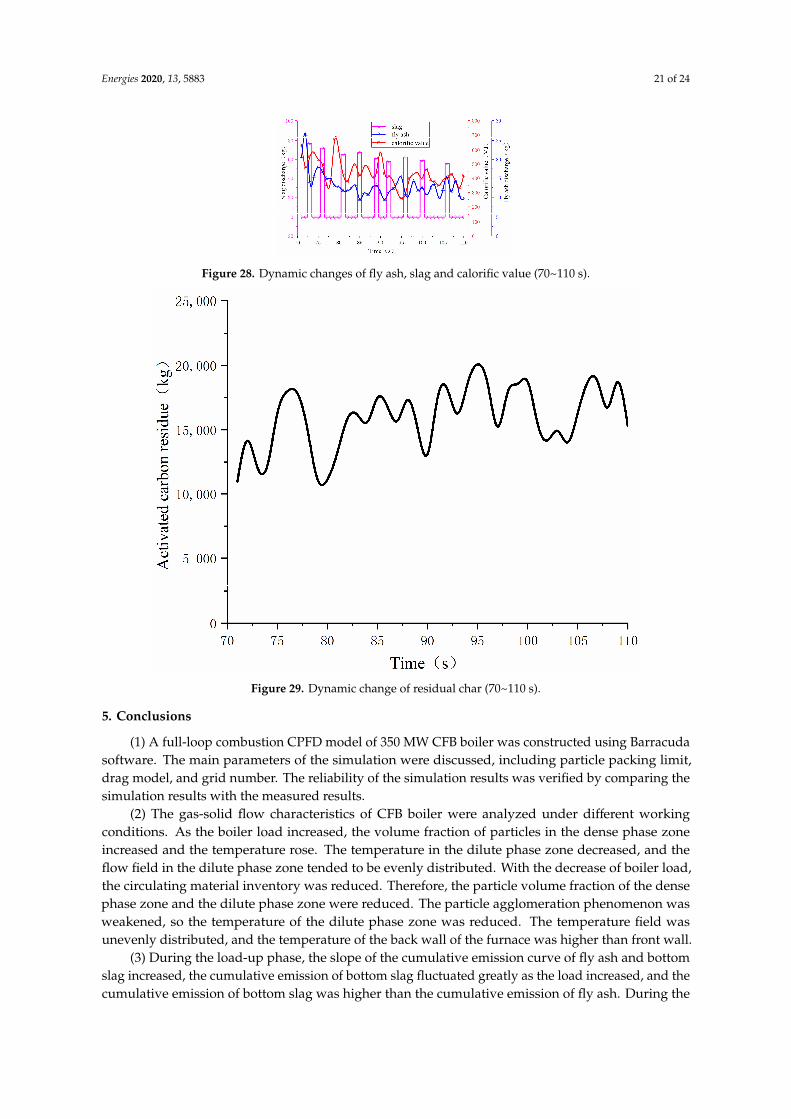
Energies 2020, 13, 5883 21 of 24
Energies 2020, 13, x FOR PEER REVIEW 22 of 26
Figure 28. Dynamic changes of fly ash, slag and calorific value (70~110 s).
Figure 29. Dynamic change of residual char (70~110 s).
5. Conclusions
(1) A full-loop combustion CPFD model of 350 MW CFB boiler was constructed using Barracuda software. The main parameters of the simulation were discussed, including particle packing limit, drag model, and grid number. The reliability of the simulation results was verified by comparing the simulation results with the measured results.
(2) The gas-solid flow characteristics of CFB boiler were analyzed under different working conditions. As the boiler load increased, the volume fraction of particles in the dense phase zone increased and the temperature rose. The temperature in the dilute phase zone decreased, and the flow field in the dilute phase zone tended to be evenly distributed. With the decrease of boiler load, the circulating material inventory was reduced. Therefore, the particle volume fraction of the dense phase zone and the dilute phase zone were reduced. The particle agglomeration phenomenon was
Figure 28. Dynamic changes of fly ash, slag and calorific value (70~110 s).
Energies 2020, 13, x FOR PEER REVIEW 22 of 26
Figure 28. Dynamic changes of fly ash, slag and calorific value (70~110 s).
Figure 29. Dynamic change of residual char (70~110 s).
5. Conclusions
(1) A full-loop combustion CPFD model of 350 MW CFB boiler was constructed using Barracuda software. The main parameters of the simulation were discussed, including particle packing limit, drag model, and grid number. The reliability of the simulation results was verified by comparing the simulation results with the measured results.
(2) The gas-solid flow characteristics of CFB boiler were analyzed under different working conditions. As the boiler load increased, the volume fraction of particles in the dense phase zone increased and the temperature rose. The temperature in the dilute phase zone decreased, and the flow field in the dilute phase zone tended to be evenly distributed. With the decrease of boiler load, the circulating material inventory was reduced. Therefore, the particle volume fraction of the dense phase zone and the dilute phase zone were reduced. The particle agglomeration phenomenon was
Figure 29. Dynamic change of residual char (70~110 s).
5. Conclusions
(1) A full-loop combustion CPFD model of 350 MW CFB boiler was constructed using Barracudasoftware. The main parameters of the simulation were discussed, including particle packing limit,drag model, and grid number. The reliability of the simulation results was verified by comparing thesimulation results with the measured results.
(2) The gas-solid flow characteristics of CFB boiler were analyzed under different workingconditions. As the boiler load increased, the volume fraction of particles in the dense phase zoneincreased and the temperature rose. The temperature in the dilute phase zone decreased, and theflow field in the dilute phase zone tended to be evenly distributed. With the decrease of boiler load,the circulating material inventory was reduced. Therefore, the particle volume fraction of the densephase zone and the dilute phase zone were reduced. The particle agglomeration phenomenon wasweakened, so the temperature of the dilute phase zone was reduced. The temperature field wasunevenly distributed, and the temperature of the back wall of the furnace was higher than front wall.
(3) During the load-up phase, the slope of the cumulative emission curve of fly ash and bottomslag increased, the cumulative emission of bottom slag fluctuated greatly as the load increased, and thecumulative emission of bottom slag was higher than the cumulative emission of fly ash. During the
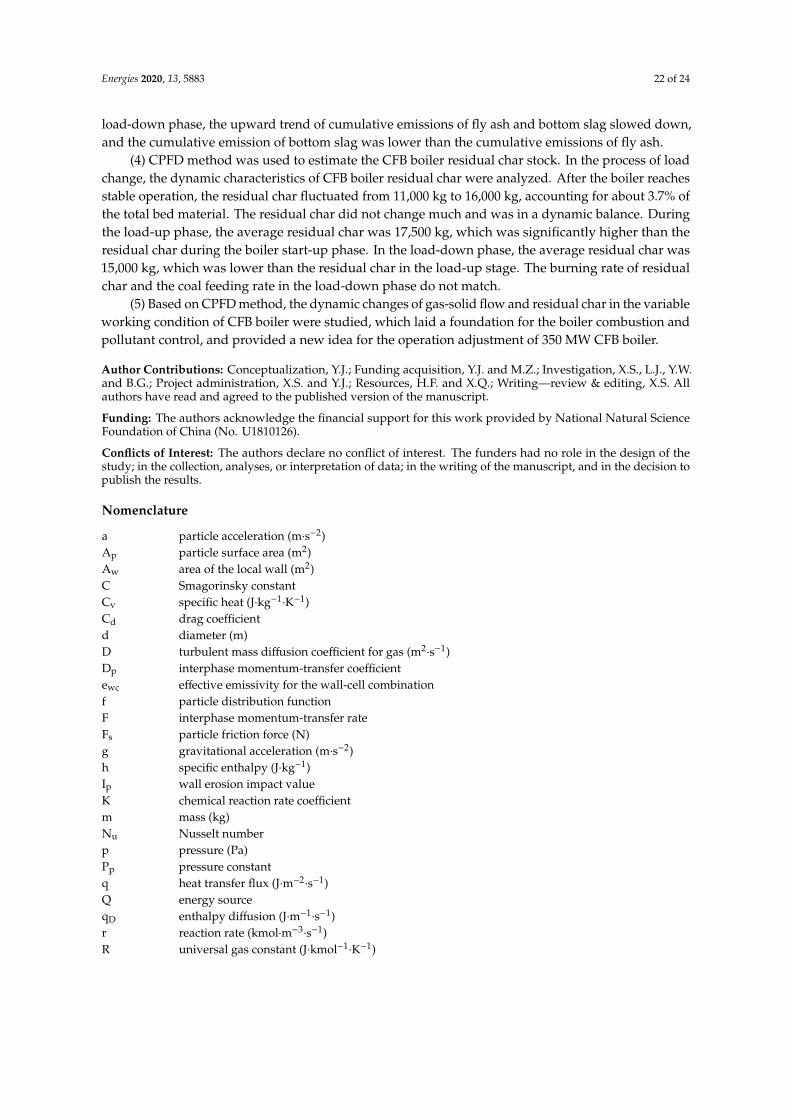
Energies 2020, 13, 5883 22 of 24
load-down phase, the upward trend of cumulative emissions of fly ash and bottom slag slowed down,and the cumulative emission of bottom slag was lower than the cumulative emissions of fly ash.
(4) CPFD method was used to estimate the CFB boiler residual char stock. In the process of loadchange, the dynamic characteristics of CFB boiler residual char were analyzed. After the boiler reachesstable operation, the residual char fluctuated from 11,000 kg to 16,000 kg, accounting for about 3.7% ofthe total bed material. The residual char did not change much and was in a dynamic balance. Duringthe load-up phase, the average residual char was 17,500 kg, which was significantly higher than theresidual char during the boiler start-up phase. In the load-down phase, the average residual char was15,000 kg, which was lower than the residual char in the load-up stage. The burning rate of residualchar and the coal feeding rate in the load-down phase do not match.
(5) Based on CPFD method, the dynamic changes of gas-solid flow and residual char in the variableworking condition of CFB boiler were studied, which laid a foundation for the boiler combustion andpollutant control, and provided a new idea for the operation adjustment of 350 MW CFB boiler.
Author Contributions: Conceptualization, Y.J.; Funding acquisition, Y.J. and M.Z.; Investigation, X.S., L.J., Y.W.and B.G.; Project administration, X.S. and Y.J.; Resources, H.F. and X.Q.; Writing—review & editing, X.S. Allauthors have read and agreed to the published version of the manuscript.
Funding: The authors acknowledge the financial support for this work provided by National Natural ScienceFoundation of China (No. U1810126).
Conflicts of Interest: The authors declare no conflict of interest. The funders had no role in the design of thestudy; in the collection, analyses, or interpretation of data; in the writing of the manuscript, and in the decision topublish the results.
Nomenclature
a particle acceleration (m·s−2)Ap particle surface area (m2)Aw area of the local wall (m2)C Smagorinsky constantCv specific heat (J·kg−1
·K−1)Cd drag coefficientd diameter (m)D turbulent mass diffusion coefficient for gas (m2
·s−1)Dp interphase momentum-transfer coefficientewc effective emissivity for the wall-cell combinationf particle distribution functionF interphase momentum-transfer rateFs particle friction force (N)g gravitational acceleration (m·s−2)h specific enthalpy (J·kg−1)Ip wall erosion impact valueK chemical reaction rate coefficientm mass (kg)Nu Nusselt numberp pressure (Pa)Pp pressure constantq heat transfer flux (J·m−2
·s−1)Q energy sourceqD enthalpy diffusion (J·m−1
·s−1)r reaction rate (kmol·m−3
·s−1)R universal gas constant (J·kmol−1
·K−1)
Energies 2020, 13, 5883 23 of 24
rp particle radius (m)Re Reynolds numberSh interphase energy exchange rateT temperature (K)u velocity vector (m·s−1)up local mass-averaged particle velocity (m·s−1)w weighting factorXwc view factor between the wall and cellYi mass fractionGreek Lettersα impact angleθ volume fractionφ viscous dissipation
εa small number on the order of 10−7 to remove thesingularity
λ thermal conductivity (W·m−2·K−1)
µ viscosity (kg·m−1·s−1)
σ Stefan-Boltzmann constantρ density (kg·m−3)τ stress tensor (Pa)ξ char conversion rate∆ length scaleSubscriptscp close packg gas phasei the ith speciesl laminar flowp solid phaset turbulent flow
References
1. Huang, Z.; Deng, L.; Che, D. Development and technical progress in large-scale circulating fluidized bedboiler in China. Front. Energy 2020, 1–16. [CrossRef]
2. Cheng, L.; Ji, J.; Wei, Y.; Wang, Q.; Fang, M.; Luo, Z.; Ni, M.; Cen, K. A note on large-size supercritical CFBtechnology development. Powder Technol. 2020, 363, 398–407. [CrossRef]
3. Lyu, J.; Yang, H.; Ling, W.; Nie, L.; Yue, G.; Li, R.; Chen, Y.; Wang, S. Development of a supercritical and anultra-supercritical circulating fluidized bed boiler. Front. Energy 2017, 13, 114–119. [CrossRef]
4. Konist, A.; Järvik, O.; Pikkor, H.; Neshumayev, D.; Pihu, T. Utilization of pyrolytic wastewater in oil shalefired CFBC boiler. J. Clean. Prod. 2019, 234, 487–493. [CrossRef]
5. Yue, G.; Cai, R.; Lu, J.; Zhang, H. From a CFB reactor to a CFB boiler – The review of R&D progress of CFBcoal combustion technology in China. Powder Technol. 2017, 316, 18–28. [CrossRef]
6. Cai, R.; Ke, X.; Lyu, J.; Yang, H.; Zhang, M.; Yue, G.; Ling, W. Progress of circulating fluidized bed combustiontechnology in China: a review. Clean Energy 2017, 1, 36–49. [CrossRef]
7. Wang, W.; Jing, S.; Sun, Y.; Liu, J.; Niu, Y.; Zeng, D.; Cui, C. Combined heat and power control consideringthermal inertia of district heating network for flexible electric power regulation. Energy 2019, 169, 988–999.[CrossRef]
8. Adams, D.; Oh, D.-H.; Kim, D.-W.; Lee, C.-H.; Oh, M. Prediction of SOx–NOx emission from a coal-fired CFBpower plant with machine learning: Plant data learned by deep neural network and least square supportvector machine. J. Clean. Prod. 2020, 270, 122310. [CrossRef]
9. Yang, W.; Wang, B.; Lei, S.; Wang, K.; Chen, T.; Song, Z.; Ma, C.; Zhou, Y.; Sun, L. Combustion optimizationand NOx reduction of a 600 MWe down-fired boiler by rearrangement of swirl burner and introduction ofseparated over-fire air. J. Clean. Prod. 2019, 210, 1120–1130. [CrossRef]
Energies 2020, 13, 5883 24 of 24
10. Gao, M.; Zhang, B.; Hong, F.; Chen, F. Design and application of the feed water control strategy for a 350 MWcirculating fluidized bed boiler. Appl. Therm. Eng. 2017, 125, 1–8. [CrossRef]
11. Gao, M.; Hong, F.; Yan, G.; Liu, J.; Chen, F. Mechanism modelling on the coordinated control system of acoal-fired subcritical circulating fluidized bed unit. Appl. Therm. Eng. 2019, 146, 548–555. [CrossRef]
12. Zhang, H.; Gao, M.; Hong, F.; Liu, J.; Wang, X. Control-oriented modelling and investigation on quick loadchange control of subcritical circulating fluidized bed unit. Appl. Therm. Eng. 2019, 163, 114420. [CrossRef]
13. Hong, F.; Yan, G.; Gao, M. The operation control and application of CFB boiler unit with high blending ratioof coal slurry. Control Eng. Pract. 2019, 85, 80–89. [CrossRef]
14. Bidwe, A.R.; Varela, G.D.; Dieter, H.; Scheffknecht, G. Experimental study of the effect of friction phenomenaon actual and calculated inventory in a small-scale CFB riser. Particuology 2015, 21, 41–47. [CrossRef]
15. Chourasia, S.; Alappat, B.J. Effects of various parameters on the attrition of bed material in a recirculatingfluidized bed with a draft tube. Particuology 2018, 38, 61–70. [CrossRef]
16. Yang, H.; Zhang, H.; Yang, S.; Yue, G.; Su, J.; Fu, Z. Effect of Bed Pressure Drop on Performance of a CFBBoiler. Energy Fuels 2009, 23, 2886–2890. [CrossRef]
17. Park, C.; Basu, P. A model for prediction of transient response to the change of fuel feed rate to a circulatingfluidized bed boiler furnace. Chem. Eng. Sci. 1997, 52, 3499–3509. [CrossRef]
18. Snider, D.M.; Clark, S.M.; O’Rourke, P.J. Eulerian–Lagrangian method for three-dimensional thermal reactingflow with application to coal gasifiers. Chem. Eng. Sci. 2011, 66, 1285–1295. [CrossRef]
19. Snider, D. An Incompressible Three-Dimensional Multiphase Particle-in-Cell Model for Dense Particle Flows.J. Comput. Phys. 2001, 170, 523–549. [CrossRef]
20. Cui, Y.; Liu, X.; Zhong, W. Simulations of Coal Combustion in a Pressurized Supercritical CO2 CirculatingFluidized Bed. Energy Fuels 2020, 134, 4977–4992. [CrossRef]
21. Xie, J.; Zhong, W.; Shao, Y.; Liu, Q.; Liu, L.; Liu, G. Simulation of Combustion of Municipal Solid Waste andCoal in an Industrial-Scale Circulating Fluidized Bed Boiler. Energy Fuels 2017, 31, 14248–14261. [CrossRef]
22. Zhong, W.; Xie, J.; Shao, Y.; Liu, X.; Jin, B. Three-dimensional modeling of olive cake combustion in CFB.Appl. Therm. Eng. 2015, 88, 322–333. [CrossRef]
23. Desroches-Ducarne, E.; Dolignier, J.; Marty, E.; Martin, G.; Delfosse, L. Modelling of gaseous pollutantsemissions in circulating fluidized bed combustion of municipal refuse. Fuel 1998, 77, 1399–1410. [CrossRef]
24. Cozzani, V. Reactivity in Oxygen and Carbon Dioxide of Char Formed in the Pyrolysis of Refuse-DerivedFuel. Ind. Eng. Chem. Res. 2000, 39, 864–872. [CrossRef]
25. Diaz-Bossio, L.M.; Squier, S.E.; Pulsifer, A.H. Reductive decomposition of calcium sulfate utilizing carbonmonoxide and hydrogen. Chem. Eng. Sci. 1985, 40, 319–324. [CrossRef]
26. Xie, J.; Zhong, W.; Jin, B.; Shao, Y.; Liu, H. Three-Dimensional Eulerian–Eulerian Modeling of GaseousPollutant Emissions from Circulating Fluidized-Bed Combustors. Energy Fuels 2014, 28, 5523–5533. [CrossRef]
27. Patel, M.K.; Pericleous, K.; Cross, M. Numerical modelling of circulating fluidized beds. Int. J. Comput. FluidDyn. 1993, 1, 161–176. [CrossRef]
28. Beetstra, R.; Van Der Hoef, M.M.; Kuipers, J.A.M. Drag force of intermediate Reynolds number flow pastmono- and bidisperse arrays of spheres. AIChE J. 2007, 53, 489–501. [CrossRef]
29. Gidaspow, D. Multiphase Flow and Fluidization: Continuum and Kinetic Theory Description; Academic Press:Boston, MA, USA, 1994.
30. Chhabra, R.; Agarwal, L.; Sinha, N. Drag on non-spherical particles: an evaluation of available methods.Powder Technol. 1999, 101, 288–295. [CrossRef]
Publisher’s Note: MDPI stays neutral with regard to jurisdictional claims in published maps and institutionalaffiliations.
© 2020 by the authors. Licensee MDPI, Basel, Switzerland. This article is an open accessarticle distributed under the terms and conditions of the Creative Commons Attribution(CC BY) license (http://creativecommons.org/licenses/by/4.0/).