study of the shear and extensional rheology of casein, waxy maize starch and their mixtures
TRANSCRIPT

This article was originally published in a journal published byElsevier, and the attached copy is provided by Elsevier for the
author’s benefit and for the benefit of the author’s institution, fornon-commercial research and educational use including without
limitation use in instruction at your institution, sending it to specificcolleagues that you know, and providing a copy to your institution’s
administrator.
All other uses, reproduction and distribution, including withoutlimitation commercial reprints, selling or licensing copies or access,
or posting on open internet sites, your personal or institution’swebsite or repository, are prohibited. For exceptions, permission
may be sought for such use through Elsevier’s permissions site at:
http://www.elsevier.com/locate/permissionusematerial

Autho
r's
pers
onal
co
py
FOODHYDROCOLLOIDS
Food Hydrocolloids 21 (2007) 716–725
Study of the shear and extensional rheology of casein,waxy maize starch and their mixtures
Philip Shiu-Kin Chana, Jianshe Chena,�, Rammile Ettelaiea, Zerah Lawa,Stefan Alevisopoulosb, Eddy Dayb, Sam Smithb
aProcter Department of Food Science, University of Leeds, Leeds LS2 9JT, UKbNational Starch and Chemical, Wexham Road, Slough, SL2 5DS, UK
Received 28 June 2006; accepted 1 February 2007
Abstract
This work investigated the shear and uniaxial extensional flow behaviour of aqueous casein and phosphated waxy maize starch systems
as a function of the deformation rate, biopolymer concentration and the temperature. Trouton ratios were calculated to compare
different responses of biopolymers to the shear and extensional deformation. It was found that the casein system (20% w/w) had a much
higher and linearly increasing Trouton ratio against the log increase of strain rate. The starch system (35% w/w) had a Trouton ratio
close to 3 at low strain rates, but increasing linearly once the strain rate exceeded 2 s�1. The apparent shear and extensional viscosity
showed an exponential increase with the concentration for both biopolymers, with casein being more concentration dependent. Their
Trouton ratios were also very much concentration dependent: remained close to 3 at low biopolymer levels, but increased significantly at
higher concentrations. Temperature variation experiments demonstrated that the flow properties of casein and waxy maize starch follow
an Arrhenius relationship, with casein showing stronger temperature dependence than starch. While casein systems displayed a decrease
in Trouton ratio with temperature increase, waxy maize starch had the opposite behaviour. The mixing of casein–waxy maize starch
resulted in higher apparent extensional viscosities and higher Trouton ratios than single biopolymer systems.
r 2007 Elsevier Ltd. All rights reserved.
Keywords: Casein; Waxy maize starch; Extensional rheology; Shear rheology; Trouton ratio; Phase separation
1. Introduction
Proteins and polysaccharides are commonly used asstructure building ingredients in solid and semi-solid foodsto confer mechanical strength and characteristic texturalproperties or as thickening agents in fluid foods to enhancethe consistency and stability of a product. Examplesinclude milk proteins in yoghurt and other dairy products,xanthan in sausage and meat products, pectins and gums insoft drinks, and etc. Proteins and polysaccharides are alsoutilized as raw materials in a variety of non-foodapplications either to modify flow behaviour, to enhancemechanical strength, or to improve adhesion performance.For example, biopolymers are used in paper coatingformulations to improve flow and consistency. Casein
and starches are used in adhesive applications because ofexcellent flow behaviour as well as superb adhesionperformance.One limiting factor for the application of a biopolymer is
its extremely complicated flow behaviour and its greatsensitivity to environmental conditions (e.g. temperature,pH, salt strength) and to the presence of other ingredients.For example, due to different molecular interactions, theviscosity of hydrocolloid solutions often shows differentpower law dependences at low and at high concentrations(Doublier, 1987; Morris, 1981). This is because, at lowconcentrations, biopolymer chains are predominantly sur-rounded by solvent molecules and exhibit low viscosities,while at higher concentrations, the increased contact andentanglement of biopolymer chains lead to a much faster rateof viscosity increase (Rao, 2005). It was also found that, dueto the different thermal sensitivity of intermolecular interac-tions (hydrogen bonding, electrostatic and hydrophobic
ARTICLE IN PRESS
www.elsevier.com/locate/foodhyd
0268-005X/$ - see front matter r 2007 Elsevier Ltd. All rights reserved.
doi:10.1016/j.foodhyd.2007.02.001
�Corresponding author. Tel.: +44113 3432748.
E-mail address: [email protected] (J. Chen).
Autho
r's
pers
onal
co
py
interactions), the biopolymer flow is also significantlyinfluenced by the temperature (Dasilva, Gonc-alves, &Rao, 1994). Such temperature effects can be convenientlyquantified using the Arrhenius analysis, where, byplotting the logarithm viscosity against the reciprocaltemperature (in Kelvin), a parameter called activationenergy can be obtained. As a general rule, the higher theactivation energy, the more temperature dependent theflow becomes.
The presence of a second biopolymer could also cause adramatic effect to the flow behaviour. The rheologicalproperties of a mixed biopolymer system differ significantlyfrom the behaviour of individual biopolymers due to theinteractions or cross-linking between the two biopolymers.Scientists have been trying to predict the rheologicalproperties of a mixed system based on the flow propertiesof the individuals. However, the thermodynamic complex-ity of the interactions between biopolymer molecules andtheir interactions with the solvent often make such aprediction questionable. For example, Kaletunc-Gencerand Peleg (1986) predicted that the viscosity of athermodynamically compatible biopolymer mixture wouldbe a combined viscosity contribution of individual bio-polymer weighted by its weight fraction, Zmix ¼ XAZA+XBZB. Although the model was found to be satisfactoryand effective for mixed systems composed of biopolymersof similar molecular weight, it became non-applicable whenthe two polymers differ significantly in molecular weight,were thermodynamically incompatible, or showed asynergistic effect (Lopes da Silva, Gonc-alves, & Rao,1992). It is, therefore, critically important to examine therheological properties of mixed biopolymer systems, eventhough the flow behaviour of individual biopolymer hasbeen well known.
Despite the progresses on biopolymer rheology, applica-tion of such knowledge is not always straightforward, dueto the complexity of material deformations in realapplications, as opposed to better controlled and oftensimplified approaches used during lab investigations. Forexample, most of the rheological studies in the literaturewere conducted under a pure shear flow, when in realitythere is often a component of extensional deformation. Insome cases, the extensional deformation could be dominat-ing, as in case of a fluid flowing through a contraction pipe,or a fluid stretched by two rotating rollers. Even in doughbaking process, the extensional deformation was alsobelieved to play an important role (Dobraszczyk &Morgenstern, 2003).
An extensional deformation differs greatly from a sheardeformation. During a shear deformation, the particleswithin the flowing body move in the same direction andslide over each other. During an extensional deformation,however, as the material being either stretched orcompressed, the particles within the fluid will either moveaway or towards each other. The different response of afluid to an extensional deformation was first revealed acentury ago by Trouton (Petrie, 2006), who observed that
the extensional viscosity of pitch and wax is three times ofits shear viscosity, a ratio was latter named as the Troutonratio. The Trouton ratio was later found very muchmaterial dependent. It equals to 3 for pure viscous fluids,but becomes much higher for viscoelastic fluids. However,the progress on extensional rheology was long hinderedbecause of the lack of a reliable technique to create a pureextensional flow. It was only until in the 1970s and 1980swhen experimental techniques became accessible forextensional studies. Cogswell (1978) developed a conver-ging flow technique for extensional investigation. However,even though the flow was mostly extensional in thisexperimental set-up, a contribution from shear flow wasstill significant. Laun and Schuch (1989) used a pair ofrollers to stretch a polymer sheet at its melting temperatureand managed to quantify the apparent extensional viscosityby measuring the resistance through a mechanical deviceattached to one roller. This technique proved useful forpolymer melts (Meissner & Hostettler, 1994), but wasbarely applicable for materials that are flowable at ambientconditions. Bazilevsky and his co-workers (Bazilevsky,Entov, Lerner, & Rozhkov, 1997; Bazilevsky, Entov, &Rozhkov, 1990) proposed to create a pure extensional flowby suddenly stretching the fluid to produce a filamentbetween two plates. The surface tension acting on thefilament squeezes the fluid out and produces a pureextensional flow. The extensional properties of the fluidcan be quantified by monitoring the kinetics of filamentthinning. This principle led to a recent development of acommercial extensiometer, a Capillary Break-up Elonga-tional Rheometer (CaBER) (Rodd, Scott, Cooper-White,& McKinley, 2005). Main advantages of this technique arethat it can create a pure extensional flow and is applicableto viscous fluids over a wide viscosity range.This work applied the above filament thinning technique
to investigate the extensional behaviour of casein, waxymaize starch and their mixtures. The results were comparedagainst their shear rheology data, in an attempt to betterunderstand the different types of resistance exhibited bybiopolymers when being subjected to shear vs. extensionaldeformation. The effects of concentration and temperatureto the above types of flow were also investigated. It ishoped that the findings from this study will help to enhanceour understanding of extensional and shear flow propertiesof biopolymer fluids.
2. Materials and methods
2.1. Materials
Water-based biopolymer systems were prepared at roomtemperature by using acid casein (ALACID 730, suppliedby NZMP, New Zealand) and Dexylose I231 (Roquette,France). According to the certificate of analysis, the caseinsample contained 89.32% w/w protein (based on Kjeldahlmethod using a Nitrogen coefficient of 6.38), 0.47% w/wfat (using Soxhlet extraction), 9.73% w/w moisture
ARTICLE IN PRESSP.S.-K. Chan et al. / Food Hydrocolloids 21 (2007) 716–725 717

Autho
r's
pers
onal
co
py
(Gravimetric method at 105 1C), and 1.6% w/w ash. Thefree acidity was 0.06% (from titration using 0.02MNaOH). Dexylose I231 is a phosphated waxy maize starchwith a Degree of Substitution (DS)40.07 and is as a resultcold water soluble. Due to its waxy nature, this starchcontains 100% amylopectin and no amylose. The samplewas in granular form and had a moisture content of 11.2%w/w (gravimetric method at 105 1C) and a particle sizedistribution of 99%o1000 mm and 65%4200 mm.
Aqueous solutions of casein with concentrations of 12.5,15.0, 17.0, 20.0, 22.5 and 25.0% (w/w) were prepared byadding 0.1M NaOH solution to the acid casein, so thatsamples achieved a final pH value of 6.770.1. Caseinsamples were stirred gently using a magnetic stirrer at aslow speed for 6 h at room temperature. Dexylose I231 hasneutral pH when dissolved in water. As it is cold watersoluble, starch solutions were prepared by slowly addingstarch powder into water at ambient temperature andunder moderate agitation. In this way, samples of 13.0,17.0, 20.0, 25.0, 30.0 and 35.0% (w/w) Dexylose I231were prepared. Three biopolymer mixtures were alsoprepared in the corresponding casein and starch concen-trations of (i) 5%+25% (w/w), (ii) 13%+13% (w/w), and(iii) 17%+5% (w/w). No biocide was added and allsamples were used within 2 days from preparation.
2.2. Rheology tests
Shear rheology tests were performed using a BohlinC-VOR rheometer (Bohlin Instruments Ltd.). The con-trolled shear rate measurements were performed using a20mm (in diameter) parallel plate geometry and a 40mm(in diameter), 41 cone-and-plate geometry. The gap size forparallel plates was set to 0.1mm. The cone-and-plategeometry has the advantage of applying a uniform shearrate to the sample and was used for measurements atconstant shear rates. On the other hand, the small gapparallel plate geometry was used for testing flow over awide range of shear rates, due to its ability to achievemuch higher shear rates. During shear flow tests, the shearrate was increased step-by-step over the chosen range ofshear rates and a steady state was obtained at eachmeasurement.
Extensional rheology tests were carried out using aHaake CaBER-1 extensional rheometer (Thermo HaakeGmbH, Karlsruhe, Germany), equipped with two 6mmcircular parallel plates. In order to minimize the influenceof gravity and shear flow during the early stages of stretch,plates were set at an initial gap of 3mm, resulting in anaspect ratio (initial length to radius, L/R) equal to 1. Fluidsamples were carefully loaded between the plates using apipette or syringe to ensure the absence of trapped airwithin the sample cylinder, or between the sample and theplates. The upper plate was suddenly raised to a pre-setheight of 11.02mm to create a filament and a laser beamaiming at the middle point of the filament monitored thechanges in diameter. All shear and extensional tests were
repeated at least three times and average was taken foranalysis.With this experimental arrangement, the extensional
flow of the filament is under the influence of the surfacetension acting on the fluid surface (Bazilevsky et al., 1990,1997; Rodd et al., 2005). The tensile stress difference, tE,acting on the filament, can be calculated using thefollowing equation:
tE ¼2s
Dmid ðtÞ; (1)
where s is the surface tension of the fluid and Dmid (t) is thefilament diameter at time t. The filament thinning wasrecorded at a rate of above 100 points per second. Theextensional strain rate, _�, can be obtained at time t:
_� ¼ �2
Dmid ðtÞ
qDmid ðtÞ
qt: (2)
Assuming the fluid is purely viscous, its apparentextensional viscosity, ZE, can then be calculated from theratio of the tensile stress and strain rate:
ZE ¼tE
_�¼ �
sðqDmid ðtÞ=qtÞ
. (3)
The sample temperature was controlled by a waterbathcirculating underneath the plates with an accuracy of0.1 1C. Prior to testing, samples were thermally equilibratedin a waterbath to testing temperature. During shearrheology tests, a solvent trap was used to minimize solventloss. During extensional rheology tests, free water wasplaced inside the sample chamber in order to minimizemoisture loss from the fluid filament. The surface tensionsof fluid samples were determined using a Surface Tensi-ometer K10 (KRUSS Gmbh, Germany), using a Platinu-m–Iridium DuNouy ring at 25 1C. Due to the difficulty ofobtaining accurate measurements with viscous fluids, thesurface tension of a number of relatively dilute casein andstarch solutions was measured and the values correspond-ing to higher concentrations were estimated by extrapola-tion. It was found that the surface tension for bothbiopolymer systems showed significant concentrationdependence at below 2% but remained little changed atabove 2% (data not shown). In this way, the surfacetension of concentrated waxy maize starch and caseinsystems was estimated to be 46mNm�1, and 41mNm�1,respectively.
3. Results and discussions
3.1. Shear and extensional flow of casein and waxy maize
starch
The shear flow behaviour of pure casein (20.0%) andwaxy maize starch (35.0%) was investigated over a widerange of shear rates (Fig. 1). Both systems had an overallshear thinning behaviour over the entire range of shearrates, even though the starch system behaved much more
ARTICLE IN PRESSP.S.-K. Chan et al. / Food Hydrocolloids 21 (2007) 716–725718

Autho
r's
pers
onal
co
py
shear thinning than the casein. The starch sample had ahigher viscosity at low shear rates (157 Pa s against 53 Pa sat 0.01 s�1), but had a much lower viscosity at highshear rates (8.5 Pa s against 28 Pa s at 100 s�1). Thissignificant difference is likely due to molecular weightand conformational differences between the two biopoly-mers. At very low shear rates, the high molecular weightamylopectin chains in starch (the average molecular weightof waxy maize starches is 360MDa) are subjected toBrownian randomization and probably in a naturalrandom configuration (or overlapped because of the highconcentration). However, when the polymer chains aresheared, they unwind and align in the direction of shear.The viscosity, as a measure of flow resistance, is thereforedecreasing. On the other hand, casein has much smallermolecular weight (between 19–25 kDa for as1-, as2-, b- andk-casein fractions) (Swaisgood, 1992). The mild thinningbehaviour of casein might also be due to the fact thatcaseins actually exist as aggregates status, rather thanindividual random polymer chains. A particulate systemwould be less dramatic in shear thinning than that of longchained polymers.
The differences between the two biopolymers were alsosignificant when they were subjected to extensionaldeformation. Fig. 2 illustrates the apparent extensionalviscosity of the two samples between strain rates 1 and10 s�1. Within this range, both systems behaved quiteindependent from the strain rate, with only casein showinga slight increase in its apparent viscosity. This contradictedto the thinning behaviour over the corresponding rates ofshear deformation (see Fig. 1). Furthermore, the apparentextensional viscosity of both samples was found signifi-cantly higher than the corresponding shear viscosity. Thissuggests that the two biopolymers have different responsesto extensional and shear deformation with both being moreresistant to extensional flow.
It should be noted, however, that although the CaBERcan generate a free-surface flow, the extensional strainrate is unfortunately uncontrollable. The observedstrain rates were pre-determined by the nature of thesample, i.e. the surface tension and viscosity of the fluid.The maximum range of deformation rates achieved forcasein and waxy maize starch samples were between 0.1and 100 s�1.
By comparing the results of Figs. 1 and 2, one can seethat the apparent extensional viscosity is always higherthan the shear viscosity at corresponding deformationrates. This means that a higher stress is needed to createan extensional flow at the same rate of strain deformation.This is why a shear flow is often called as a ‘weak’ flowwhile an extensional flow is called as a ‘strong’ flow(Barnes, 2000). The different responses of a material toshear and extensional deformation can be characterizedquantitatively by the Trouton ratio, TR, defined as theratio of the extensional viscosity over the shear viscositymeasured at a shear rate of
ffiffiffi
3p
times the equivalentextensional strain rate (Barrow, Brown, Cordy, Williams,
& Williams, 2004):
TR ¼ZEð_�Þ
Zðffiffiffi
3p
_�Þ, (4)
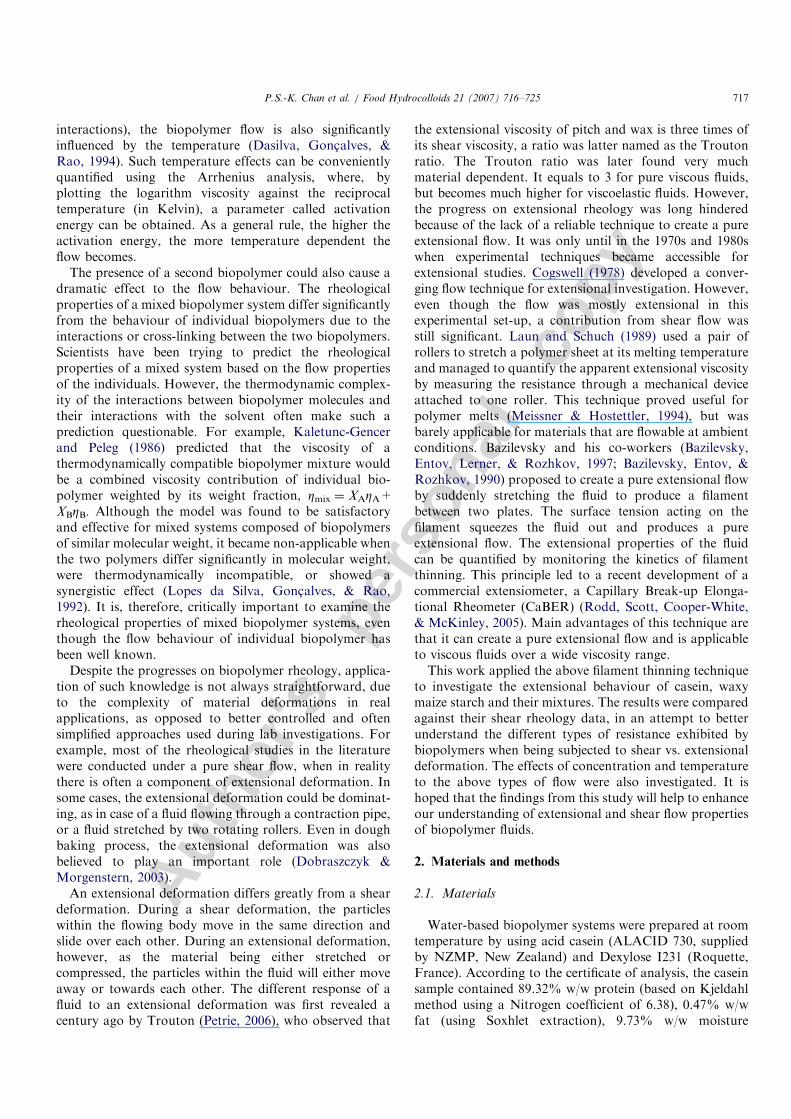
where _� is called the equivalent extensional strain rate. TheTrouton ratio is considered as an effective parameter ofreflecting the nature of a fluid. For a pure viscous fluid, theextensional viscosity should be three times that of the shearviscosity, producing a Trouton ratio of 3. However, theratio can become much larger than 3 for non-Newtonianfluids which have high elastic contributions (O’Brien &Mackay, 2002).Fig. 3 shows the Trouton ratio for casein and waxy
maize starch plotted against the extensional strain rate. Itappeared that the Trouton ratio for the casein was muchhigher than 3, indicating a viscoelastic nature of thissystem. Its Trouton ratio also showed a linear increaseagainst the log increase of deformation rate. For the starchsystem, its Trouton ratio remained close to 3 at low
ARTICLE IN PRESS
0.01 0.1 1 10 100
10
100
Appare
nt vis
cosit
y (
Pa
.s)
Shear rate (s-1)
Fig. 1. Shear viscosity of 20.0% w/w casein (solid squares) and 35.0%
w/w waxy maize starch (open circles) as a function of shear rate. The shear
flow was tested at 25 1C, using 20mm parallel plate geometry at a gap of
0.1mm. The data was the average of 3 sets of experiment results.
10
100
1000
101Strain rate (s-1)
Appare
nt V
iscosit
y (
Pa
.s)
Fig. 2. Apparent extensional viscosity as a function of strain rate for
20.0% w/w casein (solid squares) and 35.0% w/w waxy maize starch (open
circles), measured on a CaBER extensional rheometer at 25 1C. The data
was the average of 3 sets of experiment results.
P.S.-K. Chan et al. / Food Hydrocolloids 21 (2007) 716–725 719
Autho
r's
pers
onal
co
py
deformation rates (below 2 s�1), but started to increaselinearly when the strain rate exceeded 2 s�1. This suggeststhat the starch system behaved purely viscous at lowdeformation rates. However, linear increase of Troutonratio suggests an increased elastic contribution at higherstrain rates for both biopolymers.
3.2. Concentration effect
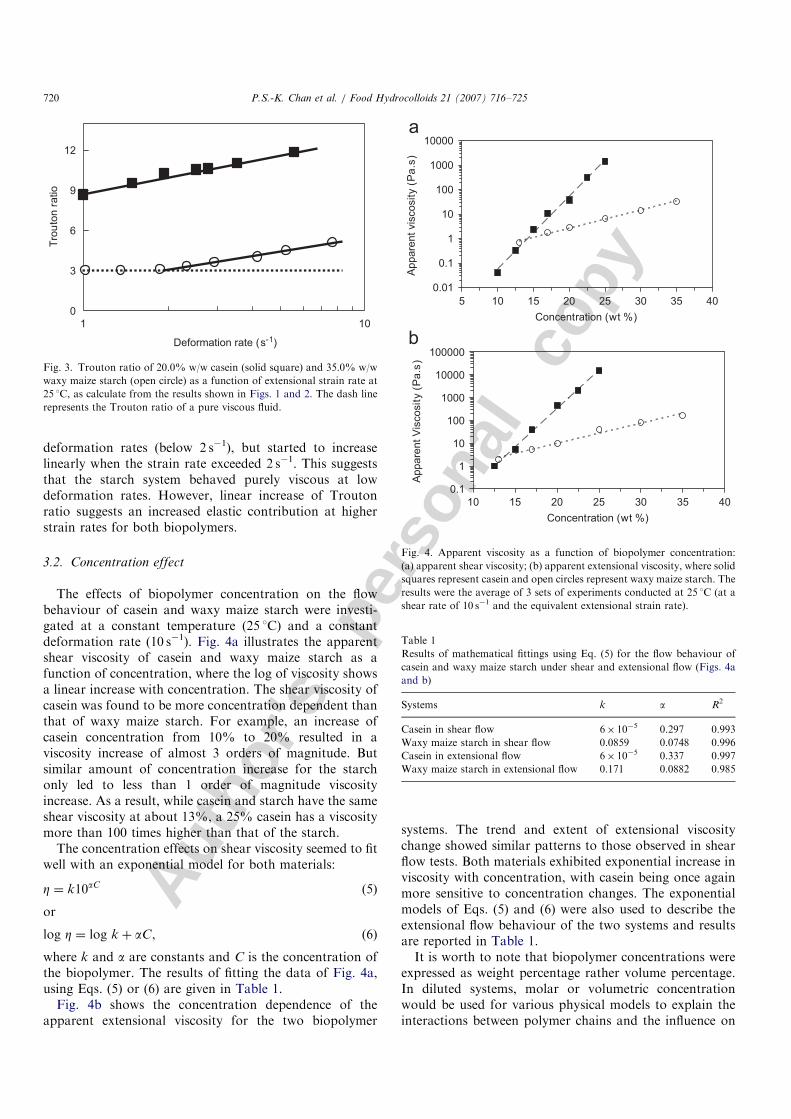
The effects of biopolymer concentration on the flowbehaviour of casein and waxy maize starch were investi-gated at a constant temperature (25 1C) and a constantdeformation rate (10 s�1). Fig. 4a illustrates the apparentshear viscosity of casein and waxy maize starch as afunction of concentration, where the log of viscosity showsa linear increase with concentration. The shear viscosity ofcasein was found to be more concentration dependent thanthat of waxy maize starch. For example, an increase ofcasein concentration from 10% to 20% resulted in aviscosity increase of almost 3 orders of magnitude. Butsimilar amount of concentration increase for the starchonly led to less than 1 order of magnitude viscosityincrease. As a result, while casein and starch have the sameshear viscosity at about 13%, a 25% casein has a viscositymore than 100 times higher than that of the starch.
The concentration effects on shear viscosity seemed to fitwell with an exponential model for both materials:
Z ¼ k10aC (5)
or
log Z ¼ log k þ aC, (6)
where k and a are constants and C is the concentration ofthe biopolymer. The results of fitting the data of Fig. 4a,using Eqs. (5) or (6) are given in Table 1.
Fig. 4b shows the concentration dependence of theapparent extensional viscosity for the two biopolymer
systems. The trend and extent of extensional viscositychange showed similar patterns to those observed in shearflow tests. Both materials exhibited exponential increase inviscosity with concentration, with casein being once againmore sensitive to concentration changes. The exponentialmodels of Eqs. (5) and (6) were also used to describe theextensional flow behaviour of the two systems and resultsare reported in Table 1.It is worth to note that biopolymer concentrations were
expressed as weight percentage rather volume percentage.In diluted systems, molar or volumetric concentrationwould be used for various physical models to explain theinteractions between polymer chains and the influence on
ARTICLE IN PRESS
0
3
6
9
12
101
Deformation rate (s-1)
Tro
uto
n r
atio
Fig. 3. Trouton ratio of 20.0% w/w casein (solid square) and 35.0% w/w
waxy maize starch (open circle) as a function of extensional strain rate at
25 1C, as calculate from the results shown in Figs. 1 and 2. The dash line
represents the Trouton ratio of a pure viscous fluid.
0.01
0.1
1
10
100
1000
10000
5 10 15 20 25 30 35 40
Concentration (wt %)
Appare
nt vis
cosit
y (
Pa
.s)
0.1
1
10
100
1000
10000
100000
10 15 20 25 30 35 40
Concentration (wt %)
Appare
nt V
iscosit
y (
Pa
.s)
Fig. 4. Apparent viscosity as a function of biopolymer concentration:
(a) apparent shear viscosity; (b) apparent extensional viscosity, where solid
squares represent casein and open circles represent waxy maize starch. The
results were the average of 3 sets of experiments conducted at 25 1C (at a
shear rate of 10 s�1 and the equivalent extensional strain rate).
Table 1
Results of mathematical fittings using Eq. (5) for the flow behaviour of
casein and waxy maize starch under shear and extensional flow (Figs. 4a
and b)
Systems k a R2
Casein in shear flow 6� 10�5 0.297 0.993
Waxy maize starch in shear flow 0.0859 0.0748 0.996
Casein in extensional flow 6� 10�5 0.337 0.997
Waxy maize starch in extensional flow 0.171 0.0882 0.985
P.S.-K. Chan et al. / Food Hydrocolloids 21 (2007) 716–725720
Autho
r's
pers
onal
co
py
flow behaviour. However, for concentrated systems wherepolymer chains overlap, volumetric concentration becomesless critical and weight concentration is often used becauseof practical convenience.
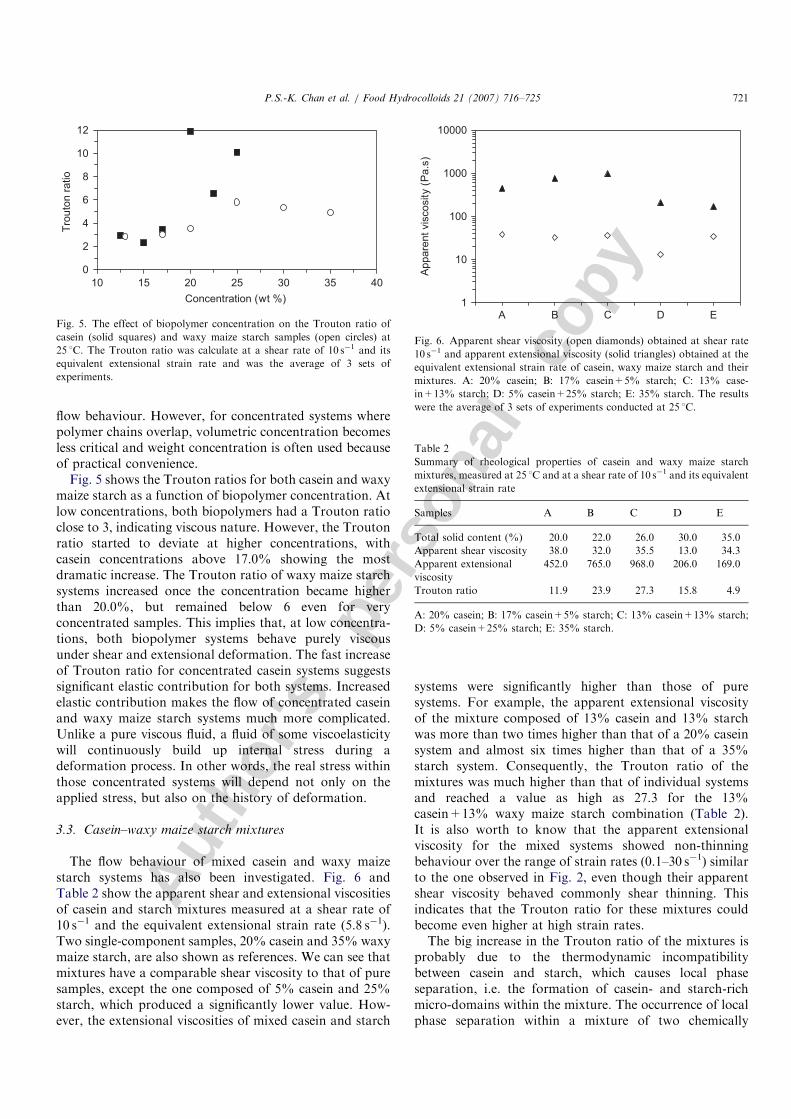
Fig. 5 shows the Trouton ratios for both casein and waxymaize starch as a function of biopolymer concentration. Atlow concentrations, both biopolymers had a Trouton ratioclose to 3, indicating viscous nature. However, the Troutonratio started to deviate at higher concentrations, withcasein concentrations above 17.0% showing the mostdramatic increase. The Trouton ratio of waxy maize starchsystems increased once the concentration became higherthan 20.0%, but remained below 6 even for veryconcentrated samples. This implies that, at low concentra-tions, both biopolymer systems behave purely viscousunder shear and extensional deformation. The fast increaseof Trouton ratio for concentrated casein systems suggestssignificant elastic contribution for both systems. Increasedelastic contribution makes the flow of concentrated caseinand waxy maize starch systems much more complicated.Unlike a pure viscous fluid, a fluid of some viscoelasticitywill continuously build up internal stress during adeformation process. In other words, the real stress withinthose concentrated systems will depend not only on theapplied stress, but also on the history of deformation.
3.3. Casein–waxy maize starch mixtures
The flow behaviour of mixed casein and waxy maizestarch systems has also been investigated. Fig. 6 andTable 2 show the apparent shear and extensional viscositiesof casein and starch mixtures measured at a shear rate of10 s�1 and the equivalent extensional strain rate (5.8 s�1).Two single-component samples, 20% casein and 35% waxymaize starch, are also shown as references. We can see thatmixtures have a comparable shear viscosity to that of puresamples, except the one composed of 5% casein and 25%starch, which produced a significantly lower value. How-ever, the extensional viscosities of mixed casein and starch
systems were significantly higher than those of puresystems. For example, the apparent extensional viscosityof the mixture composed of 13% casein and 13% starchwas more than two times higher than that of a 20% caseinsystem and almost six times higher than that of a 35%starch system. Consequently, the Trouton ratio of themixtures was much higher than that of individual systemsand reached a value as high as 27.3 for the 13%casein+13% waxy maize starch combination (Table 2).It is also worth to know that the apparent extensionalviscosity for the mixed systems showed non-thinningbehaviour over the range of strain rates (0.1–30 s�1) similarto the one observed in Fig. 2, even though their apparentshear viscosity behaved commonly shear thinning. Thisindicates that the Trouton ratio for these mixtures couldbecome even higher at high strain rates.The big increase in the Trouton ratio of the mixtures is
probably due to the thermodynamic incompatibilitybetween casein and starch, which causes local phaseseparation, i.e. the formation of casein- and starch-richmicro-domains within the mixture. The occurrence of localphase separation within a mixture of two chemically
ARTICLE IN PRESS
0
2
4
6
8
10
12
10 15 20 25 30 35 40
Concentration (wt %)
Tro
uto
n r
atio
Fig. 5. The effect of biopolymer concentration on the Trouton ratio of
casein (solid squares) and waxy maize starch samples (open circles) at
25 1C. The Trouton ratio was calculate at a shear rate of 10 s�1 and its
equivalent extensional strain rate and was the average of 3 sets of
experiments.
1
10
100
1000
10000
A B C D E
Appare
nt vis
cosity (
Pa.s
)
Fig. 6. Apparent shear viscosity (open diamonds) obtained at shear rate
10 s�1 and apparent extensional viscosity (solid triangles) obtained at the
equivalent extensional strain rate of casein, waxy maize starch and their
mixtures. A: 20% casein; B: 17% casein+5% starch; C: 13% case-
in+13% starch; D: 5% casein+25% starch; E: 35% starch. The results
were the average of 3 sets of experiments conducted at 25 1C.
Table 2
Summary of rheological properties of casein and waxy maize starch
mixtures, measured at 25 1C and at a shear rate of 10 s�1 and its equivalent
extensional strain rate
Samples A B C D E
Total solid content (%) 20.0 22.0 26.0 30.0 35.0
Apparent shear viscosity 38.0 32.0 35.5 13.0 34.3
Apparent extensional
viscosity
452.0 765.0 968.0 206.0 169.0
Trouton ratio 11.9 23.9 27.3 15.8 4.9
A: 20% casein; B: 17% casein+5% starch; C: 13% casein+13% starch;
D: 5% casein+25% starch; E: 35% starch.
P.S.-K. Chan et al. / Food Hydrocolloids 21 (2007) 716–725 721

Autho
r's
pers
onal
co
py
dissimilar macromolecular species, such as a protein (e.g.casein) and a polysaccharide (e.g. waxy maize starch, i.e.amylopectin) is well established in the literature. Variousstudies have reported the existence of phase separatednetworks in casein–polysaccharide mixtures (Bourriot,Garnier, & Doublier, 1999; Schorsch, Clark, Jones, &Norton, 1999) and the amylopectin-casein system inparticular (De Bont, Van Kempen, & Vreeker, 2002).Depending on the weight ratio of the two biopolymers inthe mixture, as well as their relative affinities for water, acasein–starch system may either have the protein- or thepolysaccharide-rich domain forming the continuous phase,with the second component dispersed as the discontinuousphase. As a result, only a fraction of the total water contentwill be available to one biopolymer phase (e.g. casein), withthe remaining water being bound by the second phase (e.g.starch). The net result is that the effective concentration ofeach biopolymer within its own phase is considerably higherthan its original nominal concentration in the mixture. Forexample, a 50:50 split of the available water between thetwo incompatible phases, would double the actual concen-tration of starch and casein within their respectivesegments. As a result, the rheological properties of themixture will resemble those of an overall more concentratedsystem, with the characteristics of the material forming thecontinuous phase dominating the overall properties of themixture. Another possibility in a mixture of two chemicallydissimilar macromolecular species would be the formationof a phase separated system with a more concentratedcontinuous phase and a more diluted dispersed phase,leading to an overall increase in viscosity.
The fact that the extensional viscosity of mixture D (5%casein+25% starch in Fig. 6 and Table 2) is closer to theone of a single starch system and significantly lower thanthose of mixtures B and C, suggests that the former is likelyto have a starch continuous network, while samples B andC have casein (the higher extensional viscosity material)forming the continuous phase. This analogy can also beseen from the data in Fig. 7, where the filament diametervs. time profiles are shown for the above mixtures, againstthose of pure waxy maize starch and casein systems. Theprofile of mixture D (5% casein+25% starch) is similar tothe curve obtained for a 30% waxy maize starch sample,suggesting a possible starch continuous phase dominatingthe overall extensional behaviour of this system. On thecontrary, the mixtures B (17% casein+5% starch) and C(13% casein+13% starch) are more likely to be caseincontinuous, as their profiles resemble closer to the curve ofa pure casein sample (22.5%).
The experimental results of Fig. 6 have also beenexamined using the models proposed by Miller and Mann(Eq. (7)) (Rao, 1999) and by Kaletunc-Gencer and Peleg(1986) (Eq. (8)):
Zmix ¼ ZX 1
1 � ZX 2
2 , (7)
Zmix ¼ X 1Z1 þ X 2Z2, (8)
where Zmix is the viscosity of the mixture, Xi is the weightfraction of component i and Zi is the viscosity of singlesolutions at the same concentration. Although the abovemodels were found to be effective for binary mixtures ofthermodynamically compatible biopolymers, such as mix-tures of pectin and locust bean gum (Lopes da Silva et al.,1992), the experimental data of Fig. 6 deviated significantlyfrom the predictions of those models. This is, once again,an indication that casein and waxy maize starch may bethermodynamically incompatible and their mixtures have anetwork of concentrated local domains.
3.4. Temperature effect
The temperature effect on the viscous flow can bedescribed by the Arrhenius relationship:
Z ¼ Z1 expðEa=RT Þ, (9)
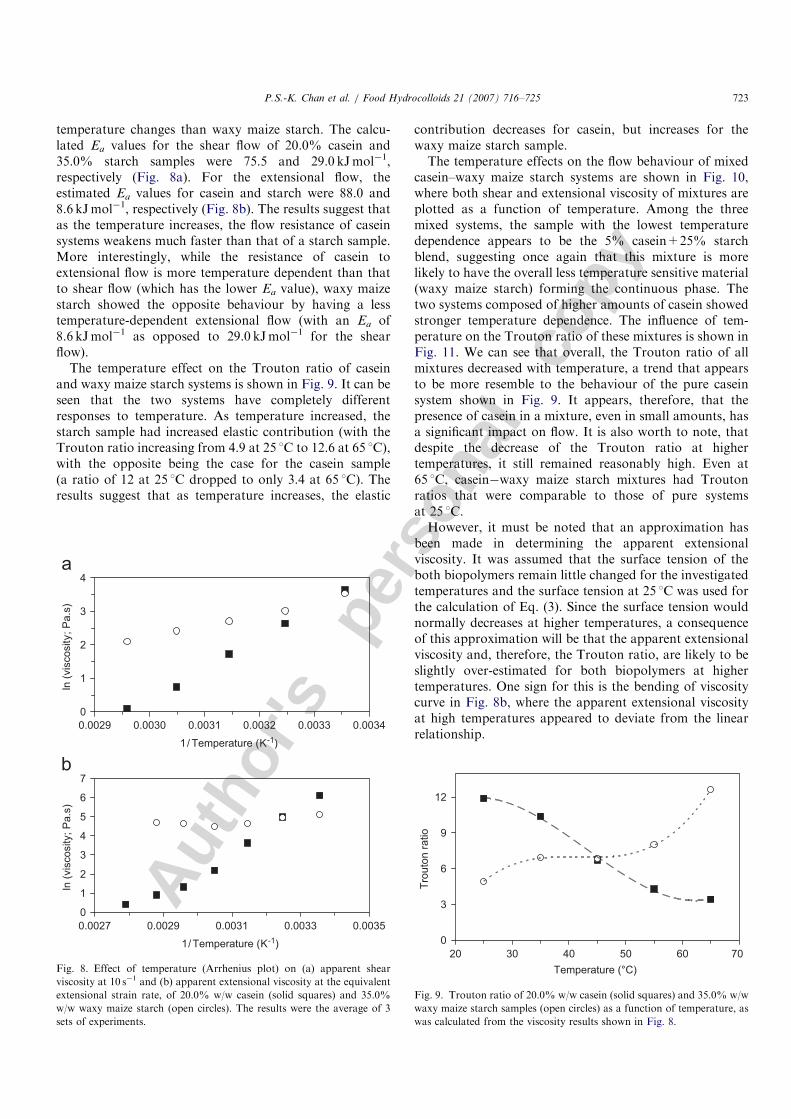
where Ea is the activation energy of the viscous flow(Jmol�1) and can be interpreted as the energy barrier thatmust be overcome before an elementary flow process canoccur, R is the universal gas constant and T is temperature(K). By rearranging Eq. (9), a (ln Z) vs. (1/T) graph can begenerated, from which the value of Ea can be estimatedfrom the slope of fitting line.The flow behaviour of casein and waxy maize starch
systems has been investigated over the temperature rangefrom 25 to 85 1C. For extensional flow tests, experimentaltemperatures higher than 85 1C were found not feasible,due to the heating limitations of the instrument, as well asthe rapid skinning effects of filament surfaces. Fig. 8 showsthe temperature dependence of the apparent shear andextensional viscosity for casein (20.0% w/w) and waxymaize starch (35.0% w/w) samples. The viscosities of bothsamples decreased with temperature increase and it wasobvious that the casein system was far more sensitive to
ARTICLE IN PRESS
0.01
0.1
1
10
0.001 0.1 10 1000
Time (s)
Dia
mete
r (m
m)
30% Starch
5% Casein + 25% Starch
13% Casein + 13% Starch
17% Casein + 5% Starch
22.5% Casein
Fig. 7. Comparison of filament diameter vs. time profiles of casein–waxy
maize starch mixtures, with those of individual casein and waxy maize
starch systems. The profiles of the mixtures (13% casein+13% starch, and
17% casein+5% starch) have a closer resemblance to a casein curve of
similar solid content. In contrast, the mixture composed of 5%
casein+25% starch has a profile similar to the one of a 30% starch
sample. All experiments were conducted at 25 1C using a CaBER
rheometer.
P.S.-K. Chan et al. / Food Hydrocolloids 21 (2007) 716–725722
Autho
r's
pers
onal
co
py
temperature changes than waxy maize starch. The calcu-lated Ea values for the shear flow of 20.0% casein and35.0% starch samples were 75.5 and 29.0 kJmol�1,respectively (Fig. 8a). For the extensional flow, theestimated Ea values for casein and starch were 88.0 and8.6 kJmol�1, respectively (Fig. 8b). The results suggest thatas the temperature increases, the flow resistance of caseinsystems weakens much faster than that of a starch sample.More interestingly, while the resistance of casein toextensional flow is more temperature dependent than thatto shear flow (which has the lower Ea value), waxy maizestarch showed the opposite behaviour by having a lesstemperature-dependent extensional flow (with an Ea of8.6 kJmol�1 as opposed to 29.0 kJmol�1 for the shearflow).
The temperature effect on the Trouton ratio of caseinand waxy maize starch systems is shown in Fig. 9. It can beseen that the two systems have completely differentresponses to temperature. As temperature increased, thestarch sample had increased elastic contribution (with theTrouton ratio increasing from 4.9 at 25 1C to 12.6 at 65 1C),with the opposite being the case for the casein sample(a ratio of 12 at 25 1C dropped to only 3.4 at 65 1C). Theresults suggest that as temperature increases, the elastic
contribution decreases for casein, but increases for thewaxy maize starch sample.The temperature effects on the flow behaviour of mixed
casein–waxy maize starch systems are shown in Fig. 10,where both shear and extensional viscosity of mixtures areplotted as a function of temperature. Among the threemixed systems, the sample with the lowest temperaturedependence appears to be the 5% casein+25% starchblend, suggesting once again that this mixture is morelikely to have the overall less temperature sensitive material(waxy maize starch) forming the continuous phase. Thetwo systems composed of higher amounts of casein showedstronger temperature dependence. The influence of tem-perature on the Trouton ratio of these mixtures is shown inFig. 11. We can see that overall, the Trouton ratio of allmixtures decreased with temperature, a trend that appearsto be more resemble to the behaviour of the pure caseinsystem shown in Fig. 9. It appears, therefore, that thepresence of casein in a mixture, even in small amounts, hasa significant impact on flow. It is also worth to note, thatdespite the decrease of the Trouton ratio at highertemperatures, it still remained reasonably high. Even at65 1C, casein�waxy maize starch mixtures had Troutonratios that were comparable to those of pure systemsat 25 1C.However, it must be noted that an approximation has
been made in determining the apparent extensionalviscosity. It was assumed that the surface tension of theboth biopolymers remain little changed for the investigatedtemperatures and the surface tension at 25 1C was used forthe calculation of Eq. (3). Since the surface tension wouldnormally decreases at higher temperatures, a consequenceof this approximation will be that the apparent extensionalviscosity and, therefore, the Trouton ratio, are likely to beslightly over-estimated for both biopolymers at highertemperatures. One sign for this is the bending of viscositycurve in Fig. 8b, where the apparent extensional viscosityat high temperatures appeared to deviate from the linearrelationship.
ARTICLE IN PRESS
0
1
2
3
4
0.0029 0.0030 0.0031 0.0032 0.0033 0.0034
1/ Temperature (K-1)
ln (
vis
cosity; P
a.s
)
a
0
1
2
3
4
5
6
7
0.0027 0.0029 0.0031 0.0033 0.0035
1/ Temperature (K-1)
ln (
vis
cosity; P
a.s
)
b
Fig. 8. Effect of temperature (Arrhenius plot) on (a) apparent shear
viscosity at 10 s�1 and (b) apparent extensional viscosity at the equivalent
extensional strain rate, of 20.0% w/w casein (solid squares) and 35.0%
w/w waxy maize starch (open circles). The results were the average of 3
sets of experiments.
0
3
6
9
12
20 30 40 50 60 70
Temperature (°C)
Tro
uto
n r
atio
Fig. 9. Trouton ratio of 20.0% w/w casein (solid squares) and 35.0% w/w
waxy maize starch samples (open circles) as a function of temperature, as
was calculated from the viscosity results shown in Fig. 8.
P.S.-K. Chan et al. / Food Hydrocolloids 21 (2007) 716–725 723

Autho
r's
pers
onal
co
py
4. Conclusions
The apparent shear and extensional viscosities of casein,waxy maize starch and their mixtures have been studied asa function of deformation rate, biopolymer concentrationand temperature. It was found that the casein systembehaved significantly elastic at the investigated strain rates,while the phosphated waxy maize starch behaved purely
viscous at low strain rates and showed increased elasticcontribution only when the equivalent extensional strainrates exceeded 2 s�1. The flow of casein was much moreconcentration dependent than that of waxy maize starch.At high biopolymer concentrations, casein had muchhigher Trouton ratios, suggesting a significant elasticcontribution to the flow of casein in comparison to waxymaize starch. Local phase separation between the twothermodynamically incompatible biopolymers (caseinbeing a protein and starch a polysaccharide) may explainthe significantly higher apparent extensional viscosities andTrouton ratios of casein–waxy maize starch blends. Astemperature increases, both casein and starch showweakened resistance to shear and extensional flow, withcasein being the more temperature-dependent biopolymer.By comparing the calculated activation energies of the twosystems, it appeared that temperature had a much strongereffect on shear, than it had on the extensional flow ofstarch samples. On the other hand, casein had significantlyhigher Ea values than starch, with the activation energy forthe extensional flow being somewhat higher than thecorresponding shear flow value. This explains why theTrouton ratio of casein showed an overall decrease, whilethe one of starch increased with temperature.
Acknowledgements
The authors would like to thank Mr. Yuhui Wu for hishelp in extensional rheology tests and Dr. MahmoodAkhtar for useful discussions.
References
Barnes, H. A. (2000). A handbook of elementary rheology. Aberystwyth:
University of Wales.
Barrow, M. S., Brown, S. W. J., Cordy, S., Williams, P. R., & Williams, R.
L. (2004). Rheology of dilute polymer solutions and engine lubricants
in high deformation rate extensional flows produced by bubble
collapse. Transactions of the ASME, 126, 162–169.
Bazilevsky, A. V., Entov, V. M., Lerner, M. M., & Rozhkov, A. N. (1997).
Failure of polymer solution filaments. Polymer Science, A, 39,
316–324.
Bazilevsky, A. V., Entov, V. M., & Rozhkov, A. N. (1990). Liquid
filament microrheometer and some of its applications. In D. R. Oliver
(Ed.), Third European rheology conference (pp. 41–43). Elsevier
Applied Science.
Bourriot, S., Garnier, C., & Doublier, J.-L. (1999). Phase separation,
rheology and microstructure of micellar casein–guar gum mixtures.
Food Hydrocolloids, 13, 43–49.
Cogswell, F. N. (1978). Converging flow and stretching flow: A
compilation. Journal of Non-Newtonian Fluid Mechanics, 4, 23–38.
Dasilva, J. A. L., Gonc-alves, M. P., & Rao, M. A. (1994). Influence of
temperature on the dynamic and steady-shear rheology of pectin
dispersions. Carbohydrate Polymers, 23, 77–87.
De Bont, P. W., Van Kempen, G. M. P., & Vreeker, R. (2002). Phase
separation in milk protein and amylopectin mixtures. Food Hydro-
colloids, 16, 127–138.
Dobraszczyk, B. J., & Morgenstern, M. P. (2003). Rheology and the
breadmaking process. Journal of Cereal Science, 38, 229–245.
Doublier, J. L. (1987). Rheological studies on starch. Flow behaviour of
wheat starch pasters. Journal of Cereal Science, 5, 247–262.
ARTICLE IN PRESS
0
5
10
15
20
25
30
20 30 40 50 60 70
Temperature (°C)
Tro
uto
n r
ati
o
Fig. 11. Trouton ratio of casein�waxy maize starch mixtures as a
function of temperature: 5% casein+25% starch (solid squares); 13%
casein+13% starch (open circles) and 17% casein+5% starch (open
triangles). The Trouton ratio was calculated based on the viscosity results
shown in Fig. 10.
0
2
4
6
8
0.0029 0.0030 0.0031 0.0032 0.0033 0.0034
1/ Temperature (K-1)
ln (
vis
cosit
y; P
a.s
)
b
0
1
2
3
4
0.0029 0.0030 0.0031 0.0032 0.0033 0.0034
1/ Temperature (K -1)
ln (
vis
cosit
y; P
a.s
)
Fig. 10. Effect of temperature (Arrhenius plot) on (a) apparent shear
viscosity at 10 s�1 and (b) apparent extensional viscosity at the equivalent
extensional strain rate, of casein–waxy maize starch mixtures: 5%
casein+25% starch (solid squares), 13% casein+13% starch (open
circles) and 17% casein+5% starch (open triangles).
P.S.-K. Chan et al. / Food Hydrocolloids 21 (2007) 716–725724

Autho
r's
pers
onal
co
py
Kaletunc-Gencer, G., & Peleg, M. (1986). Rheological characteristics of
selected food gum mixtures in solution. Journal of Texture Studies, 17,
61–70.
Laun, H. M., & Schuch, H. (1989). Transient elongational viscosities and
drawability of polymer melts. Journal of Rheology, 33, 119–175.
Lopes da Silva, J. A. L., Gonc-alves, M. P., & Rao, M. A.
(1992). Rheological properties of high-methoxyl pectin and locust
bean gum solutions in steady shear. Journal of Food Science, 57,
443–448.
Meissner, J., & Hostettler, J. (1994). A new elongational rheometer for
polymer melts and other highly viscoelastic liquids. Rheologica Acta,
33, 1–21.
Morris, E. R. (1981). Rheology of hydrocolloids. In G. O. Philips, D. J.
Wedlock, & P. A. Williams (Eds.), Gums and stabilisers for the food
industry 2 (p. 57). Oxford: Pergamon Press.
O’Brien, V. T., & Mackay, M. E. (2002). Shear and elongation flow
properties of kaolin suspensions. Journal of Rheology, 46, 557–572.
Petrie, C. J. S. (2006). One hundred years of extensional flow. Journal of
Non-Newtonian Fluid Mechanics, 137, 1–14.
Rao, M. A. (1999). Rheology of food gum and starch dispersions. In M.
A. Rao (Ed.), Rheology of fluid and semisolid foods: Principles and
applications. Gaithersburg, MD: An Aspen Publication.
Rao, M. A. (2005). Rheological properties of fluid foods. In M. A. Rao, S.
S. H. Rizvi, & A. Datta (Eds.), Engineering properties of foods (3rd ed).
New York: Marcel Dekker Inc.
Rodd, L. E., Scott, T. P., Cooper-White, J. J., & McKinley, G. H. (2005).
Capillary break-up of low-viscosity elastic fluids. Applied Rheology, 15,
12–27.
Schorsch, C., Clark, A. H., Jones, M. G., & Norton, I. T. (1999). Behavior
of milk protein/polysaccharide systems in high sucrose. Colloids and
Surfaces B, 12, 317–329.
Swaisgood, H. E. (1992). Chemistry of the caseins. In P. F. Fox (Ed.),
Advanced dairy chemistry. Volume 1: Proteins. Essex: Elsevier Science
Publishers.
ARTICLE IN PRESSP.S.-K. Chan et al. / Food Hydrocolloids 21 (2007) 716–725 725