study design - jones & bartlett learning
TRANSCRIPT
R1
CHAPTER THREE
STUDY DESIGN
Carolyn F. Masters Williams and Kenrad E. Nelson
Epidemiology is based on two fundamental tenets. The first is the observa-tion that human disease does not occur at random. The second is that there are causal, and possibly preventable, factors that influence the develop-ment of disease. Epidemiologic studies of infectious diseases try to evaluate the contribution of different factors in the transmission and acquisition of infections and those factors favoring endemic transmission and epidemics. Epidemiologic studies can also be used to evaluate the effects of interven-tions, such as HIV protease inhibitors on AIDS mortality or the protective effect of bed nets in malaria prevention. How to structure the processes of observing, or study design, is a critical step. The study design must optimize the researcher’s ability to evaluate and measure the relationship between risk factors and disease in the study population, which can then be applied to the population as a whole.
Epidemiologic studies of an infectious disease can be designed to explore landmarks along the entire temporal process during which an individual is at risk, acquires infection, develops an infectious disease, or succumbs to it. Several chronic infectious diseases, such as tuberculosis or AIDS, may have different risk factors that are important for acquiring infection and the devel-opment of disease. In addition to understanding disease among individuals, epidemiologists attempt to understand the burden of disease at a population level and the factors leading to epidemics. From these studies, measurements of the prevalence and incidence of disease and correlates and risk factors for infection are evaluated.
61
Goals of Epidemiologic ResearchThe epidemiologic triangle is used to describe the relationship between the host (i.e., the diseased person), the agent (i.e., the infecting virus, bacteria,
IDE003.indd 61 4/14/2006 06:40:59 PM
© Jones and Bartlett Publishers. NOT FOR SALE OR DISTRIBUTION
62 Chapter 3
R1
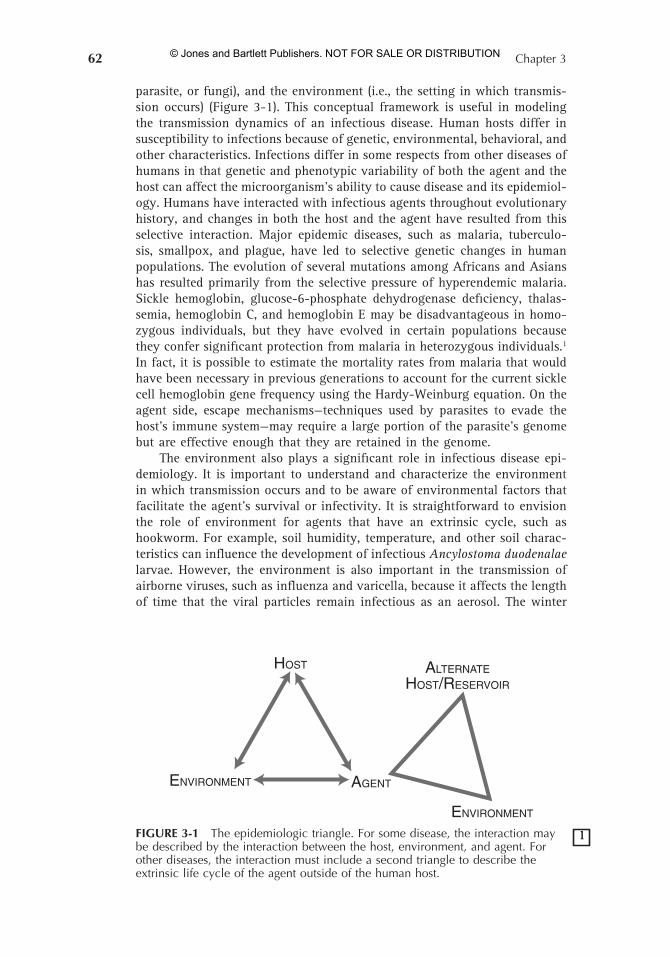
parasite, or fungi), and the environment (i.e., the setting in which transmis-sion occurs) (Figure 3-1). This conceptual framework is useful in modeling the transmission dynamics of an infectious disease. Human hosts differ in susceptibility to infections because of genetic, environmental, behavioral, and other characteristics. Infections differ in some respects from other diseases of humans in that genetic and phenotypic variability of both the agent and the host can affect the microorganism’s ability to cause disease and its epidemiol-ogy. Humans have interacted with infectious agents throughout evolutionary history, and changes in both the host and the agent have resulted from this selective interaction. Major epidemic diseases, such as malaria, tuberculo-sis, smallpox, and plague, have led to selective genetic changes in human populations. The evolution of several mutations among Africans and Asians has resulted primarily from the selective pressure of hyperendemic malaria. Sickle hemoglobin, glucose-6-phosphate dehydrogenase deficiency, thalas-semia, hemoglobin C, and hemoglobin E may be disadvantageous in homo-zygous individuals, but they have evolved in certain populations because they confer significant protection from malaria in heterozygous individuals.1 In fact, it is possible to estimate the mortality rates from malaria that would have been necessary in previous generations to account for the current sickle cell hemoglobin gene frequency using the Hardy-Weinburg equation. On the agent side, escape mechanisms—techniques used by parasites to evade the host’s immune system—may require a large portion of the parasite’s genome but are effective enough that they are retained in the genome.
The environment also plays a significant role in infectious disease epi-demiology. It is important to understand and characterize the environment in which transmission occurs and to be aware of environmental factors that facilitate the agent’s survival or infectivity. It is straightforward to envision the role of environment for agents that have an extrinsic cycle, such as hookworm. For example, soil humidity, temperature, and other soil charac-teristics can influence the development of infectious Ancylostoma duodenalae larvae. However, the environment is also important in the transmission of airborne viruses, such as influenza and varicella, because it affects the length of time that the viral particles remain infectious as an aerosol. The winter
FIGURE 3-1 The epidemiologic triangle. For some disease, the interaction may be described by the interaction between the host, environment, and agent. For other diseases, the interaction must include a second triangle to describe the extrinsic life cycle of the agent outside of the human host.
11
HOST ALTERNATE
HOST/RESERVOIR
ENVIRONMENT
AGENTENVIRONMENT
IDE003.indd 62 4/14/2006 06:40:59 PM
© Jones and Bartlett Publishers. NOT FOR SALE OR DISTRIBUTION
Study Design 63
R1
environment in temperate climates also facilitates transmission of influenza by bringing people indoors. However, influenza epidemics have been inter-rupted by extreme cold weather that has forced schools to close, thereby interrupting transmission among children and introduction of the virus into the home.3
Epidemiologic studies are used to evaluate these relationships and efforts to alter them to our advantage, be they preventive or therapeutic in nature. Several designs have been used, including ecologic and surveillance studies, cohort studies (parallel and pre- and postintervention designs), and traditional ran-domized clinical trials. Increasingly, meta-analysis, in which data from many studies is systematically combined to study a research question, is being used. In this chapter, we review several important and frequently used epidemiologic study designs and illustrate their use in evaluating infectious diseases.
Choosing a Study DesignThe optimal study design for a research question is a function of the hypoth-esis under investigation and the information that is available at the time of analysis. Prior to initiating an epidemiologic study, it is useful to consider these questions:
• Who is to be studied (sampling)?• What data are going to be collected (data collection)?• How are these data going to be analyzed (analysis)?
These issues may influence the design of an epidemiologic study.
Sampling
The design of epidemiologic studies requires the successful translation of an idea to a hypothesis that can be tested by measurable observations in a relevant study population. It is rarely possible to study the entire population at risk for a disease. Therefore, an epidemiologic study must first define the study sample—those persons who will be included in the study. Epidemiolo-gists must “sample” from the population to have a manageable study. The study sample must be at risk for the disease and representative of the popu-lations to which the study results will be applied. Also, the sample size must be large enough to ensure sufficient statistical power to evaluate the study hypothesis. Finally, the researchers must take into account other consider-ations of the sampling protocol. Issues such as cost, quality of data, degree of cooperation that can be expected from a given population, and the accessibil-ity of the population for enrollment and follow-up can influence sampling protocols. Practical issues, such as the reliability and validity of data obtained by questionnaire or other means, confidentiality of the data, and effects of the study process on data gathering, may influence the study results.
Data Collection
Infectious disease epidemiology shares many of the considerations common to epidemiologic studies of other diseases. Data collection must ensure mean-
IDE003.indd 63 4/14/2006 06:40:59 PM
© Jones and Bartlett Publishers. NOT FOR SALE OR DISTRIBUTION
64 Chapter 3
R1
Analysis
Evaluation of the study results includes evaluation of the conduct of the study as well as the data. Was the study performed in the manner in which it was designed? Did any deviations from the design alter the quality of the results? Evaluation of the success of sampling procedures should be conducted. Who was ultimately studied? Also, the study should be evaluated with respect to any potential biases. Were biases introduced into the study by the manner
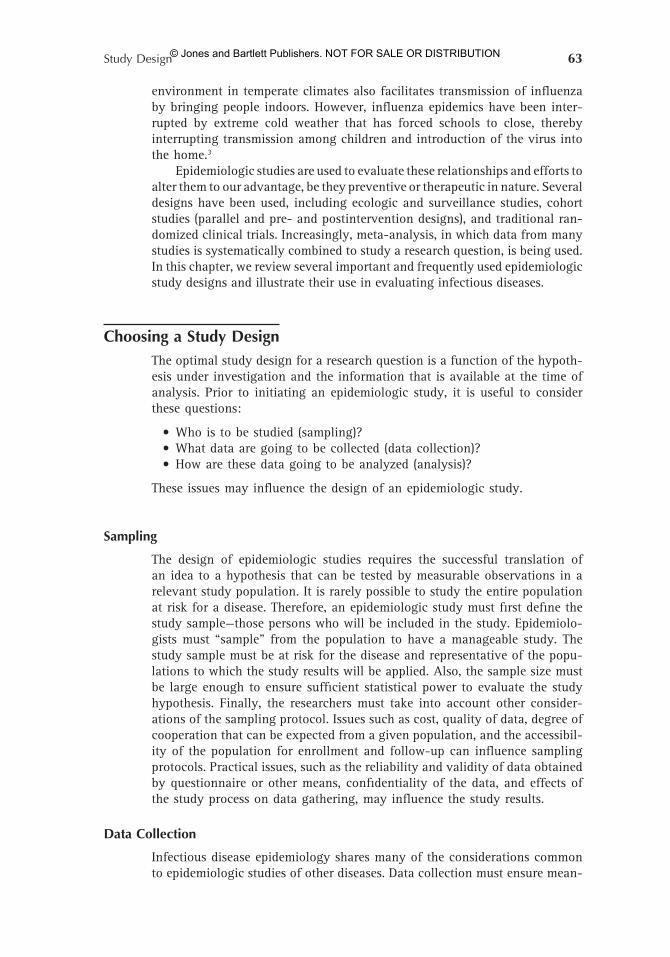
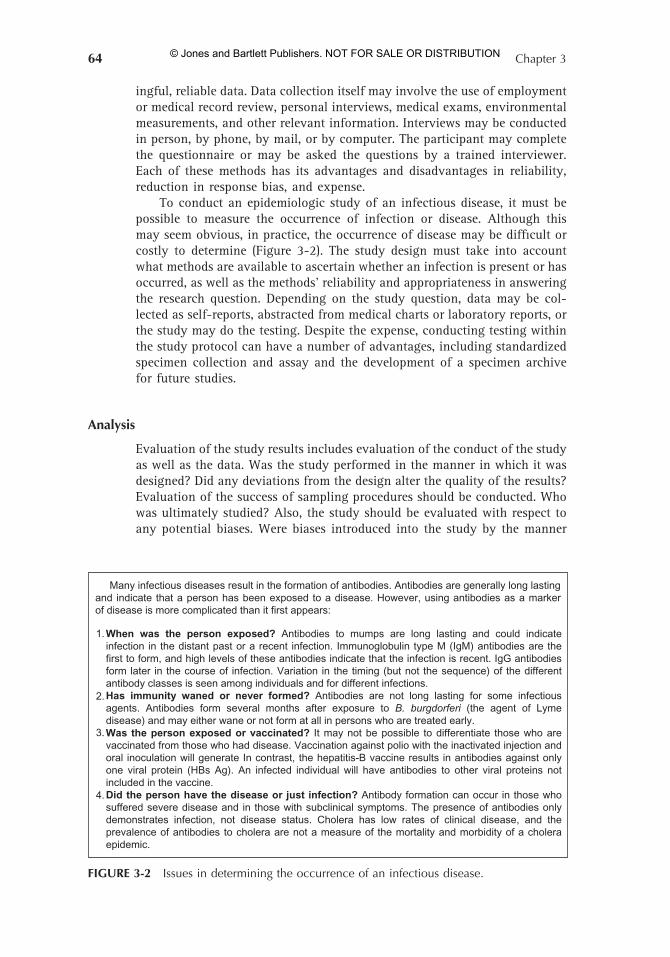
FIGURE 3-2 Issues in determining the occurrence of an infectious disease.
1.
4.
2.
3.
Many infectious diseases result in the formation of antibodies. Antibodies are generally long lastingand indicate that a person has been exposed to a disease. However, using antibodies as a markerof disease is more complicated than it first appears:
When was the person exposed? Antibodies to mumps are long lasting and could indicateinfection in the distant past or a recent infection. Immunoglobulin type M (IgM) antibodies are thefirst to form, and high levels of these antibodies indicate that the infection is recent. IgG antibodiesform later in the course of infection. Variation in the timing (but not the sequence) of the differentantibody classes is seen among individuals and for different infections.Has immunity waned or never formed? Antibodies are not long lasting for some infectiousagents. Antibodies form several months after exposure to B. burgdorferi (the agent of Lymedisease) and may either wane or not form at all in persons who are treated early.Was the person exposed or vaccinated? It may not be possible to differentiate those who arevaccinated from those who had disease. Vaccination against polio with the inactivated injection andoral inoculation will generate In contrast, the hepatitis-B vaccine results in antibodies against onlyone viral protein (HBs Ag). An infected individual will have antibodies to other viral proteins notincluded in the vaccine.Did the person have the disease or just infection? Antibody formation can occur in those whosuffered severe disease and in those with subclinical symptoms. The presence of antibodies onlydemonstrates infection, not disease status. Cholera has low rates of clinical disease, and theprevalence of antibodies to cholera are not a measure of the mortality and morbidity of a choleraepidemic.
ingful, reliable data. Data collection itself may involve the use of employment or medical record review, personal interviews, medical exams, environmental measurements, and other relevant information. Interviews may be conducted in person, by phone, by mail, or by computer. The participant may complete the questionnaire or may be asked the questions by a trained interviewer. Each of these methods has its advantages and disadvantages in reliability, reduction in response bias, and expense.
To conduct an epidemiologic study of an infectious disease, it must be possible to measure the occurrence of infection or disease. Although this may seem obvious, in practice, the occurrence of disease may be difficult or costly to determine (Figure 3-2). The study design must take into account what methods are available to ascertain whether an infection is present or has occurred, as well as the methods’ reliability and appropriateness in answering the research question. Depending on the study question, data may be col-lected as self-reports, abstracted from medical charts or laboratory reports, or the study may do the testing. Despite the expense, conducting testing within the study protocol can have a number of advantages, including standardized specimen collection and assay and the development of a specimen archive for future studies.
IDE003.indd 64 4/14/2006 06:40:59 PM
© Jones and Bartlett Publishers. NOT FOR SALE OR DISTRIBUTION
Study Design 65
R1
in which it was conducted? Comparisons should be made between the actual study sample and the population targeted for study, the response rate of subgroups, and the composition of the population from which the sample was drawn. Data should be compared with studies of the research question in other populations by other investigators. Researchers may then determine whether the observed data are valid. Key questions that an epidemiologist should address are: How much of the measured effect may be explained by bias? Is there a dose-response effect? How do the results compare with other data available on this subject?
Specific study designs and the analysis of the data are reviewed here briefly, and examples of their application to infectious diseases are described below. The reader should consult other sources for a more detailed descrip-tion. Recommended references include Rothman and Greenland3 and Diggle, Liang, and Zeger.4
Types of Epidemiologic Study Design
Descriptive Studies 3322
Epidemiologic studies of infectious diseases are designed for several purposes. When a new disease is recognized, the main purpose may be to describe the nature of the disease and to evaluate the probable means of transmission, res-ervoir, and natural history. Sometimes, a new disease is known to be caused by a specific organism, such as staphylococcal toxic shock syndrome; often, it is not, such as Hantavirus pulmonary syndrome, Legionnaires’ disease, and AIDS. Early studies may consist of descriptions of cases or groups of cases that sometimes can be linked by a possible transmission route or exposure to a reservoir. These studies do not necessarily compare cases of an infectious disease with controls but only describe the disease and the exposures in the cases. At times, case reports or case series provide considerable understanding about the epidemiology of an infectious disease.
Case Reports
Case reports are a careful evaluation of a single case of disease in which the epidemiologist may describe the transmission, natural history, and/or treat-ment. Although case reports are based on an infection in a single patient, they may yield important new epidemiologic information regarding the disease. Examples of illustrative case reports follow.
Rabies
Rabies is a zoonotic viral infection that is spread to humans by contact with body fluids, most commonly, saliva, from an infected animal. Prior to rabies vaccination of domestic animals, most US transmissions were associated with domestic animal bites.5 Rabies transmission was believed to require direct inoculation via a bite or other invasive contact with the infected animal. Infection is initially confined to the site of exposure without systemic viremia. Because of this, the rabies vaccine can be given after exposure to prevent infection of the central nervous system (CNS). Such postexposure prophy-
IDE003.indd 65 4/14/2006 06:41:00 PM
© Jones and Bartlett Publishers. NOT FOR SALE OR DISTRIBUTION
66 Chapter 3
R1
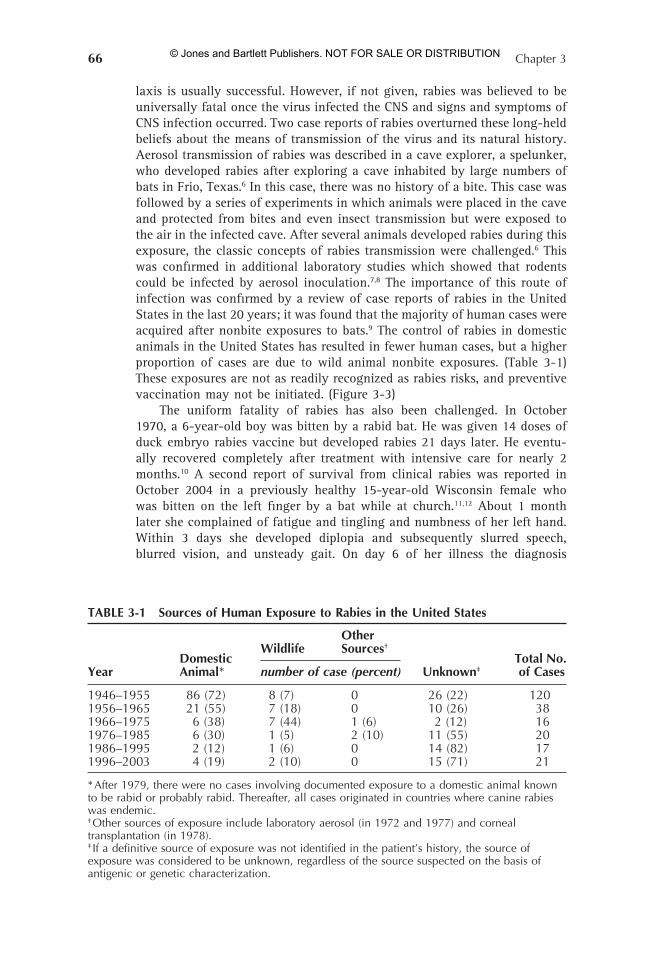
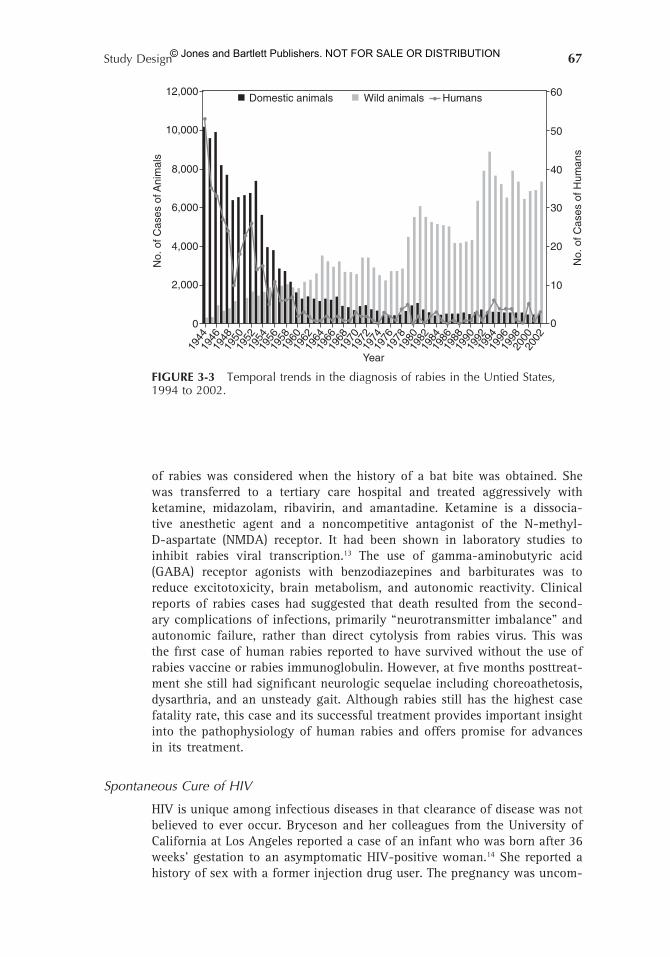
laxis is usually successful. However, if not given, rabies was believed to be universally fatal once the virus infected the CNS and signs and symptoms of CNS infection occurred. Two case reports of rabies overturned these long-held beliefs about the means of transmission of the virus and its natural history. Aerosol transmission of rabies was described in a cave explorer, a spelunker, who developed rabies after exploring a cave inhabited by large numbers of bats in Frio, Texas.6 In this case, there was no history of a bite. This case was followed by a series of experiments in which animals were placed in the cave and protected from bites and even insect transmission but were exposed to the air in the infected cave. After several animals developed rabies during this exposure, the classic concepts of rabies transmission were challenged.6 This was confirmed in additional laboratory studies which showed that rodents could be infected by aerosol inoculation.7,8 The importance of this route of infection was confirmed by a review of case reports of rabies in the United States in the last 20 years; it was found that the majority of human cases were acquired after nonbite exposures to bats.9 The control of rabies in domestic animals in the United States has resulted in fewer human cases, but a higher proportion of cases are due to wild animal nonbite exposures. (Table 3-1) These exposures are not as readily recognized as rabies risks, and preventive vaccination may not be initiated. (Figure 3-3)
The uniform fatality of rabies has also been challenged. In October 1970, a 6-year-old boy was bitten by a rabid bat. He was given 14 doses of duck embryo rabies vaccine but developed rabies 21 days later. He eventu-ally recovered completely after treatment with intensive care for nearly 2 months.10 A second report of survival from clinical rabies was reported in October 2004 in a previously healthy 15-year-old Wisconsin female who was bitten on the left finger by a bat while at church.11,12 About 1 month later she complained of fatigue and tingling and numbness of her left hand. Within 3 days she developed diplopia and subsequently slurred speech, blurred vision, and unsteady gait. On day 6 of her illness the diagnosis
TABLE 3-1 Sources of Human Exposure to Rabies in the United States
Other
Domestic Wildlife Sources†
Total No.Year Animal* number of case (percent) Unknown‡ of Cases
1946–1955 86 (72) 8 (7) 0 26 (22) 1201956–1965 21 (55) 7 (18) 0 10 (26) 381966–1975 6 (38) 7 (44) 1 (6) 2 (12) 161976–1985 6 (30) 1 (5) 2 (10) 11 (55) 201986–1995 2 (12) 1 (6) 0 14 (82) 171996–2003 4 (19) 2 (10) 0 15 (71) 21
* After 1979, there were no cases involving documented exposure to a domestic animal known to be rabid or probably rabid. Thereafter, all cases originated in countries where canine rabies was endemic.† Other sources of exposure include laboratory aerosol (in 1972 and 1977) and corneal transplantation (in 1978).‡ If a definitive source of exposure was not identified in the patient’s history, the source of exposure was considered to be unknown, regardless of the source suspected on the basis of antigenic or genetic characterization.
IDE003.indd 66 4/14/2006 06:41:00 PM
© Jones and Bartlett Publishers. NOT FOR SALE OR DISTRIBUTION
Study Design 67
R1
of rabies was considered when the history of a bat bite was obtained. She was transferred to a tertiary care hospital and treated aggressively with ketamine, midazolam, ribavirin, and amantadine. Ketamine is a dissocia-tive anesthetic agent and a noncompetitive antagonist of the N-methyl-D-aspartate (NMDA) receptor. It had been shown in laboratory studies to inhibit rabies viral transcription.13 The use of gamma-aminobutyric acid (GABA) receptor agonists with benzodiazepines and barbiturates was to reduce excitotoxicity, brain metabolism, and autonomic reactivity. Clinical reports of rabies cases had suggested that death resulted from the second-ary complications of infections, primarily “neurotransmitter imbalance” and autonomic failure, rather than direct cytolysis from rabies virus. This was the first case of human rabies reported to have survived without the use of rabies vaccine or rabies immunoglobulin. However, at five months posttreat-ment she still had significant neurologic sequelae including choreoathetosis, dysarthria, and an unsteady gait. Although rabies still has the highest case fatality rate, this case and its successful treatment provides important insight into the pathophysiology of human rabies and offers promise for advances in its treatment.
Spontaneous Cure of HIV
HIV is unique among infectious diseases in that clearance of disease was not believed to ever occur. Bryceson and her colleagues from the University of California at Los Angeles reported a case of an infant who was born after 36 weeks’ gestation to an asymptomatic HIV-positive woman.14 She reported a history of sex with a former injection drug user. The pregnancy was uncom-
FIGURE 3-3 Temporal trends in the diagnosis of rabies in the Untied States, 1994 to 2002.
0 0
10
20
30
40
50
60
1944
1946
1948
1950
1952
1954
1956
1958
1960
1962
1964
1966
1968
1970
1972
1974
1976
1978
1980
1982
1984
1986
1988
1990
1992
1994
1996
1998
2000
2002
2,000
Year
No.
of C
ases
of A
nim
als
No.
of C
ases
of H
uman
s
Domestic animals Wild animals Humans
4,000
6,000
8,000
10,000
12,000
IDE003.indd 67 4/14/2006 06:41:00 PM
© Jones and Bartlett Publishers. NOT FOR SALE OR DISTRIBUTION
68 Chapter 3
R1
plicated, and the mother had a CD4+ T-cell count of over 1000 cells/mm3 at the time of delivery. The infant was normal at birth but required hospital-ization for 8 days because of mild respiratory distress syndrome. Laboratory studies on the infant found a negative culture of cord blood for HIV. However, the infant’s blood culture was positive at 19 and 51 days of age, and the PCR was positive at 33 days of life. Subsequently, HIV antibodies disappeared by 12 months of age. Multiple cultures of peripheral blood lymphocytes and plasma for HIV were negative between 3 months and 5 years of age. The child was asymptomatic and had no laboratory evidence of HIV infection at 5 years of age. The authors believed that the infant was infected but cleared the HIV infection by immunologic or other mechanisms. This case report was followed up by a search for similar cases of spontaneous resolution of perinatal HIV infection in infants by other investigators; however, no similar cases have been reported. In adults there have been extremely small numbers of persons who have may have cleared an established HIV infection. Dr. Miles Cloyd has reported on several highly exposed patients who he believes to have been transiently infected. This work is being explored further, and it is not yet clear if these cases can be confirmed in other laboratories.15
Case reports have shed light on the immune response to HIV. Infection with one strain of HIV was believed to prevent infection with a subsequent strain. Natural infection is commonly the greatest stimulator of an immune response. Persons who are HIV positive have high antibody titers and often robust cellular immune responses. Superinfection in the face of this immunity was felt to be unlikely, particularly in persons who were not substantially immunologically impaired. Unfortunately, this was disproven by a case of superinfection reported in 2002.16 A long term nonprogressor, who had controlled his HIV infection without therapy for over several years, became infected with a second strain of HIV. He was unable to control the second strain of HIV and had a rapid decline in his immune status. Subsequent to this case, several cases of superinfection have been documented, and it is now clear that HIV-positive persons are at risk for superinfection. However, whether they might have partial protection from superinfection is unclear. Nevertheless, HIV recombinant viruses are quite common, so superinfection or coinfection with two strains occurs more commonly than was appreciated.
Case Series
A second type of descriptive epidemiologic study is a case series. In this type of study, data from a cluster or series of cases are reported. No comparison is made with controls; instead, the exposures of the cases are often described. These case series may be reported in sufficient epidemiologic detail that it is possible to infer the means of transmission and the risk factors for infection. A case series of AIDS patients, which was reported early in the epidemic and prior to the identification of HIV, is described below.
AIDS Cluster
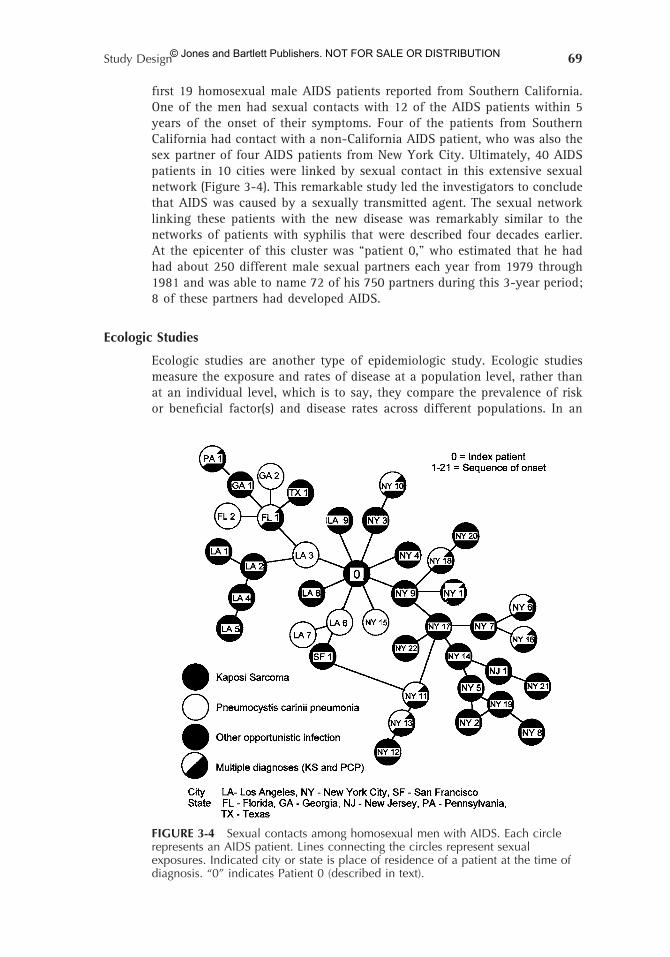
A cluster of homosexual men with Kaposi’s sarcoma (KS) and/or Pneumo-cystis carinii pneumonia (PCP) was reported in 1984, prior to the identifica-tion of the HIV.17 The investigators enumerated the sexual contacts of the
IDE003.indd 68 4/14/2006 06:41:00 PM
© Jones and Bartlett Publishers. NOT FOR SALE OR DISTRIBUTION
Study Design 69
R1
first 19 homosexual male AIDS patients reported from Southern California. One of the men had sexual contacts with 12 of the AIDS patients within 5 years of the onset of their symptoms. Four of the patients from Southern California had contact with a non-California AIDS patient, who was also the sex partner of four AIDS patients from New York City. Ultimately, 40 AIDS patients in 10 cities were linked by sexual contact in this extensive sexual network (Figure 3-4). This remarkable study led the investigators to conclude that AIDS was caused by a sexually transmitted agent. The sexual network linking these patients with the new disease was remarkably similar to the networks of patients with syphilis that were described four decades earlier. At the epicenter of this cluster was “patient 0,” who estimated that he had had about 250 different male sexual partners each year from 1979 through 1981 and was able to name 72 of his 750 partners during this 3-year period; 8 of these partners had developed AIDS.
Ecologic Studies
Ecologic studies are another type of epidemiologic study. Ecologic studies measure the exposure and rates of disease at a population level, rather than at an individual level, which is to say, they compare the prevalence of risk or beneficial factor(s) and disease rates across different populations. In an
FIGURE 3-4 Sexual contacts among homosexual men with AIDS. Each circle represents an AIDS patient. Lines connecting the circles represent sexual exposures. Indicated city or state is place of residence of a patient at the time of diagnosis. “0” indicates Patient 0 (described in text).
IDE003.indd 69 4/14/2006 06:41:00 PM
© Jones and Bartlett Publishers. NOT FOR SALE OR DISTRIBUTION
70 Chapter 3
R1
ecologic study, whether an individual member of a population is exposed and has disease or whether there is an association between a risk factor and a disease at the individual level is unknown. Furthermore, it is not possible to assess whether there are confounding factors at the individual level in the relationship between the exposure and disease. Despite the inability to make conclusions at the individual level, because ecologic studies are based on the population level and not the individual level, individual factors that may confound an analysis of individual data can be ignored in an ecologic analysis. For example, commonly the most ill patients are the ones most likely to initiate therapy. This “selection by indication” can bias a measured treatment response as those who use therapy appear sicker than those who do not use therapies. The ecologic study avoids this bias by comparing populations with different access to treatment without regard to individual therapy choices. Ecologic studies may be useful to explore hypothesized associations and to test hypotheses that may not be easily tested by other types of studies. Ecologic studies also may be conducted with relatively less financial or other resources than other epidemiologic studies. Data may be available from national or community-wide surveys of exposures and disease rates, which can be accessed inexpensively. Ecologic studies also allow for comparisons between populations that are too geographically dispersed for individual-based study designs. In some populations, the range of exposure may be too narrow to allow easy analysis of the association with a disease outcome at an individual level within that population. Studies of host nutri-tion status, such as vitamin A, on the outcome of an infection might best be evaluated in a population containing vitamin A-deficient individuals or by comparing infection outcome in several populations with different vitamin A levels. Similarly, studies of the relationship between infectious agents and unusual outcomes, such as the liver fluke Ophisthorcus viverini and bile duct cancer or Helicobacter pylori and stomach cancer, can be strengthened by ecologic data from populations with widely varying rates of infections and cancer. Ecologic studies can also be applied to the study of protective factors. The concept of herd immunity to infectious diseases is based on ecologic con-siderations. The proportion of a population that is immune to an infectious disease can influence the risk of infection in an individual in the population. Ecologic studies are also extremely important for assessing the effect of inter-vention programs on the targeted population. For example, the efficacy of measles vaccination is well established from randomized clinical studies, but population effectiveness of a vaccination program can be assessed only by surveillance using an ecologic design. Two ecologic studies, one of rheumatic fever and one of HIV infection are described below.
Crowding and Rheumatic Fever
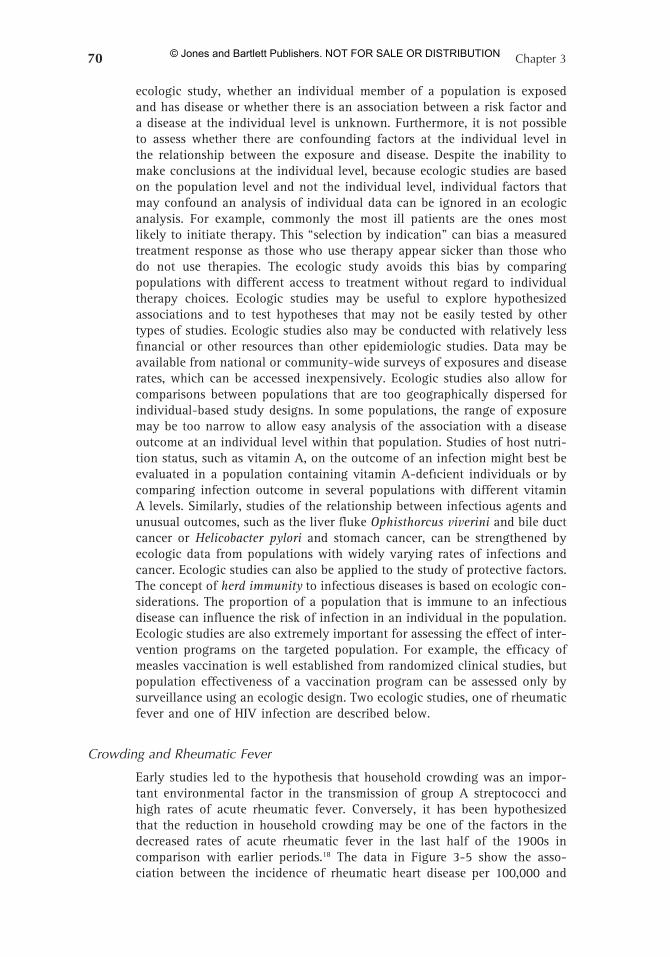
Early studies led to the hypothesis that household crowding was an impor-tant environmental factor in the transmission of group A streptococci and high rates of acute rheumatic fever. Conversely, it has been hypothesized that the reduction in household crowding may be one of the factors in the decreased rates of acute rheumatic fever in the last half of the 1900s in comparison with earlier periods.18 The data in Figure 3-5 show the asso-ciation between the incidence of rheumatic heart disease per 100,000 and
IDE003.indd 70 4/14/2006 06:41:00 PM
© Jones and Bartlett Publishers. NOT FOR SALE OR DISTRIBUTION
Study Design 71
R1
the number of persons per room in various districts in the city of Bristol, England, in 1927–1930.
Circumcision and HIV Transmission
Male circumcision is a surgical procedure in which the foreskin, or prepuce, of the male penis is removed so that the end of the penis, the glands, is exposed. After circumcision the penile shaft skin becomes keratinized over time result-ing in a thicker stronger outer layer. In contrast, the foreskin has character-istics that increase its susceptibility to HIV. The foreskin is rich in immune cells which may be infected by HIV; it is delicate and may develop microtears that may serve as an entry point for HIV, and the foreskin may trap HIV in a warm moist environment allowing more time for infection to occur. Because of these physical differences, it has been hypothesized that uncircumcised males might be at higher risk for HIV infection. Circumcised men have been
FIGURE 3-5 The correlation between the incidence of rheumatic heart disease per 100,000 and the number of persons per room (×100), as found by Perry and Roberts in various districts of the city of Bristol, England, in 1927–1930. (The size of the dots indicates roughly the comparative population size of the districts.)
50 60 70PERSONS PER ROOM × 100
INC
IDE
NC
E O
F R
HE
UM
AT
IC H
EA
RT
DIS
EA
SE
PE
R 1
00,0
00
80 90 100 1100
50
100
150
200
250
300
360
400
IDE003.indd 71 4/14/2006 06:41:01 PM
© Jones and Bartlett Publishers. NOT FOR SALE OR DISTRIBUTION
72 Chapter 3
R1
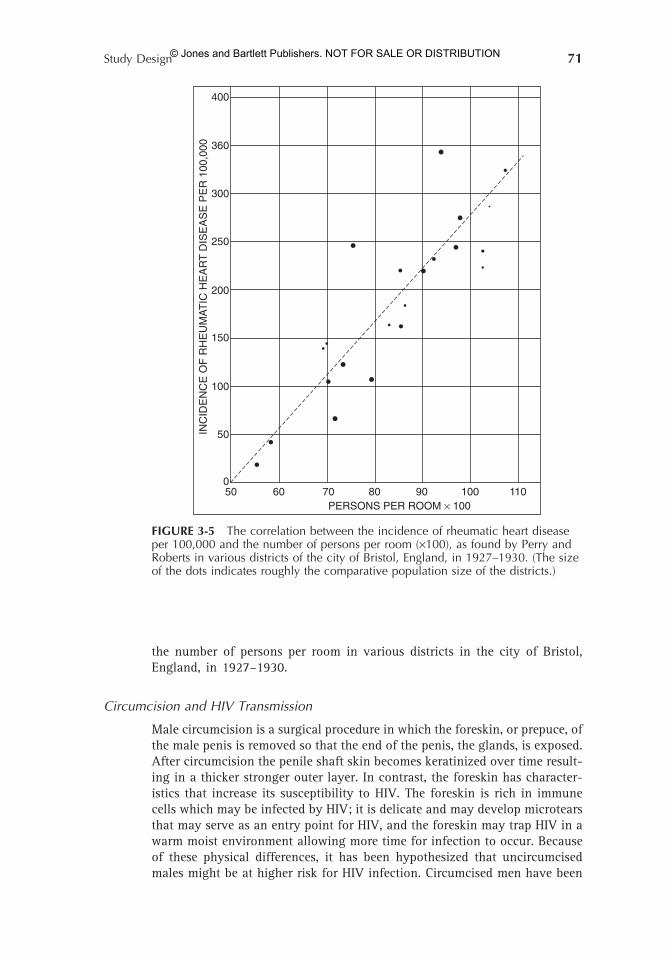
found to have lower rates of other sexually transmitted diseases (STDs).19 An ecologic study of circumcision rates and HIV seroprevalence was conducted in several African countries.20 Data on circumcision practices were extracted from an ethnographic database, the Human Relations Area File in New Haven, Connecticut, and combined with HIV seroprevalence data from a variety of published scientific literature sources and governmental data. These data were mapped to demonstrate geographical overlap between cultures that do not practice male circumcision and a high seroprevalence rate of HIV infection among males (Figure 3-6). This study introduced the hypothesis that a lack of male circumcision increased the risk of HIV transmission. However, there are obvious behavioral, cultural, and religious differences between ethnic groups that may alter the risk of HIV acquisition. Most notably that circumcised men are more likely to be Muslim in most parts of the world. Differences in sexual practices and hygiene may reduce the risk of HIV among Muslim men. Because an ecologic study design does not collect individual-level data, it cannot control for these confounding factors.
FIGURE 3-6 Map of Africa showing political boundaries and usual male circumcision practice, with point estimates of general adult population HIV seroprevalence superimposed.
IDE003.indd 72 4/14/2006 06:41:01 PM
© Jones and Bartlett Publishers. NOT FOR SALE OR DISTRIBUTION
Study Design 73
R1
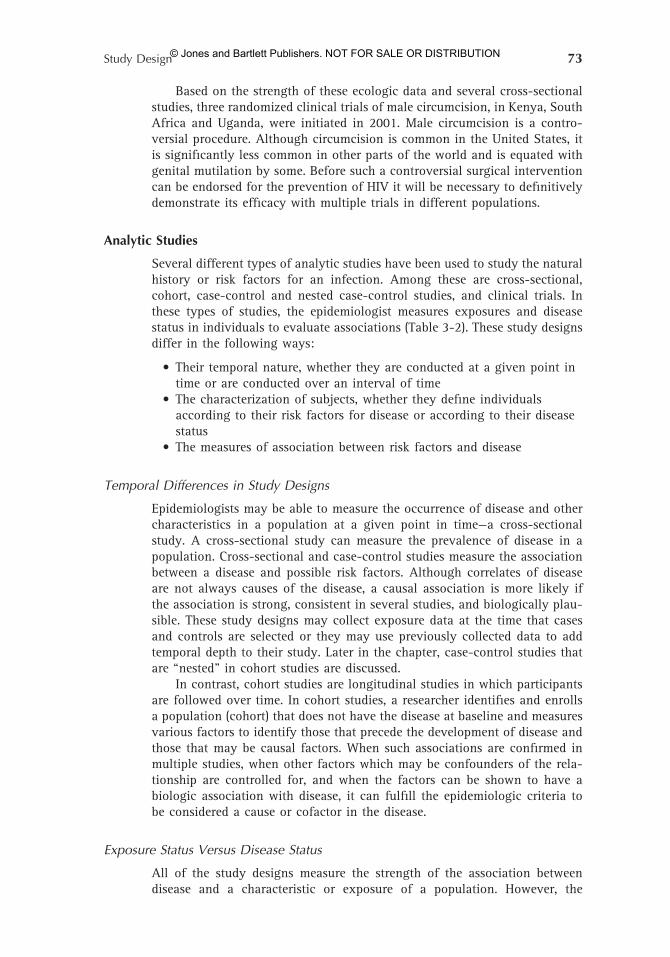
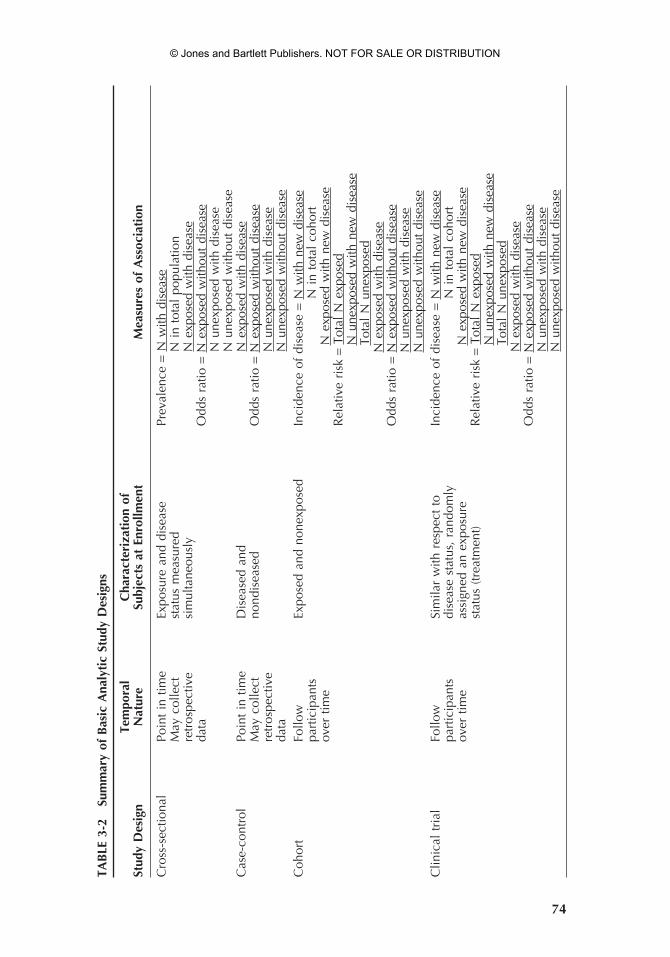
Several different types of analytic studies have been used to study the natural history or risk factors for an infection. Among these are cross-sectional, cohort, case-control and nested case-control studies, and clinical trials. In these types of studies, the epidemiologist measures exposures and disease status in individuals to evaluate associations (Table 3-2). These study designs differ in the following ways:
• Their temporal nature, whether they are conducted at a given point in time or are conducted over an interval of time
• The characterization of subjects, whether they define individuals according to their risk factors for disease or according to their disease status
• The measures of association between risk factors and disease
Analytic Studies
Temporal Differences in Study Designs
Epidemiologists may be able to measure the occurrence of disease and other characteristics in a population at a given point in time—a cross-sectional study. A cross-sectional study can measure the prevalence of disease in a population. Cross-sectional and case-control studies measure the association between a disease and possible risk factors. Although correlates of disease are not always causes of the disease, a causal association is more likely if the association is strong, consistent in several studies, and biologically plau-sible. These study designs may collect exposure data at the time that cases and controls are selected or they may use previously collected data to add temporal depth to their study. Later in the chapter, case-control studies that are “nested” in cohort studies are discussed.
In contrast, cohort studies are longitudinal studies in which participants are followed over time. In cohort studies, a researcher identifies and enrolls a population (cohort) that does not have the disease at baseline and measures various factors to identify those that precede the development of disease and those that may be causal factors. When such associations are confirmed in multiple studies, when other factors which may be confounders of the rela-tionship are controlled for, and when the factors can be shown to have a biologic association with disease, it can fulfill the epidemiologic criteria to be considered a cause or cofactor in the disease.
Based on the strength of these ecologic data and several cross-sectional studies, three randomized clinical trials of male circumcision, in Kenya, South Africa and Uganda, were initiated in 2001. Male circumcision is a contro-versial procedure. Although circumcision is common in the United States, it is significantly less common in other parts of the world and is equated with genital mutilation by some. Before such a controversial surgical intervention can be endorsed for the prevention of HIV it will be necessary to definitively demonstrate its efficacy with multiple trials in different populations.
Exposure Status Versus Disease Status
All of the study designs measure the strength of the association between disease and a characteristic or exposure of a population. However, the
IDE003.indd 73 4/14/2006 06:41:01 PM
© Jones and Bartlett Publishers. NOT FOR SALE OR DISTRIBUTION
R1 TAB
LE 3
-2
Sum
mar
y of
Bas
ic A
naly
tic
Stud
y D
esig
ns
Te
mpo
ral
Cha
ract
eriz
atio
n of
Stud
y D
esig
n N
atur
e Su
bjec
ts a
t En
rollm
ent
Mea
sure
s of
Ass
ocia
tion
Cro
ss-s
ectio
nal
Poin
t in
tim
e Ex
posu
re a
nd d
isea
se
Prev
alen
ce =
N w
ith d
isea
se
May
col
lect
st
atus
mea
sure
d
N i
n to
tal
popu
latio
n
retr
ospe
ctiv
e si
mul
tane
ousl
y
N e
xpos
ed w
ith d
isea
se
data
Odd
s ra
tio =
N e
xpos
ed w
ithou
t di
seas
e
N
une
xpos
ed w
ith d
isea
se
N
une
xpos
ed w
ithou
t di
seas
eC
ase-
cont
rol
Poin
t in
tim
e D
isea
sed
and
N
exp
osed
with
dis
ease
M
ay c
olle
ct
nond
isea
sed
Odd
s ra
tio =
N e
xpos
ed w
ithou
t di
seas
e
retr
ospe
ctiv
e
N
une
xpos
ed w
ith d
isea
se
data
N
une
xpos
ed w
ithou
t di
seas
eC
ohor
t Fo
llow
Ex
pose
d an
d no
nexp
osed
In
cide
nce
of d
isea
se =
N w
ith n
ew d
isea
se
part
icip
ants
N
in
tota
l co
hort
ov
er t
ime
N e
xpos
ed w
ith n
ew d
isea
se
Rel
ativ
e ri
sk =
Tot
al N
exp
osed
N u
nexp
osed
with
new
dis
ease
Tota
l N
une
xpos
ed
N
exp
osed
with
dis
ease
O
dds
ratio
= N
exp
osed
with
out
dise
ase
N u
nexp
osed
with
dis
ease
N u
nexp
osed
with
out
dise
ase
Clin
ical
tri
al
Follo
w
Sim
ilar
with
res
pect
to
Inci
denc
e of
dis
ease
= N
with
new
dis
ease
pa
rtic
ipan
ts
dise
ase
stat
us,
rand
omly
N i
n to
tal
coho
rt
over
tim
e as
sign
ed a
n ex
posu
re
N
exp
osed
with
new
dis
ease
stat
us (
trea
tmen
t) R
elat
ive
risk
= T
otal
N e
xpos
ed
N
une
xpos
ed w
ith n
ew d
isea
se
To
tal
N u
nexp
osed
N e
xpos
ed w
ith d
isea
se
Odd
s ra
tio =
N e
xpos
ed w
ithou
t di
seas
e
N
une
xpos
ed w
ith d
isea
se
N
une
xpos
ed w
ithou
t di
seas
e
74
IDE003.indd 74 4/14/2006 06:41:01 PM
© Jones and Bartlett Publishers. NOT FOR SALE OR DISTRIBUTION
Study Design 75
R1
Measures of Association
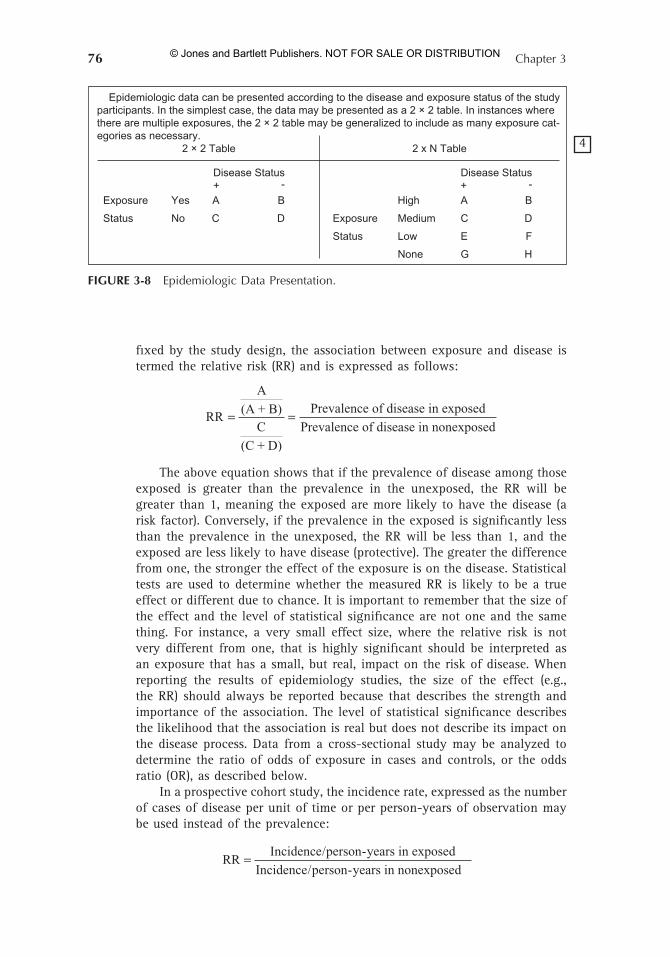
Regardless of the study design, the goal is to measure the association between exposure to a risk factor and the occurrence of a disease. Both cross-sectional and prospective studies can express the data obtained in a 2 × 2 table or a 2 × N (several categories) table. In these tables, the number of study participants who are exposed are stratified according to their disease status. In a 2 × N table, there may be multiple levels of exposure (Figure 3-8).
The calculation of the association between exposure and disease differs, based on the design of the study. In a cross-sectional study, in which the proportion of diseased individuals from a defined reference population is not
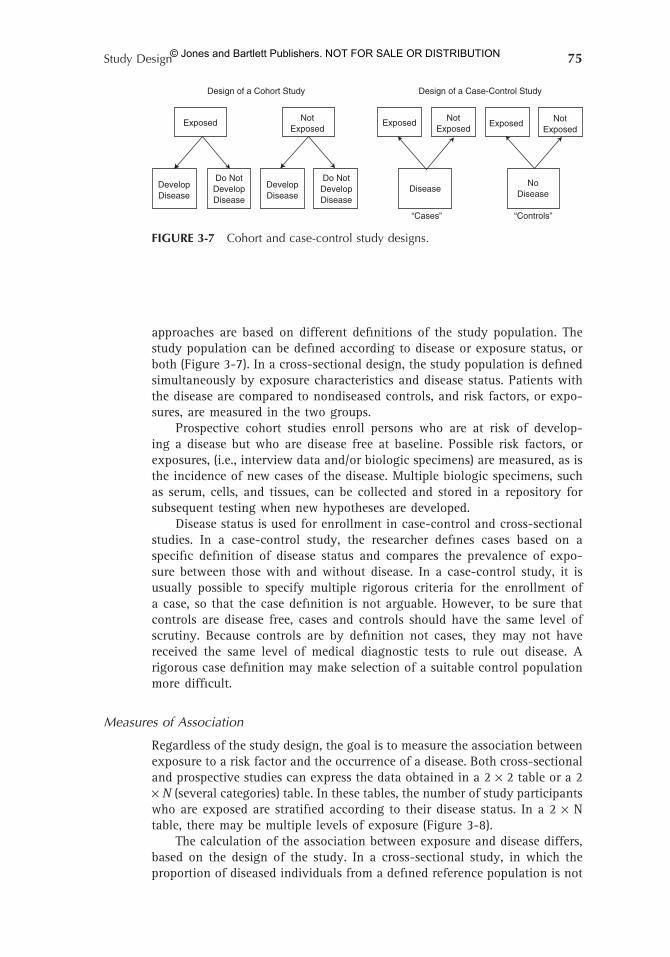
FIGURE 3-7 Cohort and case-control study designs.
Exposed ExposedNotExposed
NotExposed
Exposed NotExposed
Design of a Cohort Study Design of a Case-Control Study
DevelopDisease
DevelopDisease
Do NotDevelopDisease
Do NotDevelopDisease
DiseaseNo
Disease
“Cases” “Controls”
approaches are based on different definitions of the study population. The study population can be defined according to disease or exposure status, or both (Figure 3-7). In a cross-sectional design, the study population is defined simultaneously by exposure characteristics and disease status. Patients with the disease are compared to nondiseased controls, and risk factors, or expo-sures, are measured in the two groups.
Prospective cohort studies enroll persons who are at risk of develop-ing a disease but who are disease free at baseline. Possible risk factors, or exposures, (i.e., interview data and/or biologic specimens) are measured, as is the incidence of new cases of the disease. Multiple biologic specimens, such as serum, cells, and tissues, can be collected and stored in a repository for subsequent testing when new hypotheses are developed.
Disease status is used for enrollment in case-control and cross-sectional studies. In a case-control study, the researcher defines cases based on a specific definition of disease status and compares the prevalence of expo-sure between those with and without disease. In a case-control study, it is usually possible to specify multiple rigorous criteria for the enrollment of a case, so that the case definition is not arguable. However, to be sure that controls are disease free, cases and controls should have the same level of scrutiny. Because controls are by definition not cases, they may not have received the same level of medical diagnostic tests to rule out disease. A rigorous case definition may make selection of a suitable control population more difficult.
IDE003.indd 75 4/14/2006 06:41:01 PM
© Jones and Bartlett Publishers. NOT FOR SALE OR DISTRIBUTION
76 Chapter 3
R1
fixed by the study design, the association between exposure and disease is termed the relative risk (RR) and is expressed as follows:
RR
A
(A + B)C
(C + D)
Prevalence of disease in exposed
Prevalence of disease in nonexposed= =
The above equation shows that if the prevalence of disease among those exposed is greater than the prevalence in the unexposed, the RR will be greater than 1, meaning the exposed are more likely to have the disease (a risk factor). Conversely, if the prevalence in the exposed is significantly less than the prevalence in the unexposed, the RR will be less than 1, and the exposed are less likely to have disease (protective). The greater the difference from one, the stronger the effect of the exposure is on the disease. Statistical tests are used to determine whether the measured RR is likely to be a true effect or different due to chance. It is important to remember that the size of the effect and the level of statistical significance are not one and the same thing. For instance, a very small effect size, where the relative risk is not very different from one, that is highly significant should be interpreted as an exposure that has a small, but real, impact on the risk of disease. When reporting the results of epidemiology studies, the size of the effect (e.g., the RR) should always be reported because that describes the strength and importance of the association. The level of statistical significance describes the likelihood that the association is real but does not describe its impact on the disease process. Data from a cross-sectional study may be analyzed to determine the ratio of odds of exposure in cases and controls, or the odds ratio (OR), as described below.
In a prospective cohort study, the incidence rate, expressed as the number of cases of disease per unit of time or per person-years of observation may be used instead of the prevalence:
RRIncidence/person-years in exposed
Incidence/person-years in nonexposed=
4
FIGURE 3-8 Epidemiologic Data Presentation.
Epidemiologic data can be presented according to the disease and exposure status of the studyparticipants. In the simplest case, the data may be presented as a 2 × 2 table. In instances wherethere are multiple exposures, the 2 × 2 table may be generalized to include as many exposure cat-egories as necessary.
2 × 2 Table
Disease Status
Exposure
Status
Low
None
2 x N Table
+ -Disease Status+ -
Yes A B
Exposure
High A B
No C D
Status
Medium C D
E F
G H
IDE003.indd 76 4/14/2006 06:41:02 PM
© Jones and Bartlett Publishers. NOT FOR SALE OR DISTRIBUTION
Study Design 77
R1
Statistical Significance
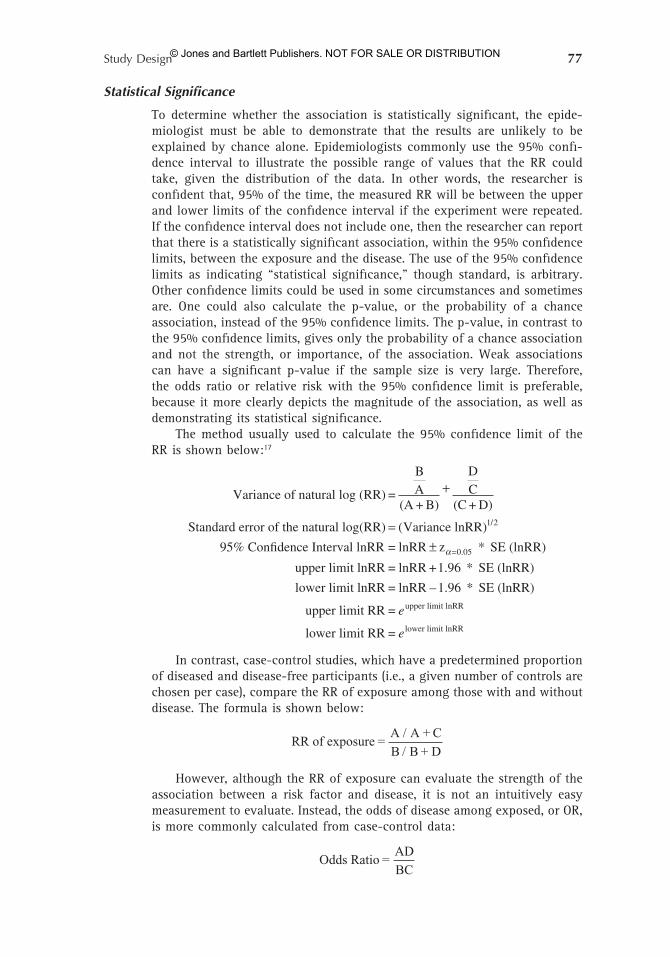
To determine whether the association is statistically significant, the epide-miologist must be able to demonstrate that the results are unlikely to be explained by chance alone. Epidemiologists commonly use the 95% confi-dence interval to illustrate the possible range of values that the RR could take, given the distribution of the data. In other words, the researcher is confident that, 95% of the time, the measured RR will be between the upper and lower limits of the confidence interval if the experiment were repeated. If the confidence interval does not include one, then the researcher can report that there is a statistically significant association, within the 95% confidence limits, between the exposure and the disease. The use of the 95% confidence limits as indicating “statistical significance,” though standard, is arbitrary. Other confidence limits could be used in some circumstances and sometimes are. One could also calculate the p-value, or the probability of a chance association, instead of the 95% confidence limits. The p-value, in contrast to the 95% confidence limits, gives only the probability of a chance association and not the strength, or importance, of the association. Weak associations can have a significant p-value if the sample size is very large. Therefore, the odds ratio or relative risk with the 95% confidence limit is preferable, because it more clearly depicts the magnitude of the association, as well as demonstrating its statistical significance.
The method usually used to calculate the 95% confidence limit of the RR is shown below:17
Variance of natural log (RR) =
BA
(A + B)
DC
(C + D)
Standard error of the natural log(RR) Variance lnRR)
Confidence Interval lnRR = lnRR z * SE (lnRR)
upper limit lnRR = lnRR +1.96 * SE (lnRR)
lower limit lnRR = lnRR –1.96 * SE (lnRR)
upper limit RR =
lower limit RR =
1/2
=0.05
upper limit lnRR
lower limit lnRR
+
=±
(
%95 α
e
e
In contrast, case-control studies, which have a predetermined proportion of diseased and disease-free participants (i.e., a given number of controls are chosen per case), compare the RR of exposure among those with and without disease. The formula is shown below:
RR of exposure =A / A + C
B / B + D
However, although the RR of exposure can evaluate the strength of the association between a risk factor and disease, it is not an intuitively easy measurement to evaluate. Instead, the odds of disease among exposed, or OR, is more commonly calculated from case-control data:
Odds Ratio =AD
BC
IDE003.indd 77 4/14/2006 06:41:02 PM
© Jones and Bartlett Publishers. NOT FOR SALE OR DISTRIBUTION
78 Chapter 3
R1
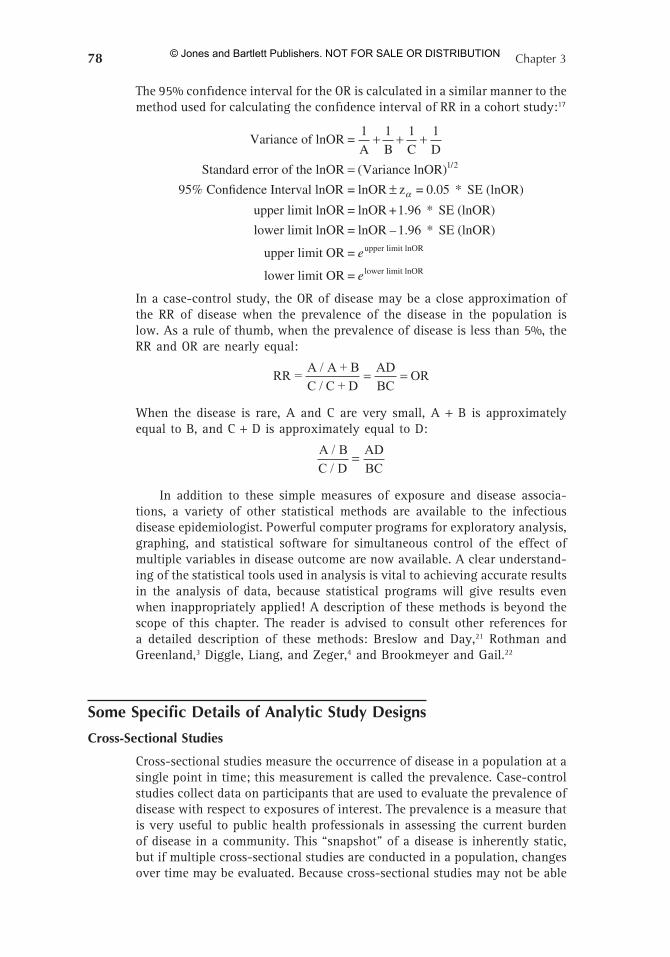
The 95% confidence interval for the OR is calculated in a similar manner to the method used for calculating the confidence interval of RR in a cohort study:17
Variance of lnOR =1
A
1
B
1
C
1
D
Standard error of the lnOR Variance lnOR)
Confidence Interval lnOR = lnOR z = 0.05 * SE (lnOR)
upper limit lnOR = lnOR +1.96 * SE (lnOR)
lower limit lnOR = lnOR –1.96 * SE (lnOR)
upper limit OR =
lower limit OR =
1/2
upper limit lnOR
lower limit lnOR
+ + +
=±
(
%95 α
e
e
In a case-control study, the OR of disease may be a close approximation of the RR of disease when the prevalence of the disease in the population is low. As a rule of thumb, when the prevalence of disease is less than 5%, the RR and OR are nearly equal:
RR =A / A + B
C / C + D
AD
BCOR= =
When the disease is rare, A and C are very small, A + B is approximately equal to B, and C + D is approximately equal to D:
A / B
C / D
AD
BC=
In addition to these simple measures of exposure and disease associa-tions, a variety of other statistical methods are available to the infectious disease epidemiologist. Powerful computer programs for exploratory analysis, graphing, and statistical software for simultaneous control of the effect of multiple variables in disease outcome are now available. A clear understand-ing of the statistical tools used in analysis is vital to achieving accurate results in the analysis of data, because statistical programs will give results even when inappropriately applied! A description of these methods is beyond the scope of this chapter. The reader is advised to consult other references for a detailed description of these methods: Breslow and Day,21 Rothman and Greenland,3 Diggle, Liang, and Zeger,4 and Brookmeyer and Gail.22
Some Specific Details of Analytic Study Designs
Cross-Sectional Studies
Cross-sectional studies measure the occurrence of disease in a population at a single point in time; this measurement is called the prevalence. Case-control studies collect data on participants that are used to evaluate the prevalence of disease with respect to exposures of interest. The prevalence is a measure that is very useful to public health professionals in assessing the current burden of disease in a community. This “snapshot” of a disease is inherently static, but if multiple cross-sectional studies are conducted in a population, changes over time may be evaluated. Because cross-sectional studies may not be able
IDE003.indd 78 4/14/2006 06:41:03 PM
© Jones and Bartlett Publishers. NOT FOR SALE OR DISTRIBUTION
Study Design 79
R1
Cross-Sectional Studies of HIV Prevalence in Young Men in Northern Thailand
Multiple cross-sectional studies of HIV prevalence in male military con-scripts in Thailand have been used to evaluate the national HIV control program. Serial cross-sectional studies of HIV prevalence and behavioral risk factors among 21-year-old men conscripted into the Royal Thai Army (RTA) were conducted between 1991 and 1998.23 The HIV/AIDS epidemic began in Thailand in 1988 and spread rapidly among urban and rural populations, especially in northern Thailand. The predominant means of spread was by heterosexual sex, although transmission by injecting drug use, homosexual sex, and perinatal transmission also occurred.
The government responded to this widespread, rapidly evolving epidemic with a program called the 100% condom program. This program included intensive health education about the risk of HIV transmission, especially during commercial sex, the provision of free condoms, and the promotion of their use wherever commercial sex occurred.
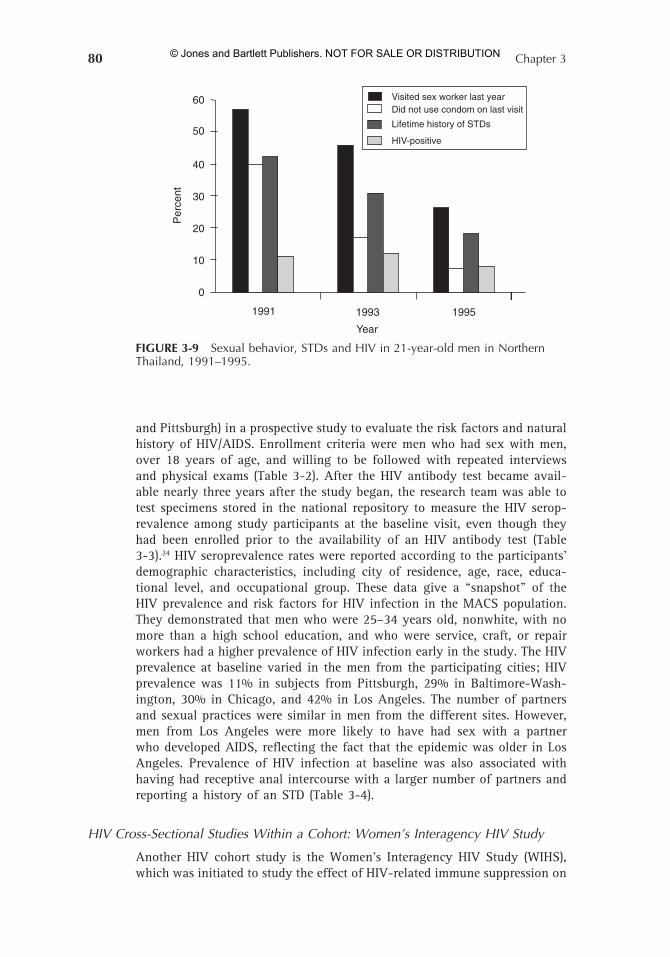
The serial cross-sectional studies were used to document temporal trends in HIV prevalence, changes in the frequency of commercial sex, condom use, and the prevalence of STDs in these young men. These data were an unbi-ased estimate of the prevalence of HIV and associated risk factors because selection of the conscripts was by a random lottery system. Approximately 9% of all eligible 21-year-old men were conscripted by lottery each year. Men were not excluded based on their HIV status, a history of male-to-male sexual behavior, or injecting drug use. Furthermore, because the average age of sexual debut was 17 years, HIV prevalence in 21-year-old males repre-sented recently acquired infection and could be used to evaluate the success of the Thai control program. The prevalence of HIV declined from 11.9% in 1991–1993 to 4.7% in 1997, whereas the lifetime history of an STD declined from 42% to 4.2% during this period. A history of paying for sex in the past year declined from 60% in 1991 to 18% in 1997, and condom use during commercial sex increased from 67% in 1991 to 95% in 1997 (Figure 3-9). These cross-sectional data documented the effectiveness of the HIV preven-tion program in Thailand.
to define the temporal relationship between factors, they cannot determine whether the exposure or disease came first. Thus, these studies are limited in their ability to draw conclusions about cause and effect. However, in some studies determining the temporal relationship is possible. Cross-sectional studies also can be done several times within a defined cohort which can yield valuable information. Some examples are described below.
Any particular visit of the individuals enrolled in a cohort study is an oppor-tunity to conduct a cross-sectional analysis. In many cohort studies, the study population is characterized initially at baseline. Such cross-sectional studies allow for description of the cohort being followed and a preliminary assess-ment of the association of risk factors with disease outcome. The Multicenter AIDS Cohort Study (MACS) enrolled more than 6000 homosexual men in 1984 from four urban areas (Los Angeles, Chicago, Baltimore-Washington,
HIV Cross-Sectional Studies Within a Cohort: Multicenter AIDS Cohort Study
IDE003.indd 79 4/14/2006 06:41:03 PM
© Jones and Bartlett Publishers. NOT FOR SALE OR DISTRIBUTION
80 Chapter 3
R1
HIV Cross-Sectional Studies Within a Cohort: Women’s Interagency HIV Study
Another HIV cohort study is the Women’s Interagency HIV Study (WIHS), which was initiated to study the effect of HIV-related immune suppression on
FIGURE 3-9 Sexual behavior, STDs and HIV in 21-year-old men in Northern Thailand, 1991–1995.
0
10
20
30
40
50
60
1991 1993 1995
Per
cent
Year
Visited sex worker last yearDid not use condom on last visit
Lifetime history of STDs
HIV-positive
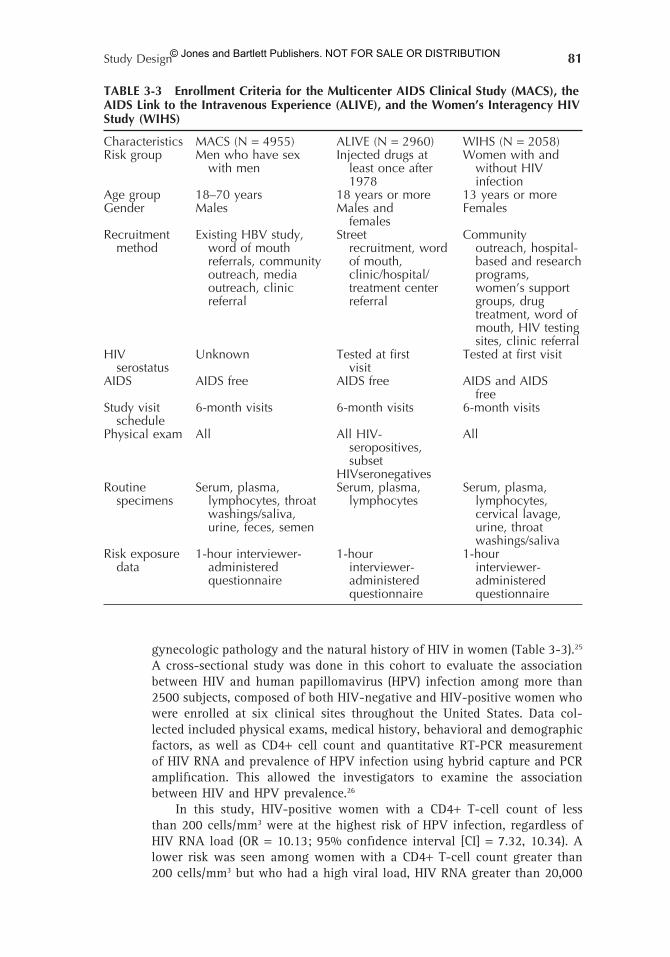
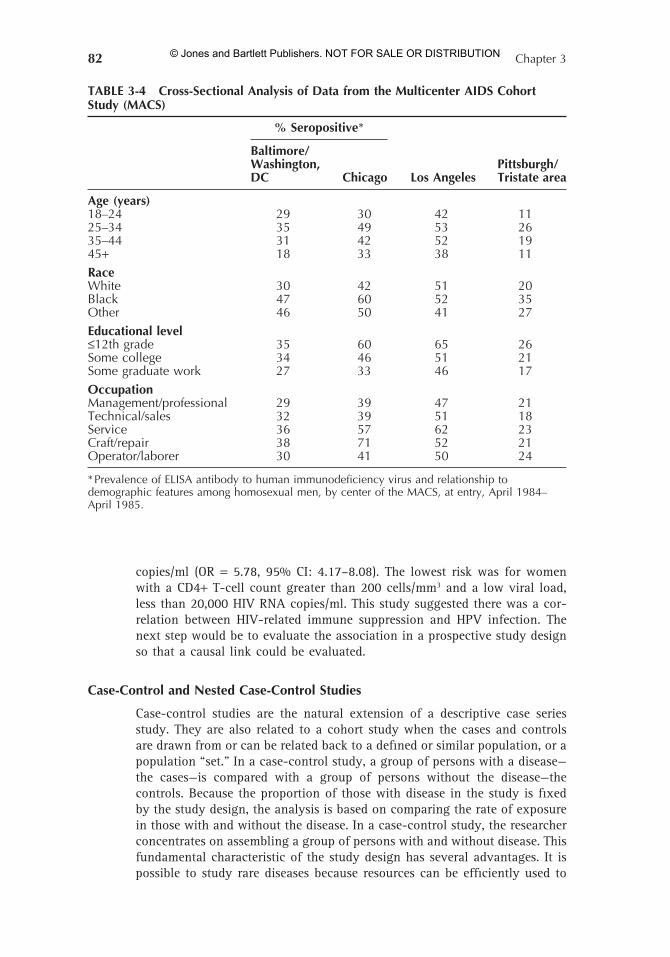
and Pittsburgh) in a prospective study to evaluate the risk factors and natural history of HIV/AIDS. Enrollment criteria were men who had sex with men, over 18 years of age, and willing to be followed with repeated interviews and physical exams (Table 3-2). After the HIV antibody test became avail-able nearly three years after the study began, the research team was able to test specimens stored in the national repository to measure the HIV serop-revalence among study participants at the baseline visit, even though they had been enrolled prior to the availability of an HIV antibody test (Table 3-3).24 HIV seroprevalence rates were reported according to the participants’ demographic characteristics, including city of residence, age, race, educa-tional level, and occupational group. These data give a “snapshot” of the HIV prevalence and risk factors for HIV infection in the MACS population. They demonstrated that men who were 25–34 years old, nonwhite, with no more than a high school education, and who were service, craft, or repair workers had a higher prevalence of HIV infection early in the study. The HIV prevalence at baseline varied in the men from the participating cities; HIV prevalence was 11% in subjects from Pittsburgh, 29% in Baltimore-Wash-ington, 30% in Chicago, and 42% in Los Angeles. The number of partners and sexual practices were similar in men from the different sites. However, men from Los Angeles were more likely to have had sex with a partner who developed AIDS, reflecting the fact that the epidemic was older in Los Angeles. Prevalence of HIV infection at baseline was also associated with having had receptive anal intercourse with a larger number of partners and reporting a history of an STD (Table 3-4).
IDE003.indd 80 4/14/2006 06:41:03 PM
© Jones and Bartlett Publishers. NOT FOR SALE OR DISTRIBUTION
Study Design 81
R1
TABLE 3-3 Enrollment Criteria for the Multicenter AIDS Clinical Study (MACS), the AIDS Link to the Intravenous Experience (ALIVE), and the Women’s Interagency HIV Study (WIHS)
Characteristics MACS (N = 4955) ALIVE (N = 2960) WIHS (N = 2058)Risk group Men who have sex Injected drugs at Women with and with men least once after without HIV 1978 infectionAge group 18–70 years 18 years or more 13 years or moreGender Males Males and Females femalesRecruitment Existing HBV study, Street Community method word of mouth recruitment, word outreach, hospital- referrals, community of mouth, based and research outreach, media clinic/hospital/ programs, outreach, clinic treatment center women’s support referral referral groups, drug treatment, word of mouth, HIV testing sites, clinic referralHIV Unknown Tested at first Tested at first visit serostatus visitAIDS AIDS free AIDS free AIDS and AIDS freeStudy visit 6-month visits 6-month visits 6-month visits schedulePhysical exam All All HIV- All seropositives, subset HIVseronegativesRoutine Serum, plasma, Serum, plasma, Serum, plasma, specimens lymphocytes, throat lymphocytes lymphocytes, washings/saliva, cervical lavage, urine, feces, semen urine, throat washings/salivaRisk exposure 1-hour interviewer- 1-hour 1-hour data administered interviewer- interviewer- questionnaire administered administered questionnaire questionnaire
gynecologic pathology and the natural history of HIV in women (Table 3-3).25 A cross-sectional study was done in this cohort to evaluate the association between HIV and human papillomavirus (HPV) infection among more than 2500 subjects, composed of both HIV-negative and HIV-positive women who were enrolled at six clinical sites throughout the United States. Data col-lected included physical exams, medical history, behavioral and demographic factors, as well as CD4+ cell count and quantitative RT-PCR measurement of HIV RNA and prevalence of HPV infection using hybrid capture and PCR amplification. This allowed the investigators to examine the association between HIV and HPV prevalence.26
In this study, HIV-positive women with a CD4+ T-cell count of less than 200 cells/mm3 were at the highest risk of HPV infection, regardless of HIV RNA load (OR = 10.13; 95% confidence interval [CI] = 7.32, 10.34). A lower risk was seen among women with a CD4+ T-cell count greater than 200 cells/mm3 but who had a high viral load, HIV RNA greater than 20,000
IDE003.indd 81 4/14/2006 06:41:03 PM
© Jones and Bartlett Publishers. NOT FOR SALE OR DISTRIBUTION
82 Chapter 3
R1
TABLE 3-4 Cross-Sectional Analysis of Data from the Multicenter AIDS Cohort Study (MACS)
% Seropositive*
Baltimore/ Washington, Pittsburgh/ DC Chicago Los Angeles Tristate area
Age (years)18–24 29 30 42 1125–34 35 49 53 2635–44 31 42 52 1945+ 18 33 38 11RaceWhite 30 42 51 20Black 47 60 52 35Other 46 50 41 27Educational level≤12th grade 35 60 65 26Some college 34 46 51 21Some graduate work 27 33 46 17OccupationManagement/professional 29 39 47 21Technical/sales 32 39 51 18Service 36 57 62 23Craft/repair 38 71 52 21Operator/laborer 30 41 50 24
* Prevalence of ELISA antibody to human immunodeficiency virus and relationship to demographic features among homosexual men, by center of the MACS, at entry, April 1984–April 1985.
Case-Control and Nested Case-Control Studies
Case-control studies are the natural extension of a descriptive case series study. They are also related to a cohort study when the cases and controls are drawn from or can be related back to a defined or similar population, or a population “set.” In a case-control study, a group of persons with a disease—the cases—is compared with a group of persons without the disease—the controls. Because the proportion of those with disease in the study is fixed by the study design, the analysis is based on comparing the rate of exposure in those with and without the disease. In a case-control study, the researcher concentrates on assembling a group of persons with and without disease. This fundamental characteristic of the study design has several advantages. It is possible to study rare diseases because resources can be efficiently used to
copies/ml (OR = 5.78, 95% CI: 4.17–8.08). The lowest risk was for women with a CD4+ T-cell count greater than 200 cells/mm3 and a low viral load, less than 20,000 HIV RNA copies/ml. This study suggested there was a cor-relation between HIV-related immune suppression and HPV infection. The next step would be to evaluate the association in a prospective study design so that a causal link could be evaluated.
IDE003.indd 82 4/14/2006 06:41:03 PM
© Jones and Bartlett Publishers. NOT FOR SALE OR DISTRIBUTION
Study Design 83
R1
evaluate known or readily available cases of a disease. More than one expo-sure can be evaluated because the original study population was not restricted with respect to exposure. Typically, case-control studies have smaller sample sizes than cohort studies, allowing for greater resources to be expended per participant and for lower costs to the study overall. Resources can be used to define disease status and the absence of disease with certainty, reducing the risk of misclassification bias.
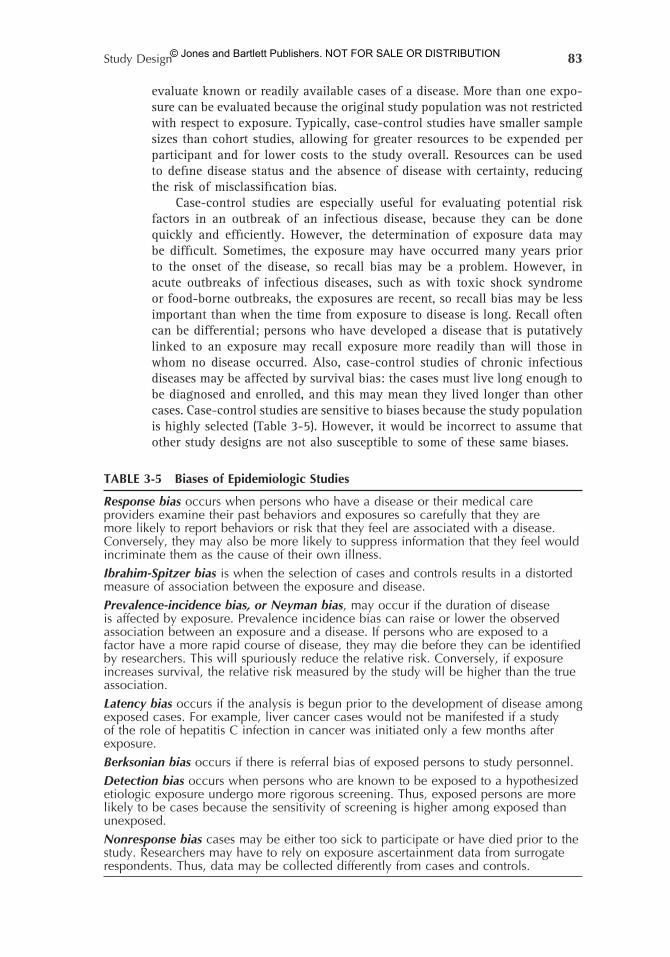
Case-control studies are especially useful for evaluating potential risk factors in an outbreak of an infectious disease, because they can be done quickly and efficiently. However, the determination of exposure data may be difficult. Sometimes, the exposure may have occurred many years prior to the onset of the disease, so recall bias may be a problem. However, in acute outbreaks of infectious diseases, such as with toxic shock syndrome or food-borne outbreaks, the exposures are recent, so recall bias may be less important than when the time from exposure to disease is long. Recall often can be differential; persons who have developed a disease that is putatively linked to an exposure may recall exposure more readily than will those in whom no disease occurred. Also, case-control studies of chronic infectious diseases may be affected by survival bias: the cases must live long enough to be diagnosed and enrolled, and this may mean they lived longer than other cases. Case-control studies are sensitive to biases because the study population is highly selected (Table 3-5). However, it would be incorrect to assume that other study designs are not also susceptible to some of these same biases.
TABLE 3-5 Biases of Epidemiologic Studies
Response bias occurs when persons who have a disease or their medical care providers examine their past behaviors and exposures so carefully that they are more likely to report behaviors or risk that they feel are associated with a disease. Conversely, they may also be more likely to suppress information that they feel would incriminate them as the cause of their own illness.Ibrahim-Spitzer bias is when the selection of cases and controls results in a distorted measure of association between the exposure and disease.Prevalence-incidence bias, or Neyman bias, may occur if the duration of disease is affected by exposure. Prevalence incidence bias can raise or lower the observed association between an exposure and a disease. If persons who are exposed to a factor have a more rapid course of disease, they may die before they can be identified by researchers. This will spuriously reduce the relative risk. Conversely, if exposure increases survival, the relative risk measured by the study will be higher than the true association.Latency bias occurs if the analysis is begun prior to the development of disease among exposed cases. For example, liver cancer cases would not be manifested if a study of the role of hepatitis C infection in cancer was initiated only a few months after exposure.Berksonian bias occurs if there is referral bias of exposed persons to study personnel.Detection bias occurs when persons who are known to be exposed to a hypothesized etiologic exposure undergo more rigorous screening. Thus, exposed persons are more likely to be cases because the sensitivity of screening is higher among exposed than unexposed.Nonresponse bias cases may be either too sick to participate or have died prior to the study. Researchers may have to rely on exposure ascertainment data from surrogate respondents. Thus, data may be collected differently from cases and controls.
IDE003.indd 83 4/14/2006 06:41:03 PM
© Jones and Bartlett Publishers. NOT FOR SALE OR DISTRIBUTION
84 Chapter 3
R1
In analytical case-control studies, the researcher attempts to determine the exposures among the cases and controls. Because the analysis is based on comparisons within the study sample, generalizability of the results to the overall population is less important than the appropriate selection of the control population. The overriding consideration in the selection of controls is to select them in such a way that they are representative of the same population from which the cases arose. Studies have sought controls from other patients in hospitals or clinics, friends of the cases, family members of cases, neighborhood or geographic controls, or other accessible populations. Whereas the risk of disease may differ between cases and controls, controls should be similar enough to cases that they too have a risk of developing disease. If the controls were completely immune to developing a disease, the risk factor of importance in the case group may not be different between the groups. For instance, a study of genetic traits and ovarian cancer, should not have men as the control group. A less extreme example is that HIV seronega-tive persons are not suitable controls for a study of Kaposi sarcoma (KS) in AIDS patients; the researcher should instead choose individuals with a similar level of immune suppression but who is KS free. Researchers must also decide whether controls should be chosen from populations with other diseases or from nondiseased persons. Frequently, data are available on persons diag-nosed with another disease as a result of diagnosis or treatment that can be used to compare risk factors between cases and controls. When controls with other diseases are selected, it is important to ensure that the exposure being evaluated is not also related to the control’s disease. Sometimes, it may be difficult to rule out the presence of disease in persons who have not received certain diagnostic procedures. However, if a study requires that the controls have had extensive diagnostic tests, it may compromise generalizability or external validity because only a select group of people will have undergone the testing requirements.
To maximize the study’s ability to analyze a given risk factor, the study design should minimize differences between cases and controls with respect to other known risk factors. Controls may be matched with cases to varying degrees. Controls may be simply drawn from homogenous populations, such as clinics that serve only specific types of patients. More closely matched controls may be chosen from subpopulations that closely conform to the demographic characteristics of the cases. Individual matching may also be used. Individual matching can reduce the variability between the cases and controls with respect to confounding factors, known and unknown, but there are several potential drawbacks. The inability to find a matched control for a particular case could result in exclusion of the case. This would be a particular problem if cases were rare. Matching increases the complexity of enrollment of participants, and this complexity could result in errors in enrollment. Because cases and controls have been chosen so that they are similar with respect to the matching variables, the distribution of the matched variables will be the same in the cases and controls. Future analysis of these matched variables cannot be assessed. In most instances, statistical adjustment of the data during analysis can account for differences in the distribution of known risk factors. Given its drawbacks, matching should only be done when the matching variables are likely to confound the data even after statistical adjustment and are of no research interest in and of themselves. In a matched
IDE003.indd 84 4/14/2006 06:41:03 PM
© Jones and Bartlett Publishers. NOT FOR SALE OR DISTRIBUTION
Study Design 85
R1
One of the major problems with case-control studies is the reliability and validity of the measurement of the exposure. Also, it may not be possible to determine whether the exposure occurred prior to the onset of disease. One type of study design that can be used to avoid these issues is a nested case-control study. Cases are selected from a cohort after the onset of illness, and they are matched with controls from the same cohort on whom similar exposure information is available and who have had the same opportunity to be diagnosed with disease. Controls should have been followed for a similar length of time as the cases, and they should have received the same diagnostic procedures. Many of the biases that can arise in reconstructing retrospective exposure data are reduced or eliminated when previously col-lected data from a cohort study are used. Furthermore, nested case-control study designs have the advantage that the researcher can know the temporal relationship between the exposure and disease. Analysis of stored specimens from the cohort study also ensures that changes in laboratory methods or artifacts due to specimen storage do not affect the study results differentially between cases and controls.
There are two commonly used methods for selecting controls in the nested case-control study. When controls are matched to cases by select-ing participants from the cohort who are disease free at the time the case becomes ill, the procedure is referred to as incidence density sampling. A second method is to select controls from the cohort at baseline—a case-cohort design. In the case-cohort study, all or some known proportion of the original cohort is sampled for the analysis. When the case-cohort design is used, it is possible to estimate the prevalence of disease in the cohort and to calculate the population-attributable risk.21 Examples of case-control and nested case-control study designs are given below.
Nested Case-Control Studies
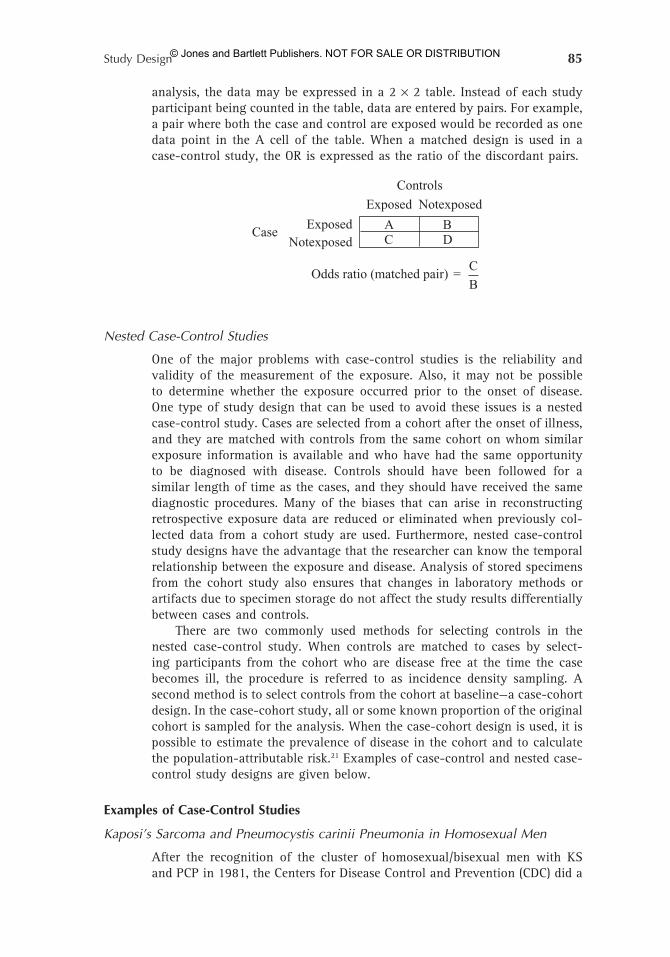
analysis, the data may be expressed in a 2 × 2 table. Instead of each study participant being counted in the table, data are entered by pairs. For example, a pair where both the case and control are exposed would be recorded as one data point in the A cell of the table. When a matched design is used in a case-control study, the OR is expressed as the ratio of the discordant pairs.
Odds ratio (matched pair) =
NotexposedCase
Exposed
Exposed Notexposed
Controls
C
B
A BC D
Examples of Case-Control Studies
Kaposi’s Sarcoma and Pneumocystis carinii Pneumonia in Homosexual Men
After the recognition of the cluster of homosexual/bisexual men with KS and PCP in 1981, the Centers for Disease Control and Prevention (CDC) did a
IDE003.indd 85 4/14/2006 06:41:04 PM
© Jones and Bartlett Publishers. NOT FOR SALE OR DISTRIBUTION
86 Chapter 3
R1
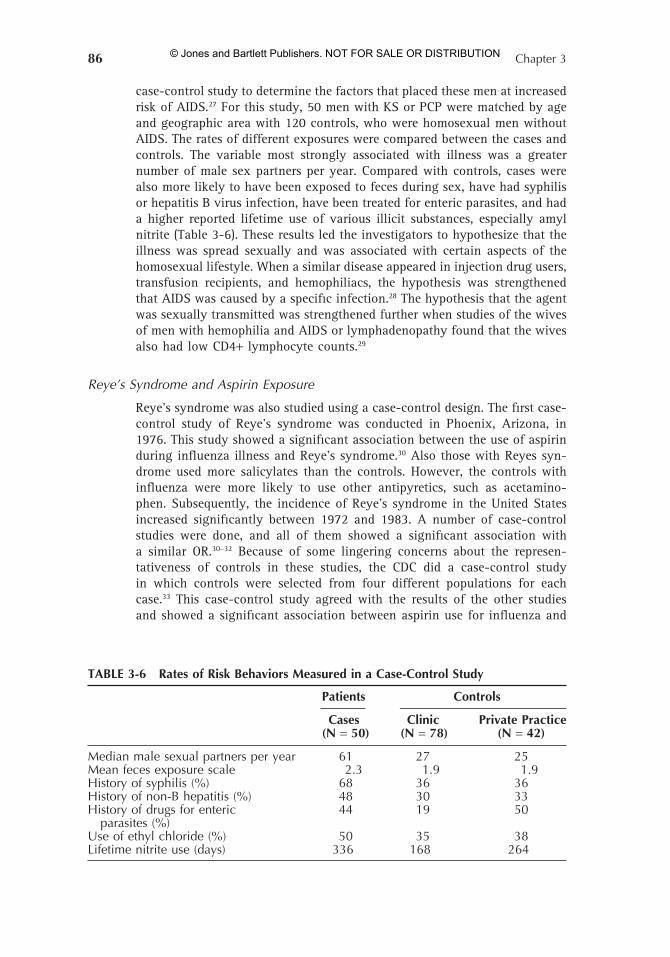
TABLE 3-6 Rates of Risk Behaviors Measured in a Case-Control Study
Patients Controls
Cases Clinic Private Practice (N = 50) (N = 78) (N = 42)
Median male sexual partners per year 61 27 25Mean feces exposure scale 2.3 1.9 1.9History of syphilis (%) 68 36 36History of non-B hepatitis (%) 48 30 33History of drugs for enteric 44 19 50 parasites (%)Use of ethyl chloride (%) 50 35 38Lifetime nitrite use (days) 336 168 264
Reye’s Syndrome and Aspirin Exposure
Reye’s syndrome was also studied using a case-control design. The first case-control study of Reye’s syndrome was conducted in Phoenix, Arizona, in 1976. This study showed a significant association between the use of aspirin during influenza illness and Reye’s syndrome.30 Also those with Reyes syn-drome used more salicylates than the controls. However, the controls with influenza were more likely to use other antipyretics, such as acetamino-phen. Subsequently, the incidence of Reye’s syndrome in the United States increased significantly between 1972 and 1983. A number of case-control studies were done, and all of them showed a significant association with a similar OR.30–32 Because of some lingering concerns about the represen-tativeness of controls in these studies, the CDC did a case-control study in which controls were selected from four different populations for each case.33 This case-control study agreed with the results of the other studies and showed a significant association between aspirin use for influenza and
case-control study to determine the factors that placed these men at increased risk of AIDS.27 For this study, 50 men with KS or PCP were matched by age and geographic area with 120 controls, who were homosexual men without AIDS. The rates of different exposures were compared between the cases and controls. The variable most strongly associated with illness was a greater number of male sex partners per year. Compared with controls, cases were also more likely to have been exposed to feces during sex, have had syphilis or hepatitis B virus infection, have been treated for enteric parasites, and had a higher reported lifetime use of various illicit substances, especially amyl nitrite (Table 3-6). These results led the investigators to hypothesize that the illness was spread sexually and was associated with certain aspects of the homosexual lifestyle. When a similar disease appeared in injection drug users, transfusion recipients, and hemophiliacs, the hypothesis was strengthened that AIDS was caused by a specific infection.28 The hypothesis that the agent was sexually transmitted was strengthened further when studies of the wives of men with hemophilia and AIDS or lymphadenopathy found that the wives also had low CD4+ lymphocyte counts.29
IDE003.indd 86 4/14/2006 06:41:04 PM
© Jones and Bartlett Publishers. NOT FOR SALE OR DISTRIBUTION
Study Design 87
R1
Examples of Nested Case-Control Studies
Epstein-Barr Virus Infection and Hodgkin’s Disease
For several years, epidemiologists have questioned whether Hodgkin’s disease (HD) might be caused by an infectious agent, especially in those with onset at an earlier age. Some investigators have found evidence of an increased prevalence of Epstein-Barr virus (EBV) antibodies in patients with HD. Also, EBV is known to cause other tumors, especially nasopharyngeal carcinoma, and to persist after the initial infection. However, EBV infection is not uncom-mon. To show a causal association, it was necessary to demonstrate that EBV infection preceded the development of HD.
A community-based public health epidemiologic study in Washington County, Maryland, afforded the opportunity to test the hypothesis that EBV might be etiologically related to HD.36 In this study, a sera repository was collected in 1963. Over two decades later, specimens from persons who had developed HD in the interim were selected, matched with controls, and tested for serologic evidence of EBV. The data showed a significant association between EBV antibodies prior to the onset of HD in cases, compared with matched controls (RR = 2.6–4.0 for various serologic markers of infection). This evidence strengthened the argument that EBV infection might be in the causal pathway for the development of HD because EBV infections were more common in the cases and preceded the onset of HD.
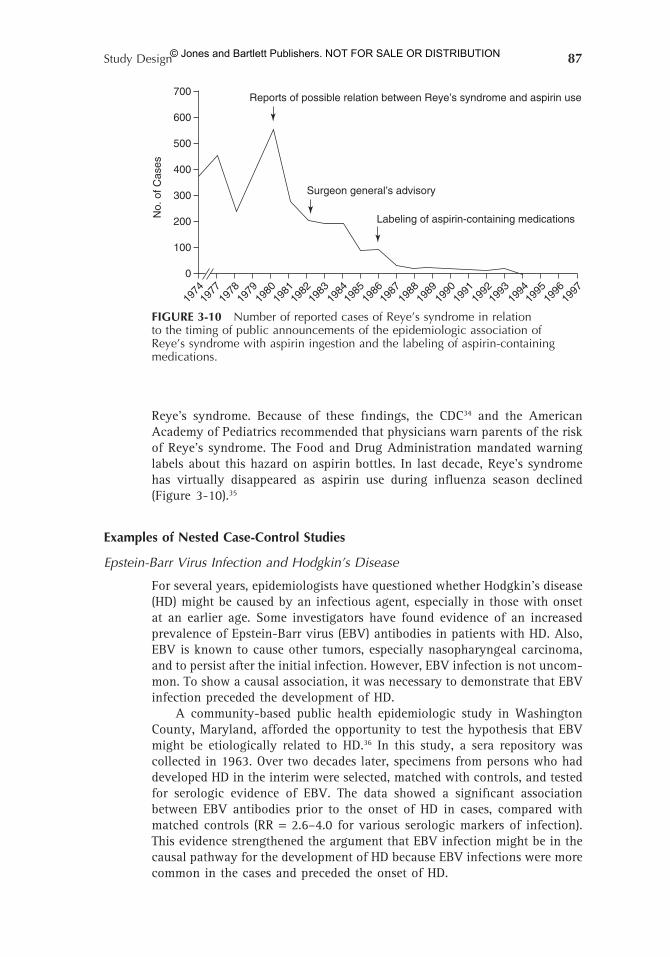
Reye’s syndrome. Because of these findings, the CDC34 and the American Academy of Pediatrics recommended that physicians warn parents of the risk of Reye’s syndrome. The Food and Drug Administration mandated warning labels about this hazard on aspirin bottles. In last decade, Reye’s syndrome has virtually disappeared as aspirin use during influenza season declined (Figure 3-10).35
FIGURE 3-10 Number of reported cases of Reye’s syndrome in relation to the timing of public announcements of the epidemiologic association of Reye’s syndrome with aspirin ingestion and the labeling of aspirin-containing medications.
700Reports of possible relation between Reye’s syndrome and aspirin use
Surgeon general’s advisory
Labeling of aspirin-containing medications
600
500
400
300
No.
of C
ases
200
100
0
1974
1977
1978
1979
1980
1981
1982
1983
1984
1985
1986
1987
1988
1989
1990
1991
1992
1993
1994
1995
1996
1997
IDE003.indd 87 4/14/2006 06:41:04 PM
© Jones and Bartlett Publishers. NOT FOR SALE OR DISTRIBUTION
88 Chapter 3
R1
A nested case-cohort study of the risk of HIV seroconversion among health care workers (HCWs) in France, the United Kingdom, and the United States was published in 1995.41 This study was done to determine whether treatment with zidovudine (or other antiretroviral drugs) after parenteral exposure in HCWs reduced the rate of HIV transmission. Several animal studies sug-gested that postexposure prophylaxis conferred protection after challenge with simian immunodeficiency virus (SIV). Furthermore, at the time of the study, zidovudine had been shown to be effective in preventing vertical transmission of HIV. Prospective studies suggested that the risk of HIV trans-mission after parenteral exposure was only 0.35%.42 Therefore a prospective study, or clinical trial, would need to be extraordinarily large to have suf-ficient statistical power to evaluate the benefit of therapy. Also, recruitment of participants for a randomized clinical trial would be difficult because zidovudine was generally felt to be effective in preventing HIV transmission, and participants who were randomized to the control arm might insist on receiving the unproven antiretroviral therapy. In this study, available data from the United States and France was analyzed in which the exposure and treatment history of all known cases of HIV transmission to HCWs n = 31 cases) was compared with that of all reported uninfected exposed HCWs (n = 679, cohort). Exposure was defined as those who had a documented penetrating injury with an instrument contaminated by blood from an HIV-positive patient. Cases and cohort members had received either zidovudine or no antiretroviral prophylaxis and had been followed at least 6 months, as of August 1994. The risk factors for HIV infection and protective effect of zidovudine are shown in Table 3-7.
Based on this study, it was recommended by the CDC that all HCWs receive zidovudine after percutaneous exposure to HIV-infected blood. However, it is clear that there are some potential biases in this study. For example, if there was significant underreporting of HCWs in whom transmission failed to occur and who had not received prophylaxis, the transmission rate in the control group could be inflated. This referral (or enrollment) bias would decrease the measured OR and increase the apparent protective efficacy of zidovudine
Case-Cohort Study of HIV Seroconversion Among Health Care Workers
Kaposi’s Sarcoma and HHV-8 (KSHV)
The presence of nucleic acid sequences of a new herpes virus (HHV-8) were detected in the lesions of AIDS patients with KS by Chang et al.37 It then became important to determine whether infection with HHV-8 preceded the occurrence of KS in patients with HIV-1 infection. The availability of specimen repositories from several large cohorts of homosexual men allowed investigators to perform nested case-control studies. The sera were examined at baseline for antibodies to HHV-8 to estimate the RR of subsequent KS in men with and without HHV-8 antibodies. Also, Kaplan-Meier survival analy-sis was done to estimate the rate of new KS cases in HIV-positive men after HHV-8 infection. Nested case-control studies showing an association between HHV-8 infection and KS have been published from several cohorts, including a Danish homosexual cohort, an Australian cohort, and the Multicenter AIDS Cohort Study (MACS).38–40
IDE003.indd 88 4/14/2006 06:41:04 PM
© Jones and Bartlett Publishers. NOT FOR SALE OR DISTRIBUTION
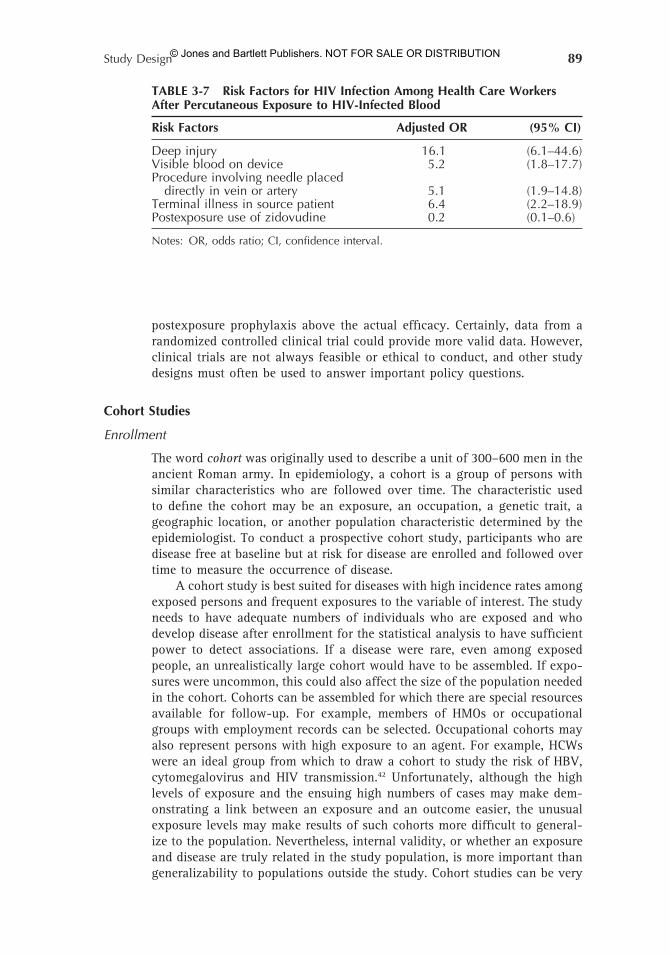
Study Design 89
R1
The word cohort was originally used to describe a unit of 300–600 men in the ancient Roman army. In epidemiology, a cohort is a group of persons with similar characteristics who are followed over time. The characteristic used to define the cohort may be an exposure, an occupation, a genetic trait, a geographic location, or another population characteristic determined by the epidemiologist. To conduct a prospective cohort study, participants who are disease free at baseline but at risk for disease are enrolled and followed over time to measure the occurrence of disease.
A cohort study is best suited for diseases with high incidence rates among exposed persons and frequent exposures to the variable of interest. The study needs to have adequate numbers of individuals who are exposed and who develop disease after enrollment for the statistical analysis to have sufficient power to detect associations. If a disease were rare, even among exposed people, an unrealistically large cohort would have to be assembled. If expo-sures were uncommon, this could also affect the size of the population needed in the cohort. Cohorts can be assembled for which there are special resources available for follow-up. For example, members of HMOs or occupational groups with employment records can be selected. Occupational cohorts may also represent persons with high exposure to an agent. For example, HCWs were an ideal group from which to draw a cohort to study the risk of HBV, cytomegalovirus and HIV transmission.42 Unfortunately, although the high levels of exposure and the ensuing high numbers of cases may make dem-onstrating a link between an exposure and an outcome easier, the unusual exposure levels may make results of such cohorts more difficult to general-ize to the population. Nevertheless, internal validity, or whether an exposure and disease are truly related in the study population, is more important than generalizability to populations outside the study. Cohort studies can be very
TABLE 3-7 Risk Factors for HIV Infection Among Health Care Workers After Percutaneous Exposure to HIV-Infected Blood
Risk Factors Adjusted OR (95% CI)
Deep injury 16.1 (6.1–44.6)Visible blood on device 5.2 (1.8–17.7)Procedure involving needle placed directly in vein or artery 5.1 (1.9–14.8)Terminal illness in source patient 6.4 (2.2–18.9)Postexposure use of zidovudine 0.2 (0.1–0.6)
Notes: OR, odds ratio; CI, confidence interval.
Cohort Studies
Enrollment
postexposure prophylaxis above the actual efficacy. Certainly, data from a randomized controlled clinical trial could provide more valid data. However, clinical trials are not always feasible or ethical to conduct, and other study designs must often be used to answer important policy questions.
IDE003.indd 89 4/14/2006 06:41:04 PM
© Jones and Bartlett Publishers. NOT FOR SALE OR DISTRIBUTION
90 Chapter 3
R1
Cohort studies collect information on exposure and on the development of disease. Simplistically, a cohort is assembled from a group of exposed individuals, and the study measures the incidence of disease in the group. Practically, however, cohorts assemble persons with a range of risk expo-sures and measure the incidence of disease across the range of risk levels. Often, it is possible in cohort studies to measure a dose-response effect of increasing disease incidence (because of higher attack rates or shorter incubation periods) with higher levels of exposure. Furthermore, in cohort studies, the subjects can develop infection or disease of varying severity. Thus, defining the appropriate end point is critical. In some cohort studies, several end points may be measured. For example, a study of influenza could measure serologically or virologically confirmed infection, clinical illness, illness with a physician visit or time away from work, hospital-ization, or death. A cohort study of influenza vaccine in the elderly has found the vaccine to be more efficacious in preventing death than it is in preventing infection.43
An interviewer-administered questionnaire can collect more detailed and complex information, can allow for more flexibility in collecting infor-mation, and often results in more complete and standardized information being collected. Interviewer-administered questionnaires can also create a stronger bond with the study participants, so they are more likely to share information and are more likely to continue their participation in the study. In some populations, literacy levels may be low, necessitating an interviewer-administered design. Other cohort studies have relied on less expensive data collection techniques, such as mail or telephone inter-
Data Collection
expensive and often require a large staff and great motivation on the part of the study subjects to remain in follow-up. Cohort studies with large losses to follow-up may not yield data that are interpretable, because the risks for disease may be different in those lost to follow-up than in the subjects who were successfully followed. The enrollment criteria for three HIV/AIDS cohorts—the Multicenter AIDS Cohort Study (MACS), the AIDS Link to the Intravenous Experience (ALIVE), and the Women’s Interagency HIV Study (WIHS) are shown in Table 3-3.
Although most cohort studies enroll and follow subjects prospectively, cohorts may also be assembled retrospectively, after disease has occurred. Such a study could bring together previously collected medical or exposure records or incorporate previously collected data with current and future assessment of disease among those exposed. A retrospective cohort, or histori-cal cohort design, takes advantage of records and specimens collected in the past and can generate results more rapidly than a truly prospective design, which must wait for the development of disease. Within existing cohorts, subgroups can evaluate hypotheses prospectively that were not proposed at the outset of the original cohort. These studies, nested cohorts, are able to study participants enrolled in the parent cohort and take advantage of the infrastructure, data, and even specimens collected by the original cohort.
IDE003.indd 90 4/14/2006 06:41:04 PM
© Jones and Bartlett Publishers. NOT FOR SALE OR DISTRIBUTION
Study Design 91
R1
Analysis
Unlike other epidemiologic study designs, cohort studies are able to measure the rate at which participants develop disease per unit of time—the incidence rate. The incidence rate is the number of people who develop disease divided by the cumulative time in the study for all participants up until the time that they develop disease.
To measure associations, cohort studies compare the incidence rate of disease among persons with different exposures or other characteristics at baseline or during the follow-up period. The ratio of the incidence rates according to exposures is expressed as the relative risk, risk ratio, or relative hazard of disease (Table 3-2). Analysis may be extended to include Kaplan-Meier types of survival curves and Cox proportional hazard analysis, in which data are stratified according to exposure characteristics and survival curves are compared. Cohort studies can also use data obtained by testing multiple biologic specimens collected from subjects during the course of the study.
In addition to methods that define exposure at an arbitrary baseline time point, there are analytical methods that take into account changes in expo-sure among individuals over time. Because cohort studies follow participants over time, the level of exposure to different risk factors may fluctuate for an individual over time. For example, an individual who uses illicit drugs may have times of abstinence and episodes of heavy drug use. Exposures that fluctuate over time, either qualitatively (e.g., present/absent) or quan-titatively (e.g., heavy/light), are termed time-dependent covariates. Those covariates that don’t change, such as sex, histocompatibility locus antigen (HLA) type, ethnicity, age at baseline, are termed fixed covariates. Note that
views. These data collection techniques commonly have lower response rates than do interviewer-administered questionnaires but are significantly less expensive. Repeated interviews of ongoing cohorts may encounter problems with “socially desirable responding” particularly on questions to assess risk behaviors. In this situation, participants respond to questions according to what they believe the interviewer might view as desirable behavior. This is not always intentional misreporting or “lying” about behavior by the subject. Sometimes, the subject’s memory is influenced by the social situation of the interview. Care must be taken to ensure that interviewers are well trained and that the questionnaire is carefully conducted to minimize these poten-tial biases. One recent technique that has been evaluated to reduce socially desirable responses is to replace the interviewer with a computer response system. The interview is administered by an audio-adapted computer assisted interview (ACASI). Another advantage of ACASI data collection over self- completed questionnaires is that ACASI questions are more readily under-stood by persons with low literacy levels, because the questions are printed on the computer screen but also spoken through the audio connection. Although some participants prefer the personal interaction with the inter-viewer, the use of ACASI to measure risk behavior generally results in higher levels of reported risk behaviors. For example, more adolescents reported unprotected sex and injection drug on ACASI than was reported in a stan-dard interview.44
IDE003.indd 91 4/14/2006 06:41:04 PM
© Jones and Bartlett Publishers. NOT FOR SALE OR DISTRIBUTION
92 Chapter 3
R1
while participants contribute data to the study at each visit, how those data are distributed in the analysis depends on their risk behaviors at that point in time. A single individual may contribute data to both the exposed and the unexposed categories over the course of the cohort study. The fluctuation in personal behaviors is accounted for in the person time analysis and gives cohort analysis considerable statistical power, as each data point from each participant is used.
The ability to assess time-dependent covariates is useful when assessing the effects of long-term therapy on chronic disease outcomes. The patients may have periods when they go off treatment (e.g., due to side effects) or may even change therapy, so that a baseline assessment of exposure would lead to misclassification of such patients. In studies of nutrition, for example, calorie intake can fluctuate with seasonal food supplies and may need to be assessed several times over a year.
The analysis of longitudinal data requires attention to some of the assumptions of the statistical models. Longitudinal data contain repeated measurements on risk behaviors for a single individual over time. The dis-tribution of these risk behaviors is not normal, nor is it independent. For example, a person who injects illicit drugs frequently will probably continue to inject at a high frequency. A plot of a hundred measurements of injection frequency on a single participant would differ from single measurements on a hundred participants. The variation in data from the single person would be much less than the variability in data from a hundred individuals. Many statistical programs assume that the data is normally distributed and that the values are independent of each other. An analysis of longitudinal data that does not take into account the smaller variance of repeated measures will give estimates of the variance that are too small and will construct confidence intervals for the estimates that are too small. In other words, the model will report that the data are better than they really are. Numerous programs are able to perform analysis on repeated measurement data and should be used for longitudinal data analysis when appropriate.
One such generalized approach, the Generalized Estimating Equations (GEE), was developed by Zieger and Liang. GEE adjusts for within-person correlation of multiple observations from the same individual45 and allows analyses that can model changes in exposure status over time. These methods were used to assess the effects of zidovudine therapy and antibiotics for PCP on HIV disease progression and death at the population level.46,47 An exten-sion of the Cox proportional hazards model that allows for time-dependent covariates also gives the epidemiologist the ability to assess the effects of changes in exposure over time. This approach has been used to assess the effectiveness of switching therapy among HIV-infected patients who were taking nucleoside reverse transcriptase inhibitor therapy at baseline.47
Examples of Cohort Studies
The use of cohort studies to evaluate the incidence of HIV, natural history of HIV, and the effectiveness of drug therapies is shown in the following four examples, two from the ALIVE cohort and two from the MACS cohort.
IDE003.indd 92 4/14/2006 06:41:04 PM
© Jones and Bartlett Publishers. NOT FOR SALE OR DISTRIBUTION
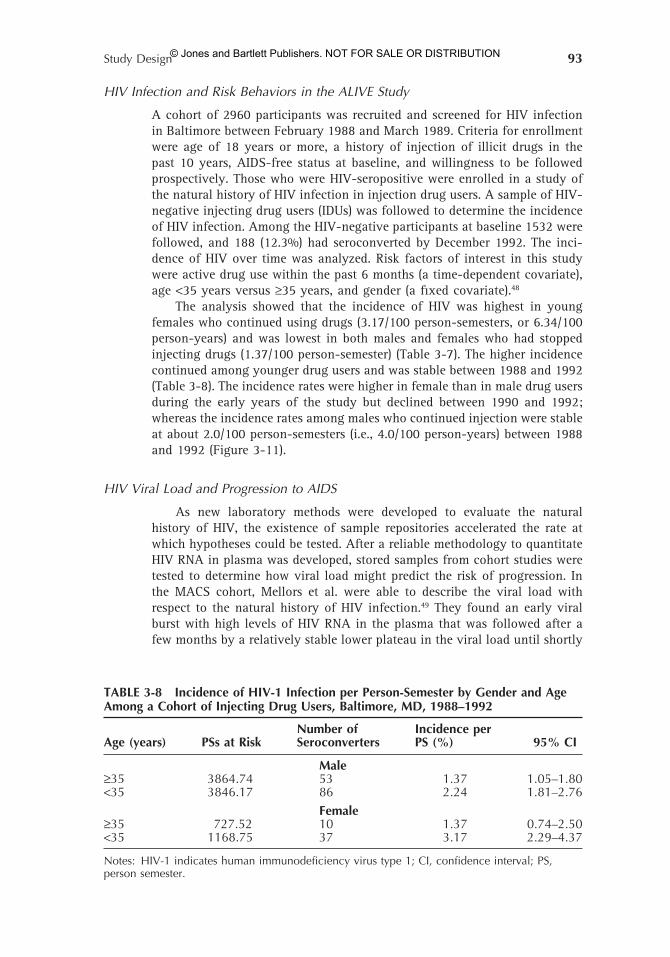
Study Design 93
R1
As new laboratory methods were developed to evaluate the natural history of HIV, the existence of sample repositories accelerated the rate at which hypotheses could be tested. After a reliable methodology to quantitate HIV RNA in plasma was developed, stored samples from cohort studies were tested to determine how viral load might predict the risk of progression. In the MACS cohort, Mellors et al. were able to describe the viral load with respect to the natural history of HIV infection.49 They found an early viral burst with high levels of HIV RNA in the plasma that was followed after a few months by a relatively stable lower plateau in the viral load until shortly
HIV Infection and Risk Behaviors in the ALIVE Study
A cohort of 2960 participants was recruited and screened for HIV infection in Baltimore between February 1988 and March 1989. Criteria for enrollment were age of 18 years or more, a history of injection of illicit drugs in the past 10 years, AIDS-free status at baseline, and willingness to be followed prospectively. Those who were HIV-seropositive were enrolled in a study of the natural history of HIV infection in injection drug users. A sample of HIV-negative injecting drug users (IDUs) was followed to determine the incidence of HIV infection. Among the HIV-negative participants at baseline 1532 were followed, and 188 (12.3%) had seroconverted by December 1992. The inci-dence of HIV over time was analyzed. Risk factors of interest in this study were active drug use within the past 6 months (a time-dependent covariate), age <35 years versus ≥35 years, and gender (a fixed covariate).48
The analysis showed that the incidence of HIV was highest in young females who continued using drugs (3.17/100 person-semesters, or 6.34/100 person-years) and was lowest in both males and females who had stopped injecting drugs (1.37/100 person-semester) (Table 3-7). The higher incidence continued among younger drug users and was stable between 1988 and 1992 (Table 3-8). The incidence rates were higher in female than in male drug users during the early years of the study but declined between 1990 and 1992; whereas the incidence rates among males who continued injection were stable at about 2.0/100 person-semesters (i.e., 4.0/100 person-years) between 1988 and 1992 (Figure 3-11).
TABLE 3-8 Incidence of HIV-1 Infection per Person-Semester by Gender and Age Among a Cohort of Injecting Drug Users, Baltimore, MD, 1988–1992
Number of Incidence perAge (years) PSs at Risk Seroconverters PS (%) 95% CI
Male≥35 3864.74 53 1.37 1.05–1.80<35 3846.17 86 2.24 1.81–2.76 Female≥35 727.52 10 1.37 0.74–2.50<35 1168.75 37 3.17 2.29–4.37
Notes: HIV-1 indicates human immunodeficiency virus type 1; CI, confidence interval; PS, person semester.
HIV Viral Load and Progression to AIDS
IDE003.indd 93 4/14/2006 06:41:04 PM
© Jones and Bartlett Publishers. NOT FOR SALE OR DISTRIBUTION
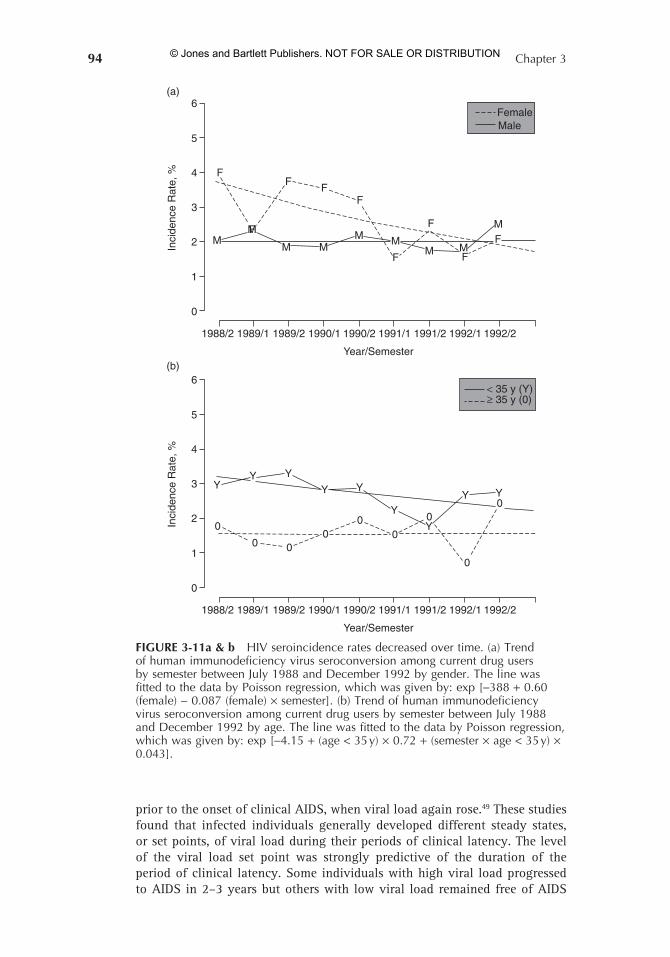
94 Chapter 3
R1
prior to the onset of clinical AIDS, when viral load again rose.49 These studies found that infected individuals generally developed different steady states, or set points, of viral load during their periods of clinical latency. The level of the viral load set point was strongly predictive of the duration of the period of clinical latency. Some individuals with high viral load progressed to AIDS in 2–3 years but others with low viral load remained free of AIDS
FIGURE 3-11a & b HIV seroincidence rates decreased over time. (a) Trend of human immunodeficiency virus seroconversion among current drug users by semester between July 1988 and December 1992 by gender. The line was fitted to the data by Poisson regression, which was given by: exp [-388 + 0.60 (female) - 0.087 (female) × semester]. (b) Trend of human immunodeficiency virus seroconversion among current drug users by semester between July 1988 and December 1992 by age. The line was fitted to the data by Poisson regression, which was given by: exp [-4.15 + (age < 35 y) × 0.72 + (semester × age < 35 y) × 0.043].
0
1988/2 1989/1 1990/1 1991/1 1992/11991/2 1992/21990/2
Year/Semester
FemaleMale
Inci
denc
e R
ate,
%
1989/2
1
2
3
4
5
6(a)
MM
M MM M
M M
MF
F
F
F
FF
FF
F
0
1988/2 1989/1 1990/1 1991/1 1992/11991/2 1992/21990/2
Year/Semester
< 35 y (Y)≥ 35 y (0)
Inci
denc
e R
ate,
%
1989/2
1
2
3 YY Y
Y Y
Y
Y
Y Y0
0
0
00
000
0
4
5
6(b)
IDE003.indd 94 4/14/2006 06:41:05 PM
© Jones and Bartlett Publishers. NOT FOR SALE OR DISTRIBUTION
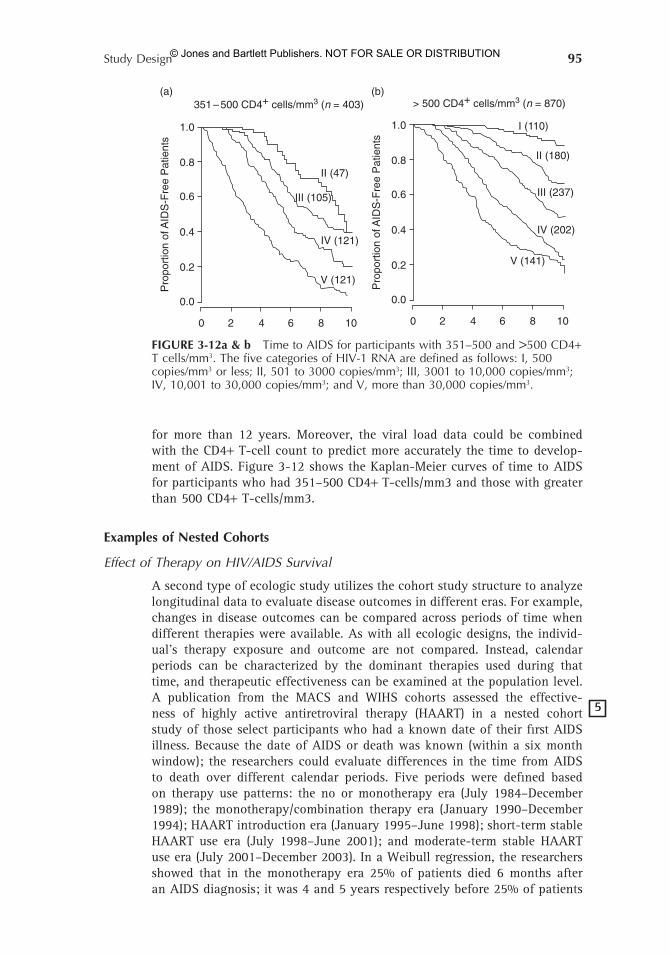
Study Design 95
R1
Examples of Nested Cohorts
Effect of Therapy on HIV/AIDS Survival
A second type of ecologic study utilizes the cohort study structure to analyze longitudinal data to evaluate disease outcomes in different eras. For example, changes in disease outcomes can be compared across periods of time when different therapies were available. As with all ecologic designs, the individ-ual’s therapy exposure and outcome are not compared. Instead, calendar periods can be characterized by the dominant therapies used during that time, and therapeutic effectiveness can be examined at the population level. A publication from the MACS and WIHS cohorts assessed the effective-ness of highly active antiretroviral therapy (HAART) in a nested cohort study of those select participants who had a known date of their first AIDS illness. Because the date of AIDS or death was known (within a six month window); the researchers could evaluate differences in the time from AIDS to death over different calendar periods. Five periods were defined based on therapy use patterns: the no or monotherapy era (July 1984–December 1989); the monotherapy/combination therapy era (January 1990–December 1994); HAART introduction era (January 1995–June 1998); short-term stable HAART use era (July 1998–June 2001); and moderate-term stable HAART use era (July 2001–December 2003). In a Weibull regression, the researchers showed that in the monotherapy era 25% of patients died 6 months after an AIDS diagnosis; it was 4 and 5 years respectively before 25% of patients
55
for more than 12 years. Moreover, the viral load data could be combined with the CD4+ T-cell count to predict more accurately the time to develop-ment of AIDS. Figure 3-12 shows the Kaplan-Meier curves of time to AIDS for participants who had 351–500 CD4+ T-cells/mm3 and those with greater than 500 CD4+ T-cells/mm3.
FIGURE 3-12a & b Time to AIDS for participants with 351–500 and >500 CD4+ T cells/mm3. The five categories of HIV-1 RNA are defined as follows: I, 500 copies/mm3 or less; II, 501 to 3000 copies/mm3; III, 3001 to 10,000 copies/mm3; IV, 10,001 to 30,000 copies/mm3; and V, more than 30,000 copies/mm3.
0.0
0
Pro
port
ion
of A
IDS
-Fre
e P
atie
nts
2 4 6 8 10
0.2
0.4
0.6
0.8
1.0
(a)
II (47)
III (105)
IV (121)
V (121)
351 – 500 CD4+ cells/mm3 (n = 403)
0.0
0
Pro
port
ion
of A
IDS
-Fre
e P
atie
nts
2 4 6 8 10
0.2
0.4
0.6
0.8
1.0
(b)
III (237)
I (110)
II (180)
IV (202)
V (141)
> 500 CD4+ cells/mm3 (n = 870)
IDE003.indd 95 4/14/2006 06:41:05 PM
© Jones and Bartlett Publishers. NOT FOR SALE OR DISTRIBUTION
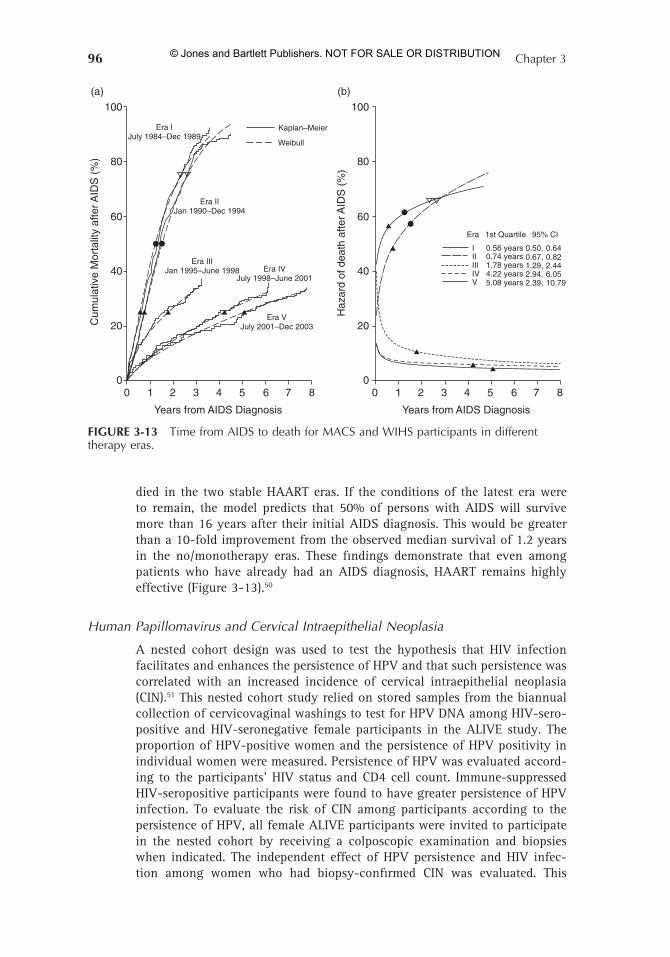
96 Chapter 3
R1
Human Papillomavirus and Cervical Intraepithelial Neoplasia
A nested cohort design was used to test the hypothesis that HIV infection facilitates and enhances the persistence of HPV and that such persistence was correlated with an increased incidence of cervical intraepithelial neoplasia (CIN).51 This nested cohort study relied on stored samples from the biannual collection of cervicovaginal washings to test for HPV DNA among HIV-sero-positive and HIV-seronegative female participants in the ALIVE study. The proportion of HPV-positive women and the persistence of HPV positivity in individual women were measured. Persistence of HPV was evaluated accord-ing to the participants’ HIV status and CD4 cell count. Immune-suppressed HIV-seropositive participants were found to have greater persistence of HPV infection. To evaluate the risk of CIN among participants according to the persistence of HPV, all female ALIVE participants were invited to participate in the nested cohort by receiving a colposcopic examination and biopsies when indicated. The independent effect of HPV persistence and HIV infec-tion among women who had biopsy-confirmed CIN was evaluated. This
died in the two stable HAART eras. If the conditions of the latest era were to remain, the model predicts that 50% of persons with AIDS will survive more than 16 years after their initial AIDS diagnosis. This would be greater than a 10-fold improvement from the observed median survival of 1.2 years in the no/monotherapy eras. These findings demonstrate that even among patients who have already had an AIDS diagnosis, HAART remains highly effective (Figure 3-13).50
FIGURE 3-13 Time from AIDS to death for MACS and WIHS participants in different therapy eras.
100
Era IJuly 1984–Dec 1989
Era
I 0.56 years 0.50,0.67,1.29,2.94,2.39,
0.640.822.446.0510.79
0.74 years1.78 years4.22 years5.08 years
IIIIIIVV
1st Quartile 95% CI
Era IIJan 1990–Dec 1994
Kaplan–Meier
Weibull
Era IIIJan 1995–June 1998 Era IV
July 1998–June 2001
Era VJuly 2001–Dec 2003
(a)
80
60
40
20
00 1 2 3
Years from AIDS Diagnosis
Cum
ulat
ive
Mor
talit
y af
ter A
IDS
(%
)
4 5 6 7 8
100
(b)
80
60
40
20
00 1 2 3
Years from AIDS Diagnosis
Haz
ard
of d
eath
afte
r AID
S (
%)
4 5 6 7 8
IDE003.indd 96 4/14/2006 06:41:05 PM
© Jones and Bartlett Publishers. NOT FOR SALE OR DISTRIBUTION
Study Design 97
R1
study found that HPV persistence was a risk factor for CIN among HIV-sero- positive women.
Clinical Trials
Clinical trials evaluate the effect of planned interventions. In contrast with cohort or case-control studies, clinical trials are experimental, rather than observational. The investigator assigns certain subjects to receive one treat-ment—the experimental group—and other subjects to receive another treat-ment—the control or comparison group. Clinical trials of interventions to prevent or treat infectious diseases are commonly used to evaluate the efficacy of vaccines; antimicrobial agents; and behavioral, immunologic, or other interventions to prevent or treat infectious disease. For a more detailed discussion of the design and analytical and ethical issues involved in clinical trials in infectious diseases the reader is referred to several excel-lent resources.52,53
In a clinical trial, a control or comparison group is usually necessary to determine whether and to what extent the treatment was efficacious or, in some instances, harmful. Although some studies are done in which a new intervention is compared with data from historical controls, this type of study is subject to many potential temporal biases and, for that reason, is not often used.
In the classic double-masked (or double-blinded) trial, subjects are assigned by a random procedure to receive an experimental treatment or placebo, and neither the subject nor the investigator knows which treatment the subject is receiving. Under some circumstances, this type of trial is not possible, for a variety of reasons. It may not always be possible to conceal the treatment group from the trial participants or the investigators. For instance, trials of medical procedures may be obvious, or medications may have certain side effects. Also, there may be times where a suitable placebo is not available. Another method of randomization is to allocate treatment or interventions at a community level. One community receives the experimen-tal treatment or intervention while another serves as the control community. Whatever the details of conducting a trial, it is critical to utilize a comparison or control population where the intervention was not applied and that is as similar to the experimental group as possible, with regard to both factors affecting the risk of disease and the measurement of the outcome. Trial study populations are often less representative of the population affected by a disease than cohort studies for two reasons. First, because the study is designed to maximize the observable differences between the treated and untreated groups, subject selection may result in a less generalizable popu-lation. Secondly, because the study is an intervention, the researchers must take every step to maximize the safety of the study participants. This may require that the study team choose participants who have more mild disease, or who have few other conditions. Intervention trials in infectious diseases can use various outcome measures, such as infection rates, disease rates, and progression of disease or death.
Determining the size of the trial is crucial for its ultimate success. The factors that are important in the determination of the sample size are:
IDE003.indd 97 4/14/2006 06:41:05 PM
© Jones and Bartlett Publishers. NOT FOR SALE OR DISTRIBUTION
98 Chapter 3
R1
• The difference in infection or disease outcome to be detected• An estimate of the likely disease incidence in the placebo group• Level of significance desired (the alpha or p value)• Power of the study required (1-beta)• Whether the significance test should be one- or two-sided
Estimating these parameters is not always easy. Infection or disease incidence in a population may not always be known. When estimates are available, they are often obtained under different conditions than will be present during a clinical trial. However, during a clinical trial, persons at lower risk may be more likely to enroll, and the incidence might be lower than predicted. Also, study subjects may not be compliant with the intervention, and the loss to follow-up may be higher than anticipated. Some trials can even be affected by competing mortality from other diseases. Furthermore, ethical considerations often mandate interventions other than the one under study, and the effects of this intervention may obscure the role of the experimental intervention.
Ethical issues have had extensive discussion and controversy in many large clinical trials of HIV/AIDS and other serious chronic infectious dis-eases. Nevertheless, the enormously important role played by clinical trials in evaluating treatments or preventive strategies for improving the prognosis of HIV/AIDS is acknowledged, even by those critical of the trials, though often in retrospect. Ethical questions that have arisen include the following:
• Is it ethical to use a placebo for an illness known to be serious or fatal, such as HIV/AIDS?
• To what extent should other interventions known to be effective be promoted in the subjects in a trial when the use of this intervention in the population from whom the subjects are recruited is not available, except during the trial? For example, in trials of HIV transmission in Africa, do researchers need to compare interventions that are economi-cally feasible in the country to expensive protocols used in the United States (i.e., ACTG 076) or offer procedures not generally available in the country (i.e., advanced cancer screening or care)?
• How much promotion of condoms and safe sex counseling is required in a trial of microbicides or other interventions in countries where these services are not available outside the study protocol?
• Is it coercive and unethical to offer the “best available treatment” to trial participants when they cannot receive these treatments without participating?
Issues such as these have been considered by the World Health Organiza-tion/United Nations AIDS (UNAIDS) program, National Institutes of Health, CDC, and other organizations that fund or supervise AIDS research. Some examples of recent illustrative clinical trials are summarized below.
Perinatal HIV Transmission: Intrapartum and Single-Dose Nevirapine (HIVNET 012 Trial)
A landmark clinical trial was reported in 1994 on the use of zidovudine therapy of HIV-infected pregnant women during their last two trimesters, during labor and delivery, and in the newborn for the first 6 weeks of life to
IDE003.indd 98 4/14/2006 06:41:05 PM
© Jones and Bartlett Publishers. NOT FOR SALE OR DISTRIBUTION
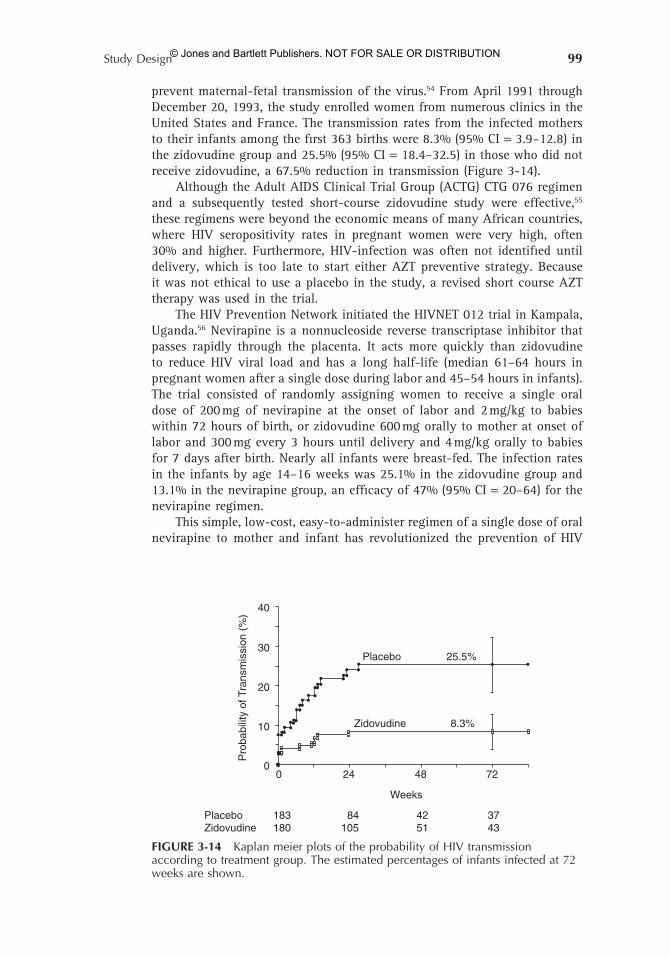
Study Design 99
R1
FIGURE 3-14 Kaplan meier plots of the probability of HIV transmission according to treatment group. The estimated percentages of infants infected at 72 weeks are shown.
25.5%
8.3%
40
30
20
10
00 24 48 72
Zidovudine
Placebo
Weeks
Pro
babi
lity
of T
rans
mis
sion
(%
)
Placebo 183180
84105
4251
3743Zidovudine
prevent maternal-fetal transmission of the virus.54 From April 1991 through December 20, 1993, the study enrolled women from numerous clinics in the United States and France. The transmission rates from the infected mothers to their infants among the first 363 births were 8.3% (95% CI = 3.9–12.8) in the zidovudine group and 25.5% (95% CI = 18.4–32.5) in those who did not receive zidovudine, a 67.5% reduction in transmission (Figure 3-14).
Although the Adult AIDS Clinical Trial Group (ACTG) CTG 076 regimen and a subsequently tested short-course zidovudine study were effective,55 these regimens were beyond the economic means of many African countries, where HIV seropositivity rates in pregnant women were very high, often 30% and higher. Furthermore, HIV-infection was often not identified until delivery, which is too late to start either AZT preventive strategy. Because it was not ethical to use a placebo in the study, a revised short course AZT therapy was used in the trial.
The HIV Prevention Network initiated the HIVNET 012 trial in Kampala, Uganda.56 Nevirapine is a nonnucleoside reverse transcriptase inhibitor that passes rapidly through the placenta. It acts more quickly than zidovudine to reduce HIV viral load and has a long half-life (median 61–64 hours in pregnant women after a single dose during labor and 45–54 hours in infants). The trial consisted of randomly assigning women to receive a single oral dose of 200 mg of nevirapine at the onset of labor and 2 mg/kg to babies within 72 hours of birth, or zidovudine 600 mg orally to mother at onset of labor and 300 mg every 3 hours until delivery and 4 mg/kg orally to babies for 7 days after birth. Nearly all infants were breast-fed. The infection rates in the infants by age 14–16 weeks was 25.1% in the zidovudine group and 13.1% in the nevirapine group, an efficacy of 47% (95% CI = 20–64) for the nevirapine regimen.
This simple, low-cost, easy-to-administer regimen of a single dose of oral nevirapine to mother and infant has revolutionized the prevention of HIV
IDE003.indd 99 4/14/2006 06:41:06 PM
© Jones and Bartlett Publishers. NOT FOR SALE OR DISTRIBUTION
100 Chapter 3
R1
Nonoxynol 9 Film to Prevent Sexual Transmission of HIV in Cameroon
Worldwide, the most frequent means of transmission of HIV is through sexual intercourse. Although condoms are known to be highly effective in prevent-ing the sexual transmission of HIV when used consistently and correctly, they are often not used in populations at high risk of infection. Therefore, additional means of preventing HIV transmission, especially those methods initiated and controlled by women, are needed. Vaginal microbicides, are being developed that are both virucidal for HIV and HSV, as well as bacte-ricidal for other STD pathogens and may or may not be contraceptive. One product already in use for its contraceptive properties was the detergent Nonoxynol 9 (N-9). N-9 had been shown to be moderately effective in vivo as prophylaxis against infection by Neisseria gonorrhoeae and Chlamydia trachomatis, and vaginal infection with Trichomonas vaginalis.58 However, the compound also had adverse effects; when applied to mucosal surfaces, it disrupts normal mucosa, and this could lead to increased HIV transmission. A double-blind placebo controlled clinical trial of a film containing N-9 was done among female sex workers in Cameroon.59 The film dissolves in 2–5 minutes, requires no applicator, is easy to use, and is not messy or affected by heat. For ethical reasons, the study made condoms available without charge to the women, and they were counseled to use them with each partner and not to assume that the film would protect them. At baseline, condoms had been used with the last client by about only 50% of the women.
The study found no difference in the rates of HIV, gonorrhea, or C. tra-chomatis infection between the N-9 and placebo groups (Table 3-9). However, one unanticipated problem emerged in the analysis of the data. Although the film was used by women in about 88% of episodes of sex with clients and 82% of sex with nonclients, the reported use of condoms also increased dramatically. Condoms were reportedly used by the women in 95% of coital episodes with clients and 83% of episodes with nonclients. Therefore, the numbers of coital events in which N-9 or placebo film only was reported to be used were quite small (Table 3-10).
This study illustrates the difficulty of doing a clinical trial of an inter-vention predicted to be modestly effective when the use of a more effective prevention (condoms) increases during this trial. In fact, it is not uncommon to find that the incidence of HIV or other STDs is lower due to behavior change among participants who are enrolled in a trial than was seen in the same population prior to a trial.
Subsequent pathogenesis research has found that the detergent proper-ties of N-9 are excessively disruptive to the mucosal epithelium.60 Research
66
infection around the world. Its ease of use, low toxicity, and acceptability has lead to massive reductions in HIV transmission to infants in even those com-munities with few resources and high HIV prevalence. A cost-effectiveness analysis of this nevirapine regimen found universal treatment ratios of $138 per infant HIV infection averted and $5.25 per disability-adjusted life-year (DALY) in populations where the HIV prevalence was 30% in pregnant women (as in many countries in East and South Africa). The researchers concluded that the HIVNET 012 regimen was likely to be as cost-effective as other public health interventions, such as immunization, in developing countries.57
IDE003.indd 100 4/14/2006 06:41:06 PM
© Jones and Bartlett Publishers. NOT FOR SALE OR DISTRIBUTION
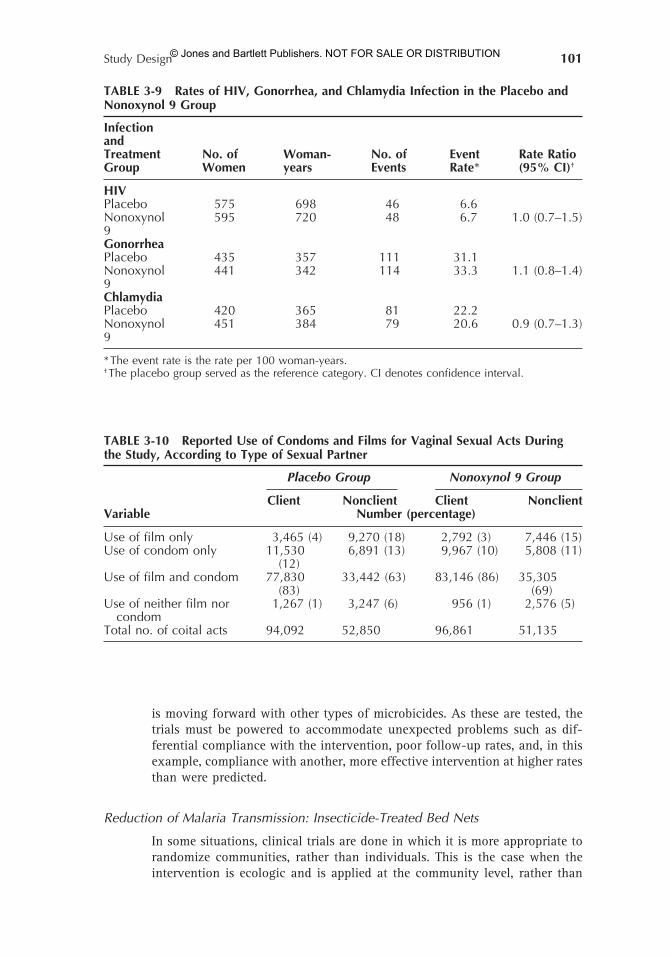
Study Design 101
R1
TABLE 3-9 Rates of HIV, Gonorrhea, and Chlamydia Infection in the Placebo and Nonoxynol 9 Group
InfectionandTreatment No. of Woman- No. of Event Rate RatioGroup Women years Events Rate* (95% CI)†
HIVPlacebo 575 698 46 6.6Nonoxynol 595 720 48 6.7 1.0 (0.7–1.5)9GonorrheaPlacebo 435 357 111 31.1Nonoxynol 441 342 114 33.3 1.1 (0.8–1.4)9ChlamydiaPlacebo 420 365 81 22.2Nonoxynol 451 384 79 20.6 0.9 (0.7–1.3)9
* The event rate is the rate per 100 woman-years.† The placebo group served as the reference category. CI denotes confidence interval.
TABLE 3-10 Reported Use of Condoms and Films for Vaginal Sexual Acts During the Study, According to Type of Sexual Partner
Placebo Group Nonoxynol 9 Group
Client Nonclient Client NonclientVariable Number (percentage)
Use of film only 3,465 (4) 9,270 (18) 2,792 (3) 7,446 (15)Use of condom only 11,530 6,891 (13) 9,967 (10) 5,808 (11) (12)Use of film and condom 77,830 33,442 (63) 83,146 (86) 35,305 (83) (69)Use of neither film nor 1,267 (1) 3,247 (6) 956 (1) 2,576 (5) condomTotal no. of coital acts 94,092 52,850 96,861 51,135
is moving forward with other types of microbicides. As these are tested, the trials must be powered to accommodate unexpected problems such as dif-ferential compliance with the intervention, poor follow-up rates, and, in this example, compliance with another, more effective intervention at higher rates than were predicted.
In some situations, clinical trials are done in which it is more appropriate to randomize communities, rather than individuals. This is the case when the intervention is ecologic and is applied at the community level, rather than
Reduction of Malaria Transmission: Insecticide-Treated Bed Nets
IDE003.indd 101 4/14/2006 06:41:06 PM
© Jones and Bartlett Publishers. NOT FOR SALE OR DISTRIBUTION
102 Chapter 3
R1
HIV Prevention: Reducing HIV Sexual Risk Behavior
Because sexually transmitted HIV infection occurs due to high-risk sexual behavior, interventions to reduce this risk are very important. However, designing, implementing, and evaluating behavioral intervention trials are quite difficult. Problems arise in designing an intervention to be applied to a group of high-risk people. Also, valid measurement of the reduction in risk behavior is difficult because the behavior is private and cannot be observed. Some social scientists have relied on risk behavior change reported by study subjects as an end point. However, after subjects have received extensive counseling, it may be difficult to differentiate socially desirable reporting from true reductions in high-risk behavior.
at the individual level. Clinical trials of health education using mass media are an example of such an intervention. Also, in infectious diseases with a human reservoir where transmission is person to person, an intervention targeted at decreasing the prevalence of infected persons or the duration of their infectivity would be expected to decrease the risk of new infection among individuals in the community.
A community-based randomized trial of insecticide-treated bed nets (ITN) was initiated in 1996.61 The trial was conducted in Asembo and Gem, two rural areas of western Kenya that sit on the shores of Lake Victoria. For this trial, villages were randomized by public lottery to receive ITN or not, and then mortality and morbidity due to malaria were assessed in children up to 5 years of age. Every 6–11 months study personnel returned to the houses to re-treat the bed nets. Adherence with using the ITN was assessed by unan-nounced visits to the homes in the early morning, 4:30–6:30 am. To be fully adherent, children under the age of 5 years had to have their body completely covered by the hanging net. Prior to the start of the study a cross-sectional survey of the communities was conducted to assess malaria-specific morbid-ity and mortality. Because of the substantial burden malaria has on the health of young children, the study team included broad measures of health such as weight and diarrheal disease as well as specific markers of malaria morbid-ity such as anemia and parasitemia. At 14 and 22 months after deployment of the ITNs study personnel returned to the villages to conduct additional cross-sectional surveys of morbidity and mortality.
In the baseline survey 70% of children had parasitemia; however, only 4% were symptomatic with a fever. Plamodium falciparum accounted for the majority of cases (86.1%). A majority of the children had hemoglo-bin levels less than 11.0 g/dl (90%) and nearly one third (30%) had severe anemia with hemoglobin levels less than 7.0 mg/dl. The follow-up surveys found a reduction in all-cause morbidity by 14.6%, an increase in anemia by 0.5 mg/dl overall, with a corresponding decrease in severe anemia (39%) in ITN villages as compared to control villages. The prevalence of malaria parasitemia was reduced by 19% and clinical cases of malaria decreased by 44% in ITN villages when compared to control villages. Subsequent research on this population has found that ITN benefits are sustained for up to 6 years of follow-up.62
77
IDE003.indd 102 4/14/2006 06:41:06 PM
© Jones and Bartlett Publishers. NOT FOR SALE OR DISTRIBUTION
Study Design 103
R1
Infectious diseases differ somewhat from those with noninfectious etiologies, in that there is biologic variation in either the host or the agent—or both—that can influence the natural history of and susceptibility to infection. Further-more, it is often of importance to detect less virulent or avirulent infectious agents that share characteristics of the virulent wild-type agent, because this information could lead to the development of a preventive vaccine. The classic example of this was Jenner’s discovery that immunity to vaccinia (the cowpox virus) was protective against human smallpox. Some examples of infectious disease studies designed to differentiate host and agent factors that influence the natural history of infectious diseases are reviewed here: first, a study of HIV/AIDS that illustrates how research can be targeted specifically to evaluate the role of the infecting organism in the natural history of a disease, and second, twin studies and other genetic studies that demonstrate the role of host susceptibility in the natural history of a disease.
Special Issues
Agent and Host Factors in Infectious Diseases
Clinical trials of behavioral change with HIV infection as an outcome have not been done frequently because of these difficulties and the large number of subjects required for such a trial. One alternative to a trial requir-ing HIV incidence as an end point is to measure the incidence of other STDs as a surrogate marker for HIV risk behavior because those who develop other STDs are engaged in behaviors that can result in HIV transmission if the partners are discordant for HIV infection.
Two randomized controlled clinical trials have been done recently in the United States to study the efficacy of a standardized behavioral intervention to prevent sexually transmitted HIV; incident STDs and reported high-risk behaviors were the end points. These are the NIMH Multisite HIV Prevention Trial63 and Project Respect, a CDC multisite trial.64 The results of the NIMH trial are described here.
In the NIMH trial, 3706 sexually active adults were recruited from 37 clinics in the United States.66 Participants were HIV-negative persons who had recently engaged in high-risk sexual behavior, as evidenced by unprotected high-risk vaginal or anal sex in the past 90 days with a new partner, more than one partner, an injection drug user, or a person infected with HIV. Participants were then assigned randomly to the control coun-seling group (N = 1855) or the intensive behavioral counseling group (N = 1851). Controls received a single 1-hour AIDS education session. Those in the intervention group received seven 90- to 120-minute HIV risk-reduc-tion counseling sessions. Reported condom use increased above baseline in both the intervention and control groups at 3 months. However, there was a 47% greater increase in reported condom use in the intervention group, which persisted for 12 months. Overall, the rates of reported STDs were not different in the two groups. However, in the participants recruited from an STD clinic, the rates of newly diagnosed gonorrhea in the intervention group was half that of the rate in the control group. Incident HIV was not studied in this population.
IDE003.indd 103 4/14/2006 06:41:06 PM
© Jones and Bartlett Publishers. NOT FOR SALE OR DISTRIBUTION
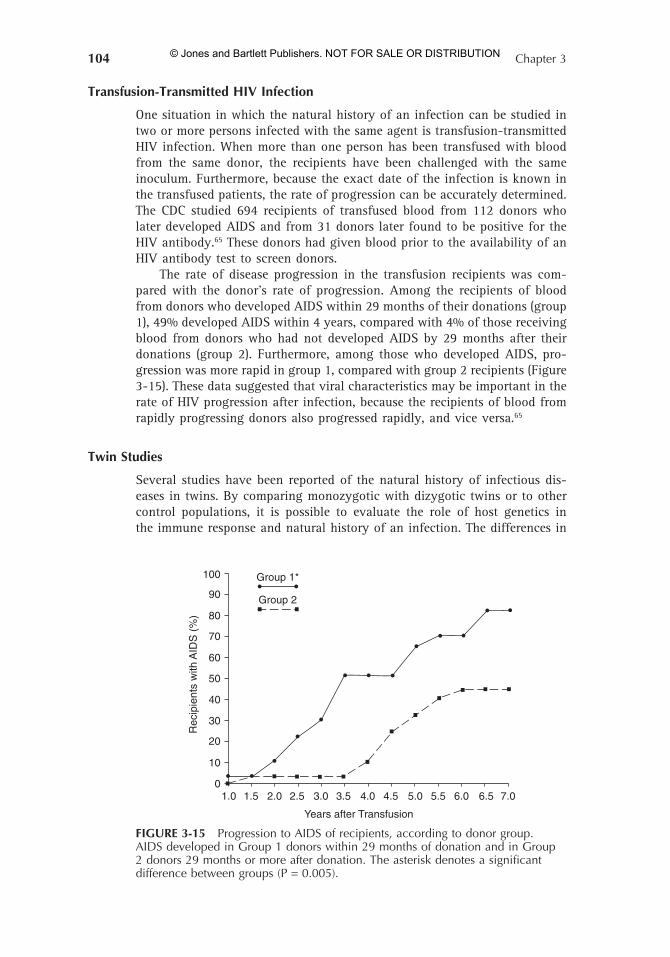
104 Chapter 3
R1
FIGURE 3-15 Progression to AIDS of recipients, according to donor group. AIDS developed in Group 1 donors within 29 months of donation and in Group 2 donors 29 months or more after donation. The asterisk denotes a significant difference between groups (P = 0.005).
Group 1*
Group 2
1.0 1.5 2.0 2.5 3.0 3.5 4.0 4.5 5.0 5.5 6.0 6.5 7.0
100
90
80
70
60
50
40
30
20
10
0
Rec
ipie
nts
with
AID
S (
%)
Years after Transfusion
Transfusion-Transmitted HIV Infection
One situation in which the natural history of an infection can be studied in two or more persons infected with the same agent is transfusion-transmitted HIV infection. When more than one person has been transfused with blood from the same donor, the recipients have been challenged with the same inoculum. Furthermore, because the exact date of the infection is known in the transfused patients, the rate of progression can be accurately determined. The CDC studied 694 recipients of transfused blood from 112 donors who later developed AIDS and from 31 donors later found to be positive for the HIV antibody.65 These donors had given blood prior to the availability of an HIV antibody test to screen donors.
The rate of disease progression in the transfusion recipients was com-pared with the donor’s rate of progression. Among the recipients of blood from donors who developed AIDS within 29 months of their donations (group 1), 49% developed AIDS within 4 years, compared with 4% of those receiving blood from donors who had not developed AIDS by 29 months after their donations (group 2). Furthermore, among those who developed AIDS, pro-gression was more rapid in group 1, compared with group 2 recipients (Figure 3-15). These data suggested that viral characteristics may be important in the rate of HIV progression after infection, because the recipients of blood from rapidly progressing donors also progressed rapidly, and vice versa.65
Twin Studies
Several studies have been reported of the natural history of infectious dis-eases in twins. By comparing monozygotic with dizygotic twins or to other control populations, it is possible to evaluate the role of host genetics in the immune response and natural history of an infection. The differences in
IDE003.indd 104 4/14/2006 06:41:06 PM
© Jones and Bartlett Publishers. NOT FOR SALE OR DISTRIBUTION
Study Design 105
R1
Other Genetic Studies
The sequence of the human genome was completed ahead of schedule in 2003.68 This achievement has burst open new opportunities in genetic evalua-tions. The technical advances of the field of genetics now allow for rapid and relatively inexpensive evaluations of multiple genes in many persons. This has expanded our capacity to explore differences in genetics and the expres-sion genes between people. Research has moved forward in evaluating differ-ences in the sequence of genes between people. These different gene alleles have varying risk of disease. In addition to the 30,000 genes now believed to be coded by the human genome, there are large stretches of DNA that do not code for specific gene products but which are crucial in determining the expression of genes near them. Variations in these regulatory regions have also been found to be important in determining disease risk. Fundamentally, genes code for proteins and the expression of genes is the phenotype of an individual. Many genes are not present in a single copy but may have mul-tiple copies in a genome. Copy number has recently been correlated with the risk of progression with HIV. And lastly, the field of proteomics is studying the phenotypic expression of genes—what proteins are actually produced and when. These studies are rapidly widening our understanding of immunology and genetic variation in susceptibility to disease.
the natural history of infection between monozygotic twin pairs and dizy-gotic twin pairs could reflect the role of the genetically controlled immune response of the host because environmental and agent differences would be minimized between same-age siblings. Susceptibility of humans to tubercu-losis and leprosy have both been studied among monozygotic and dizygotic twins. One of the most extensive twin studies of tuberculosis was done by Dr. Barbara Simmons in London.66 This study evaluated 202 twins of patients with tuberculosis in whom the zygosity could be determined. The concor-dance for tuberculosis infection was over twofold higher in monozygotic twins compared with dizygotic twins, indicating that there was important host genetic susceptibility. A similar study of leprosy was done by Chakra-varti and Vogel.67 This study enrolled 62 monozygotic and 40 dizygotic twin pairs. These investigators found a significantly increased rate of leprosy in the opposite twin when the twins were monozygotic, compared with those who were dizygotic. Also, in cases where both twins had leprosy, the type of leprosy, tuberculoid or lepromatous, was more likely to be concordant if the pair was monozygotic. Again, the similar risk of disease and similarities in the type of disease indicated that there was a genetic component that was important in determining susceptibility to leprosy.
HLA Studies
Several studies have been done of the association of HLA markers with infec-tious diseases. HLA genetic diversity is the basis of the adaptive immune system and is the most highly polymorphic biologic system known. The polymorphism is driven by the underlying HLA type, and there are biologic and ethnic variations in the distribution of HLA frequencies. These differen-tial distributions arose from the evolutionary pressure of previous epidemics
IDE003.indd 105 4/14/2006 06:41:06 PM
© Jones and Bartlett Publishers. NOT FOR SALE OR DISTRIBUTION
106 Chapter 3
R1
Meta-Analysis
A meta-analysis is a statistical analysis of a collection of studies, especially an analysis in which studies are the primary units of analysis. Meta-analysis has been used commonly by epidemiologists to synthesize data for which there is controversy between various studies or sometimes to arrive at an overall summary estimate of a relationship when individual studies are under-
Genetic Mutation in HIV Receptors
The primary receptor for HIV-1 is the CD4 surface molecule expressed on the surface of helper T-cells. However, fusion and cell entry is mediated by a second receptor. It was found recently that several chemokines, MIP-1 alpha, MIP-1 beta, and RANTES, suppressed infection by macrophage tropic isolates of HIV-1.75 Subsequently, it was discovered that the cell receptor for these chemokines, CCR5, was the second receptor for fusion and entry of macrophage-tropic isolates of HIV-1 into cells.76 Several investigators dis-covered that individuals who were homozygous for a 32 base pair deletion in the CCR5 molecule were resistant to infection with macrophage-tropic isolates.77,78 Furthermore, individuals who were heterozygous for this dele-tion, although they were susceptible to infection, had slower progression of HIV disease after they were infected.79,80 Subsequent to this it has been shown that the number of copies of some genes alters an individual’s risk of disease. Gonzalez et al. measured the impact of the number of copies of the gene that codes for MIP-1alphaP on HIV progression.81 This protein can block HIV-1 from entering the cell by engaging with the CCR5 receptor and directly interfering with HIV binding. They found that the lower the copy number of the CCL31 gene the greater the risk of disease progression. In this study, the impact of the copy number of CCL3L1 was at least as strong as the CCR5 gene itself, and the disease-accelerating influence of CCR5 varia-tion was dependent upon CCL3L1. The research on CCR5 and its ligands depended on having populations of participants in whom the natural history of HIV disease was well documented. To evaluate differences in infectivity and survival, it was necessary to have populations of HIV-negative persons who were at risk and to follow them to know which genetic profiles were associated with susceptibility or resistance, and then to measure the length of time from HIV seroconversion to the development of AIDS or death. Fur-thermore, these cohort studies needed to have a wide diversity of genetics to ensure that genetic polymorphisms could be adequately studied.
that selected resistant genotypes. Some HLA types are strongly associated with several diseases, such as B27 with ankylosing spondylitis, DR4 with rheumatoid arthritis, and DR3 with chronic hepatitis.69 HIV progression has also been associated with several HLA polymorphisms.70–73
Research has also been done on genetic variability in important genes that interact with pathogens. Notably, the gene mutation that causes sickle cell anemia also makes red cells resistant to P. falciparum malaria. Despite the detrimental effect of sickle cell on survival, this gene has persisted in populations that are also under evolutionary pressure from P. falci-parum malaria because of the malaria protection it affords to those who are heterozygous.74
IDE003.indd 106 4/14/2006 06:41:06 PM
© Jones and Bartlett Publishers. NOT FOR SALE OR DISTRIBUTION
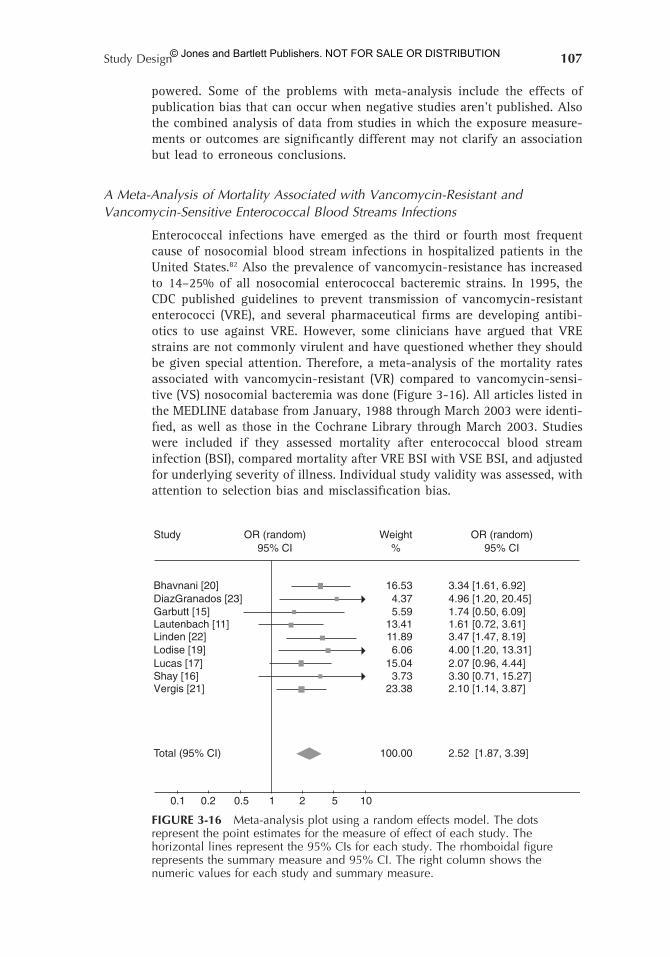
Study Design 107
R1
A Meta-Analysis of Mortality Associated with Vancomycin-Resistant and Vancomycin-Sensitive Enterococcal Blood Streams Infections
Enterococcal infections have emerged as the third or fourth most frequent cause of nosocomial blood stream infections in hospitalized patients in the United States.82 Also the prevalence of vancomycin-resistance has increased to 14–25% of all nosocomial enterococcal bacteremic strains. In 1995, the CDC published guidelines to prevent transmission of vancomycin-resistant enterococci (VRE), and several pharmaceutical firms are developing antibi-otics to use against VRE. However, some clinicians have argued that VRE strains are not commonly virulent and have questioned whether they should be given special attention. Therefore, a meta-analysis of the mortality rates associated with vancomycin-resistant (VR) compared to vancomycin-sensi-tive (VS) nosocomial bacteremia was done (Figure 3-16). All articles listed in the MEDLINE database from January, 1988 through March 2003 were identi-fied, as well as those in the Cochrane Library through March 2003. Studies were included if they assessed mortality after enterococcal blood stream infection (BSI), compared mortality after VRE BSI with VSE BSI, and adjusted for underlying severity of illness. Individual study validity was assessed, with attention to selection bias and misclassification bias.
powered. Some of the problems with meta-analysis include the effects of publication bias that can occur when negative studies aren’t published. Also the combined analysis of data from studies in which the exposure measure-ments or outcomes are significantly different may not clarify an association but lead to erroneous conclusions.
FIGURE 3-16 Meta-analysis plot using a random effects model. The dots represent the point estimates for the measure of effect of each study. The horizontal lines represent the 95% CIs for each study. The rhomboidal figure represents the summary measure and 95% CI. The right column shows the numeric values for each study and summary measure.
Study OR (random)95% CI
Weight%
OR (random)95% CI
Bhavnani [20]DiazGranados [23]Garbutt [15]
Linden [22]Lodise [19]Lucas [17]Shay [16]Vergis [21]
Total (95% CI)
16.534.375.59
13.4111.896.06
15.043.73
23.38
3.34 [1.61, 6.92]4.96 [1.20, 20.45]1.74 [0.50, 6.09]1.61 [0.72, 3.61]3.47 [1.47, 8.19]4.00 [1.20, 13.31]2.07 [0.96, 4.44]3.30 [0.71, 15.27]2.10 [1.14, 3.87]
100.00 2.52 [1.87, 3.39]
0.1 0.2 0.5 1 2 5 10
Lautenbach [11]
IDE003.indd 107 4/14/2006 06:41:06 PM
© Jones and Bartlett Publishers. NOT FOR SALE OR DISTRIBUTION
108 Chapter 3
R1
Vaccines Used as Probes to Assess Infectious Diseases
A standard vaccine efficacy trial measures disease to learn about the vaccine efficacy. A vaccine probe study uses a vaccine of known efficacy to esti-mate disease incidence. In summary, the intent of the two types of studies is reversed, but the methods are similar.
Efficacy of BCG Vaccine in the Prevention of Tuberculosis—A Meta-Analysis of the Published Literature
BCG vaccine is one of the oldest and most frequently used vaccines through-out the world. It is included as one of the routine vaccines in the expanded program on immunization (EPI) in most developing countries. However, the efficacy of BCG in the prevention of tuberculosis has been uncertain and quite variable; efficacy has varied from 80% to 0%. Therefore, a meta-analysis of reported studies was published in 1994.83 In this study MEDLINE was reviewed for published papers on BCG vaccine efficacy. Also tuberculosis experts at WHO and CDC were consulted to find unpublished studies. A total of 1264 articles or abstracts were reviewed, and 14 prospective trials and 12 case-control studies were included in the analysis. In the clinical trials the RR for tuberculosis was 0.44 (95% CI, 0.34–0.70), and in the case-control studies the OR for tuberculosis was 0.50 (95% CI, 0.39–0.64). Seven trials reporting tuberculosis deaths showed a protective efficacy of BCG vaccine of 71% (RR = 0.29; 95% CI, 0.16–0.53) and five studies showed a protective effect for meningitis of 64% (RR = 0.36; 95% CI, 0.18–0.70). Geographic latitude of the study site and study validity explained 66% of the heterogeneity among trials in a random effects regression model.
The conclusions from this meta-analysis are debated by some experts. The trials of BCG have produced highly variable results in different populations and times. Generally, BCG vaccine has been found to be less protective in tropical populations, such as Puerto Rico and Madras, India, than in tempera-ture areas. One hypothesis to explain this variability is that nontuberculous mycobacteria may be more common in the tropics and either interfere with BCG vaccine immune protection or confer some immunity among controls in tropical populations. Second, and more important, is that the BCG vaccines used in these trials all were different from each other. Therefore, the same BCG strain was not used in each of the studies included in the meta-analysis. The initial BCG vaccine was developed in 1921 by Calmette and Guiren after 230 in vitro passages. However, no stock BCG culture was established. Instead, the vaccine has undergone over 1000 subsequent passages. Behr and Small have shown a reduction in BCG efficacy over time.84 Also, they have shown the M. bovis BCG organism has lost important genes, which may have conferred efficacy in earlier vaccines that no longer exist in the current BCG vaccines.85 Finally, the effect of the HIV pandemic on increasing the risk of tuberculosis has probably overwhelmed any protective efficacy of BCG.
Of 114 studies, 9 met the inclusion criteria. All of the 9 studies found a significant increased OR for mortality associated with VRE BSI compared to VSE BSI; however, the 95% confidence interval of 3 studies overlapped (Figure 3-16).82
IDE003.indd 108 4/14/2006 06:41:06 PM
© Jones and Bartlett Publishers. NOT FOR SALE OR DISTRIBUTION
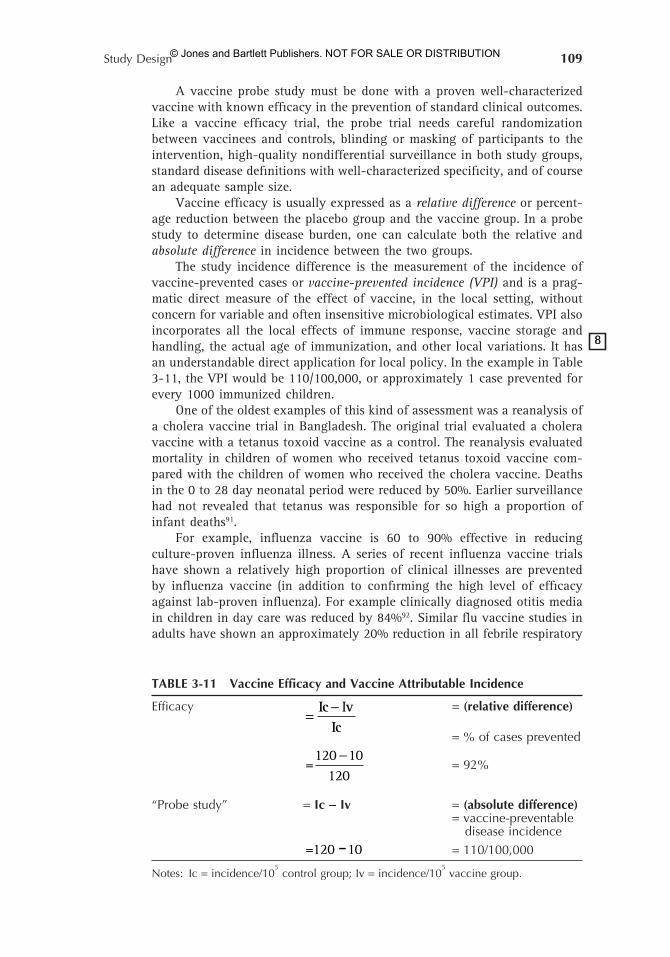
Study Design 109
R1
TABLE 3-11 Vaccine Efficacy and Vaccine Attributable Incidence
Efficacy = -Ic v
IcI = (relative difference)
= % of cases prevented
=120 10
120-
= 92%
“Probe study” = Ic - Iv = (absolute difference) = vaccine-preventable disease incidence =120 10- = 110/100,000
Notes: Ic = incidence/105 control group; Iv = incidence/10
5 vaccine group.
A vaccine probe study must be done with a proven well-characterized vaccine with known efficacy in the prevention of standard clinical outcomes. Like a vaccine efficacy trial, the probe trial needs careful randomization between vaccinees and controls, blinding or masking of participants to the intervention, high-quality nondifferential surveillance in both study groups, standard disease definitions with well-characterized specificity, and of course an adequate sample size.
Vaccine efficacy is usually expressed as a relative difference or percent-age reduction between the placebo group and the vaccine group. In a probe study to determine disease burden, one can calculate both the relative and absolute difference in incidence between the two groups.
The study incidence difference is the measurement of the incidence of vaccine-prevented cases or vaccine-prevented incidence (VPI) and is a prag-matic direct measure of the effect of vaccine, in the local setting, without concern for variable and often insensitive microbiological estimates. VPI also incorporates all the local effects of immune response, vaccine storage and handling, the actual age of immunization, and other local variations. It has an understandable direct application for local policy. In the example in Table 3-11, the VPI would be 110/100,000, or approximately 1 case prevented for every 1000 immunized children.
One of the oldest examples of this kind of assessment was a reanalysis of a cholera vaccine trial in Bangladesh. The original trial evaluated a cholera vaccine with a tetanus toxoid vaccine as a control. The reanalysis evaluated mortality in children of women who received tetanus toxoid vaccine com-pared with the children of women who received the cholera vaccine. Deaths in the 0 to 28 day neonatal period were reduced by 50%. Earlier surveillance had not revealed that tetanus was responsible for so high a proportion of infant deaths91.
For example, influenza vaccine is 60 to 90% effective in reducing culture-proven influenza illness. A series of recent influenza vaccine trials have shown a relatively high proportion of clinical illnesses are prevented by influenza vaccine (in addition to confirming the high level of efficacy against lab-proven influenza). For example clinically diagnosed otitis media in children in day care was reduced by 84%92. Similar flu vaccine studies in adults have shown an approximately 20% reduction in all febrile respiratory
88
IDE003.indd 109 4/14/2006 06:41:07 PM
© Jones and Bartlett Publishers. NOT FOR SALE OR DISTRIBUTION
110 Chapter 3
R1
1. Miller L. Impact of malaria on genetic polymorphism and genetic disease in Africans and African Americans. In: Roisman B, ed. Infectious Disease in an Age of Change. The Impact of Human Ecology and Behavior on Disease Transmission. Washington, DC: National Academies Press; 1995:99–111.
2. Glezen WP, Couch RB, Taber LH Epidemiologic observations on influenza B virus infections in Houston, Texas, 1976–1977. American Journal of Epidemiology 1980 Jan;111(1):13–22.
3. Rothman G, Greenland S. Modern Epidemiology. New York, NY: Lippincott-Raven; 1998.
4. Diggle P, Liang K-Y, Zeger S. Analysis of Longitudinal Data. Oxford, England: Clareden Press; 1994.
5. Rupprecht CE and Gibbons RU Prophylaxis against rabies NEJM 2004;351:2626–2635.
6. Constantine D. Rabies transmission by non-bite route. Public Health Rep. 1962;77:287–291.
7. Hronovsky V, Benda R. Development of inhalation rabies infection in suckling guinea pigs. Acta Virol. 1969;13:198–202.
8. Hronovsky G, Benda R. Experimental inhalation of infection of laboratory rodents with rabies virus. Acta Virol. 1969;13:193–197.
9. Noah D, Drezik C, Smith J, et al. Epidemiology of human rabies in the United States. Ann Intern Med. 1998;128:922–930.
References
illness and a ~36% reduction of absenteeism from work93. A study among health care workers showed that use of influenza vaccine averted 11 days of sick leave during the winter season for every 100 persons immunized, another version of VPI94.
Several recent studies of Haemophilus influenza type B (Hib) vaccine has shown its effectiveness in reduction of laboratory-confirmed Hib meningitis and blood culture-positive Hib pneumonia. The new data related to analyses of the reduction of clinical syndromes suggest that use of Hib vaccine reduces hospitalized severe pneumonia by approximately 20% in the Gambia and approximately 4% in Indonesia95,96. In contrast, when analyzed for the abso-lute reduction of illness, the incidence per 100,000 of vaccine-preventable clinically severe pneumonia was estimated at 83 in children under 5 years in the Gambia and 264 in children under 2 years in Indonesia. These rates of Hib vaccine-preventable severe pneumonia are far higher than rates previously estimated by standard blood culture studies and are likely a better measure of disease burden. Similarly in a prospective trial the incidence of labora-tory-proven Hib meningitis in control group children younger than 2 years in Indonesia was 19/100,000. However, the use of Hib vaccine prevented 67/100,000 meningitis cases in children admitted to hospital with lumbar puncture. These data on Hib vaccine-prevented meningitis cases suggest that only 28% of all Hib meningitis cases were detected through routine hospital surveillance and standard culture techniques, again showing the true burden of vaccine-preventable illness.
The use of vaccines with careful analysis of their effect can provide sub-stantial new information regarding the full spectrum of morbidity associated with specific vaccine-preventable agents97,98.
IDE003.indd 110 4/14/2006 06:41:07 PM
© Jones and Bartlett Publishers. NOT FOR SALE OR DISTRIBUTION
Study Design 111
R1
10. Hattwick M, Weis T, Stechschulte J, Baer GM, Gregg M. Recovery from rabies, a case report. Ann Intern Med. 1972;76:931–942.
11. Center for Disease Control and Prevention. Recovery of a patient from clinical rabies—Wisconsin, 2004, MMWR. 2004;53:1171–1173.
12. Willoughly RE Jr, Tieves KS, Hoffman GM, et al. Survival after treatment of rabies with induction of coma. N Engl J Med. 2005;352:2508–2514.
13. Luckhart BP, Tordo N, Tsiang H. Inhibition of rabies virus transcription in rat cortical neurons with the dissociative anesthetic ketamine. Antimicrob Agents Chemother. 1992;36:1750–1755.
14. Bryceson Y, Pang S, Wei L, et al. Clearance of HIV infection in a perinatally infected infant. N Engl J Med. 1995;332:833–838.
15. Sahu GK, McNearney T, Evans A, et al. Transient or occult HIV infections may occur more frequently than progressive infections: changing the paradigm about HIV persistence. Arch Virol Suppl 2005;19:131–145.
16. Altfeld M, Allen TM, Yu XG, et al. HIV-1 superinfection despite broad CD8 T-cell responses containing replication of the primary virus. Nature. 2002;420:434–439.
17. Auerbach D, Darrow W, Jaffe H, et al. Cluster of cases of the acquired immune deficiency syndrome. Patients linked by sexual contact. Am J Med. 1984;76:487–492.
18. Kass E. Infectious disease and social change. J Infect Dis. 1971;123:110–114.
19. Cook L, Koutsky L, Holmes K. Circumcision and sexually transmitted diseases. Am J Public Health. 1994;84:197–201.
20. Moses S, Bradley J, Hagelkerke N, et al. Geographical patterns of male circumcision practices in Africa: association with HIV seroprevalence. Int J Epidemiol. 1990;19:693–697.
21. Breslow NE, Day NE. Statistical Methods in Cancer Research: The Analysis of Case-Control Studies. Lyon, France: International Agency for Research on Cancer; 1980:1.
22. Brookmeyer R, Gail MH. AIDS Epidemiology: A Quantitative Approach. New York, NY: Oxford University Press; 1994.
23. Nelson K, Celentano D, Eiumtrakol S, et al. Changes in sexual behavior and a decline in HIV infection among young men in Thailand. N Engl J Med. 1996;335:297–303.
24. Kaslow R, Ostrow D, Detels R, et al. The Multicenter AIDS Cohort Study: rationale, organization, and selected characteristics of the participants. Am J Epidemiol. 1987;126:310–318.
25. Barkan S, Melnick S, Preston-Martin S, et al. The Women’s Interagency HIV Study. WIHS Collaborative Study Group. Epidemiology. 1998;9:117–125.
26. Palefsky J, Minkoff H, Kalish L. Cervicovaginal human papillomavirus infection in human immunodeficiency virus-1 (HIV)-positive and high risk HIV-negative women. J Natl Cancer Inst. 1999;91:226–236.
27. Jaffe H, Choi K, Thomas P, et al. National case-control study of Kaposi’s sarcoma and Pneumocystis carinii pneumonia in homosexual men. 1. Epidemiologic results. Ann Intern Med. 1983;99:145–151.
28. Curren JW. The epidemiology and prevention of the acquired immunodeficiency syndrome. Ann Intern Med. 1985;103:657–662.
29. deShazo R, Andes W, Nordberg J, et al. An immunologic evaluation of hemophiliac patients and their wives. Ann Intern Med. 1983;99:159–164.
99
IDE003.indd 111 4/14/2006 06:41:07 PM
© Jones and Bartlett Publishers. NOT FOR SALE OR DISTRIBUTION
112 Chapter 3
R1
30. Starko K, Ray C, Domingues L, et al. Reye’s syndrome and salicylate use. Pediatrics. 1980;66:859–864.
31. Waldman R, Hall W, McGeeh H, et al. Aspirin as a risk factor in Reye’s syndrome. JAMA. 1982;247:3089–3094.
32. Halpin T, Holtzhauer F, Campbell R, et al. Reye’s syndrome and medication use. JAMA. 1982;248:687–691.
33. Pinsky P, Hurwitz E, Schonberger L, et al. Reye’s syndrome and aspirin. Evidence for a dose-response effect. JAMA 1988;260:657–661.
34. Centers for Disease Control. Surgeon General’s advisory on the use of salicylates and Reye’s syndrome. MMWR 31(22);289–290.
35. Belay E, Bresee J, Holman R, et al. Reye’s syndrome in the United States from 1981–1987. N Engl J Med. 1999;340:1377–1382.
36. Mueller N, Evans A, Harris N, et al. Hodgkin’s disease and Epstein-Barr virus. Altered antibody pattern before diagnosis. N Engl J Med. 1989;320:689–695.
37. Chang Y, Cesarman E, Pessin M, et al. Identification of herpesvirus-like DNA sequences in AIDS-associated Kaposi’s sarcoma. Science. 1994;266:1865–1969.
38. O’Brien T, Kedes D, Ganem D, et al. Evidence for concurrent epidemics of human herpesvirus 8 and human immunodeficiency virus type 1 in US homosexual men: rates, risk factors, and relationship to Kaposi’s sarcoma. J Infect Dis. 1999;180:1010–1017.
39. Jacobson L, Yamashita T, Detels R, et al. Impact of potent antiretroviral therapy on the incidence of Kaposi’s sarcoma and non-Hodgkin’s lymphomas among HIV-1-infected individuals. Multicenter AIDS Cohort Study. J AIDS. 1999(suppl 1):S34–S41.
40. Dore G, Li Y, Grulich A, et al. Declining incidence and later occurrence of Kaposi’s sarcoma among persons with AIDS in Australia: the Australian AIDS cohort. AIDS. 1996;10:1401–1406.
41. Center for Disease Control and Prevention Case-control study of HIV seroconversion in health care workers after percutaneous exposure to HIV-infected blood—France, United Kingdom, and United States, January 1988-August 1994. MMWR. 1995;44:929–931.
42. Gerberding J. Incidence and prevalence of human immunodeficiency virus, hepatitis B virus, hepatitis C virus, and cytomeglovirus among healthcare personnel at risk for blood exposure and final report studies. J Infect Dis. 1994;170:1410–1417.
43. Glezen W. Serious morbidity and mortality associated with influenza. Epidemiol Rev. 1982;4:25–44.
44. Turner C, Ku L, Riogers S, et al. Adolescent sexual behavior, drug use, and violence: increased reporting with computer survey technology. Science. 1998;280:867–873.
45. Zieger SL, Liang KY. Longitudinal data analysis for discrete and continous outcomes. Biometrics. 1986;42:121–130.
46. Graham N, Zeger S, Park L, et al. The effects on survival of early treatment of human immunodeficiency virus infection. N Engl J Med. 1992;326:1037–1042.
47. Graham N, Hoover D, Park L, et al. Survival in HIV-infected patients who have received zidovudine: comparison of combination therapy with sequential monotherapy and continued zidovudine monotherapy. Multicenter AIDS Cohort Study Group. Ann Intern Med. 1996;124:1031–1038.
48. Nelson K, Vlahov D, Solomon L, et al. Temporal trends of incident human immunodeficiency virus infection of injecting drug users in Baltimore, MD. Arch Intern Med. 1995;155:1305–1311.
1010
IDE003.indd 112 4/14/2006 06:41:07 PM
© Jones and Bartlett Publishers. NOT FOR SALE OR DISTRIBUTION
Study Design 113
R1
49. Mellors J, Munoz A, Giorgi J, et al. Plasma viral load and CD4+ lymphocytes as prognostic markers of HIV-1 infection. Ann Intern Med. 1997;126:946–954.
50. Schnieder MF, Gange SJ, Williams CF, et al. Patterns of the hazard of death after acquired immunodeficiency syndrome through the evolution of antiretroviral therapy: 1984–2004. AIDS. Nov 18; 19(17):2009–2018.
51. Ahdieh L, Munoz A, Vlahov D, et al. Cervical neoplasia and repeated positivity of HPV infection in HIV seropositive and HIV seronegative women. Am J Epidemiol;151:1148–1157.
52. Piantadosis S. Clinical Trials, A Methodologic Perspective. New York, NY: John Wiley & Sons; 1997.
53. Meinert CL. Clinical Trials: Design, Conduct, and Analysis. New York, NY: Oxford University Press; 1986.
54. Connor E, Sperling R, Gelber R, et al. Reduction of maternal-infant transmission of human immunodeficiency virus type 1 with zidovudine treatment. Pediatric AIDS Clinical Trials Group Protocol 076 Study Group. N Engl J Med. 1994;331:1173–1180.
55. Shaffer N, Chuachoowong R, Mock P, et al. Short-course zidovudine for perinatal HIV-1 transmission in Bangkok, Thailand: a randomised controlled trial. Bangkok Collaborative Perinatal HIV Transmission Study Group. Lancet. 1999;353:773–780.
56. Guay L, Musoke P, Fleming T, et al. Intrapartum and neonatal single-dose nevirapine compared with zidovudine for prevention of mother-to-child transmission of HIV-1 in Kampala, Uganda: HIVNET 012 randomized trial. Lancet. 1999;354:795–802.
57. Marseille E, Kahn J, Mmiro F, et al. Cost effectiveness of single-dose nevirapine regimen for mothers and babies to decrease vertical HIV-1 transmission in sub-Saharan Africa. Lancet. 1999;354:803–809.
58. Louv W, Austin H, Alexander W, et al. A clinical trial of nonoxynol-9 for preventing gonococcal and chlamydial infections. J Infect Dis. 1988;158:518–523.
59. Roddy R, Zeking L, Ryan K, et al. A controlled trial of nonoxynol-9 film to reduce male-to-female transmission of sexually transmitted diseases. N Engl J Med. 1998;339:504–510.
60. Hillier SL, Moench T, Shattock R, Black R, Reichelderfer P, Veronese F. In vivo: the story of nonoxynol 9. J Acquir Immune Defic Syndr 2005;39:1–8.
61. Lindblade KA, Eisele TP, Gimnig JE, et al. Impact of permethrin-treated bed nets on malaria and all-cause morbidity in young children in an area of intense perennial malaria transmission in western Kenya: cross-sectional survey. Am J Trop Med Hyg. 2003;68(4 suppl): 100–107.
62. Linblade Ka. Eisele TP, Gimnig JE, et al. All Sustainability of reductions in malaria transmission and infant mortality in western Kenya with use of insecticide-treated bednets: 4 to 6 years of follow-up. JAMA. 2004;;291:2571–2580.
63. The NIMH Multisite HIV Prevention Trial: Reducing HIV sexual risk behavior. Science. 1998;280:1889–1894.
64. Kamb M, Fishbein M, Douglas J Jr, et al. Efficacy of risk-reduction counseling to prevent human immunodeficiency virus and sexually transmitted diseases: a randomized controlled trial. Project RESPECT Study Group. JAMA. 1998;280:1161–1167.
65. Ward J, Bush T, Perkins H, et al. The natural history of transfusion-associated infection with human immunodeficiency virus. Factors
1111
1212
1313
IDE003.indd 113 4/14/2006 06:41:07 PM
© Jones and Bartlett Publishers. NOT FOR SALE OR DISTRIBUTION
114 Chapter 3
R1
influencing the rate of progression to disease. N Engl J Med. 1989;321:947–952.
66. Comstock G. Tuberculosis in twins: a re-analysis of the Prophit survey. Am Rev Respir Dis. 1978;117:621–624.
67. Fine P. Leprosy: the epidemiology of a slow bacterium. Epidemiol Rev. 1982;4:161–188.
68 The genome international sequencing consortium: Initial sequencing and analysis of the human genome. Nature 2001;409:860–921.
69. Leffell MS, Donnenberg AD and Rose NR. Handbook of human Immunology, CRC Press, Boca Raton, FL: 1997.
70. Kaslow R, Carrington M, Apple R, et al. Influence of combinations of human major histocompatibility complex genes on the course of HIV-1 infection. Nature Med. 1996;2:405–411.
71. Just J. Genetic predisposition of HIV-1 infection and acquired immune deficiency virus syndrome. A review of the literature examining associations with HLA. Hum Immunol. 1995;44:156–169.
72. Tang J, Costello C, Keet I, et al. HLA class I homozygosity accelerates disease progression in human immunodeficiency virus type 1 infection. AIDS Res Hum Retrovirus. 1999;15:317–324.
73. Carrington M, Nelson G, Martin M, et al. HLA and HIV-1: heterozygote advantage and B*35-Cw*04 disadvantage. Science. 1999;283: 1748–1752.
74. Miller LH. Impact of malaria on genetic polymorphism and genetic diseases in Africans and African Americans. Proc Nat/Acad Sci 1994;91:2415–1419.
75. Cocchi F, DeVico A, Garzino-Demo A, et al. Identification of RANTES, MIP-1 alpha, and MIP-1 beta as the major HIV-suppressive factors produced by CD8+ T cells. Science. 1995;270:1811–1815.
76. Alkhatib G, Combadiere C, Broder C, et al. CC CKR5: a RANTES MIP-1-alpha, MIP-1-beta receptor as a fusion cofactor for macrophage-trophic HIV-1. Science. 1996;272:1955–1958.
77. Huang Y, Paxton W, Wolinsky S, et al. The role of a mutant CCR5 allele in HIV-1 transmission and disease progression. Nature Med. 1996;2:1240–1243.
78. Michael NL, Chang G, Louie LG, et al. The role of viral phenotype and CCR-5 gene defects in HIV-1 transmission and disease progression. Nat Med. 1997 Mar;3(3):338–340.
79. Dean M, Carrington M, Winkler C, et al. Genetic restriction of HIV-1 infection and progression to AIDS by a deletion allele of the CKR5 structural gene. Hemophilia Growth and Development Study, Multicenter AIDS Cohort Study, Multicenter Hemophilia Cohort Study, San Francisco City Cohort, ALIVE Study. Science. 1996;273:1856–1862.
80. Zimmerman PA, Buckler-White A, Alkhatib G, et al. Inherited resistance to HIV-1 conferred by an inactivating mutation in CC chemoking receptor 5: studies in populations with contrasting clinical phenotypes, defined racial backdground, and quantified risk. Mol Med 1997 Jan;3(1):23–36.
81. Gonzalez G, Kulkarni H, Bolivar H, et al. The influence of CCL3L1 gene-containing segmental duplications on HIV-1/AIDS susceptibility. Science. 2005;304:1434–1440.
82. DiazGrandos CA, Zimmer SM, Klein M, Jernigan JA. Comparison of mortality associated with vancomycin-resistant and vancomycin-susceptible enterococcal bloodstream infections: a meta-analysis. Clin Infect Dis. 2005;41:327–333.
IDE003.indd 114 4/14/2006 06:41:07 PM
© Jones and Bartlett Publishers. NOT FOR SALE OR DISTRIBUTION
Study Design 115
R1
83. Colditz GA, Brewer TF, Berkey CS, et al. Efficacy of BCG vaccine in the prevention of tuberculosis: meta-analysis of the published literature. JAMA. 1994;271:698–702.
84. Behr MA, Wilson MA, Gill WP, et al. Comparative genomics of BCG vaccines by whole-genome DNA microarray. Science 1999;284:1520–1523.
85. Behr MA, Wilson MA, Gill WP, et al. Comparative genomics of BCG vaccines by whole-genome DNA microarray. Science. 1999;284: 1520–1523.
86. Black RE, Huber DH, Curlin GT. Reduction of neonatal tetanus by mass immunization of non-pregnant women: duration of protection provided by 1 or 2 doses of alumi-num-absorbed tetanus toxoid. Bull WHO. 1980;58:927–930.
87. Clements DA, Langdon L, Bland C, et al. Influenza A vaccine decreases the incidence of otitis media in 6- to 30-month-old children in day care. Arch Pediatr Adolesc Med. 1995;149:1113–1117.
88. Nichol KL, Lind A, Margolis KL, et al. The effectiveness of vaccination against influenzae in healthy, working adults. N Engl J Med. 1995;333:889–893.
89. Wilde JA, McMillan J, Serwint J, et al. Effectiveness of influenza vaccine in health care professionals: a randomized controlled trial. JAMA. 1999;281:908–913.
90. Mulholland K, Hilton S, Adegbola R, et al. Randomised trial of Haemophilus influenzae type-b tetanus protein conjugate vaccine [corrected] for prevention of pneumonia and meningitis in Gambian infants. Lancet. 1997;349:1191–1197.
91. Black RE, Huber DH, Curlin GT. Reduction of neonatal tetanus by mass immunization of non-pregnant women: duration of protection provided by 1 or 2 doses of aluminium-absorbed tetanus toxoid. Bull WHO. 1980;58:927–930.
92. Clements DA, Langdon L, Bland C, et al. Influenza A vaccine decreases the incidence of otitis media in 6- to 30-month-old children in day care. Arch Pediatr Adolesc Med. 1995;149:1113–1117.
93. Nichol KL, Lind A, Margolis KL, et al. The effectiveness of vaccination against influenzae in healthy, working adults. N Engl J Med. 1995;333:889–893.
94. Wilde JA, McMillan J, Serwint J, et al. Effectiveness of influenza vaccine in health care professionals: a randomized control trial. JAMA 1999;281;908–913.
95. Mulholland K, Hilton S, Adegbola R, et al. Randomised trial of Haemophilus influenzae type b tetanus protein conjugate vaccine [corrected] for prevention of pneumonia and meningitis in Gambian infants. Lancet. 1997;349:1191–1197.
96. Gessner BD, Sutanto A, Linehan M, et al. Incidence of vaccine-preventable Haemophilus influenzae type b pneumonia and meningitis in Indonesian children: hamlet-randomized vaccine-probe trial. Lancet. 2005;365:43–52.
97. Orenstein WA, Bernier RH, Hinman AR. Assessing vaccine efficacy in the field: further observations. Epidemiol Rev. 1988;10:212–241.
98. Clemens J, Brenner R, Rao M, Tafari N, Lowe C. Evaluating new vaccines for developing countries. Efficacy or effectiveness? JAMA. 1996;275:390–397.
IDE003.indd 115 4/14/2006 06:41:07 PM
© Jones and Bartlett Publishers. NOT FOR SALE OR DISTRIBUTION

R1
IDE003.indd 116 4/14/2006 06:41:07 PM
© Jones and Bartlett Publishers. NOT FOR SALE OR DISTRIBUTION

R1
Author Query Form
Dear Author,
During the preparation of your manuscript for publication, the questions listed below have arisen. Please attend to these matters and return this form with your proof.
Many thanks for your assistance.
Query Query RemarksReferences
1 There needs to be an in-text mention of Fig. 3-1 before the figure, not after. Also, I did not receive files or hardcopy for Figs. 3-1 to 3-11a so I cannot edit them.
2 Should Design” be plural?
3 Having difficulty following hierarchy of head-ings. Case reports and case series are types of descriptive studies, so their heads should be sub-ordinate to the descriptive study head, making them H3s. But if they are H3s, then the exam-ples given for each (Rabies, HIV remission, etc.) should come under H4s. But those sections are too large for H4s (H4s are almost always run-in headings. And we don’t go deeper than H4s.
At this point, I kept the Case Report and Case Series heads at H2, even though they should be H3s.
4 Above you use the expression “2 × X” but here you use “2 × N.” Can just one be used?
5 Spell out here on first usage.
6 Should this be capped and in italics?
7 Is “decrease in severe anemia (39%) reduction” correct? It sounds redundant.
IDE_003
IDE003.indd 117 4/14/2006 06:41:07 PM
© Jones and Bartlett Publishers. NOT FOR SALE OR DISTRIBUTION