student's misconceptions of forces and motion
TRANSCRIPT
STUDENTS' MISCONCEPTIONS OF FORCES
AND MOTION
by
GEORGE LEONARD MASHER
THESIS
submitted in fulfilment of the requirements for the degree
DOCTOR EDUCATIONIS
in
SUBJECT DIDACTICS PHYSICAL SCIENCE
in the
FACULTY OF EDUCATION AND NURSING
at the
RAND AFRIKAANS UNIVERSITY
PROMOTER: PROF J STRAUSS
OCTOBER 2000
This research is dedicated to my late sister Moira Rosalind Masher who taught me in
grade 4 and always motivated and guided me to persue a career in Mathematics and
Science.
ii

ACKNOWLEDGEMENTS
I would like to express my sincere gratitude to all of those who contributed in making
this study a success. I would like to thank the following people in particular:
Prof. J. Strauss as supervisor who was always there to meet with me and provide
guidance. His warm and pleasant personality made it a great pleasure to take for work
correction. I very much appreciate his time and patience. Prof. Strauss was always
there to encourage and motivate me. My appreciation for his supervision is much
more than words can express.
Mrs Gouws who was always there to make appointments with Prof. Strauss and
accept work to be handed in. Mrs Gouws also assisted in the format and page setup. I
sincerely appreciate her assistance.
My sister Yvonne Naidoo for assisting in the typing, editing and printing. Her
assistance was a great help in relieving a lot of stress.
Joranie Wolmarans who assisted in translating the summary to Afrikaans.Her
assistance is greatly appreciated.
My director, Mr. D. Molaba for being so considerate in granting me leave to
complete the study.
All the principals and science teachers of the four ex-departmental schools.
All students that took part in the research.
My wife and children for understanding and bearing with me.
and above all
the Lord Jesus Christ for the strength, perseverance, wisdom and understan-ding.
iii

SINOPSIS
Die doel van die studie was meerdoelig. Die begeerte was om die hipotesis te toets dat
die probleem van konseptuele wanbegrippe van ver'skeie aspekte van krag en beweging
uitgeskakel kan word na die intervensie program. Die studie was gefokus op
wanopvattings van krag en beweging van graad nege en twaalf leerlinge in die Gauteng
Departement van Onderwys.
Vorige studies oor die "wereldsiening"teorie bewys in 'n groot mate dat leeromgewing
mens se seining van realiteit beiinvloed. Wanbegrippe in wetenskap onderrig vorm 'n
integrale deel van vorige studies wat gefokus het hoe hulle voorkom en die implikasies
daarvan vir die leer van wetenskap. Aandag was gefokus op die wereldsiening teorie en
konsep raamwerk, die invloed van kultuur, gemeenskap en omgewing op leer en
alternatiewe raamwerke in krag en beweging.
`n Bespreking van hoe tradisionele metodes huidige leermetodes beinvloed, vorm 'n
belangrike deel van vorige studies sodat onderwysers hulle huidige metode van onderwys
kan hersien. Daar is gefokus op die moontlike oorsake van wanbegrippe wat insluit 'n
historiese skets van onderwys vanaf 1960, integrasie van tale, alledaagse konsepte met
wetenskaplike konsepte, die konstruktivisme van onderwys en hoe onderhoude en
geskrewe metodes gebruik kan word vir die identifisering van wanbegrippe.
Daar was ook aandag gegee aan die GDE se graad 12 Fisika uitslae, wat eenvoudige
verkeerde keuses in keuse-vrae antwoorde uitgewys het — spesifiek in krag en beweging.
Dit was veronderstel dat hierdie wanbegrippe die resultant kan wees van leerlinge se
interaksie en ondervinding met hulle omgewing, onderwysers, handboeke en religieuse
agtergrond.
Vorige studies, groepsonderhoude, individuele onderhoude met leerlinge en die GDE se
Fisika uitslae was gebruik om wanbegrippe by leerlinge oor die begrip van konsepte in
krag en beweging te indentifiseer. 'n Vraestel was opgestel uit hierdie wanbegrippe om
te bepaal water wanbegrippe in teorie aanwesig was by die studiegroep.
`n Intervensie program met leerlinge was geimplimenteer wat so ver moontlik van die
konstruktivisme gebruik gemaak het. Die doel was om te sien of die wanbegrippe uit die
weg geruim kon word.
iv
Die effektiwiteit van die intervensie program was gemeet deur middel van statistiese
analise. Die statistiese analise het dit moontlik gemaak om die resultate van die
verskillende skole te vergelyk en om te sien of misverstande spesifiek was ten opsigte
van 'n spesifieke omgewing. Dit was ook moontlik om die uitslae van graad nege tot
twaalf te vergelyk om te sien of wanbegrippe oorgedra word van graad tot graad.
Die resultaat van die na —toets het bewys dat baie leerlinge se konsep van krag en
beweging heelwat verbeter het. Hopelik sal die intervensie program wat in hierdie studie
gebruik is, die onderwysers aanmoedig om remedieering oor wanbegrippe toe te pas. Die
voorstel is dat onderwysers ander programme in werking sal stel soos konsepkaarte om
wanbegrippe te verminder of uit te skakel.
TABLE OF CONTENTS
PAGE
ACKNOWLEDGEMENTS iii
SINOPSIS iv
CHAPTER 1: GENERAL ORIENTATION
1.1 INTRODUCTION 1
1.2 STATEMENT OF THE PROBLEM 4
1.3 PURPOSE AND RESEARCH METHOD 4
1.4 THE PROGRAMME 5
1.5 CONCEPTIONS AND MISCONCEPTIONS 6
1.6 CONCLUSION 8
CHAPTER 2: MISCONCEPTIONS IN SCIENCE
EDUCATION
2.1 INTRODUCTION 9
2.2 THE WORLD VIEW THEORY 9
2.3 THE INFLUENCE OF CULTURE, COMMUNITY, ENVIRON-
MENT, CLASSROOM AND TEACHING ON LEARNING 14
2.4 ALTERNATIVE FRAMEWORKS IN FORCES AND
MOTION 17
2.5 CONCLUSION 28
CHAPTER 3: METHODS OF TEACHING
3.1 INTRODUCTION 29
3.2 A HISTORICAL SKETCH OF TEACHING SINCE THE 1960'S 30
3.3 INTEGRATION OF LANGUAGE AND EVERYDAY CON-
CEPTS WITH SCIENTIFIC CONCEPTS 32
3.4 THE CONSTRUCTIVIST METHOD OF TEACHING 34
3.5 INTERVIEWS AND WRITTEN METHODS FOR IDENTI-
FYING MISCONCEPTIONS 45
3.5.1 The Interview 45
3.5.2 Written Methods 46
3.5.3 Concept Maps 46
vi
PAGE
3.6 CONCLUSION 47
CHAPTER 4: EMPIRICAL STUDY
4.1 INTRODUCTION 48
4.2 THE PURPOSE OF THE RESEARCH 48
4.3 RESEARCH QUESTIONS 48
4.4 GRADES 9 AND 12 INTERVIEWS 49
4.5 IDENTIFICATION OF MISCONCEPTIONS 50
4.6 INTERVIEWS CONDUCTED 50
4.7 PRELIMINARY (GROUP) INTERVIEWS 51
4.8 THE DETAILED (INDIVIDUAL) INVESTIGATION 53
4.9 PREDOMINANCE AND POSSIBLE SOURCES OF
MISCONCEPTIONS 53
4.10 PRETEST AND POST-TEST 54
4.11 SECTION A OPEN-ENDED QUESTIONS 55
4.12 SECTION B MULTIPLE-CHOICE QUESTIONS 55
4.13 INSTRUMENTS 57
4.14 VALIDATION OF THE QUESTIONNAIRE 59
4.15 DEVELOPMENT AND APPLICATION OF AN INSTRUC-
TIONAL METHOD 59
4.16 GRADE 12 STUDENTS 60
4.17 GRADE 9 STUDENTS 61
4.18 DEVELOPMENT OF THE TEACHING METHOD 61
4.19 THE INFLUENCE OF PREVIOUS RESEARCH ON INSTRUC-
TIONAL DESIGN 61
4.20 DESIGNING THE PROGRAMME TAKING PAST
EXPERIENCES INTO ACCOUNT 62
4.21 STATISTICAL INTERPRETATION OF RESULTS 62
4.21.1 The results 63
4.21.1.1 Grade 9 Students Present 63
4.21.1.2 Grade 12 Students Present 63
4.21.2 THE STATISTICAL ANALYSIS OF GRADE 9 AND 12
RESULTS 65
4.21.2.1 Statistical Analysis of Grade 9 EX-DET Results 65
vii
PAGE
4.21.2.2 Statistical Analysis of Grade 9 EX-TED Results 70
4.21.2.3 Statistical Analysis of 'Grade 9 EX-HOD Results 75
4.21.2.4 Statistical Analysis of Grade 9 EX-HOR Results 79
4.21.2.5. Comparisons between the Experimental Groups of the Ex-
Departments' Grade 9 Results 83
4.21.2.6 Comparisons between the Ex- departments' Grade 9 Control
Group Results 92
4.21.2.7 Statistical Analysis of Grade 12 EX-DET Results 101
4.21.2.8 Statistical Analysis of Grade 12 EX-TED Results. 106
4.21.2.9 Statistical Analysis of Grade 12 EX-HOD Results 111
4.21.2.10 Statistical Analysis of Grade 12 EX-HOR Results 116
4.21.2.11 Comparisons between the Experimental Groups of the Ex-
Departments' Grade 12 Results 121
4.21.2.12 Comparisons between the Ex- departments' Grade 12 Control
Group Results 130
4.21.2.13 Comparisons of the Experimental Groups of Grades 9 and 12
of the same Ex -department 139
4.21.2.14 Comparisons of the Control Groups Grade 9 and 12 of the same
Ex-department 146
4.22 CONCLUSION 154
CHAPTER 5: RESULTS AND DISCUSSION
5.1 INTRODUCTION 156
5.2 ANALYSIS OF INTERVIEW TRANSCRIPTS 156
5.3 ANALYSIS OF THE GROUP INTERVIEWS 156
5.4 ANALYSIS OF THE PENCIL AND PAPER TEST 158
5.5 ANALYSIS OF SECTION A FOR GRADE 9 AND 12
STUDENTS 159
5.5.1 Predominance and Possible Sources of Misconceptions 172
5.5.2 Evidence of Prevalent Misconceptions from Specific
Questionnaire Items 172
5.5.3 Prevalent Misconceptions from Newton's. Laws of Motion 172
5.5.4 The Items Based on Falling Bodies and Projectile Motion 183
viii
5.5.5 Comparisons of the Experimental Group Results between the
PAGE
Ex-departments 209
5.5.5.1 Experimental Group Comparisons 209
5.5.6 Comparison of Results of the Control Group between Ex-
departments 210
5.5.6.1 Control Group results 210
5.5.7 Findings from Individual Items 211
5.5.8 Comparisons of the Results of Grades 9 and 12 Students within
the same Ex-department 214
5.5.8.1 The Experimental Group results 214
5.5.8.2 The Control Group Results 215
5.6 CONCLUSION 217
CHAPTER 6: PROGRAMME FOR STUDENTS
6.1 INTRODUCTCION 218
6.2 WHAT TEACHERS SHOULD KNOW ABOUT THEIR
STUDENTS 218
6.3 THE INTERVIEW 219
6.4 WRITTEN METHODS 220
6.5 WHAT TEACHERS SHOULD KNOW AFTER IDENTIFYING
MISUNDERSTANDINGS AMONG STUDENTS 222
6.6 WHAT TEACHERS SHOULD DO AFTER AN INTER-
VENTION PROGRAMME 224
6.7 SOME PREVIOUS RESEARCH FINDINGS OF HOW
CONCEPTUAL CHANGE TAKES PLACE 224
6.8 SCHEMATIC MODELLING AS A METHOD OF TEACHING 226
6.9 CONCLUSION 227
CHAPTER 7: SUMMARY, CONCLUSION AND RECOM-
MENDATIONS
7.1 INTRODUCTION 228
7.2 SUMMARY 228
7.3 CONCLUSION 230
7.4 RECOMMENDATIONS 234
ix
PAGE
7.5 RECOMMENDATIONS FOR FURTHER RESEARCH 236
BIBLIOGRAPHY 238
APPENDIX A
APPENDIX B
APPENDIX C
CHAPTER 1
GENERAL ORIENTATION
1.1 INTRODUCTION
No one would deny that the culture in which the world society exists today is best described as
one that is scientific, technological and automatic- industrial. It was brought into being by the
explosive creation and application of scientific knowledge. It is quite evident that the primary
reason why Science has achieved more importance and wider public interest today lies in its
uses and the way in which it has changed modern society.
In spite of the importance of Science in society, the past few decades have seen a steady
decline in the quality of science education and the achievements of students. The reasons for
this are many and complex, and extend beyond the scarcity of resources. One reason for
students' low achievements can be that students enter the classroom with different beliefs
about the nature of the world around them. This implies that meaningful learning in the
science classroom presupposes students who enter with beliefs about the world not compatible
with science as taught in the classroom.
As internal moderator and Chief marker of grade 12 Physical Science paper I (physics) higher
grade (HG) and standard grade (SG) in the Gauteng Department of Education (GDE),
observation of students errors as recorded in statistics and diagnostic analysis reveal
misunderstandings in almost all aspects of physics. These misconceptions are found in
multiple-choice questions that include calculations, and qualitative answers such as
explanations of physics concepts and manipulative skills in problem solving. Statistics reveal
that forces and motion in particular, are major areas of concern. Meetings and workshops with
grade 12 Physical Science teachers show that these misunderstandings are also deeply
embedded in the minds of teachers. In both the multiple-choice questions and explanations
there is evidence of a common pattern of errors among students. This finding made me to dig
deeper than what is revealed on the surface.
Contemporary science education research focuses on misconceptions as shown by Bar, Zinn,
and Goldmuntz (1994:149-169) Palmer and Flanagan (1997: 317-331).
Cobern (1988:1,2) has shown that students bring with them ideas and values about the natural
world that they have formulated on their own or have acquired from previous educational
experience. There is an assumption of homogeneity among student's misconceptions even
when there is gender, racial, and cultural diversity among students. This assumption has a
tendency to keep us from a more comprehensive understanding of variables that lead to
science achievement and positive attitudes. The researcher suspects that there are more issues
at hand than factors of pedagogy and student intelligence.
A child brought up in a warm, secure home develops a confident sense of self and knows the
world (i.e., the Other) to be orderly and non-threatening. In comparison the abused child
grows up with a low self-esteem, and the child raised in an environment of unexpected trauma
could see himself as being powerless living in an unpredictable world. Kearney (1984: 72- 78)
showed that the self-other relationship with regard to the individual and society may be one of
harmony, while the individual nature relationship is one of dominance.
People strive to make sense of the natural world by making use of existing knowledge.
However since one person's knowledge differs from another, it is expected that alternative
conceptions of reality will occur. Research shows that this is the case from primary school up
to university level. According to Cobern (1988:2) the concept of "worldview" refers to a
persons fundamental view of reality. Cobern (1988:3) revealed that worldview variations in
ethnically diverse classrooms are an important factor in science achieveinent and attitude
development among students.
Students' "world views" are to a large extent influenced by their environment of learning. In
GDE schools, classrooms range from almost homogeneous ones to ethnically diverse ones. In
South Africa (SA) we have a multicultural society and it will be interesting to find out how a
student's worldview is influenced by the environment of learning.
Van Hisse (1988: 498- 502) has made me realize that students' misconceptions were not only
confined to grade 12 physics students in the GDE marking centre. Her research showed that
while students could correctly memorise new information and reproduce them on tests, they
did not believe it applied anywhere else than the strict confines of their classroom. This further
aroused my interest to carry out this research and probe student's preconceptions,
misconceptions or alternative frameworks so that I can find ways of overcoming them.
Forces and motion seem to puzzle high school students for a long time. As a physical science
teacher, the researcher observed that students are unable to understand why a car continues
moving when the driving force is equal to the opposing force and in many more examples on
forces. Another favorite misconception among students is that they are unable to predict
correctly what will happen when light and heavy objects are dropped from the same height
above the ground in the absence of air friction. Research has shown that a misconception
among students is a global problem.
An important feature to note is the historical background surrounding schools in South Africa.
Schools in South Africa can be divided into two categories viz., advanced and under
developed schools. The under developed schools have culminated into a poor culture of
teaching and learning. In most of these schools there is a backlog of learning material,
laboratories, equipment and even classrooms, which has led to overcrowding.
Grade 12 Physical Science Examination results in these schools are pathetic and disquieting.
Hence this study endeavors to find out what misconceptions are the underlying causes of the
poor grade 12 Physics results and how these misconceptions can be unlearned, replaced with
correct ones, so that the grade 12 pass rate improves. To identify the causes of the
misconception, attention will also be focused on grade 9. students where forces and motion are
part of the curricultim. The idea will be to see if there is a perpetuation of misconceptions from
grade to grade.
3
Lippert (1986) showed that students often manipulate physical quantities without necessarily
understanding the underlying concepts. There is a growing realization that conventional
examinations and tests may not assess genuine student understanding and thus may not be a
true reflection of how much a student really knows. Yarroch (1985); Champagne, Gunstone
and Klopfer (1983) have shown that investigations reveal that even after seemingly good
performance in science courses, many students exhibit gross scientific misconceptions.
A study of the Physical Science past examination question papers "Physichem" in South
Africa, by Jordan and Jordan (1997), shows that the emphasis in examinations is on
manipulative skills and very little attention is given to qualitative questions, which probe
students' qualitative answers.
The questions related to forces and motions in these examinations typically require students to
perform calculations. For example in projectile motion, students are required to manipulate the
equation s= ut + V2 ate and find the unknown value. Whereas this method of testing provides an
important check that appropriate knowledge has been committed to memory, it is inadequate
since it does not help students to interpret what they are manipulating and often encourages
rote learning.
1.2 STATEMENT OF THE PROBLEM
What do grades 9 and 12 students misconceive about forces and motion?
13 PURPOSE AND RESEARCH METHOD
The purpose of this study is to identify misconceptions in forces and motion of grade 9 and 12
physics students and to see how they are related to the "worldview" of students. It will also
investigate how misconceptions are perpetuated from grade 9 to grade 12.
However, the purpose of this investigation is to determine some of the problems, which arise
in the learning of forces and motion and in particular to assess qualitative understanding of
forces and motion.
The methods employed will include both qualitative and quantitative research methods to
identify misconceptions. Once misconceptions have been identified a learning programme will
be designed and carried out with the above students. The learning programme will amongst
others include the constructivist approach to learning. The outcomes of the learning
programme will be measured by a post-test.
This study will also be able to compare misconceptions of the ex- departments' schools. The
misconceptions identified will be made available to teachers and students with guidelines on
how they can be unlearned to improve science teaching.
1.4 THE PROGRAMME
In Chapter One an introduction to this study will be given. Findings from previous research
relating to this study will also be discussed.
In Chapter Two an in depth literature study of the possible origins and explanations of other
researchers findings of students misconceptions in science education and in particular
misconceptions in forces and motion.
Chapter Three will focus on teaching methods used in science education, ranging from
traditional methods to current methods widely used and proved to be more successful in the
classroom. The teaching methods that will be discussed will be of value for teachers to
implement in the classroom.
Chapter Four will focus on the empirical study, discussing in detail the research methodology
used in the study. The research will be conducted with grade nine and twelve students of the
four ex- departments.
5
The research will comprise one experimental group and two control groups, which will be
fully explained in chapter four. Since the research is conducted with grade nine and twelve
students' time will be of the essence, to complete the questionnaires and the support
programme in the same year. The research will include a pretest, an intervention in the form of
a support programme, and a post-test. The statistical analysis of data will appear in this
chapter.
In chapter five there will be a discussion of the results of students' responses to the
questionnaire. The discussions will include tabular form of results and discussions from the
interviews with students. This chapter will also include the discussion of the results of students
after the support programme.
Chapter 6 will give guidelines to teachers from the findings of this research. In this chapter the
guidelines will be given to teachers on how to improve science teaching.
In chapter seven the summary, conclusion and recommendations will be discussed.
1.5 CONCEPTIONS AND MISCONCEPTIONS
The terms prior knowledge or preconceptions, misconceptions, and alternative frameworks are
used in science education to describe non— scientific explanations that have been identified in
various science subjects as "false beliefs that are highly resistant to tuition" as shown by
Champaigne et al (1983). This implies that if students' misconceptions are not identified and
relevant remedial programmes put in place, then teaching will not be effective.
Fredette and Clement (1980) have suggested the following definitions:
An error is an observable event or performance, which, in a way judged to be significant,
differs from an expected, ideal (correct) model of performance
A preconception is a concept or idea which a student has upon entering a course, and
which has some consequences on the student's work within the area.
6
(iii) A misconception is a concept or idea that from the point of view of the average
professional leads to unacceptable solutions or answers to questions or problems in the context
of a course. Driver and Easley (1978) and Gilbert and Watts (1983) revealed that the word
misconception is widely used despite there being disagreement about its use. Some researchers
are of the opinion that views, which are scientifically unacceptable, should not be labeled
wrong or misconceptions but rather alternative frameworks.
The constuctivist approach, modern views in philosophy of science, and recent developments
in science education were pointed out by Driver (1979):
"...Pupils like scientist, come to science lessons with some ideas or beliefs already
formulated. These beliefs affect the observations they make and the inference they draw from
them. Pupils like scientist have constructed a view of the world to enable them to cope with
situations. This view is not as simple as giving pupil's additional experience to sense data. It
also involves helping them to reconstruct their theories or beliefs, to undergo, if you like, the
paradigm shifts which have occurred in the history of science."
Nussbaum and Novick (1982) also support this viewpoint and suggest that students acquire
these erroneous views " not because of misunderstanding the concept but understanding it
differently". Helm (1978) have reported examples of poor conceptualization among South
African students in physical science.
Fischer and Lipson (1986) see these definitions as semantically problematic since they are
given in terms of observable behaviors in performance, which require that the teacher makes a
value judgement concerning the correctness or otherwise of a student conception.
Ambibola (1988) explained that the term misconception tends to be used by science education
researchers who persist in viewing students' prior conceptions as a potential barrier to
learning.
Osborne, Bell and Gilbert (1983) view alternative conceptions as arising from three main
factors viz,
7
Concepts which have no directly observable instances (e.g. atoms) or no physical reality
(e.g. potential energy). They are outside the students experience;
Everyday observable phenomena are connected to abstract theories by increasingly
complicated reasoning;
In developing a coherent view of the world, scientists have evolved a technical vocabulary
where words have specific, unambiguous meanings. Students do not realize this. Garnett
and Treagust (1990) describes possible reasons for students' lack of understanding and
origins of misconceptions, together with suggestions for reducing the incidence of these
misconceptions.
Five problem areas were identified viz,
compartmentalization of subject knowledge
students interpretation of language
the use of multiple definitions and models
inadequate prerequisite knowledge and
the rote application of concepts and algorithms
1.6 CONCLUSION
This chapter discussed forces and motion in particular, which puzzles students at
secondary school. It discussed why this study is undertaken and briefly discussed the
world view theory. The statement of the problem, the purpose of the study and the
programme to be followed in the study was also discussed.
The next chapter will focus on misconceptions in science education. A detailed
discussion of the worldview theory, conceptual frameworks, the influence of culture,
community and environment on learning, and alternative frameworks in forces and
motion.
8
CHAPTER TWO
MISCONCEPTIONS IN SCIENCE EDUCATION
2.1 INTRODUCTION
In chapter one a background was given of the non-scientific views held by students and how
teachers also perpetuate these misconceptions. Preconceptions and misconceptions were
explained in chapter one to show how students explain phenomena and concepts against their
existing frame of reference. This chapter will focus on a review of students' misconceptions or
alternative frameworks as reported by previous researchers, which will be relevant to assist in
explaining the complexity and uniqueness of this study.
Attention will be focused on:
2.2) The World View Theory and Conceptual frameworks
2.3) The influence of Culture, Community, and Environment on learning
2.4) Alternative frameworks in Forces and Motion
2.2 THE WORLD VIEW THEORY
The role played by the cultural context in terms of understanding science has a long research
tradition. Tharp (1989) believed that at least four classes of variables viz. social organization,
sociolinguistics, cognition and motivation- vary by culture in ways that are differentially
compatible with the expectations and routines of schools.
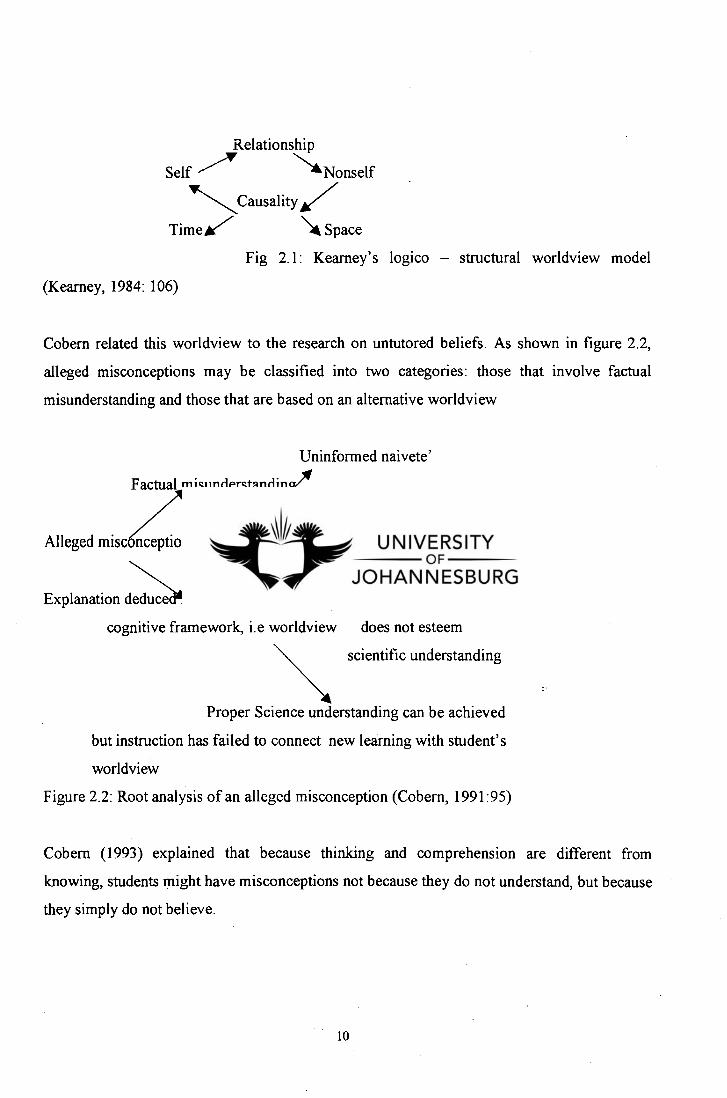
Cobern (1991) brings many of these ideas together in his worldview theory. He proposed a
logico- structural model for worldview from Kearney (1984) as shown in figure 2.1
9
Relationship
Self 41"Nonself
II Causality
TimeA7 \ Space
Fig 2.1: Kearney's logico — structural worldview model
(Kearney, 1984: 106)
Cobern related this worldview to the research on untutored beliefs. As shown in figure 2.2,
alleged misconceptions may be classified into two categories: those that involve factual
misunderstanding and those that are based on an alternative worldview
Uninformed naivete'
Factual isunderstanding,
MisAtruction and/ or misinformation
Alleged misc nception Active hindrance
4f
to scientific understanding
Explanation deduce rom an alternative understands but
cognitive framework, i.e worldview does not esteem
scientific understanding
Proper Science understanding can be achieved
but instruction has failed to connect new learning with student's
worldview
Figure 2.2: Root analysis of an alleged misconception (Cobern, 1991:95)
Cobern (1993) explained that because thinking and comprehension are different from
knowing, students might have misconceptions not because they do not understand, but because
they simply do not believe.
10
With the rise of modern science came a new way of looking at the world. Kearney (1971) in
his research showed that modern science was born out of the intellectual tumult of the 16` h to
',,8 th centuries in Europe. With Newtonianism a mechanistic worldview arose, with Aristotelian
we have "world as an organism" view, and with the Neo Platonic, arose the "mysterious
universe" view. The mechanistic view became the basis of modern science; modern physics
modified the classical scientific worldview, which remains a thoroughly empirical view,
which emphasizes the importance of testable hypotheses concerning natural causes.
The modern western new nature is characteristically mechanistic, an inorganic view of the
world as a great machine, which once it has been set in motion, by virtue of its construction
performs the work for which it was called into existence (Dijksterhuis, 1986:495). Newton
held this view with a theistic framework. The modern form of mechanicism retains the
inorganic machine metaphor but its warrant has shifted from theology to philosophy.
Mechanism essentially posits the whole as a simple sum of its parts. Causal relations are
linearly conceived and context independent. Key elements in this view are the "regularly,
performance and predictability of the universe"(Keamey, 1971:24)
Kearney (1984: 41) described a worldview as "... consists of basic assumptions and images
that provide a more or less coherent, though not necessarily accurate, way of thinking about
the world". Five functions compose a worldview as revealed by Kraft (1974:4,5):
They explain the how and why of things
They validate "....goal, institutions, and values of society and provides them with a means
for evaluating all outside influences as well as activities and attitudes within society"
They reinforce people ".., at points of anxiety or crisis in life providing security and
support for the behavior of groups and encourages and describes behavior.
Worldview assumptions function as integrators.
This system makes it possible for people to conceptualize what reality should be
like and to understand and interpret all that happens day by day in this framework.
Finally there is an adaptation function.
1 1
A worldview is ".... resilient and reconciles differences between the old understanding thetas
and the new in order to maintain a state of equilibium". For Educators worldview assumptions
are identified in two assumptions:
" that the best immediate understanding of behavior is offered by understanding of the
thoughts that underlie the behavior" and Kearney ( 1984:3,4) "... other being equal, the
economy of human thought and the nature of culture are such that cognitive assumptions at
work in one area of life, say economic production, will also organize thinking in others, say...
ideas about human nature". Knowing about students worldviews will have the advantage of
enabling educators to better understand students achievements and progress in the classroom.
The study showed that religion, culture, environment and society influence the scientific
worldviews of students, which result in non-scientific worldviews. The goal of science
education should be to develop within students a scientific worldview.
According to Kearney (1984) misconceptions can be divided into distinct categories viz.
Uninformed naivete, inadequate instruction or misinformation that leads to factual
misunderstanding.
A misconception can be an explanation logically deduced from an alternative worldview.
Because this misconception has intuitive appeal for the student, assimilation of what is
considered proper scientific understanding is hindered.or an alternative worldview which
in principle is capable of assimilating scientific understanding, but does not esteem
scientific explanations of physical reality.
Students alternative worldview might not actively hinder science understanding or interest,
meaningful learning requires that the science concepts be linked to the student's
worldview. The failure to establish such links results in the rejection or non- retention of
the science concept. The second category are logically grounded in the students view of
nature and are not truly misconceptions, they are alternative conceptions.
12
South Africa has a multicultural society with advantaged, disadvantaged and ethnically diverse
classrooms. Underlining this is the assumption that world view variations among Physical
Science teachers and students is a crucial variable in science achievement and attitude
development among students. According to Posner and Gertzog (1982: 199-209) learning has
become the result of the interaction between what the student is taught and his current idea or
concept.
The classroom environment is not to be composed of causal variables that the teacher
manipulates to foster learning, but an environment mutually shaped to fit the members of the
classroom, both teacher and students (Lincoln & Guba, 1985).
Kearney (1984: 41) refers to worldview as "... consists of basic assumptions and images that
provide a more or less coherent, though not necessarily accurate, way of thinking about the
world." This implies that everyone has his or her own frame of reference, which is not
necessarily correct. However science students with wrong ideas view science concepts against
their own frame of reference.
Cobern (1988) in his study showed that religious beliefs and philosophical views are
intimately linked to a woridview. Also people from non-technical and non-scientific societies
often have worldviews that are not in line with scientific thinking. These worldview variations
result in alternative frameworks in societies. Piaget (1929) in his early studies of children's
explanations of natural phenomena and in his most recent study (Piaget 1974) have made the
most important contribution to the study of alternative frameworks students bring to the
learning situations. Vienot (1979:205-221) and Driver (1973) have developed a more detailed
understanding of these misconceptions and why they are so robust and outlive teaching that
contradicts them.
According to Kearney's model (1984) we should not expect one, single scientific woridview.
Major variations arise from racial, cultural, religious, gender, economic class geography, and
family type differences. Perpetuation's of misunderstanding from teachers, and from textbooks
13
is another source of misconception. When current concepts are inadequate to allow students to
grasp new phenomena successfully, the student recognizes or replaces his central concept.
This radical form of change Posner, Strike, Hewson and Gertzog (1982: 211-227) referred to
as accommodation.
Hashwesh (1983) has shown that a rapidly growing body of research is revealing that students
come to the science classrooms with specific notions about the content of instruction. These
notions are in contrast with the scientific conceptions that students are expected to learn. It is
becoming clear that students' preconceptions can impede the acquisition of scientific
conceptions in certain cases.
23 THE INFLUENCE OF CULTURE, COMMUNITY, ENVIRONMENT,
CLASSROOM AND TEACHING ON LEARNING
Erickson (1991) showed that in different classrooms, schools, and communities, events that
seem ostensibly the same might have distinctly differing local meanings. Direct questioning of
students by a teacher, for example, may be seen as rude and punitive in one setting, yet
perfectly appropriate in another. Also direct questioning may be appropriate for some students
in one moment and inappropriate in the next. Considering the relations between a setting and
its wider social environments helps to clarify what is happening in the local setting itself
Erickson (1991: 122) considers the observation " Teachers don't ask for extra materials: they
just keep using the same old text and work books for each subject" may be factually accurate,
but this could be interpreted quite differently depending on contextual circumstances. For
instance if school system-wide regulations made ordering supplementary materials very
difficult in a particular school. What the teachers do at the classroom and building level is
influenced by what happens in wider spheres of social organization and cultural patterning.
Behaviours that may be inappropriate in school may be seen as quite appropriate and
reasonable in community and family life. For example, children may be encouraged in the
family to be generous in helping one another in the classroom this may be seen by the teacher
14
as attempts at cheating. If two observers were with differing orientations were placed in the
same spot to observe what was ostensibly the "same" individuals, the observers would write
substantially different accounts of what had happened, choosing differing accounts of what
had happened, choosing different kinds of verbs, nouns, adverbs, and adjectives to
characterize the actions that were described.
Erickson (1991) showed that if the interpretive role of classroom teaching were to play a
significant role in educational research, it would be:
the nature of classrooms as socially and culturally organized environments for learning
the nature of teaching as one, but only one, aspect of the reflective learning environment
and
the nature and content of the meaning-perspectives of teacher and student as intrinsic to
the educational process. Kuhn (1962) referred to an integrated set of theoretical
presuppositions that lead the researcher to see the world of one's research interest in a
particular way. The current conflict in research on teaching is not of competing paradigms,
but as
Lakatos (1978) and others have argued for natural sciences and especially for the social
sciences paradigms do not compete in scientific discourse. The older and newer paradigms
tend to coexist, as in the survival of Newtonian physics, which can be used for some purposes,
despite the competition of Einsteinian physics, which superseded it.
Research by Erickson (1991) showed that:
In the United States there are large differences across individuals on school achievement
and measured intelligence, according to the class, race, gender, and language background
of the individuals. Moreover these differences persist across generations.
Test score data accumulated in the recent process product research on teaching show
differences across different classrooms in the achievement of elementary pupils who are
15

similarly at risk for school failure because of their class, race, gender, or language
background.
(3) The same test also showed differences in achievement and measured intelligence among
individual children in each classroom.
These findings that the likelihood of low school achievement by low socioeconomic status
students and others at risk may be powerfully influenced by large scale social processes
(i.e.handicaps due to ones position in society) and individual differences (i.e. measured
intelligence), the school achievement of such children is amenable to considerable influence
by individual teachers at classroom level. Teachers then do and can make a difference to for
educational equity. We can say that the students' access ability is socially constructed. It is a
product of the students' social situation- the social system rather than an attribute of that
person.
According to Zaharluh (1992) educational productivity can be optimized only when the
context of the learners is accounted for. The immediate everyday meaningful contents in
which students learn and solve problems are very important in the learning of Science.
Education in Science has to do with the transmission of the cultural heritage of a person
(Hvitfeldt, 1986), and the conditions for effective learning are created when the role of culture
is recognized and used in the activity settings during the actual learning process.
Key aspects of mental functioning such as students use of proportional reasoning can be
understood only by considering the sociocultural context in which they are embedded
(Wertsch& Toma, 1992). This suggests a constructivist investigation of the social and cultural
dimensions of students use of proportional reasoning in physics starting from where the
students are, rather than with ideas and strategies that might hardly engage at all with the
students existing cognitive structures (Kuchemann, 1991:123)
Comber and Keeves (1973: 251,259) showed that in some developed countries, such as
Flemish speaking Belgium, Italy, Sweden, and Finland, the correlation between social class
16
background and school achievement is much lower than it is in the United States or Great
Britain, and that the correlation is lower in Japan than the United States or Great Britain.
Marx (1959) emphasized on material conditions as determining norms, beliefs, and values, he
was centrally concerned with the content of the meaning perspectives so determined. A
fundamental point of Marx is the historical embeddedness of consciousness the assumption
that one's view of self and of the world is profoundly shaped in and through the concrete
circumstances of daily living in one's specific situation of life. Marxist social theorists have
presumed that profound differences in meaning perspective will vary with social class
_position, and that presumption extends to any other special life situation, for example, that due
to ones gender status, race, and the like.
Erickson (1991) showed that in studying Native American languages linguists were
discovering aspects of language structure sound patterns and grammar that had never been
considered in traditional grammar and philology based on Indo- European languages. The new
aspects of language structure were regular and predictable in speech, but the speakers
themselves were unaware of them. Here is another domain in, which was evident, the
existence of implicit principles of order that influenced human behavior outside the
consciousness of those influenced.
2.4 ALTERNATIVE FRAMEWORKS IN FORCES AND MOTION
Research has shown that students over a wide range of age and educational background harbor
misconceptions which interfere with their understanding of many aspects of forces and
mechanics (Clement 1982; Viennot 1979; Watts and Zylbersztjan 1981). The focus of many of
these studies has been the exploration of students' alternative frameworks of forces and
motion. There is no doubt that students experience conceptual difficulty with Newton's first
and second laws. Warren (1979) argues the way in which these concepts are presented in
textbooks and consequently taught by teachers contributes to these difficulties. For example he
suggests some attempts are made to help students understand the quantitative relationship
17
expressed in the second law, promotes the association between motion and force in the
direction of motion, thereby increasing the difficulties involved in understanding the first law.
At a more advanced level, Warren (1979) suggests that in a given situation students are not
certain what forces are acting, by what mechanism they act, or indeed where they act.
Confusion between forces acting on different bodies often arises from a misunderstanding of
the third law and this in turn contributes to their conceptual difficulties with the second law.
Clearly for students to obtain a better understanding of the concept of force, they must have a
clear understanding of all three laws and appreciate the relationship between them. Any
efforts that are made to improve their conceptual understanding should be concerned with
changing their overall framework of the concept force.
As part of a wider survey of young children's ideas about force, Watts et al (1981) presented
the pupils with a series of questions about a tug of war situation. Not surprisingly, a large
majority of the children were unable to describe the situation satisfactorily in terms of the
forces involved the interactions. For example they were unclear about the direction of the
forces exerted on or by the rope and/or the people who were tugging on it. In a study
concerned with Newton's third law, Maloney (1984) investigated students understanding of
the interaction between two blocks which were in contact with each other and which moved
with constant acceleration. Of those students in the sample who had completed a high school
physics course, very few were able to successfully analyze the situation presented to them in
terms of Newton's third law. Any efforts that are made to improve their conceptual
understanding should be concerned with changing their overall framework of the concept
force.
Palmer et al (1997) points out that students should be admitted to mechanics at a younger age
because as they get older they become less willing or less able to change their ideas. To test
this proposal, his study was designed to find out whether older students were less ready to
change their conceptions than younger students. The study showed that a majority of students
in both year 6 and year 10 held the alternative conception that motion implies force. Other
studies have found that primary school students, especially in the older years, do hold clear
18
alternative conceptions about aspects of mechanics Eckstein & Shemesh (1989); Whitelock,
(1991). The results of Palmers' studies are also in close agreement with other studies that
have investigated the occurrence of this alternative conceptions among students aged 15-16 in
Astralia (Gunstone, 1990).
The study of Palmer et al (1997) showed that many of his students experienced conceptual
change. His students demonstrated metacognition of the process by describing and reflecting
upon their change of view. Metacognition or "student directed formative evaluations of their
learning" (Gunstone, Gray & Searle 1992, 177) is considered to be a powerful indication of
conceptual change. Although students in Palmers study did demonstrate conceptual change it
may have occurred at a relatively weak cognitive level. For students who hold an Aristotelian
view, their belief system underpins all their thinking about motion in the real world, so the
complete change to a Newtonian view requires strong restructuring at the level of Hewsens
conceptual exchange.
It has been suggested that a difficult or revolutionary process can only accomplish the
conceptual change from the Aristotelian to Newtonian physics. Pines and West (1986) for
example, use a vine metaphor to describe conceptions, and state that; "The classical example
of this clash between the vines is when the child's Aristotelian —like view of physical
causation and reality is challenged by the Newtonian physics taught in school. The resolution
of such conflicts, when two vines in toto clash, is a painful process, one that is difficult for the
student to accomplish"
Brink and Jones (1987:1) make note that an interesting feature of early 'scientists' was the
unquestioning faith that they had in great philosophers of their time. Until the Renaissance,
science was formulated by a process of detailed and involved philosophical reasoning, without
any real method of putting theories to the test by experimenting. A case in point was the
answer to the question: which will fall faster, a heavy ball or a light ball? By observing the
motion of a feather and a metal ball falling under gravity, scientists' could establish an answer.
But what of other objects on which air resistance has littleeffect, such as a lead cannon ball
19
and another iron? Aristotle (in about 350 BC) showed by philosophical argument that under all
conditions a ball of greater mass will fall with greater acceleration than one of lesser mass.
It seems unbelievable that for 1900 years this theory was accepted as truth without anyone
testing to see if it were true! Finally Galileo Galilei (1564 — 1642), believing that Aristotle had
perhaps been wrong, decided to put the theory to the test. Galileo had realized that air friction
is the only factor, which affects the acceleration of falling bodies, and that if it could be
eliminated completely, even a feather and a metal sphere would fall together. It is believed
that he climbed to the top of the Leaning Tower of Pisa and dropped two spheres of different
masses simultaneously. All were astonished to see them both hit the ground at almost the same
instant.
As far as classical mechanics is concerned, conceptions concerning the relationship between
force and motion can be divided historically into three major groups: the 'Aristotelian view',
`the impetus theory' of the Middle Ages, and the 'inertial view' as expressed in Newton's
theory of motion. This is a rough generalization, because researchers in these different groups
were not.unifonn in their interpretations and scientists such as Galileo, whose conceptions
represented the transition between mediaeval impetus theory and inertial conception of
motion. Nevertheless, the groupings can be a useful device in helping to conceptualize major
stages in the development of the concept of force, especially in its relation to movement.
According to the Aristotelian view, a stone falls naturally towards the earth. Not because it is
attracted by it, but because the earth occupies the centre of the universe. Aristotelian physics
of motion stresses the idea that force and velocity are directly associated: for a body to have
velocity a force must be exerted. In the case of projectiles Aristotle's theory showed no visible
motion exerting a force on the projectile was present, and Aristotle amended the theory by
conceiving the disturbed air as the source of a push, after the contact between the thrower and
the object ceased; this was the anti peristasis theory. He was aware of the weakness of this
extremely artificial and adhoc solution, but, for him the point was not very important Kuhn
(1977). The Aristotelian idea also implies that continuous action of a force is necessary to
keep an object in motion.
20
Although it represents a way of thinking that has long been rejected by the scientific
community, it has been established that this idea often predominates among students. For
example, Watts et al (1981) found that 85% of students aged 14 years associated force with
motion; and Sadanand and Kess (1990) found that 82% of their senior high school students
indicated that force is required to maintain motion. Furthermore, it appears that students hold
onto this idea tenaciously. Clement (1982) found that 75% of a group of university students
still indicated a force in the direction of motion after one semester of instruction in mechanics.
Even courses specifically designed to change this conception may have limited success: Thijs
(1992:166), working with secondary students, found only a 10% improvement in scores after 5
weeks of instruction, and concluded that the course is not successful in remedying the impetus
idea, that is simply associating force and motion.
Similarly, Gunstone, Champagene, and Klopfer(1981:31) found, after an 8-week course
designed to change their students alternative conceptions about force and motion, that most
students had not abandoned an Aristotelian view. As this alternative conception is so resistant
to change, it represents a major challenge to science educators. However, given the "crowded
curriculum" with which many teachers are faced, particularly at secondary school level, it is
unlikely that most would be in a position to devote a large amount of time to changing any one
particular alternative conception that their students hold even one as prevalent as described.
One possible solution is to teach mechanics at a younger age. Younger students would have
formed their conceptions more recently, and are therefore likely to be more easily influence by
input from the teacher. Osborne and wittrock (1983).
Numerous scientists have researched Newton's laws of motion. The impetus theory attempts
to explain why objects slow down and eventually stop. The impetus theory as revealed by
Kuhn (1977) is as follows:
"The (projector) impresses a certain impetus or motion force into the moving body, which
impetus acts in the direction toward which the mover leveled the moving body, either up or
down or laterally or circularly and by the amount the mover moves that moving body more
21
swiftly, by the same amount it will impress in it a stronger impetus. It is by that impetus that
the stone is moved after the projector ceases to move. But that impetus is continually
decreased by the resisting air and by the gravity of the stone which inclines in a direction
contrary to that in which the impetus was naturally predisposed to move it. Thus the
movement of the stone continually becomes slower until the impetus is so diminished or
corrupted that the gravity of the stone evens out over it and removes the stone down to its
natural place.
According to Drake (1970), Galileo formulated originally, and in a form equivalent to
Newton's first law, the Principle of Inertia, thus establishing the equivalence between uniform
rectilinear motion and rest. In one of the classical' thought experiments' in the ' Dialogue',
Galileo introduced the idea of conservation of motion by arguing that a ball moving in a
horizontal plane will remain in a state of uniform motion unless resisted by external
impediments.
Although the first clear statement of the principle of inertia was made by Kuhn (1977); Drake
(1970), the final step toward a fully inertial perspective in mechanics was provided by Newton
viz. "Every body continues in its state of rest, or uniform motion in a straight line, unless it is
compelled to change that state by forces impressed on it." Dijksterhuis (1961). His second and
third law and his law of uniform motion followed this axiom.
There is convincing evidence to support the statement that school children, and even some
university students, tend to use pre — Galilean ideas when analyzing movement. Watts and
Zylbersztajn (1981) showed that questions asking about the forces on a stone thrown vertically
upwards in the air, and about forces on a cannon ball in flight from muzzle to ground. The
response to these questions indicated that about 85% of the pupils associated force and
motion. They saw the stone as having a force upward away from the person's hand as the
stone move upwards; the cannon ball was seen to have a force away from the cannon, moving
it through the air.
Clement (1982) showed that pupils gave incorrect answers when asked to draw arrows
showing the forces on a coin moving upwards. In 90% of the cases, the error involved the
drawing of a force- arrow pointing upwards. Clement suggested that most students presented
conceptions, which were very similar to the Impetus theory. It is interesting to note that the
explanations advanced by the university students ofthis study, when solving the coin problem,
were similar to the ones presented by third year pupils who participated in one of the Watts
and Zylbersztajn (1981) studies, when solving the equivalent stone problem.
The studies presented above support the view that pre —Galilean ideas about force and
movement are not only prevalent among school children, but also in certain cases do persist
even after years of formal exposure to physics teaching. There is also evidence to suggest that,
at least when projectile motion is considered, the conceptions are closer to the medieval
impetus theories than to the older Aristotelian misconceptions.
Bar (1986) has shown that preconceptions existed at a very early age, four to six year olds
were shown to believe that heavy and light objects thrown from the same height , will hit the
ground at the same time. Children between the ages 6 and 7 based on their own experiences of
lighter objects going further when thrown, believe lighter objects will hit the ground first.
From age seven extending into adulthood people say that heavier objects fall faster as they
believe objects fall because they have weight. Then there are again those who believe that both
will reach the ground at the same time.
Driver and Easley (1969), Anderson (1977) have shown that students maintain a separation
between "physics" and the "real world" and avoid making basic conceptual changes, giving
the impression that by "learning " the material they have made such changes. There is a
special "school knowledge" that exists outside the child's everyday experiences and is only
used to answer "school type" problems and questions. Aguirr (1988) have shown that
preconceptions are deeply embedded in the student's minds. This study revealed that
preconceptions are amazingly tenacious and resistant to extinction, therefore efforts should be
made to help students develop a more encompassing view of physical phenomena.
23
Champagne, Klopper and Anderson (1980) showed that students in one group accepted either
on the basis of hearsay or experience that " objects accelerate when they fall freely". Of this
group some students accepted another proposition viz. " the faster an object moves the greater
the force acting on it. For these students this proposition is intelligible and plausible: they
know what it means and it accords with common everyday experience, for a car to drive faster,
the engine has to exert a greater force. In this study students accepted the notion that the force
of gravity in a laboratory is significantly greater at the floor than at the ceiling. Champagne
referred to this as the gravity gradient concept. This shows that learners reconcile the three
concepts above.
The examples show the possible interdependence of existing conceptions and conceptions
under consideration i.e. the status of one conception will depend on the status of another
through their reconcilability. According to this study a different conclusion could be reached
at a later stage if the status of one or another conception were to change.
To exemplify the problems entailed in changing status consider a second student with the
same conceptions as above. The second student then performs an experiment that shows the
force of gravity is constant in a laboratory. This is in direct contradiction to the above
concepts, which corresponds to his everyday experience. The simple way for him is to reject
the experimental findings. Another way for him is to undergo conceptual change where the
above concepts like those of the group of students can be rejected in favor of the experimental
finding. This leads him to reduce the status of those concepts held similar to the group leading
to conceptual change. An individual faced with a new conception has to consider many
aspects of both new and existing conceptions before the conception is either rejected or
incorporated.
Terry and Jones (1986) showed that pupils seem to be very unclear about the forces involved
in a case of static equilibrium. They show that a very common misconception appears to be
that the two forces of a third law pair act on the same object to keep it in equilibrium. This can
be compared with an earlier study by Terry and Jones (1985) in which younger children
thought that only one force acted on a box at rest on a table — the downward force due to
24
gravity. But older students who had been taught Newton's third law cited that this was the
reason the object was in equilibrium. This type of misconception was confirmed by a second
problem, which showed a stone falling under gravity. Some were unable to suggest a force
that could be paired with the pull of the earth on the stone. Others incorrectly identified air
resistance as the appropriate force.
Terry and Jones (1986) showed in a question based on the static situation a picture of a person
standing on the ground and pupils were asked to identify Newton's third law force which is
paired with the weight force, only two pupil's of a sample of thirty nine identified it as the
force exerted by the person on the earth. Over two thirds identified it as the force exerted on
the person by the ground. In another problem students were shown a stone falling freely under
gravity. Once again they were asked to identify the force that is paired with the gravitational
force of the earth acting on the stone. Only four corresponded correctly, about half of the
sample suggested air resistance as the paired force. In a problem where a diagram showed a
pair of magnets being used in an attempt to get a vehicle to move. About 90% thought the
vehicle would move and gave their reason as the attracted forces between them.
The same research revealed in another question two roller skaters A and B of equal mass were
connected by a rope. The pupils were asked what would happen if A only pulled on the rope.
About 90% correctly predicted that the skaters would move towards each other. But when they
were confronted with a situation in which the mass of B was clearly, greater than that of A,
about halve of them stated that B would remain stationary and A only would move. In another
question pupils were asked to compare the impact forces when an insect hits the windscreen of
a moving car. About 60% thought the force exerted by the windscreen on the insect would be
greater than force exerted by the insect on the windscreen. This altogether shows that students
misinterpret Newton's third law. Where one force was clearly shown as 'the force of the earth
on the stone', it was insufficient to prompt students to give the corresponding force as the
stone on the earth. Where pupils attempt to identify a third law pair force, they do not see the
need for forces to act on different objects.
25
Vienot (1979) provided substantial evidence based on the response of large number of
students belief based on the Aristotelian belief and its implications as can be stated viz.
An object goes in the direction on which it is pushed. Therefore, there has to be a force acting
in the direction in which it is pushed.
Similarly gravity and weight seem to puzzle students in their understanding of forces and
motion. The studies by numerous researchers below indicate that students grapple with these
misunderstandings from elementary school right up to university level.
The problematic nature of children's views on gravity and weight were documented over the
whole spectrum of student's ages, from elementary school (Nussbaum & Novak, 1976), to
high school, college, university students (Gunstone and White, 1980, 1981) and school
teachers (Kruger, Summers and Palacio,1990). Watts (1982) described students' knowledge
about weight and gravitation in terms of eight possible frameworks. Regarding the leading
science curricula in England, he showed that the relationship between weight and gravity is
not always made clear. Galili (1993) showed that the majority of science textbooks define
weight as a synonym for gravitational force exerted by the body on the earth (weight
definition I). Alternatively weight is defined as the force exerted against the support (weight
definition II). The scientific correctness of alternative definition II was discussed by King
(1962), Taylor (1974), Iona (1975) and French (1995).
The main criticism against weight definition I is that the term weight is used to measure two
different physical entities: the gravitational force which is a force acting at a distance; and the
directly measured contact elastic force, which is responsible for the result of weighing (the
spring balance reading). Because of the nonunique relationship between the two, their
unconditional equating, or the claim of their identity, is wrong.
Educational researchers, however, in their investigations of childrens' or students' views,
usually refer to weight definition I (weight gravitational force identity) as the only scientific
26
concept (e.g., Anderson,1990; Bar et al, 1994) and ignore the alternative definition II, which
they regard as non scientific. The evidence that children and adults differentiate between the
concepts weight and gravitational force (Vincentini- Missoni, 1982; Ruggiero, Carteli, Dupre
and Vincentini- Missoni, 1985; Noce, Torosantucci and Vincentini, 1988: Kruger, et al 1990)
could be evaluated completely different if one considers both weight definitions. According to
Newtonian mechanics, the gravitational force happens to be numerically equal to the elastic
force, but not in all cases. Thus this equality holds in a state of rest, but is violated by any
accelerated motion (e.g. Earth's rotation).
Within the epistemological perspective, the contact force plays a unique role in the
consolidation of the mental image of weight. Gravitational definition I, at least its introductory
version ensures the gravitating masses, the distances between them, to be the only parameters
to cause weight. When the masses are kept constant, distance becomes the only remaining
variable. Moreover, a calibrated spring scale presents a unique force-meter of practical use in
all science- physics classes (Arons, 1990). Both weight and gravitational force is any other
force, are expected by students to be measured by the force meter.
Galili and Kaplan (1996) found it possible to represent students operations with weight as the
application of few operational schemes. Although the schemes may not represent students
cognitive system, but they can be used as if they were, to obtain a comprehensive and short
description of students thinking. The schemes are as follows:
Scheme 0 There is only one weight concept
Schemel Weight (or weight force) is directly and unconditionally related to the empirical
weighing results obtained by means of a calibrated spring scale.
Scheme 2 Observable or predictable alterations of weight are related to distance parameter,
according to the rule: "more distance less weight". This relationship is the first seemingly
coming to mind.
27
Scheme 3 Observable or predictable alterations of weight are related to other forces or
pressure (of air, water, or ground), which can compete with the gravitational force causing
weight reduction or addition.
Scheme 4 Weight is due to the surrounding medium. This scheme extends scheme 3, claiming
the existence, creation, or transfer of the weight force by medium (air).
Scheme 5 Observable predictable changes of weight are related to the movement of the object
(observer). Within this framework, sensations associated with movement (such as losing
support in falling or floating) are interpreted as changes of weight reduction or addition.
Scheme 6 Eight is defined with an inherent and invariant quality of the body. This use is
reminiscent of mass, though students often attribute to the body both constant characteristics-
mass and weight.
In many ways, these schemes represent students' postinstructional knowledge, which
contradict the ideas insured by instruction and the intention of the physics teachers regarding
the knowledge "inducted" in students minds.
2.5 CONCLUSION
The literature review shows how students understanding of nature is influenced by culture,
community, religion, and their own worldviews. This provides us with sufficient information
to choose appropriate methods to acquire information about what they understand about forces
and motion, and what method of teaching to employ in assisting learners to overcome
misconceptions. The following chapter will explain what methods were used in teaching and
the results achieved. Thereafter, focus will be given to various methods that can be used in this
research, and the methods that will be implemented in this research.
28
CHAPTER THREE
METHODS OF TEACHING
3.1 INTRODUCTION
The shortcomings of the current methods of assessment in addressing the erroneous views of
students' will be highlighted in this chapter. The current methods are a continuation of
traditional methods used to emphasize quantitative manipulative tasks rather than qualitative
understanding. This chapter will discuss traditional methods. It was stated that this study
would assess high school students' qualitative understanding of forces and motion and
extraneous variables, which influence their understanding. It was also stated that any pattern
of common error prevalent in students understanding may indicate the source of
misconception or alternative frameworks and how teaching should address it in making
students unlearn them. In this chapter, attention will be given to the methods to be used in this
study.
The following will be emphasized in this chapter:
3.2 Possible Causes of Misconceptions which include a Historical
Sketch of Teaching since the 1960's.
3.3 Integration of Language and Everyday Concepts with Scientific
Concepts.
3.4 The Constructivist Method of Teaching
3.5 Interviews and Written Methods Used for Identifying
Misconceptions.
29
3.2 A HISTORICAL SKETCH OF TEACHING SINCE THE 1960'S
Previous research reports reveal that misconceptions occur in various science subjects over a
number of years. There has been a failure of traditional research, methods of teaching and
assessment in addressing the problem.
Research on teaching of the kind that flourished in the 60's and 70's had come under a severe
beating during the 80's. The research then had been characterized by Tom (1984:2) as "at best,
inconclusive, at worst, barren" and "inadequate to tell us anything secure and important about
how teachers should proceed in the classroom"
During these times teaching was based on objectives the teachers wanted to achieve rather
than outcomes students were supposed to learn. According to Barrow (1984:213) the attempt
to lay a scientific basis for the art of teaching had failed. The interpretivists Erickson(1986:
120) called for a focus on the "immediate meaning of action from the actors point of view" a
focus they found absent from the research on teaching in the 60's and 70's. There was a sharp
difference between the theoretical presuppositions and those of the quantitative, objective-
seeking researchers. Erickson (1986:120) showed that teaching focussed on behavior rather
than on behavior and its meaning (i.e. on actions), the standard researchers had disregarded the
interpretations of teachers and students. The interpretivists considered the focus on specifics of
action and meaning perspective to be overlooked by the objectivist research on teaching.
According to Erickson (1986:125) the standard researchers of the 60's and 70's rejected the
conception of cause as mechanical or chemical or biological. They rejected the assumption of
uniformity in nature-the assumption that phenomena would occur in the same way in different
places and times. Instead the interpretivists emphasized the effects of peoples' action on their
interpretations of their world, which could create the possibility that people may differ in their
responses to the same or similar situations. A person's worldview of reality was not used in
science education research.
According to Eisner (1991) schools and classes should base their models from art criticism
and not scientific investigation. Yet Eisner (1991: 114) does not deny "the primary ideal for
30
educational criticism is that it should contribute to the enhancement of the educational process
and through it to the educational enhancement of students", Eisner (1991:59) proposes that
qualitative studies can provide guides. " Guides call to our attention aspects of the situation or
place we might otherwise miss". Eisner believes qualitative inquiry has practical benefits:
Teachers who have become educational connoisseurs can critique each other's work, and such
criticism will improve teaching. We have again a causal hypothesis to the effect that a certain
kind of interaction among teachers will improve the quality of their interactions with children
and, hence, will improve the education of their children.
Erickson (1986: 132) asks us to take note of the undoubted fact that the same behavior (e.g.,
speaking while another speaker is still speaking) may have different meanings in different
cultural contexts. For this reason, his interpretive model rejects the assumption of uniformity
and looks instead for " variability between behavioral form and intended meaning".
Erickson reported that on an experiment designed to test the hypothesis that classroom failure
by some minority group children is the result of a mismatch between the culture of the home
and that of the classroom. Earlier ethnographic research established that the conversational
patterns of native Hawaiians was distinctive in that the speakers utterances overlapped one
another instead of following a brief pause. In an educational experiment derived from this
research, one set of teachers permitted overlapping speaking turns while another set of
teachers teaching matched groups did not. The children's reading achievement was found to
be higher in the experimental groups. This research is being implemented in public classrooms
with native Hawaiian students. This research appears to fit the educational trial with
conversational pattern reinforced by teachers as the independent variable and reading
achievement as the dependent variable.
Erickson (1991:137) says that the important research question is " What are the conditions of
micropolitics in the social organization of classroom life that set off a contest of wills between
teacher and students in which the students refuse to learn what the teacher intends". Erickson
(1991:137) describes a point of view that suggests that either the teacher or the students alone
do not cause these conditions. Students and teachers become locked in relations that are
31
mutually destructive. The two, " for the most part are unwittingly failing one another. The
teacher and student collaborate in producing a situation in which the student achieves school
failure". Erickson is referring to a number of possibilities, which can be the method of
teaching, which wants to achieve quantity rather than quality, or situations where teachers use
the lecture approach and students are passive listeners. In such situations students are not
actively involved in learning by doing, problem solving, analyzing, concluding but are passive
learners.
Champagne et al (1983) have shown that concept acquisition is a complex and gradual process
and one can learn better if one is an active participant in the learning process. The approach to
teaching and learning should change by both the teacher and the students, this implies a
paradigm shift. The role of the teacher should change from the traditional authoritarian figure
to that of facilitator or mediator. The teacher should plan activities where the learners become
active participants in the learning process. Students should be engaged in activities that
develop knowledge, skills, values and attitudes. The learning process should be an open
process where the students are aware of what is expected of them. Students should be exposed
to various methods and techniques of assessment, such as peer assessment, self-assessment. In
all types of assessment students should know the criteria and should be provided with a
checklist for peer and self-assessment.
On the otherhand Erickson could be referring to situations where students have preconceived
ideas, misconceived ideas or alternative frameworks and teachers are not aware of the pre-
knowledge students bring to the classroom.
33 INTEGRATION OF LANGUAGE AND EVERYDAY CONCEPTS WITH
SCIENTIFIC CONCEPTS
If science is a set of practices that reflect ways of thinking and acting, then teaching only from
the perspective of the body of knowledge creates misconceptions. If educators can gain an
understanding of the ways of thinking and acting in science, classrooms can then reflect-
32
values such as curiosity and critical thinking. The teaching of scientific concepts has been a
subject of intense interest in science education.
Vygotsky (1986: 255) " The relationship between thought and word is a living process:
thought is born through words. A word devoid of thought is a dead thing and a thought
embodied in words remain a shadow." Words are dynamic and not static, the relationship of
thought to words constantly change. Howe (1996) says that language and thinking develop
throughout childhood, the semantic components of words change, new meanings are attached
to words already known. Consider children using same words as adults' use in speaking of
observations, phenomena, or ideas, the words do not carry the same meaning for the child as
they carry for the adult. Howe ( 1996) has shown that Piagetian theory has three elements that
used widely accepted ideas of what constitute good instructional practice in elementary
science. These are:
Where students discover concepts as a consequence of applying logical thought to the
results of his or her own interaction with objects and phenomena encountered in the
classroom and everyday experience. The object of science lessons is for students to make
sense of their environment through exploration, experimentation, and discussion; there is
emphasis on the importance of the use of manipulable objects (" hands on science"), and
on the teachers' role as one of creating a supportive climate in which children can work.
Cognitive development proceeds in stages that are universal and predictable. Here
curricula are designed to take into account the developmental level of students when
deciding which science concepts are appropriate for students at the various grades and
levels.
The third aspect of the Piagetian theory is consructivism. Each indivual constructs
knowledge and meaning for himself or herself This study showed that learning is an
organic process of accumulation.
According to Vygotsky' s (1986: 146) statement " To devise successful methods of instructing
the school child in systematic knowledge it is necessary to understand the development of
scientific concepts in the childs mind" the term scientific concepts encompasses words such as
33
social sciences, languages, and mathematics as well natural sciences and content gained from
everyday experiences.
3.4 THE CONSTRUCTIVIST METHOD OF TEACHING
Over the last decade, there has been considerable effort to use the findings of research into
childrens preconceptions in science to inform teaching practice as showm by (Driver &
Oldham, 1986). Tobin, Butler Kahle, and Frazer (1990) pointed out that teachers generally do
not hold constructivist views on learning. Attempts to introduce teachers to the constructivist
ideas are asking teachers to change not only their views about learning, but also the classroom
practices, which result from them. The study has shown examples of teachers' journeys as
they try to come to grips with constructivism and its implications for teaching.
Teachers find difficulty in making a transition to what might be considered constructivist
based teaching practices. In general terms such teaching takes account of the prior ideas and
understandings of the pupils, the nature of the intended learning outcomes, the conceptual
demands placed upon the learner and the strategies available to the teacher.
(Carmichael, Driver, Holding, Phillips, Twigger and Watts, 1990; Pfundt & Duit, 1994)
showed that the 1980s saw an explosion in research focussing on children's understandings
within content- specific domains of science. The rationale has been the recognition of "
childrens' ideas" as playing an integral role in the teaching and learning process that attempts
to promote a scientific understanding of a particular domain. What a child is already thinking
it has been argued will have a crucial bearing on how he or she might interact with teaching
and has a determining role in any subsequent learning. That this is may appear obvious in
science education is a testament to wide spread influence of the "constructivist movement".
Hawkins (1994) showed that although constructivism as a general philosophy has a long
history, the article by Driver and Easley (1978) is commonly taken to mark the beginning of
the constructivist movement in science education.
34
The interpretation of childrens' expressions, gained via interview or survey, has generated a
range of ideas which has become widely accepted as a representation of what children think.
There is an established " content" of childrens' ideas as shown by (Driver , Squire,
Russhwoth, & Wood Robinson, 1994). These are ideas about various phenomena which
children have and bring with them to the classroom.
It is common belief that learning is the result of the interaction between what the student is
taught and his current ideas or concepts. " Driver et al (1978) have shown that by identifying
misconceptions or "alternative frameworks, and understanding some reason for their
persistence, does not provide a reasonable view of how a student's current ideas interact with
new, incompatible ideas. Although Piaget (1974) developed one such theory, Driver et al
(1978: 76) believe there is a need for work to focus " more on the actual content of the pupils
ideas and less on the supposed underlying logical structures". Several research studies by
Nussbaum (1979), Nussbaum et al (1976), have investigated the substance of actual beliefs
and concepts held by children. However the central question of recent philosophy of science is
how concepts change under the impact of new ideas or new information.
Lakatos (1970) labels scientists central commitments as their 'theoretical hard core" and
suggests that these commitments generate " research programmes" designed to apply them to
and defend them from experience. When the scientists require new concepts and new ways of
seeing the world, the central commitment has to be modified. For Lakatos this is a change of
research programmes. When students use existing concepts to deal with new phenomena, this
is known as assimilation. When current concepts are inadequate to deal with some new
phenomena the student replaces or reorganizes his central concept, this is known as
accommodation. However even in a major conceptual reorganization not all concepts are
replaced, many of their current concepts will govern the process of major conceptual change.
The following important conditions must be fulfilled before an accommodation can occur:
There must be dissatisfaction with existing conceptions.
A new conception must be intelligible
A new conception must appear initially plausible
35
(4) A new concept should suggest the possibility of a fruitful research programme. It should
have the potential to be extended, to open up new areas of inquiry.
Toulmin (1972) refers to concepts, which govern conceptual change, as "conceptual ecology"
.The following kinds of concepts are particularly important determinants of the direction of an
accommodation.
Anomalies: The character of specific failures of a given idea is an important part of
ecology, which selects its successor.
Analogies and metaphors: These serve to suggest new ideas and make them intelligible.
Epistemological commitments:
Explanatory ideals- subject matter specific views concerning what counts as a successful
explanation in the field
General views about the character of knowledge
4) Metaphysical beliefs and concepts:
Metaphysical beliefs about science: Beliefs concerning the extent of orderliness,
symmetry, or non randomness of the universe are often important in scientific work and
can result in epistemological views which in turn can select or reject particular kinds of
explanations. Such beliefs played a large role in Einstein's thought. Beliefs about the
relations between science and commonplace experience are important.
Metaphysical concepts of science: Specific scientific concepts often have a metaphysical
quality in that they are beliefs about the ultimate nature of the universe and are immune
from direct empirical refutation. A belief in absolute space and time is an example.
5) Other knowledge:
Knowledge in other fields
Competing concept: One condition for the selection of a new concept is that it should
appear to have more promise than its competitors.
36
Niedder and Schecker (1992) believe that learning and teaching are related multidimensional
processes of an extremely complicated nature, both of which are far from being fully explored.
Some researchers like (Minstrell, 1992) emphasized that the reorganization of preinstructional
knowledge via spontaneously constructed cognitive units or "facets". Others like (Grayson,
1993) emphasized the integration of naive knowledge with formal scientific ideas, while
Clement, Brown, Camp, Kudukey, Minstrel, Schultz, Steinberg and Veneman, (1987)
proposes to facilitate the latter's evolution through the use of anchoring analogies. A more
radical approach describes conceptual change as a type of phase transition or " conceptual
exchange" This approach analyses the conceptual tension between the students knowledge and
a taught scientific idea and the resolution of the conflict in a newly constructed schema as
shown by (Hewson, 1981), while (Posner et a1,1982) believes whether built through unfruitful
attempts or " fumbling about", or (Dykstra, 1992) who showed through well defined series of
stages. When students' operational knowledge is investigated there is often a conceptual
mismatch between what is actually acquired and formal knowledge despite satisfactory
declarative knowledge. Suppose that formal knowledge allows more than one way to describe
a certain physical phenomena or to define a particular physical concept. A factor to guide
science educators is the distance between student's original knowledge and the formally
presented dogma. From this perspective, student's knowledge in the domain should be
considered. This analysis might also elucidate origins of some commonly observed
misconceptions.
The expression "childrens' science" was suggested by Gilbert, Osborne and Fensham (1982)
in order to describe those views of the world (composed by beliefs, expectations and meanings
for words), which do not match those of their scientific counterparts, scientist science. The
expression "teacher science" was used to represent the teachers' viewpoints on ideas, as
presented to a group of students. Teachers usually prepare their lessons by using curricular
materials, and since a specific curriculum can be viewed, in itself, as a particular version of
scientific knowledge, The expression curricular science can be suggested to represent this
37
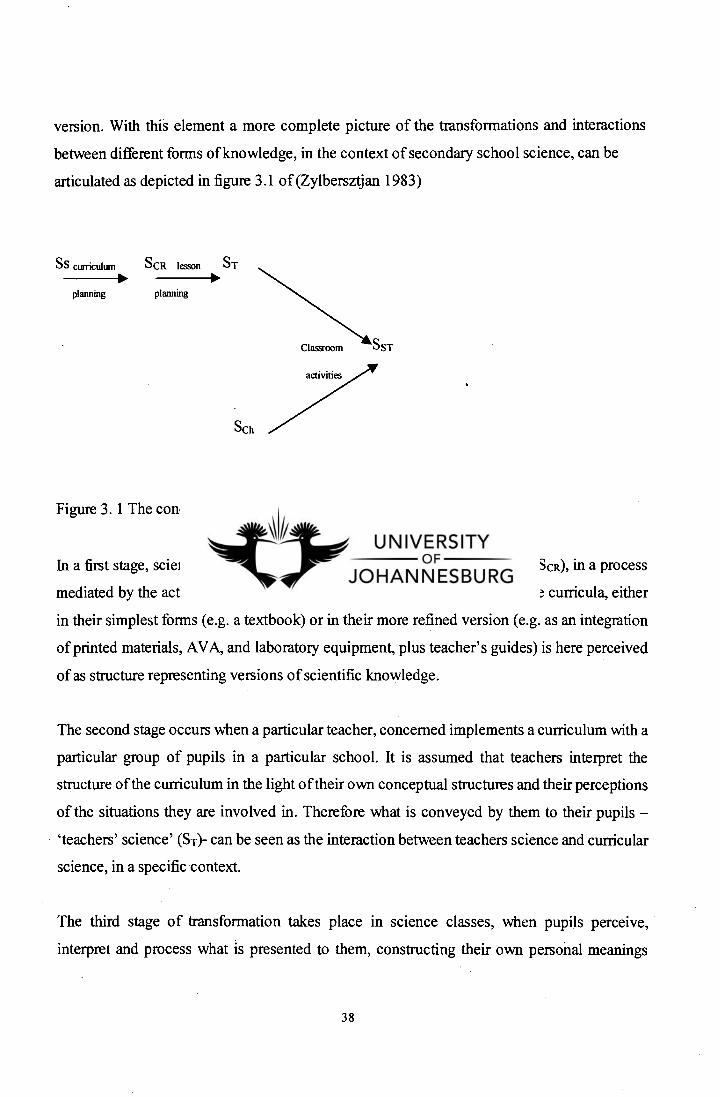
version. With this element a more complete picture of the transformations and interactions
between different forms of knowledge, in the context of secondary school science, can be
articulated as depicted in figure 3.1 of (Zylbersztjan 1983)
Ss curriculum SCR lesson ST
planning planning
activities
SCh
Figure 3. 1 The conceptual framework.
In a first stage, scientist science (Ss) is transformed into curricular science (SCR), in a process
mediated by the action of curriculum planners and textbook writers. Science curricula, either
in their simplest forms (e.g. a textbook) or in their more refined version (e.g. as an integration
of printed materials, AVA, and laboratory equipment, plus teacher's guides) is here perceived
of as structure representing versions of scientific knowledge.
The second stage occurs when a particular teacher, concerned implements a curriculum with a
particular group of pupils in a particular school. It is assumed that teachers interpret the
structure of the curriculum in the light of their own conceptual structures and their perceptions
of the situations they are involved in. Therefore what is conveyed by them to their pupils —
'teachers' science' (ST)- can be seen as the interaction between teachers science and curricular
science, in a specific -context.
The third stage of transformation takes place in science classes, when pupils perceive,
interpret and process what is presented to them, constructing their own personal meanings
38
from their activities they were asked to perform. It is in that process that their previous
knowledge, childrens' science appears to play an important role. These activities are
conceptualized in the framework as the interaction between childrens' science and teachers'
science, the result of which is students' science. Science teachers naturally aim at achieving a
close alignment between students' science and curricular science, but this is not a frequent
outcome of secondary school science classes, as revealed by Gilbert et al (1983).
Teachers often have the wrong expectations of their students especially when they use the
lecture and demonstration method. In the traditional lecture approach, physics courses are
treated as transferable commodities that students can readily consume on their own. Moreover,
concepts and principles in physics are often presented episodically. One concept or principle is
presented after another without necessarily showing how they all relate to one another in
coherent structures, and how they can be systematically used for describing, explaining,
predicting, controlling, and designing real world systems and phenomena. A common call has
been to restructure the materials presented in science courses in a manner that reflects the
nature of scientific knowledge, and to engage students actively in learning processes that build
on students initial knowledge state AAAS (1990,1993), NCEE (1983); NRC (1996) NSTA
(1993, 1995).
In schematic modeling students are guided through reflective and interactive modeling
activities whereby their initial knowledge is considered a cognitive stepping stone on their
way to the scientific world. Students initial cognitive states are discussed based on the level of
commensurability between the students' own concepts and their scientific counterparts. In this
study students will be guided to develop generic scientific reasoning skills and a coherent view
of and about scientific knowledge. Instructors need to be especially aware of the initial
Knowledge State of their students, and of the processes that can facilitate the students'
evolution into the scientific realm.
Components of initial knowledge include student's subject matter, as well as their learning
styles and general views about knowing and learning science. In the case of
incommensurability between a student construct and the desired scientific one, two situations
39
may arise that need to be treated differently. In one instance, the student's construct may have
flaws without being wrong. It can be said that the student construct is underlined at the mental
level by a paraconception. This when the student believes objects of the same mass and
different shapes are subject to gravitational interactions of different magnitudes. The student
then needs to know that a flat sheet of paper falls slower than identical sheet crumpled into a
ball not because of different gravitational pulls but because of different drag forces exerted by
the air. In such a case students' don't need to be engaged in a process of conceptual change to
replace their constructs, but in a process of refinement. Smith, Disessa and Roschelle (1993)
argues that students need to be encouraged to consider the limits of their conceptions without
denying the validity of these conceptions, and to get engaged in activities that allow them to
use what they already know in more general and powerful ways and Team where and why
pieces of knowledge that are conceptually correct may only work in more restricted contexts.
In some instances, the student construct may actually be entirely wrong from a scientific
perspective. This however is a misconception and true conceptual change is needed for the
student to evolve into the scientific realm. This is the case when a student believes that
terrestrial objects fall because air pushes down on them. Students holding this belief are wrong
on at least two accounts viz.
First they attribute the gravitational pull to the air and not the earth.
Secondly they consider air to be conducive of motion and not resistive (Wrong direction).
Unlike students with paraconceptions, students encumbered with misconceptions need to
replace their constructs with scientific ones. Conceptual evolution can be meaningfully
achieved when students are motivated to negotiate their individual constructs with their peers
and the teacher within the context of what we call paradigm situations. Modeling paradigm
situations should be done interactively. Students can then be transformed from passive
recipients of canned knowledge to critical seekers and active producers of generic knowledge.
The interaction is optimized when students cooperate in heterogeneous groups, inside as well
as outside the classroom, along the guidelines recommended by Hake (1992, 1996) and Heller,
Keith and Anderson (1992).
40
It is important for students to learn how to design, carry out, and evaluate a research project. It
is equally important that students develop the rules and ethics of teamwork, and get sensitized
to value such work and stand accountable for it. They should appreciate the value for open
minded debate, and learn how to defend their own position, how to challenge others positions,
and how to slip into others shoes so that they can see the pro's and con's of any argument both
from their own perspective and others.
The teachers' role is central in the proposed pedagogical framework. The teacher has to
mediate learning at different levels: from putting groups together to coaching their work; from
scaffolding novel scientific constructs to prompting individual students and groups with
questions that guide them through the cognitive processes and help them organize their
knowledge coherently around basic schematic models; from designing authentic assessment
instruments to consulting with individual students on their progress, and so forth. In short
there is no learning without teaching; however, for teaching to result in meaningful learning, it
must avoid episodic lecturing and promote schematic modeling in a student- centered
approach.
The constructivist view that prior knowledge is a major factor determining learning outcomes
as shown by (Ausubel, 1968) has become widely accepted. In many areas of school science,
children have prior knowledge about phenomena that significantly differ from knowledge to
be learned.
A cognitive conflict strategy will be used to design teaching/ learning activities aimed at
developing aspects of the Newtonian concept of forces and motion. The individual, group
interviews and the pretest will be used to see what correct or alternative concepts students hold
about forces and motion. Research by Dekkers (1997) showed that students beliefs about
motion and its causes, often expressed as "motion implies force", do not contradict scientific
beliefs, provided when we accept when students use the concept force, they refer to a concept
which differs from the scientific concept of force. Students do not distinguish concepts as
41
precisely as scientist, have beliefs that may be incorrectly generalized to unfamiliar contexts,
and frequently express their views in nonscientific terms.
Literature such as revealed by Clement (1982) suggests that the Newtonian concept of force is
incompatible with student's alternative, impetus conceptions. Posner et al (1982) showed that
learning the concept may require learning through accommodation, which requires students to
become dissatisfied with their initial conceptions. After determining students "alternative
frameworks" the study will attempt to create dissatisfaction using a conflict strategy. (Dreyfus,
Jungwith and Eliovitch, 1990) believes that meaningful conflict alone does not ensure the
construction of intended knowledge, but also the use of class discussion and careful mediator
guidance to assist the students in resolving the conflict.
The mediator will introduce appropriate scientific arguments if the students are unable to find
these arguments themselves as researched by (Driver & Oldham, 1986). Pre/postcousre testing
showed that the approach was successful, but only in a limited sense. Elements of students
prior knowledge that could be developed before the experience of conflict and could assist the
students in dealing with cognitive dissonance will be done for some concepts. The student's
dissatisfaction with their existing conceptions is one of the conditions for accommodations.
However, alternative conceptions may be fully adhered to by students, and are not easily
abandoned as shown by Wanderse, Mintzes, and Novak (1994). Thus, the creation of
dissatisfaction may require that students are confronted with the inadequacies and limitations
of their existing conceptions. Most of the previous investigators cited above point out that
confrontation may not always be a productive strategy.
However, the view that instruction should confront alternative conceptions is broadly adhered
to in alternative conception research as shown by (Smith, Disessa and Roschelle, 1993).
Accordingly in many teaching approaches, the students' cognitive structures are externalized,
after which students are confronted with discrepant empirical events or opposing views as
revealed by (Wandersee, et al 1994).
42
The " cognitive conflict" that arises may result in students becoming dissatisfied with their
conceptions. Conceptual change theory suggests that, if additional cognitive, motivational, and
methodical conditions are satisfied, conceptual replacement should occur. In this analysis the
educators' main challenge is not to make students aware that they have incorrect ideas, but to
make them aware of the context dependence of their statements and create in them a need for
conceptual differentiation.
To perceive the alternatives of their conceptions and to resolve the dissonance they
experience, students need the very same conceptual "tools'. Therefore, students should be
provided with the tools to resolve dissonance before the dissonance occurs. In drawing from
other approaches, the approach that will be presented here attempts to find a new balance
continuum between assimilation and accommodation learning. The use of conflict creates
stimulating and motivating learning events, ifproperly used. Concept development may utilize
more than by reasoning by analogy alone. Driver et al (1986) have realized that students will
not be able to discover scientific concepts on their own. However, developing the scientific
view, as far as it agrees with the students prior views, may start well before the restructuring
phase. Thus the students own arguments for resolving the anticipated conflict may be
enhanced.
The approach used in this research attempts to develop the tools for solving the problem by
refining the students existing knowledge, but leaves the process of solving the problem as
much as possible to the students themselves, concrete elaboration of the confrontational
approach is given in the "constuctivist teaching sequence" of Driver et al (1986).
The sequence contains five phases:
orientation;
elicitation of ideas;
restructuring of ideas;
application of restructured ideas; and
review of change in ideas.
43
In the restructuring phase (3) creation of cognitive conflict is attempted, followed by the
generation of new conceptions to resolve the conflict. Discussion and teacher guidance is
directed at the acceptance, in consensus, of a new conception of a scientifically higher quality.
Phases 4 and 5 are directed at consolidation and generalization of the new conception.
Alternative conceptions about movement and force are often used as a prototype example of a
situation where accommodation — learning is required as revealed by Pines et al (1986). These
conceptions are said to resemble mediaeval "impetus" conceptions more closely than
Newtonian concepts. Clement (1982) suggests a teaching approach based on the historical
development of the Newtonian concepts.
By retaining and developing students' correct prior conceptions of force, rather than focussing
merely on replacement of incorrect ideas, a more effective teaching approach will be sought.
Proper teaching and effective learning cannot take place with misconceptions deeply
embedded in the minds of students. As a result of the long syllabus to complete and the large
numbers of students in the classroom the teachers' task of identifying the misconceptions
becomes a mammoth task. However, this research identifies students' preconceptions by way
of the interviews and the pretest.
The programme uses group work for students to discuss and share their ideas among the
group, then to the entire class. The researcher acts as a mediator guiding students in the right
direction by means of asking questions, which directs the students to the correct way of
reasoning.
44
3.5 INTERVIEWS AND WRITTEN METHODS USED FOR IDENTIFYING
MISCONCEPTIONS
3.5.1 The Interview
Group interviews, individual interviews and written methods are useful methods for
identifying students' conceptions and misconceptions of forces and motion. The general
gathering interview is exploratory, and can be used for mapping out a field and picking up
ideas and information. The general gathering interview can be used for group interviews.
The general gathering interview can be used at the beginning to determine what a person
knows about a topic (White and Gunstone, 1981). This can be followed by the clinical
interview.
The clinical interview has been defined as " a conversation directed to a definite purpose other
than satisfaction in the conversation itself (Bingham, Moore and Gustad, 1959: 3) or what
could be called "professional conversation" Garret(1972: 5). The clinical interview draws
upon the other styles and functions of interviewing and charts its own course. The clinical
interview is directed towards an information gathering function. "It's chief goal is to ascertain
the nature and extent of an individuals knowledge about a particular domain by identifying the
relevant conceptions he or she holds and the perceived relationships among those conceptions"
Posner et al (1982). The idea is to make the person talk of his own accord and notice the
manner in which his thoughts unfold.
The clinical interview can be used for individual interviews. Both types of interviews can be
audio-taped to avoid taking notes while the interviewee's speak.
As a result of the time consuming nature of interviews especially for large samples and the
fact that transcribing interviews is tedious and demanding, written tests can also be used to
collect data for research purposes.
45
3.5.2 Written Methods
It is generally accepted that the interview method is more effective than written methods in
giving in depth information about the nature of student's conceptions. Written methods are
useful where large samples of subjects are being tested. Amir, Frankel and Tamir (1986)
suggested that the requirements to justify the choice of an alternative in a multiple-choice
question could be of great help towards improving this method. Hence teachers can research
their students asking them to provide reasons in the multiple-choice questions. This however
will clear situations where students choose a correct answer without having the correct reason.
Open-ended questions can also be used in research method. Teachers can use this method to
explore students understanding of words and also use open-ended questions to test concepts.
3.5.3 Concept Maps
In concept mapping students are expected to identify key concepts and establish links between
them. Ogude (1992) believes that the examination of such concept maps can reveal the
students misunderstanding state of existing knowledge and in turn misconceptions.
A student must be able to give a particular concept or problem involved, in the form of a
sketch. This will indicate if the problem is understood and if the solution to the problem is
possible. Maarschalk and Strauss, (1991) have shown that the technique of"concept mapping"
is still unknown to the Natural Sciences.
One of the major drawbacks of concept mapping is the time and effort needed for learners to
take part in this process. Also a lot of time has to be spent by the researcher teaching learners
how to construct concept maps.
This study will not employ this method as a result of the limited time available for the
subjects, however since teachers are full time with their students it is advisable that they use
this method of research whenever possible. However, a combination of various methods
including the constructivist method will be used in the programme of this research.
46
3.6 CONCLUSION
Chapter four will discuss in detail how the various methods discussed in this chapter have
been used in the empirical study. The various methods employed in the empirical study
includes interviews, written methods with open-ended questions, multiple-choice questions
with reasons and the constructivist approach.
47
CHAPTER FOUR
EMPIRICAL STUDY
4.1 INTRODCTION
In chapter three, methods for identifying misconceptions in Science, and forces and motion in
particular have been identified. This chapter will focus on how the detailed descriptions of
chapter three are used in the different phases of the investigation. In this chapter a detailed
description of how the procedures identified in chapter three will be used in the different
phases of this investigation
4.2 THE PURPOSE OF THE RESEARCH
As explained in chapter one, the purpose of this investigation is to identify misconceptions in
forces and motion of grade 9 and 12 Physics students. Once the misconceptions have been
identified by collecting qualitative and quantitative data, a programme will be carried out with
the students to remediate the misconceptions. A post-test will be used to assess and evaluate
the effectiveness of the programme. Finally, a programme will be produced for teachers to
implement in the classroom to reduce or possibly eliminate misconceptions of students.
4.3 RESEARCH QUESTIONS
In order to determine what views students hold about forces and motion, at different
educational levels viz. at grade 9 and 12, the following questions will be considered:
What are students difficulties or misunderstandings, if any, in relation to describing
concepts in forces and motion?
What is the pattern in student misunderstanding of these aspects at different educational
levels namely grade 9 and grade 12?
What are the possible sources of these difficulties?
48
What instructional methods can be used to help students to overcome these difficulties and
acquire scientific conceptions? How successful would that instructional method be?
The concepts to be tested in forces and motion will focus on the following:
What do students believe about the concepts viz. force, weight, mass, gravitational force
and freefall?
What do students understand about Newton's first law?
What do students understand about Newton's Second law of motion?
What do students understand about action reaction forces (Newton's third law of motion)?
What do students understand about gravity and falling bodies?
What do students understand about the relationships between force, acceleration, mass,
weight and velocity?
What do students understand about relative velocity.
4.4 GRADES 9 AND 12 INTERVIEWS
This study will be confined to schools in GDE. The GDE public schools emanates from four
ex- departments viz. EX- Transvaal Education Department (EX-TED), EX -Department of
Education and Training (EX-DET), EX- House of Representatives (EX-HOR), and EX- House
of Delegates (EX-HOD).The milieu, ethos, managerial styles and cultures of teaching and
learning vary considerably in these schools.
The research was carried out not to determine students abilities to do quantitative manipulative
tasks but rather; to assess their qualitative understanding of forces and motions.
Conducting interviews and administering questionnaires were used. Interviews were
conducted with grades 9 and 12 students on the qualitative understanding of questions on
forces and motion (see appendix A). The initial task was to build a general picture of the
problem areas by conducting group interviews. This phase of preliminary interviews were
conducted in March 1999, as recorded in appendix A. The preliminary interviews were
conducted with grade 9 and12 students from four ex-departmental schools. Subsequently
49
detailed interviews consisted of the clinical interview Posner et al (1982). The clinical
interviews were conducted in May 1999.
4.5 IDENTIFICATION OF MISCONCEPTIONS
The content and timing of both the interviews were not pre-specified since they evolved from
the difficulties as they arose in context. The interviews were conducted with high school
students on the qualitative understanding of the concept forces and motion so that the students
could verbalize their views on this concept. The initial task in this work was, to build a general
picture of the problem areas with the idea of isolating the less important views from the more
important ones required for this investigation. The students were interviewed after they
completed the topics on forces and motion.
4.6 INTERVIEWS CONDUCTED
Interviews were conducted with grade 9 students' from EX-DET, EX-TED, EX-HOD, and
EX-HOR schools in the Alberton district. Firstly a group of grade 9 students were interviewed
to determine a general picture of students understanding of forces and motion, for each of the
above mentioned schools. In May 1999 the clinical interviews were conducted with individual
students. The purpose of the clinical interview was to determine more specifically what
students understand about forces and motion. These interviews were audiotaped and then
transcribed in appendix A for the group interviews and individual interviews. Similarly the
grade 12 students were interviewed from each of the ex-departmental schools in the Alberton
district. All interviews were conducted with interest and respect for the interviewees,
flexibility in response to their points of view and to allow the interview to take its own course,
but guided by the interviewer. The questions were simple and straightforward. Leading
questions were avoided so that the interviewee did not give responses, which he/she thought
the interviewer would like to hear and be unreliable and misleading as evidence. Questions
were carefully phrased to avoid suggesting an answer and allowing the interviewer to relate
his/her understanding of the topic.
50
The tape recorder was used in such a way as not to draw attention to it and to avoid
interrupting the course of the interview. The tape recording was conducted in a quiet room
where the interview was not disturbed by others talking and no loud noises in the background.
The interview was conducted in privacy to ensure an atmosphere of full trust and to avoid
distractions and interruptions as far as possible. In the group interviews the informants'
response stimulated others in the group. This also led to debating and arguing, which led to the
emergence of consensus among the group of certain ideas and divisions about others. Most of
the time group interviews led to co-operative discussions. Lots of information was picked up
in this way.
The group interviews were exploratory to map out the field and pick up ideas and information.
In this way the problem was defined.
The clinical interview was used to ascertain the nature and extent of the individual knowledge
about forces and motion by recording the interviewee's ideas and the relationships among
those ideas.
Two groups of grade 12 students were identified viz., higher grade (HG) and standard grade
(SG) students. The two groups (HG and SG) write different exams at the end of the year, but
since the same work was covered for both groups, and both groups were taught in the same
classroom, only one group (either HG or SG) was interviewed.
The students were interviewed after the topic on forces and motion was completed.
4.7 PRELIMINARY (GROUP) INTERVIEWS
At this early stage of the research it was not possible to prescribe the content of the interviews,
since it was to be determined by the difficulties as they arose. The literature review on forces
and motion indicate that students find difficulty in understanding Newtonian mechanics, and
fall most of the time between the Aristotle view and the impetus theory. On the basis of these
51
findings and experience with student's answers especially in the grade 12 marking centres,
open-ended questions were designed to retrieve reliable information.
The aim of the questions were to elicit the interviewees qualitative understanding of forces and
motion and at the same time to allow students to speak of their own free accord that would
reveal areas of difficulty. The interviews were based on students understanding of concepts
such as weight and mass, which led to concepts such as gravitational force, free fall etc.
Student's ideas about falling bodies, action reaction pairs, and forces acting on rectilinear
surfaces were also tested.
The sections interviewed forms part of the grade 9 and 12 syllabus on forces and motion. Each
group of students was interviewed on at least eighty percent to one hundred percent of the
topics mentioned above.
Some of the misunderstandings among students were easily overcome during the course of
discussions and did not therefore represent misconceptions. However, incorrect explanations
appear to be popular among a large number of students in all categories covered and kept on
recurring during the interviews. It was these common and incorrect explanations, which were
of particular interest in this work. These interviews identified areas of concern, which were
investigated further in the interviews with individual students (see appendix A).
The full interviews for each group of grade 12 students lasted approximately one hour. The
interviews were based on general questions of forces and motion and provided a non-
intimidating atmosphere for the interviewees. The interviewees expressed their views freely.
The full interview for grade 9 students lasted approximately forty-five minutes. The level of
questions was based mostly on the sections of forces and motion prescribed for grade 9.
52
4.8 THE DETAILED (INDIVIDUAL) INVESTIGATION
A second set of interviews was planned which focussed on specific difficulties, which arose
during the preliminary investigations. They were conducted in a similar manner to the group
interviews except that they were more detailed. The questions were intended to find out what
are student qualitative understanding of forces and motion (see appendix A).
The interviews again began either with the concepts falling bodies or mass and weight, which
led on to concepts such as free fall and gravitational force, and force. In these interviews an
attempt was made to establish students reasons for presenting a particular explanation.
All the interviews were audiotaped and transcribed (see appendix A). In addition to the
interviews a pen and paper questionnaire was administered as part of the detailed
investigation. As discussed in chapter three this method can also give in — depth information
about student's perceptions. In this diagnostic approach the researcher designed a series of
questions comprising common misunderstanding in forces and motion among students, based
on misconceptions identified in the interviews. The questions covered Newton's three laws,
falling bodies and projectile motion (see appendix B).
4.9 PREDOMINANCE AND POSSIBLE SOURCES OF MISCONCEPTIONS
This phase consisted of the detailed investigation. The detailed investigation was based on
information obtained from the group interviews and the clinical interviews, GDE grade 12
results and literature review on forces and motion. In the detailed investigation a questionnaire
was designed and administered to grade nine and twelve students (see appendix B).
53
4.10 PRETESTAND POST-TEST
The pretest and post-test comprised multiple-choice questions and open-ended questions (see
appendix B). These tests were conducted with students from four different schools.
The pretest for grade 12 students comprised section A with open-ended questions on concepts
of forces and motion as well as students understanding of questions based on forces and
motion and a 20 item multiple-choice question. The post-test for grade 12 also comprised
section A which was based on open-ended questions on a girl standing in a lift on a bathroom
operated scale. The scale is calibrated in Newton's. Different readings on the scale were given
for two-second intervals up to six seconds in the questionnaire (see appendix B). Students had
to say if the lift was moving upwards or downwards, and whether the lift accelerating or
moving with constant velocity. Questions were also based on whether the weight of the girl
was changing or remaining constant during the motion of the lift and whether the scale reading
is an upward or downwards force. Section B of the post-test comprised 22 item multiple-
choice questions based on forces and motion.
For grade 9 students the pre and post-test consisted of the same questions. Both tests
comprised Section A with open-ended questions on concepts in forces and motion, and section
B comprised a ten-item multiple -choice questions. The conceptions held by students in the
group and individual interview transcripts were incorporated in the open-ended and multiple -
choice questions. The multiple-choice questions were fixed response items with alternatives
ranging mostly from three to five with six in some cases. The questions were intended to
highlight a certain misconception including distracters incorporating that misconception. The
nature of the misconception selected by subjects pointed to a possible misunderstanding or
difficulty. Where possible similar questions were used for grades 9 and 12, where the syllabi
were common.
The multiple-choice questions revealed the range and predominance of misconceptions held
by students in grades 9 and 12. It also gave insight into the possible sources of the
misconceptions. In the multiple-choice questions students had to supply reasons for their
54
researcher to see the students reasoning behind his or her choice and to save the time of
interviewing students to find out their reasoning.
Studies by Gunstone et al (1981) in mechanics leave space for scepticism and led the
researcher to ask the question to what extent do test results provide reliable evidence for the
progress we are looking for? What factors could then mislead us in our interpretation of test
results? In research, attempts are often made to find better ways for diagnosing students
understanding of basic concepts of classical mechanics. It has been mentioned more than once
(e.g. Fishbein, Stavy and Naim 1989) that correct answers are not always proof of correct
reasoning. Incorrect reasoning within 'alternative frameworks' (Osborne and Gilbert 1980,
Driver 1981) could in some cases provide students with correct answers. A good example of
possible alternative reasoning in the understanding of motion was reported recently by
Eckstein et al (1989). Therefore this research relied on answers to questions with reasons that
would enlighten the researcher as to what were students reasoning behind their answers. For
all the multiple-choice questions, students were expected to supply reasons. Before
administering the tests a pilot test was conducted with another school to validate the level of
understanding of the questions by the students and to see if the language is of the correct level.
For the grade 9 students the pretest and post-test questions were identical comprising the
fcklowing sets of questions:
Questionsland 4 were based on Newton's laws of motion.
Questions 2,3,5,6,7,8 were based on gravity and falling bodies.
Question 9 and 10 was based on the relationship between force, velocity, mass and weight. For
the purpose of determining the perpetuation of misconceptions from grade 9 to grade 12 the
questions correspond as follows:
Questionl of grade 9 corresponds with question 3 of the post-test of grade 12.
Question 2 of grade 9 corresponds with question 5 of the post-test for grade 12.
Question 3 of grade 9 corresponds with question 2 of the pretest for grade12.
Question 4 of grade 9 corresponds with question 3 of the pretest for grade 12.
Question 5 of grade 9 corresponds with question 4 of the pretest for grade 12.
-56
Question 6 of grade 9 corresponds with question 5 of the pretest.
Question 7 of grade 9 corresponds with question 6 of the pretest for grade 12.
Question 8 of grade 9 corresponds with question 7 of the pretest of grade 12.
Question 9 of grade 9 corresponds with question 8 of the pretest for grade 12.
Question 10 of grade 9 corresponds with question 11 of the pretest for grade 12.
For the grade 12 the questions were selected as follows:
Questions 1, 3,9,16 of the pretest and questions 2,3,8,15,21 of the post-test were based on
Newton's 0, 2 nd 3"I laws of motion.
Questions 2,4,5,6,7,13,14,15,17,18,19,20 of the pretest and questions
1,5,6,7,13,14,16,17,18,19,20,21 of the post-test were based on falling bodies and projectile
motion.
Questions 8,10,11 of the pretest and questions 4,9, 10,22 of the post-test were based on the
relationships between force, velocity, acceleration, mass, and weight.
Question 12 of the pretest and questions 11, 12 ofthe post-test were based on relative velocity.
4:13 INSTRUMENTS
A paper and pencil test was administered to student groups of different ages from four ex-
departmental schools. The questionnaire was administered to students after school hours and
both the pre and post-tests for grades 12 lasted approximately one hour. The pre and post-test
for grade 9 lasted approximately half an hour each. The programmes for grade 12 students
were two, two-hour sessions. For grade 9 students, the programmes were two, one-hour
sessions. The question's included tasks that probed, from different perspectives, the cognitive
link students possess between velocity and the exerted force, projectile motion, and falling
bodies. The questions were both quantitative and qualitative but at different levels of
conceptual difficulty. While they were presented in levels of increasing difficulty, the subjects
received them in a random sequence.
57
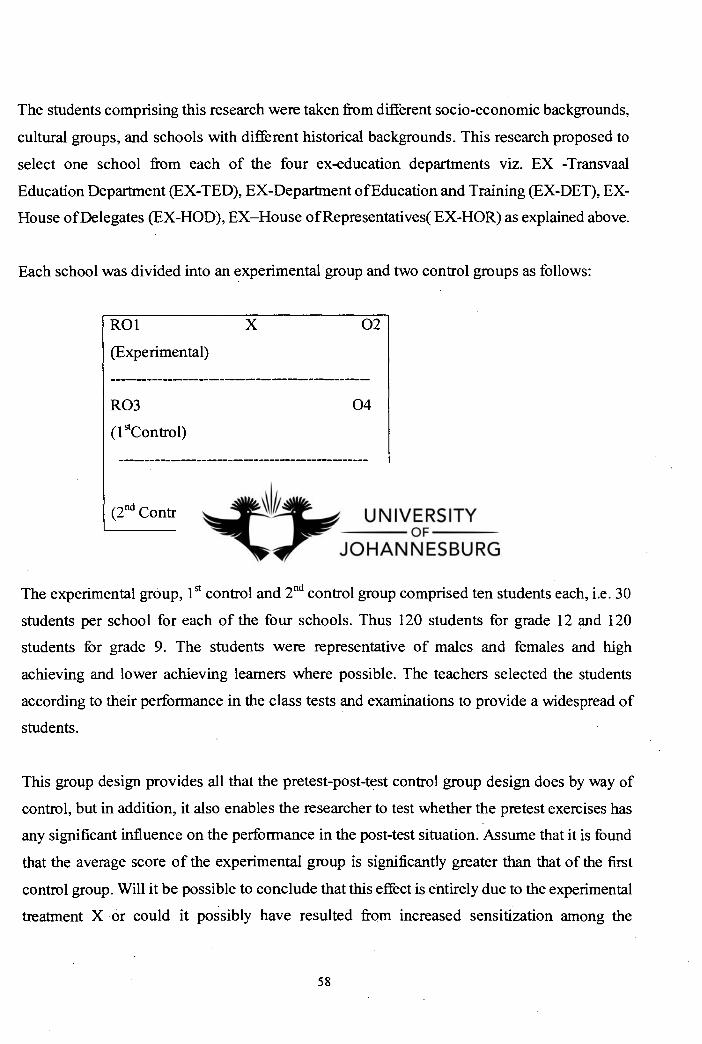
The students comprising this research were taken from different socio-economic backgrounds,
cultural groups, and schools with different historical backgrounds. This research proposed to
select one school from each of the four ex-education departments viz. EX -Transvaal
Education Department (EX-TED), EX-Department ofEducation and Training (EX-DET), EX-
House of Delegates (EX-HOD), EX—House of Representatives( EX-HOR) as explained above.
Each school was divided into an experimental group and two control groups as follows:
RO1 X 02
(Experimental)
RO3
04
(1 stControl)
X 05
(2'd Control)
The experimental group, 1 st control and 2nd control group comprised ten students each, i.e. 30
students per school for each of the four schools. Thus 120 students for grade 12 and 120
students for grade 9. The students were representative of males and females and high
achieving and lower achieving learners where possible. The teachers selected the students
according to their performance in the class tests and examinations to provide a widespread of
students.
This group design provides all that the pretest-post-test control group design does by way of
control, but in addition, it also enables the researcher to test whether the pretest exercises has
any significant influence on the performance in the post-test situation. Assume that it is found
that the average score of the experimental group is significantly greater than that of the first
control group. Will it be possible to conclude that this effect is entirely due to the experimental
treatment X or could it possibly have resulted from increased sensitization among the
58
experimental subjects as a result of the pretest? Cohen and Manion (1991:208-209). The
average score of the second control group enables us to test our suspicion. If the average score
of the second control group is significantly greater than that of the first control group, then it is
safe to conclude that the pretest itself does not exercise any sensitizing effect upon the
experimental subjects. The students subjected to test were grade nine and twelve students from
four schools in the GDE. For each school the experimental group, 1 st Control group B and the
2nd control group comprised ten subjects each. The pretests were conducted from March 2000
to April 2000. By the end of April 2000 to the middle of May 2000, the research programme
was conducted. From the middle of may 2000 to the first week of June 2000 the post-tests
were conducted.
4.14 VALIDATION OF THE QUESTIONNAIRE
The questionnaires were subject to a pilot testing to determine whether the instructions and the
items were understood for the level of subjects they were intended for. Grades 9 and 12
students of different schools validated the questionnaires. These students were specifically
identified with the help of their teacher for this purpose on the basis of their class marks. The
students responded in writing to each item in the questionnaire and this was followed by a
verbal discussion of their responses. In the discussion students were asked if they had any
problem in the understanding of the questions. The class teachers of each grade were also
asked to comment if the questions were appropriate for the students ofthe different grades. On
the basis of the student's responses and recommendations of the teacher, a few questions were
modified for clarity.
4.15 DEVELOPMENT AND APPLICATION OF AN INSTRUCTIONAL METHOD
The misunderstandings revealed in the group and individual interviews provided the basis for
the design of a research programme. The secondary schools chosen to do the research were not
prepared to allow too much time to do the research programme. The reason behind this was
that schools performed badly in the previous years examinations and the Gauteng Department
of Education had declared the schools as educational action zones and Physical Science was
59
regarded as one of the high risk subjects. However, it was negotiated with the managers and
teachers of the schools for time to do the research programme. However the schools agreed to
two two-hour sessions for the grade 12 students and two one-hour programmes for the grade 9
students. Also one hour each was allowed for the grade 12 pretest and post-test, with one half
hour each for the pretest and post-test for grade 9.
The design and application of the strategy of the programme had to be carried out after school
hours. As a result of the above conditions the following limitations had to be taken into
account:
The pretest and post-test had to be designed for not longer than an hour and the
programme had to be structured for two two hour sessions for the grade 12 students and
two one hour sessions for the grade 9 students.
The research had to be completed after sections on forces and motion were completed.
Fortunately as a result of common examinations taking place in these schools, and these
topics appearing first in the work programmes and being completed in the early part of the
first term, it was possible to do the research with grade 12 students in the first term and
grade9 students in the second term.
Since the constructivist approach was adopted, students were required to make notes as
incorrect concepts and explanations were remedied. Summaries of correct concepts were
written on the chalkboard.
4.16 GRADE 12 STUDENTS
The teachers concerned identified thirty grade 12 students in each of the four schools. The
teachers selected students on the basis of higher grade and standard grade students. The higher
grade students learn Physical Science at a more advanced level than their standard grade
counterparts. The same teacher teaches the two groups in the same class. When parts of the
syllabus which are only applicable to the higher grade, are taught in the same class, the
60
standard grades were kept busy with worksheets on work already done. Another distinguishing
factor between the two grades is the higher level of questions testing the higher grades. Also
care was taken to get an even spread of males and females. The teachers divided the groups of
students in three groups of ten. The groups were labeled A, B, and C. Group A was subjected
to the pretest, the remedial programme and the post-test. Group B was subjected to the pre and
post-test. Group C was subjected to the programme and the post-test. While the researcher
taught the experimental group, the teacher kept the control group busy.
4.17 GRADE 9 STUDENTS
The grade 9 students were selected on the same basis as the grade 12 students, except in grade
9 all students write the ordinary grade. There is no higher grade and standard grade in grade 9..
Again there was an even spread of males and females. Forces and motion at secondary school
level are taught to grades 9 and grade 12 students. These sections are not taught in any of the
other grades.
4.18 DEVELOPMENT OF THE TEACHING METHOD
The aim of compiling the teaching and learning programme was to help students reorganize
their concepts and to correct their qualitative understanding of forces and motion. In order to
achieve this, it was decided to use the constructivist approach.
4.19 THE INFLUENCE OF PREVIOUS RESEARCH ON THE INSTRUCTIONAL
DESIGN
The research programme was designed from previous research findings on the development of
teaching programmes aimed at alleviating misconceptions. An effort was made to apply the
constuctivist approach, which proved to be successful in helping students to acquire scientific
concepts, without putting emphasis on the instructional methods.
61

4.20 DESIGNING THE PROGRAMME TAKING PAST EXPERIENCES INTO
ACCOUNT
In preparing the programme there was a need to reflect on current methods of teaching in the
classroom. There was a need to move away from the traditional lecture approach. Judging
from the interviews there was an attempt to identify areas likely to be confusing to students. In
addition to the interviews the ideas of researchers who had previously reported research in this
topic was taken into account.
4.21 STATISTICAL INTERPRETATION OF RESULTS
This section focuses on the statistical analysis of results where tables, summaries and a
description of the findings to be noted as significant or not for the pretest and post-test of the
experimental and control group. The t test for two sets of independent data ( Mulder, 1987 :
147 — 150) was used to see if there were significant differences in various aspects that were
tested.
The pretests of the experimental and control groups will be compared for both grades 9 and 12
students. The pretest and post-test of the experimental group will be compared, similarly the
pre and post-test of the control group will be compared for both grade 9 and 12 students. The
post-test of the experimental group and control group B will be compared and the post-test of
the control group B and control group C will be compared for both grades 9 and 12 students.
All the Ex-Departments pretests for both the experimental group and control group B will be
compared, and similarly for the post-test for both grades 9 and 12.
There will also be a comparison of the grade 9 and 12 results of the same department.
62
4.21.1 THE RESULTS
4.21.1.1 Grade 9 Students present
In the EX-DET school, ten students per group (i.e.groups A and B) were present for the
pretest. For the post-test ten students each were present for groups A, B, and C.
For the EX-TED ten students were present for both groups ie. A and B for the pretest and ten
students each for the post-test i.e. for groups A, B and C.
For the Ex-HOD ten students were present for both groups ie. for A and B of the pretest. For
the post-test, nine were present for the group A, ten for group B, and ten for group C.
For the EX-HOR ten each were present for groups A and B of the pretest. For the post-test ten
were present for group A, nine were present for group B, and seven were present for group C.
4.21.1.2 Grade 12 Students present
In the EX-DET school, ten students per group (i.e.groups A and B) were present for the
pretest. For the post-test ten students each were present for groups A and B, with seven
students present for group C.
For the EX-TED ten students were present for both groups ie. A and B for the pretest and ten
students each for the post-test ie. for groups A, B and C.
For the EX-HOD ten students were present for both groups i.e. for A and B of the pretest. For
the post-test, ten were present for the group A, nine for group B, and ten for group C.
63
For the EX-HOR ten were present for group A and eight were present for group B of the
pretest. For the post-test seven were present for group A, ten were present for group B, and six
were present for group C.
In this chapter the table of results and the statistical analysis is given. The discussion is done in
detail in chapter 5.
Once all the results were obtained the choices in the multiple-choice questions were tabulated
in percentages in tables 4.1 to 4.16. As a result of the reduction in the number of some
students in the post-test of a few groups, the percentages were calculated for the number that
wrote the test. The correct choice was indicated by means of an asterisk (*).
In this chapter the table of results and the statistical analysis is given. The discussion is done in
detail in chapter 5.
64
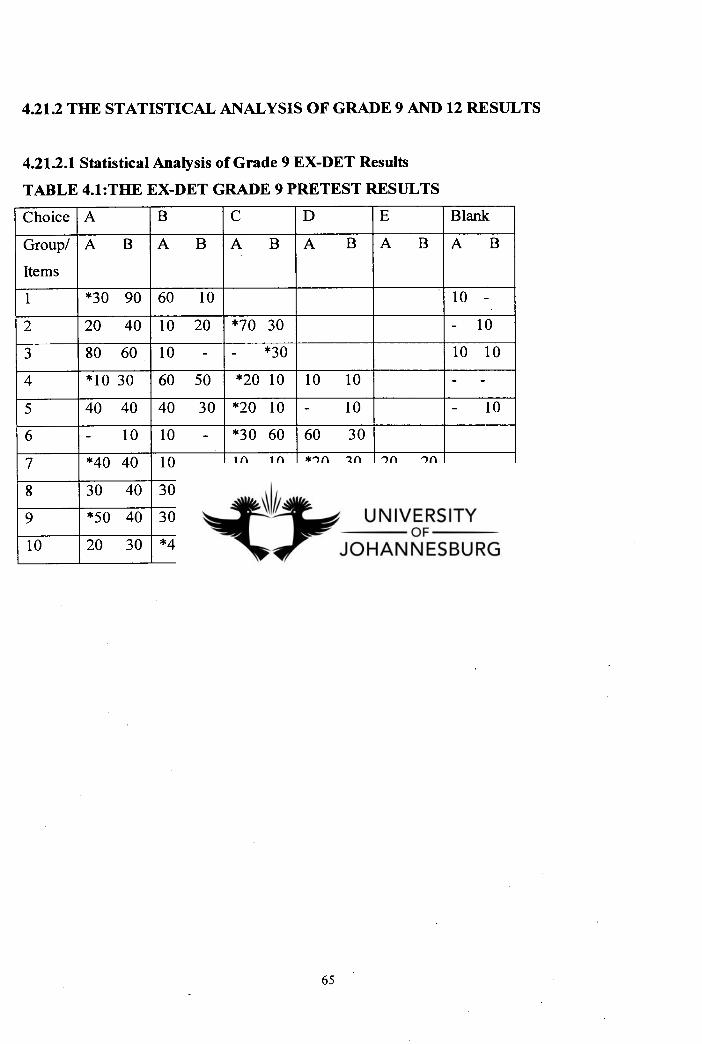
4.21.2 THE STATISTICAL ANALYSIS OF GRADE 9 AND 12 RESULTS
4.21.2.1 Statistical Analysis of Grade 9 EX-DET Results
TABLE 4.1:THE EX-DET GRADE 9 PRETEST RESULTS
Choice A B C D E Blank
Group/A
Items
BA BA BA BA BA B
1 *30 90 60 10 10 -
2 20 40 10 20 *70 30 - 10
3 80 60 10 - - *30 10 10
4 *10 30 60 50 *20 10 10 10 - -
5 40 40 40 30 *20 10 - 10 - 10
6 - 10 10 - *30 60 60 30
7 *40 40 10 - 10 10 *20 30 20 20
8 30 40 30 10. *40 40 - - - 10
9 *50 40 30 40 20 20
10 20 30 *40 40 40 10 - 20
65
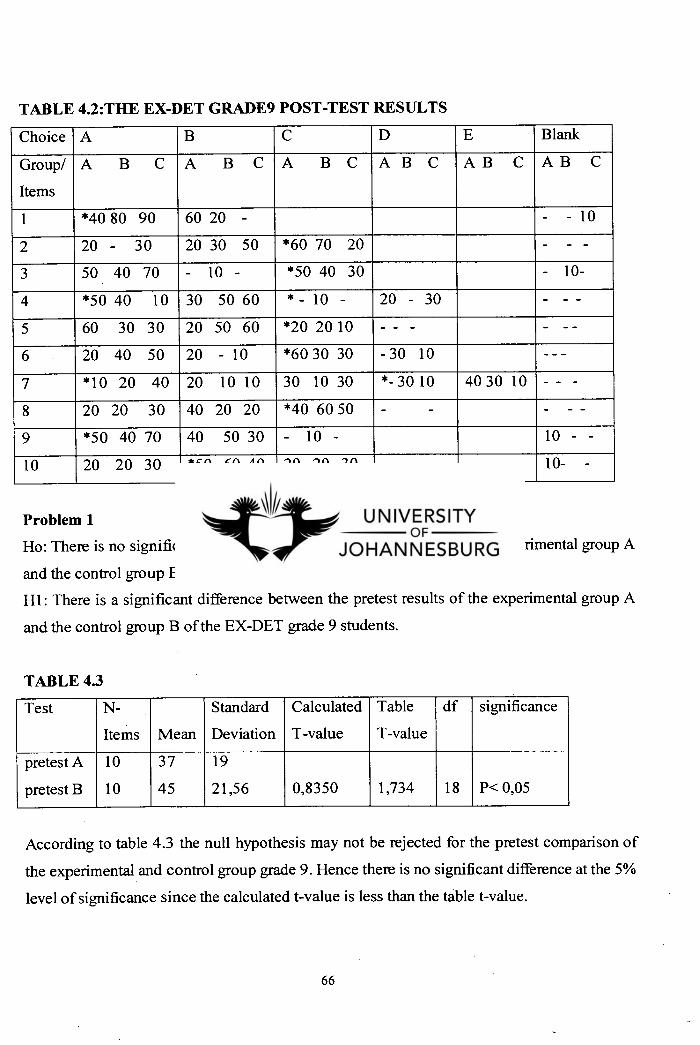
TABLE 4.2:THE EX-DET GRADE9 POST-TEST RESULTS
Choice A B C D E Blank
Group/
Items
A B CA B C A BC ABC A B C A B C
1 *40 80 90 60 20 - - - 10
2 20 - 30 20 30 50 *60 70 20
3 50 40 70 - 10 - *50 40 30 - 10-
4 *50 40 10 30 50 60 * - 10 - 20 - 30
5 60 30 30 20 50 60 *20 20 10 - - - - --
6 20 40 50 20 - 10 *60 30 30 - 30 10
7 *10 20 40 20 10 10 30 10 30 *- 30 10 40 30 10 - - -
8 20 20 30 40 20 20 *40 60 50 - -
9 *50 40 70 40 50 30 - 10 - 10 - -
10 20 20 30 *50 60 40 20 20 30 10- -
Problem 1
Ho: There is no significant difference between the pretest results of the experimental group A
and the control group B of the EX-DET grade 9 students.
Hl: There is a significant difference between the pretest results of the experimental group A
and the control group B of the EX-DET grade 9 students.
TABLE 43
Test N-
Items Mean
Standard
Deviation
Calculated
T-value
Table
T-value
df significance
pretest A
pretest B
10
10
37
45
19
21,56 0,8350 1,734 18 P< 0,05
According to table 4.3 the null hypothesis may not be rejected for the pretest comparison of
the experimental and control group grade 9. Hence there is no significant difference at the 5%
level of significance since the calculated t-value is less than the table t-value.
66
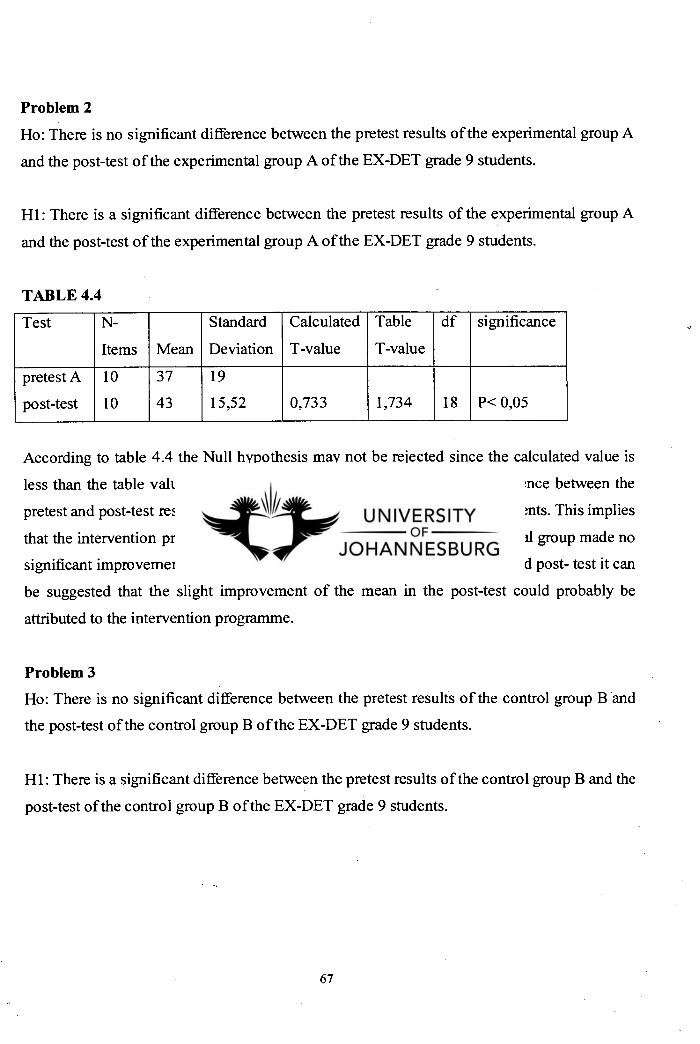
Problem 2
Ho: There is no significant difference between the pretest results of the experimental group A
and the post-test of the experimental group A of the EX-DET grade 9 students.
HI: There is a significant difference between the pretest results of the experimental group A
and the post-test of the experimental group A of the EX-DET grade 9 students.
TABLE 4.4
Test N-
Items Mean
Standard
Deviation
Calculated
T-value
Table
T-value
df significance
pretest A
post-test
10
10
37
43
19
15,52 0,733 1,734 18 P< 0,05
According to table 4.4 the Null hypothesis may not be rejected since the calculated value is
less than the table value for problem 2. Thus there is no significant difference between the
pretest and post-test results of the EX-DET grade 9 experimental group students. This implies
that the intervention programme that was implemented with the experimental group made no
significant improvement. However in comparing the means of the pretest and post- test it can
be suggested that the slight improvement of the mean in the post-test could probably be
attributed to the intervention programme.
Problem 3
Ho: There is no significant difference between the pretest results of the control group B and
the post-test of the control group B of the EX-DET grade 9 students.
Hl: There is a significant difference between the pretest results of the control group B and the
post-test of the control group B of the EX-DET grade 9 students.
67
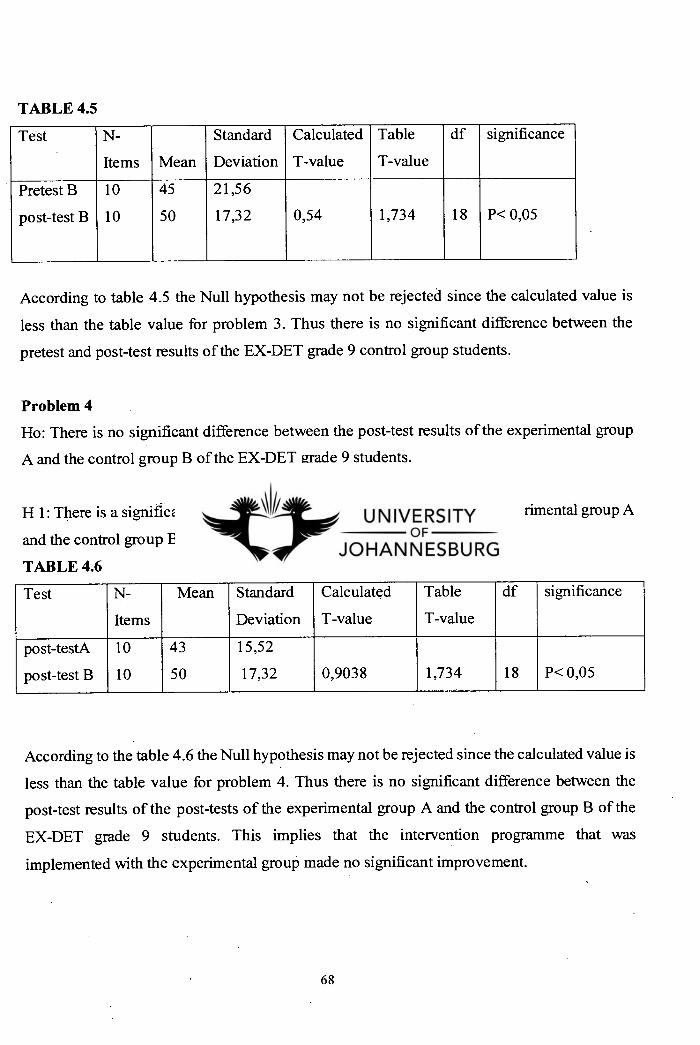
TABLE 4.5
Test N-
Items Mean
Standard
Deviation
Calculated
T-value
Table
T-value
df significance
Pretest B
post-test B
10
10
45
50
21,56
17,32 0,54 1,734 18 P< 0,05
According to table 4.5 the Null hypothesis may not be rejected since the calculated value is
less than the table value for problem 3. Thus there is no significant difference between the
pretest and post-test results of the EX-DET grade 9 control group students.
Problem 4
Ho: There is no significant difference between the post-test results of the experimental group
A and the control group B of the EX-DET grade 9 students.
H 1: There is a significant difference between the post-test results of the experimental group A
and the control group B of the EX-DET grade 9 students.
TABLE 4.6
Test N-
Items
Mean Standard
Deviation
Calculated
T-value
Table
T-value
df significance
post-testA
post-test B
10
10
43
50
15,52
17,32 0,9038 1,734 18 P< 0,05
According to the table 4.6 the Null hypothesis may not be rejected since the calculated value is
less than the table value for problem 4. Thus there is no significant difference between the
post-test results of the post-tests of the experimental group A and the control group B of the
EX-DET grade 9 students. This implies that the intervention programme that was
implemented with the experimental group made no significant improvement.
68
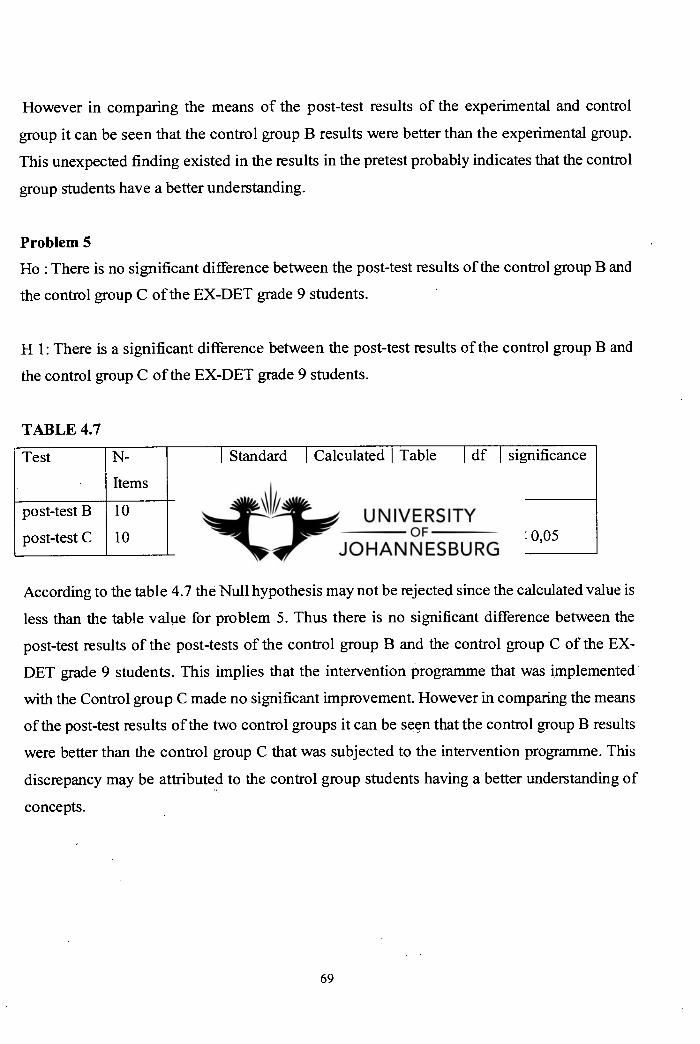
However in comparing the means of the post-test results of the experimental and control
group it can be seen that the control group B results were better than the experimental group.
This unexpected finding existed in the results in the pretest probably indicates that the control
group students have a better understanding.
Problem 5
Ho : There is no significant difference between the post-test results of the control group B and
the control group C of the EX-DET grade 9 students.
H 1: There is a significant difference between the post-test results of the control group B and
the control group C of the EX-DET grade 9 students.
TABLE 4.7
Test N-
Items Mean
Standard
Deviation
Calculated
T-value
Table
T-value
df significance
post-test B
post-test C
10
10
50
43
17,32
22,38 0,742 1,734 18 P< 0,05
According to the table 4.7 the Null hypothesis may not be rejected since the calculated value is
less than the table value for problem 5. Thus there is no significant difference between the
post-test results of the post-tests of the control group B and the control group C of the EX-
DET grade 9 students. This implies that the intervention programme that was implemented
with the Control group C made no significant improvement. However in comparing the means
of the post-test results of the two control groups it can be seen that the control group B results
were better than the control group C that was subjected to the intervention programme. This
discrepancy may be attributed to the control group students having a better understanding of
concepts.
69
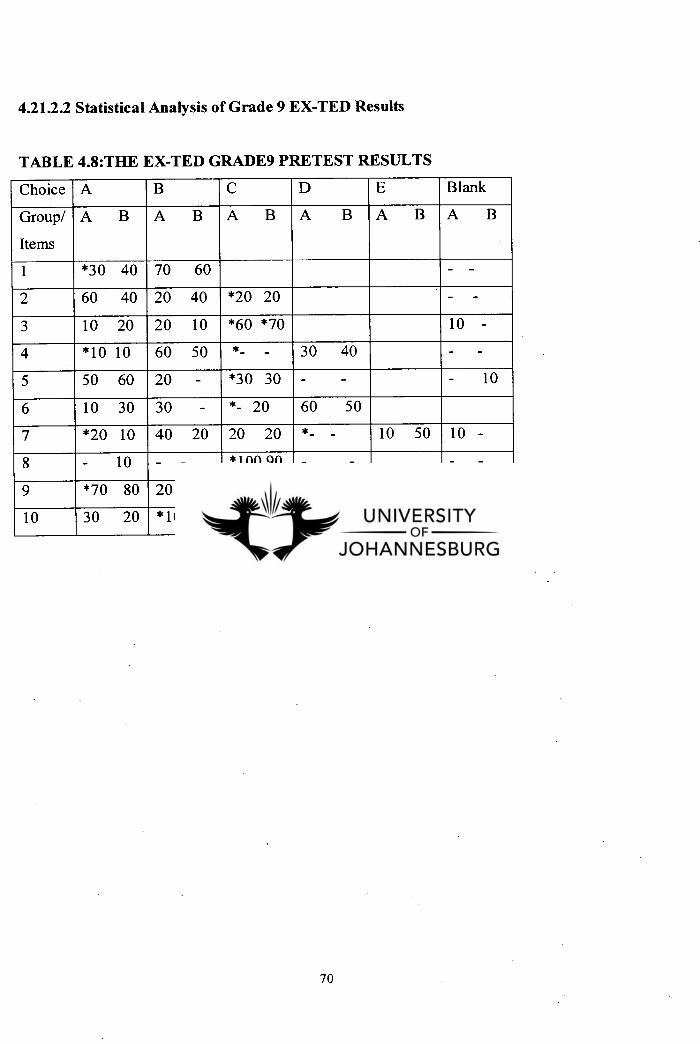
4.21.2.2 Statistical Analysis of Grade 9 EX-TED Results
TABLE 4.8:THE EX-TED GRADE9 PRETEST RESULTS
Choice A B C D E Blank
Group/A
Items
BA BA BA BA BA B
1 *30 40 70 60 - -
2 60 40 20 40 *20 20 -
3 10 20 20 10 *60 *70 10 -
4 *10 10 60 50 *- - 30 40 - -
5 50 60 20 - *30 30 - - - 10
6 10 30 30 - *- 20 60 50
7 *20 10 40 20 20 20 *- - 10 50 10 -
8 - 10 - - *100 90 - - - -
9 *70 80 20 20 10 -
10 30 20 *10 40 60 40 - -
70
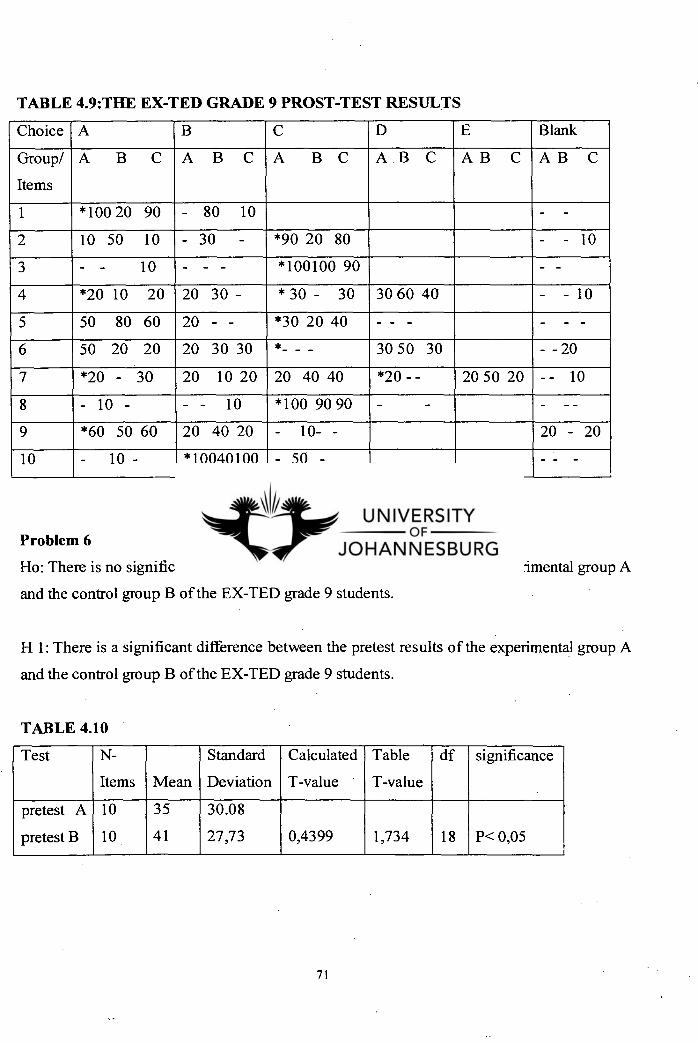
TABLE 4.9:THE EX-TED GRADE 9 PROST-TEST RESULTS
Choice A B C D E Blank
Group/
Items
A B C ABC A BC ABC ABCABC
1 *100 20 90 - 80 10
2
- -
10 50 10 - 30 - *90 20 80 - - 10
3 - - 10 - - - *100100 90 - -
4 *20 10 20 20 30 - * 30 - 30 30 60 40 - - 10
5 50 80 60 20 - - *30 20 40 - - -
6 50 20 20 20 30 30 *- - - 30 50 30 - - 20
7 *20 - 30 20 10 20 20 40 40 *20 - - 20 50 20 - - 10
8 - 10 - - - 10 *100 90 90 - -
9 *60 50 60 20 40 20 - 10- - 20 - 20
10 - 10 - *10040100 - 50 -
Problem 6
Ho: There is no significant difference between the pretest results of the experimental group A
and the control group B of the EX-TED grade 9 students.
H 1: There is a significant difference between the pretest results of the experimental group A
and the control group B of the EX-TED grade 9 students.
TABLE 4.10
Test N-
Items Mean
Standard
Deviation
Calculated
T-value
Table
T-value
df significance
pretest A
pretest B
10
10
35
41
30.08
27,73 0,4399 1,734 18 P< 0,05
71
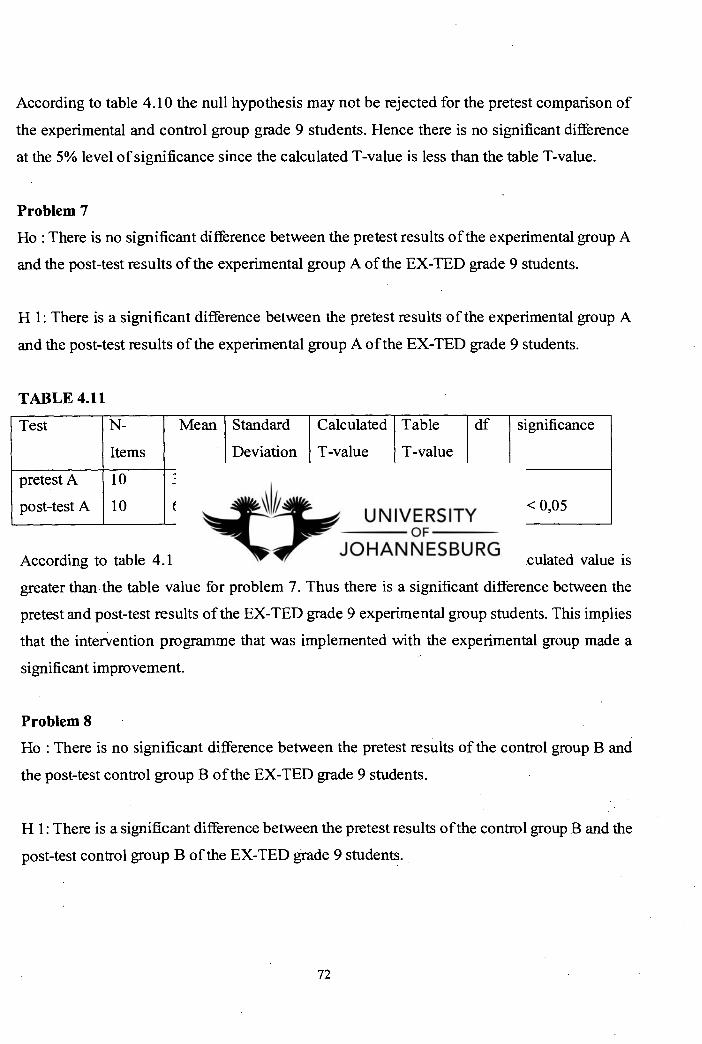
According to table 4.10 the null hypothesis may not be rejected for the pretest comparison of
the experimental and control group grade 9 students. Hence there is no significant difference
at the 5% level of significance since the calculated T-value is less than the table T-value.
Problem 7
Ho : There is no significant difference between the pretest results of the experimental group A
and the post-test results of the experimental group A of the EX-TED grade 9 students.
H 1: There is a significant difference between the pretest results of the experimental group A
and the post-test results of the experimental group A of the EX-TED grade 9 students.
TABLE 4.11
Test N-
Items
Mean Standard
Deviation
Calculated
T-value
Table
T-value
df significance
pretest A
post-test A
10
10
35
67
30.08
34,36 2,1024 1,734 18 P< 0,05
According to table 4.11 the Null hypothesis may be rejected since the calculated value is
greater than the table value for problem 7. Thus there is a significant difference between the
pretest and post-test results of the EX-TED grade 9 experimental group students. This implies
that the intervention programme that was implemented with the experimental group made a
significant improvement.
Problem 8
Ho : There is no significant difference between the pretest results of the control group B and
the post-test control group B of the EX-TED grade 9 students.
H 1: There is a significant difference between the pretest results of the control group B and the
post-test control group B of the EX-TED grade 9 students.
72
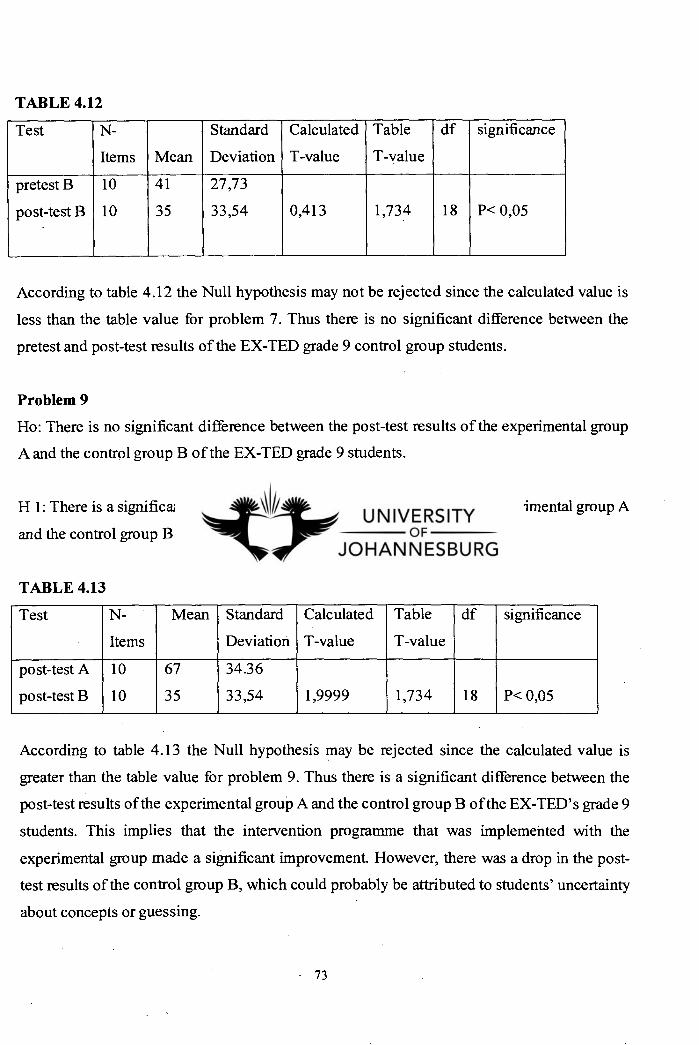
TABLE 4.12
Test N-
Items Mean
Standard
Deviation
Calculated
T-value
Table
T-value
df significance
pretest B
post-test B
10
10
41
35
27,73
33,54 0,413 1,734 18 P< 0,05
According to table 4.12 the Null hypothesis may not be rejected since the calculated value is
less than the table value for problem 7. Thus there is no significant difference between the
pretest and post-test results of the EX-TED grade 9 control group students.
Problem 9
Ho: There is no significant difference between the post-test results of the experimental group
A and the control group B of the EX-TED grade 9 students.
H 1: There is a significant difference between the post-test results of the experimental group A
and the control group B of the EX-TED grade 9 students.
TABLE 4.13
Test N-
Items
Mean Standard
Deviation
Calculated
T-value
Table
T-value
df significance
post-test A
post-test B
10
10
67
35
34.36
33,54 1,9999 1,734 18 P< 0,05
According to table 4.13 the Null hypothesis may be rejected since the calculated value is
greater than the table value for problem 9. Thus there is a significant difference between the
post-test results of the experimental group A and the control group B of the EX-TED' s grade 9
students. This implies that the intervention programme that was implemented with the
experimental group made a significant improvement. However, there was a drop in the post-
test results of the control group B, which could probably be attributed to students' uncertainty
about concepts or guessing.
- 73
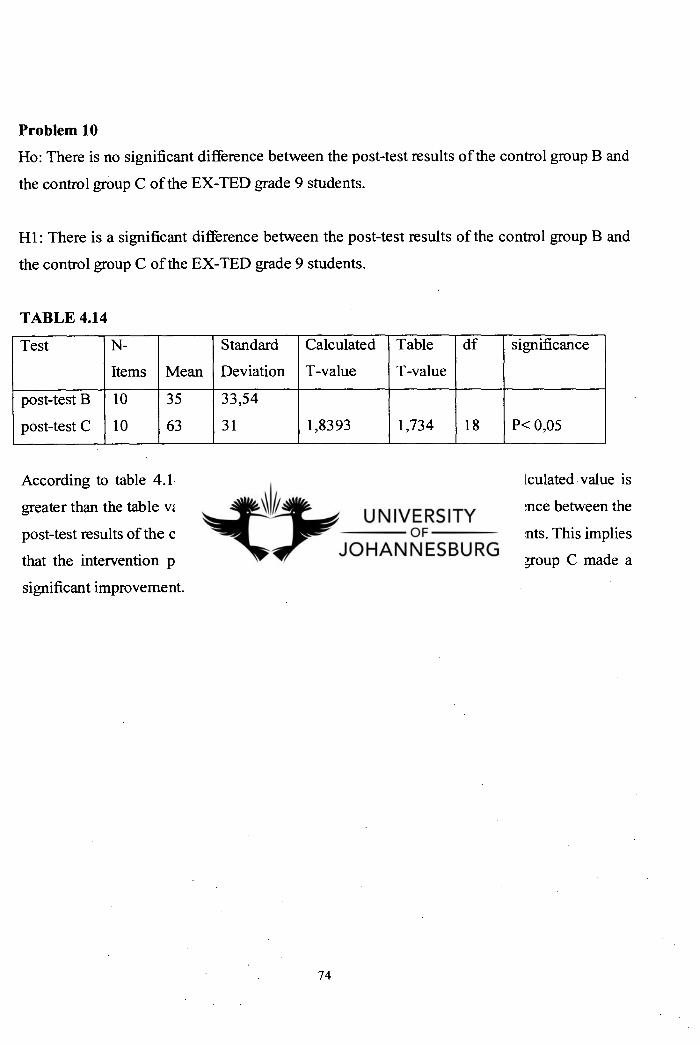
Problem 10
Ho: There is no significant difference between the post-test results of the control group B and
the control group C of the EX-TED grade 9 students.
Hl: There is a significant difference between the post-test results of the control group B and
the control group C of the EX-TED grade 9 students.
TABLE 4.14
Test N-
Items Mean
Standard
Deviation
Calculated
T-value
Table
T-value
df significance
post-test B
post-test C
10
10
35
63
33,54
31 1,8393 1,734 18 P< 0,05
According to table 4.14 the Null hypothesis may be rejected since the calculated value is
greater than the table value for problem 10. Thus there is a significant difference between the
post-test results of the control groups B and C of the EX-TED's grade 9 students. This implies
that the intervention programme that was implemented with the control group C made a
significant improvement.
74
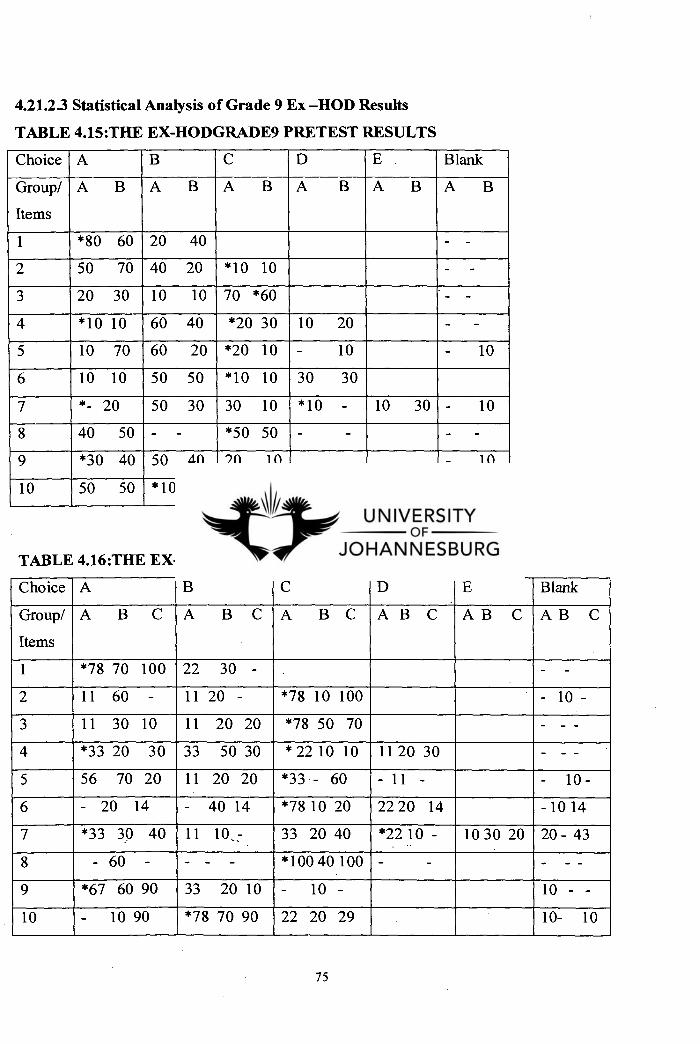
4.21.23 Statistical Analysis of Grade 9 Ex —HOD Results
TABLE 4.15:THE EX-HODGRADE9 PRETEST RESULTS
Choice A B C D E Blank
Group/A
Items
BABA BA BA BA B
1 *80 60 20 40 - -
2 50 70 40 20 *10 10 - -
3 20 30 10 10 70 *60 • _ -
4 *10 10 60 40 *20 30 10 20 - -
5 10 70 60 20 *20 10 - 10 - 10
6 10 10 50 50 *10 10 30 30
7 *- 20 50 30 30 10 *10 - 10 30 - 10
8 40 50 - - *50 50 - - - -
9 *30 40 50 40 20 10 - 10
10 50 50 *10 30 40 20 - -
TABLE 4.16:THE EX-HOD GRADE 9 POST-TEST RESULTS
Choice A B C D E Blank
Group/
Items
A B C A B C A BC ABC A B C A B C
1 *78 70 100 22 30 -
2 11 60 - 11 20 - *78 10 100 - 10 -
3 11 30 10 11 20 20 r- *78 50 70
4 *33 20 30 33 50 30 * 22 10 10 11 20 30 - - -
5 56 70 20 11 20 20 *33 - 60 - 11 - - 10 -
6 - 20 14 - 40 14 *78 10 20 22 20 14 - 10 14
7 *33 30 40 11 10, 7 33 20 40 *22 10 - 10 30 20 20 - 43
8 - 60 - - - - *100 40 100 -
9 *67 60 90 33 20 10 - 10 - 10 - -
10 - 10 90 *78 70 90 22 20 29 10- 10
75
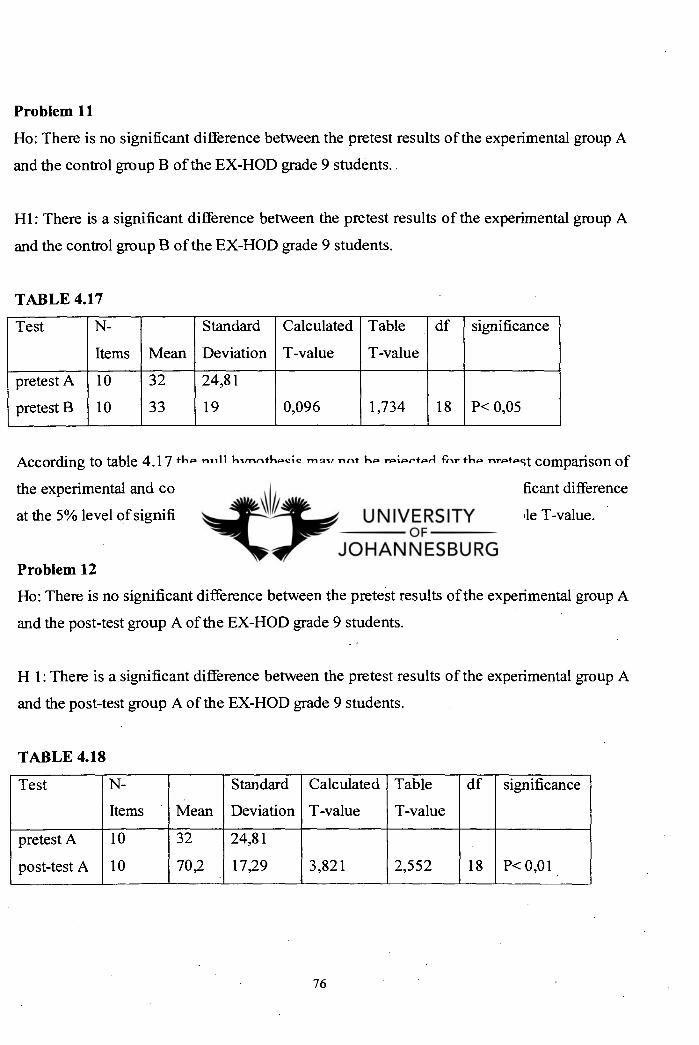
Problem 11
Ho: There is no significant difference between the pretest results of the experimental group A
and the control group B of the EX-HOD grade 9 students.
H1: There is a significant difference between the pretest results of the experimental group A
and the control group B of the EX-HOD grade 9 students.
TABLE 4.17
Test N-
Items Mean
Standard
Deviation
Calculated
T-value
Table
T-value
df significance
pretest A
pretest B
10
10
32
33
24,81
19 0,096 1,734 18 P< 0,05
According to table 4.17 the null hypothesis may not be rejected for the pretest comparison of
the experimental and control group grade 9 students. Hence there is no significant difference
at the 5% level of significance since the calculated T-value is less than the table T-value.
Problem 12
Ho: There is no significant difference between the pretest results of the experimental group A
and the post-test group A of the EX-HOD grade 9 students.
H 1: There is a significant difference between the pretest results of the experimental group A
and the post-test group A of the EX-HOD grade 9 students.
TABLE 4.18
Test N-
Items Mean
Standard
Deviation
Calculated
T-value
Table
T-value
df significance
pretest A
post-test A
10
10
32
70,2
24,81
17,29 3,821 2,552 18 P< 0,01
76
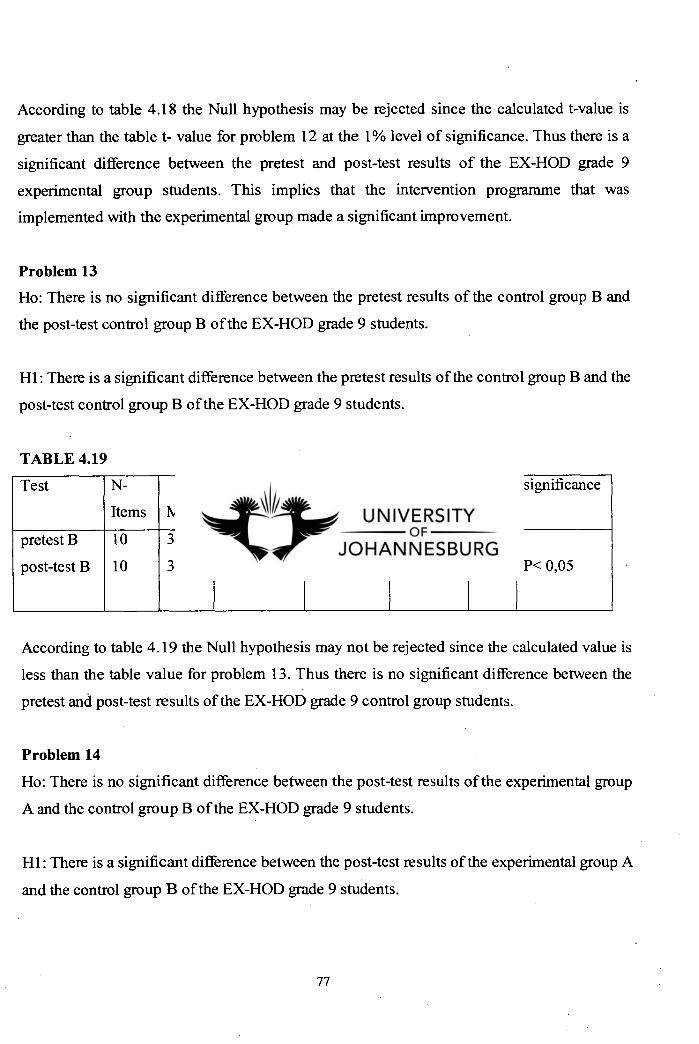
According to table 4.18 the Null hypothesis may be rejected since the calculated t-value is
greater than the table t- value for problem 12 at the 1% level of significance. Thus there is a
significant difference between the pretest and post-test results of the EX-HOD grade 9
experimental group students. This implies that the intervention programme that was
implemented with the experimental group made a significant improvement.
Problem 13
Ho: There is no significant difference between the pretest results of the control group B and
the post-test control group B of the EX-HOD grade 9 students.
Hl: There is a significant difference between the pretest results of the control group B and the
post-test control group B of the EX-HOD grade 9 students.
TABLE 4.19
Test N-
Items Mean
Standard
Deviation
Calculated
T-value
Table
T-value
df significance
pretest B
post-test B
10
10
33
34
19
29,39 0,0857 1,734 18 P< 0,05
According to table 4.19 the Null hypothesis may not be rejected since the calculated value is
less than the table value for problem 13. Thus there is no significant difference between the
pretest and post-test results of the EX-HOD grade 9 control group students.
Problem 14
Ho: There is no significant difference between the post-test results of the experimental group
A and the control group B of the EX-HOD grade 9 students.
Hl: There is a significant difference between the post-test results of the experimental group A
and the control group B of the EX-HOD grade 9 students.
77
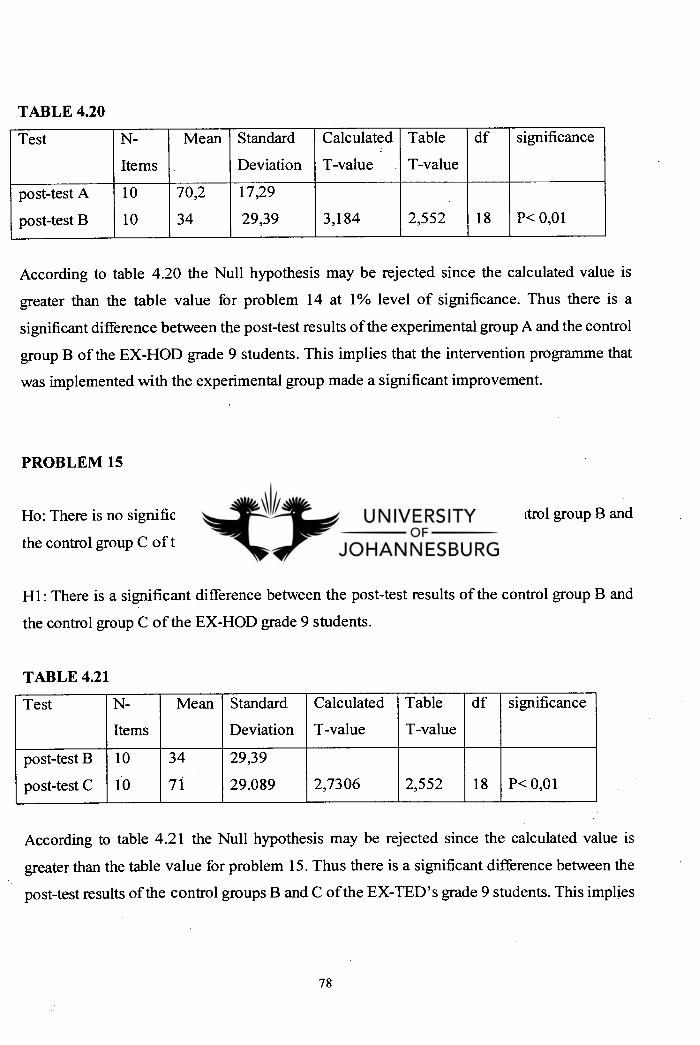
TABLE 4.20
Test N-
Items
Mean Standard
Deviation
Calculated
T-value
Table
T-value
df significance
post-test A
post-test B
10
10
70,2
34
17,29
29,39 3,184 2,552 18 P< 0,01
According to table 4.20 the Null hypothesis may be rejected since the calculated value is
greater than the table value for problem 14 at 1% level of significance. Thus there is a
significant difference between the post-test results of the experimental group A and the control
group B of the EX-HOD grade 9 students. This implies that the intervention programme that
was implemented with the experimental group made a significant improvement.
PROBLEM 15
Ho: There is no significant difference between the post-test results of the control group B and
the control group C of the EX-HOD grade 9 students.
H1: There is a significant difference between the post-test results of the control group B and
the control group C of the EX-HOD grade 9 students.
TABLE 4.21
Test N-
Items
Mean Standard
Deviation
Calculated
T-value
Table
T-value
df significance
post-test B
post-test C
10
10
34
71
29,39
29.089 2,7306 2,552 18 P< 0,01
According to table 4.21 the Null hypothesis may be rejected since the calculated value is
greater than the table value for problem 15. Thus there is a significant difference between the
post-test results of the control groups B and C of the EX-TED's grade 9 students. This implies
78
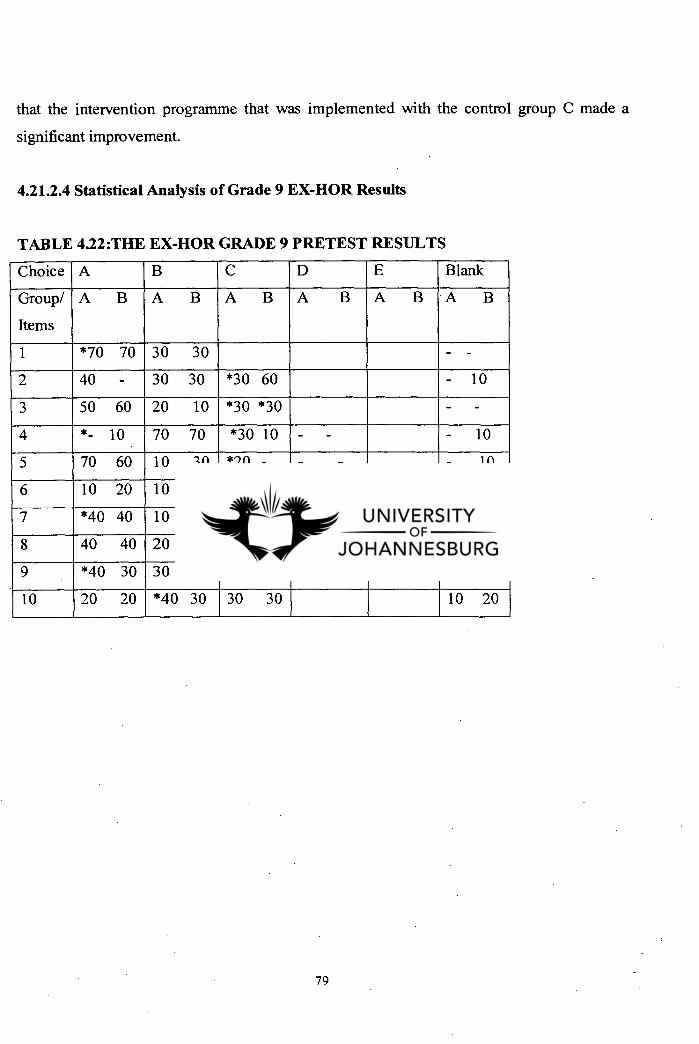
that the intervention programme that was implemented with the control group C made a
significant improvement.
4.21.2.4 Statistical Analysis of Grade 9 EX-HOR Results
TABLE 4.22:THE EX-HOR GRADE 9 PRETEST RESULTS
Choice A B C D E Blank
Group/
Items
A BA BA BA BA BA B
1 *70 70 30 30 - -
2 40 - 30 30 *30 60 - 10
3 50 60 20 10 *30 *30 - -
4 *- 10 70 70 *30 10 - - - 10
5 70 60 10 30 *20 - - - - 10
6 10 20 10 30 *50 10 30 30 - 10
7 *40 40 10 10 10 - *10 30 30 - - 20
8 40 40 20 20 *30 20 - - 10 20
9 *40 30 30 40 20 10 10 20
10 20 20 *40 30 30 30 10 20
79
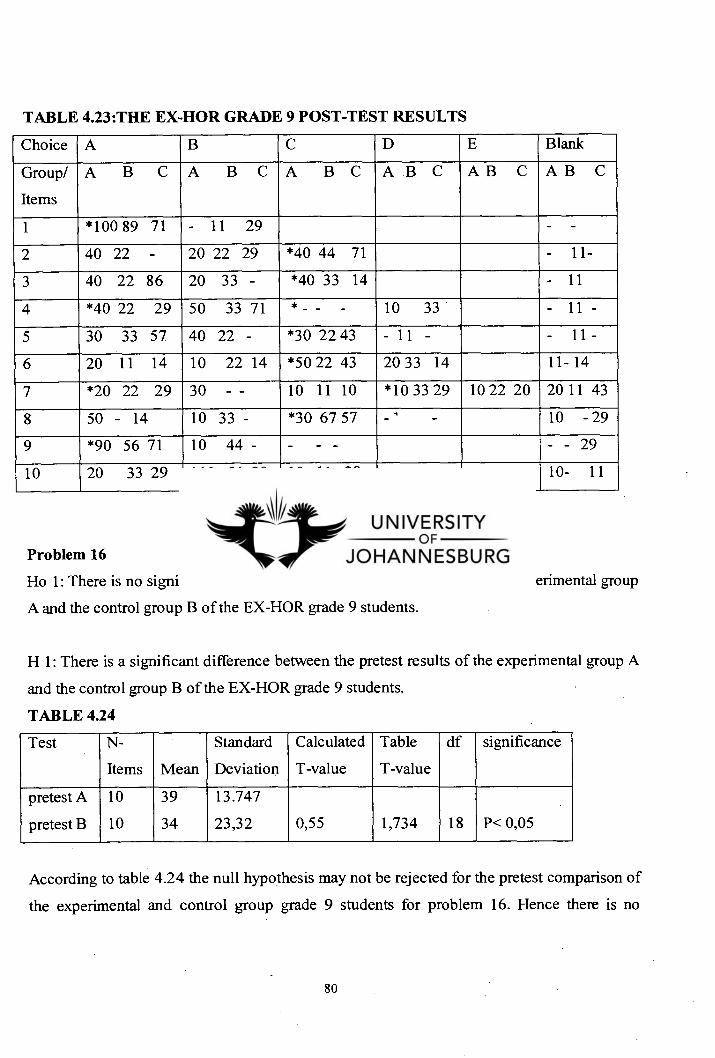
TABLE 4.23:THE EX-HOR GRADE 9 POST-TEST RESULTS
Choice A B C D E Blank
Group/
Items
A B C A BCA BC ABC A B C A B C
1 *100 89 71 - 11 29 - -
2 40 22 - 20 22 29 *40 44 71 - 11-
3 40 22 86 20 33 - *40 33 14 - 11
4 *40 22 29 50 33 71 * - - - 10 33 - 11 -
5 30 33 57 40 22 - *30 22 43 - 11 - - 11 -
6 20 11 14 10 22 14 *50 22 43 20 33 14 11- 14
7 *20 22 29 30 - - 10 11 10 *10 33 29 10 22 20 20 11 43
8 50 - 14 10 33 - *30 67 57 - ' - 10 - 29
9 *90 56 71 10 44 - - - - - - 29
10 20 33 29 *60 56 29 10 11 29 10- 11
Problem 16
Ho 1: There is no significant difference between the pretest results of the experimental group
A and the control group B of the EX-HOR grade 9 students.
H 1: There is a significant difference between the pretest results of the experimental group A
and the control group B of the EX-HOR grade 9 students.
TABLE 4.24
Test N-
Items Mean
Standard
Deviation
Calculated
T-value
Table
T-value
df significance
pretest A
pretest B
10
10
39
34
13.747
23,32 0,55 1,734 18 P< 0,05
According to table 4.24 the null hypothesis may not be rejected for the pretest comparison of
the experimental and control group grade 9 students for problem 16. Hence there is no
80
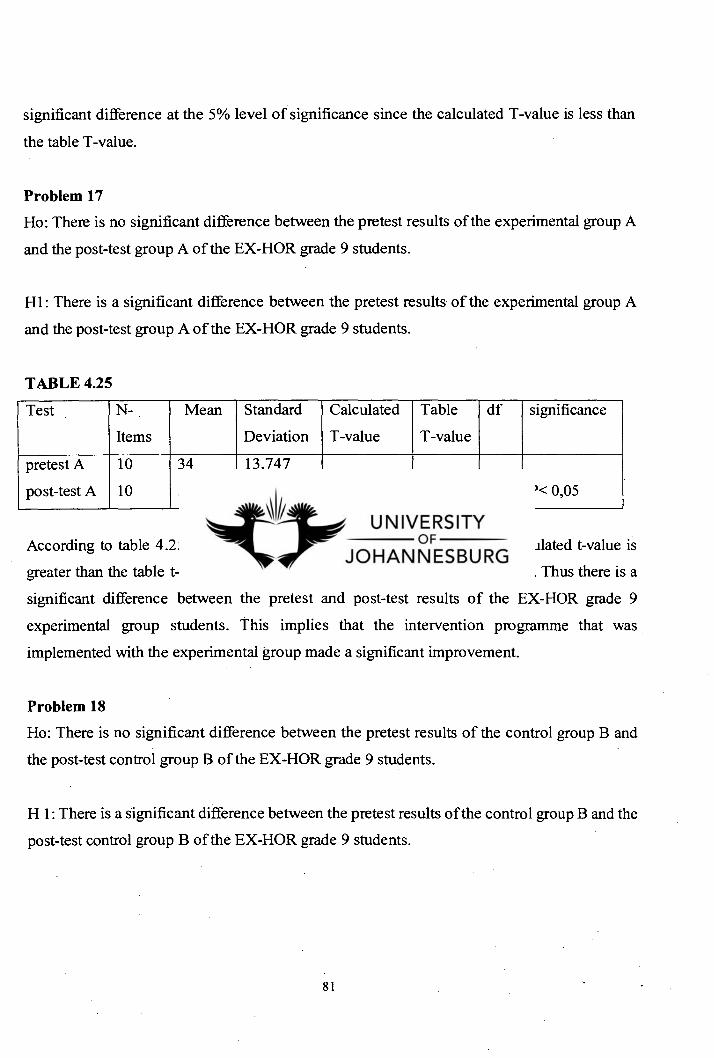
significant difference at the 5% level of significance since the calculated T-value is less than
the table T-value.
Problem 17
Ho: There is no significant difference between the pretest results of the experimental group A
and the post-test group A of the EX-HOR grade 9 students.
H1: There is a significant difference between the pretest results of the experimental group A
and the post-test group A of the EX-HOR grade 9 students.
TABLE 4.25
Test N-
Items
Mean Standard
Deviation
Calculated
T-value
Table
T-value
df significance
pretest A
post-test A
10
10
34
51
13,747
23,85 1,852 1,734 18 P< 0,05
According to table 4.25 the Null hypothesis may be rejected since the calculated t-value is
greater than the table t- value for problem 17 at the 1% level of significance. Thus there is a
significant difference between the pretest and post-test results of the EX-HOR grade 9
experimental group students. This implies that the intervention programme that was
implemented with the experimental group made a significant improvement.
Problem 18
Ho: There is no significant difference between the pretest results of the control group B and
the post-test control group B of the EX-HOR grade 9 students.
H 1: There is a significant difference between the pretest results of the control group B and the
post-test control group B of the EX-HOR grade 9 students.
81

TABLE 4.26
Test N-
Items Mean
Standard
Deviation
Calculated
T-value
Table
T-value
df significance
pretest B
post-test B
10
10
39
46,7
13,747
21,18 0,914 1,734 18 P< 0,05
According to table 4.26 the Null hypothesis may not be rejected since the calculated value is
less than the table value for problem 18. Thus there is no significant difference between the
pretest and post-test results of the EX-HOR grade 9 control group students.
Problem 19
Ho : There is no significant difference between the post-test results of the experimental group
A and the control group B of the EX-HOR grade 9 students.
Hl: There is a significant difference between the post-test results of the experimental group A
and the control group B of the EX-HOR grade 9 students.
TABLE 4.27
Test N-
Items
Mean Standard
Deviation
Calculated
T-value
Table
T-value
df significance
post-test A
post-test B
10
10
51
46,7
23,85
21,1804 0,3014 1,734 18 P< 0,05
According to table 4.27 the Null hypothesis may not be rejected since the calculated value is
less than the table value for problem 19 at the 5% level of significance. Thus there is no
significant difference between the post-test results of the experimental group A and the control
group B of the EX-HOR grade 9 students.
82
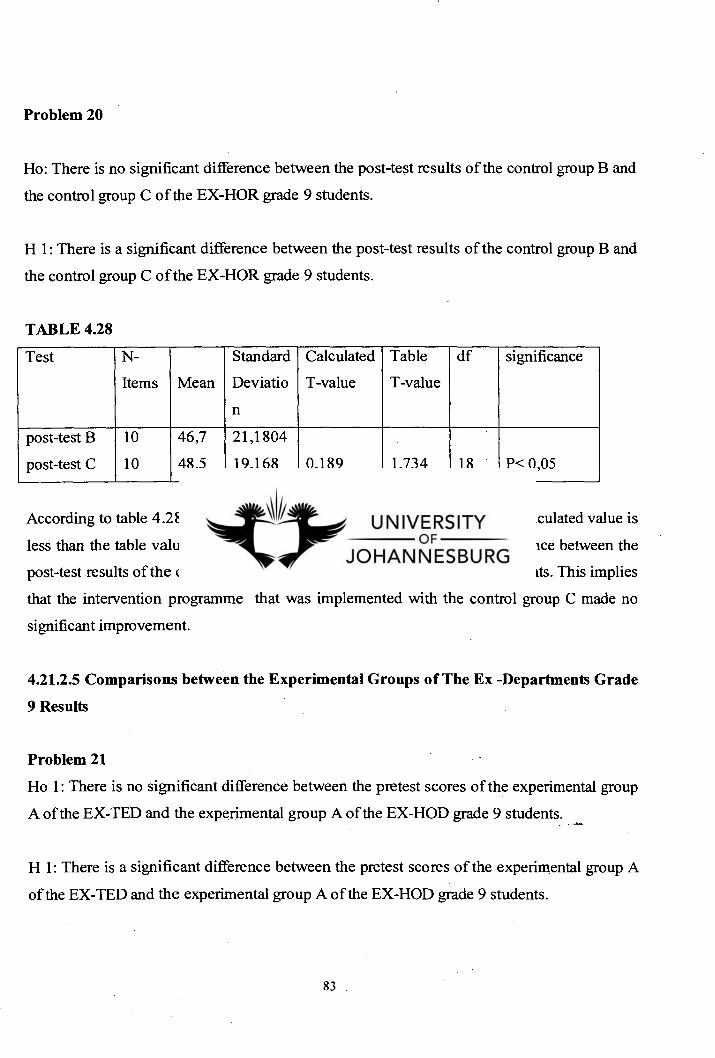
Problem 20
Ho: There is no significant difference between the post-test results of the control group B and
the control group C of the EX-HOR grade 9 students.
H 1: There is a significant difference between the post-test results of the control group B and
the control group C of the EX-HOR grade 9 students.
TABLE 4.28
Test N-
Items Mean
Standard
Deviatio
n
Calculated
T-value
Table
T-value
df significance
post-test B
post-test C
10
10
46,7
48,5
21,1804
19,168 0,189 1,734 18 P< 0,05
According to table 4.28 the Null hypothesis may not be rejected since the calculated value is
less than the table value for problem 20. Thus there is no significant difference between the
post-test results of the control groups B and C of the EX-HOR grade 9 students. This implies
that the intervention programme that was implemented with the control group C made no
significant improvement.
4.21.2.5 Comparisons between the Experimental Groups of The Ex -Departments Grade
9 Results
Problem 21
Ho 1: There is no significant difference between the pretest scores of the experimental group
A of the EX-TED and the experimental group A of the EX-HOD grade 9 students.
H 1: There is a significant difference between the pretest scores of the experimental group A
of the EX-TED and the experimental group A of the EX-HOD grade 9 students.
83
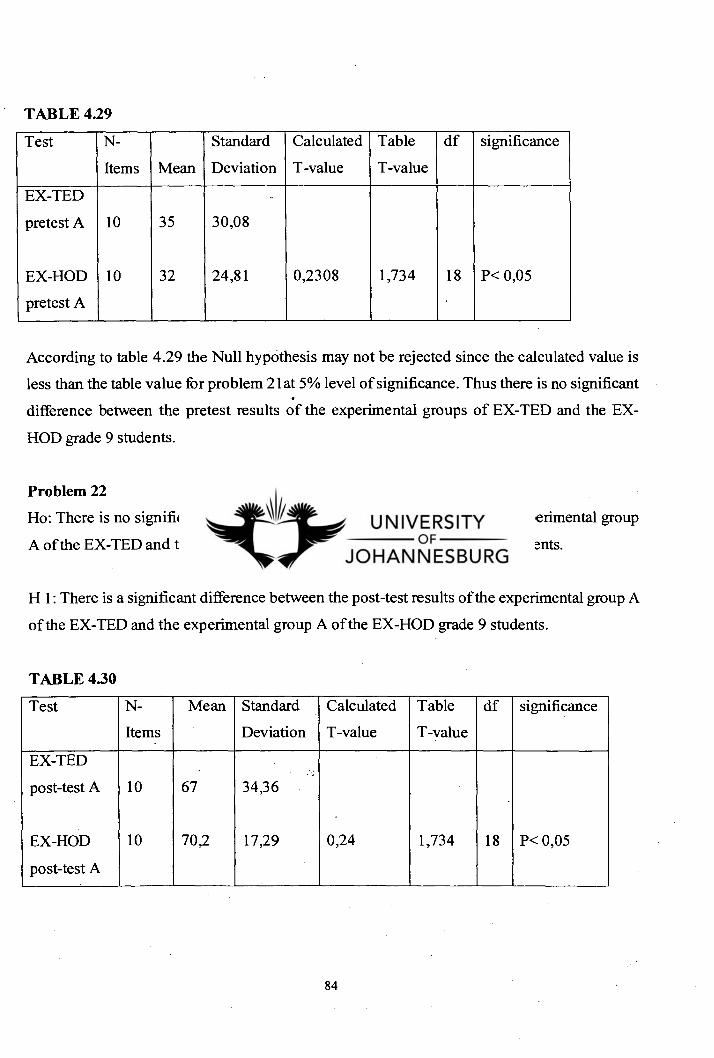
TABLE 4.29
Test N-
Items Mean
Standard
Deviation
Calculated
T-value
Table
T-value
df significance
EX-TED
pretest A 10 35 30,08
EX-HOD 10 32 24,81 0,2308 1,734 18 P< 0,05
pretest A •
According to table 4.29 the Null hypothesis may not be rejected since the calculated value is
less than the table value for problem 21 at 5% level of significance. Thus there is no significant
difference between the pretest results of the experimental groups of EX-TED and the EX-
HOD grade 9 students.
Problem 22
Ho: There is no significant difference between the post-test results of the experimental group
A of the EX-TED and the experimental group A of the EX-HOD grade 9 students.
H 1: There is a significant difference between the post-test results of the experimental group A
of the EX-TED and the experimental group A of the EX-HOD grade 9 students.
TABLE 4.30
Test N-
Items
Mean Standard
Deviation
Calculated
T-value
Table
T-value
df significance
EX-TED
post-test A 10 67 34,36
EX-HOD
post-test A
10 70,2 17,29 0,24 1,734 18 P< 0,05
84
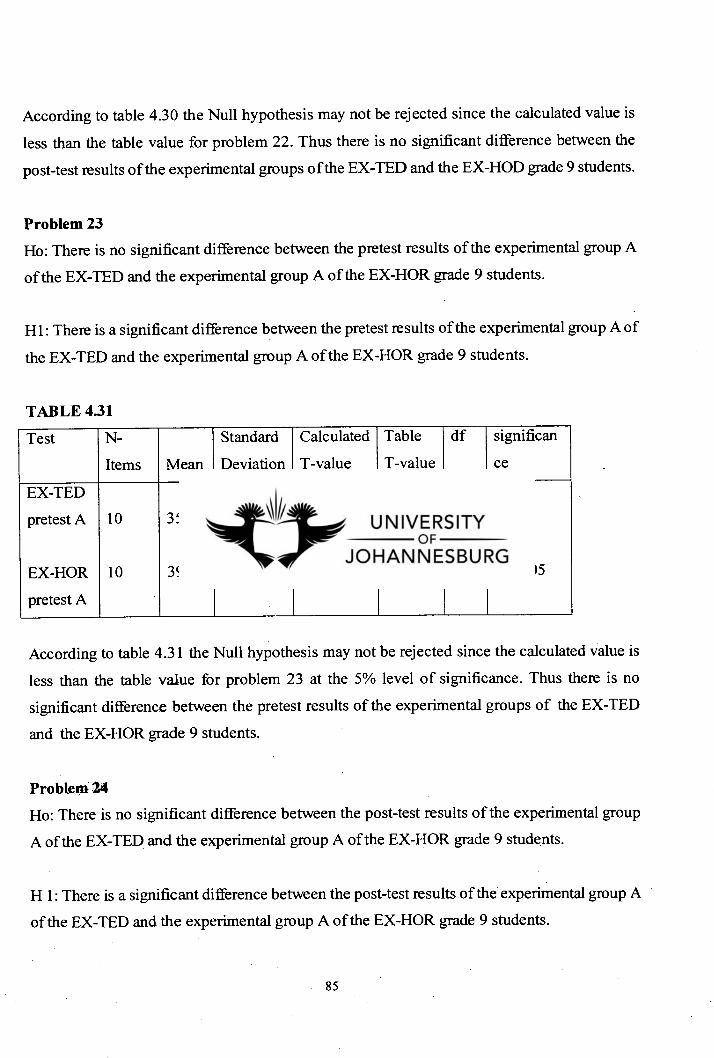
According to table 4.30 the Null hypothesis may not be rejected since the calculated value is
less than the table value for problem 22. Thus there is no significant difference between the
post-test results of the experimental groups of the EX-TED and the EX-HOD grade 9 students.
Problem 23 Ho: There is no significant difference between the pretest results of the experimental group A
of the EX-TED and the experimental group A of the EX-HOR grade 9 students.
Hl: There is a significant difference between the pretest results of the experimental group A of
the EX-TED and the experimental group A of the EX-HOR grade 9 students.
TABLE 4.31
Test N-
Items Mean
Standard
Deviation
Calculated
T-value
Table
T-value
df significan
ce
EX-TED
pretest A 10 35 30,08
EX-HOR
pretest A
10 39 13,747 0,3628 1,734 18 P< 0,05
According to table 4.31 the Null hypothesis may not be rejected since the calculated value is
less than the table value for problem 23 at the 5% level of significance. Thus there is no
significant difference between the pretest results of the experimental groups of the EX-TED
and the EX-HOR grade 9 students.
Problem 24 Ho: There is no significant difference between the post-test results of the experimental group
A of the EX-TED and the experimental group A of the EX-HOR grade 9 students.
H 1: There is a significant difference between the post-test results of the . experimental group A
of the EX-TED and the experimental group A of the EX-HOR grade 9 students.
85
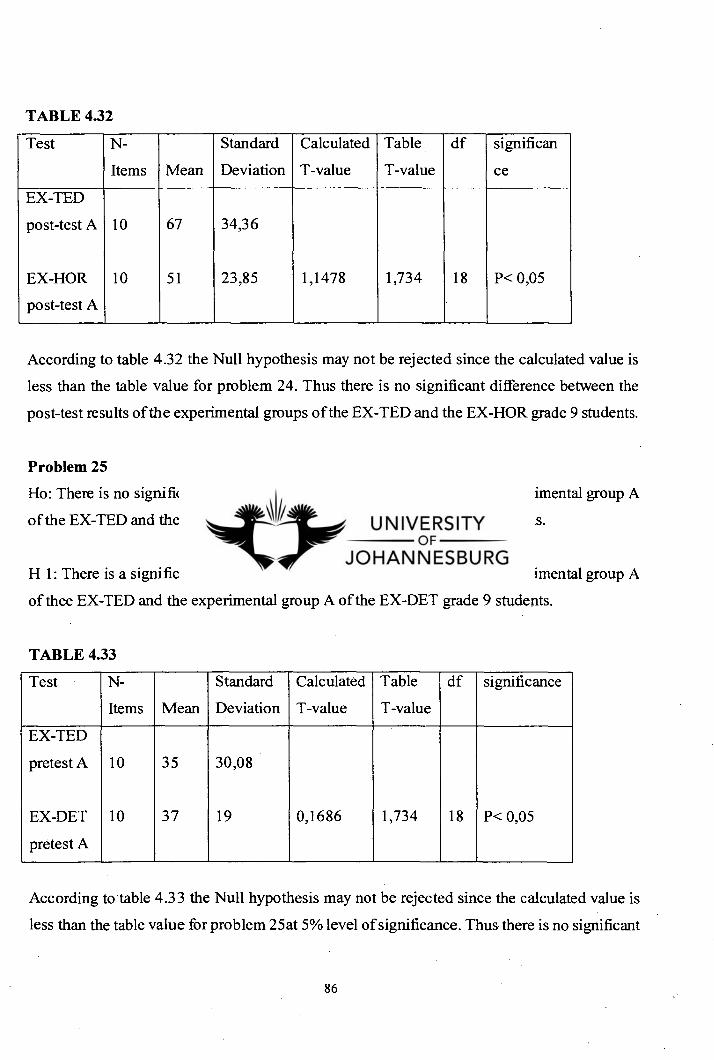
TABLE 4.32
Test N-
Items Mean
Standard
Deviation
Calculated
T-value
Table
T-value
df significan
ce
EX-TED
post-test A 10 67 34,36
EX-HOR
post-test A
10 51 23,85 1,1478 1,734 18 P< 0,05
According to table 4.32 the Null hypothesis may not be rejected since the calculated value is
less than the table value for problem 24. Thus there is no significant difference between the
post-test results of the experimental groups of the EX-TED and the EX-HOR grade 9 students.
Problem 25
Ho: There is no significant difference between the pretest results of the experimental group A
of the EX-TED and the experimental group A of the EX-DET grade 9 students.
H 1: There is a significant difference between the pretest results of the experimental group A
of thee EX-TED and the experimental group A of the EX-DET grade 9 students.
TABLE 4.33
Test N-
Items Mean
Standard
Deviation
Calculated
T-value
Table
T-value
df significance
EX-TED
pretest A 10 35 30,08
EX-DET
pretest A
10 37 19 0,1686 1,734 18 P< 0,05
According to table 4.33 the Null hypothesis may not be rejected since the calculated value is
less than the table value for problem 25at 5% level of significance. Thus there is no significant
86
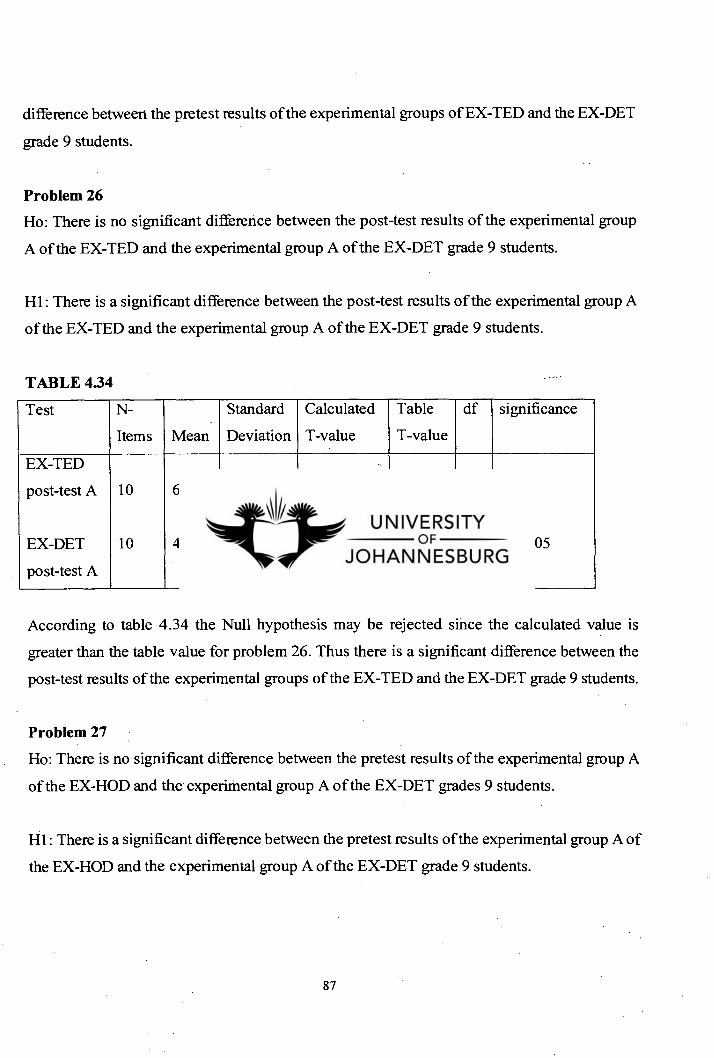
difference between the pretest results of the experimental groups of EX-TED and the EX-DET
grade 9 students.
Problem 26
Ho: There is no significant difference between the post-test results of the experimental group
A of the EX-TED and the experimental group A of the EX-DET grade 9 students.
Hl: There is a significant difference between the post-test results of the experimental group A
of the EX-TED and the experimental group A of the EX-DET grade 9 students.
TABLE 434
Test N-
Items Mean
Standard
Deviation
Calculated
T-value
Table
T-value
df significance
EX-TED
post-test A 10 67 34,36
EX-DET
post-test A
10 43 15,52 1,9099 1,734 18 P< 0,05
According to table 4.34 the Null hypothesis may be rejected since the calculated value is
greater than the table value for problem 26. Thus there is a significant difference between the
post-test results of the experimental groups of the EX-TED and the EX-DET grade 9 students.
Problem 27
Ho: There is no significant difference between the pretest results of the experimental group A
of the EX-HOD and the experimental group A of the EX-DET grades 9 students.
Hl: There is a significant difference between the pretest results of the experimental group A of
the EX-HOD and the experimental group A of the EX-DET grade 9 students.
87
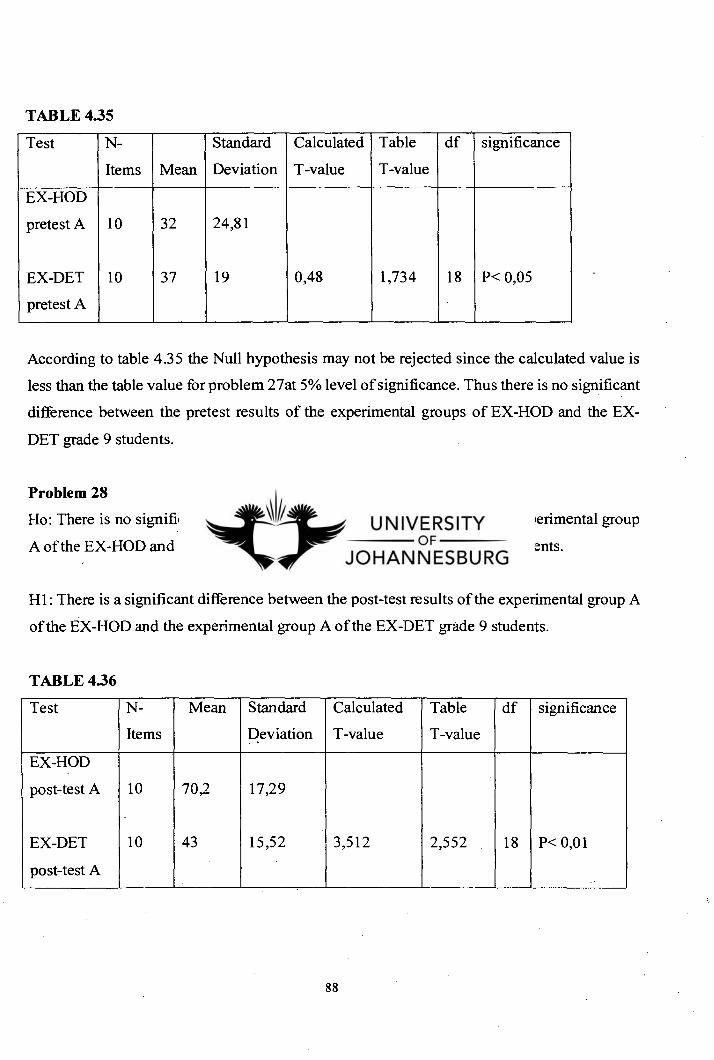
TABLE 4.35
Test N-
Items Mean
Standard
Deviation
Calculated
T-value
Table
T-value
df significance
EX-HOD
pretest A 10 32 24,81
EX-DET
pretest A
10 37 19 0,48 1,734 18 P< 0,05
According to table 4.35 the Null hypothesis may not be rejected since the calculated value is
less than the table value for problem 27at 5% level of significance. Thus there is no significant
difference between the pretest results of the experimental groups of EX-HOD and the EX-
DET grade 9 students.
Problem 28
Ho: There is no significant difference between the post-test results of the experimental group
A of the EX-HOD and the experimental group A of the EX-DET grade 9 students.
Hl: There is a significant difference between the post-test results of the experimental group A
of the EX-HOD and the experimental group A of the EX-DET grade 9 students.
TABLE 4.36
Test N-
Items
Mean Standard
Deviation
Calculated
T-value
Table
T-value
df significance
EX-HOD
post-test A 10 70,2 17,29
EX-DET
post-test A
10 43 15,52 3,512 2,552 18 P< 0,01
88
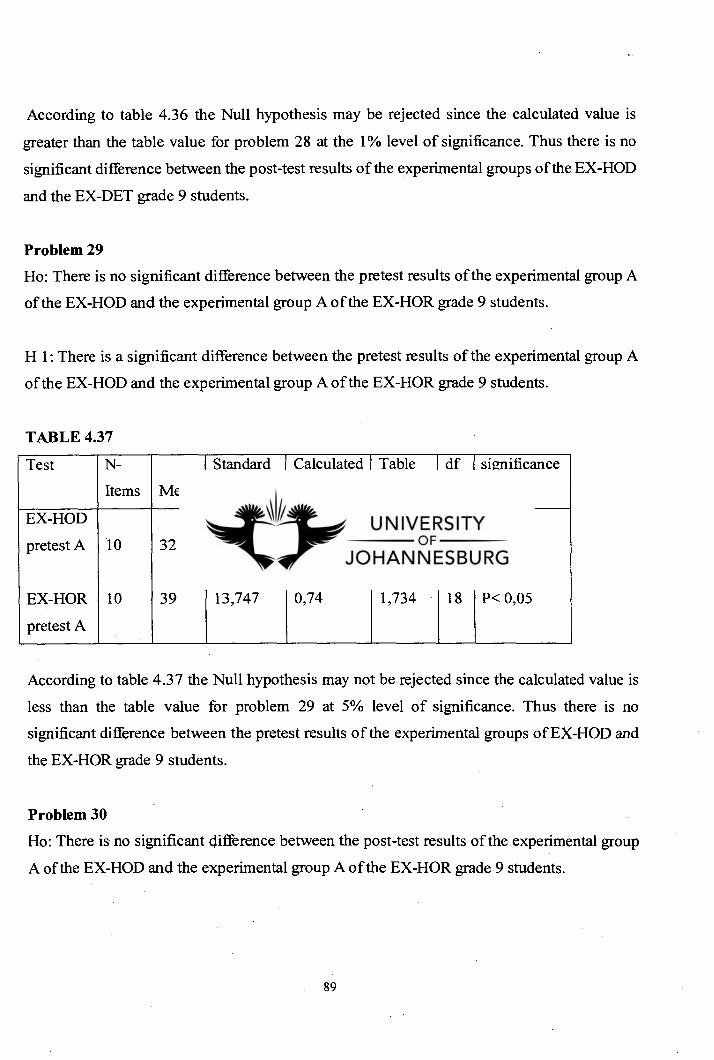
According to table 4.36 the Null hypothesis may be rejected since the calculated value is
greater than the table value for problem 28 at the 1% level of significance. Thus there is no
significant difference between the post-test results of the experimental groups of the EX-HOD
and the EX-DET grade 9 students.
Problem 29
Ho: There is no significant difference between the pretest results of the experimental group A
of the EX-HOD and the experimental group A of the EX-HOR grade 9 students.
H 1: There is a significant difference between the pretest results of the experimental group A
of the EX-HOD and the experimental group A of the EX-HOR grade 9 students.
TABLE 437
Test N-
Items Mean
Standard
Deviation
Calculated
T-value
Table
T-value
df significance
EX-HOD
pretest A 10 32 24,81
EX-HOR
pretest A
10 39 13,747 0,74 1,734 18 P< 0,05
According to table 4.37 the Null hypothesis may not be rejected since the calculated value is
less than the table value for problem 29 at 5% level of significance. Thus there is no
significant difference between the pretest results of the experimental groups of EX-HOD and
the EX-HOR grade 9 students.
Problem 30
Ho: There is no significant difference between the post-test results of the experimental group
A of the EX-HOD and the experimental group A of the EX-HOR grade 9 students.
89
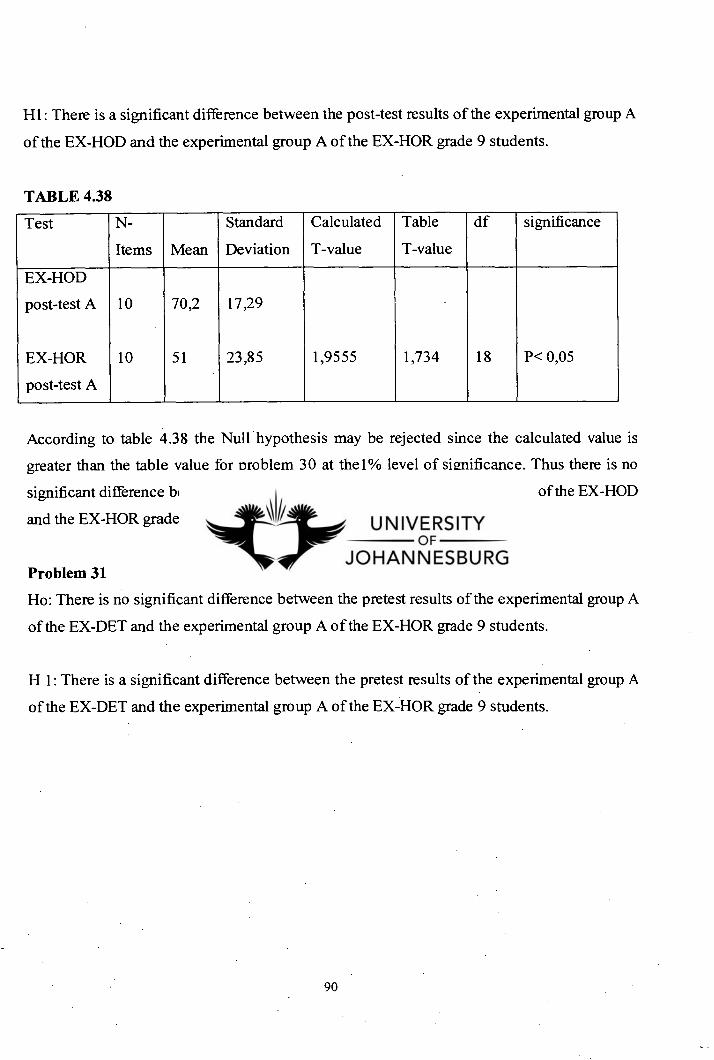
Hl: There is a significant difference between the post-test results of the experimental group A
of the EX-HOD and the experimental group A of the EX-HOR grade 9 students.
TABLE 438
Test N-
Items Mean
Standard
Deviation
Calculated
T-value
Table
T-value
df significance
EX-HOD
post-test A 10 70,2 17,29
EX-HOR
post-test A
10 51 23,85 1,9555 1,734 18 P< 0,05
According to table 4.38 the Null hypothesis may be rejected since the calculated value is
greater than the table value for problem 30 at the 1 % level of significance. Thus there is no
significant difference between the post-test results of the experimental groups of the EX-HOD
and the EX-HOR grade 9 students.
Problem 31
Ho: There is no significant difference between the pretest results of the experimental group A
of the EX-DET and the experimental group A of the EX-HOR grade 9 students.
H 1: There is a significant difference between the pretest results of the experimental group A
of the EX-DET and the experimental group A of the EX-HOR grade 9 students.
90
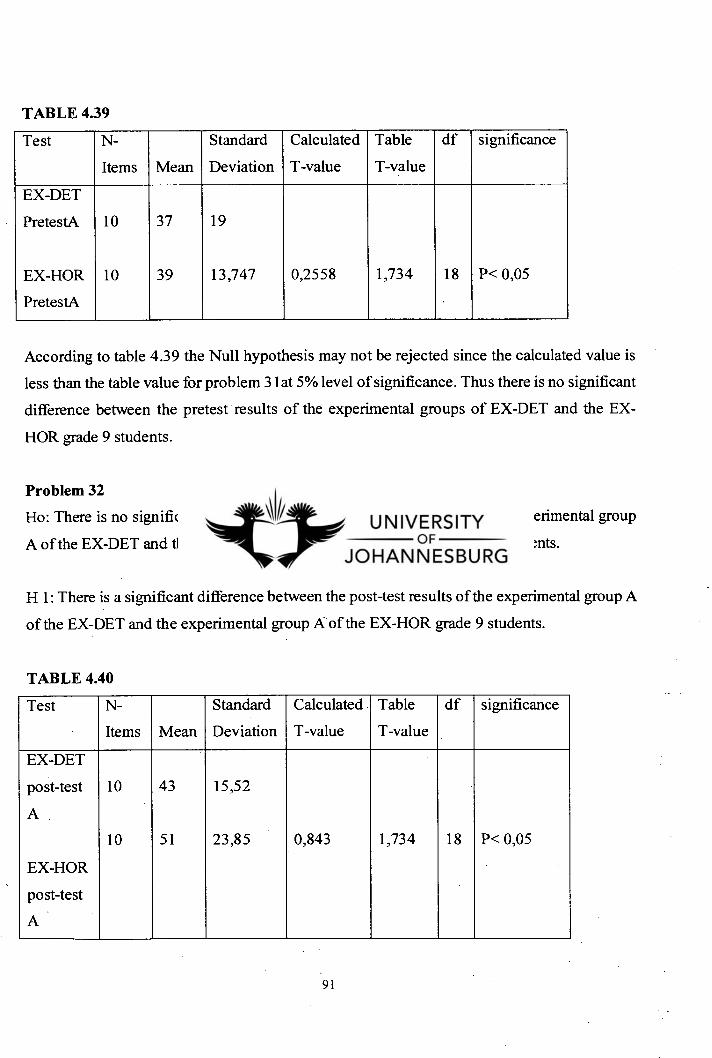
TABLE 439
Test N-
Items Mean
Standard
Deviation
Calculated
T-value
Table
T-value
df significance
EX-DET
PretestA 10 37 19
EX-HOR 10 39 13,747 0,2558 1,734 18 P< 0,05
PretestA
According to table 4.39 the Null hypothesis may not be rejected since the calculated value is
less than the table value for problem 31 at 5% level of significance. Thus there is no significant
difference between the pretest results of the experimental groups of EX-DET and the EX-
HOR grade 9 students.
Problem 32
Ho: There is no significant difference between the post-test results of the experimental group
A of the EX-DET and the experimental group A of the EX-HOR grade 9 students.
H 1: There is a significant difference between the post-test results of the experimental group A
of the EX-DET and the experimental group A of the EX-HOR grade 9 students.
TABLE 4.40
Test N-
Items Mean
Standard
Deviation
Calculated
T-value
Table
T-value
df significance
EX-DET
post-test 10 43 15,52
A
10 51 23,85 0,843 1,734 18 P< 0,05
EX-HOR
post-test
A
91
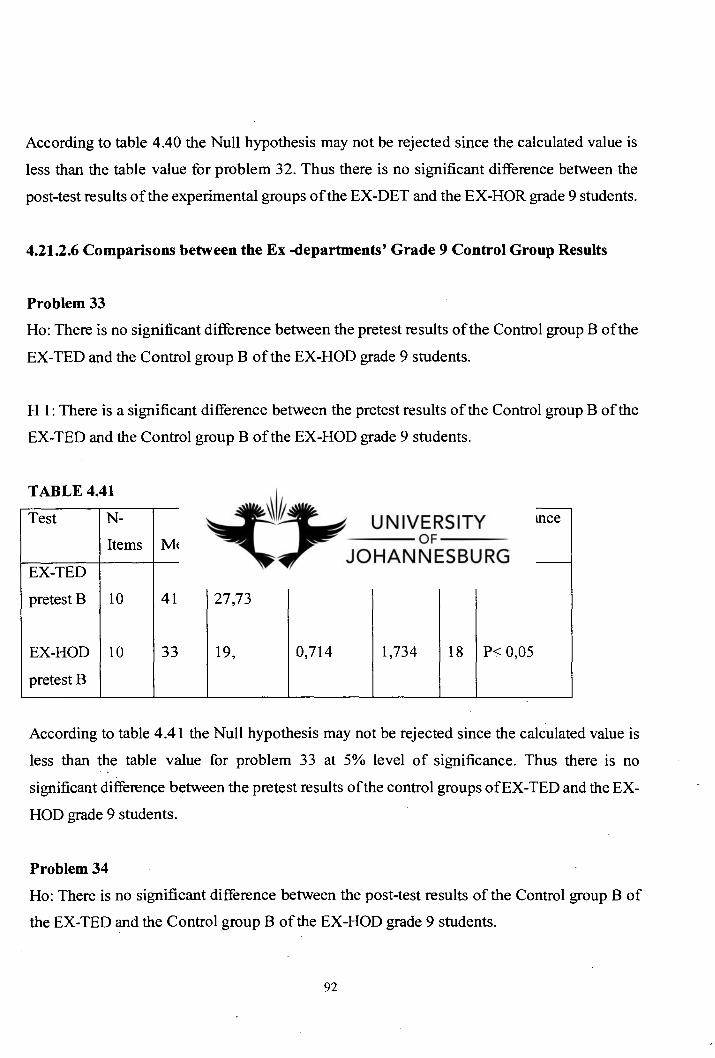
According to table 4.40 the Null hypothesis may not be rejected since the calculated value is
less than the table value for problem 32. Thus there is no significant difference between the
post-test results of the experimental groups of the EX-DET and the EX-HOR grade 9 students.
4.21.2.6 Comparisons between the Ex -departments' Grade 9 Control Group Results
Problem 33
Ho: There is no significant difference between the pretest results of the Control group B of the
EX-TED and the Control group B of the EX-HOD grade 9 students.
H 1: There is a significant difference between the pretest results of the Control group B of the
EX-TED and the Control group B of the EX-HOD grade 9 students.
TABLE 4.41
Test N-
Items Mean
Standard
Deviation
Calculated
T-value
Table
T-value
df significance
EX-TED
pretest B 10 41 27,73
EX-HOD
pretest B
10 33 19, 0,714 1,734 18 P< 0,05
According to table 4.41 the Null hypothesis may not be rejected since the calculated value is
less than the table value for problem 33 at 5% level of significance. Thus there is no
significant difference between the pretest results of the control groups ofEX-TED and the EX-
HOD grade 9 students.
Problem 34
Ho: There is no significant difference between the post-test results of the Control group B of
the EX-TED and the Control group B of the EX-HOD grade 9 students.
92
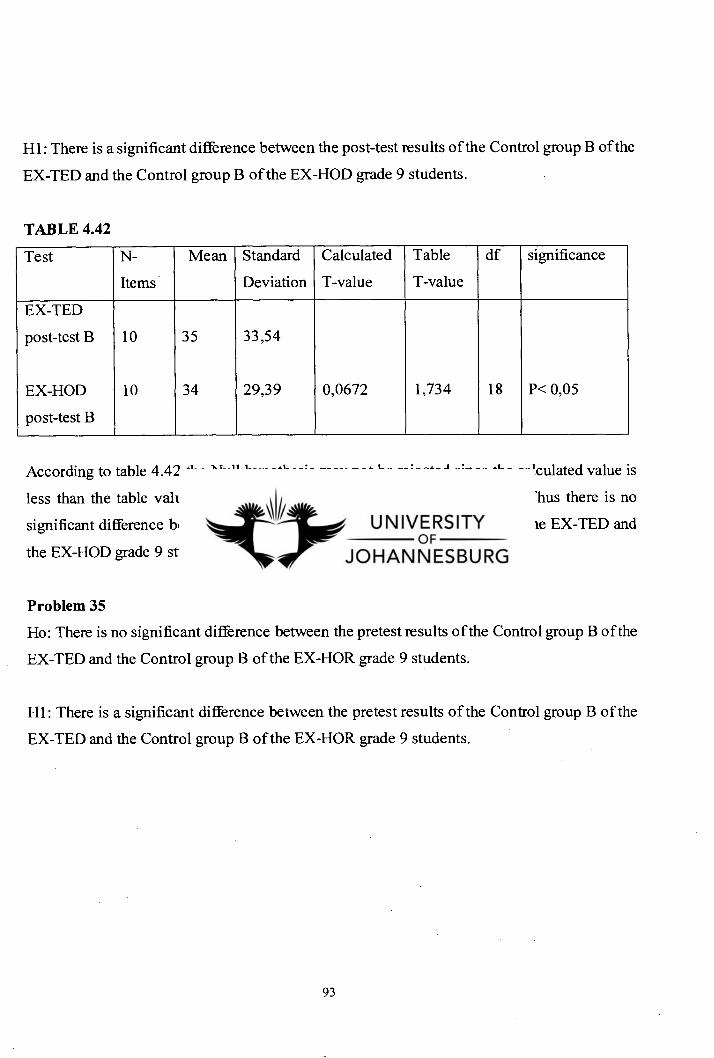
Hl: There is a significant difference between the post-test results of the Control group B of the
EX-TED and the Control group B of the EX-HOD grade 9 students.
TABLE 4.42
Test N-
Items
Mean Standard
Deviation
Calculated
T-value
Table
T-value
df significance
EX-TED
post-test B 10 35 33,54
EX-HOD
post-test B
10 34 29,39 0,0672 1,734 18 P< 0,05
According to table 4.42 the Null hypothesis may not be rejected since the calculated value is
less than the table value for problem 34 at the 5 % level of significance. Thus there is no
significant difference between the post-test results of the control groups of the EX-TED and
the EX-HOD grade 9 students.
Problem 35
Ho: There is no significant difference between the pretest results of the Control group B of the
EX-TED and the Control group B of the EX-HOR grade 9 students.
Hl: There is a significant difference between the pretest results of the Control group B of the
EX-TED and the Control group B of the EX-HOR grade 9 students.
93
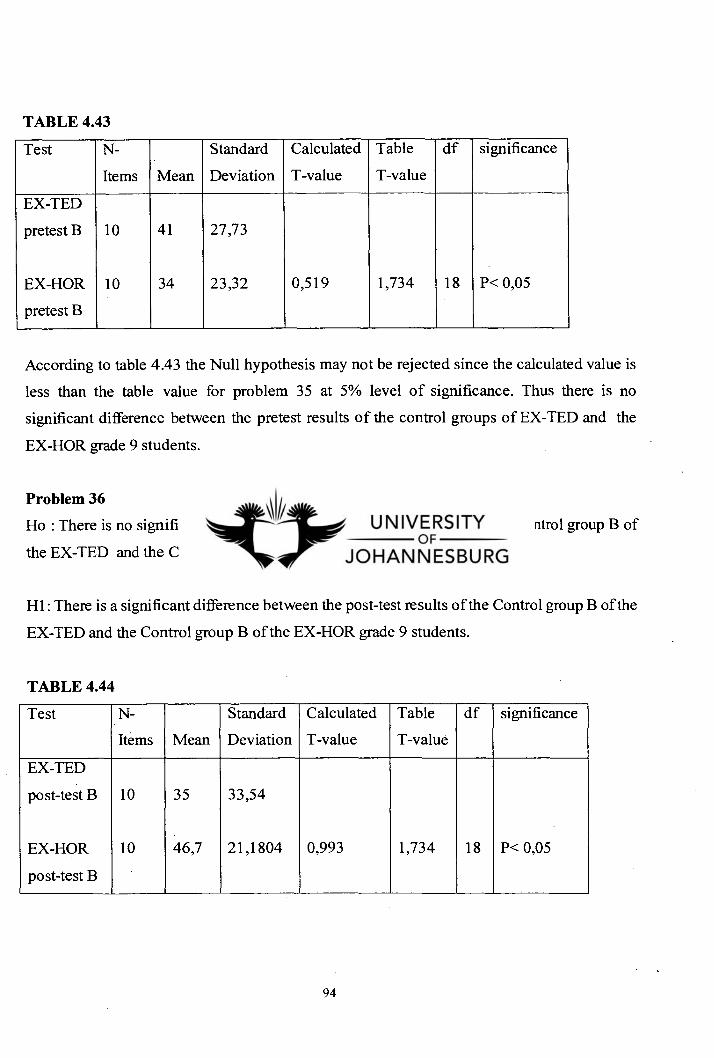
TABLE 4.43
Test N-
Items Mean
Standard
Deviation
Calculated
T-value
Table
T-value
df significance
EX-TED
pretest B 10 41 27,73
EX-HOR
pretest B
10 34 23,32 0,519 1,734 18 P< 0,05
According to table 4.43 the Null hypothesis may not be rejected since the calculated value is
less than the table value for problem 35 at 5% level of significance. Thus there is no
significant difference between the pretest results of the control groups of EX-TED and the
EX-HOR grade 9 students.
Problem 36
Ho : There is no significant difference between the post-test results of the Control group B of
the EX-TED and the Control group B of the EX-HOR grade 9 students.
Hl: There is a significant difference between the post-test results of the Control group B of the
EX-TED and the Control group B of the EX-HOR grade 9 students.
TABLE 4.44
Test N-
Items Mean
Standard
Deviation
Calculated
T-value
Table
T-value
df significance
EX-TED
post-test B 10 35 33,54
EX-HOR
post-test B
10 46,7 21,1804 0,993 1,734 18 P< 0,05
94
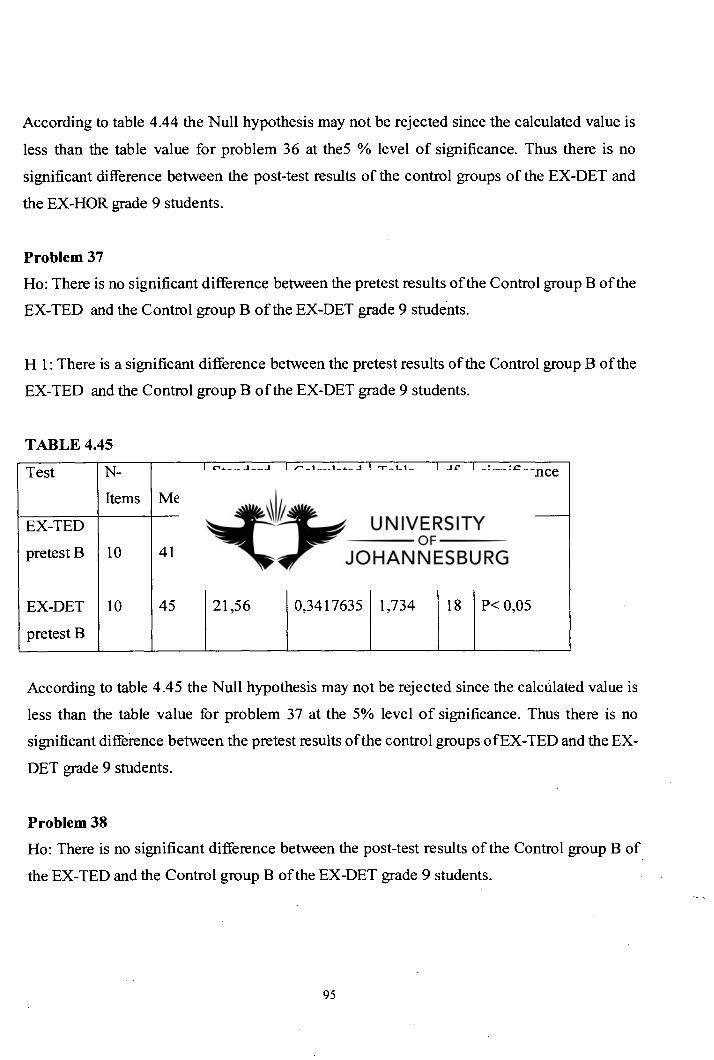
According to table 4.44 the Null hypothesis may not be rejected since the calculated value is
less than the table value for problem 36 at they % level of significance. Thus there is no
significant difference between the post-test results of the control groups of the EX-DET and
the EX-HOR grade 9 students.
Problem 37
Ho: There is no significant difference between the pretest results of the Control group B of the
EX-TED and the Control group B of the EX-DET grade 9 students.
H 1: There is a significant difference between the pretest results of the Control group B of the
EX-TED and the Control group B of the EX-DET grade 9 students.
TABLE 4.45
Test N-
Items Mean
Standard
Deviation
Calculated
T-value
Table
T-value
df significance
EX-TED
pretest B 10 41 27,73
EX-DET
pretest B
10 45 21,56 0,3417635 1,734 18 P< 0,05
According to table 4.45 the Null hypothesis may not be rejected since the calculated value is
less than the table value for problem 37 at the 5% level of significance. Thus there is no
significant difference between the pretest results of the control groups ofEX-TED and the EX-
DET grade 9 students.
Problem 38
Ho: There is no significant difference between the post-test results of the Control group B of
the EX-TED and the Control group B of the EX-DET grade 9 students.
95
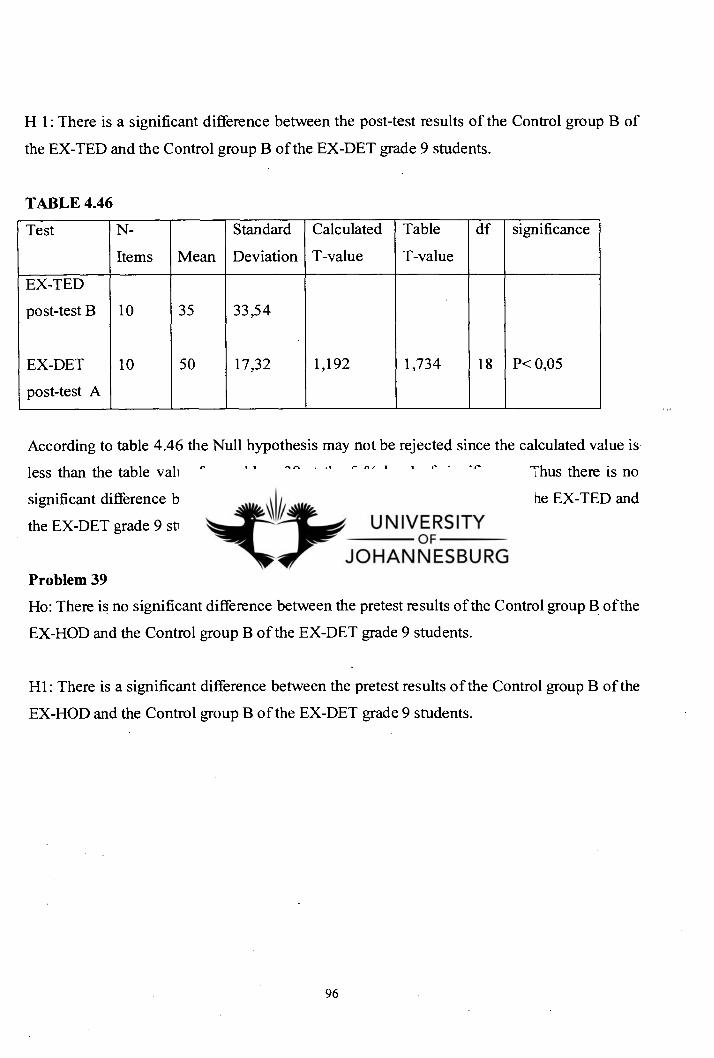
H 1: There is a significant difference between the post-test results of the Control group B of
the EX-TED and the Control group B of the EX-DET grade 9 students.
TABLE 4.46
Test N-
Items Mean
Standard
Deviation
Calculated
T-value
Table
T-value
df significance
EX-TED
post-test B 10 35 33,54
EX-DET
post-test A
10 50 17,32 1,192 1,734 18 P< 0,05
According to table 4.46 the Null hypothesis may not be rejected since the calculated value is
less than the table value for problem 38 at the 5 % level of significance. Thus there is no
significant difference between the post-test results of the control groups of the EX-TED and
the EX-DET grade 9 students.
Problem 39
Ho: There is no significant difference between the pretest results of the Control group B of the
EX-HOD and the Control group B of the EX-DET grade 9 students.
Hl: There is a significant difference between the pretest results of the Control group B of the
EX-HOD and the Control group B of the EX-DET grade 9 students.
96
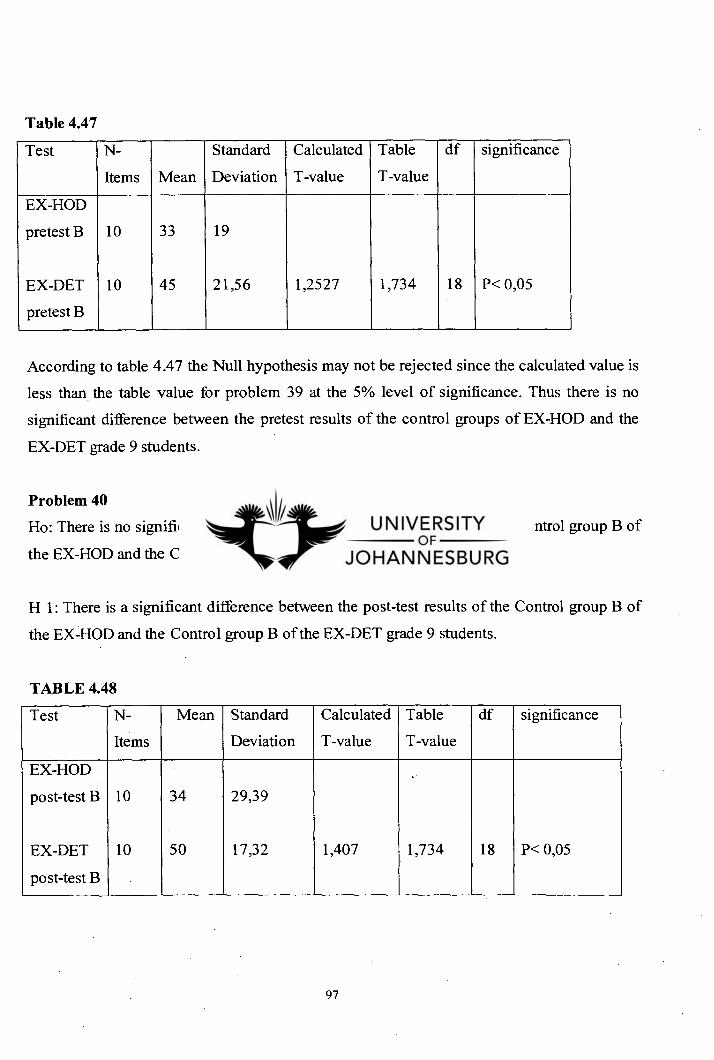
Table 4.47
Test N-
Items Mean
Standard
Deviation
Calculated
T-value
Table
T-value
df significance
EX-HOD
pretest B 10 33 19
EX-DET
pretest B
10 45 21,56 1,2527 1,734 18 P< 0,05
According to table 4.47 the Null hypothesis may not be rejected since the calculated value is
less than the table value for problem 39 at the 5% level of significance. Thus there is no
significant difference between the pretest results of the control groups of EX-HOD and the
EX-DET grade 9 students.
Problem 40
Ho: There is no significant difference between the post-test results of the Control group B of
the EX-HOD and the Control group B of the EX-DET grade 9 students.
H 1: There is a significant difference between the post-test results of the Control group B of
the EX-HOD and the Control group B of the EX-DET grade 9 students.
TABLE 4.48
Test N-
Items
Mean Standard
Deviation
Calculated
T-value
Table
T-value
df significance
EX-HOD
post-test B 10 34 29,39
EX-DET
post-test B
10 50 17,32 1,407 1,734 18 P< 0,05
97
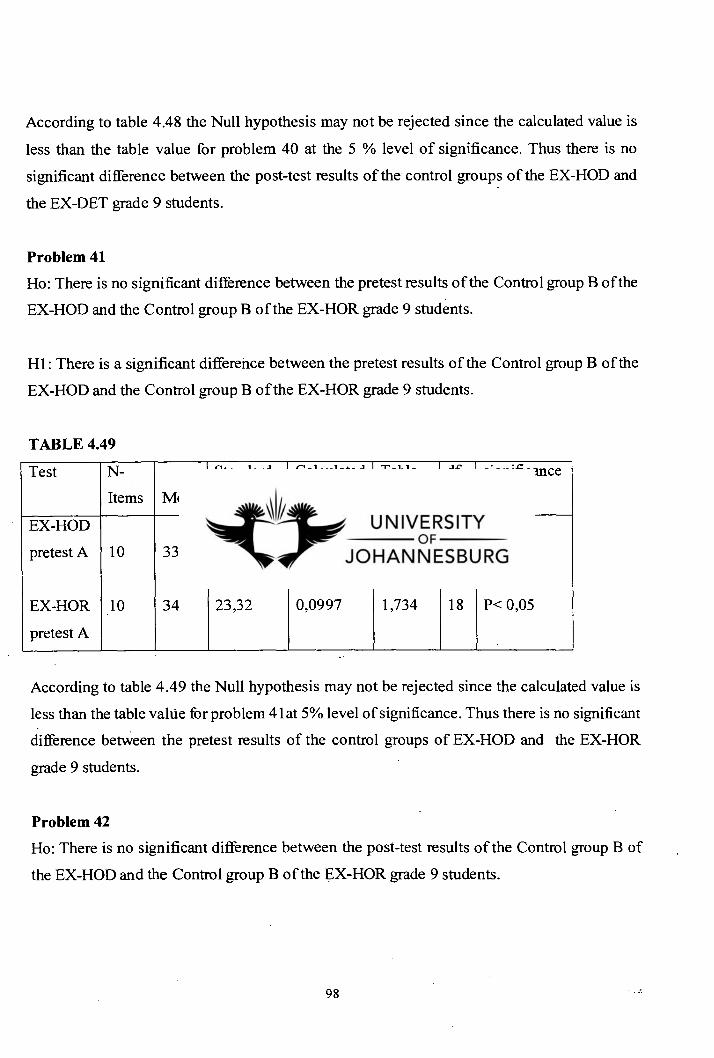
According to table 4.48 the Null hypothesis may not be rejected since the calculated value is
less than the table value for problem 40 at the 5 % level of significance. Thus there is no
significant difference between the post-test results of the control groups of the EX-HOD and
the EX-DET grade 9 students.
Problem 41
Ho: There is no significant difference between the pretest results of the Control group B of the
EX-HOD and the Control group B of the EX-HOR grade 9 students.
Hl: There is a significant difference between the pretest results of the Control group B of the
EX-HOD and the Control group B of the EX-HOR grade 9 students.
TABLE 4.49
Test N-
Items Mean
Standard
Deviation
Calculated
T-value
Table
T-value
df significance
EX-HOD
pretest A 10 33 19
EX-HOR
pretest A
10 34 23,32 0,0997 1,734 18 P< 0,05
According to table 4.49 the Null hypothesis may not be rejected since the calculated value is
less than the table value for problem 4lat 5% level of significance. Thus there is no significant
difference between the pretest results of the control groups of EX-HOD and the EX-HOR
grade 9 students.
Problem 42
Ho: There is no significant difference between the post-test results of the Control group B of
the EX-HOD and the Control group B of the EX-HOR grade 9 students.
98

Hl: There is a significant difference between the post-test results of the Control group B of the
EX-HOD and the Control group B of the EX-HOR grade 9 students.
TABLE 4.50
Test N-
Items Mean
Standard
Deviation
Calculated
T-value
Table
T-value
df significance
EX-HOD
post-test B 10 34 29,39
EX-HOR
post-test B
10 46,7 21,1804 1,05833 1,734 18 P< 0,01
According to table 4.50 the Null hypothesis may not be rejected since the calculated value is
less than the table value for problem 42 at they % level of significance. Thus there is no
significant difference between the post-test results of the control groups of the EX-DET and
the EX-HOR grade 9 students.
Problem 43
Ho: There is no significant difference between the pretest results of the Control group B of the
EX-DET and the Control group B of the EX-HOR grade 9 students.
Hl: There is a significant difference between the pretest results of the Control group B of the
EX-DET and the Control group B of the EX-HOR grade 9 students.
99
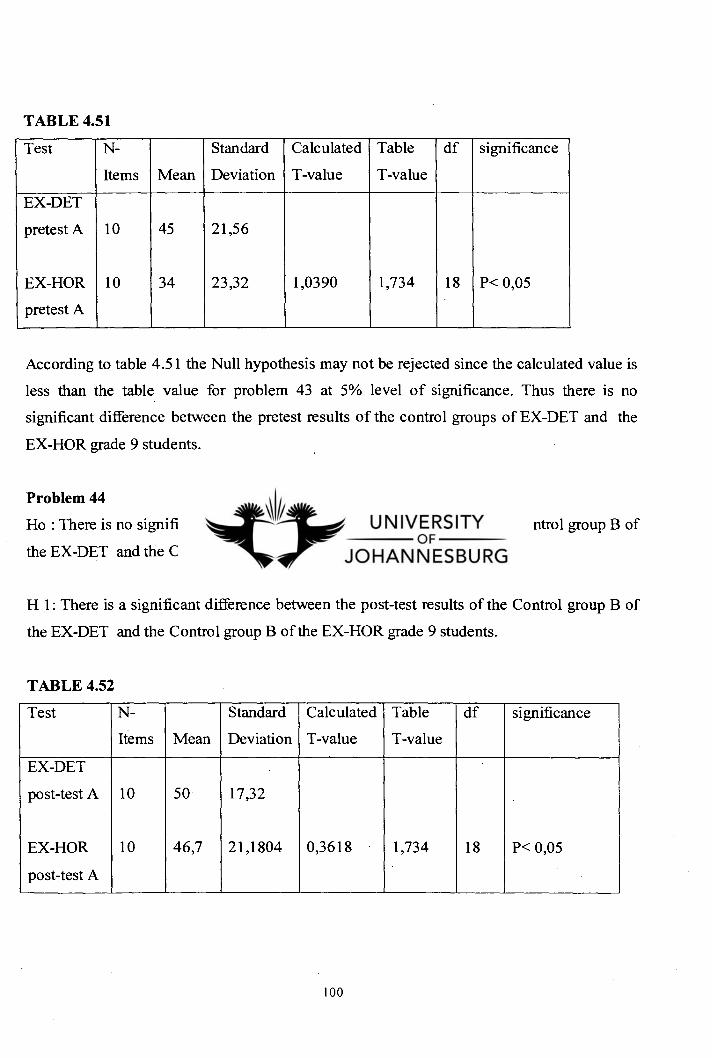
TABLE 4.51
Test N-
Items Mean
Standard
Deviation
Calculated
T-value
Table
T-value
df significance
EX-DET
pretest A 10 45 21,56
EX-HOR
pretest A
10 34 23,32 1,0390 1,734 18 P< 0,05
According to table 4.51 the Null hypothesis may not be rejected since the calculated value is
less than the table value for problem 43 at 5% level of significance. Thus there is no
significant difference between the pretest results of the control groups of EX-DET and the
EX-HOR grade 9 students.
Problem 44
Ho : There is no significant difference between the post-test results of the Control group B of
the EX-DET and the Control group B of the EX-HOR grade 9 students.
H 1: There is a significant difference between the post-test results of the Control group B of
the EX-DET and the Control group B of the EX-HOR grade 9 students.
TABLE 4.52
Test N-
Items Mean
Standard
Deviation
Calculated
T-value
Table
T-value
df significance
EX-DET
post-test A 10 50 17,32
EX-HOR
post-test A
10 46,7 21,1804 0,3618 1,734 18 P< 0,05
100
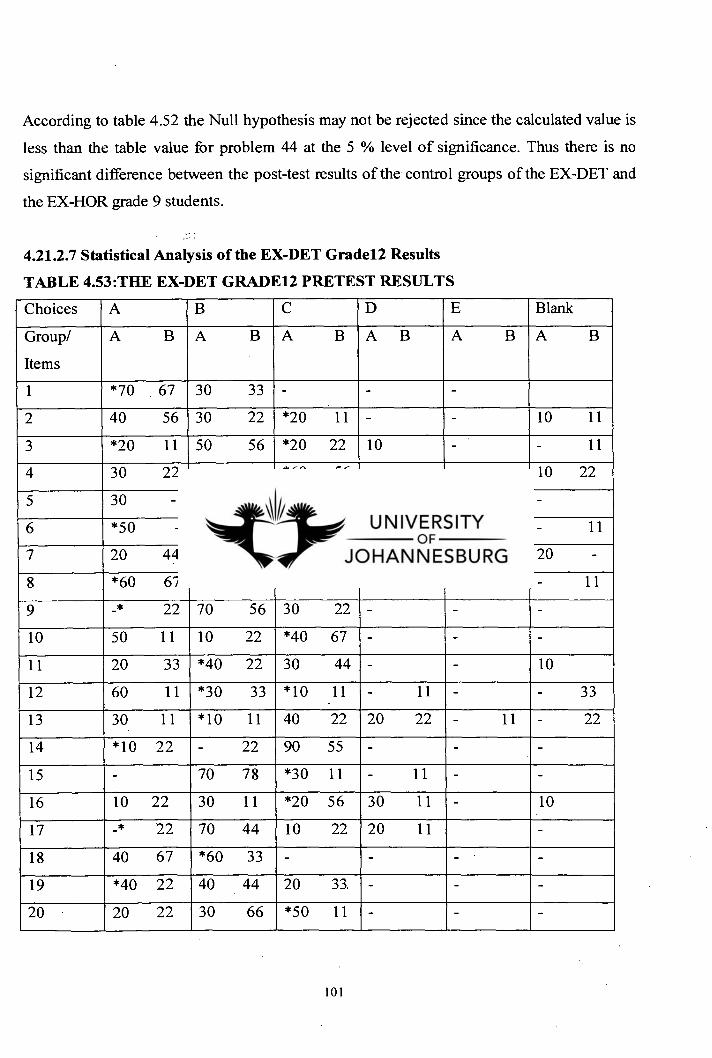
According to table 4.52 the Null hypothesis may not be rejected since the calculated value is
less than the table value for problem 44 at the 5 % level of significance. Thus there is no
significant difference between the post-test results of the control groups of the EX-DET and
the EX-HOR grade 9 students.
4.21.2.7 Statistical Analysis of the EX-DET Gradel2 Results
TABLE 4.53:THE EX-DET GRADE12 PRETEST RESULTS
Choices A B C D E Blank
Group/
Items
A BA B A BA B A BA B
1 *70 . 67 30 33 - - -
2 40 56 30 22 *20 11 - - 10 11
3 *20 11 50 56 *20 22 10 - - 11
4 30 22 - - *60 56 - - 10 22
5 30 - - 22 *50 56 20 22 - -
6 *50 - - 22 10 22 *- 11 40 33 - 11
7 20 44 - *60 56 - - 20 -
8 *60 67 20 11 20 11 - - - 11
9 -* 22 70 56 30 22 - - -
10 50 11 10 22 *40 67 - - -
11 20 33 *40 22 30 44 - - 10
12 60 11 *30 33 *10 11 - 11 - - 33
13 30 11 *10 11 40 22 20 22 - 11 - 22
14 *10 22 - 22 90 55 - - -
15 - 70 78 *30 11 - 11 - -
16 10 22 30 11 *20 56 30 11 - 10
17 -* 22 70 44 10 22 20 11 -
18 40 67 *60 33 - - - -
19 *40 22 40 44 20 33. - - -
20 20 22 30 66 *50 11 - - -
101
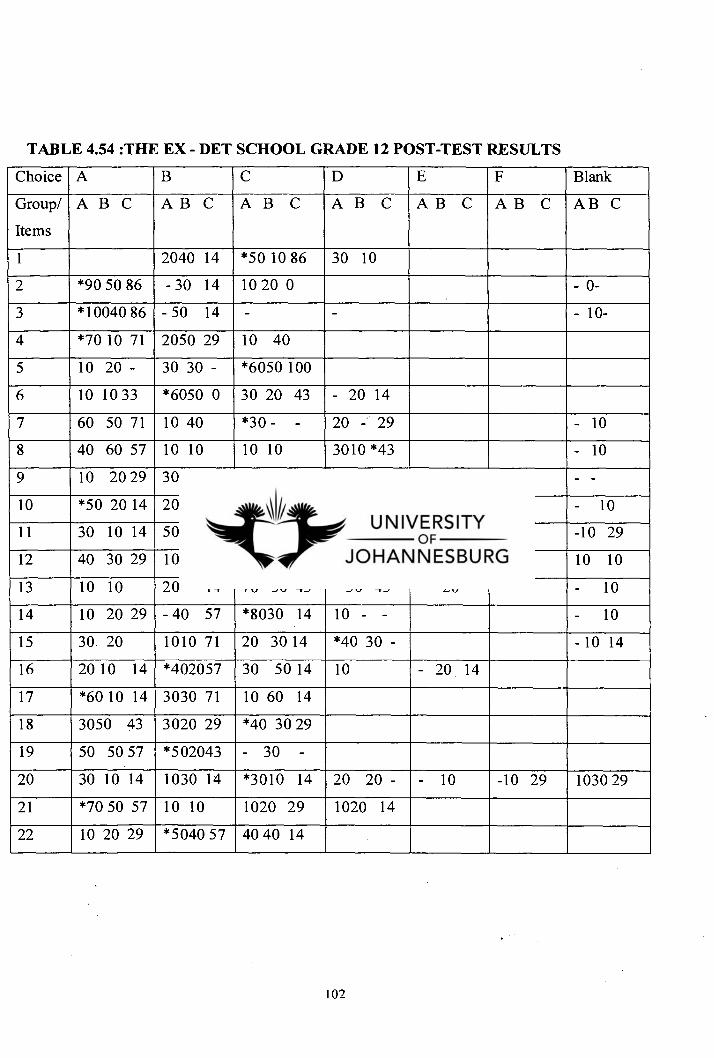
TABLE 4.54 :THE EX - DET SCHOOL GRADE 12 POST-TEST RESULTS
Choice A B C D E F Blank
Group/
Items
ABC ABC AB C AB C AB C AB C ABC
1 2040 14 *50 10 86 30 10
2 *90 50 86 - 30 14 10 20 0 - 0-
3 *10040 86 - 50 14 - - - 10-
4 *70 10 71 2050 29 10 40
5 10 20 - 30 30 - *6050 100
6 10 10 33 *6050 0 30 20 43 - 20 14
7 60 50 71 10 40 *30 - - 20 - 29 - 10
8 40 60 57 10 10 10 10 3010 *43 - 10
9 10 20 29 30 30 43 *60 50 29 - -
10 *50 20 14 20 - - 40 10 - - 60 86 - 10
11 30 10 14 50*4014 *2040 43 -10 29
12 40 30 29 10 20 - *40 30 43 - 10 29 10 10
13 10 10 20 - 14 70 *30 43 - 30 43 - 20 - 10
14 10 20 29 -40 57 *8030 14 10 - - - 10
15 30. 20 1010 71 20 30 14 *40 30 - - 10 14
16 20 10 14 *402057 30 50 14 10 - 20 14
17 *60 10 14 3030 71 10 60 14
18 3050 43 3020 29 *40 30 29
19 50 50 57 *502043 - 30 -
20 30 10 14 1030 14 *3010 14 20 20 - - 10 -10 29 1030 29
21 *70 50 57 10 10 1020 29 1020 14
22 10 20 29 *5040 57 40 40 14
102
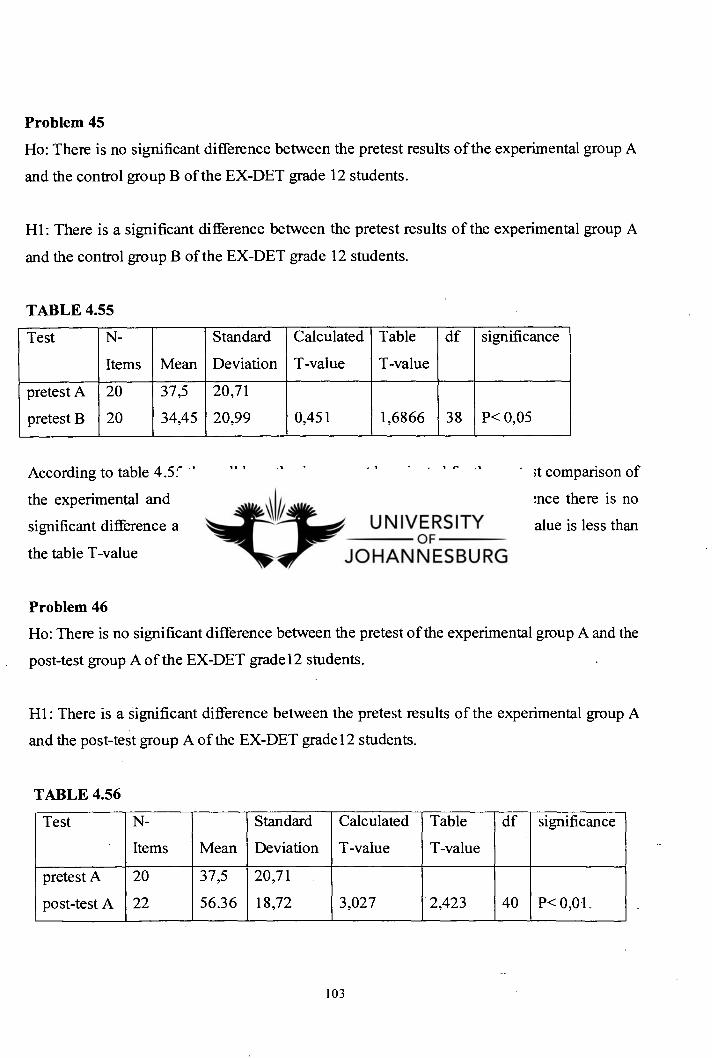
Problem 45
Ho: There is no significant difference between the pretest results of the experimental group A
and the control group B of the EX-DET grade 12 students.
Hl: There is a significant difference between the pretest results of the experimental group A
and the control group B of the EX-DET grade 12 students.
TABLE 4.55
Test N-
Items Mean
Standard
Deviation
Calculated
T-value
Table
T-value
df significance
pretest A
pretest B
20
20
37,5
34,45
20,71
20,99 0,451 1,6866 38 P< 0,05
According to table 4.55 the null hypothesis may not be rejected for the pretest comparison of
the experimental and control group grade 12 students for problem 45. Hence there is no
significant difference at the 5% level of significance since the calculated T-value is less than
the table T-value
Problem 46
Ho: There is no significant difference between the pretest of the experimental group A and the
post-test group A of the EX-DET grade12 students.
Hl: There is a significant difference between the pretest results of the experimental group A
and the post-test group A of the EX-DET grade 12 students.
TABLE 4.56
Test N-
Items Mean
Standard
Deviation
Calculated
T-value
Table
T-value
df significance
pretest A
post-test A
20
22
37,5
56.36
20,71
18,72 3,027 2,423 40 P< 0,01.
103
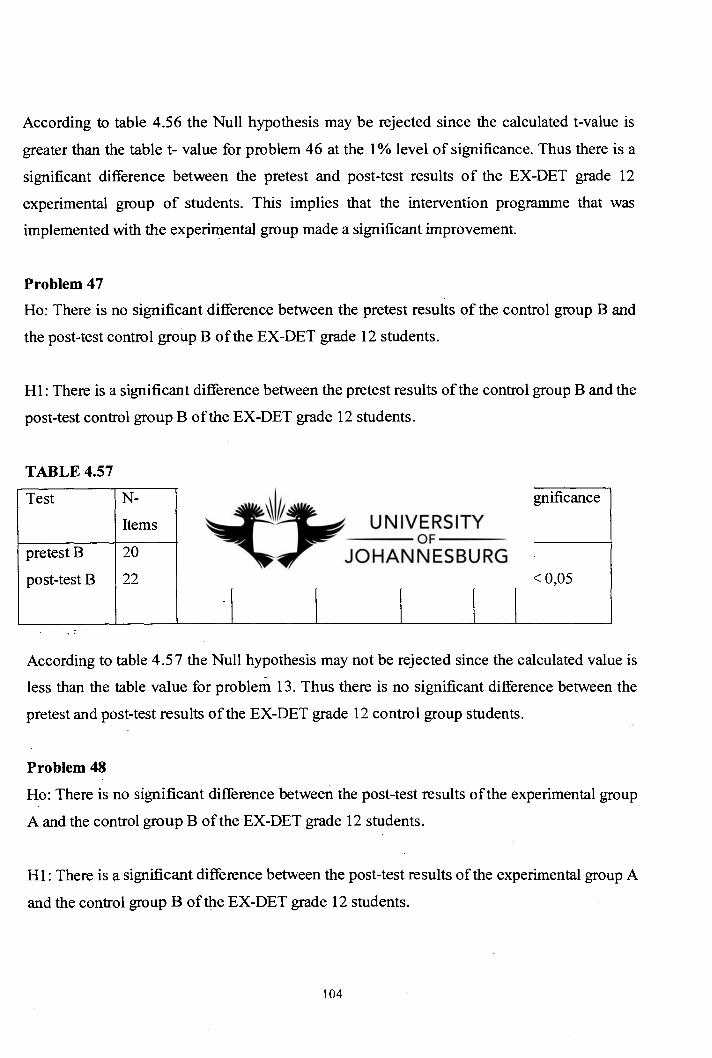
According to table 4.56 the Null hypothesis may be rejected since the calculated t-value is
greater than the table t- value for problem 46 at the 1% level of significance. Thus there is a
significant difference between the pretest and post-test results of the EX-DET grade 12
experimental group of students. This implies that the intervention programme that was
implemented with the experimental group made a significant improvement.
Problem 47
Ho: There is no significant difference between the pretest results of the control group B and
the post-test control group B of the EX-DET grade 12 students.
Hl: There is a significant difference between the pretest results of the control group B and the
post-test control group B of the EX-DET grade 12 students.
TABLE 4.57
Test N-
Items Mean
Standard
Deviation
Calculated
T-value
Table
T-value
df significance
pretest B
post-test B
20
22
34,45
30,45
20,99
18,94 0,6337 1,684 40
.
P< 0,05
According to table 4.57 the Null hypothesis may not be rejected since the calculated value is
less than the table value for problem 13. Thus there is no significant difference between the
pretest and post-test results of the EX-DET grade 12 control group students.
Problem 48
Ho: There is no significant difference between the post-test results of the experimental group
A and the control group B of the EX-DET grade 12 students.
Hl: There is a significant difference between the post-test results of the experimental group A
and the control group B of the EX-DET grade 12 students.
104
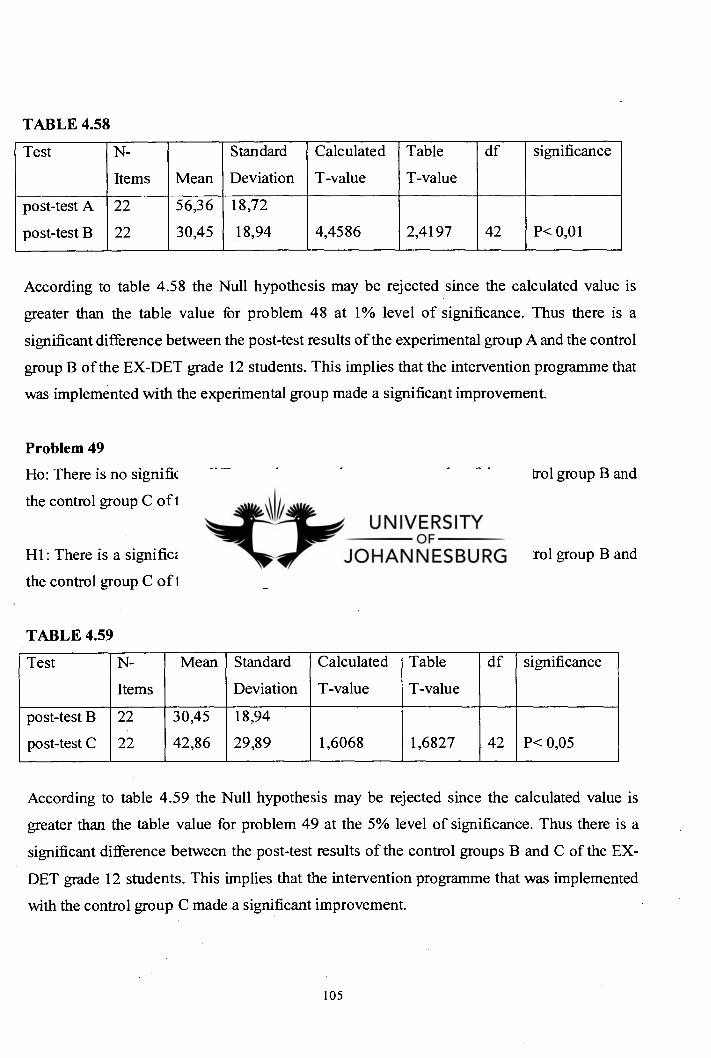
TABLE 4.58
Test N-
Items Mean
Standard
Deviation
Calculated
T-value
Table
T-value
df significance
post-test A
post-test B
22
22
56,36
30,45
18,72
18,94 4,4586 2,4197 42 P< 0,01
According to table 4.58 the Null hypothesis may be rejected since the calculated value is
greater than the table value for problem 48 at 1% level of significance. Thus there is a
significant difference between the post-test results of the experimental group A and the control
group B of the EX-DET grade 12 students. This implies that the intervention programme that
was implemented with the experimental group made a significant improvement.
Problem 49
Ho: There is no significant difference between the post-test results of the control group B and
the control group C of the EX-DET grade 12 students.
Hl: There is a significant difference between the post-test results of the control group B and
the control group C of the EX-DET grade 12 students.
TABLE 4.59
Test N-
Items
Mean Standard
Deviation
Calculated
T-value
Table
T-value
df significance
post-test B
post-test C
22
22
30,45
42,86
18,94
29,89 1,6068 1,6827 42 P< 0,05
According to table 4.59 the Null hypothesis may be rejected since the calculated value is
greater than the table value for problem 49 at the 5% level of significance. Thus there is a
significant difference between the post-test results of the control groups B and C of the EX-
DET grade 12 students. This implies that the intervention programme that was implemented
with the control group C made a significant improvement.
105
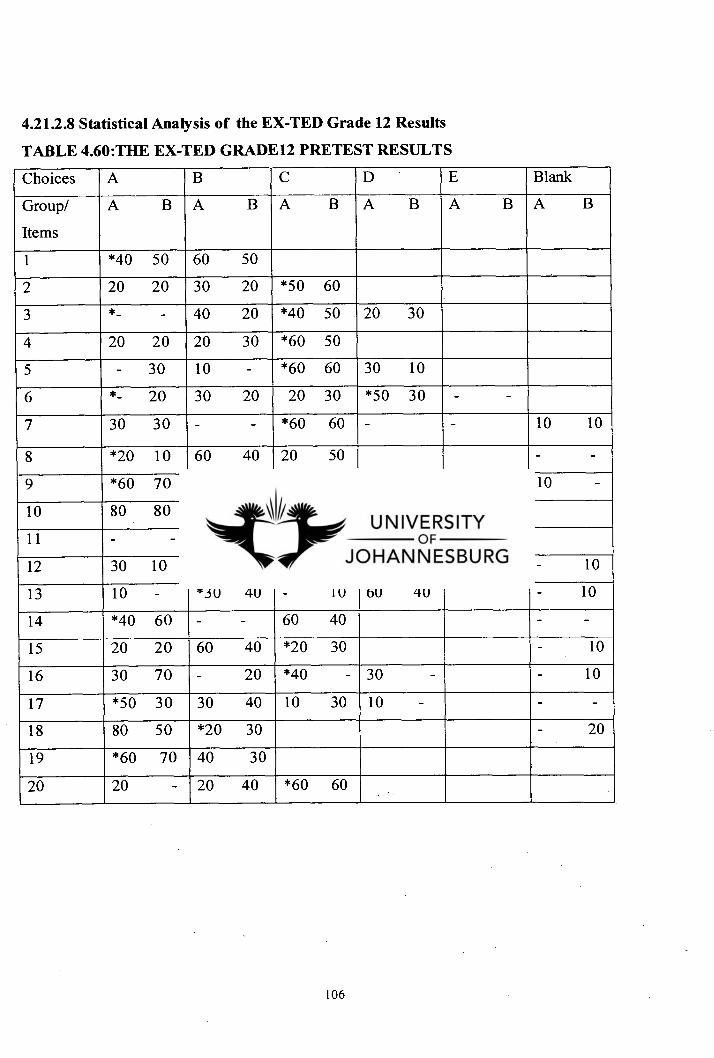
4.21.2.8 Statistical Analysis of the EX-TED Grade 12 Results
TABLE 4.60:THE EX-TED GRADE12 PRETEST RESULTS
Choices A B C D E Blank
Group/
Items
A B A B A B A B A B A B
1 *40 50 60 50
2 20 20 30 20 *50 60
3 *- - 40 20 *40 50 20 30
4 20 20 20 30 *60 50
5 - 30 10 - *60 60 30 10
6 *- 20 30 20 20 30 *50 30 - -
7 30 30 - - *60 60 - - 10 10
8 *20 10 60 40 20 50 - -
9 *60 70 20 20 10 10 10 -
10 80 80 - - *20 20
11 - - *20 40 80 60
12 30 10 *20 10 *30 50 20 20 - 10
13 10 - *30 40 - 10 60 40 - 10
14 *40 60 - - 60 40 - -
15 20 20 60 40 *20 30 - 10
16 30 70 - 20 *40 - 30 - - 10
17 *50 30 30 40 10 30 10 - - -
18 80 50 *20 30 - 20
19 *60 70 40 30
20 20 - 20 40 *60 60
106
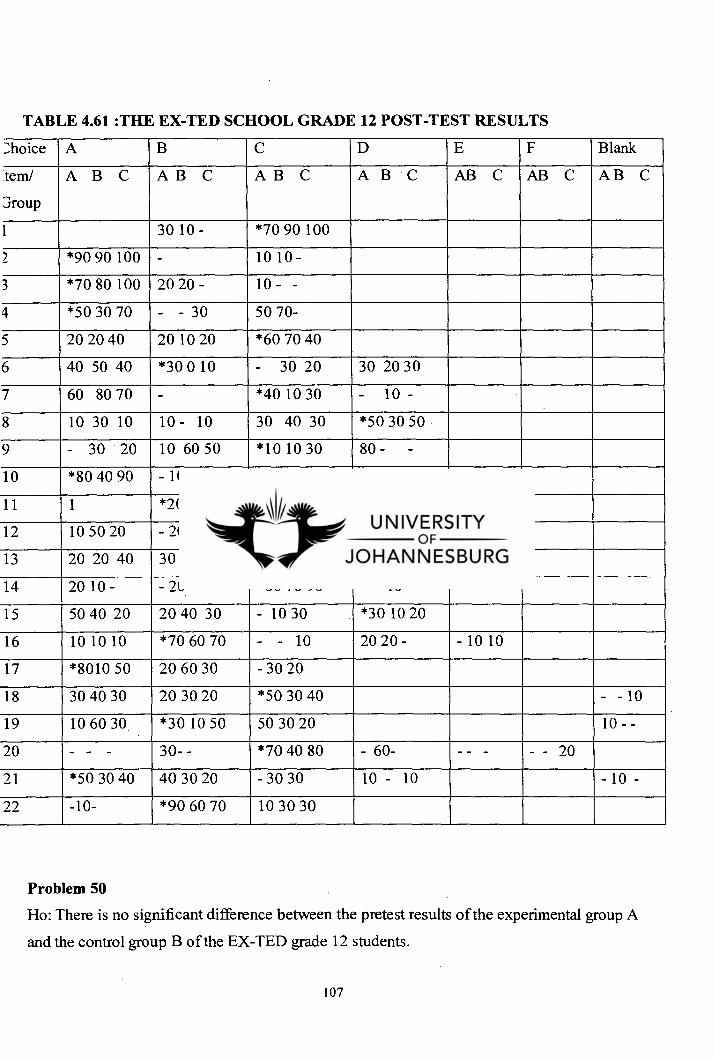
TABLE 4.61 :THE EX-TED SCHOOL GRADE 12 POST-TEST RESULTS
1;hoice A B C D E F Blank
tem/
aroup
A B C A B C A B C ABC ABC ABC ABC
1 30 10 - *70 90 100
2 *90 90 100 - 10 10 -
3 *70 80 100 20 20 - 10 - -
4 *50 30 70 - - 30 50 70-
5 20 20 40 20 10 20 *60 70 40
6 40 50 40 *30 0 10 - 30 20 30 20 30
7 60 80 70 - *40 10 30 - 10 -
8 10 30 10 10- 10 30 40 30 *50 30 50
9 - 30 20 10 60 50 *10 10 30 80- -
10 *80 40 90 - 10 10 - 10 - 20 40-
11 1 *20 40 20 *70 50 50 2
12 10 50 20 -20 10 *50 20 70 40 10 -
13 20 20 40 30 30 10 *40 30 40 10 20 10
14 20 10 - - 20- *80 70 90 - - 10
15 50 40 20 20 40 30 - 10 30 *30 10 20
16 10 10 10 *70 60 70 - - 10 20 20 - - 10 10
17 *8010 50 20 60 30 - 30 20
18 30 40 30 20 30 20 *50 30 40 - - 10
19 10 60 30 *30 10 50 50 30 20 10 - -
20 - - - 30- - *70 40 80 - 60- - - - - - 20
21 *50 30 40 40 30 20 - 30 30 10 - 10 - 10 -
22 -10- *90 60 70 10 30 30
Problem 50
Ho: There is no significant difference between the pretest results of the experimental group A
and the control group B of the EX-TED grade 12 students.
107

Hl: There is a significant difference between the pretest results of the experimental group A
and the control group B of the EX-TED grade 12 students.
TABLE 4.62
Test N-
Items Mean
Standard
Deviation
Calculated
T-value
Table
T-value
df significance
pretest A
pretest B
20
20
42,5
40,09
16,085
19,10 0,2797 1,6866 38 P< 0,05
According to table 4.62 the null hypothesis may not be rejected for the pretest comparison of
the experimental and control group grade 12 students for problem 50. Hence there is no
significant difference at the 5% level of significance since the calculated T-value is less than
the table T-value
Problem 51 .
Ho: There is no significant difference between the pretest results of the experimental group A
and the post-test group A of the EX-TED grade 12 students.
H1: There is a significant difference between the pretest results of the experimental group A
and the post-test group A of the EX-TED grade 12 students.
TABLE 4.63
Test N-
Items Mean
Standard
Deviation
Calculated
T-value
Table
T-value
df significance
pretest.A
post-test A
20
22
42,5
58,6
16,085
22,082 2,689 2,423 40 P< 0,01
According to table 4.63 the Null hypothesis may be rejected since the calculated t-value is
greater than the table t- value for problem 51 at the 1% level of significance. Thus there is a
significant difference between the pretest and post-test results of the EX-TED grade 12
108

experimental group students. This implies that the intervention programme that was
implemented with the experimental group made a significant improvement.
Problem 52
Ho: There is no significant difference between the pretest results of the control group B and
the post-test control group B of the EX-TED grade 12 students.
Hl: There is a significant difference between the pretest results of the control group B and the
post-test control group B of the EX-TED grade 12 students.
TABLE 4.64
Test N-
Items
Mean Standard
Deviation
Calculated
T-value
Table
T-value
df significance
pretest B
post-test B
20
22
40,09
35
27,73
41,36 0,173 1,684 40 P< 0,05
According to table 4.64 the Null hypothesis may not be rejected since the calculated value is
less than the table value for problem 52. Thus there is no significant difference between the
pretest and post-test results of the
EX-TED grade 12 control group students.
Problem 53
Ho: There is no significant difference between the post-test results of the experimental group
A and the control group B of the EX-TED grade 12 students.
Hl: There is a significant difference between the post-test results of the experimental group A
and the control group B of the EX-TED grade12 students.
109
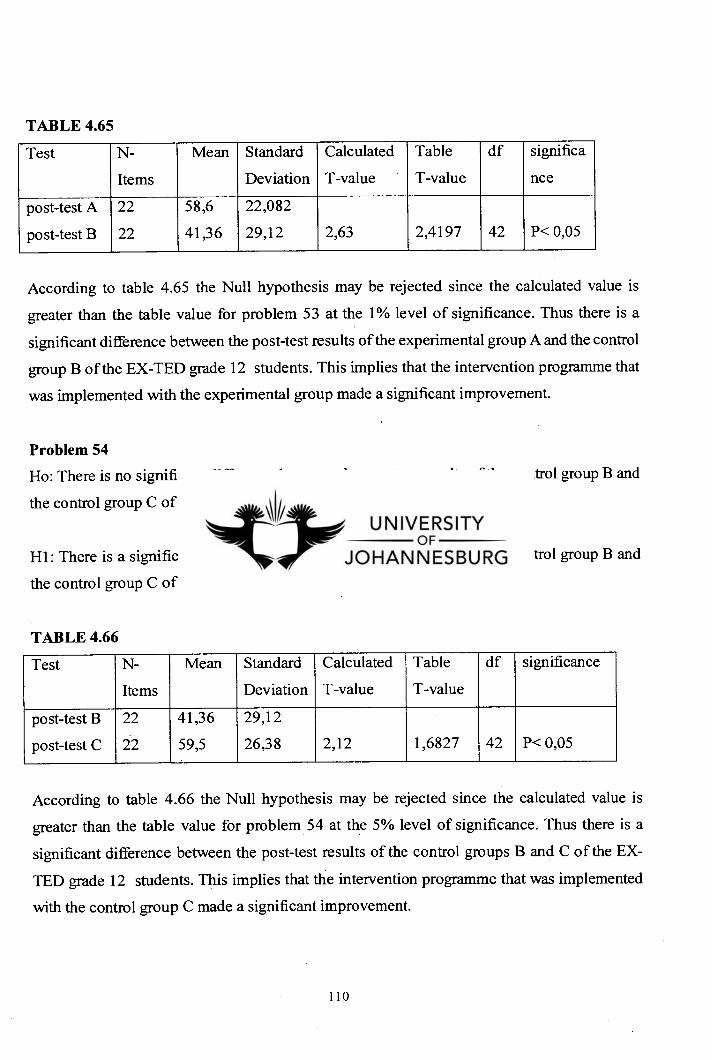
TABLE 4.65
Test N-
Items
Mean Standard
Deviation
Calculated
T-value
Table
T-value
df significa
nce
post-test A
post-test B
22
22
58,6
41,36
22,082
29,12 2,63 2,4197 42 P< 0,05
According to table 4.65 the Null hypothesis may be rejected since the calculated value is
greater than the table value for problem 53 at the 1% level of significance. Thus there is a
significant difference between the post-test results of the experimental group A and the control
group B of the EX-TED grade 12 students. This implies that the intervention programme that
was implemented with the experimental group made a significant improvement.
Problem 54 Ho: There is no significant difference between the post-test results of the control group B and
the control group C of the EX-TED grade 12 students.
Hl: There is a significant difference between the post-test results of the control group B and
the control group C of the EX-TED grade 12 students.
TABLE 4.66
Test N-
Items
Mean Standard
Deviation
Calculated
T-value
Table
T-value
df significance
post-test B
post-test C
22
22
41,36
59,5
29,12
26,38 2,12 1,6827 42 P< 0,05
According to table 4.66 the Null hypothesis may be rejected since the calculated value is
greater than the table value for problem 54 at the 5% level of significance. Thus there is a
significant difference between the post-test results of the control groups B and C of the EX-
TED grade 12 students. This implies that the intervention programme that was implemented
with the control group C made a significant improvement.
110
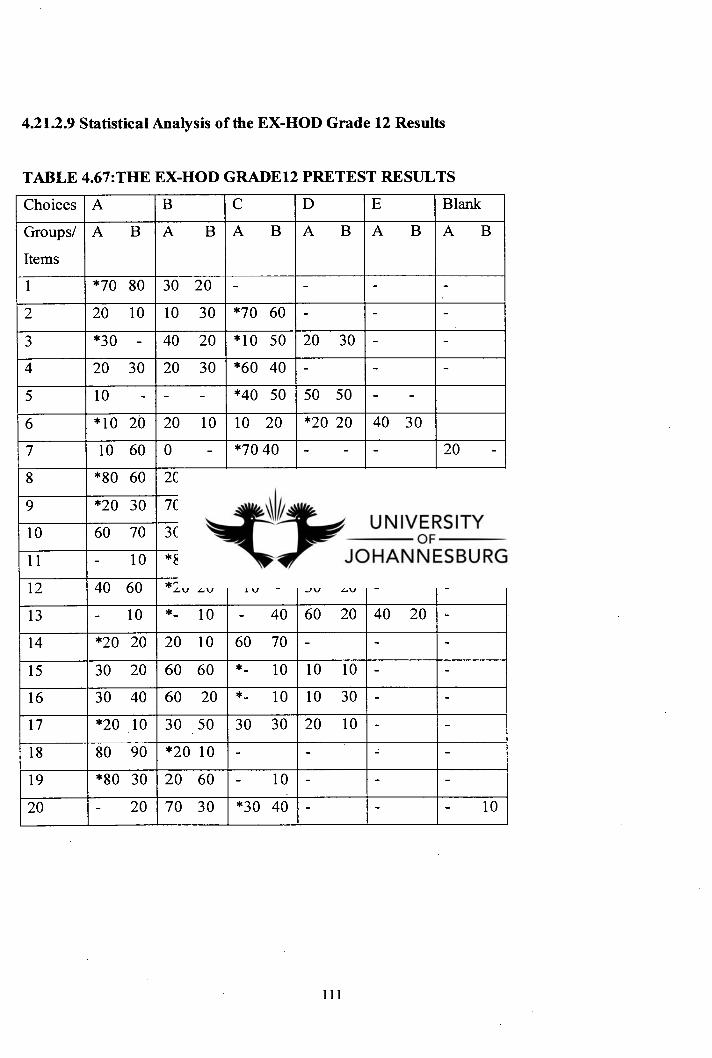
4.21.2.9 Statistical Analysis of the EX-HOD Grade 12 Results
TABLE 4.67:THE EX-HOD GRADE12 PRETEST RESULTS
Choices A B C D E Blank
Groups/
Items
A B A B A B A B A B A B
1 *70 80 30 20 - - - -
2 20 10 10 30 *70 60 - - -
3 *30 - 40 20 *10 50 20 30 - -
4 20 30 20 30 *60 40 - - -
5 10 - - - *40 50 50 50 - -
6 *10 20 20 10 10 20 *20 20 40 30
7 10 60 0 - *70 40 - - - 20 -
8 *80 60 20 10 - 30 - - -
9 *20 30 70 60 10 10 - - -
10 60 70 30 20 *10 10 - - -
11 - 10 *80 60 20 30 - - -
12 40 60 *20 20 *10 - 30 20 - -
13 - 10 *- 10 - 40 60 20 40 20 -
14 *20 20 20 10 60 70 - - -
15 30 20 60 60 *- 10 10 10 - -
16 30 40 60 20 *- 10 10 30 - -
17 *20 10 30 50 30 30 20 10 - -
18 80 90 *20 10 - - -
19 *80 30 20 60 - 10 - - -
20 - 20 70 30 *30 40 - - - 10
111
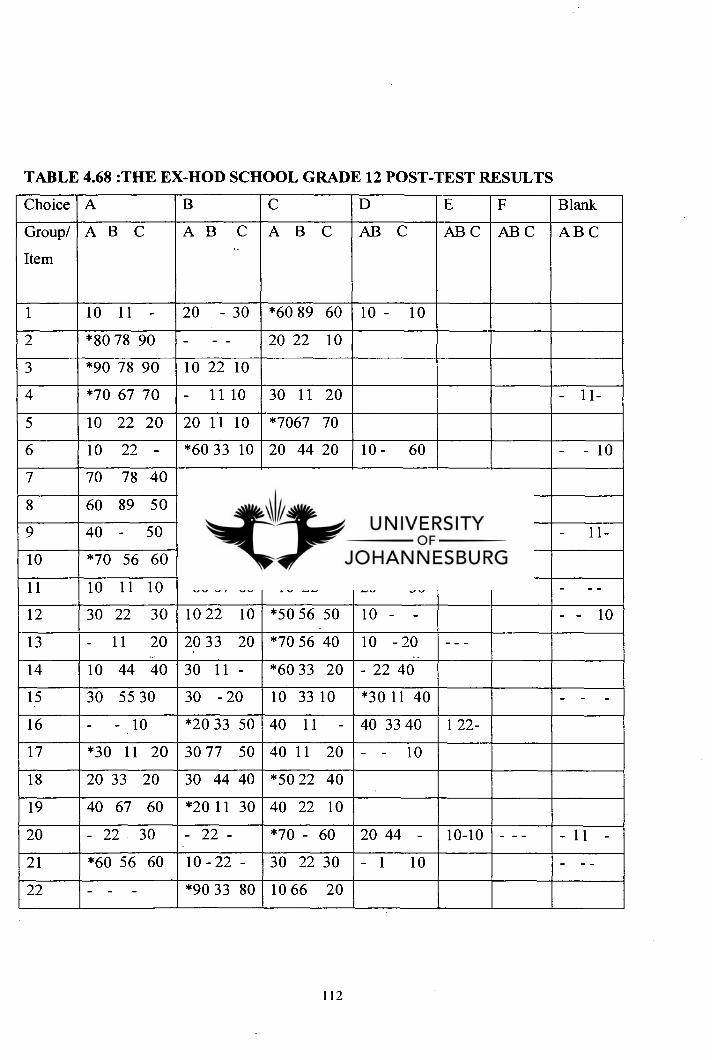
TABLE 4.68 :THE EX-HOD SCHOOL GRADE 12 POST-TEST RESULTS
Choice A B C D E F Blank
Group/
Item
A B C A B C A B C AB C AB C AB C A B C
1 10 11 - 20 - 30 *60 89 60 10 - 10
2 *80 78 90 - - - 20 22 10
3 *90 78 90 10 22 10
4 *70 67 70 - 11 10 30 11 20 - 11-
5 10 22 20 20 11 10 *7067 70
6 10 22 - *60 33 10 20 44 20 10 - 60 - - 10
7 70 78 40 - - 10 *30 22 50
8 60 89 50 10 - - 10 - 10 *20 11 40
9 40 - 50 50 56 20 *10 33 30 - - 11-
10 *70 56 60 10 22 10 - 11 - 20 11 30
11 10 11 10 *60 67 60 *10 22 - 20 - 30 - --
12 30 22 30 10 22 10 *50 56 50 10 - - - - 10
13 - 11 20 20 33 20 *70 56 40 10 - 20 - - -
14 10 44 40 30 11 - *60 33 20 - 22 40
15 30 55 30 30 - 20 10 33 10 *30 11 40 - - -
16 - - 10 *20 33 50 40 11 - 40 33 40 1 22-
17 *30 11 20 30 77 50 40 11 20 - - 10
18 20 33 20 30 44 40 *50 22 40
19 40 67 60 *20 11 30 40 22 10
20 - 22 30 - 22 - *70 - 60 20 44 - 10-10 - - - - 11 -
21 *60 56 60 10 - 22 - 30 22 30 - 1 10 - - -
22 *90 33 80 10 66 20
112
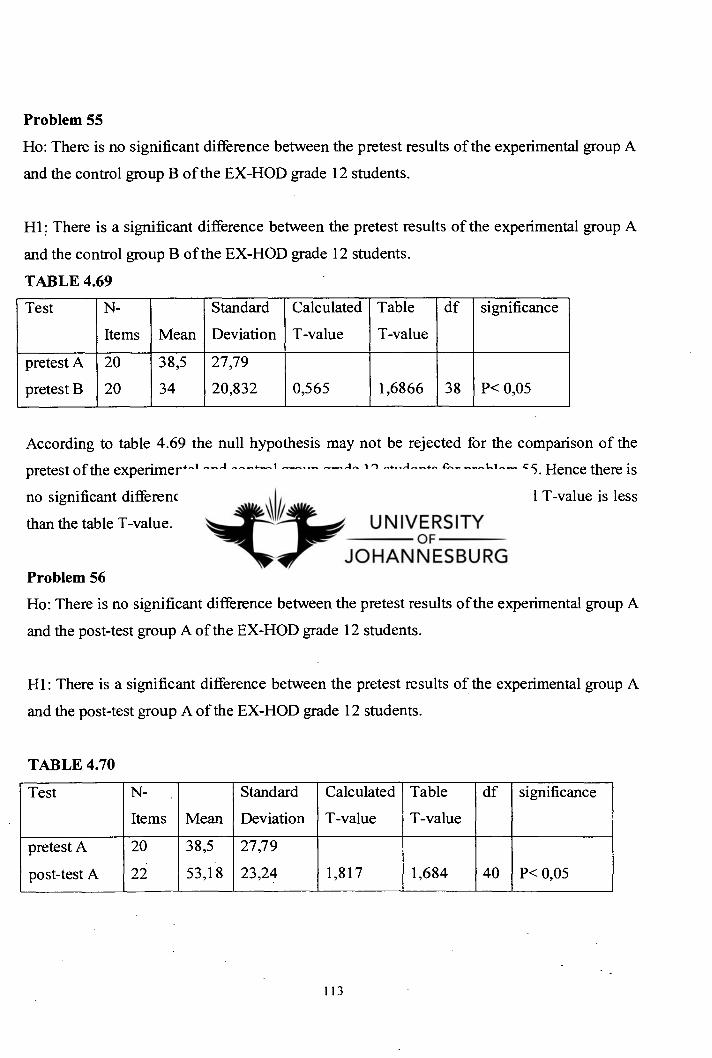
Problem 55
Ho: There is no significant difference between the pretest results of the experimental group A
and the control group B of the EX-HOD grade 12 students.
H1: There is a significant difference between the pretest results of the experimental group A
and the control group B of the EX-HOD grade 12 students.
TABLE 4.69
Test N-
Items Mean
Standard
Deviation
Calculated
T-value
Table
T-value
df significance
pretest A
pretest B
20
20
38,5
34
27,79
20,832 0,565 1,6866 38 P< 0,05
According to table 4.69 the null hypothesis may not be rejected for the comparison of the
pretest of the experimental and control group grade 12 students for problem 55. Hence there is
no significant difference at the 5% level of significance since the calculated T-value is less
than the table T-value.
Problem 56
Ho: There is no significant difference between the pretest results of the experimental group A
and the post-test group A of the EX-HOD grade 12 students.
H1: There is a significant difference between the pretest results of the experimental group A
and the post-test group A of the EX-HOD grade 12 students.
TABLE 4.70
Test N-
Items Mean
Standard
Deviation
Calculated
T-value
Table
T-value
df significance
pretest A
post-test A
20
22
38,5
53,18
27,79
23,24 1,817 1,684 40 P< 0,05
113
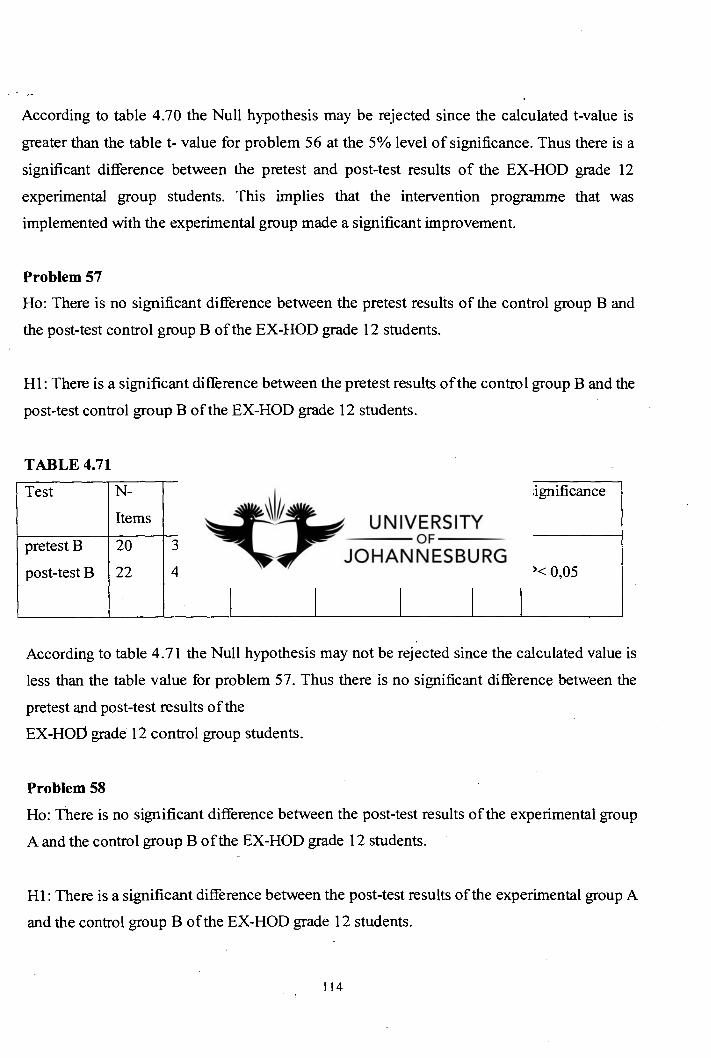
According to table 4.70 the Null hypothesis may be rejected since the calculated t-value is
greater than the table t- value for problem 56 at the 5% level of significance. Thus there is a
significant difference between the pretest and post-test results of the EX-HOD grade 12
experimental group students. This implies that the intervention programme that was
implemented with the experimental group made a significant improvement.
Problem 57
Ho: There is no significant difference between the pretest results of the control group B and
the post-test control group B of the EX-HOD grade 12 students.
Hl: There is a significant difference between the pretest results of the control group B and the
post-test control group B of the EX-HOD grade 12 students.
TABLE 4.71
Test N-
Items
Mean Standard
Deviation
Calculated
T-value
Table
T-value
df significance
pretest B
post-test B
20
22
34
41,45
20,832
26,28 0,987 1,684 40 P< 0,05
According to table 4.71 the Null hypothesis may not be rejected since the calculated value is
less than the table value for problem 57. Thus there is no significant difference between the
pretest and post-test results of the
EX-HOD grade 12 control group students.
Problem 58
Ho: There is no significant difference between the post-test results of the experimental group
A and the control group B of the EX-HOD grade 12 students.
Hl: There is a significant difference between the post-test results of the experimental group A
and the control group B of the EX-HOD grade 12 students.
114
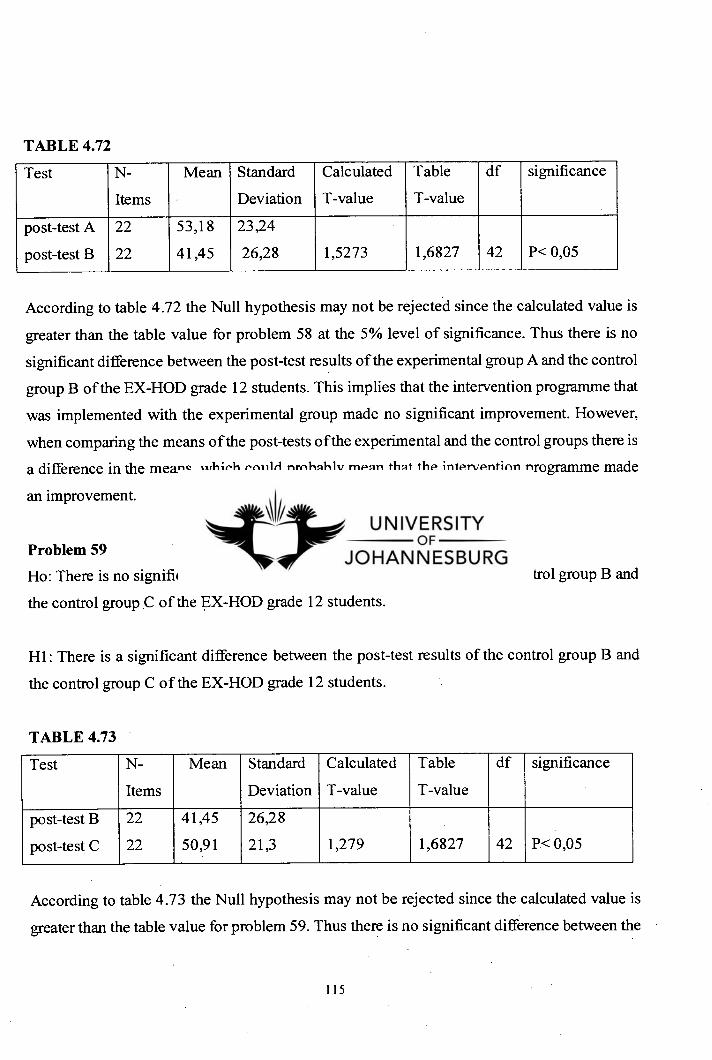
TABLE 4.72
Test N-
Items
Mean Standard
Deviation
Calculated
T-value
Table
T-value
df significance
post-test A
post-test B
22
22
53,18
41,45
23,24
26,28 1,5273 1,6827 42 P< 0,05
According to table 4.72 the Null hypothesis may not be rejected since the calculated value is
greater than the table value for problem 58 at the 5% level of significance. Thus there is no
significant difference between the post-test results of the experimental group A and the control
group B of the EX-HOD grade 12 students. This implies that the intervention programme that
was implemented with the experimental group made no significant improvement. However,
when comparing the means of the post-tests ofthe experimental and the control groups there is
a difference in the means, which could probably mean that the intervention programme made
an improvement.
Problem 59
Ho: There is no significant difference between the post-test results of the control group B and
the control group C of the EX-HOD grade 12 students.
Hl: There is a significant difference between the post-test results of the control group B and
the control group C of the EX-HOD grade 12 students.
TABLE 4.73
Test N-
Items
Mean Standard
Deviation
Calculated
T-value
Table
T-value
df significance
post-test B
post-test C
22
22
41,45
50,91
26,28
21,3 1,279 1,6827 42 P< 0,05
According to table 4.73 the Null hypothesis may not be rejected since the calculated value is
greater than the table value for problem 59. Thus there is no significant difference between the
115
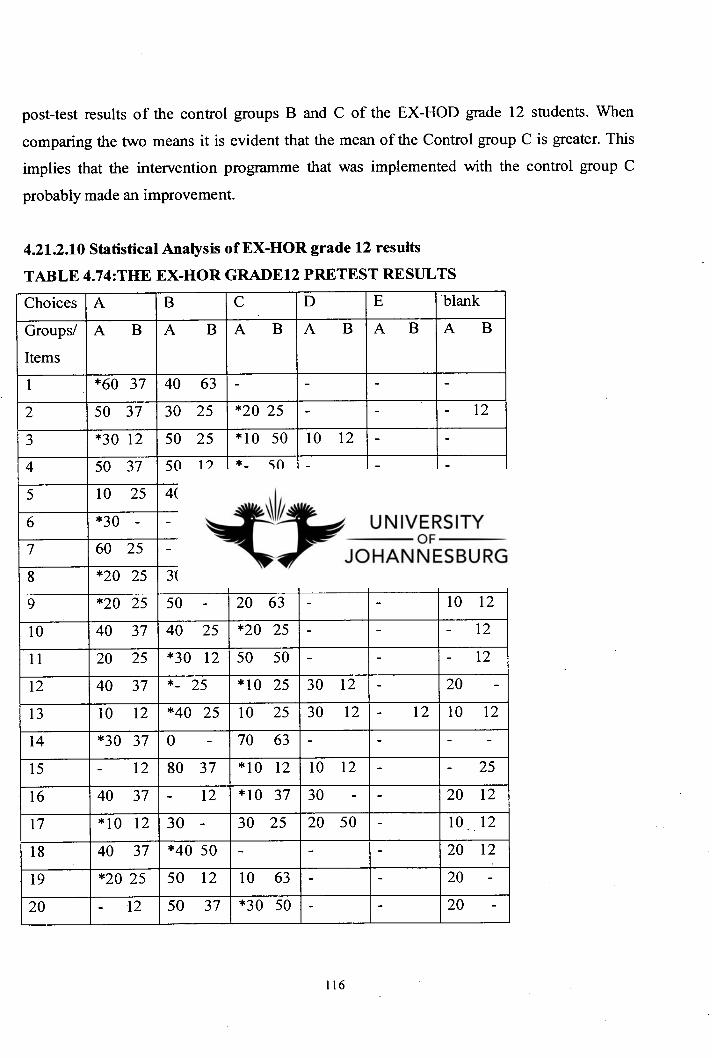
post-test results of the control groups B and C of the EX-HOD grade 12 students. When
comparing the two means it is evident that the mean of the Control group C is greater. This
implies that the intervention programme that was implemented with the control group C
probably made an improvement.
4.21.2.10 Statistical Analysis of EX-HOR grade 12 results
TABLE 4.74:THE EX-HOR GRADE12 PRETEST RESULTS
Choices A B C D E blank
Items
Groups/ABA BA BA B A B A B
1 *60 37 40 63 - - - -
2 50 37 30 25 *20 25 - - - 12
3 *30 12 50 25 *10 50 10 12 - -
4 50 37 50 12 *- 50 - - -
5 10 25 40 50 *40 25 10 - -
6 *30 - - 37 20 12 *10 25 30 12 10 12
7 60 25 - - *40 50 - - - 25
8 *20 25 30 25 40 37 - - 10 12
9 *20 25 50 - 20 63 - - 10 12
10 40 37 40 25 *20 25 - - - 12
11 20 25 *30 12 50 50 - - - 12
12 40 37 *- 25 *10 25 30 12 - 20 -
13 10 12 *40 25 10 25 30 12 - 12 10 12
14 *30 37 0 - 70 63 - - - -
15 - 12 80 37 *10 12 10 12 - - 25
16 40 37 - 12 *10 37 30 - - 20 12
17 *10 12 30 - 30 25 20 50 - 10 12
18 40 37 *40 50 - - - 20 12
19 *20 25 50 12 10 63 - - 20 -
20 - 12 50 37 *30 50 - - 20 -
116
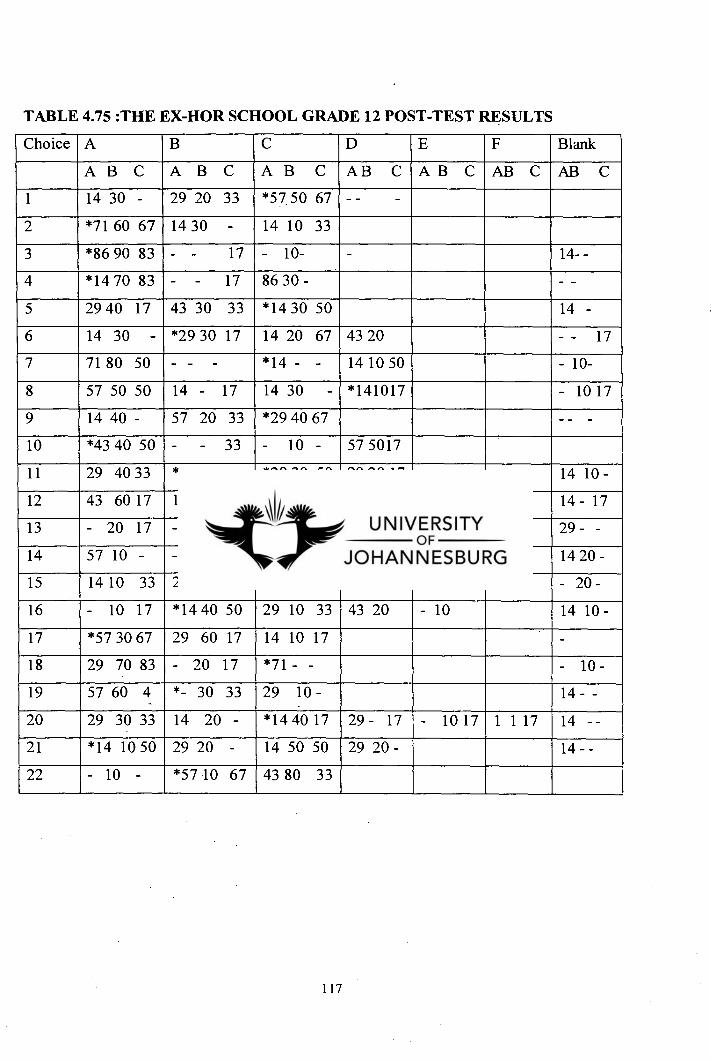
TABLE 4.75 :THE EX-HOR SCHOOL GRADE 12 POST-TEST RESULTS
Choice A B C D E F Blank
AB C A B C AB C ABC AB C AB C ABC
1 14 30 - 29 20 33 *57.50 67 - - -
2 *71 60 67 14 30 - 14 10 33
3 *86 90 83 - - 17 - 10- - 14- -
4 *14 70 83 - - 17 86 30 - - -
5 29 40 17 43 30 33 *14 30 50 14 -
6 14 30 - *29 30 17 14 20 67 43 20 - - 17
7 71 80 50 - - - *14 - - 14 10 50 - 10-
8 57 50 50 14 - 17 14 30 - *141017 - 10 17
9 14 40 - 57 20 33 *29 40 67 - - -
10 *43 40 50 - - 33 - 10 - 57 5017
11 29 40 33 *- - - *29 30 50 29 20 17 14 10 -
12 43 60 17 14 10 33 *29 20 17 - 10 17 14 - 17
13 - 20 17 - 30 - *43 30 50 14 20 17 14- 17 29 - -
14 57 10 - - 30 34 *14 30 67 14 10 - 14 20 -
15 14 10 33 29 20 50 - 40 - *571017 - 20 -
16 - 10 17 *14 40 50 29 10 33 43 20 - 10 14 10 -
17 *57 30 67 29 60 17 14 10 17 -
18 29 70 83 - 20 17 *71 - - - 10 -
19 57 60 4 *- 30 33 29 10 - 14 - -
20 29 30 33 14 20 - *14.40 17 29 - 17 - 10 17 1 1 17 14 - -
21 *14 10 50 29 20 - 14 50 50 29 20 - 14 - -
22 - 10 - *57 -10 67 43 80 33
117
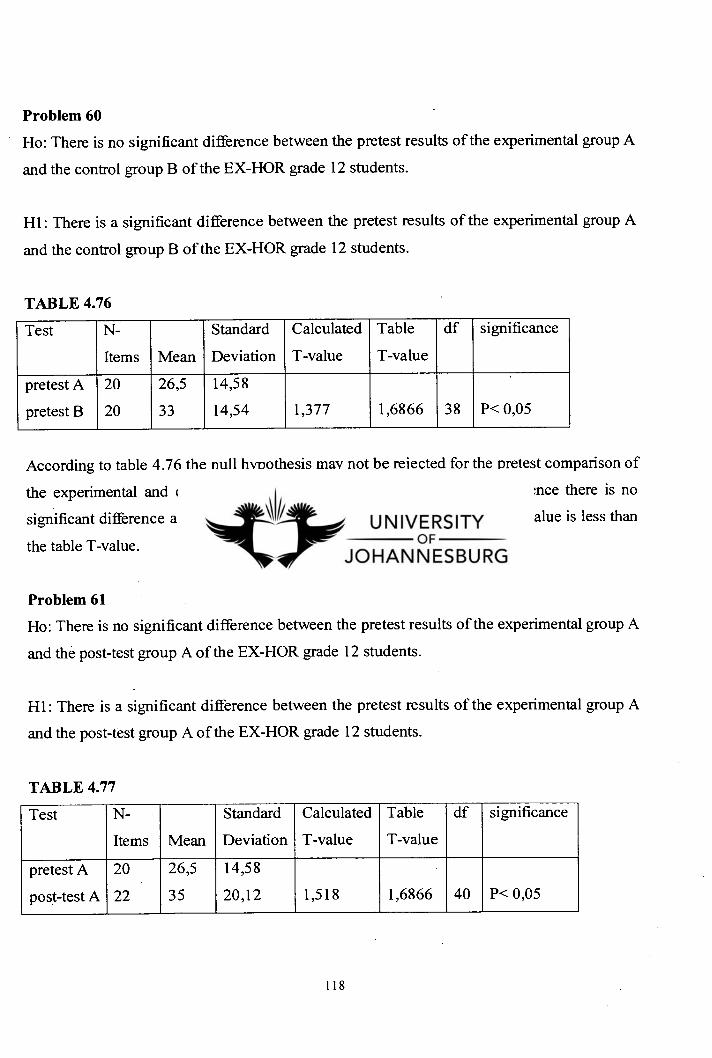
Problem 60
Ho: There is no significant difference between the pretest results of the experimental group A
and the control group B of the EX-HOR grade 12 students.
Hl: There is a significant difference between the pretest results of the experimental group A
and the control group B of the EX-HOR grade 12 students.
TABLE 4.76
Test N-
Items Mean
Standard
Deviation
Calculated
T-value
Table
T-value
df significance
pretest A
pretest B
20
20
26,5
33
14,58
14,54 1,377 1,6866 38 P< 0,05
According to table 4.76 the null hypothesis may not be rejected for the pretest comparison of
the experimental and control group grade 12 students for problem 60. Hence there is no
significant difference at the 5% level of significance since the calculated T-value is less than
the table T-value.
Problem 61
Ho: There is no significant difference between the pretest results of the experimental group A
and the post-test group A of the EX-HOR grade 12 students.
Hl: There is a significant difference between the pretest results of the experimental group A
and the post-test group A of the EX-HOR grade 12 students.
TABLE 4.77
Test N-
Items Mean
Standard
Deviation
Calculated
T-value
Table
T-value
df significance
pretest A
post-test A
20
22
26,5
35
14,58
20,12 1,518 1,6866 40 P< 0,05
118

According to table 4.77 the Null hypothesis may not be rejected since the calculated t-value is
greater than the table t- value for problem 61 at the 1% level of significance. Thus there is no
significant difference between the pretest and post-test results of the EX-HOR grade 12
experimental group students. However, when comparing the means there is a big difference.
This implies that the intervention programme that was implemented with the experimental
group probably made an improvement.
Problem 62
Ho: There is no significant difference between the pretest results of the control group B and
the post-test control group B of the EX-HOR grade 12 students.
Hl: There is a significant difference between the pretest results of the control group B and the
post-test control group B of the EX-HOR grade 12 students.
TABLE 4.78
Test N-
Items Mean
Standard
Deviation
Calculated
T-value
Table
T-value
df significance
pretest B
post-test B
20
22
33
31,8
14,54
21,67 0,2037 1,684 40 P< 0,05
According to table 4.78 the Null hypothesis may not be rejected since the calculated value is
less than the table value for problem 62. Thus there is no significant difference between the
pretest and post-test results of the
EX-HOD grade 12 control group students.
Problem 63
Ho: There is no significant difference between the post-test results of the experimental group
A and the control group B of the EX-HOR grade 12 students.
119
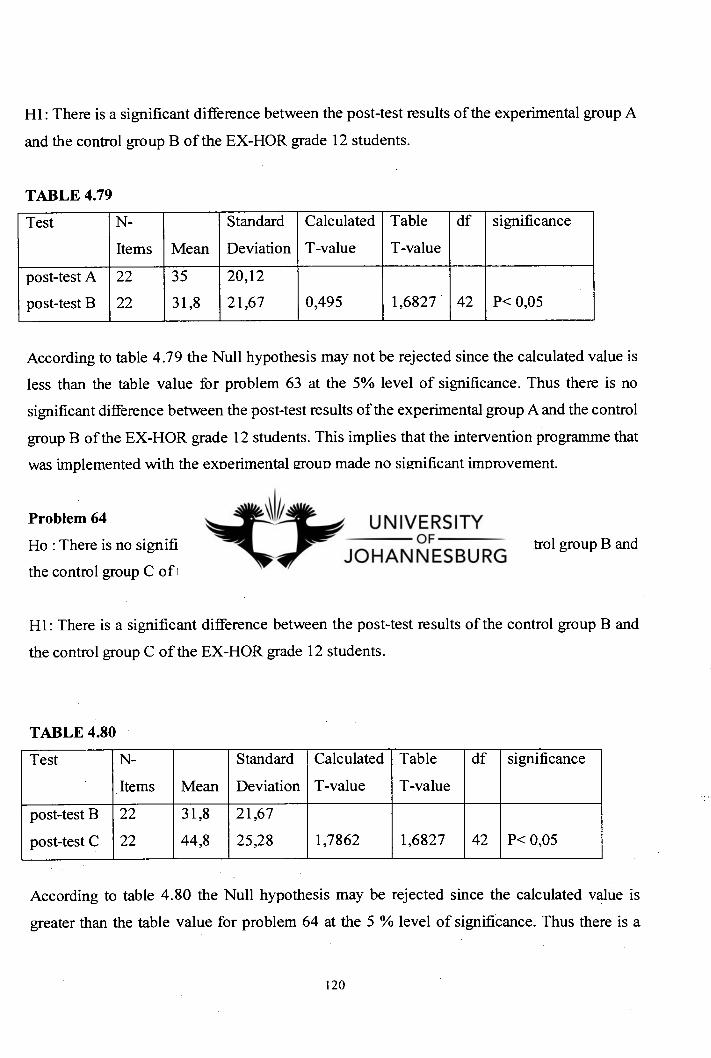
Hl: There is a significant difference between the post-test results of the experimental group A
and the control group B of the EX-HOR grade 12 students.
TABLE 4.79
Test N-
Items Mean
Standard
Deviation
Calculated
T-value
Table
T-value
df significance
post-test A
post-test B
22
22
35
31,8
20,12
21,67 0,495 1,6827 42 P< 0,05
According to table 4.79 the Null hypothesis may not be rejected since the calculated value is
less than the table value for problem 63 at the 5% level of significance. Thus there is no
significant difference between the post-test results of the experimental group A and the control
group B of the EX-HOR grade 12 students. This implies that the intervention programme that
was implemented with the experimental group made no significant improvement.
Problem 64
Ho : There is no significant difference between the post-test results of the control group B and
the control group C of the EX-HOR grade 12 students.
Hl: There is a significant difference between the post-test results of the control group B and
the control group C of the EX-HOR grade 12 students.
TABLE 4.80
Test N-
Items Mean
Standard
Deviation
Calculated
T-value
Table
T-value
df significance
post-test B
post-test C
22
22
31,8
44,8
21,67
25,28 1,7862 1,6827 42 P< 0,05
According to table 4.80 the Null hypothesis may be rejected since the calculated value is
greater than the table value for problem 64 at the 5 % level of significance. Thus there is a
120
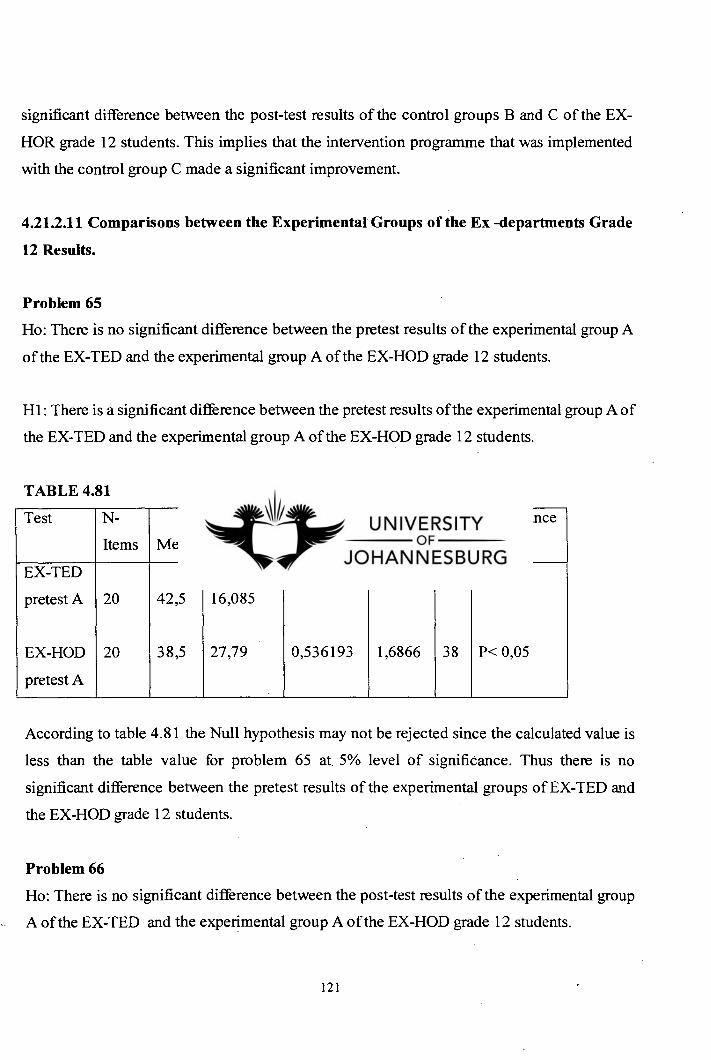
significant difference between the post-test results of the control groups B and C of the EX-
HOR grade 12 students. This implies that the intervention programme that was implemented
with the control group C made a significant improvement.
4.21.2.11 Comparisons between the Experimental Groups of the Ex -departments Grade
12 Results.
Problem 65
Ho: There is no significant difference between the pretest results of the experimental group A
of the EX-TED and the experimental group A of the EX-HOD grade 12 students.
Hl: There is a significant difference between the pretest results of the experimental group A of
the EX-TED and the experimental group A of the EX-HOD grade 12 students.
TABLE 4.81
Test N-
Items Mean
Standard
Deviation
Calculated
T-value
Table
T-value
df significance
EX-TED
pretest A 20 42,5 16,085
EX-HOD
pretest A
20 38,5 27,79 0,536193 1,6866 38 P< 0,05
According to table 4.81 the Null hypothesis may not be rejected since the calculated value is
less than the table value for problem 65 at 5% level of significance. Thus there is no
significant difference between the pretest results of the experimental groups of EX-TED and
the EX-HOD grade 12 students.
Problem 66
Ho: There is no significant difference between the post-test results of the experimental group
A of the EX-TED and the experimental group A of the EX-HOD grade 12 students.
121
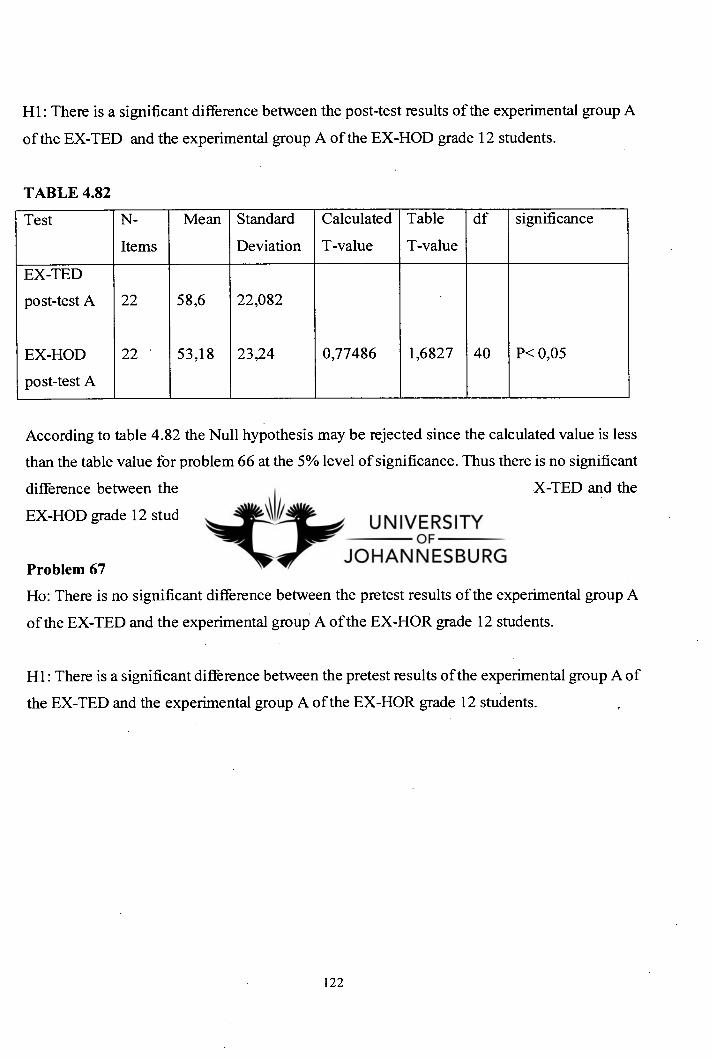
Hl: There is a significant difference between the post-test results of the experimental group A
of the EX-TED and the experimental group A of the EX-HOD grade 12 students.
TABLE 4.82
Test N-
Items
Mean Standard
Deviation
Calculated
T-value
Table
T-value
df significance
EX-TED
post-test A 22 58,6 22,082
EX-HOD
post-test A
22 53,18 23,24 0,77486 1,6827 40 P< 0,05
According to table 4.82 the Null hypothesis may be rejected since the calculated value is less
than the table value for problem 66 at the 5% level of significance. Thus there is no significant
difference between the post-test results of the experimental groups of the EX-TED and the
EX-HOD grade 12 students.
Problem 67
Ho: There is no significant difference between the pretest results of the experimental group A
of the EX-TED and the experimental group A of the EX-HOR grade 12 students.
Hl: There is a significant difference between the pretest results of the experimental group A of
the EX-TED and the experimental group A of the EX-HOR grade 12 students.
122
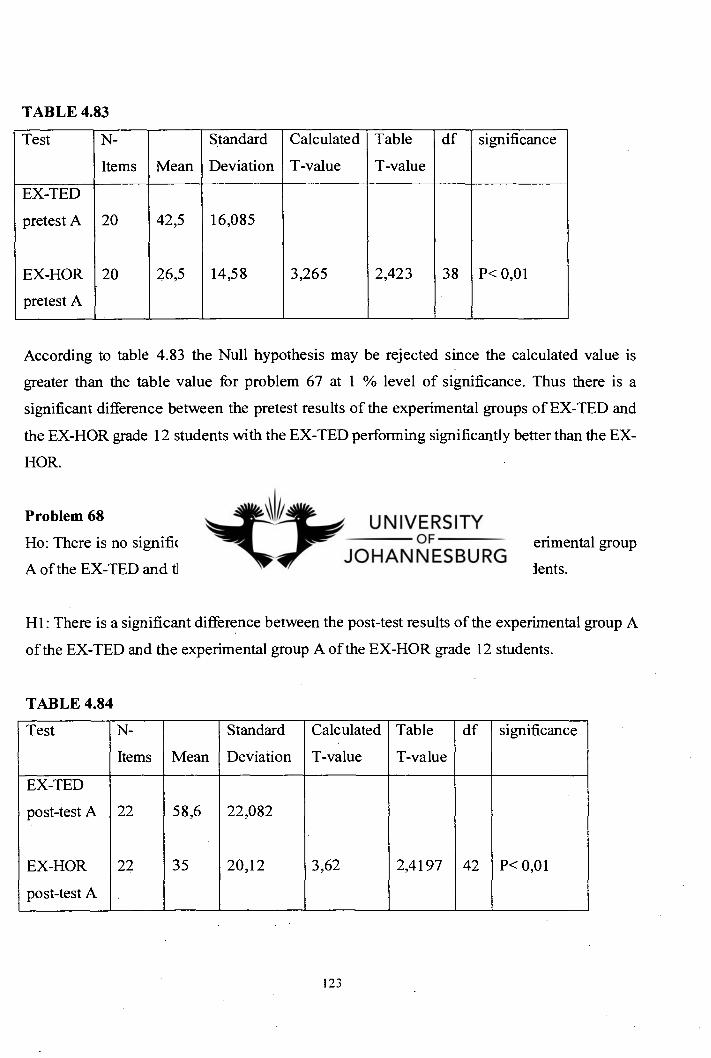
TABLE 4.83
Test N-
Items Mean
Standard
Deviation
Calculated
T-value
Table
T-value
df significance
EX-TED
pretest A 20 42,5 16,085
EX-HOR
pretest A
20 26,5 14,58 3,265 2,423 38 P< 0,01
According to table 4.83 the Null hypothesis may be rejected since the calculated value is
greater than the table value for problem 67 at 1 % level of significance. Thus there is a
significant difference between the pretest results of the experimental groups of EX-TED and
the EX-HOR grade 12 students with the EX-TED performing significantly better than the EX-
HOR.
Problem 68
Ho: There is no significant difference between the post-test results of the experimental group
A of the EX-TED and the experimental group A of the EX-HOR grade 12 students.
Hl: There is a significant difference between the post-test results of the experimental group A
of the EX-TED and the experimental group A of the EX-HOR grade 12 students.
TABLE 4.84
Test N-
Items Mean
Standard
Deviation
Calculated
T-value
Table
T-value
df significance
EX-TED
post-test A 22 58,6 22,082
EX-HOR
post-test A
22 35 20,12 3,62 2,4197 42 P< 0,01
123
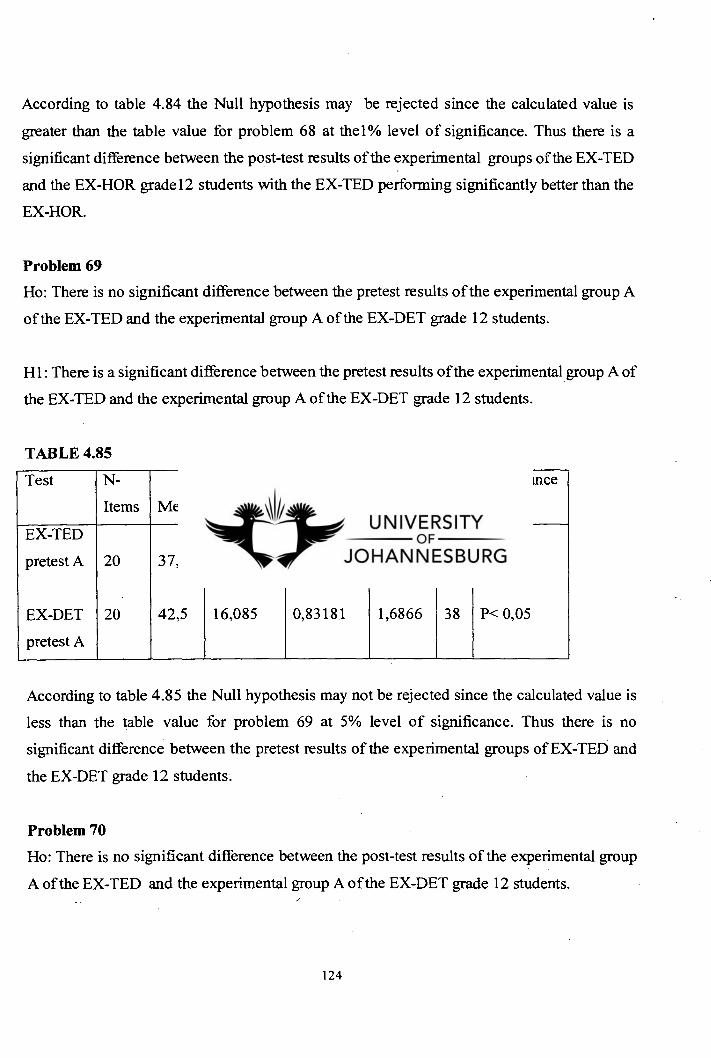
According to table 4.84 the Null hypothesis may be rejected since the calculated value is
greater than the table value for problem 68 at thel% level of significance. Thus there is a
significant difference between the post-test results of the experimental groups of the EX-TED
and the EX-HOR grade 12 students with the EX-TED performing significantly better than the
EX-HOR.
Problem 69
Ho: There is no significant difference between the pretest results of the experimental group A
of the EX-TED and the experimental group A of the EX-DET grade 12 students.
Hl: There is a significant difference between the pretest results of the experimental group A of
the EX-TED and the experimental group A of the EX-DET grade 12 students.
TABLE 4.85
Test N-
Items Mean
Standard
Deviation
Calculated
T-value
Table
T-value
df significance
EX-TED
pretest A 20 37,5 20,71
EX-DET
pretest A
20 42,5 16,085 0,83181 1,6866 38 P< 0,05
According to table 4.85 the Null hypothesis may not be rejected since the calculated value is
less than the table value for problem 69 at 5% level of significance. Thus there is no
significant difference between the pretest results of the experimental groups of EX-TED and
the EX-DET grade 12 students.
Problem 70
Ho: There is no significant difference between the post-test results of the experimental group
A of the EX-TED and the experimental group A of the EX-DET grade 12 students.
124
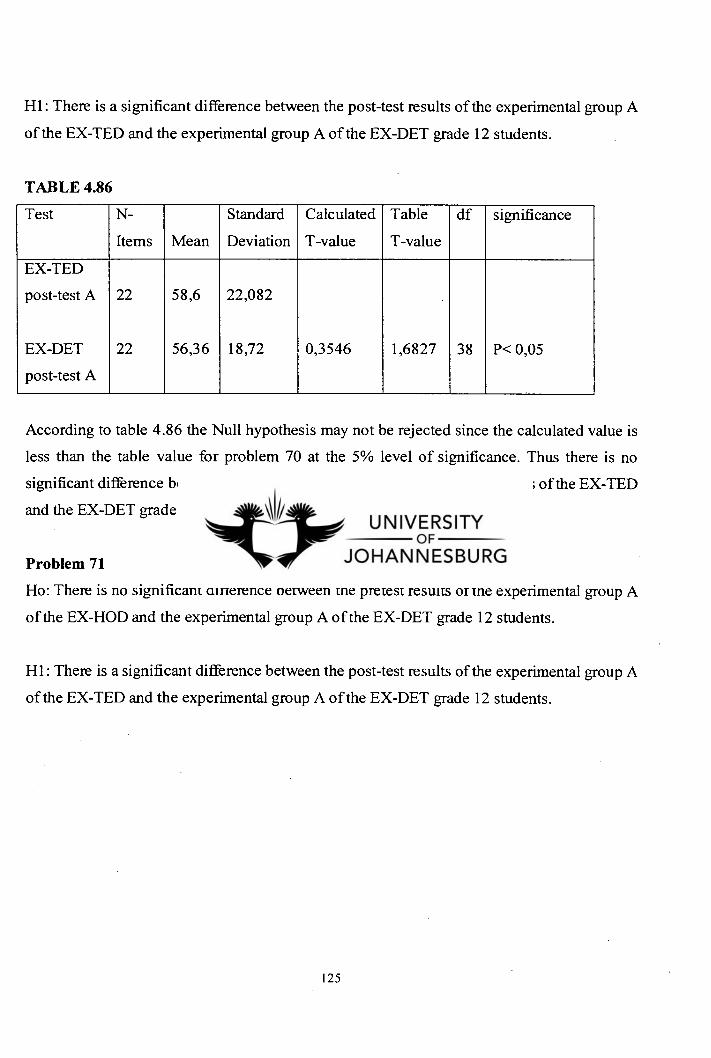
Hl: There is a significant difference between the post-test results of the experimental group A
of the EX-TED and the experimental group A of the EX-DET grade 12 students.
TABLE 4.86
Test N-
Items Mean
Standard
Deviation
Calculated
T-value
Table
T-value
df significance
EX-TED
post-test A 22 58,6 22,082
EX-DET
post-test A
22 56,36 18,72 0,3546 1,6827 38 P< 0,05
According to table 4.86 the Null hypothesis may not be rejected since the calculated value is
less than the table value for problem 70 at the 5% level of significance. Thus there is no
significant difference between the post-test results of the experimental groups of the EX-TED
and the EX-DET grade 12 students.
Problem 71
Ho: There is no significant difference between the pretest results of the experimental group A
of the EX-HOD and the experimental group A of the EX-DET grade 12 students.
Hl: There is a significant difference between the post-test results of the experimental group A
of the EX-TED and the experimental group A of the EX-DET grade 12 students.
125
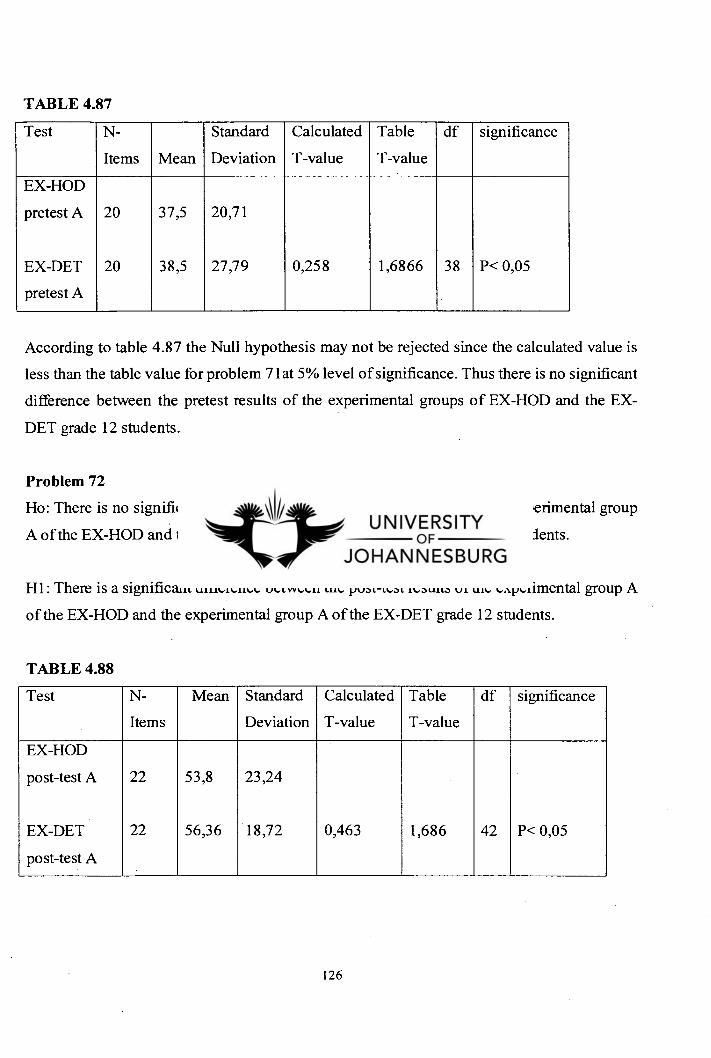
TABLE 4.87
Test N-
Items Mean
Standard
Deviation
Calculated
T-value
Table
T-value
df significance
EX-HOD
pretest A 20 37,5 20,71
EX-DET
pretest A
20 38,5 27,79 0,258 1,6866 38 P< 0,05
According to table 4.87 the Null hypothesis may not be rejected since the calculated value is
less than the table value for problem 7l at 5% level of significance. Thus there is no significant
difference between the pretest results of the experimental groups of EX-HOD and the EX-
DET grade 12 students.
Problem 72
Ho: There is no significant difference between the post-test results of the experimental group
A of the EX-HOD and the experimental group A of the EX-DET grade 12 students.
Hl: There is a significant difference between the post-test results of the experimental group A
of the EX-HOD and the experimental group A of the EX-DET grade 12 students.
TABLE 4.88
Test N-
Items
Mean Standard
Deviation
Calculated
T-value
Table
T-value
df significance
EX-HOD
post-test A 22 53,8 23,24
EX-DET
post-test A
22 56,36 18,72 0,463 1,686 42 P< 0,05
126
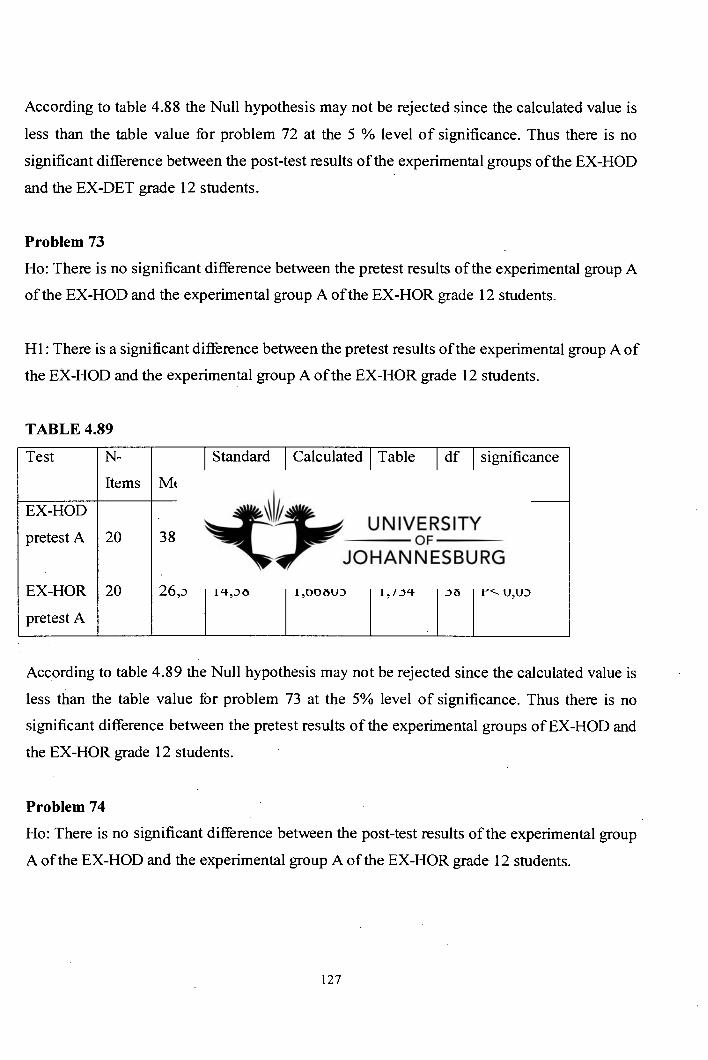
According to table 4.88 the Null hypothesis may not be rejected since the calculated value is
less than the table value for problem 72 at the 5 % level of significance. Thus there is no
significant difference between the post-test results of the experimental groups of the EX-HOD
and the EX-DET grade 12 students.
Problem 73
Ho: There is no significant difference between the pretest results of the experimental group A
of the EX-HOD and the experimental group A of the EX-HOR grade 12 students.
Hl: There is a significant difference between the pretest results of the experimental group A of
the EX-HOD and the experimental group A of the EX-HOR grade 12 students.
TABLE 4.89
Test N-
Items Mean
Standard
Deviation
Calculated
T-value
Table
T-value
df significance
EX-HOD
pretest A 20 38,5 27,79
EX-HOR
pretest A
20 26,5 14,58 1,66805 1,734 38 P< 0,05
According to table 4.89 the Null hypothesis may not be rejected since the calculated value is
less than the table value for problem 73 at the 5% level of significance. Thus there is no
significant difference between the pretest results of the experimental groups of EX-HOD and
the EX-HOR grade 12 students.
Problem 74
Ho: There is no significant difference between the post-test results of the experimental group
A of the EX-HOD and the experimental group A of the EX-HOR grade 12 students.
127
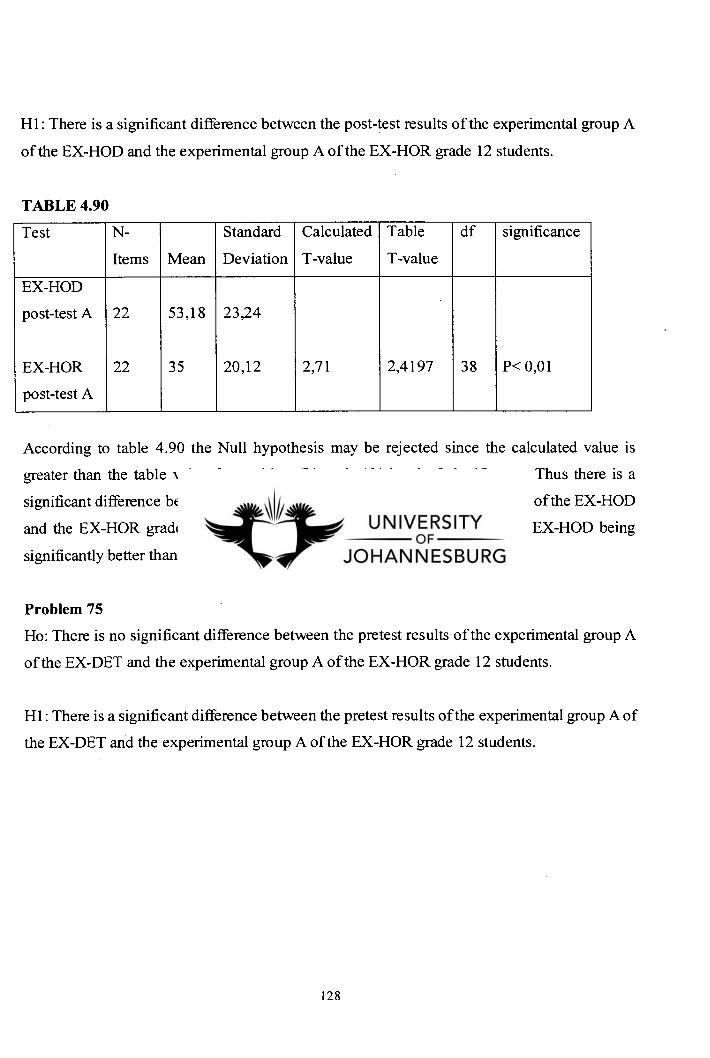
H1: There is a significant difference between the post-test results of the experimental group A
of the EX-HOD and the experimental group A of the EX-HOR grade 12 students.
TABLE 4.90
Test N-
Items Mean
Standard
Deviation
Calculated
T-value
Table
T-value
df significance
EX-HOD
post-test A 22 53,18 23,24
EX-HOR
post-test A
22 35 20,12 2,71 2,4197 38 P< 0,01
According to table 4.90 the Null hypothesis may be rejected since the calculated value is
greater than the table value for problem 74 at the 1 % level of significance. Thus there is a
significant difference between the post-test results of the experimental groups of the EX-HOD
and the EX-HOR grade 12 students with EX-HOD with the results of the EX-HOD being
significantly better than the EX-HOR.
Problem 75
Ho: There is no significant difference between the pretest results of the experimental group A
of the EX-DET and the experimental group A of the EX-HOR grade 12 students.
Hl: There is a significant difference between the pretest results of the experimental group A of
the EX-DET and the experimental group A of the EX-HOR grade 12 students.
128
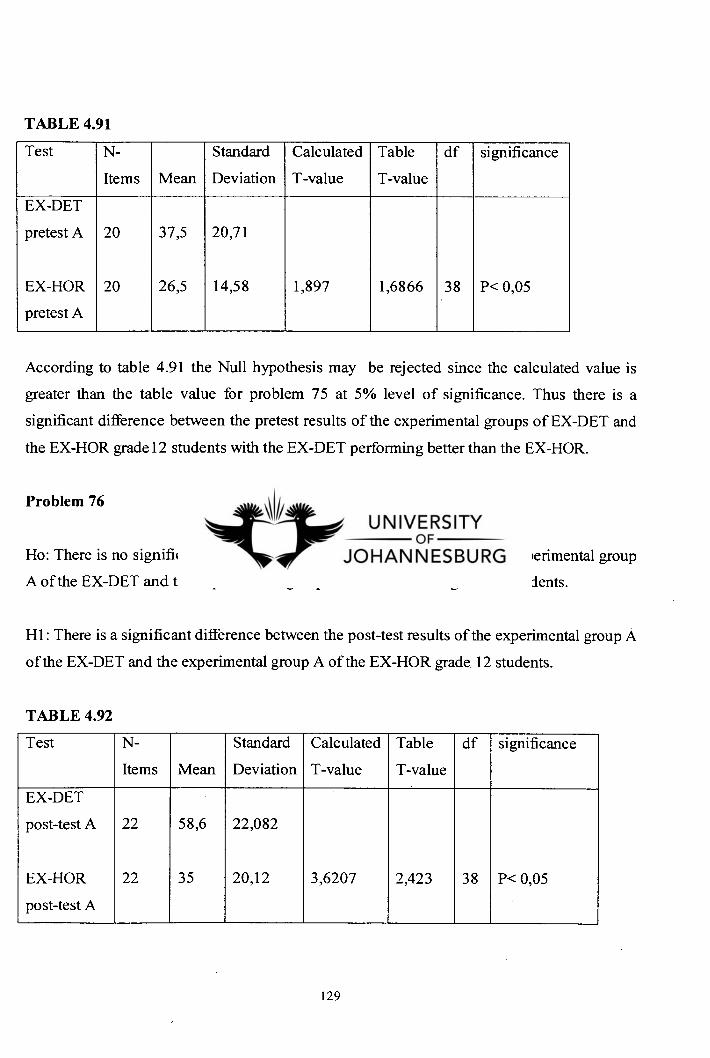
TABLE 4.91
Test N-
Items Mean
Standard
Deviation
Calculated
T-value
Table
T-value
df significance
EX-DET
pretest A 20 37,5 20,71
EX-HOR
pretest A
20 26,5 14,58 1,897 1,6866 38 P< 0,05
According to table 4.91 the Null hypothesis may be rejected since the calculated value is
greater than the table value for problem 75 at 5% level of significance. Thus there is a
significant difference between the pretest results of the experimental groups of EX-DET and
the EX-HOR grade 12 students with the EX-DET performing better than the EX-HOR.
Problem 76
Ho: There is no significant difference between the post-test results of the experimental group
A of the EX-DET and the experimental group A of the EX-HOR grade 12 students.
Hl: There is a significant difference between the post-test results of the experimental group A
of the EX-DET and the experimental group A of the EX-HOR grade 12 students.
TABLE 4.92
Test N-
Items Mean
Standard
Deviation
Calculated
T-value
Table
T-value
df significance
EX-DET
post-test A 22 58,6 22,082
EX-HOR
post-test A
22 35 20,12 3,6207 2,423 38 P< 0,05
129
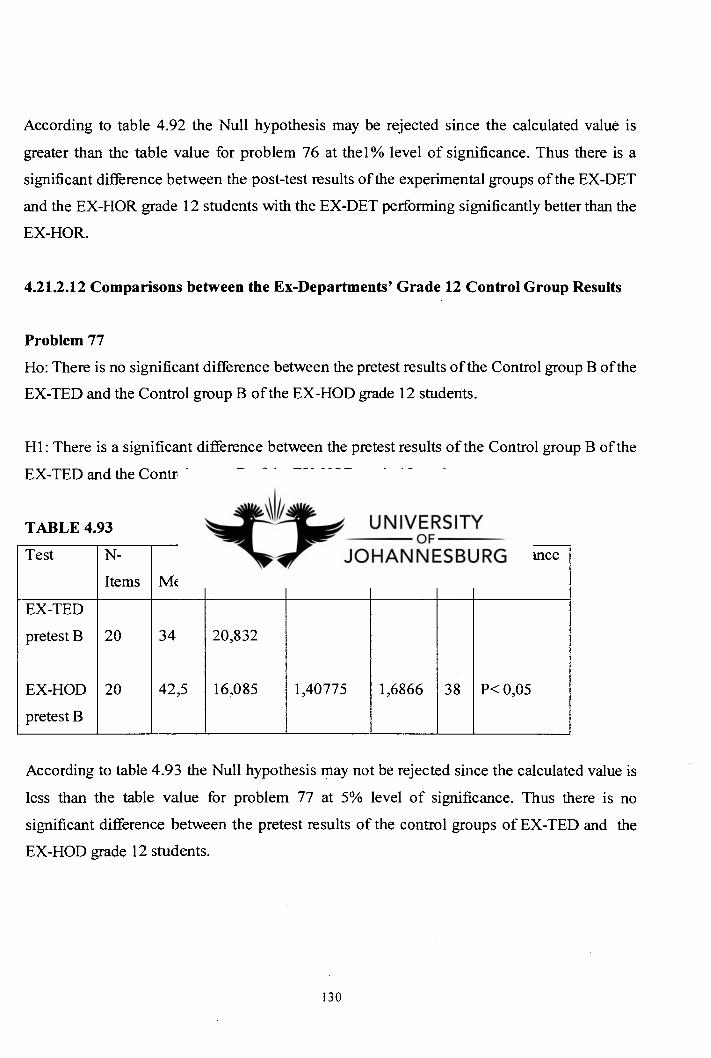
According to table 4.92 the Null hypothesis may be rejected since the calculated value is
greater than the table value for problem 76 at thel% level of significance. Thus there is a
significant difference between the post-test results of the experimental groups of the EX-DET
and the EX-HOR grade 12 students with the EX-DET performing significantly better than the
EX-HOR.
4.21.2.12 Comparisons between the Ex-Departments' Grade 12 Control Group Results
Problem 77
Ho: There is no significant difference between the pretest results of the Control group B of the
EX-TED and the Control group B of the EX-HOD grade 12 students.
Hl: There is a significant difference between the pretest results of the Control group B of the
EX-TED and the Control group B of the EX-HOD grade 12 students.
TABLE 4.93
Test N-
Items Mean
Standard
Deviation
Calculated
T-value
Table
T-value
df significance
EX-TED
pretest B 20 34 20,832
EX-HOD
pretest B
20 42,5 16,085 1,40775 1,6866 38 P< 0,05
According to table 4.93 the Null hypothesis may not be rejected since the calculated value is
less than the table value for problem 77 at 5% level of significance. Thus there is no
significant difference between the pretest results of the control groups of EX-TED and the
EX-HOD grade 12 students.
130
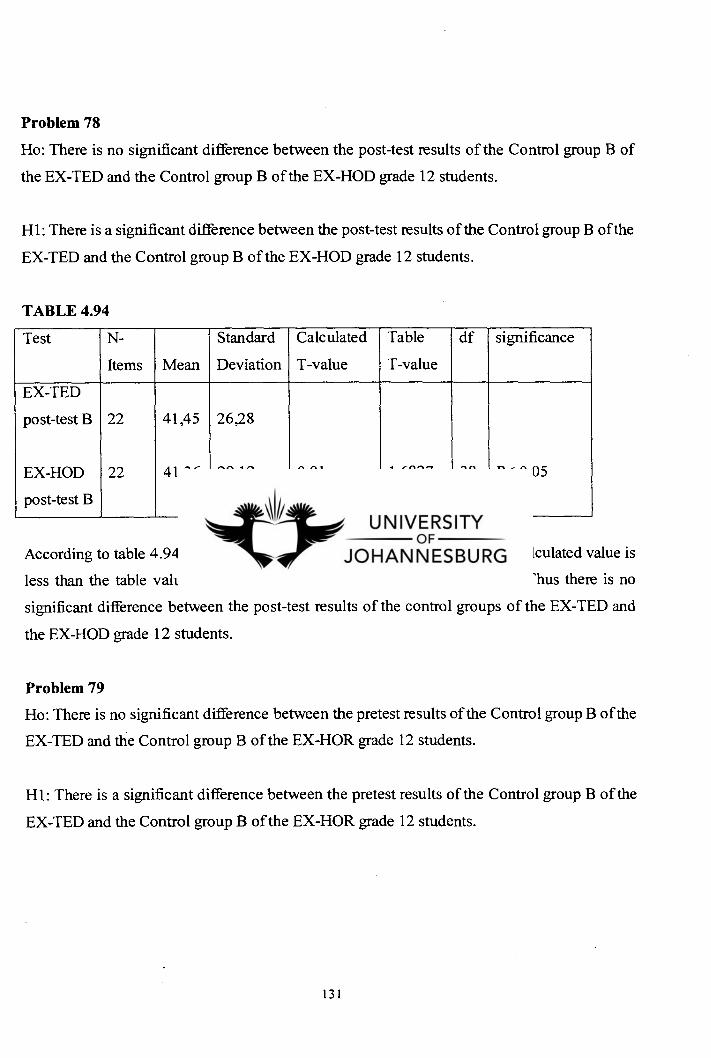
Problem 78
Ho: There is no significant difference between the post-test results of the Control group B of
the EX-TED and the Control group B of the EX-HOD grade 12 students.
Hl: There is a significant difference between the post-test results of the Control group B of the
EX-TED and the Control group B of the EX-HOD grade 12 students.
TABLE 4.94
Test N-
Items Mean
Standard
Deviation
Calculated
T-value
Table
T-value
df significance
EX-TED
post-test B 22 41,45 26,28
EX-HOD
post-test B
22 41,36 29,12 0,01 1,6827 38 P< 0,05
According to table 4.94 the Null hypothesis may not be rejected since the calculated value is
less than the table value for problem 78 at the 5 % level of significance. Thus there is no
significant difference between the post-test results of the control groups of the EX-TED and
the EX-HOD grade 12 students.
Problem 79
Ho: There is no significant difference between the pretest results of the Control group B of the
EX-TED and the Control group B of the EX-HOR grade 12 students.
Hl: There is a significant difference between the pretest results of the Control group B of the
EX-TED and the Control group B of the EX-HOR grade 12 students.
131
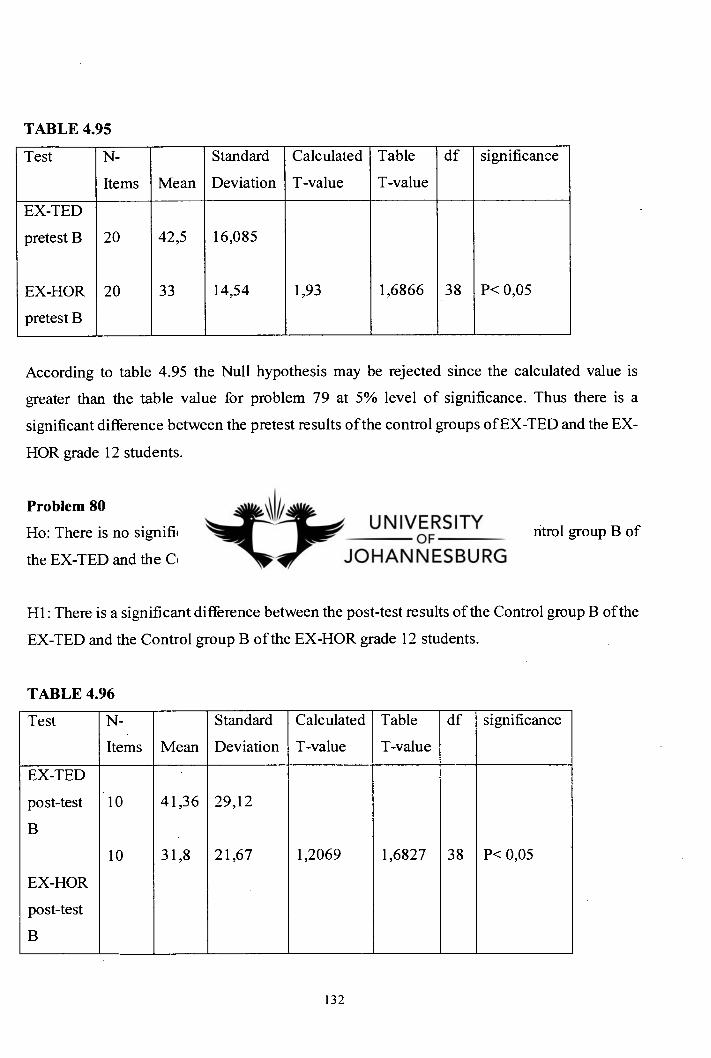
TABLE 4.95
Test N-
Items Mean
Standard
Deviation
Calculated
T-value
Table
T-value
df significance
EX-TED
pretest B 20 42,5 16,085
EX-HOR
pretest B
20 33 14,54 1,93 1,6866 38 P< 0,05
According to table 4.95 the Null hypothesis may be rejected since the calculated value is
greater than the table value for problem 79 at 5% level of significance. Thus there is a
significant difference between the pretest results of the control groups of EX-TED and the EX-
HOR grade 12 students.
Problem 80
Ho: There is no significant difference between the post-test results of the Control group B of
the EX-TED and the Control group B of the EX-HOR grade 12 students.
Hl: There is a significant difference between the post-test results of the Control group B of the
EX-TED and the Control group B of the EX-HOR grade 12 students.
TABLE 4.96
Test N-
Items Mean
Standard
Deviation
Calculated
T-value
Table
T-value
df significance
EX-TED
post-test 10 41,36 29,12
B
10 31,8 21,67 1,2069 1,6827 38 P< 0,05
EX-HOR
post-test
B
132
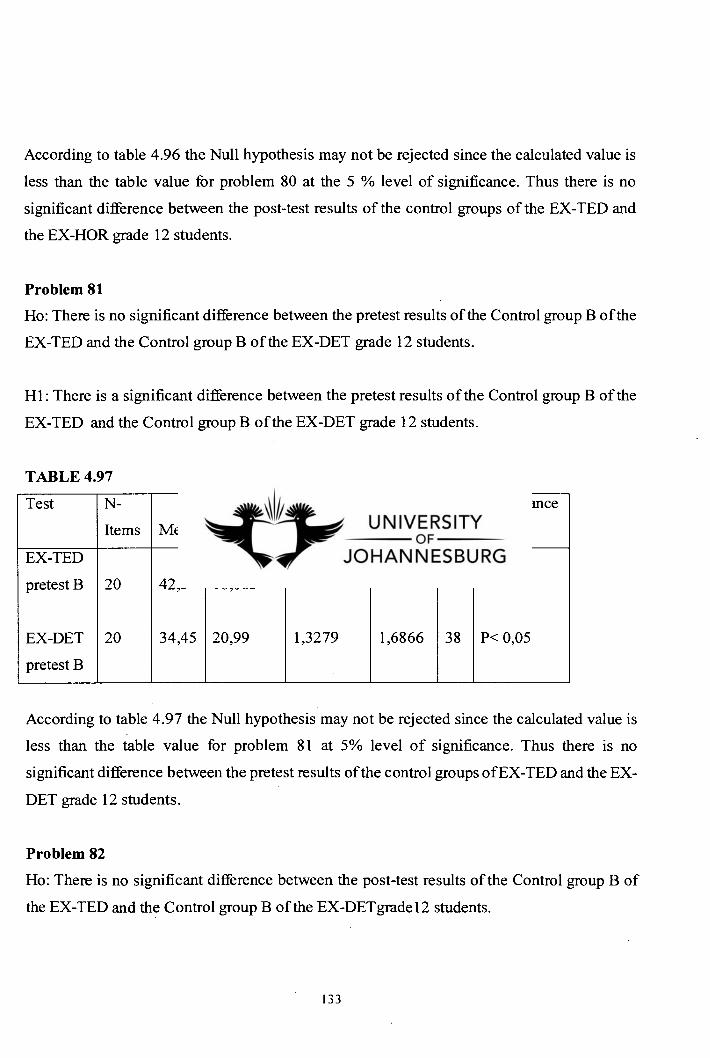
According to table 4.96 the Null hypothesis may not be rejected since the calculated value is
less than the table value for problem 80 at the 5 % level of significance. Thus there is no
significant difference between the post-test results of the control groups of the EX-TED and
the EX-HOR grade 12 students.
Problem 81
Ho: There is no significant difference between the pretest results of the Control group B of the
EX-TED and the Control group B of the EX-DET grade 12 students.
HI: There is a significant difference between the pretest results of the Control group B of the
EX-TED and the Control group B of the EX-DET grade 12 students.
TABLE 4.97
Test N-
Items Mean
Standard
Deviation
Calculated
T-value
Table
T-value
df significance
EX-TED
pretest B 20 42,5 16,085
EX-DET
pretest B
20 34,45 20,99 1,3279 1,6866 38 P< 0,05
According to table 4.97 the Null hypothesis may not be rejected since the calculated value is
less than the table value for problem 81 at 5% level of significance. Thus there is no
significant difference between the pretest results of the control groups ofEX-TED and the EX-
DET grade 12 students.
Problem 82
Ho: There is no significant difference between the post-test results of the Control group B of
the EX-TED and the Control group B of the EX-DETgradel2 students.
133

H 1: There is a significant difference between the post-test results of the Control group B of
the EX-TED and the Control group B of the EX-DETgradel2 students.
TABLE 4.98
Test N-
Items Mean
Standard
Deviation
Calculated
T-value
Table
T-value
df significance
EX-TED
post-test B 22 41,36 29,12
EX-DET
post-test B
22 30,45 18,94 1,1866 1,6827 38 P< 0,05
According to table 4.98 the Null hypothesis may not be rejected since the calculated value is
less than the table value for problem 82 at the 5 % level of significance. Thus there is no
significant difference between the post-test results of the control groups of the EX-TED and
the EX-DET grade 12 students.
Problem 83
Ho: There is no significant difference between the pretest results of the Control group B of the
EX-HOD and the Control group B of the EX-DET grade 12 students.
Hl: There is a significant difference between the pretest results of the Control group B of the
EX-HOD and the Control group B of the EX-DET grade 12 students.
134
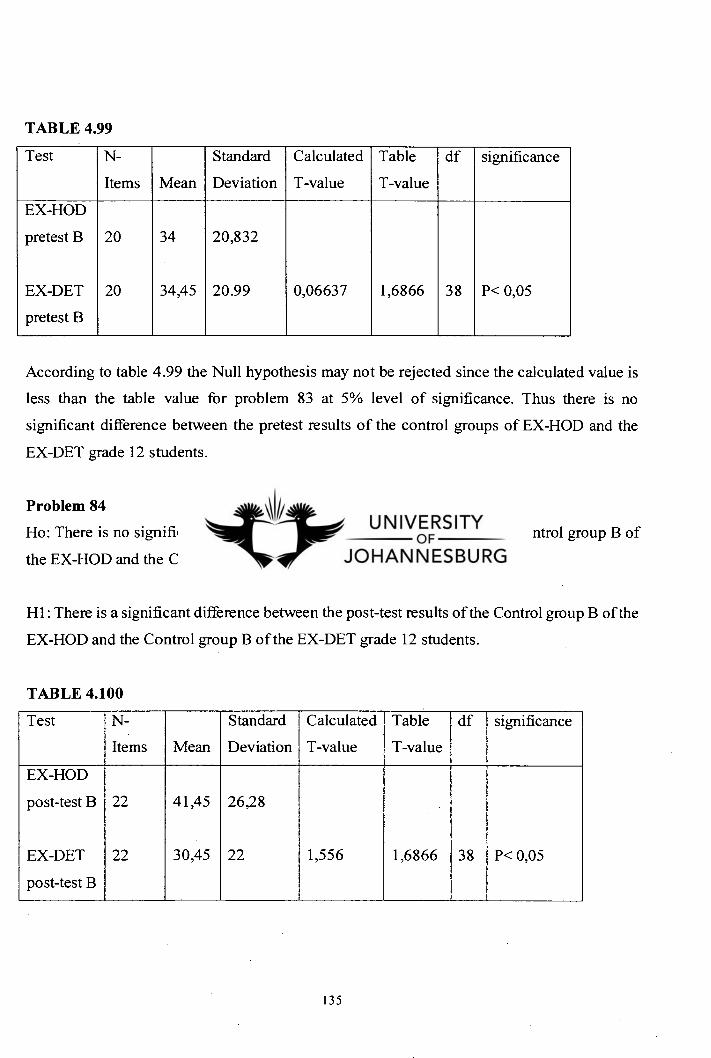
TABLE 4.99
Test N-
Items Mean
Standard
Deviation
Calculated
T-value
Table
T-value
df significance
EX-HOD
pretest B 20 34 20,832
EX-DET
pretest B
20 34,45 20.99 0,06637 1,6866 38 P< 0,05
According to table 4.99 the Null hypothesis may not be rejected since the calculated value is
less than the table value for problem 83 at 5% level of significance. Thus there is no
significant difference between the pretest results of the control groups of EX-HOD and the
EX-DET grade 12 students.
Problem 84
Ho: There is no significant difference between the post-test results of the Control group B of
the EX-HOD and the Control group B of the EX-DET grade 12 students.
Hl: There is a significant difference between the post-test results of the Control group B of the
EX-HOD and the Control group B of the EX-DET grade 12 students.
TABLE 4.100
Test N-
Items Mean
Standard
Deviation
Calculated
T-value
Table
T-value
df significance
EX-HOD
post-test B 22 41,45 26,28
EX-DET
post-test B
22 30,45 22 1,556 1,6866 38 P< 0,05
135
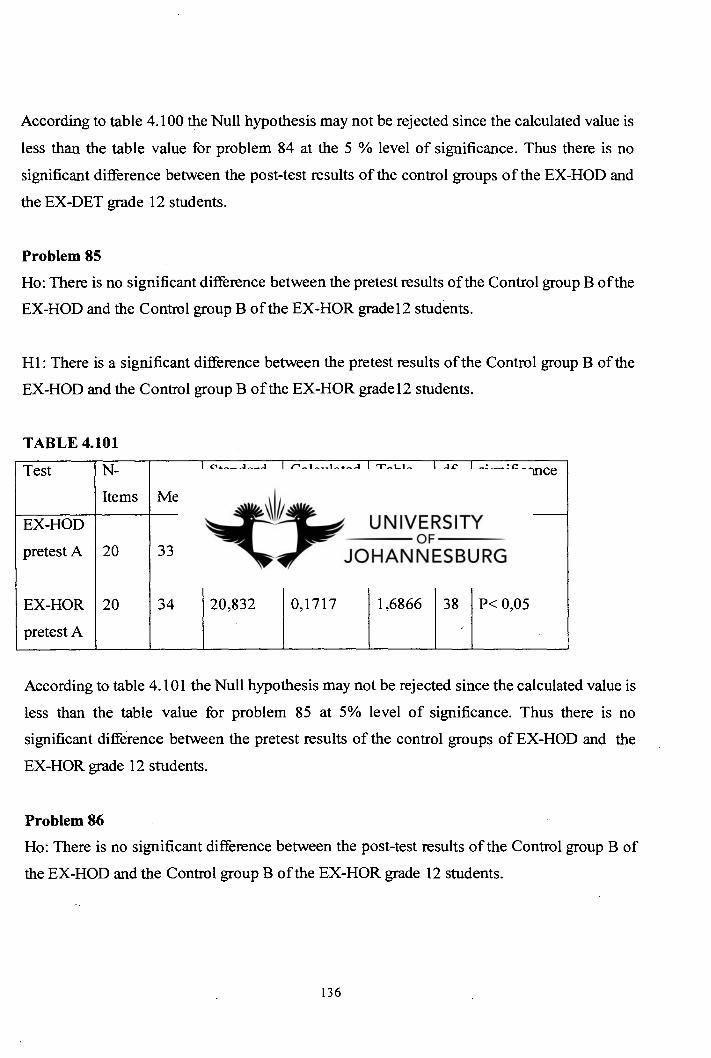
According to table 4.100 the Null hypothesis may not be rejected since the calculated value is
less than the table value for problem 84 at the 5 % level of significance. Thus there is no
significant difference between the post-test results of the control groups of the EX-HOD and
the EX-DET grade 12 students.
Problem 85
Ho: There is no significant difference between the pretest results of the Control group B of the
EX-HOD and the Control group B of the EX-HOR grade12 students.
Hl: There is a significant difference between the pretest results of the Control group B of the
EX-HOD and the Control group B of the EX-HOR grade 12 students.
TABLE 4.101
Test N-
Items Mean
Standard
Deviation
Calculated
T-value
Table
T-value
df significance
EX-HOD
pretest A 20 33 14,54
EX-HOR
pretest A
20 34 20,832 0,1717 1,6866 38 P< 0,05
According to table 4.101 the Null hypothesis may not be rejected since the calculated value is
less than the table value for problem 85 at 5% level of significance. Thus there is no
significant difference between the pretest results of the control groups of EX-HOD and the
EX-HOR grade 12 students.
Problem 86
Ho: There is no significant difference between the post-test results of the Control group B of
the EX-HOD and the Control group B of the EX-HOR grade 12 students.
136
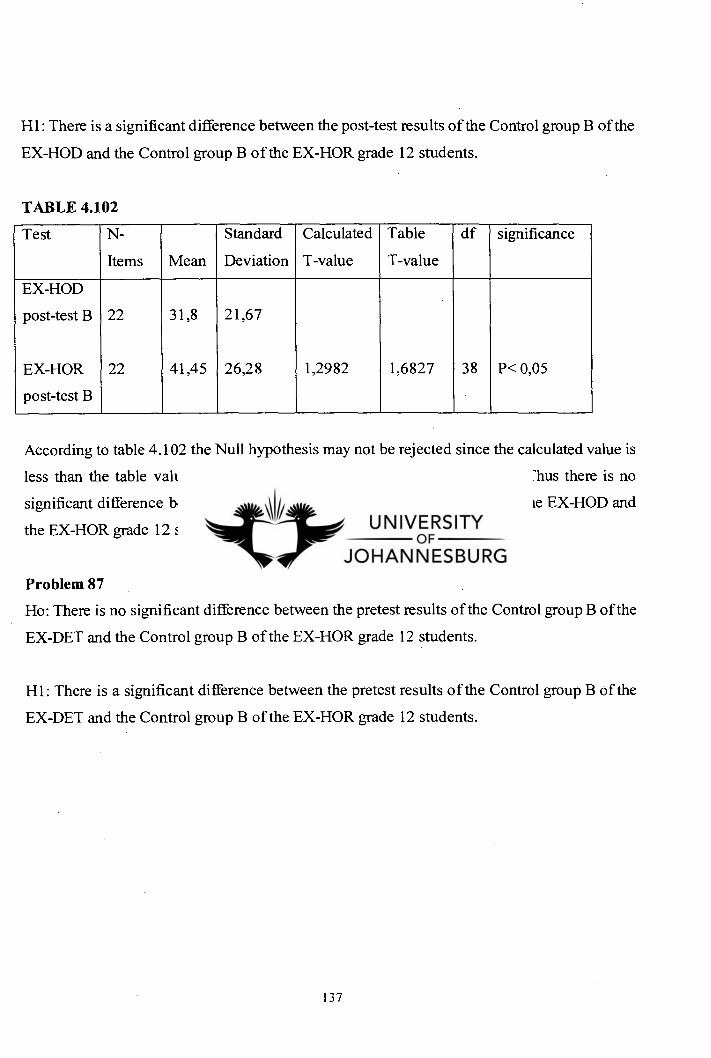
Hl: There is a significant difference between the post-test results of the Control group B of the
EX-HOD and the Control group B of the EX-HOR grade 12 students.
TABLE 4.102
Test N-
Items Mean
Standard
Deviation
Calculated
T-value
Table
T-value
df significance
EX-HOD
post-test B 22 31,8 21,67
EX-HOR
post-test B
22 41,45 26,28 1,2982 1,6827 38 P< 0,05
According to table 4.102 the Null hypothesis may not be rejected since the calculated value is
less than the table value for problem 86 at the 5 % level of significance. Thus there is no
significant difference between the post-test results of the control groups of the EX-HOD and
the EX-HOR grade 12 students.
Problem 87
Ho: There is no significant difference between the pretest results of the Control group B of the
EX-DET and the Control group B of the EX-HOR grade 12 students.
Hl: There is a significant difference between the pretest results of the Control group B of the
EX-DET and the Control group B of the EX-HOR grade 12 students.
137
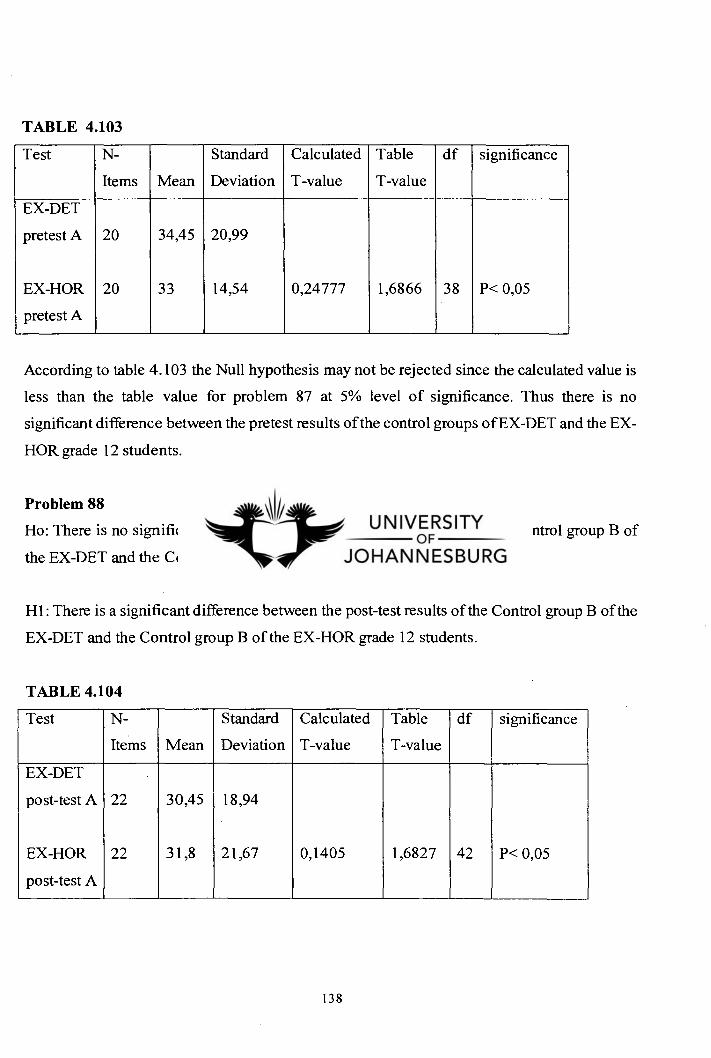
TABLE 4.103
Test N-
Items Mean
Standard
Deviation
Calculated
T-value
Table
T-value
df significance
EX-DET
pretest A 20 34,45 20,99
EX-HOR
pretest A
20 33 14,54 0,24777 1,6866 38 P< 0,05
According to table 4.103 the Null hypothesis may not be rejected since the calculated value is
less than the table value for problem 87 at 5% level of significance. Thus there is no
significant difference between the pretest results of the control groups ofEX-DET and the EX-
HOR grade 12 students.
Problem 88
Ho: There is no significant difference between the post-test results of the Control group B of
the EX-DET and the Control group B of the EX-HOR grade 12 students.
Hl: There is a significant difference between the post-test results of the Control group B of the
EX-DET and the Control group B of the EX-HOR grade 12 students.
TABLE 4.104
Test N-
Items Mean
Standard
Deviation
Calculated
T-value
Table
T-value
df significance
EX-DET
post-test A 22 30,45 18,94
EX-HOR
post-test A
22 31,8 21,67 0,1405 1,6827 42 P< 0,05
138
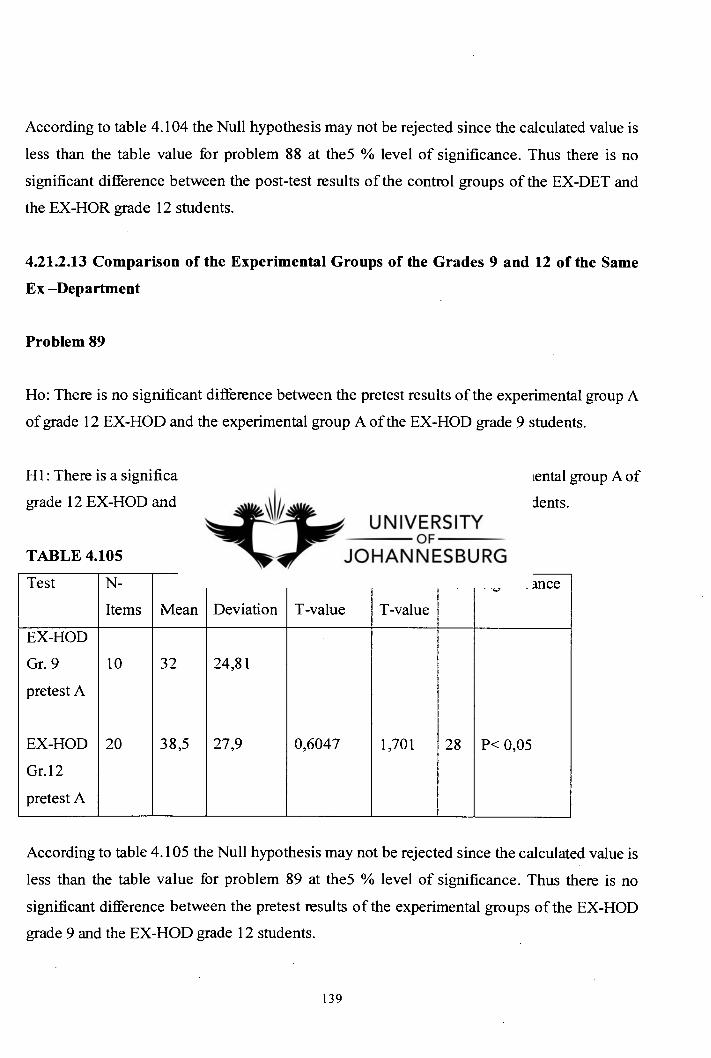
According to table 4.104 the Null hypothesis may not be rejected since the calculated value is
less than the table value for problem 88 at they % level of significance. Thus there is no
significant difference between the post-test results of the control groups of the EX-DET and
the EX-HOR grade 12 students.
4.21.2.13 Comparison of the Experimental Groups of the Grades 9 and 12 of the Same
Ex —Department
Problem 89
Ho: There is no significant difference between the pretest results of the experimental group A
of grade 12 EX-HOD and the experimental group A of the EX-HOD grade 9 students.
Hl: There is a significant difference between the pretest results of the experimental group A of
grade 12 EX-HOD and the experimental group A of the EX-HOD grade 9 students.
TABLE 4.105
Test N-
Items Mean
Standard
Deviation
Calculated
T-value
Table
T-value
df significance
EX-HOD
Gr. 9
pretest A
10 32 24,81
EX-HOD 20 38,5 27,9 0,6047 1,701 28 P< 0,05
Gr.12
pretest A
According to table 4.105 the Null hypothesis may not be rejected since the calculated value is
less than the table value for problem 89 at they % level of significance. Thus there is no
significant difference between the pretest results of the experimental groups of the EX-HOD
grade 9 and the EX-HOD grade 12 students.
139
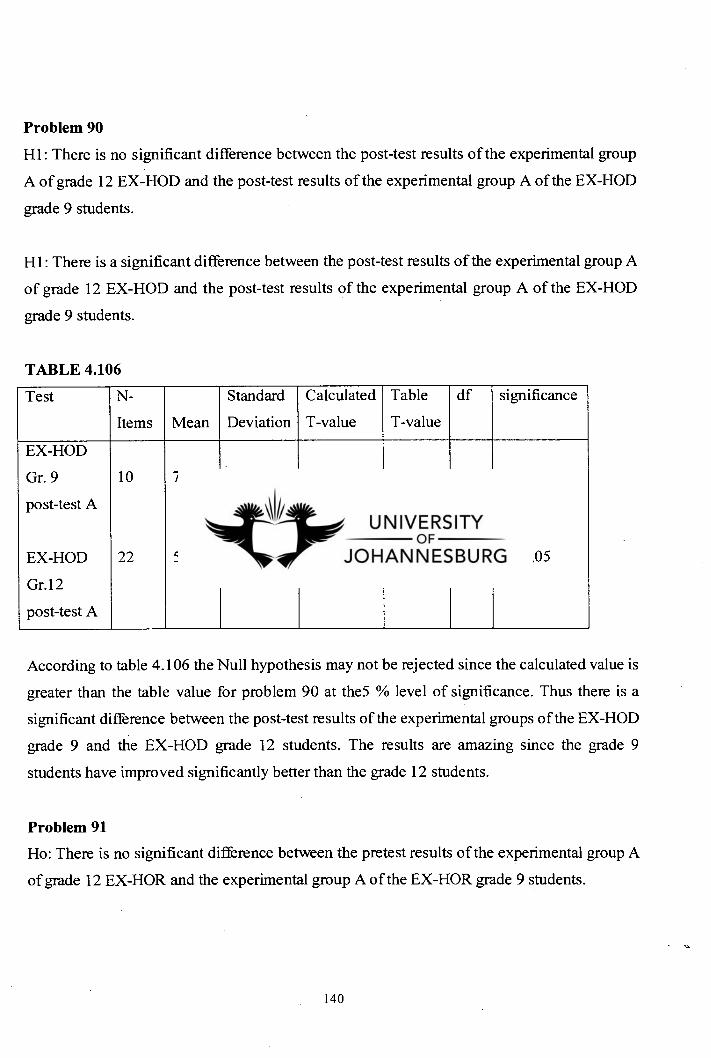
Problem 90
HI: There is no significant difference between the post-test results of the experimental group
A of grade 12 EX-HOD and the post-test results of the experimental group A of the EX-HOD
grade 9 students.
Hl: There is a significant difference between the post-test results of the experimental group A
of grade 12 EX-HOD and the post-test results of the experimental group A of the EX-HOD
grade 9 students.
TABLE 4.106
Test N-
Items Mean
Standard
Deviation
Calculated
T-value
Table
T-value
df significance
EX-HOD
Gr. 9
post-test A
10 70,2 17,29
EX-HOD 22 53,18 23,24 2,0047 1,697 30 P< 0,05
Gr.12
post-test A
According to table 4.106 the Null hypothesis may not be rejected since the calculated value is
greater than the table value for problem 90 at they % level of significance. Thus there is a
significant difference between the post-test results of the experimental groups of the EX-HOD
grade 9 and the EX-HOD grade 12 students. The results are amazing since the grade 9
students have improved significantly better than the grade 12 students.
Problem 91
Ho: There is no significant difference between the pretest results of the experimental group A
of grade 12 EX-HOR and the experimental group A of the EX-HOR grade 9 students.
140
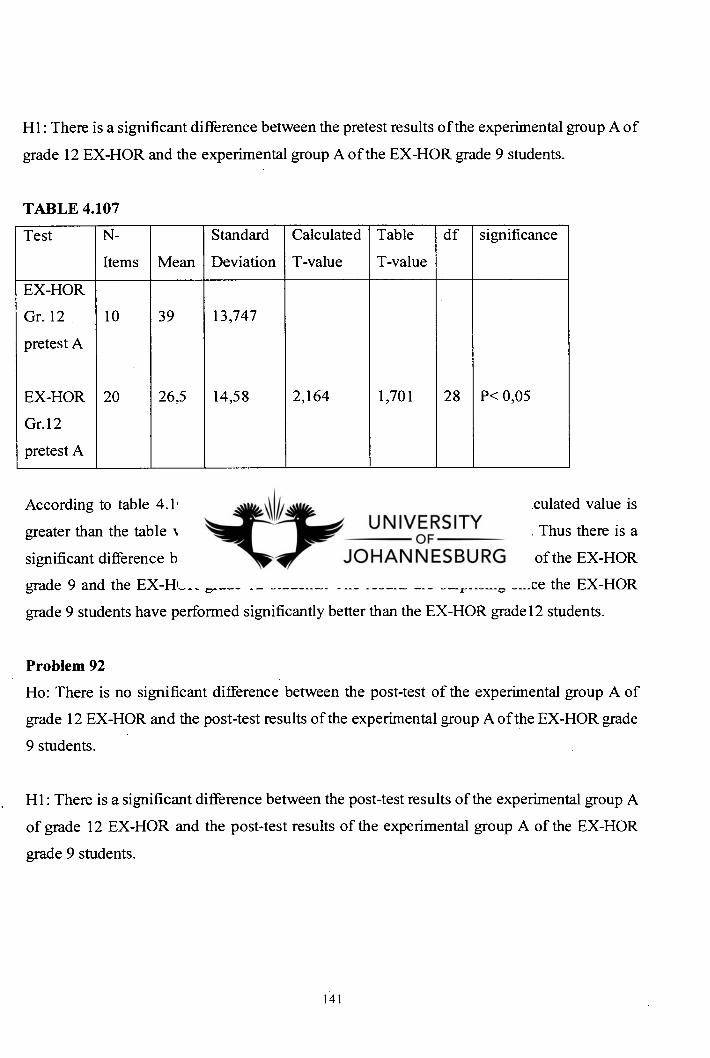
Hl: There is a significant difference between the pretest results of the experimental group A of
grade 12 EX-HOR and the experimental group A of the EX-HOR grade 9 students.
TABLE 4.107
Test N-
Items Mean
Standard
Deviation
Calculated
T-value
Table
T-value
df significance
EX-HOR
Gr. 12
pretest A
10 39 13,747
EX-HOR 20 26,5 14,58 2,164 1,701 28 P< 0,05
Gr.12
pretest A
According to table 4.107 the Null hypothesis may be rejected since the calculated value is
greater than the table value for problem 91 at the 5 % level of significance. Thus there is a
significant difference between the pretest results of the experimental groups of the EX-HOR
grade 9 and the EX-HOR grade 12 students. The results are surprising since the EX-HOR
grade 9 students have performed significantly better than the EX-HOR grade 12 students.
Problem 92
Ho: There is no significant difference between the post-test of the experimental group A of
grade 12 EX-HOR and the post-test results of the experimental group A of the EX-HOR grade
9 students.
Hl: There is a significant difference between the post-test results of the experimental group A
of grade 12 EX-HOR and the post-test results of the experimental group A of the EX-HOR
grade 9 students.
141
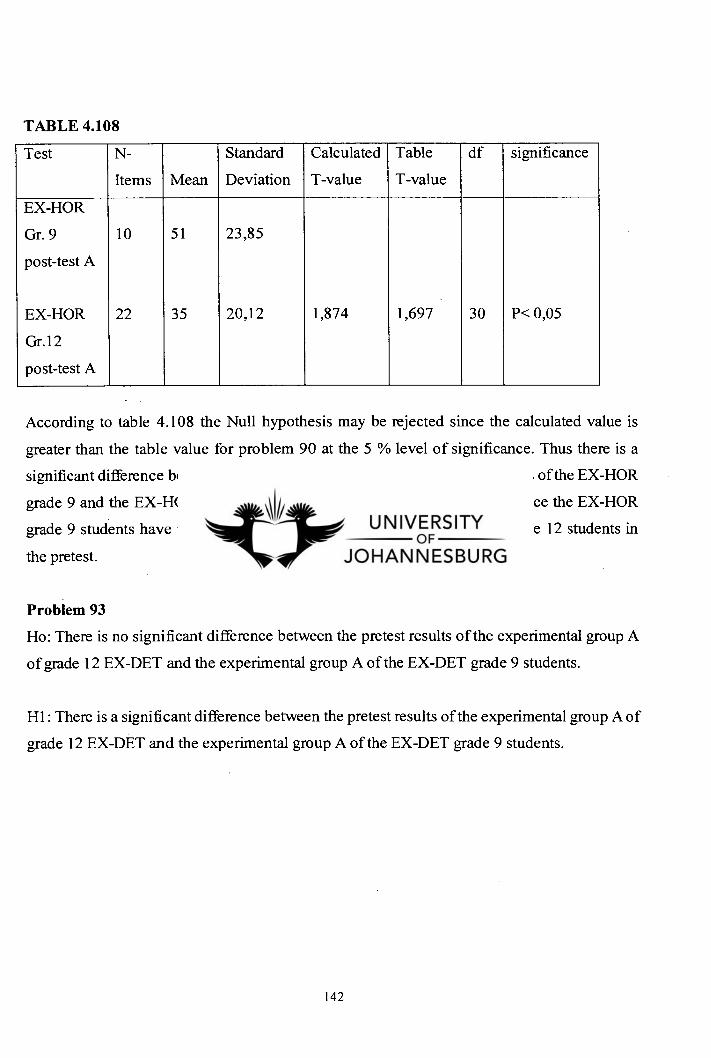
TABLE 4.108
Test N-
Items Mean
Standard
Deviation
Calculated
T-value
Table
T-value
df significance
EX-HOR
Gr. 9
post-test A
10 51 23,85
EX-HOR 22 35 20,12 1,874 1,697 30 P< 0,05
Gr.12
post-test A
According to table 4.108 the Null hypothesis may be rejected since the calculated value is
greater than the table value for problem 90 at the 5 % level of significance. Thus there is a
significant difference between the post-test results of the experimental groups of the EX-HOR
grade 9 and the EX-HOR grade 12 students. The results are as expected since the EX-HOR
grade 9 students have performed significantly better than the EX-HOR grade 12 students in
the pretest.
Problem 93
Ho: There is no significant difference between the pretest results of the experimental group A
of grade 12 EX-DET and the experimental group A of the EX-DET grade 9 students.
HI: There is a significant difference between the pretest results of the experimental group A of
grade 12 EX-DET and the experimental group A of the EX-DET grade 9 students.
142
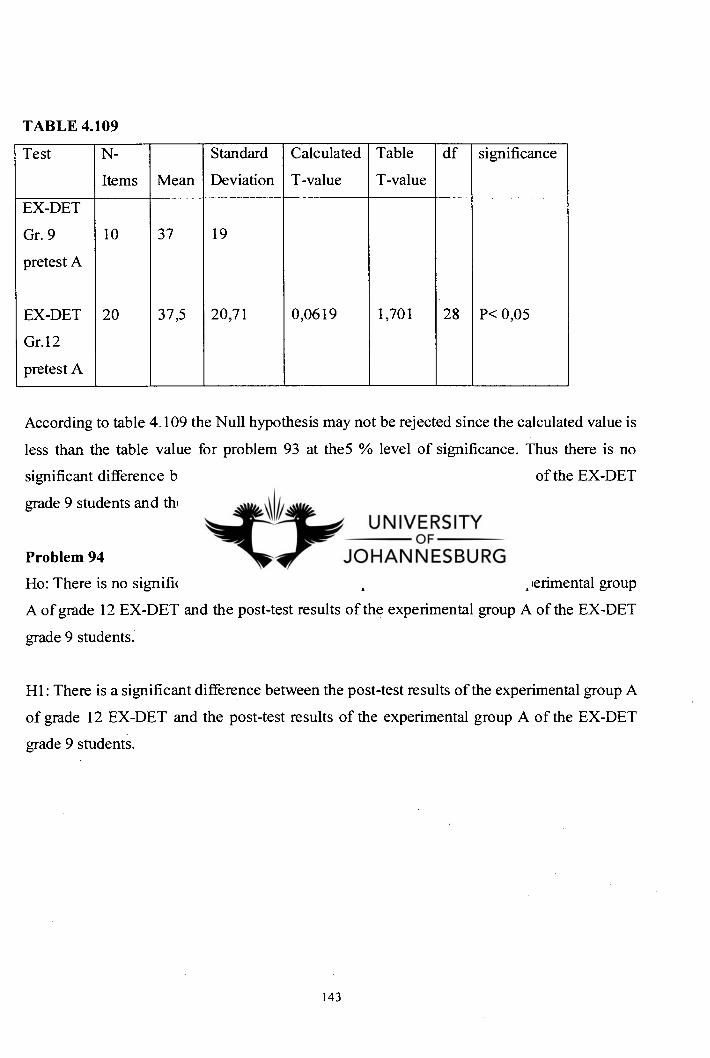
TABLE 4.109
Test N-
Items Mean
Standard
Deviation
Calculated
T-value
Table
T-value
df significance
EX-DET
Gr. 9
pretest A
10 37 19
EX-DET 20 37,5 20,71 0,0619 1,701 28 P< 0,05
Gr.12
pretest A
According to table 4.109 the Null hypothesis may not be rejected since the calculated value is
less than the table value for problem 93 at the5 % level of significance. Thus there is no
significant difference between the pretest results of the experimental groups of the EX-DET
grade 9 students and the EX-DET grade 12 students.
Problem 94
Ho: There is no significant difference between the post-test results of the experimental group
A of grade 12 EX-DET and the post-test results of the experimental group A of the EX-DET
grade 9 students.
Hl: There is a significant difference between the post-test results of the experimental group A
of grade 12 EX-DET and the post-test results of the experimental group A of the EX-DET
grade 9 students.
143
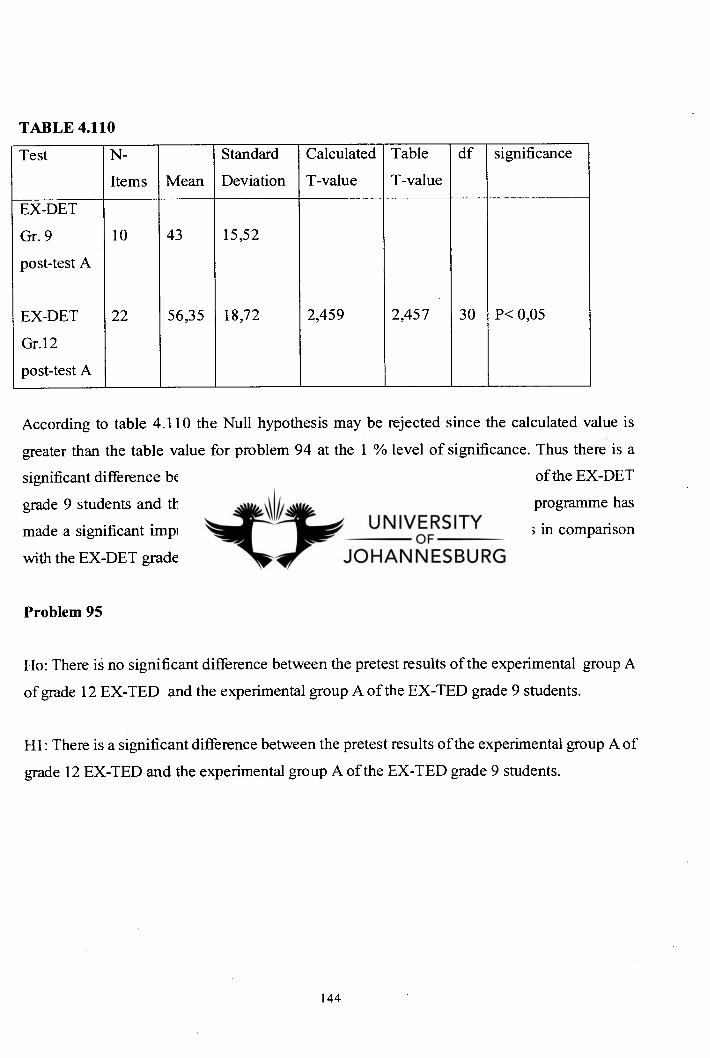
TABLE 4.110
Test N-
Items Mean
Standard
Deviation
Calculated
T-value
Table
T-value
df significance
EX-DET
Gr. 9
post-test A
10 43 15,52
EX-DET 22 56,35 18,72 2,459 2,457 30 P< 0,05
Gr.12
post-test A
According to table 4.110 the Null hypothesis may be rejected since the calculated value is
greater than the table value for problem 94 at the 1 % level of significance. Thus there is a
significant difference between the post-test results of the experimental groups of the EX-DET
grade 9 students and the EX-DET grade 12 students. Thus the intervention programme has
made a significant improvement with the EX-DET grade 12 students results in comparison
with the EX-DET grade 9 students results.
Problem 95
Ho: There is no significant difference between the pretest results of the experimental group A
of grade 12 EX-TED and the experimental group A of the EX-TED grade 9 students.
Hl: There is a significant difference between the pretest results of the experimental group A of
grade 12 EX-TED and the experimental group A of the EX-TED grade 9 students.
144
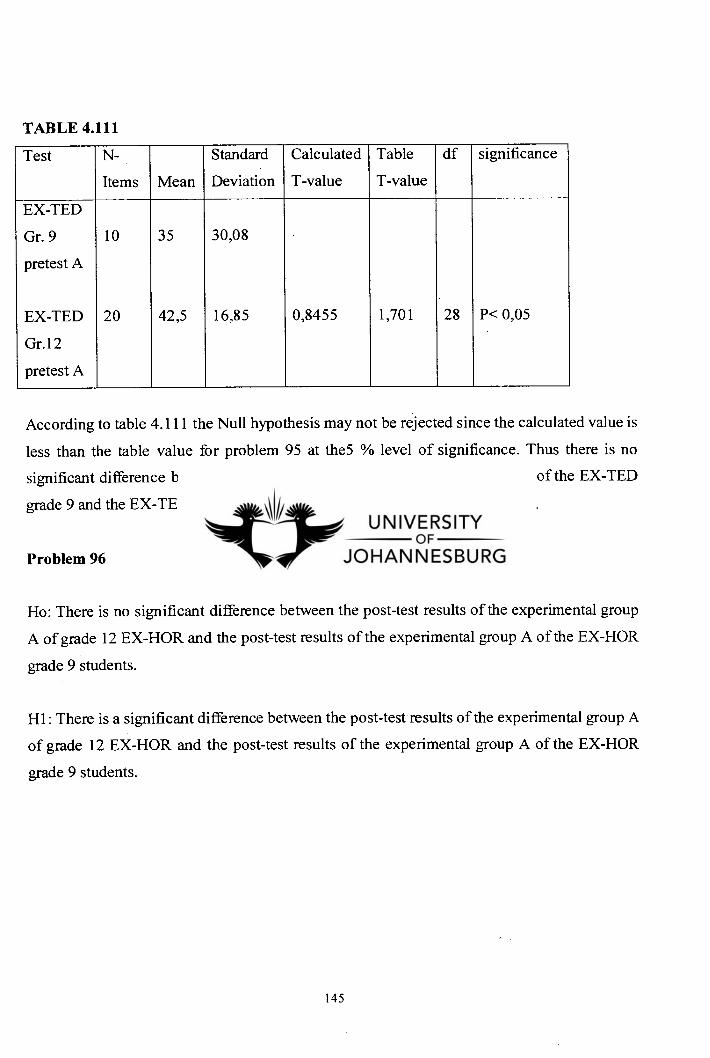
TABLE 4.111
Test N-
Items Mean
Standard
Deviation
Calculated
T-value
Table
T-value
df significance
EX-TED
Gr. 9
pretest A
10 35 30,08
EX-TED 20 42,5 16,85 0,8455 1,701 28 P< 0,05
Gr.12
pretest A
According to table 4.111 the Null hypothesis may not be rejected since the calculated value is
less than the table value for problem 95 at the5 % level of significance. Thus there is no
significant difference between the pretest results of the experimental groups of the EX-TED
grade 9 and the EX-TED grade 12 students.
Problem 96
Ho: There is no significant difference between the post-test results of the experimental group
A of grade 12 EX-HOR and the post-test results of the experimental group A of the EX-HOR
grade 9 students.
Hl: There is a significant difference between the post-test results of the experimental group A
of grade 12 EX-HOR and the post-test results of the experimental group A of the EX-HOR
grade 9 students.
145
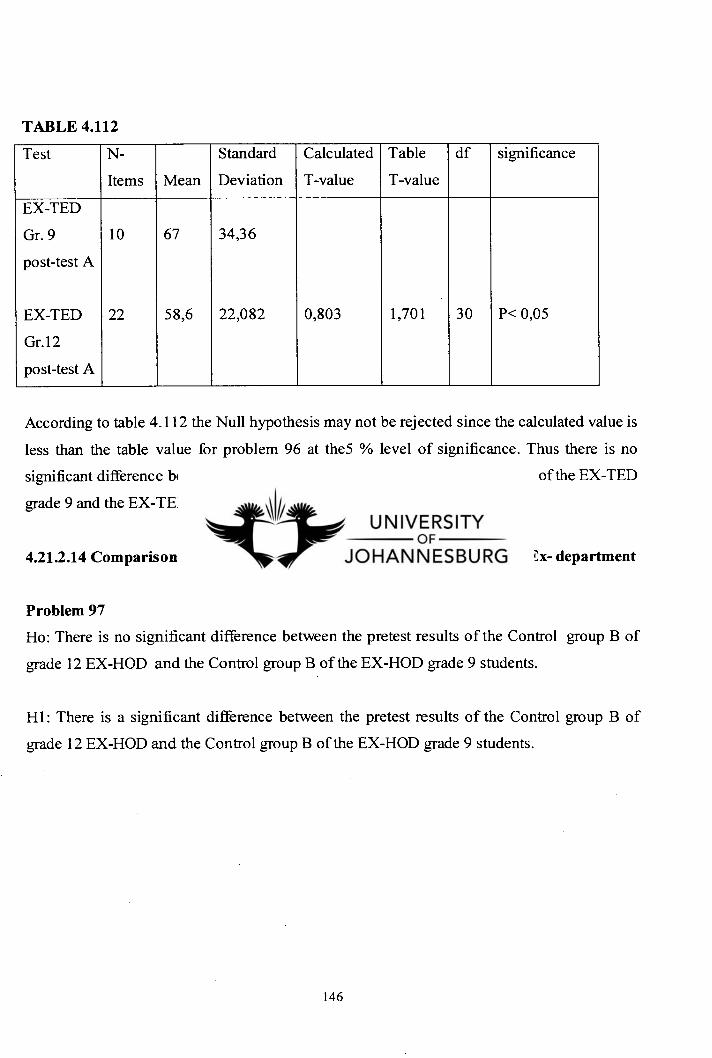
TABLE 4.112
Test N-
Items Mean
Standard
Deviation
Calculated
T-value
Table
T-value
df significance
EX-TED
Gr. 9
post-test A
10 67 34,36
EX-TED 22 58,6 22,082 0,803 1,701 30 P< 0,05
Gr.12
post-test A
According to table 4.112 the Null hypothesis may not be rejected since the calculated value is
less than the table value for problem 96 at they % level of significance. Thus there is no
significant difference between the post-test results of the experimental groups of the EX-TED
grade 9 and the EX-TED grade 12 students.
4.21.2.14 Comparison of the Control Group Grade 9 and 12 of the Same Ex- department
Problem 97
Ho: There is no significant difference between the pretest results of the Control group B of
grade 12 EX-HOD and the Control group B of the EX-HOD grade 9 students.
H1: There is a significant difference between the pretest results of the Control group B of
grade 12 EX-HOD and the Control group B of the EX-HOD grade 9 students.
146
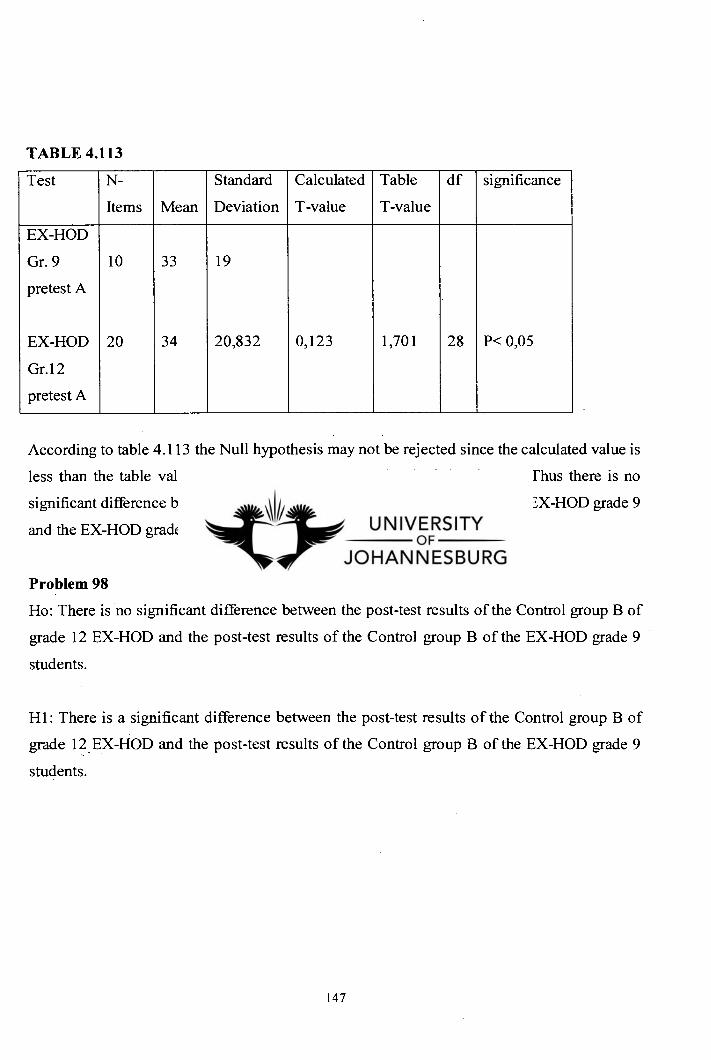
TABLE 4.113
Test N-
Items Mean
Standard
Deviation
Calculated
T-value
Table
T-value
df significance
EX-HOD
Gr. 9
pretest A
10 33 19
EX-HOD 20 34 20,832 0,123 1,701 28 P< 0,05
Gr.12
pretest A
According to table 4.113 the Null hypothesis may not be rejected since the calculated value is
less than the table value for problem 97 at the 5 % level of significance. Thus there is no
significant difference between the pretest results ofthe control groups of the EX-HOD grade 9
and the EX-HOD grade 12 students.
Problem 98
Ho: There is no significant difference between the post-test results of the Control group B of
grade 12 EX-HOD and the post-test results of the Control group B of the EX-HOD grade 9
students.
Hl: There is a significant difference between the post-test results of the Control group B of
grade 12 . EX-HOD and the post-test results of the Control group B of the EX-HOD grade 9
students.
147
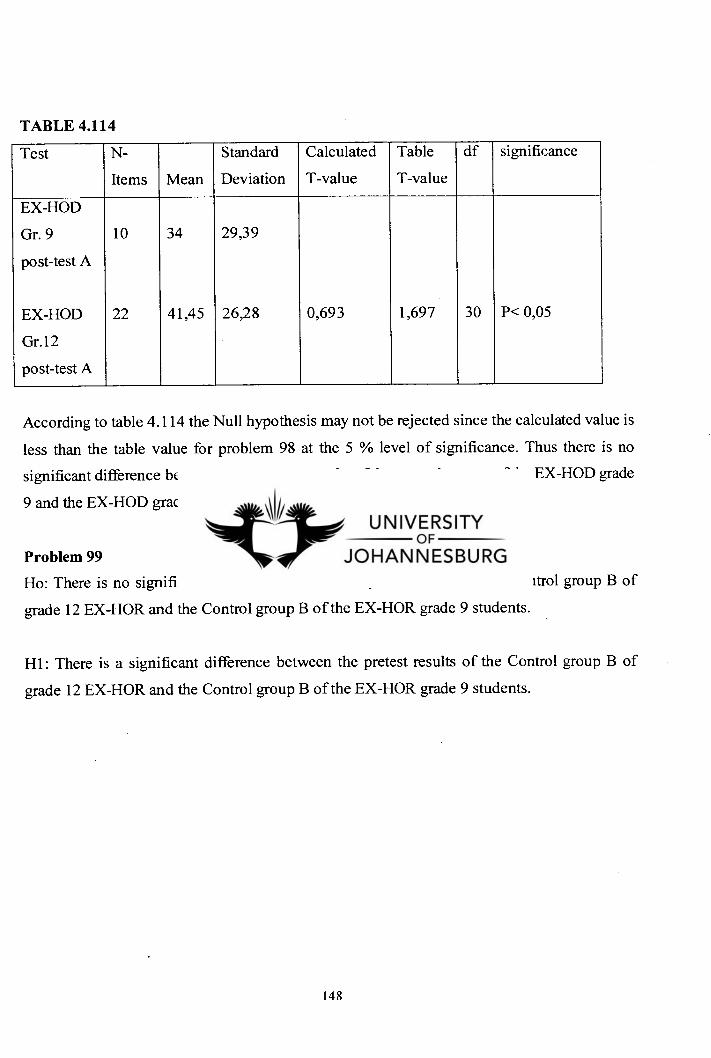
TABLE 4.114
Test N-
Items Mean
Standard
Deviation
Calculated
T-value
Table
T-value
df significance
EX-HOD
Gr. 9
post-test A
10 34 29,39
EX-HOD 22 41,45 26,28 0,693 1,697 30 P< 0,05
Gr.12
post-test A
According to table 4.114 the Null hypothesis may not be rejected since the calculated value is
less than the table value for problem 98 at the 5 % level of significance. Thus there is no
significant difference between the post-test results of the control groups of the EX-HOD grade
9 and the EX-HOD grade 12 students.
Problem 99
Ho: There is no significant difference between the pretest results of the Control group B of
grade 12 EX-HOR and the Control group B of the EX-HOR grade 9 students.
H1: There is a significant difference between the pretest results of the Control group B of
grade 12 EX-HOR and the Control group B of the EX-HOR grade 9 students.
148
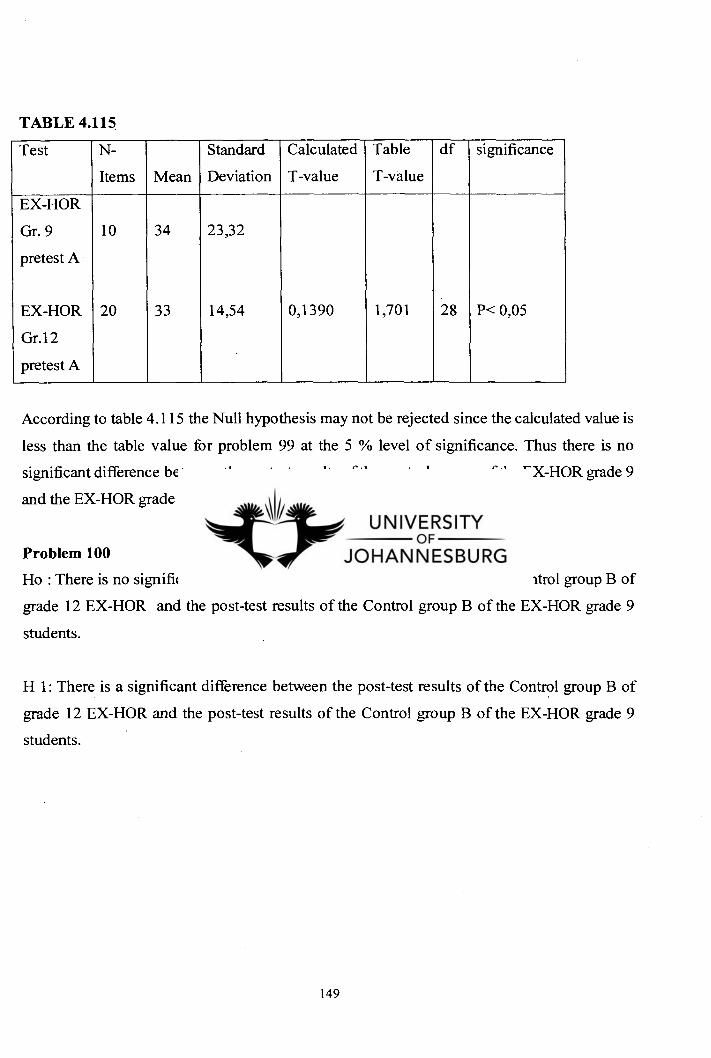
TABLE 4.115
Test N-
Items Mean
Standard
Deviation
Calculated
T-value
Table
T-value
df significance
EX-HOR
Gr. 9
pretest A
10 34 23,32
EX-HOR 20 33 14,54 0,1390 1,701 28 P< 0,05
Gr.12
pretest A
According to table 4.115 the Null hypothesis may not be rejected since the calculated value is
less than the table value for problem 99 at the 5 % level of significance. Thus there is no
significant difference between the pretest results of the control groups of the EX-HOR grade 9
and the EX-HOR grade 12 students.
Problem 100
Ho : There is no significant difference between the post-test results of the Control group B of
grade 12 EX-HOR and the post-test results of the Control group B of the EX-HOR grade 9
students.
H 1: There is a significant difference between the post-test results of the Control group B of
grade 12 EX-HOR and the post-test results of the Control group B of the EX-HOR grade 9
students.
149
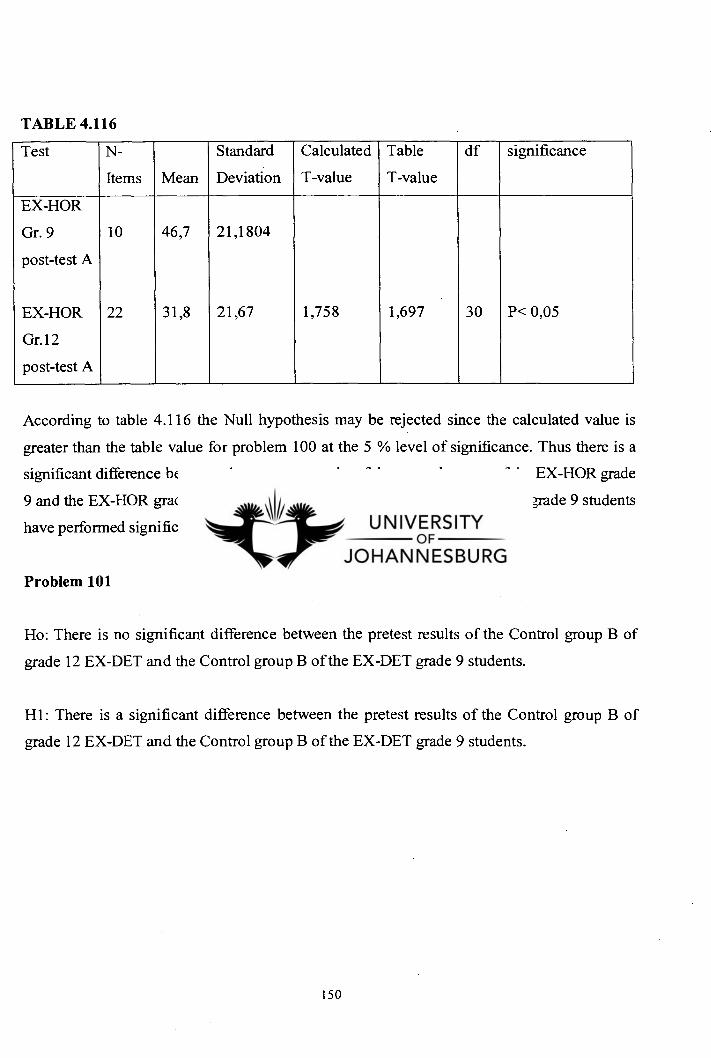
TABLE 4.116
Test N-
Items Mean
Standard
Deviation
Calculated
T-value
Table
T-value
df significance
EX-HOR
Gr. 9
post-test A
10 46,7 21,1804
EX-HOR 22 31,8 21,67 1,758 1,697 30 P< 0,05
Gr.12
post-test A
According to table 4.116 the Null hypothesis may be rejected since the calculated value is
greater than the table value for problem 100 at the 5 % level of significance. Thus there is a
significant difference between the post-test results of the control groups of the EX-HOR grade
9 and the EX-HOR grade 12 students. Again for the same ex-department the grade 9 students
have performed significantly better than the grade 12 students.
Problem 101
Ho: There is no significant difference between the pretest results of the Control group B of
grade 12 EX-DET and the Control group B of the EX-DET grade 9 students.
H1: There is a significant difference between the pretest results of the Control group B of
grade 12 EX-DET and the Control group B of the EX-DET grade 9 students.
150
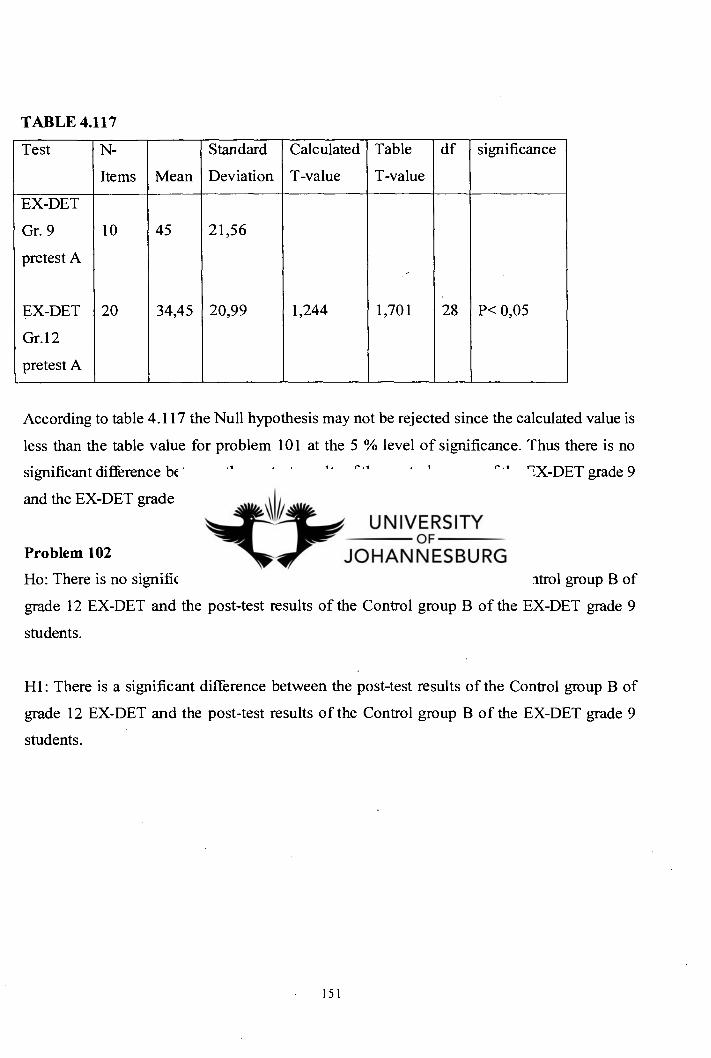
TABLE 4.117
Test N-
Items Mean
Standard
Deviation
Calculated
T-value
Table
T-value
df significance
EX-DET
Gr. 9
pretest A
10 45 21,56
EX-DET 20 34,45 20,99 1,244 1,701 28 P< 0,05
Gr.12
pretest A
According to table 4.117 the Null hypothesis may not be rejected since the calculated value is
less than the table value for problem 101 at the 5 % level of significance. Thus there is no
significant difference between the pretest results of the control groups of the EX-DET grade 9
and the EX-DET grade 12 students.
Problem 102
Ho: There is no significant difference between the post-test results of the Control group B of
grade 12 EX-DET and the post-test results of the Control group B of the EX-DET grade 9
students.
H1: There is a significant difference between the post-test results of the Control group B of
grade 12 EX-DET and the post-test results of the Control group B of the EX-DET grade 9
students.
151
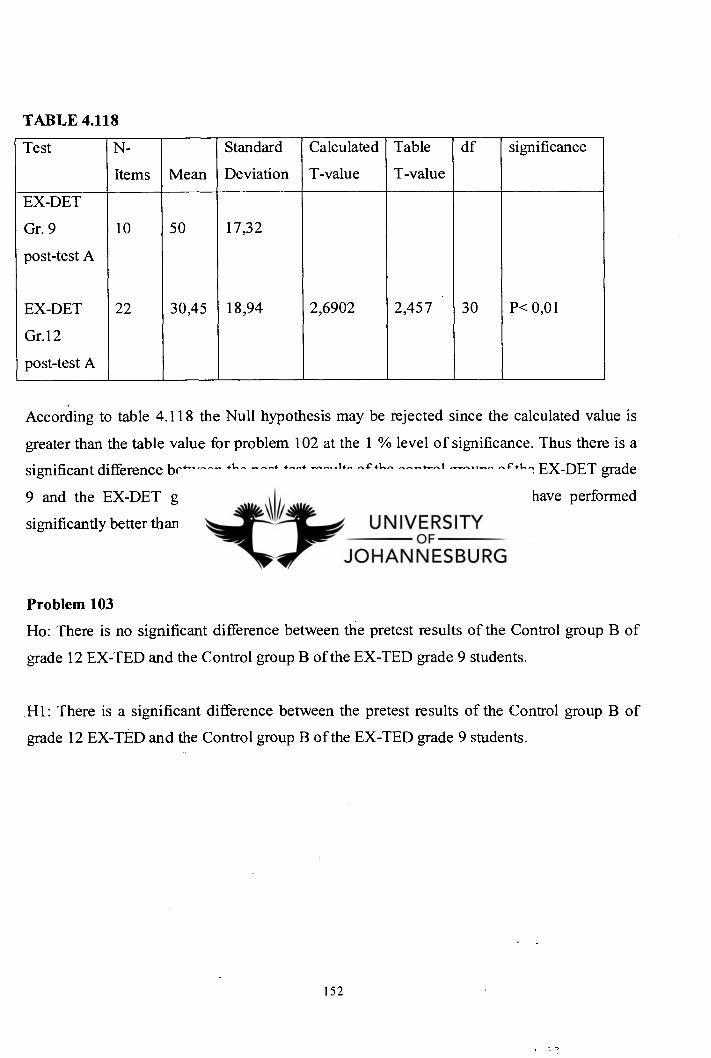
TABLE 4.118
Test N-
Items Mean
Standard
Deviation
Calculated
T-value
Table
T-value
df significance
EX-DET
Gr. 9
post-test A
10 50 17,32
EX-DET 22 30,45 18,94 2,6902 2,457 30 P< 0,01
Gr.12
post-test A
According to table 4.118 the Null hypothesis may be rejected since the calculated value is
greater than the table value for problem 102 at the 1 % level of significance. Thus there is a
significant difference between the post-test results of the control groups of the EX-DET grade
9 and the EX-DET grade 12 students. The EX-DET grade 9 students have performed
significantly better than the EX-DET grade 12 students.
Problem 103
Ho: There is no significant difference between the pretest results of the Control group B of
grade 12 EX-TED and the Control group B of the EX-TED grade 9 students.
H1: There is a significant difference between the pretest results of the Control group B of
grade 12 EX-TED and the Control group B of the EX-TED grade 9 students.
152
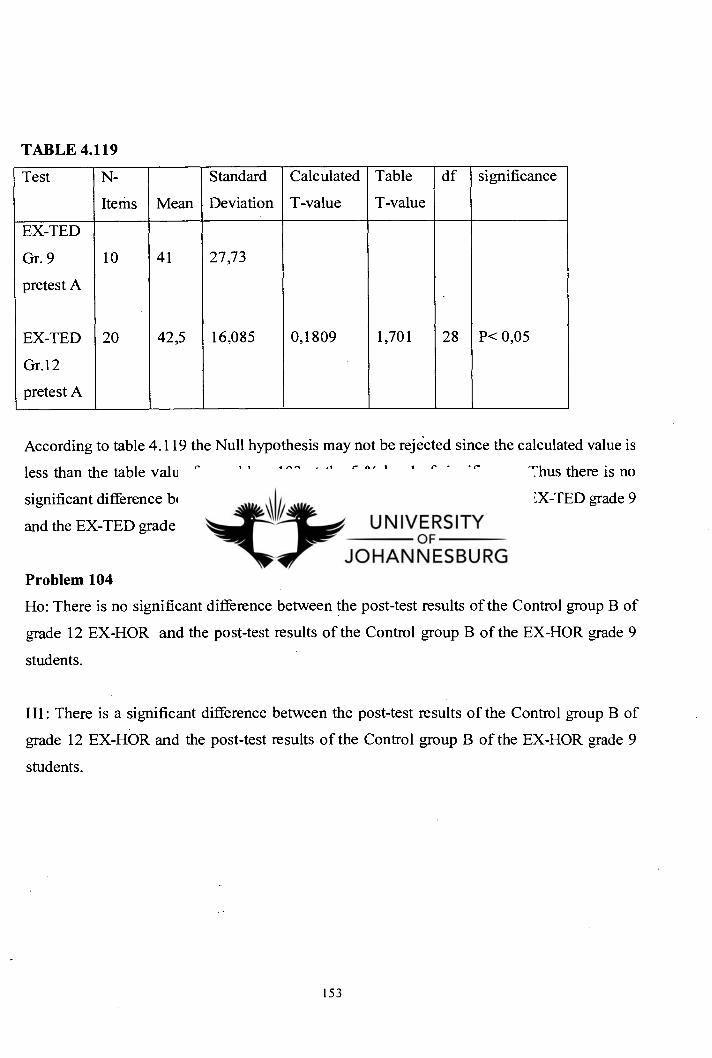
TABLE 4.119
Test N-
Items Mean
Standard
Deviation
Calculated
T-value
Table
T-value
df significance
EX-TED
Gr. 9
pretest A
10 41 27,73
EX-TED 20 42,5 16,085 0,1809 1,701 28 P< 0,05
Gr.12
pretest A
According to table 4.119 the Null hypothesis may not be rejected since the calculated value is
less than the table value for problem 103 at the 5 % level of significance. Thus there is no
significant difference between the pretest results of the control groups of the EX-TED grade 9
and the EX-TED grade 12 students.
Problem 104
Ho: There is no significant difference between the post-test results of the Control group B of
grade 12 EX-HOR and the post-test results of the Control group B of the EX-HOR grade 9
students.
H1 : There is a significant difference between the post-test results of the Control group B of
grade 12 EX-HOR and the post-test results of the Control group B of the EX-HOR grade 9
students.
153
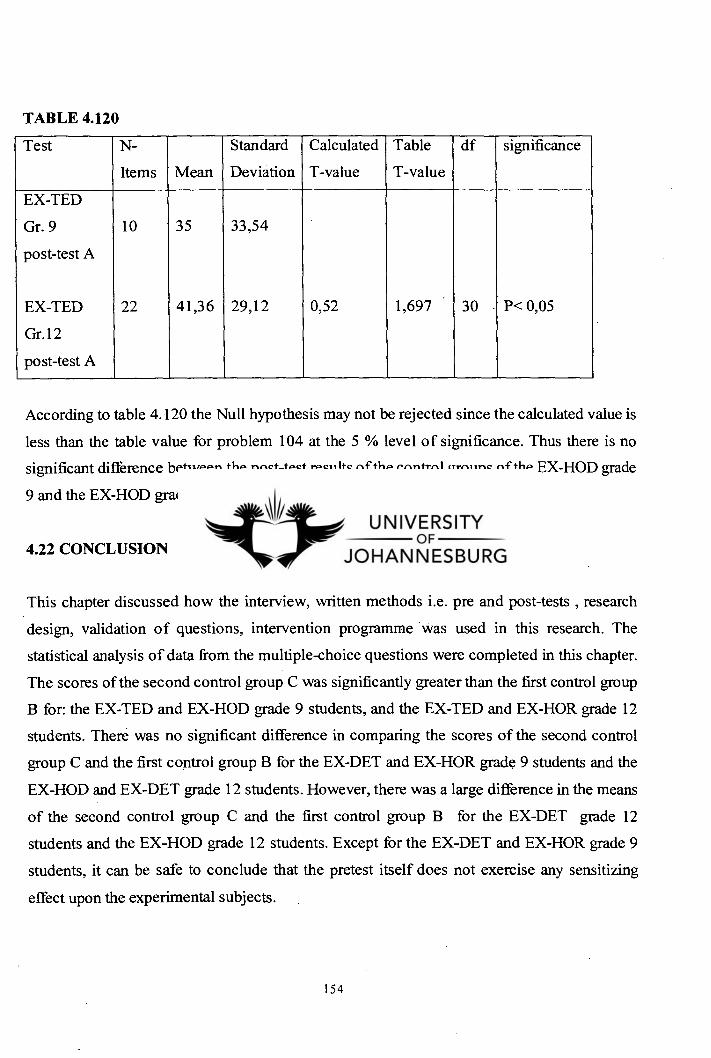
TABLE 4.120
Test N-
Items Mean
Standard
Deviation
Calculated
T-value
Table
T-value
df significance
EX-TED
Gr. 9
post-test A
10 35 33,54
EX-TED 22 41,36 29,12 0,52 1,697 30 P< 0,05
Gr.12
post-test A
According to table 4.120 the Null hypothesis may not be rejected since the calculated value is
less than the table value for problem 104 at the 5 % level of significance. Thus there is no
significant difference between the post-test results of the control groups of the EX-HOD grade
9 and the EX-HOD grade 12 students.
4.22 CONCLUSION
This chapter discussed how the interview, written methods i.e. pre and post-tests , research
design, validation of questions, intervention programme was used in this research. The
statistical analysis of data from the multiple-choice questions were completed in this chapter.
The scores of the second control group C was significantly greater than the first control group
B for: the EX-TED and EX-HOD grade 9 students, and the EX-TED and EX-HOR grade 12
students. There was no significant difference in comparing the scores of the second control
group C and the first control group B for the EX-DET and EX-HOR grade 9 students and the
EX-HOD and EX-DET grade 12 students. However, there was a large difference in the means
of the second control group C and the first control group B for the EX-DET grade 12
students and the EX-HOD grade 12 students. Except for the EX-DET and EX-HOR grade 9
students, it can be safe to conclude that the pretest itself does not exercise any sensitizing
effect upon the experimental subjects.
154

The discussion of the interviews, results of written tests, and comparisons from statistical
analysis will be discussed in detail in chapter 5.
155
CHAPTER 5
RESULTS AND DISUSSIONS
5.1 INTRODUCTION
In this chapter the findings of chapter four are reported and discussed.
The discussion of misconceptions of students involved in the group and individual interviews
will be identified from the transcripts. For the detailed investigation, misconceptions were also
identified from the responses to the written tests. A detailed account of how the interview
transcripts and written tests were analyzed is given below.
5.2 ANALYSIS OF INTERVIEW TRANSCRIPTS
(SEE APPENDIX A)
This involved the identification of alternative frameworks or ideas expressed by students in an
attempt to give a qualitative explanation of concepts in forces and motion. Reference to group
and individual interviews conducted illustrate how the misconceptions were identified. In the
individual and group interviews the letter S refers to the student and the letter R refers to the
researcher for both group and individual interviews. In all the individual interviews the letter
Si was used for the student, and in the group interviews the student's were referred to as Sl,
S2, S3 etc. Extracts will not be quoted, however reference will be made to the appendix. The
full transcripts of the interviews appear in appendix A.
53 ANALYSIS OF THE GROUP INTERVIEWS
Group and individual interviews show that the grade 9 and 12 students' in this study reveal
that objects fall because they have weight (see appendix A). Students' ideas about weight are
that it is "a power, a mass", the force of the earth acting on a body, a force of gravity, the
amount of energy you have in your body. Students revealed in the interviews that they did not
have a clear understanding of the term's weight, mass, and free fall. Mass was described as
156
matter that occupies space. Weight was considered by some grade 9 students as being
synonymous with mass because weight is when somebody weighs too much when he is fat.
Some of the grade 9 students attributed weight only to heavy objects. They regard a feather as
being weightless. Others described weight as how heavy people are and mass as measuring
volume.
Grade 12 students believed mass is how heavy a substance is, and it is measured in kilograms.
They also believed weight is how heavy a substance is but is measured in Newton's. There
was no mention of the proportionate relationship between mass and weight. Then there were
those students who believed weight is a downward force acting on an object. The force of
gravity was viewed by some students as being the attractive force of the earth, differing from
place to place and measuring 9,8ms -2. The force of gravity was also seen as a downward force
acting on an object. There were many students who believed that weight and gravitational
force are always the same.
Mostly grade 12 students viewed free fall as objects falling with an initial speed of zero.
Freefall was also described as an object falling because of the pull of gravity. Student's
descriptions of free fall seem to be synonymous with their views of the force of gravity. Force
was mostly described as a push or a pull. Some students did not believe weight is a force,
because a force is a push or a pull.
Students mostly believed objects that are dropped from the same height above the ground
reach the ground at the same time because there was no air friction, while others correctly
believed they reached the ground at the same time because there was no air friction and
gravity is a constant. However, there were also those who believed that objects which have
more weight, reach the ground first when dropped from the same height above the ground, in
the absence of air friction. There was no case in point, which mentioned that the lighter object
reaches the ground first.
Air friction was seen as acting downwards when objects fall and after objects hit the ground
and bounce off, air friction was seen as acting upwards.
157
When objects are thrown upwards it was correctly believed by grade 12 students that the
velocity at maximum height is zero and it was at the same time incorrectly believed that the
gravitational acceleration at maximum height was also zero. Students also indicated in the
interviews that for a car to move with constant velocity there must be resultant a force acting
on the car, otherwise the car would not move. For this they believed that the force in the
direction of motion has to always be greater than the opposing force. The students believed
that velocity is directly proportional to acceleration.
The interview as a method of identifying "wrong ideas" prevalent in students understanding
of forces and motion proved to be useful in the investigation. The interviews with students
have revealed that students have a number of conceptual misunderstandings. From the results
of the interview the questions to the written tests were drawn up.
5.4 ANALYSIS OF THE PENCIL AND PAPER TEST
( SEE APPENDIX B)
As in the interviews, it was the student's non-scientific explanations that were of interest.
Section A of the pretest was based on open-ended questions to test students understanding of
concepts in forces and motion. Section B comprised multiple-choice questions where students
had to provide reasons for their answers. The pretest of grade 9 students was identical to the
post-test of grade 9 students.
The questions of the pretest and post-test for grade 12 students were not identical for most of
the questions, however the questions investigated the same concepts. The questions that were
similar correspond as follows:
158
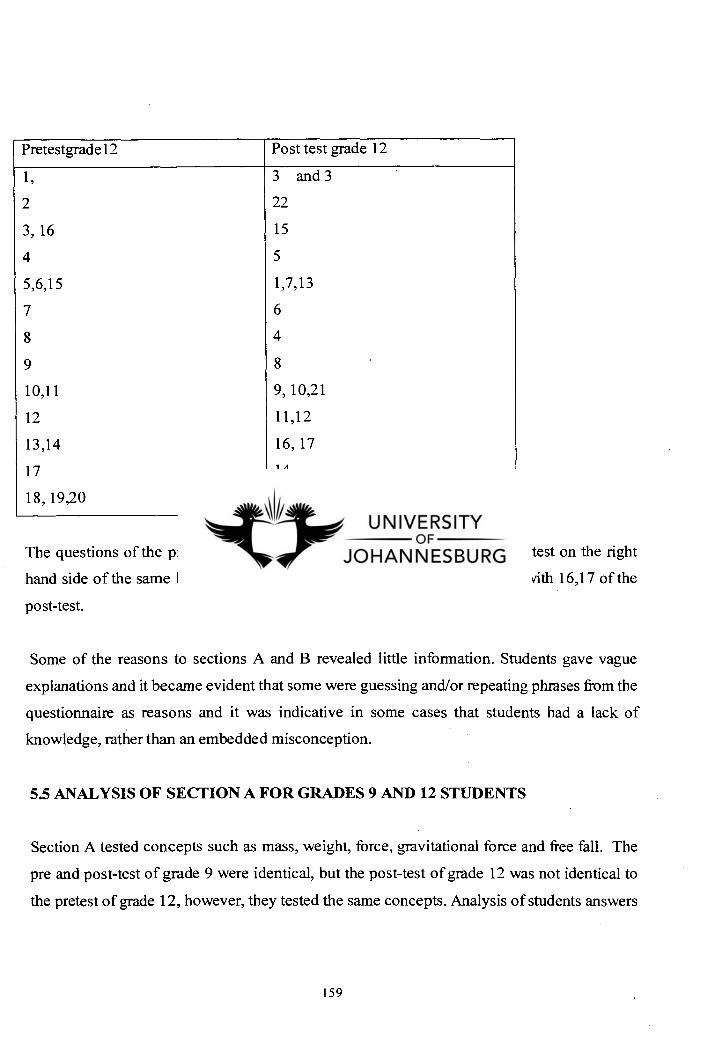
Pretestgradel2 Post test grade 12
1, 3 and 3
2 22
3, 16 15
4 5
5,6,15 1,7,13
7 6
8 4
9 8 •
10,11 9, 10,21
12 11,12
13,14 16, 17
17 14
18, 19,20 18,19,20
The questions of the pretest on the left hand side correspond with the post-test on the right
hand side of the same line e.g. questions 13, 14 of the pretest corresponds with 16,17 of the
post-test.
Some of the reasons to sections A and B revealed little information. Students gave vague
explanations and it became evident that some were guessing and/or repeating phrases from the
questionnaire as reasons and it was indicative in some cases that students had a lack of
knowledge, rather than an embedded misconception.
5.5 ANALYSIS OF SECTION A FOR GRADES 9 AND 12 STUDENTS
Section A tested concepts such as mass, weight, force, gravitational force and free fall. The
pre and post-test of grade 9 were identical, but the post-test of grade 12 was not identical to
the pretest of grade 12, however, they tested the same concepts. Analysis of students answers
159
for mass, weight, force, gravitational force and free fall for the EX-HOR, EX-HOD, EX-DET,
and EX-TED were as follows:
EX-HOR grade 9 mostly showed a lack of knowledge of the concepts mass, weight, force,
gravitational force and free fall. Weight was mostly described as the unit of a kilogram
because it measured a person's weight, weight was also described as volume when people are
fat. Force was described correctly by most students as being a push or a pull. The attempts at
defining gravitational force and free fall were nonscientific. These definitions revealed a lack
of knowledge instead of prevalent misconceptions.
EX-HOR- grade 12 students frequently described mass as how much an object weighs, or as
being a scalar quantity because it has no direction and it is measured in kilograms. Weight
was seen as the quantity of force in an object, a vector, and the force of the earth attracting an
object.
Gravitational force was frequently described as the maximum acceleration of an object
reaching the earth, an object pulled down by the force of gravity, and the force attracting
objects to the earth.
Free fall was frequently described as: an object falling freely from above, an object falling
from zero velocity with gravitational acceleration, and an object falling without any force
applied to it.
EX-HOD- grade9 students showed confusion with the understanding of the concepts weight
and mass. However, there were common understanding among students about mass as
"occupying space", and some students more correctly describing it as "the amount of matter
in an object". Weight was frequently described as "the force you exert on the earth". Force
was mostly described as a push or a pull. Gravitational force was mostly described as the
force, which attracts objects to the earth. Free fall was mostly described as a substance falling.
Very seldom reference was made to gravity and sometimes free fall was described as the
160
gravitational force, or as being constant. Most of these students believed that air caused
objects to fall.
EX-HOD grade 12 students described mass as: how heavy or light an object is, mass produces
weight, mass is the weight of an object measured in kilograms, and mass is the physical
quantity which determines the weight of an object.
Weight was frequently described as your mass x gravitational acceleration.
Gravitational force was mostly described as the force with which a body is attracted to the
centre of the earth. The gravitational force was also viewed by some students as the force of
gravity the planet has on an object, and the force that attracts all bodies and keeps them on the
ground.
Free fall was frequently described as: a body falling from rest in the absence of air, objects
falling with constant velocity and zero acceleration, and an object falling in air with no air
friction.
EX-DET grade 9 students mostly described mass as weight and vice versa, and weight was
also described as when you measure weight on a scale in kilograms. Weight was sometimes
described as a force of gravity. Most students correctly described force as a push or pull.
There seemed to be a lack of knowledge in describing gravitational force. Free fall was
mostly described as a thing falling where students made no reference to gravity or air
resistance.
EX-DET grade 12 students frequently described mass as "occupies space" and has "matter".
Sometimes it was described as something that pulls an object to act downwards and produce
the force, which is weight. Mass was also described by some students as the quantity in an
object and as being synonymous to weight.
161
Weight was frequently described as: a force acting downwards and is measured in Newton's,
objects being pulled downwards by gravitational acceleration, the measurement of an object
by W=mg
Gravitational Force was frequently described as the force that has power to pull everything
toward the earth, and the force that always pulls objects downwards.
Freefall was frequently described as: when something falls on its own without being dropped,
when an objects speed is not constant, the higher you go the harder you fall, and very seldom
as an objects falling without the disturbance of air resistance.
EX — TED grade 9 students mostly describe mass as the amount of space an object takes up,
and the amount of matter that takes up space. Very seldom describing it as the amount of
matter in an object. Weight was described as "how heavy an object is", "force used on an
object", "the gravitational pull of the earth" and very seldom as "the gravitational pull on an
object". Force was mostly described as a "push or pull".
Gravitational force was frequently described as: " the earth has a gravitational force, which
forces us to stay on the earth", "a force which the earth's gravity pulls you", "the pull from
the centre of the earth", " a force which pulls an object towards the earth", and " a force
exerted on an object to keep it on the ground".
Free fall was frequently described as: "when something falls with no strings attached", "when
something falls freely", "when there is nothing in the way of a freefalling object" and less
frequently as "an object falling without any resistance".
EX-TED grade 12 students described mass as "the total amount of matter in a substance",
"the amount of matter an object takes up in grams", and "the weight of an object".
162
Weight was described as: the downward force of an object that is applied due to the effect of
gravity on that object, the force of gravity, the earth's attraction on a body and the amount of
force an object exerts on the earth.
Gravitational force was frequently described as the force the earth has on an object pulling it
downwards. Free fall was frequently described as: an object that is dropped with no initial
velocity, an object being pulled downwards by the force of gravity towards the earth, and
when an object falls at 9,8 m/s -2 without air resistance.
Most students viewed free fall as a synonym for gravitational force. However, very seldom
there were those who more correctly explained it as an object falling under the action of
gravity with no other forces such as air friction acting on it. Then there were those who also
believed an object falling due to action of gravity and air resistance, which some scientist also
view as correct.
In the above analysis grade 9 students consider the term weight not so often as meaning force,
but more often as meaning mass. In comparison the grade 12 students more often referred to
weight as a force, and more specifically as the gravitational force with which the earth attracts
an object.
In comparing the post-test results with the pretest results for grade 9 and 12 students it was
evident that students showed some improvement in their understanding of the concepts.
However only the grade 9 students were again directly tested on the concepts mass, weight,
force, gravitational force, and free fall.
The post-test results revealed that mass was now being referred to mostly by group A and C
students that were subjected to the intervention programme as "the quantity of matter a
substance contains". As explained above in the pretest findings most students still referred to
force as "a push or a pull". Weight and gravitational force was mostly viewed as being
synonymous. Mostly group A and C students referred to these terms in the post-test as the
force with which the earth attracts an object. Weight was very seldom described as the force
163
of the body against the support. However, grade 9 students that were subjected to the
intervention programme now viewed weight as being a force, whereas previously some
students described it as not being a force.
Most of the grade 9 students in groups A and C became more comfortable with describing
free fall as an object falling under the action of gravity only, with there being no other force
acting on it. However group B students still showed a lack of knowledge, or referred to mass
as the amount of space or volume an object occupies. The other concepts such as weight,
gravitational force, and free fall of the grade 9 students showed some improvement when
compared to their explanations in the pretest. At this point it can be considered that the
intervention programme did improve the grade 9 students understanding of concepts in
section A.
Although physicists have usually made a distinction between the concepts mass and weight,
we should reconsider our definitions for these terms. As Iona (1975) has indicated that there
seems to be little controversy about what physicists mean by mass. Trying to give a definition
however may lead to arguments. A statement that mass is the "quantity of matter" may be
adequate to satisfy grade 9 and 12 students in this study who deal with the rest mass, and
probably the general public in understanding this concept.
Unless one is concerned only with the rest mass as in the school syllabus up to grade 12, mass
in general should not be identified with the number of elementary particles making up the
object, for example, this mass will not increase with speed as the relativistic mass does. It is
also important to note that a few physicists influenced by the engineering practice, approach
the concept of mass in what appears, in view of the development of the unit system and
reproducible standards, as being a backward way. Mass in this approach is weight of the
object divided by the acceleration due too gravity. However, students in this study are more
comfortable with mass as being the quantity of matter in a substance.
Force on the other hand is usually considered as a derived quantity and is defined as the
product of mass and acceleration, a, resulting when the force f is the only force acting on an
164
object of mass m: f = ma. This does not mean that all forces have to be measured by testing
what acceleration they produce if applied on an object of known mass. For example it is
assumed that a spring stretched a certain extent will exert a force, that is considered as
evidence of a force acting and the magnitude can be obtained from the elongation of the
spring. Force is also derived in most textbooks especially at grade 9 level as a "push or a
pull". Grade 9 students were more comfortable in defining force as a "push or a pull", where
as grade 12 students described force as being a "push or a pull" and also referring to force as f
= ma.
The majority of science textbooks define weight as a synonym for gravitational force exerted
on the body by the earth. In short we will distinguish between two major approaches in
defining weight, weight definition I and weight definition II. Weight definition I could mean
weight is the force with which the earth attracts an object, meaning weight and gravitational
force are synonymous. Weight definition II could mean, W, is the force exerted by the body
against the support. Most of the grade 9 students in the post-test made no distinction between
weight definition I and weight definition II. However, few grade 12 students made reference
to weight definition II in the pretest.
In section A grade 12 students were also required to answer the following questions:
If you inflate a balloon (by blowing air into a balloon), and then release it. Describe what
happens to the balloon. Explain you observations in the above question.
Another question for grade 12 students is the following:
A passenger in a moving elevator is interested in knowing the weight of a box. Only a spring
scale is available. Compared with being on the ground, will his inference about the weight of
the box be influenced by:
the accelerated movement of the elevator upwards?
The constant speed movement of the elevator downward?
165
EX-HOR students answered as follows: for the balloon question they answered that the
balloon will first move upwards for a short while, reach maximum velocity and then
eventually accelerate downwards at 10ms 2. They also believed that the balloon would be
pulled down slower by the gravitational force, because of the air inside the balloon.
For the part a) of the elevator question they answered that the weight will be influenced by the
acceleration of the elevator, providing reasons which showed a lack of knowledge. Some
students also explained that the weight would decrease because the upward acceleration is
opposite to the gravitational acceleration downwards.
For the part b) of the elevator question they answered that the box will be heavier because the
gravitational force and the downward force of the elevator is acting on the box, and it will
show a zero weight because the elevator is moving with constant velocity.
EX-HOD students frequently showed common understanding for the question on the balloon
viz. the balloon will fly around until the air is out, or the balloon will move up.
For part a) they explained that the accelerated upward movement would decrease the weight
because the lift is moving upward, against gravity. There were those who believed the weight
of an object on the earth does not change. They also believed that the accelerated upward
movement influences weight because there is an additional weight on the box and the weight
would be greater because the total force is greater.
For part b) they explained the weight of the box will be influenced by the constant speed
movement of the elevator because the elevator is moving, and the weight of the box on the
earth remains constant therefore the constant speed movement of the elevator does not
influence weight.
EX-DET students' responses to the question on the balloon was that the balloon would fall
down because the gravitational force makes it to fall. Some students explained the balloon
166
would move upwards because it was filled with air, and there those who explained it will
move sideways because of the air inside it.
For the part a) of the question on the elevator students responded as follows: the weight will
always be influenced by 10ms -2 downwards because the gravitational acceleration is always
10ms2 , "it will be influenced by the accelerated movement of the elevator and you must
weigh it when it is at rest", it will be decreased because the elevator is accelerating in the
opposite direction to gravity, and there were those who showed a lack of understanding.
For part b) their responses were as follows: the weight will be less because the constant speed
is downwards, and it will not be influenced because there is no acceleration. Some indicated a
lack of understanding.
EX-TED students responses were as follows: the balloon ascends upwards because the gas
inside it is lighter than air, the balloon will stay in the same place and slowly sink to the
ground, and the balloon drops because it is filled with carbon dioxide which is denser than air.
Then there were those who believed that the balloon falls downwards because it is pulled by
gravity, and the balloon moves slowly downwards because the air inside the balloon probably
has water vapour from your lungs which is heavier than the surrounding air.
This question seemed to have a common understanding among most students that the balloon
would first move upwards. Very few students believed that the balloon would move
downwards. Students were unable to explain that it will move slowly downwards because of
the effects of air resistance on its surface area.
For the elevator question part a) the responses were as follows: the weight reading would
increase because by moving upwards the air is forced downwards making the box seem
heavier then it really is, and the weight of the box does not change because "g" is a constant.
For the part b) the responses were as follows: the weight will be zero because the elevator
moves with constant velocity and because the boxes inertia will resist the downward motion.
167
Some explained that the boxes initial reading will be zero, but will return to normal weight
when the motion of the elevator is constant. Then there were those who explained that the
weight of the box does not change because "g" is a constant on the earth.
The predominant misconception among students in the elevator question part a) was that the
weight of the box would decrease when the elevator accelerates upwards because the elevator
was accelerating in the opposite direction to the gravitational acceleration. Students did not
realize that the weight reading is the scale reading, which is an upward force, and if the lift
accelerates upward the weight reading should increase.
Some were careful in explaining that the weight reading would increase but the weight would
not change.
For the b) part the predominant misconception was that at constant speed the acceleration is
zero and consequently the weight would be zero.
In the post-test of section A grade 12 students were expected to apply their concepts dealt
with in the intervention programme to a girl standing on a spring operated bathroom scale in
a lift, with the lift starting to move.
The question was as follows:
1. A girl of mass 50-kg stands on a spring operated bathroom scale in a lift. The scale is
calibrated in Newton's.
1.1 What will the scale reading be when the lift is stationary?
The lift starts moving as follows in the same direction:
For the first two seconds the scale reading is 250 N
For the third and fourth seconds the scale reading is 500 N
For the fifth and sixth seconds the scale reading is 625 N
168
Answer the following questions giving reasons for your answers
Is the lift moving upwards or downwards?
Describe the motion of the lift during the third and fourth seconds
Describe the motion of the lift during the fifth and sixth seconds
Does the weight of the girl change during the motion of the lift?
Name the forces acting on the girl during the motion of the lift
Which of these forces gives the reading on the scale?
Is the reading on the scale an upward or downwards force?
1.1 Most of the students in groups A, B and C answered the question correctly by giving 500
N as an answer. Students correctly applied the formula
W= mg.
1.2 (i)Some students believed it moved upward because the girl exerted more pressure on the
scale. Others believed it first moves downwards, stops and then moves upwards. Some
EX-TED students in group A correctly believed that the lift moves downwards because
the scale reading is initially less than the weight of the girl, and when the scale reading
increases the lift is slowing down. Then there were those who showed a lack of
knowledge, and showed that they were guessing.
(ii) During the third and fourth seconds, common understanding among the groups were as
follows: the reading increased to 500N because the elevator starts to accelerate, it is stationary
169
because the scale reading is upwards, it is moving downwards because the resultant upward
force has decreased, and it is moving downwards because the resultant force decreased. There
were those who believed it moved upwards because the weight is registered on the scale, and
if the lift moves upwards its force is opposing the weight therefore the reading on the scale
decreases. Some students' in group A correctly believed that the lift is moving at constant
velocity downwards.
During the fifth and sixth second most groups frequently believed: it was accelerating
upwards, it was slowing down because the difference in the forces is less, it is accelerating
upwards because of the higher reading on the scale, and the velocity is increasing in smaller
proportions. Some students believed that the lift was slowing down but incorrectly explained
that the girl is still moving at the original velocity so the weight increases.
Common beliefs among the students were that: the girl's weight does not change because
gravity is constant, the weight of the girl does change during the motion of the lift because the
force on her first decreases then increases, and the weight of the girl changes according to the
scale reading. Some explained that the weight does not change because weight is directly
proportional to mass and the mass does not increase.
Most groups frequently explained that: gravity was acting downwards and the force of the
elevator upwards, there were three forces viz. the gravitational force, resultant force and a
reaction force. Some believed the three forces were the force of gravity, the upward reaction
force to the weight and the accelerated force upwards. There were those who explained that
the force of the girl on the scale and the force of the scale on the girl are the only forces acting
on the girl.
Common beliefs among the students were: the force of gravity gave the reading on the
scale, the weight downward gave the reading on the scale because gravity is constant, and the
upward force gave the reading on the scale. A very small percentage of EX-TED students
correctly believed that the force of the scale on the girl gave the reading on the scale.
170
(vii) The responses to this question were as follows: the reading on the scale is a downward
force, the upward force is registered because the lift is moving upwards and it is pushing on
the girl. A small percentage among the EX-TED students correctly explained that it is
upwards because it is the force of the scale on the girl.
Some contradicted themselves by saying the downward force of gravity gives the reading on
the scale in (vi) and in (vii) saying the reading on the scale is an upwards force.
This question reveals that most of the students subjected to the intervention programme seem
to have a better understanding of weight, as revealed by the answers provided to question 1.2
(iv), where a large number of students believe that the weight of the girl does not change
because gravity is a constant.
The answers to question v, and vi, is evidence that a large number of students use weight as a
synonym for gravitational force. Then there are some students who confuse the term weight
with weight reading and believe that the weight changes.
The major misconception among the students is that the reading on the scale is a downward
force. This influenced students choice in 1.2 i) because they explained that the lift is moving
upwards because the scale reading decreases due to the upward movement, and in 1.2 iii) it
increases because the lift accelerates downwards.
There were those who believed that the reading in 1.2 ii) is equal to the weight of the girl
because the lift is stationary, with a few correctly believing that it is equal to the weight of the
girl because the lift is not accelerating or moving with constant velocity. Students' reasons to
this question showed another misconception that velocity is directly proportional to force.
The answers to question vi) show that students do understand that there is an action and
reaction force, but are unable in vii) to state which force gives the reading on the scale.
171
The misunderstandings were prevalent in all the ex — departments, with a few EX-TED
students providing correct answers and reasons to the entire question.
5.5.1 Predominance and Possible Sources of Misconceptions
The responses of grade 9 students to the 10-item questionnaire and the responses of the grade
12 students to the 20-item multiple-choice questionnaire are reported. Both the 10-item
questionnaire and the 20-item questionnaire derived from the interviews and previous
examination questions were used to determine the possible causes of the misunderstandings.
Both the questionnaires consisted of multiple-choice questions where students had to provide
reasons for their answers. Where students chose the correct answer and gave incorrect
reasons, the correct answer was recorded in the table of percentages of results and the
incorrect reason was noted in an inventory.
5.5.2 Evidence of Prevalent Misconceptions from Specific Questionnaire Items
The percentage of students who chose each alternative in a particular question is calculated
on the basis of the number of students who wrote the pretest. For the correct choice the
asterisk (*) is placed next to the correct letter e.g. if C is the correct choice it will be
indicated by *C. The items, which illustrate the prevalence of misconceptions in forces and
motion and require further investigation, are discussed in detail below.
5.5.3 Prevalent Misconceptions from Newton's laws of Motion
For the grade 9 students questionl and 4 were based on Newton's laws of motion. For grade
12 students' questions 1,3, 9,16 were based on Newton's laws of motion. The questions 1,3,
9 and 16 test Newton's laws of motion from different levels of complexity, starting with
simple aspects in question three and becoming more complex from question 3 to 6 and 9.
The items, which identify the prevalent misconceptions, are discussed below. In all
questions students had to cross the correct answer and provide a reason for their choice.
17 2
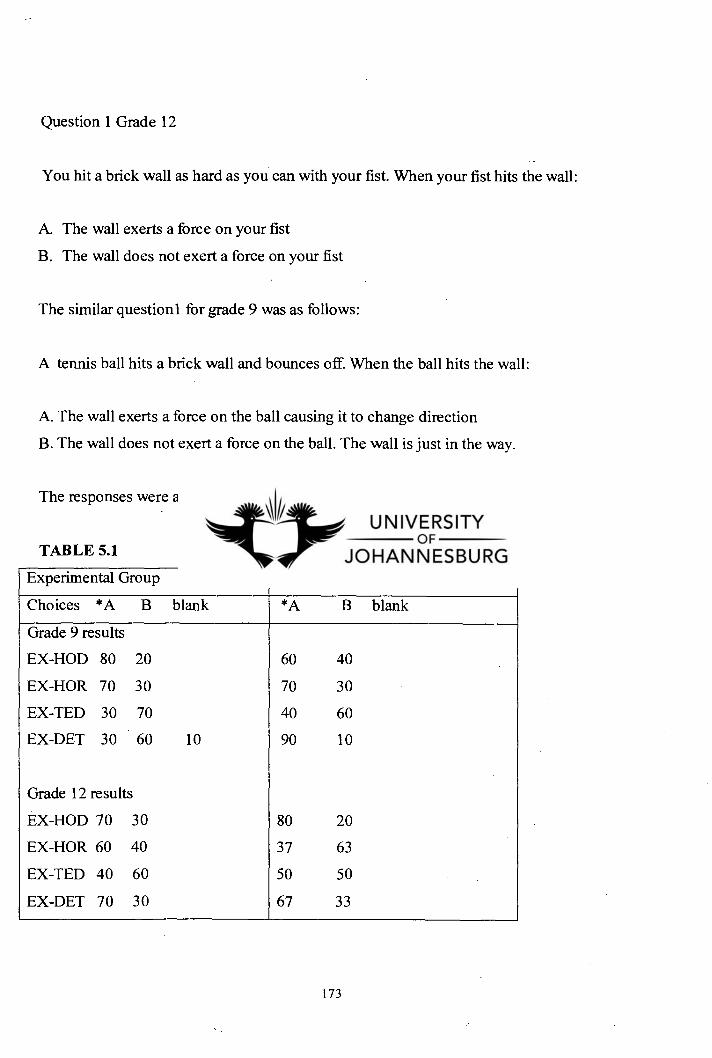
Question 1 Grade 12
You hit a brick wall as hard as you can with your fist. When your fist hits the wall:
The wall exerts a force on your fist
The wall does not exert a force on your fist
The similar questionl for grade 9 was as follows:
A tennis ball hits a brick wall and bounces off. When the ball hits the wall:
The wall exerts a force on the ball causing it to change direction
The wall does not exert a force on the ball. The wall is just in the way.
The responses were as follows:
TABLE 5.1
Vo CHOICE
Experimental Group Control Group
Choices *A B blank *A B blank
Grade 9 results
EX-HOD 80 20
EX-HOR 70 30
EX-TED 30 70
EX-DET 30 60
Grade 12 results
EX-HOD 70 30
EX-HOR 60 40
EX-TED 40 60
EX-DET 70 30
10
60
70
40
90
80
37
50
67
40
30
60
10
20
63
50
33
173
The groups of students who chose the correct choice A with a percentage of less than 50% in
grade 12 are the control group of the EX-HOR, and the experimental group of the EX-TED.
In grade 9 the students who chose A with a percentage of less than 50% are the EX-TED
experimental, the EX-TED control group, and the EX-DET experimental group.
The question investigated students' conceptions on Newton's third law of motion. Those
who chose B explained that: the wall does not push or pull the ball in any way, it has simply
deflected the ball, the wall does not move and the ball is doing all the work, the wall is just
there so that the ball can bounce back, and the ball is in motion with its own force making it
to change direction. Some of the students explained that the wall does not break or crack
therefore it does not exert a force. Others believed that the wall did not exert a force because
it does not move and is not living to exert a force. The major reason for students choosing B
seem to be that inanimate objects do not have life to exert a force.
There were those who chose A and gave incorrect explanations as follows: because the wall
is hard and thick, since the wall does not move at all stored up energy is exerted on the ball
and it bounces off, and there is always an opposing force. However, most of the students
seem to understand that for every action there is an equal and opposite reaction as most
explained for A, when a force is applied on the wall, the wall exerts a force back. At this
stage of the of the investigation the aim was to establish whether misconceptions were
present or not rather than the effect of the teaching method.
Questions 2 and 3 of the grade 12 students' post-test, and question 1 of grade 9 students'
post-test corresponds to the above items. However, in the table of results of the post-test (see
tables 4.1 to 4.16), the EX-TED grade 9 and 12 experimental group improved their scores to
between 90% and 100%. It was also amazing to note that the EX-HOR grade 9 control group
students' who scored 70% in the pretest and the EX-TED control group grade 12 students
who scored 60% in the post-test, received no intervention programme, and improved their
scores to between 90 andl 00%.
174
The EX-DET control group B grade 12 students' results showed a slight improvement in the
post-test. The EX-DET grade 9, experimental group showed a slight improvement, while the
control group C that was subjected to the programme scored 90%. Students' responses in the
post-test showed improvement in choosing the correct response and providing scientific
explanations.
Question 3 of grade 12 is identical question 4 of grade 9. The question is as follows:
A ball is resting on a person's hand. The reaction force to the weight of the ball is the force
which :
the ball exerts on the earth
the ball exerts on the hand
the hand exerts on the ball
the earth exerts on the ball
175
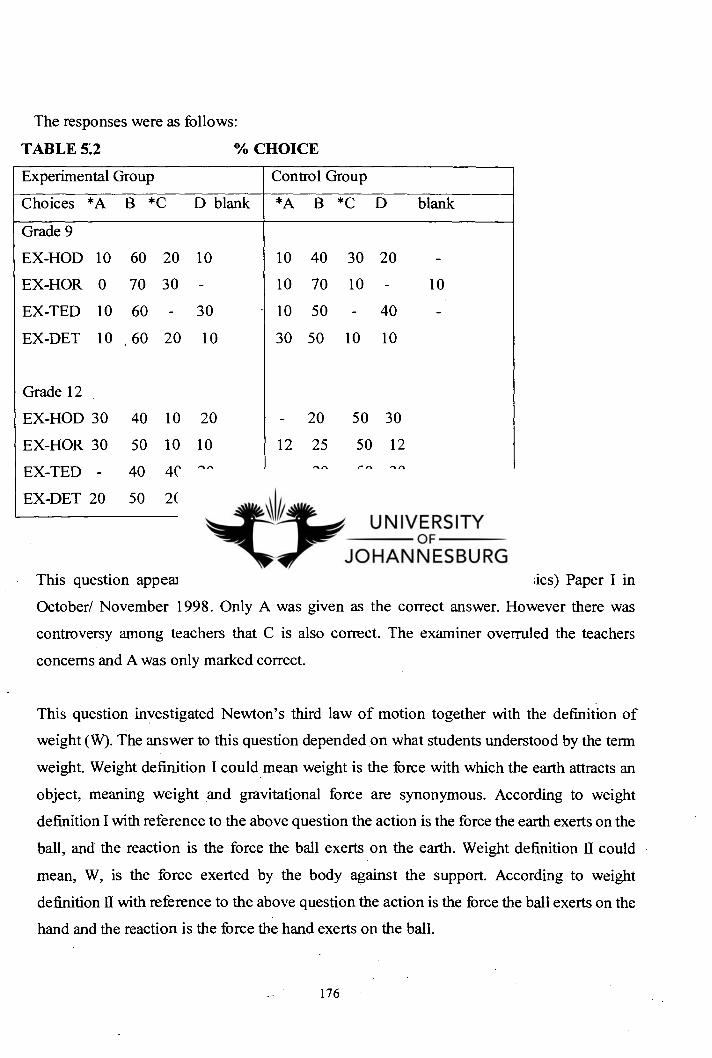
The responses were as follows:
TABLE 5:2
Vo CHOICE
Experimental Group Control Group
Choices *A B *C D blank *A B *C D blank
Grade 9
EX-HOD 10 60 20 10 10 40 30 20 -
EX-HOR 0 70 30 - 10 70 10 - 10
EX-TED 10 60 - 30 10 50 - 40 -
EX-DET 10 , 60 20 10 30 50 10 10
Grade 12
EX-HOD 30 40 10 20 - 20 50 30
EX-HOR 30 50 10 10 12 25 50 12
EX-TED - 40 40 20 - 20 50 30
EX-DET 20 50 20 10 11 56 22 11
This question appeared in one of the provinces Physical Science (Physics) Paper I in
October/ November 1998. Only A was given as the correct answer. However there was
controversy among teachers that C is also correct. The examiner overruled the teachers
concerns and A was only marked correct.
This question investigated Newton's third law of motion together with the definition of
weight (W). The answer to this question depended on what students understood by the term
weight. Weight definition I could mean weight is the force with which the earth attracts an
object, meaning weight and gravitational force are synonymous. According to weight
definition I with reference to the above question the action is the force the earth exerts on the
ball, and the reaction is the force the ball exerts on the earth. Weight definition II could
mean, W, is the force exerted by the body against the support. According to weight
definition II with reference to the above question the action is the force the ball exerts on the
hand and the reaction is the force the hand exerts on the ball.
176
Galili et al (1996) pointed out that educational researchers in their investigations of students
views, usually refer to weight definition I(weight gravitational force identity) as the only
scientific concept e.g. (Anderson ,1990 ; Bar et al 1994) and ignore the alternative definition
II which they refer as nonscientific. This finding influenced the interpretations and
inferences made in those studies. This study concentrates on the correctness of both
definitions.
The scientific correctness of the alternative definition II was discussed by King (1962),
Taylor (1974), Iona (1975), and French(1995). The main criticism against the weight
definition I is that the term weight is used to label two different physical entities: the
gravitational force, which is a force acting at a distance, and the directly measured contact
elastic force, which is responsible for the result of weighing (the spring balance reading).
Galili showed that the majority of science textbooks define weight as a synonym for the
gravitational force exerted on the body by the earth. At the advanced level there is a
separation between true (gravitational force itself) and apparent (the result of measurement)
weights (Haliday, Resnick and Walker, 1993).
Those who chose C explained because "the force the hand exerts on the ball" is the reaction
force, therefore the hand exerts an upward force. Some of those who chose A explained
"when you bounce a ball it returns to your hand". Others explained their choice for A
"because there is a gravitational pull pulling the ball down".
All the distracters in this question attracted some response. The predominant choice
according to the table is B, which says, "the ball exerts on the hand". Some of the reasons
were if anything rests on your hand it exerts a force on your hand, and the force that the ball
exerts on the hand is equal to the force that the hand exerts on the ball. Some of the students
choosing B seemed to give reasons that agree with weight definition I. It appears that some
students arrived at this response by misinterpreting the question. On the whole most of the
students choosing B seemed to have a lack of knowledge.
177
The choice of this alternative B as explained by most of the students reasons showed that
there was confusion of the word action for reaction as this choice gives the action of weight
definition I.
The information gained indicates that most of students' choosing A or C did provide correct
reasons. However more students went for choice C based on weight definition 1.
In general the majority of the students were confused by the definition of the term weight
and could not properly answer the question. Concerning this question, the term weight
should be discussed in more detail with students to broaden their understanding. Students
seemed to have failed in this question because they did not clearly understand the term
weight.
Question 16
This question tested the application of Newton's third law on a model rocket projected from
rest. Grade 12 students were only tested on this question.
Question 16 was as follows:
A model rocket of weight W, is projected vertically upwards from rest. The engine of the
rocket converts the fuel to hot gases, which it ejects at the bottom of the rocket.
Which of the following statements best gives the cause of the rockets upward acceleration?
The escaping exhaust gases push on the air
The air pushes on the escaping exhaust gases
The escaping exhaust gases push on the rocket
The rocket pushes on the escaping exhaust gases
178
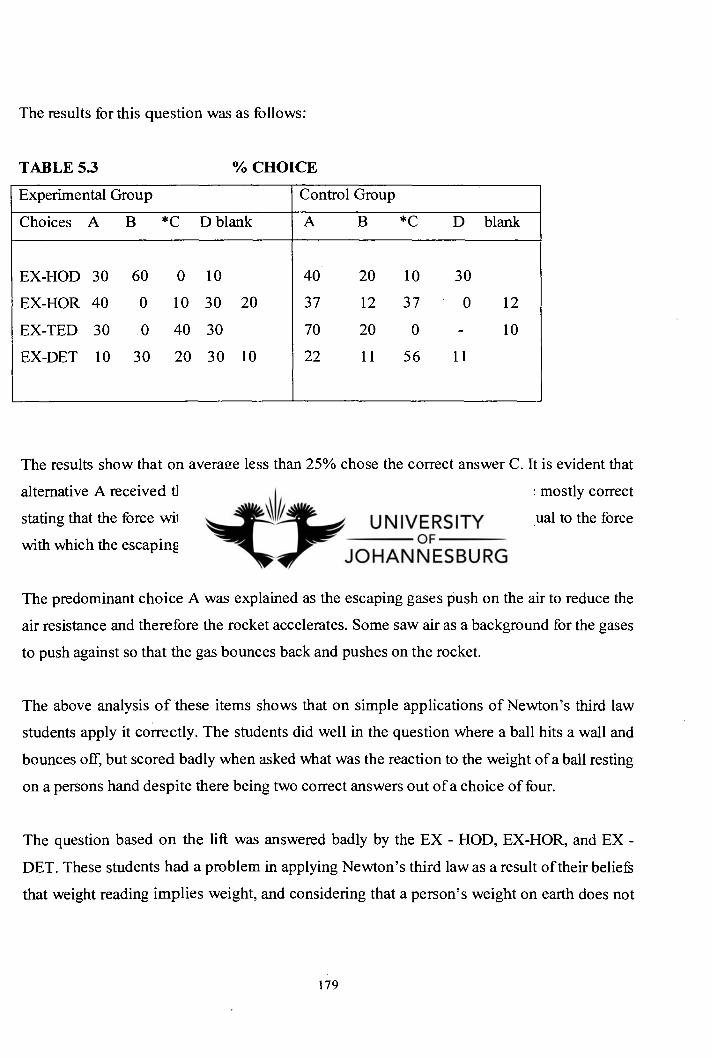
The results for this question was as follows:
TABLE 5.3
% CHOICE
Experimental Group Control Group
Choices A B *C D blank A B *C D blank
EX-HOD 30 60 0 10 40 20 10 30
EX-HOR 40 0 10 30 20 37 12 37 0 12
EX-TED 30 0 40 30 70 20 0 - 10
EX-DET 10 30 20 30 10 22 11 56 11
The results show that on average less than 25% chose the correct answer C. It is evident that
alternative A received the greatest response. The reasons provided for C were mostly correct
stating that the force with which the rocket pushes on the escaping gases is equal to the force
with which the escaping gases push back on the rocket.
The predominant choice A was explained as the escaping gases push on the air to reduce the
air resistance and therefore the rocket accelerates. Some saw air as a background for the gases
to push against so that the gas bounces back and pushes on the rocket.
The above analysis of these items shows that on simple applications of Newton's third law
students apply it correctly. The students did well in the question where a ball hits a wall and
bounces off, but scored badly when asked what was the reaction to the weight of a ball resting
on a persons hand despite there being two correct answers out of a choice of four.
The question based on the lift was answered badly by the EX - HOD, EX-HOR, and EX -
DET. These students had a problem in applying Newton's third law as a result of their beliefs
that weight reading implies weight, and considering that a person's weight on earth does not
179
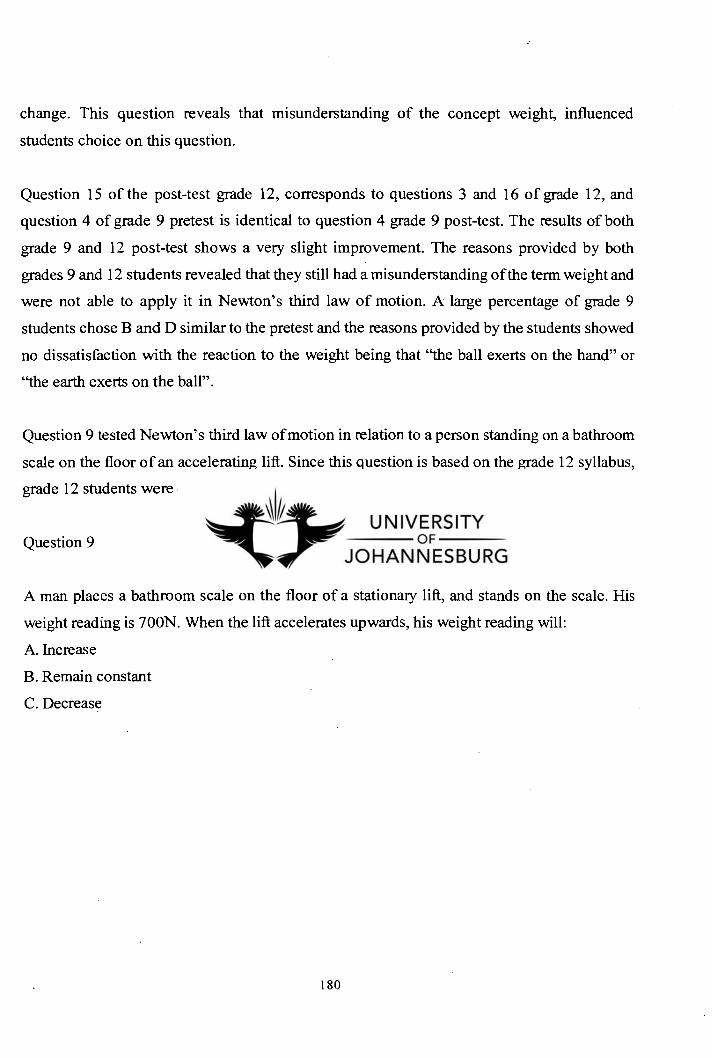
change. This question reveals that misunderstanding of the concept weight, influenced
students choice on this question.
Question 15 of the post-test grade 12, corresponds to questions 3 and 16 of grade 12, and
question 4 of grade 9 pretest is identical to question 4 grade 9 post-test. The results of both
grade 9 and 12 post-test shows a very slight improvement. The reasons provided by both
grades 9 and 12 students revealed that they still had a misunderstanding of the term weight and
were not able to apply it in Newton's third law of motion. A large percentage of grade 9
students chose B and D similar to the pretest and the reasons provided by the students showed
no dissatisfaction with the reaction to the weight being that "the ball exerts on the hand" or
"the earth exerts on the ball".
Question 9 tested Newton's third law of motion in relation to a person standing on a bathroom
scale on the floor of an accelerating lift. Since this question is based on the grade 12 syllabus,
grade 12 students were only tested.
Question 9
A man places a bathroom scale on the floor of a stationary lift, and stands on the scale. His
weight reading is 700N. When the lift accelerates upwards, his weight reading will:
Increase
Remain constant
Decrease
180
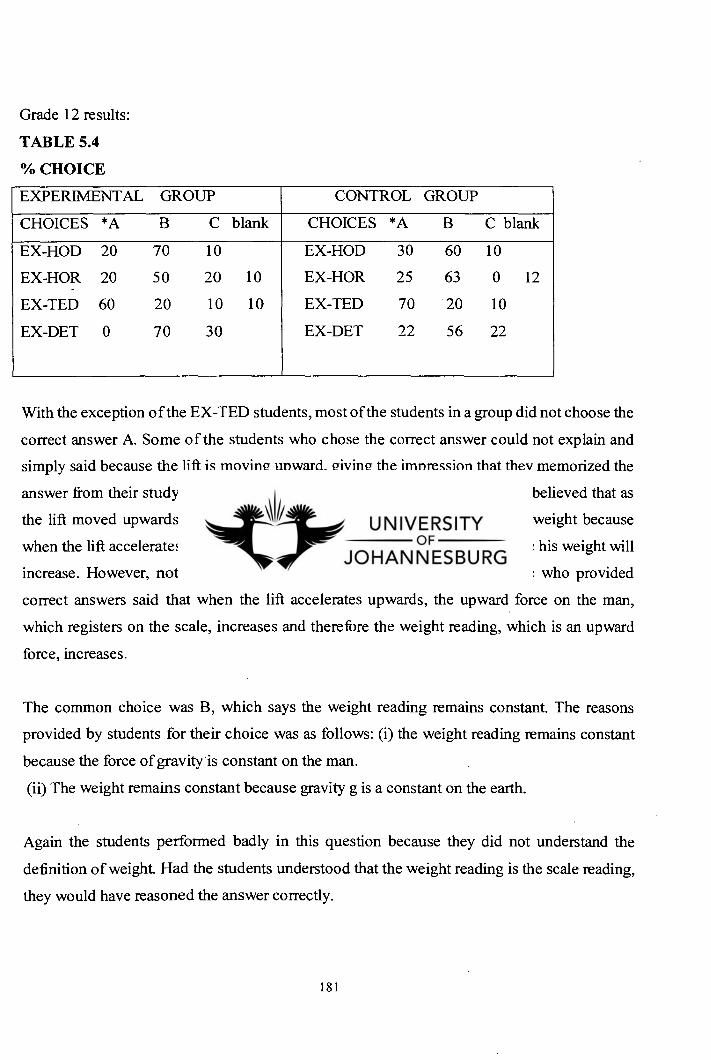
Grade 12 results:
TABLE 5.4
% CHOICE
EXPERIMENTAL GROUP CONTROL GROUP
CHOICES *A B C blank CHOICES *A B C blank
EX-HOD 20 70 10 EX-HOD 30 60 10
EX-HOR 20 50 20 10 EX-HOR 25 63 0 12
EX-TED 60 20 10 10 EX-TED 70 20 10
EX-DET 0 70 30 EX-DET 22 56 22
With the exception of the EX-TED students, most of the students in a group did not choose the
correct answer A. Some of the students who chose the correct answer could not explain and
simply said because the lift is moving upward, giving the impression that they memorized the
answer from their study of Newton's laws of motion based on the lift. Some believed that as
the lift moved upwards his body will pull more downwards, increasing the weight because
when the lift accelerates upward the gravitational force will increase, therefore his weight will
increase. However, not many students provided the correct reasons. Those who provided
correct answers said that when the lift accelerates upwards, the upward force on the man,
which registers on the scale, increases and therefore the weight reading, which is an upward
force, increases.
The common choice was B, which says the weight reading remains constant. The reasons
provided by students for their choice was as follows: (i) the weight reading remains constant
because the force of gravity is constant on the man.
(ii) The weight remains constant because gravity g is a constant on the earth.
Again the students performed badly in this question because they did not understand the
definition of weight. Had the students understood that the weight reading is the scale reading,
they would have reasoned the answer correctly.
181
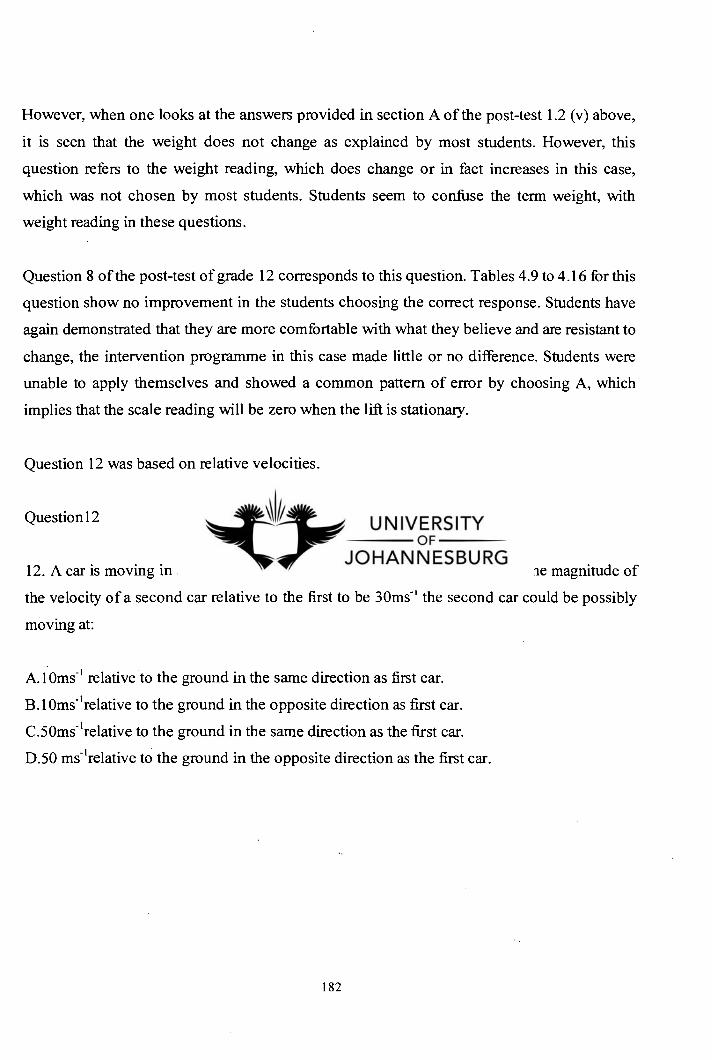
However, when one looks at the answers provided in section A of the post-test 1.2 (v) above,
it is seen that the weight does not change as explained by most students. However, this
question refers to the weight reading, which does change or in fact increases in this case,
which was not chosen by most students. Students seem to confuse the term weight, with
weight reading in these questions.
Question 8 of the post-test of grade 12 corresponds to this question. Tables 4.9 to 4.16 for this
question show no improvement in the students choosing the correct response. Students have
again demonstrated that they are more comfortable with what they believe and are resistant to
change, the intervention programme in this case made little or no difference. Students were
unable to apply themselves and showed a common pattern of error by choosing A, which
implies that the scale reading will be zero when the lift is stationary.
Question 12 was based on relative velocities.
Question12
12. A car is moving in a straight line with a velocity of 20 ms'. In order for the magnitude of
the velocity of a second car relative to the first to be 30ms -I the second car could be possibly
moving at:
A.10ms- ' relative to the ground in the same direction as first car.
B.10ms-I relative to the ground in the opposite direction as first car.
C.50ms-l relative to the ground in the same direction as the first car.
D.50 ms'relative to the ground in the opposite direction as the first car.
182
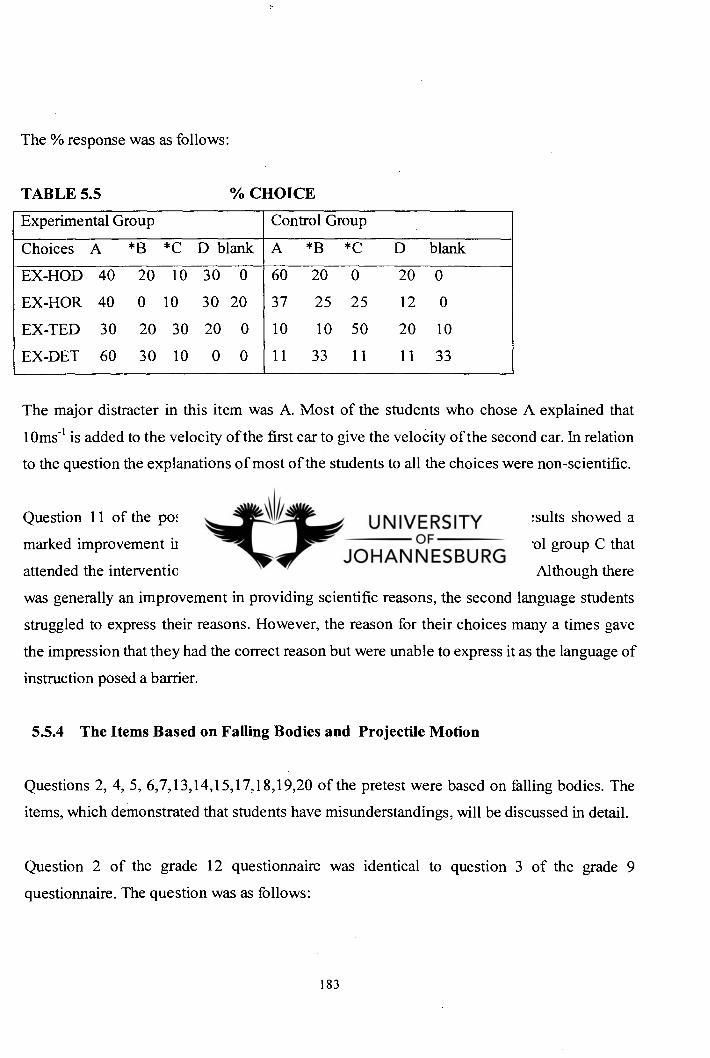
The % response was as follows:
TABLE 5.5
% CHOICE
Experimental Group Control Group
Choices A *B *C D blank A *B *C D blank
EX-HOD 40 20 10 30 0 60 20 0 20 0
EX-HOR 40 0 10 30 20 37 25 25 12 0
EX-TED 30 20 30 20 0 10 10 50 20 10
EX-DET 60 30 10 0 0 11 33 11 11 33
The major distracter in this item was A. Most of the students who chose A explained that
10ms-1 is added to the velocity of the first car to give the velocity of the second car. In relation
to the question the explanations of most of the students to all the choices were non-scientific.
Question 11 of the post-test grade 12 was identical to this question; the results showed a
marked improvement in the percentage of the experimental group and control group C that
attended the intervention programme, choosing the correct choices B and C. Although there
was generally an improvement in providing scientific reasons, the second language students
struggled to express their reasons. However, the reason for their choices many a times gave
the impression that they had the correct reason but were unable to express it as the language of
instruction posed a barrier.
5.5.4 The Items Based on Falling Bodies and Projectile Motion
Questions 2, 4, 5, 6,7,13,14,15,17,18,19,20 of the pretest were based on falling bodies. The
items, which demonstrated that students have misunderstandings, will be discussed in detail.
Question 2 of the grade 12 questionnaire was identical to question 3 of the grade 9
questionnaire. The question was as follows:
183
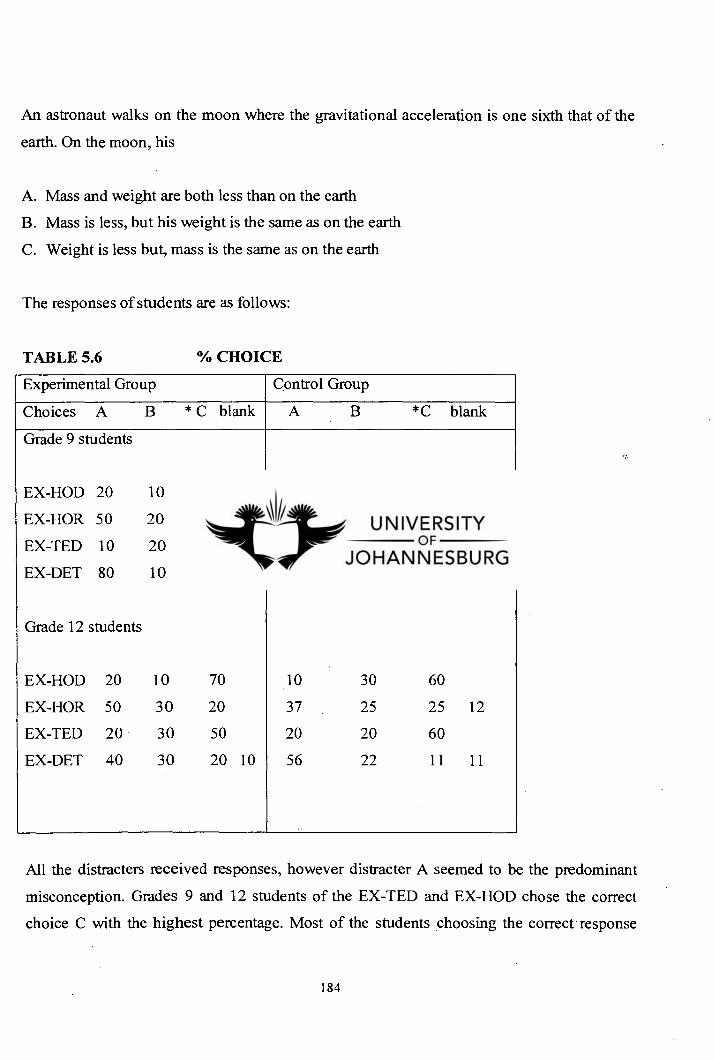
An astronaut walks on the moon where the gravitational acceleration is one sixth that of the
earth. On the moon, his
Mass and weight are both less than on the earth
Mass is less, but his weight is the same as on the earth
Weight is less but, mass is the same as on the earth
The responses of students are as follows:
TABLE 5.6
"Yo CHOICE
Experimental Group Control Group
Choices A B * C blank A B *C blank
Grade 9 students
EX-HOD 20 10 70 30 10 60
EX-HOR 50 20 30 60 10 30
EX-TED 10 20 60 10 20 10 70
EX-DET 80 10 0 10 60 0 30 10
Grade 12 students
EX-HOD 20 10 70 10 30 60
EX-HOR 50 30 20 37 25 25 12
EX-TED 20 30 50 20 20 60
EX-DET 40 30 20 10 56 22 11 11
All the distracters received responses, however distracter A seemed to be the predominant
misconception. Grades 9 and 12 students of the EX-TED and EX-HOD chose the correct
choice C with the highest percentage. Most of the students choosing the correct response
184
provided correct reasons e.g. a grade 9 student explained " His mass will remain constant
because he will always contain the same amount of matter but the gravitational pull is less on
the moon so his weight will be less." The reason provided by this student and most of the
students choosing C were based on sound reasoning and showed that they arrived at the
correct answer through correct reasoning.
It is important to note at this point that syllabi up to grade 12 deals only with the rest mass. For
the rest mass the number of particles will not increases with speed and will always contain the
same amount of particles. For the relativistic mass the number of particles increase with speed.
The few that chose C and provided incorrect reasoning mostly coincided with this students
statement that " He still takes up the same amount of space i.e. his mass, but his gravitational
pull is different". This student arrived at the correct answer through the incorrect
understanding of mass attributing it to be the amount of space occupied by the person.
There were those who explained that his mass never changes, and his weight will be effected
because he floats on the moon. Some believed the weight was less because there is no force of
gravity on the moon.
Those who chose A believed that: (i ) there is no oxygen on the moon therefore the mass and
weight is less on the moon, (ii) because there is no air and air friction on the moon therefore
both the mass and weight is less on the moon, (iii) because the gravitational acceleration on
the moon is less it reduces both the mass and weight on the moon, therefore people float on
the moon, as a result of the lack of gravitational acceleration or no gravitational acceleration
on the moon.
Some explained that the forces keeping us on the earth give us a greater mass and weight.
There were those who believed that his mass and weight become less because there is more air
friction on the moon.
Those who chose B explained because the gravitational acceleration on the moon is one sixth
that of the earth, the mass is reduced but the weight is the same. Some believed that the weight
185
of a person never changes because the gravitational acceleration is constant, but mass always
changes because it is not influenced by gravity. A small percentage that chose B believed that
the gravitational force changes on the moon but weight would be constant. Then there are
those who believed that you do not get thinner on the moon, therefore your weight remains the
same but mass changes. The weight reading was attributed to a mass in kilograms reading in
this case.
The misconceptions revealed in this question is that gravitational acceleration "g" is the result
of the amount of oxygen or air in the planet, as some students believed that because the "g" of
the moon is one sixth of the earth, there is no oxygen or air on the moon. It is also evident that
students believe that people float on the moon because mass and weight is reduced on the
moon. Then there are those who believe that gravity is the same everywhere and therefore
mass changes but not weight. It seems that students confuse universal gravitation with gravity
on specific planets and the scale reading seems to confuse students understanding of the terms
mass and weight.
Question 22 of grade 12 and question 3 of grade 9 corresponds with this item. Except for
grade 9 EX-HOR students the results in table 4.9 to 4.16, indicate that all the other groups of
students improved on this question. On analysis of the questionnaire, it was evident that EX-
HOR students in the experimental group had more English second language students than
those in the control group. This appears to be the reason why this group did not perform so
well in this question. In general the response to the questions indicate that the intervention
programme was successful in helping students understand that inertial mass remains constant
in the universe, and weight changes from one planet to another.
Question 4 of grade 12 is identical to question 5 of grade 9. This question investigates students
understanding of weight reading. However, question 2, which corresponds to these questions,
will not be discussed.
The question is as follows: A person floats in the sky in the basket of a hot air balloon. He
uses a very accurate spring balance to measure his weight. His reading will be:
186
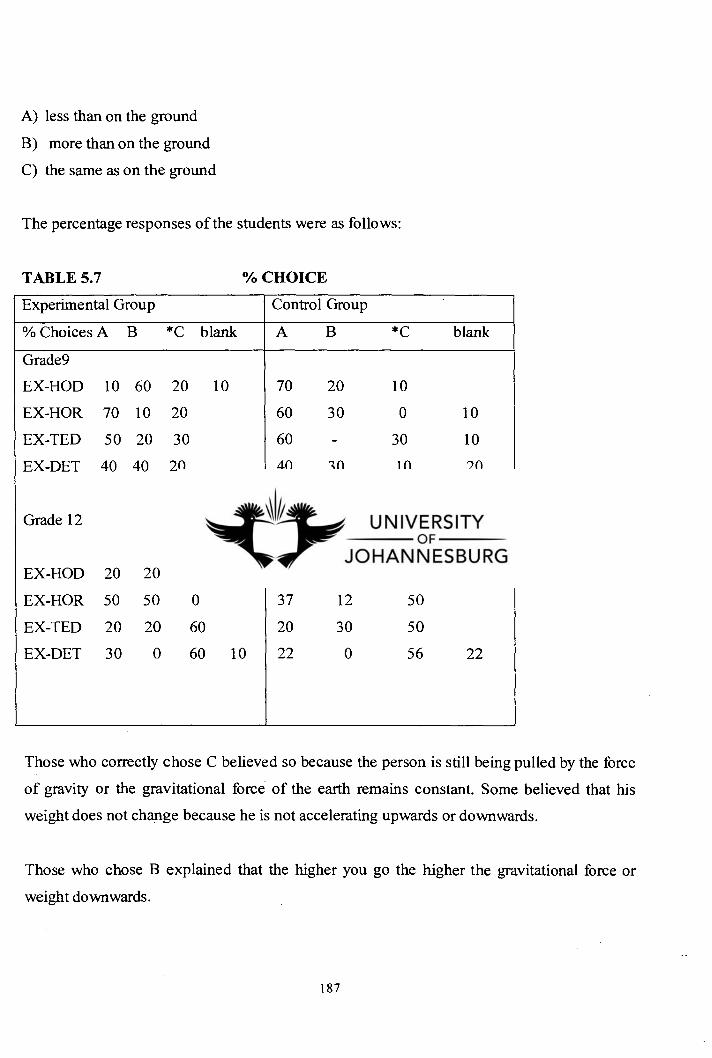
less than on the ground
more than on the ground
the same as on the ground
The percentage responses of the students were as follows:
TABLE 5.7
°A CHOICE
Experimental Group Control Group .
% Choices A B *C blank A B *C blank
Grade9
EX-HOD 10 60 20 10 70 20 10
EX-HOR 70 10 20 60 30 0 10
EX-TED 50 20 30 60 - 30 10
EX-DET 40 40 20 40 30 10 20
Grade 12
EX-HOD 20 20 60 30 30 40
EX-HOR 50 50 0 37 12 50
EX-TED 20 20 60 20 30 50
EX-DET 30 0 60 10 22 0 56 22
Those who correctly chose C believed so because the person is still being pulled by the force
of gravity or the gravitational force of the earth remains constant. Some believed that his
weight does not change because he is not accelerating upwards or downwards.
Those who chose B explained that the higher you go the higher the gravitational force or
weight downwards.
187
Those who chose A believed that air pressure decreases with altitude so there is less air
pushing down on him than on the ground, giving the impression that air pressure is responsible
for the gravitational acceleration. This group revealed in their explanations that gravity
increases as you get closer to the earth.
This question corresponds to question 5 of the grade 12 post-test and is identical to question 5
of the grade 9 post-test. Both grade 9 and 12 students' results did not improve. The major
distracter of grade 9 was A, with students mostly indicating that the air decreases as one goes
higher, therefore the weight decreases. For all the grade 12 groups of students the major
distracter was B which says that the gravitational acceleration is less at the floor than at the
ceiling. These students have indicated that they are more comfortable with their belief of
gravity, and were resistant to change.
Question 5 of grade 12 is identical to question 6 of grade 9. The question investigates whether
students attribute gravity, weight or gravitational force to accelerating free falling objects.
The question was as follows:
Free falling objects accelerate because
the weight of the object increases
gravity increases as they fall
gravity is a constant as they fall
the gravitational force increases
188
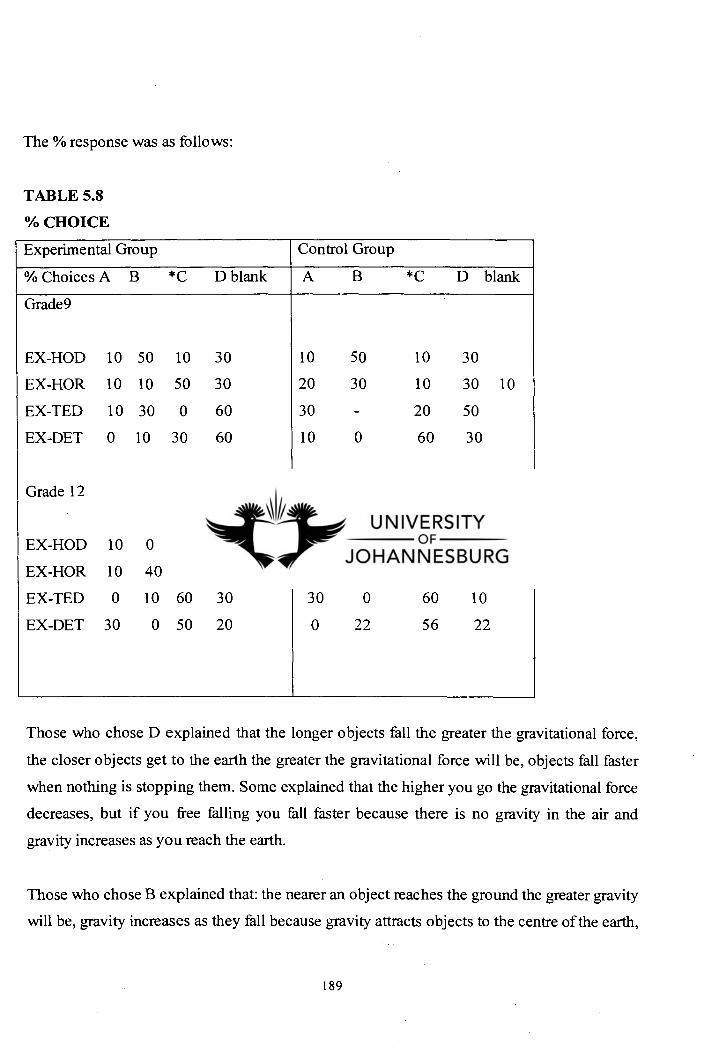
The % response was as follows:
TABLE 5.8
% CHOICE
Experimental Group Control Group
% Choices A B *C D blank A B *C D blank
Grade9
EX-HOD 10 50 10 30 10 50 10 30
EX-HOR 10 10 50 30 20 30 10 30 10
EX-TED 10 30 0 60 30 - 20 50
EX-DET 0 10 30 60 10 0 60 30
Grade 12
EX-HOD 10 0 40 50 0 50 50
EX-HOR 10 40 40 10 25 50 25
EX-TED 0 10 60 30 30 0 60 10
EX-DET 30 0 50 20 0 22 56 22
Those who chose D explained that the longer objects fall the greater the gravitational force,
the closer objects get to the earth the greater the gravitational force will be, objects fall faster
when nothing is stopping them. Some explained that the higher you go the gravitational force
decreases, but if you free falling you fall faster because there is no gravity in the air and
gravity increases as you reach the earth.
Those who chose B explained that: the nearer an object reaches the ground the greater gravity
will be, gravity increases as they fall because gravity attracts objects to the centre of the earth,
189
the closer an object is to the earth the faster it will accelerate, and the greater the gravitational
pull on it. Some students believed that objects fall faster because the attractive force of the
earth increases as they reach the ground. There were those who said because the air friction
causes "g" to increase, the pulling force gets stronger which makes the object to speed up.
Some said the closer you get to the ground the heavier you become because once you in space
there is no gravity and the closer you get to the ground gravity increases.
Those choosing C believed that gravity does not change because it is a constant on the earth,
gravity becomes constant as they fall unless another force is applied. This group confused
terminal velocity with gravity. Some said gravity is a constant when air is not present.
Those who chose A explained that as you get closer to the earth, the gravitational force pulling
you downwards becomes greater.
These results indicate that correct choices can be derived from correct reasoning, partly correct
reasoning and incorrect reasoning
Question 6 of grade 12 is identical to question 7 of grade 9. This question investigates what
students believe about free fall.
The question is as follows:
A stone falls freely from a height of between one and two meters. Which of the following
would happen to the stone?
Gravity is a constant force and the only force acting on the stone.
Gravity increases gradually and is the only force acting.
Gravity is a constant force and there is also an upward force, which is gradually reduced.
Gravity is a constant force and there is also an upward force which is gradually increased
Gravity is a constant force and there is also a downward additional force that gradually
increases gradually.
190 •.
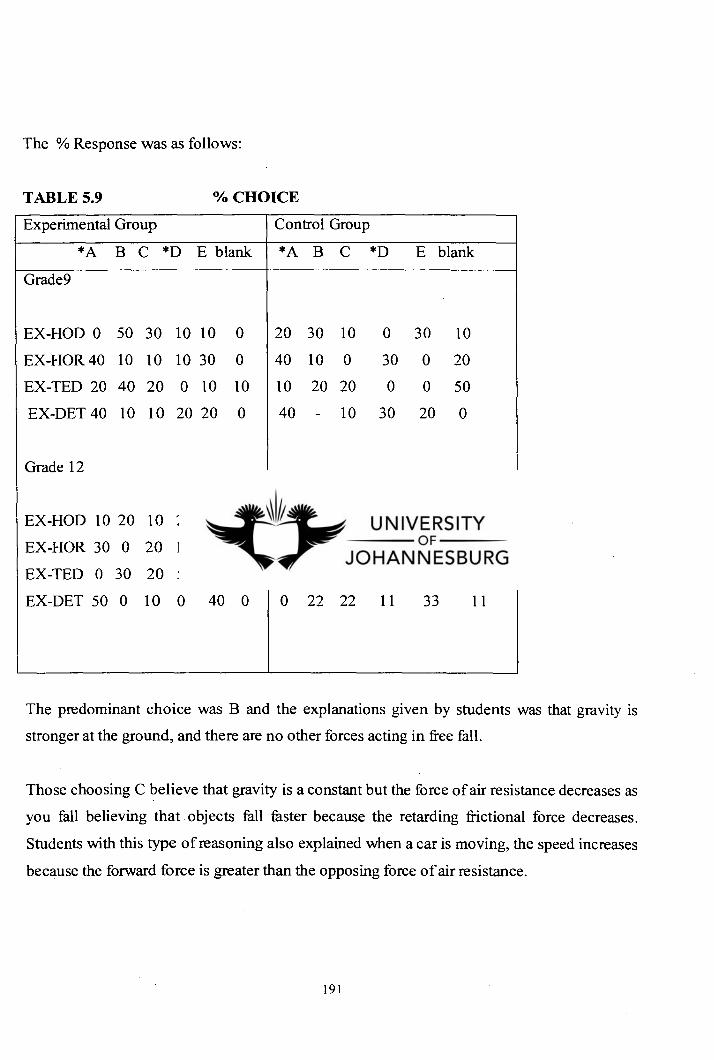
The % Response was as follows:
TABLE 5.9
Vo CHOICE
Experimental Group Control Group
*A B C *D E blank *A B C *D E blank
Grade9
EX-HOD 0 50 30 10 10 0 20 30 10 0 30 10
EX-HOR 40 10 10 10 30 0 40 10 0 30 0 20
EX-TED 20 40 20 0 10 10 10 20 20 0 0 50
EX-DET 40 10 10 20 20 0 40 - 10 30 20 0
Grade 12
EX-HOD 10 20 10 20 40 0 20 10 20 20 30 0
EX-HOR 30 0 20 10 30 10 0 37 12 25 12 12
EX-TED 0 30 20 50 0 0 20 20 30 30 0 0
EX-DET 50 0 10 0 40 0 0 22 22 11 33 11
The predominant choice was B and the explanations given by students was that gravity is
stronger at the ground, and there are no other forces acting in free fall.
Those choosing C believe that gravity is a constant but the force of air resistance decreases as
you fall believing that objects fall faster because the retarding frictional force decreases.
Students with this type of reasoning also explained when a car is moving, the speed increases
because the forward force is greater than the opposing force of air resistance.
191
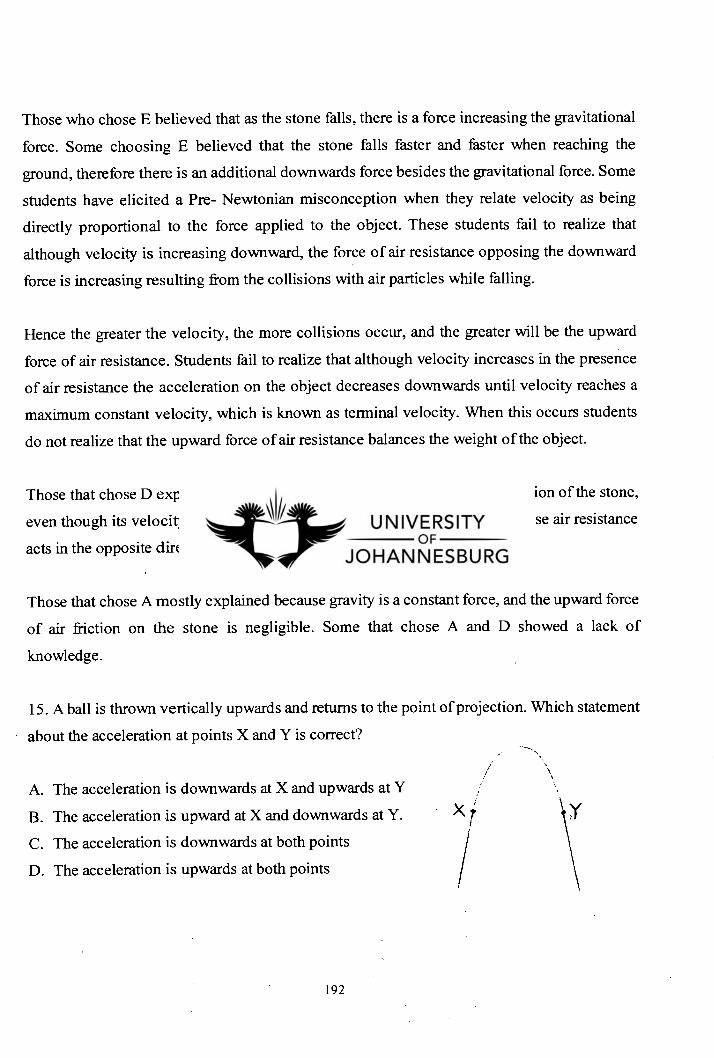
Those who chose E believed that as the stone falls, there is a force increasing the gravitational
force. Some choosing E believed that the stone falls faster and faster when reaching the
ground, therefore there is an additional downwards force besides the gravitational force. Some
students have elicited a Pre- Newtonian misconception when they relate velocity as being
directly proportional to the force applied to the object. These students fail to realize that
although velocity is increasing downward, the force of air resistance opposing the downward
force is increasing resulting from the collisions with air particles while falling.
Hence the greater the velocity, the more collisions occur, and the greater will be the upward
force of air resistance. Students fail to realize that although velocity increases in the presence
of air resistance the acceleration on the object decreases downwards until velocity reaches a
maximum constant velocity, which is known as terminal velocity. When this occurs students
do not realize that the upward force of air resistance balances the weight of the object.
Those that chose D explained because the air is slowly retarding the acceleration of the stone,
even though its velocity is increasing. Then there were those who said because air resistance
acts in the opposite direction to a moving object.
Those that chose A mostly explained because gravity is a constant force, and the upward force
of air friction on the stone is negligible. Some that chose A and D showed a lack of
knowledge.
15. A ball is thrown vertically upwards and returns to the point of projection. Which statement
about the acceleration at points X and Y is correct?
The acceleration is downwards at X and upwards at Y
The acceleration is upward at X and downwards at Y.
The acceleration is downwards at both points
The acceleration is upwards at both points
192
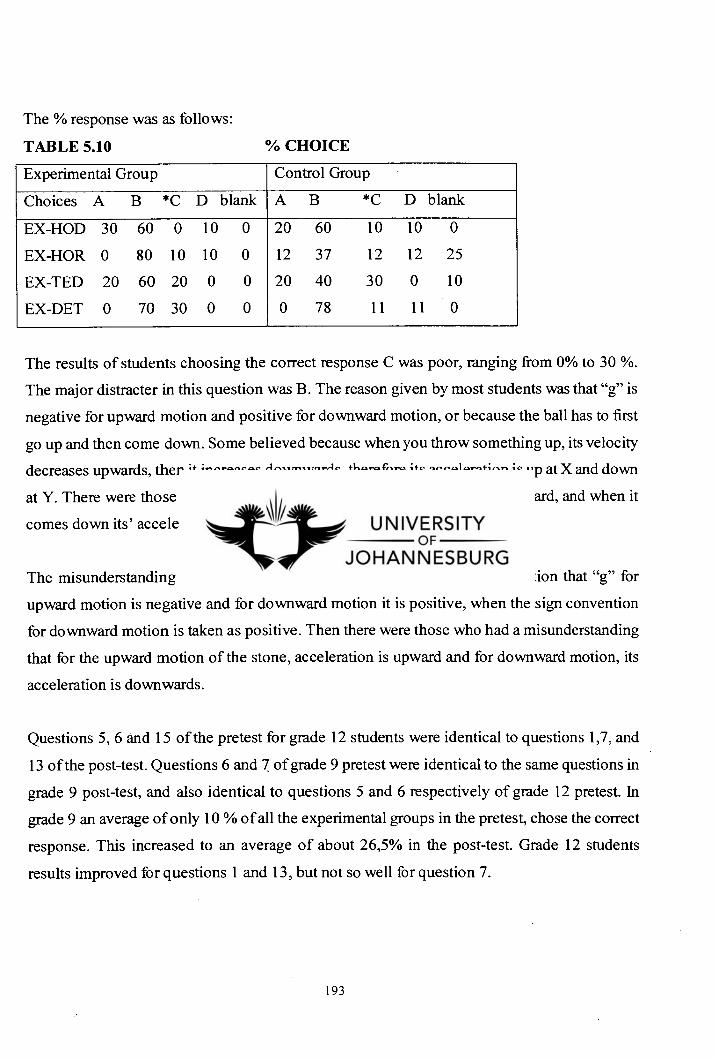
The % response was as follows:
TABLE 5.10
% CHOICE
Experimental Group Control Group
Choices A B *C D blank A B *C D blank
EX-HOD 30 60 0 10 0 20 60 10 10 0
EX-HOR 0 80 10 10 0 12 37 12 12 25
EX-TED 20 60 20 0 0 20 40 30 0 10
EX-DET 0 70 30 0 0 0 78 11 11 0
The results of students choosing the correct response C was poor, ranging from 0% to 30 %.
The major distracter in this question was B. The reason given by most students was that "g" is
negative for upward motion and positive for downward motion, or because the ball has to first
go up and then come down. Some believed because when you throw something up, its velocity
decreases upwards, then it increases downwards, therefore its acceleration is up at X and down
at Y. There were those who said that when it goes up its' acceleration is upward, and when it
comes down its' acceleration is downwards.
The misunderstanding in this item seems to be caused by the sign convention that "g" for
upward motion is negative and for downward motion it is positive, when the sign convention
for downward motion is taken as positive. Then there were those who had a misunderstanding
that for the upward motion of the stone, acceleration is upward and for downward motion, its
acceleration is downwards.
Questions 5, 6 and 15 of the pretest for grade 12 students were identical to questions 1,7, and
13 of the post-test. Questions 6 and 7 of grade 9 pretest were identical to the same questions in
grade 9 post-test, and also identical to questions 5 and 6 respectively of grade 12 pretest. In
grade 9 an average of only 10 % of all the experimental groups in the pretest, chose the correct
response. This increased to an average of about 26,5% in the post-test. Grade 12 students
results improved for questions 1 and 13, but not so well for question 7.
193
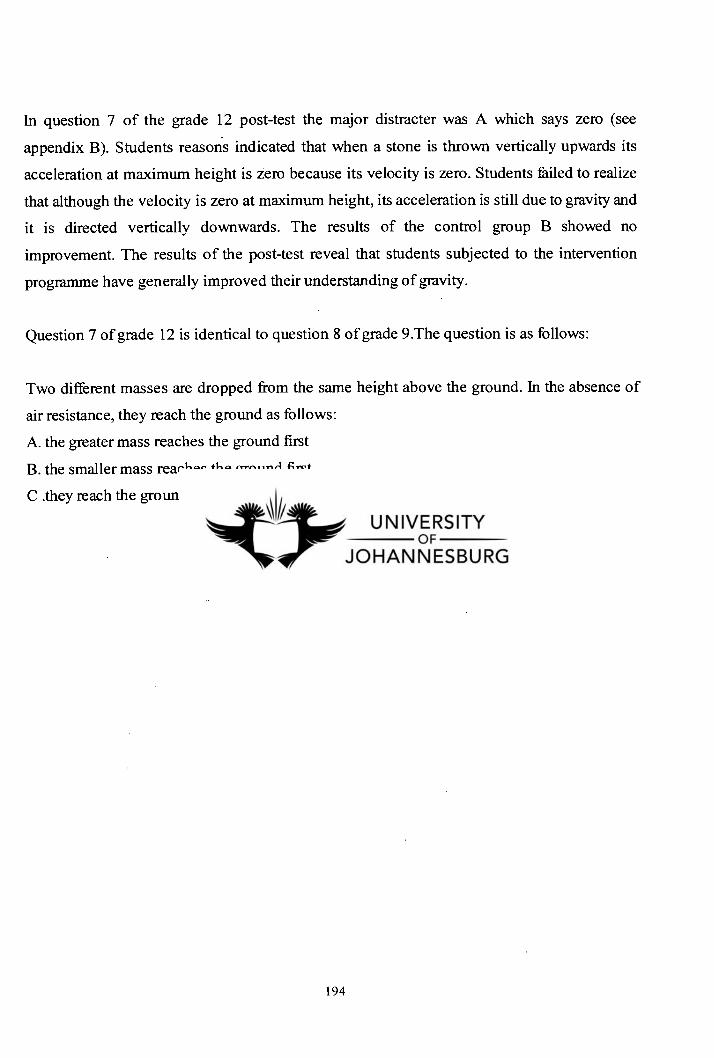
In question 7 of the grade 12 post-test the major distracter was A which says zero (see
appendix B). Students reasons indicated that when a stone is thrown vertically upwards its
acceleration at maximum height is zero because its velocity is zero. Students failed to realize
that although the velocity is zero at maximum height, its acceleration is still due to gravity and
it is directed vertically downwards. The results of the control group B showed no
improvement. The results of the post-test reveal that students subjected to the intervention
programme have generally improved their understanding of gravity.
Question 7 of grade 12 is identical to question 8 of grade 9.The question is as follows:
Two different masses are dropped from the same height above the ground. In the absence of
air resistance, they reach the ground as follows:
the greater mass reaches the ground first
the smaller mass reaches the ground first
C .they reach the ground at the same time
194
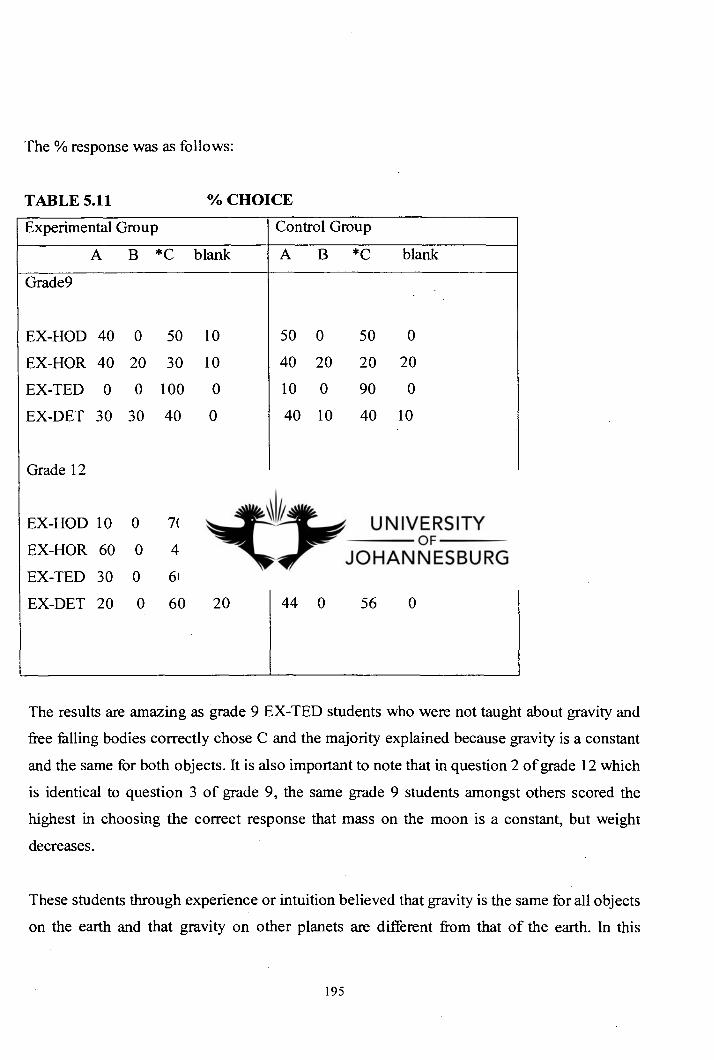
The % response was as follows:
TABLE 5.11
Vo CHOICE
Experimental Group Control Group
A B *C blank A B *C blank
Grade9
EX-HOD 40 0 50 10 50 0 50 0
EX-HOR 40 20 30 10 40 20 20 20
EX-TED 0 0 100 0 10 0 90 0
EX-DET 30 30 40 0 40 10 40 10
Grade 12
EX-HOD 10 0 70 20 60 0 40 0
EX-HOR 60 0 40 0 25 0 50 25
EX-TED 30 0 60 10 30 0 60 10
EX-DET 20 0 60 20 44 0 56 0
The results are amazing as grade 9 EX-TED students who were not taught about gravity and
free falling bodies correctly chose C and the majority explained because gravity is a constant
and the same for both objects. It is also important to note that in question 2 of grade 12 which
is identical to question 3 of grade 9, the same grade 9 students amongst others scored the
highest in choosing the correct response that mass on the moon is a constant, but weight
decreases.
These students through experience or intuition believed that gravity is the same for all objects
on the earth and that gravity on other planets are different from that of the earth. In this
195
particular questions they have explained that both light and heavy objects reach the ground at
the same time in the absence of air friction, because gravity is the same for both objects.
However, in question 7 of grade 9 pretest, which included air resistance, showed that they did
not perform well, as they fell short in their understanding of free fall.
It is also important to note that a large percentage of students chose the correct response with
most students providing correct reasons. This finding differs from a similar research on the
same question done in other countries by, Van Hisse (1988), Bar (1986). Bar (1986) explains
different stages, of which stage three shows that from age seven extending over a time span of
a few months to adulthood, children and adults believe heavier objects reach the ground first,
which she attributes to the cross over from stage two to stage three which is a cross over from
concrete to formal reasoning.
Generally for all the ex-departments there were instances where grade 9 students who chose
the correct response C, explained because they are dropped from the same height at the same
time, therefore they reach the ground at the same time. These students simply attributed the
two reaching the ground together because they are dropped at the same time. This corresponds
to stage 1 of Bars study where four to six year olds' explained they reach the ground at the
same time because they are dropped at the same time, which Bar described as the global
thought. Then there were those who chose the correct response C and believed that the mass
does not effect the time they reach the ground, only weight effects the time they reach the
ground, and others chose C by intuition as can be inferred by their explanation " I think so".
Grade 12 students who chose the correct response explained because the gravitational
acceleration is the same and there is no air resistance. Others explained because they reach the
ground with the same velocity in the absence of air resistance. Some grade 12 students
explained because it is a law, while others said it is Galileo's theory, indicating that they
memorized the concept.
The groups of students not performing well in this question were the EX-HOR grades 9 and 12
students. Students of most groups who chose A believed that the object with the greater mass
196
reaches the ground first because the weight is greater, implying that the greater mass has a
greater force, therefore it falls faster. Some explained that the heavier an object, the less the
effects of the upward force of air resistance, therefore the heavier ones reach the ground first.
A very small percentage of the EX-HOR and EX-DET grade 9 students chose B, believing
that the lighter mass reaches the ground first because it does not have weight, or because the
smaller mass is lighter and some giving no explanation.
On average about 53 % of the students' chose the correct response that both objects reach the
ground at the same time. About 30% on average believed that the greater mass reached the
ground first. Less than 5 % believed that the lighter mass reaches the ground first, and the
balance not making any choices.
This question corresponds to question 6 of the post-test for grade 12. However, the question
was changed, instead of asking what time they reach the ground, students were questioned on
how the velocities and gravitational force of two iron balls of different masses compare when
they are dropped from the same height above the ground in the absence of air friction (see
appendix B). For the grade 9 students the question was identical.
The grade 9 EX-DET and EX-HOR results did not improve. The EX-TED maintained their
high percentage between 90% and 100%. The EX-HOD experimental group grade 9 students
improved from 60% to 100% .The EX-DET and EX-HOR grade 9 students showed no
improvement in their post-test results.
All the grade 12 experimental groups showed a drop in their post-test results. The reason could
be that the question was changed from whether they reach the ground at the same time to
whether their velocities are the same on reaching the ground, and also their gravitational
forces were compared. The major distracters were C and D, indicating that the gravitational
force remains the same, and the velocity for the larger mass is either greater or the same. In C
and D the major distracter was that the gravitational forces are the same.
197
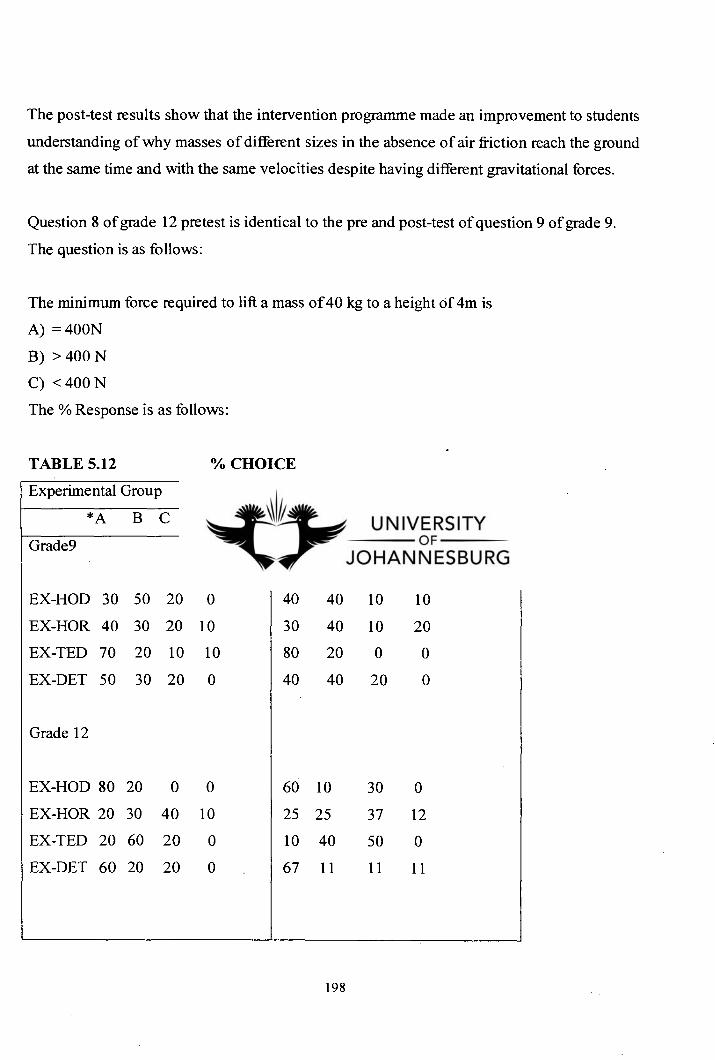
The post-test results show that the intervention programme made an improvement to students
understanding of why masses of different sizes in the absence of air friction reach the ground
at the same time and with the same velocities despite having different gravitational forces.
Question 8 of grade 12 pretest is identical to the pre and post-test of question 9 of grade 9.
The question is as follows:
The minimum force required to lift a mass of 40 kg to a height of 4m is
= 400N
> 400 N
< 400 N
The % Response is as follows:
TABLE 5.12
Vo CHOICE
Experimental Group Control Group
*A B C blank *A B C blank
Grade9
EX-HOD 30 50 20 0 40 40 10 10
EX-HOR 40 30 20 10 30 40 10 20
EX-TED 70 20 10 10 80 20 0 0
EX-DET 50 30 20 0 40 40 20 0
Grade 12
EX-HOD 80 20 0 0 60 10 30 0
EX-HOR 20 30 40 10 25 25 37 12
EX-TED 20 60 20 0 10 40 50 0
EX-DET 60 20 20 0 67 11 11 11
198
The results show that the EX-TED grade 9 students, the grade EX-DET grade 12 students, and
the EX-HOD grade 12 students performed well in this question. Most of the grade 9 and 12
students who chose the correct answer could not explain their choice. Some of the grade 9 and
12 students who chose the correct answer used the formula W= mg, and explained that the
weight is 400N, therefore a force equal to the weight will be the minimum force needed to lift
the object.
The results show that B was the major distracter. Most of the students did not explain why
they chose B. Some students who chose B believed that you had to apply a force greater than
the weight of the object to lift it up. Others explained that if you applied a force equal to the
weight, the mass will not move, therefore any force greater than 400 N is needed.
The misconception prevalent with these students is that a force greater than the weight is
needed to lift an object. In this question, students' demonstrated that force is directly
proportional to the velocity.
Question 10 was based on the grade 12 syllabus and only grade 12 students were tested on this
question.
Question 10 of the pretest grade 12 was as follows:
A car is speeding up at a constant acceleration of 2ms -2. The velocity of the car increases
because:
the resultant force of the car increases
the resultant force of the car decreases
the resultant force of the car remains constant
199
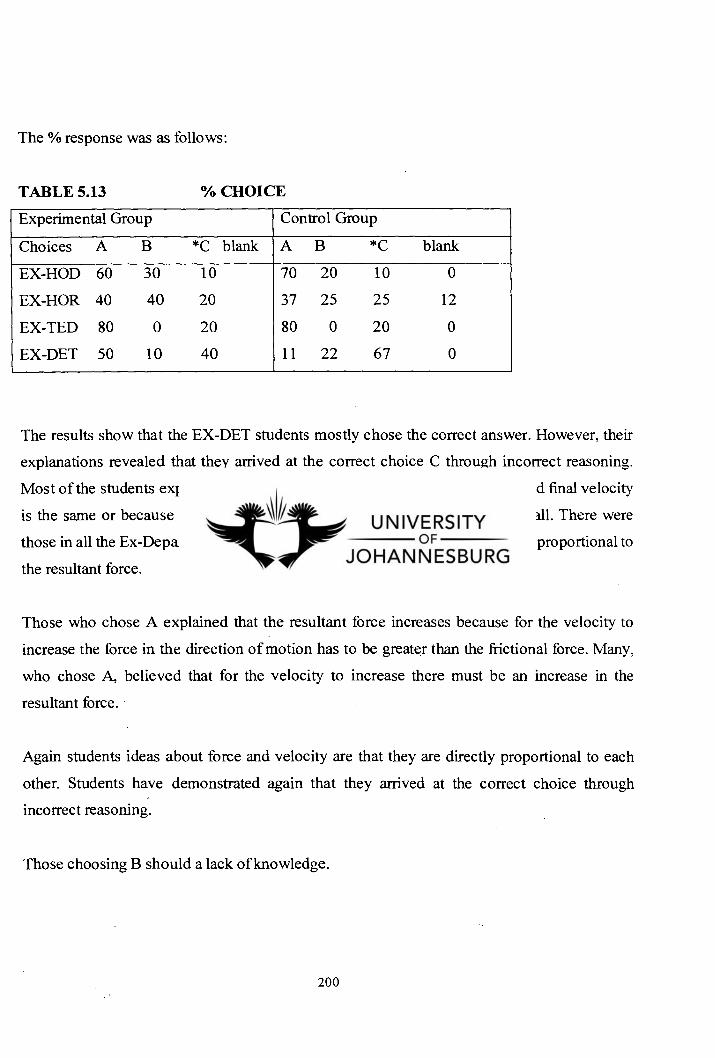
The % response was as follows:
TABLE 5.13
Vo CHOICE
Experimental Group Control Group
Choices A B *C blank A B *C blank
EX-HOD 60 30 10 70 20 10 0
EX-140R 40 40 20 37 25 25 12
EX-TED 80 0 20 80 0 20 0
EX-DET 50 10 40 11 22 67 0
The results show that the EX-DET students mostly chose the correct answer. However, their
explanations revealed that they arrived at the correct choice C through incorrect reasoning.
Most of the students explained that when acceleration is constant the initial and final velocity
is the same or because the resultant force will be zero, or not explaining at all. There were
those in all the Ex-Departments who explained because acceleration is directly proportional to
the resultant force.
Those who chose A explained that the resultant force increases because for the velocity to
increase the force in the direction of motion has to be greater than the frictional force. Many,
who chose A, believed that for the velocity to increase there must be an increase in the
resultant force.
Again students ideas about force and velocity are that they are directly proportional to each
other. Students have demonstrated again that they arrived at the correct choice through
incorrect reasoning.
Those choosing B should a lack of knowledge.
200
Question 11 of grade 12 is identical to question 10 of grade 9. The question is based on the
relation between force and velocity.
The question is as follows:
A car continues in uniform motion in a straight line. There are forces acting on the car. A is a
driving force. B is a force, which impels the car backwards, such as air resistance, or frictional
force. The relationship between the forces A and B is:
A<B
A= B
A> B
201
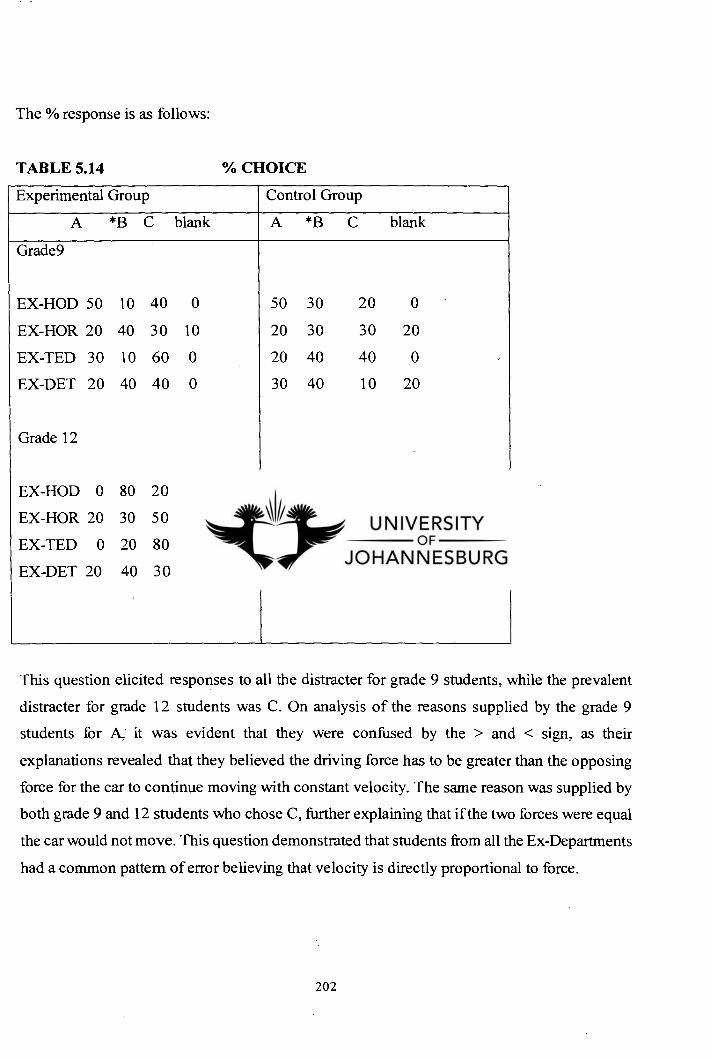
The % response is as follows:
TABLE 5.14
% CHOICE
Experimental Group Control Group
A *B C blank A *B C blank
Grade9
EX-HOD 50 10 40 0 50 30 20 0
EX-HOR 20 40 30 10 20 30 30 20
EX-TED 30 10 60 0 20 40 40 0
EX-DET 20 40 40 0 30 40 10 20
Grade 12
EX-HOD 0 80 20 0 10 60 30 0
EX-HOR 20 30 50 0 25 12 50 12
EX-TED 0 20 80 0 0 40 60 0
EX-DET 20 40 30 10 33 22 44 0
This question elicited responses to all the distracter for grade 9 students, while the prevalent
distracter for grade 12 students was C. On analysis of the reasons supplied by the grade 9
students for A, it was evident that they were confused by the > and < sign, as their
explanations revealed that they believed the driving force has to be greater than the opposing
force for the car to continue moving with constant velocity. The same reason was supplied by
both grade 9 and 12 students who chose C, further explaining that if the two forces were equal
the car would not move. This question demonstrated that students from all the Ex-Departments
had a common pattern of error believing that velocity is directly proportional to force.
202
Questions 8, 10 and 11 of the pretest of grade 12 and the corresponding questions 4, 9, 10and
21 of the post-test are based on the relationship between force, velocity, acceleration, weight
and mass. Question 4 of the post-test grade 12 and question 9 post-test were identical to
question 8 of grade 12 pretest and question 9 of grade 9 pretest.
The results for this question showed no improvement in the grade 9 control group B, except
for the EX-HOR control group B. The grade 9 EX-HOR and EX-HOD experimental groups
results showed an improvement while the EX-TED and EX-DET results remained the same.
The grade 12 control groups B EX-HOR, and EX-TED showed an improvement while the
EX-DET and EX-HOD remained the same. The experimental groups of gradl2 EX-TED and
EX-DET showed an improvement while, EX-HOD and EX-HOR showed a slight decline.
It can be inferred that the intervention programme improved the results for the EX-DET grade
12 students, and the grade 9 EX-HOD. However, due to improvement of the results in the
control group of the EX-TED grade 12 and EX-HOR grade 9, one cannot say that the
improvement in the experimental group results was due to the intervention programme in
these groups.
Questionl 0 of the pretest of the grade 12 questionnaire corresponded with question 9 of the
post-test of the grade 12 questionnaire. In question 10 the car was speeding up with constant
acceleration whereas in question 9 the car was slowing down with a constant deceleration. The
major distracter in question 10 was A, the velocity increases because the resultant force
increases, whereas in question 9 of the post-test the major distracter was B, the velocity
decreases because the resultant force decreases. The misconception that velocity is directly
proportional to the resultant force seems to be deeply embedded in the minds of students, and
resistant to change.
Question 11 of grade 12 pretest corresponds to question 10 post-test of grade 12, and is
identical to the pre and post-test question 10 of grade 9. The grade 9 post-test results of the
experimental groups showed a marked improvement, while the control group B showed a
203
slight improvement. Except for the EX-HOD question 10 of the post-test of all the
experimental groups showed an improvement, with no improvement in the control group B.
Generally one can say that the intervention programme did make an improvement to students
understanding of the relationship between force and velocity in these questions.
However, there is no doubt that students experience conceptual difficulty with Newton's first,
second and third laws of motion. This study confirms what Warren (1979) has explained that
the confusion between forces acting on different bodies often arise from a misunderstanding of
the third law and this in turn contributes to their conceptual difficulties with the second law.
Warren argues that the way in which these concepts are presented in textbooks and
consequently taught by teachers contributes to these difficulties.
Question 21 of the post-test, which investigated similar concepts, will not be discussed, as the
findings were similar to the above questions.
The information supplied here was used for 13 and 14 .A balloon is ascending upward with a
velocity of 20ms I . When the balloon is 400m above the ground, a stone is dropped from it.
13.Inunediately after being released the stone will
Continues moving upward with constant velocity, stop and then fall.
Continues moving upward with decreasing velocity, stop and then fall.
Move downward with constant velocity
Move downward with increasing velocity
Move downward with decreasing velocity
204
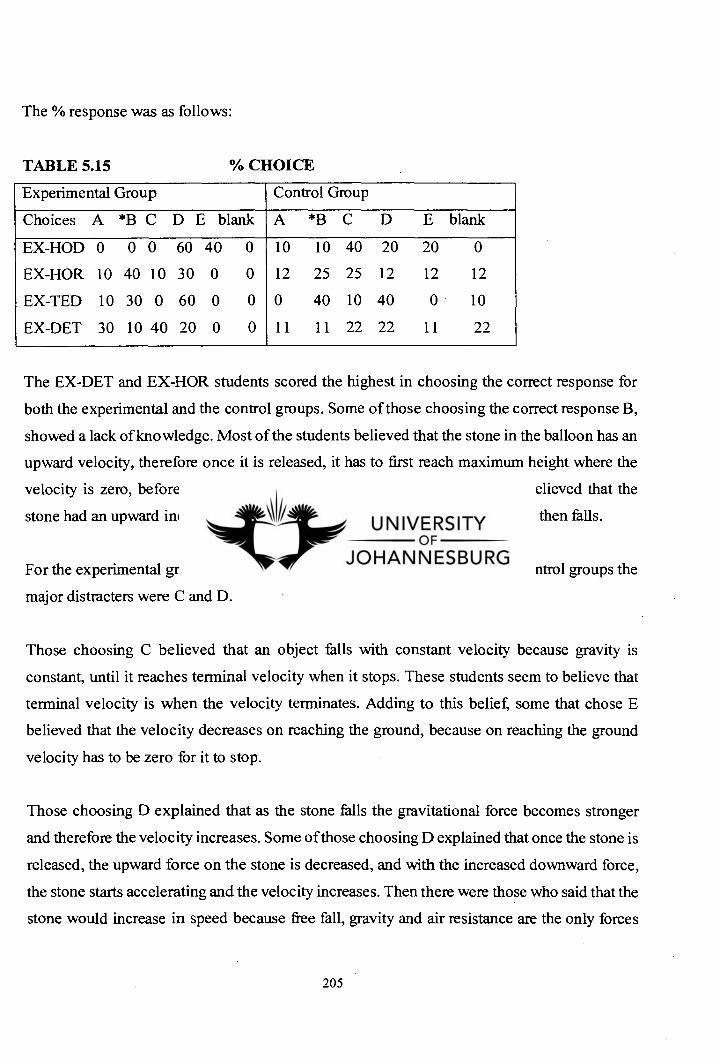
The % response was as follows:
TABLE 5.15
% CHOICE
Experimental Group Control Group
Choices A *B C D E blank A *B C D E blank
EX-HOD 0 0 0 60 40 0 10 10 40 20 20 0
EX-HOR 10 40 10 30 0 0 12 25 25 12 12 12
EX-TED 10 30 0 60 0 0 0 40 10 40 0 10
EX-DET 30 10 40 20 0 0 11 11 22 22 11 22
The EX-DET and EX-HOR students scored the highest in choosing the correct response for
both the experimental and the control groups. Some of those choosing the correct response B,
showed a lack of knowledge. Most of the students believed that the stone in the balloon has an
upward velocity, therefore once it is released, it has to first reach maximum height where the
velocity is zero, before it falls downwards with increasing velocity. Some believed that the
stone had an upward inertia or momentum, therefore it first goes up, stops and then falls.
For the experimental groups, the major distracter was choice D, and for the control groups the
major distracters were C and D.
Those choosing C believed that an object falls with constant velocity because gravity is
constant, until it reaches terminal velocity when it stops. These students seem to believe that
terminal velocity is when the velocity terminates. Adding to this belief, some that chose E
believed that the velocity decreases on reaching the ground, because on reaching the ground
velocity has to be zero for it to stop.
Those choosing D explained that as the stone falls the gravitational force becomes stronger
and therefore the velocity increases. Some of those choosing D explained that once the stone is
released, the upward force on the stone is decreased, and with the increased downward force,
the stone starts accelerating and the velocity increases. Then there were those who said that the
stone would increase in speed because free fall, gravity and air resistance are the only forces
205
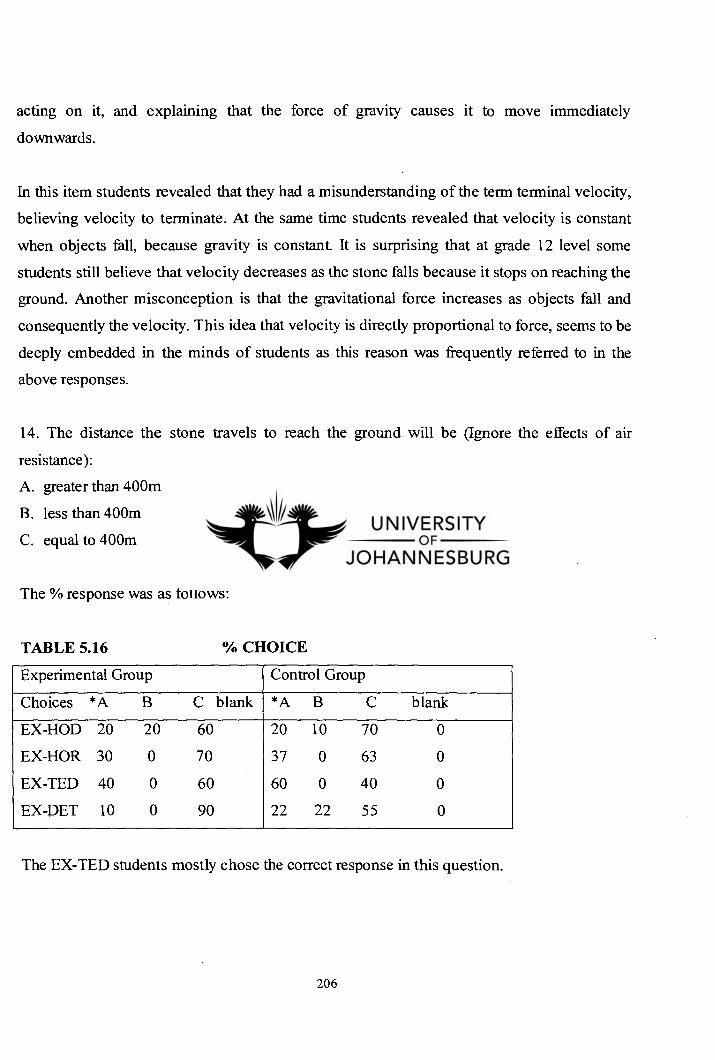
acting on it, and explaining that the force of gravity causes it to move immediately
downwards.
In this item students revealed that they had a misunderstanding of the term terminal velocity,
believing velocity to terminate. At the same time students revealed that velocity is constant
when objects fall, because gravity is constant. It is surprising that at grade 12 level some
students still believe that velocity decreases as the stone falls because it stops on reaching the
ground. Another misconception is that the gravitational force increases as objects fall and
consequently the velocity. This idea that velocity is directly proportional to force, seems to be
deeply embedded in the minds of students as this reason was frequently referred to in the
above responses.
14. The distance the stone travels to reach the ground will be (Ignore the effects of air
resistance):
greater than 400m
less than 400m
equal to 400m
The % response was as follows:
TABLE 5.16
(Y0 CHOICE
Experimental Group Control Group
Choices *A B C blank *A B C blank
EX-HOD 20 20 60 20 10 70 0
EX-HOR 30 0 70 37 0 63 0
EX-TED 40 0 60 60 0 40 0
EX-DET 10 0 90 22 22 55 0
The EX-TED students mostly chose the correct response in this question.
206
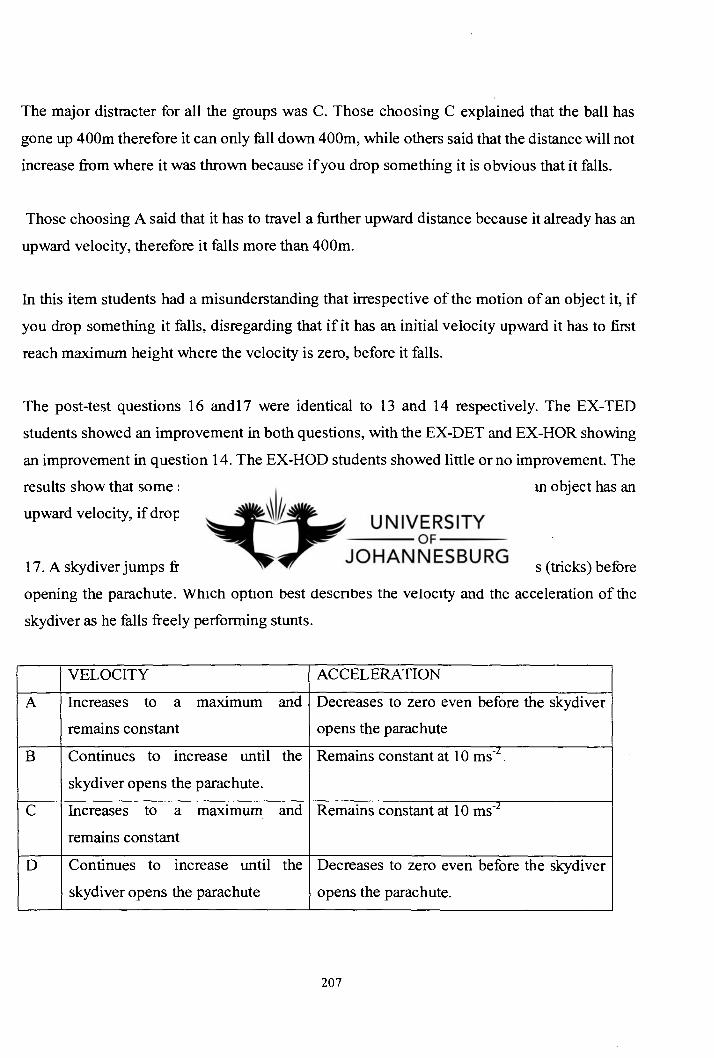
The major distracter for all the groups was C. Those choosing C explained that the ball has
gone up 400m therefore it can only fall down 400m, while others said that the distance will not
increase from where it was thrown because if you drop something it is obvious that it falls.
Those choosing A said that it has to travel a further upward distance because it already has an
upward velocity, therefore it falls more than 400m.
In this item students had a misunderstanding that irrespective of the motion of an object it, if
you drop something it falls, disregarding that if it has an initial velocity upward it has to first
reach maximum height where the velocity is zero, before it falls.
The post-test questions 16 and17 were identical to 13 and 14 respectively. The EX-TED
students showed an improvement in both questions, with the EX-DET and EX-HOR showing
an improvement in question 14. The EX-HOD students showed little or no improvement. The
results show that some students are resistant to change their views that when an object has an
upward velocity, if dropped it fall downwards.
17. A skydiver jumps from an aeroplane and falls a long way performing stunts (tricks) before
opening the parachute. Which option best describes the velocity and the acceleration of the
skydiver as he falls freely performing stunts.
VELOCITY ACCELERATION
A Increases to a maximum and
remains constant
Decreases to zero even before the skydiver
opens the parachute
B Continues to increase until the
skydiver opens the parachute.
Remains constant at 10 ms -2
C Increases to a maximum and
remains constant
Remains constant at 10 ms -2
D Continues to increase until the
skydiver opens the parachute
Decreases to zero even before the skydiver
opens the parachute.
207
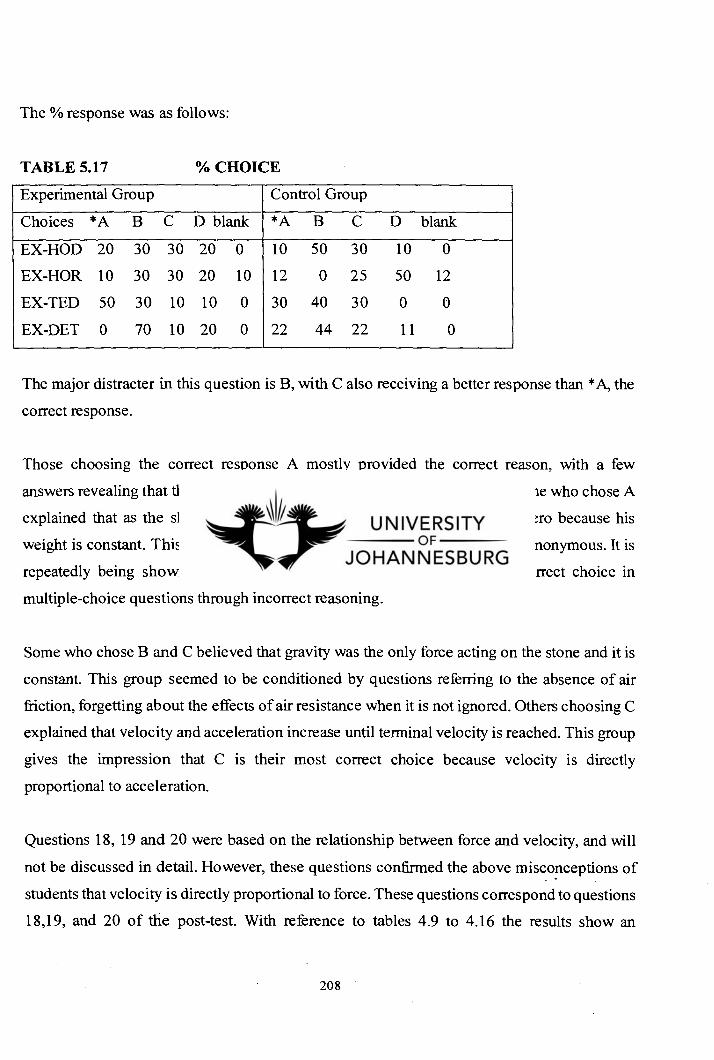
The % response was as follows:
TABLE 5.17
'Yo CHOICE
Experimental Group Control Group
Choices *A B C D blank *A B C D blank
EX-HOD 20 30 30 20 0 10 50 30 10 0
EX-HOR 10 30 30 20 10 12 0 25 50 12
EX-TED 50 30 10 10 0 30 40 30 0 0
EX-DET 0 70 10 20 0 22 44 22 11 0
The major distracter in this question is B, with C also receiving a better response than *A, the
correct response.
Those choosing the correct response A mostly provided the correct reason, with a few
answers revealing that they have guessed or provided unscientific reasons. Some who chose A
explained that as the skydiver jumps out of the plane, his acceleration is zero because his
weight is constant. This group seems to imply that weight and velocity are synonymous. It is
repeatedly being shown in this investigation that students arrive at the correct choice in
multiple-choice questions through incorrect reasoning.
Some who chose B and C believed that gravity was the only force acting on the stone and it is
constant. This group seemed to be conditioned by questions referring to the absence of air
friction, forgetting about the effects of air resistance when it is not ignored. Others choosing C
explained that velocity and acceleration increase until terminal velocity is reached. This group
gives the impression that C is their most correct choice because velocity is directly
proportional to acceleration.
Questions 18, 19 and 20 were based on the relationship between force and velocity, and will
not be discussed in detail. However, these questions confirmed the above misconceptions of
students that velocity is directly proportional to force. These questions correspond to questions
18,19, and 20 of the post-test. With reference to tables 4.9 to 4.16 the results show an
208
improvement for the experimental group, with the control group B remaining constant. The
results show that the intervention programme did make an improvement in students
understanding of forces and motion.
5.5.5 Comparison of the Experimental Group Results between the Ex -departments
5.5.5.1 Experimental Group Comparisons
The statistical analysis show that there is no significant difference between the pretest results
of the experimental groups viz. EX-TED, EX-DET and EX-HOD grade 12 results. There is a
significant difference between the pretest results of the EX-TED and EX-HOR and between
the EX-DET and EX-HOR gradel2 results. There is no significant difference between pretest
results of the experimental groups of the EX-HOR and EX-HOD grade12.
The statistical analysis show that there is no significant difference between the post-test results
of the experimental groups viz. EX-TED, EX-DET and EX-HOD grade 12 results. There is a
significant difference between the post-test results of the EX-TED and EX-HOR, between the
EX-DET and EX-HOR, and between the EX-HOD and the EX-HOR grade 12 results.
The statistical analysis show that there is no significant difference between the pretest results
of the experimental groups viz. EX-TED, EX-DET and EX-HOD and EX-HOR grade 9
results.
The statistical analysis show that there is no significant difference between the post-test results
of the experimental groups viz. EX-TED, EX-HOR and EX-HOD grade 9 results. There is no
significant difference between post-test results of the experimental groups of the EX-DET and
EX-HOD, and between the EX-DET and the EX-HOR grade 9 students. There is a significant
difference between the post-test results of the experimental group of the EX-TED and EX-
DET grade 9 students.
209
However the comparisons of the pre and post-test results of the experimental groups shown in
the statistical analysis of chapter 4 reveals that there were improvements of students overall
results as follows:
the EX-TED grades 9 and 12 students showing an improvement
the EX-HOD grade 9 and 12 students showing an improvement
the EX-DET grade 12 students showing an improvement
the EX-HOR grade 9 students showing an improvement.
The reason for the EX-DET grade 9 results not improving and the results of the EX-HOR
grade 12 students not improving in the experimental groups can be largely due to these
students being English second language students. It is also important to note that the EX-DET
students expressed themselves in English, with most of the EX-HOR students expressing
themselves in Afrikaans. The EX-HOR students were mostly taught through the medium of
Afrikaans in their schools. The fact that the research was conducted through the medium of
English with both groups, and both groups of students having to respond in English which was
not their first language could have posed a problem to these students.
5.5.6 Comparison of the Results of the Control Group between Ex-Departments
5.5.6.1 Control Group B Results
The statistical analysis show that there is no significant difference between the pretest results
of the control groups viz. EX-TED, EX-DET and EX-HOD grade 12 results. There is a
significant difference between the pretest results of the EX-TED and EX-HOR. There is no
significant difference between the EX-DET and EX-HOR grade 12 control group pretest
results and between the EX-HOD and EX-HOR grade 12 control , group pretest results.
The statistical analysis show that there is no significant difference between the post-test results
of the control groups viz. EX-TED, EX-DET and EX-HOD and EX-HOR grade 12 results.
210
The statistical analysis show that there is no significant difference between the pretest results
of the control groups viz. EX-TED, EX-DET and EX-HOD and EX-HOR grade 9 results.
The statistical analysis show that there is no significant difference between the post-test results
of the control groups viz. EX-TED, EX-DET and EX-HOD and EX-HOR grade 9 results.
However when comparing the pre and post-test results of the control groups according to the
statistical analysis in chapter 4 it was evident that the overall results as indicated in chapter 4
showed the following:
In comparing the statistical analysis of the pretest and post-test results of the control group of
the EX-TED grade 9 students there was no significant difference. Similarly for the EX-DET,
EX-HOR and EX-HOD grade 9 students.
In comparing the statistical analysis of the pretest and post-test results of the control group of
the EX-TED grade 12 students there was no significant difference. Similarly for the EX-DET,
EX-HOR and EX-HOD grade 12 students.
5.5.7 Findings from Individual Items
The above comparisons were based on the overall results. The students in this study who have
made a change in their central concept by replacing their misunderstanding or misconception,
this radical change Posner et al (1982: 211- 227) refers to as accommodation, while those
students who used their existing concepts and made little change Posner et al (1982: 199- 209)
refers to as assimilation
When analyzing individual questions, the situation is very different. In question 1 and 2 based
on Newton's laws of motion, grade 9 EX-TED experimental group and for similar questions 1
and 3 of grade 12, the EX-TED did not perform well in choosing the correct response in both
the experimental and control group of the pretest, while EX-HOR control group grade 9 did
not perform well, and the EX-DET experimental group grade 12 did not perform well.
211
However, some of those students who performed well arrived at the correct choice through
incorrect reasoning.
The post-test results of students in questionl of grade 9 and the corresponding question 3 of
grade 12, based on Newton's third law that for every action there is an equal and opposite
reaction, showed that almost all the groups of students replaced their central concept and
scored in the region between 80 to 100%, providing scientific explanations, except for the EX-
DET grade 9 students whose results dropped.
Question 2 of the pretest reveal that the EX-DET and EX-HOR grade 12 students performed
well. In the corresponding question 3 of grade 9 the EX-TED and EX-HOD grade 9 performed
well in the pretest. In the post-test the grade 9 students did not improve their results. The
response to the corresponding question 22 of the post-test grade 12, the results reveals that the
EX-TED and EX-HOD grade 12 students did improve.
This question that dealt with the mass and weight of an object on the earth in comparison with
the mass and weight of the same object on the moon, showed that not all the groups changed
their original beliefs about inertial mass being constant in the universe and that weight changes
according to the gravitational acceleration.
All the grade 9 students did not perform well in questions 5,6 and 7, for all the ex-department
groups, except the EX-HOR showing no improvement in questions 5 and 6, whereas all the
other groups showed no improvement in question 7. The EX-DET students did not perform
well in question 8 of the pretest, but showed an improvement in the post-test. The EX-HOD
and EX-HOR grade 9 students did not perform well in the question 9 pretest, with both groups
showing an improvement in the post-test.
The EX-HOR grade 12 students did not perform well in question 4 of the pretest, and showing
no improvement after the post-test. The EX-DET, EX-HOD and EX-HOR did not perform
well in question 5, with all the groups showing an improvement in the post-test. The EX-TED
and EX-HOD did not perform well in question 6, with both groups showing no improvement.
212
The EX-HOR did not perform well in question 7, and showing no improvement in the post-
test. The EX-TED and EX-HOR did not perform well in question 8, with only the EX-TED
showing an improvement in the post-test. The EX-DET, EX-HOD, and EX-HOR did not
perform well in question 9, with all groups showing no improvement in the post-test.
All the grade 12 groups did not perform well in questions 11, 12 ,13, 14 ,15 with all the groups
showing an improvement in question 11, and all the groups except the EX-HOR did not
improve on the post-test results of question 12. The EX-TED group was the only group
showing an improvement in the post-test results of question 13. All the groups except the EX-
HOD showed an improvement in the post-test results of question 14. The EX-DET and the
EX-HOD showed an improvement in the post-test results of question 15.
The EX-DET, EX-HOD, and EX-HOR did not perform well in questions 16 and 17, with the
EX-HOR, showing an improvement in question 16 and the EX-DET and EX-HOD showing an
improvement in question 17. Questions 18, 19, and 20 are not discussed as they overlap with
most of the above questions in testing the relationship between force and velocity.
In comparing the results of the Ex-Departments, it is revealed that misconceptions in
Newton's laws of motion, falling bodies and projectile motion, and the relationship between
force and velocity, are prevalent in all the Ex-Departments, despite there being individual
differences in some questions. However, the different groups did not necessarily revealed the
misconception in the same question of the pretest. The t- test results in chapter 4 shows that
for the overall results there are significant differences between some schools.
The following discussion specifies the major misconception of the ex-departmental schools as
revealed in the pretest results.
The EX-HOR, revealed in the pretest that the prevalent misconception was that an object of
greater mass reaches the ground first in the absence of air friction when dropped from the
same height above the ground with an object of lesser mass simultaneously.
213
The EX-TED revealed in the pretest that when you push against a wall, the wall does not push
back on you or if a tennis ball hits a brick wall and bounces oft the wall does not exert a force
on the ball.
The EX-DET and EX-HOD revealed in the pretest that a falling object accelerates because the
gravitational force increases as they fall.
It appears as if the language of communication was a bather to the EX-HOR students not
performing well after the intervention programme. In a similar study Bradley, Brand and
Gerrans (1987) have shown that language, symbols and representations are crucial factors in
understanding and interpreting chemical concepts, while Erickson (1991) has shown that in
the United States, there are large differences across individuals on school achievement and
measured intelligence, according to class, race, gender, and language background of the
individuals.
5.5.8 Comparisons of the Results of Grades 9 and 12 Students within The Same Ex -
Department.
The results discussed here are based on the statistical analysis in chapter 4.
5.5.8.1 The Experimental Group Results
The statistical results in chapter four reveals that there is no significant difference between
the pretest results of the experimental groups of the EX-HOD grade 9 and 12 students, the
EX-DET grade 9 and 12 students, and the EX-TED grade 9 and 12 students. There is a
significant difference between the grade 9 and grade 12 students of the EX-HOR pretest
results of the experimental group with the grade 9 students performing significantly better
than the grade 12 students.
The statistical results in chapter 4 reveals that there is a significant difference between the
post-test results of the experimental groups of the EX-HOD grade 9 and 12 students, the EX-
214
DET grade 9 and 12 students, and the EX-HOR grade 9 and 12 students. The grade 9 EX-
HOR students performed significantly better than the grade 12 students, these results were
expected as the same result was obtained in the pretest.
There was no significant difference between the grade 9 and grade 12-post-test results of the
EX-TED experimental group.
5.5.8.2 The Control Group Results
The statistical result in chapter four reveals that there is no significant difference between the
pretest results of the control groups of the EX-HOD grade 9 and 12 students, the EX-DET
grade 9 and 12 students, the EX-TED grade 9 and 12 students, and the EX-HOR grade 9 and
12 students.
The statistical result in chapter four reveals that there is no significant difference between the
post-test results of the control groups of the EX-HOD grade 9 and 12 students, and the EX-
TED grade 9 and 12 students. There was a significant difference in the post-test results of the
control groups of the EX-HOR grade 9 and12 and the EX-DET grade 9 and 12 results. The
grade 9 EX-HOR, students performed significantly better than the grade 12 students, and
grade 9 EX-DET students performed significantly better than the grade 12 EX-DET students.
These findings are amazing and difficult to explain as both these ex- departments for both
grades are English second language students as compared with the EX-TED and EX-HOD
students who are English first language students.
There was no significant difference between the grade 9 and grade 12-post-test results of the
EX-TED experimental group.
The question of a ball resting on a persons hand question 3 of grade 12 and question 4 of grade
9 (see appendix D) shows that there were misconceptions in this question for all the grades 9
and 12 students, with the post-test results showing no improvement for the results of all
215
groups. The question on a stone falling freely questions 6 of grade 12 and question 7 of grade
9 showed a similar result.
However when comparing grade 9 and 12 results within the same ex-department the results
were as follows:
It was found that EX-TED grades 9 and 12 students showed a similar pattern for the questions
based on Newton's laws of motion as shown in question 1 for both grades.
The EX-HOR students showed a similar pattern in a question indicating that an object with a
greater mass reaches the ground first when thrown from the same height above the ground in
the absence of air resistance, for grades 9 and 12 students.
The EX-HOD and EX-DET students showed a common pattern of error for grades 9 and 12 in
question 5 of grade 12, which is identical to question 6 of grade 9 indicating that free falling
objects accelerate because the gravitational force increases as they fall.
The results in the above questions show that there are perpetuation of misconceptions from
grade 9 to grade 12 for the EX-DET and EX-HOD. The EX-HOR results for the pre and post-
test was amazing since the grade 9 students performed significantly better than the grade 12
students in the pre and post-test results of the experimental groups. These differences could be
possibly due to the differences in the numbers of English first language and English second
language students, as the tests and the intervention programme was conducted in English.
For the EX-TED there were no significant difference in the results ofboth the pre and post-test
of the experimental groups, indicating that there is probably no perpetuation of
misconceptions from grade 9 to grade 12.
216
5.6 CONCLUSION
The discussion of the individual and group interviews, and pre and post-test results were
discussed in detail in this chapter. Comparisons were made between ex -departments to see if
particular misconceptions were prevalent in a particular school environment. There were also
comparisons of grade 9 and grade 12 students' results within the same school to see if there
was perpetuation of misconceptions from grade 9 to grade 12.
Chapter 6 will focus on guidelines for teachers emanating from the findings of this study. In
chapter 6, teachers will be guided on how to establish misunderstanding among students, and
suggestions on how to remediate the misunderstandings. Finally chapter 6 will refer to another
method which has not been used in this study and can be effective in remediating
misunderstandings.
217
CHAPTER 6
PROGRAMME FOR TEACHERS
6.1 INTRODUCTION
This chapter will focus on what teachers can gain from this study. The guidelines that are
suggested for teachers are based on the success of this study. Programmes, which could
improve students' misunderstandings and could not be implemented in this study because of
time constraints, will also be referred to for implementation in the classroom.
The guidelines will focus on misconceptions retrieved via the interview as a method of
research, written methods, and what teachers can do to improve their teaching.
6.2 WHAT TEACHERS SHOULD KNOW ABOUT THEIR STUDENTS?
Teachers often have the wrong expectations of their students especially when they use the
lecture and demonstration method. In the traditional lecture approach, physics courses are
treated as transferable commodities that students can readily consume on their own.
Teachers should ensure that students' initial cognitive states and their scientific counterparts
must be established. Students should then be guided to develop generic scientific reasoning
skills and a coherent view of and about scientific knowledge. However, teachers need to be
especially aware of the initial Knowledge State of their students, and of the processes that can
facilitate the students evolution into the scientific realm.
Students' own ideas, which are non-scientific, effects learning which take place in the
classroom. These non-scientific ideas act as barriers to the scientifically correct ones. Teachers
should implement a paradigm shift by using constructivist methods of teaching where the
teachers' role is that of mediator, mediating learning activities to achieve desirable learning
outcomes.
218
Teachers should realize that teaching could be effective if they have a thorough knowledge of
the students' way of thinking prior to teaching a new topic. The interview, written tests and
construction of concept maps are useful methods teachers can use in the classroom to gain an
understanding of students' prior knowledge.
6.3 THE INTERVIEW
Teachers should be encouraged to use the interview method in the beginning of their teaching
of a topic to determine students' own ideas of the topic. Teachers can use the general
gathering interview, which attempts to discover what a person knows about a topic or the
clinical interview, which focuses on a specific aspect or problem.
The general gathering interview can be used by teachers to interview groups of students.
Group interviews are useful methods that can be employed at the beginning of a lesson to get
an overall view of what students understand about a topic. In this study it was used to identify
what students conceptualize about forces and motion.
If properly used the group interview allows students to unfold what they already believe about
a topic in general. Teachers should acquire the art of listening and resist the temptation to
contradict or push the interviewees with their ideas. A good way of starting the group
interview is to map out a field such as students understanding about falling bodies. With the
help of this a problem may be defined e.g. gravity increases as an object falls. This may lead
to other students in the group confirming the misunderstanding or probably differing in their
views which may be correct or incorrect.
The group interview will engage students in debates and discussions about a concept. In this
way the teacher or interviewer comes to learn about students "own ideas" about a concept and
how these barriers impede learning. It has been shown in the interviews conducted in this
research that once students start discussing and debating their views they often reach conflict
situations where their current knowledge state is inadequate. Once they reach this state they
begin to change their ideas in line with students ideas that are correct or partly correct.
219
Once the teacher identifies this stage he/she can devise a suitable method in his teaching style
that will allow such students to overcome their misconceptions. Such methods that can be used
will be discussed later.
Should the teacher find that individual student idea as revealed in the group interview needs
further probing, the teacher can employ the clinical interview to achieve this. The clinical
interview is a useful method, which can reveal in depth knowledge on the possible causes of
the misconceptions.
It is interesting to note that both the group interview and the clinical or individual interview
can be used to identify students understanding of forces and motion. A wealth of knowledge
about how students struggle with concepts such as mass, weights, gravitational force and free-
fall can be obtained via the interview as a method of teaching. The interview can be used
effectively in the classroom to reveal students' misunderstandings about concepts, which
effect their qualitative and quantitative understanding of forces and motion in general.
Despite the success of the interview method the teacher may find it time consuming. Also if a
tape recorder is used the teacher may find it cumbersome and tedious to transcribe interview
records. However considering the vast syllabus teachers have to complete and as a result of
time constraint, written methods can be used to supplement the interview method.
6.4 WRITTEN METHODS
In the use of written methods to identify misconceptions the questionnaire is a useful tool. In
the questionnaire qualitative items viz. open-ended questions and quantitative items viz.
multiple-choice questions can be used.
Before employing the questionnaire teachers should identify important characteristics of a
questionnaire viz.
220
Identify questions, which are important in identifying common misunderstandings and
arouse the interest of the students.
The questions must be clear concise and simple to understand so that second language
students can be accommodated. The wording must address a specific question without
ambiguity.
The layout of the questions must be simple, legible, without typographical or grammatical
errors and it must be clearly printed.
The usefulness of a questionnaire is that it can be completed in a thirty five-minute period and
saves the teacher time of transcribing. It gives students more time to think at ease and to
express their views. It also has the advantage of avoiding the teachers' influence on students'
ideas.
Teachers can use open-ended questions to test terminology and how students understand
qualitative concepts. Multiple- choice questions can be used to identify common pattern of
thinking among students' qualitative understanding of concepts. However, multiple- choice
questions may be problematic since students choose an alternative without giving a reason.
Teachers are often under the impression that effective teaching and learning is taking place in
the classroom especially when they measure their achievement against the performance of
students in tests and examinations. However, very seldom do teachers realize that their tests
and examinations are based on quantitative assessment such as manipulative skills where
students are mostly required to do calculations and answer multiple-choice questions without
providing reasons.
It is important that teachers realize that there is a common pattern of error among students'
choices in multiple- choice questions, which involve qualitative understanding of concepts.
These patterns of error to mention a few, are mostly related to misconceptions students have
learnt from their experiences with the environment, from their teachers, their language of
instruction and even textbooks. These misconceptions if not identified and remediated tend to
be perpetuated by students from grade to grade.
221
It is suggested that in multiple-choice questions teachers make it a point for students to
provide a reason for their choice.
Misconceptions in forces and motion are deeply embedded in the minds of students. Teachers
should be aware that they are prevalent among students in their classrooms. Students'
incorrect qualitative understanding effects their answers to quantitative questions.
6.5 WHAT TEACHERS SHOULD DO AFTER IDENTIFYING
MISUNDERSTANDINGS AMONG STUDENTS?
Once preconceptions or misconceptions have been established, teachers should employ
different methods of teaching to remediate the misconceptions. The constructivist approach to
teaching as a method of instruction was used in this study. Other methods, which can be used
such as the schematic model, will also be referred to as a method to improve teaching.
Teachers should carefully prepare activities where students are involved in achieving
outcomes. An example of such an activity is to prepare questions for group activities viz.
Group A
Explain what you understand by force.
A fly hits the windscreen of a moving car. The fly hits the windscreen with a certain force.
Does the windscreen hit back on the fly? Discuss and give a reason for your answer.
Discuss what is the reaction to the weight of a ball falling through air.
Similar questions can be developed for groups B, C and D. The teacher can group students
into the above groups and allocate a certain amount of time for discussion among the groups.
In the group activities students should be encouraged to express their ideas. The teacher
should rotate from group to group, listening respectfully to the ideas the students express and
to their explanations why these ideas make sense to them.
222
Once the group discussions have been completed a representative of the group should report
their views to the entire class. This should now engage the entire class in discussion and
debate. The role of the teacher should be that of mediator guiding the students into developing
experiments or experiences that will allow them to test the alternatives they propose.
Once their hypotheses have been tested the teacher should encourage the students to discuss
and resolve discrepancies between their predictions or explanations and the new evidence they
discover or experience.
The teacher should then listen carefully again. If students have adjusted their conceptual
frameworks, and have noted evidence that conflicts with their ideas, or if they've begun to
search out or even adopt a view that is compatible with the new and "verifiable" evidence,
then the lesson has succeeded.
In applying the constructivist approach teachers should give students a chance to discuss and
debate their beliefs. The result may be that students either change their current beliefs or resist
change. Teachers should take cognizance that meaningful conflict alone does not ensure the
construction of intended knowledge and the use of class discussion and careful teacher
guidance to assist the students in resolving the conflict is important. If students are unable to
find reasonable scientific arguments the teacher should introduce them.
It is important that teachers note that after establishing students' preconceptions they should
focus on maintaining and developing correct prior conceptions, rather than focussing on
replacement of incorrect prior conceptions. Teachers should focus on refining the students'
prior correct conceptions and expanding the context in which students applied them. The
educators' main challenge is not to make students aware that they have incorrect ideas, but to
make them aware of the context dependence of their statements and create in them a need for
conceptual differentiation. The point of departure should be determining students existing
knowledge.
223
Drawing from Driver and Oldham (1986) the researcher recognizes that students will not be
able to discover scientific concepts on their own. Teachers should develop the scientific view
of students as far as it agrees with the students prior views, before starting the restructuring
phase. The students' own arguments for resolving the anticipated conflict must be enhanced.
6.6 WHAT TEACHERS SHOULD DO AFTER AN INTERVENTION
PROGRAMME.
Teachers should test to see if the intervention programme was effective. This can be achieved
by giving students a post-test. A written test is recommended since it does not involve
transcribing, which can be time consuming.
Like the written tests, which were suggested to identify students' misconceptions, the post-
test can be structured in the same way to test if students' conceptual understanding has
improved.
To test the validity and reliability of the intervention programme, teachers have to analyze the
data obtained from the post-test. Where quantitative data was retrieved, teachers can do
relevant statistical tests to test the reliability of their results.
Where students' initial cognitive states, which differ from their scientific counterparts, have
not changed, teachers should search previous research findings for possible answers. Once this
has been established, teachers can go back to their intervention programme and see how it can
be improved to facilitate effective learning.
6.7 SOME PREVIOUS RESEARCH FINDINGS OF HOW CONCEPTUAL
CHANGE TAKES PLACE
There are instances when the intervention programme makes little or no changes to the
student's beliefs. When this occurs teachers can refer to previous studies to find reasons why
224
this occurs. However, Posner et al (1982) have outlined the features of a model of conceptual
change which is framed around two questions:
Under what conditions does a student replace his/her current conceptual basis for
understanding a phenomenon with a more appropriate conceptual understanding?
What are the features of a students conceptual make- up which govern the selection ofnew
concepts?
This implies that students existing framework will be rejected when it is confronted with
problems, which it lacks the capacity to solve. An alternative conceptual framework will be
accepted only if it appears to have the potential to solve this problem and can be applied to
solve problems in other areas.
Terry et al (1986) has shown that the following conditions are necessary for a student to -
accommodate a new conceptual basis for understanding:
There must be dissatisfaction with existing conceptions. A student is unlikely to be
motivated to make the effort to understand a new concept unless he/she can see that it is
likely to bring adequate recompense.
The new concept must be intelligible.
The new concept must be plausible. It must not appear counterintuitive. For example, it
must be seen to be consistent with the students past and present experiences. It should fit
into the students overall view of the environment.
The adoption of the new concept is seen not as an immediate acceptance or rejection, but
rather in terms of a gradual readjustment in the students thinking to accommodate the new
idea.
225
The constructivist approach is a positive venture in developing instructional methods and
materials to help students change their core concepts that are normally highly resistant to
instruction.
However, previous research has shown that schematic model as a teaching method has also
produced positive results. Schematic model based teaching will be briefly discussed under the
next subheading.
6.8 SCHEMATIC MODELING AS A METHOD OF TEACHING
Schematic Modeling was not used in this study because of the limited time allowed by the
schools for the study.
Model — based instruction has also been presented as a viable alternative to traditional
instruction as shown by Halloun ( 1998). Accordingly, scientific concepts and principles are
developed and coherently related to one another within the concepts of conceptual models.
Schematic modeling is a model-based, student centred pedagogical framework. Models and
modeling processes are at the heart of the epistemology of schematic modeling. In the
classroom students are constantly guided through reflective and interactive modeling activities
whereby their initial knowledge is considered a cognitive stepping stone on their way to the
scientific world.
Teachers can use guidelines proposed in this method to help students avoid the
accumulation of fragmented concepts and evolve into the coherent and systematic world of
science. The concept of force as an example can be used for illustration within the context
of basic Newtonian models of mechanics.
Through schematic modeling individual students must interact in class with their peers as
well as with their teacher. In this way students can be transformed from passive recipients
of knowledge to being actively involved in activities to achieve outcomes. Through
226
implementing these methods of teaching in the classroom, teachers can become better
equipped in making a paradigm shift towards the outcomes based approach to teaching.
In implementing the outcomes based approach to teaching, science teachers should:
account for what students believe about a topic under discussion e.g. forces and motion.
Teachers should avoid merely transferring knowledge. They should mediate students
learning in the classroom so that students resolve any differences between their own
beliefs and the scientifically correct ones.
develop scientific concepts of students through various methods of teaching. Schematic
modelling can be effectively used to achieve this outcome.
6.9 CONCLUSION
This chapter focussed on how teachers can improve their teaching. The guidelines to teachers
were extracted from the findings of this research. In the guidelines reference was made to
schematic modeling which was not used in this study because of time constraints. However,
schematic modeling was suggested as an effective method to employ in identifying
misconceptions and remediating them.
Chapter seven will discuss the summary of the entire research, the conclusion and the
recommendations. In chapter seven recommendations for further research will also be
discussed.
227
CHAPTER 7
SUMMARY, CONCLUSION AND RECOMMENDATIONS
7.1 INTRODUCTION
The summary will give an overview of the entire research study. The conclusion will focus on
what can be concluded from this study. The discussions in the recommendations will focus on
recommendations from this study which teachers can implement. There will also be
recommendations for further research from this study.
7.2 SUMMARY
The purpose of the study was manifold. It desired to test the hypothesis that the problem of
conceptual misunderstanding of various aspects of forces and motion might survive after the
intervention programme. The study was focussed on misconceptions of forces and motion of
grade nine and twelve students in the Gauteng Department of Education.
In the literature review the " world view" theory showed to a large extent that the environment
of learning influences ones view of reality. Focus on misconceptions in science education
formed an integral part of the literature review to gain an understanding of how they occur and
the implications for the teaching of science. Attention was focussed on the worldview theory
and conceptual frameworks, the influence of culture, community and environment on learning,
and alternative frame works in forces and motion.
A discussion of traditional methods and how they influence current teaching methods formed
an important part of the literature review so that teachers can review their current methods of
teaching. Focus was directed to the possible causes of misconceptions which included a
historical sketch of teaching since the 1960's, integration of language and everyday concepts
228
with scientific concepts, the constructivist method of teaching and how interviews and written
methods can be used for identifying misconceptions.
Attention was also drawn to the Gauteng Department of Education (GDE) grade 12 Physics
results, which revealed common incorrect choices in multiple-choice questions, especially in
forces and motion. These misconceptions it was suggested could be the result of students
interaction and experience with their environment, teachers, textbooks and religious
backgrounds.
The literature review, group interviews and individual interviews with students and the GDE
Physics results were used to identify misconceptions in students understanding of concepts in
forces and motion. The questionnaire was drawn up from these misunderstandings to
determine which misconceptions encountered in theory, were prevalent by the study group.
The questionnaire comprised both open-ended questions and multiple-choice questions where
students had to provide a reason for their choice so that it could be seen how students arrived
at their choices. The pretest results made it possible to gain an understanding of the nature and
extent of misconceptions regarding forces and motion.
An intervention programme employing the constructivist approach as far as possible was
implemented with students to see if misconceptions could be remediated.
The effectiveness of the intervention programme was measured by means of statistical
analysis. The statistical analysis made it possible to compare the results of the different
schools to see if misconceptions were specific to a particular environment. It was also possible
to compare the results from grade 9 to grade 12 to see if misconceptions were perpetuated
from grade to grade.
The result of the post-test revealed that there were many cases of evidence where students'
conceptual understanding of forces and motion improved significantly. It is hoped that the
229
intervention programme used in this study will encourage teachers to explore in their teaching
to remediate misconceptions. It is also suggested that teachers employ other programmes such
as concept maps to reduce or eliminate misconceptions among their students.
7.3 CONCLUSION
The study has revealed numerous misconceptions among groups of students from different
educational backgrounds and environments regarding students understanding of forces and
motion. The results indicate that misconceptions are present across a wide range of students.
The misconceptions range from those that are easily remediated with intervention programmes
to those that are tenacious and resistant to change.
Although there is a decrease in the occurrence of the misconceptions from
From grade 9 to grade12, there is also evidence of perpetuation of misconceptions from grade
9 to grade 12. It is of concern that grade 12 students have "wrong ideas" similar to those of
grade 9. On a small scale there is evidence of misconceptions being related to the school
environment of students.
In the case of Newton's third law of motion the intervention programme made a great
improvement in students understanding that when you hit something, it hits back on you.
However, when Newton's third law was applied to a ball resting on a persons hand, and
student were expected to choose an alternative as to what was the reaction to the weight of the
ball, students had difficulty in choosing one of two correct answers out of four alternatives see
table 5.2. A similar result was obtained for the item where students were expected to make a
choice of four alternatives to choose a statement which best gave the cause of a rockets
upward acceleration when the engine converts fuel into hot gases when it is projected
vertically upwards from rest.
In applying Newton's laws of motion students found difficulty because they experienced
difficulty in understanding the concept weight and therefore could not arrive at the correct
choice. In the lift problem question 9 of the grade 12 pretest, students experienced difficulty in
230
distinguishing between weight and weight reading. Students misunderstanding of the concept
weight effected their answers to both qualitative and quantitative problems. In the problem
with the rocket students were not able to understand that when the rocket pushes the hot gasses
backwards, the hot gases push back on the rocket with an equal and opposite force.
By the time students reach grades 9 and 12, they have had enough experience with the concept
weight but seem to hold on to their own ideas about weight. This study has shown that
students misunderstandings with terminology influences their understanding of other aspects
of forces and motion. The main reason seems to be that students haven't been exposed to
situations such as group discussions where they could discuss or debate their views and see the
inadequacies in what they believe.
After the intervention programme the post-test results revealed that:
(1) Students improved in their understanding ofNewton's laws of motion. However, students
understanding of weight seems to be a major inhibitor, when applying Newton's third law to
situations involving weight.
Generally students improved in their understanding of gravity with some students having
problems understanding gravitational acceleration, believing that it is the result of the air
in the atmosphere, and increasing as you ascend from the earth. Another problem students
experience with gravity is that when an object is thrown vertically upward, at maximum
height when the velocity is zero, they also believe acceleration is zero.
Despite a large number of students believing that objects of different masses in the absence
of air friction reach the ground together, there was a great improvement with those
students who believed that the greater mass reaches the ground first.
The items which tested " motion implies force" showed that the intervention programme
made improvement to some groups, where little or no improvement was noted, students
231
demonstrated that their tenacious beliefs that velocity is directly proportional to force were
resistant to change.
The items based on terminal velocity and free fall showed that there was a general
improvement in understanding these concepts after the intervention programme.
Another important observation in the post-test was that there were a greater percentage of
students arriving at the correct choices through correct reasoning.
On comparing the result of the ex- departments it was evident that misconceptions are
prevalent in all the ex- departments. The results have shown that the ex- departments vary in
their percentages of misconceptions and the degree of improvement after the intervention
programme as revealed in the discussion of comparisons in chapter 5.
However, the study has revealed in limited cases that there is a pattern of common error,
which can be identified with a particular ex- department.
Amongst the EX-DET and EX-HOD students the pretest results for grade 9 and 12 students
revealed a misunderstanding that falling objects accelerate because the gravitational force
increases as they fall. On the post-test results these students had a better understanding of
gravity believing that falling objects accelerate on the earth because gravity is a constant on
the earth.
The EX-TED grade 9 and 12 students revealed in the pretest that when you push against a
wall, the wall does not push back on you because it is inanimate. The post-test results
indicated that these students improved in their results ranging from 90 to 100%. An important
feature of the EX-TED grade 9 students was their understanding that light and heavy objects
when thrown from the same height above the ground in the absence of air friction, reach the
ground at the same time. It was comforting to note that these students believed so because
gravity was a constant. This finding does not confirm studies in other countries that students of
this age believe that the heavier object reaches the ground first.
232
The EX-HOR grade 9 and 12 students revealed in the pretest that an object of greater mass
reaches the ground first in the absence of air friction when dropped from the same height
above the ground, because an object with a greater mass has a greater weight, therefore the
object with greater force reaches the ground first. This group of students was consistent with
the misconception that motion implies force. However in the post-test item there was evidence
in improvement of the concept when comparing the means of the pretest and post-test results.
The improvement in the post-test results as shown by the statistical analysis can greatly be
attributed to the intervention programme. Items, which showed little or no improvement, can
be attributed to students having English as a second medium of instruction, or possibly to
more time needed for interaction with the programme or even the implementation of another
programme, which could be more suited to these students. Also problems exploring more
avenues where students can reach a situation where their current ideas are inadequate to
answer problems, thereby stimulating the need to change their existing ideas.
The statistical analysis of the results of the experimental group of the EX-HOD and EX-DET
grade 9 and 12 students show that there is a perpetuation of misconceptions from grade 9 to
grade 12 within these ex -departments.
There was an amazing finding with the EX-HOR results as the grade 9 students performed
better than the grade 12 students in both the pre and post-test results of the experimental
groups.
For the EX-TED there were no significant difference in the results ofboth the pre and post-test
of the experimental groups when comparing grade 9 and 12 students, indicating that there is
probably no perpetuation of misconceptions from grade 9 to grade 12.
The study has identified with other research findings that students misconceptions in forces
and motion is an international problem. There were isolated cases where this study for certain
groups revealed that misconceptions prevalent in other countries for the same age group were
233
almost non existent among a particular group of students. However, since the study was
restricted to four ex-departmental schools it is not possible to generalize this finding.
7.4 RECOMMENDATIONS
It is evident that misconceptions of forces and motion is an international problem and that
there is no quick solutions to remediate the problem. However, it is important that teachers
know about misconceptions, identify them amongst their students and explore different
approaches to make students unlearn them.
Teachers should realize that if misconceptions are not identified, students receive information
from the teacher against their own frame of reference. The literature review in chapter three
has shown that students have alternative frameworks, which are partially correct, sometimes
correct and even completely incorrect. Teachers often feel disappointed after presenting
lessons which in their opinion they rate as excellent, does not produce the desired outcome
when they assess their students. The problem is that students have barriers viz. "howlers" or
misconceptions, which sometimes makes it difficult for the teacher to penetrate.
Once teachers have identified misconceptions of students, which are non-scientific, they
should make students confront situations where their alternative frameworks are inadequate to
solve problems. Students should themselves feel uncomfortable with their current ideas, which
are non-scientific, and be stimulated to engage in discussions or explore literature for
scientifically correct ones.
It is important that teachers should take time to analyze students' definitions of terminology,
which can often be categorized, with common patterns of error. The teacher can then possibly
explore the cause of the students beliefs by questioning the students, encouraging group
debates in the classroom and guiding students along ways which will lead them to unlearn the
incorrect view by replacing it with the correct one. The group or clinical interview is also a
good method of detecting and reducing the effects of the misconceptions.
234
Another important finding of the research is the language of instruction. Students being taught
in a medium of instruction other than their home language seem to have the effect of giving
different meanings to words. It was also indicated that some second language English
speaking students were less receptive to change their existing views in the contextual items,
which were incorrect. However, in the multiple-choice questions an important finding relating
to language as shown in the pretest and post-test results, was that some second language
students consistently made the correct choice but were unable to express their reasons. This
implies that sometimes they have the correct idea but language as a barrier hampers them from
expressing it.
It is recommended that teachers should be aware of the language problem and use simplified
language to make students understand. It is also highly recommended that the education
department make it a policy that the language used in internal and external examination
question papers use language which is user friendly.
The multiple-choice questions have also shown that both first and second language students
arrive at correct choices through incorrect reasoning. Teachers should explore this avenue, and
not take it for granted that in making the correct choice students understand the work.
The research has shown that misconceptions can be identified with the school or community
of the student. In these cases the teacher should probe the cause of misconception and the
possible solution to the problem.
Teachers who are not qualified in the science subject that they are teaching should make the
effort to gain knowledge of the subject. This can be achieved by attending workshops held by
subject facilitators, enrolling for inservice training courses, attending refresher courses and
reading relevant literature, otherwise they could be the source of perpetuating misconceptions.
Another way teachers can possibly resolve misconceptions is by setting questions in tests and
examinations, which addresses these problems. Teachers should concentrate on qualitative
questions where students are expected to explain, discuss, critically analyze, evaluate, interpret
235
and apply knowledge to new situations. In this way teachers will be able to identify
misconceptions and act as mediators guiding students through success.
In this study the interview and pretest was used to identify students' misconceptions. An
intervention programme using the constructivist approach was implemented to remediate the
misconceptions. The post-test results were used to assess the effects of the intervention
programme. The statistical analysis showed that there was a significant improvement among
most of the students understanding of forces and motion. Teachers are encouraged to
implement similar programmes and explore other methods such as schematic modeling, which
was not used in this study.
With the large student teacher ratio the implementing of such programmes can help alleviate
the problems teachers are faced with. For example students can be divided into groups and be
given tasks to perform. Teachers can also provide students with assignments both for groups
and for individuals. These tasks if properly prepared can alleviate problems associated with
managing large classrooms.
Finally teachers should be encouraged to be proactive in identifying such problems, putting
proper mechanisms in place to address them, measure progress and make sure that there is an
ongoing learning process. Teachers should not restrict themselves to the lecture and
demonstration styles of teaching, but explore other methods so that the student can be
developed holistically.
7.5 RECOMMENDATIONS FOR FURTHER RESEARCH
Research should also be focussed on other aspects of mechanics. Other researchers have done
research where schematic models for instance were used as a research design producing
fruitful results. Further research can focus on utilizing schematic models as an intervention
programme to remediate misconceptions.
236
Teachers conceptions of various aspects of forces and motion needs to be researched, so that
refresher courses can be arranged for teachers where discussions can enable them to see the
inadequacies of their existing conceptions and change wrong ideas or develop correct ones.
Research should also be focussed on language as a barrier to learning and what research
design will be most appropriate in addressing such problems.
Finally research should also focus on determining what misconceptions are prevalent among
particular communities, the source of the misconceptions and how they can be remediated.
237
BIBLIOGRAPHY
AGUIRR, J.M 1988: Students Preconceptions About Vector Kinematics. University of British
Columbia (Canada). The Physics Teacher, April 1988: 212 -216.
AMBIBOLA, 10 1988: The problem of terminology in the study of students conceptions of
science. Science Education, 72, 1988: 175- 184
AMERICAN ASSOCIATION FOR THE ADVANCEMENT OF SCIENCE 1990: Science for
all Americans: Project 2061. NEW York: Oxford University Press.
AMERICAN ASSOCIATION FOR THE ADVANCEMENT OF SCIENCE 1993: Benchmark
for science literacy: Project 2061. New York: Oxford University Press.
AMIR, R; FRANKEL, DR & TAMIR, P 1986: Justification of answers to multiple-choice
items as a means to identifying misconceptions. (In: H. Helm and J.D. Novak (Ed)
Proceedings of the International Seminar on Misconceptions in Science and Mathematics.
Cornell University. Ithaca, N.Y.)
ANDERSON, B 1990: Pupils conceptions of matter and its transformations (age 12 —16).
Studies in Science Education, 18, 1990: 53 — 85.
ANDERSON, RC 1977: The notion of schemata and the educational enterprise: general
discussion of the conference. (In: R.C. Anderson, R.J. Spiro, and W.E. Montague(eds),
Schooling and the Acquisition of Knowledge. Lawrence Erlbaum, Hillsdale, N).
ARONS, A B 1990: A guide to introductory physics teaching. New York: Wiley.
AUSUBEL, D P 1968: Educational Psychology: A cognitive view. New York: Holt, Rhinehart
& Winston.
238
BAR, V 1986: The Development of the Notions of Weight and Gravity: Oral Session,
International Conference on Trends in Physics Education. Tokyo: Japan.
BAR, V; ZINN, B; GOLDMUNTZ, R & SNEIDER, C 1994: Childrens' concepts about
weight and free fall. Science Education, 78, 1994: 149- 169.
BARROW, R 1984: Giving Teaching back to teachers: A critical introduction to curriculum
theory. Totowa, NJ: Barnes and Noble.
BINGHAM, WVD; MOORE, BV & GUSTAD. 1959: How to interview (fourth revised
edition). New York: J.W. Harper and Brothers.
BRADLEY, JD; BRAND, M & GERRANS, GC 1987: Excelence and the accurate use of
language, symbols and representations in Chemistry. Proceedings of the fi th International
Conference on Chemical Education (ed. Y. Takeuchi). IUPAC Blackwell Scientific
Publications.
BRINK, BP & JONES, RC 1987: Physical Science for Std 10. Juta and Company Ltd.
Nocabeni: Cape.
CARMICHAEL, P; DRIVER, R; HOLDING, B; PHILLIPS, I; TWIGGER, D & WATTS, M
1990: Research on students conceptions in science: A bibliography. Leeds, UK: University of
Leeds, Centre for Studies in Science and Mathematics Education.
CHAMPAGNE, AB; KLOPPER, LE; & ANDERSON, J H 1980: Factors influencing the
learning of classic mechanics. American Journal of Physics, 48, 1980: 1074- 1079.
CHAMPAGNE, AB; GUNSTONE, RF & KLOPPER, IE 1983: Effecting changes in cognitive
structures among physics students: Paper presented at the annual meeting of the American
Educational Research Association. Montreal.
239
CLEMENT, J 1982: Students preconceptions in introductory mechanics. American Journal of
Physics, 50, 1982: 66 —71.
CLEMENT, J; BROWN, D; CAMP, C; KUDUKEY, J; MINSTREL, J; SCHULTZ, K;
STEINBERG, M & VENEMAN, V 1987: Overcoming students' misconceptions in physics:
The role of anchoring intuitions and analogical validity. (In: J.D. Novak eds. 1987:
Proceedings of the Second International Seminar on Misconceptions and Educational
Strategies in Science and Mathematics. 3. Ithaca, NY: Cornell University).
COBERN, WW 1988: World View as a Theoretical Construct in Science Education Research.
Texas: Austin College.
COBERN, WW 1991: Worldview Theory and Science Education Research. NARST
Monograph, 3. Manhattan, KS: National Association of Research in Science Teaching.
COBERN , W W 1993: College students conceptualization of nature: An interpretive world
view analysis. Journal of Research in Science Teaching, 30, 1993: 935-951.
COHEN, L & MANION, L 1991: Research methods in education. Third edition. London and
New York: Routledge.
COMBER, LC; & KEEVES, JP 1973: Science education in nineteen countries. New York:
John Wiley.
DEKKERS, PJJM 1997: Using students beliefs productively in teaching physics. Doctoral
dissertation. Amsterdam: Huisdrukkerij VU.
DIJKERSTERHUIS, EJ 1961: The mechanization of the world picture. New York: Oxford
University Press.
240
DIJKSTERHUIS, EJ 1986: The mechanization of the world picture. Princeton, NJ: Princeton
University Press.
DRAKE, S 1970: The dispute over bodies in water. In Galileo studies. Personality, tradition
and revolution. Ann Arbor, MI: University of Michigan 159-177.
DREYFUS, A; .TUNGWIRTH, E & ELIOVITCH, R (1990). Applying the "cognitive
conflict" strategy for conceptual change - some implications, difficulties, and problems.
Science Education, 74, 1990: 555-569.
DRIVER, R 1973: The representation of conceptual frameworks in young adolescenct science
students. Unpublished PHD dissertation, University of Illionois, Urbana, II.
DRIVER, R 1979: The pupil as a scientist. Paper presented at the GIREP Conference.
Rehovot: Israel.
DRIVER, R 1981: Pupils alternative frameworks in science. European Journal of Science
Education, 3 (1), 1981: 93-101.
DRIVER, R & EASELEY, J 1969: Autonomous dynamic thinking in young adolescent
physics students. (In: J.A. Easeley, The Uses of Mathematics in Science Teaching. Final report
on Project UMIST, NSF Contract GW- 2252: University of Illinois, Urbana, Illinois).
DRIVER, R & EASELY, J 1978: Pupils and paradigms. A review of literature related to
concept development in adolescent science students. Studies in Science Education, 5, 1986:
61- 84.
DRIVER, R & OLDHAM, V 1986: A constructivist approach to curriculum development in
science. Studies in Science Education, 13, 1986: 105 — 122.
241

DRIVER, D; SQUIRES, A; RUSHWORTH, P & WOOD- ROBINSON, V 1994: Making
sense of secondary science- research into childrens ideas. London: Routledge.
DYKSTRA, DI 1992: Studying conceptual change: Constructing new understanding. (In R.
Duit, F. Goldberg, & H. Niedder (Eds). Research in Physics learning: Theoretical issues and
empirical studies. Kiel, Germany: IPN, pp.40-59).
ECKSTEIN , SG & SHEMESH, M 1989 : Development of children's ideas on motion:
intuition vs. logical thinking. International Journal of Science Education 11(3), 1989: 327-
336.
EISNER, E 1991: The enlightened eye: Qualitative inquiry and the enhancement of
educational practice. New York: Macmillan.
ERICKSON, F 1986: Qualitative methods in research on teaching. ( In M.C. Witrock (Ed),
Handbook of research on teaching (3 rd .,pp. 119-161). New York: Macmillan).
ERICKSON, G 1991: Collaborative inquiry and the development of science teachers. The
Journal of Educational Thought, 25, 1991: 228- 245.
FISHBEIN, E; STAVY, R & MA- NAIM, H 1989: The psycological structure of naïve
impetus conceptions. International Journal of Science Education, 11(1), 1989: 71- 81.
FISCHER, KH & LIPSON, JI 1986: Twenty questions about students errors. Journal of
Research in Science Teaching, 23, 1986: 783- 803.
FREDETTE, NH & CLEMENT, JJ (1980): Students misconceptions of an electric circuit: do
introductory physics experiences relate to a real world? University of Massachusetts,
Cognitive development Programme, department of physics & Astronomy, Amherst.
FRENCH, AP 1995: On weightlessness. American Journal of Physics., 63, 1995: 105.
242
GALILI, I 1993: Weight and gravity: Teachers ambiguity and students' confusion about the
concepts. International Journal of Science Education, 14, 1993:149 —162.
GALILI, I & KAPLAN, D 1996: Students Operations with the Weight Concept. Science
Education ,80(4), 1996: 457-487.
GARRET, ANN, Jr. 1972: Interviewing: Its Principles and Method. (second edition: revised
by E.P. Zaki & M.M. Mangold). New York: Family Service Association of America, 1972.
GARNETT, PJ, & TREAGUST, DF 1990: Implications of research on students understanding
of electrochemistry for improving science curricula and classroom practice. Int. J. Sci. Educ,
12, 1990: 147- 156
GILBERT, JK; OSBORNE, RJ & FENSHAM, P 1982: Children's and its consequences for
teaching. Science Education, 66(4), 1982: 623- 633.
GILBERT, JK & WATTS, M 1983: Concepts, misconceptions and alternative conceptions:
changing perspectives in science education. Studies in Science Education, 10, 1983: 61-98.
GRAYSON, D 1993: Concept substitution an approach to fostering conceptual change.
Abstracts of the International Conference: Science Education in Developing Countries: From
theory to practice. Tel Aviv, Israel: Ortra, p. 206
GUNSTONE, RF 1990. "Childrens science": A decade of development of constructivist views
of science teaching and learning. The Australian Science Teachers Journal ,36, 1990: 9-19.
GUNSTONE, RF; CHAMPAGNE, AB & KLOPFER, LE 1981: Instruction for understanding
a case study. The Australian Science Teachers Journal, 27 (3)1981: 27-32.
243
GUNSTONE, RF; GRAY, CMR & SEARLE, P 1992: Some Long Term Effects of
Uninformed Conceptual Change. Science Education , 76 (2), 1992: 175 – 197.
GUNSTONE, R F, & WHITE, RT 1980: A matter of gravity. Science Education, 10, 1980:
35 -44.
GUNSTONE, RF, & WHITE, RT 1981: Understanding of gravity. Research in Science
Education , 65, 1981: 291- 299.
HAKE, RR 1992: Socratic pedagogy in the introductory physics laboratory. The Physics
Teacher, 30, 1992: 546-552.
HAKE, RR 1996. Socratic dialogue inducing laboratories: Do they work? Manuscript
submitted for publication.
HALIDAY,D; RESNIK, R; & WALKER, J 1993: Fundamentals of Physics. New York:
McGraw- Hill.
HALLOUN, I 1998: Schematic Concepts for Schematic Models of the Real World: The
Newtonian Concept of Force. Science Education , 82, 1998: 239-263.
HASHWESH, M 1983: Toward an Explanation of Conceptual Change. Eur. J. Science Ed , 8,
1983: 229-249.
HAWKINS, D 1994: Constructivism: Some history.( In P, Fensham, R, Gunstone, and R,
White (Eds.), The content of science: A constructivist approach to its teaching and learning.
London: Falmer press).
HELLER, P; KEITH, R & ANDERSON, S 1992: Teaching problem solving through
cooperative grouping. American Journal of Physics, 60, 1992: 627-636.
244
HELM, H 1978: Misconceptions about physics concepts among South African pupils
studying physical science. South African Journal of Science, 74, 1978: 285- 290.
HEWSON, PW 1981. A conceptual change approach to learning science. European Journal of
Science Education, 3, 1981: 383- 396.
HOWE, AC 1996: Developments of Science Concepts within a Vygotskian Framework.
Science Education ,80,1996: 35-51.
HVITFELDT, C 1986: Traditional culture, perceptual style and learning: The classroom
behaviour among adults. Adult Education Quarterly, 36, 1986: 65-77.
IONA, M 1975: The meaning of weight. The Physics Teacher ,13, 1975: 263- 274.
JORDAAN, F & JORDAAN, R 1997: 97 HG Physichem. Stellenbosch Fisichem.
KEARNEY, H 1971: Science and Change. 1500-1700. New York: McGraw- Hill Book
Company.
KEARNEY, M 1984: World View. Chandler & Sharp Publishers, Inc., Novato..
KING, AL 1962: Weight and weightlessness. American Journal of Physics ,30, 1962: 387.
KRAFT, C. "Ideological Factors in Intercultural Communication." Missiology, 2, 1974: 295-
312.
KRUGER, C J; SUMMERS, M.K & PALACIO, DJ 1990: An investigation of some English
primary school teachers' understanding. British Education Research Journal, 16, 1990: 383-
397.
245
KUCHEMANN, D 1991: learning and teaching ratio: A look at some current textbooks (In:
Ernst, P (ed), Mathematics teaching: The state of art. London: Falmer.
KUHN, T 1962: The structure of scientific revolutions. Chicago: The University of Chicago
Press.
KUHN, TS 1977: The function of measurement in modern physical science.( In The essential
tension. Selected studies in scientific tradition and change. Chicago: University of Chicago
Press).
LAKATOS, I 1970: Falsification and the methodology of scientific research programmes. ( In
criticism and the growth of knowledge, I. Lakotos & A. Musgrave (Eds). Cambridge:
Cambridge University Press).
LAKATOS, I 1978: The methodology of scientific research programmes. Cambridge,
England: Cambridge University Press.
LINCOLN, YS & GUBA, EG 1985: Naturalistic inquiry. Newbury Park, CA: SAGE
Publications.
LIPPERT, R 1986: Development of expert systems: An instructional strategy for dealing with
misconceptions. (In H. Helm and J. D. Novak (Ed). Proceedins of the International Seminar on
Misconceptions in Science and Mathematics. Cornell University. New York: Ithaca).
MAARSCHALK, J & STRAUSS, J 1991: Didaktiese eise in n' tegnologiese era. Suid-
Afrikaanse Tydskrif vir Opvoedkunde, 11 (2), 1991: 73-76.
MALONEY, DP 1984: Rule governed approaches to physics. Newton's third law. Physics
Education, 19, 1984: 37- 42.
246
MARX, K 1959. Theses on Feuerbach.In S. Heuer (Ed). Marx and Engels: Basic writings on
politics and philosophy. Garden City, NY: Doubleday Anchor.
MINSTRELL, J 1992. Facets of students' knowledge and relevant instruction. (In R. Duit, F.
Goldberg, & H. Niedder(Eds)., Research in physics learning: Theoretical issues and empirical
studies. Kiel, Germany:IPN, pp. 110 —128).
MINSTRELL, J & SMITH, C 1983:. Alternative conceptions and a strategy for change.
Science and Children, November/ December, 31-33.
MULDER, JC 1987: Statistical techniques in education. Pretoria: HAUM.
THE NATIONAL COMMISSION ON EXCELLENCE IN EDUCATION 1983: A nation at
risk: The imperative for educational reform. Washington, DC: U.S. Government Printing
Office.
NATIONAL RESEARCH COUNCIL 1996: National science education standards.
Washington, DC: National Academy Press.
NATIONAL SCIENCE TEACHERS ASSOCIATION 1993: Scope, sequence, and
coordination of secondary school science Vol. 1 : The content core. Washington, DC: NSTA.
NATIONAL SCIENCE TEACHERS ASSOCIATION 1995: Scope, sequence, and
coordination of secondary school science Vol.3: A high school framework for national science
education standards. Washington, DC: NSTA.
NIEDDER, H, & SCHECKER, H 1992: Towards an explicit description of cognitive systems
for research in physics learning. ( In R. Duit, F. Goldberg. & H. Niedder (Eds.), research in
physics learning: Theoretical issues and empirical studies. Kiel, Germany: IPN, pp 74-99).
247
NOCE, G, TOROSANTUCCI, G & VINCENTINI, M 1988. The floating of objects on the
moon: Prediction from a theory or experimental facts? International Journal of Science
Education , 10, 1988: 61-70.
NUSSBAUM, J 1979: Children's conception of the earth as a cosmic body: A cross age study.
Science Education,63,1979: 83-93.
NUSSBAUM, J & NOVAK, JD 1976: An assessment of children's concept of the Earth using
structural views. Science Education ,60, 1976: 535-550.
NUSSBAUM, J & NOVICK, S 1982: Alternative frameworks, conceptual conflicts and
accomodation: Toward a principled teaching strategy. Instructional Science, 11, 1982: 183-
200.
OGUDE, NA 1992. Teaching and learning difficulties in electrochemistry. PhD thesis.
University of the wiwatersrand , Johannesburg.
OSBORNE ,RJ; BELL, BF & GILBERT, JK 1983: Science teaching and childrens views of
the world. European Journal of Science Education, 5, 1983: 1-14.
OSBORNE, RJ & GILBERT, 31( 1980. A technique for exploring students' views of the
world. Physics Education, 15, 1980: 376-379.
OSBORNE, RJ. & WITTROCK, MC 1983. Learning science: generative process. Science
Education, 67, 1983: 489 —508.
PALMER, DH & FLANAGAN, RB 1997: Readiness to Change the Conception That "
Motion- Implies — Force": A Comparison of 12- Year-Old and 16 — Year —Old Students.
Science Education ,81, 1997: 317-331.
248
PFUNDT, H & DUIT, R 1994: Bibligraphy: Students alternative frameworks and science
education (4th ed.). Kiel, Germany: Institute for Science Education.
PIAGET, J 1929: The childs conception of the world. New York: Harcourt Brace.
PIAGET, J 1974: Understanding casuality. New York: Norton.
PINES, AL & WEST, LHT 1986: Conceptual understanding and science learning: an
interpretation of research within a sources-of-knowledge framework. Science Education, 70,
1986: 583-604.
POSNER, G J & GERTZOG, W A 1982: The clinical interview and the measurement of
conceptual change. Science Education ,66, 1982: 199- 209.
POSNER, GJ; STRIKE, KA; HEWSON, PW & GERTZOG, WA 1982: Accomodation of a
scientific conception: Toward a theory of conceptual change. Science Education ,66, 1982:
211-227.
RUGGIERO, S; CARTELI, A; DUPRE, F & VINCENTINI — MISSONI, M 1985: Weight,
gravity and air pressure: Mental representations by Italian middle school pupils. European
Journal of Science Education ,7, 1985: 181- 194.
SADANAND, N & KESS,J 1990: Concepts in force and motion. The Physics Teacher,28,
1990: 530-533.
SMITH, JP; DISESSA, AA & ROSCHELLE, J 1993: Misconceptions reconceived: A
constructivist analysis of knowledge in transition. Journal of Learning Sciences,3,1993: 115-
163.
TAYLOR, K 1974: Weight and centrifugal force. Physics Education, 9, 1974: 357-360.
249
TERRY, C & JONES, G 1986: Alternative frameworks: Newton's third law and conceptual
change. European Journal of Science Education,18(3), 1986: 291-298.
TERRY, C & JONES,G & HURFORD, W 1985: Childrens conceptual understanding of
forces and equilibrium. Physics Education, 116, 1985: 360-365.
THARP, R 1989: Psychocultural variables and constraints: effects on teaching and learning
and learning in schools. American Psychologist, 44(2), 1989: 349-359.
THUS, GD 1992: Evaluation of an introductory course on "force" considering students
preconceptions. Science Education, 76, 1992: 155- 174.
TOB1N, K; BUTLER KAHLE, J & FRAZER, BJ 1990: Learning science with
understanding:In search of the Holy Grail? (In K. Tobin, J. Butler Kahle, & B.J. Frazer (Eds),
Windows into science classrooms London: Falmer Press).
TOM, A 1984: Teaching as a moral craft. New York: Longman.
TOULMAN, S 1972: Human understanding. Princeton: Princeton University Press.
VAN HISSE, YA 1988: Students Misconceptions in Mechanics: An International Problem?
The Physics Teacher , Nov 1988; 498-502.
VIENNOT, L 1979: Spontaneousreasoning in elementary dynamics. European Journal of
Science Education, 1, 1979: 205-211.
VINCENTINI – MISSONI, M 1982: Earth and gravity: Comparisons between adult's and
children's knowledge. Padagogische Hochschule Ludwigsburg, 234-253.
VYGOTSKY, L 1986: Thqught and language (A. Kozulin, Trans.). Cambridge, MA:MIT
Press(Original English translation published 1962.)
250
WANDERSEE, JH; MINTZES,JJ & NOVAK, JD 1994: Research on alternative conceptions
in science. In D.L.Gabel (Ed.), Handbook of research on science teaching and learning. New
York: Macmillan.
WARREN,JW 1979: Understanding Force (John Murray, London).
WATTS, DM 1982: Gravity- Don't take it for granted! Physics Education 17: 119-121.
WATTS, DA & ZYLBERSZTAJN, A 1981: A survey of some children's ideas about force.
Physics education,16, 1981: 360-365.
WERTSCH, JV & TOMA, C 1992: Discourse and learning in the classroom: A sociocultural
approach (In: Steffe, L Ed, Constructivism in_education. Hillsdale, NJ: Erlbaum).
WHITELOCK, D 1991: Investigating a model of commonsense thinking about causes of
motion with 7- 16 year old pupils. International Journal of Science Education, 13 (3), 321 —
340.
WHITE, RT & GUNSTONE, RF 1981: Understanding of gravity. Science Education, 65,
1981: 291 — 299.
YARROCH, WL 1985: Student Understanding of Chemical equation balancing. Journal of
Research in Science Teaching, 22, 1981: 445- 459.
ZAHARLUH, A 1992: Etnography in anthropology and its value for education. Theory into
Practice 31, 1992: 116 —125.
ZYLBERSZTJAN, A 1983: A conceptual framework for science education: investigating
curricular materials and classroom interactions in secondary school physics. Unpublished
Ph.D. thesis. UK: University of Surrey.
251

APPENDIX A: INTERVIEWS
APPENDIX A (INTERVIEWS)
All the ex-departmental groups were interviewed for group and individual interviews. For the purposes of discussion, the ex — DET grade 9 students, the ex- HOR grade 9 students , the ex- TED grade 12 students and the ex — HOD grade 12 students, group and individual interviews will be discussed. Hence only these interviews will appear in the appendix A.
Group Interview with Grade 9 Students (ex- DET)
R: Why do objects fall? Si: Because they have weight R: What do you understand by the term weight?
Weight is a power Si: Weight is a mass R: Is weight and mass the same thing?
Weight and mass is not the same thing R: Why? S3: Weight is mass x 10, weight is in Newton's, mass is in kilogram. R: What is weight? Si: Weight is a force a of gravity. R: What is a force?
Force is measured in Newton's. R: Is weight a force?
Weight is not a force. A force is a push or a pull. Weight is like a mass.
Weight and mass both fall under forces. R: Why? S2 Because weight is mass x 10 S3: Weight is a force of gravity R: What can you tell me about the gravitational force at the ceiling and the floor of a laboratory? S3: The gravitational force is smaller at the floor. R: Why is it smaller at the floor. S2: The more you go above the ground the more the earth's gravity attracts you. R: If a man walks on the moon where the gravitational acceleration is 116th that of the earth. How will his mass and weight change in comparison to the earth.
His mass a and weight will be less than the earth because there is no gravity on the moon. R: Why do you say so?
Because there is gravity only on the earth. S2: His mass will be the same but his weight will be less because the moon does not attract the body with the same power as the earth. S3: A persons mass cannot change, but as he is further away from the
earth the attractive force of the earth is less. Then his weight will be less. R: When will an object have weight? S2: When they fall.
R: When two objects, a light and heavy object are dropped from the same height above the ground in the absence of air friction, how do they hit the ground ? S4:The heavier one reaches the ground first. R: Why? S4: Because it is heavier it falls faster.
Because it has a greater force.
Ex-DET- grade 9 Individual Interview R: Why do object fall? Si: Because of force. Force is a push and a pull and the force of gravity R: What is a force of gravity? Si: Force of gravity is weight. R: What is weight? Si: Weight is a force of gravity because of the pull of the earth. R: What is mass? Si: Mass is a thing that occupies space. R: Is weight and mass the same? Si: No it is not the same. Mass is measured on a scale and the unit of mass is in kilograms.
Weight is in Newton's. Force is measured on a spring balance. R:When two objects, one of greater mass and the other of smaller mass is dropped from the same height above the ground in the absence of air friction, how do they hit the ground ? Si: The heavy one hits the ground first. R: Why? Si: Because it has more weight. R: Does the book on the table exert a force on the table? Si: No. Because the book has mass and not weight and the book is not heavy. R: What has weight? Si: Iron has weight and people have weight because they are heavy. R: What is free fall?
Si: Free fall is when you drop an object from a height and gravity pulls it down. R: Is gravity the same at the floor and at the ceiling? Si: Gravity is stronger at the ground then at the ceiling. R: Why do you say so? Si: Because gravity increases at the ground, the object is pulled down at a greater force. R: When an object, such as a balloon is dropped and air resistance cannot be ignored, what are the forces acting on the balloon? Si: There is the force of gravity and if air resistance cannot be ignored then I think air resistance also acts on the balloon. R: Do you have any idea in what directions the forces are acting. Si: Gravity increases as the balloon falls downwards, but I'm not sure in what direction air resistance is acting.
Ex HOR- Grade 9 (Group Interview)
R: Why do objects fall? Si: Because of the force between the earth and the object. R: What is force? Si : There are two forces. The pushing force and the pulling force. R: What is gravitational force? S2: Gravitational force is the force which holds a person or thing firmly to the earth. S3: Gravitational force acts on free falling objects. R: What is free fall? S3: Free fall is equal to Newton's when the gravitational force pulls on something falling. S4: It is when something falls in the air and hits the ground very hard. R: What is mass? S5: Mass is used to measure the weight on a scale.
Mass is the quantity of force acting on an object. Mass is measured in kilograms.
R: What is weight? Si: Something heavy has weight, people have weight, but a feather is weightless. S5: Weight is mass. S2: Weight is when somebody weighs too much. He is fat. R: Is mass and weight the same thing? Si: Weight is how heavy something is. S6: Mass is the measurement of volume S3: Mass is weight.
R: Is weight a force? S2: No. A force is a push or a pull and weight is like mass.
R: Does the book on the table have weight? Si: Yes. The mass of the book on the table is the weight R: What do you understand by free fall?
When something falls from a high place and you see how long it takes to reach the ground.
It's when you are pulled down towards the earth. When an object falls without any resistance.
R: What resistance effects a falling body. S4: Air resistance. R: You said an object falls without any resistance. What resistance are you referring to? S4 Air resistance. R: Does an object like the book on the table, exert a force on the table.
Yes. It is made heavy by gravity. Yes, the gravitational pull is pulling the book down.
R: What will be the reaction force to the gravitational pull? It will be the force of the table on the book. The book is resting on the table, therefore it exerts a force on the
table.
Individual interview Ex- HOR- grade 9
R: Why do objects fall? Si: When things fall in air, there is no force stopping it. R: What makes it fall? Si: When it falls, it only goes down, it does not go up. R: What pushes it down. Si: I Think because the weight becomes bigger. R: Why does the weight become bigger? Si: Because as something falls, gravity becomes bigger. R: What is weight? Si: Weight is the amount of force in something. R: What is force? Si: It is when you push something over a distance. R: What is gravitational force? Si: It is when something pushes on the earth. R: Is weight and gravitational force the same thing? Si: Weight is gravitational force. R: What is mass?
Si: Mass is the amount of volume that must be measured. R: What is free fall? Si: When something falls in the air, without anything stopping it. R: When something falls in the air what are the forces acting on it? Si: gravity R: Are there any other forces besides gravity? Si: There are no other forces. R: When a book lies on the table, what is the reaction force to the weight of the book. Si: It is the force of the book on the table. R: What is weight of the book? Si: Weight is the force in the book. R: What do you understand by free fall?
When you are falling through the air, because you are being pulled by the gravitation of the earth. R: When you are falling through the air, what are the forces acting on you? Si: There is always gravity, but you have to push through the air particles before hitting the ground. R: In what directions is the air pushing? Si: It is pushing upwards. R: In which direction is gravity pushing? Si: It is pushing downwards. R: When two objects of different masses are dropped from the same height above the ground, How do they hit the ground? S 1: They hit the ground at the same time because gravity does not decide on mass, it exerts a force on all things the same way.
R: What is the reaction force to the weight of the book on the table? Si: No. There is no reaction force.
Group interview (ex-TED)-gradel2
R: Why do objects fall? Si: Because of the force of gravity R; What is the force of gravity?
The pull of the earth. R: What is force? Si: Force is a push or a pull.
The weight of an object R: What do you understand by weight?
Weight is the force of attraction on an object S2: Weight is also the force with which the earth attracts an object. R: Is weight and gravitational force the same thing? S2: Force of gravity is the attractive force of the earth, differing from place to place and measuring 9,8 ms 2 .
No.weight is the earth's force on an object. Gravitational force is gravity. R: What is gravity?
gravity is the force of attraction of the earth. R: Is weight and mass the same thing?
No. Weight is a force and mass is the amount of matter in an object. R: When a heavy and a light object are dropped from the same height above the ground in the absence of air friction. Which one hits the ground first?
they hit the ground at the same time in the absence of air friction. S2: I think the heavier one reaches the ground first because it has more weight.
R: What do you understand by free fall? When there is no air resistance. In free fall gravity is constant but there is air resistance. When objects fall with zero velocity. Free fall is the gravitational
force. R: When a parachute falls through air what are the forces acting on the parachute? Si: Gravity downwards and air resistance upwards. R: Describe what happens to these forces as the parachute falls.
The forces stay the same. The object falls because the force of gravity is greater than the force
of air resistance , when the object falls the upward force of air resistance increases until it is equal to the force of gravity when they are equal the resultant force is zero and the object stops in air. R: What happens to the resultant force when the object falls.
It remains the same. Yes it must remain the same because gravity is a constant and air resistance remains the same.
It does not remain the same. It decreases until zero when the object stops. R: What happens to the velocity when the object falls?
S3: It supposed to increase. Okay, the velocity decreases because the resultant force decreases. R: What happens to the acceleration Si: It remains the same because gravity is a constant S3: It should decrease. R: Does the acceleration increase, decrease, or remain the same? Si: It remains the same. S2: It increases because the velocity increases. S3: It decreases because the resultant force decreases. : How does the velocity change when the acceleration changes?
S3: When the acceleration decreases the velocity decreases S2: Acceleration increases as the velocity increases. R: What would you expect about the relationship between force and velocity. S4: Force is directly proportional to velocity because when the velocity increases the acceleration increases.
R: An object thrown from the top of a building reaches a maximum height and then falls to the ground. When the object rises in what direction does gravity is act? S5: It always acts downwards. R: When the object reaches maximum height what is the direction of gravity? S3: Still downwards R: What will the value of gravity be when the object stops at maximum height before falling? S2: 10 R: Describe the forces exerted by the book on the table S5 : The book exerts a force on the table. R: Does the table exert a force back on the book?
Yes R: When a ball hits the wall does the wall hit back on the ball?
Yes. It does hit back because for every action there is an equal and opposite reaction. R: When a car speeds up, does the resultant force acting on the car increase, decrease or remains the same?
It always increases R: When a car moves at a constant velocity what can you deduce about the resultant force acting on it? Si: It will be zero. R: What can you deduce about the relationship between force and velocity?
S5: Force is always directly proportional to velocity. R: Will there always be a resultant force acting on moving objects? S3: Yes, there must be a force acting otherwise the object won't move. Only when the object stops then there will be no force.
Grade 12 individual interview (ex-TED)
R: Why do objects fall? Si: The earth attracts objects towards it. R: How does the earth do this? Si: It is the force of gravity. R: What is this force of gravity? Si: The force with which the earth attracts objects towards it. R: How is this force related to weight? Si: They are not the same. R: How is mass related to weight and gravitational force? Si: Mass is how heavy a substance is and it is measured in grams or kilograms etc. weight and gravitational force are also how heavy something is but it is measured in Newton's.
R: when two balls of different masses are dropped from the same height above the ground which one hits the ground first? Si: They fall at the same time R: Why do they fall at the same time? Si: gravity is the same. R: When a heavy and a light object are dropped from the same height above the ground in the absence of air friction. Which one hits the ground first? Si: The heavier one will hit the ground first. R: What makes you think so? S1 : Because it has more mass and therefore more weight. Generally objects which have more weight reach the ground first because they have a greater force of gravity. R: What do you understand by free fall? Si: There is no frictional force and there is a constant acceleration of 10 MS
-2
R: When a book lies on a table, does the book exert any force?
Si: Yes. The book exerts a force on the table. R: Does the table exert any force on the book? Si: Yes the table exerts a force on the book. R: When a ball hits the wall, does the wall hit back on the wall?
Yes. Why do you say so? Si: Because the ball bounces back.
R: Describe the forces acting on a car when it speeds up? S 1: As the car goes faster the frictional force increases, and the resultant force increases. R: How does the resultant force increase as a result of the frictional force? Si: The frictional force increases because the force pushing the car forward increases
R: When a car moves at a constant speed of 20 ms -1 Is there a resultant force acting on the car? Si: Yes, there is a resultant force R: Why? Si: Otherwise the car won't move. R: What is the relationship between force and velocity? Si: Velocity increases with force. R: Is there always a force acting on a moving object? Sl:Yes. Even when it stops. When it stops the forces balance out. R: When a lift moves upwards, does the resultant force acting on a person standing on a bathroom scale on the floor of he lift, increases, decreases, or remains the same? Si: It increases because when you move upward you resist the upward force.
Group interview with ex- HOD grade 12 students on forces and motion
R: What do you understand by weight? Si: Mass is the weight of an object.
Mass is how much an objects weighs R: What would you say weight is?
Weight is the downward force on an object Si: Weight is the force acting on an object
It could also be the force of gravity on an object. R : What is the force of gravity S4: It is a downward force acting on an object. R: Is weight and gravity the same thing? S3: The force of gravity is a downward force acting on an object. Weight is a force acting on an object. R: In what direction does weight act?
It acts downwards.
Si: Weight and gravity are the same forces acting downwards. R: When an object is dropped what happens to it?
It falls freely R: What do you understand by free fall? S2: It is how fast an object falls. S4: When an object falls because of the pull of gravity R: What is the pull of gravity? S3: It is the weight of an object. R : Is there a force of air friction when the object falls Si: There should be a force of air friction R: When an object falls freely is there air friction? S3: There is air friction when an object falls freely S2: I agree with him. R: What happens to an object falling in the presence of air friction?
Si : It starts falling slower R : Why does it fall slower?
Air friction acts upwards on the falling object, causing it to slow down.
Air friction is both an upwards and down wards force. R: Why is this so? S3: Because when object goes down air friction acts downwards on it, and when an object hits the ground air friction acts upwards on it.
Air friction is upwards, air in general goes down. Si: Air friction is a downward force. S6: If an object goes up air friction acts down and when an object moves down air friction acts up. R: Explain why this is so. S6: My teacher explained that air friction always acts in the opposite direction to the motion of an object. R: When two objects of different masses are dropped from the same height above the ground, describe how they hit the ground? Si: The heavier object hits the ground first, because it has more weight. R: Do you all agree with this?
It is obvious the heavier one has more weight, therefore it has to hit the ground first because it is pulled with a greater force towards the ground.. R: When an object is projected upwards, describe what happens to the object? S2: It slows down and falls. R : Why does it slow down ? S2: Because the air pushes down on it. R: At its highest point, what will its velocity be?
Si: The velocity is the highest at the top. S4: No. The velocity is zero at the top. R: What will the acceleration be at the highest point? S4: The acceleration will be zero. R: Why will the acceleration be zero? S2: Because it slows down, the velocity becomes zero and therefore the acceleration must be zero. R: When the object is in the air, what forces are acting on it? S3: The upward force keeping it moving upwards and the downward force slowing it down. R: What is the upward force? Si: The force which initially pushed it upward. R: What is the downward force? S2: It is the weight of the object. R: Let us consider an object moving on a straight horizontal surface. When a car moves on a straight horizontal road with constant velocity, there is driving force pushing it in the direction of motion and there are also opposing force such as air friction and friction between the surface and the tyres. The car moving eastwards is drawn on the chalkboard with FD shown as the driving force and FO shown as the opposing forces. The students were then asked "if the car is moving with constant velocity, what is the relationship between the two forces?"
If the car is moving in the direction as shown then the force FD must be greater than FO. R: Would you say there is a resultant force?
Yes. The resultant force is in the direction of FD. R: When will the resultant force be zero? S5: When an objects slows down.
Individual interviews (gradel2- Ex HOD)
R: Why do objects fall? Si: Because of the weight or gravity of objects. R: What is the weight of the object? Si: It is the force of attraction on a body R: What is gravity? Si: The force of the earth on a body. R: Would you say that weight and gravitational force are the same? Sl: No. R: How is mass related to weight and gravitational force? Si: Mass is how much matter there is in a substance. Weight and gravity are forces. The force of gravity is the downward force acting on an object.
R: When two balls of different masses are dropped from the same height above the ground which one hits the ground first? Si: They both hit the ground at the same time because "g" is the same. R: What do you understand by free fall? Si: In free fall you must ignore air friction. R: When a parachute falls through air, what forces act on the parachute? S 1: gravity acting downwards at 10ms and the upward force of air resistance. R: As the parachute falls what happens to these forces? Si: The force of gravity is initially greater than the force of air resistance. As they fall the forces balance out. R: What happens to the parachute? Si: He falls with terminal velocity. R: What happens to the resultant force on the parachute? Si: Gravity increases and the force of air resistance remains constant until the forces are balanced. R: What happens to the acceleration as the object falls? Si: The acceleration increases because the velocity increases R: What is the relationship between velocity and acceleration? Si: Acceleration is directly proportional to the velocity. R: What is the relationship between force and velocity? Sl: Force is always directly proportional to the velocity.
R: An object is thrown vertically upwards from the top of a building 480m above the ground. It reaches a maximum height and falls to the ground. When the object rises in which direction is gravity acting? S1 : Downwards. R: When the object stops at maximum height what is the value of the gravitational acceleration? S1: 0 R: Why? Si: Because the object is stopped
APPENDIX B:
QUESTIONNAIRE
QUESTIONNAIRE: FORCES AND MOTION PRETEST GRADE 9 STUDENTS
Name of student Group - Grade - General Science (OG) Sex: (M/F) English (1 st' 2nd, 3 rd Language)
QUESTIONNAIRE: FORCES AND MOTION POST- TEST GRADE 9
Name of student Group - Grade - General Science (OG) Sex: (M/F) English (1st' 2nd, 3rd Language)
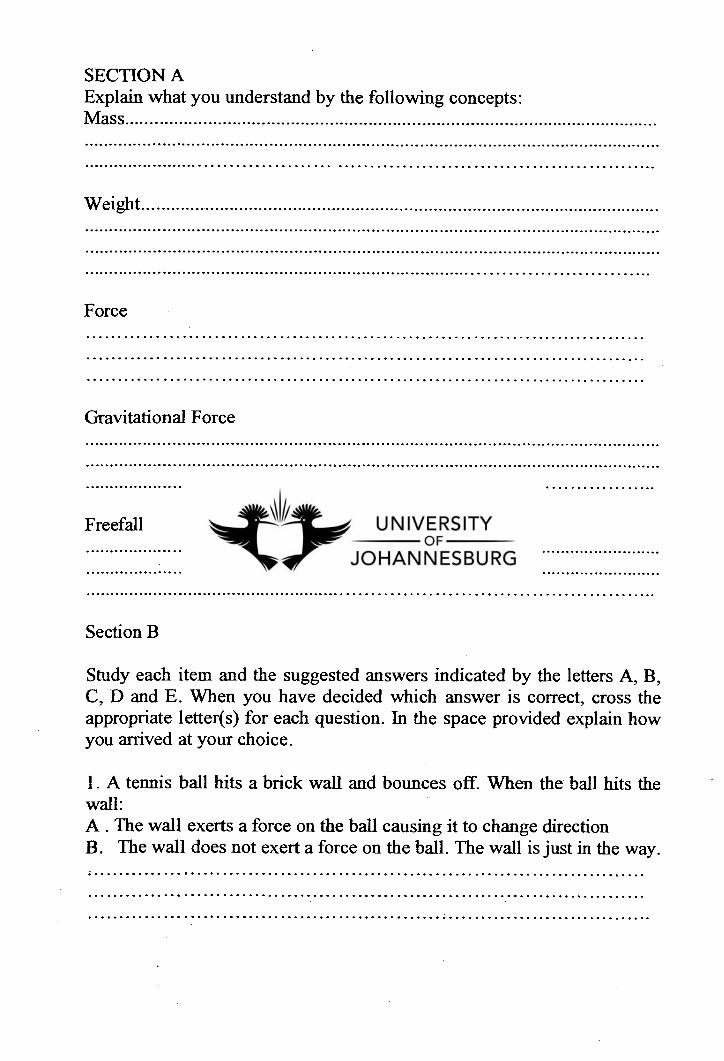
SECTION A Explain what you understand by the following concepts: Mass
Weight
Force
Gravitational Force
Freefall
Section B
Study each item and the suggested answers indicated by the letters A, B, C, D and E. When you have decided which answer is correct, cross the appropriate letter(s) for each question. In the space provided explain how you arrived at your choice.
1. A tennis ball hits a brick wall and bounces off. When the ball hits the wall. A . The wall exerts a force on the ball causing it to change direction B. The wall does not exert a force on the ball. The wall is just in the way.
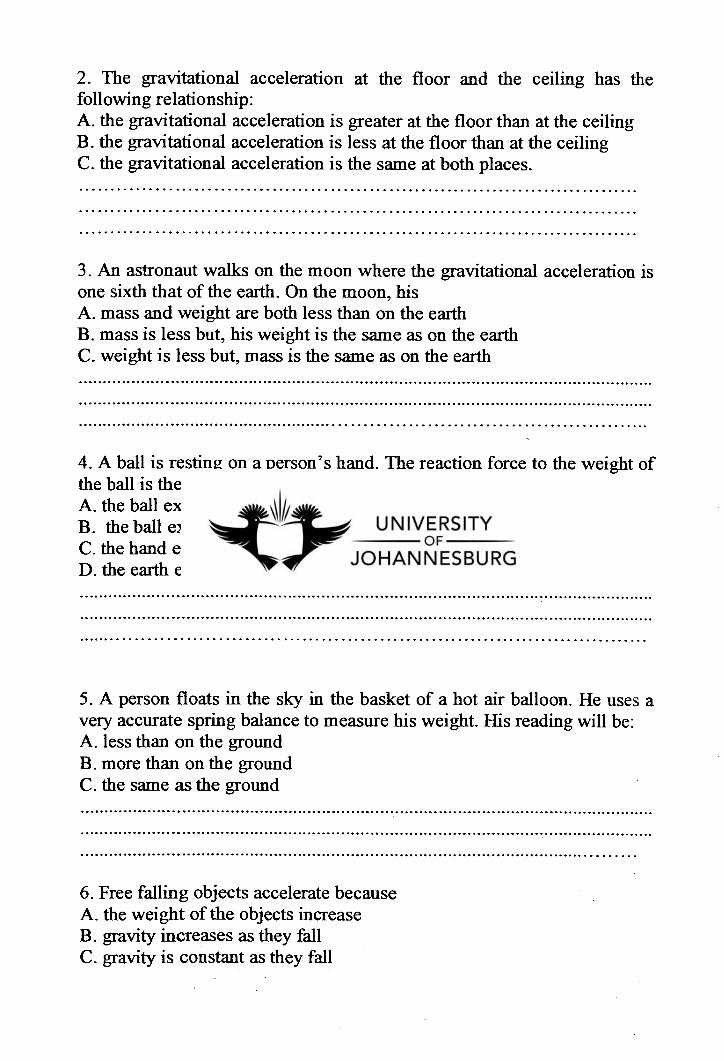
2. The gravitational acceleration at the floor and the ceiling has the following relationship:
the gravitational acceleration is greater at the floor than at the ceiling the gravitational acceleration is less at the floor than at the ceiling the gravitational acceleration is the same at both places.
3. An astronaut walks on the moon where the gravitational acceleration is one sixth that of the earth. On the moon, his
mass and weight are both less than on the earth mass is less but, his weight is the same as on the earth weight is less but, mass is the same as on the earth
4. A ball is resting on a person's hand. The reaction force to the weight of the ball is the force which the
the ball exerts on the earth the ball exerts on the hand the hand exerts on the ball the earth exerts on the ball.
5. A person floats in the sky in the basket of a hot air balloon. He uses a very accurate spring balance to measure his weight. His reading will be:
less than on the ground more than on the ground the same as the ground
6. Free falling objects accelerate because the weight of the objects increase gravity increases as they fall gravity is constant as they fall

D. the gravitational force increases
7. A stone falls freely from a height of between one and two meters. Which of the following would happen to the stone?
Gravity is a constant force and the only force acting on the stone. Gravity increases gradually and is the only force acting. Gravity is a constant force and there is also an upward force, which is
gradually reduced. Gravity is a constant force and there is also an upward force, which is
gradually increased. Gravity is a constant force and there is also a downward additional
force that increases gradually
8. Two different masses are dropped from the same height above the ground. In the absence of air resistance, they reach the ground as follows:
the greater mass reaches the ground first the smaller mass reaches the ground first they reach the ground at the same time
9.The minimum force required to lift a mass of 40 kg to a height of 4m is
= 400 N > 400N < 400N
10. A car continues in uniform motion in a straight-line. There are forces acting on the car. A is a driving force. B is a force, which impels the car
backwards, such as air resistance, or frictional force. The relationship between the forces A and B is:
A. A< B
B. A --B C. A>B
QUESTIONNAIRE: FORCES AND MOTION GRADE 12 STUDENTS PRETEST
Name of student
Group . Grade . Physical Science (HG/SG) Sex: Male Female English (1' 2nd, 3rd Language)
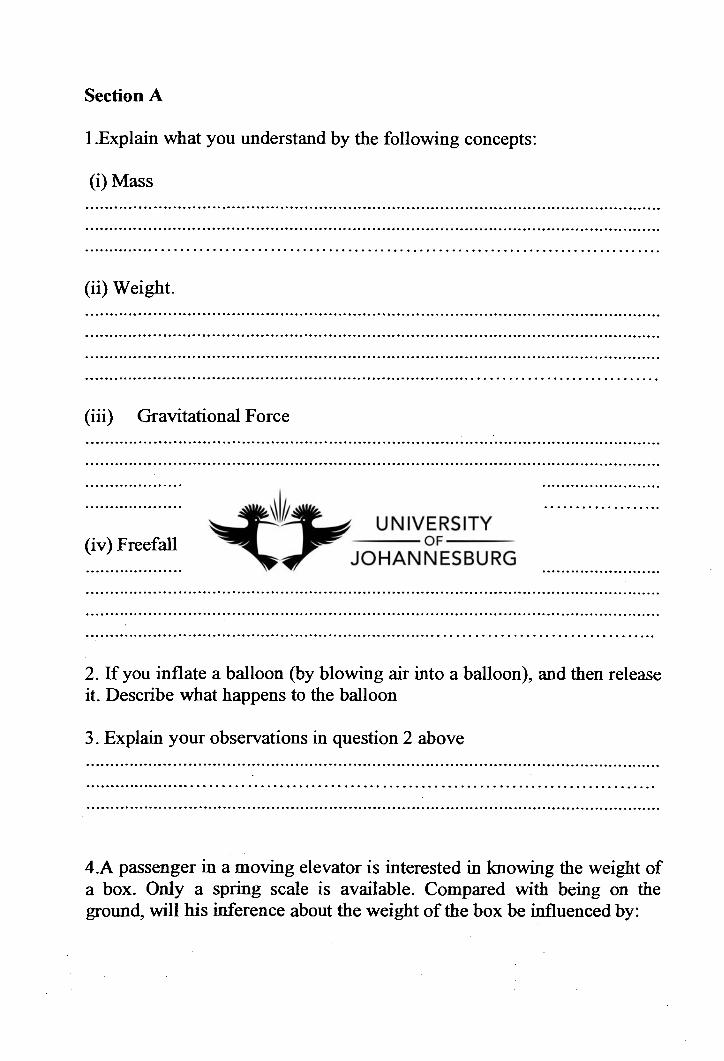
Section A
1.Explain what you understand by the following concepts:
Mass
Weight.
Gravitational Force
(iv) Freefall
If you inflate a balloon (by blowing air into a balloon), and then release it. Describe what happens to the balloon
Explain your observations in question 2 above
4.A passenger in a moving elevator is interested in knowing the weight of a box. Only a spring scale is available. Compared with being on the ground, will his inference about the weight of the box be influenced by:
the accelerated movement of the elevator upwards?
The constant speed movement of the elevator downwards?
Section B
Study each item and the suggested answers indicated by the letters A, B. C, D and E. When you have decided which answer is correct, cross the appropriate letter for each question. In the space provided explain how you arrived at your choice.
1.You hit a brick wall as hard as you can with your fist. When your fist hits the wall: A.the wall exerts a force on your fist B.the wall does not exert a force on your fist
2. An astronaut walks on the moon where the gravitational acceleration is one sixth that of the earth. On the moon, his
Mass and weight are both less than on the earth Mass is less but, his weight is the same as on the earth Weight is less but, mass is the same as on the earth
3. A ball is resting on a person's hand. The reaction force to the weight of the ball is the force which the
the ball exerts on the earth the ball exerts on the hand the hand exerts on the ball the earth exerts on the ball.
4. A person floats in the sky in the basket of a hot air balloon. He uses a very accurate spring balance to measure his weight. His reading will be:
less than on the around more than on the ground the same as the ground
5. Free falling objects accelerate because
the weight of the objects increase gravity increases as they fall gravity is constant as they fall the gravitational force increases
6. A stone falls freely from a height of between one and two meters. Which of the following would happen to the stone?
A.Gravity is a constant force and the only force acting on the stone. B.Gravity increases gradually and is the only force acting.
Gravity is a constant force and there is also an upward force, which is gradually reduced.
Gravity is a constant force and there is also an upward force, which is gradually increased.
Gravity is a constant force and there is also a downward additional force that increases gradually
7. Two different masses are dropped from the same height above the ground. In the absence of air resistance, they reach the ground as follows:
the greater mass reaches the ground first the smaller mass reaches the ground first they reach the ground at the same time
8.The minimum force required to lift a mass of 40 kg to a height of 4m is = 400 N > 400N < 400N
9. A man places a bathroom scale on the floor of a stationary lift, and stands on the scale. His weight reading is 700 N. When the lift accelerates upwards, his weight reading will :
increase remain constant decrease
10. A car is speeding up at a constant acceleration of 2ms- 2 . The velocity of the car increases because:
A.The resultant force of the car increases The resultant force of the car decreases The resultant force of the car remains constant.
11. A car continues in uniform motion in a straight line. There are forces acting on the car. A is a driving force. B is a force, which impels the car backwards, such as air resistance, or frictional force. The relationship between the forces A and B is:
A. A< B
B. A=B C. A>B
12. A car is moving in a straight line with a velocity of 20 ms -1 . In order for the magnitude of the velocity of a second car relative to the first to be 30ms-1 the second car could be possibly moving at:
A.10ms-1 relative to the ground in the same direction as first car. B.10ms-lrelative to the ground in the opposite direction as first car. C.50ms-lrelative to the ground in the same direction as the first car. D.50 ms-l relative to the ground in the opposite direction as the first car.
The information supplied here must be used for questions 13 and 14 .A balloon is ascending upward with a velocity of 20ms -1 .When the balloon is 400m above the ground, a stone is dropped from it.
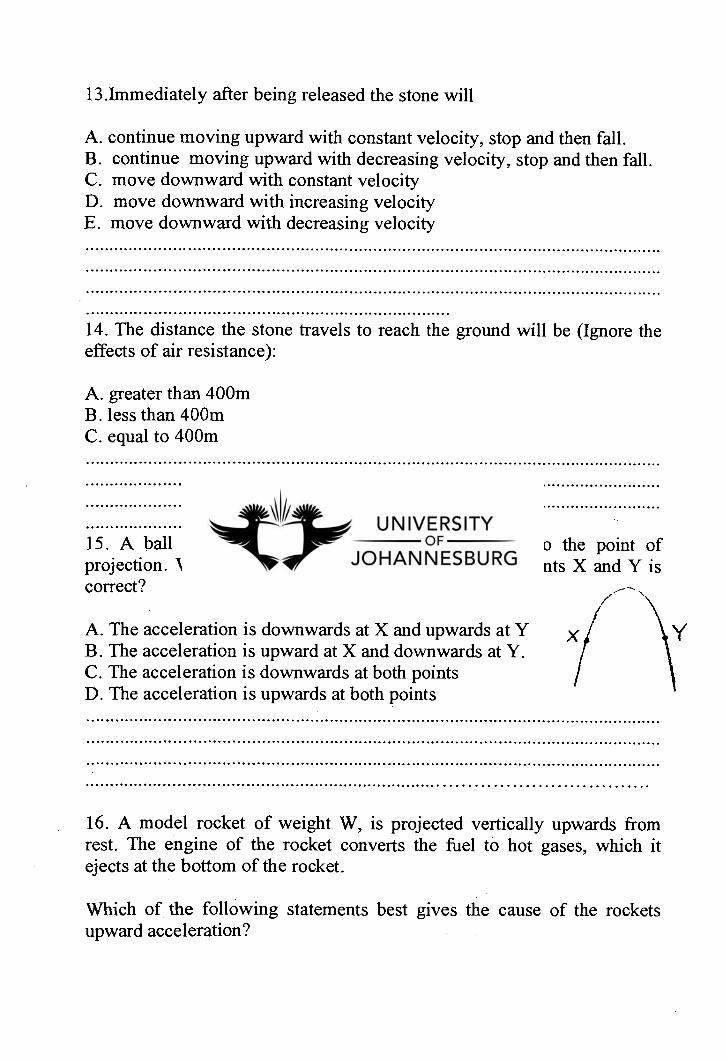
13.Immediately after being released the stone will
continue moving upward with constant velocity, stop and then fall. continue moving upward with decreasing velocity, stop and then fall. move downward with constant velocity move downward with increasing velocity move downward with decreasing velocity
14. The distance the stone travels to reach the ground will be (Ignore the effects of air resistance):
greater than 400m less than 400m equal to 400m
15. A ball is thrown vertically upwards and returns to the point of projection. Which statement about the acceleration at points X and Y is correct?
The acceleration is downwards at X and upwards at Y The acceleration is upward at X and downwards at Y. The acceleration is downwards at both points The acceleration is upwards at both points
16. A model rocket of weight W, is projected vertically upwards from rest. The engine of the rocket converts the fuel to hot gases, which it ejects at the bottom of the rocket.
Which of the following statements best gives the cause of the rockets upward acceleration?
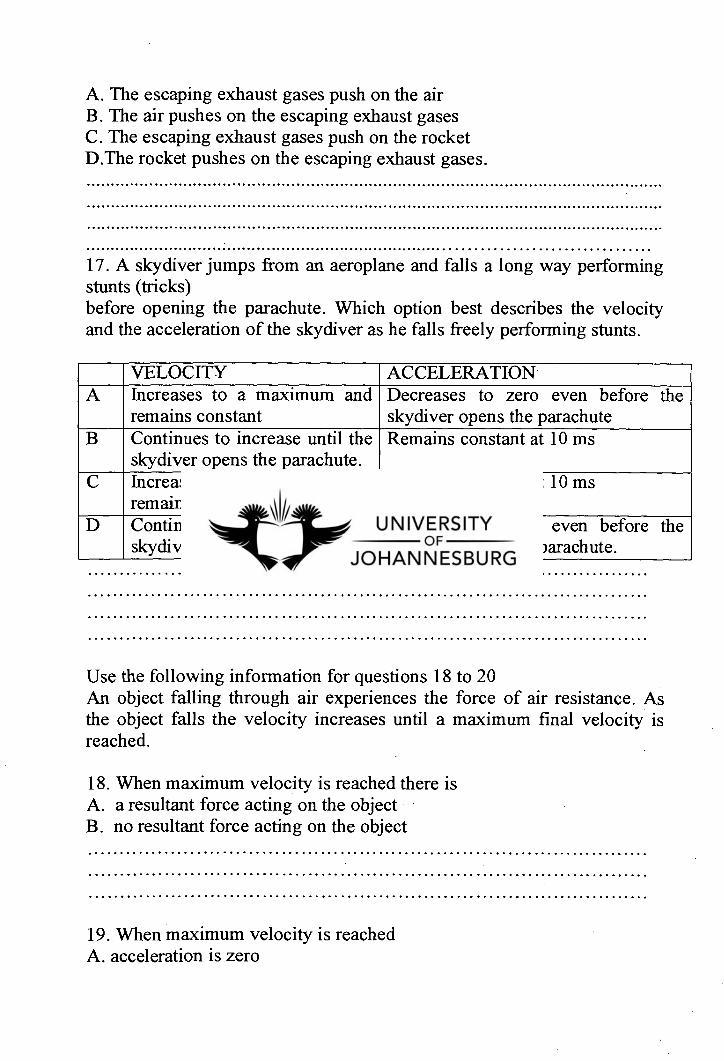
The escaping exhaust gases push on the air The air pushes on the escaping exhaust gases The escaping exhaust gases push on the rocket
D.The rocket pushes on the escaping exhaust gases.
17. A skydiver jumps from an aeroplane and falls a long way performing stunts (tricks) before opening the parachute. Which option best describes the velocity and the acceleration of the skydiver as he falls freely performing stunts.
VELOCITY ACCELERATION A Increases to a maximum and
remains constant Decreases to zero even before the skydiver opens the parachute
B Continues to increase until the skydiver opens the parachute.
Remains constant at 10 ms
C Increases to a maximum and remains constant
Remains constant at 10 ms
D Continues to increase until the skydiver opens the parachute
Decreases to zero even before the skydiver opens the parachute.
Use the following information for questions 18 to 20 An object falling through air experiences the force of air resistance. As the object falls the velocity increases until a maximum final velocity is reached.
18. When maximum velocity is reached there is a resultant force acting on the object no resultant force acting on the object
19. When maximum velocity is reached A. acceleration is zero
the acceleration is constant and greater than zero. velocity is zero
20.When maximum velocity is reached
A.the force of air resistance is greater than the force of gravity B.the force of air resistance is less than the force of gravity C.the force of air resistance is equal to the force of gravity
QUESTIONNAIRE: FORCES AND MOTION- GRADE 12 STUDENTS POST-TEST
Name of student
Group - Grade Physical Science (HG/SG) Sex: Male Female
English (1 st' 2nd, 3 rd Language)
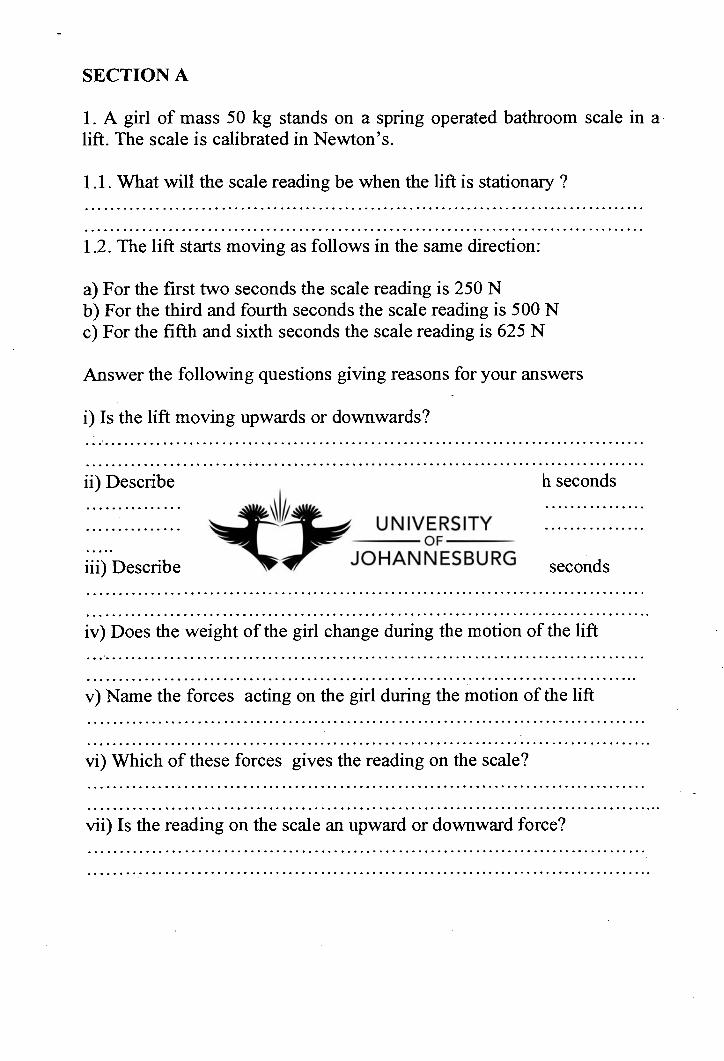
SECTION A
1. A girl of mass 50 kg stands on a spring operated bathroom scale in a lift. The scale is calibrated in Newton's.
1.1. What will the scale reading be when the lift is stationary ?
1.2. The lift starts moving as follows in the same direction:
For the first two seconds the scale reading is 250 N For the third and fourth seconds the scale reading is 500 N For the fifth and sixth seconds the scale reading is 625 N
Answer the following questions giving reasons for your answers
Is the lift moving upwards or downwards?
Describe the motion of the lift during the third and fourth seconds
Describe the motion of the lift during the fifth and sixth seconds
Does the weight of the girl change during the motion of the lift
Name the forces acting on the girl during the motion of the lift
Which of these forces gives the reading on the scale?
Is the reading on the scale an upward or downward force?
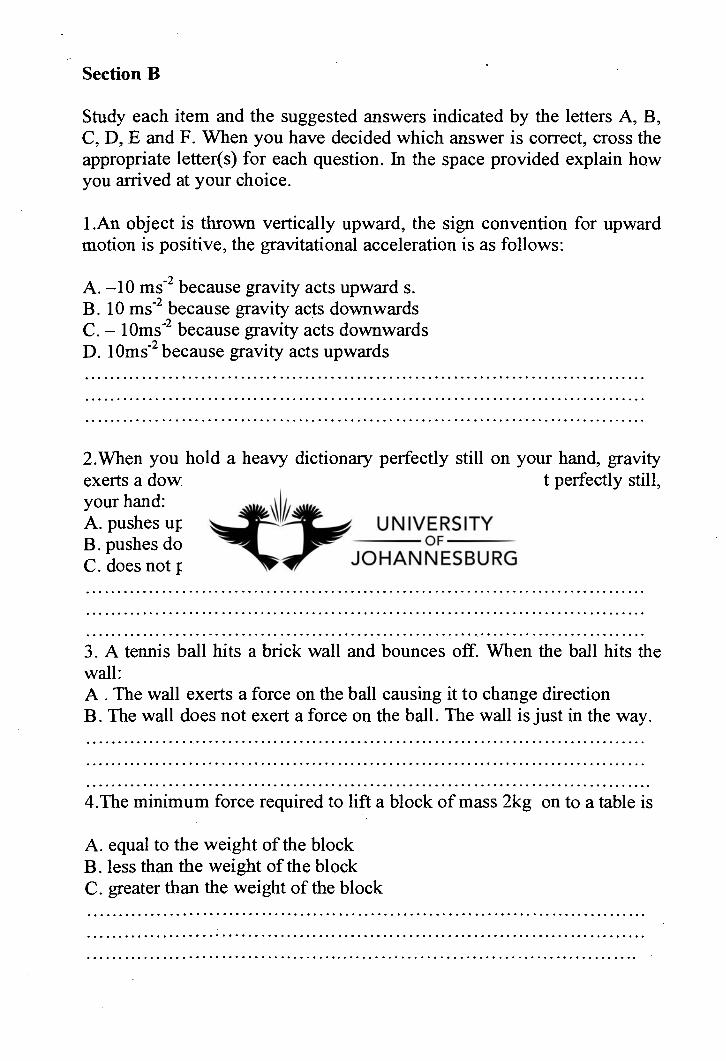
Section B
Study each item and the suggested answers indicated by the letters A, B, C, D, E and F. When you have decided which answer is correct, cross the appropriate letter(s) for each question. In the space provided explain how you arrived at your choice.
1.An object is thrown vertically upward, the sign convention for upward motion is positive, the gravitational acceleration is as follows:
—10 ms-2 because gravity acts upward s. 10 ms-2 because gravity acts downwards — 10ms-2 because gravity acts downwards 10ms-2 because gravity acts upwards
2.When you hold a heavy dictionary perfectly still on your hand, gravity exerts a downward force on the dictionary. When holding it perfectly still, your hand:
pushes up on the dictionary pushes down on the dictionary does not push on the dictionary
3. A tennis ball hits a brick wall and bounces off. When the ball hits the wall: A . The wall exerts a force on the ball causing it to change direction B. The wall does not exert a force on the ball. The wall is just in the way.
4.The minimum force required to lift a block of mass 2kg on to a table is
equal to the weight of the block less than the weight of the block greater than the weight of the block
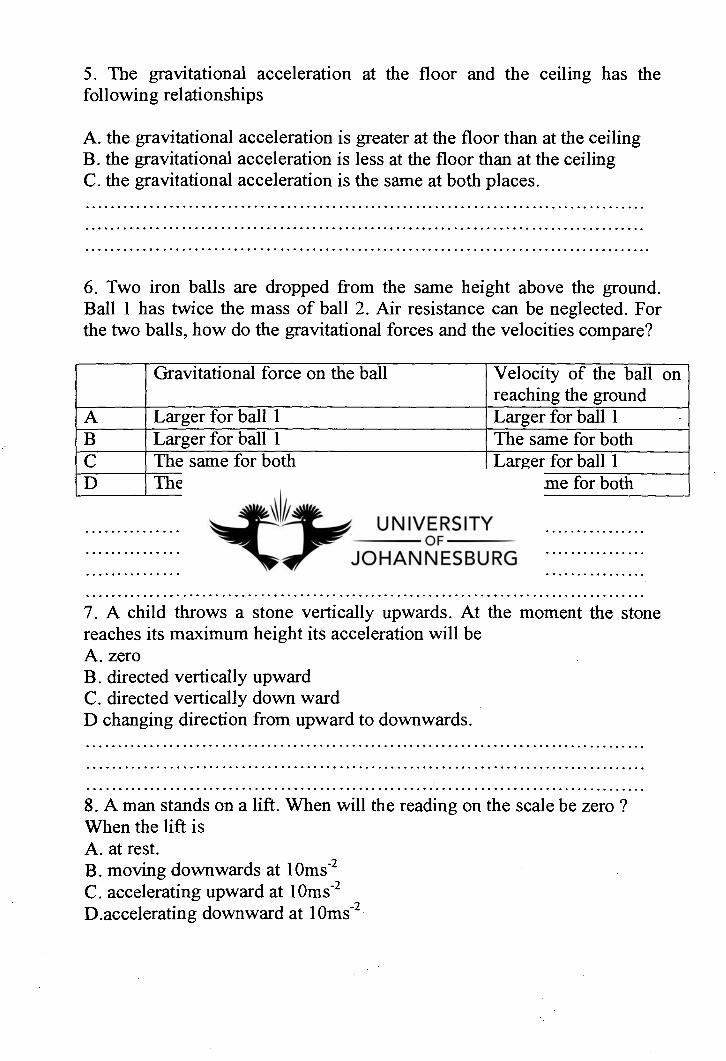
5. The gravitational acceleration at the floor and the ceiling has the following relationships
the gravitational acceleration is greater at the floor than at the ceiling the gravitational acceleration is less at the floor than at the ceiling the gravitational acceleration is the same at both places.
6. Two iron balls are dropped from the same height above the ground. Ball 1 has twice the mass of ball 2. Air resistance can be neglected. For the two balls, how do the gravitational forces and the velocities compare?
Gravitational force on the ball Velocity of the ball on reaching the ground
A Larger for ball 1 Larger for ball 1 B Larger for ball 1 The same for both C The same for both Larger for ball 1 D The same for both The same for both
7. A child throws a stone vertically upwards. At the moment the stone reaches its maximum height its acceleration will be
zero directed vertically upward directed vertically down ward
D changing direction from upward to downwards.
8. A man stands on a lift. When will the reading on the scale be zero ? When the lift is
at rest. moving downwards at 10ms -2 accelerating upward at 10ms -2
D.accelerating downward at 10ms-2
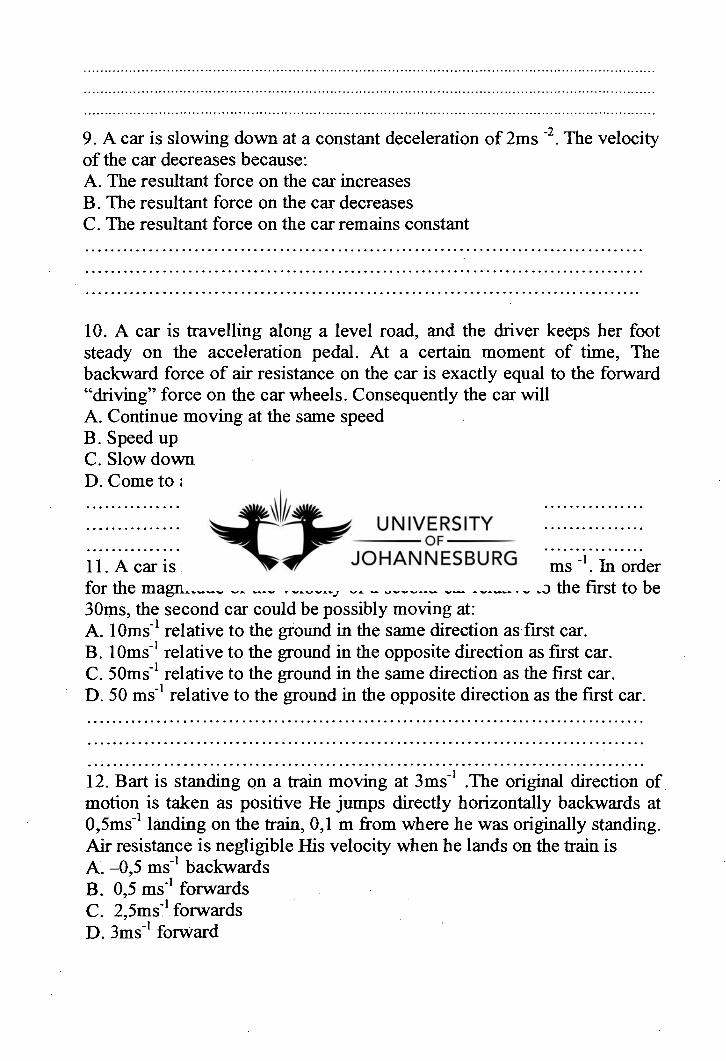
9. A car is slowing down at a constant deceleration of 2ms -2 . The velocity of the car decreases because:
The resultant force on the car increases The resultant force on the car decreases The resultant force on the car remains constant
10. A car is travelling along a level road, and the driver keeps her foot steady on the acceleration pedal. At a certain moment of time, The backward force of air resistance on the car is exactly equal to the forward "driving" force on the car wheels. Consequently the car will
Continue moving at the same speed Speed up Slow down Come to a stand still.
11. A car is moving in a straight line with a velocity of 20 ms -1 . In order for the magnitude of the velocity of a second car relative to the first to be 30ms, the second car could be possibly moving at:
10ms-1 relative to the ground in the same direction as first car. 10ms-1 relative to the ground in the opposite direction as first car. 50ms-1 relative to the ground in the same direction as the first car. 50 ms-1 relative to the ground in the opposite direction as the first car.
12. Bart is standing on a train moving at 3ms -1 .The original direction of motion is taken as positive He jumps directly horizontally backwards at 0,5ms-1 landing on the train, 0,1 m from where he was originally standing. Air resistance is negligible His velocity when he lands on the train is
—0,5 ms-1 backwards 0,5 ms-1 forwards 2,5ms-1 forwards 3ms-1 forward
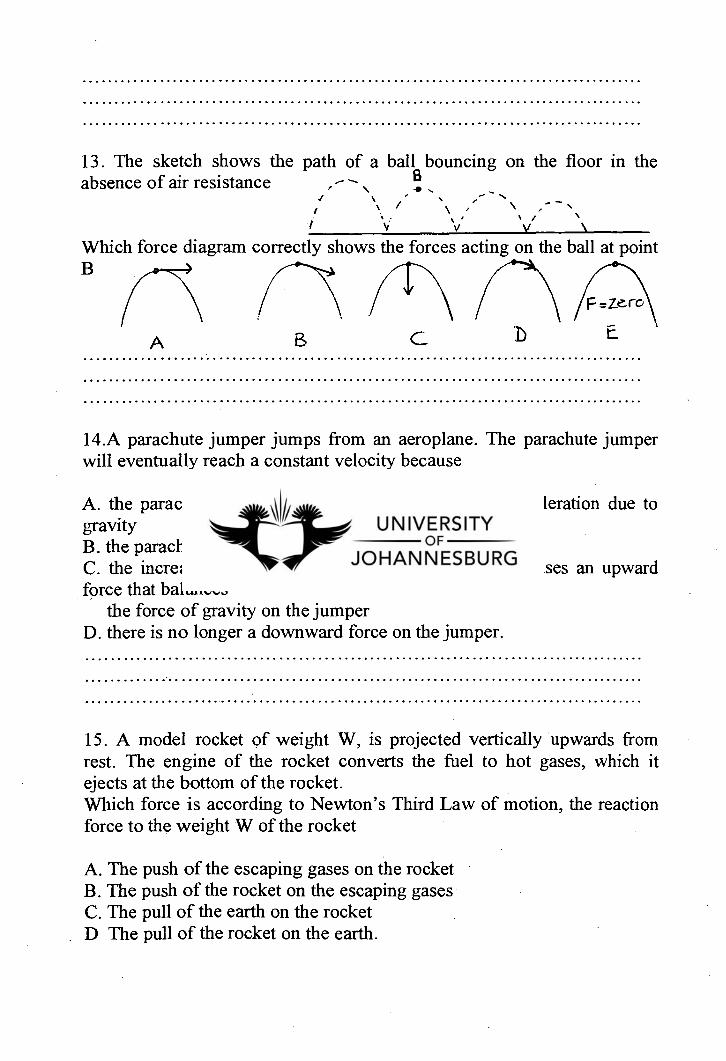
13. The sketch shows the path of a ball bouncing on the floor in the absence of air resistance
F
I •
• \ /
V V
Which force diagram correctly shows the forces acting on the ball at point B
E.
A
C
14.A parachute jumper jumps from an aeroplane. The parachute jumper will eventually reach a constant velocity because
the parachute causes a force that neutralizes the acceleration due to gravity
the parachute reduces the effective mass of the jumper the increased air friction caused by the parachute causes an upward
force that balances the force of gravity on the jumper there is no longer a downward force on the jumper.
15. A model rocket of weight W, is projected vertically upwards from rest. The engine of the rocket converts the fuel to hot gases, which it ejects at the bottom of the rocket. Which force is according to Newton's Third Law of motion, the reaction force to the weight W of the rocket
The push of the escaping gases on the rocket The push of the rocket on the escaping gases The pull of the earth on the rocket
D The pull of the rocket on the earth.
The information supplied here must be used for 16 and 17 .A balloon is ascending upward with a velocity of 20ms -1 . When the balloon is 400m above the ground, a stone is dropped from it. (Ignore air resistance)
16. Immediately after being released the stone will
continue moving upward with constant velocity continue moving upward with decreasing velocity move downward with constant velocity move downward with increasing velocity move downward with decreasing velocity
17. The distance the stone travels to reach the ground will be (Ignore the effects of air resistance):
greater than 400m less than 400m equal to 400m
Use the following information for questions 18 to 21 An object falling through air experiences the force of air resistance. As the object falls the velocity increases until a maximum final velocity is reached. 18.When the velocity increases, the acceleration due to gravity
increase decrease remain the same
19.When the velocity increases does the acceleration on the object
A.increase decrease remain the same
20.The force of air resistance on the object acts downwards increasing downwards decreasing upwards increasing upwards decreasing downward and constant upward and constant
21.A workman standing on a scaffold lowers an object of weight 300N by means of a rope at constant speed. If the weight of the rope is negligible, the force that the man exerts is
equal to 300N constant and less than 300N greater than 300N less than 300N and decreasing
22 The weight of an object on the earth is 360N.The mass of the same object on the moon is
more than the mass of the object on the earth the same as the mass of the object on the earth. less than the mass of the object on the earth.

APPENDIX C:
INTERVENTION PROGRAMME
APPENDIX C
INTERVENTION PROGRAMME INTRODUCTION
Grades 9 and 12 students were divided into groups A, B, C, D and E. Grade 9 students in each group discussed some of the tasks given to them as indicated below for about 20 minutes, while on a different day the grade 12 students' discussed some of the tasks for about 40 minutes. After the discussions the grade 9 students reported back for the next 40 minutes taking down summaries as the discussions and debates proceeded. The grade 12 students reported back to the entire class after discussions and debates took place for 80 minutes, students took down notes during this time. For the same questions, each group repeated the procedure a week later. This took place for all the groups. Where ever possible the questions were rotated among the groups. Where the questions were not rotated all students had the opportunity to discuss the questions of each group when the groups reported back to the entire class.
Questions for Grade 9 students Group Discussions
Group A
1.Explain what you understand by force. 2.Discuss: A fly hits the windscreen of a moving car. The fly hits the windscreen with a certain force. Does the windscreen hit back on the fly? Explain why? 3. Discuss what is the reaction to the weight of a ball falling through air.
Group B
Discuss what you understand by mass weight and gravitational force. An astronaut walks on the moon. Compare his mass and weight reading
on the moon with that on the earth. Discuss what is the minimum force required to lift a mass of 20 kg to a
height of lm.
Group C
Discuss what you understand by freefall. A stone falls freely from a height of 2 meters above the ground. Discuss
all the forces acting on the stone during freefall.
Group D
A car moves with a constant velocity of 20 ms -1 a straight road. A is the driving force acting in the direction of motion of the moving car. B is the opposing force consisting of air resistance, and the frictional force between the tyres and the surface of the road. 1.1.Discuss the relationship between the forces A and B?
A light and heavy object are thrown from the same height above the ground in the absence of air friction. Discuss the times they reach the ground.
Questions on Forces and Motion for Grade 12 Students Group Discussions
Group A
1.A girl stands on a bathroom scale on the floor of a lift. Her weight reading is 700 N.
1.1How will the scale reading change when the lift moves upwards?
the lift still moving upwards, moves with constant velocity the lift still moving upwards, slows down the lift still moving upwards, speeds up
1.1.1 Name the forces acting on the girl during the motion of the lift during the motions a, b and c? 1.1.2 Name the forces in 1.1.1 which is registered on the scale? 1.1.3 Is the scale reading an upward or downward force? 1.1.4 Does the weight of the girl change during the motion of the lift? 1.1.5 Answer the above questions for the downward motion of the lift.
Group B
1.Discuss what you understand by: mass, weight and gravitational force. 2.An astronaut walks on the moon . Compare his weight and mass reading on the moon with that on the earth.
Discuss what is the reaction force to the weight of a ball on a person's hand.
Discuss what will be the minimum force required to lift a mass of 20 kg to a height of lm.
A spacecraft in outer space accelerates by firing rockets. Discuss how can the hot gases escaping cause the spacecraft to accelerate if there is nothing in space for the gases to push against?
Group C
Discuss what you understand by free fall. A stone falls freely between a height of one and two metres. Discuss all
the forces acting on the stone. Also discuss the changes in the acceleration and velocity of the stone before maximum velocity is reached.
A ball is thrown vertically upwards and returns to the point of projection. Discuss the direction of the acceleration at points X and Y.
Group D
1.A car continues in uniform motion in a straight line. A is the driving force acting on the car. B is a force, which impels the car backwards, such as air resistance, or frictional force. Discuss the relationship between the forces A and B. 1.1. A car is moving in a straight line with a velocity of 20 ms -1 . In order for the magnitude of the velocity of a second car relative to the first to be 30 ms -1 . Discuss what the velocity of the second car would possibly be relative to the first car. 2. A light and heavy object are thrown from the same height above the ground in the absence of air friction. Discuss the times they reach the ground, and the velocity with which they hit the ground
Some Discussions that took place during the implementation of the Intervention programme
In the intervention programme students of each ex- department for grades 9 and 12 were divided into groups where they were given the above problems to discuss. To cite an example ex- DET grade 9 students were engaged in discussion of group D question 2 as discussed below. There were two divisions among the students in the group as some strongly believed that the heavier mass reaches the ground first and others believing they hit the ground together. After the students discussed the problem exchanging reasons, a representative from the group reported the findings of the group to the entire classroom. This resulted in further debates and discussions with students changing their views, and some being left confused.
Once the discussions were completed, the researcher demonstrated a sheet of paper and a pen being dropped from the same height above the ground, with air resistance having a greater effect on the paper resulting in the pen reaching the ground first. The researcher then took the same paper and squashed it into a ball, where air resistance had little effect or negligible effect on both the pen and the paper. The squashed paper was now dropped with the same pen from the same height above the ground, resulting in both objects reaching the ground at the same time. Thus after this session students changed their beliefs about light and heavy objects being dropped from the same height above the ground in the absence of air friction. The post-test results showed that more than 80% of the students now believed that when objects of different masses are dropped from the same height above the ground in the absence of air friction, they hit the ground at the same time.
The following are examples of discussions that took place during the implementation of the programme for grade 12 students in the ex TED school. Group D discussed the question on " A car continues in uniform motion in a straight line. A is the driving force acting on the car. B is a force, which impels the car backwards, such as resistance, or frictional force". What is the relationship between the forces A and B acting on the car? The group reporting explained that for the car to move forward the driving force A must be greater than the backward force of air resistance or frictional force. The majority of the class agreed with this view, except for a small number who said that the velocity is uniform therefore there is no acceleration and the forces A and B should be equal. However, most of the learners still believed that for the car to move forward the forward
force should be greater. The debate continued with the class divided into two groups viz. those believing the forces are equal, and those believing the forward force are greater with each group supporting their views. The researcher intervened by asking the following questions: What is the acceleration for uniform motion? Some students said zero acceleration. The researcher acknowledged by saying, "correct". Those who could not understand, asked why the acceleration is zero. Students from the class answered that in uniform velocity, the change in velocity is zero and hence the rate of change of velocity viz. acceleration is zero. The majority then agreed. Others, who did not agree were explained by means of the formula a=v-ult and f -res= ma. Hence the entire class reached consensus. Resolving the conflict meant that students gave the scientific view priority over what they expected to happen. The students were then asked to read Newton's first law from their textbook and were asked if the above situation agreed with this law. There was consensus that it agreed. The post-test results showed an improvement in students understanding of this problem.
The second question in-group D was a car is moving in a straight line with a velocity of 20 ms -1 . In order for the magnitude of the velocity of a second car relative to the first car to be 30 ms -I , students had to discuss what the velocity of the second car would be relative to the ground. The group reporting said they did not understand the part of the question referring to the second velocity relative to the first. The researcher then posed the question if you are in that first car "what is your velocity relative to the ground?" the students answered 20 ms -1 . The researcher then asked, "what is your velocity relative to the car you are in?" The students correctly answered 0 ms -1 . The group reporting, reported to the entire class their answer as 50 ms -1 relative to the ground in the direction of the first car. The researcher then asked the students if there were any other possibilities, the students replied that there were no other possibilities. The researcher then asked what about a second car moving in the opposite direction. The students then replied that in the opposite direction the car would be moving at 50 ms -1 . Some students opposed the answer, while those agreeing said that the cars would be moving in opposite directions and the differences in velocities would be 30ms -1 . Those opposing the answer said that the velocities would be relative to the ground and not relative to the first car. Hence all agreed. Students could not resolve the problem and asked the researcher for clues. The researcher asked the students "how about using sign conventions" the students began by taking the direction of the first car as positive, and the direction of the
second in the opposite direction as negative. A few students then went on to say that the differences in the two velocities must be 30 ms -1 . A few students then reasoned out that the velocity of the second car should be — 10ms-1 ( i.e. 10ms-1 relative to the ground in the opposite direction as the first car) if the first car is moving at 20ms -1 . Hence the differences in the two velocities must be 30 ms-1 because for every 10ms -1 the second car moves in its direction the first car moves 20ms -1 in the opposite direction. Hence the velocity of the second car relative to the first is 30ms -1 * Then there were those students who could not understand why the velocity of the second car should be 10ms -1 in the opposite direction relative to the ground, for it to be 30 ms-1 relative to the first car. The students who resolved the question by using sign conventions could not explain any further . The researcher then intervened by drawing a diagram representing the two cars moving in opposite directions viz.
10 ms-1 20 ms-1
• and asked the students "what distance does the second car travel in one second?" the answer given was 10m , the researcher then asked "in the same second", "what distance did the first car travel? The answer given was 20m. The researcher then asked "in that same second", "what was the total distance travelled?,. the students answered 30m.The researcher then asked in what time was the 30m covered? The students answered one second. The researcher then asked "what was the velocity of the second car relative to the first?" and the answer given by the students was 30m divided by lsecond, which is 30 ms-1 the relative to the first car.
The same pattern of discussion took place for the other questions of all the groups for all ex-departments. Where students were moving in wrong directions in their discussions the researcher intervened by asking questions leading them along the correct ways of thinking as was discussed above. Where students changed their ideas and replaced them with correct ones, they were asked to record it. This formed the basis of the students' notes during the discussions.