stronger bayanihan - fwd ph
TRANSCRIPT

Annual Report2021
Celebrate livingfwd.com.ph
Celebrate living:
Strongerbayanihan


OverviewAbout FWD Group
About FWD Life Insurance Corporation
MessagesMessage from the Chairman of the Board
Message from the President and Chief Executive Officer
Business reviewKey business highlights
Multi-channel elite distribution network
Million Dollar Round Table
Products for changing needs
Innovative customer experience and technology
The FWD brand: passion and purpose
Our people, our values2021 Senior Management Team
Investing in our people and culture
ESG strategyEnvironmental, Social, and Governance matters
Our commitment to the community
Corporate governanceShareholders
Board of Directors
Board Committees
Compliance Officer
Office of the Corporate Secretary
A strong adherence to compliance
A proactive risk culture
Objective and independent internal audit
Audit financial statementsContact information
4
6
10
12
16
18
20
24
26
28
32
38
44
47
50
52
58
60
61
62
63
65
67
148
Table of contents

1 Includes Group office employees 2 Consists of 100% of renewal premiums, 100% of first year premiums and 10% of single premiums; it provides an indication of total premiums and the new business premiums that we have generated in the reporting period and that have the potential to generate profits for shareholders 3 Also presented as segmental adjusted operating profit before tax, it consists of profit/(loss) from continuing operations after tax adjusted to exclude (i) net loss of our company and its financing subsidiaries, PCGI Intermediate and PCGI Intermediate II Holdings, (ii) tax, (iii) short-term fluctuations in investment return related to equities and property investments and other non-operating investment return, (iv) finance costs related to borrowings and long-term payables, (v) amortization of value of business acquired, (vi) mergers and acquisitions, business set-up and restructuring-related costs, (vii) costs relating to FWD Group’s public offering of shares, including incentive costs, (viii) implemental costs for IFRS 9 and 17 and Group-wide Supervision, and (ix) any other non-operating items 4 Life insurers competing in three or more of FWD’s markets, according to NMG 2020
FWD Group is a pan-Asian life insurance business with approximately 10 million customers across 10 insurance markets, including some of the fastest growing in the world. Established in 2013, FWD Group is focused on making the insurance journey simpler, faster, and smoother through innovative propositions and easy-to-understand products supported by digital technology. Employing a customer-led approach, FWD Group is committed to changing the way people feel about insurance.
About FWD Group
4

FWD GroupOur growth across Asia: 8 years, 10 markets(As of December 2021)
Top 3 in 7 markets6
for being recognized as the most different brand
Top 3 in 6 markets6
for being recognized as the most innovative brand
Top 3 in 4 markets7
for customer experience
5 Consists of the sum of 10% of single premiums and 100% of annualized first year premiums for all new policies, before reinsurance ceded. Consistent with customary industry practice, a factor of 10% is applied to single premiums because such weighting makes the value of a single premium sale broadly equivalent to the same dollar amount of first year premiums. It provides an indicative volume measure of new policies issued in the relevant period 6 Based on 2021 full year data from Blackbox Research’s Brand Tracking Survey. Blackbox Research’s Brand Tracking Survey is conducted across 8 markets, surveying 3,200 respondents every month. To measure “Different” and “Innovative”, respondents are asked to select brands that they perceive to be “A Life Insurance provider that is different to most others” and “A Life Insurance provider with innovative services and product offerings”, respectively 7 FWD is ranked no. 1 in Vietnam and Thailand according to KPMG’s Global Customer Experience Excellence Report in 2021. FWD is ranked no. 1 and no. 2 among insurers in Singapore and Indonesia respectively according to a commissioned Customer Experience Survey conducted by KPMG in 2021
6,675 employees1 and 39,200 agents
USD63.7 billion in assets
Total premiums2 of USD6.9 billion in 2021
Total value of new business of USD686 million
Operating profit before tax3 of USD205 million in 2021
Top 5 Southeast Asian life insurers4
by new business sales5
20 bancassurance partnerships (including 8 exclusive partners) and more than 30 ecosystem partners
2021 Million Dollar Round Table (MDRT) Top 10 for multinational companies (MNCs)
Launched the first group-wide Environmental, Social, and Governance (ESG) strategy for 2021-2024
5
Overview
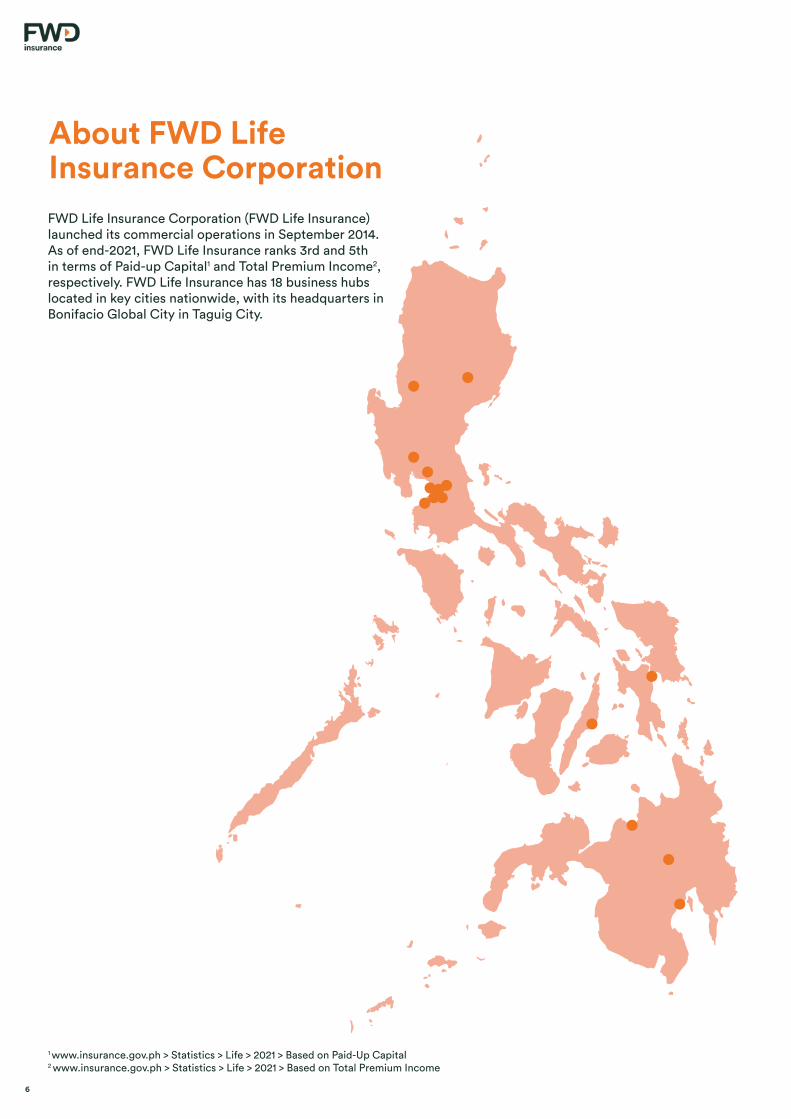
FWD Life Insurance Corporation (FWD Life Insurance) launched its commercial operations in September 2014. As of end-2021, FWD Life Insurance ranks 3rd and 5th in terms of Paid-up Capital1 and Total Premium Income2, respectively. FWD Life Insurance has 18 business hubs located in key cities nationwide, with its headquarters in Bonifacio Global City in Taguig City.
About FWD Life Insurance Corporation
1 www.insurance.gov.ph > Statistics > Life > 2021 > Based on Paid-Up Capital2 www.insurance.gov.ph > Statistics > Life > 2021 > Based on Total Premium Income
6

January 2021Launched 3-in-1 Protection Bundle, a harmonized insurance package that combines three digital products into one
May 2021Launched FWD Family Hero, a life insurance plan with built-in investment designed for Overseas Filipino Workers (OFWs) and their families
March 2021Announced a partnership with Cebuana Lhuillier that aims to strengthen financial inclusion by making affordable FWD Life Insurance plans and digital solutions available to customers of the country’s largest micro financial services provider
September 2021Launched FWD Manifest, a Variable Universal Life (VUL) plan that provides life protection, maximum opportunity for return on investment, and multiple benefits that help fast-track financial plans
October 2021Recognized as one of Asia’s Best Employer Brands at the 29th World HRD Congress
January 2021Received the Award of Excellence in Special and Experiential Events at the 18th Philippine Quill Awards for “FWD-MCX: A Road to Progress” partnership launch
June 2021Awarded Best Fintech Solution for Customer Experience for Frankie, FWD Life Insurance’s talk bot, at the DigFin Innovation Awards
March 2021Introduced a new online feature that allows FWD customers to buy insurance plans as gifts for their loved ones
August 2021Awarded Digital Insurer of the Year (Philippines) and Digital Initiative of the Year (Philippines) for FWD Online Shop at the Insurance Asia Awards
November 2021Introduced FWD Health & Wellbeing, a health protection portfolio that employs a holistic approach to achieving better quality of life through physical, mental, emotional, social, and financial fitness
February 2021 Launched FWD Babyproof, a life insurance bundle designed to help secure a child’s future—from life protection and investment to hospital and ICU allowance
July 2021Launched newest brand campaign, #StrongerYouWithFWD, which features real people’s personal stories and experiences that promote positivity and strength
February 2021 Introduced two new funds to strengthen FWD Life Insurance protection and investment offerings: FWD Global Good ESG Fund and FWD Diversity Fund
August 2021Announced the inclusion of a COVID-19 Cash Reward, which covers in-patient treatment of COVID-19 or complications from COVID-19 vaccines, in affordable and digitally accessible insurance plans
December 2021Launched our newest chatbot, Fi, with features that include handling of inquiries, connecting customers to our 24/7 live chat, and providing insurance quotations
December 2021Ranked 5th among life insurers in the Philippines based on Total Premium Income
2021 FWD Life Insurance Milestones
7
Overview

8

Messages
9
Messages

Message from the Chairman of the Board
I am gratified that in spite of the many challenges that our company faced in 2021, FWD Life Insurance had a very respectable performance that we can all be proud of. All these achievements—despite the hardships—are only proof of our company’s spirit of bayanihan (teamwork) and prevalent virtue of malasakit (compassion). It is clear that our employees saw the need for teamwork: everyone helped to keep the operations going despite the adverse impact of this virus on our employees and agency forces. The value of malasakit has become more invaluable, particularly at this time when the pandemic has affected the families of our employees, agents, customers, and other stakeholders. The company has provided not just financial assistance to those who need it, but our employees, agents, and service providers have also gone out of their way to assist our customers who find themselves in difficult circumstances. We have heard from our customers how much they appreciate the concern that we’ve shown—and continue to show—them. FWD Life Insurance has done relatively well for the fiscal year 2021. Our 2021 net worth stands at PhP4.1 billion versus PhP3.2 billion in 2020, which yields a 28% growth. Premium income is at PhP18.8 billion, a 38% growth from last year’s PhP13.6 billion. Our total assets value of PhP43.7 billion in 2021 is a 50% growth from previous year’s PhP29.5 billion.
We likewise soared to the Top 5 based on Total Premium Income—an enviable accomplishment for a seven-year-old company. This further proves our strong operational performance and sound financial position.
In 2021, we also saw stronger products and campaigns, among them: FWD Babyproof, FWD Family Hero, FWD Manifest, FWD Global Good ESG Funds, and the COVID-19 Cash Reward, which now includes COVID-19-related coverage reward with every new purchase of digital insurance products like KanMend, KanLive, and KanGuard.
We likewise partnered with Cebuana Lhuillier to bridge the financial and protection gap covering a wider socio-economic segment of the Philippine market. Affordable insurance plans and digital solutions have been made available to Cebuana Lhuillier’s close to 30 million customers. Meanwhile, our sponsorship of Viu’s Still, the streaming media’s first Filipino original musical narrative series, highlights FWD Life Insurance as a different brand. We connect with the series’ timely and inspiring narrative and see music as a powerful instrument to connect with our customers.
FWD Life Insurance was also recognized by a number of award-giving bodies in 2021. For the fourth year in a row, we landed in the Top 3 ASEAN Corporate Governance Scorecard. The FWD Online Shop won Direct Insurer of the Year and Digital Insurance Initiative of the Year - Philippines at the Insurance Asia Awards. Our talk bot, Frankie, also won Best Fintech Solution for Customer User Experience at the DigFin Innovation Awards. We likewise received the Philippine Quill Award of Excellence in Special and Experiential Events for “FWD-MCX: A Road to Progress” and was recognized as one of Asia’s Best Employer Brand Awards at the 16th Employer Branding Awards.
Innovation has always been in FWD’s DNA. The years following the pandemic were shining examples of the importance of innovation. The pandemic accelerated our digital transformation, and we intend to exploit this advantage as much as we can. Our progress will depend to a large extent on continued innovation, and we will continue to promote and encourage it among all our employees, agents, contractors, and partners.
I commend the FWD Life Insurance Management, led by our President and CEO Mr. Li Hao Zhuang. They have not only responded positively to these challenges, they overcame them and ensured that FWD Life Insurance will continue to maintain a commendable
10

position in the life insurance industry. To our agents and financial service executives, I wish to extend my personal thanks and congratulations for your valuable contributions to the company’s growth in terms of Premium Income, Total Assets, and enterprise value. To our dear employees, we truly appreciate your hard work, commitment, and inspiring teamwork. And to our dear and valued customers, we thank you for your trust and confidence in FWD Life Insurance. Our continued growth would not be possible unless you continue to believe in us and see how we are changing the way people feel about insurance. We’re here to provide protection for you and your families and help you plan for a more secure and brighter future.
For 2022, I wish everyone good health, more success, and a safer, brighter, and better year.
Innovation has always been in FWD’s DNA. The years following the pandemic were shining examples of the importance of innovation.
Amb. Jose L. Cuisia, Jr.Chairman of the BoardFWD Life Insurance
11
Messages

Message from the President and Chief Executive Officer
Dear FWD Life Insurance family and friends,
It is indeed an extraordinary feat to be able to overcome the challenges of the past two years. As we say in FWD Life Insurance, the strongest people are born from the toughest adversities.
In 2021, we continued to play our part in providing support for a stronger community. We fulfilled our promise to protect our kababayans and paid out close to PhP600 million claims. Inspired by the relentless spirit of bayanihan, we have also donated ventilators to four hospitals—The Medical City, St. Luke’s Medical Center, Philippine General Hospital, and Lung Center of the Philippines—to help in our nation’s pandemic response. Furthermore, our sponsorship with Viu’s Still musical paid tribute to our hardworking OFWs and inspired hope among our countrymen amid the pandemic. It has also been my honor to be part of the “Heroes Edition” of CNN Philippines’ The Final Pitch and personally witness the innovative ideas of Filipino entrepreneurs on how they can help rebuild the nation post-pandemic.
In my message last year, I expressed how confident and optimistic I am about 2021. Despite the challenges we have encountered, I’m proud to share that we were able to retain our strong position in the top 10 insurers by new business premiums. Our premium income rose 38% from PhP13.6 billion in 2020. The company’s assets also saw an increase of 50% from PhP29.5 billion. All these milestones can be attributed to the hard work and dedication of our Financial Solutions Consultants and Financial Wealth Planners and Leaders. Their commitment to provide excellent service is evident in their 2021 achievements, hence the rise in our Million Dollar Round Table (MDRT) qualifiers in 2021 and a significant increase in productivity of our financial solutions consultants.
True to our vision of changing the way people feel about insurance, we also continued to expand our partnerships and agency. In just seven years, FWD Life Insurance has become one of the fastest growing insurers in the country. Our brand continues to embrace an innovative culture that allows us to create fresh customer experiences and easy-to-understand products. And we do this across all experience fronts—customer, distributor, and employee—through the following key priorities:
Customer-Centric Product Innovations We took inspiration from our customers in creating products that answer their needs. We launched new solutions like FWD Babyproof, FWD Family Hero, FWD Manifest, and FWD Global Good ESG funds. FWD Babyproof is our first life insurance bundle for babies; FWD Family Hero is a source of passive income for OFWs with protection for their family in the Philippines; and FWD Manifest is a strong VUL plan that rewards customers early on for investing more and for staying invested. FWD Global Good ESG funds are for investing in top, high-performing companies that work for a better and sustainable future. We have also added COVID-19 Cash Reward in our digital product suite for complete protection at the height of the pandemic last year. And even with the long lockdown, we celebrated our customers’ special day with our Birthday Campaign 2.0.
Strengthened Partnerships and Distribution We are always grateful for our strategic partnership with Security Bank Corporation that enabled us to manage pandemic challenges. Through our product bundling and joint analytics initiatives, we were able to expand our reach and provide more accessible protection, helping us achieve the best year yet for our Bancassurance business.
We are also very excited for the partnership we have formed with Cebuana Lhuillier, which allows us to bridge the protection gap in the Philippine market, with close to 30 million customers spread across their 2,500 branches nationwide. We now have a stronger hybrid distribution model through pawnassurance, digital channels and solutions, with a fully digitized team of advisors and brand-new insurance products.
With the support of our reliable distribution force, we have established General Agencies in key areas nationwide to further financial inclusion among Filipinos. Their hard work and passion contributed to our double-digit growth in our Agency business.
Malasakit fuels us to give coverage to more Filipinos, and it gives me deep joy to share we now have more than 300 2022 MDRT qualifiers upholding the gold standard.
1
2
12

We fulfilled our promise to protect our kababayans and paid out close to PhP600 million claims.
Enhanced Cybersecurity and Disaster ProtectionThe trust and wellbeing of both our customers and employees are our top priority, and that’s why we are building on cybersecurity and cloud migration initiatives to develop an iron-clad digital infrastructure, ensuring that the business, data and processes are all kept private, safe, and secure no matter what happens. These initiatives seek to ensure our business continuity readiness and resiliency in times of crises.
The Future of Work and Employee ExperienceWe are always creating new paths, even for our employees. We are very happy our employees choose to work with us, as reflected in our Gallup and Organizational Health Index survey results. This is even more significant considering global trends in the workplace. And this is just the beginning as we have embarked on the future of work at FWD Life Insurance—integrating technology, human-centered design, people culture, and purpose in the way we show up for each other and for our customers. We are delighted to open our newly renovated head office in Bonifacio Global City and launch our homegrown work management app, Workspace+, redefining how we work and providing both a safe and collaborative workspace to our people.
Recognitions for Tech and InnovationWe have also received a number of awards that are testament to our commitment to make insurance more accessible. We were awarded Direct Insurer of the Year and Digital Insurance Initiative of the Year for FWD Online Shop at the Insurance Asia Awards. Our talk bot Frankie, which gives welcome calls to our customers, won Best Fintech Solution for Customer User Experience at the DigFin Innovation Awards. And for the sixth time, we have been recognized as one of Asia’s Best Employer Brand.
I am grateful to all our customers and employees who made 2021 a memorable chapter for FWD Life Insurance. As the economy opens up and as the market recovers, we remain optimistic as we look forward to soaring to greater heights this 2022. With our stronger bayanihan, we can achieve more wonderful milestones together. Truly, I could not ask for a better team other than my FWD Life Insurance family.
Let us continue to empower every Filipino to truly celebrate living!
Li Hao ZhuangPresident and Chief Executive OfficerFWD Life Insurance
3
4
5
13
Messages

14

Business review
Moving onward and upward
15
Business review

Key business highlights
Despite the various economic challenges of the past two years, the power of innovation, teamwork, passion, and dedication propelled FWD Life Insurance to enjoy substantial growth in numbers in 2021.
Premium Income (PhP Billion)
Premium Income 18,825,613,904
20B
18B
16B
14B
12B
10B
8B
6B
4B
2B
0
2017
4.57
2018
Agency Banca Others
7.67
2019
9.52
2020
13.65
2021
18.82
Total Assets 43,707,968,598
45B
40B
35B
30B
25B
20B
15B
10B
5B
0
2017
9.74
2018
14.68
2019
21.17
2020
29.50
2021
43.70
Total Assets (PhP Billion)
16

Ranking based on Total Premium Income
FWD Life Insurance Market Share for New Business Annualized Premium Equivalent
Market Share 6.1%
7%
6%
5%
4%
3%
2%
1%
02017
3.5%
2018
4.8%
2019
5.1%
2020
6.2%
2021
6.1%
Equity (PhP Billion)
Equity 4,087,999,149
4.5B
4.0B
3.5B
3.0B
2.5B
2.0B
1.5B
1.0B
500k
0
2017
2017
Top
13Top
11Top
9Top
9
2.17
2018
2018
2.79
2019
2019
3.35
2020
2020 2021
5TOPINSURER
3.51
2021
4.08
17
Business review

BancassuranceThe year 2021 is Bancassurance’s best year yet. Our strong alliance with Security Bank yielded wider customer reach nationwide than last year’s and our Financial Solutions Consultants continue to provide timely and relevant services and sales activities through remote selling and digital products.
• High Persistency at 85%: We retained a high percentage of clients in 2021 despite the year’s challenges.
AffinityOld and new partnerships provided easy and reliable insurance to more Filipinos.
• Strong Partnerships: We forged a partnership with Kwik.Insure, the country’s fastest growing insurance aggregator. Meanwhile, we strengthened our relationship with Cebuana Lhuillier by making pawnassurance available to all their branches nationwide and mall-assurance through Cebuana General Agency in four malls within Metro Manila.
AgencyElite General Agency and dynamic Digital Agencies created more robust distribution channels.
• Growth in Numbers: · We enjoyed significant increase in human
resources at 31%, cases at 10%, and case size at 26%.
• Growth in Distribution: We licensed and appointed three General Agencies (GAs) and one Digital Agency (brick-and-mortar agency converted to a digital platform).
Multi-channel elite distribution network
Our multi-channel elite distribution network delivers on our commitment to provide protection to more Filipinos—and continue changing the way people feel about insurance.
18

Revitalized recruitment strategies, training programs, and incentives earned more high-quality recruits.
• Higher Number of New Recruits: We registered a 15.86% growth in new recruits.
• Programs and Incentives:· Bi-weekly business opportunity presentations
were conducted and Agency Leaders were encouraged to run their own as well.
· We rolled out “Building a Recruitment Culture” and “Pit Stop” for Agency Leaders to put recruitment at the forefront of their business discussions.
· We extended assistance for Tax Identification Number (TIN), Social Security System (SSS), and notarial services to help our advisors with their application and verification.
· A mid-year trip incentive for financial advisors was launched to encourage organic recruitment.
The FWD Affiliates Program, a first-in-the-market solution, was designed to increase financial education and economic opportunities, as well as generate leads.
• Celebrate Living Promo Launch: The promo sought to help increase FWD Affiliates app downloads, registration, and affiliate engagement. The Celebrate Living promo also happened at the most opportune time. Its grand prize winner hails from Cebu and was a victim of Typhoon Odette, which wreaked havoc in Visayas and Mindanao. The PhP500,000 cash surely helped in rebuilding the prizewinner’s life.
• Dynamic Engagements: For the first time, we invested in social media live streaming and broadcasted two live stream events. Overall social media efforts resulted to 2.6 million reach and 19.9k engagements.
19
Business review
Million Dollar Round Table
Top of the Table
Court of the Table
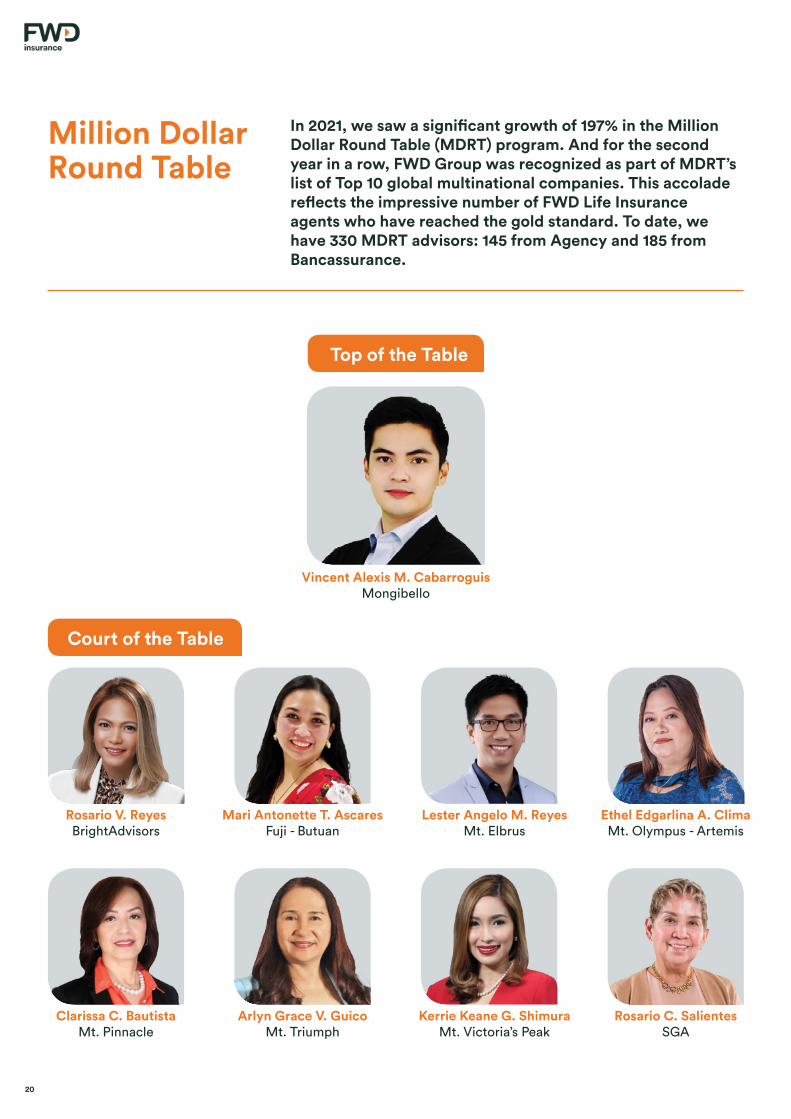
In 2021, we saw a significant growth of 197% in the Million Dollar Round Table (MDRT) program. And for the second year in a row, FWD Group was recognized as part of MDRT’s list of Top 10 global multinational companies. This accolade reflects the impressive number of FWD Life Insurance agents who have reached the gold standard. To date, we have 330 MDRT advisors: 145 from Agency and 185 from Bancassurance.
Vincent Alexis M. CabarroguisMongibello
Rosario V. ReyesBrightAdvisors
Clarissa C. BautistaMt. Pinnacle
Mari Antonette T. AscaresFuji - Butuan
Arlyn Grace V. GuicoMt. Triumph
Lester Angelo M. Reyes Mt. Elbrus
Kerrie Keane G. Shimura Mt. Victoria’s Peak
Ethel Edgarlina A. Clima Mt. Olympus - Artemis
Rosario C. SalientesSGA
20
Marilen Magundayao Ilagan
Gloria Stephanie Garay Lim
Charina Oliveria Quiambao
Reymond Matos Reyes
Keisha Mariah Catabay Lauigan
Luvisminda Catabay Mallillin
Laura Lagman Utleg
Elma Labastida Avila
Sharon Mayonila Labor
Annalyn Tuballa Perocho
Louise Belle Pablico Cabigas
Leticia Suarnaba Lapizar
Liza Paguilion Madrid
Myrna Loy Luna
A+Quest
A+Quest
A+Quest
A+Quest
A+Quest
A+Quest
A+Quest
A+Quest DFC
A+Quest DFC-PS
A+Quest IFC
Andes TWF
Andes TWF
Ararat
Ararat
Cyndi Evangelista Alvar
Margarita Corpuz Arce
Juan Miguel Gonzales Flores
Louise Eliesse Baldea Go
Johanna Medina Montalvo
Arianne Francheska Sanchez Moya
Pauline Carag Sanchez
Val Ladaban Domingo
John Cayetano Briola Pineda
Novelyn Ramos San Juan
Reynaldo Sicat Almario
Maria Aurora Cochon Paredes
Angelina Inductivo Agustin
Darriel Magpantay Encarnacion
Bogda Peak
BrightAdvisors
BrightAdvisors
BrightAdvisors
Crown Peak
Crown Peak
Crown Peak
El Manre Financials
Fuji
Fuji
Fuji - Bukidnon
Fuji - Bukidnon
Fuji - Bukidnon
Fuji - Butuan
Ann Sharlaine Enerio Bunag
Jerwin Gonzaga Lafuente
Alysses Gatdula Matro
Mariella Morales Panes
John Michael Garcia Ramos
Manfred Leo Lopina Torres
Rodrigo Martinez Cadano Jr
Ranillo Aduana Cardos
Carlos Bellido Pascual
Nashrullah Kinge Zacaria
Zedrik Froylan Paz San Lorenzo
Annalee Ang De Guia
Loremar Aguilar San Pedro
Ge Marie Lara Abuda
Gangkhar Puensum 1
Gangkhar Puensum 1
Gangkhar Puensum 1
Gangkhar Puensum 1
Gangkhar Puensum 1
Gangkhar Puensum 1
Gangkhar Puensum 2
Gangkhar Puensum 2
Gangkhar Puensum 2
Gangkhar Puensum 2
Gasherbrum II
Gerizim
Gerizim
King Mayon
Million Dollar Round Table
21
Business review

Marissa Samson Francisco
Bea Camille Villanueva Martinez
Lourdes Marzo Merano
Rowena Villas Villajos
Belinda Yumul Yabut
Maria Cristina Escobar Martin
Miguelito Jose Montines
Irineo Corpuz Guevarra
Lovely Catacutan Marimla
Sheila Cabanela Nunag
Marites Ibe Ocampo
Erwin Sarmiento Tiomico
Tirso Raymond Singh Gutierrez
Joel Artemio Garcia Salazar
Emil Vidad Faustino
Maribel Gutierrez Floresca
Mary Ann Gomez Latonio
Marisol Oliva Betonio
Jennifer Bongbong Pollisco
Joan Sabusay Reyes
Philip Cajes Dumlao
Bernadith Jimenez Ipanag
Vanessa Garcia Madayag
Anecita Recana Rabanillo
Gio Miguel Adriano Ocampo
Raymond Yu Lim
Kris Ortiz Tan
Mario Makabenta Alunan
Claudia Cleofe Pido Cui
Sarah Perez Deloraya-Mateo
Maria Ester Bautista Gabatin
Karen Mendoza Salagoste
Diana Mendoza Hernandez
Michaela Condes Jumao-as
Liezl Maquiling Quiliza
Catherine Joy Go Mendoza
George Benson Yu Mendoza
Philfa Carcedo De la Cruz
Arlene Uy Pagli-awan
Noel Suropia Hisanan
Mercielyn Gomba Melchor
Teresita Malcampo Ramoso
Adelaida Ramos Sebastian
Marlon Inciong Lopez
Ma. Sherem Jose Lumeran
Rialyn Abrasaldo Pablo
Romanito Costorio Impas III
Claire Ann Velasco Guiao
King Mayon
King Mayon
King Mayon
King Mayon
King Mayon
Matterhorn
Matterhorn
Mongibello
Mongibello
Mongibello
Mongibello
Mongibello
Mount Zion South
Mt. Bentley
Mt. Bethel
Mt. Bethel
Mt. Carmel
Mt. Carmel - Cebu
Mt. Carmel - Cebu
Mt. Carmel - Cebu
Mt. Carmel - Davao
Mt. Carmel - Davao
Mt. Carmel - Davao
Mt. Carmel - Davao
Mt. Carmel - MB
Mt. Carmel APEX
Mt. Champion
Mt. Ebal
Mt. Ebal
Mt. Ebal
Mt. Ebal
Mt. Ebal
Mt. Jungfrau
Mt. Jungfrau
Mt. Jungfrau
Mt. Malaya - Mabuhay
Mt. Malaya - Mabuhay
Mt. Olympus - Artemis
Mt. Olympus - Artemis
Mt. Olympus - Demeter
Mt. Olympus - Demeter
Mt. Olympus - Demeter
Mt. Olympus - Zeus
Mt. Olympus-Apollo
Mt. Olympus-Apollo
Mt. Olympus-Zeus 2
Mt. Parker
Mt. Pinnacle
22

Mt. Jungfrau
Mt. Jungfrau
Mt. Jungfrau
Mt. Malaya - Mabuhay
Mt. Malaya - Mabuhay
Mt. Olympus - Artemis
Mt. Olympus - Artemis
Mt. Olympus - Demeter
Mt. Olympus - Demeter
Mt. Olympus - Demeter
Mt. Olympus - Zeus
Mt. Olympus-Apollo
Mt. Olympus-Apollo
Mt. Olympus-Zeus 2
Mt. Parker
Mt. Pinnacle
Junnel Jamili Lasco
Franz Abegail Ilagan Bejasa
Michael Malibago Galaites
Barry Reonal Red
Riza Arceo Pilapil
Estela Torbiso Siboa
Dianalyn Liwanag Dela Cruz
Richelle Marie Diola Ng
Jessyl Grace Jumawan Patria-Torres
Danielle Bautista Fanlo
Ana Bautista Fanlo
Bryan Dominic Palaganas Del Castillo
Maria Celina Decena Alonzo
Charito Enrique Aruta
Julian Venedict Enriquez Baltazar
Melany De Lara Cajucom
Ronaldo Sebastian Legaspi
Joan Marriel Mangahas Miranda
Rowena Margarita Cuyco Suarez
Purita Dy Tane
Ana Katrina Macadaeg De Rosas
Betsy Liao Manapsal
Romulo Caval Manapsal Jr.
Lyne Leva Dilag
Olivia Andrade Encinares
Jennifer Cokim Patrimonio
Geraldine Alcaide Quibod
Edsel James Cabanban Sandico
Ma. Victoria Lacanlale Carlos
Alejandro Matic Clemente
Joy Penuliar Salas
Maylanie Sixto Mendoza
Caroline Ines Carig
Ma. Anunciacion Cruz Goquingco
Janedy Aguares Posadas
Alfredo Trinidad San Pedro
Maria Corazon Tajan Tan
Cereus Chang Castro
Julieta Gaw Garcia
Irene King Garcia
Lily Co Yu
Cristopher Pongco Cura
Angelyn Tamondong Nepomuceno
Anna Lorraine Dizon Cetin
Chris Jhay R Pallera Lugue
Analyn Musni Marcos
Mt. Pinnacle
Mt. Pinnacle
Mt. Pinnacle
Mt. Pinnacle
Mt. Triumph
Mt. Victoria’s Peak
Mt. Victoria’s Peak
Mt.OlympusAdvocates
Mt.OlympusAdvocates
Nebo - Cebu 2
Nebo - Davao
Nebo - Davao
Nebo - FINANCESUREPH
Nebo - FINANCESUREPH
Nebo - FINANCESUREPH
Nebo - GenSan
Nebo - Pagadian
Rainbow - Castle
Rainbow - Fortitude
Rainbow - Pulag
Rainbow 2
Rainbow 2
SGA - Aphrodite
SGA - Bicol
SGA - Bicol
SGA - Davao
SGA - Davao
SGA - DC Alliance
SGA - Manila
SGA - Manila
SGA - Manila
SGA - Manila
SGA - Manila
SGA - Manila
SGA - Manila
SGA - Manila
SGA - Manila
SGA - Mt. Phoenix
SGA - Mt. Phoenix
SGA - Mt. Phoenix
SGA - Mt. Phoenix
SGA-Lifers Pampanga
Sinai
Sinai Peak
Sinai Peak
Sinai Peak
23
Business review

Products forchanging needs
With customers’ needs constantly evolving, FWD Life Insurance makes certain to stay one step ahead in developing and offering products and services that address these needs.
Raising the Youngest Investors: FWD BabyproofThe COVID-19 generation does not need to be at a disadvantage. We support new parents with our first ever baby insurance plan that features our best investment and protection policies for babies. It provides coverage and wealth-building for babies as young as 15 days old.
To really know more about our “youngest investors,” we partnered with Mommy Mundo, the go-to community for expecting and new parents, to connect with them and know their specific needs. FWD Life Insurance was a major sponsor for the 2021 ExpoMom online conference and had a special segment on “Financial Mindfulness” to address Filipino families’ changing financial needs. Powerhouse couple, Feliz and JayJay Lucas, shared practical tips on how parents can steward and grow their money especially during the pandemic, as well as how life insurance can help them secure their family’s future.
Bridging the Distance Between Loved Ones: FWD Family HeroFor OFWs all over the world, FWD Family Hero is an investment and health plan that allows them to protect and support their families—no matter the time and distance. It works as a source of passive income, with the potential to grow your family’s wealth. It also protects your family from unexpected health setbacks.
We partnered with The Filipino Global Investors (TGFI), a group that organizes a community of Filipino financial literacy enthusiasts and advocates, to sponsor and lead segments in three major events, as well as mount two FWD Life Insurance-initiated live streams, with multiple promotional opportunities. Our overall partnership efforts produced over 41.6 million reach, more than 6.6 million engagements, and over 982k views.
24

Protection, Investment, and Wealth Growth: FWD ManifestFor opportunity-seeking Filipinos poised for success despite the pandemic, FWD Manifest is the first insurance plan that protects Filipinos and their investments while growing their wealth. Get rewarded for investing more for longer. With four unique features to help Filipinos succeed in the next normal:
· Start-up Bonus· Investment Protection Bonus· Guaranteed Milestone Increase· Premium Extension Bonus
To celebrate the launch of this product, we organized “Manifest Your Dreams,” a user-generated social campaign empowering people to manifest their dreams while offering master class mentorship to the winners. We partnered with Frances Cabatuando, creator of Home Buddies, a local Facebook community with almost 3 million active members, to inspire Filipinos to turn their pandemic challenges into dreams come true.
Holistic Fitness: FWD Health and WellbeingWe believe health and wellbeing should be fun and functional so that it becomes a way of life and your own enjoyable journey to your best life. FWD Health and Wellbeing, our health protection portfolio, is a holistic approach to attaining a better quality of life—achieved through physical, mental, emotional, social, and financial fitness.
We organized a virtual media roundtable and an innovative digital public workshop to encourage people to pursue joyfulness through holistic health and wellbeing. Top field experts, namely fitness gurus and coaches Jim and Toni Saret, renowned Filipino psychologist Dr. Shake Hocson, acclaimed physician Dr. Ging Zamora, devoted doctors and fur-parents Dr. Hanna Palomar and Dr. Kathryn Tan, investment expert Marvin Germo, FWD Life Insurance Chief Agency Officer Jun Marasigan, and FWD Life Insurance VP and Head of Marketing Roche Vandenberghe, discussed the important aspects of being healthy physically, mentally, emotionally, and financially.
New FWD Funds:1. FWD Global Good ESG Peso and Dollar Funds
We believe that doing good business is good for business. With FWD Global Good ESG Peso and Dollar Funds, Filipinos can now invest in global equities while investing in globally sustainable companies. Total weighted average return of 24.40% since inception of Peso and Dollar ESG combined, outperforming major index price returns.
2. FWD Diversity FundThe FWD Diversity Fund diversifies equity investment funds to spread the risk and optimize performance through active and passive investing. It allows multiple funds in one investment while having lower management fees versus several individual funds.
25
Business review

Innovative customer experience and technology
FWD Life Insurance is always driven to provide our customers with only the best-in-class experiences. With a proactive approach and an innovative mindset, we are continually seeking to improve our customers’ insurance journeys.
Operational Efficiency with Fi, the FWD Life Insurance ChatbotSince its launch in December 2021, Fi contributed to our operational efficiency and lessened the traffic toward our Customer Connect team. It receives an average of 10,000 messages per month and has a current monthly rating of 4.9 out of 5.
Fi is always ready to address our customers’ questions 24/7 and has the capability to deliver various tasks, such as:
• Handle a range of inquiries from product information to claims
• Recommend a product that fits customer’s needs
• Talk through an insurance quotation for select products
• Set an appointment with our financial advisors
• Link to our Customer Connect team for additional support
Improved Tapp NexGen for the Best Digital ExperiencesAfter the successful re-platforming of Tapp NexGen, we continued to develop best-in-class features and enhancements to align with our Polaris initiatives and to provide outstanding digital experiences to our customers, among them:
• Migration of login services to Cloud
• Release of new transactions aligned with digital adoption initiatives
· Update contact information (e.g., mail address, email address, and mobile number)
· Change beneficiary designation between primary and secondary and from revocable to irrevocable
• In-app notifications for when account value is no longer enough to sustain cost of insurance
• Enhanced investment details, which includes display of amount invested and investment growth
• Enhanced investment graph with a new projection based on benchmark or actual performance of funds and indices over the past five years
26

An Enterprise-Wide Agile TransformationAccenture conducted a research-based assessment in the first quarter of 2021 to give us a better understanding of our maturity in terms of business agility and in identifying focus areas that will help accelerate our transformation. Following the study results and recommendations, we pursued an enterprise-wide agile transformation. We established seven Agile Product teams (or Scrum teams) to implement the recommendations for different systems. These teams allowed both business and IT resources to operate in an agile environment and learn and adopt agile practices.
New Smart 2.0 Mobile App for Better Customer JourneyFWD Life Insurance always seeks to make the customer’s insurance journey simpler, faster, and smoother with innovative propositions and easy-to-understand products supported by digital technology. This mobile application is one such endeavor. System-ready since December 2021, its full launch is slated for the second quarter of 2022.
Better Distributor Journey Map with Voice of DistributorOur first Voice of Distributor (VOD) survey was created to understand our advisors’ sentiments on the current services provided to them. Focused group discussions with select Agency and Partnership advisors were conducted to help us develop a distributor journey map to better understand their end-to-end advisor journey, identify pain points, and create opportunities to improve their experience.
Cloud Migration for Stability and FlexibilityWe migrated our applications to Cloud to provide stability and the flexibility to expand capabilities of the applications. This initiative also sought to improve systems security, modernize applications, achieve operational excellence, improve cost efficiency, and increase system high-availability.
Robotic Process Automation for Greater Work EfficiencyWe increased our work efficiency through elimination of repetitive tasks via Robotic Process Automation (RPA), a form of business process automation technology that uses software robots to automate tasks performed by humans. In 2021, we implemented 11 new RPA functions, which gave us a total of 29 different types of tasks processed by software robots. This saved us more than 11,000 worth of people hours.
11 29 11kNew RPAfunctions
different types of tasks processed
people hourssaved
27
Business review

The FWD brand: passion and purpose
The FWD brand moves with passion and purpose, creating meaningful and relevant initiatives and campaigns that empower and inspire.
#StrongerYouWithFWD: Inspiring through Real Stories of Strength #StrongerYouWithFWD is a purpose-driven campaign that reminds Filipinos of their innate strength. Real-life stories seek to celebrate the struggles that make people stronger—and the loved ones who inspire them to remain strong.
The campaign was brought to the public through the #IAmStrongerThan stories movement, a social media user-generated campaign led by well-known artists and personalities such as Kim Chiu, Bela Padilla, LA Tenorio, and Brina and Winston Maxino. The movement inspired thousands of stories from real people and provided relevant health protection solutions, like FWD Set for Health, encouraging Filipinos to develop a stronger mindset and act on living a life free of worries.
The Final Pitch: Empowering InnovationThe Final Pitch on CNN Philippines is the country’s first business reality show designed to give a platform for investors to find and invest in up-and-coming businesses and entrepreneurs. Season 6, dubbed “Heroes Edition,” focused on startups and innovators who pitched solutions for post-pandemic recovery. FWD Life Insurance President and Chief Executive Officer Li Hao Zhuang was part of the esteemed panel of investor-judges, alongside Vince Yamat (917Ventures), John Januszczak (UBX), and Joel Santos (Thames International Business School), and personally witnessed the innovative ideas of Filipino entrepreneurs.
FWD x Still: The Power of Music to Celebrate StrengthOur creative brand intrusion in the third episode of Still, Viu’s first Filipino original musical series, features a conversation involving a financial advisor and an overseas Filipino worker and his daughter. Their dialogue underscores the essence of insurance in one’s financial security, especially during times of uncertainty.
Our partnership with Still highlights FWD Life Insurance as a different brand. We are a relevant brand that correlates with the series’ timely and inspiring narrative and sees music as a powerful instrument to connect with our customers. We are likewise a trustworthy brand that echoes the importance of insurance for a sound financial future.
28

FWD Life Insurance has been at the forefront of providing innovative customer services, digital sales channels, and marketing partnerships leveraging technology to address our customers’ evolving needs. Our Artificial Intelligence (AI) talkbot Frankie, insurance mobile app FWD Tapp, FWD Online Shop, and the “FWD-MCX:
Best Fintech Solution for Customer User Experience
Awards of Excellence in Special and Experiential Events
Digital Insurer of the Year– Philippines
Digital Initiative of the Year– Philippine
DigFin Innovation AwardsPhilippine Quill Awards
Insurance Asia Awards
Best Life Insurance App Philippines
Best Life Insurance Company for Digital Transformation Philippines
Global Banking and Finance Awards
Brand Refresh Initiatives: Better Brand Communications and Customer Mobile Journey With a strong belief that today is the right time for brand evolution, we launched a Group-wide Brand Refresh initiative in 2021 with the aim to:
• Optimize our strategic assets, positioning, and sub-brands to align with our priority customer segments
• Strengthen our brand expression and how we communicate and appeal to a broader audience
As part of the year-long initiative, we migrated our company website to NextGen Lite to bring experience, technology, and data to work in unison. With NextGen Lite, we hope to provide best-in-class mobile-first experience to our customers and empower them to take control of their site journey. In less than a year, compared to our previous website, we saw an improved session duration of 75%, decreased bounce rate of 25%, and increased goal completions of 709%.
Customer Segmentation Approach: Strategic Expansion and Product PropositionsWe developed a segment-based approach to reach specific markets, creating strategic partnerships, client forums, and product propositions in the process.
• We launched the Affluent Market segment and created the VIP Concierge, a special handling experience for well-to-do customers, which increased workflow and client servicing turnaround time.
• We collaborated with global investment management firm BlackRock and CHiNOY TV, a multiplatform media that targets the Chinese-Filipino community in the Philippines, to engage with our high net-worth customers. We also developed a hybrid experience with specialized content that provides valuable opportunities and actionable insights exclusive to the affluent market.
Road to Progress” partnership launch have been recognized by various award-giving bodies as some of the best tech innovations in the industry.
Here, a quick look at the recognitions we received for technology excellence in 2021:
Recognitions for tech innovation and excellence
29
Business review

30

Our people, our values
The power of purposeful passion
31
Our people, our values

Rozanne Parungo Chief People and Culture Officer
2021SeniorManagement Team
Irene Andas Chief Partnership Officer
D. Angela RowleyChief Risk Officer
Li Hao Zhuang President and Chief Executive Officer
Atty. Juan Sotero Roman General Counsel, Chief Compliance Officer, and Data Protection Officer
32

Rochelle Vandenberghe VP, Head of Marketing
Judith BalitonChief Life Operations Officer
Floro Marasigan, Jr.Chief Agency Officer
Adnelle ValezaChief Information and Transformation Officer
Jasper Hendrik Cheng Chief Financial Officer
Christopher Young ChiefActuary
33
Our people, our values

A strong leadership
FWD Life Insurance is led by a team of industry professionals who recognize the power of unwavering commitment, decisive action, and inspiring influence in translating visions into realities.
Li Hao ZhuangPresident andChief Executive Officer, 51
Qualifications:Mr. Zhuang holds a Master of Business Administration from Massachusetts Institute of Technology (MIT), USA and a Bachelor of Engineering (Hons) from Loughborough University, UK.
Trainings:He attended the Orientation on Corporate Governance conducted by the Institute of Corporate Directors, Makati, Philippines in 2020.
Professional Experiences:Mr. Zhuang leads our Life business in the Philippines. He has over 25 years of leadership experience in insurance, banking, and consulting across Asia, the Middle East, the UK, and the United States. Mr. Zhuang was previously our Group Head of Agency Distribution. At the time, he developed FWD’s Elite Agency strategy and successfully rolled out a number of key initiatives that lifted Elite Agency’s productivity, digital capabilities, and professionalism.
Irene AndasChief PartnershipOfficer, 52
Qualifications:Ms. Andas holds a Bachelor of Economics from the University of Santo Tomas, Manila, Philippines.
Trainings:She attended the Orientation on Corporate Governance conducted by the Institute of Corporate Directors, Makati, Philippines in 2020. She also attended the Strategic Systems Thinking: Creating Competitive Advantage and Decision Effectiveness for Bancassurance Leaders trainings organized by Ateneo de Manila University in 2018 and 2017, respectively. She likewise took part in the “Leading Bancassurance Summit” by Equip Global.
Professional Experiences:Ms. Andas draws on a proven track record that spans over 20 years in financial services. She now heads our strategic partnerships, ensuring that we’re creating a portfolio of simple, intuitive, and digitized product offerings. Ms. Andas also manages our partnerships with leading banks and oversees our relationships with other synergistic partners. She’s previously held several distribution leadership roles in local and multinational financial services firms.
34

Judith BalitonChief Life OperationsOfficer, 56
Qualifications:Ms. Baliton finished a course in Jr. Secretarial from Trinity College of Quezon City, Manila, Philippines. She also finished a Leadership Course from Wesleyan Bible College, Philippines.
Trainings:She attended the Advanced Medical Underwriting course from the Philippine Society of Insurance Medicine in 2007; Corporate Governance Orientation by Insurance Institute of Asia and PTHE Pacific in 2006; Insurance Medicine versus Clinical Medicine course by Home Office Life Underwriters Association of the Philippines (HOLUAP) in 2002; Swiss Re Life & Health’s New Underwriting Guidelines Launch by the Philippine Society of Insurance Medicine in 2000; Mood Disorders & Suicide/Preferred Risk Underwriting seminar by Lincoln National Reinsurance in 2000; Appreciation of Group Insurance seminar by HOLOUP in 2000; All Geared Up for the Year 2000: Underwriting & Development seminar by Swiss Reinsurance in 1997; and the Association of Insurance Medicine Conference in 2005 and 2007.
Professional Experiences:With over 35 years of insurance industry experience, Ms. Baliton is responsible for managing our commercial operations, ensuring we have the right people and processes in place so that we can best service our customers. Prior to working in FWD Life Insurance, she was VP, Chief Underwriter in a multinational insurance company and a financial services provider.
Jasper Hendrik ChengChief FinancialOfficer, 42
Qualifications:Mr. Cheng obtained his Bachelor of Mathematics, Major in Actuarial Science and Statistics from De La Salle University, Manila, Philippines. He went on to obtain both a Master of Computational Finance and an MBA at the same university’s Graduate School of Business.
Trainings: He attended the Orientation on Corporate Governance conducted by the Institute of Corporate Directors, Makati, Philippines in 2018. He has also obtained the FLMI, FFSI, and ARA designations of the Life Office Management Association (LOMA).
Professional Experiences:He brings over 20 years of industry experience spanning several multinational companies. Prior to joining FWD Life Insurance, Mr. Cheng held leadership roles within a number of global financial services companies. More recently, he was Chief Product Officer & Actuary, a position that encompassed all parts of the value chain from design to pricing. He is a Fellow of the Society of Actuaries, a Fellow of the Actuarial Society of the Philippines, and a charter holder of the CFA Institute.
Floro Marasigan, Jr.Chief AgencyOfficer, 53
Qualifications:Mr. Marasigan holds a Bachelor of Medical Technology from Far Eastern University – Dr. Nicanor Reyes Medical Foundation, Manila, Philippines.
Trainings:He attended the Orientation on Corporate Governance conducted by the Institute of Corporate Directors, Makati, Philippines in 2020.
Professional Experiences:Mr. Marasigan leads our Distribution team and aligns our distribution channel with our wider customer-focused strategy. He has a proven track record with over 26 years of experience in the financial services industry. He was previously Vice President and Senior Director of Agencies within a financial services organization in the Philippines.
Mr. Marasigan is a Registered Financial Consultant (RFC) at the International Association of Registered Financial Consultant (IARFC); Fellow in Life Management Institute and Associate in Customer Service of the Life Office Management Association (LOMA).
35
Our people, our values

Atty. Juan Sotero (Teroy) RomanGeneral Counsel, Chief Compliance Officer, and Data Protection Officer, 52
Qualifications:Atty. Roman holds a Bachelor of Arts in Political Science from De La Salle University, Manila, Philippines. He earned his Bachelor of Laws from the San Beda College of Law in the Philippines. He was admitted to the Philippine Bar in 1999.
Trainings:He completed the Orientation on Corporate Governance conducted by The Institute of Corporate Directors, Makati, Philippines in 2016, 2020, and 2021.
Professional Experiences:Atty. Roman has more than a decade of experience in the insurance industry. He currently holds the rank of Vice President, as General Counsel, Chief Compliance Officer, and Data Protection Officer of the company. Prior to joining FWD Life Insurance, he was with Manulife Philippines as Vice President – Legal and Compliance (2011 to 2014); Asst. Vice President, Officer-In-Charge (January to June 2011); and Senior Compliance Officer (2010 to 2011). He was also previously with Pru Life UK as Claims Head (2007 to 2010) and Sales Compliance Manager (2006 to 2007).
D. Angela RowleyChief RiskOfficer, 51
Qualifications:Ms. Rowley holds a Bachelor of Business and Finance from the University of Phoenix, USA and a Post Graduate Diploma in Computing for Commerce and Industry (PGDCCI) from Open University.
Trainings:She is an Associate in Life Management Institute of the Life Office Management Association (LOMA). She also attended the Certified Professional Risk Manager course conducted by Asia Risk Management Institute.
Professional Experiences:Ms. Rowley has over 30 years of global experience in the financial services industry, spanning life insurance, banking, pensions, and investments. She leads our Risk team and plays a critical role in ensuring that sound policies and practices are in effect and a robust risk culture is embedded across our organization. Ms. Rowley has substantial experience in the three lines of defense along with the creation of strong and sustainable risk programs including audit and risk management.
Rozanne ParungoChief People and CultureOfficer, 62
Qualifications:Ms. Parungo holds a Bachelor of Business Administration from the University of the Philippines Diliman.
Trainings:She completed a certificate course in Industrial and Labor Relations from the University of the Philippines. She also received a Hogan certification from Hogan Assessments as well as a Coach Accreditation from IELC, and completed the Orientation on Corporate Governance conducted by the Institute of Corporate Directors, Makati, Philippines in 2020.
Professional Experiences:Ms. Parungo oversees our Human Resources (HR), supporting across a range of functions—from recruitment and talent development to strategy, infrastructure, and organization. She brings a a wealth of experience working in financial services in several global brands and organizations including the development and implementation of a highly successful HR and Training system.
36

Adnelle ValezaChief Information and Transformation Officer, 46
Qualifications:Ms. Valeza obtained her Bachelor of Information Technology from Polytechnic University of the Philippines. She has also taken master’s degree units in Information Management at Ateneo de Manila University, Manila, Philippines.
Trainings:She attended the Orientation on Corporate Governance conducted by the Institute of Corporate Directors, Makati, Philippines in 2020.
Professional Experiences:Ms. Valeza leads our Technology, Transformation, and Customer Experience team. She has 25 years of experience including her previous role in FWD Group as Head of Project Management Office leading M&A, Transformation, and Integration projects. Prior to joining FWD Life Insurance, she worked for a global insurance firm as Vice President and Chief Information Officer. Based in London, she held an international role for project deployments in Europe and North America. Ms. Valeza is a Certified John Maxwell Coach, Speaker, and Trainer.
Rochelle VandenbergheVP Headof Marketing, 46
Qualifications:Ms. Vandenberghe holds a Bachelor of Science in Development Communication from the University of the Philippines Los Baños, Laguna, Philippines. She also continued her executive education at the University of Michigan Ross School of Business, USA taking up the Leadership in Action Program.
Training:She attended the Orientation on Corporate Governance conducted by the Institute of Corporate Directors, Makati, Philippines in 2020.
Professional Experiences:Ms. Vandenberghe leads a group of creative marketers and spearheaded the launch of the brand in 2014. Prior to FWD Life Insurance, she spent a major part of her career outside the country as an advertising and communications professional in top ranked companies based in South East Asia, particularly in Malaysia, Indonesia, and Vietnam. She became a General Manager of a multinational advertising firm in her early 30s and is a sought-after juror and presenter at international marketing, advertising, and e-commerce shows.
Christopher YoungChiefActuary, 37
Qualifications:Mr. Young holds a Bachelor of Science in Mathematics (summa cum laude) and a Master of Applied Mathematics (major in Actuarial Science), both from the University of the Philippines in Diliman.
Training:He attended the Orientation on Corporate Governance conducted by the Institute of Corporate Directors, Makati, Philippines in 2020.
Professional Experiences:Mr. Young has been part of FWD Life Insurance since September 2018 as our Chief Actuary, overseeing pricing, valuation, experience studies, reinsurance, capital management, and business planning. He brings with him over 15 years of professional experience in various life insurance companies spanning the Philippines and Vietnam, covering roles in actuarial, product development, risk management, and data analytics. He also taught actuarial courses at the University of the Philippines Diliman. He is a Fellow of the Actuarial Society of the Philippines, the Society of Actuaries and the Life Management Institute.
37
Our people, our values
Investing in our people and culture
We want to create a culture that is caring and inclusive, one that promotes continuous learning and innovation and takes on a proactive approach in employee engagement. The global pandemic only made us stronger and more innovative. The latest Gallup survey results, which saw an increase in our employee engagement rate from 4.05 to 4.23, is proof. This latest feat moves FWD Life Insurance to the 57th percentile in the finance and insurance industry across the Philippines.
People Development and Innovation Our people are our greatest assets, and we continually initiate training programs and experiences that help empower them to reach their highest potential. People development is such an important thrust in FWD Life Insurance. We are proud to share that, in 2021, almost 11% of our new hires came from internal movements within the organization and that 613 employees attended at least one learning program.
• People-Centered Design (PCD) Sessions: This whole-year training program is centered around a design-thinking framework that puts our customers at the heart of what we do. It has helped our leaders and employees develop a problem-solving philosophy that prioritizes and addresses our customers’ needs.
• Grisiliency Training: We partnered with Viventis and Peak Learning to empower our leaders and employees in increasing their resiliency and adversity quotient while promoting GRIT (Growth, Resiliency, Instinct, and Tenacity). All these values are important in dealing with the constantly changing business landscape and—as is most critical right now—the effects of the pandemic.
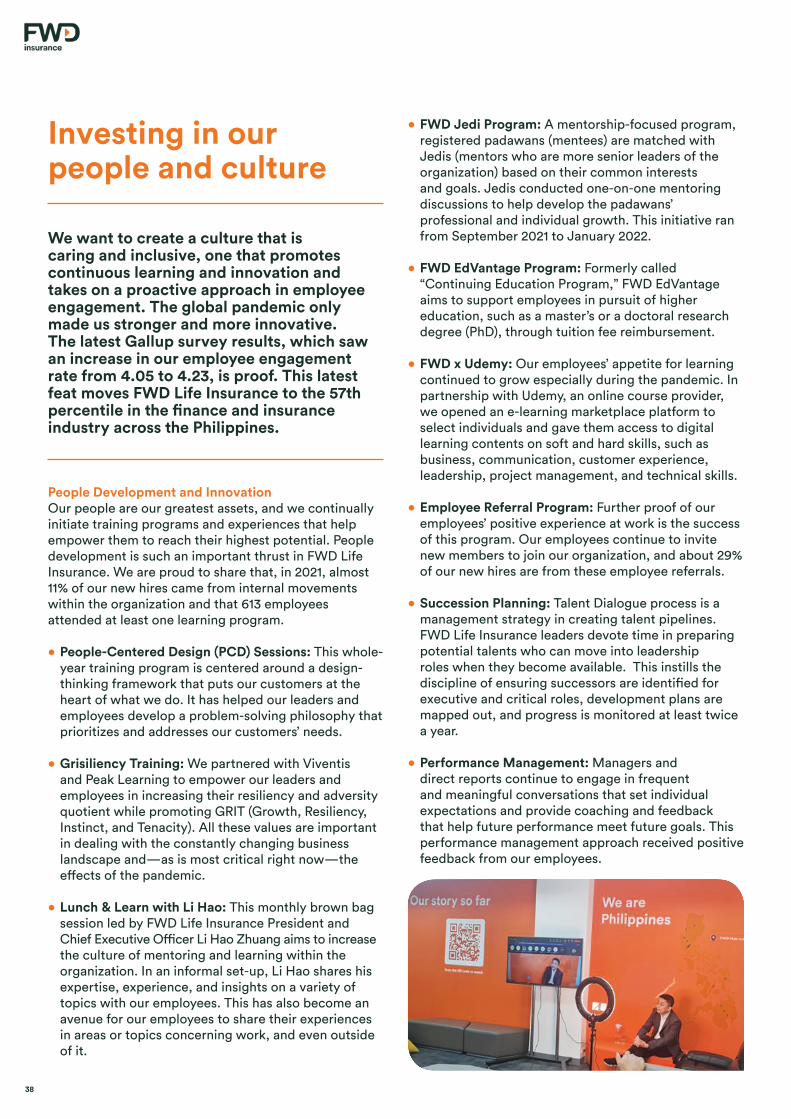
• Lunch & Learn with Li Hao: This monthly brown bag session led by FWD Life Insurance President and Chief Executive Officer Li Hao Zhuang aims to increase the culture of mentoring and learning within the organization. In an informal set-up, Li Hao shares his expertise, experience, and insights on a variety of topics with our employees. This has also become an avenue for our employees to share their experiences in areas or topics concerning work, and even outside of it.
• FWD Jedi Program: A mentorship-focused program, registered padawans (mentees) are matched with Jedis (mentors who are more senior leaders of the organization) based on their common interests and goals. Jedis conducted one-on-one mentoring discussions to help develop the padawans’ professional and individual growth. This initiative ran from September 2021 to January 2022.
• FWD EdVantage Program: Formerly called “Continuing Education Program,” FWD EdVantage aims to support employees in pursuit of higher education, such as a master’s or a doctoral research degree (PhD), through tuition fee reimbursement.
• FWD x Udemy: Our employees’ appetite for learning continued to grow especially during the pandemic. In partnership with Udemy, an online course provider, we opened an e-learning marketplace platform to select individuals and gave them access to digital learning contents on soft and hard skills, such as business, communication, customer experience, leadership, project management, and technical skills.
• Employee Referral Program: Further proof of our employees’ positive experience at work is the success of this program. Our employees continue to invite new members to join our organization, and about 29% of our new hires are from these employee referrals.
• Succession Planning: Talent Dialogue process is a management strategy in creating talent pipelines. FWD Life Insurance leaders devote time in preparing potential talents who can move into leadership roles when they become available. This instills the discipline of ensuring successors are identified for executive and critical roles, development plans are mapped out, and progress is monitored at least twice a year.
• Performance Management: Managers and direct reports continue to engage in frequent and meaningful conversations that set individual expectations and provide coaching and feedback that help future performance meet future goals. This performance management approach received positive feedback from our employees.
38

Employee Wellness Our approach to employee development has always been holistic, and employees’ personal, physical, mental, and emotional health are equally prioritized.
• FWDLivelife Wellbeing Program: Our people are at the heart of our wellbeing initiative. Together with our Group Office, we launched our new wellbeing strategy, FWDLiveLife, a program that features a series of activities covering the different aspects of wellbeing: emotional health, purpose and meaning, physical health, social connectedness, and financial wellness. Various activities, among them employee contests, cooking classes, virtual physical exercises and meditation classes, and speakership opportunities by influential personalities, sought to promote a healthy and fulfilling lifestyle within the organization.
• Mental Wellness Initiatives: Knowing that mental and emotional wellness are important in finding personal balance, especially during the pandemic, we launched initiatives that encourage our employees to focus on their mental health:
· Self-Care Day: Employees can take a break—and focus on their wellbeing—by converting one of their Community Care time-offs to Self-Care Day.
· ComPsych Digital Toolkit: Employees and their family members are given access to confidential expert consultations on matters relating to behavioral health and mental, legal, and financial concerns. In 2021, about 33% of our employees utilized the benefit—a 172% increase from the previous year.
• Work from Anywhere: Introduced in 2018, our Work from Anywhere (WFA) program enabled our employees to work on their location of choice. In 2021, we updated the program to include a hybrid set-up that allows employees (between 10% to 50%) to work onsite in accordance with the recommendations of our Crisis Management Team.
• COVID-19 Assistance: To help our employees and their loved ones recover from COVID-19 or get through the challenges brought by the pandemic, we provided different forms of assistance, among them:
· COVID-19 Vaccination Leave: Employees were allowed a two-day leave to receive COVID-19 vaccination or recover from possible effects of the vaccine.
· Salary Loan Facilitation: Employees can avail of a salary loan to help augment hospital and medical expenses for COVID-19 treatment—for them and/or their family members.
· Fuel Allowance Benefit and WFA Subsidy: Employees can take advantage of a financial subsidy to enable them to work productively, even from home.
• People Rewards: We continued to find ways to ensure that our employees and their families get the best services for their health, especially during the pandemic. In partnership with Intellicare, we offered a free extended benefit through Surehealth Bayanihan Card to our employees’ family members who are non-Intellicare members.
39
Our people, our values

Operational Processes and Improvements for Enhanced Employee Experience We constantly strive to improve operational procedures to provide our employees with the best opportunities to thrive and fully embrace the benefits of working with FWD Life Insurance.
• Digital Graduate Programme: As the starting point of their FWD journey, this 18-month pilot program gives new graduates the chance to explore different functions, work on exciting new projects, and collaborate with some of the creative minds in FWD Life Insurance. The program likewise opened our doors to a deeper pool of talents and allowed us to tap into their fresh ideas while giving them growth and development opportunities in our workplace. From a total of 155 submissions, we were able to hire two candidates who went through an extensive selection process.
• Retirement Plan: We continue to offer flexible plans that provide our employees with peace of mind, financial independence, and liquidity in their retirement years. Bank of the Philippine Islands Asset Management Group and Miravite Consulting Group are our partners in providing our employees the flexibility to choose their fund investment: conservative, moderate, or aggressive.
• Remuneration: Our remuneration structure regularly goes through approval, review, and recommendation to ensure competitiveness and adjustment for inflation. Management certifies that remuneration packages are within the company-approved tier limits, and is further reviewed by the Corporate Governance committee. Directors’ and senior management’s remuneration packages are then presented to the Shareholders and Directors for approval during their respective meetings.
Employee Experience and Engagement Employees’ active and dynamic engagement is always a priority within our organization. We recognize the importance of listening to—and learning from—our people and providing them with the best workplace experience.
• Employee Appreciation Month: Every September, we conduct online activities to recognize our employees’ earnest efforts and keep them engaged despite the pandemic. These activities include virtual coffee sessions, breakfast and lunch sessions with Engagement Champions and Leaders, and online games and trivia sessions. This annual event forms social connection between our employees across all levels and has greatly improved our employee engagement, specifically under the area of recognition. It has increased our score by .18% from last year’s Gallup Survey result, which moved us to the 50th percentile.
• Employee Virtual Town Hall: We continue to hold monthly company-wide virtual town hall meetings to enable our Senior Management Team to share business updates and listen to our employees’ feedback. The virtual town hall has served as an avenue for our leaders to provide our employees with stable support, transparency, and open communication, championing our FWD values.
• Exclusive Employee Offers: Our employees were given the opportunity to avail of limited-time products to invest and get protected: FWD Set for Life and FWD Set for Tomorrow for exclusive discounted premium rates and FWD Set for Health at a 5% discount on cost of insurance.
40

Passion Communities FWD Life Insurance communities continue to display our values of remaining committed, innovative, proactive, open, and caring.
• Innovation Community: Innovation is a big part of our commitment to changing the way people feel about insurance. In 2021, we launched the Springboard Challenge and reached out to our employees, as well as students from different universities across the Philippines, to ideate and present solutions by asking the question, “How can FWD Life Insurance change the way people like you feel about insurance?” From this program, students from the University of Asia & the Pacific bagged a spot as one of the top three teams within the FWD regional markets. The students were offered a company internship opportunity to witness their ideas come to life.
• Wellness Community: A year into the pandemic, we continued our virtual wellness programs to cater to our employees’ health and wellbeing. This time around, our wellness activities not only focused on physical wellbeing but also our mental wellbeing. We organized mindfulness sessions with Mindfulness at Play and a physical program called Fitscovery series with the Fitscovery team. Flu and pneumonia vaccines were also administered as a reimbursement program to provide our employees and their families with additional protection especially during the pandemic situation.
• Recognition Community: Our 2021 STAR and Leader quarterly awards recognized a total of 31 STAR individuals and 30 Leaders. The overall 2021 STAR awardee will be introduced to the rest of the FWD regional markets, and the overall 2021 Leader Awardee will be recognized across FWD Life Insurance.
• Diversity and Inclusion Community: To recognize the existence of diversity within our organization, we launched an internal podcast and discussed different issues on diversity in our community. The Inclusive Movement was created to build an environment of involvement, respect, and connection within the organization. Topics included—but were not limited to—prejudice against COVID-19 patients, Pride Month and SOGIE Equality Bill, National Disability Prevention and Rehabilitation Month, and cultural diversity. To end the year on a higher note, we also visited our friends from Milagros Elderly Home and shared our time with the elderlies who were left in the care of the facility.
41
Our people, our values

42

Our ESG strategy
Contributing to a better, more sustainable future
43
Our ESG strategy
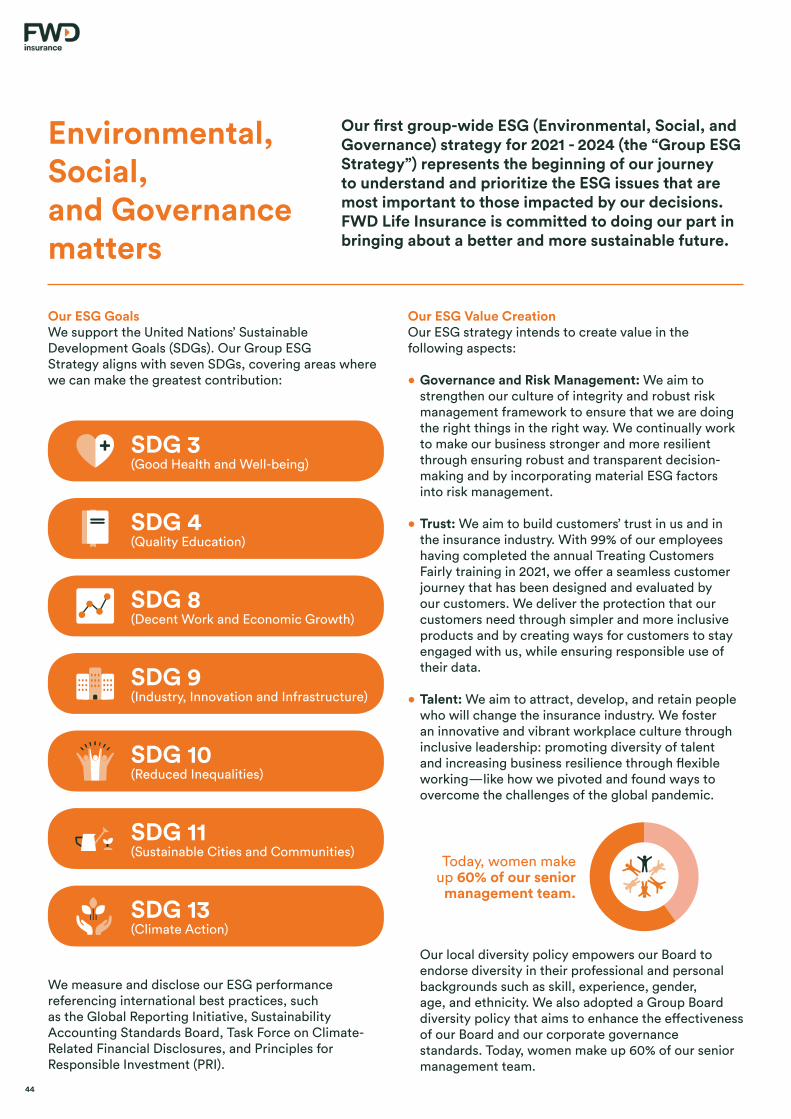
Our ESG GoalsWe support the United Nations’ Sustainable Development Goals (SDGs). Our Group ESGStrategy aligns with seven SDGs, covering areas where we can make the greatest contribution:
Our ESG Value CreationOur ESG strategy intends to create value in the following aspects:
• Governance and Risk Management: We aim to strengthen our culture of integrity and robust risk management framework to ensure that we are doing the right things in the right way. We continually work to make our business stronger and more resilient through ensuring robust and transparent decision-making and by incorporating material ESG factors into risk management.
• Trust: We aim to build customers’ trust in us and in the insurance industry. With 99% of our employees having completed the annual Treating Customers Fairly training in 2021, we offer a seamless customer journey that has been designed and evaluated by our customers. We deliver the protection that our customers need through simpler and more inclusive products and by creating ways for customers to stay engaged with us, while ensuring responsible use of their data.
• Talent: We aim to attract, develop, and retain people who will change the insurance industry. We foster an innovative and vibrant workplace culture through inclusive leadership: promoting diversity of talent and increasing business resilience through flexible working—like how we pivoted and found ways to overcome the challenges of the global pandemic.
Our local diversity policy empowers our Board to endorse diversity in their professional and personal backgrounds such as skill, experience, gender, age, and ethnicity. We also adopted a Group Board diversity policy that aims to enhance the effectiveness of our Board and our corporate governance standards. Today, women make up 60% of our senior management team.
Environmental, Social, and Governance matters
Our first group-wide ESG (Environmental, Social, and Governance) strategy for 2021 - 2024 (the “Group ESG Strategy”) represents the beginning of our journey to understand and prioritize the ESG issues that are most important to those impacted by our decisions. FWD Life Insurance is committed to doing our part in bringing about a better and more sustainable future.
• SDG 3• (Good Health and Well-being)
• SDG 10• (Reduced Inequalities)
• SDG 8• (Decent Work and Economic Growth)
• SDG 13• (Climate Action)
• SDG 4• (Quality Education)
• SDG 11• (Sustainable Cities and Communities)
• SDG 9• (Industry, Innovation and Infrastructure)
We measure and disclose our ESG performance referencing international best practices, such as the Global Reporting Initiative, Sustainability Accounting Standards Board, Task Force on Climate-Related Financial Disclosures, and Principles for Responsible Investment (PRI).
Today, women make up 60% of our senior
management team.
44

• Closing the Protection Gap: We are committed to creating a real impact on financial inclusion. We focus on younger customers in Asia who have traditionally been underserved by making our products more accessible and attractive to them. We educate people to help increase their financial literacy levels and become their life-time partner as they go through different life stages and circumstances.
• Sustainable Investment: We are a signatory to the PRI, and we aim to incorporate ESG factors into our investment process to ensure the long-term sustainability of our investments. We also invest in our local communities to support their sustainable development. With the help of our community partners, we advocate for better inclusivity and life opportunities for people with disabilities in Asia.
• Climate Change Resilience: We support the transition toward a low carbon economy through alignment with the Task Force on Climate-Related Financial Disclosures. We are conducting scenario analysis to understand our climate-related risks and opportunities.
Our ESG GovernanceAs part of our overall business strategy, we aim to ensure close alignment of our Group ESG function with our business goals and allocation of sufficient resources to our ESG functions, including establishing a Group ESG management committee in January 2020 to achieve this. The ESG management committee is chaired directly by Mr. Huynh Thanh Phong, our Group CEO and Executive Director, and comprises of senior managers from across the business. This ESG management committee is responsible for establishing our ESG goals and strategy, evaluating our performance and responding to emerging ESG risks and opportunities. This ESG management committee reports our various initiatives and progress to our Group board at least twice a year.
45
Our ESG strategy

Our ESG value-creationIn order to make the greatest impact, we’ve set ourselves 10 bold commitments. We aim to implement these by 2024 and will report our progress annually.
Strong corporate governance and risk management
Trust TalentClose the
protection gapSustainable investment Climate resilience
1 Being there in the moments that matter, offering personalized customer experiences
3Fostering an innovative and vibrant workplace culture with inclusive leadership
6Meeting the needs of underserved customers to improve financial inclusion
8Embedding ESG into our investment process to promote sustainable financial performance
10 Transitioning towards a low-carbon economy to help achieve net zero
2 Delivering the protection that our customers need via simpler, more inclusive products
4Attracting, developing, and retaining the best people in compelling careers
7Educating the next generation to ensure a brighter financial future
9Sharing our passion for a life worth celebrating by investing in local communities
5Promoting diversity of talent and business resilience through flexible ways of working
ESG SeriesIn November 2021, we launched our internal ESG (Environmental, Social, and Governance) online series, “Kwentuhan Tayo: Invest for a Better Tomorrow,” which aims to raise awareness and understanding of ESG principles within the company.
46

Our commitment to the community
The FWD Life Insurance spirit of bayanihan extends outside the confines of our walls. We remain resolute in our goals to always uplift the human spirit, empower people to overcome adversity, and extend assistance to those who need it, when they need it.
“Project Caring” Demonstrates Care and InclusivityTogether with representatives from Humanity & Inclusion and Special Olympics Pilipinas, FWD Life Insurance volunteers organized a fundraiser for those gravely affected by the massive flood brought by Typhoon Ulysses in the Cagayan Valley. Our employees raised almost PhP60,000 in cash, which was then used to purchase basic necessities for the flood victims. Two hundred residents of Alcala, Cagayan received immediate relief care packages. The initiative not only showed acts of care and compassion, it also delivered a message of unity and inclusivity—that disability is never a hindrance when helping a community in need.
“Come Back Stronger” Fundraiser for Staff in NeedOur employees raised PhP90,000 in cash donations to assist close to 25 FWD Life Insurance support staff who were affected by the prolonged lockdown in the Philippines.
Ventilator Donation to Major HospitalsTo support the nation’s pandemic response, we donated a total of six ventilators to major hospitals in Metro Manila: Lung Center of the Philippines, Philippine General Hospital, St. Luke’s Medical Center Foundation, and The Medical City.
“Project Ability” Showcases Our Beneficiaries’ TalentsTo celebrate the “International Day of People with Disabilities,” we turned the spotlight on the incredible talents of the Forward Together beneficiaries through “Project Ability.” In partnership with Humanity & Inclusion, this initiative provided a platform for Forward Together beneficiaries, Valenzuela Special Education Center and Ta & Nay’s Pot and Vases, to showcase their handicraft products and promote their livelihood. Our employees supported the cause by purchasing these handmade products, with at least 50 products sold in two weeks.
47
Our ESG strategy

48

Corporate governance
Doing the right things right
49
Corporate governance
Shareholders
Our Shareholders maintain a pivotal role in making sure that the company adheres to corporate governance policies and procedures.
Conduct of Shareholders’ MeetingsWe strongly encourage our Shareholders’ active participation in corporate affairs by ensuring their presence in Shareholders’ meetings. We consult them at the beginning of the calendar year and prioritize a flexible schedule to ensure most, if not all, Shareholders are present in person or by proxy. The formal notice (“Notice”) for Shareholders’ meetings is circulated at least 21 days prior to the meeting. The Notice is accompanied by the Agenda to encourage active participation in the meeting. Likewise, a proxy form is attached to the Notice to allow unavailable Shareholders to vote in absentia or through a representative.
The Shareholders are also reminded of the governing rules and voting procedures during the Shareholders’ meetings. Before the meeting, the Shareholders are reminded that each share is equivalent to one vote. In the election of directors, Shareholders cast their votes individually. Meetings of Shareholders and Directors are held at FWD Life Insurance’s main office in Taguig City. To ensure everyone’s safety with the COVID-19 pandemic, recent Shareholders and Directors meetings have been held via videoconference.
During the Meeting, the agenda item is read and the presenter is called. During or after the presentation, Shareholders are encouraged to raise questions or clarifications. The proposed resolution is read and voted upon, and Shareholders are given the opportunity to object. The Corporate Secretary notes any and all questions, clarifications, and objections in the minutes. Thereafter, the minutes are circulated to the attendees to ensure their accuracy before the same are submitted to the Shareholders for approval at their succeeding meeting.
FWD Life Insurance supports and implements a robust corporate governance policy that allows us to safeguard our stakeholders’ interests in an effective and transparent manner. We are committed to practicing and promoting accountability and acting in accordance with the highest performance standards and ethical guidelines. We comply with the Insurance Commission’s Revised Code of Corporate Governance and all other relevant laws, rules, regulations, and best practices on corporate governance.
50

Annual Shareholders’ Meeting on 25 March 2022Our annual Shareholders’ meeting was scheduled on25 March 2022. The formal Notice and Agenda, together with proxy forms, were routed to the Shareholders on 3 March 2022, 21 days before the scheduled meeting. The reference materials for the Shareholders’ meeting were also sent to the Shareholders in advance so that they were apprised of the rationale and explanation for each agenda item.
The Annual Shareholders’ Meeting was held at our principal office and through electronic communications pursuant to Securities and Exchange Commission Circular 2020-06. The following attended the Annual Shareholders Meeting in person and via teleconferencing and videoconferencing:
• FWD Group Financial Services Pte. Ltd.with Jasper Hendrik Cheng as proxy
• Security Bank Corporationwith Harold de Leon as proxy
• Ambassador Jose L. Cuisia, Jr.Chairperson of the Board and of the Related Party Transactions Committee
• Li Hao ZhuangExecutive Director, President and Chief Executive Officer
• Atty. Leo G. DominguezLead Independent Director and Chairperson of the Corporate Governance Committee
• Atty. Lilia B. De LimaIndependent Director and Chairperson of the Risk Committee
• Vicente B. CastilloOutgoing Independent Director and Chairperson of the Audit Committee1
• Adrian T. O’ConnorNon-Executive Director
• Binayak DuttaNon-Executive Director
• Antonio Manuel G. de RosasIncoming Independent Director and Chairperson of the Audit Committee2
1 Mr Castillo’s term as Director expired on 25 March 2022 2 Mr. de Rosas was elected on 25 March 2022
51
Corporate governance

Board of Directors
Our Board of Directors presides over Management, collectively oversees the company’s strategic direction and tenable future, and makes certain that the highest standards are constantly met with every decision-making.
Ambassador Jose L. Cuisia, Jr.Chairman
Li Hao Zhuang President and Chief Executive Officer
Leo G. Dominguez Lead Independent Director
52

Lilia De Lima Independent Director
Binayak Dutta Non-Executive Director
Adrian T. O’Connor Non-Executive Director
Vicente B. Castillo Independent Director
53
Corporate governance
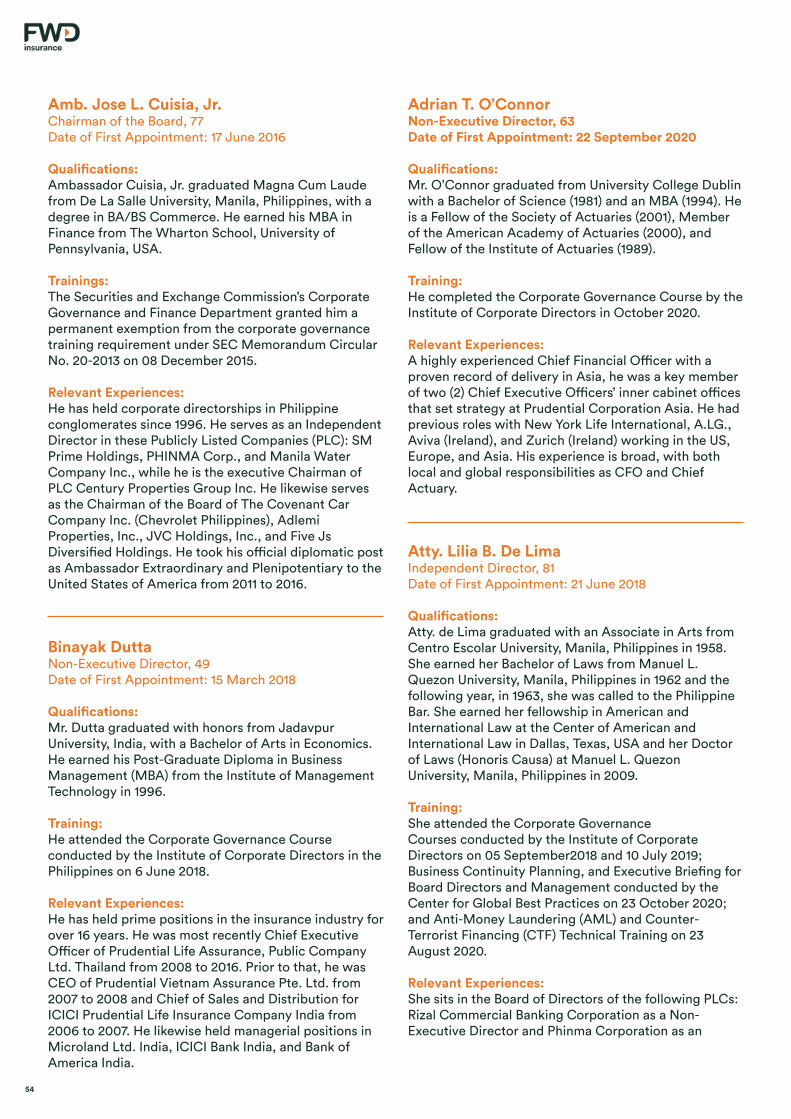
Amb. Jose L. Cuisia, Jr.Chairman of the Board, 77Date of First Appointment: 17 June 2016
Qualifications:Ambassador Cuisia, Jr. graduated Magna Cum Laude from De La Salle University, Manila, Philippines, with a degree in BA/BS Commerce. He earned his MBA in Finance from The Wharton School, University of Pennsylvania, USA.
Trainings:The Securities and Exchange Commission’s Corporate Governance and Finance Department granted him a permanent exemption from the corporate governance training requirement under SEC Memorandum Circular No. 20-2013 on 08 December 2015.
Relevant Experiences:He has held corporate directorships in Philippine conglomerates since 1996. He serves as an Independent Director in these Publicly Listed Companies (PLC): SM Prime Holdings, PHINMA Corp., and Manila Water Company Inc., while he is the executive Chairman of PLC Century Properties Group Inc. He likewise serves as the Chairman of the Board of The Covenant Car Company Inc. (Chevrolet Philippines), Adlemi Properties, Inc., JVC Holdings, Inc., and Five Js Diversified Holdings. He took his official diplomatic post as Ambassador Extraordinary and Plenipotentiary to the United States of America from 2011 to 2016.
Binayak DuttaNon-Executive Director, 49Date of First Appointment: 15 March 2018
Qualifications:Mr. Dutta graduated with honors from Jadavpur University, India, with a Bachelor of Arts in Economics. He earned his Post-Graduate Diploma in Business Management (MBA) from the Institute of Management Technology in 1996.
Training:He attended the Corporate Governance Course conducted by the Institute of Corporate Directors in the Philippines on 6 June 2018.
Relevant Experiences:He has held prime positions in the insurance industry for over 16 years. He was most recently Chief Executive Officer of Prudential Life Assurance, Public Company Ltd. Thailand from 2008 to 2016. Prior to that, he was CEO of Prudential Vietnam Assurance Pte. Ltd. from 2007 to 2008 and Chief of Sales and Distribution for ICICI Prudential Life Insurance Company India from 2006 to 2007. He likewise held managerial positions in Microland Ltd. India, ICICI Bank India, and Bank of America India.
Adrian T. O’ConnorNon-Executive Director, 63Date of First Appointment: 22 September 2020
Qualifications:Mr. O’Connor graduated from University College Dublin with a Bachelor of Science (1981) and an MBA (1994). He is a Fellow of the Society of Actuaries (2001), Member of the American Academy of Actuaries (2000), and Fellow of the Institute of Actuaries (1989).
Training:He completed the Corporate Governance Course by the Institute of Corporate Directors in October 2020.
Relevant Experiences:A highly experienced Chief Financial Officer with a proven record of delivery in Asia, he was a key member of two (2) Chief Executive Officers’ inner cabinet offices that set strategy at Prudential Corporation Asia. He had previous roles with New York Life International, A.LG., Aviva (Ireland), and Zurich (Ireland) working in the US, Europe, and Asia. His experience is broad, with both local and global responsibilities as CFO and Chief Actuary.
Atty. Lilia B. De LimaIndependent Director, 81Date of First Appointment: 21 June 2018
Qualifications:Atty. de Lima graduated with an Associate in Arts from Centro Escolar University, Manila, Philippines in 1958. She earned her Bachelor of Laws from Manuel L. Quezon University, Manila, Philippines in 1962 and the following year, in 1963, she was called to the Philippine Bar. She earned her fellowship in American and International Law at the Center of American and International Law in Dallas, Texas, USA and her Doctor of Laws (Honoris Causa) at Manuel L. Quezon University, Manila, Philippines in 2009.
Training:She attended the Corporate Governance Courses conducted by the Institute of Corporate Directors on 05 September2018 and 10 July 2019; Business Continuity Planning, and Executive Briefing for Board Directors and Management conducted by the Center for Global Best Practices on 23 October 2020; and Anti-Money Laundering (AML) and Counter-Terrorist Financing (CTF) Technical Training on 23 August 2020.
Relevant Experiences:She sits in the Board of Directors of the following PLCs: Rizal Commercial Banking Corporation as a Non-Executive Director and Phinma Corporation as an
54

Independent Director. She is also a Director of Dusit Thani Manila, Science Park of the Philippines, RFM Science Park of the Philippines, Pueblo de Oro Development Corp., Regatta Properties, Inc., Ionics EMS Inc., and Ionics Inc. She is an Executive-in-Residence at Asian Institute of Management, Member of Board of Trustees of Fatima Center for Human Development and Member, Advisory Council of AC Industrials.
Li Hao ZhuangExecutive Director, Presidentand Chief Executive Officer, 51Date of First Appointment: 1 January 2020
Qualifications:Mr. Zhuang holds a Master of Business Administration from Massachusetts Institute of Technology (MIT), USA and a Bachelor of Engineering (Hons) from Loughborough University, UK.
Training:He attended the Orientation on Corporate Governance conducted by The Institute of Corporate Directors, Makati, Philippines on 5 March 2020.
Relevant Experiences:He leads our Life business in the Philippines. He has nearly 30 years of leadership experience in insurance, banking, and consulting across Asia, the Middle East, the UK, and the United States. He was previously our Group Head of Agency Distribution. In this time, he developed FWD’s Elite Agency strategy and successfully rolled out key initiatives that lifted Elite Agency’s productivity, digital capabilities, and professionalism.
Atty. Leo DominguezLead Independent Director, 66Date of First Appointment: 6 December 2013
Qualifications:Atty. Dominguez graduated with a Bachelor of Arts in Philosophy from Ateneo de Manila University, Manila, Philippines and earned his Bachelor of Laws from the Ateneo Law School in 1980. He was admitted to the Philippine Bar in 1981.
Trainings:He completed the Orientation on Corporate Governance and Professional Directors Program of the Institute of Corporate Directors, Makati, Philippines in 2017 and the Baker & Mckenzie Partner Program of the Kellog Graduate School of Management, Northwestern University, Illinois, USA in 2000.
Relevant Experiences:A law veteran of 42 years, he was an Associate in two firms: Quisumbing Torres & Evangelista in Manila, Philippines and Baker & Mckenzie in Singapore, where he was involved in cross-transactions, merger and acquisitions, and advising multinational clients on their operations in several countries in the Asia Pacific region. He was also a Partner at Quisumbing Torres from 1991 to 2010.
Vicente B. CastilloIndependent Director, 67Date of First Appointment: 21 April 2015
Qualifications:Mr. Castillo holds Bachelor of Arts in Economics from De La Salle University, Manila, Philippines.
Training:He attended the ASEAN Corporate Governance Scorecard Orientation conducted by Institute of Corporate Directors in 2015. He also attended the Roles, Responsibilities and Liabilities of Board Directors conducted by Center for Global Best Practices last November 2021.
Relevant Experiences:He was President and Chief Executive Officer of Philippine Dealing System for 10 years. From 1995 to 2003, he worked with Banco Santander Philippines, Inc. as President and CEO. Mr. Castillo was Senior Vice President and Group Treasurer of Bank of the Philippine Islands (BPI) in 1989. He held other prime posts in BPI from 1980 to 1989.
55
Corporate governance

Overview of the Board’s ResponsibilitiesThe Board of Directors is able to exercise discretionary powers and is accountable to our Shareholders. It is guided by the Corporation Code of the Philippines, the company’s bylaws, the Corporate Governance Manual, and all other relevant laws, rules, and regulations. In the exercise of their functions, Directors act in good faith and with due care and diligence to ensure that they act in FWD Life Insurance’s best interest. The Board meets regularly, at least once a quarter, to review the company’s performance, business objectives, and strategy. The Directors also decide on matters specifically requiring Board approval by the company’s policies and frameworks. The Directors come to meetings prepared by having read the materials, which are made available at least five (5) business days prior to the meeting schedule. The Directors are likewise encouraged to ask questions and give recommendations prior to casting their votes on matters requiring approval. The Corporate Secretary records discussions in the minutes, including resolutions passed.
2021 Board Meetings and AttendanceThe 2021 meetings were proposed, scheduled, and approved by the Board of Directors at its Regular Meeting on 03 December 2020. Notices of these meetings, their Agenda and reference materials, plus minutes from the previous meeting and all other documents for discussion, were sent to the Directors one week before the actual meeting.
The Nomination and Election of Our DirectorsShareholders (including non-controlling Shareholders) individually nominate and elect candidates for the Board of Directors. Management may also suggest candidates to the Shareholders based on recommendations from external search firms. The Corporate Governance Committee evaluates the candidates’ qualifications, skills, expertise, and job experiences, and whether these align with FWD Life Insurance’s vision and mission.
The profiles of the qualified candidates, together with the Notice and Agenda for the Shareholders’ meeting, are presented to the Shareholders for election. These profiles contain the candidates’ age, academic qualification, working experience, other directorships, and appointments within the company. Elected directors hold office for a year.
The Corporate Governance Committee also reviews the candidates’ remuneration packages and certifies the same are within the approved tier limits approved by the company. Directors’ remuneration packages are then presented to the Shareholders and are ratified at the Shareholders’ meeting.
DirectorsOutgoing meeting (23 March 2021)
Organizational meeting(23 March 2021)
Special meeting(12 May 2021)
Regular meeting(22 June 2021)
Regular meeting(07 September 2021)
Special meeting(15 November 2021)
Regular meetings(10 December 2021)
% Attendance
Amb. Jose L. Cuisia, Jr. ✓ ✓ ✓ ✓ ✓ ✓ ✓ 100%
Adrian T. O’Connor ✓ ✓ ✓ ✓ ✓ - - 71%
Binayak Dutta ✓ ✓ ✓ - ✓ ✓ ✓ 85%
Atty. Leo G. Dominguez ✓ ✓ ✓ ✓ ✓ ✓ ✓ 100%
Atty. Lilia B. De Lima ✓ ✓ ✓ ✓ ✓ ✓ ✓ 100%
Li Hao Zhuang
✓ ✓ ✓ ✓ ✓ ✓ ✓ 100%
Vicente B. Castillo
✓ ✓ - ✓ ✓ ✓ ✓ 85%
% Attendance 100% 100% 70% 70% 100% 70% 70%
56

The Development of Our DirectorsThe Compliance Officer provides the orientation for Directors to explain the company’s vision and mission, organizational profile, the Corporate Governance Manual, Committee Terms of Reference, and policies and procedures of the company.
We also utilize online learning management systems, where Directors and Officers access annual development training and certification modules, such as the following:
• Code of Ethics and Business Conduct
• Gifts and Entertainment, Anti-Bribery, and Anti-Fraud
• Anti-Money Laundering and Counter-Terrorist Financing
• Whistleblower and Conflicts of Interest
• Information Security and Data Privacy
Within six months of their election and/or appointment, all Directors and Officers are required to attend Corporate Governance training seminars conducted by organizations accredited by the Insurance Commission (IC). This is to fully equip themselves with the latest information on corporate governance and matters of best practice.
In 2021, the Directors attended the following trainings and seminars to enrich their knowledge on the company’s business:
• “How Boards Have Risen to the COVID-19 Challenge, and What’s Next” seminar conducted by McKinsey & Company;
• Environmental, Social, and Governance Strategy Seminar, conducted by FWD Group;
• Anti-Money Laundering training conducted by Atty. Mel Georgie B. Racela, Executive Director of the Anti-Money Laundering Council Secretariat; and
• Anti-Bribery and Corruption training conducted by FWD Group.
The Process of Our Directors’ Evaluationsand AppraisalWe established our own annual performance evaluation for our Directors, Committee members and Chairpersons, and President and Chief Executive Officer. The assessment criteria are based on the IC circulars on corporate governance, our Corporate Governance Manual, and each Committee’s Terms of Reference.
The Board and Committee Performance Assessments were distributed on 10 December 2021. The Office of the Corporate Secretary tallied and summarized the results. On 24-25 March 2022, the results of the assessments were presented to the Board and Committees, and recommendations were noted and considered.
Remuneration of DirectorsDirectors’ remunerations are composed of fixed fees, which are based on the industry rate and fee structure within the FWD Group. They are entitled to remuneration upon their qualification and election and shall continue to be so until their retirement or cessation of their relationship with the company for any reason. Director’s renumeration is based on the table below:
For 2021, the company paid a total of 13,362,793.30 in Directors’ fees. Binayak Dutta, who is an executive of FWD Group, and Li Hao Zhuang, who is the FWD Life Insurance President and Chief Executive Officer, do not receive renumeration as Directors of FWD Life Insurance.
As President and Chief Executive Officer, Li Hao Zhuang’s executive renumeration package consists of fixed salaries and allowances, including short-term and long-term variable incentives.
Position Remuneration (PhP)
Chairman of the Board and Non-Executive Director
1,371,845.70
Member of the Board 1,066,991.10
Chairman of Committee 812,945.60
Member of Committee 558,900.10
57
Corporate governance

The Directors’ attendance at the Board Committee meetings is as follows:
Committees 22 Mar 2021 21 Jun 2021 06 Sept. 2021 15 Nov. 2021 09 Dec. 2021
Audit Committee 100% 100% 100% - 67%
Related Party Transactions Committee 100% 100% 100% - 100%
Corporate Governance Committee 100% - 100% 100% 100%
Risk Committee 100% 100% 100% - 67%
Audit CommitteeThe Audit Committee performs the following functions among other tasks enumerated in our by-laws, its Terms of Reference, and all other instructions of the Board of Directors:
• Review and approve financial reporting
• Review, approve, and make recommendations regarding internal audit
• Manage the external audit
• Review, approve, and evaluate our internal control standards, policies, and procedures
Each year, the Audit Committee reviews Internal Audit’s detailed three-year plans and confirms the adequacy of the company’s internal control systems.
The Audit Committee also approves and oversees the engagement, removal, and fees of the external auditor as well as the appointment and removal of the Head of Internal Audit. The Committee reports significant matters to the Board of Directors.
BoardCommittees
Our Board Committees remain actively engaged in addressing relevant matters. They offer strategic recommendations on specialized issues to ensure the achievement of the company’s goals.
Audit Committee 22 Mar 21 Jun 6 Sep 09 Dec
Vicente B. Castillo ✓ ✓ ✓ ✓
Atty. Leo G. Dominguez ✓ ✓ ✓ ✓
Adrian T. O’Connor ✓ ✓ ✓ -
% Attendance 100% 100% 100% 67%
58
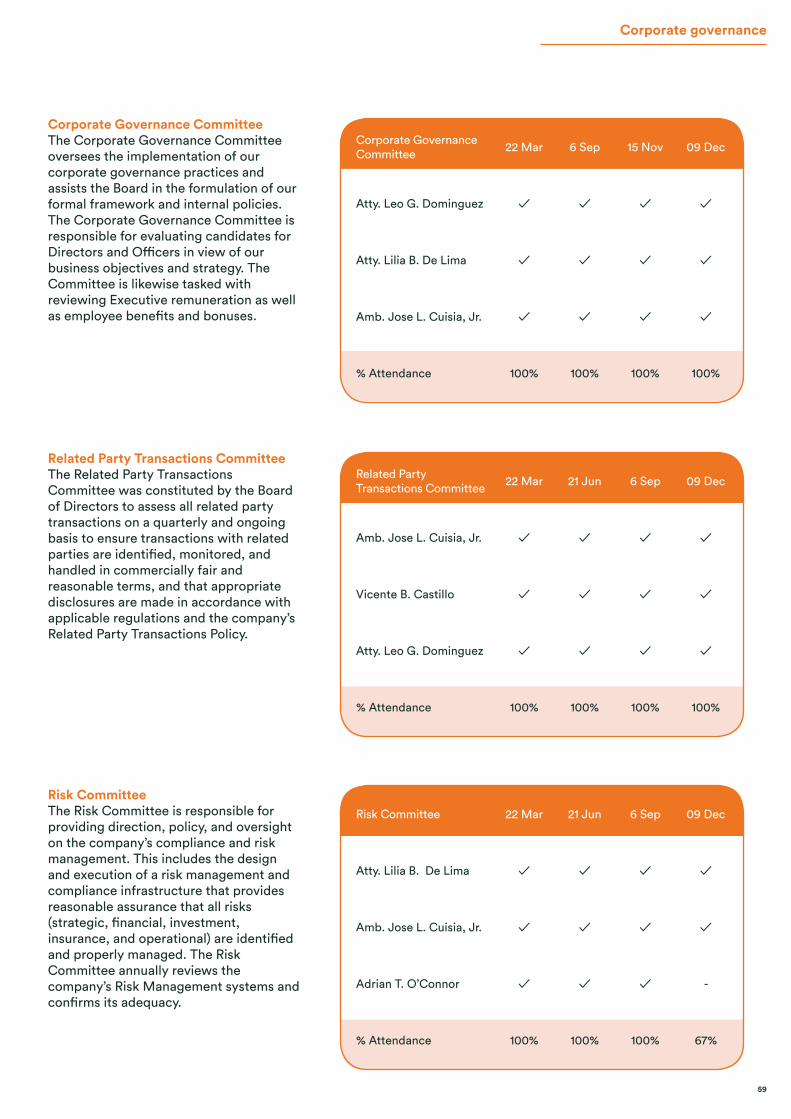
Corporate Governance CommitteeThe Corporate Governance Committee oversees the implementation of our corporate governance practices and assists the Board in the formulation of our formal framework and internal policies. The Corporate Governance Committee is responsible for evaluating candidates for Directors and Officers in view of our business objectives and strategy. The Committee is likewise tasked with reviewing Executive remuneration as well as employee benefits and bonuses.
Related Party Transactions CommitteeThe Related Party Transactions Committee was constituted by the Board of Directors to assess all related party transactions on a quarterly and ongoing basis to ensure transactions with related parties are identified, monitored, and handled in commercially fair and reasonable terms, and that appropriate disclosures are made in accordance with applicable regulations and the company’s Related Party Transactions Policy.
Risk CommitteeThe Risk Committee is responsible for providing direction, policy, and oversight on the company’s compliance and risk management. This includes the design and execution of a risk management and compliance infrastructure that provides reasonable assurance that all risks (strategic, financial, investment, insurance, and operational) are identified and properly managed. The Risk Committee annually reviews the company’s Risk Management systems and confirms its adequacy.
Corporate Governance Committee 22 Mar 6 Sep 15 Nov 09 Dec
Atty. Leo G. Dominguez ✓ ✓ ✓ ✓
Atty. Lilia B. De Lima ✓ ✓ ✓ ✓
Amb. Jose L. Cuisia, Jr. ✓ ✓ ✓ ✓
% Attendance 100% 100% 100% 100%
Related Party Transactions Committee 22 Mar 21 Jun 6 Sep 09 Dec
Amb. Jose L. Cuisia, Jr. ✓ ✓ ✓ ✓
Vicente B. Castillo ✓ ✓ ✓ ✓
Atty. Leo G. Dominguez ✓ ✓ ✓ ✓
% Attendance 100% 100% 100% 100%
Risk Committee 22 Mar 21 Jun 6 Sep 09 Dec
Atty. Lilia B. De Lima ✓ ✓ ✓ ✓
Amb. Jose L. Cuisia, Jr. ✓ ✓ ✓ ✓
Adrian T. O’Connor ✓ ✓ ✓ -
% Attendance 100% 100% 100% 67%
59
Corporate governance

Compliance Officer
The Compliance Officer acts as a corporate governance advocate and ensures that FWD Life Insurance conducts business in full compliance with all laws, policies, and regulatory matters, and that employees are following internal procedures.
Roles and ResponsibilitiesThe Compliance Officer ensures the timely submission of accurate reports and disclosures to the IC, Securities and Exchange Commission (SEC), and such other concerned regulatory agency in accordance with their respective rules and regulations. The Compliance Officer performs the following responsibilities:
• Ensures proper onboarding ofnew Directors
• Ensures the attendance of Board members and Officers in relevant trainings
• Monitors, reviews, evaluates, and ensures compliance by the company, our Officers and Directors with the relevant laws, the IC Code of Corporate Governance, rules and regulations, and all governance issuances of regulatory agencies
• Reports violations to the Board and recommends the imposition of appropriate disciplinary action
• Ensures the integrity and accuracy of all documentary submissions to regulators
• Collaborates with other departments to properly address compliance issues
• Identifies possible areas of compliance issues and works toward the resolution of the same
• Performs such other duties and responsibilities as may be prescribed by the IC and the company’s by-laws
Atty. Juan Sotero RomanChief Compliance Officer, 52Date of First Appointment: 25 July 2014
Qualifications:Atty. Roman holds a Bachelor of Arts in Political Science from De La Salle University, Manila, Philippines. He earned his Bachelor of Laws from the San Beda College of Law in the Philippines. He was admitted to the Philippine Bar in 1999.
Trainings:He completed the Orientation on Corporate Governance conducted by The Institute of Corporate Directors, Makati, Philippines in 2016, 2020, and 2021.
Relevant Experiences:He has more than a decade of experience in the insurance industry. He currently holds the rank of Vice President, as General Counsel, Chief Compliance Officer, and Data Privacy Officer of the company. Prior to joining FWD Life Insurance, he was with other insurance companies as Vice President – Legal and Compliance (2011 to 2014); Asst. Vice President, Officer-In-Charge (January to June 2011); Senior Compliance Officer (2010 to 2011); Claims Head (2007 to 2010); and Sales Compliance Manager (2006 to 2007).
60

Office of the Corporate Secretary
The Office of the Corporate Secretary commits to the integrity of the corporate governance framework and facilitates the resources needed for the Board and its Committees to diligently fulfill their duties.
Roles and ResponsibilitiesThe Office of the Corporate Secretary (OCS) ensures the proper conduct of Shareholders’, Board, and Committee meetings. The OCS also performs these functions:
• Coordinate with Shareholders and Directors for their availability
• Prepare and release the Notices and Agenda at least 21 days prior to Shareholders’ meetings and at least seven (7) days prior to Directors’ meetings
• Complete and circulate reference materials at least five (5) business days prior to meetings
• Prepare and safekeep the minutes recording the attendance (in person, through e-conferencing, or by proxy) of Shareholders, Directors, and Presenters; the discussions and voting on agenda items; and the resolutions passed
• Keep custody of company records in compliance with internal and regulatory standards
• Other functions described in the company’s by-laws
Atty. Donna C. Duque-PastoralCorporate Secretary, 41Date of First Appointment: 20 September 2019
Qualifications:Atty. Duque-Pastoral graduated from the University of the Philippines with a Bachelor of Arts in Political Science (2000) and Bachelor of Laws (2006). She was called to the Philippine Bar in 2007.
Trainings:She is an Associate in Life Management Institute (2017) and Associate in Insurance Regulatory Compliance
(2015) of the Life Office Management Association (LOMA). She attended the Orientation on Corporate Governance conducted by The Institute of Corporate Directors, Makati, Philippines in 2018 and a refresher course in Corporate Governance in 2020. She has earned her Certificate on Trust Operations and Investment Management course (2018) conducted by the Trust Institute Foundation of the Philippines.
She joined the seminar entitled “Best Practices in Corporate Housekeeping” in April 2021. She also attended the privately held seminar on “How Boards Have Risen to the COVID-19 Challenge, and What’s Next” conducted by McKinsey & Company.
Relevant Experiences:Prior to joining FWD Life Insurance, she was with other multinational insurance companies as Assistant Corporate Secretary (from 2017 to 2019); Legal Counsel; and Legal & Compliance Senior Manager and Assistant Corporate Secretary (from 2008 to 2013). She was an Associate at Soo Gutierrez Leogardo & Lee Law Offices from 2006 to 2008. She is a Special Lecturer II for Insurance Law and Credit Transactions in the University of Caloocan City College of Law for Academic Year 2021-2022.
Atty. Jordan Zafra-BernardoAssistant Corporate Secretary, 34Date of First Appointment: 22 September 2020
Qualifications:Atty. Zafra-Bernardo graduated from De La Salle University, Manila, Philippines with a Bachelor of Science in Accountancy (2008) and is a certified public accountant. She completed her Juris Doctor degree from Ateneo Law School in the Philippines in 2013 and was admitted to the Philippine Bar in 2014.
Trainings:She attended the Orientation on Corporate Governance conducted by The Institute of Corporate Directors, Makati, Philippines in August 2020. She joined the seminar entitled “Best Practices in Corporate Housekeeping” in April 2021. She also attended the privately held seminar on “How Boards Have Risen to the COVID-19 Challenge, and What’s Next” conducted by McKinsey & Company.
Relevant Experiences:She began her career in the insurance industry with FWD Life Insurance. Prior to joining the company, she was a Senior Associate at Gerodias Suchianco Estrella Law Firm from 2014 to 2019 where she acted as Corporate Secretary for various clients.
61
Corporate governance
A strong adherence to compliance
At FWD Life Insurance, we “Do the Right Things Right.” We adhere to a compliance framework that implements the highest code of professional and corporate ethics.
Code of Conduct and Business Ethics (Code)Our Code reminds Directors, Officers, employees, and distributors that all actions and decisions should be measured against high ethical standards. We are guided by the following principles: act with honesty and integrity; be informed and act responsibly; be open and clear; act with professionalism and respect for others; and be socially and environmentally responsible.
Overview of Our Policies Our policies protect our shareholders, creditors, and customers who entrust funds with FWD Life Insurance. And as a digital-first insurer, all our policies and interactive learning courses are made available to our Directors, Officers, and employees online.
• Conflict of Interest Policy: This policy seeks to identify, avoid, disclose, and manage actual, potential, or perceived conflicts of interest that can arise between and among employees, distributors, contractors, and customers. Conflicts of interest must be identified and declared so that any necessary action can be taken to manage or to avoid conflicts altogether, and to uphold the trust between FWD Life Insurance, its customers, and external stakeholders.
• Gifts, Entertainment, and Anti-Bribery Policy: We are committed to observing the highest code of professional ethics in conducting our business. This policy provides guidance on what gifts and entertainment are acceptable to ensure that both FWD Life Insurance and its employees fulfill the company’s business principles and comply with applicable regulatory requirements. It covers the general duties and obligations of all employees and contractors, in relation to the offering and accepting of gifts and other personal benefits to or from clients, prospective clients, third parties, regulatory bodies, and public officials.
• Whistleblower Policy: A culture of honesty includes our ability to speak up when we feel something is wrong. This policy covers the confidential, secure, and, if necessary, anonymous way of reporting
concerns or potential violations of our Code of Ethics and Business Conduct or anything that may pose a threat to our integrity and our reputation. This is to enable the Management to take appropriate actions. To speak up without fear of retaliation and to safeguard the confidentiality of the matter, stakeholders, Directors, Officers, employees, financial advisors, business partners, third-party suppliers, and the public may report concerns anonymously through our Speak Up Online platform at www.fwd.com/SpeakUp.
• Related Party Transactions Policy: Related Party Transactions (RPT) are transactions or dealings with related parties of the company, including its trust department, whether or not a price is charged. This policy aims to ensure that transactions are engaged into terms that promote the best interest of the company and our stakeholders. All RPTs must be conducted in the regular course of business and not undertaken on more favorable (than similar transactions with non-related parties under similar circumstances) economic terms to such related parties.
• Personal Insider Dealing Policy: This policy sets a guide of due care to our employees and to individuals who have access to non-public material information that can compromise any deal or counsel, or procures another deal in our listed securities (or their derivatives) for unfair advantage or financial gain.
• Information Security and Data Privacy Policy: This policy outlines our commitment to collect, process, and use data subject’s personal data in accordance with applicable laws and regulations on data privacy. We created the Data Privacy Champions, composed of a Data Protection Officer, Compliance Officer for Privacy, Information Security Team, and representatives from all functions, to ensure proper management of personal data across the company.
• Anti-Money and Laundering Policy: This policy establishes the general framework for FWD Life Insurance’s Anti-Money Laundering and Counter Terrorist Financing (AML-CTF) program. Senior Management, employees, distributors, and suppliers must duly comply with this policy vis-à-vis the manual. To protect the company’s reputation and avoid exposure to criminal charges, which may include fines and imprisonment, they must adhere to the guidelines in order to detect or combat money laundering and terrorist financing.
Submitting an online report through https://convercent.com/report (enter FWD in search bar).
Calling the Whistleblower Hotline Number: (02) 8626 3210
62

• Treating Customers Fairly Policy: This policy sets the minimum practices and standards expected in managing Conduct Risk, which is the risk of creating outcomes or experiences that are not in the best interest of our customers or don’t meet reasonable expectations of customers during the development, distribution, and management of our products and services. This policy ensures appropriate consideration of customers’ needs and that reasonable expectations are considered during the provision of insurance products and services to all customers.
• Regulatory Management Policy: We “do the right things right,” including compliance with relevant laws and regulations, and remaining transparent, open, and clear about our dealings with regulatory authorities. This policy outlines the key requirements on how we proactively manage our regulatory compliance and interactions, all to ensure that we build and maintain a trusting relationship with authorities and regulators.
Compliance Engagement InitiativesWe continually organize employee engagement activities that promote learning and heightened awareness of the importance of compliance.
• Workshop Sessions: Apart from policy references and online courses, we also organized workshop sessions for our employees and financial advisors to ensure our continued compliance with regulations and corporate policies especially during the height of the pandemic:
• Compliance Awareness Week: In November 2021, we had our annual Compliance Awareness Week that brought all FWD regional markets together to participate in virtual learning sessions and engaging activities highlighting the company’s guidelines and policies.
A proactive risk culture
Our business is backed by a strong, diligent, and proactive risk culture that enables us to make smart, risk-based decisions.
Stronger Risk Governance StructureThe Board of Directors has the overall responsibility to oversee FWD Life Insurance’s Enterprise Risk Management Framework, while the Management and staff are responsible for risk management. Our risk governance is based on a “three lines of defense” model that distinguishes three groups involved in effective risk management: 1) function that owns and manages risks; 2) function that oversees risks; and 3) function that provides independent assurance. The model seeks to make certain that risks are managed within the company’s risk appetite.
The Board established the Philippine Risk Committee (PRC) to supervise the key risks in the financial and non-financial sides of our business. The PRC approves overall risk plan of the company and confirms its adequacy. The PRC is supported by Local Investment and Asset & Liability Management Committee (LIALMC) and the Compliance and Operational Risk Committee (CORC). The LIALMC is responsible for overseeing the insurance, financial, investment, market, asset liability management, and capital risk of FWD Life Insurance, while the CORC is responsible for overseeing risks from daily operations involving technology, project management, business continuity, and compliance to regulatory mandates.
PH Board of Directors
2nd Line of Defense
PH RiskCommittee
Compliance &Operational Risk
Commitee
Local Investment & Asset-LiabilityManagement
1st Line of Defense
ManagementCommittees
3rd Line of Defense
AuditCommittee
Remote and Cross-Border Selling Workshop:
Based on the Insurance Commission’s regulations, this online session apprised our financial advisors of the prohibition on cross-border selling and guidelines on non-face-to-face selling of insurance products.
Data Privacy Workshop:
This online session helped increase our employees’ awareness of data privacy requirements and educated them on proper security and handling of personal data.
63
Corporate governance

Risk CultureWe aim to build a stronger risk culture that enables proactive management of risk by all employees across the organization. The guiding principles of the Code of Ethics and Business Conduct set the behavioral standards expected of Management and all Directors, employees, contractors, and distributors.
We believe that tone from the top, leadership engagement, accountabilities, and awareness communication initiatives are key to ensuring a strong risk culture. On an annual basis, we conduct survey and focused group discussions to measure and understand our strengths and areas for improvements.
We also reinforce maintenance of desired risk management behavior through Risk and Compliance Key Performance Indicator (RCKPI), a rating concluded by the Group Risk Committee and Group Compensation Committee. It serves as a basis for the short-term incentive multiplier.
Risk AppetiteWe use a common language in managing our risks. Risk appetite is clearly defined and approved up to the Board level. It is cascaded to everyone and embedded in business planning, strategic initiatives, and daily operations to make sure that decisions are made and taken within the bounds of our risk appetite.
Risk Management in ActionEvery year, we conduct risk identification and assessment through risk register update, top risk definition, and operational risk assessment. Transparency in reporting of incidents and issues is deeply engrained in each employee. This allows us to promptly respond to the exposure with mitigating strategies that follow the company’s risk appetite and reduce the likelihood of an impact—or fully avoid, transfer, or accept the risk.
Both first and second lines of defense conduct a proactive internal controls review through Key Control Self-Assessment. This is to assess if there are any control design issues and if the operating controls are still effective and consistently implemented.
Aside from adherence to our local regulator, being a subsidiary of FWD Group, FWD Life Insurance also abides by the policies of the Hong Kong Insurance Authority. This requires us to update most of our policies and procedures due to the Group-wide supervision.
Resiliency and readiness to respond to crisis that may impact our business, such as natural calamities and a pandemic, are also part of the risk management program. Business impact analysis is conducted annually to identify the resource requirement of each mission’s critical process to continue operating and serving our customers even in the event of an adversity. Following this assessment is the enhancement of the business continuity and disaster recovery plans. To best prepare our stakeholders on risk management, the business continuity and disaster recovery playbook is appraised annually through tabletop discussions and functional drills.
In response to the global pandemic, the risk management team coordinated with the local government of Taguig and a private vendor to provide COVID-19 vaccination to our employees. We’ve also put in place an online health check-in for continued health monitoring and reporting of COVID-19 cases in the company.
Our Key Risk Areas in 2021In 2021, we closely monitored these specific key risk areas:
Business performance risk brought upon by the global health pandemic. With the rise of COVID-19 cases in 2021, FWD Life Insurance bore the weight of claims related to the virus, with persistency and higher surrenders
Significant regulatory changes from both local regulator and Group-wide supervision that may impact the business
Cyber risk and data protection
Resiliency and general business operations
64
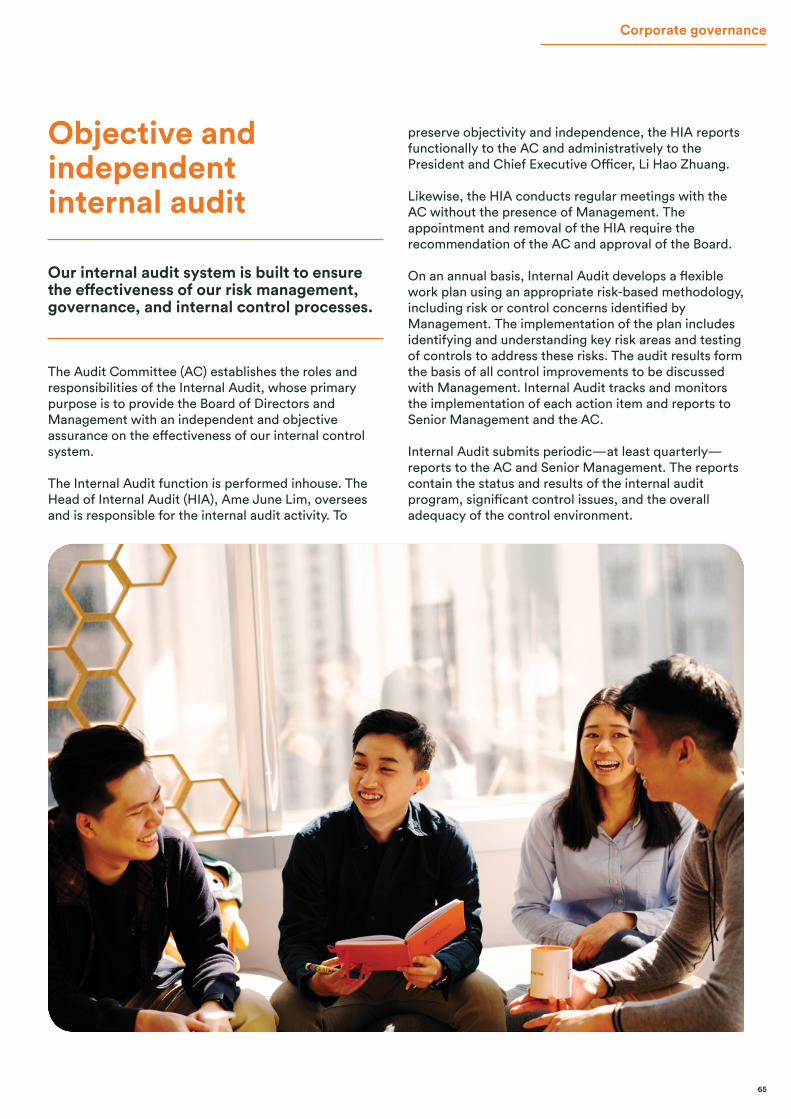
Objective and independent internal audit
Our internal audit system is built to ensure the effectiveness of our risk management, governance, and internal control processes.
The Audit Committee (AC) establishes the roles and responsibilities of the Internal Audit, whose primary purpose is to provide the Board of Directors and Management with an independent and objective assurance on the effectiveness of our internal control system.
The Internal Audit function is performed inhouse. The Head of Internal Audit (HIA), Ame June Lim, oversees and is responsible for the internal audit activity. To
preserve objectivity and independence, the HIA reports functionally to the AC and administratively to the President and Chief Executive Officer, Li Hao Zhuang.
Likewise, the HIA conducts regular meetings with the AC without the presence of Management. The appointment and removal of the HIA require the recommendation of the AC and approval of the Board.
On an annual basis, Internal Audit develops a flexible work plan using an appropriate risk-based methodology, including risk or control concerns identified by Management. The implementation of the plan includes identifying and understanding key risk areas and testing of controls to address these risks. The audit results form the basis of all control improvements to be discussed with Management. Internal Audit tracks and monitors the implementation of each action item and reports to Senior Management and the AC.
Internal Audit submits periodic—at least quarterly—reports to the AC and Senior Management. The reports contain the status and results of the internal audit program, significant control issues, and the overall adequacy of the control environment.
65
Corporate governance

66

Audited financialstatements
67
Audited financial statements
FWD Life Insurance Corporation(A Wholly Owned Subsidiary of FWDGroup Financial Services Pte. Ltd)
Financial StatementsDecember 31, 2021 and 2020
and
Independent Auditor’s Report
68

FWD Life Insurance Corporation(A Wholly Owned Subsidiary of FWDGroup Financial Services Pte. Ltd)
Financial StatementsDecember 31, 2021 and 2020
and
Independent Auditor’s Report
*SGVFS163777*
INDEPENDENT AUDITOR’S REPORT
The Stockholders and the Board of DirectorsFWD Life Insurance Corporation
Report on the Audit of the Financial Statements
Opinion
We have audited the financial statements of FWD Life Insurance Corporation (the Company), whichcomprise the statements of financial position as at December 31, 2021 and 2020, and the statementsof comprehensive income, statements of changes in equity and statements of cash flows for the yearsthen ended, and notes to the financial statements, including a summary of significant accountingpolicies.
In our opinion, the accompanying financial statements present fairly, in all material respects, thefinancial position of the Company as at December 31, 2021 and 2021, and its financial performanceand its cash flows for the years then ended in accordance with Philippine Financial ReportingStandards (PFRSs).
Basis for Opinion
We conducted our audits in accordance with Philippine Standards on Auditing (PSAs). Ourresponsibilities under those standards are further described in the Auditor’s Responsibilities for theAudit of the Financial Statements section of our report. We are independent of the Company inaccordance with the Code of Ethics for Professional Accountants in the Philippines (Code ofEthics) together with the ethical requirements that are relevant to our audit of the financialstatements in the Philippines, and we have fulfilled our other ethical responsibilities in accordancewith these requirements and the Code of Ethics. We believe that the audit evidence we haveobtained is sufficient and appropriate to provide a basis for our opinion.
Responsibilities of Management and Those Charged with Governance for the FinancialStatements
Management is responsible for the preparation and fair presentation of the financial statements inaccordance with PFRSs, and for such internal control as management determines is necessary toenable the preparation of financial statements that are free from material misstatement, whether dueto fraud or error.
SyCip Gorres Velayo & Co.6760 Ayala Avenue1226 Makati CityPhilippines
Tel: (632) 8891 0307Fax: (632) 8819 0872ey.com/ph
A member firm of Ernst & Young Global Limited 69
Audited financial statements

*SGVFS163777*
- 2 -
In preparing the financial statements, management is responsible for assessing the Company’sability to continue as a going concern, disclosing, as applicable, matters related to going concernand using the going concern basis of accounting unless management either intends to liquidate theCompany or to cease operations, or has no realistic alternative but to do so.
Those charged with governance are responsible for overseeing the Company’s financial reportingprocess.
Auditor’s Responsibilities for the Audit of the Financial Statements
Our objectives are to obtain reasonable assurance about whether the financial statements as a wholeare free from material misstatement, whether due to fraud or error, and to issue an auditor’s reportthat includes our opinion. Reasonable assurance is a high level of assurance, but is not a guaranteethat an audit conducted in accordance with PSAs will always detect a material misstatement when itexists. Misstatements can arise from fraud or error and are considered material if, individually or inthe aggregate, they could reasonably be expected to influence the economic decisions of users takenon the basis of these financial statements.
As part of an audit in accordance with PSAs, we exercise professional judgment and maintainprofessional skepticism throughout the audit. We also:
Identify and assess the risks of material misstatement of the financial statements, whether due tofraud or error, design and perform audit procedures responsive to those risks, and obtain auditevidence that is sufficient and appropriate to provide a basis for our opinion. The risk of notdetecting a material misstatement resulting from fraud is higher than for one resulting fromerror, as fraud may involve collusion, forgery, intentional omissions, misrepresentations, or theoverride of internal control.
Obtain an understanding of internal control relevant to the audit in order to design auditprocedures that are appropriate in the circumstances, but not for the purpose of expressing anopinion on the effectiveness of the Company’s internal control.
Evaluate the appropriateness of accounting policies used and the reasonableness of accountingestimates and related disclosures made by management.
Conclude on the appropriateness of management’s use of the going concern basis of accountingand, based on the audit evidence obtained, whether a material uncertainty exists related toevents or conditions that may cast significant doubt on the Company’s ability to continue as agoing concern. If we conclude that a material uncertainty exists, we are required to drawattention in our auditor’s report to the related disclosures in the financial statements or, if suchdisclosures are inadequate, to modify our opinion. Our conclusions are based on the auditevidence obtained up to the date of our auditor’s report. However, future events or conditionsmay cause the Company to cease to continue as a going concern.
Evaluate the overall presentation, structure and content of the financial statements, including thedisclosures, and whether the financial statements represent the underlying transactions andevents in a manner that achieves fair presentation.
A member firm of Ernst & Young Global Limited
70
*SGVFS163777*
- 3 -
We communicate with those charged with governance regarding, among other matters, the plannedscope and timing of the audit and significant audit findings, including any significant deficiencies ininternal control that we identify during our audit.
Report on the Supplementary Information Required Under Revenue Regulations 15-2010
Our audits were conducted for the purpose of forming an opinion on the basic financial statementstaken as a whole. The supplementary information required under Revenue Regulations 15-2010 inNote 27 to the financial statements is presented for purposes of filing with the Bureau of InternalRevenue and is not a required part of the basic financial statements. Such information is theresponsibility of the management of FWD Life Insurance Corporation. The information has beensubjected to the auditing procedures applied in our audit of the basic financial statements. In ouropinion, the information is fairly stated, in all material respects, in relation to the basic financialstatements taken as a whole.
SYCIP GORRES VELAYO & CO.
Ray Francis C. BalagtasPartnerCPA Certificate No. 108795Tax Identification No. 216-950-288BOA/PRC Reg. No. 0001, August 25, 2021, valid until April 15, 2024SEC Partner Accreditation No. 108795-SEC (Group A)
Valid to cover audit of 2021 to 2025 financial statements of SEC covered institutionsSEC Firm Accreditation No. 0001-SEC (Group A)
Valid to cover audit of 2021 to 2025 financial statements of SEC covered institutionsBIR Accreditation No. 08-001998-107-2020, November 27, 2020, valid until November 26, 2023PTR No. 8853467, January 3, 2022, Makati City
March 25, 2022
A member firm of Ernst & Young Global Limited
71
Audited financial statements
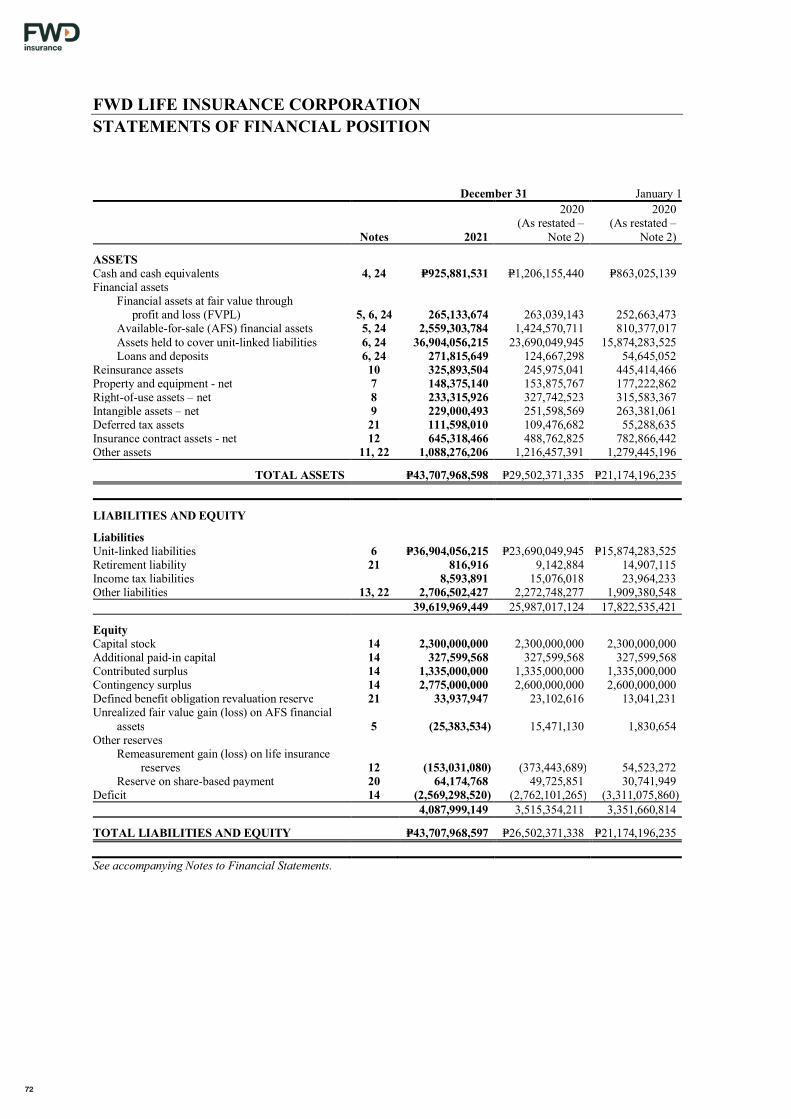
*SGVFS163777*
FWD LIFE INSURANCE CORPORATIONSTATEMENTS OF FINANCIAL POSITION
December 31 January 1
Notes 2021
2020(As restated –
Note 2)
2020(As restated –
Note 2)
ASSETSCash and cash equivalents 4, 24 P=925,881,531 P=1,206,155,440 P=863,025,139Financial assets Financial assets at fair value through
profit and loss (FVPL) 5, 6, 24 265,133,674 263,039,143 252,663,473 Available-for-sale (AFS) financial assets 5, 24 2,559,303,784 1,424,570,711 810,377,017
Assets held to cover unit-linked liabilities 6, 24 36,904,056,215 23,690,049,945 15,874,283,525Loans and deposits 6, 24 271,815,649 124,667,298 54,645,052
Reinsurance assets 10 325,893,504 245,975,041 445,414,466Property and equipment - net 7 148,375,140 153,875,767 177,222,862Right-of-use assets – net 8 233,315,926 327,742,523 315,583,367Intangible assets – net 9 229,000,493 251,598,569 263,381,061Deferred tax assets 21 111,598,010 109,476,682 55,288,635Insurance contract assets - net 12 645,318,466 488,762,825 782,866,442Other assets 11, 22 1,088,276,206 1,216,457,391 1,279,445,196
TOTAL ASSETS P=43,707,968,598 P=29,502,371,335 P=21,174,196,235
LIABILITIES AND EQUITY
LiabilitiesUnit-linked liabilities 6 P=36,904,056,215 P=23,690,049,945 P=15,874,283,525Retirement liability 21 816,916 9,142,884 14,907,115Income tax liabilities 8,593,891 15,076,018 23,964,233Other liabilities 13, 22 2,706,502,427 2,272,748,277 1,909,380,548
39,619,969,449 25,987,017,124 17,822,535,421
EquityCapital stock 14 2,300,000,000 2,300,000,000 2,300,000,000Additional paid-in capital 14 327,599,568 327,599,568 327,599,568Contributed surplus 14 1,335,000,000 1,335,000,000 1,335,000,000Contingency surplus 14 2,775,000,000 2,600,000,000 2,600,000,000Defined benefit obligation revaluation reserve 21 33,937,947 23,102,616 13,041,231Unrealized fair value gain (loss) on AFS financial
assets 5 (25,383,534) 15,471,130 1,830,654Other reserves
Remeasurement gain (loss) on life insurancereserves 12 (153,031,080) (373,443,689) 54,523,272
Reserve on share-based payment 20 64,174,768 49,725,851 30,741,949Deficit 14 (2,569,298,520) (2,762,101,265) (3,311,075,860)
4,087,999,149 3,515,354,211 3,351,660,814
TOTAL LIABILITIES AND EQUITY P=43,707,968,597 P=26,502,371,338 P=21,174,196,235
See accompanying Notes to Financial Statements.
72
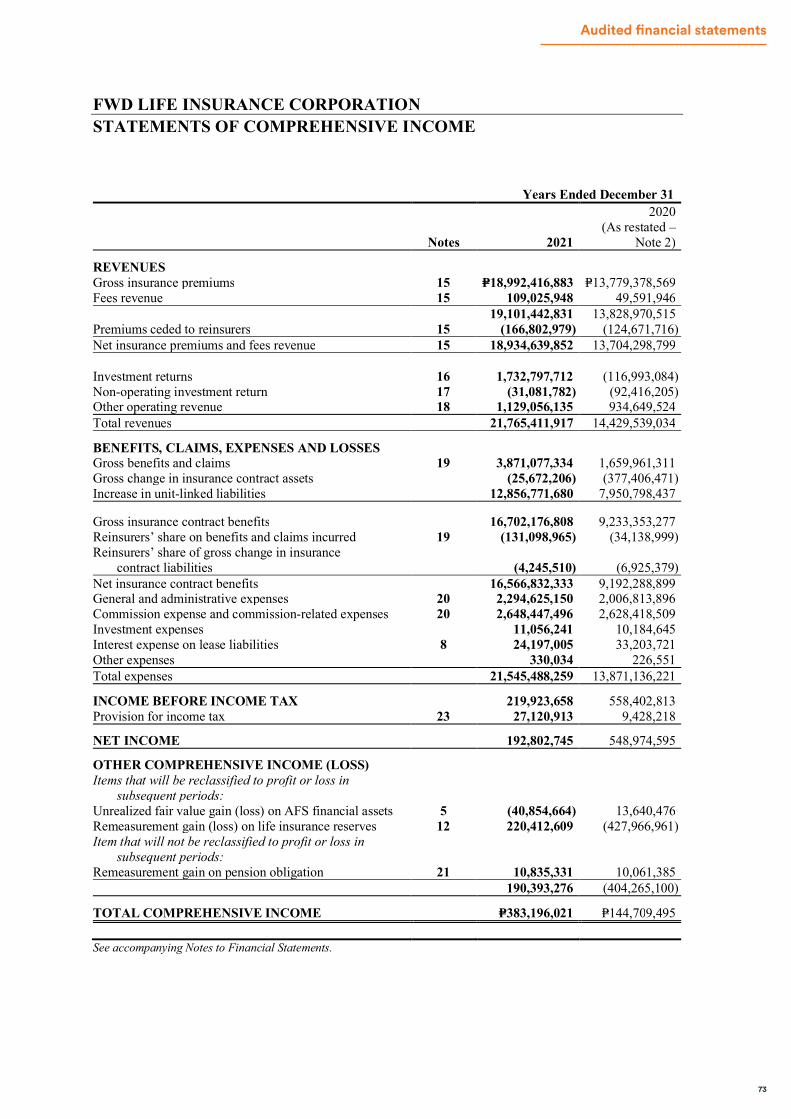
*SGVFS163777*
FWD LIFE INSURANCE CORPORATIONSTATEMENTS OF COMPREHENSIVE INCOME
Years Ended December 31
Notes 2021
2020(As restated –
Note 2)
REVENUESGross insurance premiums 15 P=18,992,416,883 P=13,779,378,569Fees revenue 15 109,025,948 49,591,946
19,101,442,831 13,828,970,515Premiums ceded to reinsurers 15 (166,802,979) (124,671,716)Net insurance premiums and fees revenue 15 18,934,639,852 13,704,298,799
Investment returns 16 1,732,797,712 (116,993,084)Non-operating investment return 17 (31,081,782) (92,416,205)Other operating revenue 18 1,129,056,135 934,649,524Total revenues 21,765,411,917 14,429,539,034
BENEFITS, CLAIMS, EXPENSES AND LOSSESGross benefits and claims 19 3,871,077,334 1,659,961,311Gross change in insurance contract assets (25,672,206) (377,406,471)Increase in unit-linked liabilities 12,856,771,680 7,950,798,437
Gross insurance contract benefits 16,702,176,808 9,233,353,277Reinsurers’ share on benefits and claims incurred 19 (131,098,965) (34,138,999)Reinsurers’ share of gross change in insurance
contract liabilities (4,245,510) (6,925,379)Net insurance contract benefits 16,566,832,333 9,192,288,899General and administrative expenses 20 2,294,625,150 2,006,813,896Commission expense and commission-related expenses 20 2,648,447,496 2,628,418,509Investment expenses 11,056,241 10,184,645Interest expense on lease liabilities 8 24,197,005 33,203,721Other expenses 330,034 226,551Total expenses 21,545,488,259 13,871,136,221
INCOME BEFORE INCOME TAX 219,923,658 558,402,813Provision for income tax 23 27,120,913 9,428,218
NET INCOME 192,802,745 548,974,595
OTHER COMPREHENSIVE INCOME (LOSS)Items that will be reclassified to profit or loss in
subsequent periods:Unrealized fair value gain (loss) on AFS financial assets 5 (40,854,664) 13,640,476Remeasurement gain (loss) on life insurance reserves 12 220,412,609 (427,966,961)Item that will not be reclassified to profit or loss in
subsequent periods:Remeasurement gain on pension obligation 21 10,835,331 10,061,385
190,393,276 (404,265,100)
TOTAL COMPREHENSIVE INCOME P=383,196,021 P=144,709,495
See accompanying Notes to Financial Statements.
73
Audited financial statements

*SGVFS163777*
FWD
LIF
E IN
SUR
AN
CE
CO
RPO
RA
TIO
NST
AT
EM
EN
TS
OF
CH
AN
GE
S E
QU
ITY
Cap
ital S
tock
(Not
e 14
)
Add
ition
alPa
id-in
Cap
ital
(Not
e 14
)
Con
trib
uted
Surp
lus
(Not
e 14
)
Con
tinge
ncy
Surp
lus
(Not
e 14
)
Res
erve
on
Shar
e-B
ased
Paym
ent
(Not
e 20
)
Rem
easu
rem
ent
Gai
n on
Pen
sion
Obl
igat
ion
(Not
e 21
)
Rem
easu
rem
ent
Gai
ns (L
osse
s) o
nL
ifeIn
sura
nce
Res
erve
s(N
ote
12)
Def
icit
(Not
e 20
)
Unr
ealiz
ed F
air
Val
ue G
ain
(Los
s) o
nA
FS F
inan
cial
Ass
ets
(Not
e 5)
Tot
alE
quity
Bal
ance
s at J
anua
ry 1
, 202
1, a
sre
stat
ed, a
s pre
viou
sly
repo
rted
P=2,3
00,0
00,0
00P=3
27,5
99,5
68P=1
,335
,000
,000
P=2,6
00,0
00,0
00P=4
9,72
5,85
1P=2
3,10
2,61
6(P=
372,
472,
400)
(P=3,
076,
683,
760)
P=15,
471,
130
P=3,2
01,7
43,0
05Ef
fect
of c
hang
e in
val
uatio
nm
etho
dolo
gy fo
r leg
al p
olic
yre
serv
es (N
ote
2)–
––
––
–(9
71,2
89)
314,
582,
495
–31
3,61
1,20
6B
alan
ces a
t Jan
uary
1, 2
021,
as
rest
ated
P=2,3
00,0
00,0
00P=3
27,5
99,5
68P=1
,335
,000
,000
P=2,6
00,0
00,0
0049
,725
,851
P=23,
102,
616
(373
,443
,689
)(2
,762
,101
,265
)P=1
5,47
1,13
03,
515,
354,
211
Unr
ealiz
ed fa
ir va
lue
loss
on
AFS
finan
cial
ass
ets
––
––
––
––
(40,
854,
664)
(40,
854,
664)
Rem
easu
rem
ent g
ain
on p
ensio
nob
ligat
ion
––
––
–10
,835
,331
––
–10
,835
,331
Impa
ct o
f Gro
ss P
rem
ium
Val
uatio
n(G
PV) r
eser
ves
––
––
––
220,
412,
609
––
220,
412,
609
Net
inco
me
––
––
––
–19
2,80
2,74
5–
192,
802,
745
Tota
l com
preh
ensiv
e in
com
e (lo
ss)
––
––
–10
,835
,331
220,
412,
609
192,
802,
745
(40,
854,
664)
383,
196,
021
Res
erve
on
shar
e-ba
sed
paym
ent
––
––
14,4
48,9
17–
––
–14
,448
,917
Add
ition
al c
ontin
genc
y su
rplu
s–
––
175,
000,
000
––
––
–17
5,00
0,00
0B
alan
ces a
t Dec
embe
r 31
, 202
1P=2
,300
,000
,000
P=327
,599
,568
P=1,3
35,0
00,0
00P=2
,775
,000
,000
P=64,
174,
768
P=33,
937,
947
(P=15
3,03
1,08
0)(P=
2,56
9,29
8,52
0)(P=
25,3
83,5
34)
P=4,0
87,9
99,1
49
74

*SGVFS163777*
FWD
LIF
E IN
SUR
AN
CE
CO
RPO
RA
TIO
NST
AT
EM
EN
TS
OF
CH
AN
GE
S E
QU
ITY
Cap
ital S
tock
(Not
e 14
)
Add
ition
alPa
id-in
Cap
ital
(Not
e 14
)
Con
trib
uted
Surp
lus
(Not
e 14
)
Con
tinge
ncy
Surp
lus
(Not
e 14
)
Res
erve
on
Shar
e-B
ased
Paym
ent
(Not
e 20
)
Rem
easu
rem
ent
Gai
n on
Pen
sion
Obl
igat
ion
(Not
e 21
)
Rem
easu
rem
ent
Gai
ns (L
osse
s) o
nL
ifeIn
sura
nce
Res
erve
s(N
ote
12)
Def
icit
(Not
e 20
)
Unr
ealiz
ed F
air
Val
ue G
ain
(Los
s) o
nA
FS F
inan
cial
Ass
ets
(Not
e 5)
Tot
alE
quity
Bal
ance
s at J
anua
ry 1
, 202
0, a
sre
stat
ed, a
s pre
viou
sly
repo
rted
P=2,3
00,0
00,0
00P=3
27,5
99,5
68P=1
,335
,000
,000
P=2,6
00,0
00,0
00P=3
0,74
1,94
9P=1
3,04
1,23
1P=5
4,15
3,44
3(3
,413
,779
,944
)P=1
,830
,654
P= 3,
248,
586,
901
Effe
ct o
f cha
nge
in v
alua
tion
met
hodo
logy
for l
egal
pol
icy
rese
rves
(Not
e 2)
––
––
––
369,
829
102,
704,
084
–10
3,07
3,91
3B
alan
ces a
t Jan
uary
1, 2
020,
as
rest
ated
2,30
0,00
0,00
032
7,59
9,56
81,
335,
000,
000
2,60
0,00
0,00
030
,741
,949
13,0
41,2
3154
,523
,272
(3,3
11,0
75,8
60)
1,83
0,65
43,
351,
660,
814
Unr
ealiz
ed fa
ir va
lue
gain
on
AFS
finan
cial
ass
ets
––
––
––
––
13,6
40,4
7613
,640
,476
Rem
easu
rem
ent g
ain
on p
ensio
nob
ligat
ion
––
––
–10
,061
,385
––
–10
,061
,385
Impa
ct o
f Gro
ss P
rem
ium
Val
uatio
n(G
PV) r
eser
ves
––
––
––
(427
,966
,961
)–
–(4
27,9
66,9
61)
Net
inco
me
––
––
––
–54
8,97
4,59
5–
548,
974,
595
Tota
l com
preh
ensiv
e in
com
e (lo
ss)
––
––
–10
,061
,385
(427
,966
,961
)54
8,97
4,59
513
,640
,476
144,
709,
495
Res
erve
on
shar
e-ba
sed
paym
ent
––
––
18,9
83,9
02–
––
–18
,983
,902
Bal
ance
s at D
ecem
ber 3
1, 2
020
P=2,3
00,0
00,0
00P=3
27,5
99,5
68P=1
,335
,000
,000
P=2,6
00,0
00,0
00P=4
9,72
5,85
1P=2
3,10
2,61
6(P=
373,
443,
689)
(P=2,
762,
101,
265)
P=15,
471,
130
P=3,5
15,3
54,2
12
See
acco
mpa
nyin
g No
tes t
o Fi
nanc
ial S
tate
men
ts.
75
Audited financial statements
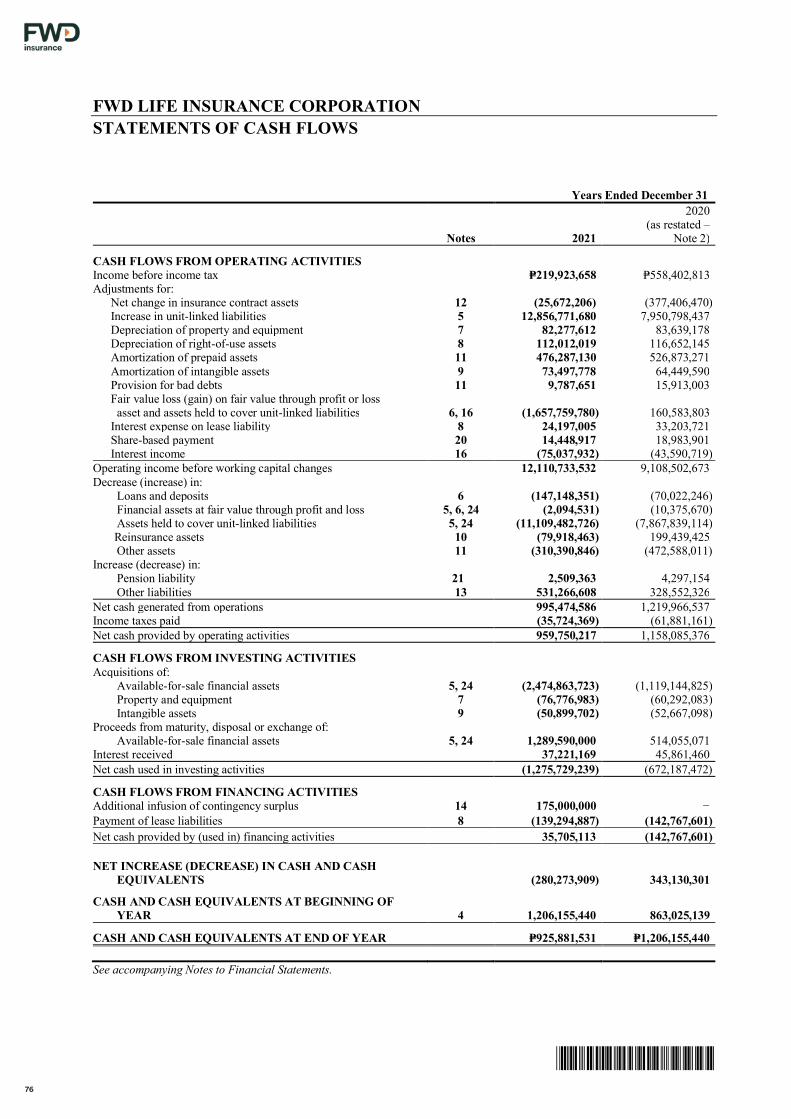
*SGVFS163777*
FWD LIFE INSURANCE CORPORATIONSTATEMENTS OF CASH FLOWS
Years Ended December 31
Notes 2021
2020(as restated –
Note 2)
CASH FLOWS FROM OPERATING ACTIVITIESIncome before income tax P=219,923,658 P=558,402,813Adjustments for:
Net change in insurance contract assets 12 (25,672,206) (377,406,470)Increase in unit-linked liabilities 5 12,856,771,680 7,950,798,437Depreciation of property and equipment 7 82,277,612 83,639,178Depreciation of right-of-use assets 8 112,012,019 116,652,145
Amortization of prepaid assets 11 476,287,130 526,873,271Amortization of intangible assets 9 73,497,778 64,449,590Provision for bad debts 11 9,787,651 15,913,003
Fair value loss (gain) on fair value through profit or lossasset and assets held to cover unit-linked liabilities 6, 16 (1,657,759,780) 160,583,803
Interest expense on lease liability 8 24,197,005 33,203,721Share-based payment 20 14,448,917 18,983,901Interest income 16 (75,037,932) (43,590,719)
Operating income before working capital changes 12,110,733,532 9,108,502,673Decrease (increase) in:
Loans and deposits 6 (147,148,351) (70,022,246)Financial assets at fair value through profit and loss 5, 6, 24 (2,094,531) (10,375,670)Assets held to cover unit-linked liabilities 5, 24 (11,109,482,726) (7,867,839,114)Reinsurance assets 10 (79,918,463) 199,439,425Other assets 11 (310,390,846) (472,588,011)
Increase (decrease) in: Pension liability 21 2,509,363 4,297,154
Other liabilities 13 531,266,608 328,552,326Net cash generated from operations 995,474,586 1,219,966,537Income taxes paid (35,724,369) (61,881,161)Net cash provided by operating activities 959,750,217 1,158,085,376
CASH FLOWS FROM INVESTING ACTIVITIESAcquisitions of:
Available-for-sale financial assets 5, 24 (2,474,863,723) (1,119,144,825)Property and equipment 7 (76,776,983) (60,292,083)Intangible assets 9 (50,899,702) (52,667,098)
Proceeds from maturity, disposal or exchange of:Available-for-sale financial assets 5, 24 1,289,590,000 514,055,071
Interest received 37,221,169 45,861,460Net cash used in investing activities (1,275,729,239) (672,187,472)
CASH FLOWS FROM FINANCING ACTIVITIESAdditional infusion of contingency surplus 14 175,000,000 −Payment of lease liabilities 8 (139,294,887) (142,767,601)Net cash provided by (used in) financing activities 35,705,113 (142,767,601)
NET INCREASE (DECREASE) IN CASH AND CASHEQUIVALENTS (280,273,909) 343,130,301
CASH AND CASH EQUIVALENTS AT BEGINNING OFYEAR 4 1,206,155,440 863,025,139
CASH AND CASH EQUIVALENTS AT END OF YEAR P=925,881,531 P=1,206,155,440
See accompanying Notes to Financial Statements.
76

*SGVFS163777*
FWD LIFE INSURANCE CORPORATIONNOTES TO FINANCIAL STATEMENTS
1. Corporate Information
FWD Life Insurance Corporation (the “Company”) was incorporated and domiciled in the Philippinesand is registered with the Securities and Exchange Commission (SEC) on November 19, 2013. Theregistered principal office of the Company is at 19th floor W Fifth Avenue Bldg., 5th Avenue, Corner32nd Street, Bonifacio Global City, Taguig City. The Company is a wholly-owned subsidiary ofFWD Group Financial Services Pte. Ltd (the Parent Company), a company domiciled in Singaporeengaged in private investment activities.
The Company was organized to primarily engage in and carry on the business of life insurance and toundertake and write insurance upon lives of individuals and every insurance appertaining thereto orconnected therewith, including reinsurance; to make contracts for insurance and re-insurance for allrisks, hazards, guarantees and contingencies to which life, accident or health insurance is applicable,to indemnify against legal liability, to compute endowments and grant, purchase or dispose annuities;to procure or acquire re-insurance of its risks; to issue policies stipulated to be with or withoutparticipation in profits and to purchase for its own benefit or for its obligations any policy ofinsurance, and perform such other powers related to or incidental to the business of life insurance.
On April 2, 2014, the Company was granted a Certificate of Authority by the Insurance Commission(IC) to operate as a life insurance company. The Company started its commercial operations onSeptember 15, 2014.
On July 17, 2014, the Company received IC approval to sell variable unit linked (VUL) products. OnApril 6, 2015, the Company received IC approval to sell traditional products, on which the first policywas issued on April 23, 2015. The Company currently sells both variable life and traditional lifeproducts.
On September 15, 2014, the Company and Security Bank Corporation (SBC) signed an agreementwhich appoints SBC to sell exclusively the life insurance products of the Company. The agreementwas filed on November 11, 2014 with the Bangko Sentral ng Pilipinas (BSP) and the IC for theirrespective approvals. On December 22, 2014, SBC received the approval of BSP through itsResolution No. 2073. On January 12, 2015, the Company received the approval of the agreementfrom IC.
The financial statements of the Company were approved and authorized for issuance by the Board ofDirectors (BOD) on March 25, 2022.
2. Significant Accounting Policies
Basis of Preparation and PresentationThe financial statements of the Company have been prepared on the historical cost basis, except foravailable-for-sale (AFS) financial assets and financial assets at fair value through profit or loss(FVPL), which have been measured at fair value. The financial statements are presented inPhilippine Peso (P=), which is the Company’s presentation and functional currency. All amounts arerounded to the nearest Peso unless otherwise indicated.
77
Audited financial statements
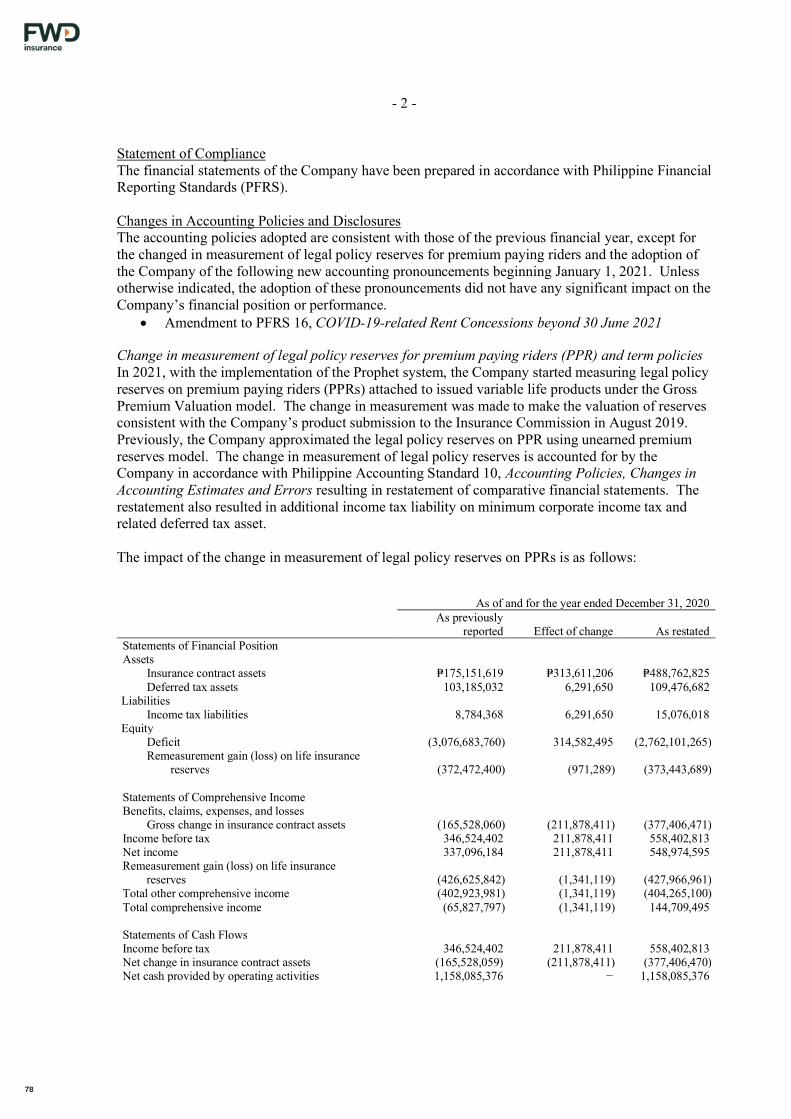
- 2 -
*SGVFS163777*
Statement of ComplianceThe financial statements of the Company have been prepared in accordance with Philippine FinancialReporting Standards (PFRS).
Changes in Accounting Policies and DisclosuresThe accounting policies adopted are consistent with those of the previous financial year, except forthe changed in measurement of legal policy reserves for premium paying riders and the adoption ofthe Company of the following new accounting pronouncements beginning January 1, 2021. Unlessotherwise indicated, the adoption of these pronouncements did not have any significant impact on theCompany’s financial position or performance.
Amendment to PFRS 16, COVID-19-related Rent Concessions beyond 30 June 2021
Change in measurement of legal policy reserves for premium paying riders (PPR) and term policiesIn 2021, with the implementation of the Prophet system, the Company started measuring legal policyreserves on premium paying riders (PPRs) attached to issued variable life products under the GrossPremium Valuation model. The change in measurement was made to make the valuation of reservesconsistent with the Company’s product submission to the Insurance Commission in August 2019.Previously, the Company approximated the legal policy reserves on PPR using unearned premiumreserves model. The change in measurement of legal policy reserves is accounted for by theCompany in accordance with Philippine Accounting Standard 10, Accounting Policies, Changes inAccounting Estimates and Errors resulting in restatement of comparative financial statements. Therestatement also resulted in additional income tax liability on minimum corporate income tax andrelated deferred tax asset.
The impact of the change in measurement of legal policy reserves on PPRs is as follows:
As of and for the year ended December 31, 2020As previously
reported Effect of change As restatedStatements of Financial PositionAssets
Insurance contract assets P=175,151,619 P=313,611,206 P=488,762,825Deferred tax assets 103,185,032 6,291,650 109,476,682
LiabilitiesIncome tax liabilities 8,784,368 6,291,650 15,076,018
EquityDeficit (3,076,683,760) 314,582,495 (2,762,101,265)Remeasurement gain (loss) on life insurance
reserves (372,472,400) (971,289) (373,443,689)
Statements of Comprehensive IncomeBenefits, claims, expenses, and losses
Gross change in insurance contract assets (165,528,060) (211,878,411) (377,406,471)Income before tax 346,524,402 211,878,411 558,402,813Net income 337,096,184 211,878,411 548,974,595Remeasurement gain (loss) on life insurance
reserves (426,625,842) (1,341,119) (427,966,961)Total other comprehensive income (402,923,981) (1,341,119) (404,265,100)Total comprehensive income (65,827,797) (1,341,119) 144,709,495
Statements of Cash FlowsIncome before tax 346,524,402 211,878,411 558,402,813Net change in insurance contract assets (165,528,059) (211,878,411) (377,406,470)Net cash provided by operating activities 1,158,085,376 − 1,158,085,376
78

- 3 -
*SGVFS163777*
For the year ended December 31, 2019As of January 1, 2020As previously
reported Effect of changeAs restated
Statements of Financial PositionAssets
Insurance contract assets P=679,792,529 P=103,073,913 P=782,866,442Equity
Deficit (3,413,779,944) 102,704,084 (3,311,075,860)Remeasurement gain (loss) on life insurance
reserves 54,153,443 369,829 54,523,272
Accounting Standard Effective but not yet AdoptedPronouncements issued but not yet effective are listed below. The Company intends to adopt thefollowing pronouncements when they become effective. Adoption of these pronouncements is notexpected to have a significant impact on the Company’s financial statements, unless otherwiseindicated.
Effective beginning on or after January 1, 2022 Amendments to PFRS 3, Reference to the Conceptual Framework Amendments to PAS 16, Plant and Equipment: Proceeds before Intended Use Amendments to PAS 37, Onerous Contracts – Costs of Fulfilling a Contract Annual Improvements to PFRSs 2018-2020 Cycle
o Amendments to PFRS 1, First-time Adoption of Philippines Financial ReportingStandards, Subsidiary as a first-time adopter
o Amendments to PFRS 9, Financial Instruments, Fees in the ’10 per cent’ test forderecognition of financial liabilities
o Amendments to PAS 41, Agriculture, Taxation in fair value measurements
Effective beginning on or after January 1, 2023 Amendments to PAS 1, Classification of Liabilities as Current or Non-current Amendments to PAS 8, Definition of Accounting Estimates Amendments to PAS 1 and PFRS Practice Statement 2, Disclosure of Accounting Policies
Effective beginning on or after January 1, 2024 Amendments to PAS 1, Classification of Liabilities as Current or Non-current
Effective beginning on or after January 1, 2025 PFRS 17, Insurance Contracts
PFRS 17 is a comprehensive new accounting standard for insurance contracts coveringrecognition and measurement, presentation and disclosure. Once effective, PFRS 17 willreplace PFRS 4, Insurance Contracts. This new standard on insurance contracts applies to alltypes of insurance contracts (i.e., life, non-life, direct insurance and re-insurance), regardlessof the type of entities that issue them, as well as to certain guarantees and financialinstruments with discretionary participation features. A few scope exceptions will apply.
The overall objective of PFRS 17 is to provide an accounting model for insurance contractsthat is more useful and consistent for insurers. In contrast to the requirements in PFRS 4,which are largely based on grandfathering previous local accounting policies, PFRS 17provides a comprehensive model for insurance contracts, covering all relevant accountingaspects. The core of PFRS 17 is the general model, supplemented by: A specific adaptation for contracts with direct participation features (the variable fee
approach)
79
Audited financial statements

- 4 -
*SGVFS163777*
A simplified approach (the premium allocation approach) mainly for short-durationcontracts
PFRS 17 is effective for reporting periods beginning on or after January 1, 2025, withcomparative figures required. Early application is permitted.
Deferred effectivity Amendments to PFRS 10, Consolidated Financial Statements, and PAS 28, Sale or
Contribution of Assets between an Investor and its Associate or Joint Venture
Accounting Standard Effective but not yet Adopted PFRS 9, Financial Instruments
PFRS 9 reflects all phases of the financial instruments project and replaces PAS 39, FinancialInstruments: Recognition and Measurement, and all previous versions of PFRS 9. The standardintroduces new requirements for classification and measurement, impairment, and hedgeaccounting. PFRS 9 is effective for annual periods beginning on or after January 1, 2018, withearly application permitted.
Retrospective application is required, but providing comparative information is not compulsory.For hedge accounting, the requirements are generally applied prospectively, with some limitedexceptions.
The adoption of PFRS 9 will have an effect on the classification and measurement of theCompany’s financial assets and impairment methodology for financial assets, but will have noimpact on the classification and measurement of the Company’s financial liabilities.
Amendments to PFRS 4, Applying PFRS 9 Financial Instruments with PFRS 4 InsuranceContracts
The amendments address concerns arising from implementing PFRS 9, the new financialinstruments standard, before implementing the new insurance contracts standard. Theamendments introduce two options for entities issuing insurance contracts: a temporaryexemption from applying PFRS 9 and an overlay approach. The temporary exemption is firstapplied for reporting periods beginning on or after January 1, 2018.
An entity may elect the overlay approach when it first applies PFRS 9 and apply that approachretrospectively to financial assets designated on transition to PFRS 9. The entity restatescomparative information reflecting the overlay approach if, and only if, the entity restatescomparative information when applying PFRS 9.
Qualifying for temporary exemption from PFRS 9The Company applied the temporary exemption from PFRS 9 as permitted by the amendments toPFRS 4 Applying PFRS 9 Financial Instruments with PFRS 4 Insurance Contracts issued inSeptember 2016. The temporary exemption permits entities whose activities are predominantlyconnected with insurance to continue applying PAS 39 rather than PFRS 9 for annual periodsbeginning before January 1, 2023
80

- 5 -
*SGVFS163777*
The assessment for whether a reporting entity’s activities are predominantly connected withinsurance is based on the liabilities connected with insurance in proportion to the entity’s totalliabilities. An entity may elect the temporary exemption if, and only if:– The carrying amount of its liabilities arising from contracts within the scope of PFRS 4 is
significant compared to the total carrying amount of all its liabilities; and– The percentage of the total carrying amount of its liabilities connected with insurance relative
to the total carrying amount of all its liabilities is: Greater than 90 percent; or Less than or equal to 90 percent but greater than 80 percent, and the insurer does not
engage in a significant activity unconnected with insurance.
The predominance assessment is performed using the carrying amounts of liabilities reported onthe statement of financial position at the annual reporting date December 31, 2015. Applying therequirements, the Company performed the predominance assessment using the Company’sstatement of financial position as of December 31, 2015.The Company concluded that it qualified for the temporary exemption from PFRS 9 because itsactivities are predominantly connected with insurance. As at December 31, 2015, the Company’sgross liabilities arising from contracts within the scope of PFRS 4 represented 88% of the totalcarrying amount of all its liabilities, and the Company did not engage in any significant activitiesnot connected with insurance. Since December 31, 2015, there has been no change in theactivities of the Company that requires reassessment of the use of the temporary exemption.
Amendments to PFRS 7, Financial Instruments: Disclosures and PFRS 9, Financial Instruments,Interest Rate Benchmark Reform
The amendments to PFRS 9 provide a number of reliefs, which apply to all hedging relationshipsthat are directly affected by the interest rate benchmark reform. A hedging relationship isaffected if the reform gives rise to uncertainties about the timing and or amount of benchmark-based cash flows of the hedged item or the hedging instrument.
Amendments to PFRS 9, PFRS 7, PFRS 4 and PFRS 16, Interest Rate Benchmark Reform –Phase 2
The amendments provide the following temporary reliefs which address the financial reportingeffects when an interbank offered rate (IBOR) is replaced with an alternative nearly risk-freeinterest rate (RFR):
o Practical expedient for changes in the basis for determining the contractual cash flows asa result of IBOR reform
o Relief from discontinuing hedging relationshipso Relief from the separately identifiable requirement when an RFR instrument is
designated as a hedge of a risk component
The Company shall also disclose information about:o The nature and extent of risks to which the entity is exposed arising from financial
instruments subject to IBOR reform, and how the entity manages those risks; ando Their progress in completing the transition to alternative benchmark rates, and how the
entity is managing that transition
81
Audited financial statements
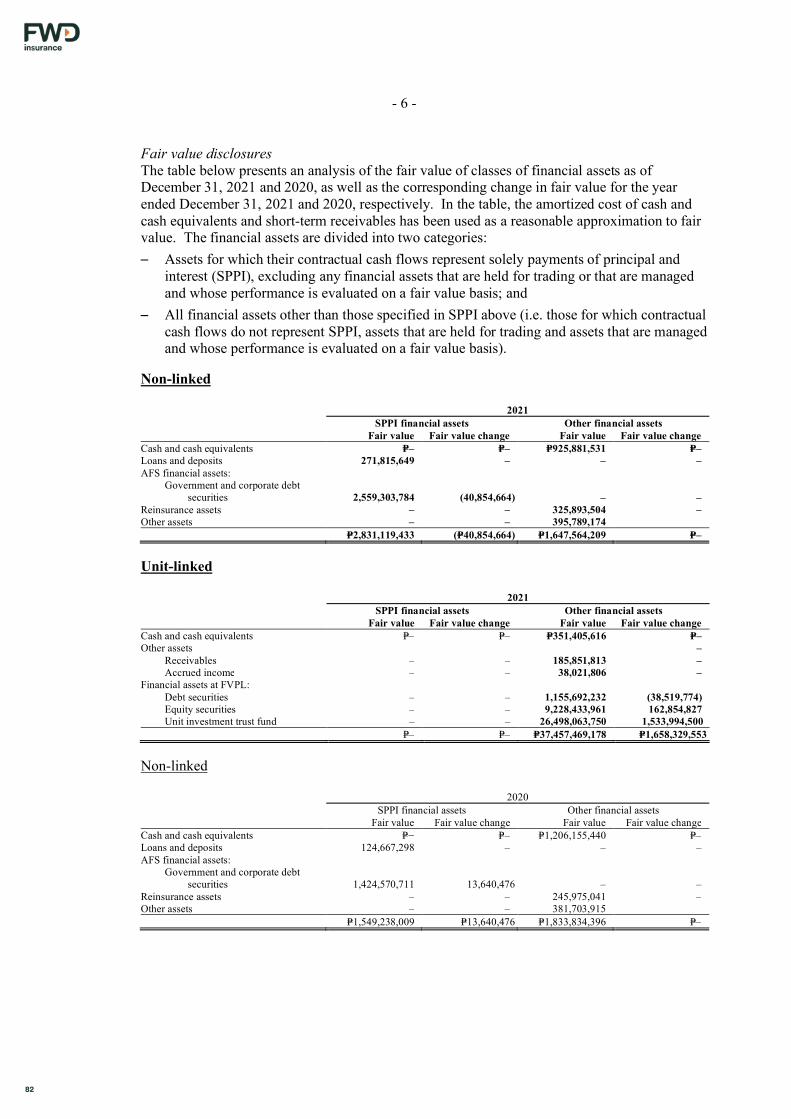
- 6 -
*SGVFS163777*
Fair value disclosuresThe table below presents an analysis of the fair value of classes of financial assets as ofDecember 31, 2021 and 2020, as well as the corresponding change in fair value for the yearended December 31, 2021 and 2020, respectively. In the table, the amortized cost of cash andcash equivalents and short-term receivables has been used as a reasonable approximation to fairvalue. The financial assets are divided into two categories:– Assets for which their contractual cash flows represent solely payments of principal and
interest (SPPI), excluding any financial assets that are held for trading or that are managedand whose performance is evaluated on a fair value basis; and
– All financial assets other than those specified in SPPI above (i.e. those for which contractualcash flows do not represent SPPI, assets that are held for trading and assets that are managedand whose performance is evaluated on a fair value basis).
Non-linked
2021SPPI financial assets Other financial assets
Fair value Fair value change Fair value Fair value changeCash and cash equivalents P=– P=– P=925,881,531 P=–Loans and deposits 271,815,649 – – –AFS financial assets:
Government and corporate debtsecurities 2,559,303,784 (40,854,664) – –
Reinsurance assets – – 325,893,504 –Other assets – – 395,789,174
P=2,831,119,433 (P=40,854,664) P=1,647,564,209 P=–
Unit-linked
2021SPPI financial assets Other financial assets
Fair value Fair value change Fair value Fair value changeCash and cash equivalents P=– P=– P=351,405,616 P=–Other assets –
Receivables – – 185,851,813 –Accrued income – – 38,021,806 –
Financial assets at FVPL:Debt securities – – 1,155,692,232 (38,519,774)Equity securities – – 9,228,433,961 162,854,827Unit investment trust fund – – 26,498,063,750 1,533,994,500
P=– P=– P=37,457,469,178 P=1,658,329,553
Non-linked
2020SPPI financial assets Other financial assets
Fair value Fair value change Fair value Fair value changeCash and cash equivalents P=− P=– P=1,206,155,440 P=–Loans and deposits 124,667,298 – – –AFS financial assets:
Government and corporate debtsecurities 1,424,570,711 13,640,476 – –
Reinsurance assets – – 245,975,041 –Other assets – – 381,703,915
P=1,549,238,009 P=13,640,476 P=1,833,834,396 P=–
82

- 7 -
*SGVFS163777*
Unit-linked
2020SPPI financial assets Other financial assets
Fair value Fair value change Fair value Fair value changeCash and cash equivalents P=– P=– P=415,486,419 P=–Other assets
Receivables – – 254,030,421 –Accrued income – – 12,966,360 –
Financial assets at FVPL:Debt securities – – 1,066,556,061 68,107,132Equity securities – – 7,255,456,973 (54,905,036)Unit investment trust fund – – 15,336,338,447 (162,111,108)
P=– P=– P=24,340,834,681 (P=148,909,012)
Credit risk disclosuresThe following table shows the carrying amounts of the SPPI assets in accordance with PAS 39categories by credit risk rating grades reported to key management personnel (with credit riskrating conventions detailed in Note 24) and non-SPPI assets. The carrying amounts are measuredin accordance with PAS 39. For assets measured at amortized cost, the carrying amount shown isbefore any allowance for impairment losses.
2021Non-linked
2021A BBB BB Not rated Total
Cash and cash equivalents P=134,660,354 P=788,833,786 P=− P=2,387,391 P=925,881,531Loans and deposits − − − 271,815,649 271,815,649AFS financial assets:
Government and corporate debtsecurities − 2,559,303,784 − − 2,559,303,784
Reinsurance assets − − − 325,893,504 325,893,504Other assets − − − 425,350,156 425,350,156
P=134,660,354 P=3,348,137,570 P=– P=1,025,446,700 P=4,508,244,624
Unit-linked
A BBB BB Not rated TotalFinancial Assets:Cash and cash equivalents P=283,298,451 P=68,107,165 P=– P=– P=351,405,616Other assets
Receivables – – – 185,851,813 185,851,813Accrued income – – – 38,021,806 38,021,806
Financial assets as FVPL:Debt securities – 1,151,669,680 – 4,022,552 1,155,692,232Equity securities – – – 9,228,433,961 9,228,433,961Unit investment trust fund – – – 26,498,063,750 26,498,063,750
P=283,298,451 P=1,219,776,845 P=– P=35,954,393,882 P=37,457,469,178
2020Non-linked
A BBB BB Not rated TotalCash and cash equivalents P=83,385,969 P=1,120,826,222 P=– P=1,943,249 P=1,206,155,440Loans and deposits – – – 124,667,298 124,667,298AFS financial assets:
Government and corporate debtsecurities – 1,424,570,711 – − 1,424,570,711
Reinsurance assets – – – 245,975,041 245,975,041Other assets 401,703,375 401,703,375
P=83,385,969 P=2,545,396,933 P=– P=774,288,963 P=3,403,071,865
83
Audited financial statements
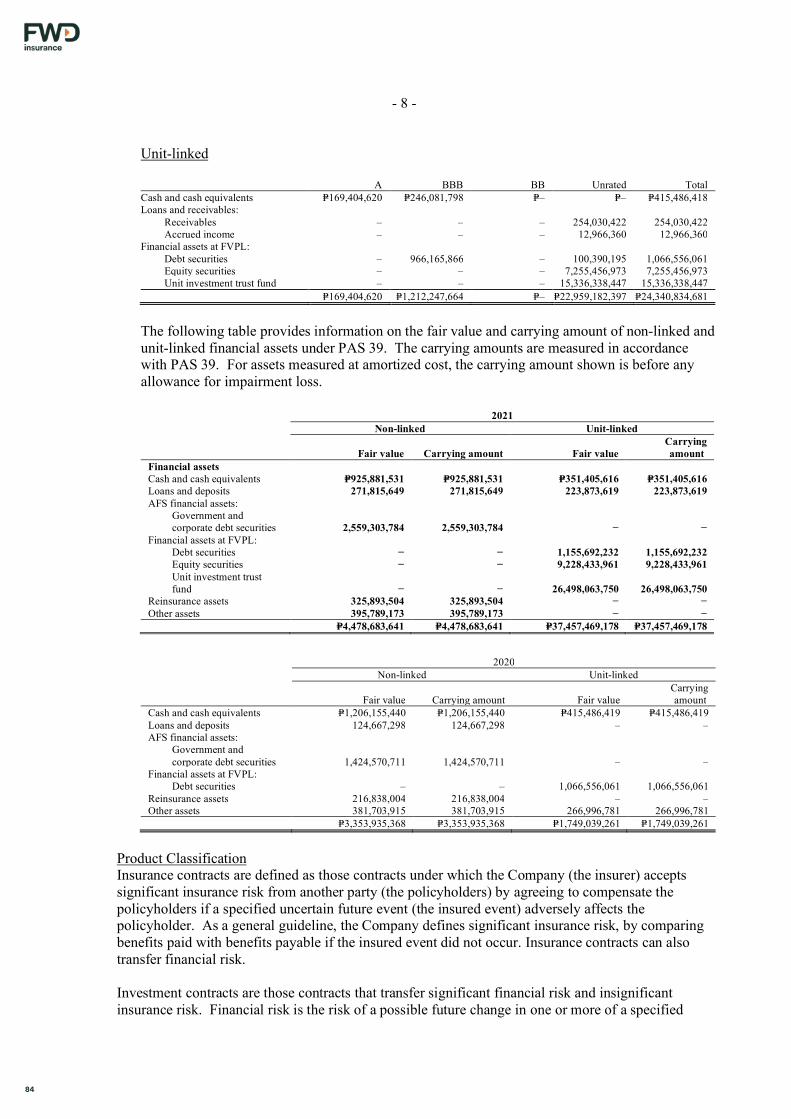
- 8 -
*SGVFS163777*
Unit-linked
A BBB BB Unrated TotalCash and cash equivalents P=169,404,620 P=246,081,798 P=– P=– P=415,486,418Loans and receivables:
Receivables – – – 254,030,422 254,030,422Accrued income – – – 12,966,360 12,966,360
Financial assets at FVPL:Debt securities – 966,165,866 – 100,390,195 1,066,556,061Equity securities – – – 7,255,456,973 7,255,456,973Unit investment trust fund – – – 15,336,338,447 15,336,338,447
P=169,404,620 P=1,212,247,664 P=– P=22,959,182,397 P=24,340,834,681
The following table provides information on the fair value and carrying amount of non-linked andunit-linked financial assets under PAS 39. The carrying amounts are measured in accordancewith PAS 39. For assets measured at amortized cost, the carrying amount shown is before anyallowance for impairment loss.
2021Non-linked Unit-linked
Fair value Carrying amount Fair valueCarryingamount
Financial assetsCash and cash equivalents P=925,881,531 P=925,881,531 P=351,405,616 P=351,405,616Loans and deposits 271,815,649 271,815,649 223,873,619 223,873,619AFS financial assets:
Government andcorporate debt securities 2,559,303,784 2,559,303,784 − −
Financial assets at FVPL:Debt securities − − 1,155,692,232 1,155,692,232Equity securities − − 9,228,433,961 9,228,433,961Unit investment trustfund − − 26,498,063,750 26,498,063,750
Reinsurance assets 325,893,504 325,893,504 − −Other assets 395,789,173 395,789,173 − −
P=4,478,683,641 P=4,478,683,641 P=37,457,469,178 P=37,457,469,178
2020Non-linked Unit-linked
Fair value Carrying amount Fair valueCarryingamount
Cash and cash equivalents P=1,206,155,440 P=1,206,155,440 P=415,486,419 P=415,486,419Loans and deposits 124,667,298 124,667,298 – –AFS financial assets:
Government andcorporate debt securities 1,424,570,711 1,424,570,711 – –
Financial assets at FVPL:Debt securities – – 1,066,556,061 1,066,556,061
Reinsurance assets 216,838,004 216,838,004 – –Other assets 381,703,915 381,703,915 266,996,781 266,996,781
P=3,353,935,368 P=3,353,935,368 P=1,749,039,261 P=1,749,039,261
Product ClassificationInsurance contracts are defined as those contracts under which the Company (the insurer) acceptssignificant insurance risk from another party (the policyholders) by agreeing to compensate thepolicyholders if a specified uncertain future event (the insured event) adversely affects thepolicyholder. As a general guideline, the Company defines significant insurance risk, by comparingbenefits paid with benefits payable if the insured event did not occur. Insurance contracts can alsotransfer financial risk.
Investment contracts are those contracts that transfer significant financial risk and insignificantinsurance risk. Financial risk is the risk of a possible future change in one or more of a specified
84
- 9 -
*SGVFS163777*
interest rate, financial instrument price, commodity price, foreign exchange rate, index of price orrates, credit rating or credit index or other variable, provided in the case of a non-financial variablethat the variable is not specific to a party to the contract.
Once a contract has been classified as an insurance contract, it remains an insurance contract for theremainder of its lifetime, even if the insurance risk reduces significantly during this period, unless allrights and obligations are extinguished or expired. Investment contracts can, however, be reclassifiedas insurance contracts after inception if the insurance risk becomes significant.
Insurance contracts are classified with or without a Discretionary Participation Feature (DPF). DPFis a contractual right to receive, as a supplement to guaranteed benefits, additional benefits that are:
likely to be a significant portion of the total contractual benefits; whose amount or timing is contractually at the discretion of the issuer; and that are contractually based on the: performance of a specified pool of contracts or a specified type of contract, realized and or unrealized investment returns on a specified pool of assets held by
the issuer, or the profit or loss of the Company, fund or other entity that issues the contract.
For financial options and guarantees which are not closely related to the host insurance contract,bifurcation is required to measure these embedded financial derivatives separately at FVPL.Bifurcation is not required if the embedded derivative is itself an insurance contract or when the hostinsurance contract itself is measured as financial assets or liabilities at FVPL. As such, the Companydoes not separately measure options to surrender insurance contracts for a fixed amount (or anamount based on a fixed amount and an interest rate). Likewise, the embedded derivative in unit-linked insurance contracts linking the payments on the contract to units of an internal investment fundmeets the definition of an insurance contract and is not therefore accounted for separately from thehost insurance contract.
Based on the Company guidelines, all products in its portfolio meet the definition of insurancecontracts, including unit-linked products which have certain features that make use of fundsspecifically segregated for the benefit of unit-linked policyholders.
Cash and Cash EquivalentsCash includes cash on hand and in banks. Cash equivalents are short-term highly liquidinvestments that are readily convertible to known amounts of cash with original maturities of three(3) months or less from date of placement and that are subject to an insignificant risk of changes invalue.
For the purpose of the statement of financial position, cash and cash equivalents comprise cash onhand and in banks, including time deposits, which are not restricted as to use.
Financial InstrumentsDate of recognitionThe Company recognizes a financial asset or a financial liability in the statement of financial positionwhen it becomes a party to the contractual provisions of the instrument. The Company follows thetrade accounting where an asset to be received and liability to be paid are recognized on the trade dateand derecognition of an asset that is sold and the recognition of a receivable from the buyer isrecognized on the trade date.Initial Recognition and MeasurementFinancial assets
85
Audited financial statements

- 10 -
*SGVFS163777*
Financial assets within the scope of PAS 39 are classified into the following categories: financialassets at FVPL, held-to-maturity (HTM) investments, AFS financial assets and loans and receivables.The Company determines the classification of its financial assets at initial recognition. Financialassets designated upon initial recognition as at FVPL are designated at the date of initial recognitiononly if the criteria under PAS 39 are satisfied. When financial assets are recognized initially, they aremeasured at fair value including transaction costs, except in the case of financial assets recorded atFVPL.
The Company’s financial assets include loans and deposits, AFS financial assets, financial assets atFVPL, and assets held to cover unit-linked liabilities.Financial liabilitiesFinancial liabilities within the scope of PAS 39 are classified as financial liabilities at FVPL and otherfinancial liabilities. The Company determines the classification of its financial liabilities at initialrecognition. Financial liabilities at FVPL are designated at the date of initial recognition and only ifthe criteria of PAS 39 are satisfied. All financial liabilities are recognized initially at fair value and,in the case of other financial liabilities, include directly attributable transaction costs.
The Company's financial liabilities include unit-linked liabilities and other financial liabilities.
‘Day 1’ profit or lossWhere the transaction price in a non-active market is different from the fair value from otherobservable current market transactions in the same instrument or based on a valuation techniquewhose variables include only data from observable market, the Company recognizes the differencebetween the transaction price and fair value (a ‘Day 1’ profit or loss) in profit or loss unless itqualifies for recognition as some other type of asset. In cases where fair value is determined usingdata which is not observable, the difference between the transaction price and model value is onlyrecognized in profit or loss when the inputs become observable or when the instrument isderecognized. For each transaction, the Company determines the appropriate method of recognizingthe ‘Day 1’ profit or loss amount.
Subsequent MeasurementThe subsequent measurement of financial assets depends on their classification as follows:
Financial assetsFinancial assets at FVPL and assets held to cover unit-linked liabilitiesFinancial assets at FVPL include financial assets held for trading and financial assets designated uponinitial recognition. Financial assets are classified as held for trading if they are acquired for thepurpose of sale in the near term. Financial assets designated upon initial recognition at FVPL aredesignated only if the criteria under PAS 39 are satisfied.
Financial assets at FVPL are carried in the statement of financial position at fair value with netchanges in fair value recognized in the profit or loss.
The Company evaluates its financial assets at FVPL (held for trading) to assess whether the intent tosell them in the near term is still appropriate. When, in rare circumstances, the Company is unable totrade these financial assets due to inactive markets and management's intent to sell them in theforeseeable future significantly changes, the Company may elect to reclassify them. Thereclassification from financial assets at FVPL to loans and receivables, AFS financial assets or HTMinvestments depends on the nature of the assets.
This evaluation does not affect any financial assets designated at FVPL using the fair value option atdesignation, as these instruments cannot be reclassified after initial recognition.
86

- 10 -
*SGVFS163777*
Financial assets within the scope of PAS 39 are classified into the following categories: financialassets at FVPL, held-to-maturity (HTM) investments, AFS financial assets and loans and receivables.The Company determines the classification of its financial assets at initial recognition. Financialassets designated upon initial recognition as at FVPL are designated at the date of initial recognitiononly if the criteria under PAS 39 are satisfied. When financial assets are recognized initially, they aremeasured at fair value including transaction costs, except in the case of financial assets recorded atFVPL.
The Company’s financial assets include loans and deposits, AFS financial assets, financial assets atFVPL, and assets held to cover unit-linked liabilities.Financial liabilitiesFinancial liabilities within the scope of PAS 39 are classified as financial liabilities at FVPL and otherfinancial liabilities. The Company determines the classification of its financial liabilities at initialrecognition. Financial liabilities at FVPL are designated at the date of initial recognition and only ifthe criteria of PAS 39 are satisfied. All financial liabilities are recognized initially at fair value and,in the case of other financial liabilities, include directly attributable transaction costs.
The Company's financial liabilities include unit-linked liabilities and other financial liabilities.
‘Day 1’ profit or lossWhere the transaction price in a non-active market is different from the fair value from otherobservable current market transactions in the same instrument or based on a valuation techniquewhose variables include only data from observable market, the Company recognizes the differencebetween the transaction price and fair value (a ‘Day 1’ profit or loss) in profit or loss unless itqualifies for recognition as some other type of asset. In cases where fair value is determined usingdata which is not observable, the difference between the transaction price and model value is onlyrecognized in profit or loss when the inputs become observable or when the instrument isderecognized. For each transaction, the Company determines the appropriate method of recognizingthe ‘Day 1’ profit or loss amount.
Subsequent MeasurementThe subsequent measurement of financial assets depends on their classification as follows:
Financial assetsFinancial assets at FVPL and assets held to cover unit-linked liabilitiesFinancial assets at FVPL include financial assets held for trading and financial assets designated uponinitial recognition. Financial assets are classified as held for trading if they are acquired for thepurpose of sale in the near term. Financial assets designated upon initial recognition at FVPL aredesignated only if the criteria under PAS 39 are satisfied.
Financial assets at FVPL are carried in the statement of financial position at fair value with netchanges in fair value recognized in the profit or loss.
The Company evaluates its financial assets at FVPL (held for trading) to assess whether the intent tosell them in the near term is still appropriate. When, in rare circumstances, the Company is unable totrade these financial assets due to inactive markets and management's intent to sell them in theforeseeable future significantly changes, the Company may elect to reclassify them. Thereclassification from financial assets at FVPL to loans and receivables, AFS financial assets or HTMinvestments depends on the nature of the assets.
This evaluation does not affect any financial assets designated at FVPL using the fair value option atdesignation, as these instruments cannot be reclassified after initial recognition.
- 11 -
*SGVFS163777*
The Company’s financial assets at FVPL pertains to the Company’s seed capital on its unit-linkedinvestment funds. The unit-linked investment funds set by the Company underlying the unit-linkedinsurance contracts are designated as financial assets at FVPL. This is consistent with the valuationbasis of the reserve for variable units held by policyholders.
AFS financial assetsAFS financial assets are debt securities which are intended to be held for an indefinite period of timeand which may be sold in response to needs for liquidity or in response to changes in marketconditions.
After initial recognition, AFS financial assets are subsequently measured at fair value, withunrealized gains or losses recognized in other comprehensive income in the “Unrealized fair valuegain or loss on AFS financial assets” in equity until the investment is de-recognized, at which timethe cumulative gain or loss is recognized in profit or loss, or until the investment is determined to beimpaired, where the cumulative loss is reclassified to profit or loss. For AFS financial debt securities,the difference between their cost and par value is amortized using the effective interest rate method.Interest and dividends earned while holding the AFS financial assets are reported as interest incomeand dividend income, respectively, in profit or loss as part of investment income.
The Company evaluates whether the ability and intention to sell its AFS financial assets in the nearterm are still appropriate. When, in rare circumstances, the Company is unable to trade thesefinancial assets due to inactive markets and management's intent to do so in the foreseeable futuresignificantly changes, the Company may elect to reclassify these financial assets. Reclassification toloans and receivables is permitted when the financial assets meet the definition of loans andreceivables and the Company has the intent and ability to hold these assets for the foreseeable futureor to maturity. Reclassification to the HTM category is permitted only when the Company has theability and intent to hold until the maturity date of the financial asset.
For a financial asset reclassified from the AFS category, the fair value amount at the date ofreclassification becomes its new amortized cost and any previous gain or loss on that asset that hasbeen recognized in other comprehensive income is amortized to profit or loss over the remaining lifeof the investment using the effective interest rate. Any difference between the new amortized costand the maturity amount is also amortized over the remaining life of the asset using the effectiveinterest rate. If the asset is subsequently determined to be impaired, then the amount recorded inother comprehensive income is reclassified to profit or loss.
The Company’s AFS financial assets pertain to government and corporate debt securities.
Loans and depositsLoans and receivables are non-derivative financial assets with fixed or determinable payments thatare not quoted in an active market. After initial measurement, such assets are subsequently measuredat amortized cost using the effective interest rate method less any allowance for impairment.
Amortized cost is calculated by taking into account any discount or premium on acquisition andincludes fees or costs that are an integral part of the effective interest rate. The effective interest rateamortization and the loss arising from impairment are included in “Interest income” in profit or loss.
87
Audited financial statements

- 12 -
*SGVFS163777*
Financial liabilitiesFinancial liabilities at FVPLFinancial liabilities at FVPL includes financial liabilities held for trading and financial liabilitiesdesignated upon initial recognition as at FVPL.
Financial liabilities are classified as held for trading if they are acquired for the purpose of selling inthe near term. Financial liabilities designated upon initial recognition at fair value through profit orloss are so designated only if the criteria of PAS 39 are satisfied. Gains or losses on liabilities heldfor trading are recognized in profit or loss.
The net fair value gain or loss recognized in profit or loss does not include any interest charged onthese financial liabilities.
The Company’s financial liabilities at FVPL pertain to its unit-linked liabilities.
Other financial liabilitiesOther financial liabilities are stated at amortized cost, with any difference between net proceeds andredemption value recognized in the profit or loss over the period using the effective interest method.
The Company’s other financial liabilities include insurance payables, accounts payables and accruedexpenses (which also includes amounts payable on redemption) and payable to related parties.
Reinsurance AssetsThe Company cedes insurance risk in the normal course of business. Reinsurance assets representbalances due from reinsurance companies. Amounts recoverable from reinsurers are estimated in amanner consistent with the outstanding claims provision or settled claims associated with thereinsurer’s policies and are in accordance with the related reinsurance contract.
Reinsurance assets are reviewed for impairment at each reporting date, or more frequently, when anindication of impairment arises during the reporting period. Impairment occurs when there isobjective evidence as a result of an event that occurred after initial recognition of the reinsuranceasset that the Company may not receive all outstanding amounts due under the terms of the contractand the event has a reliably measurable impact on the amounts that the Company will receive fromthe reinsurer.
The impairment loss is recorded in the profit or loss under “General and administrative expenses”.The impairment loss is calculated following the same method used for these financial assets.
In modified coinsurance (quota share) treaties, the Company records as reinsurance premiums thereinsurer’s proportionate share in benefits reinsured for the covered policies. Reinsurance allowancesdue from the reinsurers, on the other hand, are recorded as a separate line item in the statements ofcomprehensive income in accordance with the Company’s reinsurance policy.
Fair Value MeasurementThe Company measures its debt and equity instruments classified as AFS financial assets andfinancial assets at FVPL at the end of each reporting period. Fair value is the price that would bereceived in the sale of an asset or the price paid to transfer a liability in an orderly transactionbetween market participants at the measurement date.
The fair value measurement is based on the presumption that the transaction to sell the asset ortransfer the liability takes place either in the principal market for the asset or liability, or in theabsence of a principal market, in the most advantageous market for the asset or liability. Theprincipal or the most advantageous market must be accessible by the Company.
88
- 13 -
*SGVFS163777*
The fair value of an asset or a liability is measured using the assumptions that market participantswould use when pricing the asset or liability, assuming that market participants act in their economicbest interest.
A fair value measurement of a non-financial asset takes into account a market participant’s ability togenerate economic benefits by using the asset in its highest and best use or by selling it to anothermarket participant that would use the asset in its highest and best use.
The Company uses valuation techniques that are appropriate in the circumstances and for whichsufficient data are available to measure fair value, maximizing the use of relevant observable inputsand minimizing the use of unobservable inputs.
All assets and liabilities for which fair value is measured or disclosed in the financial statements arecategorized within the fair value hierarchy, described as follows, based on the lowest level input thatis significant to the fair value measurement as a whole:
Level 1 - based on quoted (unadjusted) prices in active markets for identical assets or liabilities.Level 2 - based on valuation techniques for which the lowest level input that is significant to the fair
value measurement is observable, either directly or indirectly.Level 3 - based on valuation techniques for which the lowest level input that is significant to the fair
value measurement is unobservable.
For assets and liabilities that are recognized in the financial statements on a recurring basis, theCompany determines whether transfers have occurred between levels in the hierarchy by reassessingcategorization (based on the lowest level input that is significant to the fair value measurement as awhole) at the end of each reporting period.
The Company’s management determines the policies and procedures for both the recurring fair valuemeasurement and for non-recurring measurement. At each reporting date, the management analysesthe movement in the value of assets and liabilities which are required to be re-measured or re-assessed as per the Company’s accounting policy. For this analysis, management verifies the majorinputs applied in the latest valuation by agreeing the information in the valuation computation tocontracts and other relevant documents with relevant external sources to determine whether thechange is reasonable.
Derecognition of Financial InstrumentsFinancial assetsA financial asset (or, where applicable, a part of a financial asset or part of a group of similarfinancial assets) is de-recognized when:
the right to receive cash flows from the asset has expired; or the Company has transferred its right to receive cash flows from the asset, or has assumed an
obligation to pay the received cash flows in full without material delay to a third party under a"pass-through" arrangement; and
either (a) the Company has transferred substantially all the risks and rewards of the asset, or (b)the Company has neither transferred nor retained substantially all the risks and rewards of theasset, but has transferred control of the asset
When the Company has transferred its right to receive cash flows from an asset or has entered into apass-through arrangement, it evaluates if and to what extent it has retained the risk and rewards ofownership of the asset. When it has neither transferred nor retained substantially all the risks andrewards of the asset nor transferred control of the asset, the asset is recognized to the extent of the
89
Audited financial statements
- 14 -
*SGVFS163777*
Company's continuing involvement in the asset. In that case, the Company also recognizes anassociated liability. The transferred asset and the associated liability are measured on a basis thatreflects the rights and obligations that the Company has retained.
Continuing involvement that takes the form of a guarantee over the transferred asset is measured atthe lower of the original carrying amount of the asset and the maximum amount of consideration thatthe Company could be required to repay.
Financial liabilitiesFinancial liabilities are derecognized when the obligation under the liability is discharged orcancelled, or has expired.
When an existing financial liability is replaced by another from the same lender on substantiallydifferent terms, or the terms of an existing liability are substantially modified, such an exchange ormodification is treated as a de-recognition of the original liability and a recognition of a new liability,and the difference between the respective carrying amounts is recognized in profit or loss.
Offsetting of Financial InstrumentsFinancial assets and financial liabilities are offset and the net amount is reported in the statement offinancial position if, and only if, there is a currently enforceable legal right to offset the recognizedamounts and there is an intention to settle on a net basis, or to realize the assets and settle theliabilities simultaneously.
Impairment of Financial AssetsThe Company assesses at the end of each reporting period whether there is objective evidence that afinancial asset or a group of financial assets is impaired. A financial asset or a group of financialassets is deemed to be impaired if, and only if, there is objective evidence of impairment as a result ofone or more events that occurred after the initial recognition of the asset (an incurred "loss event")and that loss event has an impact on the estimated future cash flows of the financial asset or the groupof financial assets that can be reliably estimated. Evidence of impairment may include indicationsthat a debtor or a group of debtors is experiencing significant financial difficulty, default ordelinquency in interest or principal payments, the probability that they will enter bankruptcy or otherfinancial reorganization and observable data indicating that there is measurable decrease in theestimated future cash flows, such as changes in arrears or economic conditions that correlate withdefaults.
Financial assets carried at amortized costFor financial assets carried at amortized cost, the Company first assesses individually whetherobjective evidence of impairment exists for financial assets that are individually significant, orcollectively for financial assets that are not individually significant. If the Company determines thatno objective evidence of impairment exists for an individually assessed financial asset, whethersignificant or not, it includes the asset in a group of financial assets with similar credit riskcharacteristics and collectively assesses them for impairment. Assets that are individually assessedfor impairment and for which an impairment loss is, or continues to be, recognized are not included ina collective assessment of impairment.
If there is objective evidence that an impairment loss has been incurred, the amount of the loss ismeasured as the difference between the asset's carrying amount and the present value of estimatedfuture cash flows (excluding future credit losses that have not yet been incurred). The present valueof the estimated future cash flows is discounted at the financial asset's original effective interest rate(i.e., the effective interest rate computed at initial recognition). If a loan has a variable interest rate,the discount rate for measuring any impairment loss is the current effective interest rate.
90
- 15 -
*SGVFS163777*
The carrying amount of the asset is reduced through direct write off or through the use of anallowance and the loss is recognized in profit or loss. Interest income continues to be accrued on thereduced carrying amount and is accrued using the rate of interest used to discount the future cashflows for the purpose of measuring the impairment loss. Loans and receivables together with anyassociated allowance are written off when there is no realistic prospect of future recovery and allcollateral has been realized or has been realized.
If, in a subsequent period, the amount of the estimated impairment loss increases or decreasesbecause of an event occurring after the impairment was recognized, the previously recognizedimpairment loss is increased or reduced by adjusting the allowance account. If a write-off is laterrecovered, the recovery is credited to other income in profit or loss.
AFS financial assets carried at fair valueFor AFS financial assets, the Company assesses at the end of each reporting period whether there isobjective evidence that an investment or a group of investments is impaired. Impairment of AFS debtsecurities are assessed based on the same criteria as financial assets carried at amortized cost.
Impairments are recorded when an issuer fails to make interest and/or principal payments (“paymentdefault”) or if, based on an evaluation of all relevant available current evidence, it is likely that theissuer is unlikely to pay (more than 50% chance) interest and/or principal payments when due underthe terms of the instrument.
If an AFS financial asset is impaired, the amount of cumulative loss that is removed from equity andrecognized in net profit is the difference between the acquisition cost (net of any principal repaymentand amortization) and current fair value, less any impairment loss on that financial asset previouslyrecognized in net profit. The fact that the impairment amount is measured using current fair valuemeans that it reflects both adverse changes in the interest rate environment and any deterioration ofthe asset’s credit quality. Accordingly, the impairment charge also reflects both the interest risk andcredit risk components of the impairment.
Future interest income continues to be accrued based on the reduced carrying amount of the asset andis accrued using the rate of interest used to discount the future cash flows for the purpose ofmeasuring the impairment loss. The interest income is recorded as part of investment income.
If in subsequent period, the amount of impairment loss relating to debt instrument carried as AFSdecreases due to an event occurring after the impairment was originally recognized, the previouslyrecognised impairment loss is reversed through profit and loss
Insurance ReceivablesInsurance receivables are recognized when due and measured on initial recognition at the fair value ofthe consideration received or receivable. Subsequent to initial recognition, insurance receivables aremeasured at amortized cost, using the effective interest rate method. The carrying value of insurancereceivables are reviewed for impairment whenever events or circumstances indicate that the carryingamount may not be recoverable, with the impairment loss recorded in the profit or loss. Insurancereceivables are derecognized when derecognition criteria for financial assets have been met.
PrepaymentsPrepayments represent expenses not yet incurred but already paid in cash. Prepayments are initiallyrecorded as assets and measured at the amount of cash paid. Subsequently, these are charged to profitor loss as these are consumed in operations or expire with the passage of time depending on the termsof the related agreements, if covered by a contract.
91
Audited financial statements
- 16 -
*SGVFS163777*
Property and EquipmentProperty and equipment are measured at cost less any subsequent accumulated depreciation,amortization and impairment losses. The cost of an asset consists of its purchase price, restorationcost and costs directly attributable to bringing the asset to its working condition for its intended use.
Subsequent expenditures relating to an item of property and equipment that have already beenrecognized are added to the carrying amount of the asset when it is probable that future economicbenefits, in excess of the originally assessed standard of performance of the existing asset, will flowto the Company. All other subsequent expenditures are recognized as expenses in the period in whichthose are incurred.
Depreciation and amortization are computed using straight-line method over the estimated useful live(EUL) of the assets. Leasehold improvements are amortized over the term of the lease or the EUL offive (5) years of the improvement, whichever is shorter. The EUL of the different categories ofproperty and equipment are as follows:
YearsMotor vehicles 5Electronic data processing equipment 3Office equipment 3Furniture and fixtures 3
The useful life and depreciation and amortization methods are reviewed periodically to ensure that themethod and period of depreciation and amortization are consistent with the expected pattern ofeconomic benefits from these assets.
An item of property and equipment is derecognized upon disposal or when no further futureeconomic benefits are expected from its use or disposal. Gain or loss arising on the disposal orretirement of an asset is determined as the difference between the sales proceeds and the carryingamount of the asset, and is recognized in the profit or loss.
Intangible AssetsIntangible assets are carried at cost less accumulated amortization and impairment in value, if any.Intangible assets, consisting mainly of access rights, and software (not an integral part of its relatedhardware), are capitalized at cost. These costs are amortized on a straight-line basis over theirestimated useful lives ranging from three (3) to fifteen (15) years. Periods and method ofamortization for intangible assets with finite useful lives are reviewed annually or earlier when anindicator of impairment exists.
Gains or losses arising from derecognition of an intangible asset are measured as the differencebetween the net disposal proceeds and the carrying amount of the asset and are recognized in profit orloss when the asset is derecognized.
Impairment of Non-financial AssetsWhere an indication of impairment exists, or when annual impairment testing for an asset is required,the asset's recoverable amount is estimated formally by the Company. An asset's recoverable amountis the higher of the asset's or cash-generating unit's value in use and its fair value, less costs todispose, and is determined for an individual asset, unless the asset does not generate cash inflows thatare largely independent of those from other assets or groups of assets, in which case, the recoverableamount is determined for the cash-generating unit to which the asset belongs.
92

- 17 -
*SGVFS163777*
An impairment loss is recognized only if the carrying amount of an asset exceeds its recoverableamount. In assessing value in use, the estimated future cash flows are discounted to their presentvalue using a pre-tax discount rate that reflects current market assessments of the time value ofmoney and the risks specific to the asset. An impairment loss is charged to profit or loss in the periodin which it arises in those expense categories consistent with the function of the impaired asset.
An assessment is made at the end of each reporting period as to whether there is an indication thatpreviously recognized impairment losses may no longer exist or may have decreased. If such anindication exists, the recoverable amount is estimated.
A previously recognized impairment loss on an asset is reversed only if there has been a change in theestimate used to determine the recoverable amount of that asset, but not to an amount higher than thecarrying amount that would have been determined (net of any depreciation and amortization) had noimpairment loss been recognized for the asset in prior years. A reversal of such an impairment loss iscredited to profit or loss in the period in which it arises.
Insurance Contract LiabilitiesLife insurance contract liabilitiesLife insurance contract liabilities represent the accumulated total liability for policies in force as ofthe reporting date. Such reserves are established at amounts adequate to meet the estimated futureobligations of all life insurance policies in force. These are recognized when the contracts are enteredinto and the premiums are recognized. The provision for life insurance contracts, other thaninvestment linked contracts, is calculated on the basis of a prudent prospective actuarial valuationmethod where the assumptions used depend on the circumstances prevailing at the valuation date.Assumptions and actuarial valuation methods are also subject to provisions of the Insurance Code(the Code) and guidelines set by IC under Circular Letter No. 2016-66 (Valuation of Life InsurancePolicy Reserves).
For investment linked contracts, contract liabilities are directly linked to the underlying investmentassets, which are portfolios maintained to meet specific investment objectives of policyholders whogenerally bear the credit and market risks on those investments. The liabilities are carried at fairvalue determined with reference to the accumulation value (current unit value). The costs of assetmanagement fee inclusive of applicable taxes assessed against customers’ account balances arepresented in the profit or loss as part of “Management fee income”.
Life insurance contract with fixed and guaranteed termsA liability for contractual benefits that are expected to be incurred in the future is recorded under“Insurance contract liabilities” in the statement of financial position when the premiums arerecognized. The liability is determined as the expected discounted value of the benefit payments andexpenses less the expected discounted value of the gross premiums based on the best estimateassumptions with provision for adverse deviations.
The liability is based on mortality, morbidity, lapse and expense assumptions with due regard to thecompany’s recent experience studies. However, liabilities for contractual benefits are computed tocomply with statutory requirements, which require discount rates to be compliant with the approvedrate issued by IC. Reserves are computed on a seriatim basis and depend on the issue age and policyduration.
93
Audited financial statements

- 18 -
*SGVFS163777*
Unit-linked insurance contractsThe Company issues unit-linked insurance contracts. In addition to providing life insurancecoverage, a unit-linked contract links payment to units of internal investment funds (unit-linkedfunds) set up by the Company with the consideration received from the policyholders. As allowed byPFRS 4, the Company chose not to unbundle the investment portion of its unit-linked products.
Premiums received from the issuance of unit-linked insurance contracts are recognized as premiumrevenue. These are separated to fund assets from which the Company withdraws administrative andcost of insurance charges in accordance with the policy provisions of the unit-linked insurancecontracts. After deduction of these charges together with applicable surrender fees, the remainingamounts in the fund assets are equal to the surrender value of the unit-linked policies, and could bewithdrawn anytime.
The assets and liabilities of the unit-linked funds have been segregated and reflected in “Assets heldto cover unit-linked liabilities” and “Unit-linked liabilities” in the statement of financial position.Income or loss arising from the unit-linked funds are classified under “Fair value gain (loss) on FVPLand assets held to cover unit-linked liabilities” in the profit or loss.
Investments under assets held to cover unit-linked liabilities are valued at market price. Changes inthe assets held to cover unit-linked liabilities due to investment earnings or market value fluctuationsresult to the same corresponding change in the unit-linked liabilities. Such changes in fund value arepresented as part of “Fair value gain (loss) on FVPL and assets held to cover unit-linked liabilities” inthe Company’s profit or loss. As of end of the reporting period, unit-linked liabilities are computedon the basis of the number of units allocated to the policyholders multiplied by the unit price of theunderlying funds.
The account value of each unit-linked policyholder in the fund is monitored through the designationof outstanding units for each policy. Hence, the account value of each unit-linked insurance contractin the fund is equal to the total number of outstanding units multiplied by the net asset value per unit(NAVPU). The NAVPU is the market value of the fund divided by the total number of outstandingunits.
EquityCapital stockCapital stock is recognized as issued when the stock is paid for or subscribed under a bindingsubscription agreement and is measured at par value.
Additional paid-in capitalWhen the shares are sold at premium, the difference between the proceeds and the par value iscredited to “Additional paid-in capital” account.
Contributed surplusContributed surplus represents the contribution of the stockholders of the Company, in addition to thepaid-up capital stock, in order to comply with the pre-licensing and capital requirements as providedunder the Code.
Contingency surplusContingency surplus represents contributions of the stockholders to cover any unexpected deficiencyin the Margin of Solvency (MOS) as required under the Code.
DeficitDeficit represent accumulated net losses of the Company.
94

- 19 -
*SGVFS163777*
Revenue Recognition (within the scope of PFRS 15)Upon adoption of PFRS 15, revenue from contracts with customers is recognized when control of thegoods or services are transferred to the customer at an amount that reflects the consideration to whichthe Company expects to be entitled in exchange for those goods or services.
The following specific recognition criteria must also be met before income is recognized:
Management fee incomeUnit-linked funds are charged for fund management and administration. These fees are recognized asrevenue in the period in which the performance obligation of pooling together into a fund by theCompany’s designated fund manager of the investment portion of premium payments ofpolicyholders based on its respective insurance contracts, and deduction of the management fees fromthe policyholders’ premium payments are simultaneously completed.
Other incomeOther income is recognized in the profit or loss as it is earned.
Revenue Recognition (outside the scope of PFRS 15)Revenue is recognized to the extent that it is probable that economic benefits will flow to theCompany and the revenue can be reliably measured. The Company assesses its revenuearrangements against specific criteria in order to determine if it is acting as principal or agent. TheCompany has concluded that it is acting as principal in all of its revenue arrangements. The followingspecific recognition criteria must also be met before revenue is recognized:
Premium incomeGross recurring premiums from life insurance contracts are recognized as revenue when payable bythe policyholder. For single premium business, revenue is recognized on the date from which thepolicy becomes effective. For regular premium contracts, receivables are recorded at the date whenpayments are due.
Interest incomeInvestment income which pertains to interest income is recognized in profit or loss as it accrues,taking into account the effective yield of the asset. Interest income includes the amortization of anydiscount or premium or other differences between the initial carrying amount of an interest-bearinginstrument and its amount at maturity calculated using the effective interest rate.
Reinsurance allowanceReinsurance allowance due from the reinsurer is computed based on the quota share that was agreedupon by the Company and its reinsurer, including any reinsurance recovery, profit share, loss carriedforward balances and interest. This is recorded as income in accordance with the Company’sreinsurance policy.
Benefits and ExpensesExpenses, in general, are recognized in the profit or loss in the period these are incurred.
Benefits and claimsLife insurance benefit claims reflect the cost of all claims arising during the year. Death claims andsurrenders are recorded on the basis of notifications received. Benefits recorded are then accrued asliabilities.
95
Audited financial statements
- 20 -
*SGVFS163777*
For unpaid benefits, a provision is made for the estimated cost of all claims but not settled at thereporting date, net of reinsurance recoveries, using the information available at the time. Provision isalso made for the cost of claims incurred but not reported (IBNR) until after the reporting date basedon the Company’s experience and historical data. These actual claims are those reported immediatelyfollowing the reporting date, whether paid or unpaid, but wherein the date of loss occurred on orbefore the reporting date.
General and administrative expensesGeneral and administrative expenses are costs attributable to administrative and other businessactivities of the Company. These are recognized as expense in the period these are incurred.
Commission and agency related expensesCommission and agency related expenses are charged against operations when the insurance contractsare entered into and related premiums are recognized. Commissions are paid to agents and financialexecutives for selling individual and group policies. Rates applied on collected premiums varydepending on the type of product and payment terms, and policy year of the contract.
LeasesThe Company applies a single recognition and measurement approach for all leases, except for short-term leases and leases of low-value assets. The Company recognizes lease liabilities to make leasepayments and right-of-use assets representing the right to use the underlying assets.
Right-of-use assetsThe Company recognizes right-of-use assets at the commencement date of the lease (i.e., the date theunderlying asset is available for use). Right-of-use assets are measured at cost, less any accumulateddepreciation and impairment losses, and adjusted for any remeasurement of lease liabilities. The costof right-of-use assets includes the amount of lease liabilities recognized, initial direct costs incurred,and lease payments made at or before the commencement date less any lease incentives received andestimate of costs to be incurred by the lessee in dismantling and removing the underlying asset,restoring the site on which it is located or restoring the underlying asset to the condition required bythe terms and conditions of the lease, unless those costs are incurred to produce inventories. Unlessthe Company is reasonably certain to obtain ownership of the leased asset at the end of the lease term,the recognized right-of-use assets are depreciated on a straight-line basis over the lease term.
Right-of-use assets are subject to impairment. Refer to the accounting policies in section impairmentof non-financial assets.
Lease liabilitiesAt the commencement date of the lease, the Company recognizes lease liabilities measured at thepresent value of lease payments to be made over the lease term. The lease payments include fixedpayments (including in substance fixed payments) less any lease incentives receivable, variable leasepayments that depend on an index or a rate, and amounts expected to be paid under residual valueguarantees. The lease payments also include the exercise price of a purchase option reasonablycertain to be exercised by the Company and payments of penalties for terminating a lease, if the leaseterm reflects the Company exercising the option to terminate. The variable lease payments that donot depend on an index or a rate are recognized as expense in the period on which the event orcondition that triggers the payment occurs.
96

- 21 -
*SGVFS163777*
In calculating the present value of lease payments, the Company uses the incremental borrowing rateat the lease commencement date if the interest rate implicit in the lease is not readily determinable.After the commencement date, the amount of lease liabilities is increased to reflect the accretion ofinterest and reduced for the lease payments made. In addition, the carrying amount of lease liabilitiesis remeasured if there is a modification, a change in the lease term, a change in the in-substance fixedlease payments or a change in the assessment to purchase the underlying asset.
Short-term leases and leases of low-value assetsThe Company applies the short-term lease recognition exemption to its short-term leases ofmachinery and equipment (i.e., those leases that have a lease term of 12 months or less from thecommencement date and do not contain a purchase option). It also applies the leases of low-valueassets recognition exemption to leases that are considered of low value. Lease payments on short-term leases and leases of low-value assets are recognized as expense on a straight-line basis over thelease term.
Foreign Currency-denominated Exchange Transactions and TranslationsTransactions in currencies other than Philippine Peso are recorded at the rate of exchange prevailingon the date of the transaction. At the end of each reporting period, monetary assets and liabilities thatare denominated in foreign currencies are retranslated at the rate prevailing at the end of eachreporting period. Non-monetary assets and liabilities carried at fair value that are denominated inforeign currencies are translated at the rate prevailing at the date the fair value was determined. Gainsand losses arising on retranslation are included in profit or loss for the year.Nonmonetary assets and liabilities denominated in foreign currencies that are measured at historicalcost are translated using the exchange rate at the date of transaction and are not subsequently restated.
Foreign exchange gains or losses are considered as taxable income or deductible expense,respectively, only upon realization.
Income TaxCurrent taxCurrent tax assets and liabilities for the current and prior periods are measured at the amount expectedto be recovered from or paid to the taxation authorities. The tax rates and tax laws used to computethe amount are those that are enacted or substantially enacted at the reporting date.
Deferred taxDeferred tax is provided using the liability method on temporary differences at the reporting datebetween the tax bases of assets and liabilities and their carrying amounts for financial reportingpurposes.
Deferred tax liabilities are recognized for all taxable temporary differences, with certain exceptions.Deferred tax assets are recognized for all deductible temporary differences, and unused net operatingloss carryover (NOLCO), to the extent that it is probable that sufficient taxable profit will beavailable against which the deductible temporary differences and carry forward of NOLCO can beutilized.
The carrying amount of deferred tax assets is reviewed at each reporting date and reduced to theextent that it is no longer probable that sufficient taxable profit will be available to allow all or part ofthe deferred tax assets to be utilized. Unrecognized deferred tax assets are reassessed at eachreporting date and are recognized to the extent that it has become probable that future taxable profitwill allow all or part of the deferred tax assets to be recovered.
97
Audited financial statements
- 22 -
*SGVFS163777*
Current tax and deferred tax relating to items recognized directly in other comprehensive income arelikewise recognized in other comprehensive income.
Deferred tax assets and liabilities are measured at the tax rate that is expected to apply to the periodwhen the asset is realized or the liability is settled, based on tax rates (and tax laws) that have beenenacted or substantively enacted as of end of the reporting period.
Movements in the deferred tax assets and liabilities arising from changes in the rates are charged orcredited to profit or loss for the period.
Deferred tax assets and deferred tax liabilities are offset, if a legally enforceable right exists to set offcurrent tax assets against current tax liabilities and the deferred taxes relate to the same taxable entityand the same taxation authority.
Provisions and ContingenciesA provision is recognized when a present obligation (legal or constructive) has arisen as a result of apast event and it is probable that a future outflow of resources will be required to settle the obligation,provided that a reliable estimate can be made of the amount of the obligation. Where the Companyexpects a provision to be reimbursed, for example under an insurance contract held, thereimbursement is recognized as a separate asset only when the reimbursement is probable. TheCompany recognizes a provision for onerous contracts when the expected benefits to be derived froma contract are less than the unavoidable costs of meeting the obligations under the contract. Provisionare reviewed at each reporting date and adjusted to reflect the current best estimates.
When the effect of discounting is material, the amount recognized for a provision is the present valueat the end of the reporting period of the expected future expenditures required to settle the obligation.The increase in the discounted present value amount arising from the passage of time is included infinance costs in the profit or loss.
Contingencies are disclosed if material and if there is a possible future obligation as a result of a pastevent, or if there is a present obligation as a result of a past event, but either a payment is not probableor the amount cannot be reliably estimated.
Related Party TransactionsA related party transaction is a transfer of resources, services or obligations between the Companyand a related party, regardless of whether a price is charged.
Employee BenefitsLong-term employee incentivesCertain employees of the Company are eligible for long-term incentives based on the duration of theirservice to the Company as defined in their employment contracts. The Company is liable to makesuch payments in the event that the employee meets the circumstances specified in those employmentcontracts. Long-term employee benefits are recognized when the services are rendered and themeasurement of the obligation reflects the probability that payment will be required and the length oftime for which payment is expected to be made.
Short-term employee benefitsShort-term employee benefits include items such as salaries and wages, social security contributions,incentives and nonmonetary benefits, that are expected to be settled wholly within twelve monthsafter the end of the reporting period in which the employees rendered the related services.
98
- 23 -
*SGVFS163777*
Short-term employee benefits are recognized as expense as incurred. When an employee hasrendered service to the Company during the reporting period, the Company recognizes theundiscounted amount of short-term employee benefits expected to be paid in exchange for thatservice as a liability (accrued expense), after deducting any amount already paid.
Share-based compensationFWD Group Management Holdings Pte. Ltd., (hereinafter referred to as “FWD Group”), an affiliateof the Company, offers a share-option award plan for the Company’s certain key employees as part ofa compensation plan aligned with services provided in achieving shareholder value targets. Thisshare-based compensation plan is an equity-settled plan and the compensation expense being re-charged by FWD Group to the Company is based on the fair value of the shares granted, the vestingperiod and the vesting conditions. The cost of the plans is recognised as an expense in profit or lossover the vesting period with a corresponding amount recorded in the Company’s equity as reserve.
In 2021, the FWD Group offered a long-term incentive bonus (share award plan) to eligibleemployees of the Company after meeting certain performance indicators over the agreed period. TheCompany has the obligation to settle the transaction with its employees in FWD Group’s equityinstruments which is purchased by the Company from FWD Group resulting to a recognition of aliability.
At each period end, FWD Group assesses the number of shares and share-options that are expected tovest from those so far granted. Any impact arising from revisions to original estimates is recognisedin profit or loss with a corresponding adjustment to equity. Where awards of share-based paymentarrangements have graded vesting terms, each tranche is recognised as a separate award, and the fairvalue of each tranche is recognised over the applicable vesting period.
FWD Group estimates the fair value of share options using the Black-Scholes model and anassessment of performance of conditions (internal rate of return or IRR achievement) to calculate thefair value of the share-option awards, taking into account the terms and conditions upon which theawards were granted.
For the share award plan, the FWD Group utilizes an appraisal value method and an assessment ofperformance conditions to calculate the fair value of the share awards, considering the terms andconditions upon which the shares are granted.
Pension obligationThe Company operates a funded, defined contribution (DC) plan, which requires contributions to bemade to a separately administered fund. Under its DC plan, the Company pays fixed contributionsbased on the employees’ monthly salaries. The Company, however, is covered under Republic Act(RA) No. 7641, The Philippine Retirement Law, which provides for its qualified employees a definedbenefit (DB) minimum guarantee. The DB minimum guarantee is equivalent to a certain percentageof the monthly salary payable to an employee at normal retirement age with the required creditedyears of service based on the provisions of RA 7641.
Accordingly, the Company accounts for its retirement obligation at each reporting date under thehigher of the DB obligation relating to the minimum guarantee and the sum of DC liability and thepresent value of the excess of the projected DB obligation over projected DC obligation.
The cost of providing benefits under the defined benefit plan is determined using the projected unitcredit (PUC) valuation method.
99
Audited financial statements

- 24 -
*SGVFS163777*
The net defined benefit asset or liability comprises the present value of the defined benefit obligation(using a discount rate) less the fair value of plan assets out of which the obligations are to be settleddirectly. Plan assets are assets that are held by a long-term employee benefit fund. Plan assets are notavailable to creditors of the Company, nor can they be paid directly to the Company. Fair value isbased on market price information, and, in the case of quoted securities, it is the published bid price.The value of any net defined benefit asset is restricted to the present value of any economic benefitsavailable in the form of refunds from the plan or reductions in future contributions to the plan.
Past service costs are recognised in profit or loss on the earlier of the date of the plan amendment orcurtailment or the date that the Company recognizes related restructuring costs or terminationbenefits.
Net interest is calculated by applying the discount rate to the net defined benefit liability or asset.
Remeasurements, comprising actuarial gains and losses and the return on plan assets (excludingamounts included in net interest on the net defined benefit liability), are recognized immediately inthe statement of financial position with a corresponding debit or credit to retained earnings throughOCI in the period in which they occur. Remeasurements are not reclassified to profit or loss insubsequent periods.
Events after the Reporting DatePost year-end events that provide additional information about the Company’s financial position atthe end of the reporting date (adjusting event) are reflected in the financial statements. Post year-endevents that are not adjusting events, if any, are disclosed when material to the financial statements.
3. Significant Accounting Judgments, Estimates and Assumptions
The Company makes judgments, estimates and assumptions that affect the reported amounts of assetsand liabilities. Judgments and estimates are continually evaluated and are based on historicalexperience and other factors, including expectations of future events that are believed to bereasonable under the circumstances.
JudgmentsIn the process of applying the Company’s accounting policies, management has made the followingjudgments which have the most significant effect on the amounts recognized in the financialstatements of the Company.
Product classificationThe Company has determined that the traditional and unit-linked insurance policies (that link thepayments on the contract to units of insurance investment fund) have significant insurance risk and,therefore meet the definition of an insurance contract and should be accounted for as such.
Recognition of income taxesSignificant management judgment on the future tax treatment of certain transactions is required indetermining income tax provisions. The Company carefully evaluates tax implications oftransactions and tax provisions are set up accordingly. The tax treatment of such transactions isreconsidered periodically to consider developments in tax laws. Tax laws evolve over time, and insome cases taxation positions are uncertain because the tax laws are subject to varied interpretation.When this is the case, management seeks to adopt a supportable and prudent tax treatment afterconsultation with professional tax advisers. However, as judicial and non-judicial interpretationsdevelop, these taxation positions may change in the future.
100

- 25 -
*SGVFS163777*
Impairment of nonfinancial assetsThe Company assesses whether there are any indicators of impairment for all non-financial assets ateach reporting date. Non-financial assets are tested for impairment when there are indicators that thecarrying amounts may not be recoverable. When value in use calculations are undertaken,management must estimate the expected future cash flows from the asset or cash-generating unit andchoose a suitable discount rate in order to calculate the present value of those cash flows.
There were no impairment indicators identified on the Company’s property and equipment, right-ofuse-asset, intangible assets and prepaid assets as of December 31, 2021 and 2020. The carryingvalues of property and equipment, right-of-use assets, intangible assets, and prepaid assets underother assets are disclosed in Notes 7, 8, 9, and 11, respectively.
Determination of lease term of contracts with renewal and termination options - Company as a lesseeThe Company has several lease contracts that include extension and termination options. TheCompany applies judgment in evaluating whether it is reasonably certain whether or not to exercisethe option to renew or terminate the lease. That is, it considers all relevant factors that create aneconomic incentive for it to exercise either the renewal or termination. After the commencement date,the Company reassesses the lease term if there is a significant event or change in circumstances that iswithin its control and affects its ability to exercise or not to exercise the option to renew or toterminate (e.g., construction of significant leasehold improvements or significant customization to theleased asset).
Refer to Note 9 for information on potential future rental payments relating to periods following theexercise date of extension and termination options that are not included in the lease term.
Share-based compensation - share-option award plan and share award planFWD Group has adopted a share-option award plan and share award plan to retain, motivate and alignthe interests of eligible officers of the Company. This share-based compensation plan is accounted foras equity-settled plans under which share-options are awarded, while the share award plan is cashsettled.
FWD Group estimates the fair value of share options using the Black-Scholes model and anassessment of performance of conditions (IRR achievement) to calculate the fair value of the share-option awards, taking into account the terms and conditions upon which the awards were granted.
FWD Group determines the fair value of share options by following inputs:• Dividend yield• Expected share price volatility• Risk-free interest rate• Expected life of the share options• Appraisal value per share, using the same valuation methodology as is used in the share award
plan
For the share award plan, the FWD Group utilizes an appraisal value method and an assessment ofperformance conditions to calculate the fair value of the share awards, considering the terms andconditions upon which the shares are granted.
101
Audited financial statements

- 26 -
*SGVFS163777*
The judgments exercised in the determination of share-option fair value and the assessment of IRRachievement affect the amounts recognised in the financial statements as share-based paymentexpense and share-based payment reserve.
Estimates and AssumptionsThe key assumptions concerning future and other key sources of estimation uncertainty at thereporting date that have significant risks of causing a material adjustment to the carrying amounts ofassets and liabilities within the next financial year are discussed below:
Claims liability arising from insurance contractsThe components of the claims liability (claims due and unpaid, claims in course of settlement, resistedclaims, and IBNR) are based on the company’s claims inventory report. In 2020, the company shiftedits IBNR methodology to using Claims Development method wherein projected ultimate claims arecomputed based on actual reported claims.
Prior to this, estimates of IBNR are made as to the expected number of deaths, illnesses and injuries foreach of the years in which the Company is exposed to risk.
Estimates are also made as to future investment income arising from the assets backing life insurancecontracts. These estimates are based on current market returns, as well as expectations about futureeconomic and financial developments. The carrying value of the claims liabilities amounted toP=504.90 million and P=334.97 million as of December 31, 2021 and 2020, respectively (see Note 12).
Estimation of allowance for impairment lossesThe Company maintains an allowance for impairment losses at a level considered adequate to providefor potential uncollectible receivables. The level of this allowance is evaluated by management basedon factors that affect the collectability of the accounts.
These factors include, but are not limited to, the length of the Company’s relationship with thedebtors, the debtor’s payment behaviour and known market factors. The Company reviews the ageand status of receivables and identifies accounts that are to be provided with allowance on acontinuous basis.
In addition to specific allowance against individually significant loans and receivables, the Companyalso makes a collective impairment allowance against exposures which, although not specificallyidentified as requiring specific allowance, have a greater risk of default than when originally granted.This collective allowance is based on any deterioration in the internal rating of the loan or investmentsince it was granted or acquired.
The carrying value of loans and deposits amounted to P=271.81 million and P=124.67 million as ofDecember 31, 2021 and 2020, respectively (see Note 5). The carrying value of insurance receivablesunder ‘Other Assets’ amounted to P=120.73 million and P=198.79 million as of December 31, 2021and 2020, respectively (see Note 11). The carrying value of accounts receivable under ‘Other Assets’amounted to P=60.23 million and P=30.04 million as of December 31, 2021 and 2020, respectively.The allowance for doubtful accounts on ‘Other assets’ amounted to P=29.56 million andP=20.00 million as of December 31, 2021 and 2020, respectively (see Note 11).
102

- 27 -
*SGVFS163777*
Estimated useful lives of property and equipment and intangible assets and prepaid assetsThe Company reviews annually the estimated useful lives of property and equipment based on theperiod over which the assets are expected to be available for use. It is possible that future results ofoperations could be materially affected by changes in these estimates. A reduction in the estimateduseful lives of property and equipment would increase recorded depreciation and amortizationexpense and decrease the related asset accounts.
The depreciable amount of intangible assets and prepaid assets are allocated on a systematic basisover their useful lives. The amortization method shall reflect the pattern in which the asset’s futureeconomic benefits are expected to be consumed by the Company. These methods include thestraight-line method and the unit of production method (UOP). On the other hand, software (not anintegral part of its related hardware) which is included as part of intangible assets, are capitalized atcost and amortized over their estimated useful lives of three (3) years.
In this regard, UOP method of amortization which is based on quantifiable and reliable source(Actual over Target production) will be used for the subsequent measurements of the prepaid Expenseasset, while intangible assets will be amortized using a straight-line method on its economic life offifteen (15) years.
As of December 31, 2021 and 2020, the carrying values of property and equipment amounted toP=148.38 million and P=153.88 million, respectively (see Note 7), the carrying values of intangibleassets amounted to P=229.00 million and P=251.60 million, respectively (see Note 9) and the carryingvalues of prepaid assets under other assets amounted to P=650.95 million and P=808.07 million,respectively (see Note 11).
Leases - Estimating the incremental borrowing rateWhen the Company cannot readily determine the interest rate implicit in the lease, it uses itsincremental borrowing rate (IBR) to measure lease liabilities. The IBR is the rate of interest that theCompany would have to pay to borrow over a similar term, and with a similar security, the fundsnecessary to obtain an asset of a similar value to the right-of-use asset in a similar economicenvironment. The IBR therefore reflects what the Company ‘would have to pay’, which requiresestimation when no observable rates are available (such as for entities that do not enter into financingtransactions) or when they need to be adjusted to reflect the terms and conditions of the lease (forexample, when leases are not in the entity’s functional currency).
The Company estimates the IBR using observable inputs (such as market interest rates) whenavailable and is required to make certain entity-specific estimates (such as the entity’s stand-alonecredit rating).
The Company’s lease liabilities under other payables amounted to P=224.64 million andP=322.00 million as of December 31, 2021 and 2020, respectively (see Note 8).
Employee benefitsThe determination of pension obligation and other employee benefits is dependent on the selection ofcertain assumptions used in calculating such amounts. Those assumptions include, among others,discount rate, expected return on plan assets, salary increase rate, mortality rate, disability rate andturnover rates. Due to the long term nature of these plans, such estimates are subject to significantuncertainty.
103
Audited financial statements

- 28 -
*SGVFS163777*
The cost of defined benefit plan and the present value of the pension obligation are determined usingactuarial valuation. An actuarial valuation involves making various assumptions that may differ fromactual developments in the future. These include the determination of the discount rate, future salaryincreases and mortality rates. Due to the complexities involved in the valuation and its long-termnature, a defined benefit obligation is highly sensitive to changes in these assumptions.
While the Company believes that the assumptions are reasonable and appropriate, significantdifferences in the actual experience or significant changes in the assumptions may materially affectthe pension obligation. All assumptions are reviewed at each reporting date.
As of December 31, 2021 and 2020, the carrying amount of retirement obligation amounted toP=0.82 million and P=9.14 million, respectively (see Note 21).
Deferred tax assetsDeferred tax assets are computed for all deductible temporary difference to the extent that it isprobable that taxable profit will be available against which the deductible temporary differences canbe utilized. Significant management judgment is required to determine the amount of deferred taxassets that can be recognized, based upon the likely timing and level of future taxable profits togetherwith future tax planning strategies. The Company did not recognize deferred tax assets on NOLCOas of December 31, 2020 since management believes that the benefits will not be realized prior totheir expiry dates. In 2021, the Company utilized a portion of the NOLCO while the remainingunutilized amount had expired.
As of December 31, 2021 and 2020, the Company recognized accumulated deferred tax assets onminimum corporate income (MCIT) amounting to P=111.60 million and P=109.48 million, respectively(see Note 23).
ContingenciesContingent liabilities are not recognized in the financial statements. They are disclosed unless thepossibility of an outflow of resources embodying economic benefits is remote. Contingent assets arenot recognized in the financial statements but disclosed when an inflow of economic benefit isprobable.
4. Cash
This account consists of:
2021 2020Cash on hand P=2,387,392 P=1,943,252Cash in banks 923,494,139 1,204,212,188
P=925,881,531 P=1,206,155,440
Cash in banks earn annual interest at the prevailing bank deposit rates ranging from 0.10% to 0.50%in 2021 and from 0.125% to 0.50% in 2020.
Interest income earned on cash in banks in 2021 and 2020 amounted to P=2.11 million and P=5.51million, respectively (see Note 16).
104

- 29 -
*SGVFS163777*
5. Financial Assets
The Company’s financial assets (other than receivables under other assets) are summarized asfollows:
2021 2020Financial assets at FVPL (Note 6) P=265,133,674 P=263,039,143AFS financial assets 2,559,303,784 1,424,570,711Assets held to cover unit-linked liabilities (Note 6) 36,904,056,215 23,690,049,945Loans and deposits 271,815,649 124,667,298
P=40,000,309,322 P=25,502,327,097
AFS financial assetsThis account consists of:
At Amortized Cost At Fair value2021 2020 2021 2020
Government debt securities P=2,440,000,724 P=1,265,016,637 P=2,437,181,970 P=1,281,214,702Corporate debt securities 123,011,709 144,082,944 122,121,814 143,356,009
P=2,563,012,433 P=1,409,099,581 P=2,559,303,784 P=1,424,570,711
Movements in AFS financial assets follow:
2021 2020At January 1 P=1,424,570,711 P=810,377,017Additions 2,474,863,723 1,119,144,825Disposals/maturities (1,289,590,000) (514,055,071)Fair value gains (losses) (40,854,664) 13,640,476Amortization of discount (9,685,986) (4,536,536)At December 31 P=2,559,303,784 P=1,424,570,711
AFS debt securities bear annual interest ranging from 2.38% to 7.63% in 2021 and 2.38% to 6.80% in2020. Interest earned amounted to P=71.77 million and P=37.11 million in 2021 and 2020, respectively(see Note 16). Interest accrued amounted to P=26.82 million and P=9.63 million as of December 31,2021 and 2020, respectively (see Note 11).
As of December 31, 2021 and 2020, AFS financial assets amounting to P=250.00 million are depositedwith the IC in accordance with the provisions of the Code as security for the benefit of policyholdersand creditors of the Company.
The rollforward analyses of unrealized fair value gains (losses) on AFS financial assets follow:
2021 2020At January 1 P=15,471,130 P=1,830,654Unrealized fair value gain (loss) (40,854,664) 13,640,476At December 31 (P=25,383,534) P=15,471,130
“Unrealized fair value gains (losses) on AFS financial assets” pertains to the difference between theamortized cost and fair value of AFS debt securities.
105
Audited financial statements

- 30 -
*SGVFS163777*
Loans and depositsThis account consists of:
2021 2020Receivable from VUL funds P=176,529,178 P=75,601,799Agency loans 71,802,215 33,483,790Employee loans and advances 18,382,088 14,621,016Policy loans 5,102,168 960,693
P=271,815,649 P=124,667,298
Receivable from VUL funds consist of uncollected proceeds from surrenders and withdrawals of costof insurance (COI) and cost of rider (COR).
Agency loans are interest-bearing loans granted to agents and settled through deduction againstagency compensation and with interest of 6% per annum. Interest income earned on agency loansamounted to P=0.32 million and P=0.68 million in 2021 and 2020, respectively.
Employee loans and advances are non-interest bearing and are settled through payroll deductions.
Policy loans bearing interest of 8% per annum are those granted by the Company as a loan topolicyholders in an amount no greater than the cash value of the policy.
The Company classifies its non-linked and unit-linked financial assets at fair value as follows:
2021Level 1 Level 2 Level 3 Total
Assets measured at fair value:Financial assets at FVPL
(Note 6) P=265,133,674 P=– P=– P=265,133,674AFS financial assets 2,559,303,784 – – 2,559,303,784Assets held to cover unit-linked
liabilities (Note 6) − 36,904,056,215 – 36,904,056,215P=2,824,437,458 P=36,904,056,215 P=– P=39,728,493,673
2020Level 1 Level 2 Level 3 Total
Assets measured at fair value:Financial assets at FVPL
(Note 6) P=263,039,143 P=– P=– P=263,039,143AFS financial assets 1,424,570,711 – – 1,424,570,711Assets held to cover unit-linked
liabilities (Note 6) − 23,690,049,945 – 23,690,049,945P=1,687,609,854 P=23,690,049,945 P=– P=25,377,659,799
As of December 31, 2021 and 2020, there were no transfers between Level 1 and Level 2 fair valuemeasurements, and no transfers into and out of Level 3 fair value measurement.
106
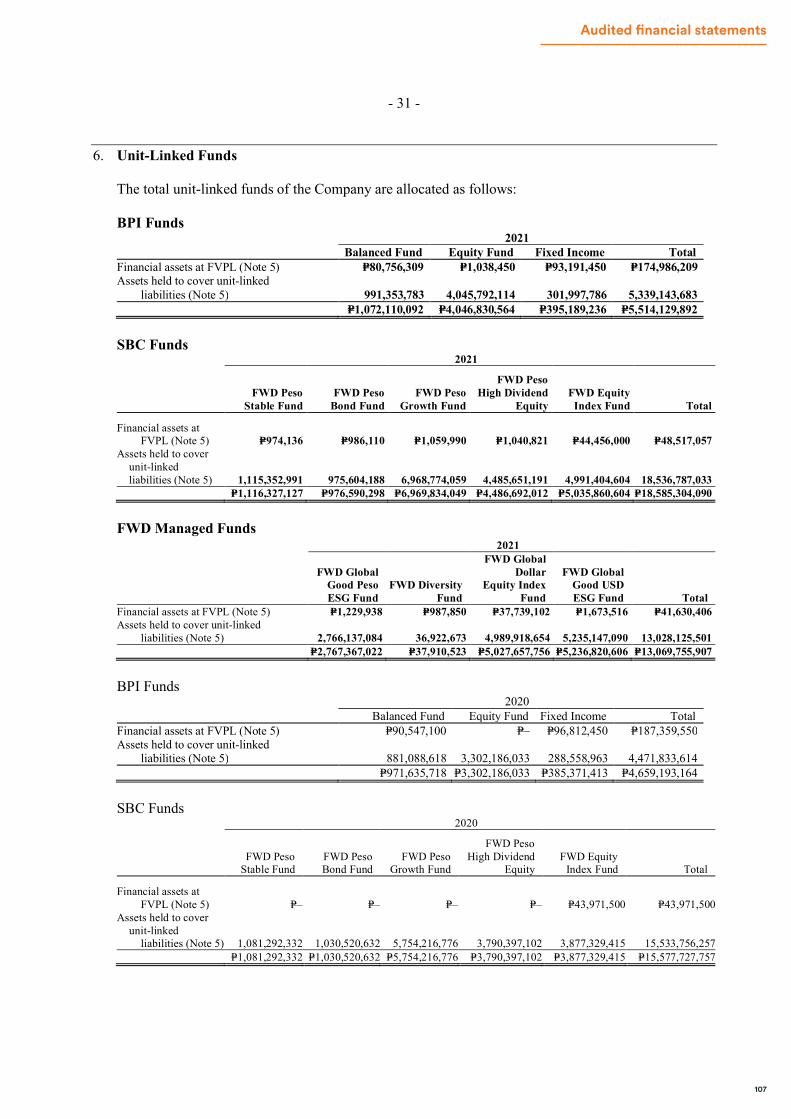
- 31 -
*SGVFS163777*
6. Unit-Linked Funds
The total unit-linked funds of the Company are allocated as follows:
BPI Funds2021
Balanced Fund Equity Fund Fixed Income TotalFinancial assets at FVPL (Note 5) P=80,756,309 P=1,038,450 P=93,191,450 P=174,986,209Assets held to cover unit-linked
liabilities (Note 5) 991,353,783 4,045,792,114 301,997,786 5,339,143,683P=1,072,110,092 P=4,046,830,564 P=395,189,236 P=5,514,129,892
SBC Funds2021
FWD PesoStable Fund
FWD PesoBond Fund
FWD PesoGrowth Fund
FWD PesoHigh Dividend
EquityFWD Equity
Index Fund Total
Financial assets atFVPL (Note 5) P=974,136 P=986,110 P=1,059,990 P=1,040,821 P=44,456,000 P=48,517,057
Assets held to coverunit-linkedliabilities (Note 5) 1,115,352,991 975,604,188 6,968,774,059 4,485,651,191 4,991,404,604 18,536,787,033
P=1,116,327,127 P=976,590,298 P=6,969,834,049 P=4,486,692,012 P=5,035,860,604 P=18,585,304,090
FWD Managed Funds2021
FWD GlobalGood PesoESG Fund
FWD DiversityFund
FWD GlobalDollar
Equity IndexFund
FWD GlobalGood USDESG Fund Total
Financial assets at FVPL (Note 5) P=1,229,938 P=987,850 P=37,739,102 P=1,673,516 P=41,630,406Assets held to cover unit-linked
liabilities (Note 5) 2,766,137,084 36,922,673 4,989,918,654 5,235,147,090 13,028,125,501P=2,767,367,022 P=37,910,523 P=5,027,657,756 P=5,236,820,606 P=13,069,755,907
BPI Funds2020
Balanced Fund Equity Fund Fixed Income TotalFinancial assets at FVPL (Note 5) P=90,547,100 P=– P=96,812,450 P=187,359,550Assets held to cover unit-linked
liabilities (Note 5) 881,088,618 3,302,186,033 288,558,963 4,471,833,614P=971,635,718 P=3,302,186,033 P=385,371,413 P=4,659,193,164
SBC Funds2020
FWD PesoStable Fund
FWD PesoBond Fund
FWD PesoGrowth Fund
FWD PesoHigh Dividend
EquityFWD Equity
Index Fund Total
Financial assets atFVPL (Note 5) P=– P=– P=– P=– P=43,971,500 P=43,971,500
Assets held to coverunit-linked liabilities (Note 5) 1,081,292,332 1,030,520,632 5,754,216,776 3,790,397,102 3,877,329,415 15,533,756,257
P=1,081,292,332 P=1,030,520,632 P=5,754,216,776 P=3,790,397,102 P=3,877,329,415 P=15,577,727,757
107
Audited financial statements

- 32 -
*SGVFS163777*
FWD Managed Funds2020FWD Global Dollar
Equity Index FundFinancial assets at FVPL (Note 5) P=31,708,093Assets held to cover unit-linked liabilities (Note 5) 3,684,460,074
P=3,716,168,167
The unit-linked funds’ net asset values consist of the following:
2021BPI Funds Balanced Fund Equity Fund Fixed Income TOTALAssetCash and cash equivalents P=22,920,751 P=85,288,278 P=2,967,964 P=111,176,993Debt securities 767,175,917 − 388,516,315 1,155,692,232Equity securities 275,174,193 3,978,915,231 − 4,254,089,424Accrued income 8,102,980 1,565,035 4,012,975 13,680,990Other receivables 2,415,968 8,100,636 589,606 11,106,210Total Assets 1,075,789,809 4,073,869,180 396,086,860 5,545,745,849LiabilitiesAmounts payable on redemption of units 901,311 15,255,889 47,267 16,204,467Other payables 2,778,407 11,782,726 850,357 15,411,490Total Liabilities 3,679,718 27,038,615 897,624 31,615,957Net Asset Value P=1,072,110,091 P=4,046,830,565 P=395,189,236 P=5,514,129,892
2021
SBC FundsFWD Peso
Stable FundFWD Peso
Bond FundFWD Peso
Growth Fund
FWD PesoHigh Dividend
EquityFWD Equity
Index Fund TOTALASSETCash and cashequivalents P=− P=− P=− P=− P=68,107,165 P=68,107,165Other investments -
feeder fund 1,115,252,137 951,091,092 6,969,367,293 4,479,383,290 − 13,515,093,812Equity securities − − − − 4,974,344,537 4,974,344,537Accrued income − − − − 1,889,676 1,889,676Other receivables 3,569,403 26,770,113 19,130,005 23,881,970 20,110,420 93,461,911Total Assets 1,118,821,540 977,861,205 6,988,497,298 4,503,265,260 5,064,451,798 18,652,897,101LiabilitiesAmounts payable on
redemption ofunits 1,705,573 459,642 13,612,491 13,206,694 19,187,533 48,171,933
Other payables 788,840 811,265 5,050,758 3,366,554 9,403,661 19,421,078Total Liabilities 2,494,413 1,270,907 18,663,249 16,573,248 28,591,194 67,593,011Net Asset Value P=1,116,327,127 P=976,590,298 P=6,969,834,049 P=4,486,692,012 P=5,035,860,604 P=18,585,304,090
2021
Dollar Equity Funds
FWD GlobalGood Peso ESG
FundFWD Diversity
Fund
FWD GlobalDollar
Equity IndexFund
FWD GlobalGood USDESG Fund Total
AssetCash and cash equivalents P=158,137,651 P=572,508 P=9,298,789 P=4,112,511 P=172,121,459Other investments - feeder fund 2,716,655,988 37,055,743 5,022,393,351 5,206,864,856 12,982,969,938Accrued income 7,565,220 − 17 14,885,903 22,451,140Other receivables 8,113,785 336,497 5,250,811 67,582,599 81,283,692Total Assets 2,890,472,644 37,964,748 5,036,942,968 5,293,445,869 13,258,826,229LiabilitiesAmounts payable on redemption of
units 118,456,577 4,982 − 43,905,830 162,367,389Other payables 4,649,044 49,244 9,285,212 12,719,433 26,702,933Total Liabilities 123,105,621 54,226 9,285,212 56,625,263 189,070,323Net Asset Value P=2,767,367,023 P=37,910,522 P=5,027,657,756 P=5,236,820,606 P=13,069,755,907
108

- 33 -
*SGVFS163777*
2020BPI Funds Balanced Fund Equity Fund Fixed Income TOTALAssetCash and cash equivalents P=19,426,069 P=109,003,395 P=4,402,462 P=132,831,926Debt securities 689,331,549 - 377,224,512 1,066,556,061Equity securities 256,183,030 3,214,010,935 - 3,470,193,965Accrued income 7,558,833 1,579,275 3,826,637 12,964,746Other receivables 6,963,992 28,704,879 819,609 36,488,480Total Assets 979,463,473 3,353,298,484 386,273,220 4,719,035,177LiabilitiesAmounts payable on redemption of units 5,216,814 40,310,513 60,561 45,587,887Other payables 2,610,941 10,801,938 841,246 14,254,126Total Liabilities 7,827,755 51,112,451 901,807 59,842,013Net Asset Value P=971,635,718 P=3,302,186,033 P=385,371,413 P=4,659,193,164
2020
SBC FundsFWD Peso
Stable FundFWD PesoBond Fund
FWD PesoGrowth Fund
FWD PesoHigh Dividend
EquityFWD Equity
Index Fund TOTALASSETCash and cashequivalents P=– P=– P=– P=– P=246,081,798 P=246,081,798Other investments -
feeder fund 1,078,177,600 1,029,876,839 5,745,124,249 3,777,780,822 – 11,630,959,510Equity securities – – – – 3,785,263,008 3,785,263,008Accrued income – – – – 1,615 1,615Other receivables 5,547,568 1,871,649 20,039,336 20,249,620 140,267,618 187,975,791Total Assets P=1,083,725,168 P=1,031,748,488 P=5,765,163,585 P=3,798,030,442 4,171,614,039 15,850,281,722LiabilitiesAmounts payable on
redemption ofunits 1,561,764 187,426 5,378,803 3,685,456 4,311,906 15,125,355
Other payables 871,072 1,040,430 5,568,006 3,947,884 246,001,218 257,428,610Total Liabilities 2,432,836 1,227,856 10,946,809 7,633,340 250,313,124 272,553,965Net Asset Value P=1,081,292,332 P=1,030,520,632 P=5,754,216,776 P=3,790,397,102 P=3,921,300,915 P=15,577,727,757
2020Dollar Equity Funds FWD Global Dollar Equity Index FundAssetCash and cash equivalents P=36,572,695Other investments - feeder fund 3,705,378,937Other receivables 29,566,151Total Assets 3,771,517,783LiabilitiesAmounts payable on redemption of units 49,427,338Other payables 5,922,278Total Liabilities 55,349,616Net Asset Value P=3,716,168,167
The movements in the unit-linked fund’s net assets follow:
2021 2020At January 1 P=23,953,089,088 P=16,126,946,998Contributions 16,172,494,896 10,068,552,688Redemptions (4,614,723,648) (2,093,501,587)Fair value gain (loss) 1,658,329,553 (148,909,011)At December 31 P=37,169,189,889 P=23,953,089,088
Investment in debt securities in the unit-linked funds bear an annual interest ranging from 2.63% to15.00% in 2021 and 2020.
109
Audited financial statements

- 34 -
*SGVFS163777*
Financial assets at FVPLFinancial assets at FVPL represent the seed capital of the Company in its three (3) Peso VUL Fundsand one (1) USD VUL Fund at initial amount of P=220.00 million and USD0.50 million respectively.
Assets held to cover unit-linked liabilities represent policyholders’ money invested into these funds.
Breakdown of the fair value gain (loss) pertaining to net income (loss) of unit-linked funds in 2021and 2020 are as follow:
2021 2020Dividend income P=204,185,976 P=78,557,114Interest income 60,782,923 57,177,716Unrealized gain (loss) on investments 1,684,293,689 (53,461,681)Realized gain (loss) on investments 57,037,325 (61,336,127)Total gain 2,006,299,913 20,937,022Management fees (305,300,756) (141,153,899)Other operating expenses (30,215,602) (17,546,642)Total expenses (335,516,358) (158,700,541)Net income (loss) before final tax 1,670,783,555 (137,763,520)Provision for final tax (12,454,002) (11,145,492)Net income (loss) after final tax P=1,658,329,553 (P=148,909,012)
The breakdown of fair value gain (loss) pertaining to net income (loss) of unit-linked funds includedin “Investment returns” and “Non-operating investment returns” follows:
2021 2020Investment returns (Note 16) P=1,657,759,780 (P=160,583,803)Non-operating investment returns (Note 17) 569,773 11,674,791
P=1,658,329,553 (P=148,909,012)
7. Property and Equipment
The rollforward analysis of this account follow:
2021
EDPEquipment
OfficeEquipment
MotorVehicles
LeaseholdImprovements
Furnitureand Fixtures Total
CostAt January 1 P=263,782,252 P=21,069,201 P=8,582,895 P=265,008,061 P=36,506,086 P=594,948,495Additions 22,136,550 241,906 18,240,776 33,171,925 2,985,828 76,776,985Disposals − − − (582,500) − (582,500)At December 31 285,918,802 21,311,107 26,823,671 297,597,486 39,491,914 671,142,980Accumulated depreciationAt January 1 209,061,029 16,633,416 3,610,381 181,282,737 30,485,165 441,072,728Depreciation (Note 21) 33,940,278 3,426,618 3,650,546 37,198,800 4,061,370 82,277,612Disposals − − − (582,500) − (582,500)At December 31 243,001,307 20,060,034 7,260,927 217,899,037 34,546,535 522,767,840Net Book Values P=42,917,495 P=1,251,073 P=19,562,744 P=79,698,449 P=4,945,379 P=148,375,140
110

- 35 -
*SGVFS163777*
2020
EDPEquipment
OfficeEquipment
MotorVehicles
LeaseholdImprovements
Furnitureand Fixtures Total
CostAt January 1 P=225,920,437 P=20,868,415 P=8,582,895 P=245,193,882 P=34,090,783 P=534,656,412Additions 37,861,815 200,786 − 19,814,179 2,415,303 60,292,083At December 31 263,782,252 21,069,201 8,582,895 265,008,061 36,506,086 594,948,495Accumulated depreciationAt January 1 176,953,182 12,572,283 1,805,899 142,296,064 23,806,122 357,433,550Depreciation (Note 21) 32,107,847 4,061,133 1,804,482 38,986,673 6,679,043 83,639,178At December 31 209,061,029 16,633,416 3,610,381 181,282,737 30,485,165 441,072,728Net Book Values P=54,721,223 P=4,435,785 P=4,972,514 P=83,725,324 P=6,020,561 P=153,875,767
The costs of fully depreciated property and equipment that are still being used as ofDecember 31, 2021 and 2020 amounted to P=312.59 million and P=260.13 million, respectively.
8. Leases
Company as a lessee
The Company entered into commercial leases on certain offices for its head office and branches.These leases have terms ranging between one (1) to five (5) years with renewal terms included insome of these contracts. Certain lease contracts also include escalation clauses. There are norestrictions placed upon the lessee by entering into these leases.
The Company had an existing five (5) year lease term agreement for its head office on the 19th FloorW Fifth Building, commencing on June 1, 2014 to May 31, 2019, renewable subject to mutuallyagreeable terms by parties. The rental charges shall be subject to 6% escalation each year over thefive-year term of the lease.
The Company exercised its renewal option on May 31, 2019, with the extended lease term tocommence on June 1, 2019 to May 31, 2024. In addition, the Company started to lease an officespace on the 9th Floor of W Fifth Building covering the period March 1, 2017 to February 28, 2022,renewable at the option of the Company subject to mutually agreeable terms by parties. The rentalcharges shall be subject to 6% escalation each year over the five-year term of the lease.
The Company also entered into lease agreements pertaining to its branch offices in the followinglocations, with terms ranging between one (1) to five (5) years with renewal terms included in someof these contracts. Some of the leases entered by the Company include parking spaces within theoffice buildings. Lease term of these parking spaces are usually parallel with the lease term of theircounterpart office premises and have similar escalation rates. These, however, has separate parkingrental rates from their counterpart office premises, and hence, accounted for separately.
The Company has also entered into leases contracts on various motor vehicles for use of qualifiedemployees under the Company’s executive car program, generally with a total lease term of five (5)years.
The Company has also entered into an expressway partnership agreement with Ayala Corporation, theconcessionaire of Daang Hari-South Luzon Expressway Link Road Project, also known as theMuntinlupa-Cavite Expressway (MCX), which grants the Company, on an exclusive, non-transferrable, and revocable basis, use of advertising space and all marketing rights and entitlementswithin MCX for a period of eight (8) years starting December 7, 2019 to December 6, 2027, subjectto a renewal option of another 8 years upon mutual agreement by both parties.
111
Audited financial statements

- 36 -
*SGVFS163777*
The Company’s obligations under its leases are secured by the lessor’s title to the leased assets.Generally, the Company is restricted from assigning and subleasing the leased assets. There areseveral lease contracts that include extension and termination options, which are further discussedbelow.
The Company also has certain leases of office premises and parking spaces with lease terms of 12months or less and/or with low value. The Company applies the ‘short-term lease’ and ‘lease of low-value assets’ recognition exemptions for these leases.
The rollforward analysis of right-of-use assets follows:
2021Head Office
& BranchPremises Parking Spaces
OfficeEquipment
MotorVehicles
AdvertisingSpaces Total
CostAt January 1 P=356,535,169 P=22,490,282 P=986,808 P=50,079,416 P=99,760,726 P=529,852,401Additions 16,185,879 145,067 − − 1,935,460 18,266,406
Terminations/expiration (28,735,792) (254,028) (986,808) (4,745,249) − (34,721,877)At December 31 343,985,256 22,381,321 − 45,334,167 101,696,186 513,396,930Accumulated amortizationAt January 1 162,151,376 8,851,552 696,571 17,108,950 13,301,430 202,109,879Depreciation (Note 20) 83,478,031 4,673,535 290,237 10,600,129 12,970,085 112,012,020Terminations/expiration (28,735,792) (254,028) (986,808) (4,064,266) − (34,040,895)At December 31 216,893,615 13,271,059 − 23,644,813 26,271,515 280,081,004Net Book Values P=127,091,641 P=9,110,262 P=− P=21,689,354 P=75,424,671 P=233,315,926
2020Head Office
& BranchPremises Parking Spaces Office Equipment
MotorVehicles
AdvertisingSpaces Total
CostAt January 1 P=344,492,152 P=21,749,063 P=4,085,675 P=40,731,983 P=− P=411,058,873Additions 19,920,673 741,219 − 12,807,240 99,760,726 133,229,858Disposals (7,877,656) − (3,098,867) (3,459,807) − (14,436,330)At December 31 356,535,169 22,490,282 986,808 50,079,416 99,760,726 529,852,401Accumulated amortizationAt January 1 79,853,808 3,998,651 1,984,051 9,638,996 − 95,475,506Depreciation (Note 20) 85,932,642 4,676,926 1,811,387 10,929,761 13,301,430 116,652,146Disposals (3,635,074) 175,975 (3,098,867) (3,459,808) − (10,017,774)At December 31 162,151,376 8,851,552 696,571 17,108,949 13,301,430 202,109,878Net Book Values P=194,383,793 P=13,638,730 P=290,237 P= 32,970,467 P=86,459,296 P=327,742,523
The following are the amounts recognized in statement of income:
2021 2020Depreciation expense of right-of-use assets
(Note 20) P=112,012,020 P=116,652,145Interest expense on lease liabilities 24,197,005 33,203,721Operating lease rentals considered short-term lease
and lease of low-value assets included in‘Office-related expenses’ (Note 20) 15,691,604 2,150,424
Total amount recognized in statement of income P=151,900,629 P=152,006,290
112
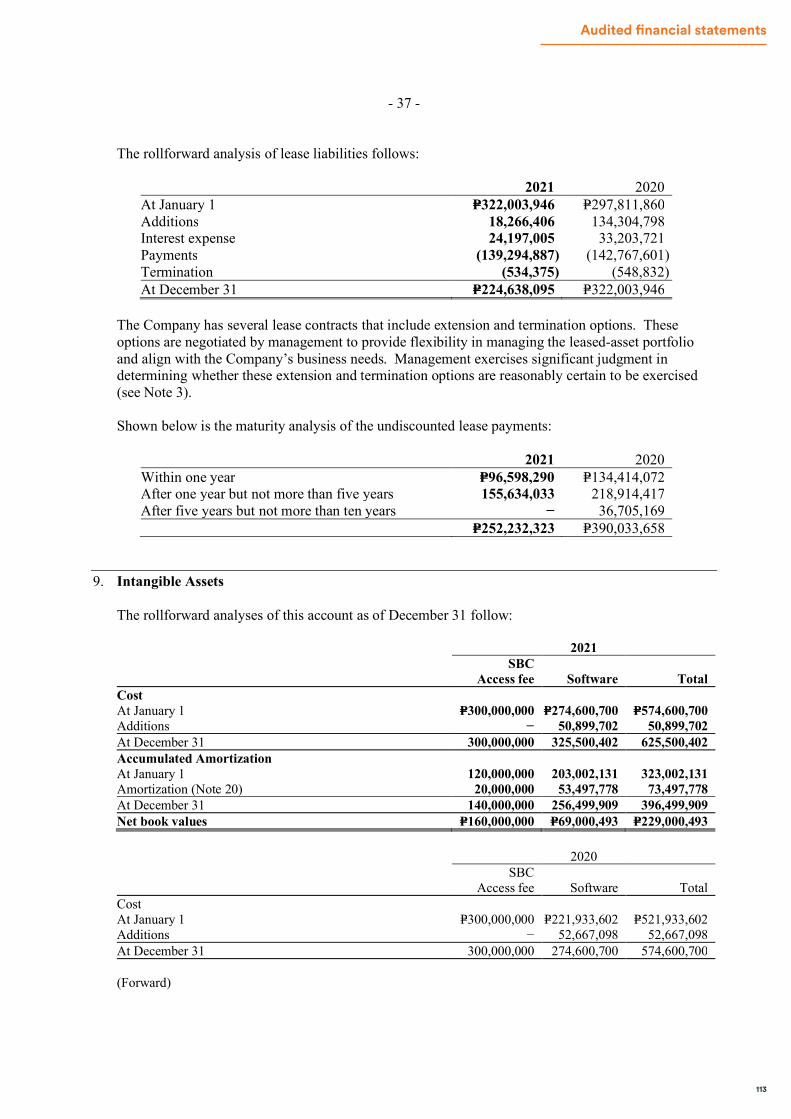
- 37 -
*SGVFS163777*
The rollforward analysis of lease liabilities follows:
2021 2020At January 1 P=322,003,946 P=297,811,860Additions 18,266,406 134,304,798Interest expense 24,197,005 33,203,721Payments (139,294,887) (142,767,601)Termination (534,375) (548,832)At December 31 P=224,638,095 P=322,003,946
The Company has several lease contracts that include extension and termination options. Theseoptions are negotiated by management to provide flexibility in managing the leased-asset portfolioand align with the Company’s business needs. Management exercises significant judgment indetermining whether these extension and termination options are reasonably certain to be exercised(see Note 3).
Shown below is the maturity analysis of the undiscounted lease payments:
2021 2020Within one year P=96,598,290 P=134,414,072After one year but not more than five years 155,634,033 218,914,417After five years but not more than ten years − 36,705,169
P=252,232,323 P=390,033,658
9. Intangible Assets
The rollforward analyses of this account as of December 31 follow:
2021SBC
Access fee Software TotalCostAt January 1 P=300,000,000 P=274,600,700 P=574,600,700Additions − 50,899,702 50,899,702At December 31 300,000,000 325,500,402 625,500,402Accumulated AmortizationAt January 1 120,000,000 203,002,131 323,002,131Amortization (Note 20) 20,000,000 53,497,778 73,497,778At December 31 140,000,000 256,499,909 396,499,909Net book values P=160,000,000 P=69,000,493 P=229,000,493
2020SBC
Access fee Software TotalCostAt January 1 P=300,000,000 P=221,933,602 P=521,933,602Additions − 52,667,098 52,667,098At December 31 300,000,000 274,600,700 574,600,700
(Forward)
113
Audited financial statements

- 38 -
*SGVFS163777*
2020SBC
Access fee Software TotalAccumulated AmortizationAt January 1 P=100,000,000 P=158,552,541 P=258,552,541Amortization (Note 20) 20,000,000 44,449,590 64,449,590At December 31 120,000,000 203,002,131 323,002,131Net book values P=180,000,000 P=71,598,569 P=251,598,569
SBC access fee pertains to the non-refundable portion of Exclusive Access Fees paid to SBC onJanuary 22, 2015. This is not a direct compensation for the production, but rather a purchase of aright and amortized until the estimated economic life of DA which is fifteen (15) years. Amortizationexpense is reported under “Commission expense and commission-related expenses” in the statementof income (see Note 20).
10. Reinsurance Assets
This account consists of:
2021 2020Reinsurance recoverable on paid losses P=292,510,958 P=216,838,004Ceded insurance and investment contracts 33,382,546 29,137,037
P=325,893,504 P=245,975,041
Reinsurance recoverable on paid losses represents the amount recoverable from reinsurers undertreaty agreements as their share in paid losses and loss adjustment expenses net of recoveries.
The ceded insurance and investment contracts can be broken further as follows:
2021 2020Reinsurer’s share in legal policy reserves Unearned premium reserves from group life
insurance contracts P=2,347,942 P=5,788,412 Unearned premium reserves from unit-linked
insurance contracts 1,172,026 1,104,359 Unearned premium reserves from individual life
insurance contracts 29,862,578 22,244,266P=33,382,546 P=29,137,037
114

- 39 -
*SGVFS163777*
11. Other Assets
This account consists of:
2021 2020Prepaid assets P=650,954,116 P=808,072,636Insurance receivables 120,730,181 198,789,897Accrued income 93,275,840 45,773,090Due from related parties (Note 22) 65,483,930 54,243,916Accounts receivable 60,230,711 30,037,130Deposits 56,068,512 52,859,882Others 41,532,916 26,680,840
P=1,088,276,206 P=1,216,457,391
Prepaid assets
The rollforward analysis of this account as of December 31 is as follow:
2021
SBC Access feeDevelopmental
feesPrepaid
Commission Prepayments TotalCostAt January 1 P=1,300,000,000 P=911,430,089 P=13,884,456 P=954,808,867 P=3,180,123,412Additions − 133,737,908 5,000,000 184,373,294 323,111,202At December 31 1,300,000,000 1,045,167,997 18,884,456 1,139,182,161 3,503,234,614Accumulated amortizationAt January 1 667,932,995 759,133,067 12,222,186 932,762,528 2,372,050,776Amortization 166,505,004 148,273,892 − 165,450,827 480,229,722At December 31 834,437,999 907,406,959 12,222,186 1,098,213,355 2,852,280,498Net Book Values P=465,562,001 P=137,761,038 P=6,662,270 P=40,968,806 P=650,954,116
2020
SBC Access feeDevelopmental
feesPrepaid
Commission Prepayments TotalCostAt January 1 P=1,300,000,000 P=776,741,305 P= 11,952,995 P=746,100,305 P=2,834,794,605Additions – 134,688,784 1,931,461 208,708,562 345,328,807At December 31 1,300,000,000 911,430,089 13,884,456 954,808,867 3,180,123,412Accumulated amortizationAt January 1 514,173,484 624,803,974 10,885,371 693,977,862 1,843,840,691Amortization 153,759,511 134,329,093 1,336,815 238,784,666 526,873,271At December 31 667,932,995 759,133,067 12,222,186 932,762,528 2,372,050,776Net Book Values P=632,067,005 P=152,297,022 P=1,662,270 P=22,046,339 P=808,072,636
SBC access fee pertains to refundable portion of the Exclusive Access fees and the Initial Milestonefee stated in the Distribution Agreement (DA) between the Company and SBC, in case of earlytermination of the DA and non-achievement of the Annualized New Premium (ANP) targets stated inthe DA. This is amortized based on UOP and presented under “Commission expense andcommission-related expenses” in the profit or loss (see Note 20).
Prepaid developmental fees paid to agency leaders are to be used exclusively in building andmaintaining an agency organization for the purpose of selling solely the Company’s products. This isto be amortized based on the agents’ contractual obligation to the Company as indicated in theagreement (see Note 25).
115
Audited financial statements
- 40 -
*SGVFS163777*
Failure to meet the contractual obligations indicated in the agreement, the Company is authorized bythe agents to clawback the unamortized amount of prepaid development fees paid. This will beconverted to receivable from the agent and will be reported as “Accounts receivable – net” under“Other assets” in the statements of financial position (see Note 5). Amortization expense is reportedunder “Commission expense and agency-related expenses” in the statements of income (see Note 20).
Prepaid commission pertains to fees deducted in advance by Distribution Partner when remittingpremium collected in behalf of the Company. This will be amortized once the policy is issued andrecorded as premium.
Prepayments consist mainly of software maintenance fee advances and license fees with terms overone (1) year.
Insurance receivables - net
This account consists of:
2021 2020Premiums due and uncollected P=95,743,385 P=179,947,630Premiums receivable 34,029,716 34,495,721Receivable from switch fees 1,095,297 259,549Insurance receivable from policyholders 130,868,398 214,702,900Less: Allowance for doubtful accounts (10,138,217) (15,913,003)
P=120,730,181 P=198,789,897
Premium due and uncollected - net pertains to premium earned, net of loadings, awaiting collectionwithin the grace period from the date premium is due.
Premium receivable pertains to premiums of issued group insurance policies for remittance to theCompany which is collected within a year.
Deposits
This account consists of:
2021 2020Rental and other deposits P=55,998,423 P=52,789,793Security fund 70,089 70,089
P=56,068,512 P=52,859,882
Rental and other deposits include security and reservation deposits, and construction bonds. Securityand reservation deposits were transacted by the Company with W Fifth Avenue, Inc. for its HeadOffice and various lessors for its branch offices. These rental deposits are refundable to the Companywithin (3) months following the expiry of their respective lease terms. Construction bonds are thoserefundable from contractors upon completion of construction period.
Security fund pertains to contribution of the Company to the Security Fund - Life Account as requiredby the Insurance Commission on all insurance companies authorized to do business in the Philippines.
116
- 41 -
*SGVFS163777*
Accrued income
This account consists of:
2021 2020Management fee accrual P=66,313,304 P=36,128,955Accrued income on:
AFS financial assets (Note 5) 26,817,636 9,625,642Policy loans (Note 5) 144,900 18,493
P=93,275,840 P=45,773,090
Management fee accrual pertains to unpaid fees relating to VUL funds of the Company and is accrueddaily and collected from the BPI and SBC managed funds monthly and quarterly basis, respectively.
Accounts receivable - net
This account consists of:
2020 2019Receivable from agents and other intermediaries P=60,249,421 P=26,516,650Employee advances 8,651,038 6,296,650Creditable withholding tax 10,753,019 1,310,287
79,653,478 34,123,587Less: Allowance for doubtful accounts (19,422,767) (4,086,457)
P=60,230,711 P=30,037,130
Receivable from agents includes amounts to be recovered from agents resulting from clawback ofprepaid developmental fees paid for failure to meet the contractual obligations as stated in contract,and cost of lost tablets, cost of trainings and memberships.
Employee advances are non-interest bearing and are settled through payroll deductions.
Creditable withholding taxes represent taxes withheld from the Company by its life insurance clientsand collection partners. The amount is fully realizable and could be applied against future income taxliability of the Company.
The rollforward analysis for allowance for doubtful accounts follow:
2021 2020At January 1 P=19,999,460 P=4,086,457Provision for (reversal of) doubtful accounts
arising from:Receivable from agents 15,336,309 −Insurance receivables (Note 20) (5,774,786) 15,913,003
At December 31 P=29,560,983 P=19,999,460
The Company provides for bad debts on insurance receivables and receivable from agents based onspecific assessment of outstanding balances.
117
Audited financial statements

- 42 -
*SGVFS163777*
12. Insurance Contract Assets - net
This account consists of:
2021
2020(As restated –
Note 2)Legal policy reserves P=1,150,217,042 P=823,730,252Policy and contract claims reserve (504,898,576) (334,967,427)Insurance contract assets - net P=645,318,466 P=488,762,825
The movements during the year in policy and contract claims reserve are as follows:
2021 2020At January 1 P=334,967,427 P=142,539,892Provision during the year 169,931,149 192,427,535At December 31 P=504,898,576 P=334,967,427
Details of the legal policy reserves follow:
2021
2020(As restated –
Note 2)Gross legal policy reserves Unearned premium reserves from group life
insurance contracts P=69,215,826 P=97,110,975 Unearned premium reserves from unit-linked
insurance contracts 29,023,303 23,022,183 Unearned premium reserves from individual life
insurance contracts 23,920,773 19,328,002 Gross premium reserves from individual life
insurance contracts (1,272,376,944) (963,191,412)Legal policy reserves (P=1,150,217,042) (P=823,730,252)
Details of gross legal policy reserves follow:
2021
2020(As restated –
Note 2)Negative legal policy reserves (P=1,809,574,454) (P=1,276,500,994)Positive legal policy reserves 537,197,510 313,309,583
(1,272,376,944) (963,191,411)Unearned premium reserves 122,159,902 139,461,159Gross legal policy reserves (P=1,150,217,042) (P=823,730,252)
118

- 43 -
*SGVFS163777*
The movements during the year in remeasurement gain (loss) on life insurance reserves follow:
2021
2020(As restated –
Note 2)At January 1 (P=373,443,689) P=54,523,272Due to change in discount rates 220,412,609 (427,966,961)At December 31 (P=153,031,080) (P=373,443,689)
On December 28, 2016, Insurance Commission (IC) released Circular Letter No. 2016-66 on theValuation Standards for the Life Insurance Policy Reserves which mandated the change in the basisof valuation of the life insurance policy reserves from Net Premium Valuation (NPV) to GrossPremium Valuation (GPV). The cumulative prior year impact of the changes, as well as any changein the assumptions under GPV computed is recognized in retained earnings except for the increase ordecrease of the reserves brought about by change in discount rates which is recognized under“remeasurement gain and loss on legal policy reserves”.
On January 1, 2017, the Company has adopted GPV in valuing its life insurance policy reserves andthe valuation result in a negative reserve. The Company has appropriated from the unassignedsurplus an amount equal to the aggregate of the negative reserves calculated on a per policy basis(Note 14).
The movement in negative legal policy reserves for 2021 can be attributed to the following: a) newissues and the aging of the in-force policies of the individual health products, b) impact of the changein the IC-prescribed discount rates, and c) change in measurement of reserves from an approximationmethod based on unearned premium method (UPR) to gross premium valuation method (GPV) forpremium-paying riders and term policies.
13. Other Payables
This account consist of:
2021 2020Due to related parties (Note 22) P=1,121,190,128 P=612,994,196Accrued expenses 714,993,466 641,110,917Accounts payable 448,352,028 528,544,063Lease liabilities (Note 8) 224,638,095 322,003,946Reinsurance payables 124,468,345 108,957,476Tax payables 72,860,365 59,137,679
P=2,706,502,427 P=2,272,748,277
Accrued expenses
This account consists of:
2021 2020Accruals for:
Commission-related expenses P=380,549,939 P=414,534,446Employee incentives 151,650,627 129,317,521
Other accrued expenses 182,792,900 97,258,950P=714,993,466 P=641,110,917
119
Audited financial statements

- 44 -
*SGVFS163777*
Accrued commission-related expenses include agency and bancassurance channel-related salesexpenses, such as commissions, bank fees, variable pay, bonuses and incentives. These are normallysettled within one (1) year.
Accrued employee incentives include short-term incentives (STI) and long-term incentives (LTI)payable to Company’s qualified employees, which is settled within one (1) year.
Other accrued expenses include accrual for utilities, information technology development costs, staffcosts and various accruals.
Accounts payable
This account consists of:
2021 2020Unit-linked subscription payable P=171,703,770 P=278,372,308Premium received in advance 137,257,389 113,959,184Insurance payables to policyholders 52,975,709 93,044,839Agency payables 41,468,274 10,829,617Supplier invoices 23,068,205 7,619,727Others 21,878,681 24,718,388
P=448,352,028 P=528,544,063
Reinsurance payables
Reinsurance payable pertains to premiums due to reinsurers which are non-interest bearing,amounting to P=124.47million and P=108.96 million as of December 31, 2021 and 2020, respectively.
Taxes payable
This account consists of:
2021 2020Premium tax payable P=29,205,948 P=25,412,218Expanded withholding tax 19,629,604 17,701,269Withholding VAT payable 12,757,031 7,444,354Withholding tax on compensation 9,453,673 7,029,502Fringe benefit tax payable 785,643 998,669Documentary stamp tax payable 646,192 539,960Final withholding tax payable 382,274 11,707
P=72,860,365 P=59,137,679
Taxes payable are normally settled the following month after year-end.
120

- 45 -
*SGVFS163777*
14. Equity
Capital StockThis account consists of common shares of stock as of December 31, 2021 and 2020 as follows:
Authorized - 5,000,000,000 shares, P=1 par value P=5,000,000,000Issued and outstanding - 2,300,000,000 shares 2,300,000,000
There were no movements in Company’s common share in 2021 and 2020.
Contingency SurplusThe BOD approved the infusion of additional contingency surplus amounting to P=175.00 million onNovember 23, 2021.
DeficitLife insurance companies shall value their policy reserves for life business at the end of each calendaryear as required by IC pursuant to Sections 216 and 423 of the Amended Insurance Code (RA10607), in accordance with valuation standards, which was implemented on January 1, 2017.
The reserves for traditional life insurance policies shall be valued, where appropriate, using grosspremium valuation. However, should the calculation result in a negative reserve, the Company shallappropriate from the unassigned surplus an amount equal to the aggregate of the negative reservescalculated on per policy basis.
The movements of the Company’s deficit follow:
20212020 (As restated
– Note 2)Deficit P=4,374,930,381 P=3,752,985,025Appropriation for negative reserves (Note 12) (1,805,631,861) (990,883,760)Deficit after reserves P=2,569,298,520 P=2,762,101,265
15. Net Insurance Premiums
This account consists of:
2021 2020Premium revenue arising from contracts issued
Unit-linked insurance contracts P=16,889,567,643 P=12,257,588,206Life insurance contracts 2,102,849,240 1,521,790,363
18,992,416,883 13,779,378,569Fee Income
Unit-linked insurance contracts 108,380,246 49,412,645Life insurance contracts 645,702 179,301
109,025,948 49,591,946
(Forward)
121
Audited financial statements

- 46 -
*SGVFS163777*
2021 2020Premium revenue ceded to reinsurers on contracts
issuedUnit-linked insurance contracts (P=47,542,785) (P=41,048,809)Life insurance contracts (119,260,194) (83,622,907)
(166,802,979) (124,671,716)Net insurance premiums and fees revenue P=18,934,639,852 P=13,704,298,799
16. Investment Returns
This account consists of:
2021 2020Interest income arising from:
AFS financial assets (Note 5) P=71,774,858 P=37,105,337Cash and cash equivalents 2,114,017 5,511,568Other financial receivables 1,149,057 973,814
75,037,932 43,590,719Net fair value gains (losses) of assets held to cover
unit linked liabilities (Notes 5 and 6) 1,657,759,780 (160,583,803)P=1,732,797,712 (P=116,993,084)
Interest income pertains to the interest earned on government and corporate debt securities, timedeposits and short-term investments.
17. Non-Operating Investment Return
This account consists of:
2021 2020Net foreign exchange losses (gains) - net P=31,651,555 P=104,090,996Net fair value gains of financial assets at FVPL
(Note 5) (569,773) (11,674,791)(P=31,081,782) (P=92,416,205)
18. Other Operating Revenue
This account consists of:
2021 2020Reinsurance allowance P=645,665,365 P=645,026,922Management fee income 483,178,381 279,970,328Other income (Note 8) 212,389 9,652,274
P=1,129,056,135 P=934,649,524
122
- 47 -
*SGVFS163777*
Reinsurance allowanceThe Company entered into a modified coinsurance agreement with Munich Re (the Reinsurer) inOctober 2018. Under the agreement, the balance due shall be the Reinsurer’s proportionate share onthe benefits reinsured less the reinsurance allowance. If the balance is positive, the amount shall bedue from the Company to the Reinsurer and shall be accounted for as reinsurance premium. If thebalance is negative, the absolute value of that amount shall be due from the Reinsurer to the Companyand shall be accounted for as reinsurance allowance.
Management fee incomeManagement fee income pertains to fees earned for managing the VUL funds.
Other IncomeOther income pertains to sundry income, gain (loss) on re-measurement of lease liability and variousre-charges for the reimbursement of expense incurred by the Company on behalf of other entities withinthe FWD Group such as travel expenses, salary of seconded employee and training.
19. Benefits and Claims
This account consists of:
2021 2020Surrenders P=3,153,330,401 P=1,301,437,064Death and hospitalization benefits 695,288,446 358,524,246Other benefits 22,458,487 −Gross benefits and claims 3,871,077,334 1,659,961,310Reinsurers’ share on claims and benefits incurred (131,098,965) (34,138,999)Net benefits and claims P=3,739,978,369 P=1,625,822,311
20. Operating Expenses
General and administrative expenses
General and administrative expenses consist of:
2021 2020Employee benefits P=977,678,801 P=922,065,933Depreciation (Notes 7 and 8) 194,289,631 200,291,323Information technology expenses 134,463,312 118,310,942Marketing and advertising 98,043,655 54,580,252Professional service fees 82,476,705 68,271,954Amortization (Note 9) 53,497,778 44,449,590Operating lease rentals (Note 8) 15,691,604 2,150,424Other operating expenses
Group Office management fee (Note 22) 541,444,658 396,127,232Office-related expenses 57,607,530 62,731,115Bank service charges 36,546,975 31,017,975Shared services fee (Note 22) 32,318,467 −
(Forward)
123
Audited financial statements

- 48 -
*SGVFS163777*
2021 2020Tax-related expenses P=30,017,377 P=29,513,663Distribution-related expenses 9,514,332 13,900,852Travel and entertainment 8,167,546 13,029,129Courier charges 4,628,846 10,686,242Printing and stationery 4,301,067 7,984,881Other new business expenses 1,986,654 1,110,881Conference expenses 98,137 −
Provision (recovery) of doubtfulaccounts expense (5,774,786) 15,913,003
Others 17,626,861 14,032,397P=2,294,625,150 P=2,006,813,896
Employee benefits expenses consist of:
2021 2020Salaries and wages P=775,678,239 P=740,866,112Benefits and allowances 157,779,002 157,309,105Directors’ fees 11,178,002 9,689,126Share-based payments 30,284,049 18,983,902Net pension expense 2,759,509 3,634,704
P=977,678,801 P=930,482,949
Share-based paymentsFWD Group operates share-option award plans that provides FWD Group Limited share-options toparticipants from the Company upon vesting. Eligible employees are granted share-option awards toreward service and the achievement of shareholder value targets. These awards are in the form of acontingent right to receive share-options or a conditional allocation of share-options. These share-option awards have vesting periods of up to three years and are at nil cost to the employee. Vestingof certain awards is conditional upon the employee being in active employment at the time of vesting.Each share-option grant has a 10-year exercise period and confers the right to the award holder tosubscribe for an ordinary share of FWD Group Limited at a nominal exercise price of US$0.01.
In 2021, the FWD Group offered a long-term incentive bonus (share award plan) to eligibleemployees of the Company after meeting certain performance indicators over the agreed period. TheCompany has the obligation to settle the transaction with its employees in FWD Group’s equityinstruments which is purchased by the Company from FWD Group resulting to a recognition of aliability.
The following table shows the movement of number of share-options under the award plans chargedto the Company:
2021 2020At January 1 10,913 13,913Granted −Vested (3,729) (3,000)Forfeited (731)At December 31 6,453 10,913
124

- 49 -
*SGVFS163777*
The following table shows the number of share awards under the award plan charged to the Companyin 2021:
At January 1 −Granted 4,439VestedForfeited (180)At December 31 4,250
FWD Group utilises an appraisal value methodology (embedded value plus a multiple of value ofnew business) and an assessment of performance conditions (IRR achievement) for calculation ofshare awards and the Black-Scholes model and an assessment of performance conditions (IRRachievement) for calculation of share-options, taking into account the terms and conditions uponwhich the awards were granted. The expected volatility reflects the assumption that historicalvolatility patterns continue, which may not be the actual outcome.
The expected life of the share options is derived from the output of the valuation model and iscalculated based on an analysis of expected exercise behaviour of the Company’s employees.Weighted average share price is determined by appraisal value per share.
The fair value calculated for share options is inherently subjective due to the assumptions made andthe limitations of the model utilized.
2021 2020Risk-free interest rate (in %) Nil 0.02Volatility (in %) Nil 30.00Dividend yield (in %) Nil −Expected life of share-options (in years) Nil 0.5Exercise price per share Nil US$0.01Weighted average price per share Nil 104.33
The total recognised share-based payments related to share-option award by the Group included in“Employee benefit expense” amounted to P=30.28 million and P=18.98 million in 2021 and 2020,respectively.
Commission and commission-related expensesCommission expense and commission-related expenses consist of:
2021 2020Commission expense P=1,146,103,217 P=1,101,418,839Override commission expense 225,500,134 216,394,154Commission-related expenses (CRE) 802,630,916 886,449,657Premium tax expense 110,041,260 102,312,499Prepaid asset (Developmental fees) (Note 11) 148,273,892 134,329,093Prepaid asset (SBC access fee) (Note 11) 166,505,004 153,759,511Intangible asset (SBC access fee) (Note 9) 20,000,000 20,000,000Distribution operation expenses 14,056,764 13,754,756Provision for credit losses (Note 11) 15,336,309 −
P=2,648,447,496 P=2,628,418,509
125
Audited financial statements
- 50 -
*SGVFS163777*
Commission-related expenses consist mainly of bonuses such as annual performance bonus andannual over-achievement bonus given to bancassurance agents, and incentives and allowances givento agents for the issuance of policy contracts (see Note 27).
Provision for credit losses amounting to P=15.34 million and nil in 2021 and 2020, respectively, isbased on specific assessment of outstanding balance of agent’s receivable (see Note 11).
Distribution operation allowance represents expenses incurred by Agency and Bancassurance channelsuch as trainings, sales events, and sales tool.
21. Employee Benefits
The Company has a funded, defined contribution plan, covering all employees from the start of thedate of employment which requires contributions to be made to a separately administered retirementfund. The plan is effective January 1, 2016 and was approved by the Bureau of Internal Revenue(BIR) last May 3, 2017. Under the plan, the Company makes contributions on behalf of theemployees, but it allows employees to participate in the plan by way of voluntary contributions.
The Company’s Employees’ Retirement Funds are administered by its Trustee, BPI Asset Managementand Trust Corporation. The Trustee has full and complete management and control of the funds andits investment strategy. The Trustee has the absolute and sole right to sell, convert, invest, reinvest,commingle with other accounts, exchange, transfer, assign, endorse or otherwise dispose the moneys,assets or securities comprising the Trust Fund without necessity of prior approval or authority from theTrustor.
Upon normal retirement, the employee shall be entitled to a lump sum benefit equal to the following:
1) One hundred percent (100%) of individual account balance in the defined benefit plan attributableto employee voluntary contributions as of the most recent valuation date prior to normalretirement date and adjusted for subsequent contributions, if any,
2) And the higher of:a) One hundred percent (100%) of individual account balance attributable to employer voluntary
contributions as of the most recent valuation date prior to normal retirement date and adjustedfor subsequent contributions, if any,
b) One hundred percent (100%) of employee’s monthly salary for every year of service or theminimum statutory requirement at the time of the employee’s retirement whichever is higher.
The Company recognized pension expense relating to its defined benefit plan included in thestatement of comprehensive income which consists of:
2021 2020Current service cost P=40,831,238 P=39,202,733Net interest expense 365,715 700,634
P=41,196,953 P=39,903,367
As of December 31, 2021 and 2020, the carrying amount of retirement obligation as shown in thestatement of financial position as “Provisions” amounted to P=0.82 million and P=9.14 million,respectively.
126

- 51 -
*SGVFS163777*
Changes in the present value of the defined benefit obligation are as follows:
2021 2020At January 1 P=188,650,860 P=154,535,049Current service cost 40,831,238 39,202,733Interest expense 7,546,034 7,263,147Benefits paid (22,703,820) (15,781,673)Remeasurement losses (gains)
Defined contribution component (9,965,159)Changes in financial assumptions (5,444,836) (5,116,539)Experience adjustment (5,390,495) 8,548,143
At December 31 P=193,523,822 P=188,650,860
Changes in the fair value of plan assets are as follows:
2021 2020At January 1 P=179,507,976 P=139,627,934Contributions 38,687,589 35,606,213Interest income 7,180,319 6,562,513Benefits paid (22,703,820) (15,781,673)Remeasurement gains (losses) (9,965,159) 13,492,989At December 31 P=192,706,905 P=179,507,976
The rollforward analysis of remeasurement gain on pension obligation follows:
2021 2020At January 1 P=23,102,616 P=13,041,231Actuarial gain on obligation
Experience adjustment (5,390,495) 4,944,846Change in financial assumptions (5,444,836) 5,116,539
10,835,331 10,061,385At December 31 P=33,937,947 P=23,102,616
The principal actuarial assumptions used in determining net pension cost for the Company’sretirement plan are shown below:
2021 2020Salary increase rate 6.00% 6.00%Discount rate 5.10% 4.00%Expected average remaining working lives 9 years 9 years
The following tables demonstrate the sensitivity to a reasonably possible change in discount rates andsalary increase for the next financial year, with all other variables held constant, of the Company’stotal comprehensive income using the projected unit cost (PUC) method:
Change inAssumptions
Impact on totalcomprehensive
incomeDiscount rate +1.00% P=(257,063)
-1.00% 5,532,651Salary rate +1.00% (5,311,115)
-1.00% P=266,216
127
Audited financial statements

- 52 -
*SGVFS163777*
The table below summarizes the maturity profile of the Company’s benefit liabilities based on theremaining period at the end of the reporting period.
Year 2021 20201-5 years P=399,034 P=2,981,2516-10 years 1,115,092 8,267,92611-15 years 1,112,562 22,798,81716 years and up 12,777,351 193,514,005
P=15,404,039 P=227,561,999
22. Related Party Disclosures
Transactions between related parties are based on terms similar to those offered to nonrelated parties.Parties are related if one party has the ability, directly or indirectly, to control the other party or exercisesignificant influence over the other party in making financial and operating decisions and the partiesare subject to common control or common significant influence. Related parties may be individuals orcorporate entities.
Related party transactions consist of the following:
2021 2020
Category Amount OutstandingBalances Amount Outstanding
Balances Terms Conditions
Receivables from Affiliates:
FWD Group Ltd. P=− P=42,618,225 P=− P=42,618,226
Interest-free,
settlement in cash;
annual Unsecured
FWD Group Management HoldingsLtd. 8,930,465 13,474,422 (4,155,543) 8,443,373
Interest-free,
settlement in cash;
annual Unsecured
FWD Indonesia − 3,161,317 (3,161,317) 3,161,317
Interest-free,
settlement in cash;
annual Unsecured
Valdimir Pte. Ltd. 1,537,368 1,521,895 − −
Interest-free,
settlement in cash;
annual Unsecured
FWD Thailand 772,182 772,182 (1,829,604) −
Interest-free,
settlement in cash;
annual Unsecured
FWD Vietnam − 21,000 − 21,000
Interest-free,
settlement in cash;
annual UnsecuredP=11,240,015 P=61,569,041 (P=9,146,464) P=54,243,916
(Forward)
- 53 -
*SGVFS163777*
2021 2020
Category Amount OutstandingBalances Amount Outstanding
Balances Terms Conditions
Payable to Affiliates:
FWD Group Management HoldingsLtd. (a) (Note 21) P=307,331,982 P=723,950,604 P=299,414,200 P=448,863,872
Interest-free,settlement in cash;annual
Unsecured
Valdimir Pte. Ltd. (b) 191,997,716 325,342,735 136,866,181 137,165,508
Interest-free,settlement in cash;annual
Unsecured
FWD Technology and InnovationMalaysia Sdn. Bhd. 62,786,125 51,936,033 − −
Interest-free,settlement in cash;annual
Unsecured
FWD Information Technology(Guangzhou) Co., Ltd. 13,417,997 3,399,886 − −
Interest-free,settlement in cash;annual
Unsecured
FWD Information Technology(Shanghai) Co., Ltd 18,982,782 − − −
Interest-free,settlement in cash;annual
Unsecured
FWD Group Developments(Malaysia) Sch. Bhd. (GDM) − − 22,227,070 26,964,816
Interest-free,settlement in cash;annual
Unsecured
FWD Group Limited 15,835,131 16,560,870 − −
Interest-free,settlement in cash;annual
Unsecured
P=594,516,602 P=1,121,190,128 P=458,507,451 P=612,994,196
In the normal course of business, the Company has various transactions with its related companies asfollows:
a. The amount due to FWD Group Management Holdings Ltd (GMH). is in respect of expenditureincurred on behalf of the Company and comprised mainly pertaining to IT time charges anddirect and indirect cost charged for the portion of time spent by GMH staff in providing service tothe Company, software amortization costs on software purchased by FWD Group for FWD PH,external service fees, data communication lines and traveling expenses. These charges areincluded in “Group Office Management Fee” in Note 20.
The amount due to Valdimir Pte. Ltd. is in respect of brand licensing agreement (royalty fees) forthe Company’s use of the FWD brand name which is based in the Company’s production for theyear and expenditure on behalf of the Company. The royalty fees is based on the Company’sproduction for the year and is included in “Marketing and advertising” in Note 20. This alsoincludes the Company’s share in cost of conferences, travel expenses, and direct and indirect costcharged for the portion of time spent by Valdimir staff in providing service to the Company.These charges are included in “Group Office Management Fee” in Note 20.
The amount due to FWD Technology and Innovation Malaysia (TIM) pertains to the sharedservice costs for Technology Services, Solutions Delivery, IT Security, Innovation Hub andCenter of Excellence at no mark-up, as well as cost for time spent by TIM employees providing
128
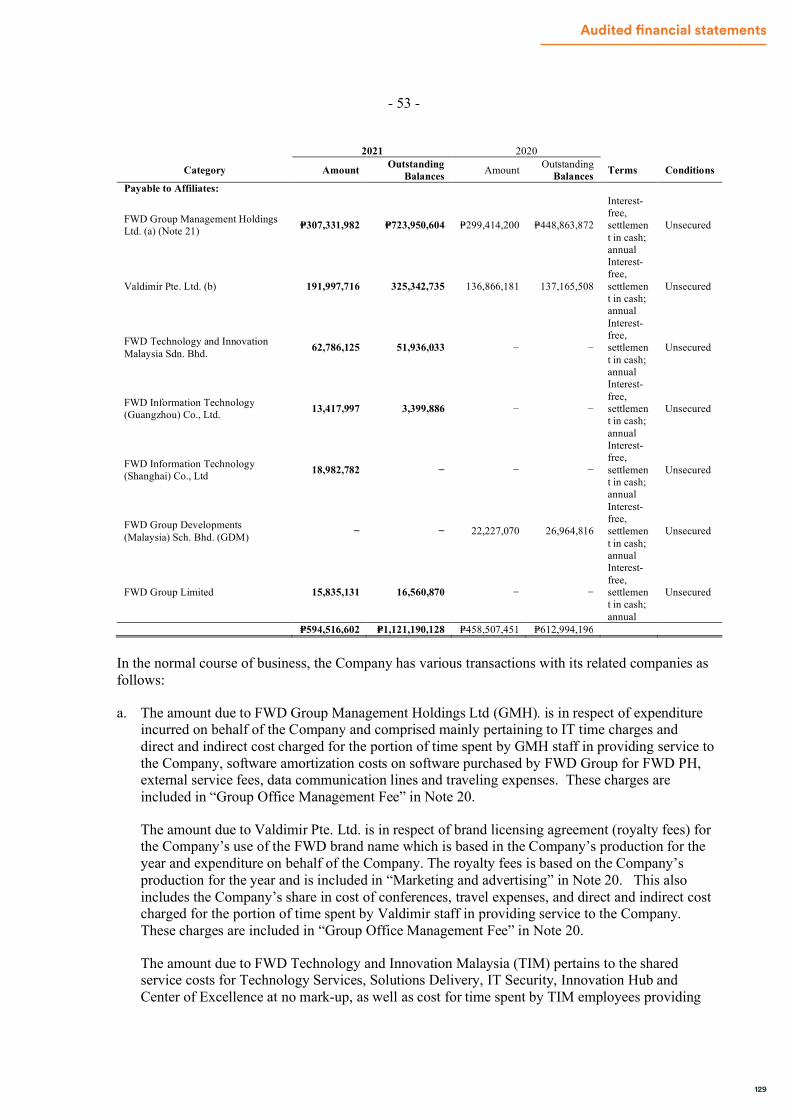
- 53 -
*SGVFS163777*
2021 2020
Category Amount OutstandingBalances Amount Outstanding
Balances Terms Conditions
Payable to Affiliates:
FWD Group Management HoldingsLtd. (a) (Note 21) P=307,331,982 P=723,950,604 P=299,414,200 P=448,863,872
Interest-free,settlement in cash;annual
Unsecured
Valdimir Pte. Ltd. (b) 191,997,716 325,342,735 136,866,181 137,165,508
Interest-free,settlement in cash;annual
Unsecured
FWD Technology and InnovationMalaysia Sdn. Bhd. 62,786,125 51,936,033 − −
Interest-free,settlement in cash;annual
Unsecured
FWD Information Technology(Guangzhou) Co., Ltd. 13,417,997 3,399,886 − −
Interest-free,settlement in cash;annual
Unsecured
FWD Information Technology(Shanghai) Co., Ltd 18,982,782 − − −
Interest-free,settlement in cash;annual
Unsecured
FWD Group Developments(Malaysia) Sch. Bhd. (GDM) − − 22,227,070 26,964,816
Interest-free,settlement in cash;annual
Unsecured
FWD Group Limited 15,835,131 16,560,870 − −
Interest-free,settlement in cash;annual
Unsecured
P=594,516,602 P=1,121,190,128 P=458,507,451 P=612,994,196
In the normal course of business, the Company has various transactions with its related companies asfollows:
a. The amount due to FWD Group Management Holdings Ltd (GMH). is in respect of expenditureincurred on behalf of the Company and comprised mainly pertaining to IT time charges anddirect and indirect cost charged for the portion of time spent by GMH staff in providing service tothe Company, software amortization costs on software purchased by FWD Group for FWD PH,external service fees, data communication lines and traveling expenses. These charges areincluded in “Group Office Management Fee” in Note 20.
The amount due to Valdimir Pte. Ltd. is in respect of brand licensing agreement (royalty fees) forthe Company’s use of the FWD brand name which is based in the Company’s production for theyear and expenditure on behalf of the Company. The royalty fees is based on the Company’sproduction for the year and is included in “Marketing and advertising” in Note 20. This alsoincludes the Company’s share in cost of conferences, travel expenses, and direct and indirect costcharged for the portion of time spent by Valdimir staff in providing service to the Company.These charges are included in “Group Office Management Fee” in Note 20.
The amount due to FWD Technology and Innovation Malaysia (TIM) pertains to the sharedservice costs for Technology Services, Solutions Delivery, IT Security, Innovation Hub andCenter of Excellence at no mark-up, as well as cost for time spent by TIM employees providing
129
Audited financial statements
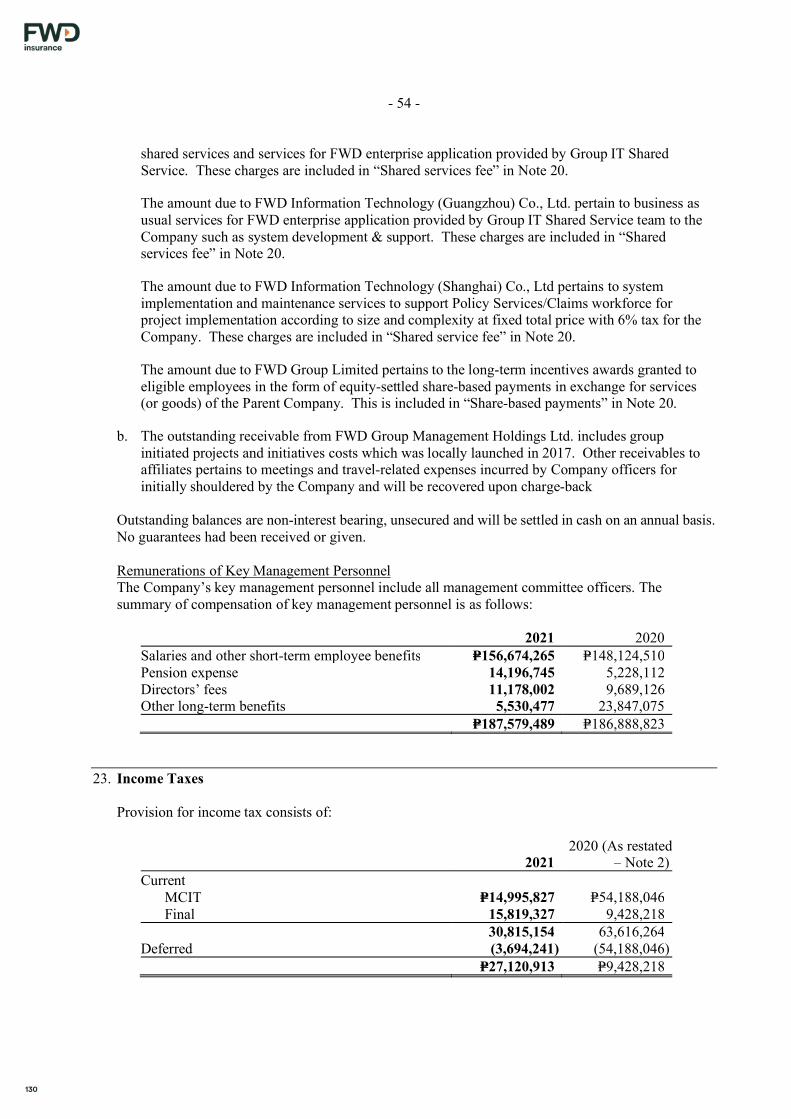
- 54 -
*SGVFS163777*
shared services and services for FWD enterprise application provided by Group IT SharedService. These charges are included in “Shared services fee” in Note 20.
The amount due to FWD Information Technology (Guangzhou) Co., Ltd. pertain to business asusual services for FWD enterprise application provided by Group IT Shared Service team to theCompany such as system development & support. These charges are included in “Sharedservices fee” in Note 20.
The amount due to FWD Information Technology (Shanghai) Co., Ltd pertains to systemimplementation and maintenance services to support Policy Services/Claims workforce forproject implementation according to size and complexity at fixed total price with 6% tax for theCompany. These charges are included in “Shared service fee” in Note 20.
The amount due to FWD Group Limited pertains to the long-term incentives awards granted toeligible employees in the form of equity-settled share-based payments in exchange for services(or goods) of the Parent Company. This is included in “Share-based payments” in Note 20.
b. The outstanding receivable from FWD Group Management Holdings Ltd. includes groupinitiated projects and initiatives costs which was locally launched in 2017. Other receivables toaffiliates pertains to meetings and travel-related expenses incurred by Company officers forinitially shouldered by the Company and will be recovered upon charge-back
Outstanding balances are non-interest bearing, unsecured and will be settled in cash on an annual basis.No guarantees had been received or given.
Remunerations of Key Management PersonnelThe Company’s key management personnel include all management committee officers. Thesummary of compensation of key management personnel is as follows:
2021 2020Salaries and other short-term employee benefits P=156,674,265 P=148,124,510Pension expense 14,196,745 5,228,112Directors’ fees 11,178,002 9,689,126Other long-term benefits 5,530,477 23,847,075
P=187,579,489 P=186,888,823
23. Income Taxes
Provision for income tax consists of:
20212020 (As restated
– Note 2)Current
MCIT P=14,995,827 P=54,188,046Final 15,819,327 9,428,218
30,815,154 63,616,264Deferred (3,694,241) (54,188,046)
P=27,120,913 P=9,428,218
130

- 55 -
*SGVFS163777*
Reconciliation between provision for income tax and the income tax at statutory income tax ratefollows:
20212020 (As restated
– Note 2)Provision for income tax at statutory tax rate of 25%
in 2021 and 30% in 2020 P=54,980,914 P=167,520,844Tax effects of:
Interest income subjected to final tax (3,955,092) (4,717,851)Non-deductible expenses 12,547,895 11,383,691Expired NOLCO 132,157,772 303,991,246Change in unrecognized deferred tax assets (168,610,576) (468,749,712)
Effective income tax P=27,120,913 P=9,428,218
Under Republic Act No. 8424, the Company is subject to regular corporate income tax (RCIT) of30% or 2% Minimum Corporate Income Tax (MCIT), whichever is higher. However, the Companyis required to file MCIT beginning on the 4th taxable year immediately following the taxable year inwhich such corporation commenced its business operations.
On April 11, 2021, The Corporate Recovery and Tax Incentives for Enterprise (CREATE) Law wasenacted which aims to reduce the regular corporate income tax rate from 30% to 25% starting July2020 and to rationalize the current fiscal incentives. MCIT rate is also reduced from 2% to 1%effective July 1, 2020 to June 30, 2023. The reduction of tax rates under CREATE is appliedretrospectively for tax reporting but financial reporting impact will be made in the 2021 financialstatements under PAS 12, Income Taxes. This resulted to a reduction in current tax and deferred taxassets by P=13.55 million.
Details of the Company’s NOLCO that can be claimed as deduction from future taxable profit are asfollows:
Year Incurred NOLCOApplication and
Expired Balance Year of Expiry2018 P=610,439,958 P=610,439,958 P=− 2021
P=610,439,958 P=610,439,958 P=−
NOLCO incurred in 2018 and 2017 amounting to P=528.63 million and P=885.94 million expired in2021 and 2020, respectively.
Details of the Company’s MCIT that can be claimed as tax credits from future regular corporateincome tax are as follows:
Year Recognized MCITApplication and
Expired Balance Year of Expiry2021 P=26,969,927 P=– P=26,969,927 20242020 40,641,034 – 40,641,034 20232019 43,987,049 – 43,987,049 20222018 11,301,586 11,301,586 − 2021
P=122,899,596 P=11,301,586 P=111,598,010*The excess MCIT over RCIT amount in 2020 is reduced by P=11.97 million due to implementation of CREATE
As of December 31, 2021 and 2020, the deferred tax asset recognized pertains excess MCIT overRCIT amounting to P=111.60 million and P=109.48 million, respectively.
131
Audited financial statements
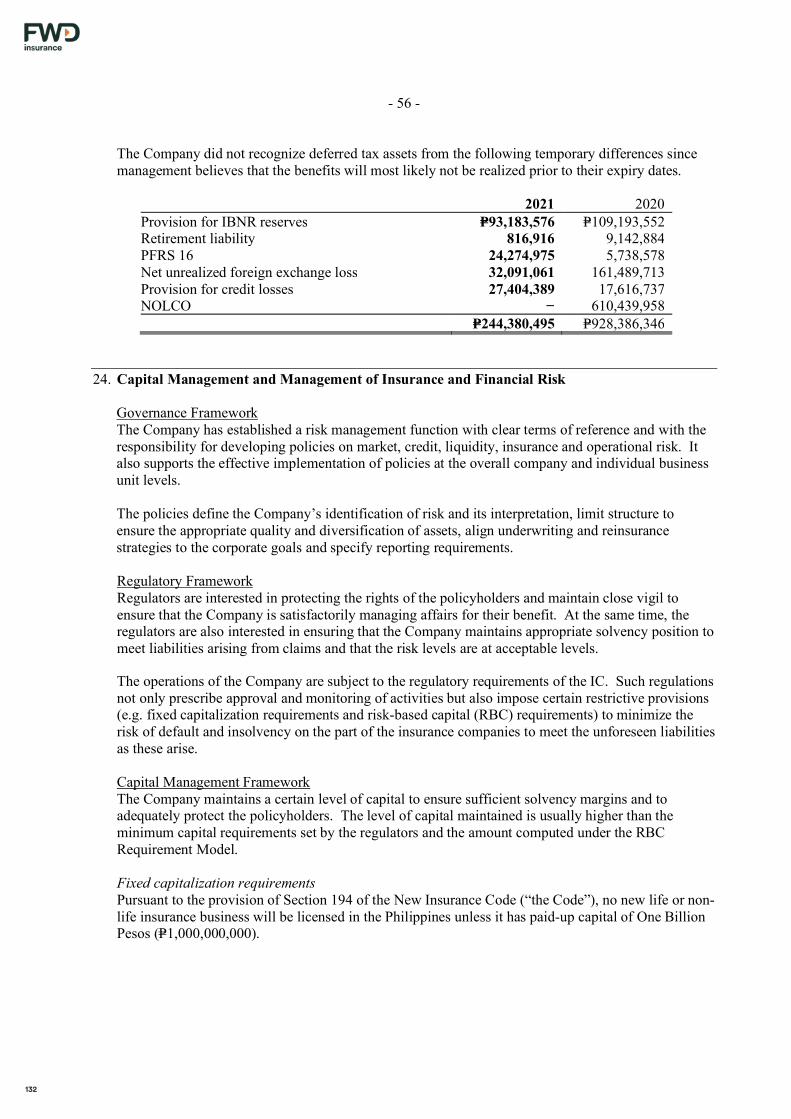
- 56 -
*SGVFS163777*
The Company did not recognize deferred tax assets from the following temporary differences sincemanagement believes that the benefits will most likely not be realized prior to their expiry dates.
2021 2020Provision for IBNR reserves P=93,183,576 P=109,193,552Retirement liability 816,916 9,142,884PFRS 16 24,274,975 5,738,578Net unrealized foreign exchange loss 32,091,061 161,489,713Provision for credit losses 27,404,389 17,616,737NOLCO − 610,439,958
P=244,380,495 P=928,386,346
24. Capital Management and Management of Insurance and Financial Risk
Governance FrameworkThe Company has established a risk management function with clear terms of reference and with theresponsibility for developing policies on market, credit, liquidity, insurance and operational risk. Italso supports the effective implementation of policies at the overall company and individual businessunit levels.
The policies define the Company’s identification of risk and its interpretation, limit structure toensure the appropriate quality and diversification of assets, align underwriting and reinsurancestrategies to the corporate goals and specify reporting requirements.
Regulatory FrameworkRegulators are interested in protecting the rights of the policyholders and maintain close vigil toensure that the Company is satisfactorily managing affairs for their benefit. At the same time, theregulators are also interested in ensuring that the Company maintains appropriate solvency position tomeet liabilities arising from claims and that the risk levels are at acceptable levels.
The operations of the Company are subject to the regulatory requirements of the IC. Such regulationsnot only prescribe approval and monitoring of activities but also impose certain restrictive provisions(e.g. fixed capitalization requirements and risk-based capital (RBC) requirements) to minimize therisk of default and insolvency on the part of the insurance companies to meet the unforeseen liabilitiesas these arise.
Capital Management FrameworkThe Company maintains a certain level of capital to ensure sufficient solvency margins and toadequately protect the policyholders. The level of capital maintained is usually higher than theminimum capital requirements set by the regulators and the amount computed under the RBCRequirement Model.
Fixed capitalization requirementsPursuant to the provision of Section 194 of the New Insurance Code (“the Code”), no new life or non-life insurance business will be licensed in the Philippines unless it has paid-up capital of One BillionPesos (P=1,000,000,000).
132

- 57 -
*SGVFS163777*
The Code also provided the new capitalization requirement of all existing insurance companies basedon net worth on a staggered basis starting June 30, 2013 up to December 31, 2022. The followingpresents the amount of required net worth and the schedule of compliance:
Net worth Compliance DateP=250,000,000 June 30, 2013
550,000,000 December 31 ,2016900,000,000 December 31, 2019
1,300,000,000 December 31, 2022
In 2021 and 2020, the Company fully complied with the externally imposed capital requirementswith Statutory Net Worth amounting to P=1.81 billion. This amount is still subject for examinationof Insurance Commission.
Unimpaired capital requirementIMC 22-2008 provided that for the purpose of determining compliance with the law, rules andregulations requiring that the paid-up capital should remain intact and unimpaired at all times, thestatement of financial position should show that the net worth or equity is at least equal to the actualpaid-up capital. The Company has complied with the unimpaired capital requirement.
RBC requirementsIC CL No. 2016-68 (Amended Risk-Based Capital (RBC2) Framework) provides the three pillar risk-based approach to solvency that is adopted by IC: (a) Pillar 1 includes the quantitative requirementsin relation to the calculation of capital requirements and recognition of eligible capital; (b) Pillar 2covers the governance and risk management requirement that consist of a supervisory review processwhich may include a supervisory adjustment to capital; and (c) Pillar 3 comprises the disclosurerequirements designed to encourage market discipline. Every life insurance company is quarterlyrequired to maintain a minimum RBC ratio of 100% and not to fail the trend test. Trend Test hasfailed, in the event that all have occurred:a) The RBC ratio computed for the period (i.e. first quarter) is less than 125% but is not below
100%,b) The RBC ratio has decreased over the past period, andc) The difference between RBC ratio (presented in (i) above) and the decrease in the RBC ratio
(presented in (ii) above) over the past period is less than 100%.
Failure to meet the minimum RBC ratio shall subject the insurance company to the correspondingregulatory intervention which has been defined at various levels.
In addition, IC issued CL No. 2016-69 (Implementation Requirements for Financial Reporting,Valuation Standards for Insurance Policy Reserves and Amended RBC2 Framework) which statesRBC2 shall take effect beginning January 1, 2017. This CL also provided for relaxed requirementsfor initial implementation for RBC2 as follows:
Level of sufficiency2017 95th percentile2018 97.5th percentile2019 99.5th percentile
The RBC ratio shall be calculated as Total Available Capital (TAC) divided by the RBC requirement.TAC, which is the aggregate of Tier 1 and Tier 2 capital minus deductions, and RBC requirement aredefined in Section 2 of ICL 2016-68.
133
Audited financial statements

- 58 -
*SGVFS163777*
The following table shows how the RBC ratio was determined by the Company based on itscalculations:
2021 2020Total Available Capital P=2,755,423,601 P=1,816,590,111RBC requirement 1,807,503,420 1,521,645,686RBC Ratio 152% 119%
The final RBC Ratio for 2021 can be determined only after the accounts of the Company have beenexamined by IC specifically as to admitted and non-admitted assets as defined under the Code. RBCratio for 2020 is based on the Verification of the Annual Statement as approved by the InsuranceCommission dated October 19, 2021.
Product Design and Pricing RiskProduct design risk refers to potential defects in the development of a particular insurance product.The Company manages product design risk through its product approval process where products arereviewed against pricing, design and operational risk parameters. All new products and productenhancements are reviewed and approved by the Group Office and are certified by the Company’sChief Actuary.
Product pricing phase starts with reinsurance negotiation, assumption-setting, preparation of productapproval report, review and sign-off by the Group Office of pricing model, key product metrics basedon target range set by Group, and risk assessment and mitigation measures consistent with the riskmanagement policy of Group. Approved products are then filed with IC and BSP (for Bancassuranceproducts).
The Company closely monitors the performance of new products and actively manages the productportfolio to minimize risks in the in-force book and new products.
Insurance RiskNature of RiskThe risk under an insurance contract is the risk that an insured event will occur, including theuncertainty of the amount and timing of any resulting claim. The principal risk the Company facesunder such contracts is that the actual claims and benefit payments exceed the carrying amount ofinsurance liabilities. This is influenced by the frequency and severity of claims and actual benefitamount at the time of claim, and subsequent development of long-term claims. The variability ofrisks is improved by diversification of the risk of loss. A large diversified portfolio of insurancecontracts is less likely to be affected across the board by changes in any subset of the portfolio. Thevariability of risks is also improved by careful selection and implementation of underwritingstrategies and guidelines, as well as the use of reinsurance arrangements.
For contracts where death is the insured risk, the significant factors that could increase the overallfrequency of claims are epidemics, widespread changes in lifestyle and natural disasters, resulting inearlier or more claims than expected. These risks currently do not vary significantly in relation to thelocation of the risks insured by the Company while undue concentration by amounts could have animpact on the severity of benefit payments.
Terms and conditionsThe Company principally writes life insurance where the life of policyholder is insured against death,illness, injury or permanent disability, usually for a pre-determined amount. Life insurance contractscurrently offered by the Company are mainly unit-linked, accident and health and group lifeinsurance products. Unit-linked products differ from conventional policies in that a pre-determined
134

- 59 -
*SGVFS163777*
percentage of each premium is allocated to units in a pooled investment fund and the policyholderbenefits directly from the total investment growth and income of the fund.
There are no mitigating terms and conditions that reduce the insured risk accepted for contracts withfixed, guaranteed terms and fixed future benefits.
The Company has an objective to control and manage insurance risk, and to maintain a strong capitalbase to safeguard the Company’s ability to continue as a going-concern. The Company managesinsurance risk through the following mechanism: The use and maintenance of sophisticated management information systems that provide up to
date, accurate and reliable data on risk exposure at any point in time; Actuarial models based on industry past experience and sound actuarial formulations; Guidelines for concluding insurance contracts and assuming insurance risks; Pro-active compliance of claims handling procedures to investigate and adjust claims, thereby
ensuring payment of valid claims; Reinsurance to limit the Company’s exposure to large claims by placing risk with reinsurers
providing high security; and Eventually, diversification strategy will be implemented to ensure that underwritten risks are
well-diversified in terms of type and amount of risk, industry and geography.
Insurance risk is also affected by the policyholders’ rights to terminate the contract, pay reducedpremiums, and cease to pay premiums. Thus, the insurance risk is subject to the behaviour anddecisions of the policyholders.
The Company's concentration of insurance risk, before and after reinsurance, in relation to the type ofinsurance contract is as follows:
2021 2020Variable unit-linkedGross P=102,661,156,895 P=79,342,026,113Net 88,654,444,470 66,730,317,413Accident and healthGross 24,647,198,901 20,961,789,336Net 13,795,329,363 12,545,669,154Ordinary lifeGross 13,721,120,019 8,440,862,642Net 10,564,590,883 5,988,745,669Group lifeGross 136,879,252,419 181,514,422,192Net 116,479,376,304 166,966,640,318TotalGross P=277,908,728,234 P=290,259,100,284Net 229,493,741,019 252,231,372,555
The risks associated with the life and accident and health products are underwriting risk and investmentrisk.
135
Audited financial statements

- 60 -
*SGVFS163777*
Underwriting RiskUnderwriting risk represents the exposure to loss resulting from actual policy experience adverselydeviating from assumptions made in the product pricing. Underwriting risks are brought about by acombination of the following: Mortality risk - risk of loss arising from the policyholders’ death experience being different than
expected. Morbidity risk - risk of loss arising from the policyholder’s health experience being different than
expected. Expense risk - risk of loss arising from expense experience being different than expected. Policyholder decision risk - risk of loss arising from the policyholder behavior (lapses and
surrenders) being different than expected.
The Company’s underwriting strategy is designed to ensure that risks are evaluated and rateappropriately. This is largely achieved through the use of health questionnaires and medicalscreening in order to ensure that pricing takes account of current health conditions family medicalhistory, regular review of actual claims experience and product pricing, as well as detailed claimshandling procedures. Underwriting limits are in place to enforce appropriate risk selection criteria.
Investment RiskThe investment risk represents the exposure to loss resulting from cash flows from invested assets,primarily long-term fixed rate investments, being less than the cash flows required to meet theobligations of the expected policy contract liabilities and the necessary return on investments.Additionally, there exists a future investment risk associated with certain policies currently in forcewhich will have premium receipts in the future. That is, the investment of those future premiumreceipts may be at a yield below that required to meet future policy liabilities.
To maintain an adequate yield to match the interest necessary to support future policy liabilities,management focus is required to reinvest the proceeds of the maturing securities and to invest thefuture premium receipts while continuing to maintain satisfactory investment quality.
The Company utilizes dynamic asset allocation strategies consistent with its risk appetite frameworkto manage investment risk and to ensure sustainable investment returns.
Financial InstrumentsThe following table sets forth the carrying values and fair values of non-linked and unit-linkedfinancial assets and liabilities recognized as of December 31:
December 31, 2021Non-linked Unit-linked
Fair value Carrying amount Fair valueCarryingamount
Financial assetsCash and cash equivalents P=925,881,531 P=925,881,531 P=351,405,616 351,405,616Loans and deposits 271,815,649 271,815,649 223,873,619 223,873,619AFS financial assets:
Government and corporate debtsecurities 2,559,303,784 2,559,303,784 − −
Financial assets at FVPL:Debt securities − − 1,155,692,232 1,155,692,232Equity securities − − 9,228,433,961 9,228,433,961Unit investment trust fund − − 26,498,063,750 26,498,063,750
Reinsurance assets 325,893,504 325,893,504 − −Other assets 395,789,173 395,789,173 − −
P=4,478,683,641 4,478,683,641 P=37,457,469,178 37,457,469,178Financial liabilitiesOther liabilities P=2,424,601,111 P=2,424,601,111 P=288,279,290 P=288,279,290
136

- 61 -
*SGVFS163777*
December 31, 2020Non-linked Unit-linked
Fair value Carrying amount Fair valueCarryingamount
Financial assetsCash and cash equivalents P=1,206,155,440 P=1,206,155,440 P=415,486,419 P=415,486,419Loans and deposits 124,667,298 124,667,298 – –AFS financial assets:
Government and corporate debtsecurities 1,424,570,711 1,409,099,581 – –
Financial assets at FVPL:Debt securities – – 1,066,556,061 1,066,556,061Equity securities – – 7,255,456,973 7,255,456,973Unit investment trust fund – – 15,336,338,447 15,336,338,447
Reinsurance assets 245,975,041 245,975,041 – –Other assets 408,384,756 408,384,756 266,996,781 266,996,781
P=3,409,753,246 P=3,394,282,116 P=24,340,834,681 P=24,340,834,681Financial liabilitiesOther liabilities P=2,011,686,637 P=2,011,686,637 P=387,745,593 P=387,745,593
Fair values of financial assets and financial liabilities are estimated as follows:
Due to the short-term nature of cash and cash equivalents, short-term investments, receivables,accrued income, insurance payables, accrued payables and accrued expenses, payable to relatedparties, and amounts payable on redemption, their carrying values reasonably approximate theirfair values at year end.
The fair value of financial assets at FVPL and AFS financial assets that are actively traded inorganized financial markets is determined by reference to quoted market prices (BVAL/BSP 813Reference rate for bonds, PSE closing price for equities and the published NAV per unit forinvestments in UITF), at the close of business on the reporting date, or the last trading day asapplicable.
Financial RiskThe Company is exposed to financial risk through its financial assets and financial liabilities. Inparticular, the key financial risk is that the proceeds from its financial assets are not sufficient to fundthe obligations arising from its insurance contracts. The most important components of this financialrisk are credit risk, liquidity risk and market risk. These risks arise from open positions in interestrate, currency and equity products, all of which are exposed to general and specific marketmovements.
The Company has established a risk management function with terms of reference and withresponsibility for developing policies on market, credit, liquidity, insurance and operational risk. Theinvestment policies define the Company’s limit structure to ensure the appropriate quality anddiversification of assets, in accordance with the Code.
Credit RiskCredit risk is the risk that one party to a financial instrument will fail to discharge an obligation andcause the other party to incur a financial loss. The Company manages the level of credit risk itaccepts through a credit risk policy which focuses on minimizing credit risk exposures. The creditrisk policies are set as follows:
a. Concentration limit - The Company sets maximum exposure to an individual issuer and to aparticular sector.
137
Audited financial statements

- 62 -
*SGVFS163777*
b. Counterparty ratings - The Company reviews and recommends financial institutions that willcomplement over-all investment objectives and service requirements.
Reporting of credit risk exposures, monitoring compliance with credit risk policy and review of creditrisk policy is done on a regular basis.
A credit exposure exists with respect to reinsurance ceded, to the extent that any reinsurer may beunable to meet its obligations assumed under such reinsurance agreements. The Company selectsonly domestic and foreign companies with strong financial standing and excellent track records whichare allowed to participate in the Company’s reinsurance programs. The Company also set maximumexposure for deposit products of accredited banks which will be the equivalent to the maximumallocation for the said instruments.
As of December 31, 2021 and 2020, the Company’s maximum exposure to credit risk and investmentrisk from its financial assets (loans and receivables, AFS financial assets and financial assets atFVPL) is equal to their carrying amount. In addition, there is no significant concentration of creditrisk identified. The gross maximum exposure to credit risk of the Company approximates its netmaximum exposure. There were no amounts that are set-off in accordance with the criteria in PAS32, Financial Instruments: Presentation. There were no amounts subject to an enforceable masternetting arrangement or similar agreement as of December 31, 2021 and 2020.
Credit quality of financial assetsIt is the Company’s policy to maintain accurate and consistent risk ratings across the financial assets.The Company utilizes an internal credit rating system based on its assessment of the quality of thefinancial assets.
The Company uses conventions which have been adapted to conform to the various ratings asfollows:
Standard and Poor’s Moody’s Reported asAAA AAA AAAAA+ to AA- Aa1 to Aa3 AAA+ to A- A1 to A3 ABBB+ to BBB- Baa1 to Baa3 BBBBB+ and below Ba1 and below Below investment grade
The tables below show the credit quality of the Company’s financial assets as of December 31:
Non-linked2021
A BBB BB Not rated TotalCash and cash equivalents P=134,660,354 P=788,833,786 P=− P=2,387,391 P=925,881,531Loans and deposits − − − 271,815,649 271,815,649AFS financial assets:
Government and corporate debtsecurities − 2,559,303,784 − − 2,559,303,784
Reinsurance assets − − − 325,893,504 325,893,504Other assets − − − 425,350,156 425,350,156
P=134,660,354 P=3,348,137,570 P=– P=1,025,446,700 P=4,508,244,624
138
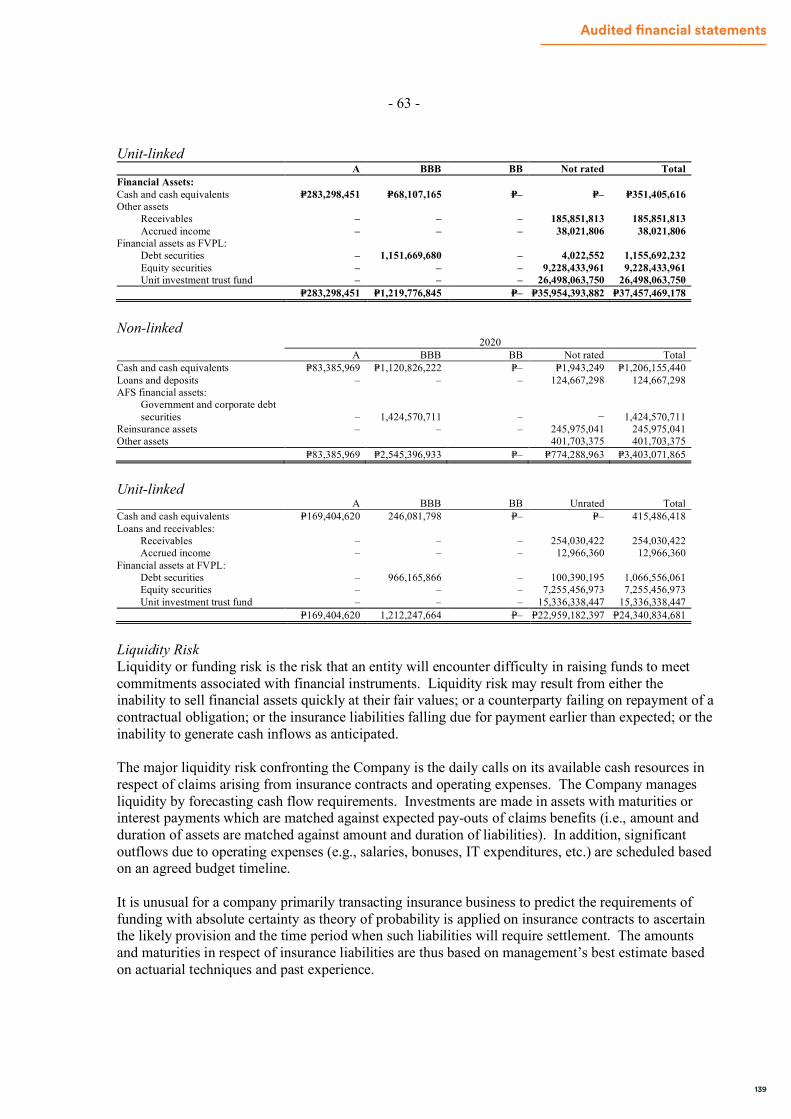
- 63 -
*SGVFS163777*
Unit-linkedA BBB BB Not rated Total
Financial Assets:Cash and cash equivalents P=283,298,451 P=68,107,165 P=– P=– P=351,405,616Other assets
Receivables – – – 185,851,813 185,851,813Accrued income – – – 38,021,806 38,021,806
Financial assets as FVPL:Debt securities – 1,151,669,680 – 4,022,552 1,155,692,232Equity securities – – – 9,228,433,961 9,228,433,961Unit investment trust fund – – – 26,498,063,750 26,498,063,750
P=283,298,451 P=1,219,776,845 P=– P=35,954,393,882 P=37,457,469,178
Non-linked2020
A BBB BB Not rated TotalCash and cash equivalents P=83,385,969 P=1,120,826,222 P=– P=1,943,249 P=1,206,155,440Loans and deposits – – – 124,667,298 124,667,298AFS financial assets:
Government and corporate debtsecurities – 1,424,570,711 – − 1,424,570,711
Reinsurance assets – – – 245,975,041 245,975,041Other assets 401,703,375 401,703,375
P=83,385,969 P=2,545,396,933 P=– P=774,288,963 P=3,403,071,865
Unit-linkedA BBB BB Unrated Total
Cash and cash equivalents P=169,404,620 246,081,798 P=– P=– 415,486,418Loans and receivables:
Receivables – – – 254,030,422 254,030,422Accrued income – – – 12,966,360 12,966,360
Financial assets at FVPL:Debt securities – 966,165,866 – 100,390,195 1,066,556,061Equity securities – – – 7,255,456,973 7,255,456,973Unit investment trust fund – – – 15,336,338,447 15,336,338,447
P=169,404,620 1,212,247,664 P=– P=22,959,182,397 P=24,340,834,681
Liquidity RiskLiquidity or funding risk is the risk that an entity will encounter difficulty in raising funds to meetcommitments associated with financial instruments. Liquidity risk may result from either theinability to sell financial assets quickly at their fair values; or a counterparty failing on repayment of acontractual obligation; or the insurance liabilities falling due for payment earlier than expected; or theinability to generate cash inflows as anticipated.
The major liquidity risk confronting the Company is the daily calls on its available cash resources inrespect of claims arising from insurance contracts and operating expenses. The Company managesliquidity by forecasting cash flow requirements. Investments are made in assets with maturities orinterest payments which are matched against expected pay-outs of claims benefits (i.e., amount andduration of assets are matched against amount and duration of liabilities). In addition, significantoutflows due to operating expenses (e.g., salaries, bonuses, IT expenditures, etc.) are scheduled basedon an agreed budget timeline.
It is unusual for a company primarily transacting insurance business to predict the requirements offunding with absolute certainty as theory of probability is applied on insurance contracts to ascertainthe likely provision and the time period when such liabilities will require settlement. The amountsand maturities in respect of insurance liabilities are thus based on management’s best estimate basedon actuarial techniques and past experience.
139
Audited financial statements
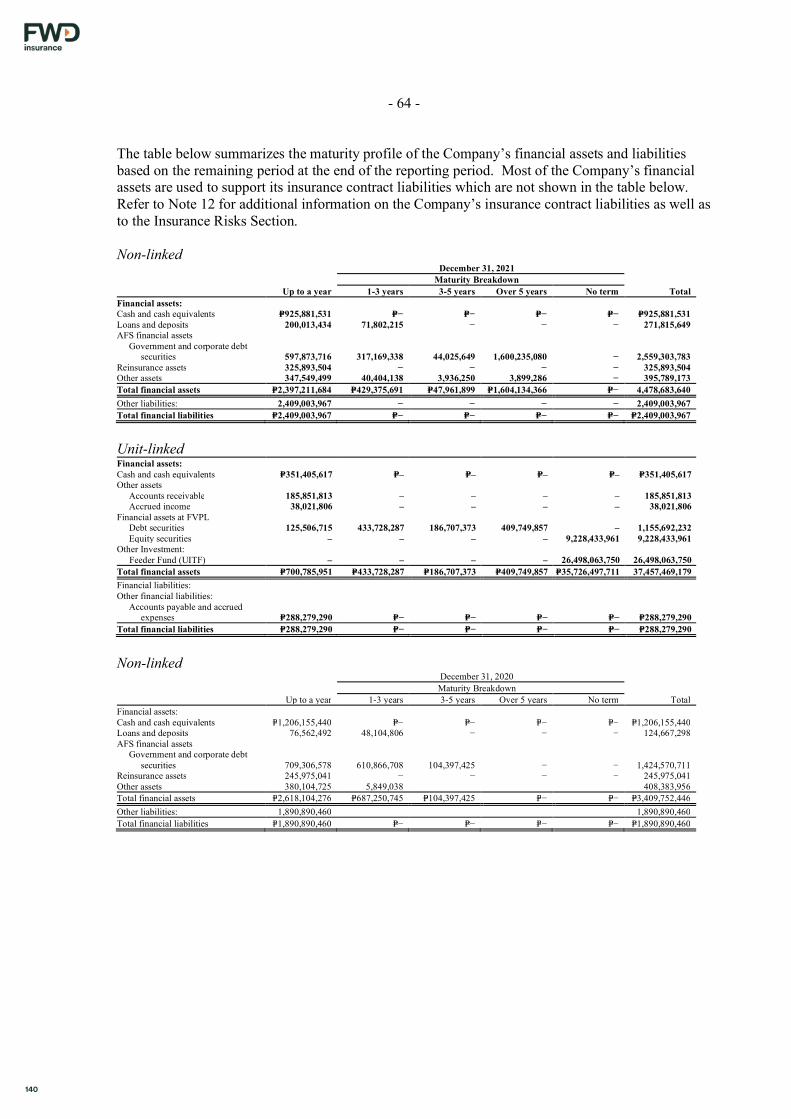
- 64 -
*SGVFS163777*
The table below summarizes the maturity profile of the Company’s financial assets and liabilitiesbased on the remaining period at the end of the reporting period. Most of the Company’s financialassets are used to support its insurance contract liabilities which are not shown in the table below.Refer to Note 12 for additional information on the Company’s insurance contract liabilities as well asto the Insurance Risks Section.
Non-linkedDecember 31, 2021
Maturity BreakdownUp to a year 1-3 years 3-5 years Over 5 years No term Total
Financial assets:Cash and cash equivalents P=925,881,531 P=− P=− P=− P=− P=925,881,531Loans and deposits 200,013,434 71,802,215 − − − 271,815,649AFS financial assets Government and corporate debt
securities 597,873,716 317,169,338 44,025,649 1,600,235,080 − 2,559,303,783Reinsurance assets 325,893,504 − − − − 325,893,504Other assets 347,549,499 40,404,138 3,936,250 3,899,286 − 395,789,173Total financial assets P=2,397,211,684 P=429,375,691 P=47,961,899 P=1,604,134,366 P=− 4,478,683,640Other liabilities: 2,409,003,967 − − − − 2,409,003,967Total financial liabilities P=2,409,003,967 P=− P=− P=− P=− P=2,409,003,967
Unit-linkedFinancial assets:Cash and cash equivalents P=351,405,617 P=– P=– P=– P=– P=351,405,617Other assets
Accounts receivable 185,851,813 – – – – 185,851,813Accrued income 38,021,806 – – – – 38,021,806
Financial assets at FVPLDebt securities 125,506,715 433,728,287 186,707,373 409,749,857 – 1,155,692,232Equity securities – – – – 9,228,433,961 9,228,433,961
Other Investment:Feeder Fund (UITF) – – – – 26,498,063,750 26,498,063,750
Total financial assets P=700,785,951 P=433,728,287 P=186,707,373 P=409,749,857 P=35,726,497,711 37,457,469,179Financial liabilities:Other financial liabilities: Accounts payable and accrued
expenses P=288,279,290 P=− P=− P=− P=− P=288,279,290Total financial liabilities P=288,279,290 P=− P=− P=− P=− P=288,279,290
Non-linkedDecember 31, 2020Maturity Breakdown
Up to a year 1-3 years 3-5 years Over 5 years No term TotalFinancial assets:Cash and cash equivalents P=1,206,155,440 P=− P=− P=− P=− P=1,206,155,440Loans and deposits 76,562,492 48,104,806 − − − 124,667,298AFS financial assets Government and corporate debt
securities 709,306,578 610,866,708 104,397,425 − − 1,424,570,711Reinsurance assets 245,975,041 − − − − 245,975,041Other assets 380,104,725 5,849,038 408,383,956Total financial assets P=2,618,104,276 P=687,250,745 P=104,397,425 P=− P=− P=3,409,752,446Other liabilities: 1,890,890,460 1,890,890,460Total financial liabilities P=1,890,890,460 P=− P=− P=− P=− P=1,890,890,460
140

- 65 -
*SGVFS163777*
Unit-linkedFinancial assets: − − − −Cash and cash equivalents P=415,486,419 − − − − P=415,486,419Other assets
Accounts receivable 254,030,421 − − − − 254,030,421Accrued income 12,966,360 − − − − 12,966,360
Financial assets at FVPLDebt securities 104,677,103 254,814,990 236,396,117 470,667,850 104,677,103 1,066,556,061Equity securities − − − − 7,255,456,973 7,255,456,973
Other Investment:Feeder Fund (UITF) − − − − 15,336,338,447 15,336,338,447
Total financial assets P=787,160,304 P=254,814,990 P=236,396,117 P=470,667,850 P= 22,696,472,523 P=24,340,834,681Financial liabilities:Other financial liabilities: Accounts payable and accrued
expenses P=387,745,593 P=− P=− P=− P=− P=387,745,593Total financial liabilities P=387,745,593 P=− P=− P=− P=− P=387,745,593
Market Risk Currency risk
Currency risk is the risk that the value of the Company’s financial instruments will decreaseresulting from changes in the foreign currency exchange rates. The Company’s financial assetsare predominantly denominated in the same currencies as its insurance and other financialliabilities, which serves to mitigate the foreign currency exchange risks on its intercompanypayables.
The following tables show the details of the Company’s foreign currency-denominated monetarytransactions and their Philippine peso equivalents:
2021USD PHP HKD PHP
AssetsCash $3,334,703 P=169,999,132 HK$– P=–Financial assets at FVPL 783,118 39,922,406 – –Assets held to cover unit-linked liabilities 200,574,889 10,225,065,708 – –Loans and deposits 2,208,717 112,597,745 – –Reinsurance assets (630,018) (32,117,543)Property and equipment - net 29,699 1,427,126Intangible assets - net 1,536,164 77,269,966 – –Other assets 7,155 378,010 – –Insurance contract assets (7,585) (386,652) – –
207,836,843 10,594,155,898 – –LiabilitiesUnit-linked liabilities (200,574,889) (10,225,065,708) – –Other payables (7,811,259) (398,208,555) – –Payable to related parties (15,024,196) (765,915,385) (54,335,484) (355,294,297)
($223,410,344) (P=11,389,189,648) (HK$54,335,484) (P=355,294,297)
2020USD PHP HKD PHP
AssetsCash $2,083,861 P=100,880,921 HK$– P=–Financial assets at FVPL 660,163 31,708,093 – –Assets held to cover unit-linked liabilities 77,297,632 3,712,662,475 – –Loans and deposits 1,029,077 49,427,338 – –Intangible assets - net 780,424 39,532,789 – –Other assets (484,882) (25,045,451) – –Insurance contract assets (7,585) (398,805) – –
$81,358,690 P=3,908,767,360 HK$– P=–LiabilitiesUnit-linked liabilities ($76,710,458) (P=3,684,460,074) HK$– P=–Other payables (3,751,060) (180,393,662) – –Payable to related parties (6,256,458) (398,785,827) (54,335,484) (421,205,302)
($86,717,976) (P=4,263,639,563) (HK$54,335,484) (P=421,205,302)
141
Audited financial statements

- 66 -
*SGVFS163777*
The following table demonstrates the sensitivity to a reasonably possible change in the foreignexchange rates, with all other variables held constant, of the Company’s income before tax.
2021 2020
Currency
Changes inforeign
exchangerates
Impact onincome
before tax
Changes inforeign exchange
rates
Impact onincome
before taxHong Kong Dollar 5.00% (P=17,764,715) 5.00% (P=21,060,265)
(5.00%) 17,764,715 (5.00%) 21,060,265US Dollar 1.00% (103,891,896) 1.00% (42,636,396)
(1.00%) 103,891,896 (1.00%) 42,636,396
Equity price riskEquity price risk is the risk that the fair value of equities will decrease resulting from changes inthe levels of equity indices and the value of individual stocks. The Company is exposed to equityprice risks arising from equity investments. Equity investments are held for the Company’svariable unit linked funds. Exposure is being managed through equity asset class allocation targetand range defined in the Investment Policy of the funds and is being monitored on a monthlybasis.
The effect on profit or loss (as a result of a change in fair value of instruments held in the unit-linked assets) due to a reasonably possible change in indices, with all other variables heldconstant, is as follows:
2021Change in Equity
Price (%)Effect on profit or loss
Increase (Decrease)Equity securities 10% P=26,513,367
-10% (26,513,367)
2020Change in Equity
Price (%)Effect on profit or loss
Increase (Decrease)Equity securities 10% P=26,303,914
-10% (26,303,914)
Interest rate riskFair value interest rate risk is the risk that the value of a financial instrument will fluctuatebecause of changes in market interest rates. The Company’s investments classified as AFSfinancial assets and financial assets at FVPL in particular are exposed to such risk. TheCompany’s investment policy manages interest rate risk by aiming to match the maturities ofinterest-bearing financial assets and interest-bearing financial liabilities. The amount, durationand yield to maturity of assets are matched against the amount and duration of the liabilities.
The Company’s exposure to interest rate risk arises from its investment in government bonds andcorporate bonds for the VUL funds. Exposure is being managed through asset class allocationand ranges defined in the Investment Policy of the funds.
142

- 67 -
*SGVFS163777*
The following tables demonstrate the sensitivity to a reasonably possible change in interest ratesfor the next financial year, with all other variables held constant, of the Company’s totalcomprehensive income follows:
2021Change in Yield
(bps)Effect on profit or loss
Increase (Decrease)Debt securities +50 bps (P=90,224,972)
-50 bps 96,397,845
2020Change in Yield
(bps)Effect on profit or loss
Increase (Decrease)Debt securities +50 bps P=6,644,397
-50 bps (6,644,397)
25. Commitments
Developmental FeesThe Company entered into Deeds of Undertaking (DOU) with the agency leaders to assist in buildingand maintaining of the agencies for the purpose of exclusively selling the Company’s life insuranceproducts. The remaining developmental fees shall be released monthly based on the first yearcommissions (FYC) requirement as defined in the DOU. In the event that the FYC requirement is notmet in any given month, the pay-out of the monthly developmental fees will be suspended(see Note 11).
Developmental fee commitments are as follows:
2021 2020Within one year P=109,033,297 P=209,447,552After one year but not more than five years 253,042,748 1,165,467,995
P=362,076,045 P=1,374,915,547
Distribution AgreementOn September 15, 2014, FWD Life and Security Bank Corporation (SBC) signed a DistributionAgreement (DA) under which SBC will sell exclusively FWD Life products. The terms of theAgreement provides for payment by FWD Life of an Upfront Fee and Exclusive Access Feeamounting to a total of P=600 million in consideration for FWD Life’s exclusive access to thedistribution network. The DA also provides for payment of Initial Milestone Fee (IMF), if thecumulative ANP reaches the target of P=3.886 billion and Subsequent Milestone Fee (SMF), if thecumulative ANP reaches the target of P=16.854 billion. On December 10, 2018, the Company paidSBC the Initial Milestone Fee amounting to P=1.00 billion.
Amortization of the P=300.00 million Intangible Asset shall be amortized over its economic life offifteen (15) years while the amortization of the Prepaid Asset for the remaining P=300.00 million andP=1.00 billion shall be expressed in terms of Unit of Production (UOP), at the rate of 7.7% of actualANP production.
143
Audited financial statements
- 68 -
*SGVFS163777*
The bancassurance agents are given annual performance bonus and over-achievement bonus underthe DA with SBC. Annual performance bonus is given in the event that the ANP generated fromeligible sales during the year achieves the annual performance target of the bancassurance agent forthe financial year. Annual over-achievement performance bonus is provided to bancassurance agentsin the event that the ANP generated from eligible sales during the year achieves the annual over-achievement performance target.
Management Fee IncomeThe Company entered into a Discretionary Investment Management Agreement with BPI wherein theCompany availed of the services of BPI as investment manager relative to the management andinvestment of the funds of the Company for its unit-linked products. Currently, the Company has 3Funds that are managed by BPI.
The Company also entered into a Participating Trust Agreement with SBC wherein the Companyagrees to participate in the Unit Investment Trust Fund established by SBC for the purpose ofproviding investment opportunities for higher investment yields through a diversified portfolio ofinvestments for the Company’s unit-linked products. Currently, the Company has participation in 4Funds.
In 2017, the Company entered into a Discretionary Investment Management Agreement with SBCwherein the company availed of the services of SBC as investment manager relative to themanagement and investment of funds of the Company for its unit-linked products. The Company has1 fund that is managed by SBC under this arrangement.
In 2017, the Company has also set up a US dollar denominated equity index-linked fund. The fundreplicates an index-based strategy and is administered by the Company.
Management fees ranging from 1.92% up to 2.20% of the Net Asset Value are collected from thefund wherein the Company’s share ranges from 1.60% up to 1.88%. Management fees are collectedon a monthly and quarterly basis from the funds managed by BPI and SBC, respectively. Theremaining shares/portions goes to the Fund managers /Fund administrators.
26. Contingencies
The Company has not been involved in any lawsuit arising from the normal course of carrying out itsinsurance business.
27. Supplementary Tax Information Required Under Revenue Regulation (RR) 15-2010
The following supplementary information under RR 15-2010 is presented for purposes of filing withthe BIR and is not a required part of the basic financial statements.
144

- 69 -
*SGVFS163777*
Output VATDetails of the Company’s output VAT declared are as follows:
Fee income: Management fee income on assets held to cover unit-linked
liabilities P=460,102,331Interest – Staff loans 520,391Interest – Agency loans 255,077Sundry Income 61,053
Total P=460,938,852Output VAT rate 12%
P=55,312,662
Documentary stamp taxThe Company’s documentary stamp tax paid or accrued in 2021 follows:
Source PaymentLife insurance premiums/coverage P=6,438,090Other documents 175,873Total P=6,613,963
Other taxes and licensesThis includes all local taxes including Premium Taxes under the account “Commission-relatedexpenses” and licenses and permit fees under the account “Taxes and Licenses” and under “Generaland Administration” expenses.
Local TaxesBusiness registration fees P=12,662,828Real property tax 135,979Community tax certificate 10,500
National TaxesPercentage taxes (see Note 20) 110,041,260Insurance commission license 612,442Notarial fee 128,356BIR annual registration 10,500
Total P=123,601,866
Withholding taxesDetails of the Company’s withholding taxes paid and accrued during the year are as follows:
Total remittance BalanceTax on compensation and benefits P=255,507,157 P=9,911,364Expanded withholding tax 210,570,353 19,440,187Final withholding tax 7,781,174 104,266Final Withholding VAT 6,040,598 8,631Fringe benefit tax 2,854,791 876,552
P=482,754,074 P=30,340,999
145
Audited financial statements

- 70 -
*SGVFS163777*
Tax assessmentsOn March 15, 2022, the Company received a preliminary assessment notice covering all taxes for thetaxable year 2017 totalling P=1,766.03 million. The Company has yet to submit a letter of protest onthe preliminary assessment notice.
As of December 31, 2021, the Company does not have any tax cases outstanding or pending in courtsor bodies outside the BIR in any of the open taxable years.
146

Contactinformation
Contact information

FWD Head Office9F and 19F W Fifth Avenue Building, 5th Avenue corner 32nd Street, Bonifacio Global City, Taguig City 1634, Philippines+632.8888.8393
FWD Business Hub -Del Rosario Law Center, BGC10-11/F Del Rosario Law Centre,21st Drive Corner 20th Drive, Bonifacio Global City, Taguig City 1630, Philippines+632.7776.5559
FWD Business Hub -MDI Corporate Center, BGCUnit 1203 MDI Corporate Center, 10th Ave Cor 39th St.,Bonifacio Global City, Taguig City 1639, Philippines+632.8805.1641
FWD Business Hub - Pacific Star 23F Pacific Star Building,Sen. Gil Puyat cornerMakati Avenue Makati City 1226, Philippines+632.8807.8410
FWD Business Hub -AlabangG/F Capella Building,ASEAN Drive, Filinvest City, Alabang, Muntinlupa City 1770, Philippines+632.8829.1487
FWD Business Hub - Binondo, Manila11/F A.CBK Bldg., Quintin Paredes St., Binondo, Manila, Philippines+632.8362.5851
FWD Business Hub -Ortigas26F IBP Tower,Julia Vargas Avenue, Ortigas Center, Pasig City 1605, Philippines+632.8281.7108
FWD Business Hub - Angeles City, Pampanga2/F Metropolis Centre, McArthur Highway, Angeles City, Pampanga, Philippines+6345.304.7253
FWD Business Hub -BaguioUnit 404-405 DBP Building,Session Road, Baguio City 2600, Philippines+6374.447.9799
FWD Business Hub - Cagayan de Oro 1st Level, East Annex Building, Limketkai Mall, Lapasan, Cagayan de Oro City 9000, Philippines+6388.323.6393
FWD Business Hub -Cebu 1G/F eBloc Tower 1 Geonzon St., JP Morgan Bldg., Cebu IT Park,Cebu City 6000, Philippines+6332.412.3013
FWD Business Hub -Cebu 2G/F China Bank Corporate Center, Cebu Business Park,Cebu City 6000, Philippines+6332.328.8271
FWD Business Hub -Davao 1 & 23F B.I. Zone Building,J.P. Laurel Ave. Bajada,Davao City 8000, Philippines+6382.224.6550
FWD Business Hub -Imus, CaviteG/F VMI Building,Emilio Aguinaldo Highway, Palico 1, Imus City, Cavite 4103, Philippines+6346.416.1090
FWD Business Hub - Malolos, BulacanV. Ladia Space, Maharlika Highway Sumapang MatandaMalolos City 3000, Philippines+6344.795.1447
FWD Business Hub - Santiago, IsabelaUpper G/F, Mango Suites Calao East, Santiago City, Isabela 3311, Philippines+6378.305.5505
FWD Business Hub - Valencia, BukidnonG/F, JBE Bldg., Sayre Highway, Valencia City, Bukidnon, Philippines+6388.828.7321
FWD Business Hub - TaclobanTacloban City Center Hub Building 2nd Floor Unit 6 & 7, Real St.Brgy. Aslum, Sagkahan, Tacloban City, Philippines
148
Contact information

149

fwdlife.ph fwdlife_ph
fwdlife_ph fwdlifeph
Celebrate Livingfwd.com.ph