strengthening indonesia's exports of fish and processed fish
TRANSCRIPT
CANADA–INDONESIA TRADE AND PRIVATE SECTOR ASSISTANCE PROJECTTPSASTEP-BY-STEP GUIDE
SEPTEMBER 2016
Program undertaken with the financialsupport of the Government of Canadaprovided through Global Affairs Canada
IN PARTNERSHIP WITH
Strengthening Indonesia’s Exports of Fish and Processed Fish Products to CanadaRahayu Ningsih
CANADA–INDONESIA TRADE AND PRIVATE SECTOR ASSISTANCE PROJECTTPSAREPORT
JANUARY 2018
Strengthening Indonesia’s Exports of Fish and Processed Fish Products to Canada II
Strengthening Indonesia’s Exports of Fish and Processed Fish Products to CanadaBy: Rahayu Ningsih
About the AuthorRahayu Ningsih works for the Center for Analysis of International Trade Cooperation at the Ministry of Trade of the Republic of Indonesia. She produced this research and report during a two-month internship at The Conference Board of Canada in spring 2017.
About the TPSA ProjectTPSA is a five-year C$12-million project funded by the Government of Canada through Global Affairs Canada. The project is executed by The Conference Board of Canada, and the primary implementation partner is the Directorate General for National Export Development, Ministry of Trade.
TPSA is designed to provide training, research, and technical assistance to Indonesian government agencies, the private sector—particularly small and medium-sized enterprises (SMEs)—academics, and civil society organizations on trade-related information, trade policy analysis, regulatory reforms, and trade and investment promotion by Canadian, Indonesian, and other experts from public and private organizations.
The overall objective of TPSA is to support higher sustainable economic growth and reduce poverty in Indonesia through increased trade and trade-enabling investment between Indonesia and Canada. TPSA is intended to increase sustainable and gender-responsive trade and investment opportunities, particularly for Indonesian SMEs, and to increase the use of trade and investment analysis by Indonesian stakeholders for expanded trade and investment partnerships between Indonesia and Canada.
© 2018 TPSA Project
Strengthening Indonesia’s Exports of Fish and Processed Fish Products to Canada III
ContentsChapter 1: Introduction . . . . . . . . . . . . . . . . . . . . . . . . . . . . . . . . . . . . . . . . . . . . . . . . . . . . . . . . . . . . . . . . . . . . . . . . . . . . . .1
Background . . . . . . . . . . . . . . . . . . . . . . . . . . . . . . . . . . . . . . . . . . . . . . . . . . . . . . . . . . . . . . . . . . . . . . . . . . . . . . . . . . . . . . . . . . 1
Methodology . . . . . . . . . . . . . . . . . . . . . . . . . . . . . . . . . . . . . . . . . . . . . . . . . . . . . . . . . . . . . . . . . . . . . . . . . . . . . . . . . . . . . . . . 2
Report Organization . . . . . . . . . . . . . . . . . . . . . . . . . . . . . . . . . . . . . . . . . . . . . . . . . . . . . . . . . . . . . . . . . . . . . . . . . . . . . . . . . . 3
Chapter 2: Trends in Fish and Processed Fish Product Exports and Imports . . . . . . . . . . . . . . . . . . . . . . . . . . 4
Indonesian Global Exports of Fish Products . . . . . . . . . . . . . . . . . . . . . . . . . . . . . . . . . . . . . . . . . . . . . . . . . . . . . . . . . . 5
Indonesian Global Exports of Processed Fish Products . . . . . . . . . . . . . . . . . . . . . . . . . . . . . . . . . . . . . . . . . . . . . . . 6
Canadian Global Imports of Fish Products . . . . . . . . . . . . . . . . . . . . . . . . . . . . . . . . . . . . . . . . . . . . . . . . . . . . . . . . . . . . 8
Canadian Global Imports of Processed Fish Products . . . . . . . . . . . . . . . . . . . . . . . . . . . . . . . . . . . . . . . . . . . . . . . 10
Canadian Imports of Fish Products From Indonesia . . . . . . . . . . . . . . . . . . . . . . . . . . . . . . . . . . . . . . . . . . . . . . . . . . 11
Canadian Imports of Processed Fish Products From Indonesia . . . . . . . . . . . . . . . . . . . . . . . . . . . . . . . . . . . . . . 12
Chapter 3: Canadian Market Potential for Indonesian Fish and Processed Fish Products . . . . . . . . . . . . 14
Step 1: Choose Products With an Indicative Trade Potential Larger Than Us$5 Million . . . . . . . . . . . . . . . . 14
Step 2: Refine the List Using a Market Growth Criteria Matrix . . . . . . . . . . . . . . . . . . . . . . . . . . . . . . . . . . . . . . . . . 16
Step 3: Investigate Other Factors That May Affect Potential, Including Trade Costs and Level of Competition . . . . . . . . . . . . . . . . . . . . . . . . . . . . . . . . . . . . . . . . . . . . . . . . . . . . . . . . . . . . . . . . . . . . . . . . . . . . . . . . . . . . . . 19
Import Tariffs . . . . . . . . . . . . . . . . . . . . . . . . . . . . . . . . . . . . . . . . . . . . . . . . . . . . . . . . . . . . . . . . . . . . . . . . . . . . . . . . . . . . . 21
Competitors . . . . . . . . . . . . . . . . . . . . . . . . . . . . . . . . . . . . . . . . . . . . . . . . . . . . . . . . . . . . . . . . . . . . . . . . . . . . . . . . . . . . . 21
Chapter 4: Public and Private Standards in Canada . . . . . . . . . . . . . . . . . . . . . . . . . . . . . . . . . . . . . . . . . . . . . . . . . 22
Regulatory Framework . . . . . . . . . . . . . . . . . . . . . . . . . . . . . . . . . . . . . . . . . . . . . . . . . . . . . . . . . . . . . . . . . . . . . . . . . . . . . . 22
Non-Governmental Stakeholder Engagement in Canada’s Food Safety System . . . . . . . . . . . . . . . . . . . . . 24
Standards for Fish and Processed Fish Products . . . . . . . . . . . . . . . . . . . . . . . . . . . . . . . . . . . . . . . . . . . . . . . . . . . . 26
Traceability Regulations in Canada . . . . . . . . . . . . . . . . . . . . . . . . . . . . . . . . . . . . . . . . . . . . . . . . . . . . . . . . . . . . . . . 26
Environmental Sustainability Standards . . . . . . . . . . . . . . . . . . . . . . . . . . . . . . . . . . . . . . . . . . . . . . . . . . . . . . . . . . 27
Canadian Market and Buyer Expectations . . . . . . . . . . . . . . . . . . . . . . . . . . . . . . . . . . . . . . . . . . . . . . . . . . . . . . . . . . . 28
Chapter 5: How Can Indonesia Better Access the Canadian Market for Fish and Processed Fish Products? . . . . . . . . . . . . . . . . . . . . . . . . . . . . . . . . . . . . . . . . . . . . . . . . . . . . . . . . . . . . . . . . . . . . . . . . . . . . . . . . . . . . . 29
Requirements and Procedures for Importing Food to Canada . . . . . . . . . . . . . . . . . . . . . . . . . . . . . . . . . . . . . . . 29
Indonesian Regulations and Food-Safety-Related Requirements . . . . . . . . . . . . . . . . . . . . . . . . . . . . . . . . . . . . 31
Identifying Challenges Faced by Indonesian Fish and Processed Fish Products When Exporting to Canada . . . . . . . . . . . . . . . . . . . . . . . . . . . . . . . . . . . . . . . . . . . . . . . . . . . . . . . . . . . . . . . . . . . . . . . . . . . . . . . . . . . . . . . . . . . 32

Strengthening Indonesia’s Exports of Fish and Processed Fish Products to Canada IV
Chapter 6: Lessons Learned, Best Practices, and Next Steps . . . . . . . . . . . . . . . . . . . . . . . . . . . . . . . . . . . . . . . 34
Lessons Learned and Best Practices . . . . . . . . . . . . . . . . . . . . . . . . . . . . . . . . . . . . . . . . . . . . . . . . . . . . . . . . . . . . . . . . 34
Next Steps . . . . . . . . . . . . . . . . . . . . . . . . . . . . . . . . . . . . . . . . . . . . . . . . . . . . . . . . . . . . . . . . . . . . . . . . . . . . . . . . . . . . . . . . . . 34
Conclusion . . . . . . . . . . . . . . . . . . . . . . . . . . . . . . . . . . . . . . . . . . . . . . . . . . . . . . . . . . . . . . . . . . . . . . . . . . . . . . . . . . . . . . . . . . 35
Appendix A: HS 03 Products With an Indicative Trade Potential Greater Than US$5 Million . . . . . . . . . . 36
Appendix B: HS 16 Products With an Indicative Trade Potential Greater Than US$5 Million . . . . . . . . . . 37
Strengthening Indonesia’s Exports of Fish and Processed Fish Products to Canada 1
CHAPTER 1
IntroductionBackgroundIndonesia is an archipelago with vast oceans that constitute nearly two-thirds of its total area. The contri-bution of the fisheries sector to Indonesia’s national GDP in 2016 was 2.3 per cent.1 The export values of Indonesian fish and processed fish products were US$2.9 billion and US$0.96 billion respectively in 2016, which represent compound annual growth rates of 3.5 per cent and 5.3 per cent over 2011.2
Yet exports from this sector could be an even greater source of economic activity in Indonesia. Indonesia should further develop its exports of fish and processed fish products. These products collectively make up one of the 10 commodities of export focus identified by the Ministry of Trade of Indonesia. However, Indonesian fish and processed fish products still face obstacles to global exporting. For example, Indonesian tuna has been refused by the United States and Russia several times due to salmonella con-tamination, indicating that Indonesian fish products are not always compliant with food safety standards in destination markets.3
A prerequisite to penetrating global markets is to ensure that producers and suppliers in exporting coun-tries comply with global standards, whether public or private. In principle, food safety standards, the most common of which are sanitary and phytosanitary (SPS) standards,4 are introduced by governments in the interest of society, to achieve the important social objectives of protecting public, animal, and plant health and protecting the environment.
Canada’s 2002 Mutual Recognition Agreement (MRA) with Indonesia focuses on the inspection and quality control of fisheries products. This MRA provides a solid basis from which Indonesia can better penetrate the Canadian market, especially since the demand for fisheries products is growing. World demand for Indonesian fish and processed fish products grew by 4.2 per cent per year between 2006 and 2016, reach-ing a total value of $2.6 billion in 2016.5
Yet Canada is currently not a main destination market for Indonesian fish and processed fish products, ranking in 17th place. Canada imports fish and processed fish products mainly from the United States, China, and Thailand. Indonesia ranks in eighth place, with a market share slightly above 1 per cent.
1 Statistics Indonesia database, accessed April 22, 2017, www.bps.go.id.2 International Trade Centre, Trade Map database, accessed April 22, 2017, http://www.intracen.org/itc/market-info-tools/
trade-statistics/.3 Rahayu Ningsih, “Prospek Perdagangan Tuna Indonesia: Peluang dan Tantangan Menembus Pasar Global,” in Info Komoditi Ikan
Tuna, eds. Zamroni Salim and Ernawati Munadi (Jakarta: BPPKP Kementerian Perdagangan, 2014), 83–104.4 According to the WTO Agreement on the Application of Sanitary and Phytosanitary Measures (SPS Agreement), “sanitary or
phytosanitary measures include all relevant laws, decrees, regulations, requirements and procedures including, inter alia, end product criteria; processes and production methods; testing, inspection, certification and approval procedures; quarantine treatments including relevant requirements associated with the transport of animals or plants, or with the materials necessary for their survival during transport; provisions on relevant statistical methods, sampling procedures and methods of risk assessment; and packaging and labelling requirements directly related to food safety.” World Trade Organization, “The WTO Agreement on the Application of Sanitary and Phytosanitary Measures (SPS Agreement),” accessed November 16, 2017, https://www.wto.org/english/tratop_e/sps_e/spsagr_e.htm.
5 International Trade Centre, Trade Map database, accessed April 22, 2017, http://www.intracen.org/itc/market-info-tools/trade-statistics/.
Strengthening Indonesia’s Exports of Fish and Processed Fish Products to Canada 2
Canada is one of the highest-ranked countries in adopting food safety standards, according to a 2014 report by The Conference Board of Canada. The report ranks food safety performance for 17 Organization for Economic Co-operation and Development (OECD) countries.6 Canada’s excellent grades on most food safety performance metrics were due to its consistently low number of food-borne illness cases and reported food recalls, its new policy on allergen labeling, and a greater focus on transparency. Indeed, 67 per cent of Canadians in 2011 believed their food to be safer than it had been five years earlier.7
Canada has built a strong food safety reputation globally, also due in part to routine improvements built into the system following lessons learned and recommendations stemming from various food-borne ill-ness crises, including the 2008 listeriosis outbreak.8 Increasingly, however, more food regulators around the world are compelling industry to become more accountable to consumers in order to better mitigate systemic food-safety risks.
Stricter food safety standards beyond Hazard Analysis Critical Control Points (HACCP) and quality- benchmark schemes have influenced and encouraged the market and industries to adopt a better and safer food production and management system for consumers. The implementation of public and pri-vate food safety standards can challenge exporting countries, including Indonesia, to comply with those standards.
This research report will explore the challenges faced by Indonesian fish and processed fish products as they enter the Canadian market, particularly how to meet both public and private food safety standards. This report is expected to have broad implications for Indonesia’s fisheries sector in general. The aims of the report are:1. to identify Indonesian fish and processed fish products that are currently important or have potential
in the Canadian market;2. to identify food safety standards and regulatory challenges Indonesia faces when exporting fish and
processed fish products to Canada;3. to deliver solutions on how Indonesia can better access the Canadian market for fish and processed
fish products.
MethodologyThe methods used in this report are both qualitative and quantitative. Information and data from literature, site visits, and discussions with food safety stakeholders in Canada are used. The stakeholders consist of:
• government departments (Health Canada, Canadian Food Inspection Agency, and Ontario Ministry of Agriculture, Food and Rural Affairs);
• industry (Loblaws and Farm Boy);
• non-governmental organizations (National Standards Foundation, CanadaGAP, Food Processing Human Resources Council, and Canada Halal);
• other sector stakeholders (Biodiversity Institute of Ontario and Food Starter).
6 Jean-Charles Le Vallée and Sylvain Charlebois, 2014 World Ranking: Food Safety Performance (Ottawa: The Conference Board of Canada, 2014).
7 Corporate Research Associates, Food Safety: Canadians’ Awareness, Attitudes and Behaviours (2011–12), Final Report (Halifax: Corporate Research Associates, March 2012), accessed April 15, 2017, http://epe.lac-bac.gc.ca/100/200/301/pwgsc-tpsgc/por-ef/canadian_food_inspection_agency/2012/029-11/report.pdf.
8 Sheila Weatherill, Report of the Independent Investigator into the 2008 Listeriosis Outbreak (Ottawa: Government of Canada, July 2009), accessed April 15, 2017, http://publications.gc.ca/site/eng/361474/publication.html.
Strengthening Indonesia’s Exports of Fish and Processed Fish Products to Canada 3
To identify Indonesian fish and processed fish products that have potential in the Canadian market, data from the International Trade Centre (ITC) are used, and a modified version of the approach outlined in a 2006 ITC report is followed.9
Report OrganizationThe remainder of this report is organized as follows: Chapter 2 provides an overview of Indonesia’s global exports of fish and processed fish products, Canada’s global imports of fish and processed fish products, and Canada’s imports of Indonesian fish and processed fish products. Chapter 3 analyzes the future poten-tial of Indonesian fish and processed fish products in the Canadian market. Chapter 4 provides details on the regulatory framework of the food safety system in Canada, describes stakeholder cooperation on food safety, and illustrates Canadian market demand and buyer requirements. Chapter 5 discusses the requirements and procedures for importing foods into Canada, Indonesian regulations and require-ments for exporting fish and processed fish products, and the effect of Canadian food safety standards on Indonesian fish and processed fish product exports. Finally, Chapter 6 outlines lessons learned, including best practices and recommendations on how to improve the capacity of Indonesian fish and processed fish exporters to successfully export their products to Canada.
9 Christian Helmers and Jean-Michel Pasteesl, Assessing Bilateral Trade Potential at the Commodity Level: An Operational Approach (Geneva: International Trade Centre, November 2006), accessed April 11, 2017, http://docplayer.net/33221437-Assessing-bilateral-trade-potential-at-the-commodity-level-an-operational-approach.html.
Strengthening Indonesia’s Exports of Fish and Processed Fish Products to Canada 4
CHAPTER 2
Trends in Fish and Processed Fish Product Exports and ImportsThis chapter assesses the potential of Indonesian fish and processed fish products to enter the Canadian market. It begins by examining recent export trends for Indonesia’s fish and processed fish products in the global market, highlighting the main export destinations as well as the main exported products. The Canadian import market for fish and processed fish products is then analyzed, including an examination of the market share and trend of each imported fish and processed fish product. From this analysis, a list of Indonesian fish and processed fish products that have high potential to do better in the Canadian market is identified. See “Data and Definitions” for a detailed explanation of the data used in the report as well as how fish and processed fish products are defined within the datasets.
DATA AND DEFINITIONS
Data source: The analysis was conducted using the International Trade Centre database on both an import and export basis. The database is a reliable source of trade data and offers the flexibility to obtain annual data by classification of goods over the appropriate period at the level of detail required.
Classification of goods: The Harmonized Commodity Description and Coding System (HS) was used in the report. The HS is an international system developed by the World Customs Organization that is used to classify traded products using standardized names and numbers. It is used by both Canada and Indonesia to classify the products they export and import. There are two levels of HS code used in the report: four-digit (HS4) and six-digit (HS6). More digits in the HS code means greater detail in the description of products.
Frequency and period of trade data: The report uses annual data. The most recent year for which trade data for all countries were available was 2016. The base year chosen was 2011, which allows a five-year period of change to be analyzed.
Definition of fish products: Fish products refers to HS 03 and its all derivatives at the four-digit and six-digit level. The classification of HS 03 at the four-digit level is:HS 0301 Live fishHS 0302 Fresh or chilled fish (excluding fish fillets)HS 0303 Frozen fish (excluding fish fillets)HS 0304 Fish fillets and other fish meat (fresh, chilled, or frozen)HS 0305 Fish (dried, salted, smoked, or in brine)HS 0306 Crustaceans, whether in shell or not (live, fresh, chilled, frozen, dried, salted, etc.)
Strengthening Indonesia’s Exports of Fish and Processed Fish Products to Canada 5
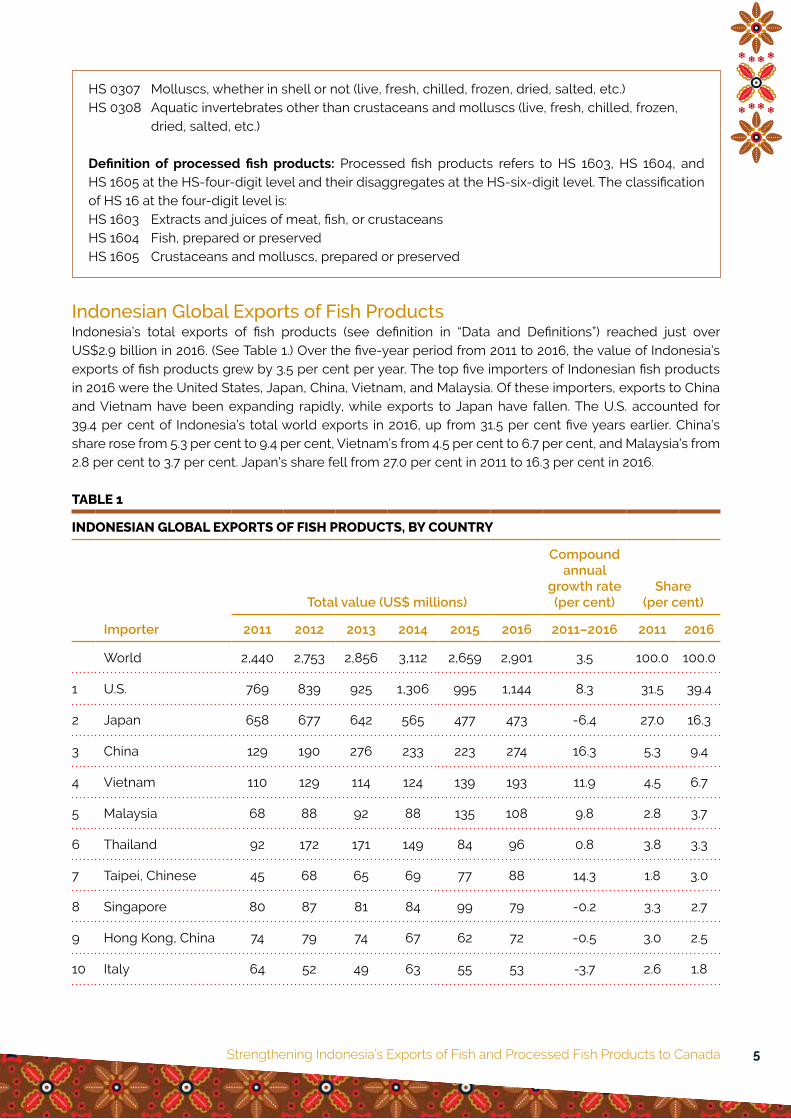
Indonesian Global Exports of Fish ProductsIndonesia’s total exports of fish products (see definition in “Data and Definitions”) reached just over US$2.9 billion in 2016. (See Table 1.) Over the five-year period from 2011 to 2016, the value of Indonesia’s exports of fish products grew by 3.5 per cent per year. The top five importers of Indonesian fish products in 2016 were the United States, Japan, China, Vietnam, and Malaysia. Of these importers, exports to China and Vietnam have been expanding rapidly, while exports to Japan have fallen. The U.S. accounted for 39.4 per cent of Indonesia’s total world exports in 2016, up from 31.5 per cent five years earlier. China’s share rose from 5.3 per cent to 9.4 per cent, Vietnam’s from 4.5 per cent to 6.7 per cent, and Malaysia’s from 2.8 per cent to 3.7 per cent. Japan’s share fell from 27.0 per cent in 2011 to 16.3 per cent in 2016.
TABLE 1
INDONESIAN GLOBAL EXPORTS OF FISH PRODUCTS, BY COUNTRY
Importer
Total value (US$ millions)
Compound annual
growth rate (per cent)
Share (per cent)
2011 2012 2013 2014 2015 2016 2011–2016 2011 2016
World 2,440 2,753 2,856 3,112 2,659 2,901 3.5 100.0 100.0
1 U.S. 769 839 925 1,306 995 1,144 8.3 31.5 39.4
2 Japan 658 677 642 565 477 473 -6.4 27.0 16.3
3 China 129 190 276 233 223 274 16.3 5.3 9.4
4 Vietnam 110 129 114 124 139 193 11.9 4.5 6.7
5 Malaysia 68 88 92 88 135 108 9.8 2.8 3.7
6 Thailand 92 172 171 149 84 96 0.8 3.8 3.3
7 Taipei, Chinese 45 68 65 69 77 88 14.3 1.8 3.0
8 Singapore 80 87 81 84 99 79 -0.2 3.3 2.7
9 Hong Kong, China 74 79 74 67 62 72 -0.5 3.0 2.5
10 Italy 64 52 49 63 55 53 -3.7 2.6 1.8
HS 0307 Molluscs, whether in shell or not (live, fresh, chilled, frozen, dried, salted, etc.)HS 0308 Aquatic invertebrates other than crustaceans and molluscs (live, fresh, chilled, frozen,
dried, salted, etc.)
Definition of processed fish products: Processed fish products refers to HS 1603, HS 1604, and HS 1605 at the HS-four-digit level and their disaggregates at the HS-six-digit level. The classification of HS 16 at the four-digit level is:HS 1603 Extracts and juices of meat, fish, or crustaceansHS 1604 Fish, prepared or preservedHS 1605 Crustaceans and molluscs, prepared or preserved
Strengthening Indonesia’s Exports of Fish and Processed Fish Products to Canada 6
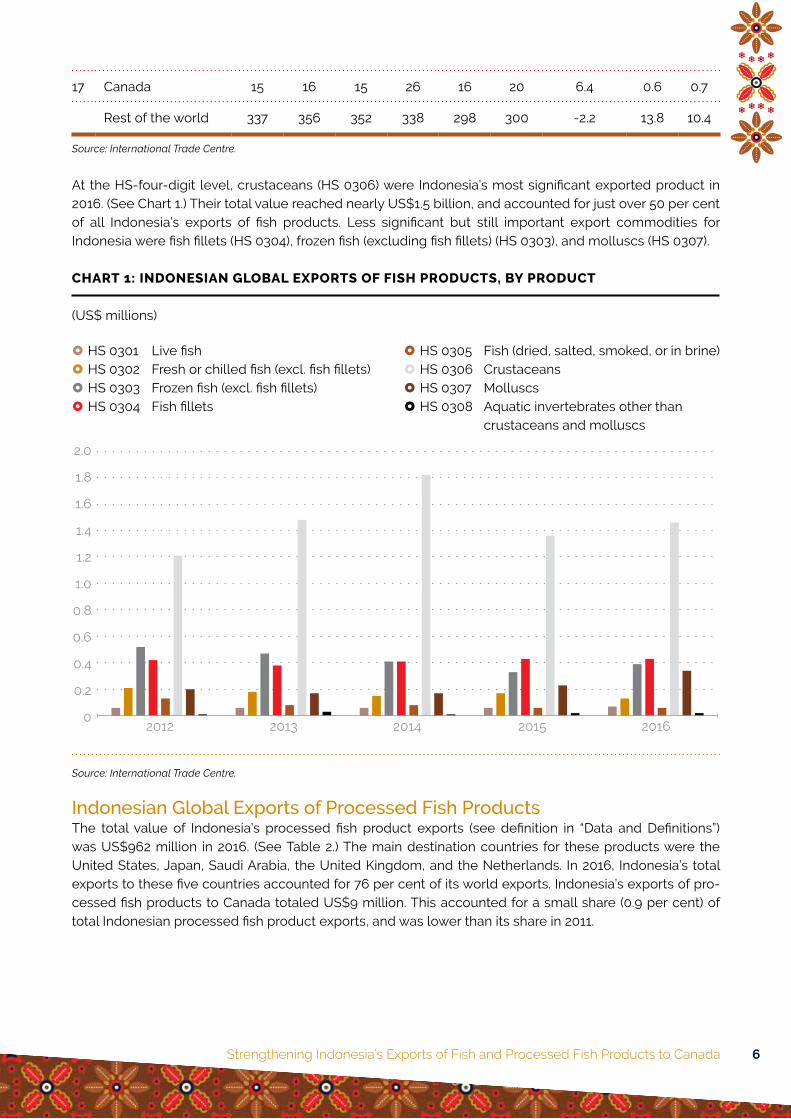
17 Canada 15 16 15 26 16 20 6.4 0.6 0.7
Rest of the world 337 356 352 338 298 300 -2.2 13.8 10.4
Source: International Trade Centre.
At the HS-four-digit level, crustaceans (HS 0306) were Indonesia’s most significant exported product in 2016. (See Chart 1.) Their total value reached nearly US$1.5 billion, and accounted for just over 50 per cent of all Indonesia’s exports of fish products. Less significant but still important export commodities for Indonesia were fish fillets (HS 0304), frozen fish (excluding fish fillets) (HS 0303), and molluscs (HS 0307).
CHART 1: INDONESIAN GLOBAL EXPORTS OF FISH PRODUCTS, BY PRODUCT
(US$ millions)
} HS 0301 Live fish} HS 0302 Fresh or chilled fish (excl. fish fillets)} HS 0303 Frozen fish (excl. fish fillets)} HS 0304 Fish fillets
} HS 0305 Fish (dried, salted, smoked, or in brine)} HS 0306 Crustaceans} HS 0307 Molluscs} HS 0308 Aquatic invertebrates other than
crustaceans and molluscs
2.0
1.8
1.6
1.4
1.2
1.0
0.8
0.6
0.4
0.2
0 2012 2013 2014 2015 2016
Source: International Trade Centre.
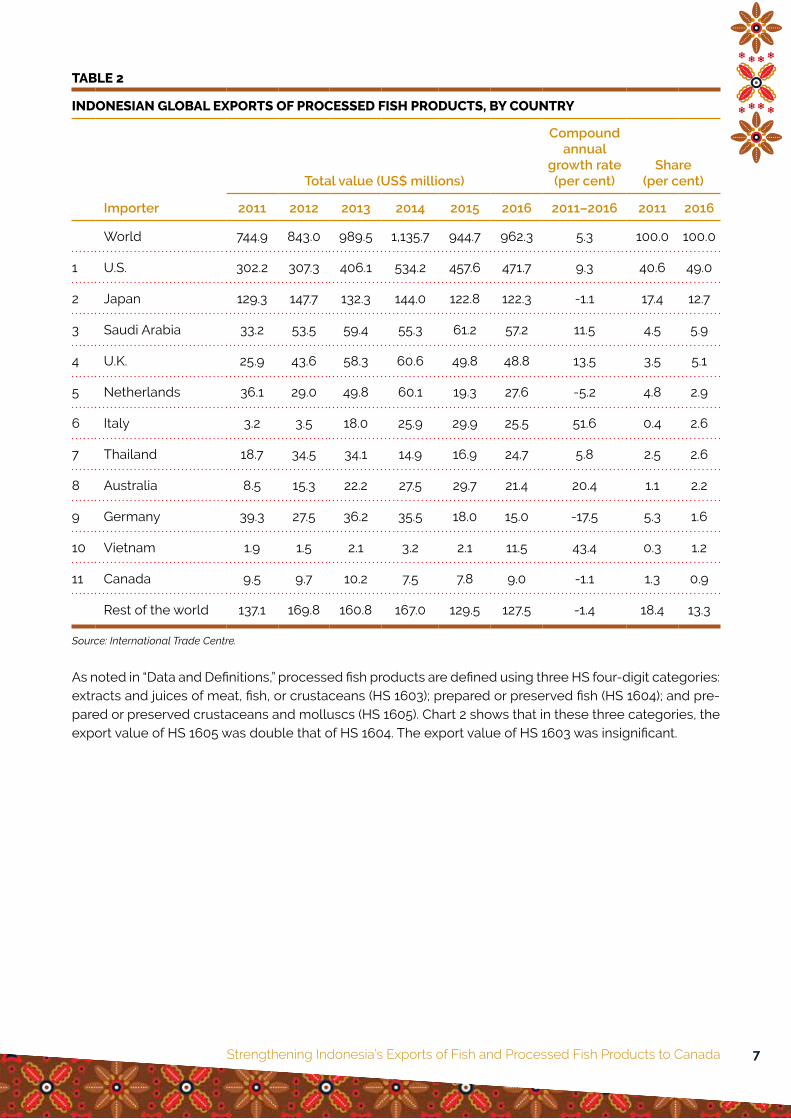
Indonesian Global Exports of Processed Fish ProductsThe total value of Indonesia’s processed fish product exports (see definition in “Data and Definitions”) was US$962 million in 2016. (See Table 2.) The main destination countries for these products were the United States, Japan, Saudi Arabia, the United Kingdom, and the Netherlands. In 2016, Indonesia’s total exports to these five countries accounted for 76 per cent of its world exports. Indonesia’s exports of pro-cessed fish products to Canada totaled US$9 million. This accounted for a small share (0.9 per cent) of total Indonesian processed fish product exports, and was lower than its share in 2011.
Strengthening Indonesia’s Exports of Fish and Processed Fish Products to Canada 7
TABLE 2
INDONESIAN GLOBAL EXPORTS OF PROCESSED FISH PRODUCTS, BY COUNTRY
Importer
Total value (US$ millions)
Compound annual
growth rate (per cent)
Share (per cent)
2011 2012 2013 2014 2015 2016 2011–2016 2011 2016
World 744.9 843.0 989.5 1,135.7 944.7 962.3 5.3 100.0 100.0
1 U.S. 302.2 307.3 406.1 534.2 457.6 471.7 9.3 40.6 49.0
2 Japan 129.3 147.7 132.3 144.0 122.8 122.3 -1.1 17.4 12.7
3 Saudi Arabia 33.2 53.5 59.4 55.3 61.2 57.2 11.5 4.5 5.9
4 U.K. 25.9 43.6 58.3 60.6 49.8 48.8 13.5 3.5 5.1
5 Netherlands 36.1 29.0 49.8 60.1 19.3 27.6 -5.2 4.8 2.9
6 Italy 3.2 3.5 18.0 25.9 29.9 25.5 51.6 0.4 2.6
7 Thailand 18.7 34.5 34.1 14.9 16.9 24.7 5.8 2.5 2.6
8 Australia 8.5 15.3 22.2 27.5 29.7 21.4 20.4 1.1 2.2
9 Germany 39.3 27.5 36.2 35.5 18.0 15.0 -17.5 5.3 1.6
10 Vietnam 1.9 1.5 2.1 3.2 2.1 11.5 43.4 0.3 1.2
11 Canada 9.5 9.7 10.2 7.5 7.8 9.0 -1.1 1.3 0.9
Rest of the world 137.1 169.8 160.8 167.0 129.5 127.5 -1.4 18.4 13.3
Source: International Trade Centre.
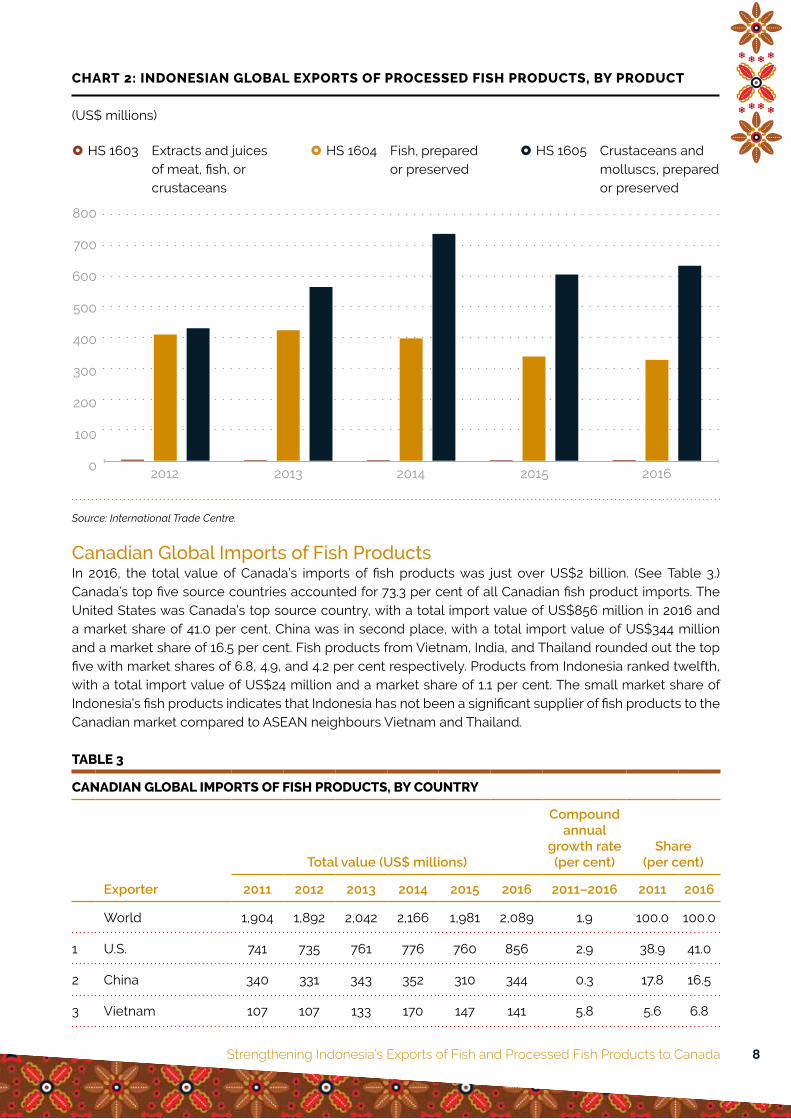
As noted in “Data and Definitions,” processed fish products are defined using three HS four-digit categories: extracts and juices of meat, fish, or crustaceans (HS 1603); prepared or preserved fish (HS 1604); and pre-pared or preserved crustaceans and molluscs (HS 1605). Chart 2 shows that in these three categories, the export value of HS 1605 was double that of HS 1604. The export value of HS 1603 was insignificant.
Strengthening Indonesia’s Exports of Fish and Processed Fish Products to Canada 8
CHART 2: INDONESIAN GLOBAL EXPORTS OF PROCESSED FISH PRODUCTS, BY PRODUCT
(US$ millions)
} HS 1603 Extracts and juices of meat, fish, or crustaceans
} HS 1604 Fish, prepared or preserved
} HS 1605 Crustaceans and molluscs, prepared or preserved
2012 2013 2014 2015 2016
800
700
600
500
400
300
200
100
0
Source: International Trade Centre.
Canadian Global Imports of Fish ProductsIn 2016, the total value of Canada’s imports of fish products was just over US$2 billion. (See Table 3.) Canada’s top five source countries accounted for 73.3 per cent of all Canadian fish product imports. The United States was Canada’s top source country, with a total import value of US$856 million in 2016 and a market share of 41.0 per cent. China was in second place, with a total import value of US$344 million and a market share of 16.5 per cent. Fish products from Vietnam, India, and Thailand rounded out the top five with market shares of 6.8, 4.9, and 4.2 per cent respectively. Products from Indonesia ranked twelfth, with a total import value of US$24 million and a market share of 1.1 per cent. The small market share of Indonesia’s fish products indicates that Indonesia has not been a significant supplier of fish products to the Canadian market compared to ASEAN neighbours Vietnam and Thailand.
TABLE 3
CANADIAN GLOBAL IMPORTS OF FISH PRODUCTS, BY COUNTRY
Exporter
Total value (US$ millions)
Compound annual
growth rate (per cent)
Share (per cent)
2011 2012 2013 2014 2015 2016 2011–2016 2011 2016
World 1,904 1,892 2,042 2,166 1,981 2,089 1.9 100.0 100.0
1 U.S. 741 735 761 776 760 856 2.9 38.9 41.0
2 China 340 331 343 352 310 344 0.3 17.8 16.5
3 Vietnam 107 107 133 170 147 141 5.8 5.6 6.8
Strengthening Indonesia’s Exports of Fish and Processed Fish Products to Canada 9
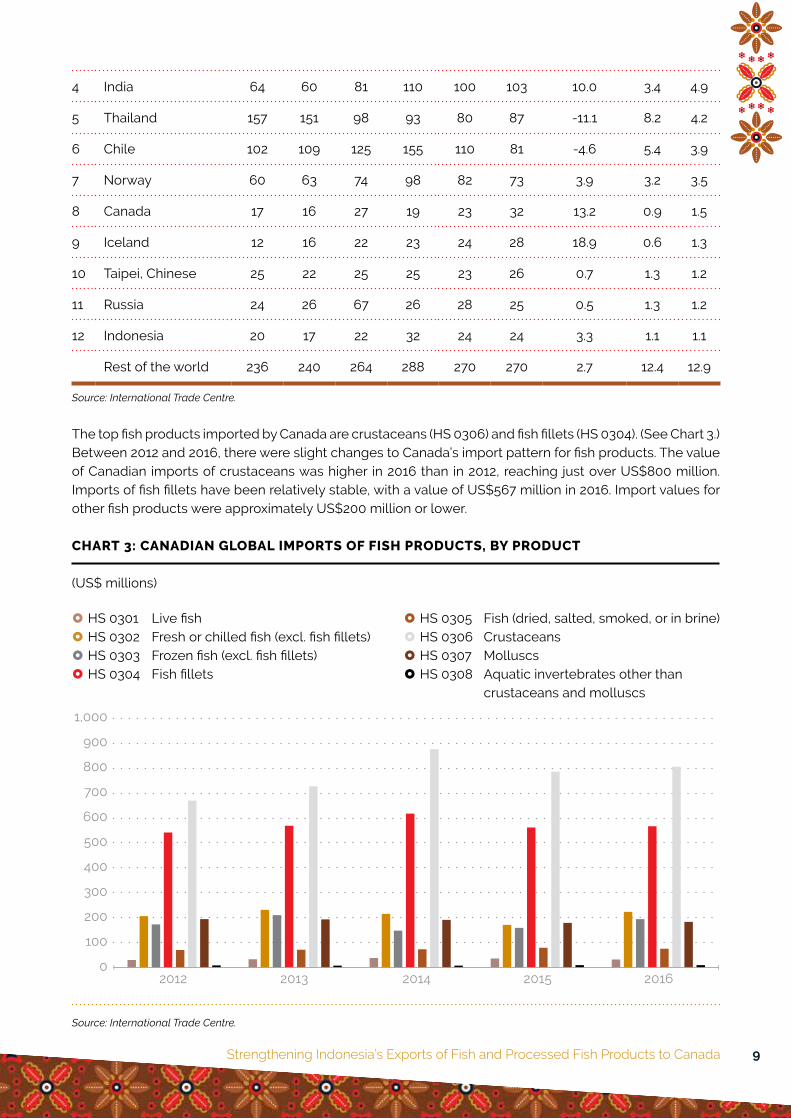
4 India 64 60 81 110 100 103 10.0 3.4 4.9
5 Thailand 157 151 98 93 80 87 -11.1 8.2 4.2
6 Chile 102 109 125 155 110 81 -4.6 5.4 3.9
7 Norway 60 63 74 98 82 73 3.9 3.2 3.5
8 Canada 17 16 27 19 23 32 13.2 0.9 1.5
9 Iceland 12 16 22 23 24 28 18.9 0.6 1.3
10 Taipei, Chinese 25 22 25 25 23 26 0.7 1.3 1.2
11 Russia 24 26 67 26 28 25 0.5 1.3 1.2
12 Indonesia 20 17 22 32 24 24 3.3 1.1 1.1
Rest of the world 236 240 264 288 270 270 2.7 12.4 12.9
Source: International Trade Centre.
The top fish products imported by Canada are crustaceans (HS 0306) and fish fillets (HS 0304). (See Chart 3.) Between 2012 and 2016, there were slight changes to Canada’s import pattern for fish products. The value of Canadian imports of crustaceans was higher in 2016 than in 2012, reaching just over US$800 million. Imports of fish fillets have been relatively stable, with a value of US$567 million in 2016. Import values for other fish products were approximately US$200 million or lower.
CHART 3: CANADIAN GLOBAL IMPORTS OF FISH PRODUCTS, BY PRODUCT
(US$ millions)
} HS 0301 Live fish} HS 0302 Fresh or chilled fish (excl. fish fillets)} HS 0303 Frozen fish (excl. fish fillets)} HS 0304 Fish fillets
} HS 0305 Fish (dried, salted, smoked, or in brine)} HS 0306 Crustaceans} HS 0307 Molluscs} HS 0308 Aquatic invertebrates other than
crustaceans and molluscs
2012 2013 2014 2015 2016
1,000
900
800
700
600
500
400
300
200
100
0
Source: International Trade Centre.
Strengthening Indonesia’s Exports of Fish and Processed Fish Products to Canada 10
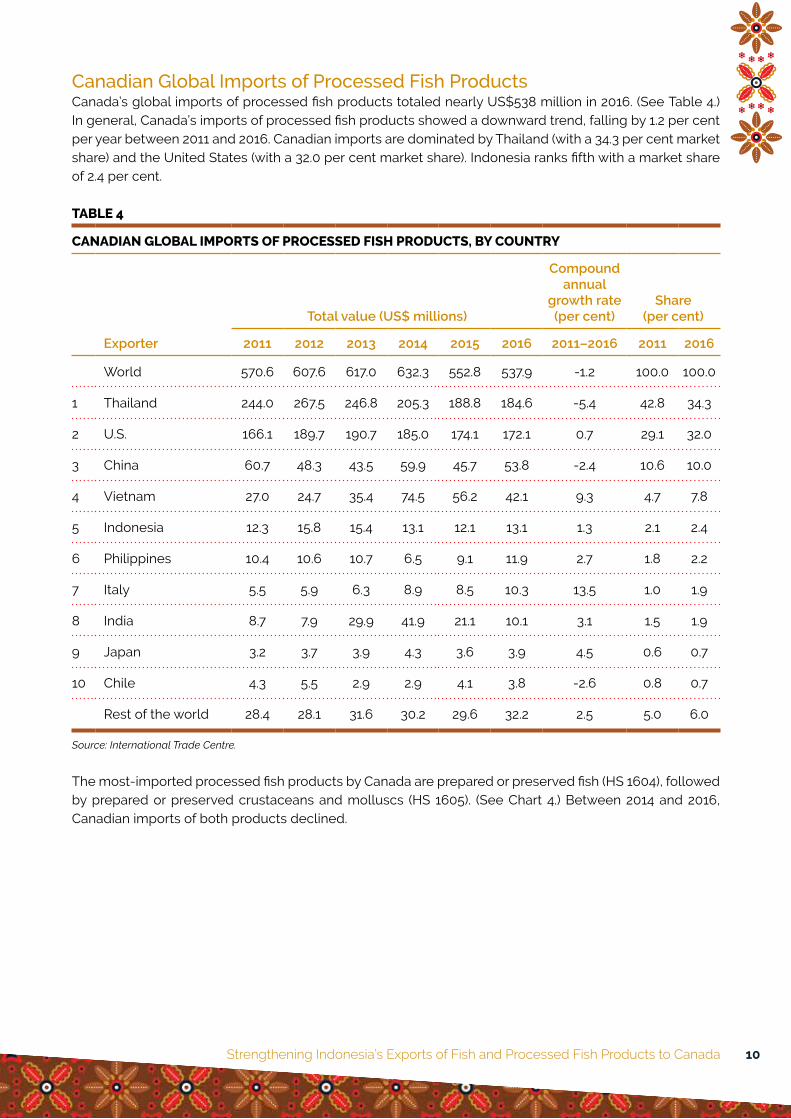
Canadian Global Imports of Processed Fish ProductsCanada’s global imports of processed fish products totaled nearly US$538 million in 2016. (See Table 4.) In general, Canada’s imports of processed fish products showed a downward trend, falling by 1.2 per cent per year between 2011 and 2016. Canadian imports are dominated by Thailand (with a 34.3 per cent market share) and the United States (with a 32.0 per cent market share). Indonesia ranks fifth with a market share of 2.4 per cent.
TABLE 4
CANADIAN GLOBAL IMPORTS OF PROCESSED FISH PRODUCTS, BY COUNTRY
Exporter
Total value (US$ millions)
Compound annual
growth rate (per cent)
Share (per cent)
2011 2012 2013 2014 2015 2016 2011–2016 2011 2016
World 570.6 607.6 617.0 632.3 552.8 537.9 -1.2 100.0 100.0
1 Thailand 244.0 267.5 246.8 205.3 188.8 184.6 -5.4 42.8 34.3
2 U.S. 166.1 189.7 190.7 185.0 174.1 172.1 0.7 29.1 32.0
3 China 60.7 48.3 43.5 59.9 45.7 53.8 -2.4 10.6 10.0
4 Vietnam 27.0 24.7 35.4 74.5 56.2 42.1 9.3 4.7 7.8
5 Indonesia 12.3 15.8 15.4 13.1 12.1 13.1 1.3 2.1 2.4
6 Philippines 10.4 10.6 10.7 6.5 9.1 11.9 2.7 1.8 2.2
7 Italy 5.5 5.9 6.3 8.9 8.5 10.3 13.5 1.0 1.9
8 India 8.7 7.9 29.9 41.9 21.1 10.1 3.1 1.5 1.9
9 Japan 3.2 3.7 3.9 4.3 3.6 3.9 4.5 0.6 0.7
10 Chile 4.3 5.5 2.9 2.9 4.1 3.8 -2.6 0.8 0.7
Rest of the world 28.4 28.1 31.6 30.2 29.6 32.2 2.5 5.0 6.0
Source: International Trade Centre.
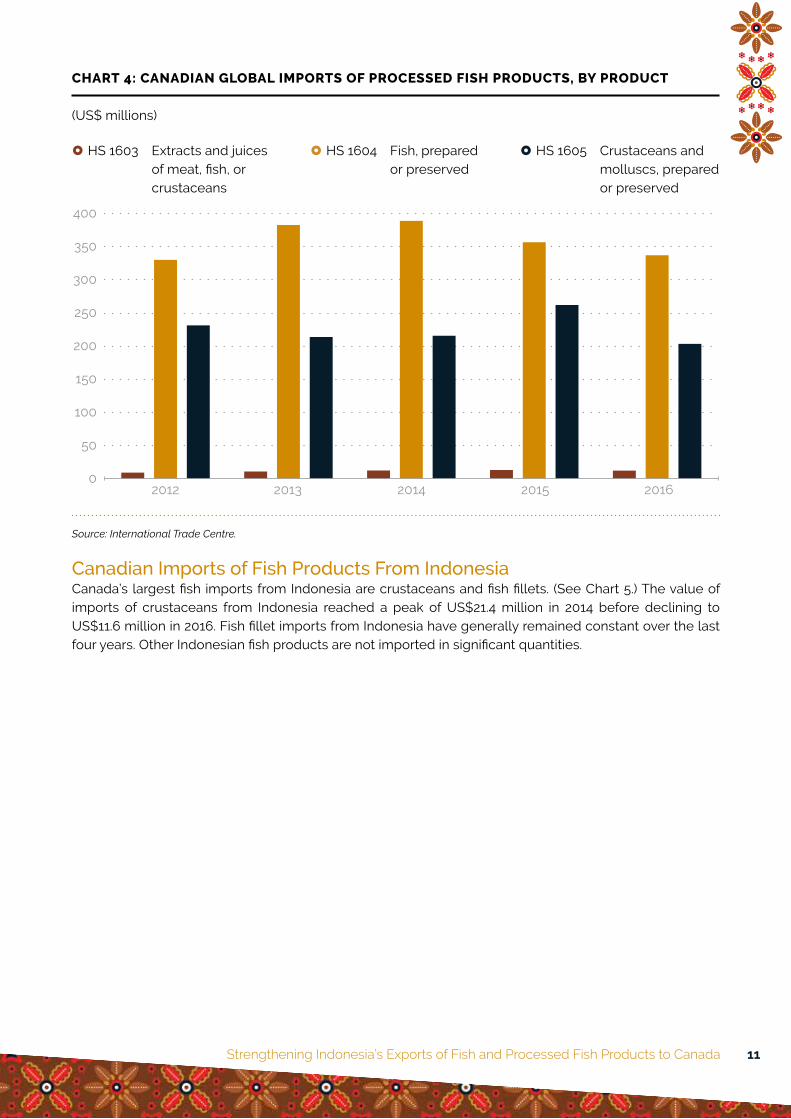
The most-imported processed fish products by Canada are prepared or preserved fish (HS 1604), followed by prepared or preserved crustaceans and molluscs (HS 1605). (See Chart 4.) Between 2014 and 2016, Canadian imports of both products declined.
Strengthening Indonesia’s Exports of Fish and Processed Fish Products to Canada 11
CHART 4: CANADIAN GLOBAL IMPORTS OF PROCESSED FISH PRODUCTS, BY PRODUCT
(US$ millions)
} HS 1603 Extracts and juices of meat, fish, or crustaceans
} HS 1604 Fish, prepared or preserved
} HS 1605 Crustaceans and molluscs, prepared or preserved
2012 2013 2014 2015 2016
400
350
300
250
200
150
100
50
0
Source: International Trade Centre.
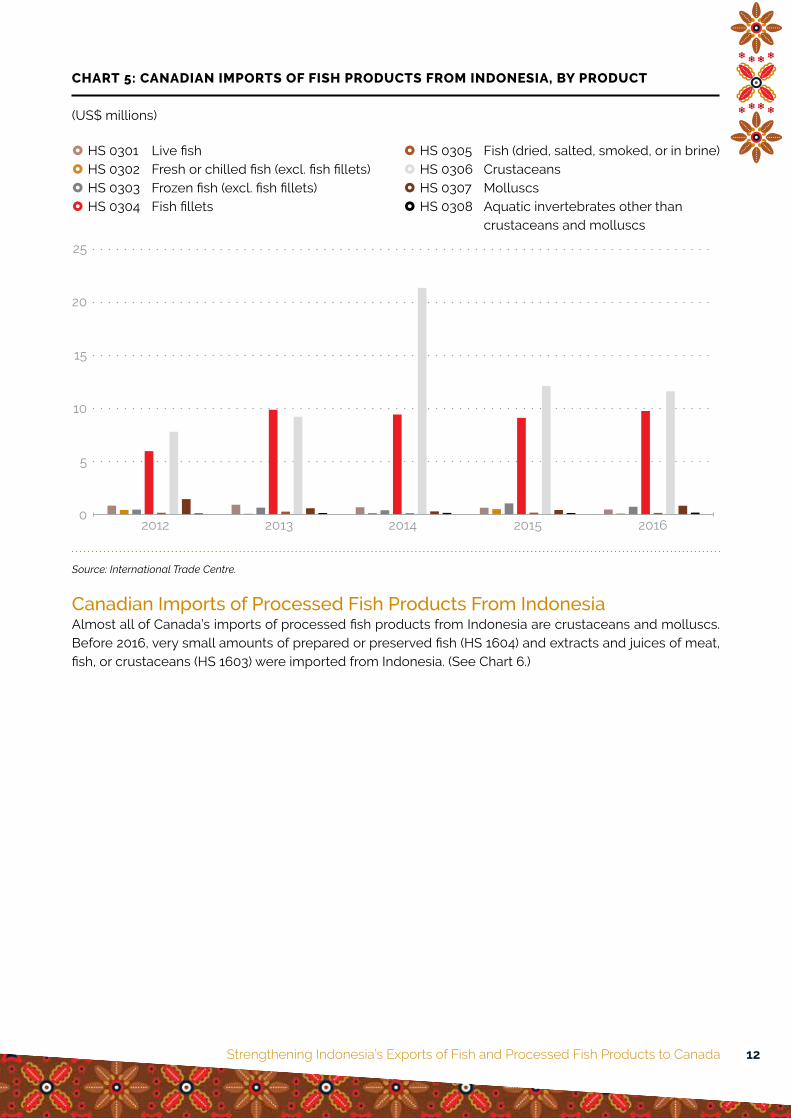
Canadian Imports of Fish Products From IndonesiaCanada’s largest fish imports from Indonesia are crustaceans and fish fillets. (See Chart 5.) The value of imports of crustaceans from Indonesia reached a peak of US$21.4 million in 2014 before declining to US$11.6 million in 2016. Fish fillet imports from Indonesia have generally remained constant over the last four years. Other Indonesian fish products are not imported in significant quantities.
Strengthening Indonesia’s Exports of Fish and Processed Fish Products to Canada 12
CHART 5: CANADIAN IMPORTS OF FISH PRODUCTS FROM INDONESIA, BY PRODUCT
(US$ millions)
} HS 0301 Live fish} HS 0302 Fresh or chilled fish (excl. fish fillets)} HS 0303 Frozen fish (excl. fish fillets)} HS 0304 Fish fillets
} HS 0305 Fish (dried, salted, smoked, or in brine)} HS 0306 Crustaceans} HS 0307 Molluscs} HS 0308 Aquatic invertebrates other than
crustaceans and molluscs
2012 2013 2014 2015 2016
25
20
15
10
5
0
Source: International Trade Centre.
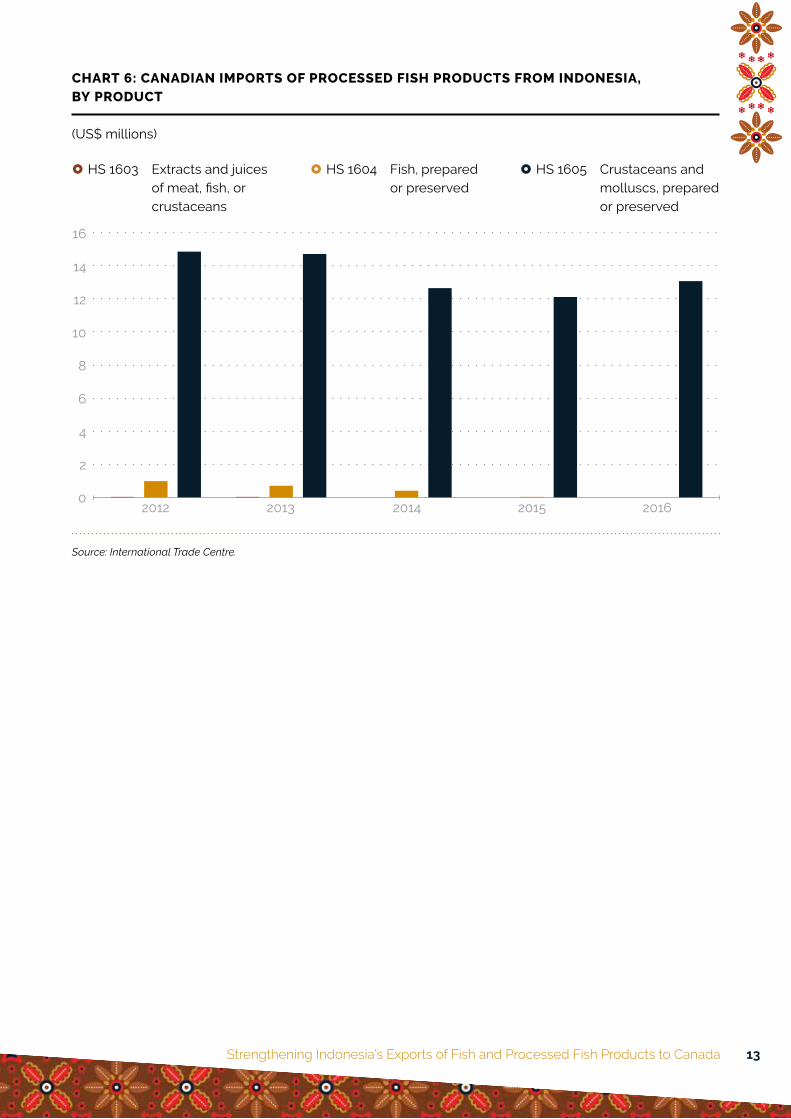
Canadian Imports of Processed Fish Products From IndonesiaAlmost all of Canada’s imports of processed fish products from Indonesia are crustaceans and molluscs. Before 2016, very small amounts of prepared or preserved fish (HS 1604) and extracts and juices of meat, fish, or crustaceans (HS 1603) were imported from Indonesia. (See Chart 6.)
Strengthening Indonesia’s Exports of Fish and Processed Fish Products to Canada 13
CHART 6: CANADIAN IMPORTS OF PROCESSED FISH PRODUCTS FROM INDONESIA, BY PRODUCT
(US$ millions)
} HS 1603 Extracts and juices of meat, fish, or crustaceans
} HS 1604 Fish, prepared or preserved
} HS 1605 Crustaceans and molluscs, prepared or preserved
16
14
12
10
8
6
4
2
0 2012 2013 2014 2015 2016
Source: International Trade Centre.
Strengthening Indonesia’s Exports of Fish and Processed Fish Products to Canada 14
CHAPTER 3
Canadian Market Potential for Indonesian Fish and Processed Fish ProductsThis chapter analyzes the potential for Indonesian fish and processed fish products to be exported to the Canadian market. To take advantage of the most detailed data available, data at the HS six-digit level are used. The analysis of future potential includes the following three steps:
• Step 1: Choose products with an indicative trade potential (ITP) larger than US$5 million.
• Step 2: Refine the list using a market growth criteria matrix.
• Step 3: Investigate other factors that may affect potential, including trade costs and level of competition.
As explained in “Data and Definitions” in Chapter 2, fish products refers to HS 03 and all its derivatives at the four-digit and six-digit level. There are eight product categories at the four-digit level and 224 product categories at the six-digit level:HS 0301 Live fish [eight HS-six-digit products]HS 0302 Fresh or chilled fish (excluding fish fillets) [45 HS-six-digit products]HS 0303 Frozen fish (excluding fish fillets) [44 HS-six-digit products]HS 0304 Fish fillets and other fish meat (fresh, chilled, or frozen) [48 HS-six-digit products]HS 0305 Fish (dried, salted, smoked, or in brine) [23 HS-six-digit products]HS 0306 Crustaceans, whether in shell or not (live, fresh, chilled, frozen, dried, salted, etc.)
[20 HS-six-digit products]HS 0307 Molluscs, whether in shell or not (live, fresh, chilled, frozen, dried, salted, etc.)
[28 HS-six-digit products]HS 0308 Aquatic invertebrates other than crustaceans and molluscs (live, fresh, chilled, frozen, dried,
salted, etc.) [eight HS-six-digit products]
Processed fish products refers to HS 1603, HS 1604, and HS 1605 and their derivatives at the HS-six-digit level. There are 34 product categories at the HS-six-digit level:HS 1603 Extracts and juices of meat, fish, or crustaceans [one HS-six-digit product]HS 1604 Fish, prepared or preserved [13 HS-six-digit products]HS 1605 Crustaceans and molluscs, prepared or preserved [20 HS-six-digit products]
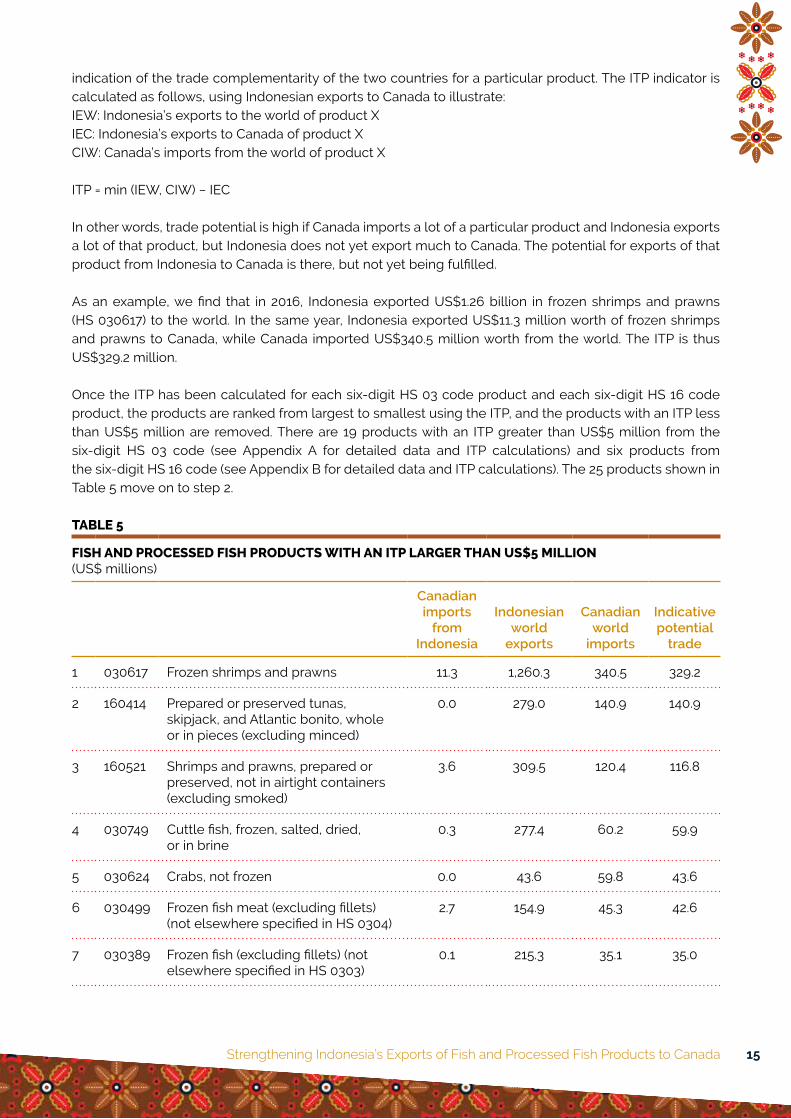
Step 1: Choose Products With an Indicative Trade Potential Larger Than Us$5 MillionThe indicative trade potential (ITP) must be calculated for each of the 224 HS-six-digit fish products and 34 HS-six-digit processed fish products. The ITP is defined as the lower value of the country’s exports and the partner country’s imports, minus the actual current trade between the two countries. It gives an
Strengthening Indonesia’s Exports of Fish and Processed Fish Products to Canada 15
indication of the trade complementarity of the two countries for a particular product. The ITP indicator is calculated as follows, using Indonesian exports to Canada to illustrate:IEW: Indonesia’s exports to the world of product XIEC: Indonesia’s exports to Canada of product XCIW: Canada’s imports from the world of product X
ITP = min (IEW, CIW) − IEC
In other words, trade potential is high if Canada imports a lot of a particular product and Indonesia exports a lot of that product, but Indonesia does not yet export much to Canada. The potential for exports of that product from Indonesia to Canada is there, but not yet being fulfilled.
As an example, we find that in 2016, Indonesia exported US$1.26 billion in frozen shrimps and prawns (HS 030617) to the world. In the same year, Indonesia exported US$11.3 million worth of frozen shrimps and prawns to Canada, while Canada imported US$340.5 million worth from the world. The ITP is thus US$329.2 million.
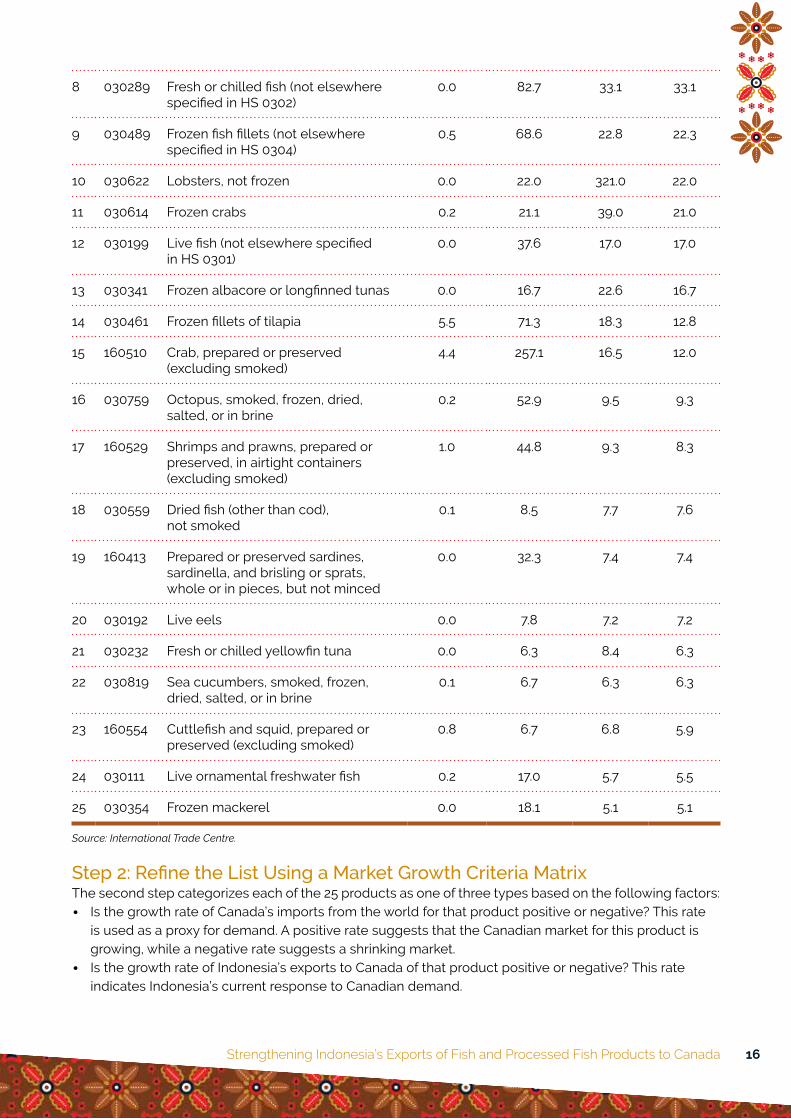
Once the ITP has been calculated for each six-digit HS 03 code product and each six-digit HS 16 code product, the products are ranked from largest to smallest using the ITP, and the products with an ITP less than US$5 million are removed. There are 19 products with an ITP greater than US$5 million from the six-digit HS 03 code (see Appendix A for detailed data and ITP calculations) and six products from the six-digit HS 16 code (see Appendix B for detailed data and ITP calculations). The 25 products shown in Table 5 move on to step 2.
TABLE 5
FISH AND PROCESSED FISH PRODUCTS WITH AN ITP LARGER THAN US$5 MILLION(US$ millions)
Canadian imports
from Indonesia
Indonesian world
exports
Canadian world
imports
Indicative potential
trade
1 030617 Frozen shrimps and prawns 11.3 1,260.3 340.5 329.2
2 160414 Prepared or preserved tunas, skipjack, and Atlantic bonito, whole or in pieces (excluding minced)
0.0 279.0 140.9 140.9
3 160521 Shrimps and prawns, prepared or preserved, not in airtight containers (excluding smoked)
3.6 309.5 120.4 116.8
4 030749 Cuttle fish, frozen, salted, dried, or in brine
0.3 277.4 60.2 59.9
5 030624 Crabs, not frozen 0.0 43.6 59.8 43.6
6 030499 Frozen fish meat (excluding fillets) (not elsewhere specified in HS 0304)
2.7 154.9 45.3 42.6
7 030389 Frozen fish (excluding fillets) (not elsewhere specified in HS 0303)
0.1 215.3 35.1 35.0
Strengthening Indonesia’s Exports of Fish and Processed Fish Products to Canada 16
8 030289 Fresh or chilled fish (not elsewhere specified in HS 0302)
0.0 82.7 33.1 33.1
9 030489 Frozen fish fillets (not elsewhere specified in HS 0304)
0.5 68.6 22.8 22.3
10 030622 Lobsters, not frozen 0.0 22.0 321.0 22.0
11 030614 Frozen crabs 0.2 21.1 39.0 21.0
12 030199 Live fish (not elsewhere specified in HS 0301)
0.0 37.6 17.0 17.0
13 030341 Frozen albacore or longfinned tunas 0.0 16.7 22.6 16.7
14 030461 Frozen fillets of tilapia 5.5 71.3 18.3 12.8
15 160510 Crab, prepared or preserved (excluding smoked)
4.4 257.1 16.5 12.0
16 030759 Octopus, smoked, frozen, dried, salted, or in brine
0.2 52.9 9.5 9.3
17 160529 Shrimps and prawns, prepared or preserved, in airtight containers (excluding smoked)
1.0 44.8 9.3 8.3
18 030559 Dried fish (other than cod), not smoked
0.1 8.5 7.7 7.6
19 160413 Prepared or preserved sardines, sardinella, and brisling or sprats, whole or in pieces, but not minced
0.0 32.3 7.4 7.4
20 030192 Live eels 0.0 7.8 7.2 7.2
21 030232 Fresh or chilled yellowfin tuna 0.0 6.3 8.4 6.3
22 030819 Sea cucumbers, smoked, frozen, dried, salted, or in brine
0.1 6.7 6.3 6.3
23 160554 Cuttlefish and squid, prepared or preserved (excluding smoked)
0.8 6.7 6.8 5.9
24 030111 Live ornamental freshwater fish 0.2 17.0 5.7 5.5
25 030354 Frozen mackerel 0.0 18.1 5.1 5.1
Source: International Trade Centre.
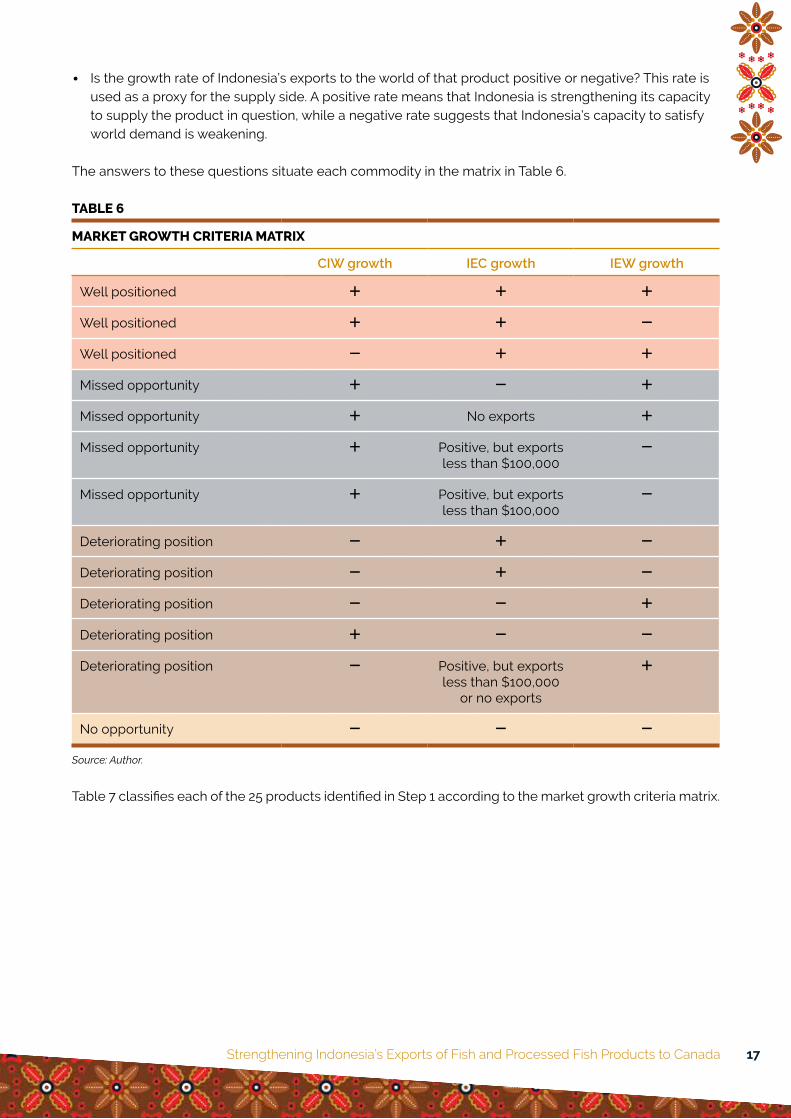
Step 2: Refine the List Using a Market Growth Criteria MatrixThe second step categorizes each of the 25 products as one of three types based on the following factors:
• Is the growth rate of Canada’s imports from the world for that product positive or negative? This rate is used as a proxy for demand. A positive rate suggests that the Canadian market for this product is growing, while a negative rate suggests a shrinking market.
• Is the growth rate of Indonesia’s exports to Canada of that product positive or negative? This rate indicates Indonesia’s current response to Canadian demand.
Strengthening Indonesia’s Exports of Fish and Processed Fish Products to Canada 17
• Is the growth rate of Indonesia’s exports to the world of that product positive or negative? This rate is used as a proxy for the supply side. A positive rate means that Indonesia is strengthening its capacity to supply the product in question, while a negative rate suggests that Indonesia’s capacity to satisfy world demand is weakening.
The answers to these questions situate each commodity in the matrix in Table 6.
TABLE 6
MARKET GROWTH CRITERIA MATRIX
CIW growth IEC growth IEW growth
Well positioned ! ! !
Well positioned ! ! "
Well positioned " ! !
Missed opportunity ! " !
Missed opportunity ! No exports !
Missed opportunity ! Positive, but exports less than $100,000
"
Missed opportunity ! Positive, but exports less than $100,000
"
Deteriorating position " ! "
Deteriorating position " ! "
Deteriorating position " " !
Deteriorating position ! " "
Deteriorating position " Positive, but exports less than $100,000
or no exports
!
No opportunity " " "
Source: Author.
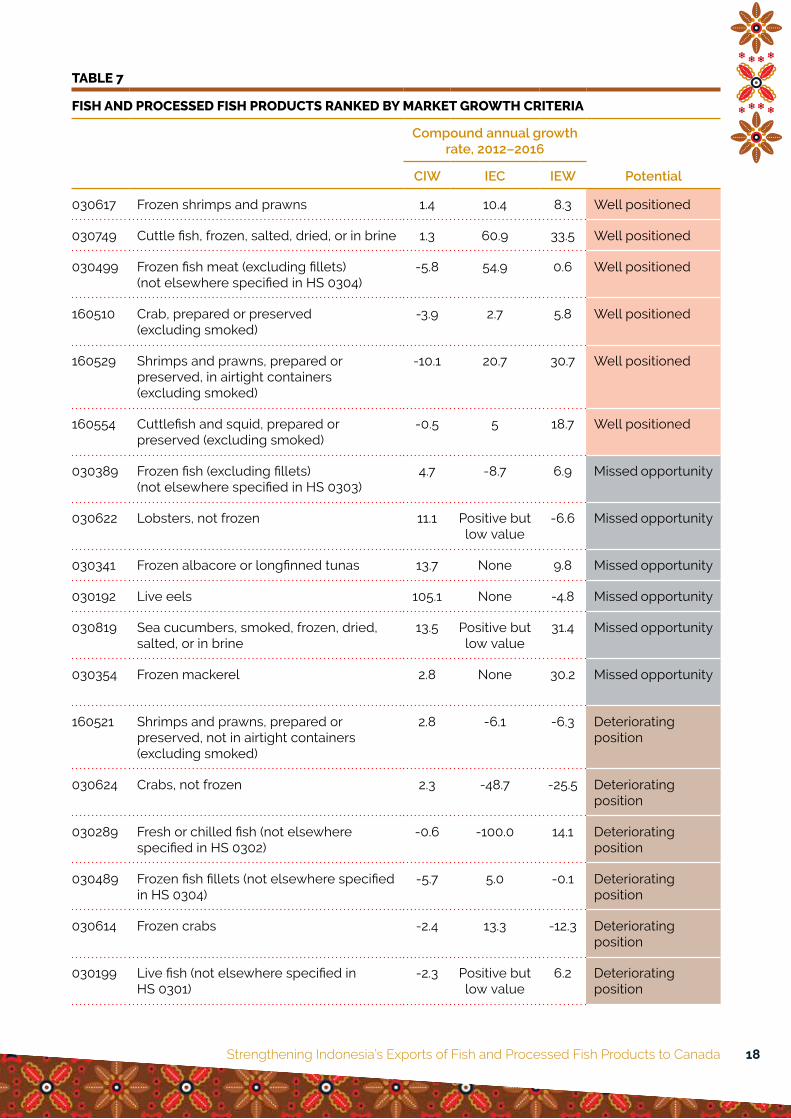
Table 7 classifies each of the 25 products identified in Step 1 according to the market growth criteria matrix.
Strengthening Indonesia’s Exports of Fish and Processed Fish Products to Canada 18
TABLE 7
FISH AND PROCESSED FISH PRODUCTS RANKED BY MARKET GROWTH CRITERIA
Compound annual growth rate, 2012–2016
PotentialCIW IEC IEW
030617 Frozen shrimps and prawns 1.4 10.4 8.3 Well positioned
030749 Cuttle fish, frozen, salted, dried, or in brine 1.3 60.9 33.5 Well positioned
030499 Frozen fish meat (excluding fillets) (not elsewhere specified in HS 0304)
-5.8 54.9 0.6 Well positioned
160510 Crab, prepared or preserved (excluding smoked)
-3.9 2.7 5.8 Well positioned
160529 Shrimps and prawns, prepared or preserved, in airtight containers (excluding smoked)
-10.1 20.7 30.7 Well positioned
160554 Cuttlefish and squid, prepared or preserved (excluding smoked)
-0.5 5 18.7 Well positioned
030389 Frozen fish (excluding fillets) (not elsewhere specified in HS 0303)
4.7 -8.7 6.9 Missed opportunity
030622 Lobsters, not frozen 11.1 Positive but low value
-6.6 Missed opportunity
030341 Frozen albacore or longfinned tunas 13.7 None 9.8 Missed opportunity
030192 Live eels 105.1 None -4.8 Missed opportunity
030819 Sea cucumbers, smoked, frozen, dried, salted, or in brine
13.5 Positive but low value
31.4 Missed opportunity
030354 Frozen mackerel 2.8 None 30.2 Missed opportunity
160521 Shrimps and prawns, prepared or preserved, not in airtight containers (excluding smoked)
2.8 -6.1 -6.3 Deteriorating position
030624 Crabs, not frozen 2.3 -48.7 -25.5 Deteriorating position
030289 Fresh or chilled fish (not elsewhere specified in HS 0302)
-0.6 -100.0 14.1 Deteriorating position
030489 Frozen fish fillets (not elsewhere specified in HS 0304)
-5.7 5.0 -0.1 Deteriorating position
030614 Frozen crabs -2.4 13.3 -12.3 Deteriorating position
030199 Live fish (not elsewhere specified in HS 0301)
-2.3 Positive but low value
6.2 Deteriorating position
Strengthening Indonesia’s Exports of Fish and Processed Fish Products to Canada 19
030461 Frozen fillets of tilapia -6.3 3.8 -0.8 Deteriorating position
030559 Dried fish (other than cod), not smoked 6.5 -7.5 -27.7 Deteriorating position
030232 Fresh or chilled yellowfin tuna 0.7 -28.4 -31.0 Deteriorating position
030111 Live ornamental freshwater fish -7.5 -21.4 2.3 Deteriorating position
160414 Prepared or preserved tunas, skipjack, and Atlantic bonito, whole or in pieces (excluding minced)
-100 -4.4 -4.3 No opportunity
030759 Octopus, smoked, frozen, dried, salted, or in brine
-2.3 -33.1 -7.5 No opportunity
160413 Prepared or preserved sardines, sardinella, and brisling or sprats, whole or in pieces, but not minced
none -1 -1 No opportunity
Sources: International Trade Centre; author’s calculation.
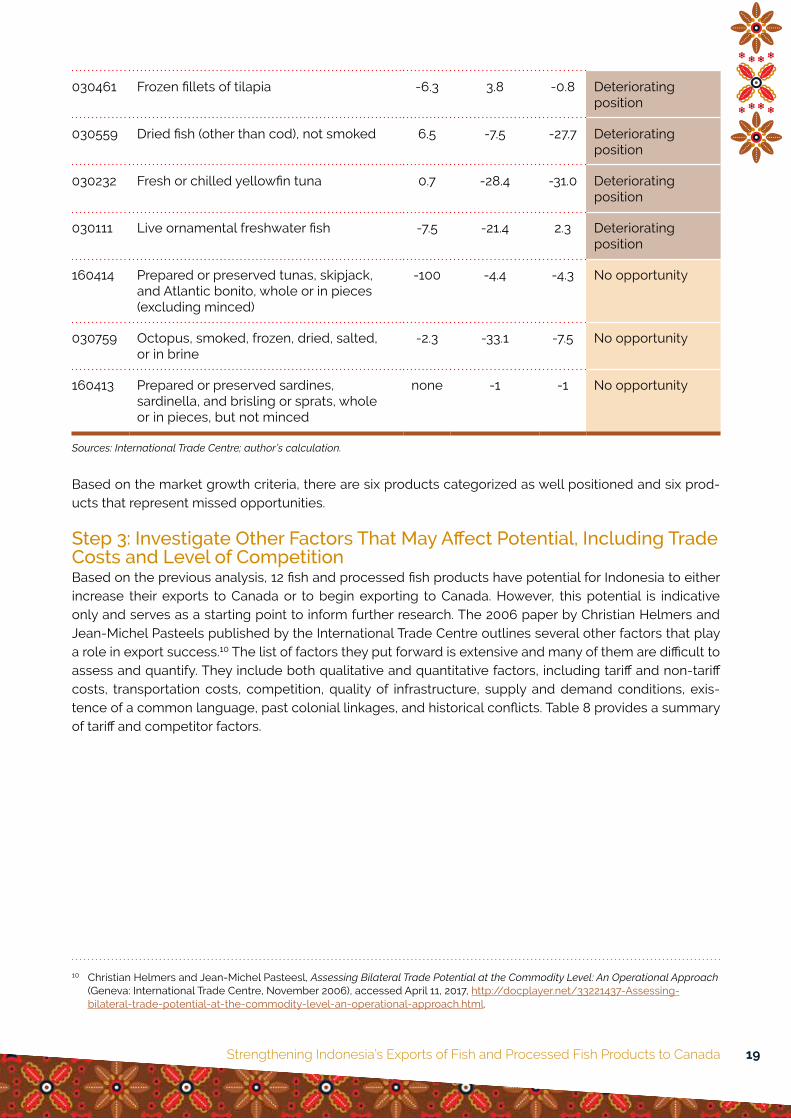
Based on the market growth criteria, there are six products categorized as well positioned and six prod-ucts that represent missed opportunities.
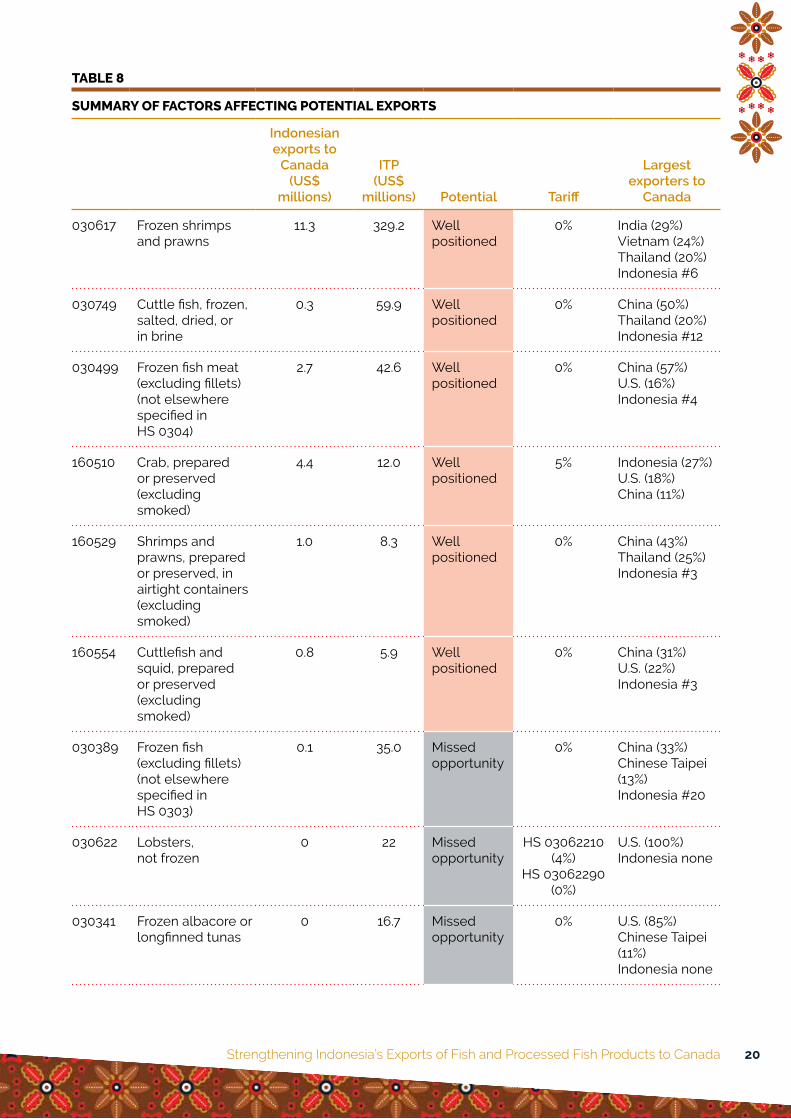
Step 3: Investigate Other Factors That May Affect Potential, Including Trade Costs and Level of CompetitionBased on the previous analysis, 12 fish and processed fish products have potential for Indonesia to either increase their exports to Canada or to begin exporting to Canada. However, this potential is indicative only and serves as a starting point to inform further research. The 2006 paper by Christian Helmers and Jean-Michel Pasteels published by the International Trade Centre outlines several other factors that play a role in export success.10 The list of factors they put forward is extensive and many of them are difficult to assess and quantify. They include both qualitative and quantitative factors, including tariff and non-tariff costs, transportation costs, competition, quality of infrastructure, supply and demand conditions, exis-tence of a common language, past colonial linkages, and historical conflicts. Table 8 provides a summary of tariff and competitor factors.
10 Christian Helmers and Jean-Michel Pasteesl, Assessing Bilateral Trade Potential at the Commodity Level: An Operational Approach (Geneva: International Trade Centre, November 2006), accessed April 11, 2017, http://docplayer.net/33221437-Assessing-bilateral-trade-potential-at-the-commodity-level-an-operational-approach.html.
Strengthening Indonesia’s Exports of Fish and Processed Fish Products to Canada 20
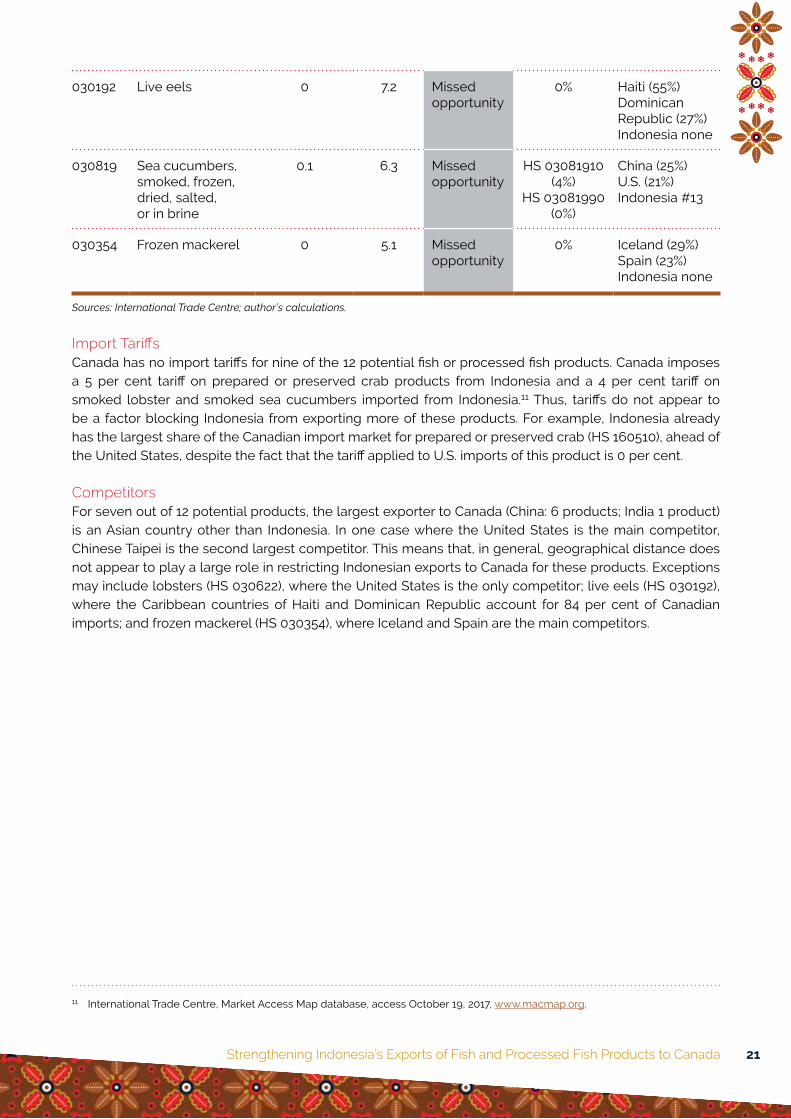
TABLE 8
SUMMARY OF FACTORS AFFECTING POTENTIAL EXPORTS
Indonesian exports to
Canada (US$
millions)
ITP (US$
millions) Potential Tariff
Largest exporters to
Canada
030617 Frozen shrimps and prawns
11.3 329.2 Well positioned
0% India (29%) Vietnam (24%) Thailand (20%) Indonesia #6
030749 Cuttle fish, frozen, salted, dried, or in brine
0.3 59.9 Well positioned
0% China (50%) Thailand (20%) Indonesia #12
030499 Frozen fish meat (excluding fillets) (not elsewhere specified in HS 0304)
2.7 42.6 Well positioned
0% China (57%) U.S. (16%) Indonesia #4
160510 Crab, prepared or preserved (excluding smoked)
4.4 12.0 Well positioned
5% Indonesia (27%) U.S. (18%) China (11%)
160529 Shrimps and prawns, prepared or preserved, in airtight containers (excluding smoked)
1.0 8.3 Well positioned
0% China (43%) Thailand (25%) Indonesia #3
160554 Cuttlefish and squid, prepared or preserved (excluding smoked)
0.8 5.9 Well positioned
0% China (31%) U.S. (22%) Indonesia #3
030389 Frozen fish (excluding fillets) (not elsewhere specified in HS 0303)
0.1 35.0 Missed opportunity
0% China (33%) Chinese Taipei (13%) Indonesia #20
030622 Lobsters, not frozen
0 22 Missed opportunity
HS 03062210 (4%)
HS 03062290 (0%)
U.S. (100%) Indonesia none
030341 Frozen albacore or longfinned tunas
0 16.7 Missed opportunity
0% U.S. (85%) Chinese Taipei (11%) Indonesia none
Strengthening Indonesia’s Exports of Fish and Processed Fish Products to Canada 21
030192 Live eels 0 7.2 Missed opportunity
0% Haiti (55%) Dominican Republic (27%) Indonesia none
030819 Sea cucumbers, smoked, frozen, dried, salted, or in brine
0.1 6.3 Missed opportunity
HS 03081910 (4%)
HS 03081990 (0%)
China (25%) U.S. (21%) Indonesia #13
030354 Frozen mackerel 0 5.1 Missed opportunity
0% Iceland (29%) Spain (23%) Indonesia none
Sources: International Trade Centre; author’s calculations.
Import TariffsCanada has no import tariffs for nine of the 12 potential fish or processed fish products. Canada imposes a 5 per cent tariff on prepared or preserved crab products from Indonesia and a 4 per cent tariff on smoked lobster and smoked sea cucumbers imported from Indonesia.11 Thus, tariffs do not appear to be a factor blocking Indonesia from exporting more of these products. For example, Indonesia already has the largest share of the Canadian import market for prepared or preserved crab (HS 160510), ahead of the United States, despite the fact that the tariff applied to U.S. imports of this product is 0 per cent.
CompetitorsFor seven out of 12 potential products, the largest exporter to Canada (China: 6 products; India 1 product) is an Asian country other than Indonesia. In one case where the United States is the main competitor, Chinese Taipei is the second largest competitor. This means that, in general, geographical distance does not appear to play a large role in restricting Indonesian exports to Canada for these products. Exceptions may include lobsters (HS 030622), where the United States is the only competitor; live eels (HS 030192), where the Caribbean countries of Haiti and Dominican Republic account for 84 per cent of Canadian imports; and frozen mackerel (HS 030354), where Iceland and Spain are the main competitors.
11 International Trade Centre, Market Access Map database, access October 19, 2017, www.macmap.org.
Strengthening Indonesia’s Exports of Fish and Processed Fish Products to Canada 22
CHAPTER 4
Public and Private Standards in CanadaRegulatory FrameworkIn response to food safety and standards developments, governments around the world are rethinking their approach to food safety and consumer protection. This includes renewing legislative frameworks and better supervision of food safety. These actions are designed to ensure that the food products people consume are produced and processed safely. In Canada, about 4 million (one in eight) people are affected by foodborne illnesses every year, 11,600 are hospitalized, and 238 deaths occur.12
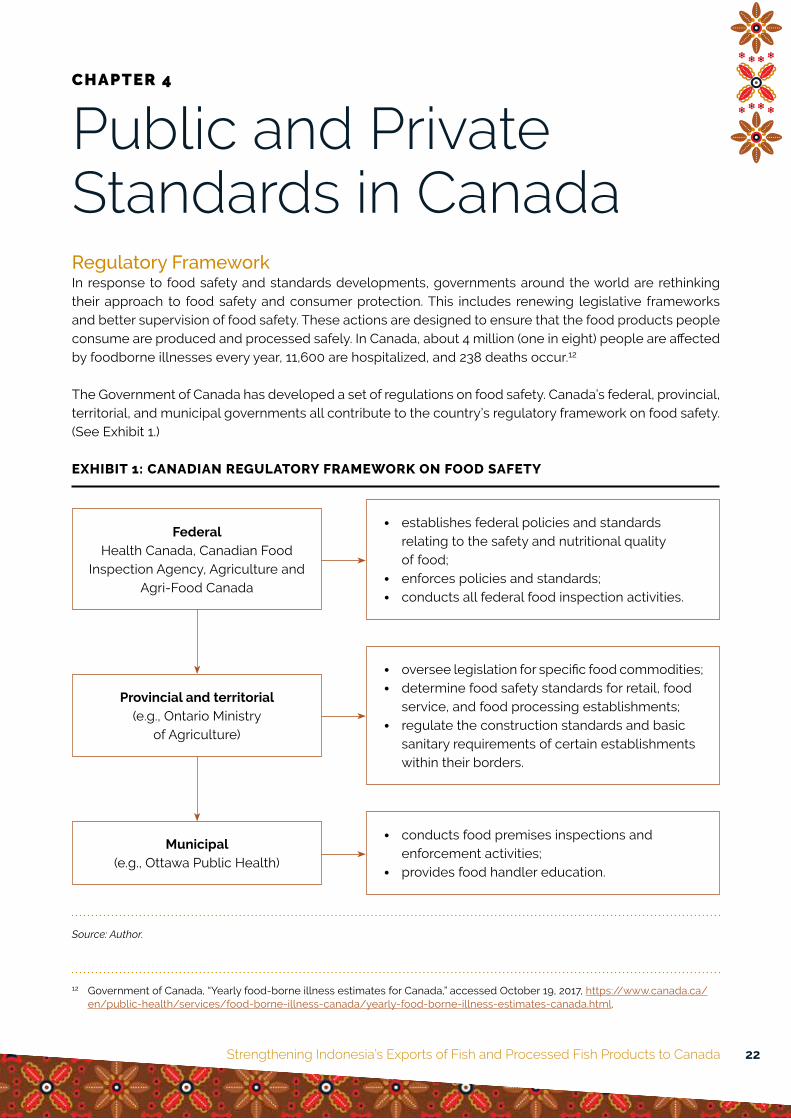
The Government of Canada has developed a set of regulations on food safety. Canada’s federal, provincial, territorial, and municipal governments all contribute to the country’s regulatory framework on food safety. (See Exhibit 1.)
EXHIBIT 1: CANADIAN REGULATORY FRAMEWORK ON FOOD SAFETY
Provincial and territorial(e.g., Ontario Ministry
of Agriculture)
• oversee legislation for specific food commodities;
• determine food safety standards for retail, food service, and food processing establishments;
• regulate the construction standards and basic sanitary requirements of certain establishments within their borders.
Municipal(e.g., Ottawa Public Health)
• conducts food premises inspections and enforcement activities;
• provides food handler education.
FederalHealth Canada, Canadian Food
Inspection Agency, Agriculture and Agri-Food Canada
• establishes federal policies and standards relating to the safety and nutritional quality of food;
• enforces policies and standards;
• conducts all federal food inspection activities.
Source: Author.
12 Government of Canada, “Yearly food-borne illness estimates for Canada,” accessed October 19, 2017, https://www.canada.ca/en/public-health/services/food-borne-illness-canada/yearly-food-borne-illness-estimates-canada.html.
Strengthening Indonesia’s Exports of Fish and Processed Fish Products to Canada 23
At the federal level, under the Food and Drugs Act, Health Canada is responsible for establishing policies and standards relating to the safety and nutritional quality of food sold in Canada. This includes deter-mining the residual quantities of pesticides allowed in foods and the safety of new foods, such as those derived from genetically modified organisms (GMOs). These standards and policies are partly based on risk assessment, research on food safety, and Health Canada’s disease monitoring activities. The Canadian Food Inspection Agency (CFIA), which reports to the Minister of Agriculture and Agri-Food Canada (AAFC), is responsible for enforcing the standards and policies set by Health Canada and for applying the trade laws applicable to certain food products. The CFIA conducts all federal food inspection activities. It is also responsible for the administration and enforcement of the Consumer Packaging and Labelling Act, which applies to selected food products sold in Canada.
The CFIA has further responsibilities for animal health and plant protection. It is the only agency in the world with responsibilities that cover the whole food continuum (before and after agricultural production). Health Canada is responsible for assessing the effectiveness of the CFIA’s activities.
Under their public health and trade mandates, the jurisdictions of provinces and territories extend to all food manufactured and sold within their borders. Provincial governments regulate all food premises, including food retailers and service establishments (such as restaurants), as well as federally registered establishments such as food manufacturing plants. Most provinces regulate the construction standards and basic sanitary requirements of certain establishments within their borders.13 In some provinces, munic-ipal governments also enforce regulations.
In Ontario, for example, provincial responsibility for food safety rests partly with the Ontario Ministry of Agriculture, Food and Rural Affairs (OMAFRA). OMAFRA’S role is to administer and enforce legislation designed to minimize food safety risks and promote the orderly marketing of various commodities pro-duced, manufactured, and sold in Ontario. There are provisions on a variety of food products such as:
• milk and milk products (Milk Act);
• eggs and processed eggs (Food Safety and Quality Act);
• horticulture products including fruits, vegetables, honey, and maple syrup (Food Safety and Quality Act);
• meat slaughter and processing at provincially licensed plants (Food Safety and Quality Act);
• fish interim audit program (Fish Inspection Act).
The Ontario Ministry of Health and Long-Term Care (OMHLTC) is also responsible for food safety. The OMHLTC administers and enforces the Health Protection and Promotion Act in food premises.
Meanwhile, municipal public health units conduct food premises inspections and enforcement activities in retail, food service, and food processing establishments. For example, Ottawa Public Health offers the Food Handler Certification program, which teaches new employees of restaurants, food service establish-ments, and processing plants how to prepare food safely.14
Because of this shared responsibility, mechanisms are needed to ensure that the system works effec-tively. The Canadian Food Inspection System Implementation Group, now part of the Federal/Provincial/Territorial Food Safety Committee (FPTFSC), was established to promote a fully integrated inspection sys-tem. Among other things, the FPTFSC now formulates harmonized regulations and model codes for cer-tain industries. These regulations and codes provide a package of standards that any level of government can use to formulate its own laws and codes of practice.
13 Multinational companies are under CFIA jurisdiction, SMEs are under provincial/territorial jurisdiction, and restaurants, food service, and food processing establishments are under municipal jurisdiction.
14 A food handler certificate is required for people (both owners and employees) who wish to start a food sector business such as a restaurant, cafeteria, or food-processing establishment.
Strengthening Indonesia’s Exports of Fish and Processed Fish Products to Canada 24
The Government of Canada introduced the Safe Food for Canadians Act on June 7, 2012, and it received Royal Assent on November 22, 2012. The Act aims to strengthen the Canadian food safety system and pro-vides industries with clear, consistent, and straightforward inspection and enforcement rules. These rules help industries meet their responsibilities to develop safe food for consumers.
While Canada’s existing food regulations strengthen the food safety system, there is still room for improvement. Currently, the government of Canada is establishing new, more comprehensive regulations called the Safe Food for Canadians Regulations (SFCR). The SFCR would consolidate 13 food commodity- based regulations, in addition to the food-related provisions of the Consumer Packaging and Labeling Regulations (CPLR), into a single food regulation. In addition, the SFCR would support market access for Canadian exporters by following food safety modernization efforts in other countries. The SFCR will strengthen Canada’s reputation for having a world-class food safety control system.
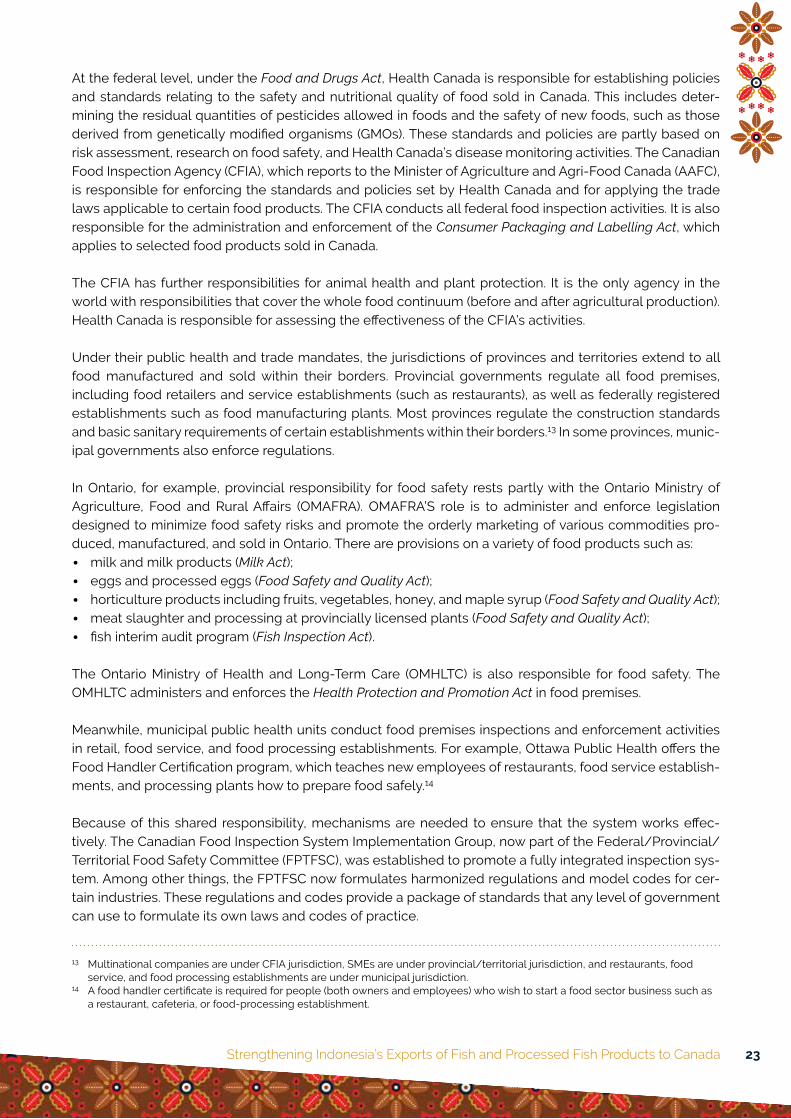
Non-Governmental Stakeholder Engagement in Canada’s Food Safety SystemIn developing the food safety system in Canada, governments involve all stakeholders. (See Exhibit 2.) This engagement aims to ensure that the concerns of all relevant stakeholders are considered and to help enforce Canada’s food safety system.
EXHIBIT 2: STAKEHOLDER ENGAGEMENT ON FOOD SAFETY SYSTEM IN CANADA
Industries:Farmers, food manufacturers, food distributors, food services establishments, retailers (e.g., Loblaws, Farm Boy)
Standards and certification bodies:(e.g., CanadaGAP, National Standard Foundation (NSF), Canada Halal)
Others:ConsumersTraining agencies(e.g., Food Processing HR Council)Start-up incubators (e.g., Food Starter)
Government:Federal (Health Canada, CFIA)Provincial and territorial(e.g., OMAFRA, MOHLTC)Municipal(e.g., Ottawa Public Health)
Source: Author.
Strengthening Indonesia’s Exports of Fish and Processed Fish Products to Canada 25
Industries include farmers, food manufacturers, food distributors, food services establishments, and retailers (e.g., Loblaws and Farm Boy). Their role is to produce safe food, comply with regulatory require-ments, adhere to generally recognized good practices, and develop and implement mandatory or voluntary food safety control systems.
Standards and certification bodies are crucial elements of Canada’s food safety system, providing train-ing, education, and certification services. There are several types of standards and certification bodies, each of which specializes in certain products or sectors. Here are some examples:
CanadaGAPRecent cases of foodborne illness have increased consumer awareness of the potential for contamination of products. To reassure buyers and consumers, maintain a high level of consumer confidence, and remain competitive in an international marketplace, Canadian suppliers of fresh producer must ensure their oper-ations meet food safety standards. CanadaGAP is a national, voluntary food safety program authorized by the Government of Canada as a national certification body. It provides a food safety standard and certifi-cation program based on HACCP principles and recognized by government and the Global Food Safety Initiative (GFSI).15 CanadaGAP provides services such as production, packaging, storage (of harvested product), repacking, wholesaling, and brokerage (of market products) for fresh fruits and vegetables. In this function, it collaborates with third-party certification bodies such as the Bureau de normalization du Québec (BNQ), NSF Canada Agricultural Certification Company, and SGS Canada.
Similar to CanadaGAP, GlobalG.A.P. operates on a wider, international scope. It was formed in 2007, and was previously known as EUREPGAP. GlobalG.A.P. covers the food sector more broadly, including fresh fruit and vegetables, crops, livestock, and aquaculture products. Its certifications are recognized globally.
National Standard Foundation (NSF) InternationalNSF is a non-governmental organization established in 1944. Its mission is to protect and improve global human health by providing testing, auditing, and certification services, including education risk manage-ment. In certifying food products, NSF collaborates with CanadaGAP as a third-party certification body. NSF coverage is not limited to food, but includes other products such as bottled water, consumer prod-ucts, and water treatment systems. NSF provides services such as Hazard Analysis and Critical Control Points (HACCP) compliance verification, non-allergic and organic labelling, supply-chain food safety audit services, and animal welfare audit services.
Canada Halal Examination and CertificationThe Canadian halal food market is estimated to be worth more than C$1 billion and could reach up to C$1 trillion, according to a report from Thomson Reuters.16 In addition, Canada’s Muslim population is increasing at roughly 13 per cent annually. Halal certification gives assurance that processed food fulfills Sharia law but also the concept of toyibban, or wholesomeness (safe, clean, and nutritious). Food safety factors play a significant role in determining the toyibban aspects of the food. Canada Halal Examination and Certification (CHEC) was formed to respond to this market. It is recognized and respected worldwide as a certification company that provides assessment, auditing, and training services. CHEC prescribes standards and processes for halal certification of food and non-food products, as well as research and advanced laboratory testing facilities.
15 The GFSI is a business-driven initiative to develop a platform of food-safety standards based on existing international standards for use as a unifying standard accepted by many retailers. GFSI is adopted to ensure confidence in the delivery of safe food to consumers worldwide.
16 Country Guide, “The Halal Market,” accessed July 13, 2017, https://www.country-guide.ca/2017/02/07/are-farmers-ready-to-profit-from-canadas-booming-halal-market/50325/.
Strengthening Indonesia’s Exports of Fish and Processed Fish Products to Canada 26
OthersConsumers can minimize health and safety risks by using good practices in food storage, handling, prepa-ration, and cooking. Consumers can register complaints related to food products that contain ingredients that are harmful to health, and can participate in public consultations as part of the process of regulation and policy formulation.
The Food Processing Human Resource Council (FPHRC) is a non-profit organization that was established in 2009 as a council for Canadian food processors. The FPHRC works long-term with industry partners, processors, educators, and regulatory agencies, and provides training courses, programs, and educa-tional tools for the Canadian and international food and beverage workforce. The FPHRC provides national support to industries in overcoming skilled human resources scarcity on food safety, and plays a role in developing competency frameworks for human resources in food sectors.
Food Starter is a non-profit organization located in Toronto, established in 2015 to help small and medi-um-sized businesses and start-up entrepreneurs in the food processing sector. It provides access to shared production and packaging facilities, business advisory services, and a structured training program to help entrepreneurs build and grow their food processing business. The Toronto Food Business Incubator part-nered with the City of Toronto to access funding from Growing Forward 217 to develop and launch Food Starter in November 2015. Food Starter helps new entrepreneurs launch their businesses without having to worry about acquiring enough capital to invest in the necessary equipment.
Standards for Fish and Processed Fish ProductsThis section describes Canada’s public and private standards for fish products, which are applied equally to domestic and international producers. Understanding these standards will help Indonesian producers export more easily to the Canadian market. The two most common standards applied in the Canadian market are related to traceability and environmental sustainability.
Traceability Regulations in CanadaFood traceability is a component of food production management that helps inform consumers about the source and destination of food products. Food traceability has become a global concern in preventing foodborne diseases. A number of countries and regions that have strong trade with Canada, such as the United States and the European Union, have adopted regulations requiring traceability for some or all food products. These regulations apply to both domestically produced and imported products. Nonetheless, compared to other jurisdictions such as the United States, the EU, and Australia, Canada has fewer regu-latory requirements governing traceability.
In Canada, there are three main pillars of traceability systems: animal/product identification, premises identification, and animal/product movement. Governments in Canada have already taken some steps to regulate traceability, both as a way to enhance food safety and as a means to protect the economic inter-ests of the food industry. Federal and provincial/territorial governments have mandatory traceability reg-ulations for cattle, bison, and sheep. Alberta and Quebec have specific traceability requirements for their respective provinces, and several provinces require producers to register their agricultural premises18 in a provincial database. In practice, retailers and food processors with strong brands tend to apply traceability to protect the public interest.
17 Growing Forward 2 (GF 2) is a federal/provincial/territorial initiative. The Agricultural Adaptation Council assists in the delivery of GF 2 in Ontario.
18 Premise identification systems assign a unique number to a piece of land where animals or food are kept, assembled, grown, or disposed of. Premises include farms, feedlots, zoos, abattoirs, livestock sale facilities, racetracks, and rendering plants. Premise identification is mandatory in Quebec, Alberta, and Manitoba. Other provinces, such as British Columbia, register premises on a voluntary basis.
Strengthening Indonesia’s Exports of Fish and Processed Fish Products to Canada 27
A traceability-based system is an example of a partnership between government and industry to ensure food safety. That is why there is no purely public standard on food safety in Canada; government and industry work hand in hand. Some initiatives that involve both government and industry are the Canadian Industry Traceability Infrastructure Program (CITIP) and the Can-Trace Initiative.
CITIP is part of the Canadian Integrated Food Safety Initiative. It provides up to C$2 million per project to develop and implement industry-led traceability systems. The program covers the implementation of these systems for products such as eggs, herbs and spices, maple syrup, beef, and pork. The Fisheries Council of Canada not only developed and piloted a Canadian eco-certification system to certify that fish-eries products are being harvested in a responsible way, but also developed a system to track fish from harvest to final sale.
The Can-Trace Initiative is an industry-led program that developed traceability standards for all food prod-ucts sold in Canada. In 2004, Can-Trace established the model of the Canadian Food Traceability Data Standard which is based on a “one step forward, one step back” approach, whereby all food business operators must be able to identify the businesses their products have been supplied to (one step forward) as well as to trace food-chain inputs back to the supplier (one step back).
Loblaws, as the largest food retailer in Canada, has invested heavily in establishing and sustaining its brand name and its reputation for quality and safety. Loblaws is a leader in the adoption of traceability systems to help ensure higher food-safety standards. Loblaws was also the first national retailer to require its private-label suppliers to be certified compliant with GFSI standards, which oblige companies to use traceability systems that trace one step forward and one step back. This has had a significant impact on the traceability practices of many firms in the Canadian food system.
Environmental Sustainability StandardsConsumers also consider ecological or environmental sustainability aspects. This is because the fish har-vesting process can sometimes result in non-targeted, non-commercial species being caught, as well as juveniles and non-fish. For wild-capture fish products, there are many types of certification for complying with ecological or environmental sustainability.
The Marine Stewardship Council (MSC) manages the certification of wild-capture fisheries. MSC is the commonly recognized and adopted global sustainability standard. It examines the sustainability of fish stocks, the impact on ecosystems, and management effectiveness and responsiveness. In 2011, more than 50 per cent of the volume of Canadian salt water was certified under full assessment to the MSC standard. Supplier commitment to adopt sustainability efforts is widespread in the Canadian market. This includes demand for MSC-certified products prepared and sold by processors, retailers, and food services such as High Liner Food, Janes Family Foods, Clearwater, Ocean Choice International, Bento Sushi, Walmart, Sodexo, and McDonald’s Restaurants.
Other eco-labelling and certification schemes include Friend of the Sea, which certifies products originat-ing from sustainable fisheries and aquaculture, and Responsible Fisheries Management (RFM) for both farmed and capture fisheries.
For aquaculture products, the Global Aquaculture Alliance adopts Best Aquaculture Practices (BAP) stan-dards. It combines site inspections and effluent sampling with sanitary controls, therapeutic controls, and traceability. Another model of standards is the Aquaculture Stewardship Council (ASC), which sets global standards for farming fish and seafood. Chain of Custody (CoC) certification assures that ASC-certified seafood delivered to supply chain players originated from a farm certified by ASC. As a major player in the supply chain, Loblaws has become the lead retailer selling farmed seafood certified by ASC.
Strengthening Indonesia’s Exports of Fish and Processed Fish Products to Canada 28
Global standards emphasizing sustainability, such as MSC and BAP, have been adopted widely in the Canadian market. Many retail and distribution firms in Canada, such as Loblaws, Sobeys, and Safeway, currently have 100 per cent sustainable certified fish and seafood products. Loblaws emphasizes MSC certification while Sobeys supports a broader range of eco-labels, including MSC. Walmart committed to source only wild-caught seafood from MSC-certified fisheries in 2006 and expanded to include BAP cer-tification or equivalent standards. As of October 2011, McDonald’s Restaurants has committed to sourcing 100 per cent of its fish from MSC-certified fisheries.
Canadian Market and Buyer ExpectationsSuccessfully accessing the global market is closely related to the ability of exporters to comply with stan-dards, requirements, and expectations of buyers abroad. A survey conducted by The Conference Board of Canada on agri-food imports from developing countries identified several key factors that determine whether Canadian companies import products from those countries. These factors include product quality (72 per cent of respondents), price (56 per cent), and reliability of long-term supply (44 per cent). Other factors considered by buyers include sourcing from certified environmentally sustainable providers (88 per cent), improving the supplier country’s natural resources and environment (76 per cent), wom-en-owned businesses (87 per cent), and small and medium-sized enterprises (SMEs) that employ women (79 per cent).
From the Canadian company or importer point of view, the top obstacles faced when importing products from developing countries are differences in regulations, volatile exchange rates, and challenges trans-porting products from small farms to distribution centres. Other challenges include uncertainty of product quality, inconsistency and delays in product supply, and difficulty finding products that have organic, fair trade, and ethical certification.
To take advantage of the market opportunities in Canada, the above factors should be taken seriously by Indonesian exporters.
Strengthening Indonesia’s Exports of Fish and Processed Fish Products to Canada 29
CHAPTER 5
How Can Indonesia Better Access the Canadian Market for Fish and Processed Fish Products?In order to increase exports to the Canadian market, Indonesian exporters must know all requirements and standards being enforced in that market. The first two sections of this chapter will explain the existing regulations and food safety requirements, including standards that must be fulfilled by Indonesian export-ers and Canadian importers. The third section will discuss some standards and requirements adopted by most buyers in the Canadian market. Prior to discussing how to penetrate the Canadian market, we will explain the challenges faced by Indonesian fish and processed fish products producers when exporting to Canada.
Requirements and Procedures for Importing Food to CanadaBased on information from CFIA officials, there are six CFIA generic import processes:19
1. Requirements CFIA develops import requirements based on applicable acts, regulations, and policies. Importers can access information on these requirements through the CFIA and its Automated Import Reference System (AIRS).
2. Permission Import permissions may involve obtaining a license, permit, registration, or other supporting documentation. Inspections may also be required. Exporters may require approval by foreign authorities or the CFIA. The requirements for permission depend on the commodity, country of origin, destination, end use, or global health conditions.
3. Clearance In this stage, the importer submits import information pre-arrival to obtain confirmation that all regulatory requirements have been met. This information may include verification of commodity, verification that regulatory requirements are met in the documentation submitted, applying risk criteria, and notification of release recommendation to Canada Border Services Agency (CBSA).
4. At the border The shipment arrives at the Canadian border and is processed according to standard procedures in order to determine whether it will be released into Canada. These procedures may include CBSA verification of shipment details, CBSA verification of CFIA release recommendation, visual inspection
19 Canadian Food Inspection Agency, “CFIA Overview,” (PowerPoint presentation at CFIA site visit, Ottawa, April 10, 2017).
Strengthening Indonesia’s Exports of Fish and Processed Fish Products to Canada 30
at the border by CBSA (and, if required, by CFIA), and release decision and notification of inspection at destination, if required.
5. Inspection The imported shipment arrives at the destination and is either held for further inspection or is readied for distribution into Canada. This may include inspection and notifying the CFIA of the shipment’s final destination.
6. Reporting Import reporting happens throughout all stages. The information gathered is used to inform risk-based decisions and/or changes to import requirements or procedures.
There are multiple government agencies responsible for imported food. These include:
• Canadian Food Inspection Agency (CFIA)
• Canada Border Services Agency (CBSA)
• Global Affairs Canada (GAC)
• Environment and Climate Change Canada (ECCC)
• Fisheries and Oceans Canada (DFO)
• Health Canada (HC)
• Measurement Canada (MC)
• Provincial and territorial governments
CBSA supports the administration and enforcement of legislation as it applies to imported products. Customs inspectors review import documentation (permits, certificates, licenses presented before goods released) and perform examinations of incoming goods. The CFIA/CBSA Border Lookout System is a national interdepartmental system used to control products at the border and includes a mechanism to inform the CFIA of the arrival of these products in Canada. The system also assists in controlling the move-ment of certain food, animal, and plant products at Canadian ports of entry.
For imported fish and seafood products, the Government of Canada asks foreign suppliers for some requirements as explained below. More detail on these requirements can be found on the CFIA website.
Licensing: Before importers export their products to Canada, they are required to have a fish import license issued by the CFIA.
Sourcing product: This step requires the importer to ensure that the fish being exported to Canada will meet the requirements of the Fish Inspection Regulations (FIR) and any other applicable regulatory requirements.
Import product notification, control, storage, and identification: Import shipments must be reported to CBSA through the electronic data interchange (EDI) before entering Canada. Importers must also notify the CFIA of their shipment either prior to entry or within 48 hours of importation into Canada. The importer must hold the imported fish at the storage location declared on the fish import notification (FIN) until they are notified by CFIA of the inspection decision. The importer must ensure that the products are packaged and stored in a manner that prevents contamination and deterioration and that the product is properly identified and labelled.
Product inspection process: The importer must make available imported fish or fish containers for inspec-tion, and must not move, sell, or dispose of any fish or container of fish that has been placed under deten-tion by the CFIA. Product that does not meet the applicable requirements will be placed on the mandatory inspection list and refused distribution in Canada. Product that meets regulatory requirements will be released from detention.
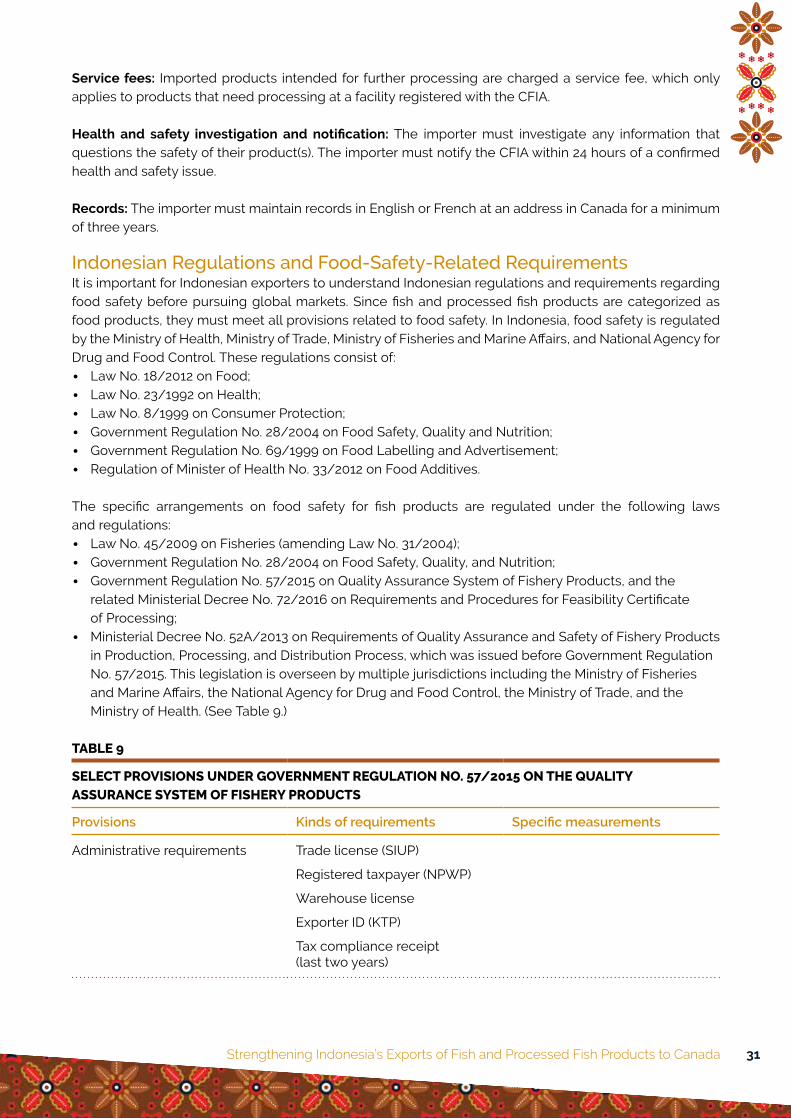
Strengthening Indonesia’s Exports of Fish and Processed Fish Products to Canada 31
Service fees: Imported products intended for further processing are charged a service fee, which only applies to products that need processing at a facility registered with the CFIA.
Health and safety investigation and notification: The importer must investigate any information that questions the safety of their product(s). The importer must notify the CFIA within 24 hours of a confirmed health and safety issue.
Records: The importer must maintain records in English or French at an address in Canada for a minimum of three years.
Indonesian Regulations and Food-Safety-Related RequirementsIt is important for Indonesian exporters to understand Indonesian regulations and requirements regarding food safety before pursuing global markets. Since fish and processed fish products are categorized as food products, they must meet all provisions related to food safety. In Indonesia, food safety is regulated by the Ministry of Health, Ministry of Trade, Ministry of Fisheries and Marine Affairs, and National Agency for Drug and Food Control. These regulations consist of:
• Law No. 18/2012 on Food;
• Law No. 23/1992 on Health;
• Law No. 8/1999 on Consumer Protection;
• Government Regulation No. 28/2004 on Food Safety, Quality and Nutrition;
• Government Regulation No. 69/1999 on Food Labelling and Advertisement;
• Regulation of Minister of Health No. 33/2012 on Food Additives.
The specific arrangements on food safety for fish products are regulated under the following laws and regulations:
• Law No. 45/2009 on Fisheries (amending Law No. 31/2004);
• Government Regulation No. 28/2004 on Food Safety, Quality, and Nutrition;
• Government Regulation No. 57/2015 on Quality Assurance System of Fishery Products, and the related Ministerial Decree No. 72/2016 on Requirements and Procedures for Feasibility Certificate of Processing;
• Ministerial Decree No. 52A/2013 on Requirements of Quality Assurance and Safety of Fishery Products in Production, Processing, and Distribution Process, which was issued before Government Regulation No. 57/2015. This legislation is overseen by multiple jurisdictions including the Ministry of Fisheries and Marine Affairs, the National Agency for Drug and Food Control, the Ministry of Trade, and the Ministry of Health. (See Table 9.)
TABLE 9
SELECT PROVISIONS UNDER GOVERNMENT REGULATION NO. 57/2015 ON THE QUALITY ASSURANCE SYSTEM OF FISHERY PRODUCTS
Provisions Kinds of requirements Specific measurements
Administrative requirements Trade license (SIUP)
Registered taxpayer (NPWP)
Warehouse license
Exporter ID (KTP)
Tax compliance receipt (last two years)
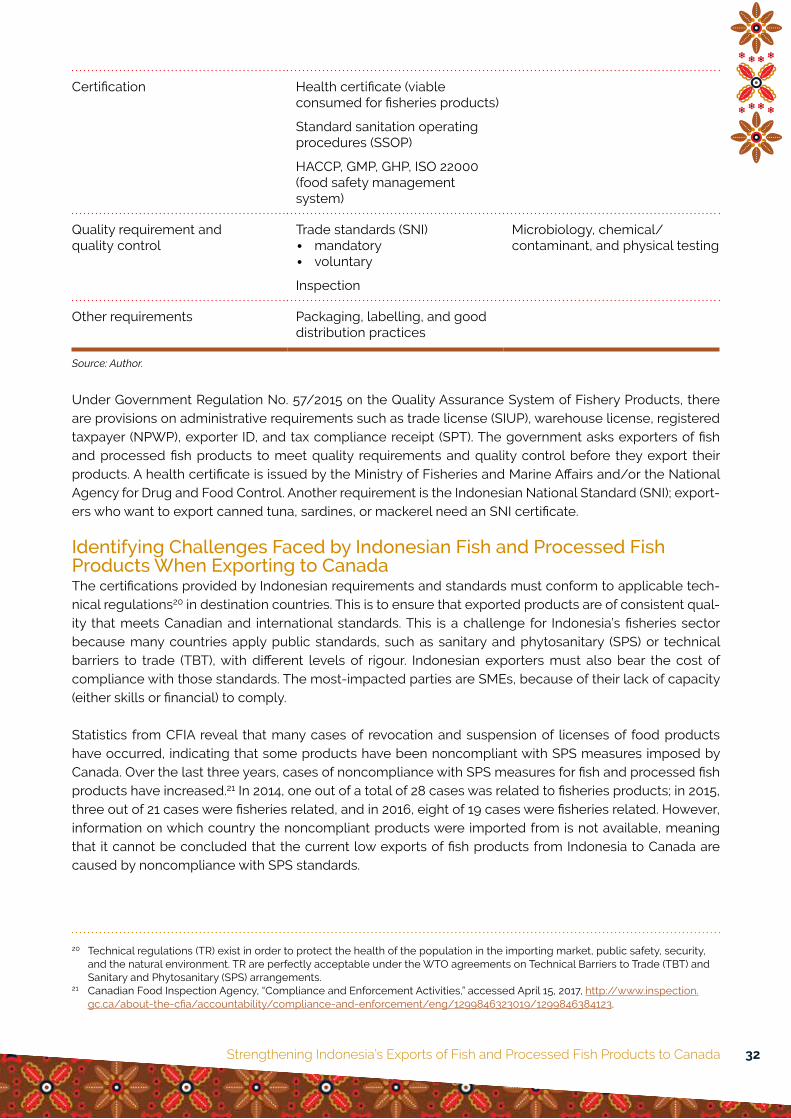
Strengthening Indonesia’s Exports of Fish and Processed Fish Products to Canada 32
Certification Health certificate (viable consumed for fisheries products)
Standard sanitation operating procedures (SSOP)
HACCP, GMP, GHP, ISO 22000 (food safety management system)
Quality requirement and quality control
Trade standards (SNI) • mandatory • voluntary
Inspection
Microbiology, chemical/contaminant, and physical testing
Other requirements Packaging, labelling, and good distribution practices
Source: Author.
Under Government Regulation No. 57/2015 on the Quality Assurance System of Fishery Products, there are provisions on administrative requirements such as trade license (SIUP), warehouse license, registered taxpayer (NPWP), exporter ID, and tax compliance receipt (SPT). The government asks exporters of fish and processed fish products to meet quality requirements and quality control before they export their products. A health certificate is issued by the Ministry of Fisheries and Marine Affairs and/or the National Agency for Drug and Food Control. Another requirement is the Indonesian National Standard (SNI); export-ers who want to export canned tuna, sardines, or mackerel need an SNI certificate.
Identifying Challenges Faced by Indonesian Fish and Processed Fish Products When Exporting to CanadaThe certifications provided by Indonesian requirements and standards must conform to applicable tech-nical regulations20 in destination countries. This is to ensure that exported products are of consistent qual-ity that meets Canadian and international standards. This is a challenge for Indonesia’s fisheries sector because many countries apply public standards, such as sanitary and phytosanitary (SPS) or technical barriers to trade (TBT), with different levels of rigour. Indonesian exporters must also bear the cost of compliance with those standards. The most-impacted parties are SMEs, because of their lack of capacity (either skills or financial) to comply.
Statistics from CFIA reveal that many cases of revocation and suspension of licenses of food products have occurred, indicating that some products have been noncompliant with SPS measures imposed by Canada. Over the last three years, cases of noncompliance with SPS measures for fish and processed fish products have increased.21 In 2014, one out of a total of 28 cases was related to fisheries products; in 2015, three out of 21 cases were fisheries related, and in 2016, eight of 19 cases were fisheries related. However, information on which country the noncompliant products were imported from is not available, meaning that it cannot be concluded that the current low exports of fish products from Indonesia to Canada are caused by noncompliance with SPS standards.
20 Technical regulations (TR) exist in order to protect the health of the population in the importing market, public safety, security, and the natural environment. TR are perfectly acceptable under the WTO agreements on Technical Barriers to Trade (TBT) and Sanitary and Phytosanitary (SPS) arrangements.
21 Canadian Food Inspection Agency, “Compliance and Enforcement Activities,” accessed April 15, 2017, http://www.inspection.gc.ca/about-the-cfia/accountability/compliance-and-enforcement/eng/1299846323019/1299846384123.
Strengthening Indonesia’s Exports of Fish and Processed Fish Products to Canada 33
Nonetheless, a trade survey conducted by the Centre for Food in Canada found that food safety and traceability is a top challenge for Canadian firms importing from developing countries.22 It is difficult for suppliers in developing countries to get food safety certification since they do not have adequate food safety practices in their countries. An executive at a national commodity association noted that stringent licensing requirements in the soon-to-be released update to the Safe Food for Canadians Act will make it difficult and costly for many suppliers in developing countries to export to Canada.23
The same survey also revealed that producers in developing countries are challenged by other factors such as inadequate physical infrastructure, lack of financial resources and support, strong competition, high cost of logistics, and a lack of knowledge on how to export.
In line with these findings, a study on Indonesia’s trade access to the European Union highlighted simi-lar constraints faced by Indonesian exporters trying to enter the EU and other global markets.24 A major impediment is SPS requirements in the international market. Another is meeting international standards, since exporters often lack information and face excessively high costs in meeting those standards. In addition, most Indonesian laboratories are unable to provide the testing and analysis required by international standards.
Policy support from government is important. In a 2015 meeting on food safety requirements and stan-dards abroad, a representative of the Indonesian association of pole and hand-line fishing stated that Indonesian tuna products were still not certified by the Marine Stewardship Council (MSC).25 While the Indonesian Ministry of Fisheries and Marine Affairs has proposed MSC certification for certain fish products (such as skipjack, crab, big eye grouper, and yellowfin tuna), they have not yet been approved. Lack of regulatory support from government restricts local tuna producers’ ability to comply with MSC standards. Support here is defined as the issuance of policy or regulations to regulate the distribution of capture quota at sea. Without having a clear distribution of capture quota at sea, producers cannot obtain the MSC certificate, which is one of the most requested by importers in the Canadian market. It may be chal-lenging for the government of Indonesia to begin formulating regulations that can meet this need.
22 Centre for Food in Canada, Building Food Market Linkages Between LDC and MIC Agri-Food SMEs to Export to the Canadian Market (Ottawa: The Conference Board of Canada, unpublished).
23 Ibid.24 Montague Lord, Indonesia’s Trade Access to the European Union: Opportunities and Challenges (Jakarta: European
Union, November 2010), accessed April 10, 2017, http://www.google.ca/url?sa=t&rct=j&q=&esrc=s&source=web&cd=1&cad=rja&uact=8&ved=0ahUKEwj_-9ugxLfXAhWG14MKHZ5QByIQFggmMAA&url=http%3A%2F%2Feeas.europa.eu%2Farchives%2Fdelegations%2Findonesia%2Fdocuments%2Fpress_corner%2Ftradeaccess_report_en.pdf&usg=AOvVaw2WhXIxjREcI0UWDgrykJ_S.
25 M. Ambari, “Nelayan Tuna Kejar Sertifikat MSC,” Mongabay Indonesia, December 18, 2015, http://www.mongabay.co.id/2015/12/18/nelayan-tuna-kejar-sertifikat-msc/.
Strengthening Indonesia’s Exports of Fish and Processed Fish Products to Canada 34
CHAPTER 6
Lessons Learned, Best Practices, and Next StepsLessons Learned and Best PracticesFisheries sectors in other countries can provide valuable lessons on how to enhance and develop capacity and competitiveness to successfully enter global markets. For example, the Alaska Seafood Marketing Institute (ASMI), a public-private partnership between the State of Alaska and the Alaska seafood indus-try, aims to enhance the competitiveness of Alaska’s seafood products.26 ASMI builds partnerships with retail grocers, food service distributors, restaurant chains, food service operators, universities, culinary schools, and the media, and plays a key role in establishing Alaska’s seafood industry as a competitive, market-driven food production industry. ASMI also functions as a brand manager of the Alaska Seafood family of brands.
Another example is the Norwegian Seafood Council (NSC), a public company owned by the Norwegian Ministry of Trade, Industry, and Fisheries.27 The NSC works together with the Norwegian fisheries and aquaculture industry to develop markets for Norwegian seafood. The seafood industry finances the activ-ities of the NSC through fees levied on all exports of Norwegian seafood. The NSC aims to increase the value of Norwegian seafood resources through market insights, market development, and market risk management in select markets around the world.
In addition, the NSC is the approval authority for Norwegian seafood exporters and acts as an advisor for the Ministry of Trade, Industry, and Fisheries in matters regarding seafood exports and trade. The council has representatives in several countries, including Singapore and China, works to identify opportunities for Norwegian seafood products in both new and established markets, and has helped to establish Norway as a top global supplier of fishery products.
At the micro level, the role of Food Starter in Canada as an incubator for food start-up businesses, through the provision of standardized facilities for the process of food production and packaging, creates a more conducive atmosphere for business development in the food sector. Food Starter’s success in supporting Canada’s food safety system can help inform Indonesian efforts to develop food processing sectors, par-ticularly for SMEs who wish to export their products overseas.
Next StepsFor the Indonesian fisheries sector to become a leading engine of future economic growth, the Indonesian government must be willing to help develop the sector. To gain Canadian market share, which is dominated by MSC-certified products, the government can start by preparing a regulatory
26 Alaska Seafood, “About ASMI,” accessed April 11, 2017, http://www.alaskaseafood.org/about/.27 Norwegian Seafood Council, “About Us,” accessed April 11, 2017, https://en.seafood.no/about-norwegian-seafood-council/
about-us/.

Strengthening Indonesia’s Exports of Fish and Processed Fish Products to Canada 35
framework to support products that are economically viable and environmentally responsible. For Indonesia’s exporters to acquire MSC certification, the government needs to enforce quotas so that it can assure export destination countries that its products are sustainably sourced. This is paramount since Canadian consumers are increasingly interested in ecologically friendly products.
The Government of Indonesia currently has no program specifically focused on building marketing channels and branding. However, the Ministry of Fisheries and Marine Affairs encourages fishery worker cooperatives to participate in the National Fish Logistic System (SLIN), which provides aid for fishing equipment, cool boxes, ice flakes, reefer trucks, and integrated cool storage, with support from state-owned enterprises (SOEs) in the sector. In addition, the Government of Indonesia has set up a public service agency to provide working capital through a revolving fund deposit of Rp500 billion. The Government of Indonesia should further strengthen its fisheries sector through marketing and branding initiatives so that Indonesia’s fish and processed fish products become well known in Canada and other global markets. This could be achieved by optimizing the role of trade representatives in linking Indonesian suppliers with buyers in destination countries.
Cooperation between government and the private sector also needs to be strengthened. This will encourage the development of policies and standards aligned with international market demands. Private enterprises should be helped to adopt food safety practices that meet international standards.
The government could also explore adopting an incubator model like Food Starter. Small units of incu-bators can be established through government and private support. These incubators would then assist SMEs to improve their capacity to comply with food safety standards.
Many Canadian consumers are interested in the participation and role of women in the fisheries sector. To take advantage of this opportunity, the Indonesian government can support women’s participation in the sector by providing them with capacity building and capital.
ConclusionIndonesia’s fish and processed fish products have untapped potential in overseas markets, including the Canadian market. This report has identified 12 Indonesian fish and processed fish products that are either well-positioned to increase their Canadian market share, or could potentially succeed in the Canadian market but have not been pursued.
Despite this potential, Indonesia’s fish producers and exporters face several obstacles to entering Canadian and other foreign markets. The variety of standards and requirements in foreign countries, such as Canada’s SPS measures, often hamper Indonesian export efforts because of their high compliance costs. Private standards, including environmental sustainability products such as MSC, ASC and BAP, also become challenging since these are widely requested by importers.
Many efforts have been made by the Government of Indonesia to support its fisheries sector, but these efforts have not provided enough support for the sector to grow more strongly. Cooperation between the government and private sector is needed to build a more connected system. This will help improve the quality of fish products so that they can successfully enter foreign markets. This includes more regu-latory support to encourage a more conducive and competitive business environment for fish products in Indonesia, and in particular to increase producers’ capacity to comply with international standards.
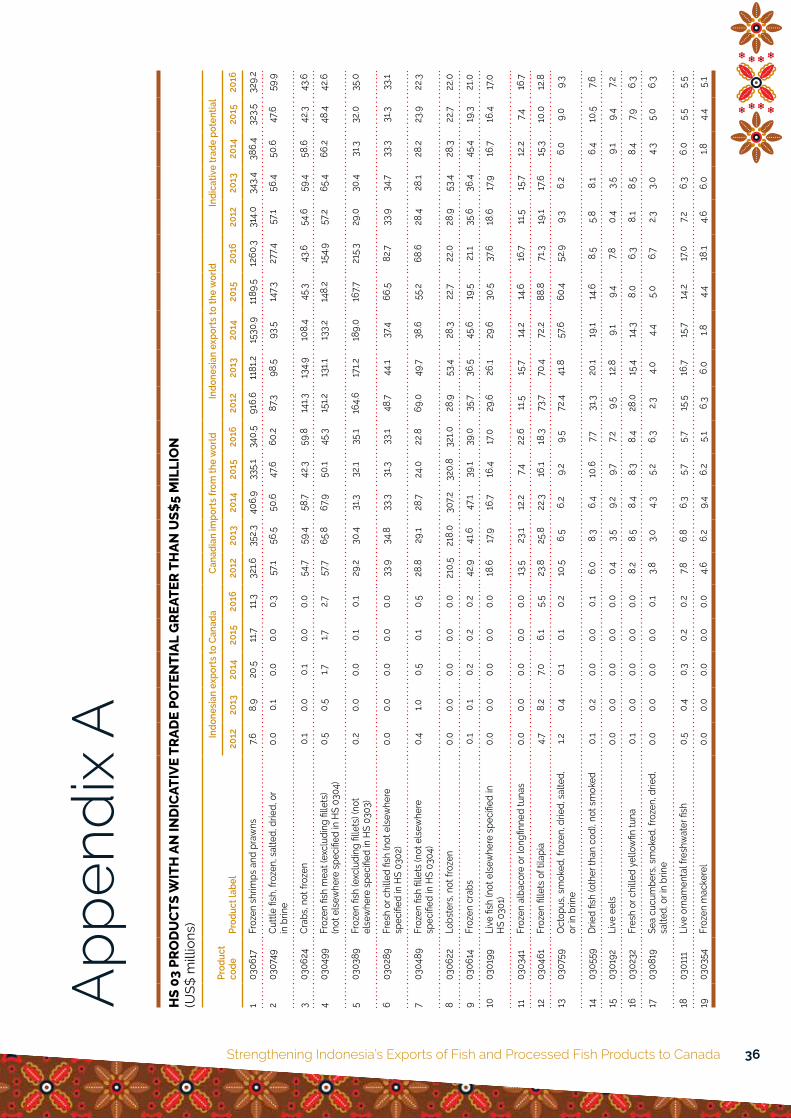
Strengthening Indonesia’s Exports of Fish and Processed Fish Products to Canada 36
Ap
pen
dix
AH
S 0
3 P
RO
DU
CT
S W
ITH
AN
IND
ICAT
IVE
TR
AD
E P
OT
ENT
IAL
GR
EAT
ER T
HA
N U
S$
5 M
ILLI
ON
(US
$ m
illio
ns)
Prod
uct
code
Prod
uct l
abel
In
done
sian
exp
orts
to C
anad
a
Can
adia
n im
port
s fr
om th
e w
orld
In
done
sian
exp
orts
to th
e w
orld
In
dica
tive
trad
e po
tent
ial
2012
2013
2014
2015
2016
2012
2013
2014
2015
2016
2012
2013
2014
2015
2016
2012
2013
2014
2015
2016
103
0617
Froz
en s
hrim
ps a
nd p
raw
ns7.6
8.9
20.5
11.7
11.3
321.6
352.
340
6.9
335.
134
0.5
916.
611
81.2
1530
.911
89.5
1260
.331
4.0
343.
438
6.4
323.
532
9.2
203
0749
Cut
tle fi
sh, f
roze
n, s
alte
d, d
ried,
or
in b
rine
0.0
0.1
0.0
0.0
0.3
57.1
56.5
50.6
47.6
60.2
87.3
98.5
93.5
147.3
277.4
57.1
56.4
50.6
47.6
59.9
303
0624
Cra
bs, n
ot fr
ozen
0.1
0.0
0.1
0.0
0.0
54.7
59.4
58.7
42.3
59.8
141.3
134.
910
8.4
45.3
43.6
54.6
59.4
58.6
42.3
43.6
403
0499
Froz
en fi
sh m
eat (
excl
udin
g fil
lets
) (n
ot e
lsew
here
spe
cifie
d in
HS
0304
)0.
50.
51.7
1.72.
757
.765
.867
.950
.145
.315
1.213
1.113
3.2
148.
215
4.9
57.2
65.4
66.2
48.4
42.6
503
0389
Froz
en fi
sh (e
xclu
ding
fille
ts) (
not
else
whe
re s
pecifie
d in
HS
0303
)0.
20.
00.
00.
10.
129
.230
.431
.332
.135
.116
4.6
171.2
189.
016
7.721
5.3
29.0
30.4
31.3
32.0
35.0
603
0289
Fres
h or
chi
lled fis
h (n
ot e
lsew
here
sp
ecifi
ed in
HS
0302
)0.
00.
00.
00.
00.
033
.934
.833
.331
.333
.148
.744
.137
.466
.582
.733
.934
.733
.331
.333
.1
703
0489
Froz
en fi
sh fi
llets
(not
els
ewhe
re
spec
ified
in H
S 03
04)
0.4
1.00.
50.
10.
528
.829
.128
.724
.022
.869
.049
.738
.655
.268
.628
.428
.128
.223
.922
.3
803
0622
Lobs
ters
, not
froz
en0.
00.
00.
00.
00.
021
0.5
218.
030
7.232
0.8
321.0
28.9
53.4
28.3
22.7
22.0
28.9
53.4
28.3
22.7
22.0
903
0614
Froz
en c
rabs
0.1
0.1
0.2
0.2
0.2
42.9
41.6
47.1
39.1
39.0
35.7
36.5
45.6
19.5
21.1
35.6
36.4
45.4
19.3
21.0
1003
0199
Live
fish
(not
els
ewhe
re s
pecifie
d in
H
S 03
01)
0.0
0.0
0.0
0.0
0.0
18.6
17.9
16.7
16.4
17.0
29.6
26.1
29.6
30.5
37.6
18.6
17.9
16.7
16.4
17.0
1103
0341
Froz
en a
lbac
ore
or lo
ngfin
ned
tuna
s0.
00.
00.
00.
00.
013
.523
.112
.27.4
22.6
11.5
15.7
14.2
14.6
16.7
11.5
15.7
12.2
7.416
.7
1203
0461
Froz
en fi
llets
of t
ilapi
a4.
78.
27.0
6.1
5.5
23.8
25.8
22.3
16.1
18.3
73.7
70.4
72.2
88.8
71.3
19.1
17.6
15.3
10.0
12.8
1303
0759
Oct
opus
, sm
oked
, fro
zen,
drie
d, s
alte
d,
or in
brin
e1.2
0.4
0.1
0.1
0.2
10.5
6.5
6.2
9.2
9.5
72.4
41.8
57.6
60.4
52.9
9.3
6.2
6.0
9.0
9.3
1403
0559
Drie
d fis
h (o
ther
than
cod
), no
t sm
oked
0.1
0.2
0.0
0.0
0.1
6.0
8.3
6.4
10.6
7.731
.320
.119
.114
.68.
55.
88.
16.
410
.57.6
1503
0192
Live
eel
s0.
00.
00.
00.
00.
00.
43.
59.
29.
77.2
9.5
12.8
9.1
9.4
7.80.
43.
59.
19.
47.2
1603
0232
Fres
h or
chi
lled
yello
wfin
tuna
0.1
0.0
0.0
0.0
0.0
8.2
8.5
8.4
8.3
8.4
28.0
15.4
14.3
8.0
6.3
8.1
8.5
8.4
7.96.
3
1703
0819
Sea
cucu
mbe
rs, s
mok
ed, f
roze
n, d
ried,
sa
lted,
or i
n br
ine
0.0
0.0
0.0
0.0
0.1
3.8
3.0
4.3
5.2
6.3
2.3
4.0
4.4
5.0
6.7
2.3
3.0
4.3
5.0
6.3
1803
0111
Live
orn
amen
tal f
resh
wat
er fi
sh0.
50.
40.
30.
20.
27.8
6.8
6.3
5.7
5.7
15.5
16.7
15.7
14.2
17.0
7.26.
36.
05.
55.
5
1903
0354
Froz
en m
acke
rel
0.0
0.0
0.0
0.0
0.0
4.6
6.2
9.4
6.2
5.1
6.3
6.0
1.84.
418
.14.
66.
01.8
4.4
5.1
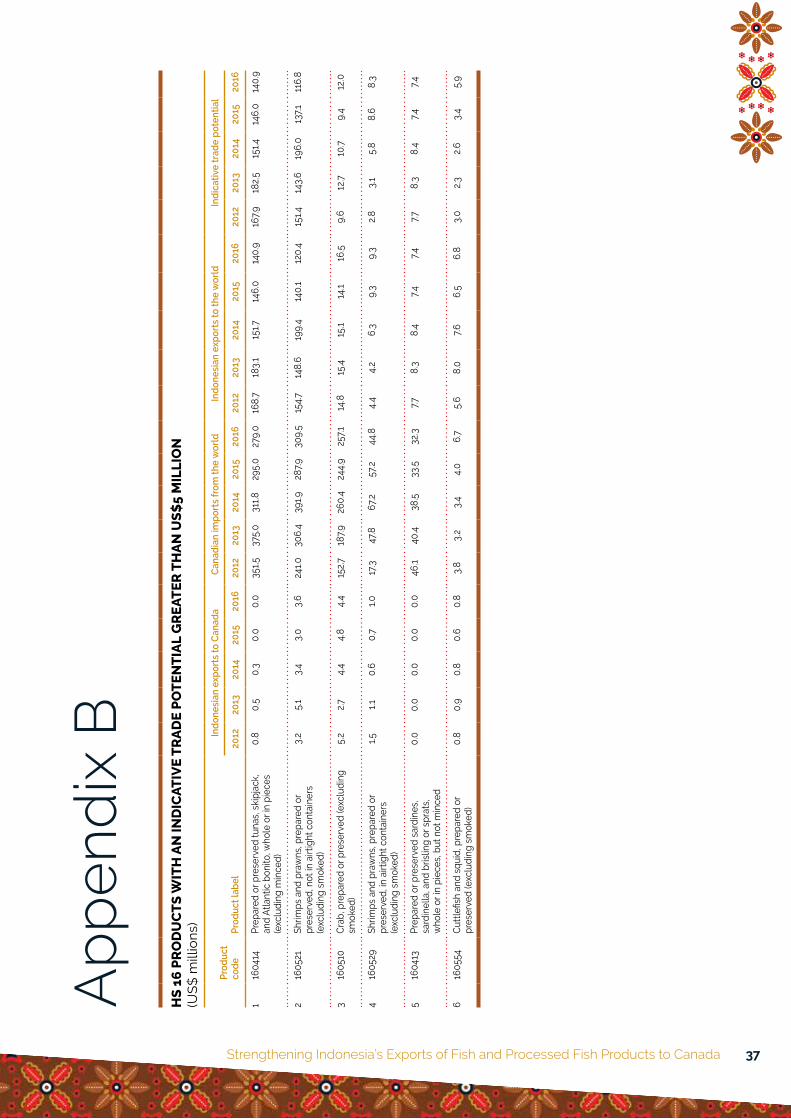
Strengthening Indonesia’s Exports of Fish and Processed Fish Products to Canada 37
Ap
pen
dix
BH
S 1
6 P
RO
DU
CT
S W
ITH
AN
IND
ICAT
IVE
TR
AD
E P
OT
ENT
IAL
GR
EAT
ER T
HA
N U
S$
5 M
ILLI
ON
(US
$ m
illio
ns)
Prod
uct
code
Prod
uct l
abel
In
done
sian
exp
orts
to C
anad
a C
anad
ian
impo
rts
from
the
wor
ld
Indo
nesi
an e
xpor
ts to
the
wor
ld
Indi
cativ
e tr
ade
pote
ntia
l
2012
2013
2014
2015
2016
2012
2013
2014
2015
2016
2012
2013
2014
2015
2016
2012
2013
2014
2015
2016
116
0414
Prep
ared
or p
rese
rved
tuna
s, s
kipj
ack,
an
d At
lant
ic b
onito
, who
le o
r in
piec
es
(exc
ludi
ng m
ince
d)
0.8
0.5
0.3
0.0
0.0
351.5
375.
031
1.829
5.0
279.
016
8.7
183.
115
1.714
6.0
140.
916
7.918
2.5
151.4
146.
014
0.9
216
0521
Shrim
ps a
nd p
raw
ns, p
repa
red
or
pres
erve
d, n
ot in
airt
ight
con
tain
ers
(exc
ludi
ng s
mok
ed)
3.2
5.1
3.4
3.0
3.6
241.0
306.
439
1.928
7.930
9.5
154.
714
8.6
199.
414
0.1
120.
415
1.414
3.6
196.
013
7.111
6.8
316
0510
Cra
b, p
repa
red
or p
rese
rved
(exc
ludi
ng
smok
ed)
5.2
2.7
4.4
4.8
4.4
152.
718
7.926
0.4
244.
925
7.114
.815
.415
.114
.116
.59.
612
.710
.79.
412
.0
416
0529
Shrim
ps a
nd p
raw
ns, p
repa
red
or
pres
erve
d, in
airt
ight
con
tain
ers
(exc
ludi
ng s
mok
ed)
1.51.1
0.6
0.7
1.017
.347
.867
.257
.244
.84.
44.
26.
39.
39.
32.
83.
15.
88.
68.
3
516
0413
Prep
ared
or p
rese
rved
sar
dine
s,
sard
inel
la, a
nd b
rislin
g or
spr
ats,
w
hole o
r in
piec
es, b
ut n
ot m
ince
d
0.0
0.0
0.0
0.0
0.0
46.1
40.4
38.5
33.5
32.3
7.78.
38.
47.4
7.47.7
8.3
8.4
7.47.4
616
0554
Cut
tlefis
h an
d sq
uid,
pre
pare
d or
pr
eser
ved
(exc
ludi
ng s
mok
ed)
0.8
0.9
0.8
0.6
0.8
3.8
3.2
3.4
4.0
6.7
5.6
8.0
7.66.
56.
83.
02.
32.
63.
45.
9

CANADA–INDONESIA TRADE AND PRIVATE SECTOR ASSISTANCE PROJECTTPSA
Canada Centre, World Trade Centre 5, 15th FloorJl. Jend. Sudirman Kav 29-31 Jakarta 12190, IndonesiaP: +62-21-5296-0376, or 5296-0389F: +62-21-5296-0385E: [email protected]
TPSAPROJECT.COM