strategies for demand-driven supply chains – a decoupling
TRANSCRIPT
Strategies for Demand-Driven Supply Chains
– A Decoupling Thinking Perspective
Doctoral Thesis
Fredrik Tiedemann
Jönköping UniversitySchool of EngineeringDissertation Series No. 056 • 2020

Doctoral Thesis in Production Systems
Strategies for Demand-Driven Supply Chains – A Decoupling Thinking PerspectiveDissertation Series No. 056
© 2020 Fredrik Tiedemann
Published bySchool of Engineering, Jönköping UniversityP.O. Box 1026SE-551 11 JönköpingTel. +46 36 10 10 00www.ju.se
Printed by Stema Specialtryck AB, year 2020
ISBN 978-91-87289-59-0
i
Abstract
In environments where customer requirements are constantly changing, such as for demand-driven manufacturing companies, the competition involves the ability to act and adapt to customer needs, sometimes even based on commitment from actual customer orders. In this context it is perhaps even more challenging to balance supply and demand. Several strategies proposed in the literature aid in this balancing act and are in this dissertation labelled demand-driven supply chain operations management strategies (DDSCOMSs). The research purpose is then to explore how demand-driven manufacturing companies can combine DDSCOMSs for effectiveness, focusing on five DDSCOMSs: segmentation, leagility, customization, transparency and postponement.
Based on an interactive approach, the research combines analytical conceptual research and empirical case studies. The data are mainly collected from literature reviews, interviews, workshops, observations and archival documents.
The research operationalizes the concept of demand driven using decoupling thinking, before identifying and describing relations between decoupling thinking and the five DDSCOMSs. The results are summarized in a process for aligning supply chains with the characteristics of the products and the market demand. This process can be used by supply chain operations managers to understand the relations between the DDSCOMSs and how they can be combined.
Furthermore, the relations between the financial performance measure – return on investment – and the five DDSCOMSs are established through decoupling thinking and summarized in a framework for how the DDSCOMSs can be combined for effectiveness. This framework, as well as the empirical data on which it is developed, equips supply chain operations managers with the knowledge and the ability to analyze the financial implications of a potential change in the supply chain design.
The research contributes to literature and practice by both summarizing existing and establishing new relations between some commonly used DDSCOMSs, as well as their relations to financial performance. The approach to developing the DDSCOMS framework for effectiveness also allows future research to expand on the framework by including additional DDSCOMSs, constructs of decoupling thinking and/or financial performance measures. Finally, in using constructs of decoupling thinking to establish the relations between the five DDSCOMSs and their implications for financial performance, the research also contributes towards establishing decoupling thinking as a theory. Keywords: demand driven, decoupling points, decoupling thinking, lead time, supply chain management, operations management, market segmentation, leagility, mass customization, supply chain visibility, postponement, financial performance.
Trycksak3041 0234
SVANENMÄRKET
i
Abstract
In environments where customer requirements are constantly changing, such as for demand-driven manufacturing companies, the competition involves the ability to act and adapt to customer needs, sometimes even based on commitment from actual customer orders. In this context it is perhaps even more challenging to balance supply and demand. Several strategies proposed in the literature aid in this balancing act and are in this dissertation labelled demand-driven supply chain operations management strategies (DDSCOMSs). The research purpose is then to explore how demand-driven manufacturing companies can combine DDSCOMSs for effectiveness, focusing on five DDSCOMSs: segmentation, leagility, customization, transparency and postponement.
Based on an interactive approach, the research combines analytical conceptual research and empirical case studies. The data are mainly collected from literature reviews, interviews, workshops, observations and archival documents.
The research operationalizes the concept of demand driven using decoupling thinking, before identifying and describing relations between decoupling thinking and the five DDSCOMSs. The results are summarized in a process for aligning supply chains with the characteristics of the products and the market demand. This process can be used by supply chain operations managers to understand the relations between the DDSCOMSs and how they can be combined.
Furthermore, the relations between the financial performance measure – return on investment – and the five DDSCOMSs are established through decoupling thinking and summarized in a framework for how the DDSCOMSs can be combined for effectiveness. This framework, as well as the empirical data on which it is developed, equips supply chain operations managers with the knowledge and the ability to analyze the financial implications of a potential change in the supply chain design.
The research contributes to literature and practice by both summarizing existing and establishing new relations between some commonly used DDSCOMSs, as well as their relations to financial performance. The approach to developing the DDSCOMS framework for effectiveness also allows future research to expand on the framework by including additional DDSCOMSs, constructs of decoupling thinking and/or financial performance measures. Finally, in using constructs of decoupling thinking to establish the relations between the five DDSCOMSs and their implications for financial performance, the research also contributes towards establishing decoupling thinking as a theory. Keywords: demand driven, decoupling points, decoupling thinking, lead time, supply chain management, operations management, market segmentation, leagility, mass customization, supply chain visibility, postponement, financial performance.
ii
Sammanfattning
I miljöer där kundkraven ständigt förändras, så som för efterfrågedrivna tillverkande företag, är det viktigt att kunna agera på och anpassa efter kunders behov, ibland till och med baserat på faktiska kundorder. I en efterfrågedriven kontext är det därför mer problematiskt, och kanske än viktigare, att balansera tillgång och efterfrågan. I denna avhandling beskrivs fem strategier som kan bistå i detta balanseringsarbete, vilka benämns demand-driven supply chain operations management strategies och förkortas DDSCOMSs (på svenska ungefär strategier för ledning och styrning av efterfrågedrivna försörjningskedjor). Syftet med avhandlingen är att undersöka hur efterfrågedrivna tillverkande företag kan kombinera DDSCOMSs för yttre effektivitet, med fokus på de fem DDSCOMSs: segmentering, leagility, kundanpassning, flödestransparens och senareläggning.
Forskningen är baserad på ett interaktivt tillvägagångssätt och består av en kombination av analytisk konceptuell forskning och empiriska fallstudier. Data har huvudsakligen samlats in via litteraturstudier, intervjuer, workshops, observationer och dokumentstudier.
I avhandlingen operationaliseras konceptet ”efterfrågedriven” med hjälp av frikopplingstänkandet, för att därefter identifiera och beskriva relationer mellan byggstenar inom frikopplingstänkandet och de fem DDSCOMSs. De identifierade relationerna utmynnar i en process för att anpassa försörjningskedjor till produktegenskaper och efterfrågan. Processen kan stödja yrkesverksamma inom logistikverksamhet att planera och styra försörjningskedjor genom att öka deras förståelsen för relationerna mellan olika DDSCOMSs och hur dessa kan kombineras.
Avhandlingen presenterar även relationer mellan de fem DDSCOMSs och mätetalet ”avkastning på investerat kapital” (engelskans return on investment). Dessa resultat utmynnar i ett ramverk för hur DDSCOMSs kan kombineras för ökad yttre effektivitet. Ramverket, inklusive den empiriska data som ramverket är baserat på, bidrar med kunskap som behövs inom en logistikverksamhet för att analysera potentiella logistiklösningars påverkan på finansiell prestation.
Forskningen bidrar till litteraturen och praktiken genom att både summera befintliga och etablera nya relationer mellan vanligt förekommande DDSCOMSs och deras påverkan på finansiell prestation. DDSCOMSs-ramverket för yttre effektivitet är utformat för att underlätta för framtida forskning att utvidga ramverket och inkludera ytterligare DDSCOMSs, byggstenar inom frikopplingstänkandet och/eller finansiella mätetal. Slutligen, genom användandet av frikopplingstänkandet för att skapa relationer mellan de fem DDSCOMSs och deras påverkan på finansiell prestation bidrar forskningen även till etableringen av frikopplingstänkandet som en frikopplingsteori. Nyckelord: efterfrågedrivet, frikopplingspunkter, frikopplingstänkandet, ledtid, logistik, verksamhetsledning, segmentering, leagility, kundanpassning, transparens, senareläggning, räntabilitet.
iii
Acknowledgements
Numerous people have supported and helped me throughout my PhD process. I could thank you all, but the dissertation is unfortunately too long as it is. Still, some individuals deserve special mention for making this dissertation possible. First and foremost, I express my deepest gratitude and appreciation to my three supervisors. Joakim Wikner, you have certainly challenged my thoughts and helped me become a better academic. You never cease to amaze me with your knowledge and ideas. I think that Nikolas Käkelä (2019, p. III) hit the nail on the head when he wrote that ‘you certainly bring the best out of the people around you, and I think that is much thanks to the fact that you are in this game for all the right reasons’. To Eva Johansson, you are not only a great supervisor but also an exceptional person and academic. You put 110% into whatever you do, something that I realized already during my bachelor’s studies. You always have time for your students and colleagues and see the best in everyone, including a hopeless case as I am (especially in grammar and spelling). These are some of the many reasons why I enjoy working with you. Jenny Bäckstrand, you are not only a great colleague but a good friend. Thank you for putting your trust in me and convincing me to pursue a career in academia. Thanks to you, I am doing something for a living that I truly cherish. I will always be grateful for that. In academia, we frequently say that ‘we stand on the shoulders of giants’, meaning that we make discoveries and progress or gain insights due to the previous discoveries or works of those who have come before us. I would also like to think that for supervisors, it means helping others to bring out the best in them. Therefore, in many ways, you are my giants! Thank you for putting your trust in me and making this journey interesting, educational and enjoyable. Even though this is an end of some sort, I would like to see it as the beginning of a long and fruitful collaboration.
I also take this opportunity to thank my present and former colleagues at Jönköping University, School of Engineering — especially the PhD candidates at the School of Engineering and my colleagues at the Department of Supply Chain & Operations Management — for always supporting me, as well as providing a warm, productive and enjoyable work environment.
Special thanks to Jonathan Gosling at Cardiff Business School for the countless meetings and sharing your knowledge and expertise. I am fortunate to consider you my friend.
I am also grateful to Professor Magnus Wiktorsson at KTH Royal Institute of Technology for the constructive and educational discussion during the final seminar, for scrutinizing an earlier version of this dissertation and for your helpful suggestions and comments.
My appreciation also goes out to the representatives and respondents at the case companies, as well as the founding organizations, Swedish Knowledge Foundation and Jönköping University, School of Engineering. This research would not have been possible without the support of these organizations.

iv
Finally, I thank my family for always supporting me. Thank you, Mom, Dad, Emma, Elin, Markus, Iris and Flora for always being there for me and giving me the strength to continue with my work. Special thanks to my life companion and fiancée, Madelene. Thank you for your support, understanding and always being there for me. I am lucky to have you in my life. You are my rock! You and our daughter Alice bring joy and meaning to my life.
Fredrik Tiedemann Jönköping, 2020
v
List of appended papers
The following seven publications constitute the foundation of this dissertation. Rather than being presented in the order in which they have been written, the sequence is based on the order in which they respond to the four research questions presented in the dissertation. In addition to the publication references, the presentation also includes information on the work distribution and whether the publications are based on an earlier version. Paper 1 Tiedemann, F., Johansson, E. and Gosling, J. (2020), “Structuring a new product development process portfolio using decoupling thinking”, Production Planning & Control, Vol. 31 No. 1, pp. 38–59. Tiedemann presented an earlier version of the paper at the 22nd EurOMA Conference: Operations Management for Sustainable Competitiveness, 26 June–1 July 2015, Neuchâtel, Switzerland. Work distribution: The paper was initiated by Johansson and Tiedemann. Tiedemann collected data from all the six case companies included in the study, with three of them together with Johansson and two of them together with Gosling and Johansson. Tiedemann, and partly Johansson and Gosling, conducted the analysis. Johansson, Gosling and Tiedemann co-wrote the paper, where Tiedemann had the main responsibility as the lead author. Paper 2 Wikner, J., Bäckstrand, J., Tiedemann, F. and Johansson, E. (2015), “Leagility in a triad with multiple decoupling points”, in Umeda, S., Nakano, M., Mizuyama, H., Hibino, N., Kiritsis, D. and von Cieminski, G. (Eds.), Advances in production management systems: innovative production management towards sustainable growth, Springer International Publishing, Cham, pp. 113–120. Tiedemann presented the paper at the 2015 APMS Conference: Innovative Production Management Towards Sustainable Growth, 7–9 September 2015, Tokyo, Japan. Work distribution: Tiedemann and Wikner initiated the paper. Wikner wrote the conceptual part, Tiedemann wrote the empirical illustrative part, and Bäckstrand improved on it. Bäckstrand, Johansson and Tiedemann proofread and improved the readability of the paper. Paper 3 Wikner, J. and Tiedemann, F. (2019), “Customization and variants in terms of form, place and time”, in Ameri F., Stecke K.E., von Cieminski G. and Kiritsis D. (Eds), Advances in production management systems. Production management for the factory of the future, Springer International Publishing, Cham, pp. 383–391. Tiedemann presented the paper at
vi
the 2019 APMS Conference: Toward Smart Production Management Systems, 1–5 September 2019, Austin, Texas, US. An earlier version of the paper was presented at the 9th Research and Application Conference on Logistics and Operations Management [PLANs forsknings- och tillämpningskonferens], 19–20 October 2016, Växjö, Sweden. Work distribution: Tiedemann and Wikner initiated the paper. Tiedemann revised the paper based on an earlier version of the conference paper presented in Swedish. Wikner improved the paper’s structure and readability. Paper 4 Tiedemann, F. (2020), “Demand-driven supply chain operations management strategies – a literature review and conceptual model”, Under review in Production & Manufacturing Research. Work distribution: Tiedemann initiated and wrote the paper. Paper 5 Tiedemann, F. and Wikner, J. (2019), “Postponement revisited – a typology for displacement”, in Ameri F., Stecke K.E., von Cieminski G. and Kiritsis D. (Eds), Advances in production management systems. Towards smart production management systems, Springer International Publishing, Cham, pp. 204–211. Tiedemann presented the paper at the 2019 APMS Conference: Toward Smart Production Management Systems, 1–5 September 2019, Austin, Texas, US. Work distribution: Tiedemann initiated and wrote the paper. Wikner improved its structure and readability.
Paper 6 Tiedemann, F. and Wikner, J. (2018), “Some common and fundamental characteristics of four supply chain strategies – customization, leagility, postponement and segmentation”. Paper presented by Tiedemann at the 25th EurOMA Conference: To Serve, to Produce and to Servitize in the Era of Networks, Big Data, and Analytics, 24–26 June 2018, Budapest, Hungary. Work distribution: Tiedemann and Wikner initiated the paper and developed the conceptual process. Tiedemann conducted the literature review and wrote the paper. Wikner improved the paper’s structure and readability.
Paper 7 Tiedemann, F., Wikner, J. and Johansson, E. (2020), “Understanding lead-time implications for financial performance – a qualitative study”, Under review in Journal of Manufacturing Technology Management. Tiedemann presented an earlier version of the
vii
paper at the 23rd EurOMA Conference: Interactions, 17–22 June 2016, Trondheim, Norway. Work distribution: Tiedemann and Wikner initiated the paper. Tiedemann collected and analyzed the data, as well as wrote the first version of the paper. Its final version was co-written and improved by all authors.

viii
ix
Table of Contents
Introduction ............................................................................................................ 1
1.1 Background ........................................................................................................ 1
1.2 Problem statement .............................................................................................. 3
1.3 Purpose and research questions ......................................................................... 4
1.4 Research scope and delimitations ...................................................................... 6
1.5 Dissertation outline ............................................................................................ 8
Frame of references ................................................................................................ 9
2.1 Important concepts for the research ................................................................. 10
2.1.1 Supply chain operations management ...................................................... 10
2.1.2 Supply chain fit ......................................................................................... 11
2.1.3 Concept of demand driven ........................................................................ 12
2.2 Decoupling thinking ........................................................................................ 14
2.2.1 Control-based constructs .......................................................................... 16
2.2.2 Risk-based constructs ............................................................................... 17
2.2.3 Variant-based constructs .......................................................................... 19
2.2.4 Information-based constructs ................................................................... 21
2.2.5 Decoupling thinking, a pre-theory............................................................ 22
2.3 Demand-driven supply chain operations management strategies .................... 23
2.3.1 Segmentation strategy .............................................................................. 24
2.3.2 Leagility strategy ...................................................................................... 25
2.3.3 Customization strategy ............................................................................. 25
2.3.4 Transparency strategy .............................................................................. 26
2.3.5 Postponement (preponement) strategy ..................................................... 28
2.4 Research on lead-time implications for financial performance ....................... 30
2.4.1 Synthesis of publications addressing lead-time implications for financial performance ............................................................................................................ 30
2.4.2 Common relative financial performance measures .................................. 31
Methodology .......................................................................................................... 33
3.1 Research design ............................................................................................... 33
3.2 Research process .............................................................................................. 36
3.2.1 Part 1. Empirical case study research...................................................... 37
x
3.2.2 Part 2. Analytical conceptual research .................................................... 38
3.3 Studies, including data collection and analysis ............................................... 40
3.3.1 Study A. Concept of demand driven in terms of the ability to adapt products .................................................................................................................. 42
3.3.2 Study B. Concept of demand driven in terms of multiple customers in sequence.................................................................................................................. 44
3.3.3 Study C. Relations and combinations of constructs and DDSCOMSs ..... 45
3.3.4 Study D. Strategic lead times’ implications for ROI ................................ 49
3.4 Research quality and ethical considerations .................................................... 52
3.4.1 Research quality ....................................................................................... 52
3.4.2 Ethical considerations .............................................................................. 55
Summary of appended papers ............................................................................. 57
4.1 Paper 1. Structuring a new product development process portfolio using decoupling thinking .................................................................................................... 57
4.2 Paper 2. Leagility in a triad with multiple decoupling points .......................... 59
4.3 Paper 3. Customization and variants in terms of form, place and time ........... 60
4.4 Paper 4. Demand-driven supply chain operations management strategies – a literature review and conceptual model ...................................................................... 62
4.5 Paper 5. Postponement revisited – a typology for displacement ..................... 63
4.6 Paper 6. Some common and fundamental characteristics of four supply chain strategies – customization, leagility, postponement and segmentation ...................... 64
4.7 Paper 7. Understanding lead-time implications for financial performance – a qualitative study .......................................................................................................... 65
Concluding analysis .............................................................................................. 67
5.1 RQ1. What constructs can be used to operationalize the concept of demand driven? ........................................................................................................................ 68
5.2 RQ2. What are the relations between the constructs and the DDSCOMSs? ... 72
5.2.1 Relation between the constructs and the segmentation strategy .............. 72
5.2.2 Relation between the constructs and the leagility strategy ...................... 74
5.2.3 Relation between the constructs and the customization strategy ............. 74
5.2.4 Relation between the constructs and the transparency strategy .............. 74
5.2.5 Relation between the constructs and the postponement strategy ............. 75
5.3 RQ3. How can the DDSCOMSs be combined? .............................................. 75
5.3.1 Phase 1. Identifying segments .................................................................. 77
5.3.2 Phase 2. Designing the supply chain for supply chain fit ........................ 77
xi
5.3.3 Phase 3. Operating the supply chain for financial return ........................ 79
5.3.4 Phase 4. Adjusting the supply chain to maintain supply chain fit ............ 79
5.4 RQ4. What are the constructs’ implications for financial performance?......... 80
5.4.1 Control-based constructs’ implications for ROI ...................................... 80
5.4.2 Risk-based constructs’ implications for ROI ............................................ 81
5.4.3 Variant-based constructs’ implications for ROI ...................................... 81
5.4.4 Summarizing the constructs’ implications for ROI into propositions ...... 82
5.5 Summarizing the relations between RQs and the research purpose ................ 83
Discussion .............................................................................................................. 85
6.1 The use of constructs within the pre-theory decoupling thinking.................... 85
6.2 Combining DDSCOMSs using direct and transitive relations ........................ 87
6.3 Relation between supply chain design and financial performance .................. 92
Conclusions ........................................................................................................... 95
7.1 Theoretical contributions ................................................................................. 95
7.1.1 Nuancing different types of drivers for engineering activities ................. 95
7.1.2 Nuancing customization and presenting a typology for displacement ..... 96
7.1.3 DDSCOMS framework for effectiveness and decoupling theory ............. 96
7.1.4 Combining DDSCOMSs for supply chain fit ............................................ 96
7.1.5 Lead-time implications for financial performance ................................... 97
7.2 Managerial contributions ................................................................................. 98
7.2.1 Increased understanding of the concept of demand driven ...................... 98
7.2.2 Analyzing operational implications of displacement options ................... 98
7.2.3 Understanding DDSCOMSs and a process for maintaining supply chain fit .................................................................................................................. 99
7.2.4 Demystifying lead times’ implications for ROI ........................................ 99
7.3 Limitations and further research .................................................................... 100
7.3.1 Internal and external types of forecast-based drivers in engineering .... 100
7.3.2 Establishing decoupling thinking as a theory......................................... 100
7.3.3 Expanding the DDSCOMS framework for effectiveness ........................ 101
7.3.4 Benefits of using the displacement typology ........................................... 101
7.3.5 Improving the DDSCOMS process for maintaining supply chain fit ..... 101
7.3.6 Augmenting lead times’ implications for ROI ........................................ 102
References.................................................................................................................... 103

xii
Appendices .................................................................................................................. 125
Appendix 1. Workshops and steering group meetings in KOPtimera ...................... 126
Appendix 2. Interview protocol used in Study D ..................................................... 129
Glossary of key terms, acronyms and abbreviations .............................................. 131
Definitions of some key terms used in the main text ............................................... 131
Abbreviations and acronyms used for some key terms ............................................ 135
xiii
List of figures
Figure 1.1. Outlining the relations between the RQs ....................................................... 6
Figure 2.1. Order and content of Chapter 2 ...................................................................... 9
Figure 2.2. Triadic supply chain ..................................................................................... 11
Figure 2.3. Supply chain fit, matching supply chain with products and demand ........... 12
Figure 2.4. Nuancing the concept of demand driven ...................................................... 13
Figure 2.5. Material-based and time-phased BOM ........................................................ 16
Figure 3.1. Relating RQs to studies ................................................................................ 34
Figure 3.2. Relating the studies to research methods, appended papers, RQs and purpose ........................................................................................................................................ 35
Figure 3.3. Major classes and subcategories of theory building. ................................... 37
Figure 3.4. Timeline of the research process .................................................................. 37
Figure 4.1. A structured NPD process portfolio ............................................................. 58
Figure 4.2. Four interface configurations combining efficiency and responsiveness .... 60
Figure 4.3. Combining flow structures with the form and the place dimensions ........... 61
Figure 4.4. Transitive DDSCOMS relations model ....................................................... 62
Figure 4.5. Process of balancing efficiency and responsiveness using four DDSCOMSs ........................................................................................................................................ 65
Figure 5.1. Activities conducted in different NPD processes......................................... 71
Figure 5.2. DDSCOMS process for maintaining supply chain fit .................................. 76
Figure 5.3. Illustrating the relations between the RQs, their outcomes and the research purpose ........................................................................................................................... 83
Figure 6.1. Analyzing the effect of a postponed activity using the time-phased BOM tool ........................................................................................................................................ 89
Figure 6.2. Transitive relations between decoupling thinking and each DDSCOMS .... 90
Figure 6.3. DDSCOMS framework for effectiveness .................................................... 94
xiv
List of tables
Table 2.1. Compilation of the eleven constructs of decoupling thinking ....................... 15
Table 2.2. Four elements or properties of a theory ......................................................... 22
Table 2.3. Three common relative financial performance measures .............................. 31
Table 3.1. Case companies ............................................................................................. 39
Table 3.2. Summaries of four conducted studies............................................................ 41
Table 3.3. Sources of evidence specifically collected for Study A ................................ 43
Table 3.4. Interviews conducted in Study D .................................................................. 50
Table 3.5. Information needed by the reader to decide on transferability of research results ........................................................................................................................................ 54
Table 4.1. Preponement and postponement in terms of form, place and time ............... 63
Table 4.2. Comparison of conceptual model with empirical data .................................. 66
Table 5.1. Appended papers’ contributions to the four RQs .......................................... 67
Table 5.2. Compilation of the constructs of demand driven .......................................... 69
Table 5.3. Relations between the constructs of demand driven and the five DDSCOMSs ........................................................................................................................................ 73
Table 5.4. Summaries of lead-time constructs’ implications for ROI ............................ 82
Table 6.1. The transitive relations that are considered strong or fair ............................. 88
Table 7.1. Summaries of theoretical contributions and order in which they are addressed ........................................................................................................................................ 95
Table 7.2. Summaries of managerial contributions and order in which they are addressed ........................................................................................................................................ 98
Table 7.3. Summaries of limitations and further research and order in which they are addressed ...................................................................................................................... 100
1
Introduction This chapter aims to introduce the reader to the context and the research problem, as well as clarify why this research is important. As such, the chapter starts by presenting the background of the research problem, followed by the three managerial challenges that comprise this problem. From these three challenges, the purpose is formulated and broken down into four research questions (RQs). The chapter then concludes by addressing the research scope and delimitations, as well as presenting an outline of the dissertation.
A list of the definitions, abbreviations and acronyms of some key terms used in this dissertation is provided in the Glossary at the end of the main text, that is, before the appended papers.
1.1 Background For any business to be competitive, there must be a demand for its products, and customers are behind this demand. As such, customers are important for any business that sells products because without customers, there is no one to buy the products (Hines, 2013). However, for customers to consider a product, the value gained (i.e., customer value) from acquiring it should be equal to or preferably exceed what the customers must give up to obtain the product (Johnson and Weinstein, 2004). This is equally true for products offered by manufacturing companies operating in a business-to-business (B2B) environment, where their customers are other companies.
However, what constitutes customer value is constantly changing with changing customer requirements (Medini et al., 2019). In striving to deliver customer value, even functional products have become exposed to proliferation, where demand for variants and updates have resulted in shorter product life cycles (Ptak and Smith, 2019). Additionally, globalization and digitalization continue to open up markets, giving customers the ability to both find and choose from a greater number of offerings. This has resulted in fragmented markets and more demanding and informed customers (Hines, 2013; Ptak and Smith, 2019). To be competitive, manufacturing companies therefore need to be perceptive about customer demands in an effort to continue creating customer value (Goldratt and Cox, 2016; Hines, 2013).
One way in which manufacturing companies have become more perceptive is by shifting their competitive focus to accommodate customer needs and become more demand driven (see, e.g., Duray, 2002; Hines, 2013; Melnyk et al., 2010; Salvador et al., 2004), that is, increase their ability to act and adapt to customer needs. One demand-driven approach is to even become customer-order driven1, which offers the possibility to act and adapt the offerings based on commitment to actual customer orders. This way
1 The reader is directed to Chapter 2, Section 2.1.3 (Concept of demand driven) for more information on the concepts of demand driven and customer-order driven, as well as the relation between them.
2
of creating customer value and achieving the business objective should then be incorporated into the business strategy and broken down into a set of operational strategies (Hines, 2013). These operational strategies support effective decision making (i.e., doing the right things; Drucker, 2007), setting a broad plan for how the organizational resources should be used to support the business strategy and safeguard the business’ long-term competitiveness. Supply chain operations management (SCOM) strategies fall under this category of operational strategies (Hines, 2013), intending to support and operationalize the business objectives. As such, SCOM strategies are pivotal to the success of most manufacturing companies as they represent the fundamentals of how companies intend to create competitive advantage in terms of the set of customer demands that they seek to satisfy through their supply chain operations (Chopra and Meindl, 2013; Christopher et al., 2006; Hines, 2013; Sabri, 2019; Stank et al., 2005). Consequently, SCOM strategies employed by demand-driven manufacturing companies should provide support in designing and managing supply chains that adhere to the business objective of satisfying customer demands.
Introduced by Fisher (1997), the notion that the supply chain design should be aligned with the nature of the demand and the products’ characteristics is now known as ‘supply chain fit’ (see, e.g., Gligor, 2017; Lee, 2002; Randall et al., 2003; Sabri, 2019; Stock et al., 1998; Wagner et al., 2012). Segmentation, leagility, customization, transparency and postponement are some SCOM strategies that can be used to achieve supply chain fit and support demand-driven manufacturing companies’ ability to act on customer orders and to adapt their offerings. For example, the segmentation strategy can provide support in segmenting markets to tailor to different customers’ needs for adaptations (Fuller et al., 1993; Hilletofth, 2009). However, the question of how to adapt products based on customers’ unique requirements is better addressed by the customization strategy (Akinc and Meredith, 2015; McCarthy, 2004; Spring and Dalrymple, 2000). The leagility and the transparency strategies can then support supply chain operations managers in deciding when the company should be able to act on actual customer orders (Naylor et al., 1999), as well as what and when demand- and supply-related information should be transferred in order to support this ability (Williams et al., 2013). Finally, the postponement strategy adds a dynamic capability; for instance, it advocates that transformation activities should be delayed until better decision support can be attained, such as customer demand information (Van Hoek, 2001; Yang et al., 2005). Since these strategies can be used by demand-driven manufacturing companies to achieve supply chain fit, they are further addressed as demand-driven supply chain operations management strategies (DDSCOMSs). Note that these five DDSCOMSs are not absolute, meaning that other DDSCOMSs exist2. However, the set of selected strategies reflects unique aspects of demand driven.
2 For more information on the selection of DDSCOMSs, the reader is directed to Section 1.4 (Research scope and delimitations) and Chapter 3, Section 3.3.3 (Study C. Relations and combinations of constructs and DDSCOMSs), where this issue is further addressed.
3
1.2 Problem statement The use of these DDSCOMSs comes with different managerial challenges, where supply chain operations managers need to understand (i) how DDSCOMSs can be used in combination, (ii) how changes in the business environment affect the use of DDSCOMSs and how these can be handled and (iii) how the use of DDSCOMSs have implications for the businesses’ financial performance. These three challenges make up the research problem and are further elaborated on hereafter.
To achieve supply chain fit, the chosen DDSCOMSs should fit the characteristics of the companies’ products, markets and processes (Kim, 2014). However, most demand-driven manufacturing companies manage a portfolio of products, markets and processes and are therefore members of several supply chains (Aitken et al., 2005; Godsell et al., 2011; Hilletofth, 2009; Pagh and Cooper, 1998). In doing so, such companies tend to employ more than one DDSCOMS simultaneously (Hines, 2013). To add to the complexity of using multiple DDSCOMSs, achieving supply chain fit is not necessarily the same as maintaining it. In other words, business objectives and market requirements are dynamic and change over time. What constitutes an appropriate supply chain design can thus change with these changing objectives and requirements (Aitken et al., 2005; Childerhouse et al., 2002; Christopher and Towill, 2000; Gligor, 2017; Hines, 2013; Medini et al., 2019; Melnyk et al., 2010; Sebastiao and Golicic, 2008). Supply chain fit is consequently as much a process as it is a state, adding a dynamic challenge of both achieving and maintaining supply chain fit (Gligor, 2017; Van de Ven et al., 2013; Wagner et al., 2012).
Herein lie the first two challenges faced by supply chain operations managers in demand-driven manufacturing companies. The first challenge is ensuring that the elements of the set of employed DDSCOMSs do not conflict with one another but are compatible and designed to work together to support the business objectives (Hines, 2013; Kim, 2014; Melnyk et al., 2010). Second, the managers also need to apply a dynamic approach to supply chain design, realizing that the changes in customer needs and what is perceived as customer value also have implications for the design of supply chain operations (Defee and Stank, 2005; Melnyk et al., 2010).
Furthermore, as for all for-profit demand-driven manufacturing companies, the ultimate goal is to create business value, specifically to generate money and earn profits (Goldratt and Cox, 2016; Harrison and Horngren, 2008; Leon, 2016; Ptak and Smith, 2019). In other words, achieving and maintaining supply chain fit and delivering customer value constitute the foundation for generating business value (Droge et al., 2004; Flynn et al., 2010; Gligor, 2017; Stank et al., 2012; Wagner et al., 2012), where supply chain operations can be perceived as a bridge between the customers and the generation of business value. As such, supply chain operations managers are not only confined to operational issues but also play a strategic role, where the design and control of supply chains have direct implications for the business bottom line (Gligor, 2017; Mendes, 2011; Wagner et al., 2012). Historically, in many cases, supply chain operations managers have intuitively understood this linkage, working to reduce supply chain operation costs in order to increase business value (Stank et al., 2019). Nonetheless, supply chain operations
4
managers have currently started to gain a more widespread understanding of this relation, also realizing that supply chain operations can be used to compete and contribute to profit generation (Stank et al., 2019). In other words, cost cutting is only one way of increasing business value; two others are increasing revenue and/or decreasing working capital. This notion has also been supported in the literature, where research has shown that supply chain design has implications for financial performance (see, e.g., Blackburn, 2012; Christensen et al., 2007; Droge et al., 2004; Flynn et al., 2010; Gligor, 2017; Jayaram et al., 1999; Vickery et al., 1995; Wagner et al., 2012). Still, current research has mainly focused on the question of whether supply chain operations have implications for financial performance and how substantial these implications are, largely using quantitative approaches (see, e.g., Blackburn, 2012; Gligor, 2017; Jayaram et al., 1999; Vickery et al., 1995; Wagner et al., 2012). The qualitative aspects and the question of how these implications appear have thus been somewhat bypassed. As such, even though managers in demand-driven manufacturing companies know that supply chain operations have implications for generating business value, they still lack a detailed understanding of how these implications are manifested in practice (Stank et al., 2019).
Herein lies the third and final challenge. To be able to design effective demand-driven supply chains, supply chain operations managers also need to understand more explicitly how the supply chain operations have implications for financial performance.
To sum up, there are still gaps in the knowledge about how different DDSCOMSs can be applied in combination and dynamically, as well as their implications for financial performance.
1.3 Purpose and research questions To address the three challenges presented in the problem statement, the purpose of this research is to explore how demand-driven manufacturing companies can combine DDSCOMSs for effectiveness. This purpose is further broken down into four RQs.
As stressed in the introduction, the concept of demand driven is important for this research. Therefore, the first step is to analyze and operationalize this concept in order to create a solid foundation on which the rest of the research can be based. Here, analyzing is perceived as studying the meaning of the concept so that it can be separated into its constituent elements, that is, constructs. Operationalize is then to make something clearly distinguishable, measurable and understandable so that it can be used in practice (based on Merriam-Webster Dictionary, 2020a; Wikipedia Encyclopedia, 2020). RQ1 is therefore stated as follows:
RQ1 – What constructs can be used to operationalize the concept of demand driven?
The set of constructs that provides the answer to RQ1 can thus be used to
operationalize the concept of demand driven. As by definition, the DDSCOMSs are demand driven, the constructs should logically also be possible to use for operationalizing the five selected DDSCOMSs, that is, how the latter can be applied within demand-driven
5
manufacturing companies. However, to do so, relations between the constructs and the DDSCOMSs should first be established. RQ2 is therefore formulated as follows:
RQ2 – What are the relations between the constructs and the DDSCOMSs?
Still, RQ2 focuses on the relations between the set of constructs and each of the
DDSCOMSs, but not necessarily the relations between the DDSCOMSs themselves. However, as presented in the problem statement, demand-driven manufacturing companies tend to employ more than one DDSCOMS. Thus, to understand how these DDSCOMSs can support one another and be combined, the relations between them also have to be established. In this regard, RQ3 is as follows:
RQ3 – How can the DDSCOMSs be combined? The expected outcome of answering RQ3 is thus knowledge on how demand-driven
manufacturing companies can combine DDSCOMSs. Still, the outcome does not explicitly address whether the DDSCOMSs are combined for effectiveness, generating the desired results. As presented in the problem statement, for-profit demand-driven manufacturing companies’ ultimate goal is to earn profit. Therefore, to identify the implications of the demand-driven supply chain design for financial performance, RQ4 is formulated as follows:
RQ4 – What are the constructs’ implications for financial performance?
The following text and Figure 1.1 sum up the intended outcomes of the four RQs and
the relations between the RQs. First, the intention behind RQ1 is to operationalize the concept of demand driven through a set of constructs. The intention behind RQ2 is then to use the identified set of constructs in order to recognize and/or establish the relations between them and the DDSCOMSs, illustrated with the bidirectional arrow between the ‘DDSCOMSs’ and the ‘constructs of demand driven’ (see Figure 1.1). The intention behind the approach to first establish a foundation of constructs of demand driven, on which the relations to some DDSCOMSs are then identified and/or established, is that the resulting constructs and relations can act as a robust framework within which other DDSCOMSs and constructs of demand driven can be added in the future, with no or little effort.
Next, using the findings from RQ1 and RQ2, RQ3 focuses on the first two challenges, addressing how the five DDSCOMSs can be combined and used to handle changes in the business environment, illustrated with the bidirectional arrows among the five DDSCOMSs, forming a star. Finally, RQ4 focuses on the third challenge – how the use of the DDSCOMSs has implications for financial performance – by addressing the relation between the constructs of demand driven and financial performance. This is indicated with the unidirectional arrow from the ‘constructs of demand driven’ to ‘financial performance’.
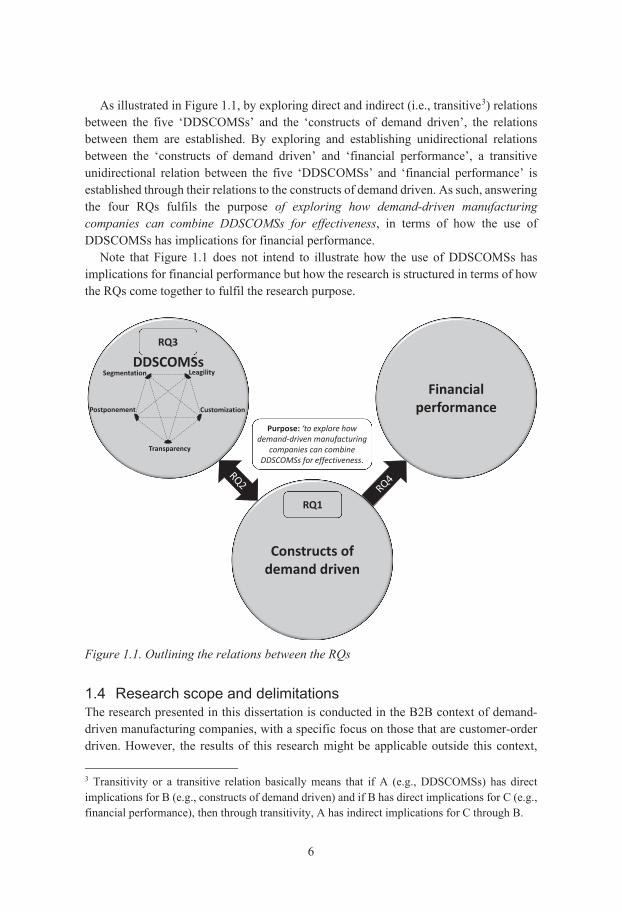
6
As illustrated in Figure 1.1, by exploring direct and indirect (i.e., transitive3) relations between the five ‘DDSCOMSs’ and the ‘constructs of demand driven’, the relations between them are established. By exploring and establishing unidirectional relations between the ‘constructs of demand driven’ and ‘financial performance’, a transitive unidirectional relation between the five ‘DDSCOMSs’ and ‘financial performance’ is established through their relations to the constructs of demand driven. As such, answering the four RQs fulfils the purpose of exploring how demand-driven manufacturing companies can combine DDSCOMSs for effectiveness, in terms of how the use of DDSCOMSs has implications for financial performance.
Note that Figure 1.1 does not intend to illustrate how the use of DDSCOMSs has implications for financial performance but how the research is structured in terms of how the RQs come together to fulfil the research purpose.
Figure 1.1. Outlining the relations between the RQs
1.4 Research scope and delimitations The research presented in this dissertation is conducted in the B2B context of demand-driven manufacturing companies, with a specific focus on those that are customer-order driven. However, the results of this research might be applicable outside this context,
3 Transitivity or a transitive relation basically means that if A (e.g., DDSCOMSs) has direct implications for B (e.g., constructs of demand driven) and if B has direct implications for C (e.g., financial performance), then through transitivity, A has indirect implications for C through B.
DDSCOMSs
Constructs of demand driven
RQ3
Financial performance
RQ1
Purpose: ‘to explore how demand-driven manufacturing
companies can combine DDSCOMSs for effectiveness.
Segmentation Leagility
Customization
Transparency
Postponement
7
given that the body of literature on decoupling thinking and supply chain fit, for instance, is more general than the context of the present research. Additionally, although the demand-driven manufacturing companies are customer-order driven, they can still have market segments where activities are conducted entirely based on expected future demands, that is, forecast driven.
Furthermore, the intention behind this research is to establish a robust framework for how the DDSCOMSs can be combined for effectiveness. Hence, the focus is not on providing an all-inclusive view of DDSCOMSs but on creating a robust framework that can be expanded in the future by including other DDSCOMSs and/or other constructs of demand driven. However, to create such a robust framework, the set of selected strategies should reflect unique aspects of the concept of demand driven, and to its advantage, received substantial interest in both literature and practice. The number of DDSCOMSs and the selected ones are based on a similar logic applied in designing a case study and can be considered a convenience sample (see Voss et al., 2002).
First, to create a robust framework and offer the possibility to combine DDSCOMSs, two or more DDSCOMSs must be explored. The choice of including five DDSCOMSs follows the recommendations of Eisenhardt (1989) and Voss et al. (2002) regarding the number of cases to study in order to increase the possibility to build a theory and at the same time, reduce the complexity that comes with a larger number of cases.
Second, although resembling a convenience sample, the selected DDSCOMSs are based on the purpose of the research. To be deemed appropriate, the strategies need to (i) address and be applicable to supply chain operations, (ii) improve manufacturing companies’ ability to act and adapt to customer needs, (iii) focus on the flow of materials and/or information, (iv) address different aspects of demand driven and (v) have received substantial interest in both literature and practice. Segmentation, leagility, customization, transparency and postponement all comply with these criteria.
Finally, RQ2 and RQ3 include the terms relation and combine, respectively. A relation is usually bidirectional and can rather subjectively be considered either positive or negative. Since part of the research purpose is to ‘combine DDSCOMSs for effectiveness’, to do the right things (intended to be positive), the focus is on positive relations rather than differences, conflicts and weaknesses. As such, the studies conducted in relation to RQ2 and RQ3 have focused on identifying and establishing strengths and commonalities between the constructs of demand driven and the DDSCOMSs, as well as between the DDSCOMSs, in order to combine them. Moreover, it is obviously important for manufacturing companies to be both efficient and effective. However, improving efficiency without effectiveness is futile (Drucker, 2007). This research therefore focuses on supporting effective decision making rather than on how to make the flow efficient.
8
1.5 Dissertation outline This is a compilation dissertation, consisting of the main text and seven appended papers. The main text is structured into seven chapters, as follows:
Chapter 1. The Introduction presents the background of the research problem and the three managerial challenges that comprise the research problem. Based on these three challenges, the purpose is defined and broken down into four RQs. The chapter then provides the research scope and delimitations, as well as the outline of the dissertation.
Chapter 2. The Frame of references starts by defining important concepts for the research, such as SCOM, supply chain fit and demand driven, including customer-order driven. The chapter then introduces and synthesizes decoupling thinking, before describing DDSCOMSs and elaborating on the five selected DDSCOMSs. The chapter ends by synthesizing the literature on lead-time implications for financial performance, as well as addressing commonly used financial performance measures.
Chapter 3. The Methodology explains the research design and presents the research process, including the employed research approach and methods. This is followed by a detailed presentation of the four conducted studies, focusing on how and what data have been collected and analyzed. The chapter concludes by discussing the research quality and ethical considerations.
Chapter 4. The Summary of and contributions of the appended papers presents a summary of each of the seven appended papers, focusing on the purpose, the research design and the findings presented in each paper. The chapter also provides a summary of each paper’s key contributions and the RQ(s) that each addresses.
Chapter 5. The chapter starts by presenting the RQ(s) to which each paper responds, before providing the Concluding analysis of the research findings offered in the seven appended papers, providing answers to the four stated RQs. The chapter concludes with a discussion on the relation between the answers to the RQs and the main purpose of the research.
Chapter 6. This chapter covers the Discussion of the findings, relating them to the Frame of references and the three challenges raised in the Introduction.
Chapter 7. The dissertation ends with the Conclusions chapter by presenting the theoretical and the managerial contributions, as well as research limitations, and proposing further research to address these limitations.
9
Frame of references This chapter introduces the concepts and the constructs that are used as analysis tools. To some degree, it also synthesizes the research that has been done within the different bodies of literature used in this dissertation. The order in which the literature fields are addressed is based on the order in which they are used to answer the stated RQs (see Figure 2.1).
Figure 2.1. Order and content of Chapter 2
The chapter starts by discussing and defining some important concepts for the research (Section 2.1) and its context, including what SCOM (Subsection 2.1.1), supply chain fit (Subsection 2.1.2) and demand-driven context (Subsection 2.1.3) mean. Thereafter, the eleven constructs of decoupling thinking are presented in detail (Section 2.2). These constructs are used to answer RQ1 by operationalizing the concept of demand driven. This is followed by a clarification of what a DDSCOMS is, as well as an elaboration on the five DDSCOMSs (segmentation, leagility, customization, transparency and postponement) used in this dissertation to answer RQ2 and RQ3 (Section 2.3). The chapter ends by synthesizing the published research on lead-time implications for financial performance, addressing some commonly used financial performance measures, including return on investment (ROI), which is used to answer RQ4 (Section 2.4).
DDSCOMSs
Constructs of demand driven (found within decoupling thinking)
Section 2.3
Financial performance measures in relation to
lead time
Section 2.2
Section 2.4
Section 2.1Important
concepts for the research
Segmentation Leagility
Customization
Transparency
Postponement
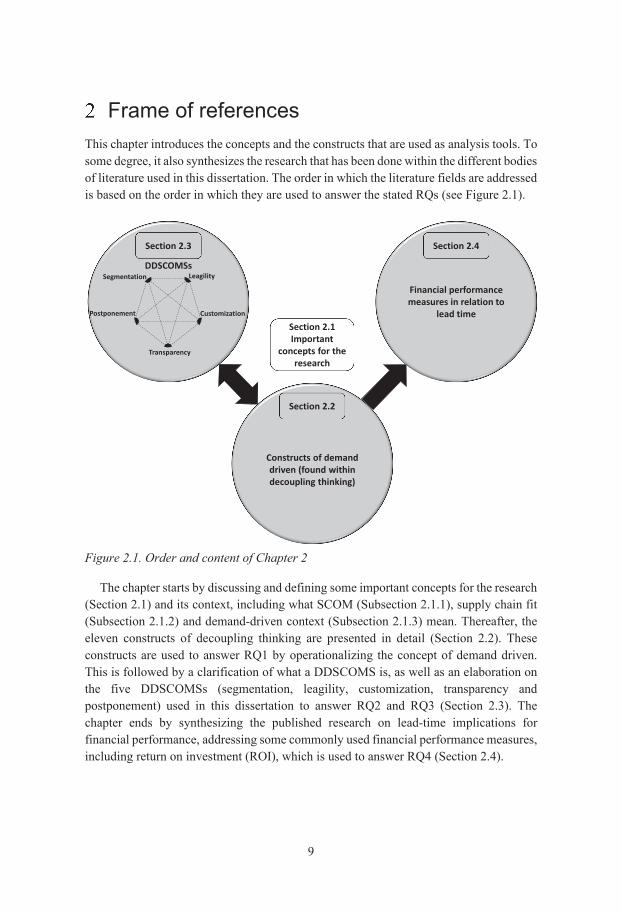
10
2.1 Important concepts for the research This section addresses some of the important concepts for this research, starting by elaborating on the word(s) and the phrase(s) that SCOM is composed of or related to, before synthesizing the meaning of SCOM, as used in this dissertation. This is followed by defining supply chain fit, also elaborating on the concept’s relation to manufacturing companies’ operational and financial performance (Subsection 2.1.2). Finally, Subsection 2.1.3 discusses the concept of demand driven, addressing its meaning and underlying classes, as well as relating the focus of this research to the demand-driven classes.
2.1.1 Supply chain operations management Operations management (OM) and Supply chain management (SCM) are two concepts that are highly interlinked and often combined in different constellations, such as operations and supply chain management or supply chain and operations management. Two commonly used definitions of these concepts are offered by Slack et al. (2010) and Mentzer et al. (2001), respectively:
• OM is ‘the activity of managing the resources which produce and deliver products and services’ (Slack et al., 2010, p. 4).
• SCM is ‘the systemic, strategic coordination of the traditional business functions and the tactics across these business functions within a particular company and across businesses within the supply chain, for the purposes of improving the long-term performance of the individual companies and the supply chain as a whole’ (Mentzer et al., 2001, p. 18).
Simplified, both OM and SCM are about the activity of organizing, planning and controlling4 the resources that produce and deliver products (Ivanov et al., 2017), and as such about creating flows. However, the emphasis of OM is on the value-adding activities within, and controllable by, a specific company (i.e., the focal company; hereafter termed the focal actor). SCM is then more about the coordination of the focal actor’s business (controllable) with the uncontrollable upstream and downstream actors in a supply chain, defined as ‘a set of three or more entities (organizations or individuals) directly involved in the upstream and downstream flows of products, services, finances, and/or information from a source to a customer’ (Mentzer et al., 2001, p. 4).
Having a foundation within a flow perspective, OM and SCM thus have much in common, and are even complementary in terms of that OM has a base in controllable flows and SCM in uncontrollable flows. Nevertheless, the organisation and planning of flows requires a high degree of control, giving OM and controllable flows a central role. Still, the uncontrollable flows are also important to consider, being that they constrain the alternatives in the controllable flows. For example, the volume and type of products produced are constrained by the availability of purchased items. The use of the phrase
4 Control is here related to actors’ abilities to use resources at their system’s discretion, giving them the ability to govern the resources.
11
supply chain operations management [SCOM] is thus meant to emphasise that the focus of this research is on the controllable part of a focal actor but is viewed from a supply chain perspective (flow perspective), also taking into consideration the uncontrollable part to support the controllable part. SCOM is therefore defined as the organization, planning and control of the controllable part of the supply chain by also considering the uncontrollable part.
Furthermore, even though the term chain is used, in practice, manufacturing companies’ supply chains are usually complex networks of suppliers and customers. Following the definition of Mentzer et al. (2001, p. 4), this research employs a triadic perspective to avoid the unnecessary complexity of including more actors yet maintaining the fundamental characteristics of a supply chain. Specifically, a supply chain consists of three (or more) actors in a sequence, directly involved in the upstream and the downstream flows of products, services and information. This is illustrated in Figure 2.2, where the supplier actor supplies the focal actor, which in turn supplies the customer actor, also referred to as a direct supply chain (see Mentzer et al., 2001, p. 5).
Figure 2.2. Triadic supply chain Source: Adapted from Bäckstrand (2012, p. 2)
2.1.2 Supply chain fit Another important aspect of this research is supply chain fit, which can be defined as strategic consistencies among the characteristics of a product and its demand, with the supply chain used for supplying the customer(s) with that product (based on Wagner et al., 2012, p. 340). Supply chain fit as a concept has been popularized by Fisher (1997), although not explicitly using the term. What Fisher (1997) advocates is that before designing a supply chain, the nature of the demand and the product type should be considered. Fisher (1997) illustrates this by dividing products into functional types with predictable demand (e.g., toothpaste) and innovative types with unpredictable demand (e.g., high-fashion clothes). Functional products should be supplied using an efficient supply chain, also referred to as cost efficient, while innovative products should be supplied using a responsive supply chain (see Figure 2.3).
Sabri (2019) states that the cumulative knowledge (i.e., the body of literature) on supply chain fit indicates that achieving this fit has a positive effect on companies’ operational performance (Hallavo, 2015), as well as financial performance (Hallavo, 2015; Wagner et al., 2012). Wagner et al. (2012) even find that not only does a higher supply chain fit result in higher returns on assets but that companies with a negative misfit show a lower financial performance than that of a positive misfit. In other words, having an efficient supply chain design in an environment with high supply and demand uncertainty (i.e., positive misfit) is more profitable than having a responsive supply chain design in an environment with low supply and demand uncertainty (i.e., negative misfit).
Supplier Actor Focal Actor Customer Actor
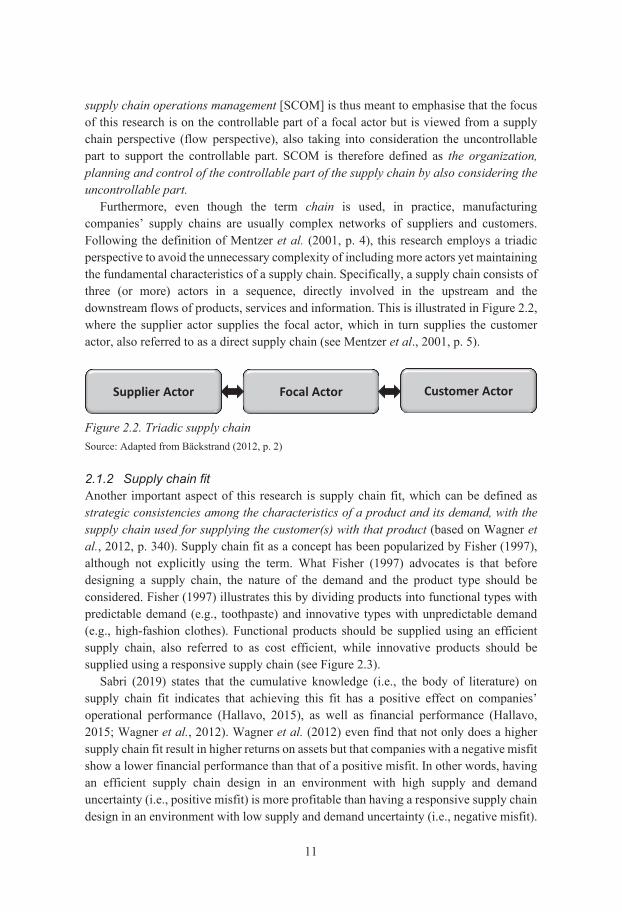
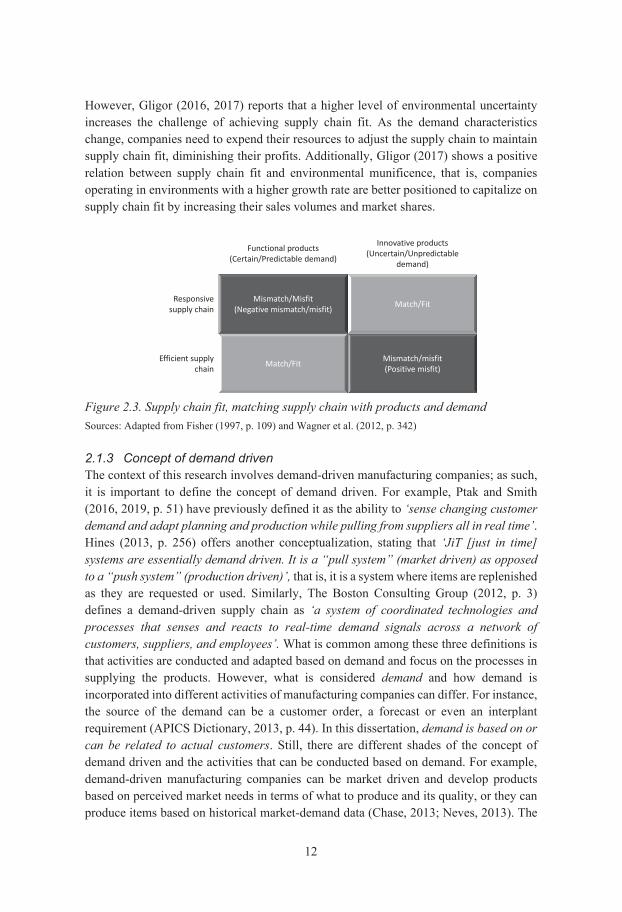
12
However, Gligor (2016, 2017) reports that a higher level of environmental uncertainty increases the challenge of achieving supply chain fit. As the demand characteristics change, companies need to expend their resources to adjust the supply chain to maintain supply chain fit, diminishing their profits. Additionally, Gligor (2017) shows a positive relation between supply chain fit and environmental munificence, that is, companies operating in environments with a higher growth rate are better positioned to capitalize on supply chain fit by increasing their sales volumes and market shares.
Figure 2.3. Supply chain fit, matching supply chain with products and demand Sources: Adapted from Fisher (1997, p. 109) and Wagner et al. (2012, p. 342)
2.1.3 Concept of demand driven The context of this research involves demand-driven manufacturing companies; as such, it is important to define the concept of demand driven. For example, Ptak and Smith (2016, 2019, p. 51) have previously defined it as the ability to ‘sense changing customer demand and adapt planning and production while pulling from suppliers all in real time’. Hines (2013, p. 256) offers another conceptualization, stating that ‘JiT [just in time] systems are essentially demand driven. It is a “pull system” (market driven) as opposed to a “push system” (production driven)’, that is, it is a system where items are replenished as they are requested or used. Similarly, The Boston Consulting Group (2012, p. 3) defines a demand-driven supply chain as ‘a system of coordinated technologies and processes that senses and reacts to real-time demand signals across a network of customers, suppliers, and employees’. What is common among these three definitions is that activities are conducted and adapted based on demand and focus on the processes in supplying the products. However, what is considered demand and how demand is incorporated into different activities of manufacturing companies can differ. For instance, the source of the demand can be a customer order, a forecast or even an interplant requirement (APICS Dictionary, 2013, p. 44). In this dissertation, demand is based on or can be related to actual customers. Still, there are different shades of the concept of demand driven and the activities that can be conducted based on demand. For example, demand-driven manufacturing companies can be market driven and develop products based on perceived market needs in terms of what to produce and its quality, or they can produce items based on historical market-demand data (Chase, 2013; Neves, 2013). The
Functional products (Certain/Predictable demand)
Innovative products (Uncertain/Unpredictable
demand)
Responsive supply chain
Mismatch/Misfit(Negative mismatch/misfit) Match/Fit
Efficient supply chain Match/Fit Mismatch/misfit
(Positive misfit)
13
second example pertains to demand-driven manufacturing companies that are customer driven, producing goods for specific customers but still based on forecasted demand, for instance. The third example refers to demand-driven manufacturing companies that are customer-order driven, producing goods based on actual customer orders, where they have the ability to attend to individual customers’ demands. This can be regarded as ‘100 percent demand-driven’ (Ayers and Malmberg, 2002, p. 23; Mendes, 2011, p. 8). As such, Ayers and Malmberg (2002) and Mendes (2011) acknowledge that the concept of demand driven is one of degree, meaning that the three discussed demand-driven categories are only three discrete points or types on a demand-driven continuum (see Figure 2.4), where these types can be nuanced as being more or less demand driven. For example, in terms of being customer-order driven, the magnitude of customer involvement and the abilities to adapt the offering can differ, where an adaptation can be minor or major (e.g., bespoke, one of a kind).
The new aspects of the concept of demand driven in this dissertation (cf. the definitions of Hines, 2013; Ptak and Smith, 2019; The Boston Consulting Group, 2012) are that (i) the concept is nuanced by presenting demand driven as a continuum and offering three different types of demand-driven manufacturing companies (see Figure 2.4) and that (ii) it specifically includes the discussion on adapting the product based on actual customer orders. As stated in Chapter 1, Section 1.1 (Introduction), demand driven is therefore defined as the ability to act and adapt to customer needs.
Figure 2.4. Nuancing the concept of demand driven
However, as stated in Chapter 1, Section 1.4 (Research scope and delimitations), this dissertation focuses on demand-driven manufacturing companies that are customer-order driven (indicated by the red rectangle in Figure 2.4). The demand-driven subcategory customer-order driven, as used in this dissertation, thus entails that a customer order at least partially drives the flow of material and information and that activities are conducted based on commitment from actual customers. One of the major reasons for producing goods per customer commitment is the ability to offer some form of variant or customization (Olhager, 2003). Customer-order driven is therefore defined as the ability to act on commitment to actual customer orders, where at least parts of the production and the movement of material and information are initiated, that is, driven by actual customer orders, providing the ability to adapt the offerings accordingly.
Demand driven
Customer-order driven Customer driven Market driven
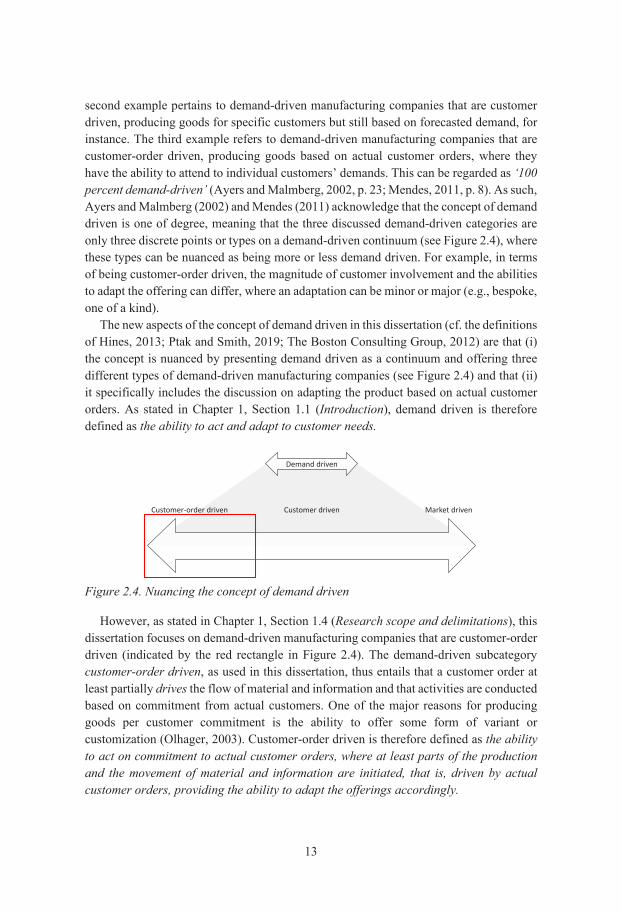
14
2.2 Decoupling thinking This section starts by defining decoupling thinking and presenting the eleven constructs that are found in decoupling thinking and later used to operationalize the concept of demand driven. The constructs are classified into four categories, each addressed under a separate subheading. The section ends with a discussion on the relation between decoupling thinking and theory, using the four elements comprising the latter.
Decoupling thinking, as used in this dissertation, is defined as a management philosophy based on a holistic and integrated approach to flow discontinuities, focusing on creating effective flows using strategic lead times and positioning of strategic decoupling points (adapted from Wikner, 2018, p. 445). Strategic lead times and strategic decoupling points are further denoted as constructs of decoupling thinking. However, in line with the purpose of the dissertation, only the constructs of decoupling thinking that are related to the concept of demand driven are presented and used hereafter. (For more information on the remaining constructs of decoupling thinking, see, e.g., Wikner 2014a, 2018).
Lead time is a general term that can be defined as ‘a span of time required to perform a process’ (or series of operations; APICS Dictionary, 2013, p. 90). Lead time is thus also a general measure that can be used to address different lead-time segments of a supply system5 (e.g., manufacturing lead time) or the specific type of activity that is conducted during the lead time (e.g., set-up time). For the purpose of this dissertation, the former types of lead times are of interest, enabling the discussion on different lead-time segments of a supply chain and the differentiation among several aspects of the concept of demand driven. Strategic lead times are examples of such lead times, defined as lead times that are of particular importance from either a demand or a supply perspective and based on the boundary of the system (based on Wikner, 2014a, p. 185; 2018, p. 442). The six strategic lead times employed are delivery lead time (D), system lead time (S), internal lead time (I), external upstream lead time (EUS), adapt lead time – supply-based (AS) and adapt lead time – demand-based (AD). These strategic lead times and their definitions are compiled in Table 2.1.
Furthermore, these strategic lead times are related to the positioning of strategic decoupling points, defined as ‘DPs [decoupling points] that play a role of critical importance to the interface of the supply system and its context’ (Wikner and Johansson, 2015, p. 220). Four of these strategic decoupling points are the customer order decoupling point (CODP), the customer adaptation decoupling point (CADP), the demand information decoupling point (DIDP) and the supply information decoupling point (Wikner, 2014a). The last one can be divided into a downstream supply information decoupling point (DSIDP) and an upstream supply information decoupling point (USIDP) (Wikner, 2018), totalling five decoupling point constructs. Note that this research focuses on distinct strategic decoupling points, with a clear demarcation line. However, this
5 Supply system is a more general term than supply chain, not bound by being comprised of three or more actors, as in the definition of the latter. Nevertheless, the term is used interchangeably in this dissertation.
15
dichotomy, as well as the distinction between upstream and downstream properties, might not always be as obvious, where a mix or a hybrid might occur, referred to as a decoupling zone (cf. Wikner, 2014a, 2018; Wikner and Rudberg, 2005b).
Table 2.1. Compilation of the eleven constructs of decoupling thinking Construct Definition Control-based constructs Internal lead time (I) The part of the supply system that is controllable by
an actor External lead time upstream (EUS) The upstream part of the supply system beyond an
actor’s control Risk-based constructs System lead time (S) The cumulative lead time of the complete supply
system Delivery lead time (D) The time from the receipt of a customer order to
the time when the customer requested the delivery of the product
Customer order decoupling point (CODP)
Separates decisions about initiating flow based on speculation for future customer orders from commitment to actual customer orders
Variant-based constructs Adapt lead time – supply-based
(AS) The lead time downstream from the point where it is possible to make variants
Adapt lead time – demand-based (AD)
The lead time downstream from the point where the delivery-unique offering is made
Customer adaptation decoupling point (CADP)
Separates decisions about differentiating flow based on standardization for a market of different customers from adaptation to actual customer orders
Information-based constructs Demand information decoupling
point (DIDP) The upstream point from where demand information is constrained
Upstream supply information decoupling point (USIDP)
The point from where supply information is constrained upstream
Downstream supply information decoupling point (DSIDP)
The point from where supply information is constrained downstream
Sources: Based on definitions by Wikner (2014a, 2018) and APICS Dictionary (2013)
These six lead-time constructs and five decoupling-point constructs can be categorized into control-based, risk-based, variant-based and information-based constructs (adapted from Wikner, 2015, 2018). These four categories and the including constructs are further elaborated on hereafter and exemplified using a time-phased bill of materials (BOM; see Figure 2.5). The left part of the figure illustrates a fictitious traditional BOM, also referred to as a product structure, and is defined as ‘a listing of all the subassemblies, intermediates, parts, and raw materials that go into a parent assembly showing the quantity of each required to make an assembly’ (APICS Dictionary, 2013, p. 15). In the traditional BOM, Li represents the number of time units it takes to perform segment i, that is, the time it takes to perform the activities related to that item. The right-hand part of
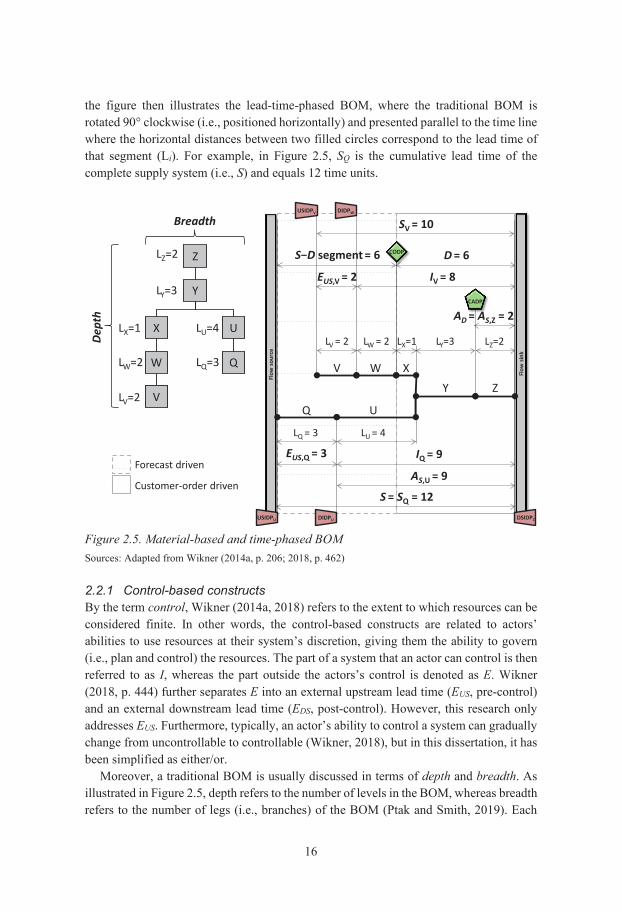
16
the figure then illustrates the lead-time-phased BOM, where the traditional BOM is rotated 90° clockwise (i.e., positioned horizontally) and presented parallel to the time line where the horizontal distances between two filled circles correspond to the lead time of that segment (Li). For example, in Figure 2.5, SQ is the cumulative lead time of the complete supply system (i.e., S) and equals 12 time units.
Figure 2.5. Material-based and time-phased BOM Sources: Adapted from Wikner (2014a, p. 206; 2018, p. 462)
2.2.1 Control-based constructs By the term control, Wikner (2014a, 2018) refers to the extent to which resources can be considered finite. In other words, the control-based constructs are related to actors’ abilities to use resources at their system’s discretion, giving them the ability to govern (i.e., plan and control) the resources. The part of a system that an actor can control is then referred to as I, whereas the part outside the actors’s control is denoted as E. Wikner (2018, p. 444) further separates E into an external upstream lead time (EUS, pre-control) and an external downstream lead time (EDS, post-control). However, this research only addresses EUS. Furthermore, typically, an actor’s ability to control a system can gradually change from uncontrollable to controllable (Wikner, 2018), but in this dissertation, it has been simplified as either/or.
Moreover, a traditional BOM is usually discussed in terms of depth and breadth. As illustrated in Figure 2.5, depth refers to the number of levels in the BOM, whereas breadth refers to the number of legs (i.e., branches) of the BOM (Ptak and Smith, 2019). Each
Z
Y
UX
V
QW
V
LZ=2
LY=3
LX=1 LU=4
LW=2 LQ=3
LV=2
Flow
sin
k
Flow
sou
rce
LZ=2LY=3LV = 2 LW = 2 LX=1
ZY
XWV
Q U
LU = 4LQ = 3
D = 6
AD = AS,Z = 2
AS,U = 9
EUS,Q = 3
EUS,V = 2 IV = 8
IQ = 9
S = SQ = 12
SV = 10
S−D segment = 6
USIDPU DIDPU DSIDPZ
USIDPV DIDPW
Forecast driven
Customer-order driven
Breadth
Dep
th
CADP
CODP
17
branch in a time-phased BOM then has a separate set of EUS and I. For instance, the fictitious BOM in Figure 2.5 consists of two branches and thus two sets of EUS and I, that is, EUS,V + IV (for the branch of item V) and EUS,Q + IQ (for the branch of item Q).
2.2.2 Risk-based constructs The risk-based constructs are related to demand-based risk and the amount of activities that need to be based on speculation (Wikner, 2015, 2018). In other words, activities conducted on speculation are considered to entail a higher risk than activities conducted on commitment to actual customer orders (Mather, 1988; Wikner, 2015, 2018). The three risk-based constructs are S, D and CODP.
S corresponds to the cumulative lead time of the complete supply system (adapted from Wikner, 2018, p. 443) and is also known as the production period or the production cycle (Shingo and Dillon, 1989) and supply lead time (see, e.g., Bäckstrand and Wikner, 2013; Wikner, 2014a; Wikner and Bäckstrand, 2018; Wikner and Johansson, 2015). S can thus be perceived as the length of the critical path (Sun et al., 2008), from flow source, which is the upstream end of the studied system, to flow sink, which is the downstream end of the studied system (see Figure 2.5).
Note that from an item perspective, each branch within a time-phased BOM has a separate S (Wikner, 2015) that consists of EUS,k + Ik (for each branch k). In terms of the time-phased BOM in Figure 2.5, two branches can be found, that is, SV = 10 time units
and SQ = 12 time units. However, from a product perspective, as used here, the branch with the longest cumulative lead time also represents the cumulative lead time of the supply system under study, that is, SQ = S = 12 time units.
D is then the time during which a customer has to wait for the ordered product and can be (D1) what the customer is told, without any input in the decision, (D2) the requested lead time by the customer or (D3) the lead time that would give the actor a competitive edge in the marketplace (Mather, 1988). Obviously, in reality, these three Ds can coincide, but for this research, D2 is used, simply abbreviated as D and corresponds to the time from the receipt of a customer order to the time when the customer requested the delivery of the product, that is, the customer’s requested delivery lead time (APICS Dictionary, 2013, p. 44; Wikner, 2018, p. 443). Note that in case administrative time is required for dealing with the customer order, the D used here should either be reduced by that administrative time or explicitly included, that is Dtot = Dadmin + D (see, e.g., Ågren, 1992, p. 18). Furthermore, D should not be negative (i.e., D < 0). If this occurs, then it is regarded as a deviation or an indication of an error in the system, such as a customer order not forwarded in time or an unfeasible request by the customer.
The D:S ratio (Wikner, 2014a, 2018) can be seen as the ‘relation of D:P’ (P stands for ‘production cycle’) introduced by Shingo (Shingo and Dillon, 1989, originally published in 1981), also known as the P:D ratio (Mather, 1984, 1988, 1999), where P stands for ‘stacked procurement and processing time’. This relationship between D and S is most critical when D < S (i.e., the D:S ratio is < 1). This means that D is shorter than the cumulative lead time of manufacturing the said product. In Figure 2.5, D and S are equal to 6 time units and 12 time units, respectively, for a D:S ratio of 1:2. This means that the
18
cumulative lead time for supplying the product (i.e., S) is twice the length of what the customer requested (i.e., D) and that some activities have to be conducted before the receipt of a customer order, that is, on speculation.
The point at which a customer order penetrates a flow is also known as the CODP, defined as the point that separates decisions about initiating flow based on speculation for future customer orders from commitment to actual customer orders (adapted from Wikner, 2014a, p. 194). This construct has been developed in parallel in different contexts and published in several national and international publications in different countries (Wikner, 2014a). However, the two publications that are usually cited as the origins of the construct are those of Sharman (1984) and Hoekstra and Romme (1992; originally published in 1985 in Dutch), calling the construct as the order penetration point and the decoupling point (ontkoppelpunt in Dutch), respectively (Ceryno et al., 2013; Wikner, 2014a; Wikner and Bäckstrand, 2018; Yang and Burns, 2003). However, other terms do exist, such as customer decoupling point (Hofmann and Knébel, 2013), customer order point (Ågren, 1986, 1992; Mason-Jones and Towill, 1999; Olhager and Östlund, 1990; Pagh and Cooper, 1998), supply stream decision point (Hines and Rich, 1997), material decoupling point (Mason-Jones and Towill, 1999; Nieuwenhuis and Katsifou, 2015), demand penetration point (Christopher, 1998), decision point (Hines and Rich, 1997), push-pull boundary (Chopra and Meindl, 2013; Gupta and Benjaafar, 2004), product supply decoupling point (Olhager et al., 2006), physical supply decoupling point (Wikner and Wong, 2007), order entry point (Dekkers, 2006; Dekkers et al., 2013; Dekkers and Sopers, 2001) and order decoupling point (Serrano et al., 2009).
To simplify the discussion, the term used in the dissertation is CODP, also used by Giesberts and van der Tang (1992), Wikner (2014a, 2018), Wortmann (1992), Wortmann et al. (1997) and Wouters (1991). The term CODP facilitates the differentiation among the five strategic decoupling points employed, both specifying the type of order (i.e., customer order) and indicating that the point separates the flow into two distinct subflows (i.e., decoupling), where the part upstream of the CODP is significantly different from that downstream (Olhager, 2010).
Since D corresponds to the customer’s requested D, the upstream end of D is also where a customer order is received and hence where the CODP is positioned (Bäckstrand and Wikner, 2013; Hoekstra and Romme, 1992; Wikner, 2014a). This is illustrated in Figure 2.5, where D equals 6 time units; hence, the CODP is positioned at 6 time units (here illustrated as a diamond, in line with Wikner, 2014a). This also means that the activities conducted upstream of the CODP (i.e., the S─D segment, also known as the ‘lead time gap’ (Christopher, 1998) and P minus D [P─D] (Mather, 1988)) are performed on speculation (i.e., forecast driven), which in turn usually implies a higher risk (Mather, 1988; Wikner, 2015, 2018). Downstream of the CODP (during D), the activities are instead performed on commitment to customer orders (i.e., customer-order driven, also referred to as commitment driven), thus neutralizing the risk (Mather, 1988; Wikner, 2015, 2018). In other words, in issuing a customer order, the customer has committed to buy the said product. Nevertheless, the term commitment can also be viewed as bidirectional or mutual, where the supplier actor commits to deliver the said product. For
19
the research presented in this dissertation, the emphasis is on the former aspect, that is, the customer committing to buy the product. The forecast-driven part of the supply system is indicated with a grey dashed outline and light upward diagonal lines in Figure 2.5, whereas the customer order-driven part is indicated with a grey solid outline.
Furthermore, the CODP generally coincides with the main buffer point in the flow from which customers are served (Hoekstra and Romme, 1992; Olhager, 2010; Olhager and Wikner, 2000; Sharman, 1984). The activities carried out upstream of the CODP (i.e., the S─D segment) should thus focus on maintaining an optimal mix and inventory levels at the CODP. Since these activities are forecast driven, they do not need to focus on delivery speed but on efficiency (Olhager, 2003, 2010). Nevertheless, if a customer can accept D that is as long as or even longer than S (the S─D segment ≤ 0), it becomes possible for the supplier actor to perform all supplying activities after receipt of a customer order (Wikner, 2014a). From this discussion, it is obvious that the CODP positioning is a strategic decision (Olhager, 2003; Wikner and Rudberg, 2005b) and should be based on following three criteria (see, e.g., Aitken et al., 2005; Aktan and Akyuz, 2017; van Donk, 2000, 2001; Hemmati and Rabbani, 2010; Hoekstra and Romme, 1992; Mason-Jones and Towill, 1999; Olhager, 2003; Rafiei and Rabbani, 2011; Sharman, 1984):
• customer/market characteristics, such as D requirements, demand volatility, product volumes, product range, customization requirements, customer order size and frequency;
• product characteristics, such as modular product design, customization opportunities, product structure, the complexity of the BOM, risk of obsolescence or proliferation; and
• production/supply chain characteristics, such as S, number of planning points, bottleneck position, sequence-dependent resources, supply chain approach, process and equipment flexibility.
The CODP has frequently been applied in the manufacturing context (Wikner et al., 2017b), normally for production and distribution-related activities (Rudberg and Wikner, 2004). Furthermore, the construct has mainly been treated as a single CODP within a dyadic relation, for example, where a customer places an order with a supplier actor. However, Hoekstra and Romme (1992) and Sun et al. (2008) explain that each individual product or product–market combination can generate a CODP. Sun et al. (2008) therefore introduce the term multiple CODPs (see also Shidpour et al., 2014; Verdouw et al., 2008). Since then, other forms or dimensions of multiple CODPs have been presented or interpreted as multiple CODPs, such as when there are three or more actors in a sequence (e.g., a supply chain) and where each actor (interface) results in a CODP (e.g., Banerjee et al., 2012; Ghalehkhondabi et al., 2016; Verdouw et al., 2008).
2.2.3 Variant-based constructs The preceding discussion mentions that the CODP construct separates forecast-driven activities from customer-order-driven ones. However, the activities downstream of the
20
CODP can still be standard (Amaro et al., 1999; Olhager and Östlund, 1990; Olhager and Rapp, 1985), that is, the point where a potential customization can be made does not necessarily have to coincide with the CODP (Amaro et al., 1999; García‐Dastugue and Lambert, 2007; Holweg, 2005; Van der Vorst et al., 2001). The discussion on when demand or supply provides a basis for creating variants based on a customer’s requirements is instead addressed in the three variant-based constructs (i.e., AS, AD and CADP) (Wikner, 2015, 2018).
AS corresponds to the lead time downstream from the point where it is possible to make variants (adapted from Wikner, 2014a, p. 186; 2018, p. 443). Thus, there can be multiple ASs in a BOM (Wikner, 2014a), as shown in Figure 2.5, AS,U and AS,Z. Comparing these ASs with D makes it possible to identify the subset that can be used for delivery-unique offerings, also referred to as delivery-unique customizations. The lead time downstream from the point where the delivery-unique offering is made is then referred to as AD, which is the AS finally selected for the delivery-unique offering (Wikner, 2014a, 2018). Out of the two potential ASs in Figure 2.5, only AS,Z is within D and possible for delivery-unique offerings; hence, AS,Z is selected as AD. For AS and AD, it is particularly important to be specific about the length if they are relatively short, for instance, where AD = 0 indicates that no adaptation is made and that the product is hence standardized (Wikner, 2018) and where AD closer to 0 but still not zero (AD ≠ 0) indicates that a delivery-unique offering is made but in the final part of the supply system, that is, closer to flow sink (see Figure 2.5).
The upstream point of AD is thus the point at which a delivery-unique offering is initiated. Wikner (2014a) calls this point the CADP, defined as the point that separates decisions about differentiating flow based on standardization for a market of different customers from adaptation to actual customer orders (adapted from Wikner, 2014a, p. 196). In line with this definition, the CADP must be positioned at or downstream of the CODP in order for an actor to customize a product based on an actual customer’s requirements (Bäckstrand, 2012; Olhager and Östlund, 1990; Squire et al., 2006; Wikner, 2014a, 2018). The CODP thus acts as an upstream boundary for when it is possible to make a delivery-unique offering, where the part upstream of the CODP (i.e., the S─D segment) cannot include any delivery-unique offering (Amaro et al., 1999; Fogliatto et al., 2012; Olhager and Östlund, 1990). The properties of the offering upstream of the CADP are hence standardized, whereas downstream, they are individualized (Wikner, 2018). In Figure 2.5, two potential points for creating a delivery-unique solution are identified and discussed in relation to AS (i.e., AS,U and AS,Z). Consequently, item U and end product Z are possible to make the delivery unique. However, since the CADP has to be at or downstream of the CODP, only end product Z is possible to make customer-order unique. Thus, the CADP is positioned at 2 time units, where the upstream end of AD coincides with the CADP (see Figure 2.5).
Nevertheless, repositioning the CODP upstream makes it possible for more activities to be conducted based on actual customer orders (Rudberg and Wikner, 2004; Wikner and Rudberg, 2005a). Hence, by simultaneously moving the CODP and the CADP upstream, the ability to meet the specifications of individual customers increases
21
(Mikkola and Skjøtt-Larsen, 2004; Sharman, 1984). For instance, in terms of Figure 2.5, if D can be extended to 9 time units or more, item U can also be offered as a delivery-unique solution, that is, D is equal to or longer than AS,U and AS;Z (i.e., D ≥ AS,U and D ≥ AS;Z). Moving the CODP farther downstream will have the opposite effect, reducing the ability to meet individual customers’ requests (Yao and Liu, 2009) if no changes are made in how the customization is achieved.
The risk of creating variants and offering customizations is of course related to both the volume and the repetition of the demand (Bäckstrand, 2012). If an offering can be provided to multiple customers and at more than one time (i.e., multiple deliveries), it is classified as a customer generic (standard) offering. If the offering is delivered to a single customer but with multiple deliveries, it is classified as customer unique. However, if the offering is delivered only once and to a single customer, it is classified as delivery unique (Wikner, 2018).
2.2.4 Information-based constructs As indicated by the phrase, information-based constructs are related to the sharing of demand- and supply-related information. As such, information-based constructs address the question of how far into the supply chain the demand- and supply-related information is shared and thus where the information is decoupled (Wikner, 2014a, 2018).
In terms of demand-related information, Mason-Jones and Towill (1999) have introduced the information decoupling point as ‘the point in the information pipeline to which the marketplace order data penetrates without modification. It is here where market driven and forecast driven information flows meet’ (p. 17). This point can be viewed as the so-called demand mediation decoupling point (Olhager et al., 2006; Wikner and Wong, 2007), later relabelled as the DIDP (Wikner, 2014a, 2018) and defined as the upstream point from where demand information is constrained (adapted from Wikner, 2014a, p. 204; 2018, p. 452). The DIDP is thus related to the sharing of available demand information upstream of the supply chain. Note that the term demand information concerns observable information that can be used for decision making, such as point-of-sales data, customer orders, direct sales, delivery schedules and call-offs (Wikner, 2014a). Such information as real demand (i.e., customer orders) must be available downstream of the CODP; otherwise, it would be impossible to act on customer orders (Olhager et al., 2006; Wikner, 2014a, 2018). Hence, the DIDP must be positioned at or upstream of the CODP, where the decision domain upstream of the DIDP is estimated demand and where the decision domain downstream is real demand (Wikner, 2018). The farther upstream the flow of the DIDP is positioned, the more pure (i.e., undistorted, unbiased and up to date) the point-of-sales data can be used to improve the forecast-driven part of the flow (Christopher, 2000; Hedenstierna and Ng, 2011; Mason-Jones et al., 2000a; Mason-Jones and Towill, 1997, 1999; Van der Vorst et al., 2001; Wikner et al., 2017a). For the example in Figure 2.5, items V and Q are purchased from one or more suppliers. However, items W and U are internally produced. The positioning of the two DIDPs (DIDPW and DIDPU) thus indicates that the company has full demand information for product Z, such as point-of-sales data, but does not share that data with the supplier(s).

22
Nonetheless, demand information is only one type of information, where information related to available capacity and/or usage of capacity is also of importance (Wikner, 2014a). This is covered by the USIDP and the DSIDP, concerning the availability of information about available and required capacity, that is, real supply information. The USIDP and the DSIDP thus represent the point from where real supply information is constrained, either upstream (USIDP) or downstream (DSIDP). As such, the decision domain upstream of the USIDP is estimated supply, whereas downstream, it is real supply (Wikner, 2018). For the DSIDP, the opposite relationship applies, where the decision domain upstream is real supply, whereas downstream, it is estimated supply. As shown in Figure 2.5, all information on available and required capacity is available to the focal actor; thus, the DSIDP is positioned in the downstream end of the supply system, at the flow sink, and where the two USIDPs are positioned at the upstream end. Hence, in this example, the focal actor also have information on available and required capacity for items V and Q, from the supplier(s) of said items (see Figure 2.5).
2.2.5 Decoupling thinking, a pre-theory This subsection discusses decoupling thinking in relation to what a theory should comprise, arguing that decoupling thinking is a pre-theory.
According to Bacharach (1989) and Bhattacherjee (2012), a theory consists of four elements, namely (i) constructs, (ii) propositions, (iii) logic and (iv) boundary conditions/assumptions. Wacker (1998, 2008) provides a similar classification, arguing that academics generally point out that a theory consists of the following four components: (i) definitions of terms or variables, (ii) a domain where the theory applies, (iii) a set of relationships of variables and (iv) specific predictions (factual claims). The four elements of a theory and what questions they address are summarized in Table 2.2.
Table 2.2. Four elements or properties of a theory Element Common
question Constructs (definitions) are theoretical definitions of terms or variables, which by their very nature cannot be observed directly and are thus conceptual in nature. These constructs are the ‘what’ of the theory, used to explain a phenomenon.
What? (Who?)
Propositions (relationships between constructs) constitute an explained set of conceptual relationships between the constructs, explaining how (and why) the constructs are related to each other.
How? (Why?)
Logic (predictions) refers to the underlying causal logic as to why something will occur and is used for making predictions. From a pragmatic perspective, logic helps managers make predictions and answer the questions of should, could and would.
Why? Should? Could? Would?
Boundary conditions/assumptions (domain) presents for who, where and when the theory is applicable. That is, under what circumstances will these constructs and propositions work.
Who? When? Where?
Sources: Based on Bacharach (1989), Bhattacherjee (2012), Wacker (1998, 2008) and Whetten (1989)
23
The constructs of decoupling thinking, including the eleven presented in Table 2.1, can be regarded as constructs that are found in a theory, offering definitions of variables that by their very nature cannot be observed directly but can be used to explain a phenomenon. The body of literature on decoupling thinking also offers propositions (i.e., relations between the different constructs). The time-phased BOM in Figure 2.5 can be perceived as a summary of how the eleven constructs are related to each other, for example, where the CODP is located at the upstream end of D or where the CADP has to be positioned downstream of the CODP. The body of literature on decoupling thinking also offers casual logic as to why something will occur, such as why D is reduced if the CODP is moved downstream, as well as what should happen if the S─D segment is extended. Finally, decoupling thinking also discusses in which domain (i.e., boundary conditions) it is applicable. As such, decoupling thinking possesses all the four elements of a theory. However, according to Meredith (1993), in building a theory, it should undergo several iterative continuous cycles, passing from description through explanation to testing. If it withstands these tests, eventually, it is developed into a theory. Arguably, some of the constructs of decoupling thinking have gone through these iterations, such as the CODP constructs, which is even called the CODP theory (e.g., Cannas et al., 2018). Nevertheless, some of the constructs are relatively new and have not gone through this iterative process of theory development. As such, in this dissertation, despite possessing all the necessary elements, decoupling thinking is classified as a pre-theory (a term used by Meredith, 1993), which in many ways is possible to substitute as a theory (Meredith, 1993).
2.3 Demand-driven supply chain operations management strategies
In the following five subsections, the selected DDSCOMSs (segmentation, leagility, customization, transparency and postponement) are described. Before doing so, the term DDSCOMSs is discussed to present its meaning.
The term demand driven has been defined as the ability to act and adapt to customer needs and is used to define the domain of the manufacturing companies in which the SCOM strategies are applicable. SCOM has then been explained as the organization, planning and control of the controllable part of the supply chain by also considering the uncontrollable part, where strategy is defined as ‘a careful plan of action(s) to achieve an objective’ (based on Merriam-Webster Dictionary, 2020b; Vitasek, 2013, p. 184).
Combining and synthesizing these three terms, in this dissertation, DDSCOMS is defined as a strategy that can be used by demand-driven manufacturing companies to organization, plan and control the controllable part of the supply chain, while taking into consideration the uncontrollable part, to support the company’s ability to act and adapt to customer needs.
24
2.3.1 Segmentation strategy According to Merriam-Webster Dictionary (2020c), segmentation is ‘the process of dividing something into parts or segments’. In the context of SCOM and the upstream part of the supply chain, segmentation has been used to divide the supplier base in terms of the level of involvement and co-ordination between buyers and suppliers (see, e.g., Kraljic, 1983; Olsen and Ellram, 1997). At the opposite end, the downstream part of the supply chain, segmentation has been used to segment markets based on similar customer preferences, that is, to identify and assign customers to relatively homogeneous groups (Harrison and Kjellberg, 2010; Smith, 1956). The latter type of segmentation (also referred to as market segmentation) is the one that is further used in this dissertation, defined as a strategy in which the total market is disaggregated into submarkets or segments that share some measurable characteristics based on demographics, psychographics, lifestyles, geography, benefits and so forth (adapted from APICS Dictionary, 2013, p. 101).
In Smith’s (1956, p. 5) seminal paper, segmentation is introduced as aiming ‘to bring about recognition of several demand schedules where only one was recognized before’ (see also Chatrathi and Zhengyuan, 1995; Godsell et al., 2011; Harrison and Kjellberg, 2010; Jenkins and McDonald, 1997; Johansen et al., 2012; Kumar et al., 2007; Xu and Coatney, 2015). This strategy is thus closely related to product differentiation, where an increased product differentiation gives way for segmentation and disaggregation (Smith, 1956). Furthering this line of thinking, Su et al. (2005) state that product proliferation results from companies customizing their products for smaller customer groups or segments.
Segmentation is thus based on the logic that ‘one size does not fit all’ (Christopher and Towill, 2002, p. 1; Hilletofth, 2009, p. 17; Lovell et al., 2005, p. 142; Roscoe and Baker, 2014; Sabri, 2015; Shaikh et al., 2017, p. 18; Shewchuk, 1998, p. 144), meaning that companies delivering products to a wide range of customers with different requirements cannot fulfil all customers’ requirements with one standard market offer and/or one supply chain (Christopher and Towill, 2002; Hilletofth, 2009; Van der Veeken and Rutten, 1998). In doing so, customers demanding customized or even individualized and bespoke products might be underserved, while others demanding standardized products may be overcharged (Fuller et al., 1993; Johansen et al., 2012), or some customers are provided a higher service compared with the turnover that they generate (Berry et al., 1995; D’Alessandro and Baveja, 2000; Huiskonen et al., 2003; Thomas, 2012; Van der Veeken and Rutten, 1998). The goal with segmentation is thus to organize the business to compete across the span of the company’s markets without having to overcharge some customers or underserve others, for instance (Fuller et al., 1993). Hence, the company needs to find out the range of customer needs that stand in danger of being ‘averaged’ and to segment the market, that is, create segments that are homogeneous within the segment but heterogenous across segments (Kara and Kaynak, 1997).
25
2.3.2 Leagility strategy Lean (see, e.g., Womack and Jones, 1996; Womack et al., 2007) and agile (see, e.g., Goldman et al., 1995; Goldman and Preiss, 1991) are two strategies that have received substantial interest in both literature and practice (Mahdavi and Olsen, 2017). Lean has been considered as emphasizing efficiency and how to perform a supply chain in the most efficient way possible by eliminating waste and using levelled production (Christopher and Towill, 2000, 2002; Naim and Gosling, 2011; Naylor et al., 1999; Womack and Jones, 1996). However, since then, it has become clear that with lean production, a degree of flexibility is lost (Nieuwenhuis and Katsifou, 2015). In reaction to this efficiency-based approach, the agile strategy has been suggested as an alternative, emphasizing flexibility and speed as capabilities to serve fluctuating demands in terms of volume and variety (Christopher, 2000; Christopher and Towill, 2000; Naylor et al., 1999; Purvis et al., 2014). As these two strategies have been developed, there has been a tendency to view them in isolation (Krishnamurthy and Yauch, 2007; Naylor et al., 1999). However, in the late 1990s and the early 2000s, the two strategies were combined in different ways (Goldsby et al., 2006; Nieuwenhuis and Katsifou, 2015), such as the Pareto curve approach, the separation of ‘base’ and ‘surge’ demands approach and the decoupling point approach (Christopher and Towill, 2001). The most referenced combination of lean and agile is the leagile strategy (Banerjee et al., 2012), introduced and defined by Naylor et al. (1999) as a combination of lean and agile within a total supply chain, where the CODP has to be positioned to best suit the need for responding to a volatile demand downstream yet providing level scheduling upstream (Agarwal et al., 2006; Mason-Jones et al., 2000a; Naylor et al., 1999). As such, the CODP acts as a buffer from which the customer is served (Childerhouse and Towill, 2000; Naylor et al., 1999) and should thus be positioned according to the longest lead time during which a customer is willing to wait or the point at which variability in the product demand dominates, that is, the point of differentiation (Naylor et al., 1999).
2.3.3 Customization strategy According to Merriam-Webster Dictionary (2020d), to customize means ‘to build, fit, or alter according to individual specifications’. Consequently, customization could vary from a simple modification of a standard product all the way to a complete individualized and bespoke (i.e., one-of-a-kind) product. The customization strategy should therefore be viewed as a continuum consisting of discrete categories or points of different levels of customization (see, e.g., Alford et al., 2000; Coronado et al., 2004; Da Silveira et al., 2001; Davis, 1989; Gilmore and Pine, 1997; Lampel and Mintzberg, 1996; Ross, 1996; Sharma, 1987) rather than a strict dichotomy of standard versus customized (Akinc and Meredith, 2015; Spring and Dalrymple, 2000).
The point at which a variant or customization is made has been referred to as the point of differentiation (e.g., Childerhouse and Towill, 2000; Garg and Tang, 1997; Tang, 2006), point of product differentiation (e.g., Childerhouse and Towill, 2000; García‐Dastugue and Lambert, 2007; Mason-Jones and Towill, 1999; Naylor et al., 1999; Nieuwenhuis and Katsifou, 2015), product differentiation point (Daaboul et al., 2015;
26
Daaboul and Da Cunha, 2014) and differentiation point (Wikner and Wong, 2007; Wong et al., 2009). Differentiation or customization is thus done by either inserting specialized items and/or performing special processes (Daaboul et al., 2015; Daaboul and Da Cunha, 2014; Garg and Tang, 1997).
A subordinate strategy of customization is mass customization. This was introduced by Davis (1987, 1989) as a way to accommodate the increasing demand for product variety, without affecting delivery lead times, cost and quality (Buffington, 2011; Feitzinger and Lee, 1997; Fogliatto and da Silveira, 2008; Haug et al., 2009; MacCarthy et al., 2002, 2003; Mahdavi and Olsen, 2017; Mason and Lalwani, 2008; McCarthy, 2004; Tu et al., 2001). Mass customization can thus be perceived as a paradox, simultaneously competing on the two rival priorities – low price (gaining economics of scale) and high customization (achieving economics of scope) (Duray et al., 2000; Kotha, 1995; Kumar et al., 2007; Mikkola and Skjøtt-Larsen, 2004; Squire et al., 2006; Van Hoek et al., 1999). Whereas Davis (1987, 1989) coined the term mass customization, Pine (1993) then increased its popularity and made it more practical (Kara and Kaynak, 1997; Kumar et al., 2007; MacCarthy et al., 2003; Mahdavi and Olsen, 2017; Mason and Lalwani, 2008). Pine (1993, p. 171) introduced five fundamental methods of achieving the goal of mass customization: (i) Customize services around standardized products or services. (ii) Mass produce customized services (or products that customers can easily adapt to their individual needs). (iii) Provide point-of-delivery customization. (iv) Provide a quick response throughout the supply chain. (v) Modularize components to customize end products and services.
2.3.4 Transparency strategy Transparency, also known as supply chain visibility, stems from different perspectives, capturing different functions and requirements (Somapa et al., 2018; Zhang et al., 2011). As such, there has yet to be an established unified definition of the concept (Barratt and Oke, 2007; Caridi et al., 2010a, 2010b; Caridi et al., 2013; Francis, 2008; Goh et al., 2009; Klueber and O’Keefe, 2013; Mahadevan, 2010; Papert et al., 2016; Vilko et al., 2012; Zhang et al., 2011). There are also differences in the type of information that could be shared (Goh et al., 2009; Zhou and Benton, 2007), pertaining to transparency, such as the following:
• cost transparency, that is, sharing costing information between the customer and the supplier (Hultman and Axelsson, 2007; Lamming et al., 2001),
• demand visibility, that is, transparency of point-of-sale and forecast data, for instance (Aviv, 2001; Barratt and Barratt, 2011; Barratt and Oke, 2007; Brandon-Jones et al., 2015; Croson and Donohue, 2003; Goh et al., 2009; Lee et al., 1997a, 1997b, 2004; Lee and Whang, 2000; Småros et al., 2003; Swaminathan and Tayur, 2003; Williams et al., 2013),
• exception/event visibility, that is, transparency of exceptions and events, such as promotions (Goh et al., 2009; Williams et al., 2013),
27
• inventory visibility, that is, sharing information on where any given item is located and the inventory levels, for instance (Barratt and Barratt, 2011; Barratt and Oke, 2007; Bradley, 2002; Brandon-Jones et al., 2015; Christopher and Lee, 2004; Goh et al., 2009; Lee and Whang, 2000; Petersen et al., 2005; Swaminathan and Tayur, 2003; Williams et al., 2013; Zhang et al., 2011),
• process visibility, that is, sharing process-related information (Barratt and Oke, 2007; Francis, 2008; Goh et al., 2009; Lee et al., 1997a, 1997b; Lee and Whang, 2000; Swaminathan and Tayur, 2003), and
• traceability visibility, that is, origin of raw material, human and environment-related conditions, such as work conditions and product temperature during distribution (Busse et al., 2017; Carter and Easton, 2011; Carter and Rogers, 2008; Earley, 2013; Klueber and O’Keefe, 2013; Morgan et al., 2018; Papert et al., 2016; Ringsberg, 2014; Trienekens et al., 2012; Tse and Tan, 2012).
In relation to the purpose of this dissertation, it focuses on the information that provides greater transparency about the factors affecting both supply and demand, such as inventory, demand and process. Transparency is therefore defined as a strategy that accommodates informed decisions and improves decision making by advocating the need for sharing high-quality information that describes various factors of demand and supply throughout the supply chain (adapted from Williams et al., 2013, p. 545). In other words, the idea behind transparency is for each actor in the supply chain to provide demand- and supply-related information of high quality to and from relevant supply chain actors for better decision support in order to improve supply chain performance, such as delivery and supply chain efficiency (Christopher and Lee, 2004; Zhang et al., 2011). Examples of demand-related information are point-of-sales data, actual sales data, demand forecasts, customer inventory levels and customer promotional plans. Supply-related information then comprises supplier inventory levels, supplier lead time, delivery dates and distribution network inventory levels, for example (Williams et al., 2013).
By sharing demand-related information, such as point-of-sales data from the end customer, throughout the supply chain, more actors can act on ‘real’ demand (Aitken et al., 2005; Christopher and Lee, 2004; Christopher and Towill, 2000; Kaipia and Hartiala, 2006; Kiely, 1998; Mason-Jones and Towill, 1997, 1999; Somapa et al., 2018; Zhang et al., 2011). As such, the benefit of sharing and using true customer demand is that each actor in the supply chain can operate on ‘real orders’ rather than distorted data, that is, data that have been delayed, magnified and/or manipulated by other actors, for instance (Mason-Jones and Towill, 1999; Towill et al., 1992). However, point-of-sales data do not reflect issues such as out-of-stock situations. Therefore, supply-related data, such as production plans and demand plans, should also be shared throughout the supply chain (Kaipia and Hartiala, 2006). In summary, sharing demand-related and supply-related information can help in increasing the accuracy of demand forecasts, meaning that the gap between forecasted and real demand, as well as between forecasted and real supply, can be reduced. In other words, sharing demand-related and supply-related information can improve the match between production plans and demand; in the end, it can improve
28
delivery performance and reduce the amount of inventory throughout the supply chain (Barratt and Barratt, 2011; Barratt and Oke, 2007; Lee and Whang, 2000).
2.3.5 Postponement (preponement) strategy Postponement was put into practice as early as the 1920s (Council of Logistics Management, 1995; Wang et al., 2003; Yang and Burns, 2003) but was introduced in the marketing literature (Alderson, 1950) as an approach to reduce or eliminate risks and uncertainty costs associated with product differentiation (Mahdavi and Olsen, 2017; Moradlou and Backhouse, 2016; Pagh and Cooper, 1998; Van Hoek, 2000, 2001; Yang and Yang, 2010; Zinn, 2019). As Alderson (1950) has realized, products become more differentiated closer to the point of consumer purchase. In other words, products are progressively differentiated into specific end products as specialized components are inserted and/or special processes are performed (Garg and Tang, 1997; Lee and Tang, 1997). For many kinds of products, the individual customer’s demand is unique, especially when considering basic use, special features, colours, size and place of purchase (Alderson, 1950). To illustrate this, Alderson (1950) presents a simple yet useful example where a person in Philadelphia, with both long and wide feet, is looking for a pair of new shoes. Such a pair of shoes (both long and wide, i.e., its form) is unsuitable for the vast majority of consumers. Taking into consideration that such shoes also need to be stocked by a store in Philadelphia (i.e., place) by the time the customer visits the store (i.e., time) eliminates them from practical consideration by customers in San Francisco and New Orleans, for instance. Hence, each step taken to differentiate the product based on speculation involves a certain marketing risk (Alderson, 1950), that is, risk and uncertainty costs tied to the differentiation of the product (Bucklin, 1965; Yang et al., 2005). Stated another way, every differentiation that makes it more suitable for a specific customer makes it less suitable for other customers (Alderson, 1950), where some operations are even irreversible (Yang et al., 2005).
If this point of differentiation could be postponed, then the risks and uncertainty costs tied to the differentiation of the product could be reduced (Bucklin, 1965; Yang et al., 2005). Greater flexibility can also be achieved (Aviv and Federgruen, 1999; Feitzinger and Lee, 1997; Huang and Li, 2008; Lee et al., 1993), where the company is better able to respond to changes in the mix of demands from the different segments (Lee et al., 1993) and where the need for reversibility is reduced. Postponement could therefore be perceived as based on the idea of substitutability (Bucklin, 1965; Christopher, 2000; Yang et al., 2005; Yang et al., 2007) and a strategy to reduce the risks associated with product variety (Aviv and Federgruen, 1999, 2001). In fact, the strategy is also known as delayed product differentiation (Aviv and Federgruen, 1999, 2001; Blackburn et al., 2004; Garg and Lee, 1999; Gupta and Benjaafar, 2004; Lee and Tang, 1997; Swaminathan and Lee, 2003), delayed differentiation (Christopher, 1998) and late customization (Garg and Lee, 1999; Swaminathan and Lee, 2003).
Through the years, Alderson’s (1950) view of postponement has been extended, renamed and classified in different ways (García‐Dastugue and Lambert, 2007) in terms of where and when postponement is used (Yang et al., 2004a), that is, manufacturing
29
postponement (Bowersox and Closs, 1996; Pagh and Cooper, 1998; Yang et al., 2010; Zinn and Bowersox, 1988), assembly postponement (Yang et al., 2004b; Zinn and Bowersox, 1988), logistics postponement (Boone et al., 2007; Bowersox and Closs, 1996; Lee, 1998; Pagh and Cooper, 1998; Van Hoek, 1998b; Yang et al., 2004a; Yang et al., 2007), geographic postponement (LaLonde and Mason, 1985) and others. However, many of these can be condensed into or regarded as subcategories of one or more of the following dimensions: physical (i.e., form), spatial (i.e., place) and temporal (i.e., time) (Aitken et al., 2005; Christopher, 1998). Form postponement means that variety and mix are obtained later. Time postponement refers to an activity carried out later. Place postponement signifies that a movement is delayed.
Although many success stories owing to postponement have been reported in the literature (e.g., Aviv and Federgruen, 2001; Li et al., 2007), there are still mixed answers about the meaning of postponement and how far downstream an activity should be postponed. In relation to the CODP, these different publications can be divided into three main groups:
• The first group of publications, starting with Alderson’s (1950) work, argues that the point of differentiation should be eliminated or delayed as far downstream as possible (e.g., Aviv and Federgruen, 2001; García‐Dastugue and Lambert, 2007; Lee and Tang, 1997; Li et al., 2007; Swaminathan and Tayur, 1998; Yang et al., 2004a).
• The second group of publications states that the point of differentiation should be postponed as close as possible to the customer order entry, that is, the CODP. As such, these studies do not specifically state that the point of differentiation should be delayed until or even downstream of the CODP (e.g., Cooper, 1993; Mikkola and Skjøtt-Larsen, 2004).
• The third group specifically states that the point of differentiation should be postponed until customer orders are received or even farther downstream, that is, at or downstream of the CODP (e.g., Bowersox and Closs, 1996; Pagh and Cooper, 1998; Van Hoek, 1998a, 2000, 2001; Waller et al., 2000; Wang et al., 2003; Yang and Burns, 2003; Yang et al., 2005; Zinn and Bowersox, 1988).
The mixed answers regarding the definition of postponement have obviously resulted in mixed answers about how postponement relates to operational performance and even why it is beneficial to pursue (Forza et al., 2008). For instance, some authors argue that postponement leads to longer Ds (e.g., Pagh and Cooper, 1998; Waller et al., 2000), whereas others claim the opposite (e.g., Cannas et al., 2018; Swaminathan and Lee, 2003). To reconcile these apparently conflicting findings, Forza et al. (2008) propose a form postponement typology that centres on the CODP. Still, according to their typology, a form postponement can result in a reduced D, an unchained D, as well as an extended D. Hence, the implications for operational performance will differ, depending on the approach through which the form postponement is achieved. For this dissertation, postponement is defined as a strategy aimed at reducing demand-related risk by delaying
30
transformation activities to a later point in time when better decision support can be attained (based on Van Hoek, 2001; Yang et al., 2005).
Moreover, in an analogy with the concept of postponement, in reverse supply chains, Blackburn et al. (2004) introduce the concept of preponement, arguing that managers should diagnose a product’s condition as early as possible to avoid processing returns with no recoverable value. The concept of preponement can also be used in forward supply chains (i.e., forward movement of goods towards demand and the point of sale), which is the focus of this research. In such a context, the concept can be considered the antithesis of postponement (Mahdavi and Olsen, 2017), that is, if postponement means the delay of an activity until a later time, preponement entails bringing forward an activity to an earlier time. That is, preponement is the repositioning of transformation activities to an earlier point in time.
2.4 Research on lead-time implications for financial performance The following two subsections synthesize the published research on lead-time implications for financial performance, as well as present some well-known and frequently used relative financial performance measures. Note that an absolute measure is calculated in units such as pieces or euros, whereas a relative financial performance measure is obtained when an absolute financial performance measure is divided by another.
2.4.1 Synthesis of publications addressing lead-time implications for financial performance
Previous research has mostly used a cost perspective in studying the value of lead time, such as changes in inventory costs from switching from a supplier in a high-cost country to one in a low-cost country (see, e.g., Blackburn, 2012; De Treville et al., 2014; Heydari et al., 2016; Whicker et al., 2009).
However, there are some exceptions where the value of lead time has been measured using a relative financial performance measure, such as ROI, return on assets (ROA) and others (see, e.g., Christensen et al., 2007; Jayaram et al., 1999; Vickery et al., 1995). For example, Christensen et al. (2007) find that the end-to-end lead time of the supply chain has no direct impact on companies’ financial performance, such as ROI. In contrast, Vickery et al. (1995) and Jayaram et al. (1999) provide empirical support for a positive relation between shorter lead times and ROI. One possible reason for the mixed results is that Christensen et al. (2007) have only studied the end-to-end lead time of a supply chain, whereas Vickery et al. (1995) and Jayaram et al. (1999) have respectively examined four and six types of lead times. As such, Vickery et al. (1995) and Jayaram et al. (1999) indirectly acknowledge the fact that different lead-time segments can have varying implications for ROI, such as delivery speed (i.e., D) and manufacturing lead time. Still, Vickery et al. (1995) and Jayaram et al. (1999) focus on the question of whether lead times have implications for financial performance, not what these implications are. They
31
also pay attention to reducing lead times, excluding the implications for financial performance from maintaining or even prolonging lead times.
Some important exceptions do exist, where qualitative aspects of lead-time implications for financial performance are addressed (see, e.g., Stalk and Hout, 1990a, 1990b; Towill, 1996; Wouters, 1991). These cited authors acknowledge that different lead-time segments, such as delivery lead time, can have different implications for the three absolute measures of ROI, that is, revenue, investment and cost. Research has also shown that both the length of and the variation in lead times have implications for financial performance (see, e.g., Christensen et al., 2007; Handfield and Pannesi, 1992; Jayaram et al., 1999).
2.4.2 Common relative financial performance measures According to Gelsomino et al. (2016) and Godinho and Veloso (2013), financial performance measures should both support managerial decisions and be easy to use. Some commonly used financial performance measures that have these two characteristics are return on equity (ROE), ROA and ROI (Leon, 2016), as summarized in Table 2.3. These measures’ common features are that they calculate financial profitability and are ratios, easy to use and frequently applied in industry today (Leon, 2016).
Table 2.3. Three common relative financial performance measures Relative financial measure Calculation
Return on equity (ROE) Net income (Revenue-cost)-Preferred dividends
Average common stockholders’ equity
Return on assets (ROA) Net income (Revenue-cost)+Interest expense
Average total expense (e.g., total assets)
Return on investment (ROI) Net income (Revenue-cost)
Investment
Sources: Based on definitions by Harrison and Horngren (2008, p. 499) and APICS Dictionary (2013, p. 151)
Many executives focus heavily on ROE to analyze the return to the stockholders (Hagel et al., 2010). However, this financial performance measure can divert attention from business fundamentals in order to maintain a healthy ROE (Hagel et al., 2010). Since ROE depends on the mix of debt and equity, a company can show a higher ROE simply by choosing to finance its business with more debt and less equity (Leon, 2016), for instance.
In turn, ROA measures a company’s use of assets to earn income and gives an ROA ratio (Harrison and Horngren, 2008). This measure has received far less attention from executives but is considered a better measure of financial performance than income statement profitability measures (Harrison and Horngren, 2008). ROA explicitly takes into account the assets used to support business activities and focuses the management’s
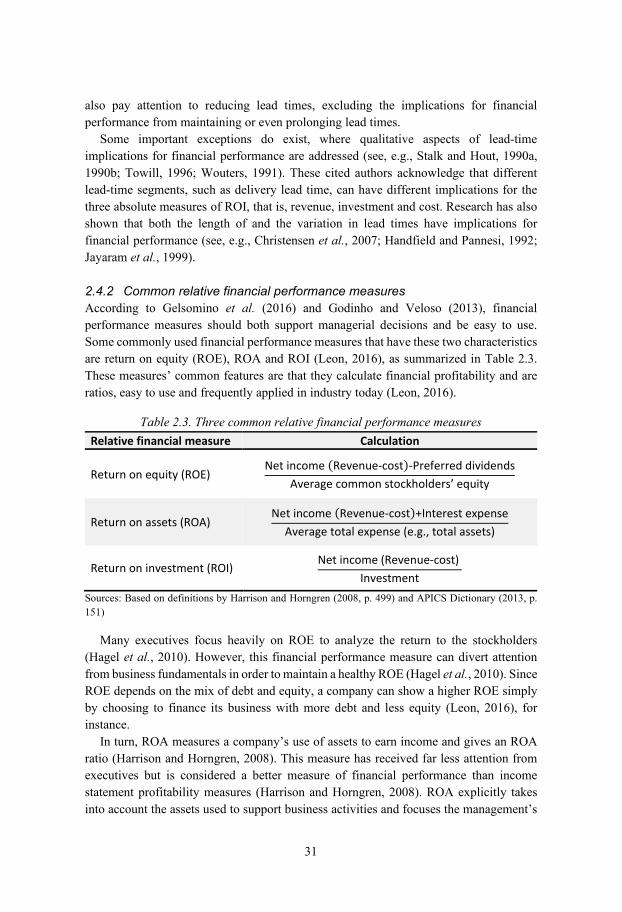
32
attention on these assets (Hagel et al., 2010), as well as indicates how efficiently the management employs the company’s assets (on the balance sheet) to generate profits (in the income statement) (Leon, 2016).
A financial performance measure similar to ROA is ROI, which is ‘a relative measure of financial performance that provides a means for comparing various investments by calculating the profits returned during a specific time period’ (APICS Dictionary, 2013, p. 151). ROI is hence suitable for determining where a financial investment might generate the most profit (Leon, 2016) and provides a useful overall approximation of the success of the company’s past investment policy (Drury, 2000). ROI is therefore preferred to ROE and ROA when comparing investment alternatives. Furthermore, ROI is the most widely used financial performance measure and can be employed for inter-division and inter-company comparisons (Drury, 2000). In short, ROI can be defined as net income (revenue minus cost) divided by investment (Leon, 2016); see Table 2.3. Hence, this relative measure consists of the three absolute measures: revenue, cost and investment.
33
Methodology This chapter describes how the research has been designed and conducted, the decisions made during the research and the reasons behind them. Thus, it outlines the chosen methods and data collection techniques, as well as how they were used.
The chapter starts by presenting the research design and how it is based on the research purpose and the four RQs. The presentation addresses the four studies and the methods employed, the resulting papers, as well as the RQs to which they contribute. Next, it focuses on the research process, addressing when each study was conducted and when each appended paper was written. Each study is thereafter presented on a study-by-study basis, focusing on how and what data were collected and analyzed. The chapter concludes by discussing the research quality and some ethical considerations.
3.1 Research design This section describes the overall research design, in terms of how the purpose and the four RQs come together, the methods chosen for answering each RQ, the conducted studies, the resulting papers and the RQ to which each paper contributes.
As presented in Chapter 1, Section 1.4 (Research scope and delimitations), to achieve the research purpose, the intention is to establish a robust framework for how the DDSCOMSs can be combined for effectiveness. Hence, the focus is not on presenting an all-inclusive view of DDSCOMSs but on creating a robust framework that can be expanded on in the future. The study is designed in this way so that the constructs of demand driven serve as a foundation or a bridge between the five selected DDSCOMSs and financial performance, as illustrated in Figure 3.1. In other words, direct relations exist between DDSCOMSs and financial performance, but this research is designed to investigate the relation between constructs of demand driven and DDSCOMSs, as well as the constructs of demand driven implications for financial performance, thereby establishing transitive relations between DDSCOMSs and financial performance. In designing the study in this way, the established relations can be expanded on in the future by including other DDSCOMSs and/or more constructs of demand driven, as well as other financial performance measures.
Regarding the selected research methods and data collection techniques, these should be guided by the phenomenon under study (Alvesson and Sköldberg, 2008). The unit of analysis in this research constitutes the five selected DDSCOMSs: segmentation, leagility, customization, transparency and postponement. For this research, it has been important to understand how demand-driven manufacturing companies can combine DDSCOMSs for effectiveness. This in turn has been divided into smaller work packages or subphenomena, formulated into the four RQs presented in Chapter 1, Section 1.3.
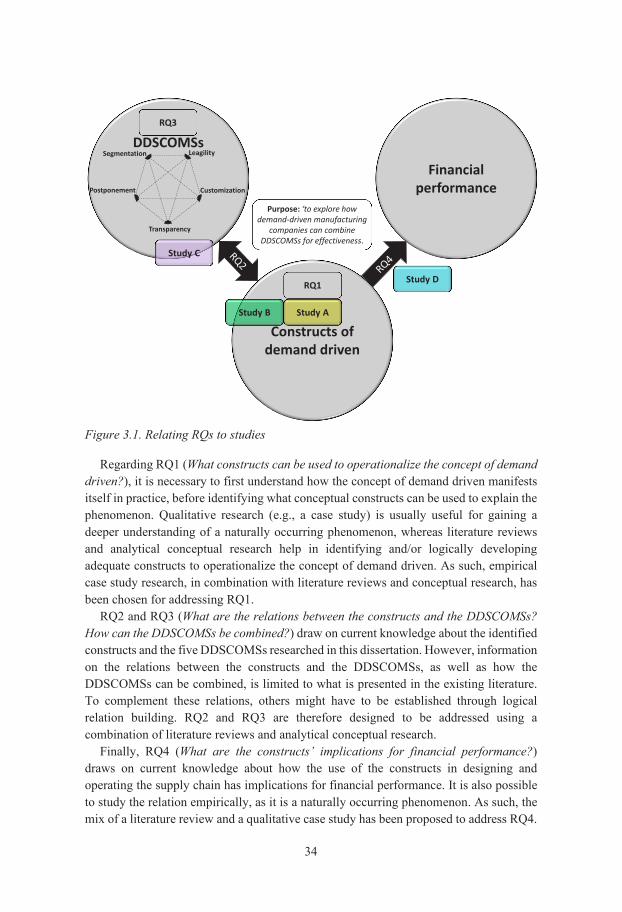
34
Figure 3.1. Relating RQs to studies
Regarding RQ1 (What constructs can be used to operationalize the concept of demand driven?), it is necessary to first understand how the concept of demand driven manifests itself in practice, before identifying what conceptual constructs can be used to explain the phenomenon. Qualitative research (e.g., a case study) is usually useful for gaining a deeper understanding of a naturally occurring phenomenon, whereas literature reviews and analytical conceptual research help in identifying and/or logically developing adequate constructs to operationalize the concept of demand driven. As such, empirical case study research, in combination with literature reviews and conceptual research, has been chosen for addressing RQ1.
RQ2 and RQ3 (What are the relations between the constructs and the DDSCOMSs? How can the DDSCOMSs be combined?) draw on current knowledge about the identified constructs and the five DDSCOMSs researched in this dissertation. However, information on the relations between the constructs and the DDSCOMSs, as well as how the DDSCOMSs can be combined, is limited to what is presented in the existing literature. To complement these relations, others might have to be established through logical relation building. RQ2 and RQ3 are therefore designed to be addressed using a combination of literature reviews and analytical conceptual research.
Finally, RQ4 (What are the constructs’ implications for financial performance?) draws on current knowledge about how the use of the constructs in designing and operating the supply chain has implications for financial performance. It is also possible to study the relation empirically, as it is a naturally occurring phenomenon. As such, the mix of a literature review and a qualitative case study has been proposed to address RQ4.
DDSCOMSs
Constructs of demand driven
RQ3
Financial performance
RQ1
Purpose: ‘to explore how demand-driven manufacturing
companies can combine DDSCOMSs for effectiveness.
Segmentation Leagility
Customization
Transparency
Postponement
Study AStudy B
Study C
Study D
35
Figure 3.2. Relating the studies to research methods, appended papers, RQs and purpose
Moreover, to address these four RQs, four studies have been conducted (Study A–Study D), as presented in Figure 3.1 and Figure 3.2. Figure 3.1 positions the four studies in terms of the main RQ that each addresses. Figure 3.2 then illustrates the documented outcome (i.e., the seven appended papers) of each study. The figure also covers the RQs to which the documented results contribute, separated into primary and secondary contributions6 (see the legend in Figure 3.2). Finally, the arrows from the RQs illustrate that the contributions and the answers to the four RQs also add to the fulfilment of the research purpose. The discussion on the fulfilment is addressed in Chapter 5, Section 5.5 (Summarizing the relations between RQs and the research purpose) ̧as well as in Chapter 6 (Discussion).
As illustrated in Figure 3.1 and Figure 3.2, Study A specifically addresses RQ1, in terms of demand-driven manufacturing companies’ ability to adapt their offerings based on actual customer orders.
Study B also specifically addresses RQ1 from the aspect of actual customer orders initiating and driving the activities in a supply chain. The study also has a secondary contribution to RQ2, as it utilizes the leagility strategy, presenting the relations between
6 The discussion on primary and secondary contributions is based on the analysis presented in Chapter 5 (Concluding analysis). If a paper contributes to more than one RQ, then if not considered a primary contribution, it is classified as a secondary contribution.
Study A – Case study using an interactive research approach
Study B – Analytical conceptual research and case study data
Study D – Case study using an
interactive research approach
Paper 1 – NPD process portfolio
Paper 2 – Leagility in a triad
Paper 3 – Customization and variants
Paper 4 – DDSCOMS literature review and model
Paper 5 – Postponement revisited
Paper 6 – DDSCOMS process
Paper 7 – Strategic leadtimes and ROI
Secondary contribution
Studies and methods
Study C – Structured literature review and analytical conceptual
research
Output/relation/Primary contribution
Papers
RQ1 – What constructs can be used to operationalize the concept of demand driven?
RQ2 – What are the relations between the constructs and
the DDSCOMSs?
RQ3 – How can the DDSCOMSs be combined?
RQ4 – What are the constructs’ implications for financial
performance?
Purpose: to explore how demand-driven manufacturing
companies can combine DDSCOMSs for effectiveness.
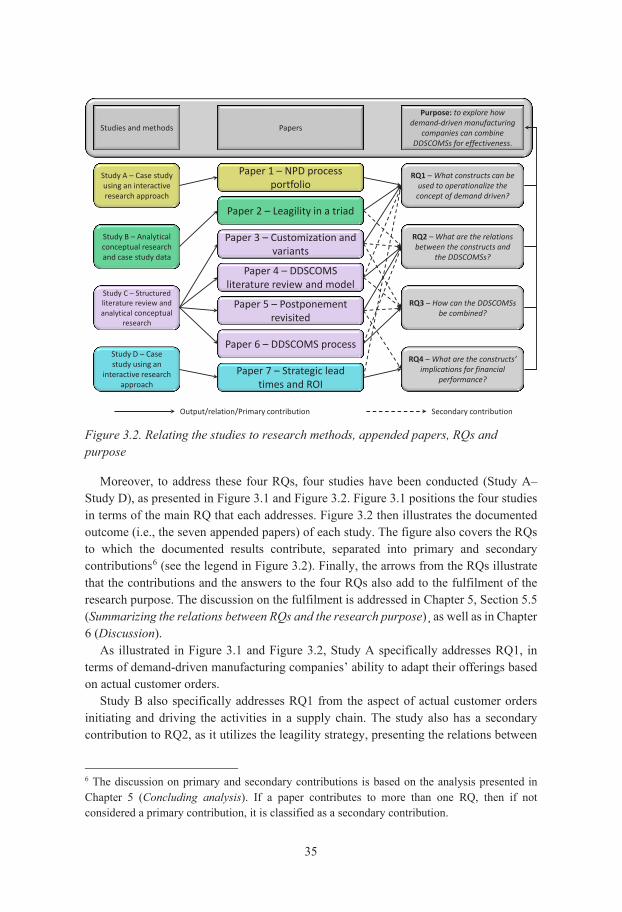
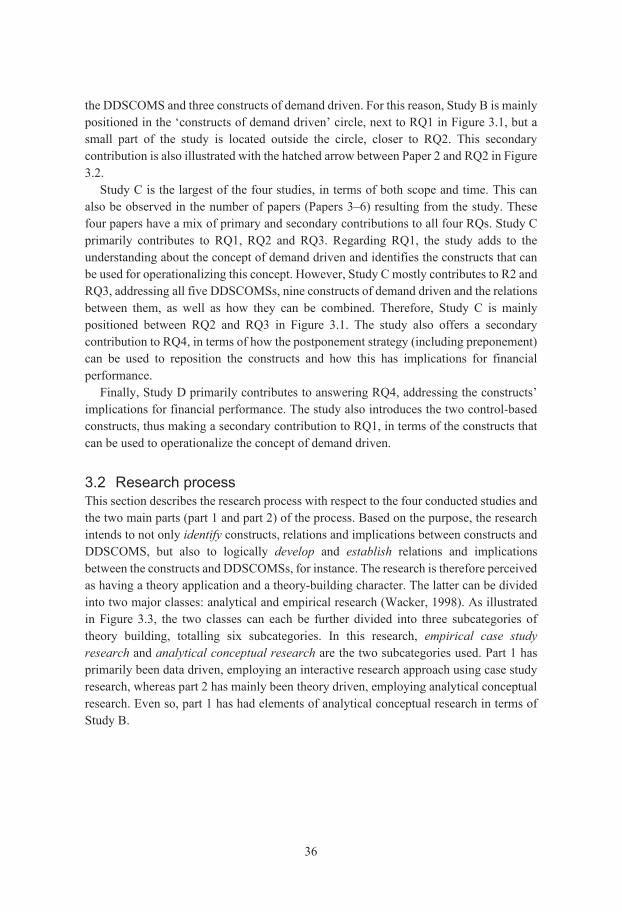
36
the DDSCOMS and three constructs of demand driven. For this reason, Study B is mainly positioned in the ‘constructs of demand driven’ circle, next to RQ1 in Figure 3.1, but a small part of the study is located outside the circle, closer to RQ2. This secondary contribution is also illustrated with the hatched arrow between Paper 2 and RQ2 in Figure 3.2.
Study C is the largest of the four studies, in terms of both scope and time. This can also be observed in the number of papers (Papers 3–6) resulting from the study. These four papers have a mix of primary and secondary contributions to all four RQs. Study C primarily contributes to RQ1, RQ2 and RQ3. Regarding RQ1, the study adds to the understanding about the concept of demand driven and identifies the constructs that can be used for operationalizing this concept. However, Study C mostly contributes to R2 and RQ3, addressing all five DDSCOMSs, nine constructs of demand driven and the relations between them, as well as how they can be combined. Therefore, Study C is mainly positioned between RQ2 and RQ3 in Figure 3.1. The study also offers a secondary contribution to RQ4, in terms of how the postponement strategy (including preponement) can be used to reposition the constructs and how this has implications for financial performance.
Finally, Study D primarily contributes to answering RQ4, addressing the constructs’ implications for financial performance. The study also introduces the two control-based constructs, thus making a secondary contribution to RQ1, in terms of the constructs that can be used to operationalize the concept of demand driven.
3.2 Research process This section describes the research process with respect to the four conducted studies and the two main parts (part 1 and part 2) of the process. Based on the purpose, the research intends to not only identify constructs, relations and implications between constructs and DDSCOMS, but also to logically develop and establish relations and implications between the constructs and DDSCOMSs, for instance. The research is therefore perceived as having a theory application and a theory-building character. The latter can be divided into two major classes: analytical and empirical research (Wacker, 1998). As illustrated in Figure 3.3, the two classes can each be further divided into three subcategories of theory building, totalling six subcategories. In this research, empirical case study research and analytical conceptual research are the two subcategories used. Part 1 has primarily been data driven, employing an interactive research approach using case study research, whereas part 2 has mainly been theory driven, employing analytical conceptual research. Even so, part 1 has had elements of analytical conceptual research in terms of Study B.
37
Figure 3.3. Major classes and subcategories of theory building. Sources: Adapted from Bäckstrand (2012, p. 20) and Wacker (1998, pp. 373–375)
The process is further summarized in Figure 3.4, also presenting a rough representation of when each study was conducted, as well as when the appended papers were written, documenting the findings from the studies. Each study and the resulting paper (papers) are presented using the same colour scheme as in Figure 3.2. Moreover, the findings from Studies A and D were each documented in a conference version (C), before being rewritten in a journal version (J). The process is further discussed based on the two main parts of the research process (Subsections 3.2.1 and 3.2.2).
Figure 3.4. Timeline of the research process
3.2.1 Part 1. Empirical case study research Part 1 employed an interactive research approach, where the author of this dissertation had access to five companies that participated in the research project KOPtimera. The choice of an interactive research approach stems from its underlying idea that co-producing the results can contribute to both managerial and theoretical knowledge, as well as enhance the competencies of all parties involved (Ellström, 2007; Gunnarsson et al., 2015). Considering that both the case companies and their representatives stood to gain from the research, it is believed that the approach resulted in easier access to the case companies, as well as facilitated obtaining more credible data.
Furthermore, prior to the current research, the author of this dissertation undertook his master’s thesis project (see Hedén and Tiedemann, 2014) within the KOPtimera project. Though not originally intended as such, the master’s thesis project can thus be regarded
Theory building
Analytical
Empirical
Conceptual
Mathematical
Statistical
Statistical
Experimental
Case study
2014 2015 2016 2017 2018 2019 2020
Part 1 Part 2
Study A
Paper 1 (C)
Study B
Paper 2 Study D
Paper 7 (C)
Lic. thesis Dissertation
Paper 1 (J)
Paper 7 (J)
Study C
Paper 4
Paper 5
Paper 3
Paper 6
Major parts of the process Study B and resulting paper Study C and resulting papers Study D and resulting papersStudy A and resulting papers Lic. thesis and dissertation
= Master’s thesis project (C) = Conference version (J) = Journal version Lic. = Licentiate
Study A
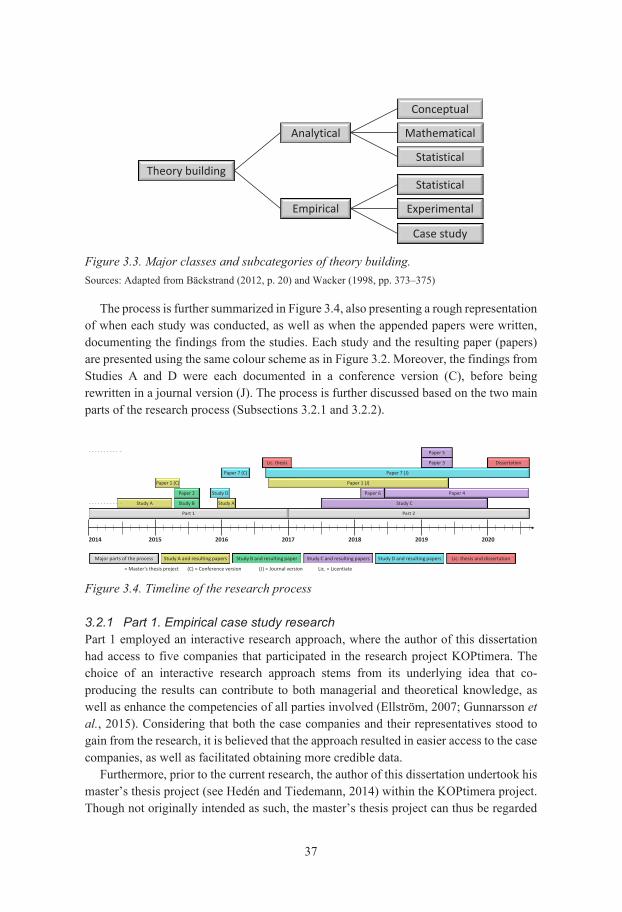
38
as a preliminary study, which helped contextualize the research problem and enabled the author to familiarize himself with the companies’ processes and products. Furthermore, Study A and the empirical data collection for Paper 1 commenced in mid-May 2014, before the author officially became a PhD student at the School of Engineering, Jönköping University, on 1 July 2014. This early start of the research is shown in Figure 3.4, where the pre-study (i.e., the master’s thesis project) is also illustrated with the hatched upward diagonal lines overlaying the far left side of the figure.
Because of the accessibility to the companies and the empirical data, the three studies (Study A, Study B and Study D) that were designed to include empirical research or empirical data were conducted during part 1. As a result, part 1 primarily addressed RQ1 and RQ4, where RQ4 had been attended to before concentrating on RQ2 and RQ3. For Study A, Study B and Study D, traditional literature reviews had been employed to synthesize the current knowledge about the phenomena at hand, as well as to develop an analysis tool for each study.
Table 3.1 summarizes the data about the case companies involved in the research, including contextual information, such as the country where each is based, year it was founded, type of products, number of employees, yearly turnover in euros (EUR) and company size. The table also provides information on the respondents (i.e., R1–24) in terms of their roles or titles in the companies. However, for the purpose of confidentiality, the companies’ products in combination with ‘Co’ (abbreviation of company) are used as pseudonyms. The information regarding the number of employees, turnover and company size is based on the annual reports for 2015 in the Amadeus (2020) database because Study A, Study B and Study D were mostly conducted during that year (see Figure 3.4), and the database offered contemporary data for the specific time period. Table 3.1 also offers the possibility to distinguish which case companies have been used in which study. The case selection criteria and the resulting case companies are further addressed in relation to their respective studies (see Subsections 3.3.1, 3.3.2 and 3.3.4).
3.2.2 Part 2. Analytical conceptual research In part 2, the focus turned to Study D. A mix of structured literature review and analytical conceptual research was employed to specifically address RQ2 and RQ3. These two RQs then added to the purpose of Study D, namely to identify and establish the relations between the constructs of demand driven and the five DDSCOMSs, as well as between the DDSCOMSs and how they can be used in combination.
At the outset of part 2, the current explicit knowledge about the relations between the constructs of demand driven and the five DDSCOMSs, as well as the relations between the DDSCOMSs, were sought after. The study thus started with a structured literature review to identify and summarize such knowledge and how the said relations can be combined. However, this knowledge offers a limited number of relations – those already documented in the literature. To complement the current knowledge, other relations were established, somewhat in parallel to the literature review, using analytical conceptual research. The strength of such research is that it offers a way of adding new insights into
39
Tabl
e 3.
1. C
ase
com
pani
es
Com
pany
(Co)
, co
untr
y w
here
bas
ed Fo
unde
d Pr
oduc
ts
Empl
oyee
s1 Tur
nove
r EU
R (€
)1 Co
mpa
ny
size
1 In
clud
ed
in st
udy
Resp
onde
nts (
R)
Tele
com
Co,
Swed
en
1876
Te
leco
mm
unic
atio
n eq
uipm
ent
19,2
272
13,1
62,9
522
Very
larg
e D
(R1)
Sen
ior s
uppl
y de
velo
per
(R2)
Ope
ratio
nal d
evel
oper
(R
3) G
loba
l sup
ply
chai
n ar
chite
ct
Airc
raft
Co, S
wed
en
1937
Ai
rcra
ft sy
stem
s 14
,545
3 3,
003,
1023
Very
larg
e D
(R4)
Sen
ior l
ogist
ics m
anag
er
Turb
ineC
o, S
wed
en
1913
Gas t
urbi
nes
2,59
7 1,
201,
030
Very
larg
e A,
D
(R5)
Dem
and
plan
ner,
sale
s and
ope
ratio
ns p
lann
ing
(R
6) S
trat
egic
logi
stic
s dev
elop
er
(R7)
Str
ateg
ic p
urch
aser
(R
8) M
anag
er, s
ales
and
ope
ratio
ns p
lann
ing
(R9)
Pro
duct
dev
elop
er
(R10
) Pur
chas
ing
man
ager
, ser
vice
Lum
inai
reCo
, Sw
eden
1943
Lum
inai
res
586
137,
678
Very
larg
e A,
D
(R11
) Log
istic
s man
ager
(R
12) M
aste
r pla
nner
and
pla
nnin
g te
am le
ader
(R
13) T
eam
lead
er, o
pera
tiona
l pur
chas
er
(R14
) Pro
ject
lead
er fo
r pro
duct
dev
elop
men
t (R
15) M
anuf
actu
ring
man
ager
(R
16) C
usto
mer
des
ign
man
ager
Furn
iture
Co, W
ales
19
98
Furn
iture
and
task
se
atin
g 36
1 75
,816
La
rge
A (R
17) N
ew p
rodu
ct in
trod
uctio
n m
anag
er
(R18
) Con
tinuo
us im
prov
emen
t man
ager
Pum
pCo,
Sw
eden
19
674
Hydr
aulic
pum
ps
and
mot
ors
230
39,5
675
Med
ium
A,
B, D
(R
19) I
nbou
nd a
nd o
utbo
und
man
ager
(R
20) P
roje
ct a
dmin
istra
tor,
pum
p an
d m
otor
div
ision
Fo
ilCo,
Sw
eden
19
454
Plas
tic fo
ils
107
25,6
65
Med
ium
A
(R21
) Pro
duct
man
ager
Chim
neyC
o, W
ales
19
97
Pref
abric
ated
ch
imne
ys a
nd
bric
k ar
ches
70
5,
110
Med
ium
A
(R22
) Pro
duct
dev
elop
men
t and
mar
ketin
g m
anag
er
(R23
) Man
agin
g di
rect
or
(R24
) Pro
duct
ion
dire
ctor
N
otes
: 1 The
info
rmat
ion
conc
erni
ng th
e nu
mbe
r of e
mpl
oyee
s, tu
rnov
er a
nd c
ompa
ny si
ze c
omes
from
the
Am
adeu
s (20
20) d
atab
ase,
rela
ting
to a
nnua
l rep
orts
for 2
015.
2 T
he n
umbe
rs a
re fo
r the
com
pany
div
isio
n pr
oduc
ing
com
mun
icat
ion
equi
pmen
t, of
whi
ch th
e st
udie
d si
te is
onl
y a
part.
3 The
num
bers
are
for t
he w
hole
org
aniz
atio
n.
The
stud
ied
site
mak
es u
p ab
out 2
0% o
f the
se n
umbe
rs. 4 T
he c
ompa
nies
wer
e fo
unde
d ea
rlier
, but
thes
e w
ere
the
resp
ectiv
e ye
ars w
hen
they
star
ted
prod
ucin
g th
e ty
pe
of p
rodu
cts
that
they
are
cur
rent
ly m
anuf
actu
ring.
5 The
turn
over
pre
sent
ed h
ere
is a
n es
timat
e fo
r the
spe
cific
site
stu
died
in th
is re
sear
ch, a
ccou
ntin
g fo
r 50%
of t
he
turn
over
for t
he w
hole
Sw
edis
h or
gani
zatio
n.
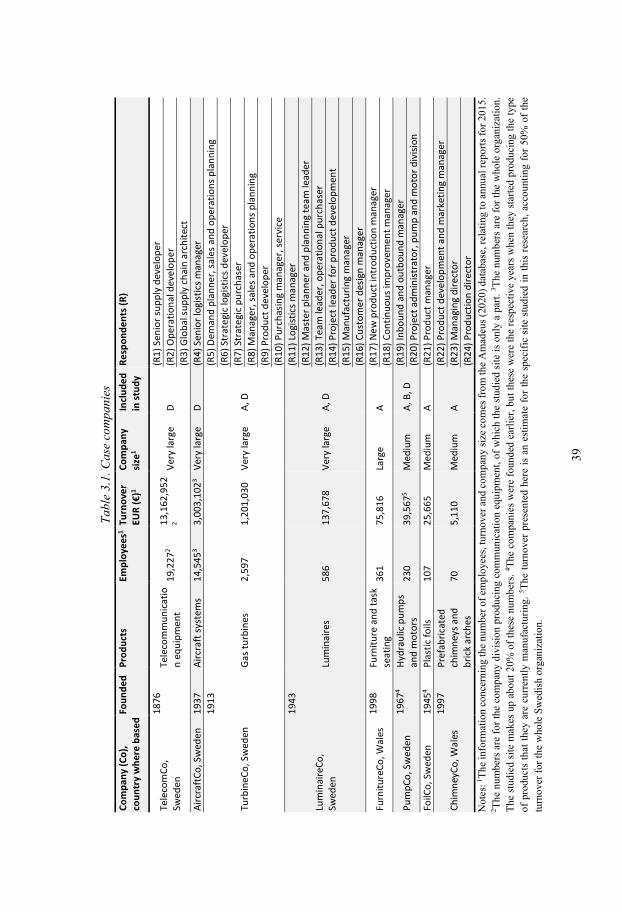
40
problems through logical relationship building (Wacker, 1998), for instance, by logically developing relations between constructs and determining why these relations exist.
Note that traditional literature reviews were used in part 1 of this research. However, part 2 applied a structured literature review approach. The difference between these two forms mainly lies in how the literature review is designed and documented. A traditional literature review is often based on a personal selection of materials and written in a narrative style. An example is a conceptual review, which aims to synthesize areas of conceptual knowledge in order to contribute to a better understanding of the issue at hand (Jesson et al., 2011). As such, a traditional literature review usually offers summaries and interpretations of previous contributions but is usually done in a subjective and narrative fashion compared with a systematic literature review (Denyer and Tranfield, 2006), which starts with a clear purpose and a defined search approach, stating inclusion and exclusion criteria (Jesson et al., 2011). In this dissertation, a structured literature review means an intermediate version of a traditional literature review and a systematic literature review, that is, it is arranged and carried out using a predefined search approach, with inclusion and exclusion criteria, and documented in parallel to being conducted. Still, the literature review has subjective elements where backward and forward reference searches are used. As such, a structured literature review is more robust and objective than a traditional literature review but less so than a systematic literature review.
3.3 Studies, including data collection and analysis In this section, the data collection and analysis are addressed on a study-by-study basis. At times, the discussion is presented at a rather holistic and summarizing level. For a detailed account of the design, data collection and data analysis, the reader is directed to the specific papers in which the studies are presented. However, for Study B, a somewhat more thorough discussion is presented, since Paper 2 (documenting Study B) excludes any discussion on the research design or process. For Study C, the reader is directed to Paper 4 because it includes a more detailed account of the conducted structured literature review compared with Paper 3, Paper 5 and Paper 6.
Each of the following subsections focuses on the literature review, data collection and data analysis but also addresses the purpose of each study and the case selection criteria (if applicable). The four studies are also summarized in Table 3.2 in terms of the research approach, research methods, case companies (if applicable), data collection techniques and data analysis techniques.
41
Tabl
e 3.
2. S
umm
arie
s of f
our c
ondu
cted
stud
ies
Stud
y ap
proa
ch
Rese
arch
met
hod
Case
co
mpa
ny
Data
col
lect
ion
tech
niqu
e/
liter
atur
e co
llect
ion
tool
s Da
ta a
naly
sis t
echn
ique
A De
scrip
tive
lead
ing
to
expl
anat
ory
Trad
ition
al li
tera
ture
revi
ew a
nd a
hol
istic
m
ultip
le c
ase
stud
y Tu
rbin
eCo
Lum
inai
reCo
Fu
rnitu
reCo
Pu
mpC
o Fo
ilCo
Chim
neyC
o
Inte
rvie
ws,
wor
ksho
ps,
obse
rvat
ions
, arc
hiva
l do
cum
ents
and
stee
ring
grou
p m
eetin
gs/E
lsevi
er S
copu
s,
Goog
le S
chol
ar, a
nd T
hom
son
Reut
ers W
eb o
f Sci
ence
Map
ping
dat
a in
the
engi
neer
ing
deco
uplin
g po
int f
ram
ewor
k (a
dapt
ed fr
om G
oslin
g et
al
., 20
17),
patt
ern
mat
chin
g, a
s wel
l as
with
in- a
nd c
ross
-cas
e an
alys
is B
Mix
of e
xplo
rato
ry a
nd
expl
anat
ory
Trad
ition
al li
tera
ture
revi
ew a
nd a
naly
tical
co
ncep
tual
rese
arch
Pu
mpC
o1 Se
cond
ary
data
pub
lishe
d in
Bä
ckst
rand
(201
2) a
nd H
edén
an
d Ti
edem
ann
(201
4)/E
lsevi
er
Scop
us, G
oogl
e Sc
hola
r and
Th
omso
n Re
uter
s Web
of
Scie
nce
Patt
ern
mat
chin
g be
twee
n th
e th
eore
tical
fr
amew
ork
and
the
seco
ndar
y da
ta
C M
ix o
f exp
lora
tory
and
ex
plan
ator
y St
ruct
ured
lite
ratu
re re
view
and
ana
lytic
al
conc
eptu
al re
sear
ch
N/A
El
sevi
er S
copu
s, G
oogl
e Sc
hola
r2 and
Tho
mso
n Re
uter
s W
eb o
f Sci
ence
A fo
rm o
f with
in- a
nd
cros
s-bo
dy o
f lite
ratu
re
anal
ysis
and
logi
cal
rela
tions
hip
build
ing
D Ex
plan
ator
y Tr
aditi
onal
lite
ratu
re re
view
and
a h
olist
ic
mul
tiple
cas
e st
udy
Tele
com
Co
Airc
raft
Co
Turb
ineC
o Lu
min
aire
Co
Pum
pCo
Inte
rvie
ws,
focu
s gro
ups,
w
orks
hops
, obs
erva
tions
and
ar
chiv
al d
ocum
ents
/Else
vier
Sc
opus
, Goo
gle
Scho
lar a
nd
Thom
son
Reut
ers W
eb o
f Sc
ienc
e
With
in- a
nd c
ross
-cas
e an
alys
is an
d pa
tter
n m
atch
ing
Not
es: 1 S
tudy
B is
not
a c
ase
stud
y; h
owev
er, s
econ
dary
cas
e st
udy
data
on
Pum
pCo’
s pr
oces
ses
and
prod
ucts
wer
e us
ed. 2 G
oogl
e Sc
hola
r was
onl
y us
ed to
retri
eve
publ
icat
ions
foun
d th
roug
h ba
ckw
ard
and
forw
ard
refe
renc
e se
arch
es.
42
3.3.1 Study A. Concept of demand driven in terms of the ability to adapt products
Study A addressed RQ1, where the purpose was to increase the understanding of the concept of demand driven in terms of demand-driven manufacturing companies’ ability to adapt products, based on either speculation or actual customer orders. Since many of the adaptations made must go through product development, the unit of analysis comprised the development processes in each case company, through which new technology, new product designs or reconfigured ones were realized, that is, the new product development (NPD) processes.
To do this, Study A employed a mix of a traditional literature review and a holistic multiple-case study (Yin, 2009), including six case companies, where the same issue was addressed in each company. The literature reviews were in the traditional form and carried out using Elsevier Scopus, Google Scholar and Thomson Reuters Web of Science. The search terms used were in the areas of NPD, co-creation, codes and standards, and strategic decoupling points, among others. The literature that was found was used to understand the current knowledge on the phenomena, as well as to develop a tool for the analysis of the collected empirical data. Literature searches were carried out throughout the study as it evolved.
The decision to conduct a multiple-case study stemmed from the notion that compared with a single-case study, the former would create a more robust theory since the propositions would be more deeply grounded on varied empirical evidence (Eisenhardt and Graebner, 2007; Yin, 2009). The study combined the research activities from the funded programmes in Sweden and the UK (specifically Wales) and drew on engaged and extensive joint research with industry collaborators. The case company selection criteria were based on the purpose of the study. To be deemed appropriate, the case companies should (i) be demand-driven manufacturing companies; (ii) have internal NPD processes; (iii) show an interest and a willingness to study the NPD processes in a research setting; (iv) develop relatively complex products, including both standardized and customized types; and (v) represent different industries, sizes and maturity levels. The six chosen case companies were TurbineCo, LuminaireCo, FurnitureCo, PumpCo, FoilCo and ChimneyCo, whose contextual information is summarized in Table 3.1.
Since the study was conducted in relation to KOPtimera and a research programme in Wales, extensive data were collected from interviews, observations, archival documents, workshops and steering group meetings (the series of workshops and steering group meetings in KOPtimera are summarized in Appendix 1). The main sources of the empirical data and the techniques used to collect the data for Study A are summarized in Table 3.3. The observations and the interviews were conducted, and the archival documents were mostly collected by two or more researchers, including the author of this dissertation. The observations were made via site tours, focusing on products and material flows to obtain an overview. The archival documents mainly described NPD processes and provided details on them (see Table 3.3).
43
Tabl
e 3.
3. S
ourc
es o
f evi
denc
e sp
ecifi
cally
col
lect
ed fo
r Stu
dy A
Co
mpa
ny
Obs
erva
tions
In
terv
iew
s Ar
chiv
al d
ocum
ents
Fo
cus o
f the
obs
erva
tion
Dura
tion
(min
.) Da
te
Resp
onde
nt/s
(R
) Du
ratio
n (m
in.)
Date
Turb
ineC
o Du
ring
Wor
ksho
p 3,
R5
guid
ed t
he in
dust
rial r
esea
rche
rs a
nd t
he a
cade
mic
re
sear
cher
s in
KO
Ptim
era
thro
ugh
Turb
ineC
o’s
prod
uctio
n sit
e. T
he t
our
focu
sed
on T
urbi
neCo
’s p
rodu
cts,
pro
duct
ion
syst
em, l
ayou
t, as
wel
l as i
ts N
PD
proc
esse
s.
180
2014
-11-
26 R5
, R9,
R10
65
20
14-1
0-23
Sta
ge-g
ate
mod
els,
pro
cess
cha
rts a
nd
proc
ess d
escr
iptio
ns, c
ompa
ny
web
page
sear
ches
, wor
ksho
p do
cum
ents
, list
of c
odes
and
stan
dard
s
R5, R
9, R
10
97
2014
-10-
23
R91
49
2015
-03-
16
R91
49
2015
-03-
31
Lum
inai
reCo
Durin
g a
com
pany
visi
t, R1
1 an
d R1
4 co
nduc
ted
a gu
ided
tou
r of
the
pr
oduc
tion
site.
The
tou
r fo
cuse
d on
Lum
inai
reCo
’s p
rodu
cts,
inve
ntor
y an
d th
e pr
oduc
tion
as su
ch.
40
2014
-08-
27 R1
4 74
20
14-0
5-21
Stag
e-ga
te m
odel
s, p
roce
ss c
hart
s and
pr
oces
s des
crip
tions
, com
pany
w
ebpa
ge se
arch
es, w
orks
hop
docu
men
ts, i
n- a
nd o
ut-p
hasin
g do
cum
ents
(gen
erat
iona
l shi
fts)
R11,
R12
, R15
78
20
14-0
5-21
Durin
g W
orks
hop
2, R
11 a
nd R
14 g
uide
d th
e in
dust
rial r
esea
rche
rs a
nd t
he
acad
emic
res
earc
hers
in K
OPt
imer
a th
roug
h Lu
min
aire
Co’s
pro
duct
ion
site.
R1
1 an
d R1
4 al
so h
eld
a pr
esen
tatio
n. B
oth
the
tour
and
the
pre
sent
atio
n fo
cuse
d on
Lum
inai
reCo
’s p
rodu
cts,
pro
duct
ion
syst
em a
nd la
yout
. Dire
ctly
ob
serv
able
pro
duct
s an
d pr
ojec
ts u
nder
take
n us
ing
diffe
rent
NPD
pro
cess
es
wer
e al
so d
iscus
sed.
60
2014
-09-
16 R1
6 41
20
14-0
5-21
R11,
R14
10
6 20
14-1
0-23
Furn
iture
Co Du
ring
a co
mpa
ny v
isit,
R18
held
a g
uide
d to
ur o
f Fu
rnitu
reCo
’s p
rodu
ctio
n sit
e. T
he t
our
focu
sed
on F
urni
ture
Co’s
pro
duct
s, p
rodu
ctio
n sy
stem
and
la
yout
. Dire
ctly
obs
erva
ble
prod
ucts
and
pro
ject
s un
dert
aken
usin
g di
ffere
nt
NPD
pro
cess
es w
ere
also
disc
usse
d.
43
2015
-12-
09 R
17, R
182
44
2015
-12-
09 C
ompa
ny w
ebpa
ge se
arch
es
Pum
pCo
Durin
g a
com
pany
visi
t, R1
9 an
d R2
0 he
ld a
gui
ded
tour
of
Pum
pCo’
s pr
oduc
tion
site.
The
tour
focu
sed
on P
umpC
o’s
prod
ucts
, pro
duct
ion
syst
em
and
layo
ut, a
s wel
l as i
ts w
ork
with
Lea
n an
d Ka
nban
. 45
20
14-1
1-06
R19,
R20
58
20
14-1
1-06
Stag
e-ga
te m
odel
s, p
roce
ss c
hart
s and
pr
oces
s des
crip
tions
, com
pany
w
ebpa
ge se
arch
es, w
orks
hop
docu
men
ts
R19,
R20
58
20
14-1
1-06
FoilC
o
Durin
g a
com
pany
visi
t (in
bet
wee
n th
e tw
o in
terv
iew
s), R
21 h
eld
a gu
ided
tour
of
Foi
lCo’
s pr
oduc
tion
site.
The
tour
focu
sed
on F
oilC
o’s
prod
ucts
, pro
duct
ion
syst
em a
nd la
yout
, as
wel
l as
its p
rodu
ct te
stin
g fa
cilit
ies.
Dire
ctly
obs
erva
ble
prod
ucts
and
pro
ject
s un
dert
aken
usin
g di
ffere
nt N
PD p
roce
sses
wer
e al
so
disc
usse
d.
55
2016
-03-
23 R2
1 9
2016
-03-
23 S
tage
-gat
e m
odel
s, p
roce
ss c
hart
s and
pr
oces
s des
crip
tions
, com
pany
w
ebpa
ge se
arch
es, o
rgan
izatio
n ch
art,
com
pany
pre
sent
atio
n R2
1 75
20
16-0
3-23
Chim
neyC
o
Durin
g a
com
pany
visi
t, R2
2 an
d R2
3 he
ld a
gui
ded
tour
of
Chim
neyC
o’s
prod
uctio
n sit
e. T
he t
our
focu
sed
on C
him
neyC
o’s
prod
ucts
, pr
oduc
tion
syst
em a
nd l
ayou
t. Di
rect
ly o
bser
vabl
e pr
oduc
ts a
nd p
roje
cts
unde
rtak
en
usin
g di
ffere
nt N
PD p
roce
sses
wer
e al
so d
iscus
sed.
35
2015
-12-
10 R2
23 45
20
15-1
2-10
Sta
ge-g
ate
mod
els,
pro
cess
cha
rts a
nd
proc
ess d
escr
iptio
ns, w
orks
hop
docu
men
ts, p
rodu
ct h
iera
rchy
di
agra
ms
R23
35
2015
-12-
10
R24
20
2015
-12-
10
Sour
ce: A
dapt
ed fr
om T
iede
man
n (2
017,
pp.
27–
28) a
nd T
iede
man
n et
al.
(202
0a, p
. 44)
. Not
es: 1 I
nter
view
con
duct
ed e
lect
roni
cally
(i.e
., us
ing
onlin
e co
mm
unic
atio
n to
ols o
r tel
epho
ne).
2 Tw
o fo
llow
-up
inte
rvie
ws w
ere
held
with
R18
at F
urni
ture
Co.
(3) T
wo
follo
w-u
p in
terv
iew
s wer
e he
ld w
ith R
22 a
t Chi
mne
yCo.
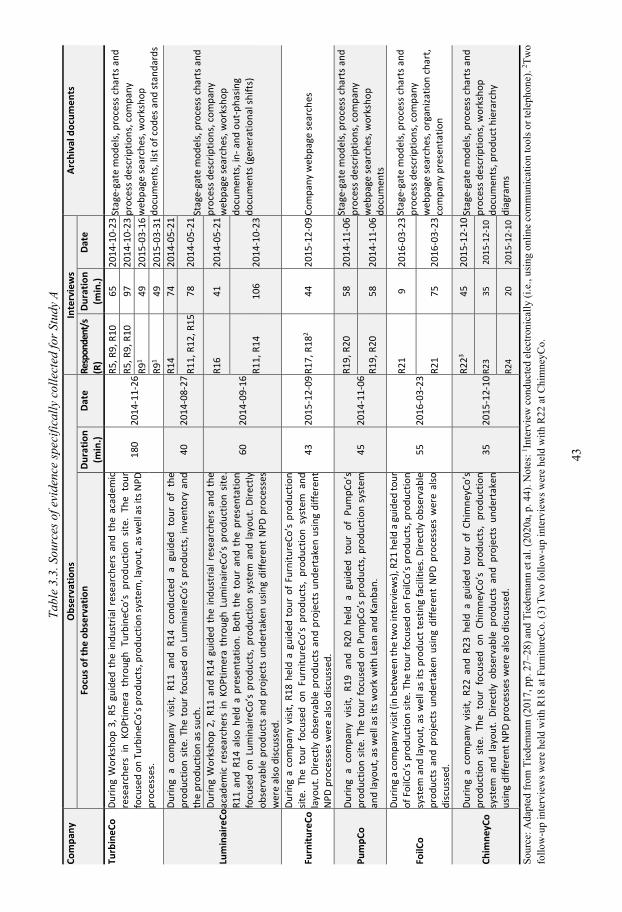
44
In total, 20 interviews were carried out (18 face-to-face and 2 using online communication tools), each including one to three respondents (R; for more information, compare Table 3.3 with Table 3.1). Four were follow-up interviews with FurnitureCo and ChimneyCo, conducted by the third author of Paper 1, in which the results of Study A are documented. The other 16 interviews were conducted by the author of this dissertation alone or together with one or both co-authors of Paper 1. The questions asked during the interviews were mostly open-ended, focusing on the company’s technology and product development processes, examples of projects undertaken using these processes, products developed and adapted within these projects, and the activities that were carried out based on forecasts or customer orders. For more information on the processes and the questions asked, the reader is directed to the research protocol in Paper 1 (p. 45). Moreover, all interviews were audio-recorded, except those at ChimneyCo. Transcript summaries of the recordings were made by the author of this dissertation shortly after each interview. The data were then used to describe the different NPD processes applied by the case companies, for example.
The data were mainly analyzed by positioning the companies’ NPD processes into the engineering decoupling point framework (adapted from Gosling et al., 2017), classifying them according to Wheelwright and Clark’s (1992) four categories and visualizing their lead times. This approach can be perceived as pattern matching (see, e.g., Saunders et al., 2012; Yin, 2009), where the study’s theoretical framework was used to position, categorize and compare the theoretical framework with the data. This was first done for each company before comparing the data with one another, which can be considered a within-case analysis and a cross-case analysis, respectively (Eisenhardt, 1989). The analysis focused on revealing similarities and differences among the NPD processes and the suitability of different configurations.
Method and source triangulations, as well as investigator triangulation (Denzin, 2009; Torrance, 2012; Williamson, 2002), were applied to the data from different data collection techniques, among the participants in the same case companies and among the three authors (i.e., researchers). When needed, follow-up questions were discussed with the respective respondents by telephone or email. The participants were provided with initial interpretations of their interviews, mostly by the feedback on their processes that were mapped into the engineering decoupling point framework, together with the written data. The results were then sent back to the companies for their review of the data presented, as well as whether they recognized the emerging account as fair and reasonable – a process that Carlson (2010) defines as member checking. The results of Study A are documented in the appended Paper 1.
3.3.2 Study B. Concept of demand driven in terms of multiple customers in sequence
The purpose of Study B was to examine the concept of demand driven from the aspect of customer orders initiating and driving the activities in a supply chain, simplified into three actors acting individually in a sequence.
45
The study was designed as a combination of a traditional literature review and analytical conceptual research. The traditional literature review was carried out using Elsevier Scopus, Google Scholar and Thomson Reuters Web of Science. The search terms used were in the areas of lean, agile, leagility, strategic decoupling points and strategic lead times. From this review, the theoretical framework was formulated. Using analytical conceptual research, the theoretical framework was then used to logically develop the relations between leagility and decoupling thinking (here only S, D and CODP), integrating them within a triad of actors. This resulted in a conceptual framework of four interfaced configurations, where each was illustrated using the secondary data presented by Bäckstrand (2012) and in the master’s thesis written by the author of this dissertation (Hedén and Tiedemann, 2014). The secondary data were therefore partially collected by the author of this dissertation, using a multiple-case study. The choice of using data from PumpCo resembles that of a convenience sample (see Voss et al., 2002), that is, the data were readily available and known to the four academic researchers involved in the study. Nonetheless, PumpCo was also found appropriate, (i) being a demand-driven manufacturing company, (ii) having some form of customer-order-driven production (i.e., D > 0) and (iii) producing both standardized and customized products, where the company and its suppliers both produce a mix of products based on forecasts and customer orders. Furthermore, as the data were collected on separate occasions by two separate researchers, it was possible to have a form of data triangulation between the two data sets. The analysis was mainly done by comparing the theoretical framework with the empirical data on PumpCo’s products and processes and can be regarded as a form of pattern matching. In line with the process of member checking (see, e.g., Carlson, 2010), the result of the pattern matching was then sent to R19 and R20 at PumpCo, offering them the possibility to review the data and the results in order to edit any information that might be considered false or misleading and to judge whether the emerging account was fair and reasonable. The results of Study B are documented in the appended Paper 2.
3.3.3 Study C. Relations and combinations of constructs and DDSCOMSs The purpose of Study C was to explore the relations between the constructs of demand driven (i.e., S, D, CODP, AS, AD, CADP, DIDP, USIDP and DSIDP) and the five DDSCOMSs (i.e., segmentation, leagility, customization, transparency and postponement), as well as the transitive relations between the DDSCOMSs.
As addressed in Chapter 1, Section 1.4 (Research scope and delimitations), the intention of this research is to establish a robust framework for how the DDSCOMSs can be combined for effectiveness. It is thus acknowledged that the selected five DDSCOMSs are not absolute, meaning that others exist. However, as also addressed in Section 1.4, the five selected DDSCOMSs are still based on the research purpose. The selection criteria are repeated here, that is, to be deemed appropriate, the strategies need to (i) address and be applicable to supply chain operations, (ii) improve manufacturing companies’ ability to act and adapt to customer needs, (iii) focus on the flow of material and/or information, (iv) address different aspects of demand driven and (v) have received substantial interest
46
in both literature and practice. All of the five selected DDSCOMSs comply with these criteria.
Moreover, to fulfil the purpose of Study C, it was condensed into two major parts. These two parts were in practice performed somewhat in parallel, both overlapping and iteratively. However, to increase its comprehensibility, the process was somewhat simplified and presented as two consecutive parts performed in a linear fashion: part 1, the structured literature review, and part 2, the analytical conceptual research. Both parts are addressed hereafter. Note that the following two subsections present a summary of the study. For a detailed presentation of the process and the choices made, the reader is directed to Paper 4, in which the study is thoroughly discussed.
Part 1. Structured literature review As the first step of the literature review, it was decided what information was needed to obtain the relations between the DDSCOMSs and the constructs of decoupling thinking, as well as the relations between the DDSCOMSs. This is considered to be information on (i) what the strategies and the constructs of decoupling thinking are, (ii) how they are intended to be used and (iii) how these areas of literature have progressed and been used in combination.
To answer these types of questions, published literature reviews on the DDSCOMSs and decoupling thinking were sought. The reason is that published literature reviews are usually condensed overviews on a specific topic (Seuring and Gold, 2012). Such reviews are usually excellent in presenting information on questions, such as the following: Where do the DDSCOMSs and the constructs of decoupling thinking stem from? How are they defined? How have they evolved? Have they been combined with other DDSCOMSs? As such, the study was designed around the idea of identifying published literature reviews on each of the DDSCOMSs and decoupling thinking. From these published literature reviews, it was then possible to obtain a condensed summary of each DDSCOMS and decoupling thinking, as well as to identify seminal publications and other publications citing them. Based on this logic, a structured literature review was designed as first using a protocol-driven method (see Greenhalgh and Peacock, 2005), identifying literature reviews on the DDSCOMSs and decoupling thinking. This was followed by a reference search method (also known as snowballing), using the identified published literature reviews to find both earlier and more recent publications. In comparison to the process described by Greenhalgh and Peacock (2005), this study neither intended nor claimed to be systematic (cf. Tranfield et al., 2003) but structured, that is, arranged and carried out using a predefined procedure, as well as documented in parallel to being conducted.
In the protocol-driven part, published literature reviews on the DDSCOMSs were sought separately, using the two electronic databases Thomson Reuters Web of Science and Elsevier Scopus. The search strings were structured using the same Boolean logic, that is ((<the name of the DDSCOMS> OR <alternative spellings/synonyms>) AND (*review*)).
In the reference search method part of the study, the published literature reviews were then used as starting points for searches within each DDSCOMS and decoupling thinking.
47
The publications cited in these literature reviews and deemed interesting for the study were further obtained. Reading these publications made it possible to find others that were cited in the obtained publications or that cited the obtained publications. This use of backward and forward reference searches, suggested by Greenhalgh and Peacock (2005) and Thomé et al. (2016), enabled not only seminal publications to be identified but also publications that cited the seminal publications and as such, how the literature on each DDSCOMS and decoupling thinking had progressed. The reference searches ended when new publications added nothing or little to existing findings, that is, saturation was reached.
Part 2. Analytical conceptual research Parallel and iteratively to the structured literature review, the analysis and the analytical conceptual work commenced. In other words, from reading the publications on the DDSCOMSs and decoupling thinking, both narrative descriptions and an Excel spreadsheet were used to summarize such publications and information. The set of narrative summaries can be perceived as a form of within-the-body of literature analysis, summarizing the body of literature on each DDSCOMS and decoupling thinking, respectively. These narrative summaries include information on seminal publications, definitions, references to publications (both seminal and more contemporary), strengths and limitations. The Excel document includes a spreadsheet per DDSCOMS and decoupling thinking, respectively. Each spreadsheet includes the following codes in this order: ‘title of the publication’, ‘name of the journal/conference/book’, ‘publication year’, ‘author(s)’, ‘definition(s)’, ‘retrieved from which database’, ‘type of document’, ‘date of search’, ‘interesting publications cited or have been cited by’, ‘print screens of tables and figures’ and ‘text clippings related to the constructs of decoupling thinking, such as lead time(s) or decoupling point(s)’. These codes were developed prior to the structured literature review.
During the structured literature review on the customization strategy and the establishment of the narrative summary, it was found that there were deviations between the point of differentiation (the point at which a product is adapted) and the CADP construct of decoupling thinking. Furthermore, the publications on customization offered mixed definitions of customization. To reconcile these conflicting findings and define customization, the customization strategy needed to be further studied. The analysis of the meaning of customization and its relation to the concept of a variant was mainly conducted by studying definitions of customization and conceptually comparing these with the CODP and the CADP constructs. Using a time-phased BOM in combination with the constructs S, D, CODP, AS, AD and CADP made it possible to analyze the fundamental characteristics of a customization, a variant, as well as the similarities and the differences between them. This part of Study C and its outcome are documented in the appended Paper 3 (Wikner and Tiedemann, 2019).
Similarly, during the structured literature review on the postponement strategy and the establishment of the narrative summary, it was found that there were mixed answers regarding the meaning of postponement, and as such, the operational benefits that it
48
offers. This became even more evident when populating the Excel spreadsheet and coding the relation between the CODP construct and postponement. Some publications reported that a postponement resulted in the CODP being moved farther upstream of the supply system, while others noted that the CODP was moved farther downstream of the supply system or that the CODP remained unchanged. The structured literature review also identified the term preponement, which was first mentioned by Blackburn et al. (2004) and could be considered the antithesis of postponement (Mahdavi and Olsen, 2017). These apparently conflicting findings and the concept of preponement would need further studies in order to understand and reconcile the relation between postponement and the constructs of decoupling thinking. This conceptual work of reconciling the mixed answers was mostly done by summarizing what the publications stated would happen to the CODP when postponing an activity. The publications were then arranged into different subgroups, depending on what they stated would happen to the CODP. This result was also analyzed using time-phased BOMs, where two different published postponement cases were conceptually plotted into two time-phased BOMs, that is, the postponing of colour in the paint industry (Council of Logistics Management, 1995; Yang and Yang, 2010), and United Colors of Benetton’s (formally known simply as Benetton) changing of the knitting and dying processes of garments (Andries and Gelders, 1995; Lee, 1998; Yang and Burns, 2003). The resulting time-phased BOMs were then compared with the original description of the operational implications. Thereafter, the two time-phased BOMs were also compared with each other to see if the two postponement examples had different operational implications. This part of Study C and its outcome are documented in the appended Paper 5.
The narrative summaries of each of the DDSCOMSs made it possible to identify the relations between the DDSCOMSs that were explicitly presented in the sample of publications, that is, using the exact or similar wording in discussing the relation between two or more DDSCOMSs. Likewise, some relations between the DDSCOMSs and the constructs of decoupling thinking were also addressed explicitly in the sample of publications, that is, using the exact or similar wording in discussing the relation between a DDSCOMS and one or more constructs of decoupling thinking. This comparison among the narrative summaries can be regarded as a form of cross-body of literature analysis.
However, for those not explicitly stated, the relations were established using analytical conceptual research, relying on logical reasoning and logical relationship building rather than empirical data (cf. Wacker, 1998). Using the resulting narrative summaries made it possible to analyze the fundamental characteristics and underlying meaning of each of the DDSCOMSs. Then, using analytical conceptual research, the relations between these fundamental characteristics of each DDSCOMS and the constructs of decoupling thinking were logically established. These relations between the constructs of decoupling thinking and each of the DDSCOMSs were further used to establish transitive relations between the DDSCOMSs, using their established relations to the constructs of decoupling thinking. This part of Study C and its outcome are documented in the appended Paper 4.
49
The established relations have then been used to conceptually develop a process of balancing efficiency and responsiveness using four out of the five DDSCOMSs, that is, segmentation, leagility, customization and postponement (also including its converse – preponement). This part of Study C focused on the relations among the DDSCOMSs and the risk-based and variant-based constructs. For this part, the transparency strategy was excluded, given that the DDSCOMS was found to have a weaker relation to these constructs. Through logical reasoning, the fundamental characteristics of each DDSCOMS, their relations to the risk-based and the variant-based constructs and the body of literature on decoupling thinking were used to establish a dynamic process that would use and emphasize each DDSCOMS’s fundamental characteristics in a logical order. This part of Study C and its outcome are documented in the appended Paper 6.
3.3.4 Study D. Strategic lead times’ implications for ROI The purpose of Study D was to understand the lead-time constructs’ implications for financial performance, exploring how these implications would manifest themselves in practice. Hence, the study was designed to use the six strategic lead times.
Study D was based on a theory application approach with an element of theory-building logic (see, e.g., Voss et al., 2002), where a conceptual model (presented in Wikner, 2015) was more carefully positioned in relation to the literature, before being used as a form of a proposition that was compared with the collected empirical data (i.e., a form of pattern matching). The literature review took the traditional form and was carried out using Elsevier Scopus, Google Scholar and Thomson Reuters Web of Science. The search terms used were in the areas of lead times, financial performance, ROI and others. The literature found was used to understand the current knowledge on the phenomena, that is, strategic lead times implications’ for financial performance, as well as to position the model in relation to the body of literature.
The empirical investigation was then performed by using a holistic multiple-case study (see Yin, 2009), where the linkages between strategic lead times and ROI were examined using five case companies. The design was further based on the suggestions of Voss et al. (2002) when matching the research purpose with the methodology, as well as on Wacker’s (1998) recommendations regarding how to refute analytical conceptual work (i.e., the substantiated work of Wikner, 2015).
The criteria for case company selection were based on the study’s purpose. To be deemed appropriate, the case companies and their representatives needed to (i) be demand-driven manufacturing companies, (ii) have some form of customer-order-driven production (i.e., D > 0), (iii) produce customized products (i.e., AD > 0) to be able to study all the six strategic lead times and (iv) be interested in and possess basic knowledge of strategic lead times to enable relevant and fruitful discussion, as well as credible empirical data. The five selected case companies met these criteria, and their representatives could be perceived as key informants, being managers in supply chain operations, with substantial knowledge of their respective organizations’ supply systems (see Table 3.4).
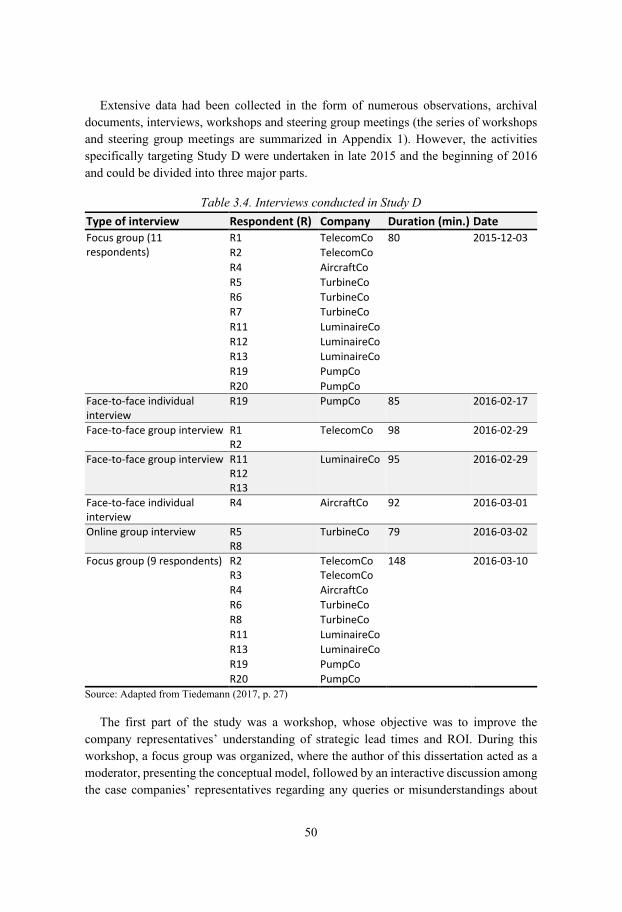
50
Extensive data had been collected in the form of numerous observations, archival documents, interviews, workshops and steering group meetings (the series of workshops and steering group meetings are summarized in Appendix 1). However, the activities specifically targeting Study D were undertaken in late 2015 and the beginning of 2016 and could be divided into three major parts.
Table 3.4. Interviews conducted in Study D Type of interview Respondent (R) Company Duration (min.) Date Focus group (11 respondents)
R1 TelecomCo 80 2015-12-03 R2 TelecomCo R4 AircraftCo R5 TurbineCo R6 TurbineCo R7 TurbineCo R11 LuminaireCo R12 LuminaireCo R13 LuminaireCo R19 PumpCo R20 PumpCo
Face-to-face individual interview
R19 PumpCo 85 2016-02-17
Face-to-face group interview R1 R2
TelecomCo 98 2016-02-29
Face-to-face group interview R11 R12 R13
LuminaireCo 95 2016-02-29
Face-to-face individual interview
R4 AircraftCo 92 2016-03-01
Online group interview R5 R8
TurbineCo 79 2016-03-02
Focus group (9 respondents) R2 TelecomCo 148 2016-03-10 R3 TelecomCo R4 AircraftCo R6 TurbineCo R8 TurbineCo R11 LuminaireCo R13 LuminaireCo R19 PumpCo R20 PumpCo
Source: Adapted from Tiedemann (2017, p. 27)
The first part of the study was a workshop, whose objective was to improve the company representatives’ understanding of strategic lead times and ROI. During this workshop, a focus group was organized, where the author of this dissertation acted as a moderator, presenting the conceptual model, followed by an interactive discussion among the case companies’ representatives regarding any queries or misunderstandings about
51
the conceptual model. During the focus group session, one to three representatives from each company attended, totalling 11 respondents (see Table 3.4; focus group conducted on 2015-12-03).
In the second part of the study, a combination of individual and group interviews was conducted (see Table 3.4; the five interviews conducted between 2016-02-17 and 2016-03-02). Following the definition of Saunders et al. (2012), a standard list of questions (i.e., an interview protocol; see Appendix 2) was developed for these semi-structured interviews, and probing questions were asked to follow up on interesting leads given by the respondents. Shortly before the interviews, an interview protocol outline was sent to the respondents to prepare them properly, as recommended by Voss et al. (2002). Based on the conceptual model, the interview protocol focused on asking the respondents about each strategic lead time’s implications for the absolute measures constituting ROI (i.e., revenue, cost and investment). The respondents were also asked about how the absolute measures would change if a strategic lead time would be either reduced or prolonged, with all the other strategic lead times held constant (i.e., ceteris paribus). The straightforward questions regarding each strategic lead time were asked in sequence, one by one. Lasting around two hours each, all the interviews were conducted on site and face-to-face, except that with TurbineCo (see Table 3.4; interview conducted 2016-03-02), which was held via an online communication tool. For each interview, the raw data (i.e., notes and audio recordings) were grouped by case unit and imported to QSR NVivo version 11, before being transcribed, coded and grouped by construct category (e.g., the different strategic lead times and the three absolute measures) in the same software. The raw data were first analyzed separately for each company (i.e., case) and entered in separate condensed tables (i.e., data display). The tables were then sent to the corresponding companies’ respondents for feedback and data checking before being compared with the data from the other companies’ respondents. These steps can be considered within-case and cross-case analyses, respectively.
In the third part of the study, the results of the cross-case analysis were discussed at a workshop. One respondent from AircraftCo and two respondents from each of the other four companies attended, totalling nine participants (see Table 3.4; focus group conducted 2016-03-10). Lasting approximately two and a half hours, the discussion corresponded to a focus group session (see, e.g., Saunders et al., 2012). This session was conducted in the same way as in the first focus group (i.e., the one held on 2015-12-03), where the author of this dissertation acted as a moderator and presented the empirical results for each strategic lead time, followed by interactive discussions among the respondents. The session was also audio recorded, transcribed shortly afterward and imported to QSR NVivo. The results of the cross-case analysis were further analyzed, using the transcribed data from the focus group session in QSR NVivo. These results were then compared with the conceptual model, using a pattern-matching logic, as described by Yin (2009, p. 136). QSR NVivo has thus been used as both an analysis tool and a data management tool, supporting the possibility of achieving a chain of evidence, from data collection to conclusions.
52
In the beginning and at the end of the KOPtimera research project, each case company’s representatives produced written reports, documenting the need for the project, as well as their results and the usefulness of participating in the project. These written reports were analyzed and used to justify the need for the study and expand its results. The results of Study D are documented in the appended Paper 7.
3.4 Research quality and ethical considerations In this section, the quality of the research and some ethical considerations are discussed under separate subheadings.
3.4.1 Research quality Research quality can be assessed using different criteria, which also vary in their terms and definitions. While the conventional criteria for assessing quantitative research are internal validity, external validity, reliability and objectivity (Halldórsson and Aastrup, 2003; Schwandt et al., 2007), Halldórsson et al. (2007) and Shenton (2004) state that their qualitative counterparts – credibility, transferability, dependability and conformability – are suitable for assessing qualitative research. The author of this dissertation is of the opinion that it is not so much what these criteria are called but how they are defined and how the research is conducted in terms of these criteria. The criteria chosen for discussing the present research are credibility, transferability, dependability and conformability.
Credibility Credibility deals with the question of how research findings match reality, that is, are the findings credible, given the data presented? (Merriam, 2009). Hence, credibility is associated with the research design and the sufficiency of the collected data to draw conclusions and to reduce bias. To reduce the risk of bias and misunderstandings, the author of this dissertation audio recorded the interviews and made transcript summaries. This allowed the author to review the empirical data several times, which would help reduce bias, according to Saunders et al. (2012) and Voss (2009). The empirical data were also sent back to the corresponding respondents for their comments. This way, the respondents had the opportunity to both normalize any empirical data that were not to be published as is, as well as to edit any data that could be misleading or false. This process of member checking helps reduce the risk of researcher bias and misunderstandings and is the most important way of achieving credibility in research, according to Guba and Lincoln (1989). Additionally, most of the empirical data were collected in parallel with the data analysis, where complementary data were searched when needed. This way of working with the data analysis helps in further reducing the bias, according to Eisenhardt and Graebner (2007).
Another way of achieving credibility is through the use of triangulation (i.e., method, source and investigator triangulation; Merriam, 2009; Shenton, 2004; Voss et al., 2002; Yin, 2009). However, Denscombe (2010) raises the concern that results from triangulation can sometimes be overestimated. Thus, a multiple-case study design was
53
used whenever possible, which is one way of mitigating the problem with overestimated results (Voss, 2009, pp. 170, 181; Voss et al., 2002). The use of multiple cases also offered the author of this dissertation the possibility to compare the data both within and between cases (e.g., within- and cross-case analysis). Similar to the multiple cases, in terms of the structured literature review, several sources of evidence (number of publications) were used for establishing the relations between the constructs of demand driven and the DDSCOMSs. Thus, the design of the literature review and the use of several publications hopefully helped in mitigating overestimated findings in any individual publication.
Finally, the use of an interactive research approach, where both the case companies and the company representatives stood to gain from resolving the co-identified and co-defined problems, is believed to have resulted in easier access to the case companies and probably yielded more credible data. In other words, by benefiting from the resolved problems, the respondents were more likely to disseminate credible data. Additionally, all respondents had been informed about their voluntary participation, which supported credibility, according to Shenton (2004).
Transferability Transferability ‘is concerned with the extent to which the findings of one study can be applied to other situations’ (Merriam, 2009, p. 223). However, to strive for high transferability, the findings must first be credible, since ‘there is no point in asking whether meaningless information has any general applicability’ (Guba and Lincoln, 1981, p. 115).
Compared to quantitative research, the criterion of transferability for qualitative research, such as case studies, is usually more problematic to meet (Yin, 2009). Thus, in line with Guba and Lincoln (1989) and Merriam (2009), the author of this dissertation means that it should be up to the reader to decide whether or not the results are applicable or transferable to the reader’s context. Obviously, this puts the burden of proof on the reader. Nevertheless, to make this decision, the reader needs access to the theories used, as well as the empirical data from which the results are deduced (Guba and Lincoln, 1989). Following these criteria, a summary of the empirical data, as well as the literature and the theories used, can be found in the appended papers (where applicable). In terms of the structured literature review, the reader can also find the references to each included publication. The reader can also follow the concluding analysis and the discussion leading to the conclusion, regardless of whether the study in question is empirical or a structured literature review. However, Shenton (2004) argues that in order for the reader to decide whether or not an empirical study’s results are transferable, specific information should be provided to the reader. The type of information and where to find it are presented in Table 3.5.
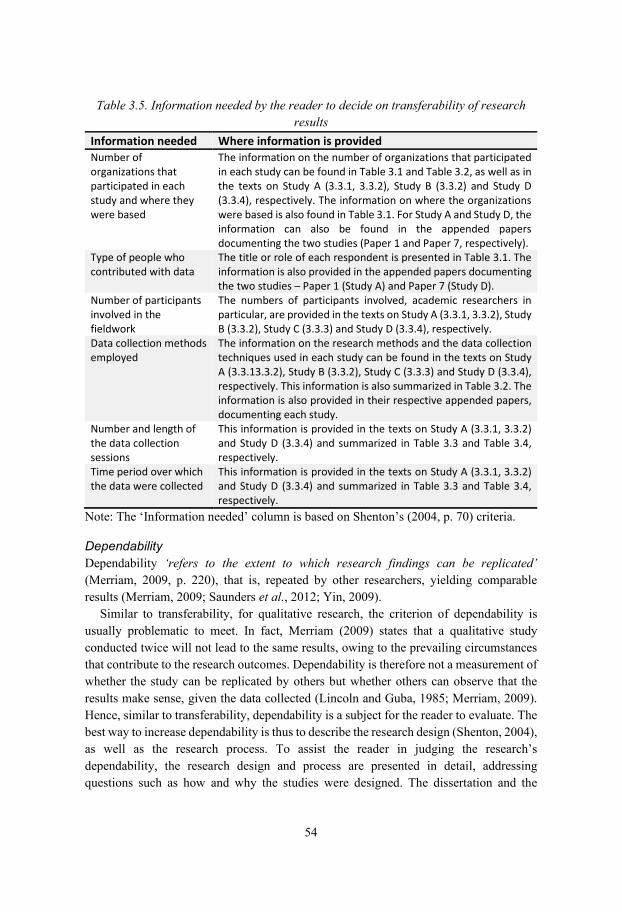
54
Table 3.5. Information needed by the reader to decide on transferability of research results
Information needed Where information is provided Number of organizations that participated in each study and where they were based
The information on the number of organizations that participated in each study can be found in Table 3.1 and Table 3.2, as well as in the texts on Study A (3.3.1, 3.3.2), Study B (3.3.2) and Study D (3.3.4), respectively. The information on where the organizations were based is also found in Table 3.1. For Study A and Study D, the information can also be found in the appended papers documenting the two studies (Paper 1 and Paper 7, respectively).
Type of people who contributed with data
The title or role of each respondent is presented in Table 3.1. The information is also provided in the appended papers documenting the two studies – Paper 1 (Study A) and Paper 7 (Study D).
Number of participants involved in the fieldwork
The numbers of participants involved, academic researchers in particular, are provided in the texts on Study A (3.3.1, 3.3.2), Study B (3.3.2), Study C (3.3.3) and Study D (3.3.4), respectively.
Data collection methods employed
The information on the research methods and the data collection techniques used in each study can be found in the texts on Study A (3.3.13.3.2), Study B (3.3.2), Study C (3.3.3) and Study D (3.3.4), respectively. This information is also summarized in Table 3.2. The information is also provided in their respective appended papers, documenting each study.
Number and length of the data collection sessions
This information is provided in the texts on Study A (3.3.1, 3.3.2) and Study D (3.3.4) and summarized in Table 3.3 and Table 3.4, respectively.
Time period over which the data were collected
This information is provided in the texts on Study A (3.3.1, 3.3.2) and Study D (3.3.4) and summarized in Table 3.3 and Table 3.4, respectively.
Note: The ‘Information needed’ column is based on Shenton’s (2004, p. 70) criteria.
Dependability Dependability ‘refers to the extent to which research findings can be replicated’ (Merriam, 2009, p. 220), that is, repeated by other researchers, yielding comparable results (Merriam, 2009; Saunders et al., 2012; Yin, 2009).
Similar to transferability, for qualitative research, the criterion of dependability is usually problematic to meet. In fact, Merriam (2009) states that a qualitative study conducted twice will not lead to the same results, owing to the prevailing circumstances that contribute to the research outcomes. Dependability is therefore not a measurement of whether the study can be replicated by others but whether others can observe that the results make sense, given the data collected (Lincoln and Guba, 1985; Merriam, 2009). Hence, similar to transferability, dependability is a subject for the reader to evaluate. The best way to increase dependability is thus to describe the research design (Shenton, 2004), as well as the research process. To assist the reader in judging the research’s dependability, the research design and process are presented in detail, addressing questions such as how and why the studies were designed. The dissertation and the
55
appended papers also present what choices were made, in terms of case selection and publication inclusion and exclusion criteria, for instance.
Conformability Finally, conformability ‘refers to the extent to which a measure actually measures the construct (abstract concept) it was designed to measure’ (Williamson, 2002, p. 128). In other words, the findings reflect the results of the research conducted and are free from researcher bias (Guba and Lincoln, 1989; Yin, 2009).
This criterion is probably the most difficult to fulfil, where such a simple matter as selecting what body of literature to use can be biased. For instance, the literature reviews and publications used for this research were to some extent based on the bachelor’s and the master’s studies of the author of this dissertation, as well as on his fellow researchers’ previous experiences and knowledge. However, to reduce any bias owing to empirical data, multiple sources of evidence were used whenever possible. The data were also sent back to the key informants in each case company, for their review of the drafts, further increasing objectivity. Regarding the structured literature review, a rather large sample of publications was included to compare the findings between publications, where multiple references were sought for each finding. As such, the author of this dissertation had been aware of these possible biases throughout the research process, working on reducing any bias, supporting and improving the chain of evidence throughout the process.
3.4.2 Ethical considerations There are different ethical considerations to think of and reflect on throughout the research process (Creswell, 2002). Here, ethical considerations in relation to funding, dissemination of the findings and data collection are addressed.
The research presented in this dissertation has mainly been funded by Jönköping University, as well as by the Swedish Knowledge Foundation (KKS) and the participating companies. Both Jönköping University and KKS are, in one way or another, funded by the Swedish government and thereby the public through taxes. The findings and the knowledge gained from the research should therefore not only be disseminated to participating companies, but as much as possible, also to the public. This is consistent with the bylaws of the KKS (2017) and the guidelines from Jönköping University’s board (Högskolan i Jönköping, 2007; Jönköping University, 2017), which advocates that knowledge and know-how should be communicated to the public. Therefore, the appended papers and the main text of the dissertation have been or will be published in open-access outlets as much as possible. By publishing in open-access journals and databases, such as the Digitala Vetenskapliga Arkivet/Digital Scientific Archive (DiVA), the research results are made available also to those who lack access to scholarly journals and commercial journal databases.
Moreover, whatever methodology is used, the fundamental ethical principle of all research is to ‘do no harm’ (Miles et al., 2014; Simons, 2009). In case studies, and especially during interviews, sensitive, personal or problematic information may be disclosed (Simons, 2009). To safely keep the respondents’ integrity, all participants were

56
informed about what the data would be used for and that these would only be used for research purposes. The respondents were also informed that participating in the research was voluntary (i.e., by oral informed consent; see Blumberg et al., 2011, p. 116). Furthermore, in accordance with the Swedish Research Council (Vetenskapsrådet, 2017), information that was considered identifiable or confidential (e.g., names and financial figures) was removed or normalized (anonymized) in reports and scientific publications if required by the respondents and their companies. The data and the personal information were also processed and stored in such a way that could not be accessed without authorization. Finally, in addition to member checking (see, e.g., Carlson, 2010; Miles et al., 2014), the respondents were given the chance to edit their information before the appended papers were published.
57
Summary of appended papers This chapter summarizes the seven appended papers in terms of their key contributions to this dissertation. Each paper’s purpose, research design and findings are briefly presented before providing a bullet list of the essential aspects used in the analysis in Chapter 5.
4.1 Paper 1. Structuring a new product development process portfolio using decoupling thinking
The purpose of Paper 1 is ‘to develop a structured NPD [new product development] process portfolio for manufacturing companies that facilitates the organization of NPD processes for both standardized products, focusing on time-to-market, and customized products, focusing on time-to-customer’ (Tiedemann et al., 2020a, p. 39). The paper is based on Study A, contributing to the answer to RQ1. It is designed as a multiple-case study, including six demand-driven manufacturing companies.
The paper specifically addresses the activities conducted in NPD projects of demand-driven manufacturing companies, distinguishing the activities conducted on speculation from those conducted based on commitment from specific customers. As such, the paper recognizes and illustrates that demand-driven manufacturing companies can perform production-related activities based on commitment from customers, as well as engineering-related activities. The paper thus recognizes that the CODP can be positioned in the engineering dimension, that is, the customer order can initiate a continuum of engineering activities, ranging from simple adaptations of a product’s component to more complex research-based activities, such as proof of concept or testing materials, principles and applications. The paper extends the view of the concept of demand driven, recognizing that it is one of degree. In particular, the paper discusses different degrees or levels of customer-order-driven activities, in terms of what type (form), as well as where (place) and when (time) the activities are performed based on commitment from actual customer orders.
Using empirical data from the six case companies on such areas as types of NPD processes used for different projects, types of activities conducted within processes, outcomes of projects and process lead times, a structured NPD process portfolio is developed (see Figure 4.1). This portfolio illustrates and emphasizes that demand-driven manufacturing companies should adopt a holistic view when designing their NPD processes, taking into consideration not only the lead times of conducting the processes but also what types of activities are performed and if they are based on speculation or commitment from specific customers. The resulting portfolio also acknowledges that different project outcomes, and thus NPD process outcomes, can be used in another process. In other words, developed standardized products can be updated or even customized in future projects that are performed within another process. As such, a product can be developed on speculation but later customized on commitment from a specific customer.
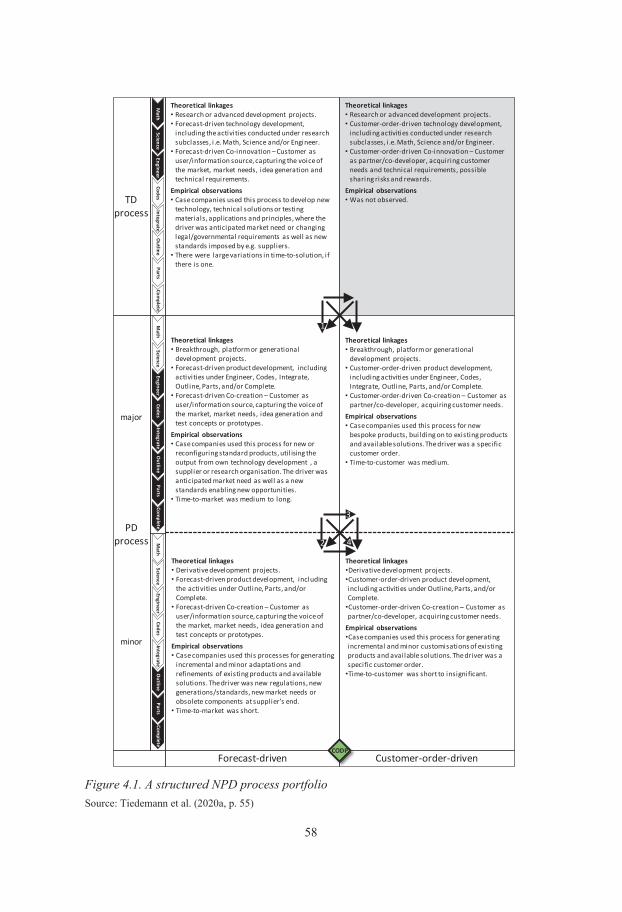
58
Figure 4.1. A structured NPD process portfolio Source: Tiedemann et al. (2020a, p. 55)
Forecast-driven Customer-order-driven
TDprocess
PDprocess
major
minor
2
3
4
1
CODP
EngineerScience
Math
CodesIntegrate
Outline
PartsCom
pleteEngineer
ScienceM
athCodes
IntegrateO
utlineParts
Complete
EngineerScience
Math
CodesIntegrate
Outline
PartsCom
plete
Theoretical linkages• Research or advanced development projects.• Forecast-driven technology development,
including the activities conducted under research subclasses, i .e. Math, Science and/or Engineer.
• Forecast-driven Co-innovation – Customer as user/information source, capturing the voice of the market, market needs, idea generation and technical requirements.
Empirical observations• Case companies used this process to develop new
technology, technical solutions or testing materials, applications and principles, where the driver was anticipated market need or changing legal/governmental requirements as well as new standards imposed by e.g. suppliers.
• There were large variations in time-to-solution, if there is one.
Theoretical linkages• Research or advanced development projects.• Customer-order-driven technology development,
including activities conducted under research subclasses, i .e. Math, Science and/or Engineer.
• Customer-order-driven Co-innovation – Customer as partner/co-developer, acquiring customer needs and technical requirements, possible sharing risks and rewards.
Empirical observations• Was not observed.
Theoretical linkages• Breakthrough, platform or generational
development projects.• Forecast-driven product development, including
activities under Engineer, Codes, Integrate, Outline, Parts, and/or Complete.
• Forecast-driven Co-creation – Customer as user/information source, capturing the voice of the market, market needs, idea generation and test concepts or prototypes.
Empirical observations• Case companies used this process for new or
reconfiguring standard products, util ising the output from own technology development , a supplier or research organisation. The driver was anticipated market need as well as a new standards enabling new opportunities.
• Time-to-market was medium to long.
Theoretical linkages• Breakthrough, platform or generational
development projects.• Customer-order-driven product development,
including activities under Engineer, Codes, Integrate, Outline, Parts, and/or Complete.
• Customer-order-driven Co-creation – Customer as partner/co-developer, acquiring customer needs.
Empirical observations• Case companies used this process for new
bespoke products, building on to existing products and available solutions. The driver was a specific customer order.
• Time-to-customer was medium.
Theoretical linkages• Derivative development projects.• Forecast-driven product development, including
the activities under Outline, Parts, and/or Complete.
• Forecast-driven Co-creation – Customer as user/information source, capturing the voice of the market, market needs, idea generation and test concepts or prototypes.
Empirical observations• Case companies used this processes for generating
incremental and minor adaptations and refinements of existing products and available solutions. The driver was new regulations, new generations/standards, new market needs or obsolete components at supplier’s end.
• Time-to-market was short.
Theoretical linkages•Derivative development projects.•Customer-order-driven product development, including activities under Outline, Parts, and/or Complete.
•Customer-order-driven Co-creation – Customer as partner/co-developer, acquiring customer needs.
Empirical observations•Case companies used this process for generating incremental and minor customisations of existing products and available solutions. The driver was a specific customer order.
•Time-to-customer was short to insignificant.
59
Paper 1 contributes to the dissertation and addresses RQ1 in the following ways:
• It increases and enriches the understanding of the concept of demand driven, specifically customer-order driven, addressing what types of engineering activities are conducted by demand-driven manufacturing companies.
o The paper uses the CODP in analyzing and differentiating engineering activities conducted on speculation from those conducted on commitment from customer orders.
• It directly addresses demand-driven manufacturing companies’ ability to adapt and customize products through engineering activities.
o The paper also indirectly addresses the CADP, given that products are differentiated and customized based on actual customer orders.
4.2 Paper 2. Leagility in a triad with multiple decoupling points The purpose of Paper 2 is ‘to describe the different types of actor interfaces that can be identified when a leagility strategy is employed by the two supply actors in a triad’ (Wikner et al., 2015, p. 114). The paper is based on Study B, addressing RQ1 and RQ2. The paper is based on analytical conceptual research, where the four identified interfaces are illustrated using empirical data from PumpCo.
The paper addresses leagility from a triad of actors using multiple CODPs. In having two or more CODPs employed by a sequence of actors, different combinations of forecast-driven flows (lean or efficient) and customer-order-driven flows (agile or responsive) can be identified. However, as addressed by Naylor et al. (1999), leagility entails a total supply chain perspective, meaning that the total supply chain flow can make the transition from a lean to an agile approach but should not do the opposite. If companies are unaware of this complexity related to actor interfaces, the potential advantage of employing a leagile strategy cannot be realized. The study contributes by identifying two interface alignments and two interface misalignments when two consecutive supply actors (supplier actor and focal actor) act individually (see Figure 4.2). The paper concludes that the S and the D of the actors, and consequently, the position of the CODPs, have a critical impact on how to balance efficiency with responsiveness at the actor interfaces.
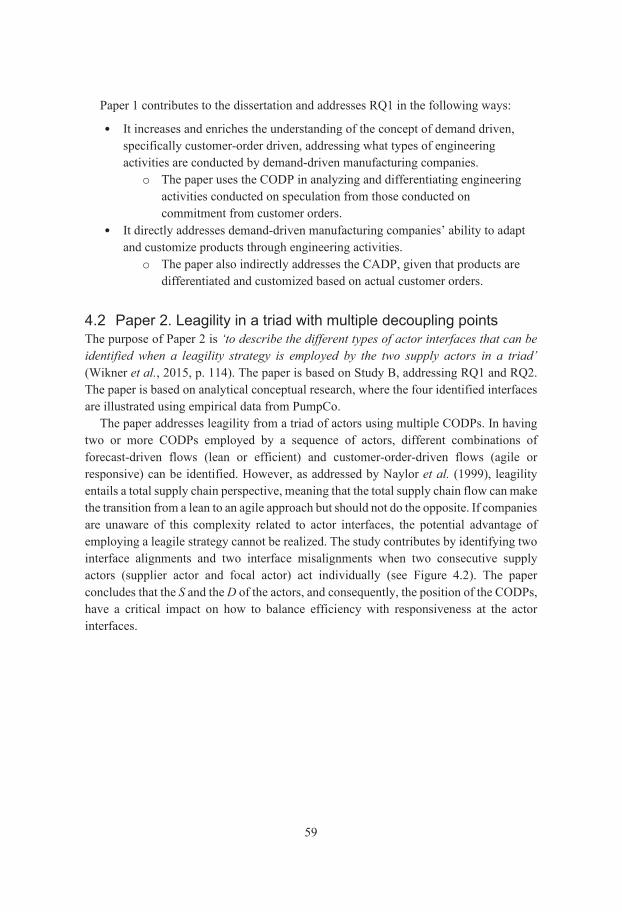
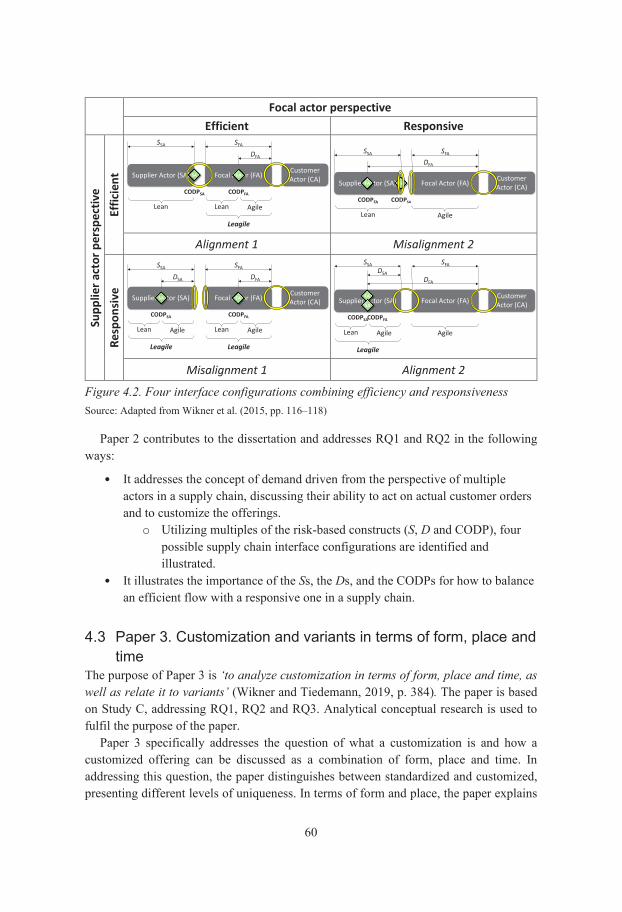
60
Focal actor perspective Efficient Responsive
Supp
lier a
ctor
per
spec
tive
Effic
ient
Alignment 1 Misalignment 2
Resp
onsi
ve
Misalignment 1 Alignment 2
Figure 4.2. Four interface configurations combining efficiency and responsiveness Source: Adapted from Wikner et al. (2015, pp. 116–118)
Paper 2 contributes to the dissertation and addresses RQ1 and RQ2 in the following ways:
• It addresses the concept of demand driven from the perspective of multiple actors in a supply chain, discussing their ability to act on actual customer orders and to customize the offerings.
o Utilizing multiples of the risk-based constructs (S, D and CODP), four possible supply chain interface configurations are identified and illustrated.
• It illustrates the importance of the Ss, the Ds, and the CODPs for how to balance an efficient flow with a responsive one in a supply chain.
4.3 Paper 3. Customization and variants in terms of form, place and time
The purpose of Paper 3 is ‘to analyze customization in terms of form, place and time, as well as relate it to variants’ (Wikner and Tiedemann, 2019, p. 384). The paper is based on Study C, addressing RQ1, RQ2 and RQ3. Analytical conceptual research is used to fulfil the purpose of the paper.
Paper 3 specifically addresses the question of what a customization is and how a customized offering can be discussed as a combination of form, place and time. In addressing this question, the paper distinguishes between standardized and customized, presenting different levels of uniqueness. In terms of form and place, the paper explains
Supplier Actor (SA) Focal Actor (FA)
CODPFA
Lean Agile
Leagile
Customer Actor (CA)
DFA
SFA
CODPSA
Lean
SSA
SA FA
Supplier Actor (SA) SAFA Focal Actor (FA)
CODPSA
Agile
Customer Actor (CA)
DFA
SFA
CODPFA
Lean
SSA
Focal Actor (FA)
CODPFA
Lean Agile
Leagile
Customer Actor (CA)
DFA
SFA
Supplier Actor (SA)
CODPSA
Lean Agile
Leagile
DSA
SSA
SA FA Supplier Actor (SA)FA
Focal Actor (FA)
CODPFA
Agile
Customer Actor (CA)
DFA
SFA
CODPSA
Leagile
DSA
SSA
SA
Lean Agile
61
that the creation of variants is related to the BOM and converging and diverging flow structures. In terms of form, a converging flow structure is one where two or more items are combined into one item (see Figure 4.3; B1 and B2 are combined into C) by assembling or mixing, whereas in a diverging flow structure, one item is or can be separated into two or more items (B is divided into C1 and/or C2) by splitting or creating variants. Diverging flow structures can further be divided into two main types, where the attribute-based kind is passive, meaning that the result is already given at the point of divergence. The decision-based type is then active, meaning that what mix to make must be decided. Using these types of flow structures, the paper also addresses the issue of the relation between a variant and a customization, concluding that a variant is a more general term than customization, where the latter can only be made on commitment to actual customer orders. In other words, a customization can only be made if the customer has conveyed the needed information to the actor performing the actual customization, whereas a variant can be made based on speculation.
The paper also states that if a variant created on speculation can be postponed so that the variant instead is made on commitment from a customer, then the variant can be regarded as a customization option. In line with this finding, one of the main conclusions of the paper is that the pre-theory decoupling thinking and the two constructs, CODP and CADP, provide a better understanding of the questions of what (form), where (place) and when (time) customization can be made.
Converging Diverging (attribute-based) Diverging (decision-based) Form Assembling or mixing Splitting in a process Creating variants
Place Moving from local to central warehouse - Moving from central to local
warehouse
Figure 4.3. Combining flow structures with the form and the place dimensions Source: Adapted from Wikner and Tiedemann (2019, p. 385)
Paper 3 contributes to the dissertation and addresses RQ1, RQ2 and RQ3 in the following ways:
• It addresses the concept of demand driven, discussing what an offering is, as well as what can be considered a customized offering.
o It distinguishes between standardized and customized offerings, addressing the relation between a variant and customization.
• It presents the relations between the concept of demand driven and the two constructs of decoupling thinking, CODP and CADP.
X
A1
A2
C
B1
B2
A
C1
C2
B
X1
X2
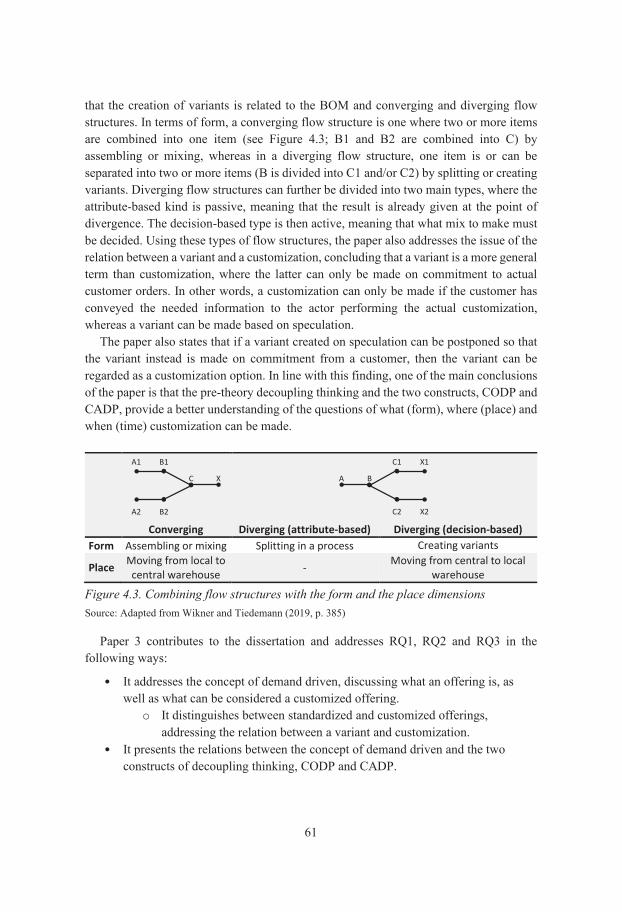
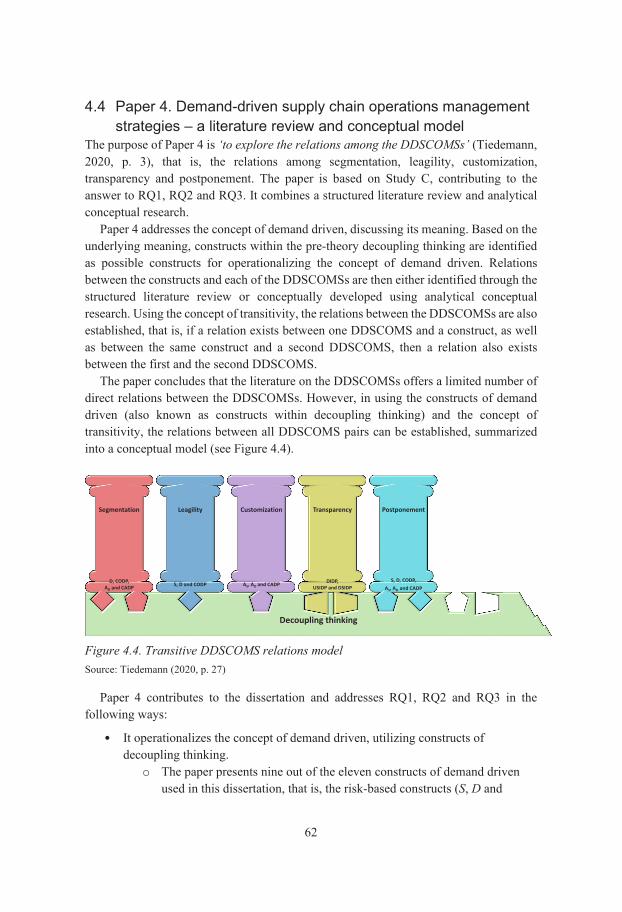
62
4.4 Paper 4. Demand-driven supply chain operations management strategies – a literature review and conceptual model
The purpose of Paper 4 is ‘to explore the relations among the DDSCOMSs’ (Tiedemann, 2020, p. 3), that is, the relations among segmentation, leagility, customization, transparency and postponement. The paper is based on Study C, contributing to the answer to RQ1, RQ2 and RQ3. It combines a structured literature review and analytical conceptual research.
Paper 4 addresses the concept of demand driven, discussing its meaning. Based on the underlying meaning, constructs within the pre-theory decoupling thinking are identified as possible constructs for operationalizing the concept of demand driven. Relations between the constructs and each of the DDSCOMSs are then either identified through the structured literature review or conceptually developed using analytical conceptual research. Using the concept of transitivity, the relations between the DDSCOMSs are also established, that is, if a relation exists between one DDSCOMS and a construct, as well as between the same construct and a second DDSCOMS, then a relation also exists between the first and the second DDSCOMS.
The paper concludes that the literature on the DDSCOMSs offers a limited number of direct relations between the DDSCOMSs. However, in using the constructs of demand driven (also known as constructs within decoupling thinking) and the concept of transitivity, the relations between all DDSCOMS pairs can be established, summarized into a conceptual model (see Figure 4.4).
Figure 4.4. Transitive DDSCOMS relations model Source: Tiedemann (2020, p. 27)
Paper 4 contributes to the dissertation and addresses RQ1, RQ2 and RQ3 in the following ways:
• It operationalizes the concept of demand driven, utilizing constructs of decoupling thinking.
o The paper presents nine out of the eleven constructs of demand driven used in this dissertation, that is, the risk-based constructs (S, D and
Decoupling thinking
Leagility Customization Transparency PostponementSegmentation
D, CODP,AD and CADP S, D and CODP AS, AD and CADP DIDP,
USIDP and DSIDPS, D, CODP,
AS, AD and CADP
63
CODP), variant-based constructs (AS, AD and CADP) and information-based constructs (DIDP, USIDP and DSIDP).
• It presents the relations between the nine constructs and the five DDSCOMSs: segmentation, leagility, customization, transparency and postponement.
o Using the idea of transitivity, the relations between the DDSCOMSs are also addressed.
4.5 Paper 5. Postponement revisited – a typology for displacement The purpose of Paper 5 is ‘to establish a typology that highlights the three key properties of displacement’ (Tiedemann and Wikner, 2019, p. 205). The paper is based on Study C, contributing the answers to RQ2, RQ3 and RQ4. The paper combines a structured literature review and analytical conceptual research to fulfil its purpose.
Paper 5 specifically addresses the ambiguities in the postponement literature regarding what postponement means, and as such, the operational benefits of utilizing the strategy. In analyzing the meaning of the word postpone, as well as its converse, prepone, a typology for displacement is proposed (displacement being a collective term for preponement and postponement). The typology (see Table 4.1) is based not only on the meaning of the phrases ‘to prepone’ and ‘to postpone’ but also the CODP construct and a time-phased BOM, as well as the three dimensions of form, place and time. The proposed typology offers a more nuanced understanding of displacement, also recognizing that activities can be preponed rather than postponed. The typology also enables the comparison of different displacement alternatives and their operational benefits.
Table 4.1. Preponement and postponement in terms of form, place and time Preponement Postponement Form A form transformation activity
performed earlier in the flow structure
A form transformation activity performed later in the flow structure
Place A place transformation activity performed earlier in the flow structure
A place transformation activity performed later in the flow structure
Time CODP earlier in the flow structure CODP later in the flow structure Source: Adapted from Tiedemann and Wikner (2019, p. 207)
Paper 5 contributes to the dissertation and addresses RQ2, RQ3 and RQ4 in the following ways:
• It provides nuances to the postponement strategy and recognizes its converse, realizing that operational benefits can be gained by also preponing activities.
o It discusses the CODP construct’s importance for postponement and preponement.
• It utilizes the three dimensions of an offering, that is, form, place and time.
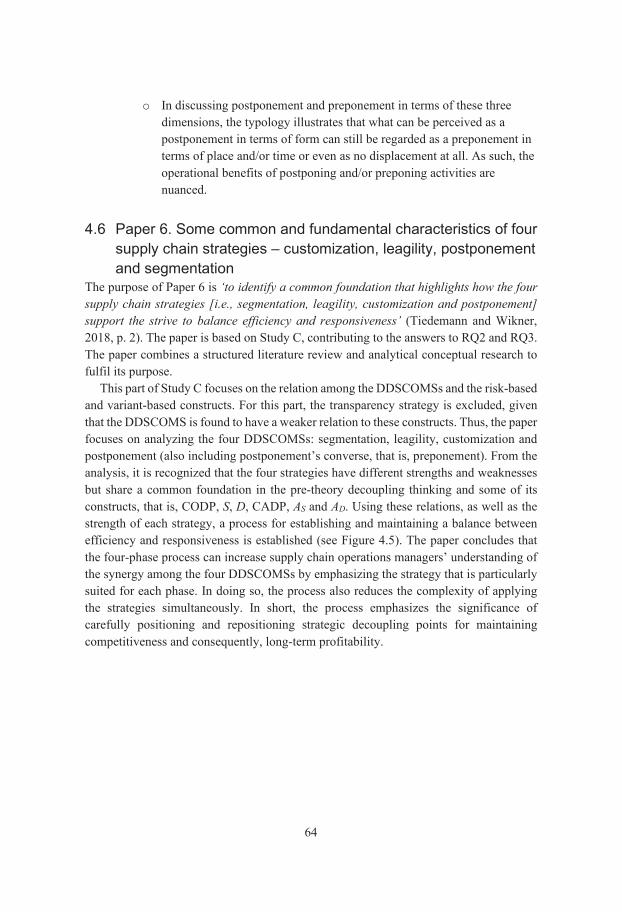
64
o In discussing postponement and preponement in terms of these three dimensions, the typology illustrates that what can be perceived as a postponement in terms of form can still be regarded as a preponement in terms of place and/or time or even as no displacement at all. As such, the operational benefits of postponing and/or preponing activities are nuanced.
4.6 Paper 6. Some common and fundamental characteristics of four supply chain strategies – customization, leagility, postponement and segmentation
The purpose of Paper 6 is ‘to identify a common foundation that highlights how the four supply chain strategies [i.e., segmentation, leagility, customization and postponement] support the strive to balance efficiency and responsiveness’ (Tiedemann and Wikner, 2018, p. 2). The paper is based on Study C, contributing to the answers to RQ2 and RQ3. The paper combines a structured literature review and analytical conceptual research to fulfil its purpose.
This part of Study C focuses on the relation among the DDSCOMSs and the risk-based and variant-based constructs. For this part, the transparency strategy is excluded, given that the DDSCOMS is found to have a weaker relation to these constructs. Thus, the paper focuses on analyzing the four DDSCOMSs: segmentation, leagility, customization and postponement (also including postponement’s converse, that is, preponement). From the analysis, it is recognized that the four strategies have different strengths and weaknesses but share a common foundation in the pre-theory decoupling thinking and some of its constructs, that is, CODP, S, D, CADP, AS and AD. Using these relations, as well as the strength of each strategy, a process for establishing and maintaining a balance between efficiency and responsiveness is established (see Figure 4.5). The paper concludes that the four-phase process can increase supply chain operations managers’ understanding of the synergy among the four DDSCOMSs by emphasizing the strategy that is particularly suited for each phase. In doing so, the process also reduces the complexity of applying the strategies simultaneously. In short, the process emphasizes the significance of carefully positioning and repositioning strategic decoupling points for maintaining competitiveness and consequently, long-term profitability.
65
Figure 4.5. Process of balancing efficiency and responsiveness using four DDSCOMSs Source: Tiedemann and Wikner (2018, p. 8)
Paper 6 contributes to the dissertation and addresses RQ2 and RQ3 in the following ways:
• It outlines the relations between the constructs of demand driven and the DDSCOMSs.
o It identifies and establishes the relations between the risk-based constructs (S, D and CODP), the variant-based constructs (AS, AD and CADP) and the four DDSCOMSs (segmentation, leagility, customization and postponement).
• It utilizes the relations between the four DDSCOMSs and the constructs of demand driven in outlining a four-phase process that exploits each strategy’s strengths.
4.7 Paper 7. Understanding lead-time implications for financial performance – a qualitative study
The purpose of Paper 7 is ‘to qualitatively explore what implications SLTs [strategic lead times] have for ROI’ (Tiedemann et al., 2020b, p. 3). The paper is based on Study D, contributing the answers to RQ1 and RQ4. In the paper, a conceptual model (presented in Wikner, 2015) is substantiated and empirically investigated through a multiple-case study, using a combination of interviews and focus groups.
Paper 7 specifically addresses the relation between lead-time performance and financial performance from a qualitative perspective. To do so, it substantiates a conceptual model that outlines the implications of the control-based, risk-based and variant-based strategic lead times (i.e., EUS, I, S, D, AS and AD) for the absolute measures
1. Segmentation(Flow identification)
2a. Leagility(Flow driver, CODP)
2b. Customization(Flow differentiation, CADP)
3. Performance(Flow enactment)
4. Postponement/Preponement(Flow innovation)
(Flow design)
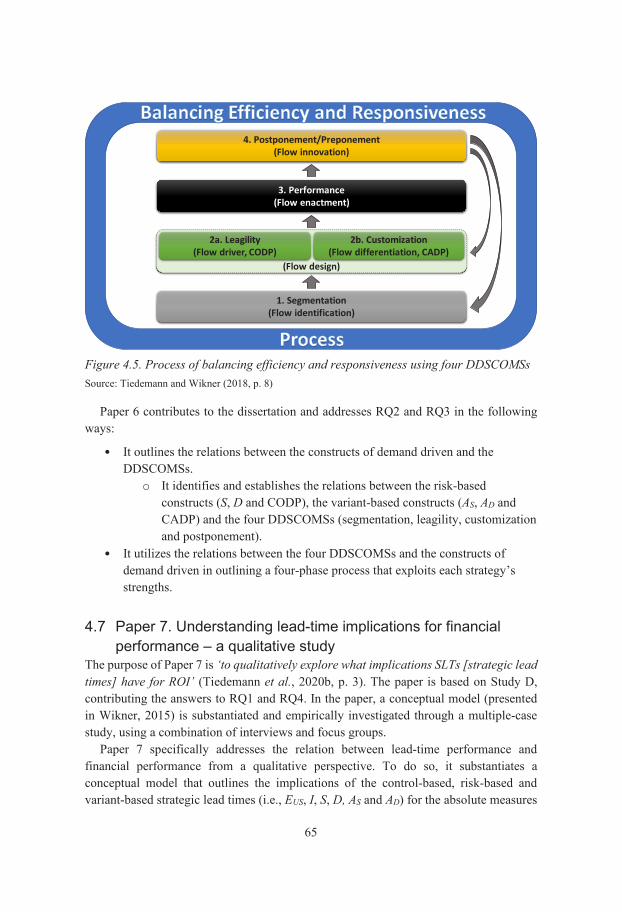
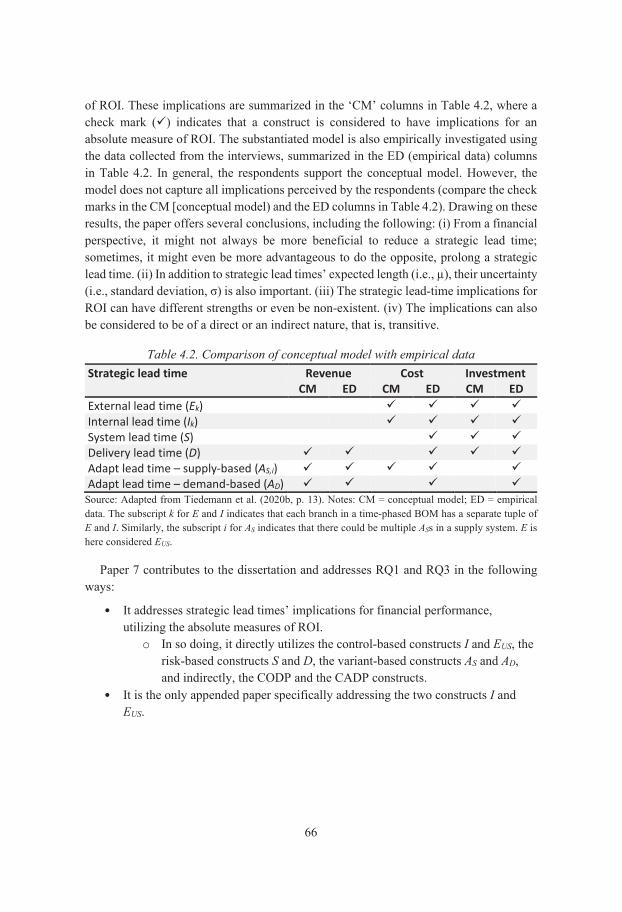
66
of ROI. These implications are summarized in the ‘CM’ columns in Table 4.2, where a check mark () indicates that a construct is considered to have implications for an absolute measure of ROI. The substantiated model is also empirically investigated using the data collected from the interviews, summarized in the ED (empirical data) columns in Table 4.2. In general, the respondents support the conceptual model. However, the model does not capture all implications perceived by the respondents (compare the check marks in the CM [conceptual model) and the ED columns in Table 4.2). Drawing on these results, the paper offers several conclusions, including the following: (i) From a financial perspective, it might not always be more beneficial to reduce a strategic lead time; sometimes, it might even be more advantageous to do the opposite, prolong a strategic lead time. (ii) In addition to strategic lead times’ expected length (i.e., µ), their uncertainty (i.e., standard deviation, σ) is also important. (iii) The strategic lead-time implications for ROI can have different strengths or even be non-existent. (iv) The implications can also be considered to be of a direct or an indirect nature, that is, transitive.
Table 4.2. Comparison of conceptual model with empirical data Strategic lead time Revenue Cost Investment CM ED CM ED CM ED External lead time (Ek) Internal lead time (Ik) System lead time (S) Delivery lead time (D) Adapt lead time – supply-based (AS,i) Adapt lead time – demand-based (AD)
Source: Adapted from Tiedemann et al. (2020b, p. 13). Notes: CM = conceptual model; ED = empirical data. The subscript k for E and I indicates that each branch in a time-phased BOM has a separate tuple of E and I. Similarly, the subscript i for AS indicates that there could be multiple ASs in a supply system. E is here considered EUS.
Paper 7 contributes to the dissertation and addresses RQ1 and RQ3 in the following ways:
• It addresses strategic lead times’ implications for financial performance, utilizing the absolute measures of ROI.
o In so doing, it directly utilizes the control-based constructs I and EUS, the risk-based constructs S and D, the variant-based constructs AS and AD, and indirectly, the CODP and the CADP constructs.
• It is the only appended paper specifically addressing the two constructs I and EUS.
67
Concluding analysis This chapter presents a concluding analysis of the research findings presented in the seven appended papers, provides answers to the four RQs raised in Chapter 1, Section 1.3, and discusses the relations between the stated RQs and the appended papers.
As explained in Section 1.3, the purpose of RQ1 is to create a solid foundation on which the rest of the research can be based. Although not the focus of the research per se, the answer to RQ1 is an important one that has repercussions for RQ2, RQ3 and RQ4. This is evident from the analysis, where RQ1 is answered collectively using the findings reported in Papers 1–4 and 7. This can also be seen in Table 5.1, summarizing which RQ each of the appended papers’ address. Moreover, the RQ that each paper primarily addresses is indicated with an uppercase check mark (i.e., ). If a paper addresses more than one RQ, the secondary contribution is indicated with a lowercase check mark (i.e., ). Note that the primary and the secondary contributions presented in Table 5.1 are in relation to each paper’s contributions, that is, the table does not compare the magnitude of each paper’s contribution relative to the others.
Furthermore, the answers to RQ2 and RQ3 use the findings reported in Papers 2–6 and Papers 3–6, respectively. Finally, RQ4 is primarily addressed and answered in Paper 7, though using the idea of postponement and preponement, presented in Paper 5.
Table 5.1. Appended papers’ contributions to the four RQs Paper RQ1 RQ2 RQ3 RQ4
1 2 3 4 5 6 7
Notes: indicating which RQ each paper primarily addresses. indicating a secondary contribution to the answer to a RQ.
The remainder of this chapter offers a more detailed analysis of the relations between each RQ and the findings reported in the papers (see Table 5.1) in answering the four RQs. The RQs are addressed in a consecutive order under separate headings. The chapter concludes with a discussion on the relation between the answers to the RQs (outcomes) and the research purpose.
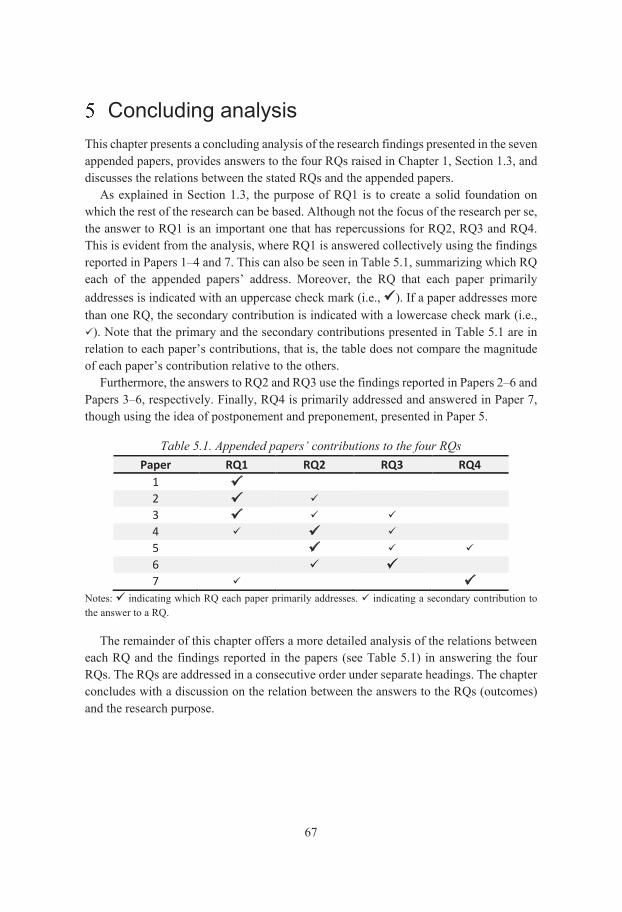
68
5.1 RQ1. What constructs can be used to operationalize the concept of demand driven?
To answer RQ1, the findings reported in Papers 1–4 and 7 are used to analyze and illustrate the concept of demand driven so as to understand the underlying meaning.
The analysis results in demand driven being defined as the ability to act and adapt to customer needs. The analysis further shows that the concept of demand driven is that of degree and can be divided into different subcategories, such as customer-order driven, defined as the ability to act on commitment to actual customer orders, where at least parts of the production and movement of material and information are initiated, that is, driven by actual customer orders, providing the ability to adapt the offerings based on actual customer orders.
Papers 1–4 then illustrate different and important aspects of demand driven from a customer-order-driven perspective, such as demand-driven manufacturing companies’ ability to act on and adapt products based on actual customer orders. In using the pre-theory decoupling thinking, the papers also demonstrate that decoupling thinking, through some of its constructs (see Table 5.2), can be used to operationalize the concept of demand driven.
Paper 2 specifically addresses the concept of demand driven from the aspect of customer orders initiating and driving the activities in a supply chain, simplified as three actors in sequence acting individually. As addressed in the paper, depending on what manufacturing strategy the focal actor and the supplier actor employ, the customer order penetrates the supply system at different points in relation to when the product should be delivered, resulting in different Ds. Furthermore, as each actor orders from the actor upstream of itself, multiple customer orders are generated throughout the supply system. The commonly used term for describing this phenomenon is multiple decoupling points (Sun et al., 2008) or more specifically, multiple CODPs (Shidpour et al., 2014; Verdouw et al., 2008). As addressed in Paper 2, the constructs of CODP can thus be used to illustrate this phenomenon. Depending on the combinations of CODP positioning by the focal actor and the supplier actor, different combinations of the cumulative lead time for each actor, as well as the lead time from the customer order receipt to delivery can be identified, that is, different combinations of the constructs S and D of decoupling thinking.
Four of these combinations of CODP positionings are further addressed in Paper 2, illustrating four generic possibilities for when the supplier actor initiates activities based on actual customer orders from the focal actor. Through this, two interface alignments and two interface misalignments are identified. These four interface combinations indirectly address the second aspect of demand driven, that is, the ability to adapt offerings based on actual customer orders. In alignment 1 and misalignment 2, the supplier actor is either unable or not requested to adapt the offering for the focal actor, at least, not in terms of form, since the supplier actor’s D = 0 (excluding any potential lead time for moving the product between the actors; see Figure 4.2). However, the focal actor can still be able to use the material in making an adaptation, since the focal actor’s D > 0. In terms of misalignment 1 and alignment 2, both the supplier actor and the focal actor
69
have a D > 0, meaning that an adaptation can be made by either one of the actors. In fact, in terms of alignment 2, the adaptation (i.e., customization) for the customer actor can even be made by the supplier actor, as the supplier actor’s CODP resides at or downstream of the focal actor’s CODP (see Figure 4.2).
Table 5.2. Compilation of the constructs of demand driven Construct Definition Control-based constructs Internal lead time (I) The part of the supply system that is controllable by
an actor External lead time upstream (EUS) The upstream part of the supply system beyond an
actor’s control Risk-based constructs System lead time (S) The cumulative lead time of the complete supply
system Delivery lead time (D) The time from the receipt of a customer order to
the time when the customer requested the delivery of the product
Customer order decoupling point (CODP)
Separates decisions about initiating flow based on speculation for future customer orders from commitment to actual customer orders
Variant-based constructs Adapt lead time – supply-based
(AS) The lead time downstream from the point where it is possible to make variants
Adapt lead time – demand-based (AD)
The lead time downstream from the point where the delivery-unique offering is made
Customer adaptation decoupling point (CADP)
Separates decisions about differentiating flow based on standardization for a market of different customers from adaptation to actual customer orders
Information-based constructs Demand information decoupling
point (DIDP) The upstream point from where demand information is constrained
Upstream supply information decoupling point (USIDP)
The point from where supply information is constrained upstream
Downstream supply information decoupling point (DSIDP)
The point from where supply information is constrained downstream
Sources: Based on definitions by Wikner (2014a, 2018) and APICS Dictionary (2013)
However, the ability to offer an adaptation is more specifically addressed in Papers 1 and 3. Paper 3 states that an offering is usually categorized by not only its physical properties (i.e., form) but also where (i.e., place) and when (i.e., time) it will be available to the customer. Form, place and time can thus be perceived as three dimensions of an offering, where customization can be described as a combination of form, place and time. Furthermore, as discussed in Paper 3, customization is a term commonly used to distinguish between a standardized offering and a customized offering. A construct that has been introduced specifically for this distinction is the CADP (Wikner, 2014a, 2018;
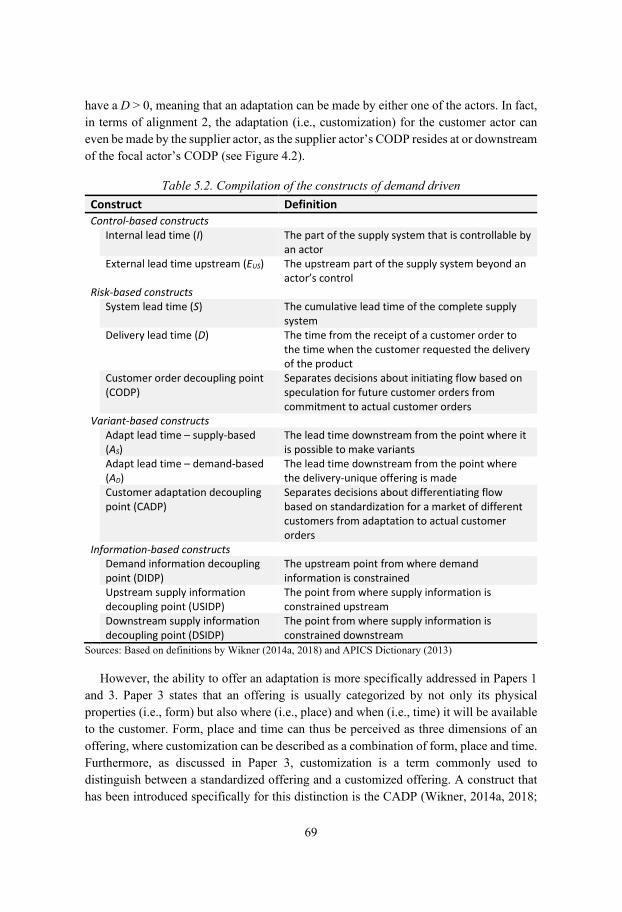
70
Wikner and Bäckstrand, 2012). Moreover, one of the main conclusions in Paper 3 is that a common aspect of customized offerings is their basis on individual customer requirements. In other words, for an actor to customize a product, a customer order must first be received, stating what has to be customized. Thus, by definition, a customization cannot be performed on complete speculation but should be based on commitment from a customer, that is, at or downstream of the CODP (Hoekstra and Romme, 1992; Wikner, 2018). Hence, as concluded in Paper 3, decoupling thinking and the two constructs of CODP and CADP provide a better understanding of the questions of what (form), where (place) and when (time) an adaptation can be made based on actual customer orders.
This point is further addressed in Paper 1, presenting different engineering-related activities that can be conducted based on actual customer orders. The paper addresses demand-driven manufacturing companies’ ability to act on actual customer orders within NPD, using a customer-order-driven perspective. As illustrated in Figure 5.1, customer requests can result in a standard design just being brought together for a specific need, with individual parts being customized on an order-by-order basis (activities under ‘outline’), or even existing items being only assembled for a solution (activities under ‘parts’), for instance. Still, a customer request might result in materials, principles or applications needing to be tested (activities under ‘engineer’), for instance. Using the CODP construct, Paper 1 thus illustrates and concludes that demand-driven manufacturing companies can and do act on actual customer orders within NPD. Furthermore, as the paper addresses customer involvement in NPD, where the projects are of a one-time nature, the developed products are customizations in themselves. Hence, the paper indirectly addresses and empirically illustrates demand-driven manufacturing companies’ ability to adapt their offerings based on actual customer orders.
Paper 2 also indirectly illustrates the importance of sharing demand-related and supply-related information between actors, such as what is requested and what is the capacity for supplying the ordered product. As addressed in Paper 4, these aspects of demand driven can be operationalized using the constructs DIDP, USIDP and DSIDP of decoupling thinking. Furthermore, Paper 2 raises the question of controllability. The three actors featured in Paper 2 act individually, indicating that each actor can apply control within its own boundary, but the parts upstream and downstream of it are beyond its control. The aspects of information sharing and controllability are not bound to only the concept of demand driven but remain important for the ability to offer adaptations, for instance. Papers 4 and 7 address these aspects using the constructs DIDP, USIDP, DSIDP and I and EUS, respectively.
Papers 1–4 and 7 thus illustrate that constructs of decoupling thinking (see, e.g., Hoekstra and Romme, 1992; Sharman, 1984; Wikner, 2014a, 2018) can and are often used for studying questions related to the concept of demand driven. These constructs can be used to operationalize the concept of demand driven and address questions such as when and where demand-driven manufacturing companies can act on customer orders (related to the constructs S, D and CODP), as well as when and where they adapt their offerings based on actual customer orders (related to the constructs AS, AD and CADP).
71
Decoupling thinking also addresses additional aspects of importance to the concept of demand driven, such as controllability (related to the constructs I and EUS, addressed in Paper 7) and information sharing (related to the constructs DIDP, USIDP and DSIDP, addressed in Paper 4). Additionally, decoupling thinking offers practical managerial tools for analyzing flows and operationalizes the constructs, such as a time-phased BOM (see, e.g., Bäckstrand, 2012; Wikner, 2014a, 2018).
Figure 5.1. Activities conducted in different NPD processes Source: Tiedemann et al. (2020a, p. 52)
To synthesize the answer to RQ1, the control-based, risk-based, variant-based and information-based constructs of decoupling thinking presented in Table 5.2 can thus be used to operationalize the concept of demand driven. Hence, the answer to RQ1 constitutes the eleven constructs of demand driven found in the pre-theory of decoupling thinking that are compiled in Table 5.2. These are also thoroughly elaborated on in Chapter 2, Section 2.2, as well as in the appended papers, particularly Papers 4 and 7.
CoDPD
FDPD/CoDPD medium
Research activities Codes and standards activities Existing designs activities
Furn
iture
Co
FDTDFDPD major
FDPD mediumFDPD minor
CoDPD majorCoDPD minor
FDPDCoDPD major
Pum
pCo FDTD
FDPD
FDTDFDPD/CoDPD major
FDPD/CoDPD minorCoDPD package
CoDPD minor
Lum
inai
reC
oT
urbi
neC
oC
ompa
ny
FDPD/CoDPDFDTD
FoilC
oC
him
neyC
o FDPDCoDPD major
= Forecast-drivenFD = Customer-order-drivenCoD = Zone of departure for the process
= Could be both forecast-driven and customer-order-driven1 = Research or advanced development projects 2 = Breakthrough development projects3 4= Platform or generational development projects = Derivative development projects
1
1
1
1
2
2
2
2
2
21
3
3
33
3
3
3
3
44
44
4
4
4
4
CoDPD minor
Lead time (months)
N/A
N/A
N/A
EngineerScienceMaths Codes Integrate Outline Parts Complete
= The end of the lead time shows the midpoint
= The time interval of customer-order-driven processes = The time interval of forecast-driven processes
N/A = Lead time is not presented since it largely depends on each project’s complexity
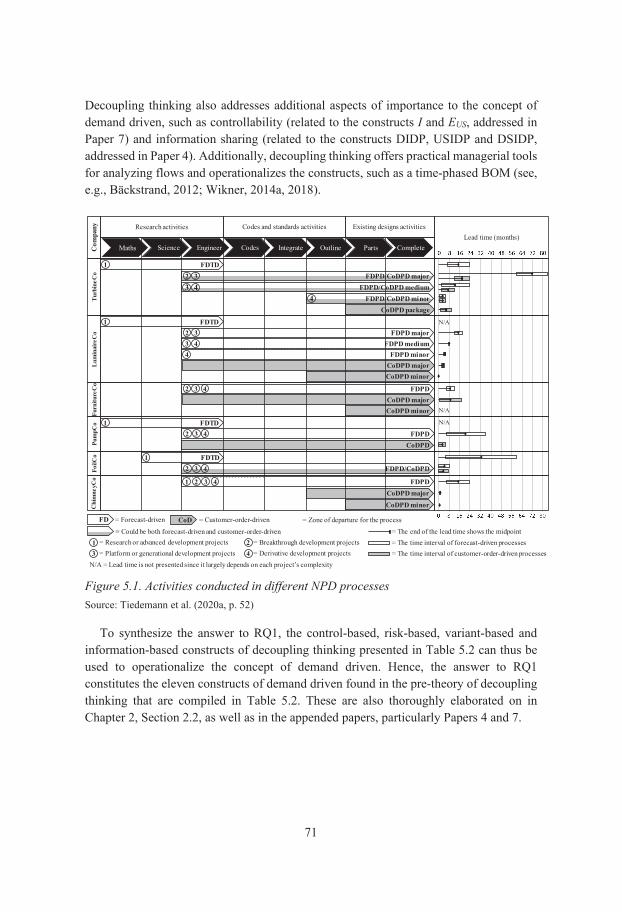
72
5.2 RQ2. What are the relations between the constructs and the DDSCOMSs?
The answer to RQ1 indicates that the concept of demand driven and the eleven identified constructs of decoupling thinking share a common foundation. As such, it is reasonable to assume that these constructs can be used to answer RQ2 by identifying and/or logically developing the relations between the constructs of demand driven and the five DDSCOMSs researched in this dissertation, that is, segmentation, leagility, customization, transparency and postponement. The answer to RQ2 is particularly addressed in Paper 4. Nevertheless, the findings reported in Papers 2, 3, 5 and 6 are also analyzed and used to support and substantiate the answer to RQ2.
The relations are addressed on a strategy-by-strategy basis and summarized in Table 5.3, using the three categories of risk-based, variant-based and information-based constructs. The relations are also classified as weak, fair or strong, using the following criteria:
• Weak = The relations are not explicitly presented in the publications and do not use exact or similar wording for the constructs; indirect relations have to be established.
• Fair = A mix of direct and indirect relations is somewhat explicitly presented in the publications but does not use exact or similar wording for the constructs.
• Strong = Direct relations are explicitly presented in the publications, where even exact or similar wording for the constructs is used.
The three different classes are illustrated using a greyscale from light to dark, with a typographical emphasis, where italic font is used for a weak relation, regular font for a fair or intermediate relation and bold font for a strong relation. Note that the relations between the two control-based constructs and the five DDSCOMSs are not addressed here but are left for further research.
5.2.1 Relation between the constructs and the segmentation strategy As indicated in Paper 4, when establishing segments based on a combination of customers, products and processes, requirements such as service level, required D and level of uniqueness should be addressed (Aitken et al., 2005; Sabri, 2015; Shaikh et al., 2017). The segmentation strategy is thus viewed as having a strong relation to the positioning of the two constructs CODP and CADP, where even multiple CODPs and CADPs can exist between and within the segments. Consequently, the established segments have various implications for the prerequisites on which the supply chain is designed and operated. Furthermore, when and what type of demand- and supply-related information is needed can also differ between segments, due to the suppliers used and the customer served in each segment, for instance. Thus, the segmentation strategy is also perceived as having relations to the three information-based constructs, DIDP, USIDP and DSIDP (though considered weak).
73
Table 5.3. Relations between the constructs of demand driven and the five DDSCOMSs Decoupling thinking
Risk-based constructs S, D and CODP
Variant-based constructs AS, AD and CADP
Information-based constructs DIDP, USIDP and DSIDP
Segmentation Segmentation in terms of market, product and process characteristics results in multiple CODPs, different D offerings and/or different D:S ratios.
Segmentation can result in multiple CADPs, where each segment can be offered different solutions and different ADs.
When and what type of demand information and supply information is needed can differ between segments and suppliers, resulting in multiple DIDPs and multiple USIDPs and DSIDPs, respectively.
Leagility The CODP is used to define and describe leagility. The lean part of the flow is the S─D segment, and the agile part is D.
The CADP will most likely be situated in the agile flow of leagility.
The DIDP must be positioned at or upstream of the CODP in the lean part of the leagile flow. The USIDP and the DSIDP will have implications for a company’s ability to produce and distribute products in a manner that is appropriate for the lean (efficient) or agile (responsive) part of the leagile flow.
Customization The CODP positioning constrains possible customization offerings. A relatively longer D usually implies that a higher degree or level of customization can be offered.
The CADP is the point where customization can be offered. The CADP positioning, and thus the length of the AD, have implications for the degree of possible customizations offered.
To make customizations based on customer orders, the DIDP should be located at or upstream of the CODP and thus the CADP. Moving the USIDP upstream and/or the DSIDP downstream and sharing information on the available and needed capacity to carry out customizations enable actors of the supply system to make more informed and feasible production and distribution plans.
Transparency Transparency in terms of real demand needs to be shared at or preferably upstream of the CODP and D.
Transparency in terms of real demand needs to be shared at or preferably upstream of the CODP and thus the CADP.
The point where transparency in terms of demand-related information is constrained can be seen as the DIDP, whereas the point where transparency in terms of supply-related information is constrained can be seen as either the USIDP or the DSIDP.
Postponement Time postponement is about reducing the S─D segment to minimize the risk of conducting activities based on speculation.
Form and place postponement are about delaying AD and/or AS, moving the CADP downstream of the supply system or generating new potential CADPs and potential customization offerings by repositioning AS downstream of D.
Postponement is related to improving decision making and reducing the need for reversibility. Moving the DIDP upstream can enable better decision support, just as moving the USIDP upstream and/or the DSIDP downstream can enable actors in the supply system to make more informed and improved production and distribution plans. This in turn can lead to form, place and/or time postponement by reducing safety lead times.
Source: Adapted from Tiedemann (2020, p. 22)
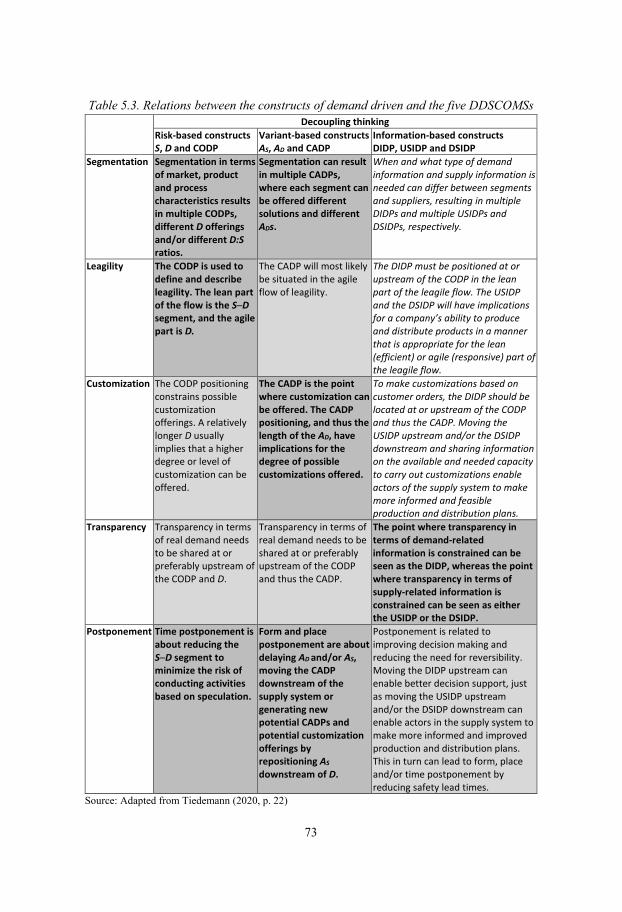
74
5.2.2 Relation between the constructs and the leagility strategy Papers 2, 4 and 6 illustrate the obvious relation between the leagility strategy and the CODP construct, where the construct is even used to define or describe the strategy as such (see, e.g., Christopher and Towill, 2000; Mason-Jones et al., 2000a, 2000b; Naylor et al., 1999; Prince and Kay, 2003; Van der Vorst et al., 2001; Van Hoek, 2000). The risk-based constructs S, D and CODP thus have a strong relation to leagility, where the lean (efficient) and the agile (responsive) parts of the flow can be discussed in terms of the S─D segment and D, respectively. This is specifically addressed in Paper 2, when discussing leagility within a triad of actors, using S, D and CODP.
Furthermore, the leagility strategy usually does not directly address the level of uniqueness. However, as presented in Papers 4 and 6, since the demand is stable and predictable upstream of the CODP but can be volatile and variable downstream, the CADP should be located in the agile part of the flow (Naylor et al., 1999). The ability to offer customizations and the positioning of the CADP are thus indirectly related to the CODP positioning.
In Paper 4, the DIDP, USIDP and DSIDP are not found to have a strong relation to leagility. However, as discussed in the paper, the DIDP must be positioned at or upstream of the CODP, having implications for the CODP positioning and thus the use and the design of the leagile flow. Similarly, the positioning of the USIDP and the DSIDP will have implications for a company’s ability to produce and distribute products in a manner that is appropriate for the lean or agile part of the flow, that is, either efficient or responsive.
5.2.3 Relation between the constructs and the customization strategy By definition, the CADP, AS and AD have a strong relation to the customization strategy. As discussed in Paper 4, the positioning of the CADP and thus the AD will have strong implications for what type of customization is possible to offer (Duray et al., 2000; Ogawa and Piller, 2006). Still, as discussed in Paper 3, the CADP must be positioned downstream of the CODP. Hence, the CODP has indirect implications for the types of customizations that are possible to make. The DIDP, the USIDP and the DSIDP also have indirect implications for the CADP and thus the customization strategy. As presented in Paper 4, these relations are considered weaker, addressing the need for demand-related information upstream of the CODP and thus the CADP. Furthermore, moving the USIDP upstream and/or the DSIDP downstream can enable other actors in the supply chain to increase their delivery reliability by making more feasible production and distribution plans, knowing about the available and needed capacity for carrying out the customization activities. As such, the DIDP, the USIDP and the DSIDP are perceived more as enablers of the customization strategy.
5.2.4 Relation between the constructs and the transparency strategy The relation between the constructs of demand driven and transparency is exclusively addressed in Paper 4. Given that transparency is about sharing high-quality demand and
75
supply-related information among the actors in the supply chain (Barratt and Barratt, 2011; Barratt and Oke, 2007; Christopher and Lee, 2004; Lee and Whang, 2000; Zhang et al., 2011), it has strong relations to the three information-based constructs DIDP, USIDP and DSIDP. For instance, the point where the transparency of demand-related information is constrained can be seen as the DIDP. Similarly, the point where supply-related information is constrained can be seen as either the USIDP or the DSIDP.
Furthermore, as concluded in Paper 4, the relations between the transparency strategy and the CODP and the CADP are not observed as strong but fair and of an indirect nature. This means that the demand-related information needs to be positioned upstream of both the CADP and the CODP for the company to act on customer orders. The point where the transparency of demand-related information is constrained can thus act as an upstream boundary for feasible CODP and CADP positionings.
5.2.5 Relation between the constructs and the postponement strategy In summarizing the discussion on postponement in Papers 4, 5 and 6, postponement can be condensed into a strategy for reducing the supply risk by intentionally delaying activities until better decision support is gained. However, as discussed in Paper 5, there are mixed answers about the meaning of postponement and whether an activity should be postponed (i) closer to the CODP, (ii) until the CODP or even (iii) downstream of the CODP. Whichever option is selected, the CODP has a strong relation to the postponement strategy, where activities related to variants, and hence converging and diverging flows (see Paper 3), usually entail a higher risk if performed on speculation (i.e., upstream of the CODP). Related to this, the strategy has also been known as delayed product differentiation, delayed differentiation and even late customization. Arguably, postponement is also related to the CADP, where the risk of carrying out customized-related activities can be reduced by postponing the point in time when they are performed.
Furthermore, as addressed above, information is arguably important for the postponement strategy to increase the decision support and reduce the supply risk. This can be done by sharing demand-related information farther upstream of the supply chain, moving the DIDP upstream. Similarly, sharing supply-related information can enable more actors in the supply chain to make more informed and feasible production and distribution plans, reducing the need for safety lead times, for instance. As such, activities can be postponed simply by moving the USIDP upstream and/or the DSIDP farther downstream of the supply chain. Nonetheless, Paper 4 concludes that the relations between postponement and the three information-based constructs (DIDP, USIDP and DSIDP) have to be considered fair rather than strong.
5.3 RQ3. How can the DDSCOMSs be combined? In answering RQ2, the relations between the constructs of demand driven and the DDSCOMSs are identified and/or established. Using this knowledge, the next step is to identify and/or establish the relations between the DDSCOMSs and thus how the strategies can be combined. In answering RQ3, a DDSCOMS process for maintaining
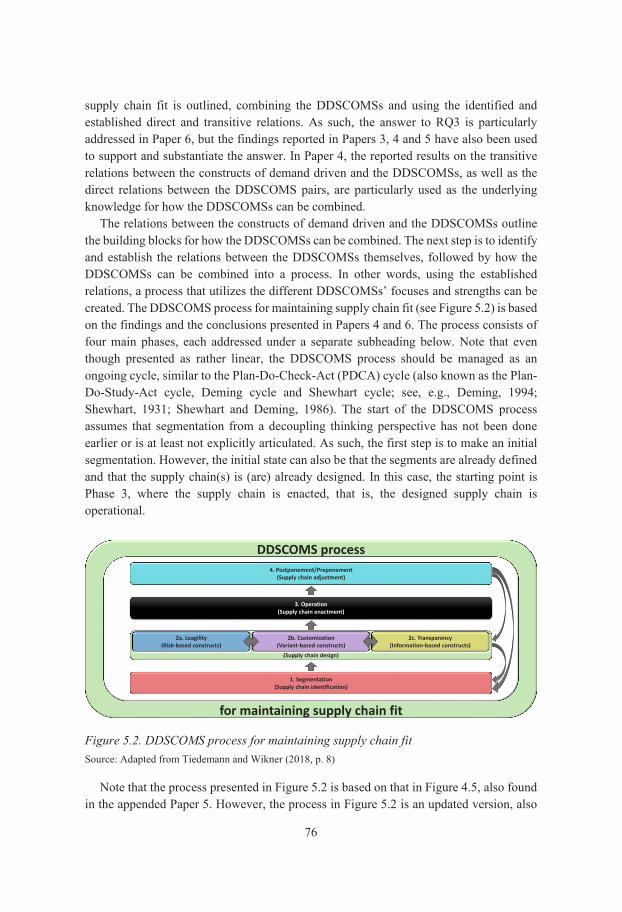
76
supply chain fit is outlined, combining the DDSCOMSs and using the identified and established direct and transitive relations. As such, the answer to RQ3 is particularly addressed in Paper 6, but the findings reported in Papers 3, 4 and 5 have also been used to support and substantiate the answer. In Paper 4, the reported results on the transitive relations between the constructs of demand driven and the DDSCOMSs, as well as the direct relations between the DDSCOMS pairs, are particularly used as the underlying knowledge for how the DDSCOMSs can be combined.
The relations between the constructs of demand driven and the DDSCOMSs outline the building blocks for how the DDSCOMSs can be combined. The next step is to identify and establish the relations between the DDSCOMSs themselves, followed by how the DDSCOMSs can be combined into a process. In other words, using the established relations, a process that utilizes the different DDSCOMSs’ focuses and strengths can be created. The DDSCOMS process for maintaining supply chain fit (see Figure 5.2) is based on the findings and the conclusions presented in Papers 4 and 6. The process consists of four main phases, each addressed under a separate subheading below. Note that even though presented as rather linear, the DDSCOMS process should be managed as an ongoing cycle, similar to the Plan-Do-Check-Act (PDCA) cycle (also known as the Plan-Do-Study-Act cycle, Deming cycle and Shewhart cycle; see, e.g., Deming, 1994; Shewhart, 1931; Shewhart and Deming, 1986). The start of the DDSCOMS process assumes that segmentation from a decoupling thinking perspective has not been done earlier or is at least not explicitly articulated. As such, the first step is to make an initial segmentation. However, the initial state can also be that the segments are already defined and that the supply chain(s) is (are) already designed. In this case, the starting point is Phase 3, where the supply chain is enacted, that is, the designed supply chain is operational.
Figure 5.2. DDSCOMS process for maintaining supply chain fit Source: Adapted from Tiedemann and Wikner (2018, p. 8)
Note that the process presented in Figure 5.2 is based on that in Figure 4.5, also found in the appended Paper 5. However, the process in Figure 5.2 is an updated version, also
1. Segmentation(Supply chain identification)
3. Operation(Supply chain enactment)
4. Postponement/Preponement(Supply chain adjustment)
(Supply chain design)
DDSCOMS process
for maintaining supply chain fit
2a. Leagility(Risk-based constructs)
2b. Customization(Variant-based constructs)
2c. Transparency(Information-based constructs)
77
including Subphase 2c. Furthermore, the figure uses the term supply chain instead of the more general term flow, which is used in the original Figure 4.5.
5.3.1 Phase 1. Identifying segments As addressed in Paper 6, before designing or redesigning a demand-driven supply chain, demand-driven manufacturing companies first need to understand their customers’ requirements, as well as their own products and process characteristics, in order to develop homogeneous segments (Aitken et al., 2005; Ghosh et al., 2018; Roscoe and Baker, 2014; Sabri, 2015; Shaikh et al., 2017). Papers 4 and 6 conclude that the segmentation strategy can be used to identify or create these segments, allowing companies to organize their businesses to compete across the span of their markets, thus reducing the risk of having to overcharge some customers or underserve others (Fuller et al., 1993; Sharma and Lambert, 1994). The identified segments also set the CODP and the CADP positions for the different supply chains. Practical examples of these include differentiated inventory policies, differentiated D options, differentiated allocation and order promising, differentiated supplier bases (Thomas, 2012) and differentiated customization options (Smith, 1956; Su et al., 2005). In short, the use of the segmentation strategy results in homogeneous segments, providing the basis for the DDSCOMS process. Hence, the segmentation strategy can be regarded as a supply chain identifier and is positioned at the bottom of Figure 5.2, acting as a foundation for the following phases of the DDSCOMS process for maintaining supply chain fit.
5.3.2 Phase 2. Designing the supply chain for supply chain fit As addressed in Paper 6, Phase 2 builds on the identified segments, aiming at balancing the need for efficiency and responsiveness using the two strategies, leagility and customization. Furthermore, as presented in Paper 4, the transparency strategy supports the leagility and the customization strategies in establishing better decision support. The transparency strategy can thus also be used in Phase 2, supporting the act of balancing efficiency and responsiveness. However, note that the CODP, CADP, DIDP, USIDP and/or DSIDP are positioned or constrained by the resulting segments established in Phase 1. For instance, the D and customization requirements within a segment will have direct implications for the CODP and the CADP positioning, respectively. Thus, Phase 2 is about designing the supply chain for supply chain fit under these constraints, balancing the need between forecast driven and customer-order driven, standardized variants and customized ones, as well as the need for demand-related and supply-related information. Phase 2 is further divided into three subphases (2a, 2b and 2c; see Figure 5.2).
Phase 2a As addressed in Papers 4 and 6, the leagility strategy can help balance the need for efficiency with responsiveness (Agarwal et al., 2006; Mason-Jones et al., 2000a; Naylor et al., 1999). This is done by addressing the demands’ characteristics, for instance, whether the demand is stable or volatile in volume and variety, low or high in volume and low or high in variety (Christopher and Towill, 2002; Mason-Jones et al., 2000a;
78
Narasimhan et al., 2006; Naylor et al., 1999). In particular, the leagility strategy can be used to address the two risk-based constructs S and D and thereby the D:S ratio and the S–D segment. Paper 4 points out that the leagility strategy also addresses the CADP, stating that it should be at or downstream of the CODP (Childerhouse and Towill, 2000; Mason-Jones et al., 2000a; Naylor et al., 1999). However, what is considered a customization, and what the difference is between standard variants and customized one are addressed more by the customization strategy.
Phase 2b In this subphase, the customization strategy can be employed to address questions such as how to target individual customers in the segments with unique offerings reflected in the product (Akinc and Meredith, 2015; McCarthy, 2004; Spring and Dalrymple, 2000), discussing both variants and customizations. As such, the strategy also addresses the degree of customer involvement (i.e., the CODP and CADP positioning), the level of mix flexibility and the type of product modularity offered (McCarthy, 2004). Paper 6 concludes that the customization strategy can be used to design the supply chain for differentiation, based on the customization needs in each customer/product/process segment.
Phase 2c As presented in Paper 4, transparency can be used to support the leagility and the customization strategies. For instance, the transparency strategy can support decision makers in deciding on what demand information to share, as well as how far upstream it should be shared (i.e., the DIDP positioning). As such, it can support the leagility strategy in enabling forecast improvements and strengthening an efficient flow upstream of the CODP. Similarly, transparency in supply-related information can support the leagility and the customization strategies in deciding on what supply-related information to share, as well as how far upstream (i.e., the USIDP positioning) and downstream (i.e., the DSIDP positioning). The transparency strategy can thus enable the actors in the supply chain to produce and distribute their products in an appropriate manner for them, either efficiently or responsively. In improving the transparency of both demand-related and supply-related information, the supply chain actors can also improve their planning and control, knowing more about what customizations are requested and the capacity needed for making these customizations. The transparency strategy can thus aid both the leagility and the customization strategies in enabling better decision support, addressing questions such as what information to share, when to do so and with whom, as well as what its operational benefits are.
Although Subphases 2a, 2b and 2c are described as conducted in sequence, the three subphases might need to be conducted in parallel, where an even iteration between them may well be necessary. This is in line with the statement by Daaboul et al. (2015) that the best customization strategy is the one where both the CODP and the CADP are considered simultaneously. For instance, when positioning the CADP, the CODP positioning might need to be re-evaluated if the positioning allows reducing D, or where the existing CODP
79
position constrains the possible customization offerings. This is indicated with the bidirectional arrows between Subphases 2a and 2b, as well as between Subphases 2b and 2c in Figure 5.2. Furthermore, if discrepancies in the segments are identified during the design of the supply chain, when using the strategies of leagility, customization and transparency, then Phase 1 might need to be revisited once more to modify the segments. This is indicated with the arrow between Phases 1 and 2 on the far-right side of Figure 5.2.
5.3.3 Phase 3. Operating the supply chain for financial return As presented in Paper 6, once the segments are identified (Phase 1) and the supply chain is designed and balanced (Phase 2), the next step is to put the supply chain to use by enacting it for financial return. However, as discussed in Papers 4 and 6, business conditions and market requirements are dynamic and change over time. Thus, what is considered an appropriate supply chain design can also change over time (Aitken et al., 2005; Childerhouse et al., 2002; Christopher and Towill, 2000; Gligor, 2017; Hines, 2013; Sebastiao and Golicic, 2008). Hence, it might be necessary to introduce some changes in the actual supply chain design to respond to new preconditions. This is addressed in Phase 4.
5.3.4 Phase 4. Adjusting the supply chain to maintain supply chain fit Misalignments might be identified during supply chain operations, which in turn would require a realignment between supply and demand to once again achieve supply chain fit. As presented in Paper 6, these misalignments could arise as demand changes, where competitive priorities have shifted or where the supply chain might have changed on the supply side, for instance. Whatever the case, the changes might result in the need to adjust the supply chain design. Papers 4 and 6 address this issue, stating that the postponement strategy offers such a dynamic aspect to SCOM, emphasizing that the supply chain as such must adapt to changes in the preconditions (Aitken et al., 2005). However, as discussed in Papers 3 and 5, postponement could be perceived as only a delay in activities to a later point in the supply chain. However, a supplier actor might also want to perform activities earlier in the supply chain. As such, postponement’s converse (i.e., preponement) could also be interesting to utilize. In Phase 4, postponement and preponement, in combination with a time-phased BOM, for example, could thus assist supply chain operations managers in analyzing what activities would need to be postponed or preponed to maintain supply chain fit.
If the analysis in Phase 4 necessitates changes to the segments and/or supply chain(s), Phase 4 is followed by either Phase 1 or Phase 2. In other words, just as the supply chain needs to be adjusted and realigned, it is important to note that the segmentation analysis might also require updating over time, not treated as a ‘one-off’ exercise (Ghosh et al., 2018). Thus, this might need revisiting Phase 1, where the segments are re-evaluated and updated, or Phase 2, where the supply chain is redesigned and balanced using the leagility, customization and/or transparency strategies in combination with risk-based, variant-
80
based and information-based constructs, respectively. This is indicated by the two downward arrows on the far-right side of Figure 5.2, going from Phase 4 to Phase 1 and Phase 2, respectively.
5.4 RQ4. What are the constructs’ implications for financial performance?
The answer to RQ3 is explicitly addressed in Paper 7 by empirically explaining the implications of the constructs I, EUS, S, D, AS and AD for the absolute measures of ROI (i.e., revenue, cost and investment). However, in addressing the implications, the idea behind the typology presented in Paper 5 is used, where the strategic lead times’ implications for the absolute measures are discussed in terms of how the absolute measures would change if the strategic lead times were reduced or prolonged, and as such, if the activities would be preponed or postponed. Since Paper 7 addresses changes to S, D, AS and AD, it also indirectly addresses the CODP and the CADP constructs. However, the focus is on the strategic lead times and their implications for ROI. Furthermore, the constructs’ implications for the absolute measures are addressed in the following subsections using the categories of control-based, risk-based, and variant-based constructs, as well as summarized in Table 5.4. The analysis focuses on the physical material flow and as such, does not address the information-based constructs (i.e., DIDP, USIDP and DSIDP). The relations between these three information-based constructs and ROI are left for further research.
5.4.1 Control-based constructs’ implications for ROI The construct I is the controllable part of the supply system (Wikner, 2018), usually related to the manufacturing company’s internal process, where items spend time in being transformed from raw materials to finished products. Consequently, I is considered to have implications for the amount of materials in the system (both as a cost and an investment), such as work in process (WIP) inventory (Gregory and Rawling, 1997; Liker, 2004; Wouters, 1991), as well as the cost of resources transforming inputs into outputs (i.e., both labour and machine costs).
Furthermore, being the upstream part of the supply system that is uncontrollable by the focal actor, the construct EUS is usually associated with purchased materials and consequently with direct material costs and investments made in the raw material inventory. As suggested in Paper 7, the length of and the uncertainties in EUS thus have implications for cost and investment.
In conclusion, Paper 7 states that both I and EUS have implications for both cost and investment, yet neither I nor EUS is found to have direct implications for revenue (marked N/A in Table 5.4).
81
5.4.2 Risk-based constructs’ implications for ROI The upstream end of S indicates the point in the supply chain at which a company should start taking a material-based risk (Mather, 1988; Towill, 1996; Wikner, 2015), especially if conducted on speculation, upstream of the CODP and thus D (Hoekstra and Romme, 1992; Wikner, 2015, 2018). In extending S, more materials will most likely accumulate in the system, especially if the S–D segment is extended. However, an extended S–D segment can in fact be beneficial if the added lead time can be used for levelling production and reducing the need for volume flexibility. Nevertheless, the consequences of extending S can be longer cash-to-cash cycles, as well as a system that is less responsive to product and technology changes. This further increases costs, especially for companies with shorter product life cycles, for instance. In summary, S is important from both cost and investment perspectives. However, no significant relation is found between S and its revenue-generating capability (marked N/A in Table 5.4).
The upstream end of D then indicates the CODP positioning and the main inventory point that is related to the CODP (Hoekstra and Romme, 1992; Olhager, 2010; Sharman, 1984). D is thus related to the main buffer point at which customers are served and consequently, the investment and the cost of capital tied up in the materials in this inventory. Furthermore, D is recognized as a key lead time for creating competitive advantage. Reducing D can increase revenue (Hoekstra and Romme, 1992; Vickery et al., 1995) through the increased demand and/or the possibility to charge premium prices (Gunasekaran et al., 2001; Wouters, 1991). D can also be reduced by postponing the CODP or decreasing the load on the resources downstream of the CODP.
Paper 7 thus concludes that D has strong implications for all three absolute measures of ROI. Furthermore, S is perceived as having implications for both cost and investment but no significant implications for revenue.
5.4.3 Variant-based constructs’ implications for ROI The construct AS relates to potential variants that can be offered by a manufacturing company and can thus be regarded as offering untapped possibilities for customization. In extending D or reducing AS downstream of the CODP, these possible customizations can be offered to customers (Wikner, 2015). As discussed in Paper 7, this will most likely have implications for cost and investment, leading to an increase in item numbers, product range, potential suppliers and time slack, as adding complexity typically adds queue time, for instance. Furthermore, AS is found to have direct implications for revenue, specifically loss, due to the inability or the untapped possibility to offer customization, thus resulting in lost sales. Therefore, AS has implications for all three absolute measures of ROI.
Similar to D, AD is also considered a key lead time for creating competitive advantage, that is, if a customization is requested by customers and can be offered within the requested time (i.e., D), which AD is, by definition. AD is thus found to have an obvious potential for increasing revenue. Moreover, as discussed in Paper 7, by postponing the form activities related to the customization, the customers’ input for product differentiation features is required at a later point in the supply system, resulting in
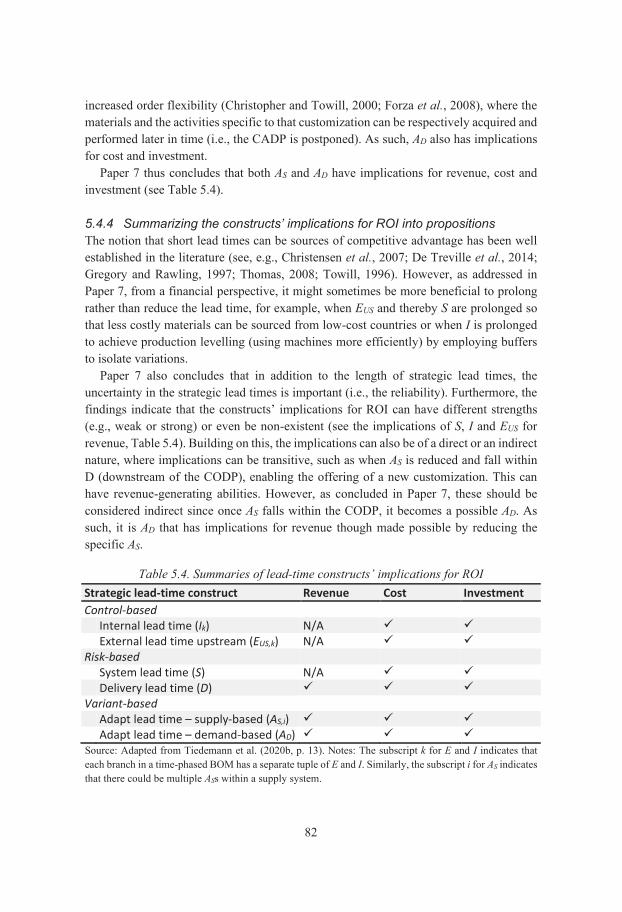
82
increased order flexibility (Christopher and Towill, 2000; Forza et al., 2008), where the materials and the activities specific to that customization can be respectively acquired and performed later in time (i.e., the CADP is postponed). As such, AD also has implications for cost and investment.
Paper 7 thus concludes that both AS and AD have implications for revenue, cost and investment (see Table 5.4).
5.4.4 Summarizing the constructs’ implications for ROI into propositions The notion that short lead times can be sources of competitive advantage has been well established in the literature (see, e.g., Christensen et al., 2007; De Treville et al., 2014; Gregory and Rawling, 1997; Thomas, 2008; Towill, 1996). However, as addressed in Paper 7, from a financial perspective, it might sometimes be more beneficial to prolong rather than reduce the lead time, for example, when EUS and thereby S are prolonged so that less costly materials can be sourced from low-cost countries or when I is prolonged to achieve production levelling (using machines more efficiently) by employing buffers to isolate variations.
Paper 7 also concludes that in addition to the length of strategic lead times, the uncertainty in the strategic lead times is important (i.e., the reliability). Furthermore, the findings indicate that the constructs’ implications for ROI can have different strengths (e.g., weak or strong) or even be non-existent (see the implications of S, I and EUS for revenue, Table 5.4). Building on this, the implications can also be of a direct or an indirect nature, where implications can be transitive, such as when AS is reduced and fall within D (downstream of the CODP), enabling the offering of a new customization. This can have revenue-generating abilities. However, as concluded in Paper 7, these should be considered indirect since once AS falls within the CODP, it becomes a possible AD. As such, it is AD that has implications for revenue though made possible by reducing the specific AS.
Table 5.4. Summaries of lead-time constructs’ implications for ROI Strategic lead-time construct Revenue Cost Investment Control-based Internal lead time (Ik) N/A External lead time upstream (EUS,k) N/A Risk-based System lead time (S) N/A Delivery lead time (D) Variant-based Adapt lead time – supply-based (AS,i) Adapt lead time – demand-based (AD) Source: Adapted from Tiedemann et al. (2020b, p. 13). Notes: The subscript k for E and I indicates that each branch in a time-phased BOM has a separate tuple of E and I. Similarly, the subscript i for AS indicates that there could be multiple ASs within a supply system.
83
5.5 Summarizing the relations between RQs and the research purpose
The research purpose presented in this dissertation is to explore how demand-driven manufacturing companies can combine DDSCOMSs for effectiveness. The purpose is further broken down into four RQs, where the meaning of the concept of demand driven is first analyzed and operationalized by the constructs identified within the pre-theory decoupling thinking. The outcome of answering RQ1 comprises the eleven constructs of demand driven found within decoupling thinking, here presented using a summarized version of Table 5.2 in the lower centered circle in Figure 5.3, compiling the eleven constructs. These constructs, and decoupling thinking in general, provide tools (such as a time-phased BOM) for analyzing and designing supply systems within demand-driven manufacturing companies.
Figure 5.3. Illustrating the relations between the RQs, their outcomes and the research purpose
Moreover, the relations between the DDSCOMSs and how they can be combined are not always clearly stated in the body of literature on each DDSCOMS. This gap is addressed by RQ2 and RQ3. First, as illustrated with the bidirectional arrow between the decoupling thinking circle and the DDSCOMSs circle in Figure 5.3, the purpose of RQ2 is to identify or conceptually develop the relations between the constructs of demand driven and the DDSCOMSs. The outcome of answering RQ2 constitutes the relations between the constructs and the DDSCOMSs, illustrated in Figure 5.3 using a summarized version of Table 5.3, which presents the relations between the constructs of demand driven and the five selected DDSCOMSs. Second, in answering RQ3, direct relations
Decoupling thinking
Financial performance
(ROI)
RevenueCost
Investment
Decoupling thinking
Risk-based constructs
Variant-based constructs
Information-based
constructsSegmentation
Leagility
Customization
Transparency Postponement
RQ1
RQ3
DDSCOMSs
ConstructsControl-based constructs Variant-based constructs
I AS
EUS AD
CADPRisk-based constructs Information-based constructs
S DIDPD USIDPCODP DSIDP
Purpose: ‘to explore how demand-driven manufacturing companies can combine DDSCOMSs for effectiveness.
1. Segmentation(Supply chain identification)
3. Operation(Supply chain enactment)
4. Postponement/Preponement(Supply chain adjustment)
(Supply chain design)
DDSCOMS process
for maintaining supply chain fit
2a. Leagility(Risk-based constructs)
2b. Customization(Variant-based constructs)
2c. Transparency(Information-based constructs)
Strategic lead-time construct Revenue Cost InvestmentControl-based constructs
Internal lead time (Ik) N/A
External lead time upstream (EUS,k) N/A
Risk-based constructs
System lead time (S) N/A
Delivery lead time (D)
Variant-based constructs
Adapt lead time – supply-based (AS,i)
Adapt lead time – demand-based (AD)
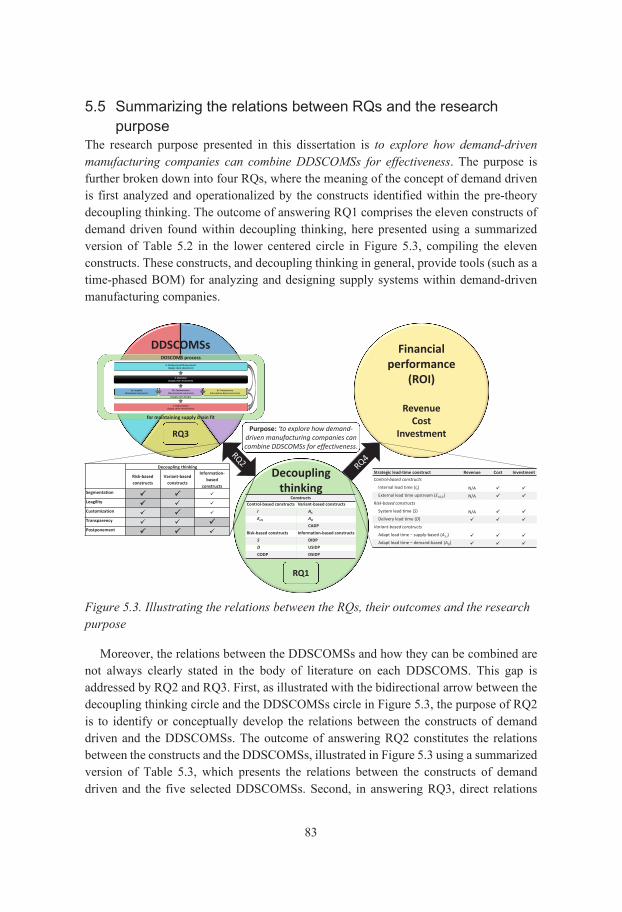
84
between the DDSCOMSs are identified. Using the identified and established relations among the constructs of demand driven and the DDSCOMSs (i.e., the outcome of answering RQ2) also makes it possible to identify the transitive relations between the DDSCOMS pairs through their relations to the constructs of demand driven. Both the direct and the transitive relations are then used to develop the DDSCOMS process for maintaining supply chain fit, combining the five selected DDSOCMSs. Hence, the answer to RQ3 is the developed process, illustrated in Figure 5.3 using the process figure itself (Figure 5.2).
Still, the outcome of RQ3 assumes the effective use of the DDSCOMSs. In knowing more explicitly if the DDSCOMSs are effective, it should also be understood how the supply chain design has implications for demand-driven manufacturing companies’ effectiveness. In this research, the term effective means doing the right things, which in turn should lead to competitiveness and as such, business value and profitability. Business value and profitability are therefore converted into financial performance in RQ4. The purpose of RQ4 is thus to explore the constructs’ implications for financial performance, in terms of the absolute measure ROI. This is illustrated with the solid arrow going from the decoupling thinking circle to the financial performance circle (see Figure 5.3). The answer to RQ4 is then summarized in Table 5.4, which is also used to summarize the answer to RQ4 in Figure 5.3.
By answering the four RQs, the relations are established between the constructs, the DDSCOMSs and the financial performance measure ROI. These relations further enable the transitive relation between DDSCOMSs and financial performance, illustrated in Figure 5.3 with the two black arrows between the DDSCOMSs circle and the decoupling thinking circle, as well as the decoupling thinking circle and the financial performance circle, respectively. In other words, the established relations also make possible the transitive relation between DDSCOMSs and ROI, adding to supply chain operations managers’ understanding of how demand-driven manufacturing companies can combine DDSCOMSs for effectiveness.
To summarize, the purpose can be separated into three major parts, as follows: (i) What is meant by demand driven and thereby demand-driven manufacturing companies? (ii) How can the DDSCOMSs be combined? (iii) How do the design and the operations of supply chains have implications for effectiveness? The answers to the four RQs each address one of these three major parts, where RQ1 is aimed at analyzing the underlying meaning of the concept of demand driven. RQ2 and RQ3 then address the questions of how the DDSCOMSs can be combined. Finally, RQ4 addresses the issue of how the design of demand-driven manufacturing companies’ supply chain operations has implications for their effectiveness. The totality of the answers to the four RQs thus accommodates the purpose, concluding that constructs within decoupling thinking can be used to operationalize the concept of demand driven, as well as to combine DDSCOMSs for designing supply chains for supply chain fit. Then, through the constructs’ relations to ROI, it is possible to gain a better understanding of how the supply chain design has implications for financial performance and thereby its effectiveness.
85
Discussion The purpose of this research is ‘to explore how demand-driven manufacturing companies can combine DDSCOMSs for effectiveness’. This purpose is further based on the three challenges raised in the introduction, as follows: (i) the challenge of ensuring that the employed DDSCOMSs do not conflict with one another but are compatible and designed to work together to support the business objectives; (ii) the challenge of employing a dynamic approach to supply chain design, realizing that the changes in customer needs and what is perceived as customer value also have implications for the design of supply chain operations; and (iii) the challenge of knowing how the supply chain operations’ implications for financial performance are manifested.
This chapter discusses the findings presented in Chapter 5 and relates them to the three challenges, stated in Chapter 1, Section 1.2, as well as the frame of reference in Chapter 2. Moreover, in operationalizing the concept of demand driven using constructs found within decoupling thinking, it is logical that the research produces findings related to the pre-theory decoupling thinking. These findings are also discussed in this chapter.
The chapter is further organized in a similar order as that of the four RQs, starting with a discussion on the use of decoupling thinking to operationalize the concept of demand driven. This is followed by a collective discussion on the findings related to challenges (i) and (ii) since they are somewhat intertwined, both focusing on the relations among the DDSCOMSs and how the DDSCOMSs can be combined and used in a more dynamic manner. The chapter ends with a discussion on challenge (iii), how the supply chain operations’ implications for financial performance are manifested.
6.1 The use of constructs within the pre-theory decoupling thinking As addressed beforehand, the body of literature on decoupling thinking and its constructs has a rather significant impact on and for this research. Not only are the constructs of decoupling thinking used to operationalize the concept of demand driven, but the constructs also provide a better understanding of the context itself. For instance, applying the CODP and the engineering decoupling point framework by Gosling et al. (2017) provides a better understanding of the types and the range of engineering activities that demand-driven manufacturing companies can conduct based on actual customer orders. These findings demonstrate that such companies not only accommodate customers’ requests in production and distribution but can even develop products and conduct engineering-related activities based on actual customer orders. Interestingly, though, within decoupling thinking, the driver is usually discussed as either a forecast or a customer order, that is, the decision domain upstream of the CODP is speculation, and downstream, it is commitment (Wikner, 2018). When applying the CODP construct on NPD projects of demand-driven manufacturing companies, the drivers are specifically addressed and empirically exemplified. An unexpected finding from this application
86
involves the range and the types of forecast-based drivers that initiate NPD projects, some of which are as follows:
• new technologies offering opportunities for designing novel and innovative products or production processes,
• components being discontinued by suppliers, • material and chemical substances becoming restricted (e.g., restriction of the use
of certain hazardous substances [RoHS]) and needing subsidies or • a new catalogue of products being developed.
These findings illustrate that there are different drivers or reasons for starting an NPD project based on speculation and that these drivers can be either internal or external. In other words, an NPD project can be undertaken due to changes by actors outside the company (e.g., test institutes and suppliers) or by actors within the company (e.g., CEO, marketing department, or research and development). These drivers can also be classified as reactive (e.g., due to components becoming obsolete) or proactive (e.g., updating or developing new innovative products to stay competitive).
Establishing the relations between the constructs of decoupling thinking and the DDSCOMSs also yields some interesting findings. For instance, establishing the relations between the constructs of decoupling thinking and the customization strategy results in the term customization being nuanced. In the customization body of literature, the term differentiation is frequently used, such as the point of differentiation in the supply system at which an adaptation is made (see, e.g., Childerhouse and Towill, 2000; Garg and Tang, 1997; Tang, 2006). However, differentiation is a broader term, meaning that a component or a product can have variants and the differentiation can be based on either forecasts or customer orders. The findings show that the CODP and the CADP constructs can be used for a nuanced difference, where the point at which the customization occurs (the CADP) can only be conducted downstream of the CODP. Hence, only the points of differentiation that are at or downstream of the CODP can be considered feasible points of customization.
Establishing the relations between the constructs of decoupling thinking and the postponement strategy also generates some interesting findings. Illustrating different postponement examples cited in the literature reveals mixed answers, not only to what postponement is, but also how it can be achieved. Hence, the implications for operational performance will differ accordingly. These conflicting answers are made even more apparent when developing the typology for displacement, including the three dimensions of form, place and time, as well as the CODP and the CADP constructs. Using these dimensions and constructs of decoupling thinking, the typology offers the possibility to compare different displacement options, whether to prepone or postpone activities. The result is a more nuanced illustration of the operational implications that comes from displacing activities. The typology can thus assist in comparing and nuancing different displacement options, possibly leading to better decision support.
87
6.2 Combining DDSCOMSs using direct and transitive relations Challenges (i) and (ii) are associated with the relations among the DDSCOMSs and how they can be combined in a dynamic way. These challenges are addressed by RQ2 and RQ3, though using the answer to RQ1, that is, the constructs of demand driven. A structured literature review has been conducted to identify the relations among the DDSCOMSs and the constructs of demand driven. The review concludes that there is a vast body of literature on each DDSCOMS and that it offers a comprehensive understanding of what the strategies are, how they should be used, as well as the expected results from using them, for instance. Nevertheless, the literature review also shows that the publications on the DDSCOMSs provide limited support for what the relations are between the DDSCOMSs and how they can be combined. This is particularly noticeable for the relations between (i) transparency and segmentation and (ii) transparency and leagility. As shown in Table 6.1 (see also Table 4 in Paper 4), only two publications each are found for these two relations (note that the number of publications addressing each DDSCOMS or the relation between the DDSCOMS pairs is indicated in parentheses in each intersection in Table 6.1). In fact, out of the 246 publications on the DDSCOMSs in the sample, only 2 to 8 publications address the relations between transparency and each of the other DDSCOMSs (see the boxes where transparency intersects the other four DDSCOMSs in Table 6.1). Still, some exceptions are found, such as the relation between customization and segmentation (28 publications), where customers’ different customization requirements have resulted in companies creating more and even smaller segments to tailor to the customers’ specific needs (MacCarthy et al., 2002; McCarthy, 2004; Su et al., 2005). Another more prevailing example is the relation between postponement and customization (79 publications), particularly mass customization, where postponing the point of differentiation is perceived as a way of offering mass customization (Feitzinger and Lee, 1997; Garg and Tang, 1997; Mikkola and Skjøtt-Larsen, 2004; Salvador et al., 2002; Swaminathan, 2001). Despite the exceptions, the findings indicate that a great majority of the relations between the DDSCOMSs is not explicitly addressed in the literature. Here, the constructs of demand driven (i.e., constructs found within decoupling thinking) are proven to be useful. The findings show that all the DDSCOMSs are based on key aspects of decoupling thinking, even if the terminologies differ, and that some relations are stronger than others (see Table 5.3). Using these established relations between the constructs and the DDSCOMSs also makes it possible to establish the transitive relations between the DDSCOMSs. Table 6.1 uses the summarized information in Table 5.3, presenting the fair or the strong relations, both between the constructs of demand driven and each DDSCOMS (the diagonal intersection where each DDSCOMS intersects itself), as well as the transitive relations between the DDSCOMSs (the boxes where two different DDSCOMSs intersect). The relations’ strength is indicated using the same logic as in Table 5.3, that is, using a greyscale from light to dark and a typographical emphasis, where regular font is used for a fair relation and bold font for a strong relation.
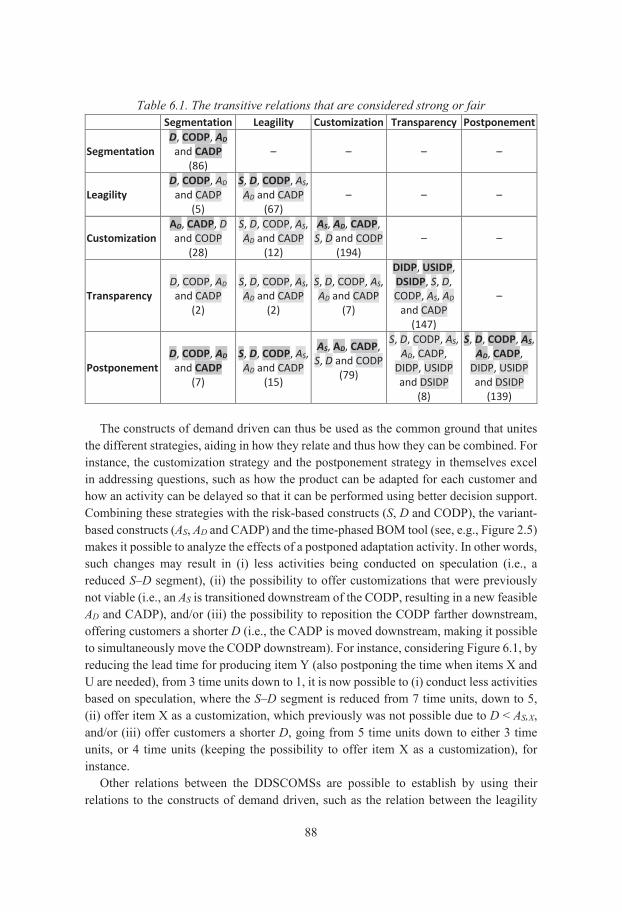
88
Table 6.1. The transitive relations that are considered strong or fair Segmentation Leagility Customization Transparency Postponement
Segmentation D, CODP, AD and CADP
(86) – – – –
Leagility D, CODP, AD
and CADP (5)
S, D, CODP, AS, AD and CADP
(67) – – –
Customization AD, CADP, D and CODP
(28)
S, D, CODP, AS, AD and CADP
(12)
AS, AD, CADP, S, D and CODP
(194) – –
Transparency D, CODP, AD and CADP
(2)
S, D, CODP, AS, AD and CADP
(2)
S, D, CODP, AS, AD and CADP
(7)
DIDP, USIDP, DSIDP, S, D, CODP, AS, AD
and CADP (147)
–
Postponement D, CODP, AD and CADP
(7)
S, D, CODP, AS, AD and CADP
(15)
AS, AD, CADP, S, D and CODP
(79)
S, D, CODP, AS, AD, CADP,
DIDP, USIDP and DSIDP
(8)
S, D, CODP, AS, AD, CADP,
DIDP, USIDP and DSIDP
(139)
The constructs of demand driven can thus be used as the common ground that unites the different strategies, aiding in how they relate and thus how they can be combined. For instance, the customization strategy and the postponement strategy in themselves excel in addressing questions, such as how the product can be adapted for each customer and how an activity can be delayed so that it can be performed using better decision support. Combining these strategies with the risk-based constructs (S, D and CODP), the variant-based constructs (AS, AD and CADP) and the time-phased BOM tool (see, e.g., Figure 2.5) makes it possible to analyze the effects of a postponed adaptation activity. In other words, such changes may result in (i) less activities being conducted on speculation (i.e., a reduced S–D segment), (ii) the possibility to offer customizations that were previously not viable (i.e., an AS is transitioned downstream of the CODP, resulting in a new feasible AD and CADP), and/or (iii) the possibility to reposition the CODP farther downstream, offering customers a shorter D (i.e., the CADP is moved downstream, making it possible to simultaneously move the CODP downstream). For instance, considering Figure 6.1, by reducing the lead time for producing item Y (also postponing the time when items X and U are needed), from 3 time units down to 1, it is now possible to (i) conduct less activities based on speculation, where the S–D segment is reduced from 7 time units, down to 5, (ii) offer item X as a customization, which previously was not possible due to D < AS,X, and/or (iii) offer customers a shorter D, going from 5 time units down to either 3 time units, or 4 time units (keeping the possibility to offer item X as a customization), for instance.
Other relations between the DDSCOMSs are possible to establish by using their relations to the constructs of demand driven, such as the relation between the leagility
89
strategy and the transparency strategy. Transparency in the form of demand-related information may enable a leagile flow, where the information is shared upstream of the CODP as far as possible to support an efficient flow (within the S–D segment). For more examples of transitive relations, see Paper 4.
Figure 6.1. Analyzing the effect of a postponed activity using the time-phased BOM tool Source: Adapted from Tiedemann and Wikner (2019, p. 206)
These transitive relations are further illustrated in Figure 6.2, where each DDSCOMS is represented by a piece of a jigsaw puzzle that can be joined together with the foundation, that is, decoupling thinking. The DDSCOMSs’ jigsaw-puzzle pieces are fixed to the foundation using the construct(s) of decoupling thinking to which the respective DDSCOMSs have a strong relation (compare Table 5.3 or Table 6.1 with Figure 6.2).
Flow
sink
Flow
sour
ce
ZY
Q U
XWV
CADP
S−D segment = 7 CODP
AD = AS,Y = 5
D = 5
AS,X = 6
AD = AS,Y = 3
D = 5
AS,X = 4
CADP
CODP
024681012
Before
After
5 3
S−D segment = 5
9 7
Flow
sour
ce
ZY
XWV
Q U
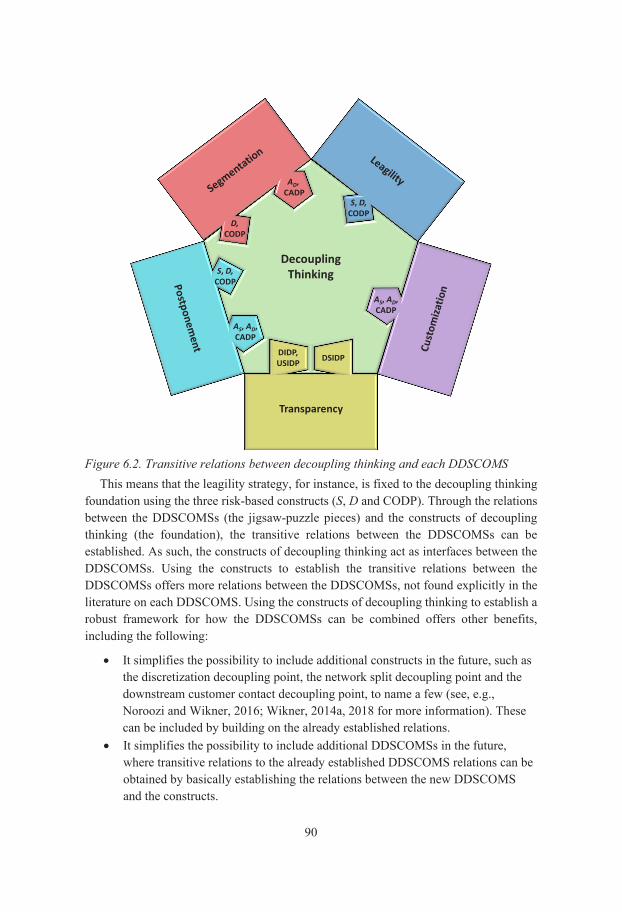
90
Figure 6.2. Transitive relations between decoupling thinking and each DDSCOMS
This means that the leagility strategy, for instance, is fixed to the decoupling thinking foundation using the three risk-based constructs (S, D and CODP). Through the relations between the DDSCOMSs (the jigsaw-puzzle pieces) and the constructs of decoupling thinking (the foundation), the transitive relations between the DDSCOMSs can be established. As such, the constructs of decoupling thinking act as interfaces between the DDSCOMSs. Using the constructs to establish the transitive relations between the DDSCOMSs offers more relations between the DDSCOMSs, not found explicitly in the literature on each DDSCOMS. Using the constructs of decoupling thinking to establish a robust framework for how the DDSCOMSs can be combined offers other benefits, including the following:
• It simplifies the possibility to include additional constructs in the future, such as the discretization decoupling point, the network split decoupling point and the downstream customer contact decoupling point, to name a few (see, e.g., Noroozi and Wikner, 2016; Wikner, 2014a, 2018 for more information). These can be included by building on the already established relations.
• It simplifies the possibility to include additional DDSCOMSs in the future, where transitive relations to the already established DDSCOMS relations can be obtained by basically establishing the relations between the new DDSCOMS and the constructs.
AD,CADP
DecouplingThinkingS, D,
CODP
AS, AD,CADP
AS, AD,CADP
S, D,CODP
D,CODP
Transparency
DSIDPDIDP, USIDP
91
• The constructs offer the possibility to utilize other established relations to decoupling thinking that are presented in the literature. For example, the time-phased BOM tool can aid in nuancing the operational effects of changing the supply chain design using the DDSCOMSs (see, e.g., Figure 6.1).
Furthermore, the identified and established relations between each DDSCOMS and the constructs of demand driven also present the strengths of each DDSCOMS. Using these relations, it is thus possible to identify how the DDSCOMSs can be combined, using and leveraging the different strategies’ strengths. The proposed DDSCOMS process of maintaining supply chain fit (see Figure 5.2) is such an example, which operationalizes the knowledge on these relations. The process highlights the different DDSCOMSs’ strengths and focuses them into different phases. In doing so, the process also helps in reducing the overwhelming complexity of applying the five DDSCOMSs simultaneously. Instead, the process emphasizes the DDSCOMS that is particularly suited for each phase. Moreover, by applying the constructs of decoupling thinking, the process can be operationalized using the knowledge and the tools offered in the decoupling thinking body of literature. For example, the established segments in Phase 1 can be seen as different clusters of BOMs and thus clusters of time-phased BOMs. These clusters are then designed in Phase 2, where the time-phased BOM aids in illustrating the operational effects of positioning the CODP, CADP, DIDP, USIDP and DSIDP. In Phase 4, as customers’ requirements and business environments change, the time-phased BOM once again can aid in illustrating the cause–effect relation of postponing or preponing activities to accommodate the new requirements.
Moreover, the established segments of product-customer-process combinations in Phase 1 can in practice result in different inventory policies, different D options, differentiated allocation and order promising, as well as differentiated supplier bases (Thomas, 2012). When the business environment changes, these segments might need to be changed for the company to stay competitive and continue to deliver customer value. By its cyclic design, the dynamic DDSCOMS process for maintaining supply chain fit (see Figure 5.2) emphasizes the need to carefully position and reposition the strategic decoupling points in order to maintain competitiveness through the supply chain fit. The findings on the relations between the DDSCOMSs thus address the first two challenges of (i) ensuring that the employed DDSCOMSs do not conflict with one another but are compatible and designed to work together to support the business objectives and (ii) employing a dynamic approach to supply chain design, realizing that the changes in customer needs and what is perceived as customer value also have implications for the design of supply chain operations.
92
6.3 Relation between supply chain design and financial performance
The third (iii) and final challenge presented in Chapter 1, Section 1.2 (Problem statement) is that of knowing how the supply chain operations’ implications for financial performance are manifested. This challenge is addressed in RQ4.
The findings on strategic lead times’ implications for financial performance build on and contribute to a long stream of research that acknowledges lead times’ importance for manufacturing companies’ competitiveness and implications for financial performance. Still, the qualitative research approach slightly separates itself from the majority of studies conducted and reported in the literature (see, e.g., Blackburn, 2012; Christiansen et al., 2007; De Treville et al., 2014; Jayaram et al., 1999; Vickery et al., 1995). In using a qualitative approach, the focus has not been on answering the questions of whether the lead times have implications for financial performance and how significant these implications are but on understanding how these implications manifest themselves in practice. Still, the research findings support the aforementioned publications, concluding that both the length of and the variation in lead times have implications for financial performance (see, e.g., Christensen et al., 2007; Handfield and Pannesi, 1992; Jayaram et al., 1999) and that these implications are relative, meaning that they can differ in strength.
Furthermore, by using a system of strategic lead times and decoupling points, the notion that lead time is a general term is stressed, acknowledging different types of lead times. As such, lead times’ implications for financial performance can differ substantially, depending on what part of the supply system the lead time concerns and the activities that are performed within that time. For instance, many of the benefits of having a shorter D can be gained without reducing S, such as when the CODP is shifted downstream. For example, this means that the manufacturing lead time can stay unchanged, where only D is reduced. Stalk and Hout’s (1990a, 1990b) belief that shorter lead times offer competitive advantage remains true to this day. This is perhaps truer in terms of D, making it possible to offer customers a shorter lead time from order to fulfilment compared with competitors’ offers. However, in terms of EUS (similar to the supply lead time), demand-driven manufacturing companies evidently replace regional suppliers for less costly ones in other parts of the world, thereby extending EUS in many cases. Similarly, there are reasons why not all manufacturing companies shift their transportation mode to a faster one, from sea to air delivery, for instance.
Another one of the more prevalent findings stems from the use of ROI. Specifically, this research acknowledges that lead times have significant implications for cost (Blackburn, 2012; De Treville et al., 2014; Whicker et al., 2009), but beyond this, it also explores the strategic lead times’ implications for investment and revenue. The identified implications of strategic lead times for the absolute measures of ROI further emphasize the question of whether lead times should always be shortened. In other words, a relative measure such as ROI goes beyond the cost perspective and increases the possibility to compare two or more supply chain design options. For instance, in comparing two supply chain design options, the costlier alternative could still be more profitable if the potential
93
revenue would exceed these costs. Likewise, although the ability to offer a shorter D is viewed as a competitive advantage, there are limits to the degree to which demand-driven manufacturing companies should work on reducing their D. This dissertation’s findings indicate that a shorter D might not always be more advantageous in terms of financial performance. Clearly, the cost of reducing D will at a certain point exceed the financial reward of increasing the revenue. This finding is perhaps not so surprising. Nonetheless, the results illustrate the importance of understanding how strategic lead times have implications for financial performance, and it might be worth questioning the belief that all lead times should always be reduced. Sometimes, doing the opposite might even be more financially rewarding. The findings on strategic lead times’ implications for ROI increase the possibility to ask these questions, supporting managerial decision making.
Considering that strategic lead times are designed as a system, it is also possible to use them to simulate a supply chain design. As such, the findings help in establishing and illustrating the relations between supply chain design and business value in terms of ROI. As encouraged by Stank et al. (2019), the research’s findings arguably help in demystifying the relations between supply chain design and business value. Using this nuanced understanding of strategic lead times’ implications for ROI, supply chain operations managers can be more equipped to design their supply chains, understanding how and why the supply chain design has implications for financial performance, providing the ability to more explicitly judge its effectiveness, that is, whether they do the right things, based on how the supply chain operations contribute to the manufacturing companies’ financial performance.
The findings of this research thus provide information on the relations between DDSCOMSs and how they can be combined to design and manage supply chains for supply chain fit and effectiveness. This is illustrated in the DDSCOMS framework for effectiveness (see Figure 6.3), which combines the information in Table 5.3 and Table 5.4, for instance. Here, decoupling thinking (the green pentagon) serves as the foundation on which the DDSCOMSs are fixed in order to use the construct(s) of decoupling thinking to which the respective DDSCOMSs have a strong relation (see Table 5.3 or Table 6.1). The relative financial performance measure ROI then comprises the ‘core’, illustrating that the ultimate goal of all for-profit demand-driven manufacturing companies is to create business value (i.e., to generate money and earn profits; Goldratt and Cox, 2016; Harrison and Horngren, 2008; Leon, 2016; Ptak and Smith, 2019). The core (i.e., ROI) is also fixed to the decoupling thinking foundation using the risk-based and the variant-based constructs. Figure 6.3 should thus be interpreted as follows: decoupling thinking and its constructs (the foundation) can both be used to design supply chains and aid in understanding the relation between the DDSCOMSs and the operational effects of changing the supply chain design. Through decoupling thinking and its constructs, it is then also possible to understand how the changes to the supply chain design will have implications for ROI. Figure 6.3 is thus meant as an illustrative summary of the findings, catering to the three challenges raised in Chapter 1, Section 1.2, as well as contributing
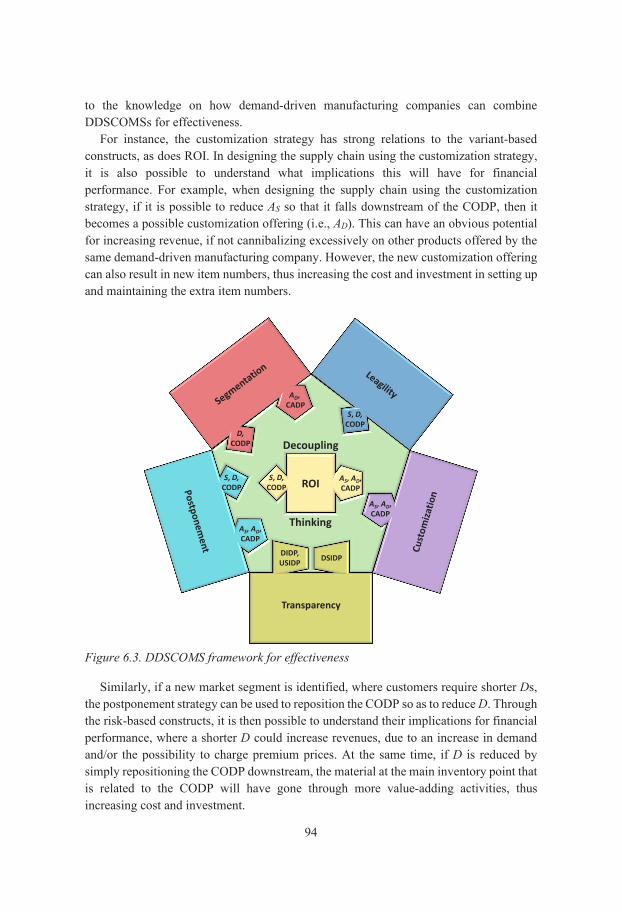
94
to the knowledge on how demand-driven manufacturing companies can combine DDSCOMSs for effectiveness.
For instance, the customization strategy has strong relations to the variant-based constructs, as does ROI. In designing the supply chain using the customization strategy, it is also possible to understand what implications this will have for financial performance. For example, when designing the supply chain using the customization strategy, if it is possible to reduce AS so that it falls downstream of the CODP, then it becomes a possible customization offering (i.e., AD). This can have an obvious potential for increasing revenue, if not cannibalizing excessively on other products offered by the same demand-driven manufacturing company. However, the new customization offering can also result in new item numbers, thus increasing the cost and investment in setting up and maintaining the extra item numbers.
Figure 6.3. DDSCOMS framework for effectiveness
Similarly, if a new market segment is identified, where customers require shorter Ds, the postponement strategy can be used to reposition the CODP so as to reduce D. Through the risk-based constructs, it is then possible to understand their implications for financial performance, where a shorter D could increase revenues, due to an increase in demand and/or the possibility to charge premium prices. At the same time, if D is reduced by simply repositioning the CODP downstream, the material at the main inventory point that is related to the CODP will have gone through more value-adding activities, thus increasing cost and investment.
AD,CADP
ROI
Decoupling
Thinking
S, D,CODP
AS, AD,CADP
S, D,CODP
AS, AD,CADP
AS, AD,CADP
S, D,CODP
D,CODP
Transparency
DSIDPDIDP, USIDP
95
Conclusions This chapter concludes the dissertation, starting by presenting the theoretical contributions of this research. Thereafter, the managerial contributions are addressed, discussing how managers can use the results, as well as the possible benefits of doing so. The chapter ends by presenting the research limitations and proposing further research to address them. The sequence in which the contributions, limitations and recommended further research is presented resembles the order in which the areas are discussed in Chapter 6, similar to the order of the four RQs from which the results are drawn. Hence, the sequence should not be interpreted as a rating of their significance.
7.1 Theoretical contributions This research makes several noteworthy contributions to the existing literature. The five primary contributions are addressed below, following the order presented in Table 7.1.
Table 7.1. Summaries of theoretical contributions and order in which they are addressed
RQ Heading Contribution title 1 7.1.1 Nuancing different types of drivers for engineering activities 1 and 2 7.1.2 Nuancing customization and presenting a typology for displacement 1–4 7.1.3 DDSCOMS framework for effectiveness and decoupling theory 2 and 3 7.1.4 Combining DDSCOMSs for supply chain fit 4 7.1.5 Lead-time implications for financial performance
7.1.1 Nuancing different types of drivers for engineering activities In answering RQ1, activities within NPD are separated into forecast-driven and customer-order-driven types using the CODP construct, for instance. The result of this research contributes to nuancing the types of engineering-related activities that demand-driven manufacturing companies can perform based on customer orders. In applying the engineering decoupling point framework (Gosling et al., 2017) on NPD processes in demand-driven manufacturing companies, the research contributes by using the framework in a new context, both substantiating and advancing decoupling thinking (see, e.g., Dekkers, 2006; Rudberg and Wikner, 2004; Wikner and Rudberg, 2005a). The use of the CODP construct in NPD also contributes to the more traditional marketing and innovation literature, nuancing the difference between customer-driven and demand-driven activities. Specifically, the research highlights the difference between performing activities based on actual customer orders and those involving customers based on forecasts to obtain market needs and test concepts, such as customer participation, co-creation and co-innovation (see, e.g., Chang and Taylor, 2016; Eslami and Lakemond, 2016; O’Hern and Rindfleisch, 2010; Song et al., 2016).
96
7.1.2 Nuancing customization and presenting a typology for displacement The three dimensions of form, place and time (Debreu, 1987), in combination with the CODP and the CADP constructs, were used in Study C to answer RQ1. The results of this study help in refining the relation and the difference between standardization and customization, as well as between variant and customization. As such, the results contribute to the body of literature on customization, building on the works of Duray (2002) and Käkelä (2019), among others.
Furthermore, in answering RQ2, the three dimensions and the CODP construct were also used in developing a typology for displacement. This displacement typology recognizes that an activity can either be postponed or preponed, offering the possibility to reconcile the apparently conflicting views of the meaning of postponement, as well as the operational benefits of employing the strategy. The typology thus builds on and substantiates the body of literature on postponement, separating postponement into three dimensions, as well as including its converse – preponement.
7.1.3 DDSCOMS framework for effectiveness and decoupling theory To answer the four RQs and fulfil the purpose of this research, the intention has been to develop a robust framework based on the constructs that operationalize the concept of demand driven. This approach has made it possible to develop a robust framework for how the DDSCOMSs can be combined for effectiveness (see Figure 6.3). In using decoupling thinking as the foundation, the framework becomes robust and not dependent on any specific DDSCOMS. In other words, the framework is insensitive to the chosen DDSCOMSs and can be expanded by including other DDSCOMSs, constructs or financial performance measures in the future. The framework contributes to the literature by proving the relations between DDSCOMSs and financial performance in terms of ROI.
In identifying and establishing these relations, the research also establishes the relations among the different streams of literature, including decoupling thinking, DDSCOMSs, supply chain fit and management accounting, among others. Overall, the research substantiates the body of literature on decoupling thinking (see, e.g., Giesberts and van der Tang, 1992; Hoekstra and Romme, 1992; Olhager, 2003; Sharman, 1984; Wikner, 2014b, 2018) by relating it to other bodies of literature and using them to build theory, thereby contributing towards establishing decoupling thinking as a theory.
7.1.4 Combining DDSCOMSs for supply chain fit In answering RQ1 and RQ2, by analyzing the strategies that can be used for establishing supply chain fit, the research results also contribute to the growing body of literature on supply chain fit (see, e.g., Fisher, 1997; Gligor, 2017; Lee, 2002; Randall et al., 2003; Sabri, 2019; Stock et al., 1998; Wagner et al., 2012).
First, as highlighted by Sabri (2019), the vast majority of contemporary supply chain fit publications employs quantitative approaches, such as a survey-based approach (see, e.g., Flynn et al., 2010; Gligor, 2016, 2017; Qi et al., 2017; Qi et al., 2011; Rojo et al., 2016; Wagner et al., 2012). Moreover, the supply chain fit literature depends mainly on
97
theory-testing studies rather than theory-developing studies, which probably hinders the theory generation of what is considered a relatively new body of literature (Sabri, 2019). The use of a theory-building analytical conceptual approach thus complements and substantiates the vast majority of supply chain fit research, contributing to the development of the theory.
Second, the structured literature review that was conducted to establish the relations between the DDSCOMSs and the constructs of demand driven offers a unique and extensive summary of both the DDSCOMSs themselves and the publications on them. As such, the research results make another contribution by not only summarizing but also refining the literature on each DDSCOMS by presenting the relations between these strategies.
Third, contemporary research (e.g., Chang et al., 2015) has shown the importance of incorporating supply chain strategies into strategy models and frameworks. Gligor (2017) even proposes that further research can expand the Fisher (1997) model on supply chain fit by integrating other strategies, such as agility (i.e., part of leagility) and visibility (i.e., transparency). This research contributes to this by extending the literature on supply chain fit, including the work of Fisher (1997), presenting the relations between the five DDSCOMSs and how they can be combined.
7.1.5 Lead-time implications for financial performance The answer to RQ4 contributes to the long stream of publications on the relation between lead time and financial performance (see, e.g., Blackburn, 2012; De Treville et al., 2014; Droge et al., 2004; Heydari et al., 2016; Jayaram et al., 1999; Stalk and Hout, 1990a, 1990b; Stank et al., 2019; Vickery et al., 1995; Whicker et al., 2009; Wouters, 1991). Previous studies have mainly approached this problem using a quantitative approach, focusing on the questions of whether lead time has implications for financial performance and how strong the implications are, bypassing the question of how these implications are manifested in practice. Similarly, studies on supply chain fit have concluded that it has implications for financial performance (e.g., ROA), also elaborating on how strong these implications are (Gligor, 2016, 2017; Wagner et al., 2012). Additionally, most studies (see, e.g., Blackburn, 2012; De Treville et al., 2014) have focused on the lead times’ implications for cost, as well as the idea that lead times by default should be reduced. This research thus sets itself apart from these studies. Using a qualitative approach and the strategic lead times, this research has focused on the question of how the strategic lead times’ implications for ROI are manifested. In presenting answers to the ‘how question’, the findings contribute to the body of literature on supply chain fit, as well as that on the relation between lead time and financial performance, presenting the implications of strategic lead times for ROI. Furthermore, the research results acknowledge that extending rather than reducing lead times can sometimes be more financially rewarding. Nonetheless, the results support previous research findings that the length of and the variation in lead times have implications for financial performance (see, e.g., Christensen et al., 2007; Handfield and Pannesi, 1992; Jayaram et al., 1999) and that the implications’
98
strengths can differ and even be considered direct or indirect (transitive). The research results thus contribute to demystifying the relation between supply chain design and financial performance, as advocated by Stank et al. (2019).
7.2 Managerial contributions Practitioners in demand-driven manufacturing companies can also benefit from the results of this research. The four primary contributions are presented below, following the order listed in Table 7.2.
Table 7.2. Summaries of managerial contributions and order in which they are addressed
RQ Heading Contribution title 1 7.2.1 Increased understanding of the concept of demand driven 2 7.2.2 Analyzing operational implications of displacement options 2 and 3 7.2.3 Understanding DDSCOMSs and a process for maintaining supply chain fit 4 7.2.4 Demystifying lead times’ implications for ROI
7.2.1 Increased understanding of the concept of demand driven In terms of RQ1 and the analysis of the concept of demand driven, this result can increase managers’ understanding of what activities are performed by demand-driven manufacturing companies based on customer orders. Specifically, this research extends the discussion from production-related activities to engineering-related ones. For example, the applied engineering decoupling point framework (see Figure 5.1) and the proposed structured NPD process portfolio (see Figure 4.1) can be used by practitioners and stakeholders to visualize and reflect more deeply on the configuration of NPD processes and the relation between the business-level objectives and customer involvement in NPD. This is pointed out in the statement by R18, where the engineering decoupling point framework ‘could be a good way of making people think at the very early stages, where strategically, do we want to engage customers?’
7.2.2 Analyzing operational implications of displacement options In answering RQ2, the relation between the customization strategy and the CODP and the CADP constructs has been researched. The results of this analysis contribute to increasing the understanding of what customization is and how standard variants can be offered as customizations using the postponement strategy, for example. Specifically, using the CODP and the CADP constructs, the research results help in nuancing the difference between standardization and customization, as well as between variants and customizations. Combined with the time-phased BOM tool, the initial state can be illustrated and the operational implications of displacing the CODP and/or the CADP can be analyzed (see, e.g., Figure 6.1).
99
7.2.3 Understanding DDSCOMSs and a process for maintaining supply chain fit Answering RQ2 and RQ3 has established the relations between the DDSCOMSs and decoupling thinking and the transitive relations between the DDSCOMSs. These relations can increase managers’ understanding of the strengths of each strategy, as well as how the strategies can be combined. The proposed DDSCOMS process for maintaining supply chain fit operationalizes this knowledge and can be used by supply chain operations managers in demand-driven manufacturing companies to design and manage their supply chain operations. The cyclic process contributes by specifically stressing the dynamic aspects of supply chain fit, that is, as the prerequisites change, so should the design of supply chain operations. This is emphasized in the process of carefully positioning and repositioning the strategic decoupling points to maintain competitiveness, consequently contributing to using the supply chain operations effectively. The four phases also reduce the overwhelming effort of applying the five DDSCOMSs simultaneously, instead emphasizing the strategy that is particularly suited for each phase, thus attending to the usability of the process.
7.2.4 Demystifying lead times’ implications for ROI The results of RQ4 provide supply chain operations managers with insights that can help them better understand the relations between the supply chain operations’ design and financial performance. This is done by presenting illustrative examples of strategic lead times’ implications for the absolute measures of ROI (see Paper 7). The research also stresses important aspects of these implications, that is, both the length of and the variation in lead times have implications for ROI, and these implications differ in strength and can be direct or even indirect (transitive). Furthermore, the constructs of demand driven and their implications for ROI allow themselves to be operationalized using a time-phased BOM tool, for instance. This visual aid has proven useful in analyzing different supply chain design options from a financial performance perspective. For instance, R8 expresses these benefits in the following words: ‘The relation between “cost for lead time” and “change in lead time” has been highlighted and exemplified for some of our products, which has led to a correction of the strategic focus where we in a better way have managed to justify where we are going and why’. In other words, this research establishes and highlights the relations between the constructs of decoupling thinking, DDSCOMSs and their implications for ROI in the context of demand-driven manufacturing companies. As such, the research highlights how tools within decoupling thinking can be complemented with the understanding of how supply chains can be designed and operated for generating profits by establishing and maintaining supply chain fit. Here, decoupling thinking equips managers with the ability to analyze the financial implications of a potential change to the supply chain design, as advocated by Stank et al. (2019).
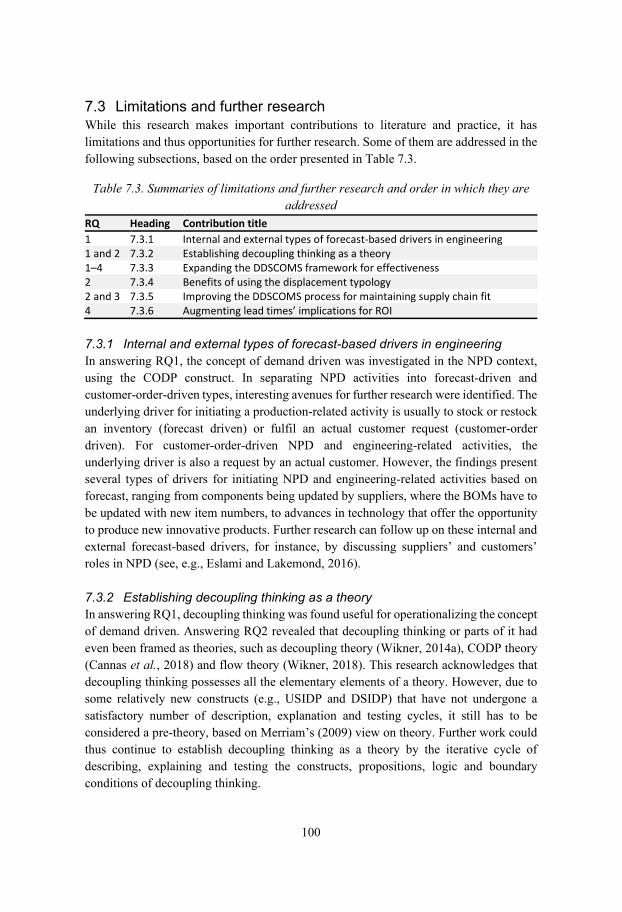
100
7.3 Limitations and further research While this research makes important contributions to literature and practice, it has limitations and thus opportunities for further research. Some of them are addressed in the following subsections, based on the order presented in Table 7.3.
Table 7.3. Summaries of limitations and further research and order in which they are addressed
RQ Heading Contribution title 1 7.3.1 Internal and external types of forecast-based drivers in engineering 1 and 2 7.3.2 Establishing decoupling thinking as a theory 1–4 7.3.3 Expanding the DDSCOMS framework for effectiveness 2 7.3.4 Benefits of using the displacement typology 2 and 3 7.3.5 Improving the DDSCOMS process for maintaining supply chain fit 4 7.3.6 Augmenting lead times’ implications for ROI
7.3.1 Internal and external types of forecast-based drivers in engineering In answering RQ1, the concept of demand driven was investigated in the NPD context, using the CODP construct. In separating NPD activities into forecast-driven and customer-order-driven types, interesting avenues for further research were identified. The underlying driver for initiating a production-related activity is usually to stock or restock an inventory (forecast driven) or fulfil an actual customer request (customer-order driven). For customer-order-driven NPD and engineering-related activities, the underlying driver is also a request by an actual customer. However, the findings present several types of drivers for initiating NPD and engineering-related activities based on forecast, ranging from components being updated by suppliers, where the BOMs have to be updated with new item numbers, to advances in technology that offer the opportunity to produce new innovative products. Further research can follow up on these internal and external forecast-based drivers, for instance, by discussing suppliers’ and customers’ roles in NPD (see, e.g., Eslami and Lakemond, 2016).
7.3.2 Establishing decoupling thinking as a theory In answering RQ1, decoupling thinking was found useful for operationalizing the concept of demand driven. Answering RQ2 revealed that decoupling thinking or parts of it had even been framed as theories, such as decoupling theory (Wikner, 2014a), CODP theory (Cannas et al., 2018) and flow theory (Wikner, 2018). This research acknowledges that decoupling thinking possesses all the elementary elements of a theory. However, due to some relatively new constructs (e.g., USIDP and DSIDP) that have not undergone a satisfactory number of description, explanation and testing cycles, it still has to be considered a pre-theory, based on Merriam’s (2009) view on theory. Further work could thus continue to establish decoupling thinking as a theory by the iterative cycle of describing, explaining and testing the constructs, propositions, logic and boundary conditions of decoupling thinking.
101
7.3.3 Expanding the DDSCOMS framework for effectiveness In answering the four RQs and fulfilling the research purpose, the DDSCOMS framework for effectiveness was developed. As previously stated, this framework contributes to the literature by proving the relations between DDSCOMSs and financial performance in terms of ROI, using the constructs found within decoupling thinking. However, in answering RQ2 and RQ3, the focus was on the constructs that were considered to have strong relations to the selected DDSCOMSs, excluding EUS and I. Similarly, in answering RQ4, the focus was on the physical material flow; as such, the information-based constructs (i.e., DIDP, USIDP and DSIDP) were not addressed. Hence, the DDSCOMS framework presents the transitive relations between the DDSCOMSs and ROI, using the risk-based and the variant-based constructs. However, the relations between the DDSCOMSs and the control-based constructs, as well as between ROI and the information-based constructs, are left for further research. The framework could also be expanded by including other constructs, DDSCOMSs and/or financial performance measures in the future.
7.3.4 Benefits of using the displacement typology When answering RQ2, it was found that the literature on postponement offered mixed answers to the relations between postponement and the risk-based and the variant-based constructs of decoupling thinking. To reconcile these conflicting findings, a displacement typology was developed using analytical conceptual research, that is, in a logical way using the existing literature on postponement and decoupling thinking. Although the typology is illustrated using secondary empirical data, the practical use of the typology is not fully recognized. Using either primary or secondary data, the typology for displacement could be applied to and compared with other typologies (e.g., Forza et al., 2008) or representations of postponement (Alderson, 1950; Lee, 1998; Yang and Burns, 2003), for instance. From such comparison(s), the operational benefits of using the typology to compare the displacement of different supply chain operation activities can be better understood.
7.3.5 Improving the DDSCOMS process for maintaining supply chain fit In answering RQ2 and RQ3, the DDSCOMS process for maintaining supply chain fit was proposed. This process presents an avenue for further research. First, the process stems only from using analytical conceptual research. Hence, the operational benefits of the process could be empirically tested, such as by investigating the application in practice and possibly supplementing it with procedures to support its practical use. One way is to apply the process in one or several demand-driven manufacturing companies, using a case study approach. Second, the process could be extended, including other DDSCOMSs. Third, this research only includes a subset of the constructs of decoupling thinking presented in the literature (see, e.g., Noroozi and Wikner, 2016; Wikner, 2014a, 2018 for other constructs). Hence, more constructs of decoupling thinking could be added to the already established relations, where the relations between the two control-based
102
constructs and the DDSCOMSs should also be researched. In fact, the approach of using transitive relations through the constructs of decoupling thinking facilitates the ability to include additional constructs, as well as DDSCOMSs.
7.3.6 Augmenting lead times’ implications for ROI Finally, the answer to RQ4 presents strategic lead times’ implications for the absolute measures of financial performance. These implications are by no means exhaustive, and it is acknowledged that other implications and strategic lead times exist. For example, in terms of controllability, it would be interesting to complement the relations and include the downstream external lead time (EDS). Just as EUS relates to the purchased material and the supplier in many instances, EDS should relate to customers and third-party actors in charge of distributing the products (movement) to the customers. As such, facing the customers, EDS might have direct or indirect implications for revenue, for instance. Other studies could address strategic lead times’ implications for broader performance measures, such as resilience and sustainability. In fact, during the second focus group session in Study D, R1 and R13 briefly discussed the implications of strategic lead times for non-financial performance measures, such as environmental sustainability. Additional qualitative studies can expand on the implications identified in this research and complement them by including more constructs, such as EDS, as well as the information-based constructs (DIDP, USIDP and DSIDP). Furthermore, despite the possibility of operationalizing strategic lead times’ implications for ROI through a time-phased BOM tool, the findings could be augmented with a method or a procedure to support the practical use of the results.
103
References Agarwal, A., Shankar, R. and Tiwari, M.K. (2006), “Modeling the metrics of lean, agile
and leagile supply chain: an ANP-based approach”, European Journal of Operational Research, Vol. 173 No. 1, pp. 211–225.
Ågren, B. (1986), Påverkande faktorer vid bestämning av kundorderpunkten: en förstudie till kundorderpunktprojektet i Ramprogrammet för MA-forskning [In Swedish], Linköping University, Department of Management and Economics, Linköping, Sweden.
Ågren, B. (1992), Förändring av ledtider och kapitalbindning i kundorderstyrda produktionsflöden [In Swedish], Linköping University, Department of Management and Economics, Linköping, Sweden.
Aitken, J., Childerhouse, P., Christopher, M. and Towill, D.R. (2005), “Designing and managing multiple pipelines”, Journal of Business Logistics, Vol. 26 No. 2, pp. 73–96.
Akinc, U. and Meredith, J.R. (2015), “Make-to-forecast: customization with fast delivery”, International Journal of Operations & Production Management, Vol. 35 No. 5, pp. 728–750.
Aktan, H.E. and Akyuz, G. (2017), “Positioning the decoupling point along a supply chain: a case study”, International Journal of Productivity and Quality Management, Vol. 22 No. 3, pp. 309–339.
Alderson, W. (1950), “Marketing efficiency and the principle of postponement”, Cost and Profit Outlook, Vol. 3 No. 4, pp. 1–3.
Alford, D., Sackett, P. and Nelder, G. (2000), “Mass customisation — an automotive perspective”, International Journal of Production Economics, Vol. 65 No. 1, pp. 99–110.
Allen, E. (2009), Fundamentals of building construction: materials and methods (5th ed.), Wiley, Hoboken, NJ.
Alvesson, M. and Sköldberg, K. (2008), Tolkning och reflektion: vetenskapsfilosofi och kvalitativ metod (Vol. 2), Studentlitteratur, Denmark.
Amadeus. (2020), Amadeus: a database of comparable financial information for public and private companies across Europe. Retrieved from https://amadeus.bvdinfo.com
Amaro, G., Hendry, L. and Kingsman, B. (1999), “Competitive advantage, customisation and a new taxonomy for non make‐to‐stock companies”, International Journal of Operations & Production Management, Vol. 19 No. 4, pp. 349–371.
Andries, B. and Gelders, L. (1995), “Time‐based manufacturing logistics”, Logistics Information Management, Vol. 8 No. 3, pp. 30–36.
APICS Dictionary. (2013), APICS Dictionary: the essential supply chain reference (Blackstone Jr, J.H. (Ed.) (14th ed.), APICS, Chicago.
Aviv, Y. (2001), “The effect of collaborative forecasting on supply chain performance”, Management Science, Vol. 47 No. 10, pp. 1326–1343.
Aviv, Y. and Federgruen, A. (1999), “The benefits of design for postponement”, in Tayur, S., Ganeshan, R. and Magazine, M. (Eds.), Quantitative models for supply chain management, Springer US, Boston, MA, pp. 553–584.
Aviv, Y. and Federgruen, A. (2001), “Design for postponement: a comprehensive characterization of its benefits under unknown demand distributions”, Operations Research, Vol. 49 No. 4, pp. 578–598.
104
Ayers, J.B. and Malmberg, D.M. (2002), “Supply chain systems: are you ready?”, Information Strategy: The Executive’s Journal, Vol. 19 No. 1, pp. 18–27.
Bacharach, S.B. (1989), “Organizational theories: some criteria for evaluation” (Special Forum on Theory Building), Academy of Management Review, Vol. 14 No. 4, pp. 496–515.
Bäckstrand, J. (2012), A method for customer-driven purchasing: aligning supplier interaction and customer-driven manufacturing. (Doctoral dissertation), School of Engineering, Jönköping University, Department of Industrial Engineering and Management. Retrieved from http://www.diva-portal.org/smash/get/diva2:570194/FULLTEXT02.pdf (no. 2)
Bäckstrand, J. and Wikner, J. (2013, 10–13 December), “Time-phasing and decoupling points as analytical tools for purchasing”. Paper presented at the IEEE International Conference on Industrial Engineering and Engineering Management, Bangkok, Thailand.
Banerjee, A., Sarkar, B. and Mukhopadhyay, S.K. (2012), “Multiple decoupling point paradigms in a global supply chain syndrome: a relational analysis”, International Journal of Production Research, Vol. 50 No. 11, pp. 3051–3065.
Barratt, M. and Barratt, R. (2011), “Exploring internal and external supply chain linkages: evidence from the field”, Journal of Operations Management, Vol. 29 No. 5, pp. 514–528.
Barratt, M. and Oke, A. (2007), “Antecedents of supply chain visibility in retail supply chains: a resource-based theory perspective”, Journal of Operations Management, Vol. 25 No. 6, pp. 1217–1233.
Berry, W.L., Hill, T.J. and Klompmaker, J.E. (1995), “Customer‐driven manufacturing”, International Journal of Operations & Production Management, Vol. 15 No. 3, pp. 4–15.
Bhattacherjee, A. (2012), Social science research: principles, methods, and practices. Textbooks Collection 3. Retrieved from http://scholarcommons.usf.edu/oa_textbooks/3
Blackburn, J.D. (2012), “Valuing time in supply chains: establishing limits of time-based competition”, Journal of Operations Management, Vol. 30 No. 5, pp. 396–405.
Blackburn, J.D., Guide Jr, V.D.R., Souza, G.C. and Van Wassenhove, L.N. (2004), “Reverse supply chains for commercial returns”, California Management Review, Vol. 46 No. 2, pp. 6–22.
Blumberg, B., Cooper, D. and Schindler, P. (2011), Business research methods (3rd European ed.), McGraw-Hill Higher Education, Maidenhead.
Boone, C.A., Craighead, C.W. and Hanna, J.B. (2007), “Postponement: an evolving supply chain concept”, International Journal of Physical Distribution & Logistics Management, Vol. 37 No. 8, pp. 594–611.
Bowersox, D.J. and Closs, D.J. (1996), Logistical management: the integrated supply chain process (International ed.), McGraw-Hill, Singapore.
Bradley, P. (2002), “How far can you see?”, Logistics Management, Vol. 41 No. 9, pp. 27–34.
Brandon-Jones, E., Squire, B. and Van Rossenberg, Y.G.T. (2015), “The impact of supply base complexity on disruptions and performance: the moderating effects of slack and visibility”, International Journal of Production Research, Vol. 53 No. 22, pp. 6903–6918.
105
Bucklin, L.P. (1965), “Postponement, speculation and the structure of distribution channels”, Journal of Marketing Research, Vol. 2 No. 1, pp. 26–31.
Buffington, J. (2011), “Comparison of mass customization and generative customization in mass markets”, Industrial Management & Data Systems, Vol. 111 No. 1, pp. 41–62.
Busse, C., Schleper, M.C., Weilenmann, J. and Wagner, S.M. (2017), “Extending the supply chain visibility boundary: utilizing stakeholders for identifying supply chain sustainability risks”, International Journal of Physical Distribution & Logistics Management, Vol. 47 No. 1, pp. 18–40.
Cannas, V.G., Pero, M., Rossi, T. and Gosling, J. (2018), “Integrate customer order decoupling point and mass customisation concepts: a literature review”, in Hankammer, S., Nielsen, K., Piller, F., Schuh, G. and Wang, N. (Eds.), Customization 4.0, Springer Proceedings in Business and Economics, Springer International Publishing, Cham, pp. 495–517.
Caridi, M., Crippa, L., Perego, A., Sianesi, A. and Tumino, A. (2010a), “Do virtuality and complexity affect supply chain visibility?”, International Journal of Production Economics, Vol. 127 No. 2, pp. 372–383.
Caridi, M., Crippa, L., Perego, A., Sianesi, A. and Tumino, A. (2010b), “Measuring visibility to improve supply chain performance: a quantitative approach”, Benchmarking: An International Journal, Vol. 17 No. 4, pp. 593–615.
Caridi, M., Perego, A. and Tumino, A. (2013), “Measuring supply chain visibility in the apparel industry”, Benchmarking: An International Journal, Vol. 20 No. 1, pp. 25–44.
Carlson, J.A. (2010), “Avoiding traps in member checking”, Qualitative Report, Vol. 15 No. 5, pp. 1102–1113.
Carswell, A.T. (2012), The encyclopedia of housing (2nd ed.), Sage Publications, Los Angeles, CA.
Carter, C.R. and Easton, P.L. (2011), “Sustainable supply chain management: evolution and future directions”, International Journal of Physical Distribution & Logistics Management, Vol. 41 No. 1, pp. 46–62.
Carter, C.R. and Rogers, D.S. (2008), “A framework of sustainable supply chain management: moving toward new theory”, International Journal of Physical Distribution & Logistics Management, Vol. 38 No. 5, pp. 360–387.
Ceryno, P.d.S., Scavarda, L.F., Klingebiel, K. and Grossmann, A.R. (2013), “Order penetration point: a content analysis approach”. Paper presented at the 22nd International Conference on Production Research, Foz do Iguaçú, Brasil.
Chang, W., Ellinger Alexander, E. and Blackhurst, J. (2015), “A contextual approach to supply chain risk mitigation”, International Journal of Logistics Management, Vol. 26 No. 3, pp. 642–656.
Chang, W. and Taylor, S.A. (2016), “The effectiveness of customer participation in new product development: a meta-analysis”, Journal of Marketing, Vol. 80 No. 1, pp. 47–64.
Chase, C.W. (2013), Demand-driven forecasting: a structured approach to forecasting, John Wiley & Sons, Incorporated, Somerset, NJ.
Chatrathi, P.R. and Zhengyuan, W. (1995), “Evaluating alternative segmentation strategies in standard industrial markets”, European Journal of Marketing, Vol. 29 No. 2, pp. 58–75.
Childerhouse, P., Aitken, J. and Towill, D.R. (2002), “Analysis and design of focused demand chains”, Journal of Operations Management, Vol. 20 No. 6, pp. 675–689.
106
Childerhouse, P. and Towill, D.R. (2000), “Engineering supply chains to match customer requirements”, Logistics Information Management, Vol. 13 No. 6, pp. 337–346.
Chopra, S. and Meindl, P. (2013), Supply chain management: strategy, planning & operation (5th ed.), Pearson Education Limited, Harlow.
Christensen, W.J., Germain, R.N. and Birou, L. (2007), “Variance vs average: supply chain lead‐time as a predictor of financial performance”, Supply Chain Management: An International Journal, Vol. 12 No. 5, pp. 349–357.
Christiansen, P.E., Kotzab, H. and Mikkola, J.H. (2007), “Coordination and sharing logistics information in leagile supply chains”, International Journal of Procurement Management, Vol. 1 No. 1–2, pp. 79–96.
Christopher, M. (1998), Logistics and supply chain management: strategies for reducing costs and improving services (2nd ed. Vol. 1), Financial Times, Pitman Publishing, London.
Christopher, M. (2000), “The agile supply chain: competing in volatile markets”, Industrial Marketing Management, Vol. 29 No. 1, pp. 37–44.
Christopher, M. and Lee, H. (2004), “Mitigating supply chain risk through improved confidence”, International Journal of Physical Distribution & Logistics Management, Vol. 34 No. 5, pp. 388–396.
Christopher, M., Peck, H. and Towill, D.R. (2006), “A taxonomy for selecting global supply chain strategies”, International Journal of Logistics Management, Vol. 17 No. 2, pp. 277–287.
Christopher, M. and Towill, D.R. (2000), “Supply chain migration from lean and functional to agile and customised”, Supply Chain Management, Vol. 5 No. 4, pp. 206–213.
Christopher, M. and Towill, D.R. (2001), “An integrated model for the design of agile supply chains”, International Journal of Physical Distribution & Logistics Management, Vol. 31 No. 4, pp. 235–246.
Christopher, M. and Towill, D.R. (2002), “Developing market specific supply chain strategies”, International Journal of Logistics Management, Vol. 13 No. 1, pp. 1–14.
Cooper, J.C. (1993), “Logistics strategies for global businesses”, International Journal of Physical Distribution & Logistics Management, Vol. 23 No. 4, pp. 12–23.
Coronado, A.E., Lyons, A.C., Kehoe, D.F. and Coleman, J. (2004), “Enabling mass customization: extending build-to-order concepts to supply chains”, Production Planning & Control, Vol. 15 No. 4, pp. 398–411.
Council of Logistics Management. (1995), World class logistics: the challenge of managing continuous change, Council of Logistics Management, Oak Brook, IL.
Creswell, J.W. (2002), Research design: qualitative, quantitative, and mixed methods approaches (2nd ed.), Sage Publications, Thousand Oaks.
Croson, R. and Donohue, K. (2003), “Impact of POS data sharing on supply chain management: an experimental study”, Production and Operations Management, Vol. 12 No. 1, pp. 1–11.
D’Alessandro, A.J. and Baveja, A. (2000), “Divide and conquer: Rohm and Haas’ response to a changing specialty chemicals market”, Interfaces, Vol. 30 No. 6, pp. 1–16.
Da Silveira, G., Borenstein, D. and Fogliatto, F.S. (2001), “Mass customization: literature review and research directions”, International Journal of Production Economics, Vol. 72 No. 1, pp. 1–13.
107
Daaboul, J. and Da Cunha, C.M. (2014). “Differentiation and customer decoupling points: key value enablers for mass customization”, in Grabot, B., Vallespir, B., Gomes, S., Bouras, A. and Kiritsis, D. (Eds.), Advances in production management systems. Innovative and knowledge-based production management in a global-local world, Springer International Publishing, Cham, pp. 43–50.
Daaboul, J., Da Cunha, C., Le Duigou, J., Novak, B. and Bernard, A. (2015), “Differentiation and customer decoupling points: an integrated design approach for mass customization”, Concurrent Engineering, Vol. 23 No. 4, pp. 284–295.
Davis, S.M. (1987), Future perfect, Addison-Welsey Publishing Company, Inc., Reading, MA.
Davis, S.M. (1989), “From ‘future perfect’: mass customizing”, Planning Review, Vol. 17 No. 2, pp. 16–21.
De Treville, S., Bicer, I., Chavez-Demoulin, V., Hagspiel, V., Schürhoff, N., Tasserit, C. and Wager, S. (2014), “Valuing lead time”, Journal of Operations Management, Vol. 32 No. 6, pp. 337–346.
Debreu, G. (1987), Theory of value: an axiomatic analysis of economic equilibrium, Yale University Press, London.
Defee, C.C. and Stank, T.P. (2005), “Applying the strategy-structure-performance paradigm to the supply chain environment”, International Journal of Logistics Management, Vol. 16 No. 1, pp. 28–50.
Dekkers, R. (2006), “Engineering management and the order entry point”, International Journal of Production Research, Vol. 44 No. 18–19, pp. 4011–4025.
Dekkers, R., Chang, C.M. and Kreutzfeldt, J. (2013), “The interface between ‘product design and engineering’ and manufacturing: a review of the literature and empirical evidence”, International Journal of Production Economics, Vol. 144 No. 1, pp. 316–333.
Dekkers, R. and Sopers, F. (2001), “Production control and the order entry point”. Paper presented at the 16th International Conference on Production Research.
Deming, W.E. (1994), The new economics for industry, government, education (2nd ed.), MIT Press, Cambridge, MA.
Denscombe, M. (2010), The good research guide: for small-scale social research projects (4th ed.), Open University Press, Maidenhead.
Denyer, D. and Tranfield, D. (2006), “Using qualitative research synthesis to build an actionable knowledge base”, Management Decision, Vol. 44 No. 2, pp. 213–227.
Denzin, N.K. (2009), The research act: a theoretical introduction to sociological methods, Prentice Hall, Englewood Cliffs, NJ.
van Donk, D.P. (2000), “Customer‐driven manufacturing in the food processing industry”, British Food Journal, Vol. 102 No. 10, pp. 739–747.
van Donk, D.P. (2001), “Make to stock or make to order: the decoupling point in the food processing industries”, International Journal of Production Economics, Vol. 69 No. 3, pp. 297–306.
Droge, C., Jayaram, J. and Vickery, S.K. (2004), “The effects of internal versus external integration practices on time-based performance and overall firm performance”, Journal of Operations Management, Vol. 22 No. 6, pp. 557–573.
Drucker, P.F. (2007), The effective executive (2007 ed.), Butterworth-Heinemann, Oxford, UK.
Drury, C. (2000), Management and cost accounting (5th ed.), Business Press, London.
108
Duray, R. (2002), “Mass customization origins: mass or custom manufacturing?”, International Journal of Operations & Production Management, Vol. 22 No. 3, pp. 314–328.
Duray, R., Ward, P.T., Milligan, G.W. and Berry, W.L. (2000), “Approaches to mass customization: configurations and empirical validation”, Journal of Operations Management, Vol. 18 No. 6, pp. 605–625.
Earley, K. (2013), “Supply chain transparency: forging better relationships with suppliers”, The Guardian, Vol. 9.
Eisenhardt, K.M. (1989), “Building theories from case study research”, Academy of Management Review, Vol. 14 No. 4, pp. 532–550.
Eisenhardt, K.M. and Graebner, M.E. (2007), “Theory building from case: opportunities and challenges”, Academy of Management Journal, Vol. 50 No. 1, pp. 25–32.
Ellström, P.-E. (2007, 8–11 May), “Knowledge creation through interactive research: a learning perspective”. Paper presented at the HHS-07 Conference, Jönköping University, Jönköping, Sweden.
Eslami, M.H. and Lakemond, N. (2016), “Knowledge integration with customers in collaborative product development projects”, Journal of Business & Industrial Marketing, Vol. 31 No. 7, pp. 889–900.
Feitzinger, E. and Lee, H.L. (1997), “Mass customization at Hewlett-Packard: the power of postponement”, Harvard Business Review, Vol. 75 No. January–February, pp. 116–121.
Fisher, M.L. (1997), “What is the right supply chain for your product?”, Harvard Business Review, Vol. 75 No. March–April, pp. 105–116.
Flynn, B.B., Huo, B. and Zhao, X. (2010), “The impact of supply chain integration on performance: a contingency and configuration approach”, Journal of Operations Management, Vol. 28 No. 1, pp. 58–71.
Fogliatto, F.S. and da Silveira, G.J.C. (2008), “Mass customization: a method for market segmentation and choice menu design”, International Journal of Production Economics, Vol. 111 No. 2, pp. 606–622.
Fogliatto, F.S., da Silveira, G.J.C. and Borenstein, D. (2012), “The mass customization decade: an updated review of the literature”, International Journal of Production Economics, Vol. 138 No. 1, pp. 14–25.
Foliente, G.C. (2000), “Developments in performance-based building codes and standards”, Forest Products Journal, Vol. 50 No. 7/8, pp. 12–21.
Forza, C., Salvador, F. and Trentin, A. (2008), “Form postponement effects on operational performance: a typological theory”, International Journal of Operations & Production Management, Vol. 28 No. 11, pp. 1067–1094.
Francis, V. (2008), “Supply chain visibility: lost in translation?”, Supply Chain Management: An International Journal, Vol. 13 No. 3, pp. 180–184.
Fuller, J.B., O’Conor, J. and Rawlinson, R. (1993), “Tailored logistics: the next advantage”, Harvard Business Review, Vol. 71 No. 3, pp. 87–98.
García‐Dastugue, S.J. and Lambert, D.M. (2007), “Interorganizational time‐based postponement in the supply chain”, Journal of Business Logistics, Vol. 28 No. 1, pp. 57–81.
Garg, A. and Lee, H.L. (1999), “Managing product variety: an operations perspective”, in Tayur, S., Ganeshan, R., and Magazine, M. (Eds.), Quantitative models for supply chain management, Springer Science+Business Media, New York, NY, pp. 467–490.
109
Garg, A. and Tang, C.S. (1997), “On postponement strategies for product families with multiple points of differentiation”, IIE Transactions, Vol. 29 No. 8, pp. 641–650.
Gelsomino, L.M., Mangiaracina, R., Perego, A. and Tumino, A. (2016), “Supply chain finance: a literature review”, International Journal of Physical Distribution & Logistics Management, Vol. 46 No. 4, pp. 348–366.
Ghalehkhondabi, I., Sormaz, D. and Weckman, G. (2016), “Multiple customer order decoupling points within a hybrid MTS/MTO manufacturing supply chain with uncertain demands in two consecutive echelons”, OPSEARCH, Vol. 53 No. 4, pp. 976–997.
Ghosh, S., Hersh, M. and Sharpe, R. (2018), “Driving profitability via analytics-based value chain segmentation”, CSCMP Supply Chain Quarterly, (Quarter 1). Retrieved from http://www.supplychainquarterly.com/topics/Strategy/20180228-driving-profitability-via-analytics-based-value-chain-segmentation/
Giesberts, P.M. and van der Tang, L. (1992), “Dynamics of the customer order decoupling point: impact on information systems for production control”, Production Planning & Control, Vol. 3 No. 3, pp. 300–313.
Gilmore, J.H. and Pine, B.J. (1997), “The four faces of mass customization”, Harvard Business Review, Vol. 75 No. January–February, pp. 91–101.
Gligor, D.M. (2016), “The role of supply chain agility in achieving supply chain fit”, Decision Sciences, Vol. 47 No. 3, pp. 524–553.
Gligor, D.M. (2017), “Re-examining supply chain fit: an assessment of moderating factors”, Journal of Business Logistics, Vol. 38 No. 4, pp. 253–265.
Godinho, F.M. and Veloso, S.E. (2013), “From time-based competition (TBC) to quick response manufacturing (QRM): the evolution of research aimed at lead time reduction”, International Journal of Advanced Manufacturing Technology, Vol. 64 No. 5–8, pp. 1177–1191.
Godsell, J., Diefenbach, T., Towill, D.R. and Christopher, M. (2011), “Enabling supply chain segmentation through demand profiling”, International Journal of Physical Distribution & Logistics Management, Vol. 41 No. 3, pp. 296–314.
Goh, M., De Souza, R., Zhang, A.N., He, W. and Tan, P.S. (2009, 25–27 May), “Supply chain visibility: a decision making perspective”. Paper presented at the 2009 4th IEEE Conference on Industrial Electronics and Applications.
Goldman, S.L., Nagel, R.N. and Preiss, K. (1995), Agile competitors and virtual organizations: strategies for enriching the customer, Van Nostrand Reinhold, New York.
Goldman, S.L. and Preiss, K. (Ed.). (1991), 21st century manufacturing enterprise strategy: an industry-led view, Iacocca Institute, Lehigh University, Bethlehem, PA.
Goldratt, E.M. and Cox, J. (2016), The goal: a process of ongoing improvement (3rd revised ed.), Routledge, New York, NY.
Goldsby, T.J., Griffis, S.E. and Roath, A.S. (2006), “Modeling lean, agile, and leagile supply chain strategies”, Journal of Business Logistics, Vol. 27 No. 1, pp. 57–80.
Gosling, J., Hewlett, B. and Naim, M.M. (2017), “Extending customer order penetration concepts to engineering designs”, International Journal of Operations & Production Management, Vol. 37 No. 4, pp. 402–422.
Greenhalgh, T. and Peacock, R. (2005), “Effectiveness and efficiency of search methods in systematic reviews of complex evidence: audit of primary sources”, BMJ, Vol. 331 No. 7524, pp. 1064–1065.
110
Gregory, I.C. and Rawling, S. (1997), Profit from time: speed up business improvement by implementing time compression, Mcmillan Business, London.
Guba, E.G. and Lincoln, Y.S. (1981), Effective evaluation: improving the usefulness of evaluation results through responsive and naturalistic approaches, Jossey-Bass, San Francisco, CA.
Guba, E.G. and Lincoln, Y.S. (1989), Fourth generation evaluation, Sage, Newbury Park, CA.
Gunasekaran, A., Patel, C. and Tirtiroglu, E. (2001), “Performance measures and metrics in a supply chain environment”, International Journal of Operations & Production Management, Vol. 21 No. 1/2, pp. 71–87.
Gunnarsson, E., Hansen, H.P., Nielsen, B.S. and Sriskandarajah, N. (2015), Action research for democracy: new ideas and perspectives from Scandinavia (Vol. 17), Routledge, New York, NY.
Gupta, D. and Benjaafar, S. (2004), “Make-to-order, make-to-stock, or delay product differentiation? A common framework for modeling and analysis”, IIE Transactions, Vol. 36 No. 6, pp. 529–546.
Hagel, J., Brown, J.S. and Davison, L. (2010, 30 November), “The best way to measure company performance”. Retrieved from https://hbr.org/2010/03/the-best-way-to-measure-compan.html
Hallavo, V. (2015), “Superior performance through supply chain fit: a synthesis”, Supply Chain Management: An International Journal, Vol. 20 No. 1, pp. 71–82.
Halldórsson, Á. and Aastrup, J. (2003), “Quality criteria for qualitative inquiries in logistics”, European Journal of Operational Research, Vol. 144 No. 2, pp. 321–332.
Halldórsson, Á., Kotzab, H., Mikkola, J.H. and Skjøtt-Larsen, T. (2007), “Complementary theories to supply chain management”, Supply Chain Management: An International Journal, Vol. 12 No. 4, pp. 284–296.
Handfield, R.B. and Pannesi, R.T. (1992), “An empirical study of delivery speed and reliability”, International Journal of Operations & Production Management, Vol. 12 No. 2, pp. 58–72.
Harrison, W.T. and Horngren, C.T. (2008), Financial accounting (7th ed.), Pearson Prentice Hall, Upper Saddle River, NJ.
Harrison, D. and Kjellberg, H. (2010), “Segmenting a market in the making: industrial market segmentation as construction”, Industrial Marketing Management, Vol. 39 No. 5, pp. 784–792.
Haug, A., Ladeby, K. and Edwards, K. (2009), “From engineer‐to‐order to mass customization”, Management Research News, Vol. 32 No. 7, pp. 633–644.
Hedén, E. and Tiedemann, F. (2014), How to improve the inbound flow of a manufacturing company: analyzing and refining the customer-driven purchasing method. (Master’s thesis), School of Engineering, Jönköping University, Department of Industrial Engineering and Management. Retrieved from http://hj.diva-portal.org/smash/get/diva2:740295/FULLTEXT01.pdf
Hedenstierna, P. and Ng, A.H.C. (2011), “Dynamic implications of customer order decoupling point positioning”, Journal of Manufacturing Technology Management, Vol. 22 No. 8, pp. 1032–1042.
Hemmati, S. and Rabbani, M. (2010), “Make-to-order/make-to-stock partitioning decision using the analytic network process”, International Journal of Advanced Manufacturing Technology, Vol. 48 No. 5, pp. 801–813.
111
Heydari, J., Mahmoodi, M. and Taleizadeh, A.A. (2016), “Lead time aggregation: a three-echelon supply chain model”, Transportation Research Part E: Logistics and Transportation Review, Vol. 89 No. May, pp. 215–233.
Hilletofth, P. (2009), “How to develop a differentiated supply chain strategy”, Industrial Management & Data Systems, Vol. 109 No. 1, pp. 16–33.
Hines, T. (2013), Supply chain strategies: demand driven and customer focused (2nd ed.), Routledge, New York, NY.
Hines, P. and Rich, N. (1997), “The seven value stream mapping tools”, International Journal of Operations & Production Management, Vol. 17 No. 1, pp. 46–64.
Hoekstra, S. and Romme, J. (Ed.). (1992), Integral logistic structures: developing customer-oriented goods flow, McGraw-Hill, London.
Hofmann, E. and Knébel, S. (2013), “Alignment of manufacturing strategies to customer requirements using analytical hierarchy process”, Production & Manufacturing Research, Vol. 1 No. 1, pp. 19–43.
Högskolan i Jönköping. (2007), Policy för open access och elektronisk registrering av publicerat material. Retrieved from https://ju.se/download/18.6d29d72d12b581f232180003889/1520578771509/policy_open_access.pdf
Holweg, M. (2005), “The three dimensions of responsiveness”, International Journal of Operations & Production Management, Vol. 25 No. 7, pp. 603–622.
Huang, Y.-Y. and Li, S.-J. (2008), “Suitable application situations of different postponement approaches: standardization vs. modularization”, Journal of Manufacturing Systems, Vol. 27 No. 3, pp. 111–122.
Huiskonen, J., Niemi, P. and Pirttilä, T. (2003), “An approach to link customer characteristics to inventory decision making”, International Journal of Production Economics, Vol. 81–82 No. January, pp. 255–264.
Hultman, J. and Axelsson, B. (2007), “Towards a typology of transparency for marketing management research”, Industrial Marketing Management, Vol. 36 No. 5, pp. 627–635.
Ivanov, D., Tsipoulanidis, A. and Schönberger, J. (2017), Global supply chain and operations management: a decision-oriented introduction to the creation of value, Springer, Cham.
Jayaram, J., Vickery, S.K. and Droge, C. (1999), “An empirical study of time‐based competition in the North American automotive supplier industry”, International Journal of Operations & Production Management, Vol. 19 No. 10, pp. 1010–1034.
Jenkins, M. and McDonald, M. (1997), “Market segmentation: organizational archetypes and research agendas”, European Journal of Marketing, Vol. 31 No. 1, pp. 17–32.
Jesson, J., Matheson, L. and Lacey, F.M. (2011), Doing your literature review: traditional and systematic techniques, Sage, London.
Johansen, J.A., Madsen, E.S. and Arlbjørn, J.S. (2012, 7–8 June), “Supply chain management models: a question of mudlling throught?” Paper presented at the 24th Annual Nordic Logistics Research Network Conference (NOFOMA), Naantali, Finland.
Johnson, W.C. and Weinstein, A. (2004), Superior customer value in the new economy: concepts and cases, CRC Press, New York, NY.
Jönköping University. (2017, 10 January). About DiVA [Digitala Vetenskapliga Arkivet/Digital Scientific Archive]. Retrieved from http://ju.se/library/research--teaching-support/diva---academic-archive-online.html
112
Kaipia, R. and Hartiala, H. (2006), “Information‐sharing in supply chains: five proposals on how to proceed”, International Journal of Logistics Management, Vol. 17 No. 3, pp. 377–393.
Käkelä, N. (2019), Customization-based interaction in ETO. (Licentiate dissertation), School of Engineering, Jönköping University. Retrieved from http://urn.kb.se/resolve?urn=urn:nbn:se:hj:diva-46868 (50)
Kara, A. and Kaynak, E. (1997), “Markets of a single customer: exploiting conceptual developments in market segmentation”, European Journal of Marketing, Vol. 31 No. 11/12, pp. 873–895.
Kiely, D.A. (1998), “Synchronizing supply chain operations with consumer demand using customer data”, Journal of Business Forecasting, Vol. 17 No. 4, pp. 3–9.
Kim, S.-H. (2014), “Postponement for designing mass-customized supply chains: categorization and framework for strategic decision making”, International Journal of Supply Chain Management, Vol. 3 No. 1, pp. 1–11.
Kim, S.-H., Fowler, J.W., Shunk, D.L. and Pfund, M.E. (2012), “Improving the push–pull strategy in a serial supply chain by a hybrid push–pull control with multiple pulling points”, International Journal of Production Research, Vol. 50 No. 19, pp. 5651–5668.
Klueber, R. and O’Keefe, R.M. (2013), “Defining and assessing requisite supply chain visibility in regulated industries”, Journal of Enterprise Information Management, Vol. 26 No. 3, pp. 295–315.
Kotha, S. (1995), “Mass customization: implementing the emerging paradigm for competitive advantage”, Strategic Management Journal, Vol. 16 No. S1, pp. 21–42.
Kraljic, P. (1983), “Purchasing must become supply management”, Harvard Business Review, Vol. 61 No. 5, pp. 109–117.
Krishnamurthy, R. and Yauch, C.A. (2007), “Leagile manufacturing: a proposed corporate infrastructure”, International Journal of Operations & Production Management, Vol. 27 No. 6, pp. 588–604.
Kumar, A., Gattoufi, S. and Reisman, A. (2007), “Mass customization research: trends, directions, diffusion intensity, and taxonomic frameworks”, International Journal of Flexible Manufacturing Systems, Vol. 19 No. 4, pp. 637–665.
LaLonde, B.J. and Mason, B.E. (1985), “Some thoughts on logistics policy and strategies: management challenges for the 1980s”, International Journal of Physical Distribution & Materials Management, Vol. 15 No. 5, pp. 5–15.
Lamming, R.C., Caldwell, N.D., Harrison, D.A. and Phillips, W. (2001), “Transparency in supply relationships: concept and practice”, Journal of Supply Chain Management, Vol. 37 No. 3, pp. 4–10.
Lampel, J. and Mintzberg, H. (1996), “Customizing customization”, MIT Sloan Management Review, Vol. 38 No. 1, pp. 21–30.
Law, J. (Ed.). (2016), A dictionary of business and management (6th ed.), Oxford University Press, Oxford.
Lee, H.L. (1998), “Postponement for mass customization: satisfying customer demands for tailor-made products”, in Gattorna, J. (Ed.), Strategic supply chain alignment: best practice in supply chain management, Gower, Aldershot, pp. 77–91.
Lee, H.L. (2002), “Aligning supply chain strategies with product uncertainties”, California Management Review, Vol. 44 No. 3, pp. 105–119.
113
Lee, H.L., Billington, C. and Carter, B. (1993), “Hewlett-Packard gains control of inventory and service through design for localization”, Interfaces, Vol. 23 No. 4, pp. 1–11.
Lee, H.L., Padmanabhan, V. and Whang, S. (1997a), “The bullwhip effect in supply chains”, Sloan Management Review, Vol. 38 No. 3, pp. 93–102.
Lee, H.L., Padmanabhan, V. and Whang, S. (1997b), “Information distortion in a supply chain: the bullwhip effect”, Management Science, Vol. 43 No. 4, pp. 546–558.
Lee, H.L., Padmanabhan, V. and Whang, S. (2004), “Comments on ‘information distortion in a supply chain: the bullwhip effect’”, Management Science, Vol. 50 No. 12 Supplements, pp. 1887–1893.
Lee, H.L. and Tang, C.S. (1997), “Modelling the costs and benefits of delayed product differentiation”, Management Science, Vol. 43 No. 1, pp. 40–53.
Lee, H.L. and Whang, S. (2000), “Information sharing in a supply chain”, International Journal of Manufacturing Technology and Management, Vol. 1 No. 1, pp. 79–93.
Leon, S.M. (2016), Financial intelligence for supply chain managers: understanding the link between operations and corporate financial performance, Pearson Education, Old Tappan, NJ.
Li, J., Cheng, E.T.C. and Wang, S. (2007), “Analysis of postponement strategy for perishable items by EOQ-based models”, International Journal of Production Economics, Vol. 107 No. 1, pp. 31–38.
Liker, J.K. (2004), The Toyota way, McGraw-Hill, New York, NY. Lincoln, Y.S. and Guba, E.G. (1985), Naturalistic inquiry (Vol. 75), Sage, Berverly Hills,
CA. Lovell, A., Saw, R. and Stimson, J. (2005), “Product value‐density: managing diversity
through supply chain segmentation”, International Journal of Logistics Management, Vol. 16 No. 1, pp. 142–158.
MacCarthy, B.L., Brabazon, P.G. and Bramham, J. (2002), “Key value attributes in mass customization”, in Rautenstrauch, C., Seelmann-Eggebert, R. and Turowski, K. (Eds.), Moving into mass customization: information systems and management principles, Springer, Berlin, Heidelberg, pp. 71–87.
MacCarthy, B.L., Brabazon, P.G. and Bramham, J. (2003), “Fundamental modes of operation for mass customization”, International Journal of Production Economics, Vol. 85 No. 3, pp. 289–304.
Mahadevan, K. (2010, 26–28 February), “Supply chain visibility and integration – the current directions in organisations: a comprehensive literature review and research questions”. Paper presented at the 2010 2nd International Conference on Computer and Automation Engineering (ICCAE).
Mahdavi, M. and Olsen, T.L. (2017), “Designing effective supply chains in strategic alignment with demand characteristics and market requirements”, Foundations and Trends® in Technology, Information and Operations Management, Vol. 10 No. 2, pp. 89–208.
Mason, R. and Lalwani, C. (2008), “Mass customised distribution”, International Journal of Production Economics, Vol. 114 No. 1, pp. 71–83.
Mason-Jones, R., Naylor, J.B. and Towill, D.R. (2000a), “Engineering the leagile supply chain”, International Journal of Agile Management Systems, Vol. 2 No. 1, pp. 54–61.
Mason-Jones, R., Naylor, J.B. and Towill, D.R. (2000b), “Lean, agile or leagile? Matching your supply chain to the marketplace”, International Journal of Production Research, Vol. 38 No. 17 SPEC., pp. 4061–4070.
114
Mason-Jones, R. and Towill, D.R. (1997), “Information enrichment: designing the supply chain for competitive advantage”, Supply Chain Management: An International Journal, Vol. 2 No. 4, pp. 137–148.
Mason-Jones, R. and Towill, D.R. (1999), “Using the information decoupling point to improve supply chain performance”, International Journal of Logistics Management, Vol. 10 No. 2, pp. 13–26.
Mather, H. (1984), “Attack your P:D ratio”. Paper presented at the 1984 APICS Conference.
Mather, H. (1988), Competitive manufacturing, Prentice Hall, Englewood Cliffs, NJ. Mather, H. (1999), How to profitably delight your customers, Woodhead Publishing,
Cambridge. McCarthy, I.P. (2004), “Special issue editorial: the what, why and how of mass
customization”, Production Planning & Control, Vol. 15 No. 4, pp. 347–351. Medini, K., Andersen, A.-L., Wuest, T., Christensen, B., Wiesner, S., Romero, D., Liu,
A. and Tao, F. (2019), “Highlights in customer-driven operations management research”, Procedia CIRP, Vol. 86, pp. 12–19.
Melnyk, S.A., Davis, E.W., Spekman, R.E. and Sandor, J. (2010), “Outcome-driven supply chains”, MIT Sloan Management Review, Vol. 51 No. 2, pp. 33–38.
Mendes, P.J. (2011), Demand driven supply chain: a structured and practical roadmap to increase profitability, Springer Science & Business Media, Heidelberg.
Mentzer, J.T., DeWitt, W., Keebler, J.S., Min, S., Nix, N.W., Smith, C.D. and Zacharia, Z.G. (2001), “Defining supply chain management”, Journal of Business Logistics, Vol. 22 No. 2, pp. 1–25.
Meredith, J. (1993), “Theory building through conceptual methods”, International Journal of Operations & Production Management, Vol. 13 No. 5, pp. 3–11.
Merriam, S.B. (2009), Qualitative research: a guide to design and implementation (2nd ed.), Jossey-Bass, San Francisco, CA.
Merriam-Webster Dictionary. (2020a), Operationalize. Retrieved from https://www.merriam-webster.com/dictionary/operationalize
Merriam-Webster Dictionary. (2020b), Strategy. Retrieved from https://www.merriam-webster.com/dictionary/strategy
Merriam-Webster Dictionary. (2020c), Segmentation. Retrieved from https://www.merriam-webster.com/dictionary/segmentation
Merriam-Webster Dictionary. (2020d), Customize. Retrieved from https://www.merriam-webster.com/dictionary/customize
Merriam-Webster Dictionary. (2020e), Transative. Retrieved from https://www.merriam-webster.com/dictionary/transitive
Mikkola, J.H. and Skjøtt-Larsen, T. (2004), “Supply-chain integration: implications for mass customization, modularization and postponement strategies”, Production Planning & Control, Vol. 15 No. 4, pp. 352–361.
Miles, M.B., Huberman, A.M. and Saldaña, J. (2014), Qualitative data analysis: a method sourcebook (3rd ed.), Sage Publications, Thousand Oaks, CA.
Moradlou, H. and Backhouse, C.J. (2016), “A review of manufacturing re-shoring in the context of customer-focused postponement strategies”, Proceedings of the Institution of Mechanical Engineers, Part B: Journal of Engineering Manufacture, Vol. 230 No. 9, pp. 1561–1571.
115
Morgan, T.R., Richey Jr, R.G. and Ellinger, A.E. (2018), “Supplier transparency: scale development and validation”, International Journal of Logistics Management, Vol. 29 No. 3, pp. 959–984.
Naim, M.M. and Gosling, J. (2011), “On leanness, agility and leagile supply chains”, International Journal of Production Economics, Vol. 131 No. 1, pp. 342–354.
Narasimhan, R., Swink, M. and Kim, S.W. (2006), “Disentangling leanness and agility: an empirical investigation”, Journal of Operations Management, Vol. 24 No. 5, pp. 440–457.
Naylor, J.B., Naim, M.M. and Berry, D. (1999), “Leagility: integrating the lean and agile manufacturing paradigms in the total supply chain”, International Journal of Production Economics, Vol. 62 No. 1, pp. 107–118.
Neves, M.F. (2013), Demand driven strategic planning, Routledge, Taylor & Francis, New York, NY.
Nieuwenhuis, P. and Katsifou, E. (2015), “More sustainable automotive production through understanding decoupling points in leagile manufacturing”, Journal of Cleaner Production, Vol. 95 No. 15 May, pp. 232–241.
Noroozi, S. and Wikner, J. (2016), “A modularized framework for sales and operations planning with focus on process industries”, Production & Manufacturing Research, Vol. 4 No. 1, pp. 65–89.
Ogawa, S. and Piller, F.T. (2006), “Reducing the risks of new product development”, MIT Sloan Management Review, Vol. 47 No. 2, pp. 65–71.
O’Hern, M.S. and Rindfleisch, A. (2010), “Customer co-creation: a typology and research agenda”, in Malhotra, N.K. (Ed.), Review of marketing research, Emerald Group Publishing Limited, Bingley, pp. 84–106.
Olhager, J. (2003), “Strategic positioning of the order penetration point”, International Journal of Production Economics, Vol. 85 No. 3, pp. 319–329.
Olhager, J. (2010), “The role of the customer order decoupling point in production and supply chain management”, Computers in Industry, Vol. 61 No. 9, pp. 863–868.
Olhager, J. and Östlund, B. (1990), “An integrated push–pull manufacturing strategy”, European Journal of Operational Research, Vol. 45 No. 2, pp. 135–142.
Olhager, J. and Rapp, B. (1985), Effektiv MPS: referenssystem för datorbaserad material-och produktionsstyrning [In Swedish], Studentlitteratur, Lund.
Olhager, J., Selldin, E. and Wikner, J. (2006), “Decoupling the value chain”, International Journal of Value Chain Management, Vol. 1 No. 1, pp. 19–32.
Olhager, J. and Wikner, J. (2000), “Production planning and control tools”, Production Planning & Control, Vol. 11 No. 3, pp. 210–222.
Olsen, R.F. and Ellram, L.M. (1997), “A portfolio approach to supplier relationships”, Industrial Marketing Management, Vol. 26 No. 2, pp. 101–113.
Pagh, J.D. and Cooper, M.C. (1998), “Supply chain postponement and speculation strategies: how to choose the right strategy”, Journal of Business Logistics, Vol. 19 No. 2, pp. 13–33.
Papert, M., Rimpler, P. and Pflaum, A. (2016), “Enhancing supply chain visibility in a pharmaceutical supply chain: solutions based on automatic identification technology”, International Journal of Physical Distribution & Logistics Management, Vol. 46 No. 9, pp. 859–884.
Petersen, K.J., Ragatz, G.L. and Monczka, R.M. (2005), “An examination of collaborative planning effectiveness and supply chain performance”, Journal of Supply Chain Management, Vol. 41 No. 2, pp. 14–25.
116
Pine, B.J. (1993), Mass customization: the new frontier in business competition, Harvard Business School Press, Boston, MA.
Prince, J. and Kay, J.M. (2003), “Combining lean and agile characteristics: creation of virtual groups by enhanced production flow analysis”, International Journal of Production Economics, Vol. 85 No. 3, pp. 305–318.
Ptak, C. and Smith, C. (2016), Demand driven material requirements planning (DDMRP), Industrial Press, South Norwalk, CT.
Ptak, C. and Smith, C. (2019), Demand driven material requirements planning (DDMRP) (3rd ed.), Industrial Press, South Norwalk, CT.
Purvis, L., Gosling, J. and Naim, M.M. (2014), “The development of a lean, agile and leagile supply network taxonomy based on differing types of flexibility”, International Journal of Production Economics, Vol. 151 No. May, pp. 100–111.
Qi, Y., Huo, B., Wang, Z. and Yeung, H.Y.J. (2017), “The impact of operations and supply chain strategies on integration and performance”, International Journal of Production Economics, Vol. 185 No. March, pp. 162–174.
Qi, Y., Zhao, X. and Sheu, C. (2011), “The impact of competitive strategy and supply chain strategy on business performance: the role of environmental uncertainty”, Decision Sciences, Vol. 42 No. 2, pp. 371–389.
Rafiei, H. and Rabbani, M. (2011), “Order partitioning and order penetration point location in hybrid make-to-stock/make-to-order production contexts”, Computers & Industrial Engineering, Vol. 61 No. 3, pp. 550–560.
Randall, T.R., Morgan, R.M. and Morton, A.R. (2003), “Efficient versus responsive supply chain choice: an empirical examination of influential factors”, Journal of Product Innovation Management, Vol. 20 No. 6, pp. 430–443.
Ringsberg, H. (2014), “Perspectives on food traceability: a systematic literature review”, Supply Chain Management: An International Journal, Vol. 19 No. 5/6, pp. 558–576.
Rojo, A., Llorens-Montes, J. and Perez-Arostegui Maria, N. (2016), “The impact of ambidexterity on supply chain flexibility fit”, Supply Chain Management: An International Journal, Vol. 21 No. 4, pp. 433–452.
Roscoe, S. and Baker, P. (2014), “Supply chain segmentation in the sporting goods industry”, International Journal of Logistics Research and Applications, Vol. 17 No. 2, pp. 136–155.
Ross, A. (1996), “Selling uniqueness”, Manufacturing Engineer, Vol. 75 No. 6, pp. 260–263.
Rudberg, M. and Wikner, J. (2002). “The customer order decoupling point: definition and application areas”. Paper presented at the PLAN’s forsknings- och tillämpningskonferens 2002.
Rudberg, M. and Wikner, J. (2004), “Mass customization in terms of the customer order decoupling point”, Production Planning & Control, Vol. 15 No. 4, pp. 445–458.
Sabri, E.H. (2015), “Supply chain segmentation: concept and best practice transformation framework”, in Sabri, E.H. (Ed.), Optimization of supply chain management in contemporary organizations, Business Science Reference, Hershey, PA, pp. 87–116.
Sabri, Y. (2019), “In pursuit of supply chain fit”, International Journal of Logistics Management, Vol. 30 No. 3, pp. 821–844.
Salvador, F., Forza, C. and Rungtusanatham, M. (2002), “Modularity, product variety, production volume, and component sourcing: theorizing beyond generic prescriptions”, Journal of Operations Management, Vol. 20 No. 5, pp. 549–575.
117
Salvador, F., Rungtusanatham, M. and Forza, C. (2004), “Supply-chain configurations for mass customization”, Production Planning & Control, Vol. 15 No. 4, pp. 381–397.
Saunders, M., Lewis, P. and Thornhill, A. (2012), Research methods for business students (6th ed.), Pearson Education, Harlow, NY.
Schwandt, T.A., Lincoln, Y.S. and Guba, E.G. (2007), “Judging interpretations: but is it rigorous? Trustworthiness and authenticity in naturalistic evaluation”, New Directions for Evaluation, Vol. 2007 No. 114, pp. 11–25.
Sebastiao, H.J. and Golicic, S. (2008), “Supply chain strategy for nascent firms in emerging technology markets”, Journal of Business Logistics, Vol. 29 No. 1, pp. 75–91.
Serrano, L.I., De Castro, V.R. and Goienetxea, U.A. (2009), “Pacemaker, bottleneck and order decoupling point in lean production systems”, International Journal of Industrial Engineering, Vol. 16 No. 4, pp. 293–304.
Seuring, S. and Gold, S. (2012), “Conducting content‐analysis based literature reviews in supply chain management”, Supply Chain Management: An International Journal, Vol. 17 No. 5, pp. 544–555.
Shaikh, S., Sabri, E.H. and Esturi, S. (2017), “Making the journey to a multimodal, segmented supply chain”, CSCMP Supply Chain Quarterly, No. Quarter 2, pp. 18–27.
Sharma, D. (1987), Manufacturing strategy: an empirical analysis. (Doctoral dissertation), The Ohio State University, Ann Arbor, MI. Retrieved from https://etd.ohiolink.edu/!etd.send_file?accession=osu1487585645578279&disposition=inline
Sharman, G. (1984), “The rediscovery of logistics”, Harvard Business Review, Vol. 62 No. 5, pp. 71–79.
Shenton, A.K. (2004), “Strategies for ensuring trustworthiness in qualitative research projects”, Education for Information, Vol. 22 No. 2, pp. 63–75.
Shewchuk, J.P. (1998), “Agile manufacturing: one size does not fit all”, in Bititci, U.S. and Carrie, A.S. (Eds.), Strategic management of the manufacturing value chain. Proceedings of the International Conference of the Manufacturing Value-Chain August ‘98, Troon, Scotland, UK, Springer US, Boston, MA, pp. 143–150.
Shewhart, W.A. (1931), Economic control of quality of manufactured product, Macmillan and Co Ltd, London.
Shewhart, W.A. and Deming, W.E. (1986), Statistical method from the viewpoint of quality control, Dover Publications, Inc, Mineola, NY.
Shidpour, H., Da Cunha, C. and Bernard, A. (2014), “Analyzing single and multiple customer order decoupling point positioning based on customer value: a multi-objective approach”, Procedia CIRP, Vol. 17, pp. 669–674.
Shingo, S. and Dillon, A.P. (1989), A study of the Toyota production system: from an industrial engineering viewpoint, Productivity Press, Portland, OR.
Simons, H. (2009), Case study research in practice, SAGE Publications, London. Slack, N., Chambers, S. and Johnston, R. (2010), Operations management (6th ed.),
Pearson Education, Harlow, UK. Småros, J., Lehtonen, J.M., Appelqvist, P. and Holmström, J. (2003), “The impact of
increasing demand visibility on production and inventory control efficiency”, International Journal of Physical Distribution & Logistics Management, Vol. 33 No. 4, pp. 336–354.
Smith, W.R. (1956), “Product differentiation and market segmentation as alternative marketing strategies”, Journal of Marketing, Vol. 21 No. 1, pp. 3–8.
118
Somapa, S., Cools, M. and Dullaert, W. (2018), “Characterizing supply chain visibility – a literature review”, International Journal of Logistics Management, Vol. 29 No. 1, pp. 308–339.
Song, W., Cao, J. and Zheng, M. (2016), “Towards an integrative framework of innovation network for new product development project”, Production Planning & Control, Vol. 27 No. 12, pp. 967–978.
Spring, M. and Dalrymple, J.F. (2000), “Product customisation and manufacturing strategy”, International Journal of Operations & Production Management, Vol. 20 No. 4, pp. 441–467.
Squire, B., Brown, S., Readman, J. and Bessant, J. (2006), “The impact of mass customisation on manufacturing trade‐offs”, Production and Operations Management, Vol. 15 No. 1, pp. 10–21.
Stalk, G. and Hout, T.M. (1990a), Competing against time: how time-based competition is reshaping global markets, The Free Press, New York, NY.
Stalk, G. and Hout, T.M. (1990b), “How time‐based management measures performance”, Planning Review, Vol. 18 No. 6, pp. 26–29.
Stank, T.P., Davis, B.R. and Fugate, B.S. (2005), “A strategic framework for supply chain oriented logistics”, Journal of Business Logistics, Vol. 26 No. 2, pp. 27–46.
Stank, T.P., Esper, T.L., Crook, T.R. and Autry, C.W. (2012), “Creating relevant value through demand and supply integration”, Journal of Business Logistics, Vol. 33 No. 2, pp. 167–172.
Stank, T.P., Pellathy, D.A. and Dittmann, J.P. (2019), “The key to the C-suite? Shareholders value”, Supply Chain Management Review, No. September/October, pp. 37–42.
Stock, G.N., Greis, N.P. and Kasarda, J.D. (1998), “Logistics, strategy and structure: a conceptual framework”, International Journal of Operations & Production Management, Vol. 18 No. 1, pp. 37–52.
Su, J.C.P., Chang, Y.-L. and Ferguson, M. (2005), “Evaluation of postponement structures to accommodate mass customization”, Journal of Operations Management, Vol. 23 No. 3, pp. 305–318.
Sun, X.Y., Ji, P., Sun, L.Y. and Wang, Y.L. (2008), “Positioning multiple decoupling points in a supply network”, International Journal of Production Economics, Vol. 113 No. 2, pp. 943–956.
Swaminathan, J.M. (2001), “Enabling customization using standardized operations”, California Management Review, Vol. 43 No. 3, pp. 125–135.
Swaminathan, J.M. and Lee, H.L. (2003), “Design for postponement”, in de Kok, S.C. and Graves, S.C. (Eds.), Handbooks in operations research and management science, Elsevier Publisher, Amsterdam, pp. 199–226.
Swaminathan, J.M. and Tayur, S.R. (1998), “Managing broader product lines through delayed differentiation using vanilla boxes”, Management Science, Vol. 44 No. 12-part-2, pp. S161–S172.
Swaminathan, J.M. and Tayur, S.R. (2003), “Models for supply chains in e-business”, Management Science, Vol. 49 No. 10, pp. 1387–1406.
Swedish Knowledge Foundation. (2017), Stadgar. Retrieved from http://www.kks.se/om/SitePages/Stadgar.aspx
Tang, C.S. (2006), “Perspectives in supply chain risk management”, International Journal of Production Economics, Vol. 103 No. 2, pp. 451–488.
119
The Boston Consulting Group. (2012), The demand-driven supply chain: making it work and delivering results. Boston Consulting Group, Inc, Boston, MA.
Thomas, R. (2008), “Exploring relational aspects of time-based competition”, International Journal of Physical Distribution & Logistics Management, Vol. 38 No. 7, pp. 540–550.
Thomas, K. (2012), Supply chain segmentation: 10 steps to greater profits. CSCMP Supply Chain Quarterly, (Quarter 1), pp. 1–6. Retrieved from http://www.supplychainquarterly.com/topics/Strategy/201201segmentation/
Thomé, A.M.T., Scavarda, L.F. and Scavarda, A.J. (2016), “Conducting systematic literature review in operations management”, Production Planning & Control, Vol. 27 No. 5, pp. 408–420.
Tiedemann, F. (2017). Strategic lead-times and their implications on financial performance. (Licentiate thesis), Jönköping University, School of Engineering, Jönköping, Sweden. (18)
Tiedemann, F. (2020), “Demand-driven supply chain and operations management strategies – a literature review and conceptual model”, Working manuscript.
Tiedemann, F., Johansson, E. and Gosling, J. (2020a), “Structuring a new product development process portfolio using decoupling thinking”, Production Planning & Control, Vol. 31 No. 1, pp. 38–59.
Tiedemann, F. and Wikner, J. (2018, 24–26 June), “Some common and fundamental characteristics of four supply chain strategies – customization, leagility, postponement and segmentation”. Paper presented at the 25th EurOMA International Annual Conference, Budapest, Hungary.
Tiedemann, F. and Wikner, J. (2019), "Postponement revisited – a typology for displacement", in Ameri, F., Stecke, K.E., von Cieminski, G. and Kiritsis, D. (Eds.), Advances in production management systems. Towards smart production management systems, Springer International Publishing, Cham, pp. 204–211.
Tiedemann, F., Wikner, J. and Johansson, E. (2020b), “Understanding lead-time implications for financial performance – a qualitative study”, Working manuscript.
Torrance, H. (2012), “Triangulation, respondent validation, and democratic participation in mixed methods research”, Journal of Mixed Methods Research, Vol. 6 No. 2, pp. 111–123.
Towill, D.R. (1996), “Time compression and supply chain management – a guided tour”, Supply Chain Management: An International Journal, Vol. 1 No. 1, pp. 15–27.
Towill, D.R., Naim, M.M. and Wikner, J. (1992), “Industrial dynamics simulation models in the design of supply chains”, International Journal of Physical Distribution & Logistics Management, Vol. 22 No. 5, pp. 3–13.
Tranfield, D., Denyer, D. and Smart, P. (2003), “Towards a methodology for developing evidence-informed management knowledge by means of systematic review”, British Journal of Management, Vol. 14 No. 3, pp. 207–222.
Trienekens, J.H., Wognum, P.M., Beulens, A.J.M. and van der Vorst, J.G.A.J. (2012), “Transparency in complex dynamic food supply chains”, Advanced Engineering Informatics, Vol. 26 No. 1, pp. 55–65.
Tse, Y.K. and Tan, K.H. (2012), “Managing product quality risk and visibility in multi-layer supply chain”, International Journal of Production Economics, Vol. 139 No. 1, pp. 49–57.
120
Tu, Q., Vonderembse, M.A. and Ragu-Nathan, T.S. (2001), “The impact of time-based manufacturing practices on mass customization and value to customer”, Journal of Operations Management, Vol. 19 No. 2, pp. 201–217.
Van der Veeken, D.J. and Rutten, W.G. (1998), “Logistics service management: opportunities for differentiation”, International Journal of Logistics Management, Vol. 9 No. 2, pp. 91–98.
Van der Vorst, J.G., van Dijk, S.J. and Beulens, A.J. (2001), “Supply chain design in the food industry”, International Journal of Logistics Management, Vol. 12 No. 2, pp. 73–86.
Van de Ven, A.H., Ganco, M. and Hinings, C.R. (2013), “Returning to the frontier of contingency theory of organizational and institutional designs”, The Academy of Management Annals, Vol. 7 No. 1, pp. 393–440.
Van Hoek, R.I. (1998a), “Logistics and virtual integration: postponement, outsourcing and the flow of information”, International Journal of Physical Distribution & Logistics Management, Vol. 28 No. 7, pp. 508–523.
Van Hoek, R.I. (1998b), “Reconfiguring the supply chain to implement postponed manufacturing”, International Journal of Logistics Management, Vol. 9 No. 1, pp. 95–110.
Van Hoek, R.I. (2000), “The thesis of leagility revisited”, International Journal of Agile Management Systems, Vol. 2 No. 3, pp. 196–201.
Van Hoek, R.I. (2001), “The rediscovery of postponement: a literature review and directions for research”, Journal of Operations Management, Vol. 19 No. 2, pp. 161–184.
Van Hoek, R.I., Peelen, E. and Commandeur, H.R. (1999), “Achieving mass customization through postponement: a study of international changes”, Journal of Market-Focused Management, Vol. 3 No. 3, pp. 353–368.
Verdouw, C.N., Beulens, A.J.M., Bouwmeester, D. and Trienekens, J.H. (2008), “Modelling demand-driven chain networks using multiple CODPs”, in Koch, T. (Ed.), Lean business systems and beyond, Springer US, Boston, MA, pp. 433–442.
Vetenskapsrådet. (2017), God forskningssed [in Swedish]. Retrieved from https://www.vr.se/download/18.2412c5311624176023d25b05/1555332112063/God-forskningssed_VR_2017.pdf
Vickery, S.K., Dröge, C.L., Yeomans, J.M. and Markland, R.E. (1995), “Time-based competition in the furniture industry”, Production and Inventory Management Journal, Vol. 36 No. 4, pp. 14–21.
Vilko, J., Rumpu, A. and Koivuniemi, J. (2012), “An information-exchange perspective on supply-chain risk management: systemic organisational motives and cognitive barriers”, International Journal of Logistics Systems and Management, Vol. 12 No. 4, pp. 460–482.
Vitasek, K. (2013), Council of Supply Chain Management Professionals – Supply chain management definitions and glossary. Retrieved from https://cscmp.org/CSCMP/Educate/SCM_Definitions_and_Glossary_of_Terms/CSCMP/Educate/SCM_Definitions_and_Glossary_of_Terms.aspx?hkey=60879588-f65f-4ab5-8c4b-6878815ef921
Voss, C. (2009), “Case research in operations management”, in Karlsson, C. (Ed.), Researching operations management, Routledge, London, pp. 162–195.
121
Voss, C., Tsikriktsis, N. and Frohlich, M. (2002), “Case research in operations management”, International Journal of Operations & Production Management, Vol. 22 No. 2, pp. 195–219.
Wacker, J.G. (1998), “A definition of theory: research guidelines for different theory-building research methods in operations management”, Journal of Operations Management, Vol. 16 No. 4, pp. 361–385.
Wacker, J.G. (2008), “A conceptual understanding of requirements for theory‐building research: guidelines for scientific theory building”, Journal of Supply Chain Management, Vol. 44 No. 3, pp. 5–15.
Wagner, S.M., Grosse-Ruyken, P.T. and Erhun, F. (2012), “The link between supply chain fit and financial performance of the firm”, Journal of Operations Management, Vol. 30 No. 4, pp. 340–353.
Waller, M.A., Dabholkar, P.A. and Gentry, J.J. (2000), “Postponement, product customization, and market-oriented supply chain management”, Journal of Business Logistics, Vol. 21 No. 2, pp. 133–160.
Wang, H.-J., Ma, S.-H. and Zhou, X. (2003), “Postponement in mass customization: a literature review”, Journal of Donghua University (Eng. ed.), Vol. 20 No. 4, pp. 111–117.
Wheelwright, S.C. and Clark, K.B. (1992), Revolutionizing product development: quantum leaps in speed, efficiency and quality, Free Press, New York, NY.
Whetten, D.A. (1989), “What constitutes a theoretical contribution?”, The Academy of Management Review, Vol. 14 No. 4, pp. 490–495.
Whicker, L., Bernon, M., Templar, S. and Mena, C. (2009), “Understanding the relationships between time and cost to improve supply chain performance”, International Journal of Production Economics, Vol. 121 No. 2, pp. 641–650.
Wikipedia Encyclopedia. (2020), Operationalize. Retrieved from https://en.wikipedia.org/wiki/Operationalization.
Wikner, J. (2014a), “On decoupling points and decoupling zones”, Production & Manufacturing Research, Vol. 2 No. 1, pp. 167–215.
Wikner, J. (2014b), “Supply chain management strategies in terms of decoupling points and decoupling zones”, in Grabot, B., Vallespir, B., Gomes, S., Bouras, A. and Kiritsis, D. (Eds.), Advances in production management systems. Innovative and knowledge-based production management in a global–local world, Springer International Publishing, Cham, pp. 371–378.
Wikner, J. (2015), “Financial measures and their relations to decoupling points and decoupling zones”, in Umeda, S., Nakano, M., Mizuyama, H., Hibino, N., Kiritsis, D. and von Cieminski, G. (Eds.), Advances in production management systems: innovative production management towards sustainable growth, Springer International Publishing, London, pp. 186–193.
Wikner, J. (2018), “An ontology for flow thinking based on decoupling points – unravelling a control logic for lean thinking”, Production & Manufacturing Research, Vol. 6 No. 1, pp. 433–469.
Wikner, J. and Bäckstrand, J. (2012, 1–5 July), “Decoupling points and product uniqueness impact on supplier relations”. Paper presented at the EurOMA 2012 – P&OM 4th World Conference, Amsterdam.
Wikner, J. and Bäckstrand, J. (2018), “Triadic perspective on customization and supplier interaction in customer-driven manufacturing”, Production & Manufacturing Research, Vol. 6 No. 1, pp. 3–25.
122
Wikner, J., Bäckstrand, J., Tiedemann, F. and Johansson, E. (2015), “Leagility in a triad with multiple decoupling points”, in Umeda, S., Nakano, M., Mizuyama, H., Hibino, N., Kiritsis, D. and von Cieminski, G. (Eds.), Advances in production management systems: innovative production management towards sustainable growth, Springer International Publishing, Cham, pp. 113–120.
Wikner, J. and Johansson, E. (2015), “Inventory classification based on decoupling points”, Production & Manufacturing Research, Vol. 3 No. 1, pp. 218–235.
Wikner, J., Naim, M.M., Spiegler, V.L.M. and Lin, J. (2017a), “IOBPCS based models and decoupling thinking”, International Journal of Production Economics, Vol. 194 No. December, pp. 153–166.
Wikner, J. and Rudberg, M. (2005a), “Integrating production and engineering perspectives on the customer order decoupling point”, International Journal of Operations & Production Management, Vol. 25 No. 7, pp. 623–641.
Wikner, J. and Rudberg, M. (2005b), “Introducing a customer order decoupling zone in logistics decision-making”, International Journal of Logistics Research and Applications, Vol. 8 No. 3, pp. 211–224.
Wikner, J. and Tiedemann, F. (2019), "Customization and variants in terms of form, place and time", in Ameri, F., Stecke, K.E., von Cieminski, G., and Kiritsis, D. (Eds.), Advances in production management systems. Production management for the factory of the future, Springer International Publishing, Cham, pp. 383–391.
Wikner, J. and Wong, H. (2007), “Postponement based on the positioning of the differentiation and decoupling points”, in Olhager, J. and Persson, F. (Eds.), Advances in production management systems: International Federation for Information Processing, Springer, Boston, pp. 143–150.
Wikner, J., Yang, B., Yang, Y. and Williams, S.J. (2017b), “Decoupling thinking in service operations: a case in healthcare delivery system design”, Production Planning & Control, Vol. 28 No. 5, pp. 387–397.
Williams, B.D., Roh, J., Tokar, T. and Swink, M. (2013), “Leveraging supply chain visibility for responsiveness: the moderating role of internal integration”, Journal of Operations Management, Vol. 31 No. 7, pp. 543–554.
Williamson, K. (2002), Research methods for students, academics and professionals: information management and systems (2nd ed.), Centre for Information Studies, Wagga Wagga, New South Wales.
Womack, J.P. and Jones, D.T. (1996), Lean thinking: banish waste and create wealth in your corporation, Simon & Schuster, New York, NY.
Womack, J.P., Jones, D.T. and Roos, D. (2007), The machine that changed the world: the story of lean production – Toyota’s secret weapon in the global car wars that is now revolutionizing world industry, Simon and Schuster, New York, NY.
Wong, H., Wikner, J. and Naim, M.M. (2009), “Analysis of form postponement based on optimal positioning of the differentiation point and stocking decisions”, International Journal of Production Research, Vol. 47 No. 5, pp. 1201–1224.
Wortmann, J.C. (1992), “Production management systems for one-of-a-kind products”, Computers in Industry, Vol. 19 No. 1, pp. 79–88.
Wortmann, J.C., Muntslag, D.R. and Timmermans, P.J. (1997), Customer-driven manufacturing, Chapman and Hall, London.
Wouters, M.J. (1991), “Economic evaluation of leadtime reduction”, International Journal of Production Economics, Vol. 22 No. 2, pp. 111–120.
123
Xu, X. and Coatney, K.T. (2015), “Product market segmentation and output collusion within substitute products”, Journal of Economics and Business, Vol. 77 No. January–February, pp. 1–15.
Yang, B. and Burns, N.D. (2003), “Implications of postponement for the supply chain”, International Journal of Production Research, Vol. 41 No. 9, pp. 2075–2090.
Yang, B., Burns, N.D. and Backhouse, C.J. (2004a), “Management of uncertainty through postponement”, International Journal of Production Research, Vol. 42 No. 6, pp. 1049–1064.
Yang, B., Burns, N.D. and Backhouse, C.J. (2004b), “Postponement: a review and an integrated framework”, International Journal of Operations & Production Management, Vol. 24 No. 5, pp. 468–487.
Yang, B., Burns, N.D. and Backhouse, C.J. (2005), “The application of postponement in industry”, IEEE Transactions on Engineering Management, Vol. 52 No. 2, pp. 238–248.
Yang, B. and Yang, Y. (2010), “Postponement in supply chain risk management: a complexity perspective”, International Journal of Production Research, Vol. 48 No. 7, pp. 1901–1912.
Yang, B., Yang, Y. and Wijngaard, J. (2007), “Postponement: an inter-organizational perspective”, International Journal of Production Research, Vol. 45 No. 4, pp. 971–988.
Yang, B., Yang, Y. and Williams, S. (2010), “Service postponement: translating manufacturing postponement to service operations”, Journal of Manufacturing Technology Management, Vol. 21 No. 4, pp. 470–483.
Yao, J. and Liu, L. (2009), “Optimization analysis of supply chain scheduling in mass customization”, International Journal of Production Economics, Vol. 117 No. 1, pp. 197–211.
Yin, R.K. (2009), Case study research: design and methods (4th ed.), Sage, London. Zhang, A.N., Goh, M. and Meng, F. (2011), “Conceptual modelling for supply chain
inventory visibility”, International Journal of Production Economics, Vol. 133 No. 2, pp. 578–585.
Zhou, H. and Benton, W.C. (2007), “Supply chain practice and information sharing”, Journal of Operations Management, Vol. 25 No. 6, pp. 1348–1365.
Zinn, W. (2019), “A historical review of postponement research”, Journal of Business Logistics, Vol. 40 No. 1, pp. 66–72.
Zinn, W. and Bowersox, D.J. (1988), “Planning physical distribution with the principle of postponement”, Journal of Business Logistics, Vol. 9 No. 2, pp. 117–136.

124
125
Appendices Appendix 1 Workshops and steering group meetings in KOPtimera Appendix 2 Interview protocol used in Study D

124
125
Appendices Appendix 1 Workshops and steering group meetings in KOPtimera Appendix 2 Interview protocol used in Study D
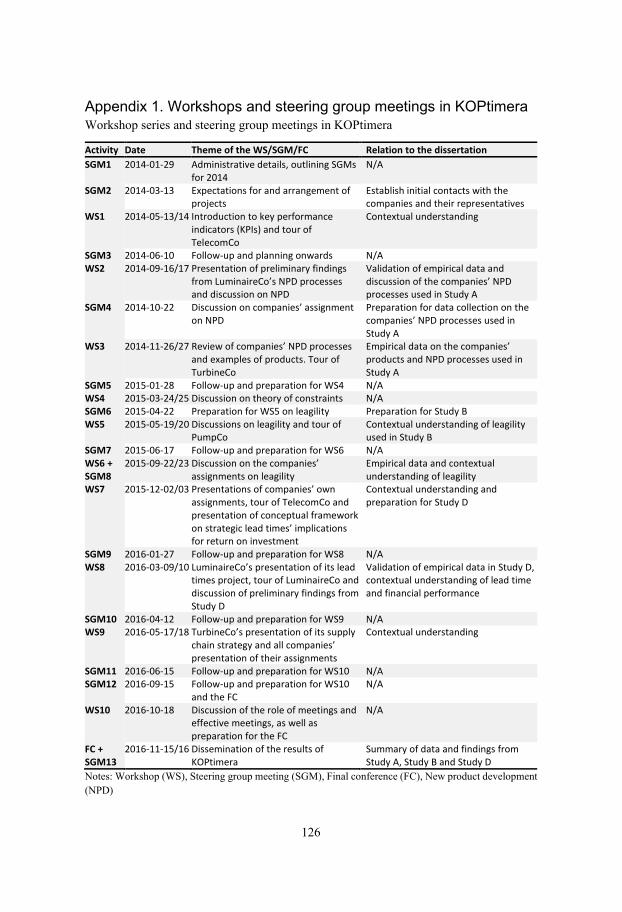
126
Appendix 1. Workshops and steering group meetings in KOPtimera Workshop series and steering group meetings in KOPtimera
Activity Date Theme of the WS/SGM/FC Relation to the dissertation SGM1 2014-01-29 Administrative details, outlining SGMs
for 2014 N/A
SGM2 2014-03-13 Expectations for and arrangement of projects
Establish initial contacts with the companies and their representatives
WS1 2014-05-13/14 Introduction to key performance indicators (KPIs) and tour of TelecomCo
Contextual understanding
SGM3 2014-06-10 Follow-up and planning onwards N/A WS2 2014-09-16/17 Presentation of preliminary findings
from LuminaireCo’s NPD processes and discussion on NPD
Validation of empirical data and discussion of the companies’ NPD processes used in Study A
SGM4 2014-10-22 Discussion on companies’ assignment on NPD
Preparation for data collection on the companies’ NPD processes used in Study A
WS3 2014-11-26/27 Review of companies’ NPD processes and examples of products. Tour of TurbineCo
Empirical data on the companies’ products and NPD processes used in Study A
SGM5 2015-01-28 Follow-up and preparation for WS4 N/A WS4 2015-03-24/25 Discussion on theory of constraints N/A SGM6 2015-04-22 Preparation for WS5 on leagility Preparation for Study B WS5 2015-05-19/20 Discussions on leagility and tour of
PumpCo Contextual understanding of leagility used in Study B
SGM7 2015-06-17 Follow-up and preparation for WS6 N/A WS6 + SGM8
2015-09-22/23 Discussion on the companies’ assignments on leagility
Empirical data and contextual understanding of leagility
WS7 2015-12-02/03 Presentations of companies’ own assignments, tour of TelecomCo and presentation of conceptual framework on strategic lead times’ implications for return on investment
Contextual understanding and preparation for Study D
SGM9 2016-01-27 Follow-up and preparation for WS8 N/A WS8 2016-03-09/10 LuminaireCo’s presentation of its lead
times project, tour of LuminaireCo and discussion of preliminary findings from Study D
Validation of empirical data in Study D, contextual understanding of lead time and financial performance
SGM10 2016-04-12 Follow-up and preparation for WS9 N/A WS9 2016-05-17/18 TurbineCo’s presentation of its supply
chain strategy and all companies’ presentation of their assignments
Contextual understanding
SGM11 2016-06-15 Follow-up and preparation for WS10 N/A SGM12 2016-09-15 Follow-up and preparation for WS10
and the FC N/A
WS10 2016-10-18 Discussion of the role of meetings and effective meetings, as well as preparation for the FC
N/A
FC + SGM13
2016-11-15/16 Dissemination of the results of KOPtimera
Summary of data and findings from Study A, Study B and Study D
Notes: Workshop (WS), Steering group meeting (SGM), Final conference (FC), New product development (NPD)
127
Participants during the Workshops in KOPtimera
Company Title or role
WS1
– 2
014-
05-1
3/14
W
S2 –
201
4-09
-16/
17
WS3
– 2
014-
11-2
6/27
W
S4 –
201
5-03
-24/
25
WS5
– 2
015-
05-1
9/20
W
S6 –
201
5-09
-22/
23
WS7
– 2
015-
12-0
2/03
W
S8 –
201
6-03
-09/
10
WS9
– 2
016-
05-1
7/18
W
S10
– 20
16-1
0-18
FC
– 2
016-
11-1
5
SoE
PhD candidate (the author of this dissertation) 1 1 1 1 1 1 1 1 1 1 1 Supervisor 1 1 1 1 1 1 1 1 1 1 1 1 Supervisor 2 1 1 1 1 1 1 1 1 1 1 1 Supervisor 3 1 1 1 1 1 1 1 1 1 1 1 Assistant professor, logistics 1 1 1 1 1 1 1 PhD candidate 1 1 MSc student 1
ConsultantCo
Business unit manager 1 1 1 1 Business area manager 1 1 1 1 1 Consultant manager, logistics and purchasing 1 1 1 1 1 1 1 Consultant manager, design 1 1 1 1 1 1 1 Senior consultant, logistics 1 1 1 1
TelecomCo
Global supply chain architect (R3) 1 Operational developer 1 1 1 1 Senior supply developer (R1) 1 1 1 1 1 1 1 1 1 1 Operational developer (R2) 1 1 1 1 1 1
LuminaireCo
Logistics manager (R11) 1 1 1 1 1 1 1 1 1 1 Project leader for product development (R14) 1 1 1 Team leader, operational purchaser (R13) 1 1 1 1 1 Master planner and planning team leader (R12) 1 1 1 1
PumpCo Inbound and outbound manager (R19) 1 1 1 1 1 1 1 1 1 1 1 Project administrator, pump and motor division (R20) 1 1 1 1 1 1 1 1 1 1 1
TurbineCo
Demand planner, sales and operations planning (R5) 1 1 1 1 1 1 1 1 1
Purchasing manager, service (R10) 1 1 1 1 1 Strategic purchaser (R7) 1 1 Strategic logistics developer (R6) 1 1 1 1 1 1 1 Manager, sales and operations planning (R8) 1 1 1 1 1 1 1 1 1 Product developer (R9) 1 1 1 1 1
Guests
Professor, logistics and supply chain management 1
Professor, construction logistics and management 1
Reader, supply chain management 1 Chief information officer (CIO) of a consultancy firm on supply chain management 1
Professor, logistics and operations management 1 Adjunct professor, logistics 1 Assistant professor, work organization 1
Notes: Workshop (WS), Final Conference (FC), Respondent (R; see Table 3.1), School of Engineering, Jönköping University (SoE)

128
Participants during the Steering Group Meetings in KOPtimera
Company Title or role
SGM
1 –
2014
-01-
29
SGM
2 –
2014
-03-
13
SGM
3 –
2014
-06-
10
SGM
4 –
2014
-10-
22
SGM
5 –
2015
-01-
28
SGM
6 –
2015
-04-
22
SGM
7 –
2015
-06-
17
SGM
8 –
2015
-09-
23
SGM
9 –
2016
-01-
27
SGM
10 –
201
6-04
-12
SGM
11 –
201
6-06
-15
SGM
12 –
201
6-09
-15
SGM
13 –
201
6-11
-16
SoE
PhD candidate (the author of this dissertation) 1 1 1 1 1 1 1 1 1 1 1
Supervisor 1 1 1 1 1 1 1 1 1 1 1 1 1 1 Supervisor 2 1 1 1 1 1 1 1 1 1 1 1 1 1 Supervisor 3 1 1 1 1 1 1 1 1 1 1 1 1 1 Assistant professor, logistics 1 1 1 1 1 Professor, operations and supply chain management 1
MSc student 1 1 MSc student 2 1 MSc student 3 1
ConsultantCo
Business unit manager 1 1 1 1 Business area manager 1 1 1 1 1 1 Consultant manager, logistics and purchasing 1
Consultant manager, design 1 1 1 1 Senior consultant, logistics 1 1 1
TelecomCo Operational developer 1 Senior supply developer (R1) 1 1 1 1 1 1 1 (1) 1 1 1 1 1 Operational developer (R2) 1
LuminaireCo
Logistics manager (R11) 1 1 1 1 1 1 1 1 1 1 1 1 Project leader for product development (R14) 1
Team leader, operational purchaser (R13) 1
Master planner and planning team leader (R12) 1
PumpCo
Inbound and outbound manager (R19) 1 1 1 1 1 1 1 1 1 1
Project administrator, pump and motor division (R20) 1 1
TurbineCo
Demand planner, sales and operations planning (R5) 1 1 1
Purchasing manager, service (R10) 1 1 1 1 Strategic logistics developer (R6) 1 1 Manager, sales and operations planning (R8) 1 1 1 1 1 1 1 1 1 1 1
Notes: Steering group meeting (SGM), Respondent (R; see Table 3.1), School of Engineering, Jönköping University (SoE), (1) = Participated using an online communication tool
129
Appendix 2. Interview protocol used in Study D
Reve
nue
Cost
Inve
stm
ent
Syst
em le
ad ti
me
( S)
Exte
nd (+
)
Redu
ce (−
)
Del
iver
y le
ad ti
me
(D)
Exte
nd (+
)
Redu
ce (−
)
Inte
rnal
lead
tim
e (I)
Exte
nd (+
)
Redu
ce (−
)
Exte
rnal
lead
tim
e (E
)
Exte
nd (+
)
Redu
ce (−
)
Adap
t lea
d tim
e –
dem
and-
base
d (A
D)
Exte
nd (+
)
Redu
ce (−
)
Adap
t lea
d tim
e –
supp
ly-b
ased
(AS)
Exte
nd (+
)
Redu
ce (−
)

128
Participants during the Steering Group Meetings in KOPtimera
Company Title or role
SGM
1 –
2014
-01-
29
SGM
2 –
2014
-03-
13
SGM
3 –
2014
-06-
10
SGM
4 –
2014
-10-
22
SGM
5 –
2015
-01-
28
SGM
6 –
2015
-04-
22
SGM
7 –
2015
-06-
17
SGM
8 –
2015
-09-
23
SGM
9 –
2016
-01-
27
SGM
10 –
201
6-04
-12
SGM
11 –
201
6-06
-15
SGM
12 –
201
6-09
-15
SGM
13 –
201
6-11
-16
SoE
PhD candidate (the author of this dissertation) 1 1 1 1 1 1 1 1 1 1 1
Supervisor 1 1 1 1 1 1 1 1 1 1 1 1 1 1 Supervisor 2 1 1 1 1 1 1 1 1 1 1 1 1 1 Supervisor 3 1 1 1 1 1 1 1 1 1 1 1 1 1 Assistant professor, logistics 1 1 1 1 1 Professor, operations and supply chain management 1
MSc student 1 1 MSc student 2 1 MSc student 3 1
ConsultantCo
Business unit manager 1 1 1 1 Business area manager 1 1 1 1 1 1 Consultant manager, logistics and purchasing 1
Consultant manager, design 1 1 1 1 Senior consultant, logistics 1 1 1
TelecomCo Operational developer 1 Senior supply developer (R1) 1 1 1 1 1 1 1 (1) 1 1 1 1 1 Operational developer (R2) 1
LuminaireCo
Logistics manager (R11) 1 1 1 1 1 1 1 1 1 1 1 1 Project leader for product development (R14) 1
Team leader, operational purchaser (R13) 1
Master planner and planning team leader (R12) 1
PumpCo
Inbound and outbound manager (R19) 1 1 1 1 1 1 1 1 1 1
Project administrator, pump and motor division (R20) 1 1
TurbineCo
Demand planner, sales and operations planning (R5) 1 1 1
Purchasing manager, service (R10) 1 1 1 1 Strategic logistics developer (R6) 1 1 Manager, sales and operations planning (R8) 1 1 1 1 1 1 1 1 1 1 1
Notes: Steering group meeting (SGM), Respondent (R; see Table 3.1), School of Engineering, Jönköping University (SoE), (1) = Participated using an online communication tool
129
Appendix 2. Interview protocol used in Study D
Reve
nue
Cost
Inve
stm
ent
Syst
em le
ad ti
me
(S)
Exte
nd (+
)
Redu
ce (−
)
Del
iver
y le
ad ti
me
(D)
Exte
nd (+
)
Redu
ce (−
)
Inte
rnal
lead
tim
e (I)
Exte
nd (+
)
Redu
ce (−
)
Exte
rnal
lead
tim
e (E
)
Exte
nd (+
)
Redu
ce (−
)
Adap
t lea
d tim
e –
dem
and-
base
d (A
D)
Exte
nd (+
)
Redu
ce (−
)
Adap
t lea
d tim
e –
supp
ly-b
ased
(AS)
Exte
nd (+
)
Redu
ce (−
)

130
131
Glossary of key terms, acronyms and abbreviations This glossary contains a list of definitions of some key terms, as well as a list of some key abbreviations and acronyms used in the main text of this dissertation.
Definitions of some key terms used in the main text • Adapt lead time – demand-based (AD) – The lead time downstream from the point
where the delivery-unique offering is made (adapted from Wikner, 2014a, p. 186; 2018, p. 443)
• Adapt lead time – supply-based (AS) – The lead time downstream from the point where it is possible to make variants (adapted from Wikner, 2014a, p. 186; 2018, p. 443)
• Bill of materials (BOM) – ‘A listing of all the subassemblies, intermediates, parts, and raw materials that go into a parent assembly showing the quantity of each required to make an assembly’ (APICS Dictionary, 2013, p. 15)
• Constructs – Definitions of terms or variables, which by their very nature cannot be observed directly. Constructs are thus conceptual in nature and used to explain phenomena (based on Bacharach, 1989, p. 500; Wacker, 1998, p. 363)
• Constructs of decoupling thinking – Constructs that comprise and are defined in decoupling thinking
• Constructs of demand driven – Constructs found within decoupling thinking that operationalize the concept of demand driven
• Customer adaptation decoupling point (CADP) – Separates decisions about differentiating flow based on standardization for a market of different customers from adaptation to actual customer orders (adapted from Wikner, 2014a, p. 196)
• Customer order decoupling point (CODP) – Separates decisions about initiating flow based on speculation for future customer orders from commitment to actual customer orders (adapted from Wikner, 2014a, p. 194)
• Customer-order driven – The ability to act on commitment to actual customer orders, where at least parts of the production and movement of material and information are initiated, that is, driven by actual customer orders, providing the ability to adapt the offerings based on actual customer orders
• Customization – A strategy that is used to accommodate customer demand for adapted and unique products, by building, fitting or altering according to customer specifications (based on Merriam-Webster Dictionary, 2020d)
• Customize – ‘To build, fit, or alter according to individual specifications’ (Merriam-Webster Dictionary, 2020d)
• Decoupling thinking – A management philosophy based on a holistic and integrated approach to flow discontinuities, focusing on creating effective flows
132
using strategic lead times and positioning of strategic decoupling points (adapted from Wikner, 2018, p. 445)
• Delivery lead time (D) – The time from the receipt of a customer order to the time when the customer requested the delivery of the product (adapted from APICS Dictionary, 2013, p. 44; Wikner, 2018, p. 443)
• Demand driven – The ability to act and adapt to customer needs • Demand-driven supply chain operations management strategy (DDSCOMS) –
A strategy that can be used by demand-driven manufacturing companies to organization, plan and control the controllable part of the supply chain, while taking into consideration the uncontrollable part, to support the company’s ability to act and adapt to customer needs.
• Demand information decoupling point (DIDP) – The upstream point from where demand information is constrained (adapted from Wikner, 2014a, p. 204; 2018, p. 452)
• Displacement – A collective term for preponement and postponement, that is, repositioning of transformation activities to an earlier or a later point in time (see preponement and postponement)
• Downstream supply information decoupling point (DSIDP) – The point from where supply information is constrained downstream (adapted from Wikner, 2014a, p. 205; 2018, p. 452)
• Effective (or effectiveness) – Referring to doing the right things (based on Drucker, 2007), the word can be used in relative (more or less effective) or absolute terms (effective or ineffective)
• External lead time upstream (EUS) – The upstream part of the supply system beyond an actor’s control (adapted from Wikner, 2018, p. 443)
• Internal lead time (I) – The part of the supply system that is controllable by an actor (adapted from Wikner, 2014a, p. 186; 2018, p. 443)
• Lead time – ‘A span of time required to perform a process’ (or series of operations; APICS Dictionary, 2013, p. 90)
• Leagility – A strategy combining the two strategies, lean and agile, within a total supply chain, where the CODP is positioned to best suit the need for responding to a volatile demand downstream yet providing level scheduling upstream (adapted from Agarwal et al., 2006; Mason-Jones et al., 2000a; Naylor et al., 1999)
• New product development (NPD) – A process in which ideas are developed into viable new products or extensions to existing products or product ranges (adapted from Law, 2016)
• Operationalize – Make something clearly distinguishable, measurable and understandable so that it can be used in practice (based on Merriam-Webster Dictionary, 2020a; Wikipedia Encyclopedia, 2020)
• Operations management (OM) – ‘The activity of managing the resources which produce and deliver products and services’ (Slack et al., 2010, p. 4)
133
• Postponement – A strategy aimed at reducing demand-related risk by delaying transformation activities to a later point in time when better decision support can be attained (based on Van Hoek, 2001; Yang et al., 2005)
• Preponement – Repositioning of transformation activities to an earlier point in time. In this research, preponement is regarded as postponement’s converse or antonym
• Segmentation – A strategy in which the total market is disaggregated into submarkets or segments that share some measurable characteristics based on demographics, psychographics, lifestyles, geography, benefits and so forth (adapted from APICS Dictionary, 2013, p. 101)
• Strategic decoupling point – ‘DPs [decoupling points] that play a role of critical importance to the interface of the supply system and its context’ (Wikner and Johansson, 2015, p. 220)
• Strategic lead times – Lead times that are of particular importance from either a demand or a supply perspective and based on the boundary of the system (based on Wikner, 2014a, 2018)
• Strategy – A careful plan of action(s) to achieve an objective (based on Merriam-Webster Dictionary, 2020b; Vitasek, 2013, p. 184)
• Supply chain – ‘A set of three or more entities (organizations or individuals) directly involved in the upstream and downstream flows of products, services, finances, and/or information from a source to a customer’ (Mentzer et al., 2001, p. 4)
• Supply chain fit – Strategic consistencies among the characteristics of a product and its demand, with the supply chain used for supplying the customer(s) with that product (based on Fisher, 1997; Wagner et al., 2012)
• Supply chain management (SCM) – ‘The systemic, strategic coordination of the traditional business functions and the tactics across these business functions within a particular company and across businesses within the supply chain, for the purposes of improving the long-term performance of the individual companies and the supply chain as a whole’ (Mentzer et al., 2001, p. 18)
• Supply chain operations management (SCOM) – The organization, planning and control of the controllable part of the supply chain by also considering the uncontrollable part.
• System lead time (S) – The cumulative lead time of the complete supply system (adapted from Wikner, 2018, p. 443)
• Transitive relation – If A has direct implications for B, and if B has direct implications for C, then through transitivity, A has indirect implications for C through B (adapted from Merriam-Webster Dictionary, 2020e)
• Transparency – A strategy that accommodates informed decisions and improves decision making by advocating the need for sharing high-quality information that

134
describes various factors of demand and supply throughout the supply chain (adapted from Williams et al., 2013, p. 545)
• Upstream supply information decoupling point (USIDP) – The point from where supply information is constrained upstream (adapted from Wikner, 2014a, p. 205; 2018, p. 452)
• Work in process (WIP) – ‘A good or goods in various stages of completion throughout the plant, including all material from raw material that has been released for initial processing up to completely processed material awaiting final inspection and acceptance as finished goods inventory’ (APICS Dictionary, 2013, p. 190)
135
Abbreviations and acronyms used for some key terms AD Adapt lead time – demand-based AS Adapt lead time – supply-based BOM Bill of materials (singular) BOMs Bills of materials (plural) CADP Customer adaptation decoupling point CM Conceptual model CODP Customer order decoupling point D Delivery lead time DDSCOMS Demand-driven supply chain operations management strategy DIDP Demand information decoupling point DSIDP Downstream supply information decoupling point ED Empirical data EUS External lead time upstream
I Internal lead time N/A Not applicable or not available NPD New product development Rx Respondent number x (e.g., respondent 10 = R10) ROI Return on investment RQ Research question S System lead time SCM Supply chain management SCOM Supply chain operations management UCDP Upstream controllability decoupling point USIDP Upstream supply information decoupling point WIP Work in process
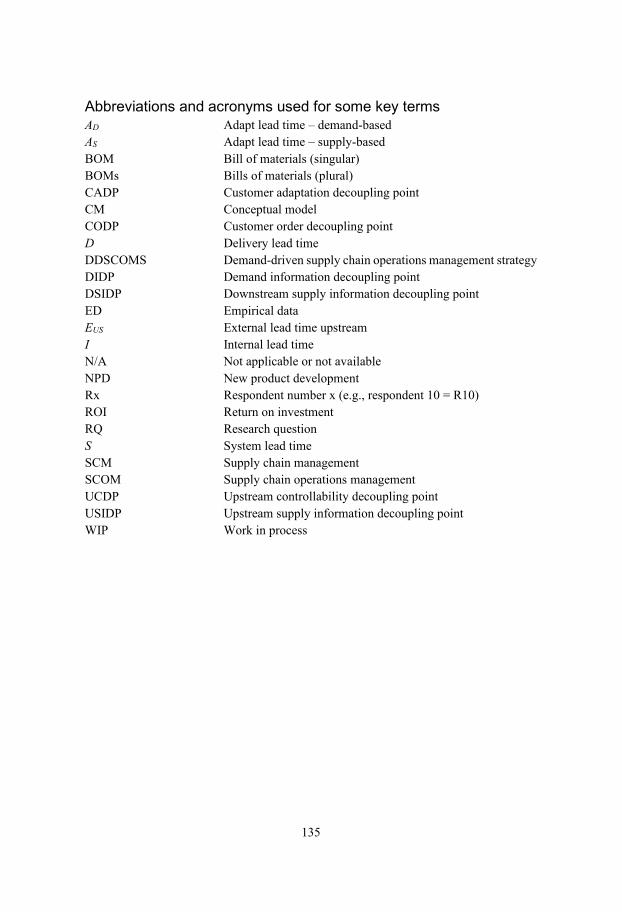