strategic trajectory de-confliction to enable seamless aircraft
TRANSCRIPT
Strategic Trajectory De-confliction to Enable Seamless AircraftConflict Management
Sergio Ruiz Navarro
PhD Thesis
Directed by Dr. Miquel A. Piera Eroles
Barcelona - 12th September 2013
With the support of:
Department of Telecommunications and System Engineering
Engineering School
1

2
Dr. Miquel Àngel Piera Eroles, profesor titular de la Universidad Autónoma deBarcelona,
CERTIFICA
Que la tesis doctoral titulada "Strategic Trajectory De-confliction to EnableSeamless Aircraft Conflict Management" por Sergio Ruiz Navarro, presentadacomo parte de los requerimientos para la obtención del Título de Doctor en Tele-comunicaciones e Ingeniería de Sistemas, se ha desarrollado y redactado bajo susupervisión.
CERTIFICATES
That the doctoral thesis entitled "Strategic Trajectory De-confliction to En-able Seamless Aircraft Conflict Management" by Sergio Ruiz Navarro, presentedas part of the requeriments for the obtention of the Title of Doctor in Telecom-munications and Systems Engineering, has been developed and written under hissupervision.
Dr. Miquel Àngel Piera Eroles
Barcelona, 12th September 2013
3

4
Prologue
Motivation
Currently the European Union is financing important investments in R&D in orderto strategically foster the Single European Sky. Through EUROCONTROL (theorganization in charge of the safety along the European airspace), the EuropeanUnion has been able to bring the main research groups and airspace stakeholdersinto the picture in order to define the main roadmaps of the future European airtraffic system. Such a project for the modernization of the European sky is namedSESAR (Single European Sky ATM Research).
Universidad Autónoma de Barcelona has been collaborating directly with someEUROCONTROL technological partners that are involved in different researchprojects related to SESAR, partners such as ATOS Origin, INDRA, ALG-INDRAand Boeing Research and Technology Europe (BR&TE). The present dissertationis the result of some of these collaborated projects, such as the project ATLAN-TIDA (a project leaded by BR&TE aiming at exploring the full automation ofair navigation and traffic management procedures in the context of a potentialfuture ATM concept) and the SESAR WP-E project STREAM (a project leadedby ALG-INDRA aiming at exploring strategic de-confliction algorithms for a largeamount of trajectories).
Under the supervision and direction of Dr. M.A. Piera, the present researchhas been focused on the design and implementation of Decision Support Toolsto improve some of the decision-making processes related to Air Traffic Manage-ment, considering the use of 4D trajectories along the entire European airspace.Specifically, a Conflict Detection and Resolution system for Strategic
De-confliction has been designed and implemented in this research, which hasbeen a fundamental part of the system proposed by the STREAM project (seeSection 1.6 and Chapter 3).
On the other hand, this dissertation has been written down with the intentionto qualify and pass the requirements of the PhD programme in Telecommunica-
5
6
tions and Systems Engineering of the Universidad Autónoma de Barcelona. Thus,a compendium of five articles that have been published in relevant journals andcongresses of the research field has been attached and constitute the core of thisdissertation.
For the development of this research a deep and exhaustive literature reviewhas been conducted, in addition to the contributions and insights provided spe-cially by BR&TE and ALG-INDRA during internal project meetings, as well asdirect consultations to experimented air controllers and pilots from recognizedorganizations (EUROCONTROL, AENA, Air Europa. . . ) also involved in thedevelopment of the SESAR project.
The feedback obtained from the project reviewers (especially during sched-uled and informal meetings with STREAM project supervisors form EUROCON-TROL) has also became an important source of knowledge, together with thefeedback obtained from the referees of several international journals and con-gresses of the aeronautical field to which selected partial pieces of this researchwere gradually sent with the most updated findings. Thanks to theses formalreviews (and also to more informal talks happened during the networking oppor-tunities in congresses) a lot of high-quality information could be obtained, thusallowing the research being refined while making steps forward. Those journalswere IEEE Intelligent Transportation Systems, Elsevier Transportation Research:part C and Journal of Aerospace Operations, among others, and the congresseswere UAV’09 (Reno, US), the Boeing CDA Procedures’09 (Barcelona, Spain), theNAV’09 (London, UK), the WAMS’10 (Búzios, Brazil), the ICRAT’10 (Budapest,Hungría) where a best paper award was granted, the ATACCS’11 (Barcelona,Spain), the ATM Seminar’11 (Berlin, Germany) (only assistance, no publica-tion), the SID’11 (Toulouse, France), the ICRAT’12 (Berkley, US) and the SID’12(Braunschweig, Germany) where the SESAR Young Scientist Award 2012was granted (see Appendix B).
Acknowledgements
The publication of this dissertation would have not been possible without the col-laboration and support of many persons. In the first place I would like to grantpart of the credit to the director of the research, Dr. Miquel Àngel Piera, who pro-posed the fields and topics of the research, and who contributed with many ideasand rigorously reviewed this dissertation. In addition, he established most of therelevant contacts with different international organizations that were crucial forthe right development of the research. He has been also aware of the internationalevents and congresses of recognized prestige in the field, which allowed sharing
7
and discussing the most updated findings and developments achieved during theresearch with the best ATM scientists and professionals around the world.
On the other hand, I would like also to thank to Rubén Martínez from ALG-INDRA who gave us the opportunity to link our research with a project sponsoredby EUROCONTROL (i.e., the STREAM project). Also many thanks to all histeam, especially to Andrea Ranieri and Alex Corbacho, who have actively parti-cipated throughout the entire STREAM project duration and contributed to theorientation and development of this research with their deep knowledge in ATMconsultancy.
I extend my gratitude to Miguel Vilaplana, Javier López, Isabel del Pozo andJohan de Prins, among other staff working at the Boieing Reseach and Techno-logy Europe (BR&TE) centre, located in Madrid. All of them have contributedwith ideas, classified information (such as the actual optimal trajectory profilesof some aircraft models), the construction of some of the traffic scenarios used inthe simulations of this research and with the Trajectory Predictor tool that “flew”the trajectories of the worked scenarios taking into consideration realistic aircraftperformances.
Of course, I would like to be grateful with the project reviewers of EURO-CONTROL, especially to Colin Meckiff, Leila Zerrouki and Jean-Luc Marchan,who kindly listened and discussed our new ATM concepts and many times sugges-ted changes and indentified areas of improvement to adapt our proposals to theactual needs of the airspace and also to ease the transition towards the SESARATM concept.
Also the anonymous reviewers of the journals and congresses deserve part ofthe credit of this dissertation, since with their feedback they notably contributeto improve the quality of the written articles and also of the entire research.
I would like also to appreciate the help given by some of my colleagues andfriends: Jordi Manzano, captain of Air Europa that is very actively involved inthe SESAR processes, thank you for contributing with the view of the pilots andfor kindly answer all my questions about the current and future ATM systems.Thank you also to Jordi Jiménez and his team of programmers in CIMNE (Uni-versidad Politécnica de Cataluña) as well as to Liana Napalkova and her team ofprogrammers in ASLOGIC, who offered their help during those difficult momentsin which a programmer leads with errors (sometimes esoteric) of any programmingprocess. Many thanks to Jenaro Nosedal, Olatunde Baruwa, Mónica Gutierrezand Catya Zúñiga, colleagues at the Universidad Autónoma de Barcelona, fortheir contributions and help.

8
And of course I cannot forget to thank my parents for their financial, logisticaland emotional aid given to me during all of these years and that made easier theachievement of my personal goals.
Executive Summary
Nowadays, due to the continuously growing demand of the air transportationin Europe, which facilitates fast and safe displacements, a high density of airtraffic across the European airspace can be observed. Some sectors of the cur-rent European airspace can be notably congested in certain periods, and can beeven fully saturated during most confluent peak hours. Some forecasts conductedby the European Union have predicted that the air traffic operations will be inthe next decade the double of the current observed traffic volume, therefore theEuropean Union has started a project (i.e., the SESAR project) to modernize thetechnology and procedures currently used by the air traffic management in orderto increase the current airspace capacity (thus being able to allocate the expectedfuture demand) as well as to improve the efficiency and coordination of all theoperations.
As a technological contribution, this research project introduces a strategicde-confliction algorithm developed under the EUROCONTROL’s STREAM pro-ject and launched under the umbrella of the Single European Sky ATM Research(SESAR) Programme. The underlying fundamental concept is to make use ofthe enriched information included in the flights prior to take-off and/or whilethe flights are airborne in order to allocate conflict-free routes/trajectories in atraffic-planning phase that, in the absence of flight and/or network uncertainties,should lead to an actual conflict-free scenario during the flight execution phase.
It is expected that the proposed approach could decrease the workload of theair traffic controllers, thus improving the Air Traffic Management (ATM) capacitywhile meeting the maximum possible expectations of the Airspace Users’ require-ments in terms of horizontal flight efficiency.
The main modules of the implemented system are presented in this disserta-tion, i.e., the conflict detection and the conflict resolution modules; these modulesare designed to enable the processing of thousands of trajectories within a fewseconds and encompass a global network scope with a planning horizon of approx-imately 2 to 3 hours.
9
10
The conflict detection (CD) module makes use of Spatial Data Structures asthe vehicular technology to create an ATM micro-scale model framework in whichit is possible to store and manage the precise micro-scale description of the overall4D trajectories in the ATM system, thus potentially enabling a centralized andcomplete view of the current state-space of the system and its evolution alongthe time. This is a key contribution of this research since such micro-scale modelframework provides with a global discrete event representation of the dynamicsystem, which is necessary for a better understanding of the complexities andemerging dynamics that cannot be understood without a global (4D/nD) per-spective of the ATM system.
The conflict resolution (CR) module is divided into two sub-modules, the Res-olution Trajectory Generator (RTG) that aims at providing feasible trajectoriesfor each aircraft in conflict with a local optimization scope, and the InteractionCausal Solver (ICS) that applies a causal model for finding efficient network solu-tions with a global scope through the analysis of the emergent dynamics (i.e.,domino effects). This architecture facilitates that the potential domino effectsgenerated by the local trajectory amendments can be analysed during the entireflight routing allocation process and, at the end of the process, different conflict-free Pareto-efficient network scenarios can be identified. Various performanceindicators can be taken into account in the multi-criteria optimization process,thus offering to the network manager a flexible tool for fostering a collaborativeplanning process.
The implementation of the system has been conducted in C++ with an ObjectOriented approach, and several simulations using realistic scenarios (both withand without uncertainties) have been performed and analysed to verify the correctfunctioning of the concepts. Simulation results have shown that this strategicCD&R tool is excellent from the computational-efficiency point of view and thatit is able to identify and manage the emergent dynamics of the system.
Contents
Prologue 5
Motivation . . . . . . . . . . . . . . . . . . . . . . . . . . . . . . . . . . 5Acknowledgements . . . . . . . . . . . . . . . . . . . . . . . . . . . . . . 6
Executive Summary 9
1 Introduction 19
1.1 The Single European Sky . . . . . . . . . . . . . . . . . . . . . . . 191.2 The SESAR Programme . . . . . . . . . . . . . . . . . . . . . . . . 211.3 The Current ATM System: Airspace and Flows Oriented . . . . . 241.4 The Current ATM Shortages and Improvement Areas . . . . . . . 281.5 The Future SESAR ATM: Trajectory Oriented . . . . . . . . . . . 32
1.5.1 The Trajectory Management Concept . . . . . . . . . . . . 321.5.2 Need for Modern Technologies . . . . . . . . . . . . . . . . 351.5.3 Trajectory Based Operations . . . . . . . . . . . . . . . . . 371.5.4 The ATM Planning Process . . . . . . . . . . . . . . . . . . 391.5.5 Conflict Management and Traffic Synchronization . . . . . 421.5.6 Summary of the SESAR ATM Concept . . . . . . . . . . . 44
1.6 The Motivation of this Research: the STREAM Project . . . . . . 491.7 Objectives and Dissertation Structure . . . . . . . . . . . . . . . . 50
2 State of the Art 53
2.1 System Classification by the Look Ahead Time . . . . . . . . . . . 532.2 Current Situation of CD&R Systems in ATM . . . . . . . . . . . . 542.3 Strategic De-confliction . . . . . . . . . . . . . . . . . . . . . . . . 59
3 Conflict Detection and Resolution Algorithms for Strategic De-
confliction 63
3.1 Data Framework to Store and Manage the ATM State-Space In-formation . . . . . . . . . . . . . . . . . . . . . . . . . . . . . . . . 63
3.2 Concept of Operations . . . . . . . . . . . . . . . . . . . . . . . . . 653.3 Uncertainty . . . . . . . . . . . . . . . . . . . . . . . . . . . . . . . 69
11
12 CONTENTS
3.4 STREAM Assumptions . . . . . . . . . . . . . . . . . . . . . . . . 703.5 Summary of the CD&R Main Features . . . . . . . . . . . . . . . 72
3.5.1 System Architecture . . . . . . . . . . . . . . . . . . . . . . 723.5.2 System Logical Functionality . . . . . . . . . . . . . . . . . 733.5.3 Technological Framework for the Conflict Detection Module 753.5.4 Technological Framework for the Conflict Resolution Mod-
ule . . . . . . . . . . . . . . . . . . . . . . . . . . . . . . . 80
4 Guidance and Chronology of the Published Articles 89
5 Scenario Design, Simulations and Discussion of Results 93
5.1 Strategic De-confliction of European Traffic Scenarios . . . . . . . . 935.2 Description of the CD Process . . . . . . . . . . . . . . . . . . . . . 955.3 Description of the CR Process . . . . . . . . . . . . . . . . . . . . . 975.4 Performance Analysis of the CD&R System . . . . . . . . . . . . . 995.5 Analysis and Impact Assessment of the Uncertainty in the Nominal
and the De-conflicted Scenarios . . . . . . . . . . . . . . . . . . . . 1005.5.1 Robustness of the Nominal Scenario . . . . . . . . . . . . . 1005.5.2 Robustness of the Strategically De-conflicted Scenario . . . 106
6 Conclusions, Main Contributions and Future Work 109
6.1 Summary of the Reseach . . . . . . . . . . . . . . . . . . . . . . . 1096.2 Conclusions . . . . . . . . . . . . . . . . . . . . . . . . . . . . . . . 1126.3 Main Contributions . . . . . . . . . . . . . . . . . . . . . . . . . . . 1136.4 Future Work . . . . . . . . . . . . . . . . . . . . . . . . . . . . . . 116
7 Compendium of Published Articles 129
7.1 “A Medium Term Conflict Detection and Resolution system forTerminal Manoeuvring Area based on Spatial Data Structures and4D Trajectories” . . . . . . . . . . . . . . . . . . . . . . . . . . . . 131
7.2 “Relational Time-Space Data Structure To Enable Strategic De-Confliction with a Global Scope in the Presence of a Large Numberof 4D Trajectories” . . . . . . . . . . . . . . . . . . . . . . . . . . . 155
7.3 “Computational Efficient Conflict Detection and Resolution throughSpatial Data Structures” . . . . . . . . . . . . . . . . . . . . . . . . 183
7.4 “Causal Decision Support Tools for Strategic Trajectory De-conflictionto Enable Seamless Aircraft Conflict Management (STREAM)” . . 193
7.5 “Strategic de-confliction in the presence of a large number of 4Dtrajectories using a causal modeling approach . . . . . . . . . . . . 205
Appendixes 231
CONTENTS 13
A Further Explanations about the CD&R System 231
A.1 Integration with SWIM . . . . . . . . . . . . . . . . . . . . . . . . 231A.2 Trajectory Identification Through Modular Arithmetic . . . . . . . 235A.3 Adaptation of the SDS to Consider the Curvature of the Earth . . 239A.4 Adaptation of Geometric Optimization Approach Algorithm to Stra-
tegic De-confliction . . . . . . . . . . . . . . . . . . . . . . . . . . 241A.5 Strategies to Tackle some Sources of ATM Uncertainty . . . . . . . 245
B SESAR Young Scientist Award 2012 Certificate 257
List of Acronyms 260
Bibliography 265

14 CONTENTS
List of Figures
1.1 Major phases of SESAR programme . . . . . . . . . . . . . . . . . 221.2 Scheme of Air Navigation Services (ANS). . . . . . . . . . . . . . . 241.3 Simplified representation of the current ATM system . . . . . . . . 271.4 Complex air traffic flows through European ATM route network . 311.5 4D Trajectory . . . . . . . . . . . . . . . . . . . . . . . . . . . . . 331.6 The unique description of the 4D Trajectory . . . . . . . . . . . . 341.7 Differences between the traditional vertical profile and the ideal
efficient profile . . . . . . . . . . . . . . . . . . . . . . . . . . . . 381.8 Collaborative Layered Planning . . . . . . . . . . . . . . . . . . . 401.9 Simplified representation of the future ATM system . . . . . . . . . 471.10 STREAM proposed Decision Support Tool for strategic conflict
management and traffic planning . . . . . . . . . . . . . . . . . . . 50
2.1 Holding procedures . . . . . . . . . . . . . . . . . . . . . . . . . . . 552.2 Models of aircraft state propagation during flight execution . . . . 56
3.1 Conceptual representation of the psysical shape of a Spatial DataStructure (SDS) . . . . . . . . . . . . . . . . . . . . . . . . . . . . 64
3.2 STREAM air traffic planning concept based on the SESAR ATMconcept of oferations . . . . . . . . . . . . . . . . . . . . . . . . . . 66
3.3 STREAM CD&R architecture . . . . . . . . . . . . . . . . . . . . . 733.4 Evolution of the SDS towards the Relational SDS concept . . . . . 773.5 Evolution of the SDS towards the Time-Space Data Structure concept 783.6 Performance comparison between a pairwise CD without filters and
a CD based on RTSDS utilisation . . . . . . . . . . . . . . . . . . . 793.7 Near-Neighbour Search applied to filter some pairwise comparisons 793.8 Approximate shape representation of the Geodesic SDS applied for
strategic CD&R over European ATM . . . . . . . . . . . . . . . . . 803.9 First CR strategies to find conflict-free trajectories . . . . . . . . . 813.10 Domino Effects emerged among the original and amendmed tra-
jectories . . . . . . . . . . . . . . . . . . . . . . . . . . . . . . . . . 823.11 Conflict-free scenario delivered by the first CR module version . . . 84
15
16 LIST OF FIGURES
3.12 Relative geometic framework to find analytical solutions through aGeometric Optimization Approach . . . . . . . . . . . . . . . . . . 85
3.13 Comparison between resolutions of the first and final version of theCR module . . . . . . . . . . . . . . . . . . . . . . . . . . . . . . . 87
5.1 Cluster statistics for the nominal case (Dsep = 5NM). 211 conflicts. 975.2 Cluster statistics for the nominal case with WPE uncertainties,
case 1 (Dsep = 5NM). 204 conflicts. . . . . . . . . . . . . . . . . . 1025.3 Cluster statistics for the nominal case with WPE uncertainties,
case 2 (Dsep = 5NM). 207 conflcits. . . . . . . . . . . . . . . . . . 1025.4 Cluster statistics for the nominal case with ETD uncertainties, case
1 (Dsep = 5NM). 196 conflcits. . . . . . . . . . . . . . . . . . . . . 1035.5 Cluster statistics for the nominal case with ETD uncertainties, case
2 (Dsep = 5NM). 180 conflcits. . . . . . . . . . . . . . . . . . . . . 1045.6 Cluster statistics for the nominal case (Dsep = 6NM). 254 conflcits. 1045.7 Cluster statistics for the nominal case (Dsep = 7NM). 297 conflcits. 1055.8 Cluster statistics for the nominal case (Dsep = 10NM). 430 conflcits.105
6.1 TPAS system architecture . . . . . . . . . . . . . . . . . . . . . . . 1246.2 Probabilistic SBTs/RBTs to tackle some sources of ATM uncertainty127
A.1 STREAM CD&R architecture integrated with SWIM . . . . . . . . 232A.2 Safety SWIM Nets application presented in the First SWIM Master
Class . . . . . . . . . . . . . . . . . . . . . . . . . . . . . . . . . . 232A.3 Example of a conflicted scenario to show the trajectory identifica-
tion algorithm . . . . . . . . . . . . . . . . . . . . . . . . . . . . . 236A.4 Conflict table information of an example scenario . . . . . . . . . . 237A.5 Modular Arithmetic application to obtain the historical record of
a trajectory . . . . . . . . . . . . . . . . . . . . . . . . . . . . . . . 237A.6 Evolution of the SDS towards a Geodesic SDS . . . . . . . . . . . . 240A.7 Transformation from the curved Earth to a planar geometric frame-
work . . . . . . . . . . . . . . . . . . . . . . . . . . . . . . . . . . . 243A.8 Adaptation of the GOA algorithms to adapt to the presence of
geodesic trajectories . . . . . . . . . . . . . . . . . . . . . . . . . . 244A.9 Adaptation of the GOA algorithms to adapt to the presence of
de-synchronized trajectories . . . . . . . . . . . . . . . . . . . . . . 244A.10 Application of spatial buffers to tackle some sources of uncertainties 247A.11 Structured uncertainty of delays . . . . . . . . . . . . . . . . . . . 248A.12 Temporal looseness of a trajectory . . . . . . . . . . . . . . . . . . 249A.13 Application of temporal buffers to tackle some sources of uncertainty250A.14 Risk-of-deviation during the flight execution phase . . . . . . . . . 252A.15 Application of n-dimensional ATM information to tackle some sources
of uncertainty . . . . . . . . . . . . . . . . . . . . . . . . . . . . . . 253

LIST OF FIGURES 17
A.16 A risk-of-deviation model that could be considered during strategicflight planning to reduce the number of tactical amendments . . . 255
B.1 SESAR Young Scientist Award 2012 Certificate . . . . . . . . . . . 259

18 LIST OF FIGURES
Chapter 1
Introduction
For many years Europe has been involved in the unifying process of its founda-tional countries. For instance, in 1985 the European Single Market was created,a fact that supposed the actual elimination of the terrestrial borders and thefree circulation of goods and persons. Later, in 1990, the Economic and Mon-etary Union was initiated, thus abolishing the economic and finantial frontiersand, consequently, allowing the free movement of capitals while some communityorganisms were founded to control the economic and monetary policies amongall the involved countries in an unified way, upon the final adoption of a com-mon currency, the Euro. It seems logical, therefore, considering this unifyingframework of the European countries, that such dynamics shall also affect to thecontinental airspace management policies, which up to now they have been char-acterized by a big fragmentation, not only geographical (many airspace sectors),but also technological (non-integrated information systems) and legislative (withmany particular laws for each of the countries).
1.1 The Single European Sky
In 2001 the European Commission decided to start the process of eliminating theairspace borders, with the intention of organizing and managing the Europeanairspace and the air navigation in an allied way, thus conceiving what is knownas the Single European Sky. This process, which is still alive and not expectedto end up to at least 2030, will bring the total modernization of the technologiesand procedures used to manage the air traffic in Europe.
The current Air Traffic Management (ATM) model is based on a largely frag-mented and sectored management of the air traffic flows, and thus it is not match-ing the airspace requirements that come along with the new unifying process of thesky management. Due to that, the European Commission requested to EURO-
19
20 Chapter 1. Introduction
CONTROL [18] the task of designing the future European ATM, with the purposeof adapting it to the new needs and opportunities of the Single European Sky.
It must be noted that, beyond the safety factors (that of course are considereda must-have for any ATM model), there are other performance factors evenly im-portant that should be also considered in order to deliver a good design for thefuture ATM in Europe. Among these factors, three are especially important, andthus EUROCONTROL has to pay maximum attention to them, which are: theavailable airspace/ATM capacity, the cost-efficiency relationship of flight routesand procedures, and the environmental impact of the air transport.
With regards to the airspace/ATM capacity, it is convenient to point out thecurrent situation. In last decades the air transportation system has experiencedan important growth in the demand, probably due to factors such as the newintra-continental relationships (direct cause of the territorial, political and eco-nomical unification of the continent), together with the comfort, speed and safetythat air transport currently offers for intercity and international journeys, as wellas to the considerable fall of prices in the market since the introduction of thelow-cost carriers. Altogether these factors have caused that from 2002 onwardsthe market has experienced a growth rate trend of 5% per year (except in 2008,2009, 2012 and 2013 due to the economic crisis) [99, 34, 49, 46], which means thatthe European airspace must safely afford a huge amount of daily flights (nowadaysaround 30.000), with peaks of several thousands of aircraft flying over Europe atthe same time (around 5000 simultaneous aircraft in the most demanded hours),and thus sometimes bringing many of the air sectors to their maximum capacitylimits. On the other hand, some economic forecasts predict that the air transportdemand could keep growing at same levels for at least the next two decades, thusa demand two times bigger is expected by 2030 [105, 30, 46, 31]. Therefore, theachievement of relevant improvements in the airspace/ATM capacity is a neces-sary condition and a key strategic goal for the successfulness of Single EuropeanSky project.
On the other side, another important objective to reach with the introductionof the new European ATM model is the reduction of the costs and the augmenta-tion of the system efficiency by improving the air routes available among airportsand the manoeuvres and procedures executed by aircraft during all phases offlight. For that purpose it is important to take advantage of the new opportun-ities arising with the unification of skies, such as the economies of scales andsynergies, and the potential synchronization of all the Single European Sky stake-holders.
Finally, another fundamental pillar of the incoming ATM paradigm is the min-
1.2 The SESAR Programme 21
imization of the negative environmental impact of the air transportation system,which is a key strategy for the achievement of a sustainable economic and societalgrowth. Important reductions of the negative gas emissions (Greenhouse Effectcontributors) can be expected thanks to the introduction of new route manage-ment strategies (e.g., dynamic free-route allocation) and new flight procedures(e.g., continuous climbing and descent operations), altogether with new advanceddesigns of aircraft fuselage and engines.
Note that all the aforementioned target factors (i.e., safety, capacity, cost-efficiency and environmental impact) are tightly coupled, thus actions driven toimprove any of them may directly or indirectly affect the others (in a positive ora negative way). For instance, the introduction of the technological enablers thatbring the free-route navigation available for the airspace users (i.e., more flexib-ility for the flight route planning, with only a few restrictions applied to ensuretraffic separation and synchronization), will suppose an improvement for both thecost-efficiency and the environmental impact of the flights (i.e., more direct flightsand less burned fuel), while at the same time it will allow an effective augment-ation of capacity and safety, due to a more efficient utilization of airspace and abetter synchronization of operations.
1.2 The SESAR Programme
The SESAR programme, whose acronym stands for Single European Sky ATMResearch, aims at defining (with a high-level description) the technological andprocedural requirements needed to build the project of the Single European Sky,as well as to coordinate the posterior development and deployment activities[99, 100, 101, 102, 103, 104, 105].
Currently, the Air Navigation Service Providers (ANSPs) in Europe and theircorresponding Decision Support Tools (DSTs) are not efficiently integrated andare often based on technologies and procedures that are close to work at theirmaximum capacities. Some of these technologies have their origin 50 or 60 yearsago (e.g., voice radiotelephony communications) and thus they were designed torespond to the needs of other ages and to work under scenarios with much lessair traffic densities. Up to now controllers of the different European nations havebeen able to maintain a safely and orderly flow of air traffic across the contin-ent. However, some of the controllers’ decisions could be nowadays being over-conservative and inefficient due to the currently established decision support toolsand traffic management procedures and protocols, which altogether are somehowold-fashioned. For instance, the traditional use of voice communications (i.e.,analogic communications and phraseology) is still extensively used between pilot
22 Chapter 1. Introduction
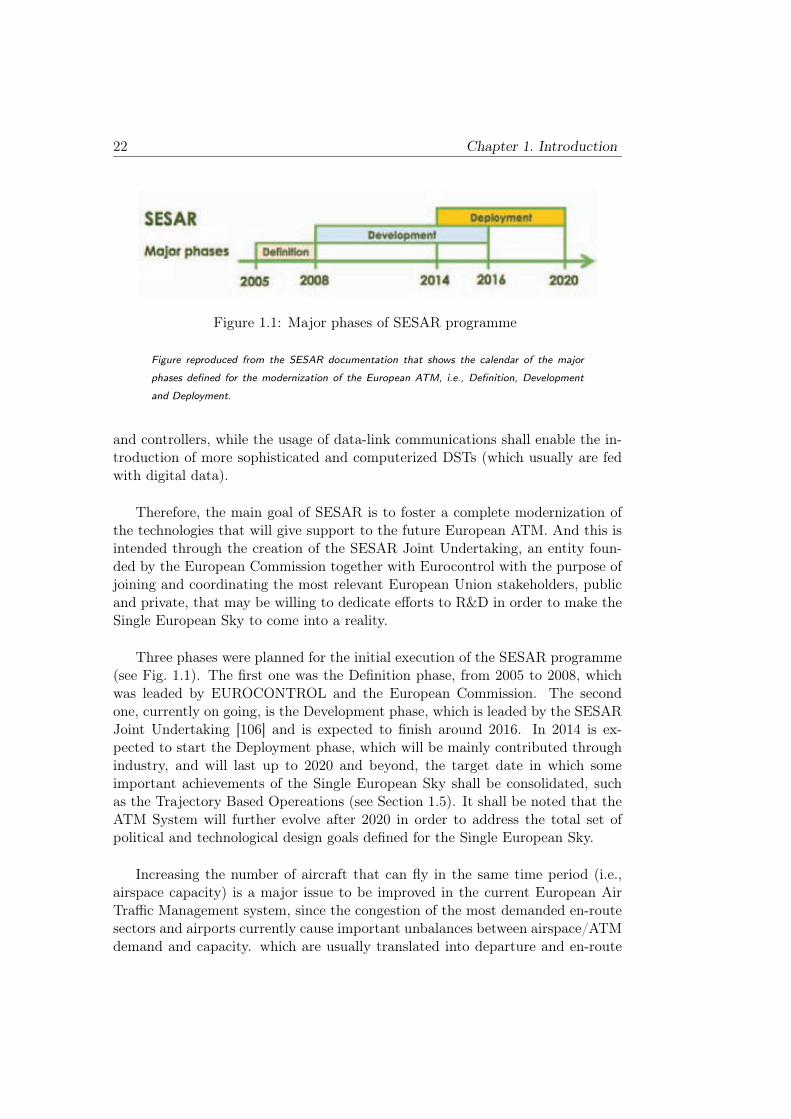
Figure 1.1: Major phases of SESAR programme
Figure reproduced from the SESAR documentation that shows the calendar of the major
phases defined for the modernization of the European ATM, i.e., Definition, Development
and Deployment.
and controllers, while the usage of data-link communications shall enable the in-troduction of more sophisticated and computerized DSTs (which usually are fedwith digital data).
Therefore, the main goal of SESAR is to foster a complete modernization ofthe technologies that will give support to the future European ATM. And this isintended through the creation of the SESAR Joint Undertaking, an entity foun-ded by the European Commission together with Eurocontrol with the purpose ofjoining and coordinating the most relevant European Union stakeholders, publicand private, that may be willing to dedicate efforts to R&D in order to make theSingle European Sky to come into a reality.
Three phases were planned for the initial execution of the SESAR programme(see Fig. 1.1). The first one was the Definition phase, from 2005 to 2008, whichwas leaded by EUROCONTROL and the European Commission. The secondone, currently on going, is the Development phase, which is leaded by the SESARJoint Undertaking [106] and is expected to finish around 2016. In 2014 is ex-pected to start the Deployment phase, which will be mainly contributed throughindustry, and will last up to 2020 and beyond, the target date in which someimportant achievements of the Single European Sky shall be consolidated, suchas the Trajectory Based Opereations (see Section 1.5). It shall be noted that theATM System will further evolve after 2020 in order to address the total set ofpolitical and technological design goals defined for the Single European Sky.
Increasing the number of aircraft that can fly in the same time period (i.e.,airspace capacity) is a major issue to be improved in the current European AirTraffic Management system, since the congestion of the most demanded en-routesectors and airports currently cause important unbalances between airspace/ATMdemand and capacity. which are usually translated into departure and en-route
1.2 The SESAR Programme 23
delays that negatively impact on the flights punctuality and in turn generatescollateral economical and societal costs of significant order [99, 101, 105].
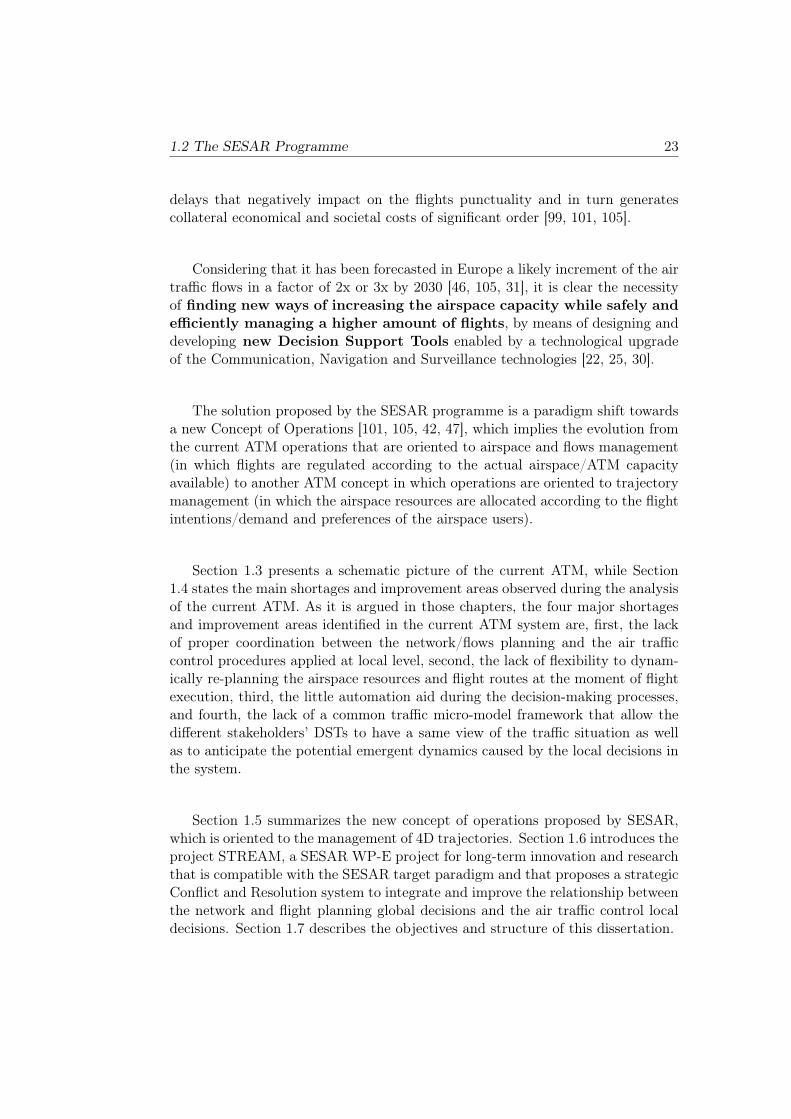
Considering that it has been forecasted in Europe a likely increment of the airtraffic flows in a factor of 2x or 3x by 2030 [46, 105, 31], it is clear the necessityof finding new ways of increasing the airspace capacity while safely and
efficiently managing a higher amount of flights, by means of designing anddeveloping new Decision Support Tools enabled by a technological upgradeof the Communication, Navigation and Surveillance technologies [22, 25, 30].
The solution proposed by the SESAR programme is a paradigm shift towardsa new Concept of Operations [101, 105, 42, 47], which implies the evolution fromthe current ATM operations that are oriented to airspace and flows management(in which flights are regulated according to the actual airspace/ATM capacityavailable) to another ATM concept in which operations are oriented to trajectorymanagement (in which the airspace resources are allocated according to the flightintentions/demand and preferences of the airspace users).
Section 1.3 presents a schematic picture of the current ATM, while Section1.4 states the main shortages and improvement areas observed during the analysisof the current ATM. As it is argued in those chapters, the four major shortagesand improvement areas identified in the current ATM system are, first, the lackof proper coordination between the network/flows planning and the air trafficcontrol procedures applied at local level, second, the lack of flexibility to dynam-ically re-planning the airspace resources and flight routes at the moment of flightexecution, third, the little automation aid during the decision-making processes,and fourth, the lack of a common traffic micro-model framework that allow thedifferent stakeholders’ DSTs to have a same view of the traffic situation as wellas to anticipate the potential emergent dynamics caused by the local decisions inthe system.
Section 1.5 summarizes the new concept of operations proposed by SESAR,which is oriented to the management of 4D trajectories. Section 1.6 introduces theproject STREAM, a SESAR WP-E project for long-term innovation and researchthat is compatible with the SESAR target paradigm and that proposes a strategicConflict and Resolution system to integrate and improve the relationship betweenthe network and flight planning global decisions and the air traffic control localdecisions. Section 1.7 describes the objectives and structure of this dissertation.
24 Chapter 1. Introduction
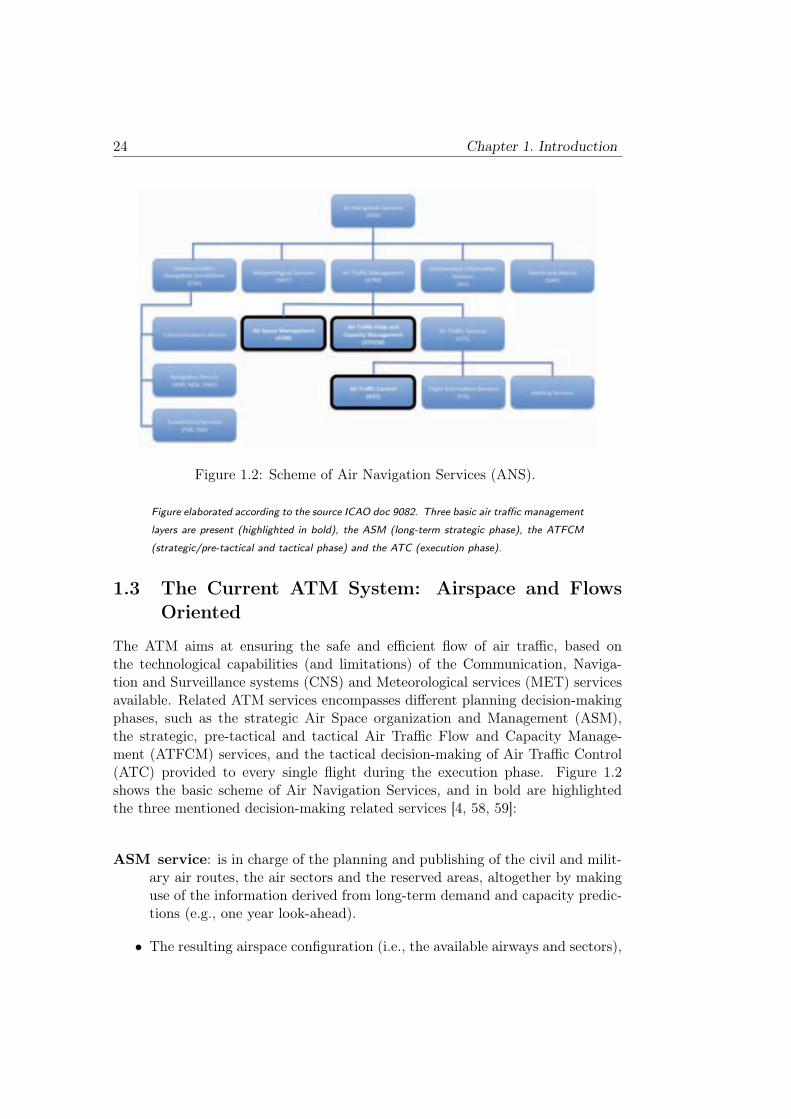
Figure 1.2: Scheme of Air Navigation Services (ANS).
Figure elaborated according to the source ICAO doc 9082. Three basic air traffic management
layers are present (highlighted in bold), the ASM (long-term strategic phase), the ATFCM
(strategic/pre-tactical and tactical phase) and the ATC (execution phase).
1.3 The Current ATM System: Airspace and Flows
Oriented
The ATM aims at ensuring the safe and efficient flow of air traffic, based onthe technological capabilities (and limitations) of the Communication, Naviga-tion and Surveillance systems (CNS) and Meteorological services (MET) servicesavailable. Related ATM services encompasses different planning decision-makingphases, such as the strategic Air Space organization and Management (ASM),the strategic, pre-tactical and tactical Air Traffic Flow and Capacity Manage-ment (ATFCM) services, and the tactical decision-making of Air Traffic Control(ATC) provided to every single flight during the execution phase. Figure 1.2shows the basic scheme of Air Navigation Services, and in bold are highlightedthe three mentioned decision-making related services [4, 58, 59]:
ASM service: is in charge of the planning and publishing of the civil and milit-ary air routes, the air sectors and the reserved areas, altogether by makinguse of the information derived from long-term demand and capacity predic-tions (e.g., one year look-ahead).
• The resulting airspace configuration (i.e., the available airways and sectors),
1.3 The Current ATM System: Airspace and Flows Oriented 25
together with the available ground infrastructures (i.e., airports, navaids,ATC Officers. . . ) determines the –maximum– airspace ATM supply/capacityat the day of operations.
• Airlines make use of the (fixed) routes network published by ASM to issuetheir Filled Flight Plans (FPLs) several days –even months– in advance,which express the expected demand of the airspace infrastructures (i.e., air-ways, sectors, airports. . . ) and ATM services at day of operations.
ATFCM service: is established to utilize the European airspace capacity tothe maximum extent possible, while enabling safe, orderly and expeditiousTraffic Flows1. The current ATFCM authority in Europe is EUROCON-TROL CFMU (which will act as Network Manager in the future ATM sys-tem).
• The main goal of this service is to ensure that supply and demand matchin order to avoid (unsafe) overloaded sectors at any time, i.e. Demand andCapacity Balancing (DCB), performed at the day of operations D.
• ATFCM makes a prediction of the airspace demand by computing (throughroughly accurate models) the expected trajectories and their evolution overthe time from the information of each individual FPL. Also from the pre-declared information of the ATC operators it is possible to anticipate theavailable capacity of every airspace sector. Those predictions are refinedas the day of operations becomes closer, since the quantity and quality ofinformation used for predictions usually increases.
• ATFCM presents 3 levels of decision-making actions, i.e. strategic (from 1year up to 1 week before the day of operations D), pre-tactical (from 1 weekto 1 day before D) and tactical (during all day D).
• In case that any imbalance is detected at day of operations D between thepredicted traffic and the available network capacity, the ATFCM shall applyregulations2 to some selected flights (usually delays but also re-routings andflight level changes).
• ATFCM decisions are made using aggregated airspace demand models (i.e.,Traffic Flows) with the purpose of not oversaturating the pre-declared ca-pacity of any sector. However, decisions made over individual flights dur-
1A Traffic Flow is composed by several flights moving through a given airspace region at a
given time period and in a common direction2A regulation is a method of matching traffic demand to available capacity by limiting the
number of flights planned to enter in a given airspace or aerodrome, and it is achieved by issuing
new departure slots and/or new routes to selected specific flights.
26 Chapter 1. Introduction
ing flight execution are delegated to the ATC services of each specific air-space sector. Therefore, the ATFCM actions do not ensure traffic separ-ation/synchronization at individual flight level, neither there is a preciseinsight of how ATFCM decisions impact over the ATC sectors workload.
ATC service: is provided by the different ANSPs for the purpose of guiding andfacilitating the navigation of each individual aircraft through the differentairspace sectors while preserving safety distances among all aircraft duringthe flight execution.
• The ATC service is provided to each individual flight by different Air TrafficControl Officers (ATCOs) during all the execution phases of a particularflight, i.e. take-off, climbing, cruise/en-route, descent/approach, landingand taxiing [4, 58, 59, 57].
• Each of the ATCOs provides assistance to different flights crossing theirassigned ATC sectors (i.e., with a local/specialized sector view).
• To preserve the safety distances among the traffic, the ATCOs are in chargeof the tactical management of conflicts (i.e., predicted loss of minimumseparation between two or more aircraft), also called interactions [58], andgive instructions to pilots whenever necessary to modify their trajectorieswithin the local sector.
• ATCOs of different ANSPs may use different technologies and DSTs to assistthe traffic in the sectors under their responsability.
• Conflict Detection and Resolution (CD&R) processes for tactical planningpurposes are currently executed with a look-ahead time typically limited to amaximum of 20 minutes (i.e., tactical applications) and with no global ATMperspective of how the decisions made at local/sector level may affect therest of the network, i.e. considering the traffic only at local airspace-sectorlevel and with little or none coordination with other downstream sectors.In other words, ATC decisions are made with no regards of the potentialATM system emergent dynamics/domino effects [69, 61].
• ATCOs tasks currently are highly human-dependent. In recent times, someautomated tools have been developed to assist ATC during the tacticalconflict management, like Medium Term Conflict Detection (MTCD) de-cision support tools (FASTI, iFACTS, ERATO or VAFORIT, among others[27, 23, 26, 35, 86]), or the early operational automated Conflict Resolution(CR) [28, 108, 74]. However, in all cases the CD&R processes (automated ornot) are making decisions with a local specialized view of the traffic crossinga specific sector and with little or none coordination with other downstream
1.3 The Current ATM System: Airspace and Flows Oriented 27
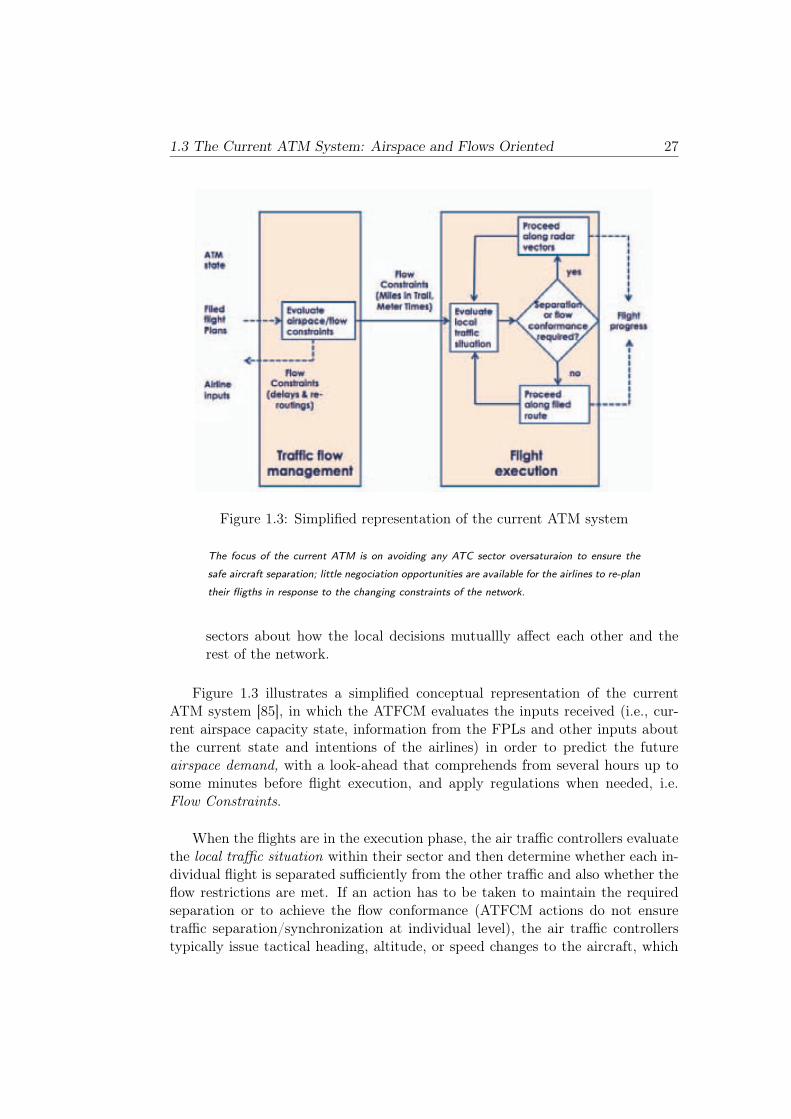
Figure 1.3: Simplified representation of the current ATM system
The focus of the current ATM is on avoiding any ATC sector oversaturaion to ensure the
safe aircraft separation; little negociation opportunities are available for the airlines to re-plan
their fligths in response to the changing constraints of the network.
sectors about how the local decisions mutuallly affect each other and therest of the network.
Figure 1.3 illustrates a simplified conceptual representation of the currentATM system [85], in which the ATFCM evaluates the inputs received (i.e., cur-rent airspace capacity state, information from the FPLs and other inputs aboutthe current state and intentions of the airlines) in order to predict the futureairspace demand, with a look-ahead that comprehends from several hours up tosome minutes before flight execution, and apply regulations when needed, i.e.Flow Constraints.
When the flights are in the execution phase, the air traffic controllers evaluatethe local traffic situation within their sector and then determine whether each in-dividual flight is separated sufficiently from the other traffic and also whether theflow restrictions are met. If an action has to be taken to maintain the requiredseparation or to achieve the flow conformance (ATFCM actions do not ensuretraffic separation/synchronization at individual level), the air traffic controllerstypically issue tactical heading, altitude, or speed changes to the aircraft, which
28 Chapter 1. Introduction
are often referred to as radar vectors. Note that these ATC actions, due to theirsector-specialized ATM view, do not consider potential downstream traffic inter-actions and/or de-synchronization. If no controller intervention is required, theflights proceed along their filled routings (but still with no care about traffic syn-chronization at other sectors). Note that in this (simplified) ATM model the flightplanning is conducted by the airlines off-line and prior to the execution phase andexpressed through the FPLs. Thus, under this framework there is little flexibility(almost null) on either re-planning a flight or reconfiguring the airspace structure(e.g., routes) during the tactical ATFCM and/or the ATC procedures at execu-tion phase.
1.4 The Current ATM Shortages and Improvement Areas
After analysing the current ATM organization the following shortages and poten-tial improvement areas have been identified:
• Lack of ATCFM and ATC integration: network capacity and demandare balanced through macro-scale models (i.e., Traffic Flows) in which thepre-declared capacities of the ATC sectors (in terms of maximum numberof aircraft per hour within an airspace sector) are taken into account by theATFCM to issue “regulations” (i.e., delays and/or re-routings) in order toavoid the oversaturation of those sectors, while trying to keep the averagedelay at the lowest possible. However, during the ATFCM decision-makingprocesses no impact assessment is considered of how the network/flow de-cisions affect to the real/actual micro-scale traffic pattern characteristics ateach ATC sector. On the other side, the ATC decisions are made on thebasis of particular micro-scale/trajectory models, but also with no impactassessment of the potential emergent dynamics/domino effects occurring atother sectors or at network/flow level. Therefore, this lack of integrationbetween the ATFCM and ATC procedures during the execution phase cur-rently causes poor traffic predictions and high uncertainty on the trafficevolution (i.e., traffic desynchronization), thus increasing the number andduration of flight delays as well as the ATC workload (due to the frequentseparation tasks) across the network.
• Lack of flexibility for a better planning/re-planning of both the
airspace and the flights during the execution phase: the actual evol-ution of traffic during the execution phase is often significantly differentwith respect to the planned one. For instance, if the capacity of a sectoris predicted to be overloaded, the air traffic flow management issues timeconstraints on the take-off of some selected flights, i.e. new ATFCM de-parture slots, that are intended to modify the temporal airspace demand
1.4 The Current ATM Shortages and Improvement Areas 29
path of flights in order to comply with the available capacity at airportsand at airspace sectors. However, the ATFCM slots introduce delays tothe flights that generate important economic and societal costs, so duringthe execution phase it would be desirable to re-plan the airspace structure(e.g., airspace routes, ATC resources, among others) to increase capacityand mitigate delays, ot to re-plan the flights in order to optimize them atthe maximum extent possible according to the business logics of the AUs.The lack of proper mechanisms for the coordination among ATCFM, ATCand AUs impedes the efficient dynamic planning in real-time in which refersto the airspace routes and resources available and also to the flight routesprefered by the airlines.
• Little automation of some ATM procedures: the current ATM systemheavily relies on the skills of air traffic controllers and traffic flow managers.Most of the short term and medium term predictions are made by controllersand flow managers looking at air traffic displays and mentally extrapolatingthe situation, thus using little automation aid during the decision-makingprocesses. In recent years there has been a considerable amount of worksdone to generate new Decision Support Tools (DSTs) for the automation ofsome ATM tasks, such as Medium Term Conflict Detection and Resolution(MTCD&R) [35], Arrival/Departure Manager (AMAN/DMAN) [84], ShortTerm Conflict Alert (SCTA) [33], among others. However, they still relyon different particular non-coordinated subjective view of the ATM (i.e., alocal specialized view and a limited working look-ahead horizon) during thedecision-making process and thus they cannot be properly coordinated withthe rest of the ATM stakeholders’ DSTs.
• Lack of a common and global traffic model framework to integ-
rate different DSTs: the current ATM involves multiple decision makersthat nowadays cannot be properly coordinated among the different sectors[71]. The complex ATM emergent dynamics appearing during local decision-making processes require a micro-level traffic description of the flights to-gether with a global network perspective about the current and future ATMstates in which the intentions of each individual stakeholder are considered.This is particularly true during the flight planning and execution phases ifthe goal of the ATM is to increase the predictability and efficiency of flightswhile reducing the total number of tactical –reactive– interventions (thus,increasing ATM capacity) along the air traffic system [71, 61, 69]. However,the current system is focused on ensuring the due separation between air-craft within a well structured local traffic problem, but with an incompletepicture of the overall ATM current and predicted states: from the ATCFMside, macro-scope/flow models are used rather than micro-scope/trajectorymodels, whereas from the ATCOs side there is a narrowed sector-specialized
30 Chapter 1. Introduction
ATM view with no visibility of the potential downstream emergent dynam-ics. One example can be found in the tactical conflict resolution proceduresof ATC that do not consider the emergent dynamics/domino effects of atrajectory resolution maneuver downstream in other sectors.
With the separation management as the primary objective, the current ATM
system has to be considered safe but inefficient, i.e. the current proceduresused to manage the air traffic flows without considering the single flight trajector-ies across sectors, combined with the high volume of air traffic observed in Europe,actually causes the saturation of several air sectors during the most con-
fluent hours, thus strongly limiting the ATM capacity and causing im-
portant economic, environmental and societal costs [30, 78, 105]. SeeFig. 1.4.
These capacity problems are currently especially severe in Terminal Manoeuv-ring Area (TMA) sectors, particularly in those TMAs at where the most demandedairports are located and in which the number of flights and trajectory interactionsare relatively high (i.e., high-complexity terminal operations). The congestion ofsuch sectors derives in frequent and long-duration airborne holding proced-ures nearby the airports (a predetermined manoeuvre which keeps an aircraftwithin a specified airspace while awaiting for further clearance), which resultson important extra fuel consumption and pollution [103, 78]. In addition, boththe take-off delays (often imposed by ATFCM) and the en-route delays (oftenconsequence of ATC radar vectors and/or flight navigation imprecisions) may beaffecting to landing operations, thus causing a trajectory de-synchronization
that quickly may propagate to surrounding feeder sectors and may also
affect to other TMAs and to the entire en-route airspace (TMAs are cur-rently considered one of the main bottlenecks of the ATM system due the strongnegative effects that trajectory de-synchronization causes on the traffic convergingto runways) [80, 30].
Therefore, as a conclusion of the analysis of ATM shortages and potentialimprovements areas it can be stated that, in order to noticeably improve thecurrent ATM system, it is necessary a proper integration between the ATFCMand ATC procedures, while having the stakeholders airspace demands as a priorityduring the pre-departure and execution phases of flight. It is expected that furtherresearch in the following points could contribute to achieve such requirements:
• A microscopic 4D trajectory model of the traffic flows, i.e. aprecise 4D micro-scale description of all expected/planned flights crossingthe European airspace would be necessary to consider the complete expec-ted/planned trajectory in a precise way from the entry point up to the exitpoint of the flight in the airspace under consideration (from gate to gate in
1.4 The Current ATM Shortages and Improvement Areas 31
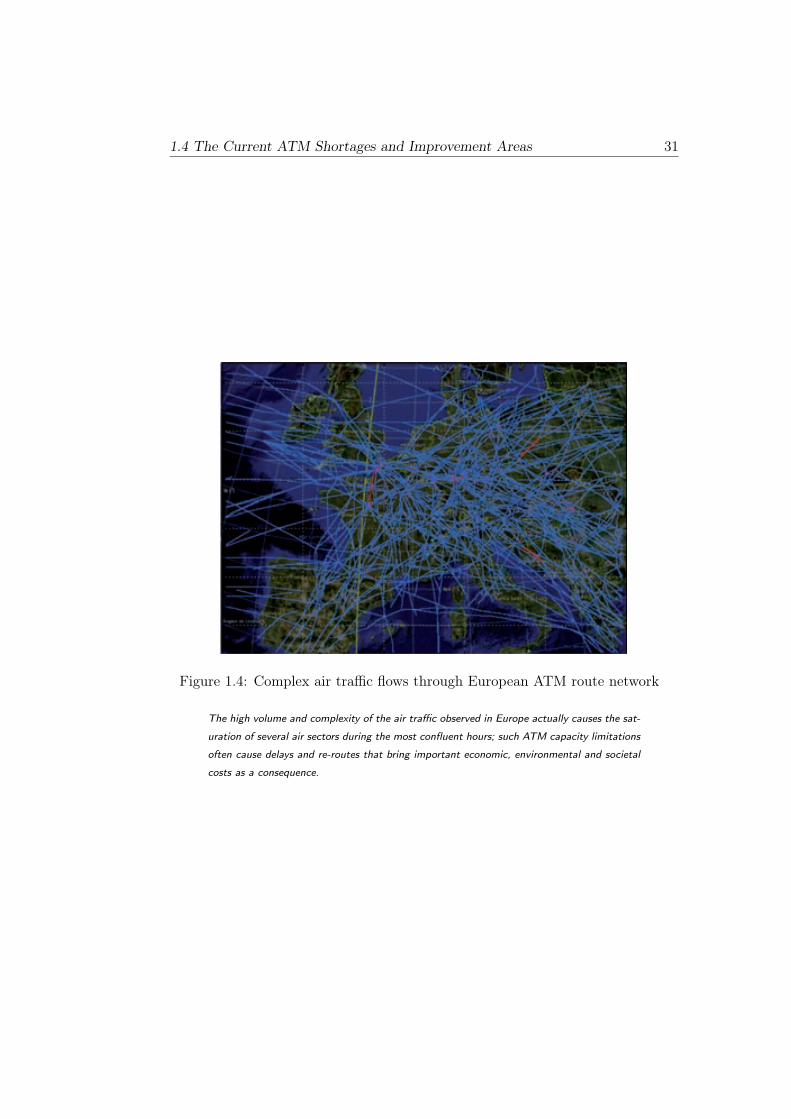
Figure 1.4: Complex air traffic flows through European ATM route network
The high volume and complexity of the air traffic observed in Europe actually causes the sat-
uration of several air sectors during the most confluent hours; such ATM capacity limitations
often cause delays and re-routes that bring important economic, environmental and societal
costs as a consequence.
32 Chapter 1. Introduction
case of intra-European flights).
• Automated and coordinated stakeholders’ DSTs to ensure a more
precise and stable traffic synchronization along the network, thuscontributing to more efficient and complex local-specialized decision-makingresponding to different ATM stakeholders and network needs. Note that theusage of digital data for automated DSTs may potentially enable an efficientdata exchange and coordination between the different DST applications.
• Allow the participation of the Airspace Users through arbitrated
negotiation processes during the entire network planning process,which would lead to a more efficient utilization of the airspace capacity andalso to more efficient flight plans.
• A common overall sight of the ATM current and predicted states,i.e. the same view of the actual ATM capacity and predicted airspace de-mand would be necessary in order to allow a proper coordination betweenthe different DSTs.
• The anticipation of the potential emergent dynamics at the net-
work due to local decisions shared among all the ATM stake-
holders DSTs, a concept that might improve the synchronization of allstakeholders procedures and that only can be achieved through the proper(digital) information sharing among all the agents, together with a networkanalysis tool able of providing the information of the expected emergentdynamics. A common information framework to share the current and pre-dicted ATM states among all the stakeholders is also needed.
1.5 The Future SESAR ATM: Trajectory Oriented
1.5.1 The Trajectory Management Concept
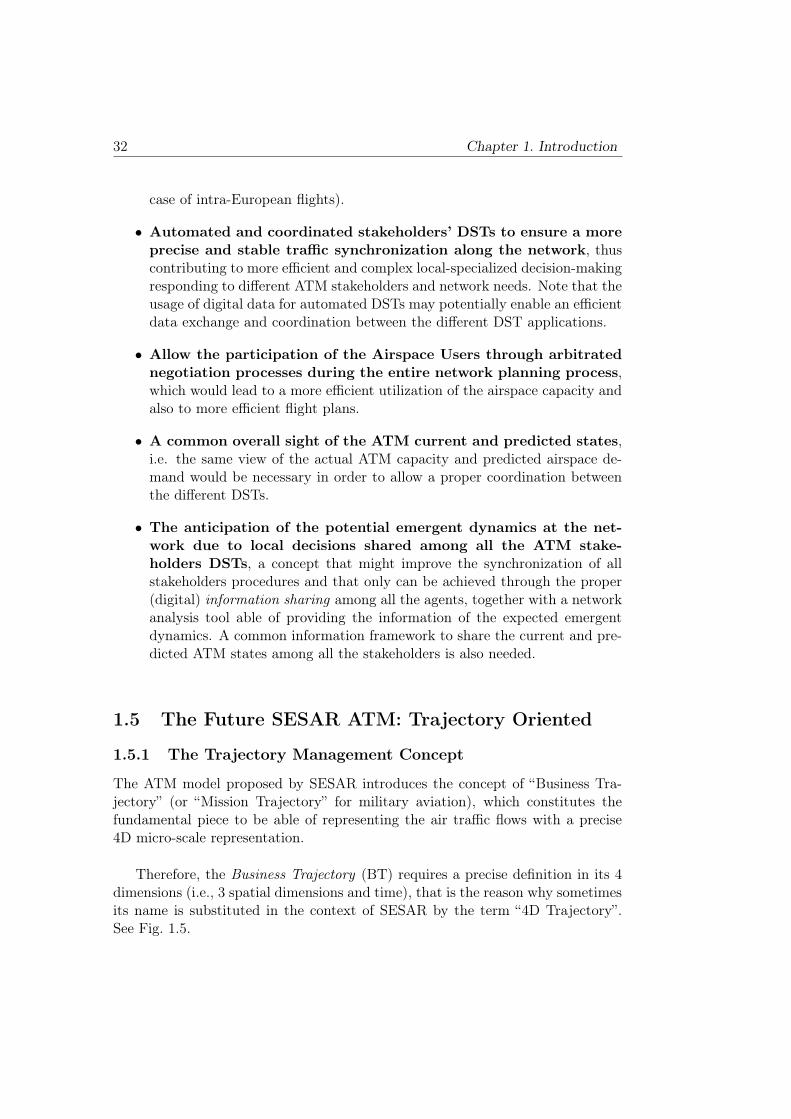
The ATM model proposed by SESAR introduces the concept of “Business Tra-jectory” (or “Mission Trajectory” for military aviation), which constitutes thefundamental piece to be able of representing the air traffic flows with a precise4D micro-scale representation.
Therefore, the Business Trajectory (BT) requires a precise definition in its 4dimensions (i.e., 3 spatial dimensions and time), that is the reason why sometimesits name is substituted in the context of SESAR by the term “4D Trajectory”.See Fig. 1.5.
1.5 The Future SESAR ATM: Trajectory Oriented 33
Figure 1.5: 4D Trajectory
The 4D trajectories are completely defined in the three spatial dimensions and in time.
At a first step, the BTs will be internally generated by the Airspace Users(AUs) (e.g.„ airline operators) even years before of the day of operations basedon their business planning goals. At this stage the BTs are called Business De-velopment Trajectories (BDTs) and they might not be shared with the rest of theATM community.
However, the final execution of a BT requires that all stakeholders, includingthe airlines, the ANSPs and the airport providers, agree in a collaborative nego-tiation process the optimal gate-to-gate flight plan for each of the scheduled flights.
Thus, during this negotiation process among airlines, airports and controllers,the Business Trajectory receives the name of Shared Business Trajectory (SBT).In this process, the airline will propose a trajectory that best fits its businessneeds to cover the distance between two airports. Then, the different ANSPs willaccept or deny the trajectory according to the airspace and airports restrictions.This process will be iteratively repeated until an agreement is reached among allthe agents (i.e., a good-enough feasible trajectory is found), except in time-criticalsituations in which the ANSPs or the Network Manager (NM) may impose theirtrajectories.
Once all the stakeholders accept a SBT, and few minutes before to the take-off3, its name comes out to Reference Business Trajectory (RBT). From thismoment on, this trajectory will be considered to be the optimal one for that par-ticular flight, since it takes into account all the controllers and airspace restrictionsas well as the airlines preferences (it is assumed that airlines will optimize their
3For instance during push-back since then the take-off time is often known with high accuracy.
34 Chapter 1. Introduction
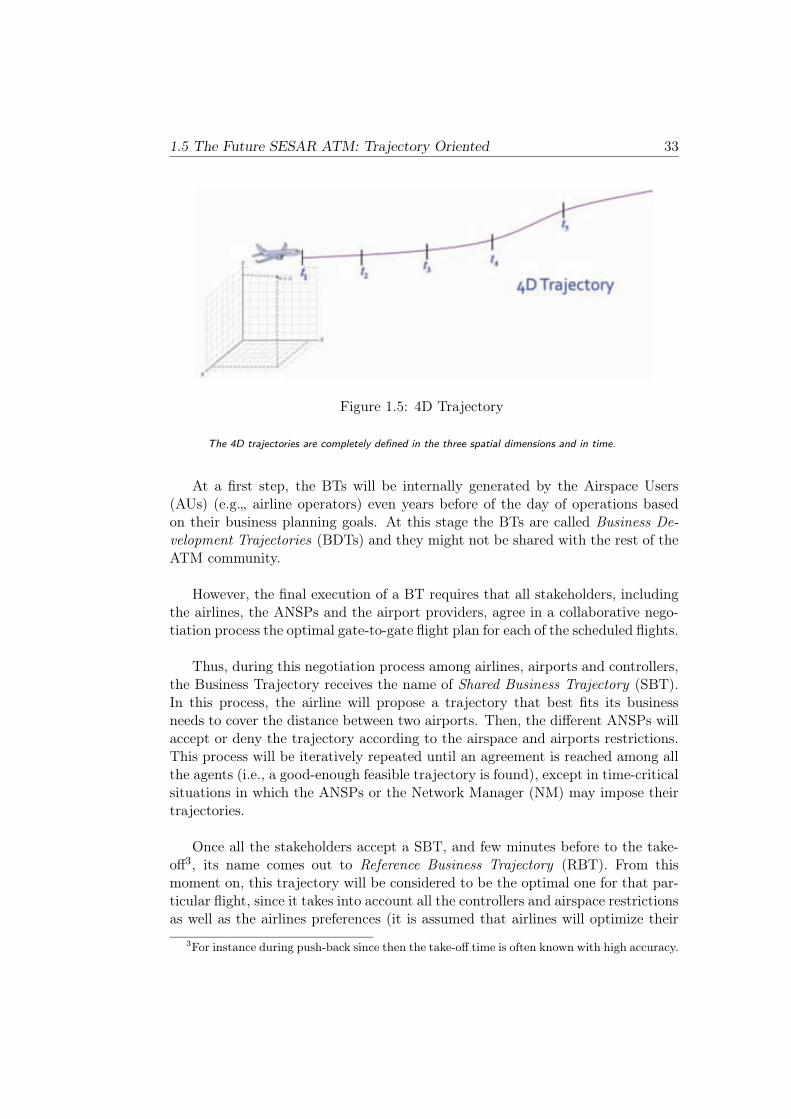
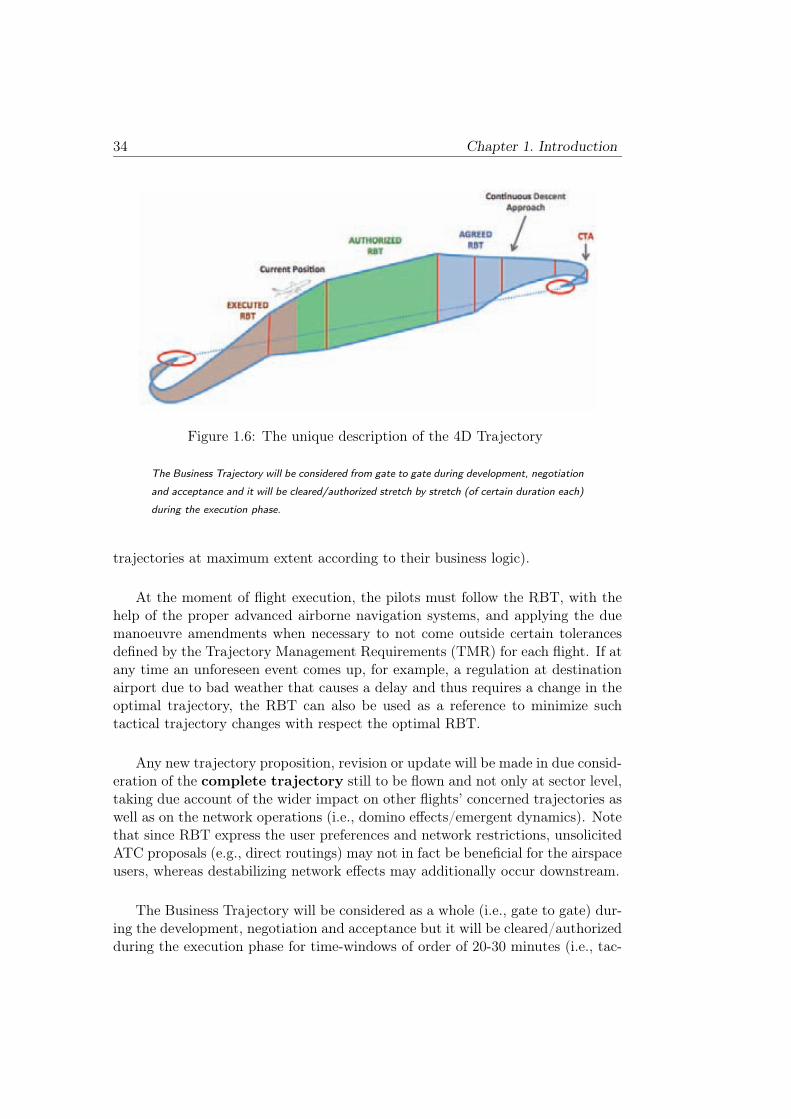
Figure 1.6: The unique description of the 4D Trajectory
The Business Trajectory will be considered from gate to gate during development, negotiation
and acceptance and it will be cleared/authorized stretch by stretch (of certain duration each)
during the execution phase.
trajectories at maximum extent according to their business logic).
At the moment of flight execution, the pilots must follow the RBT, with thehelp of the proper advanced airborne navigation systems, and applying the duemanoeuvre amendments when necessary to not come outside certain tolerancesdefined by the Trajectory Management Requirements (TMR) for each flight. If atany time an unforeseen event comes up, for example, a regulation at destinationairport due to bad weather that causes a delay and thus requires a change in theoptimal trajectory, the RBT can also be used as a reference to minimize suchtactical trajectory changes with respect the optimal RBT.
Any new trajectory proposition, revision or update will be made in due consid-eration of the complete trajectory still to be flown and not only at sector level,taking due account of the wider impact on other flights’ concerned trajectories aswell as on the network operations (i.e., domino effects/emergent dynamics). Notethat since RBT express the user preferences and network restrictions, unsolicitedATC proposals (e.g., direct routings) may not in fact be beneficial for the airspaceusers, whereas destabilizing network effects may additionally occur downstream.
The Business Trajectory will be considered as a whole (i.e., gate to gate) dur-ing the development, negotiation and acceptance but it will be cleared/authorizedduring the execution phase for time-windows of order of 20-30 minutes (i.e., tac-
1.5 The Future SESAR ATM: Trajectory Oriented 35
tical look-ahead). See Fig. 1.6.
On the other hand, note that the term 4D Trajectory also contemplates (ac-cording to SESAR definitions) other kind of trajectories, such as:
• Planned: properly called Business Trajectory (or Mission Trajectory ifmilitary) and potentially adopting different forms according to the timehorizon (e.g., SBT or RBTs).
• Predicted: trajectory computed by a Trajectory Predictor (TP), whichcorresponds to what the aircraft is expected to fly (also with different predic-tion horizons, i.e., for near, medium term or for strategic planning purposes)and it is continuously updated during the flight execution by both on-boardand on-ground systems.
• Executed: trajectory actually flown by aircraft.
• Alternate: used for “what if” purposes during the planning process, thusmeaning that each aircraft/flight may have several potential trajectories forplanning purposes (although only one will be executed).
1.5.2 Need for Modern Technologies
The new SESAR paradigm requires of the effective development and deploymentof the necessary Communication, Navigation and Surveillance (CNS) as well asthe proper improved Meteorology (MET) technologies that will give support tothe whole ATM system in order to achieve the goals of maximizing capacity andsafety while minimizing costs and environmental impact.
In its simplest form, the 2020 CNS baseline to support the new SESAR ATMparadigm can be characterized as follows:
• Communication: technologies (e.g., data-link, CPDLC, among others)that will enable improved voice communications and digital data exchangesbetween service actors within the system, such as those necessary to supportthe System Wide Information Management (SWIM), a net-centric ATM in-tranet that will allow to share information from and among all the stake-holders, thus enabling a Collaborative Decision Making (CDM) philosophy.
• Navigation: technologies (e.g., GNSS, P-RNAV, among others) that willenable precise positioning, timing and guidance of the aircraft to supporthigh-performance and efficient 4D trajectory operations in all phases offlight, thus allowing the use of Free-Routing (i.e., user-preferred routing)whenever possible;
36 Chapter 1. Introduction
• Surveillance: technologies (e.g., ADS-B, ASAS, TCAS, among others)that will enable precise monitoring of all the traffic to assure safe and effi-cient operations, including enhanced Traffic Situational Awareness, AirborneSeparation Assurance System (ASAS) and Traffic Collision Avoidance Sys-tem (TCAS).
• Meteorology: technologies (e.g., ground, airborne and satellite sensors,improved prediction models, among others) that will enable accurate andtimely meteorological information incorporated as an integrated componentof the system to give support for all phases of flight and for the determinationof the optimum route/trajectory for each flight in both the planning andexecution phases.
These technologies will be gradually implemented thus facilitating the transitiontowards the SESAR target Operational Concept through three complementarySteps:
Step 1, “time-based operations” (approximately 2008-2013): focused on flightefficiency, predictability and the environment, the goal is a synchronizedEuropean ATM system. Main characteristics:
• Time prioritization for arrivals at airports is initiated;
• Data-link is widely used;
• Initial trajectory-based operations are deployed through the use of airborne-calculated trajectories in the ground systems (sent through data-link) anda controlled time of arrival (to sequence traffic and manage queues).
Step 2, “trajectory-based operations” (TBOs) (approximately 2013-2020): fo-cused on flight efficiency, predictability, environment and capacity, the goalis a trajectory-based ATM system where partners optimize “business andmission trajectories” through common 4D trajectory information. Maincharacteristics:
• Initial 4D-based business/mission trajectory management
• System Wide Information Management (SWIM) fully functional
• Air/ground trajectory exchange to enable tactical planning and new separa-tion modes (i.e., strategic de-confliction and self-separation). Allocating allSBTs and RBTs through a strategic conflict management action based ona Collaborative Flight Planning may contribute to a higher flight plan op-timization (according to each AU different definitions of “optimality”) whilereducing the ATC workload (at least in which refers to tactical conflictmanagement), thus augmenting the overall ATM capacity.
1.5 The Future SESAR ATM: Trajectory Oriented 37
Step 3, “performance-based operations” (2020+): based on the same concepts ofTBOs, the goal is the implementation of a European high-performance, in-tegrated, network-centric, collaborative and seamless air/ground ATM sys-tem, thus not only focusing the system in the enhanced separation provisionprovided by TBOs, but also managing the overall system to conform withother higher-level performance objectives (e.g., taking into account equityand fairness criteria, and reaching a good trade-off between flexibility, effi-ciency and robustness).
1.5.3 Trajectory Based Operations
Based on the above 4D trajectory management principles, the so-called conceptof Trajectory Based Operations (TBOs) assumes that the proper new CNS tech-nologies will be available to support the due positioning and navigation precisionrequirements, a more flexible planning process of flight routes and trajectories, animproved information availability (quantity and quality) for all on-board and on-ground systems, and a fast and reliable transmission of such information amongall the relevant systems.
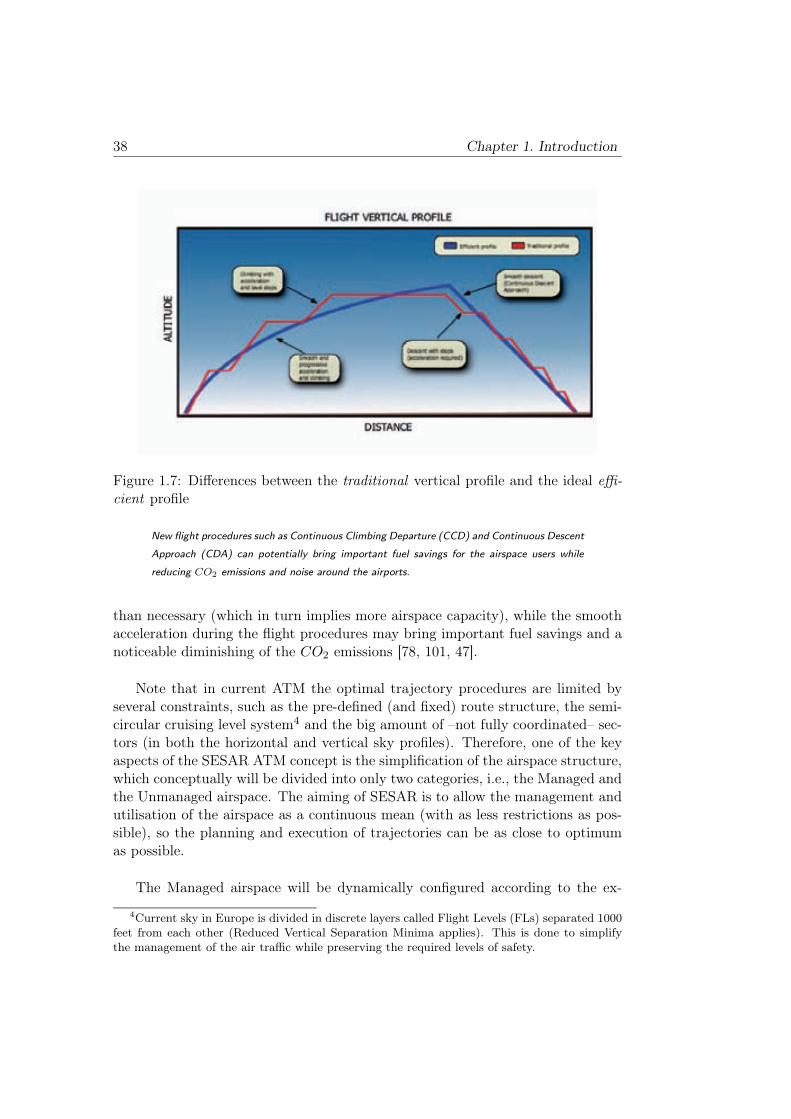
The aiming of TBOs is to allow pilots, whenever possible, to follow traject-ories close to the optimal fuel consumption (“optimal” according to a calculatedcost-index that relates operational costs and fuel costs). In general, an optimaltrajectory consists on a horizontal dimension (i.e., track) that follows the mostdirect route possible between two airports, although not always it follows theshortest distance (i.e., Great Circle) since the expected wind maps are also takeninto account, e.g. a jet stream in the flight direction may imply longer distancebut less time and/or fuel consumption [15]; also the service taxation to fly acrosssectors is taken into account in case that relevant differences are present among thedifferent ANSPs (the service taxation is expected to be more homogeneous amongall the sectors in the future SESAR ATM). In the vertical plane, the preferredprofile usually consists on climbing manoeuvres that are executed with a uniformand smooth acceleration until the top optimal cruise flight level is reached. Notethat for each flight plan and aircraft mass there is an optimum flight level thatrise up as soon as the mass is lowering. Therefore, since mass is continuouslylowering (i.e., fuel burn), the optimum vertical profile is a trajectory continuouslyclimbing up to a maximum altitude (i.e., Continous Climbing Departure or CCD)in which a continuous descent is started (i.e., Continous Descent Approach orCDA), which is calculated to land at the destination airport with a certain glideslope (typically 3º or 4º), thus to be executed with idle throttle whenever possibleand up to ground contact (see Fig. 1.7). In this way, if the optimal horizontal,vertical and speed profiles are applied, the aircraft will not be airborne longer
38 Chapter 1. Introduction
Figure 1.7: Differences between the traditional vertical profile and the ideal effi-cient profile
New flight procedures such as Continuous Climbing Departure (CCD) and Continuous Descent
Approach (CDA) can potentially bring important fuel savings for the airspace users while
reducing CO2 emissions and noise around the airports.
than necessary (which in turn implies more airspace capacity), while the smoothacceleration during the flight procedures may bring important fuel savings and anoticeable diminishing of the CO2 emissions [78, 101, 47].
Note that in current ATM the optimal trajectory procedures are limited byseveral constraints, such as the pre-defined (and fixed) route structure, the semi-circular cruising level system4 and the big amount of –not fully coordinated– sec-tors (in both the horizontal and vertical sky profiles). Therefore, one of the keyaspects of the SESAR ATM concept is the simplification of the airspace structure,which conceptually will be divided into only two categories, i.e., the Managed andthe Unmanaged airspace. The aiming of SESAR is to allow the management andutilisation of the airspace as a continuous mean (with as less restrictions as pos-sible), so the planning and execution of trajectories can be as close to optimumas possible.
The Managed airspace will be dynamically configured according to the ex-
4Current sky in Europe is divided in discrete layers called Flight Levels (FLs) separated 1000
feet from each other (Reduced Vertical Separation Minima applies). This is done to simplify
the management of the air traffic while preserving the required levels of safety.
1.5 The Future SESAR ATM: Trajectory Oriented 39
pected needs at each time of the planning look-ahead. During low/medium com-plexity operations, and whenever possible, it will be allowed in the SESAR ATMconcept that aircraft fly the user-preferred routes (i.e., Free-Routes) across theen-route sectors, while in TMAs it will be possible to execute optimum (or closeto optimum) vertical procedures, i.e., CCDs and CDAs.
When complexity will be temporarily high, the required capacity will be onlyachieved at the cost of some constraints on individual optimum trajectories, thusFree-Routing might be totally or partially suspended in high-complexity en-routeareas and TMAs since some forcing 2D, 3D and/or 4D constraints will be issuedthrough a Dynamic Route Allocation process that shall allow adapting the air-space traffic demand to the actual available capacity in real-time.
A Flexible Use of Airspace (FUA) will be also possible for coordinating civiland military operations, thus some airspace regions may be temporarily unavail-able for civil flights, which together with the rest of the 4D network constraints(i.e., traffic synchronization measures) makes necessary a dynamic and collabor-ative ATM planning process.
1.5.4 The ATM Planning Process
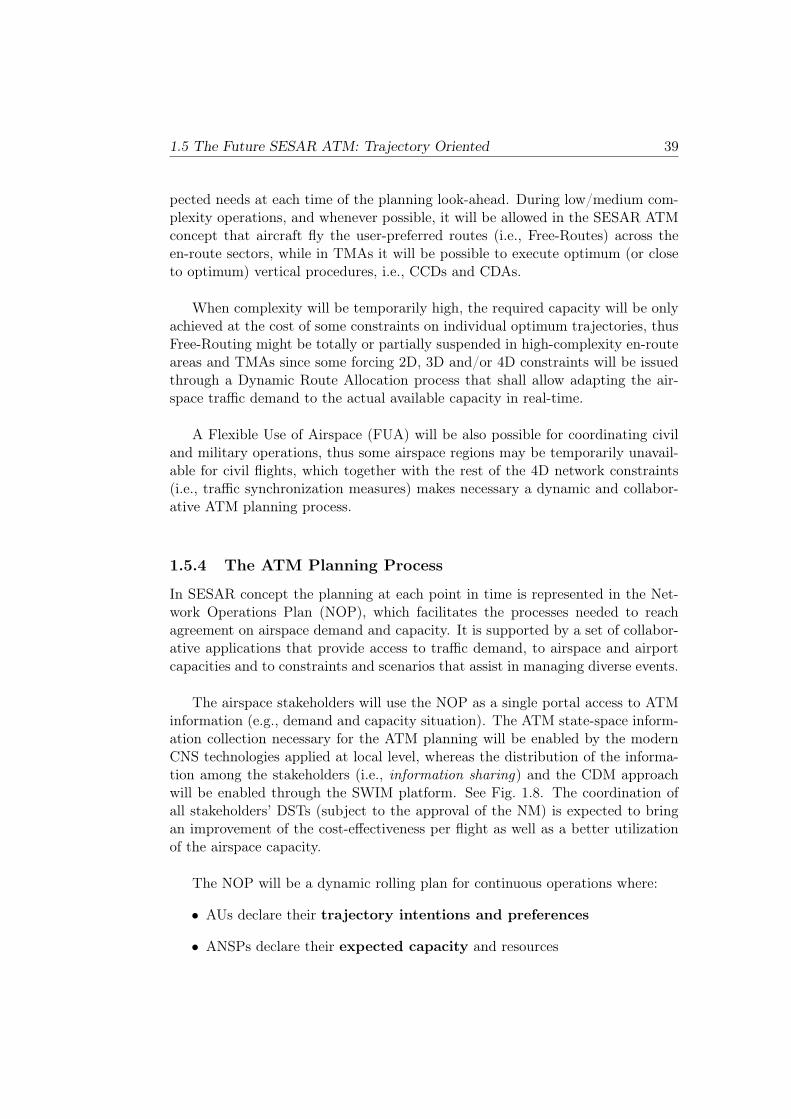
In SESAR concept the planning at each point in time is represented in the Net-work Operations Plan (NOP), which facilitates the processes needed to reachagreement on airspace demand and capacity. It is supported by a set of collabor-ative applications that provide access to traffic demand, to airspace and airportcapacities and to constraints and scenarios that assist in managing diverse events.
The airspace stakeholders will use the NOP as a single portal access to ATMinformation (e.g., demand and capacity situation). The ATM state-space inform-ation collection necessary for the ATM planning will be enabled by the modernCNS technologies applied at local level, whereas the distribution of the informa-tion among the stakeholders (i.e., information sharing) and the CDM approachwill be enabled through the SWIM platform. See Fig. 1.8. The coordination ofall stakeholders’ DSTs (subject to the approval of the NM) is expected to bringan improvement of the cost-effectiveness per flight as well as a better utilizationof the airspace capacity.
The NOP will be a dynamic rolling plan for continuous operations where:
• AUs declare their trajectory intentions and preferences
• ANSPs declare their expected capacity and resources
40 Chapter 1. Introduction
Figure 1.8: Collaborative Layered Planning
The Business Trajectory of a flight will evolve along different planning phases from the long
term up to the execution phase. The planning and re-planning phases will be supported
through a Collaborative Decision Making Process among all the ATM stakeholders enabled
by SWIM network.
1.5 The Future SESAR ATM: Trajectory Oriented 41
• NM facilitates dialogue to resolve demand/capacity imbalances in a
collaborative manner (NM can impose decisions in case of no agreementreached in timely-critical situations).
• Agreements, trajectories and/or resources changes, and other ATM data
is publicly available to all stakeholders.
• In case of sudden demand/capacity shortfall the NM initiates a User Driven
Prioritization Process (UDPP) allowing a resource trading among
stakeholders to self-solve the imbalance situation (NM will monitor theprocess to make sure that an acceptable solution is available in due time).
• During execution phase the NOP continues showing the most updatedinformation
The Collaborative Decision Making to achieve a traffic Demand and CapacityBalancing can be schematized as follows (see also Fig. 1.8):
Long term planning:
• BDT is progressively enriched but not shared.
Medium and Short term planning:
• Published SBTs in the NOP express the users intentions.
• ANSPs provide with the information about the expected airspace capacitiesand potential constraints.
• NM analyses the network impact (i.e., emergent dynamics) of user intentionsand facilitate collaborative planning to balance demand and capacity.
• Information quality increases (e.g., weather forecasts) near to the day ofoperations and thus the network planning is refined to ensure stability.
• A Strategic De-confliction process (ideally delivering conflict-free routes)applied to flights at pre-departure phase will reduce the need for tacticalintervention at the execution phase.
Execution phase:
• RBTs are instantiated.
• In case of network disruptions (e.g., sudden loss of capacity in a sector orairport) the planning process respond rapidly to the changing situation.
42 Chapter 1. Introduction
• A Strategic De-confliction process (ideally delivering conflict-free routes)applied to airborne flights during the execution phase will reduce the needfor downstream tactical intervention.
Note that an important enabler for the introduction of such a new ATM paradigmthat relies on Trajectory Based Operations is to provide with a common modellingframework to store and share the same State-Space (SS)5 information among allthe stakeholders, thus enabling a common view of the ATM operations [71]. Notethat a simplified 4D ATM model will be assumed in this dissertation, thus the SSinformation of interest will consist on the spatial definition of the nominal traffictrajectories together with the corresponding time-stamps (i.e., 4D Trajectories),with no consideration of other ATM aspects such as weather, ATC sector capa-cities, or ATM uncertainties, among others.
1.5.5 Conflict Management and Traffic Synchronization
The new advanced CNS groundside and airborne capabilities will enable the in-troduction of new separation modes (that will coexist with the traditional ones,i.e., the ATC tactical vectors and clearances), such as the strategic trajectoryde-confliction and the aircraft self-separation, which may be used not only to en-sure safe navigation but also to achieve the proper traffic synchronization whenneeded (in general along the entire airspace, but especially during high-complexitylanding operations, in order to ensure the maximum utilization of the availableairport/runway capacity).
The term Strategic De-confliction is often used to define actions taken whenthe SBT take-off time is known with sufficient accuracy (e.g., after push-back) oreven after the flight is airborne, but always with sufficient time to allow a Col-laborative Decision Making (i.e., Collaborative Flight Planning) process to occur.It excludes tactical instructions and clearances that need an immediate response,but includes activities such as dynamic route allocation [42, 47].
The use of strategic conflict management measures during the collaborativeflight and ATM planning processes, together with more accurate flight navigationand trajectory predictions, will allow longer duration clearances, which in turn
5By definition, the state of a dynamic system is the minimum amount of variables (called
state variables) such that by knowing the current value of those variables and the future inputs
to the system, it is possible to completely determine the evolution and values of the future states
that the system can reach [70]. If n state variables are necessary to describe the system, then a
state vector is a vector with n components (one for each state variable) whose values completely
determine the state of a system at a certain time instant. Therefore, the SS of a system is an
n-dimensional space in which each state variable can assume its domain values.
1.5 The Future SESAR ATM: Trajectory Oriented 43
may notably reduce a portion of the ATCOs workload, thus increasing the ATMcapacity and safety (i.e., less risk of collision). Therefore, moving from currentshort-term tactical instructions to more strategic 2D, 3D and 4D clearances (forsuitable equipped aircraft) is a corner stone of the SESAR concept [42, 47, 101].
The new advanced navigation avionics allow implementing ASAS and TCAS,therefore in case of –slight– traffic de-synchronization (thus requiring separationmeasures) the pilots will be able to assume (by ATC delegation) the responsib-ility of separation and apply the necessary trajectory amendments. Automaticconstant monitoring may trigger a RBT negotiation process if the execution ofthe trajectory amendments are predicted to negatively affect the previous Net-work Operations Plan. In addition, the future 4D-FMS avionics are expectedto be able of working with Target Times (TTAs/TTOs) and Controlled Times(CTAs/CTOs) in order to ensure due synchronization, either for conflict dilutionpurposes or for efficient airspace resource utilization (especially of runways).
The initial traffic synchronisation of a flight will start as the destination air-port initiates the negotiation of Target Times of Arrival (TTAs). Once agreeda TTA between the Airspace User and the Airport agents, the TTAs will be al-located and distributed by NM to all concerned actors through the NOP/SWIM.Since a TTA will not be compulsory (is a target), a tolerance will be associatedto the TTA, thus in the execution phase the airline could change the RBT profileand therefore not to reach the TTA (it depends on Airline policy, e.g. economicalspeed versus higher speed to meet connecting flights).
After receiving clearance of the TTA from the NM and the Airport, the AUwill update its preferred take off time (from trajectory backtracking), thus feedingthe CDM process at the departure airport for the calculation of a Target Take-OffTime (TTOT). Note that current regulation of departure flights (i.e., CTOT) willnot be necessary anymore if airports (and ATM in general) are operating normally.
An imposed time-constraint, i.e. Controlled Time of Arrival (CTA), with onlyfew seconds of looseness, will be only used as an exception in relation to capa-city constrained environments to ensure appropriate sequencing. TTAs/CTAsassociated to incoming flights will be taken into account at airports for RunwayManagement and Surface routing and guidance.
Multiple Target/Controlled Times can be issued along the trajectory to ensuresynchronization/separation of traffic not only in approach and landing phases, butalso during all phases of flight. Such soft and hard time-constraints are respect-ively called Target Time Over (TTO) and Controlled Time Over (CTO) andwill represent a –negotiated– trade-off between the airspace users preferences and
44 Chapter 1. Introduction
the network capacity available. Note that between two consecutive 4D restric-tions (whatever TTOT, TTO/CTO or CTO/CTA) the Airspace User will be ableto plan and execute its trajectory with some navigational looseness, which willleave room to the navigational systems to find the most optimal procedures tomeet with the targets/constraints while considering the presence of small flightuncertainties such as wind/weather forecast imprecisions, and potential tactical(self-)separation events that will be only known with precision at the moment (orfew minutes before) of operations.
Tactical monitoring and separation provision will still be a responsibility ofATCOs, thus they will be properly trained and equipped to adapt to their tasksto the new ATM concept procedures, especially with the potential introductionof more advanced and automated DSTs that may be able of coordinating withthe rest of the stakeholders DSTs through a common ATM state-space overallview (i.e., the NOP) [71], thus aiding to assess the network impact of their localdecisions while reducing the task-load of controllers associated to repetitive andmonotonous tasks.
1.5.6 Summary of the SESAR ATM Concept
SESAR aims at completely modernizing the CNS technologies and ATM proced-ures in order to achieve the following main (high-level) goals: to increase the airtraffic system capacity, the flight efficiency and the safety in order to allocatefuture expected airspace demand while reducing ATM direct costs and envir-
onmental impact per flight.
The most important differences with respect the current ATM concept areidentified as follow:
• Trajectory Based Operations (TBOs): which implies the usage of 4Dtrajectories (trajectories defined in the 3 spatial dimensions together witha time-stamp), also known as Business Trajectories (BT) in the SESAR’sterminology for civil flights. The BT evolves out of a collaborative layeredplanning process, through which it progresses from the form of a SharedBusiness Trajectory (SBT), which is shared for planning and negotiationpurposes with all the involved stakeholders, to the Reference Business Tra-jectory (RBT), which is instantiated few minutes before the flight execution,and represents the trajectory which the Airspace User agrees to fly and theNetwork Manager, the Air Navigation Service Providers (ANSPs) and theAirports agree to facilitate [102, 5].
• Improvement of the infrastructures of Communication, Navig-
ation and Surveillance systems (CNS), Meteorological services
1.5 The Future SESAR ATM: Trajectory Oriented 45
(MET) and ground/airborne Trajectory Predictor systems (TP):
the progressive improvements of ATM technologies will lead to improvedperformance of both flight planning and navigation execution. The en-hanced coordination of the airborne systems with the controllers’ supporttools together with the availability of high quality trajectory predictions(greater accuracy and longer prediction horizons), will be a fundamentalenabler for TBOs, which in turn will imply a reduced controller workloadper flight (fewer clearances with longer effective duration).
• NOP through SWIM and CDM: SBT negotiations and RBT accept-ances are managed and published through the NOP (Network OperationsPlans), which is accessed and contributed by the Airspace Users, the AN-SPs, the Airports and the Network Manager over the SWIM platform. Theintroduction of modern technologies (e.g., data-link, P-RNAV, ADS-B. . . )combined with the development of specific ATM procedures based on TBOs(e.g., online RBT re-planning) is intended to provide the traffic managerswith more flexibility to dynamically reconfigure the airspace to adapt it tothe ATM changing conditions (e.g., severe weather affecting sectors/airportscapacity, system disruptions, Flexible Use of Airspace...) and to the user-preferred routing [110, 73].
• User preferred/Free route operations: this will imply the relaxation ofthe structured routing constraints for flights, supported by new CNS tech-nologies (CPDLC, P-RNAV, ADS-B. . . ), and implying the possibility forthe Airspace Users to plan their trajectories freely between a defined entrypoint and a defined exit point of the free route airspace, with the possibil-ity of deviating via intermediate navigation points without reference to thefixed route structure, which implies important fuel savings and pollutionreduction with respect the current fixed route procedures [103, 105]. Dur-ing high-complexity operations at certain airspace regions the Free-Routingmight be suspended by NM or ANSPs that can issue 2D, 3D or 4D airspaceconstraints to separate and/or synchronize traffic.
• Automation support tools for ATCOs and new separation and syn-
chronization modes: Within free route airspace, flights will remain at alltimes subject to air traffic control and to any overriding airspace restrictions.However, the new advanced CNS groundside and airborne capabilities willenable the introduction of new separation modes such as the aircraft self-separation and the strategic de-confliction of the flight routes/trajectories,which together with the automation support to the new and traditionalATC tasks (situation monitoring, medium term conflict detection, conflictresolution, etc.), will be one of the principal changes for increasing airspacecapacity.
46 Chapter 1. Introduction
Moving from current short-term tactical instructions to more strategic
2D, 3D and 4D clearances, i.e. Strategic De-confliction, and providing with
the proper automation support (though different advanced and coordinatedDSTs) to aid and reduce a portion of the ATCOs workload is the main strategyfollowed by the SESAR concept in order to achieve the targets of increasing capa-city and safety in the ATM while reducing costs. The air-ground harmonizationof the trajectory predictions, supported by robust meteorologic forecast (wind,temperature, etc) and shared via data link, improves significantly the accuracyand reliability of trajectory data used for decision making, especially for ground-based tools, thus enabling longer usable prediction horizons and permitting theissue of longer duration clearances.
The main strategy followed to improve flight efficiency and to reduce costsand pollution is to allow the direct involvement of AUs into the ATM
planning process, by means of a Collaborative Flight Planning based upona dynamic rolling Network Operations Plan (NOP) that provides a common ref-erence view of the ATM state-space that is available to all stakeholders throughSWIM communication network. Therefore, airlines are able to optimize theirbusiness trajectories while ANSPs can update the actual available airspace/ATMcapacity in real-time [39, 40].
The Network Manager (NM) will be in charge of coordinating and arbitratingthose DSTs processes in which the local decisions might negatively affect the restof the ATM network operations, especially along those decision-making processesin which the flight safety could be compromised (e.g., during Collaborative FlightPlanning), thus taking action by means of prioritization or imposition of finaldecisions to ensure the proper levels of safety during the execution of all flightphases. The NM generates, if necessary, a set of time constraints assuring thatthe local airspace sector capacities are not overloaded at any given time.
Thus, at the end of the trajectory synchronization process (through a trans-parent, accessible and fair Collaborative Flight Planning process arbitrated bythe NM), a cost-efficient network of pre-deconflicted 3D (free-)routes is expected(subject to dynamic refinement or adjustment during flight, i.e. 4D contracts),which constitutes a paradigm shift with respect to the current airspace structure(often based on predefined fixed airways) and ATM procedures.
Figure 1.9 illustrates a simplified block diagram showing the SESAR ATMplanning concept. Note that this ATM model will reduce the existing gap betweenthe CFMU flow management (current NM) and the ATC tactical traffic manage-ment processes through joining the strategic conflict management (i.e., networkand flight planning phases, which can now be dynamically changed according to
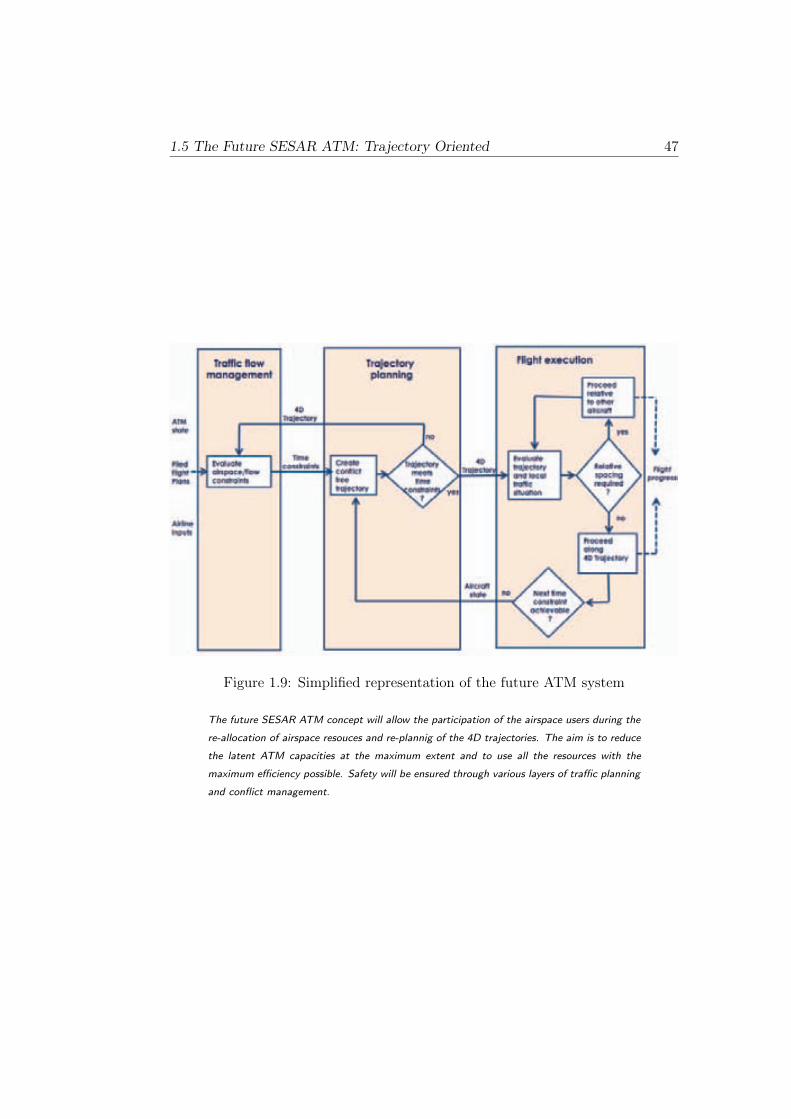
1.5 The Future SESAR ATM: Trajectory Oriented 47
Figure 1.9: Simplified representation of the future ATM system
The future SESAR ATM concept will allow the participation of the airspace users during the
re-allocation of airspace resouces and re-plannig of the 4D trajectories. The aim is to reduce
the latent ATM capacities at the maximum extent and to use all the resources with the
maximum efficiency possible. Safety will be ensured through various layers of traffic planning
and conflict management.
48 Chapter 1. Introduction
the feedback received from the ATM updated state) with the tactical conflict man-agement conducted during the flight execution. The system is trajectory-based,so a micro-scale model of the traffic flows is needed. There is also a time-basedtraffic flow/trajectory management (i.e., adjustment of the trajectories at theplanning phase articulated through Target/Controlled Times) with the purposeof achieving strategic separation and traffic synchronization along the network.The tactical safety layer is in charge of assuring local spacing in the flight execu-tion phase, although due to the strategic de-confliction measures and the airborneself-separation mechanisms it is expected to trigger trajectory re-planning feed-back requests only in exceptional cases. The NM, that is monitoring the available(dynamically) declared airspace/ATM capacities, generates if necessary a set oftime constraints assuring that local airspace sector capacities are not overloadedat any time. During the planning phase of flights, also monitored by the NM, aset of conflict free trajectories is generated that comply with all these networkconstraints (i.e., strategically de-conflicted flight routes/trajectories).
If a trajectory that meets the requirements cannot be generated during thetrajectory-planning negotiation (e.g., due to aircraft performance limitations), anew alternate preferred trajectory will be generated and fed back to the NOP inorder to find a new set of time constraints that can be actually accommodated.Once a feasible 4D trajectory has been generated, the flight will be executedalong such 4D trajectory unless there is a local spacing separation requirementwith another aircraft (e.g., due to the de-synchronization effects of uncertainty)or if there is a change in the network restrictions (e.g., a sector capacity reductiondue to the uncertain conditions of weather). In the first case, i.e., a local lossof separation, the local situation can be resolved relative to the other aircraftand, in case that any of the amendments results in a relevant deviation from thereference 4D trajectory, a new (strategically de-conflicted) 4D trajectory will becooperatively planned. In the second case, i.e., relevant changes at network level,it is expected that a higher number of trajectories will be re-negotiated (and stra-tegically de-conflicted) in response to the new ATM conditions and with the goalto efficiently balance the available capacity and demand.
ATCOs working method will be updated in the SESAR context since con-trollers will have to comply with specific 4D constraints to guarantee that theflights meet their agreed RBT. This shall not necessarily increase their workload,since they will be provided with clear targets to be met by flights, automatedDSTs suggesting priorities and maneuvers for resolving conflicts and increasingsituational awareness and whenever possible some separation functions will bedelegated to aircraft onboard systems (i.e., self-separation). When required, thenecessary trajectory revisions/updates will be made in due consideration of thecomplete trajectory still to be flown and not only at sector level (thus opening
1.6 The Motivation of this Research: the STREAM Project 49
the possibility to take into account the wider impact on other flights’ concernedtrajectories as well as on the network operations, i.e. domino effects/emergentdynamics of the local decision-making).
1.6 The Motivation of this Research: the STREAM
Project
STREAM (Strategic Trajectory de-confliction to Enable seamless Aircraft con-flict Management) [http://www.hala-sesar.net/stream] has been a SESAR fun-ded WP-E project (i.e., long term innovative research to contribute to the SESARATM concept) that has been undertaken by a consortium integrated by AdvancedLogistics Group (ALG-Indra), Boeing Research & Technology Europe (BR&TE)and Universitat Autònoma de Barcelona (UAB).
The main goal of this project (which is also the goal of this dissertation)has been investigating innovative computational-efficient Conflict Detec-
tion and Resolution (CD&R) algorithms for strategic de-confliction of
thousands of trajectories within few seconds or minutes taking into consider-ation the AUs preferences and the network constraints. This is aimed at enablingtraffic to be de-conflicted for wide airspace regions and permitting large look-
ahead times of order of hours (e.g., two or three hours), which can reduce thecurrent existing gap between the conflict management processes conducted duringthe pre-departure planning and the flight execution phases [36, 88, 37, 43, 48].
Therefore, the underlying concept is extending the NOP continuously-
rolling planning concept to separation management by means of a seam-less conflict management process that would run continuously from the stra-tegic phase (pre-departure, collaborative design of the NOP) up to the executionone (automation-assisted, controller-driven conflict resolution). This doctoral
dissertation will give results and details and will discuss about the
functionality, limitations and benefits of the proposed CD&R module
[43, 48].
In addition, during the project new metrics and a performance assess-
ment methodologic framework have been proposed [44] to evaluate theperformance of such CD&R algorithms as well as the potential impact of thesolutions on airspace users and on the ATM system. For instance, a metric tomeasure the fairness of a trajectory de-confliction solution has been defined, inorder to evaluate how fairly the cost penalties associated to the deviations fromthe original SBTs proposed by the de-confliction algorithms are distributed among
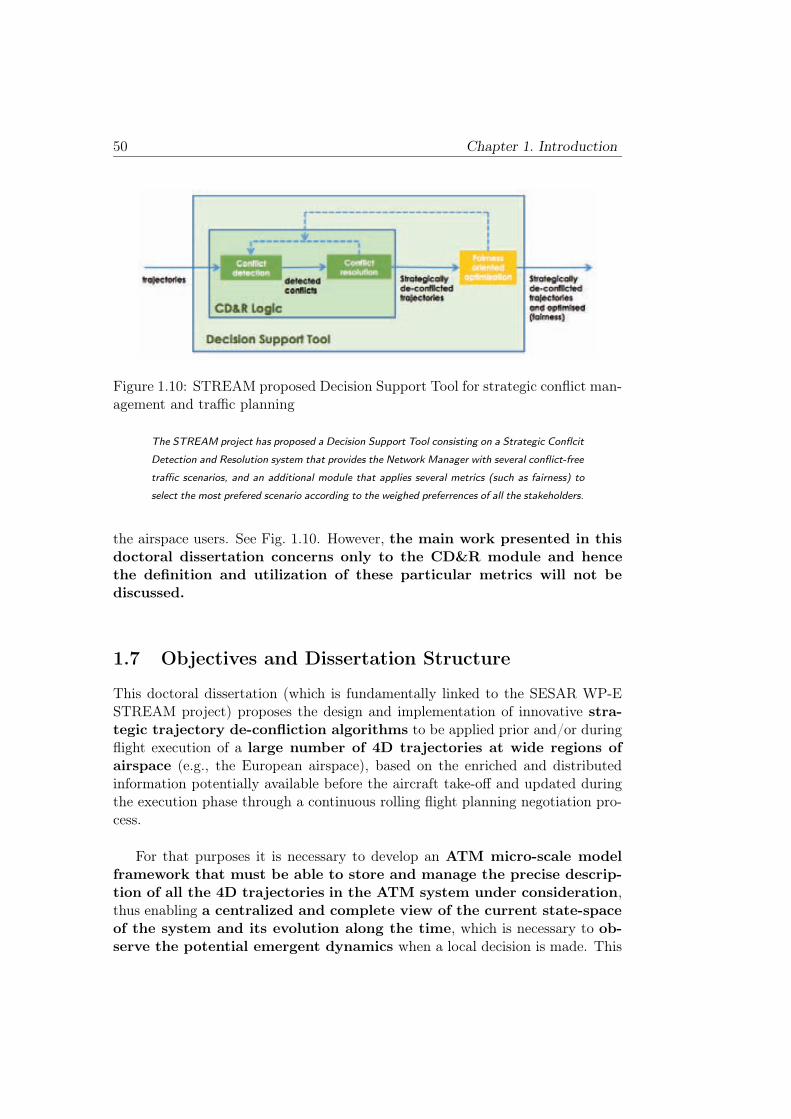
50 Chapter 1. Introduction
Figure 1.10: STREAM proposed Decision Support Tool for strategic conflict man-agement and traffic planning
The STREAM project has proposed a Decision Support Tool consisting on a Strategic Conflcit
Detection and Resolution system that provides the Network Manager with several conflict-free
traffic scenarios, and an additional module that applies several metrics (such as fairness) to
select the most prefered scenario according to the weighed preferrences of all the stakeholders.
the airspace users. See Fig. 1.10. However, the main work presented in this
doctoral dissertation concerns only to the CD&R module and hence
the definition and utilization of these particular metrics will not be
discussed.
1.7 Objectives and Dissertation Structure
This doctoral dissertation (which is fundamentally linked to the SESAR WP-ESTREAM project) proposes the design and implementation of innovative stra-
tegic trajectory de-confliction algorithms to be applied prior and/or duringflight execution of a large number of 4D trajectories at wide regions of
airspace (e.g., the European airspace), based on the enriched and distributedinformation potentially available before the aircraft take-off and updated duringthe execution phase through a continuous rolling flight planning negotiation pro-cess.
For that purposes it is necessary to develop an ATM micro-scale model
framework that must be able to store and manage the precise descrip-
tion of all the 4D trajectories in the ATM system under consideration,thus enabling a centralized and complete view of the current state-space
of the system and its evolution along the time, which is necessary to ob-
serve the potential emergent dynamics when a local decision is made. This
1.7 Objectives and Dissertation Structure 51
technological contribution could help the NM, in an automated way, to:
• Maintain or improve the levels of safety within the en-route sectors atEuropean airspace scale by applying early de-confliction measures and con-sidering some levels of uncertainty.
• Improve the European ATM capacity by delivering the en-route trafficalready (fully or partially) de-conflicted to the tactical conflict managementphase conducted by ATCOs, thus reducing the numbers of necessary tacticalATC interventions (specially at more congested sectors during peak hour oftraffic).
• Provide with efficient and environmental-friendly trajectories, by meansof minimizing the trajectory changes with respect the user-preferred RBTs(simplified here as Direct Routes), always considering the full trajectory(simplified here from TOC to TOD, in an airspace in which the semi-circularcruising level system applies), and also through the minimization of the po-tential negative network emergent dynamics/domino effects derived fromthe local decisions (while taking advantage of the potential positive dominoeffects whenever possible).
• Be consistent with the future procedures and tools of SESAR (e.g., 4Dnavigation, Free-Route, Strategic De-Confliction, Dynamic Route Alloca-tion, Collaborative Flight Planning. . . )
The implementation of the system has been done in C++ with an Object Ori-ented approach, and several simulations using realistic scenarios have beenperformed and analysed to verify the correct functioning of the concepts.
The dissertation is divided in 7 chapters. First Chapter is the Introduction,which corresponds to this chapter, and that will be used as a baseline for the restof the chapters.
Second Chapter is about the State of the Art of Conflict Detection and
Resolution algorithms, in which the extensive bibliographic review conductedduring the research is summarized in order to let the reader the easy under-standing and identification of the most important concepts presented along thisdissertation.
In the third Chapter a summarized high-level description of the Conflict De-
tection and Resolution Algorithms for Strategic De-confliction can befound, giving details about the main assumptions of the approach as well as thetechnologies used in the CD&R algorithms.
52 Chapter 1. Introduction
In Chapter 4 a Guidance and Chronology of the Published Articles
is included, which explains the chronological and logical sequence of the articlespresented in this dissertation (in Chapter 7) in order to guide the reader in theunderstanding of the thematic unit of the papers and in the gradual presentationof the results.
Chapter 5 presents the Scenario Design, Simulations and Discussion of
Results in which the concepts and findings introduced in the previous chaptersare critically argued related to their potential contributions to the SESAR ATM2020 and beyond paradigm.
Chapter 6 will read the Conclusions, Main Contributions and Future
Work in which the conclusions and main contributions extracted after the ana-lysis of the results will be stated while a set of research lines will be proposed toextent some of the identified topics.
Chapter 7 includes a Compendium of Published Articles in first-orderinternational journals and/or relevant congresses. Those papers constitute thecore of this dissertation and thus the most relevant details and findings of theresearch can be found in that chapter.
Finally, the Appendixes include some other sections that give more detailedinformation about some important aspects of this research, but that do not con-form part of the core and main line of argument of this dissertation.
Chapter 2
State of the Art
2.1 System Classification by the Look Ahead Time
Conflict Detection and Resolution Systems can be classified according to theirworking prediction time-horizon (i.e., look-ahead time) [75, 47]. Hence, threedifferent categories can be found, each of them furnishing different functionalitiessince they respond to different airspace management needs:
• Long Term CD&R (LTCD&R): useful for airspace planning at strategiclevel (a.k.a. Strategic De-confliction). It includes the planning of all airtraffic trajectories within a look-ahead time-window of several hours (e.g.,2 hours). Predictions are made from several days up to few minutes beforethe flights execution phase. The main goal of these systems is to max-imize the network route efficiency while minimizing the global operationalcosts, taking into consideration the airspace/network restrictions such asthe available capacity at the airports and sectors, among other restrictions[47, 14, 83, 11, 88].
• Medium Term CD&R (MTCD&R): planning systems that work at tac-tical level, thus considering prediction look-ahead time-horizons of severalminutes (typically 20 minutes). These systems are often used by air trafficcontrollers due to the presence of disturbances caused by unforeseen eventsthat cannot be predicted beforehand with enough accuracy (i.e., during thestrategic flight planning) and that usually make impossible to accomplishwith the LTCD&R’s proposed flight plans during the execution phase. Notethat the MTCD&R systems are planning tools rather than collision avoid-ance systems, since the time-window look-ahead time is large enough toallow a safe tactical planning and thus there is no risk of any imminentcrash among airplanes [52, 107, 28, 111]. Therefore, it is possible to usethese systems to optimize the trajectoriy amendments when tactical ATCtraffic changes are required, while trying to maintain stable at the maximum
53
54 Chapter 2. State of the Art
extent possible the strategic network planning proposed by the LTCD&Rsystem.
• Short Term CD&R (STCD&R): systems that work at operational level andwhose main functionality is to avoid imminent crashes. Since they are notplanning systems, no fuel or flight optimization is taken into considera-tion. These systems include alert mechanisms for controllers, e.g. ShortTerm Conflict Alert (STCA), as well as alert mechanisms for pilots, suchas Traffic Alert and Collision Avoidance (TCAS), both based on AutomaticDependent Surveillance-Broadcast (ADS-B) technologies [62, 33, 29]. Notethat ideally the triggering of these systems should be avoided by the stra-tegic and tactical traffic planning layers, i.e., the Strategic De-conflictionand MTCD&R systems.
2.2 Current Situation of CD&R Systems in ATM
Currently, air traffic controllers’ tasks are supported by systems with little
levels of automation in the decision-making functions [87, 101], thus re-quiring of comprehensive human intervention in a large set of repetitive operationsthat do not always generate added value to the navigation services provided by theATM, such as for example the traditional requests to pilots to tune the radio fre-quency of the next sector (modern avionics can automatically tune itself withoutincreasing the workload neither of the controllers nor of the pilots). In addition,some of the airspace safety prescriptions given by the International Civil AviationOrganization (ICAO) [58] may often result in relatively conservative and inefficientprocedures, both from the point of view of the fuel consumption and of the air-space sectors capacity utilization. For instance, due to traffic de-synchronizationsobserved in the current ATM, air traffic controllers frequently demand to pilotsto execute holding procedures in order to have the airplanes in safety airspacezones, flying in circular patterns while awaiting for further clearance. Such pro-cedures are especially frequent during approach and landing operations in whichthe holding aircraft must wait to other flight landings or take-offs (see Fig. 2.1).
The official European Commission predictions about the future demand of theair transportation (which expects important lack of airspace capacity for the year2030), have fostered in recent years the interest for finding new positioning andnavigation technologies, as well as new traffic-awareness technologies, and alsonew improved ways for communications between the airside and the groundside(currently most communications between pilot and controller are still done viavoice). New Decision Support Tools have been also developed to aid controllersin some of their tasks, altogether with the purpose to improve the capacity and theefficiency of the ATM. Conflict Detection and Resolution systems are examples of
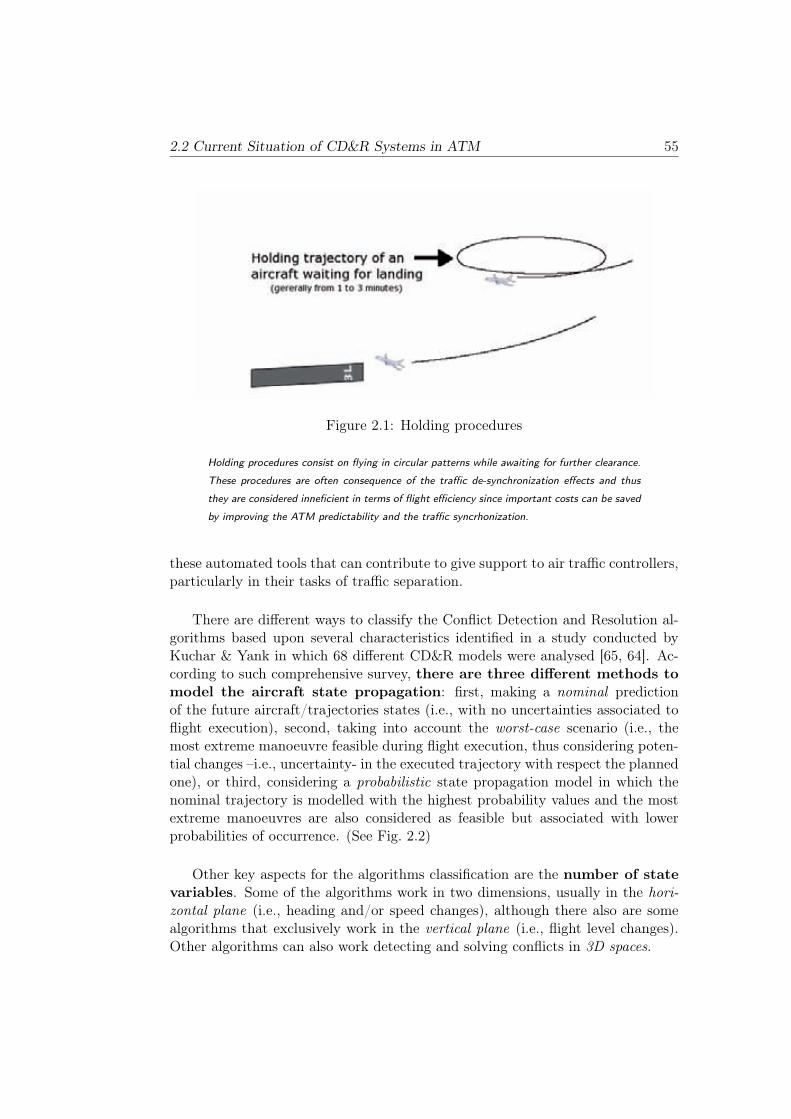
2.2 Current Situation of CD&R Systems in ATM 55
Figure 2.1: Holding procedures
Holding procedures consist on flying in circular patterns while awaiting for further clearance.
These procedures are often consequence of the traffic de-synchronization effects and thus
they are considered inneficient in terms of flight efficiency since important costs can be saved
by improving the ATM predictability and the traffic syncrhonization.
these automated tools that can contribute to give support to air traffic controllers,particularly in their tasks of traffic separation.
There are different ways to classify the Conflict Detection and Resolution al-gorithms based upon several characteristics identified in a study conducted byKuchar & Yank in which 68 different CD&R models were analysed [65, 64]. Ac-cording to such comprehensive survey, there are three different methods to
model the aircraft state propagation: first, making a nominal predictionof the future aircraft/trajectories states (i.e., with no uncertainties associated toflight execution), second, taking into account the worst-case scenario (i.e., themost extreme manoeuvre feasible during flight execution, thus considering poten-tial changes –i.e., uncertainty- in the executed trajectory with respect the plannedone), or third, considering a probabilistic state propagation model in which thenominal trajectory is modelled with the highest probability values and the mostextreme manoeuvres are also considered as feasible but associated with lowerprobabilities of occurrence. (See Fig. 2.2)
Other key aspects for the algorithms classification are the number of state
variables. Some of the algorithms work in two dimensions, usually in the hori-zontal plane (i.e., heading and/or speed changes), although there also are somealgorithms that exclusively work in the vertical plane (i.e., flight level changes).Other algorithms can also work detecting and solving conflicts in 3D spaces.
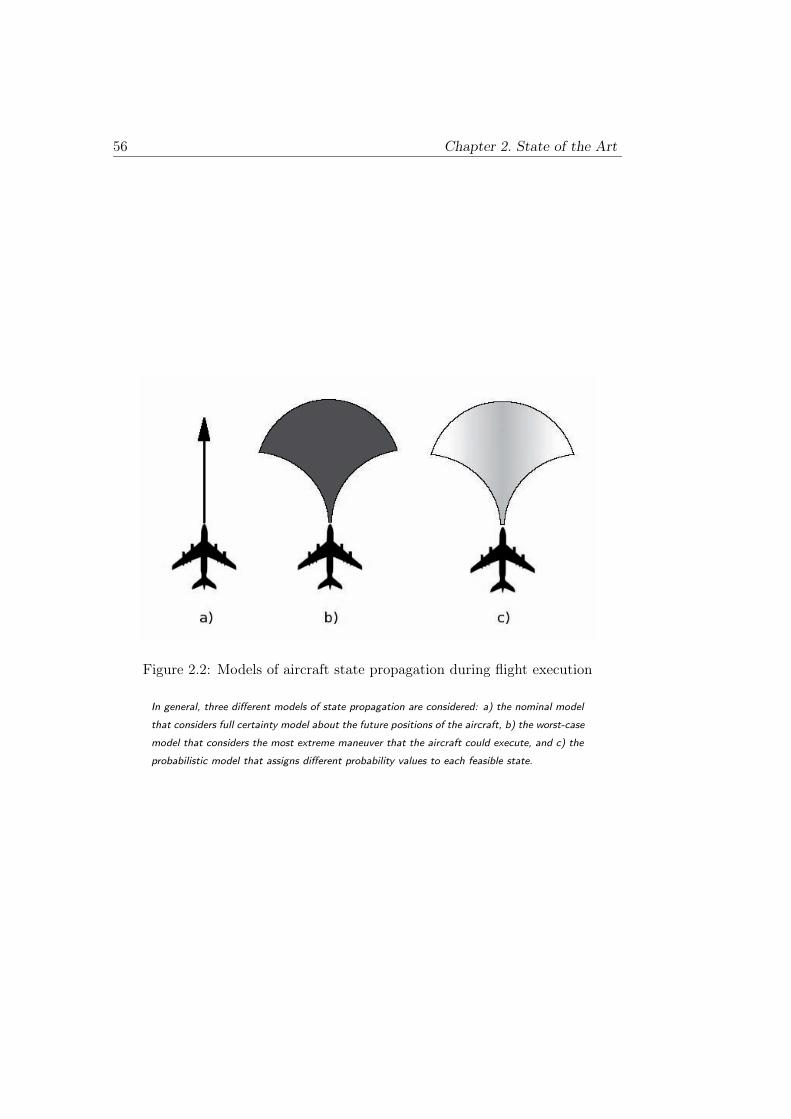
56 Chapter 2. State of the Art
Figure 2.2: Models of aircraft state propagation during flight execution
In general, three different models of state propagation are considered: a) the nominal model
that considers full certainty model about the future positions of the aircraft, b) the worst-case
model that considers the most extreme maneuver that the aircraft could execute, and c) the
probabilistic model that assigns different probability values to each feasible state.
2.2 Current Situation of CD&R Systems in ATM 57
Another feature of the CD&R systems is the resolution method. Gener-ally, the different types of resolutions might be classified as prescribed resolutions(a.k.a. “rules of the road”), heuristic optimization models (for example, geneticalgorithms, expert systems or games theory), analytical equations (e.g., ForceField methods) or manual resolutions based on human intuition (therefore withautomated support only for conflict detection).
The type of manoeuvres that are used to propose the trajectory amend-ments is also an important characteristic to distinguish among the different al-gorithms. Basic de-confliction manoeuvres are heading angle changes, flight level-altitude variations, or speed changes. A mix of any of these three basic types ofmanoeuvres might be also an option to solve conflicts.
Another relevant characteristic among the different CD&R algorithms is howthey process detection/resolution when multiple conflicts arise among two ormore trajectories. If the algorithms sequentially detect and solve the conflictthrough the consideration of the minimum safety distances between each pair oftrajectories without concerning of the rest of the trajectories in the network, thenthey are based on a pairwise strategy. In contrast, if the entire traffic situation isexamined simultaneously, they are based on a global strategy.
Other model elements are also important, for instance how the algorithmsmanage uncertainties, or whether the algorithms consider cooperative resolutionsor not.
Finally, it is also convenient to determine whether an algorithm can be actu-ally implemented with the current available technology and, in such a case, if thealgorithm is able to operate in real time basis.
Kuchar & Yang’s survey concludes that none of the analysed algorithms mightbe considered strictly better than the others, as all of them present relative advant-ages and disadvantages, and thus all might be useful in different circumstancesand/or for different purposes.
Many of the investigation efforts done in the CD&R field have been also fo-cused on the designing and implementation of systems for real operational ATCpurposes. As a result, some of the first automated decision support tools for airtraffic controllers have emerged from the 80’s up to recent times (SCTA, CTAS,VERA, ERATO, VAFORIT, URET, FASTI, CORA, or iFACTS, among others)[86, 33, 24, 60, 2, 55, 94, 10].
58 Chapter 2. State of the Art
According to the research done by Ehrmanntraut, Fricke and von Villiez[86], the CD&R systems have been historically oriented to aid decisions at localairspace-sector level, with a look-ahead time typically limited to a maximum of20 minutes (i.e., tactical applications) and lacking of a global perspective on howthe decisions made at the local level may affect the rest of the network. Only theacademic approach (i.e., non-operational) developed by Dr. Durand (and whoseapproach makes use of Genetic Algorithms applied to strategic en-route conflictresolution) has been focused on computing conflict-free trajectory scenarios witha global optimization scope while obtaining the solutions in timely manner [16, 53].
On the other hand, the Programme for Harmonised ATM Research in EURO-CONTROL (PHARE) developed during the 90’s (1989 to 1999) [21, 86], was thefirst conflict solving assistance concept that used the concepts of 4D trajectorymanagement from gate to gate through multi-sector planning. However the pro-posed CD&R system only included automated conflict detection (conflict probe)but not automated conflict resolution. Instead of this, a set of co-operative toolstogether with the Problem Solver was investigated in order to provide assistanceto the controllers for de-conflicting the trajectories with some coordination withother downstream sectors.
More recently, the project ERASMUS [50] aims at strategically de-conflictpart of the traffic by adjusting the 4D Business Trajectories through minor speedadjustments (subliminal action) not directly perceivable by controllers and thatwill not interfere with their own action and responsibility. ERASMUS estimatesthat the residual number of conflicts to be considered by controllers could there-fore be significantly lowered, thus reducing the controller’s workload associatedwith routine monitoring and conflict detection as well as reducing the interven-tions of ATC in changing flight profiles to resolve potential conflicts. Nevertheless,the results of the project showed that subliminal control speed can only slightlycontribute to the strategic de-confliction of traffic, and therefore other comple-mentary strategies should be applied.
Hence, based on the current state of art of the CD&R systems, it can be statedthat there are still many research lines opened for further study in the field ofCD and CR algorithms, and in particular in the area of strategic de-conflictionaccording to the SESAR’s objectives established to enable the future EuropeanATM.
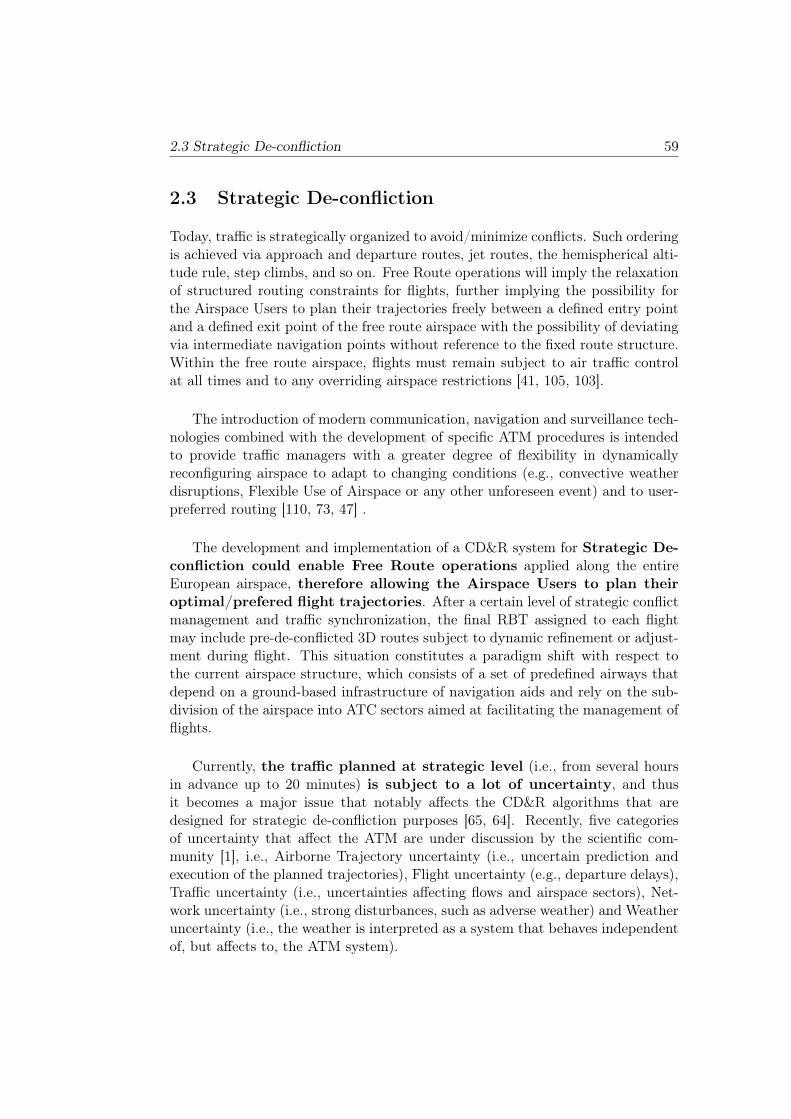
2.3 Strategic De-confliction 59
2.3 Strategic De-confliction
Today, traffic is strategically organized to avoid/minimize conflicts. Such orderingis achieved via approach and departure routes, jet routes, the hemispherical alti-tude rule, step climbs, and so on. Free Route operations will imply the relaxationof structured routing constraints for flights, further implying the possibility forthe Airspace Users to plan their trajectories freely between a defined entry pointand a defined exit point of the free route airspace with the possibility of deviatingvia intermediate navigation points without reference to the fixed route structure.Within the free route airspace, flights must remain subject to air traffic controlat all times and to any overriding airspace restrictions [41, 105, 103].
The introduction of modern communication, navigation and surveillance tech-nologies combined with the development of specific ATM procedures is intendedto provide traffic managers with a greater degree of flexibility in dynamicallyreconfiguring airspace to adapt to changing conditions (e.g., convective weatherdisruptions, Flexible Use of Airspace or any other unforeseen event) and to user-preferred routing [110, 73, 47] .
The development and implementation of a CD&R system for Strategic De-
confliction could enable Free Route operations applied along the entireEuropean airspace, therefore allowing the Airspace Users to plan their
optimal/prefered flight trajectories. After a certain level of strategic conflictmanagement and traffic synchronization, the final RBT assigned to each flightmay include pre-de-conflicted 3D routes subject to dynamic refinement or adjust-ment during flight. This situation constitutes a paradigm shift with respect tothe current airspace structure, which consists of a set of predefined airways thatdepend on a ground-based infrastructure of navigation aids and rely on the sub-division of the airspace into ATC sectors aimed at facilitating the management offlights.
Currently, the traffic planned at strategic level (i.e., from several hoursin advance up to 20 minutes) is subject to a lot of uncertainty, and thusit becomes a major issue that notably affects the CD&R algorithms that aredesigned for strategic de-confliction purposes [65, 64]. Recently, five categoriesof uncertainty that affect the ATM are under discussion by the scientific com-munity [1], i.e., Airborne Trajectory uncertainty (i.e., uncertain prediction andexecution of the planned trajectories), Flight uncertainty (e.g., departure delays),Traffic uncertainty (i.e., uncertainties affecting flows and airspace sectors), Net-work uncertainty (i.e., strong disturbances, such as adverse weather) and Weatheruncertainty (i.e., the weather is interpreted as a system that behaves independentof, but affects to, the ATM system).
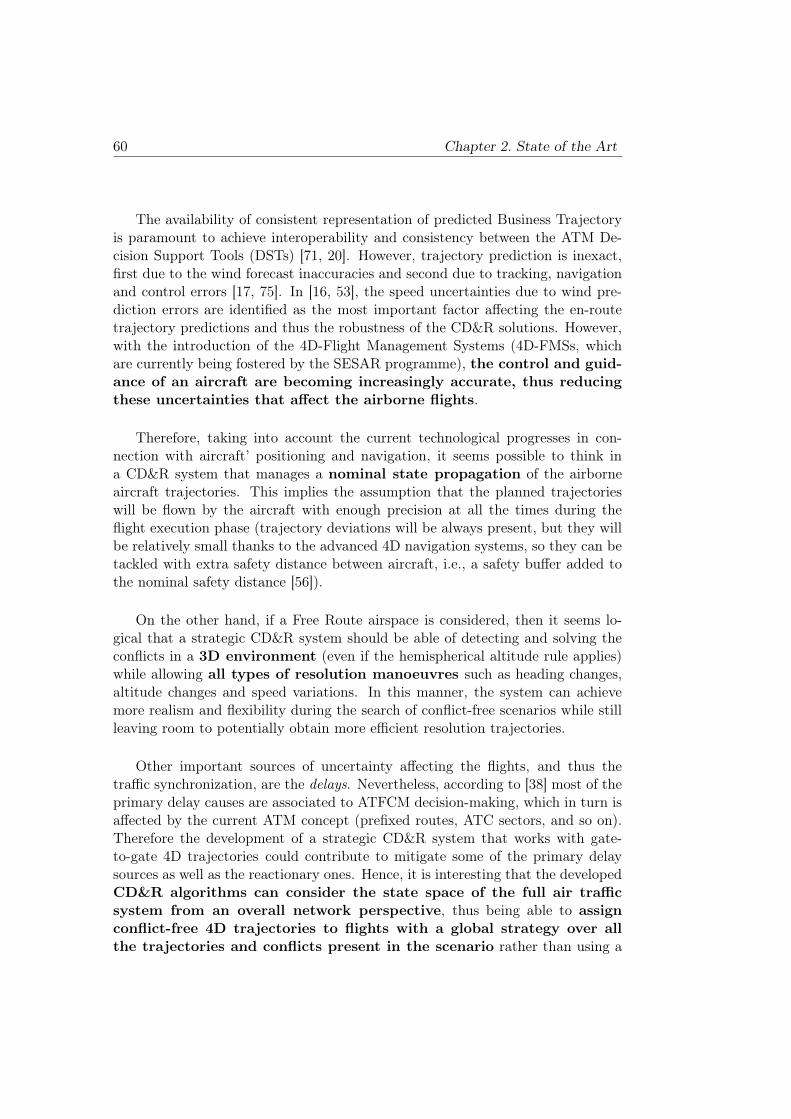
60 Chapter 2. State of the Art
The availability of consistent representation of predicted Business Trajectoryis paramount to achieve interoperability and consistency between the ATM De-cision Support Tools (DSTs) [71, 20]. However, trajectory prediction is inexact,first due to the wind forecast inaccuracies and second due to tracking, navigationand control errors [17, 75]. In [16, 53], the speed uncertainties due to wind pre-diction errors are identified as the most important factor affecting the en-routetrajectory predictions and thus the robustness of the CD&R solutions. However,with the introduction of the 4D-Flight Management Systems (4D-FMSs, whichare currently being fostered by the SESAR programme), the control and guid-
ance of an aircraft are becoming increasingly accurate, thus reducing
these uncertainties that affect the airborne flights.
Therefore, taking into account the current technological progresses in con-nection with aircraft’ positioning and navigation, it seems possible to think ina CD&R system that manages a nominal state propagation of the airborneaircraft trajectories. This implies the assumption that the planned trajectorieswill be flown by the aircraft with enough precision at all the times during theflight execution phase (trajectory deviations will be always present, but they willbe relatively small thanks to the advanced 4D navigation systems, so they can betackled with extra safety distance between aircraft, i.e., a safety buffer added tothe nominal safety distance [56]).
On the other hand, if a Free Route airspace is considered, then it seems lo-gical that a strategic CD&R system should be able of detecting and solving theconflicts in a 3D environment (even if the hemispherical altitude rule applies)while allowing all types of resolution manoeuvres such as heading changes,altitude changes and speed variations. In this manner, the system can achievemore realism and flexibility during the search of conflict-free scenarios while stillleaving room to potentially obtain more efficient resolution trajectories.
Other important sources of uncertainty affecting the flights, and thus thetraffic synchronization, are the delays. Nevertheless, according to [38] most of theprimary delay causes are associated to ATFCM decision-making, which in turn isaffected by the current ATM concept (prefixed routes, ATC sectors, and so on).Therefore the development of a strategic CD&R system that works with gate-to-gate 4D trajectories could contribute to mitigate some of the primary delaysources as well as the reactionary ones. Hence, it is interesting that the developedCD&R algorithms can consider the state space of the full air traffic
system from an overall network perspective, thus being able to assign
conflict-free 4D trajectories to flights with a global strategy over all
the trajectories and conflicts present in the scenario rather than using a
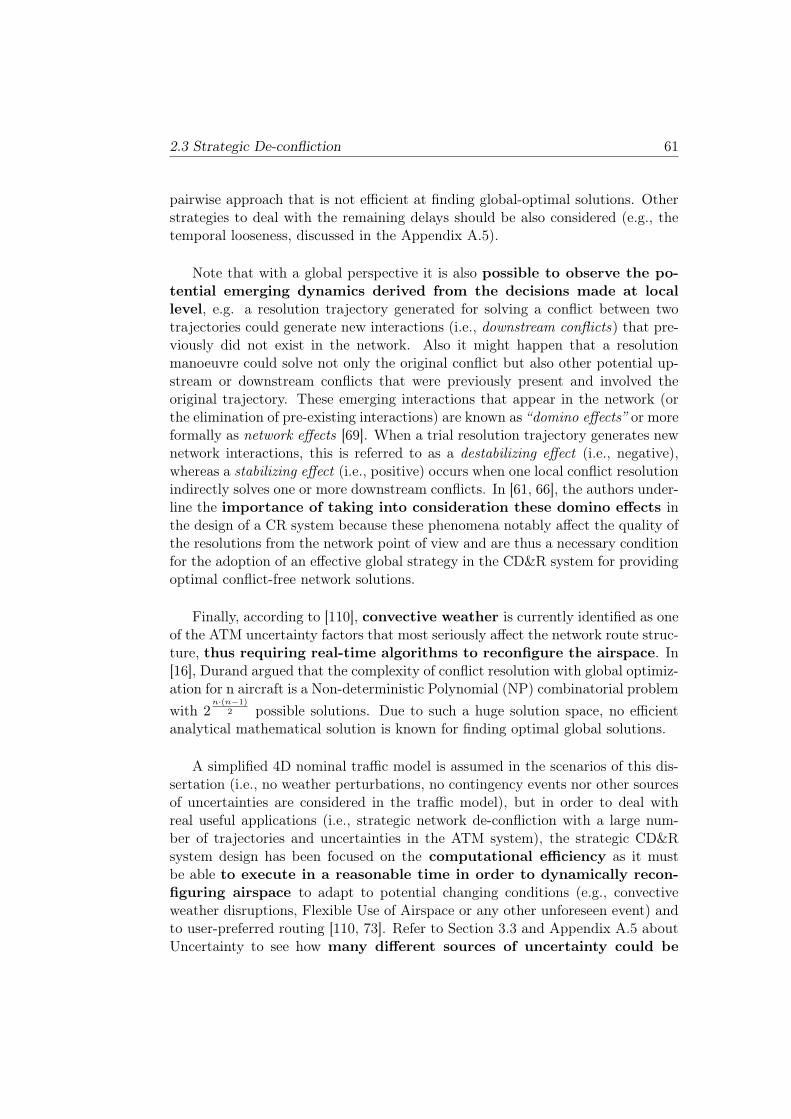
2.3 Strategic De-confliction 61
pairwise approach that is not efficient at finding global-optimal solutions. Otherstrategies to deal with the remaining delays should be also considered (e.g., thetemporal looseness, discussed in the Appendix A.5).
Note that with a global perspective it is also possible to observe the po-
tential emerging dynamics derived from the decisions made at local
level, e.g. a resolution trajectory generated for solving a conflict between twotrajectories could generate new interactions (i.e., downstream conflicts) that pre-viously did not exist in the network. Also it might happen that a resolutionmanoeuvre could solve not only the original conflict but also other potential up-stream or downstream conflicts that were previously present and involved theoriginal trajectory. These emerging interactions that appear in the network (orthe elimination of pre-existing interactions) are known as “domino effects” or moreformally as network effects [69]. When a trial resolution trajectory generates newnetwork interactions, this is referred to as a destabilizing effect (i.e., negative),whereas a stabilizing effect (i.e., positive) occurs when one local conflict resolutionindirectly solves one or more downstream conflicts. In [61, 66], the authors under-line the importance of taking into consideration these domino effects inthe design of a CR system because these phenomena notably affect the quality ofthe resolutions from the network point of view and are thus a necessary conditionfor the adoption of an effective global strategy in the CD&R system for providingoptimal conflict-free network solutions.
Finally, according to [110], convective weather is currently identified as oneof the ATM uncertainty factors that most seriously affect the network route struc-ture, thus requiring real-time algorithms to reconfigure the airspace. In[16], Durand argued that the complexity of conflict resolution with global optimiz-ation for n aircraft is a Non-deterministic Polynomial (NP) combinatorial problemwith 2
n·(n−1)2 possible solutions. Due to such a huge solution space, no efficient
analytical mathematical solution is known for finding optimal global solutions.
A simplified 4D nominal traffic model is assumed in the scenarios of this dis-sertation (i.e., no weather perturbations, no contingency events nor other sourcesof uncertainties are considered in the traffic model), but in order to deal withreal useful applications (i.e., strategic network de-confliction with a large num-ber of trajectories and uncertainties in the ATM system), the strategic CD&Rsystem design has been focused on the computational efficiency as it mustbe able to execute in a reasonable time in order to dynamically recon-
figuring airspace to adapt to potential changing conditions (e.g., convectiveweather disruptions, Flexible Use of Airspace or any other unforeseen event) andto user-preferred routing [110, 73]. Refer to Section 3.3 and Appendix A.5 aboutUncertainty to see how many different sources of uncertainty could be

62 Chapter 2. State of the Art
supported by the CD&R model design presented in this dissertation.
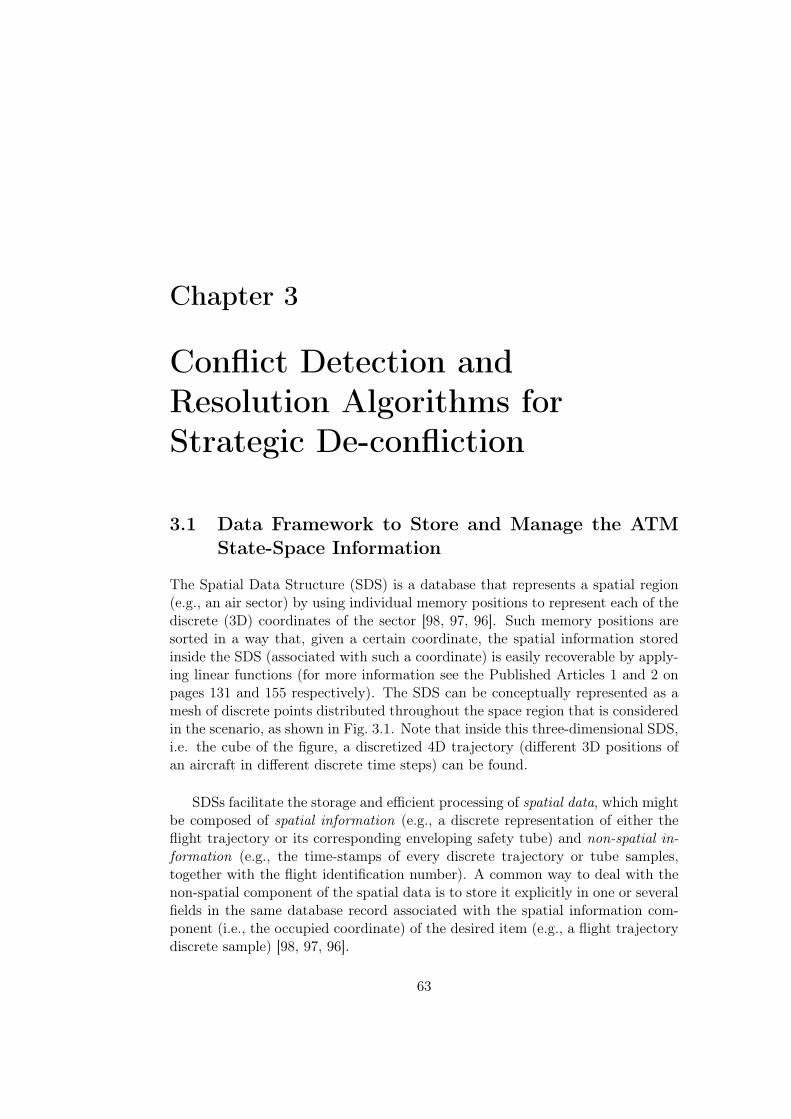
Chapter 3
Conflict Detection andResolution Algorithms forStrategic De-confliction
3.1 Data Framework to Store and Manage the ATM
State-Space Information
The Spatial Data Structure (SDS) is a database that represents a spatial region(e.g., an air sector) by using individual memory positions to represent each of thediscrete (3D) coordinates of the sector [98, 97, 96]. Such memory positions aresorted in a way that, given a certain coordinate, the spatial information storedinside the SDS (associated with such a coordinate) is easily recoverable by apply-ing linear functions (for more information see the Published Articles 1 and 2 onpages 131 and 155 respectively). The SDS can be conceptually represented as amesh of discrete points distributed throughout the space region that is consideredin the scenario, as shown in Fig. 3.1. Note that inside this three-dimensional SDS,i.e. the cube of the figure, a discretized 4D trajectory (different 3D positions ofan aircraft in different discrete time steps) can be found.
SDSs facilitate the storage and efficient processing of spatial data, which mightbe composed of spatial information (e.g., a discrete representation of either theflight trajectory or its corresponding enveloping safety tube) and non-spatial in-formation (e.g., the time-stamps of every discrete trajectory or tube samples,together with the flight identification number). A common way to deal with thenon-spatial component of the spatial data is to store it explicitly in one or severalfields in the same database record associated with the spatial information com-ponent (i.e., the occupied coordinate) of the desired item (e.g., a flight trajectorydiscrete sample) [98, 97, 96].
63
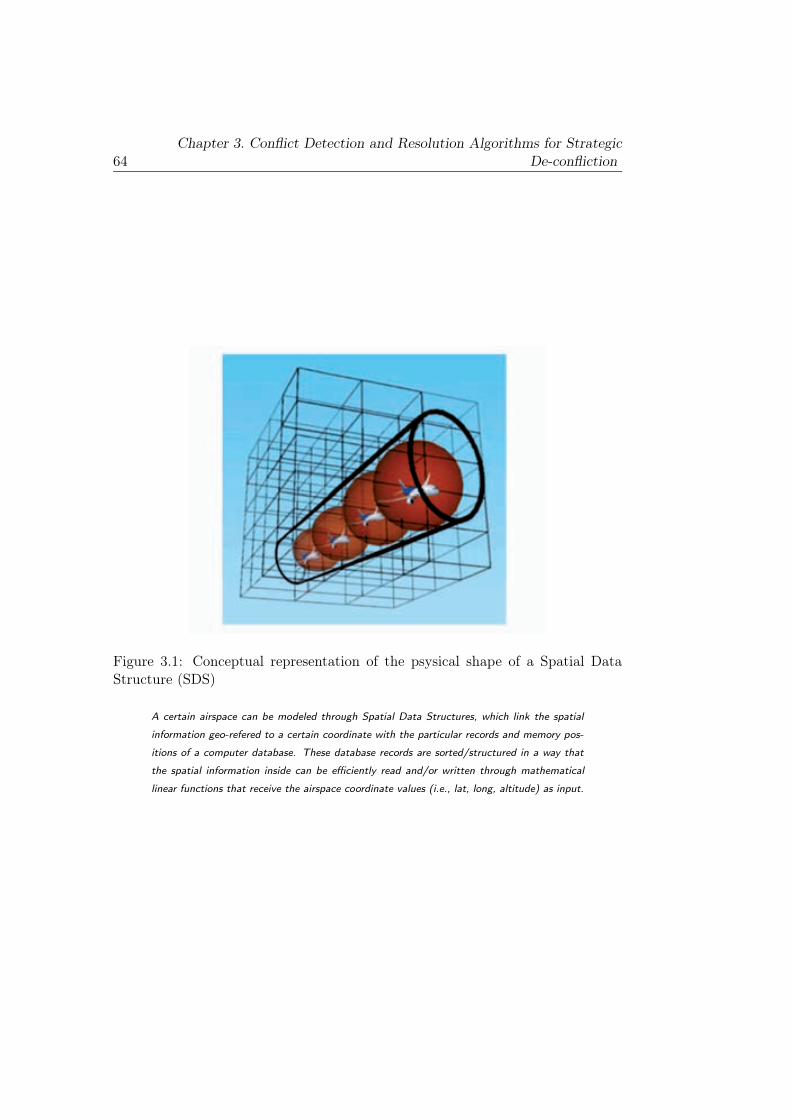
64Chapter 3. Conflict Detection and Resolution Algorithms for Strategic
De-confliction
Figure 3.1: Conceptual representation of the psysical shape of a Spatial DataStructure (SDS)
A certain airspace can be modeled through Spatial Data Structures, which link the spatial
information geo-refered to a certain coordinate with the particular records and memory pos-
itions of a computer database. These database records are sorted/structured in a way that
the spatial information inside can be efficiently read and/or written through mathematical
linear functions that receive the airspace coordinate values (i.e., lat, long, altitude) as input.
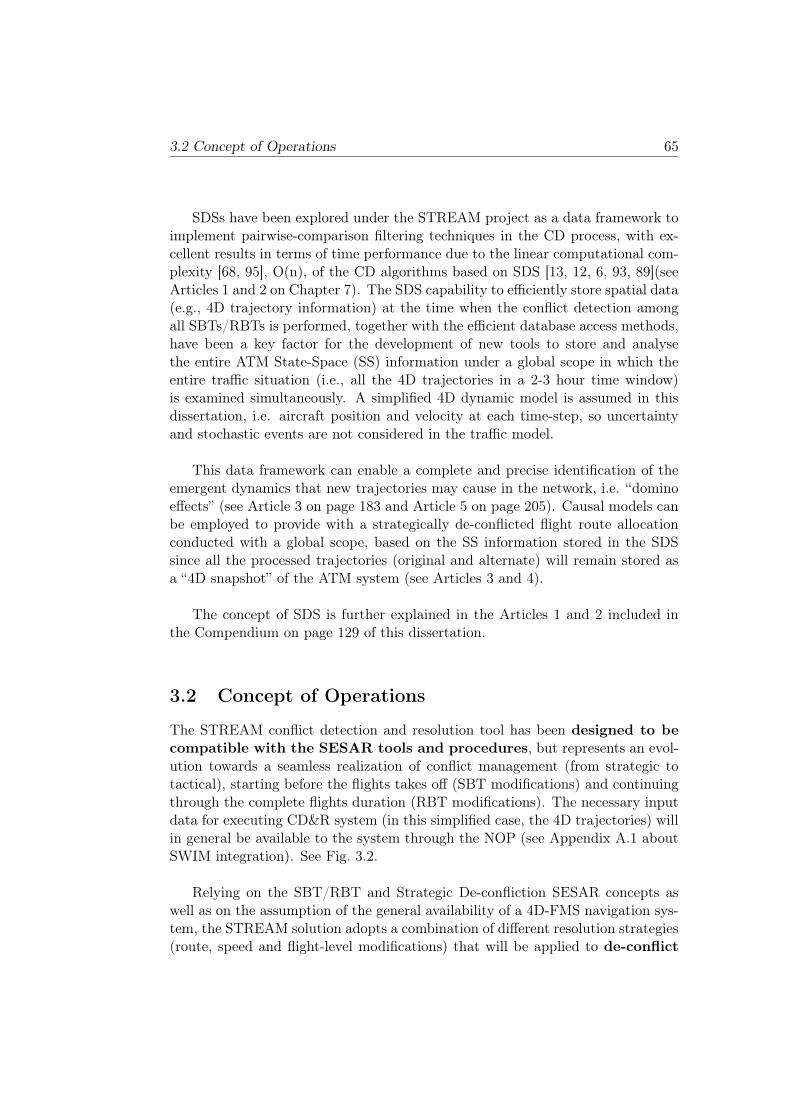
3.2 Concept of Operations 65
SDSs have been explored under the STREAM project as a data framework toimplement pairwise-comparison filtering techniques in the CD process, with ex-cellent results in terms of time performance due to the linear computational com-plexity [68, 95], O(n), of the CD algorithms based on SDS [13, 12, 6, 93, 89](seeArticles 1 and 2 on Chapter 7). The SDS capability to efficiently store spatial data(e.g., 4D trajectory information) at the time when the conflict detection amongall SBTs/RBTs is performed, together with the efficient database access methods,have been a key factor for the development of new tools to store and analysethe entire ATM State-Space (SS) information under a global scope in which theentire traffic situation (i.e., all the 4D trajectories in a 2-3 hour time window)is examined simultaneously. A simplified 4D dynamic model is assumed in thisdissertation, i.e. aircraft position and velocity at each time-step, so uncertaintyand stochastic events are not considered in the traffic model.
This data framework can enable a complete and precise identification of theemergent dynamics that new trajectories may cause in the network, i.e. “dominoeffects” (see Article 3 on page 183 and Article 5 on page 205). Causal models canbe employed to provide with a strategically de-conflicted flight route allocationconducted with a global scope, based on the SS information stored in the SDSsince all the processed trajectories (original and alternate) will remain stored asa “4D snapshot” of the ATM system (see Articles 3 and 4).
The concept of SDS is further explained in the Articles 1 and 2 included inthe Compendium on page 129 of this dissertation.
3.2 Concept of Operations
The STREAM conflict detection and resolution tool has been designed to be
compatible with the SESAR tools and procedures, but represents an evol-ution towards a seamless realization of conflict management (from strategic totactical), starting before the flights takes off (SBT modifications) and continuingthrough the complete flights duration (RBT modifications). The necessary inputdata for executing CD&R system (in this simplified case, the 4D trajectories) willin general be available to the system through the NOP (see Appendix A.1 aboutSWIM integration). See Fig. 3.2.
Relying on the SBT/RBT and Strategic De-confliction SESAR concepts aswell as on the assumption of the general availability of a 4D-FMS navigation sys-tem, the STREAM solution adopts a combination of different resolution strategies(route, speed and flight-level modifications) that will be applied to de-conflict
66Chapter 3. Conflict Detection and Resolution Algorithms for Strategic
De-confliction
Figure 3.2: STREAM air traffic planning concept based on the SESAR ATMconcept of oferations
The ATM plannning architecture proposed by the STREAM project is based on, and is
compatible with, the SESAR ATM concept. The Strategic CD&R tool is supposed to be
under the control of the Network Manager and is based on the use of Spatial Data Structures
that will be fed with the available information though the NOP/SWIM, in which the main
ATM stakeholders can share their intentions and negotiate the use of the airspace resources.
3.2 Concept of Operations 67
the involved SBTs and RBTs at a strategic level by taking into account thecharacterization of the conflict (i.e., type, location and duration) and the prefer-ences of the Airspace Users [43, 48, 88].
The idea is to capitalize on the availability of the 4D trajectory informationavailable prior to take-off (i.e., SBT) or from the actual flight (i.e., RBT) withthe highest accuracy possible depending on the planning horizon. The analysis ofthis information will allow the Network Manager, in close cooperation with theLocal Traffic Managers (i.e., ATCOs) and the Airspace Users, to build an “uncer-tainty 4D tube” by adding buffers around each nominally predicted trajectory inorder to create a picture of the traffic evolution that could contribute to
increase the robustness to certain sources of uncertainty (e.g., navigationand tracking errors, tactical delays, risk of trajectory deviation, etc.). Unexpec-ted events such as trajectory deviations that require tactical interventions (i.e.,aircraft flying outside the 4D tube) could still occur, and thus the ATC Officerclearances will continue to be necessary. However, the overall predictability ofthe system will be enhanced, thus implying fewer tactical interventions and morestable plans.
The outputs of the STREAM CD&CR algorithms are the proposed amend-ments to SBTs/RBTs that are anticipated during the flight planning in order toavoid/minimize conflicts during the execution phase. A precise Trajectory Pre-diction enables the algorithms to detect the potential conflicts and to guaranteethat the proposed SBT amendments will result in conflict-free trajectories. Con-sequently, the effectiveness of the algorithms is strongly dependent on
the accuracy and robustness of the trajectory prediction capability in
which they rely upon.
Note that for strategic de-confliction purposes (i.e., de-conflicting trajector-ies from several hours up to some minutes in advance, e.g. from 2 hours to 20minutes) there is a lot of uncertainty related to the effective prediction of thefinal execution of the flight (i.e., adherence of the actually flown aircraft traject-ory to its predicted trajectory), which is often referred as trajectory predictionerrors.
In STREAM the same SESAR future CNS capabilities are assumed
(i.e., data-link, 4D-FMS, ADS-B. . . ) that would allow a precise 4D navigationfor each flight together with a precise real-time traffic monitoring, whereas theair-ground trajectory predictions will be harmonized (shared by data link) andsupported by robust wind and temperature forecasts, thus significantly improvingthe accuracy and reliability of the trajectory prediction data. Therefore, like in[19], the uncertainty related to trajectory prediction errors can be trun-
68Chapter 3. Conflict Detection and Resolution Algorithms for Strategic
De-confliction
cated to a maximum look-ahead time (e.g., 20 minutes) about its scheduledtrajectory, since it is presumed that tactical trajectory and conflict managementtools (e.g., MTCD) will amend (if necessary) any trajectory deviation until theoriginal trajectory (i.e., original 3D path and downstream time restrictions) isreached again, or otherwise will clear a new negotiated RBT.
The presence of convective weather (e.g., thunderstorms) or other sources ofuncertainty with deep impact on the strategically generated plans will be ad-dressed via a real-time reconfiguration of the routes allocated to each
flight. The information on flight intentions and on the current and forecastedstatus of the entire European network will be available through the NOP, a con-tinuously updated rolling plan that enables a seamless conflict management pro-cess running continuously from the strategic phase (pre-departure, collaborativedesign of the NOP) up to the execution phase (automation-assisted, controller-driven conflict resolution).
A typical scenario at the European level with a planning horizon of 2-3 hoursis expected to include up to 5000 simultaneously active flights [88]. The highdensity and complexity of European air traffic implies a high number of inter-actions among the different trajectories, especially in those regions with moreexpected congestion. Thus, high computational efficiency is required in
the CD&R algorithms for storing and analysing the state-space informationof several thousands of trajectories to ensure that the proposed local resolutionsdo not generate secondary reactive conflicts in other zones of the network (i.e.,the CD&R system must consider potential emergent dynamics in the
network for global optimization).
After the CD&R process, different conflict-free solution scenarios will
be generated. Each of these feasible scenarios will be weighted according todifferent performance indicators for efficiency, robustness, fairness and equity[43, 48, 88]. Under all circumstances, a final agreement between the involvedservice providers and the impacted Airspace Users will be necessary to close theSBT negotiation and implement a RBT for each flight. Thus, during the nego-tiation process, the Airspace Users may express their preferences according totheir business targets, which will be used to identify the most beneficial globalsolution according to selected commonly agreed metrics, thus formally realizing amulti-criteria global optimization of the network route-structure allocation.
For simplicity purposes, the application of the hemispherical altitude rule (i.e.,organization of traffic in oriented Flight Levels) is considered in the Europeanairspace as occurring in the current ATM concept. However, the CD&R toolspresented in this dissertation can be adapted to a continuous (i.e., not discrete)
3.3 Uncertainty 69
vertical usage of the airspace. In addition, the STREAM concept of operationsonly considers en-route traffic (i.e., from Top of Climb (ToC) to Top of Descent(ToD)), and Direct Routes are applied as a simplification of the Free-Routingconcept (the CD&R tools presented are fully compatible with concept of FreeRoute, but the introduction of this concept requires to have real informationabout the user preferences, the aircraft performance and the weather forecasts,among other information that has not been available in this research).
3.3 Uncertainty
Since uncertainty is a major issue affecting strategic de-confliction systems, sev-eral sources of uncertainty have been addressed in the framework of the STREAMproject (see Appendix A.5). However, the strategic de-confliction system presen-ted in this dissertation only considers a simplified categorization of uncertainties.
For instance, the uncertainty related to navigational imprecision and trackingerrors, which could be tackled by adding uncertainty buffers to the SBTs/RBTs,and whose final result can be treated as 4D corridors in which aircraft can ex-ecute their flights within a high confidence interval (4D-FMS navigation assumed).
Once all the trajectories in the network have been de-conflicted (consider-ing the nominal safety distance plus the extra buffers), unexpected events (i.e.,perturbations) can still occur, thus requiring a modification of the NOP. In thisdissertation, the perturbations are classified and simplified as:
• Individual-level perturbations, referring to those unexpected events causedby the AUs that generally affect only a reduced set of trajectories, e.g., largedelays and/or trajectory deviations outside of the uncertainty buffer. Theproblem of how to address individual-level perturbations is a complex topicthat is not covered in this dissertation. However, in general, these issuescan be addressed by first identifying the AUs responsible for the produceddeviation and forcing them to correct the deviation by applying tacticalamendments (the same automated STREAM CD&R algorithms could beadapted to tactical operations) according to the principle of “the one thatdeviates is the one that pays”.
• Network-level perturbations, referring to those perturbations that are inde-pendent from the behaviour of the AUs and generally affect a large set oftrajectories or even the entire network, e.g., convective weather and vol-canic ash, among others. In presence of network-level perturbations, suchas a dangerous storm that forces the NM to close certain (demanded) air-space sectors, the complete network route allocation must be reconsidered.
70Chapter 3. Conflict Detection and Resolution Algorithms for Strategic
De-confliction
Again, the AUs may provide the NM with their preferred SBTs/RBTs byconsidering the most updated information on the state of the network. Ifthe CD&R tools applied are sufficiently rapid, then the NM can provide anew airspace configuration/route allocation adapted to the AU preferencesthat is subject to the changing network restrictions in real-time (see Article2 on page 155). According to the STREAM ConOps, an acceptable look-ahead time horizon for the NOP would be approximately 2 hours and theupdating frequency less than a minute.
Note that the strategic de-confliction system proposed in this research is compat-ible with the current tactical surveillance and management of conflicts as well aswith the on-board collision avoidance systems (i.e., TCAS). Thus the air trafficcan be protected by three different layers of conflict management (i.e., strategic,tactical and operational) that may reduce the negative impact of uncertainty inthe ATM safety levels.
3.4 STREAM Assumptions
The main assumptions upon which the STREAM solution for conflict detectionand conflict resolution relies are:
• Airspace Users are capable of submitting the SBTs and RBT updates (sentfrom aircraft via data-link) for all the flights they are planning to operateor they are actually operating within the European airspace, with at least2 hours of trajectory prediction look-ahead.
• The NM has the technical capability of receiving the SBT requests andRBT updates from AUs, performing the necessary data pre-processing todata parsing and insertion into the SDS.
• The Airspace Users and the NM have all the systems in place enabling theiterative negotiation of 4D Trajectories from the strategic phase up to theexecution one (i.e., from SBT definition up to the agreement and updatingof the RBT).
• Different levels of weather forecast accuracy are achievable according to thetime horizon and the variable forecasted. The STREAM solution will betested under several different conditions in order to explore the potentialperformance of the algorithms. In particular the project will assume differ-ent levels of Trajectory Prediction (TP) performance to study the feasibilityand potential benefits of STREAM, with weather forecasts (mainly wind andtemperature) being a key factor for the TP performance.
3.4 STREAM Assumptions 71
• The information in the SDS is maintained constantly updated by the NM,by periodically reflecting the status of the RBTs already on execution, aswell as registering their deviations and also allowing to compare the SBTsof flights still on the ground with the most updated picture of current andestimated future traffic situation in the SDS.
Additionally a number of additional assumptions are also relevant, although notdirectly impacting the STREAM implementation, but rather for guaranteeing thatthe trajectory strategic amendments proposed by the conflict resolution moduleare later achievable during the execution phase:
• 4D Trajectory Datalink Services (4DTRAD) are fully implemented and us-able by ground and airborne systems. This allows data exchange and co-ordination between air and ground during the execution phase, permittingATCOs to assess the compliance of aircraft with the agreed RBTs and toreact to changes according to a specified TMR.
• All aircraft are 4D-FMS equipped thus being able to receive and automat-ically load in onboard navigation system multiple constraints (includingseveral time constraints) that will be executed with enough precision.
• P-RNAV operations are available at European airspace level and all aircrafthave RNP-1 navigation capabilities, thus 1NM mile of horizontal deviationfrom the RBT might be allowed.
• The European en-route airspace is considered to be organized through thesemi-circular cruising levels system, even if Free Route operations are con-sidered [41]. Thus, aircraft are vertically separated with the current safetystandards (i.e., 1000 ft since Reduced Vertical Separation Minima applies)and thus vertical deviations/overshots around 200 ft could be acceptable.
• ADS-B is fully operative in all aircraft, enabling ASAS and TCAS functions.The ASAS system allows the precise self-separation and syncronization ofaircraft, while the TCAS system empowers a last safety layer to avoid colli-sions in case that both strategic and tactical conflict management fails (i.e.,safety nets).
• Uncertainty related to trajectory prediction errors can be truncated to amaximum look-ahead time (e.g., 20 minutes) about its scheduled trajectory[19], since it is presumed that tactical trajectory and conflict managementtools (e.g., MTCD) will amend any trajectory deviation (if necessary) untilthe original trajectory is reached again.
• Network uncertanties which may cause important losses of capacity at anysector or airport are not considered/not explored in the nominal traffic
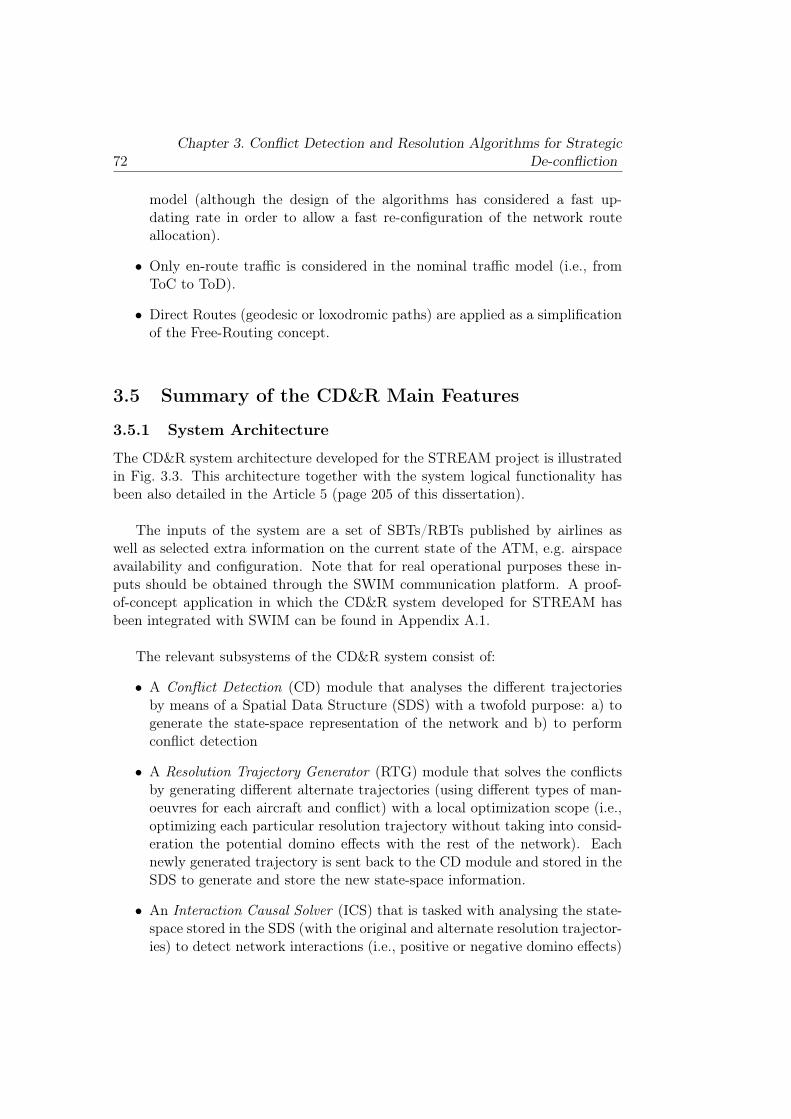
72Chapter 3. Conflict Detection and Resolution Algorithms for Strategic
De-confliction
model (although the design of the algorithms has considered a fast up-dating rate in order to allow a fast re-configuration of the network routeallocation).
• Only en-route traffic is considered in the nominal traffic model (i.e., fromToC to ToD).
• Direct Routes (geodesic or loxodromic paths) are applied as a simplificationof the Free-Routing concept.
3.5 Summary of the CD&R Main Features
3.5.1 System Architecture
The CD&R system architecture developed for the STREAM project is illustratedin Fig. 3.3. This architecture together with the system logical functionality hasbeen also detailed in the Article 5 (page 205 of this dissertation).
The inputs of the system are a set of SBTs/RBTs published by airlines aswell as selected extra information on the current state of the ATM, e.g. airspaceavailability and configuration. Note that for real operational purposes these in-puts should be obtained through the SWIM communication platform. A proof-of-concept application in which the CD&R system developed for STREAM hasbeen integrated with SWIM can be found in Appendix A.1.
The relevant subsystems of the CD&R system consist of:
• A Conflict Detection (CD) module that analyses the different trajectoriesby means of a Spatial Data Structure (SDS) with a twofold purpose: a) togenerate the state-space representation of the network and b) to performconflict detection
• A Resolution Trajectory Generator (RTG) module that solves the conflictsby generating different alternate trajectories (using different types of man-oeuvres for each aircraft and conflict) with a local optimization scope (i.e.,optimizing each particular resolution trajectory without taking into consid-eration the potential domino effects with the rest of the network). Eachnewly generated trajectory is sent back to the CD module and stored in theSDS to generate and store the new state-space information.
• An Interaction Causal Solver (ICS) that is tasked with analysing the state-space stored in the SDS (with the original and alternate resolution trajector-ies) to detect network interactions (i.e., positive or negative domino effects)
3.5 Summary of the CD&R Main Features 73
Figure 3.3: STREAM CD&R architecture
The STREAM proposed architecture for the strategic CD&R system consists on three modules
that cyclically interact among them. The CD module is enabled by a SDS configured to store
all the relevant state variables of the ATM along the considered planning horizon. The CR
consist on two sub-modules, the RTG that generates local-optimal resolution trajectories for
each detected conflict treated as issolated in the network, and the ICS that analyzes the
domino effects of those local-optimal trajecories and finds several conflict-free scenarios (if
any exists) through a state-space exploration based on a causal analysis model.The third
CD&R module is in charge of managing the information and coordination between the CD
and CR modules.
among all of the processed trajectories and to subsequently propose sev-eral conflict-free scenarios at the network level. Post-processing could applymetrics to the available feasible solutions to obtain the globally optimalsolution scenario.
• A communication interface used to coordinate the CD, RTG and ICS mod-ules.
3.5.2 System Logical Functionality
The system architecture presented in the previous section is applied according tothe following steps:
0. A set of user-preferred free-route trajectories is introduced into the CD&R
74Chapter 3. Conflict Detection and Resolution Algorithms for Strategic
De-confliction
system.
1. Given a set of trajectories, the CD module detects the conflicts amongthem. All of the processed trajectories remain stored in the SDS to ease thedetection of conflicts among new sets of trajectories and their interactionswith previously processed sets.
2. The RTG module generates several locally optimal trajectories per each pairof trajectories and conflicts by considering different restrictions, i.e., differ-ent types of manoeuvres used to solve single conflicts, multiple conflicts,to match time-restrictions or to find cooperative resolutions, among others.The local optimality of the trajectories is defined by the AUs, who express(directly or indirectly) their preferred alternate SBTs/RBTs for each flightgiven a set of restrictions provided by the NM through the CD module. Notethat the order of conflict processing does not affect the local optimality ofthe alternate SBTs/RBTs because each pair of trajectories in the conflictare processed at this step and treated as totally isolated in the network, i.e.,the optimal AU (local) resolutions are generated with no consideration ofother potential interactions with the rest of the trajectories. This assump-tion is based on the fact that the later causal analysis (step 7) will exploredifferent combinations of potential conflict-free scenarios in which each ofthe alternate trajectories (that are generated by the RTG in this step) maybe considered as valid in at least one scenario (i.e., in at least one combinat-orial branch) and, in each case, the rest of the alternate trajectories will beconfigured around the trajectories already considered valid, also by explor-ing different combinations of valid alternate trajectories (i.e., trajectoriesthat do not generate conflicts with the previously accepted trajectories ineach combinatorial branch).
3. The CD module again evaluates the new set of alternate SBTs/RBTs todetect conflicts among them as well as with the previously processed sets oftrajectories. The conflicts detected among different alternate SBTs/RBTsgenerated for the same flight are discarded (an aircraft will only fly one ofits alternate SBTs/RBTs so they cannot be in conflict among themselves).
4. Points 1, 2 and 3 described above constitute a cycle that can be repeatedseveral times to detect and provide resolution SBTs/RBTs to secondary andtertiary emergent conflicts, thus increasing the probabilities of finding finalfeasible solutions. At the end of this step, a complete 4D representationof the airspace’s present and future (expected) states remains stored in theSDS.
5. All of the alternate SBTs/RBTs generated at point 2 per each flight aresorted according to a given order of preference expressed (directly or through
3.5 Summary of the CD&R Main Features 75
agreed indirect methods) by the AUs. The information taken from the AUpreferences will avoid exploration of sub-optimal feasible solutions, thusreducing the exploration of the solution space to the set of Pareto-efficientfeasible solutions.
6. Causal exploration with constraint propagation involves the following pro-cess. The causal model consists of opening a branch of the reachabilitytree per each SBTs/RBTs and subsequently propagating the constraints byactivating/deactivating the set of primary, secondary or tertiary conflicts(extracted from the SDS at step 4) and the availability of the pre-sorted al-ternate SBTs/RBTs (introduced as input in step 0 or generated by the RTGat step 2). This model takes into consideration all of the possible emergentdynamics (i.e., domino effects), thus achieving completeness of the solutionspace, and at the same time, reducing the solution space exploration byfocusing on the Pareto frontier of the feasible set of solutions.
7. The computation of online metrics (of efficiency or any other criteria) duringthe causal exploration and their comparison among the branches that belongto the same level of the reachability tree allows a driven search via a hill-climbing/minimal-gradient algorithm, which outputs the feasible final stateswith better metrics first (i.e., more efficient scenarios are found first).
Note that the order in which conflicts are processed and locally solved by theRTG module (step 2) does not affect the ICS causal analysis used to find globalconflict-free solutions (step 6 and 7) because the ICS analyses the overall 4Dstate-space information stored in the SDS once the CD-RTG-CD sequence (steps1, 2 and 3) has halted after a (parameterizable) maximum number of cycles (step4).
3.5.3 Technological Framework for the Conflict Detection Mod-
ule
Spatial Data Structures have been firstly explored as a technique for implement-ing a MTCD process (see Article 1 in page 131) with excellent results in terms oftime performance due to the linear computational complexity (denoted by O(n))of the CD algorithms based on SDS [89, 93, 81, 92, 91]. In addition, the use ofSDS allows the storage of the entire state-space description of the traffic amongall of the processed trajectories at the time when the conflict detection analysis isperformed. Causal models can be employed based on the SS information storedin the SDS because all of the processed trajectories (both planned and alternate“what-if” types of trajectories) will remain stored as a “4D snapshot” of the ATMsystem [89, 93, 92, 90, 81]. See Articles 2, 3, 4 and 5 on pages 155, 183, 193 and
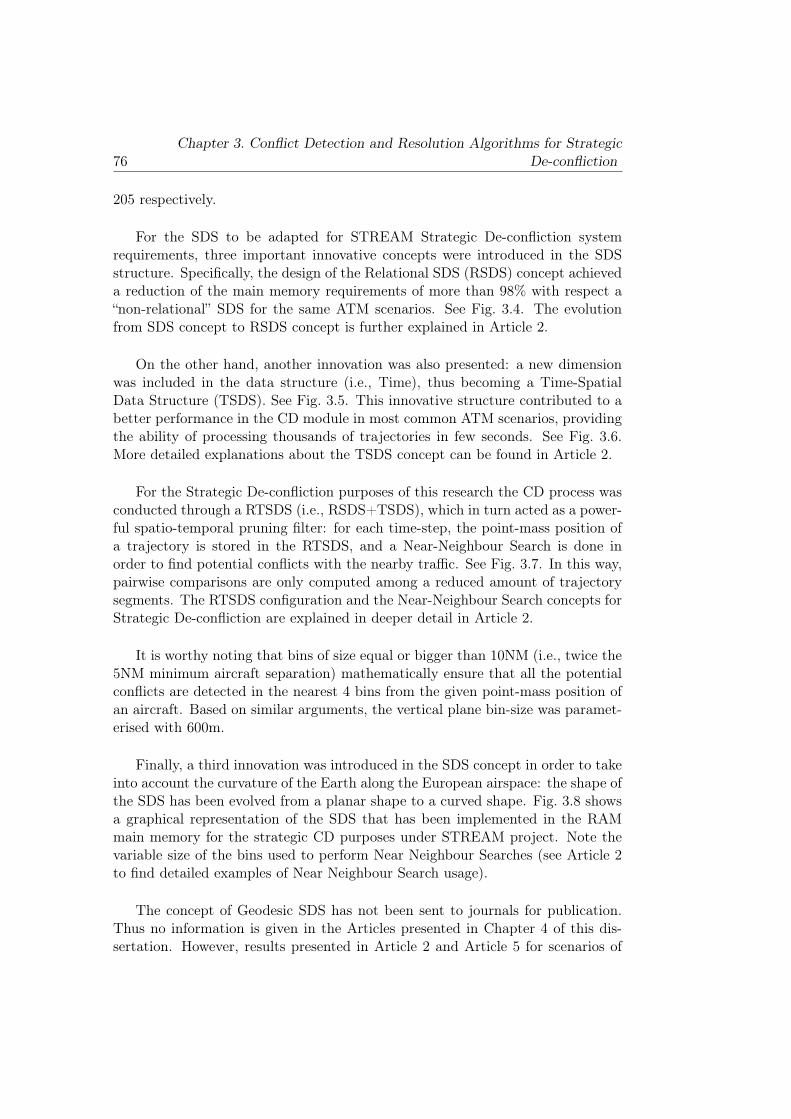
76Chapter 3. Conflict Detection and Resolution Algorithms for Strategic
De-confliction
205 respectively.
For the SDS to be adapted for STREAM Strategic De-confliction systemrequirements, three important innovative concepts were introduced in the SDSstructure. Specifically, the design of the Relational SDS (RSDS) concept achieveda reduction of the main memory requirements of more than 98% with respect a“non-relational” SDS for the same ATM scenarios. See Fig. 3.4. The evolutionfrom SDS concept to RSDS concept is further explained in Article 2.
On the other hand, another innovation was also presented: a new dimensionwas included in the data structure (i.e., Time), thus becoming a Time-SpatialData Structure (TSDS). See Fig. 3.5. This innovative structure contributed to abetter performance in the CD module in most common ATM scenarios, providingthe ability of processing thousands of trajectories in few seconds. See Fig. 3.6.More detailed explanations about the TSDS concept can be found in Article 2.
For the Strategic De-confliction purposes of this research the CD process wasconducted through a RTSDS (i.e., RSDS+TSDS), which in turn acted as a power-ful spatio-temporal pruning filter: for each time-step, the point-mass position ofa trajectory is stored in the RTSDS, and a Near-Neighbour Search is done inorder to find potential conflicts with the nearby traffic. See Fig. 3.7. In this way,pairwise comparisons are only computed among a reduced amount of trajectorysegments. The RTSDS configuration and the Near-Neighbour Search concepts forStrategic De-confliction are explained in deeper detail in Article 2.
It is worthy noting that bins of size equal or bigger than 10NM (i.e., twice the5NM minimum aircraft separation) mathematically ensure that all the potentialconflicts are detected in the nearest 4 bins from the given point-mass position ofan aircraft. Based on similar arguments, the vertical plane bin-size was paramet-erised with 600m.
Finally, a third innovation was introduced in the SDS concept in order to takeinto account the curvature of the Earth along the European airspace: the shape ofthe SDS has been evolved from a planar shape to a curved shape. Fig. 3.8 showsa graphical representation of the SDS that has been implemented in the RAMmain memory for the strategic CD purposes under STREAM project. Note thevariable size of the bins used to perform Near Neighbour Searches (see Article 2to find detailed examples of Near Neighbour Search usage).
The concept of Geodesic SDS has not been sent to journals for publication.Thus no information is given in the Articles presented in Chapter 4 of this dis-sertation. However, results presented in Article 2 and Article 5 for scenarios of
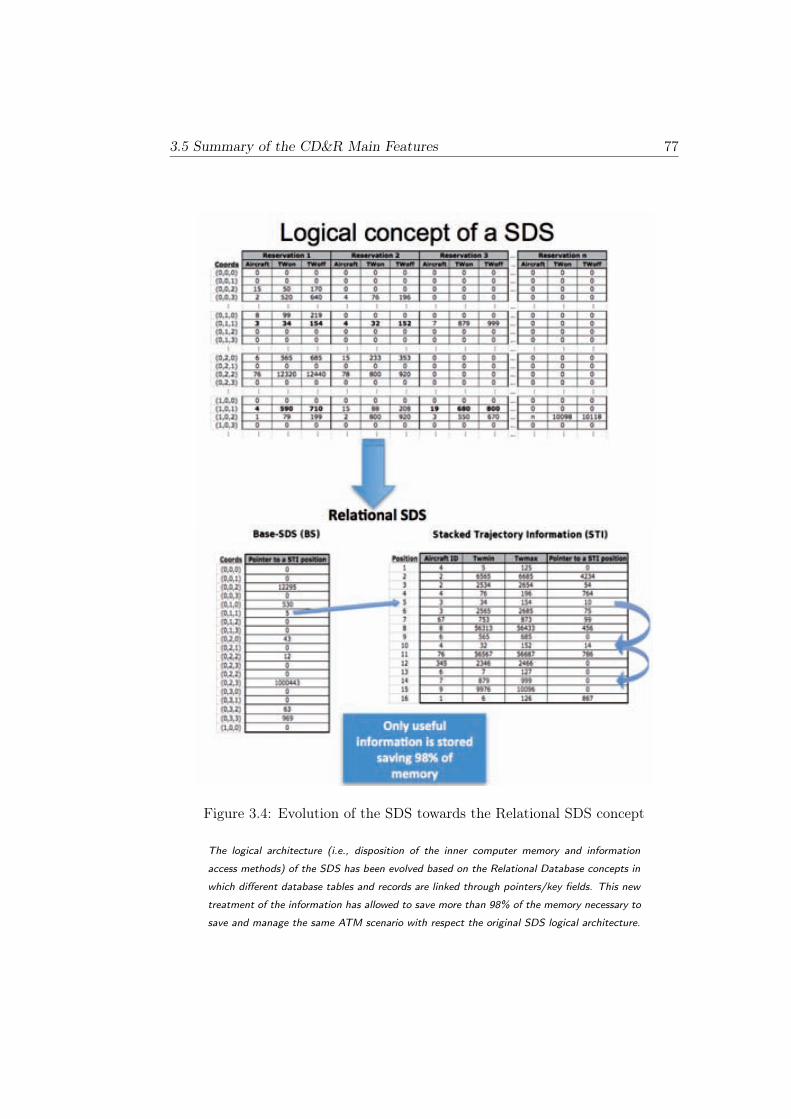
3.5 Summary of the CD&R Main Features 77
Figure 3.4: Evolution of the SDS towards the Relational SDS concept
The logical architecture (i.e., disposition of the inner computer memory and information
access methods) of the SDS has been evolved based on the Relational Database concepts in
which different database tables and records are linked through pointers/key fields. This new
treatment of the information has allowed to save more than 98% of the memory necessary to
save and manage the same ATM scenario with respect the original SDS logical architecture.
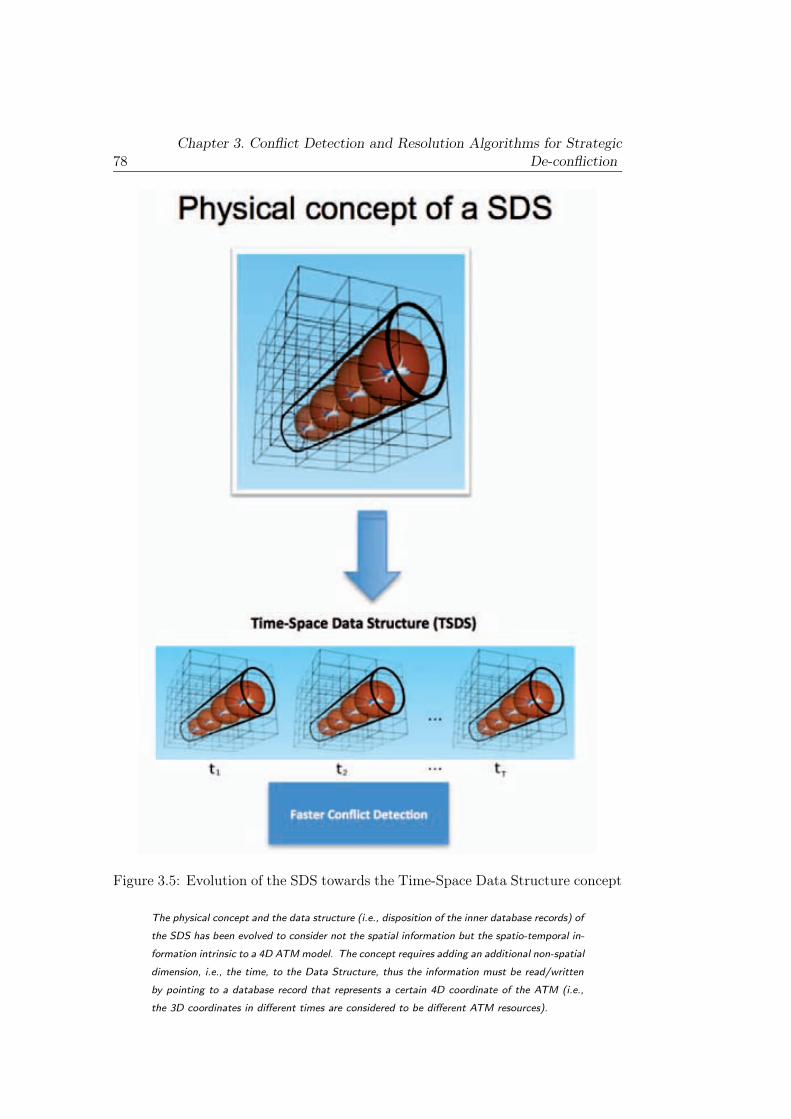
78Chapter 3. Conflict Detection and Resolution Algorithms for Strategic
De-confliction
Figure 3.5: Evolution of the SDS towards the Time-Space Data Structure concept
The physical concept and the data structure (i.e., disposition of the inner database records) of
the SDS has been evolved to consider not the spatial information but the spatio-temporal in-
formation intrinsic to a 4D ATM model. The concept requires adding an additional non-spatial
dimension, i.e., the time, to the Data Structure, thus the information must be read/written
by pointing to a database record that represents a certain 4D coordinate of the ATM (i.e.,
the 3D coordinates in different times are considered to be different ATM resources).
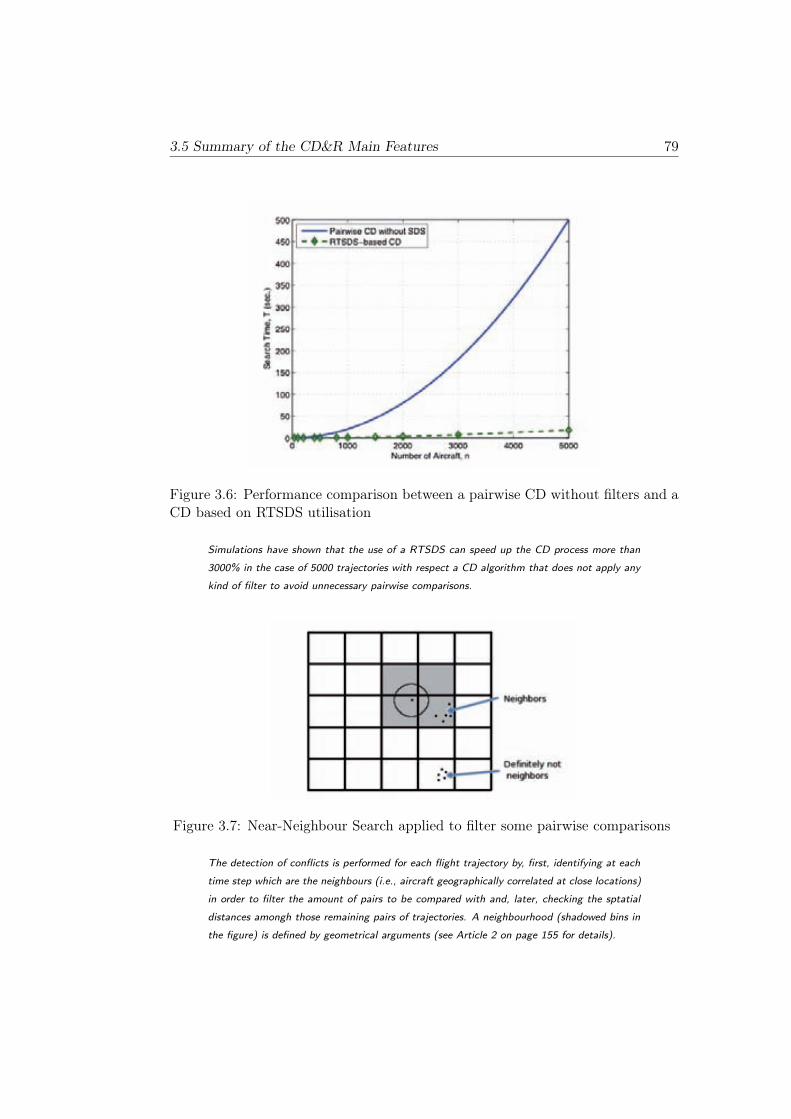
3.5 Summary of the CD&R Main Features 79
Figure 3.6: Performance comparison between a pairwise CD without filters and aCD based on RTSDS utilisation
Simulations have shown that the use of a RTSDS can speed up the CD process more than
3000% in the case of 5000 trajectories with respect a CD algorithm that does not apply any
kind of filter to avoid unnecessary pairwise comparisons.
Figure 3.7: Near-Neighbour Search applied to filter some pairwise comparisons
The detection of conflicts is performed for each flight trajectory by, first, identifying at each
time step which are the neighbours (i.e., aircraft geographically correlated at close locations)
in order to filter the amount of pairs to be compared with and, later, checking the sptatial
distances amongh those remaining pairs of trajectories. A neighbourhood (shadowed bins in
the figure) is defined by geometrical arguments (see Article 2 on page 155 for details).
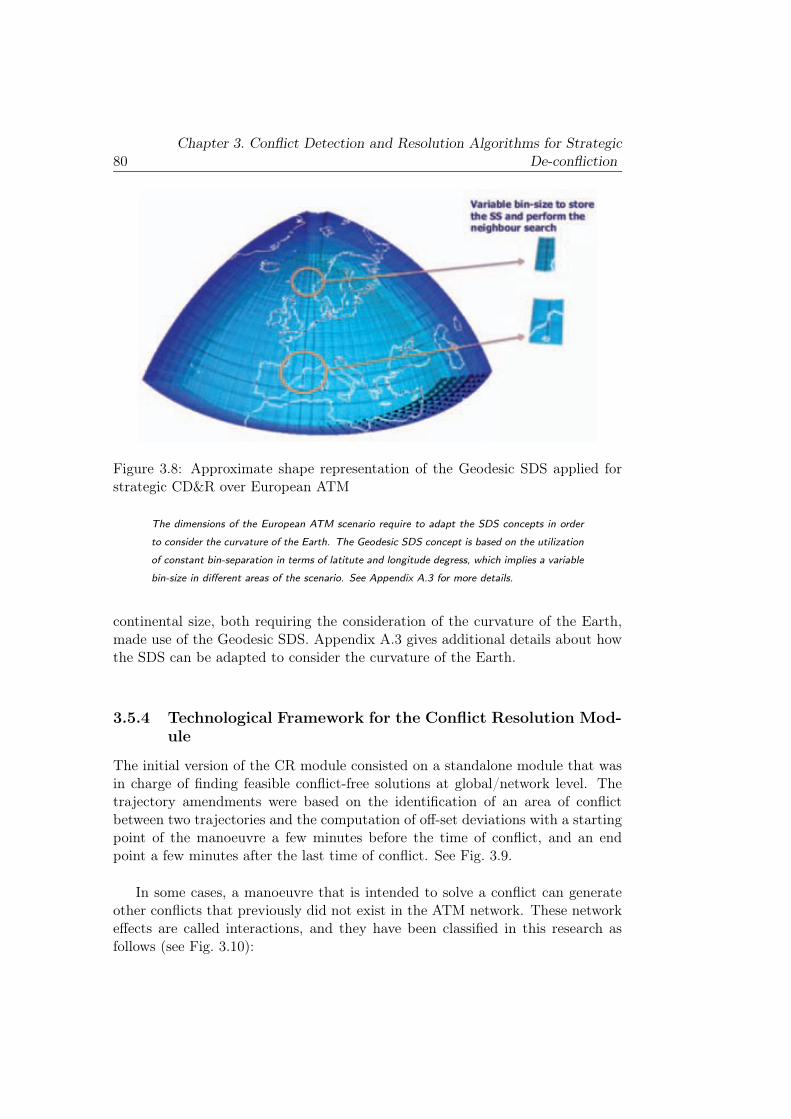
80Chapter 3. Conflict Detection and Resolution Algorithms for Strategic
De-confliction
Figure 3.8: Approximate shape representation of the Geodesic SDS applied forstrategic CD&R over European ATM
The dimensions of the European ATM scenario require to adapt the SDS concepts in order
to consider the curvature of the Earth. The Geodesic SDS concept is based on the utilization
of constant bin-separation in terms of latitute and longitude degress, which implies a variable
bin-size in different areas of the scenario. See Appendix A.3 for more details.
continental size, both requiring the consideration of the curvature of the Earth,made use of the Geodesic SDS. Appendix A.3 gives additional details about howthe SDS can be adapted to consider the curvature of the Earth.
3.5.4 Technological Framework for the Conflict Resolution Mod-
ule
The initial version of the CR module consisted on a standalone module that wasin charge of finding feasible conflict-free solutions at global/network level. Thetrajectory amendments were based on the identification of an area of conflictbetween two trajectories and the computation of off-set deviations with a startingpoint of the manoeuvre a few minutes before the time of conflict, and an endpoint a few minutes after the last time of conflict. See Fig. 3.9.
In some cases, a manoeuvre that is intended to solve a conflict can generateother conflicts that previously did not exist in the ATM network. These networkeffects are called interactions, and they have been classified in this research asfollows (see Fig. 3.10):
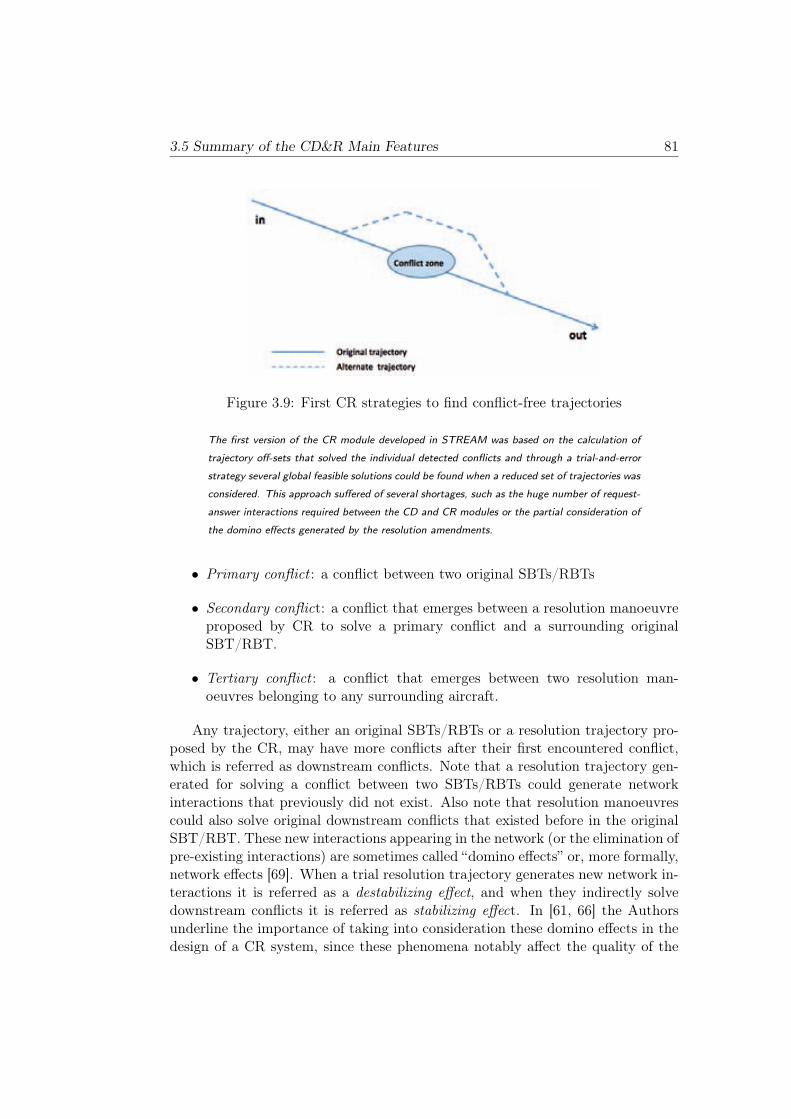
3.5 Summary of the CD&R Main Features 81
Figure 3.9: First CR strategies to find conflict-free trajectories
The first version of the CR module developed in STREAM was based on the calculation of
trajectory off-sets that solved the individual detected conflicts and through a trial-and-error
strategy several global feasible solutions could be found when a reduced set of trajectories was
considered. This approach suffered of several shortages, such as the huge number of request-
answer interactions required between the CD and CR modules or the partial consideration of
the domino effects generated by the resolution amendments.
• Primary conflict : a conflict between two original SBTs/RBTs
• Secondary conflict: a conflict that emerges between a resolution manoeuvreproposed by CR to solve a primary conflict and a surrounding originalSBT/RBT.
• Tertiary conflict : a conflict that emerges between two resolution man-oeuvres belonging to any surrounding aircraft.
Any trajectory, either an original SBTs/RBTs or a resolution trajectory pro-posed by the CR, may have more conflicts after their first encountered conflict,which is referred as downstream conflicts. Note that a resolution trajectory gen-erated for solving a conflict between two SBTs/RBTs could generate networkinteractions that previously did not exist. Also note that resolution manoeuvrescould also solve original downstream conflicts that existed before in the originalSBT/RBT. These new interactions appearing in the network (or the elimination ofpre-existing interactions) are sometimes called “domino effects” or, more formally,network effects [69]. When a trial resolution trajectory generates new network in-teractions it is referred as a destabilizing effect, and when they indirectly solvedownstream conflicts it is referred as stabilizing effect. In [61, 66] the Authorsunderline the importance of taking into consideration these domino effects in thedesign of a CR system, since these phenomena notably affect the quality of the
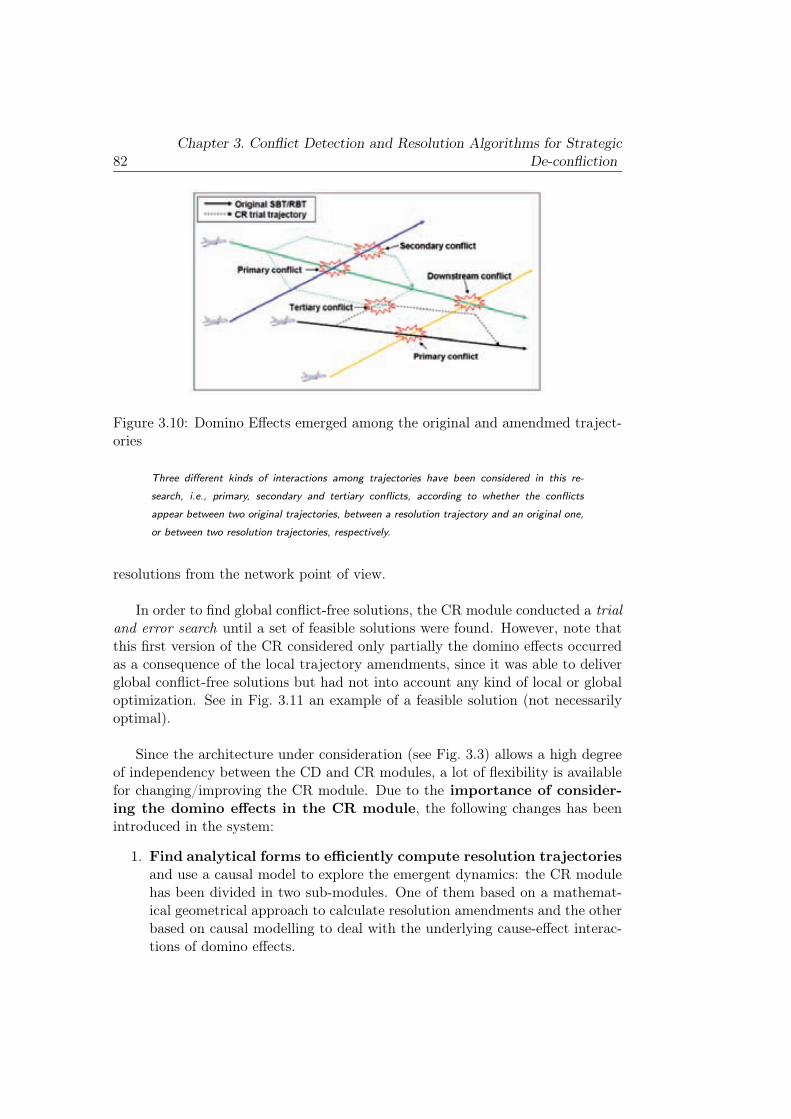
82Chapter 3. Conflict Detection and Resolution Algorithms for Strategic
De-confliction
Figure 3.10: Domino Effects emerged among the original and amendmed traject-ories
Three different kinds of interactions among trajectories have been considered in this re-
search, i.e., primary, secondary and tertiary conflicts, according to whether the conflicts
appear between two original trajectories, between a resolution trajectory and an original one,
or between two resolution trajectories, respectively.
resolutions from the network point of view.
In order to find global conflict-free solutions, the CR module conducted a trialand error search until a set of feasible solutions were found. However, note thatthis first version of the CR considered only partially the domino effects occurredas a consequence of the local trajectory amendments, since it was able to deliverglobal conflict-free solutions but had not into account any kind of local or globaloptimization. See in Fig. 3.11 an example of a feasible solution (not necessarilyoptimal).
Since the architecture under consideration (see Fig. 3.3) allows a high degreeof independency between the CD and CR modules, a lot of flexibility is availablefor changing/improving the CR module. Due to the importance of consider-
ing the domino effects in the CR module, the following changes has beenintroduced in the system:
1. Find analytical forms to efficiently compute resolution trajectories
and use a causal model to explore the emergent dynamics: the CR modulehas been divided in two sub-modules. One of them based on a mathemat-ical geometrical approach to calculate resolution amendments and the otherbased on causal modelling to deal with the underlying cause-effect interac-tions of domino effects.
3.5 Summary of the CD&R Main Features 83
2. Avoid conducting trial-and-error state-space analyses to find globalconflict-free solutions. The huge amount of trajectories and conflicts tobe managed at European ATM level makes the trial and error search im-practical, given the big computational burden required. The current causalmodel implemented in the ICS module takes advantage of the state-spaceinformation generated and stored in the SDS and applies causal explorationto divide the problem into unconnected clusters and also to reduce the setof scenarios to be analysed to the Pareto-frontier of the feasible solutions.
3. Reduction of information transmission: again, the huge amount of in-formation to be transmitted between the CD and CR modules has forced tochange the communication interface (previously through an external data-base) and substitute it by a complete integration of all the modules andsub-modules in the same C++ application. The new interface includes anefficient trajectory identification method based on modular arithmetic (seeAppendix A.2).
To cope with the above limitations the CR has been divided in two sub-modules:the RTG and the ICS. The main purpose of the RTG module is to compute newoptimal alternate trajectories for each aircraft in conflict (and for each conflict ifan aircraft is involved in more than one). Ideally, the RTG module could supportAUs defining their own preferred alternate flight plans in response to a set ofrestrictions imposed by the NM generated in order to synchronize the traffic andavoid the conflicts. This user-defined local optimality of the resolutions (that meetthe network and flow constraints) can then be used by the ICS module to reducethe solution space search and to find global-optimal solutions. For simplicity, inthis research the generation of these user-preferred resolution trajectories is basedon (and substituted by) a Geometric Optimization Approach (GOA) algorithm[8, 51].
The advantage of the GOA model is that it takes into account the geometriccharacteristics of 2 aircraft trajectories that are in conflict in a relative frame-work (see Fig. 3.12), and applies a set of closed-form analytical expressions
to find the required conflict avoidance commands for each of the flights. Thistechnique allows to solve the conflicts through the application of different kindof manoeuvres such as Heading Angle Changes (HAC), Speed Changes (SC),Flight Level Changes (FLC) or a combination of them in a cooperative or non-cooperative mode. These resolutions are called “optimal” in the sense that theyminimize the velocity vector changes with respect the original trajectory.
Figure 3.13 shows one example scenario solved with the first CR version (left),and the same scenario using the new CR with the GOA approach (right) in whichthe “local optimality” of the new RTG amendments can be observed. Note that
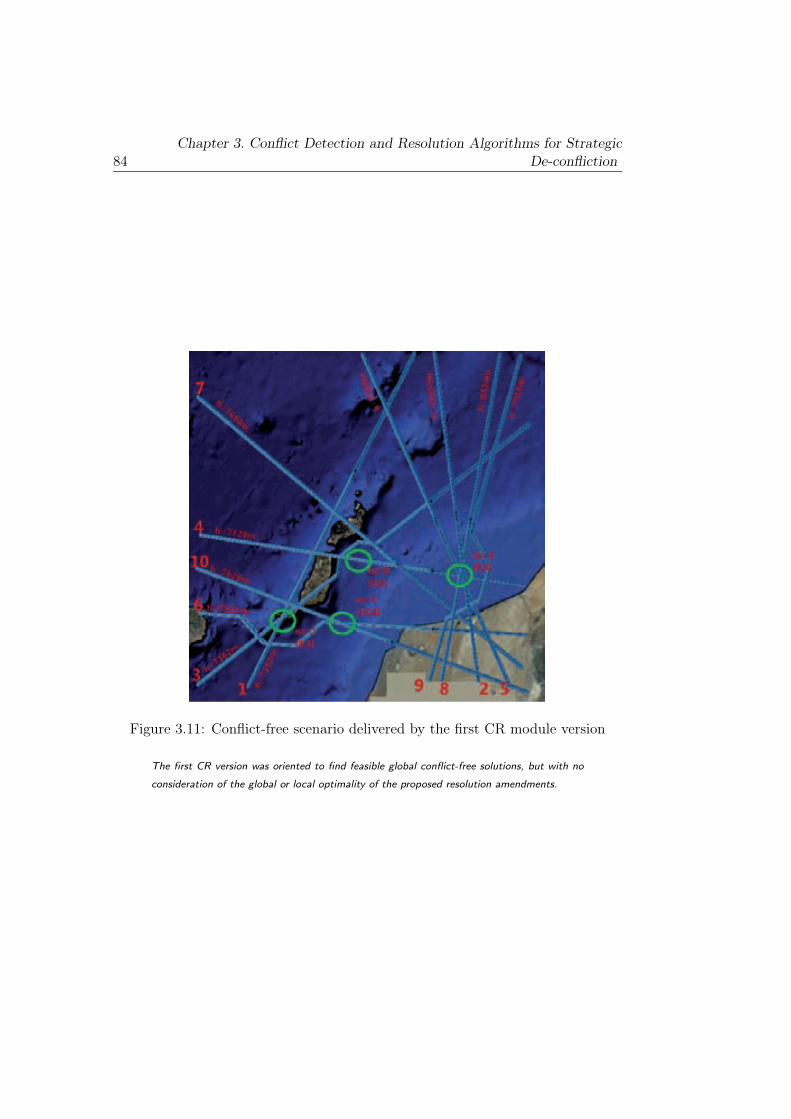
84Chapter 3. Conflict Detection and Resolution Algorithms for Strategic
De-confliction
Figure 3.11: Conflict-free scenario delivered by the first CR module version
The first CR version was oriented to find feasible global conflict-free solutions, but with no
consideration of the global or local optimality of the proposed resolution amendments.
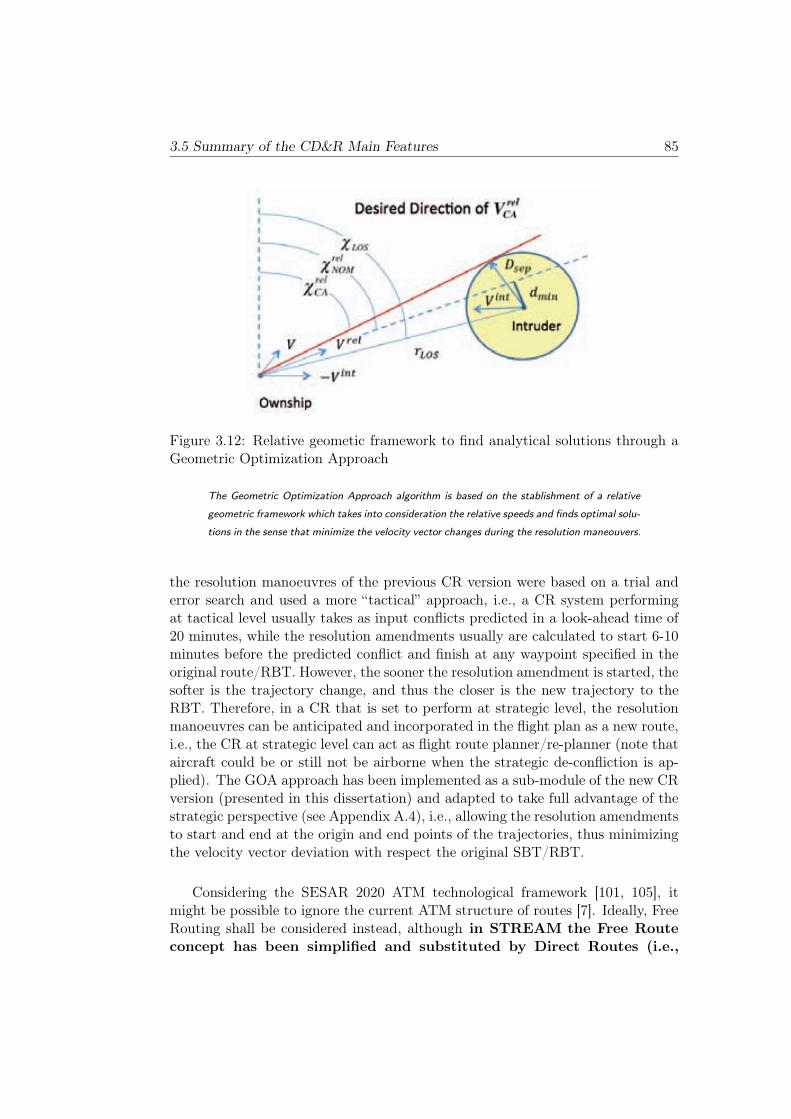
3.5 Summary of the CD&R Main Features 85
Figure 3.12: Relative geometic framework to find analytical solutions through aGeometric Optimization Approach
The Geometric Optimization Approach algorithm is based on the stablishment of a relative
geometric framework which takes into consideration the relative speeds and finds optimal solu-
tions in the sense that minimize the velocity vector changes during the resolution maneouvers.
the resolution manoeuvres of the previous CR version were based on a trial anderror search and used a more “tactical” approach, i.e., a CR system performingat tactical level usually takes as input conflicts predicted in a look-ahead time of20 minutes, while the resolution amendments usually are calculated to start 6-10minutes before the predicted conflict and finish at any waypoint specified in theoriginal route/RBT. However, the sooner the resolution amendment is started, thesofter is the trajectory change, and thus the closer is the new trajectory to theRBT. Therefore, in a CR that is set to perform at strategic level, the resolutionmanoeuvres can be anticipated and incorporated in the flight plan as a new route,i.e., the CR at strategic level can act as flight route planner/re-planner (note thataircraft could be or still not be airborne when the strategic de-confliction is ap-plied). The GOA approach has been implemented as a sub-module of the new CRversion (presented in this dissertation) and adapted to take full advantage of thestrategic perspective (see Appendix A.4), i.e., allowing the resolution amendmentsto start and end at the origin and end points of the trajectories, thus minimizingthe velocity vector deviation with respect the original SBT/RBT.
Considering the SESAR 2020 ATM technological framework [101, 105], itmight be possible to ignore the current ATM structure of routes [7]. Ideally, FreeRouting shall be considered instead, although in STREAM the Free Route
concept has been simplified and substituted by Direct Routes (i.e.,
86Chapter 3. Conflict Detection and Resolution Algorithms for Strategic
De-confliction
geodesic path between two coordinates) from the ToC and the ToD pointsand subject to the current semi-circular cruising level system [41] (ideally thestarting and end points of the resolution manoeuvres should coincide with thebeginning and end points of the RBT, i.e. gate to gate). Note that other ways
to obtain optimal/user-preferred resolution trajectories could be also
compatible with the STREAM concept, e.g., introducing more complex andadvanced resolution algorithms that better exploits the concept of free routing(e.g., taking advantage of favourable wind flows, minimizing en-route charges,etc.). Cooperative resolutions could be also accepted since the STREAM solutionworks at strategic/pre-tactical level thus generating a dynamic route allocationwithin the European ATM rather than reacting to near-term or medium-termconflicts.
Besides to the “local optimality” of the resolution amendments, another im-portant advantage of using the GOA analytical framework in the RTG module isthat, given a kind of resolution manoeuvre for one of the aircraft in conflict (e.g.,heading change, altitude change, speed change, and so on), it is possible to de-
termine with little computational and time effort if there is a feasible
resolution or not rather than exploring the state-space with a trial-and-errorsearch (ideally, it is expected that Airspace Users could apply a similar analyticalapproach if they were requested to calculate their preferred trajectories to feed theCD&R system). Thus, thousands of trial trajectories can be efficiently generatedwith the GOA analytical framework and sent to the CD, which in turn this mod-ule will provide feedback about the network interactions of these new generatedtrial resolution trajectories. This state-space feedback information can be givenby the CD module thanks to the data framework supported by the SDS, and thusthis information can be analysed by the causal model that is implemented in theICS module.
Note, however, that adapting the GOA algorithm for the strategic de-
confliction of trajectories at European continental level has required
dealing with some major limitations, i.e., the original GOA algorithm hasbeen designed for planar geometry and assumes straight lines (constant courselines) rather than geodesic lines (variable course curved lines). Appendix A.4gives more details about how original GOA algorithm has been modified and ad-apted to consider the curvature of the Earth and also about other aspects requiredfor strategic trajectory de-confliction such as to solve conflicts between asynchron-ous trajectories.
With regards to the technological framework of the ICS module, a newcausal model has been designed and implemented to take into consideration
the upstream/downstream effects (i.e., domino effects) of the local resolution
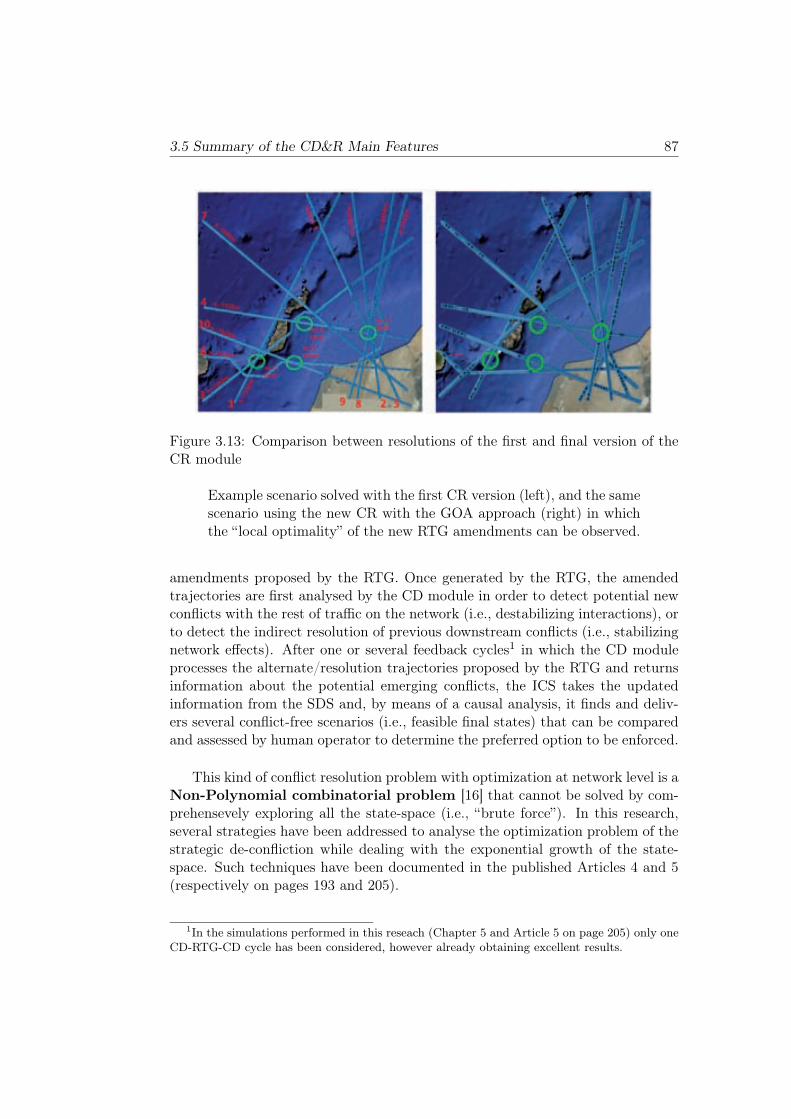
3.5 Summary of the CD&R Main Features 87
Figure 3.13: Comparison between resolutions of the first and final version of theCR module
Example scenario solved with the first CR version (left), and the samescenario using the new CR with the GOA approach (right) in whichthe “local optimality” of the new RTG amendments can be observed.
amendments proposed by the RTG. Once generated by the RTG, the amendedtrajectories are first analysed by the CD module in order to detect potential newconflicts with the rest of traffic on the network (i.e., destabilizing interactions), orto detect the indirect resolution of previous downstream conflicts (i.e., stabilizingnetwork effects). After one or several feedback cycles1 in which the CD moduleprocesses the alternate/resolution trajectories proposed by the RTG and returnsinformation about the potential emerging conflicts, the ICS takes the updatedinformation from the SDS and, by means of a causal analysis, it finds and deliv-ers several conflict-free scenarios (i.e., feasible final states) that can be comparedand assessed by human operator to determine the preferred option to be enforced.
This kind of conflict resolution problem with optimization at network level is aNon-Polynomial combinatorial problem [16] that cannot be solved by com-prehensevely exploring all the state-space (i.e., “brute force”). In this research,several strategies have been addressed to analyse the optimization problem of thestrategic de-confliction while dealing with the exponential growth of the state-space. Such techniques have been documented in the published Articles 4 and 5(respectively on pages 193 and 205).
1In the simulations performed in this reseach (Chapter 5 and Article 5 on page 205) only one
CD-RTG-CD cycle has been considered, however already obtaining excellent results.
88Chapter 3. Conflict Detection and Resolution Algorithms for Strategic
De-confliction
These techniques have permitted reducing the size of the problem to a treat-able one, relying on: first, desiging a causal model to properly represent theunderlying emergent dynamics of the system, second, finding strategies for redu-cing the problem to a set of multiple unconnected sub-problems known as clusters,and finally, reducing the exploration to the Pareto frontier of a multicriteria
optimization function.
The causal model can provide optimal or near-optimal solutions forclusters with a relatively small number of trajectories (clusters of the order ofa few dozens or more can still result intractable in practice). At the end of theICS process, several combinations of conflict-free solutions are delivered. With thecomputation of different metrics to measure efficiency, safety, robustness, equityand fairness, among other criteria, it would be possible to determine which of thefeasible conflict-free solutions is the most preferred for all the airspace stakehold-ers.
In order to not deliver an unpractical amount of feasible solutions for evalu-ation purposes, a minimum gradient search can be introduced in the causalmodel. Thus, the ICS can be restricted to deliver a maximum amount of feasiblesolutions, e.g. 100 feasible solutions, thus delivering the first 100 feasible solutionsthat also would be the 100 conflict-free solutions with the minimum cost (accord-ing to a certain metric). The metric used for the minimum gradient search mightbe different than the cumulated cost used for simplification in this research.
Chapter 4
Guidance and Chronology of thePublished Articles
Five articles have been included in this dissertation that have been anonymouslypeer-reviewed by experts in the ATM field before being accepted for publication injournals and/or congresses of recognized quality (see Chapter 7 and the SESARYoung Scientist Award 2012 certificate in Appendix B in which the quality ofthese scientific contributions to the ATM is recognized). These articles have beensorted according to the chronological order of the findings presented, which inturn is congruent with the line of argument of this dissertation:
Article 1, “A Medium Term Conflict Detection and Resolution system for Ter-minal Manoeuvring Area based on Spatial Data Structures and 4D Traject-ories” (on page 131), has been published in the journal of Elsevier Trans-portation Research part C. The content of this paper is presented as theseed of the technological framework that has been developed for the Stra-tegic De-confliction system presented in this dissertation. In the paper itis presented a MTCD system that uses time-based separations to dynamic-ally synchronize the traffic that enters into a TMA and start the approachand landing phases. One of the main contributions of this paper is the in-troduction of Spatial Data Structures as a way to efficiently manage andstore spatial information. The SDS allows having a complete 4D descriptionof the TMA sector, thus taking into account the entire planned/expectedtrajectories of the arriving flights. So, decisions can be efficiently made inreal-time with a (potential) coordination among different Decision SupportTools (e.g., AMAN/DMAN).
Article 2, “Relational Time-Space Data Structure To Enable Strategic De-Conflictionwith a Global Scope in Presence of Large Number of 4D Trajectories” (on
89
90 Chapter 4. Guidance and Chronology of the Published Articles
page 155), has been published in the Journal of Aerospace Operations. Itpresents two technological innovations applied to the SDS concept presen-ted in previous paper in order to enable and set the usage for the strategicde-confliction of thousands of trajectories at the European airspace. One ofthe main shortcomings of the SDS presented in Article 1 was that it neededa lot of computer main memory, which made difficult the usage of the sameSDS concept for wider airspace sectors and larger number of trajectories. Inthis paper the Relational SDS (RSDS) concept is presented, which modifiesthe internal logical architecture of the SDS (i.e., how the SDS allocates thebytes of memory to store the ATM information), and thus achieves reduc-tions of more than 98% with respect the memory needs to store the sameATM information in the original SDS. A second concept, the Time-SpatialData Structure (TSDS), has added the time in the structure of the SDS,which has represented an important qualitative shift of the concept and hasnotably improved the efficiency of the SDS during the processing of thou-sands of trajectories for strategic de-confliction purposes. Note that theproblem presented in this paper (i.e., Strategic De-confliction) is differentto the problems tackled in Article 1 (i.e., tactical time-based separations),thus the SDS configuration (i.e., which ATM information is stored and how)and methods used during conflict detection process must be also different.
Article 3, “Computational Efficient Conflict Detection and Resolution throughSpatial Data Structures” (on page 183) has been published in the Interna-tional Conference on Research in Air Transportation (ICRAT). It highlightsthe importance of the SDS to keep stored a (pre-configured) ATM micro-model framework in which the complete 4D (or nD) representation of theATM state (i.e., current state and its expected evolution over the time) canbe efficiently stored and managed. Several applications of interest that usethe available 4D information of that framework are presented, including thecomputation of temporal looseness among trajectories, the anticipation ofemergent dynamics/domino effects, and the identification of network hot-spots. An empirical demonstration has been also included in order to showhow the information available within the SDS can be used by a conflict res-olution module (based on a causal model) in order to find global optimalsolutions. Note that the scenario presented for the simulations is a con-gested tactical scenario (30-minute flight segments freely crossing an ATCsector), which was used as an intermediate step to the final European-levelstrategic de-confliction tool.
Article 4, “Causal Decision Support Tools for Strategic Trajectory De-conflictionto Enable Seamless Aircraft Conflict Management (STREAM)” (on page193), has been published in the SESAR Innovation Days (SID) conferences.It presents the advances achieved in the use of the ATM 4D information
91
available through the SDS by integrating an improved version of the con-flict resolution module based on causal modelling to deal with the emergentdynamics of the air traffic system. This paper gives details of the conflictresolution algorithm specified in Coloured Petri Nets and presents some ofthe preliminary results found at that moment during STREAM project exe-cution. In addition, an important strategy to deal with the highly interact-ive European network with more than 4000 trajectories crossing Europeanairspace at certain peak hours of traffic is also presented, the Clusteringcausal model, which allows reducing the global problem to a set of unconnec-ted sub-problems, thus considerably reducing the combinatorial state-spacesearch of the problem and the time required to solve it.
Article 5, “Strategic de-confliction in the presence of a large number of 4D tra-jectories using a causal modeling approach” (on page 205), is at the momentof writting these lines in a “conditionally accepted” state in the journalof Elsevier Transportation Research part C. It gives detailed informationabout the final architecture and logical functioning of the CD&R used inSTREAM. It also describes in detail the causal model applied in the conflictresolution module, which works in a and cyclical way with the SDS. Finalresults of the STREAM project (complementary to the results presentedin Chapter 5) after the strategic de-confliction of a nominal scenario withmore than 4000 trajectories flying within the European airspace can be alsofound.

92 Chapter 4. Guidance and Chronology of the Published Articles
Chapter 5
Scenario Design, Simulations andDiscussion of Results
This chapter presents the results of the performance assessment of the Stra-tegic De-confliction algorithms that has been developed in this research for theSTREAM project. The initial assessment is based on the nominal synthesizedtrajectories of realistic European traffic scenarios, thus assuming no relevant TPerrors and no Expected Time of Departure (ETD) uncertainty (i.e., assumedperfect pre-departure predictions), neither other sources of uncertainty, for thelook-ahead time of the scenario. Posterior assessment introduces TP errors andETD delays in order to analyse the robustness of the algorithms presented.
5.1 Strategic De-confliction of European Traffic Scen-
arios
As presented in the Article 5, (on page 205) several simulations were executed ap-plying the real air traffic demand data of a yearly peak traffic day (July 1st 2011)provided by EUROCONTROL and simulated with a precise Trajectory Predictordeveloped by Boeing Research & Technology Europe (BR&TE) to obtain the Dir-ect Routes corresponding to such set of trajectories.
Taking as input the original airports demand of each historical flight plan,a realistic trajectory was synthesized for each user-preferred 4D trajectory (as-sumed Direct Routes). These trajectories represent the hypothetical “truthful”trajectories that would be flown if the aircraft were left to fly according to theirpreferences and assuming no ATM intervention during the execution phase. Theresulting trajectories were used as the reference baseline for the final assessmentof the CD and CR algorithms presented in this dissertation. The trajectories were
93
94 Chapter 5. Scenario Design, Simulations and Discussion of Results
synthesized using BR&TE’s high-fidelity Trajectory Prediction system. An over-view of this infrastructure can be found in Deliverable 4.2 generated as part of thedocumentation of STREAM project [48]. The synthesized trajectories have beencalculated emulating the trajectory planning process of a Flight ManagementSystem (FMS) and they include detailed aircraft state information (Lat/Longposition, velocities, weight, etc.) at 1-second intervals. These trajectories havebeen synthesized from departure to destination, including the climb and descentphases. However, only the cruise phase has been considered for the application ofthe de-confliction algorithms, i.e. from Top Of Climb to Top Of Descent.
The resulting en-route trajectories were cropped to fit within a spatial regioncovering most of the European airspace as defined with the latitudes in the in-terval [30, 70], the longitudes in the interval [-20, 30] and the flight levels fromFL130 to FL430. A time-window filter corresponding to two hours of maximumairspace demand during the day (i.e., from 16.00 to 18.00) was also applied to thecomputed trajectories. The resulting scenario included 4010 trajectories with anaverage length of 32.5 minutes.
Results presented in Article 5 are based on loxodromic Direct Routes (i.e.,constant course path between two fixes). In this Section some additional resultsobtained from the final scenarios used at the last stages of the STREAM projectare also presented. These scenarios share similar characteristics (i.e., 4010 traject-ories over the European airspace) but the Trajectory Predictor of the FMS wasconfigured to fly geodesic Direct Routes (i.e., shortest path with variable coursebetween two fixes) instead of the loxodromic Direct Routes. Surprisingly thenumber of detected conflicts is considerably different between the two scenarios,being notably lower in the case of geodesic trajectories.
In addition, two different parameterization versions of the CR algorithm havebeen applied during the simulations, whose only difference between them is theminimum inter-aircraft separation (composed by the nominal 5 NM separationplus a buffer) applied by the CD&R system to assume that a predicted conflictwill be actually resolved:
• Separation of 7 NM (referred to as the 7NM CR version), thus applying a2NM buffer to the nominal 5NM separation.
• Separation of 10 NM (referred to as the 10NM CR version), thus applyinga 5NM buffer buffer to the nominal 5NM separation.
The selection of these two buffers (i.e., 2 NM and 5 NM) is fairly arbitrary atthis stage of development (40% and 100% of nominal safety distance) and theirmain purpose in this document is to illustrate a sensitivity analysis conducted
5.2 Description of the CD Process 95
by using different algorithm parameterizations. The ATM insight generated maycontribute to the designing of more efficient and robust traffic scenarios.
The result of applying the CD&R algorithms has been a single set of con-flicts detected and two different sets of trajectory amendments to solve the de-tected/predicted conflicts (i.e., one for each CR parameterization version). Thetrajectory amendments have mainly consisted in changes applied to the originalplanned path route although in a certain few cases changes in the planned cruiseflight level have been also applied. For each of the versions of the algorithm, theCR has assigned trajectory amendments to different sets of flights in the scenario.The two new sets of 4010 de-conflicted trajectories generated from the 7NM and10NM CR versions have been re-synthesized again by the Trajectory Predictorand processed again by the CD module in order to verify the effectiveness of theStrategic De-confliction algorithms.
It must be pointed out that the CD&R algorithms presented in this disserta-tion and the Trajectory Predictor developed by BR&TE have been designed anddeveloped independent of each other. Thus, as it often occurs with independentand heterogeneous systems, they assume different models and types of data thatcan generate imprecisions when sharing information among them. Specifically, theCD&R algorithms that have been introduced in this dissertation use a sphericalEarth model (i.e., the standard FAI sphere) whereas the TP tool uses the ellips-oidal Earth model WGS84. These discrepancies cause as a consequence that thecovered distances calculated by the CD&R to solve the conflicts and the covereddistances “flown” by the TP are approximate but not equal, thus causing somede-synchronization effects that sometimes can lead to the ineffective resolution ofsome conflicts (see Sub-Section 5.5.2). Trajectories were adjusted during the dataprocessing (varying the cruise speeds as necessary to synchronize the trajectoriesduration) to reduce the errors to the maximum extent possible but the modeluncertainties were still present.
Finally, a diverse set of experiments have been conducted to explore the ro-bustness of the CD&R algorithms in the presence of some sources of uncertainties(i.e., trajectory prediction errors and ETD delays) as well as to explore some basicstrategies that can contribute to the achievement of more stable/robust networkplans.
5.2 Description of the CD Process
Several simulations have been executed with the (geodesic) trajectories obtainedfrom the application of Direct Routes to the nominal baseline scenario described
96 Chapter 5. Scenario Design, Simulations and Discussion of Results
in previous section. Once the 4D trajectories (sampled every 1 second) have beenintroduced as inputs for the CD&R system, they have been processed by the CDmodule and stored in the SDS. A total number of 211 conflicts have been detectedamong the original trajectories.
Note that the number of conflicts obtained with the application of ortho-dromic trajectories (i.e., 211) is considerably smaller than the number of conflictsobtained with the loxodromic trajectories (i.e., 325). No explanation has beenfound to explain such important reduction of conflicts found except that it couldhave happened by chance. However, this fact seems to be associated to the in-trinsic characteristics of the European traffic patterns under consideration, thusit might contribute to justify some ATM policies such as to boost the implement-ation of modern flight navigation systems to fly geodesic routes.
In the same direction, the 4010 trajectories of the nominal scenario have beenalso synthesized following the original (structured) routes as provided in the scen-ario data from EUROCONTROL. The number of conflicts found has been 386while the average track distance flown by each flight has been around 7% longerthan with the application of geodesic Direct Routes. Thus, these findings alsojustify the application of geodesic Direct Routes at European level.
Another important piece of information to remark about the simulated scen-arios is the distribution of the detected conflicts into clusters of different sizessince such distribution determines the complexity of the CR process. Figure 5.1shows the clustering statistics for the nominal scenario. It can be observed that itfollows a negative exponential shape in which most of the clusters involve only 2aircraft (i.e., easiest case to find locally-optimal solutions) and that more than the98% of the clusters are composed by less than 7 aircraft. The causal analysis inthe CR process (i.e., ICS module) is able to find solutions very efficiently (i.e., infew milliseconds each) in the horizontal plane (i.e., HAC manoeuvres) when theclusters are made of 7 or less aircraft. As for clusters composed of 8 or more air-craft, the ICS is able to: identify those trajectories that are more tightly coupledwithin the clusters and then to propose flight level steps for those trajectories tosolve the “tightly coupling” conflicts in a manner that “big” clusters are brokendown into a set of clusters of a maximum of 7 aircraft.
Note that results obtained after several simulation experiments with differentscenarios and assumptions indicate that the statistical frequency distribution ofclusters shown in Fig. 5.1 is similar in all scenarios with comparable air trafficdensities. This observation suggests that the cluster distributions presented inthis research might be extrapolated to similar European air traffic scenarios ingeneral.
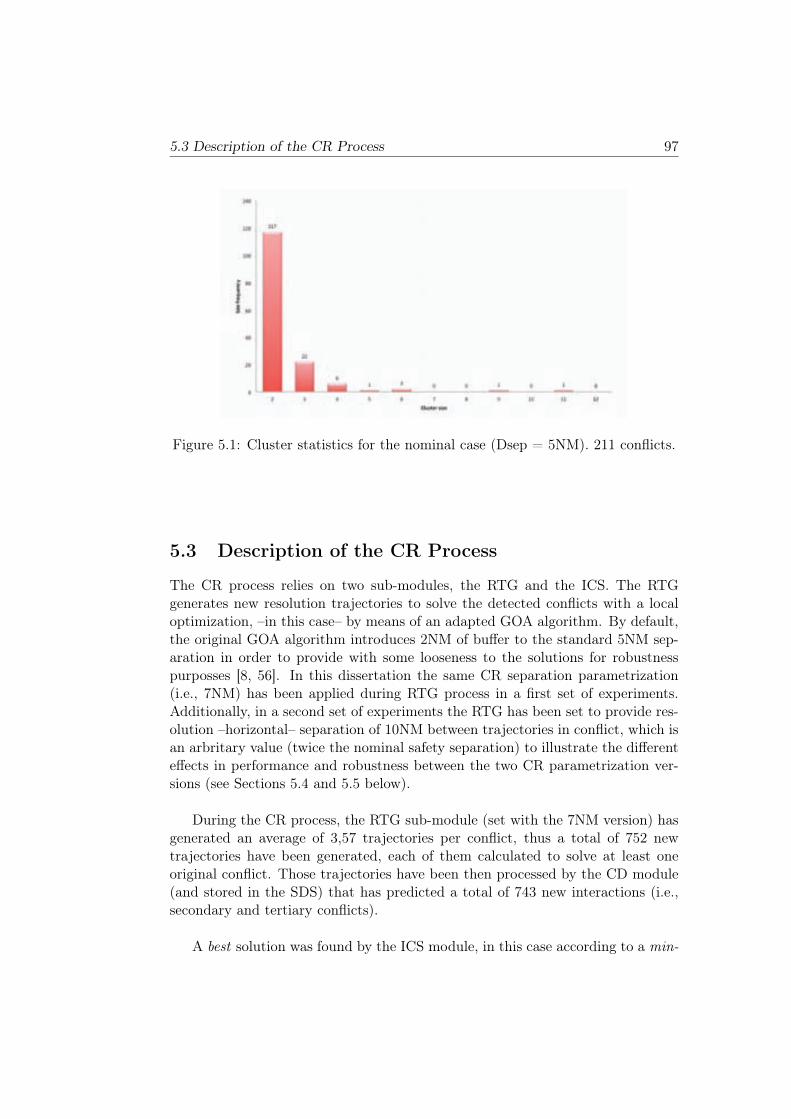
5.3 Description of the CR Process 97
Figure 5.1: Cluster statistics for the nominal case (Dsep = 5NM). 211 conflicts.
5.3 Description of the CR Process
The CR process relies on two sub-modules, the RTG and the ICS. The RTGgenerates new resolution trajectories to solve the detected conflicts with a localoptimization, –in this case– by means of an adapted GOA algorithm. By default,the original GOA algorithm introduces 2NM of buffer to the standard 5NM sep-aration in order to provide with some looseness to the solutions for robustnesspurposses [8, 56]. In this dissertation the same CR separation parametrization(i.e., 7NM) has been applied during RTG process in a first set of experiments.Additionally, in a second set of experiments the RTG has been set to provide res-olution –horizontal– separation of 10NM between trajectories in conflict, which isan arbritary value (twice the nominal safety separation) to illustrate the differenteffects in performance and robustness between the two CR parametrization ver-sions (see Sections 5.4 and 5.5 below).
During the CR process, the RTG sub-module (set with the 7NM version) hasgenerated an average of 3,57 trajectories per conflict, thus a total of 752 newtrajectories have been generated, each of them calculated to solve at least oneoriginal conflict. Those trajectories have been then processed by the CD module(and stored in the SDS) that has predicted a total of 743 new interactions (i.e.,secondary and tertiary conflicts).
A best solution was found by the ICS module, in this case according to a min-
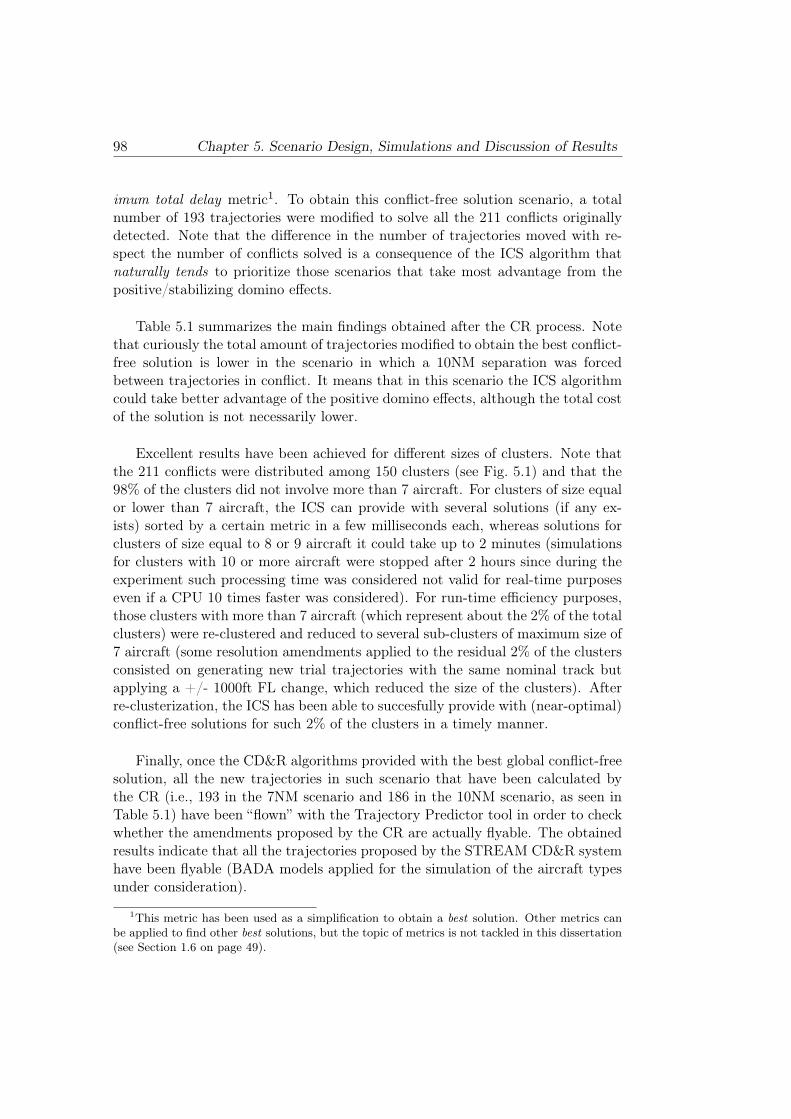
98 Chapter 5. Scenario Design, Simulations and Discussion of Results
imum total delay metric1. To obtain this conflict-free solution scenario, a totalnumber of 193 trajectories were modified to solve all the 211 conflicts originallydetected. Note that the difference in the number of trajectories moved with re-spect the number of conflicts solved is a consequence of the ICS algorithm thatnaturally tends to prioritize those scenarios that take most advantage from thepositive/stabilizing domino effects.
Table 5.1 summarizes the main findings obtained after the CR process. Notethat curiously the total amount of trajectories modified to obtain the best conflict-free solution is lower in the scenario in which a 10NM separation was forcedbetween trajectories in conflict. It means that in this scenario the ICS algorithmcould take better advantage of the positive domino effects, although the total costof the solution is not necessarily lower.
Excellent results have been achieved for different sizes of clusters. Note thatthe 211 conflicts were distributed among 150 clusters (see Fig. 5.1) and that the98% of the clusters did not involve more than 7 aircraft. For clusters of size equalor lower than 7 aircraft, the ICS can provide with several solutions (if any ex-ists) sorted by a certain metric in a few milliseconds each, whereas solutions forclusters of size equal to 8 or 9 aircraft it could take up to 2 minutes (simulationsfor clusters with 10 or more aircraft were stopped after 2 hours since during theexperiment such processing time was considered not valid for real-time purposeseven if a CPU 10 times faster was considered). For run-time efficiency purposes,those clusters with more than 7 aircraft (which represent about the 2% of the totalclusters) were re-clustered and reduced to several sub-clusters of maximum size of7 aircraft (some resolution amendments applied to the residual 2% of the clustersconsisted on generating new trial trajectories with the same nominal track butapplying a +/- 1000ft FL change, which reduced the size of the clusters). Afterre-clusterization, the ICS has been able to succesfully provide with (near-optimal)conflict-free solutions for such 2% of the clusters in a timely manner.
Finally, once the CD&R algorithms provided with the best global conflict-freesolution, all the new trajectories in such scenario that have been calculated bythe CR (i.e., 193 in the 7NM scenario and 186 in the 10NM scenario, as seen inTable 5.1) have been “flown” with the Trajectory Predictor tool in order to checkwhether the amendments proposed by the CR are actually flyable. The obtainedresults indicate that all the trajectories proposed by the STREAM CD&R systemhave been flyable (BADA models applied for the simulation of the aircraft typesunder consideration).
1This metric has been used as a simplification to obtain a best solution. Other metrics can
be applied to find other best solutions, but the topic of metrics is not tackled in this dissertation
(see Section 1.6 on page 49).
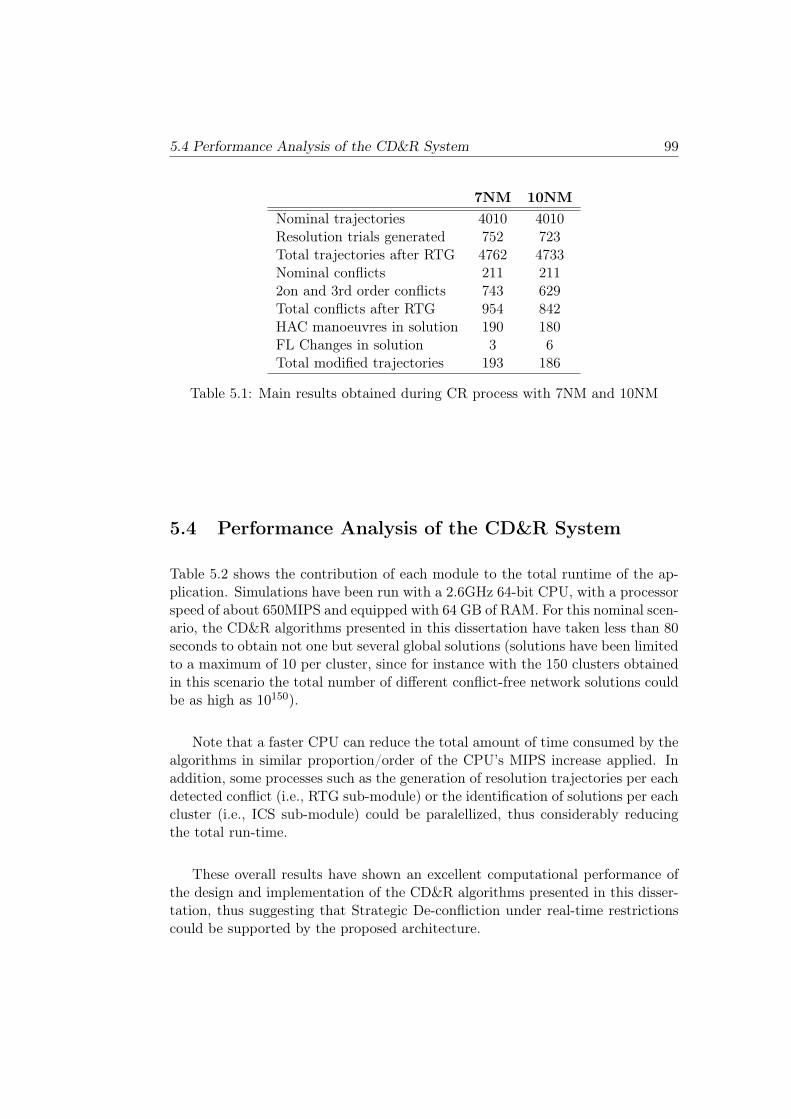
5.4 Performance Analysis of the CD&R System 99
7NM 10NM
Nominal trajectories 4010 4010Resolution trials generated 752 723Total trajectories after RTG 4762 4733Nominal conflicts 211 2112on and 3rd order conflicts 743 629Total conflicts after RTG 954 842HAC manoeuvres in solution 190 180FL Changes in solution 3 6Total modified trajectories 193 186
Table 5.1: Main results obtained during CR process with 7NM and 10NM
5.4 Performance Analysis of the CD&R System
Table 5.2 shows the contribution of each module to the total runtime of the ap-plication. Simulations have been run with a 2.6GHz 64-bit CPU, with a processorspeed of about 650MIPS and equipped with 64 GB of RAM. For this nominal scen-ario, the CD&R algorithms presented in this dissertation have taken less than 80seconds to obtain not one but several global solutions (solutions have been limitedto a maximum of 10 per cluster, since for instance with the 150 clusters obtainedin this scenario the total number of different conflict-free network solutions couldbe as high as 10150).
Note that a faster CPU can reduce the total amount of time consumed by thealgorithms in similar proportion/order of the CPU’s MIPS increase applied. Inaddition, some processes such as the generation of resolution trajectories per eachdetected conflict (i.e., RTG sub-module) or the identification of solutions per eachcluster (i.e., ICS sub-module) could be paralellized, thus considerably reducingthe total run-time.
These overall results have shown an excellent computational performance ofthe design and implementation of the CD&R algorithms presented in this disser-tation, thus suggesting that Strategic De-confliction under real-time restrictionscould be supported by the proposed architecture.
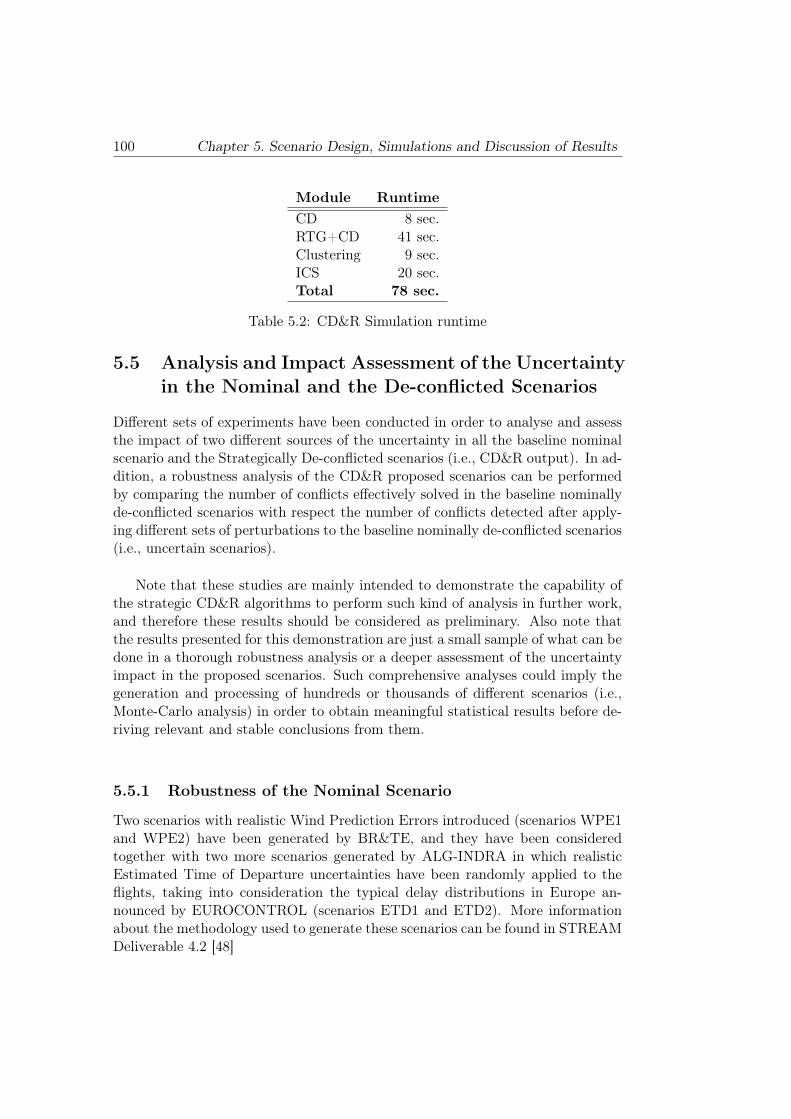
100 Chapter 5. Scenario Design, Simulations and Discussion of Results
Module Runtime
CD 8 sec.RTG+CD 41 sec.Clustering 9 sec.ICS 20 sec.Total 78 sec.
Table 5.2: CD&R Simulation runtime
5.5 Analysis and Impact Assessment of the Uncertainty
in the Nominal and the De-conflicted Scenarios
Different sets of experiments have been conducted in order to analyse and assessthe impact of two different sources of the uncertainty in all the baseline nominalscenario and the Strategically De-conflicted scenarios (i.e., CD&R output). In ad-dition, a robustness analysis of the CD&R proposed scenarios can be performedby comparing the number of conflicts effectively solved in the baseline nominallyde-conflicted scenarios with respect the number of conflicts detected after apply-ing different sets of perturbations to the baseline nominally de-conflicted scenarios(i.e., uncertain scenarios).
Note that these studies are mainly intended to demonstrate the capability ofthe strategic CD&R algorithms to perform such kind of analysis in further work,and therefore these results should be considered as preliminary. Also note thatthe results presented for this demonstration are just a small sample of what can bedone in a thorough robustness analysis or a deeper assessment of the uncertaintyimpact in the proposed scenarios. Such comprehensive analyses could imply thegeneration and processing of hundreds or thousands of different scenarios (i.e.,Monte-Carlo analysis) in order to obtain meaningful statistical results before de-riving relevant and stable conclusions from them.
5.5.1 Robustness of the Nominal Scenario
Two scenarios with realistic Wind Prediction Errors introduced (scenarios WPE1and WPE2) have been generated by BR&TE, and they have been consideredtogether with two more scenarios generated by ALG-INDRA in which realisticEstimated Time of Departure uncertainties have been randomly applied to theflights, taking into consideration the typical delay distributions in Europe an-nounced by EUROCONTROL (scenarios ETD1 and ETD2). More informationabout the methodology used to generate these scenarios can be found in STREAMDeliverable 4.2 [48]
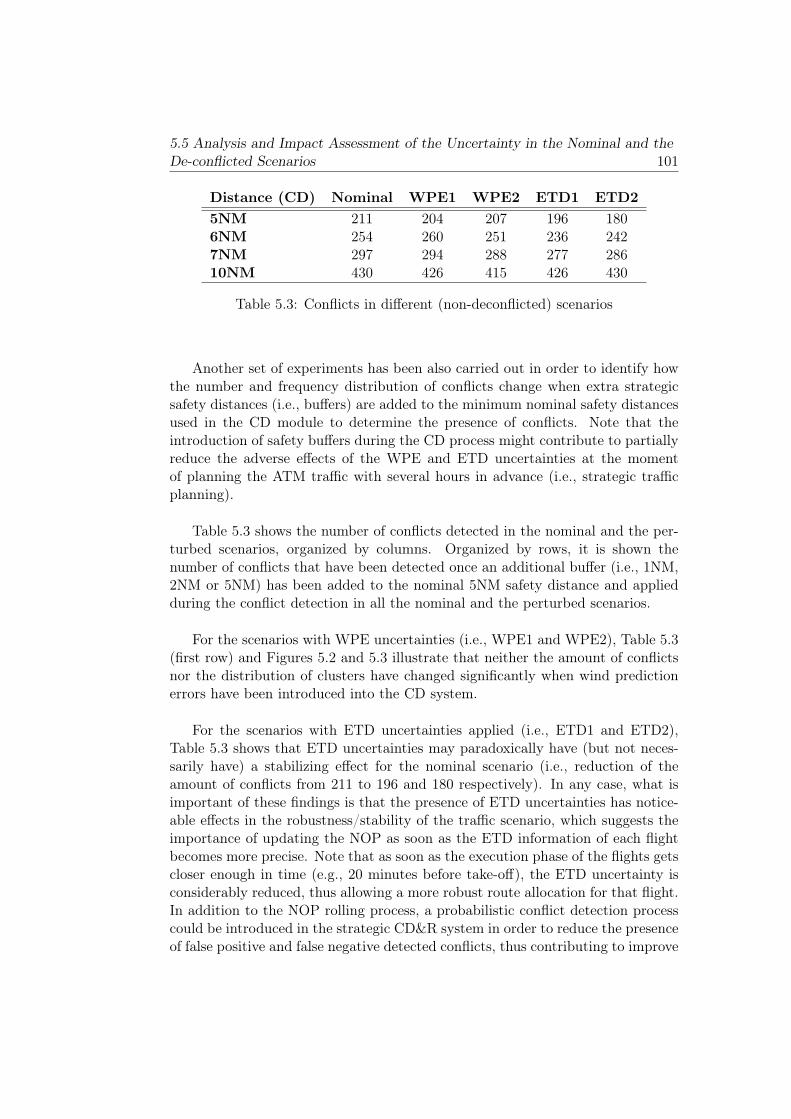
5.5 Analysis and Impact Assessment of the Uncertainty in the Nominal and theDe-conflicted Scenarios 101
Distance (CD) Nominal WPE1 WPE2 ETD1 ETD2
5NM 211 204 207 196 1806NM 254 260 251 236 2427NM 297 294 288 277 28610NM 430 426 415 426 430
Table 5.3: Conflicts in different (non-deconflicted) scenarios
Another set of experiments has been also carried out in order to identify howthe number and frequency distribution of conflicts change when extra strategicsafety distances (i.e., buffers) are added to the minimum nominal safety distancesused in the CD module to determine the presence of conflicts. Note that theintroduction of safety buffers during the CD process might contribute to partiallyreduce the adverse effects of the WPE and ETD uncertainties at the momentof planning the ATM traffic with several hours in advance (i.e., strategic trafficplanning).
Table 5.3 shows the number of conflicts detected in the nominal and the per-turbed scenarios, organized by columns. Organized by rows, it is shown thenumber of conflicts that have been detected once an additional buffer (i.e., 1NM,2NM or 5NM) has been added to the nominal 5NM safety distance and appliedduring the conflict detection in all the nominal and the perturbed scenarios.
For the scenarios with WPE uncertainties (i.e., WPE1 and WPE2), Table 5.3(first row) and Figures 5.2 and 5.3 illustrate that neither the amount of conflictsnor the distribution of clusters have changed significantly when wind predictionerrors have been introduced into the CD system.
For the scenarios with ETD uncertainties applied (i.e., ETD1 and ETD2),Table 5.3 shows that ETD uncertainties may paradoxically have (but not neces-sarily have) a stabilizing effect for the nominal scenario (i.e., reduction of theamount of conflicts from 211 to 196 and 180 respectively). In any case, what isimportant of these findings is that the presence of ETD uncertainties has notice-able effects in the robustness/stability of the traffic scenario, which suggests theimportance of updating the NOP as soon as the ETD information of each flightbecomes more precise. Note that as soon as the execution phase of the flights getscloser enough in time (e.g., 20 minutes before take-off), the ETD uncertainty isconsiderably reduced, thus allowing a more robust route allocation for that flight.In addition to the NOP rolling process, a probabilistic conflict detection processcould be introduced in the strategic CD&R system in order to reduce the presenceof false positive and false negative detected conflicts, thus contributing to improve
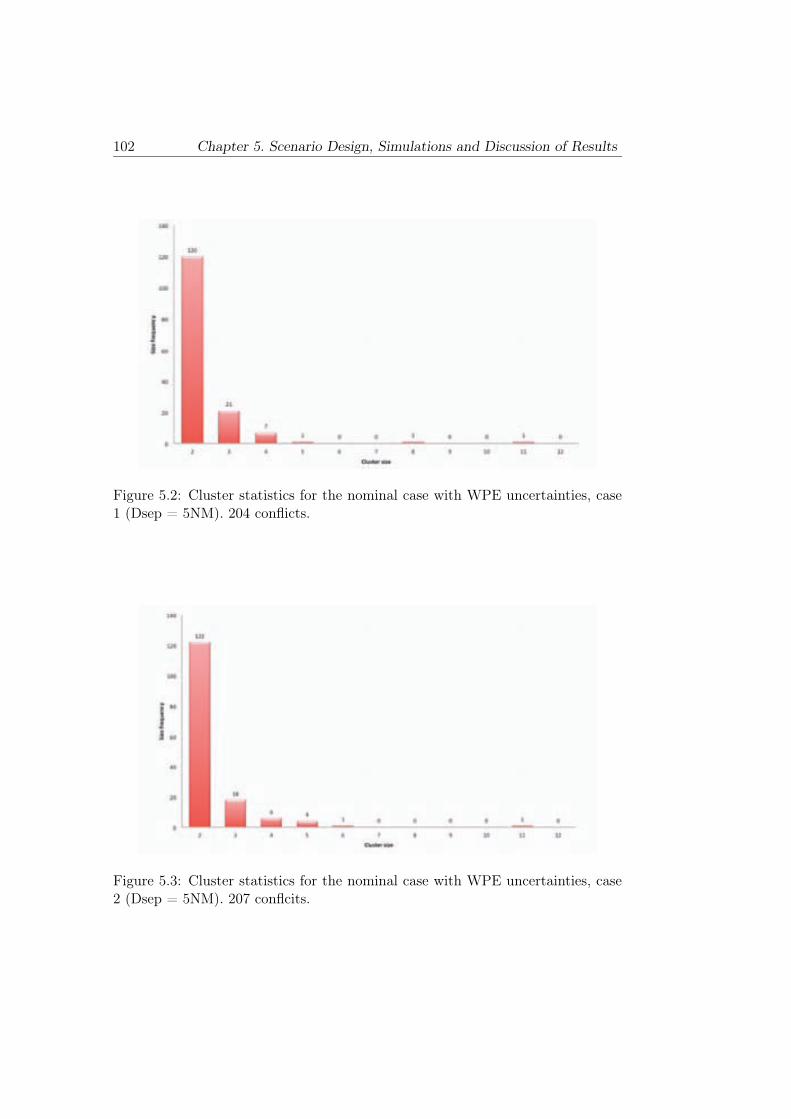
102 Chapter 5. Scenario Design, Simulations and Discussion of Results
Figure 5.2: Cluster statistics for the nominal case with WPE uncertainties, case1 (Dsep = 5NM). 204 conflicts.
Figure 5.3: Cluster statistics for the nominal case with WPE uncertainties, case2 (Dsep = 5NM). 207 conflcits.
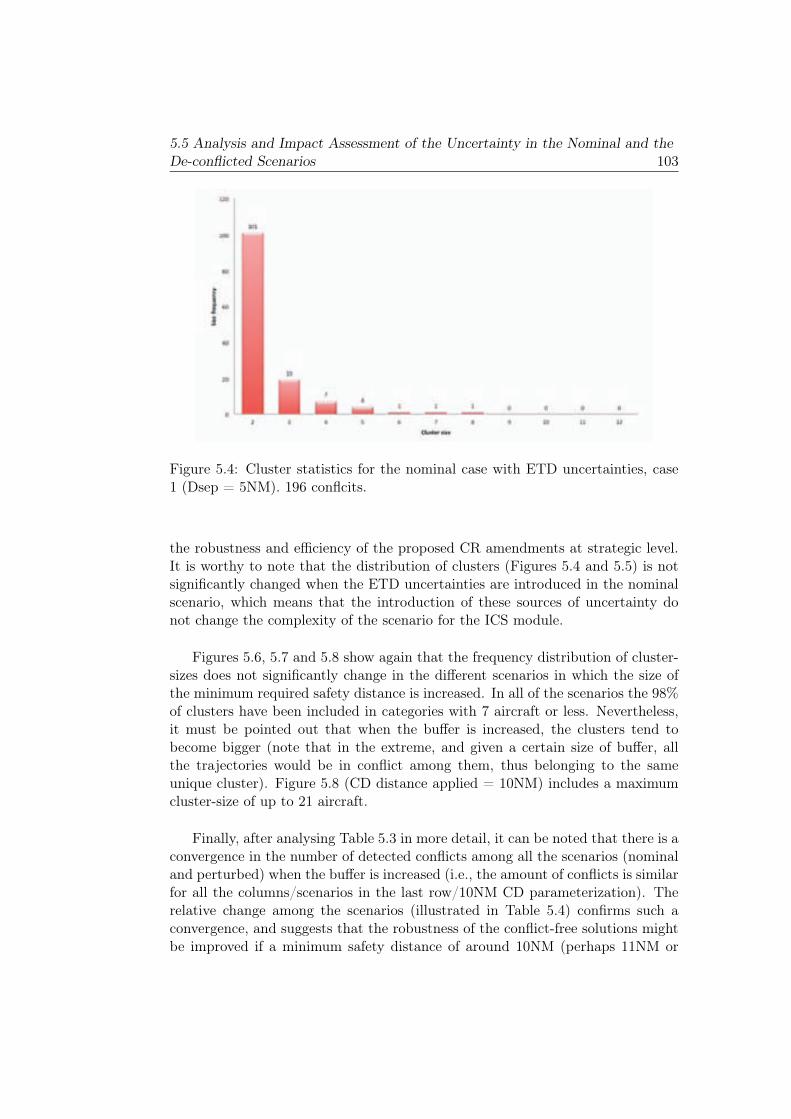
5.5 Analysis and Impact Assessment of the Uncertainty in the Nominal and theDe-conflicted Scenarios 103
Figure 5.4: Cluster statistics for the nominal case with ETD uncertainties, case1 (Dsep = 5NM). 196 conflcits.
the robustness and efficiency of the proposed CR amendments at strategic level.It is worthy to note that the distribution of clusters (Figures 5.4 and 5.5) is notsignificantly changed when the ETD uncertainties are introduced in the nominalscenario, which means that the introduction of these sources of uncertainty donot change the complexity of the scenario for the ICS module.
Figures 5.6, 5.7 and 5.8 show again that the frequency distribution of cluster-sizes does not significantly change in the different scenarios in which the size ofthe minimum required safety distance is increased. In all of the scenarios the 98%of clusters have been included in categories with 7 aircraft or less. Nevertheless,it must be pointed out that when the buffer is increased, the clusters tend tobecome bigger (note that in the extreme, and given a certain size of buffer, allthe trajectories would be in conflict among them, thus belonging to the sameunique cluster). Figure 5.8 (CD distance applied = 10NM) includes a maximumcluster-size of up to 21 aircraft.
Finally, after analysing Table 5.3 in more detail, it can be noted that there is aconvergence in the number of detected conflicts among all the scenarios (nominaland perturbed) when the buffer is increased (i.e., the amount of conflicts is similarfor all the columns/scenarios in the last row/10NM CD parameterization). Therelative change among the scenarios (illustrated in Table 5.4) confirms such aconvergence, and suggests that the robustness of the conflict-free solutions mightbe improved if a minimum safety distance of around 10NM (perhaps 11NM or
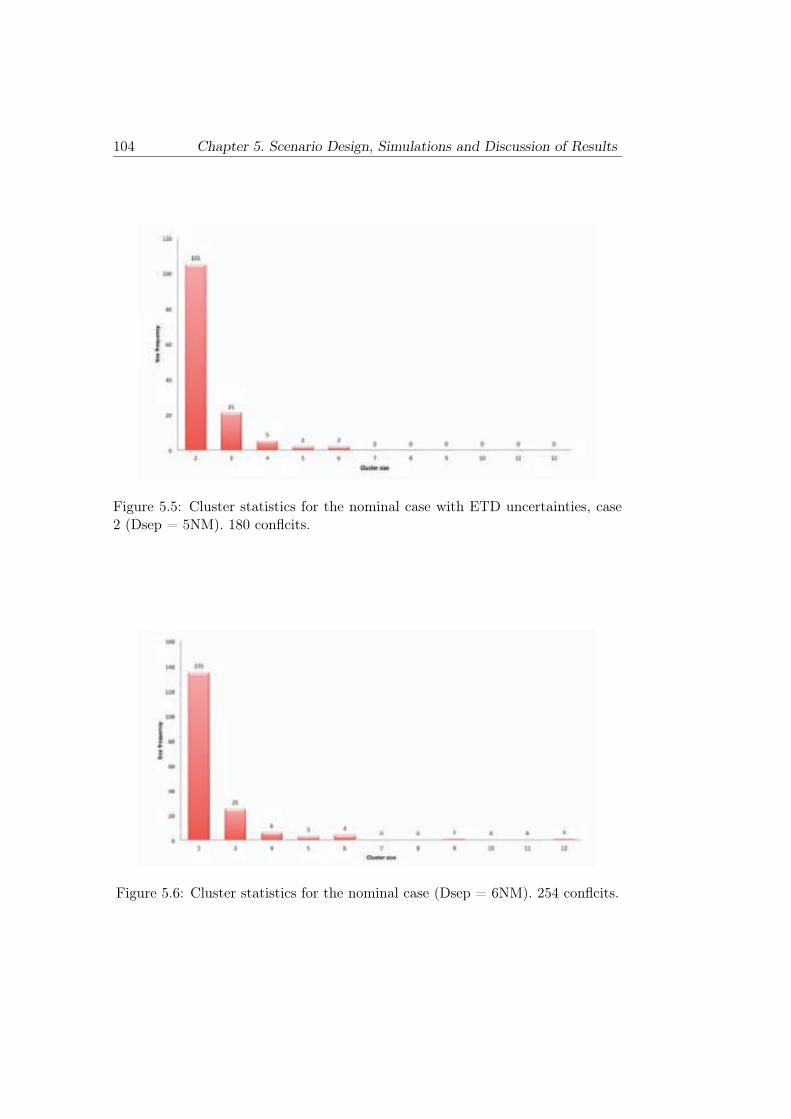
104 Chapter 5. Scenario Design, Simulations and Discussion of Results
Figure 5.5: Cluster statistics for the nominal case with ETD uncertainties, case2 (Dsep = 5NM). 180 conflcits.
Figure 5.6: Cluster statistics for the nominal case (Dsep = 6NM). 254 conflcits.
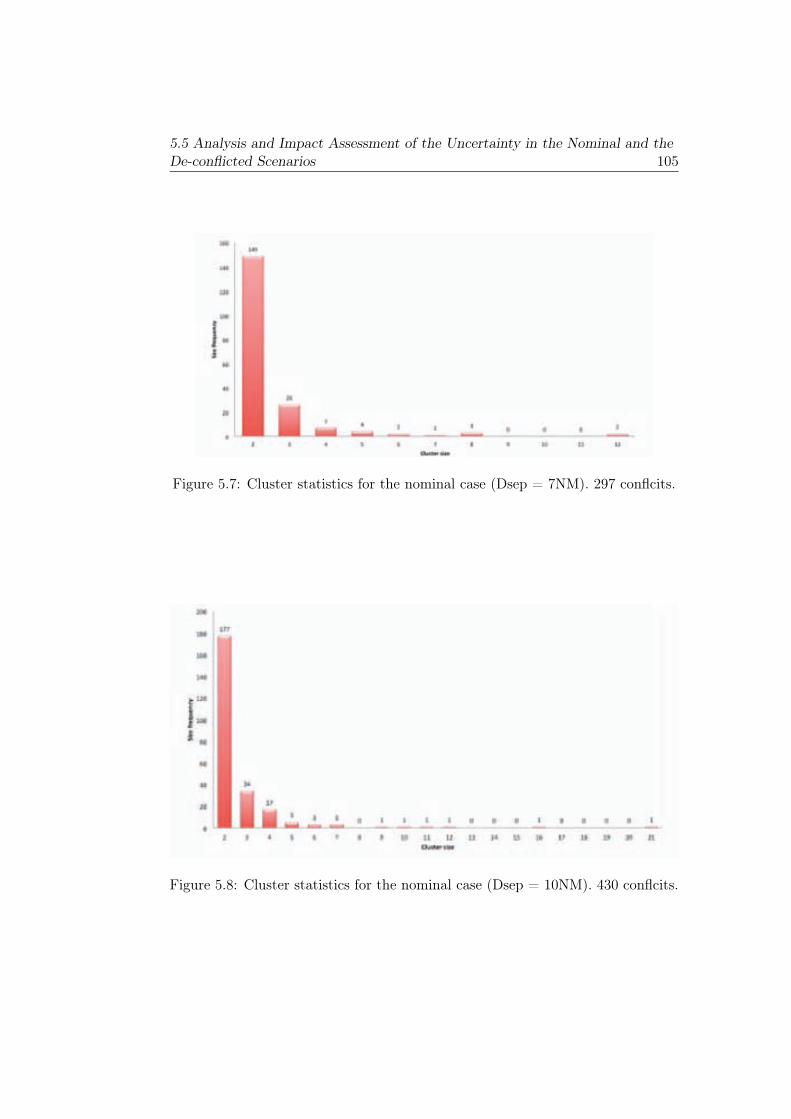
5.5 Analysis and Impact Assessment of the Uncertainty in the Nominal and theDe-conflicted Scenarios 105
Figure 5.7: Cluster statistics for the nominal case (Dsep = 7NM). 297 conflcits.
Figure 5.8: Cluster statistics for the nominal case (Dsep = 10NM). 430 conflcits.
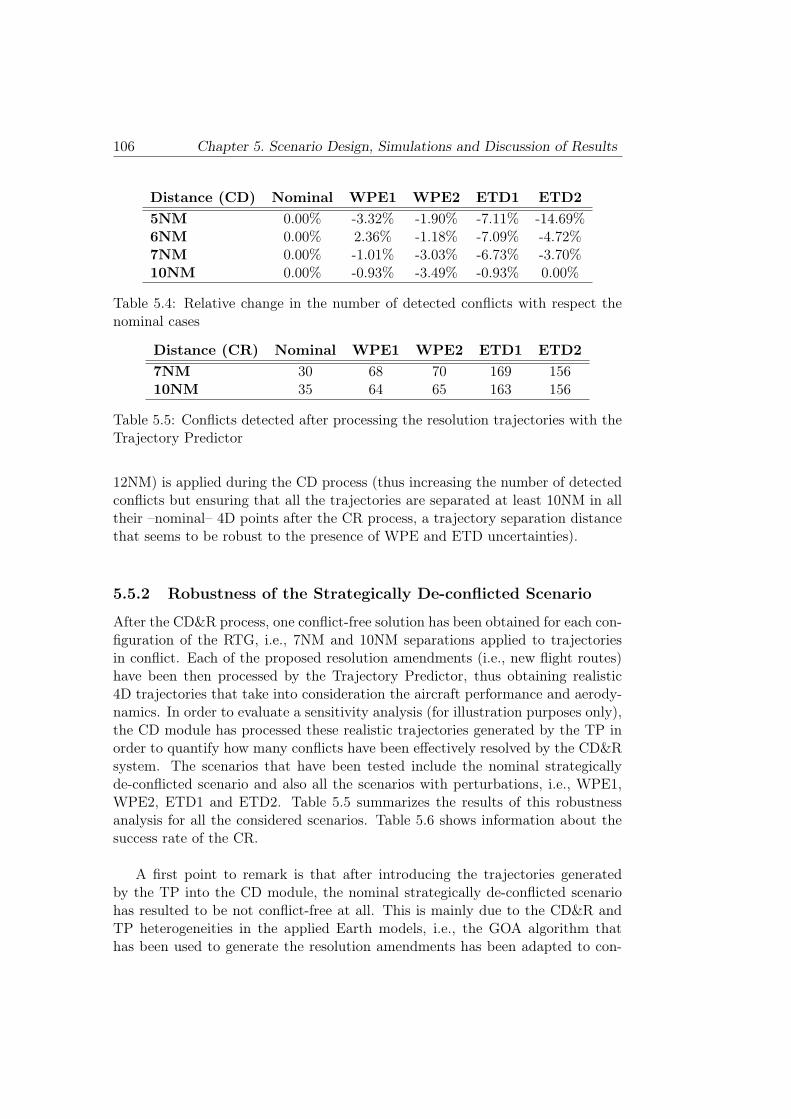
106 Chapter 5. Scenario Design, Simulations and Discussion of Results
Distance (CD) Nominal WPE1 WPE2 ETD1 ETD2
5NM 0.00% -3.32% -1.90% -7.11% -14.69%6NM 0.00% 2.36% -1.18% -7.09% -4.72%7NM 0.00% -1.01% -3.03% -6.73% -3.70%10NM 0.00% -0.93% -3.49% -0.93% 0.00%
Table 5.4: Relative change in the number of detected conflicts with respect thenominal cases
Distance (CR) Nominal WPE1 WPE2 ETD1 ETD2
7NM 30 68 70 169 15610NM 35 64 65 163 156
Table 5.5: Conflicts detected after processing the resolution trajectories with theTrajectory Predictor
12NM) is applied during the CD process (thus increasing the number of detectedconflicts but ensuring that all the trajectories are separated at least 10NM in alltheir –nominal– 4D points after the CR process, a trajectory separation distancethat seems to be robust to the presence of WPE and ETD uncertainties).
5.5.2 Robustness of the Strategically De-conflicted Scenario
After the CD&R process, one conflict-free solution has been obtained for each con-figuration of the RTG, i.e., 7NM and 10NM separations applied to trajectoriesin conflict. Each of the proposed resolution amendments (i.e., new flight routes)have been then processed by the Trajectory Predictor, thus obtaining realistic4D trajectories that take into consideration the aircraft performance and aerody-namics. In order to evaluate a sensitivity analysis (for illustration purposes only),the CD module has processed these realistic trajectories generated by the TP inorder to quantify how many conflicts have been effectively resolved by the CD&Rsystem. The scenarios that have been tested include the nominal strategicallyde-conflicted scenario and also all the scenarios with perturbations, i.e., WPE1,WPE2, ETD1 and ETD2. Table 5.5 summarizes the results of this robustnessanalysis for all the considered scenarios. Table 5.6 shows information about thesuccess rate of the CR.
A first point to remark is that after introducing the trajectories generatedby the TP into the CD module, the nominal strategically de-conflicted scenariohas resulted to be not conflict-free at all. This is mainly due to the CD&R andTP heterogeneities in the applied Earth models, i.e., the GOA algorithm thathas been used to generate the resolution amendments has been adapted to con-
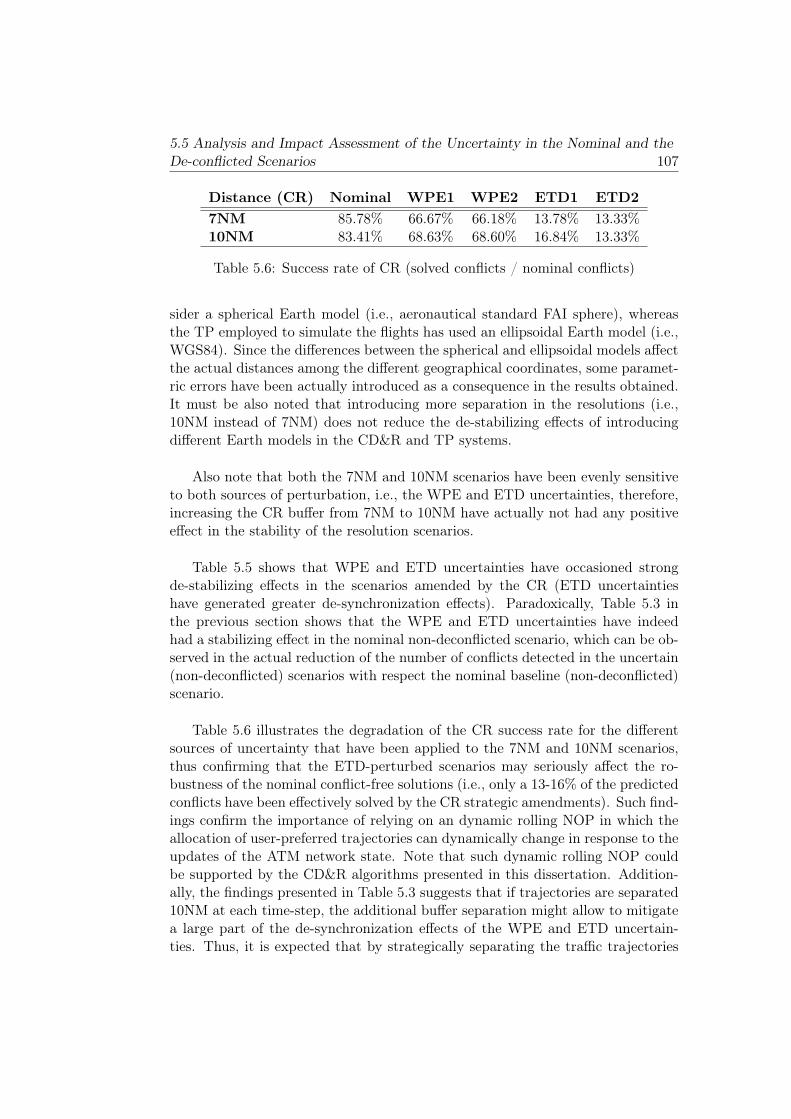
5.5 Analysis and Impact Assessment of the Uncertainty in the Nominal and theDe-conflicted Scenarios 107
Distance (CR) Nominal WPE1 WPE2 ETD1 ETD2
7NM 85.78% 66.67% 66.18% 13.78% 13.33%10NM 83.41% 68.63% 68.60% 16.84% 13.33%
Table 5.6: Success rate of CR (solved conflicts / nominal conflicts)
sider a spherical Earth model (i.e., aeronautical standard FAI sphere), whereasthe TP employed to simulate the flights has used an ellipsoidal Earth model (i.e.,WGS84). Since the differences between the spherical and ellipsoidal models affectthe actual distances among the different geographical coordinates, some paramet-ric errors have been actually introduced as a consequence in the results obtained.It must be also noted that introducing more separation in the resolutions (i.e.,10NM instead of 7NM) does not reduce the de-stabilizing effects of introducingdifferent Earth models in the CD&R and TP systems.
Also note that both the 7NM and 10NM scenarios have been evenly sensitiveto both sources of perturbation, i.e., the WPE and ETD uncertainties, therefore,increasing the CR buffer from 7NM to 10NM have actually not had any positiveeffect in the stability of the resolution scenarios.
Table 5.5 shows that WPE and ETD uncertainties have occasioned strongde-stabilizing effects in the scenarios amended by the CR (ETD uncertaintieshave generated greater de-synchronization effects). Paradoxically, Table 5.3 inthe previous section shows that the WPE and ETD uncertainties have indeedhad a stabilizing effect in the nominal non-deconflicted scenario, which can be ob-served in the actual reduction of the number of conflicts detected in the uncertain(non-deconflicted) scenarios with respect the nominal baseline (non-deconflicted)scenario.
Table 5.6 illustrates the degradation of the CR success rate for the differentsources of uncertainty that have been applied to the 7NM and 10NM scenarios,thus confirming that the ETD-perturbed scenarios may seriously affect the ro-bustness of the nominal conflict-free solutions (i.e., only a 13-16% of the predictedconflicts have been effectively solved by the CR strategic amendments). Such find-ings confirm the importance of relying on an dynamic rolling NOP in which theallocation of user-preferred trajectories can dynamically change in response to theupdates of the ATM network state. Note that such dynamic rolling NOP couldbe supported by the CD&R algorithms presented in this dissertation. Addition-ally, the findings presented in Table 5.3 suggests that if trajectories are separated10NM at each time-step, the additional buffer separation might allow to mitigatea large part of the de-synchronization effects of the WPE and ETD uncertain-ties. Thus, it is expected that by strategically separating the traffic trajectories

108 Chapter 5. Scenario Design, Simulations and Discussion of Results
in 10NM (perhaps 11-12NM) the conflict-free scenarios provided by the CD&Rsystems may be fairly robust in the presence of WPE and ETD uncertainties, i.e.,scenarios strategically de-conflicted with a high CR success rate (not confirmedin this research, since the corresponding scenarios have not been flown with theTP of BR&TE).
Chapter 6
Conclusions, Main Contributionsand Future Work
6.1 Summary of the Reseach
The foundation of the Single European Sky, and thus the adoption of the SESARATM concept, requires of new traffic management tools and procedures that canensure the proper safety and efficiency levels for all the flights, while in turn en-abling enough airspace/ATM capacity to support the future air transport demandexpected.
This doctoral dissertation (which is fundamentally linked to SESAR WP-ESTREAM project) has proposed the design and implementation of an innovativeCD&R system for strategic trajectory de-confliction to be applied priorand/or during the flight execution of a large number of 4D trajectories at
wide regions of airspace.
The strategic CD&R system has been successfully implemented (as a proto-type proof-of-concept of the STREAM Strategic De-confliction concept) and hasdemonstrated the ability of supporting the storage and management of the entire4D state space corresponding to the (simplified) European ATM system. Themain characteristics and contributions of the modules that compose
the system can be summarized as follows:
CD module:
• Spatial Data Structures have been used in the CD module as the vehicu-lar technology to create a micro-scale model framework of the ATM inwhich it is possible to store and manage the entire set of 4D trajectories that
109
110 Chapter 6. Conclusions, Main Contributions and Future Work
shall be considered during the strategic planning of realistic European ATMscenarios (i.e., thousands of coexisting trajectories in a 2-hour look-aheadtime).
• The use of a micro-scale model framework enables a centralized and com-
plete view of the state-space of the system (i.e., the current state vari-ables and its expected evolution along the time). Such a data frameworkis a key contribution since it provides with a global discrete event repres-entation of the dynamic system, necessary for a better understanding of
the complexities and emerging dynamics that cannot be understoodwithout a global (4D/nD) perspective of the ATM system.
• The concept of Relational SDS (RSDS) has permitted considerably re-ducing the needs for computer main memory in more than 98%, which inturn has habilitated the possibility to store and manage the 4D in-
formation of thousands of trajectories flying across the European
airspace.
• The concept of Time-Space Data Structure (TSDS) has allowed ex-panding the Near Neighbour Search to four dimensions (i.e., defining neigh-bourhoods as spatio-temporal regions), therefore such a pairwise spatio-temporal filter allows the comparison of thousands of trajectories (to detectpotential conflicts among them) in a few seconds. The computational
runtime results obtained are excellent for real-time applications.
• A combination of the RSDS and TSDS technologies (i.e., RTSDS)
has been used to instantiate the ATM micro-model framework used in theStrategic De-confliction system, thus benefiting of the advantages offeredby both techniques (i.e., little memory and runtime requirements).
• The RTSDS concept has been evolved to also take into consideration thecurvature of the Earth, thus utilizing the Geodesic SDS concept (shownin the Appendixes) that is necessary to model a spatial region as wide asthe European airspace.
CR module:
• The CR has been divided into two sub-modules in order to support the Stra-tegic De-confliction requirements, i.e., the Resolution Trajectory Gen-
erator module (RTG) has been used to provide local-optimal traject-
ories to individual conflicts without having into consideration the restof the traffic in the network (i.e., in an isolated way), while the Interaction
Causal Solver (ICS) has been able to explore the emergent dynamics
(i.e., domino-effect interactions) between the alternate resolution trajector-ies that are generated by the RTG (locally and isolated resolutions) with
6.1 Summary of the Reseach 111
the rest of the trajectories in the network, thus being able to find global
optimal or near-optimal network solutions (i.e., the best conflict-freeroute structures according to a set of agreed-upon metrics). The model isflexible to different objective functions commonly agreed to by the ATMstakeholders.
• A Geometric Optimization Approach (GOA) algorithm adapted
to the Strategic De-confliction requirements has been introduced
into the RTG module as an approximation of the Airspace Users’
preferences, thus substituting the direct participation of the AUs by in-direct methods, but without affecting the general validity of the CD&R sys-tem concept presented in this research (ideally, the Airspace Users shouldparticipate through direct or indirect methods in the calculation of theselocal-optimal trajectories, in a way such that the “optimality” of each flightis defined by the AUs according to their own business optimization logics).
• The analytical conflict resolution formulae of the GOA algorithm have
been adapted to take into consideration the curvature of the Earth
and to approximate geodesic trajectory resolution amendments, since theymight be executed across a wide airspace of continental size. Some extraadaptations have been also necessary for adapting the GOA al-
gorithms to asynchronous traffic, a traffic characteristic that can befound in strategic de-confliction scenarios (e.g., RBTs of airborne flightscan be in conflict with SBTs of traffic already on ground).
• The excellent runtime performance of the RTG has allowed an efficient
integration between the CD and RTG modules, which is neces-
sary to complete the ATM 4D picture stored in the SDS with theinformation about the alternate trajectories that could potentially be as-signed to the different flights of the scenario. Although the CD-RTG-CDcyclical process has been set in this research to a single iteration duringthe simulations conducted (a parameterization that has indeed resulted tobe powerful enough to find fairly good near-optimal conflict-free solutions),the implemented CD&R system has left enough room to support the
parameterization of more CD-RTG-CD cycles, which is expected toprovide with more flexibility to find solutions to tertiary conflicts and tofind more efficient solutions at network level.
• The causal model in this research has been designed and implemen-
ted to reduce the size of the solution space to the Pareto-efficient
frontier in which to explore and find feasible solutions (the compre-hensive analysis of the state-space cannot be afforded by current analyticalor combinatorial methods since the strategic de-confliction with route multi-
112 Chapter 6. Conclusions, Main Contributions and Future Work
criteria optimization is a highly combinatorial problem that is consideredto be untreatable, i.e., Non-deterministic Polynomial).
• The ICS module has been able to take as input the qualitative
information generated by the CD module after the RTG process (i.e.,interactions/conflicts among all the alternate trajectories that belong todifferent aircraft), a piece of information that can be extracted from theATM micro-scale model stored in the RTSDS.
• The ICS module allows the participation of the AUs in several steps
of the Strategic De-confliction process and includes their criteria in thecalculation of the preferred solutions, i.e., facilitating Collaborative FlightPlanning through dynamic route allocation at network level.
• The CR module has presented excellent runtime performance suitablefor real-time environments.
6.2 Conclusions
The Strategic De-confliction system has been implemented in C++ with an Ob-ject Oriented approach. Several simulations of realistic scenarios have been per-formed and analysed to verify the correct functioning of the concepts. Simula-tion results have shown that this strategic CD&R tool is excellent from the
computational-efficiency point of view, since it has been able of deliveringa large set of conflict-free scenarios in less than 80 seconds provided a 650MIPScentral process unit (CPU).
Several scenarios have been simulated to test the CD&R system, some of themintroducing different assumptions and/or parameterizations, such as the use ofloxodromic and orthodromic trajectories in distinct simulations, the applicationof spatial buffers of different sizes to separate the traffic in conflict (two differentseparation distances applied, i.e., 7NM and 10NM), and also the introduction ofuncertainties in the traffic model, such as the presence of Wind Prediction Errors(which affect the precision of the 4D navigation) and the presence of uncertaintyin the Expected Time of Departures (which also affects the longitudinal/temporaldimension of the trajectories). Results have showed that the application of or-
thodromic trajectories have generated less number of conflicts than the
loxodromic trajectories in the considered scenario and that the conflict-freescenarios (calculated either with the 7NM or the 10NM parameterization versionsof the CR) are notably sensitive to the perturbations derived from the
WPE and ETD uncertainties.
6.3 Main Contributions 113
All the trajectories proposed by the CD&R system has been “flown”
with a precise Trajectory Predictor developed Boeing R&TE, thus confirm-ing the flyability of the proposed de-conflicted scenarios.
Simulations with random WPE and ETD uncertainties applied to the trafficmodel (thus introducing errors in wind prediction and/or take-off times) con-
firmed the importance of relying on a dynamic and continuously rolling
NOP in which the allocation of the user-preferred trajectories can be
dynamically changed in response to the updates of the ATM network
state. The CD&R algorithms developed for the STREAM project in this researchhave been designed for that purpose, and thus the SDS can update the complete4D picture of the ATM every few seconds. The RTG and ICS algorithms canalso provide with several near-optimal conflict-free solutions in a few seconds orminutes if a medium-powered computer is used. An update frequency of around2 minutes for the NOP could actually contribute to manage the uncertainty byupdating the state of the ATM as soon as the relevant information becomes moreprecise (e.g., the ETD of a flight).
If the safety distance is increased with the application of a buffer during theCD process (e.g., declaring a conflict when 2 aircraft are in the horizontal plane atless distance than 10NM instead of the nominal 5NM) could improve the robust-ness of the de-conflicted scenarios. As seen in the simulation results, increasingthe CD buffer entails more conflicts (around 43 conflicts per extra NM bufferin the considered scenarios) which implies higher costs related to the additionalresolution amendements required; however, the achievement of more robust
and predictable scenarios might compensate the cost of the additional
resolution amendments.
Finally, the preliminary results obtained indicate that the proposed CD&R
system could contribute to developing a subset of the aspects required
for Strategic De-confliction during real-time Collaborative Flight Plan-
ning in the presence of large number of trajectories, thus representing abaseline for more advanced and realistic solutions and an evolution towards thefull ATM automation.
6.3 Main Contributions
With regards to the objectives stated for this research (which in turn are tightlyrelated to the objectives of the SESAR programme), the following main contri-butions of the CD&R algorithms developed have been identified:
114 Chapter 6. Conclusions, Main Contributions and Future Work
Safety: It is expected that the anticipation of the aircraft separation tasks throughstrategic de-confliction for the entire duration of all the flights may contrib-ute to maintain or outperform the current safety levels in the ATM whilestill leaving room for the optimization of routes and to support an increaseof the airspace demand. Note that the strategic de-confliction system pro-posed in this research is compatible with the others layers of safety providedby the current tactical surveillance and management of conflicts of ATC aswell as with the on-board collision avoidance systems (i.e., TCAS). Alsonote that the simulation results have showed that the addition of buffers tothe nominal safety distances could contribute to generate conflict-free scen-arios that are robust to most typical sources of uncertainty, i.e., navigationuncertainties due to wind prediction errors and take-off delays (i.e., WPEand ETD uncertainties), thus actually reducing the probability of conflicts(and mid-air collisions) in the ATM network.
Capacity: The system has shown the ability of efficiently performing strategicde-confliction among thousands of 4D trajectories, thus finding new conflict-free flight plans (through a dynamic route allocation process) in a fewseconds (less than 90 with a medium-power 650MIPS computer). The po-tential reduction of the ATC’s workload may contribute to reduce the latentcapacities present in the current ATM system, while the elimination of fixedroute structures may contribute to take better advantage of the availablecapacity during the flight planning process.
Flight efficiency, ATM cost-efficiency and environmental impact: Ac-cording to a certain agreed-upon definition of trajectory optimality for eachflight, the system is able to find optimal or near-optimal global networksolutions. The system allows the introduction of the Free-Route concept(simplified as Direct Route in this document), which may contribute to savefuel and time as well as to reduce pollution in the ATM. In addition, theconsideration of the emergent dynamics and potential interactions amongthe different 4D trajectories allows the CD&R system to find those feasiblenetwork solutions that are closest to the AUs preferences taking into accounta global perspective. Note that the CD&R system is compatible with otherstrategies applied by the NM to manage the ATM direct costs per flightand to reduce the environmental impact of flights, such as the applicationof different taxations to flights according to the sectors crossed or the estim-ated pollution generated (i.e., the concept of Free-Route allows the AirspaceUsers defining their prefered trajectories, thus all their proposed trajectoriesalready internalize the different ATM direct-costs and restrictions).
SESAR conformance: The CD&R developed for STREAM project relies onthe same future technologies that will give support to the SESAR ATM
6.3 Main Contributions 115
concept, such as the deployment of the 4D-FMS navigation, the data-linkcommunications, and the new aircraft-dependent surveillance systems, to-gether with the SWIM platform to share and synchronize the entire ATMinformation. The use of 4D trajectories, the CDM philosophy, the unifica-tion of different airspaces into a single one, the flight and network efficiency,the equity and fairness considerations and the flexible dynamic route alloc-ation are all concepts that match with the SESAR strategic interests:
• Use of 4D trajectories: The CD&R system presented is able to pro-cess and store the complete 4D description of all the alternate trajectories(either in SBT or RBT format) associated to all the flights present in acertain scenario under consideration. The sampling rate of the trajectorieshas been parameterized to one sample per second, which is a fairly highresolution taking into account the dimensions and speeds of the commercialaircraft. Other parameterizations are also possible (e.g., a sample for each10 seconds).
• CDM philosophy: The system allows the participation of AUs in vari-ous levels of the CD&R process taking into account their local and globalpreferences in order to deliver the solutions with transparency.
• Global scope: The entire European airspace is examined simultaneouslyas a single sector, thus avoiding any border problems within the currentsectors of the European ATM. In addition, a global scope may contributeto obtain more efficient solutions since the emergent dynamics derived fromlocal decisions of the system can be analysed with a network perspective,thus providing with global solutions that naturally tend to prioritize thosescenarios that take most advantage of the positive/stabilizing domino ef-fects (i.e., less trajectories are modified with respect the number of conflictsdetected in the baseline non-deconflicted scenario). Note that the presentedsystem is still compatible with the NM restrictions potentially applied toregulate the traffic at the level of flows as well as to limit the number ofaircraft crossing a certain ATC sector.
• Equity and Fairness: The potential assessment of several conflict-freePareto-efficient scenarios to evaluate their impact on the ATM stakehold-ers may be a key factor to ensure equity and fairness among all the AUs(considered but not evaluated in this dissertation).
• Flexibility: In SESAR, flexibility is the ability to adapt the ATM planningto unexpected network changes. The fast updating rate of the (4D/nD)ATM state-space micro-scale model together with the CD&R algorithmspresented in this dissertation can be a contributor to support strategic de-confliction in real-time applications, which in turn could be useful to enable
116 Chapter 6. Conclusions, Main Contributions and Future Work
the necessary real-time negotiations of the NOP (through a dynamic routeallocation process negotiated among all the stakeholders), and it may alsocontribute to deal with some sources of uncertainties that often cause unex-pected changes in the network (e.g., delays, weather, wind prediction errors,trajectory deviations, and so on).
6.4 Future Work
The following list is a summary of interesting ways forward in the developmentof the CD&R algorithms presented in this research:
1. Technological enabler for the Integrated Network Management
and extended ATC Planning Function (INAP)
Recently, the SESAR ConOps Step 2 [47] has introduced a new planning layercalled INAP (or Integrated Network Management and extended ATC PlanningFunction), which aims at coordinating the ATFCM decisions made re-
garding the network flows with the ATC decisions made regarding the
individual flight trajectories at local sectors. The underlying concepts ofthis layer are similar to the ones researched under the STREAM project, and thusthe strategic de-confliction algorithms presented in this dissertation could actuallycontribute to the materialization of this new traffic planning layer of SESAR ATM.
2. Improvement of the RTG module
The RTG module presented in this dissertation has been based on a GOA al-gorithm adapted for Strategic De-confliction and has been used as a simplificationmethod to obtain the “user-preferred” trajectories generated to avoid the conflictsdetected. Note that for researching purposes in general, and for this research inparticular, such abstraction has been found to be fairly appropriate. However,in the current CD&R system implementation only heading change manoeuvreshave been implemented as a general resolution method to solve conflicts (notethat flight level changes have been also applied in a few some cases, but not asa general method for all the conflicts). Therefore, although the results obtainedhave been actually excellent, it is still recognized that the implementation of
more resolution manoeuvres (such as flight level changes, speed control, andthe imposition of controlled times at certain points of the route) may contributeto obtain more efficient and robust scenarios.
3. Improvement of the ICS module
As stated in the limitations identified for this research in Article 5, there areseveral ways to improve the current ICS module. For instance, the number of
CD-RTG-CD cycles could be increased and thus parameterized to several
6.4 Future Work 117
cycles (currently it is parameterized to one single cycle). So, the ICS could usethe information about the additional secondary and tertiary conflicts, thus havinginto account a more complete set of local-optimal trajectories, which increases theprobability of finding conflict-free solutions in a given scenario (specially amongtightly coupled trajectories) and also gives more flexibility to optimize the conflict-free scenarios. New strategies to re-cluster can also bring new insight to thelight about the complex interactions that sometimes can occur among diversetrajectories.
4. Multi-criteria cost-benefit analysis
Only the metric of minimum delay has been considered online during the ICSprocess to (simplistically) determine the optimality of the conflict-free scenarios tobe provided by the system. Under the STREAM project several metrics have beendefined (efficiency, robustness, equity, fairness, among others) in order to analyseand evaluate the performance of the solutions delivered by the CD&R tool presen-ted in this dissertation. Therefore, these metrics could be actually implementedin the current CD&R system in order to improve the automated decision-makingthrough the online evaluation of a multi-criteria cost-benefit analysis.The introduction of more sophisticated metrics that can be considered onlineshall contribute to define a set of Pareto-optimal conflict-free scenarios and theposterior evaluation in order to decide which one of the feasible scenarios is themost preferred one and thus to proceed with the plan execution.
5. Use of a more realistic n-dimensional ATM model
The prototype version of the strategic CD&R algorithms presented in thisdissertation only have considered simple strategies to tackle uncertainties (e.g.,increasing the minimum safety distances with buffers in both the CD and the CRmodules). Nevertheless, the CD&R algorithms of this dissertation have been de-signed with the perspective of a potential future version upgrade that integratesadditional state-space variables to model a more realistic n-dimensional
ATM (e.g. including probability values to model different ATM aspects, such asthe risk-of-deviation of the trajectories or the severe weather occurrance in a givensector or airport) during the CD&R processing in order to take better decisionswith an overall consideration of the network. This approach could potentially helpto the ATM stakeholders in relation with the different SESAR Validation Activ-ities for real-life applications in which more state variables must be considered.
The introduction of a probabilistic conflict detection (e.g., based on knownprobabilistic distributions that allow describing both the Wind Prediction Er-rors and Estimated Time of Departure uncertainties) could help to generate morestable/robust route allocation plans. Thus, the resolution amendments that areproposed in the current CD&R version could be reduced or adapted in the presence
118 Chapter 6. Conclusions, Main Contributions and Future Work
of conflicts identified as “improbable”. In addition, note that such probabilisticconflict detection (and resolution) might be strongly benefited from the fast net-work re-planning frequency achieved in this research (that allows de-conflicting allthe trajectories in less than 2 minutes), since the conflict probabilities associatedto uncertain events (such as conflicts) are expected to change and become moreprecise as soon as the time of execution becomes closer.
6. Temporal looseness computation to tackle some sources of flight
uncertainty
The speed uncertainties derived from the wind prediction errors and the ETDuncertainty derived from a typical European delay distribution have been themain flight uncertainties considered in the framework of STREAM project (seeSection 3.3 and Appendix A.5). As seen in this dissertation, the negative de-synchronization effects of these uncertainties can be mitigated at certain extentwith the use of additional buffers applied to the minimum safety distances re-quired among aircraft. Note, however, that these uncertainties affect to the tem-poral/longitudinal dimension of the trajectories, thus it seems more appropriateand more precise to tackle these uncertainties in the temporal dimension and notin the spatial domain. The concepts shown in Article 3 and in the AppendixA.5about uncertainty with regards to the calculation and management of the tem-poral looseness of the trajectories can bring to light new insight and new
strategies to tackle those uncertainties that affect the temporal dimen-
sion of the trajectories.
Similar configuration of the SDS showed in Article 1 (see on page 131) thatcan be applied to detect wake vortex encounters can be also applied to computethe temporal looseness of the trajectories, i.e., how many units of time can atrajectory be delayed or advanced without generating a new interaction in thenetwork. This information may be useful as a strategy to tackle some sources ofuncertainties (such as speed and ETD uncertainties) and also could be useful toidentify more robust conflict-free scenarios (e.g., less efficient loose/robustscenarios could be preferred over more efficient but tightly coupled scenarios).Also the information about the loosness of a flight could be useful for ATCOs incase the traffic at their local sector level need a re-planning, since by identifying
the less tightly coupled trajectories ATCOs could minimize the poten-
tial negative impact of their decisions in the downstream sectors.
7. Consider TP uncertainty at strategic level
An important new concept has been introduced in the Appendix A.5 of thisdissertation with regard to the possibility of planning the 4D trajectories of allflights at strategic level whereas taking into account what the tactical con-
trollers will see at each ATC sector during the execution phase. Specific-
6.4 Future Work 119
ally, the risk-of-deviation (considered here as part of the TP uncertainty) that iscurrently only computed during the tactical conflict management should be alsoconsidered at the strategic de-confliction phase (enough TP precision is assumedas in the SESAR context). The risk-of-deviation can increase the workload of theATCOs during flight execution phase, since the strategic traffic plans will be mod-ified at the tactical phase if the ATCOs observe a situation that, even when thenominal trajectories may be conflict-free, the risk of collision computed throughthe TP risk-of-deviation model is considered too high (thus usually getting lessefficient and more unstable traffic plans than the planned at strategic planninglevel). Therefore it is proposed as a further work to extent the CD&R algorithmswith a risk-of-deviation model applied not only at tactical level, but also duringthe strategic de-confliction process.
8. Simulation of a dynamic NOP with eventual/stochastic Network
disruptions
Simulations presented in this dissertation have only considered one strategicCD&R run per scenario. However the system has been designed to update thestate-space in few seconds or minutes, in order to respond in a flexible way to thechanging ATM conditions. Thus, it is proposed as a further work the implement-ation of a complementary simulation platform that generates random networkperturbations (such as severe weather, trajectory deviations, the sudden closureof sectors and/or runways, and so on) that obligates to reconsider the originalnominal planning and to generate a new one during the execution phase in acontinuous rolling CD&R process.
This would provide a more realistic environment in which the simulationof a dynamic NOP can feed and update the strategic CD&R system every 2minutes and the conflicts are defined probabilistically according to some reason-able/realistic statistical distributions which in turn can be weighed up accord-ing to the look-ahead time of the predicted conflict compared with the updatedcurrent-time of simulation. Relevant insight about the ATM can be obtainedwith the results provided by the CD&R system, thus contributing to develop newstrategies to mitigate the adverse effects of several sources of uncertainty and todesign more robust strategically de-conflicted scenarios.
9. Extensions of the technological framework for the deployment of
real-time applications
Note that updating the CD&R system with improvements in the technologicalframework, such a faster runtime performance, may contribute to support
larger amount of trajectories and conflicts in a timely manner for real-time purposes. It also may contribute to compensate the potentially large
information transmission lead-times in case of real-life applications in
120 Chapter 6. Conclusions, Main Contributions and Future Work
which the aircraft must send/receive the trajectory information to/from the NOP.Therefore, extra opportunities to improve the execution performance have beenidentified, for instance, a faster CPU can be used (the used 650MIPS processoris indeed a relatively slow CPU compared to nowadays computational capabilit-ies) and/or some of the algorithmic processes can be parallelized, especially thegeneration of local resolution trajectories per identified conflict (i.e., each conflictcan be processed in parallel in the RTG module), and the causal analysis afterthe identification of conflict clusters (i.e., each cluster can be processed in parallelin the ICS module). Additionally, the causal analysis of big clusters (i.e., size ofmore than 7 or 8 aircraft) can also be benefited of parallel computing, since manyof the internal operations of the ICS module causal exploration can also be runin different processors. In this manner the amount of time required to reach anoptimal solution for a big cluster could be drastically reduced, thus increasing themaximum cluster size supported without needing of re-clustering (better solutionsmay be found if re-clustering is avoided).
10. Integrate the Strategic De-confliction system with the MTCD
for TMA as a first step for airport integration
According to new SESAR ATM concepts, the planned take-off time of a flightwill be conditioned (through backtracking the trajectory) to the target time ofarrival negotiated between the airlines and the airports and agreed by the NM.However, once the aircraft will be airborne, and due to the negative effects gener-ated by the presence of uncertainties and perturbations, it is expected that somedegree of traffic de-synchronization will be present, which could be partly allevi-ated in the en-route phase by a continous rolling strategic de-confliction systemlike the one presented in this dissertation.
However, the trajectories arriving to TMAs that are still de-synchronized
at the begining or during the approach phase may require the integ-
ration of the en-route strategic de-confliction system with a tactical
MTCD system (like the one presented in Article 1), which in turn shall worktogether with an AMAN/DMAN system in order to schedule/re-schedule theapproaching traffic with the purpose to optimize the runway utilization, spe-cially during high-complexity operations [77, 79] (and ideally also minimizing thechanges on the take-off schedule, in case the runway is configured in mixed mode,in order to avoid/minimize the reactionary de-synchronization effects at othersectors).
Hence, once the AMAN/DMAN has calculated the optimal landing sequencefor the traffic that is approaching to the airport and that is in the working horizon(e.g., 30-40 minutes look-ahead), the MTCD can start a dynamic route allocationprocess in which the actual airport and sector restrictions are taken into account
6.4 Future Work 121
together with the aircraft performance and the user preferences through a col-laborative decision making approach. At the end of this negotiated tactical de-confliction process, a set of 3D waypoints and time-restrictions (i.e., CTAs) shallbe calculated online with precision (i.e., waypoints not previously published) inorder to generate a set of conflict-free trajectories that will be assigned to eachcorresponding flight and cleared during the approximation, descent and landingphases. Note that this strategic and tactical integration at TMAs could consti-tute an important step towards the airport integration targets pursued by SESAR.
11. Complete airport integration
The full airport integration in the ATM concept is perhaps the most ambi-tious target of SESAR since it implies the integration of the airside planning withthe complex logistics of all the airports in the network [32] (including taxiing,turn-around, flight services at airport, handling and boarding processes amongothers), and thus also requiring to take into account the schedule of the airlinesfor different flights that may be served with the same aircraft and same or differ-ent crews.
After the integration of the MTCD for TMAs (explained in previous point),the next natural step should be the complete integration of airports, thus theCD&R system presented in this dissertation could be useful to perform studies inwhich to observe how decisions made in the airports at local level may
propagate across the network, thus affecting the robustness of the trajectoryplanning as well as the potential complex reactionary effects indirectly caused bylocal decisions at a given airport over the same airport, e.g. decisions made tooptimize the performance of airport A for a certain look-ahead time could oblig-ate to change the optimal local decisions made in airport B, which in turn couldaffect again (directly or indirectly) to the optimal decisions in airport A, thusquestioning if the first decisions in airport A were actually optimal.
12. Extension of the technological framework to other ATM re-
search programmes
This research has been developed taking into consideration the SESAR ATMconcepts and objectives. Nevertheless, the same technological framework could beadapted and applied to other similar ATM research programmes such as NextGenin USA or CARATS in Japan, among others. It could additionally contribute tothe potential coordination of the traffic planning between the European
ATM and other ATM research programmes (see for instance the Forum forthe Integration and Harmonization of NextGen and SESAR into the Global ATMFramework [http://legacy.icao.int/inexses]).
13. Wake vortex encounters avoidance in the en-route airspace
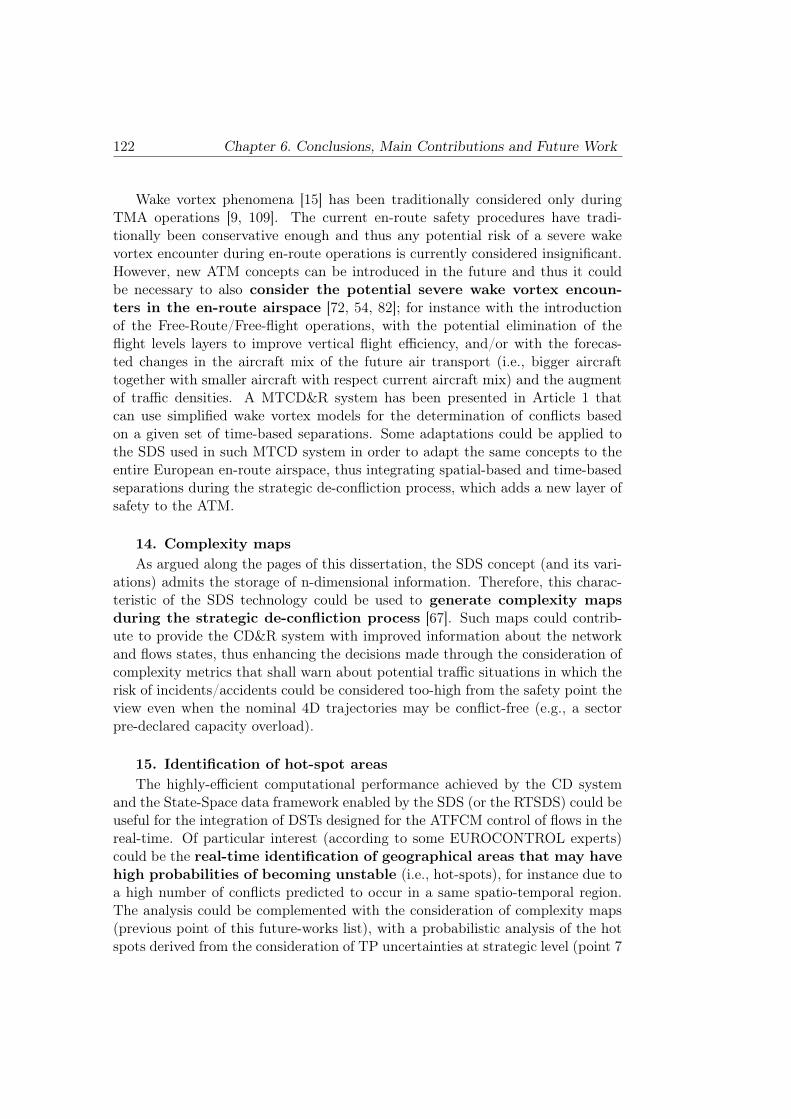
122 Chapter 6. Conclusions, Main Contributions and Future Work
Wake vortex phenomena [15] has been traditionally considered only duringTMA operations [9, 109]. The current en-route safety procedures have tradi-tionally been conservative enough and thus any potential risk of a severe wakevortex encounter during en-route operations is currently considered insignificant.However, new ATM concepts can be introduced in the future and thus it couldbe necessary to also consider the potential severe wake vortex encoun-
ters in the en-route airspace [72, 54, 82]; for instance with the introductionof the Free-Route/Free-flight operations, with the potential elimination of theflight levels layers to improve vertical flight efficiency, and/or with the forecas-ted changes in the aircraft mix of the future air transport (i.e., bigger aircrafttogether with smaller aircraft with respect current aircraft mix) and the augmentof traffic densities. A MTCD&R system has been presented in Article 1 thatcan use simplified wake vortex models for the determination of conflicts basedon a given set of time-based separations. Some adaptations could be applied tothe SDS used in such MTCD system in order to adapt the same concepts to theentire European en-route airspace, thus integrating spatial-based and time-basedseparations during the strategic de-confliction process, which adds a new layer ofsafety to the ATM.
14. Complexity maps
As argued along the pages of this dissertation, the SDS concept (and its vari-ations) admits the storage of n-dimensional information. Therefore, this charac-teristic of the SDS technology could be used to generate complexity maps
during the strategic de-confliction process [67]. Such maps could contrib-ute to provide the CD&R system with improved information about the networkand flows states, thus enhancing the decisions made through the consideration ofcomplexity metrics that shall warn about potential traffic situations in which therisk of incidents/accidents could be considered too-high from the safety point theview even when the nominal 4D trajectories may be conflict-free (e.g., a sectorpre-declared capacity overload).
15. Identification of hot-spot areas
The highly-efficient computational performance achieved by the CD systemand the State-Space data framework enabled by the SDS (or the RTSDS) could beuseful for the integration of DSTs designed for the ATFCM control of flows in thereal-time. Of particular interest (according to some EUROCONTROL experts)could be the real-time identification of geographical areas that may have
high probabilities of becoming unstable (i.e., hot-spots), for instance due toa high number of conflicts predicted to occur in a same spatio-temporal region.The analysis could be complemented with the consideration of complexity maps(previous point of this future-works list), with a probabilistic analysis of the hotspots derived from the consideration of TP uncertainties at strategic level (point 7
6.4 Future Work 123
of this list) and also from the consideration of probabilistic RBTs in the presenceof uncertain events that may affect the network capacity (point 19 of this list).A major degree of realism and more trustful results could be obtained during theidentification of hot spots if the simulations are run as a dynamic rolling processin which stochastic network perturbations are systematically introduced (point 8of this list). Therefore, such analytical tool could contribute to a more preciseand robust ATFCM management of capacities and flows in a Trajectory BasedOperations environment.
16. Add weather information
Similarly to complexity maps, the SDS could also store different weather
parameters information, thus being able to generate wind 4D maps, temper-ature 4D maps, and so on. This information can be used by the CD&R to makebetter decisions with regards to the efficiency of the flights and the robustness ofthe scenarios.
17. Impact assessment models
The availability of the discrete event ATM representation supported by theSDS technology, together with the possibility to integrate causal models that ex-plore the state space of the system (to anticipate the propagation of the localdecisions and their collateral effects across the network), could be used to developmodels that assess the impact of those local decisions. Such impact assess-ment models shall allow improving the decision-making processes or to performoffline studies of past scenarios in order to assess the effectiveness of the decisionspreviously made.
18. Test-bed Platform for ATM Studies (TPAS)
The CD&R algorithms that have been presented here (and which are sup-ported by the modelling data framework provided by the SDS technology) arecurrently being re-coded in format of a distributable DLL to facilitate the inter-action to third party users through the usage of a set of properly documentedAPI functionalities. The idea is to offer to the scientific community a simulationplatform with several tools that are integrated in a single modelling framework inorder to facilitate the fast prototyping of new ATM concepts and the test of newDecision Support Tools.
Therefore, the Test-bed Platform for ATM Studies (TPAS) has been designed
to provide a computer-based test bed environment for the development
and evaluation of new ATM tools as well as the verification of new ATM
concepts that may contribute to a better understanding of the ATM system.TPAS can efficiently manage, represent and store ATM information of micro-level objects (such as 4D trajectories either in SBT or RBT format, airspace data
124 Chapter 6. Conclusions, Main Contributions and Future Work
Figure 6.1: TPAS system architecture
The Test-bed Platform for ATM Studies consist on a kernel that includes a SDS and the
Information Management module together with different functionalities that could be useful
for researchers and ATM users to generate insight about the ATM and also to ease the design,
implementation and testing of new Desision Support Tools and ATM concepts.
and weather information) with a global and n-dimensional view (thus potentiallyextending the simplified 4D ATM model assumed in this dissertation). This canrepresent a key contribution for ATM researchers and users since this frameworkshall enable the observation and management of the potential emergent dynamicsappeared in the network as a consequence of the decision-making processes thatare based on a narrowed local-level perspective.
The system architecture that has been developed for TPAS is illustrated inFig. 6.1. The following modules will compose the kernel of TPAS:
• State-Space storage and management (Spatial Data Structure)The State-Space storage and management module is in charge of enabling amicro-model discrete event representation of the ATM as well as in chargeof providing efficient access methods (reading/writing) to such state-spaceinformation. This module is enabled by the use of a database with specialdesign and implementation requirements, i.e. Spatial Data Structure (SDS),
6.4 Future Work 125
which is detailed in Articles 1 and 2 (on pages 131 and 155respectively) .
• Information ManagerThe Information Manager (IM) is in charge of an efficient management ofAircraft, Routes, Trajectories, and any other ATM information required inthe models under consideration. Specifically, this module is in charge of the:o Management of aircraft information (e.g. flight number, aircraft model,mass. . . )o Management of original trajectories/flight plans o Management of altern-ative/trial trajectories/flight plans (e.g. proposed by a CR system)o Generate trajectories from routes/flight plans (through simple or advancedTPs)o Add ATM information to the SDS (e.g. 4D trajectories) o Delete ATMinformation from the SDS (e.g. 4D trajectories)o Extract ATM post-processed SS information from SDS (e.g. conflicts,temporal looseness, complexity map. . . )o Management and classification of ATM SS information (e.g. temporalsorting of conflicts, computation of basic metrics, statistics. . . )o Coordination of the functionalities of all the modules
Aircraft may have more than one potential trajectory, yet because of the consider-ation of uncertainty (i.e., probabilistic trajectories), yet because the considerationof alternate trajectories generated during a trial and error flight planning optimiz-ation. Therefore, the IM and other TPAS modules (e.g. the CD, CR. . . ) requirea method of identification for the trajectories that are associated to the sameaircraft. TPAS provides the users with efficient automated methods for such tra-jectory identification (see Appendixes of this dissertation).
To aid the ATM stakeholders with the creation and verification of new ATMconcepts and DSTs, the TPAS system has been designed with a modular approachthat supports the integration of external tools, through the use of a set of APIsthat include several primitive functionalities (e.g. create and parameterize air-craft, create route/flight plan and assign it to an aircraft, generate a 4DT froma route/flight plan, load a 4DT from a file and assign it to an aircraft, computegeodesic or loxodromic distances between waypoints, etc.) and different tools andfunctionalities that are already integrated and distributed with TPAS that shallbe helpful to perform several kinds of ATM studies (i.e., conflict detection tool,clusterizer tool, temporal looseness calculator, strategic de-confliction and more).Also some realistic network-level scenarios for test-bed purposes will be included,thus providing a common modelling framework to test different external DecisionSupport Tools and new ATM concepts and thus enabling performance comparisonamong different approaches applied to the study of a certain same ATM concept.
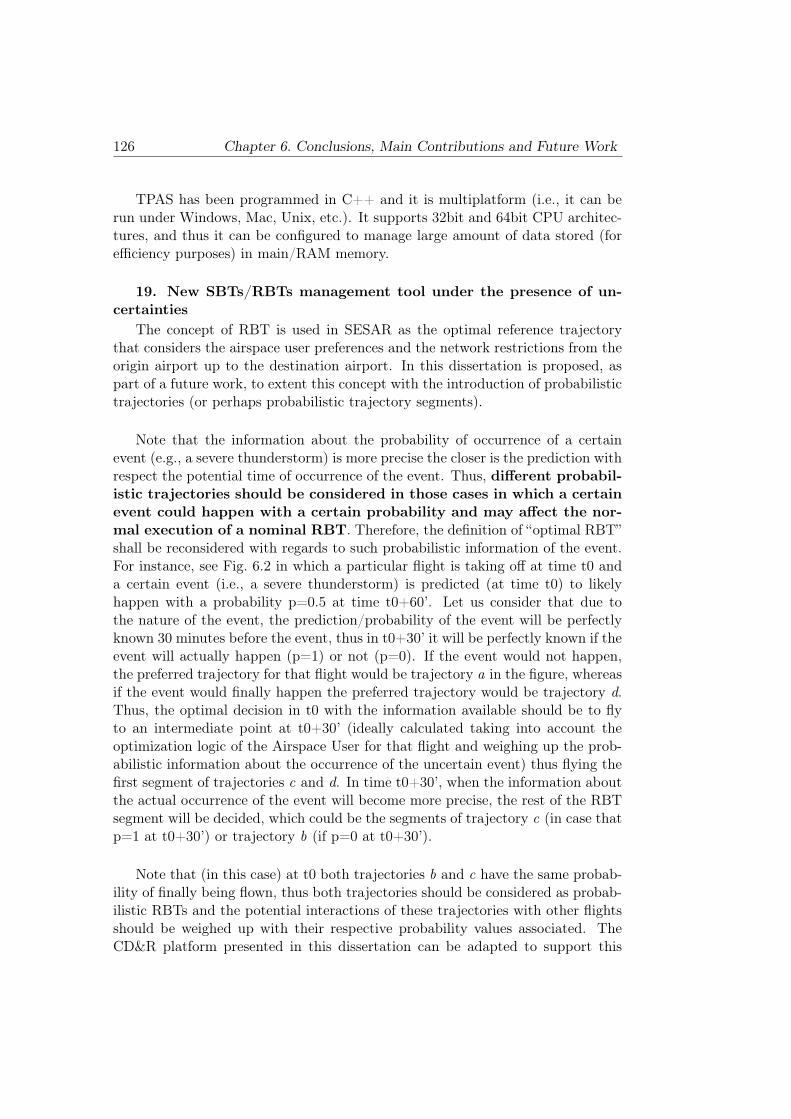
126 Chapter 6. Conclusions, Main Contributions and Future Work
TPAS has been programmed in C++ and it is multiplatform (i.e., it can berun under Windows, Mac, Unix, etc.). It supports 32bit and 64bit CPU architec-tures, and thus it can be configured to manage large amount of data stored (forefficiency purposes) in main/RAM memory.
19. New SBTs/RBTs management tool under the presence of un-
certainties
The concept of RBT is used in SESAR as the optimal reference trajectorythat considers the airspace user preferences and the network restrictions from theorigin airport up to the destination airport. In this dissertation is proposed, aspart of a future work, to extent this concept with the introduction of probabilistictrajectories (or perhaps probabilistic trajectory segments).
Note that the information about the probability of occurrence of a certainevent (e.g., a severe thunderstorm) is more precise the closer is the prediction withrespect the potential time of occurrence of the event. Thus, different probabil-
istic trajectories should be considered in those cases in which a certain
event could happen with a certain probability and may affect the nor-
mal execution of a nominal RBT. Therefore, the definition of “optimal RBT”shall be reconsidered with regards to such probabilistic information of the event.For instance, see Fig. 6.2 in which a particular flight is taking off at time t0 anda certain event (i.e., a severe thunderstorm) is predicted (at time t0) to likelyhappen with a probability p=0.5 at time t0+60’. Let us consider that due tothe nature of the event, the prediction/probability of the event will be perfectlyknown 30 minutes before the event, thus in t0+30’ it will be perfectly known if theevent will actually happen (p=1) or not (p=0). If the event would not happen,the preferred trajectory for that flight would be trajectory a in the figure, whereasif the event would finally happen the preferred trajectory would be trajectory d.Thus, the optimal decision in t0 with the information available should be to flyto an intermediate point at t0+30’ (ideally calculated taking into account theoptimization logic of the Airspace User for that flight and weighing up the prob-abilistic information about the occurrence of the uncertain event) thus flying thefirst segment of trajectories c and d. In time t0+30’, when the information aboutthe actual occurrence of the event will become more precise, the rest of the RBTsegment will be decided, which could be the segments of trajectory c (in case thatp=1 at t0+30’) or trajectory b (if p=0 at t0+30’).
Note that (in this case) at t0 both trajectories b and c have the same probab-ility of finally being flown, thus both trajectories should be considered as probab-ilistic RBTs and the potential interactions of these trajectories with other flightsshould be weighed up with their respective probability values associated. TheCD&R platform presented in this dissertation can be adapted to support this
6.4 Future Work 127
Figure 6.2: Probabilistic SBTs/RBTs to tackle some sources of ATM uncertainty
The ATM conditions and constraints may dynamically change due to the presence of uncertain
events in the network, thus potentially affecting the decisions made several minutes or hours
in advance with regards to the 4D trajectory intentions. Thus, airspace users might want to
consider different alternate plans for their 4D trajectories calculated with probability values
associated as a potential response to the uncertain/probabilistic events of the network.
kind of probabilistic models in which the probabilistic information of the traject-ories can be stored as extra n-dimensional information in the SDS. Also note thatthe high updating rate of the SDS content and of the strategic de-confliction pro-cess is a key factor to take better decisions as soon as the probabilistic informationassociated to certain ATM events becomes more precise with the pass of the time.

128 Chapter 6. Conclusions, Main Contributions and Future Work
Chapter 7
Compendium of PublishedArticles
129

130 Chapter 7. Compendium of Published Articles
7.1 “A Medium Term Conflict Detection and Resolution system for TerminalManoeuvring Area based on Spatial Data Structures and 4D Trajectories” 131
7.1 “A Medium Term Conflict Detection and Resolu-tion system for Terminal Manoeuvring Area basedon Spatial Data Structures and 4D Trajectories”
Article 1, “A Medium Term Conflict Detection and Resolution system for Ter-minal Manoeuvring Area based on Spatial Data Structures and 4D Traject-ories”, has been published in the journal of Elsevier Transportation Researchpart C. The content of this paper is presented as the seed of the technologicalframework that has been developed for the Strategic De-confliction systempresented in this dissertation. In the paper it is presented a MTCD systemthat uses time-based separations to dynamically synchronize the traffic thatenters into a TMA and start the approach and landing phases. One of themain contributions of this paper is the introduction of Spatial Data Struc-tures as a way to efficiently manage and store spatial information. The SDSallows having a complete 4D description of the TMA sector, thus taking intoaccount the entire planned/expected trajectories of the arriving flights. So,decisions can be efficiently made in real-time with a (potential) coordinationamong different Decision Support Tools (e.g. AMAN/DMAN).

132 Chapter 7. Compendium of Published Articles
A Medium Term Conflict Detection and Resolution system forTerminal Maneuvering Area based on Spatial Data Structuresand 4D Trajectories
Sergio Ruiz a,!, Miquel A. Piera a, Isabel Del Pozo b
a Technical Innovation Cluster on Aeronautical Management, Universidad Autònoma de Barcelona, Sabadell, SpainbBoeing Research & Technology Europe, Madrid, Spain
a r t i c l e i n f o
Keywords:Conflict detection and resolution algorithmsTime–distance separation4D trajectoriesAir traffic managementSingle European Sky ATM Research (SESAR)Airspace capacity
a b s t r a c t
In this paper an efficient Medium Term Conflict Detection and Resolution (MTCD&R)approach based on 4D trajectories to solve conflicts in a Terminal Maneuvering Area(TMA) is presented. The conflict detection subsystem (CD) is based on a Spatial Data Struc-ture (SDS), avoiding non-efficient pairwise trajectory comparisons, and using a simplifiedwake vortex modeling through 4D tubes to detect time-based separation infringementsbetween aircraft. The conflict resolution subsystem (CR) solves the detected conflicts withan efficient and dynamic 3D allocation of the arrival routes that takes into considerationthe execution of Continuous Descent Approaches (CDAs). Algorithms have been tested withseveral stressing traffic scenarios (rush hour and saturation rush hour) taking place in a 3Dsimulation model of Gran Canaria Extended TMA. The resulting conflict-free trajectorieshave been validated for flyability conformance both with real A380 FMS avionics and witha certified B738 Full Flight Simulator. A new CR performance metric to measure the degreeof runway utilization is also proposed in order to enable comparisons between differentMTCD&R systems. Finally, a discussion about strengths and limitations of the algorithmsfor reducing controller’s workload while increasing airspace capacity of the future SingleEuropean Sky is outlined.
! 2012 Elsevier Ltd. All rights reserved.
1. Introduction
The European Commission (EC) and the European Organization for the Safety of Air Navigation (EUROCONTROL) startedin 2005 a program called SESAR (Single European Sky ATM Research) whose main goal is to modernize the technologies, avi-onics and procedures used in the European Air Traffic Management (ATM) system in order to: improve predictabilitythroughout the whole system, increase capacity, productivity and safety of the ATM, and reduce environmental noise andemissions (SESAR Consortium, 2007, 2009).
One of the most important challenges to reach these targets consists on the introduction of the Trajectory Based Opera-tions (TBOs), which implies the use of 4D trajectories (trajectories defined in the three spatial dimensions together with atime-stamp), also known as Business Trajectories (BTs) in the SESAR’s terminology for civil flights (Cook, 2010). The requiredtechnologies to enable and support this new ATM paradigm include, among others, precise navigation equipment (P-RNAV)based on satellite technologies (GNSS) (Civil Aviation Safety Authority (Australian Goverment), 2006; EUROCONTROL, 2007a,2007b), and aircraft-state information broadcasting and self-separation systems (ADS-B) (EUROCONTROL, 2007a).
With regards to the capacity of the ATM, nowadays the high volume of air traffic observed in Europe, combined with thecurrent procedures used to manage the air traffic flows, causes the saturation of several air sectors during most confluent
0968-090X/$ - see front matter ! 2012 Elsevier Ltd. All rights reserved.http://dx.doi.org/10.1016/j.trc.2012.10.005
! Corresponding author. Tel.: +34 937287754.E-mail address: [email protected] (S. Ruiz).
Transportation Research Part C 26 (2013) 396–417
Contents lists available at SciVerse ScienceDirect
Transportation Research Part C
journal homepage: www.elsevier .com/locate / t rc
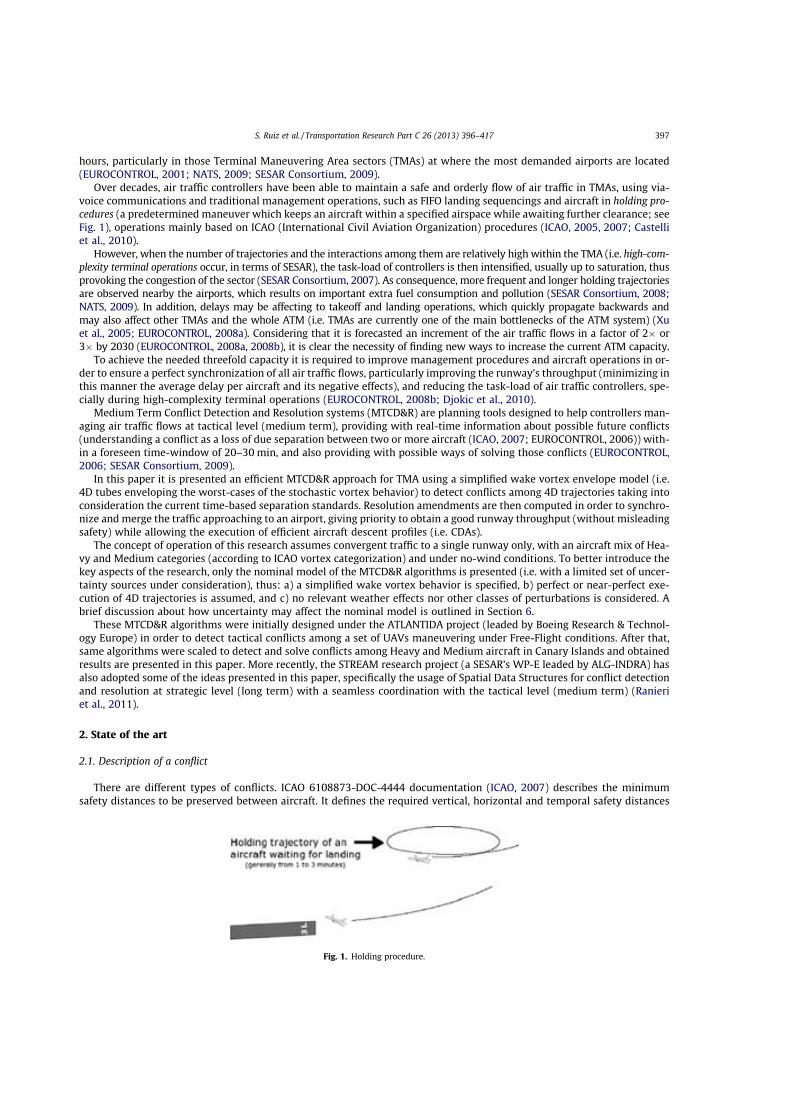
hours, particularly in those Terminal Maneuvering Area sectors (TMAs) at where the most demanded airports are located(EUROCONTROL, 2001; NATS, 2009; SESAR Consortium, 2009).
Over decades, air traffic controllers have been able to maintain a safe and orderly flow of air traffic in TMAs, using via-voice communications and traditional management operations, such as FIFO landing sequencings and aircraft in holding pro-cedures (a predetermined maneuver which keeps an aircraft within a specified airspace while awaiting further clearance; seeFig. 1), operations mainly based on ICAO (International Civil Aviation Organization) procedures (ICAO, 2005, 2007; Castelliet al., 2010).
However, when the number of trajectories and the interactions among them are relatively high within the TMA (i.e. high-com-plexity terminal operations occur, in terms of SESAR), the task-load of controllers is then intensified, usually up to saturation, thusprovoking the congestion of the sector (SESAR Consortium, 2007). As consequence, more frequent and longer holding trajectoriesare observed nearby the airports, which results on important extra fuel consumption and pollution (SESAR Consortium, 2008;NATS, 2009). In addition, delays may be affecting to takeoff and landing operations, which quickly propagate backwards andmay also affect other TMAs and the whole ATM (i.e. TMAs are currently one of the main bottlenecks of the ATM system) (Xuet al., 2005; EUROCONTROL, 2008a). Considering that it is forecasted an increment of the air traffic flows in a factor of 2! or3! by 2030 (EUROCONTROL, 2008a, 2008b), it is clear the necessity of finding new ways to increase the current ATM capacity.
To achieve the needed threefold capacity it is required to improve management procedures and aircraft operations in or-der to ensure a perfect synchronization of all air traffic flows, particularly improving the runway’s throughput (minimizing inthis manner the average delay per aircraft and its negative effects), and reducing the task-load of air traffic controllers, spe-cially during high-complexity terminal operations (EUROCONTROL, 2008b; Djokic et al., 2010).
Medium Term Conflict Detection and Resolution systems (MTCD&R) are planning tools designed to help controllers man-aging air traffic flows at tactical level (medium term), providing with real-time information about possible future conflicts(understanding a conflict as a loss of due separation between two or more aircraft (ICAO, 2007; EUROCONTROL, 2006)) with-in a foreseen time-window of 20–30 min, and also providing with possible ways of solving those conflicts (EUROCONTROL,2006; SESAR Consortium, 2009).
In this paper it is presented an efficient MTCD&R approach for TMA using a simplified wake vortex envelope model (i.e.4D tubes enveloping the worst-cases of the stochastic vortex behavior) to detect conflicts among 4D trajectories taking intoconsideration the current time-based separation standards. Resolution amendments are then computed in order to synchro-nize and merge the traffic approaching to an airport, giving priority to obtain a good runway throughput (without misleadingsafety) while allowing the execution of efficient aircraft descent profiles (i.e. CDAs).
The concept of operation of this research assumes convergent traffic to a single runway only, with an aircraft mix of Hea-vy and Medium categories (according to ICAO vortex categorization) and under no-wind conditions. To better introduce thekey aspects of the research, only the nominal model of the MTCD&R algorithms is presented (i.e. with a limited set of uncer-tainty sources under consideration), thus: a) a simplified wake vortex behavior is specified, b) perfect or near-perfect exe-cution of 4D trajectories is assumed, and c) no relevant weather effects nor other classes of perturbations is considered. Abrief discussion about how uncertainty may affect the nominal model is outlined in Section 6.
These MTCD&R algorithms were initially designed under the ATLANTIDA project (leaded by Boeing Research & Technol-ogy Europe) in order to detect tactical conflicts among a set of UAVs maneuvering under Free-Flight conditions. After that,same algorithms were scaled to detect and solve conflicts among Heavy and Medium aircraft in Canary Islands and obtainedresults are presented in this paper. More recently, the STREAM research project (a SESAR’s WP-E leaded by ALG-INDRA) hasalso adopted some of the ideas presented in this paper, specifically the usage of Spatial Data Structures for conflict detectionand resolution at strategic level (long term) with a seamless coordination with the tactical level (medium term) (Ranieriet al., 2011).
2. State of the art
2.1. Description of a conflict
There are different types of conflicts. ICAO 6108873-DOC-4444 documentation (ICAO, 2007) describes the minimumsafety distances to be preserved between aircraft. It defines the required vertical, horizontal and temporal safety distances
Fig. 1. Holding procedure.
S. Ruiz et al. / Transportation Research Part C 26 (2013) 396–417 397
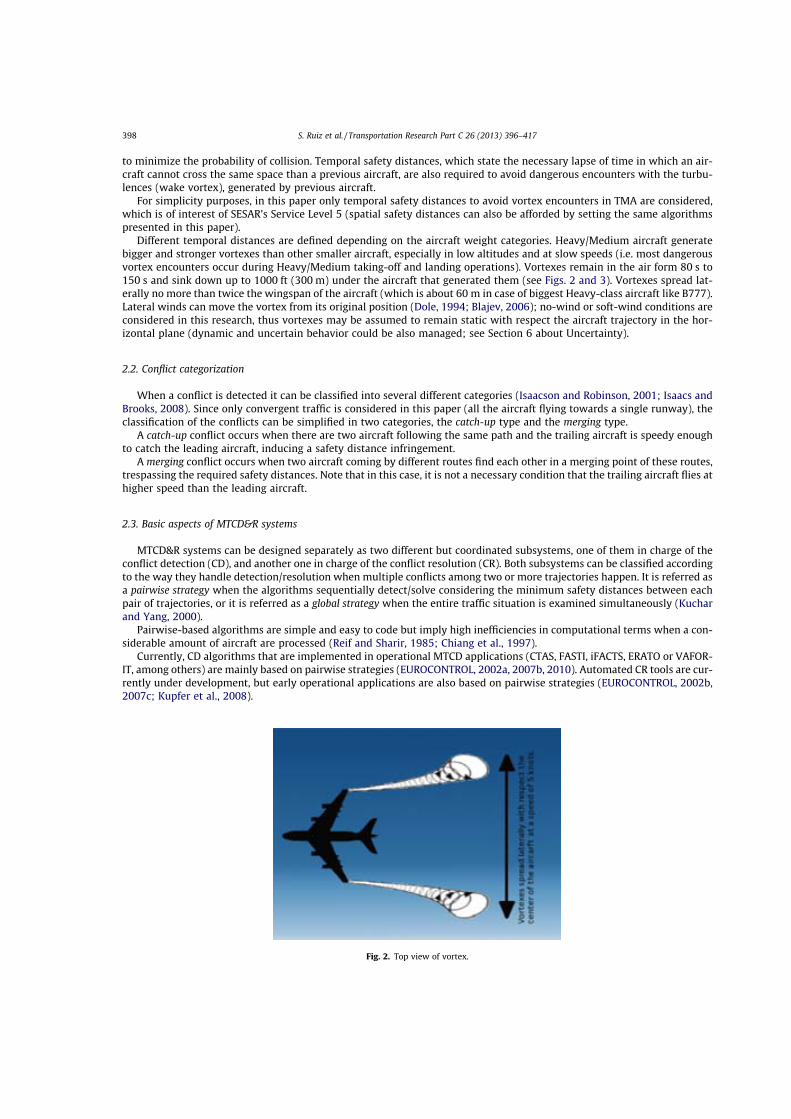
to minimize the probability of collision. Temporal safety distances, which state the necessary lapse of time in which an air-craft cannot cross the same space than a previous aircraft, are also required to avoid dangerous encounters with the turbu-lences (wake vortex), generated by previous aircraft.
For simplicity purposes, in this paper only temporal safety distances to avoid vortex encounters in TMA are considered,which is of interest of SESAR’s Service Level 5 (spatial safety distances can also be afforded by setting the same algorithmspresented in this paper).
Different temporal distances are defined depending on the aircraft weight categories. Heavy/Medium aircraft generatebigger and stronger vortexes than other smaller aircraft, especially in low altitudes and at slow speeds (i.e. most dangerousvortex encounters occur during Heavy/Medium taking-off and landing operations). Vortexes remain in the air form 80 s to150 s and sink down up to 1000 ft (300 m) under the aircraft that generated them (see Figs. 2 and 3). Vortexes spread lat-erally no more than twice the wingspan of the aircraft (which is about 60 m in case of biggest Heavy-class aircraft like B777).Lateral winds can move the vortex from its original position (Dole, 1994; Blajev, 2006); no-wind or soft-wind conditions areconsidered in this research, thus vortexes may be assumed to remain static with respect the aircraft trajectory in the hor-izontal plane (dynamic and uncertain behavior could be also managed; see Section 6 about Uncertainty).
2.2. Conflict categorization
When a conflict is detected it can be classified into several different categories (Isaacson and Robinson, 2001; Isaacs andBrooks, 2008). Since only convergent traffic is considered in this paper (all the aircraft flying towards a single runway), theclassification of the conflicts can be simplified in two categories, the catch-up type and the merging type.
A catch-up conflict occurs when there are two aircraft following the same path and the trailing aircraft is speedy enoughto catch the leading aircraft, inducing a safety distance infringement.
A merging conflict occurs when two aircraft coming by different routes find each other in a merging point of these routes,trespassing the required safety distances. Note that in this case, it is not a necessary condition that the trailing aircraft flies athigher speed than the leading aircraft.
2.3. Basic aspects of MTCD&R systems
MTCD&R systems can be designed separately as two different but coordinated subsystems, one of them in charge of theconflict detection (CD), and another one in charge of the conflict resolution (CR). Both subsystems can be classified accordingto the way they handle detection/resolution when multiple conflicts among two or more trajectories happen. It is referred asa pairwise strategy when the algorithms sequentially detect/solve considering the minimum safety distances between eachpair of trajectories, or it is referred as a global strategy when the entire traffic situation is examined simultaneously (Kucharand Yang, 2000).
Pairwise-based algorithms are simple and easy to code but imply high inefficiencies in computational terms when a con-siderable amount of aircraft are processed (Reif and Sharir, 1985; Chiang et al., 1997).
Currently, CD algorithms that are implemented in operational MTCD applications (CTAS, FASTI, iFACTS, ERATO or VAFOR-IT, among others) are mainly based on pairwise strategies (EUROCONTROL, 2002a, 2007b, 2010). Automated CR tools are cur-rently under development, but early operational applications are also based on pairwise strategies (EUROCONTROL, 2002b,2007c; Kupfer et al., 2008).
Fig. 2. Top view of vortex.
398 S. Ruiz et al. / Transportation Research Part C 26 (2013) 396–417
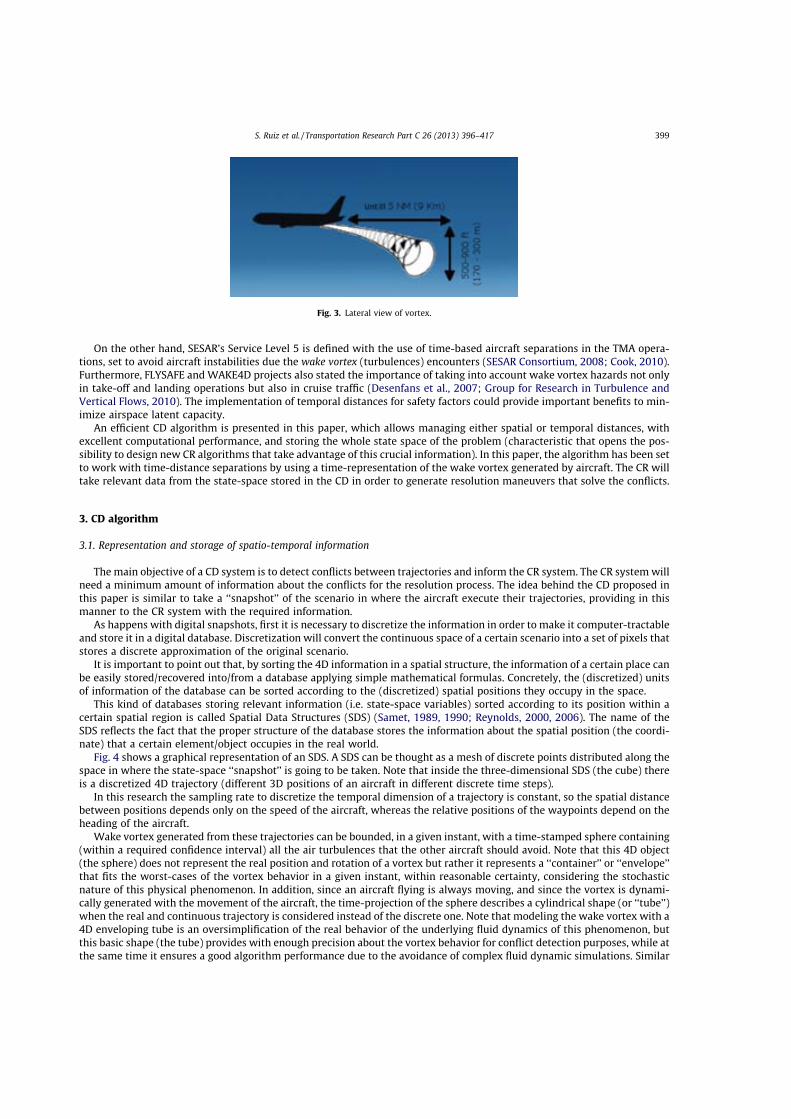
On the other hand, SESAR’s Service Level 5 is defined with the use of time-based aircraft separations in the TMA opera-tions, set to avoid aircraft instabilities due the wake vortex (turbulences) encounters (SESAR Consortium, 2008; Cook, 2010).Furthermore, FLYSAFE and WAKE4D projects also stated the importance of taking into account wake vortex hazards not onlyin take-off and landing operations but also in cruise traffic (Desenfans et al., 2007; Group for Research in Turbulence andVertical Flows, 2010). The implementation of temporal distances for safety factors could provide important benefits to min-imize airspace latent capacity.
An efficient CD algorithm is presented in this paper, which allows managing either spatial or temporal distances, withexcellent computational performance, and storing the whole state space of the problem (characteristic that opens the pos-sibility to design new CR algorithms that take advantage of this crucial information). In this paper, the algorithm has been setto work with time-distance separations by using a time-representation of the wake vortex generated by aircraft. The CR willtake relevant data from the state-space stored in the CD in order to generate resolution maneuvers that solve the conflicts.
3. CD algorithm
3.1. Representation and storage of spatio-temporal information
The main objective of a CD system is to detect conflicts between trajectories and inform the CR system. The CR systemwillneed a minimum amount of information about the conflicts for the resolution process. The idea behind the CD proposed inthis paper is similar to take a ‘‘snapshot’’ of the scenario in where the aircraft execute their trajectories, providing in thismanner to the CR system with the required information.
As happens with digital snapshots, first it is necessary to discretize the information in order to make it computer-tractableand store it in a digital database. Discretization will convert the continuous space of a certain scenario into a set of pixels thatstores a discrete approximation of the original scenario.
It is important to point out that, by sorting the 4D information in a spatial structure, the information of a certain place canbe easily stored/recovered into/from a database applying simple mathematical formulas. Concretely, the (discretized) unitsof information of the database can be sorted according to the (discretized) spatial positions they occupy in the space.
This kind of databases storing relevant information (i.e. state-space variables) sorted according to its position within acertain spatial region is called Spatial Data Structures (SDS) (Samet, 1989, 1990; Reynolds, 2000, 2006). The name of theSDS reflects the fact that the proper structure of the database stores the information about the spatial position (the coordi-nate) that a certain element/object occupies in the real world.
Fig. 4 shows a graphical representation of an SDS. A SDS can be thought as a mesh of discrete points distributed along thespace in where the state-space ‘‘snapshot’’ is going to be taken. Note that inside the three-dimensional SDS (the cube) thereis a discretized 4D trajectory (different 3D positions of an aircraft in different discrete time steps).
In this research the sampling rate to discretize the temporal dimension of a trajectory is constant, so the spatial distancebetween positions depends only on the speed of the aircraft, whereas the relative positions of the waypoints depend on theheading of the aircraft.
Wake vortex generated from these trajectories can be bounded, in a given instant, with a time-stamped sphere containing(within a required confidence interval) all the air turbulences that the other aircraft should avoid. Note that this 4D object(the sphere) does not represent the real position and rotation of a vortex but rather it represents a ‘‘container’’ or ‘‘envelope’’that fits the worst-cases of the vortex behavior in a given instant, within reasonable certainty, considering the stochasticnature of this physical phenomenon. In addition, since an aircraft flying is always moving, and since the vortex is dynami-cally generated with the movement of the aircraft, the time-projection of the sphere describes a cylindrical shape (or ‘‘tube’’)when the real and continuous trajectory is considered instead of the discrete one. Note that modeling the wake vortex with a4D enveloping tube is an oversimplification of the real behavior of the underlying fluid dynamics of this phenomenon, butthis basic shape (the tube) provides with enough precision about the vortex behavior for conflict detection purposes, while atthe same time it ensures a good algorithm performance due to the avoidance of complex fluid dynamic simulations. Similar
Fig. 3. Lateral view of vortex.
S. Ruiz et al. / Transportation Research Part C 26 (2013) 396–417 399
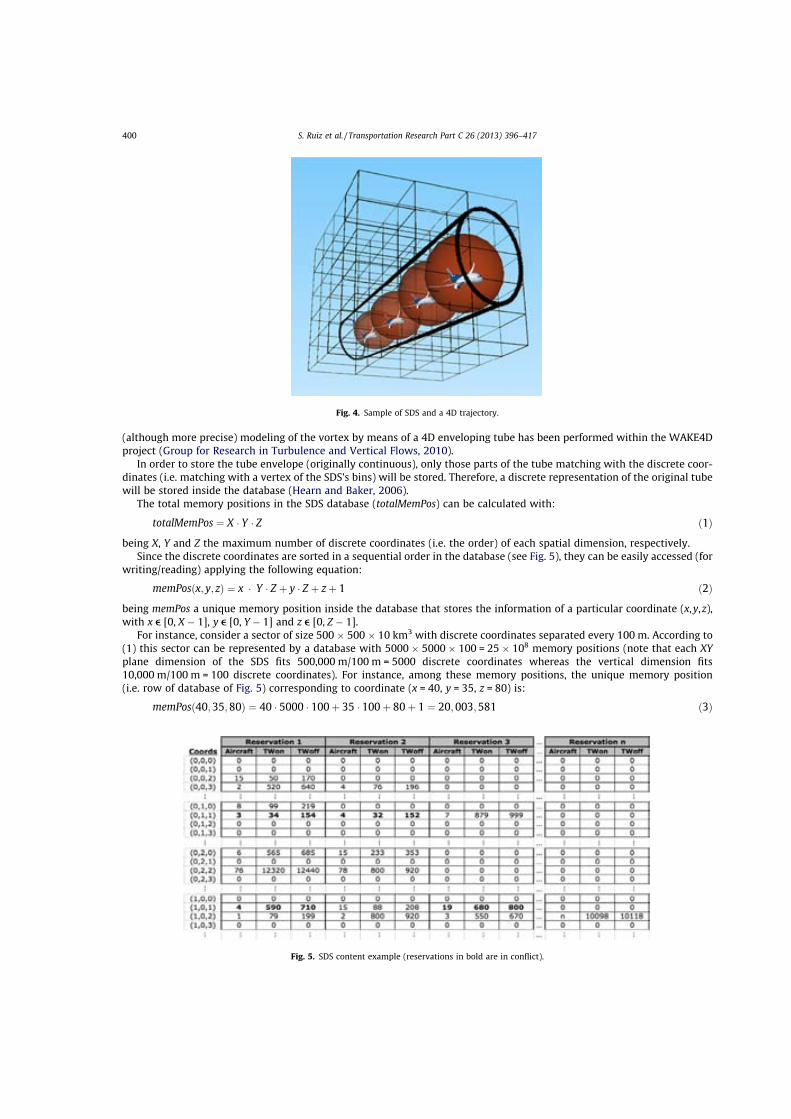
(although more precise) modeling of the vortex by means of a 4D enveloping tube has been performed within the WAKE4Dproject (Group for Research in Turbulence and Vertical Flows, 2010).
In order to store the tube envelope (originally continuous), only those parts of the tube matching with the discrete coor-dinates (i.e. matching with a vertex of the SDS’s bins) will be stored. Therefore, a discrete representation of the original tubewill be stored inside the database (Hearn and Baker, 2006).
The total memory positions in the SDS database (totalMemPos) can be calculated with:
totalMemPos " X # Y # Z $1%
being X, Y and Z the maximum number of discrete coordinates (i.e. the order) of each spatial dimension, respectively.Since the discrete coordinates are sorted in a sequential order in the database (see Fig. 5), they can be easily accessed (for
writing/reading) applying the following equation:
memPos$x; y; z% " x # Y # Z & y # Z & z& 1 $2%
being memPos a unique memory position inside the database that stores the information of a particular coordinate (x,y,z),with x e [0, X ' 1], y e [0, Y ' 1] and z e [0, Z ' 1].
For instance, consider a sector of size 500 ! 500 ! 10 km3 with discrete coordinates separated every 100 m. According to(1) this sector can be represented by a database with 5000 ! 5000 ! 100 = 25 ! 108 memory positions (note that each XYplane dimension of the SDS fits 500,000 m/100 m = 5000 discrete coordinates whereas the vertical dimension fits10,000 m/100 m = 100 discrete coordinates). For instance, among these memory positions, the unique memory position(i.e. row of database of Fig. 5) corresponding to coordinate (x = 40, y = 35, z = 80) is:
memPos$40;35;80% " 40 # 5000 # 100& 35 # 100& 80& 1 " 20; 003;581 $3%
Fig. 4. Sample of SDS and a 4D trajectory.
Fig. 5. SDS content example (reservations in bold are in conflict).
400 S. Ruiz et al. / Transportation Research Part C 26 (2013) 396–417
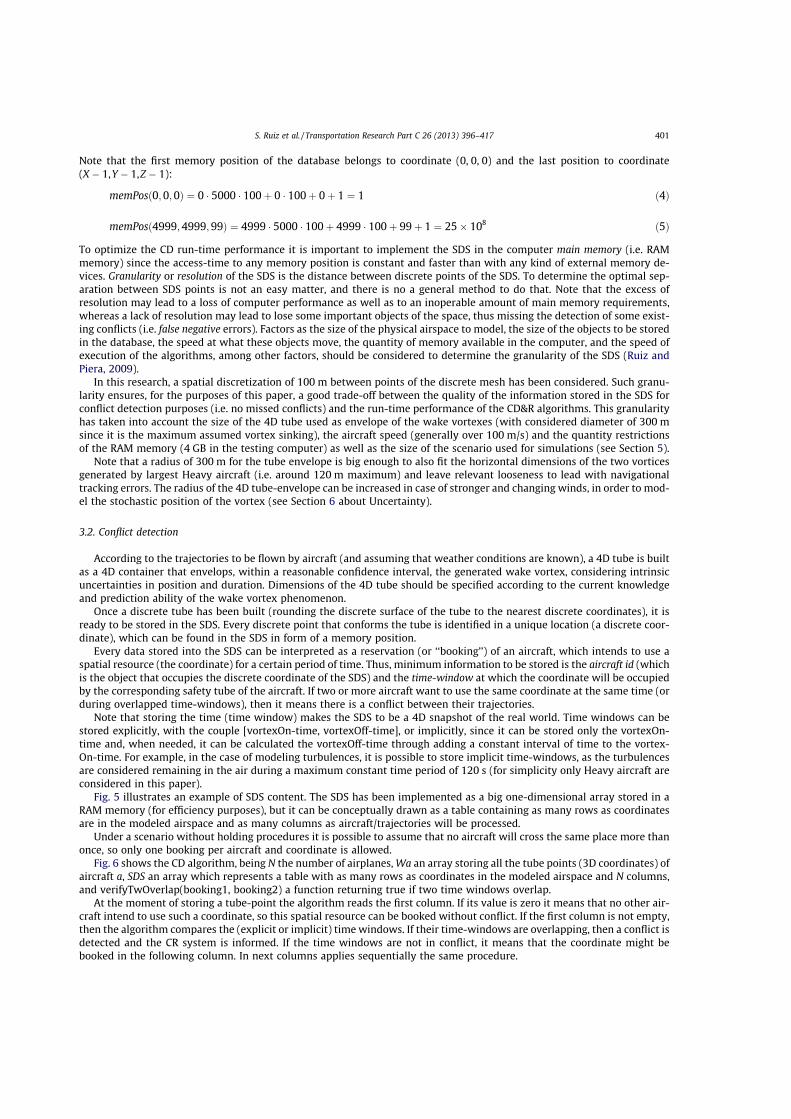
Note that the first memory position of the database belongs to coordinate (0, 0, 0) and the last position to coordinate(X ' 1,Y ' 1,Z ' 1):
memPos$0;0;0% " 0 # 5000 # 100& 0 # 100& 0& 1 " 1 $4%
memPos$4999;4999;99% " 4999 # 5000 # 100& 4999 # 100& 99& 1 " 25! 108 $5%
To optimize the CD run-time performance it is important to implement the SDS in the computer main memory (i.e. RAMmemory) since the access-time to any memory position is constant and faster than with any kind of external memory de-vices. Granularity or resolution of the SDS is the distance between discrete points of the SDS. To determine the optimal sep-aration between SDS points is not an easy matter, and there is no a general method to do that. Note that the excess ofresolution may lead to a loss of computer performance as well as to an inoperable amount of main memory requirements,whereas a lack of resolution may lead to lose some important objects of the space, thus missing the detection of some exist-ing conflicts (i.e. false negative errors). Factors as the size of the physical airspace to model, the size of the objects to be storedin the database, the speed at what these objects move, the quantity of memory available in the computer, and the speed ofexecution of the algorithms, among other factors, should be considered to determine the granularity of the SDS (Ruiz andPiera, 2009).
In this research, a spatial discretization of 100 m between points of the discrete mesh has been considered. Such granu-larity ensures, for the purposes of this paper, a good trade-off between the quality of the information stored in the SDS forconflict detection purposes (i.e. no missed conflicts) and the run-time performance of the CD&R algorithms. This granularityhas taken into account the size of the 4D tube used as envelope of the wake vortexes (with considered diameter of 300 msince it is the maximum assumed vortex sinking), the aircraft speed (generally over 100 m/s) and the quantity restrictionsof the RAM memory (4 GB in the testing computer) as well as the size of the scenario used for simulations (see Section 5).
Note that a radius of 300 m for the tube envelope is big enough to also fit the horizontal dimensions of the two vorticesgenerated by largest Heavy aircraft (i.e. around 120 m maximum) and leave relevant looseness to lead with navigationaltracking errors. The radius of the 4D tube-envelope can be increased in case of stronger and changing winds, in order to mod-el the stochastic position of the vortex (see Section 6 about Uncertainty).
3.2. Conflict detection
According to the trajectories to be flown by aircraft (and assuming that weather conditions are known), a 4D tube is builtas a 4D container that envelops, within a reasonable confidence interval, the generated wake vortex, considering intrinsicuncertainties in position and duration. Dimensions of the 4D tube should be specified according to the current knowledgeand prediction ability of the wake vortex phenomenon.
Once a discrete tube has been built (rounding the discrete surface of the tube to the nearest discrete coordinates), it isready to be stored in the SDS. Every discrete point that conforms the tube is identified in a unique location (a discrete coor-dinate), which can be found in the SDS in form of a memory position.
Every data stored into the SDS can be interpreted as a reservation (or ‘‘booking’’) of an aircraft, which intends to use aspatial resource (the coordinate) for a certain period of time. Thus, minimum information to be stored is the aircraft id (whichis the object that occupies the discrete coordinate of the SDS) and the time-window at which the coordinate will be occupiedby the corresponding safety tube of the aircraft. If two or more aircraft want to use the same coordinate at the same time (orduring overlapped time-windows), then it means there is a conflict between their trajectories.
Note that storing the time (time window) makes the SDS to be a 4D snapshot of the real world. Time windows can bestored explicitly, with the couple [vortexOn-time, vortexOff-time], or implicitly, since it can be stored only the vortexOn-time and, when needed, it can be calculated the vortexOff-time through adding a constant interval of time to the vortex-On-time. For example, in the case of modeling turbulences, it is possible to store implicit time-windows, as the turbulencesare considered remaining in the air during a maximum constant time period of 120 s (for simplicity only Heavy aircraft areconsidered in this paper).
Fig. 5 illustrates an example of SDS content. The SDS has been implemented as a big one-dimensional array stored in aRAM memory (for efficiency purposes), but it can be conceptually drawn as a table containing as many rows as coordinatesare in the modeled airspace and as many columns as aircraft/trajectories will be processed.
Under a scenario without holding procedures it is possible to assume that no aircraft will cross the same place more thanonce, so only one booking per aircraft and coordinate is allowed.
Fig. 6 shows the CD algorithm, being N the number of airplanes,Wa an array storing all the tube points (3D coordinates) ofaircraft a, SDS an array which represents a table with as many rows as coordinates in the modeled airspace and N columns,and verifyTwOverlap(booking1, booking2) a function returning true if two time windows overlap.
At the moment of storing a tube-point the algorithm reads the first column. If its value is zero it means that no other air-craft intend to use such a coordinate, so this spatial resource can be booked without conflict. If the first column is not empty,then the algorithm compares the (explicit or implicit) time windows. If their time-windows are overlapping, then a conflict isdetected and the CR system is informed. If the time windows are not in conflict, it means that the coordinate might bebooked in the following column. In next columns applies sequentially the same procedure.
S. Ruiz et al. / Transportation Research Part C 26 (2013) 396–417 401
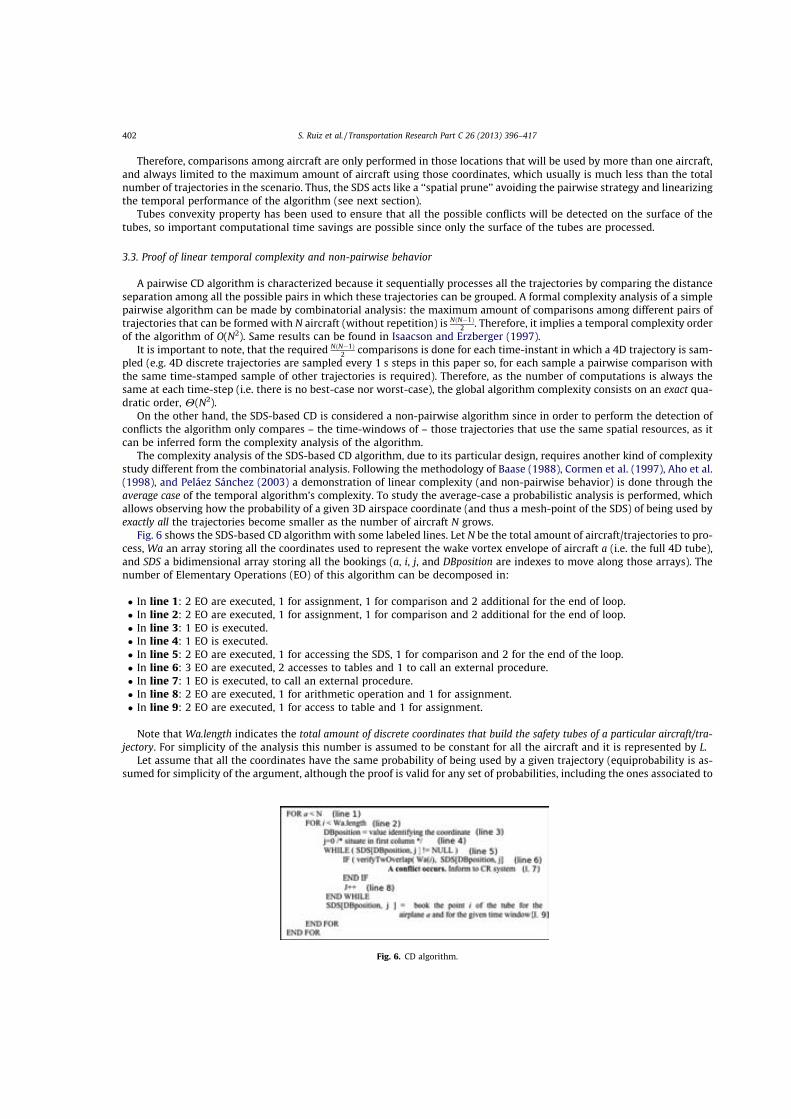
Therefore, comparisons among aircraft are only performed in those locations that will be used by more than one aircraft,and always limited to the maximum amount of aircraft using those coordinates, which usually is much less than the totalnumber of trajectories in the scenario. Thus, the SDS acts like a ‘‘spatial prune’’ avoiding the pairwise strategy and linearizingthe temporal performance of the algorithm (see next section).
Tubes convexity property has been used to ensure that all the possible conflicts will be detected on the surface of thetubes, so important computational time savings are possible since only the surface of the tubes are processed.
3.3. Proof of linear temporal complexity and non-pairwise behavior
A pairwise CD algorithm is characterized because it sequentially processes all the trajectories by comparing the distanceseparation among all the possible pairs in which these trajectories can be grouped. A formal complexity analysis of a simplepairwise algorithm can be made by combinatorial analysis: the maximum amount of comparisons among different pairs oftrajectories that can be formed with N aircraft (without repetition) is N$N'1%
2 . Therefore, it implies a temporal complexity orderof the algorithm of O(N2). Same results can be found in Isaacson and Erzberger (1997).
It is important to note, that the required N$N'1%2 comparisons is done for each time-instant in which a 4D trajectory is sam-
pled (e.g. 4D discrete trajectories are sampled every 1 s steps in this paper so, for each sample a pairwise comparison withthe same time-stamped sample of other trajectories is required). Therefore, as the number of computations is always thesame at each time-step (i.e. there is no best-case nor worst-case), the global algorithm complexity consists on an exact qua-dratic order, H(N2).
On the other hand, the SDS-based CD is considered a non-pairwise algorithm since in order to perform the detection ofconflicts the algorithm only compares – the time-windows of – those trajectories that use the same spatial resources, as itcan be inferred form the complexity analysis of the algorithm.
The complexity analysis of the SDS-based CD algorithm, due to its particular design, requires another kind of complexitystudy different from the combinatorial analysis. Following the methodology of Baase (1988), Cormen et al. (1997), Aho et al.(1998), and Peláez Sánchez (2003) a demonstration of linear complexity (and non-pairwise behavior) is done through theaverage case of the temporal algorithm’s complexity. To study the average-case a probabilistic analysis is performed, whichallows observing how the probability of a given 3D airspace coordinate (and thus a mesh-point of the SDS) of being used byexactly all the trajectories become smaller as the number of aircraft N grows.
Fig. 6 shows the SDS-based CD algorithm with some labeled lines. Let N be the total amount of aircraft/trajectories to pro-cess, Wa an array storing all the coordinates used to represent the wake vortex envelope of aircraft a (i.e. the full 4D tube),and SDS a bidimensional array storing all the bookings (a, i, j, and DBposition are indexes to move along those arrays). Thenumber of Elementary Operations (EO) of this algorithm can be decomposed in:
( In line 1: 2 EO are executed, 1 for assignment, 1 for comparison and 2 additional for the end of loop.( In line 2: 2 EO are executed, 1 for assignment, 1 for comparison and 2 additional for the end of loop.( In line 3: 1 EO is executed.( In line 4: 1 EO is executed.( In line 5: 2 EO are executed, 1 for accessing the SDS, 1 for comparison and 2 for the end of the loop.( In line 6: 3 EO are executed, 2 accesses to tables and 1 to call an external procedure.( In line 7: 1 EO is executed, to call an external procedure.( In line 8: 2 EO are executed, 1 for arithmetic operation and 1 for assignment.( In line 9: 2 EO are executed, 1 for access to table and 1 for assignment.
Note that Wa.length indicates the total amount of discrete coordinates that build the safety tubes of a particular aircraft/tra-jectory. For simplicity of the analysis this number is assumed to be constant for all the aircraft and it is represented by L.
Let assume that all the coordinates have the same probability of being used by a given trajectory (equiprobability is as-sumed for simplicity of the argument, although the proof is valid for any set of probabilities, including the ones associated to
Fig. 6. CD algorithm.
402 S. Ruiz et al. / Transportation Research Part C 26 (2013) 396–417
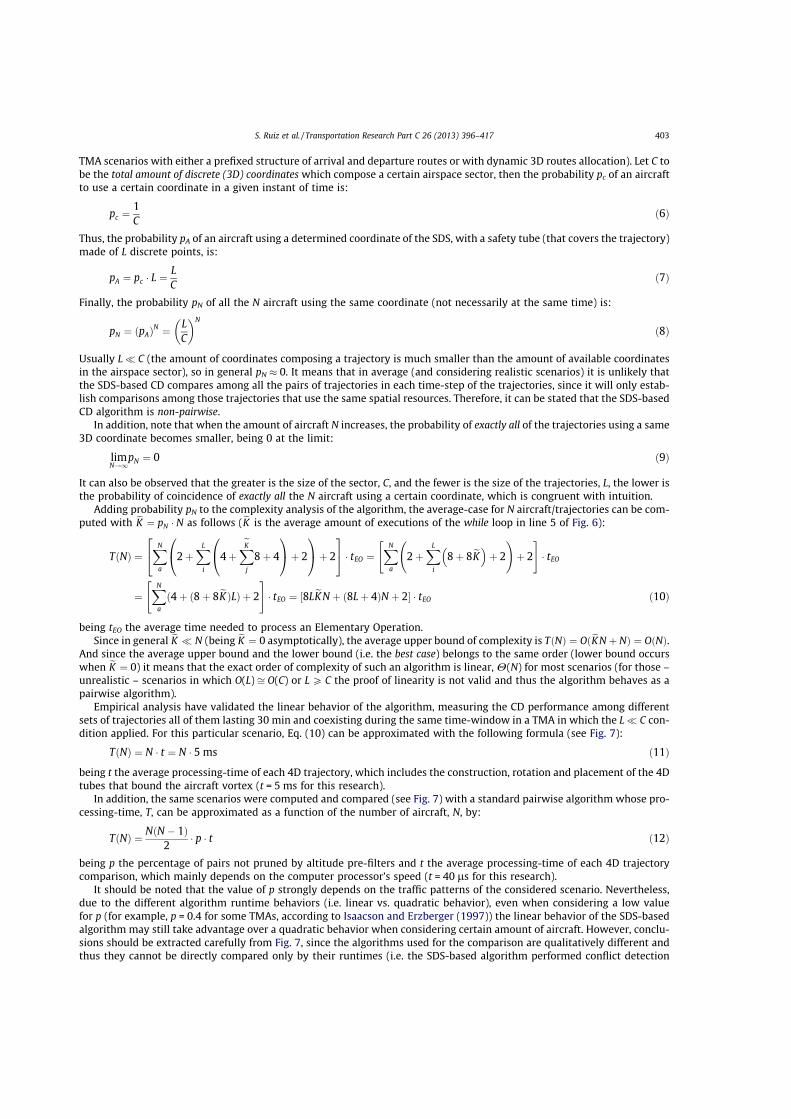
TMA scenarios with either a prefixed structure of arrival and departure routes or with dynamic 3D routes allocation). Let C tobe the total amount of discrete (3D) coordinates which compose a certain airspace sector, then the probability pc of an aircraftto use a certain coordinate in a given instant of time is:
pc "1C
$6%
Thus, the probability pA of an aircraft using a determined coordinate of the SDS, with a safety tube (that covers the trajectory)made of L discrete points, is:
pA " pc # L " LC
$7%
Finally, the probability pN of all the N aircraft using the same coordinate (not necessarily at the same time) is:
pN " $pA%N " L
C
! "N
$8%
Usually L) C (the amount of coordinates composing a trajectory is much smaller than the amount of available coordinatesin the airspace sector), so in general pN * 0. It means that in average (and considering realistic scenarios) it is unlikely thatthe SDS-based CD compares among all the pairs of trajectories in each time-step of the trajectories, since it will only estab-lish comparisons among those trajectories that use the same spatial resources. Therefore, it can be stated that the SDS-basedCD algorithm is non-pairwise.
In addition, note that when the amount of aircraft N increases, the probability of exactly all of the trajectories using a same3D coordinate becomes smaller, being 0 at the limit:
limN!1
pN " 0 $9%
It can also be observed that the greater is the size of the sector, C, and the fewer is the size of the trajectories, L, the lower isthe probability of coincidence of exactly all the N aircraft using a certain coordinate, which is congruent with intuition.
Adding probability pN to the complexity analysis of the algorithm, the average-case for N aircraft/trajectories can be com-puted with eK " pN # N as follows (eK is the average amount of executions of the while loop in line 5 of Fig. 6):
T$N% "XN
a
2&XL
i
4&XeK
j
8& 4
0
@
1
A& 2
0
@
1
A& 2
2
4
3
5 # tEO "XN
a
2&XL
i
8& 8eK# $
& 2
!
& 2
" #
# tEO
"XN
a
$4& $8& 8eK %L% & 2
" #
# tEO " +8LeKN & $8L& 4%N & 2, # tEO $10%
being tEO the average time needed to process an Elementary Operation.Since in general eK ) N (being eK " 0 asymptotically), the average upper bound of complexity is T$N% " O$eKN & N% " O$N%.
And since the average upper bound and the lower bound (i.e. the best case) belongs to the same order (lower bound occurswhen eK " 0) it means that the exact order of complexity of such an algorithm is linear,H(N) for most scenarios (for those –unrealistic – scenarios in which O(L) - O(C) or LP C the proof of linearity is not valid and thus the algorithm behaves as apairwise algorithm).
Empirical analysis have validated the linear behavior of the algorithm, measuring the CD performance among differentsets of trajectories all of them lasting 30 min and coexisting during the same time-window in a TMA in which the L) C con-dition applied. For this particular scenario, Eq. (10) can be approximated with the following formula (see Fig. 7):
T$N% " N # t " N # 5 ms $11%
being t the average processing-time of each 4D trajectory, which includes the construction, rotation and placement of the 4Dtubes that bound the aircraft vortex (t = 5 ms for this research).
In addition, the same scenarios were computed and compared (see Fig. 7) with a standard pairwise algorithm whose pro-cessing-time, T, can be approximated as a function of the number of aircraft, N, by:
T$N% " N$N ' 1%2
# p # t $12%
being p the percentage of pairs not pruned by altitude pre-filters and t the average processing-time of each 4D trajectorycomparison, which mainly depends on the computer processor’s speed (t = 40 ls for this research).
It should be noted that the value of p strongly depends on the traffic patterns of the considered scenario. Nevertheless,due to the different algorithm runtime behaviors (i.e. linear vs. quadratic behavior), even when considering a low valuefor p (for example, p = 0.4 for some TMAs, according to Isaacson and Erzberger (1997)) the linear behavior of the SDS-basedalgorithm may still take advantage over a quadratic behavior when considering certain amount of aircraft. However, conclu-sions should be extracted carefully from Fig. 7, since the algorithms used for the comparison are qualitatively different andthus they cannot be directly compared only by their runtimes (i.e. the SDS-based algorithm performed conflict detection
S. Ruiz et al. / Transportation Research Part C 26 (2013) 396–417 403
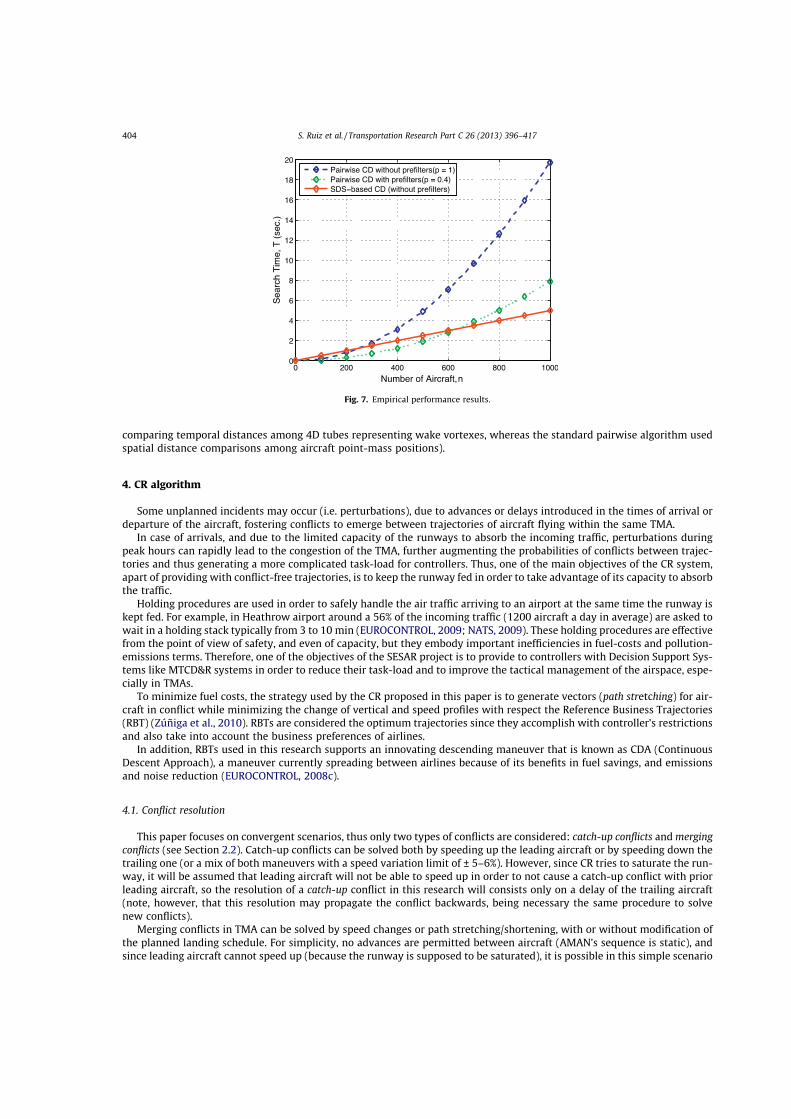
comparing temporal distances among 4D tubes representing wake vortexes, whereas the standard pairwise algorithm usedspatial distance comparisons among aircraft point-mass positions).
4. CR algorithm
Some unplanned incidents may occur (i.e. perturbations), due to advances or delays introduced in the times of arrival ordeparture of the aircraft, fostering conflicts to emerge between trajectories of aircraft flying within the same TMA.
In case of arrivals, and due to the limited capacity of the runways to absorb the incoming traffic, perturbations duringpeak hours can rapidly lead to the congestion of the TMA, further augmenting the probabilities of conflicts between trajec-tories and thus generating a more complicated task-load for controllers. Thus, one of the main objectives of the CR system,apart of providing with conflict-free trajectories, is to keep the runway fed in order to take advantage of its capacity to absorbthe traffic.
Holding procedures are used in order to safely handle the air traffic arriving to an airport at the same time the runway iskept fed. For example, in Heathrow airport around a 56% of the incoming traffic (1200 aircraft a day in average) are asked towait in a holding stack typically from 3 to 10 min (EUROCONTROL, 2009; NATS, 2009). These holding procedures are effectivefrom the point of view of safety, and even of capacity, but they embody important inefficiencies in fuel-costs and pollution-emissions terms. Therefore, one of the objectives of the SESAR project is to provide to controllers with Decision Support Sys-tems like MTCD&R systems in order to reduce their task-load and to improve the tactical management of the airspace, espe-cially in TMAs.
To minimize fuel costs, the strategy used by the CR proposed in this paper is to generate vectors (path stretching) for air-craft in conflict while minimizing the change of vertical and speed profiles with respect the Reference Business Trajectories(RBT) (Zúñiga et al., 2010). RBTs are considered the optimum trajectories since they accomplish with controller’s restrictionsand also take into account the business preferences of airlines.
In addition, RBTs used in this research supports an innovating descending maneuver that is known as CDA (ContinuousDescent Approach), a maneuver currently spreading between airlines because of its benefits in fuel savings, and emissionsand noise reduction (EUROCONTROL, 2008c).
4.1. Conflict resolution
This paper focuses on convergent scenarios, thus only two types of conflicts are considered: catch-up conflicts andmergingconflicts (see Section 2.2). Catch-up conflicts can be solved both by speeding up the leading aircraft or by speeding down thetrailing one (or a mix of both maneuvers with a speed variation limit of ± 5–6%). However, since CR tries to saturate the run-way, it will be assumed that leading aircraft will not be able to speed up in order to not cause a catch-up conflict with priorleading aircraft, so the resolution of a catch-up conflict in this research will consists only on a delay of the trailing aircraft(note, however, that this resolution may propagate the conflict backwards, being necessary the same procedure to solvenew conflicts).
Merging conflicts in TMA can be solved by speed changes or path stretching/shortening, with or without modification ofthe planned landing schedule. For simplicity, no advances are permitted between aircraft (AMAN’s sequence is static), andsince leading aircraft cannot speed up (because the runway is supposed to be saturated), it is possible in this simple scenario
Fig. 7. Empirical performance results.
404 S. Ruiz et al. / Transportation Research Part C 26 (2013) 396–417
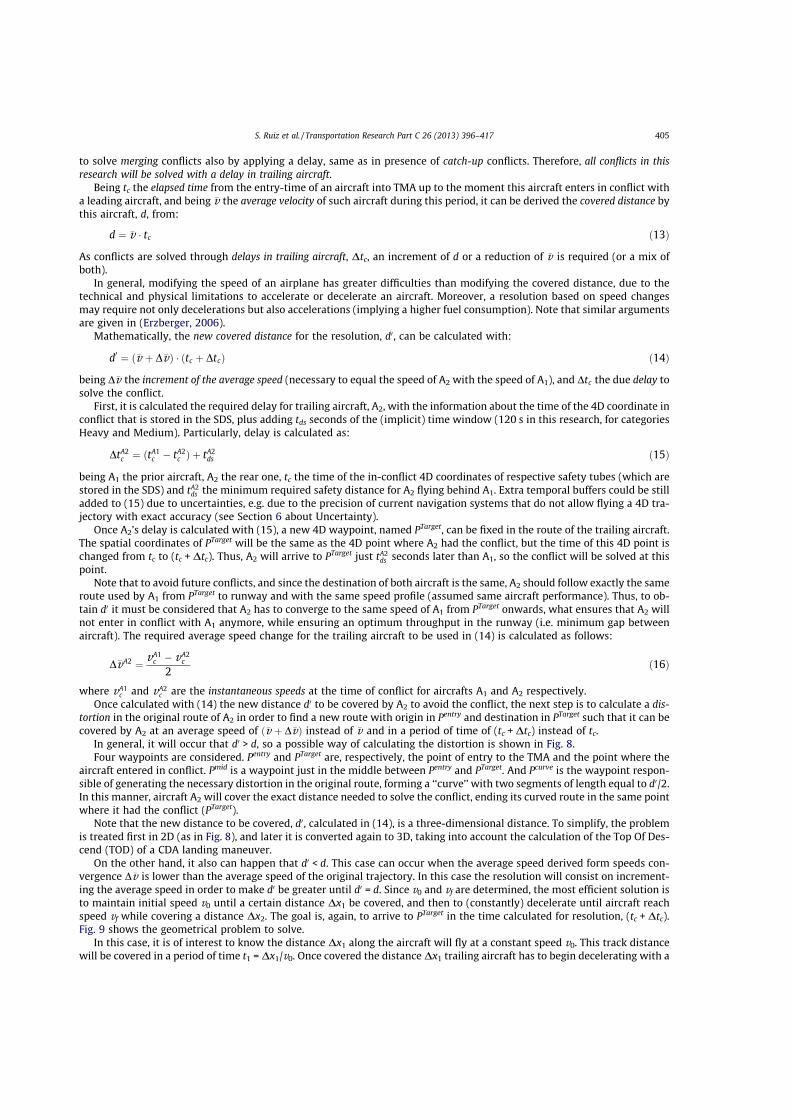
to solve merging conflicts also by applying a delay, same as in presence of catch-up conflicts. Therefore, all conflicts in thisresearch will be solved with a delay in trailing aircraft.
Being tc the elapsed time from the entry-time of an aircraft into TMA up to the moment this aircraft enters in conflict witha leading aircraft, and being !v the average velocity of such aircraft during this period, it can be derived the covered distance bythis aircraft, d, from:
d " !v # tc $13%
As conflicts are solved through delays in trailing aircraft, Dtc, an increment of d or a reduction of !v is required (or a mix ofboth).
In general, modifying the speed of an airplane has greater difficulties than modifying the covered distance, due to thetechnical and physical limitations to accelerate or decelerate an aircraft. Moreover, a resolution based on speed changesmay require not only decelerations but also accelerations (implying a higher fuel consumption). Note that similar argumentsare given in (Erzberger, 2006).
Mathematically, the new covered distance for the resolution, d0, can be calculated with:
d0 " $!v & D!v% # $tc & Dtc% $14%
being D!v the increment of the average speed (necessary to equal the speed of A2 with the speed of A1), and Dtc the due delay tosolve the conflict.
First, it is calculated the required delay for trailing aircraft, A2, with the information about the time of the 4D coordinate inconflict that is stored in the SDS, plus adding tds seconds of the (implicit) time window (120 s in this research, for categoriesHeavy and Medium). Particularly, delay is calculated as:
DtA2c " $tA1c ' tA2c % & tA2ds $15%
being A1 the prior aircraft, A2 the rear one, tc the time of the in-conflict 4D coordinates of respective safety tubes (which arestored in the SDS) and tA2ds the minimum required safety distance for A2 flying behind A1. Extra temporal buffers could be stilladded to (15) due to uncertainties, e.g. due to the precision of current navigation systems that do not allow flying a 4D tra-jectory with exact accuracy (see Section 6 about Uncertainty).
Once A2’s delay is calculated with (15), a new 4D waypoint, named PTarget, can be fixed in the route of the trailing aircraft.The spatial coordinates of PTarget will be the same as the 4D point where A2 had the conflict, but the time of this 4D point ischanged from tc to (tc + Dtc). Thus, A2 will arrive to PTarget just tA2ds seconds later than A1, so the conflict will be solved at thispoint.
Note that to avoid future conflicts, and since the destination of both aircraft is the same, A2 should follow exactly the sameroute used by A1 from PTarget to runway and with the same speed profile (assumed same aircraft performance). Thus, to ob-tain d0 it must be considered that A2 has to converge to the same speed of A1 from PTarget onwards, what ensures that A2 willnot enter in conflict with A1 anymore, while ensuring an optimum throughput in the runway (i.e. minimum gap betweenaircraft). The required average speed change for the trailing aircraft to be used in (14) is calculated as follows:
D!vA2 " vA1c ' vA2
c
2$16%
where vA1c and vA2
c are the instantaneous speeds at the time of conflict for aircrafts A1 and A2 respectively.Once calculated with (14) the new distance d0 to be covered by A2 to avoid the conflict, the next step is to calculate a dis-
tortion in the original route of A2 in order to find a new route with origin in Pentry and destination in PTarget such that it can becovered by A2 at an average speed of $!v & D!v% instead of !v and in a period of time of (tc +Dtc) instead of tc.
In general, it will occur that d0 > d, so a possible way of calculating the distortion is shown in Fig. 8.Four waypoints are considered. Pentry and PTarget are, respectively, the point of entry to the TMA and the point where the
aircraft entered in conflict. Pmid is a waypoint just in the middle between Pentry and PTarget. And Pcurve is the waypoint respon-sible of generating the necessary distortion in the original route, forming a ‘‘curve’’ with two segments of length equal to d0/2.In this manner, aircraft A2 will cover the exact distance needed to solve the conflict, ending its curved route in the same pointwhere it had the conflict (PTarget).
Note that the new distance to be covered, d0, calculated in (14), is a three-dimensional distance. To simplify, the problemis treated first in 2D (as in Fig. 8), and later it is converted again to 3D, taking into account the calculation of the Top Of Des-cend (TOD) of a CDA landing maneuver.
On the other hand, it also can happen that d0 < d. This case can occur when the average speed derived form speeds con-vergence D!v is lower than the average speed of the original trajectory. In this case the resolution will consist on increment-ing the average speed in order to make d0 be greater until d0 = d. Since v0 and vf are determined, the most efficient solution isto maintain initial speed v0 until a certain distance Dx1 be covered, and then to (constantly) decelerate until aircraft reachspeed vf while covering a distance Dx2. The goal is, again, to arrive to PTarget in the time calculated for resolution, (tc + Dtc).Fig. 9 shows the geometrical problem to solve.
In this case, it is of interest to know the distance Dx1 along the aircraft will fly at a constant speed v0. This track distancewill be covered in a period of time t1 = Dx1/v0. Once covered the distanceDx1 trailing aircraft has to begin decelerating with a
S. Ruiz et al. / Transportation Research Part C 26 (2013) 396–417 405
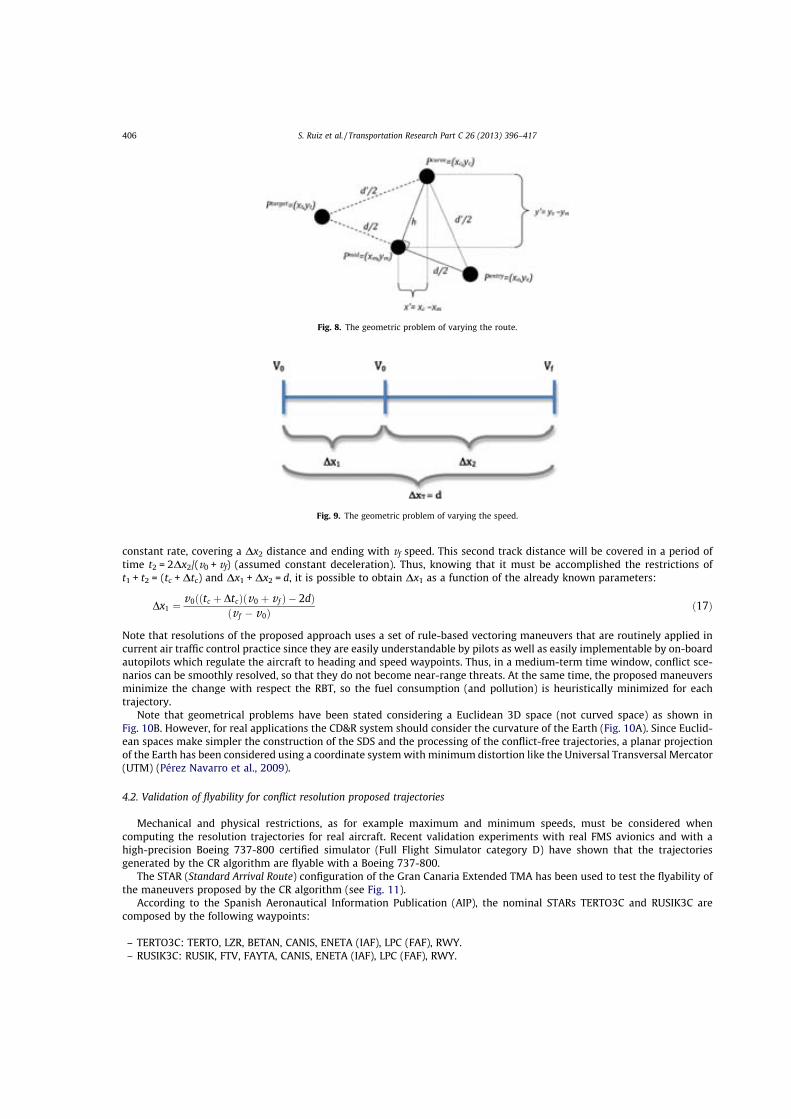
constant rate, covering a Dx2 distance and ending with vf speed. This second track distance will be covered in a period oftime t2 = 2Dx2/(v0 + vf) (assumed constant deceleration). Thus, knowing that it must be accomplished the restrictions oft1 + t2 = (tc +Dtc) and Dx1 + Dx2 = d, it is possible to obtain Dx1 as a function of the already known parameters:
Dx1 "v0$$tc & Dtc%$v0 & v f % ' 2d%
$v f ' v0%$17%
Note that resolutions of the proposed approach uses a set of rule-based vectoring maneuvers that are routinely applied incurrent air traffic control practice since they are easily understandable by pilots as well as easily implementable by on-boardautopilots which regulate the aircraft to heading and speed waypoints. Thus, in a medium-term time window, conflict sce-narios can be smoothly resolved, so that they do not become near-range threats. At the same time, the proposed maneuversminimize the change with respect the RBT, so the fuel consumption (and pollution) is heuristically minimized for eachtrajectory.
Note that geometrical problems have been stated considering a Euclidean 3D space (not curved space) as shown inFig. 10B. However, for real applications the CD&R system should consider the curvature of the Earth (Fig. 10A). Since Euclid-ean spaces make simpler the construction of the SDS and the processing of the conflict-free trajectories, a planar projectionof the Earth has been considered using a coordinate systemwith minimum distortion like the Universal Transversal Mercator(UTM) (Pérez Navarro et al., 2009).
4.2. Validation of flyability for conflict resolution proposed trajectories
Mechanical and physical restrictions, as for example maximum and minimum speeds, must be considered whencomputing the resolution trajectories for real aircraft. Recent validation experiments with real FMS avionics and with ahigh-precision Boeing 737-800 certified simulator (Full Flight Simulator category D) have shown that the trajectoriesgenerated by the CR algorithm are flyable with a Boeing 737-800.
The STAR (Standard Arrival Route) configuration of the Gran Canaria Extended TMA has been used to test the flyability ofthe maneuvers proposed by the CR algorithm (see Fig. 11).
According to the Spanish Aeronautical Information Publication (AIP), the nominal STARs TERTO3C and RUSIK3C arecomposed by the following waypoints:
– TERTO3C: TERTO, LZR, BETAN, CANIS, ENETA (IAF), LPC (FAF), RWY.– RUSIK3C: RUSIK, FTV, FAYTA, CANIS, ENETA (IAF), LPC (FAF), RWY.
Fig. 8. The geometric problem of varying the route.
Fig. 9. The geometric problem of varying the speed.
406 S. Ruiz et al. / Transportation Research Part C 26 (2013) 396–417
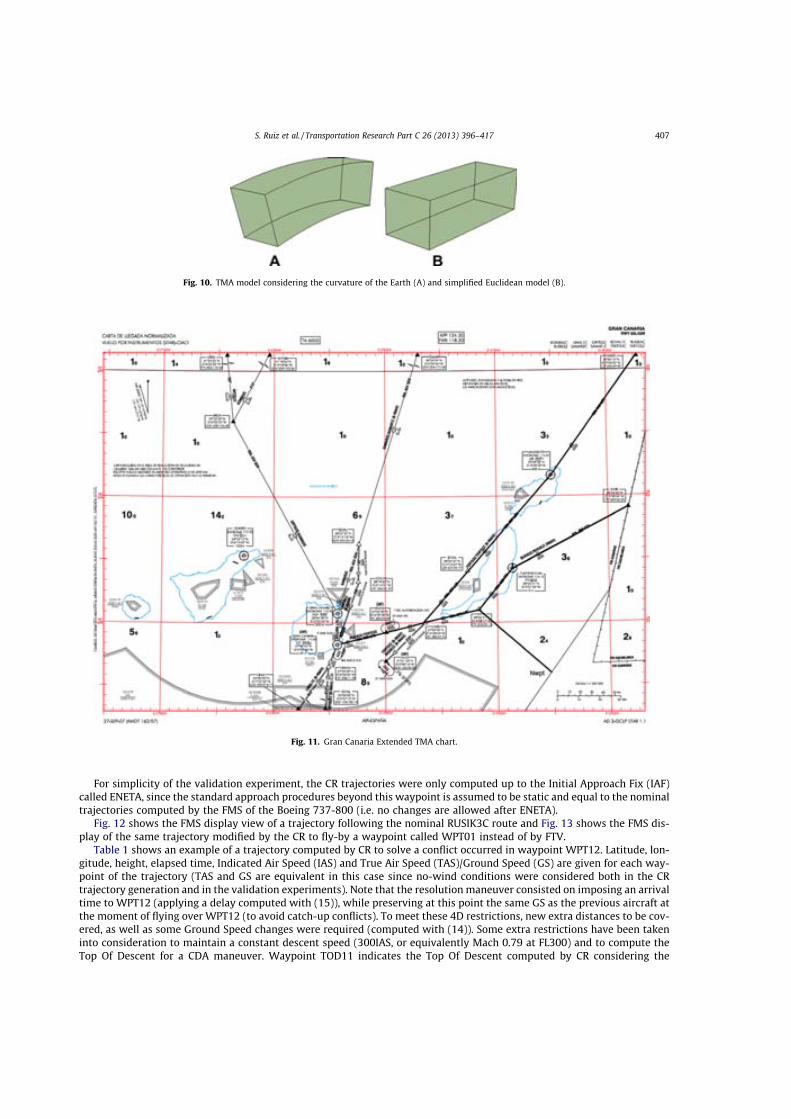
For simplicity of the validation experiment, the CR trajectories were only computed up to the Initial Approach Fix (IAF)called ENETA, since the standard approach procedures beyond this waypoint is assumed to be static and equal to the nominaltrajectories computed by the FMS of the Boeing 737-800 (i.e. no changes are allowed after ENETA).
Fig. 12 shows the FMS display view of a trajectory following the nominal RUSIK3C route and Fig. 13 shows the FMS dis-play of the same trajectory modified by the CR to fly-by a waypoint called WPT01 instead of by FTV.
Table 1 shows an example of a trajectory computed by CR to solve a conflict occurred in waypoint WPT12. Latitude, lon-gitude, height, elapsed time, Indicated Air Speed (IAS) and True Air Speed (TAS)/Ground Speed (GS) are given for each way-point of the trajectory (TAS and GS are equivalent in this case since no-wind conditions were considered both in the CRtrajectory generation and in the validation experiments). Note that the resolutionmaneuver consisted on imposing an arrivaltime to WPT12 (applying a delay computed with (15)), while preserving at this point the same GS as the previous aircraft atthe moment of flying over WPT12 (to avoid catch-up conflicts). To meet these 4D restrictions, new extra distances to be cov-ered, as well as some Ground Speed changes were required (computed with (14)). Some extra restrictions have been takeninto consideration to maintain a constant descent speed (300IAS, or equivalently Mach 0.79 at FL300) and to compute theTop Of Descent for a CDA maneuver. Waypoint TOD11 indicates the Top Of Descent computed by CR considering the
Fig. 10. TMA model considering the curvature of the Earth (A) and simplified Euclidean model (B).
Fig. 11. Gran Canaria Extended TMA chart.
S. Ruiz et al. / Transportation Research Part C 26 (2013) 396–417 407
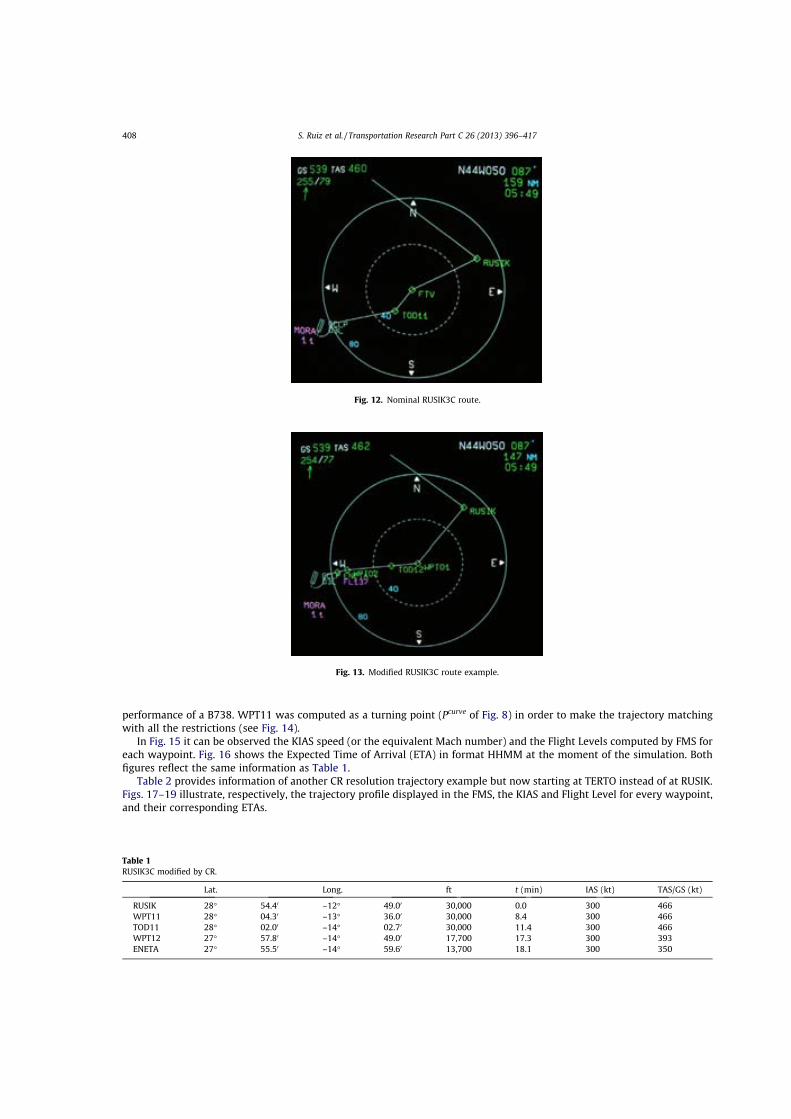
performance of a B738. WPT11 was computed as a turning point (Pcurve of Fig. 8) in order to make the trajectory matchingwith all the restrictions (see Fig. 14).
In Fig. 15 it can be observed the KIAS speed (or the equivalent Mach number) and the Flight Levels computed by FMS foreach waypoint. Fig. 16 shows the Expected Time of Arrival (ETA) in format HHMM at the moment of the simulation. Bothfigures reflect the same information as Table 1.
Table 2 provides information of another CR resolution trajectory example but now starting at TERTO instead of at RUSIK.Figs. 17–19 illustrate, respectively, the trajectory profile displayed in the FMS, the KIAS and Flight Level for every waypoint,and their corresponding ETAs.
Fig. 12. Nominal RUSIK3C route.
Fig. 13. Modified RUSIK3C route example.
Table 1RUSIK3C modified by CR.
Lat. Long. ft t (min) IAS (kt) TAS/GS (kt)
RUSIK 28" 54.40 –12" 49.00 30,000 0.0 300 466WPT11 28" 04.30 –13" 36.00 30,000 8.4 300 466TOD11 28" 02.00 –14" 02.70 30,000 11.4 300 466WPT12 27" 57.80 –14" 49.00 17,700 17.3 300 393ENETA 27" 55.50 –14" 59.60 13,700 18.1 300 350
408 S. Ruiz et al. / Transportation Research Part C 26 (2013) 396–417
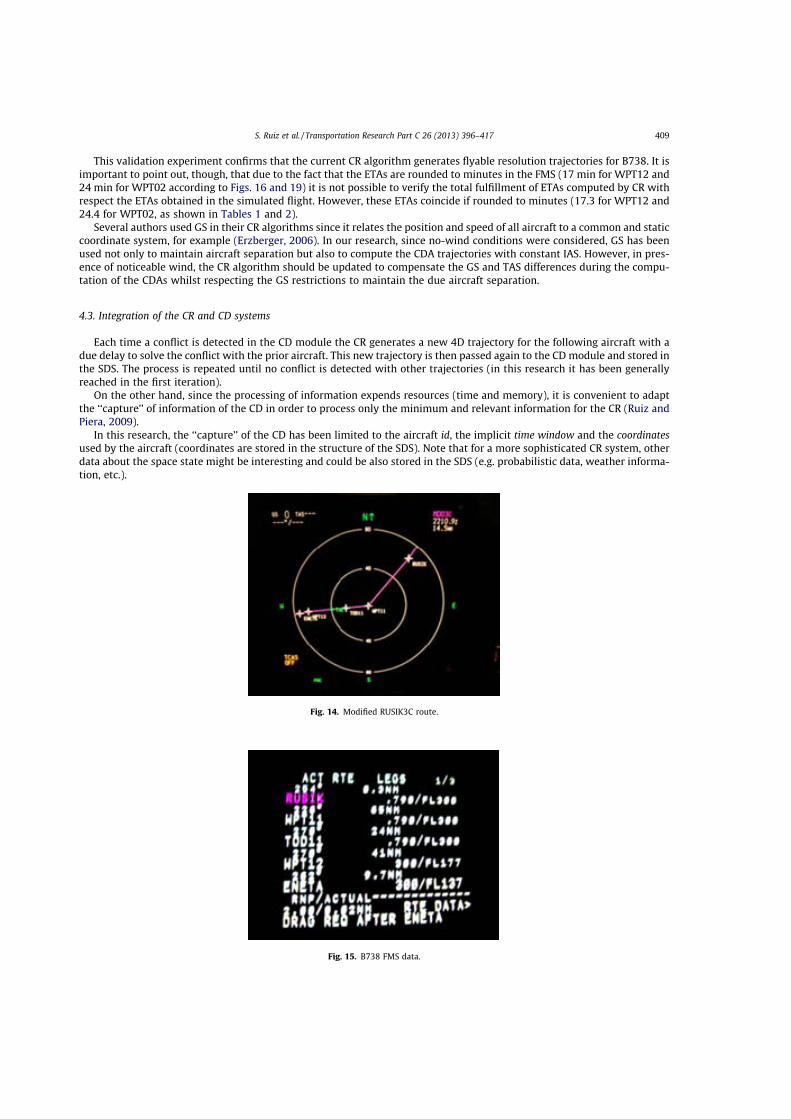
This validation experiment confirms that the current CR algorithm generates flyable resolution trajectories for B738. It isimportant to point out, though, that due to the fact that the ETAs are rounded to minutes in the FMS (17 min for WPT12 and24 min for WPT02 according to Figs. 16 and 19) it is not possible to verify the total fulfillment of ETAs computed by CR withrespect the ETAs obtained in the simulated flight. However, these ETAs coincide if rounded to minutes (17.3 for WPT12 and24.4 for WPT02, as shown in Tables 1 and 2).
Several authors used GS in their CR algorithms since it relates the position and speed of all aircraft to a common and staticcoordinate system, for example (Erzberger, 2006). In our research, since no-wind conditions were considered, GS has beenused not only to maintain aircraft separation but also to compute the CDA trajectories with constant IAS. However, in pres-ence of noticeable wind, the CR algorithm should be updated to compensate the GS and TAS differences during the compu-tation of the CDAs whilst respecting the GS restrictions to maintain the due aircraft separation.
4.3. Integration of the CR and CD systems
Each time a conflict is detected in the CD module the CR generates a new 4D trajectory for the following aircraft with adue delay to solve the conflict with the prior aircraft. This new trajectory is then passed again to the CD module and stored inthe SDS. The process is repeated until no conflict is detected with other trajectories (in this research it has been generallyreached in the first iteration).
On the other hand, since the processing of information expends resources (time and memory), it is convenient to adaptthe ‘‘capture’’ of information of the CD in order to process only the minimum and relevant information for the CR (Ruiz andPiera, 2009).
In this research, the ‘‘capture’’ of the CD has been limited to the aircraft id, the implicit time window and the coordinatesused by the aircraft (coordinates are stored in the structure of the SDS). Note that for a more sophisticated CR system, otherdata about the space state might be interesting and could be also stored in the SDS (e.g. probabilistic data, weather informa-tion, etc.).
Fig. 14. Modified RUSIK3C route.
Fig. 15. B738 FMS data.
S. Ruiz et al. / Transportation Research Part C 26 (2013) 396–417 409
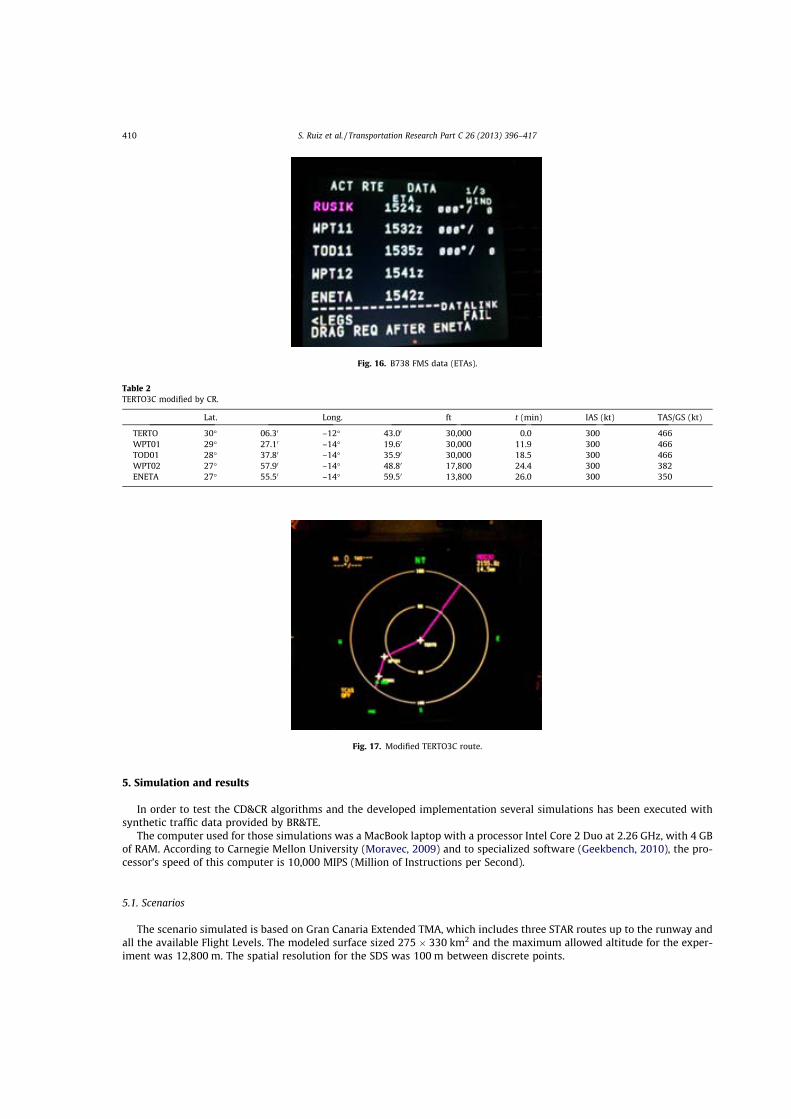
5. Simulation and results
In order to test the CD&CR algorithms and the developed implementation several simulations has been executed withsynthetic traffic data provided by BR&TE.
The computer used for those simulations was a MacBook laptop with a processor Intel Core 2 Duo at 2.26 GHz, with 4 GBof RAM. According to Carnegie Mellon University (Moravec, 2009) and to specialized software (Geekbench, 2010), the pro-cessor’s speed of this computer is 10,000 MIPS (Million of Instructions per Second).
5.1. Scenarios
The scenario simulated is based on Gran Canaria Extended TMA, which includes three STAR routes up to the runway andall the available Flight Levels. The modeled surface sized 275 ! 330 km2 and the maximum allowed altitude for the exper-iment was 12,800 m. The spatial resolution for the SDS was 100 m between discrete points.
Fig. 16. B738 FMS data (ETAs).
Table 2TERTO3C modified by CR.
Lat. Long. ft t (min) IAS (kt) TAS/GS (kt)
TERTO 30" 06.30 –12" 43.00 30,000 0.0 300 466WPT01 29" 27.10 –14" 19.60 30,000 11.9 300 466TOD01 28" 37.80 –14" 35.90 30,000 18.5 300 466WPT02 27" 57.90 –14" 48.80 17,800 24.4 300 382ENETA 27" 55.50 –14" 59.50 13,800 26.0 300 350
Fig. 17. Modified TERTO3C route.
410 S. Ruiz et al. / Transportation Research Part C 26 (2013) 396–417
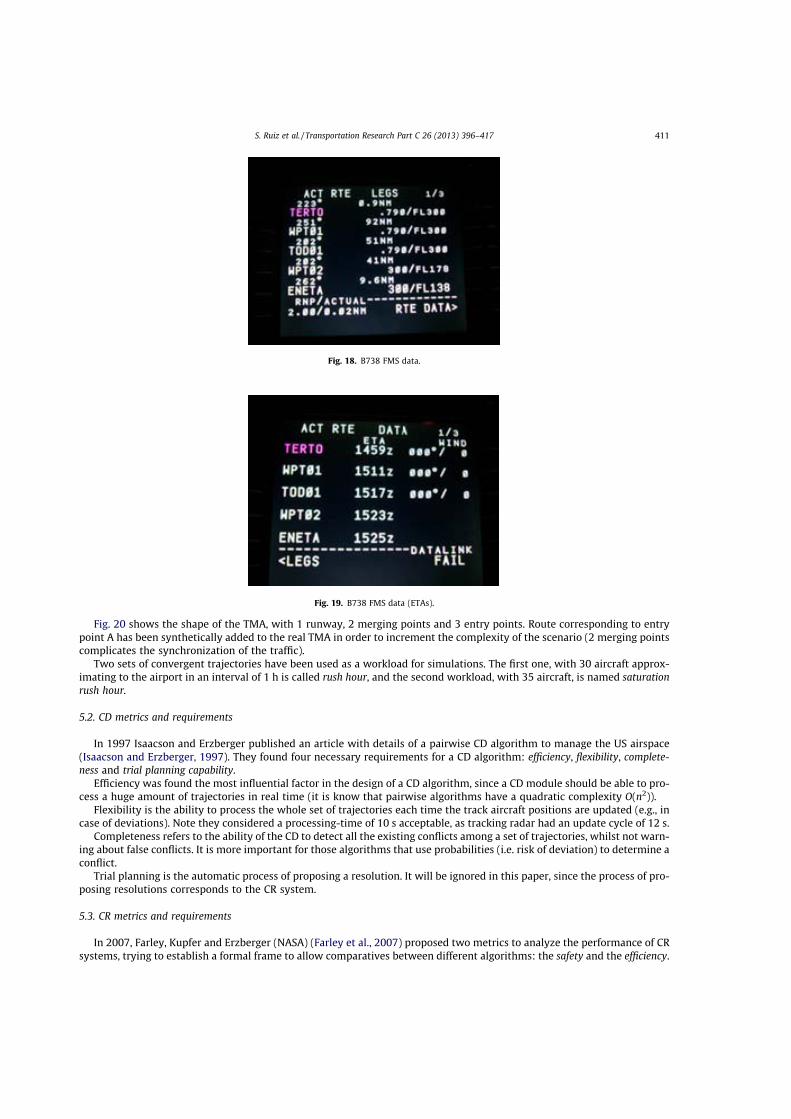
Fig. 20 shows the shape of the TMA, with 1 runway, 2 merging points and 3 entry points. Route corresponding to entrypoint A has been synthetically added to the real TMA in order to increment the complexity of the scenario (2 merging pointscomplicates the synchronization of the traffic).
Two sets of convergent trajectories have been used as a workload for simulations. The first one, with 30 aircraft approx-imating to the airport in an interval of 1 h is called rush hour, and the second workload, with 35 aircraft, is named saturationrush hour.
5.2. CD metrics and requirements
In 1997 Isaacson and Erzberger published an article with details of a pairwise CD algorithm to manage the US airspace(Isaacson and Erzberger, 1997). They found four necessary requirements for a CD algorithm: efficiency, flexibility, complete-ness and trial planning capability.
Efficiency was found the most influential factor in the design of a CD algorithm, since a CD module should be able to pro-cess a huge amount of trajectories in real time (it is know that pairwise algorithms have a quadratic complexity O(n2)).
Flexibility is the ability to process the whole set of trajectories each time the track aircraft positions are updated (e.g., incase of deviations). Note they considered a processing-time of 10 s acceptable, as tracking radar had an update cycle of 12 s.
Completeness refers to the ability of the CD to detect all the existing conflicts among a set of trajectories, whilst not warn-ing about false conflicts. It is more important for those algorithms that use probabilities (i.e. risk of deviation) to determine aconflict.
Trial planning is the automatic process of proposing a resolution. It will be ignored in this paper, since the process of pro-posing resolutions corresponds to the CR system.
5.3. CR metrics and requirements
In 2007, Farley, Kupfer and Erzberger (NASA) (Farley et al., 2007) proposed two metrics to analyze the performance of CRsystems, trying to establish a formal frame to allow comparatives between different algorithms: the safety and the efficiency.
Fig. 18. B738 FMS data.
Fig. 19. B738 FMS data (ETAs).
S. Ruiz et al. / Transportation Research Part C 26 (2013) 396–417 411
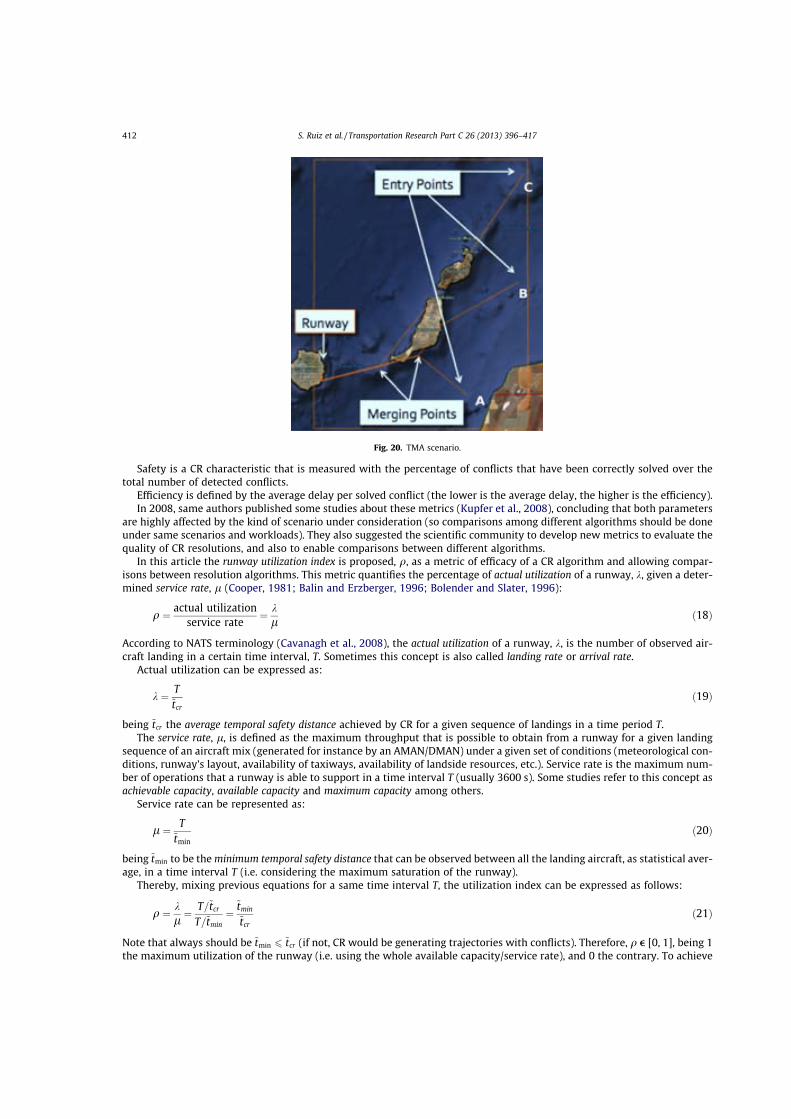
Safety is a CR characteristic that is measured with the percentage of conflicts that have been correctly solved over thetotal number of detected conflicts.
Efficiency is defined by the average delay per solved conflict (the lower is the average delay, the higher is the efficiency).In 2008, same authors published some studies about these metrics (Kupfer et al., 2008), concluding that both parameters
are highly affected by the kind of scenario under consideration (so comparisons among different algorithms should be doneunder same scenarios and workloads). They also suggested the scientific community to develop new metrics to evaluate thequality of CR resolutions, and also to enable comparisons between different algorithms.
In this article the runway utilization index is proposed, q, as a metric of efficacy of a CR algorithm and allowing compar-isons between resolution algorithms. This metric quantifies the percentage of actual utilization of a runway, k, given a deter-mined service rate, l (Cooper, 1981; Balin and Erzberger, 1996; Bolender and Slater, 1996):
q " actual utilizationservice rate
" kl $18%
According to NATS terminology (Cavanagh et al., 2008), the actual utilization of a runway, k, is the number of observed air-craft landing in a certain time interval, T. Sometimes this concept is also called landing rate or arrival rate.
Actual utilization can be expressed as:
k " T~tcr
$19%
being ~tcr the average temporal safety distance achieved by CR for a given sequence of landings in a time period T.The service rate, l, is defined as the maximum throughput that is possible to obtain from a runway for a given landing
sequence of an aircraft mix (generated for instance by an AMAN/DMAN) under a given set of conditions (meteorological con-ditions, runway’s layout, availability of taxiways, availability of landside resources, etc.). Service rate is the maximum num-ber of operations that a runway is able to support in a time interval T (usually 3600 s). Some studies refer to this concept asachievable capacity, available capacity and maximum capacity among others.
Service rate can be represented as:
l " T~tmin
$20%
being ~tmin to be theminimum temporal safety distance that can be observed between all the landing aircraft, as statistical aver-age, in a time interval T (i.e. considering the maximum saturation of the runway).
Thereby, mixing previous equations for a same time interval T, the utilization index can be expressed as follows:
q " kl " T=~tcr
T=~tmin"~tmin
~tcr$21%
Note that always should be ~tmin 6 ~tcr (if not, CR would be generating trajectories with conflicts). Therefore, q e [0, 1], being 1the maximum utilization of the runway (i.e. using the whole available capacity/service rate), and 0 the contrary. To achieve
Fig. 20. TMA scenario.
412 S. Ruiz et al. / Transportation Research Part C 26 (2013) 396–417
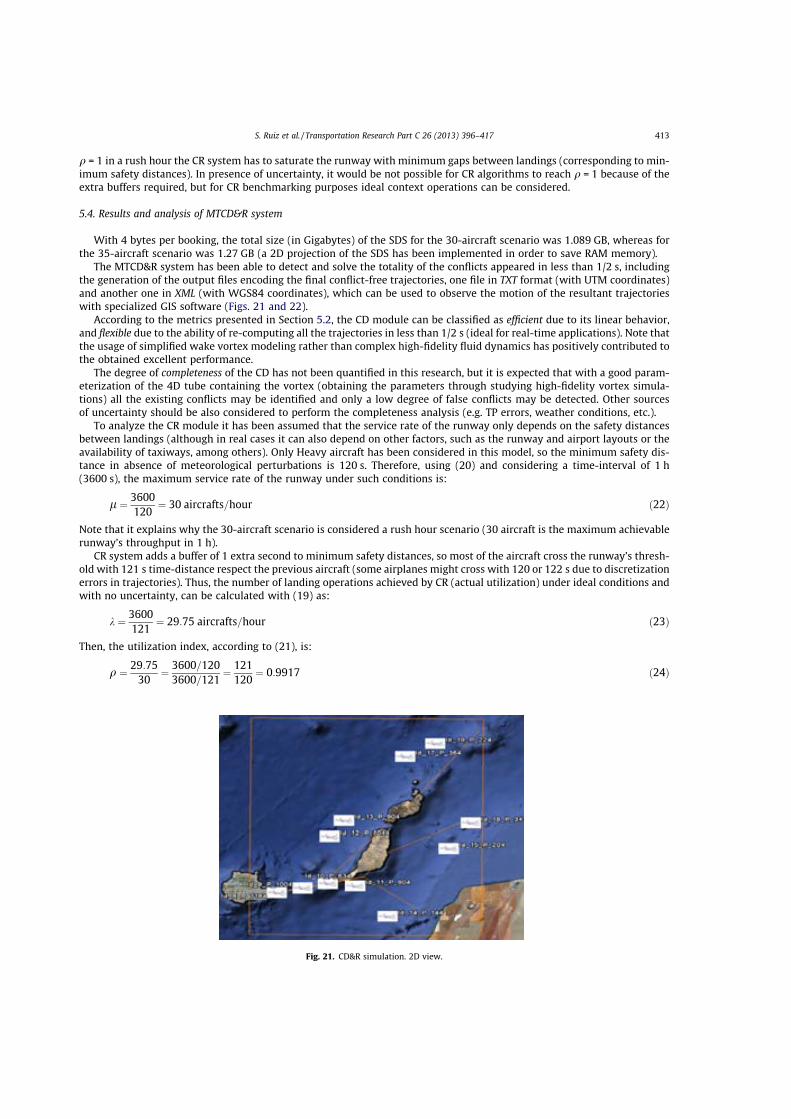
q = 1 in a rush hour the CR system has to saturate the runway with minimum gaps between landings (corresponding to min-imum safety distances). In presence of uncertainty, it would be not possible for CR algorithms to reach q = 1 because of theextra buffers required, but for CR benchmarking purposes ideal context operations can be considered.
5.4. Results and analysis of MTCD&R system
With 4 bytes per booking, the total size (in Gigabytes) of the SDS for the 30-aircraft scenario was 1.089 GB, whereas forthe 35-aircraft scenario was 1.27 GB (a 2D projection of the SDS has been implemented in order to save RAM memory).
The MTCD&R system has been able to detect and solve the totality of the conflicts appeared in less than 1/2 s, includingthe generation of the output files encoding the final conflict-free trajectories, one file in TXT format (with UTM coordinates)and another one in XML (with WGS84 coordinates), which can be used to observe the motion of the resultant trajectorieswith specialized GIS software (Figs. 21 and 22).
According to the metrics presented in Section 5.2, the CD module can be classified as efficient due to its linear behavior,and flexible due to the ability of re-computing all the trajectories in less than 1/2 s (ideal for real-time applications). Note thatthe usage of simplified wake vortex modeling rather than complex high-fidelity fluid dynamics has positively contributed tothe obtained excellent performance.
The degree of completeness of the CD has not been quantified in this research, but it is expected that with a good param-eterization of the 4D tube containing the vortex (obtaining the parameters through studying high-fidelity vortex simula-tions) all the existing conflicts may be identified and only a low degree of false conflicts may be detected. Other sourcesof uncertainty should be also considered to perform the completeness analysis (e.g. TP errors, weather conditions, etc.).
To analyze the CR module it has been assumed that the service rate of the runway only depends on the safety distancesbetween landings (although in real cases it can also depend on other factors, such as the runway and airport layouts or theavailability of taxiways, among others). Only Heavy aircraft has been considered in this model, so the minimum safety dis-tance in absence of meteorological perturbations is 120 s. Therefore, using (20) and considering a time-interval of 1 h(3600 s), the maximum service rate of the runway under such conditions is:
l " 3600120
" 30 aircrafts=hour $22%
Note that it explains why the 30-aircraft scenario is considered a rush hour scenario (30 aircraft is the maximum achievablerunway’s throughput in 1 h).
CR system adds a buffer of 1 extra second to minimum safety distances, so most of the aircraft cross the runway’s thresh-old with 121 s time-distance respect the previous aircraft (some airplanes might cross with 120 or 122 s due to discretizationerrors in trajectories). Thus, the number of landing operations achieved by CR (actual utilization) under ideal conditions andwith no uncertainty, can be calculated with (19) as:
k " 3600121
" 29:75 aircrafts=hour $23%
Then, the utilization index, according to (21), is:
q " 29:7530
" 3600=1203600=121
" 121120
" 0:9917 $24%
Fig. 21. CD&R simulation. 2D view.
S. Ruiz et al. / Transportation Research Part C 26 (2013) 396–417 413
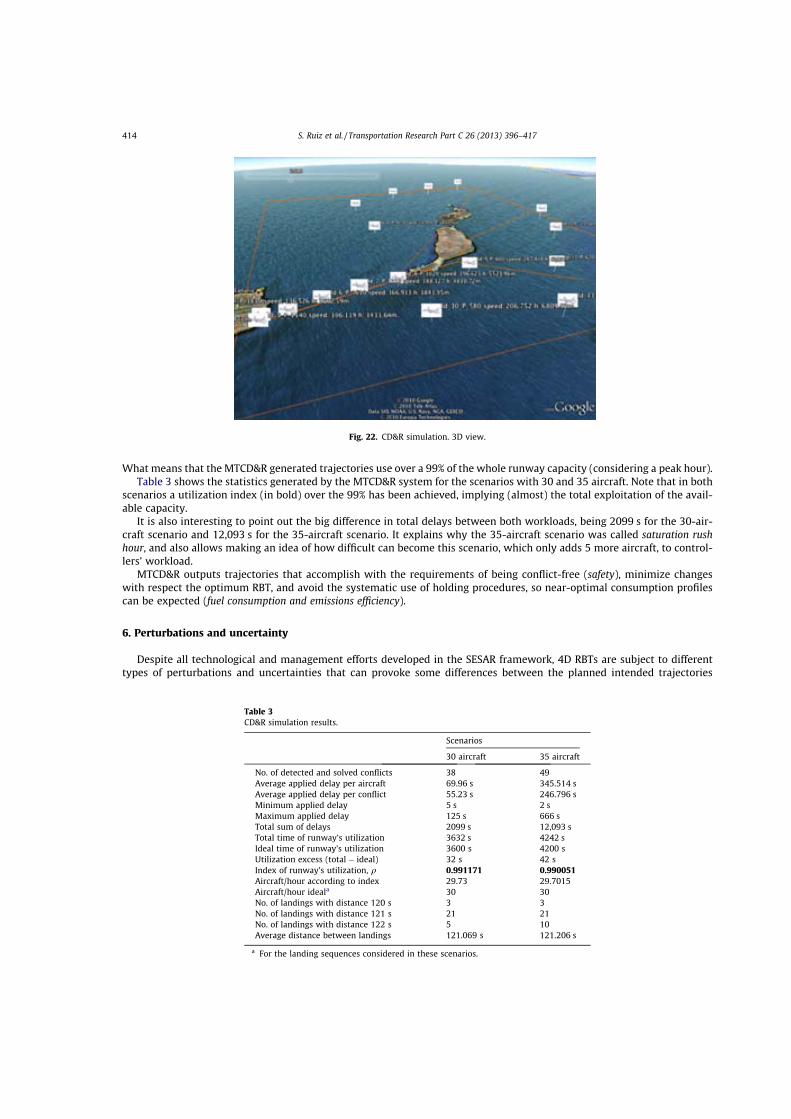
What means that the MTCD&R generated trajectories use over a 99% of the whole runway capacity (considering a peak hour).Table 3 shows the statistics generated by the MTCD&R system for the scenarios with 30 and 35 aircraft. Note that in both
scenarios a utilization index (in bold) over the 99% has been achieved, implying (almost) the total exploitation of the avail-able capacity.
It is also interesting to point out the big difference in total delays between both workloads, being 2099 s for the 30-air-craft scenario and 12,093 s for the 35-aircraft scenario. It explains why the 35-aircraft scenario was called saturation rushhour, and also allows making an idea of how difficult can become this scenario, which only adds 5 more aircraft, to control-lers’ workload.
MTCD&R outputs trajectories that accomplish with the requirements of being conflict-free (safety), minimize changeswith respect the optimum RBT, and avoid the systematic use of holding procedures, so near-optimal consumption profilescan be expected (fuel consumption and emissions efficiency).
6. Perturbations and uncertainty
Despite all technological and management efforts developed in the SESAR framework, 4D RBTs are subject to differenttypes of perturbations and uncertainties that can provoke some differences between the planned intended trajectories
Fig. 22. CD&R simulation. 3D view.
Table 3CD&R simulation results.
Scenarios
30 aircraft 35 aircraft
No. of detected and solved conflicts 38 49Average applied delay per aircraft 69.96 s 345.514 sAverage applied delay per conflict 55.23 s 246.796 sMinimum applied delay 5 s 2 sMaximum applied delay 125 s 666 sTotal sum of delays 2099 s 12,093 sTotal time of runway’s utilization 3632 s 4242 sIdeal time of runway’s utilization 3600 s 4200 sUtilization excess (total ' ideal) 32 s 42 sIndex of runway’s utilization, q 0.991171 0.990051Aircraft/hour according to index 29.73 29.7015Aircraft/hour ideala 30 30No. of landings with distance 120 s 3 3No. of landings with distance 121 s 21 21No. of landings with distance 122 s 5 10Average distance between landings 121.069 s 121.206 s
a For the landing sequences considered in these scenarios.
414 S. Ruiz et al. / Transportation Research Part C 26 (2013) 396–417
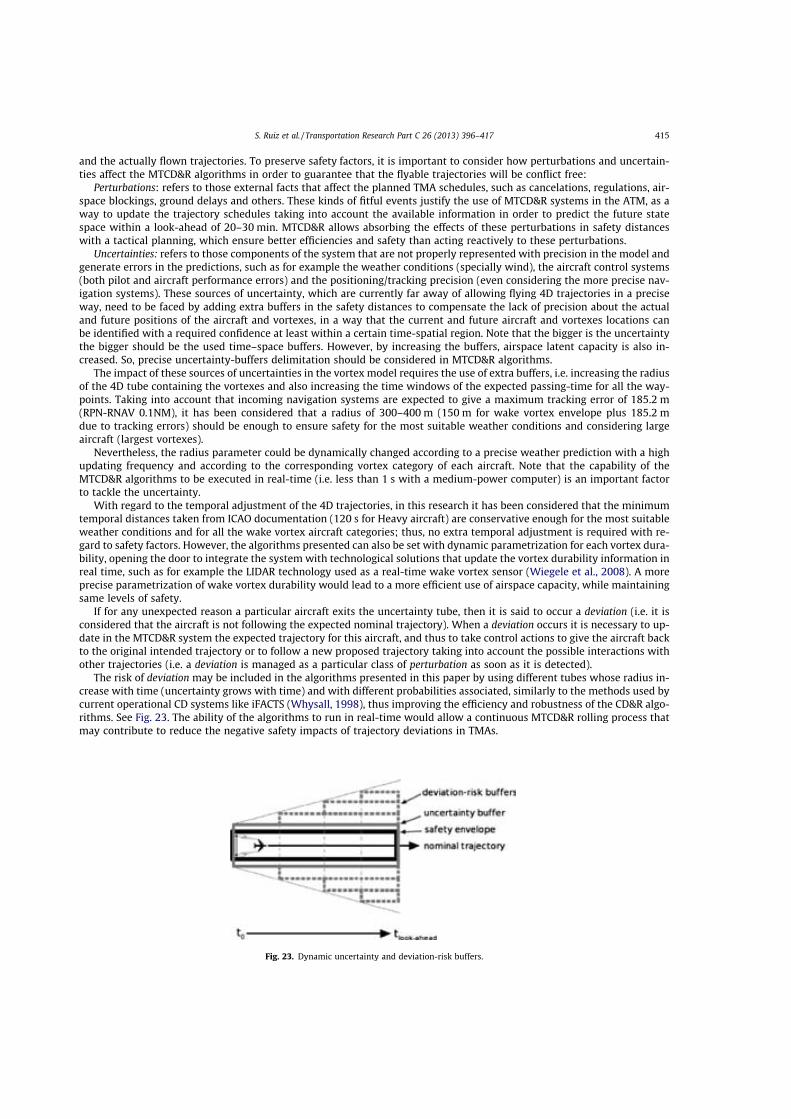
and the actually flown trajectories. To preserve safety factors, it is important to consider how perturbations and uncertain-ties affect the MTCD&R algorithms in order to guarantee that the flyable trajectories will be conflict free:
Perturbations: refers to those external facts that affect the planned TMA schedules, such as cancelations, regulations, air-space blockings, ground delays and others. These kinds of fitful events justify the use of MTCD&R systems in the ATM, as away to update the trajectory schedules taking into account the available information in order to predict the future statespace within a look-ahead of 20–30 min. MTCD&R allows absorbing the effects of these perturbations in safety distanceswith a tactical planning, which ensure better efficiencies and safety than acting reactively to these perturbations.
Uncertainties: refers to those components of the system that are not properly represented with precision in the model andgenerate errors in the predictions, such as for example the weather conditions (specially wind), the aircraft control systems(both pilot and aircraft performance errors) and the positioning/tracking precision (even considering the more precise nav-igation systems). These sources of uncertainty, which are currently far away of allowing flying 4D trajectories in a preciseway, need to be faced by adding extra buffers in the safety distances to compensate the lack of precision about the actualand future positions of the aircraft and vortexes, in a way that the current and future aircraft and vortexes locations canbe identified with a required confidence at least within a certain time-spatial region. Note that the bigger is the uncertaintythe bigger should be the used time–space buffers. However, by increasing the buffers, airspace latent capacity is also in-creased. So, precise uncertainty-buffers delimitation should be considered in MTCD&R algorithms.
The impact of these sources of uncertainties in the vortex model requires the use of extra buffers, i.e. increasing the radiusof the 4D tube containing the vortexes and also increasing the time windows of the expected passing-time for all the way-points. Taking into account that incoming navigation systems are expected to give a maximum tracking error of 185.2 m(RPN-RNAV 0.1NM), it has been considered that a radius of 300–400 m (150 m for wake vortex envelope plus 185.2 mdue to tracking errors) should be enough to ensure safety for the most suitable weather conditions and considering largeaircraft (largest vortexes).
Nevertheless, the radius parameter could be dynamically changed according to a precise weather prediction with a highupdating frequency and according to the corresponding vortex category of each aircraft. Note that the capability of theMTCD&R algorithms to be executed in real-time (i.e. less than 1 s with a medium-power computer) is an important factorto tackle the uncertainty.
With regard to the temporal adjustment of the 4D trajectories, in this research it has been considered that the minimumtemporal distances taken from ICAO documentation (120 s for Heavy aircraft) are conservative enough for the most suitableweather conditions and for all the wake vortex aircraft categories; thus, no extra temporal adjustment is required with re-gard to safety factors. However, the algorithms presented can also be set with dynamic parametrization for each vortex dura-bility, opening the door to integrate the system with technological solutions that update the vortex durability information inreal time, such as for example the LIDAR technology used as a real-time wake vortex sensor (Wiegele et al., 2008). A moreprecise parametrization of wake vortex durability would lead to a more efficient use of airspace capacity, while maintainingsame levels of safety.
If for any unexpected reason a particular aircraft exits the uncertainty tube, then it is said to occur a deviation (i.e. it isconsidered that the aircraft is not following the expected nominal trajectory). When a deviation occurs it is necessary to up-date in the MTCD&R system the expected trajectory for this aircraft, and thus to take control actions to give the aircraft backto the original intended trajectory or to follow a new proposed trajectory taking into account the possible interactions withother trajectories (i.e. a deviation is managed as a particular class of perturbation as soon as it is detected).
The risk of deviation may be included in the algorithms presented in this paper by using different tubes whose radius in-crease with time (uncertainty grows with time) and with different probabilities associated, similarly to the methods used bycurrent operational CD systems like iFACTS (Whysall, 1998), thus improving the efficiency and robustness of the CD&R algo-rithms. See Fig. 23. The ability of the algorithms to run in real-time would allow a continuous MTCD&R rolling process thatmay contribute to reduce the negative safety impacts of trajectory deviations in TMAs.
Fig. 23. Dynamic uncertainty and deviation-risk buffers.
S. Ruiz et al. / Transportation Research Part C 26 (2013) 396–417 415
7. Conclusions and outlook
One of the most important strategic challenges related with the deployment of the Single European Sky is the need offinding efficient ways for managing the available airspace capacity to ensure a sustainable air transportation system, espe-cially in TMAs since they currently are the main bottleneck of the airspace system. Improving the decision support tools usedto reduce the task-load of air traffic controllers and to improve the runways throughput is one of the ways to take betteradvantage of the airspace capacity.
In this paper, a CD and CR algorithm has been presented, integrated in a single MTCD&R system. Simulations with twodifferent scenarios of heavy traffic entering to a TMA, rush hour (30 aircraft) and saturation rush hour (35 aircraft), has beenused to show the excellent results of the implemented MTCD&R.
The CD algorithm has shown capabilities to work with wake vortex simplified models to perform the conflict detectionusing time-based distances and, at the same time, storing the state-space of the problem (like a 4D snapshot).
The excellent runtime performance of the CD module, due in part to the use of a non-pairwise (and SDS-based) CD algo-rithm, may enable the development of MTCD&R applications that provide in real-time with an updated feedback about thestate-space. This feature could contribute to tackle the uncertainty related to the (expected) trajectories to be flown byaircraft.
The CR algorithm presented is based on vectorizations calculated to absorb the necessary delays to solve a conflict. Theconflict-free trajectories have been calculated to minimize the change with respect the optimum reference (RBT), while tak-ing into account the required 4D restrictions to solve the conflicts whilst maintaining at minimum the safety distances (effi-cient use of the available runway’s capacity), as well as the computation of the Top of Descent for a CDA maneuver with aconstant descent indicated air speed. Holding procedures were avoided by MTCD&R as they can imply strong fuel-consump-tion inefficiencies.
Flyability of these CR trajectories has been validated with real FMS avionics and with a certified B738 Full Flight Simu-lator. The proposed CR algorithm is still far away of considering resolutions for complex scenarios (i.e. considering arrivals,departures and cruise traffic mixed in the same TMA), however, it showed to be effective in relaxed scenarios and demon-strated good interaction with the SDS-based CD algorithm. Due to that, it can contribute as a baseline for the design of im-proved CR applications.
An index of runway utilization has been proposed as a new metric to measure the quality of MTCD&R outputs, as well as toenable comparisons between different systems. Analysis based on this metric (in absence of uncertainty) has also showngood results for the MTCD&R system.
Altogether, these results suggest that this MTCD&R systemmay contribute, as a baseline of a future Decision Support Sys-tem platform, to improve the air traffic management, especially in congested TMAs, since it adapts to the requirements of theSingle European Sky established by the SESAR programme, that is: it maintains or improves the safety levels of operations (allthe conflicts were detected and solved), it augments the use of the latent capacity (by reducing controllers’ task-load andmaximizing the throughput of the runways), it gives flexibility to aircraft’s planned trajectories (with 3D route dynamic allo-cation), and it reduces the fuel-costs, as well as the CO2 emissions in the airport vicinities (by considering CDA operations andby avoiding holding procedures).
A technique based on 2D projections was used to reduce the memory requirements of the SDS but future work should befocused on reducing, even more, the growth in memory of the SDS. SDSs based on relational databases should be explored,since they might drastically reduce the memory growth.
The 4D snapshot provided by the SDS opens the door to explore the state-space of the problem. The integration of thisMTCD&R system with Petri Nets that exploits the state space stored in the SDS could lead to find new CR algorithms thattakes into account the network domino effects caused by the proposed resolution maneuvers, thus with potential for achiev-ing better ATM global resolutions.
Finally, future research will also be addressed to analyze how the consideration of uncertainty in the models affects theMTCD&R algorithms as well as the index of runway utilization, and how to tackle this uncertainty in order to generate morerobust conflict-free trajectories.
Acknowledgements
This work is partly funded by the Ministry of Economy and Competivity in the project ‘‘Fire Guided Unmanned Aircraftsand Resources Distribution (FireGUARD)’’, CICYT Spanish program TIN2011-29494-C03-01 and the Catalan Government(AGAUR) support to the research team ‘‘LOGISIM: Modelado, Simulación y Optimización de Sistemas Logísticos’’ reference2009 SGR 629.
References
Aho, A.V., Hopcroft, J.E., Ullman, J.D., 1998. Data Structures and Algorithms. Pearson.Baase, S., 1988. Computer Algorithms, second ed. Addison-Wesley.Balin, Mark G., Erzberger, Heinz, 1996. An Analysis of Landing Rates and Separations at the Dallas/Fort Worth International Airport.Blajev, T., 2006. Wake Vortex Turbulence. Hindsight (EUROCONTROL), p. 18.Bolender, Michael A., Slater, G.L., 1996. Evaluation of Scheduling Methods for Multiple Runways.
416 S. Ruiz et al. / Transportation Research Part C 26 (2013) 396–417
Castelli, Lorenzo, Pesenti, Raffaele, Ranieri, Andrea, 2010. The design of a market mechanism to allocate air traffic flow management slots. TransportationResearch Part C: Emerging Technologies.
Cavanagh, Nicola, Nordeen, Norliza, Dow, John, 2008. Terms and Definitions Used in Airport Capacity Studies.Chiang, Yi-Jen, Klosowski, James T., Lee, Changkil, 1997. Geometric algorithms for conflict detection/resolution in air traffic management. In: 36th IEEE
Conference on Decision and Control. Presented at the in 36th IEEE Conference on Decision and Control.Civil Aviation Safety Authority (Australian Goverment), 2006. Navigation using Global Navigation Satellite Systems (GNSS). Public report.Cook, Andrew, 2010. The Fourth Dimension: Implementing 4D Aircraft Trajectories. Navigation News. The Magazine of the Royal Institute of Navigation pp.
17–20.Cooper, Robert B., 1981. Introduction to Queuing Theory, second ed. North Holland.Cormen, T.H., Leiserson, C.E., Rivest, R.L., 1997. Introduction to Algorithms. MIT Press.Desenfans, O., Lonls, T., Winckelmans, G., Holzapfel, F., 2007. Description of Probabilistic Wake Predictors Adapted to Cruise Flight, FLYSAFE DI231-2.
Universite catholique de Louvain (UCL) and DLR.Djokic, Jelena, Lorenz, Bernd, Fricke, Hartmut, 2010. Air traffic control complexity as workload driver. Transportation Research Part C: Emerging
Technologies 18, 930–936.Dole, C., 1994. Flight Theory for Pilots, fourth ed. Jeppesen, Englewood.Erzberger, Heinz, 2006. Automated conflict resolution for air traffic control. In: 25th International Congress of the Aeronautical Science. Presented at the
25th International Congress of the Aeronautical Science, Hamburg, Germany.EUROCONTROL, 2001. Study of Constraints to Growth.EUROCONTROL, 2002a. MTCD Algorithms Overview.EUROCONTROL, 2002b. Towards a Controller-Based Conflict Resolution Tool – A Literature Review.EUROCONTROL, 2006. Interoperability Requirements Document (IRD) – Medium Term Conflict Detection & Resolution (MTCD&R).EUROCONTROL, 2007a. Surveillance. A Decade of Developments. Skyway, pp. 76–84.EUROCONTROL, 2007b. FASTI Operational Concept.EUROCONTROL, 2007c. FASTI Baseline Description.EUROCONTROL, 2008a. Challenges of Growth 2008.EUROCONTROL, 2008b. Long-Term Forecast: Flight Movements 2007–2030.EUROCONTROL, 2008c. CDA – Implementation Guidance Information.EUROCONTROL, 2009. ATM Airport Performance (ATMAP) Framework.EUROCONTROL, 2010. Specification for Medium-Term Conflict Detection.Farley, Todd, Kupfer, Michael, Erzberger, Heinz, 2007. Automated conflict resolution: a simulation evaluation under high demand including merging
arrivals. In: Proc. 6th USA/Europe ATM Research and Development Seminar, Baltimore, MD, USA.Geekbench, 2010. <http://www.primatelabs.ca/geekbench/> (WWW Document).Group for Research in Turbulence and Vertical Flows, 2010. UCL Operational Tools for Predicting Aircraft Wake Vortex Transport and Decay: The
Deterministic/Probabilistic Wake Vortex Models (DVM/PVM) and the WAKE4D Platform (No. v. 2.2), UCL Report.Hearn, D., Baker, M.P., 2006. Gráficos por computadora con openGL, 3a ed. Prentice Hall.ICAO, 2005. Procedures for Air Navigation Services – Aircrafts Operations (Doc 8168).ICAO, 2007. Procedures for Air Navigation Services – Air Traffic Management, 15th ed. (Doc 4444).Isaacs, Anne, Brooks, Victoria, 2008. Avoiding the Conflict. Hindsight (EUROCONTROL), pp. 34–36.Isaacson, D.R., Erzberger, H., 1997. Design of a conflict detection algorithm for the Center/TRACON automation system. In: Digital Avionics Systems
Conference. Presented at the Digital Avionics Systems Conference, Irvine, CA.Isaacson, Douglas R., Robinson III, John E., 2001. A knowledge-based conflict resolution algorithm for terminal area air traffic control advisory generation. In:
AIAA Guidance, Navigation, and Control Conference. Presented at the AIAA Guidance, Navigation, and Control Conference, Montreal, Canada.Kuchar, James K., Yang, Lee C., 2000. A Review of Conflict Detection and Resolution Modeling Methods. IEEE Transactions on Intelligent Transportation
Systems, vol. I, pp. 179–189.Kupfer, M., Farley, T., Chu, Y., Erzberger, H., 2008. Automated conflict resolution – a simulation-based sensitivity study of airspace and demand. In: Proc.
26th International Congress of the Aeronautical Sciences (ICAS).Moravec, Hans, 2009. Rise of the Robots – The Future of Artificial Intelligence. Scientific American.NATS, 2009. Acting Responsibly: NATS and the Environment 2009.Peláez Sánchez, J.I., 2003. Análisis y diseño de algoritmos: un enfoque teórico y práctico. Universidad de Málaga.Pérez Navarro, Antoni et al, 2009. Sistemes d’informacio geografica i geotelematica, 1a ed. FUOC, Barcelona.Ranieri, A., Martinez, R., Piera, M.A., Lopez, J., Vilaplana, M., 2011. Strategic Trajectory De-confliction to Enable Seamless Aircraft Conflict Management (WP-
E project STREAM). Presented at the SESAR Innovation Days, ENAC, Toulouse.Reif, J.H., Sharir, M., 1985. Motion planning in the presence of moving obstacles. In: Proc. 26th Annu. IEEE Sympos. Found. Comput. Sci. Presented at the Proc.
26th Annu. IEEE Sympos. Found. Comput. Sci., pp. 144–154.Reynolds, Craig W., 2000. Interaction with groups of autonomous characters. In: Game Developers Conference 2000. Presented at the Game Developers
Conference 2000, pp. 449–460.Reynolds, Craig W., 2006. Big fast crowds on PS3. In: Sandbox Symposium. Presented at the Sandbox Symposium.Ruiz, Sergio, Piera, Miquel A., 2009. Spatial data structure based algorithm for improving conflict detection/conflict resolution algorithms. In: Proceedings of
Unmaned Aerial Vehicles Conferences (UAV Conferences 2009). Presented at the UAV Conferences 2009, Reno, Nevada, USA.Samet, H., 1989. Applications of Spatial Data Structures. Addison-Wesley.Samet, H., 1990. The Design and Analysis of Spatial Data Structures. Addison-Wesley.SESAR Consortium, 2007. The ATM Target Concept – SESAR Definition Phase, Deliverable 3.SESAR Consortium, 2008. The SESAR Master Plan – SESAR Definition Phase, Deliverable 5.SESAR Consortium, 2009. European ATM Master Plan.Whysall, Peter, 1998. Future area control tools support – FACTS. In: Presented at the 2nd USA–Europe Air Traffic Management R and D Seminar, Orlando.Wiegele, A., Rahm, S., Smalikho, I., 2008. Ground-Based and Air-Borne Lidar for Wake Vortex Detection and Characterisation, No. DLR-FB-2008-15, DLR-
Forschungsbericht, DLR.Xu, Ning, Donohue, George, Laskey, Kathryn Blackmond, Chen, Chun-Hung, 2005. Estimation of delay propagation in the national aviation system using
Bayesian networks. In: Proceedings of 6th ATM Seminar. Presented at the 6th ATM Seminar, Baltimore, MD, USA.Zúñiga, C.A, Piera, M.A, Ruiz, S., Del Pozo, I., 2010. A TMA 4DT CD/CR causal model based in path shortening/path stretching techniques. In Proc. of 4th
International Conference on Research in Air Transportation – ICRAT 2010. Presented at the ICRAT 2010, Budapest, Hungary.
S. Ruiz et al. / Transportation Research Part C 26 (2013) 396–417 417
7.2 “Relational Time-Space Data Structure To Enable Strategic De-Conflictionwith a Global Scope in the Presence of a Large Number of 4D Trajectories” 155
7.2 “Relational Time-Space Data Structure To EnableStrategic De-Confliction with a Global Scope in thePresence of a Large Number of 4D Trajectories”
Article 2, “Relational Time-Space Data Structure To Enable Strategic De-Conflictionwith a Global Scope in Presence of Large Number of 4D Trajectories”, hasbeen published in the Journal of Aerospace Operations. It presents twotechnological innovations applied to the SDS concept presented in previouspaper in order to enable and set the usage for the strategic de-conflictionof thousands of trajectories at the European airspace. One of the mainshortcomings of the SDS presented in Article 1 was that it needed a lot ofcomputer main memory, which made difficult the usage of the same SDSconcept for wider airspace sectors and larger number of trajectories. Inthis paper the Relational SDS (RSDS) concept is presented, which modifiesthe internal logical architecture of the SDS (i.e., how the SDS allocates thebytes of memory to store the ATM information), and thus achieves reduc-tions of more than 98% with respect the memory needs to store the sameATM information in the original SDS. A second concept, the Time-SpatialData Structure (TSDS), has added the time in the structure of the SDS,which has represented an important qualitative shift of the concept and hasnotably improved the efficiency of the SDS during the processing of thou-sands of trajectories for strategic de-confliction purposes. Note that theproblem presented in this paper (i.e., Strategic De-confliction) is differentto the problems tackled in Article 1 (i.e., tactical time-based separations),thus the SDS configuration (i.e., which ATM information is stored and how)and methods used during conflict detection process must be also different.

156 Chapter 7. Compendium of Published Articles
Journal of Aerospace Operations 2 (2013) 53–78DOI 10.3233/AOP-130034IOS Press
53
Relational time-space data structure to enablestrategic de-confliction with a global scope inthe presence of a large number of 4Dtrajectories
Sergio Ruiz! and Miquel A. PieraDepartment Telecommunication and System Engineering, Universidad Autonoma de Barcelona- Aeronautical Management Technology Innovation Cluster, Sabadell (Barcelona), Spain
Abstract. This paper introduces an innovative framework for the design and implementation of new ATM decision support toolsfor strategic de-confliction. The main key implementation aspects to support an efficient state space analysis of more than 40004D Trajectories in the entire European ATM is described. The paper focuses on the innovative aspects developed to improveSpatial Data Structures, i.e. the paper focuses on the new Relational Space Data Structures and Time-Space Data Structuresconcepts, that allow supporting strategic Conflict Detection (CD) between a large number of 4D trajectories and a wide airspaceregion. Results have been tested in the WP-E project STREAM, whose aim is to coordinate the entire European ATM trafficat strategic and tactical levels, thus requiring the processing of large number of trajectories under heavy traffic conditions. Thenew and efficient CD algorithms presented in this paper may contribute to increase airspace capacity in the SESAR frameworkfor the period up to 2020.
Keywords: Trajectory based operations, 4D trajectories, strategic de-confliction, spatial data structure, dynamic route allocation,air traffic management
1. Introduction
One of the most important challenges of SESAR with respect the current ATM is the introduction ofthe Trajectory Based Operations (TBOs), which implies the use of 4D gate-to-gate precision trajectories(trajectories defined in the 3 spatial dimensions together with a time-stamp), also known as BusinessTrajectories (BT) in the SESAR’s terminology for civil flights. The BT evolves out of a collaborativelayered planning process, through which it progresses from the form of Shared Business Trajectory (SBT),which is shared for planning and negotiation purposes with all the involved stakeholders, to the ReferenceBusiness Trajectory (RBT), which is instantiated few minutes before the flight execution, representingthe trajectory which the Airspace User agrees to fly and the Air Navigation Service Providers (ANSPs)and Airports agree to facilitate [1, 2].
!Corresponding author: Sergio Ruiz, Department Telecommunication and System Engineering, Universidad Autonoma deBarcelona - Aeronautical Management Technology Innovation Cluster, Sabadell (Barcelona), Spain. E-mails: [email protected]; [email protected] (M.A. Piera).
ISSN 2211-002X/13/$27.50 © 2013 – IOS Press and the authors. All rights reserved
54 S. Ruiz and M.A. Piera / Relational time-space data structure to enable strategic de-confliction
The term strategic de-confliction, is a new concept used in SESAR referring to actions taken byNetwork Manager (NM) to minimize the amount of conflicts (i.e. loss of due separation between twoaircraft [3]) either prior to flight execution, when the takeoff time is known with sufficient accuracy (e.g.after push-back), or when the flight is airborne, but always with sufficient time to allow a CollaborativeDecision Making (i.e. Collaborative Flight Planning) process to occur. It excludes tactical instructionsand clearances that need an immediate response, but includes activities such as dynamic route allocation[25].
One of the goal of the SESAR concept is to deploy tools to assist the controller with complex situationsand to reduce complexity by strategic deconfliction measures where necessary to increase capacity (extracapacity is required since an increment of the current air traffic levels in a factor of x2 is forecasted by2030 [12, 13]). In this context, the introduction of automation support to conflict detection, situationmonitoring and conflict resolution will be one of the principal changes for increasing airspace capacityin the period up to 2020.
Thus, strategic conflict management and traffic synchronization, would lead to pre-deconflicted 3Droutes subject to dynamic refinement or adjustment during flight (i.e. 4D contracts). This constitutes aquantum leap with respect to the current airspace structure, which consists of a set of predefined airwaysdepending on a ground-based infrastructure of navigation aids and relying on the subdivision of airspaceinto Air Traffic Control (ATC) sectors aimed at facilitating the management of flights. A progressiveimprovement in the accuracy of ground-based trajectory prediction through reduced flight uncertaintywill lead to improved performance of controller support tools (greater accuracy and longer predictionhorizons) and reduced controller task load per flight (fewer clearances with longer effective duration andincreased dependence on the tools themselves to monitor compliance with the clearance and to checkthe progression of detected potential conflicts). In addition, because the data held and used by each subregion will be common, conflict prediction will be possible over a much longer timeframe and wider areathan is currently possible.
The STREAM (Strategic Trajectory de-confliction to Enable seamless Aircraft conflict Management)project, launched within SESAR WP-E [http://www.hala-sesar.net/stream], aims at developing innovativecomputational-efficient Conflict Detection and Resolution (CD&R) algorithms for strategic de-conflictionof thousands of trajectories within few seconds or minutes taking into consideration Airspace Users (AUs)preferences and network constraints. This is aimed at enabling traffic to be de-conflicted for wide airspaceregions and permitting large look-ahead times of order of hours (e.g. two or three hours).
The principal scope for application is therefore represented by the (managed) European airspace,which falls under the responsibility of a single European Network Manager (NM) for what concerns thecoordination and optimization of air traffic flows.
The strategic de-confliction STREAM algorithms can contribute to the achievement of NM’s goalsthrough the development of a proper traffic micro-model framework in which all the traffic at Europeanairspace scale can be represented and managed as a (large) set of individual 4D business trajectories(i.e. micro-scale), and by suggesting strategically de-conflicted trajectories which closely match AUspreferred ones in a free-route environment, i.e. not constrained by pre-structured routes as occurringtoday. Note that this approach is congruent (and could contribute) to the INAP function (“IntegratedNetwork management and ATC Planning”) defined in the SESAR Concept of Operations Step 2 [37].
In order for the conflict resolution amendments to be effective, the complex interactions and emergentdynamics among trajectories must be taken into account with a global scope, since the resolution of apotential conflict may imply the reactive generation of a new set of conflicts in the network (i.e. dominoeffects). Due to the high degree of connectivity in the European ATM Network it is foreseen that only
S. Ruiz and M.A. Piera / Relational time-space data structure to enable strategic de-confliction 55
by considering at micro level the whole European Airspace (i.e. global scope), it can be ensured that allpotential interactions are identified and that the final route allocation is globally de-conflicted under acollaborative optimization approach.
Spatial Data Structures (SDSs) have been explored under the STREAM project as a technique to imple-ment the CD process, with excellent results in terms of time performance due to the linear computationalcomplexity, O(n), of the CD algorithms based on SDS [18, 22]. The SDS capability to efficiently storespatial data (e.g. 4D trajectory information) at the time when the conflict detection among all SBTs/RBTsis performed, together with the efficient database access methods, have been a key factor for the devel-opment of new tools to analyze the entire ATM State-Space (SS) information under a global scope (asimplified 4D dynamic model is assumed in this paper, i.e. aircraft position and velocity at each time-step,so uncertainty and stochastic events are not considered in the traffic model). This enables for instancea complete and precise identification of the emergent dynamics that new trajectories may cause in thenetwork (i.e. “domino effects”) [17]. Causal models can be employed to provide with a strategicallyde-conflicted flight route allocation with a global scope, based on the SS information stored in the SDSsince all the processed trajectories will remain stored as a “4D snapshot” of the ATM system [17, 33].
Original SDS-based CD algorithm [21, 22] presents some shortages in the scalability of the algorithmwhich invalidates it for STREAM purposes (i.e., to manage the 4D BTs of the whole European ATMcoordinating the strategic and tactical phases of the conflict management by delivering a set of pre-deconflicted 3D routes). In this paper a new SDS-based CD algorithm is presented, which includes twoinnovations developed under STREAM, named:
• Relational SDS (RSDS): allows reducing the amount of Main Memory used by original SDS archi-tecture approximately in a 98% whilst keeping the computational time performance (and the rest ofthe advantages) of the original algorithm. This massive memory reduction has been a key factor toenable the storage of the overall European ATM 4D state-space with a look-ahead time of severalhours.
• Time-Space Data Structure (TSDS): adds a fourth dimension to the original concept of the SDS, whichallows an efficient management of 4D data while considerably improves the run-time performance ofthe CD process when a large amount of trajectories is considered. The fast processing time achievedin the CD process might be an important contributor to efficiently adapt the ATM planning touncertainties, perturbations and system disruptions, since the whole SS can be updated in real-time.
The design of these CD&R tools present good characteristics to ease the introduction of different sourcesof ATM uncertainty in the nominal models (e.g. by considering extensions for adding probabilisticinformation to the nominal models, or by achieving a fast update of the CD&R solutions in case ofnetwork changes). However, only a simplified ATM 4D nominal model will be considered in the resultsof this paper.
Section 2 includes the state of the art of the CD algorithms and the SDS concepts. Section 3 explainsthe technical and conceptual aspects applied to constitute the RSDS concept, while Section 4 introducesthe technical and conceptual aspects of the TSDS. Section 5 gives details about how the RTSDS (i.e.RSDS + TSDS) has been configured for STREAM purposes, and how the CD process has been adaptedand improved in consequence. A performance analysis including proof of algorithm linear complexity isincluded in Section 6. In Section 7 simulations and results are presented based on different academic andrealistic (nominal) scenarios in order to confirm the advantages of the RTSDS, i.e. SS storage and highupdating frequency. Section 8 reads the conclusions.
56 S. Ruiz and M.A. Piera / Relational time-space data structure to enable strategic de-confliction
2. State of the art
2.1. Strategic conflict management
Conflict Detection (CD) and Conflict Resolution (CR) systems can be classified according to the waythey handle detection/resolution when multiple conflicts among two or more trajectories materialize.When the algorithms sequentially detect and solve the conflict considering the minimum safety distancesbetween each pair of trajectories without concern of other trajectories in the network they are based on apairwise strategy, while they are based on a global strategy when the entire traffic situation is examinedsimultaneously [5].
CD&R processes for planning purposes are currently executed by Air Traffic Control Officers (ATCOs)only at a local airspace-sector level, with a look-ahead time typically limited to a maximum of 20 minutes(i.e. tactical applications) and with no global ATM perspective (i.e. pairwise) of how the decisions takenat local level affect the rest of the network. Some automated Medium Term CD (MTCD) tools have beendeveloped to aid ATCOs during the tactical management of conflicts, e.g. FASTI, iFACTS, ERATO orVAFORIT, among others [6–9]. Early operational Automated CR tools are also focused on the tacticalmanagement of conflicts [9, 10].
A global CD&R perspective is required to strategically de-conflict the air traffic network. A resolutiontrajectory generated for solving a conflict between 2 trajectories could generate new interactions (i.e.downstream or upstream conflicts) that previously did not exist in the network. Also a resolution maneuvercould solve original downstream/upstream conflicts that existed before in the original trajectory. Thesenew interactions appearing in the network (or the elimination of pre-existing interactions) are called“domino effects” or more formally, network effects [26]. In [27] the authors underline the importance oftaking into consideration these domino effects in the design of a CR system since these phenomena notablyaffect the quality of the resolutions from the network point of view, thus being a necessary conditionfor the adoption of an effective global strategy in the CD&R system, in order to provide optimal (ornear-optimal) conflict-free network solutions. An interesting academic approach (i.e. non-operational)for en-route conflict resolution with global optimization by means of genetic algorithms was presentedin [28].
The CD&R system proposed in STREAM project [29] takes into account a Collaborative Flight Plan-ning approach. During the negotiation process Airspace Users may express their preferences accordingto their business targets (Free-Routing and 4D navigation capabilities are assumed), which will be usedto find the most beneficial global solution (in absence of system disruptions and unforeseen big-impactnetwork events) according to some commonly agreed metrics, thus formally realizing a multi-criteriaglobal optimization of the –dynamically reconfigured– network route-structure. First, a pairwise strat-egy approach is followed, generating several locally-optimal (i.e. user-preferred) resolution trajectoriesper each detected conflict with no regarding of the potential emergent dynamics (i.e. “domino effects”).Later, a global strategy is applied through a causal model post-processing driven to determine severalconflict-free network solutions, including the identification of the most preferred (i.e. globally-optimal)scenario. This is achieved through the causal analysis of the observed emergent dynamics (informationobtained from the SDS) and by computing a global multi-criteria optimization function (e.g. efficiency,robustness, safety, equity, fairness . . . ) commonly agreed between the NM and the AUs.
Uncertainty is a major topic affecting CD&R systems, especially when considering trajectories atstrategic level [5]. A source of uncertainties comes from the limited accuracy of the positioning/trackingand navigation systems (even in most precise 4D navigation systems). These sources of uncertainty,which affect to the aircraft state (e.g., current position and velocity) are usually faced by adding extra
S. Ruiz and M.A. Piera / Relational time-space data structure to enable strategic de-confliction 57
buffers/tolerances in the safety distances in such a way that the current and future aircraft locations canbe identified at certain time-spatial region with a required confidence interval.
Another source of uncertainty comes from Trajectory Predictor (TP) systems, which are used to projectthe states of the trajectories into the future, based on dynamic and aircraft performance models, in orderto predict whether a conflict will occur. Unexpected trajectory deviations (i.e. aircraft crossing outsidethe allowed 4D uncertainty corridor) can occur, usually requiring an ATC action in case of tacticalconflict management (e.g. MTCD systems). The uncertainty is near-zero at the last known positionof the aircraft and increases with projected time ahead into the future (up to infinite). For strategicde-confliction purposes (e.g. STREAM), however, the uncertainty can be truncated to a maximum look-ahead time (e.g. 20 minutes) about its scheduled trajectory since it is presumed that tactical trajectoryand conflict management tools (e.g. MTCD) will amend any trajectory deviation (if necessary) untilthe original trajectory is reached again. Similar concept was seen in [30]. In this paper a simplified 4Dnominal dynamic model is presented, i.e. flight trajectories are assumed to be executed with no relevantuncertainties/deviations with respect the planning. Nevertheless, advanced probabilistic state-propagationmodel for a more realistic ATM representation, [4, 5, 15, 16] may be also supported with little impact inthe design of the presented RTSDS (e.g. adding probabilistic information as a fifth SS dimension).
Finally, network disruptions are also an important source of uncertainty during strategic route allo-cation. According to [31] severe weather is identified as one of the factors currently most affecting thepredictability of the network capacity and strategic flight planning. Other sources of uncertainties affect-ing the network capacity availability might be sudden military closed sectors, volcanic ash, wars, etcetera.These kinds of network perturbations in which capacity and demand can be drastically unbalanced requirereal-time algorithms to reconfigure the airspace while strategically de-conflicting the new allocation ofroutes.
A typical scenario at current European ATM with a planning horizon of 2–3 hours, is expected toinclude up to 5.000 flights active at the same time [29]. The high density and complexity of Europeanair traffic implies a high number of interactions among the different trajectories, especially in thoseregions that are foreseen to be more congested. Conflict resolution with global optimization scope isconsidered an untreatable combinatorial problem (i.e. Non-Polynomial). Therefore the use of classicaloptimization techniques, analytical methods or exhaustive combinatorial exploration of the solution space,do not constitute practical methods to find conflict-free optimal solutions [28]. Thus a high computationalefficiency in the STREAM strategic CD&R algorithms is required for analyzing and refreshing (updating)the state-space information of a several thousands of trajectories in real-time (i.e. in seconds or in fewminutes), in order to dynamically adapt the airspace demand (i.e. flights) to the actual state of the ATM(i.e. available capacity) and ensure that, in presence of –probabilistic or nominal- conflicts among anySBTs/RBTs, the proposed local resolutions do not generate any secondary reactive conflicts on otherzones of the network, while preserving flight efficiency and cost-effectiveness of flights as close to theoptimum as possible.
2.2. SDS-based CD algorithms
A SDS (Spatial Data Structure) is a database that represents a spatial region (e.g., an air sector) byusing individual memory positions to represent each of the discrete (3D) coordinates of the sector. Suchmemory positions are sorted in a way that, given a certain coordinate, the spatial information stored insidethe SDS (associated with such a coordinate) is easily recoverable applying simple mathematical formulas[18]. The SDS can be conceptually represented as a mesh of discrete points distributed throughout the
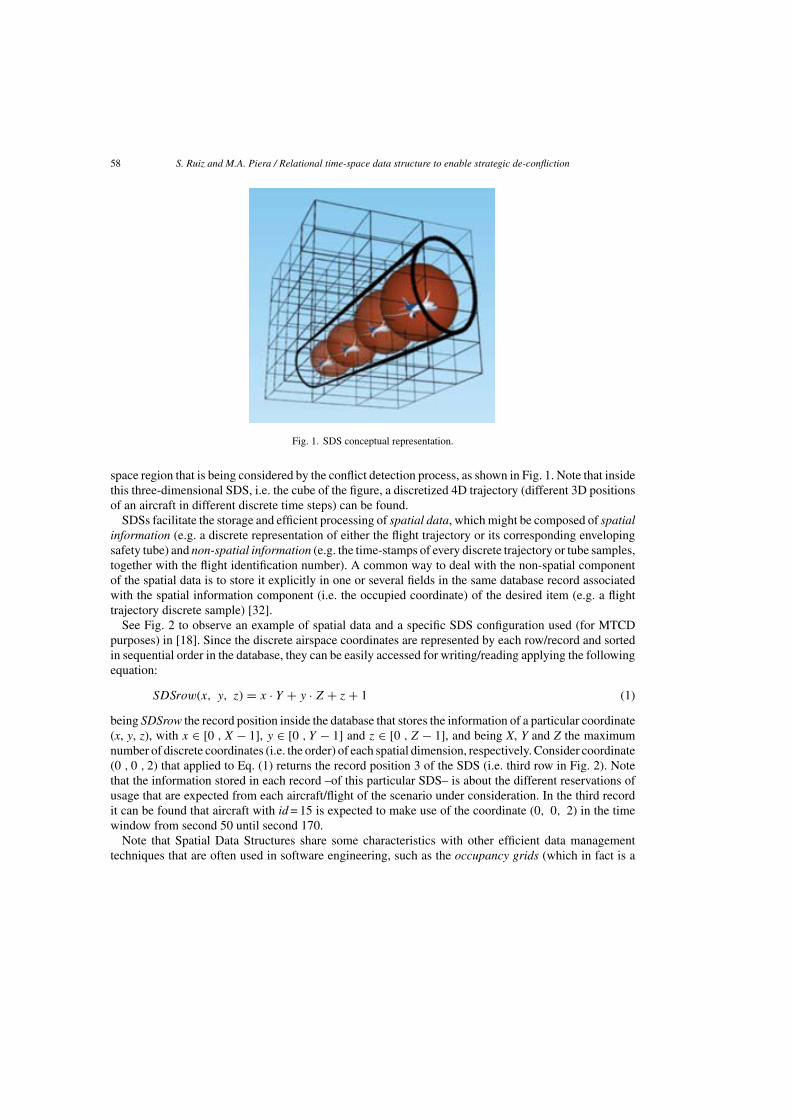
58 S. Ruiz and M.A. Piera / Relational time-space data structure to enable strategic de-confliction
Fig. 1. SDS conceptual representation.
space region that is being considered by the conflict detection process, as shown in Fig. 1. Note that insidethis three-dimensional SDS, i.e. the cube of the figure, a discretized 4D trajectory (different 3D positionsof an aircraft in different discrete time steps) can be found.
SDSs facilitate the storage and efficient processing of spatial data, which might be composed of spatialinformation (e.g. a discrete representation of either the flight trajectory or its corresponding envelopingsafety tube) and non-spatial information (e.g. the time-stamps of every discrete trajectory or tube samples,together with the flight identification number). A common way to deal with the non-spatial componentof the spatial data is to store it explicitly in one or several fields in the same database record associatedwith the spatial information component (i.e. the occupied coordinate) of the desired item (e.g. a flighttrajectory discrete sample) [32].
See Fig. 2 to observe an example of spatial data and a specific SDS configuration used (for MTCDpurposes) in [18]. Since the discrete airspace coordinates are represented by each row/record and sortedin sequential order in the database, they can be easily accessed for writing/reading applying the followingequation:
SDSrow(x, y, z) = x · Y + y · Z + z + 1 (1)
being SDSrow the record position inside the database that stores the information of a particular coordinate(x, y, z), with x " [0 , X # 1], y " [0 , Y # 1] and z " [0 , Z # 1], and being X, Y and Z the maximumnumber of discrete coordinates (i.e. the order) of each spatial dimension, respectively. Consider coordinate(0 , 0 , 2) that applied to Eq. (1) returns the record position 3 of the SDS (i.e. third row in Fig. 2). Notethat the information stored in each record –of this particular SDS– is about the different reservations ofusage that are expected from each aircraft/flight of the scenario under consideration. In the third recordit can be found that aircraft with id = 15 is expected to make use of the coordinate (0, 0, 2) in the timewindow from second 50 until second 170.
Note that Spatial Data Structures share some characteristics with other efficient data managementtechniques that are often used in software engineering, such as the occupancy grids (which in fact is a
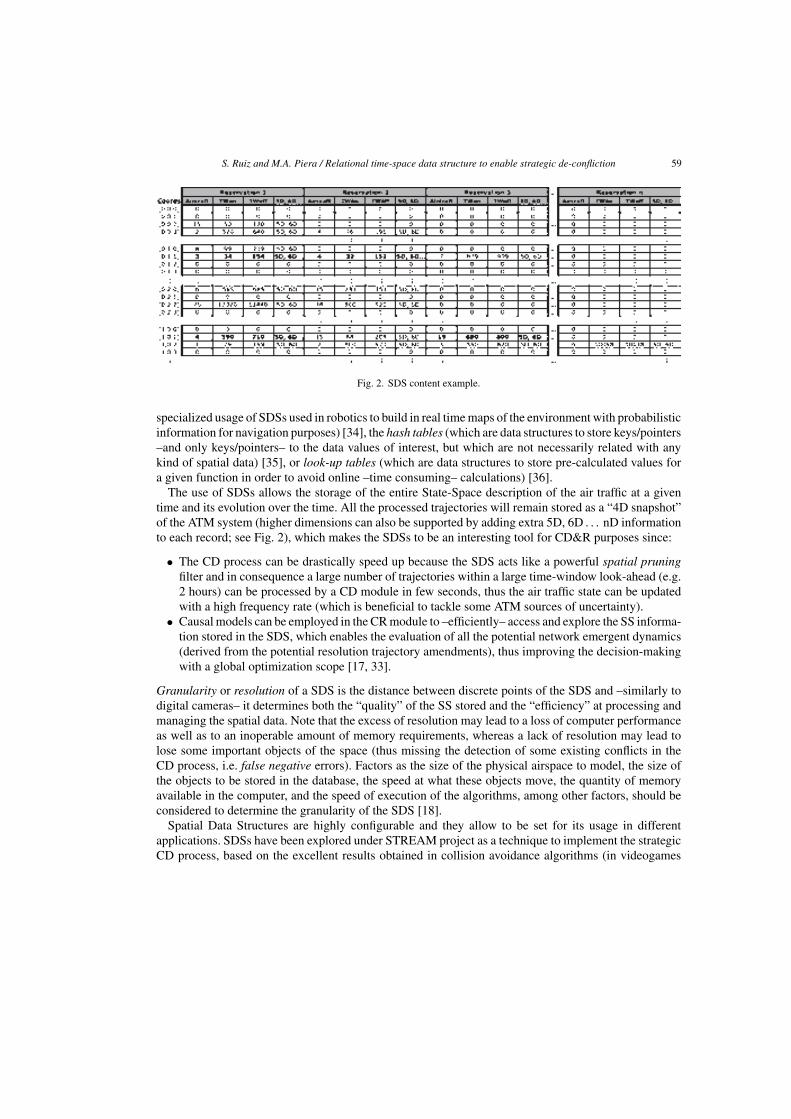
S. Ruiz and M.A. Piera / Relational time-space data structure to enable strategic de-confliction 59
Fig. 2. SDS content example.
specialized usage of SDSs used in robotics to build in real time maps of the environment with probabilisticinformation for navigation purposes) [34], the hash tables (which are data structures to store keys/pointers–and only keys/pointers– to the data values of interest, but which are not necessarily related with anykind of spatial data) [35], or look-up tables (which are data structures to store pre-calculated values fora given function in order to avoid online –time consuming– calculations) [36].
The use of SDSs allows the storage of the entire State-Space description of the air traffic at a giventime and its evolution over the time. All the processed trajectories will remain stored as a “4D snapshot”of the ATM system (higher dimensions can also be supported by adding extra 5D, 6D . . . nD informationto each record; see Fig. 2), which makes the SDSs to be an interesting tool for CD&R purposes since:
• The CD process can be drastically speed up because the SDS acts like a powerful spatial pruningfilter and in consequence a large number of trajectories within a large time-window look-ahead (e.g.2 hours) can be processed by a CD module in few seconds, thus the air traffic state can be updatedwith a high frequency rate (which is beneficial to tackle some ATM sources of uncertainty).
• Causal models can be employed in the CR module to –efficiently– access and explore the SS informa-tion stored in the SDS, which enables the evaluation of all the potential network emergent dynamics(derived from the potential resolution trajectory amendments), thus improving the decision-makingwith a global optimization scope [17, 33].
Granularity or resolution of a SDS is the distance between discrete points of the SDS and –similarly todigital cameras– it determines both the “quality” of the SS stored and the “efficiency” at processing andmanaging the spatial data. Note that the excess of resolution may lead to a loss of computer performanceas well as to an inoperable amount of memory requirements, whereas a lack of resolution may lead tolose some important objects of the space (thus missing the detection of some existing conflicts in theCD process, i.e. false negative errors). Factors as the size of the physical airspace to model, the size ofthe objects to be stored in the database, the speed at what these objects move, the quantity of memoryavailable in the computer, and the speed of execution of the algorithms, among other factors, should beconsidered to determine the granularity of the SDS [18].
Spatial Data Structures are highly configurable and they allow to be set for its usage in differentapplications. SDSs have been explored under STREAM project as a technique to implement the strategicCD process, based on the excellent results obtained in collision avoidance algorithms (in videogames
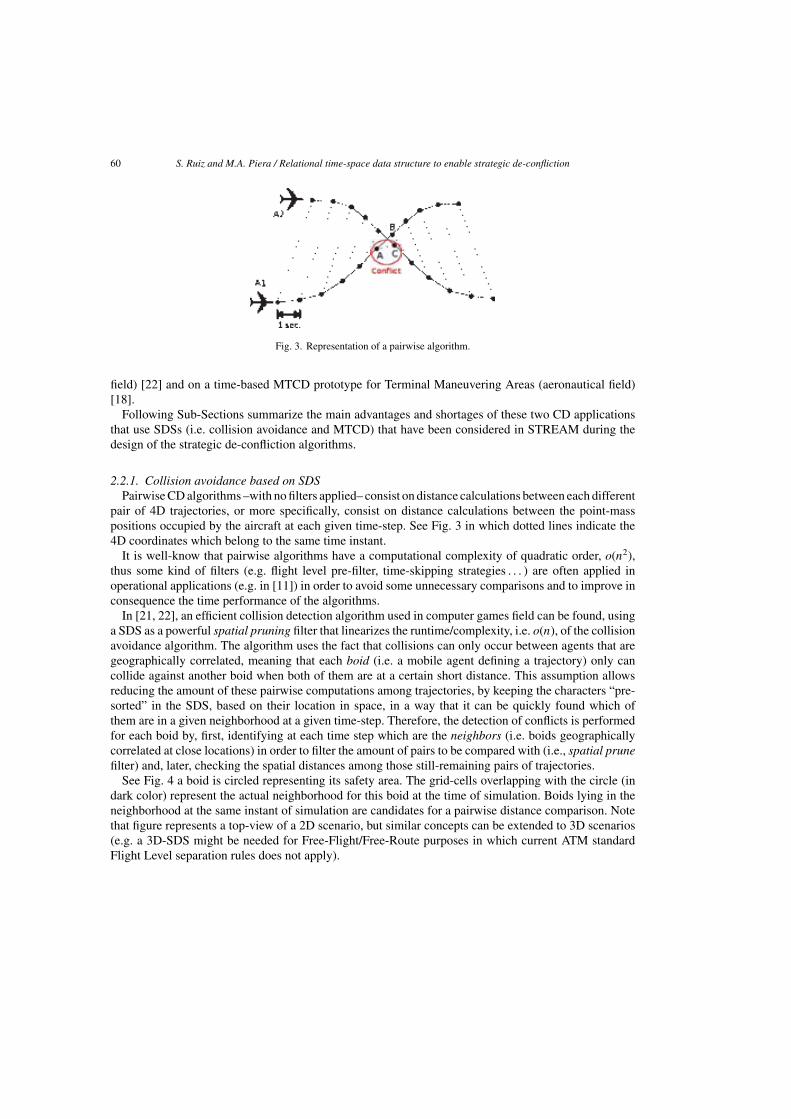
60 S. Ruiz and M.A. Piera / Relational time-space data structure to enable strategic de-confliction
Fig. 3. Representation of a pairwise algorithm.
field) [22] and on a time-based MTCD prototype for Terminal Maneuvering Areas (aeronautical field)[18].
Following Sub-Sections summarize the main advantages and shortages of these two CD applicationsthat use SDSs (i.e. collision avoidance and MTCD) that have been considered in STREAM during thedesign of the strategic de-confliction algorithms.
2.2.1. Collision avoidance based on SDSPairwise CD algorithms –with no filters applied– consist on distance calculations between each different
pair of 4D trajectories, or more specifically, consist on distance calculations between the point-masspositions occupied by the aircraft at each given time-step. See Fig. 3 in which dotted lines indicate the4D coordinates which belong to the same time instant.
It is well-know that pairwise algorithms have a computational complexity of quadratic order, o(n2),thus some kind of filters (e.g. flight level pre-filter, time-skipping strategies . . . ) are often applied inoperational applications (e.g. in [11]) in order to avoid some unnecessary comparisons and to improve inconsequence the time performance of the algorithms.
In [21, 22], an efficient collision detection algorithm used in computer games field can be found, usinga SDS as a powerful spatial pruning filter that linearizes the runtime/complexity, i.e. o(n), of the collisionavoidance algorithm. The algorithm uses the fact that collisions can only occur between agents that aregeographically correlated, meaning that each boid (i.e. a mobile agent defining a trajectory) only cancollide against another boid when both of them are at a certain short distance. This assumption allowsreducing the amount of these pairwise computations among trajectories, by keeping the characters “pre-sorted” in the SDS, based on their location in space, in a way that it can be quickly found which ofthem are in a given neighborhood at a given time-step. Therefore, the detection of conflicts is performedfor each boid by, first, identifying at each time step which are the neighbors (i.e. boids geographicallycorrelated at close locations) in order to filter the amount of pairs to be compared with (i.e., spatial prunefilter) and, later, checking the spatial distances among those still-remaining pairs of trajectories.
See Fig. 4 a boid is circled representing its safety area. The grid-cells overlapping with the circle (indark color) represent the actual neighborhood for this boid at the time of simulation. Boids lying in theneighborhood at the same instant of simulation are candidates for a pairwise distance comparison. Notethat figure represents a top-view of a 2D scenario, but similar concepts can be extended to 3D scenarios(e.g. a 3D-SDS might be needed for Free-Flight/Free-Route purposes in which current ATM standardFlight Level separation rules does not apply).
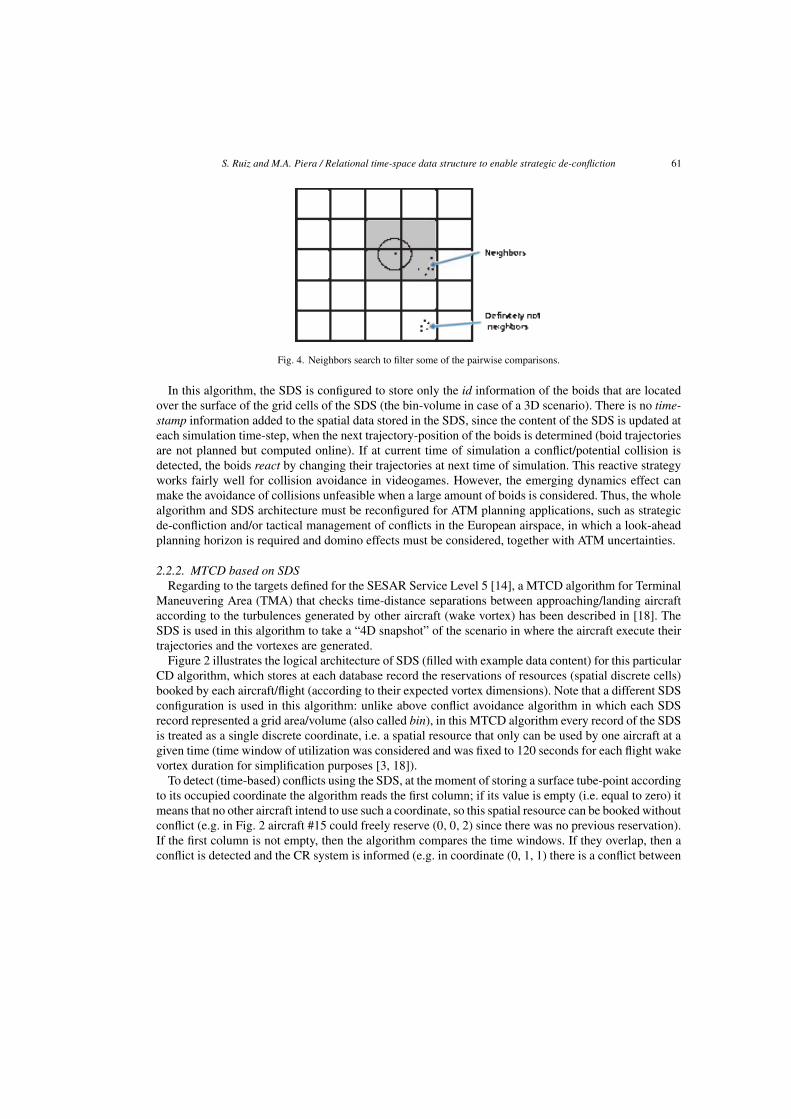
S. Ruiz and M.A. Piera / Relational time-space data structure to enable strategic de-confliction 61
Fig. 4. Neighbors search to filter some of the pairwise comparisons.
In this algorithm, the SDS is configured to store only the id information of the boids that are locatedover the surface of the grid cells of the SDS (the bin-volume in case of a 3D scenario). There is no time-stamp information added to the spatial data stored in the SDS, since the content of the SDS is updated ateach simulation time-step, when the next trajectory-position of the boids is determined (boid trajectoriesare not planned but computed online). If at current time of simulation a conflict/potential collision isdetected, the boids react by changing their trajectories at next time of simulation. This reactive strategyworks fairly well for collision avoidance in videogames. However, the emerging dynamics effect canmake the avoidance of collisions unfeasible when a large amount of boids is considered. Thus, the wholealgorithm and SDS architecture must be reconfigured for ATM planning applications, such as strategicde-confliction and/or tactical management of conflicts in the European airspace, in which a look-aheadplanning horizon is required and domino effects must be considered, together with ATM uncertainties.
2.2.2. MTCD based on SDSRegarding to the targets defined for the SESAR Service Level 5 [14], a MTCD algorithm for Terminal
Maneuvering Area (TMA) that checks time-distance separations between approaching/landing aircraftaccording to the turbulences generated by other aircraft (wake vortex) has been described in [18]. TheSDS is used in this algorithm to take a “4D snapshot” of the scenario in where the aircraft execute theirtrajectories and the vortexes are generated.
Figure 2 illustrates the logical architecture of SDS (filled with example data content) for this particularCD algorithm, which stores at each database record the reservations of resources (spatial discrete cells)booked by each aircraft/flight (according to their expected vortex dimensions). Note that a different SDSconfiguration is used in this algorithm: unlike above conflict avoidance algorithm in which each SDSrecord represented a grid area/volume (also called bin), in this MTCD algorithm every record of the SDSis treated as a single discrete coordinate, i.e. a spatial resource that only can be used by one aircraft at agiven time (time window of utilization was considered and was fixed to 120 seconds for each flight wakevortex duration for simplification purposes [3, 18]).
To detect (time-based) conflicts using the SDS, at the moment of storing a surface tube-point accordingto its occupied coordinate the algorithm reads the first column; if its value is empty (i.e. equal to zero) itmeans that no other aircraft intend to use such a coordinate, so this spatial resource can be booked withoutconflict (e.g. in Fig. 2 aircraft #15 could freely reserve (0, 0, 2) since there was no previous reservation).If the first column is not empty, then the algorithm compares the time windows. If they overlap, then aconflict is detected and the CR system is informed (e.g. in coordinate (0, 1, 1) there is a conflict between
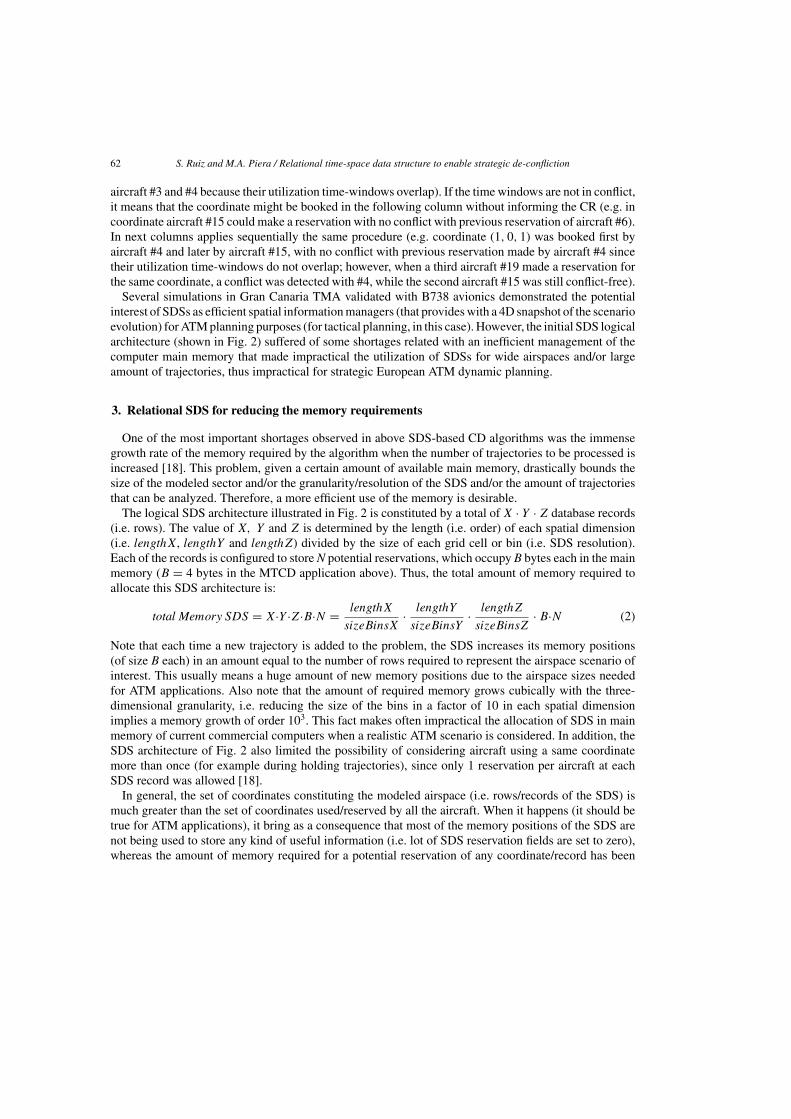
62 S. Ruiz and M.A. Piera / Relational time-space data structure to enable strategic de-confliction
aircraft #3 and #4 because their utilization time-windows overlap). If the time windows are not in conflict,it means that the coordinate might be booked in the following column without informing the CR (e.g. incoordinate aircraft #15 could make a reservation with no conflict with previous reservation of aircraft #6).In next columns applies sequentially the same procedure (e.g. coordinate (1, 0, 1) was booked first byaircraft #4 and later by aircraft #15, with no conflict with previous reservation made by aircraft #4 sincetheir utilization time-windows do not overlap; however, when a third aircraft #19 made a reservation forthe same coordinate, a conflict was detected with #4, while the second aircraft #15 was still conflict-free).
Several simulations in Gran Canaria TMA validated with B738 avionics demonstrated the potentialinterest of SDSs as efficient spatial information managers (that provides with a 4D snapshot of the scenarioevolution) for ATM planning purposes (for tactical planning, in this case). However, the initial SDS logicalarchitecture (shown in Fig. 2) suffered of some shortages related with an inefficient management of thecomputer main memory that made impractical the utilization of SDSs for wide airspaces and/or largeamount of trajectories, thus impractical for strategic European ATM dynamic planning.
3. Relational SDS for reducing the memory requirements
One of the most important shortages observed in above SDS-based CD algorithms was the immensegrowth rate of the memory required by the algorithm when the number of trajectories to be processed isincreased [18]. This problem, given a certain amount of available main memory, drastically bounds thesize of the modeled sector and/or the granularity/resolution of the SDS and/or the amount of trajectoriesthat can be analyzed. Therefore, a more efficient use of the memory is desirable.
The logical SDS architecture illustrated in Fig. 2 is constituted by a total of X · Y · Z database records(i.e. rows). The value of X, Y and Z is determined by the length (i.e. order) of each spatial dimension(i.e. lengthX, lengthY and lengthZ) divided by the size of each grid cell or bin (i.e. SDS resolution).Each of the records is configured to store N potential reservations, which occupy B bytes each in the mainmemory (B = 4 bytes in the MTCD application above). Thus, the total amount of memory required toallocate this SDS architecture is:
total Memory SDS = X·Y ·Z·B·N = lengthX
sizeBinsX· lengthY
sizeBinsY· lengthZ
sizeBinsZ· B·N (2)
Note that each time a new trajectory is added to the problem, the SDS increases its memory positions(of size B each) in an amount equal to the number of rows required to represent the airspace scenario ofinterest. This usually means a huge amount of new memory positions due to the airspace sizes neededfor ATM applications. Also note that the amount of required memory grows cubically with the three-dimensional granularity, i.e. reducing the size of the bins in a factor of 10 in each spatial dimensionimplies a memory growth of order 103. This fact makes often impractical the allocation of SDS in mainmemory of current commercial computers when a realistic ATM scenario is considered. In addition, theSDS architecture of Fig. 2 also limited the possibility of considering aircraft using a same coordinatemore than once (for example during holding trajectories), since only 1 reservation per aircraft at eachSDS record was allowed [18].
In general, the set of coordinates constituting the modeled airspace (i.e. rows/records of the SDS) ismuch greater than the set of coordinates used/reserved by all the aircraft. When it happens (it should betrue for ATM applications), it bring as a consequence that most of the memory positions of the SDS arenot being used to store any kind of useful information (i.e. lot of SDS reservation fields are set to zero),whereas the amount of memory required for a potential reservation of any coordinate/record has been
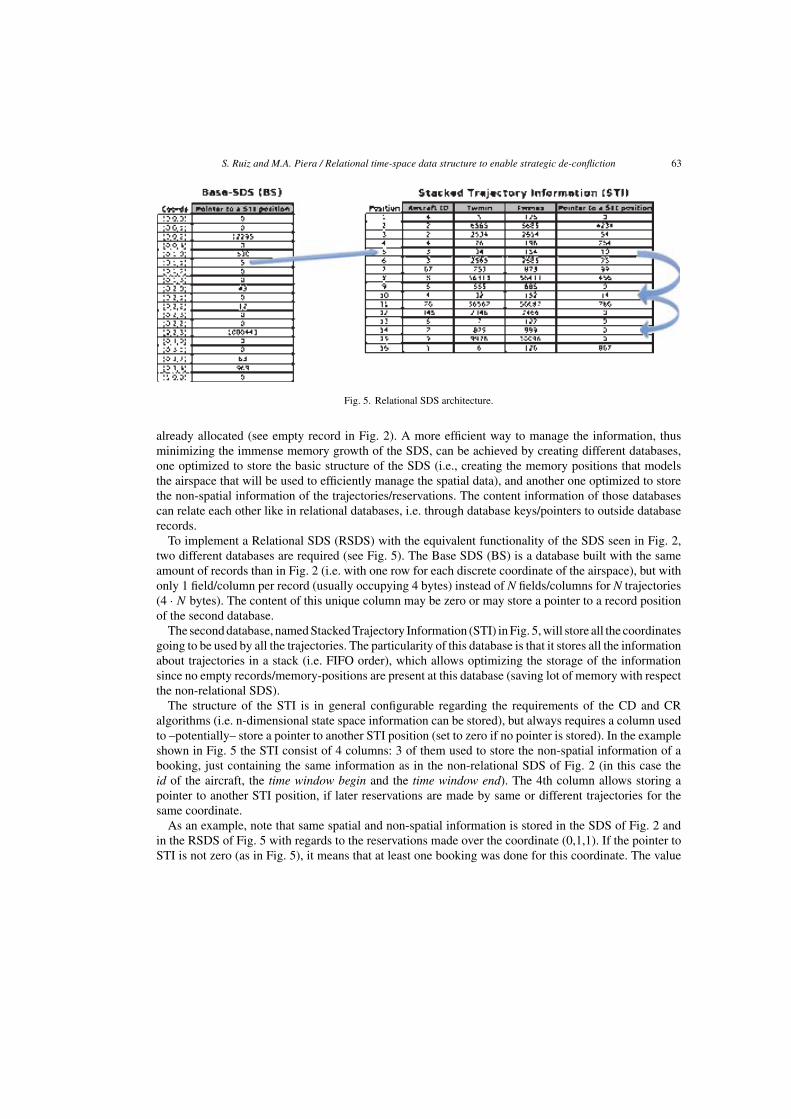
S. Ruiz and M.A. Piera / Relational time-space data structure to enable strategic de-confliction 63
Fig. 5. Relational SDS architecture.
already allocated (see empty record in Fig. 2). A more efficient way to manage the information, thusminimizing the immense memory growth of the SDS, can be achieved by creating different databases,one optimized to store the basic structure of the SDS (i.e., creating the memory positions that modelsthe airspace that will be used to efficiently manage the spatial data), and another one optimized to storethe non-spatial information of the trajectories/reservations. The content information of those databasescan relate each other like in relational databases, i.e. through database keys/pointers to outside databaserecords.
To implement a Relational SDS (RSDS) with the equivalent functionality of the SDS seen in Fig. 2,two different databases are required (see Fig. 5). The Base SDS (BS) is a database built with the sameamount of records than in Fig. 2 (i.e. with one row for each discrete coordinate of the airspace), but withonly 1 field/column per record (usually occupying 4 bytes) instead of N fields/columns for N trajectories(4 · N bytes). The content of this unique column may be zero or may store a pointer to a record positionof the second database.
The second database, named Stacked Trajectory Information (STI) in Fig. 5, will store all the coordinatesgoing to be used by all the trajectories. The particularity of this database is that it stores all the informationabout trajectories in a stack (i.e. FIFO order), which allows optimizing the storage of the informationsince no empty records/memory-positions are present at this database (saving lot of memory with respectthe non-relational SDS).
The structure of the STI is in general configurable regarding the requirements of the CD and CRalgorithms (i.e. n-dimensional state space information can be stored), but always requires a column usedto –potentially– store a pointer to another STI position (set to zero if no pointer is stored). In the exampleshown in Fig. 5 the STI consist of 4 columns: 3 of them used to store the non-spatial information of abooking, just containing the same information as in the non-relational SDS of Fig. 2 (in this case theid of the aircraft, the time window begin and the time window end). The 4th column allows storing apointer to another STI position, if later reservations are made by same or different trajectories for thesame coordinate.
As an example, note that same spatial and non-spatial information is stored in the SDS of Fig. 2 andin the RSDS of Fig. 5 with regards to the reservations made over the coordinate (0,1,1). If the pointer toSTI is not zero (as in Fig. 5), it means that at least one booking was done for this coordinate. The value
64 S. Ruiz and M.A. Piera / Relational time-space data structure to enable strategic de-confliction
of the pointer indicates the position of the STI where the previous booking is stored (in the example, forcoordinate (0,1,1) a pointer is stored to position 5 of STI). By accessing this record/row in the STI, itis possible to check if there is a conflict between the current and the previous booking (by checking iftheir utilization time-windows overlap). Once determined whether there is a conflict with such a previousbooking, the fourth column of the STI current position is checked to search if another pointer to STI ispresent. If the pointer is set to zero, it means that no more previous booking for such a coordinate exists,so the current booking can be stored in the last free position of the STI (FIFO order) and a key/pointer tothat record is stored in the fourth column of the actual current record of the STI. If the pointer is not zero,it sequentially proceeds with the same algorithm until a free position is found to complete the booking(in the example, positions 10 and 14 are sequentially checked).
The main advantage of the RSDS design is that the amount of memory required for the constructionof the BS is mostly related with the size of the airspace sector to model and the desired granularity, thusits size does not increase with the amount of trajectories considered in the problem:
total Memory BS = X·Y ·Z·P = lengthX
sizeBinsX· lengthY
sizeBinsY· lengthZ
sizeBinsZ·P (3)
being P the amount of bytes required to store a pointer to a record (typically P = 4 or P = 8) and therest of the parameters with the same meaning as in Eq. 2.
On the other hand, the amount of memory needed for the STI is calculated by:
total Memory STI = N·L · (B + P) (4)
being N the number of trajectories to be processed, L the average amount of time-steps per trajectory andB and P with the same meaning as in Eq. 2 and Eq. 3. Therefore, the total memory space needed to storethe STI when N increase grows with a constant linear rate much lower than in the case of the originallogical SDS architecture shown in Fig. 2.
According to calculations made for several RSDS configurations adapted to different ATM scenarios,the memory management improvement presented here has implied important reductions in the quantityof used main memory, needing about a 95–99% less memory (in most ATM practical cases) than usingnon-relational SDS for the same scenario.
The state space of the problem is still available in the RSDS, like a 4D snapshot (or nD snapshot) of theATM, thus being possible to extract and summarize useful information about the state-space as feed fornew CR algorithms that may take advantage of the state-space exploration in order to find efficient andoptimal conflict-free trajectories. CR algorithms based on Coloured Petri Nets has been able to explorethe state-space generated by the RSDS with excellent results [23, 33].
4. Time-space data structures
The kind of SDS introduced in Section 2.2.1 for collision avoidance presents the ability of storing theinformation of the trajectories according to the grid cells/bins they occupy at a given instant of simulation,information that can be used as a spatial pruning filter to reduce the amount of pairwise comparisonsduring the CD process. For ATM planning purposes a similar CD algorithm could be used, refreshingthe SDS at each time of simulation and filling a registry with the detected conflicts to be solved by a CRmodule. However, a historical record of the evolution of all trajectories over the time (like a 4D snapshot)is highly beneficial to provide a network overall view of the users’ flight intentions and thus to generateinformation about potential emergent dynamics in an efficient way.
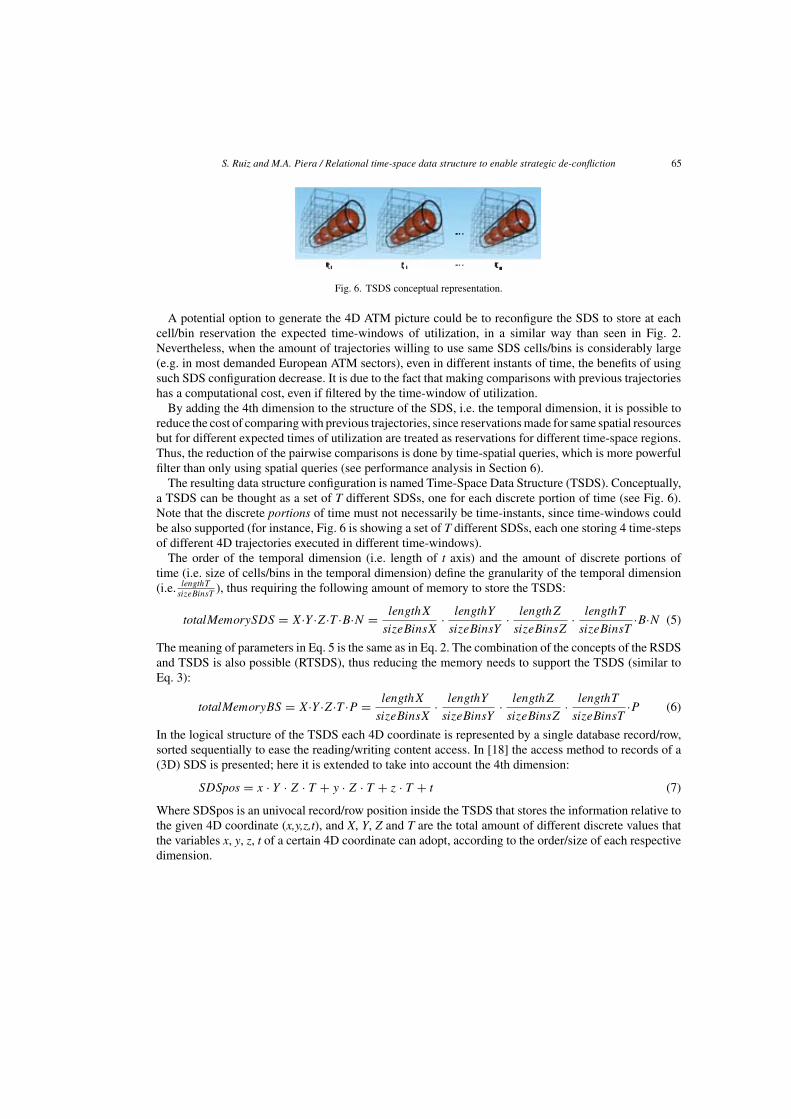
S. Ruiz and M.A. Piera / Relational time-space data structure to enable strategic de-confliction 65
Fig. 6. TSDS conceptual representation.
A potential option to generate the 4D ATM picture could be to reconfigure the SDS to store at eachcell/bin reservation the expected time-windows of utilization, in a similar way than seen in Fig. 2.Nevertheless, when the amount of trajectories willing to use same SDS cells/bins is considerably large(e.g. in most demanded European ATM sectors), even in different instants of time, the benefits of usingsuch SDS configuration decrease. It is due to the fact that making comparisons with previous trajectorieshas a computational cost, even if filtered by the time-window of utilization.
By adding the 4th dimension to the structure of the SDS, i.e. the temporal dimension, it is possible toreduce the cost of comparing with previous trajectories, since reservations made for same spatial resourcesbut for different expected times of utilization are treated as reservations for different time-space regions.Thus, the reduction of the pairwise comparisons is done by time-spatial queries, which is more powerfulfilter than only using spatial queries (see performance analysis in Section 6).
The resulting data structure configuration is named Time-Space Data Structure (TSDS). Conceptually,a TSDS can be thought as a set of T different SDSs, one for each discrete portion of time (see Fig. 6).Note that the discrete portions of time must not necessarily be time-instants, since time-windows couldbe also supported (for instance, Fig. 6 is showing a set of T different SDSs, each one storing 4 time-stepsof different 4D trajectories executed in different time-windows).
The order of the temporal dimension (i.e. length of t axis) and the amount of discrete portions oftime (i.e. size of cells/bins in the temporal dimension) define the granularity of the temporal dimension(i.e. lengthT
sizeBinsT), thus requiring the following amount of memory to store the TSDS:
totalMemorySDS = X·Y ·Z·T ·B·N = lengthX
sizeBinsX· lengthY
sizeBinsY· lengthZ
sizeBinsZ· lengthT
sizeBinsT·B·N (5)
The meaning of parameters in Eq. 5 is the same as in Eq. 2. The combination of the concepts of the RSDSand TSDS is also possible (RTSDS), thus reducing the memory needs to support the TSDS (similar toEq. 3):
totalMemoryBS = X·Y ·Z·T ·P = lengthX
sizeBinsX· lengthY
sizeBinsY· lengthZ
sizeBinsZ· lengthT
sizeBinsT·P (6)
In the logical structure of the TSDS each 4D coordinate is represented by a single database record/row,sorted sequentially to ease the reading/writing content access. In [18] the access method to records of a(3D) SDS is presented; here it is extended to take into account the 4th dimension:
SDSpos = x · Y · Z · T + y · Z · T + z · T + t (7)
Where SDSpos is an univocal record/row position inside the TSDS that stores the information relative tothe given 4D coordinate (x,y,z,t), and X, Y, Z and T are the total amount of different discrete values thatthe variables x, y, z, t of a certain 4D coordinate can adopt, according to the order/size of each respectivedimension.
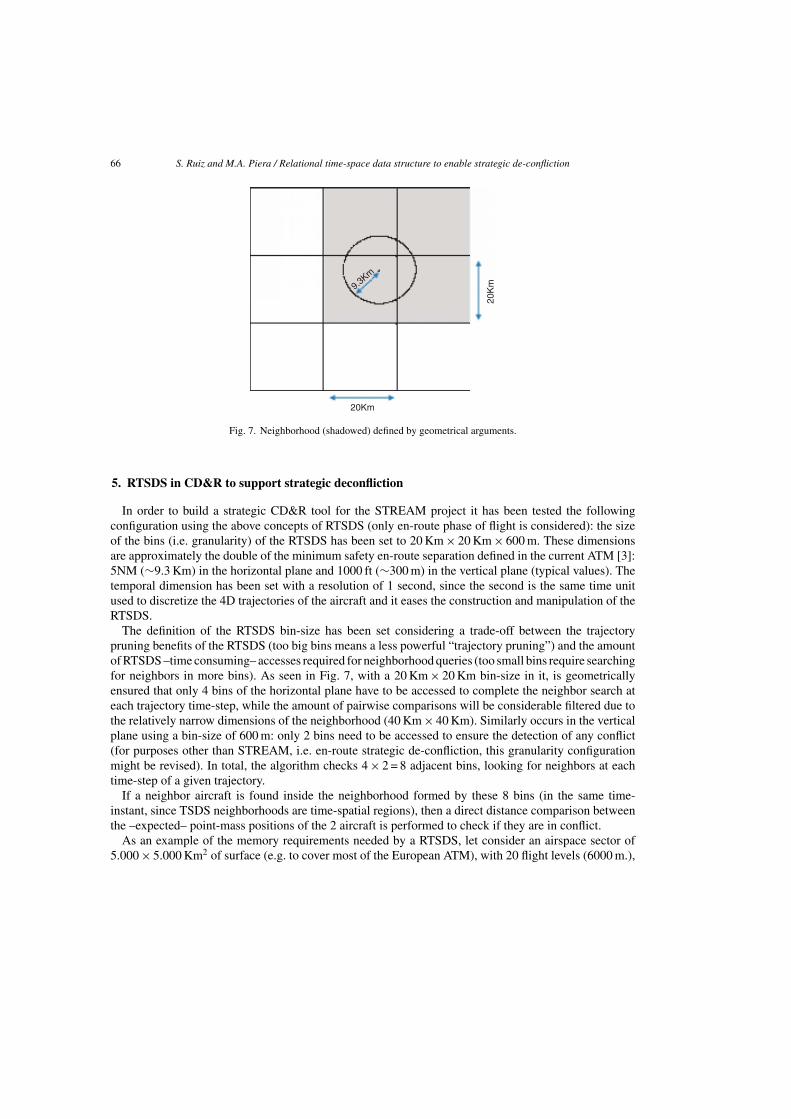
66 S. Ruiz and M.A. Piera / Relational time-space data structure to enable strategic de-confliction
9.3Km
20Km
20K
m
Fig. 7. Neighborhood (shadowed) defined by geometrical arguments.
5. RTSDS in CD&R to support strategic deconfliction
In order to build a strategic CD&R tool for the STREAM project it has been tested the followingconfiguration using the above concepts of RTSDS (only en-route phase of flight is considered): the sizeof the bins (i.e. granularity) of the RTSDS has been set to 20 Km $ 20 Km $ 600 m. These dimensionsare approximately the double of the minimum safety en-route separation defined in the current ATM [3]:5NM (%9.3 Km) in the horizontal plane and 1000 ft (%300 m) in the vertical plane (typical values). Thetemporal dimension has been set with a resolution of 1 second, since the second is the same time unitused to discretize the 4D trajectories of the aircraft and it eases the construction and manipulation of theRTSDS.
The definition of the RTSDS bin-size has been set considering a trade-off between the trajectorypruning benefits of the RTSDS (too big bins means a less powerful “trajectory pruning”) and the amountof RTSDS –time consuming– accesses required for neighborhood queries (too small bins require searchingfor neighbors in more bins). As seen in Fig. 7, with a 20 Km $ 20 Km bin-size in it, is geometricallyensured that only 4 bins of the horizontal plane have to be accessed to complete the neighbor search ateach trajectory time-step, while the amount of pairwise comparisons will be considerable filtered due tothe relatively narrow dimensions of the neighborhood (40 Km $ 40 Km). Similarly occurs in the verticalplane using a bin-size of 600 m: only 2 bins need to be accessed to ensure the detection of any conflict(for purposes other than STREAM, i.e. en-route strategic de-confliction, this granularity configurationmight be revised). In total, the algorithm checks 4 $ 2 = 8 adjacent bins, looking for neighbors at eachtime-step of a given trajectory.
If a neighbor aircraft is found inside the neighborhood formed by these 8 bins (in the same time-instant, since TSDS neighborhoods are time-spatial regions), then a direct distance comparison betweenthe –expected– point-mass positions of the 2 aircraft is performed to check if they are in conflict.
As an example of the memory requirements needed by a RTSDS, let consider an airspace sector of5.000 $ 5.000 Km2 of surface (e.g. to cover most of the European ATM), with 20 flight levels (6000 m.),
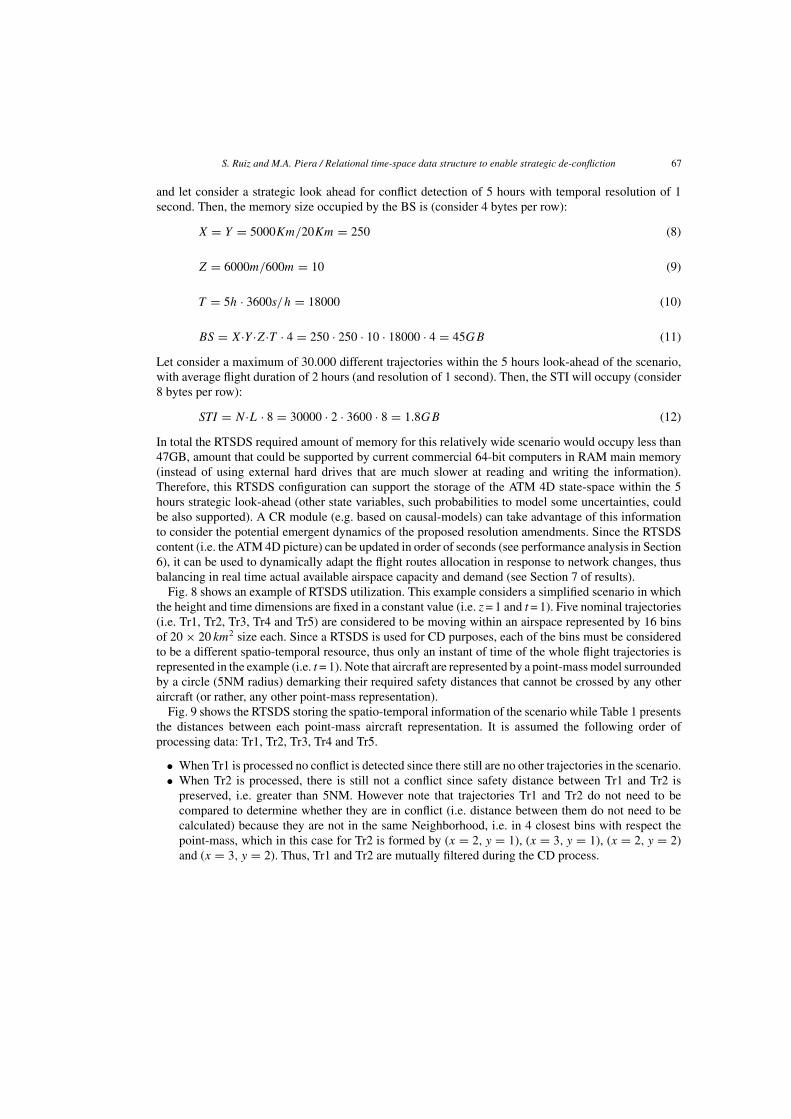
S. Ruiz and M.A. Piera / Relational time-space data structure to enable strategic de-confliction 67
and let consider a strategic look ahead for conflict detection of 5 hours with temporal resolution of 1second. Then, the memory size occupied by the BS is (consider 4 bytes per row):
X = Y = 5000Km/20Km = 250 (8)
Z = 6000m/600m = 10 (9)
T = 5h · 3600s/h = 18000 (10)
BS = X·Y ·Z·T · 4 = 250 · 250 · 10 · 18000 · 4 = 45GB (11)
Let consider a maximum of 30.000 different trajectories within the 5 hours look-ahead of the scenario,with average flight duration of 2 hours (and resolution of 1 second). Then, the STI will occupy (consider8 bytes per row):
STI = N·L · 8 = 30000 · 2 · 3600 · 8 = 1.8GB (12)
In total the RTSDS required amount of memory for this relatively wide scenario would occupy less than47GB, amount that could be supported by current commercial 64-bit computers in RAM main memory(instead of using external hard drives that are much slower at reading and writing the information).Therefore, this RTSDS configuration can support the storage of the ATM 4D state-space within the 5hours strategic look-ahead (other state variables, such probabilities to model some uncertainties, couldbe also supported). A CR module (e.g. based on causal-models) can take advantage of this informationto consider the potential emergent dynamics of the proposed resolution amendments. Since the RTSDScontent (i.e. the ATM 4D picture) can be updated in order of seconds (see performance analysis in Section6), it can be used to dynamically adapt the flight routes allocation in response to network changes, thusbalancing in real time actual available airspace capacity and demand (see Section 7 of results).
Fig. 8 shows an example of RTSDS utilization. This example considers a simplified scenario in whichthe height and time dimensions are fixed in a constant value (i.e. z = 1 and t = 1). Five nominal trajectories(i.e. Tr1, Tr2, Tr3, Tr4 and Tr5) are considered to be moving within an airspace represented by 16 binsof 20 $ 20 km2 size each. Since a RTSDS is used for CD purposes, each of the bins must be consideredto be a different spatio-temporal resource, thus only an instant of time of the whole flight trajectories isrepresented in the example (i.e. t = 1). Note that aircraft are represented by a point-mass model surroundedby a circle (5NM radius) demarking their required safety distances that cannot be crossed by any otheraircraft (or rather, any other point-mass representation).
Fig. 9 shows the RTSDS storing the spatio-temporal information of the scenario while Table 1 presentsthe distances between each point-mass aircraft representation. It is assumed the following order ofprocessing data: Tr1, Tr2, Tr3, Tr4 and Tr5.
• When Tr1 is processed no conflict is detected since there still are no other trajectories in the scenario.• When Tr2 is processed, there is still not a conflict since safety distance between Tr1 and Tr2 is
preserved, i.e. greater than 5NM. However note that trajectories Tr1 and Tr2 do not need to becompared to determine whether they are in conflict (i.e. distance between them do not need to becalculated) because they are not in the same Neighborhood, i.e. in 4 closest bins with respect thepoint-mass, which in this case for Tr2 is formed by (x = 2, y = 1), (x = 3, y = 1), (x = 2, y = 2)and (x = 3, y = 2). Thus, Tr1 and Tr2 are mutually filtered during the CD process.
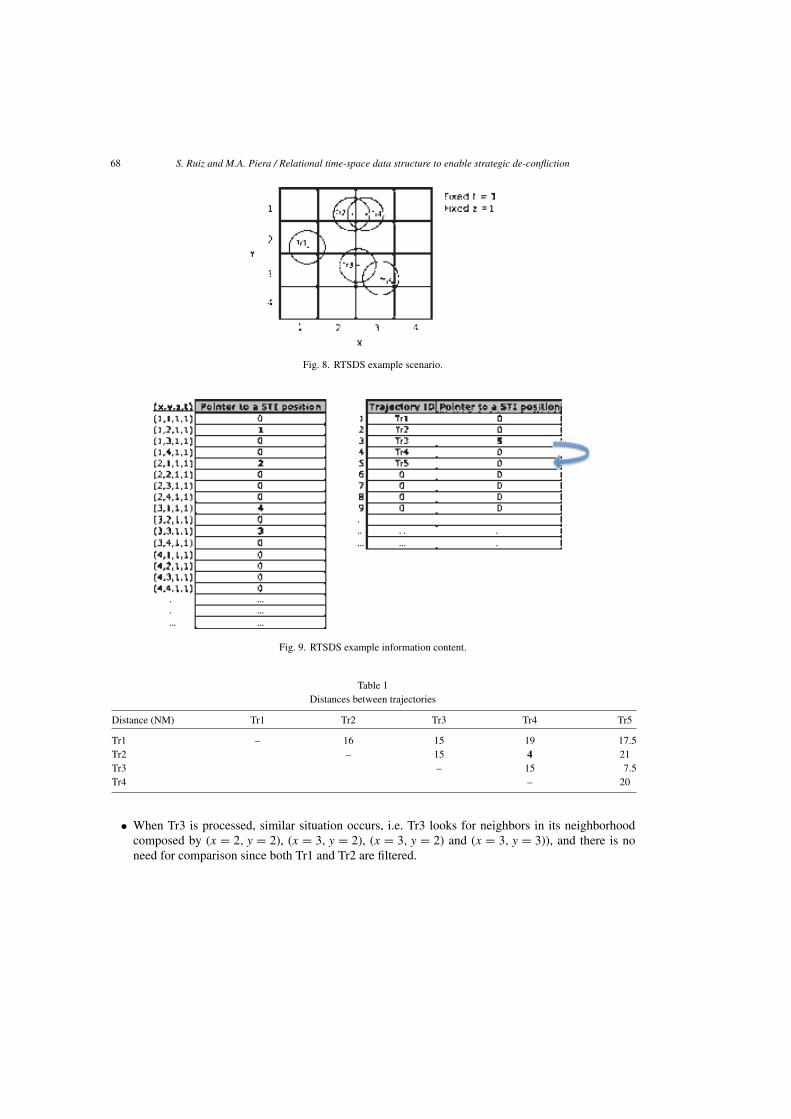
68 S. Ruiz and M.A. Piera / Relational time-space data structure to enable strategic de-confliction
Fig. 8. RTSDS example scenario.
Fig. 9. RTSDS example information content.
Table 1Distances between trajectories
Distance (NM) Tr1 Tr2 Tr3 Tr4 Tr5
Tr1 – 16 15 19 17.5Tr2 – 15 4 21Tr3 – 15 7.5Tr4 – 20
• When Tr3 is processed, similar situation occurs, i.e. Tr3 looks for neighbors in its neighborhoodcomposed by (x = 2, y = 2), (x = 3, y = 2), (x = 3, y = 2) and (x = 3, y = 3)), and there is noneed for comparison since both Tr1 and Tr2 are filtered.
S. Ruiz and M.A. Piera / Relational time-space data structure to enable strategic de-confliction 69
• When Tr4 is processed, Tr2 is found in its neighborhood, (x = 2, y = 1), (x = 3, y = 1), (x = 2, y =2) and (x = 3, y = 2), and a distance computation is done thus detecting a conflict because the safetydistance is lower than 5NM (i.e. their point-mass representation mutually crosses the safety circleof each other).
• When Tr5 is processed, a Neighbor Search is done in bins (x = 3, y = 3), (x = 4, y = 3),(x = 3, y = 4) and (x = 4, y = 4), where Tr3 is found as candidate for distance computation; noconflict is detected since distance is greater than 5NM. Note in Fig. 9 that the STI pointer of Tr5 hasbeen stored in the second column of the STI of the Tr3 record, since Tr3 was processed first (seeSection 3 about Relational SDS).
Note that only 2 distance computations were required to detect 1 conflict, instead of the 5·(5#1)2 = 10
required without the RTSDS filtering.
6. Performance analysis
6.1. Proof of linear temporal complexity
Let B the total amount of bins necessary to represent a given airspace of interest and N the number oftrajectories coexisting/synchronized (i.e. worst case) in the scenario, and assume that all the bins havethe same probability of being used by a given trajectory at a given instant (equiprobability is assumed forsimplicity of the argument, but the proof is valid for any set of probabilities, including the ones associatedto current ATM fixed route structure). Therefore, the probability pB of an aircraft using a certain bin ina given instant is:
PB = 1B
(13)
Thus, the expected number of trajectories found at certain bin, NB, at a given instant is:
NB = N · pB = N
B(14)
Considering a neighborhood search like in Fig. 7 or Fig. 8 but in 3D version (8 accesses to RTSDS recordsare required), the expected amount of pairwise comparisons, K, is found with following equation:
K = 8 · NB = 8 · N
B(15)
Usually N & B (i.e. the amount of trajectories is much smaller than the amount of available bins inthe airspace sector), so in general K ' 0. Therefore, since each of the N trajectories will be comparedat each time-step with K trajectories (i.e. neighbors), the temporal complexity of the RTSDS-based CDalgorithm is linear, i.e. O (N) (a constant amount of RTSDS accesses is required for each trajectory, e.g.8 for a 3D space).
Similar proof can be stated for the SDS collision avoidance algorithm [22], however the RTSDS hasthe advantage of providing with a 4D/nD snapshot of the ATM at the end of the CD process.
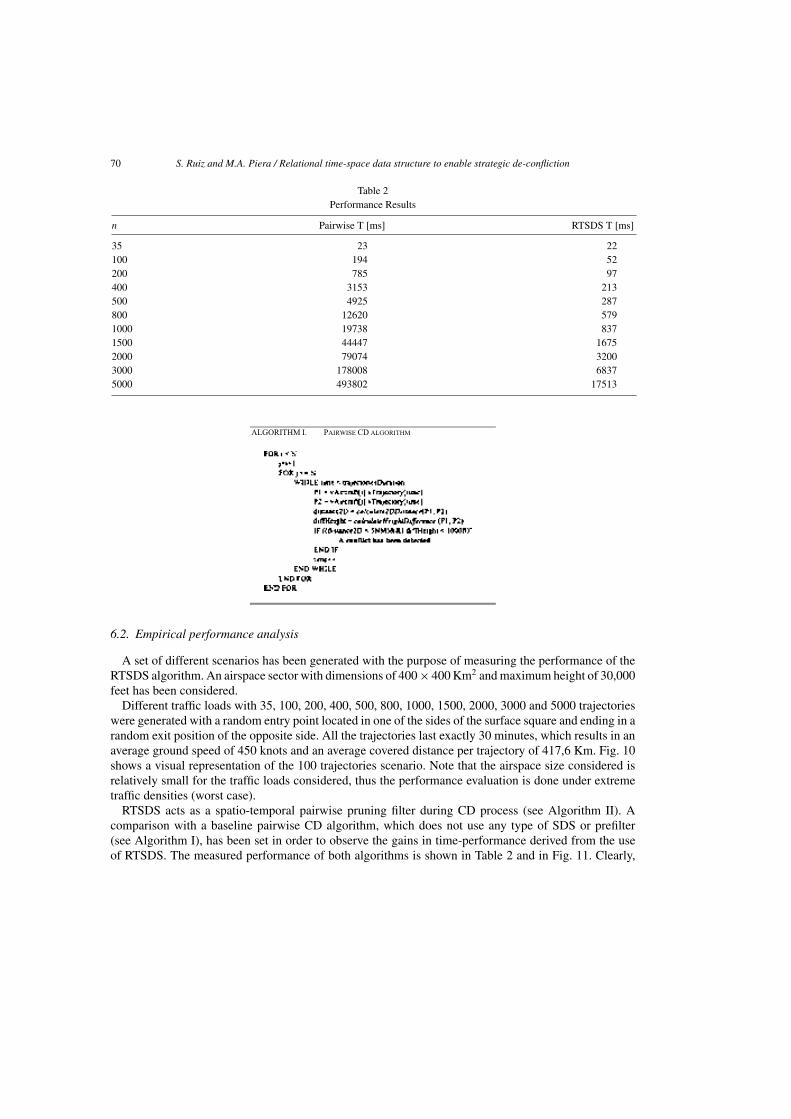
70 S. Ruiz and M.A. Piera / Relational time-space data structure to enable strategic de-confliction
Table 2Performance Results
n Pairwise T [ms] RTSDS T [ms]
35 23 22100 194 52200 785 97400 3153 213500 4925 287800 12620 5791000 19738 8371500 44447 16752000 79074 32003000 178008 68375000 493802 17513
6.2. Empirical performance analysis
A set of different scenarios has been generated with the purpose of measuring the performance of theRTSDS algorithm. An airspace sector with dimensions of 400 $ 400 Km2 and maximum height of 30,000feet has been considered.
Different traffic loads with 35, 100, 200, 400, 500, 800, 1000, 1500, 2000, 3000 and 5000 trajectorieswere generated with a random entry point located in one of the sides of the surface square and ending in arandom exit position of the opposite side. All the trajectories last exactly 30 minutes, which results in anaverage ground speed of 450 knots and an average covered distance per trajectory of 417,6 Km. Fig. 10shows a visual representation of the 100 trajectories scenario. Note that the airspace size considered isrelatively small for the traffic loads considered, thus the performance evaluation is done under extremetraffic densities (worst case).
RTSDS acts as a spatio-temporal pairwise pruning filter during CD process (see Algorithm II). Acomparison with a baseline pairwise CD algorithm, which does not use any type of SDS or prefilter(see Algorithm I), has been set in order to observe the gains in time-performance derived from the useof RTSDS. The measured performance of both algorithms is shown in Table 2 and in Fig. 11. Clearly,
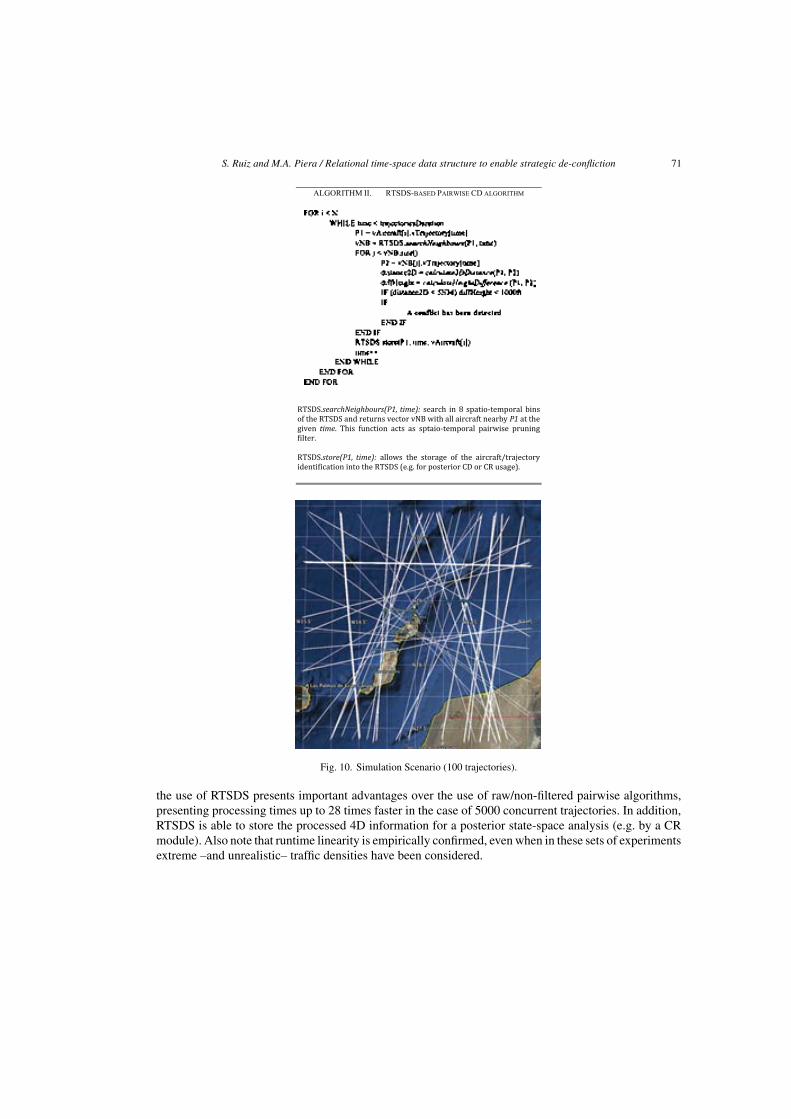
S. Ruiz and M.A. Piera / Relational time-space data structure to enable strategic de-confliction 71
Fig. 10. Simulation Scenario (100 trajectories).
the use of RTSDS presents important advantages over the use of raw/non-filtered pairwise algorithms,presenting processing times up to 28 times faster in the case of 5000 concurrent trajectories. In addition,RTSDS is able to store the processed 4D information for a posterior state-space analysis (e.g. by a CRmodule). Also note that runtime linearity is empirically confirmed, even when in these sets of experimentsextreme –and unrealistic– traffic densities have been considered.
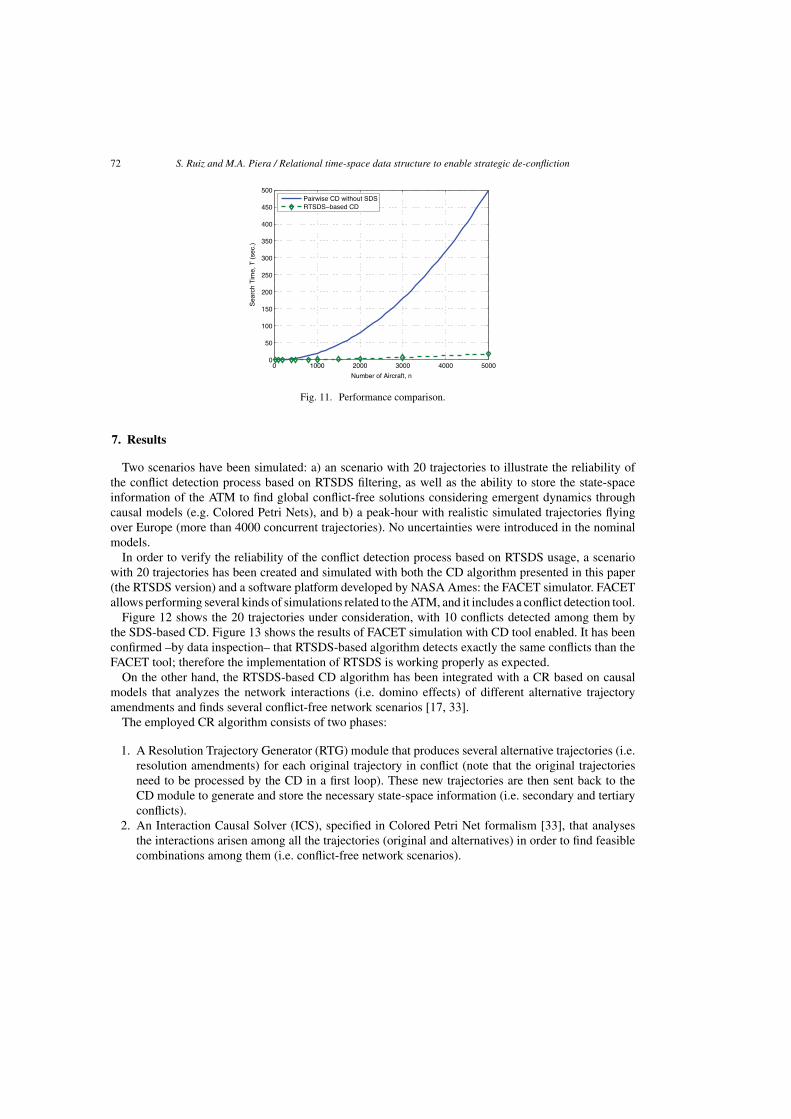
72 S. Ruiz and M.A. Piera / Relational time-space data structure to enable strategic de-confliction
Fig. 11. Performance comparison.
7. Results
Two scenarios have been simulated: a) an scenario with 20 trajectories to illustrate the reliability ofthe conflict detection process based on RTSDS filtering, as well as the ability to store the state-spaceinformation of the ATM to find global conflict-free solutions considering emergent dynamics throughcausal models (e.g. Colored Petri Nets), and b) a peak-hour with realistic simulated trajectories flyingover Europe (more than 4000 concurrent trajectories). No uncertainties were introduced in the nominalmodels.
In order to verify the reliability of the conflict detection process based on RTSDS usage, a scenariowith 20 trajectories has been created and simulated with both the CD algorithm presented in this paper(the RTSDS version) and a software platform developed by NASA Ames: the FACET simulator. FACETallows performing several kinds of simulations related to the ATM, and it includes a conflict detection tool.
Figure 12 shows the 20 trajectories under consideration, with 10 conflicts detected among them bythe SDS-based CD. Figure 13 shows the results of FACET simulation with CD tool enabled. It has beenconfirmed –by data inspection– that RTSDS-based algorithm detects exactly the same conflicts than theFACET tool; therefore the implementation of RTSDS is working properly as expected.
On the other hand, the RTSDS-based CD algorithm has been integrated with a CR based on causalmodels that analyzes the network interactions (i.e. domino effects) of different alternative trajectoryamendments and finds several conflict-free network scenarios [17, 33].
The employed CR algorithm consists of two phases:
1. A Resolution Trajectory Generator (RTG) module that produces several alternative trajectories (i.e.resolution amendments) for each original trajectory in conflict (note that the original trajectoriesneed to be processed by the CD in a first loop). These new trajectories are then sent back to theCD module to generate and store the necessary state-space information (i.e. secondary and tertiaryconflicts).
2. An Interaction Causal Solver (ICS), specified in Colored Petri Net formalism [33], that analysesthe interactions arisen among all the trajectories (original and alternatives) in order to find feasiblecombinations among them (i.e. conflict-free network scenarios).
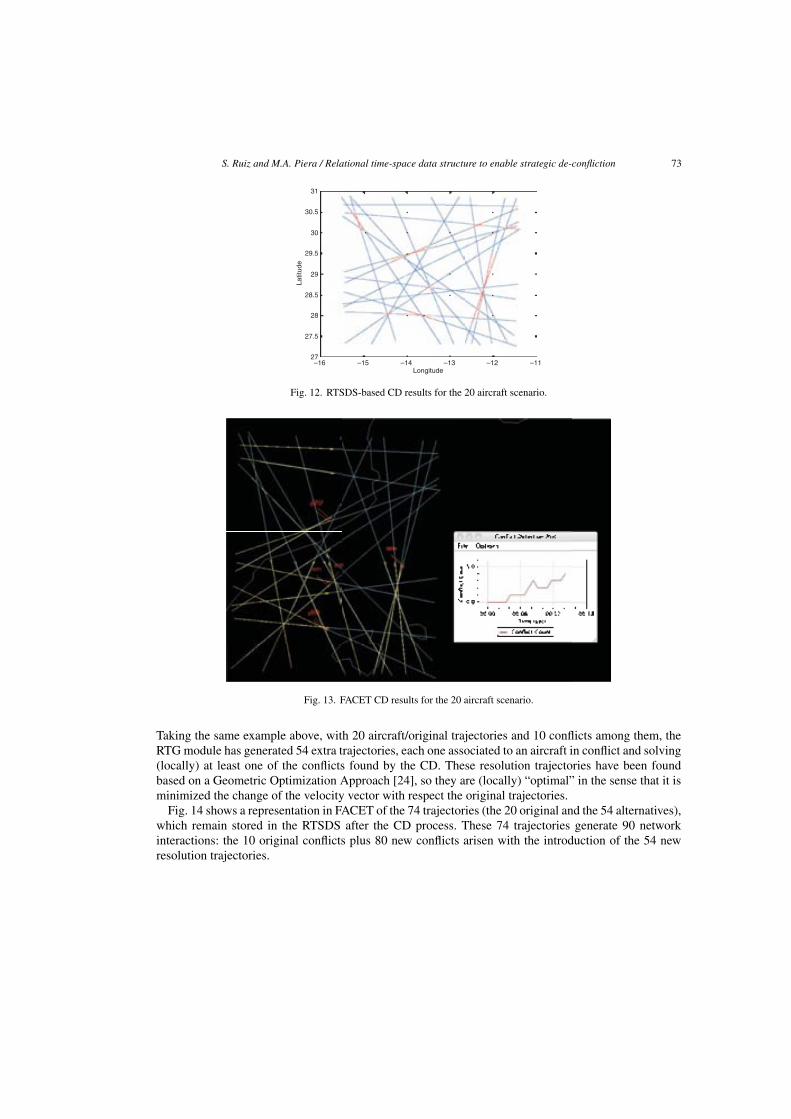
S. Ruiz and M.A. Piera / Relational time-space data structure to enable strategic de-confliction 73
31
30.5
30
29.5
29
28.5
28
27.5
27
Latit
ude
–16 –15 –14 –13 –12 –11Longitude
Fig. 12. RTSDS-based CD results for the 20 aircraft scenario.
Fig. 13. FACET CD results for the 20 aircraft scenario.
Taking the same example above, with 20 aircraft/original trajectories and 10 conflicts among them, theRTG module has generated 54 extra trajectories, each one associated to an aircraft in conflict and solving(locally) at least one of the conflicts found by the CD. These resolution trajectories have been foundbased on a Geometric Optimization Approach [24], so they are (locally) “optimal” in the sense that it isminimized the change of the velocity vector with respect the original trajectories.
Fig. 14 shows a representation in FACET of the 74 trajectories (the 20 original and the 54 alternatives),which remain stored in the RTSDS after the CD process. These 74 trajectories generate 90 networkinteractions: the 10 original conflicts plus 80 new conflicts arisen with the introduction of the 54 newresolution trajectories.
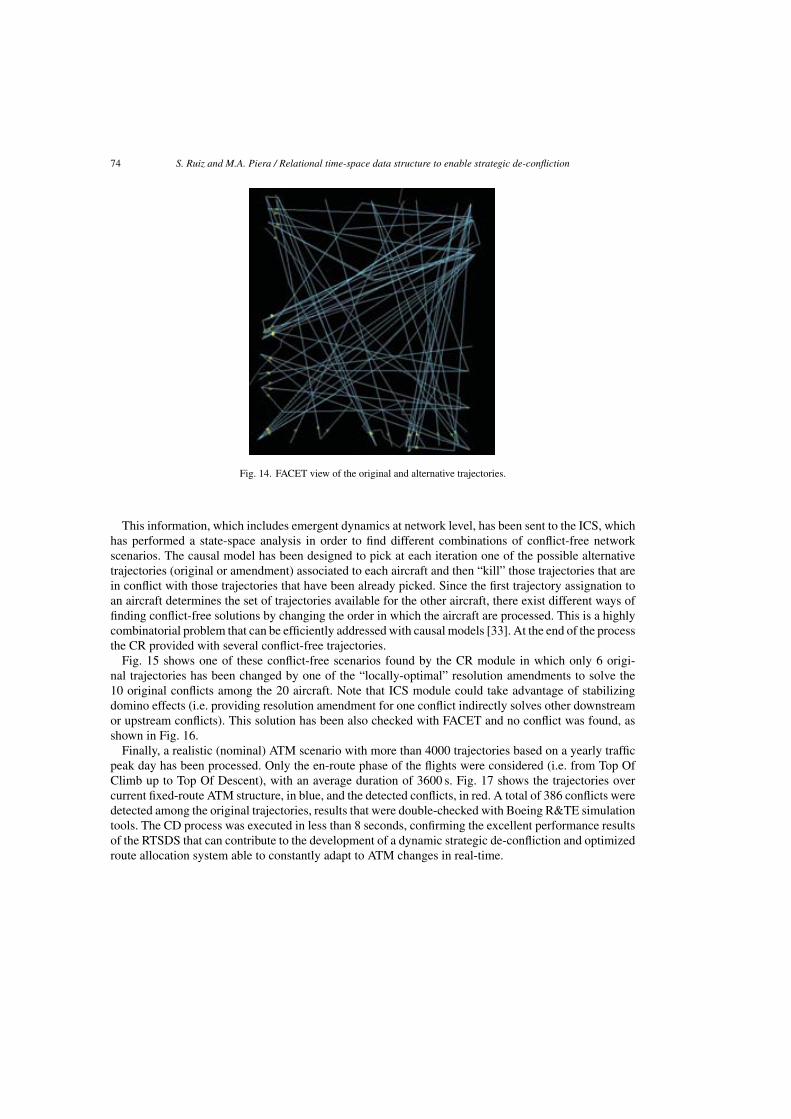
74 S. Ruiz and M.A. Piera / Relational time-space data structure to enable strategic de-confliction
Fig. 14. FACET view of the original and alternative trajectories.
This information, which includes emergent dynamics at network level, has been sent to the ICS, whichhas performed a state-space analysis in order to find different combinations of conflict-free networkscenarios. The causal model has been designed to pick at each iteration one of the possible alternativetrajectories (original or amendment) associated to each aircraft and then “kill” those trajectories that arein conflict with those trajectories that have been already picked. Since the first trajectory assignation toan aircraft determines the set of trajectories available for the other aircraft, there exist different ways offinding conflict-free solutions by changing the order in which the aircraft are processed. This is a highlycombinatorial problem that can be efficiently addressed with causal models [33]. At the end of the processthe CR provided with several conflict-free trajectories.
Fig. 15 shows one of these conflict-free scenarios found by the CR module in which only 6 origi-nal trajectories has been changed by one of the “locally-optimal” resolution amendments to solve the10 original conflicts among the 20 aircraft. Note that ICS module could take advantage of stabilizingdomino effects (i.e. providing resolution amendment for one conflict indirectly solves other downstreamor upstream conflicts). This solution has been also checked with FACET and no conflict was found, asshown in Fig. 16.
Finally, a realistic (nominal) ATM scenario with more than 4000 trajectories based on a yearly trafficpeak day has been processed. Only the en-route phase of the flights were considered (i.e. from Top OfClimb up to Top Of Descent), with an average duration of 3600 s. Fig. 17 shows the trajectories overcurrent fixed-route ATM structure, in blue, and the detected conflicts, in red. A total of 386 conflicts weredetected among the original trajectories, results that were double-checked with Boeing R&TE simulationtools. The CD process was executed in less than 8 seconds, confirming the excellent performance resultsof the RTSDS that can contribute to the development of a dynamic strategic de-confliction and optimizedroute allocation system able to constantly adapt to ATM changes in real-time.
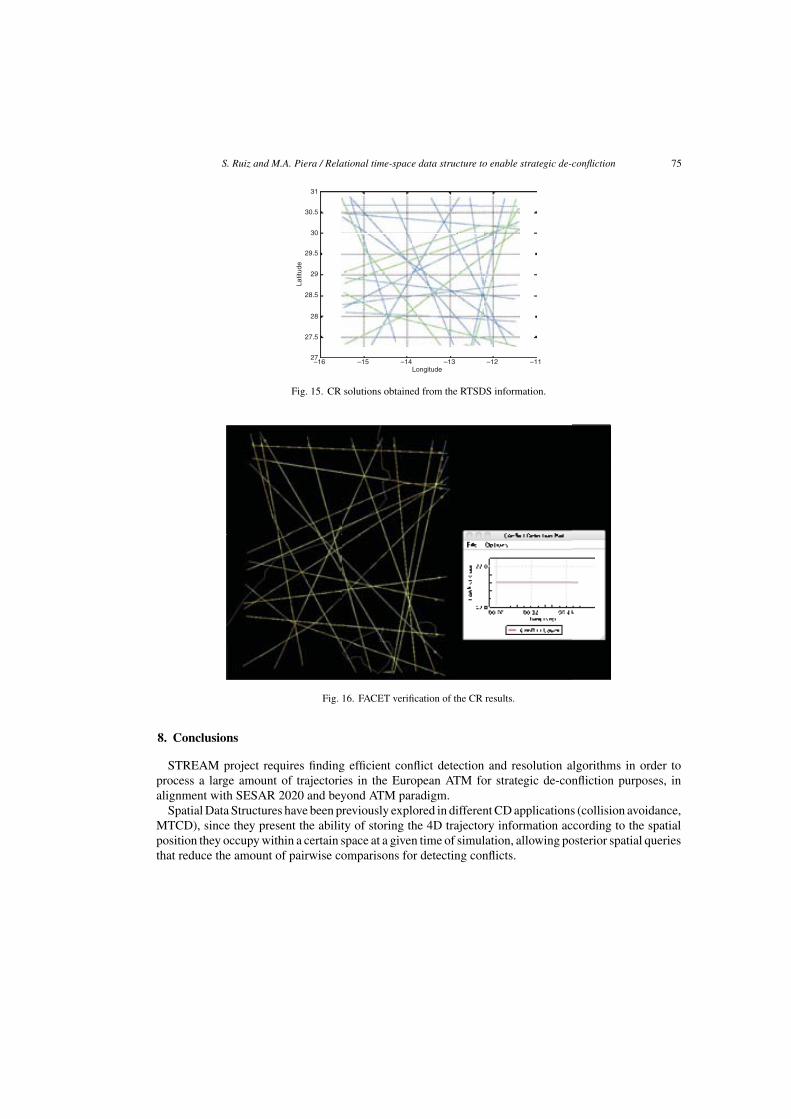
S. Ruiz and M.A. Piera / Relational time-space data structure to enable strategic de-confliction 75
31
30.5
30
29.5
29
28.5
28
27.5
27
Latit
ude
–16 –15 –14 –13 –12 –11Longitude
Fig. 15. CR solutions obtained from the RTSDS information.
Fig. 16. FACET verification of the CR results.
8. Conclusions
STREAM project requires finding efficient conflict detection and resolution algorithms in order toprocess a large amount of trajectories in the European ATM for strategic de-confliction purposes, inalignment with SESAR 2020 and beyond ATM paradigm.
Spatial Data Structures have been previously explored in different CD applications (collision avoidance,MTCD), since they present the ability of storing the 4D trajectory information according to the spatialposition they occupy within a certain space at a given time of simulation, allowing posterior spatial queriesthat reduce the amount of pairwise comparisons for detecting conflicts.
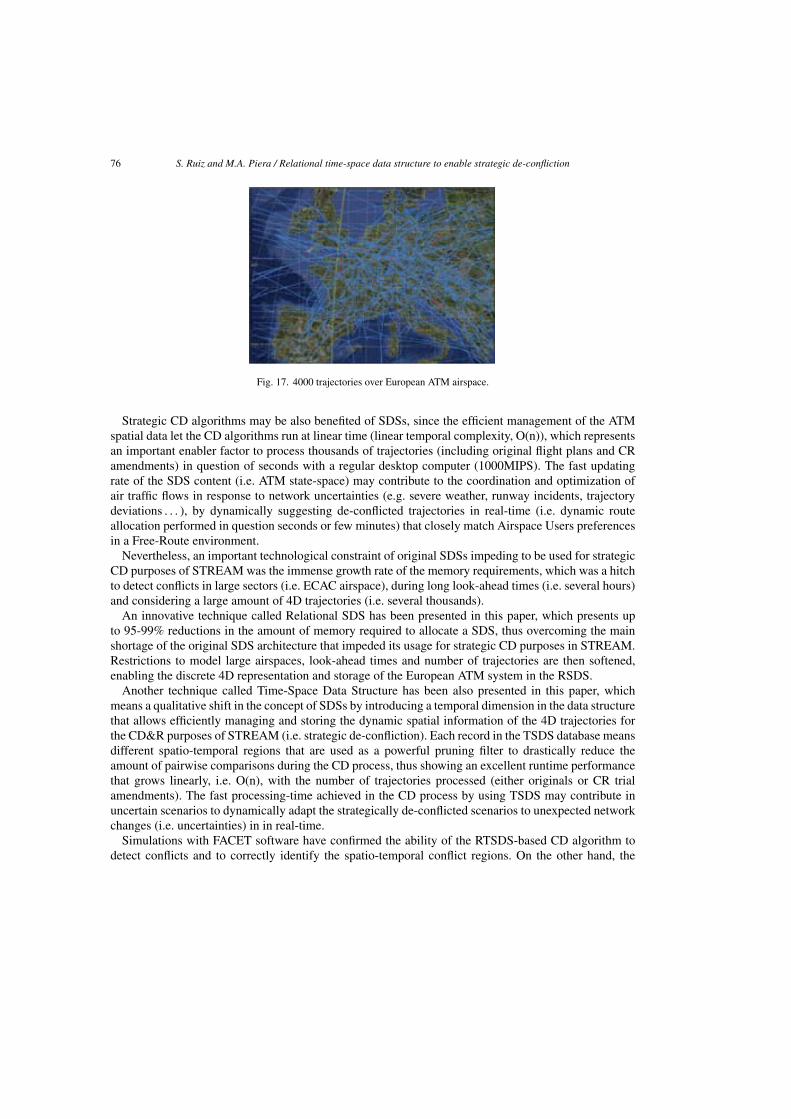
76 S. Ruiz and M.A. Piera / Relational time-space data structure to enable strategic de-confliction
Fig. 17. 4000 trajectories over European ATM airspace.
Strategic CD algorithms may be also benefited of SDSs, since the efficient management of the ATMspatial data let the CD algorithms run at linear time (linear temporal complexity, O(n)), which representsan important enabler factor to process thousands of trajectories (including original flight plans and CRamendments) in question of seconds with a regular desktop computer (1000MIPS). The fast updatingrate of the SDS content (i.e. ATM state-space) may contribute to the coordination and optimization ofair traffic flows in response to network uncertainties (e.g. severe weather, runway incidents, trajectorydeviations . . . ), by dynamically suggesting de-conflicted trajectories in real-time (i.e. dynamic routeallocation performed in question seconds or few minutes) that closely match Airspace Users preferencesin a Free-Route environment.
Nevertheless, an important technological constraint of original SDSs impeding to be used for strategicCD purposes of STREAM was the immense growth rate of the memory requirements, which was a hitchto detect conflicts in large sectors (i.e. ECAC airspace), during long look-ahead times (i.e. several hours)and considering a large amount of 4D trajectories (i.e. several thousands).
An innovative technique called Relational SDS has been presented in this paper, which presents upto 95-99% reductions in the amount of memory required to allocate a SDS, thus overcoming the mainshortage of the original SDS architecture that impeded its usage for strategic CD purposes in STREAM.Restrictions to model large airspaces, look-ahead times and number of trajectories are then softened,enabling the discrete 4D representation and storage of the European ATM system in the RSDS.
Another technique called Time-Space Data Structure has been also presented in this paper, whichmeans a qualitative shift in the concept of SDSs by introducing a temporal dimension in the data structurethat allows efficiently managing and storing the dynamic spatial information of the 4D trajectories forthe CD&R purposes of STREAM (i.e. strategic de-confliction). Each record in the TSDS database meansdifferent spatio-temporal regions that are used as a powerful pruning filter to drastically reduce theamount of pairwise comparisons during the CD process, thus showing an excellent runtime performancethat grows linearly, i.e. O(n), with the number of trajectories processed (either originals or CR trialamendments). The fast processing-time achieved in the CD process by using TSDS may contribute inuncertain scenarios to dynamically adapt the strategically de-conflicted scenarios to unexpected networkchanges (i.e. uncertainties) in in real-time.
Simulations with FACET software have confirmed the ability of the RTSDS-based CD algorithm todetect conflicts and to correctly identify the spatio-temporal conflict regions. On the other hand, the
S. Ruiz and M.A. Piera / Relational time-space data structure to enable strategic de-confliction 77
integration of the RTSDS-based CD algorithm with a CR module based on causal models has confirmedthe importance of having the state-space of the processed trajectories stored in the RTSDS. Finally,a realistic ATM scenario with more than 4000 trajectories has been processed with excellent resultsconfirming the potential contribution of RTSDS to strategic de-confliction algorithms.
More research is required to extend the benefits of using RTSDS for CD in STREAM, as for exampleto adapt the RTSDS to consider the curvature of the Earth when covering different time-zones (e.g., tocover the entire European ATM airspace), which may require adapting the SDS to work with geodesiccoordinates. More research will be also produced using real traffic data to perform strategic de-conflictionunder the consideration of current European air traffic levels, such as for example introducing flight andnetwork uncertainties in the models.
Acknowledgements
This work is partly funded by the Ministry of Economy and Competitiveness in the project “Fire GuidedUnmanned Aircraft and Resources Distribution (FireGUARD), CICYT Spanish program TIN2011-29494-C03-01, and the Stream project funded by EuroControl.
References
[1] A. Cook, The Fourth Dimension: Implementing 4D Aircraft Trajectories, Navigation News, The magazine of the RoyalInstitute of Navigation, 2010, pp. 17–20.
[2] SESAR Consortium, The SESAR Master Plan - SESAR Definition Phase, Deliverable 5. Abr-2008.[3] ICAO, Procedures for Air Navigation Services - Air Traffic Management, 15o ed. (Doc 4444), 2007.[4] M. Prandini and O.J. Watkins, Probabilistic Aircraft Conflict Detection, 2005.[5] J.K. Kuchar and L.C. Yang, A Review of Conflict Detection and Resolution Modeling Methods, IEEE Transactions on
Intelligent Transportation Systems Vol.I(4) (2000), 179–189.[6] EUROCONTROL, FASTI Baseline Description, 2007.[7] EUROCONTROL, MTCD Algorithms Overview, 2002.[8] EUROCONTROL, Specification for Medium-Term Conflict Detection, 2010.[9] EUROCONTROL, FASTI Operational Concept, 2007.
[10] M. Kupfer, T. Farley, Y. Chu and H. Erzberger, Automated Conflict Resolution - A simulation-based sensitivity study ofairspace and demand, in Proc 26th International Congress of the Aeronautical Sciences (ICAS), 2008.
[11] D.R. Isaacson and H. Erzberger, Design of a conflict detection algorithm for the Center/TRACON automation system, inDigital Avionics Systems Conference, Irvine, CA, 1997.
[12] EUROCONTROL, Challenges of Growth 2008, 2008.[13] EUROCONTROL, Long-Term Forecast: Flight Movements 2007-2030, 2008.[14] SESAR Consortium, European ATM Master Plan, 2009.[15] K. Blin, M. Akian, F. Bonnans, E. Hoffman, C. Martini and K. Zeghal, A stochastic conflict detection model revisited. In
Proceedings of AIAA GNC, Denver, AIAA-2000-4270, 2000.[16] T. Loureiro, K. Blin, E. Hoffman and K. Zeghal, Development of A Tool for Comparing Conflict Detection Algorithms
for Air Traffic Management, AIAA-2001-4053, 2001.[17] S. Ruiz, M. A. Piera, A. Ranieri and R. Martinez, A Computational Efficient Conflict Detection and Resolution through
Spatial Data Structures, In Proc 5th International Conference on Research in Air Transportation, ICRAT 2012, Universityof California (Berkeley), 2012.
[18] S. Ruiz, M.A. Piera and I. del Pozo, A Medium Term Conflict Detection and Resolution system forTMA Based on Spatial Data Structures and 4D Trajectories, Elsevier Transportation Research: Part C,http://dx.doi.org/10.1016/j.trc.2012.10.005.
[19] O. Desenfans, T. Lonls, G. Winckelmans and F. Holzapfel, Description of probabilistic wake predictors adapted to cruiseflight, Universite catholique de Louvain (UCL) and DLR, 2007.
78 S. Ruiz and M.A. Piera / Relational time-space data structure to enable strategic de-confliction
[20] Group for Research in Turbulence and Vertical Flows, UCL operational tools for predicting aircraft wake vortex transportand decay: The deterministic/Probabilistic wake vortex Models (DVM/PVM) and the WAKE4D platform, v. 2.2, 2010.
[21] C.W. Reynolds, Flocks, Herds, and Schools: A distributed Behavioural Model, in SIGGRAPH 87 Conference Proceedings,1987, pp. 25–34.
[22] Craig W. Reynolds, Big Fast Crowds on PS3, in Sandbox Symposium, 2006.[23] C. Zuniga, M.A. Piera, S. Ruiz and I. del Pozo, A CD&CR causal model based on path shortening/path stretching
techniques, Elsevier Transportation Research: part C, 2012.[24] K. Bilimoria, A Geometric Optimization Approach to Aircraft Conflict Resolution, AIAA Guidance, Navigation, and
Control Conference, Denver, 2000.[25] SESAR Consortium. The ATM Target Concept, SESAR Definition Phase, Deliverable 3, 2007.[26] K.D. Bilimoria, K.S. Sheth, H.Q. Lee and S.R. Grabbe, Performance Evaluation of Aircraft Separation Assurance for
Free Flight, Presented at the AIAA Guidance, Navigation and Control Conference, 2000.[27] J. Krozel, M. Peters, K.D. Bilimoria, C. Lee and J.S.B. Mitchel. System performance characteristics of centralized and
decentralized air traffic separation strategies, Presented at the Fourth USA/Europe Air Traffic Management Research andDevelopment Seminar, 2001.
[28] N. Durand, J. Alliot and O. Chansou, Resolution of En Route Conflicts, Air Traffic Control Quarterly, 3(3), 1995, 139–161.
[29] A. Ranieri, R. Martinez, M.A Piera, J. Lopez and M. Vilaplana. Strategic Trajectory De-confliction to Enable Seam-less Aircraft Conflict Management (WP-E project STREAM). Presented at the SESAR Innovation Days 2011, ENAC(Toulouse), 2011.
[30] EUROCONTROL. PHARE: Highly Interactive Problem Solver. Version 4 API Definitions, 1997.[31] S. Zelinski and M. Jastrzebski, Defining Dynamic Route Structure for Airspace Configuration, Presented at ICAS 2012,
2012.[32] H. Samet, Spatial data structures, Modern Database Systems, The Object Model, Interoperability and Beyond, ACM Press
and Addison-Wesley, New York, 1995 361–385.[33] J. Nosedal, S. Ruiz, M. Piera and A. Ranieri. Causal Decision Support Tools for Strategic ATM, In Proc of SESAR
Innovation Days (SID), 2012.[34] S. Thrun and Bucken, A. Integrating Grid-Based and Topological Maps for Mobile Robot Navigation, In: Proceedings of
the Thirteenth National Conference on Artificial Intelligence AAAI, Portland, Oregon, 1996.[35] N. Askitis and J. Zobel, Cache-Conscious Collision Resolution in String Hash Tables, Lecture Notes in Computer Science
Volume 3772, 2005.[36] B. Parhami, Analysis of the Lookup Table Size for Square-Rooting, In: Proceedings of Conferences of Signals, Systems,
and Computers, Pacific Grove, CA, USA, 1999.[37] SESAR Consortium, SESAR Concept of Operations Step 2, 2013.

7.3 “Computational Efficient Conflict Detection and Resolution through SpatialData Structures” 183
7.3 “Computational Efficient Conflict Detection and Res-olution through Spatial Data Structures”
Article 3, “Computational Efficient Conflict Detection and Resolution throughSpatial Data Structures”, has been published in the International Conferenceon Research in Air Transportation (ICRAT). It highlights the importanceof the SDS to keep stored a (pre-configured) ATM micro-model frameworkin which the complete 4D (or nD) representation of the ATM state (i.e.,current state and its expected evolution over the time) can be efficientlystored and managed. Several applications of interest that use the available4D information of that framework are presented, including the computa-tion of temporal looseness among trajectories, the anticipation of emergentdynamics/domino effects, and the identification of network hot-spots. Anempirical demonstration has been also included in order to show how theinformation available within the SDS can be used by a conflict resolutionmodule (based on a causal model) in order to find global optimal solutions.Note that the scenario presented for the simulations is a congested tacticalscenario (30-minute flight segments freely crossing an ATC sector), whichwas used as an intermediate step to the final European-level strategic de-confliction tool.

184 Chapter 7. Compendium of Published Articles

Computational Efficient Conflict Detection and Resolution through Spatial Data Structures
Sergio Ruiz, Catya Zuñiga, Miquel Angel Piera Dept. Telecommunication and System Engineering
Universidad Autónoma de Barcelona Sabadell (Barcelona), Spain
[Sergio.ruiz, MiquelA.Piera, CatyaA.Zúñiga]@uab.cat
Andrea Ranieri, Rubén Martinez Advanced Logistics Group
Indra Barcelona, Spain
[aranieri, rmartinez]@alg-global.com
Abstract— The SESAR concept of operations establishes a new paradigm for the management of air traffic based on the concept of 4D Business Trajectory, which will be shared by the Airspace Users with all the relevant stakeholders prior to departure for planning purposes. This paper presents the conceptual and technological framework developed by the STREAM project, whose objective is to apply conflict detection and resolution algorithms on this Shared Business Trajectory, in order to deliver traffic to air traffic controllers already de-conflicted. This implies the need for computationally-efficient algorithms able to process a considerable quantity of trajectories within few seconds and to store enough information to ensure that the resolution of a primary conflict does not imply the creation of another one somewhere else in the network. Spatial Data Structures (SDS) constitute a perfect choice for this application, since they permit the conflict detection problem to be reduced to a linear complexity O(n) and provide a very natural representation of the status of the ATM system and of its evolution over time. The state-space information stored in the SDS by the conflict detection module makes it possible to run a conflict resolution algorithm to calculate the trajectory amendments, taking into account the network interactions and also allowing the extraction of individual and aggregated traffic information to improve tactical and strategic ATM decision-making.
Keywords-component; 4D Trajectory, strategic conlict detection & resolution, spatial data structures, SESAR STREAM project.
I. INTRODUCTION Currently, most Conflict Detection (CD) algorithms that are
implemented in operational applications (CTAS, FASTI, iFACTS, ERATO or VAFORIT, among others) are mainly based on pairwise strategies [1–3]. Automated Conflict Resolution (CR) tools are currently under development, but early operational applications are also based on pairwise strategies [4, 5]. Unfortunately, it is well known that CD algorithms, when based on traditional pairwise strategies, have a temporal complexity of quadratic order, O(n2) [6]. This reduces their practical application to limited portions of airspace and traffic, due to the computational burden when trying to process thousands or tens of thousands trajectories. The number of trajectories currently using the European ATM every day is of the order of tens of thousands.
The STREAM project, a SESAR WP-E project in progress, aims at developing innovative computationally-efficient CD&CR algorithms that can process thousands of trajectories
within few seconds. This will enable traffic to be de-conflicted for wider airspace regions and will permit longer look-ahead times than in current applications, thus contributing to fill the current gap between strategic and tactical planning in the ATM. The idea is to capitalize on the availability of the 4D trajectory information available prior to take-off, with the most accurate level of detail, according to the planning horizon, and based on the SESAR concept of operation [7]. The information on flight intentions and on the current and forecast status of the whole European network will be available through the Network Operations Plan (NOP), a continuously-updated rolling plan that could enable a seamless conflict management process running continuously from the strategic phase (pre-departure, collaborative design of the NOP) up to the execution one (automation-assisted, controller-driven conflict resolution).
Spatial Data Structures (SDS) have been explored under the STREAM project as a means to implement the concept, with excellent results in time performance due to the linear temporal complexity of the algorithms, O(n) [8].
In addition, the use of correctly-configured SDS allows the storage of the entire state-space description of the traffic at the time when the conflict detection analysis is performed, since all the processed trajectories may be stored as a “4D snapshot” of the ATM system.
This paper focuses on explaining the opportunities that SDSs could offer for the better understanding of the ATM and to make better decisions both at strategic and tactical levels of operation. The information that can be obtained from the state space stored in the SDS includes but is not limited to:
• Analysis of interactions: once the CR gets a set of conflicts detected by the CD, it can generate and propose different trajectory trials to solve a conflict. The SDS can be re-fed with these new trajectories in order to detect possible new conflicts (i.e. interactions) generated among the new trajectory proposals and the rest of the network. This ability has been initially validated with CR specified in Coloured Petri Nets formalism, giving promising results that are still not published.
• Sensitivity analysis of departure-time changes: most of the perturbations in the ATM occur prior
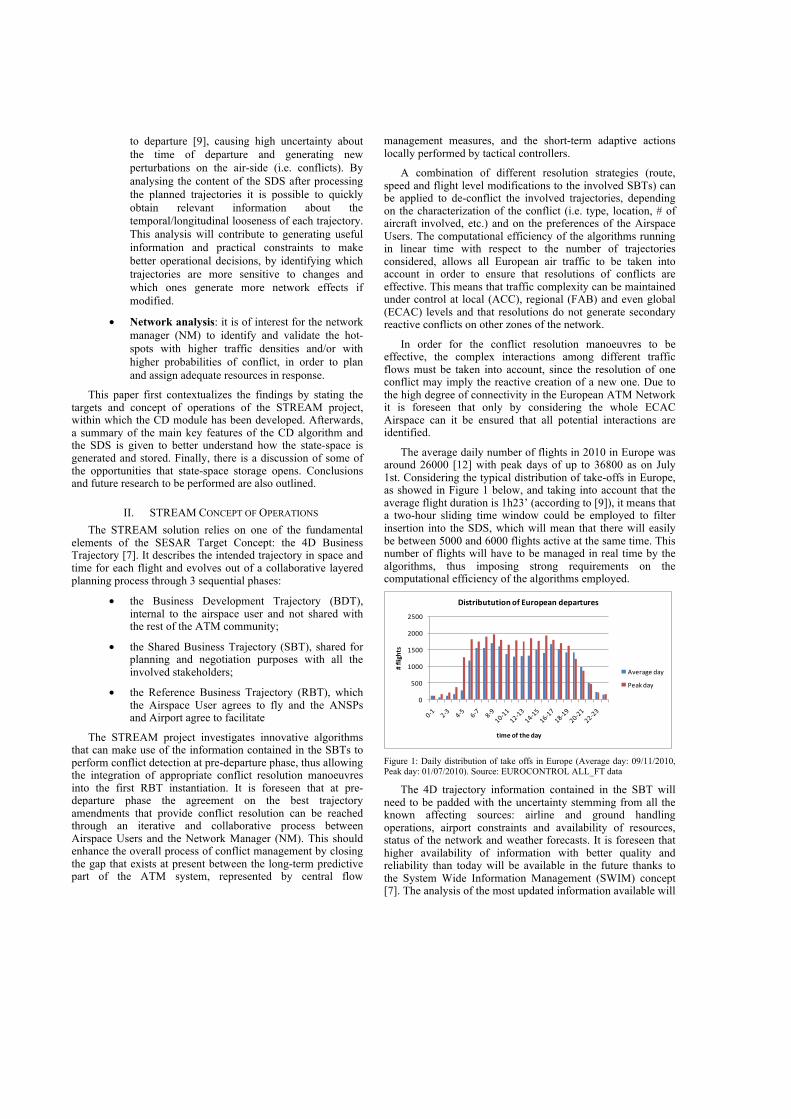
to departure [9], causing high uncertainty about the time of departure and generating new perturbations on the air-side (i.e. conflicts). By analysing the content of the SDS after processing the planned trajectories it is possible to quickly obtain relevant information about the temporal/longitudinal looseness of each trajectory. This analysis will contribute to generating useful information and practical constraints to make better operational decisions, by identifying which trajectories are more sensitive to changes and which ones generate more network effects if modified.
• Network analysis: it is of interest for the network manager (NM) to identify and validate the hot-spots with higher traffic densities and/or with higher probabilities of conflict, in order to plan and assign adequate resources in response.
This paper first contextualizes the findings by stating the targets and concept of operations of the STREAM project, within which the CD module has been developed. Afterwards, a summary of the main key features of the CD algorithm and the SDS is given to better understand how the state-space is generated and stored. Finally, there is a discussion of some of the opportunities that state-space storage opens. Conclusions and future research to be performed are also outlined.
II. STREAM CONCEPT OF OPERATIONS The STREAM solution relies on one of the fundamental
elements of the SESAR Target Concept: the 4D Business Trajectory [7]. It describes the intended trajectory in space and time for each flight and evolves out of a collaborative layered planning process through 3 sequential phases:
• the Business Development Trajectory (BDT), internal to the airspace user and not shared with the rest of the ATM community;
• the Shared Business Trajectory (SBT), shared for planning and negotiation purposes with all the involved stakeholders;
• the Reference Business Trajectory (RBT), which the Airspace User agrees to fly and the ANSPs and Airport agree to facilitate
The STREAM project investigates innovative algorithms that can make use of the information contained in the SBTs to perform conflict detection at pre-departure phase, thus allowing the integration of appropriate conflict resolution manoeuvres into the first RBT instantiation. It is foreseen that at pre-departure phase the agreement on the best trajectory amendments that provide conflict resolution can be reached through an iterative and collaborative process between Airspace Users and the Network Manager (NM). This should enhance the overall process of conflict management by closing the gap that exists at present between the long-term predictive part of the ATM system, represented by central flow
management measures, and the short-term adaptive actions locally performed by tactical controllers.
A combination of different resolution strategies (route, speed and flight level modifications to the involved SBTs) can be applied to de-conflict the involved trajectories, depending on the characterization of the conflict (i.e. type, location, # of aircraft involved, etc.) and on the preferences of the Airspace Users. The computational efficiency of the algorithms running in linear time with respect to the number of trajectories considered, allows all European air traffic to be taken into account in order to ensure that resolutions of conflicts are effective. This means that traffic complexity can be maintained under control at local (ACC), regional (FAB) and even global (ECAC) levels and that resolutions do not generate secondary reactive conflicts on other zones of the network.
In order for the conflict resolution manoeuvres to be effective, the complex interactions among different traffic flows must be taken into account, since the resolution of one conflict may imply the reactive creation of a new one. Due to the high degree of connectivity in the European ATM Network it is foreseen that only by considering the whole ECAC Airspace can it be ensured that all potential interactions are identified.
The average daily number of flights in 2010 in Europe was around 26000 [12] with peak days of up to 36800 as on July 1st. Considering the typical distribution of take-offs in Europe, as showed in Figure 1 below, and taking into account that the average flight duration is 1h23’ (according to [9]), it means that a two-hour sliding time window could be employed to filter insertion into the SDS, which will mean that there will easily be between 5000 and 6000 flights active at the same time. This number of flights will have to be managed in real time by the algorithms, thus imposing strong requirements on the computational efficiency of the algorithms employed.
!
"!!
#!!!
#"!!
$!!!
$"!!
!"#$%&'()
(%*+",#"('+"-./
0%)(1%23(3(%,4",#"531,6+.4"-+6.1(31+)
%&'()*'+,)-
.')/+,)-
Figure 1: Daily distribution of take offs in Europe (Average day: 09/11/2010, Peak day: 01/07/2010). Source: EUROCONTROL ALL_FT data
The 4D trajectory information contained in the SBT will need to be padded with the uncertainty stemming from all the known affecting sources: airline and ground handling operations, airport constraints and availability of resources, status of the network and weather forecasts. It is foreseen that higher availability of information with better quality and reliability than today will be available in the future thanks to the System Wide Information Management (SWIM) concept [7]. The analysis of the most updated information available will
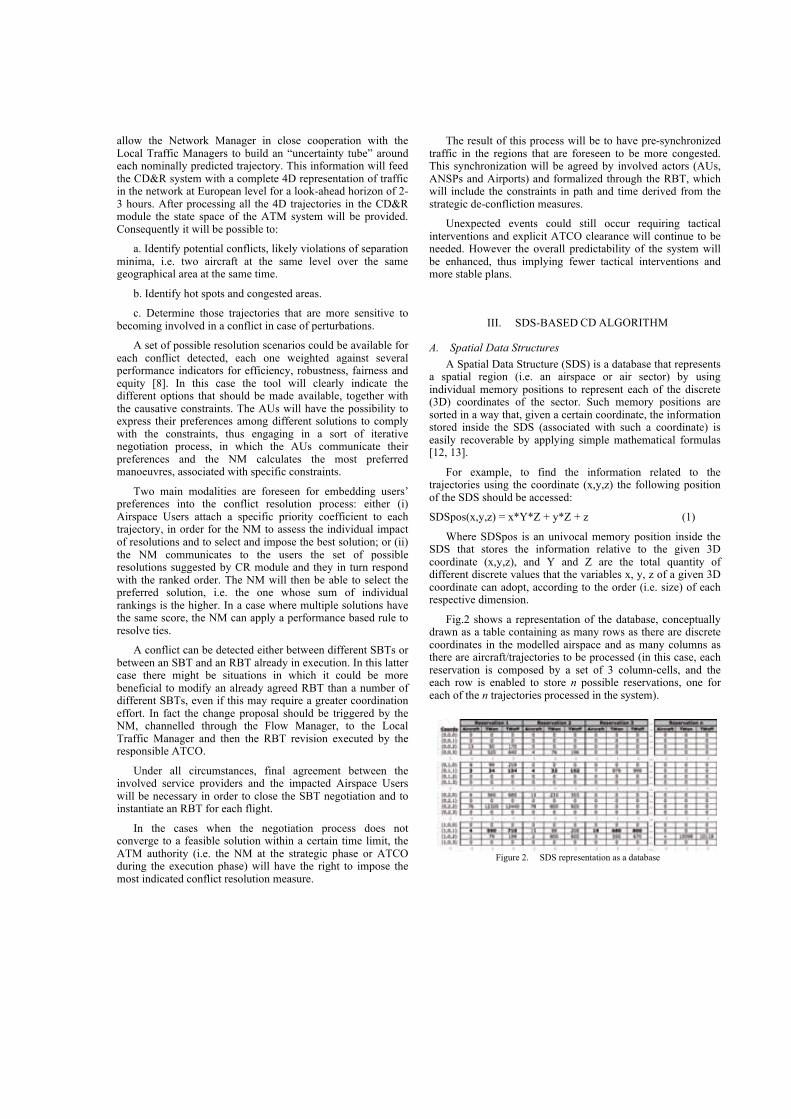
allow the Network Manager in close cooperation with the Local Traffic Managers to build an “uncertainty tube” around each nominally predicted trajectory. This information will feed the CD&R system with a complete 4D representation of traffic in the network at European level for a look-ahead horizon of 2-3 hours. After processing all the 4D trajectories in the CD&R module the state space of the ATM system will be provided. Consequently it will be possible to:
a. Identify potential conflicts, likely violations of separation minima, i.e. two aircraft at the same level over the same geographical area at the same time.
b. Identify hot spots and congested areas.
c. Determine those trajectories that are more sensitive to becoming involved in a conflict in case of perturbations.
A set of possible resolution scenarios could be available for each conflict detected, each one weighted against several performance indicators for efficiency, robustness, fairness and equity [8]. In this case the tool will clearly indicate the different options that should be made available, together with the causative constraints. The AUs will have the possibility to express their preferences among different solutions to comply with the constraints, thus engaging in a sort of iterative negotiation process, in which the AUs communicate their preferences and the NM calculates the most preferred manoeuvres, associated with specific constraints.
Two main modalities are foreseen for embedding users’ preferences into the conflict resolution process: either (i) Airspace Users attach a specific priority coefficient to each trajectory, in order for the NM to assess the individual impact of resolutions and to select and impose the best solution; or (ii) the NM communicates to the users the set of possible resolutions suggested by CR module and they in turn respond with the ranked order. The NM will then be able to select the preferred solution, i.e. the one whose sum of individual rankings is the higher. In a case where multiple solutions have the same score, the NM can apply a performance based rule to resolve ties.
A conflict can be detected either between different SBTs or between an SBT and an RBT already in execution. In this latter case there might be situations in which it could be more beneficial to modify an already agreed RBT than a number of different SBTs, even if this may require a greater coordination effort. In fact the change proposal should be triggered by the NM, channelled through the Flow Manager, to the Local Traffic Manager and then the RBT revision executed by the responsible ATCO.
Under all circumstances, final agreement between the involved service providers and the impacted Airspace Users will be necessary in order to close the SBT negotiation and to instantiate an RBT for each flight.
In the cases when the negotiation process does not converge to a feasible solution within a certain time limit, the ATM authority (i.e. the NM at the strategic phase or ATCO during the execution phase) will have the right to impose the most indicated conflict resolution measure.
The result of this process will be to have pre-synchronized traffic in the regions that are foreseen to be more congested. This synchronization will be agreed by involved actors (AUs, ANSPs and Airports) and formalized through the RBT, which will include the constraints in path and time derived from the strategic de-confliction measures.
Unexpected events could still occur requiring tactical interventions and explicit ATCO clearance will continue to be needed. However the overall predictability of the system will be enhanced, thus implying fewer tactical interventions and more stable plans.
III. SDS-BASED CD ALGORITHM
A. Spatial Data Structures A Spatial Data Structure (SDS) is a database that represents
a spatial region (i.e. an airspace or air sector) by using individual memory positions to represent each of the discrete (3D) coordinates of the sector. Such memory positions are sorted in a way that, given a certain coordinate, the information stored inside the SDS (associated with such a coordinate) is easily recoverable by applying simple mathematical formulas [12, 13].
For example, to find the information related to the trajectories using the coordinate (x,y,z) the following position of the SDS should be accessed:
SDSpos(x,y,z) = x*Y*Z + y*Z + z (1)
Where SDSpos is an univocal memory position inside the SDS that stores the information relative to the given 3D coordinate (x,y,z), and Y and Z are the total quantity of different discrete values that the variables x, y, z of a given 3D coordinate can adopt, according to the order (i.e. size) of each respective dimension.
Fig.2 shows a representation of the database, conceptually drawn as a table containing as many rows as there are discrete coordinates in the modelled airspace and as many columns as there are aircraft/trajectories to be processed (in this case, each reservation is composed by a set of 3 column-cells, and the each row is enabled to store n possible reservations, one for each of the n trajectories processed in the system).
Figure 2. SDS representation as a database
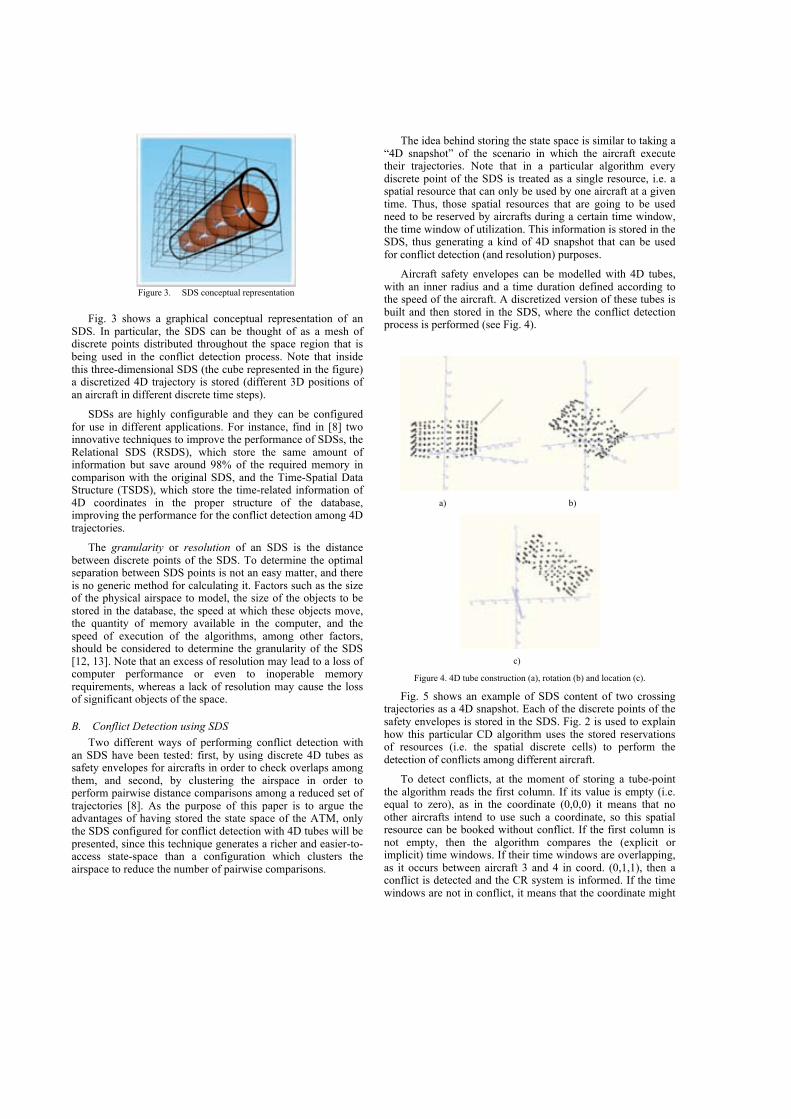
Fig. 3 shows a graphical conceptual representation of an SDS. In particular, the SDS can be thought of as a mesh of discrete points distributed throughout the space region that is being used in the conflict detection process. Note that inside this three-dimensional SDS (the cube represented in the figure) a discretized 4D trajectory is stored (different 3D positions of an aircraft in different discrete time steps).
SDSs are highly configurable and they can be configured for use in different applications. For instance, find in [8] two innovative techniques to improve the performance of SDSs, the Relational SDS (RSDS), which store the same amount of information but save around 98% of the required memory in comparison with the original SDS, and the Time-Spatial Data Structure (TSDS), which store the time-related information of 4D coordinates in the proper structure of the database, improving the performance for the conflict detection among 4D trajectories.
The granularity or resolution of an SDS is the distance between discrete points of the SDS. To determine the optimal separation between SDS points is not an easy matter, and there is no generic method for calculating it. Factors such as the size of the physical airspace to model, the size of the objects to be stored in the database, the speed at which these objects move, the quantity of memory available in the computer, and the speed of execution of the algorithms, among other factors, should be considered to determine the granularity of the SDS [12, 13]. Note that an excess of resolution may lead to a loss of computer performance or even to inoperable memory requirements, whereas a lack of resolution may cause the loss of significant objects of the space.
B. Conflict Detection using SDS Two different ways of performing conflict detection with
an SDS have been tested: first, by using discrete 4D tubes as safety envelopes for aircrafts in order to check overlaps among them, and second, by clustering the airspace in order to perform pairwise distance comparisons among a reduced set of trajectories [8]. As the purpose of this paper is to argue the advantages of having stored the state space of the ATM, only the SDS configured for conflict detection with 4D tubes will be presented, since this technique generates a richer and easier-to-access state-space than a configuration which clusters the airspace to reduce the number of pairwise comparisons.
The idea behind storing the state space is similar to taking a “4D snapshot” of the scenario in which the aircraft execute their trajectories. Note that in a particular algorithm every discrete point of the SDS is treated as a single resource, i.e. a spatial resource that can only be used by one aircraft at a given time. Thus, those spatial resources that are going to be used need to be reserved by aircrafts during a certain time window, the time window of utilization. This information is stored in the SDS, thus generating a kind of 4D snapshot that can be used for conflict detection (and resolution) purposes.
Aircraft safety envelopes can be modelled with 4D tubes, with an inner radius and a time duration defined according to the speed of the aircraft. A discretized version of these tubes is built and then stored in the SDS, where the conflict detection process is performed (see Fig. 4).
a) b)
c)
Figure 4. 4D tube construction (a), rotation (b) and location (c).
Fig. 5 shows an example of SDS content of two crossing trajectories as a 4D snapshot. Each of the discrete points of the safety envelopes is stored in the SDS. Fig. 2 is used to explain how this particular CD algorithm uses the stored reservations of resources (i.e. the spatial discrete cells) to perform the detection of conflicts among different aircraft.
To detect conflicts, at the moment of storing a tube-point the algorithm reads the first column. If its value is empty (i.e. equal to zero), as in the coordinate (0,0,0) it means that no other aircrafts intend to use such a coordinate, so this spatial resource can be booked without conflict. If the first column is not empty, then the algorithm compares the (explicit or implicit) time windows. If their time windows are overlapping, as it occurs between aircraft 3 and 4 in coord. (0,1,1), then a conflict is detected and the CR system is informed. If the time windows are not in conflict, it means that the coordinate might
Figure 3. SDS conceptual representation
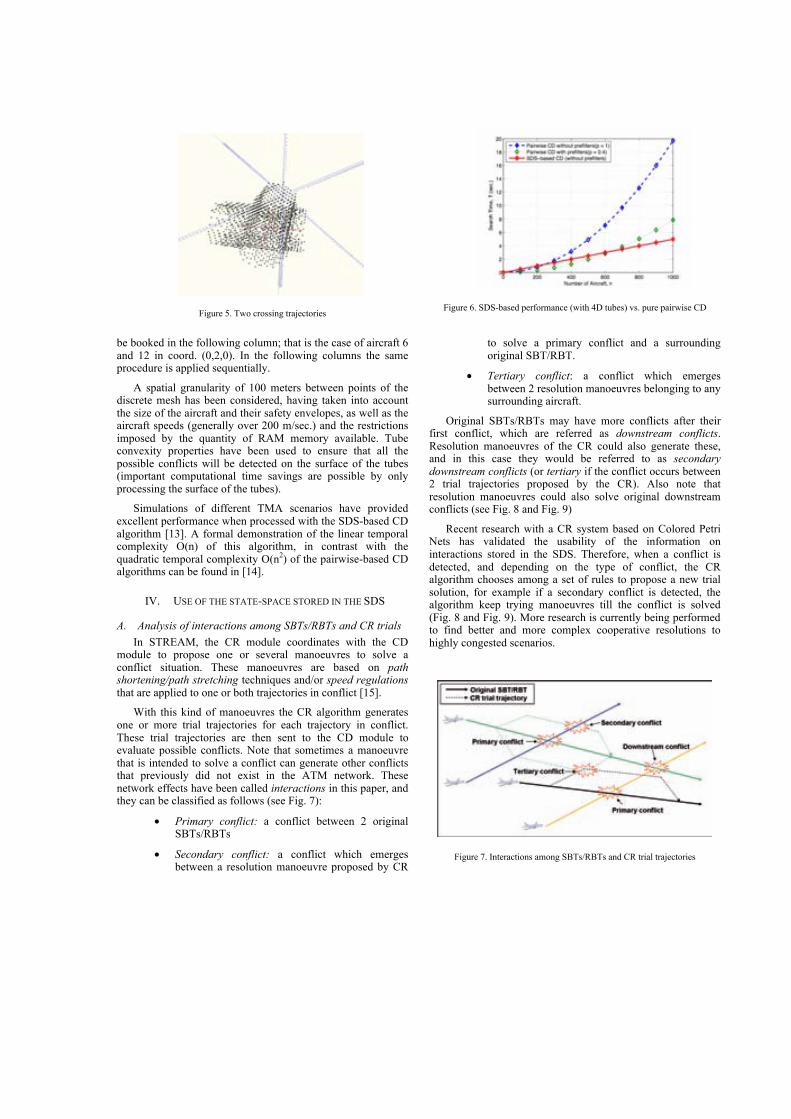
be booked in the following column; that is the case of aircraft 6 and 12 in coord. (0,2,0). In the following columns the same procedure is applied sequentially.
A spatial granularity of 100 meters between points of the discrete mesh has been considered, having taken into account the size of the aircraft and their safety envelopes, as well as the aircraft speeds (generally over 200 m/sec.) and the restrictions imposed by the quantity of RAM memory available. Tube convexity properties have been used to ensure that all the possible conflicts will be detected on the surface of the tubes (important computational time savings are possible by only processing the surface of the tubes).
Simulations of different TMA scenarios have provided excellent performance when processed with the SDS-based CD algorithm [13]. A formal demonstration of the linear temporal complexity O(n) of this algorithm, in contrast with the quadratic temporal complexity O(n2) of the pairwise-based CD algorithms can be found in [14].
IV. USE OF THE STATE-SPACE STORED IN THE SDS
A. Analysis of interactions among SBTs/RBTs and CR trials In STREAM, the CR module coordinates with the CD
module to propose one or several manoeuvres to solve a conflict situation. These manoeuvres are based on path shortening/path stretching techniques and/or speed regulations that are applied to one or both trajectories in conflict [15].
With this kind of manoeuvres the CR algorithm generates one or more trial trajectories for each trajectory in conflict. These trial trajectories are then sent to the CD module to evaluate possible conflicts. Note that sometimes a manoeuvre that is intended to solve a conflict can generate other conflicts that previously did not exist in the ATM network. These network effects have been called interactions in this paper, and they can be classified as follows (see Fig. 7):
• Primary conflict: a conflict between 2 original SBTs/RBTs
• Secondary conflict: a conflict which emerges between a resolution manoeuvre proposed by CR
to solve a primary conflict and a surrounding original SBT/RBT.
• Tertiary conflict: a conflict which emerges between 2 resolution manoeuvres belonging to any surrounding aircraft.
Original SBTs/RBTs may have more conflicts after their first conflict, which are referred as downstream conflicts. Resolution manoeuvres of the CR could also generate these, and in this case they would be referred to as secondary downstream conflicts (or tertiary if the conflict occurs between 2 trial trajectories proposed by the CR). Also note that resolution manoeuvres could also solve original downstream conflicts (see Fig. 8 and Fig. 9)
Recent research with a CR system based on Colored Petri Nets has validated the usability of the information on interactions stored in the SDS. Therefore, when a conflict is detected, and depending on the type of conflict, the CR algorithm chooses among a set of rules to propose a new trial solution, for example if a secondary conflict is detected, the algorithm keep trying manoeuvres till the conflict is solved (Fig. 8 and Fig. 9). More research is currently being performed to find better and more complex cooperative resolutions to highly congested scenarios.
Figure 5. Two crossing trajectories
Figure 6. SDS-based performance (with 4D tubes) vs. pure pairwise CD
Figure 7. Interactions among SBTs/RBTs and CR trial trajectories
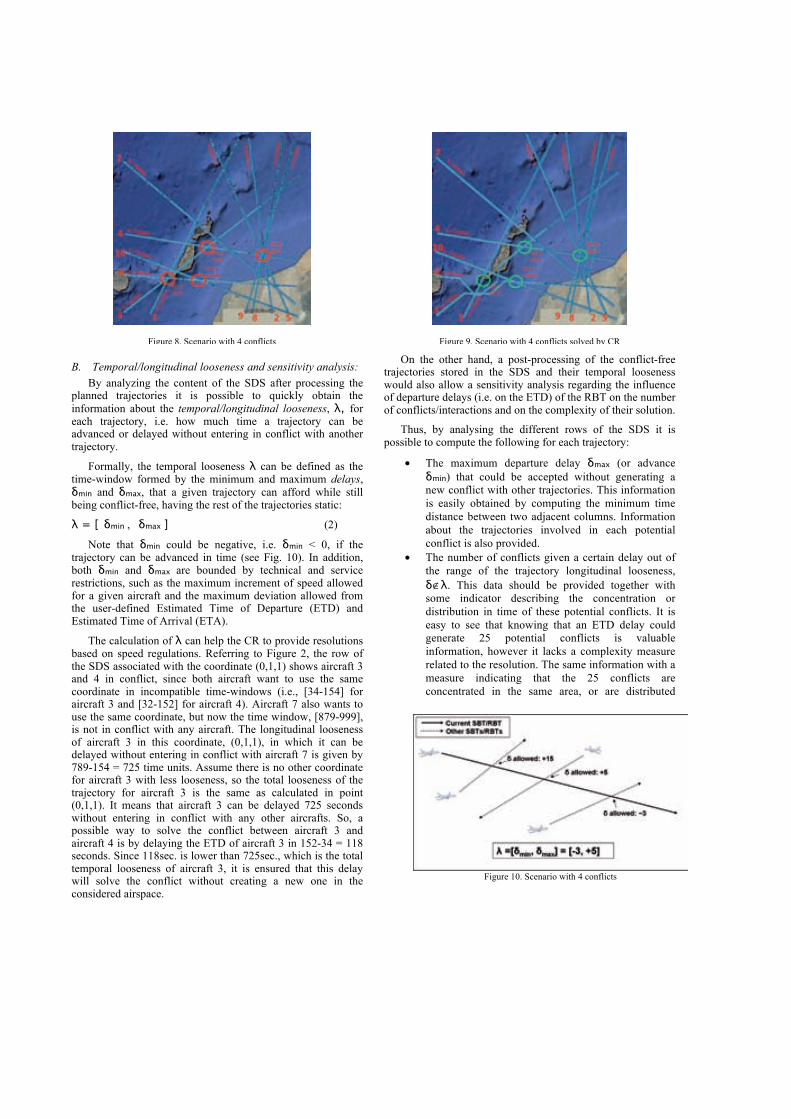
B. Temporal/longitudinal looseness and sensitivity analysis: By analyzing the content of the SDS after processing the
planned trajectories it is possible to quickly obtain the information about the temporal/longitudinal looseness, λ, for each trajectory, i.e. how much time a trajectory can be advanced or delayed without entering in conflict with another trajectory.
Formally, the temporal looseness λ can be defined as the time-window formed by the minimum and maximum delays, δmin and δmax, that a given trajectory can afford while still being conflict-free, having the rest of the trajectories static:
λ = [ δmin , δmax ] (2)
Note that δmin could be negative, i.e. δmin < 0, if the trajectory can be advanced in time (see Fig. 10). In addition, both δmin and δmax are bounded by technical and service restrictions, such as the maximum increment of speed allowed for a given aircraft and the maximum deviation allowed from the user-defined Estimated Time of Departure (ETD) and Estimated Time of Arrival (ETA).
The calculation of λ can help the CR to provide resolutions based on speed regulations. Referring to Figure 2, the row of the SDS associated with the coordinate (0,1,1) shows aircraft 3 and 4 in conflict, since both aircraft want to use the same coordinate in incompatible time-windows (i.e., [34-154] for aircraft 3 and [32-152] for aircraft 4). Aircraft 7 also wants to use the same coordinate, but now the time window, [879-999], is not in conflict with any aircraft. The longitudinal looseness of aircraft 3 in this coordinate, (0,1,1), in which it can be delayed without entering in conflict with aircraft 7 is given by 789-154 = 725 time units. Assume there is no other coordinate for aircraft 3 with less looseness, so the total looseness of the trajectory for aircraft 3 is the same as calculated in point (0,1,1). It means that aircraft 3 can be delayed 725 seconds without entering in conflict with any other aircrafts. So, a possible way to solve the conflict between aircraft 3 and aircraft 4 is by delaying the ETD of aircraft 3 in 152-34 = 118 seconds. Since 118sec. is lower than 725sec., which is the total temporal looseness of aircraft 3, it is ensured that this delay will solve the conflict without creating a new one in the considered airspace.
On the other hand, a post-processing of the conflict-free trajectories stored in the SDS and their temporal looseness would also allow a sensitivity analysis regarding the influence of departure delays (i.e. on the ETD) of the RBT on the number of conflicts/interactions and on the complexity of their solution.
Thus, by analysing the different rows of the SDS it is possible to compute the following for each trajectory:
• The maximum departure delay δmax (or advance δmin) that could be accepted without generating a new conflict with other trajectories. This information is easily obtained by computing the minimum time distance between two adjacent columns. Information about the trajectories involved in each potential conflict is also provided.
• The number of conflicts given a certain delay out of the range of the trajectory longitudinal looseness, δ!λ. This data should be provided together with some indicator describing the concentration or distribution in time of these potential conflicts. It is easy to see that knowing that an ETD delay could generate 25 potential conflicts is valuable information, however it lacks a complexity measure related to the resolution. The same information with a measure indicating that the 25 conflicts are concentrated in the same area, or are distributed
Figure 8. Scenario with 4 conflicts
Figure 10. Scenario with 4 conflicts
Figure 9. Scenario with 4 conflicts solved by CR
along the trajectory, provides better knowledge about the impact of the delay on ATC workload.
The sensitivity analysis could provide highly valuable information on the airport departure schedule (DMAN), in trying to preserve the ETD of those flights that could generate extra-workload to controllers.
In addition, the constraints imposed on the strategically de-conflicted RBTs will allow the different actors involved to visualise the level of sensitivity of each trajectory to tactical modifications. This will help air traffic controllers in assigning priorities to different flights when it comes to tactically vectoring traffic (for whatever need) in order to minimize network impact by selecting the less constrained trajectories.
The concept of Target Window proposed by CATS project [11] is a good choice to easily represent the resulting constraints and their degree of looseness: these are 4D windows located at sensitive points along the trajectory, depending on airspace configuration and ATM needs.
A set of metrics and methods to obtain and synthesize the information stored in the SDS which is of interest for the sensitivity analysis, also taking into account uncertainties and the probability of conflicts, is currently under development within STREAM.
C. Network analysis: The content of the SDS can be also studied from a network
perspective, by aggregating the information about the interactions, looseness and sensitivity for a selected set of trajectories (e.g. a specific conflict-free scenario) in order to generate new aggregated metrics and ratios able to explain the behaviour of the ATM as traffic flows rather than as single trajectories.
For example, it could be useful to take into account the aggregated flows and the different probabilities of conflicts and interactions, with their inner uncertainties in space and time, in order to analyse and generate a complexity map of the network.
Once a conflict-free scenario is selected, the traffic stored in the SDS on this scenario will represent a reliable picture of the traffic for a time horizon of 2-3 hours, thus allowing the NM to identify congested areas and hot spots and to plan necessary actions, such as sizing the ATM with the appropriate resources or creating alternative plans to deal with contingencies.
The analysis of the rows of the SDS can also provide useful information about the demand that airspace users produce over a specific spatial resource, i.e. a discrete coordinate. A sector demand analysis is also possible by aggregating the information of the rows according to the coordinates that belong to a specific sector, which could be of interest in the process of demand/capacity balancing.
A set of metrics and methods to generate network knowledge from the information stored in the SDS is currently under development within STREAM project.
V. CONCLUSIONS AND FUTURE WORK A CD based on SDS has been presented as a fundamental
part of the STREAM project, investigating the feasibility of strategic conflict detection & resolution on the Shared Business Trajectory.
The CD algorithm based on SDS presents 2 advantages with respect to classical CD algorithms (i.e. pairwise algorithms):
• Its temporal complexity is linear (i.e., it process trajectories in linear time).
• It is able to store the state-space of the ATM.
A linear temporal complexity allows the processing of large numbers of trajectories (i.e. tens of thousands) in a very efficient time window (i.e., seconds, with a medium power computer). This ability is a key factor to complement those CR algorithms that work by proposing different trajectory trials to solve the detected conflicts, since they can considerably increase the total quantity of trajectories to be processed.
The ability to store the state-space means that once all the trajectories have been processed (both the original SBTs/RBTs and the CR trials), all of the information remains in the SDS, with all the found resolutions and also with non-acceptable trajectories. This ability is useful to complement those CRs that want to explore the interactions between their proposed trial trajectories and the rest of trajectories in the network. Since all the trajectories remain stored in the SDS, even the trials proposed by CRs, it is possible to detect conflicts among these trials and the original SBTs/RBTs (i.e. secondary conflicts) or even among other trial trajectories (tertiary conflicts) and then to take advantage of this qualitative information to improve the conflict resolution process.
In addition, having the state space stored in the SDS allows different kinds of post-processing to be performed in order to obtain useful information about the ATM. For example it is possible to obtain the temporal looseness for each trajectory of interest, since it is quite straightforward to calculate how many minutes or seconds a given trajectory can be advanced or delayed without creating interactions (i.e. conflicts) with other accepted trajectories.
Another example of post-processing analysis over the SDS content could be a sensitivity analysis for a set of trajectories of interest. This would allow the generation of information on how many interactions a trajectory could generate in the network if the final RBT were changed by tactical requirements. This information would be useful for tactical controllers in order to apply tactical/operational changes over those trajectories with less impact on the rest of the network.
In the same way, an aggregated sensitivity analysis could generate useful information about the network, such as the identification of hot zones in the ATM system, which would allow the dimensioning of the requirements for each zone (i.e. the number of controllers) and the calculation of the capacity of the air sectors.
Simulation experiments have validated the ability to explore some of the interactions among trial trajectories
proposed by a CR specified in Coloured Petri Nets formalism (used in STREAM project). However, more research should be done to explore the information stored in the SDS on the secondary and tertiary conflicts in order to obtain more efficient resolutions (i.e. global cooperative resolutions).
A set of ratios and metrics are currently under development with the intention of illustrating and synthesizing the information obtained in the state-space post-process experiments. This information should be useful in order to have a better understanding of the ATM and make better decisions at strategic and tactical/operational levels, and also to perform efficiency/efficacy analysis of the CR proposals and make comparisons among different CR algorithms.
A series of simulations will be run to validate the concept, based on current and forecast traffic scenarios. For each one, an ideal baseline will be defined by running the simulation without any ATM intervention, assuming all flights are hypothetically conducted as user-preferred Business Trajectories subject only to the applicable static airspace constraints. This will establish the maximum level of efficiency achievable from the users’ perspective. Then, each of the scenarios will be run on the trajectories already de-conflicted by the STREAM solution, i.e. on the amended ones. Several disturbances (wind, delays, etc.) will be introduced in the simulation to test the robustness of the amended trajectories under conditions of uncertainty. This will make possible to establish requirements on the accepted tolerances in the trajectory information at the pre-departure stage. A stochastic analysis will be conducted to estimate the probability of tactical interventions due to resolution of conflicts which were assumed to be solved by the STREAM solution already at the planning level.
ACKNOWLEDGMENT The STREAM project is partially funded by the SESAR
WP-E under the umbrella of the HALA! Automation network.
VI. REFERENCES [1] EUROCONTROL, «FASTI Baseline Description». 2007. [2] EUROCONTROL, «MTCD Algorithms Overview». 2002. [3] EUROCONTROL, «Specification for Medium-Term Conflict
Detection». 2010 [4] EUROCONTROL, «FASTI Operational Concept». 2007. [5] M. Kupfer, T.Farley, Y. Chu, y H. Erzberger, «Automated Conflict
Resolution - A simulation-based sensitivity study of airspace and demand», in Proc. 26th International Congress of the Aeronautical Sciences (ICAS), 2008.
[6] Isaacson, D.R. y Erzberger, H, «Design of a conflict detection algorithm for the Center/TRACON automation system», in Digital Avionics Systems Conference, Irvine, CA, 1997.
[7] SESAR Consortium, «The ATM target concept, milestone deliverable 3», Version 1.0, 2007;
[8] A.Ranieri, R.Martinez, M.A.Piera, M.Vilaplana, J.Lopez, «STREAM – Strategic Trajectory de-confliction to Enable seamless Aircraft conflict Management», in Schaefer, Dirk (ed.) Proceedings of the SESAR Innovation Days (2011) EUROCONTROL.
[9] EUROCONTROL PRU, «Performance Review Report 2010, Assessment of the performance of the European Air Traffic management Systems for the calendar year 2010”.
[10] EUROCONTROL Medium-Term Forecast Flight Movements 2011 - 2017, February 2011.
[11] CATS consortium: “CATS Concept of Operation Document”, v.3.0, 30/09/2010.
[12] Sergio Ruiz y Miquel A. Piera, «Spatial Data Structure based Algorithm for Improving Conflict Detection/Conflict Resolution algorithms», in Proceedings of Unmaned Aerial Vehicles Conferences (UAV Conferences 2009), Reno, Nevada (USA), 2009.
[13] Sergio Ruiz y Miquel A. Piera, «A TMA Simulation Model for Efficient Conflict Detection and resolution Based on Spatial Data Structures», in In Proc. of WAMS 2010, Búzios (Rio de Janerio), Brasil, 2010.
[14] S. Ruiz, M. A. Piera, C. A. Zúñiga, y I. del Pozo, «Medium Term Conflict Detection System Using Time-Distance Separations With An Algorithm Of Linear Complexity», IEEE Transactions on Intelligent Transportation Systems, unpublished
[15] Catya Zúñiga; Miquel A Piera; Sergio Ruiz; Isabel Del Pozo. “A CD&CR causal model based on path shortening/path stretching techniques” Transportation Research Part C (2010), DOI information: 10.1016/j.trc.2011.11.010.
7.4 “Causal Decision Support Tools for Strategic Trajectory De-confliction toEnable Seamless Aircraft Conflict Management (STREAM)” 193
7.4 “Causal Decision Support Tools for Strategic Tra-jectory De-confliction to Enable Seamless AircraftConflict Management (STREAM)”
Article 4, “Causal Decision Support Tools for Strategic Trajectory De-conflictionto Enable Seamless Aircraft Conflict Management (STREAM)”, has beenpublished in the SESAR Innovation Days (SID) conferences. It presents theadvances achieved in the use of the ATM 4D information available throughthe SDS by integrating an improved version of the conflict resolution modulebased on causal modelling to deal with the emergent dynamics of the airtraffic system. This paper gives details of the conflict resolution algorithmspecified in Coloured Petri Nets and presents some of the preliminary resultsfound at that moment during STREAM project execution. In addition, animportant strategy to deal with the highly interactive European networkwith more than 4000 trajectories crossing European airspace at certain peakhours of traffic is also presented, the Clustering causal model, which allowsreducing the global problem to a set of unconnected sub-problems, thusconsiderably reducing the combinatorial state-space search of the problemand the time required to solve it.

194 Chapter 7. Compendium of Published Articles
EUROCONTROL WP-E
Causal Decision Support Tools for Strategic Trajectory De-confliction to Enable Seamless Aircraft
Conflict Management (STREAM) Clustering and Interaction Causal Solver Models
Jenaro Nosedal, Sergio Ruiz, Miquel A. Piera Technical Innovation Cluster on Aeronautical Management
Universitat Autònoma de Barcelona Sabadell, Spain
[email protected] [Sergio.ruiz, MiquelA.Piera]@uab.cat
Andrea Ranieri, Rubén Martínez, Àlex Corbacho Advanced Logistics Group
Indra Barcelona, Spain
[aranieri, rmartinez, acorbacho]@alg-global.com
Foreword - This paper describes a project that is part of SESAR Work Package E, which is addressing long-term and innovative research.
Abstract SESA R WP-E ST R E A M project seeks to fill a currently existing gap between the strategic and the tactical planning in A T M , by designing innovative tools capable of detecting and solving conflicts among aircraft in a time-efficient manner , in order to deliver traffic to A T C Os with a diminished number of conflicts. In this paper , C luster ing and Interaction Causal Solver (I CS) models are presented, being developed under the formalism of Colored Petr i Nets for the generation of several feasible conflict free solutions. By cluster ing, the computational complexity is significantly reduced. The separation of trajectories according to thei r interactions is the key idea in high-density traffic scenarios, bringing several benefits such as a direct increase of processing capacity and troubleshooting. In the same direction, the I CS model makes an intelligent construction through the use of causal interactions, thus limiting the search exploration process only to those combinations supported within each cluster . Therefore, both tools offer significant advantages over the efficiency and effectiveness for the construction and evaluation of A ir T raffic Management conflict-free scenarios. According to the ST R E A M concept, these models produce multiple combinations of feasible conflict free solutions, to be later weighted according to different metr ics (for efficiency, safety, robustness, equity and fairness among others) and selected
Considered as a whole, the decision support tool , once implemented, provides a new and efficient network-oriented conflict detection and resolution process, fitting into the overall performance framework currently implemented at European level.
Keywords-Strategic ATM; Causal Modeling; Decision Support Tools; Colored Petri Nets.
I. INTRODUCTION
SESAR WP-E project STREAM (Strategic Trajectory de-confliction to Enable seamless Aircraft conflict Management) [http://www.hala-sesar.net/stream] is currently being undertaken by a consortium composed of Advanced Logistics Group (ALG-Indra), Boeing Research & Technology Europe (BR&TE) and Universitat Autònoma de Barcelona (UAB). The project aims to fill the current existing gap between the strategic and the tactical planning in ATM, by designing Conflict Detection & Resolution (CD&R) tools that re-organize air traffic at strategic level (thus, diminishing the amount of conflicts to be solved at a tactical level), while generating useful network information in order to improve the decision making process [1].
For a thorough description of the concept and of the high level architecture of the STREAM solution, the reader is referred to [3]. Several results have been obtained under project activities during the course of 2012, within the different technical Work Packages: WP2 Strategic trajectory de-confliction tool development, WP3 Metrics & methodology development and WP4 Analysis & evaluation. This paper however focuses only on the algorithmic innovations related with the conflict resolution thread of the research. These innovations were achieved under WP2 and have been selected for publication due to their interest for scientific community and maturity for presentation. The work in WP3 and WP4 is underway and results should be available for presentation within the next few months.
The approach proposed by WP2 for conflict resolution is based on the generation of several resolution trajectories per conflict and on a post-processing activity based on the causal network interactions. This determines several conflict-free network solutions or network solutions with a diminished number of conflicts (i.e. several final states).
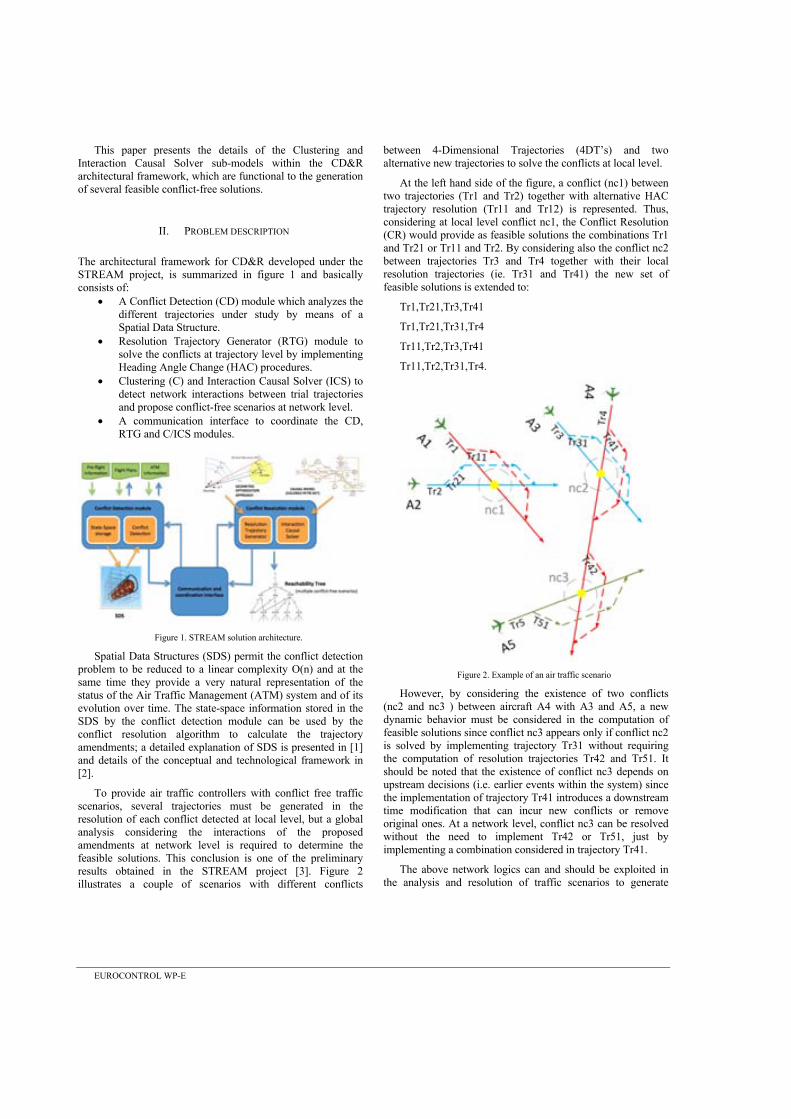
EUROCONTROL WP-E
This paper presents the details of the Clustering and Interaction Causal Solver sub-models within the CD&R architectural framework, which are functional to the generation of several feasible conflict-free solutions.
II. PROBLEM DESCRIPTION
The architectural framework for CD&R developed under the STREAM project, is summarized in figure 1 and basically consists of:
A Conflict Detection (CD) module which analyzes the different trajectories under study by means of a Spatial Data Structure.
Resolution Trajectory Generator (RTG) module to solve the conflicts at trajectory level by implementing Heading Angle Change (HAC) procedures.
Clustering (C) and Interaction Causal Solver (ICS) to detect network interactions between trial trajectories and propose conflict-free scenarios at network level.
A communication interface to coordinate the CD, RTG and C/ICS modules.
Figure 1. STREAM solution architecture.
Spatial Data Structures (SDS) permit the conflict detection problem to be reduced to a linear complexity O(n) and at the same time they provide a very natural representation of the status of the Air Traffic Management (ATM) system and of its evolution over time. The state-space information stored in the SDS by the conflict detection module can be used by the conflict resolution algorithm to calculate the trajectory amendments; a detailed explanation of SDS is presented in [1] and details of the conceptual and technological framework in [2].
To provide air traffic controllers with conflict free traffic scenarios, several trajectories must be generated in the resolution of each conflict detected at local level, but a global analysis considering the interactions of the proposed amendments at network level is required to determine the feasible solutions. This conclusion is one of the preliminary results obtained in the STREAM project [3]. Figure 2 illustrates a couple of scenarios with different conflicts
between 4-Dimensional Trajectories ( ) and two alternative new trajectories to solve the conflicts at local level.
At the left hand side of the figure, a conflict (nc1) between two trajectories (Tr1 and Tr2) together with alternative HAC trajectory resolution (Tr11 and Tr12) is represented. Thus, considering at local level conflict nc1, the Conflict Resolution (CR) would provide as feasible solutions the combinations Tr1 and Tr21 or Tr11 and Tr2. By considering also the conflict nc2 between trajectories Tr3 and Tr4 together with their local resolution trajectories (ie. Tr31 and Tr41) the new set of feasible solutions is extended to:
Tr1,Tr21,Tr3,Tr41
Tr1,Tr21,Tr31,Tr4
Tr11,Tr2,Tr3,Tr41
Tr11,Tr2,Tr31,Tr4.
Figure 2. Example of an air traffic scenario
However, by considering the existence of two conflicts (nc2 and nc3 ) between aircraft A4 with A3 and A5, a new dynamic behavior must be considered in the computation of feasible solutions since conflict nc3 appears only if conflict nc2 is solved by implementing trajectory Tr31 without requiring the computation of resolution trajectories Tr42 and Tr51. It should be noted that the existence of conflict nc3 depends on upstream decisions (i.e. earlier events within the system) since the implementation of trajectory Tr41 introduces a downstream time modification that can incur new conflicts or remove original ones. At a network level, conflict nc3 can be resolved without the need to implement Tr42 or Tr51, just by implementing a combination considered in trajectory Tr41.
The above network logics can and should be exploited in the analysis and resolution of traffic scenarios to generate
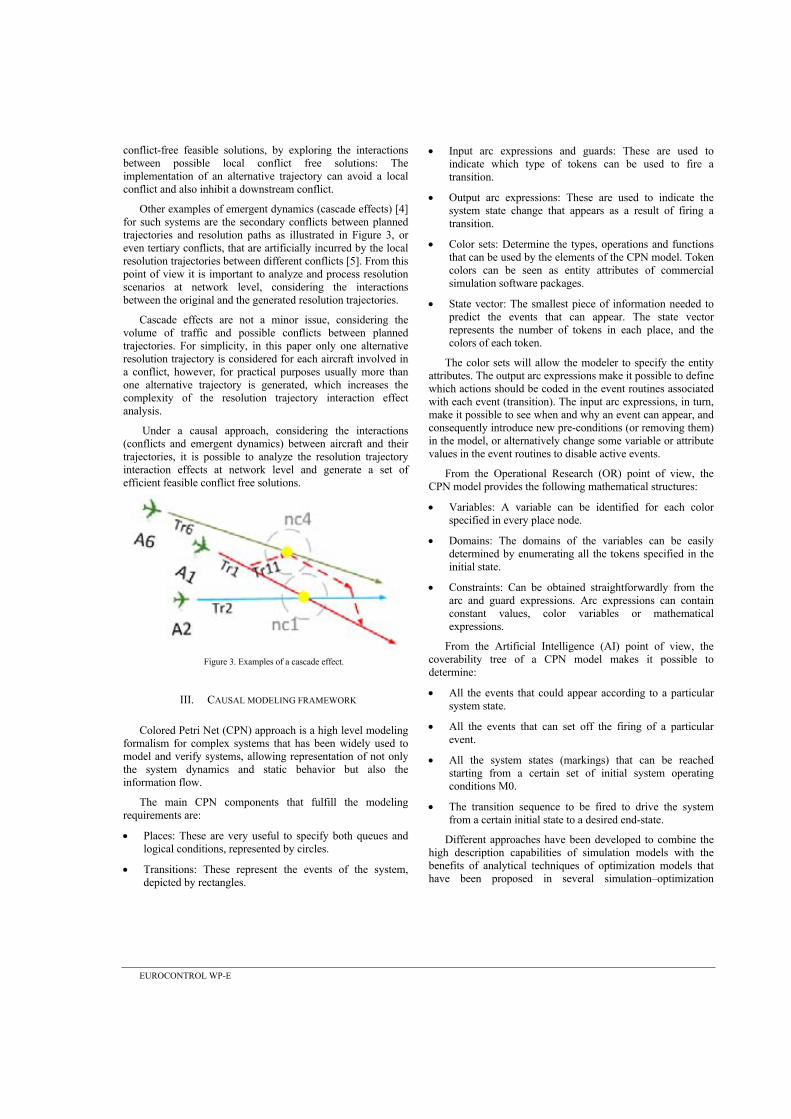
EUROCONTROL WP-E
conflict-free feasible solutions, by exploring the interactions between possible local conflict free solutions: The implementation of an alternative trajectory can avoid a local conflict and also inhibit a downstream conflict.
Other examples of emergent dynamics (cascade effects) [4] for such systems are the secondary conflicts between planned trajectories and resolution paths as illustrated in Figure 3, or even tertiary conflicts, that are artificially incurred by the local resolution trajectories between different conflicts [5]. From this point of view it is important to analyze and process resolution scenarios at network level, considering the interactions between the original and the generated resolution trajectories.
Cascade effects are not a minor issue, considering the volume of traffic and possible conflicts between planned trajectories. For simplicity, in this paper only one alternative resolution trajectory is considered for each aircraft involved in a conflict, however, for practical purposes usually more than one alternative trajectory is generated, which increases the complexity of the resolution trajectory interaction effect analysis.
Under a causal approach, considering the interactions (conflicts and emergent dynamics) between aircraft and their trajectories, it is possible to analyze the resolution trajectory interaction effects at network level and generate a set of efficient feasible conflict free solutions.
Figure 3. Examples of a cascade effect.
III. CAUSAL MODELING FRAMEWORK
Colored Petri Net (CPN) approach is a high level modeling formalism for complex systems that has been widely used to model and verify systems, allowing representation of not only the system dynamics and static behavior but also the information flow.
The main CPN components that fulfill the modeling requirements are:
Places: These are very useful to specify both queues and logical conditions, represented by circles.
Transitions: These represent the events of the system, depicted by rectangles.
Input arc expressions and guards: These are used to indicate which type of tokens can be used to fire a transition.
Output arc expressions: These are used to indicate the system state change that appears as a result of firing a transition.
Color sets: Determine the types, operations and functions that can be used by the elements of the CPN model. Token colors can be seen as entity attributes of commercial simulation software packages.
State vector: The smallest piece of information needed to predict the events that can appear. The state vector represents the number of tokens in each place, and the colors of each token.
The color sets will allow the modeler to specify the entity attributes. The output arc expressions make it possible to define which actions should be coded in the event routines associated with each event (transition). The input arc expressions, in turn, make it possible to see when and why an event can appear, and consequently introduce new pre-conditions (or removing them) in the model, or alternatively change some variable or attribute values in the event routines to disable active events.
From the Operational Research (OR) point of view, the CPN model provides the following mathematical structures:
Variables: A variable can be identified for each color specified in every place node.
Domains: The domains of the variables can be easily determined by enumerating all the tokens specified in the initial state.
Constraints: Can be obtained straightforwardly from the arc and guard expressions. Arc expressions can contain constant values, color variables or mathematical expressions.
From the Artificial Intelligence (AI) point of view, the coverability tree of a CPN model makes it possible to determine:
All the events that could appear according to a particular system state.
All the events that can set off the firing of a particular event.
All the system states (markings) that can be reached starting from a certain set of initial system operating conditions M0.
The transition sequence to be fired to drive the system from a certain initial state to a desired end-state.
Different approaches have been developed to combine the high description capabilities of simulation models with the benefits of analytical techniques of optimization models that have been proposed in several simulation optimization
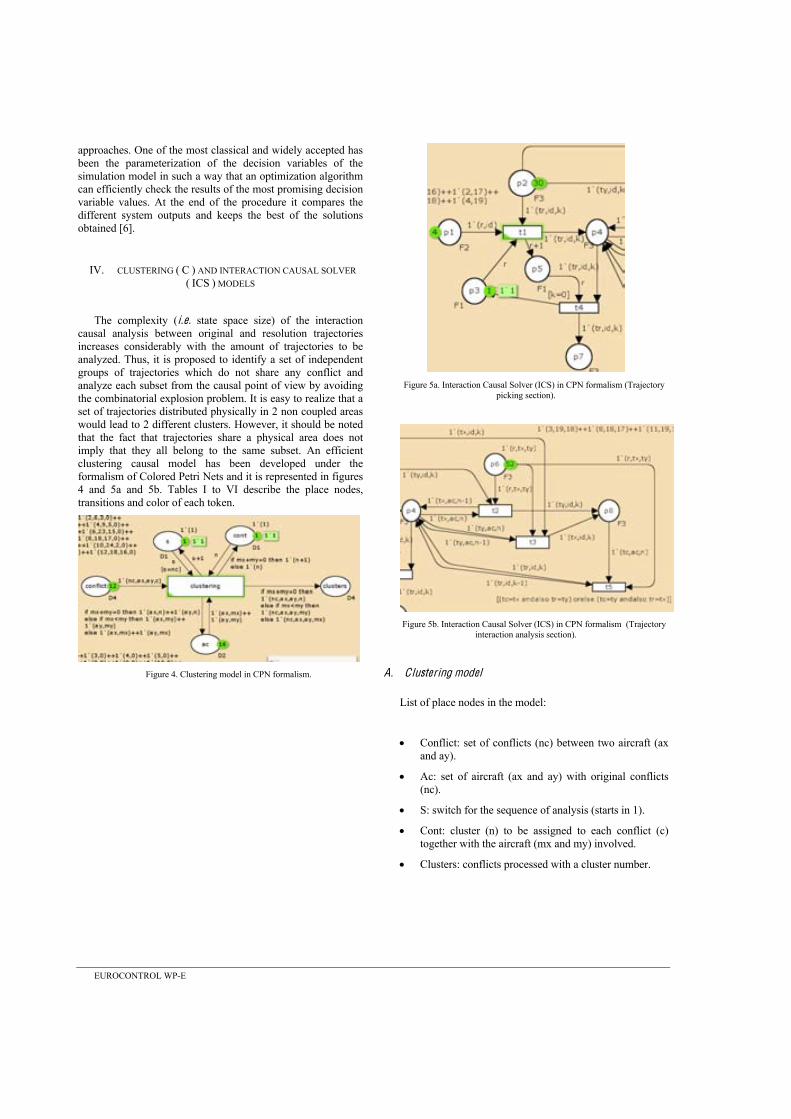
EUROCONTROL WP-E
approaches. One of the most classical and widely accepted has been the parameterization of the decision variables of the simulation model in such a way that an optimization algorithm can efficiently check the results of the most promising decision variable values. At the end of the procedure it compares the different system outputs and keeps the best of the solutions obtained [6].
IV. CLUSTERING ( C ) AND INTERACTION CAUSAL SOLVER ( ICS ) MODELS
The complexity (i.e. state space size) of the interaction causal analysis between original and resolution trajectories increases considerably with the amount of trajectories to be analyzed. Thus, it is proposed to identify a set of independent groups of trajectories which do not share any conflict and analyze each subset from the causal point of view by avoiding the combinatorial explosion problem. It is easy to realize that a set of trajectories distributed physically in 2 non coupled areas would lead to 2 different clusters. However, it should be noted that the fact that trajectories share a physical area does not imply that they all belong to the same subset. An efficient clustering causal model has been developed under the formalism of Colored Petri Nets and it is represented in figures 4 and 5a and 5b. Tables I to VI describe the place nodes, transitions and color of each token.
Figure 4. Clustering model in CPN formalism.
Figure 5a. Interaction Causal Solver (ICS) in CPN formalism (Trajectory
picking section).
Figure 5b. Interaction Causal Solver (ICS) in CPN formalism (Trajectory
interaction analysis section).
A. Clustering model
List of place nodes in the model:
Conflict: set of conflicts (nc) between two aircraft (ax and ay).
Ac: set of aircraft (ax and ay) with original conflicts (nc).
S: switch for the sequence of analysis (starts in 1).
Cont: cluster (n) to be assigned to each conflict (c) together with the aircraft (mx and my) involved.
Clusters: conflicts processed with a cluster number.
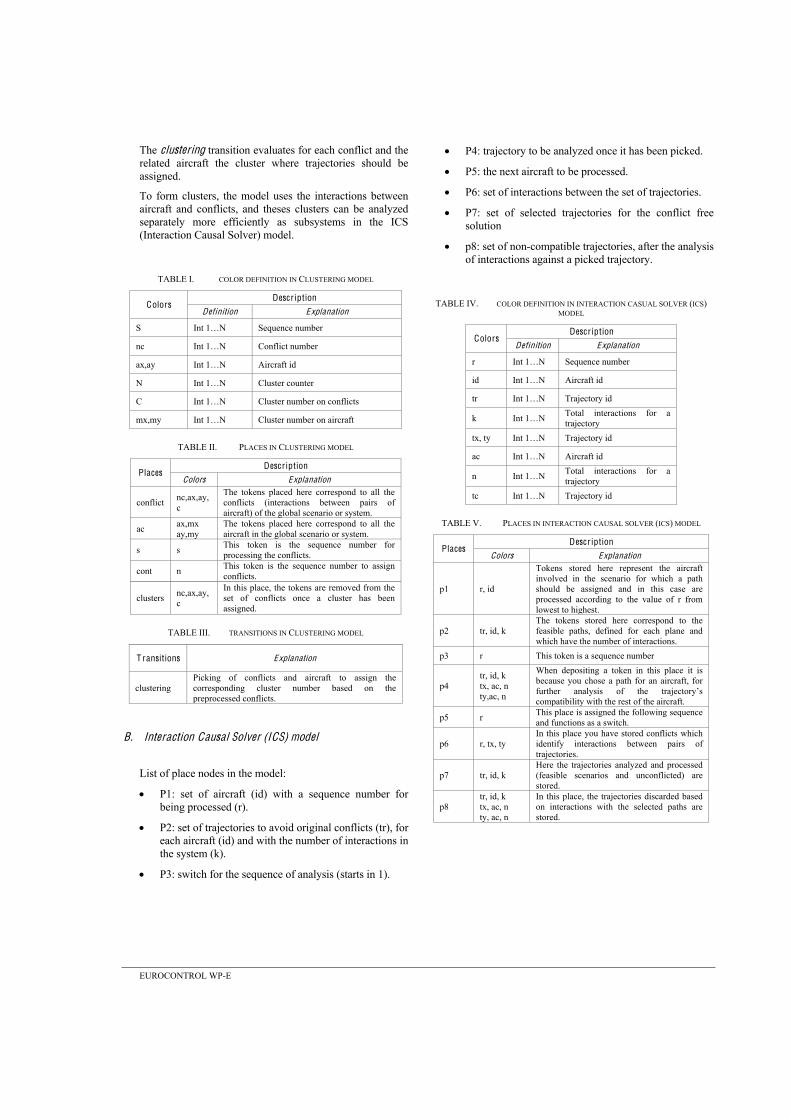
EUROCONTROL WP-E
The clustering transition evaluates for each conflict and the related aircraft the cluster where trajectories should be assigned.
To form clusters, the model uses the interactions between aircraft and conflicts, and theses clusters can be analyzed separately more efficiently as subsystems in the ICS (Interaction Causal Solver) model.
TABLE I. COLOR DEFINITION IN CLUSTERING MODEL
Colors Descr iption
Definition Explanation
S Sequence number
nc Conflict number
ax,ay Aircraft id
N Cluster counter
C Cluster number on conflicts
mx,my Cluster number on aircraft
TABLE II. PLACES IN CLUSTERING MODEL
Places Descr iption
Colors Explanation
conflict nc,ax,ay,c
The tokens placed here correspond to all the conflicts (interactions between pairs of aircraft) of the global scenario or system.
ac ax,mx ay,my
The tokens placed here correspond to all the aircraft in the global scenario or system.
s s This token is the sequence number for processing the conflicts.
cont n This token is the sequence number to assign conflicts.
clusters nc,ax,ay,c
In this place, the tokens are removed from the set of conflicts once a cluster has been assigned.
TABLE III. TRANSITIONS IN CLUSTERING MODEL
T ransitions Explanation
clustering Picking of conflicts and aircraft to assign the corresponding cluster number based on the preprocessed conflicts.
B. Interaction Causal Solver (ICS) model
List of place nodes in the model:
P1: set of aircraft (id) with a sequence number for being processed (r).
P2: set of trajectories to avoid original conflicts (tr), for each aircraft (id) and with the number of interactions in the system (k).
P3: switch for the sequence of analysis (starts in 1).
P4: trajectory to be analyzed once it has been picked.
P5: the next aircraft to be processed.
P6: set of interactions between the set of trajectories.
P7: set of selected trajectories for the conflict free solution
p8: set of non-compatible trajectories, after the analysis of interactions against a picked trajectory.
TABLE IV. COLOR DEFINITION IN INTERACTION CASUAL SOLVER (ICS) MODEL
Colors Descr iption
Definition Explanation
r Sequence number
id Aircraft id
tr Trajectory id
k Total interactions for a trajectory
tx, ty Trajectory id
ac Aircraft id
n Int Total interactions for a trajectory
tc Trajectory id
TABLE V. PLACES IN INTERACTION CAUSAL SOLVER (ICS) MODEL
Places Descr iption
Colors Explanation
p1 r, id
Tokens stored here represent the aircraft involved in the scenario for which a path should be assigned and in this case are processed according to the value of r from lowest to highest.
p2 tr, id, k The tokens stored here correspond to the feasible paths, defined for each plane and which have the number of interactions.
p3 r This token is a sequence number
p4 tr, id, k tx, ac, n ty,ac, n
When depositing a token in this place it is because you chose a path for an aircraft, for further analysis of the trajector compatibility with the rest of the aircraft.
p5 r This place is assigned the following sequence and functions as a switch.
p6 r, tx, ty In this place you have stored conflicts which identify interactions between pairs of trajectories.
p7 tr, id, k Here the trajectories analyzed and processed (feasible scenarios and unconflicted) are stored.
p8 tr, id, k tx, ac, n ty, ac, n
In this place, the trajectories discarded based on interactions with the selected paths are stored.
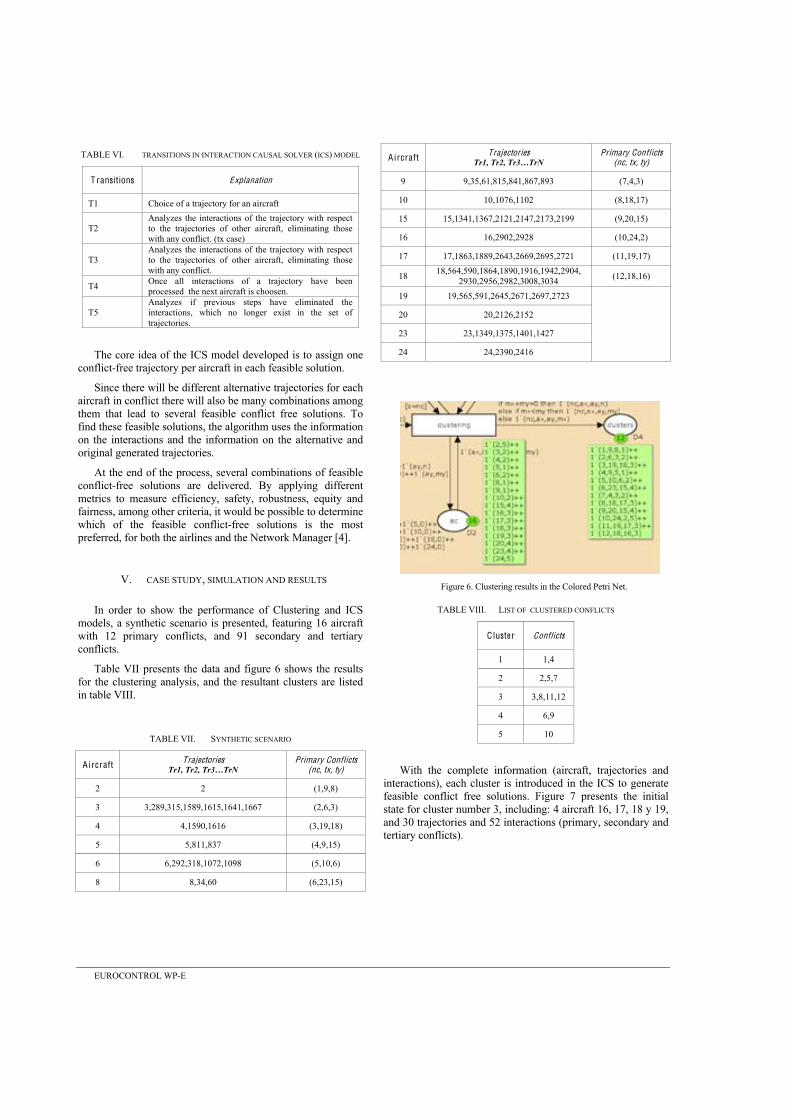
EUROCONTROL WP-E
TABLE VI. TRANSITIONS IN INTERACTION CAUSAL SOLVER (ICS) MODEL
T ransitions Explanation
T1 Choice of a trajectory for an aircraft
T2 Analyzes the interactions of the trajectory with respect to the trajectories of other aircraft, eliminating those with any conflict. (tx case)
T3 Analyzes the interactions of the trajectory with respect to the trajectories of other aircraft, eliminating those with any conflict.
T4 Once all interactions of a trajectory have been processed the next aircraft is choosen.
T5 Analyzes if previous steps have eliminated the interactions, which no longer exist in the set of trajectories.
The core idea of the ICS model developed is to assign one conflict-free trajectory per aircraft in each feasible solution.
Since there will be different alternative trajectories for each aircraft in conflict there will also be many combinations among them that lead to several feasible conflict free solutions. To find these feasible solutions, the algorithm uses the information on the interactions and the information on the alternative and original generated trajectories.
At the end of the process, several combinations of feasible conflict-free solutions are delivered. By applying different metrics to measure efficiency, safety, robustness, equity and fairness, among other criteria, it would be possible to determine which of the feasible conflict-free solutions is the most preferred, for both the airlines and the Network Manager [4].
V. CASE STUDY, SIMULATION AND RESULTS
In order to show the performance of Clustering and ICS models, a synthetic scenario is presented, featuring 16 aircraft with 12 primary conflicts, and 91 secondary and tertiary conflicts.
Table VII presents the data and figure 6 shows the results for the clustering analysis, and the resultant clusters are listed in table VIII.
TABLE VII. SYNTHETIC SCENARIO
Aircraft Trajectories
Primary Conflicts (nc, tx, ty)
2 2 (1,9,8)
3 3,289,315,1589,1615,1641,1667 (2,6,3)
4 4,1590,1616 (3,19,18)
5 5,811,837 (4,9,15)
6 6,292,318,1072,1098 (5,10,6)
8 8,34,60 (6,23,15)
Aircraft Trajectories
Primary Conflicts (nc, tx, ty)
9 9,35,61,815,841,867,893 (7,4,3)
10 10,1076,1102 (8,18,17)
15 15,1341,1367,2121,2147,2173,2199 (9,20,15)
16 16,2902,2928 (10,24,2)
17 17,1863,1889,2643,2669,2695,2721 (11,19,17)
18 18,564,590,1864,1890,1916,1942,2904, 2930,2956,2982,3008,3034 (12,18,16)
19 19,565,591,2645,2671,2697,2723
20 20,2126,2152
23 23,1349,1375,1401,1427
24 24,2390,2416
Figure 6. Clustering results in the Colored Petri Net.
TABLE VIII. LIST OF CLUSTERED CONFLICTS
Cluster Conflicts
1 1,4
2 2,5,7
3 3,8,11,12
4 6,9
5 10
With the complete information (aircraft, trajectories and interactions), each cluster is introduced in the ICS to generate feasible conflict free solutions. Figure 7 presents the initial state for cluster number 3, including: 4 aircraft 16, 17, 18 y 19, and 30 trajectories and 52 interactions (primary, secondary and tertiary conflicts).
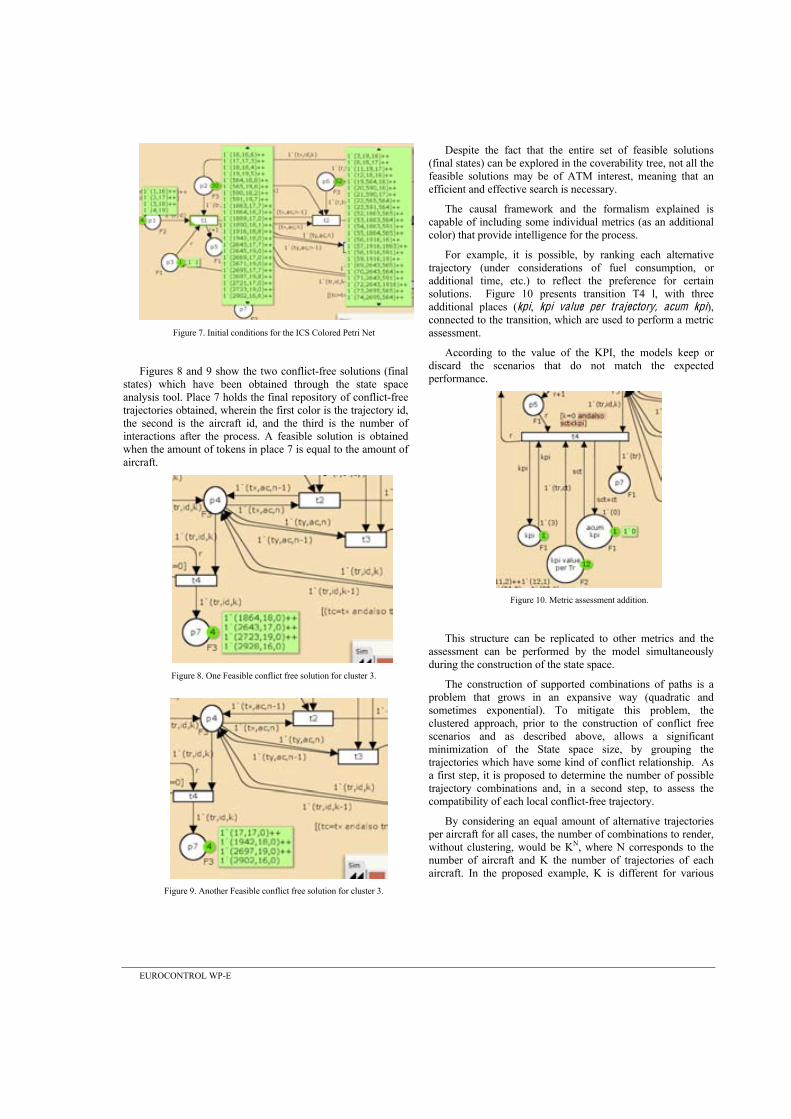
EUROCONTROL WP-E
Figure 7. Initial conditions for the ICS Colored Petri Net
Figures 8 and 9 show the two conflict-free solutions (final states) which have been obtained through the state space analysis tool. Place 7 holds the final repository of conflict-free trajectories obtained, wherein the first color is the trajectory id, the second is the aircraft id, and the third is the number of interactions after the process. A feasible solution is obtained when the amount of tokens in place 7 is equal to the amount of aircraft.
Figure 8. One Feasible conflict free solution for cluster 3.
Figure 9. Another Feasible conflict free solution for cluster 3.
Despite the fact that the entire set of feasible solutions (final states) can be explored in the coverability tree, not all the feasible solutions may be of ATM interest, meaning that an efficient and effective search is necessary.
The causal framework and the formalism explained is capable of including some individual metrics (as an additional color) that provide intelligence for the process.
For example, it is possible, by ranking each alternative trajectory (under considerations of fuel consumption, or additional time, etc.) to reflect the preference for certain solutions. Figure 10 presents transition T4 l, with three additional places (kpi, kpi value per trajectory, acum kpi), connected to the transition, which are used to perform a metric assessment.
According to the value of the KPI, the models keep or discard the scenarios that do not match the expected performance.
Figure 10. Metric assessment addition.
This structure can be replicated to other metrics and the assessment can be performed by the model simultaneously during the construction of the state space.
The construction of supported combinations of paths is a problem that grows in an expansive way (quadratic and sometimes exponential). To mitigate this problem, the clustered approach, prior to the construction of conflict free scenarios and as described above, allows a significant minimization of the State space size, by grouping the trajectories which have some kind of conflict relationship. As a first step, it is proposed to determine the number of possible trajectory combinations and, in a second step, to assess the compatibility of each local conflict-free trajectory.
By considering an equal amount of alternative trajectories per aircraft for all cases, the number of combinations to render, without clustering, would be KN, where N corresponds to the number of aircraft and K the number of trajectories of each aircraft. In the proposed example, K is different for various
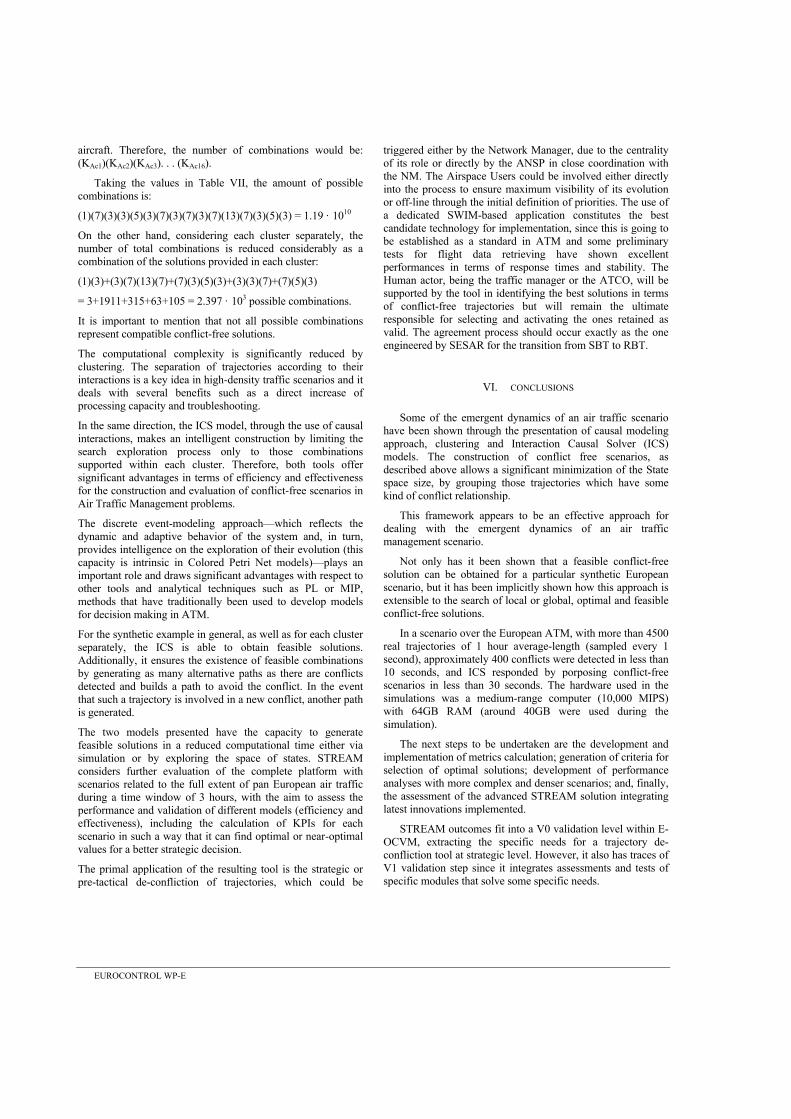
EUROCONTROL WP-E
aircraft. Therefore, the number of combinations would be: (KAc1)(KAc2)(KAc3). . . (KAc16).
Taking the values in Table VII, the amount of possible combinations is:
(1)(7)(3)(3)(5)(3)(7)(3)(7)(3)(7)(13)(7)(3)(5)(3) = 1.19 · 1010
On the other hand, considering each cluster separately, the number of total combinations is reduced considerably as a combination of the solutions provided in each cluster:
(1)(3)+(3)(7)(13)(7)+(7)(3)(5)(3)+(3)(3)(7)+(7)(5)(3)
= 3+1911+315+63+105 = 2.397 · 103 possible combinations.
It is important to mention that not all possible combinations represent compatible conflict-free solutions.
The computational complexity is significantly reduced by clustering. The separation of trajectories according to their interactions is a key idea in high-density traffic scenarios and it deals with several benefits such as a direct increase of processing capacity and troubleshooting.
In the same direction, the ICS model, through the use of causal interactions, makes an intelligent construction by limiting the search exploration process only to those combinations supported within each cluster. Therefore, both tools offer significant advantages in terms of efficiency and effectiveness for the construction and evaluation of conflict-free scenarios in Air Traffic Management problems.
The discrete event-modeling approach which reflects the dynamic and adaptive behavior of the system and, in turn, provides intelligence on the exploration of their evolution (this capacity is intrinsic in Colored Petri Net models) plays an important role and draws significant advantages with respect to other tools and analytical techniques such as PL or MIP, methods that have traditionally been used to develop models for decision making in ATM.
For the synthetic example in general, as well as for each cluster separately, the ICS is able to obtain feasible solutions. Additionally, it ensures the existence of feasible combinations by generating as many alternative paths as there are conflicts detected and builds a path to avoid the conflict. In the event that such a trajectory is involved in a new conflict, another path is generated.
The two models presented have the capacity to generate feasible solutions in a reduced computational time either via simulation or by exploring the space of states. STREAM considers further evaluation of the complete platform with scenarios related to the full extent of pan European air traffic during a time window of 3 hours, with the aim to assess the performance and validation of different models (efficiency and effectiveness), including the calculation of KPIs for each scenario in such a way that it can find optimal or near-optimal values for a better strategic decision.
The primal application of the resulting tool is the strategic or pre-tactical de-confliction of trajectories, which could be
triggered either by the Network Manager, due to the centrality of its role or directly by the ANSP in close coordination with the NM. The Airspace Users could be involved either directly into the process to ensure maximum visibility of its evolution or off-line through the initial definition of priorities. The use of a dedicated SWIM-based application constitutes the best candidate technology for implementation, since this is going to be established as a standard in ATM and some preliminary tests for flight data retrieving have shown excellent performances in terms of response times and stability. The Human actor, being the traffic manager or the ATCO, will be supported by the tool in identifying the best solutions in terms of conflict-free trajectories but will remain the ultimate responsible for selecting and activating the ones retained as valid. The agreement process should occur exactly as the one engineered by SESAR for the transition from SBT to RBT.
VI. CONCLUSIONS
Some of the emergent dynamics of an air traffic scenario have been shown through the presentation of causal modeling approach, clustering and Interaction Causal Solver (ICS) models. The construction of conflict free scenarios, as described above allows a significant minimization of the State space size, by grouping those trajectories which have some kind of conflict relationship.
This framework appears to be an effective approach for dealing with the emergent dynamics of an air traffic management scenario.
Not only has it been shown that a feasible conflict-free solution can be obtained for a particular synthetic European scenario, but it has been implicitly shown how this approach is extensible to the search of local or global, optimal and feasible conflict-free solutions.
In a scenario over the European ATM, with more than 4500 real trajectories of 1 hour average-length (sampled every 1 second), approximately 400 conflicts were detected in less than 10 seconds, and ICS responded by porposing conflict-free scenarios in less than 30 seconds. The hardware used in the simulations was a medium-range computer (10,000 MIPS) with 64GB RAM (around 40GB were used during the simulation).
The next steps to be undertaken are the development and implementation of metrics calculation; generation of criteria for selection of optimal solutions; development of performance analyses with more complex and denser scenarios; and, finally, the assessment of the advanced STREAM solution integrating latest innovations implemented.
STREAM outcomes fit into a V0 validation level within E-OCVM, extracting the specific needs for a trajectory de-confliction tool at strategic level. However, it also has traces of V1 validation step since it integrates assessments and tests of specific modules that solve some specific needs.
EUROCONTROL WP-E
Stemming from this initial validation provided by STREAM (between V0 and V1), further steps towards the generation of a real decision support tool might be taken in more than one direction. The future developments can be derived in two main threads that can be combined. On one hand, it can focus on the specific development and refinement of the conflict detection and resolution with the aim of validating and producing an actual specific tool or application. Alternatively, on the other hand, the future developments can capitalize STREAM valuable outcomes and extrapolate their benefits to be used as a base for decision support tools addressing problems other than only de-confliction, such as demand/capacity balancing and complexity management.
The concepts used in STREAM algorithms can, therefore, be the input to generate new algorithms that focus on the optimization of trajectory design accounting for multiple KPAs and factors affecting the network. This approach would lead to a more thorough integration within a real and more ATM-extended decision support tool that could be used by different stakeholders (e.g. traffic manager, AN
ACKNOWLEDGMENT
The authors acknowledge the technical and financial contribution received from EUROCONTROL acting on behalf of the SESAR Joint Undertaking with funds from the EUROPEAN UNION. The opinions expressed herein are those of the authors and do not represent the official position either of the SESAR Joint Undertaking or of EUROCONTROL.
REFERENCES
[1] Ruiz, S., Piera, M., Zúñiga, C., 2011. -Space Data Structure To Speed Up Conflict Detection Under Heavy Traffic Conditions . Presented at the SESAR Innovation Days (SID) 2011 EUROCONTROL, ENAC (Toulouse).
[2] Sergio Ruiz, Jenaro Nosedal, Miquel A. Piera, and Andrea Ranieri.
through Spatial Data Structures and Colored Petri Nets unpublished. [3] Ranieri, A., Martinez, R., Piera, M.A., Lopez, J., Vilaplana, M., 2011.
-confliction to Enable Seamless Aircraft Conflict Management (WP-E project STREAM) . Presented at the SESAR Innovation Days, ENAC (Toulouse).
[4] Krozel, Bilimoria, Lee, 2001. System performance characteristics of centralized and decentralized air traffic separation strategies. ATM Seminar.
[5] Ruiz, S., Piera, M., Ranieri, A., 2012. Computational Efficient Conflict Detection and Resolution through Spatial Data Structures, in: Proc. of International Conferences on Research in Air Transportation 2012 (ICRAT). Berkley, CA, USA.
[6] Mújica, A., Piera, M., 2011. A compact timed state space approach for the analysis of manufacturing systems: key algorithmic improvements. Int. J. Comput. Integ. Manuf. 24, 135 156.

204 Chapter 7. Compendium of Published Articles
7.5 “Strategic de-confliction in the presence of a large number of 4D trajectoriesusing a causal modeling approach 205
7.5 “Strategic de-confliction in the presence of a largenumber of 4D trajectories using a causal modelingapproach
Article 5, “Strategic de-confliction in the presence of a large number of 4D tra-jectories using a causal modeling approach”, is at the moment of writtingthese lines in a “conditionally accepted” state in the journal of ElsevierTransportation Research part C. It gives detailed information about the fi-nal architecture and logical functioning of the CD&R used in STREAM. Italso describes in detail the causal model applied in the conflict resolutionmodule, which works in a and cyclical way with the SDS. Final results of theSTREAM project (complementary to the results presented in Chapter 5)after the strategic de-confliction of a nominal scenario with more than 4000trajectories flying within the European airspace can be also found.

206 Chapter 7. Compendium of Published Articles
! "!
Strategic de-confliction in the presence of a large number of 4D trajectories using a causal modeling approach !!SERGIO RUIZ(1), JENARO NOSEDAL(2), MIQUEL A. PIERA(3), AND ANDREA RANIERI(4) #"$#%$#&$! Technical Innovation Cluster on Aeronautical Management'! ()*+,-.*/0/! 12/3)450! 6,! 70-8,94)0'!:0;06,99!#70-8,94)0$'!:<0*)!(4) ALG-INDRA, Barcelona, Spain. !!
This paper presents a strategic de-confliction algorithm based on causal modeling developed under the STREAM project and launched under the umbrella of the Single European Sky ATM Research (SESAR) Program. The basic underlying concept makes use of the enriched information included in the Shared Business Trajectories (SBTs) of the flights prior to takeoff (or in the Reference Business Trajectories (RBTs) if the flight is airborne) to allocate conflict-free trajectories in a traffic planning phase that should lead to an actual conflict-free scenario in the flight execution phase in the absence of flight and/or network uncertainties. The proposed approach could decrease the workload of the air traffic controllers, thus improving the Air Traffic Management (ATM) capacity while meeting the maximum possible expectations of the Airspace Users’ requirements in terms of horizontal flight efficiency. The main modules of the implemented system are also presented in this paper; these modules are designed to enable the processing of thousands of trajectories within a few seconds or minutes and encompass a global network scope with a planning horizon of approximately 2 to 3 hours. The causal model applied for network conflict resolution and flight routing allocation is analyzed to demonstrate how the emergent dynamics (i.e., domino effects) of local trajectory amendments can be efficiently explored to identify conflict-free Pareto-efficient network scenarios. Various performance indicators can be taken into account in the multi-criteria optimization process, thus offering to the network manager a flexible tool for fostering a collaborative planning process.
!!
Keywords: 4D trajectories, causal analysis, strategic conflict detection and resolution, strategic de-confliction, dynamic route allocation, SESAR programme
!
1. INTRODUCTION
The 4D Business Trajectory constitutes a fundamental element of the SESAR Target Concept for 2020, which is aimed at evolving from the current airspace-based ATM system to a trajectory-based system designed to accommodate Airspace Users’ (AUs) requests to the maximum extent possible (SESAR Consortium, 2007). The Business Trajectory is expressed for each flight in space and time and evolves out of a collaborative layered planning process, from the form of the Shared Business Trajectory (SBT), which is shared with all the involved stakeholders for planning and negotiation purposes, to the Reference Business Trajectory (RBT), which is implemented a few minutes before flight execution and represents the trajectory through which the Airspace User agrees to fly and that the Air Navigation Service Providers (ANSPs) and airports agree to facilitate.
The SESAR Concept of Operations (SESAR Consortium, 2013, 2007) highlights the importance of Strategic De-confliction in achieving the targets of increasing capacity and safety in Air Traffic Management (ATM) while improving flight efficiency, reducing costs and involving the AUs directly in the process by means of a Collaborative Flight Planning effort based on a dynamic rolling Network Operations Plan (NOP). This plan provides a common reference upon which the partners are able to optimize their business trajectories (EUROCONTROL 2012a, 2012b).
The term Strategic De-confliction is often used to define actions taken when the SBT takeoff time is known with sufficient accuracy (e.g., after push-back) or even after the flight is airborne but with sufficient time to allow a Collaborative Decision-Making (i.e., Collaborative Flight Planning) process to occur. This term excludes tactical instructions and clearances that require an immediate response but includes activities such as dynamic route allocation (SESAR Consortium, 2013, 2007).
The STREAM (Strategic TRajectory de-confliction to Enable seamless Aircraft conflict Management) project, launched under the auspices of SESAR WP-E [http://www.hala-sesar.net/stream] is aimed at developing innovative and computationally efficient Conflict Detection and Resolution (CD&R) algorithms for strategic de-confliction of thousands of trajectories within a few seconds or minutes by taking into consideration the AU preferences and network constraints. This system will enable air traffic to be de-conflicted over wide airspace
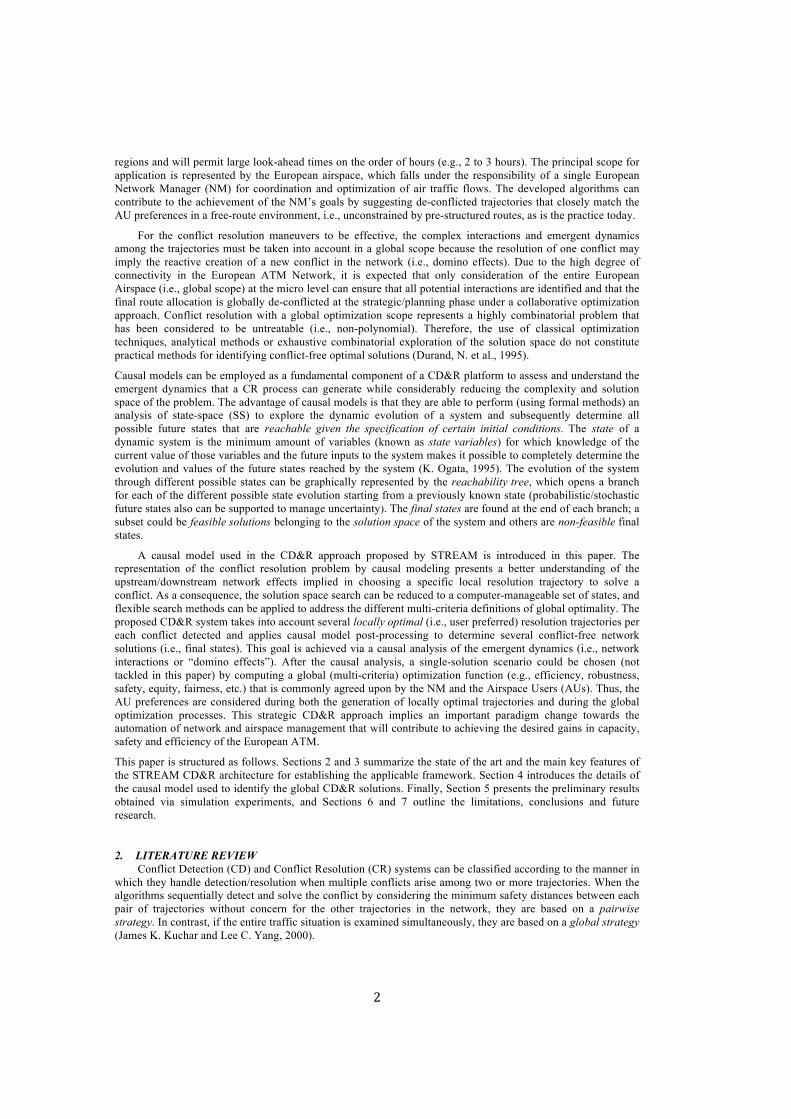
! %!
regions and will permit large look-ahead times on the order of hours (e.g., 2 to 3 hours). The principal scope for application is represented by the European airspace, which falls under the responsibility of a single European Network Manager (NM) for coordination and optimization of air traffic flows. The developed algorithms can contribute to the achievement of the NM’s goals by suggesting de-conflicted trajectories that closely match the AU preferences in a free-route environment, i.e., unconstrained by pre-structured routes, as is the practice today.
For the conflict resolution maneuvers to be effective, the complex interactions and emergent dynamics among the trajectories must be taken into account in a global scope because the resolution of one conflict may imply the reactive creation of a new conflict in the network (i.e., domino effects). Due to the high degree of connectivity in the European ATM Network, it is expected that only consideration of the entire European Airspace (i.e., global scope) at the micro level can ensure that all potential interactions are identified and that the final route allocation is globally de-conflicted at the strategic/planning phase under a collaborative optimization approach. Conflict resolution with a global optimization scope represents a highly combinatorial problem that has been considered to be untreatable (i.e., non-polynomial). Therefore, the use of classical optimization techniques, analytical methods or exhaustive combinatorial exploration of the solution space do not constitute practical methods for identifying conflict-free optimal solutions (Durand, N. et al., 1995).
Causal models can be employed as a fundamental component of a CD&R platform to assess and understand the emergent dynamics that a CR process can generate while considerably reducing the complexity and solution space of the problem. The advantage of causal models is that they are able to perform (using formal methods) an analysis of state-space (SS) to explore the dynamic evolution of a system and subsequently determine all possible future states that are reachable given the specification of certain initial conditions. The state of a dynamic system is the minimum amount of variables (known as state variables) for which knowledge of the current value of those variables and the future inputs to the system makes it possible to completely determine the evolution and values of the future states reached by the system (K. Ogata, 1995). The evolution of the system through different possible states can be graphically represented by the reachability tree, which opens a branch for each of the different possible state evolution starting from a previously known state (probabilistic/stochastic future states also can be supported to manage uncertainty). The final states are found at the end of each branch; a subset could be feasible solutions belonging to the solution space of the system and others are non-feasible final states.
A causal model used in the CD&R approach proposed by STREAM is introduced in this paper. The representation of the conflict resolution problem by causal modeling presents a better understanding of the upstream/downstream network effects implied in choosing a specific local resolution trajectory to solve a conflict. As a consequence, the solution space search can be reduced to a computer-manageable set of states, and flexible search methods can be applied to address the different multi-criteria definitions of global optimality. The proposed CD&R system takes into account several locally optimal (i.e., user preferred) resolution trajectories per each conflict detected and applies causal model post-processing to determine several conflict-free network solutions (i.e., final states). This goal is achieved via a causal analysis of the emergent dynamics (i.e., network interactions or “domino effects”). After the causal analysis, a single-solution scenario could be chosen (not tackled in this paper) by computing a global (multi-criteria) optimization function (e.g., efficiency, robustness, safety, equity, fairness, etc.) that is commonly agreed upon by the NM and the Airspace Users (AUs). Thus, the AU preferences are considered during both the generation of locally optimal trajectories and during the global optimization processes. This strategic CD&R approach implies an important paradigm change towards the automation of network and airspace management that will contribute to achieving the desired gains in capacity, safety and efficiency of the European ATM.
This paper is structured as follows. Sections 2 and 3 summarize the state of the art and the main key features of the STREAM CD&R architecture for establishing the applicable framework. Section 4 introduces the details of the causal model used to identify the global CD&R solutions. Finally, Section 5 presents the preliminary results obtained via simulation experiments, and Sections 6 and 7 outline the limitations, conclusions and future research.
2. LITERATURE REVIEW Conflict Detection (CD) and Conflict Resolution (CR) systems can be classified according to the manner in
which they handle detection/resolution when multiple conflicts arise among two or more trajectories. When the algorithms sequentially detect and solve the conflict by considering the minimum safety distances between each pair of trajectories without concern for the other trajectories in the network, they are based on a pairwise strategy. In contrast, if the entire traffic situation is examined simultaneously, they are based on a global strategy (James K. Kuchar and Lee C. Yang, 2000).
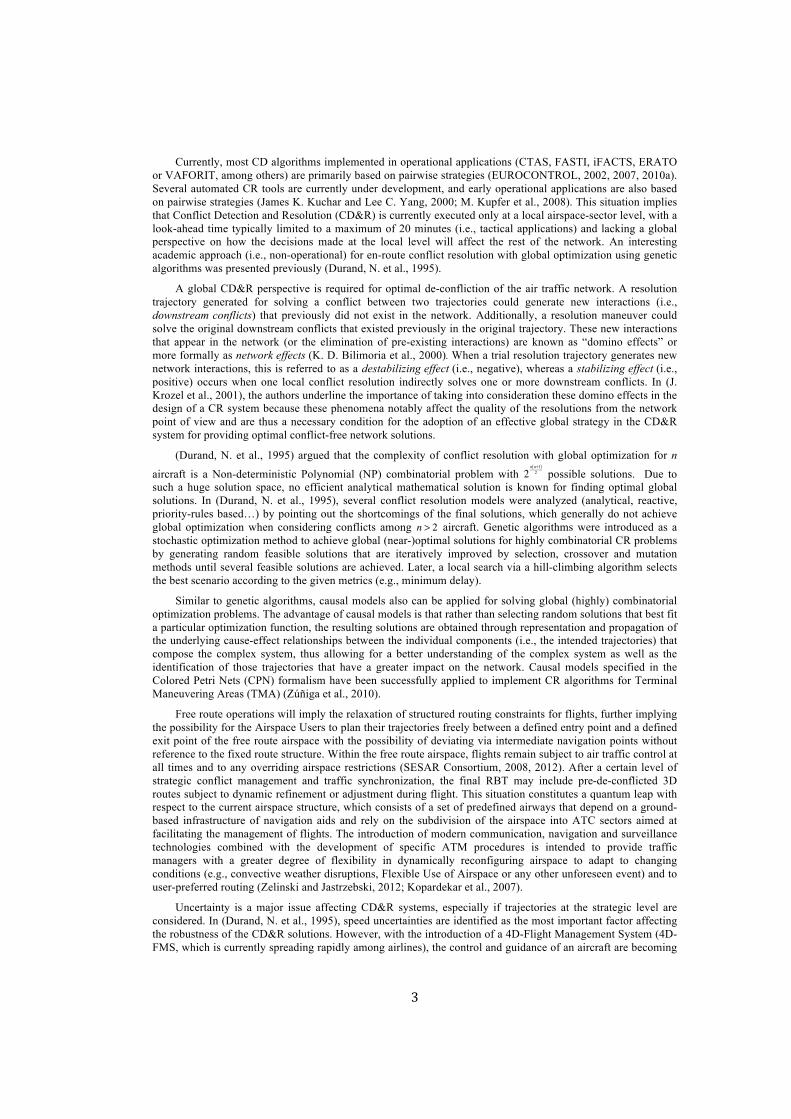
! &!
Currently, most CD algorithms implemented in operational applications (CTAS, FASTI, iFACTS, ERATO or VAFORIT, among others) are primarily based on pairwise strategies (EUROCONTROL, 2002, 2007, 2010a). Several automated CR tools are currently under development, and early operational applications are also based on pairwise strategies (James K. Kuchar and Lee C. Yang, 2000; M. Kupfer et al., 2008). This situation implies that Conflict Detection and Resolution (CD&R) is currently executed only at a local airspace-sector level, with a look-ahead time typically limited to a maximum of 20 minutes (i.e., tactical applications) and lacking a global perspective on how the decisions made at the local level will affect the rest of the network. An interesting academic approach (i.e., non-operational) for en-route conflict resolution with global optimization using genetic algorithms was presented previously (Durand, N. et al., 1995).
A global CD&R perspective is required for optimal de-confliction of the air traffic network. A resolution trajectory generated for solving a conflict between two trajectories could generate new interactions (i.e., downstream conflicts) that previously did not exist in the network. Additionally, a resolution maneuver could solve the original downstream conflicts that existed previously in the original trajectory. These new interactions that appear in the network (or the elimination of pre-existing interactions) are known as “domino effects” or more formally as network effects (K. D. Bilimoria et al., 2000). When a trial resolution trajectory generates new network interactions, this is referred to as a destabilizing effect (i.e., negative), whereas a stabilizing effect (i.e., positive) occurs when one local conflict resolution indirectly solves one or more downstream conflicts. In (J. Krozel et al., 2001), the authors underline the importance of taking into consideration these domino effects in the design of a CR system because these phenomena notably affect the quality of the resolutions from the network point of view and are thus a necessary condition for the adoption of an effective global strategy in the CD&R system for providing optimal conflict-free network solutions.
(Durand, N. et al., 1995) argued that the complexity of conflict resolution with global optimization for n
aircraft is a Non-deterministic Polynomial (NP) combinatorial problem with 2n n+1( )2 possible solutions. Due to
such a huge solution space, no efficient analytical mathematical solution is known for finding optimal global solutions. In (Durand, N. et al., 1995), several conflict resolution models were analyzed (analytical, reactive, priority-rules based…) by pointing out the shortcomings of the final solutions, which generally do not achieve global optimization when considering conflicts among n > 2 aircraft. Genetic algorithms were introduced as a stochastic optimization method to achieve global (near-)optimal solutions for highly combinatorial CR problems by generating random feasible solutions that are iteratively improved by selection, crossover and mutation methods until several feasible solutions are achieved. Later, a local search via a hill-climbing algorithm selects the best scenario according to the given metrics (e.g., minimum delay).
Similar to genetic algorithms, causal models also can be applied for solving global (highly) combinatorial optimization problems. The advantage of causal models is that rather than selecting random solutions that best fit a particular optimization function, the resulting solutions are obtained through representation and propagation of the underlying cause-effect relationships between the individual components (i.e., the intended trajectories) that compose the complex system, thus allowing for a better understanding of the complex system as well as the identification of those trajectories that have a greater impact on the network. Causal models specified in the Colored Petri Nets (CPN) formalism have been successfully applied to implement CR algorithms for Terminal Maneuvering Areas (TMA) (Zúñiga et al., 2010).
Free route operations will imply the relaxation of structured routing constraints for flights, further implying the possibility for the Airspace Users to plan their trajectories freely between a defined entry point and a defined exit point of the free route airspace with the possibility of deviating via intermediate navigation points without reference to the fixed route structure. Within the free route airspace, flights remain subject to air traffic control at all times and to any overriding airspace restrictions (SESAR Consortium, 2008, 2012). After a certain level of strategic conflict management and traffic synchronization, the final RBT may include pre-de-conflicted 3D routes subject to dynamic refinement or adjustment during flight. This situation constitutes a quantum leap with respect to the current airspace structure, which consists of a set of predefined airways that depend on a ground-based infrastructure of navigation aids and rely on the subdivision of the airspace into ATC sectors aimed at facilitating the management of flights. The introduction of modern communication, navigation and surveillance technologies combined with the development of specific ATM procedures is intended to provide traffic managers with a greater degree of flexibility in dynamically reconfiguring airspace to adapt to changing conditions (e.g., convective weather disruptions, Flexible Use of Airspace or any other unforeseen event) and to user-preferred routing (Zelinski and Jastrzebski, 2012; Kopardekar et al., 2007).
Uncertainty is a major issue affecting CD&R systems, especially if trajectories at the strategic level are considered. In (Durand, N. et al., 1995), speed uncertainties are identified as the most important factor affecting the robustness of the CD&R solutions. However, with the introduction of a 4D-Flight Management System (4D-FMS, which is currently spreading rapidly among airlines), the control and guidance of an aircraft are becoming
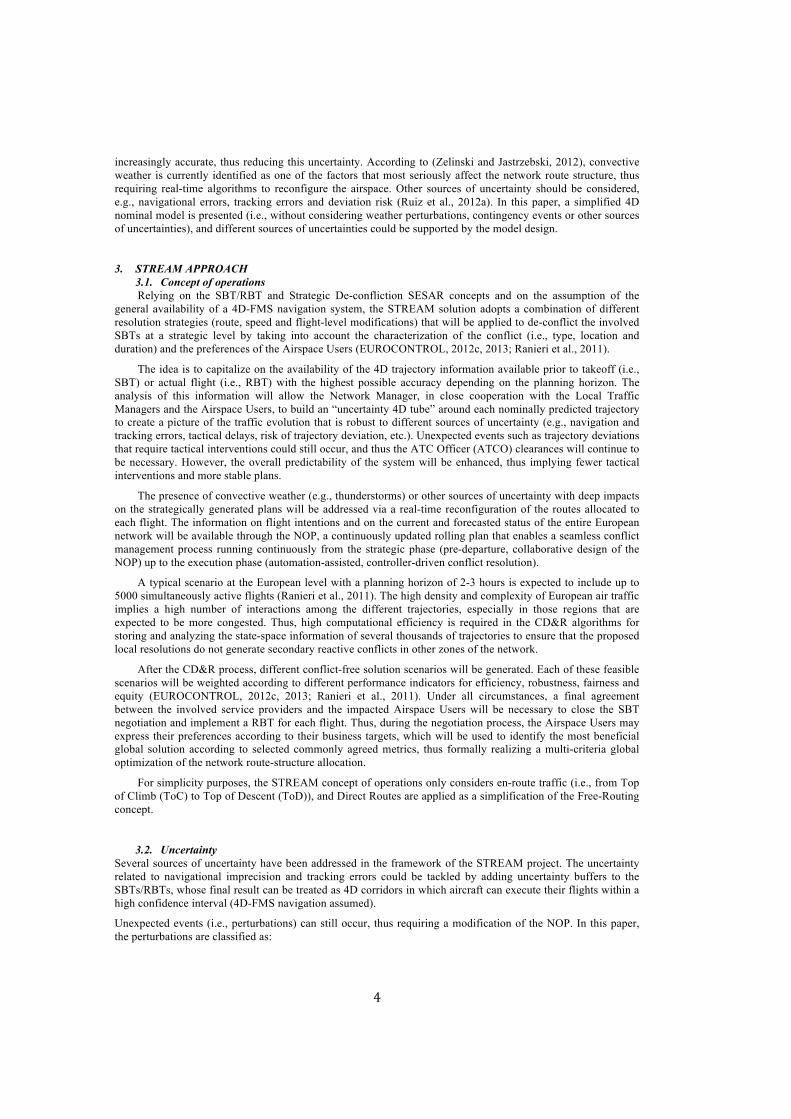
! =!
increasingly accurate, thus reducing this uncertainty. According to (Zelinski and Jastrzebski, 2012), convective weather is currently identified as one of the factors that most seriously affect the network route structure, thus requiring real-time algorithms to reconfigure the airspace. Other sources of uncertainty should be considered, e.g., navigational errors, tracking errors and deviation risk (Ruiz et al., 2012a). In this paper, a simplified 4D nominal model is presented (i.e., without considering weather perturbations, contingency events or other sources of uncertainties), and different sources of uncertainties could be supported by the model design.
3. STREAM APPROACH 3.1. Concept of operations Relying on the SBT/RBT and Strategic De-confliction SESAR concepts and on the assumption of the
general availability of a 4D-FMS navigation system, the STREAM solution adopts a combination of different resolution strategies (route, speed and flight-level modifications) that will be applied to de-conflict the involved SBTs at a strategic level by taking into account the characterization of the conflict (i.e., type, location and duration) and the preferences of the Airspace Users (EUROCONTROL, 2012c, 2013; Ranieri et al., 2011).
The idea is to capitalize on the availability of the 4D trajectory information available prior to takeoff (i.e., SBT) or actual flight (i.e., RBT) with the highest possible accuracy depending on the planning horizon. The analysis of this information will allow the Network Manager, in close cooperation with the Local Traffic Managers and the Airspace Users, to build an “uncertainty 4D tube” around each nominally predicted trajectory to create a picture of the traffic evolution that is robust to different sources of uncertainty (e.g., navigation and tracking errors, tactical delays, risk of trajectory deviation, etc.). Unexpected events such as trajectory deviations that require tactical interventions could still occur, and thus the ATC Officer (ATCO) clearances will continue to be necessary. However, the overall predictability of the system will be enhanced, thus implying fewer tactical interventions and more stable plans.
The presence of convective weather (e.g., thunderstorms) or other sources of uncertainty with deep impacts on the strategically generated plans will be addressed via a real-time reconfiguration of the routes allocated to each flight. The information on flight intentions and on the current and forecasted status of the entire European network will be available through the NOP, a continuously updated rolling plan that enables a seamless conflict management process running continuously from the strategic phase (pre-departure, collaborative design of the NOP) up to the execution phase (automation-assisted, controller-driven conflict resolution).
A typical scenario at the European level with a planning horizon of 2-3 hours is expected to include up to 5000 simultaneously active flights (Ranieri et al., 2011). The high density and complexity of European air traffic implies a high number of interactions among the different trajectories, especially in those regions that are expected to be more congested. Thus, high computational efficiency is required in the CD&R algorithms for storing and analyzing the state-space information of several thousands of trajectories to ensure that the proposed local resolutions do not generate secondary reactive conflicts in other zones of the network.
After the CD&R process, different conflict-free solution scenarios will be generated. Each of these feasible scenarios will be weighted according to different performance indicators for efficiency, robustness, fairness and equity (EUROCONTROL, 2012c, 2013; Ranieri et al., 2011). Under all circumstances, a final agreement between the involved service providers and the impacted Airspace Users will be necessary to close the SBT negotiation and implement a RBT for each flight. Thus, during the negotiation process, the Airspace Users may express their preferences according to their business targets, which will be used to identify the most beneficial global solution according to selected commonly agreed metrics, thus formally realizing a multi-criteria global optimization of the network route-structure allocation.
For simplicity purposes, the STREAM concept of operations only considers en-route traffic (i.e., from Top of Climb (ToC) to Top of Descent (ToD)), and Direct Routes are applied as a simplification of the Free-Routing concept.
3.2. Uncertainty Several sources of uncertainty have been addressed in the framework of the STREAM project. The uncertainty related to navigational imprecision and tracking errors could be tackled by adding uncertainty buffers to the SBTs/RBTs, whose final result can be treated as 4D corridors in which aircraft can execute their flights within a high confidence interval (4D-FMS navigation assumed).
Unexpected events (i.e., perturbations) can still occur, thus requiring a modification of the NOP. In this paper, the perturbations are classified as:
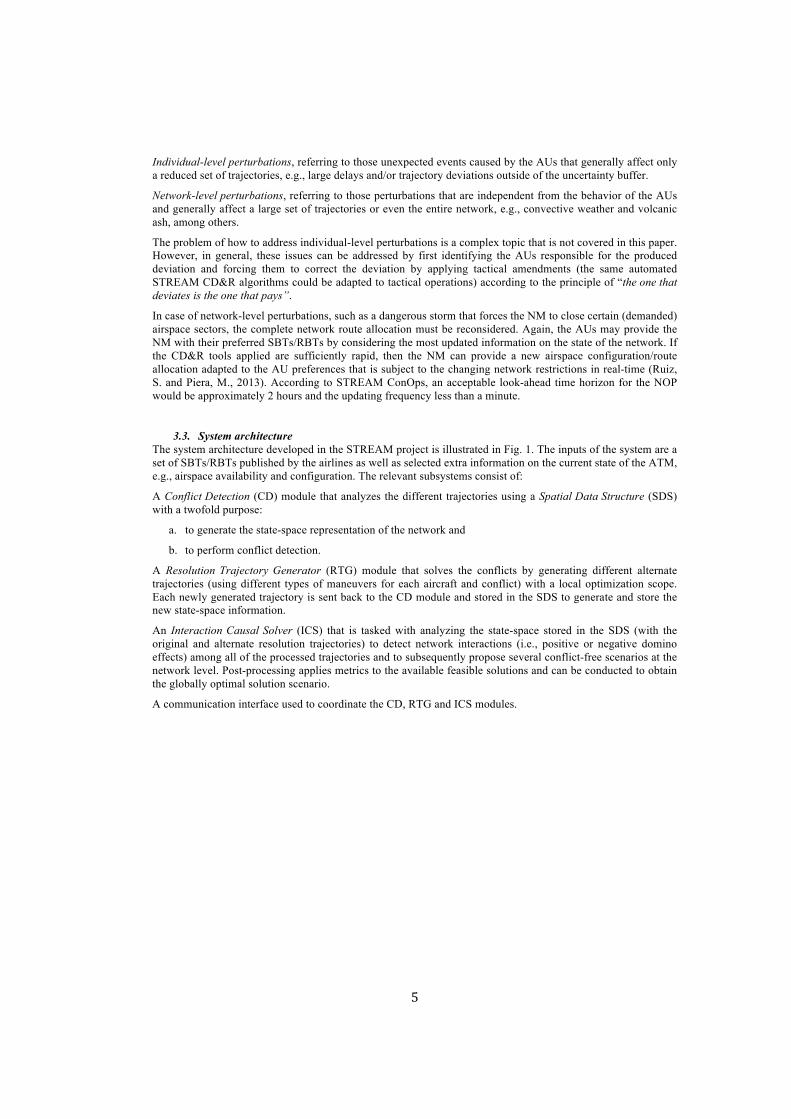
! >!
Individual-level perturbations, referring to those unexpected events caused by the AUs that generally affect only a reduced set of trajectories, e.g., large delays and/or trajectory deviations outside of the uncertainty buffer.
Network-level perturbations, referring to those perturbations that are independent from the behavior of the AUs and generally affect a large set of trajectories or even the entire network, e.g., convective weather and volcanic ash, among others.
The problem of how to address individual-level perturbations is a complex topic that is not covered in this paper. However, in general, these issues can be addressed by first identifying the AUs responsible for the produced deviation and forcing them to correct the deviation by applying tactical amendments (the same automated STREAM CD&R algorithms could be adapted to tactical operations) according to the principle of “the one that deviates is the one that pays”.
In case of network-level perturbations, such as a dangerous storm that forces the NM to close certain (demanded) airspace sectors, the complete network route allocation must be reconsidered. Again, the AUs may provide the NM with their preferred SBTs/RBTs by considering the most updated information on the state of the network. If the CD&R tools applied are sufficiently rapid, then the NM can provide a new airspace configuration/route allocation adapted to the AU preferences that is subject to the changing network restrictions in real-time (Ruiz, S. and Piera, M., 2013). According to STREAM ConOps, an acceptable look-ahead time horizon for the NOP would be approximately 2 hours and the updating frequency less than a minute.
3.3. System architecture The system architecture developed in the STREAM project is illustrated in Fig. 1. The inputs of the system are a set of SBTs/RBTs published by the airlines as well as selected extra information on the current state of the ATM, e.g., airspace availability and configuration. The relevant subsystems consist of:
A Conflict Detection (CD) module that analyzes the different trajectories using a Spatial Data Structure (SDS) with a twofold purpose:
a. to generate the state-space representation of the network and
b. to perform conflict detection.
A Resolution Trajectory Generator (RTG) module that solves the conflicts by generating different alternate trajectories (using different types of maneuvers for each aircraft and conflict) with a local optimization scope. Each newly generated trajectory is sent back to the CD module and stored in the SDS to generate and store the new state-space information.
An Interaction Causal Solver (ICS) that is tasked with analyzing the state-space stored in the SDS (with the original and alternate resolution trajectories) to detect network interactions (i.e., positive or negative domino effects) among all of the processed trajectories and to subsequently propose several conflict-free scenarios at the network level. Post-processing applies metrics to the available feasible solutions and can be conducted to obtain the globally optimal solution scenario.
A communication interface used to coordinate the CD, RTG and ICS modules.
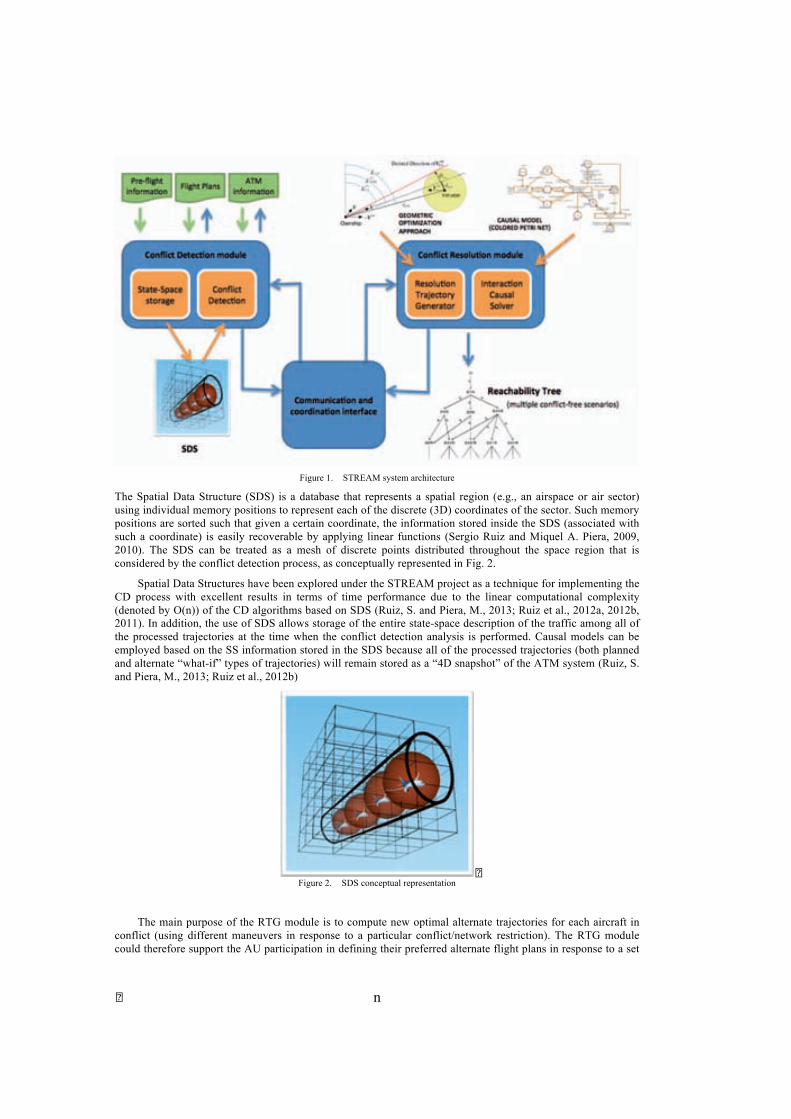
� )�
Figure 1. STREAM system architecture
The Spatial Data Structure (SDS) is a database that represents a spatial region (e.g., an airspace or air sector) using individual memory positions to represent each of the discrete (3D) coordinates of the sector. Such memory positions are sorted such that given a certain coordinate, the information stored inside the SDS (associated with such a coordinate) is easily recoverable by applying linear functions (Sergio Ruiz and Miquel A. Piera, 2009, 2010). The SDS can be treated as a mesh of discrete points distributed throughout the space region that is considered by the conflict detection process, as conceptually represented in Fig. 2.
Spatial Data Structures have been explored under the STREAM project as a technique for implementing the CD process with excellent results in terms of time performance due to the linear computational complexity (denoted by O(n)) of the CD algorithms based on SDS (Ruiz, S. and Piera, M., 2013; Ruiz et al., 2012a, 2012b, 2011). In addition, the use of SDS allows storage of the entire state-space description of the traffic among all of the processed trajectories at the time when the conflict detection analysis is performed. Causal models can be employed based on the SS information stored in the SDS because all of the processed trajectories (both planned and alternate “what-if” types of trajectories) will remain stored as a “4D snapshot” of the ATM system (Ruiz, S. and Piera, M., 2013; Ruiz et al., 2012b)
�Figure 2. SDS conceptual representation
The main purpose of the RTG module is to compute new optimal alternate trajectories for each aircraft in conflict (using different maneuvers in response to a particular conflict/network restriction). The RTG module could therefore support the AU participation in defining their preferred alternate flight plans in response to a set
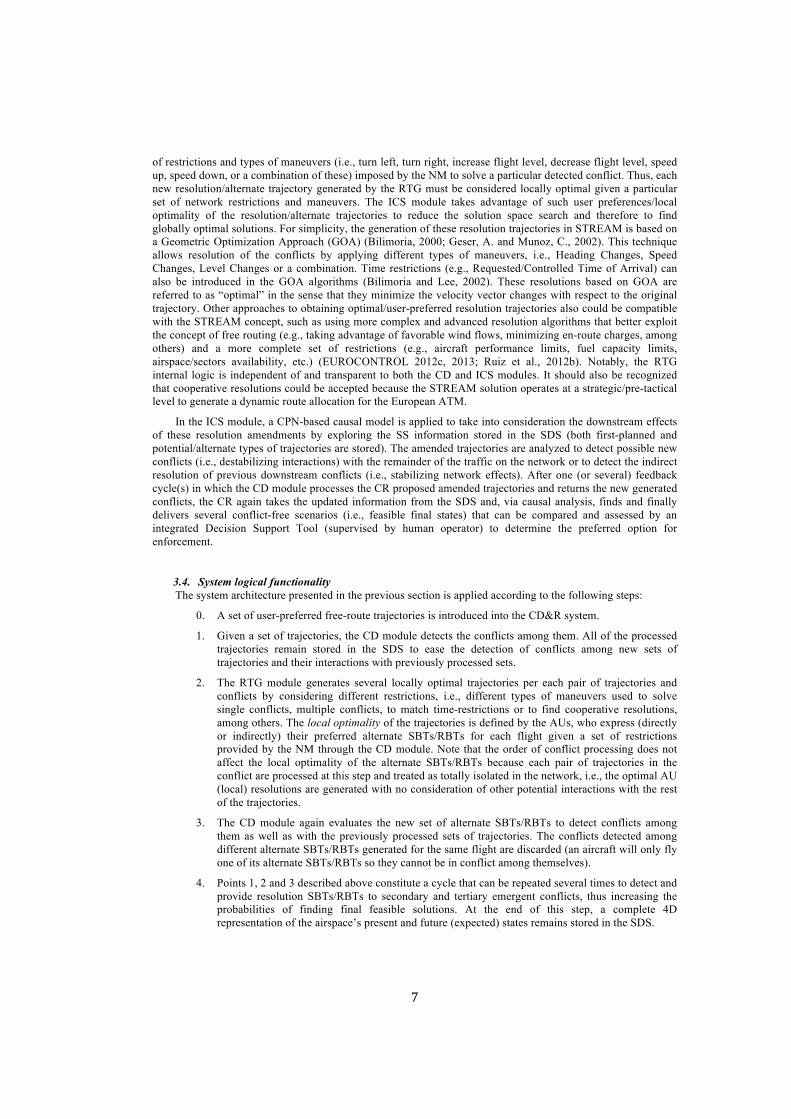
! @!
of restrictions and types of maneuvers (i.e., turn left, turn right, increase flight level, decrease flight level, speed up, speed down, or a combination of these) imposed by the NM to solve a particular detected conflict. Thus, each new resolution/alternate trajectory generated by the RTG must be considered locally optimal given a particular set of network restrictions and maneuvers. The ICS module takes advantage of such user preferences/local optimality of the resolution/alternate trajectories to reduce the solution space search and therefore to find globally optimal solutions. For simplicity, the generation of these resolution trajectories in STREAM is based on a Geometric Optimization Approach (GOA) (Bilimoria, 2000; Geser, A. and Munoz, C., 2002). This technique allows resolution of the conflicts by applying different types of maneuvers, i.e., Heading Changes, Speed Changes, Level Changes or a combination. Time restrictions (e.g., Requested/Controlled Time of Arrival) can also be introduced in the GOA algorithms (Bilimoria and Lee, 2002). These resolutions based on GOA are referred to as “optimal” in the sense that they minimize the velocity vector changes with respect to the original trajectory. Other approaches to obtaining optimal/user-preferred resolution trajectories also could be compatible with the STREAM concept, such as using more complex and advanced resolution algorithms that better exploit the concept of free routing (e.g., taking advantage of favorable wind flows, minimizing en-route charges, among others) and a more complete set of restrictions (e.g., aircraft performance limits, fuel capacity limits, airspace/sectors availability, etc.) (EUROCONTROL 2012c, 2013; Ruiz et al., 2012b). Notably, the RTG internal logic is independent of and transparent to both the CD and ICS modules. It should also be recognized that cooperative resolutions could be accepted because the STREAM solution operates at a strategic/pre-tactical level to generate a dynamic route allocation for the European ATM.
In the ICS module, a CPN-based causal model is applied to take into consideration the downstream effects of these resolution amendments by exploring the SS information stored in the SDS (both first-planned and potential/alternate types of trajectories are stored). The amended trajectories are analyzed to detect possible new conflicts (i.e., destabilizing interactions) with the remainder of the traffic on the network or to detect the indirect resolution of previous downstream conflicts (i.e., stabilizing network effects). After one (or several) feedback cycle(s) in which the CD module processes the CR proposed amended trajectories and returns the new generated conflicts, the CR again takes the updated information from the SDS and, via causal analysis, finds and finally delivers several conflict-free scenarios (i.e., feasible final states) that can be compared and assessed by an integrated Decision Support Tool (supervised by human operator) to determine the preferred option for enforcement.
3.4. System logical functionality The system architecture presented in the previous section is applied according to the following steps:
0. A set of user-preferred free-route trajectories is introduced into the CD&R system.
1. Given a set of trajectories, the CD module detects the conflicts among them. All of the processed trajectories remain stored in the SDS to ease the detection of conflicts among new sets of trajectories and their interactions with previously processed sets.
2. The RTG module generates several locally optimal trajectories per each pair of trajectories and conflicts by considering different restrictions, i.e., different types of maneuvers used to solve single conflicts, multiple conflicts, to match time-restrictions or to find cooperative resolutions, among others. The local optimality of the trajectories is defined by the AUs, who express (directly or indirectly) their preferred alternate SBTs/RBTs for each flight given a set of restrictions provided by the NM through the CD module. Note that the order of conflict processing does not affect the local optimality of the alternate SBTs/RBTs because each pair of trajectories in the conflict are processed at this step and treated as totally isolated in the network, i.e., the optimal AU (local) resolutions are generated with no consideration of other potential interactions with the rest of the trajectories.
3. The CD module again evaluates the new set of alternate SBTs/RBTs to detect conflicts among them as well as with the previously processed sets of trajectories. The conflicts detected among different alternate SBTs/RBTs generated for the same flight are discarded (an aircraft will only fly one of its alternate SBTs/RBTs so they cannot be in conflict among themselves).
4. Points 1, 2 and 3 described above constitute a cycle that can be repeated several times to detect and provide resolution SBTs/RBTs to secondary and tertiary emergent conflicts, thus increasing the probabilities of finding final feasible solutions. At the end of this step, a complete 4D representation of the airspace’s present and future (expected) states remains stored in the SDS.
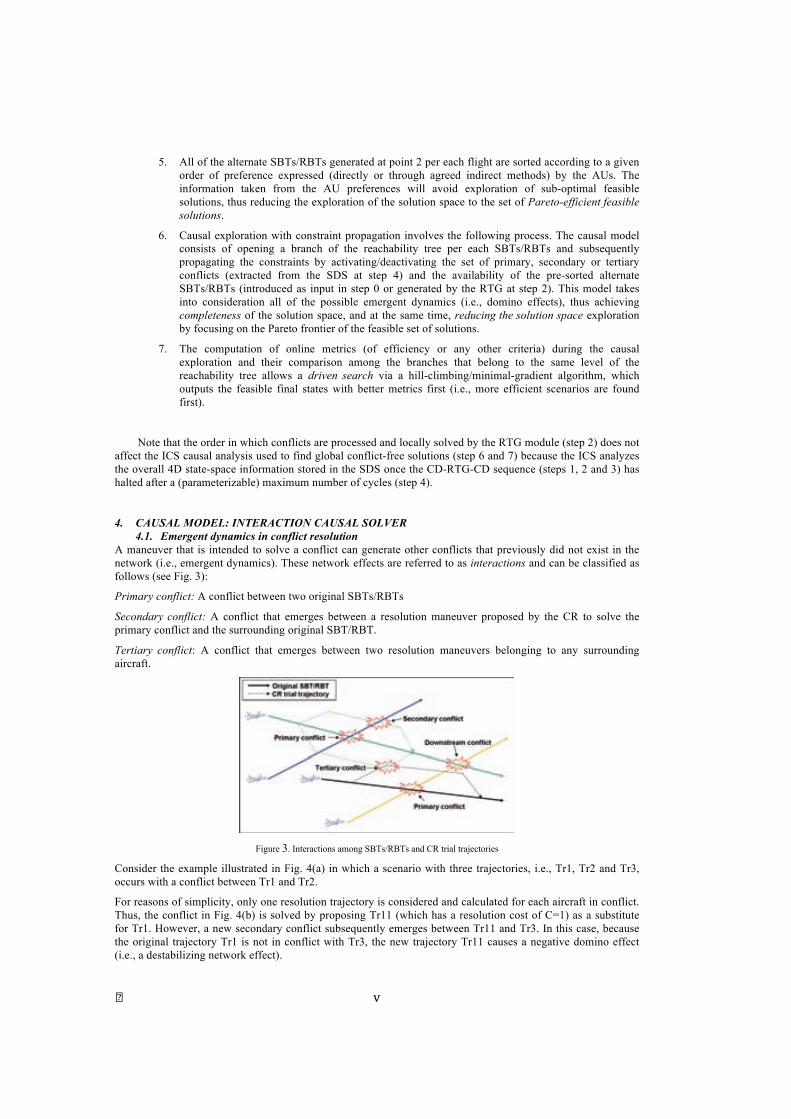
� + �
5. All of the alternate SBTs/RBTs generated at point 2 per each flight are sorted according to a given order of preference expressed (directly or through agreed indirect methods) by the AUs. The information taken from the AU preferences will avoid exploration of sub-optimal feasible solutions, thus reducing the exploration of the solution space to the set of Pareto-efficient feasible solutions.
6. Causal exploration with constraint propagation involves the following process. The causal model consists of opening a branch of the reachability tree per each SBTs/RBTs and subsequently propagating the constraints by activating/deactivating the set of primary, secondary or tertiary conflicts (extracted from the SDS at step 4) and the availability of the pre-sorted alternate SBTs/RBTs (introduced as input in step 0 or generated by the RTG at step 2). This model takes into consideration all of the possible emergent dynamics (i.e., domino effects), thus achieving completeness of the solution space, and at the same time, reducing the solution space exploration by focusing on the Pareto frontier of the feasible set of solutions.
7. The computation of online metrics (of efficiency or any other criteria) during the causal exploration and their comparison among the branches that belong to the same level of the reachability tree allows a driven search via a hill-climbing/minimal-gradient algorithm, which outputs the feasible final states with better metrics first (i.e., more efficient scenarios are found first).
Note that the order in which conflicts are processed and locally solved by the RTG module (step 2) does not affect the ICS causal analysis used to find global conflict-free solutions (step 6 and 7) because the ICS analyzes the overall 4D state-space information stored in the SDS once the CD-RTG-CD sequence (steps 1, 2 and 3) has halted after a (parameterizable) maximum number of cycles (step 4).
4. CAUSAL MODEL: INTERACTION CAUSAL SOLVER 4.1. Emergent dynamics in conflict resolution
A maneuver that is intended to solve a conflict can generate other conflicts that previously did not exist in the network (i.e., emergent dynamics). These network effects are referred to as interactions and can be classified as follows (see Fig. 3):
Primary conflict: A conflict between two original SBTs/RBTs
Secondary conflict: A conflict that emerges between a resolution maneuver proposed by the CR to solve the primary conflict and the surrounding original SBT/RBT.
Tertiary conflict: A conflict that emerges between two resolution maneuvers belonging to any surrounding aircraft.
Figure 3. Interactions among SBTs/RBTs and CR trial trajectories
Consider the example illustrated in Fig. 4(a) in which a scenario with three trajectories, i.e., Tr1, Tr2 and Tr3, occurs with a conflict between Tr1 and Tr2.
For reasons of simplicity, only one resolution trajectory is considered and calculated for each aircraft in conflict. Thus, the conflict in Fig. 4(b) is solved by proposing Tr11 (which has a resolution cost of C=1) as a substitute for Tr1. However, a new secondary conflict subsequently emerges between Tr11 and Tr3. In this case, because the original trajectory Tr1 is not in conflict with Tr3, the new trajectory Tr11 causes a negative domino effect (i.e., a destabilizing network effect).
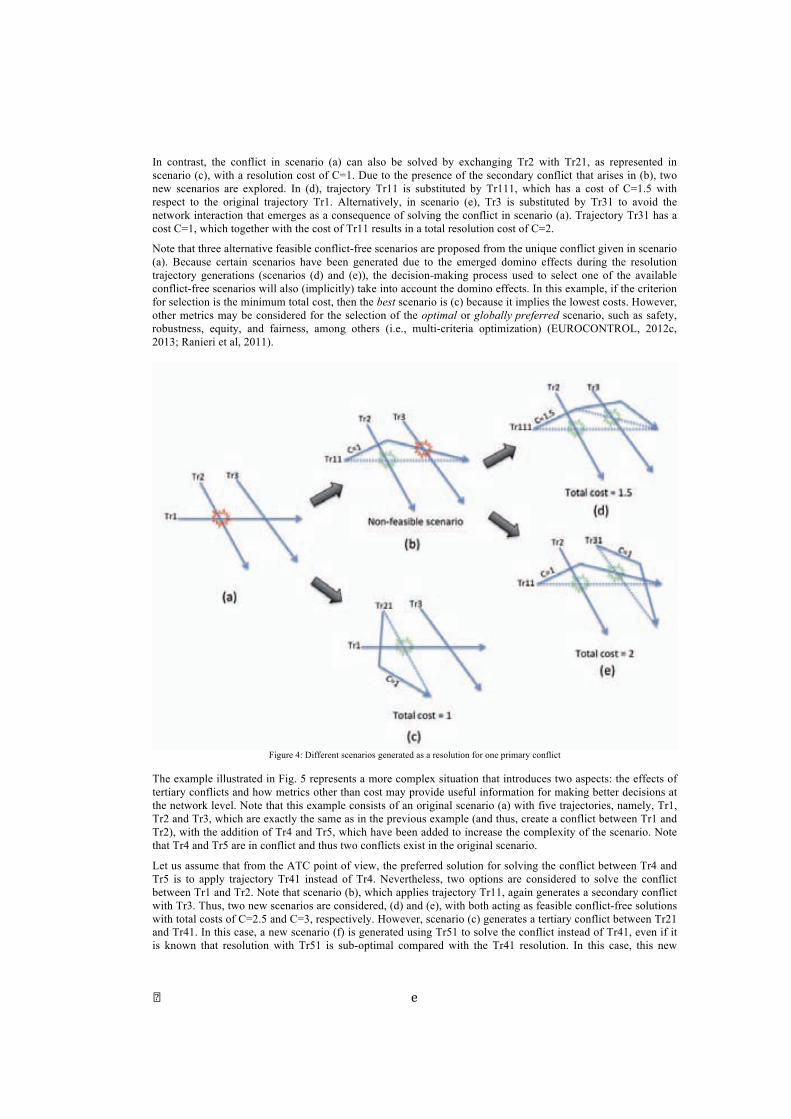
� , �
In contrast, the conflict in scenario (a) can also be solved by exchanging Tr2 with Tr21, as represented in scenario (c), with a resolution cost of C=1. Due to the presence of the secondary conflict that arises in (b), two new scenarios are explored. In (d), trajectory Tr11 is substituted by Tr111, which has a cost of C=1.5 with respect to the original trajectory Tr1. Alternatively, in scenario (e), Tr3 is substituted by Tr31 to avoid the network interaction that emerges as a consequence of solving the conflict in scenario (a). Trajectory Tr31 has a cost C=1, which together with the cost of Tr11 results in a total resolution cost of C=2.
Note that three alternative feasible conflict-free scenarios are proposed from the unique conflict given in scenario (a). Because certain scenarios have been generated due to the emerged domino effects during the resolution trajectory generations (scenarios (d) and (e)), the decision-making process used to select one of the available conflict-free scenarios will also (implicitly) take into account the domino effects. In this example, if the criterion for selection is the minimum total cost, then the best scenario is (c) because it implies the lowest costs. However, other metrics may be considered for the selection of the optimal or globally preferred scenario, such as safety, robustness, equity, and fairness, among others (i.e., multi-criteria optimization) (EUROCONTROL, 2012c, 2013; Ranieri et al, 2011).
Figure 4: Different scenarios generated as a resolution for one primary conflict
The example illustrated in Fig. 5 represents a more complex situation that introduces two aspects: the effects of tertiary conflicts and how metrics other than cost may provide useful information for making better decisions at the network level. Note that this example consists of an original scenario (a) with five trajectories, namely, Tr1, Tr2 and Tr3, which are exactly the same as in the previous example (and thus, create a conflict between Tr1 and Tr2), with the addition of Tr4 and Tr5, which have been added to increase the complexity of the scenario. Note that Tr4 and Tr5 are in conflict and thus two conflicts exist in the original scenario.
Let us assume that from the ATC point of view, the preferred solution for solving the conflict between Tr4 and Tr5 is to apply trajectory Tr41 instead of Tr4. Nevertheless, two options are considered to solve the conflict between Tr1 and Tr2. Note that scenario (b), which applies trajectory Tr11, again generates a secondary conflict with Tr3. Thus, two new scenarios are considered, (d) and (e), with both acting as feasible conflict-free solutions with total costs of C=2.5 and C=3, respectively. However, scenario (c) generates a tertiary conflict between Tr21 and Tr41. In this case, a new scenario (f) is generated using Tr51 to solve the conflict instead of Tr41, even if it is known that resolution with Tr51 is sub-optimal compared with the Tr41 resolution. In this case, this new
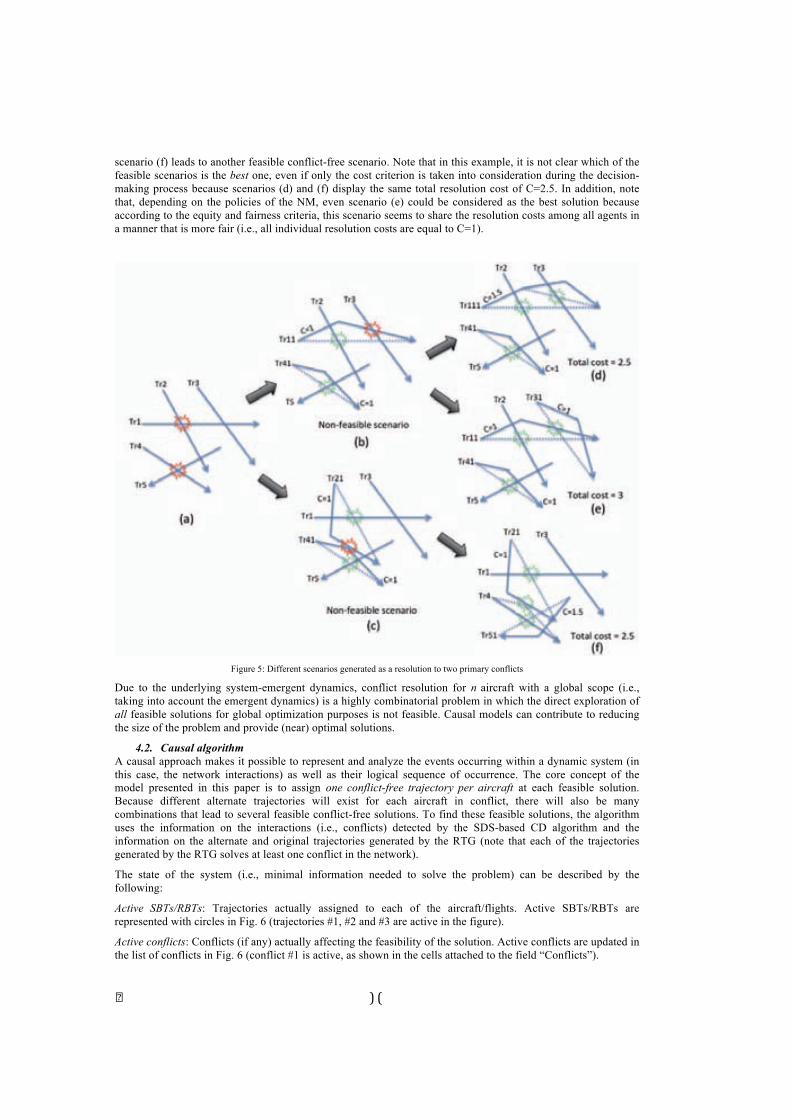
� $ # �
scenario (f) leads to another feasible conflict-free scenario. Note that in this example, it is not clear which of the feasible scenarios is the best one, even if only the cost criterion is taken into consideration during the decision-making process because scenarios (d) and (f) display the same total resolution cost of C=2.5. In addition, note that, depending on the policies of the NM, even scenario (e) could be considered as the best solution because according to the equity and fairness criteria, this scenario seems to share the resolution costs among all agents in a manner that is more fair (i.e., all individual resolution costs are equal to C=1).
Figure 5: Different scenarios generated as a resolution to two primary conflicts
Due to the underlying system-emergent dynamics, conflict resolution for n aircraft with a global scope (i.e., taking into account the emergent dynamics) is a highly combinatorial problem in which the direct exploration of all feasible solutions for global optimization purposes is not feasible. Causal models can contribute to reducing the size of the problem and provide (near) optimal solutions.
4.2. Causal algorithm A causal approach makes it possible to represent and analyze the events occurring within a dynamic system (in this case, the network interactions) as well as their logical sequence of occurrence. The core concept of the model presented in this paper is to assign one conflict-free trajectory per aircraft at each feasible solution. Because different alternate trajectories will exist for each aircraft in conflict, there will also be many combinations that lead to several feasible conflict-free solutions. To find these feasible solutions, the algorithm uses the information on the interactions (i.e., conflicts) detected by the SDS-based CD algorithm and the information on the alternate and original trajectories generated by the RTG (note that each of the trajectories generated by the RTG solves at least one conflict in the network).
The state of the system (i.e., minimal information needed to solve the problem) can be described by the following:
Active SBTs/RBTs: Trajectories actually assigned to each of the aircraft/flights. Active SBTs/RBTs are represented with circles in Fig. 6 (trajectories #1, #2 and #3 are active in the figure).
Active conflicts: Conflicts (if any) actually affecting the feasibility of the solution. Active conflicts are updated in the list of conflicts in Fig. 6 (conflict #1 is active, as shown in the cells attached to the field “Conflicts”).
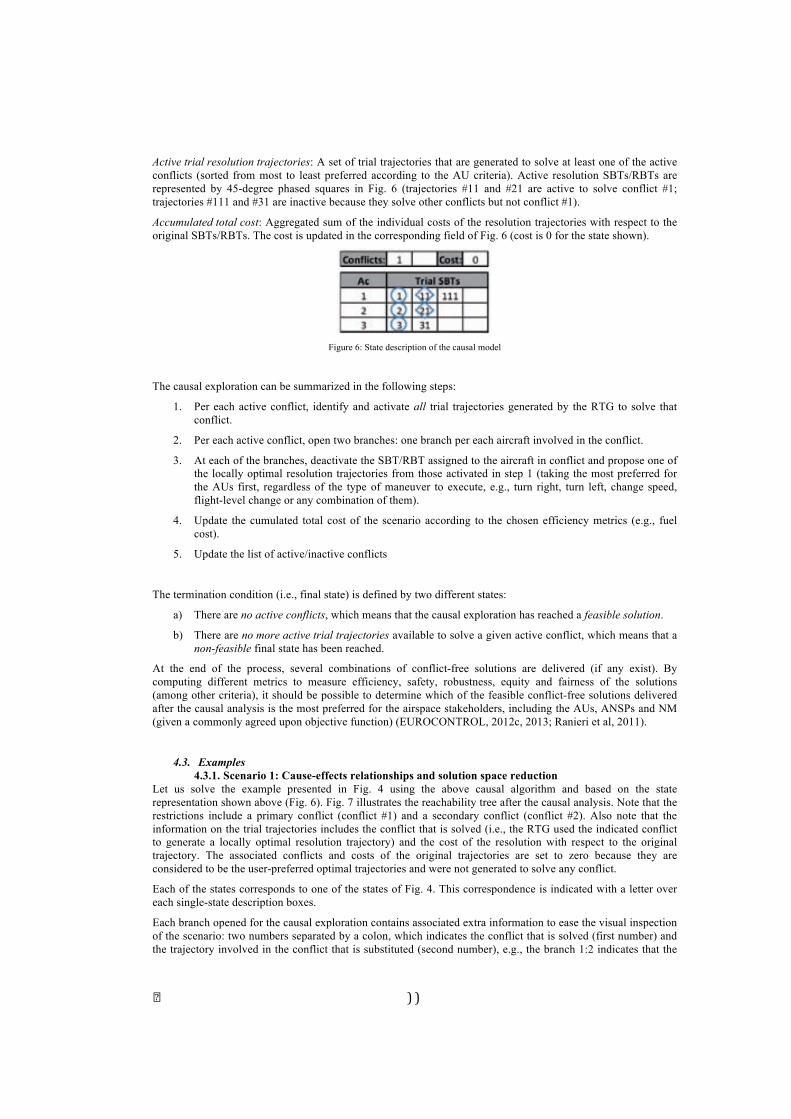
� $ $ �
Active trial resolution trajectories: A set of trial trajectories that are generated to solve at least one of the active conflicts (sorted from most to least preferred according to the AU criteria). Active resolution SBTs/RBTs are represented by 45-degree phased squares in Fig. 6 (trajectories #11 and #21 are active to solve conflict #1; trajectories #111 and #31 are inactive because they solve other conflicts but not conflict #1).
Accumulated total cost: Aggregated sum of the individual costs of the resolution trajectories with respect to the original SBTs/RBTs. The cost is updated in the corresponding field of Fig. 6 (cost is 0 for the state shown).
Figure 6: State description of the causal model
The causal exploration can be summarized in the following steps:
1. Per each active conflict, identify and activate all trial trajectories generated by the RTG to solve that conflict.
2. Per each active conflict, open two branches: one branch per each aircraft involved in the conflict.
3. At each of the branches, deactivate the SBT/RBT assigned to the aircraft in conflict and propose one of the locally optimal resolution trajectories from those activated in step 1 (taking the most preferred for the AUs first, regardless of the type of maneuver to execute, e.g., turn right, turn left, change speed, flight-level change or any combination of them).
4. Update the cumulated total cost of the scenario according to the chosen efficiency metrics (e.g., fuel cost).
5. Update the list of active/inactive conflicts
The termination condition (i.e., final state) is defined by two different states:
a) There are no active conflicts, which means that the causal exploration has reached a feasible solution.
b) There are no more active trial trajectories available to solve a given active conflict, which means that a non-feasible final state has been reached.
At the end of the process, several combinations of conflict-free solutions are delivered (if any exist). By computing different metrics to measure efficiency, safety, robustness, equity and fairness of the solutions (among other criteria), it should be possible to determine which of the feasible conflict-free solutions delivered after the causal analysis is the most preferred for the airspace stakeholders, including the AUs, ANSPs and NM (given a commonly agreed upon objective function) (EUROCONTROL, 2012c, 2013; Ranieri et al, 2011).
4.3. Examples 4.3.1. Scenario 1: Cause-effects relationships and solution space reduction
Let us solve the example presented in Fig. 4 using the above causal algorithm and based on the state representation shown above (Fig. 6). Fig. 7 illustrates the reachability tree after the causal analysis. Note that the restrictions include a primary conflict (conflict #1) and a secondary conflict (conflict #2). Also note that the information on the trial trajectories includes the conflict that is solved (i.e., the RTG used the indicated conflict to generate a locally optimal resolution trajectory) and the cost of the resolution with respect to the original trajectory. The associated conflicts and costs of the original trajectories are set to zero because they are considered to be the user-preferred optimal trajectories and were not generated to solve any conflict.
Each of the states corresponds to one of the states of Fig. 4. This correspondence is indicated with a letter over each single-state description boxes.
Each branch opened for the causal exploration contains associated extra information to ease the visual inspection of the scenario: two numbers separated by a colon, which indicates the conflict that is solved (first number) and the trajectory involved in the conflict that is substituted (second number), e.g., the branch 1:2 indicates that the
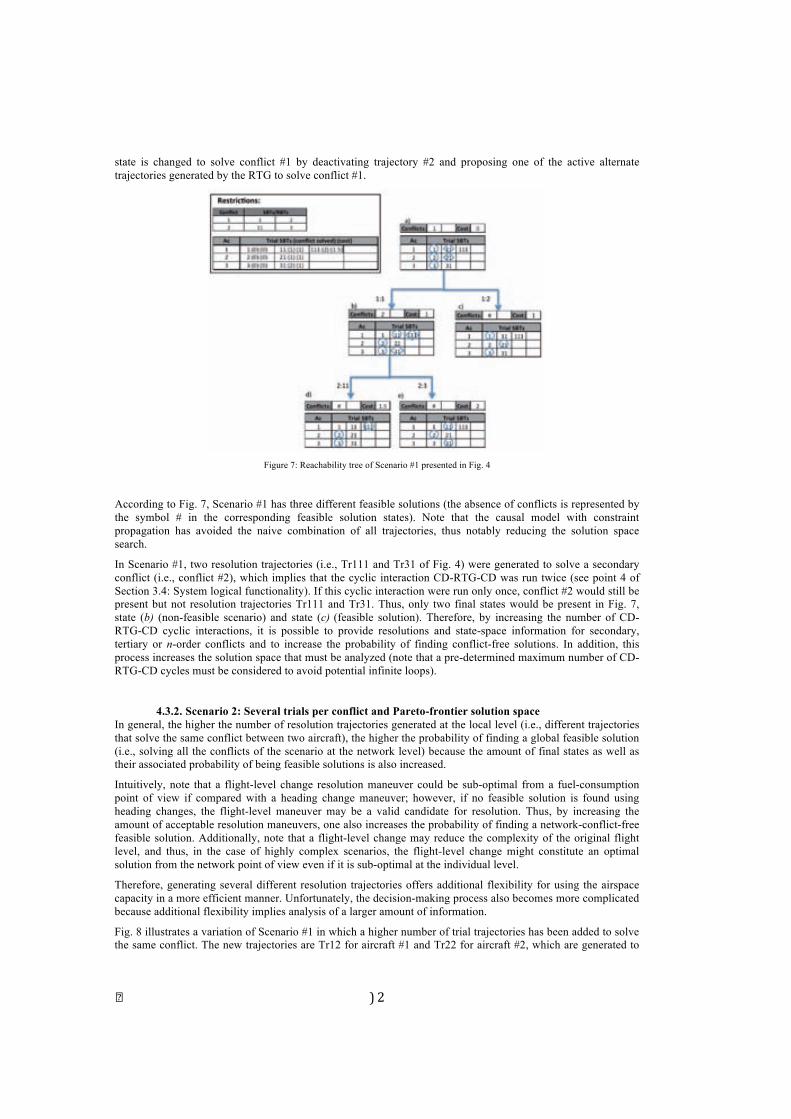
� $ %�
state is changed to solve conflict #1 by deactivating trajectory #2 and proposing one of the active alternate trajectories generated by the RTG to solve conflict #1.
Figure 7: Reachability tree of Scenario #1 presented in Fig. 4
According to Fig. 7, Scenario #1 has three different feasible solutions (the absence of conflicts is represented by the symbol # in the corresponding feasible solution states). Note that the causal model with constraint propagation has avoided the naive combination of all trajectories, thus notably reducing the solution space search.
In Scenario #1, two resolution trajectories (i.e., Tr111 and Tr31 of Fig. 4) were generated to solve a secondary conflict (i.e., conflict #2), which implies that the cyclic interaction CD-RTG-CD was run twice (see point 4 of Section 3.4: System logical functionality). If this cyclic interaction were run only once, conflict #2 would still be present but not resolution trajectories Tr111 and Tr31. Thus, only two final states would be present in Fig. 7, state (b) (non-feasible scenario) and state (c) (feasible solution). Therefore, by increasing the number of CD-RTG-CD cyclic interactions, it is possible to provide resolutions and state-space information for secondary, tertiary or n-order conflicts and to increase the probability of finding conflict-free solutions. In addition, this process increases the solution space that must be analyzed (note that a pre-determined maximum number of CD-RTG-CD cycles must be considered to avoid potential infinite loops).
4.3.2. Scenario 2: Several trials per conflict and Pareto-frontier solution space In general, the higher the number of resolution trajectories generated at the local level (i.e., different trajectories that solve the same conflict between two aircraft), the higher the probability of finding a global feasible solution (i.e., solving all the conflicts of the scenario at the network level) because the amount of final states as well as their associated probability of being feasible solutions is also increased.
Intuitively, note that a flight-level change resolution maneuver could be sub-optimal from a fuel-consumption point of view if compared with a heading change maneuver; however, if no feasible solution is found using heading changes, the flight-level maneuver may be a valid candidate for resolution. Thus, by increasing the amount of acceptable resolution maneuvers, one also increases the probability of finding a network-conflict-free feasible solution. Additionally, note that a flight-level change may reduce the complexity of the original flight level, and thus, in the case of highly complex scenarios, the flight-level change might constitute an optimal solution from the network point of view even if it is sub-optimal at the individual level.
Therefore, generating several different resolution trajectories offers additional flexibility for using the airspace capacity in a more efficient manner. Unfortunately, the decision-making process also becomes more complicated because additional flexibility implies analysis of a larger amount of information.
Fig. 8 illustrates a variation of Scenario #1 in which a higher number of trial trajectories has been added to solve the same conflict. The new trajectories are Tr12 for aircraft #1 and Tr22 for aircraft #2, which are generated to
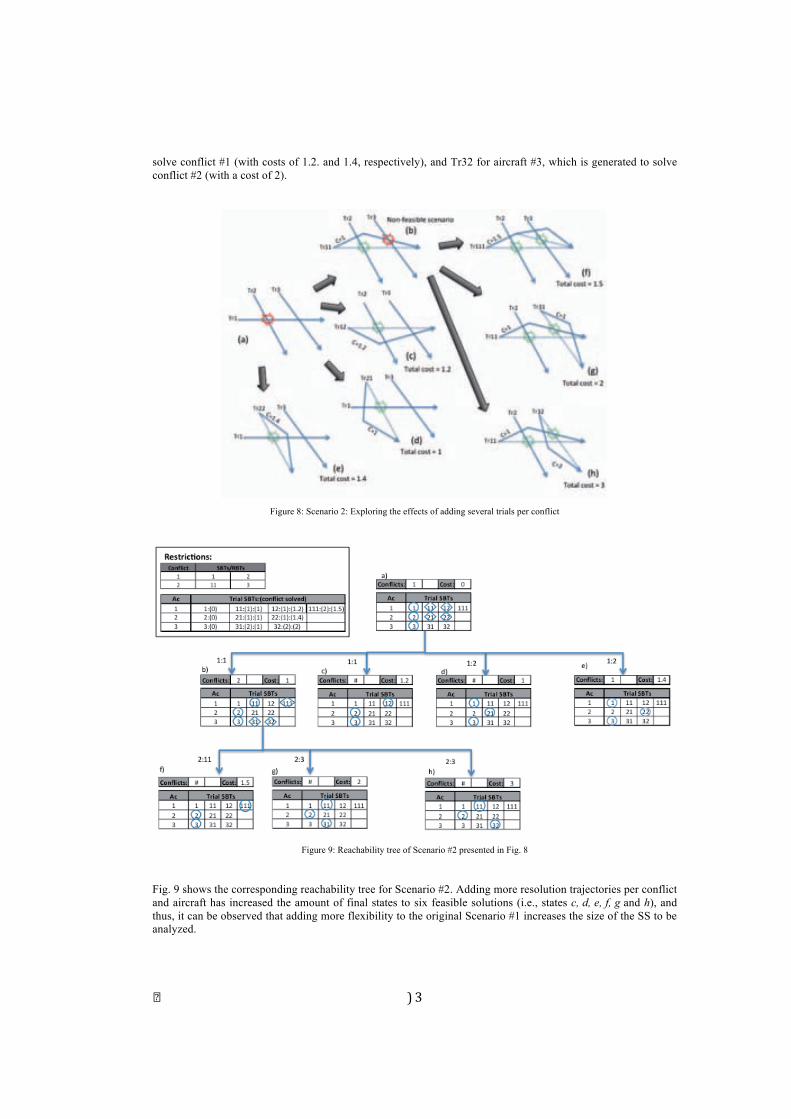
� $ &�
solve conflict #1 (with costs of 1.2. and 1.4, respectively), and Tr32 for aircraft #3, which is generated to solve conflict #2 (with a cost of 2).
Figure 8: Scenario 2: Exploring the effects of adding several trials per conflict
Figure 9: Reachability tree of Scenario #2 presented in Fig. 8
Fig. 9 shows the corresponding reachability tree for Scenario #2. Adding more resolution trajectories per conflict and aircraft has increased the amount of final states to six feasible solutions (i.e., states c, d, e, f, g and h), and thus, it can be observed that adding more flexibility to the original Scenario #1 increases the size of the SS to be analyzed.
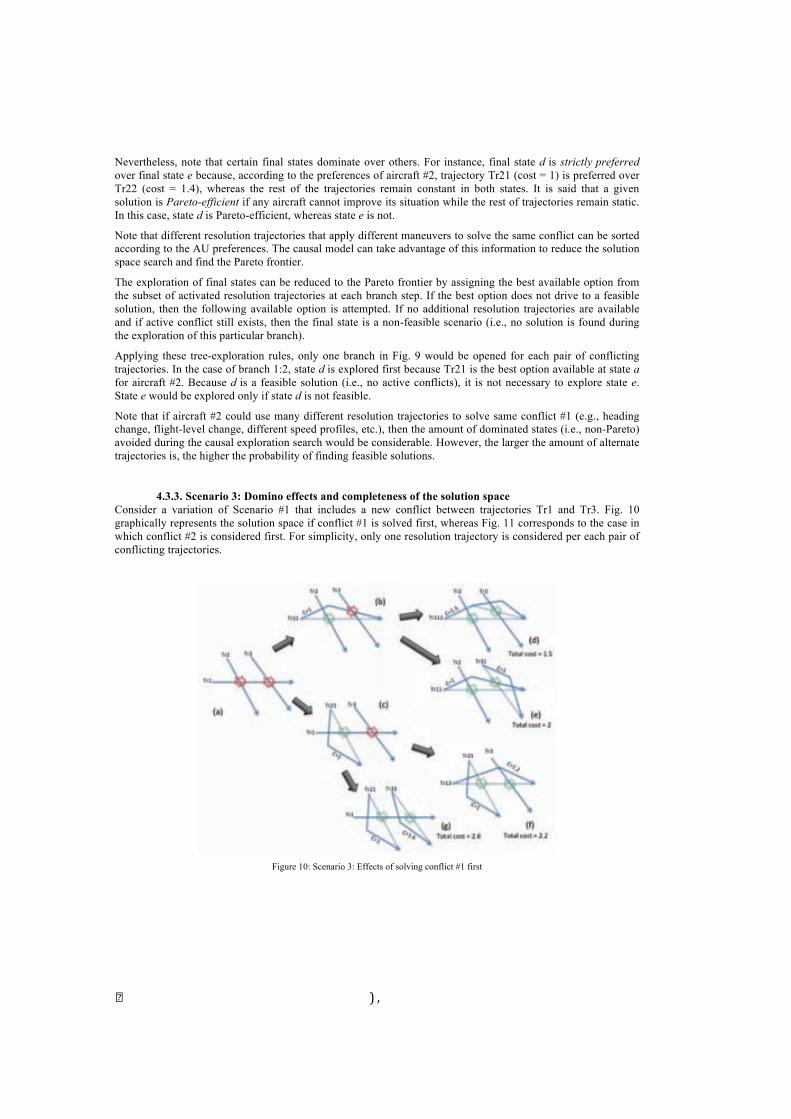
� $ ' �
Nevertheless, note that certain final states dominate over others. For instance, final state d is strictly preferred over final state e because, according to the preferences of aircraft #2, trajectory Tr21 (cost = 1) is preferred over Tr22 (cost = 1.4), whereas the rest of the trajectories remain constant in both states. It is said that a given solution is Pareto-efficient if any aircraft cannot improve its situation while the rest of trajectories remain static. In this case, state d is Pareto-efficient, whereas state e is not.
Note that different resolution trajectories that apply different maneuvers to solve the same conflict can be sorted according to the AU preferences. The causal model can take advantage of this information to reduce the solution space search and find the Pareto frontier.
The exploration of final states can be reduced to the Pareto frontier by assigning the best available option from the subset of activated resolution trajectories at each branch step. If the best option does not drive to a feasible solution, then the following available option is attempted. If no additional resolution trajectories are available and if active conflict still exists, then the final state is a non-feasible scenario (i.e., no solution is found during the exploration of this particular branch).
Applying these tree-exploration rules, only one branch in Fig. 9 would be opened for each pair of conflicting trajectories. In the case of branch 1:2, state d is explored first because Tr21 is the best option available at state a for aircraft #2. Because d is a feasible solution (i.e., no active conflicts), it is not necessary to explore state e. State e would be explored only if state d is not feasible.
Note that if aircraft #2 could use many different resolution trajectories to solve same conflict #1 (e.g., heading change, flight-level change, different speed profiles, etc.), then the amount of dominated states (i.e., non-Pareto) avoided during the causal exploration search would be considerable. However, the larger the amount of alternate trajectories is, the higher the probability of finding feasible solutions.
4.3.3. Scenario 3: Domino effects and completeness of the solution space Consider a variation of Scenario #1 that includes a new conflict between trajectories Tr1 and Tr3. Fig. 10 graphically represents the solution space if conflict #1 is solved first, whereas Fig. 11 corresponds to the case in which conflict #2 is considered first. For simplicity, only one resolution trajectory is considered per each pair of conflicting trajectories.
Figure 10: Scenario 3: Effects of solving conflict #1 first
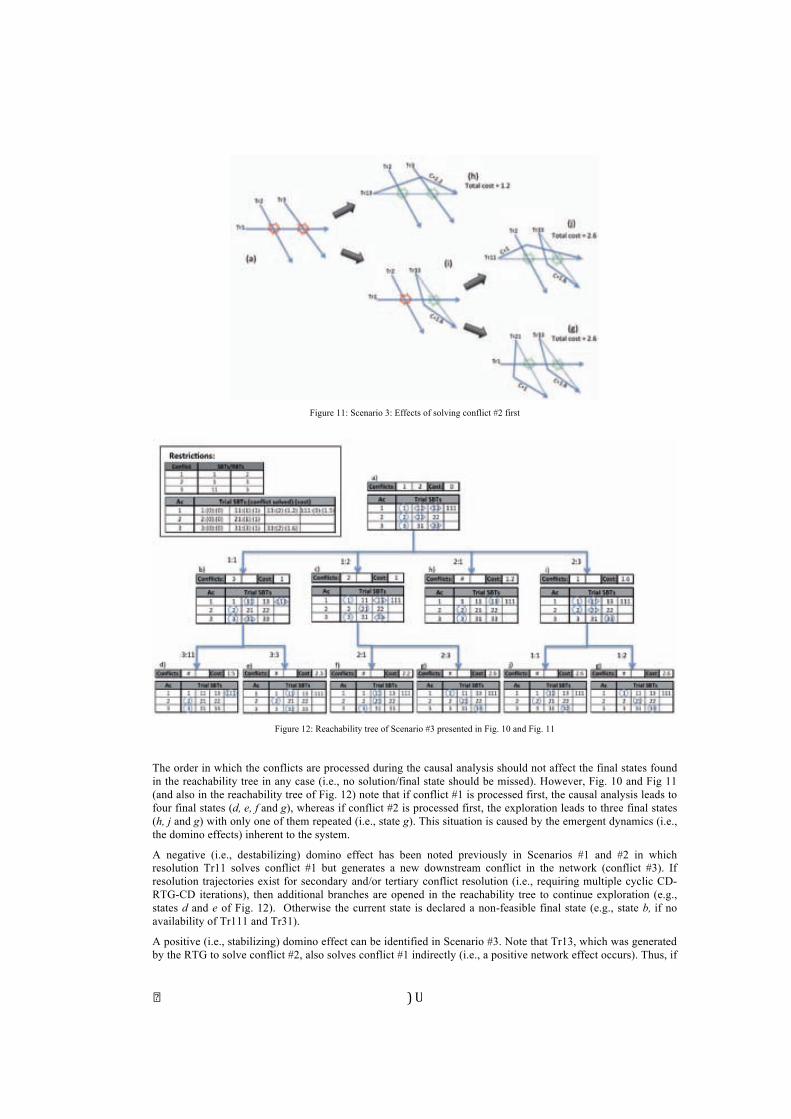
� $ (�
Figure 11: Scenario 3: Effects of solving conflict #2 first
Figure 12: Reachability tree of Scenario #3 presented in Fig. 10 and Fig. 11
The order in which the conflicts are processed during the causal analysis should not affect the final states found in the reachability tree in any case (i.e., no solution/final state should be missed). However, Fig. 10 and Fig 11 (and also in the reachability tree of Fig. 12) note that if conflict #1 is processed first, the causal analysis leads to four final states (d, e, f and g), whereas if conflict #2 is processed first, the exploration leads to three final states (h, j and g) with only one of them repeated (i.e., state g). This situation is caused by the emergent dynamics (i.e., the domino effects) inherent to the system.
A negative (i.e., destabilizing) domino effect has been noted previously in Scenarios #1 and #2 in which resolution Tr11 solves conflict #1 but generates a new downstream conflict in the network (conflict #3). If resolution trajectories exist for secondary and/or tertiary conflict resolution (i.e., requiring multiple cyclic CD-RTG-CD iterations), then additional branches are opened in the reachability tree to continue exploration (e.g., states d and e of Fig. 12). Otherwise the current state is declared a non-feasible final state (e.g., state b, if no availability of Tr111 and Tr31).
A positive (i.e., stabilizing) domino effect can be identified in Scenario #3. Note that Tr13, which was generated by the RTG to solve conflict #2, also solves conflict #1 indirectly (i.e., a positive network effect occurs). Thus, if
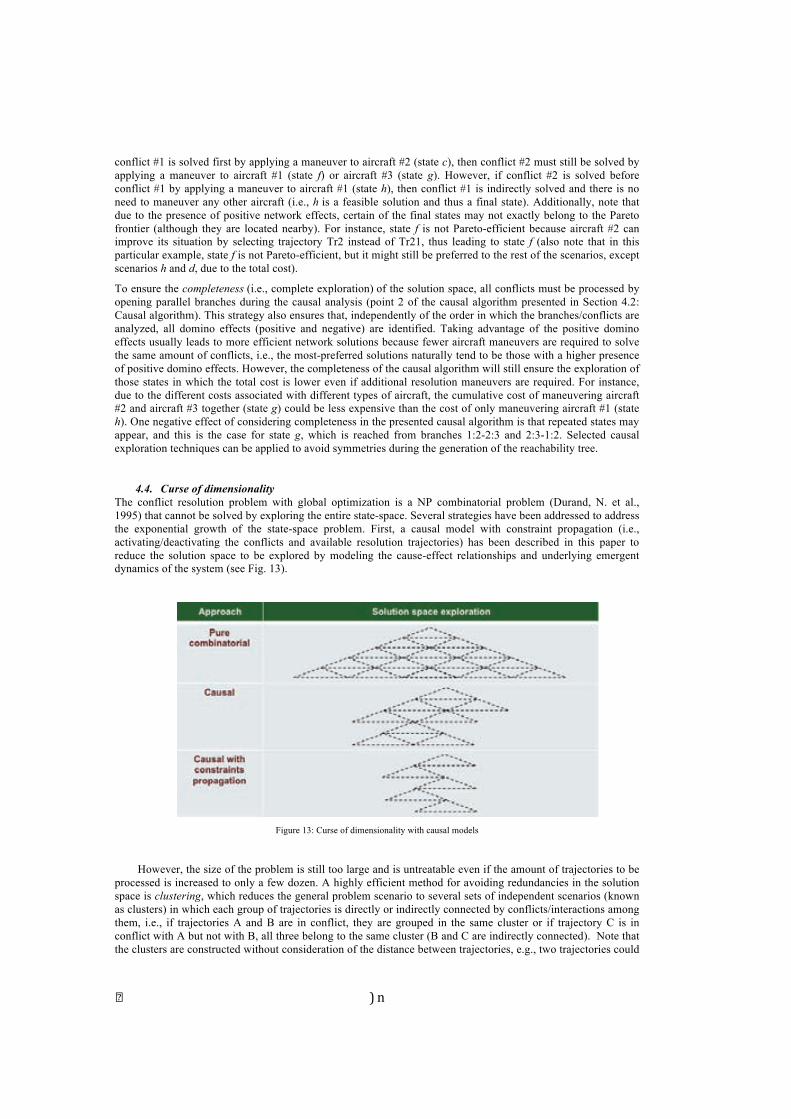
� $ )�
conflict #1 is solved first by applying a maneuver to aircraft #2 (state c), then conflict #2 must still be solved by applying a maneuver to aircraft #1 (state f) or aircraft #3 (state g). However, if conflict #2 is solved before conflict #1 by applying a maneuver to aircraft #1 (state h), then conflict #1 is indirectly solved and there is no need to maneuver any other aircraft (i.e., h is a feasible solution and thus a final state). Additionally, note that due to the presence of positive network effects, certain of the final states may not exactly belong to the Pareto frontier (although they are located nearby). For instance, state f is not Pareto-efficient because aircraft #2 can improve its situation by selecting trajectory Tr2 instead of Tr21, thus leading to state f (also note that in this particular example, state f is not Pareto-efficient, but it might still be preferred to the rest of the scenarios, except scenarios h and d, due to the total cost).
To ensure the completeness (i.e., complete exploration) of the solution space, all conflicts must be processed by opening parallel branches during the causal analysis (point 2 of the causal algorithm presented in Section 4.2: Causal algorithm). This strategy also ensures that, independently of the order in which the branches/conflicts are analyzed, all domino effects (positive and negative) are identified. Taking advantage of the positive domino effects usually leads to more efficient network solutions because fewer aircraft maneuvers are required to solve the same amount of conflicts, i.e., the most-preferred solutions naturally tend to be those with a higher presence of positive domino effects. However, the completeness of the causal algorithm will still ensure the exploration of those states in which the total cost is lower even if additional resolution maneuvers are required. For instance, due to the different costs associated with different types of aircraft, the cumulative cost of maneuvering aircraft #2 and aircraft #3 together (state g) could be less expensive than the cost of only maneuvering aircraft #1 (state h). One negative effect of considering completeness in the presented causal algorithm is that repeated states may appear, and this is the case for state g, which is reached from branches 1:2-2:3 and 2:3-1:2. Selected causal exploration techniques can be applied to avoid symmetries during the generation of the reachability tree.
4.4. Curse of dimensionality The conflict resolution problem with global optimization is a NP combinatorial problem (Durand, N. et al., 1995) that cannot be solved by exploring the entire state-space. Several strategies have been addressed to address the exponential growth of the state-space problem. First, a causal model with constraint propagation (i.e., activating/deactivating the conflicts and available resolution trajectories) has been described in this paper to reduce the solution space to be explored by modeling the cause-effect relationships and underlying emergent dynamics of the system (see Fig. 13).
Figure 13: Curse of dimensionality with causal models
However, the size of the problem is still too large and is untreatable even if the amount of trajectories to be processed is increased to only a few dozen. A highly efficient method for avoiding redundancies in the solution space is clustering, which reduces the general problem scenario to several sets of independent scenarios (known as clusters) in which each group of trajectories is directly or indirectly connected by conflicts/interactions among them, i.e., if trajectories A and B are in conflict, they are grouped in the same cluster or if trajectory C is in conflict with A but not with B, all three belong to the same cluster (B and C are indirectly connected). Note that the clusters are constructed without consideration of the distance between trajectories, e.g., two trajectories could
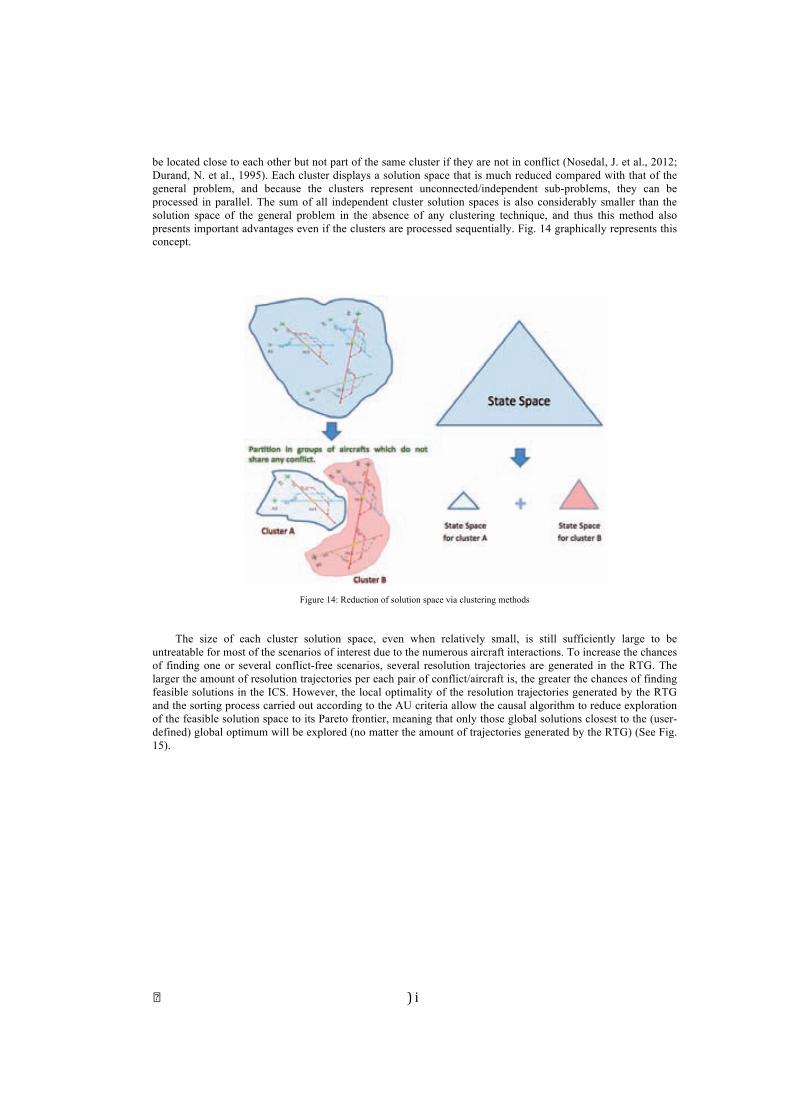
� $ * �
be located close to each other but not part of the same cluster if they are not in conflict (Nosedal, J. et al., 2012; Durand, N. et al., 1995). Each cluster displays a solution space that is much reduced compared with that of the general problem, and because the clusters represent unconnected/independent sub-problems, they can be processed in parallel. The sum of all independent cluster solution spaces is also considerably smaller than the solution space of the general problem in the absence of any clustering technique, and thus this method also presents important advantages even if the clusters are processed sequentially. Fig. 14 graphically represents this concept.
Figure 14: Reduction of solution space via clustering methods
The size of each cluster solution space, even when relatively small, is still sufficiently large to be untreatable for most of the scenarios of interest due to the numerous aircraft interactions. To increase the chances of finding one or several conflict-free scenarios, several resolution trajectories are generated in the RTG. The larger the amount of resolution trajectories per each pair of conflict/aircraft is, the greater the chances of finding feasible solutions in the ICS. However, the local optimality of the resolution trajectories generated by the RTG and the sorting process carried out according to the AU criteria allow the causal algorithm to reduce exploration of the feasible solution space to its Pareto frontier, meaning that only those global solutions closest to the (user-defined) global optimum will be explored (no matter the amount of trajectories generated by the RTG) (See Fig. 15).
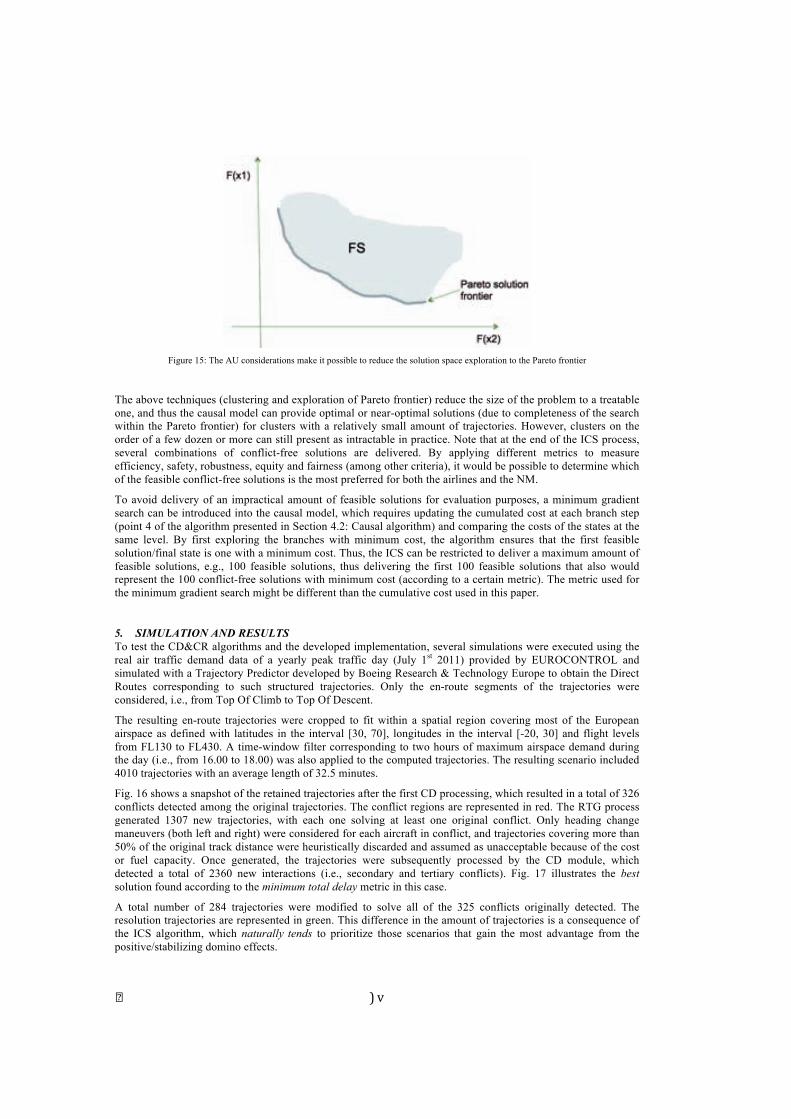
� $ +�
Figure 15: The AU considerations make it possible to reduce the solution space exploration to the Pareto frontier
The above techniques (clustering and exploration of Pareto frontier) reduce the size of the problem to a treatable one, and thus the causal model can provide optimal or near-optimal solutions (due to completeness of the search within the Pareto frontier) for clusters with a relatively small amount of trajectories. However, clusters on the order of a few dozen or more can still present as intractable in practice. Note that at the end of the ICS process, several combinations of conflict-free solutions are delivered. By applying different metrics to measure efficiency, safety, robustness, equity and fairness (among other criteria), it would be possible to determine which of the feasible conflict-free solutions is the most preferred for both the airlines and the NM.
To avoid delivery of an impractical amount of feasible solutions for evaluation purposes, a minimum gradient search can be introduced into the causal model, which requires updating the cumulated cost at each branch step (point 4 of the algorithm presented in Section 4.2: Causal algorithm) and comparing the costs of the states at the same level. By first exploring the branches with minimum cost, the algorithm ensures that the first feasible solution/final state is one with a minimum cost. Thus, the ICS can be restricted to deliver a maximum amount of feasible solutions, e.g., 100 feasible solutions, thus delivering the first 100 feasible solutions that also would represent the 100 conflict-free solutions with minimum cost (according to a certain metric). The metric used for the minimum gradient search might be different than the cumulative cost used in this paper.
5. SIMULATION AND RESULTS To test the CD&CR algorithms and the developed implementation, several simulations were executed using the real air traffic demand data of a yearly peak traffic day (July 1st 2011) provided by EUROCONTROL and simulated with a Trajectory Predictor developed by Boeing Research & Technology Europe to obtain the Direct Routes corresponding to such structured trajectories. Only the en-route segments of the trajectories were considered, i.e., from Top Of Climb to Top Of Descent.
The resulting en-route trajectories were cropped to fit within a spatial region covering most of the European airspace as defined with latitudes in the interval [30, 70], longitudes in the interval [-20, 30] and flight levels from FL130 to FL430. A time-window filter corresponding to two hours of maximum airspace demand during the day (i.e., from 16.00 to 18.00) was also applied to the computed trajectories. The resulting scenario included 4010 trajectories with an average length of 32.5 minutes.
Fig. 16 shows a snapshot of the retained trajectories after the first CD processing, which resulted in a total of 326 conflicts detected among the original trajectories. The conflict regions are represented in red. The RTG process generated 1307 new trajectories, with each one solving at least one original conflict. Only heading change maneuvers (both left and right) were considered for each aircraft in conflict, and trajectories covering more than 50% of the original track distance were heuristically discarded and assumed as unacceptable because of the cost or fuel capacity. Once generated, the trajectories were subsequently processed by the CD module, which detected a total of 2360 new interactions (i.e., secondary and tertiary conflicts). Fig. 17 illustrates the best solution found according to the minimum total delay metric in this case.
A total number of 284 trajectories were modified to solve all of the 325 conflicts originally detected. The resolution trajectories are represented in green. This difference in the amount of trajectories is a consequence of the ICS algorithm, which naturally tends to prioritize those scenarios that gain the most advantage from the positive/stabilizing domino effects.
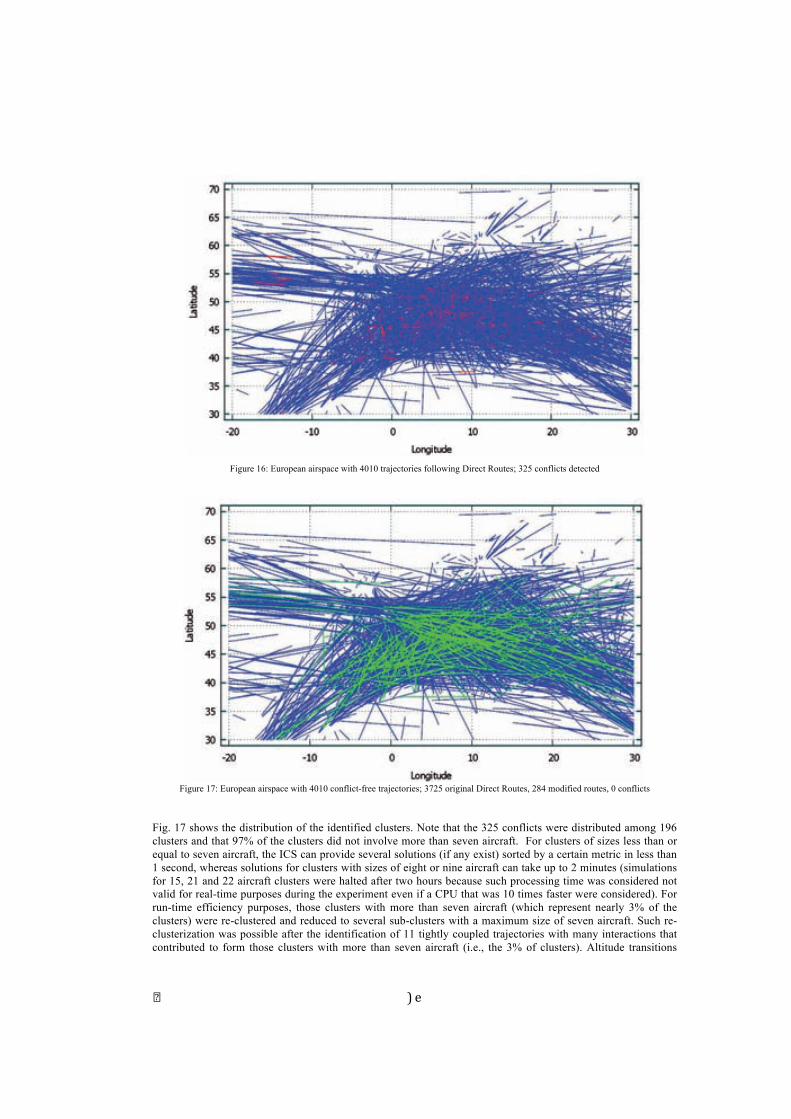
� $ , �
Figure 16: European airspace with 4010 trajectories following Direct Routes; 325 conflicts detected
Figure 17: European airspace with 4010 conflict-free trajectories; 3725 original Direct Routes, 284 modified routes, 0 conflicts
Fig. 17 shows the distribution of the identified clusters. Note that the 325 conflicts were distributed among 196 clusters and that 97% of the clusters did not involve more than seven aircraft. For clusters of sizes less than or equal to seven aircraft, the ICS can provide several solutions (if any exist) sorted by a certain metric in less than 1 second, whereas solutions for clusters with sizes of eight or nine aircraft can take up to 2 minutes (simulations for 15, 21 and 22 aircraft clusters were halted after two hours because such processing time was considered not valid for real-time purposes during the experiment even if a CPU that was 10 times faster were considered). For run-time efficiency purposes, those clusters with more than seven aircraft (which represent nearly 3% of the clusters) were re-clustered and reduced to several sub-clusters with a maximum size of seven aircraft. Such re-clusterization was possible after the identification of 11 tightly coupled trajectories with many interactions that contributed to form those clusters with more than seven aircraft (i.e., the 3% of clusters). Altitude transitions
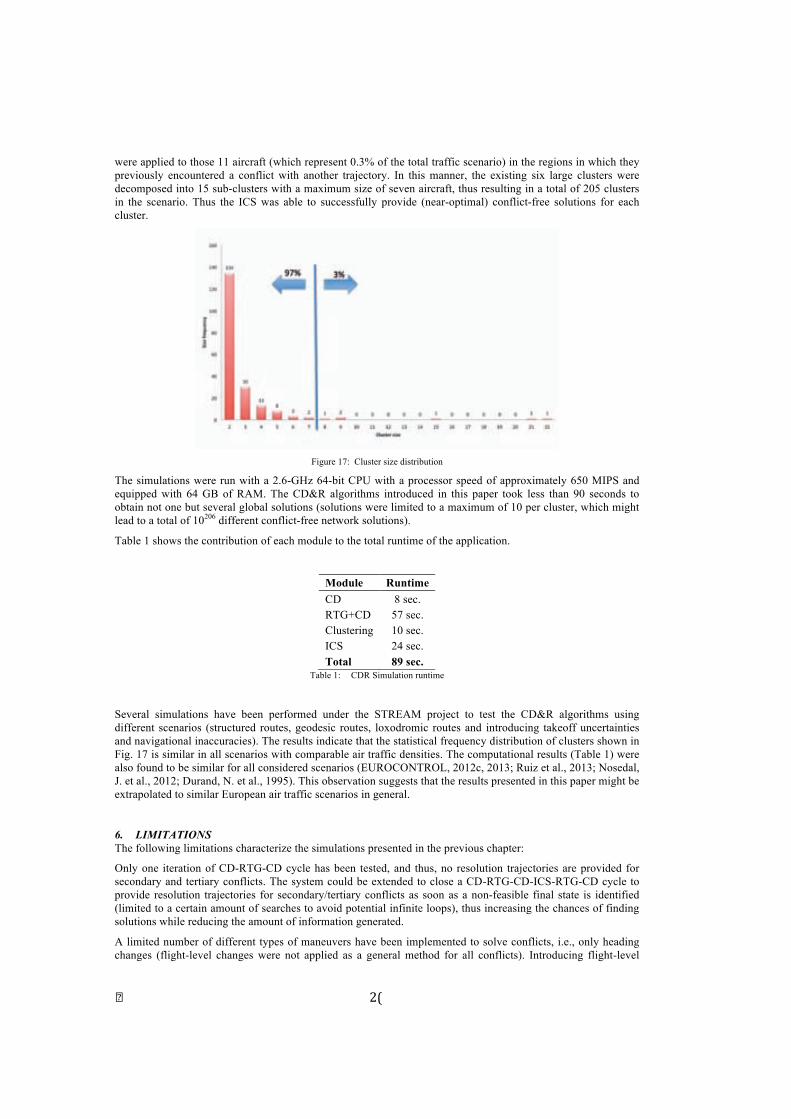
� %# �
were applied to those 11 aircraft (which represent 0.3% of the total traffic scenario) in the regions in which they previously encountered a conflict with another trajectory. In this manner, the existing six large clusters were decomposed into 15 sub-clusters with a maximum size of seven aircraft, thus resulting in a total of 205 clusters in the scenario. Thus the ICS was able to successfully provide (near-optimal) conflict-free solutions for each cluster.
Figure 17: Cluster size distribution
The simulations were run with a 2.6-GHz 64-bit CPU with a processor speed of approximately 650 MIPS and equipped with 64 GB of RAM. The CD&R algorithms introduced in this paper took less than 90 seconds to obtain not one but several global solutions (solutions were limited to a maximum of 10 per cluster, which might lead to a total of 10206 different conflict-free network solutions).
Table 1 shows the contribution of each module to the total runtime of the application.
Module Runtime CD 8 sec. RTG+CD 57 sec. Clustering 10 sec. ICS 24 sec. Total 89 sec.
Table 1: CDR Simulation runtime
Several simulations have been performed under the STREAM project to test the CD&R algorithms using different scenarios (structured routes, geodesic routes, loxodromic routes and introducing takeoff uncertainties and navigational inaccuracies). The results indicate that the statistical frequency distribution of clusters shown in Fig. 17 is similar in all scenarios with comparable air traffic densities. The computational results (Table 1) were also found to be similar for all considered scenarios (EUROCONTROL, 2012c, 2013; Ruiz et al., 2013; Nosedal, J. et al., 2012; Durand, N. et al., 1995). This observation suggests that the results presented in this paper might be extrapolated to similar European air traffic scenarios in general.
6. LIMITATIONS The following limitations characterize the simulations presented in the previous chapter:
Only one iteration of CD-RTG-CD cycle has been tested, and thus, no resolution trajectories are provided for secondary and tertiary conflicts. The system could be extended to close a CD-RTG-CD-ICS-RTG-CD cycle to provide resolution trajectories for secondary/tertiary conflicts as soon as a non-feasible final state is identified (limited to a certain amount of searches to avoid potential infinite loops), thus increasing the chances of finding solutions while reducing the amount of information generated.
A limited number of different types of maneuvers have been implemented to solve conflicts, i.e., only heading changes (flight-level changes were not applied as a general method for all conflicts). Introducing flight-level
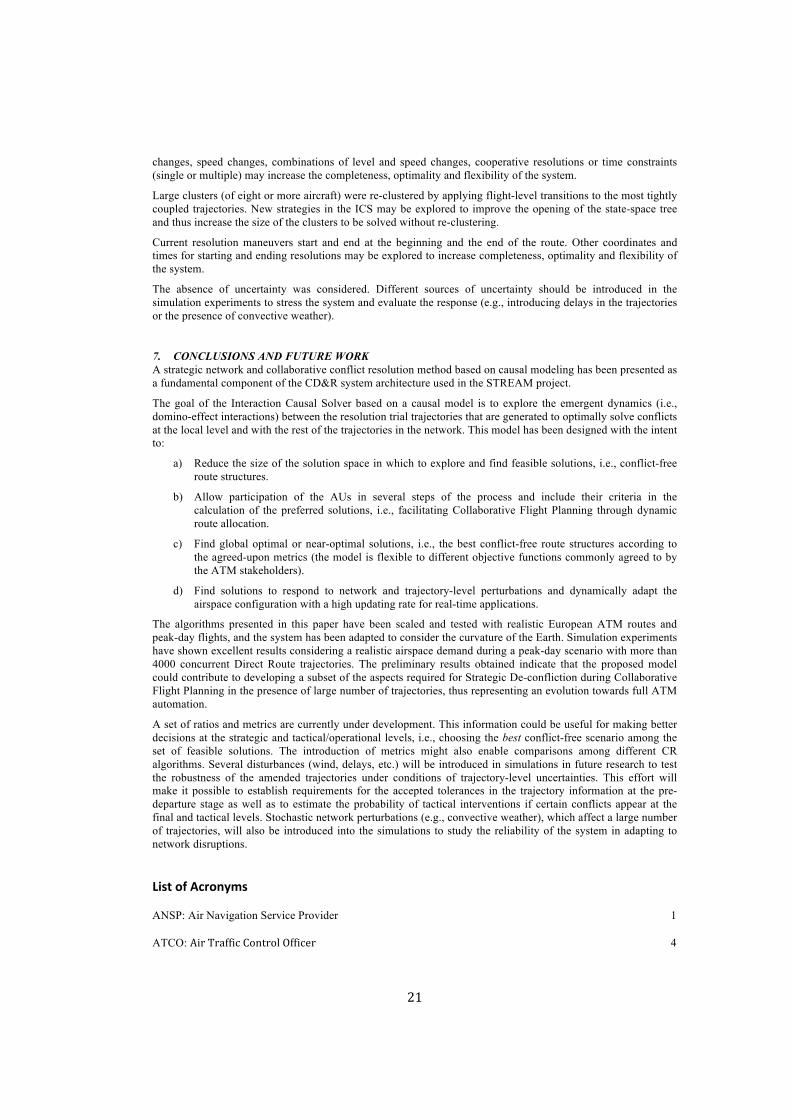
! %"!
changes, speed changes, combinations of level and speed changes, cooperative resolutions or time constraints (single or multiple) may increase the completeness, optimality and flexibility of the system.
Large clusters (of eight or more aircraft) were re-clustered by applying flight-level transitions to the most tightly coupled trajectories. New strategies in the ICS may be explored to improve the opening of the state-space tree and thus increase the size of the clusters to be solved without re-clustering.
Current resolution maneuvers start and end at the beginning and the end of the route. Other coordinates and times for starting and ending resolutions may be explored to increase completeness, optimality and flexibility of the system.
The absence of uncertainty was considered. Different sources of uncertainty should be introduced in the simulation experiments to stress the system and evaluate the response (e.g., introducing delays in the trajectories or the presence of convective weather).
7. CONCLUSIONS AND FUTURE WORK A strategic network and collaborative conflict resolution method based on causal modeling has been presented as a fundamental component of the CD&R system architecture used in the STREAM project.
The goal of the Interaction Causal Solver based on a causal model is to explore the emergent dynamics (i.e., domino-effect interactions) between the resolution trial trajectories that are generated to optimally solve conflicts at the local level and with the rest of the trajectories in the network. This model has been designed with the intent to:
a) Reduce the size of the solution space in which to explore and find feasible solutions, i.e., conflict-free route structures.
b) Allow participation of the AUs in several steps of the process and include their criteria in the calculation of the preferred solutions, i.e., facilitating Collaborative Flight Planning through dynamic route allocation.
c) Find global optimal or near-optimal solutions, i.e., the best conflict-free route structures according to the agreed-upon metrics (the model is flexible to different objective functions commonly agreed to by the ATM stakeholders).
d) Find solutions to respond to network and trajectory-level perturbations and dynamically adapt the airspace configuration with a high updating rate for real-time applications.
The algorithms presented in this paper have been scaled and tested with realistic European ATM routes and peak-day flights, and the system has been adapted to consider the curvature of the Earth. Simulation experiments have shown excellent results considering a realistic airspace demand during a peak-day scenario with more than 4000 concurrent Direct Route trajectories. The preliminary results obtained indicate that the proposed model could contribute to developing a subset of the aspects required for Strategic De-confliction during Collaborative Flight Planning in the presence of large number of trajectories, thus representing an evolution towards full ATM automation.
A set of ratios and metrics are currently under development. This information could be useful for making better decisions at the strategic and tactical/operational levels, i.e., choosing the best conflict-free scenario among the set of feasible solutions. The introduction of metrics might also enable comparisons among different CR algorithms. Several disturbances (wind, delays, etc.) will be introduced in simulations in future research to test the robustness of the amended trajectories under conditions of trajectory-level uncertainties. This effort will make it possible to establish requirements for the accepted tolerances in the trajectory information at the pre-departure stage as well as to estimate the probability of tactical interventions if certain conflicts appear at the final and tactical levels. Stochastic network perturbations (e.g., convective weather), which affect a large number of trajectories, will also be introduced into the simulations to study the reliability of the system in adapting to network disruptions.
!"#$%&'%()*&+,-#%!
ANSP: Air Navigation Service Provider 1
ATCO: 1*-!D-0EE*8!F4)/-49!GEE*8,- 4
! %%!
ATM: Air Traffic Management! "!
AUs: Airspace Users! "!
CD: Conflict Detection! %!
CD&R: Conflict Detection and Resolution 1
CPN: Colored Petri Net 3
CR: Conflict Resolution! %!
GOA: Geometric Optimization Approach 7
ICS: Interaction Causal Solver 5
NM: Network Manager 2
NOP: Network Operation Plan! "!
NP: Non-Polynomial! &
RBT: Reference Business Trajectory! &!
RTG: Resolution Trajectory Generator 5
SBT: Shared Business Trajectory! "!
SDS: Spatial Data Structure! >!
SESAR: Single European Sky ATM Research! "!
SS: State Space 2
STREAM: Strategic Trajectory de-confliction to Enable seamless Aircraft conflict Management 1
DH1I!D,-5*)09!H0),2+-*)J!1-,0! &!
!D4FI!D4<!4E!F9*5;! =!
D4KI!D4<!4E!K,.8,)/! =! ACKNOWLEDGMENT This work is partially funded by the Ministry of Economy and Competitiveness under the project “Fire Guided Unmanned Aircrafts and Resources Distribution (FireGUARD), CICYT Spanish program TIN2011-29494-C03-01. The STREAM project has been funded by EUROCONTROL acting on behalf of the SESAR Joint Undertaking with funds from the EUROPEAN UNION. The opinions expressed herein are those of the paper’s authors and do not represent the official position either of the SESAR Joint Undertaking or of EUROCONTROL.
REFERENCES
Bilimoria, K., Sridhar, B., Chatterji, G., Sheth, K., Grabbe, S., 2000. FACET: Future ATM Concepts Evaluation Tool. Presented at the 3rd USA/Europe Air Traffic Management R&D Seminar, Napoli, Italy.
! %&!
Bilimoria, K.D., 2000. A geometric optimization approach to aircraft conflict resolution. Presented at the AIAA Guidance, Navigation, and Control Conference and Exhibit.
Bilimoria, K.D. and Lee, H.Q, 2002. Aircraft conflict resolution with an arrival time constraint. Presented at the AIAA Guidance, Navigation, and Control Conference and Exhibit.
Craig W. Reynolds, 2000. Interaction with Groups of Autonomous Characters, in: Game Developers Conference 2000. Presented at the Game Developers Conference 2000, pp. 449–460.
Craig W. Reynolds, 2006. Big Fast Crowds on PS3, in: Sandbox Symposium. Presented at the Sandbox Symposium.
Durand, N., Alliot, J., and O. Chansou, 1995. Resolution of En Route Conflicts, Air Traffic Control Quarterly, Vol.3, No. 3, p.p 139-161.
EUROCONTROL, 2002. MTCD Algorithms Overview.
EUROCONTROL, 2007. FASTI Baseline Description.
EUROCONTROL, 2010a. Specification for Medium-Term Conflict Detection.
EUROCONTROL, 2010b. Performance Review Report. Assessment of the performance of the European Air Traffic management Systems for the calendar year 2010.
EUROCONTROL, 2012a. European Network Operations Plan 2012-2014.
EUROCONTROL, 2012b. European Route Network Improvement Plan. Part 3: Airspace Management Handbook.
EUROCONTROL, 2012c. STREAM Deliverable 2.2, Development of Advanced Algorithms.
EUROCONTROL, 2013. STREAM Deliverable 4.2, Final Performance Assessment.
Geser, A., Munoz, C., 2002. A geometric approach to strategic conflict detection and resolution, in: Proc. of Digital Avionics Systems Conference, 2002.
ICAO, 2007. Procedures for Air Navigation Services - Air Traffic Management, 15th ed. (Doc 4444).
Isaacson, D.R., Erzberger, H, 1997. Design of a conflict detection algorithm for the Center/TRACON automation system, in: Digital Avionics Systems Conference. Presented at the Digital Avionics Systems Conference, Irvine, CA.
J. H. Reif, M. Sharir, 1985. Motion planning in the presence of moving obstacles, in: In Proc. 26th Annu. IEEE Sympos. Found. Comput. Sci. Presented at the In Proc. 26th Annu. IEEE Sympos. Found. Comput. Sci., pp. pp. 144 –154.
J. Krozel, M. Peters, K. D. Bilimoria, C. Lee, J. S. B. Mitchell, 2001. System performance characteristics of centralized and decentralized air traffic separation strategies. Presented at the Fourth USA/Europe Air Traffic Management Research and Development Seminar.
James K. Kuchar, Lee C. Yang, 2000. A Review of Conflict Detection and Resolution Modeling Methods. IEEE Transactions on Intelligent Transportation Systems Vol.I, pp.179–189.
K. D. Bilimoria, K. S. Sheth, H. Q. Lee, S. R. Grabbe, 2000. Performance Evaluation of Aircraft Separation Assurance for Free Flight. Presented at the AIAA Guidance, Navigation and Control Conference.
K. Ogata, 1995. Discrete-Time Control Systems, 2nd Ed. ed. Prentice Hall.
Kopardekar., P., Bilimoria, K., and Sridhar, B., 2007. Initial Concepts for Dynamic Airspace Configuration. Presented at 7th AIAA Aviation Technology, Integration and Operations Conference (ATIO) 2007, Belfast, Northern Ireland.
M. Kupfer, T.Farley, Y. Chu, H. Erzberger, 2008. Automated Conflict Resolution - A simulation-based sensitivity study of airspace and demand, in: Proc. 26th International Congress of the Aeronautical Sciences (ICAS).
Mújica, A., Piera, M., 2011. A compact timed state space approach for the analysis of manufacturing systems: key algorithmic improvements. Int. J. Comput. Integ. Manuf. 24, 135–156.
Nodedal, J., Ruiz, S., Piera, M.A., Ranieri, A., Martinez, R., Corbacho, A., 2012. Causal Decision Support Tools for Strategic Trajectory De-confliction to Enable Seamless Aircraft Conflict Management (STREAM). Presented at the SESAR Innovation Days 2012, University of Braunschweig (Braunschweig, Germany).
! %=!
Ranieri, A., Martinez, R., Piera, M.A., Lopez, J., Vilaplana, M., 2011. Strategic Trajectory De-confliction to Enable Seamless Aircraft Conflict Management (WP-E project STREAM). Presented at the SESAR Innovation Days 2011, ENAC (Toulouse, France).
Ruiz, S. and Piera, M, 2013. Relational Time-Space Data Structure To Enable Strategic De-Confliction with a Global Scope in Presence of Large Number of 4D Trajectories. Journal of Aerospace Operations.
Ruiz, S., Piera, M., del Pozo, I., 2012a. A Medium Term Conflict Detection and Resolution system for Terminal Maneuvering Area based on Spatial Data Structures and 4D trajectories. Transport. Res. Part C, http://dx.doi.org/10.1016/j.trc.2012.10.005
Ruiz, S., Piera, M., Ran, A., 2012b. Computational Efficient Conflict Detection and Resolution through Spatial Data Structures, in: Proc. of International Conferences on Research in Air Transportation 2012 (ICRAT). Berkley, CA, USA.
Ruiz, S., Piera, M., Zúñiga, C., 2011. Relational Time-Space Data Structure To Speed Up Conflict Detection Under Heavy Traffic Conditions. Presented at the SESAR Innovation Days (SID) 2011 EUROCONTROL, ENAC (Toulouse).
SESAR Consortium, 2007. The ATM Target Concept - SESAR Definition Phase, Deliverable 3.
SESAR Consortium, 2008. The SESAR Master Plan - SESAR Definition Phase, Deliverable 5.
SESAR Consortium, 2012. European ATM Master Plan, Edition 2.
SESAR Consortium, 2013. SESAR Concept of Operations Step 2.
Yi-Jen Chiang, James T. Klosowski, Changkil Lee, 1997. Geometric Algorithms for Conflict Detection/Resolution in Air Traffic Management. Presented at the in 36th IEEE Conference on Decision and Control.
Zelinski, S., ans Jastrzebski, M., 2012. Defining Dynamic Route Structure for Airspace Configuration. Presented at ICAS 2012.
Zúñiga, C.A., Piera, M.A., Ruiz, S., del Pozo, I., 2010. A CD&CR causal model based on path shortening/path stretching techniques. Elsevier Transportation Research: part C.
!
Appendix A
Further Explanations about theCD&R System
A.1 Integration with SWIM
Some of the core ideas of STREAM concept have been presented in the 1st editionof the SESAR Master Class challenge as a proof-of-concept project named SafetySWIM Nets: http://www.sesarju.eu/programme/workpackages/swim/safety-swim-nets-11569.
This integration of STREAM CD&R and SWIM (see Fig. A.1) and the parti-cipation in the challenge has been useful to go a step forward in the materializa-tion of the STREAM concepts and also to obtain positive feedback from differentEUROCONTROL experts (including CFMU workers and engineers) that has beenused to consolidate and improve the proposed ideas.
The application that has been presented is a simplified version of the STREAMCD&R system (still under development at the moment of the challenge). The toolconsists on a front-end programmed in C# which enables an interactive GUI forthe human user and which en-suits the processes of communication with SWIMthrough SOAP protocols. See Fig. A.2.
The CD&R corpus of the system has been programmed in C++ to obtain themaximum computer efficiency in the deployment of the algorithms. Communic-ation between the front-end and the CD&R core is done through DLL integration.
As a proof-of-concept version of STREAM only the following SWIM inform-ation has been used:
Aerodrome: loaded at local level from the baseline files
231
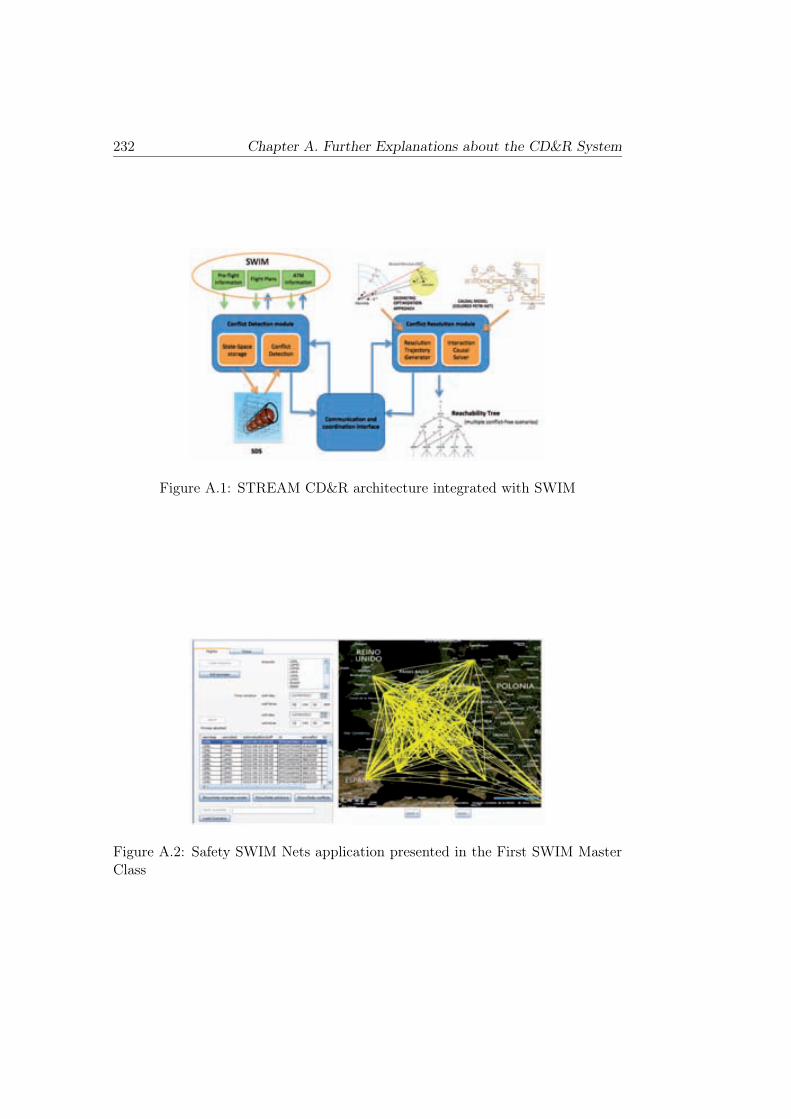
232 Chapter A. Further Explanations about the CD&R System
Figure A.1: STREAM CD&R architecture integrated with SWIM
Figure A.2: Safety SWIM Nets application presented in the First SWIM MasterClass
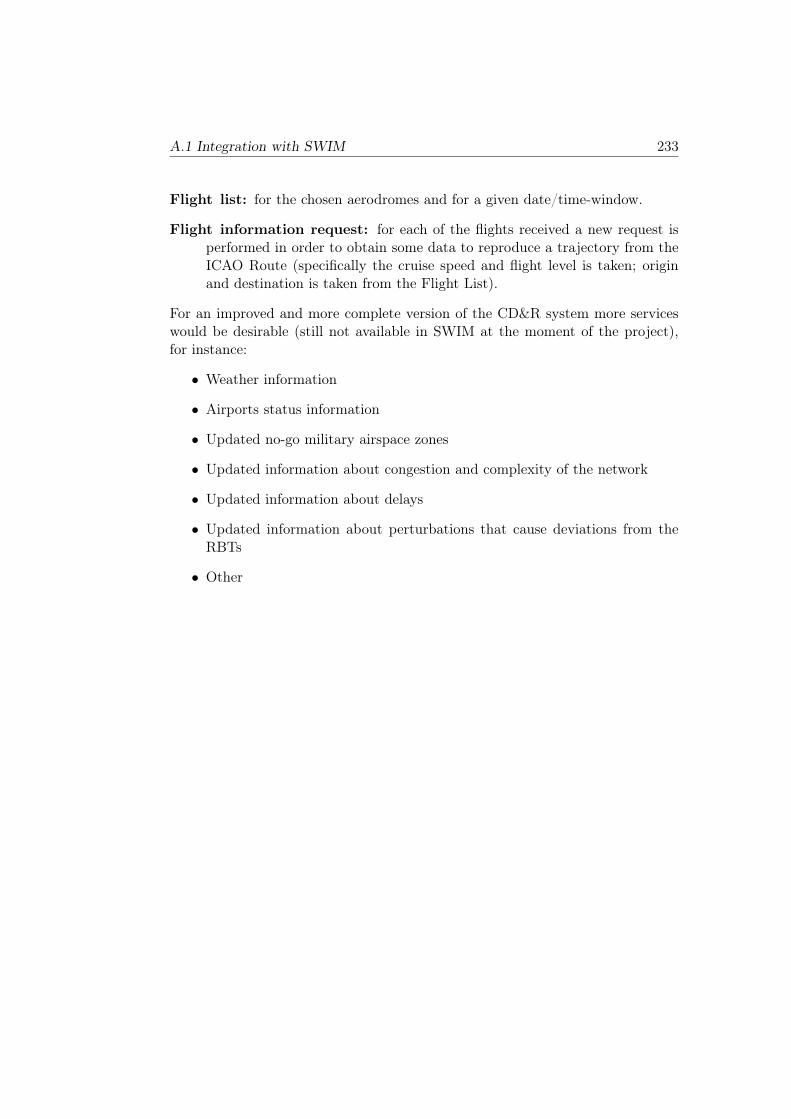
A.1 Integration with SWIM 233
Flight list: for the chosen aerodromes and for a given date/time-window.
Flight information request: for each of the flights received a new request isperformed in order to obtain some data to reproduce a trajectory from theICAO Route (specifically the cruise speed and flight level is taken; originand destination is taken from the Flight List).
For an improved and more complete version of the CD&R system more serviceswould be desirable (still not available in SWIM at the moment of the project),for instance:
• Weather information
• Airports status information
• Updated no-go military airspace zones
• Updated information about congestion and complexity of the network
• Updated information about delays
• Updated information about perturbations that cause deviations from theRBTs
• Other

234 Chapter A. Further Explanations about the CD&R System
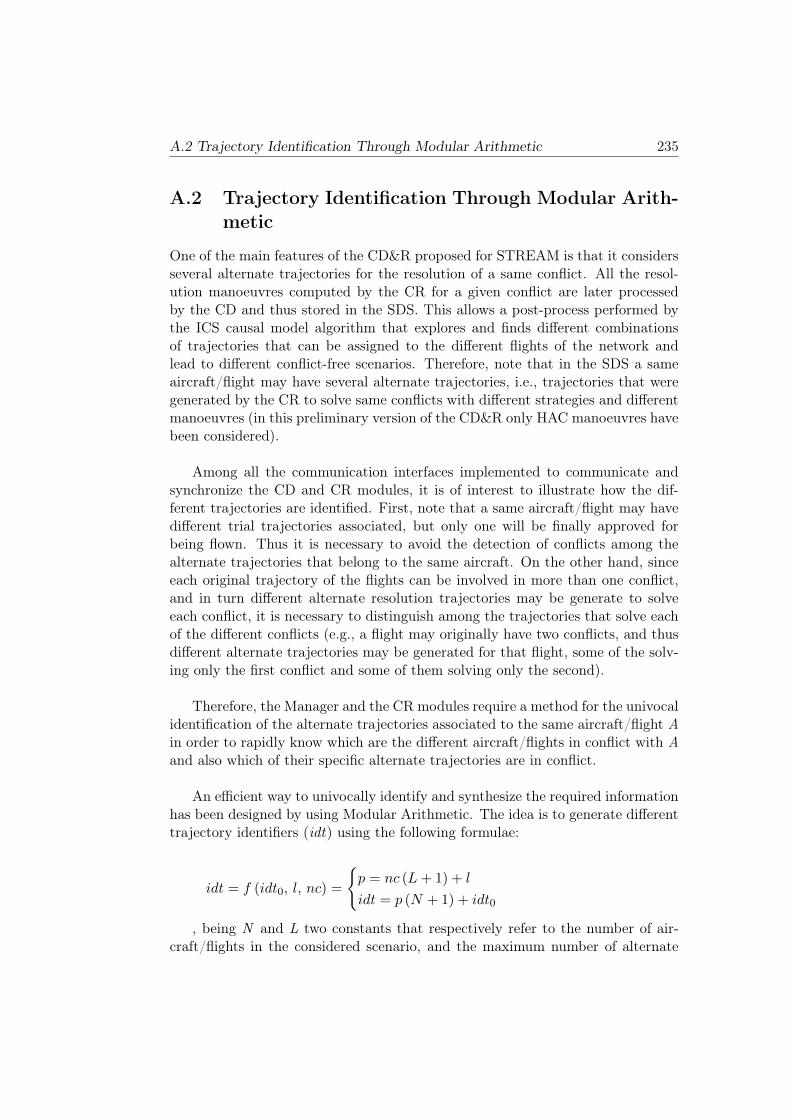
A.2 Trajectory Identification Through Modular Arithmetic 235
A.2 Trajectory Identification Through Modular Arith-
metic
One of the main features of the CD&R proposed for STREAM is that it considersseveral alternate trajectories for the resolution of a same conflict. All the resol-ution manoeuvres computed by the CR for a given conflict are later processedby the CD and thus stored in the SDS. This allows a post-process performed bythe ICS causal model algorithm that explores and finds different combinationsof trajectories that can be assigned to the different flights of the network andlead to different conflict-free scenarios. Therefore, note that in the SDS a sameaircraft/flight may have several alternate trajectories, i.e., trajectories that weregenerated by the CR to solve same conflicts with different strategies and differentmanoeuvres (in this preliminary version of the CD&R only HAC manoeuvres havebeen considered).
Among all the communication interfaces implemented to communicate andsynchronize the CD and CR modules, it is of interest to illustrate how the dif-ferent trajectories are identified. First, note that a same aircraft/flight may havedifferent trial trajectories associated, but only one will be finally approved forbeing flown. Thus it is necessary to avoid the detection of conflicts among thealternate trajectories that belong to the same aircraft. On the other hand, sinceeach original trajectory of the flights can be involved in more than one conflict,and in turn different alternate resolution trajectories may be generate to solveeach conflict, it is necessary to distinguish among the trajectories that solve eachof the different conflicts (e.g., a flight may originally have two conflicts, and thusdifferent alternate trajectories may be generated for that flight, some of the solv-ing only the first conflict and some of them solving only the second).
Therefore, the Manager and the CR modules require a method for the univocalidentification of the alternate trajectories associated to the same aircraft/flight Ain order to rapidly know which are the different aircraft/flights in conflict with Aand also which of their specific alternate trajectories are in conflict.
An efficient way to univocally identify and synthesize the required informationhas been designed by using Modular Arithmetic. The idea is to generate differenttrajectory identifiers (idt) using the following formulae:
idt = f (idt0, l, nc) =
�p = nc (L+ 1) + l
idt = p (N + 1) + idt0
, being N and L two constants that respectively refer to the number of air-craft/flights in the considered scenario, and the maximum number of alternate
236 Chapter A. Further Explanations about the CD&R System
Figure A.3: Example of a conflicted scenario to show the trajectory identificationalgorithm
trajectories that the CR can propose (it is parameterizable) to solve a singleconflict. The input of the function is formed by the aircraft/flight identifier(0 < idt0 ≤ N), the resolution manoeuvre identifier (0 ≤ l ≤ L), and the conflictidentifier nc (0 ≤ nc),.
As an example, consider N = 20 and L = 3. In the following Fig. A.3 theaircraft with idt0 = 9 is in conflict with aircraft idt0 = 5. Consider that onlytwo manoeuvres are proposed by CR to solve the conflict nc = 3. One of theresolution maneouvers is a left-turn (identified with l = 1) that generates a newtrajectory identified with idt = 219, and the other is a right-turn (identified withl = 2) that generates a new trajectory identified with idt = 240).
With the use of modular arithmetic to generate the trajectory identifiers, it ispossible for the CD to process the new trajectories #219 and #240 with no detec-tion of conflicts between the trajectories that belong to the same aircraft/flight.To know if two aircraft, idt1 and idt2, belong to the same aircraft the CD hasonly to check the following condition:
idt1mod (N + 1) = idt2mod(N + 1)
This way of generating idt’s is also useful for the Manager and CR modules tohave an efficient resolution manoeuvre record for those trajectories that have beenevolved to solve several detected conflicts. For example, consider the followinglist of conflicts in which a certain trajectory with idt = 3432 can be found in the60th row:
With the computation of idt/ (N + 1) and idtmod (N + 1) it is possible toobtain p and idt0 respectively, and by computing p/ (L+ 1) and pmod (L+ 1) it
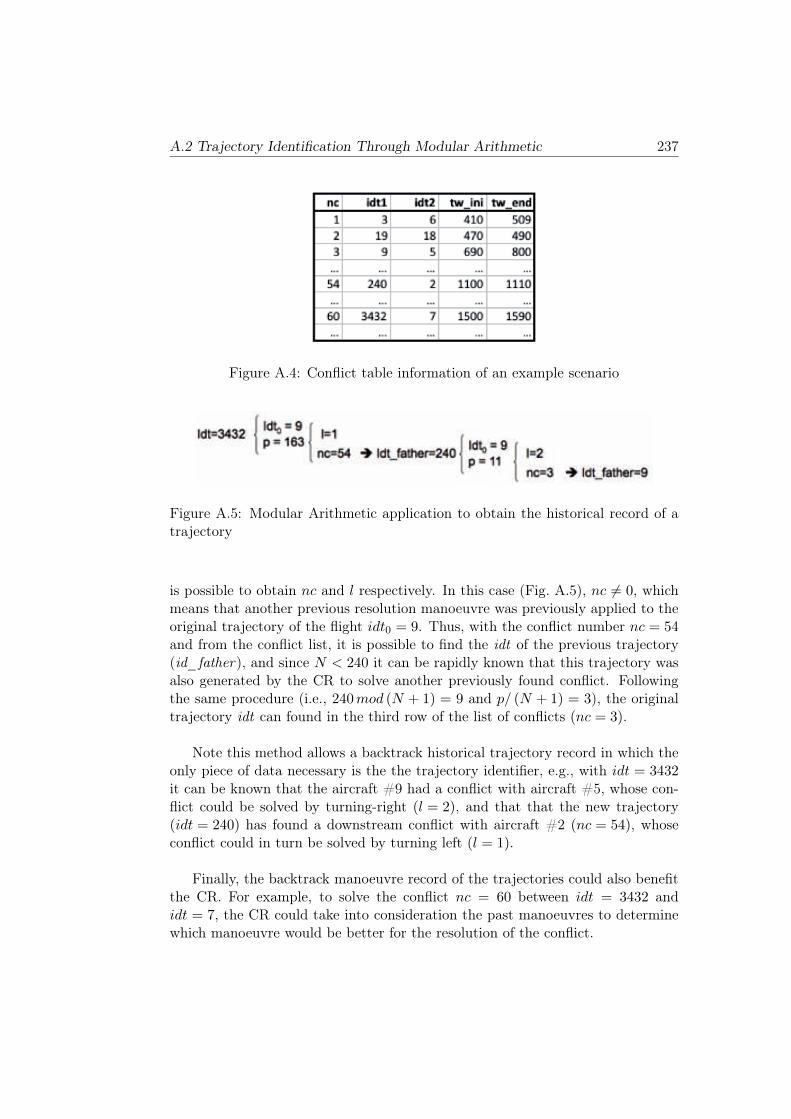
A.2 Trajectory Identification Through Modular Arithmetic 237
Figure A.4: Conflict table information of an example scenario
Figure A.5: Modular Arithmetic application to obtain the historical record of atrajectory
is possible to obtain nc and l respectively. In this case (Fig. A.5), nc �= 0, whichmeans that another previous resolution manoeuvre was previously applied to theoriginal trajectory of the flight idt0 = 9. Thus, with the conflict number nc = 54and from the conflict list, it is possible to find the idt of the previous trajectory(id_father), and since N < 240 it can be rapidly known that this trajectory wasalso generated by the CR to solve another previously found conflict. Followingthe same procedure (i.e., 240mod (N + 1) = 9 and p/ (N + 1) = 3), the originaltrajectory idt can found in the third row of the list of conflicts (nc = 3).
Note this method allows a backtrack historical trajectory record in which theonly piece of data necessary is the the trajectory identifier, e.g., with idt = 3432it can be known that the aircraft #9 had a conflict with aircraft #5, whose con-flict could be solved by turning-right (l = 2), and that that the new trajectory(idt = 240) has found a downstream conflict with aircraft #2 (nc = 54), whoseconflict could in turn be solved by turning left (l = 1).
Finally, the backtrack manoeuvre record of the trajectories could also benefitthe CR. For example, to solve the conflict nc = 60 between idt = 3432 andidt = 7, the CR could take into consideration the past manoeuvres to determinewhich manoeuvre would be better for the resolution of the conflict.

238 Chapter A. Further Explanations about the CD&R System
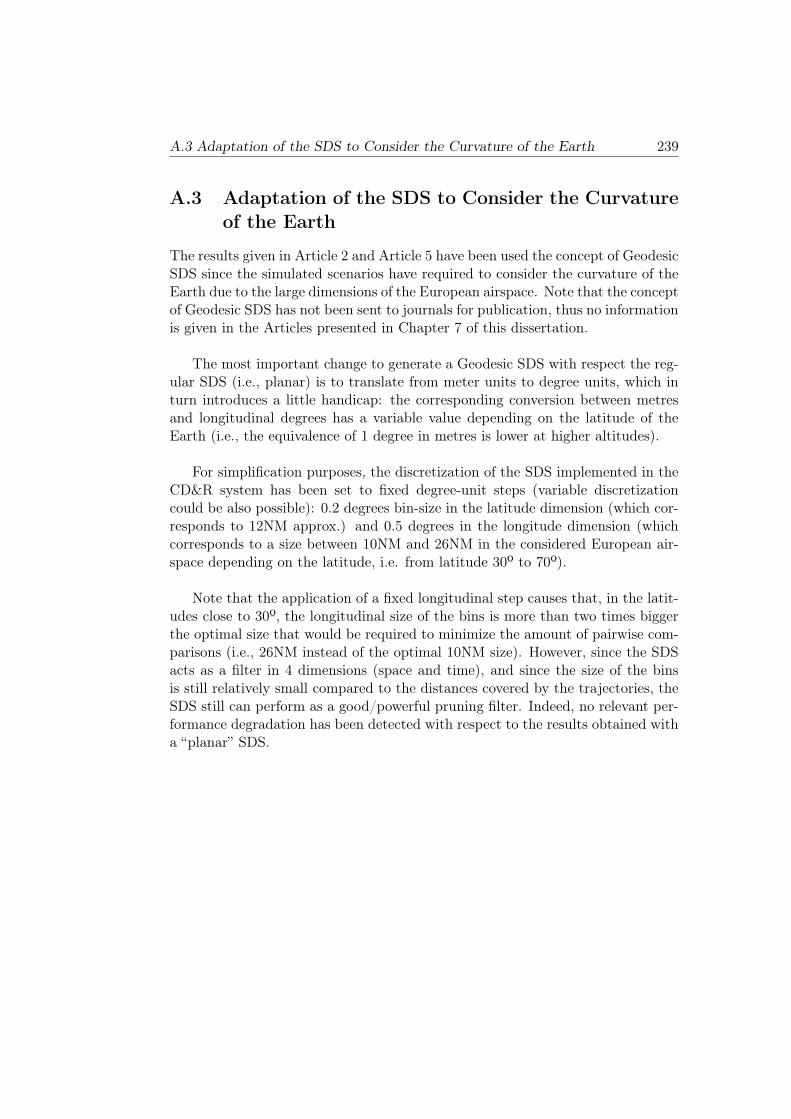
A.3 Adaptation of the SDS to Consider the Curvature of the Earth 239
A.3 Adaptation of the SDS to Consider the Curvature
of the Earth
The results given in Article 2 and Article 5 have been used the concept of GeodesicSDS since the simulated scenarios have required to consider the curvature of theEarth due to the large dimensions of the European airspace. Note that the conceptof Geodesic SDS has not been sent to journals for publication, thus no informationis given in the Articles presented in Chapter 7 of this dissertation.
The most important change to generate a Geodesic SDS with respect the reg-ular SDS (i.e., planar) is to translate from meter units to degree units, which inturn introduces a little handicap: the corresponding conversion between metresand longitudinal degrees has a variable value depending on the latitude of theEarth (i.e., the equivalence of 1 degree in metres is lower at higher altitudes).
For simplification purposes, the discretization of the SDS implemented in theCD&R system has been set to fixed degree-unit steps (variable discretizationcould be also possible): 0.2 degrees bin-size in the latitude dimension (which cor-responds to 12NM approx.) and 0.5 degrees in the longitude dimension (whichcorresponds to a size between 10NM and 26NM in the considered European air-space depending on the latitude, i.e. from latitude 30º to 70º).
Note that the application of a fixed longitudinal step causes that, in the latit-udes close to 30º, the longitudinal size of the bins is more than two times biggerthe optimal size that would be required to minimize the amount of pairwise com-parisons (i.e., 26NM instead of the optimal 10NM size). However, since the SDSacts as a filter in 4 dimensions (space and time), and since the size of the binsis still relatively small compared to the distances covered by the trajectories, theSDS still can perform as a good/powerful pruning filter. Indeed, no relevant per-formance degradation has been detected with respect to the results obtained witha “planar” SDS.
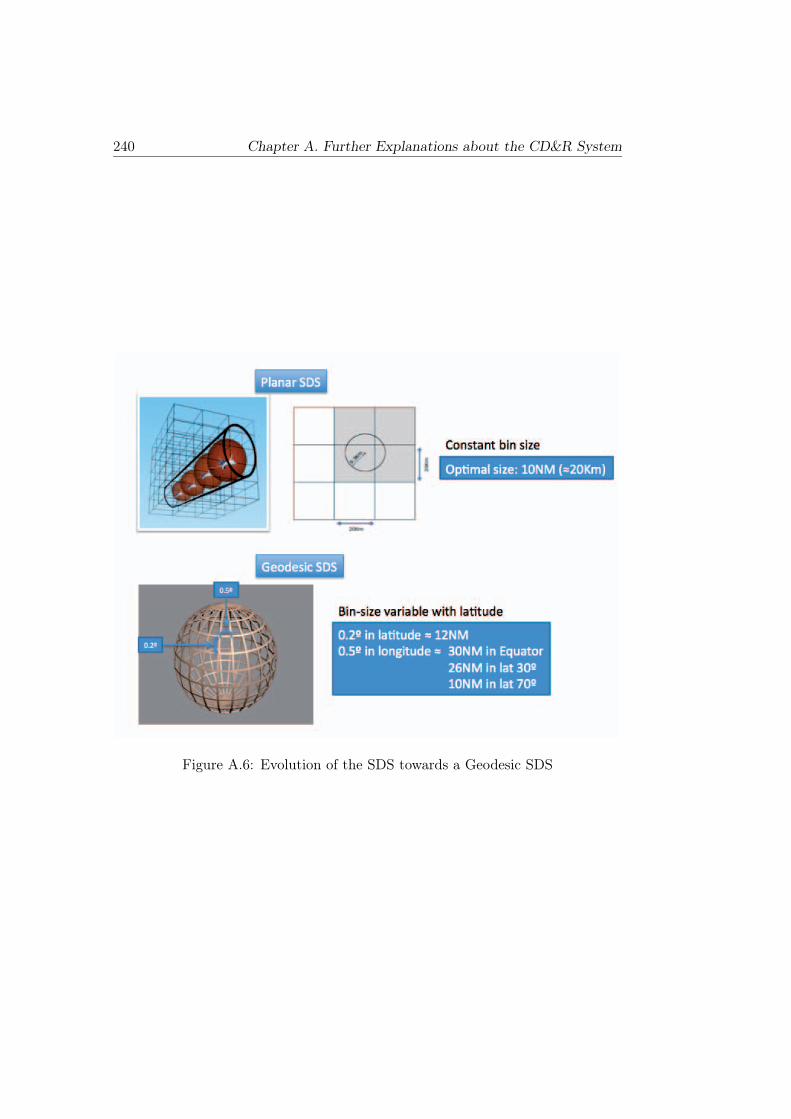
240 Chapter A. Further Explanations about the CD&R System
Figure A.6: Evolution of the SDS towards a Geodesic SDS
A.4 Adaptation of Geometric Optimization Approach Algorithm to StrategicDe-confliction 241
A.4 Adaptation of Geometric Optimization Approach
Algorithm to Strategic De-confliction
The advantage of the GOA model is that it takes into account the geometric char-acteristics of 2 aircraft trajectories in conflict (see Fig. 3.12 on page 85) and areutilized to determine closed-form analytical expressions for conflict avoidancecommands. However, the usage of GOA concepts for the strategic de-conflictionapproach proposed by STREAM has required dealing with three major limitationsof original GOA algorithms:
1. The geometric relative framework was based on planar geometry. Suchapproach works well for tactical de-confliction purposes, since the distancescovered by aircraft during a 20-minute time window are short enough (i.e.,less than 1000Km) to allow the consideration of a planar geometry. However,for the strategic purposes considered in STREAM project, the curvatureof the Earth must be considered and thus the GOA algorithms must beupdated.
2. Trajectories are assumed to be straight lines (i.e., fixed course lines).Again, such approximation is precise enough if tactical amendments areunder consideration (i.e., relatively short distances). However, for strategicroute allocation the curvature of the Earth must be taken into accountsince distances are often relatively large. The shortest distance betweentwo points in a spherical shape is represented by a geodesic curve (the equi-valent of a straight line in planar geometry). The problem with geodesictrajectories is that they require constant course changes, which are diffi-cult to be flown by human pilots. However, current FMSs and aircraftautopilots are able to fly geodesic trajectories (also called orthodromic tra-jectories) with precision, and thus the GOA algorithm had to be updatedfor the consideration of geodesic Direct Routes as proposed in the STREAMconcept.
3. Fully synchronous co-existing trajectories are assumed. Again, this as-sumption works fine for tactical purposes, since conflicts are detected betweenaircraft that are already airborne at the moment of the CD process andthus at the moment of applying a resolution amendment. However, for stra-tegic purposes, in which the resolution amendments are applied from thedeparture (or the TOC) of the trajectory, it must be considered that thetrajectories involved in a conflict may start at different absolute times. Thisrequires updating the GOA algorithms to take into account the computationof the relative geometric framework between the asynchronous amendmentstarting points of the two trajectories.
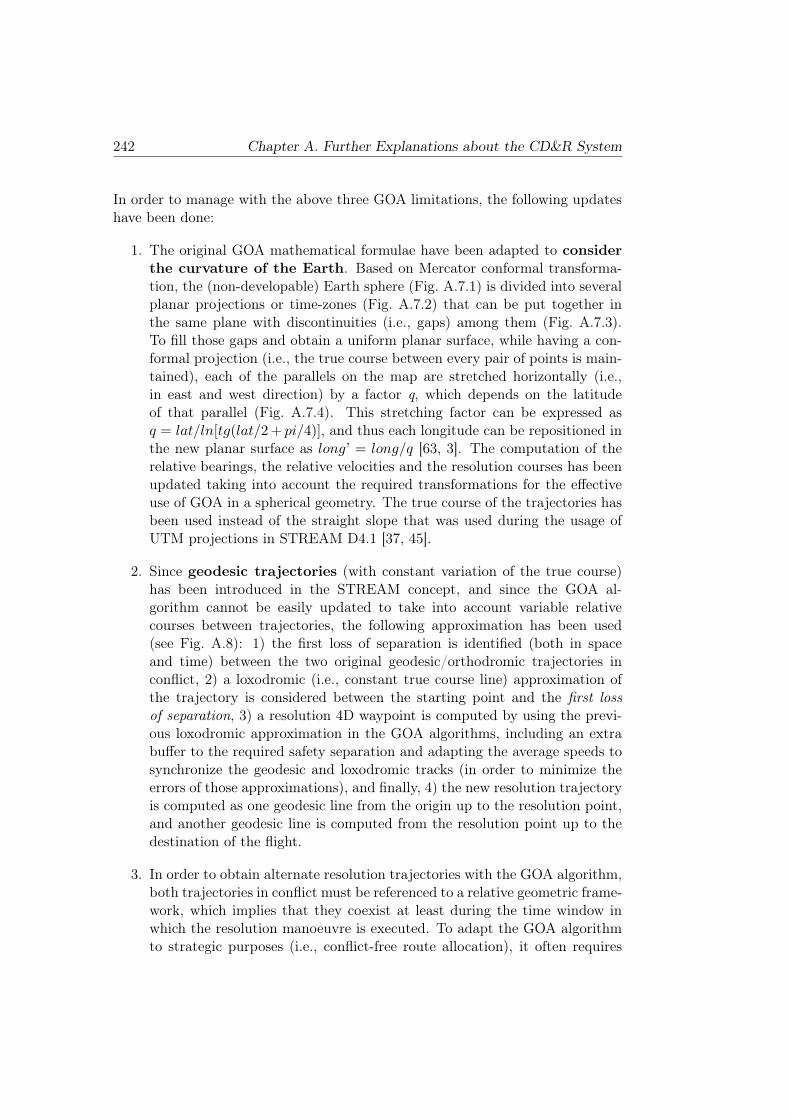
242 Chapter A. Further Explanations about the CD&R System
In order to manage with the above three GOA limitations, the following updateshave been done:
1. The original GOA mathematical formulae have been adapted to consider
the curvature of the Earth. Based on Mercator conformal transforma-tion, the (non-developable) Earth sphere (Fig. A.7.1) is divided into severalplanar projections or time-zones (Fig. A.7.2) that can be put together inthe same plane with discontinuities (i.e., gaps) among them (Fig. A.7.3).To fill those gaps and obtain a uniform planar surface, while having a con-formal projection (i.e., the true course between every pair of points is main-tained), each of the parallels on the map are stretched horizontally (i.e.,in east and west direction) by a factor q, which depends on the latitudeof that parallel (Fig. A.7.4). This stretching factor can be expressed asq = lat/ln[tg(lat/2+ pi/4)], and thus each longitude can be repositioned inthe new planar surface as long’ = long/q [63, 3]. The computation of therelative bearings, the relative velocities and the resolution courses has beenupdated taking into account the required transformations for the effectiveuse of GOA in a spherical geometry. The true course of the trajectories hasbeen used instead of the straight slope that was used during the usage ofUTM projections in STREAM D4.1 [37, 45].
2. Since geodesic trajectories (with constant variation of the true course)has been introduced in the STREAM concept, and since the GOA al-gorithm cannot be easily updated to take into account variable relativecourses between trajectories, the following approximation has been used(see Fig. A.8): 1) the first loss of separation is identified (both in spaceand time) between the two original geodesic/orthodromic trajectories inconflict, 2) a loxodromic (i.e., constant true course line) approximation ofthe trajectory is considered between the starting point and the first lossof separation, 3) a resolution 4D waypoint is computed by using the previ-ous loxodromic approximation in the GOA algorithms, including an extrabuffer to the required safety separation and adapting the average speeds tosynchronize the geodesic and loxodromic tracks (in order to minimize theerrors of those approximations), and finally, 4) the new resolution trajectoryis computed as one geodesic line from the origin up to the resolution point,and another geodesic line is computed from the resolution point up to thedestination of the flight.
3. In order to obtain alternate resolution trajectories with the GOA algorithm,both trajectories in conflict must be referenced to a relative geometric frame-work, which implies that they coexist at least during the time window inwhich the resolution manoeuvre is executed. To adapt the GOA algorithmto strategic purposes (i.e., conflict-free route allocation), it often requires
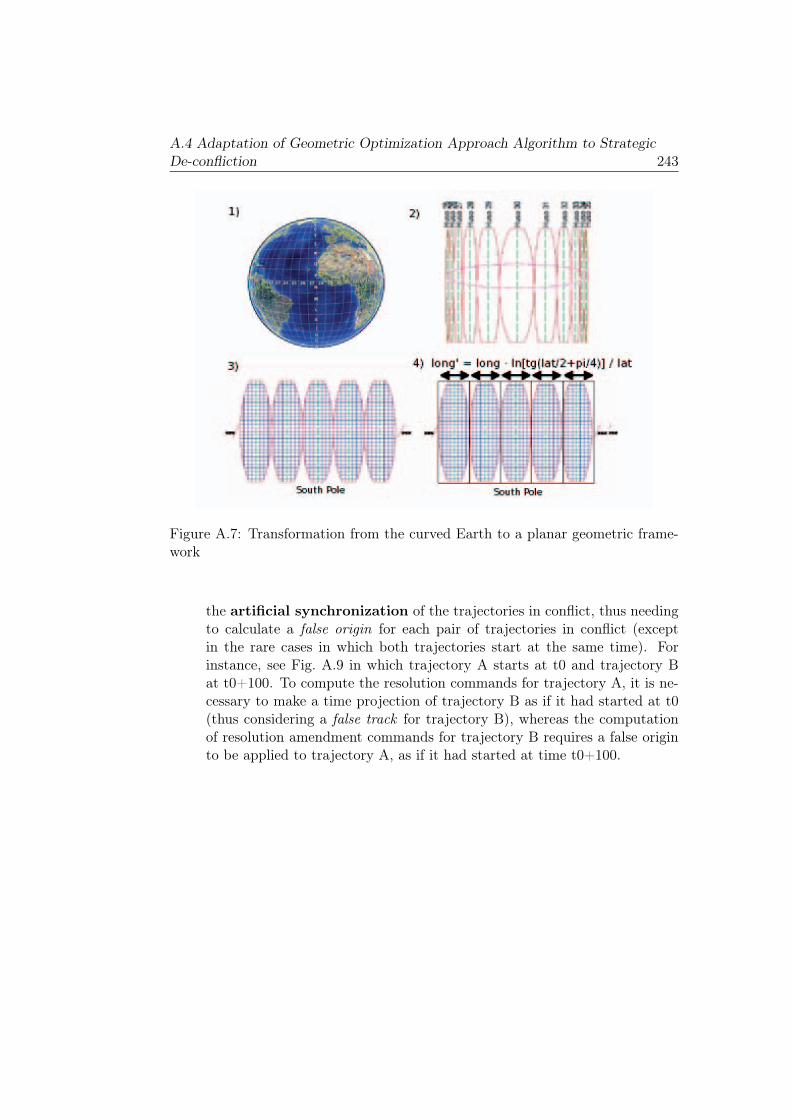
A.4 Adaptation of Geometric Optimization Approach Algorithm to StrategicDe-confliction 243
Figure A.7: Transformation from the curved Earth to a planar geometric frame-work
the artificial synchronization of the trajectories in conflict, thus needingto calculate a false origin for each pair of trajectories in conflict (exceptin the rare cases in which both trajectories start at the same time). Forinstance, see Fig. A.9 in which trajectory A starts at t0 and trajectory Bat t0+100. To compute the resolution commands for trajectory A, it is ne-cessary to make a time projection of trajectory B as if it had started at t0(thus considering a false track for trajectory B), whereas the computationof resolution amendment commands for trajectory B requires a false originto be applied to trajectory A, as if it had started at time t0+100.
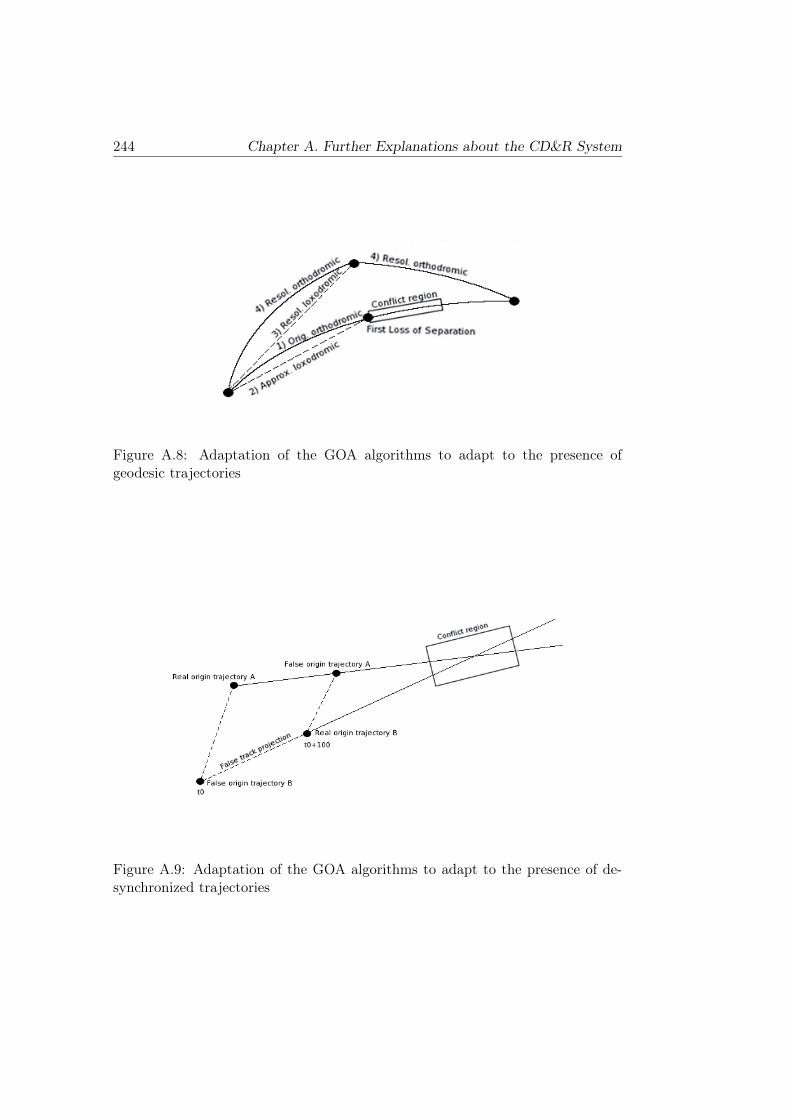
244 Chapter A. Further Explanations about the CD&R System
Figure A.8: Adaptation of the GOA algorithms to adapt to the presence ofgeodesic trajectories
Figure A.9: Adaptation of the GOA algorithms to adapt to the presence of de-synchronized trajectories
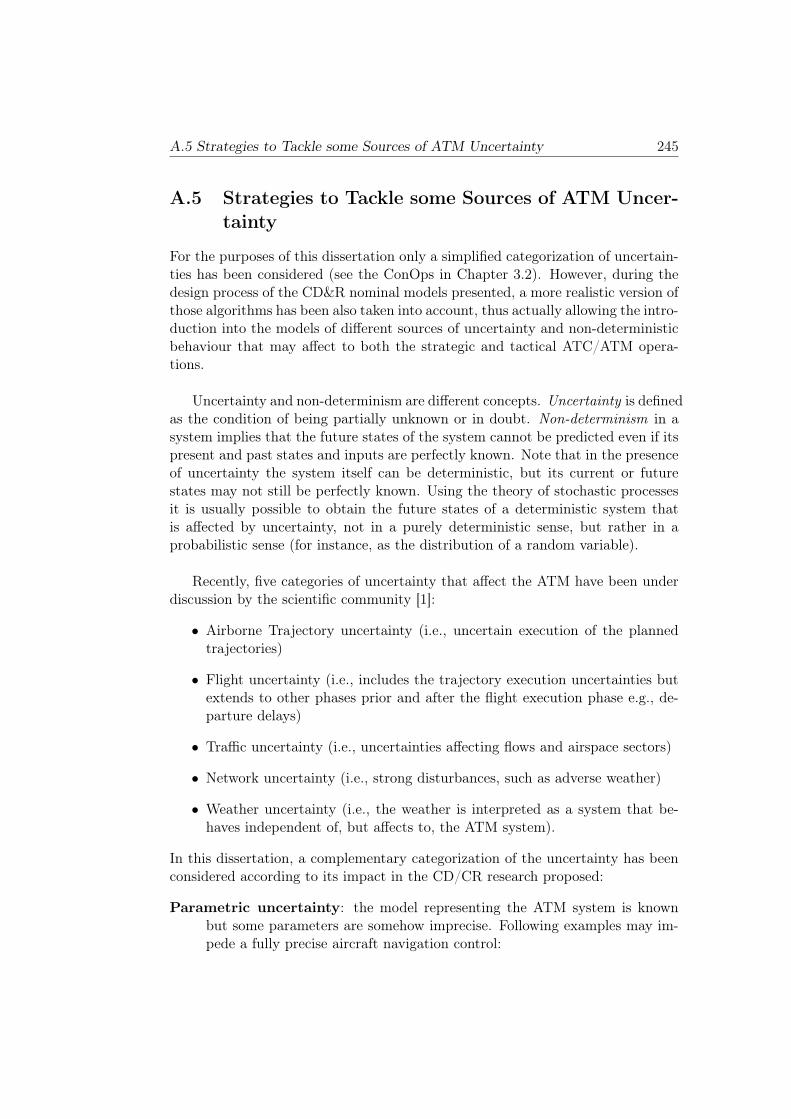
A.5 Strategies to Tackle some Sources of ATM Uncertainty 245
A.5 Strategies to Tackle some Sources of ATM Uncer-
tainty
For the purposes of this dissertation only a simplified categorization of uncertain-ties has been considered (see the ConOps in Chapter 3.2). However, during thedesign process of the CD&R nominal models presented, a more realistic version ofthose algorithms has been also taken into account, thus actually allowing the intro-duction into the models of different sources of uncertainty and non-deterministicbehaviour that may affect to both the strategic and tactical ATC/ATM opera-tions.
Uncertainty and non-determinism are different concepts. Uncertainty is definedas the condition of being partially unknown or in doubt. Non-determinism in asystem implies that the future states of the system cannot be predicted even if itspresent and past states and inputs are perfectly known. Note that in the presenceof uncertainty the system itself can be deterministic, but its current or futurestates may not still be perfectly known. Using the theory of stochastic processesit is usually possible to obtain the future states of a deterministic system thatis affected by uncertainty, not in a purely deterministic sense, but rather in aprobabilistic sense (for instance, as the distribution of a random variable).
Recently, five categories of uncertainty that affect the ATM have been underdiscussion by the scientific community [1]:
• Airborne Trajectory uncertainty (i.e., uncertain execution of the plannedtrajectories)
• Flight uncertainty (i.e., includes the trajectory execution uncertainties butextends to other phases prior and after the flight execution phase e.g., de-parture delays)
• Traffic uncertainty (i.e., uncertainties affecting flows and airspace sectors)
• Network uncertainty (i.e., strong disturbances, such as adverse weather)
• Weather uncertainty (i.e., the weather is interpreted as a system that be-haves independent of, but affects to, the ATM system).
In this dissertation, a complementary categorization of the uncertainty has beenconsidered according to its impact in the CD/CR research proposed:
Parametric uncertainty: the model representing the ATM system is knownbut some parameters are somehow imprecise. Following examples may im-pede a fully precise aircraft navigation control:
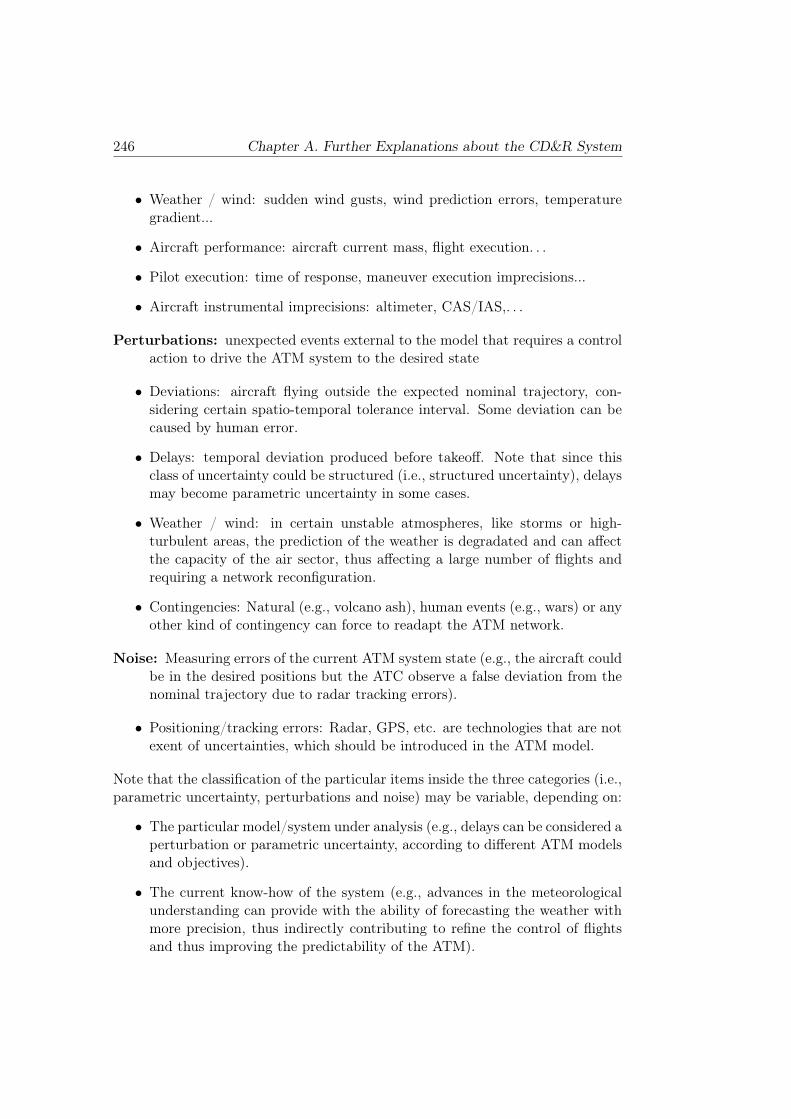
246 Chapter A. Further Explanations about the CD&R System
• Weather / wind: sudden wind gusts, wind prediction errors, temperaturegradient...
• Aircraft performance: aircraft current mass, flight execution. . .
• Pilot execution: time of response, maneuver execution imprecisions...
• Aircraft instrumental imprecisions: altimeter, CAS/IAS,. . .
Perturbations: unexpected events external to the model that requires a controlaction to drive the ATM system to the desired state
• Deviations: aircraft flying outside the expected nominal trajectory, con-sidering certain spatio-temporal tolerance interval. Some deviation can becaused by human error.
• Delays: temporal deviation produced before takeoff. Note that since thisclass of uncertainty could be structured (i.e., structured uncertainty), delaysmay become parametric uncertainty in some cases.
• Weather / wind: in certain unstable atmospheres, like storms or high-turbulent areas, the prediction of the weather is degradated and can affectthe capacity of the air sector, thus affecting a large number of flights andrequiring a network reconfiguration.
• Contingencies: Natural (e.g., volcano ash), human events (e.g., wars) or anyother kind of contingency can force to readapt the ATM network.
Noise: Measuring errors of the current ATM system state (e.g., the aircraft couldbe in the desired positions but the ATC observe a false deviation from thenominal trajectory due to radar tracking errors).
• Positioning/tracking errors: Radar, GPS, etc. are technologies that are notexent of uncertainties, which should be introduced in the ATM model.
Note that the classification of the particular items inside the three categories (i.e.,parametric uncertainty, perturbations and noise) may be variable, depending on:
• The particular model/system under analysis (e.g., delays can be considered aperturbation or parametric uncertainty, according to different ATM modelsand objectives).
• The current know-how of the system (e.g., advances in the meteorologicalunderstanding can provide with the ability of forecasting the weather withmore precision, thus indirectly contributing to refine the control of flightsand thus improving the predictability of the ATM).
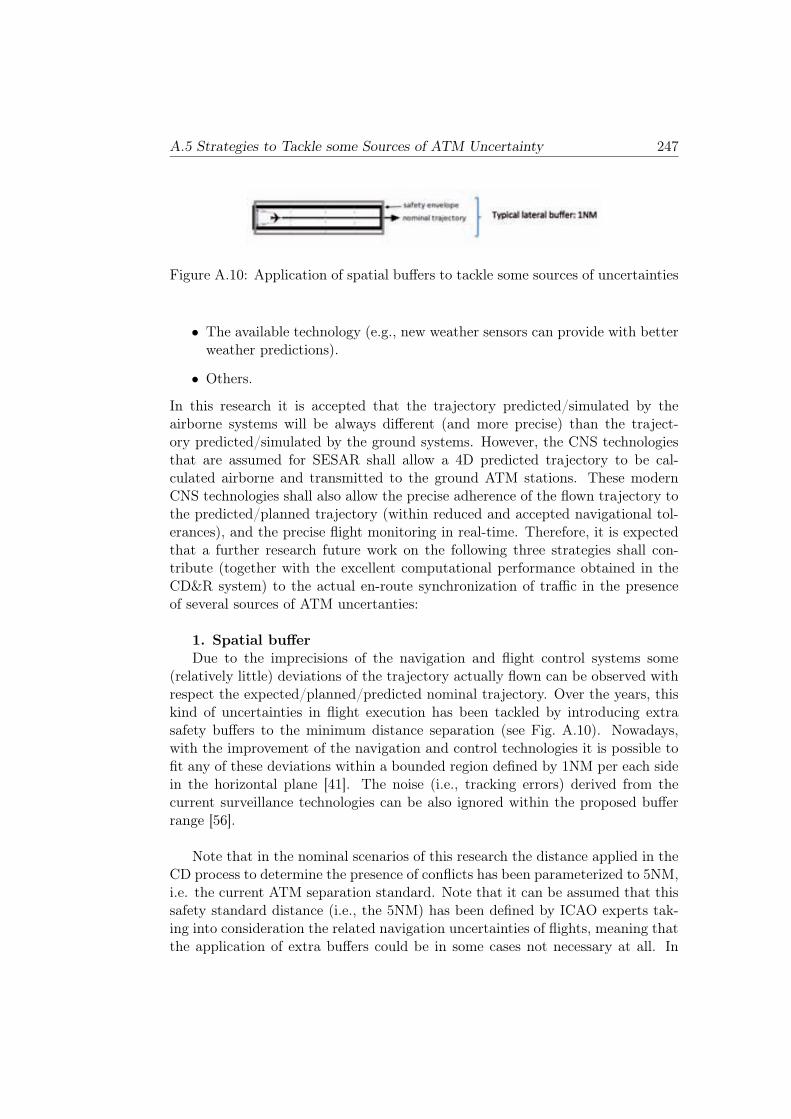
A.5 Strategies to Tackle some Sources of ATM Uncertainty 247
Figure A.10: Application of spatial buffers to tackle some sources of uncertainties
• The available technology (e.g., new weather sensors can provide with betterweather predictions).
• Others.
In this research it is accepted that the trajectory predicted/simulated by theairborne systems will be always different (and more precise) than the traject-ory predicted/simulated by the ground systems. However, the CNS technologiesthat are assumed for SESAR shall allow a 4D predicted trajectory to be cal-culated airborne and transmitted to the ground ATM stations. These modernCNS technologies shall also allow the precise adherence of the flown trajectory tothe predicted/planned trajectory (within reduced and accepted navigational tol-erances), and the precise flight monitoring in real-time. Therefore, it is expectedthat a further research future work on the following three strategies shall con-tribute (together with the excellent computational performance obtained in theCD&R system) to the actual en-route synchronization of traffic in the presenceof several sources of ATM uncertanties:
1. Spatial buffer
Due to the imprecisions of the navigation and flight control systems some(relatively little) deviations of the trajectory actually flown can be observed withrespect the expected/planned/predicted nominal trajectory. Over the years, thiskind of uncertainties in flight execution has been tackled by introducing extrasafety buffers to the minimum distance separation (see Fig. A.10). Nowadays,with the improvement of the navigation and control technologies it is possible tofit any of these deviations within a bounded region defined by 1NM per each sidein the horizontal plane [41]. The noise (i.e., tracking errors) derived from thecurrent surveillance technologies can be also ignored within the proposed bufferrange [56].
Note that in the nominal scenarios of this research the distance applied in theCD process to determine the presence of conflicts has been parameterized to 5NM,i.e. the current ATM separation standard. Note that it can be assumed that thissafety standard distance (i.e., the 5NM) has been defined by ICAO experts tak-ing into consideration the related navigation uncertainties of flights, meaning thatthe application of extra buffers could be in some cases not necessary at all. In
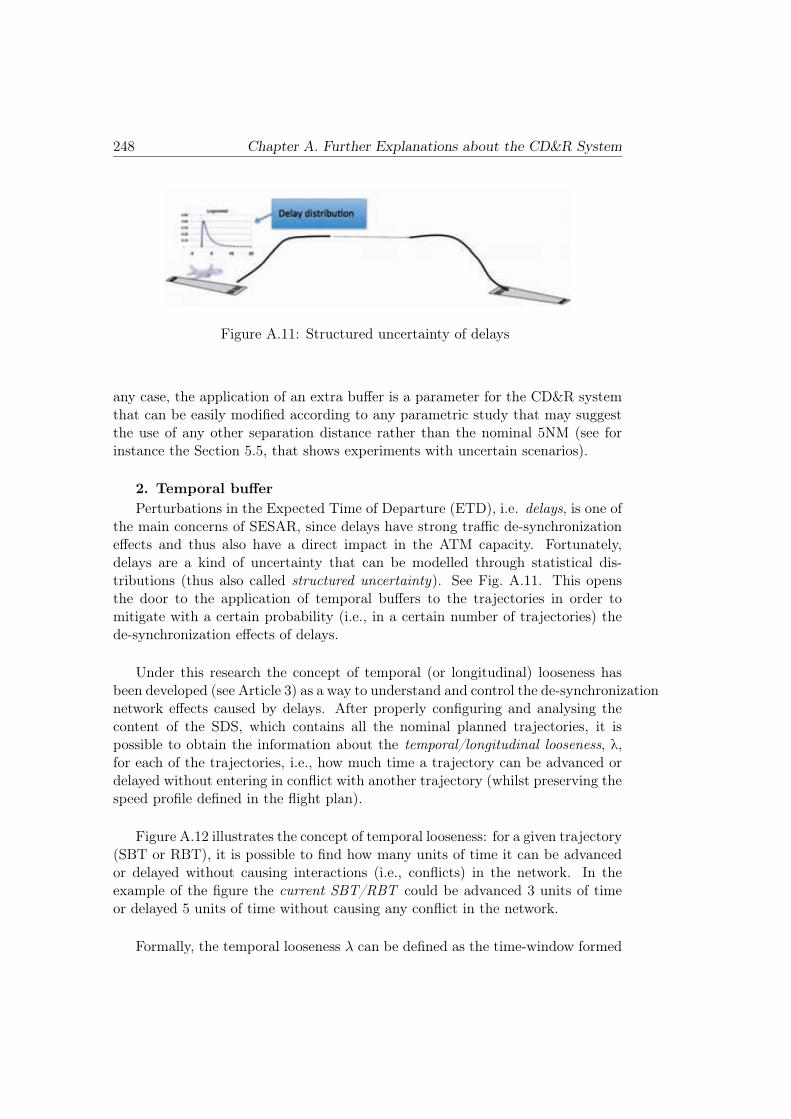
248 Chapter A. Further Explanations about the CD&R System
Figure A.11: Structured uncertainty of delays
any case, the application of an extra buffer is a parameter for the CD&R systemthat can be easily modified according to any parametric study that may suggestthe use of any other separation distance rather than the nominal 5NM (see forinstance the Section 5.5, that shows experiments with uncertain scenarios).
2. Temporal buffer
Perturbations in the Expected Time of Departure (ETD), i.e. delays, is one ofthe main concerns of SESAR, since delays have strong traffic de-synchronizationeffects and thus also have a direct impact in the ATM capacity. Fortunately,delays are a kind of uncertainty that can be modelled through statistical dis-tributions (thus also called structured uncertainty). See Fig. A.11. This opensthe door to the application of temporal buffers to the trajectories in order tomitigate with a certain probability (i.e., in a certain number of trajectories) thede-synchronization effects of delays.
Under this research the concept of temporal (or longitudinal) looseness hasbeen developed (see Article 3) as a way to understand and control the de-synchronizationnetwork effects caused by delays. After properly configuring and analysing thecontent of the SDS, which contains all the nominal planned trajectories, it ispossible to obtain the information about the temporal/longitudinal looseness, λ,for each of the trajectories, i.e., how much time a trajectory can be advanced ordelayed without entering in conflict with another trajectory (whilst preserving thespeed profile defined in the flight plan).
Figure A.12 illustrates the concept of temporal looseness: for a given trajectory(SBT or RBT), it is possible to find how many units of time it can be advancedor delayed without causing interactions (i.e., conflicts) in the network. In theexample of the figure the current SBT/RBT could be advanced 3 units of timeor delayed 5 units of time without causing any conflict in the network.
Formally, the temporal looseness λ can be defined as the time-window formed
A.5 Strategies to Tackle some Sources of ATM Uncertainty 249
Figure A.12: Temporal looseness of a trajectory
by the minimum and maximum delays, δmin and δmax , that a given trajectorycan afford while still being conflict-free, having the rest of the trajectories static:
λ = [δmin, δmax]
Note that δmin could be negative, i.e. δmin < 0, if the trajectory can be ad-vanced in time, and δmax could also be negative, δmax < 0 if the only way to solvethe conflicts is by anticipating the flight. In addition, both δmin and δmax arebounded by technical and service restrictions, such as the maximum increment ofspeed allowed for a given aircraft and the maximum deviation allowed from theuser-defined Estimated Time of Departure (ETD) and Estimated Time of Arrival(ETA).
The calculation of λ can help to identify trajectories that are more sens-itive to delays (i.e., less robust) and give this relevant network information tothe airport controllers in order to prioritize the departures according to such in-formation. A post-processing of the conflict-free trajectories stored in the SDSand their temporal looseness would also allow a sensitivity analysis regardingthe influence of departure delays (i.e., on the ETD) of the RBT on the numberof conflicts/interactions and on the complexity of their solution. The sensitivityanalysis could provide highly valuable information on the airport departure sched-ule (DMAN), in trying to preserve the ETD of those flights that could generateextra workload to controllers.
Thus, it is possible to compute the following data for each trajectory from the
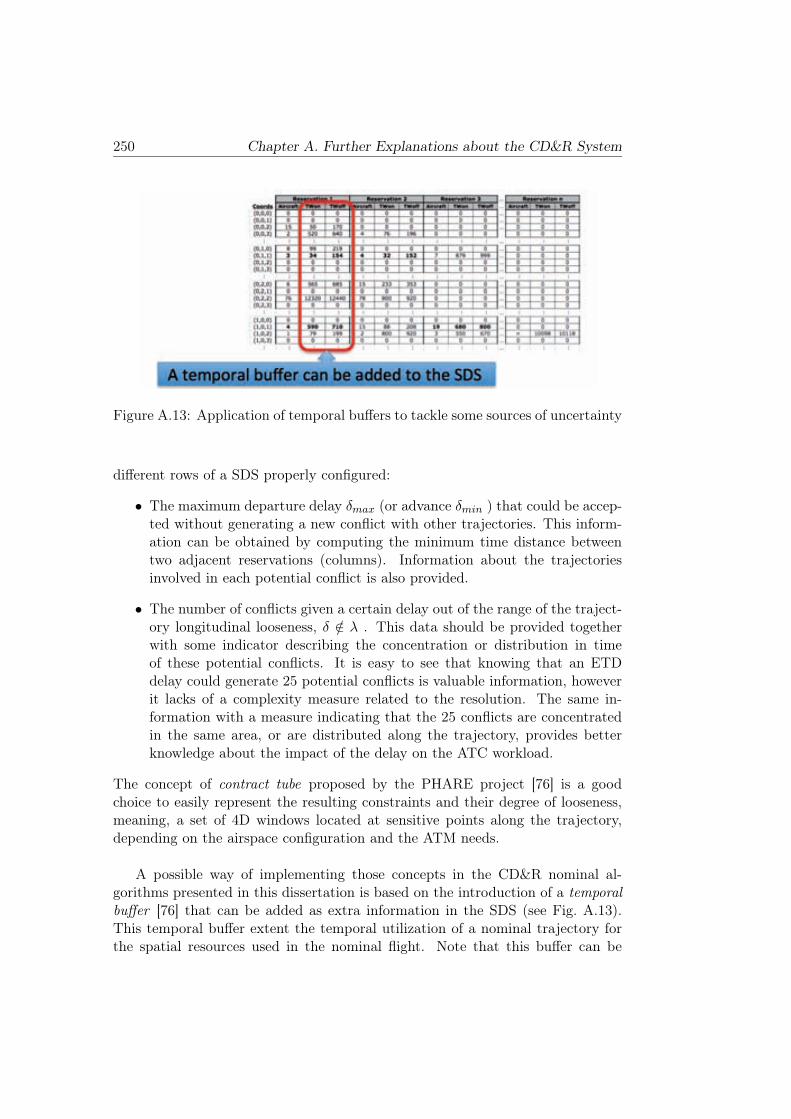
250 Chapter A. Further Explanations about the CD&R System
Figure A.13: Application of temporal buffers to tackle some sources of uncertainty
different rows of a SDS properly configured:
• The maximum departure delay δmax (or advance δmin ) that could be accep-ted without generating a new conflict with other trajectories. This inform-ation can be obtained by computing the minimum time distance betweentwo adjacent reservations (columns). Information about the trajectoriesinvolved in each potential conflict is also provided.
• The number of conflicts given a certain delay out of the range of the traject-ory longitudinal looseness, δ /∈ λ . This data should be provided togetherwith some indicator describing the concentration or distribution in timeof these potential conflicts. It is easy to see that knowing that an ETDdelay could generate 25 potential conflicts is valuable information, howeverit lacks of a complexity measure related to the resolution. The same in-formation with a measure indicating that the 25 conflicts are concentratedin the same area, or are distributed along the trajectory, provides betterknowledge about the impact of the delay on the ATC workload.
The concept of contract tube proposed by the PHARE project [76] is a goodchoice to easily represent the resulting constraints and their degree of looseness,meaning, a set of 4D windows located at sensitive points along the trajectory,depending on the airspace configuration and the ATM needs.
A possible way of implementing those concepts in the CD&R nominal al-gorithms presented in this dissertation is based on the introduction of a temporalbuffer [76] that can be added as extra information in the SDS (see Fig. A.13).This temporal buffer extent the temporal utilization of a nominal trajectory forthe spatial resources used in the nominal flight. Note that this buffer can be
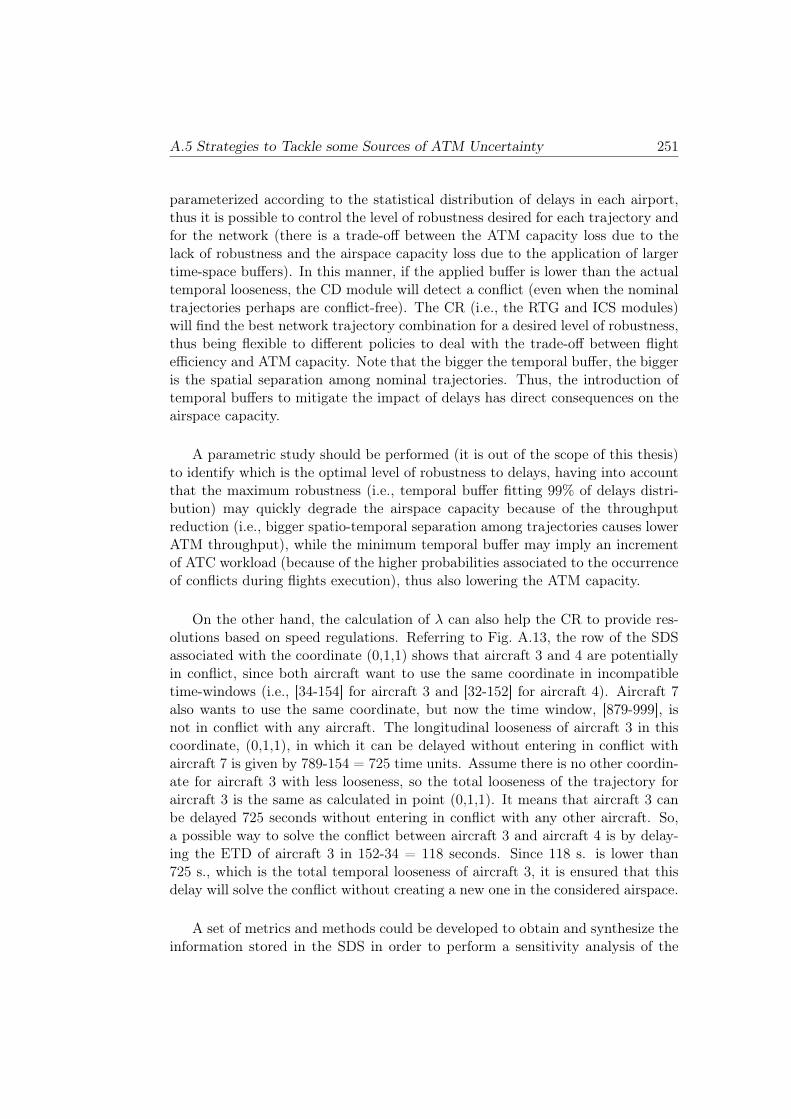
A.5 Strategies to Tackle some Sources of ATM Uncertainty 251
parameterized according to the statistical distribution of delays in each airport,thus it is possible to control the level of robustness desired for each trajectory andfor the network (there is a trade-off between the ATM capacity loss due to thelack of robustness and the airspace capacity loss due to the application of largertime-space buffers). In this manner, if the applied buffer is lower than the actualtemporal looseness, the CD module will detect a conflict (even when the nominaltrajectories perhaps are conflict-free). The CR (i.e., the RTG and ICS modules)will find the best network trajectory combination for a desired level of robustness,thus being flexible to different policies to deal with the trade-off between flightefficiency and ATM capacity. Note that the bigger the temporal buffer, the biggeris the spatial separation among nominal trajectories. Thus, the introduction oftemporal buffers to mitigate the impact of delays has direct consequences on theairspace capacity.
A parametric study should be performed (it is out of the scope of this thesis)to identify which is the optimal level of robustness to delays, having into accountthat the maximum robustness (i.e., temporal buffer fitting 99% of delays distri-bution) may quickly degrade the airspace capacity because of the throughputreduction (i.e., bigger spatio-temporal separation among trajectories causes lowerATM throughput), while the minimum temporal buffer may imply an incrementof ATC workload (because of the higher probabilities associated to the occurrenceof conflicts during flights execution), thus also lowering the ATM capacity.
On the other hand, the calculation of λ can also help the CR to provide res-olutions based on speed regulations. Referring to Fig. A.13, the row of the SDSassociated with the coordinate (0,1,1) shows that aircraft 3 and 4 are potentiallyin conflict, since both aircraft want to use the same coordinate in incompatibletime-windows (i.e., [34-154] for aircraft 3 and [32-152] for aircraft 4). Aircraft 7also wants to use the same coordinate, but now the time window, [879-999], isnot in conflict with any aircraft. The longitudinal looseness of aircraft 3 in thiscoordinate, (0,1,1), in which it can be delayed without entering in conflict withaircraft 7 is given by 789-154 = 725 time units. Assume there is no other coordin-ate for aircraft 3 with less looseness, so the total looseness of the trajectory foraircraft 3 is the same as calculated in point (0,1,1). It means that aircraft 3 canbe delayed 725 seconds without entering in conflict with any other aircraft. So,a possible way to solve the conflict between aircraft 3 and aircraft 4 is by delay-ing the ETD of aircraft 3 in 152-34 = 118 seconds. Since 118 s. is lower than725 s., which is the total temporal looseness of aircraft 3, it is ensured that thisdelay will solve the conflict without creating a new one in the considered airspace.
A set of metrics and methods could be developed to obtain and synthesize theinformation stored in the SDS in order to perform a sensitivity analysis of the
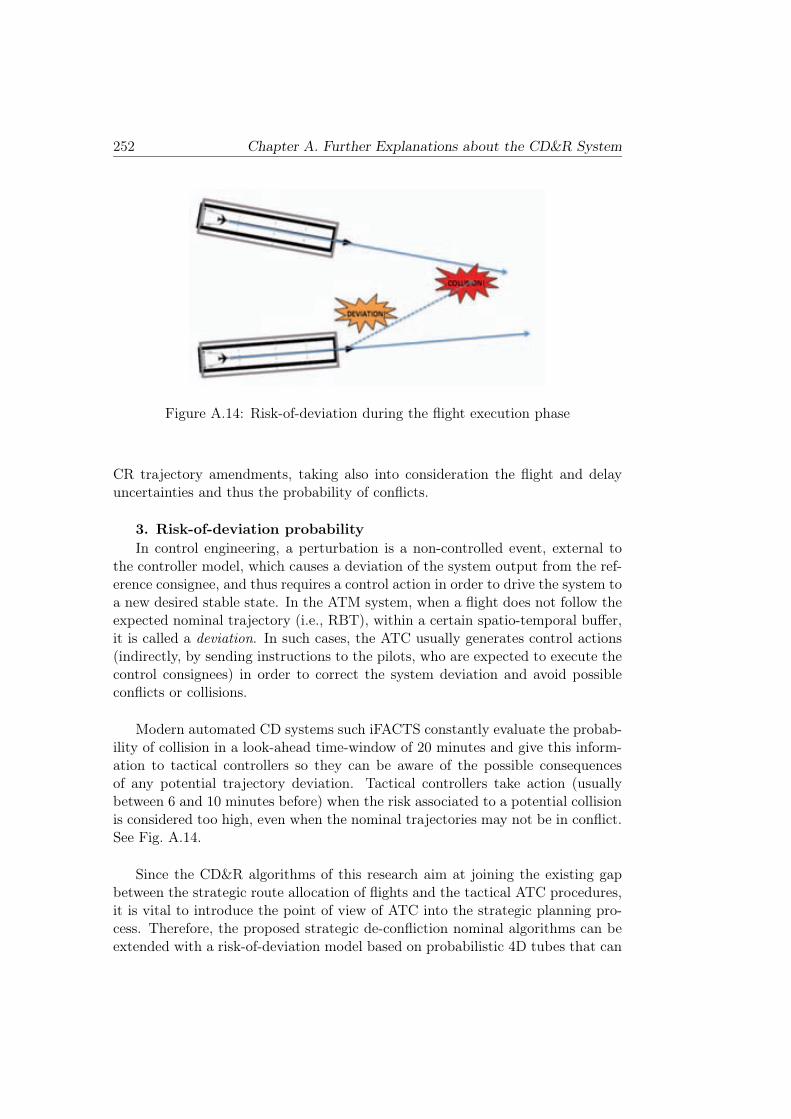
252 Chapter A. Further Explanations about the CD&R System
Figure A.14: Risk-of-deviation during the flight execution phase
CR trajectory amendments, taking also into consideration the flight and delayuncertainties and thus the probability of conflicts.
3. Risk-of-deviation probability
In control engineering, a perturbation is a non-controlled event, external tothe controller model, which causes a deviation of the system output from the ref-erence consignee, and thus requires a control action in order to drive the system toa new desired stable state. In the ATM system, when a flight does not follow theexpected nominal trajectory (i.e., RBT), within a certain spatio-temporal buffer,it is called a deviation. In such cases, the ATC usually generates control actions(indirectly, by sending instructions to the pilots, who are expected to execute thecontrol consignees) in order to correct the system deviation and avoid possibleconflicts or collisions.
Modern automated CD systems such iFACTS constantly evaluate the probab-ility of collision in a look-ahead time-window of 20 minutes and give this inform-ation to tactical controllers so they can be aware of the possible consequencesof any potential trajectory deviation. Tactical controllers take action (usuallybetween 6 and 10 minutes before) when the risk associated to a potential collisionis considered too high, even when the nominal trajectories may not be in conflict.See Fig. A.14.
Since the CD&R algorithms of this research aim at joining the existing gapbetween the strategic route allocation of flights and the tactical ATC procedures,it is vital to introduce the point of view of ATC into the strategic planning pro-cess. Therefore, the proposed strategic de-confliction nominal algorithms can beextended with a risk-of-deviation model based on probabilistic 4D tubes that can
A.5 Strategies to Tackle some Sources of ATM Uncertainty 253
Figure A.15: Application of n-dimensional ATM information to tackle somesources of uncertainty
be computed for every time-instant of the nominal trajectories, and projecting theuncertainty along a certain time-window look-ahead (typically 20 minutes) afterwhich the evolution of uncertainty can be truncated (controllers are expected totake action before that time in case a deviation is detected)[19]. See Fig. A.14.
The parameterization of those probabilistic 4D tubes (i.e., the size and theassociated probability values) can be obtained through off-line TP studies andcustomized for every type of aircraft and weather conditions. The parametersobtained through exhaustive off-line studies can be introduced in a knowledgedatabase optimized for the access of the strategic CD&R algorithms, in a way suchthat by taking the information of the aircraft model and the weather conditions(among other), the required parameters to build the probabilistic 4D tubes canbe efficiently accessed for a real-time execution of the algorithms.
With regards to the technical aspects, the risk-of-deviation model can be ad-apted to the CD&R algorithms of this research thanks to the flexibility of theSDS to store n-dimensional state-space information. In this case, the reservationof the ATM spatial resources (i.e., little portions of airspace) can be made during
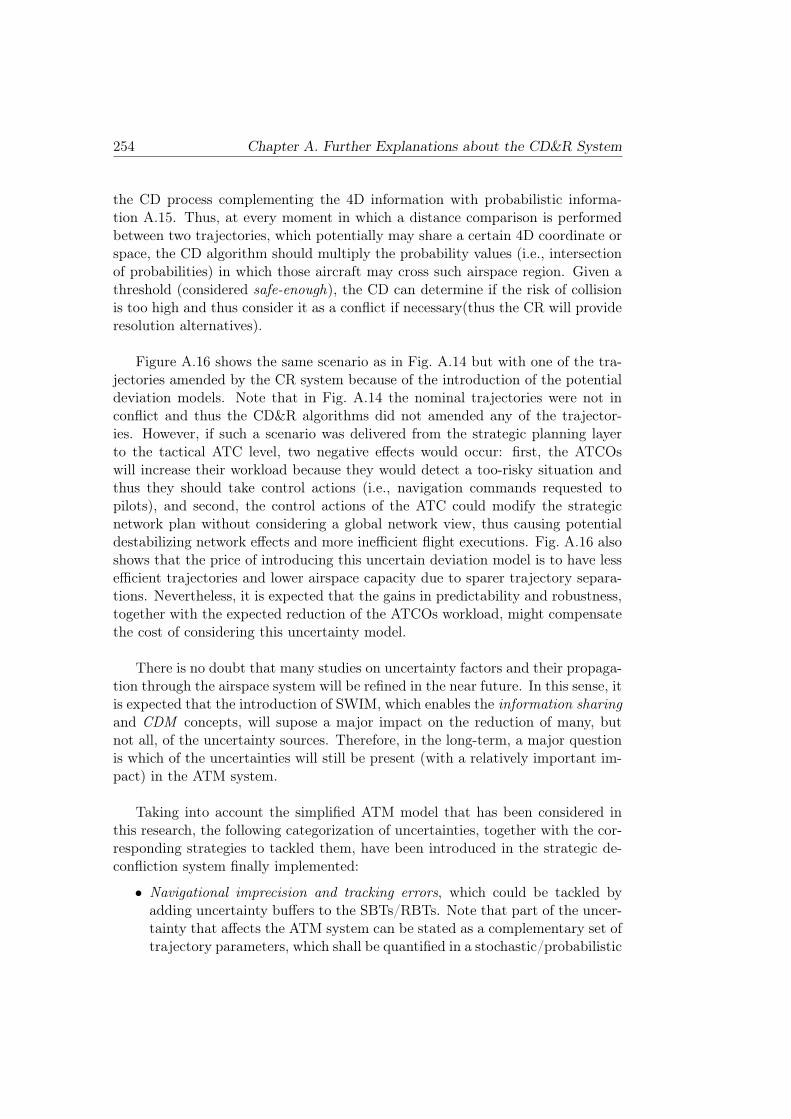
254 Chapter A. Further Explanations about the CD&R System
the CD process complementing the 4D information with probabilistic informa-tion A.15. Thus, at every moment in which a distance comparison is performedbetween two trajectories, which potentially may share a certain 4D coordinate orspace, the CD algorithm should multiply the probability values (i.e., intersectionof probabilities) in which those aircraft may cross such airspace region. Given athreshold (considered safe-enough), the CD can determine if the risk of collisionis too high and thus consider it as a conflict if necessary(thus the CR will provideresolution alternatives).
Figure A.16 shows the same scenario as in Fig. A.14 but with one of the tra-jectories amended by the CR system because of the introduction of the potentialdeviation models. Note that in Fig. A.14 the nominal trajectories were not inconflict and thus the CD&R algorithms did not amended any of the trajector-ies. However, if such a scenario was delivered from the strategic planning layerto the tactical ATC level, two negative effects would occur: first, the ATCOswill increase their workload because they would detect a too-risky situation andthus they should take control actions (i.e., navigation commands requested topilots), and second, the control actions of the ATC could modify the strategicnetwork plan without considering a global network view, thus causing potentialdestabilizing network effects and more inefficient flight executions. Fig. A.16 alsoshows that the price of introducing this uncertain deviation model is to have lessefficient trajectories and lower airspace capacity due to sparer trajectory separa-tions. Nevertheless, it is expected that the gains in predictability and robustness,together with the expected reduction of the ATCOs workload, might compensatethe cost of considering this uncertainty model.
There is no doubt that many studies on uncertainty factors and their propaga-tion through the airspace system will be refined in the near future. In this sense, itis expected that the introduction of SWIM, which enables the information sharingand CDM concepts, will supose a major impact on the reduction of many, butnot all, of the uncertainty sources. Therefore, in the long-term, a major questionis which of the uncertainties will still be present (with a relatively important im-pact) in the ATM system.
Taking into account the simplified ATM model that has been considered inthis research, the following categorization of uncertainties, together with the cor-responding strategies to tackled them, have been introduced in the strategic de-confliction system finally implemented:
• Navigational imprecision and tracking errors, which could be tackled byadding uncertainty buffers to the SBTs/RBTs. Note that part of the uncer-tainty that affects the ATM system can be stated as a complementary set oftrajectory parameters, which shall be quantified in a stochastic/probabilistic
A.5 Strategies to Tackle some Sources of ATM Uncertainty 255
Figure A.16: A risk-of-deviation model that could be considered during strategicflight planning to reduce the number of tactical amendments
way (and according to models based on their natural physical behaviour),rather than by deterministic values. The sources of trajectory uncertaintycan be either the error in the input data measurement, the error during thedata processing (e.g., due to the limitations of the model) or the error in theoperational practices of the airspace user, thus altogether forming the totalsystem error (TSE) that can be fitted within a certain tolerance or buffer.
• Individual-level perturbations, which refer to those unexpected events thatare often caused by the AUs and that generally affect only a reduced set oftrajectories, e.g., delays and/or trajectory deviations (outside of the uncer-tainty tolerance/buffer). A new re-allocation of all the flight routes or onlyof the affected ones can mitigate this problem if done in timely manner (lessthan 2 minutes has been achieved in this research with a regular computer).Note that the use of extra safety distance (i.e., buffer) to give tolerance forthe navigational and tracking errors with a buffer-size “bigger than neces-sary”, can also contribute to partially give system tolerance to delays andtrajectory deviations of certain dimensions (the bigger the buffer the biggerthe dimensions tolerable), thus achieving a more stable flight route config-uration. In this case, the trade-off between the robustness and the capacityof the system must be taken into account.
• Network-level perturbations, which refer to those perturbations that are of-ten independent from the behaviour of the AUs and generally affect a largeset of trajectories or even the entire network, e.g., convective weather andvolcanic ash, among others. In the presence of network-level perturbations,such as a dangerous storm that forces the NM to close certain (demanded)
256 Chapter A. Further Explanations about the CD&R System
airspace sectors, the complete network route allocation must be reconsideredin real time. Note that in this case, the “bigger than necessary” buffers arenot helpful to mitigate the negative effects of the network-level perturba-tions and, in fact, the presence of these buffers can negatively contributein these cases (especially when a demanded sector is suddenly affected bya huge capacity reduction) due to the extra space and time required inthe airspace to safely allocate a certain flight trajectory. Thus, the beststrategy to tackle network-level perturbations is to initiate a new Collab-orative Flight Planning process in which the AUs can re-negotiate the useof the capacity actually available and adapt in consequence their airspacedemand through the generation of new flight trajectories planned (and stra-tegically de-conflicted) in real-time.
Note that the strategic de-confliction system proposed in this research is compat-ible with most of the current flight surveillance and tactical conflict managementpractices as well as with the on-board collision avoidance systems (i.e., TCAS).Thus, with the CD&R system proposed the air traffic can still be protected bythree different layers of conflict management (i.e., strategic, tactical and opera-tional) that may reduce the negative impact of uncertainty in the ATM safetylevels.
Appendix B
SESAR Young Scientist Award2012 Certificate
257

258 Chapter B. SESAR Young Scientist Award 2012 Certificate
259
Figura B.1: SESAR Young Scientist Award 2012 Certificate

260 Chapter B. SESAR Young Scientist Award 2012 Certificate
List of Acronyms
4D Four Dimension
4DTRAD 4D Trajectory Datalink Services
ADS-B Automatic Dependent Surveillance - Broadcast
ALG Advanced Logistics Group
AMAN Arrival MANager
ANS Air Navigation Services
ANS Air Navigation Services
ANSP Air Navigation Service Provider
ASAS Airborne Separation Assurance System
ASM Air Space organization and Management
ATC Air Traffic Control
ATCO Air Traffic Control Officer
ATFCM Air Traffic Flow and Capacity Management
ATM Air Traffic Management
AU Airspace User
BDT Business Development Trajectory
BR&TE Boeing Research and Technology Europe
BT Business Trajectory
CCD Continous Climbing Departure
CD Conflict Detection
261

262 Chapter B. SESAR Young Scientist Award 2012 Certificate
CD&R Conflict Detection and Resolution
CDA Continous Descent Approach
CDM Collaborative Decision Making
CFMU Central Flow Management Unit
CNS Communication, Navigation and Surveillance
CPDLC Controller Pilot Data Link Communication
CPU Central Process Unit
CR Conflict Resolution
CTA Controlled Time of Arrival
CTO Controlled Time Over
CTOT Controlled Take-Off Time
DCB Demand and Capacity Balancing
DMAN Departure MANager
DST Decision Support Tool
ETD Expected Time of Departure
FL Flight Level
FLC Flight Level Change
FMS Flight Management System
FPL Filled Flight Plan
FUA Flexible Use of Airspace
GNSS Global Navigation Satellite System
GOA Geometric Optimization Approach
HAC Heading Angle Change
ICAO International Civil Aviation Organization
ICS Interaction Causal Solver
263
INAP Integrated Network Management and extended ATC Planning Func-tion
LTCD&R Long Term Conflict Detection and Resolution
MET Meteorological services
MIPS Millions Instructions Per Second
MTCD Medium Term Conflict Detection
MTCD&R Medium Term Conflict Detection and Resolution
NM Nautical Mile
NM Network Manager
NOP Network Operations Plan
NP Non-deterministic Polynomial
P-RNAV Precision aRea NAVigation
PHARE Programme for Harmonised ATM Research in EUROCONTROL
RBT Reference Business Trajectory
RNAV aRea NAVigation
RNP Required Navigation Performance
RSDS Relational Spatial Data Structure
RTG Resolution Trajectory Generator
RTSDS Relational Time-Spatial Data Structure
SBT Shared Business Trajectory
SC Speed Change
SCTA Short Term Conflict Alert
SDS Spatial Data Structure
SESAR Single European Sky ATM Research
SS State-Space
STCD&R Short Term Conflict Detection and Resolution
264 Chapter B. SESAR Young Scientist Award 2012 Certificate
STREAM Strategic Trajectory de-confliction to Enable seamless Aircraft con-flict Management
SWIM System Wide Information Management
TBOs Trajectory-Based Operations
TCAS Traffic Collision Avoidance System
TMA Terminal Manoeuvring Area
TMR Trajectory Management Requirements
ToC Top of Climb
ToD Top of Descent
TP Trajectory Predictor
TPAS Test-bed Platform for ATM Studies
TSDS Time-Spatial Data Structure
TTA Target Time of Arrival
TTO Target Time Over
TTOT Target Take-Off Time
UAB Universitat Autònoma de Barcelona
UDPP User Driven Prioritization Process
WP-E Work Package E
WPE Wind Prediction Errors
Bibliography
[1] http://complexworld.eu/wiki/Uncertainty_in_ATM.
[2] Alfons Geser, César Muñoz, Gilles Dowek, and Florent Kirchner. Air trafficconflict resolution and recovery, May 2002.
[3] Ali Maor. Trigonometric Delights. Princeton University Press, 1998.
[4] Andrew Cook. European Air Traffic Management. Ashgate, UK, 2007.
[5] Andrew Cook. The fourth dimension: Implementing 4D aircraft trajector-ies. Navigation News, The magazine of the Royal Institute of Navigation,(January/February):p.17–20, 2010.
[6] A.V.Aho, J.E.Hopcroft, and J.D.Ullman. Data Structures and Algorithms.Pearson„ 1998.
[7] K. Bilimoria and H.Q. Lee. Properties of air traffic conflicts for free andstructured routing. August 2001.
[8] Karl D. Bilimoria. A geometric optimization approach to aircraft conflictresolution. 2000.
[9] T. Blajev. Wake vortex turbulence. Hindsight (EUROCONTROL), (Janu-ary):p.18, 2006.
[10] Cem Cetek. Realistic speed change maneuvers for air traffic conflict avoid-ance and their impact on aircarft economics. International Journal of CivilAviation, Vol.1(No.1: E5), 2009.
[11] Christos G. Panayiotou and Christos G. Cassandras. A sample path ap-proach for solving the ground-holding policy problem in air traffic control.In In Proc. 38th IEEE Conference on Decision and Control, Phoenix, AZ,USA, 1999.
[12] Craig W. Reynolds. Interaction with groups of autonomous characters. InGame Developers Conference 2000, pages 449–460, 2000.
265
266 BIBLIOGRAPHY
[13] Craig W. Reynolds. Big fast crowds on PS3. In Sandbox Symposium, 2006.
[14] D. Bertsimas and S. Stock Patterson. The air traffic flow managementproblem with enroute capacities. Operations Research, (46):pp.406–422,1998.
[15] C.E Dole. Flight Theory for Pilots. Jeppesen, Englewood, 4th ed. edition,1994.
[16] Nicolas Durand. Algorithmes Génétiques et autres méthodes d’optimisationappliqués à la gestion de trafic aérien. PhD thesis, Thèse d’habilitation,2004.
[17] Heinz Erzberger, Russell A. Paielli, Douglas R. Isaacson, and Michelle M.Eshow. Conflict Detection and Resolution In the Presence of PredictionError. 1997.
[18] EUROCONTROL. http://www.eurocontrol.int.
[19] EUROCONTROL. PHARE highly interactive problem solver version 4 APIdefinitions, 1997.
[20] EUROCONTROL. Operational requirements for trajectory prediction forEATCHIP phase III, 1998.
[21] EUROCONTROL. NLR PHARE demonstration 3 final report, 2000.
[22] EUROCONTROL. Study of constraints to growth, 2001.
[23] EUROCONTROL. MTCD algorithms overview, 2002.
[24] EUROCONTROL. Towards a controller-based conflict resolution tool - aliterature review, 2002.
[25] EUROCONTROL. Challenges to Growth, 2004.
[26] EUROCONTROL. Interoperability requirements document (IRD) - me-dium term conflict detection & resolution (MTCD&R), 2006.
[27] EUROCONTROL. FASTI baseline description, 2007.
[28] EUROCONTROL. FASTI operational concept, March 2007.
[29] EUROCONTROL. Surveillance: A decade of developments. Skyway, (No.46):p.76–84, 2007.
[30] EUROCONTROL. Challenges of Growth 2008, 2008.
BIBLIOGRAPHY 267
[31] EUROCONTROL. Long-Term Forecast: Flight Movements 2007-2030,2008.
[32] EUROCONTROL. ATM Airport Performance (ATMAP) Framework, di-ciembre 2009.
[33] EUROCONTROL. Specification for short term conflict alert, edition 1.1,May 2009.
[34] EUROCONTROL. Business Aviation in Europe 2009, volume Vol.6 ofEUROCONTROL Trends in Air Traffic. 2010.
[35] EUROCONTROL. Specification for medium-term conflict detection, 2010.
[36] EUROCONTROL. STREAM concept of operations, deliverable 1.1,September 2011.
[37] EUROCONTROL. STREAM preliminary technical descriptions, deliver-able 2.1, December 2011.
[38] EUROCONTROL. CODA digest - delays to air transport in europe, Novem-ber 2012.
[39] EUROCONTROL. European network operations plan 2012-2014, 2012.
[40] EUROCONTROL. European route network improvement plan. part 3: Air-space management handbook, 2012.
[41] EUROCONTROL. Free route developments in europe, February 2012.
[42] EUROCONTROL. SESAR concept of operations step 1, May 2012.
[43] EUROCONTROL. STREAM development of advanced algorithms, deliv-erable 2.2, December 2012.
[44] EUROCONTROL. STREAM final metrics and methodology, deliverable3.2, November 2012.
[45] EUROCONTROL. STREAM preliminary performance assessment, deliv-erable 4.1, March 2012.
[46] EUROCONTROL. PERFORMANCE REVIEW REPORT an assessmentof air traffic management in europe during the calendar year 2012, March2013.
[47] EUROCONTROL. SESAR concept of operations step 2, April 2013.
[48] EUROCONTROL. STREAM final performance assessment, deliverable 4.2,March 2013.
268 BIBLIOGRAPHY
[49] EUROSTAT. http://ec.europa.eu/eurostat.
[50] Fabrice Drogoul, Philippe Averty, and Rosa Weber. ERASMUS strategicdeconfliction to benefit SESAR. In Eighth USA/Europe Air Traffic Man-agement Research and Development Seminar (ATM2009), 2009.
[51] Geser, A. and Munoz, C. A geometric approach to strategic conflict detec-tion and resolution. In Proc. of Digital Avionics Systems Conference, 2002.,2002.
[52] Gilles Dowek, Alfons Geser, and César Muñoz. Tactical conflict detectionand resolution in a 3-d airspace. In 4th USA/Europe Air Traffic ManagementResearch and Development Seminar, Santa Fe, December 2001.
[53] Geraud Granger, Nicolas Durand, and Jean-marc Alliot. Optimal resolutionof en route conflicts. In In 4th USA/Europe Air Traffic Management R&DSeminar (ATM-2001). Santa Fe, 2001.
[54] Group for Research in Turbulence and Vertical Flows,. UCL operationaltools for predicting aircraft wake vortex transport and decay: The determ-inistic/Probabilistic wake vortex models (DVM/PVM) and the WAKE4Dplatform. Technical Report v. 2.2, 2010.
[55] Heinz Erzberger. Automated conflict resolution for air traffic control. In 25thInternational Congress of the Aeronautical Science, Hamburg, Germany„2006.
[56] ICAO. Air traffic services planning manual, part II, methods of applicationemployed by air traffic services (doc 9426), 1992.
[57] ICAO. Procedures for Air Navigation Services - Aircrafts Operations. (Doc8168), 2005.
[58] ICAO. Procedures for air navigation services - air traffic management, 2007.
[59] ICAO. Policies on charges for airports and air navigation services, 8thedition, (doc 9082), 2009.
[60] Isaacson, D.R. and Erzberger, H. Design of a conflict detection algorithmfor the Center/TRACON automation system. In Digital Avionics SystemsConference, Irvine, CA, October 1997.
[61] J. Krozel, M. Peters, K. D. Bilimoria, C. Lee, and J. S. B. Mitchell. Sys-tem performance characteristics of centralized and decentralized air trafficseparation strategies. 2001.
BIBLIOGRAPHY 269
[62] J. Lygeros and N. Lynch. On the formal verification of the TCAS conflictresolution algorithms. In In Proc. of the 36th Conf. on Decision and Control,pages pp.1829 – 1834, San Diego CA, December 1997.
[63] James Alexander. Loxodromes: A rhumb way to go. Mathematics Magazineof the Mathematical Association of America, 2004.
[64] James K. Kuchar and Lee C. Yang. Survey conflict detection resolutionmodeling methods. In AIAA Guidance, Navigation, and Control Conf.,New Orleans, LA, August 1997.
[65] James K. Kuchar and Lee C. Yang. A review of conflict detection and resol-ution modeling methods. IEEE Transactions on Intelligent TransportationSystems, Vol.I(No.4):pp.179–189, December 2000.
[66] Matt R. Jardin. Air traffic conflict models. Chicago, September 2004.
[67] Jelena Djokic, Bernd Lorenz, and Hartmut Fricke. Air traffic control com-plexity as workload driver. Transportation Research Part C: Emerging Tech-nologies, 18(6):930–936, 2010.
[68] J.I. Peláez Sánchez. Análisis y diseño de algoritmos: un enfoque teórico ypráctico. Universidad de Málaga, 2003.
[69] K. D. Bilimoria, K. S. Sheth, H. Q. Lee, and S. R. Grabbe. Performanceevaluation of aircraft separation assurance for free flight. 2000.
[70] K. Ogata. Discrete-Time Control Systems. Prentice Hall, 2nd ed. edition,1995.
[71] Klooster, J., Torres, S., Earman, D., Castillo-Effen, M., Subbu, R., Kam-mer, L., Chan, D., and Tomlinson, T. Trajectory synchronization and ne-gotiation in trajectory based operations. 2010.
[72] Koen De Cleyn and Dennis Hart. Forecast based Wake Turbulence Separa-tion. TU Delft, October 2011.
[73] Kopardekar., P., Bilimoria, K., and Sridhar, B. Initial concepts for dynamicairspace configuration. 2007.
[74] M. Kupfer, T.Farley, Y. Chu, and H. Erzberger. Automated conflict resolu-tion - a simulation-based sensitivity study of airspace and demand. In Proc.26th International Congress of the Aeronautical Sciences (ICAS), 2008.
[75] María Prandini and Oliver J. Watkins. Probabilistic aircraft conflict detec-tion, May 2005. Project: HYBRIDGE.
270 BIBLIOGRAPHY
[76] Colin Meckiff, Renaud Chone, and Jean-Pierre Nicolaon. The tactical loadsmoother for multi-sector planning. December 1998.
[77] Michael A. Bolender and G.L. Slater. Evaluation of scheduling methods formultiple runways, 1996.
[78] NATS. Acting Responsibly: NATS and the Environment 2009, 2009.
[79] Nicola Cavanagh, Norliza Nordeen, and John Dow. Terms and definitionsused in airport capacity studies, 2008.
[80] Ning Xu, George Donohue, Kathryn Blackmond Laskey, and Chun-HungChen. Estimation of delay propagation in the national aviation system usingbayesian networks. In Proceeedings of 6th ATM Seminar, Baltimore, MD,USA, 2005.
[81] Jenaro Nosedal, Sergio Ruiz, Miquel Piera, Andrea Ranieri, Rubén Mar-tinez, and Álex Corbacho. Causal decision support tools for strategictrajectory de-confliction to enable seamless aircraft conflict management(STREAM). TU Braunschweig and DLR, Braunschweig, 2012.
[82] O. Desenfans, T. Lonls, G. Winckelmans, and F. Holzapfel. Descriptionof probabilistic wake predictors adapted to cruise flight. Technical report,Universite catholique de Louvain (UCL) and DLR, 2007.
[83] P.B.M Vranas, D. Bertsimas, and A.R. Odoni. Dynamic gound-holdingpolicies for a net- work of airports. Transportation Science, (28):pp.275–291, 1994.
[84] Pina, P., de Pablo, J.M., and Mas, M. Linking existing on ground, arrivaland departure operations. 2001.
[85] Thomas Prevot, Stephen Shelden, and Joey Mercer. ATM concept integrat-ing trajectory-orientation and airborne separation assistance in the presenceof time-based traffic flow management. In In Proceedings of the 22nd DigitalAvionics Systems Conference, 2003.
[86] R. Ehrmanntraut, Hartmut Fricke (supervisor), and Hansjurgen Frhr. vonVilliez (supervisor). Full Automation of Air Traffic Management in HighComplexity Airspace. PhD thesis, Technischen Universitat Dresden, March2010.
[87] Raja Parasuraman, Thomas B. Sheridan, and Christopher D. Wickens. Amodel for types and levels of human interaction with automation. IEEETransactions on Systems, Man, and Cybernetics —Part A: Systems andHuman, May 2000.
BIBLIOGRAPHY 271
[88] Andrea Ranieri, Rubén Martinez, Miquel A. Piera, Javier Lopez, and MiguelVilaplana. Strategic trajectory de-confliction to enable seamless aircraftconflict management (WP-E project STREAM). ENAC (Toulouse), Octo-ber 2011.
[89] S. Ruiz and M. Piera. Relational time-space data structure to enable stra-tegic de-confliction with a global scope in the presence of a large number of4D trajectories. Journal of Aerospace Operations, 2013.
[90] Sergio Ruiz, Jenaro Nosedal, Miquel A. Piera, and Andrea Ranieri. Strategicde-confliction in the presence of a large number of 4D trajectories usinga causal modeling approach. Transportation Research Part C: EmergingTechnologies, 2013.
[91] Sergio Ruiz, Miquel Piera, and Catya Zúñiga. Relational time-space datastructure to speed up conflict detection under heavy traffic conditions.ENAC (Toulouse), December 2011.
[92] Sergio Ruiz, Miquel Piera, and Catya Zúñiga. Computational efficient con-flict detection and resolution through spatial data structures. In Proc. of In-ternational Conferences on Research in Air Transportation 2012 (ICRAT),Berkley, CA, USA, May 2012.
[93] Sergio Ruiz, Miquel A. Piera, and Isabel del Pozo. A medium term conflictdetection and resolution system for TMA based on spatial data structuresand 4D trajectories. Transportation Research Part C: Emerging Technolo-gies, (26):396–417, 2013.
[94] Russell A. Paielli. Tactical conflict resolution using vertical maneuvers inenroute airspace. AIAA Journal of Aircraft, Vol. 45(No. 6), December 2008.
[95] S. Baase. Computer algorithms. Addison-Wesley, 2on edition edition, 1988.
[96] Hanan Samet. Applications of Spatial Data Structures. Addison-Wesley,1989.
[97] Hanan Samet. The design and analysis of spatial data structures. Addison-Wesley, 1990.
[98] Hanan Samet. Spatial Data Structures. Addison-Wesley, 1995.
[99] SESAR Consortium. The air transport framework: The current situation -SESAR definition phase, deliverable 1, July 2006.
[100] SESAR Consortium. The performance targets - SESAR definition phase,deliverable 2, December 2006.
272 BIBLIOGRAPHY
[101] SESAR Consortium. The ATM target concept - SESAR definition phase,deliverable 3, September 2007.
[102] SESAR Consortium. The ATM deployment sequence - SESAR definitionphase, deliverable 4, February 2008.
[103] SESAR Consortium. The SESAR master plan - SESAR definition phase,deliverable 5, April 2008.
[104] SESAR Consortium. The work programme for 2008-2013 - SESAR defini-tion phase, deliverable 6, April 2008.
[105] SESAR Consortium. European ATM master plan, edition 2, October 2012.
[106] SESAR Joint Undertaking. http://www.sesarju.eu.
[107] Thomas Prevot, Vernol Battiste, Everett Palmer, and Stephen Shelden. Airtraffic concept utilizing 4D trajectories and airbone separation assistance. InAIAA Guidance, Navigation, and Control Conference and Exhibit, Austin,TX, USA, 2003.
[108] Todd Farley, Michael Kupfer, and Heinz Erzberger. Automated conflictresolution: A simulation evaluation under high demand including mergingarrivals. In Proc. 6th USA/Europe ATM Research and Development Sem-inar, Baltimore, MD, USA, 2007.
[109] Wiegele, A, Rahm, S, and Smalikho, I. Ground-based and air-borne lidarfor wake vortex detection and characterisation. Technical Report DLR-FB–2008-15, DLR, 2008.
[110] Zelinski, S and Jastrzebski, M. Defining dynamic route structure for airspaceconfiguration. 2012.
[111] Catya A. Zúñiga, Miquel A. Piera, Sergio Ruiz, and Isabel del Pozo. ACD&CR causal model based on path shortening/path stretching techniques.Elsevier Transportation Research: part C, 2010.