status of heavy metal residues in fish species of pakistan
TRANSCRIPT
Volume 230
David M. Whitacre Editor
With Cumulative and Comprehensive Index Subjects Covered Volumes 221–230

Reviews ofEnvironmental Contamination
and Toxicology
VOLUME 230
For further volumes: http://www.springer.com/series/398

Reviews ofEnvironmental Contamination
and Toxicology
With Cumulative and Comprehensive Index Subjects Covered Volumes 221–230
EditorDavid M. Whitacre
Editorial BoardMaria Fernanda, Cavieres, Valparaiso, Chile • Charles P. Gerba, Tucson, Arizona, USA
John Giesy, Saskatoon, Saskatchewan, Canada • O. Hutzinger, Bayreuth, Germany
James B. Knaak, Getzville, New York, USA
James T. Stevens, Winston-Salem, North Carolina, USA
Ronald S. Tjeerdema, Davis, California, USA • Pim de Voogt, Amsterdam, The Netherlands
George W. Ware, Tucson, Arizona, USA
Founding EditorFrancis A. Gunther
VOLUME 230
ISSN 0179-5953 ISSN 2197-6554 (electronic)ISBN 978-3-319-04410-1 ISBN 978-3-319-04411-8 (eBook) DOI 10.1007/978-3-319-04411-8 Springer Cham Heidelberg New York Dordrecht London
© Springer International Publishing Switzerland 2014 This work is subject to copyright. All rights are reserved by the Publisher, whether the whole or part of the material is concerned, specifi cally the rights of translation, reprinting, reuse of illustrations, recitation, broadcasting, reproduction on microfi lms or in any other physical way, and transmission or information storage and retrieval, electronic adaptation, computer software, or by similar or dissimilar methodology now known or hereafter developed. Exempted from this legal reservation are brief excerpts in connection with reviews or scholarly analysis or material supplied specifi cally for the purpose of being entered and executed on a computer system, for exclusive use by the purchaser of the work. Duplication of this publication or parts thereof is permitted only under the provisions of the Copyright Law of the Publisher’s location, in its current version, and permission for use must always be obtained from Springer. Permissions for use may be obtained through RightsLink at the Copyright Clearance Center. Violations are liable to prosecution under the respective Copyright Law. The use of general descriptive names, registered names, trademarks, service marks, etc. in this publication does not imply, even in the absence of a specifi c statement, that such names are exempt from the relevant protective laws and regulations and therefore free for general use. While the advice and information in this book are believed to be true and accurate at the date of publication, neither the authors nor the editors nor the publisher can accept any legal responsibility for any errors or omissions that may be made. The publisher makes no warranty, express or implied, with respect to the material contained herein.
Printed on acid-free paper
Springer is part of Springer Science+Business Media (www.springer.com)
Coordinating Board of Editors
Dr. David M. Whitacre, EditorReviews of Environmental Contamination and Toxicology
5115 Bunch RoadSummerfi eld, North Carolina 27358, USA
(336) 634-2131 (PHONE and FAX)E-mail: [email protected]
Dr. Erin R. Bennett, EditorBulletin of Environmental Contamination and Toxicology
Great Lakes Institute for Environmental Research
University of WindsorWindsor, Ontario, Canada
E-mail: [email protected]
Peter S. Ross, EditorArchives of Environmental Contamination and Toxicology
Fisheries and Oceans CanadaInstitute of Ocean Sciences Sidney
British Colombia, CanadaE-mail: [email protected]
v
Foreword
International concern in scientifi c, industrial, and governmental communities over traces of xenobiotics in foods and in both abiotic and biotic environments has justi-fi ed the present triumvirate of specialized publications in this fi eld: comprehensive reviews, rapidly published research papers and progress reports, and archival docu-mentations. These three international publications are integrated and scheduled to provide the coherency essential for nonduplicative and current progress in a fi eld as dynamic and complex as environmental contamination and toxicology. This series is reserved exclusively for the diversifi ed literature on “toxic” chemicals in our food, our feeds, our homes, recreational and working surroundings, our domestic animals, our wildlife, and ourselves. Tremendous efforts worldwide have been mobilized to evaluate the nature, presence, magnitude, fate, and toxicology of the chemicals loosed upon the Earth. Among the sequelae of this broad new emphasis is an undeniable need for an articulated set of authoritative publications, where one can fi nd the latest important world literature produced by these emerging areas of science together with documentation of pertinent ancillary legislation.
Research directors and legislative or administrative advisers do not have the time to scan the escalating number of technical publications that may contain articles important to current responsibility. Rather, these individuals need the background provided by detailed reviews and the assurance that the latest information is made available to them, all with minimal literature searching. Similarly, the scientist assigned or attracted to a new problem is required to glean all literature pertinent to the task, to publish new developments or important new experimental details quickly, to inform others of fi ndings that might alter their own efforts, and eventu-ally to publish all his/her supporting data and conclusions for archival purposes.
In the fi elds of environmental contamination and toxicology, the sum of these concerns and responsibilities is decisively addressed by the uniform, encompassing, and timely publication format of the Springer triumvirate:
Reviews of Environmental Contamination and Toxicology [Vol. 1 through 97 (1962–1986) as Residue Reviews] for detailed review articles concerned with any
vi
aspects of chemical contaminants, including pesticides, in the total environment with toxicological considerations and consequences.
Bulletin of Environmental Contamination and Toxicology (Vol. 1 in 1966) for rapid publication of short reports of signifi cant advances and discoveries in the fi elds of air, soil, water, and food contamination and pollution as well as method-ology and other disciplines concerned with the introduction, presence, and effects of toxicants in the total environment.
Archives of Environmental Contamination and Toxicology (Vol. 1 in 1973) for important complete articles emphasizing and describing original experimental or theoretical research work pertaining to the scientifi c aspects of chemical con-taminants in the environment.
Manuscripts for Reviews and the Archives are in identical formats and are peer reviewed by scientists in the fi eld for adequacy and value; manuscripts for the Bulletin are also reviewed, but are published by photo-offset from camera-ready copy to provide the latest results with minimum delay. The individual editors of these three publications comprise the joint Coordinating Board of Editors with referral within the board of manuscripts submitted to one publication but deemed by major emphasis or length more suitable for one of the others.
Coordinating Board of Editors
Foreword
vii
Preface
The role of Reviews is to publish detailed scientifi c review articles on all aspects of environmental contamination and associated toxicological consequences. Such arti-cles facilitate the often complex task of accessing and interpreting cogent scientifi c data within the confi nes of one or more closely related research fi elds.
In the nearly 50 years since Reviews of Environmental Contamination and Toxicology ( formerly Residue Reviews) was fi rst published, the number, scope, and complexity of environmental pollution incidents have grown unabated. During this entire period, the emphasis has been on publishing articles that address the presence and toxicity of environmental contaminants. New research is published each year on a myriad of environmental pollution issues facing people worldwide. This fact, and the routine discovery and reporting of new environmental contamination cases, cre-ates an increasingly important function for Reviews.
The staggering volume of scientifi c literature demands remedy by which data can be synthesized and made available to readers in an abridged form. Reviews addresses this need and provides detailed reviews worldwide to key scientists and science or policy administrators, whether employed by government, universities, or the private sector.
There is a panoply of environmental issues and concerns on which many scien-tists have focused their research in past years. The scope of this list is quite broad, encompassing environmental events globally that affect marine and terrestrial eco-systems; biotic and abiotic environments; impacts on plants, humans, and wildlife; and pollutants, both chemical and radioactive; as well as the ravages of environmen-tal disease in virtually all environmental media (soil, water, air). New or enhanced safety and environmental concerns have emerged in the last decade to be added to incidents covered by the media, studied by scientists, and addressed by governmen-tal and private institutions. Among these are events so striking that they are creating a paradigm shift. Two in particular are at the center of everincreasing media as well as scientifi c attention: bioterrorism and global warming. Unfortunately, these very worrisome issues are now superimposed on the already extensive list of ongoing environmental challenges.
viii
The ultimate role of publishing scientifi c research is to enhance understanding of the environment in ways that allow the public to be better informed. The term “informed public” as used by Thomas Jefferson in the age of enlightenment con-veyed the thought of soundness and good judgment. In the modern sense, being “well informed” has the narrower meaning of having access to suffi cient informa-tion. Because the public still gets most of its information on science and technology from TV news and reports, the role for scientists as interpreters and brokers of sci-entifi c information to the public will grow rather than diminish. Environmentalism is the newest global political force, resulting in the emergence of multinational con-sortia to control pollution and the evolution of the environmental ethic.Will the new politics of the twenty-fi rst century involve a consortium of technologists and envi-ronmentalists, or a progressive confrontation? These matters are of genuine concern to governmental agencies and legislative bodies around the world.
For those who make the decisions about how our planet is managed, there is an ongoing need for continual surveillance and intelligent controls to avoid endanger-ing the environment, public health, and wildlife. Ensuring safety-in-use of the many chemicals involved in our highly industrialized culture is a dynamic challenge, for the old, established materials are continually being displaced by newly developed molecules more acceptable to federal and state regulatory agencies, public health offi cials, and environmentalists.
Reviews publishes synoptic articles designed to treat the presence, fate, and, if possible, the safety of xenobiotics in any segment of the environment. These reviews can be either general or specifi c, but properly lie in the domains of analytical chem-istry and its methodology, biochemistry, human and animal medicine, legislation, pharmacology, physiology, toxicology, and regulation. Certain affairs in food tech-nology concerned specifi cally with pesticide and other food-additive problems may also be appropriate.
Because manuscripts are published in the order in which they are received in fi nal form, it may seem that some important aspects have been neglected at times. However, these apparent omissions are recognized, and pertinent manuscripts are likely in preparation or planned. The fi eld is so very large and the interests in it are so varied that the editor and the editorial board earnestly solicit authors and sugges-tions of underrepresented topics to make this international book series yet more useful and worthwhile.
Justifi cation for the preparation of any review for this book series is that it deals with some aspect of the many real problems arising from the presence of foreign chemicals in our surroundings. Thus, manuscripts may encompass case studies from any country. Food additives, including pesticides, or their metabolites that may persist into human food and animal feeds are within this scope. Additionally, chemi-cal contamination in any manner of air, water, soil, or plant or animal life is within these objectives and their purview.
Preface

ix
Manuscripts are often contributed by invitation. However, nominations for new topics or topics in areas that are rapidly advancing are welcome. Preliminary com-munication with the editor is recommended before volunteered review manuscripts are submitted.
Summerfi eld, NC, USA David M. Whitacre
Preface

xi
Contents
Removal of Vapor-Phase Elemental Mercury from Stack Emissions with Sulfur- Impregnated Activated Carbon .......... 1 Mohammad Hossein Sowlat, Mohammad Abdollahi, Hamed Gharibi, Masud Yunesian, and Noushin Rastkari
Setting Water Quality Criteria in China: Approaches for Developing Species Sensitivity Distributions for Metals and Metalloids ....................................................... 35 Yuedan Liu, Fengchang Wu, Yunsong Mu, Chenglian Feng, Yixiang Fang, Lulu Chen, and John P. Giesy
Toxicity Reference Values for Protecting Aquatic Birds in China from the Effects of Polychlorinated Biphenyls ............................. 59 Hailei Su, Fengchang Wu, Ruiqing Zhang, Xiaoli Zhao, Yunsong Mu, Chenglian Feng, and John P. Giesy
Fabricated Nanoparticles: Current Status and Potential Phytotoxic Threats .................................................................. 83 Tushar Yadav, Alka A. Mungray, and Arvind K. Mungray
Status of Heavy Metal Residues in Fish Species of Pakistan ...................... 111 Majid Hussain, Said Muhammad, Riffat N. Malik, Muhammad U. Khan, and Umar Farooq
Index................................................................................ ................................. 133
1D.M. Whitacre (ed.), Reviews of Environmental Contamination and Toxicology Volume 230, Reviews of Environmental Contamination and Toxicology 230, DOI 10.1007/978-3-319-04411-8_1, © Springer International Publishing Switzerland 2014
Removal of Vapor-Phase Elemental Mercury from Stack Emissions with Sulfur- Impregnated Activated Carbon
Mohammad Hossein Sowlat , Mohammad Abdollahi , Hamed Gharibi , Masud Yunesian , and Noushin Rastkari
M. H. Sowlat • N. Rastkari (*) Center for Air Pollution Research (CAPR) , Institute for Environmental Research (IER), Tehran University of Medical Sciences , Kargar Shomali St. , Tehran , Iran e-mail: [email protected]
M. Abdollahi Faculty of Pharmacy, and Pharmaceutical Sciences Research Center, and Endocrinology & Metabolism Research Center , Tehran University of Medical Sciences , Enqelab Sq. , Tehran , Iran
H. Gharibi School of Public Health , Shahroud University of Medical Sciences , Shahroud , Iran
M. Yunesian Center for Air Pollution Research (CAPR) , Institute for Environmental Research (IER), Tehran University of Medical Sciences , Kargar Shomali St. , Tehran , Iran
Department of Environmental Health Engineering , School of Public Health, Tehran University of Medical Sciences , Enqelab Sq. , Tehran , Iran
Contents
1 Introduction .......................................................................................................................... 22 Review Approach and Methodology ................................................................................... 33 S-Impregnated AC for Removing Hg .................................................................................. 4
3.1 The Removal Effi ciency of Sulfur-Impregnated ACs vs. Virgin ACs ........................ 263.2 Effect of Operational Temperature ............................................................................. 273.3 Effect of Inlet Hg0 Concentration ............................................................................... 283.4 Effect of Sulfur-to-Carbon (S/C) Ratio and Sulfur Content ....................................... 283.5 Effect of Impregnation Temperature and Time ........................................................... 29
4 Summary .............................................................................................................................. 31References .................................................................................................................................. 32
2
1 Introduction
Mercury (Hg) is a trace element that can cause severe health effects in exposed individuals. Clakson ( 1993 ) reported that the high solubility of mercury vapor in cell membranes results in its rapid absorption and transport to target tissues, including kidneys and brain. After wet or dry deposition on vegetation, Hg may reach the human body via food ingestion, where it is transported to target tissues and induces adverse effects (Berlin 1979 ). Hg is listed as a hazardous air pollutant (HAP) in the US Clean Air Act Amendments (CAAA) of 1990, mainly because of its severe public health and environmental affects. Approximately 2,500 t of Hg are emitted annually from natural sources, and another 3,500 t are emitted via anthropogenic sources, such as coal-fi red power plants and solid waste combustors (Johnson 1997 ; Pacyna and Munch 1991 ). In the USA alone, 150 t of Hg is annually released from anthropogenic sources (Brenneman et al. 2000 ).
Hg is present in the stack emissions of coal-fi red power plants and solid waste combustors in three primary forms: elemental Hg (Hg 0 ); the oxidized form, e.g., mer-curic chloride (HgCl 2 ); and as particulate-bound Hg (Hg p ) (Galbreath and Zygarlicke 1996 ; Pavlish et al. 2003 ). Although Hg p can be captured by electrostatic precipita-tions (ESP) and the oxidized Hg form can be removed by fl ue gas desulfurization (FGD) or fabric fi lters (also called baghouse) (Galbreath and Zygarlicke 1996 ; Pavlish et al. 2003 ; Volland 1991 ), it is much more diffi cult to remove Hg 0 from stack emissions because of its low solubility in water, high equilibrium vapor pressure, and low melting point (Schroedor et al. 1991 ; Schuster 1991 ; Weast 1983 ).
Therefore, other methods have been proposed for controlling Hg 0 emissions, among which granular activated carbon (GAC) and powdered activated carbon (PAC) have shown promising results (Sinha and Walker 1972 ; Young et al. 1994 ). Despite their substantially high effi ciency for removing Hg 0 , activated carbons (ACs) have high operating costs (Cal et al. 2000 ; Dorman et al. 2002 ), necessitating remark-able improvements in their performance if they are to be economically viable. Early studies revealed that impregnation of ACs with sulfur signifi cantly increased the per-formance for removing Hg 0 from stack emissions (Sinha and Walker 1972 ). More recently, many studies have been conducted to explore the effect of different param-eters on the performance of sulfur-impregnated ACs for removing Hg 0 and to com-pare their effi ciency with virgin forms of AC. Notwithstanding, after performing a search of the literature, no systematic review was found that addressed the relative effi ciency of or effect of operational and impregnation parameters on virgin and sulfur-impregnated ACs for removing Hg 0 .
Therefore, our main objective in this chapter is to systematically review the existing data and evidence relating to the relative effi ciency of sulfur-impregnated ACs, vs. virgin ACs, for removing Hg 0 from sources of industrial stack emissions. A second goal is to present an overview of the effect of different operational and impregnation parameters on removal effi ciency of virgin and sulfur-impregnated ACs.
In preparing this chapter, we relied on the methods of Khan et al. ( 2003 ), which emphasize the importance of a systematic approach in preparing reviews. Utilizing such rigorous methods is designed to enhance the validity, trustworthiness, and strength of the conclusions presented (Green et al. 2001 ).
M.H. Sowlat et al.
3
2 Review Approach and Methodology
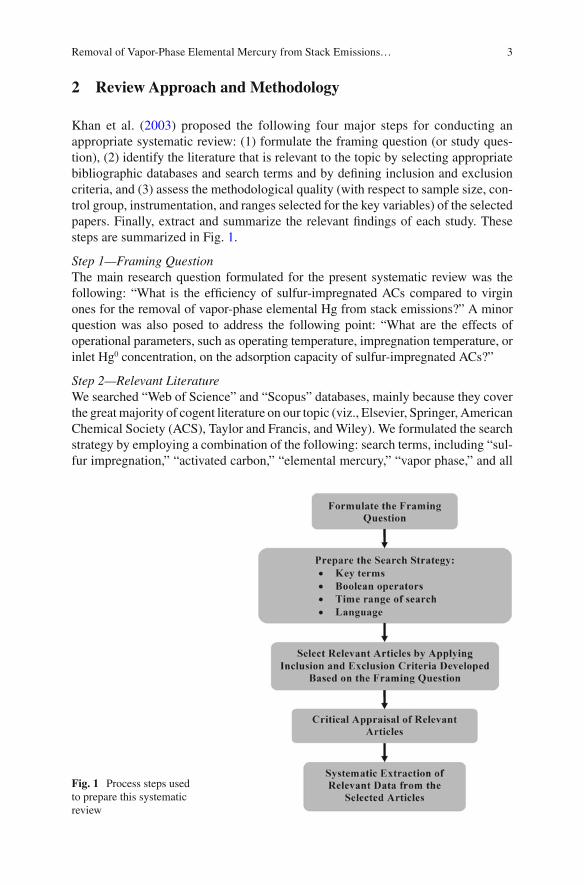
Khan et al. ( 2003 ) proposed the following four major steps for conducting an appropriate systematic review: (1) formulate the framing question (or study ques-tion), (2) identify the literature that is relevant to the topic by selecting appropriate bibliographic databases and search terms and by defi ning inclusion and exclusion criteria, and (3) assess the methodological quality (with respect to sample size, con-trol group, instrumentation, and ranges selected for the key variables) of the selected papers. Finally, extract and summarize the relevant fi ndings of each study. These steps are summarized in Fig. 1 .
Step 1—Framing Question The main research question formulated for the present systematic review was the following: “What is the effi ciency of sulfur-impregnated ACs compared to virgin ones for the removal of vapor-phase elemental Hg from stack emissions?” A minor question was also posed to address the following point: “What are the effects of operational parameters, such as operating temperature, impregnation temperature, or inlet Hg 0 concentration, on the adsorption capacity of sulfur-impregnated ACs?”
Step 2—Relevant Literature We searched “Web of Science” and “Scopus” databases, mainly because they cover the great majority of cogent literature on our topic (viz., Elsevier, Springer, American Chemical Society (ACS), Taylor and Francis, and Wiley). We formulated the search strategy by employing a combination of the following: search terms, including “sul-fur impregnation,” “activated carbon,” “elemental mercury,” “vapor phase,” and all
Fig. 1 Process steps used to prepare this systematic review
Removal of Vapor-Phase Elemental Mercury from Stack Emissions…
4
of their possible variations and synonyms, and Boolean operators, such as “AND,” “OR,” and “NOT.” The fi nal terms used in the search strategy were:
((mercury OR Hg OR “mercury vapor” OR “Hg vapor” OR “elemental mercury” OR “elemental Hg” OR “vapor phase mercury” OR “vapor phase Hg” OR “mercury emission” OR “Hg emission”) AND (capture OR sorption OR adsorption OR “adsorp-tion capacity” OR removal OR uptake OR “uptake capacity” OR “scavenging capac-ity”)) AND ((((“gaseous sulfur” OR SO 2 OR “sulfur dioxide” OR H 2 S OR “hydrogen sulfi de” OR sulfur OR “elemental sulfur” OR “organic sulfur”) AND (impregnat* OR deposit* OR chemisor* OR incorporat* OR fi xat*)) OR sulfuri?ed) AND (“activated carbon” OR AC OR “carbon sorbent” OR “granular activated carbon” OR GAC))
These databases were searched up to March 2012 using the above search strategy. To ensure that relevant papers were not missed, we reviewed the reference list of the retrieved papers for additional potentially relevant studies.
We defi ned inclusion criteria as being all original papers published in English that reported on the effi ciency of sulfur-impregnated ACs vs. virgin ones for removing gas-phase Hg 0 from stack emissions. We excluded papers published in any language other than English, those reporting fi ndings on any phase other than gas (such as liquid phase), studies conducted on ACs impregnated with other chemicals (halogens, for example), or those published on any other forms of Hg (e.g., oxidized forms). We also excluded studies in which sulfur impregnation of ACs was done without subsequent testing for Hg 0 removal or those not comparing the Hg 0 adsorption capacity of sulfur-impregnated ACs with virgin ones.
Step 3—Quality Assessment As stated earlier, we did not fi nd any systematic reviews that addressed sulfur- impregnated AC effi ciency for removing gas-phase Hg 0 . Therefore, we developed a checklist of fi ve questions that allowed us to rate the quality of each paper we included in this review. Each question in the checklist was allocated 1 point (Yes = 1 point, No = 0 point); thus, the overall quality scale ranged between 1 and 5 points, with stud-ies scoring 2 or less being rated as low quality, whereas those with 3 or higher being rated as high quality. We excluded all low-quality studies from our review. Finally, after assessing the quality of each included paper, information was extracted on impregnation parameters (i.e., S/C—sulfur to carbon—ratio, impregnation tempera-ture, impregnation time, and sulfur type), carbon characteristics (i.e., surface area, sulfur content, and pore volume) before and after the impregnation, operational set-tings (i.e., inlet Hg 0 concentration and bed temperature), and outcomes.
3 S-Impregnated AC for Removing Hg
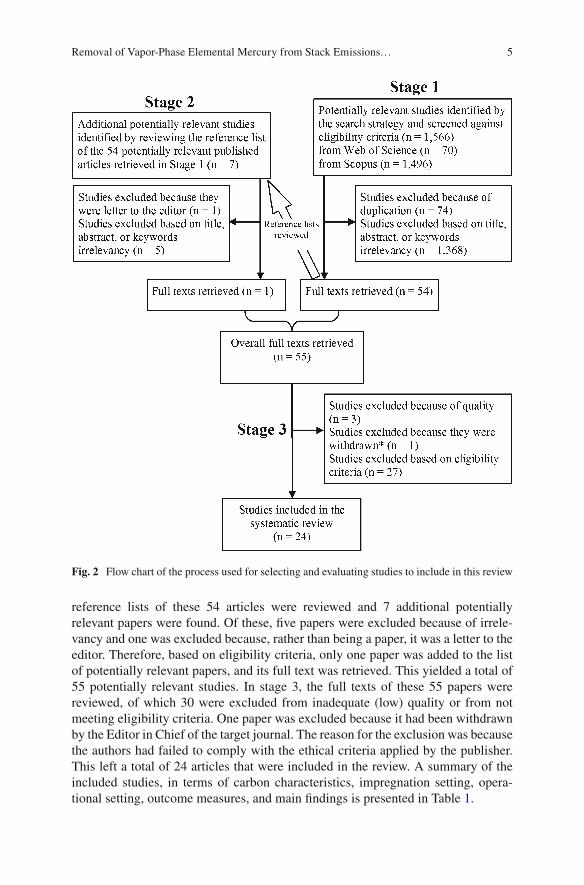
Figure 2 depicts the fl ow chart of the process used for selecting and evaluating studies to include in this review. As shown in this fi gure, our search strategy yielded a total of 1,566 hits: 70 from Web of Science and 1,496 from Scopus. In stage 1, duplica-tions (i.e., the same articles found in both databases) were removed; then, poten-tially relevant articles were screened against eligibility criteria, and their full texts were retrieved ( n = 54). In stage 2, to ensure that no relevant papers were missed, the
M.H. Sowlat et al.
5
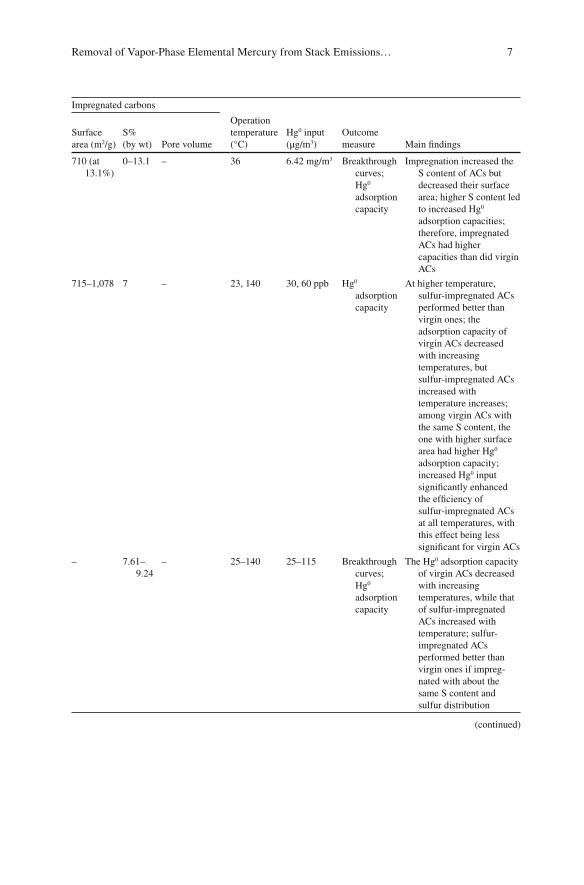
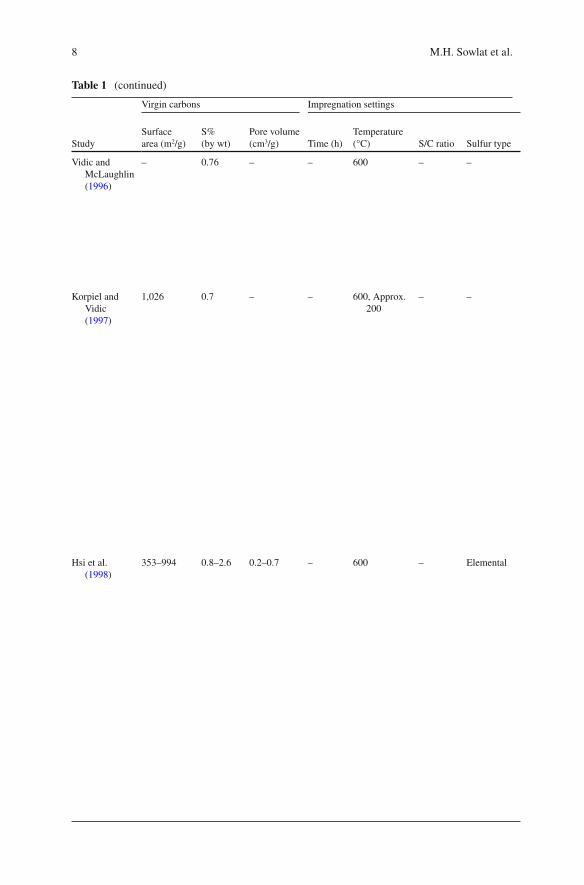
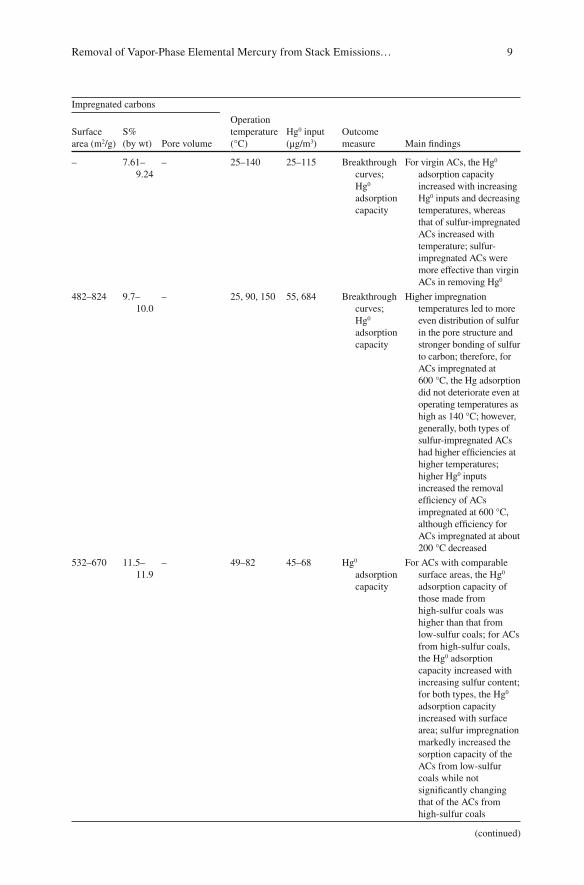
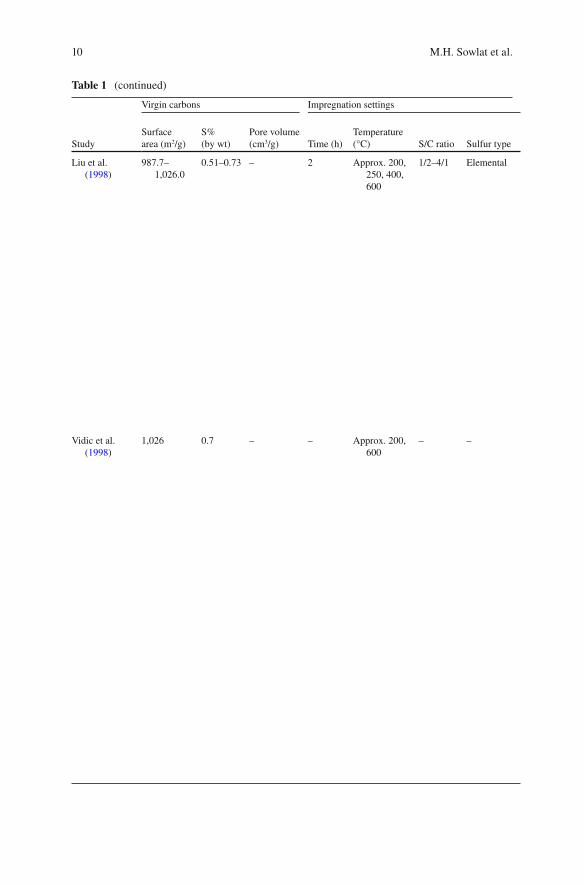
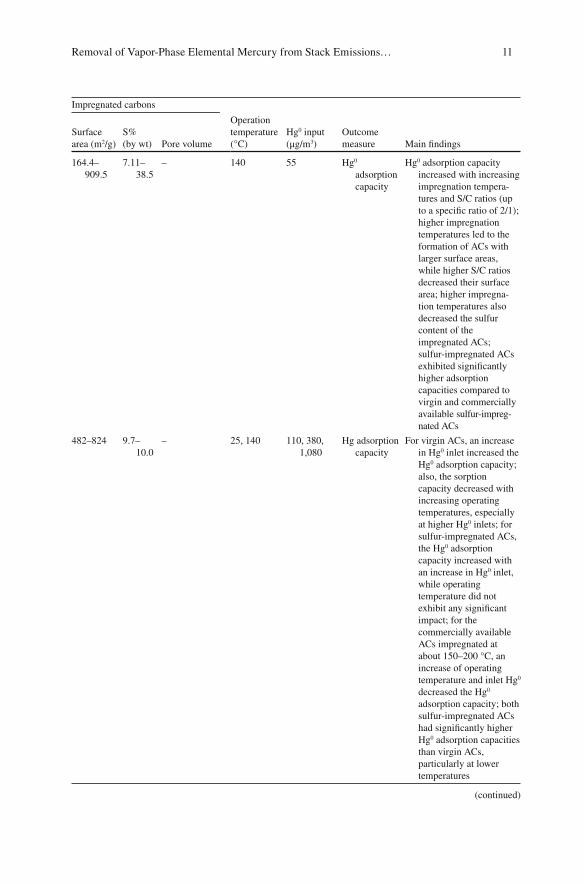
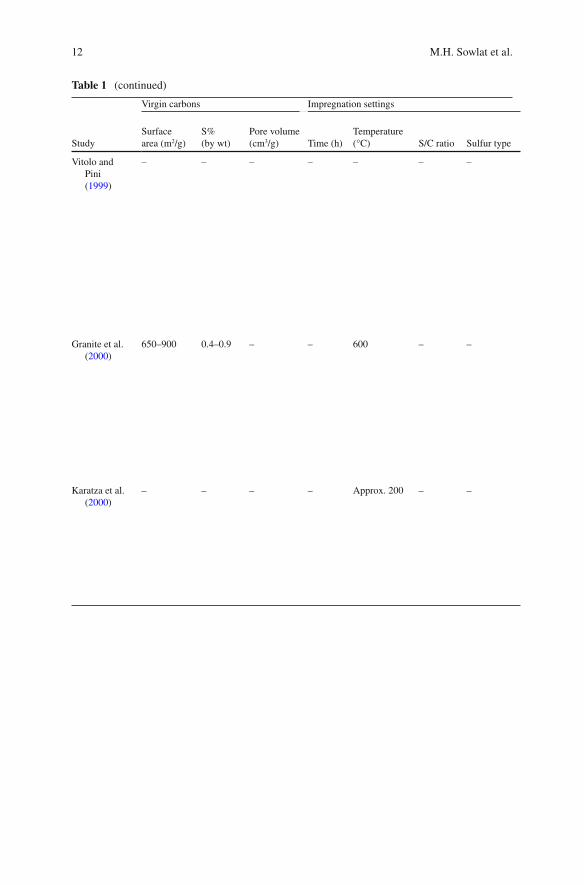
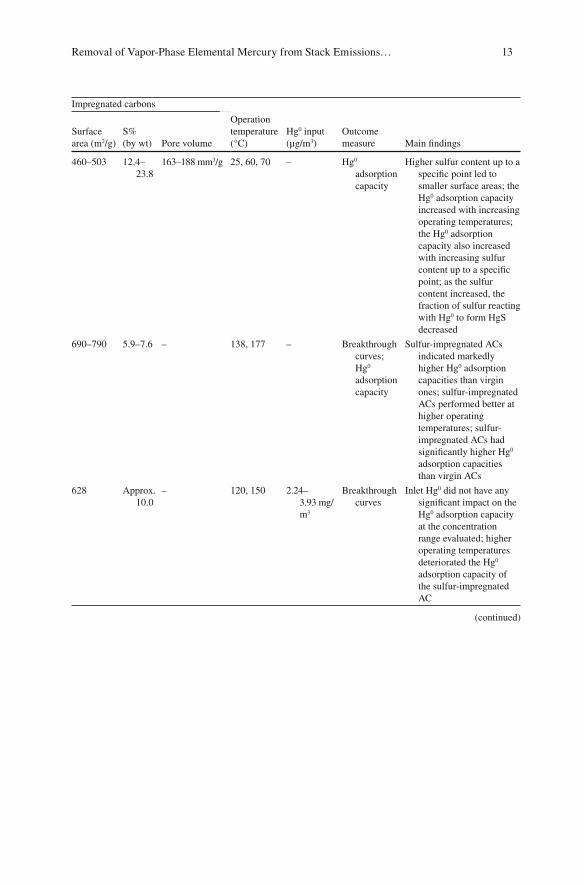
reference lists of these 54 articles were reviewed and 7 additional potentially relevant papers were found. Of these, fi ve papers were excluded because of irrele-vancy and one was excluded because, rather than being a paper, it was a letter to the editor. Therefore, based on eligibility criteria, only one paper was added to the list of potentially relevant papers, and its full text was retrieved. This yielded a total of 55 potentially relevant studies. In stage 3, the full texts of these 55 papers were reviewed, of which 30 were excluded from inadequate (low) quality or from not meeting eligibility criteria. One paper was excluded because it had been withdrawn by the Editor in Chief of the target journal. The reason for the exclusion was because the authors had failed to comply with the ethical criteria applied by the publisher. This left a total of 24 articles that were included in the review. A summary of the included studies, in terms of carbon characteristics, impregnation setting, opera-tional setting, outcome measures, and main fi ndings is presented in Table 1 .
Fig. 2 Flow chart of the process used for selecting and evaluating studies to include in this review
Removal of Vapor-Phase Elemental Mercury from Stack Emissions…

6
Study
Virgin carbons Impregnation settings
Surface area (m 2 /g)
S% (by wt)
Pore volume (cm 3 /g) Time (h)
Temperature (°C) S/C ratio Sulfur type
Otani et al. ( 1988 )
1,250 0 0.56 – – – CS 2
Krishnan et al. ( 1994 )
547–964 <1 – – – – –
Vidic ( 1996 ) – 0.76 – – 600 – –
Table 1 Summary fi ndings of the papers included in this systematic review
M.H. Sowlat et al.
7
Impregnated carbons
Operation temperature (°C)
Hg 0 input (μg/m 3 )
Outcome measure Main fi ndings
Surface area (m 2 /g)
S% (by wt) Pore volume
710 (at 13.1%)
0–13.1 – 36 6.42 mg/m 3 Breakthrough curves; Hg 0 adsorption capacity
Impregnation increased the S content of ACs but decreased their surface area; higher S content led to increased Hg 0 adsorption capacities; therefore, impregnated ACs had higher capacities than did virgin ACs
715–1,078 7 – 23, 140 30, 60 ppb Hg 0 adsorption capacity
At higher temperature, sulfur- impregnated ACs performed better than virgin ones; the adsorption capacity of virgin ACs decreased with increasing temperatures, but sulfur- impregnated ACs increased with temperature increases; among virgin ACs with the same S content, the one with higher surface area had higher Hg 0 adsorption capacity; increased Hg 0 input signifi cantly enhanced the effi ciency of sulfur- impregnated ACs at all temperatures, with this effect being less signifi cant for virgin ACs
– 7.61–9.24
– 25–140 25–115 Breakthrough curves; Hg 0 adsorption capacity
The Hg 0 adsorption capacity of virgin ACs decreased with increasing temperatures, while that of sulfur- impregnated ACs increased with temperature; sulfur- impregnated ACs performed better than virgin ones if impreg-nated with about the same S content and sulfur distribution
(continued)
Removal of Vapor-Phase Elemental Mercury from Stack Emissions…
8
Study
Virgin carbons Impregnation settings
Surface area (m 2 /g)
S% (by wt)
Pore volume (cm 3 /g) Time (h)
Temperature (°C) S/C ratio Sulfur type
Vidic and McLaughlin ( 1996 )
– 0.76 – – 600 – –
Korpiel and Vidic ( 1997 )
1,026 0.7 – – 600, Approx. 200
– –
Hsi et al. ( 1998 )
353–994 0.8–2.6 0.2–0.7 – 600 – Elemental
Table 1 (continued)
M.H. Sowlat et al.
9
Impregnated carbons
Operation temperature (°C)
Hg 0 input (μg/m 3 )
Outcome measure Main fi ndings
Surface area (m 2 /g)
S% (by wt) Pore volume
– 7.61–9.24
– 25–140 25–115 Breakthrough curves; Hg 0 adsorption capacity
For virgin ACs, the Hg 0 adsorption capacity increased with increasing Hg 0 inputs and decreasing temperatures, whereas that of sulfur- impregnated ACs increased with temperature; sulfur- impregnated ACs were more effective than virgin ACs in removing Hg 0
482–824 9.7–10.0
– 25, 90, 150 55, 684 Breakthrough curves; Hg 0 adsorption capacity
Higher impregnation temperatures led to more even distribution of sulfur in the pore structure and stronger bonding of sulfur to carbon; therefore, for ACs impregnated at 600 °C, the Hg adsorption did not deteriorate even at operating temperatures as high as 140 °C; however, generally, both types of sulfur- impregnated ACs had higher effi ciencies at higher temperatures; higher Hg 0 inputs increased the removal effi ciency of ACs impregnated at 600 °C, although effi ciency for ACs impregnated at about 200 °C decreased
532–670 11.5–11.9
– 49–82 45–68 Hg 0 adsorption capacity
For ACs with comparable surface areas, the Hg 0 adsorption capacity of those made from high-sulfur coals was higher than that from low-sulfur coals; for ACs from high-sulfur coals, the Hg 0 adsorption capacity increased with increasing sulfur content; for both types, the Hg 0 adsorption capacity increased with surface area; sulfur impregnation markedly increased the sorption capacity of the ACs from low-sulfur coals while not signifi cantly changing that of the ACs from high-sulfur coals
(continued)
Removal of Vapor-Phase Elemental Mercury from Stack Emissions…
10
Study
Virgin carbons Impregnation settings
Surface area (m 2 /g)
S% (by wt)
Pore volume (cm 3 /g) Time (h)
Temperature (°C) S/C ratio Sulfur type
Liu et al. ( 1998 )
987.7–1,026.0
0.51–0.73 – 2 Approx. 200, 250, 400, 600
1/2–4/1 Elemental
Vidic et al. ( 1998 )
1,026 0.7 – – Approx. 200, 600
– –
Table 1 (continued)
M.H. Sowlat et al.
11
Impregnated carbons
Operation temperature (°C)
Hg 0 input (μg/m 3 )
Outcome measure Main fi ndings
Surface area (m 2 /g)
S% (by wt) Pore volume
164.4–909.5
7.11–38.5
– 140 55 Hg 0 adsorption capacity
Hg 0 adsorption capacity increased with increasing impregnation tempera-tures and S/C ratios (up to a specifi c ratio of 2/1); higher impregnation temperatures led to the formation of ACs with larger surface areas, while higher S/C ratios decreased their surface area; higher impregna-tion temperatures also decreased the sulfur content of the impregnated ACs; sulfur-impregnated ACs exhibited signifi cantly higher adsorption capacities compared to virgin and commercially available sulfur-impreg-nated ACs
482–824 9.7–10.0
– 25, 140 110, 380, 1,080
Hg adsorption capacity
For virgin ACs, an increase in Hg 0 inlet increased the Hg 0 adsorption capacity; also, the sorption capacity decreased with increasing operating temperatures, especially at higher Hg 0 inlets; for sulfur-impregnated ACs, the Hg 0 adsorption capacity increased with an increase in Hg 0 inlet, while operating temperature did not exhibit any signifi cant impact; for the commercially available ACs impregnated at about 150–200 °C, an increase of operating temperature and inlet Hg 0 decreased the Hg 0 adsorption capacity; both sulfur-impregnated ACs had signifi cantly higher Hg 0 adsorption capacities than virgin ACs, particularly at lower temperatures
(continued)
Removal of Vapor-Phase Elemental Mercury from Stack Emissions…
12
Study
Virgin carbons Impregnation settings
Surface area (m 2 /g)
S% (by wt)
Pore volume (cm 3 /g) Time (h)
Temperature (°C) S/C ratio Sulfur type
Vitolo and Pini ( 1999 )
– – – – – – –
Granite et al. ( 2000 )
650–900 0.4–0.9 – – 600 – –
Karatza et al. ( 2000 )
– – – – Approx. 200 – –
Table 1 (continued)
M.H. Sowlat et al.
13
Impregnated carbons
Operation temperature (°C)
Hg 0 input (μg/m 3 )
Outcome measure Main fi ndings
Surface area (m 2 /g)
S% (by wt) Pore volume
460–503 12.4–23.8
163–188 mm 3 /g 25, 60, 70 – Hg 0 adsorption capacity
Higher sulfur content up to a specifi c point led to smaller surface areas; the Hg 0 adsorption capacity increased with increasing operating temperatures; the Hg 0 adsorption capacity also increased with increasing sulfur content up to a specifi c point; as the sulfur content increased, the fraction of sulfur reacting with Hg 0 to form HgS decreased
690–790 5.9–7.6 – 138, 177 – Breakthrough curves; Hg 0 adsorption capacity
Sulfur-impregnated ACs indicated markedly higher Hg 0 adsorption capacities than virgin ones; sulfur-impregnated ACs performed better at higher operating temperatures; sulfur-impregnated ACs had signifi cantly higher Hg 0 adsorption capacities than virgin ACs
628 Approx. 10.0
– 120, 150 2.24–3.93 mg/m 3
Breakthrough curves
Inlet Hg 0 did not have any signifi cant impact on the Hg 0 adsorption capacity at the concentration range evaluated; higher operating temperatures deteriorated the Hg 0 adsorption capacity of the sulfur-impregnated AC
(continued)
Removal of Vapor-Phase Elemental Mercury from Stack Emissions…

14
Study
Virgin carbons Impregnation settings
Surface area (m 2 /g)
S% (by wt)
Pore volume (cm 3 /g) Time (h)
Temperature (°C) S/C ratio Sulfur type
Kwon and Vidic ( 2000 )
1,020 0.1 – 0.25, 0.05, 1, 2
200, 600 – Elemental, H 2 S
Liu et al. ( 2000 )
988–1,026 0.5–0.7 – 2 Approx. 200, 600
1/5–4/1 Elemental
Table 1 (continued)
M.H. Sowlat et al.
15
Impregnated carbons
Operation temperature (°C)
Hg 0 input (μg/m 3 )
Outcome measure Main fi ndings
Surface area (m 2 /g)
S% (by wt) Pore volume
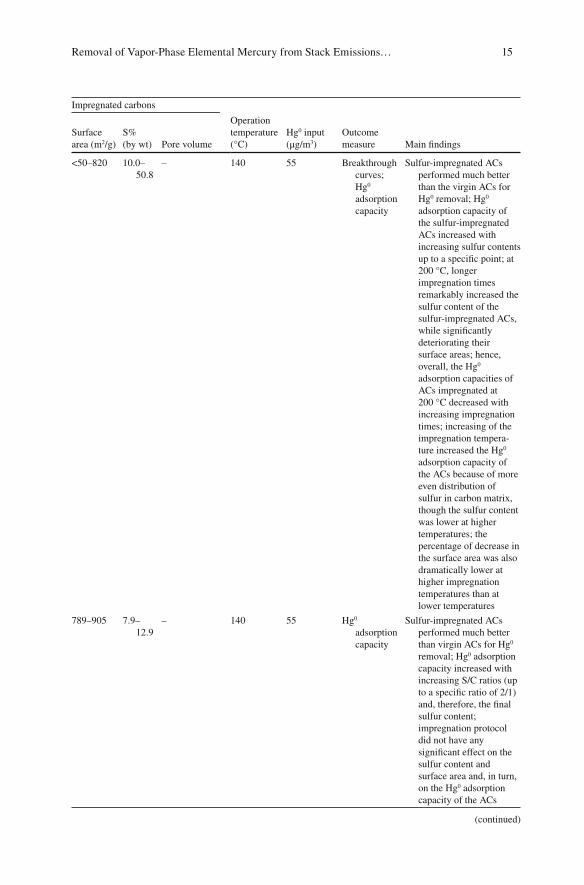
<50–820 10.0–50.8
– 140 55 Breakthrough curves; Hg 0 adsorption capacity
Sulfur-impregnated ACs performed much better than the virgin ACs for Hg 0 removal; Hg 0 adsorption capacity of the sulfur-impregnated ACs increased with increasing sulfur contents up to a specifi c point; at 200 °C, longer impregnation times remarkably increased the sulfur content of the sulfur-impregnated ACs, while signifi cantly deteriorating their surface areas; hence, overall, the Hg 0 adsorption capacities of ACs impregnated at 200 °C decreased with increasing impregnation times; increasing of the impregnation tempera-ture increased the Hg 0 adsorption capacity of the ACs because of more even distribution of sulfur in carbon matrix, though the sulfur content was lower at higher temperatures; the percentage of decrease in the surface area was also dramatically lower at higher impregnation temperatures than at lower temperatures
789–905 7.9–12.9
– 140 55 Hg 0 adsorption capacity
Sulfur-impregnated ACs performed much better than virgin ACs for Hg 0 removal; Hg 0 adsorption capacity increased with increasing S/C ratios (up to a specifi c ratio of 2/1) and, therefore, the fi nal sulfur content; impregnation protocol did not have any signifi cant effect on the sulfur content and surface area and, in turn, on the Hg 0 adsorption capacity of the ACs
(continued)
Removal of Vapor-Phase Elemental Mercury from Stack Emissions…

16
Study
Virgin carbons Impregnation settings
Surface area (m 2 /g)
S% (by wt)
Pore volume (cm 3 /g) Time (h)
Temperature (°C) S/C ratio Sulfur type
Hsi et al. ( 2001 )
1,971 0 – 6 250–650 – Elemental
Hsi et al. ( 2002 )
503–1,405 0–1.2 0.391–1.169 6 400 1/1 Elemental
M.H. Sowlat et al.
Table 1 (continued)
17
Impregnated carbons
Operation temperature (°C)
Hg 0 input (μg/m 3 )
Outcome measure Main fi ndings
Surface area (m 2 /g)
S% (by wt) Pore volume
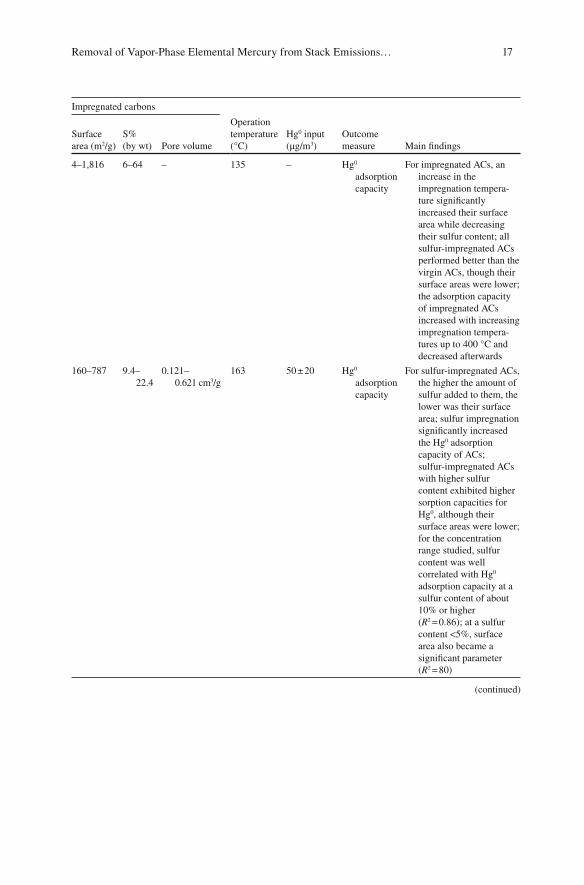
4–1,816 6–64 – 135 – Hg 0 adsorption capacity
For impregnated ACs, an increase in the impregnation tempera-ture signifi cantly increased their surface area while decreasing their sulfur content; all sulfur-impregnated ACs performed better than the virgin ACs, though their surface areas were lower; the adsorption capacity of impregnated ACs increased with increasing impregnation tempera-tures up to 400 °C and decreased afterwards
160–787 9.4–22.4
0.121–0.621 cm 3 /g
163 50 ± 20 Hg 0 adsorption capacity
For sulfur-impregnated ACs, the higher the amount of sulfur added to them, the lower was their surface area; sulfur impregnation signifi cantly increased the Hg 0 adsorption capacity of ACs; sulfur-impregnated ACs with higher sulfur content exhibited higher sorption capacities for Hg 0 , although their surface areas were lower; for the concentration range studied, sulfur content was well correlated with Hg 0 adsorption capacity at a sulfur content of about 10% or higher ( R 2 = 0.86); at a sulfur content <5%, surface area also became a signifi cant parameter ( R 2 = 80)
(continued)
Removal of Vapor-Phase Elemental Mercury from Stack Emissions…

18
Study
Virgin carbons Impregnation settings
Surface area (m 2 /g)
S% (by wt)
Pore volume (cm 3 /g) Time (h)
Temperature (°C) S/C ratio Sulfur type
Lee and Park ( 2003 )
1,008–1,237 Approx. 0 – – Approx. 200, 400
– –
Ho et al. ( 2004 )
540 <1 – – – – –
M.H. Sowlat et al.
Table 1 (continued)

19
Impregnated carbons
Operation temperature (°C)
Hg 0 input (μg/m 3 )
Outcome measure Main fi ndings
Surface area (m 2 /g)
S% (by wt) Pore volume
462–573 1–15 – 30, 70, 100, 140
160 Hg 0 adsorption capacity
For virgin ACs with a sulfur content of approximately 0%, the highest Hg 0 adsorption capacity belonged to the one with the highest surface area and vice versa; the ACs impregnated at 400 °C had a signifi cantly higher Hg 0 adsorption capacity than the commercially available sulfur-impreg-nated ACs, which are commonly activated at temperatures in the range of 150–200 °C; for sulfur-impregnated ACs, the Hg 0 adsorption capacity increased with an increase in the sulfur content; the Hg 0 adsorption capacity of the sulfur-impregnated AC also increased with increasing the operating temperature up to a specifi c point and decreased afterwards
429.7 Approx. 10
– 25 25.3 Hg 0 adsorption capacity
Due to the low operating temperature, the virgin ACs performed better than the commercially available sulfur-impreg-nated ACs; under such conditions, the surface area and particle size of the activated carbons became the controlling factors
(continued)
Removal of Vapor-Phase Elemental Mercury from Stack Emissions…
20
Study
Virgin carbons Impregnation settings
Surface area (m 2 /g)
S% (by wt)
Pore volume (cm 3 /g) Time (h)
Temperature (°C) S/C ratio Sulfur type
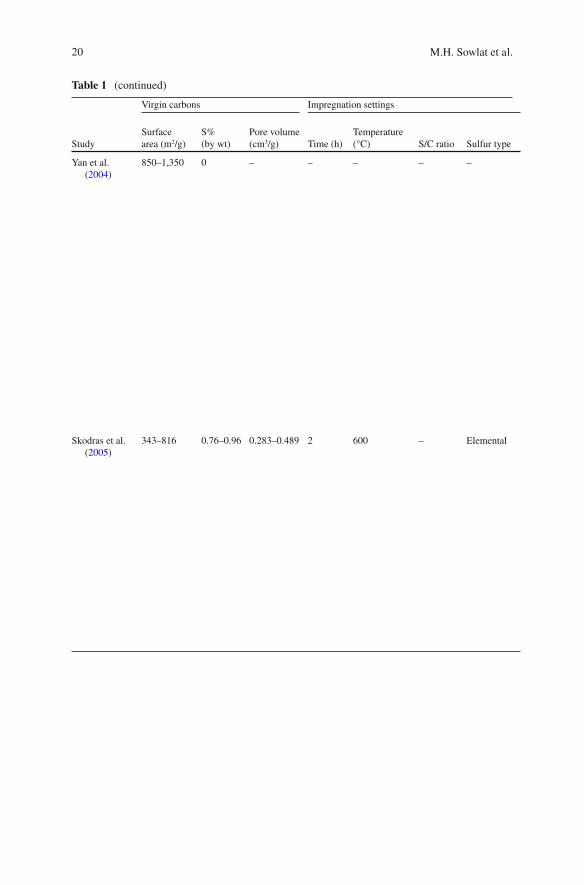
Yan et al. ( 2004 )
850–1,350 0 – – – – –
Skodras et al. ( 2005 )
343–816 0.76–0.96 0.283–0.489 2 600 – Elemental
M.H. Sowlat et al.
Table 1 (continued)
21
Impregnated carbons
Operation temperature (°C)
Hg 0 input (μg/m 3 )
Outcome measure Main fi ndings
Surface area (m 2 /g)
S% (by wt) Pore volume
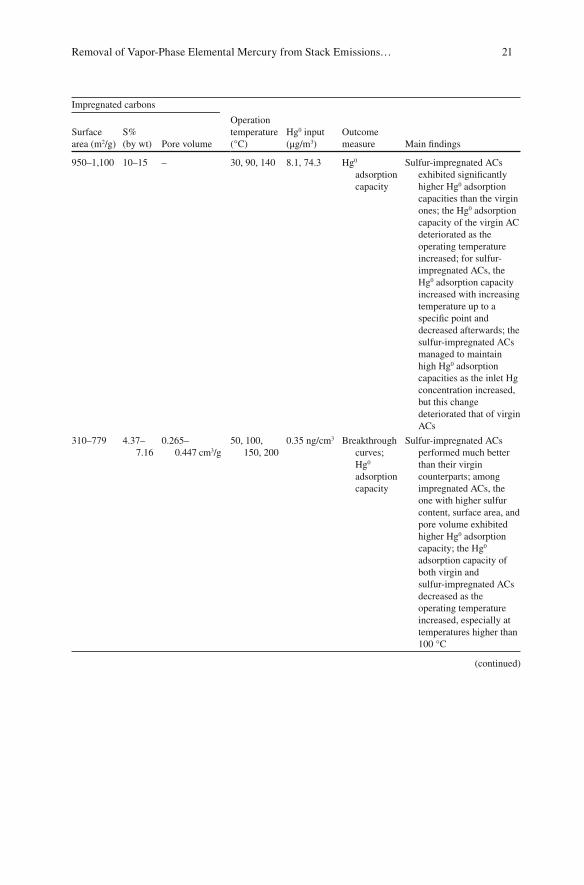
950–1,100 10–15 – 30, 90, 140 8.1, 74.3 Hg 0 adsorption capacity
Sulfur-impregnated ACs exhibited signifi cantly higher Hg 0 adsorption capacities than the virgin ones; the Hg 0 adsorption capacity of the virgin AC deteriorated as the operating temperature increased; for sulfur-impregnated ACs, the Hg 0 adsorption capacity increased with increasing temperature up to a specifi c point and decreased afterwards; the sulfur-impregnated ACs managed to maintain high Hg 0 adsorption capacities as the inlet Hg concentration increased, but this change deteriorated that of virgin ACs
310–779 4.37–7.16
0.265–0.447 cm 3 /g
50, 100, 150, 200
0.35 ng/cm 3 Breakthrough curves; Hg 0 adsorption capacity
Sulfur-impregnated ACs performed much better than their virgin counterparts; among impregnated ACs, the one with higher sulfur content, surface area, and pore volume exhibited higher Hg 0 adsorption capacity; the Hg 0 adsorption capacity of both virgin and sulfur-impregnated ACs decreased as the operating temperature increased, especially at temperatures higher than 100 °C
(continued)
Removal of Vapor-Phase Elemental Mercury from Stack Emissions…
22
Study
Virgin carbons Impregnation settings
Surface area (m 2 /g)
S% (by wt)
Pore volume (cm 3 /g) Time (h)
Temperature (°C) S/C ratio Sulfur type
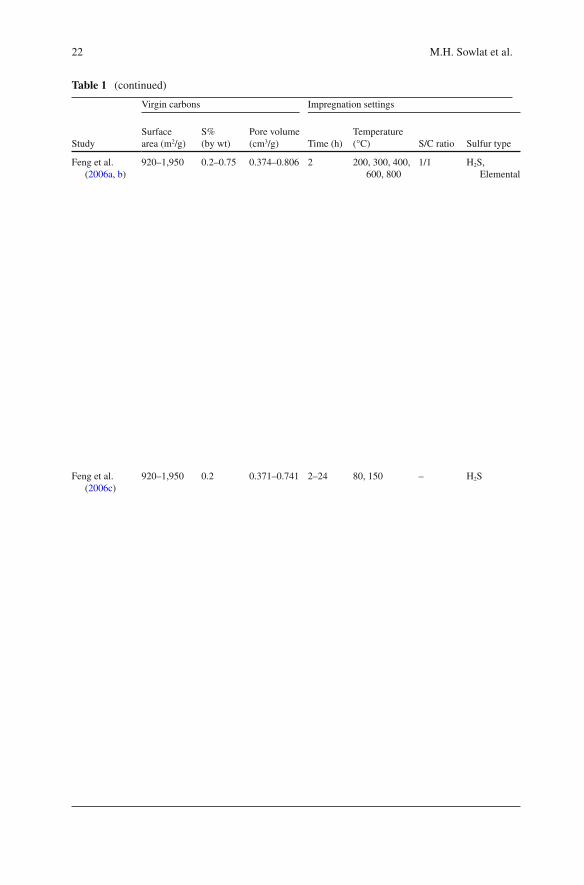
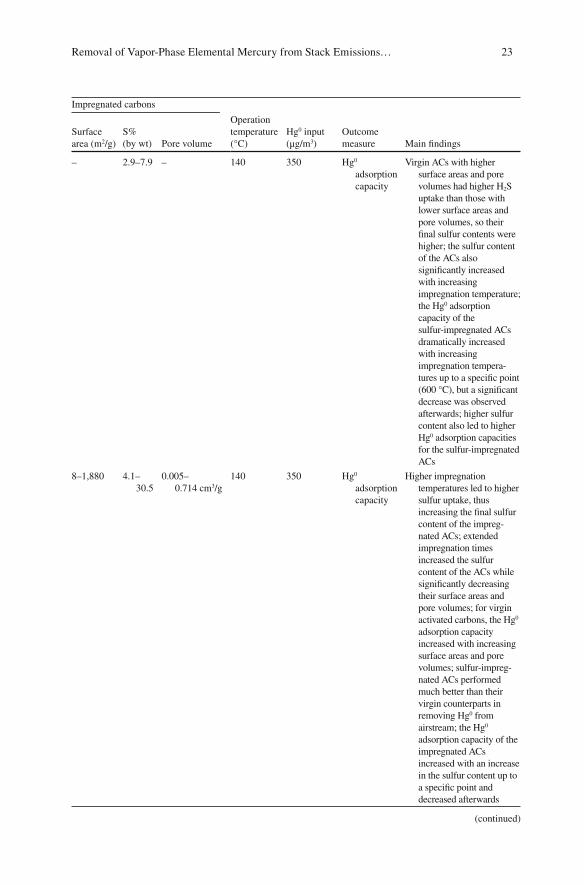
Feng et al. ( 2006a , b )
920–1,950 0.2–0.75 0.374–0.806 2 200, 300, 400, 600, 800
1/1 H 2 S, Elemental
Feng et al. ( 2006c )
920–1,950 0.2 0.371–0.741 2–24 80, 150 – H 2 S
M.H. Sowlat et al.
Table 1 (continued)
23
Impregnated carbons
Operation temperature (°C)
Hg 0 input (μg/m 3 )
Outcome measure Main fi ndings
Surface area (m 2 /g)
S% (by wt) Pore volume
– 2.9–7.9 – 140 350 Hg 0 adsorption capacity
Virgin ACs with higher surface areas and pore volumes had higher H 2 S uptake than those with lower surface areas and pore volumes, so their fi nal sulfur contents were higher; the sulfur content of the ACs also signifi cantly increased with increasing impregnation temperature; the Hg 0 adsorption capacity of the sulfur-impregnated ACs dramatically increased with increasing impregnation tempera-tures up to a specifi c point (600 °C), but a signifi cant decrease was observed afterwards; higher sulfur content also led to higher Hg 0 adsorption capacities for the sulfur-impregnated ACs
8–1,880 4.1–30.5
0.005–0.714 cm 3 /g
140 350 Hg 0 adsorption capacity
Higher impregnation temperatures led to higher sulfur uptake, thus increasing the fi nal sulfur content of the impreg-nated ACs; extended impregnation times increased the sulfur content of the ACs while signifi cantly decreasing their surface areas and pore volumes; for virgin activated carbons, the Hg 0 adsorption capacity increased with increasing surface areas and pore volumes; sulfur-impreg-nated ACs performed much better than their virgin counterparts in removing Hg 0 from airstream; the Hg 0 adsorption capacity of the impregnated ACs increased with an increase in the sulfur content up to a specifi c point and decreased afterwards
(continued)
Removal of Vapor-Phase Elemental Mercury from Stack Emissions…
24
Study
Virgin carbons Impregnation settings
Surface area (m 2 /g)
S% (by wt)
Pore volume (cm 3 /g) Time (h)
Temperature (°C) S/C ratio Sulfur type
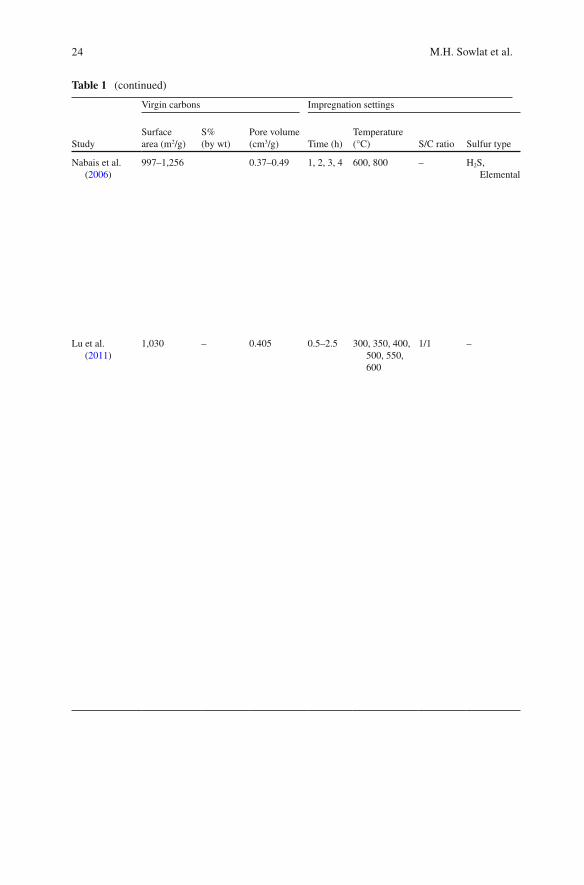
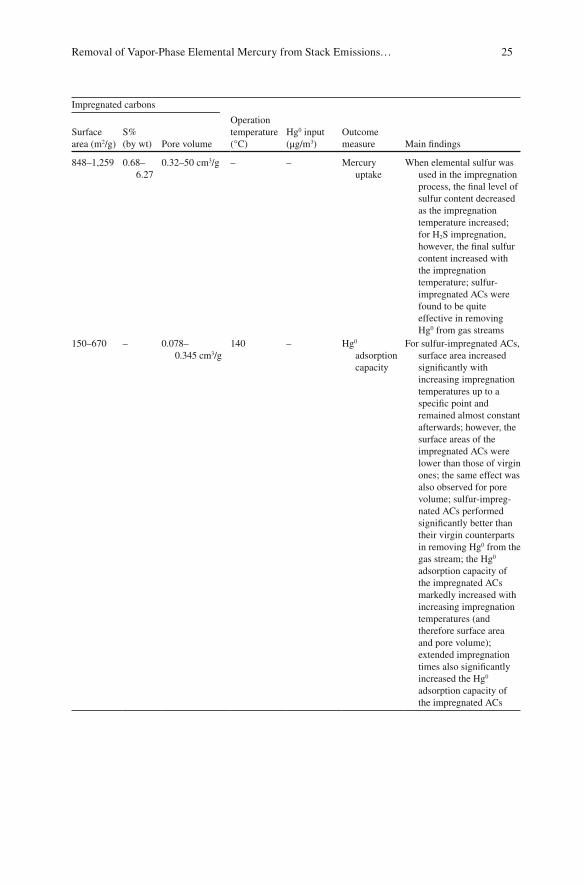
Nabais et al. ( 2006 )
997–1,256 0.37–0.49 1, 2, 3, 4 600, 800 – H 2 S, Elemental
Lu et al. ( 2011 )
1,030 – 0.405 0.5–2.5 300, 350, 400, 500, 550, 600
1/1 –
M.H. Sowlat et al.
Table 1 (continued)
25
Impregnated carbons
Operation temperature (°C)
Hg 0 input (μg/m 3 )
Outcome measure Main fi ndings
Surface area (m 2 /g)
S% (by wt) Pore volume
848–1,259 0.68–6.27
0.32–50 cm 3 /g – – Mercury uptake
When elemental sulfur was used in the impregnation process, the fi nal level of sulfur content decreased as the impregnation temperature increased; for H 2 S impregnation, however, the fi nal sulfur content increased with the impregnation temperature; sulfur-impregnated ACs were found to be quite effective in removing Hg 0 from gas streams
150–670 – 0.078–0.345 cm 3 /g
140 – Hg 0 adsorption capacity
For sulfur-impregnated ACs, surface area increased signifi cantly with increasing impregnation temperatures up to a specifi c point and remained almost constant afterwards; however, the surface areas of the impregnated ACs were lower than those of virgin ones; the same effect was also observed for pore volume; sulfur-impreg-nated ACs performed signifi cantly better than their virgin counterparts in removing Hg 0 from the gas stream; the Hg 0 adsorption capacity of the impregnated ACs markedly increased with increasing impregnation temperatures (and therefore surface area and pore volume); extended impregnation times also signifi cantly increased the Hg 0 adsorption capacity of the impregnated ACs
Removal of Vapor-Phase Elemental Mercury from Stack Emissions…
26
Below, we address the effi ciency of sulfur-impregnated ACs, compared to virgin ones, for gas-phase Hg 0 removal. In addition, in the following subsections, we sepa-rately address the effect of infl uential operational parameters on Hg removal effi ciency.
3.1 The Removal Effi ciency of Sulfur-Impregnated ACs vs. Virgin ACs
In the present work, it was not possible to compare Hg 0 adsorption capacities of sulfur-impregnated ACs between studies, because each study we reviewed had adopted different points on the breakthrough curves for calculating Hg 0 adsorption capacity. Therefore, a single pooled value representing the mean Hg 0 adsorption capacity could not be obtained. For example, in one study, a c / c 0 ratio (outlet to initial Hg 0 concentration ratio) of 0.6 had been selected as the breakthrough point, whereas a ratio of 1 had been used in other studies. Second, as can be seen from Table 1 , the impregnation settings and the operational conditions applied in differ-ent studies were so varied that inter-study comparisons of Hg 0 adsorption capacities would be invalid. The reason is that Hg 0 adsorption rates are dependent upon both impregnation settings and operational conditions.
However, all included studies indicated signifi cantly higher Hg 0 adsorption capacities for sulfur-impregnated ACs than for virgin ones (Feng et al. 2006a , b , c ; Granite et al. 2000 ; Ho et al. 2004 ; Hsi et al. 1998 , 2001 , 2002 ; Karatza et al. 2000 ; Korpiel and Vidic 1997 ; Krishnan et al. 1994 ; Kwon and Vidic 2000 ; Lee and Park 2003 ; Liu et al. 1998 , 2000 ; Lu et al. 2011 ; Nabais et al. 2006 ; Otani et al. 1988 ; Skodras et al. 2005 ; Vidic 1996 ; Vidic et al. 1998 ; Vidic and McLaughlin 1996 ; Vitolo and Pini 1999 ; Yan et al. 2004 ). From the different operational conditions applied, the sulfur-impregnated ACs exhibited a range of Hg 0 adsorption capacities that were between 1.5 (e.g., (Hsi et al. 1998 )) and 32 (e.g., (Hsi et al. 2001 )) times higher than those of virgin ACs. This is primarily because Hg 0 captured by virgin ACs follows a physisorption mechanism (Krishnan et al. 1994 ), whereas that cap-tured by sulfur-impregnated ACs occurred by a combination of physisorption of Hg 0 on carbon texture and chemical reactions between Hg 0 and impregnated sulfur, with subsequent formation of HgS (the latter being the dominant mechanism) (Steijns et al. 1976 ).
Therefore, capturing Hg 0 with virgin ACs depends primarily on AC surface area. Krishnan et al. ( 1994 ) suggested that using either a higher AC surface area or sulfur- impregnated AC effectively captured Hg 0 . However, S impregnation signifi cantly decreases the surface area of ACs from sulfur deposition. The greater Hg 0 adsorp-tion capacities of S-impregnated ACs exceed those of virgin ACs that have higher surface areas. Hsi et al. ( 1998 ) suggested that, although sulfur impregnation of an AC decreased its surface area from 505 to 427 m 2 /g (a 14% decrease), its Hg 0 adsorption capacity nevertheless increased from 1,304 to 2,051 μg Hg 0 /g C (>50% increase), and this increase was due to a 11% increase in the sulfur content.
M.H. Sowlat et al.
27
3.2 Effect of Operational Temperature
Studies have indicated that the operational (also called reaction or bed) temperature has a pronounced effect on Hg 0 adsorption capacities of both virgin and sulfur- impregnated ACs (Granite et al. 2000 ; Karatza et al. 2000 ; Korpiel and Vidic 1997 ; Krishnan et al. 1994 ; Lee and Park 2003 ; Skodras et al. 2005 ; Vidic 1996 ; Vidic et al. 1998 ; Vidic and McLaughlin 1996 ; Vitolo and Pini 1999 ; Yan et al. 2004 ). In particu-lar, a signifi cant decrease in the Hg 0 adsorption capacity occurs as operating tempera-tures increase; the effect is more intense at operating temperatures higher than 100 °C (Granite et al. 2000 ; Krishnan et al. 1994 ; Skodras et al. 2005 ; Vidic 1996 ; Vidic et al. 1998 ; Vidic and McLaughlin 1996 ; Yan et al. 2004 ). Krishnan et al. ( 1994 ), for example, indicated that the Hg 0 adsorption capacities of virgin ACs halved as the temperature increased from 23 to 140° C. The authors suggested that this behavior resulted from the physisorption mechanism of Hg 0 capture by virgin ACs. They also suggested that altering surface properties (i.e., deactivation of surface sites that cap-ture Hg 0 ) at higher temperatures might contribute to this effect (Krishnan et al. 1994 ). It is noteworthy that higher temperatures produced faster kinetics of Hg 0 capture; thus, Hg breakthrough is achieved in a shorter time (Vidic et al. 1998 ).
For sulfur-impregnated ACs, some authors have reported increased Hg 0 adsorp-tion capacities with increasing operational temperatures, mainly from the chemi-sorptive nature of Hg 0 capture by sulfur-impregnated ACs (Granite et al. 2000 ; Korpiel and Vidic 1997 ; Krishnan et al. 1994 ; Lee and Park 2003 ; Vidic 1996 ; Vidic and McLaughlin 1996 ; Vitolo and Pini 1999 ). Others have reported either no or a negative impact (Ho et al. 2004 ; Karatza et al. 2000 ; Skodras et al. 2005 ; Vidic et al. 1998 ; Yan et al. 2004 ). However, these differences in results are primarily attributed to varied ranges of operational temperatures that were applied in different studies. Closer inspection of the study results revealed that up to temperatures of about 100° C, the Hg 0 adsorption capacities of all AC types increased as temperature increased. This behavior resulted from the chemisorptive nature of Hg 0 capture by sulfur-impregnated ACs and the subsequently improved kinetics of HgS formation from the increased temperature (Vidic and McLaughlin 1996 ). The effect of tem-peratures above 100° C, however, depended primarily on the type of AC applied. For commercially available sulfur-impregnated ACs, which are believed to be impregnated at temperatures between 150 and 200° C (Lee and Park 2003 ), any further increase in operational temperature above 100° C (higher than the melting point of sulfur, i.e., 115.2 °C) deteriorates Hg 0 adsorption capacity. The main reason for this is that high concentrations lead to melting and agglomeration at the weakly bonded sulfur to carbon surface boundary (i.e., the liquid being present in the form of long polymer chains (Hampel 1968 )), which in turn decrease the available sur-face area for Hg 0 capture. For ACs impregnated at high temperatures (600° C, for instance), however, increasing the operational temperature above 100° C does not deteriorate the Hg 0 adsorption capacity. This is primarily because the bonding of sulfur to carbon is much stronger and the sulfur is more evenly distributed into the carbon matrix (Korpiel and Vidic 1997 ). We address the effect of impregnation temperature in-depth in Sect. 3.5 .
Removal of Vapor-Phase Elemental Mercury from Stack Emissions…
28
3.3 Effect of Inlet Hg 0 Concentration
Certain fi ndings on the effect of inlet Hg 0 concentration on Hg 0 adsorption capacity of both virgin and sulfur-impregnated ACs are controversial. A vast majority of authors have reported increased Hg 0 adsorption capacities at higher inlet Hg 0 con-centrations (Korpiel and Vidic 1997 ; Krishnan et al. 1994 ; Vidic et al. 1998 ; Vidic and McLaughlin 1996 ). Such behavior is attributed to the natural driving force of concentration; Jozewicz and Gullett ( 1993 ) suggested that higher inlet Hg 0 concen-trations would produce higher Hg 0 uptakes, mainly from providing a higher driving force. In addition, faster kinetics of Hg 0 capture by ACs can be achieved by apply-ing higher inlet Hg 0 concentrations (Vidic et al. 1998 ). Two studies, however, have reported either no signifi cant effect or a negative impact on Hg 0 adsorption capacity at higher inlet Hg 0 concentrations (Karatza et al. 2000 ; Yan et al. 2004 ). It was sug-gested that this behavior occurs primarily with commercially available sulfur- impregnated ACs, in which sulfur is primarily deposited in the macropores of ACs rather than in micropores. When this occurs, the sulfur molecules at the surface can easily become saturated with Hg 0 molecules at higher Hg 0 concentrations, making the sulfur in the bulk carbon unavailable for Hg 0 molecules due to their low diffu-sion rate into the sulfur matrix (Korpiel and Vidic 1997 ; Vidic et al. 1998 ). Nevertheless, the existing evidence appears to favor the former effect, i.e., increased Hg 0 adsorption capacities at higher inlet Hg 0 concentrations.
3.4 Effect of Sulfur-to-Carbon (S/C) Ratio and Sulfur Content
Although surface area and pore volume are the most infl uential characteristics of virgin ACs, sulfur content also signifi cantly affects Hg 0 adsorption capacity of sulfur- impregnated ACs. Authors have reported that increasing the initial S/C ratio during the impregnation process signifi cantly increases the fi nal sulfur content as well as the sorption capacity of the impregnated ACs (Liu et al. 1998 , 2000 ). However, this effect is strong up to a ratio of about 2/1, whereas it becomes less signifi cant at higher ratios. For example, Liu et al. ( 1998 ) reported that increasing the initial S/C ratio from 1/4 to 2/1 increased the sulfur content from 7.17 to 10.11% (an approximately 60% rise) and the Hg 0 adsorption capacity from approx-imately 105 μg/g to about 2,050 μg/g (slightly less than a 100% increase) (Liu et al. 1998 ). However, a further increase of the S/C ratio to 4/1 did not exhibit this impact; the fi nal sulfur content and the Hg 0 adsorption capacity rose slightly to 10.45% and about 2,250 μg/g, respectively (Liu et al. 1998 ). It is also noteworthy that the surface area decreased as the initial S/C ratios increased during impregna-tion (Liu et al. 1998 ).
Several authors have reported good correlations between the sulfur content of impregnated ACs and their Hg 0 adsorption capacities (Feng et al. 2006a , c ; Hsi et al. 1998 , 2002 ; Kwon and Vidic 2000 ; Lee and Park 2003 ; Skodras et al. 2005 ; Vitolo
M.H. Sowlat et al.
29
and Pini 1999 ). Up to a sulfur content of about 10–20%, the Hg 0 adsorption capacity increased with rising sulfur content. As mentioned in Sect. 3.1 , this is mainly because of strong chemical bonds between Hg and S on the carbon surface, which is the major mechanism for Hg 0 capture by sulfur-impregnated ACs (Anton Lopez et al. 2002 ). In fact, sulfur atoms that exist on the carbon surface accept electrons from Hg 0 atoms and improve the electrode characteristics of the carbon surface (Bansal et al. 1988 ; Li et al. 2003 ). However, above a sulfur content of about 10–20%, the Hg 0 adsorption capacity of sulfur-impregnated ACs deteriorates sig-nifi cantly. This is believed to result primarily from the fact that at lower levels (i.e., up to 20%), the sulfur deposited on the carbon surface is available for binding with Hg 0 , but at higher levels, sulfur stratifi cation may render the sulfur unavailable for binding with Hg 0 and subsequent HgS formation (Vitolo and Pini 1999 ). This fi nd-ing was confi rmed by Vitolo and Pini ( 1999 ), who observed a signifi cant decrease in the fraction of sulfur reacted with Hg 0 as S content increased (Vitolo and Pini 1999 ). Another reason might be the blockage of carbon micropores by sulfur deposition.
The effect of adding sulfur and pore volume to the carbon surface area has also been well studied (Hsi et al. 2002 ; Kwon and Vidic 2000 ; Vitolo and Pini 1999 ). The authors found that surface area and pore volume signifi cantly decreased as sulfur content increased. Hsi et al. ( 2002 ) found an almost-linear association between the amount of sulfur added to the carbon texture with surface area ( R 2 = 0.73) and pore volume ( R 2 = 0.78). This effect is believed to result from the fi lling of car-bon pore volume by sulfur molecules.
Although Hg 0 capture by sulfur-impregnated ACs occurs from chemisorption of Hg 0 through HgS formation, under some conditions (e.g., lower temperatures), the physisorption mechanism also becomes important (Bylina et al. 2009 ). This is prob-ably because some associations exist between the surface area and Hg 0 adsorption capacity of sulfur-impregnated ACs (Feng et al. 2006c ; Hsi et al. 2002 ; Skodras et al. 2005 ). However, the extent of this association is considerably smaller than that observed for sulfur content. Surface area becomes important only when the sulfur content among different ACs is similar.
3.5 Effect of Impregnation Temperature and Time
Impregnation temperature is one of the most critical parameters infl uencing carbon characteristics and, therefore, its Hg 0 adsorption capacity. Studies have indicated that for ACs impregnated with elemental sulfur at temperatures of up to 400–600 °C, any increase in the impregnation process decreases both the sulfur content and the loss of surface area during impregnation (Hsi et al. 2001 ; Korpiel and Vidic 1997 ; Kwon and Vidic 2000 ; Lee and Park 2003 ; Lu et al. 1998 , 2011 ). Liu et al. ( 1998 ), for example, indicated that AC samples impregnated at 600° C had their sulfur con-tent and surface areas in the range of 10.04–10.18% and 813.7–845.7 m 2 /g, respec-tively, whereas the corresponding values for those impregnated at 250° C were 36.2–38.5% and 164.4–170.6 m 2 /g. Kwon and Vidic ( 2000 ) suggested that this is
Removal of Vapor-Phase Elemental Mercury from Stack Emissions…
30
due mainly to the effect of temperature on sulfur allotropes present on the carbon surface. At higher temperatures, sulfur exists primarily in the form of S 2 and S 6 linear chains, which are quite small and can therefore penetrate into the narrower pores of the carbon matrix; this results in few pore blockages and, in turn, little loss in surface area during the impregnation process. At lower temperatures (e.g., 200° C), sulfur primarily exists in the form of S 7 and S 8 rings, which can only enter large pores, wherein they form clusters. Formation of these clusters blocks pore entrances, which ultimately decrease the available surface area (Liu et al. 1998 ).
Although increasing impregnation temperatures decreases the sulfur content, the Hg 0 adsorption capacity of ACs impregnated at higher temperatures are signifi -cantly higher than those impregnated at lower temperatures (Feng et al. 2006a , b , c ; Hsi et al. 2001 ; Korpiel and Vidic 1997 ; Kwon and Vidic 2000 ; Lee and Park 2003 ; Liu et al. 1998 ; Lu et al. 2011 ; Nabais et al. 2006 ). For example, Liu et al. ( 1998 ) studied the Hg 0 adsorption capacity of the AC impregnated at 250 °C and found that it was 550 μg/g, whereas the capacity of the AC impregnated at 600 °C was 2,200 μg/g (300% increase). This effect can be attributed to several reasons. First, in contrast to sulfur content, surface area increases with rising impregnation tem-peratures, which can facilitate mercury capture (Liu et al. 1998 ). Second, as men-tioned above, sulfur allotropes present at 600 °C (S 2 and S 6 chains) are smaller and more easily penetrate into the narrow pores of the AC, while S 8 rings present at 200 °C tend to form clusters, which only enter large pores, blocking narrower ones. Therefore, the sulfur impregnated at 600 °C is expected to be more evenly distrib-uted in the pore structure of ACs, while the sulfur impregnated at lower tempera-tures is most likely to be condensed on the external surface of the carbon (Korpiel and Vidic 1997 ). Third, S 2 -to-S 6 chains are much more reactive than S 8 rings, mainly because they encompass more sulfur terminal atoms (Daza et al. 1991 ). Finally, thermogravimetric analyses (TGA) have indicated that when sulfur-impregnated ACs are subjected to signifi cantly higher temperatures (as high as 400–100 °C), the percent of sulfur loss from ACs impregnated at higher temperatures is negligible. In contrast, those impregnated at lower temperatures lose a major fraction of their sulfur (as much as 90%), which is due to the stronger binding of sulfur and carbon at higher impregnation temperatures (Hsi et al. 2001 ; Korpiel and Vidic 1997 ; Kwon and Vidic 2000 ; Liu et al. 1998 ).
Several authors have suggested that increases above 600 °C in the impregnation temperature deteriorate Hg 0 adsorption capacity, although these ACs posses a high sulfur content (Feng et al. 2006a , b ; Granite et al. 2000 ; Hsi et al. 2001 ; Nabais et al. 2006 ). The suggested mechanism behind this behavior is that the sulfur molecules present on the surface of ACs impregnated above 600 °C have already reacted with metals or other compounds and, therefore, are not available for Hg 0 capture (Feng et al. 2006a ). In addition, studies have also indicated that when H 2 S rather than elemental sulfur is used for impregnation, the sulfur content increases with increasing impregnation temperatures (Feng et al. 2006a , b , c ; Nabais et al. 2006 ).
Impregnation time also has a signifi cant impact on both sulfur content and surface area, with prolonged impregnation times markedly increasing the former while dramatically deteriorating the latter (Feng et al. 2006c ; Kwon and Vidic 2000 ;
M.H. Sowlat et al.
31
Lu et al. 2011 ; Nabais et al. 2006 ). However, the effect of impregnation time on Hg 0 adsorption capacity is also temperature dependent. At lower impregnation tempera-tures (200 °C), extended impregnation times signifi cantly deteriorate the Hg 0 adsorption capacity (Kwon and Vidic 2000 ); in contrast, at higher temperatures, Hg 0 capture increases at prolonged impregnation times (Lu et al. 2011 ). The reasons for this behavior are most likely similar to those observed for Hg 0 capture behavior of ACs impregnated at different temperatures.
4 Summary
This systematic review of high-quality, relevant original research articles existing in the literature was conducted to comprehensively explore the effi ciency of Hg 0 cap-ture from stack emissions by sulfur-impregnated vs. virgin ACs. Our systematic overview suggested that signifi cantly higher amounts of Hg 0 are absorbed by sulfur- impregnated ACs than by virgin ones (1.5–32 times higher, based on the applied operational conditions). The main reason for this is because Hg 0 capture by virgin ACs follows a physisorption mechanism, whereas that by sulfur-impregnated ACs occurs from a combination of physisorption of Hg 0 on carbon texture and chemical reaction between Hg 0 and impregnated sulfur, with subsequent formation of HgS. Temperature increased the Hg 0 adsorption capacity of virgin ACs, especially when temperatures exceeded 100 °C. For sulfur-impregnated ACs, increasing the tem-perature up to 100 °C increased the Hg 0 adsorption capacity by enhancing the che-misorption of Hg 0 capture. A further increase in temperature enhanced the effi ciency of ACs that were impregnated with S at higher temperatures (600 °C, for instance). This mainly resulted from production of stronger bonding of sulfur to carbon at higher impregnation temperatures and also from a more even distribution of sulfur in the carbon matrix.
The authors of different papers reported different results with respect to whether there is an effect of initial Hg 0 concentration on AC adsorption capacity. The authors of two studies could fi nd no such effect. The predominant evidence, however, favors the view that increased Hg 0 adsorption capacities exist at higher inlet Hg 0 concen-trations. Such behavior is attributed to faster kinetics of Hg 0 capture and an enhanced higher driving force at higher initial Hg 0 inlet concentrations. Results from reviewed studies also indicated that the optimum S/C ratio and sulfur content are 2/1 and 10–20%, respectively. Surface area has a less signifi cant impact on Hg 0 adsorption capacity than does sulfur content. However, at equivalent sulfur content, AC surface area also becomes an important factor, in that Hg 0 adsorption capacity is accentu-ated at higher surface areas.
We conclude from having prepared this review that sulfur-impregnated ACs have signifi cantly greater effi ciencies than virgin ACs for capturing Hg 0 from stack emis-sions. Therefore, using them is more cost effective than using raw ACs; using them can also partly resolve the problem of high costs posed by applying carbon sorbents. In addition, the sulfur deposited in the ACs impregnated at higher temperatures is
Removal of Vapor-Phase Elemental Mercury from Stack Emissions…
32
more evenly distributed in the carbon micropores and binds more strongly to the carbon matrix. Hence, sulfur-impregnated ACs can retain higher Hg 0 adsorption capacities under actual stack conditions, if the temperature is at least 140 °C. Finally, since the major mechanism for Hg 0 removal by sulfur-impregnated ACs is through the chemical reaction between Hg 0 and S, and subsequent formation via strong bonds of HgS, the Hg 0 adsorbed on ACs is quite stable and is not easily released when discharged as waste to the environment.
Acknowledgements This research has been supported by Tehran University of Medical Sciences and Health Services grant (project no. 90-04-46-16808). Hereby, the cooperation of the University and Institute for Environmental Research (IER) is highly appreciated.
References
Anton Lopez AM, Tascon MDJ, Martinez-Tarazona MR (2002) Retention of mercury in activated carbons in coal combustion and gasifi cation fl ue gases. Fuel Process Technol 77–78:353–358
Bansal CR, Donnet BJ, Stoeckli F (1988) Active carbon. Marcel Dekker, New York Berlin M (1979) Mercury. In: Friberg L, Nordberg GF, Vouk VB (eds) Handbook on toxicology of
metals. Elsevier, Amsterdam Brenneman KA, James RA, Gross EA, Dorman DC (2000) Olfactory neuron loss in adult male CD
rats following subchronic inhalation exposure to hydrogen sulfi de. Toxicol Pathol 28:326–333 Bylina IV, Tong S, Jia CQ (2009) Thermal analysis of sulphur impregnated activated carbons with
mercury adsorbed from the vapour phase. J Therm Anal Calorim 96:91–98 Cal MP, Strickler BW, Lizzio AA (2000) High temperature hydrogen sulfi de adsorption on acti-
vated carbon I. Effects of gas composition and metal addition. Carbon 38:1757–1765 Clakson T (1993) Health effects associated with mercury contamination. In: Proceedings of the
1993 international municipal waste combustion conference, Williamsburg, VA, pp 591–597 Daza L, Mendioroz S, Pajares JA (1991) Mercury adsorption by sulfurized fi brous silicates. Clays
Clay Miner 39:14–21 Dorman DC, Moulin FJM, McManus BE, Mahle KC, James RA, Struve MF et al (2002)
Cytochrome oxidase inhibition induced by acute hydrogen sulfi de inhalation: correlation with tissue sulfi de concentrations in the rat brain, liver, lung, and nasal epithelium. Toxicol Sci 65:18–25
Feng W, Borguet E, Vidic RD (2006a) Sulfurization of a carbon surface for vapor phase mercury removal—II: Sulfur forms and mercury uptake. Carbon 44:2998–3004
Feng W, Borguet E, Vidic RD (2006b) Sulfurization of carbon surface for vapor phase mercury removal—I: Effect of temperature and sulfurization protocol. Carbon 44:2990–2997
Feng W, Kwon S, Feng X, Borguet E, Vidic RD (2006c) Sulfur impregnation on activated carbon fi bers through H 2 S oxidation for vapor phase mercury removal. J Environ Eng 132:292–300
Galbreath KC, Zygarlicke C (1996) Mercury speciation in coal combustion and gasifi cation fl ue gases. Environ Sci Technol 30:2421–2426
Granite EJ, Pennline HW, Hargis RA (2000) Novel sorbents for mercury removal from fl ue gas. Ind Eng Chem Res 39:1020–1029
Green BN, Johnson CD, Adams A (2001) Writing narrative literature reviews for peer-reviewed journals: secrets of the trade. J Sports Chiropr Rehabil 15:5–19
Hampel CA (ed) (1968) The encyclopedia of the chemical elements. Reinhold Book Corporation, New York
Ho TC, Kobayashi N, Lee Y, Lin J, Hopper JR (2004) Experimental and kinetic study of mercury adsorption on various activated carbons in a fi xed-bed adsorber. Environ Eng Sci 21:21–27
M.H. Sowlat et al.
33
Hsi HC, Chen SG, Rostam-Abadi M, Rood MJ, Richardson CF, Carey TR, Chang R (1998) Preparation and evaluation of coal-derived activated carbons for removal of mercury vapor from simulated coal combustion fl ue gases. Energy Fuel 12:1061–1070
Hsi HC, Rood MJ, Rostam-Abadi M, Chen SG, Chang R (2001) Effects of sulfur impregnation temperature on the properties and mercury adsorption capacities of activated carbon fi bers (ACFs). Environ Sci Technol 35:2785–2791
Hsi HC, Rood MJ, Rostam-Abadi M, Chen SG, Chang R (2002) Mercury adsorption properties of sulfur-impregnated adsorbents. J Environ Eng 128:1080–1089
Johnson J (1997) Controversial EPA mercury study endorsed by science panel. Environ Sci Technol 31:218A–219A
Jozewicz W, Gullett BK (1993) The 1993 international conference on managing hazardous air pollution. Electric Power Research Institute, Palo Alto, CA, pp VII-85–VII-99
Karatza D, Lancia A, Musmarra D, Zucchini C (2000) Study of mercury absorption and desorption on sulfur impregnated carbon. Exp Therm Fluid Sci 21:150–155
Khan KS, Kunz R, Kleijen J, Antes G (2003) Systematic reviews to support evidence-based medi-cine: how to write and apply fi ndings of healthcare research. Royal Society of Medicine Press, London
Korpiel JA, Vidic RD (1997) Effect of sulfur impregnation method on activated carbon uptake of gas-phase mercury. Environ Sci Technol 31:2319–2325
Krishnan SV, Gullett BK, Jozewicz W (1994) Sorption of elemental mercury by activated carbons. Environ Sci Technol 28:1506–1512
Kwon S, Vidic RD (2000) Evaluation of two sulfur impregnation methods on activated carbon and bentonite for the production of elemental mercury sorbents. Environ Eng Sci 17:303–313
Lee SH, Park YO (2003) Gas-phase mercury removal by carbon-based sorbents. Fuel Process Technol 84:197–206
Li HY, Lee WC, Gullett KB (2003) Importance of activated carbon’s oxygen surface functional groups on elemental mercury adsorption. Fuel 82:451–457
Liu W, Vidic RD, Brown TD (1998) Optimization of sulfur impregnation protocol for fi xed bed application of activated carbon-based sorbents for gas-phase mercury removal. Environ Sci Technol 32:531–538
Liu W, Vidic RD, Brown TD (2000) Optimization of high temperature sulfur impregnation on activated carbon for permanent sequestration of elemental mercury vapors. Environ Sci Technol 34:483–488
Lu C, Liu Q, Gao W, Yang J (2011) Microstructure and surface morphology of sulfur-loaded acti-vated carbons for mercury removal in coal-fi red fl ue gas. Fresen Environ Bull 20:135–139
Nabais JV, Carrott PJM, Carrott MMLR, Belchior M, Boavida D, Diall T, Gulyurtlu I (2006) Mercury removal from aqueous solution and fl ue gas by adsorption on activated carbon fi bres. Appl Surf Sci 252:6046–6052
Otani Y, Emi H, Kanaoka C, Uchijima I, Nishino H (1988) Removal of mercury vapor from air with sulfur-impregnated adsorbents. Environ Sci Technol 22:708–711
Pacyna JM, Munch J (1991) Anthropogenic mercury emission in Europe. Water Air Soil Pollut 5:51–61
Pavlish JH, Sondreal EA, Mann MD, Olson ES, Galbreath KC, Laudal DL, Benson SA (2003) Status review of mercury control options for coal-fi red power plants. Fuel Process Technol 82:89–165
Schroedor WH, Yarwood G, Niki H (1991) Involving mercury species in the atmosphere. Water Air Soil Pollut 56:653–666
Schuster E (1991) The behavior of Hg in soil with special emphasis on complexation and adsorp-tion process. Water Air Soil Pollut 56:667–680
Sinha RK, Walker PL (1972) Removal of mercury by sulfurized carbons. Carbon 10:754–756 Skodras G, Diamantopoulou I, Natas P, Palladas A, Sakellaropoulos GP (2005) Postcombustion
measures for cleaner solid fuels combustion: activated carbons for toxic pollutants removal from fl ue gases. Energy Fuel 19:2317–2327
Removal of Vapor-Phase Elemental Mercury from Stack Emissions…

34
Steijns M, Peppelenbos A, Mars P (1976) Mercury chemisorption by sulfur adsorbed in porous materials. J Colloid Interface Sci 57:181–186
Vidic RD (1996) Control of mercury emissions in fl ue gases by activated carbon adsorption. ACS Division of Fuel Chemistry, Preprints, vol 41, pp 437–439
Vidic RD, McLaughlin JB (1996) Uptake of elemental mercury vapors by activated carbons. J Air Waste Manag Assoc 46:241–250
Vidic RD, Chang MT, Thurnau RC (1998) Kinetics of vapor-phase mercury uptake by virgin and sulfur-impregnated activated carbons. J Air Waste Manag Assoc 48:247–255
Vitolo S, Pini R (1999) Deposition of sulfur from H 2 S on porous adsorbents and effect on their mercury adsorption capacity. Geothermics 28:341–354
Volland C (1991) 84th Annual meeting and exhibition. AWMA, Vancouver, BC, Paper 91-35.91 Weast RC (ed) (1983) CRC handbook of chemistry and physics. CRC Press, Boca Raton, FL Yan R, Liang DT, Tsen L, Wong YP, Lee YL (2004) Bench-scale experimental evaluation of
carbon performance on mercury vapour adsorption. Fuel 83:2401–2409 Young BC, Miller SJ, Laudal DL (1994) The 1994 Pittsburgh coal conference, Pittsburgh, PA
M.H. Sowlat et al.
35D.M. Whitacre (ed.), Reviews of Environmental Contamination and Toxicology volume 230, Reviews of Environmental Contamination and Toxicology 230, DOI 10.1007/978-3-319-04411-8_2, © Springer International Publishing Switzerland 2014
Setting Water Quality Criteria in China: Approaches for Developing Species Sensitivity Distributions for Metals and Metalloids
Yuedan Liu, Fengchang Wu, Yunsong Mu, Chenglian Feng, Yixiang Fang, Lulu Chen, and John P. Giesy
Y. Liu State Key Laboratory of Environmental Criteria and Risk Assessment, Chinese Research Academy of Environmental Sciences, Beijing 100012, China
Environmental Simulation and Pollution Control Research Center, South China Institute of Environmental Sciences, Guangzhou 510065, China
F. Wu (*) • Y. Mu • C. Feng • Y. Fang • L. ChenState Key Laboratory of Environmental Criteria and Risk Assessment, Chinese Research Academy of Environmental Sciences, Beijing 100012, Chinae-mail: [email protected]
J.P. Giesy Department of Veterinary Biomedical Sciences and Toxicology Centre, University of Saskatchewan, Saskatoon, SK, Canada
Zoology Department and Center for Integrative Toxicology, Michigan State University, East Lansing, MI 48824, USA
Contents
1 Introduction .......................................................................................................................... 362 Data Selection and Analysis ................................................................................................. 38
2.1 Data Collection ........................................................................................................... 382.2 Methods Used to Construct SSDs ............................................................................... 402.3 Risk Assessment Procedure ........................................................................................ 43
3 SSD Construction and Model Comparison .......................................................................... 433.1 Hazardous Concentration (HC5) ................................................................................ 433.2 Comparison of Approaches ......................................................................................... 443.3 Species Sensitivity ...................................................................................................... 46
4 Risk Assessments ................................................................................................................. 494.1 Measured Exposure Concentrations ........................................................................... 494.2 Correlation Analysis ................................................................................................... 494.3 Hazard Quotients ........................................................................................................ 50
36
1 Introduction
Water quality criteria (WQCs) refer to the maximum acceptable concentrations ofspecific chemicals or magnitudes of parameters in water that protect aquatic life and human health under certain conditions (USEPA 1976). When deriving WQC for usein regional ecosystems, sociopolitical and economic factors need to be considered (Meng and Wu2010). The WQC concept is often used for making policy, managingthe environment, assessing water quality, controlling pollution, restoring ecosys-tems, and managing environmental crises (Wu et al. 2010). Some countries and organizations have created WQC guidelines that describe what is suitable for thespecific conditions prevalent in that country or region. Since the 1960s, the UnitedStates has undertaken a series of long-term studies to develop national WQC forspecific water pollutants that threaten aquatic organisms and human health (USEPA 1968, 1976, 1986, 1999, 2002, 2004, 2009). In the past few decades, Australia, Canada, the European Union, the Netherlands, and the World Health Organization have, respectively, developed their own WQCs to protect national or regional waterenvironments (CCME 1999; ANZECC and ARMCANZ 2000; ECB 2003; WHO 2006; RIVM 2007).
As a country with rich aquatic species and vast freshwater regions, China also plays an important role in protecting its share of the world aquatic ecosystems. However, the water environment of China is suffering from contamination with metals and metalloids that has and is being released from human activities; much of this contamination is a consequence of China’s rapid economic development and the expansion of its human population. Like other countries, China manages water quality by establishing or adopting water quality standards. However, the WQCstandards for other countries may not be wholly appropriate for conditions in China. WQCs that are specific to certain geographic regions, other than China, and the spe-cies composition therein may not be appropriate for managing the environment in China. Thus, it is urgent to establish guidelines or WQCs that are based on thecharacteristics, composition, and distribution of aquatic species endemic to China.
Information on the toxicity of chemicals to aquatic organisms that is applied in ecological risk assessments usually comes from tests with single species. However, the entity to be protected is not limited to individuals but rather extends to popula-tions, communities, and ecosystems. Species sensitivity distributions (SSDs) are useful for extrapolating between the macro-scale (such as communities) and the microscale (such as individuals) in an integrative risk assessment across temporal and spatial scales (Newman et al. 2000). As an efficient tool for ecological risk
5 Discussion ............................................................................................................................ 515.1 Evaluation of Approaches ........................................................................................... 515.2 Selection of Approaches ............................................................................................. 525.3 Proportion of Species to Be Protected ........................................................................ 535.4 HQ for Risk Assessment ............................................................................................. 53
6 Summary .............................................................................................................................. 53References .................................................................................................................................. 54
Y. Liu et al.
37
assessment, SSDs have received considerable attention since the 1980s (Stephanet al. 1985; Aldenberg and Slob 1993). SSDs are used to investigate relationships among sensitivities of species to environmental stressors, such as metals and organic chemicals. The primary purpose of establishing SSDs is to determine the tolerated concentration of a substance for protecting individuals of a defined proportion of a species found in an assemblage (usually 95%), and this tolerated concentration maybe hazardous to 5% of total species (HC5) (van Straalen and Denneman 1989). For this purpose, SSDs are visualized as a plot of a cumulative distribution function against the logarithm of the concentrations of toxicity data (Solomon et al. 2000). Also, SSDs offer greater statistical confidence in calculating a predicted no effect concentration (PNEC) for use in risk assessments than does the commonly used quotient approaches (Grist et al. 2002; Wheeler et al. 2002; Wang et al. 2008). The latter approaches are usually calculated by applying a safety factor to the statistical summary of a single toxicity test such as no observed effect concentration (NOEC) or a 50%-effect concentration (EC50) (van Dam et al. 2012).
When constructing SSDs, there are no standard approaches to achieve fits to all toxicity data. However, several approaches have been applied to develop SSDs and to estimate HC5 values, which include Burr Type III (Shao 2000), Gompertz (Newman et al. 2000), log-logistic, lognormal (Pennington 2003), and Weibull (van Straalen 2002). A recent study reported and compared the array of statistical distri-butions used to analyze air contaminant data (Marchant et al. 2013). The common characteristic of these approaches is the assumption that species sensitivities follow certain specific statistical distributions. However, this assumption is often violated due to statistical limitations resulting from deviations between theoretical and empirical data (Forbes and Forbes 1993; Calow 1996; Power and McCarty 1997; Grist et al. 2002). In practice, a majority of the data selected usually do not meet all assumptions. For instance, the most commonly used lognormal distribution failed to fit the toxicity data on a number of occasions (Newman et al. 2000). To resolve this limitation in deriving HC5 values for contaminants, without making any assump-tions about the underlying distributions, use of a more robust nonparametric method, known as bootstrap, has been suggested. Bootstrap resampling methods were first used to estimate HC5 values of pesticide by constructing SSDs (Jagoe and Newman 1997; Newman et al. 2000). The bootstrap regression was further developed by combining a nonparametric bootstrap with a parametric log-logistic model to solve the difficulty of the limited toxicity data available (Grist et al. 2002). Based on the standard bootstrap, we applied artificial interpolations to avoid repetitive values in each resample and to expand the data beyond the limited original datasets (Wang et al. 2008).Metals and metalloids (Power and McCarty 1997; Duffus 2002; Batley 2012;
Chapman 2012) are widely distributed in the environment and can adversely affect the diversity and the evolution of aquatic organisms (Shaw and Grushkin 1957; Campbel and Stokes 1985; Mance 1987). For instance, cadmium is a typical metal pollutant that has been associated with many epidemiological diseases such as the itai-itai disease in Japan (Nogawa and Kido 1993). Although zinc is an essential element for many metabolic functions of most organisms, it is toxic to aquatic life when concentrations exceed the threshold for effects (Van Sprang et al. 2009;
Setting Water Quality Criteria in China: Approaches for Developing Species…
38
Tsushima et al. 2010). The first WQC guideline for metals was developed by theUSEPA in 1976; WQCs were developed for 12 metals and metalloids. Thus far,WQCs of 167 typical water pollutants have been established and these pollutantshave been divided into priority and non-priority toxic classes (USEPA 1976, 1986, 1999, 2002, 2004, 2009). However, only 16 WQC values have been promulgatedfor protecting aquatic organisms, which include 11 for priority toxic metals and metalloids and 4 for non-priority metals (USEPA1985; Meng and Wu2010). SSDs have been applied in ecological risk assessments for freshwater environments, pre-dominantly for single metals or organic pesticides. However, the reported works on SSDs have primarily focused on single metals or organic molecules (Solomon et al. 1996; Giesy et al. 1999; Campbell et al. 2000; TenBrook et al. 2010; Vardy et al. 2011). These works have not included many systematic and comparative studies on SSDs or WQC values established for multiple metals and metalloids inaquatic environments.One goal in this study is to compare different approaches for deriving WQCs
through SSDs that are based on toxicity data of representative aquatic species in China. First, we employed parametric and nonparametric approaches to develop SSDs through fitting chronic toxicity values. We evaluated sensitivities of species exposed to various chemicals before selecting indicator species for chemical bio- monitoring in the water environments. We further compared the approaches by using several statistical indicators to evaluate the applicability of different approaches. Criteria for model selection were further addressed by evaluating other data parameters, including species amounts and composition, species sensitivity, and geographic structure of aquatic habitats. Differences between the WQC valueswe derived to meet salient needs in China were then compared to those promulgated by selected other countries. Another study goal is to determine the risk of eight met-als and metalloids to Chinese aquatic species by using Tai Lake (Ch: Taihu) as a study area. We performed the risk assessment of the metals and metalloids to aquatic species in Tai Lake by utilizing the measured exposure concentration (MEC) andWQC values derived from SSDs created by using different approaches.
2 Data Selection and Analysis
2.1 Data Collection
2.1.1 Toxicity Data
Chronic toxicity data for aquatic species were used for constructing SSDs. The toxicity data from the literature that was used for the species and chemicals are shown in Table 1. All data were collected from the ECOTOX database of the USEPA (http://www.epa.gov/ecotox) and the database of the China National Knowledge Infrastructure (CNKI, http://www.cnki.net/). Accuracy, reliability, and relevance of
Y. Liu et al.
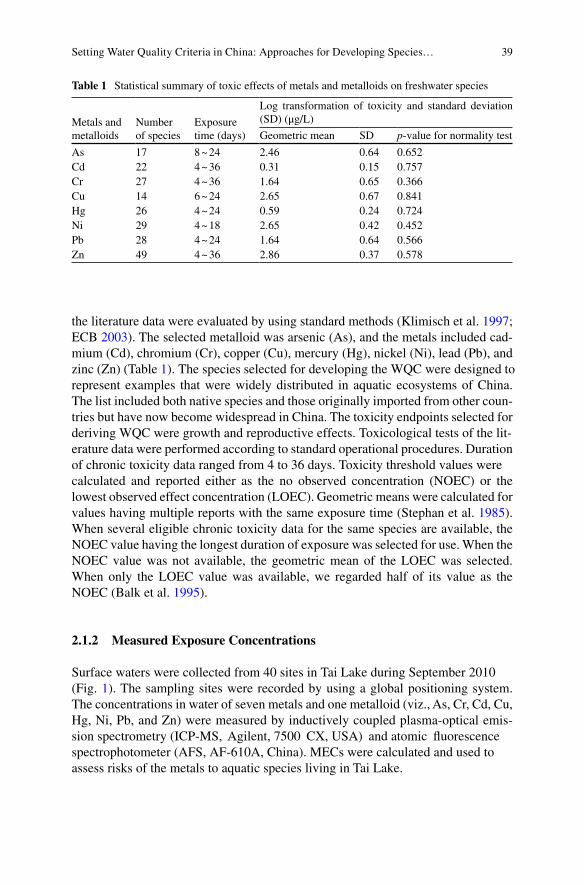
39
the literature data were evaluated by using standard methods (Klimisch et al. 1997; ECB 2003). The selected metalloid was arsenic (As), and the metals included cad-mium (Cd), chromium (Cr), copper (Cu), mercury (Hg), nickel (Ni), lead (Pb), and zinc (Zn) (Table 1). The species selected for developing the WQC were designed torepresent examples that were widely distributed in aquatic ecosystems of China. The list included both native species and those originally imported from other coun-tries but have now become widespread in China. The toxicity endpoints selected for deriving WQC were growth and reproductive effects. Toxicological tests of the lit-erature data were performed according to standard operational procedures. Duration of chronic toxicity data ranged from 4 to 36 days. Toxicity threshold values werecalculated and reported either as the no observed concentration (NOEC) or the lowest observed effect concentration (LOEC). Geometric means were calculated for values having multiple reports with the same exposure time (Stephan et al. 1985). When several eligible chronic toxicity data for the same species are available, the NOEC value having the longest duration of exposure was selected for use. When the NOEC value was not available, the geometric mean of the LOEC was selected. When only the LOEC value was available, we regarded half of its value as the NOEC (Balk et al. 1995).
2.1.2 Measured Exposure Concentrations
Surface waters were collected from 40 sites in Tai Lake during September 2010(Fig. 1). The sampling sites were recorded by using a global positioning system. The concentrations in water of seven metals and one metalloid (viz., As, Cr, Cd, Cu, Hg, Ni, Pb, and Zn) were measured by inductively coupled plasma-optical emis-sion spectrometry (ICP-MS, Agilent, 7500 CX, USA) and atomic fluorescencespectrophotometer (AFS, AF-610A, China). MECs were calculated and used toassess risks of the metals to aquatic species living in Tai Lake.
Table 1 Statistical summary of toxic effects of metals and metalloids on freshwater species
Metals andmetalloids
Number of species
Exposure time (days)
Log transformation of toxicity and standard deviation (SD) (μg/L)
Geometric mean SD p-value for normality test
As 17 8~24 2.46 0.64 0.652Cd 22 4~36 0.31 0.15 0.757Cr 27 4~36 1.64 0.65 0.366Cu 14 6~24 2.65 0.67 0.841Hg 26 4~24 0.59 0.24 0.724Ni 29 4~18 2.65 0.42 0.452Pb 28 4~24 1.64 0.64 0.566Zn 49 4~36 2.86 0.37 0.578
Setting Water Quality Criteria in China: Approaches for Developing Species…
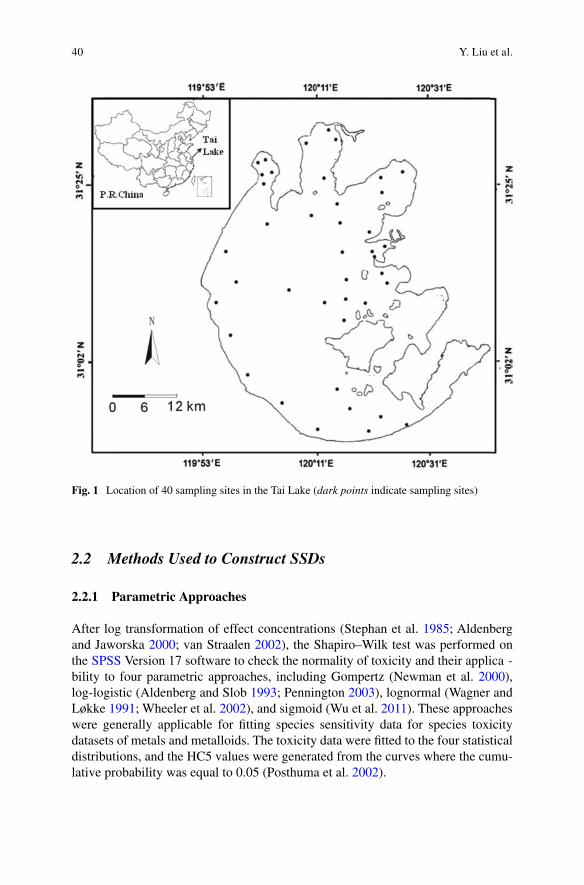
40
2.2 Methods Used to Construct SSDs
2.2.1 Parametric Approaches
After log transformation of effect concentrations (Stephan et al. 1985; Aldenberg and Jaworska 2000; van Straalen 2002), the Shapiro–Wilk test was performed on the SPSS Version 17 software to check the normality of toxicity and their applica -bility to four parametric approaches, including Gompertz (Newman et al. 2000), log-logistic (Aldenberg and Slob 1993; Pennington 2003), lognormal (Wagner and Løkke 1991; Wheeler et al. 2002), and sigmoid (Wu et al. 2011). These approaches were generally applicable for fitting species sensitivity data for species toxicity datasets of metals and metalloids. The toxicity data were fitted to the four statistical distributions, and the HC5 values were generated from the curves where the cumu-lative probability was equal to 0.05 (Posthuma et al. 2002).
Fig. 1 Location of 40 sampling sites in the Tai Lake (dark points indicate sampling sites)
Y. Liu et al.
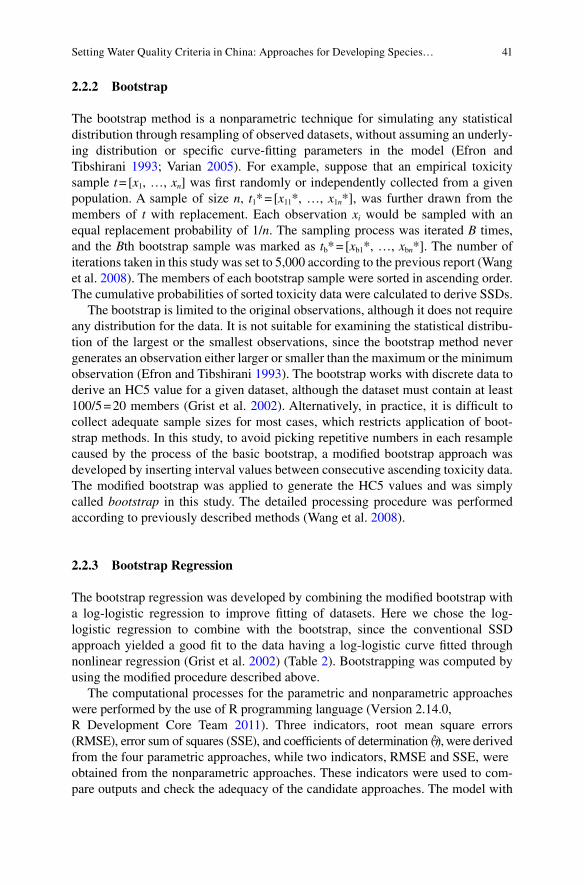
41
2.2.2 Bootstrap
The bootstrap method is a nonparametric technique for simulating any statistical distribution through resampling of observed datasets, without assuming an underly-ing distribution or specific curve-fitting parameters in the model (Efron and Tibshirani 1993; Varian 2005). For example, suppose that an empirical toxicity sample t = [x1, …, xn] was first randomly or independently collected from a given population. A sample of size n, t1* = [x11*, …, x1n*], was further drawn from the members of t with replacement. Each observation xi would be sampled with an equal replacement probability of 1/n. The sampling process was iterated B times, and the Bth bootstrap sample was marked as tb* = [xb1*, …, xbn*]. The number of iterations taken in this study was set to 5,000 according to the previous report (Wang et al. 2008). The members of each bootstrap sample were sorted in ascending order. The cumulative probabilities of sorted toxicity data were calculated to derive SSDs.
The bootstrap is limited to the original observations, although it does not require any distribution for the data. It is not suitable for examining the statistical distribu-tion of the largest or the smallest observations, since the bootstrap method never generates an observation either larger or smaller than the maximum or the minimum observation (Efron and Tibshirani 1993). The bootstrap works with discrete data to derive an HC5 value for a given dataset, although the dataset must contain at least 100/5 = 20 members (Grist et al. 2002). Alternatively, in practice, it is difficult to collect adequate sample sizes for most cases, which restricts application of boot-strap methods. In this study, to avoid picking repetitive numbers in each resample caused by the process of the basic bootstrap, a modified bootstrap approach was developed by inserting interval values between consecutive ascending toxicity data. The modified bootstrap was applied to generate the HC5 values and was simply called bootstrap in this study. The detailed processing procedure was performed according to previously described methods (Wang et al. 2008).
2.2.3 Bootstrap Regression
The bootstrap regression was developed by combining the modified bootstrap with a log-logistic regression to improve fitting of datasets. Here we chose the log- logistic regression to combine with the bootstrap, since the conventional SSD approach yielded a good fit to the data having a log-logistic curve fitted through nonlinear regression (Grist et al. 2002) (Table 2). Bootstrapping was computed by using the modified procedure described above.
The computational processes for the parametric and nonparametric approaches were performed by the use of R programming language (Version 2.14.0, R Development Core Team 2011). Three indicators, root mean square errors (RMSE), error sum of squares (SSE), and coefficients of determination (r2), were derived from the four parametric approaches, while two indicators, RMSE and SSE, wereobtained from the nonparametric approaches. These indicators were used to com-pare outputs and check the adequacy of the candidate approaches. The model with
Setting Water Quality Criteria in China: Approaches for Developing Species…
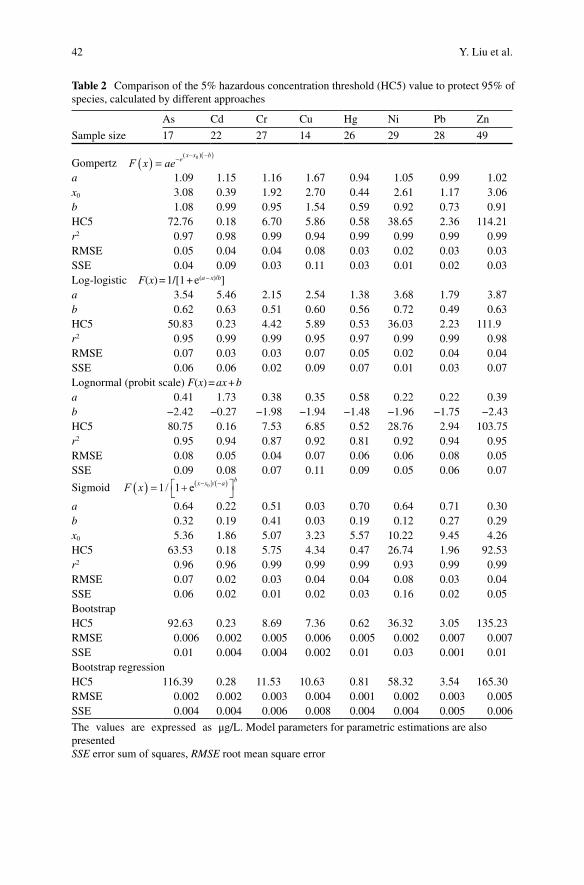
42
Table 2 Comparison of the 5% hazardous concentration threshold (HC5) value to protect 95% ofspecies, calculated by different approaches
As Cd Cr Cu Hg Ni Pb Zn
Sample size 17 22 27 14 26 29 28 49
Gompertz F ex aex x b
( ) = − − −( )( 0 )
a 1.09 1.15 1.16 1.67 0.94 1.05 0.99 1.02x0 3.08 0.39 1.92 2.70 0.44 2.61 1.17 3.06b 1.08 0.99 0.95 1.54 0.59 0.92 0.73 0.91HC5 72.76 0.18 6.70 5.86 0.58 38.65 2.36 114.21r2 0.97 0.98 0.99 0.94 0.99 0.99 0.99 0.99RMSE 0.05 0.04 0.04 0.08 0.03 0.02 0.03 0.03SSE 0.04 0.09 0.03 0.11 0.03 0.01 0.02 0.03Log-logistic F(x) = 1/[1 + e(a − x)/b]a 3.54 5.46 2.15 2.54 1.38 3.68 1.79 3.87b 0.62 0.63 0.51 0.60 0.56 0.72 0.49 0.63HC5 50.83 0.23 4.42 5.89 0.53 36.03 2.23 111.9r2 0.95 0.99 0.99 0.95 0.97 0.99 0.99 0.98RMSE 0.07 0.03 0.03 0.07 0.05 0.02 0.04 0.04SSE 0.06 0.06 0.02 0.09 0.07 0.01 0.03 0.07Lognormal (probit scale) F(x) = ax + ba 0.41 1.73 0.38 0.35 0.58 0.22 0.22 0.39b −2.42 −0.27 −1.98 −1.94 −1.48 −1.96 −1.75 −2.43HC5 80.75 0.16 7.53 6.85 0.52 28.76 2.94 103.75r2 0.95 0.94 0.87 0.92 0.81 0.92 0.94 0.95RMSE 0.08 0.05 0.04 0.07 0.06 0.06 0.08 0.05SSE 0.09 0.08 0.07 0.11 0.09 0.05 0.06 0.07
Sigmoid F x x x ab
( ) = +éëùû
-( ) -( )1 1 0/ /e
a 0.64 0.22 0.51 0.03 0.70 0.64 0.71 0.30b 0.32 0.19 0.41 0.03 0.19 0.12 0.27 0.29x0 5.36 1.86 5.07 3.23 5.57 10.22 9.45 4.26HC5 63.53 0.18 5.75 4.34 0.47 26.74 1.96 92.53r2 0.96 0.96 0.99 0.99 0.99 0.93 0.99 0.99RMSE 0.07 0.02 0.03 0.04 0.04 0.08 0.03 0.04SSE 0.06 0.02 0.01 0.02 0.03 0.16 0.02 0.05BootstrapHC5 92.63 0.23 8.69 7.36 0.62 36.32 3.05 135.23RMSE 0.006 0.002 0.005 0.006 0.005 0.002 0.007 0.007SSE 0.01 0.004 0.004 0.002 0.01 0.03 0.001 0.01Bootstrap regressionHC5 116.39 0.28 11.53 10.63 0.81 58.32 3.54 165.30RMSE 0.002 0.002 0.003 0.004 0.001 0.002 0.003 0.005SSE 0.004 0.004 0.006 0.008 0.004 0.004 0.005 0.006
The values are expressed as μg/L. Model parameters for parametric estimations are alsopresentedSSE error sum of squares, RMSE root mean square error
Y. Liu et al.
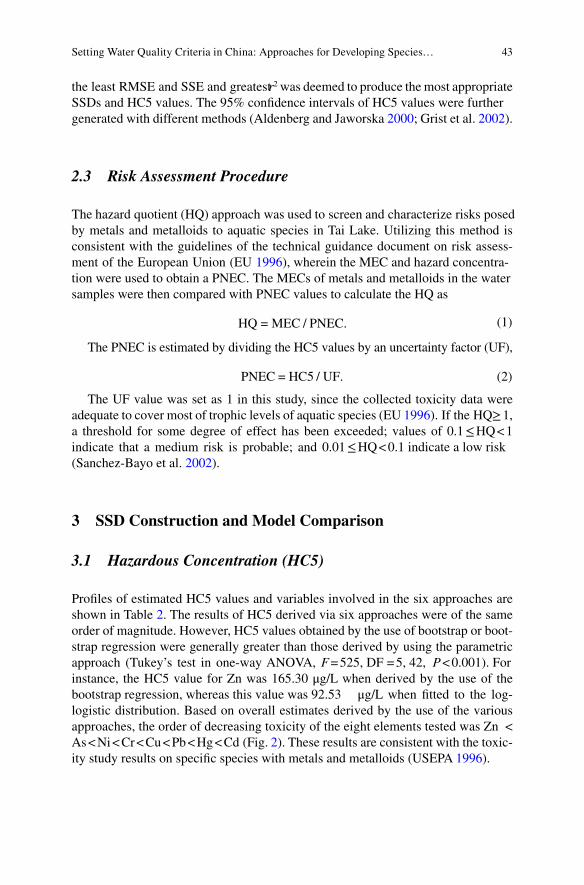
43
the least RMSE and SSE and greatestr2 was deemed to produce the most appropriate SSDs and HC5 values. The 95% confidence intervals of HC5 values were furthergenerated with different methods (Aldenberg and Jaworska 2000; Grist et al. 2002).
2.3 Risk Assessment Procedure
The hazard quotient (HQ) approach was used to screen and characterize risks posedby metals and metalloids to aquatic species in Tai Lake. Utilizing this method is consistent with the guidelines of the technical guidance document on risk assess-ment of the European Union (EU 1996), wherein the MEC and hazard concentra-tion were used to obtain a PNEC. The MECs of metals and metalloids in the watersamples were then compared with PNEC values to calculate the HQ as
HQ = MEC / PNEC. (1)
The PNEC is estimated by dividing the HC5 values by an uncertainty factor (UF),
PNEC = HC5 / UF. (2)
The UF value was set as 1 in this study, since the collected toxicity data were adequate to cover most of trophic levels of aquatic species (EU 1996). If the HQ≥ 1, a threshold for some degree of effect has been exceeded; values of 0.1 ≤HQ<1indicate that a medium risk is probable; and 0.01 ≤HQ<0.1 indicate a low risk(Sanchez-Bayo et al. 2002).
3 SSD Construction and Model Comparison
3.1 Hazardous Concentration (HC5)
Profiles of estimated HC5 values and variables involved in the six approaches are shown in Table 2. The results of HC5 derived via six approaches were of the same order of magnitude. However, HC5 values obtained by the use of bootstrap or boot-strap regression were generally greater than those derived by using the parametric approach (Tukey’s test in one-way ANOVA, F=525, DF =5, 42, P<0.001). Forinstance, the HC5 value for Zn was 165.30 μg/L when derived by the use of the bootstrap regression, whereas this value was 92.53 μg/L when fitted to the log- logistic distribution. Based on overall estimates derived by the use of the various approaches, the order of decreasing toxicity of the eight elements tested was Zn <As<Ni<Cr<Cu<Pb<Hg<Cd (Fig. 2). These results are consistent with the toxic-ity study results on specific species with metals and metalloids (USEPA 1996).
Setting Water Quality Criteria in China: Approaches for Developing Species…
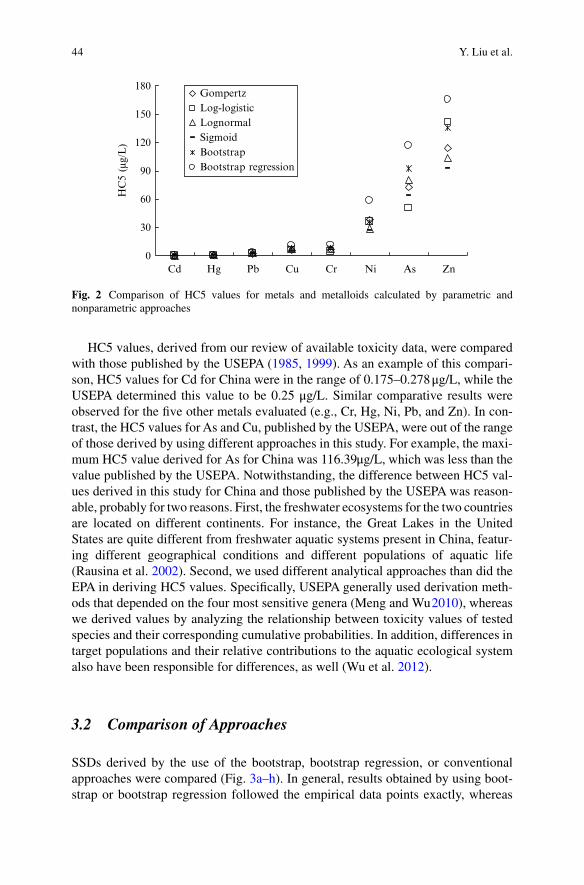
44
HC5 values, derived from our review of available toxicity data, were compared with those published by the USEPA (1985, 1999). As an example of this compari-son, HC5 values for Cd for China were in the range of 0.175–0.278μg/L, while the USEPA determined this value to be 0.25 μg/L. Similar comparative results were observed for the five other metals evaluated (e.g., Cr, Hg, Ni, Pb, and Zn). In con-trast, the HC5 values for As and Cu, published by the USEPA, were out of the range of those derived by using different approaches in this study. For example, the maxi-mum HC5 value derived for As for China was 116.39μg/L, which was less than the value published by the USEPA. Notwithstanding, the difference between HC5 val-ues derived in this study for China and those published by the USEPA was reason-able, probably for two reasons. First, the freshwater ecosystems for the two countries are located on different continents. For instance, the Great Lakes in the United States are quite different from freshwater aquatic systems present in China, featur-ing different geographical conditions and different populations of aquatic life (Rausina et al. 2002). Second, we used different analytical approaches than did the EPA in deriving HC5 values. Specifically, USEPA generally used derivation meth-ods that depended on the four most sensitive genera (Meng and Wu2010), whereas we derived values by analyzing the relationship between toxicity values of tested species and their corresponding cumulative probabilities. In addition, differences in target populations and their relative contributions to the aquatic ecological system also have been responsible for differences, as well (Wu et al. 2012).
3.2 Comparison of Approaches
SSDs derived by the use of the bootstrap, bootstrap regression, or conventional approaches were compared (Fig. 3a–h). In general, results obtained by using boot-strap or bootstrap regression followed the empirical data points exactly, whereas
0
30
60
90
120
150
180
Cd Hg Pb Cu Cr Ni As Zn
HC
5 (µ
g/L
)
GompertzLog-logisticLognormalSigmoidBootstrapBootstrap regression
Fig. 2 Comparison of HC5 values for metals and metalloids calculated by parametric and nonparametric approaches
Y. Liu et al.
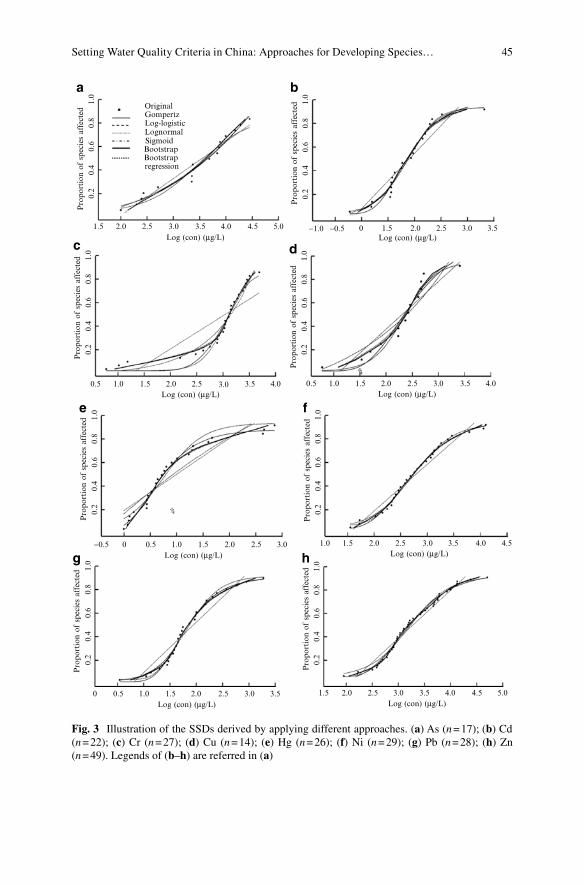
45
1.5
0.2
0.4
0.6
0.8
1.0
0.2
0.4
0.6
0.8
1.0
0.2
0.4
0.6
0.8
1.0
0.2
0.4
0.6
0.8
1.0
0.2
0.4
0.6
0.8
1.0
0.2
0.4
0.6
0.8
1.0
0.2
0.4
0.6
0.8
1.0
0.2
0.4
0.6
0.8
1.0
1.0 1.5 2.0 2.5 3.0 3.5 4.00.5 1.0 1.5 2.0 2.5 3.0 3.5 4.00.5
1.0 1.5 2.0 2.5 3.01.00.5−0.5 0 1.5 2.0 2.5 3.0
−0.5−1.0 0 1.5 2.0 2.5 3.0 3.5
1.00.50 1.5 2.0 2.5 3.0 3.5
3.5 4.0 4.5
2.0 2.5
OriginalGompertzLog-logisticLognormalSigmoidBootstrapBootstrapregression
3.0
a b
c d
e f
g h
3.5Log (con) (µg/L)
Pro
port
ion
of s
peci
es a
ffec
ted
Pro
port
ion
of s
peci
es a
ffec
ted
Pro
port
ion
of s
peci
es a
ffec
ted
Pro
port
ion
of s
peci
es a
ffec
ted
Pro
port
ion
of s
peci
es a
ffec
ted
Pro
port
ion
of s
peci
es a
ffec
ted
Pro
port
ion
of s
peci
es a
ffec
ted
Pro
port
ion
of s
peci
es a
ffec
ted
Log (con) (µg/L)
Log (con) (µg/L)
Log (con) (µg/L)
Log (con) (µg/L)
Log (con) (µg/L)Log (con) (µg/L)
Log (con) (µg/L)4.0 4.5 5.0
1.5 2.0 2.5 3.0 3.5 4.0 4.5 5.0
Fig. 3 Illustration of the SSDs derived by applying different approaches. (a) As (n=17); (b) Cd (n = 22); (c) Cr (n=27); (d) Cu (n=14); (e) Hg (n = 26); (f) Ni (n=29); (g) Pb (n=28); (h) Zn (n=49). Legends of (b–h) are referred in (a)
Setting Water Quality Criteria in China: Approaches for Developing Species…
46
some curves derived by using other methods deviated from these points. For example, the curve fitted by using the sigmoid distribution (Fig. 3c) significantly deviated from the original data. In addition, the lower tail failed to exactly follow the raw data, although the data for Cr were generally well fitted by parametric approaches such as the log-logistic distribution (Fig. 3c). Consequently, the approaches shown in Fig. 3c, d are obviously not perfectly fitted results, since the first 5% of data on the curve could directly affect the HC5 values.
To compare the applicability of the bootstrap and conventional approaches for deriving an HC5 in SSDs, the SSE and RMSE values were calculated (Table 2) (Willmott et al. 1985; Moriasi et al. 2007). The RMSE values in the nonparametricestimates, bootstrap and bootstrap regression, were less than those observed in the parametric estimates. The nonparametric bootstrap approaches (Fig. 3e, f) fit the toxicity data better than the parametric approaches, where various frequency distri-butions were assumed (Fig. 3a–d).
Relationships between the variation of HC5 and the number of iterations during computational processes of parametric and nonparametric approaches are shown in Fig. 4a–f. The nonparametric processes (Fig. 4e, f) converged more quickly to a sufficiently small value of RSME, after iterations (700) than those conducted by theparametric approaches (2,000) (Fig. 4a–d) (Grist et al. 2002; Wang et al. 2008). Nonparametric approaches were superior (in convergence) to parametric curve- fitting methods during the computational processes (Townsend et al. 2007). In addi-tion, the range of variation in HC5 values estimated by nonparametric methods was also narrower than that generated by parametric approaches. For instance, HC5 val-ues for Zn estimated by the Gompertz distribution ranged 89.4–158.5 μg/L, which was wider than the results conducted by the bootstrap regression with a range of 137.8–167.1 μg/L. Bootstrap methods were generally more stable than those devel-oped by the use of the parametric approaches.
3.3 Species Sensitivity
The SSDs used to derive HC5 showed that there was variability in species sensitiv-ity. Compared with other taxa, aquatic plants showed a relatively wide range in sensitivities to all eight metallic elements. For instance, Chlorella sp. were gener-ally sensitive to the effects of Cd, Cr, Cu, Hg, and Zn (Fig. 5b–e, h), while they were less sensitive to As and were tolerant to Pb. There was a range in tolerances of the angiosperm, Lemna minor. This species showed toxic effects when exposed to Cd and Zn (Fig. 5b, h) but was less sensitive to Cu and Hg (Fig. 5d, e).
Fishes were differentially sensitive to the toxicity of the elements studied. For example, the zebra fish (Danio rerio) was sensitive to Hg, Ni, and Pb (Fig. 5f, g), was moderately sensitive to As and Cd (Fig. 5a, b), and was tolerant of Zn (Fig. 5a–h). In contrast, the walking catfish (Clarias gariepinus) was tolerant to almost all of the polluting chemicals, especially Cu, Hg, and Ni (Fig. 5d, e, h).
Y. Liu et al.
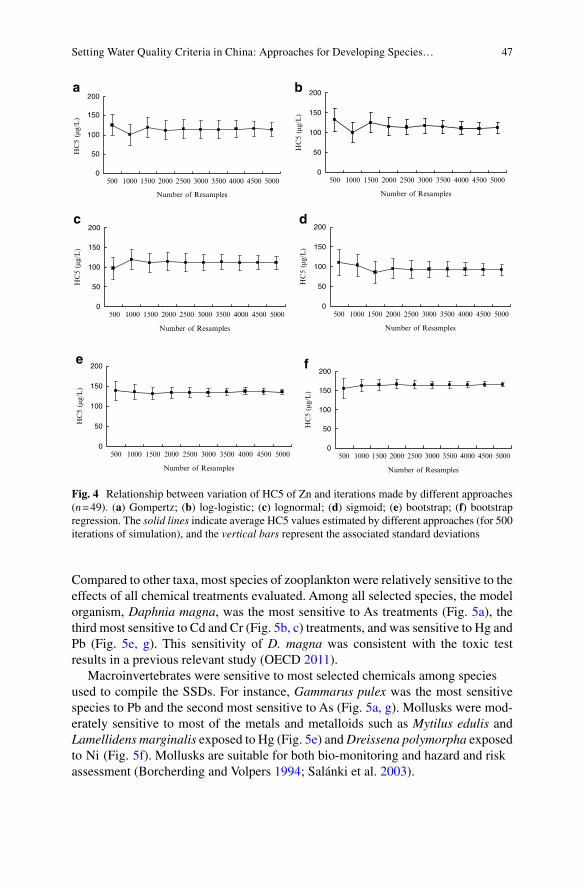
47
Compared to other taxa, most species of zooplankton were relatively sensitive to the effects of all chemical treatments evaluated. Among all selected species, the model organism, Daphnia magna, was the most sensitive to As treatments (Fig. 5a), the third most sensitive to Cd and Cr (Fig. 5b, c) treatments, and was sensitive to Hg and Pb (Fig. 5e, g). This sensitivity of D. magna was consistent with the toxic test results in a previous relevant study (OECD 2011).Macroinvertebrates were sensitive to most selected chemicals among species
used to compile the SSDs. For instance, Gammarus pulex was the most sensitive species to Pb and the second most sensitive to As (Fig. 5a, g). Mollusks were mod-erately sensitive to most of the metals and metalloids such as Mytilus edulis and Lamellidens marginalis exposed to Hg (Fig. 5e) and Dreissena polymorpha exposed to Ni (Fig. 5f). Mollusks are suitable for both bio-monitoring and hazard and riskassessment (Borcherding and Volpers 1994; Salánki et al. 2003).
0
50
100
150
200
Number of Resamples
0
50
100
150
200
Number of Resamples
0
50
100
150
200
Number of Resamples
0
50
100
150
200
Number of Resamples
0
50
100
150
200
Number of Resamples
0
50
100
150
200
Number of Resamples
HC
5 (µ
g/L
)H
C5
(µg/
L)
HC
5 (µ
g/L
)
HC
5 (µ
g/L
)H
C5
(µg/
L)
HC
5 (µ
g/L
)
500 1000 1500 2500 3000 3500 4000 4500 50002000
500 1000 1500 2500 3000 3500 4000 4500 50002000
500 1000 1500 2500 3000 3500 4000 4500 50002000 500 1000 1500 2500 3000 3500 4000 4500 50002000
500 1000 1500 2500 3000 3500 4000 4500 50002000
500 1000 1500 2500 3000 3500 4000 4500 50002000
a b
c d
e f
Fig. 4 Relationship between variation of HC5 of Zn and iterations made by different approaches (n=49). (a) Gompertz; (b) log-logistic; (c) lognormal; (d) sigmoid; (e) bootstrap; (f) bootstrap regression. The solid lines indicate average HC5 values estimated by different approaches (for 500 iterations of simulation), and the vertical bars represent the associated standard deviations
Setting Water Quality Criteria in China: Approaches for Developing Species…
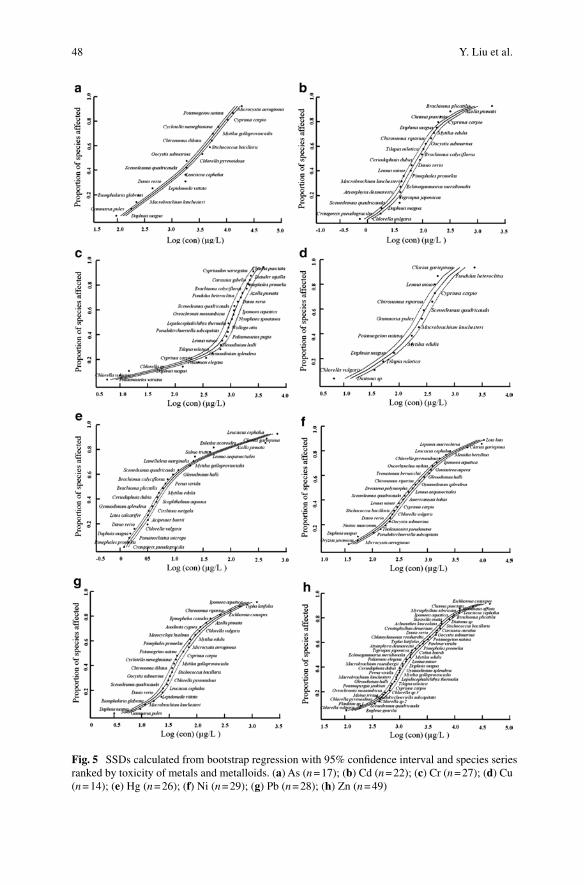
48
Fig. 5 SSDs calculated from bootstrap regression with 95% confidence interval and species seriesranked by toxicity of metals and metalloids. (a) As (n=17); (b) Cd (n = 22); (c) Cr (n=27); (d) Cu (n=14); (e) Hg (n = 26); (f) Ni (n=29); (g) Pb (n=28); (h) Zn (n=49)
Y. Liu et al.
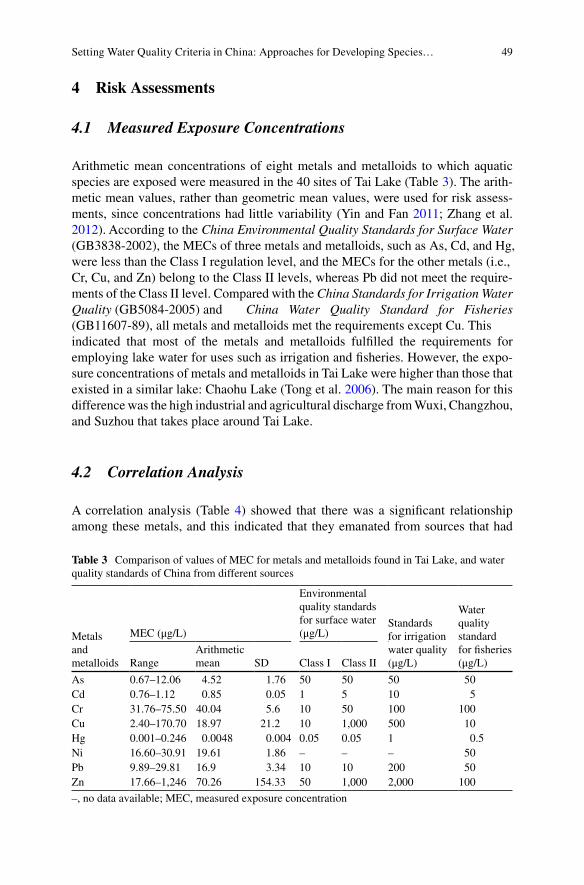
49
4 Risk Assessments
4.1 Measured Exposure Concentrations
Arithmetic mean concentrations of eight metals and metalloids to which aquatic species are exposed were measured in the 40 sites of Tai Lake (Table 3). The arith-metic mean values, rather than geometric mean values, were used for risk assess-ments, since concentrations had little variability (Yin and Fan 2011; Zhang et al. 2012). According to the China Environmental Quality Standards for Surface Water (GB3838-2002), the MECs of three metals and metalloids, such as As, Cd, and Hg,were less than the Class I regulation level, and the MECs for the other metals (i.e.,Cr, Cu, and Zn) belong to the Class II levels, whereas Pb did not meet the require-ments of the Class II level. Compared with the China Standards for Irrigation Water Quality (GB5084-2005) and China Water Quality Standard for Fisheries (GB11607-89), all metals and metalloids met the requirements except Cu. Thisindicated that most of the metals and metalloids fulfilled the requirements for employing lake water for uses such as irrigation and fisheries. However, the expo-sure concentrations of metals and metalloids in Tai Lake were higher than those that existed in a similar lake: Chaohu Lake (Tong et al. 2006). The main reason for this difference was the high industrial and agricultural discharge from Wuxi, Changzhou, and Suzhou that takes place around Tai Lake.
4.2 Correlation Analysis
A correlation analysis (Table 4) showed that there was a significant relationship among these metals, and this indicated that they emanated from sources that had
Table 3 Comparison of values of MEC for metals and metalloids found in Tai Lake, and waterquality standards of China from different sources
Metalsand metalloids
MEC (μg/L)
Environmental quality standards for surface water (μg/L)
Standards for irrigation water quality (μg/L)
Water quality standard for fisheries (μg/L)Range
Arithmetic mean SD Class I Class II
As 0.67–12.06 4.52 1.76 50 50 50 50Cd 0.76–1.12 0.85 0.05 1 5 10 5Cr 31.76–75.50 40.04 5.6 10 50 100 100Cu 2.40–170.70 18.97 21.2 10 1,000 500 10Hg 0.001–0.246 0.0048 0.004 0.05 0.05 1 0.5Ni 16.60–30.91 19.61 1.86 – – – 50Pb 9.89–29.81 16.9 3.34 10 10 200 50Zn 17.66–1,246 70.26 154.33 50 1,000 2,000 100
–, no data available; MEC, measured exposure concentration
Setting Water Quality Criteria in China: Approaches for Developing Species…
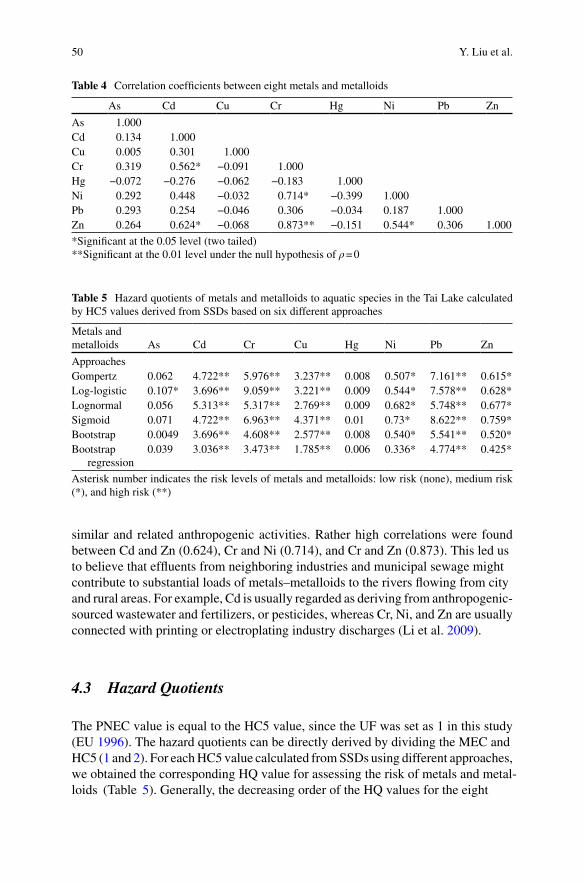
50
similar and related anthropogenic activities. Rather high correlations were found between Cd and Zn (0.624), Cr and Ni (0.714), and Cr and Zn (0.873). This led usto believe that effluents from neighboring industries and municipal sewage mightcontribute to substantial loads of metals–metalloids to the rivers flowing from cityand rural areas. For example, Cd is usually regarded as deriving from anthropogenic- sourced wastewater and fertilizers, or pesticides, whereas Cr, Ni, and Zn are usually connected with printing or electroplating industry discharges (Li et al. 2009).
4.3 Hazard Quotients
The PNEC value is equal to the HC5 value, since the UF was set as 1 in this study (EU 1996). The hazard quotients can be directly derived by dividing the MEC andHC5 (1 and 2). For each HC5 value calculated from SSDs using different approaches, we obtained the corresponding HQ value for assessing the risk of metals and metal-loids (Table 5). Generally, the decreasing order of the HQ values for the eight
Table 5 Hazard quotients of metals and metalloids to aquatic species in the Tai Lake calculated by HC5 values derived from SSDs based on six different approaches
Metals andmetalloids As Cd Cr Cu Hg Ni Pb Zn
ApproachesGompertz 0.062 4.722** 5.976** 3.237** 0.008 0.507* 7.161** 0.615*Log-logistic 0.107* 3.696** 9.059** 3.221** 0.009 0.544* 7.578** 0.628*Lognormal 0.056 5.313** 5.317** 2.769** 0.009 0.682* 5.748** 0.677*Sigmoid 0.071 4.722** 6.963** 4.371** 0.01 0.73* 8.622** 0.759*Bootstrap 0.0049 3.696** 4.608** 2.577** 0.008 0.540* 5.541** 0.520*Bootstrap
regression0.039 3.036** 3.473** 1.785** 0.006 0.336* 4.774** 0.425*
Asterisk number indicates the risk levels of metals and metalloids: low risk (none), medium risk (*), and high risk (**)
Table 4 Correlation coefficients between eight metals and metalloids
As Cd Cu Cr Hg Ni Pb Zn
As 1.000Cd 0.134 1.000Cu 0.005 0.301 1.000Cr 0.319 0.562* −0.091 1.000Hg −0.072 −0.276 −0.062 −0.183 1.000Ni 0.292 0.448 −0.032 0.714* −0.399 1.000Pb 0.293 0.254 −0.046 0.306 −0.034 0.187 1.000Zn 0.264 0.624* −0.068 0.873** −0.151 0.544* 0.306 1.000
*Significant at the 0.05 level (two tailed)**Significant at the 0.01 level under the null hypothesis of ρ = 0
Y. Liu et al.
51
elements was as follows: Hg<As<Ni<Zn<Cu<Cd<Pb<Cr. The more toxic elements,Cr, Pb, and Cd, exhibited greater risks. This is reasonable considering that these three metals have both greater toxic potency and greater rates of discharge. Manyfactories exist around Tai Lake, including printing houses and electroplating facto-ries, and thereby serve as sources of these metallic contaminants. From our analysis, risks of Cu, Zn, and Ni were somewhat in the middle range, although their human health toxicities are not that great. Of course, these are also essential dietary metals for humans. The last two elements, As and Hg, showed the least risk to aquatic species. This is mainly due to their lesser natural concentrations, although they are commonly thought of as being among the most toxic metals.
Applying different SSD approaches to the data produced different HC5 values for protecting aquatic species from metals and metalloids. Moreover, utilizing dif-ferent approaches affected the hazard quotients and risk levels for aquatic species. For instance, the HQ for As, calculated by HC5 through bootstrap regression, was0.039 at the lesser level of risk, whereas it was 0.107 at the medium level of riskwhen conducted by a log-logistic distribution. Consequently, what model is selected to treat the data is not only important when deriving WQC values but also a keyissue when assessing the risk of water pollutants.
5 Discussion
5.1 Evaluation of Approaches
When constructing SSDs, one limitation of conventional parametric methodologies is that no single frequency distribution adequately fits all of the available data (Grist et al. 2006). In particular, the accuracy and precision are poor when sample sizes are very small (Moore and Caux 1997). This effect can be seen from curves fitted with the standard log-logistic and sigmoid distributions for Cr (Fig. 3c). In such cases, the HC5 obtained are distorted. Because bootstrapping does not require designation of a particular statistical distribution of chemical effects on species assemblages, it could be an alternative tool to deal with this limitation. Bootstrapping requires a precondition that the empirical distribution of endpoint values could truly represent the real distribution of the source data in the world (Efron and Tibshirani 1993; Grist et al. 2002). Advantages and disadvantages of both conventional parametric and bootstrap approaches were addressed by Grist et al. (2002), when the bootstrap-ping regression approach was first introduced to construct SSDs for ecological risk assessments. The bootstrap approach does not force a distribution onto data, but it is a relatively data-intensive technique that completely ignores a priori information about distributions of biological responses. In contrast, the parametric approaches most frequently used in deriving SSDs for ecological risk assessment generally require simple computations but make more demanding assumptions about the distribution of data.
Setting Water Quality Criteria in China: Approaches for Developing Species…
52
5.2 Selection of Approaches
Using toxicity data of representative aquatic species and typical water contami-nants in China, a comparison of six approaches showed that nonparametric meth-ods based on bootstrapping were statistically superior to the parametric curve-fitting approaches. These results were generally consistent with previous comparisons of multiple approaches that have been applied to derive hazardous concentrations of contaminants in water. For instance, Wheeler et al. (2002) applied four approaches (viz., log-logistic, lognormal, bootstrap, and bootstrap regression) to construct SSDs based on acute lethality of Ni and Cd to saltwater organisms. They found that curves generated by bootstrap and bootstrap regres-sion best matched toxicity data among the approaches. The superiority of boot-strap methods was also reported when developing SSDs on the toxicity of organochlorine pesticides (Wang et al. 2008). These results suggested that boot-strap methods showed promising applications for protecting sensitive species than conventional parametric fitting methods. However, it is still too early to conclude that the bootstrap is the best model to simulate SSDs for all circumstances. Like HC5 values, the applicability of a particular model could be affected by several factors, including available data amounts, species composition, data selected, chemical toxicity, and geographical characteristics.
As the main components in SSD, the species composition and species sensitivity to chemicals could directly affect modeling of predictive values and accuracy of SSDs. The composition of species and sensitivities of organisms to chemicals in different ecosystems relate to their geographic distribution (Brock et al. 2006). For instance, the most common fishes in China are species of Cyprinidae, while in North America it is Salmonidae. Moreover, because of limited toxicity data fromliteratures, the species used in this study cannot represent all common aquatic organisms in the natural aquatic environment of China. A more sufficient set of toxicity data, covering as many as possible representative species, will be used in further studies. Applications of the same model and metal on chronic toxicity data would be different from those on acute toxicity data. One example is developing SSDs for acute and chronic toxicity of Zn to Chinese species by using parametric fitting methods (Wu et al. 2011). The exponential distribution (F(x) = 1 − exp(−λx), x > 0) gave the best fit to the acute data, while the sigmoid distribution was superior to other methods for fitting the chronic data.
Considering both the advantages and disadvantages of the approaches investi-gated in this study, if there are sufficient data and if parametric approaches fit the data well, they should be chosen for because of their computational simplicity (Wheeler et al. 2002). However, if the parametric descriptors fail to fit the toxicity data, in which species number is over than 20, the standard bootstrap methods should be used; otherwise, if the data number is less than 20, the bootstrap regres-sion is a better choice by stochastically inserting values.
Y. Liu et al.
53
5.3 Proportion of Species to Be Protected
Values for HC5 derived in this study indicate that if the concentration of a certain pol-lutant is less than the HC5, more than 95% of aquatic species that are chronicallyexposed would not be adversely affected (Aldenberg and Jaworska 2000). The species proportion to be protected from pollutant chemicals involved in SSDs would be a key issue for establishing water quality criteria. The goal of the WQC is to ensure thattoxicants appearing in water and sediment do not adversely affect all or most popula-tions of species in a particular ecosystem and do not impair the overall structure or function of the ecosystem. Although the use of the fifth centile of the biological spe-cies is arbitrary, it is generally applied in slightly to moderately disturbed areas and is widely used. A 99% level of protection is appropriate in areas of greater ecologicalvalue or where there are concerns about bioaccumulation or toxicity to endangered species. A lesser level of protection might be appropriate, at least as an interim mea-sure, in more disturbed areas. Consequently, the level adopted varies among countries or geographies. For instance, Canadian guidelines aim to protect 100% of specieseverywhere from long-term exposure (CCME 1999), whereas Australia (ANZECC and ARMCANZ 2000), the European Union (European Commission 2000), and the United States (USEPA 1986) seek to protect a percentage of species, usually 95%,sometimes 99% (pristine areas) or 80% (heavily modified ecosystems).
5.4 HQ for Risk Assessment
HQ values were effectively used for screening-level ecological risk assessments forTai Lake. However, the results of ecological risk assessment are conservative and preliminary considering several factors such as sampling frequency, available toxicity data, and environmental conditions. First, water samples were only collected over a short period in September of 2009. To better reflect and characterize the status of thesemetals for the long term, seasonal sampling of metal content is needed. Second, lim-ited numbers of metals and metalloids and exposed species were addressed. Inclusion of additional metals or organic pollutants may change the potential risk to aquatic species. Third, exposure concentrations are dynamic in the context of environmental factors such as temperature, pH, and dissolved oxygen. In addition, the species com-position in the assessed target water body is variable from seasonal change. Such dynamic changes in the community need to be considered in future studies.
6 Summary
Both nonparametric and parametric approaches were used to construct SSDs for use in ecological risk assessments. Based on toxicity to representative aquatic species and typical water contaminants of metals and metalloids in China,
Setting Water Quality Criteria in China: Approaches for Developing Species…
54
nonparametric methods based on the bootstrap were statistically superior to the parametric curve- fitting approaches. Knowing what the SSDs for each targeted spe-cies are might help in selecting efficient indicator species to use for water quality monitoring. The species evaluated herein showed sensitivity variations to different chemical treatments that were used in constructing the SSDs. For example, D. magna was more sensitive than most species to most chemical treatments, whereas D. rerio was sensitive to Hg and Pb but was tolerant to Zn.
HC5 values, derived for the pollutants in this study for protecting Chinese spe-cies, differed from those published by the USEPA. Such differences may result from differences in geographical conditions and biota between China and the United States. Thus, the degree of protection desired for aquatic organisms should be formulated to fit local conditions. For approach selection, we recommend all approaches be considered and the most suitable approaches chosen. The selection should be based on the practical information needs of the researcher (viz., species composition, species sensitivity, and geological characteristics of aquatic habi-tats), since risk assessments usually are focused on certain substances, species, or monitoring sites.
We used Tai Lake as a typical freshwater lake in China to assess the risk of metals and metalloids to the aquatic species. We calculated hazard quotients for the metals and metalloids that were found in the water of this lake. Results indicated the decreasing ecological risk of these contaminants in the following order: Hg <As<Ni<Zn<Cu<Cd<Pb<Cr. From the methodological perspective, six SSDapproaches used delivered different WQC values and affected the risk assessmentresults of the metals and metalloids to aquatic species. Based on the MEC and HC5derived from SSDs by nonparametric and parametric approaches together, the risk levels of metals and metalloids were characterized from their hazard quotients as being high risk (Cr, Pb, Cd, and Cu), medium risk (Zn and Ni), or low risk (As and Hg).
Acknowledgements The research was supported by the National Basic Research Program of China (973 Program) (No. 2008CB418200) and the National Natural Science Foundation of China(No. U0833603 and 41130743). Prof. Giesy was supported by the program of 2012 “High LevelForeign Experts” (#GDW20123200120) funded by the State Administration of Foreign Experts Affairs, the P.R. China to Nanjing University, and the Einstein Professor Program of the Chinese Academy of Sciences. He was also supported by the Canada Research Chair program, a Visiting Distinguished Professorship in the Department of Biology and Chemistry and State Key Laboratory in Marine Pollution, City University of Hong Kong. The authors give special thanks to Dr. YanpingChen in Southern Medical University, China, for his helpful comments on solving statistical prob-lems during the review process.
References
Aldenberg T, Jaworska JS (2000) Uncertainty of the hazardous concentration and fraction affected for normal species sensitivity distributions. Ecotoxicol Environ Saf 46:1–18
Aldenberg T, Slob W (1993) Confidence limits for hazardous concentrations based on logisticallydistributed NOEC toxicity data. Ecotoxicol Environ Saf 25:48–63
Y. Liu et al.
55
ANZECC, ARMCANZ (2000) Australian and New Zealand guidelines for fresh and marine waterquality. Australian and New Zealand Environment and Conservation Council and Agriculture and Resource Management Council of Australia and New Zealand, Canberra
Balk F, Okkerman PC, Dogger JW (1995) Guidance document for aquatic effects assessment.Organization for Economic Co-operation and Development (OECD), Paris
Batley GE (2012) “Heavy metal”—a useful term. Integr Environ Assess Manag 8:215Borcherding J, Volpers M (1994) The “Dreissena-monitor”. First results on the application of this
biological early warning system in the continuous monitoring of water quality. Water Sci Technol 29:199–201
Brock TCM, Arts GHP, Maltby L, Van den Brink PJ (2006) Aquatic risks of pesticides, ecologicalprotection goals, and common aims in European Union legislation. Integr Environ Assess Manag 2:20–46
Calow P (1996) Variability: noise or information in ecotoxicology? Environ Toxicol Pharmacol2:121–123
Campbel P, Stokes P (1985) Acidification and toxicity of metals to aquatic biota. Can J Fish AquatSci 42:2034–2049
Campbell KR, Bartell SM, Shaw JL (2000) Characterizing aquatic ecological risks from pesticidesusing a diquat dibromide case study. II. Approaches using quotients and distributions. Environ Toxicol Chem 19:760–774
CCME (1999) Canadian environmental quality guidelines. Canadian Council of Ministers of theEnvironment, Winnipeg
Chapman PM (2012) “Heavy metal”—cacophony, not symphony. Integr Environ Assess Manag 8:216R Development Core Team (2011) R: a language and environment for statistical computing. R Foundation for Statistical Computing, Vienna, Austria. ISBN 3-900051-07-0, URL http://www.R-project.org/
Duffus JH (2002) “Heavy metals” a meaningless term? Pure Appl Chem 74:793–807ECB (2003) Technical guidance document on risk assessment—Part II. Technical report. Institute
for Health and Consumer Protection, Ispra, ItalyEfron B, Tibshirani R (1993) An introduction to the bootstrap. Chapman & Hall, Boca Raton, FLEU (1996) Technical guidance document on risk assessment in support of council directive 93/67/EEC on risk assessment for new notified substances, commission regulation (EC) 1488/94 onrisk assessment for existing substances
European Commission (2000) Directive 2000/60/EC of the European Parliament and of the Council establishing a framework for the Community action in the field of water policy. OJEC L327:1–72
Forbes TL, Forbes VE (1993) A critique of the use of distribution-based extrapolation models inecotoxicology. Funct Ecol 7:249–254
Giesy JP, Solomon KR, Coats JR, Dixon KR, Giddings JM, Kenaga EE (1999) Chlorpyrifos: eco-logical risk assessment in North American aquatic environments. Rev Environ Contam Toxicol 160:1–129
Grist EPM, Leung KMY, Wheeler JR, Crane M (2002) Better bootstrap estimation of hazardousconcentration thresholds for aquatic assemblages. Environ Toxicol Chem 21:1515–1524
Grist EPM, O’Hagan A, Crane M, Sorokin N, Sims I, Whitehouse P (2006) Bayesian and time-independent species sensitivity distributions for risk assessment of chemicals. Environ Sci Technol 40:395–401
Jagoe R, Newman MC (1997) Bootstrap estimation of community NOEC values. Ecotoxicology6:293–306
Klimisch H, Andreae M, Tillmann U (1997) A systematic approach for evaluating the quality ofexperimental toxicological and ecotoxicological data. Regul Toxicol Pharmacol 25:1–5
Li JL, He M, Han W, Gu YF (2009)Analysis and assessment on heavy metal sources in the coastalsoils developed from alluvial deposits using multivariate statistical methods. J Hazard Mater164:976–981
Mance G (1987) Pollution threat of heavy metals in aquatic environments. Springer, New YorkMarchant C, Leiva V, Cavieres MF, Sanhueza A (2013) Statistical distributions with application toPM10 in Santiago, Chile. Rev Environ Contam Toxicol 223:1–31
Setting Water Quality Criteria in China: Approaches for Developing Species…
56
Meng W, Wu FC (2010) Introduction of water quality criteria theory and methodology (in Chinese).Science Press, Beijing
Moore DRJ, Caux PY (1997) Estimating low toxic effects. Environ Toxicol Chem 16:794–801Moriasi D, Arnold J, Van Liew M, Bingner R, Harmel R, Veith T (2007) Model evaluation guide-
lines for systematic quantification of accuracy in watershed simulations. Trans ASABE 50:885–900
Newman MC, Ownby DR, Mezin LCA, Powell DC, Christensen TRL, Lerberg SB, Anderson BA(2000) Applying species sensitivity distributions in ecological risk assessment: assumptions of distribution type and sufficient numbers of species. Environ Toxicol Chem 19:508–515
Nogawa K, Kido T (1993) Biological monitoring of cadmium exposure in itai-itai disease epide-miology. Int Arch Occup Environ Health 65:43–46
OECD (2011) Proposal for updated guideline 211 Daphnia magna reproduction test. Organization for Economic Co-operation and Development, Paris
Pennington DW (2003) Extrapolating ecotoxicological measures from small data sets. Ecotoxicol Environ Saf 56:238–250
Posthuma L, Suter GW, Traas TP (2002) Species sensitivity distributions in ecotoxicology. CRC Press, Boca Raton, FL
Power M, McCarty LS (1997) Fallacies in ecological risk assessment practices. Environ SciTechnol 31:370A–375A
Rausina GA, Wong DCL, Raymon Arnold W, Mancini ER, Steen AE (2002) Toxicity of methyltert-butyl ether to marine organisms: ambient water quality criteria calculation. Chemosphere 47:525–534
RIVM (2007) Guidance document on deriving environmental risk limits in The Netherlands,report 601501012. National Institute of Public Health and the Environment, Bilthoven, The Netherlands
Salánki J, Farkas A, Kamardina T, Rózsa KS (2003) Molluscs in biological monitoring of waterquality. Toxicol Lett 140:403–410
Sanchez-Bayo F, Baskaran S, Kennedy IR (2002) Ecological relative risk (EcoRR): another approach for risk assessment of pesticides in agriculture. Agric Ecosyst Environ 91:37–57
Shao Q (2000) Estimation for hazardous concentrations based on NOEC toxicity data: an alterna-tive approach. Environmetrics 11:583–595
Shaw WHR, Grushkin B (1957) The toxicity of metal ions to aquatic organisms. Arch BiochemBiophys 67:447–452
Solomon KR, Baker DB, Richards RP, Dixon KR, Klaine SJ, La Point TW, Kendall RJ, Weisskopf CP, Giddings JM, Giesy JP, Hall LW, Williams WM (1996) Ecological risk assessment of atra-zine in North American surface waters. Environ Toxicol Chem 15:31–76
Solomon KR, Giesy JP, Jones P (2000) Probabilistic risk assessment of agrochemicals in the envi-ronment. Crop Prot 19:649–655
SPSS Inc. (2008) SPSS statistics for windows, version 17.0. SPSS Inc., Chicago, ILStephan CE, Mount DI, Hansen DJ, Gentile JH, Chapman GA, Brungs WA (1985) Guidelines for
deriving numeric national water quality criteria for the protection of aquatic organisms and their uses. PB85-227049. National Technical Information Services, Springfield, VA
TenBrook PL, Palumbo AJ, Fojut TL, Hann P, Karkoski J, Tjeerdema RS (2010) The University of California-Davis methodology for deriving aquatic life pesticide water quality criteria. In: Whitacre DM (ed) Reviews of environmental contamination and toxicology, vol 209. SpringerScience+Business Media, LLC, New York, pp 1–155
Tong JH, Huang XM, Chen Y (2006) Evaluation of contamination of heavy metal in Chaohu lake(in Chinese). J Anhui Agric Sci 17:4373–4374
Townsend PA, PapeşM, Eaton M (2007) Transferability and model evaluation in ecological nichemodeling: a comparison of GARP and Maxent. Ecography 30:550–560
Tsushima K, Naito W, Kamo M (2010) Assessing ecological risk of zinc in Japan using organism-and population-level species sensitivity distributions. Chemosphere 80:563–569
USEPA (1968) Report of the subcommittee of water quality criteria. Technical report. USDepartment of the Interior, Washington, DC
Y. Liu et al.
57
USEPA (1976) Quality criteria for water. EPA 440/9-76/023. Office of Water Planning andStandards, Washington, DC
USEPA (1985) Guidelines for deriving numerical national water quality criteria for the protectionof aquatic organisms and their uses, PB-85-227049. US Environmental Protection Agency,National Technical Information Service, Springfield, VA
USEPA (1986) Quality criteria for water. EPA-440/5-86-001. Office of Water Regulations andStandards, Washington, DC
USEPA (1996) Water quality criteria documents for the protection of aquatic life in ambient water:1995 updates. EPA-820-B-96-001. Office of Water, Washington, DC
USEPA (1999) National recommended water quality criteria-correction. EPA-822-Z-99-001.Office of Water, Washington, DC
USEPA (2002) National recommended water-quality criteria: 2002. EPA-822-R-02-047. Office ofWater, Washington, DC
USEPA (2004) National recommended water quality criteria. Office of Water, Office of Scienceand Technology, Washington, DC
USEPA (2009) National recommended water quality criteria. Office of Water, Washington, DCvan Dam RA, Harford AJ, Warne MSJ (2012) Time to get off the fence: the need for definitiveinternational guidance on statistical analysis of ecotoxicity data. Integr Environ Assess Manag8:242–245
van Sprang PA, Verdonck FAM, van Assche F, Regoli L, De Schamphelaere KAC (2009)Environmental risk assessment of zinc in European freshwaters: a critical appraisal. Sci Total Environ 407:5373–5391
van Straalen NM (2002) Threshold models for species sensitivity distributions applied to aquaticrisk assessment for zinc. Environ Toxicol Pharmacol 11:167–172
van Straalen NM, Denneman CAJ (1989) Ecotoxicological evaluation of soil quality criteria.Ecotoxicol Environ Saf 18:241–251
Vardy DW, Tompsett AR, Sigurdson JL, Doering JA, Zhang X, Giesy JP, Hecker M (2011) Effectsof subchronic exposure of early life stages of white sturgeon (Acipenser transmontanus) to copper, cadmium, and zinc. Environ Toxicol Chem 30:2497–2505
Varian H (2005) Bootstrap tutorial. Math J 9:768–775Wagner C, Løkke H (1991) Estimation of ecotoxicological protection levels from NOEC toxicitydata. Water Res 25:1237–1242
Wang B, Yu G, Huang J, Hu H (2008) Development of species sensitivity distributions and estima-tion of HC5 of organochlorine pesticides with five statistical approaches. Ecotoxicology 17:716–724
Wheeler JR, Grist EPM, Leung KMY, Morritt D, Crane M (2002) Species sensitivity distributions:data and model choice. Mar Pollut Bull 45:192–202
WHO (2006) Guidelines for drinking water quality: incorporation 1st and 2nd addenda. Technical report, vol 1, 3rd edn. WHO, Geneva, recommendations
Willmott CJ, Ackleson SG, Davis RE, Feddema JJ, Klink KM, Legates DR, O’Donnell J, RoweCM (1985) Statistics for the evaluation and comparison of models. J Geophys Res 90: 8995–9005
Wu FC, Meng W, Zhao XL, Li HX, Zhang RQ, Cao YJ, Liao HQ (2010) China embarking ondevelopment of its own national water quality criteria system. Environ Sci Technol 44: 7992–7993
Wu FC, Feng CL, Cao YJ, Zhang RQ, Li HX, Liao HQ, Zhao XL (2011) Toxicity characteristic ofzinc to freshwater biota and its water quality criteria (in Chinese). Asian J Ecotoxicol 6:367–382
Wu FC, Feng CL, Zhang RQ, Li YS, Du DY (2012) Derivation of water quality criteria for repre-sentative water-body pollutants in China. Sci China Earth Sci 55:900–906
Yin HY, Fan C (2011) Dynamics of reactive sulfide and its control on metal bioavailability and toxicity in metal-polluted sediments from Lake Taihu, China. Arch Environ Contam Toxicol 60:565–575
Zhang Y, Hu X, Yu T (2012) Distribution and risk assessment of metals in sediments from Taihu Lake, China using multivariate statistics and multiple tools. Bull Environ Contam Toxicol 89:1009–1015
Setting Water Quality Criteria in China: Approaches for Developing Species…
59D.M. Whitacre (ed.), Reviews of Environmental Contamination and Toxicology volume 230, Reviews of Environmental Contamination and Toxicology 230, DOI 10.1007/978-3-319-04411-8_3, © Springer International Publishing Switzerland 2014
Toxicity Reference Values for Protecting Aquatic Birds in China from the Effects of Polychlorinated Biphenyls
Hailei Su, Fengchang Wu, Ruiqing Zhang, Xiaoli Zhao, Yunsong Mu, Chenglian Feng, and John P. Giesy
H. Su College of Water Sciences, Beijing Normal University, Beijing 100875, China
State Key Laboratory of Environmental Criteria and Risk Assessment, Chinese Research Academy of Environmental Sciences, Beijing 100012, China
F. Wu (*) • R. Zhang • X. Zhao • Y. Mu • C. Feng State Key Laboratory of Environmental Criteria and Risk Assessment, Chinese Research Academy of Environmental Sciences, Beijing 100012, Chinae-mail: [email protected]
J.P. Giesy Department of Veterinary Biomedical Sciences and Toxicology Centre, University of Saskatchewan, Saskatoon, SK, Canada
Zoology Department and Center for Integrative Toxicology, Michigan State University, East Lansing, MI 48824, USA
Contents
1 Introduction .......................................................................................................................... 602 Data Collection and Analysis Methods ................................................................................ 61
2.1 Selection of Representative Species in China and Toxicity Data ............................... 612.2 Methods for Deriving TRVs and TRGs ...................................................................... 62
3 Review of PCB Bird Toxicity Studies.................................................................................. 643.1 Domestic Chicken (Gallus gallus domesticus) ........................................................... 643.2 Double-Crested Cormorant (Phalacrocorax auritus) .................................................. 683.3 Common Tern (Sterna hirundo) .................................................................................. 693.4 Osprey (Pandion haliaetus ) ......................................................................................... 693.5 Bald Eagle (Haliaeetus leucocephalus) ....................................................................... 693.6 American Kestrel (Falco sparverius) .......................................................................... 703.7 Great Horned Owl (Bubo virginianus) ....................................................................... 70
4 Derivation of TRVs and TRGs ............................................................................................. 704.1 Species Sensitivity Distribution Method .................................................................... 704.2 Critical Study Approach ............................................................................................. 734.3 Toxicity Percentile Rank Method ............................................................................... 74
5 Results and Discussion ........................................................................................................ 75
60
1 Introduction
Polychlorinated biphenyls (PCBs) are widely distributed, persistent, bioaccumulative, and toxic pollutants of abiotic matrices, such as soils, sediments, and water, and of wildlife such as fish and birds (Kannan et al. 2000; Giesy et al. 1994b). PCBs are stable in water and adsorb to particles that can be deposited in sediment or accumu-lated in aquatic food webs. Because of their persistent and lipophilic properties, PCBs bioaccumulate and biomagnify through aquatic food webs, and if thresholds for adverse effects are exceeded, cause effects on wildlife. As top predators that feed at the top of the aquatic food chain, fish-eating birds are exposed to greater concentra-tions of PCBs (Giesy et al. 1994a; Bosveld and Van den Berg 1994). Potential adverse effects reported for PCBs on wild birds include reduced hatchability, embryonic deformities, immune suppression, mortality (Kannan et al. 2000; Giesy et al. 1994a; Bosveld and Van den Berg 1994; Brunström 1989; Bosveld et al. 1995, 2000; Hoffman et al. 1998), and population-level effects (CCME 1998; Sanderson et al. 1994).
PCBs cause dioxin-like effects by binding to the aryl hydrocarbon receptor (AhR) in birds (Safe 1990, 1994; Kennedy et al. 1996). The primary PCB congeners that cause AhR-mediated effects to birds are the non- and mono-ortho-substituted congeners (Bosveld and Van den Berg 1994; Bosveld et al. 2000). As the most sen-sitive biological effect, ethoxyresorufin-O-deethylase (EROD) activity induction has been suggested to be a suitable biochemical indicator for exposure to dioxin- like compounds, such as some PCB congeners (Elliott et al. 2001). It is thought that the developing embryo is the life stage that is most sensitive to the toxic effects of pollutants (Lam et al. 2008; Peterson et al. 1993). Accordingly, PCB concentrations in eggs were the more predictive measure of exposure to derive toxic reference val-ues (TRVs). The tissue-based risk of great blue herons was assessed on the basis of an egg-based TRV, and was developed by taking the geometric mean of effect con-centrations in three egg-injection studies (Seston et al. 2010).
PCB congeners have different toxic potencies because their physical and chemi-cal properties and structures are different. Such differences determine the binding affinity of PCBs to the AhR. Assessments of the PCB hazard to humans and wildlife are complicated because PCBs occur in mixtures that change as a function of time from weathering, differential accumulation, and metabolism. Log-Kow values for the PCBs are between 4.3 and 8.26. PCBs that have even moderate Kow values accu-mulate in aquatic organisms and their predators. Relative Potency Factors (RePs) have been used to calculate concentrations of 2,3,7,8-TCDD toxicity equivalents (TEQ) in samples as the sum of the product of the ReP multiplied by the concentra-tion of the respective congeners (Van den Berg et al. 1998).
6 Assessment of the Risk PCBs Pose to Birds ........................................................................ 766.1 Comparison of TRVs to PCB Concentrations in Birds ............................................... 766.2 Comparison of TRGs to PCB Concentrations in Fish ................................................ 77
7 Summary .............................................................................................................................. 77References .................................................................................................................................. 78
H. Su et al.
61
Wildlife, such as birds, consumes persistent substances mainly via consumption of fish, crustaceans, invertebrates, and plants. Governments have established allow-able residue concentrations in tissues to protect wildlife that feed on aquatic organ-isms contaminated by persistent, bioaccumulative, and toxic substances. Tissue residue guidelines (TRGs) are concentrations of xenobiotics in tissues that are established for aquatic biota to protect wildlife that consume them. Generally, as concentrations of xenobiotics increase, the greater is the expectation that adverse effects will occur on birds and mammals feeding on aquatic organisms (CCME 1998). The USEPA (1995a) used NOAEL (no observed adverse effects levels) or LOAEL (lowest observed adverse effects levels) values to derive wildlife criteria for PCBs. Hatching success of pheasant eggs was the endpoint and appropriate uncer-tainty factors were used. In addition, the EPA derived wildlife criteria for the PCBs for kingfisher, silver gulls, and bald eagles, and the geometric mean of the values for these three species was taken as the PCB wildlife criterion for birds by the USEPA. The tissue residue guideline for PCBs in aquatic birds derived in Canada was 2.4 ng TEQs/kg food wet mass (wm), and was based on a toxicity study in white Leghorn hens (CCME 1998, 2001).
We had two objectives in the present study:
1. Derive TRVs and TRGs for the effects of PCBs on aquatic birds by using the toxicity percentile rank method (TPRM), the species sensitivity distribution (SSD) and critical study approach (CSA), along with the method used in the USA and Canada for deriving the wildlife criteria for PCBs in birds.
2. Assess the PCB hazard to birds by comparing TRVs and TRGs derived in this study, with the actual concentrations of PCBs measured in birds and fish in selected regions of China. The additional value contributed by this study is that it provides a scientific baseline for risk management of PCBs in China.
2 Data Collection and Analysis Methods
2.1 Selection of Representative Species in China and Toxicity Data
The primary criterion for selecting representative avian species is their exposure to pollutants via aquatic food webs (USEPA 1995a), such as fish-eating birds. The night heron (Nycticorax nycticorax), little egret (Egretta garzetta), and Eurasian spoonbill (Platalea leucorodia) were selected as three representative avian species in China (ZRQ). All of these are widely distributed in Chinese aquatic ecosystems and are known to feed on aquatic prey (Barter et al. 2005). These three species have been studied extensively as bioindicators of wetland health and environmental pol-lution (Lam et al. 2008; Levengood et al. 2007; An et al. 2006). Body masses (bm) and rates of food ingestion (FI) for these three avian species are shown in Table 1.
Toxicity Reference Values for Protecting Aquatic Birds in China…
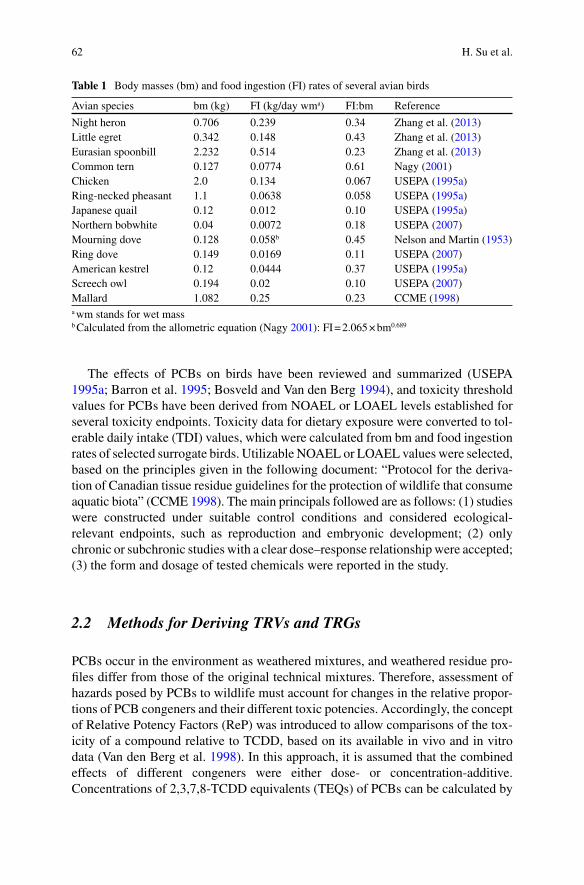
62
The effects of PCBs on birds have been reviewed and summarized (USEPA 1995a; Barron et al. 1995; Bosveld and Van den Berg 1994), and toxicity threshold values for PCBs have been derived from NOAEL or LOAEL levels established for several toxicity endpoints. Toxicity data for dietary exposure were converted to tol-erable daily intake (TDI) values, which were calculated from bm and food ingestion rates of selected surrogate birds. Utilizable NOAEL or LOAEL values were selected, based on the principles given in the following document: “Protocol for the deriva-tion of Canadian tissue residue guidelines for the protection of wildlife that consume aquatic biota” (CCME 1998). The main principals followed are as follows: (1) studies were constructed under suitable control conditions and considered ecological- relevant endpoints, such as reproduction and embryonic development; (2) only chronic or subchronic studies with a clear dose–response relationship were accepted; (3) the form and dosage of tested chemicals were reported in the study.
2.2 Methods for Deriving TRVs and TRGs
PCBs occur in the environment as weathered mixtures, and weathered residue pro-files differ from those of the original technical mixtures. Therefore, assessment of hazards posed by PCBs to wildlife must account for changes in the relative propor-tions of PCB congeners and their different toxic potencies. Accordingly, the concept of Relative Potency Factors (ReP) was introduced to allow comparisons of the tox-icity of a compound relative to TCDD, based on its available in vivo and in vitro data (Van den Berg et al. 1998). In this approach, it is assumed that the combined effects of different congeners were either dose- or concentration-additive. Concentrations of 2,3,7,8-TCDD equivalents (TEQs) of PCBs can be calculated by
Table 1 Body masses (bm) and food ingestion (FI) rates of several avian birds
Avian species bm (kg) FI (kg/day wma) FI:bm Reference
Night heron 0.706 0.239 0.34 Zhang et al. (2013)Little egret 0.342 0.148 0.43 Zhang et al. (2013)Eurasian spoonbill 2.232 0.514 0.23 Zhang et al. (2013)Common tern 0.127 0.0774 0.61 Nagy (2001)Chicken 2.0 0.134 0.067 USEPA (1995a)Ring-necked pheasant 1.1 0.0638 0.058 USEPA (1995a)Japanese quail 0.12 0.012 0.10 USEPA (1995a)Northern bobwhite 0.04 0.0072 0.18 USEPA (2007)Mourning dove 0.128 0.058b 0.45 Nelson and Martin (1953)Ring dove 0.149 0.0169 0.11 USEPA (2007)American kestrel 0.12 0.0444 0.37 USEPA (1995a)Screech owl 0.194 0.02 0.10 USEPA (2007)Mallard 1.082 0.25 0.23 CCME (1998)a wm stands for wet massb Calculated from the allometric equation (Nagy 2001): FI = 2.065 × bm0.689
H. Su et al.
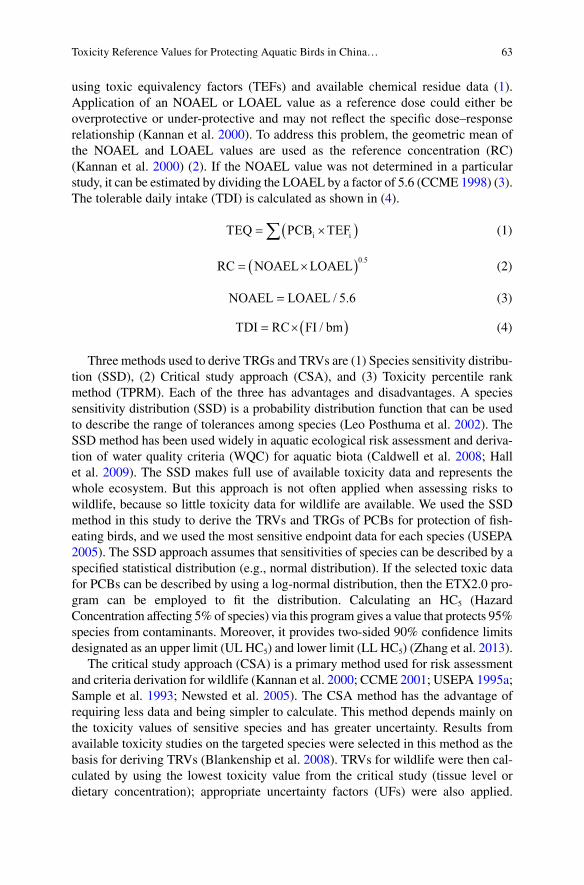
63
using toxic equivalency factors (TEFs) and available chemical residue data (1). Application of an NOAEL or LOAEL value as a reference dose could either be overprotective or under-protective and may not reflect the specific dose–response relationship (Kannan et al. 2000). To address this problem, the geometric mean of the NOAEL and LOAEL values are used as the reference concentration (RC) (Kannan et al. 2000) (2). If the NOAEL value was not determined in a particular study, it can be estimated by dividing the LOAEL by a factor of 5.6 (CCME 1998) (3). The tolerable daily intake (TDI) is calculated as shown in (4).
TEQ PCB TEFi i= ´( )å
(1)
RC NOAEL LOAEL= ´( )0 5.
(2)
NOAEL LOAEL= / .5 6 (3)
TDI RC FI bm= ´( )/
(4)
Three methods used to derive TRGs and TRVs are (1) Species sensitivity distribu-tion (SSD), (2) Critical study approach (CSA), and (3) Toxicity percentile rank method (TPRM). Each of the three has advantages and disadvantages. A species sensitivity distribution (SSD) is a probability distribution function that can be used to describe the range of tolerances among species (Leo Posthuma et al. 2002). The SSD method has been used widely in aquatic ecological risk assessment and deriva-tion of water quality criteria (WQC) for aquatic biota (Caldwell et al. 2008; Hall et al. 2009). The SSD makes full use of available toxicity data and represents the whole ecosystem. But this approach is not often applied when assessing risks to wildlife, because so little toxicity data for wildlife are available. We used the SSD method in this study to derive the TRVs and TRGs of PCBs for protection of fish- eating birds, and we used the most sensitive endpoint data for each species (USEPA 2005). The SSD approach assumes that sensitivities of species can be described by a specified statistical distribution (e.g., normal distribution). If the selected toxic data for PCBs can be described by using a log-normal distribution, then the ETX2.0 pro-gram can be employed to fit the distribution. Calculating an HC5 (Hazard Concentration affecting 5% of species) via this program gives a value that protects 95% species from contaminants. Moreover, it provides two-sided 90% confidence limits designated as an upper limit (UL HC5) and lower limit (LL HC5) (Zhang et al. 2013).
The critical study approach (CSA) is a primary method used for risk assessment and criteria derivation for wildlife (Kannan et al. 2000; CCME 2001; USEPA 1995a; Sample et al. 1993; Newsted et al. 2005). The CSA method has the advantage of requiring less data and being simpler to calculate. This method depends mainly on the toxicity values of sensitive species and has greater uncertainty. Results from available toxicity studies on the targeted species were selected in this method as the basis for deriving TRVs (Blankenship et al. 2008). TRVs for wildlife were then cal-culated by using the lowest toxicity value from the critical study (tissue level or dietary concentration); appropriate uncertainty factors (UFs) were also applied.
Toxicity Reference Values for Protecting Aquatic Birds in China…
64
Uncertainty factors were determined primarily from guidance given by the US-EPA (USEPA 1995a, b; Weseloh et al. 1995). Three types of uncertainty factors were considered: interspecies uncertainty factor (UFA), sub-chronic to chronic uncertainty factor (UFS), and LOAEL-to-NOAEL uncertainty factor (UFL). Values of 1–10 were assigned to represent the degree of uncertainty for each factor and were based on the nature of available scientific information as well as professional judgment.
The toxicity percentile rank method (TPRM) is the standard method recom-mended by the USEPA for deriving water quality criteria for protecting aquatic organisms (USEPA 1985). The TPRM more comprehensively reflects the toxic effects of pollutants to organisms and ultimately provides better protection for wild-life. When using the TPRM, the reference concentrations (RC) for avian species are first ordered from largest to least, and ranks (R) are assigned to RCs from 1 for the lowest to N (N is the number of avian species) for the highest. Second, the cumula-tive probability P is calculated for each species using the equation: P = R/(N + 1). Finally, four RCs, which have cumulative probabilities closest to 0.05 (always the four least RCs,) are selected as the basis to calculate the TRVs (5–8).
Sln RC ln RC
P P
2
2 2
2
4
4=
( ) - ( )éë ùû
( ) - ( )éë
ùû
éë
ùûå å
å å
/
/
(5)
L ln RC S P= ( ) - ( )é
ëùû{ }å å / 4
(6)
A S L= ( ) +0 05.
(7)
TRV eA= (8)
3 Review of PCB Bird Toxicity Studies
The toxicity of PCBs to birds, emphasizing reproduction and developmental effects, was summarized by Barron et al. (1995). To augment the information from Barron et al. (1995), additional recent and relevant toxicity studies of PCB effects on birds were compiled, reviewed, and critiqued. All available toxicity data (both diet and tissue data) were summarized and are presented in Table 2.
3.1 Domestic Chicken (Gallus gallus domesticus)
It has been shown in several studies that chickens are among the most sensitive species to the effects of PCBs; moreover, PCB126 was the most toxic congener and
H. Su et al.
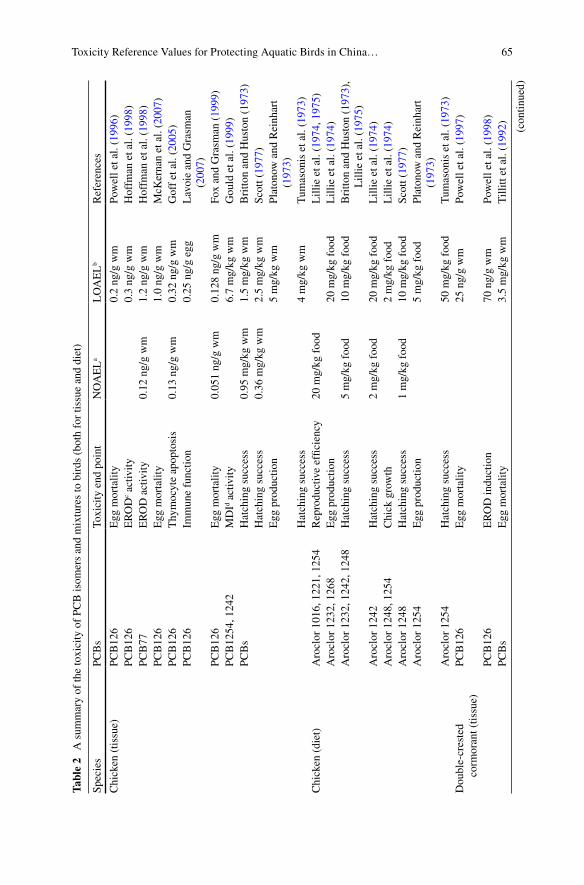
65
Tabl
e 2
A s
umm
ary
of th
e to
xici
ty o
f PC
B is
omer
s an
d m
ixtu
res
to b
irds
(bo
th f
or ti
ssue
and
die
t)
Spec
ies
PCB
sTo
xici
ty e
nd p
oint
NO
AE
La
LO
AE
Lb
Ref
eren
ces
Chi
cken
(tis
sue)
PCB
126
Egg
mor
talit
y0.
2 ng
/g w
mPo
wel
l et a
l. (1
996)
PCB
126
ER
OD
c act
ivity
0.3
ng/g
wm
Hof
fman
et a
l. (1
998)
PCB
77E
RO
D a
ctiv
ity0.
12 n
g/g
wm
1.2
ng/g
wm
Hof
fman
et a
l. (1
998)
PCB
126
Egg
mor
talit
y1.
0 ng
/g w
mM
cKer
nan
et a
l. (2
007)
PCB
126
Thy
moc
yte
apop
tosi
s0.
13 n
g/g
wm
0.32
ng/
g w
mG
off
et a
l. (2
005)
PCB
126
Imm
une
func
tion
0.25
ng/
g eg
gL
avoi
e an
d G
rasm
an
(200
7)PC
B12
6E
gg m
orta
lity
0.05
1 ng
/g w
m0.
128
ng/g
wm
Fox
and
Gra
sman
(19
99)
PCB
1254
, 124
2M
DId a
ctiv
ity6.
7 m
g/kg
wm
Gou
ld e
t al.
(199
9)PC
Bs
Hat
chin
g su
cces
s0.
95 m
g/kg
wm
1.5
mg/
kg w
mB
ritto
n an
d H
usto
n (1
973)
Hat
chin
g su
cces
s0.
36 m
g/kg
wm
2.5
mg/
kg w
mSc
ott (
1977
)E
gg p
rodu
ctio
n5
mg/
kg w
mPl
aton
ow a
nd R
einh
art
(197
3)H
atch
ing
succ
ess
4 m
g/kg
wm
Tum
ason
is e
t al.
(197
3)C
hick
en (
diet
)A
rocl
or 1
016,
122
1, 1
254
Rep
rodu
ctiv
e ef
ficie
ncy
20 m
g/kg
foo
dL
illie
et a
l. (1
974,
197
5)A
rocl
or 1
232,
126
8E
gg p
rodu
ctio
n20
mg/
kg f
ood
Lill
ie e
t al.
(197
4)A
rocl
or 1
232,
124
2, 1
248
Hat
chin
g su
cces
s5
mg/
kg f
ood
10 m
g/kg
foo
dB
ritto
n an
d H
usto
n (1
973)
, L
illie
et a
l. (1
975)
Aro
clor
124
2H
atch
ing
succ
ess
2 m
g/kg
foo
d20
mg/
kg f
ood
Lill
ie e
t al.
(197
4)A
rocl
or 1
248,
125
4C
hick
gro
wth
2 m
g/kg
foo
dL
illie
et a
l. (1
974)
Aro
clor
124
8H
atch
ing
succ
ess
1 m
g/kg
foo
d10
mg/
kg f
ood
Scot
t (19
77)
Aro
clor
125
4E
gg p
rodu
ctio
n5
mg/
kg f
ood
Plat
onow
and
Rei
nhar
t (1
973)
Aro
clor
125
4H
atch
ing
succ
ess
50 m
g/kg
foo
dT
umas
onis
et a
l. (1
973)
Dou
ble-
cres
ted
corm
oran
t (tis
sue)
PCB
126
Egg
mor
talit
y25
ng/
g w
mPo
wel
l et a
l. (1
997)
PCB
126
ER
OD
indu
ctio
n70
ng/
g w
mPo
wel
l et a
l. (1
998)
PCB
sE
gg m
orta
lity
3.5
mg/
kg w
mT
illitt
et a
l. (1
992) (c
ontin
ued)
Toxicity Reference Values for Protecting Aquatic Birds in China…
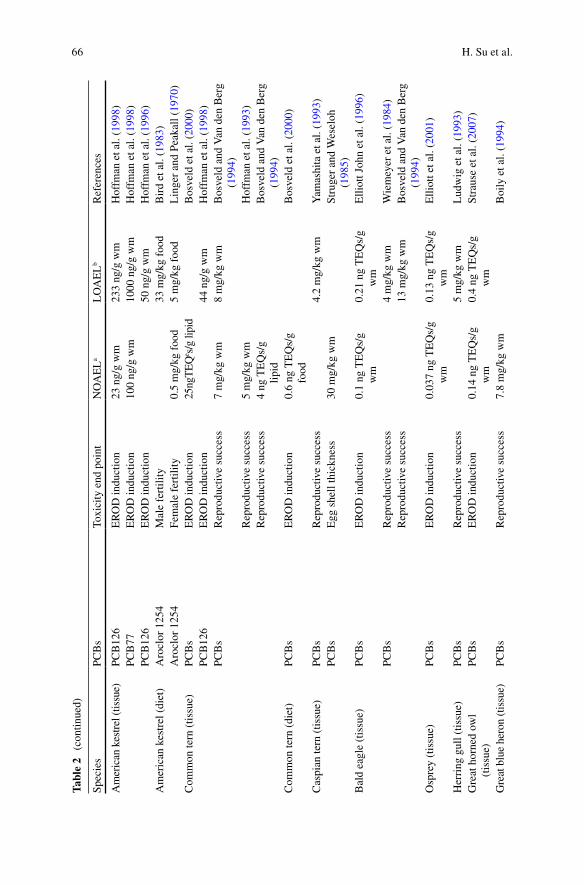
66
Spec
ies
PCB
sTo
xici
ty e
nd p
oint
NO
AE
La
LO
AE
Lb
Ref
eren
ces
Am
eric
an k
estr
el (t
issu
e)PC
B12
6E
RO
D in
duct
ion
23 n
g/g
wm
233
ng/g
wm
Hof
fman
et a
l. (1
998)
PCB
77E
RO
D in
duct
ion
100
ng/g
wm
1000
ng/
g w
mH
offm
an e
t al.
(199
8)PC
B12
6E
RO
D in
duct
ion
50 n
g/g
wm
Hof
fman
et a
l. (1
996)
Am
eric
an k
estr
el (
diet
)A
rocl
or 1
254
Mal
e fe
rtili
ty33
mg/
kg f
ood
Bir
d et
al.
(198
3)A
rocl
or 1
254
Fem
ale
fert
ility
0.5
mg/
kg f
ood
5 m
g/kg
foo
dL
inge
r an
d Pe
akal
l (19
70)
Com
mon
tern
(tis
sue)
PCB
sE
RO
D in
duct
ion
25ng
TE
Qe s
/g li
pid
Bos
veld
et a
l. (2
000)
PCB
126
ER
OD
indu
ctio
n44
ng/
g w
mH
offm
an e
t al.
(199
8)PC
Bs
Rep
rodu
ctiv
e su
cces
s7
mg/
kg w
m8
mg/
kg w
mB
osve
ld a
nd V
an d
en B
erg
(199
4)R
epro
duct
ive
succ
ess
5 m
g/kg
wm
Hof
fman
et a
l. (1
993)
Rep
rodu
ctiv
e su
cces
s4
ng T
EQ
s/g
lipid
Bos
veld
and
Van
den
Ber
g (1
994)
Com
mon
tern
(di
et)
PCB
sE
RO
D in
duct
ion
0.6
ng T
EQ
s/g
food
Bos
veld
et a
l. (2
000)
Cas
pian
tern
(tis
sue)
PCB
sR
epro
duct
ive
succ
ess
4.2
mg/
kg w
mY
amas
hita
et a
l. (1
993)
PCB
sE
gg s
hell
thic
knes
s30
mg/
kg w
mSt
ruge
r an
d W
esel
oh
(198
5)B
ald
eagl
e (t
issu
e)PC
Bs
ER
OD
indu
ctio
n0.
1 ng
TE
Qs/
g w
m0.
21 n
g T
EQ
s/g
wm
Elli
ott J
ohn
et a
l. (1
996)
PCB
sR
epro
duct
ive
succ
ess
4 m
g/kg
wm
Wie
mey
er e
t al.
(198
4)R
epro
duct
ive
succ
ess
13 m
g/kg
wm
Bos
veld
and
Van
den
Ber
g (1
994)
Osp
rey
(tis
sue)
PCB
sE
RO
D in
duct
ion
0.03
7 ng
TE
Qs/
g w
m0.
13 n
g T
EQ
s/g
wm
Elli
ott e
t al.
(200
1)
Her
ring
gul
l (tis
sue)
PCB
sR
epro
duct
ive
succ
ess
5 m
g/kg
wm
Lud
wig
et a
l. (1
993)
Gre
at h
orne
d ow
l (t
issu
e)PC
Bs
ER
OD
indu
ctio
n0.
14 n
g T
EQ
s/g
wm
0.4
ng T
EQ
s/g
wm
Stra
use
et a
l. (2
007)
Gre
at b
lue
hero
n (t
issu
e)PC
Bs
Rep
rodu
ctiv
e su
cces
s7.
8 m
g/kg
wm
Boi
ly e
t al.
(199
4)
Tabl
e 2
(con
tinue
d)
H. Su et al.
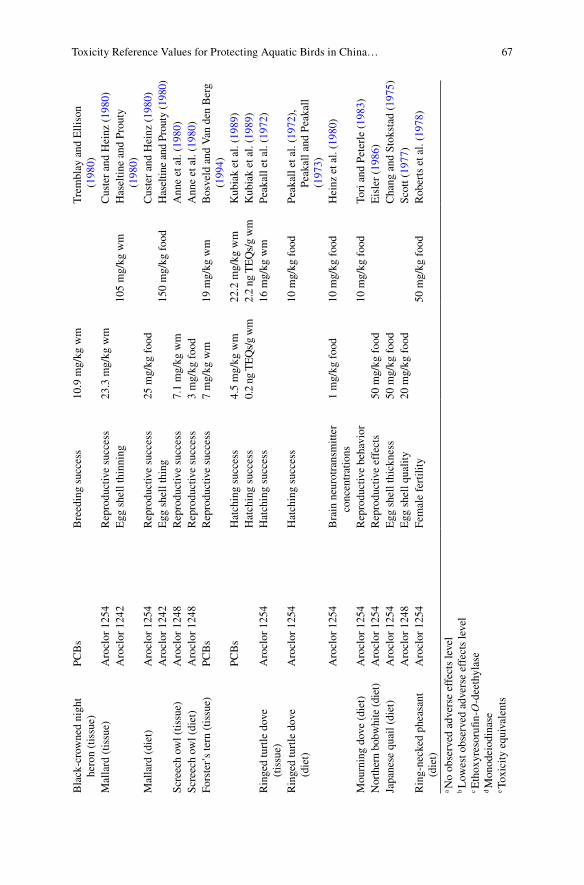
67Sp
ecie
sPC
Bs
Toxi
city
end
poi
ntN
OA
EL
aL
OA
EL
bR
efer
ence
s
Bla
ck-c
row
ned
nigh
t he
ron
(tis
sue)
PCB
sB
reed
ing
succ
ess
10.9
mg/
kg w
mT
rem
blay
and
Elli
son
(198
0)M
alla
rd (
tissu
e)A
rocl
or 1
254
Rep
rodu
ctiv
e su
cces
s23
.3 m
g/kg
wm
Cus
ter
and
Hei
nz (
1980
)A
rocl
or 1
242
Egg
she
ll th
inni
ng10
5 m
g/kg
wm
Has
eltin
e an
d Pr
outy
(1
980)
Mal
lard
(di
et)
Aro
clor
125
4R
epro
duct
ive
succ
ess
25 m
g/kg
foo
dC
uste
r an
d H
einz
(19
80)
Aro
clor
124
2E
gg s
hell
thin
g15
0 m
g/kg
foo
dH
asel
tine
and
Prou
ty (1
980)
Scre
ech
owl (
tissu
e)A
rocl
or 1
248
Rep
rodu
ctiv
e su
cces
s7.
1 m
g/kg
wm
Ann
e et
al.
(198
0)Sc
reec
h ow
l (di
et)
Aro
clor
124
8R
epro
duct
ive
succ
ess
3 m
g/kg
foo
dA
nne
et a
l. (1
980)
Fors
ter’
s te
rn (
tissu
e)PC
Bs
Rep
rodu
ctiv
e su
cces
s7
mg/
kg w
m19
mg/
kg w
mB
osve
ld a
nd V
an d
en B
erg
(199
4)PC
Bs
Hat
chin
g su
cces
s4.
5 m
g/kg
wm
22.2
mg/
kg w
mK
ubia
k et
al.
(198
9)H
atch
ing
succ
ess
0.2
ng T
EQ
s/g
wm
2.2
ng T
EQ
s/g
wm
Kub
iak
et a
l. (1
989)
Rin
ged
turt
le d
ove
(tis
sue)
Aro
clor
125
4H
atch
ing
succ
ess
16 m
g/kg
wm
Peak
all e
t al.
(197
2)
Rin
ged
turt
le d
ove
(die
t)A
rocl
or 1
254
Hat
chin
g su
cces
s10
mg/
kg f
ood
Peak
all e
t al.
(197
2),
Peak
all a
nd P
eaka
ll (1
973)
Aro
clor
125
4B
rain
neu
rotr
ansm
itter
co
ncen
trat
ions
1 m
g/kg
foo
d10
mg/
kg f
ood
Hei
nz e
t al.
(198
0)
Mou
rnin
g do
ve (
diet
)A
rocl
or 1
254
Rep
rodu
ctiv
e be
havi
or10
mg/
kg f
ood
Tori
and
Pet
erle
(19
83)
Nor
ther
n bo
bwhi
te (
diet
)A
rocl
or 1
254
Rep
rodu
ctiv
e ef
fect
s50
mg/
kg f
ood
Eis
ler
(198
6)Ja
pane
se q
uail
(die
t)A
rocl
or 1
254
Egg
she
ll th
ickn
ess
50 m
g/kg
foo
dC
hang
and
Sto
ksta
d (1
975)
Aro
clor
124
8E
gg s
hell
qual
ity20
mg/
kg f
ood
Scot
t (19
77)
Rin
g-ne
cked
phe
asan
t (d
iet)
Aro
clor
125
4Fe
mal
e fe
rtili
ty50
mg/
kg f
ood
Rob
erts
et a
l. (1
978)
a No
obse
rved
adv
erse
eff
ects
leve
lb L
owes
t obs
erve
d ad
vers
e ef
fect
s le
vel
c Eth
oxyr
esor
ufin-
O-d
eeth
ylas
ed M
onod
eiod
inas
ee T
oxic
ity e
quiv
alen
ts
Toxicity Reference Values for Protecting Aquatic Birds in China…
68
the major contributor to TEQs (Wiesmüller et al. 1999; Senthilkumar et al. 2002; Strause et al. 2007).
The toxic effects of PCB126 and PCB77 on chickens (Gallus gallus) through hatching were studied, focusing on embryonic development and induction of EROD activity (Hoffman et al. 1998). Doses of two congeners were injected into chicken embryos at the following doses: PCB126 (0.3, 0.5, 1, or 3.2 ng/g wet mass (wm)), or PCB77 (0.12, 1.2, 6, or 12 ng/g wm). The LD50 and LOAEL values of PCB126 for chicken were 0.4 and 0.3 ng/g wm and the LD50, NOAEL, and LOAEL of PCB77 were 2.6, 0.12, and 1.2 ng/g wm, respectively. In addition, the effects of PCB126 (0.1, 0.2, 0.4, 0.8, 1.6, 3.2, 6.4, or 12.8 ng PCB126/g wm egg) on hatching and development of chicken were also investigated via injection into eggs. The LOAEL of PCB126 was 0.2 ng/g wm (Powell et al. 1996). Three doses (viz., 0.5, 1, and 2.0 ng PCB126/g wm egg) were injected into eggs, and the LOAEL value, based on hatching success, survival, and edema, was 1.0 ng PCB126/g wm egg (McKernan et al. 2007). The toxic effects of PCB126 on chicken embryos were determined by injection of 0.051, 0.13, 0.32, or 0.80 ng PCB126/g egg, wm. The NOEC and LOEC values (0.051 and 0.13 ng/g wm egg, respectively) for PCB126 (injected into chicken embryos) were based on mortality, immune organ quality, and lymphocyte structure (Fox and Grasman 1999).
The effects of PCB126 on thymus atrophy in chicken embryo was examined by egg injection (0.05, 0.13, 0.32, 0.64, or 0.80 ng/g wm egg); the resulting LD50, NOEC, and LOEC values were respectively 1.01, 0.13, or 0.32 ng/g wm egg (Goff et al. 2005). The effects of PCB126 on death and immune function of chickens were determined by egg injection, and the LOAEL was 0.25 ng/g wm egg (Lavoie and Grasman 2007). LOAELs of total PCBs for reproductive success of chicken were 1,500–5,000 ng/g of egg wm (Barron et al. 1995), which were greater than PCB126 values (the most toxic congener of PCBs).
3.2 Double-Crested Cormorant (Phalacrocorax auritus)
The double-crested cormorant is a typical fish-eating bird that has exhibited adverse effects attributed to PCB exposure. Such effects include embryonic lethal and devel-opmental defects, from ingesting fish contaminated with PCBs and other substances. Based on a toxic endpoint of egg mortality, the LOAEL value for PCBs was 3,500 ng/g wm egg (Tillitt et al. 1992; Yamashita et al. 1993). In another study, eggs of double-crested cormorants were injected with 5, 10, 25, 50, 100, 200, 400, or 800 ng PCB126/g wm to examine double-crested cormorant toxicity. The LD50 and LOAEL values of PCB126 for double-crested cormorant were 158 and 25 ng/g egg, respectively (Powell et al. 1997). The LD50 of PCB126 was greater than that for chicken, which value was 2.3 ng/g wm egg. This result indicated that chickens were more sensitive to the effects of PCB126 than were double-crested cormorants (Powell et al. 1997; Fox and Grasman 1999). In another study, the co- planar PCB congener, PCB126, was injected into the eggs of double-crested cormorants at doses
H. Su et al.
69
of 60, 150, 300, or 600 ng/g egg. Based on induction of EROD activity, the LOAEL and LD50 values of PCB126 for double-crested cormorant were 70 and 177 ng/g wm egg, respectively (Powell et al. 1998).
3.3 Common Tern (Sterna hirundo)
As fish-eating birds that top the aquatic food chain, common terns are exposed to the lipophilic and persistent PCBs (Bosveld et al. 1995). The toxicity of PCB126 on common tern was examined by egg injection at three doses (0, 240 or 434 ng/g wm). The LD50 and LOAEL, based on reproductive success and induction of EROD activ-ity, were 104 and 44 ng/g wm, respectively (Hoffman et al. 1998).
Biochemical and reproductive effects of PCB126 on chicks of common terns fed fish containing PCB126, or mixtures of PCB126 and PCB153, were examined (Bosveld et al. 2000). The most sensitive parameter affected by PCBs was induction of EROD activity. A nonlinear concentration–effect relationship was observed between TEQ concentrations and EROD activity induction. The LOAEL value for induction of EROD activity was 25 ng TEQs/g liver lipid mass (lm), and was caused by 0.6 ng TEQs/g wm food. The lipid content of common tern was assumed to be 1.9% (Ricklefs 1979), and the LOAEL value was calculated to be 475 pg TEQs/g wm. Based on reproductive success, the NOAEL of PCBs for common tern was <4 ng TEQs/g lm (Bosveld and Van den Berg 1994).
3.4 Osprey (Pandion haliaetus )
As a top predator, osprey accumulates lipophilic substances and accordingly can be used as a biological indicator of exposure to PCBs in the aquatic ecosystems (Elliott et al. 2001). Elliott et al. (2001) studied the ecological effects of PCBs on osprey chicks and found that the NOAEL and LOAEL values, based on induction of EROD activity, were 37 and 130 ng TEQs/kg wm, respectively (Elliott et al. 2001).
3.5 Bald Eagle (Haliaeetus leucocephalus)
As a top predator of the aquatic food chain, bald eagles feed mainly on fish and other fish-eating birds (Knight et al. 1990). PCBs can reduce the reproductive suc-cess of bald eagle populations (Anthony et al. 1993; Wiemeyer et al. 1993). Chicks of bald eagles were more sensitive to the effects of PCBs than were adults. Induction of EROD activity was the most sensitive biomarker for bald eagles exposed to PCBs (Sanderson et al. 1994). Based on induction of EROD activity, the LOAEL and NOAEL values were 100 and 210 ng TEQs/kg wm, respectively (Elliott John et al. 1996).
Toxicity Reference Values for Protecting Aquatic Birds in China…
70
3.6 American Kestrel (Falco sparverius)
Exposure of the American kestrel to a daily intake of 7 mg PCB/kg bm/day produced a body concentration of 34.1 mg PCBs/kg wm, which was consistent with PCB concentrations in birds collected from the Great Lakes basin (Fernie et al. 2001b; Fisher et al. 2006). Breeding behavior was affected and reproductive success was reduced. Subsequent studies have shown that embryos exposed to PCBs could affect propagation of offspring (Fernie et al. 2001a). The developmental toxicity of American kestrel was studied by egg injection of PCB126 (0, 2.3, 23, or 233 ng/g wm) or PCB77 (0, 100, or 1,000 ng/g wm) (Hoffman et al. 1998). Results showed that the LOAELs, based on induction of EROD activity, were 233 and 1,000 ng/g wm for PCB126 and PCB77, respectively. When American kestrel were exposed orally to 50, 250, or 1,000 ng/g bm, the LOAEL value, based on developmental toxicity, was 50 ng PCB126/g bm (Hoffman et al. 1996).
3.7 Great Horned Owl (Bubo virginianus)
Great horned owls are another species that feeds at the top of the terrestrial food chain, and hence are very sensitive to PCBs, and are often used as a biological indi-cator species. Based on induction of EROD activity, the NOAEL and LOAEL val-ues for PCB exposure were 135 and 400 pg TEQs/g wm egg, respectively (Strause et al. 2007; Elliott John et al. 1996).
4 Derivation of TRVs and TRGs
TRGs and TRVs for birds were derived for PCBs by using three approaches: SSD, TPRM, and CSA. The toxic endpoints recorded for PCBs on birds are shown in Table 2. Because of the toxicity differences among PCB congeners, TEQs were selected and used to derive TRVs and TRGs. NOAEL and LOAEL values for the most sensitive toxicity endpoints were selected and the geometric mean of these two values was used as the reference concentration (RC). If a value was available only for the NOAEL or the LOAEL, then the other one was calculated by using (3). Toxicity data were transformed to equivalent concentrations by using TEFs for birds (Van den Berg et al. 1998), and TEFs for PCB commercial mixtures (Table 3).
4.1 Species Sensitivity Distribution Method
Using the data selection principles mentioned above, toxicity data (tissue) on PCBs was selected to derive a TRV of PCBs for the following birds: chicken,
H. Su et al.
71
double- crested cormorant, American kestrel, common tern, bald eagle, osprey, great horned owl, mallard, screech owl, Forster’s tern, and ringed turtle dove (Table 4). From the data on these species, the SSD was constructed and the hazard concentration affecting 5% of species (HC5) was estimated by using the ETX2.0 software. The HC5 value, which theoretically protects 95% species, is known to be a good predictor of the threshold for community-level effects. We determined the HC5 value, along with the 90% upper and lower confidence limits (UL HC5 and LL HC5) and show them in Fig. 1. The HC5 was predicted to be 15.5 pg TEQs/g, wm, which was defined as the TRV with UL HC5 and LL HC5 of 1.8 and 54.5 pg TEQs/g, wm, respectively.
Toxicity data on the PCBs for common tern, chicken, ring-necked pheasant, Japanese quail, Northern bobwhite, mourning dove, ringed turtle dove, American kestrel, screech owl, and mallard based on diet were selected to derive the TRG of PCBs (Table 5). Data expressed as TEQs were obtained by use of TEFs (1). The Total Daily Intake (TDI) was calculated from FI and bm using (2) and (4) (Table 1). TDI values were calculated for all ten avian species as shown in Table 5.
The TDI values were then used to construct a SSD curve (Fig. 2). The HC5 value was predicted to be 3.43 pg TEQs/kg bm/day, and the UL HC5 and LL HC5 were
Table 3 Toxic equivalent conversion factors for some commercial PCB mixtures for birds (CCME 2001)
MixtureConversion factor (ng TEQ/mg product)
Aroclor 1242 234.6Aroclor 1248 251.3Aroclor 1254 44.5Aroclor 1260 25.5
Table 4 Reference concentrations (RC) used to construct SSD curves (pg TEQs/g wm)
Avian speciesPCBsa NOAEL/LOAEL
TEQsb NOAEL/LOAEL RCc Reference
Chicken 0.051/0.128 0.0051/0.0128 8 Fox and Grasman (1999)Double-crested
cormorant0.45/25 0.45/2.5 1,060 Powell et al. (1997)
American kestrel 8.9/50 0.89/5 2,110 Hoffman et al. (1996)Common tern 7.9/44 0.79/4.4 1,860 Hoffman et al. (1998)Bald eagle N/N 0.1/0.21 140 Elliott John et al. (1996)Osprey N/N 0.037/0.13 70 Elliott et al. (2001)Great horned owl N/N 0.14/0.4 240 Strause et al. (2007)Mallard 23,300/130,480 1.04/5.82 2,460 Custer and Heinz (1980)Screech owl 7,100/39,760 1.78/9.97 4,210 Anne et al. (1980)Forster’s tern 4,500/22,200 0.2/2.2 660 Kubiak et al. (1989)Ringed turtle dove 2,857/16,000 0.13/0.71 90 Peakall et al. (1972)
N no dataa ng PCBs/g eggb ng TEQs/g wm eggc pg TEQs/g bm/day
Toxicity Reference Values for Protecting Aquatic Birds in China…
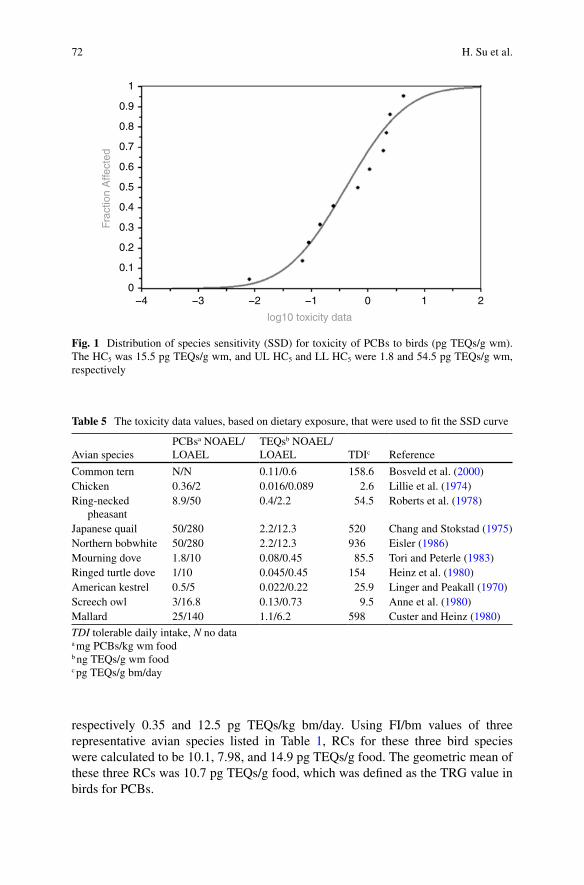
72
respectively 0.35 and 12.5 pg TEQs/kg bm/day. Using FI/bm values of three representative avian species listed in Table 1, RCs for these three bird species were calculated to be 10.1, 7.98, and 14.9 pg TEQs/g food. The geometric mean of these three RCs was 10.7 pg TEQs/g food, which was defined as the TRG value in birds for PCBs.
1
0.9
0.8
0.7
0.6
0.5
0.4
0.3
0.2
0.1
0−4 −3 −2 −1
Frac
tion
Affe
cted
log10 toxicity data
0 1 2
Fig. 1 Distribution of species sensitivity (SSD) for toxicity of PCBs to birds (pg TEQs/g wm). The HC5 was 15.5 pg TEQs/g wm, and UL HC5 and LL HC5 were 1.8 and 54.5 pg TEQs/g wm, respectively
Table 5 The toxicity data values, based on dietary exposure, that were used to fit the SSD curve
Avian speciesPCBsa NOAEL/LOAEL
TEQsb NOAEL/LOAEL TDIc Reference
Common tern N/N 0.11/0.6 158.6 Bosveld et al. (2000)Chicken 0.36/2 0.016/0.089 2.6 Lillie et al. (1974)Ring-necked
pheasant8.9/50 0.4/2.2 54.5 Roberts et al. (1978)
Japanese quail 50/280 2.2/12.3 520 Chang and Stokstad (1975)Northern bobwhite 50/280 2.2/12.3 936 Eisler (1986)Mourning dove 1.8/10 0.08/0.45 85.5 Tori and Peterle (1983)Ringed turtle dove 1/10 0.045/0.45 154 Heinz et al. (1980)American kestrel 0.5/5 0.022/0.22 25.9 Linger and Peakall (1970)Screech owl 3/16.8 0.13/0.73 9.5 Anne et al. (1980)Mallard 25/140 1.1/6.2 598 Custer and Heinz (1980)
TDI tolerable daily intake, N no dataa mg PCBs/kg wm foodb ng TEQs/g wm foodc pg TEQs/g bm/day
H. Su et al.
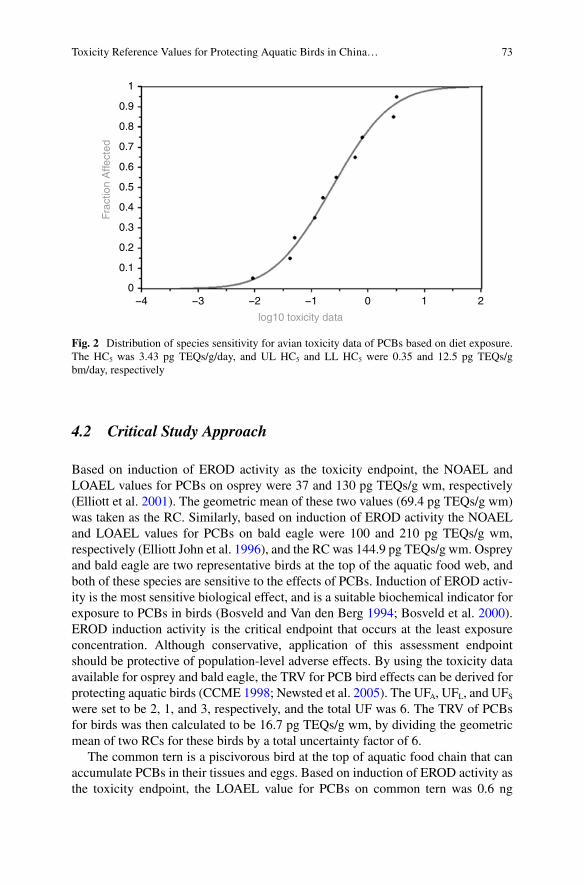
73
4.2 Critical Study Approach
Based on induction of EROD activity as the toxicity endpoint, the NOAEL and LOAEL values for PCBs on osprey were 37 and 130 pg TEQs/g wm, respectively (Elliott et al. 2001). The geometric mean of these two values (69.4 pg TEQs/g wm) was taken as the RC. Similarly, based on induction of EROD activity the NOAEL and LOAEL values for PCBs on bald eagle were 100 and 210 pg TEQs/g wm, respectively (Elliott John et al. 1996), and the RC was 144.9 pg TEQs/g wm. Osprey and bald eagle are two representative birds at the top of the aquatic food web, and both of these species are sensitive to the effects of PCBs. Induction of EROD activ-ity is the most sensitive biological effect, and is a suitable biochemical indicator for exposure to PCBs in birds (Bosveld and Van den Berg 1994; Bosveld et al. 2000). EROD induction activity is the critical endpoint that occurs at the least exposure concentration. Although conservative, application of this assessment endpoint should be protective of population-level adverse effects. By using the toxicity data available for osprey and bald eagle, the TRV for PCB bird effects can be derived for protecting aquatic birds (CCME 1998; Newsted et al. 2005). The UFA, UFL, and UFS were set to be 2, 1, and 3, respectively, and the total UF was 6. The TRV of PCBs for birds was then calculated to be 16.7 pg TEQs/g wm, by dividing the geometric mean of two RCs for these birds by a total uncertainty factor of 6.
The common tern is a piscivorous bird at the top of aquatic food chain that can accumulate PCBs in their tissues and eggs. Based on induction of EROD activity as the toxicity endpoint, the LOAEL value for PCBs on common tern was 0.6 ng
1
0.9
0.8
0.7
0.6
0.5
0.4
0.3
0.2
0.1
0−4 −3 −2 −1
Frac
tion
Affe
cted
log10 toxicity data
0 1 2
Fig. 2 Distribution of species sensitivity for avian toxicity data of PCBs based on diet exposure. The HC5 was 3.43 pg TEQs/g/day, and UL HC5 and LL HC5 were 0.35 and 12.5 pg TEQs/g bm/ day, respectively
Toxicity Reference Values for Protecting Aquatic Birds in China…
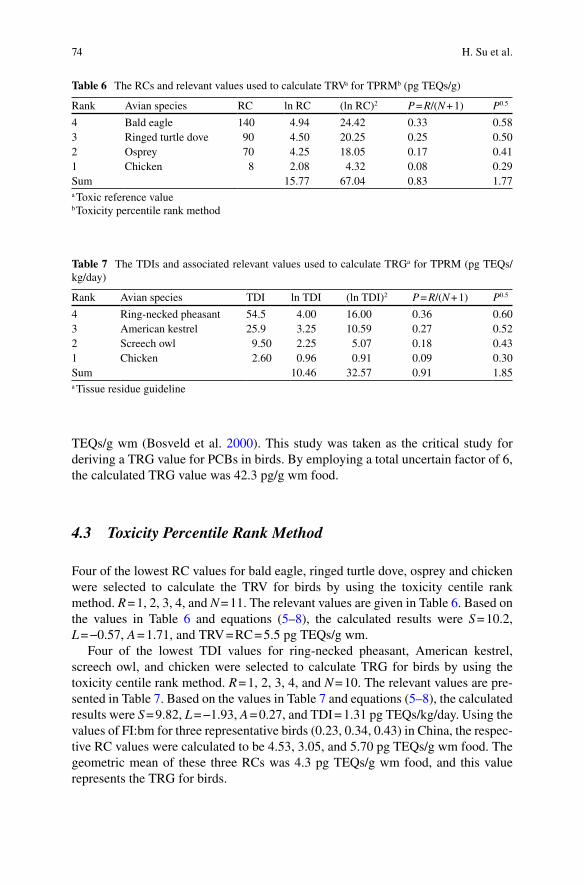
74
TEQs/g wm (Bosveld et al. 2000). This study was taken as the critical study for deriving a TRG value for PCBs in birds. By employing a total uncertain factor of 6, the calculated TRG value was 42.3 pg/g wm food.
4.3 Toxicity Percentile Rank Method
Four of the lowest RC values for bald eagle, ringed turtle dove, osprey and chicken were selected to calculate the TRV for birds by using the toxicity centile rank method. R = 1, 2, 3, 4, and N = 11. The relevant values are given in Table 6. Based on the values in Table 6 and equations (5–8), the calculated results were S = 10.2, L = −0.57, A = 1.71, and TRV = RC = 5.5 pg TEQs/g wm.
Four of the lowest TDI values for ring-necked pheasant, American kestrel, screech owl, and chicken were selected to calculate TRG for birds by using the toxicity centile rank method. R = 1, 2, 3, 4, and N = 10. The relevant values are pre-sented in Table 7. Based on the values in Table 7 and equations (5–8), the calculated results were S = 9.82, L = −1.93, A = 0.27, and TDI = 1.31 pg TEQs/kg/day. Using the values of FI:bm for three representative birds (0.23, 0.34, 0.43) in China, the respec-tive RC values were calculated to be 4.53, 3.05, and 5.70 pg TEQs/g wm food. The geometric mean of these three RCs was 4.3 pg TEQs/g wm food, and this value represents the TRG for birds.
Table 6 The RCs and relevant values used to calculate TRVa for TPRMb (pg TEQs/g)
Rank Avian species RC ln RC (ln RC)2 P = R/(N + 1) P0.5
4 Bald eagle 140 4.94 24.42 0.33 0.583 Ringed turtle dove 90 4.50 20.25 0.25 0.502 Osprey 70 4.25 18.05 0.17 0.411 Chicken 8 2.08 4.32 0.08 0.29Sum 15.77 67.04 0.83 1.77a Toxic reference valueb Toxicity percentile rank method
Table 7 The TDIs and associated relevant values used to calculate TRGa for TPRM (pg TEQs/ kg/day)
Rank Avian species TDI ln TDI (ln TDI)2 P = R/(N + 1) P0.5
4 Ring-necked pheasant 54.5 4.00 16.00 0.36 0.603 American kestrel 25.9 3.25 10.59 0.27 0.522 Screech owl 9.50 2.25 5.07 0.18 0.431 Chicken 2.60 0.96 0.91 0.09 0.30Sum 10.46 32.57 0.91 1.85a Tissue residue guideline
H. Su et al.
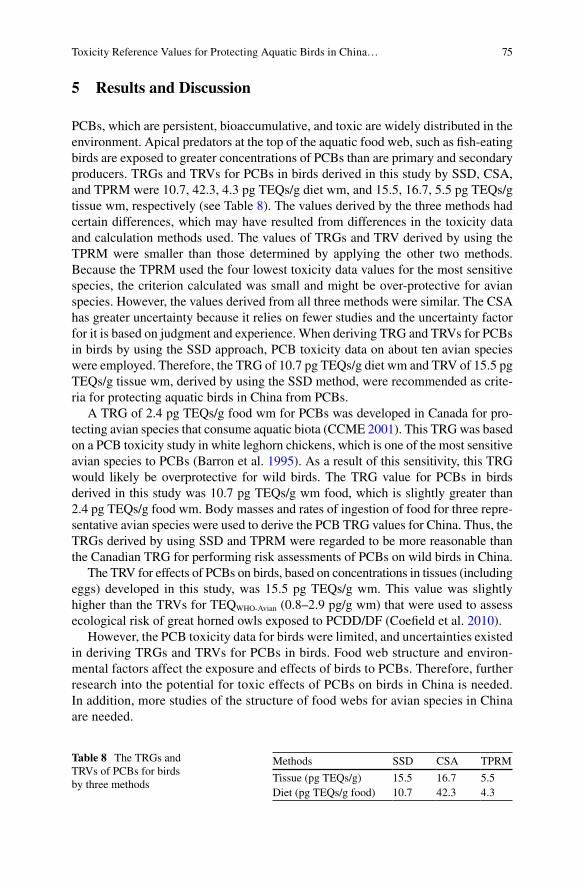
75
5 Results and Discussion
PCBs, which are persistent, bioaccumulative, and toxic are widely distributed in the environment. Apical predators at the top of the aquatic food web, such as fish-eating birds are exposed to greater concentrations of PCBs than are primary and secondary producers. TRGs and TRVs for PCBs in birds derived in this study by SSD, CSA, and TPRM were 10.7, 42.3, 4.3 pg TEQs/g diet wm, and 15.5, 16.7, 5.5 pg TEQs/g tissue wm, respectively (see Table 8). The values derived by the three methods had certain differences, which may have resulted from differences in the toxicity data and calculation methods used. The values of TRGs and TRV derived by using the TPRM were smaller than those determined by applying the other two methods. Because the TPRM used the four lowest toxicity data values for the most sensitive species, the criterion calculated was small and might be over-protective for avian species. However, the values derived from all three methods were similar. The CSA has greater uncertainty because it relies on fewer studies and the uncertainty factor for it is based on judgment and experience. When deriving TRG and TRVs for PCBs in birds by using the SSD approach, PCB toxicity data on about ten avian species were employed. Therefore, the TRG of 10.7 pg TEQs/g diet wm and TRV of 15.5 pg TEQs/g tissue wm, derived by using the SSD method, were recommended as crite-ria for protecting aquatic birds in China from PCBs.
A TRG of 2.4 pg TEQs/g food wm for PCBs was developed in Canada for pro-tecting avian species that consume aquatic biota (CCME 2001). This TRG was based on a PCB toxicity study in white leghorn chickens, which is one of the most sensitive avian species to PCBs (Barron et al. 1995). As a result of this sensitivity, this TRG would likely be overprotective for wild birds. The TRG value for PCBs in birds derived in this study was 10.7 pg TEQs/g wm food, which is slightly greater than 2.4 pg TEQs/g food wm. Body masses and rates of ingestion of food for three repre-sentative avian species were used to derive the PCB TRG values for China. Thus, the TRGs derived by using SSD and TPRM were regarded to be more reasonable than the Canadian TRG for performing risk assessments of PCBs on wild birds in China.
The TRV for effects of PCBs on birds, based on concentrations in tissues (including eggs) developed in this study, was 15.5 pg TEQs/g wm. This value was slightly higher than the TRVs for TEQWHO-Avian (0.8–2.9 pg/g wm) that were used to assess ecological risk of great horned owls exposed to PCDD/DF (Coefield et al. 2010).
However, the PCB toxicity data for birds were limited, and uncertainties existed in deriving TRGs and TRVs for PCBs in birds. Food web structure and environ-mental factors affect the exposure and effects of birds to PCBs. Therefore, further research into the potential for toxic effects of PCBs on birds in China is needed. In addition, more studies of the structure of food webs for avian species in China are needed.
Methods SSD CSA TPRM
Tissue (pg TEQs/g) 15.5 16.7 5.5Diet (pg TEQs/g food) 10.7 42.3 4.3
Table 8 The TRGs and TRVs of PCBs for birds by three methods
Toxicity Reference Values for Protecting Aquatic Birds in China…
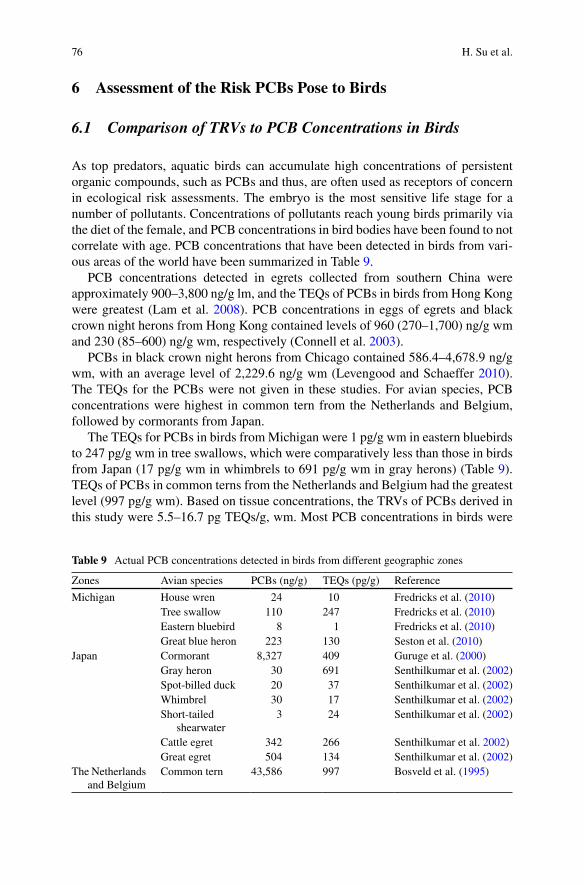
76
6 Assessment of the Risk PCBs Pose to Birds
6.1 Comparison of TRVs to PCB Concentrations in Birds
As top predators, aquatic birds can accumulate high concentrations of persistent organic compounds, such as PCBs and thus, are often used as receptors of concern in ecological risk assessments. The embryo is the most sensitive life stage for a number of pollutants. Concentrations of pollutants reach young birds primarily via the diet of the female, and PCB concentrations in bird bodies have been found to not correlate with age. PCB concentrations that have been detected in birds from vari-ous areas of the world have been summarized in Table 9.
PCB concentrations detected in egrets collected from southern China were approximately 900–3,800 ng/g lm, and the TEQs of PCBs in birds from Hong Kong were greatest (Lam et al. 2008). PCB concentrations in eggs of egrets and black crown night herons from Hong Kong contained levels of 960 (270–1,700) ng/g wm and 230 (85–600) ng/g wm, respectively (Connell et al. 2003).
PCBs in black crown night herons from Chicago contained 586.4–4,678.9 ng/g wm, with an average level of 2,229.6 ng/g wm (Levengood and Schaeffer 2010). The TEQs for the PCBs were not given in these studies. For avian species, PCB concentrations were highest in common tern from the Netherlands and Belgium, followed by cormorants from Japan.
The TEQs for PCBs in birds from Michigan were 1 pg/g wm in eastern bluebirds to 247 pg/g wm in tree swallows, which were comparatively less than those in birds from Japan (17 pg/g wm in whimbrels to 691 pg/g wm in gray herons) (Table 9). TEQs of PCBs in common terns from the Netherlands and Belgium had the greatest level (997 pg/g wm). Based on tissue concentrations, the TRVs of PCBs derived in this study were 5.5–16.7 pg TEQs/g, wm. Most PCB concentrations in birds were
Table 9 Actual PCB concentrations detected in birds from different geographic zones
Zones Avian species PCBs (ng/g) TEQs (pg/g) Reference
Michigan House wren 24 10 Fredricks et al. (2010)Tree swallow 110 247 Fredricks et al. (2010)Eastern bluebird 8 1 Fredricks et al. (2010)Great blue heron 223 130 Seston et al. (2010)
Japan Cormorant 8,327 409 Guruge et al. (2000)Gray heron 30 691 Senthilkumar et al. (2002)Spot-billed duck 20 37 Senthilkumar et al. (2002)Whimbrel 30 17 Senthilkumar et al. (2002)Short-tailed
shearwater3 24 Senthilkumar et al. (2002)
Cattle egret 342 266 Senthilkumar et al. 2002)Great egret 504 134 Senthilkumar et al. (2002)
The Netherlands and Belgium
Common tern 43,586 997 Bosveld et al. (1995)
H. Su et al.
77
greater than these TRVs. Therefore, it may be that some species of wild birds are experiencing harmful effects from PCB exposure, which is consistent with reported incidents of PCB effects on birds.
6.2 Comparison of TRGs to PCB Concentrations in Fish
PCB concentrations were measured in 20 species of fish (i.e., ten each from fresh and marine waters) from aquatic environments of the Pearl River Delta in China (Wei et al. 2011). Results showed that levels of PCBs in fish ranged from 0.065 to 5.25 pg TEQ/g wm. Based on the levels of PCBs in fish sampled from the Hudson River and New York Bight (Hong and Bush 1990), the TEQs were calculated to be from 0.47 to 6.86 ng TEQs/g wm, which were much higher than those in China.
The TRGs of PCBs calculated in this study were 4.3–42.3 pg TEQs/g food wm, which were higher than most PCB concentrations in fish from the Pearl River Delta in China (0.065–5.25 pg TEQ/g wm). It was indicated that food consumption would not cause harmful effects to birds. But the PCB concentrations in fish from the Hudson River and New York Bight were higher than the TRGs derived in this study, which showed that harmful effects would be caused to birds from food exposure.
7 Summary
PCBs are typical of persistent, bioaccumulative and toxic compounds (PBTs) that are widely distributed in the environment and can biomagnify through aquatic food webs, because of their stability and lipophilic properties. Fish-eating birds are top predators in the aquatic food chain and may suffer adverse effects from exposure to PCB concentrations.
In this review, we address the toxicity of PCBs to birds and have derived tissue residue guidelines (TRGs) and toxic reference values (TRVs) for PCBs for protect-ing birds in China. In deriving these protective indices, we utilized available data and three approaches, to wit: species sensitivity distribution (SSD), critical study approach (CSA) and toxicity percentile rank method (TPRM). The TRGs and TRVs arrived at by using these methods were 42.3, 10.7, 4.3 pg TEQs/g diet wm and 16.7, 15.5, and 5.5 pg TEQs/g tissue wm for the CSA SSD and TPRM approaches, respectively. These criteria values were analyzed and compared with those derived by others. The following TRG and TRV, derived by SSD, were recommended as avian criteria for protecting avian species in China: 10.7 pg TEQs/g diet wm and 15.5 pg TEQs/g tissue wm, respectively. The hazard of PCBs to birds was assessed by comparing the TRVs and TRGs derived in this study with actual PCB concentra-tions detected in birds or fish.
The criteria values derived in this study can be used to evaluate the risk of PCBs to birds in China, and to provide indices that are more reasonable for protecting
Toxicity Reference Values for Protecting Aquatic Birds in China…
78
Chinese avian species. However, several sources of uncertainty exists when deriving TRGs and TRVs for the PCBs in birds, such as lack of adequate toxicity data for birds and need to use uncertainty factors. Clearly, relevant work on PCBs and birds in China are needed in the future. For example, PCB toxicity data for resident avian species in China are needed. In addition, studies are needed on the actual PCB levels in birds and fish in China. Such information is needed to serve as a more firm foun-dation for future risk assessments.
Acknowledgements This work was supported by National Basic Research Program of China (2008CB418200) and National Natural Science Foundation of China (41261140337, 40973090).
References
An W, Hu J, Wan Y, An L, Zhang Z (2006) Deriving site-specific 2,2-bis(chlorophenyl)-1, 1- dichloroethylene quality criteria of water and sediment for protection of common tern popu-lations in Bohai bay, north China. Environ Sci Technol 40(8):2511–2516
Anne M, McLane R, Hughes DL (1980) Reproductive success of screech owls fed Aroclor® 1248. Arch Environ Contam Toxicol 9(6):661–665
Anthony RG, Garrett MG, Schuler CA (1993) Environmental contaminants in bald eagles in the Columbia River estuary. J Wildl Manage 57:10–19
Barron M, Galbraith H, Beltman D (1995) Comparative reproductive and developmental toxicol-ogy of PCBs in birds. Comp Biochem Physiol C Pharmacol Toxicol 112(1):1–14
Barter M, Cao L, Chen L, Lei G (2005) Results of a survey for waterbirds in the lower Yangtze floodplain, China, in January–February 2004. Forktail 21:1
Bird D, Tucker P, Fox GA, Lague P (1983) Synergistic effects of Aroclor® 1254 and mirex on the semen characteristics of American kestrels. Arch Environ Contam Toxicol 12(6):633–639
Blankenship AL, Kay DP, Zwiernik MJ, Holem RR, Newsted JL, Hecker M, Giesy JP (2008) Toxicity reference values for mink exposed to 2,3,7,8-tetrachlodibenzo-p-dioxin (TCDD) equivalents (TEQs). Ecotoxicol Environ Saf 69(3):325–349
Boily M, Champoux L, Bourbonnais D, Granges J, Rodrigue J, Spear P (1994) β-carotene and reti-noids in eggs of Great Blue Herons (Ardea herodias) in relation to St Lawrence River contami-nation. Ecotoxicology 3(4):271–286
Bosveld A, Van den Berg M (1994) Effects of polychlorinated biphenyls, dibenzo-p-dioxins, and dibenzofurans on fish-eating birds. Environ Rev 2(2):147–166
Bosveld A, Gradener J, van Den Berg M, Murk A, Brouwer A, van Kampen M, Evers E (1995) Effects of PCDDs, PCDFs and PCBs in common tern (Sterna hirundo) breeding in estuarine and coastal colonies in the Netherlands and Belgium. Environ Toxicol Chem 14(1):99–115
Bosveld ATC, Nieboer R, de Bont A, Mennen J, Murk AJ, Feyk LA, Giesy JP, van den Berg M (2000) Biochemical and developmental effects of dietary exposure to polychlorinated biphe-nyls 126 and 153 in common tern chicks (Sterna hirundo). Environ Toxicol Chem 19(3): 719–730
Britton W, Huston T (1973) Influence of polychlorinated biphenyls in the laying hen. Poult Sci 52(4):1620–1624
Brunström B (1989) Toxicity of coplanar polychlorinated biphenyls in avian embryos. Chemosphere 19(1):765–768
Caldwell DJ, Mastrocco F, Hutchinson TH, Länge R, Heijerick D, Janssen C, Anderson PD, Sumpter JP (2008) Derivation of an aquatic predicted no-effect concentration for the synthetic hormone, 17α-ethinyl estradiol. Environ Sci Technol 42(19):7046–7054
H. Su et al.
79
CCME (1998) Protocol for derivation of Canadian tissue residue guidelines for the protection of wildlife consumers of aquatic biota. Canadian Council of Ministers of the Environment, Winnipeg
CCME (2001) Canadian tissue residue guidelines for the protection of wildlife consumers of aquatic biota: polychlorinated biphenyls(PCBs). Canadian Council of Ministers of the Environment, Winnipeg
Chang ES, Stokstad E (1975) Effect of chlorinated hydrocarbons on shell gland carbonic anhy-drase and egg shell thickness in Japanese quail. Poult Sci 54(1):3–10
Coefield SJ, Fredricks TB, Seston RM, Nadeau MW, Tazelaar DL, Kay DP, Newsted J, Giesy JP, Zwiernik MJ (2010) Ecological risk assessment of great horned owls (Bubo virginianus) exposed to PCDD/DF in the Tittabawassee River floodplain in Midland, Michigan, USA. Environ Toxicol Chem 29(10):2341–2349
Connell D, Fung C, Minh T, Tanabe S, Lam P, Wong B, Lam M, Wong L, Wu R, Richardson B (2003) Risk to breeding success of fish-eating Ardeids due to persistent organic contaminants in Hong Kong: evidence from organochlorine compounds in eggs. Water Res 37(2):459–467
Custer TW, Heinz GH (1980) Reproductive success and nest attentiveness of mallard ducks fed Aroclor 1254. Environ Pollut A Ecol Biol 21(4):313–318
Eisler R (1986) Polychlorinated biphenyl hazards to fish, wildlife, and invertebrates: a synoptic review. U.S. Fish and Wildlife Service Biological Report 85(1.7). Contaminant Hazard Reviews
Elliott John E, Hart LE, Cheng KM, Norstrom RJ, Lorenzen A, Kennedy SW, Philibert H, Stegeman JJ, Bellward GD (1996) Biological effects of polychlorinated dibenzo-p-dioxins, dibenzofurans, and biphenyls in bald eagle (Haliaeetus leucocephalus) chicks. Environ Toxicol Chem 15(5):782–793
Elliott JE, Wilson LK, Henny CJ, Trudeau SF, Leighton FA, Kennedy SW, Cheng KM (2001) Assessment of biological effects of chlorinated hydrocarbons in osprey chicks. Environ Toxicol Chem 20(4):866–879
Fernie K, Smits J, Bortolotti G, Bird D (2001a) In ovo exposure to polychlorinated biphenyls: reproductive effects on second-generation American kestrels. Arch Environ Contam Toxicol 40(4):544–550
Fernie KJ, Smits JE, Bortolotti GR, Bird DM (2001b) Reproduction success of American kestrels exposed to dietary polychlorinated biphenyls. Environ Toxicol Chem 20(4):776–781
Fisher SA, Bortolotti GR, Fernie KJ, Bird DM, Smits JE (2006) Behavioral variation and its con-sequences during incubation for American kestrels exposed to polychlorinated biphenyls. Ecotoxicol Environ Saf 63(2):226–235
Fox LL, Grasman KA (1999) Effects of PCB 126 on primary immune organ development in chicken embryos. J Toxicol Environ Health A 58(4):233–244
Fredricks TB, Zwiernik MJ, Seston RM, Coefield SJ, Plautz SC, Tazelaar DL, Shotwell MS, Bradley PW, Kay DP, Giesy JP (2010) Passerine exposure to primarily PCDFs and PCDDs in the river floodplains near Midland, Michigan, USA. Arch Environ Contam Toxicol 58(4):1048–1064
Giesy JP, Ludwig JP, Tillitt DE (1994a) Deformities in birds of the Great Lakes region. Assigning causality. Environ Sci Technol 28(3):128–135
Giesy JP, Ludwig JP, Tillitt DE (1994b) Dioxins, dibenzofurans, PCBs and colonial, fish-eating water birds. In: Schecter A (ed) Dioxins and health. Plenum, New York, pp 249–307
Goff KF, Hull BE, Grasman KA (2005) Effects of PCB 126 on primary immune organs and thy-mocyte apoptosis in chicken embryos. J Toxicol Environ Health A 68(6):485–500
Gould JC, Cooper KR, Scanes CG (1999) Effects of polychlorinated biphenyls on thyroid hor-mones and liver type I monodeiodinase in the chick embryo. Ecotoxicol Environ Saf 43(2):195–203
Guruge K, Tanabe S, Fukuda M (2000) Toxic assessment of PCBs by the 2,3,7,8-tetrachlorodibenzo- p-dioxin equivalent in common cormorant (Phalacrocorax carbo) from Japan. Arch Environ Contam Toxicol 38(4):509–521
Hall LW, Scott MC, Killen WD (2009) Ecological risk assessment of copper and cadmium in surface waters of Chesapeake Bay watershed. Environ Toxicol Chem 17(6):1172–1189
Toxicity Reference Values for Protecting Aquatic Birds in China…
80
Haseltine SD, Prouty RM (1980) Aroclor 1242 and reproductive success of adult mallards (Anas platyrhynchos). Environ Res 23(1):29–34
Heinz GH, Hill EF, Contrera JF (1980) Dopamine and norepinephrine depletion in ring doves fed DDE, dieldrin, and Aroclor 1254. Toxicol Appl Pharmacol 53(1):75–82
Hoffman DJ, Smith GJ, Rattner BA (1993) Biomarkers of contaminant exposure in common terns and black-crowned night herons in the Great Lakes. Environ Toxicol Chem 12(6):1095–1103
Hoffman DJ, Melancon MJ, Klein PN, Rice CP, Eisemann JD, Hines RK, Spann JW, Pendleton GW (1996) Developmental toxicity of PCB 126 (3,3′,4,4′,5-pentachlorobiphenyl) in nestling American kestrels (Falco sparverius). Toxicol Sci 34(2):188–200
Hoffman DJ, Melancon MJ, Klein PN, Eisemann JD, Spann JW (1998) Comparative developmen-tal toxicity of planar polychlorinated biphenyl congeners in chickens, American kestrels, and common terns. Environ Toxicol Chem 17(4):747–757
Hong C-S, Bush B (1990) Determination of mono-and non-ortho coplanar PCBs in fish. Chemosphere 21(1):173–181
Kannan K, Blankenship A, Jones P, Giesy J (2000) Toxicity reference values for the toxic effects of polychlorinated biphenyls to aquatic mammals. Hum Ecol Risk Assess 6(1):181–201
Kennedy S, Lorenzen A, Jones S, Hahn M, Stegeman J (1996) Cytochrome P4501A induction in avian hepatocyte cultures: a promising approach for predicting the sensitivity of avian species to toxic effects of halogenated aromatic hydrocarbons. Toxicol Appl Pharmacol 141(1):214–230
Knight R, Randolph P, Allen G, Young L, Wigen R (1990) Diets of nesting bald eagles, Haliaeetus leucocephalus in western Washington. Can Field Nat 104(4):545–551
Kubiak TJ, Harris H, Smith L, Schwartz T, Stalling D, Trick J, Sileo L, Docherty D, Erdman T (1989) Microcontaminants and reproductive impairment of the Forster’s tern on Green Bay, Lake Michigan-1983. Arch Environ Contam Toxicol 18(5):706–727
Lam JCW, Murphy MB, Wang Y, Tanabe S, Giesy JP, Lam PKS (2008) Risk assessment of organo-halogenated compounds in water bird eggs from South China. Environ Sci Technol 42(16): 6296–6302
Lavoie E, Grasman K (2007) Effects of in ovo exposure to PCBs 126 and 77 on mortality, deformi-ties and post-hatch immune function in chickens. J Toxicol Environ Health A 70(6):547–558
Leo Posthuma GW, Theo PT, Posthuma L, Suter GW, Traas TP (2002) Species sensitivity distribu-tions in ecotoxicology, Environmental and ecological risk assessment. CRC Press, New York
Levengood JM, Schaeffer DJ (2010) Comparison of PCB congener profiles in the embryos and principal prey of a breeding colony of black-crowned night-herons. J Great Lakes Res 36(3): 548–553
Levengood JM, Wiedenmann L, Custer TW, Schaeffer DJ, Matson CW, Melancon MJ, Hoffman DJ, Scott JW, Talbott JL, Bordson GO (2007) Contaminant exposure and biomarker response in embryos of black-crowned night-herons (Nycticorax nycticorax) nesting near Lake Calumet, Illinois. J Great Lakes Res 33(4):791–805
Lillie RJ, Cecil HC, Bitman J, Fries G (1974) Differences in response of caged white leghorn lay-ers to various polychlorinated biphenyls (PCBs) in the diet. Poult Sci 53(2):726–732
Lillie RJ, Cecil HC, Bitman J, Fries GF, Verrett J (1975) Toxicity of certain polychlorinated and polybrominated biphenyls on reproductive efficiency of caged chickens. Poult Sci 54(5):1550–1555
Linger JL, Peakall DB (1970) Metabolic effects of polychlorinated biphenyls in the American kestrel. Nature 228(5273):783–784
Ludwig JP, Giesy JP, Summer CL, Bowerman W, Aulerich R, Bursian S, Auman HJ, Jones PD, Williams LL, Tillitt DE (1993) A comparison of water quality criteria for the Great Lakes based on human and wildlife health. J Great Lakes Res 19(4):789–807
McKernan MA, Rattner BA, Hale RC, Ottinger MA (2007) Egg incubation position affects toxic-ity of air cell administered polychlorinated biphenyl 126 (3,3′,4,4′,5-pentachlorobiphenyl) in chicken (Gallus gallus) embryos. Environ Toxicol Chem 26(12):2724–2727
Nagy K (2001) Food requirements of wild animals: predictive equations for free-living mammals, reptiles, and birds. Nutr Abstr Rev B 71:1R–12R
H. Su et al.
81
Nelson AL, Martin AC (1953) Gamebird weights. J Wildl Manage 17(1):36–42Newsted JL, Jones PD, Coady K, Giesy JP (2005) Avian toxicity reference values for perfluorooc-
tane sulfonate. Environ Sci Technol 39(23):9357–9362Peakall DB, Peakall ML (1973) Effect of a polychlorinated biphenyl on the reproduction of artifi-
cially and naturally incubated dove eggs. J Appl Ecol 10:863–868Peakall DB, Lincer JL, Bloom SE (1972) Embryonic mortality and chromosomal alterations
caused by Aroclor 1254 in ring doves. Environ Health Perspect 1:103Peterson RE, Theobald HM, Kimmel GL (1993) Developmental and reproductive toxicity of diox-
ins and related compounds: cross-species comparisons. CRC Crit Rev Toxicol 23(3):283–335Platonow N, Reinhart B (1973) The effects of polychlorinated biphenyls (Aroclor 1254) on
chicken egg production, fertility and hatchability. Can J Comp Med 37(4):341–346Powell D, Aulerich R, Meadows J, Tillitt D, Giesy J, Stromborg K, Bursian S (1996) Effects of
3,3′,4,4′,5-pentachlorobiphenyl (PCB 126) and 2,3,7,8-tetrachlorodibenzo-p-dioxin (TCDD) injected into the yolks of chicken (Gallus domesticus) eggs prior to incubation. Arch Environ Contam Toxicol 31(3):404–409
Powell DC, Aulerich RJ, Meadows JC, Tillitt DE, Powell JF, Restum JC, Stromborg KL, Giesy JP, Bursian SJ (1997) Effects of 3,3′,4,4′,5-pentachlorobiphenyl (PCB 126), 2,3,7,8-tetrachlorodibenzo- p-dioxin (TCDD), or an extract derived from field-collected cormo-rant eggs injected into double-crested cormorant (Phalacrocorax auritus) eggs. Environ Toxicol Chem 16(7):1450–1455
Powell DC, Aulerich RJ, Meadows JC, Tillitt DE, Kelly ME, Stromborg KL, Melancon MJ, Fitzgerald SD, Bursian SJ (1998) Effects of 3,3′,4,4′,5-pentachlorobiphenyl and 2,3,7,8-tetrachlorodibenzo- p-dioxin injected into the yolks of double-crested cormorant (Phalacrocorax auritus) eggs prior to incubation. Environ Toxicol Chem 17(10):2035–2040
Ricklefs RE (1979) Patterns of growth in birds. V. A comparative study of development in the starling, common tern, and Japanese quail. Auk 96:10–30
Roberts J, Rodgers D, Bailey J, Rorke M (1978) Polychlorinated biphenyls: biological criteria for an assessment of their effects on environmental quality. National Research Council Canada, Associate Committee on Scientific Criteria for Environmental Quality, Ottawa, ON
Safe S (1990) Polychlorinated biphenyls (PCBs), dibenzo-p-dioxins (PCDDs), dibenzofurans (PCDFs), and related compounds: environmental and mechanistic considerations which sup-port the development of toxic equivalency factors (TEFs). CRC Crit Rev Toxicol 21(1):51–88
Safe SH (1994) Polychlorinated biphenyls (PCBs): environmental impact, biochemical and toxic responses, and implications for risk assessment. CRC Crit Rev Toxicol 24(2):87–149
Sample B, Opresko DM, Suter GW (1993) Toxicological benchmarks for wildlife. ORNL Oak Ridge National Laboratory, Oak Ridge, TN
Sanderson JT, Elliott JE, Norstrom RJ, Whitehead PE, Hart LE, Cheng KM, Bellward GD (1994) Monitoring biological effects of polychlorinated dibenzo-p-dioxins, dibenzofurans, and biphe-nyls in great blue heron chicks (Ardea herodias) in British Columbia. J Toxicol Environ Health A 41(4):435–450
Scott M (1977) Effects of PCBs, DDT, and mercury compounds in chickens and Japanese quail. In: Federation proceedings, p 1888
Senthilkumar K, Iseki N, Hayama S, Nakanishi J, Masunaga S (2002) Polychlorinated dibenzo-p- dioxins, dibenzofurans, and dioxin-like polychlorinated biphenyls in livers of birds from Japan. Arch Environ Contam Toxicol 42(2):244–255
Seston RM, Fredricks TB, Tazelaar DL, Coefield SJ, Bradley PW, Newsted JL, Kay DP, Fitzgerald SD, Giesy JP, Zwiernik MJ (2010) Tissue-based risk assessment of great blue heron (Ardea herodias) exposed to PCDD/DF in the Tittabawassee River floodplain, Michigan, USA. Environ Toxicol Chem 29(11):2544–2558
Strause KD, Zwiernik MJ, Im SH, Bradley PW, Moseley PP, Kay DP, Park CS, Jones PD, Blankenship AL, Newsted JL (2007) Risk assessment of great horned owls (Bubo virginianus) exposed to polychlorinated biphenyls and DDT along the Kalamazoo River, Michigan, USA. Environ Toxicol Chem 26(7):1386–1398
Toxicity Reference Values for Protecting Aquatic Birds in China…
82
Struger J, Weseloh DV (1985) Great Lakes Caspian terns: egg contaminants and biological implications. Colonial Waterbirds 8:142–149
Tillitt DE, Ankley GT, Giesy JP, Ludwig JP, Kurita-Matsuba H, Weseloh DV, Ross PS, Bishop CA, Sileo L, Stromborg KL (1992) Polychlorinated biphenyl residues and egg mortality in double- crested cormorants from the great lakes. Environ Toxicol Chem 11(9):1281–1288
Tori GM, Peterle TJ (1983) Effects of PCBs on mourning dove courtship behavior. Bull Environ Contam Toxicol 30(1):44–49
Tremblay J, Ellison LN (1980) Breeding success of the black-crowned night heron in the St. Lawrence Estuary. Can J Zool 58(7):1259–1263
Tumasonis CF, Bush B, Baker FD (1973) PCB levels in egg yolks associated with embryonic mortality and deformity of hatched chicks. Arch Environ Contam Toxicol 1(4):312–324
USEPA (1985) Guidelines for deriving numerical national water quality criteria for the protection of aquatic organisms and their uses. United States Environmental Protection Agency, Office of Research and Development, Duluth, MN
USEPA (1995a) Great lakes water quality initiative criteria documents for the protection of wildlife. EPA-820-B-95-008. Office of Water, Washington, DC
USEPA (1995b) Great lakes water quality initiative technical support document for wildlife criteria. EPA-820-B-95-009. Office of Water, Washington, DC
USEPA (2005) Science Advisory Board Consultation Document. Proposed revisions to aquatic life guidelines: tissue-based criteria for “bioaccumulative” chemicals. Office of Water, Washington, DC
USEPA (2007) Ecological soil screening level for DDT and metabolites. Office of Solid Waste and Emergency Response, Washington, DC
Van den Berg M, Birnbaum L, Bosveld A, Brunström B, Cook P, Feeley M, Giesy JP, Hanberg A, Hasegawa R, Kennedy SW (1998) Toxic equivalency factors (TEFs) for PCBs, PCDDs, PCDFs for humans and wildlife. Environ Health Perspect 106(12):775
Wei X, Leung K, Wong M, Giesy J, Cai Z, Wong CKC (2011) Assessment of risk of PCDD/Fs and dioxin-like PCBs in marine and freshwater fish in Pearl River Delta, China. Mar Pollut Bull 63(5–12):166–171
Weseloh D, Hamr P, Bishop CA, Norstrom RJ (1995) Organochlorine contaminant levels in water-bird species from Hamilton Harbour, Lake Ontario: an IJC area of concern. J Great Lakes Res 21(1):121–137
Wiemeyer SN, Lamont TG, Bunck CM, Sindelar CR, Gramlich FJ, Fraser JD, Byrd MA (1984) Organochlorine pesticide, polychlorobiphenyl, and mercury residues in bald eagle eggs—1969–79—and their relationships to shell thinning and reproduction. Arch Environ Contam Toxicol 13(5):529–549
Wiemeyer SN, Bunck CM, Stafford CJ (1993) Environmental contaminants in bald eagle eggs—1980–84—and further interpretations of relationships to productivity and shell thickness. Arch Environ Contam Toxicol 24(2):213–227
Wiesmüller T, Schlatterer B, Wuntke B, Schneider R (1999) PCDDs/PCDFs, coplanar PCBs and PCBs in barn owl eggs from different areas in the state of Brandenburg, Germany. Bull Environ Contam Toxicol 63(1):15–24
Yamashita N, Tanabe S, Ludwig JP, Kurita H, Ludwig ME, Tatsukawa R (1993) Embryonic abnormalities and organochlorine contamination in double-crested cormorants (Phalacrocorax auritus) and Caspian terns (Hydroprogne caspia) from the upper Great Lakes in 1988. Environ Pollut 79(2):163–173
Zhang R, Wu F, Li H, Guo G, Feng C, Giesy JP, Chang H (2013) Toxicity reference values and tissue residue criteria for protecting avian wildlife exposed to methylmercury in China. Rev Environ Contam Toxicol 223:53–80
H. Su et al.
83D.M. Whitacre (ed.), Reviews of Environmental Contamination and Toxicology volume 230, Reviews of Environmental Contamination and Toxicology 230, DOI 10.1007/978-3-319-04411-8_4, © Springer International Publishing Switzerland 2014
Fabricated Nanoparticles: Current Status and Potential Phytotoxic Threats
Tushar Yadav, Alka A. Mungray, and Arvind K. Mungray
T. Yadav • A.A. Mungray • A.K. Mungray (*) Chemical Engineering Department, Sardar Vallabhbhai National Institute of Technology,Ichchhanath, Surat, Gujarat 395007, Indiae-mail: [email protected]
Contents
1 Introduction ........................................................................................................................ 842 Entry of Nanoparticles into the Environment .................................................................... 873 Factors Affecting Nanoparticle Phytotoxicity.................................................................... 883.1 Environmental Factors ............................................................................................ 893.2 Stabilizers and Dispersion Medium ........................................................................ 893.3 Particle Size ............................................................................................................ 903.4 Surface Characteristics and Concentration ............................................................. 90
4 Nanoparticle Entry into Plant Systems .............................................................................. 915 Phytotoxic Effects of Nanoparticles .................................................................................. 925.1 Single-Walled Carbon Nanotubes (SWCNTs)
and Multiwalled Carbon Nanotubes (MWCNTs) ................................................... 925.2 Titanium Nanoparticles ........................................................................................... 965.3 Zinc Nanoparticles .................................................................................................. 975.4 Silver Nanoparticles ................................................................................................ 985.5 Copper Nanoparticles.............................................................................................. 995.6 Cerium Nanoparticles ............................................................................................. 995.7 Molybdenum Nanoparticles .................................................................................... 1005.8 Gold Nanoparticles ................................................................................................. 1015.9 Magnetic Nanoparticles .......................................................................................... 1015.10 Other Nanoparticles ................................................................................................ 101
6 Discussion .......................................................................................................................... 1027 Summary ............................................................................................................................ 104References ................................................................................................................................ 105
84
1 Introduction
Nanotechnology is a relatively new technology that involves manipulating matteron an atomic and molecular scale. In general, nanotechnology deals with materials,devices, and other structures having at least one dimension in a size range from 1 to100 nm (Roco 2003; SCENIHR 2005; Moore 2006). The recent growth in this sec-tor has promised several benefits to society by exploiting the novel properties ofnanoparticles. Nanotechnology offers an array of potential applications, and isbecoming a key technology for the upcoming generation. Billions of dollars havebeen invested in nanotechnology research and development across the world. Forinstance, in the USA, the National Nanotechnology Initiative has invested $3.7 billion,whereas, respectively, the European Union (EU) and Japan have respectivelyinvested $1.2 billion and $750 million dollars in this technology (ANUI 2012). Today, nanotechnology is increasingly occupying a prominent position in humanlife and in human lifestyle. Moreover, the development of nanomaterials andnanodevices has opened many novel applications in science and technology.Nanomaterials may be defined as containing constituent particles that have
nanoscale dimensions, and are fabricated to remain as surface-bounded, dispersedstate or aggregate forms. Nanoparticles (NPs) can be categorized on the basis oftheir origin, viz., natural, incidental, and fabricated (Bhatt and Tripathi 2011; Farreet al. 2011; Smita et al. 2012) as described in Table 1. Nanoparticles have existed innature from the beginning of the earth’s history and they are still found in the envi-ronment in the form of volcanic dust, lunar dust, mineral composites, etc. (Rietmeijerand Mackinnon 1997; Reid et al. 2000; Verma et al. 2002; Lee and Richards 2004).
Table 1 A list of naturally and anthropogenically produced nanoparticles
Nanoparticles Particle type References
NaturalVolcanic dust Bismuth oxide Rietmeijer and Mackinnon (1997)Volcanic ash Crystalline silica Lee and Richards (2004)Ocean surface microlayer Colloids, carbon particles El Nemr and Abd-Allah (2003),
Wigginton et al. (2007)Soil Mineral particles, colloids Reid et al. (2000)Ice cores Carbon nanotubes, fullerenes,
silicon dioxideMurr et al. (2004)
Historic sediments Hematite, silicates Verma et al. (2002)Forest fire Carbon particles Smita et al. (2012)IncidentalVehicle exhaust, coal/oil/gasboiler, wielding
Carbon particles, colloids Novack and Bucheli (2007),Remedios et al. (2012),Smita et al. (2012)
FabricatedDrug delivery, diagnostic, groundwater remediation, industrialproduction process
Silicon dioxide, silver, zero valent iron, cerium oxide, etc.
Farre et al. (2011), Remedios et al. (2012),Smita et al. (2012)
T. Yadav et al.
85
Incidental nanoparticles, also defined as anthropogenic nanoparticle waste, areproduced as a result of human activities such as industrial processes, coal combus-tion, welding fumes, vehicle exhaust, etc. (Novack and Bucheli 2007; Smita et al.2012). In contrast, fabricated nanoparticles are designed and produced to achievespecific physicochemical properties targeted towards unique applications. Fabricatednanoparticles comprise four major types:
1. Carbon-based nanomaterials that usually include fullerene, single walled carbonnanotubes (SWCNT) and multiwalled carbon nanotubes (MWCNT), or nanowires
2. Metal-based nanomaterials such as quantum dots, nanogold, nanosilver,nanoiron, and nanoscale metal oxides like TiO2, ZnO, and CeO2
3. Dendrimers that are nano-sized polymeric structures constructed from branchedunits that are capable of being customized to achieve explicit biological andchemical functions (Klajnert and Bryszewska 2001)
4. Nanocomposites that are combinations of different nanoparticles or nanoparti-cles with larger bulk-type materials (Lin and Xing 2007), and are fabricated tohave different morphologies such as spheres, rods, tubes and prisms (Yu-Namand Lead 2008).
Fabricated nanoparticles have received intense interest as a result of their posi-tive impact and wide applicability in several sectors of the economy (Table 2). Examples of fabricated NP industrial applications include the following: electron-ics, textiles, pharmaceuticals, cosmetics, water treatment technology, and energyand agriculture, among others. Progressively, more nanochemicals are being pro-duced and are being slated for use in various new industrial applications (Novackand Bucheli 2007). A Swiss survey (Schmid and Riediker 2008) indicated that theestimated annual production of nanomaterials was 2,419 t. This figure is muchhigher than estimates made by the Royal Society and those in a Royal Academy ofEngineering report on Nanotechnology (2004) for the year 2010. This suggests thatthe actual worldwide production of nanomaterials may be higher than thought. Thereason is that existing production quantities of nanomaterials are not well known,and the production rates of these nanomaterials and associated products have rap-idly increased from kilograms to thousands of tons in a relatively few decades. Ofcourse, this rapid introduction of new nanomaterials will result in increased futureenvironmental discharge of these materials.Because of the volumes being produced, concern is growing about the environ-
mental risks of many fabricated nanomaterials (USEPA 2007). Work is proceedingto evaluate the potential undesirable risks of nanomaterials on the environment andon human well-being. The concern for nanotechnology-derived risks has given riseto a new field of study called nanotoxicity. Nanotoxicity addresses the toxicity ofnanomaterials to various life forms and to the environment.One may legitimately ask why NPs are of such concern, since certain forms of
them already exist naturally in the environment (e.g., volcanic dust, forest fire, soil;Rietmeijer and Mackinnon 1997; Reid et al. 2000; Lee and Richards 2004; Smitaet al. 2012). In response, it is clear that natural substances may also be hazardous.Indeed, naturally occurring nanoparticles under certain circumstances may harm
Fabricated Nanoparticles: Current Status and Potential Phytotoxic Threats
86
life forms. In addition, the production and use on a large scale of man-made nano-materials will increase their environmental concentrations and human exposure tothem. Such increased environmental concentrations will concomitantly increase thepossibility of harmful interactions between nanoparticles and life forms. Someresearch reports also exist on the interaction with, and adsorption of environmentalpollutants by nanomaterials (Cheng et al. 2004; Yang et al. 2006; Gotovac et al.2007; Hu et al. 2008). Owing to their minute size and high surface reactivity, NPsmay traverse cell barriers of living organisms and interact with intracellular entities.Therefore, they may contribute to potential cellular and genetic turmoil. Yet greatervolumes are incrementally being commercially manufactured and released into theopen environment, irrespective of health concerns or the need for prior safety assess-ment for environmental or health impact. To properly deal with the safety of nano-technology in the future, we will require a multidisciplinary approach that mustenjoin and enlist scientists, risk assessors, regulators, and policy makers in scientificdebate and action.
Table 2 An inventory of various fabricated nanoparticles and their commercial applications
Fabricated NPs Field of applications References
Carbon nanotubesand derivatives
Electronics and computers, catalyst,battery, fuel cell electrodes,supercapacitors, etc.
Pulickel and Zhou (2001), Bhatt and Tripathi (2011)
TiO2 Cosmetics, skin care products,sunscreen lotions, solar cells,paints and coatings
Bhatt and Tripathi (2011), Gupta and Tripathi (2011)
ZnO Skin care products, bottle coatings, etc.
Bhatt and Tripathi (2011), Smijsand Pavel (2011)
CeO2 Combustion catalyst in diesel fuels to improve emission quality, gassensor, solar cells, oxygen pumps
Kosynkin et al. (2000), Cormaet al. (2004), Livingston andHelvajian (2005), Bhatt andTripathi (2011)
Silver NPs Disinfectants, wound dressings,antibacterial clothing and spray
Bosetti et al. (2002), Yeo et al.(2003), Cho et al. (2005), Bhatt and Tripathi (2011)
Gold NPs Cancer therapy, sensors, catalyst,flexible conducting inks and films
Peng et al. (2010), Perrault and Chan (2010), Bhatt and Tripathi (2011)
Iron and iron oxide In medical imaging, cleaning upgroundwater pollution
Huber (2005), Bhatt and Tripathi(2011)
Silica Thermal and electrical insulators, drug delivery, etc.
Foraker et al. (2003), O’Farrellet al. (2006)
Quantum dots Medicine (medical imaging andtargeted therapeutics), in solarcells, photovoltaic cells, securityinks, photonics, andtelecommunications
Howarth et al. (2008),Konstantatos and Sargent(2009), Bhatt and Tripathi(2011), Hoshino et al. (2012)
Dendrimers Manufacture of macrocapsules,nanolatex, colored glasses, drugdelivery and DNA chips, tumortreatment
Roy et al. (1993), Capala et al.(1996), Twyman et al. (1999),Kukowska-Latallo et al. (2000),Bhatt and Tripathi (2011)
T. Yadav et al.
87
Plants are a critical base life form of all ecosystems and have a significant posi-tion in trophic transfer and maintenance of worldwide ecological balance.Environmental conditions highly influence plant growth and viability. Therefore,exposure of plants to certain natural or xenobiotic substances above a certain opti-mum concentration may cause toxicity. In addition, toxic substances that have noknown function in plant systems are nonetheless accumulated in plant tissues,with potential lethal effects for non-tolerant species. Plants have evolved in thepresence of several natural nanomaterials (Rietmeijer and Mackinnon 1997; Reid et al. 2000; Lee and Richards2004; Smita et al. 2012). However, as the productionand use of fabricated nanomaterials has increased, the probability of plant expo-sure to nanomaterials (NMs) has greatly increased (Ruffini and Cremonini 2009; Rico et al. 2011).The uptake, accumulation, translocation, and toxicity of nanoparticles in plant
systems are a very recently formed field of research. Researchers have reportedpositive, negative, and/or inconsequential effects from plants being exposed tonanoparticles. NP-associated alteration of morphological features such as effects onroots, leaves and seed germination have been reported. Unfortunately, to date, veryfew studies have been conducted on the genetic response of plants that are exposedto nanoparticles.In this review, we summarize recent findings on the potential phytotoxic threats
posed by fabricated NPs. In addition, we discuss the various factors that affect thephytotoxicity of nanoparticles and recommend how the challenges presented bynanoparticle toxicity to plants can be addressed.
2 Entry of Nanoparticles into the Environment
As mentioned earlier nanoparticles exist in the environment naturally; however,natural nanoparticles are present at very low concentrations and have negligibleimpact (Klaine et al. 2008; Remedios et al. 2012). In recent decades, fabricated NPshave emerged and have been incorporated into a growing number of commercialproducts. The effort, both scientific and commercial, to better understand the threatposed by nanoparticles and to control their discharge into the environment hasbecome very large. Although, in many cases, the release of nanoparticles is unavoid-able, the goal should be to minimize those releases of NMs that could pose a signifi-cant risk to the environment or to humans.In Fig. 1, we present an outline of the major possible pathways through which fab-
ricated nanoparticles may enter into environment to potentially cause toxicity to plants.Nanowastes are released from many different human activities, such as research
and development, industrial production, transport and storage, and primarily afterdisposal of consumer products that contain nanomaterials (Novack and Bucheli2007; Farre et al. 2011; Smita et al. 2012). Nanowastes may enter the environmentdirectly or via municipal or industrial waste treatment plants (WTPs). CurrentlyWTPs are not efficient in removing nanoparticles from waste streams or from water.Once released to the environment, nanowastes accumulate in ecosystems and pose
Fabricated Nanoparticles: Current Status and Potential Phytotoxic Threats
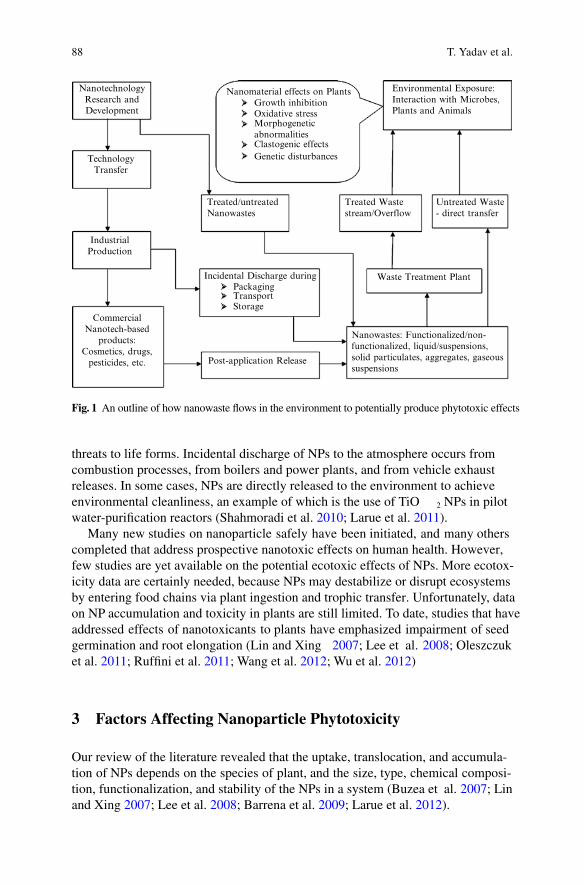
88
threats to life forms. Incidental discharge of NPs to the atmosphere occurs fromcombustion processes, from boilers and power plants, and from vehicle exhaustreleases. In some cases, NPs are directly released to the environment to achieveenvironmental cleanliness, an example of which is the use of TiO 2 NPs in pilotwater-purification reactors (Shahmoradi et al. 2010; Larue et al. 2011).Many new studies on nanoparticle safely have been initiated, and many others
completed that address prospective nanotoxic effects on human health. However,few studies are yet available on the potential ecotoxic effects of NPs. More ecotox-icity data are certainly needed, because NPs may destabilize or disrupt ecosystemsby entering food chains via plant ingestion and trophic transfer. Unfortunately, dataon NP accumulation and toxicity in plants are still limited. To date, studies that haveaddressed effects of nanotoxicants to plants have emphasized impairment of seedgermination and root elongation (Lin and Xing 2007; Lee et al. 2008; Oleszczuket al. 2011; Ruffini et al. 2011; Wang et al. 2012; Wu et al. 2012)
3 Factors Affecting Nanoparticle Phytotoxicity
Our review of the literature revealed that the uptake, translocation, and accumula-tion of NPs depends on the species of plant, and the size, type, chemical composi-tion, functionalization, and stability of the NPs in a system (Buzea et al. 2007; Linand Xing 2007; Lee et al. 2008; Barrena et al. 2009; Larue et al. 2012).
NanotechnologyResearch andDevelopment
TechnologyTransfer
IndustrialProduction
CommercialNanotech-based
products:Cosmetics, drugs,
pesticides, etc.
Treated/untreatedNanowastes
Packaging
Growth inhibitionOxidative stress
Clastogenic effectsGenetic disturbances
Morphogeneticabnormalities
TransportStorage
Treated Wastestream/Overflow
Nanowastes: Functionalized/non-functionalized, liquid/suspensions, solid particulates, aggregates, gaseoussuspensions
Environmental Exposure:Interaction with Microbes,Plants and Animals
Untreated Waste- direct transfer
Waste Treatment Plant
Post-application Release
Incidental Discharge during
Nanomaterial effects on Plants
Fig. 1 An outline of how nanowaste flows in the environment to potentially produce phytotoxic effects
T. Yadav et al.
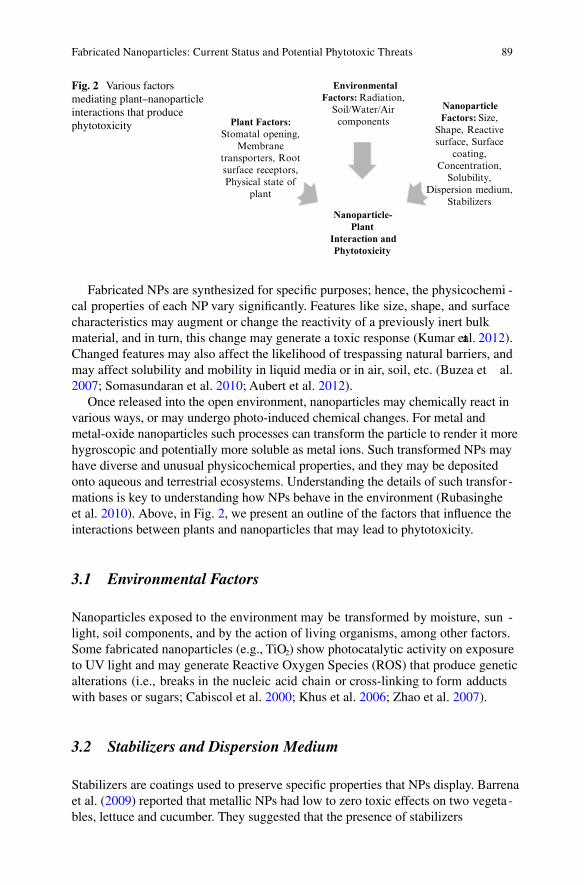
89
Fabricated NPs are synthesized for specific purposes; hence, the physicochemi -cal properties of each NP vary significantly. Features like size, shape, and surfacecharacteristics may augment or change the reactivity of a previously inert bulkmaterial, and in turn, this change may generate a toxic response (Kumar etal. 2012). Changed features may also affect the likelihood of trespassing natural barriers, andmay affect solubility and mobility in liquid media or in air, soil, etc. (Buzea et al.2007; Somasundaran et al. 2010; Aubert et al. 2012).Once released into the open environment, nanoparticles may chemically react in
various ways, or may undergo photo-induced chemical changes. For metal andmetal-oxide nanoparticles such processes can transform the particle to render it morehygroscopic and potentially more soluble as metal ions. Such transformed NPs mayhave diverse and unusual physicochemical properties, and they may be depositedonto aqueous and terrestrial ecosystems. Understanding the details of such transfor -mations is key to understanding how NPs behave in the environment (Rubasingheet al. 2010). Above, in Fig. 2, we present an outline of the factors that influence theinteractions between plants and nanoparticles that may lead to phytotoxicity.
3.1 Environmental Factors
Nanoparticles exposed to the environment may be transformed by moisture, sun -light, soil components, and by the action of living organisms, among other factors.Some fabricated nanoparticles (e.g., TiO2) show photocatalytic activity on exposureto UV light and may generate Reactive Oxygen Species (ROS) that produce geneticalterations (i.e., breaks in the nucleic acid chain or cross-linking to form adductswith bases or sugars; Cabiscol et al. 2000; Khus et al. 2006; Zhao et al. 2007).
3.2 Stabilizers and Dispersion Medium
Stabilizers are coatings used to preserve specific properties that NPs display. Barrenaet al. (2009) reported that metallic NPs had low to zero toxic effects on two vegeta -bles, lettuce and cucumber. They suggested that the presence of stabilizers
NanoparticleFactors: Size,
Shape, Reactivesurface, Surface
coating,Concentration,
Solubility,Dispersion medium,
Stabilizers
EnvironmentalFactors: Radiation,
Soil/Water/Aircomponents
Nanoparticle-Plant
Interaction andPhytotoxicity
Plant Factors:Stomatal opening,
Membranetransporters, Rootsurface receptors,Physical state of
plant
Fig. 2 Various factorsmediating plant–nanoparticleinteractions that producephytotoxicity
Fabricated Nanoparticles: Current Status and Potential Phytotoxic Threats
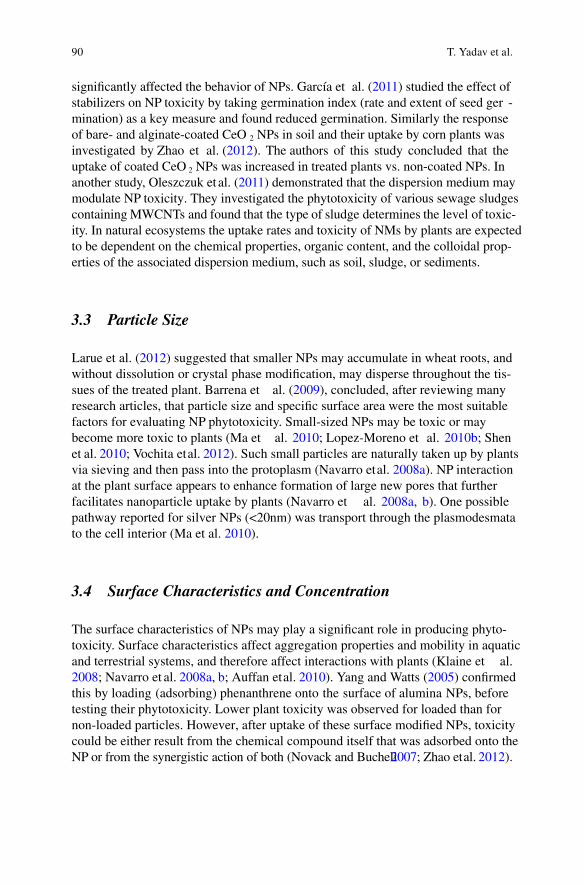
90
significantly affected the behavior of NPs. García et al. (2011) studied the effect ofstabilizers on NP toxicity by taking germination index (rate and extent of seed ger -mination) as a key measure and found reduced germination. Similarly the responseof bare- and alginate-coated CeO 2 NPs in soil and their uptake by corn plants wasinvestigated by Zhao et al. (2012). The authors of this study concluded that theuptake of coated CeO 2 NPs was increased in treated plants vs. non-coated NPs. Inanother study, Oleszczuk et al. (2011) demonstrated that the dispersion medium maymodulate NP toxicity. They investigated the phytotoxicity of various sewage sludgescontainingMWCNTs and found that the type of sludge determines the level of toxic-ity. In natural ecosystems the uptake rates and toxicity of NMs by plants are expectedto be dependent on the chemical properties, organic content, and the colloidal prop-erties of the associated dispersion medium, such as soil, sludge, or sediments.
3.3 Particle Size
Larue et al. (2012) suggested that smaller NPs may accumulate in wheat roots, andwithout dissolution or crystal phase modification, may disperse throughout the tis-sues of the treated plant. Barrena et al. (2009), concluded, after reviewing manyresearch articles, that particle size and specific surface area were the most suitablefactors for evaluating NP phytotoxicity. Small-sized NPs may be toxic or maybecome more toxic to plants (Ma et al. 2010; Lopez-Moreno et al. 2010b; Shenet al. 2010; Vochita etal. 2012). Such small particles are naturally taken up by plantsvia sieving and then pass into the protoplasm (Navarro etal. 2008a). NP interactionat the plant surface appears to enhance formation of large new pores that furtherfacilitates nanoparticle uptake by plants (Navarro et al. 2008a, b). One possiblepathway reported for silver NPs (<20nm) was transport through the plasmodesmatato the cell interior (Ma et al. 2010).
3.4 Surface Characteristics and Concentration
The surface characteristics of NPs may play a significant role in producing phyto-toxicity. Surface characteristics affect aggregation properties and mobility in aquaticand terrestrial systems, and therefore affect interactions with plants (Klaine et al.2008; Navarro et al. 2008a, b; Auffan etal. 2010). Yang and Watts (2005) confirmedthis by loading (adsorbing) phenanthrene onto the surface of alumina NPs, beforetesting their phytotoxicity. Lower plant toxicity was observed for loaded than fornon-loaded particles. However, after uptake of these surface modified NPs, toxicitycould be either result from the chemical compound itself that was adsorbed onto theNP or from the synergistic action of both (Novack and Bucheli2007; Zhao etal. 2012).
T. Yadav et al.
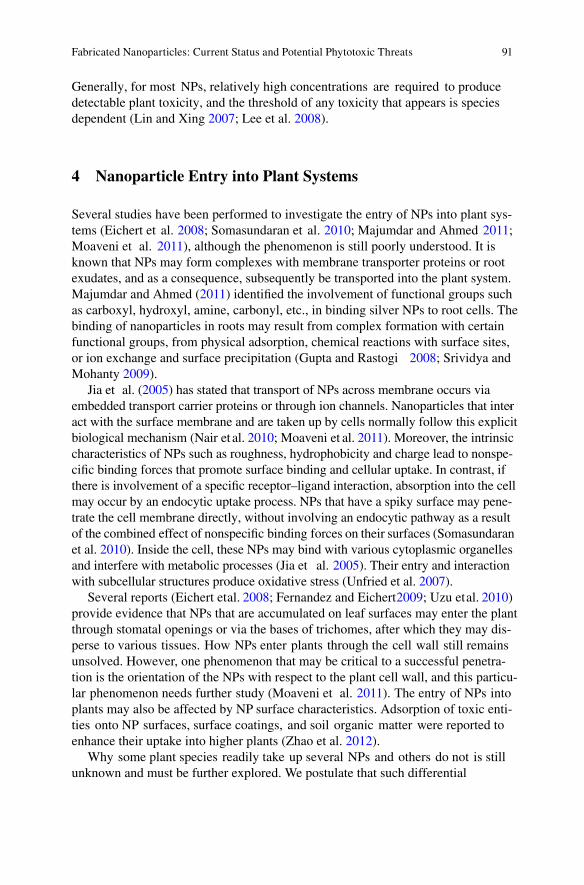
91
Generally, for most NPs, relatively high concentrations are required to producedetectable plant toxicity, and the threshold of any toxicity that appears is speciesdependent (Lin and Xing 2007; Lee et al. 2008).
4 Nanoparticle Entry into Plant Systems
Several studies have been performed to investigate the entry of NPs into plant sys-tems (Eichert et al. 2008; Somasundaran et al. 2010; Majumdar and Ahmed 2011; Moaveni et al. 2011), although the phenomenon is still poorly understood. It isknown that NPs may form complexes with membrane transporter proteins or rootexudates, and as a consequence, subsequently be transported into the plant system.Majumdar and Ahmed (2011) identified the involvement of functional groups suchas carboxyl, hydroxyl, amine, carbonyl, etc., in binding silver NPs to root cells. Thebinding of nanoparticles in roots may result from complex formation with certainfunctional groups, from physical adsorption, chemical reactions with surface sites,or ion exchange and surface precipitation (Gupta and Rastogi 2008; Srividya andMohanty 2009).Jia et al. (2005) has stated that transport of NPs across membrane occurs via
embedded transport carrier proteins or through ion channels. Nanoparticles that inter-act with the surface membrane and are taken up by cells normally follow this explicitbiological mechanism (Nair et al. 2010; Moaveni et al. 2011). Moreover, the intrinsiccharacteristics of NPs such as roughness, hydrophobicity and charge lead to nonspe-cific binding forces that promote surface binding and cellular uptake. In contrast, ifthere is involvement of a specific receptor–ligand interaction, absorption into the cellmay occur by an endocytic uptake process. NPs that have a spiky surface may pene-trate the cell membrane directly, without involving an endocytic pathway as a resultof the combined effect of nonspecific binding forces on their surfaces (Somasundaranet al. 2010). Inside the cell, these NPs may bind with various cytoplasmic organellesand interfere with metabolic processes (Jia et al. 2005). Their entry and interactionwith subcellular structures produce oxidative stress (Unfried et al. 2007).Several reports (Eichert etal. 2008; Fernandez and Eichert2009; Uzu etal. 2010)
provide evidence that NPs that are accumulated on leaf surfaces may enter the plantthrough stomatal openings or via the bases of trichomes, after which they may dis-perse to various tissues. How NPs enter plants through the cell wall still remainsunsolved. However, one phenomenon that may be critical to a successful penetra-tion is the orientation of the NPs with respect to the plant cell wall, and this particu-lar phenomenon needs further study (Moaveni et al. 2011). The entry of NPs intoplants may also be affected by NP surface characteristics. Adsorption of toxic enti-ties onto NP surfaces, surface coatings, and soil organic matter were reported toenhance their uptake into higher plants (Zhao et al. 2012).Why some plant species readily take up several NPs and others do not is still
unknown and must be further explored. We postulate that such differential
Fabricated Nanoparticles: Current Status and Potential Phytotoxic Threats
92
accumulation may be explained by differences in root microstructures of differentplants, and/or the physical and chemical interactions that occur between the NPsand the root exudates in the rhizosphere.
5 Phytotoxic Effects of Nanoparticles
In this section we summarize the phytotoxicological aspects of NPs and how theyaffect the plant system. In Table3, we summarize the toxic effects that NPs produceon different plant species.
5.1 Single-Walled Carbon Nanotubes (SWCNTs) and Multiwalled Carbon Nanotubes (MWCNTs)
As a result of their small size, carbon nanotubes are hypothesized to interact withproteins and polysaccharides on the cell wall to elicit hypersensitive responses simi-lar to those produced by plant pathogens. This eventually leads to cell mortality(Tan and Fugetsu 2007; Lin et al. 2009a, b; Tan et al. 2009). Lin et al. (2009a, b) examined the uptake and translocation of carbon NPs by rice plants (Oryza sativa). They found that fullerene C70 might easily be taken up by roots and transported toshoots. This study also proved that, if C70 entered plants through the leaves, it maypossibly be transported downward from leaves to roots through the phloem. Linet al. (2009a, b) suggested that the presence of metallic impurities (i.e., residualmetal catalysts, etc.) during the synthesis of CNTs may also contribute to toxicity.Shen et al. (2010) studied the impact of SWCNTs in rice andArabidopsis proto-
plast cells. The results were that the nanoscale size and concentration of SWCNTswere major characteristics responsible for potential cytotoxic effects. Profuse endo-nucleolytic cleavage of DNA was evident in the Arabidopsis cells, indicating thegenotoxic potential of SWCNTs in plant system.Lin and Xing (2007) soaked plant seeds in a MWCNT suspension for 2 h and
observed the response. They concluded that no significant phytotoxic effect or phys-iological response was notable after MWCNTs were applied. Instead, seed germi-nation was accelerated, and percent germination rate and vegetative mass wereobserved to increase (Khodakovskaya etal. 2009). This response may have resultedfrom increased water uptake induced by contact with the CNTs. The possible toxiceffects of MWCNTs on suspended rice cells (Oryza sativa L.) was investigated byTan et al. (2009). They demonstrated decreased cell viability from increased accu-mulation of ROS. This response to MWCNTs exposure was dose-dependent andproduced reduced cell density of the cultured rice cell suspension.Canas et al. (2008) studied the phytotoxicity of nanotubes functionalized with
poly-3-aminobenzenesulfonic acid. In some cases, they found that root lengthswere affected more by non-functionalized carbon nanotubes than by functionalized
T. Yadav et al.
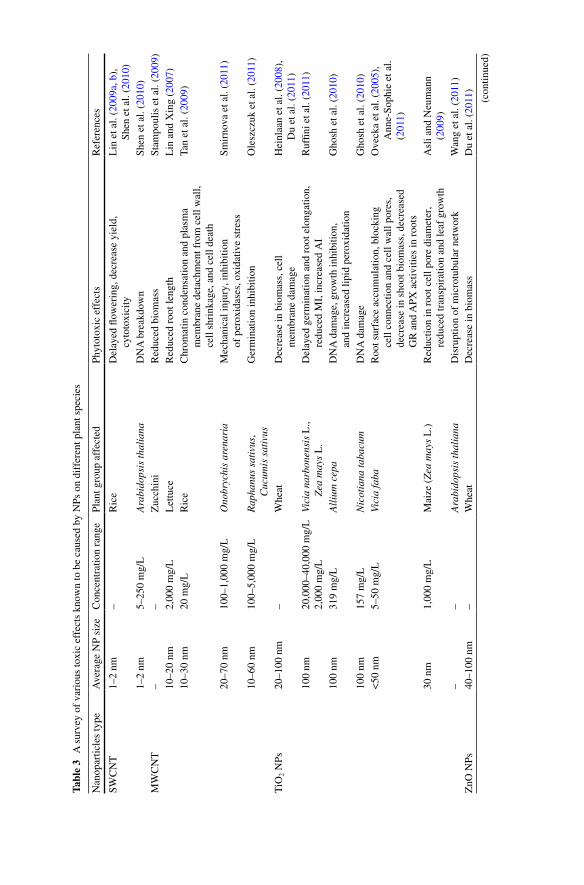
Tabl
e 3AsurveyofvarioustoxiceffectsknowntobecausedbyNPsondifferentplantspecies
Nanoparticlestype
AverageNPsizeConcentrationrangePlantgroupaffected
Phytotoxiceffects
References
SWCNT
1–2nm
–R
ice
Delayedflowering,decreaseyield,
cytotoxicity
Linetal.(2009a,b),
Shenetal.(2010
)1–2nm
5–250mg/L
Ara
bido
psis
thal
iana
DNAbreakdown
Shenetal.(2010
)MWCNT
––
Zucchini
Reducedbiomass
Stampoulisetal.(2009
)10–20nm
2,000mg/L
Lettuce
Reducedrootlength
LinandXing(2007)
10–30nm
20mg/L
Ric
eChromatincondensationandplasma
membranedetachmentfromcellwall,
cellshrinkage,andcelldeath
Tanetal.(2009
)
20–70nm
100–1,000mg/L
Ono
bryc
his
aren
aria
Mechanicalinjury,inhibition
ofperoxidases,oxidativestress
Smirnovaetal.(2011
)
10–60nm
100–5,000mg/L
Rap
hanu
s sa
tivu
s,
Cuc
umis
sat
ivus
Germinationinhibition
Oleszczuketal.(2011
)
TiO
2NPs
20–100nm
–Wheat
Decreaseinbiomass,cell
membranedamage
Heinlaanetal.(2008),
Duetal.(2011
)100nm
20,000–40,000mg/L
2,000mg/L
Vici
a na
rbon
ensi
sL.,
Z
ea m
ays
L.
Delayedgerminationandrootelongation,
reducedMI,increasedAI
Ruffinietal.(2011)
100nm
319mg/L
All
ium
cep
aDNAdamage,growthinhibition,
andincreasedlipidperoxidation
Ghoshetal.(2010
)
100nm
157mg/L
Nic
otia
na ta
bacu
mDNAdamage
Ghoshetal.(2010
)<50nm
5–50mg/L
Vici
a fa
baRootsurfaceaccumulation,blocking
cellconnectionandcellwallpores,
decreaseinshootbiomass,decreased
GRandAPXactivitiesinroots
Oveckaetal.(2005),
Anne-Sophieetal.
(2011)
30nm
1,000mg/L
Maize(Z
ea m
ays
L.)
Reductioninrootcellporediameter,
reducedtranspirationandleafgrowth
AsliandNeumann
(2009)
––
Ara
bido
psis
thal
iana
Disruptionofmicrotubularnetwork
Wangetal.(2011
)ZnONPs
40–100nm
–Wheat
Decreaseinbiomass
Duetal.(2011
)
(continued)
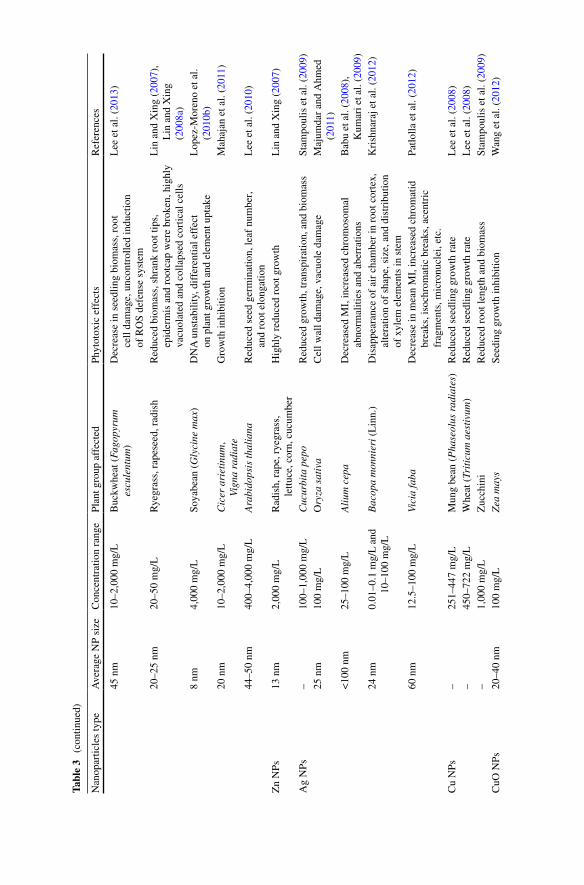
Nanoparticlestype
AverageNPsizeConcentrationrangePlantgroupaffected
Phytotoxiceffects
References
45nm
10–2,000mg/L
Buckwheat(F
agop
yrum
es
cule
ntum
)Decreaseinseedlingbiomass,root
celldamage,uncontrolledinduction
ofROSdefensesystem
Leeetal.(2013
)
20–25nm
20–50mg/L
Ryegrass,rapeseed,radish
Reducedbiomass,shrankroottips,
epidermisandrootcapwerebroken,highly
vacuolatedandcollapsedcorticalcells
LinandXing(2007),
LinandXing
(2008a
)8nm
4,000mg/L
Soyabean(G
lyci
ne m
ax)
DNAunstability,differentialeffect
onplantgrowthandelementuptake
Lopez-Morenoetal.
(2010b
)20nm
10–2,000mg/L
Cic
er a
riet
inum,
Vign
a ra
diat
eGrowthinhibition
Mahajanetal.(2011
)
44–50nm
400–4,000mg/L
Ara
bido
psis
thal
iana
Reducedseedgermination,leafnumber,
androotelongation
Leeetal.(2010
)
ZnNPs
13nm
2,000mg/L
Radish,rape,ryegrass,
lettuce,corn,cucumber
Highlyreducedrootgrowth
LinandXing(2007)
AgNPs
–100–1,000mg/L
Cuc
urbi
ta p
epo
Reducedgrowth,transpiration,andbiomass
Stampoulisetal.(2009
)25nm
100mg/L
Ory
za s
ativ
aCellwalldamage,vacuoledamage
MajumdarandAhmed
(2011)
<100nm
25–100mg/L
Ali
um c
epa
DecreasedMI,increasedchromosomal
abnormalitiesandaberrations
Babuetal.(2008),
Kumarietal.(2009)
24nm
0.01–0.1mg/Land
10–100mg/L
Bac
opa
mon
nier
i(Linn.)
Disappearanceofairchamberinrootcortex,
alterationofshape,size,anddistribution
ofxylemelementsinstem
Krishnarajetal.(2012)
60nm
12.5–100mg/L
Vici
a fa
baDecreaseinmeanMI,increasedchromatid
breaks,isochromaticbreaks,acentric
fragments,micronuclei,etc.
Patlollaetal.(2012
)
CuNPs
–251–447mg/L
Mungbean(P
hase
olus
rad
iate
s)Reducedseedlinggrowthrate
Leeetal.(2008
)–
450–722mg/L
Wheat(T
riti
cum
aes
tivu
m)
Reducedseedlinggrowthrate
Leeetal.(2008
)–
1,000mg/L
Zucchini
Reducedrootlengthandbiomass
Stampoulisetal.(2009
)CuONPs
20–40nm
100mg/L
Zea
may
sSeedinggrowthinhibition
Wangetal.(2012
)
Tabl
e 3(continued)
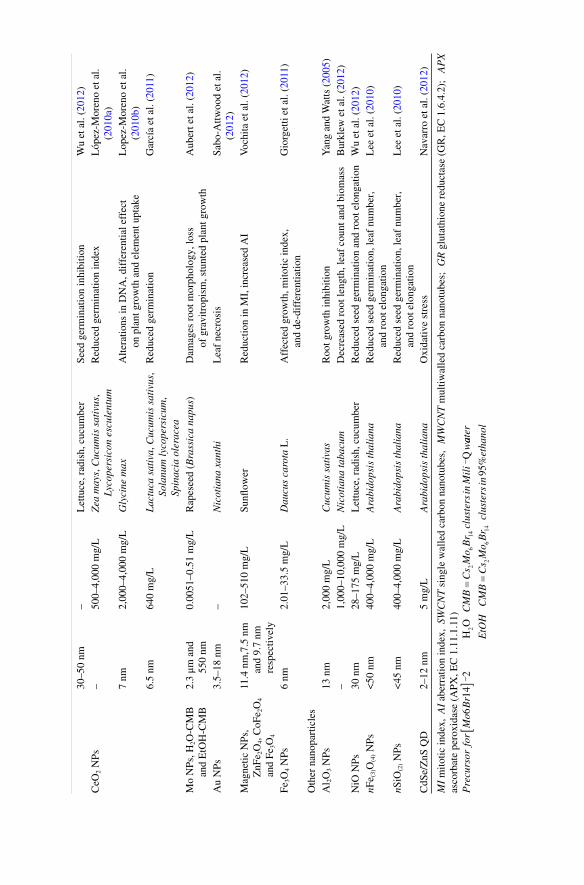
Nanoparticlestype
AverageNPsizeConcentrationrangePlantgroupaffected
Phytotoxiceffects
References
30–50nm
–Lettuce,radish,cucumber
Seedgerminationinhibition
Wuetal.(2012
)CeO
2NPs
–500–4,000mg/L
Zea
may
s,C
ucum
is s
ativ
us,
Lyco
pers
icon
esc
ulen
tum
Reducedgerminationindex
López-Morenoetal.
(2010a
)7nm
2,000–4,000mg/L
Gly
cine
max
AlterationsinDNA,differentialeffect
onplantgrowthandelementuptake
Lopez-Morenoetal.
(2010b
)6.5nm
640mg/L
Lac
tuca
sat
iva,
Cuc
umis
sat
ivus,
Sola
num
lyco
pers
icum,
Spin
acia
ole
race
a
Reducedgermination
Garcíaetal.(2011
)
MoNPs,H
2O-CMB
andEtOH-CMB
2.3
μmand
550nm
0.0051–0.51mg/L
Rapeseed(B
rass
ica
napu
s)Damagesrootmorphology,loss
ofgravitropism,stuntedplantgrowth
Aubertetal.(2012)
AuNPs
3.5–18nm
–N
icot
iana
xan
thi
Leafnecrosis
Sabo-Attwoodetal.
(2012)
MagneticNPs,
ZnFe 2O
4,CoFe 2O
4 andFe
3O4
11.4nm,7.5nm
and9.7nm
respectively
102–510mg/L
Sunflower
ReductioninMI,increasedAI
Vochitaetal.(2012
)
Fe3O
4NPs
6nm
2.01–33.5mg/L
Dau
cus
caro
ta L
.Affectedgrowth,mitoticindex,
andde-differentiation
Giorgettietal.(2011
)
Othernanoparticles
Al 2O
3NPs
13nm
2,000mg/L
Cuc
umis
sat
ivas
Rootgrowthinhibition
YangandWatts(2005)
–1,000–10,000mg/L
Nic
otia
na ta
bacu
mDecreasedrootlength,leafcountandbiomassBurklewetal.(2012
)NiONPs
30nm
28–175mg/L
Lettuce,radish,cucumber
ReducedseedgerminationandrootelongationWuetal.(2012
)nF
e (3)O(4)NPs
<50nm
400–4,000mg/L
Ara
bido
psis
thal
iana
Reducedseedgermination,leafnumber,
androotelongation
Leeetal.(2010
)
nSiO(2)NPs
<45nm
400–4,000mg/L
Ara
bido
psis
thal
iana
Reducedseedgermination,leafnumber,
androotelongation
Leeetal.(2010
)
CdSe/ZnSQD
2–12nm
5mg/L
Ara
bido
psis
thal
iana
Oxidativestress
Navarroetal.(2012
)
MImitoticindex,
AIaberrationindex,
SWC
NTsinglewalledcarbonnanotubes,
MW
CN
Tmultiwalledcarbonnanotubes;
GRglutathionereductase(GR,EC1.6.4.2);
AP
X
ascorbateperoxidase(APX,EC1.11.1.11)
Pre
curs
orfo
rM
oB
rC
MB
Cs
Mo
Br
clus
ters
inM
ili
w6
142
22
614
[]
=-
-
HO
Qaat
er
EtO
HC
MB
Cs
Mo
Br
clus
ters
inet
hano
l
=2
614
95%
96
ones. Non-functionalized nanotubes inhibited root elongation in tomato (Solanum lycopersicum) plants, whereas enhanced root elongation occurred in onion (Allium cepa) and cucumber (Cucumis sativus). Root elongation in lettuce (Lactuca sativa) was inhibited by functionalized nanotubes, but exposed cabbages (Brassica olera-cea) and carrots (Daucus carota) were unaffected by either form of nanotubes.These effects after CNT exposure tended to be more prominent at a 24-h than at a48-h incubation. Microscopy images revealed the presence of the nanotube layerson root surfaces, but there was no evidence of uptake (Canas et al. 2008). Nevertheless, this work demonstrated the effect of NP surface properties on phyto-toxicity. Results of this study also suggested that plant response to NP exposuresdepends on the plant species involved, the plant growth stage and nature of thenanomaterial tested.The toxicity of CNTs also depends on type of dispersion medium in which they
are tested. Oleszczuk et al. (2011) evaluated the toxicity of sewage sludge that con-tained MWCNTs on various plant species. Seed germination and root growth wasinhibited. One possible explanation for the inhibition was strong binding of pollut-ants by the CNTs, thereby inducing plant toxicity. Such a mechanism has beendemonstrated in other studies (Yang et al. 2006; Lin and Xing 2008b; Pan and Xing2008; Oleszczuk et al. 2009).
5.2 Titanium Nanoparticles
Evidence available in the Nanowerk nanomaterial database (Database 2013), indi-cates that the TiO 2 nanoparticle (Anatase form), among all other NP categories, isthe major type of NP produced worldwide. TiO 2 nanoparticles are utilized in paintpigments, paper, ink and in plastics. It is also incorporated into cosmetics such assunscreens to provide protection against UV light (Larue et al. 2011). Therefore,publications on TiO2 NPs and their interactions with biological entities like plantsare increasingly appearing in the literature. Larue et al. (2012) demonstrated thatTiO2 NPs accumulate in roots and are distributed throughout wheat plants (Triticum aestivum spp.) without being dissolved or having their crystal phase modified.These authors also suggested that there was an upper limit of NP diameter abovewhich no accumulation would occur.Du et al. (2011) studied the TiO 2 NPs under field conditions using a lysimeter.
They added the TiO 2 NP to soil (0.09 g/kg) and after aging for 2 months, wheat(Triticum aestivum L.) was sown. Using TEM (Transmission Electron Microscope)imaging and SEM-X act analysis (X-ray-based detection), TiO2 NPs were observed inprimary root tips of wheat plants grown in the presence of TiO2 NPs. Decreased shootbiomass occurred in wheat and provided evidence that the TiO2 NPs caused toxicity.The toxic effect may have been caused by the existence of NPs in cells or theiraccumulation in cell walls. Other studies indicated that changes wrought by contactwith NPs in the microenvironment of the contact area (site of interaction betweenNP and cell), either from increased metal solubility or from extracellular generation
T. Yadav et al.
97
of ROS, could damage cell membranes (Heinlaan et al. 2008; Du et al. 2011). A concentration-dependent abnormality in narbon bean (Vicia narbonensis L.) andmaize (Zea mays L.) was observed by Ruffini et al. (2011). In particular theseauthors reported effects on the Mitotic Index (MI) and the Aberration Index (AI),which represent expressions of the rate of mitotic cell division and level of chromo-somal abnormalities encountered, respectively. Ruffini etal. (2011) reported delayedgermination and root elongation from increasing TiO2 NP exposure concentrations.In Vicia narbonensis L., the highest tested concentrations (2 and 4%) were requiredto significantly decrease the MI. In contrast, the MI in Zea mays L. was affected ata much lower concentration (0.2%). The increased AI from TiO 2 NP exposureswere concentration dependent for both plant species. There was also evidence thatTiO2 NP caused genotoxicity, characterized primarily by abnormalities rising in thespindle apparatus (c-metaphases, anomalous anaphases, chromosome bridging).Chromosomal damage such as lagging chromosome, fragmentation, micronucleirelease, and strand breaks in DNAwere also identified, and weresimilar to changesfound in in vivo mouse studies (Trouiller et al. 2009).Ghosh et al. (2010) observed TiO2 (100 nm) toxicity in Allium cepa in the form
of DNA damage, growth inhibition and increased lipid peroxidation at a concentra-tion of 319 mg/L. In the same study, TiO2 caused DNA damage to Nicotiana taba-cum, at a concentration 157mg/L. Recently, sunscreen-based TiO2 nanocompositeshave been studied to determine effects on faba bean (Vicia faba) (Anne-Sophie etal.2011). Results revealed that particles were deposited in the outer root tissue of thisplant, possibly from an electrostatic attraction. Such behavior could clog cell poresand interstices, and curtail water circulation and nutrient exchange in the plants.Moreover, deposition in outer root tissue could enhance intake of smaller TiO2 par-ticles by endocytosis via root hairs (Ovecka et al. 2005), or by diffusion into roottissues through the intercellular space without entering cells.
5.3 Zinc Nanoparticles
ZnO NPs are one of the most common industrial additives. Like other metal-basedNPs, the uptake, translocation, and accumulation of ZnO NPs are poorly understoodin plant systems. ZnO NPs are usually dissolved when applied to soil, whichenhances plant uptake and phytotoxicity (Du et al. 2011). The way in which ZnONPs produce toxicity in plants is unclear. Franklin et al. (2007) suggested that ZnONPs toxicity results from its solubility, whereas Lin and Xing (2008a), studyingryegrass (Lolium perenne), indicated that dissolution alone could not be consideredas a potential cause of toxicity.Recently, Lee et al. (2013) studied the effect of ZnO NPs on buckwheat
(Fagopyrum esculentum) at high concentrations (10–2,000 mg/L). Such exposurescaused a biomass drop in buckwheat seedlings, damaged root surface cells, andinduced an uncontrolled ROS defense system, i.e., stimulation of catalase activityand antioxidants (Lee et al. 2013).
Fabricated Nanoparticles: Current Status and Potential Phytotoxic Threats
98
A RAPD (Random Amplified Polymorphic DNA) analysis was performed byLopez-Moreno et al. (2010b) to check the effect of ZnO NPs in soybean (Glycine max) plants. They found a new DNAband in the RAPD profile of soybean roots thathad been treated with ZnO NPs (8 nm) at a 4,000 mg/L concentration. The authorsbelieved that the profile resulted from toxicity due either to the interaction of DNAwith zinc ions leached from the ZnO NPs, or from direct interaction with the ZnONPs. In the same study, XANES (X-ray Absorption Near Edge Structure) spectrafrom roots treated with 4,000 mg/L ZnO NPs showed the presence of zinc in theoxidized state as Zn (II) within tissues and not as ZnO NPs. No conclusion wasreached on how this genotoxic effect had occurred.
5.4 Silver Nanoparticles
Silver nanoparticles (Ag NPs) are NPs that are frequently employed in a variety ofmedical and healthcare products. Their good fit to healthcare derives from theirbroad-spectrum biocidal properties. Because of their characteristics, these NPs areclassified as environmental hazards by the EPA (Environment Protection Agency).Stampoulis et al. (2009) investigated the effects of Ag NPs and their correspond-
ing bulk counterparts on seed germination, root elongation, and biomass of zucchini(Cucurbita pepo). They reported that exposure to Ag NPs at 500 and 100 mg/Lresulted in a 57% and 41% decrease in plant biomass and transpiration, respectively,vs. similar measures in controls and plants exposed to bulk Ag. Even shoot accumu-lation of Ag NPs was an average of 4.7 times greater than for the correspondingbulk solutions. The reason for this may have been that silver NPs produce a greaterion release than does the bulk silver counterpart.Majumdar and Ahmed (2011) reported that the toxicity of Ag NPs to rice (Oryza
sativa) was both concentration- and exposure-time-dependent. This conclusion wassupported by TEM analysis, which depicted the deposition of silver NPs inside rootcells. Those Ag NPs that produced cell wall and vacuole damage primarily had anaverage diameter of 25 nm. Moreover, Haverkamp and Marshall (2009) observedthat silver NPs deposited and accumulated in plant cells did so as a function of thereduction potential present in the system.After treating water hyssop (Bacopa monnieri Linn.) with Ag NPs, mild stress
conditions appeared in root, stem and leaf tissue (Krishnaraj etal. 2012). This treat-ment caused an inconsequential reduction of root and shoot length, disappearanceof the air chamber in root cortex, and altered the shape, size, and distribution ofxylem elements in stems.Kumari et al. (2009) treated onion (Allium cepa) root tip cells with Ag NPs
(diameter <100 nm, 25–100 mg/L) and noted a dose-dependent response. Theyfound a reduced MI frequency from 60.3% (control) to 27.62% (100 mg/L) amongsilver NP-treated cells. Other chromosomal aberrations also occurred at various sil-ver NP concentrations. Similarly, an in vivo cytogenetic assay carried out by Babuet al. (2008) revealed a dose- and a duration-dependent reduction in MI, along withother chromosomal and mitotic abnormalities in Allium cepa. The induction of
T. Yadav et al.
99
chromosomal abnormalities indicates that silver NPs has clastogenic potential;clastogenesis is an irreversible genotoxic endpoint in plants. Patlolla et al. (2012) studied the genotoxic effects of silver NPs inVicia faba root-tip, and found that NPsmay penetrate the plant system. Once absorbed, silver NPs interfere with intracel-lular components and cause a dose-dependent decrease in MI and increased chro-mosomal aberration frequencies.
5.5 Copper Nanoparticles
The effect of copper NPs on bioaccumulation and plant seedling growth was inves-tigated by Lee etal. (2008) by using two crop species, mung bean (Phaseolus radia-tus) and wheat (Triticum aestivum). Copper NPs inhibited mung bean (335 mg/L)seedling growth more than wheat (570 mg/L) seedling growth. The higher suscep-tibility of mung bean seedlings was ascribed to its particular root anatomy andgrowth architecture.The first report of root–shoot–root redistribution of CuO NPs (20–40nm) within
maize (Zea mays L.) plants was given by Wang et al. (2012). CuO NPs, up to100 mg/L, had no effect on germination, whereas inhibition of maize seedlingsgrowth occurred. The presence of CuO NPs in xylem sap was detected by TEM andenergy dispersive spectroscopy (EDS), proving that CuO NPs are transported fromroots to shoots via the xylem. Split-root experiments and high-resolution TEMobservations further revealed that CuO NPs were translocated from shoots back tothe roots via the phloem, during which Cu (II) was reduced to Cu (I). This studydirectly confirmed that CuO NPs bioaccumulate and are biotransformed in maize,which increases concern that significant risks may be associated with NPs in food.
5.6 Cerium Nanoparticles
Cerium oxide (CeO2) NPs are employed as polishing materials, in fuel cell materi-als, as additives in glass and ceramics, in agricultural products, and for other uses inthe automobile industry (Kosynkin et al. 2000; Corma et al. 2004; Livingston andHelvajian 2005). This rather wide array of uses results in significant releases ofCeO2 NPs to the environment. Limbach et al. (2008) estimated the soil concentra-tion of CeO 2 NPs to be between 0.32 and 1.12 mg/kg; further, they believed thatfuture releases will continue to rise as time passes.There are few reports on the toxicity of CeO 2 in plants. Lopez-Moreno et al.
(2010b) investigated the genotoxicity of CeO 2 in soyabean seedlings by using theRAPD assay. The RAPD profile of soyabean roots treated with CeO2 NPs (7 nm) at2,000 and 4,000 mg/L showed four and three new bands, respectively. The treatedplants exhibited an incidence of genetic instability as a result of exposure to thesenanoparticles. This genotoxic response was further supported by the appearance ofCeO2 NPs in tissues as shown by XANES spectra. In another study with CeO2 NPs,
Fabricated Nanoparticles: Current Status and Potential Phytotoxic Threats
100
López-Moreno et al. (2010a) identified reduced germination in corn (30%), tomato(30%), and cucumber (20%) after the plants were treated at 2,000 mg/L.Zhao et al. (2012) reported how surface coatings and organic matter affected the
bioavailability of CeO2 NPs, and studied its uptake mechanism in maize plants (Zea mays). Plants were grown in both an unenriched (sandy loam soil) and organic soil(unenriched soil plus high organic matter potting soil in a 1:1 ratio) that had beentreated with alginate-coated and uncoated CeO 2 NPs. Plants were also exposed tofluorescein isothiocyanate (FITC)-stained CeO 2 NPs before being examined underconfocal microscopy. In the organic soil, roots treated with uncoated and coatedNPs contained more Ce than did roots grown in unenriched soil. In contrast, therewas significantly more Ce observed in plant shoots from unenriched soil than inshoots from an organic soil. Confocal fluorescence images revealed the presence ofFITC-stained CeO2 NP aggregates in cell walls of the epidermis and cortex of themaize plants that were suggestive of the apoplastic pathway of entry. The presenceof CeO2 NP aggregates within vascular tissues was demonstrated by using μXRF(Micro X-Ray Fluorescence) analysis. The tendency of CeO2 NPs to accumulate inplant parts may represent a sizable future threat, i.e., the possibility of entering andmoving through the food chain to exhibit toxic responses.
5.7 Molybdenum Nanoparticles
Molybdenum NPs are used as catalysts, pigments, corrosion inhibitors, lubricants,etc., and are considered to be naturally toxic unless exposures are low. The phyto-toxicity of molybdenum NPs on rapeseed plants (Brasicca napus) was tested byAubert et al. (2012). The form tested by these authors was Cs 2Mo6Br14 (CMB),which provided nanosized hexamolybdenum clusters (H 2O-CMB system,2.3±0.5 μm diameter, 390 ±60 nm thickness and 95% Ethanol-CMB system,550±180 nm diameter, 100 ±30 nm thickness) in two systems, water and ethanol.Several toxic effects of these CMB clusters were detected on plants. A concentration-dependent inhibition on rapeseed growth resulted from the treatment. The rootswere more affected than the shoots. An exponential increment in root growth inhibi-tion occurred with increasing Mo concentrations. The nanosized Ethanol-CMBcluster treatment produced disturbances in root gravitropism, whereas treatmentwith H2O-CMB produced high root hair proliferation, and eroded root caps, amongother effects. Analysis by surface imaging Nano SIMS (Secondary Ion MassSpectrometry) showed root morphology damage, perhaps from easier penetration ofclusters in the root (Aubert et al. 2012).
T. Yadav et al.
101
5.8 Gold Nanoparticles
Gold nanoparticles (Au NPs) are used in or for organic photovoltaics, sensoryprobes, electronic conductors and catalysis, therapeutic agents, drug delivery, andother biological and medical applications (Peng etal. 2010; Perrault and Chan2010; Bhatt and Tripathi 2011). Sabo-Attwood et al. (2012) conducted a study to assessthe uptake, biodistribution, and toxicity of Au NPs on tobacco plants (Nicotiana xanthi). They utilized Synchrotron-based X-ray microanalysis with X-ray absorp-tion near-edge microspectroscopy and high-resolution electron microscopy to local-ize Au NPs within plants. Results from these experiments revealed that Au NPsentered plants through the roots and moved into the vasculature. Aggregate particleswere also detected within the root cell cytoplasm. Furthermore, the Au NP uptakewas size selective (viz., 3.5 nm Au NPs were detected in plants but 18 nm Au NPsremained agglomerated on the root outer surfaces). Other effects like leaf necrosiswas also observed after 14 days of exposure to 3.5nm Au NPs. These results gener-ally showed that Au NP entry into plants was size-dependent, and translocation tovarious tissues occurred to cause phytotoxicity (Sabo-Attwood et al. 2012).
5.9 Magnetic Nanoparticles
The impact of magnetic fluid in several plant species has shown significant frequen-cies of chromosomal aberration and other cytogenetic abnormalities (Pavel et al.1999; Pavel and Creanga 2005; Racuciu and Creanga 2007). Vochita et al. (2012) reported various genetic effects in sunflower seedling root tip cells from exposure toseveral magnetic NPs: ZnFe2O4, CoFe2O4, and Fe3O4. Magnetic NP suspensions inthe concentration range of 20–100 μl/L produced a 35–50% reduction in MI and anincreased AI. Various chromosomal aberrations such as singular or multiple inter-chromatidian bridges, retard or expulsed chromosomes, chromosome fragments,and micronuclei were also produced. Giorgetti et al. (2011) analyzed the effect ofFe3O4 NPs on developmental processes of plant by utilizingDaucus carota L. in anin vitro model system. Fe3O4 NPs of 6 nm diameter and a exposure range of 2.01–33.5 mg/L affected the growth, MI and de-differentiation to some extent.
5.10 Other Nanoparticles
Several other nanoparticles have been reported to affect plants significantly at dif-ferent exposure levels. Alumina nanoparticles were toxic to plant species such asCucumis sativus (Yang and Watts 2005) and Nicotiana tabacum (Burklew et al.2012), and affected both root growth and biomass. Wu et al. (2012) assessed theeffect of nickel oxide (NiO) and CuO nanoparticles on various plants, measuring
Fabricated Nanoparticles: Current Status and Potential Phytotoxic Threats
102
seed germination and root elongation effects. Lee et al. (2010) studied Arabidopsis thaliana and found that Fe 3O4 and SiO 2 nanoparticles significantly affected seedgermination and root elongation at various concentrations. The effect of quantumdots (QD) such as CdSe/ZnS (2–12nm) also caused oxidative stress inArabidopsis thaliana at a very low concentration (Navarro et al. 2012).
6 Discussion
The value of fabricated NPs to society has grown rapidly, and so has the emissionsfrom their increased production. Hence, it has become very important to study theimpact of NPs on the environment. Although limited ecotoxicity testing protocolshave been designed and used, there is still a dearth of methods adequate to study theeffect of NPs on plants.In the last few decades, the toxicological studies performed on nanoparticles in
several plant species revealed that not all treated plants manifested toxic effects.However, many researchers believe that the toxicity observed in plants from apply-ing NPs results from plant–nanoparticle physical interactions. The NPs may alterthe surface chemistry of the root, thereby affecting the interaction of roots with itsenvironment (Canas et al. 2008). Plant development is negatively affected by expo-sure to NPs (Asli and Neumann 2009).In most NP toxicity studies with plants, seed germination and root elongation
were used as standard indicators of phytotoxicity, as recommended by the USEnvironmental Protection Agency. However, seed germination was unaffected byNPs in several studies (Stampoulis et al. 2009), which necessitates finding othertoxic endpoints for plants. Plant biomass and chlorophyll levels may well be accept-able phytotoxic endpoints, but need further investigation. Because direct detectionand assessment of NP behavior in plants and the environment is difficult, it will benecessary in the future to design more elaborate modeling techniques that betterrepresent and measure the behavior of NPs in biological systems.Among badly needed research is more detailed information on NP uptake by
biological species, NP accumulation in the plant system, and the environmental fac-tors that affect uptake. In addition, more insight is needed on the surface character-istics of roots, shoots, and leaves that significantly affects NP penetration intoplants. A predictive model for estimating the toxicity of fabricated NPs is needed,but can only be developed when all major factors that affect mobility, bioaccumula-tion and cytotoxicity of NPs are sufficiently understood. Any plan that is devised toassess the risks of NPs should, we believe, incorporate four levels of analysis, asdepicted in Fig. 3:
1. The assessment should begin with the newly formulated nanoproduct. The prod-uct should be screened and analyzed to address the various types of coatings,stabilizers, and matrices that could play a significant role in its environmentalsafety or behavior.
T. Yadav et al.
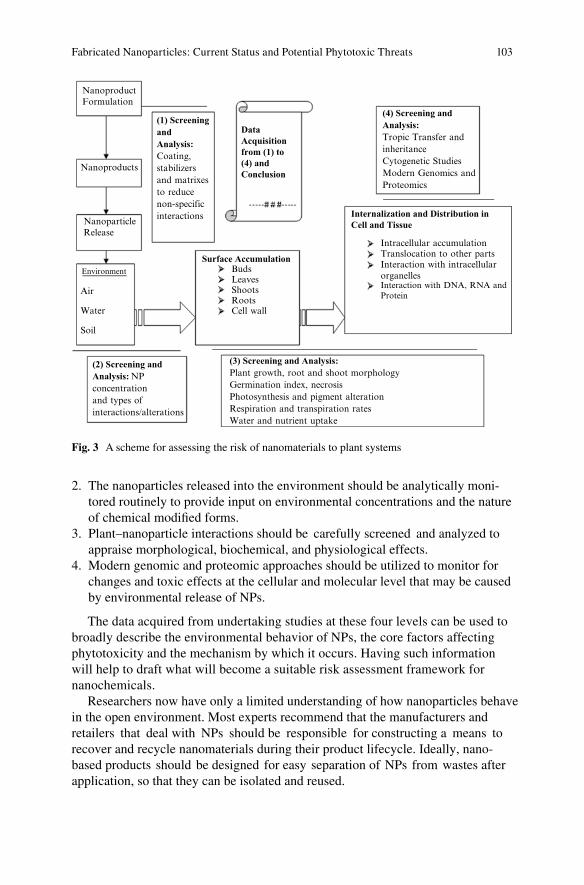
103
2. The nanoparticles released into the environment should be analytically moni-tored routinely to provide input on environmental concentrations and the natureof chemical modified forms.
3. Plant–nanoparticle interactions should be carefully screened and analyzed toappraise morphological, biochemical, and physiological effects.
4. Modern genomic and proteomic approaches should be utilized to monitor forchanges and toxic effects at the cellular and molecular level that may be causedby environmental release of NPs.
The data acquired from undertaking studies at these four levels can be used tobroadly describe the environmental behavior of NPs, the core factors affectingphytotoxicity and the mechanism by which it occurs. Having such informationwill help to draft what will become a suitable risk assessment framework fornanochemicals.Researchers now have only a limited understanding of how nanoparticles behave
in the open environment. Most experts recommend that the manufacturers andretailers that deal with NPs should be responsible for constructing a means torecover and recycle nanomaterials during their product lifecycle. Ideally, nano-based products should be designed for easy separation of NPs from wastes afterapplication, so that they can be isolated and reused.
NanoproductFormulation
Nanoproducts
NanoparticleRelease
Environment
Air
BudsSurface Accumulation
DataAcquisitionfrom (1) to(4) andConclusion
(4) Screening andAnalysis:Tropic Transfer andinheritanceCytogenetic StudiesModern Genomics andProteomics
(1) ScreeningandAnalysis:Coating,stabilizersand matrixesto reducenon-specificinteractions
LeavesShootsRootsCell wall
(2) Screening andAnalysis: NPconcentrationand types ofinteractions/alterations
(3) Screening and Analysis:Plant growth, root and shoot morphologyGermination index, necrosisPhotosynthesis and pigment alterationRespiration and transpiration ratesWater and nutrient uptake
Intracellular accumulation
Internalization and Distribution inCell and Tissue
Translocation to other partsInteraction with intracellularorganellesInteraction with DNA, RNA andProtein
Water
Soil
Fig. 3 A scheme for assessing the risk of nanomaterials to plant systems
Fabricated Nanoparticles: Current Status and Potential Phytotoxic Threats
104
7 Summary
Nanotechnology offers unique attributes to various industrial and consumer sectors,and has become a topic of high interest to scientific communities across the world.Our society has greatly benefitted from nanotechnology already, in that many prod-ucts with novel properties and wide applicability have been developed and com-mercialized. However, the increased production and use of nanomaterials haveraised concerns about the environmental fate and toxicological implications ofnanoparticles and nanomaterials. Research has revealed that various nanomaterialsmay be hazardous to living organisms. Among biota, plants are widely exposed toreleased nanomaterials and are sensitive to their effects. The accumulation of nano-materials in the environment is a potential threat, not only because of potential dam-age to plants but also because nanoparticles may enter the food chain. Although theliterature that addresses the safety of nanoproducts is growing, little is known aboutthe mechanisms by which these materials produce toxicity on natural species,including humans.In this paper, we have reviewed the literature relevant to what phytotoxic impact
fabricated nanoparticles (e.g., carbon nanotubes, metallic and metal oxide nanopar-ticles, and certain other nanomaterials) have on plants. Nanoparticles produce sev-eral effects on plant physiology and morphology. Nanoparticles are known to affectroot structure, seed germination, and cellular metabolism. Nanoparticles inhibitgrowth, induce oxidative stress, morphogenetic abnormalities and produce clasto-genic disturbances in several plant species. The size, shape and surface coating ofNPs play an important role in determining their level of toxicity. Of course, thedose, route of administration, type of dispersion media, and environmental exposurealso contribute to how toxic nanoparticles are to plants.Currently, nanotoxicity studies are only in their initial phases of development
and more research will be required to identify the actual threat nanoproducts poseto the plant system. To date, data show that there is a large variation in the phytotox-icity caused by different NPs. Moreover, the studies conducted thus far have mostlyrelied on microscopy to detect effects. Studies that incorporate measures and analysesundertaken with more modern tools are needed. Among new data that are mosturgently needed on NPs is how fabricated NPs behave once released into the envi-ronment, and how exposure to them may affect plant resistance, metabolic path-ways, and plant genetic responses.In this review, we have attempted to collect, present and summarize recent find-
ings from the literature on nanoparticle toxicity in plants. To strengthen the analysis,we propose a scheme for accessing NP toxicity. We also recommend how the poten-tial challenges presented by increased production and release of NPs should beaddressed. It is our belief and recommendation that every nanomaterial-based prod-uct be subjected to appropriate toxicity and associated assessment before beingcommercialized.
T. Yadav et al.
105
References
Anne-Sophie F, Masfaraud JF, Bigorgne E, Nahmani J, Chaurand P, Botta C, Labille J, Rose J,Férard JF, Cotelle S (2011) Environmental impact of sunscreen nanomaterials: ecotoxicity andgenotoxicity of altered TiO2 nanocomposites on Vicia faba. Environ Pollut 159:2515–2522
ANUI (2012) Apply nanotech to up industrial, agri output. The Daily Star (Bangladesh). http://www.thedailystar.net/newDesign/news-details.php?nid=230436
Asli S, Neumann M (2009) Colloidal suspensions of clay or titanium dioxide nanoparticles caninhibit leaf growth and transpiration via physical effects on root water transport. Plant CellEnviron 32:577–584
Aubert T, Burel A, Esnault MA, Cordier S, Grasset F, Cabello-Hurtado F (2012) Root uptake andphytotoxicity of nanosized molybdenum octahedral clusters. J Hazard Mater 219–220:111–118
Auffan M, Bottero JY, Chaneac C, Rose J (2010) Inorganic manufactured nanoparticles: how theirphysicochemical properties influence their biological effects in aqueous environments.Nanomedicine 5(6):999–1007
Babu K, Deepa M, Shankar SG, Rai S (2008) Effect of nano-silver on cell division and mitoticchromosomes: a prefatory siren. Internet J Nanotechnol 2(2):2. doi:10.5580/10eb
Barrena R, Casals E, Colan J, Font X, Sanchez A, Puntes V (2009) Evaluation of the ecotoxicologyof model nanoparticles. Chemosphere 75:850–857
Bhatt I, Tripathi BN (2011) Interaction of engineered nanoparticles with various components ofthe environment and possible strategies for their risk assessment. Chemosphere 82:308–317
Bosetti M, Mass A, Tobin E, Cannas M (2002) Silver coated materials for external fixation devices:in vitro biocompatibility and genotoxicity. Biomaterials 23:887–892
Burklew CE, Ashlock J, Winfrey WB, Zhang B (2012) Effects of aluminum oxide nanoparticleson the growth, development, and microRNA expression of tobacco (Nicotiana tabacum). PLoSOne 7(5):e34783
Buzea C, Pacheco II, Robbie K (2007) Nanomaterials and nanoparticles: sources and toxicity.Biointerphases 2(4):17–71
Cabiscol E, Tamarit J, Ros J (2000) Oxidative stress in bacteria and protein damage by reactiveoxygen species. Int Microbiol 3:3–8
Canas JE, Long M, Nations S, Vadan R, Dai L, Luo M, Ambikapathi R, Lee EH, Olszyk D (2008)Effects of functionalized and non-functionalized single-walled carbon nanotubes on root elon-gation of select crop species. Environ Toxicol Chem 27:1922–1931
Capala J, Barth RF, Bendayam M, Lauzon M, Adams DM, Soloway AH, Fenstermaker RA,Carlsson J (1996) Boronated epidermal growth factor as a potential targeting agent for boronneutron capture therapy of brain tumors. Bioconjug Chem 7:7–15
Cheng XK, Kan AT, Tomsom MB (2004) Naphthalene adsorption and desorption from aqueousC-60 fullerene. J Chem Eng Data 49:675–683
Cho M, Chung H, Choi W, Yoon J (2005) Different inactivation behaviors of MS-2 phage andEscherichia coli in TiO2 photocatalytic disinfection. Appl Environ Microbiol 71(1):270–275
Corma A, Atienzar P, Garcia H, Chane-Ching JY (2004) Hierarchically mesostructured dopedCeO2 with potential form solar-cell use. Nat Mater 3:394–397
Database (2013) Nanowerk Nanomaterial Database [Internet]. Available from: http://www.nanowerk.com/phpscripts/n_dbsearch.php
Du W, Sun Y, Ji R, Zhu J, Wu J, Guo H (2011) TiO2 and ZnO nanoparticles negatively affect wheatgrowth and soil enzyme activities in agricultural soil. J Environ Monit 13:822–828
Eichert T, Kurtz A, Steiner U, Goldbach HE (2008) Size exclusion limits and lateral heterogeneityof the stomatal foliar uptake pathway for aqueous solutes and water-suspended nanoparticles.Physiol Plant 134:151–160
El Nemr A, Abd-Allah AMA (2003) Contamination of polycyclic aromatic hydrocarbons (PAHs)in microlayer and subsurface waters along Alexandria coast, Egypt. Chemosphere52:1711–1716
Fabricated Nanoparticles: Current Status and Potential Phytotoxic Threats
106
Farre M, Sanchis J, Barcelo D (2011) Analysis and assessment of the occurrence, the fate and thebehavior of nanomaterials in the environment. TrendsAnal Chem 30(3):517–527
Fernandez V, Eichert T (2009) Uptake of hydrophilic solutes through plant leaves: current state ofknowledge and perspectives of foliar fertilization. Crit Rev Plant Sci 28:36–68
Foraker AB, Walczak RJ, Cohen MH (2003) Microfabricated porous silicon particles enhanceparacellular delivery of insulin across intestinal Caco-2 cell monolayers. Pharm Res20:110–116
Franklin NM, Rogers NJ, Apte SC, Batley GE, Gadd GE, Casey PS (2007) Comparative toxicityof nanoparticulate ZnO, bulk ZnO, and ZnCl 2 to a freshwater microalga (Pseudokirchneriella subcapitata): the importance of particle solubility. Environ Sci Technol 41(24):8484–8490
García A, Espinosa R, Delgado L, Casals E, González E, Puntes V, Barata C, Font X, Sánchez A(2011) Acute toxicity of cerium oxide, titanium oxide and iron oxide nanoparticles using stan-dardized tests. Desalination 269:136–141
Ghosh M, Bandyopadhyay M, Mukherjee A (2010) Genotoxicity of titanium dioxide TiO2 nanopar-ticles at two trophic levels: plant and human lymphocytes. Chemosphere 81:1253–1262
Giorgetti L, Ruffini Castiglione M, Bernerbini M, Geri C (2011) Nanoparticles effects on growthand differentiation in cell culture of carrot—Daucus carota L.. Agrochimica LV:45–53
Gotovac S, Honda H, Hattori Y, Takahashi K, Kanoh H, Kaneko K (2007) Effect of nanoscalecurvature of single-walled carbon nanotubes on adsorption of polycyclic aromatic hydrocar -bons. Nano Lett 7:583–587
Gupta VK, Rastogi A (2008) Biosorption of lead from aqueous solution by green algae Spirogyra species: kinetic and equilibrium studies. J Hazard Mater 152(1):407–414
Gupta SM, Tripathi M (2011) A review of TiO2 nanoparticles. Chin Sci Bull 56:1639–1657Haverkamp RG, Marshall AT (2009) The mechanism of metal nanoparticle formation in plants:limits on accumulation. J Nanopart Res 11:1453–1463
Heinlaan M, Ivask A, Blinova I, Dubourguier H, Kahru A (2008) Toxicity of nanosized and bulkZnO, CuO and TiO 2 to bacteria Vibrio fischeri and crustaceans Daphnia magna andThamnocephalus platyurus. Chemosphere 71:1308–1316
Hoshino K, Gopal A, Glaz M, Bout DV, Zhang XJ (2012) Nanoscale fluorescence imaging withquantum dot near-field electroluminescence. Appl Phys Lett 101(2–3):043118
Howarth M, Liu W, Puthenveetil S, Zheng Y, Marshall LF, Schmidt MM, Wittrup KD, BawendiMG, Ting AY (2008) Monovalent, reduced-size quantum dots for imaging receptors on livingcells. Nat Methods 5(5):397–399
Hu X, Liu J, Mayer P, Jiang G (2008) Impacts of some environmentally relevant parameters on thesorption of polycyclic hydrocarbons to aqueous suspensions of fullerene. Environ ToxicolChem 27(9):1868–1874
Huber DL (2005) Synthesis, properties, and applications of iron nanoparticles. Small 1(5):482–501Jia G, Wang HF, Yan L, Wang X, Pei RJ, Yan T, Zhao YL, Guo XB (2005) Cytotoxicity of carbonnanomaterials: single-wall nanotube, multiwall nanotube, and fullerene. Environ Sci Technol39:1378–1383
Khodakovskaya M, Dervishi E, Mahmood M, Xu Y, Li Z, Watanabe F, Biris AS (2009) Carbonnanotubes are able to penetrate plant seed coat and dramatically affect seed germination andplant growth. ACS Nano 3:3221–3227
Khus M, Gernjak W, Ibanez PF, Rodriguez SM, Galvez JB, Icli S (2006) A comparative study ofsupported TiO 2 as photocatalyst in water decontamination at solar pilot plant scale. J SolEnergy 128:331–337
Klaine SJ, Alvarez PJJ, Batley GE, Fernandes TF, Handy RD, Lyon DY, Mahendra S, McLaughlinMJ, Lead JR (2008) Nanomaterials in the environment: behavior, fate, bioavailability, andeffects. Environ Toxicol Chem 27(9):1825–1851
Klajnert B, Bryszewska M (2001) Dendrimers: properties and applications. Acta Biochim Pol48(1):199–208
Konstantatos G, Sargent EH (2009) Solution-processed quantum dot photodetectors. Proc IEEE97(10):1666–1683
T. Yadav et al.
107
Kosynkin VD, Arzgatkina AA, Ivanov EN, Chtoutsa MG, Grabko AI, Kardapolov AV, Sysina NA(2000) The study of process production of polishing powder based on cerium dioxide. J AlloysCompd 303–304:421–425
Krishnaraj C, Jagan EG, Ramachandran R, Abirami SM, Mohan N, Kalaichelvan PT (2012) Effectof biologically synthesized silver nanoparticles on Bacopa monnieri (Linn.)Wettst. plantgrowth metabolism. Process Biochem 47:651–658
Kukowska-Latallo JF, Raczka E, Quintana A, Chen CL, Rymaszewski M, Baker JR (2000)Intravascular and endobronchial DNA delivery to murine lung tissue using a novel, nonviralvector. Hum Gene Ther 11:1385–1395
Kumar V, Kumari A, Guleria P, Yadav SK (2012) Evaluating the toxicity of selected types ofnanochemicals. Rev Environ Contamin Toxicol 215:39–121
Kumari M, Mukherjee A, Chandrasekaran N (2009) Geno-toxicity of silver nanoparticles inAllium cepa. Sci Total Environ 407:5243–5245
Larue C, Khodja H, Herlin-Boime N, Brisset F, Flank AM, Fayard B, Chaillou S, Carriere M(2011) Investigation of titanium dioxide nanoparticles toxicity and uptake by plants. J PhysConf Ser 304(1):012057
Larue C, Laurette J, Herlin-Boime N, Khodja H, Fayard B, Flank AM, Brisset F, Carriere M (2012)Accumulation, translocation and impact of TiO 2 nanoparticles in wheat (Triticum aestivum spp.): influence of diameter and crystal phase. Sci Total Environ 431:197–208
Lee SH, Richards RJ (2004) Montserrat volcanic ash induces lymph node granuloma and delayedlung inflammation. Toxicology 195:155–165
Lee W, An Y, Yoon H, Kweon H (2008) Toxicity and bioavailability of copper nanoparticles to theterrestrial plants mung bean (Phaseolus radiatus) and wheat (Triticum aestivum): plant uptakefor water insoluble nanoparticles. Environ Toxicol Chem 27(9):1915–1921
Lee CW, Mahendra S, Zodrow K, Li D, Tsai YC, Braam J, Alvarez PJ (2010) Developmentalphytotoxicity of metal oxide nanoparticles to Arabidopsis thaliana. Environ Toxicol Chem3:669–675
Lee S, Kim S, Kim S, Lee I (2013) Assessment of phytotoxicity of ZnO NPs on a medicinal plant,Fagopyrum esculentum. Environ Sci Pollut Res Int 20(2):848–854
Limbach LK, Bereiter R, Muller E, Krebs R, Galli R, Stark WJ (2008) Removal of oxide nanopar-ticles in a model wastewater treatment plant: influence of agglomeration and surfactants onclearing efficiency. Environ Sci Technol 42:5828–5833
Lin D, Xing B (2007) Phytotoxicity of nanoparticles: inhibition of seed germination and rootgrowth. Environ Pollut 150:243–250
Lin D, Xing B (2008a) Root uptake and phytotoxicity of ZnO nanoparticles. Environ Sci Technol42:5580–5585
Lin DH, Xing B (2008b) Adsorption of phenolic compounds by carbon nanotubes: role of aroma-ticity and substitution of hydroxyl groups. Environ Sci Technol 42:7254–7259
Lin C, Fugetsu B, Su Y, Watari F (2009a) Studies on toxicity of multi-walled carbon nanotubes onArabidopsis T87 suspension cells. J Hazard Mater 170:578–583
Lin S, Reppert J, Hu Q, Hudson JS, Reid ML, Ratnikova TA, Rao AM, Luo H, Ke PC (2009b)Uptake, translocation, and transmission of carbon nanomaterials in rice plants. Small5:1128–1132
Livingston FE, Helvajian H (2005) Variable UV laser exposure processing of photosensitiveglass–ceramics: maskless micro to meso-scale structure fabrication. Appl Phys A81:1569–1581
López-Moreno ML, de la Rosa G, Hernández-Viezcas JA, Peralta-Videa JR, Gardea-Torresdey JL(2010a) XAS Corroboration of the uptake and storage of CeO2 nanoparticles and assessment oftheir differential toxicity in four edible plant species. J Agric Food Chem 58(6):3689–3693
Lopez-Moreno ML, De La Rosa G, Hernandez-Viezcas JA, Castillo-Michel H, Botez CE, Peralta-Videa JR, Gardea-Torresdey JL (2010b) Evidence of the differential biotransformation andgenotoxicity of ZnO and CeO 2 nanoparticles on soybean (Glycine max) plants. Environ SciTechnol 44:7315–7320
Fabricated Nanoparticles: Current Status and Potential Phytotoxic Threats
108
MaX, Lee JG,DengY,Kolmakov A(2010) Interactions between engineered nanoparticles (ENPs)and plants: phytotoxicity, uptake and accumulation. Sci Total Environ 408(16):3053–3061
Mahajan P, Dhoke SK, Khanna AS (2011) Effect of nano-ZnO particle suspension on growth ofMung (Vigna radiata) and Gram (Cicer arietinum) seedlings using plant agar method.J Nanotechnol 2011:1–7
Majumdar H, Ahmed GU (2011) Phytotoxicity effect of silver nanoparticles onOryza sativa. Int JChemTech Res 3(3):1494–1500
Moaveni P, Karimi K, Zare Valojerdi M (2011) The nanoparticles in plants: review paper.J Nanostruct Chem 2(1):59–78
Moore MN (2006) Do nanoparticles present ecotoxicological risks for the health of the aquaticenvironment? Environ Int 32:967–976
Murr LE, Esquivel EV, Bang JJ, de la Rosa G, Gardea-Torresdey JL (2004) Chemistry andnanoparticulate compositions of a 10,000 year-old ice core melt water. Water Resour38:4282–4296
Nair R, Varghese SH, Nair BG, Maekawa T, YoshidaY, Kumar DS (2010) Nanoparticulate materialdelivery to plants. Plant Sci 179:154–163
Navarro E, Baun A, Behra R, Hartmann NB, Filser J, Miao AJ, Quigg A, Santschi PH, Sigg L(2008a) Environmental behaviour and ecotoxicology of engineered nanoparticles to algae,plant and fungi. Environ Sci Technol 17:372–386
Navarro E, Piccipetra F, Wagner B, Marconi F, Kaegi R, Odzak N, Sigg L, Behra R (2008b) Toxicityof silver nanoparticles to Chlamydomonas reinhardtii. Environ Sci Technol 42:8959–8964
Navarro DA, Bisson MA, Agaa DS (2012) Investigating uptake of water-dispersible CdSe/ZnSquantum dot nanoparticles by Arabidopsis thaliana plants. J Hazard Mater 211–212:427–435
Novack B, Bucheli TD (2007) Occurrence, behavior and effects of nanoparticles in the environ-ment. Environ Pollut 150:5–22
O’Farrell N, Houlton A, Horrocks BR (2006) Silicon nanoparticles: applications in cell biologyand medicine. Int J Nanomed 1(4):451–472
Oleszczuk P, Pan B, Xing B (2009) Adsorption and desorption of oxytetracycline and carbamaze-pine by multiwalled carbon nanotubes. Environ Sci Technol 43:9167–9173
Oleszczuk P, Jósko I, Xing B (2011) The toxicity to plants of the sewage sludges containing mul-tiwalled carbon nanotubes. J Hazard Mater 186:436–442
Ovecka M, Lang I, Baluska F, Ismail A, Illes P, Lichtscheidl IK (2005) Endocytosis and vesicletrafficking during tip growth of root hairs. Protoplasma 226(1–2):39–54
Pan B, Xing B (2008) Adsorption mechanisms of organic chemicals on carbon nanotubes. EnvironSci Technol 42:9005–9013
Patlolla AK, Berry A, May L, Tchounwou PB (2012) Genotoxicity of silver nanoparticles inVicia faba: a pilot study on the environmental monitoring of nanoparticles. Int J Environ Res PublHealth 9:1649–1662
Pavel A, Creanga DE (2005) Chromosomal aberrations in plants under magnetic fluid influence.J Magn Magn Mater 289:469–472
Pavel A, Trifan M, Bara II, Creanga DE, Cotae C (1999) Accumulation dynamics and some cyto-genetical tests atChelidonium majus and Papaver somniferum callus under the magnetic liquideffect. J Magn Magn Mater 201(1–3):443–445
Peng G, Hakim M, Broza YY, Billan S, Abdah-Bortnyak R, Kuten A, Tisch U, Haick H (2010)Detection of lung, breast, colorectal, and prostate cancers from exhaled breath using a singlearray of nanosensors. Br J Cancer 103(4):542–551
Perrault SD, Chan WCW (2010)In vivo assembly of nanoparticle components to improve targetedcancer imaging. Proc Natl Acad Sci U S A 107:11194–11199
Pulickel MA, Zhou OZ (2001) Applications of carbon nanotubes. Top Appl Phys 80:391–425Racuciu M, Creanga DE (2007) Cytogenetic changes induced by aqueous ferrofluids in agricul-tural plants. J Magn Magn Mater 311(1):288–291
Reid BJ, Jones KC, Semple KT (2000) Bioavailability of persistent organic pollutants in soils andsediments—a perspective on mechanisms, consequences and assessment. Environ Pollut108:103–112
T. Yadav et al.
109
Remedios C, Rosario F, Bastos V (2012) Environmental nanoparticles interactions with plants:morphological, physiological, and genotoxic aspects. J Bot 2012:1–8
Rico CM, Majumdar S, Duarte-Gardea M, Peralta-Videa JR, Gardea-Torresdey JL (2011)Interaction of nanoparticles with edible plants and their possible implications in the food chain.JAgric Food Chem 59(8):3485–3498
Rietmeijer FJM, Mackinnon IDR (1997) Bismuth oxide nanoparticles in the stratosphere.J Geophys Res E 102:6621–6627
Roco MC (2003) Nanotechnology: convergence with modern biology and medicine. Curr OpinBiotechnol 14:337–346
Roy R, Zanini D, Meunier SJ, Romanowska A (1993) Solid-phase synthesis of dendritic sialosideinhibitors of influenza A virus haemagglutinin. J Chem Soc Chem Commun 1869–1872
Royal Society (2004) Nanoscience and nanotechnologies: opportunities and uncertainties. Reportby the Royal Society and the Royal Academy of Engineering. http://www.nanotec.org.uk/finalReport.htm
Rubasinghe G, Elzey S, Baltrusaitis J, Jayaweera PM, Grassian VH (2010) Reactions on atmo-spheric dust particles: surface photochemistry and size-dependent nanoscale redox chemistry.J Phys Chem Lett 1:1729–1737
Ruffini Castiglione M, Cremonini R (2009) Nanoparticles and higher plants. Caryologia62(2):161–165
Ruffini Castiglione M, Geri C, Giorgetti L, Cremonini R (2011) The effects of nano-TiO2 on seedgermination, development and mitosis of root tip cells of Vicia narbonensis L. and Zea mays L..J Nanopart Res 13:2443–2449
Sabo-Attwood T, Unrine JM, Stone JW, Murphy CJ, Ghoshroy S, Blom D, Bertsch PM, NewmanLA (2012) Uptake, distribution and toxicity of gold nanoparticles in tobacco (Nicotiana xanthi) seedlings. Nanotoxicology 6(4):353–360
SCENIHR (Scientific Committee on Emerging and Newly Identified Health Risks) (2005) Theappropriateness of existing methodologies to assess the potential risks associated with engi-neered and adventitious products of nanotechnologies (SCENIHR report 002/05) (EuropeanCommission: Scientific Committee on Emerging and Newly Identified Health Risks). http://ec.europa.eu/health/ph_risk/committees/04_scenihr/docs
Schmid K, Riediker M (2008) Use of nanoparticles in Swiss industry: a targeted survey. EnvironSci Technol 42(7):2253–2260
Shahmoradi B, Ibrahim IA, Sakamoto N, Ananda S, Somashekar R, Guru Row TN, Byrappa K(2010) Photocatalytic treatment of municipal wastewater using modified neodymium dopedTiO2 hybrid nanoparticles. J Environ Sci Health A 45:1248–1255
Shen CX, Zhang QF, Li J, Bi FC, Yao N (2010) Induction of programmed cell death inArabidopsis and rice by single-wall carbon nanotubes. Am J Bot 97:1–8
Smijs TG, Pavel S (2011) Titanium dioxide and zinc oxide nanoparticles in sunscreens: focus ontheir safety and effectiveness. Nanotechnol Sci Appl 4:95–112
Smirnova EA, Gusev AA, Zaitseva ON, Lazareva EM, Onishchenko GE, Kuznetsova EV, TkachevAG, Feofanov AV, Kirpichnikov MP (2011) Multi-walled carbon nanotubes penetrate intoplant cells and affect the growth of Onobrychis arenaria seedlings. Acta Nat 3(1):99–106
Smita S, Gupta SK, Bartonova A, Dusinska M, Gutleb AC, Rahman Q (2012) Nanoparticles in theenvironment: assessment using the causal diagram approach. Environ Health 11(Suppl 1):S13,10.1186/1476-069X-11-S1-S13
Somasundaran P, Fang X, Ponnurangam S, Li B (2010) Nanoparticles: characteristics, mecha-nisms and modulation of biotoxicity. KONA Powder Part J 28:38–49
Srividya K, Mohanty K (2009) Biosorption of hexavalent chromium from aqueous solutions byCatla catla scale: equilibrium and kinetics studies. Chem Eng J 155:666–673
Stampoulis D, Sinha SK, White JC (2009) Assay-dependent phytotoxicity of nanoparticles toplants. Environ Sci Technol 43:9473–9479
Tan XM, Fugetsu B (2007) Multi-walled carbon nanotubes interact with cultured rice cells:evidence of a self-defense response. J Biomed Nanotechnol 3:285–288
Fabricated Nanoparticles: Current Status and Potential Phytotoxic Threats
110
TanXM,LinC, FugetsuB (2009)Studies on toxicity ofmulti-walled carbonnanotubes on suspen-sion rice cells. Carbon 47:3479–3487
Trouiller B, Reliene R, Westbrook A, Solaimani P, Schiestl RH (2009) Titanium dioxide nanopar-ticles induce DNA damage and genetic instability in vivo in mice. Cancer Res 69:8784–8789
Twyman LJ, Beezer AE, Esfand R, Hardy MJ, Mitchell JC (1999) The synthesis of water soluble den-drimers, and their application as possible drug delivery systems. Tetrahedron Lett 40:1743–1746
Unfried K, Albrecht C, Klotz LO, Mikecz A, Grether-Beck S, Schin RPF (2007) Cellular responsesto nanoparticles: target structures and mechanisms. Nanotoxicology 1(1):52–71
USEPA (2007) Nanotechnology white paper. Document Number EPA 100/B-07001. http://www.epa.gov/osa
Uzu G, Sobanska S, Sarret G, Munoz M, Dumat C (2010) Foliar lead uptake by lettuce exposed toatmospheric pollution. Environ Sci Technol 44:1036–1042
Verma HC, Upadhyay C, Tripathi A, Tripathi RP, Bhandari N (2002) Thermal decomposition pat-tern and particle size estimation of iron minerals associated with the cretaceous-tertiary bound-ary at Gubbio. Meteorit Planet Sci 37:901–909
Vochita G, Creanga D, Focanici-Ciurlica EL (2012) Magnetic nanoparticle genetic impact on roottip cells of sunflower seedlings. Water Air Soil Pollut 223:2541–2549
Wang S, Kurepa J, Smalle JA (2011) Ultra-small TiO2 nanoparticles disrupt microtubular networksin Arabidopsis thaliana. Plant Cell Environ 34(5):811–820
Wang Z, Xie X, Zhao J, Liu X, Feng W, White JC, Xing B (2012) Xylem- and phloem-based trans-port of CuO nanoparticles in maize (Zea mays L.). Environ Sci Technol 46(8):4434–4441
Wigginton NS, Haus KL, Hochella MF (2007) Aquatic environmental nanoparticles. J EnvironMonit 9:1306–1316
Wu SG, Huang L, Head J, Chen DR, Kong IC, Tang YJ (2012) Phytotoxicity of metal oxidenanoparticles is related to both dissolved metal ions and adsorption of particles on seed sur -faces. J Pet Environ Biotechnol 3(4):126
Yang L, Watts J (2005) Particle surface characteristics may play an important role in phytotoxicityof alumina nanoparticles. Toxicol Lett 158:122–132
Yang K, Zhu L, Xing B (2006) Adsorption of polycyclic aromatic hydrocarbons by carbon nano-materials. Environ Sci Technol 40(6):1855–1861
Yeo SY, Lee HJ, Jeong SH (2003) Preparation of nanocomposite fibers for permanent antibacterialeffect. J Mater Sci 38:2143–2147
Yu-Nam Y, Lead R (2008) Manufactured nanoparticles: an overview of their chemistry, interac-tions and potential environmental implications. Sci Total Environ 400:396–414
Zhao XU, Liz W, Chen Y, Ahi LY, Zhu YF (2007) Solid-phase photocatalytic degradation of poly-ethylene plastic under UV and solar light irradiation. J Mol Catal A Chem 268:101–106
Zhao L, Peralta-Videa JR, Varela-Ramirez A, Castillo-Michel H, Li C, Zhang J, Aguilera RJ,Keller AA, Gardea-Torresdey JL (2012) Effect of surface coating and organic matter on theuptake of CeO2 NPs by corn plants grown in soil: insight into the uptake mechanism. J HazardMater 225–226:131–138
T. Yadav et al.
111D.M. Whitacre (ed.), Reviews of Environmental Contamination and Toxicology Volume 230, Reviews of Environmental Contamination and Toxicology 230, DOI 10.1007/978-3-319-04411-8_5, © Springer International Publishing Switzerland 2014
1 Introduction
Heavy metals (HM) are considered to be dangerous because of their toxicity and natural persistence, and pollution by them in recent decades has become a global issue (Vuren et al. 1999 ; Shahid et al. 2011 ; Shah et al. 2012 ). These HM are concentrated
Status of Heavy Metal Residues in Fish Species of Pakistan
Majid Hussain , Said Muhammad , Riffat N. Malik , Muhammad U. Khan, and Umar Farooq
M. Hussain Department of Forestry and Wildlife Management , University of Haripur , Hattar Road Haripur , Khyber Pakhtunkhwa , Pakistan
S. Muhammad (*) Key Laboratory of Alpine Ecology and Biodiversity , Institute of Tibetan Plateau Research, Chinese Academy of Sciences , Beijing 100101 , PR China
Department of Earth Sciences , COMSATS Institute of Information Technology (CIIT) , Abbottabad , Pakistan e-mail: [email protected]
R. N. Malik • M. U. Khan Environmental Biology and Ecotoxicology Laboratory, Department of Environmental Sciences , Quaid-i-Azam University , Islamabad 45320 , Pakistan
U. FarooqDepartment of Physics, Islamic International University, Islamabad 44000, Pakistan
Contents
1 Introduction ........................................................................................................................ 1112 Heavy Metal Residues in Fish Species .............................................................................. 113
2.1 Freshwater Fish ......................................................................................................... 1132.2 Marine Fish ............................................................................................................... 1242.3 Heavy Metal Residues in Fish Species of Neighboring Countries ........................... 126
3 Conclusions and Recommendations .................................................................................. 1284 Summary ............................................................................................................................ 128References ................................................................................................................................ 129
112
in certain environmental compartments such as soil, sediment, tailing deposits, and wastewater (Demirak et al. 2006 ; Malik et al. 2011 ; Muhammad et al. 2011a , 2013 ; Hajeb et al. 2012 ; Shah et al. 2013 ; Shahid et al. 2013 ). As a result of various natural (i.e., weathering and erosion of bed rocks and ore deposits) and anthropogenic (i.e., urban, industrial, mining, and agricultural) activities, HM released into the environ-ment (Zhang et al. 2008 ; Muhammad et al. 2010 , 2011b ). HM are mobile in the envi-ronment and ultimately fi nd their way to aquatic ecosystems (Javid 2005 ; Demirak et al. 2006 ; Swaileh and Sansur 2006 ; Shah et al. 2012 ). Fresh water ecosystems (e.g., streams, rivers, and lakes) are severely affected by HM contamination (Paul and Meyer 2001 ; Arian et al. 2008 ; Muhammad et al. 2010 , 2011b ).
Heavy metals represented by some examples that are severe toxicants (As, Hg, Cd, and Pb), and these may alter water quality, cause adverse effects, and can struc-turally modify aquatic life, especially fi sh (Chang et al. 1998 ; Shah et al. 2012 ; Khan et al. 2012 ). However, when fi sh take these toxicants in, they are sometimes metabolized to even more toxic derivatives (Duffus 1980 ). For example, mercury is microbially converted into methyl mercury, which is much more bioavailable and more toxic than metallic mercury (Dix 1981 ).
Among aquatic biota, certain fi sh species are top consumers (Dallinger et al. 1987 ). Fish contact HM in four major ways: from consuming food, via direct water uptake (gills), from consuming nonedible particles, and via skin absorption. Once absorbed, HM enter the bloodstream and ultimately are carried to various fi sh organs like liver, kidneys, and gills prior to being eliminated or stored (Nussey et al. 2000 ). Intake of HM by fi sh may reduce food utilization and ultimately reduce metabolic rates. As a result, the skin, muscles, liver, kidneys, and other tissues are affected in ways that hamper growth and development (Javid 2005 ). Once fi sh absorb HM, their concentrations in muscle remain nearly constant for life (Rashed 2001 ). However, the degree to which fi sh store and bioaccumulate HM depends on both absorption and elimination rates in different body organs.
Assessing and monitoring HM levels that exist in fi sh muscles gives a direct measure of how much metal may be transferred to humans that consume fi sh, and therefore, of the potential subsequent effects on human health. Moreover, assessing the HM content of fi sh tissues may also provide input on the environmental status of aquatic ecosystems (Widianarko et al. 2000 ). Hence, fi sh may act as a bioindica-tor from which one can determine the extent to which HM contaminate an aquatic ecosystem (Javid 2003 ).
Pakistan has a number of rivers (Indus, Jhelum, Chenab, Kabul, etc.) and lakes (Mancher, Keenjhar, Rawal, etc.). Among these the Indus River represents one of the largest water distribution systems in South East Asia (Ittekkot and Arian 1986 ). Unfortunately, rivers worldwide too frequently receive waste from bedrock and ore deposits, mining activities, tailing deposits, industry effl uent, and solid waste and wastewater disposal that impair water quality and threaten aquatic life and human health (Jaffar et al. 1988 ; Jaleel et al. 1991 ; Ashraf et al. 1991 ; Muhammad et al. 2010 , 2011b ; Khan et al. 2011 ). During the last few decades the human population in many areas has increased many times, and this has produced both rapid urbaniza-tion and industrialization. Such urbanization and industrialization utilizes more
M. Hussain et al.
113
natural resources to fulfi ll human needs and produces huge quantities of solid and liquid wastes that includes hazardous HM that are dumped into the environment. Ultimately hazardous HM reach and contaminate natural waters and fi sh (Qadir and Malik 2011 ; Khan et al. 2012 ). In Pakistan, the contamination by HM of aquatic ecosystems is reaching alarming levels, despite the fact that the Indus River and its tributaries serve to feed and water millions of people (Tariq et al. 1996 ; Javid 2005 ; Qadir et al. 2008 ). Such examples justify the attention given to HM contamination of water and fi sh by environmental scientists in recent years (Fatoki and Mathabatha 2001 ; Qadir and Malik 2011 ; Khan et al. 2012 ; Cardwell et al. 2013 ).
To date, no comprehensive review of HM contamination of fi sh has been per-formed in Pakistan. The studies that have been conducted on HM residues in fi sh species of Pakistan were limited either to a single catch site or to a specifi c HM or fi sh species. Therefore, it is our aim in this study to summarize and evaluate the results of HM concentrations in fi sh species of Pakistan, both to provide a clear picture of the current status of this topic and to suggest future research that is needed to fi ll the gaps in this topic area.
2 Heavy Metal Residues in Fish Species
Globally, extensive research has been carried out on HM contamination of and uptake by fi sh species. The main body of research has addressed the biological effects of the HM focusing on endpoints such as immunotoxicity, carcinogenicity, teratogenicity, and neurotoxicity. In Pakistan, several researchers have reported the distribution and sources of HM contamination in fi sh and degree of uptake by fi sh species (Table 1 and Fig. 1 ). HM residues in fi sh species vary signifi cantly from location to location (Fig. 2 ). In this article, we place emphasis on reviewing the HM contaminations of fi sh species collected at different locations in Pakistan.
2.1 Freshwater Fish
Freshwater reservoirs (i.e., rivers and lakes) in Pakistan provide drinking water to local inhabitants and for irrigating cropland (Qadir et al. 2008 ). The streams that drain the main rivers and fl ow across the alluvial plains of Pakistan are locally called Nullahs. These Nullahs have been become contaminated with a large quantity of untreated industrial effl uents and household sewage, which ultimately deteriorates water quality and the involved ecosystems (Malik and Nadeem 2010 ; Khan et al. 2012 ). These Nullahs are known to be contaminated by Cr (18.20 mg/L), Ni (1.29 mg/L), Mn (4.88 mg/L), Pb (7.32 mg/L), and Cd (0.64 mg/L), and these HM may concentrate in fi sh and in other environmental compartments (Qadir and Malik 2011 ; Khan et al. 2013 ). Below, we address the degree to which HM residues have contaminated fi sh species of different provinces of Pakistan.
Status of Heavy Metal Residues in Fish Species of Pakistan
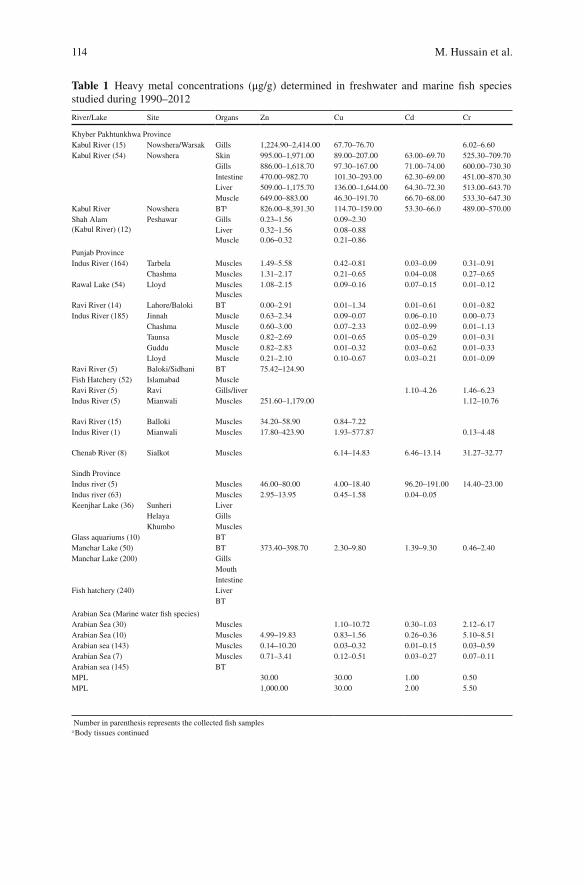
114
Table 1 Heavy metal concentrations (μg/g) determined in freshwater and marine fi sh speciesstudied during 1990–2012
River/Lake Site Organs Zn Cu Cd Cr
Khyber Pakhtunkhwa Province Kabul River (15) Nowshera/Warsak Gills 1,224.90–2,414.00 67.70–76.70 6.02–6.60 Kabul River (54) Nowshera Skin 995.00–1,971.00 89.00–207.00 63.00–69.70 525.30–709.70
Gills 886.00–1,618.70 97.30–167.00 71.00–74.00 600.00–730.30 Intestine 470.00–982.70 101.30–293.00 62.30–69.00 451.00–870.30 Liver 509.00–1,175.70 136.00–1,644.00 64.30–72.30 513.00–643.70 Muscle 649.00–883.00 46.30–191.70 66.70–68.00 533.30–647.30
Kabul River Nowshera BT a 826.00–8,391.30 114.70–159.00 53.30–66.0 489.00–570.00 Shah Alam (Kabul River) (12)
Peshawar Gills 0.23–1.56 0.09–2.30 Liver 0.32–1.56 0.08–0.88 Muscle 0.06–0.32 0.21–0.86
Punjab Province Indus River (164) Tarbela Muscles 1.49–5.58 0.42–0.81 0.03–0.09 0.31–0.91
Chashma Muscles 1.31–2.17 0.21–0.65 0.04–0.08 0.27–0.65 Rawal Lake (54) Lloyd Muscles
Muscles 1.08–2.15 0.09–0.16 0.07–0.15 0.01–0.12
Ravi River (14) Lahore/Baloki BT 0.00–2.91 0.01–1.34 0.01–0.61 0.01–0.82 Indus River (185) Jinnah Muscle 0.63–2.34 0.09–0.07 0.06–0.10 0.00–0.73
Chashma Muscle 0.60–3.00 0.07–2.33 0.02–0.99 0.01–1.13 Taunsa Muscle 0.82–2.69 0.01–0.65 0.05–0.29 0.01–0.31 Guddu Muscle 0.82–2.83 0.01–0.32 0.03–0.62 0.01–0.33 Lloyd Muscle 0.21–2.10 0.10–0.67 0.03–0.21 0.01–0.09
Ravi River (5) Baloki/Sidhani BT 75.42–124.90 Fish Hatchery (52) Islamabad Muscle Ravi River (5) Ravi Gills/liver 1.10–4.26 1.46–6.23 Indus River (5) Mianwali Muscles 251.60–1,179.00 1.12–10.76
Ravi River (15) Balloki Muscles 34.20–58.90 0.84–7.22 Indus River (1) Mianwali Muscles 17.80–423.90 1.93–577.87 0.13–4.48
Chenab River (8) Sialkot Muscles 6.14–14.83 6.46–13.14 31.27–32.77
Sindh Province Indus river (5) Muscles 46.00–80.00 4.00–18.40 96.20–191.00 14.40–23.00 Indus river (63) Muscles 2.95–13.95 0.45–1.58 0.04–0.05 Keenjhar Lake (36) Sunheri Liver
Helaya Gills Khumbo Muscles
Glass aquariums (10) BT Manchar Lake (50) BT 373.40–398.70 2.30–9.80 1.39–9.30 0.46–2.40 Manchar Lake (200) Gills
Mouth Intestine
Fish hatchery (240) Liver BT
Arabian Sea (Marine water fi sh species) Arabian Sea (30) Muscles 1.10–10.72 0.30–1.03 2.12–6.17 Arabian Sea (10) Muscles 4.99–19.83 0.83–1.56 0.26–0.36 5.10–8.51 Arabian sea (143) Muscles 0.14–10.20 0.03–0.32 0.01–0.15 0.03–0.59 Arabian Sea (7) Muscles 0.71–3.41 0.12–0.51 0.03–0.27 0.07–0.11 Arabian sea (145) BT MPL 30.00 30.00 1.00 0.50 MPL 1,000.00 30.00 2.00 5.50
Number in parenthesis represents the collected fi sh samples a Body tissues continued
M. Hussain et al.
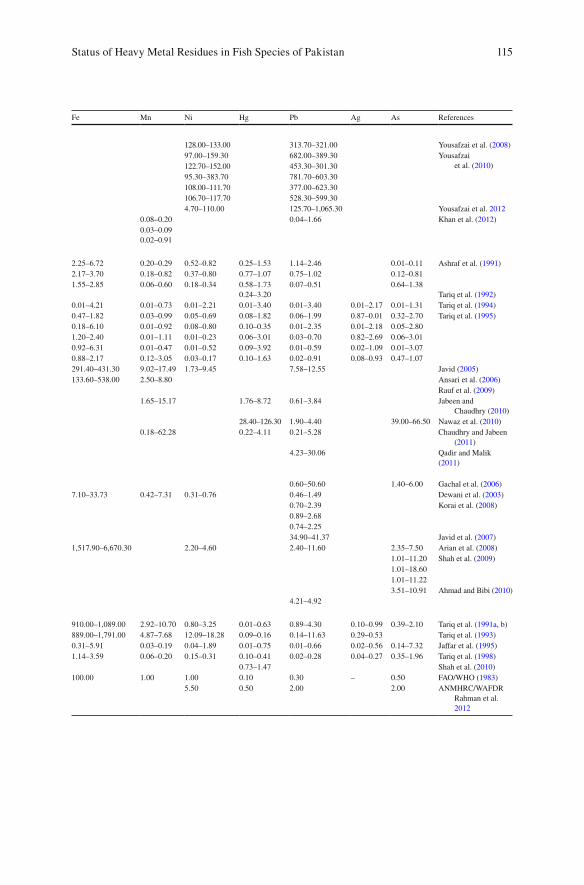
115
Fe Mn Ni Hg Pb Ag As References
128.00–133.00 313.70–321.00 Yousafzai et al. ( 2008 ) 97.00–159.30 682.00–389.30 Yousafzai
et al. ( 2010 ) 122.70–152.00 453.30–301.30 95.30–383.70 781.70–603.30 108.00–111.70 377.00–623.30 106.70–117.70 528.30–599.30 4.70–110.00 125.70–1,065.30 Yousafzai et al. 2012
0.08–0.20 0.04–1.66 Khan et al. ( 2012 ) 0.03–0.09 0.02–0.91
2.25–6.72 0.20–0.29 0.52–0.82 0.25–1.53 1.14–2.46 0.01–0.11 Ashraf et al. ( 1991 ) 2.17–3.70 0.18–0.82 0.37–0.80 0.77–1.07 0.75–1.02 0.12–0.81 1.55–2.85 0.06–0.60 0.18–0.34 0.58–1.73
0.24–3.20 0.07–0.51 0.64–1.38
Tariq et al. ( 1992 ) 0.01–4.21 0.01–0.73 0.01–2.21 0.01–3.40 0.01–3.40 0.01–2.17 0.01–1.31 Tariq et al. ( 1994 ) 0.47–1.82 0.03–0.99 0.05–0.69 0.08–1.82 0.06–1.99 0.87–0.01 0.32–2.70 Tariq et al. ( 1995 ) 0.18–6.10 0.01–0.92 0.08–0.80 0.10–0.35 0.01–2.35 0.01–2.18 0.05–2.80 1.20–2.40 0.01–1.11 0.01–0.23 0.06–3.01 0.03–0.70 0.82–2.69 0.06–3.01 0.92–6.31 0.01–0.47 0.01–0.52 0.09–3.92 0.01–0.59 0.02–1.09 0.01–3.07 0.88–2.17 0.12–3.05 0.03–0.17 0.10–1.63 0.02–0.91 0.08–0.93 0.47–1.07 291.40–431.30 9.02–17.49 1.73–9.45 7.58–12.55 Javid ( 2005 ) 133.60–538.00 2.50–8.80 Ansari et al. ( 2006 )
Rauf et al. ( 2009 ) 1.65–15.17 1.76–8.72 0.61–3.84 Jabeen and
Chaudhry ( 2010 ) 28.40–126.30 1.90–4.40 39.00–66.50 Nawaz et al. ( 2010 )
0.18–62.28 0.22–4.11 0.21–5.28 Chaudhry and Jabeen ( 2011 )
4.23–30.06 Qadir and Malik ( 2011 )
0.60–50.60 1.40–6.00 Gachal et al. ( 2006 ) 7.10–33.73 0.42–7.31 0.31–0.76 0.46–1.49 Dewani et al. ( 2003 )
0.70–2.39 Korai et al. ( 2008 ) 0.89–2.68 0.74–2.25 34.90–41.37 Javid et al. ( 2007 )
1,517.90–6,670.30 2.20–4.60 2.40–11.60 2.35–7.50 Arian et al. ( 2008 ) 1.01–11.20 Shah et al. ( 2009 ) 1.01–18.60 1.01–11.22 3.51–10.91 Ahmad and Bibi ( 2010 )
4.21–4.92
910.00–1,089.00 2.92–10.70 0.80–3.25 0.01–0.63 0.89–4.30 0.10–0.99 0.39–2.10 Tariq et al. ( 1991a , b ) 889.00–1,791.00 4.87–7.68 12.09–18.28 0.09–0.16 0.14–11.63 0.29–0.53 Tariq et al. ( 1993 ) 0.31–5.91 0.03–0.19 0.04–1.89 0.01–0.75 0.01–0.66 0.02–0.56 0.14–7.32 Jaffar et al. ( 1995 ) 1.14–3.59 0.06–0.20 0.15–0.31 0.10–0.41 0.02–0.28 0.04–0.27 0.35–1.96 Tariq et al. ( 1998 )
0.73–1.47 Shah et al. ( 2010 ) 100.00 1.00 1.00 0.10 0.30 – 0.50 FAO/WHO ( 1983 )
5.50 0.50 2.00 2.00 ANMHRC/WAFDR Rahman et al. 2012
Status of Heavy Metal Residues in Fish Species of Pakistan
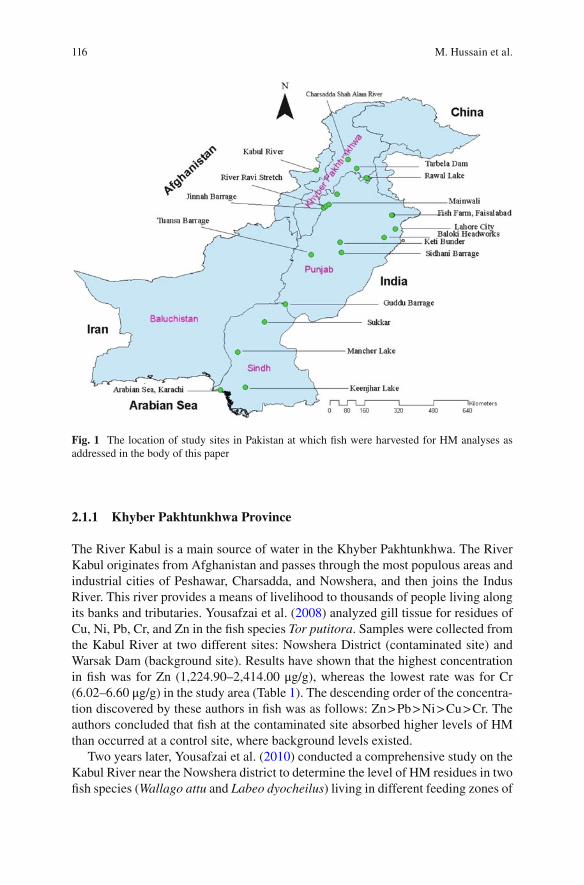
116
2.1.1 Khyber Pakhtunkhwa Province
The River Kabul is a main source of water in the Khyber Pakhtunkhwa. The River Kabul originates from Afghanistan and passes through the most populous areas and industrial cities of Peshawar, Charsadda, and Nowshera, and then joins the Indus River. This river provides a means of livelihood to thousands of people living along its banks and tributaries. Yousafzai et al. ( 2008 ) analyzed gill tissue for residues of Cu, Ni, Pb, Cr, and Zn in the fi sh species Tor putitora . Samples were collected from the Kabul River at two different sites: Nowshera District (contaminated site) and Warsak Dam (background site). Results have shown that the highest concentration in fi sh was for Zn (1,224.90–2,414.00 μg/g), whereas the lowest rate was for Cr (6.02–6.60 μg/g) in the study area (Table 1 ). The descending order of the concentra-tion discovered by these authors in fi sh was as follows: Zn > Pb > Ni > Cu > Cr. The authors concluded that fi sh at the contaminated site absorbed higher levels of HM than occurred at a control site, where background levels existed.
Two years later, Yousafzai et al. ( 2010 ) conducted a comprehensive study on the Kabul River near the Nowshera district to determine the level of HM residues in two fi sh species ( Wallago attu and Labeo dyocheilus ) living in different feeding zones of
Fig. 1 The location of study sites in Pakistan at which fi sh were harvested for HM analyses as addressed in the body of this paper
M. Hussain et al.
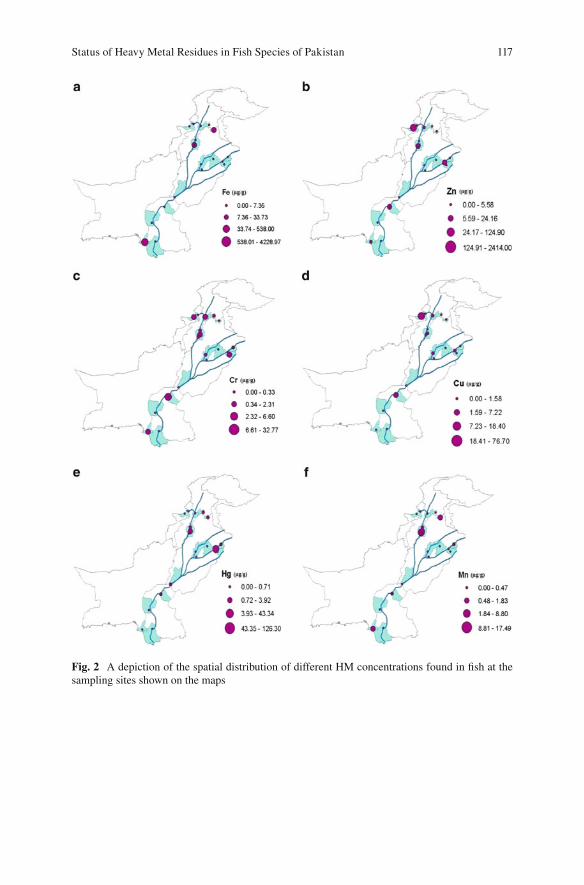
117
Fig. 2 A depiction of the spatial distribution of different HM concentrations found in fi sh at the sampling sites shown on the maps
Status of Heavy Metal Residues in Fish Species of Pakistan
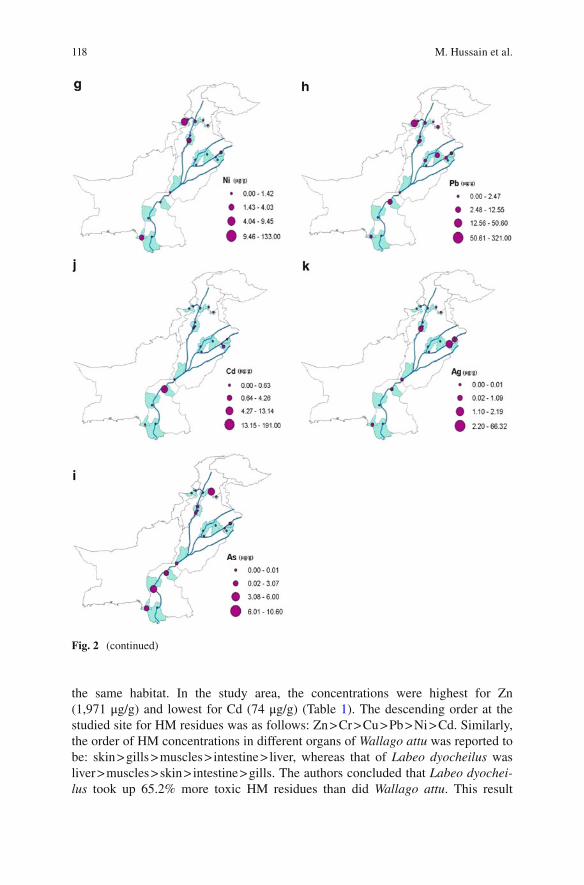
118
the same habitat. In the study area, the concentrations were highest for Zn (1,971 μg/g) and lowest for Cd (74 μg/g) (Table 1 ). The descending order at the studied site for HM residues was as follows: Zn > Cr > Cu > Pb > Ni > Cd. Similarly, the order of HM concentrations in different organs of Wallago attu was reported to be: skin > gills > muscles > intestine > liver, whereas that of Labeo dyocheilus was liver > muscles > skin > intestine > gills. The authors concluded that Labeo dyochei-lus took up 65.2% more toxic HM residues than did Wallago attu . This result
Fig. 2 (continued)
M. Hussain et al.
119
indicated that Labeo dyocheilus , which is an omnivorous fi sh, may take more HM up from natural habitats than does Wallago attu , which is a carnivorous fi sh.
Recently, a comprehensive study has been conducted by Khan et al. ( 2012 ) to investigate the occurrence of Pb, Cu, Zn, and Mn concentrations in the Shah Alam River (River Kabul) fi sh species. Results revealed that Cyprinus caprio exhibited the highest concentrations of Zn in the liver, gills, and muscles, whereas Cu and Mn had lower levels. However, Pb concentrations (0.04 μg/g) were observed only in liver. HM uptake by Cyprinus caprio occurred at levels in the descending order of gills > liver > muscles. The highest Cu and Zn concentrations were determined in liver and gills of Cirrhinus marigala , with Mn levels being lower. The highest Mn levels were found in muscles. Liver exhibited a lower Pb concentration (0.17 μg/g). The highest concentrations found in Mystus bleekeri were of Cu, followed by lev-els of Zn and Mn. In the same species, the highest Pb concentration was found in liver (1.17 μg/g). The general pattern of HM residue was in the order of gills > liver > muscles.
In another study, Yousafzai et al. ( 2012 ) reported the HM (Zn, Ni, Cr, Cu, and Pb) residue contents in body tissues of common crap ( Cyprinus carpio ) sampled from the Kabul River of the Nowshera district. Results showed that HM residues in fi sh were highest (826.00–8,391.30 μg/g) for Zn, and lowest (53.30–66.70 μg/g) for Cd (Table 1 ). There was a descending pattern of HM residues in fi sh tissues as fol-lows: intestine > skin > liver > gills > muscle. The intestine exhibited the highest HM residues, which resulted from direct dietary exposure; muscle tissue levels of HM were minimal.
River Kabul fi sh samples collected from sites within the Nowshera district showed multifold higher concentrations than those at the Warsak and Peshawar sites. These multifold concentrations in Nowshera fi sh may have resulted from several sources that include agricultural runoff, pollution from surrounding min-ing operations, or releases of urban and untreated industrial sewage from the nearby Amangarh Industrial Estate and Peshawar city (Yousafzai et al. 2008 ; Khan et al. 2011 , 2012 ). Concentrations of HM (e.g., Zn, Cu, Cd, Cr, Ni, and Pb) in fi sh collected from the River Kabul were found to exceed the maximum permis-sible limits (MPL) established by FAO/WHO ( 1983 ) and The Australian National Health and Medical Research Council (ANMHRC)/Western Australian Food and Drug Regulation (WAFDR) as reported by Plaskett and Potter ( 1979 ) and Rahman et al. ( 2012 ) (Table 1 ).
2.1.2 Punjab Province
Punjab hosts several rivers (viz., Indus, Chenab, Sutlej, Ravi, and Jhelum), which form the upper Indus plain, and remain one of the most agriculturally rich and fertile of areas. These rivers provide water for agricultural and domestic uses (Khan et al. 2013 ). Ashraf et al. ( 1991 ) reported HM concentrations in three fi sh species, viz., Rita rita , Wallago attu , and Cirrhinus mrigala from three sites that included the Tarbela reservoir, Chashma, and Lloyd barrage, along the Indus River. Among the fi sh species
Status of Heavy Metal Residues in Fish Species of Pakistan
120
studied, Rita rita collected from the Tarbela reservoir showed the highest (6.72 μg/g) concentrations for Fe. The estimated pattern of HM residues in fi sh species from these sites were found in the order Rita rita > Wallago attu > Cirrhinus mrigala .
One year later, Tariq et al. ( 1992 ) reported Hg concentrations (1.16–1.38 μg/g) in two fi sh species (viz., Catla catla and Chela chanius ) collected from the Rawal Lake, Islamabad/Rawalpindi. The uptake of Hg in male Chela chanius was 0.07 μg/g per unit length, whereas the female Chela chanius displayed a smaller uptake rate of Hg (0.04 μg/g) per unit length. Moreover, the Hg concentration in male Catla catla was twice that of the females. This study also revealed species specifi city regarding Hg uptake in both fi sh species studied. The maximum Hg residue was documented in male specimens, which is in line with the results reported by Lyle ( 1984 ) and Marcovecchio et al. ( 1986 ).
Tariq et al. ( 1994 ) sampled 14 commercial fi sh species from the Ravi River at Lahore and Baloki sites and analyzed the collected specimens for HM (viz., Ni, Ag, Cu, Cr, and Mn, Cd, As, Hg, Pb, Zn, and Fe) contents. Results showed that the high-est HM concentrations were found in Labeo calbesu (Ag 2.17 μg/g), Mystus vitattus (Cd 0.62 μg/g), Labeo rohita (Mn 0.73 μg/g and Pb 3.40 μg/g), and Labeo gonius (Cu 1.18 μg/g) collected from the Lahore site. Similarly, the fi sh species Channa marulius (Ag 2.17 μg/g), Labeo gonius (Cd 0.62 μg/g), Catla catla (Cu 1.34 μg/g) showed maximum concentrations of HM at the Baloki site. The study also demon-strated that Labeo gonius and Labeo rohita could serve as indicators of HM pollu-tion, because they showed their maximum concentrations at both the Lahore and Baloki sites.
Tariq et al. ( 1996 ) also investigated the presence of HM in various fi sh species captured at the Chashma, Jinnah, Guddu, Lloyd, and Taunsa barrages along the Indus River. The highest concentrations of Hg (3.92 μg/g) and As (3.07 μg/g) were found in fi sh muscle tissue from the Guddu barrage (Table 1 ). Among fi sh species evaluated, specimens of Hetroptirus fossilus had the highest concentrations of Ag (2.19 μg/g), Cu (2.34 μg/g), and Pb (1.99 μg/g) in muscles. Similarly, Labeo cal-basu showed the highest concentrations of As (3.07 μg/g) in specimens taken from Guddu barrage. Mystus vitatus samples collected from the Chashma barrage revealed high concentrations of Cd (0.99 μg/g) and Fe (6.10 μg/g). Tilapia nilotica showed the highest concentration of Mn (3.05 μg/g) when test specimens were col-lected from the Lloyd barrage. The trend of HM concentrations found in the muscle tissue of the different fi sh species tested was as follows: Ag > As > Cu > Fe > Cd > Cr.
Javid ( 2005 ) reported HM concentrations in body tissues of Cirrhina mrigala , Labeo rohita , and Catla catla specimens collected from the Ravi River (Baloki headworks to Sidhani barrage) and its tributaries. The authors reported the highest (291.40–431.30 μg/g) concentrations for Fe, whereas the lowest (1.73–9.45 μg/g) levels were for Ni at the Baloki site (Table 1 ). The highest concentrations of HM were found in fi sh taken from the Baloki site. The authors reported that fi sh mus-cles, kidney, and liver were the main depository organs for HM. The magnitude of HM among sampled fi sh species was in the following order: Catla catla > Labeo rohita > Cirrhina mrigala , whereas the order of the concentration in tissues was liver > kidney > gills > muscles.
M. Hussain et al.
121
Ansari et al. ( 2006 ) studied wild fi sh ( Puntius chola ) for the magnitude of Zn, Fe, Cu, Cd, and Mn residues. Results showed that, except for Cu and Cd, the concentra-tions of HM taken up were directly related to the increase in body weight of Puntius chola . However, Zn, Fe, Cu exhibited negative allometry to an increase in HM concen-trations, because the residue levels were less than the rate of excretion as the fi sh grew.
Rauf et al. ( 2009 ) performed an interesting study on the residues of Cd and Cr in Cirrhina mrigala , Labeo rohita , and Catla catla that were collected from the Lahore Siphon, Shahdera Bridge, and Baloki headworks in the Ravi River, Pakistan. The concentration of HM found in these fi sh varied considerably, and depended upon the fi sh species, tissue examined and collection site. Results showed that liver had the highest level of Cd (4.26 μg/g) and Cr (6.23 μg/g), whereas gills had the lowest con-centrations of Cd (1.10 μg/g) and Cr (1.46 μg/g) (Table 1 ). Catla catla exhibited the highest concentration of Cd (2.58 μg/g) and Cr (3.58 μg/g). The authors concluded that the Balloki headworks had the highest contamination level, and this level may be attributed to industrial effl uents, agricultural runoff, and domestic sewage releases.
Jabeen and Chaudhry ( 2010 ) reported HM residues in common carp ( Cyprinus caprio ) and Oreochromis mossambicus at the Chashma and Shebhaz Khel in the Mianwali district, along the Indus River. Among the HM detected, Zn (251.60–1,179.00 μg/g) displayed the highest concentrations in fi sh; the lowest reported con-centrations were for Hg (1.76–8.72 μg/g) (Table 1 ). Maximum Zn, Pb, and Mn concentrations were found in fi sh tissues collected at the Chashma site, whereas Cr and Hg levels were highest at the Shebhaz Khel. The pattern of HM residues among tissues varied greatly, when specimens were collected from the Chashma verses Shabazkhel.
Nawaz et al. ( 2010 ) reported Pb, Hg, As, Cu, and Zn residues in either edible or nonedible fi sh species collected from two sites of the River Ravi at the Balloki head-works. The highest As concentration (66.50 μg/g) was found in Cirrhinus mrigala (edible fi sh), whereas the lowest (39.00 μg/g) was in a Mystus vittatus specimen (nonedible fi sh). Water of the Lahore and Kasur districts had the highest (32–47 μg/L) As concentrations (Farooqi et al. 2007 ). Maximum (126.30 μg/g) Hg con-centrations were found in Notopterus notopterus (edible fi sh) and minimum (28.40 μg/g) ones in Xenentodon cancila (nonedible fi sh). The Hg levels were high in both edible and nonedible fi sh species. However, the source of Hg contamination that caused these residues is still unknown and needs further study. Edible fi sh spe-cies such as Labeo rohita showed the highest (58.90 μg/g) concentrations of Zn, while the lowest (34.20 μg/g) levels were in Cirrhinus mrigala . Similarly, Cu and Pb concentrations in both edible and nonedible fi sh ranged from 1.93 to 577.87 μg/g and 1.90 to 4.40 μg/g, respectively.
Chaudhry and Jabeen ( 2011 ) reported the effects of HM contamination in organs of Labeo rohita , collected from the Indus River in the Mianwali district. The order in which HM concentrations appeared in fi sh tissues was as follows: liver > gills > skin > muscles at the Shehbaz Khel and Chashma collections sites, whereas at Kukranwala the order was: gills > liver > skin > muscles. Mn, Cr, Pb, and Zn showed maximum concentrations in gills, whereas Hg and Cu exhibited maxima in the liver. Results revealed that gills were the most susceptible organ to HM
Status of Heavy Metal Residues in Fish Species of Pakistan
122
contamination, followed by liver, skin, and fi sh muscle tissue. The study authors concluded that high HM concentrations exist in fi sh organs from specimens col-lected at the Shehbaz Khel and Chashma.
Qadir and Malik ( 2011 ) reported that four HM (viz., Pb, Cu, Cr, and Cd) were concentrated in the organs (viz., gills, kidneys, liver, and muscles) of eight fi sh spe-cies. Fish in this study were sampled from two tributaries (Nullah Palkhu and Nullah Aik) of the River Chenab, Pakistan during both post and pre-monsoon seasons. Pb and Cr residues in fi sh collected during the pre-monsoon period existed in the fol-lowing descending order: gills > liver > kidneys > muscles, whereas Cd and Cu resi-due levels showed liver > gills > kidneys > muscles. The authors reported the highest mean concentrations of Pb in gills (30.06 μg/g) and muscles (9.53 μg/g) of Heteropneustes fossilis , and the lowest levels in gills (15.72 μg/g) of Wallago attu , or in muscle tissues (4.23 μg/g) of Cirrhinus punctata sampled from the Nullah Aik. The maximum mean concentration of Cd was reported in liver (13.14 μg/g) of Mystus cavasius (post-monsoon season), whereas the minimum occurred in the gills (6.46 μg/g) of Cirrhinus punctata (pre-monsoon season) sampled from the Nullah Palkhu. The highest mean concentration of Cr in gills (31.27 μg/g) was detected in a Wallago attu specimen collected from the Nullah Aik (post-monsoon period). Similarly, the maximum average concentration of Cr was reported in gills (32.77 μg/g) from both Nullah sites (pre-monsoon period). The maximum mean concentration of Cr was found in Heteropneustes fossilis , whereas the minimum was detected in a specimen of Puntius sophore . The highest mean concentration of Cu was found in the liver (14.83 μg/g) of a Puntius sophore specimen sampled from the Nullah Aik (post-monsoon period). Similarly, the maximum concentration of Cu was recorded in liver (6.14 μg/g) of a Cirrhinus punctata specimen sampled from the Nullah Aik (pre-monsoon period). Results showed that Puntius sophore and Labeo rohita accumulated the highest mean concentrations of Cu, whereas the lowest Cu levels were in a Wallago attu sample.
The River Indus and its tributary waters are highly contaminated with HM (Yousafzai et al. 2008 ; Muhammad et al. 2011a ; Khan et al. 2013 ). The HM con-tamination of such waterways results from release of household and urban sewage, agricultural runoff, mobilization from bedrock, or from mining operations or release of untreated industrial waste in the catchment area (Yousafzai et al. 2008 ; Muhammad et al. 2010 , 2011b ; Khan et al. 2013 ). As a result, these HM are taken up in fi sh species that then display concentrations that greatly exceed the MPL val-ues set by regulating entities, such as the FAO/WHO ( 1983 ) and ANMHRC/WAFDR (Rahman et al. 2012 ) for the respective HM contaminants (Table 1 ). The degree to which HM concentrate in fi sh greatly varied from species to species and by location as reported by Jabeen and Chaudhry ( 2010 ). Fish sampled from streams and rivers located along or near urban areas or industrial estates/complexes revealed a higher concentration than others lacking such proximity to sources of potential HM release (Tariq et al. 1995 ; Javid 2005 ; Rauf et al. 2009 ; Chaudhry and Jabeen 2011 ) (Fig. 2 ). The levels of HM that occur in individual fi sh species depends on the feeding source and position in the food chain of the consuming fi sh (Tariq et al. 1993 ; Yousafzai et al. 2008 , 2010 ). Among fi sh tissues, liver, kidney, gill, skin, and
M. Hussain et al.
123
muscles were the primary depository organs (Javid 2005 ; Rauf et al. 2009 ; Chaudhry and Jabeen 2011 ). Of main concern to humans, is the level of HM residues that ends up in muscle tissue. Humans consume the HM-contaminated muscle tissue, and at certain levels these contaminants may pose a potential threat to health (Khan et al. 2012 ; Yousafzai et al. 2012 ).
2.1.3 Sindh Province
Ahmad et al. ( 2004 ) reported that 16–36% of the population of Sindh province has been exposed to high levels (10–50 ppb) of As-contaminated water. Humans that consume excessive As may suffer toxic effects to liver, bladder, and skin (cancer). Tariq et al. ( 1996 ) and Wallace et al. ( 1977 ) reported that release of domestic sew-age, agricultural runoff, and untreated industrial effl uents fi nd their way into the Indus River at numerous places, and HM may exist in these releases at levels that impair water quality.
Dewani et al. ( 2003 ) investigated the HM contamination in fi sh species collected from the polluted Fuleli canal. The fi sh species studied revealed great variability in the amount of HM retained. In all fi shes examined, Fe was the most prominent resi-due, and Cd was the lowest. The highest Fe and Zn concentrations (33.73 and 13.95 μg/g) were found in Eutropiicheythys vacha , while the lowest concentration was for Fe (7.10 μg/g), which was detected in a specimen of Wallago attu . The high-est Mn level (7.31 μg/g) was recorded in the muscles of Rita rita , whereas Wallago attu exhibited the lowest Mn concentration (0.42 μg/g). The highest Cu concentra-tion (1.58 μg/g) was detected in samples of Labeo dero . High concentrations of Pb (1.49 μg/g), Ni (1.76 μg/g) and Co (0.41 μg/g) were also documented to occur in the sampled fi sh species.
Scientists have proposed that the Indus Dolphin be considered as an endangered species across the globe, because it faces risks from many water pollutants (Gachal et al. 2006 ). Gachal et al. ( 2006 ) reported that Cd displayed the highest level of any HM in the Indus Dolphin (96.20–191.00), whereas As levels were the lowest (1.40–6.00 μg/g). Other HM (viz., Zn, Cu, Cr, and Pb) displayed residue levels between these two extremes (Table 1 ).
In addition, Javid et al. ( 2007 ) reported the presence of Pb in Labeo rohita , Cirrhina mrigala , and Catla catla collected from glass aquaria at room temperature. Catla catla was observed to be the most sensitive to Pb pollution, followed by Labeo rohita and Cirrhina mrigala . The Pb concentration was highest in Labeo rohita (41.37 μg/g), followed by Cirrhina mrigala (35.12 μg/g) and then Catla catla (34.90 μg/g).
Korai et al. ( 2008 ) investigated the presence of Pb concentrations in organs of Catla catla captured from three sites (Sunheri, Helaya, and Khumbo) of the Keenjhar Lake over a 3-year period. The Pb concentration present in the tissues of Catla catla varied with tissue, with the highest (0.89–2.68 μg/g) level in liver, and the lowest level (0.74–2.25 μg/g) in muscles during January 2003 to December 2005. The concentration of Pb (2.19 μg/g) was observed to be highest in fi sh liver sampled
Status of Heavy Metal Residues in Fish Species of Pakistan
124
from the Helaya site, whereas the lowest (1.14 μg/g) was recorded in muscle tissue from fi sh collected from the Khumbo site during 2003. Moreover, the Pb concentra-tion varied between 1.14 and 2.21 μg/g in fi sh tissues collected during 2004. The highest Pb concentration (2.21 μg/g) was detected in liver at the Helaya site, where as the lowest (1.14 μg/g) was in muscle tissue from fi sh at the Khumbo site. Liver showed the highest (2.68 μg/g) concentration of Pb in fi sh captured from the Sunheri site, whereas muscles revealed the lowest concentration (0.59 μg/g) in fi sh sampled from the Helaya site. The authors concluded that liver and gills had a higher affi nity for concentrating Pb than did muscle tissue. The authors suggested that the main sources of Pb contamination in the Keenjhar Lake were contaminated wastewater released from households, and industry and runoff from agriculture land located in the surrounding areas.
Arian et al. ( 2008 ) investigated the HM concentrations in tissues of fi sh speci-mens ( Oreochromis mossambicus ) collected from the Manchar Lake. Liver showed the highest (6,670.30 μg/g) concentration for Fe, where as the lowest (0.46 μg/g) were recorded for Cr (Table 1 ). The descending order of HM concentrations in body tissues was as follows: Fe > Zn > Pb > As > Cu > Ni > Cd > Cr, whereas that of liver was Fe > Zn > Cu > Cd > Pb > As > Ni > Cr. HM concentrations in tissues greatly var-ied, which may be attributed to differences in their adsorption and retention capac-ity. The authors concluded that the fi sh species collected from the Manchar Lake had higher As concentrations than did those of the Indus River. The most important sources of HM contamination in the Manchar Lake were from the Nara Valley drainage that carries releases from ore mining, dye manufacturing and tannery activities, household and industrial wastewater releases, and runoff of pesticides from agricultural land (Sarkar and Datta 2004 ).
Ahmad and Bibi ( 2010 ) evaluated the uptake of Pb concentrations in the tissues of Catla catla , sampled from polluted and control sites. The Pb concentration was highest (4.92 μg/g) in skin, and lowest (4.21 μg/g) in intestine of fi sh collected from the polluted site. Similar Pb concentrations from fi sh at the polluted site existed in internal fi sh tissues, as follows: liver (4.79 μg/g), muscles (4.41 μg/g), and intestine (4.21 μg/g). The authors concluded that the source of Pb concentration in fi sh tis-sues (viz., skin, liver, gills, eyes, muscles, and intestine) of the study area may be attributed to untreated industrial effl uents and municipal wastewater releases. In addition, the main sources of Pb contamination in the aquatic environment were from the fertilizer industry, planting processes, ore refi ning and burning of Pb-containing gasoline that leaked from fi shery boats, and municipal and industrial sewages (Handy 1994 ).
2.2 Marine Fish
Toxic HM contamination, which is persistent and bioaccumulative, increasingly threatens marine ecosystems (Balkas et al. 1982 ). Karachi, Pakistan is a coastal city facing multiple urbanization and industrialization problems. Therefore, nearby coastal
M. Hussain et al.
125
areas of the Arabian Sea are receiving a huge quantity of unregulated industrial sewage releases that ultimately affect aquatic life (Jaffar et al. 1995 ; Tariq et al. 1998 ).
Tariq et al. ( 1991a , b ) performed a very important study, in which HM residues were investigated in fi sh species that were sampled along coastal areas near Karachi. Ten fi sh species were collected from near-shore (5–10 km) and off-shore (15–40 km) sites. Results revealed that Hg and Fe were highly concentrated in Loligo duvauceli and Cr, Pb, Mn, and Ni in Sardinella longiceps , whereas Cd was present in Lapturacanthus savala . As mentioned earlier, fi sh can serve as bioindicators of HM pollution of marine ecosystems, particularly in coastal waters (Tariq et al. 1991a , b ; Jaffar et al. 1995 ). The authors of this study (Tariq et al. 1991a , b ) con-cluded that two species could be used to effectively biomonitor for HM pollution along the coast of the Arabian Sea. Sardinella longiceps is suited for tracing the extent of HM contamination for Cr, Pb, Mn, and Ni, whereas Loligo duvauceli is most suited to trace contamination by Hg and Fe.
Tariq et al. ( 1993 ) reported the presence of HM in fi sh sampled off-shore along the Arabian Sea coast. They sampled coastal fi sh species ( Rastrelliger kanagurta and Pomadasys maculatus ), that primarily feed on invertebrates and small fi sh. However, Chaetodon jayakeri , which is a migratory coastal fi sh that feeds on inver-tebrates and small fi sh, was also sampled (Bianchi 1985 ). The highest residues recorded from this experiment of any HM for all species were for Fe (889.00–1,791.00 μg/g), whereas the lowest residues (0.09–0.16 μg/g) were recorded for Hg. However, other HM were present in the fi sh at levels that were between these two extremes (Table 1 ). The highest HM residues in Rastrelliger kanagurta were for Fe (1,791 μg/g). The lowest HM residues were for Hg (0.09 μg/g), which appeared in specimens of Chaetodon jayakeri . The authors concluded that HM residues vary considerably among fi sh species and their uptake is species specifi c.
Jaffar et al. ( 1995 ) investigated HM concentrations in fi sh species collected along the southwest coast of the Arabian Sea. The highest HM values found were for Zn (0.14–10.20 μg/g), and the lowest (0.05–0.15 μg/g) were for Cd (Table 1 ). The authors concluded that the mean concentration of toxic HM in fi sh species were higher for those that had been discharged to waters from industrial activities (viz., Fe, As, Cu, Hg, Cr, Zn, Cd, and Ni).
Tariq et al. ( 1998 ) reported toxic HM residue levels in muscle of seven marine fi sh species that were sampled from the southwest coastal area of the Arabian Sea. Among toxic HM, Zn and Fe showed the highest (3.41 μg/g and 3.59 μg/g) concentrations, respectively. Argyrops spinifer showed the highest (0.27 μg/g) concentration for Ag, whereas Chaetodon jayakeri had the lowest (0.04 μg/g). Similarly, Atrobucca trewava-sii revealed the highest (1.96 μg/g) concentration for As, whereas Acanthopagarus lactus had the lowest (0.35 μg/g) level. Moreover, Argyrops spinifer showed the high-est levels (viz., 3.59 μg/g and 0.20 μg/g) for Fe and Mn, respectively.
Shah et al. ( 2010 ) studied the effects of total Hg concentration in muscle tissues of four marine fi sh species. The Hg concentrations measured in muscles ranged from 0.71 to 1.41 μg/g. At this level, daily intake of Hg residues in 250 g of fresh fi sh muscle would exceed the WHO permissible human consumption limit (0.22 μg/person/day) (WHO 1989 ).
Status of Heavy Metal Residues in Fish Species of Pakistan
126
Tabinda et al. ( 2010 ) studied HM residues in six fi sh species collected from the coastal waters at the Keti Bunder, Thatta, of Sindh province. The highest (3.60 μg/g) concentrations were measured for Pb, whereas the lowest (0.01 μg/g) were for As. These results indicated that the Pb and Cu concentrations appearing in Pampus argenetus and Tenualosa ilisha , and the Cr levels in most remaining fi sh species, exceeded the recommended limits of the FAO/WHO ( 1983 ) and ANMHRC/WAFDR (Rahman et al. 2012 ) as shown in the Table 1 .
2.3 Heavy Metal Residues in Fish Species of Neighboring Countries
Although the focus of this review is HM fi sh residues in Pakistan, we realize that neither Pakistan nor the aquatic species that exists in and around it are wholly iso-lated from adjoining geographical areas. Therefore, we thought that comparing selected data on fi sh residues from neighboring countries to those in Pakistan would be instructive and useful to readers of our review.
2.3.1 Bangladesh
Amin et al. ( 2011 ) reported the Zn (3.14–186.90 μg/g), Mn (4.10–51.67 μg/g), Cu (1.48–21.30 μg/g), Ni (1.80–8.40 μg/g), Pb (0.5–4.05 μg/g) residue levels that existed in muscle tissue of fi sh captured from the Gumti River (Bangladesh). Similarly, Rahman et al. ( 2012 ) reported the HM (Pb, Cd, Cu, Cr, Ni, Zn, As, and Zn) concentrations in fi sh sampled from the Bangshi River. The concentrations of HM in fi sh were as follows: Zn (42.83–418.00 μg/g), Mn (9.43–51.17 μg/g), Cu (8.33–43.18 μg/g), Pb (1.76–10.27 μg/g), As (1.97–6.24 μg/g), Ni (0.69–4.36 μg/g), Cr (0.47–2.07 μg/g), Cd (0.09–0.87 μg/g). These concentrations of HM (Zn, Ni, Cr, and Cd) were within the MPL set by ANMHRC/WAFDR for human consumption. HM residues in fi sh species of Bangladesh were found to be lower than those reported by Yousafzai et al. ( 2008 , 2010 , 2012 ) for fi sh in Pakistan.
2.3.2 China
Qiu et al. ( 2011 ) studied the mean concentrations of Pb, Cu, Zn, Cd, Cr, Hg, and As in poppano and snapper sampled from Daya and Hailing Bays. The resulting respec-tive residue levels were: 2.7, 1.6, 27.3, 0.025, 0.62, 0.18, and 0.59 μg/g in pompano, and 2.6, 1.5, 23.6, 0.020, 0.55, 0.22, and 0.53 μg/g in snapper. Similarly, Fu et al. ( 2013 ) analyzed the residue levels of HM such as Zn (54.09–367.39 μg/g), Cu (1.06–83.88 μg/g), Pb (4.14–27.18 μg/g), Cr (1.01–6.11 μg/g), and Cd (0.31–1.76 μg/g) in fi sh species collected from the Yangtze River and Taihu Lake, Jiangsu Province. The concentrations of various HM (Cu, Zn, Cd, Cr, Hg, and As), except for Pb were within the MPL set by ANMHRC/WAFDR for human consumption.
M. Hussain et al.
127
HM residue levels in Chinese fi sh species were found to be lower than those reported by Javid ( 2005 ) and Qadir and Malik ( 2011 ) for Pakistan.
2.3.3 India
Javed and Usmani ( 2011 ) reported HM residues in fi sh species collected from the Rasagani, a popular fi sh market in Aligarh. Results revealed that the highest (39.00–1,850.00 μg/g) HM levels were for Fe, Cu (9.00–1,250.00 μg/g) and Zn (42.00–459.40 μg/g), followed by Ni (10.80–187.50 μg/g), Mn (1.00–109.40 μg/g), Cr (1.00–27.00 μg/g), and Co (3.00–25.00 μg/g). Similarly, Gummadavelli et al. ( 2013 ) investigated HM residue levels in the muscles of Cyprinus carpio communis col-lected from Edulabad Water Reservoir (EBWR) in Andhra Pradesh. The concentra-tions found in fi sh muscle tissues were: Pb (290.00–702.00 μg/g), Fe (399.00–1,232.00 μg/g), Ni (236.00–464.00 μg/g), Cr (461.00–798.00 μg/g), and Cd (333.00–883.00 μg/g). The authors of these studies concluded that all HM except Zn have multifold higher concentrations than the MPL set by the FAO/WHO and ANMHRC/WAFDR. These study results further suggested that the HM residue lev-els found in these fi sh species render them not fi t for human consumption, and consuming them would pose human health risks. We conclude that HM residue levels in Indian fi sh species were higher than those in Pakistan as reported by Chaudhry and Jabeen ( 2011 ) and Khan et al. ( 2012 ).
2.3.4 Iran
Ebrahimi and Taherianfard ( 2010 ) reported the concentration of HM (Cd, Pb, Hg, and As) in fi sh species caught from three sites of the Kor River. The highest mean concentration reported in fi sh for different HM were: 0.11 μg/g for Cd, 1.84 μg/g for Pb, 1.14 μg/g for Hg, and 0.98 μg/g for As. Alhashemi et al. ( 2012 ) investigated the HM (Cd, Pb, Mn, Co, Ni, Cr, Zn, and Cu) concentration in fi sh species collected from wetland in the southwest of Iran. The HM concentration ranges reported were: Zn (28.57–49.50 μg/g), Mn (1.03–24.80 μg/g), V (4.87–6.75 μg/g), Pb (2.90–6.39 μg/g), Cu (3.21–5.00 μg/g), Ni (0.96–2.63 μg/g), Cr (0.7–2.60 μg/g), Co (0.41–1.26 μg/g), and Cd (0.13–0.41 μg/g). The HM (Hg, Mn, Pb) residue levels exceeded the MPL set by ANMHRC/WAFDR. HM concentrations in Iranian fi sh species were found to be lower than those reported by Arian et al. ( 2008 ) and Nawaz et al. ( 2010 ) for fi sh in Pakistan.
Generally, the HM concentrations in fi sh collected from neighboring countries (viz., Bangladesh, China, and Iran) were lower than residue levels found in Pakistani fi sh. However, fi sh collected in India were an exception, because their HM levels tended to be higher than those from Pakistan. Yousafzai et al. ( 2010 , 2012 ), Javed and Usmani ( 2011 ) and Gummadavelli et al. ( 2013 ) reported that the higher HM residue levels in Pakistani and Indian fi sh may be attributed to disposal of untreated domestic and industrial waste into the waterways and tributaries of these two countries.
Status of Heavy Metal Residues in Fish Species of Pakistan
128
3 Conclusions and Recommendations
In general, samples of fi sh collected from both fresh and marine water sources in Pakistan exhibited HM residues. Some of the more common HM found in fi sh were As, Fe, Zn, Pb, Cd, Hg, Ni, and Cu. Fish collected from contaminated sites (near urban and industrial estates) showed the highest concentrations of HM. This refl ected the reality that wide scale discharge of HM to water occurs from releases to household and urban sewage, from industrial effl uents and from disposal of solid wastes to waterways. We expect that HM also contaminate environmental matrices in other urban and industrial areas of Pakistan, although the data to confi rm this are still unavailable. We believe there is urgency in performing monitoring studies that are more comprehensive than those that now exist, so as to defi ne the status, distri-bution, and sources of these HM in the environmental matrices of Pakistan.
Our key conclusions and recommendations are as follows:
1. Although few studies have been conducted in Pakistan on the degree of HM contamination of aquatic species, the data available discloses that residues of HM are present in fi sh and dolphins, sometimes at excessive levels that may pose a danger to both the exposed species and to humans who consume them for food. The major sources of HM in the Pakistani aquatic environment are agricultural runoff, household sewage release, and industrial effl uents.
2. The levels of HM (viz., As, Hg, Cd, Pb, Cr, Ni, Fe, and Mn) found, often exceed MPL set by various domestic or international organizations, e.g., FAO/WHO, and ANMHRC/WAFDR.
3. We urge action to initiate a wider range of HM monitoring studies that will per-mit defi ning where HM exist in environmental media in Pakistan, and the degree of risk posed by such concentrations.
4 Summary
In this review, we evaluate and summarize the available data that addresses the levels of HM that exist in aquatic species, mainly fi sh, of Pakistan. Data on this topic were collected from the literature of the last two decades (1990–2012). Results revealed that the highest number (>50%) of studies addressing HM-contaminated fi sh have occurred in the Punjab province, followed by the Sindh and Khyber Pakhtunkhwa provinces. Our review disclosed that the HM concentrations in Pakistani fi sh species varied considerably with location. Generally, the level of HM residues detected in fi sh species had the following descending order: Fe > Zn > Pb > Cd > Hg > Ni > Cu > Ag > Cr > Mn > As. Fish samples collected from the Kabul River near the Nowshera district, Stretch of Ravi River, Indus River near Mainwali dis-trict, and Arabian Sea at Karachi revealed extremely high HM concentrations (range: 0.34–8,381.30 μg/g), compared to other fresh water bodies, such as the Llyold Barrage, Guddu Barrage, Jinnah Barrage, and Chashma Barrage (0.01–2.13 μg/g). As a reference point, we also reviewed selected data on HM fi sh residues
M. Hussain et al.
129
that exist in countries that neighbor Pakistan. With the exception of fi sh collected in India, the majority of fi sh analyzed for HM residues in neighboring countries dis-played lower residues than did fi sh from Pakistan.
We concluded from reviewing the available published data that the most proba-ble sources for the HM contaminants found in Pakistani water and fi sh were release of domestic sewage, agricultural runoff, and industrial effl uents. We strongly rec-ommend that action be taken to better control the discharges of unregulated waste that enters the Pakistani aquatic environment, with the intent to mitigate any con-tinuing future damage to the aquatic ecosystem. We also recommend intensifying research programs that address the toxicity of HM to the aquatic environment, so that a better understanding of metal effects on fi sh can be achieved that will lead to a sustainable ecological harmony in Pakistan.
Acknowledgement We would like to thank and highly acknowledge the efforts of Dr. David M. Whitacre, Summerfi eld, NC, USA, for his time to comment on the structure and English of the manuscript.
References
Ahmad MS, Bibi S (2010) Uptake and bioaccumulation of water borne lead (Pb) in the fi ngerlings of a freshwater Cyprinid, Catla catla . J Anim Plant Sci 20(3):201–207
Ahmad T, Kahlown MA, Tahir A, Rashid H (2004) Arsenic an emerging issue, experiences from Pakistan. In: 30th WEDC international conference, Vientiane, Lao PDR
Alhashemi AH, Sekhavatjou MS, Kiabi BH, Karbassi AR (2012) Bioaccumulation of trace elements in water, sediment, and six fi sh species from a freshwater wetland, Iran. Microchem J 104:1–6
Amin MN, Begum A, Mondal MGK (2011) Trace element concentrations present in fi ve species of freshwater fi sh of Bangladesh. Bangladesh J Sci Ind Res 46:27–32
Ansari TM, Saeed MA, Raza A, Naeem M, Salam A (2006) Effect of body size on metal concen-tration in wild Puntius chola. Pak J Environ Anal Chem 7(2):116–119
Arian MB, Kazi TG, Jamali MK, Jalbani N, Afridi HI, Shah A (2008) Total dissolved and bioavail-able elements in water and sediment samples and their accumulation in Oreochromis mossam-bicus of polluted Manchar Lake. Chemosphere 70:1845–1856
Ashraf M, Tariq J, Jaffer M (1991) Content of trace metals in fi sh, sediments and water from three freshwater reservoirs on the Indus River Pakistan. Fish Res 12:355–364
Balkas IT, Tugrel S, Salhogln I (1982) Trace metal level in fi sh and Crustacea from the Northeastern Mediterranean waters. Mar Environ Res 6:281–289
Bianchi GW (1985) FAO species identifi cation sheets for fi shery purposes. Field guide to the com-mercial marine and brackish-water species of Pakistan. Prepared with support of PAK/77/033 and FAO (FIRM) Regular Programme. FAO, Rome
Cardwell RD, DeForest DK, Brix KV, Adams WJ (2013) Do Cd, Cu, Ni, Pb, and Zn biomagnify in aquatic ecosystems? Rev Environ Contam Toxicol 226:101–121
Chang S, Zdanowicz VS, Murchelano RA (1998) Associations between liver lesions in winter fl ounder ( Pleuronectes americanus ) and sediment chemical contaminants from north-east United States estuaries. ICES J Mar Sci 55:954–969
Chaudhry AS, Jabeen F (2011) Assessing metal, protein, and DNA profi les in Labeo rohita from the Indus River in Mianwali, Pakistan. Environ Monit Assess 174:665–679
Dallinger R, Prosi F, Segner H, Black H (1987) Contaminated food and uptake of heavy metals by rainbow trout ( Salmo gairdneri ): a fi eld study. Oecologia 73:91–98
Status of Heavy Metal Residues in Fish Species of Pakistan
130
Demirak A, Yilmaz F, Tuna AL, Ozdemir N (2006) Heavy metals in water, sediment and tissues of Leuciscus cephalus from a stream in south western Turkey. Chemosphere 63:1451–1458
Dewani VK, Ansari IA, Khuhawar MY (2003) Profi le of metal contents of sewage contaminated canal fi shes. J Chem Soc Pak 25(1):11–15
Dix HM (1981) Environmental pollution. Wiley, New York Duffus JH (1980) Environmental toxicology. Edward Arnold Publications Ltd., London Ebrahimi M, Taherianfard M (2010) Concentration of four heavy metals (cadmium, lead, mercury,
and arsenic) in organs of two cyprinid fi sh (Cyprinus carpio and Capoeta sp.) from the Kor River (Iran). Environ Monit Assess 168:575–585
FAO (1983) Compilation of legal limits for hazardous substances in fi sh and fi shery products. FAO Fish Circ 464:5–100
Farooqi A, Masuda H, Firdous N (2007) Toxic fl uoride and arsenic contaminated groundwater in the Lahore and Kasur districts, Punjab, Pakistan and possible contaminant sources. Environ Pollut 145:839–849
Fatoki OS, Mathabatha S (2001) An assessment of heavy metals pollution in the East London and Port Elizabeth Harbors. Water SA 27:233–236
Fu J, Hub X, Tao X, Yu H, Zhang X (2013) Risk and toxicity assessments of heavy metals in sedi-ments and fi shes from the Yangtze River and Taihu Lake, China. Chemosphere http://dx.doi.org/10.1016/j.chemosphere.2013.06.061
Gachal GS, Slater FM, Nisa Z, Qadri AH, Zuhra (2006) Ecological effect to the status of the Indus Dolphin. Pak J Biol Sci 9(11):2117–2121
Gummadavelli V, Piska RS, Noothi S, Manikonda PK (2013) Seasonal bioaccumulation of heavy metals in Cyprinus carpio of Edulabad water reservoir, Andhra Pradesh, India. Int J Life Sci Bt Pharm Res 2(3):127–143
Hajeb P, Jinap S, Ismail A, Mahyudin NA (2012) Mercury pollution in Malaysia. Rev Environ Contam Toxicol 220:45–66
Handy RD (1994) Intermittent exposure to aquatic pollutants assessment, toxicity and sublethal responses in fi sh and invertebrates. Comp Biochem Physiol 107c:184
Ittekkot V, Arian R (1986) Nature of particulate organic matter in the River Indus, Pakistan. Geochim Cosmochim Acta 50:1643–1653
Jabeen F, Chaudhry AS (2010) Environmental impacts of anthropogenic activities on the mineral uptake in Oreochromis mossambicus from Indus River in Pakistan. Environ Monit Assess 166:641–651
Jaffar M, Ashraf M, Rasool A (1988) Heavy metal contents in some selected local fresh water fi sh and relevant waters. Pak J Sci Ind Res 31:189–193
Jaffar M, Ashrif M, Tariq J (1995) Assessment of current trace metals pollution status of the South- east Arabian Sea coast of Pakistan through fi sh analysis. J Chem Soc Pak 17(4):204–207
Jaleel T, Jaffar M, Ashraf M (1991) Levels of selected heavy metals in commercial fi sh from fi ve fresh water lakes in Pakistan. Toxicol Environ Chem 33:133–140
Javed M, Usmani N (2011) Accumulation of heavy metals in fi shes: a human health concern. Int J Environ Sci 2(2):659–670
Javid M (2003) Relationship among water, sediments and plankton for the uptake and accumula-tion of heavy metals in the River Ravi. Int J Plant Sci 2:326–331
Javid M (2005) Heavy metal contamination of freshwater fi sh and bed sediments in the River Ravi stretch and related tributaries. Pak J Biol Sci 8(10):1337–1341
Javid A, Javid M, Abdullah S, Ali Z (2007) Bio-accumulation of lead in the bodies of major carps ( Catla catla , Labeo rohita and Cirrhina mrigala ) during 96-h LC 50 exposures. Int J Biol 9(6):909–912
Khan T, Muhammad S, Khan B, Khan H (2011) Investigating the levels of selected heavy metals in surface water of Shah Alam River (a tributary of River Kabul, Khyber Pakhtunkhwa). J Himalaya Earth Sci 44(2):71–79
Khan B, Khan H, Muhammad S, Khan T (2012) Heavy metals concentration trends in three fi sh species from Shah Alam River, Khyber Pakhtunkhwa Province, Pakistan. J Nat Environ Sci 1:1–8
M. Hussain et al.
131
Khan MU, Malik RN, Muhammad S (2013) Human health risk from heavy metal via food crops consumption with wastewater irrigation practices in Pakistan. Chemosphere 93(10):2230–2238, http://dx.doi.org/ 10.1016/j.chemosphere.2013.07.067
Korai AL, Sahato GA, Kazi TG, Lashari KH (2008) Lead concentrations in fresh water, muscle, gill and liver of Catla catla (Hamilton) from Keenjhar lake. Pak J Anal Environ Chem 9(1):1119
Lyle JM (1984) Mercury concentrations in four carcharhinid and three hammerhead sharks from coastal waters of the Northern Territory. Aust J Mar Freshw Res 20:679–685
Malik RN, Nadeem M (2010) Spatial and temporal characterization of trace elements and nutrients in Rawal lake reservoir, Pakistan using multivariate analysis techniques. Environ Geochem Health 33(6):525–541
Malik RN, Moeckel C, Hughes D (2011) Polybrominated diphenyl ethers (PBDEs) in feather of colonial water birds species from Pakistan. Environ Pollut 159(10):3044–3050
Marcovecchio JE, Moreno VJ, Perez A (1986) Bio-magnifi cation of total mercury in Bahia Blanca estuary shark. Mar Pollut Bull 17:276–278
Muhammad S, Shah MT, Khan S (2010) Arsenic health risk assessment in drinking water and source apportionment using multivariate statistical techniques in Kohistan region, northern Pakistan. Food Chem Toxicol 48:2855–2864
Muhammad S, Shah MT, Khan S (2011a) Health risk assessment of heavy metals and their source apportionment in drinking water of Kohistan region, northern Pakistan. Microchem J 98:334–343
Muhammad S, Shah MT, Khan S (2011b) Heavy metal concentrations in soil and wild plants grow-ing around Pb-Zn sulfi de terrain in Kohistan region, northern Pakistan. Microchem J 99:67–75
Muhammad S, Shah MT, Khan S, Saddique U, Gul N, Khan MU, Malik RN, Farooq M, Naz A (2013) Wild plant assessment for heavy metal phytoremediation potential along the mafi c and ultramafi c terrain in northern Pakistan. Biomed Res Int 2013:1–9, http://dx.doi.org/ 10.1155/2013/194765
Nawaz S, Nagra SA, Saleem Y, Priydarshi A (2010) Determination of heavy metals in fresh water fi sh species of the River Ravi, Pakistan compared to farmed fi sh varieties. Environ Monit Assess 167:461–471
Nussey G, Van Vuren JHJ, Du Preez HH (2000) Bioaccumulation of chromium, manganese, nickel and lead in the tissues of the moggel, Labeo umbratus (Cyprinidae), from Witbank Dam, Mpumalanga. Water SA 26(2):269–284
Paul MJ, Meyer JL (2001) Streams in the urban landscape. Annu Rev Ecol Syst 32:333–365 Plaskett D, Potter IC (1979) Heavy metal concentrations in the muscle tissue of 12 species of
teleost from Cockburn Sound, Western Australia. Aust J Mar Freshw Res 30:607–616 Qadir A, Malik RN (2011) Heavy metals in eight edible fi sh species from two polluted tributaries
(Aik and Palkhu) of the River Chenab, Pakistan. Biol Trace Elem Res 143:1524–1540 Qadir A, Malik RN, Husain SZ (2008) Spatio-temporal variations in water quality of Nullah Aik-
tributary of the River Chenab, Pakistan. Environ Monit Assess 140:43–59 Qiu YW, Lin D, Liu JQ, Zeng EY (2011) Bioaccumulation of trace metals in farmed fi sh from
South China and potential risk assessment. Ecotoxicol Environ Saf 74:284–293 Rahman MS, Molla AH, Saha N, Rahman A (2012) Study on heavy metals levels and its risk
assessment in some edible fi shes from Bangshi River, Savar, Dhaka, Bangladesh. Food Chem 134:1847–1854
Rashed MN (2001) Cadmium and lead levels in fi sh ( Tilapia nilotica ) tissues as biological indica-tor for lake water pollution. Environ Monit Assess 68(1):75–89
Rauf A, Javed M, Ubaidullah M (2009) Heavy metal levels in three major carps ( Catla catla , Labeo rohita and Cirrhina mrigala ) from the River Ravi Pakistan. Pak J Vet 29(1):24–26
Sarkar D, Datta R (2004) Arsenic fate and bioavailability in two soils contaminated with sodium arsenate pesticide: an indication study. Bull Environ Contam Toxicol 72:240–247
Shah AQ, Kazi TG, Arain MB, Baig JA, Afridi HI, Kandhro GA, Khan S, Jamalib M (2009) Hazardous impact of arsenic on tissues of same fi sh species collected from two ecosystems. J Hazard Mater 167:511–515
Shah AQ, Kazmi TG, Baig JA, Afridi HI, Khandhro GA, Khan S, Kolachi NF, Wadhwa SK (2010) Determination of total mercury in muscle tissues of marine fi sh species by ultrasonic assisted extraction followed by cold vapor atomic absorption spectrometry. Pak J Anal Environ Chem 11(2):12–17
Status of Heavy Metal Residues in Fish Species of Pakistan
132
Shah MT, Ara A, Muhammad S, Khan S, Tariq S (2012) Health risk assessment via surface water and sub-surface water consumption in the mafi c and ultramafi c terrain, Mohmand agency, northern Pakistan. J Geochem Explor 118:60–67
Shah MT, Ara J, Muhammad S, Khan S, Asad SA, Ali L (2013) Potential heavy metal accumulation of indigenous plant species along the mafi c and ultramafi c terrain in the Mohmand agency, Pakistan. Clean. doi: 10.1002/clen.201200632
Shahid M, Pourrut B, Dumat C, Winterton P, Pinelli E (2011) Lead uptake, toxicity, and detoxifi ca-tion in plants. Rev Environ Contam Toxicol 213:113–136
Shahid M, Ferrand E, Schreck E, Dumat C (2013) Behavior and impact of zirconium in the soil- plant system: plant uptake and phytotoxicity. Rev Environ Contam Toxicol 221:107–127
Swaileh KM, Sansur R (2006) Monitoring urban heavy metal pollution using the house sparrow ( Passer domesticus ). J Environ Monit 8:209–213
Tabinda AB, Hussain M, Ahmed I, Yasar A (2010) Accumulation of toxic and essential trace metals in fi sh and prawns from Keti Bunder Thatta District, Sindh. Pak J Zool 42(5):631–638
Tariq J, Jaffar M, Ashraf M, Moazzam M (1991a) Heavy metals concentration in fi sh, shrimp, seaweed, sediment and water from the Arabian Sea, Pakistan. Mar Pollut Bull 26(11):644–647
Tariq J, Jaffar M, Moazzam M (1991b) Concentration correlations between major cations and heavy metals in fi sh from the Arabian Sea. Mar Pollut Bull 22(11):562–565
Tariq J, Jaffar M, Ashraf M (1992) Relationship between mercury concentration and length, weight and sex of two sprinid fi sh, Catla catla and Chela chanius from Rawal Lake Pakistan. Fish Res 14:335–341
Tariq J, Jaffar M, Ashraf M, Moazzam M (1993) Heavy metal concentrations in fi sh, shrimp, sea-weed, sediment, and water from the Arabian Sea, Pakistan. Mar Pollut Bull 26(11):644–647
Tariq J, Jaffar M, Ashraf M (1994) Trace metal concentration, distribution and correlation in water, sediment and fi sh from the Ravi River, Pakistan. Fish Res 19:131–139
Tariq J, Ashraf M, Jaffar M, Afzal M (1995) Pollution status of Indus River Pakistan, through heavy metals and macronutrient content of fi sh sediments and water. Water Res 30(6):1837–1844
Tariq SS, Ashraf M, Jaffar M, Afzal M (1996) Pollution status of the Indus River, Pakistan, through heavy metals and macronutrient contents of fi sh, sediment and water. Water Res 30:1337–1344
Tariq J, Ashraf M, Jaffar M, Masud K (1998) Selected trace metals concentration in seven fi sh species from the Arabian Sea, Pakistan. J Chem Soc Pak 20(4):249–251
Vuren VJHJ, Preez HHD, Wepener V, Adendorfe A, Barnhroom IEJK (1999) Lethal and sub-lethal effects of metals on the physiology of fi sh. An experimental approach with monitoring support, WRC Report. Water Research Commission, Pretoria. 608/11/99
Wallace JRGT, Hoffman GL, Duce RA (1977) The infl uences of organic matter and atmospheric deposition on the particulate trace metal concentration of northwest Atlantic surface water. Mar Chem 5:143–170
WHO/FAO (1989) Evaluation of certain food additives and contaminants, FAO/WHO expert com-mittee on food additives: 33rd Report Tech. Rep. Ser. 776. World Health Organization, Geneva
Widianarko B, VanGestel CAM, Verweij RA, Van-Straalen NM (2000) Associations between trace metals in sediment, water and guppy, Poecilia reticulata (Peters), from urban streams of Semarang, Indonesia. Ecotoxicol Environ Saf 46:101–107
Yousafzai AM, Khan AR, Shakoori AR (2008) Metal accumulation in the gills of an endangered South Asian fresh water fi sh as an indicator of aquatic pollution. Pak J Zool 40(5):331–339
Yousafzai AM, Chivers DP, Khan AR, Ahmad F, Siraj M (2010) Comparison of heavy metals burden in two freshwater fi shes Wallago attu and Labeo dyocheilus with regards to their feed-ing habits in natural ecosystem. Pak J Zool 42(5):537–544
Yousafzai AM, Siraj M, Ahmad B, Chivers DP (2012) Bioaccumulation of heavy metals in com-mon crap: implications for human health. Pak J Zool 44(2):489–494
Zhang G, Chakrabotry P, Li J, Sampathkumar P, Balasubramanian T, Kathiresan K, Takahashi S, Subramanian A, Tanabe S, Jones KC (2008) Passive atmospheric sampling of organochlorine pesticides, polychlorinated biphenyls, and polybrominated diphenyl ethers in urban, rural and wetland sites along the coastal length of India. Environ Sci Technol 42:818–822
M. Hussain et al.
133D.M. Whitacre (ed.), Reviews of Environmental Contamination and Toxicology Volume 230, Reviews of Environmental Contamination and Toxicology 230, DOI 10.1007/978-3-319-04411-8, © Springer International Publishing Switzerland 2014
INDEX FOR RECT VOLS. 221 to 230
17-[Beta]-estradiol (E2), predicted no-effect concentration (PNEC) in Chinese waters, 228 : 29 ff. 8-Hydroxyquinoline, acid mine drainage
control, 226 : 17 9,10-Dihydro-9-oxa-10-phosphaphenanthrene-
10-oxide, fl ame retardant, 222 : 42 9,10-Dihydro-9-oxa-10-phosphaphenanthrene-
10-oxide, toxic & environmental properties, 222 : 43
9,10-Dihydro-9-oxa-10-phosphaphenanthrene-10-oxide, toxic & physical-chemical properties (table), 222 : 44
A bbreviations, defi ned (table), 227 : 57 Abiotic conditions, landfi lls & phthalates, 224 :
39 ff. Abiotic degradation, 227 : 15 Abiotic degradation, fenpropathrin, 225 : 85 Abiotic degradation, methomyl, 222 : 98 Abiotic degradation, phthalate esters,
224 : 43 Absorption and transport, addictive
substances, 227 : 66 Absorption, mercury, 229 : 5 Abuse by pregnant women, addictive
substances (diag.), 227 : 56 Abused substance analysis value, for mothers,
newborns and fetuses (diag.), 227 : 68 Abused substance biomonitoring, metabolites
& biomarkers (table), 227 : 68–9 ACC (1-aminocyclopropane-1-carboxylic
acid) deaminase, role in plant stress reduction, 223 : 44
ACC, plant root ethylene effect (diag.), 223 : 45
Accessory reproductive organs, bisphenol A effects, 228 : 72
Accumulation levels of copper, in land snails (table), 225 : 107
Accumulation processes, chemical elimination role, 227 : 111
Acetoanilide pesticides, leaching characteristics, 221 : 73
Acetoanilide pesticides, soil column leaching (table), 221 : 62–65
Acid & base hydrolysis, phthalates (diag.), 224 : 45
Acid mine drainage control, 8-hydroxyquinoline, 226 : 17
Acid mine drainage control, alkaline materials, 226 : 13
Acid mine drainage control, alkoxysilanes, 226 : 16
Acid mine drainage control, bactericides, 226 : 9 Acid mine drainage control, BDET, 226 : 17 Acid mine drainage control, catechol, 226 : 18 Acid mine drainage control, desulfurization,
226 : 19 Acid mine drainage control, electrochemical
cover, 226 : 18 Acid mine drainage control, fatty acids, 226 : 17 Acid mine drainage control, humic acid, 226 : 15 Acid mine drainage control, inorganic
coatings, 226 : 9 Acid mine drainage control, lipid use, 226 : 15 Acid mine drainage control, organic coatings,
226 : 15 Acid mine drainage control, oxalic acid, 226 : 17 Acid mine drainage control, passivation, 226 : 9 Acid mine drainage control, phosphate
coating, 226 : 9
Index
134
Acid mine drainage control, physical barriers, 226 : 4
Acid mine drainage control, polyethylene polyamine, 226 : 16
Acid mine drainage control, silica treatment, 226 : 11
Acid mine drainage locations, worldwide, 226 : 2
Acid mine drainage prevention, organic matter, 226 : 8
Acid mine drainage prevention, physical barriers, 226 : 5
Acid mine drainage, associated coal deposits (table), 226 : 3
Acid mine drainage, associated with sulfi de deposits (table), 226 : 3
Acid mine drainage, control strategies, 226 : 4 Acid mine drainage, described, 226 : 2 Acid mine drainage, dry cover barriers, 226 : 6 Acid mine drainage, environmental problem,
226 : 2 Acid mine drainage, hazards, 226 : 3 Acid mine drainage, mineral associations
(table), 226 : 3 Acid mine drainage, mitigation, 226 : 1 ff. Acid mine drainage, prevention measures
(diag.), 226 : 5 Acid mine drainage, prevention strategies,
226 : 5 Acid mine drainage, sulfi de mineral oxidation,
226 : 2 Acid mine drainage, water cover, 226 : 6 Acidic effl uent wastes, dry cover prevention
(diag.), 226 : 7 Acidic mine effl uent prevention, polymer
barriers, 226 : 7 Acute toxicity to aquatic species, diazinon,
223 : 130 Acute toxicity to freshwater aquatic species,
diazinon (table), 223 : 131 Addicted mothers, children effects, 227 : 58 Addiction implication, pregnant women,
227 : 58 Addiction monitoring, options & approaches,
227 : 56 Addiction severity index, described, 227 : 59 Addictive substance abuse, problem
magnitude, 227 : 58 Addictive substance analysis, in biological
media, 227 : 67 Addictive substance analysis, target biological
materials (table), 227 : 70–3 Addictive substance biomonitoring, placenta
role, 227 : 64
Addictive substance effects, during pregnancy & infancy, 227 : 55 ff.
Addictive substance effects, on mothers, fetuses & newborns (table), 227 : 60–3
Addictive substance exposures, prenatal effects, 227 : 59
Addictive substance use, by pregnant women, 227 : 58
Addictive substances abuse, by pregnant women (diag.), 227 : 56
Addictive substances analysis, in biological materials, 227 : 55 ff.
Addictive substances, abuse & prevalence, 227 : 55
Addictive substances, defi ned, 227 : 58 Addictive substances, in utero biomonitoring,
227 : 63 Addictive substances, maternal absorption &
transport, 227 : 66 Addictive substances, metabolism, 227 : 64 Adult asthma causes, human exposure
pathways (diag.), 226 : 35 Adult asthma infl uence, air pollution, 226 : 46 Adult asthma prevalence, rural vs. urban areas,
226 : 36 Adult asthma, changing rates, 226 : 34 Adult asthma, combustion products, 226 : 37 Adult asthma, environmental tobacco smoke,
226 : 37 Adverse effects, phthalate esters, 224 : 42 Aerobic soil metabolism, trace elements,
225 : 19 Afl atoxins, drinking water contaminant,
228 : 122 Agbogbloshie (Ghana) scrap yard, e-waste
water pollution, 229 : 22 Agbogbloshie (Ghana), e-waste recycling
(illus.), 229 : 23 Agricultural fi lms, PBM (polymer-based
materials) waste, 227 : 9 Agricultural vs. urban use in California,
diazinon (table), 223 : 113 Air behavior, diazinon, 223 : 126 Air behavior, fenpropathrin, 225 : 82 Air behavior, methomyl, 222 : 98 Air contaminants, categories, 223 : 3 Air contaminants, gases, 223 : 5 Air contaminants, health effects, 223 : 5 Air contaminants, heavy metals, 223 : 7 Air contaminants, persistent organic pollutants
(POPs), 223 : 7 Air contaminants, Santiago, Chile, 223 : 1ff. Air contaminants, statistical distributions,
223 : 8
Index
135
Air contaminants, suspended solid particles, 223 : 7
Air contamination studies, based on Birnbaum-Saunder’s models (table), 223 : 13
Air contamination studies, Santiago, Chile (table), 223 : 13
Air contamination, Santiago, Chile, 223 : 12 Air contamination, worldwide (table), 223 :
9–11 Air degradation pathway, diazinon (diag.),
223 : 127 Air exposure, copper, 225 : 100 Air monitoring locations, Santiago, Chile
(illus.), 223 : 15 Air monitoring, diazinon in California,
223 : 128 Air pollutant characteristics, Santiago, Chile,
223 : 17 Air pollutant concerns, the Americas, 223 : 2 Air pollutant effects, Santiago, Chile, 223 : 15 Air pollutant hazards, Chilean guidelines
(table), 223 : 16 Air pollutant monitoring, Santiago, Chile,
223 : 14 Air pollutant, Hg from stack emissions, 230 : 2 Air pollutants, maximum permitted levels
(table), 223 : 16 Air pollutants, particulate matter, 223 : 3 Air pollution data, statistical analysis, 223 : 17 Air pollution data, statistical models, 223 : 3 Air pollution study, Santiago, Chile, 223 : 16 Air pollution, health effects, 223 : 2 Air pollution, infl uence on adult asthma,
226 : 46 Air pollution, people effects, 226 : 34 Air pollution, Santiago, Chile, 223 : 2 Alfl atoxin biosynthesis-clustered genes, fungi
(diag.), 228 :128 Alien species spread, PBM debris role, 227 : 27 Alkaline materials, acid mine drainage control,
226 : 13 Alkoxysilanes, acid mine drainage control,
226 : 16 Allergic disease incidence, from biological
contaminant exposure, 226 : 43 Aluminum diethylphosphinate, fl ame
retardant, 222 : 45 Aluminum diethylphosphinate, physical-
chemical & environmental character, 222 : 45
Aluminum diethylphosphinate, toxic, physical-chemical & environmental properties (table), 222 : 46
Aluminum diethylphosphinate, toxicity, 222 : 48 Aluminum trihydroxide, chemical &
environmental character (table), 222 : 11 Aluminum trihydroxide, environmental
behavior, 222 : 9 Aluminum trihydroxide, inorganic fl ame
retardant, 222 : 9 Aluminum trihydroxide, toxicity, 222 : 10 Alzheimer’s disease link, mercury, 229 : 10 Alzheimer’s disease, main features, 229 : 11 American kestrel, methyl mercury toxicity,
223 : 64 American kestrels, DE-71 (PBDE isomer)
NOAEL & LOAEL (table), 229 : 125 Ammonium polyphosphate, chemical structure
(illus.), 222 : 14 Ammonium polyphosphate, fl ame retardant,
222 : 13 Ammonium polyphosphate, physical-chemical
properties (table), 222 : 15 Ammonium polyphosphate, toxicity &
environmental character, 222 : 14–16 Amphibian toxicity, of 17-[beta]-estradiol
(E2), 228 : 33 Amyotrophic lateral sclerosis, description,
229 : 11 Amyotrophic lateral sclerosis, mercury link,
229 : 6, 10 Anaerobic soil metabolism, trace elements,
225 : 19 Analysis and detection, mycotoxins, 228 :113 Analysis method, ptaquiloside, 224 : 76 Analysis of complex matrices, general scheme
(diag.), 227 : 69 Analytical scheme, for biological sample
analysis (diag.), 227 : 69 Androgen/estrogen synthesis & action effects,
bisphenol A (BPA)(table), 228 : 66 Animal effects of metals, genetic diversity,
227 : 92 Animal energetics implication,
bioamplifi cation, 227 : 114 Animal energetics, lipid reserve management,
227 : 114 Animal genetic effects, metal pollution (table),
227 : 86–91 Animal health effects, boron, 225 : 59 Animal models, Bracken fern toxicity, 224 : 67 Animal populations, assessing genetic
variability, 227 : 95 Animal populations, genetic diversity effects,
227 : 79 ff. Animal populations, genetic structure effects,
227 : 79 ff.
Index
136
Animal test results, Bracken fern intake (table), 224 : 68
Animal toxicity, boron, 225 : 60 Animal toxicity, Bracken fern intake, 224 : 67 Animals, boron intake & effects, 225 : 59 Animals, role of boron, 225 : 58 Anthropogenic emissions, zirconium, 221 : 109 Anthropogenic releases, mercury, 226 : 66 Anthropogenic sources, cadmium, 229 : 53 Anthropogenically-produced compounds,
nanoparticles (table), 230 : 84 Antibacterial properties, silver compounds,
223 : 89 Aphagia effects, on bioamplifi cation, 227 : 124 Apoptosis, ROS (reactive oxygen species)
mode of action for nanosilver, 223 : 87 Applications described, fabricated
nanoparticles, 230 : 85 Applications, fabricated nanoparticles (table),
230 : 86 Aquatic avian species in China, PBDE egg
TRVs (diag.), 229 : 129 Aquatic biota, mercury residues, 226 : 77 Aquatic birds in China, PCBs (polychlorinated
biphenyls), 230 : 59 ff. Aquatic birds, PBDE TRV derivation, 229 : 121 Aquatic birds, PBDE TRV, 229 : 125 Aquatic Chinese species, setting WQC (water
quality criteria), 230 : 38 Aquatic ecosystems, do heavy metals
biomagnify?, 226 : 101 ff. Aquatic environment degradation, PBMs,
227 : 22 Aquatic environmental effects, e-waste
disposal, 229 : 19 ff. Aquatic environments, diazinon persistence,
223 : 125 Aquatic life criteria, pesticides in sediments,
224 : 97 ff. Aquatic life effects, heavy metals, 229 : 26 Aquatic life sediment quality criteria,
protection defi ned, 224 : 112 Aquatic life, organic pollutant effects, 229 : 28 Aquatic life-benchmarks, diazinon, 223 : 133 Aquatic mammals, PBDE TRV derivation,
229 : 115 Aquatic mammals, TRV for PBDEs, 229 : 119 Aquatic organism toxicity, nanosilver, 223 : 83 Aquatic organism toxicity, of E2, 228 : 31 Aquatic organism toxicity, PBDEs, 229 : 28 Aquatic organisms, e-waste contaminant
effects, 229 : 25 Aquatic organisms, lead & cadmium toxicity,
229 : 27
Aquatic organisms, methomyl toxicity (table), 222 : 104
Aquatic photolysis, diazinon, 223 : 126 Aquatic residues, mercury, 226 : 68 Aquatic sediments, characterized, 224 : 98 Aquatic species acute toxicity, diazinon
(table), 223 : 131 Aquatic species chronic toxicity, diazinon
(table), 223 : 132 Aquatic species ecotoxicity, fenpropathrin,
225 : 89 Aquatic species in China, PBDE TRVs (diag.),
229 : 129 Aquatic species toxicity, diazinon, 223 : 130 Aquatic species toxicity, E2 (table), 228 : 34–5 Aquatic species toxicity, nanosilver, 223 : 93 Aquatic species, clomazone toxicity, 229 : 44 Aquatic species, E2 NOEC values (table),
228 : 38 Aquatic species, methomyl toxicity, 222 : 103 Aquatic species, risk assessments, 230 : 49 Aquatic toxicity, diazinon, 223 : 129 Aquatic toxicity, pesticides, 224 : 99 Aquatic-life benchmark values, diazinon
(table), 223 : 133 Aqueous environments, fi eld data on trophic
transfer, 226 : 106 Arsenate metabolism, arsenate reductases,
224 : 15 Arsenate reductases, arsenate metabolism,
224 : 15 Arsenate, description, 224 : 2 Arsenic & chromium metabolism,
rhizospheric soil effect (diag.), 225 : 29 Arsenic acid derivatives, arsenic metabolism,
224 : 9 Arsenic behavior, soils, 225 : 4 Arsenic contamination, bioremediation
methods, 224 : 19–25 Arsenic cycle, global (diag.), 224 : 5 Arsenic cycle, microbial interactions, 224 : 1 ff. Arsenic cycle, microbial transformations, 224 : 6 Arsenic detoxifi cation, eukaryotic cells (diag.),
224 : 11 Arsenic forms, posttransductional regulation,
224 : 17 Arsenic in soil, uses (table), 225 : 5 Arsenic metabolism effect, soil amendment
(diag.), 225 : 35 Arsenic metabolism, arsenic permeases, 224 : 16 Arsenic metabolism, infl uencing factors, 225 : 23 Arsenic metabolism, methylarsines, 224 : 9 Arsenic metabolism, soil microbes, 225 : 19 Arsenic permeases, arsenic metabolism 224 : 16
Index
137
Arsenic pollution, sources, 224 : 5 Arsenic trioxide, “Gasio-gas” poisoning,
225 : 3 Arsenic, ars operon & transcriptional
regulation, 224 : 14 Arsenic, biosensors, 224 : 25 Arsenic, characteristics (table), 224 : 2 Arsenic, description & uses, 224 : 2 Arsenic, detoxifi cation mechanism, 224 : 12 Arsenic, environmental distribution, 224 : 4 Arsenic, environmental fate, 224 : 4 Arsenic, environmental levels (table), 224 : 3 Arsenic, enzyme reduction, 224 : 7 Arsenic, measuring bioavailability, 224 : 25 Arsenic, methylation and demethylation, 224 : 8 Arsenic, microbial detoxifi cation & transport
(diag.), 224 : 9 Arsenic, microbial resistance, 224 : 6 Arsenic, microbial sensing, 224 : 13 Arsenic, microbial uptake & extrusion, 224 : 10 Arsenic, mobilization and immobilization,
224 : 10 Arsenic, soil sources & behavior, 225 : 4 Arsenic, the ars operon & proteins, 224 : 13 Arsenic, toxicity, 224 : 2 Arsenic-resistant microbes, examples (table),
224 : 6 Arsenic-resistant microbes, examples, 224 : 20 Arsenic-toxicity mitigation, organismal
strategies, 224 : 20 Arsenite reduction, pathways (table), 224 : 8 Arsenite, oxidation processes, 224 : 7 Arylalkanoate pesticides, leaching
characteristics, 221 : 73 Arylalkanoate pesticides, soil column leaching
(table), 221 : 62–65 Asthma & smoking behavior, urban vs. rural
differences, 226 : 37 Asthma cause, coal & biomass fuel, 226 : 39 Asthma cause, nitrogen dioxide exposure,
226 : 39 Asthma cause, particulate matter exposure,
226 : 39 Asthma effects, urban vs. rural residents
(table), 226 : 53–55 Asthma in adults, atopy in rural vs. urban
residents, 226 : 45 Asthma incidence, socioeconomic effects,
226 : 49 Asthma infl uence, climatic factors, 226 : 48 Asthma infl uence, geographic factors, 226 : 48 Asthma morbidity factors, biological
contaminants, 226 : 40 Asthma morbidity, rural living benefi t, 226 : 44
Asthma prevalence, healthcare access effects, 226 : 49
Asthma prevalence, urban vs. rural differences (table), 226 : 52
Asthma, described, 226 : 34 Atmospheric mercury, Mexico, 226 : 65 ff. Atmospheric pollutants, Gaussian statistical
modeling, 223 : 8 Atmospheric pollutants, worldwide (table),
223 : 9–11 Atmospheric release, mercury levels, 226 : 67 Atopy & asthma in adults, urban vs. rural
effects, 226 : 45 Australian drinking water guidelines, chemical
contaminants (table), 222 : 122 Australian guidelines, drinking water quality,
222 : 121 Australian trends, potable water disinfection,
222 : 127 Autocorrelation analysis, Santiago, Chile, air
pollution data, 223 : 18 Autoimmune effects, mercury, 229 : 6 Avian species in China, compared (table),
223 : 56 Avian species in China, methyl mercury levels
(diag.), 223 : 73 Avian species in China, TRV (toxicity
reference value) & TRC (tissue residue criteria) derivation, 223 : 66
Avian species toxicity thresholds, methyl mercury, 223 : 65
Avian species toxicity, methyl mercury, 223 : 58 Avian species toxicity, selecting data for
protection, 223 : 56 Avian species, body masses & food ingestion
rates (table), 230 : 62 Avian sub-chronic and chronic toxicity, methyl
mercury (table), 223 : 59–61 Avian wildlife protection in China, methyl
mercury, 223 : 53 ff. Avian wildlife TRV uncertainty factors,
methyl mercury (table), 223 : 66 Avian wildlife TRVs & TRCs, methyl mercury
(table), 223 : 67 Avian wildlife, Chinese species to protect,
223 : 55 B acteria, boron effects, 225 : 62 Bacteria, plant growth effect, 223 : 40 Bacterial cell-wall interaction, silver
nanoparticles, 223 : 90 Bacterial inhibition, acid mine drainage
control, 226 : 8 Bacterial waterborne pathogens, in drinking
water, 222 : 130
Index
138
Bactericides, acid mine drainage control, 226 : 9 Bald eagle, PCB toxicity, 230 : 69 Bangladesh fi sh residues, heavy metals,
230 : 126 BDET (3-benzenediamidoethanthiol), acid
mine drainage control, 226 : 17 Bioaccumulation effects, soil pH, 225 : 24 Bioaccumulation effects, trace elements,
225 : 36 Bioaccumulation mechanism,
bioamplifi cation, 227 : 107 ff., 108 Bioaccumulation mechanism,
bioamplifi cation, 227 : 109 Bioaccumulation of copper, by land snails,
225 : 111 Bioaccumulation of copper, land snails (table),
225 : 101 Bioaccumulation of HFFRs (halogen free
fl ame retardants), classifi cation scheme (table), 222 : 9
Bioaccumulation process, described, 226 : 102, 227 : 107
Bioaccumulation simulations, model parameters (table), 227 : 138–9, 143–5
Bioaccumulation, 9,10-Dihydro-9-oxa-10-phosphaphenanthrene-10-oxide, 222 : 43
Bioaccumulation, aluminum diethylphosphinate (table), 222 : 46
Bioaccumulation, ammonium polyphosphate (table), 222 : 15
Bioaccumulation, bisphenol-A bis(diphenylphosphate) (table), 222 : 40
Bioaccumulation, bisphenol-A bis(diphenylphosphate), 222 : 38
Bioaccumulation, diazinon, 223 : 132 Bioaccumulation, HFFRs (table), 222 : 59 Bioaccumulation, HFFRs, 222 : 1 ff. Bioaccumulation, HFFRs, 222 : 58 Bioaccumulation, HFFRs, 222 : 6 Bioaccumulation, implication for deriving
sediment quality criteria, 224 : 158 Bioaccumulation, melamine polyphosphate
(table), 222 : 49 Bioaccumulation, melamine polyphosphate,
222 : 51 Bioaccumulation, pentaerythritol (table),
222 : 54 Bioaccumulation, pentaerythritol, 222 : 52 Bioaccumulation, resorcinol
bis(diphenylphosphate (table), 222 : 32 Bioaccumulation, resorcinol
bis(diphenylphosphate), 222 : 36 Bioaccumulation, scientifi c value, 227 : 108 Bioaccumulation, trace elements, 225 : 7
Bioaccumulation, triphenylphosphate (table), 222 : 27
Bioaccumulation, triphenylphosphate, 222 : 30 Bioaccumulation, zinc hydroxystannate, 222 : 20 Bioaccumulation, zinc stannate, 222 : 22 Bioamplifi cation effect, aphagia, 227 : 124 Bioamplifi cation factor, described, 227 : 112 Bioamplifi cation factors, herring gull
modeling (table), 227 : 131 Bioamplifi cation factors, yellow perch
modeling (table), 227 : 129 Bioamplifi cation modeling, herring gulls
(diags.), 227 : 130 Bioamplifi cation modeling, yellow perch
(diags.), 227 : 127 Bioamplifi cation of POPs (persistent organic
pollutants), modeling approaches, 227 : 124
Bioamplifi cation simulation, herring gull model, 227 : 141
Bioamplifi cation simulation, yellow perch model, 227 : 137
Bioamplifi cation, and lipid loss, 227 : 113 Bioamplifi cation, animal energetics
implication, 227 : 114 Bioamplifi cation, bioaccumulation
mechanism, 227 : 107 ff. Bioamplifi cation, case studies (table), 227 :
116–7 Bioamplifi cation, case studies, 227 : 114 Bioamplifi cation, data gaps identifi ed, 227 : 135 Bioamplifi cation, during metamorphosis &
reproduction, 227 : 119 Bioamplifi cation, during migration, 227 : 122 Bioamplifi cation, during overwintering &
hibernation, 227 : 121 Bioamplifi cation, embryo & juvenile
development, 227 : 115 Bioamplifi cation, implication, 227 : 133 Bioamplifi cation, independent
bioaccumulation mechanism, 227 : 109 Bioamplifi cation, measurement, 227 : 112 Bioamplifi cation, summary conclusions,
227 : 135 Bioamplifi cation, term defi ned & described,
227 : 108 Bioamplifi cation, vs. other accumulation
processes, 227 : 110 Bioamplifi cation, weight-loss link, 227 : 111 Bioavailability considerations, in deriving
sediment quality criteria, 224 : 135 Bioavailability in soil, metals, 223 : 37 Bioavailability in soil, trace elements, 225 : 1ff. Bioavailability in soils, zirconium, 221 : 110
Index
139
Bioavailability of arsenic, measurement, 224 : 25
Bioavailability of metals, hyperaccumulator plant effect, 223 : 39
Biochar ageing effect, soil microbes, 228 : 93 Biochar effect, biomass source, 228 : 89 Biochar effect, soil pH, 228 : 90 Biochar effects, factors affecting performance
(diag.), 228 : 90 Biochar elemental composition, biomass
source effects (diag.), 228 : 88 Biochar elemental composition, processing
effects (table), 228 : 92 Biochar performance effects, soil organic
matter & minerals, 228 : 91 Biochar performance, pyrolysis temperature
effects, 228 : 87 Biochar remediation performance, temperature
effects, 228 : 93 Biochar, description & characteristics, 228 : 84 Biochar, for remediating contaminated soils,
228 : 83 ff., 85 Biochar, future research needs, 228 : 94 Biochar, organics & metal adsorption, 228 : 86–7 Biochar, pesticide & metal adsorption, 228 : 86 Biochar, properties and performance, 228 : 86 Bioconcentration, defi ned, 227 : 109 Bioconcentration, described, 226 : 102 Biodegradation effects, pesticide mobility,
221 : 23 Biodegradation rate, method effects, 221 : 24 Biodegradation, PBMs (polymer-based
materials), 227 : 21 Biodegradation, phthalates, 224 : 47 Biodiversity effects, marine debris, 228 : 19 Biofi lm formation, in drinking water, 222 : 144 Biogeochemical behavior effects, zirconium
speciation, 221 : 113 Biogeochemical cycle, mercury, 226 : 66 Bioindicator organisms, described, 225 : 96 Biokinetic data for trophic transfer,
accumulator marine species (diag.), 226 : 112
Biokinetic heavy metal data, freshwater trophic transfer factors (diag.), 226 : 110
Biokinetic marine data, heavy metal trophic transfer (diag.), 226 : 111
Biokinetic models, for estimating trophic transfer factors, 226 : 104
Biological attributes, land snails, 225 : 96 Biological contaminant exposure, allergic
disease incidence, 226 : 43 Biological contaminants, adult asthma cause,
226 : 40
Biological effects, nanosilver, 223 : 81 ff. Biological effects, of boron, 225 : 57 ff. Biological material analysis, for addictive
substances, 227 : 55 ff. Biological materials selected, for addictive
substance analysis (table), 227 : 70–3 Biological media analysis, for addictive
substances, 227 : 67 Biological organization level to protect,
sediment quality criteria, 224 : 112 Biological pollutants, drinking water, 228 :122 Biological sample analysis, analytical scheme
(diag.), 227 : 69 Biological specimen analysis, of maternal, fetus
& newborn samples (diag.), 227 : 68 Biomagnifi cation of heavy metals, does it
occur?, 226 : 101 ff. Biomagnifi cation, described, 226 : 102, 227 : 110 Biomarker in land snails, histopathology,
225 : 114 Biomarker in land snails, lysosomal stability,
225 : 117 Biomarker in land snails, membrane integrity,
225 : 117 Biomarker in land snails, ultrastructure,
225 : 114 Biomarker role, genetic damage monitoring,
227 : 84 Biomarkers in land snail, metallothionein
induction, 225 : 118 Biomarkers in land snails, copper pollution,
225 : 113 Biomarkers in land snails, dependencies
(table), 225 : 115 Biomarkers, abused substance biomonitoring
(table), 227 : 68–9 Biomarkers, to detect genetic diversity effects,
227 : 85 Biomass fuel & coal, adult asthma cause,
226 : 39 Biomass source, biochar effect, 228 : 89 Biomass sources, biochar elemental
composition (diag.), 228 : 88 Biomethylation, selenium, 225 : 20 Biomethylation, trace elements in soil, 225 : 17 Biomonitoring in utero , addictive substances,
227 : 63 Biomonitoring of abused substances,
metabolites & biomarkers (table), 227 : 68–9
Biomonitoring of addictive substances, placenta role, 227 : 64
Bioremediation methods, arsenic contamination, 224 : 19–25
Index
140
Bioremediation, defi nition, 223 : 35, 224 : 20 Bioremediation, of metalloid contamination,
225 : 38 Biosensors, arsenic, 224 : 25 Biosorption of trace elements, in aquatic
environment (table), 225 : 9 Biosorption processes, trace elements,
225 : 11 Biosorption, trace elements (table), 225 : 9 Biota, copper exposure routes, 225 : 97 Biotic degradation, fenpropathrin, 225 : 84 Biotic degradation, methomyl, 222 : 101 Biotic degradation, PBMs, 227 : 21 Biotic processes, chlomazone, 229 : 40 Bird ecotoxicity, fenpropathrin, 225 : 90 Bird residues in Mexico, mercury, 226 : 84 Bird residues, of PCBs (table), 230 : 76 Bird tissue residues, mercury (table), 226 : 85 Bird toxicity studies, PCBs, 230 : 64 Bird toxicity, methomyl, 222 : 104 Bird toxicity, of DE-71 (PBDE isomer),
229 : 121 Bird toxicity, PCB mixtures and isomers
(table), 230 : 65–67 Birds, PBDE TRVs (table), 229 : 127 Birds, PCB risk assessment, 230 : 76 Birnbaum-Saunder’s models, air contaminant
distribution, 223 : 12 Bisphenol A derivatives, male reproductive
effects, 228 : 72 Bisphenol A effects, on hypothalamic-
pituitary-testicular axis, 228 : 62 Bisphenol A effects, on sperm function,
228 : 70 Bisphenol A effects, testicular & epididymal
antioxidant system, 228 : 70 Bisphenol A in utero exposure, male
reproductive effects, 228 : 6–20 Bisphenol A, accessory reproductive organs,
228 : 72 Bisphenol A, described, 228 : 58 Bisphenol A, exposure sources & routes,
228 : 58 Bisphenol A, human residues, 228 : 59 Bisphenol A, male reproductive effects, 228 :
57 ff. Bisphenol A, occupational exposure, 228 : 60 Bisphenol A, spermatogenesis effects, 228 : 62,
68 Bisphenol-A bis(diphenylphosphate), fl ame
retardant, 222 : 37 Bisphenol-A bis(diphenylphosphate),
physical-chemical & environmental properties, 222 : 38
Bisphenol-A bis(diphenylphosphate), toxic, environmental & physical-chemical properties (table), 222 : 39–41
Bisphenol-A bis(diphenylphosphate, structure (illus.), 222 : 38
Body masses, avian species (table), 230 : 62 Bootstrapping, constructing species sensitivity
distributions, 230 : 41 Boron & borax, rat subchronic toxicity, 225 : 68 Boron defi ciency effects, plants, 225 : 62 Boron effects, bacteria & fungi, 225 : 62 Boron effects, on enzymes & minerals, 225 : 63 Boron in cattle, herpes virus resistance, 225 : 65 Boron intake & effects, animals, 225 : 59 Boron intake & sources, humans, 225 : 61 Boron intake effects, humans, 225 : 61 Boron regulatory role, minerals, 225 : 65 Boron toxicity, human fatality, 225 : 67 Boron toxicity, humans, 225 : 66 Boron toxicity, in animals, 225 : 60 Boron vs. borax, toxicity, 225 : 66 Boron, acute toxicity in rats, 225 : 67 Boron, biological effects, 225 : 57 ff. Boron, chicken toxicity, 225 : 60, 67 Boron, clinical effects in animals, 225 : 59 Boron, description & characteristics, 225 : 57 Boron, natural chemical forms, 225 : 58 Boron, natural sources, 225 : 58 Boron, plant toxicity, 225 : 69 Boron, role in animals, 225 : 58 Boron, role in living organisms, 225 : 58 Boron, role in plants, 225 : 61 Boron, toxicity symptoms in humans, 225 : 67 Boron, toxicity, 225 : 66 Bovine papillomavirus amplifi cation,
polymerase chain reaction, 224 : 83 Bovine papillomavirus diagnosis, polymerase
chain reaction role, 224 : 85 Bovine papillomavirus role, tumor induction
& progression, 224 : 64 Bovine papillomavirus, Bracken fern
interaction, 224 : 65 Bovine papillomavirus, described, 224 : 64 Bovine papillomavirus, tumor progression &
Bracken fern, 224 : 64 Bovine tumor classifi cation, pathology, 224 : 66 BPA (bisphenol A), environmental
concentrations, 227 : 33 BPA (bisphenol A), male reproductive effects
(table), 228 : 63 BPA action sites, male reproductive function
(diag.), 228 : 71 BPA, androgen/estrogen synthesis & action
effects (table), 228 : 66
Index
141
BPA, testicular effects, 228 : 65 BPA, tolerable daily intake values, 228 : 73 Bracken & other ferns, cause of EBH (enzootic
bovine hematuria) in cattle, 224 : 57 Bracken fern carcinogen, ptaquiloside, 224 : 57 Bracken fern effects, animals (table), 224 : 68 Bracken fern interaction, bovine
papillomavirus, 224 : 65 Bracken fern plant, photos (illus.), 224 : 58 Bracken fern toxicity, animal models, 224 : 67 Bracken fern toxicity, animals, 224 : 67 Bracken fern, gene mutations, 224 : 79 Bracken fern, oxidative stress role, 224 : 82 Brazilian coastal waters, DDT contamination,
228 : 8 Brominated fl ame retardants, applications &
alternatives thereto (table), 222 : 4 Brominated fl ame retardants, described, 222 : 2 Brominated fl ame retardants, uses curtailed,
222 : 3 Bulk PBMs, environmental release, 227 : 7 C admium effects, chlorophyll & carotenoids,
229 60, 61 Cadmium effects, on fatty acid composition,
229 : 63 Cadmium effects, on free amino acids &
proline, 229 : 62 Cadmium effects, on genetic material, 229 : 63 Cadmium effects, on key organic osmotica,
229 : 65 Cadmium effects, on plant growth (table),
229 : 56 Cadmium effects, on protein levels, 229 : 61 Cadmium effects, photosynthesis, 229 : 69 Cadmium effects, plant growth regulators,
229 : 67 Cadmium effects, plant metal uptake, 229 : 64 Cadmium toxicity, to aquatic organisms,
229 : 27 Cadmium, described, 229 : 52 Cadmium, environmental sources, 229 : 52 Cadmium, natural vs. anthropogenic sources,
229 : 52 Cadmium, oxidative defense system effects,
229 : 66 Cadmium, plant accumulation, 229 : 54 Cadmium, plant effects, 229 : 59 Cadmium, plant morphology effects, 229 : 55 Cadmium, plant pigment effects, 229 : 59 Cadmium, plant water relations effect, 229 : 70 Cadmium, protein and protease effects, 229 : 61 Cadmium, soil and plant behavior, 229 : 54 Cadmium-enriched environments, plant
growth effects, 229 : 51 ff.
Cadmium-enriched environments, plant metabolic effects, 229 : 51 ff.
California agricultural counties, diazinon water monitoring data (table), 223 : 124
California annual insecticide use, diazinon (illus.), 223 : 111
California counties, highest diazinon use, 223 : 111
California counties, major diazinon use (table), 223 : 112
California crop use, fenpropathrin (diag.), 225 : 80
California pesticides, types used, 224 : 99 California top crop uses, diazinon (diag.),
223 : 113 California urban watersheds, diazinon residues
(table), 223 : 124 California use by application method, diazinon
(diag.), 223 : 114 California use profi le, diazinon, 223 : 107, 110 California use volume (2000–2010),
fenpropathrin (diag.), 225 : 79 California, county map (illus.), 223 : 110 California, fenpropathrin weight used (diag.),
225 : 80 Canadian drinking water guidelines,
microbial & chemical contaminants (tables), 222 : 121
Canadian guidelines, drinking water quality, 222 : 120
Canadian trends, potable water disinfection, 222 : 126
Cancer diagnostic aid, ultrasonography, 224 : 82 Cancer-promoting metabolites, fumonisins,
228 : 106 Carbamate pesticides, soil column leaching
results (table), 221 : 54–57 Carbamate pesticides, soil leaching results,
221 : 53 Carcinogenic mechanism, ptaquiloside (diag.),
224 : 63 Carcinogenic mechanism, ptaquiloside, 224 : 62 Cardiac laboratories, radiation exposure routes
(illus.), 222 : 87 Cardiac medical procedures, described, 222 : 74 Cardiology staff effects, radiation exposure,
222 : 85 Cardiology staff exposure, radiation, 222 : 73 ff. Cardiology staff radiation dose, eyes &
forehead (diag.), 222 : 80 Cardiology staff radiation exposure, cataract
formation, 222 : 84 Cardiology staff radiation exposure, eye &
thyroid gland, 222 : 82
Index
142
Cardiology staff radiation exposure, literature searched, 222 : 75
Cardiology staff, health effects from radiation, 222 : 73 ff.
Cardiology staff, radiation dose by procedure (diag.), 222 : 79
Cardiology staff, radiation dose to hands (diag.), 222 : 82
Cardiology staff, radiation dose to thyroid/neck region (illus.), 222 : 81
Cardiology staff, radiation doses, 222 : 78 Cardiology staff, radiation hand and wrist
exposure, 222 : 80 Cardiology staff, radiation safety practices,
222 : 85 Carotenoid effects, cadmium, 229 : 60 Case studies described, bioamplifi cation,
227 : 114 Cataract formation, irradiated cardiology staff,
222 : 84 Catechol, acid mine drainage control, 226 : 18 Catheterization laboratories, radiation
exposure routes (illus.), 222 : 87 Catheterization laboratory, growth & trends,
222 : 76 Catheterization safety practices, radiation,
222 : 85 Cd biomagnifi cation, in aquatic ecosystems,
226 : 101 ff. Cd residues, in Guiana dolphin kidney & liver
(table), 228 : 14 Cereal levels, Fusarium toxins (table), 228 : 104 Cerium nanoparticles, described, 230 : 99 Cetacean liver, mercury contamination (diag.),
228 : 12 Cetacean threat, endocrine disruptors, 228 : 2 Cetaceans, DDT & PCB residues (diag.),
228 : 8 Cetaceans, pollutant accumulation, 228 : 2 Chemical additives to plastics, toxicity, 227 : 34 Chemical behavior, elemental mercury, 229 : 2 Chemical behavior, phthalates, 224 : 39 ff. Chemical compounds, placental transport
(diag.), 227 : 67 Chemical contaminants in drinking water, EU
Directive (table), 222 : 123 Chemical contaminants, Australian drinking
water guidelines (table), 222 : 122 Chemical contaminants, Canadian drinking
water guidelines (table), 222 : 121 Chemical contamination, drinking water
guidelines (table), 222 : 116 Chemical contamination, in cetaceans, 228 : 2 Chemical damage to DNA, implications, 227 : 83
Chemical degradation, microbe involvement, 221 : 25
Chemical elimination, in accumulation processes, 227 : 111
Chemical forms & sources, boron, 225 : 58 Chemical forms, mercury, 229 : 2 Chemical mixtures, effect on deriving
sediment quality criteria, 224 : 155 Chemical standards, for drinking water (table),
222 : 117 Chemical washing, during food processing,
229 : 101 Chemical-physical properties, ammonium
polyphosphate (table), 222 : 15 Chemical-physical properties, HFFRs, 222 : 5 Chemical-physical properties, magnesium
hydroxide (table), 222 : 13 Chemical-physical properties, phthalates,
224 : 41 Chemistry, clomazone, 229 : 36 Chemistry, diazinon, 223 : 107ff. Chemistry, methomyl, 222 : 95 Chemodynamics, chlomazone, 229 : 37 Chemodynamics, methomyl, 222 : 95 Chicken (domestic), PCB toxicity, 230 : 64 Chicken toxicity, boron, 225 : 60, 67 Children, of addicted-substance mothers,
227 : 58 Chile, Santiago air contamination, 223 : 1ff. Chilean guidelines, air pollutant hazards
(table), 223 : 16 China, Hg as environmental contaminant,
223 : 54 China, TRVs for avian wildlife, 223 : 53 ff. Chinese aquatic birds, PCB TRVs, 230 : 59 ff. Chinese aquatic species hazard quotients,
metals-metalloids (table), 230 : 50 Chinese aquatic species, risk assessment,
230 : 49 Chinese bird species, characterized (table),
223 : 56 Chinese bird species, methyl mercury levels
(diag.), 223 : 73 Chinese bird species, most vulnerable to
xenobiotics, 223 : 55 Chinese fi sh residues, heavy metals, 230 : 126 Chinese fi sh residues, methyl mercury (diag.),
223 : 70 Chinese pollutants, metals & metalloids, 230 : 36 Chinese residues, E2 risk assessment, 228 : 44 Chinese water quality criteria (WQC), metals
& metalloids, 230 : 35 ff. Chloramination, drinking water history,
222 : 114
Index
143
Chlorinated water reactions, methomyl (diag.), 222 : 99
Chlorination, origins in drinking water, 222 : 112, 113
Chlorophyll effects, cadmium, 229 : 59 Chromate phytotoxicity, carbon amendment
effect (illus.), 225 : 34 Chromate soil reduction, organic amendment
effect (diag.), 225 : 33 Chromium characteristics, profi le, 225 : 6 Chromium immobilization, in carbon amended
soils (illus.), 225 : 38 Chromium in soil, uses (table), 225 : 5 Chromium soil metabolism, infl uencing
factors (diag.), 225 : 24 Chromosomal aberrations, human bladder
cancer role, 224 : 81 Chronic toxicity to aquatic species, diazinon,
223 : 130 Chronic toxicity to freshwater aquatic species,
diazinon (table), 223 : 132 Classifi cation scheme, HFFRs for
bioaccumulation (table), 222 : 9 Classifi cation scheme, HFFRs for persistence
(table), 222 : 9 Classifi cation scheme, HFFRs for toxicity
(table), 222 : 9 Clastogen, ptaquiloside, 224 : 57 Clay effects, soil sorption processes, 221 : 20 Climate effects, soil column leaching, 221 : 14 Climate effects, zirconium release, 221 : 112 Climatic factors, infl uence on adult asthma,
226 : 48 Clinical profi le, EBH in cattle (table), 224 : 56 Clinical symptoms, of EBH in cattle, 224 : 55 Clomazone toxicity, aquatic species, 229 : 44 Clomazone toxicity, to non-target species,
229 : 45 Clomazone, air & volatilization, 229 : 39 Clomazone, biotic processes, 229 : 40 Clomazone, chemistry & physicochemical
properties, 229 : 36 Clomazone, description, 229 : 36 Clomazone, environmental chemodynamics,
229 : 37 Clomazone, environmental degradation,
229 : 39 Clomazone, environmental fate & toxicology,
229 : 35 ff. Clomazone, metabolic pathway in soybeans
(diag.), 229 : 44 Clomazone, microbial breakdown pathway
(diag.), 229 : 41 Clomazone, photolysis & hydrolysis, 229 : 39
Clomazone, photolytic degradation (diag.), 229 : 40
Clomazone, physicochemical properties (table), 229 : 37
Clomazone, plant effects, 229 : 43 Clomazone, plant mode-of-action, 229 : 42 Clomazone, soil interactions, 229 : 37 Clomazone, structure (illus.), 229 : 36 Clomazone, toxicology, 229 : 42 Clomazone, water behavior, 229 : 38 CO, air contaminant, 223 : 5 Coal & biomass fuel exposure, adult asthma
cause, 226 : 39 Coal deposits, acid mine drainage (table),
226 : 3 Coastal sediment levels, mercury, 226 : 68 Colloids, pesticide transport effects, 221 : 7 Combustion products, and adult asthma, 226 : 37 Common loon, methyl mercury toxicity, 223 : 63 Community effects, pollution, 227 : 79 Concentration effects, nanoparticles, 230 : 90 Consumption by users, polymers (table), 227 : 6 Consumption proportion, polymer types, 227 : 6 Consumption, PBMs, 227 : 3 Contaminants present, e-waste, 229 : 24 Contaminants present, in e-waste (table),
229 : 24 Contaminated soil remediation, with biochar,
228 : 83 ff. Contaminated soil, biochar remediation
(diag.), 228 : 85 Contamination by chemicals, drinking water
guidelines (table), 222 : 116 Control methods for fungi, in water, 228 :131 Control strategies, acid mine drainage, 226 : 4 Controlling EBH, approaches, 224 : 85 Copper accumulation levels, in land snails
(table), 225 : 107 Copper bioaccumulation values, land snails
(table), 225 : 101 Copper bioaccumulation, by land snails,
225 : 111 Copper biomarker in land snails, lysosomal
stability, 225 : 117 Copper biomarker in land snails, membrane
integrity, 225 : 117 Copper biomarker in land snails,
metallothionein induction, 225 : 118 Copper exposure level, land snails, 225 : 99 Copper exposure routes, organisms, 225 : 97 Copper exposure sources, land snails, 225 : 99 Copper forms, toxicity & tolerance (table),
225 : 101 Copper in food, land snail exposure, 225 : 105
Index
144
Copper mining, mercury release, 226 : 71 Copper nanoparticles, described, 230 : 99 Copper pollution biomarker, land snail
oxidative stress, 225 : 119 Copper pollution monitoring, land snails
(Pulmonata), 225 : 95 ff. Copper pollution, land snail biomarkers,
225 : 113 Copper toxicity, among species (table), 225 : 98 Copper toxicity, expression methods, 225 : 100 Copper transfer, in soil-plant systems, 225 : 108 Copper uptake in land snails, shell vs. soft
tissues, 225 : 113 Copper, air exposure, 225 : 100 Copper, as an environmental pollutant, 225 : 97 Copper, fi eld exposure, 225 : 105 Copper, food chain movement, 225 : 105 Copper, land snail metabolic regulation,
225 : 108 Copper, plant levels, 225 : 106 Copper, soil exposure, 225 : 103 Criteria calculation, for sediment water
quality, 224 : 131 Criteria setting for Chinese birds, toxicity data
selection, 223 : 56 Critical study approach, in risk assessment,
230 : 73 Crop use in California, fenpropathrin (diag.),
225 : 80 Cu biomagnifi cation, in aquatic ecosystems,
226 : 101 ff. D aphnids, silver nanoparticle uptake,
223 : 96 Daphnids, silver toxicity, 223 : 93 Data analysis, setting sediment quality criteria
for pesticides, 224 : 122 Data sources, for deriving sediment quality
criteria, 224 : 114 DDT contamination, Brazilian coastal waters,
228 : 8 DDT residues, Guiana dolphins, 228 : 6 DDT residues, in small cetaceans (diag.),
228 : 8 DE-71 (PBDE isomer) NOAEL & LOAEL,
American kestrels (table), 229 : 125 DE-71 NOAEL & LOAEL, mink (table),
229 : 119 DE-71 toxicity thresholds (diag.), 229 : 127 DE-71 toxicity, to birds, 229 : 121 Death rate in Americas, from air pollution,
223 : 3 Decomposition, phthalates, 224 : 43 Degradates of PBMs, potential effects (diag.),
227 : 25
Degradation half-life, fenpropathrin (table), 225 : 82
Degradation in the environment, PBMs, 227 : 14 Degradation of PBMs, abiotic processes, 227 : 15 Degradation pathways, fenpropathrin (diag.),
225 : 86 Degradation pathways, PBMs (diag.), 227 : 15 Degradation, methomyl, 222 : 98 Degradation, polymer-based materials, 227 : 1 ff. Degradation, ptaquiloside, 224 : 77 Degradation-infl uencing factors, PBMs, 227 : 14 Demethylation in soils, trace elements (table),
225 : 18 Demethylation, of arsenic, 224 : 8 Demethylation, trace element detoxifi cation,
225 : 16 Deoxynivalenol=vomitoxin, symptoms
described, 228 : 109 Deriving TRC & TRV values, methodology,
223 : 57 Desulfurization, acid mine drainage control,
226 : 19 Detergent washing, during food processing,
229 : 101 Detoxifi cation & transport, arsenic (diag.),
224 : 9 Detoxifi cation mechanism, arsenic, 224 : 12 Diacetoxyscirpenol, a trichothecene
mycotoxin, 228 : 109 Diagnosing bovine papillomavirus,
polymerase chain reaction role, 224 : 85 Diazinon annual use, California urban vs. total
(diag.), 223 : 111 Diazinon application methods, total use in
California (diag.), 223 : 114 Diazinon effects, microbial populations,
223 : 121 Diazinon in California, air monitoring, 223 : 128 Diazinon insecticide, uses, 223 : 107 Diazinon persistence, aquatic environments,
223 : 125 Diazinon residues, California urban
watersheds (table), 223 : 124 Diazinon residues, water, 223 : 122 Diazinon soil degradation, infl uencing factors,
223 : 120 Diazinon soil mobility, temperature effect,
223 : 118 Diazinon use volume, major California
counties (table), 223 : 112 Diazinon water monitoring data, California
agricultural counties (table), 223 : 124 Diazinon, acute & chronic toxicity to aquatic
species, 223 : 130
Index
145
Diazinon, air degradation pathway (diag.), 223 : 127
Diazinon, aquatic life-benchmark and water quality criteria, 223 : 133
Diazinon, aquatic photolysis, 223 : 126 Diazinon, aquatic toxicity, 223 : 129 Diazinon, aquatic-life benchmark values
(table), 223 : 133 Diazinon, behavior in air, 223 : 126 Diazinon, bioaccumulation, 223 : 132 Diazinon, California use profi le, 223 : 107, 110 Diazinon, chemical structure (illus.), 223 : 108 Diazinon, chemistry & environmental fate,
223 : 107ff. Diazinon, earthworm toxicity, 223 : 122 Diazinon, environmental fate, 223 : 114 Diazinon, ground- & surface-water residues,
223 : 122–3 Diazinon, groundwater detections, 223 : 108 Diazinon, mode of toxic action, 223 : 129 Diazinon, partition coeffi cient, 223 : 115 Diazinon, photolysis, 223 : 120 Diazinon, physicochemical properties (table),
223 : 109 Diazinon, physicochemical properties, 223 : 108 Diazinon, soil dissipation, 223 : 119 Diazinon, soil leaching, 223 : 117 Diazinon, soil microbial degradation, 223 : 119 Diazinon, soil mineralization, 223 : 118 Diazinon, soil photolysis pathway (diag.),
223 : 121 Diazinon, soil sorption, 223 : 115 Diazinon, soil-sediment degradation, 223 : 114 Diazinon, top crop uses in California (diag.),
223 : 113 Diazinon, urban vs. agricultural uses in
California, 223 : 113 Diazinon, volatilization loss, 223 : 127 Diazinon, water quality criteria (table), 223 : 133 Dietary intake effects mapped, heavy metals
(diag.), 226 : 108 Diphenyl ether pesticides, leaching
characteristics, 221 : 73 Diphenyl ether pesticides, soil column
leaching (table), 221 : 62–65 Disease etiology, EBH in cattle, 224 : 57 Disease in dolphins, environmental link,
228 : 13 Disease sentinels, Guiana dolphins, 228 : 1 ff. Diseases, caused by fungi, 228 :129 Disinfectant residual loss, drinking water,
222 : 149 Disinfection by-products, formation in water,
222 : 141
Disinfection by-products, formed in water (table), 222 : 142
Disinfection of drinking water, regulation, 222 : 115
Disinfection of water, successes & challenges, 222 : 111 ff.
Disintegration, PBMs, 227 : 21 Dispersion medium, nanoparticles, 230 : 89 Dissolved organic matter, pesticide transport
effects, 221 : 7, 8 Distribution, mercury, 229 : 5 DNA damage by chemicals, implications,
227 : 83 Dolphin sentinels, ecotoxicity and emerging
diseases, 228 : 1 ff. Dolphin sentinels, marine ecotoxicity, 228 : 1 ff. Double-crested cormorant, PCB toxicity,
230 : 68. Drinking water contaminants, mycotoxins &
afl atoxins, 228 :122 Drinking water contamination, by fungi,
228 :121 ff. Drinking water contamination, sources of
fungi, 228 :123 Drinking water disinfection, history, 222 :
112, 113 Drinking water disinfection, ozone, 222 : 115 Drinking water disinfection, recent advances,
222 : 135 Drinking water disinfection, regulation,
222 : 115 Drinking water disinfection, risk management
concepts, 222 : 150, 153 Drinking water disinfection, successes &
challenges, 222 : 111 ff. Drinking water fungal contamination,
common types, 228 :123 Drinking water guidelines, chemical
contamination (table), 222 : 116 Drinking water history, chloramination,
222 : 114 Drinking water limits, chemical contaminants
in EU (table), 222 : 123 Drinking water pathogens, of emerging
concern, 222 : 129 Drinking water quality, Australia, 222 : 122 Drinking water quality, Canada, 222 : 120 Drinking water quality, microbial indicators,
222 : 128 Drinking water quality, South Africa, 222 : 117 Drinking water regulations, for US
disinfectants (table), 222 : 119 Drinking water, biofi lm formation & control,
222 : 144
Index
146
Drinking water, biological pollutants, 228 :122 Drinking water, disinfectant residual loss,
222 : 149 Drinking water, emerging bacterial waterborne
pathogens, 222 : 130 Drinking water, emerging fungal waterborne
pathogens, 222 : 134 Drinking water, emerging viral & protozoan
waterborne pathogens, 222 : 133 Drinking water, formation of disinfection
by-products, 222 : 141 Drinking water, nitrifi cation, 222 : 145 Drinking water, sources & types of fungi,
228 :123 Dry cover barrier, to prevent acidic mine
effl uents, 226 : 7 E 2 (17-[beta]-estradiol), predicted no-effect
concentration (PNEC) in Chinese waters, 228 : 29 ff.
E2 NOEC values, aquatic species (table), 228 : 38
E2 PNEC values, calculated via models (table), 228 : 39
E2 residues, in surface water, sediment and STP (sewage treatment plant) effl uent (table), 228 : 45
E2 risk assessment, for Chinese concentrations, 228 : 44
E2 SSD (species sensitivity distribution), reproductive toxicity (diag.), 228 : 40
E2 toxicity, in aquatic organisms, 228 : 31 E2 toxicity, on aquatic species (table), 228 : 34–5 E2 toxicity, species sensitivity distribution
(SSD) (diag.), 228 : 39 E2, amphibian toxicity, 228 : 33 E2, as an environmental contaminant, 228 : 30 E2, no observed effect concentration (NOEC)
for reproduction, 228 : 37 E2, PNEC derivation method, 228 : 36 E2, rainbow trout toxicity, 228 : 34 Earthworm burrows, pesticide leaching effects,
221 : 33 Earthworm toxicity, diazinon, 223 : 122 Earthworms, soil macropore formation, 221 : 6 EBH (enzootic bovine hematuria), disease in
cattle described, 224 : 54 EBH cause, Pteridium aquilinum , 224 : 54 EBH in cattle, caused by bracken & other
ferns, 224 : 57 EBH in cattle, disease etiology, 224 : 57 EBH, clinical symptoms, 224 : 55 EBH, enzootic localities and incidence, 224 : 54 EBH, in India, 224 : 55 EBH, prevention & control, 224 : 85
EBH, symptoms & clinical character (table), 224 : 56
Ecosystem effects, pollution, 227 : 79 Ecotoxicity data needs, acute vs. chronic
exposure, 224 : 120 Ecotoxicity data quality, deriving sediment
quality criteria, 224 : 124 Ecotoxicity data quantity needed, deriving
sediment quality criteria, 224 : 129 Ecotoxicity data, role in deriving sediment
quality criteria, 224 : 120 Ecotoxicity sentinels, Guiana dolphins, 228 : 1 ff. Ecotoxicity to aquatic species, fenpropathrin,
225 : 89 Ecotoxicity, fenpropathrin (table), 225 : 89 Ecotoxicity, HFFRs, 222 : 7 Ecotoxicology, fenpropathrin, 225 : 77 ff. Ecotoxicology, fenpropathrin, 225 : 88 Ecotoxicology, use of sentinel organisms,
227 : 97 Effects of addictive substances, on mothers,
fetuses & newborns (table), 227 : 60–3 Effects, PBM degradates (diag.), 227 : 25 Elasmobranch tissues, mercury residues
(table), 226 : 80 Electrochemical cover, acid mine drainage
control, 226 : 18 Electrochemical protection system, acid mine
drainage control (illus.), 226 : 19 Elemental mercury, chemical behavior, 229 : 2 Elution medium effects, pesticide mobility
(table), 221 : 37 Embryo development, bioamplifi cation, 227 : 115 Emerging pathogens, in drinking water, 222 : 129 Empirical approaches, to developing sediment
quality criteria, 224 : 107 Endangered species, implication for deriving
sediment quality criteria, 224 : 157 Endocrine disrupting effects, of E2, 228 : 30 Endocrine disruptors, and cetaceans, 228 : 2 Endocrine-disrupting chemicals, description,
228 : 30 Endotoxin levels, in urban vs. rural areas,
226 : 42 Entanglement, PBMs, 227 : 24 Environmental aquatic toxicity, pesticides,
224 : 99 Environmental behavior, aluminum
trihydroxide, 222 : 9 Environmental chemodynamics, clomazone,
229 : 37 Environmental concentrations, phthalates &
BPA, 227 : 33 Environmental contaminant, E2, 228 : 30
Index
147
Environmental degradation, clomazone, 229 : 39 Environmental degradation, PBMs, 227 : 14 Environmental degradation, polymer-based
materials, 227 : 1 ff. Environmental distribution, arsenic, 224 : 4 Environmental effects, e-waste disposal,
229 : 19 ff. Environmental effects, PBMs, 227 : 24 Environmental effects, polymer-based
materials, 227 : 1 ff. Environmental effects, ptaquiloside-induced
enzootic bovine hematuria, 224 : 53 ff. Environmental fate, arsenic, 224 : 4, 8–10 Environmental fate, clomazone, 229 : 35 ff. Environmental fate, diazinon, 223 : 107ff., 114 Environmental fate, fenpropathrin, 225 : 77 ff. Environmental fate, fenpropathrin, 225 : 82 Environmental fate, methomyl, 222 : 93 ff. Environmental fate, polymer additives, 227 : 28 Environmental fl ow, nanowaste (diag.), 230 : 88 Environmental implication, polymer additives,
227 : 27 Environmental interactions, nanoparticles,
230 : 89 Environmental levels, natural arsenic (table),
224 : 3 Environmental management, arsenic cycle,
224 : 1 ff. Environmental matrices, polymer degradation
(table), 227 : 16–19 Environmental mobilization, arsenic, 224 : 10 Environmental movement & transport, fungi
(diag.), 228 :130 Environmental occurrence, PBMs, 227 : 9 Environmental occurrence, polymer additives,
227 : 30 Environmental occurrence, polymer-based
materials, 227 : 1 ff. Environmental pollutants, metals &
metalloids, 230 : 37 Environmental pollutants, polymer additives,
227 : 28 Environmental presence, HFFRs, 222 : 6 Environmental problem, acid mine drainage,
226 : 2 Environmental release, bulk PBMs, 227 : 7 Environmental release, nanoparticles, 230 : 87 Environmental residues detected,
fenpropathrin, 225 : 79 Environmental residues, mercury, 226 : 66 Environmental residues, polymer additives
(table), 227 : 30–2 Environmental sentinels, Guiana dolphins,
228 : 3
Environmental sentinels, marine mammals, 228 : 2
Environmental sink, PBM waste, 227 : 10 Environmental source, phthalates, 224 : 40 Environmental sources, cadmium, 229 : 52 Environmental stressors, disease link in
dolphins, 228 : 13 Environmental tobacco smoke, adult asthma,
226 : 37 Enzootic bovine hematuria (EBH),
ptaquiloside-induced, 224 : 53 ff. Enzootic localities, EBH, 224 : 54 Enzymatic reduction, arsenic, 224 : 7 Enzyme inhibition, mercury, 229 : 10 Enzyme interactions, nanosilver toxicity, 223 : 98 Enzymes, boron effects, 225 : 63 Epididymal antioxidant system, bisphenol A
effects, 228 : 70 Estrogen/androgen synthesis & action effects,
BPA (table), 228 : 66 Estrogenic chemicals, described, 228 : 30 Ethyl mercury, thimerosal in vaccines, 229 : 4 EU (European Union) Directive, chemical
contaminants in drinking water (table), 222 : 123
EU Directive, chemical contaminants in drinking water, 222 : 123
European trends, potable water disinfection, 222 : 127
E-waste contaminant effects, on aquatic organisms, 229 : 25
E-Waste contaminants (Korle Lagoon), vs. sediment quality guideline values (table), 229 : 25
E-Waste export, to developing countries, 229 : 20 E-Waste generated, globally, 229 : 20 E-Waste in Ghana, quantity imported (diag.),
229 : 21 E-Waste management, in Ghana, 229 : 21 E-Waste pollution issue, Ghana, 229 : 20 E-Waste quantity imported, into Ghana (diag.),
229 : 21 E-waste recycling, Agbogbloshie (Ghana)
(illus.), 229 : 23 E-Waste recycling, in Ghana, 229 : 22 E-Waste water pollution, Agbogbloshie
(Ghana) scrap yard, 229 : 22 E-Waste, aquatic environmental effects,
229 : 19 ff. E-waste, contaminants present (table), 229 : 24 E-waste, contaminants present, 229 : 24 E-Waste, toxic chemicals present, 229 : 20 Exceedance probabilities, Santiago, Chile air
pollutant data, 223 : 23
Index
148
Exposure concentrations in a Chinese lake, metals-metalloids, 230 : 49
Exposure duration, setting sediment quality criteria, 224 : 132
Exposure frequency, setting sediment quality criteria, 224 : 132
Exposure magnitude, setting sediment quality criteria, 224 : 132
Exposure routes & sources, bisphenol A, 228 : 58
Eye exposure to radiation, cardiology staff, 222 : 82
Eyes, cardiology staff radiation dose (diags.), 222 : 80
F abricated nanoparticles, applications, 230 : 85 Fabricated nanoparticles, classes described,
230 : 85 Fabricated nanoparticles, commercial
applications (table), 230 : 86 Fabricated nanoparticles, phytotoxicity, 230 :
83 ff. Facilitated transport, pesticides in soil, 221 : 42 Fate in the body, mercury (diag.), 229 : 5 Fate in the environment, polymer additives,
227 : 28 Fatty acid composition, cadmium effects,
229 : 63 Fatty acids, acid mine drainage control, 226 : 17 Fenpropathrin ecotoxicity, aquatic species,
225 : 89 Fenpropathrin ecotoxicity, birds, 225 : 90 Fenpropathrin ecotoxicity, insects, 225 : 88 Fenpropathrin ecotoxicity, mammals, 225 : 91 Fenpropathrin, abiotic degradation, 225 : 85 Fenpropathrin, behavior in air, 225 : 82 Fenpropathrin, behavior in water, 225 : 83 Fenpropathrin, biotic degradation, 225 : 84 Fenpropathrin, California crop use (diag.),
225 : 80 Fenpropathrin, California use volume
(2000–2010; diag.), 225 : 79 Fenpropathrin, degradation half-life (table),
225 : 82 Fenpropathrin, degradation pathways (diag.),
225 : 86 Fenpropathrin, description & characteristics,
225 : 78 Fenpropathrin, ecotoxicity (table), 225 : 89 Fenpropathrin, ecotoxicity, 225 : 77 ff. Fenpropathrin, ecotoxicology, 225 : 88 Fenpropathrin, environmental fate, 225 : 77 ff. Fenpropathrin, environmental fate, 225 : 82 Fenpropathrin, environmental residues
detected, 225 : 79
Fenpropathrin, hydrolysis, 225 : 87 Fenpropathrin, mode of action, 225 : 80 Fenpropathrin, photolysis, 225 : 85 Fenpropathrin, physicochemical properties
(table), 225 : 81 Fenpropathrin, physicochemical properties,
225 : 81 Fenpropathrin, plant metabolism, 225 : 85 Fenpropathrin, soil behavior, 225 : 83 Fenpropathrin, soil degradation, 225 : 84 Fenpropathrin, soil leaching behavior, 225 : 83 Fenpropathrin, structure (illus.), 225 : 78 Fenpropathrin, uses in the United States, 225 : 78 Fenpropathrin, weight used in California
(diag.), 225 : 80 Fern carcinogen, ptaquiloside, 224 : 55 Fern content, ptaquiloside, 224 : 60 Fern fronds, ptaquiloside content, 224 : 60, 76 Fern-induced tumors, ptaquiloside adducts,
224 : 80 Fertilizer effects, pesticide mobility in soil,
221 : 43 Fetus effects, of addicted mothers (table), 227 :
60–3 Fetus specimen analysis, benefi ts (diag.),
227 : 68 Field data on tropic transfer, in aqueous
environments, 226 : 106 Field exposure, copper, 225 : 105 Field leaching, pesticides, 221 : 16 Field studies, heavy metal accumulation
results, 226 : 112 Field vs. laboratory studies, pesticide leaching,
221 : 53 Fingers, dose to cardiology staff (diag.),
222 : 79 Fish collection sites in Pakistan, heavy metal
residues (illus.), 230 : 116 Fish heavy metal residues, China and
Bangladesh, 230 : 126 Fish heavy metal residues, Iran and India,
230 : 127 Fish metal levels, spatial distribution (illus.),
230 : 117 Fish muscle residues, mercury (table), 226 : 82 Fish residues in China, methyl mercury
(diag.), 223 : 70 Fish residues in Pakistan, heavy metals, 230 :
111 ff. Fish residues, Khyber Pakhtunkhwa Province
(Pakistan), 230 : 116 Fish residues, of heavy metals, 230 : 113 Fish residues, of mercury, 226 : 89 Fish residues, of PCBs, 230 : 77
Index
149
Fish residues, Punjab Province (Pakistan), 230 : 119
Fish residues, Sindh Province (Pakistan), 230 : 123
Fish toxicity mechanism, silver, 223 : 93 Fish toxicity, E2, 228 : 31 Fish, pollutant exposures and uptake, 230 : 112 Fishing gear entanglement, Guiana dolphins,
228 : 4 Flame retardant compounds,
organophosphates, 222 : 22 Flame retardant, 9,10-Dihydro-9-oxa-10-
phosphaphenanthrene-10-oxide, 222 : 42 Flame retardant, aluminum
diethylphosphinate, 222 : 45 Flame retardant, bisphenol-A
bis(diphenylphosphate), 222 : 37 Flame retardant, melamine polyphosphate,
222 : 48 Flame retardant, pentaerythritol, 222 : 51 Flame retardant, resorcinol
bis(diphenylphosphate), 222 : 35 Flame retardant, triphenylphosphate, 222 : 22 Flame retardant, zinc borate, 222 : 16 Flame retardant, zinc hydroxystannate, 222 : 18 Flame retardant, zinc stannate, 222 : 21 Flame retardantcy requirements, organic
materials, 222 : 2 Flame retardants, described, 222 : 2 Flyash amendment of soil, pesticide mobility
effects, 221 : 40 Food (fruit & vegetable) processing methods,
pyrethroid insecticide residue effects (table), 229 : 92–99
Food and water threat, fungal diseases, 228 :130 Food blanching, pesticide residue effect,
229 : 104 Food chain movement, copper, 225 : 105 Food chain risks, of polymer-based materials,
227 : 2 Food exposure to copper, land snails, 225 : 105 Food freezing, pesticide residue effect, 229 : 104 Food ingestion rates, avian species (table),
230 : 62 Food juicing, pesticide residue effect, 229 : 102 Food processing & pesticides, described,
229 : 90 Food processing effects, from boiling &
cooking, 229 : 103 Food processing of vegetables & fruit, peeling,
229 : 102 Food processing, described, 229 : 91 Food processing, washing with chemicals or
detergents, 229 : 101
Food processing, washing with salt solutions, 229 : 101
Food processing, washing with tap water, 229 : 91
Food washing effects, hydrophilic pesticide residues, 229 :100
Forehead, cardiology staff radiation dose (diags.), 222 : 80
Free amino acid effects, cadmium, 229 : 62 Freshwater fi sh residues, heavy metals, 230 : 113 Freshwater fi sh, heavy metal residues (table),
230 : 114 Freshwater species, metal & metalloid toxicity
(table), 230 : 39 Freshwater trophic transfer factors, biokinetic
heavy metal data (diag.), 226 : 110 Freshwater trophic transfer, heavy metals
(diag.), 226 : 109 Fruit processing, pyrethroid insecticide residue
effect, 229 : 89 ff. Fumonisins, toxic fungal metabolites, 228 : 106 Fumonisins, toxic syndromes described,
228 : 106 Fungal allergen levels, in urban vs. rural areas,
226 : 42 Fungal diseases, threats, 228 :130 Fungal drinking water contaminants, common
types, 228 :123 Fungal genera, disease causing, 228 :129 Fungal waterborne pathogens, in drinking
water, 222 : 134 Fungal-produced toxins, mycotoxin risks,
228 :129 Fungi contamination, drinking water, 228 :
121 ff. Fungi in drinking water, sources & types,
228 :123 Fungi in drinking water, sources, 228 :123 Fungi, boron effects, 225 : 62 Fungi, clustered genes & afl atoxin
biosynthesis (diag.), 228 :128 Fungi, control in water sources, 228 :131 Fungi, environmental transport & movement
(diag.), 228 :130 Fungi, fusarial toxin producers, 228 : 101 ff. Fungi, identifi cation methods, 228 :125 Fungi, isolation methods, 228 :124 Fungi, molecular identifi cation methods,
228 :125 Fungi, universal PCR (polymerase chain
reaction) primers (table), 228 :126 Fusarial toxins, prevention and control, 228 :110 Fusarial toxins, secondary metabolites of
Fusarium fungi, 228 : 101 ff.
Index
150
Fusarium fungal species, mycotoxins produced (table), 228 : 103
Fusarium fungi, fusarial toxins, 228 : 101 ff. Fusarium fungi, mycotoxin producers, 228 : 102 Fusarium mycotoxins, structures (diag.),
228 :130 Fusarium toxins, cereal levels (table), 228 : 104 Fusarium toxins, host plants & growth
infl uences, 228 : 104 Fusarium -produced mycotoxin, moniliformin,
228 : 107 Fusarium -produced mycotoxin,
trichothecenes, 228 : 108 Fusarium -produced mycotoxins, T -2 and
HT-2, 228 : 108 G ases, air contaminants, 223 : 5 Gaussian statistical modeling, atmospheric
pollutants, 223 : 8 Gene mutations, Bracken fern, 224 : 79 Gene pool effects, xenobiotics, 227 : 82 Genetic damage monitoring, biomarker role,
227 : 84 Genetic diversity effects, biomarker detection,
227 : 85 Genetic diversity effects, metal pollution
(table), 227 : 86–91 Genetic diversity effects, metals, 227 : 85 Genetic diversity in animals, metal effects,
227 : 92 Genetic diversity threats, metal pollution
(diag.), 227 : 83 Genetic diversity, metal-pollution effects, 227 :
79 ff. Genetic ecotoxicity, of metals, 227 : 80 Genetic ecotoxicity, sentinel organism use,
227 : 97 Genetic ecotoxicology, described, 227 : 80 Genetic effects, metal-exposed animals, 227 :
79 ff. Genetic effects, metals, 227 : 79 Genetic effects, vs. natural genetic changes,
227 : 82 Genetic markers, to assess genetic variability,
227 : 95 Genetic material effects, cadmium, 229 : 63 Genetic structure response, selection forces,
227 : 80 Genetic structure, metal-pollution effects, 227 :
79 ff. Genetic variability assessment, with genetic
markers, 227 : 95 Genotoxic activity, ptaquiloside, 224 : 77 Genotoxicity, methylated As(III), 224 : 10 Genotoxin carcinogen, ptaquiloside, 224 : 57
Geographic distribution, Guiana dolphins (diag.), 228 : 4
Geographic factors, infl uence on adult asthma, 226 : 48
Ghana, e-waste disposal effects, 229 : 19 ff. Ghana, e-waste management, 229 : 21 Ghana, e-waste pollution issue, 229 : 20 Ghana, e-waste recycling, 229 : 22 Giardiasis, in Guiana dolphins, 228 : 15 Global cycle, arsenic (diag.), 224 : 5 Global trends, potable water disinfection,
222 : 124 Gold nanoparticles, described, 230 : 101 Great egret, methyl mercury toxicity, 223 : 62 Great horned owl, PCB toxicity, 230 : 70 Groundwater contamination risk, mobility
indices (table), 221 : 27 Groundwater residues, diazinon, 223 : 122 Groundwater ubiquity score (GUS), relative
soil mobility (diag.), 221 : 30 Guiana dolphin blubber, organochlorine
residues (table), 228 : 7 Guiana dolphin kidney & liver residues, Cd,
Hg & Pb (table), 228 : 14 Guiana dolphin livers, metal accumulation,
228 : 12 Guiana dolphin residues, gender differences,
228 : 9 Guiana dolphin threat, lipophilic
contaminants, 228 : 5 Guiana dolphin threats, environmental
contamination, 228 : 4 Guiana dolphins, contaminants in prey,
228 : 5 Guiana dolphins, description (illus.), 228 : 3 Guiana dolphins, description, 228 : 3 Guiana dolphins, distribution (diag.), 228 : 4 Guiana dolphins, environmental sentinels,
228 : 3 Guiana dolphins, fi shing gear entanglement,
228 : 4 Guiana dolphins, geographic distribution,
228 : 3 Guiana dolphins, hexachlorobenzene residues,
228 : 9 Guiana dolphins, hexachlorocyclohexane
residues, 228 : 9 Guiana dolphins, human-related threats, 228 : 4 Guiana dolphins, lobomycosis & tattoo skin
disease, 228 : 16 Guiana dolphins, marine ecosystem sentinels,
228 : 1 ff. Guiana dolphins, PCB & DDT residues, 228 : 6 Guiana dolphins, PFCs, 228 : 10
Index
151
Guiana dolphins, toxoplasmosis & giardiasis, 228 : 15
Guidelines, air pollution in Santiago, Chile, 223 : 15
Guinea dolphins, human-induced injuries & marine debris, 228 : 18
Guinea dolphins, metal contamination, 228 : 11 Guinea dolphins, PBDEs, 228 : 10 Guinea dolphins, plastic debris effects, 228 : 19 Guinea dolphins, virus & helminth diseases,
228 : 17 GUS, relative pesticide mobility, 221 : 30 H alogenated pollutants, and cetaceans, 228 : 2 Halogen-free fl ame retardants (HFFRs),
toxicity, 222 : 1 ff. Halogen-free fl ame, persistence &
bioaccumulation, 222 : 1 ff. Halogens, for disinfecting drinking water,
222 : 139 Hands exposure to radiation, cardiology staff
(diag.), 222 : 82 Hands, dose to cardiology staff (diag.), 222 : 79 Hazard quotients compared in Chinese aquatic
species, metals-metalloids (table), 230 : 50
Hazard quotients, for Chinese aquatic species, 230 : 50
Hazardous concentration threshold (HC5) calculations, method comparisons (table), 230 : 42
Hazards of, acid mine drainage, 226 : 3 Hazards, polymer additives, 227 : 28 HC5 (hazardous concentration threshold)
calculations, method comparisons (table), 230 : 42
HC5 value calculations, metals-metalloids (diag.), 230 : 44
HC5 values for Zn, analysis approach effects (diag.), 230 : 47
HC5 values, calculated via different methods (diag.), 230 : 44
Health effects from irradiation, cardiology staff, 222 : 85
Health effects from radiation, cardiology staff, 222 : 73 ff.
Health effects, air contaminants, 223 : 5 Health effects, air pollution, 223 : 2 Health effects, phthalates, 224 : 40 Healthcare access effects, asthma prevalence,
226 : 49 Heavy metal accumulation results, from fi eld
studies, 226 : 112 Heavy metal accumulation, Guiana dolphin
livers, 228 : 12
Heavy metal binding, land snails, 225 : 97 Heavy metal biokinetic data, freshwater trophic
transfer factors (diag.), 226 : 110 Heavy metal characteristics, described, 230 : 112 Heavy metal concentrations in fi sh, spatial
distribution (illus.), 230 : 117 Heavy metal effects, on aquatic life, 229 : 26 Heavy metal induction, reactive oxygen
species, 223 : 40 Heavy metal phytoremediation, rhizobacteria
role, 223 : 33ff. Heavy metal plant stress, PGPR (plant
growth-promoting rhizobacteria) counter effect, 223 : 42
Heavy metal residues, in fi sh species, 230 : 113 Heavy metal residues, in freshwater fi sh,
230 : 113 Heavy metal residues, in marine & freshwater
fi sh (table), 230 : 114 Heavy metal residues, in Pakistani fi sh, 230 :
111 ff. Heavy metal residues, in Pakistani marine fi sh,
230 : 124 Heavy metal trophic transfer, biokinetic-
derived marine data (diag.), 226 : 111 Heavy metals in fi sh, Bangladesh and China,
230 : 126 Heavy metals in fi sh, India and Iran, 230 : 127 Heavy metals in soils, uses (table), 225 : 5 Heavy metals, air contaminants, 223 : 7 Heavy metals, described, 229 : 52 Heavy metals, dietary intake effects mapped
(diag.), 226 : 108 Heavy metals, dietary tropic transfer factors
(diag.), 226 : 107 Heavy metals, do they biomagnify?, 226 : 101 ff. Heavy metals, exposures & interactions, 223 : 34 Heavy metals, in Guiana dolphins, 228 : 11 Heavy metals, remediation, 223 : 35 Heavy metals, role in plants, 223 : 34 Heavy metals, soil bioavailability, 223 : 37 Heavy metals, toxic mechanisms in plants,
223 : 34 Heavy-metal remediation, PGPR role, 223 : 43 Helminth diseases, of Guinea dolphins, 228 : 17 Herpes virus resistance, boron in cattle, 225 : 65 Herring gull bioamplifi cation factors,
modeling (table), 227 : 131 Herring gull model, bioamplifi cation
simulation, 227 : 141 Herring gull simulation, bioamplifi cation
model parameters (table), 227 : 143–5 Herring gulls, bioamplifi cation modeling
(diags.), 227 : 130
Index
152
Hexachlorobenzene residues, Guiana dolphins, 228 : 9
Hexachlorocyclohexane residues, Guiana dolphins, 228 : 9
HFFR (halogen-free fl ame retardant), properties, environmental character (table), 222 : 59
HFFRs, brominated fl ame retardant alternatives (table), 222 : 4
HFFRs, categories & uses, 222 : 3 HFFRs, characteristics, 222 : 5 HFFRs, classifi cation & categories, 222 : 8 HFFRs, classifi cation of persistence, toxicity
& bioaccumulation (table), 222 : 9 HFFRs, data availability & consistency, 222 : 57 HFFRs, environmental behavior, 222 : 58 HFFRs, environmental presence & production
volumes, 222 : 6 HFFRs, in vitro toxicity, 222 : 8 HFFRs, in vivo toxicity, 222 : 7 HFFRs, persistence & bioaccumulation, 222 : 6 HFFRs, physical-chemical properties, 222 : 5 HFFRs, REACH system data, 222 : 5 HFFRs, toxicity & ecotoxicity, 222 : 7 Hg adsorption variables, stack emissions,
230 : 28 Hg emissions removal, results summary
(table), 230 : 6–25 Hg emissions to air, removal methods, 230 : 2 Hg removal effi ciency, by S-impregnated
activated carbon, 230 : 26 Hg removal effi ciency, virgin- vs.
S-impregnated-activated carbons, 230 : 26
Hg removal from airstacks, results summary (table), 230 : 6–25
Hg removal, by S-impregnated activated carbon, 230 : 4
Hg residues, in Guiana dolphin kidney & liver (table), 228 : 14
Hg 0 adsorption effects, sulfur to carbon ratio, 230 : 28
Hg 0 adsorption, inlet concentration effects, 230 : 28
Hg 0 adsorption, sulfur-content effects, 230 : 28 Hg 0 adsorption, temperature effects, 230 : 27 Hibernation effects, bioamplifi cation, 227 : 121 Host plants, Fusarium toxins, 228 : 104 Human activities, mercury release, 226 : 66 Human bladder cancer, chromosomal
aberration role, 224 : 81 Human consumed seafood, mercury levels,
226 : 89 Human effects, mercury, 226 : 89
Human effects, ptaquiloside-induced enzootic bovine hematuria, 224 : 53 ff.
Human exposure pathways, adult asthma causes (diag.), 226 : 35
Human exposure risks, from mining activities, 226 : 90
Human exposure sources, mercury, 229 : 3 Human exposure, to mercury, 229 : 3 Human fatality, boron toxicity, 225 : 67 Human food chain, fl ow of ptaquiloside
(diag.), 224 : 75 Human food chain, ptaquiloside entry points
(diag.), 224 : 74 Human health effects, ptaquiloside, 224 : 73 Human health effects, relation to statistical
information, 223 : 24 Human health effects, Santiago, Chile air
pollution, 223 : 15 Human male effects, bisphenol A in utero
exposure, 228 : 60–2 Human morbidity, urban vs. rural affects,
226 : 34 Human per capita consumption, polymers
(table), 227 : 6 Human poisoning events, methyl mercury,
229 : 4 Human residues, bisphenol A, 228 : 59 Human-induced injuries, Guinea dolphins,
228 : 18 Human-related threats, to Guiana dolphins,
228 : 4 Humans, boron intake & sources, 225 : 61 Humans, boron intake effects, 225 : 61 Humans, boron toxicity, 225 : 66 Humic acid amendment of soil, pesticide
mobility effects, 221 : 40 Humic acid, acid mine drainage control, 226 : 15 Hydrolysis, clomazone, 229 : 39 Hydrolysis, fenpropathrin, 225 : 87 Hydrolysis, methomyl, 222 : 98 Hydrolysis, phthalate esters, 224 : 44 Hydrolysis, phthalates transformation (diag.),
224 : 45 Hydrolytic degradation, PBMs, 227 : 21 Hyperaccumulator plants, in phytoremediaton,
223 : 37 Hyperaccumulator plants, metal bioavailability
effect, 223 : 39 Hypothalamic-pituitary-testicular axis effects,
of bisphenol A, 228 : 62 Hysteresis effects, pesticide absorption-
desorption, 221 : 21 I mmunohistochemical expression, tumor
biomarkers, 224 : 80
Index
153
Implications, bioamplifi cation process, 227 : 133 Impregnation time, Hg adsorption from stack
emissions, 230 : 30 In utero biomonitoring, addictive substances,
227 : 63 In vitro toxicity, silver, 223 : 83, 92 India, EBH disease in cattle, 224 : 55 Indian fi sh residues, heavy metals, 230 : 127 Indoor air pollution, people effects, 226 : 34 Industrial sources, PBM pollution, 227 : 8 Infants, addictive substance effects, 227 : 55 ff. Ingestion, PBMs, 227 : 24 Inorganic coatings, controlling acid mine
drainage, 226 : 9 Inorganic fl ame retardant, aluminum
trihydroxide character (table), 222 : 11 Inorganic fl ame retardant, aluminum
trihydroxide, 222 : 9 Inorganic fl ame retardant, ammonium
polyphosphate, 222 : 13 Inorganic fl ame retardant, magnesium
hydroxide, 222 : 12 Inorganic fl ame retardants, described, 222 : 9 Inorganic fl ame retardants, synergists, 222 : 9 Inorganic mercury, in breast milk, 229 : 6 Insecticide described, methomyl, 222 : 94 Insecticide residue effects, from vegetable &
fruit processing, 229 : 89 ff. Insects, fenpropathrin ecotoxicity, 225 : 88 Insects, methomyl toxicity, 222 : 102 International standards, maximum
concentrations for air pollutants (table), 223 : 16
Interventional cardiology staff, radiation doses, 222 : 78
Interventional cardiology staff, radiation exposure, 222 : 74
Intumescent fl ame retardant, pentaerythritol, 222 : 51
Inversion effects, Santiago, Chile air pollution, 223 : 14
Invertebrates, Mexican mercury residues, 226 : 77
Iranian fi sh residues, heavy metals, 230 : 127 Iraqi poisoning event, methyl mercury, 229 : 4 Iron oxidizing bacteria, mineral oxidation,
226 : 2 Isolation methods, fungi, 228 :124 J uvenile development, bioamplifi cation,
227 : 115 K awasaki disease, mercury link, 229 : 6 Kestrel (American), PCB toxicity, 230 : 70 Khyber Pakhtunkhwa Province (Pakistan), fi sh
residues, 230 : 116
L aboratory vs. fi eld studies, pesticide leaching, 221 : 53
Land snail accumulation, copper (table), 225 : 107
Land snail biomarker, lysosomal stability, 225 : 117
Land snail biomarker, membrane integrity, 225 : 117
Land snail biomarker, metallothionein induction, 225 : 118
Land snail biomarkers, copper pollution, 225 : 113
Land snail biomarkers, dependencies (table), 225 : 115
Land snail biomarkers, histopathology & ultrastructure, 225 : 114
Land snail exposure, copper in soil, 225 : 103 Land snail metabolic regulation, copper,
225 : 108 Land snail oxidative stress, biomarker of
copper pollution, 225 : 119 Land snail tolerance, chemical elements,
225 : 97 Land snail use, terrestrial ecosystem
monitoring, 225 : 95 ff. Land snails, biological attributes, 225 : 96 Land snails, copper bioaccumulation, 225 : 111 Land snails, copper exposure levels, 225 : 99 Land snails, copper exposure sources, 225 : 99 Land snails, copper pollution monitoring,
225 : 95 ff. Land snails, copper soil pollution, 225 : 103 Land snails, fi eld exposure to copper, 225 : 106 Land waste, macro PBMs, 227 : 10 Land waste, micro PBMs, 227 : 13 Land-based pollution, by PBMs, 227 : 7 Landfi lls, PBM disposal, 227 : 8 Landfi lls, phthalate behavior, 224 : 39 ff. Landfi lls, source of phthalate esters, 224 : 42 Land-snail bioaccumulation values, copper
(table), 225 : 101 Land-snail exposure, copper in food, 225 : 105 Leaching behavior, pesticides, 221 : 2 Leaching characteristics, pesticide classes,
221 : 73 Leaching potential, fenpropathrin, 225 : 83 Leaching study types, relative reliability,
221 : 53 Lead toxicity, to aquatic organisms, 229 : 27 Lipid loss, bioamplifi cation implication,
227 : 113 Lipid reserve management, animal energetics,
227 : 114 Lipid use, acid mine drainage control, 226 : 15
Index
154
Lobomycosis, in Guiana dolphins, 228 : 16 Log-normal distribution, fi tting air pollutant
data, 223 : 12 Lysimeter (outdoor) results, pesticides (diag.),
221 : 72 Lysimeter advantages, pesticide mobility
measurement, 221 : 16 Lysimeter studies, pesticide loss rate, 221 : 15 Lysimeter studies, use of radiotracers, 221 : 15 Lysimeters (outdoor), measuring pesticide
mobility, 221 : 14 Lysosomal stability, land snail biomarker,
225 : 117 M acro PBM waste, ocean, 227 : 9 Macro PBM waste, on shore and land, 227 : 10 Macrophyte mercury levels, Mexico (table),
226 : 88 Macropore disruption, soil tillage, 221 : 31 Macropores in soil, defi nition, 221 : 4 Macropores, formation in soils, 221 : 5 Magnesium hydroxide, chemical &
environmental character, 222 : 12 Magnesium hydroxide, toxicity & physical-
chemical properties (table), 222 : 13 Magnetic nanoparticles, described, 230 : 101 Male reproductive effects, bisphenol A, 228 :
57 ff. Male reproductive effects, BPA (table), 228 : 63 Male reproductive function, BPA action sites
(diag.), 228 : 71 Mallard, methyl mercury toxicity, 223 : 58 Mammal residues in Mexico, mercury, 226 : 84 Mammal tissue residues, mercury (table),
226 : 85 Mammalian ecotoxicity, fenpropathrin, 225 : 91 Mammalian toxicity, methomyl, 222 : 104 Mammals, PBDE TRVs (table), 229 : 127 Mammals, pollution assessment, 227 : 98 Manufacturing process, PBMs, 227 : 3 Marine accumulator species, biokinetic trophic
transfer data (diag.), 226 : 112 Marine biokinetic data, heavy metal trophic
transfer (diag.), 226 : 111 Marine debris component, PBMs (table),
227 : 11 Marine debris, biodiversity effects, 228 : 19 Marine debris, Guinea dolphin effects, 228 : 18 Marine fi sh residues in Pakistan, heavy metals,
230 : 124 Marine fi sh toxicity, of E2, 228 : 31 Marine fi sh, heavy metal residues (table),
230 : 114 Marine habitat, PBM sink, 227 : 10 Marine mammal threat, pathogens, 228 : 2
Marine mammals, as environmental sentinels, 228 : 2
Marine mammals, persistent organic contaminants, 228 : 5
Marine mammals, toxoplasmosis affl iction, 228 : 15
Marine pathogens, marine mammal threat, 228 : 2
Marine species, pollutant threats, 228 : 2 Maritime anti-dumping rules, PBMs, 227 : 7 Maternal absorption & transport, addictive
substances, 227 : 66 Maternal effects, of addictive substances
(table), 227 : 60–3 Maternal specimen analysis, benefi ts (diag.),
227 : 68 Maternal transport to child, of xenobiotics
(diag.), 227 : 65 Mathematical modeling, pesticide transport in
soil, 221 : 50 Maximum residual disinfectant levels, USEPA
(table), 222 : 118 Measured exposure concentrations, metals-
metalloids in a Chinese Lake (table), 230 : 49
Measurement in organisms, bioamplifi cation, 227 : 112
Mechanical disintegration, PBMs, 227 : 21 Mechanism, of arsenic detoxifi cation (diag.),
224 : 11 Mechanistic approach, to developing sediment
quality guidelines, 224 : 107 MeHg toxicity, effects described, 229 : 7 MeHg, selenium effects, 229 : 8 MeHg, thiol interactions, 229 : 7 Melamine polyphosphate, fl ame retardant,
222 : 48 Melamine polyphosphate, persistence &
bioaccumulation, 222 : 50, 51 Melamine polyphosphate, physical-chemical
& toxic properties (table), 222 : 49 Membrane integrity, land snail biomarker,
225 : 117 Membrane technology, drinking water
disinfection, 222 : 137 Mercury characteristics, profi le, 225 : 6 Mercury chelators, structures (illus.), 229 : 9 Mercury contamination, in small cetacean
liver (diag.), 228 : 12 Mercury cycle, complexity, 226 : 66 Mercury exposure, humans, 229 : 3 Mercury fi sh residues, muscle tissue (table),
226 : 82 Mercury forms, human exposure, 229 : 3
Index
155
Mercury in soil, uses (table), 225 : 5 Mercury levels in Mexico, molluscs (table),
226 : 78 Mercury levels in Mexico, shrimp (table),
226 : 78 Mercury levels, in human consumed seafood,
226 : 89 Mercury levels, in Mexican coastal waters
(table), 226 : 76 Mercury levels, macrophytes &
vestimentiferan tube worms (table), 226 : 88
Mercury levels, Mexican coastal sediments (table), 226 : 69
Mercury link, amyotrophic lateral sclerosis, 229 : 6, 10
Mercury link, Kawasaki disease, 229 : 6 Mercury metabolism, infl uencing factors,
225 : 22 Mercury nephrotoxic effects, on humans,
226 : 90 Mercury release levels, to the atmosphere,
226 : 67 Mercury removal, by sulfur-impregnated
activated carbon, 230 : 1 ff. Mercury removal, stack emissions, 230 : 1 ff. Mercury residues, aquatic biota in Mexico,
226 : 77 Mercury residues, in consumable fi sh, 226 : 89 Mercury residues, in reptiles, birds and
mammals, 226 : 84 Mercury residues, in the aquatic environment,
226 : 68 Mercury residues, Mexican coastal waters,
226 : 75 Mercury residues, Mexican invertebrates,
226 : 77 Mercury residues, Mexican vertebrates, 226 : 79 Mercury tissue levels, birds, reptiles &
mammals (table), 226 : 85 Mercury tissue residues, in Mexican
elasmobranchs (table), 226 : 80 Mercury toxicity, metallothionein effects,
229 : 8 Mercury toxicity, mitochondrial effects, 229 : 8 Mercury toxicity, molecular mechanism,
229 : 7 Mercury toxicity, neurodegenerative effects,
229 : 1 ff. Mercury toxicity, reactive oxygen species,
229 : 8 Mercury toxicity, symptoms, 229 : 6 Mercury vapor, toxicity, 229 : 6 Mercury, absorption and distribution, 229 : 5
Mercury, Alzheimer’s disease, 229 : 10 Mercury, and neurodegenerative diseases,
229 : 10 Mercury, anthropogenic releases, 226 : 66 Mercury, as Chinese environmental
contaminant, 223 : 54 Mercury, as global environmental
contaminant, 223 : 54 Mercury, as worldwide contaminant, 226 : 65 Mercury, autoimmune effects, 229 : 6 Mercury, biogeochemical cycle, 226 : 66 Mercury, chemical forms and properties,
229 : 2 Mercury, coastal sediment levels, 226 : 68–75 Mercury, effects described, 230 : 2 Mercury, environmental residues, 226 : 66 Mercury, enzyme inhibition, 229 : 10 Mercury, fate in the body (diag.), 229 : 5 Mercury, from copper mining, 226 : 71 Mercury, hazardous air pollutant, 230 : 2 Mercury, human effects, 226 : 89 Mercury, in Mexico, 226 : 65 ff. Mercury, in the atmosphere, 226 : 67 Mercury, neuronal degeneration, 229 : 7 Mercury, organic vs. reactive forms (diag.),
225 : 22 Mercury, releases to environment, 230 : 2 Mercury, sources, 226 : 66 Mercury, total gaseous levels released (table),
226 : 68 Mercury, toxicity, 229 : 5 Metabolic pathway in soybeans, chlomazone
(diag.), 229 : 44 Metabolic regulation in land snails, copper,
225 : 108 Metabolism, addictive substances, 227 : 65 Metabolites, abused substance biomonitoring
(table), 227 : 68–9 Metal & metalloid toxicity, freshwater species
(table), 230 : 39 Metal adsorption, biochar, 228 : 86 Metal contamination, Guiana dolphins, 228 : 11 Metal disinfectants, drinking water
disinfection, 222 : 138 Metal effects, genetic diversity in animals,
227 : 92 Metal effects, genetic diversity, 227 : 85 Metal pollutants, and cetaceans, 228 : 2 Metal pollutants, genetic effects, 227 : 79 Metal pollutants, sources, 223 : 33 Metal pollution effects, animal genetic
diversity (table), 227 : 86–91 Metal pollution effects, genetic diversity &
structure, 227 : 79 ff.
Index
156
Metal pollution, genetic diversity threats (diag.), 227 : 82
Metal species in soil, uses (table), 225 : 5 Metal stress, population genetic response,
227 : 84 Metal toxicity, population genetic response,
227 : 81 Metal uptake in plants, cadmium effects,
229 : 64 Metal-binding properties, metallothionein
proteins, 223 : 39 Metal-exposed animals, genetic effects, 227 :
79 ff. Metallic elements toxicity, species sensitivity,
230 : 46 Metalloid contamination, bioremediation,
225 : 38 Metalloids, setting WQC in China, 230 : 35 ff. Metallothionein effects, mercury toxicity,
229 : 8 Metallothionein induction, land snail
biomarker, 225 : 118 Metallothionein proteins, metal-binding
properties, 223 : 39 Metal-metalloid concentrations, in Chinese
surface waters, 230 : 39 Metal-metalloid toxicity, SSD bootstrap
regression (diag.), 230 : 48 Metals & metalloids, Chinese pollutants, 230 : 36 Metals and metalloids, environmental
pollutants, 230 : 37 Metals, genetic ecotoxicity, 227 : 80 Metals, plant detoxifi cation mechanisms,
223 : 39 Metals, plant uptake and transport, 223 : 38 Metals, setting WQC in China, 230 : 35 ff. Metals, soil bioavailability, 223 : 37 Metals-metalloids in a Chinese Lake, sampling
sites (illus.), 230 : 40 Metals-metalloids, Chinese lake exposure
concentrations, 230 : 49 Metals-metalloids, correlation coeffi cients
(table), 230 : 50 Metals-metalloids, hazard quotients compared
in aquatic species (table), 230 : 50 Metals-metalloids, hazard quotients for
Chinese aquatic species, 230 : 50 Metals-metalloids, HC5 value calculations
(diag.), 230 : 44 Metals-metalloids, measured exposure
concentrations in a Chinese lake (table), 230 : 49
Metals-metalloids, risk assessment procedure, 230 : 43
Metamorphosis effects, bioamplifi cation, 227 : 119
Method effects, pesticide dissipation rate, 221 : 24
Methodology components, sediment quality criteria, 224 : 101
Methods discussed, for WQC setting, 230 : 51 Methomyl degradation, hydrolysis &
photolysis, 222 : 98 Methomyl toxicity, aquatic organisms (table),
222 : 104 Methomyl, aquatic species toxicity, 222 : 103 Methomyl, behavior in air, 222 : 98 Methomyl, biotic degradation, 222 : 101 Methomyl, bird & mammalian toxicity, 222 : 104 Methomyl, chemical structure (illus.), 222 : 94 Methomyl, chemistry & chemodynamics,
222 : 95 Methomyl, chlorinated water reactions (diag.),
222 : 99 Methomyl, described, 222 : 94 Methomyl, environmental degradation, 222 : 98 Methomyl, environmental fate & toxicity,
222 : 93 ff. Methomyl, insect toxicity, 222 : 102 Methomyl, photocatalytic breakdown (diag.),
222 : 100 Methomyl, physicochemical properties (table),
222 : 95 Methomyl, soil behavior, 222 : 95 Methomyl, toxicity & mode of action, 222 : 102 Methomyl, toxicity, 222 : 94 Methomyl, water behavior, 222 : 96 Methyl mercury avian toxicity, species
sensitivity distribution (diag.), 223 : 68 Methyl mercury in China, bird protection
criteria, 223 : 53 ff. Methyl mercury levels, avian species in China
(diag.), 223 : 73 Methyl mercury toxicity, common Chinese
wildfowl species, 223 : 58–64 Methyl mercury, avian species toxicity
thresholds (diag.), 223 : 65 Methyl mercury, avian wildlife TRV
uncertainty factors (table), 223 : 66 Methyl mercury, avian wildlife TRVs & TRCs
(table), 223 : 67 Methyl mercury, bird reproductive effects,
223 : 62 Methyl mercury, bird toxicity, 223 : 58 Methyl mercury, fi sh concentrations in China
(diag.), 223 : 70 Methyl mercury, human poisoning events,
229 : 4
Index
157
Methyl mercury, Minamata disease, 225 : 3 Methyl mercury, nature & origin, 229 : 2 Methyl mercury, sub-chronic & chronic avian
toxicity (table), 223 : 59–61 Methyl mercury, toxicity thresholds for avian
species (table), 223 : 67 Methyl mercury, wildlife contaminant, 223 : 55 Methylarsines, arsenic metabolism, 224 : 9 Methylated As(III), genotoxicity, 224 : 10 Methylation & demethylation, role in arsenic
transport, 224 : 9 Methylation in soils, trace elements (table),
225 : 18 Methylation, of arsenic, 224 : 8 Methylation, trace element detoxifi cation,
225 : 16 Methylmercury, soil degradation, 225 : 19 Mexican bird tissue residues, mercury (table),
226 : 85 Mexican coastal areas, mercury residues,
226 : 65 ff. Mexican coastal sediment levels, mercury
(table), 226 : 69 Mexican coastal waters, mercury levels
(table), 226 : 76 Mexican coastal waters, mercury residues,
226 : 75 Mexican elasmobranchs, mercury tissue
residues (table), 226 : 80 Mexican macrophytes & vestimentiferan tube
worms, mercury levels (table), 226 : 88
Mexican mammal residues, mercury (table), 226 : 85
Mexican mercury contamination, invertebrates, 226 : 77
Mexican mercury contamination, vertebrates, 226 : 79
Mexican mollusks, mercury residues (table), 226 : 78
Mexican reptile residues, mercury (table), 226 : 85
Mexican reptiles, birds and mammals, mercury residues, 226 : 84
Mexican shrimp, mercury residues (table), 226 : 78
Mexican teleost fi sh, mercury residues (table), 226 : 82
Mexico, mercury residues in aquatic biota, 226 : 77
Mexico, release of gaseous mercury (table), 226 : 68
Micro PBM waste, ocean, 227 : 13 Micro PBM waste, shores and land, 227 : 13
Microbe involvement, chemical degradation, 221 : 25
Microbes, resistant to arsenic (table), 224 : 6 Microbes, toxin sensing, 224 : 26 Microbial activity, trace element metabolism,
225 : 21 Microbial aspects, trace element
immobilization (diag.), 225 : 36 Microbial bioaccumulation, trace elements,
225 : 8 Microbial biomethylation, of trace elements in
soil, 225 : 17 Microbial breakdown pathway, clomazone
(diag.), 229 : 41 Microbial contaminants, Canadian drinking
water guidelines (table), 222 : 121 Microbial detoxifi cation & transport, arsenic
(diag.), 224 : 9 Microbial indicators, drinking water quality,
222 : 128 Microbial interactions in soil, with trace
elements, 225 : 11 Microbial interactions, arsenic cycle, 224 : 1 ff. Microbial interactions, trace elements, 225 : 2 Microbial oxidation, arsenite, 224 : 7 Microbial population effects, diazinon, 223 : 121 Microbial redox reactions, trace elements,
225 : 12 Microbial resistance, arsenic, 224 : 6 Microbial risk assessment, in water
disinfection, 222 : 153 Microbial sensing, arsenic, 224 : 13 Microbial transformation processes, trace
elements (diag.), 225 : 8 Microbial transformation processes, trace
elements, 225 : 20 Microbial transformation, in arsenic cycle,
224 : 6 Microbial transformation, processes, 225 : 7 Microbial transformation, trace elements in
soil, 225 : 1ff. Microbial transformation, trace elements, 225 : 3 Microbial uptake, arsenic, 224 : 10 Microbiological standards, for drinking water
(table), 222 : 117 Microencapsulation, controlling acid mine
drainage, 226 : 9 Microplastics, oceanic waste, 227 : 13 Migration effects, on bioamplifi cation, 227 : 122 Minamata disease, mercury poisoning event,
229 : 4 Minamata disease, methyl mercury, 225 : 3 Mineral effects, on biochar soil remediation
performance, 228 : 91
Index
158
Mineral oxidation role, phosphate coatings, 226 : 10
Mineral oxidation, iron oxidizing bacterial, 226 : 2
Mineral oxidation, to form acid mine drainage, 226 : 2
Minerals, boron effects, 225 : 63 Minerals, boron regulatory role, 225 : 65 Minerals, linked to acid mine drainage (table),
226 : 3 Mining activities, human mercury exposure,
226 : 90 Minks, DE-71 (PBDE isomer), NOAEL &
LOAEL (Table), 229 : 119 Mitigation, acid mine drainage, 226 : 1 ff. Mitochondrial effects, mercury toxicity, 229 : 8 Mobility indices, groundwater contamination
risk (table), 221 : 27 Mobility indices, pesticides, 221 : 26 Mobility of pesticides, soil column leaching
studies, 221 : 52 Mobilization & demobilization, arsenic, 224 : 10 Mode of action for nanosilver, apoptosis via
ROS, 223 : 87 Mode of action, fenpropathrin, 225 : 80 Mode of action, methomyl, 222 : 102 Mode of toxic action, diazinon, 223 : 129 Model simulations, bioamplifi cation factors
(table), 227 : 129, 131 Model, pesticide soil mobility (diag.), 221 : 46 Modeling approaches, bioamplifi cation of
POPs, 227 : 124 Modeling soil mobility, pesticides, 221 : 45 Modeling, pesticide transport in soil, 221 : 50 Modes of action possibilities, nanosilver
(diag.), 223 : 88 Modes of action, nanosilver, 223 : 81 ff. Molecular identifi cation methods, fungi,
228 :125 Molecular mechanism, mercury toxicity, 229 : 7 Molecular tools, to assess mutagenicity, 227 : 84 Molluscs, mercury levels in Mexico (table),
226 : 78 Molybdenum nanoparticles, description,
230 : 100 Moniliformin, Fusarium -produced mycotoxin,
228 : 107 Morbidity in rural & urban areas, from adult
asthma, 226 : 36 Multipathway exposures, in deriving sediment
quality criteria, 224 : 134 Multiwalled carbon nanotubes (MWCNTs),
description, 230 : 92 Mutagen, ptaquiloside, 224 : 57
Mutagenicity assessment, molecular & phylogenetic tools, 227 : 84
MWCNTs (multiwalled carbon nanotubes), description, 230 : 92
Mycotoxin producers, Fusarium fungi, 228 : 102 Mycotoxin risks, fungal-produced toxins,
228 :129 Mycotoxins produced, by selected fungal
species (table), 228 : 103 Mycotoxins, analysis and detection, 228 :113 Mycotoxins, characteristics, 228 :130 Mycotoxins, described, 228 : 101 Mycotoxins, drinking water contaminant,
228 :122 N anoparticle aggregation, toxicity effect,
223 : 94 Nanoparticle penetration, into plants, 230 : 91 Nanoparticle release, to the environment,
230 : 87 Nanoparticle risk assessment scheme, for
plants (diag.), 230 : 103 Nanoparticle silver uptake, daphnids, 223 : 96 Nanoparticle toxic effects, a survey (table),
230 : 93–95 Nanoparticle toxicity role, silver ions, 223 : 97 Nanoparticle, factors affecting phytotoxicity,
230 : 88 Nanoparticle-plant interactions, mediating
factors (diag.), 230 : 89 Nanoparticles described, copper- & cerium-
based, 230 : 99 Nanoparticles described, gold-based, 230 : 101 Nanoparticles described, magnetic and other
types, 230 : 101 Nanoparticles described, molybdenum-based,
230 : 100 Nanoparticles described, silver-based, 230 : 97 Nanoparticles described, titanium-based,
230 : 96 Nanoparticles described, zink-based, 230 : 96 Nanoparticles, and plants, 230 : 87 Nanoparticles, commercial applications
(table), 230 : 86 Nanoparticles, concentration effects, 230 : 90 Nanoparticles, description, 223 : 81 Nanoparticles, environmental interactions,
230 : 89 Nanoparticles, natural & man-made (table),
230 : 84 Nanoparticles, particle size effects, 230 : 90 Nanoparticles, phytotoxic effects, 230 : 92 Nanoparticles, phytotoxic threats, 230 : 83 ff. Nanoparticles, stabilizers & dispersion
medium, 230 : 89
Index
159
Nanoparticles, surface characteristics, 230 : 90 Nanosilver environmental behavior,
infl uencing factors, 223 : 82 Nanosilver toxicity in vivo, effective
concentration (table), 223 : 95 Nanosilver toxicity, causes, 223 : 98 Nanosilver toxicity, infl uencing factors, 223 : 82 Nanosilver toxicity, ROS mode of action
(table), 223 : 85 Nanosilver toxicity, vs. silver ion toxicity,
223 : 89 Nanosilver, applications, 223 : 82 Nanosilver, aquatic organism toxicity, 223 : 83 Nanosilver, aquatic species toxicity, 223 : 93 Nanosilver, biological effects & modes of
action, 223 : 81 ff. Nanosilver, possible modes of action (diag.),
223 : 88 Nanosilver, size-dependent toxicity, 223 : 84 Nanotechnology, defi ned, 230 : 84 Nanotechnology, for disinfecting water,
222 : 140 Nanotechnology, investment level, 230 : 84 Nanowaste fl ows, in the environment (diag.),
230 : 88 Natural genetic changes, vs. genetic effects,
227 : 82 Natural rubber, worldwide demand, 227 : 6 Natural sources, cadmium, 229 : 53 Naturally-produced compounds, nanoparticles
(table), 230 : 84 Neck exposure, cardiology staff to radiation
(diag.), 222 : 81 Nephrotoxic effects on humans, mercury,
226 : 90 Neurodegenerative diseases, mercury, 229 : 10 Neurodegenerative effects, mercury toxicity,
229 : 1 ff. Neurodegenerative toxicity, defi ned, 229 : 1 Neuronal degeneration, mercury, 229 : 7 Newborn effects, via addicted mothers (table),
227 : 60–3 Newborn specimen analysis, benefi ts (diag.),
227 : 68 Ni biomagnifi cation, in aquatic ecosystems,
226 :101 ff. Nitrifi cation, drinking water, 222 : 145 Nitrogen dioxide exposure, adult asthma
cause, 226 : 39 N ivalenol, a B trichothecene mycotoxin,
228 : 110 NO 2 , air contaminant, 223 : 6 NOEC (no observed effect concentration) for
reproduction, E2, 228 : 37
Non-parametric vs. parametric methods, for deriving HC5 values, 230 : 46
Non-target species toxicity, clomazone, 229 : 45 North Pacifi c gyre, plastic debris
accumulation, 227 : 13 O 3 , air contaminant, 223 : 6 Occupational exposure, bisphenol A, 228 : 60 Ocean bottom, PBM debris density, 227 : 13 Ocean pollutants, PBMs, 227 : 7 Ocean waste, macro PBMs, 227 : 9 Oceanic debris, fl oating PBM waste, 227 : 10 Oceanic waste, micro PBMs, 227 : 13 Odontocetes, pollutant accumulation, 228 : 2 Organic amendment effect, chromate soil
reduction (diag.), 225 : 33 Organic amendment, remediating trace
element toxicity (table), 225 : 31 Organic coatings, acid mine drainage control,
226 : 15 Organic materials, fl ame retardantcy
requirements, 222 : 2 Organic matter barriers, to prevent acid mine
drainage, 226 : 8 Organic osmotica effects, cadmium, 229 : 65 Organic pollutant effects, on aquatic life,
229 : 28 Organic-rich soil amendments, enhance Cr &
Se reduction, 225 : 33 Organics adsorption, biochar, 228 : 86–7 Organism ingestion, PBM fragments, 227 : 25 Organism ingestion, PBMs, 227 : 24 Organochlorine pollutants, and cetaceans,
228 : 2 Organochlorine residues in Guiana dolphins,
gender differences, 228 : 9 Organochlorine residues, Guiana dolphin
blubber (table), 228 : 7 Organophosphate compounds, fl ame
retardants, 222 : 22 Organophosphorous pesticides, soil column
leaching results (table), 221 : 54–57 Organophosphorous pesticides, soil leaching
results, 221 : 53 Osprey, PCB toxicity, 230 : 69 Overwintering effects, bioamplifi cation,
227 : 121 Oxalic acid, acid mine drainage control, 226 : 17 Oxidation process, pyrite (diag.), 226 : 4 Oxidation, of arsenite, 224 : 7 Oxidation-reduction reactions, trace elements
(table), 225 : 14 Oxidative defense system effects, cadmium,
229 : 66 Oxidative degradation, PBMs, 227 : 20
Index
160
Oxidative stress in land snails, biomarker of copper pollution, 225 : 119
Oxidative stress role, Bracken fern-induced cancer, 224 : 82
Ozone, drinking water disinfection, 222 : 115 P akistani fi sh residues, heavy metal
distribution (illus.), 230 : 117 Pakistani fi sh residues, heavy metals,
230 : 111 ff. Pakistani marine fi sh residues, heavy metals,
230 : 124 Pakistani study sites, fi sh specimens (illus.),
230 : 116 Parametric vs. non-parametric methods, for
deriving HC5 values, 230 : 46 Particle (plastic) fragments, POP sorption,
227 : 26 Particle size effects, nanoparticles, 230 : 90 Particulate matter exposure, adult asthma
cause, 226 : 39 Particulate matter, air pollutants, 223 : 3 Partition coeffi cient, diazinon, 223 : 115 Passivation (=microencapsulation), controlling
acid mine drainage, 226 : 9 Passivation role, permanganate, 226 : 12 Pathogens of concern, in drinking water,
222 : 129 Pathogens, marine mammal threat, 228 : 2 Pathology, bovine bladder tumor classifi cation,
224 : 66 Pb biomagnifi cation, in aquatic ecosystems,
226 : 101 ff. Pb residues, in Guiana dolphin kidney & liver
(table), 228 : 14 PBDE congener profi le, wild lake fi sh (diag.),
229 : 130 PBDE egg TRVs, for Chinese aquatic avian
species (diag.), 229 : 129 PBDE residues, in wild fi sh from China
(diag.), 229 : 132 PBDE residues, in wild fi sh from Chinese
lakes (table), 229 : 131 PBDE toxicity reference values, birds &
mammals, 229 : 111 ff. PBDE TRV derivation, aquatic birds, 229 : 121 PBDE TRV derivation, for aquatic mammals,
229 : 115 PBDE TRV, for aquatic birds, 229 : 125 PBDE TRV, for aquatic mammals, 229 : 119 PBDE TRV, mammals & birds (table), 229 : 127 PBDE TRVs, Chinese aquatic species (diag.),
229 : 129 PBDEs (polybrominated diphenyl ethers)
toxicity, to aquatic organisms, 229 : 28
PBDEs (polybrominated diphenylethers), Guiana dolphins, 228 : 10
PBDEs, described, 229 : 112 PBDEs, ecological risk assessment, 229 : 130 PBM (polymer-based material), debris density,
ocean bottom, 227 : 13 PBM debris role, alien-species-spread, 227 : 27 PBM degradates, potential effects (diag.),
227 : 25 PBM degradation, in aquatic environments,
227 : 22 PBM degradation, in the natural environment,
227 : 22 PBM degradation, polymer characteristics,
227 : 14 PBM degradation, soil environment, 227 : 22 PBM fragment ingestion, organisms, 227 : 25 PBM pollution, industrial sources, 227 : 8 PBM sink, marine habitat, 227 : 10 PBM waste, agricultural fi lms, 227 : 9 PBMs, abiotic degradation, 227 : 15 PBMs, biotic degradation=biodegradation,
227 : 21 PBMs, categories produced, 227 : 6 PBMs, degradation pathways (diag.), 227 : 15 PBMs, entanglement & ingestion, 227 : 24 PBMs, environmental degradation, 227 : 14 PBMs, environmental effects, 227 : 24 PBMs, environmental occurrence, 227 : 9 PBMs, factors affecting degradation, 227 : 14 PBMs, fl oating oceanic waste, 227 : 10 PBMs, food chain risks, 227 : 2 PBMs, hydrolytic degradation, 227 : 21 PBMs, in landfi lls, 227 : 8 PBMs, land-based pollution, 227 : 7 PBMs, manufacturing process, 227 : 3 PBMs, maritime anti-dumping rules, 227 : 7 PBMs, mechanical disintegration, 227 : 21 PBMs, ocean pollutants, 227 : 7 PBMs, oxidative degradation, 227 : 20 PBMs, photodegradation, 227 : 15 PBMs, sewage-related debris, 227 : 8 PBMs, thermal degradation, 227 : 20 PBMs, usage and consumption, 227 : 3 PCB (polychlorinated biphenyls) bird dietary
toxicity data, SSD (diag.), 230 : 73 PCB (polychlorinatedbiphenyl) residues,
Guiana dolphins, 228 : 6 PCB bird toxicity, SSD (diag.), 230 : 72 PCB isomer-mixture toxicity, to birds (table),
230 : 65–67 PCB mixtures, toxic equivalent conversion
factors (table), 230 : 71 PCB residues, in birds (table), 230 : 76
Index
161
PCB residues, in fi sh, 230 : 77 PCB residues, in small cetaceans (diag.), 228 : 8 PCB toxicity, American Kestrel, 230 : 70 PCB toxicity, bald eagle, 230 : 69 PCB toxicity, common tern, 230 : 69 PCB toxicity, domestic chicken, 230 : 64 PCB toxicity, double-crested cormorant, 230 : 68 PCB toxicity, Great horned owl, 230 : 70 PCB toxicity, osprey, 230 : 69 PCB TRV-TRG values, derivation methods
compared (table), 230 : 75 PCBs, bird toxicity studies, 230 : 64 PCBs, nature and characteristics described,
230 : 60 PCBs, risk assessment to birds, 230 : 76 PCBs, TRVs for aquatic Chinese birds, 230 :
59 ff. Peat amendment of soil, pesticide mobility
effects, 221 : 40 Peat effects, pesticide soil leaching, 221 : 44 Peeling of vegetables & fruits, pesticide
residue effect, 229 : 102 Pentaerythritol, intumescent system, 222 : 51 Pentaerythritol, toxic & environmental
character, 222 : 52 Pentaerythritol, toxic & physical-chemical
properties (table), 222 : 53 Perfl uorinated compounds (PFCs), Guiana
dolphins, 228 : 10 Performance factors, biochar soil remediation
(diag.), 228 : 90 Permanganate, passivation role, 226 : 12 Persistence of HFFRs, classifi cation scheme
(table), 222 : 9 Persistence, 9,10-Dihydro-9-oxa-10-
phosphaphenanthrene-10-oxide, 222 : 43 Persistence, bisphenol-A
bis(diphenylphosphate) (table), 222 : 39 Persistence, bisphenol-A
bis(diphenylphosphate), 222 : 38 Persistence, HFFRs (table), 222 : 59 Persistence, HFFRs, 222 : 1 ff. Persistence, HFFRs, 222 : 58 Persistence, HFFRs, 222 : 6 Persistence, melamine polyphosphate, 222 : 50 Persistence, pentaerythritol, 222 : 52 Persistence, resorcinol bis(diphenylphosphate),
222 : 36 Persistence, triphenylphosphate (table), 222 : 25 Persistence, triphenylphosphate, 222 : 23 Persistent compound consumption, wildlife,
230 : 61 Persistent organic contaminants, in marine
mammals, 228 : 5
Persistent organic pollutant air contaminants, 223 : 7
Persistent organic pollutants, bioamplifi cation in wildlife, 227 : 107 ff.
Pesticide absorption-desorption, hysteresis effects, 221 : 21
Pesticide adsorption, biochar, 228 : 86 Pesticide biodegradation effect, plant material
amendment of soil, 221 : 41 Pesticide biodegradation rate, method effects,
221 : 24 Pesticide criteria derivation, sediments, 224 :
97 ff. Pesticide criteria for sediments, methodologies
compared (table), 224 : 163 Pesticide degradation, mobility effects, 221 : 19 Pesticide degradation, soil macropore effects,
221 : 33 Pesticide dissipation rate, soil & method
effects, 221 : 24 Pesticide leaching effects, colloids &
dissolved organic matter, 221 : 7, 8 Pesticide leaching effects, earthworm burrows,
221 : 33 Pesticide leaching, laboratory vs. fi eld studies,
221 : 53 Pesticide leaching, lysimeter (outdoor) results
(diag.), 221 : 72 Pesticide leaching, soil adsorption effects,
221 : 26 Pesticide leaching, soils, 221 : 1 ff. Pesticide leaching, turf thatch effects, 221 : 18 Pesticide loss rate, from soil lysimeters,
221 : 15 Pesticide mobility determination, soil column
apparatus (diag.), 221 : 12 Pesticide mobility effect, preferential fl ow,
221 : 32 Pesticide mobility effects, soil vegetation,
221 : 41 Pesticide mobility in soil, fertilizer effects,
221 : 43 Pesticide mobility measurement, lysimeter
advantages, 221 : 16 Pesticide mobility, biodegradation effects,
221 : 23 Pesticide mobility, degradation effects, 221 : 19 Pesticide mobility, elution medium effects
(table), 221 : 37 Pesticide mobility, groundwater ubiquity
score, 221 : 30 Pesticide mobility, in agriculture, 221 : 3 Pesticide mobility, modeling & simulation
methods, 221 : 45
Index
162
Pesticide mobility, outdoor lysimeter methods, 221 : 14
Pesticide mobility, prospective groundwater studies, 221 : 17
Pesticide mobility, soil amendment & vegetation effects, 221 : 34
Pesticide mobility, soil amendment effects (table), 221 : 37
Pesticide mobility, soil amendment effects, 221 : 36
Pesticide mobility, soil column leaching method, 221 : 11
Pesticide mobility, soil column leaching studies, 221 : 52
Pesticide mobility, soil factor effects, 221 : 31 Pesticide mobility, soil macropore effects,
221 : 3 Pesticide mobility, soil moisture effects, 221 : 31 Pesticide mobility, soil process effects, 221 : 18 Pesticide mobility, soil property effects, 221 : 3 Pesticide mobility, soil thin-layer
chromatography, 221 : 10 Pesticide mobility, soil tillage effects (table),
221 : 35 Pesticide mobility, soil tillage effects, 221 : 34 Pesticide mobility, surfactant effects, 221 : 18 Pesticide mobility, urea amendment effects,
221 : 36 Pesticide mobility, vegetation effects (table),
221 : 37 Pesticide residue effect, from boiling or
cooking food, 229 : 103 Pesticide residue effect, from food blanching
or freezing, 229 : 103 Pesticide residue effect, from food juicing,
229 : 102 Pesticide residue effects, food washing,
229 : 100 Pesticide residue effects, from fruit &
vegetable peeling, 229 : 102 Pesticide soil leaching, achieving material
balance, 221 : 132 Pesticide soil leaching, peat amendment
effects, 221 : 44 Pesticide soil leaching, tannic acid effects,
221 : 44 Pesticide soil mobility, conceptional model
(diag.), 221 : 46 Pesticide sorption, soil mobility effects, 221 : 19 Pesticide toxicity, aquatic environments, 224 : 99 Pesticide transport effects, colloid effects,
221 : 7 Pesticide transport in soil, mathematical
modeling, 221 : 50
Pesticide transport, dissolved organic matter effects, 221 : 7
Pesticide types, toxicity, 224 : 99 Pesticide types, used in California, 224 : 99 Pesticides (misc.), leaching characteristics,
221 : 74 Pesticides in soil, equilibrium vs. non-
equilibrium transport, 221 : 46 Pesticides in soil, facilitated transport, 221 : 42 Pesticides, fi eld leaching, 221 : 16 Pesticides, leaching behavior, 221 : 2 Pesticides, leaching methods, 221 : 10 Pesticides, mobility indices, 221 : 26 Pesticides, structures (appendix), 221 : 77 Pesticides, terrestrial fi eld dissipation studies,
221 : 17 Pesticides, transport processes, 221 : 2 PFCs (perfl uorinated compounds), Guiana
dolphins, 228 : 10 PGPR (plant growth-promoting rhizobacteria),
functions, 223 : 35 PGPR, counter heavy-metal plant stress, 223 : 42 PGPR, heavy metal phytoremediation, 223 :
33ff. PGPR, in plant heavy-metal remediation,
223 : 43 PGPR, in rhizosphere, 223 : 40 PGPR, plant growth-regulating compounds
(table), 223 : 41 pH effects on trace elements, bioaccumulation,
225 : 24 pH effects, on zirconium behavior, 221 : 112 pH effects, soil sorption processes, 221 : 20 Phosphate coating, acid mine drainage control,
226 : 9 Phosphate coating, bonding pattern on pyrite
& FePO 4 (illus.), 226 : 10 Phosphate coatings, mineral oxidation role,
226 : 10 Photocatalytic breakdown, methomyl (diag.),
222 : 100 Photocatalytic oxidation, phthalates, 224 : 46 Photodegradation, methylmercury, 225 : 19 Photodegradation, PBMs, 227 : 15 Photolysis, clomazone, 229 : 39 Photolysis, diazinon, 223 : 120 Photolysis, fenpropathrin, 225 : 85 Photolysis, methomyl (diag.), 222 : 100 Photolysis, methomyl, 222 : 98 Photolysis, phthalates, 224 : 47 Photolytic breakdown, diazinon pathway in
soil (diag.), 223 : 121 Photolytic degradation, clomazone (diag.),
229 : 40
Index
163
Photosynthesis effects, cadmium, 229 : 69 Phthalate esters, abiotic degradation, 224 : 43 Phthalate esters, adverse effects, 224 : 42 Phthalate esters, hydrolysis, 224 : 44 Phthalate esters, in landfi lls, 224 : 42 Phthalate, structure (illus.), 224 : 41 Phthalates, abiotic conditions in landfi lls,
224 : 39 ff. Phthalates, acid & base hydrolysis (diag.),
224 : 45 Phthalates, biodegradation, 224 : 47 Phthalates, chemical behavior, 224 : 39 ff. Phthalates, chemical-physical properties,
224 : 41 Phthalates, degradation-decomposition, 224 : 43 Phthalates, described, 224 : 39 Phthalates, environmental concentrations,
227 : 33 Phthalates, fugitive nature, 224 : 40 Phthalates, health effects, 224 : 40 Phthalates, hydrolytic transformation (diag.),
224 : 45 Phthalates, photocatalytic oxidation, 224 : 46 Phthalates, photolysis, 224 : 47 Phthalates, synthesis via esterifi cation, 224 : 40 Phylogenetic tools, to assess mutagenicity,
227 : 84 Physical barriers, acid mine drainage, 226 : 4 Physical barriers, to prevent acid mine
drainage, 226 : 5 Physical properties, As, Hg & Se (table),
225 : 17 Physical-chemical properties, 9,10-Dihydro-9-
oxa-10-phosphaphenanthrene-10-oxide, 222 : 43
Physical-chemical properties, aluminum diethylphosphinate (table), 222 : 46
Physical-chemical properties, aluminum diethylphosphinate, 222 : 45
Physical-chemical properties, ammonium polyphosphate (table), 222 : 15
Physical-chemical properties, bisphenol-A bis(diphenylphosphate) (table), 222 : 39
Physical-chemical properties, HFFRs, 222 : 5 Physical-chemical properties, magnesium
hydroxide (table), 222 : 13 Physical-chemical properties, melamine
polyphosphate (table), 222 : 49 Physical-chemical properties, melamine
polyphosphate, 222 : 49 Physical-chemical properties, pentaerythritol
(table), 222 : 53 Physical-chemical properties, pentaerythritol,
222 : 52
Physical-chemical properties, phosphaphenanthrene-10-oxide (table), 222 : 44
Physical-chemical properties, phthalates, 224 : 41
Physical-chemical properties, resorcinol bis(diphenylphosphate), 222 : 35
Physical-chemical properties, triphenylphosphate (table), 222 : 24
Physical-chemical properties, triphenylphosphate, 222 : 23
Physical-chemical properties, zinc borate (table), 222 : 18
Physical-chemical properties, zinc borate, 222 : 17
Physical-chemical properties, zinc hydroxystannate (table), 222 : 19
Physical-chemical properties, zinc stannate (table), 222 : 21
Physicochemical data needs, deriving sediment quality criteria, 224 : 117
Physicochemical properties, clomazone (table), 229 : 37
Physicochemical properties, diazinon (table), 223 : 109
Physicochemical properties, diazinon, 223 : 108
Physicochemical properties, fenpropathrin (table), 225 : 81
Physicochemical properties, fenpropathrin, 225 : 81
Physicochemical properties, methomyl (table), 222 : 95
Physiochemical alterations in plants, cadmium, 229 : 59
Physiochemical effects, cadmium (table), 229 : 56
Phytodegradation, phytoremediation type, 223 : 37
Phytoestrogenic toxin, zearalenone, 228 : 104 Phytoextraction, plant bioremediation, 223 :
35, 36 Phytoextraction, uptake process, 223 : 38 Phytoremediation of heavy metals,
rhizobacteria role, 223 : 33ff. Phytoremediation role, PGPR, 223 : 35 Phytoremediation role, rhizobacteria, 223 : 35 Phytoremediation success, variables, 223 : 35 Phytoremediation, defi ned, 223 : 36 Phytoremediation, hyperaccumulator plant
role, 223 : 37 Phytoremediation, types defi ned, 223 : 36 Phytostabilization, type of phytoremediation,
223 : 36
Index
164
Phytostimulation, type of phytoremediation, 223 : 36
Phytotoxic effects, nanoparticles, 230 : 92 Phytotoxicity of nanoparticles, factors
affecting potency, 230 : 88 Phytotoxicity, fabricated nanoparticles,
230 : 83 ff. Phytotoxicity, zirconium, 221 : 107 ff. Phytovolatilization, type of phytoremediation,
223 : 36 Pilot whale contamination, mercury, 229 : 4 Placenta role, addictive substance
biomonitoring, 227 : 64 Placental transport, chemical compounds
(diag.), 227 : 67 Plant accumulation, cadmium, 229 : 54 Plant alterations, cadmium, 229 : 59 Plant behavior, cadmium, 229 : 54 Plant detoxifi cation mechanisms, metals,
223 : 39 Plant distribution, zirconium, 221 : 115 Plant effects, clomazone, 229 : 43 Plant growth effects, cadmium (table), 229 : 56 Plant growth inhibition, zirconium, 221 : 117 Plant growth regulators, cadmium effects,
229 : 67 Plant growth-promoting rhizobacteria (PGPR),
phytoremediation role, 223 : 35 Plant heavy-metal remediation, PGPR
synergy, 223 : 43 Plant levels, copper, 225 : 106 Plant material amendment of soil, pesticide
biodegradation effect, 221 : 41 Plant metabolism, fenpropathrin, 225 : 85 Plant metal uptake, cadmium effects, 229 : 64 Plant mode-of-action, clomazone, 229 : 42 Plant penetration, nanoparticles, 230 : 91 Plant pigment effects, cadmium, 229 : 59 Plant root ethylene effect, ACC (diag.), 223 : 45 Plant stress reduction, ACC role, 223 : 44 Plant toxicity effects, reactive oxygen species,
223 : 39 Plant toxicity mechanisms, heavy metals,
223 : 34 Plant toxicity, boron, 225 : 69 Plant toxicity, heavy metals, 223 : 34 Plant toxicity, zirconium, 221 : 107 ff., 116 Plant trait effects, cadmium, 229 : 55 Plant translocation rate, zirconium, 221 : 116 Plant translocation, zirconium, 221 : 114 Plant uptake & transport, metals, 223 : 38 Plant uptake from soil, zirconium, 221 : 114, 115 Plant uptake, zirconium, 221 : 107 ff. Plant water relations effect, cadmium, 229 : 70
Plant-nanoparticle interactions, mediating factors (diag.), 230 : 89
Plants, and nanoparticles, 230 : 87 Plants, boron defi ciency effects, 225 : 62 Plants, boron role, 225 : 61 Plants, containing boron, 225 : 62 Plants, role of heavy metals, 223 : 34 Plant-soil interactions, heavy metals, 223 : 34 Plastic debris accumulation, North Pacifi c
gyre, 227 : 13 Plastic debris effects, Guinea dolphins, 228 : 19 PM10 98 th percentile, air pollutant data in
Santiago, Chile (table), 223 : 24 PM10 air pollutant data analysis, Santiago,
Chile, 223 : 20 PM10 air pollutant data, Santiago, Chile
locations (table), 223 : 21 PM10 air pollutant levels, Santiago, Chile
monitoring stations (table), 223 : 18 PM10 data analysis, Santiago, Chile, 223 : 17 PM10 level histograms, Santiago, Chile air
pollution (diag.), 223 : 19 PM10 levels time series, Santiago, Chile air
pollution (diag.), 223 : 19 PNEC (predicted no-effect concentration) of
17-[beta]-estradiol, in Chinese waters, 228 : 29 ff.
PNEC derivation method, E2, 228 : 36 PNEC values for E2, calculated via models
(table), 228 : 39 Pollutant accumulation, cetaceans, 228 : 2 Pollutant characteristics, copper, 225 : 97 Pollutant exposures, in fi sh, 230 : 112 Pollutant threats, marine species, 228 : 2 Pollution assessment, with mammals, 227 : 98 Pollution sources, arsenic, 224 : 5 Polybrominated diphenyl ethers (PBDEs),
toxicity reference values, 229 : 111 ff. Polybrominated diphenylethers, Guiana
dolphins, 228 : 10 Polyethylene polyamine, acid mine drainage
control, 226 : 16 Polymer additives, described, 227 : 28 Polymer additives, environmental fate, 227 : 28 Polymer additives, environmental implication,
227 : 27 Polymer additives, environmental occurrence,
227 : 30 Polymer additives, environmental residues
(table), 227 : 30–2 Polymer additives, hazards described,
227 : 28 Polymer additives, toxicity (table), 227 : 35–39 Polymer additives, toxicity, 227 : 34
Index
165
Polymer barriers, to prevent acidic mine effl uents, 226 : 7
Polymer characteristics, PBM degradation, 227 : 14
Polymer degradation, environmental matrices (table), 227 : 16–19
Polymer types, proportion of consumption, 227 : 6
Polymerase chain reaction, bovine papillomavirus amplifi cation, 224 : 83
Polymer-based materials (PBMs), risks to food chain organisms, 227 : 2
Polymer-based materials, characterized, 227 : 1–2
Polymer-based materials, environmental degradation & effects, 227 : 1 ff.
Polymer-based materials, marine debris component (table), 227 : 11
Polymer-based materials, shoreline debris component (table), 227 : 12
Polymers, fl ame retardantcy requirements, 222 : 2
Polymers, per capita consumption (table), 227 : 6
Polymers, types and uses (table), 227 : 3–5 POPs (persistent organic pollutants) &
bioamplifi cation, modeling, 227 : 124 POPs bioamplifi cation, in wildlife, 227 : 107 ff. POPs sorption, of PBMs, 227 : 26 POPs sorption, to PBM fragments, 227 : 26 Population effects, of pollution, 227 : 79 Population genetic responses, metal stress,
227 : 84 Population genetics, metal toxicity, 227 : 81 Posttransductional regulation, arsenic forms,
224 : 17 Potable water disinfection, regulation, 222 : 115 Preferential fl ow, pesticide mobility effect,
221 : 32 Preferential fl ow, through soil macropores,
221 : 32 Pregnant women, addictive substance abuse
(diag.), 227 : 56 Pregnant women, addictive substance effects,
227 : 55 ff. Pregnant women, addictive substance use,
227 : 58 Pregnant women, implications of addiction,
227 : 58 Prenatal exposure effects, to addictive
substances, 227 : 59 Preventing EBH, approaches, 224 : 85 Prevention and control , Fusarial toxins,
228 :110
Prevention measures, acid mine drainage (diag.), 226 : 5
Prevention strategies, acid mine drainage, 226 : 5
Probability plots, PM10 air pollutant data for Santiago, Chile (diags.), 223 : 23, 24
Production volumes, HFFRs, 222 : 6 Proline effects, cadmium, 229 : 62 Properties, clomazone, 229 : 36 Prospective groundwater studies, pesticide
mobility, 221 : 17 Protease activity effects, cadmium, 229 : 61 Protein level effects, cadmium, 229 : 61 Protozoan waterborne pathogens, in drinking
water, 222 : 133 Ptaquilosid, carcinogenic mechanism (diag.),
224 : 63 Ptaquiloside & similars, structure (illus.),
224 : 59 Ptaquiloside adducts, fern-induced tumors,
224 : 80 Ptaquiloside, analysis method, 224 : 76 Ptaquiloside, cancer types induced, 224 : 62 Ptaquiloside, carcinogen in fern, 224 : 55 Ptaquiloside, carcinogenic mechanism, 224 : 62 Ptaquiloside, content in fern species, 224 :
57, 60 Ptaquiloside, environmental residues, 224 : 74 Ptaquiloside, fern fronds, 224 : 76 Ptaquiloside, genotoxic activity, 224 : 77 Ptaquiloside, genotoxic carcinogen, 224 : 57 Ptaquiloside, human food chain fl ow (diag.),
224 : 75 Ptaquiloside, human health effects, 224 : 73 Ptaquiloside, in the human food chain, 224 : 73 Ptaquiloside in human food, entry points
(diag.), 224 : 74 Ptaquiloside, physiological behavior, 224 : 62 Ptaquiloside, soil & water effects, 224 : 75 Ptaquiloside, soil degradation, 224 : 77 Ptaquiloside, soil leaching, 224 : 76 Ptaquiloside-induced bovine hematuria,
environmental effects, 224 : 53 ff. Ptaquiloside-induced bovine hematuria,
human effects, 224 : 53 ff. Ptaquiloside-induced cancer, tumor modeling,
224 : 78 Pteridium aquilinum , EBH cause, 224 : 54 Pulmonata, copper pollution monitoring,
225 : 95 ff. Punjab Province (Pakistan), fi sh residues,
230 : 119 Pyrethroid insecticides, residue changes from
food processing, 229 : 89 ff.
Index
166
Pyrethroid pesticides, soil column leaching results (table), 221 : 54–57
Pyrethroid pesticides, soil leaching results, 221 : 53
Pyrethroid residue effects, from food processing methods (table), 229 : 92–99
Pyrite & FePO 4 , phosphate bonding pattern (illus.), 226 : 10
Pyrite bonding pattern, silica coating (illus), 226 : 11
Pyrite Fe-oxyhydroxide, coatings cross-section (illus.), 226 : 14
Pyrite, oxidation process (diag.), 226 : 4 Pyrite, silica coatings to prevent acid mine
drainage, 226 : 11 Pyrolysis temperature effects, biochar
performance, 228 : 87 Q SARs (quantitative structure activity
relationships), in deriving sediment quality criteria for pesticides, 224 : 130
R adiation dose by procedure, cardiology staff (diag.) , 222 : 79
Radiation dose for cardiology staff, hands, fi ngers & wrists (diag.), 222 : 79
Radiation dose for cardiology staff, thyroid/neck region (diag.), 222 : 81
Radiation dose to hands, cardiology staff (diag.), 222 : 82
Radiation dose, cardiology staff eyes & forehead (diags.), 222 : 80
Radiation doses, interventional cardiology staff, 222 : 78
Radiation exposure effects, cardiology staff, 222 : 85
Radiation exposure of cardiology staff, cataract formation, 222 : 84
Radiation exposure of cardiology staff, eye & thyroid gland, 222 : 82
Radiation exposure routes, cardiac catheterization laboratories (illus.), 222 : 87
Radiation exposure to cardiology staff, data sources (diag.), 222 : 76
Radiation exposure, cardiology staff wrists & hands, 222 : 80
Radiation exposure, cardiology staff, 222 : 74 Radiation exposure, vs. radioimaging
apparatus, 222 : 77 Radiation safety practices, for cardiology staff,
222 : 85 Radiation, cardiology staff exposure, 222 : 73 ff. Radioimaging apparatus, vs. radiation
exposure, 222 : 77 Rainbow trout toxicity, E2, 228 : 34
Rat acute toxicity, boron, 225 : 67 Rat sub-chronic toxicity, boron, 225 : 68 REACH (Registration, Evaluation,
Authorisation and Restriction of Chemical substances) system data, HFFRs, 222 : 5
Reactive oxygen species (ROS), heavy metal induction, 223 : 40
Reactive oxygen species, mercury toxicity, 229 : 8
Redox potential values, trace elements (table), 225 : 14
Redox reactions in the aquatic environment, trace elements (table), 225 : 13
Redox reactions, trace elements in soil (table), 225 : 13
Reduction pathways, arsenite (table), 224 : 8 Reductions vs. oxidations, trace elements in
soil, 225 : 15 Reference concentrations, SSD curve
construction (table), 230 : 71 Reference concentrations, TRV calculation
(table), 230 : 74 Regulating air pollutants, Santiago, Chile,
223 : 4 Regulating water disinfection, USA, 222 : 118 Regulation of water disinfectants, USEPA
(table), 222 : 119 Regulations, drinking water disinfection,
222 : 115 Release of gaseous mercury, worldwide sites
(table), 226 : 68 Remediation implications, trace elements,
225 : 36 Remediation in soil, trace elements, 225 : 1ff. Remediation of soils, biochar properties,
228 : 86 Remediation of trace element toxicity, organic
amendment (table), 225 : 31 Representative species selection, for TRV
setting, 230 : 61 Reproduction effects, bioamplifi cation, 227 : 119 Reproductive effects in birds, methyl mercury,
223 : 62 Reproductive effects in males, bisphenol A
derivatives, 228 : 72 Reproductive effects in males, bisphenol A,
228 : 57 ff. Reproductive effects in males, BPA (table),
228 : 63 Reproductive effects, in utero exposure to
bisphenol A, 228 : 60–2 Reproductive function in males, BPA action
sites (diag.), 228 : 71
Index
167
Reproductive toxicity, SSD for E2 (diag.), 228 : 40
Reptile residues in Mexico, mercury, 226 : 84 Reptile tissue residues, mercury (table), 226 : 85 Residue criteria for methyl mercury, bird
protection in China, 223 : 53 ff. Residues in air, ptaquiloside, 224 : 74 Residues in Bracken fern, ptaquiloside, 224 : 74 Residues in water, ptaquiloside, 224 : 74 Resorcinol bis(diphenylphosphate), fl ame
retardant, 222 : 35 Resorcinol bis(diphenylphosphate),
persistence, bioaccumulation & toxicity, 222 : 36
Resorcinol bis(diphenylphosphate), physical-chemical properties, 222 : 35
Resorcinol bis(diphenylphosphate), toxic & physical-chemical properties (table), 222 : 31
Rhizobacteria, in heavy metal phytoremediation, 223 : 33ff.
Rhizobacteria, role in phytoremediation, 223 : 35 Rhizofi ltration, type of phytoremediation,
223 : 37 Rhizosphere effects, trace element soil
metabolism, 225 : 28 Rhizosphere vs. non-rhizosphere soils, As &
Cr metabolic effects (illus.), 225 : 29 Rhizovolatilization, type of phytoremediation,
223 : 36 Risk assessment procedure, metals-metalloids,
230 : 43 Risk assessment role, SSDs, 230 : 37 Risk assessment scheme for nanoparticles, in
plants (diag.), 230 : 103 Risk assessment, ambient E2 concentrations in
China, 228 : 44 Risk assessment, of 17-[beta]-estradiol, in
Chinese waters, 228 : 29 ff. Risk assessment, PBDEs in Chinese lakes,
229 : 130 Risk assessments, Chinese aquatic species,
230 : 49 Risk management, in drinking water
disinfection, 222 : 150, 153 ROS generation, nanosilver toxicity role,
223 : 98 ROS, nanosilver toxicity mechanism, 223 : 82 ROS, nanosilver toxicity mode of action
(table), 223 : 85 ROS, plant toxicity effects, 223 : 39 ROS, silver nanoparticle-induced toxicity,
223 : 84 Rural asthma, causes in adults, 226 : 33 ff.
Rural living, asthma morbidity benefi t, 226 : 44 Rural vs. urban differences, asthma prevalence
(table), 226 : 52 Rural vs. urban environments, differences,
226 : 36 Rural vs. urban residents, asthma effects
(table), 226 : 53–55 Rural vs. urban residents, atopy & asthma in
adults, 226 : 45 S alt solution washing, during food processing,
229 : 101 Sampling sites, metals-metalloids in a Chinese
Lake (illus), 230 : 40 S antiago, Chile air pollutant data, exceedance
probabilities & percentiles, 223 : 223 Santiago, Chile air pollutant data, PM10 98 th
percentile (table), 223 : 24 Santiago, Chile air pollution data,
autocorrelation analysis, 223 : 18 Santiago, Chile air pollution, human health
effects & guidelines, 223 : 15 Santiago, Chile air pollution, inversion effects,
(table), 223 : 14 Santiago, Chile air pollution, PM10 level
histograms & boxplots (diag.), 223 : 19 Santiago, Chile air pollution, PM10 levels
time series (diag.), 223 : 19 Santiago, Chile air pollution, statistical
treatment, 223 : 17 Santiago, Chile locations, PM10 air pollutant
data, (table), 223 : 21 Santiago, Chile PM10 levels, boxplots (diag.),
(table), 223 : 22 Santiago, Chile, air contamination,
223 : 1ff., 12 Santiago, Chile, air monitoring locations
(illus.), 223 : 15 Santiago, Chile, air pollutant characteristics,
223 : 17 Santiago, Chile, air pollutant problems &
regulations, 223 : 4 Santiago, Chile, air pollution data, 223 : 16 Santiago, Chile, air pollution monitoring, 223 :
14 Santiago, Chile, PM10 air pollutant levels
(table), 223 : 18 Santiago, Chile, PM10 air pollutant data
analysis, 223 : 20 Se degradation in soil, reducing conditions,
225 : 20 Secondary poisoning, implication for deriving
sediment quality criteria, 224 : 158 Sediment levels, along Mexican coasts,
226 : 68–75
Index
168
Sediment levels, mercury in Mexico (table), 226 : 69
Sediment pesticide criteria, aquatic life, 224 : 97 ff.
Sediment quality criteria derivation, bioaccumulation & secondary poisoning implication, 224 : 158
Sediment quality criteria derivation, bioavailability considerations, 224 : 135
Sediment quality criteria derivation, calculating criteria, 224 : 131
Sediment quality criteria derivation, data required, 224 : 114
Sediment quality criteria derivation, data sources, 224 : 114
Sediment quality criteria derivation, ecotoxicity data needs, 224 : 120
Sediment quality criteria derivation, ecotoxicity data quality, 224 : 124
Sediment quality criteria derivation, ecotoxicity data quantity needed, 224 : 129
Sediment quality criteria derivation, endpoint choices, 224 : 123
Sediment quality criteria derivation, exposure parameters role, 224 : 132
Sediment quality criteria derivation, interspecies relationship data, 224 : 124
Sediment quality criteria derivation, methodology summary & analysis, 224 : 139–155
Sediment quality criteria derivation, mixtures effect, 224 : 155
Sediment quality criteria derivation, multipathway exposures, 224 : 134
Sediment quality criteria derivation, numeric criteria vs. advisory levels, 224 : 110
Sediment quality criteria derivation, physicochemical data needs, 224 : 117
Sediment quality criteria derivation, QSARs role, 224 : 130
Sediment quality criteria derivation, single- vs. multi-species data, 224 : 122
Sediment quality criteria derivation, species selected (table), 224 : 127
Sediment quality criteria derivation, threatened & endangered species implication, 224 : 157
Sediment quality criteria derivation, value of harmonizing across media, 224 : 160
Sediment quality criteria methodology, survey (table), 224 : 105–6
Sediment quality criteria, biological organization level to protect, 224 : 112
Sediment quality criteria, components (table), 224 : 101
Sediment quality criteria, data analysis methods, 224 : 122
Sediment quality criteria, derivation approaches, 224 : 100
Sediment quality criteria, deriving from numeric criteria vs. advisory levels, 224 : 110
Sediment quality criteria, empirical methods, 224 : 107
Sediment quality criteria, mechanistic approach, 224 : 104
Sediment quality criteria, methodologies compared (table), 224 : 163
Sediment quality criteria, methodology, 224 : 100 Sediment quality criteria, numeric criteria
defi nitions & uses, 224 : 111 Sediment quality criteria, over- & under-
protection, 224 : 113 Sediment quality criteria, portion of species to
protect, 224 : 113 Sediment quality criteria, protection defi ned,
224 : 112 Sediment quality criteria, relevant acronyms
(table), 224 : 102–4 Sediment quality criteria, spiked-sediment
toxicity approach, 224 : 108 Sediment quality criteria, uses & defi nitions,
224 : 108 Sediment quality guideline values, vs. e-waste
contaminants (table), 229 : 25 Sediment quality guidelines, mechanistic
approach, 224 : 107 Sediment toxicity testing methods, selected
list (table), 224 : 125 Sediment, E2 residues (table), 228 : 45 Sediments characterized, aquatic
environments, 224 : 98 Selection forces, genetic structure response,
227 : 80 Selenium characteristics, profi le, 225 : 6 Selenium effects, MeHg, 229 : 8 Selenium in soil, uses (table), 225 : 5 Selenium metabolic reduction, infl uencing
factors, 225 : 23 Selenium volatilization, vs. soil water potential
(diag.), 225 : 26 Selenium, biomethylation, 225 : 20 Sentinel organisms, use in ecotoxicology
studies, 227 : 97 Sewage treatment plant (STP), E2 residues
(table), 228 : 45 Sewage-related debris, PBMs, 227 : 8
Index
169
Shell vs. soft tissues, copper uptake in land snails, 225 : 113
Shoreline debris component, PBMs (table), 227 : 12
Shoreline waste, macro PBMs, 227 : 10 Shoreline waste, micro PBMs, 227 : 13 Shrimp, mercury levels in Mexico (table),
226 : 78 Silica coating, pyrite bonding pattern (illus.),
226 : 11 Silica coatings, for pyrite, 226 : 11 Silver compounds, antibacterial properties,
223 : 89 Silver ions, nanoparticle toxicity cause,
223 : 97, 99 Silver nanoparticle toxicity, infl uencing
factors, 223 : 92 Silver nanoparticle toxicity, ROS, 223 : 84 Silver nanoparticle toxicity, zebrafi sh, 223 : 94 Silver nanoparticles, bacterial cell-wall
interaction, 223 : 90 Silver nanoparticles, daphnid uptake, 223 : 96 Silver nanoparticles, described, 230 : 97 Silver toxicity mechanisms, freshwater fi sh &
daphnids, 223 : 93 Silver toxicity, in vitro exposure, 223 : 83 Silver toxicity, in vivo exposure, 223 : 92 Silver, basal cell function disruption, 223 : 83 S-impregnated activated carbon effi ciency, for
removing Hg, 230 : 26 S-impregnated activated carbon, for removing
Hg, 230 : 2, 4 Sindh Province (Pakistan), fi sh residues,
230 : 123 Single-walled carbon nanotubes (SWCNTs),
description, 230 : 92 Smoking behavior & asthma, urban vs. rural
areas, 226 : 37 Snails (Pulmonata), copper pollution
monitoring, 225 : 95 ff. SO 2 , air contaminant, 223 : 6 Socioeconomic effects, on asthma incidence,
226 : 49 Soil & water effects, ptaquiloside, 224 : 75 Soil adsorption effects, pesticide leaching,
221 : 26 Soil amendment effect, arsenic metabolism
(diag.), 225 : 35 Soil amendment effects, pesticide mobility
(table), 221 : 37 Soil amendment effects, pesticide mobility,
221 : 34, 36 Soil amendment effects, trace element
metabolism, 225 : 30
Soil amendments, chromium immobilization (illus.), 225 : 38
Soil behavior modeling, pesticides, 221 : 45 Soil behavior, arsenic, 225 : 4 Soil behavior, cadmium, 229 : 54 Soil behavior, copper, 225 : 103 Soil behavior, fenpropathrin, 225 : 83 S oil behavior, methomyl, 222 : 95 Soil bioavailability, heavy metals, 223 : 37 Soil bioavailability, trace elements, 225 : 1ff. Soil bioavailability, zirconium, 221 : 110 Soil biosorption, trace elements (table), 225 : 9 Soil column elution, experimental methods,
221 : 13 Soil column leaching effects, dissolved
organic matter, 221 : 8 Soil column leaching studies, pesticide
mobility, 221 : 52 Soil column leaching, acetoanilide pesticides
(table), 221 : 62–65 Soil column leaching, arylalkanoate pesticides
(table), 221 : 62–65 Soil column leaching, carbamate pesticides
(table), 221 : 54–57 Soil column leaching, climate effects, 221 : 14 Soil column leaching, diphenyl ether
pesticides (table), 221 : 62–65 Soil column leaching, dissolved organic matter
effects, 221 : 9 Soil column leaching, measuring pesticide
mobility, 221 : 11 Soil column leaching, misc. pesticides (table),
221 : 66–71 Soil column leaching, organophosphorous
pesticides (table), 221 : 54–57 Soil column leaching, pyrethroid pesticides
(table), 221 : 54–57 Soil column leaching, triazine pesticides
(table), 221 : 62–65 Soil column leaching, typical apparatus
(diag.), 221 : 12 Soil column leaching, urea & sulfonylurea
herbicides (table), 221 : 58–61 Soil column leaching, water-dispersible
colloid effects, 221 : 9 Soil columns for pesticide leaching, described,
221 : 12 Soil columns, pesticide leaching, 221 : 1 ff. Soil degradation of diazinon, infl uencing
factors, 223 : 120 Soil degradation, fenpropathrin, 225 : 84 Soil degradation, methylmercury, 225 : 19 Soil degradation, ptaquiloside, 224 : 77 Soil degradation, Se, 225 : 20
Index
170
Soil dissipation, diazinon, 223 : 119 Soil effects, pesticide dissipation rate, 221 : 24 Soil environment, PBM degradation, 227 : 22 Soil exposure, copper, 225 : 103 Soil facilitated transport, pesticides, 221 : 42 Soil factor effects, pesticide mobility, 221 : 31 Soil interactions, clomazone, 229 : 37 Soil leaching methods, pesticides, 221 : 10 Soil leaching results, organophosphorous &
carbamate pesticides, 221 : 53 Soil leaching results, synthetic pyrethroid
insecticides, 221 : 53 Soil leaching, diazinon, 223 : 117 Soil leaching, pesticides, 221 : 1 ff., 2 Soil leaching, ptaquiloside, 224 : 76 Soil macropore effects, pesticide degradation,
221 : 33 Soil macropores, characteristics, 221 : 4 Soil macropores, dye studies, 221 : 4 Soil macropores, earthworm role, 221 : 6 Soil macropores, formation, 221 : 5 Soil macropores, pesticide mobility, 221 : 3 Soil macropores, preferential fl ow, 221 : 32 Soil metabolism of chromium, infl uencing
factors (diag.), 225 : 24 Soil metabolism of trace elements, rhizosphere
effects, 225 : 28 Soil metabolism of trace elements,
temperature effects, 225 : 26 Soil metabolism, arsenic, 225 : 19 Soil microbes, biochar aging effect, 228 : 93 Soil microbial degradation, diazinon, 223 : 119 Soil mineralization, diazinon, 223 : 118 Soil mobility of pesticides, conceptional
model (diag.), 221 : 46 Soil mobility of pesticides, fertilizer effects,
221 : 43 Soil mobility, groundwater ubiquity score
(GUS; diag.), 221 : 30 Soil mobility, zirconium, 221 : 111 Soil moisture & aeration effects, trace element
metabolism, 225 : 25 Soil moisture effects, pesticide mobility, 221 : 31 Soil organic matter effects, zirconium
mobility, 221 : 112 Soil organic matter, biochar performance
effects, 228 : 91 Soil pH, biochar effect, 228 : 90 Soil pH, trace element metabolic effect, 225 : 24 Soil photolysis pathway, diazinon (diag.),
223 : 121 Soil process effects, pesticide mobility, 221 : 18 Soil properties, vs. K d values, 221 : 22 Soil property effects, pesticide mobility, 221 : 3
Soil remediation, trace elements, 225 : 1ff. Soil remediation, with biochar (diag.), 228 : 85 Soil remediation, with biochar, 228 : 83 ff. Soil retention & mobility, zirconium, 221 : 110 Soil sorption effects, pesticide mobility, 221 : 19 Soil sorption processes, pH & clay effects,
221 : 20 Soil sorption, diazinon, 223 : 114, 115 Soil sorption, processes, 221 : 19 Soil texture effects, zirconium behavior,
221 : 112 Soil thin-layer chromatography, pesticide
mobility, 221 : 10 Soil tillage effects, pesticide mobility (table),
221 : 35 Soil tillage effects, pesticide mobility, 221 : 34 Soil tillage, macropore disruption, 221 : 31 Soil to plant transfer, zirconium, 221 : 115 Soil transformation, trace elements, 225 : 1ff. Soil transformation, trace elements, 225 : 3 Soil vegetation, pesticide mobility effects,
221 : 41 Soil water potential, vs. selenium volatilization
(diag.), 225 : 26 Soil, trace element sink, 225 : 2 Soil-plant system behavior, zirconium,
221 : 107 ff. Soil-plant systems, copper transfer, 225 : 108 Soil-plant transfer, zirconium, 221 : 114 Soils, structure & character, 221 : 3 Soils, trace element sources, 225 : 4 Soils, trace element speciation, 225 : 4 Soil-sediment degradation, diazinon, 223 : 114 Solar radiation, drinking water disinfection,
222 : 136 Solute concentration, trace element metabolic
effect, 225 : 21 South Africa trends, potable water
disinfection, 222 : 124 South Africa, drinking water quality, 222 : 117 Soybean metabolic pathway, clomazone
(diag.), 229 : 44 Speciation of trace elements, metabolic effect,
225 : 21 Speciation, zirconium, 221 : 113 Species selected, deriving sediment quality
criteria (table), 224 : 127 Species sensitivity distribution (SSD), for E2
toxicity (diag.), 228 : 39 Species sensitivity distribution, methyl
mercury avian toxicity (diag.), 223 : 68
Species sensitivity distributions (SSDs), setting WQCs, 230 : 35 ff.
Index
171
Species sensitivity, to metallic elements, 230 : 46 Species to protect, sediment quality criteria,
224 : 113 Sperm function effects, bisphenol A, 228 : 70 Spermatogenesis effects, of bisphenol A, 228 :
62, 68 Spiked-sediment toxicity approach, sediment
quality criteria, 224 : 108 SSD (species sensitivity distribution) bootstrap
regression, metal-metalloid toxicity (diag.), 230 : 48
SSD (species sensitivity distribution), E2 toxicity (diag.), 228 : 39
SSD construction, bootstrapping approaches, 230 : 41
SSD construction, parametric approaches, 230 : 40
SSD construction, via different models, 230 : 43 SSD curve construction, reference
concentrations (table), 230 : 71 SSD curve fi tting, toxicity values (table),
230 : 72 SSD for E2, reproductive toxicity (diag.),
228 : 40 SSD plots, derived via different approaches
(diag.), 230 : 45 SSD, method described, 230 : 70 SSD, PCB bird dietary toxicity data (diag.),
230 : 73 SSD, PCB bird toxicity (diag.), 230 : 72 SSDs, derived via different approaches, 230 : 45 SSDs, risk assessment role, 230 : 37 Stabilizers, nanoparticles, 230 : 89 Stack emissions, Hg adsorption variables,
230 : 28 Stack emissions, removing vapor-phase Hg,
230 : 1 ff. Statistical distribution uses, air pollution data,
223 : 4 Statistical distributions, relation to air
pollutant data, 223 : 3, 8 Statistical distributions, Santiago, Chile air
contaminants, 223 : 1ff. Statistical model effect, on HC5 values (diag.),
230 : 44 Statistical model validation, for Santiago,
Chile air pollutant data, 223 : 20 Statistical models, air pollution data, 223 : 3 Statistics, relation to adverse human effects,
223 : 24 STPs (sewage treatment plants), E2 residues
(table), 228 : 45 Sulfi de deposits, acid mine drainage (table),
226 : 3
Sulfi de mineral oxidation, acid mine drainage, 226 : 2
Sulfonylurea herbicides, leaching characteristics, 221 : 73
Sulfonylurea herbicides, soil column leaching (table), 221 : 58–61
Sulfur to carbon ratio, Hg 0 adsorption effects, 230 : 28
Sulfur-content effects, Hg 0 adsorption, 230 : 28 Surface water, E2 residues (table), 228 : 45 Surface-water concentrations, metals-
metalloids in China, 230 : 39 Surface-water residues, diazinon, 223 : 123 Surfactant effects, pesticide mobility, 221 : 18 Suspended solid particles, air pollutants, 223 : 7 SWCNTs (single-walled carbon nanotubes),
description, 230 : 92 Synthesis methodology, phthalates, 224 : 40 Systematic research reviews, methodology,
230 : 3 Systematic reviews, fl ow chart process (diag.),
230 : 5 Systematic reviews, process steps (diag.),
230 : 3 T -2 and HT-2 toxins, Fusarium -produced
mycotoxins, 228 : 108 Tannic acid effects, pesticide soil leaching,
221 : 44 Tattoo skin disease, in Guinea dolphins,
228 : 16 Taxa effects, heavy metal uptake (diag.),
226 : 107 Taxonomic group case studies,
bioamplifi cation (table), 227 : 116–7 Teleost fi sh muscle residues, mercury (table),
226 : 82 Temperature effect, diazinon soil mobility,
223 : 118 Temperature effects, Hg 0 adsorbed by
activated carbon, 230 : 29 Temperature effects, Hg 0 adsorption, 230 : 27 Temperature effects, on biochar remediation
performance, 228 : 93 Temperature effects, trace element soil
metabolism, 225 : 26 Tern (common), PCB toxicity, 230 : 69 Terrestrial ecosystem monitoring, using land
snails, 225 : 95 ff. Terrestrial fi eld dissipation studies, pesticides,
221 : 17 Testicular antioxidant system, bisphenol A
effects, 228 : 70 Testicular effects, BPA, 228 : 65 Thermal degradation, PBMs, 227 : 20
Index
172
Thermal inversion effects, Santiago, Chile air pollution, 223 : 14
Thimerosal in vaccines, ethyl mercury, 229 : 4 Thiol interactions, MeHg, 229 : 7 Thyroid exposure, cardiology staff to radiation
(diag.), 222 : 81 Thyroid gland exposure to radiation,
cardiology staff, 222 : 82 Time effects, Hg 0 adsorbed by activated
carbon, 230 : 29 Tissue residue criteria (TRC), for avian
wildlife in China, 223 : 53 ff. Tissue residue guideline (TRG) derivation,
methods, 230 : 62 Titanium nanoparticles, described, 230 : 96 Tobacco smoke, adult asthma, 226 : 37 Tolerable daily intake values, for BPA, 228 : 73 Tolerable daily intake values, TRV calculation
(table), 230 : 74 Tolerance of land snails, chemical elements,
225 : 97 Tolerance of land snails, to copper forms
(table), 225 : 101 Toxic effects survey, nanoparticles (table),
230 : 93–95 Toxic equivalent conversion factors, PCB
mixtures (table), 230 : 71 Toxic metals, in e-waste, 229 : 20 Toxic syndromes described, fumonisins,
228 : 106 Toxic trace elements, As, Cr, Hg & Se, 225 : 3 Toxicity among species, copper (table), 225 : 98 Toxicity effect, nanoparticle aggregation,
223 : 94 Toxicity expression methods, copper, 225 : 100 Toxicity infl uencing factors, silver
nanoparticles, 223 : 92 Toxicity mechanism for nanosilver, ROS,
223 : 82 Toxicity mechanisms, heavy metals in plants,
223 : 34 Toxicity of copper, to land snails (table),
225 : 101 Toxicity of HFFRs, classifi cation scheme
(table), 222 : 9 Toxicity of Hg, neurodegenerative effects,
229 : 1 ff. Toxicity of nanosilver, effective in vivo
concentration (table), 223 : 95 Toxicity of nanosilver, via ROS induction
(table), 223 : 85 Toxicity of PCB isomers-mixtures, to birds
(table), 230 : 65-67 Toxicity of silver, in vitro exposure, 223 : 83
Toxicity of silver, in vivo exposure, 223 : 92 Toxicity percentile rank method, for
calculating TRVs, 230 : 74 Toxicity reference values (TRV), avian
wildlife protection, 223 : 53 ff. Toxicity reference values (TRV), development
process, 229 : 114 Toxicity reference values, aquatic birds in
China, 230 : 59 ff. Toxicity reference values, for PBDEs, 229 :
111 ff. Toxicity remediation, organic amendments
(table), 225 : 31 Toxicity symptoms in humans, boron, 225 : 67 Toxicity symptoms, mercury, 229 : 6 Toxicity thresholds for avian species, methyl
mercury (diag.), 223 : 65 Toxicity thresholds for DE-71, wildlife (diag.),
229 : 127 Toxicity thresholds for methyl mercury,
species sensitivity curve fi tting (table), 223 : 67
Toxicity to aquatic organisms, methomyl (table), 222 : 104
Toxicity to birds & mammals, methomyl, 222 : 104
Toxicity values, SSD curve fi tting (table), 230 : 72
Toxicity, 9,10-Dihydro-9-oxa-10-phosphaphenanthrene-10-oxide, 222 : 43
Toxicity, aluminum diethylphosphinate (table), 222 : 46
Toxicity, aluminum diethylphosphinate, 222 : 48 Toxicity, aluminum trihydroxide, 222 : 10 Toxicity, ammonium polyphosphate (table),
222 : 15 Toxicity, ammonium polyphosphate, 222 : 16 Toxicity, arsenic, 224 : 2 Toxicity, bisphenol-A bis(diphenylphosphate)
(table), 222 : 41 Toxicity, bisphenol-A bis(diphenylphosphate)
(table), 222 : 42 Toxicity, boron, 225 : 66 Toxicity, heavy metals in plants, 223 : 34 Toxicity, HFFRs (table), 222 : 59 Toxicity, HFFRs, 222 : 1 ff. Toxicity, HFFRs, 222 : 58 Toxicity, HFFRs, 222 : 7 Toxicity, magnesium hydroxide (table), 222 : 13 Toxicity, magnesium hydroxide, 222 : 12 Toxicity, melamine polyphosphate (table),
222 : 50 Toxicity, melamine polyphosphate, 222 : 51 Toxicity, mercury vapor, 229 : 6
Index
173
Toxicity, mercury, 229 : 5 Toxicity, methomyl to aquatic species, 222 : 103 Toxicity, methomyl, 222 : 102 Toxicity, methomyl, 222 : 93 ff. Toxicity, methomyl, 222 : 94 Toxicity, pentaerythritol (table), 222 : 54 Toxicity, pentaerythritol, 222 : 52 Toxicity, pesticide types, 224 : 99 Toxicity, pesticides in aquatic environments,
224 : 99 Toxicity, phosphaphenanthrene-10-oxide
(table), 222 : 44 Toxicity, polymer additives (table), 227 : 35–39 Toxicity, polymer additives, 227 : 34 Toxicity, resorcinol bis(diphenylphosphate)
(table), 222 : 33 Toxicity, resorcinol bis(diphenylphosphate),
222 : 36 Toxicity, triphenylphosphate (table), 222 : 27 Toxicity, triphenylphosphate, 222 : 30 Toxicity, zinc borate (table), 222 : 18 Toxicity, zinc borate, 222 : 17 Toxicity, zinc hydroxystannate, 222 : 20 Toxicity, zinc stannate (table), 222 : 21 Toxicology, clomazone, 229 : 35 ff., 42 Toxin sensing, microbes, 224 : 26 Toxoplasmosis, in marine mammals, 228 : 15 Trace element biosorption, by microbes,
225 : 11 Trace element detoxifi cation, methylation &
demethylation, 225 : 16 Trace element immobilization, microbial
aspects (diag.), 225 : 36 Trace element interactions, soil microbes,
225 : 2 Trace element metabolic effect, soil pH,
225 : 24 Trace element metabolism, microbial activity,
225 : 21 Trace element metabolism, soil amendment
effects, 225 : 30 Trace element metabolism, soil moisture &
aeration effects, 225 : 25 Trace element metabolism, solute
concentration effect, 225 : 21 Trace element metabolism, speciation effect,
225 : 21 Trace element sink, soil, 225 : 2 Trace element soil metabolism, rhizosphere
effects, 225 : 28 Trace element soil metabolism, temperature
effects, 225 : 26 Trace element sources, soils & sediments,
225 : 4
Trace element speciation, soils & sediments, 225 : 4
Trace element toxicity, organic amendment remediation (table), 225 : 31
Trace elements in soil, microbial biomethylation, 225 : 17
Trace elements, bioaccumulation & remediation effects, 225 : 36
Trace elements, bioaccumulation, 225 : 7 Trace elements, biosorption (table), 225 : 9 Trace elements, defi ned, 225 : 2 Trace elements, methylation & demethylation
in soil, 225 : 18 Trace elements, microbial redox reactions,
225 : 12 Trace elements, microbial transformation
processes (diag.), 225 : 8 Trace elements, microbial transformation
processes, 225 : 20 Trace elements, oxidation-reduction reactions
(table), 225 : 14 Trace elements, pH effects on
bioaccumulation, 225 : 24 Trace elements, physical properties (table),
225 : 17 Trace elements, redox reactions (table), 225 : 13 Trace elements, remediation and
bioavailability, 225 : 1ff. Trace elements, soil microbial transformation,
225 : 1ff. Trace elements, soil reductions vs. oxidations,
225 : 15 Transport model for xenobiotics, mother to
child (diag.), 227 : 65 TRC (tissue residue criteria), for avian wildlife
in China, 223 : 53 ff. TRC, for Chinese bird protection, 223 : 53 ff. TRCs for selected avian species in China,
methyl mercury (table), 223 : 67 TRG (tissue residue guideline) derivation,
methods, 230 : 62 TRG calculation, methods compared for PCBs
(table), 230 : 75 TRG derivation, method, 230 : 70 Triazine pesticides, leaching characteristics,
221 : 73 Triazine pesticides, soil column leaching
(table), 221 : 62–65 Trichothecene mycotoxin, diacetoxyscirpenol,
228 : 109 Trichothecene mycotoxin, nivalenol, 228 : 110 Trichothecenes, Fusarium -produced
mycotoxin, 228 : 108 Triphenylphosphate, fl ame retardant, 222 : 22
Index
174
Triphenylphosphate, toxic, environmental & physical-chemical properties, 222 : 22–35
Triphenylphosphate, toxic, environmental & physical-chemical properties (table), 222 : 23–29
Trophic transfer data analysis, method described, 226 : 103
Trophic transfer factor estimates, from biokinetic modeling, 226 : 104
Trophic transfer factors, biokinetic heavy metal data (diag.), 226 : 110
Trophic transfer factors, defi ned, 226 : 102 Trophic transfer factors, dietary uptake of
heavy metals (diag.), 226 : 107 Trophic transfer in freshwater, heavy metals
(diag.), 226 : 109 Trophic transfer of accumulator species,
biokinetic data (diag.), 226 : 112 Trophic transfer, defi ned, 226 : 102 TRV & TRC derivation, avian species in
China, 223 : 66 TRV & TRC values for methyl mercury,
reasonableness, 223 : 68 TRV (toxicity reference value) calculation,
methods compared for PCBs (table), 230 : 75
TRV (toxicity reference value), for avian wildlife in China, 223 : 53 ff.
TRV (toxicity reference values), development process, 229 : 114
TRV and TRC values, derivation methods, 223 : 57
TRV calculation, reference concentrations (table), 230 : 74
TRV calculation, tolerable daily intake values (table), 230 : 74
TRV calculation, via the toxicity percentile rank method, 230 : 74
TRV derivation, method, 230 : 70 TRV derivation, methods, 230 : 62 TRV setting, role in protecting wildlife,
223 : 55 TRV, for avian wildlife in China, 223 : 53 ff. TRVs & TRCs, uncertainty evaluation,
223 : 72 TRVs for selected avian species in China,
methyl mercury (table), 223 : 67 TRVs, aquatic birds in China, 230 : 59 ff. TRV-setting, selecting representative species,
230 : 61 Tumor biomarkers, expression, 224 : 80 Tumor induction & progression, role for
bovine papillomavirus, 224 : 64
Tumor modeling, ptaquiloside-induced cancer, 224 : 78
Tumorous disease of cattle, enzootic bovine hematuria, 224 : 53 ff.
Turf thatch effects, pesticide leaching, 221 : 18 U ltrasonic disinfection, of drinking water,
222 : 139 Ultrasonography, cancer diagnostic aid,
224 : 82 United States registered uses, fenpropathrin,
225 : 78 Universal PCR (polymerase chain reaction)
primers, fungi (table), 228 :126 Urban asthma, causes in adults, 226 : 33 ff. Urban vs. agricultural uses in California,
diazinon (table), 223 : 113 Urban vs. rural areas, adult asthma prevalence
& morbidity, 226 : 36 Urban vs. rural areas, endotoxin levels, 226 : 42 Urban vs. rural areas, fungal allergen levels,
226 : 42 Urban vs. rural differences, asthma prevalence
(table), 226 : 52 Urban vs. rural environments, differences,
226 : 36 Urban vs. rural residents, asthma effects
(table), 226 : 53–55 Urban vs. rural residents, atopy & asthma in
adults, 226 : 45 Urea amendment effects, pesticide mobility,
221 : 36 Urea herbicides, characteristics, 221 : 73 Urea herbicides, soil column leaching (table),
221 : 58–61 USA trends, potable water disinfection, 222 : 124 USA, water disinfectant regulations, 222 : 118 Usage, PBMs, 227 : 3 USEPA, maximum residual disinfectant levels
(table), 222 : 118 USEPA, regulating water disinfectants (table),
222 : 119 Uses, of major polymer types (table), 227 : 3–5 V apor-phase Hg removal, by sulfur-
impregnated activated carbon, 230 : 1 ff. Vapor-phase Hg removal, stack emissions,
230 : 1 ff. Vegetable processing, pyrethroid insecticide
residue effect, 229 : 89 ff. Vegetation effects, pesticide mobility (table),
221 : 37 Vegetation effects, pesticide mobility, 221 : 34 Vertebrates in Mexico, mercury residues, 226 : 79 Vestimentiferan tube worms in Mexico,
mercury residues (table), 226 : 88
Index
175
Viral waterborne pathogens, in drinking water, 222 : 133
Virus diseases, Guinea dolphins, 228 : 17 Volatile organic compounds, air contaminants,
223 : 6 Volatilization loss, diazinon, 223 : 127 Volatilization, chlomazone, 229 : 39 W ater & soil effects, ptaquiloside, 224 : 75 Water behavior, clomazone, 229 : 38 Water behavior, fenpropathrin, 225 : 83 Water behavior, methomyl, 222 : 96 Water contamination by fungi, control,
228 :131 Water cover, acid mine drainage, 226 : 6 Water disinfectant regulations, USA, 222 : 118 Water disinfection trends, Australia & Europe,
222 : 127 Water disinfection trends, Canada, 222 : 126 Water disinfection trends, South Africa,
222 : 124 Water disinfection trends, USA, 222 : 124 Water disinfection, benchmarking processes,
222 : 154 Water disinfection, by-products present
(table), 222 : 142 Water disinfection, global trends, 222 : 124 Water disinfection, history, 222 : 112, 113 Water disinfection, microbial risk assessment,
222 : 153 Water disinfection, practice survey (table),
222 : 125 Water disinfection, successes & challenges,
222 : 111 ff. Water monitoring data for California, diazinon
(table), 223 : 124 Water quality criteria (WQC), metals &
metalloids in China, 230 : 35 ff. Water quality criteria, diazinon (table), 223 : 133 Water quality criteria, diazinon 223 : 133 Water residues of mercury, in Mexico (table),
226 : 76 Water residues, diazinon, 223 : 122 Water safety planning, process (diag.), 222 : 152 Water, sources & types of fungi, 228 :123 Water-dispersible colloids, pesticide leaching
effects, 221 : 7 Watersheds in California, diazinon residues
(table), 223 : 124 Weight-loss link, bioamplifi cation, 227 : 111 White ibis, methyl mercury toxicity, 223 : 63 Wild fi sh from Chinese lakes, PBDE residues
(diag.), 229 : 132 Wild fi sh in Chinese lakes, PBDE congener
profi le (diag.), 229 : 130
Wild fi sh residues in China, PBDE (table), 229 : 131
Wildlife contaminant, methyl mercury, 223 : 55 Wildlife protection, TRV role, 223 : 55 Wildlife, persistent compound consumption,
230 : 61 Wildlife, POPs bioamplifi cation, 227 : 107 ff. Wind inversion effects, Santiago, Chile air
pollution, 223 : 14 World mine production trend, zirconium
(diag.), 221 : 110 Worldwide contaminant, mercury, 226 : 65 Worldwide demand, natural rubber, 227 : 6 WQC (water quality criteria), metals &
metalloids in China, 230 : 35 ff. WQC method-setting, in China, 230 : 35 ff. WQC standards, need in China, 230 : 36 WQC, defi ned & described, 230 : 36 WQC-setting, for aquatic Chinese species,
230 : 38 WQC-setting, methods & approaches, 230 : 38 WQC-setting, methods discussed, 230 : 51 Wrists, dose to cardiology staff (diag.), 222 : 79 X enobiotic transport model, mother to child
(diag.), 227 : 65 Xenobiotics, gene pool effects, 227 : 82 Y ellow perch bioamplifi cation factors,
modeling (table), 227 : 129 Yellow perch simulation, bioamplifi cation
model parameters (table), 227 : 138–9 Yellow perch simulation, bioamplifi cation,
227 : 137 Yellow perch, bioamplifi cation modeling
(diags.), 227 : 127 Z earalenone, phytoestrogenic toxin, 228 : 105 Zebrafi sh, silver nanoparticle toxicity, 223 : 94 Zinc borate, fl ame retardant, 222 : 16 Zinc borate, toxicity & physical-chemical
properties (table), 222 : 18 Zinc borate, toxicity & physical-chemical
properties, 222 : 17 Zinc hydroxystannate, bioaccumulation &
toxicity, 222 : 20 Zinc hydroxystannate, fl ame retardant, 222 : 18 Zinc hydroxystannate, physical-chemical
properties, 222 : 18 Zinc hydroxystannate, toxicity & physical-
chemical properties (table), 222 : 19 Zinc stannate, bioaccumulation, 222 : 22 Zinc stannate, fl ame retardant, 222 : 21 Zinc stannate, toxicity & physical-chemical
properties (table), 222 : 21 Zinc stannate, toxicity & physical-chemical
properties, 222 : 21
Index
176
Zink nanoparticles, described, 230 : 96 Zirconium behavior, pH & soil texture effects,
221 : 112 Zirconium behavior, soil-plant systems,
221 : 107 ff. Zirconium isotopes, described, 221 : 109, 110 Zirconium minerals, described, 221 : 109 Zirconium mobility, soil organic matter
effects, 221 : 112 Zirconium release, climate effects, 221 : 112 Zirconium speciation, biogeochemical
behavior effects, 221 : 113 Zirconium toxicity, plant defenses, 221 : 117 Zirconium, commercial uses, 221 : 109 Zirconium, crustal abundance, 221 : 113 Zirconium, description, 221 : 108 Zirconium, factors affecting mobility &
bioavailability, 221 : 112 Zirconium, mineral structure, 221 : 111
Zirconium, minerals & isotopes, 221 : 108 Zirconium, organism toxicity, 221 : 116 Zirconium, plant growth inhibition, 221 : 117 Zirconium, plant translocation rate, 221 : 116 Zirconium, plant translocation, 221 : 114 Zirconium, plant uptake & distribution,
221 : 115 Zirconium, plant uptake from soil, 221 : 114 Zirconium, soil bioavailability, 221 : 110 Zirconium, soil mobility, 221 : 111 Zirconium, soil retention & mobility, 221 : 110 Zirconium, soil to plant transfer, 221 : 115 Zirconium, sources & abundance, 221 : 108 Zirconium, speciation, 221 : 113 Zirconium, toxicity, 221 : 116 Zirconium, worldwide production trend
(diag.), 221 : 110 Zn HC5 values, analysis approach effects
(diag.), 230 : 47
Index