statewide caseload trends - california courts
TRANSCRIPT
2022 Court Statistics Report
Statewide Caseload Trends2011–12 Through 2020–21

2022 Court Statistics Report
Statewide Caseload Trends2011–12 Through 2020–21
Judicial Council of California455 Golden Gate AvenueSan Francisco, California 94102-3688415-865-7740California Courts Infoline: [email protected]
© 2022 by Judicial Council of California. All rights reserved.
Except as permitted under the Copyright Act of 1976 and as otherwise expressly provided herein, no part of this publication may be reproduced in any form or by any means, electronic, online, or mechanical, including the use of information storage and retrieval systems, without permission in writing from the copyright holder. Permission is hereby granted to nonprofit institutions to reproduce and distribute this publication for educational purposes if the copies credit the copyright holder.
This report is available on the California Courts website: www.courts.ca.gov/12941.htm#id7495
JUDICIAL COUNCIL OF CALIFORNIA
Martin HoshinoAdministrative Director
Millicent Tidwell Chief Deputy Director
Operations and Programs Division
Robert OyungChief Operating Officer
Business Management Services
Office of Court Research
Leah Rose-GoodwinManager
Savet HongSupervising Analyst
Cheryl KingResearch Analyst
Jazmin LogronoResearch Analyst
Kyle CapuliAssociate Analyst
C O NT E NT S
Introduction . . . . . . . . . . . . . . . . . . . . . . . . . . . . . . . . . . . . . . . . . . . . . . . . 1 The California Court System . . . . . . . . . . . . . . . . . . . . . . . . . . . . . . . . . . . . . . . . 1
SUPREME COURT . . . . . . . . . . . . . . . . . . . . . . . . . . . . . . . . . . . . . . . . 9
Total Filings and Dispositions............................................................................................................. 11 Figure 1 Total Filings ......................................................................................................... 11 Figure 2 Total Dispositions ............................................................................................... 11
Filings and Dispositions: Summary .................................................................................................... 12 Figure 3 Petitions for Review ............................................................................................ 12 Figure 4 Original Proceedings .......................................................................................... 12 Figure 5 Automatic Appeals .............................................................................................. 12 Figure 6 Habeas Corpus Related To Automatic Appeals ................................................ 12 Figure 7 State Bar Matters ............................................................................................... 12
Data for Figures 3–7: Filings and Dispositions: Summary ............................................................... 13
Filings and Dispositions: Petitions for Review ................................................................................... 14 Figure 8 Total Petitions for Review .................................................................................. 14 Figure 9 Civil Total ............................................................................................................. 14 Figure 9a Civil Appeals ........................................................................................................ 14 Figure 9b Civil Writs ............................................................................................................ 14 Figure 10 Criminal Total ...................................................................................................... 14 Figure 10a Criminal Appeals ................................................................................................. 14 Figure 10b Criminal Habeas Corpus .................................................................................... 14 Figure 10c Criminal Other Writs ........................................................................................... 14
Data for Figures 8–10c: Filings and Dispositions: Petitions for Review.......................................... 15
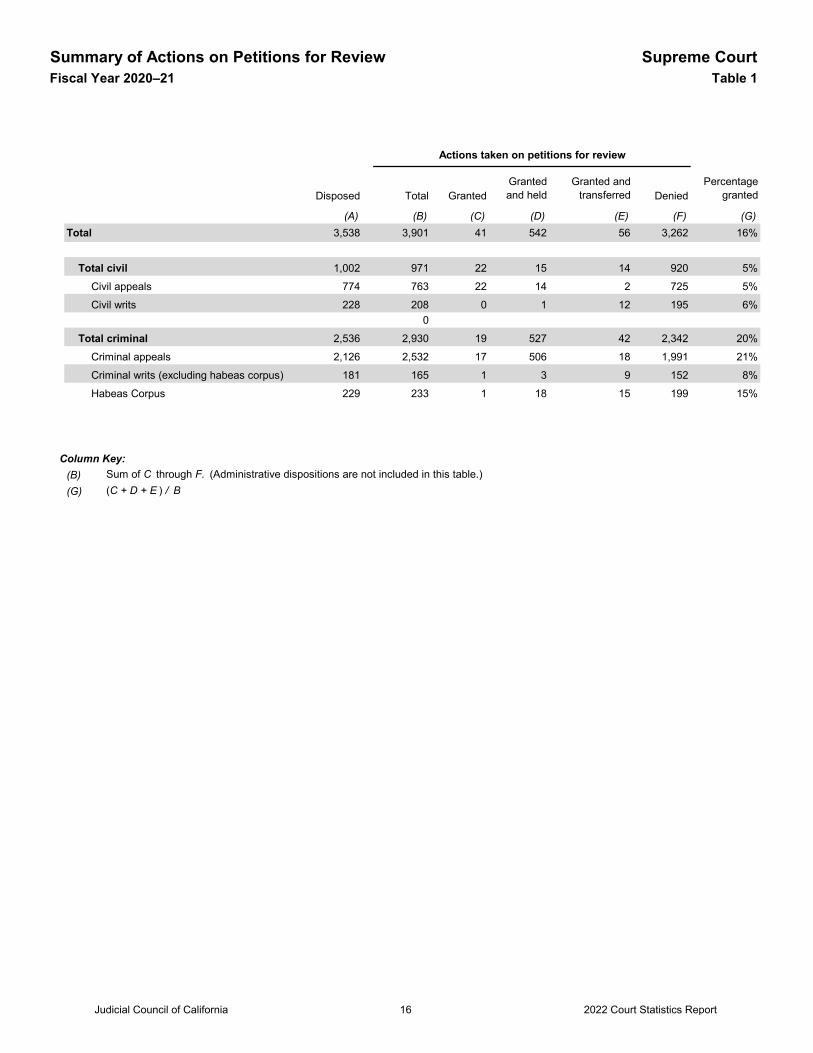
Summary of Actions on Petitions for Review ..................................................................................... 16 Table 1 Summary of Actions on Petitions for Review .................................................... 16
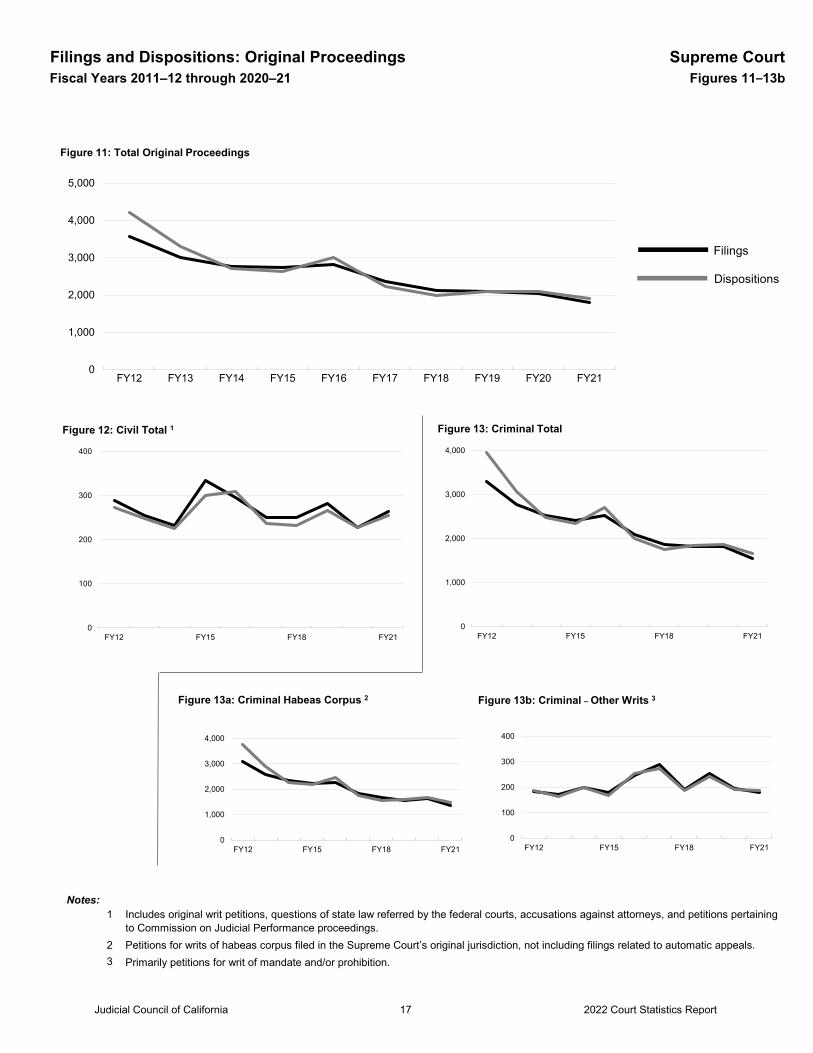
Filings and Dispositions: Original Proceedings ................................................................................. 17 Figure 11 Total Original Proceedings ................................................................................. 17 Figure 12 Civil Total ............................................................................................................. 17 Figure 13 Criminal Total ...................................................................................................... 17 Figure 13a Criminal Habeas Corpus .................................................................................... 17 Figure 13b Criminal Other Writs ........................................................................................... 17
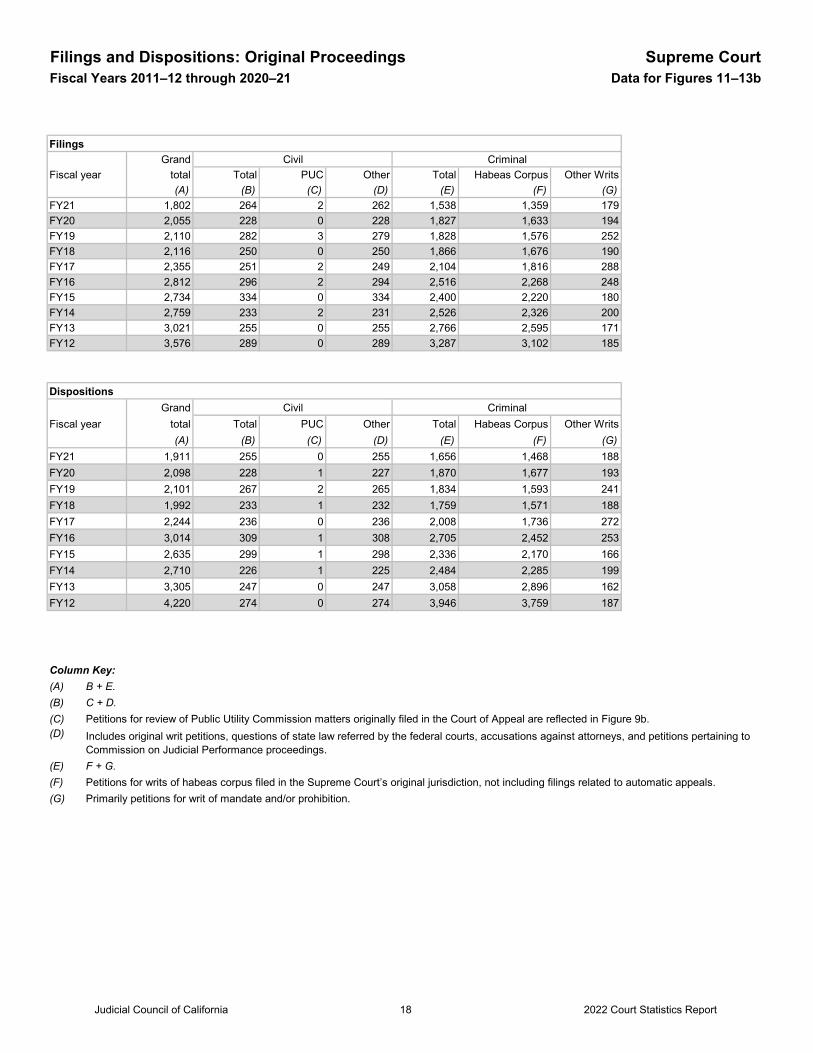
Data for Figures 11–13b: Filings and Dispositions: Original Proceedings ...................................... 18
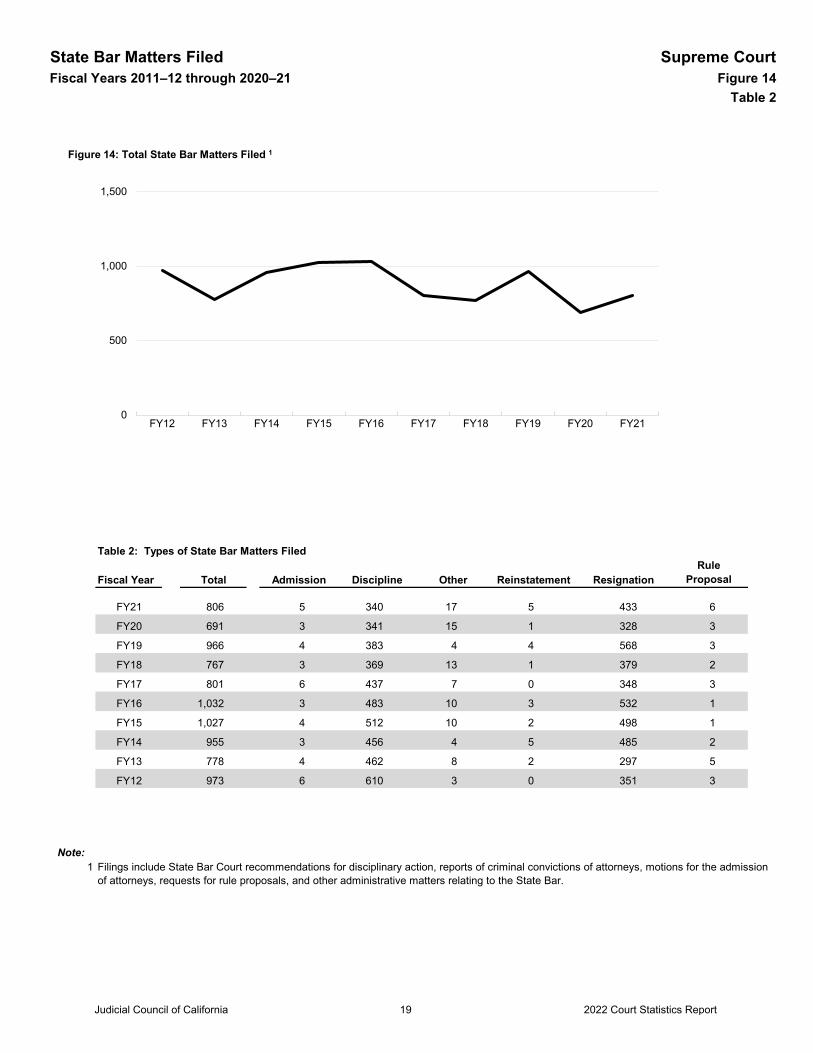
State Bar Matters Filed ....................................................................................................................... 19 Figure 14 Total State Bar Matters Filed ............................................................................. 19
Judicial Council of California v 2022 Court Statistics Report
Table 2 Types of State Bar Matters Filed ....................................................................... 19
Business Transacted .......................................................................................................................... 20 Figure 15 Written Opinions ................................................................................................. 20 Figure 16 Original Proceedings .......................................................................................... 20 Figure 17 Petitions for Review – Granted .......................................................................... 20 Figure 18 Petitions for Review – Denied ........................................................................... 20 Figure 19 Petitions for Review – Percent Granted ............................................................ 20 Figure 20 Rehearings – Granted ........................................................................................ 20 Figure 21 Rehearings – Denied ......................................................................................... 20 Figure 22 Executive Clemency Applications ...................................................................... 20
Data for Figures 15–22: Business Transacted ................................................................................. 21
Court of Appeal Opinions Ordered Depublished by the Supreme Court, Fiscal Years 2010–11 through 2019–20 ......................................................................................... 22
Figure 23 Depublished Opinions ........................................................................................ 22
Data for Figure 23: Court of Appeal Opinions Ordered Depublished by the Supreme Court ......... 23
Capital Cases in Which the Record Was Not Certified for Completeness Within 90 Days, and for Accuracy Within 120 Days ......................................................................... 24
Table 3 ................................................................................................................................... 24
COURTS OF APPEAL . . . . . . . . . . . . . . . . . . . . . . . . . . . . . . . . . . . . . . 25
Performance Indicator Data ............................................................................................................... 27 Table 1 Performance Indicator Data .............................................................................. 27 Figure 1 Ratio of Pending Fully Briefed Appeals per 100 Appeals
Disposed of by Written Opinion ......................................................................... 28 Figure 2 Pending Fully Briefed Appeals per Authorized Justice ..................................... 28 Figure 3 Majority Opinions per Judge Equivalent ............................................................ 28
Caseload Comparisons ....................................................................................................................... 29 Table 2 Caseload Comparisons ...................................................................................... 29 Figure 4 Pending Appeals: Caseload Comparison per Authorized Justice .................... 30 Figure 5 Filings and Dispositions: Caseload Comparison per Authorized Justice ........ 30
Summary of Filings ............................................................................................................................. 31 Figure 6 Total Contested Matters .................................................................................... 31 Figure 7 Total Contested Matters per Authorized Justice .............................................. 31
Record of Appeal Filings ..................................................................................................................... 32 Figure 8 All Districts .......................................................................................................... 32 Figure 9 First District ......................................................................................................... 32 Figure 10 Second District ................................................................................................... 32 Figure 11 Third District ....................................................................................................... 32
Judicial Council of California vi 2022 Court Statistics Report
Figure 12 Fourth District ..................................................................................................... 32 Figure 13 Fifth District ........................................................................................................ 32 Figure 14 Sixth District ........................................................................................................ 32
Original Proceedings Filings ............................................................................................................... 33 Figure 15 All Districts .......................................................................................................... 33 Figure 16 First District ......................................................................................................... 33 Figure 17 Second District ................................................................................................... 33 Figure 18 Third District ....................................................................................................... 33 Figure 19 Fourth District ..................................................................................................... 33 Figure 20 Fifth District ........................................................................................................ 33 Figure 21 Sixth District ........................................................................................................ 33
Appeals Disposed of by Written Opinion ........................................................................................... 34 Figure 22 Total Appeals ...................................................................................................... 34 Figure 23 Criminal Appeals by Defendants ....................................................................... 34 Figure 24 Criminal Appeals by Prosecution ....................................................................... 34 Figure 25 Civil Appeals ........................................................................................................ 34 Figure 26 Juvenile Appeals (Criminal Violation) ................................................................ 34 Figure 27 Other Juvenile Appeals ....................................................................................... 34
Percentage of Majority Opinions Published ...................................................................................... 35 Figure 28 Total Appeals ...................................................................................................... 35 Figure 29 Criminal Appeals ................................................................................................. 35 Figure 30 Civil Appeals ........................................................................................................ 35 Figure 31 Juvenile Appeals ................................................................................................. 35 Figure 32 Original Proceedings .......................................................................................... 35
Civil Appeals: Time From Notice of Appeal to Filing Opinion ........................................................... 36 Figure 33 90th Percentile and Median .............................................................................. 36
Criminal Appeals: Time From Notice of Appeal to Filing Opinion .................................................... 37 Figure 34 90th Percentile and Median .............................................................................. 37
Summary of Filings and Dispositions................................................................................................. 38 Table 3 ............................................................................................................................. 38
Summary of Filings ............................................................................................................................. 39 Table 4 ............................................................................................................................. 39
Appeals—Method of Disposition ......................................................................................................... 40 Table 5 ............................................................................................................................. 40
Dispositions of Original Proceedings ................................................................................................. 41 Table 6 ............................................................................................................................. 41
Opinions Written ............................................................................................................................. 42 Table 7 ............................................................................................................................. 42
Judicial Council of California vii 2022 Court Statistics Report
Pending Appeals—Total and Fully Briefed ......................................................................................... 43 Table 8 ............................................................................................................................. 43
SUPERIOR COURTS . . . . . . . . . . . . . . . . . . . . . . . . . . . . . . . . . . . . . . . 45
Caseloads and Authorized Judicial Positions .................................................................................... 47 Figure 1 Total Filings and Dispositions ............................................................................ 47 Figure 2 Total Filings and Dispositions per Judicial Position ......................................... 47
Civil Filings and Dispositions .............................................................................................................. 48 Figure 3 Total Civil ............................................................................................................. 48 Figure 4 Civil Unlimited ..................................................................................................... 48 Figure 5 Motor Vehicle PI/PD/WD ................................................................................... 48 Figure 6 Other PI/PD/WD ................................................................................................. 48 Figure 7 Civil Complaints .................................................................................................. 48 Figure 8 Civil Limited......................................................................................................... 48 Figure 9 Unlawful Detainer ............................................................................................... 48 Figure 10 Small Claims ....................................................................................................... 48
CalCourTools: Caseload Clearance Rates—Civil ................................................................................ 49 Figure 11 Total Civil ............................................................................................................. 49 Figure 12 Civil Unlimited ..................................................................................................... 49 Figure 13 Motor Vehicle PI/PD/WD ................................................................................... 49 Figure 14 Other PI/PD/WD ................................................................................................. 49 Figure 15 Civil Complaints .................................................................................................. 49 Figure 16 Civil Limited......................................................................................................... 49 Figure 17 Unlawful Detainer ............................................................................................... 49 Figure 18 Small Claims ....................................................................................................... 49
CalCourTools: Time to Disposition—Civil ............................................................................................ 50 Figure 19 Civil Unlimited ..................................................................................................... 50 Figure 20 Civil Limited......................................................................................................... 50 Figure 21 Unlawful Detainer ............................................................................................... 50 Figure 22 Small Claims ....................................................................................................... 50
Caseflow Management Data: Stage of Case at Disposition—Civil ................................................... 51 Figure 23 Civil Unlimited, Civil Limited, Unlawful Detainer, Small Claims ....................... 51
Criminal Filings and Dispositions ....................................................................................................... 52 Figure 24 Felony .................................................................................................................. 52 Figure 25 Nontraffic Misdemeanor .................................................................................... 52 Figure 26 Traffic Misdemeanor .......................................................................................... 52 Figure 27 Nontraffic Infraction ........................................................................................... 52
Judicial Council of California viii 2022 Court Statistics Report
Figure 28 Traffic Infraction ................................................................................................. 52
CalCourTools: Caseload Clearance Rates—Criminal ......................................................................... 53 Figure 29 Felony .................................................................................................................. 53 Figure 30 Nontraffic Misdemeanor .................................................................................... 53 Figure 31 Traffic Misdemeanor .......................................................................................... 53 Figure 32 Nontraffic Infraction ........................................................................................... 53 Figure 33 Traffic Infraction ................................................................................................. 53
Caseflow Management Data: Stage of Case at Disposition—Criminal ............................................ 54 Figure 34 Felony .................................................................................................................. 54 Figure 35 Misdemeanors and Infractions.......................................................................... 55
Family and Juvenile Filings and Dispositions .................................................................................... 56 Figure 36 Family Law—Marital ............................................................................................ 56 Figure 37 Family Law—Parentage ...................................................................................... 56 Figure 38 Family Law—Domestic Violence ......................................................................... 56 Figure 39 Family Law—Child Support ................................................................................. 56 Figure 40 Family Law—Other Petitions ............................................................................... 56 Figure 41 Juvenile Delinquency .......................................................................................... 56 Figure 42 Juvenile Dependency ......................................................................................... 56
CalCourTools: Caseload Clearance Rates—Family and Juvenile ...................................................... 57 Figure 43 Family Law—Marital ............................................................................................ 57 Figure 44 Family Law—Parentage ...................................................................................... 57 Figure 45 Family Law—Domestic Violence ......................................................................... 57 Figure 46 Family Law—Child Support ................................................................................. 57 Figure 47 Family Law—Other Petitions ............................................................................... 57 Figure 48 Juvenile Delinquency .......................................................................................... 57 Figure 49 Juvenile Dependency ......................................................................................... 57
Probate, Mental Health, Appeals, Habeas Corpus Filings and Dispositions ................................... 58 Figure 50 Conservatorship & Guardianship ...................................................................... 58 Figure 51 Other Probate ..................................................................................................... 58 Figure 52 Mental Health ..................................................................................................... 58 Figure 53 Appeals ............................................................................................................... 58 Figure 54 Criminal Habeas Corpus .................................................................................... 58
CalCourTools: Caseload Clearance Rates—Probate, Mental Health, Appeals, Habeas ................. 59 Figure 55 Conservatorship & Guardianship ...................................................................... 59 Figure 56 Other Probate ..................................................................................................... 59 Figure 57 Mental Health ..................................................................................................... 59 Figure 58 Appeals ............................................................................................................... 59 Figure 59 Criminal Habeas Corpus .................................................................................... 59
Judicial Council of California ix 2022 Court Statistics Report
Caseflow Management Data: Trials By Type of Proceeding ............................................................. 60 Figure 60 Total Jury and Court Trials ................................................................................. 60 Figure 61 Felony Jury Trials ................................................................................................ 60 Figure 62 Misdemeanor Jury Trials .................................................................................... 60 Figure 63 PI/PD/WD Civil Unlimited Jury Trials ................................................................. 60 Figure 64 Other Civil Unlimited Jury Trials ......................................................................... 60 Figure 65 Civil Limited Jury Trials ....................................................................................... 60 Figure 66 Probate and Mental Health Jury Trials .............................................................. 60 Figure 67 Felony Court Trials .............................................................................................. 60 Figure 68 Misdemeanor and Infraction Court Trials ......................................................... 60 Figure 69 PI/PD/WD Civil Unlimited Court Trials .............................................................. 60 Figure 70 Other Civil Unlimited Court Trials ....................................................................... 60 Figure 71 Civil Limited Court Trials .................................................................................... 60 Figure 72 Probate and Mental Health Court Trials ........................................................... 60
Trial Court Workload and Resources: Judicial Positions and Use of Judicial Assistance ............... 61 Figure 73 Total Judicial Position Equivalents (JPE) and
Assessed Judicial Need (AJN) ............................................................................ 61 Figure 74 Total Authorized Judicial Positions (AJP) and AJN ............................................ 61 Figure 75 Authorized Judgeships ....................................................................................... 61 Figure 76 Judicial Assistance Received by Trial Courts .................................................... 61
JBSIS Courts as of Fiscal Year 2019–20 .......................................................................................... 62
APPENDIXES . . . . . . . . . . . . . . . . . . . . . . . . . . . . . . . . . . . . . . . . . . . . 64
Appendix A Courts With Incomplete Data ............................................................................. 66
Appendix B Supreme Court Glossary .................................................................................... 68
Appendix C Courts of Appeal Glossary .................................................................................. 69
Appendix D Superior Courts Glossary ................................................................................... 70
Appendix E Courts of Appeal Data Tables for Figures ......................................................... 73
Data for Figures 6–7: Summary of Filings ..................................................................................... 73
Data for Figures 8–14: Record of Appeal Filings ........................................................................... 74
Data for Figures 15–21: Original Proceeding Filings .................................................................... 75
Data for Figures 22–27: Appeals Disposed of by Written Opinion ............................................... 76
Data for Figures 28–32: Percentage of Majority Opinions Published .......................................... 77
Appendix F Superior Court Statewide Data Tables for Figures ........................................... 78
Data for Figures 1–2: Caseloads and Judicial Positions ............................................................... 78
Data for Figures 3–18: Civil Filings, Dispositions, and Caseload Clearance Rate ...................... 79
Judicial Council of California x 2022 Court Statistics Report
Data for Figures 19–22: Civil Case Processing Time .................................................................... 80
Data for Figure 23: Stage of Case at Disposition—Civil ................................................................. 81
Data for Figures 24–33: Criminal Filings, Dispositions, and Caseload Clearance Rate ............. 82
Data for Figure 34: Stage of Case at Disposition—Felony ............................................................. 83
Data for Figure 35: Stage of Case at Disposition—Misdemeanors and Infractions .................... 84
Data for Figures 36–49: Family and Juvenile Filings, Dispositions, and Caseload Clearance Rate ................................................................................................................ 85
Data for Figures 50–59: Probate, Mental Health, Appeals, Habeas Corpus Filings, Dispositions, and Caseload Clearance Rate ..................................................................... 86
Data for Figures 60–72: Trials By Type of Proceeding .................................................................. 87
Data for Figures 73–75: Judicial Positions and Use of Judicial Assistance ................................ 88
Data for Figure 76: Assistance Received and Rendered by Type of Court .................................. 89
Appendix G County Tables ..................................................................................................... 90 Table 1 Caseload and Authorized Judicial Positions ..................................................... 90 Table 2 Court Trials .......................................................................................................... 92 Table 3 Jury Trials ............................................................................................................ 94 Table 4a Total Civil Filings ................................................................................................. 96 Table 4b Total Civil Dispositions ....................................................................................... 98 Table 5a Total Civil—Method of Disposition ................................................................... 100 Table 5b Unlimited Civil—Method of Disposition ........................................................... 102 Table 5c Unlimited Civil: Motor Vehicle Personal Injury, Property Damage,
and Wrongful Death—Method of Disposition .................................................. 104 Table 5d Unlimited Civil: Other Personal Injury, Property Damage,
and Wrongful Death—Method of Disposition .................................................. 106 Table 5e Unlimited Civil: Other Civil Complaints and Petitions—
Method of Disposition ...................................................................................... 108 Table 5f Small Claims Appeals—Stage of Case at Disposition ..................................... 110 Table 5g Limited Civil—Method of Disposition ............................................................... 112 Table 5h Limited Civil: Non-Unlawful Detainer—Method of Disposition ....................... 114 Table 5i Limited Civil: Unlawful Detainer—Method of Disposition ............................... 116 Table 5j Small Claims—Method of Disposition.............................................................. 118 Table 6a Civil Case Processing Time .............................................................................. 120 Table 7a Total Criminal Filings ........................................................................................ 122 Table 7b Total Criminal Dispositions .............................................................................. 124 Table 8a Felonies—Method of Disposition ..................................................................... 126 Table 8b Felonies—Dispositions by Outcome ................................................................. 128 Table 9a Nontraffic Misdemeanors—Method of Disposition ......................................... 130 Table 9b Nontraffic Infractions—Method of Disposition ................................................ 132
Judicial Council of California xi 2022 Court Statistics Report
Table 9c Traffic Misdemeanors—Method of Disposition ............................................... 134 Table 9d Traffic Infractions—Method of Disposition ...................................................... 136 Table 10a Family Filings .................................................................................................... 138 Table 10b Family Dispositions .......................................................................................... 140 Table 10c Family Law (Marital)—Method of Disposition .................................................. 142 Table 10d Family Law (Parentage)—Method of Disposition ............................................ 144 Table 10e Family Law (Domestic Violence)—Method of Disposition .............................. 146 Table 10f Family Law (Child Support)—Method of Disposition ....................................... 148 Table 10g Family Law Other Petitions—Method of Disposition ....................................... 150 Table 11a Juvenile Filings.................................................................................................. 152 Table 11b Juvenile Dispositions ........................................................................................ 154 Table 11c Juvenile Delinquency—Stage of Case at Disposition ...................................... 156 Table 11d Juvenile Dependency—Stage of Case at Disposition ..................................... 158 Table 12a Probate, Mental Health Filings ........................................................................ 160 Table 12b Probate, Mental Health Dispositions .............................................................. 162 Table 12c Probate (Conservatorship, Guardianship)—Method of Disposition ............... 164 Table 12d Probate (Estates, Trusts, Other Probate)—Method of Disposition................. 166 Table 12e Mental Health—Stage of Case at Disposition ................................................. 168 Table 13a Appeals, Habeas Corpus Filings ...................................................................... 170 Table 13b Appeals, Habeas Corpus Dispositions ............................................................ 172 Table 13c Civil and Criminal Appeals—Stage of Case at Disposition ............................. 174 Table 13d Habeas Corpus Criminal—Stage of Case at Disposition ................................ 176 Table 14a Authorized Judicial Positions and Judicial Position Equivalents ................... 178 Table 14b Judicial Position Equivalents ........................................................................... 180
Judicial Council of California xii 2022 Court Statistics Report
INTRODUCTION
Court Statistics Report
The Court Statistics Report is published annually by the Judicial Council of California and is designed to fulfill the provisions of article VI, section 6 of the California Constitution, which requires the Judicial Council to survey the condition and business of the California courts. The Court Statistics Report combines 10-year statewide summaries of superior court filings and dispositions with similar workload indicators for the California Supreme Court and Courts of Appeal. The 2022 Court Statistics Report also provides more detailed information on filings and dispositions in the individual superior courts for the most recent fiscal year for which data are available, 2020–21.
The California Court System
California’s court system serves a population of more than 40 million people—about 12.1 percent of the total U.S. population—and processed over 4.4 million cases in fiscal year (FY) 2020–21. The judicial branch budget for the 2020–21 fiscal year of $4 billion (excluding infrastructure) represents about 2 percent of the California state budget and makes possible the case-processing activity detailed below while also providing the basis of support for approximately 2,000 judicial officers and just over 18,000 judicial branch employees statewide.
The vast majority of cases in the California courts begin in the superior (or trial) court, one of which resides in each of the state’s 58 counties. With more than 500 court buildings throughout the state, these courts hear both civil and criminal cases as well as family, probate, mental health, and juvenile cases. The equivalent of more than 2,000 judicial positions statewide address the full range of cases heard each year by the superior courts, as reflected in the sheer number of case filings and dispositions reported here. The superior courts report summaries of their case filing counts to the Judicial Council, and the Court Statistics Report presents those figures here in aggregate form.
The next level of court authority within the state’s judicial branch resides with the Courts of Appeal. Most of the cases that come before the Courts of Appeal involve the review of a superior court decision that is being contested by a party to the case. The Legislature has divided the state geographically into six appellate districts, each containing a Court of Appeal. Currently, 106 appellate justices preside in nine locations in the state to hear matters brought for review. Totals of Court of Appeal case filings are forwarded to the Judicial Council; these are summarized in the tables that follow.
The Supreme Court sits at the apex of the state’s judicial system and has discretion to review decisions of the Courts of Appeal in order to settle important questions of law and resolve conflicts among the Courts of Appeal. Although the Supreme Court generally has considerable discretion in determining which cases to grant review, it must review the appeal in any case in which a trial court has imposed the death penalty. The Supreme Court sends the Judicial Council its annual case filing figures, which are reported here in summary form.
Caseload Data and Court Workload
The Court Statistics Report contains essential information about the annual caseload of the California judicial branch, with a particular emphasis on the number and types of cases that are filed and disposed of in the courts. This information is submitted to the California Legislature and used in numerous judicial branch reports. As with any published data, the numbers in this report represent a snapshot of the most complete and reliable information available at the time of compilation.
Judicial Council of California 2022 Court Statistics Report1
Statewide trends in filings and dispositions may be influenced by a number of factors. For example, changes in the number of filings and dispositions may reflect the shifting needs or behavior of residents of a court’s service area as well as new policy emphases in the work of justice system partners. The following are some of the more common causes of statistical variations.
Amended Data To ensure that the statistics used for making policy decisions are as accurate as possible, courts may amend the data they submit to the Judicial Council should new, more detailed, or more complete information become available. For this reason, the data in this report may change slightly over time as courts revise their calculations and submit new caseload estimates.
Missing Data Statewide totals in the Court Statistics Report may be influenced by missing data for certain courts. Typically, when courts do not report data to the Judicial Council, it is because they have encountered difficulties generating automated reports from their case management systems. Filings data submitted by the courts tend to be more complete than disposition data.
Incomplete Data The reporting of incomplete data typically occurs when courts transmit partial data totals for a particular case type because of the limits of their case management systems. It should be noted that incomplete data are more difficult to spot in the tables that follow, but in general they will cause downward shifts in the number of filings and dispositions. (Courts reporting incomplete data for FY 2020-21 are also detailed in Appendix A.)
Variation in Local Business Practices Data reported in the Court Statistics Report are compiled in a data warehouse, the Judicial Branch Statistical Information System (JBSIS). Because many different case management systems are used in the courts, data must be “mapped” from local systems into the standard categories used for reporting purposes. One essential function of JBSIS is to standardize the basic definitions of case types and case events across all courts in California. Another important aspect of JBSIS is its role in the extraction of court data through different transmission methods, including web-based reports through the JBSIS Portal and automated JBSIS reports. Through this process, JBSIS contributes to the warehousing of this data in a structure that is comparable from one court to another.
Maintaining quality control over the data contained in the JBSIS data warehouse involves:
• Training court staff on the standards for the classification, entry, and reporting of data;
• Providing information to the courts for resolving technical questions associated with data definitions,processing, and aggregation;
• Developing and adopting a new case management system infrastructure in the courts; and
• Documenting and disseminating information related to changes in the ways that courts define orreport data.
Although a growing number of courts now transmit their data electronically from their case management system to the Judicial Council, there continue to be differences among superior courts’ case processing and other business practices that reflect the histories of individual courts and the unique needs of the communities they serve. These differences may influence the ways in which superior courts report data to the Judicial Council. On that basis, while the filings and disposition data reported by any one court are largely comparable to data from other courts, some local variations in the classification and reporting of cases still occur.
COVID-19 Pandemic In the last four months of the previous fiscal year (March 2020 to June 2020), trial court filings declined about 40% lower than expected due to pandemic-related impacts that altered the normal course of court business.
Judicial Council of California 2022 Court Statistics Report2
Case dispositions were similarly impacted, particularly in courts where public health orders precluded or limited in-person appearances, Similar issues affected the Supreme Court and Courts of Appeal data, although those courts make up a smaller overall share of court workload.
The judicial branch has undertaken intense efforts to modify service delivery and maintain access to justice. As a result of those actions, by June 2020, filings in some casetypes had already returned to pre-pandemic levels. But while courts were able to restore service levels, court workload in FY 2020–21 still reflects impacts of the pandemic. For example, fewer drivers on the road means fewer infraction filings; shelter-in-place restrictions and remote schooling have impacted the number of juvenile justice matters brought to the courts.
Aside from juvenile justice, the majority of casetypes experiencing filing declines in FY 2020–21 are high-volume, low-workload cases. Filings in the more workload-intensive casetypes such as felony, mental health, and civil unlimited, have increased compared to the prior year.
Summary of 2022 Court Statistics Report
Caseload data for the California Supreme Court, Courts of Appeal, and superior courts for fiscal year 2020–21 are summarized below.
Supreme Court
• The Supreme Court issued 59 written opinions during the year.
• Filings totaled 6,522, and dispositions totaled 6,311.
• Automatic appeals arising out of judgments of death totaled 12 cases, and the court disposed of 22such appeals by written opinion.
• The Supreme Court ordered 28 Court of Appeal opinions depublished in this fiscal year.
Courts of Appeal
• Total contested matters for the Courts of Appeal totaled 15,781, made up of 10,171 records ofappeal and 5,610 original proceedings.
• Dispositions in the Courts of Appeal totaled 20,159. Of these dispositions, 14,682 were appeals and6,024 were original proceedings.
• Dispositions of appeals by written opinion totaled 9,147, appeals disposed of without written opiniontotaled 3,397, and appeals disposed of without a record filed totaled 2,137. Dispositions of originalproceedings by written opinion totaled 301, and original proceedings disposed of without writtenopinion totaled 5,302.
• Statewide, 9 percent of Court of Appeal majority opinions were published.
Superior Courts
In FY 2020–21, over 4.4 million cases were filed statewide in the superior courts. The Court Statistics Report organizes all the cases filed in the courts into four main case categories: (1) Civil; (2) Criminal; (3) Family and Juvenile; and (4) Probate, Mental Health, Appeals, and Habeas. The case filing totals for the individual case types reported by the courts for FY 2020–21 are as follows:
Civil: The civil case category is made up of unlimited civil, limited civil, and small claims matters. Civil unlimited cases are matters in which the petitioner is seeking more than $25,000. There were 222,381 unlimited civil cases filed in the courts. Limited civil filings are cases in which the petitioner is seeking $25,000 or less. Limited civil cases totaled 351,685 statewide. Small claims filings are cases in which the petitioner is seeking $10,000 or less and is not represented by counsel. A total of 62,076 small claims
Judicial Council of California 2022 Court Statistics Report3
cases were filed statewide.
Criminal: The criminal case category is made up of felonies, misdemeanors, and infractions. Felony filings represented 186,319 cases, misdemeanor filings totaled 505,210 cases, and infraction filings accounted for 2,628,554 cases.
Family and Juvenile: Marital filings (dissolutions, legal separations, and nullities) accounted for 114,238 cases, and other family law filings (e.g., paternity, child support) totaled 183,719 cases. Juvenile delinquency filings totaled 19,520 cases, and juvenile dependency filings totaled 37,755 cases.
Probate, Mental Health, Appeals, and Habeas: Probate filings totaled 54,795 cases, mental health filings totaled 89,064 cases, civil and criminal appeal filings totaled 1,791 cases, and criminal habeas corpus filings totaled 7,273 cases.
The largest changes in statewide filings for superior courts over the past year are mostly driven by infractions and misdemeanors in the criminal case category, juvenile delinquency cases, and small claims cases. Filings increased from the previous year in probate, felony, marital, mental health, civil unlimited, and petitions for a writ of habeas corpus case categories.
Terminology and Rules for Counting Filings
Technical definitions of most terms used in this Court Statistics Report can be found in the appendixes. Some core definitions are presented here in more detail.
Appellate Courts
APPEAL. An appeal is a proceeding undertaken to have a decision of a lower trial court reviewed by a court with appellate authority over the matter. (Certain limited matters are reviewed by the appellate department of the superior courts.) A notice of appeal is a written notification filed in the superior court to initiate the appeal of a judgment to the Court of Appeal. The Courts of Appeal have appellate jurisdiction in all trial court matters, except when a judgment of death is entered, in which case the California Supreme Court has appellate jurisdiction. If the matter is appealable, the court must hear the appeal. A fully briefed appeal is one in which all briefs have been filed with the court. Dismissal of an appeal involves the termination of a case for reasons other than its merit. An appeal that is awaiting a final decision is said to be pending. Each notice of appeal is counted as one new filing.
PETITION FOR REVIEW. A petition for review is filed in the California Supreme Court to ask that court to exercise its discretion to review a decision issued by a Court of Appeal in an appeal or an original proceeding. The Supreme Court has a total of 90 days to consider a petition for review, after which it loses jurisdiction. If a petition for review is granted by the Supreme Court, then full briefing occurs on the case; if a petition is denied, then the judgment of the lower court becomes final as to the case.
AUTOMATIC APPEAL. An automatic appeal is the appeal following a judgment of death in the trial court. This type of appeal is unique because it moves directly from a superior court to the Supreme Court without first being reviewed by a Court of Appeal. Like other types of appeals, it is fully briefed before being heard. An automatic appeal is counted as one new filing.
ORIGINAL PROCEEDING. An original proceeding is an action that may be filed and heard for the first time in an appellate court. This action is not an appeal; rather, it is ordinarily a petition for a writ. Examples of original proceedings include a writ of mandamus, which instructs a lower court to perform mandatory duties correctly; a writ of prohibition, or an order that forbids certain actions; and a writ of habeas corpus, which is described below. Each original proceeding is counted as one new filing.
Judicial Council of California 2022 Court Statistics Report4
PETITION FOR A WRIT OF HABEAS CORPUS. A petition for the issuance of a writ of habeas corpus is typically filed to contest the legality of a party’s imprisonment or conditions of confinement. Each habeas corpus petition is counted as one new filing.
WRITTEN OPINION. A written opinion is a document issued by an appellate court explaining the terms and reasoning in its disposition of a case. The written opinion includes a statement of the legal facts in the case, relevant points of law, and the court’s analysis and rationale for its decision. In addition to the written majority opinion in a case, concurring and dissenting opinions also may be filed in each case. For each case, only the majority opinion is counted as a written opinion in these tables.
DISPOSITIONS. The appellate court may dispose of a case by affirming or reversing the action of the lower court, or it may send the case back to the lower court for further proceedings if appropriate.
RECORD OF APPEAL. A record of appeal is the compilation of documents and transcripts associated with a given superior court case under review by an appellate court. The record is a component of a new appellate case and as such is not counted separately from the initial appeal.
REVERSAL OF CASE DECISION. A reversal is the overturning of a lower court’s decision by an appellate court.
Superior Courts
FILING. In the most general sense, a filing is the initiation of a legal action with the court through a carefully prescribed legal procedure.
How Filings Are Counted. The procedure used to count filings for this report follows a set of rules consistent with national standards for statistical reporting. These rules differ according to case type:
• Each filing in a civil case pertains to the complaint or petition that has been submitted to the court foraction. A given civil complaint may name one or more individuals or groups as its object. However,regardless of the number of parties named in a case, each civil case is reported as one filing or onedisposition.
• Each filing in a criminal case is associated with a single defendant against whom criminal chargeshave been filed. Multiple criminal charges may occur in a case in which different charges have beenbrought against the same defendant, but only the single most severe charge against a defendant in agiven case is counted as a new criminal filing. When multiple defendants are charged with a crime,multiple filings are reported.
• Each filing in a juvenile case pertains to a minor who is the subject of a petition made to the court foradjudication. A minor may have an initial filing that brought the minor to the attention of the court, andsubsequent filings if new petitions or charges are filed over time. This practice continues untiltermination of the dependency or delinquency jurisdiction by the court or when the minor has reachedthe legal definition of adulthood. In a single case involving multiple minors, each minor is counted as aseparate filing.
DISPOSITION. In a general sense, a disposition may be described as a final settlement or determination in a case. A disposition may occur either before or after a civil or criminal case has been scheduled for trial. A final judgment, a dismissal of a case, and the sentencing of a criminal defendant are all examples of dispositions. In certain case types, however, a disposition may merely signal the beginning of the court’s authority over a case. For example, after the petition to appoint a conservator is disposed of in conservatorship cases, the court assumes control over that case. Rules for counting and reporting dispositions mirror those for filings, although a case filed in one year may be disposed of by the court in a subsequent year.
Judicial Council of California 2022 Court Statistics Report5
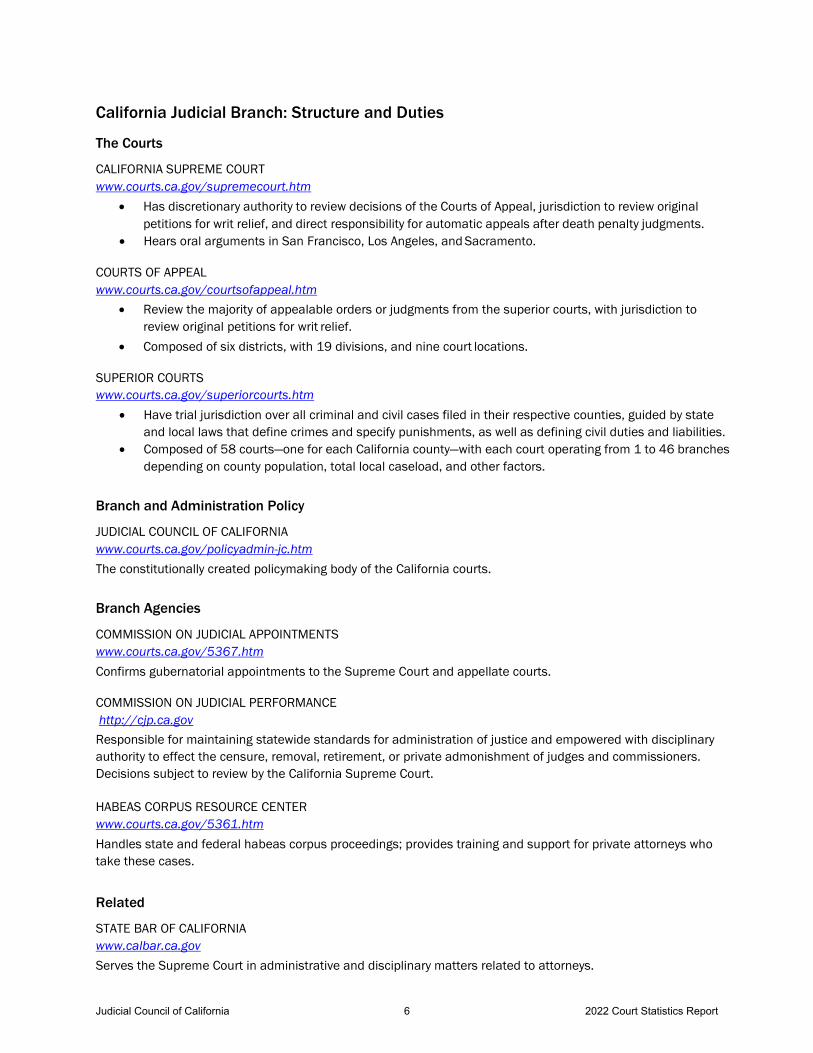
California Judicial Branch: Structure and Duties
The Courts
CALIFORNIA SUPREME COURT www.courts.ca.gov/supremecourt.htm
• Has discretionary authority to review decisions of the Courts of Appeal, jurisdiction to review original petitions for writ relief, and direct responsibility for automatic appeals after death penalty judgments.
• Hears oral arguments in San Francisco, Los Angeles, and Sacramento.
COURTS OF APPEAL www.courts.ca.gov/courtsofappeal.htm
• Review the majority of appealable orders or judgments from the superior courts, with jurisdiction to review original petitions for writ relief.
• Composed of six districts, with 19 divisions, and nine court locations.
SUPERIOR COURTS www.courts.ca.gov/superiorcourts.htm
• Have trial jurisdiction over all criminal and civil cases filed in their respective counties, guided by state and local laws that define crimes and specify punishments, as well as defining civil duties and liabilities.
• Composed of 58 courts—one for each California county—with each court operating from 1 to 46 branches depending on county population, total local caseload, and other factors.
Branch and Administration Policy
JUDICIAL COUNCIL OF CALIFORNIA www.courts.ca.gov/policyadmin-jc.htm The constitutionally created policymaking body of the California courts.
Branch Agencies
COMMISSION ON JUDICIAL APPOINTMENTS www.courts.ca.gov/5367.htm Confirms gubernatorial appointments to the Supreme Court and appellate courts.
COMMISSION ON JUDICIAL PERFORMANCE http://cjp.ca.gov Responsible for maintaining statewide standards for administration of justice and empowered with disciplinary authority to effect the censure, removal, retirement, or private admonishment of judges and commissioners. Decisions subject to review by the California Supreme Court.
HABEAS CORPUS RESOURCE CENTER www.courts.ca.gov/5361.htm Handles state and federal habeas corpus proceedings; provides training and support for private attorneys who take these cases.
Related
STATE BAR OF CALIFORNIA www.calbar.ca.gov Serves the Supreme Court in administrative and disciplinary matters related to attorneys.
Judicial Council of California 2022 Court Statistics Report6
Rev. 02/22
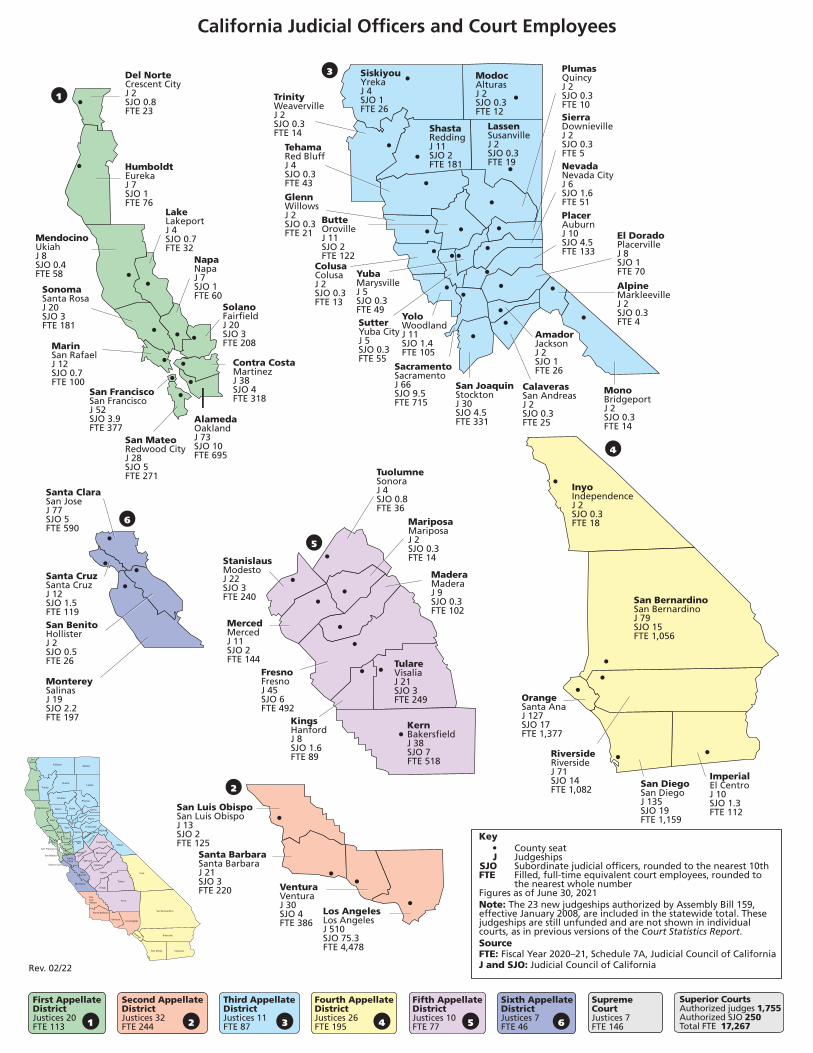
Key • County seat
J Judgeships SJO Subordinate judicial officers, rounded to the nearest 10thFTE Filled, full-time equivalent court employees, rounded to
the nearest whole numberFigures as of June 30, 2021Note: The 23 new judgeships authorized by Assembly Bill 159, effective January 2008, are included in the statewide total. Thesejudgeships are still unfunded and are not shown in individual courts, as in previous versions of the Court Statistics Report.SourceFTE: Fiscal Year 2020–21, Schedule 7A, Judicial Council of CaliforniaJ and SJO: Judicial Council of California
Alameda
Contra
Costa
Marin
Napa
San Francisco»
San Mateo»
Solano
Sonoma
DelNorte
Humboldt
Lake
Mendocino
Los Angeles
San Luis Obispo
Santa Barbara
Ventura
Alpine
Amador
Cala
vera
s
MonoSan
Joaquin
Butte
Colusa
El Dorado
Glenn
Lassen
Modoc
Nevada
Placer
Plumas
Sacra-
mento
Shasta
Sierra
Siskiyou
Sutter
Tehama
Trinity
Yolo
Yuba
Inyo
Imperial
OrangeRiverside
San Bernardino
San Diego
Fresno
Kings
Madera
Mariposa
Merced
Stanisla
us
Tulare
Tuolumne
Kern
SantaClara
Santa Cruz»
Monterey
SanBenito
Santa ClaraSan JoseJ 77SJO 5FTE 590
Santa CruzSanta CruzJ 12SJO 1.5FTE 119
MontereySalinasJ 19SJO 2.2FTE 197
San BenitoHollisterJ 2SJO 0.5FTE 26
6
StanislausModestoJ 22SJO 3FTE 240
MercedMercedJ 11SJO 2FTE 144
FresnoFresnoJ 45SJO 6FTE 492
KingsHanfordJ 8SJO 1.6FTE 89
KernBakersfieldJ 38SJO 7FTE 518
TulareVisaliaJ 21SJO 3FTE 249
MaderaMaderaJ 9SJO 0.3FTE 102
MariposaMariposaJ 2SJO 0.3FTE 14
TuolumneSonoraJ 4SJO 0.8FTE 36
5
InyoIndependenceJ 2SJO 0.3FTE 18
San BernardinoSan BernardinoJ 79SJO 15FTE 1,056
RiversideRiversideJ 71SJO 14FTE 1,082
San DiegoSan DiegoJ 135SJO 19FTE 1,159
ImperialEl CentroJ 10SJO 1.3FTE 112
OrangeSanta AnaJ 127SJO 17FTE 1,377
4
SiskiyouYrekaJ 4SJO 1FTE 26
TrinityWeavervilleJ 2SJO 0.3FTE 14
TehamaRed BluffJ 4SJO 0.3FTE 43
GlennWillowsJ 2SJO 0.3FTE 21
ColusaColusaJ 2SJO 0.3FTE 13
YoloWoodlandJ 11SJO 1.4FTE 105
SutterYuba CityJ 5SJO 0.3FTE 55
YubaMarysvilleJ 5SJO 0.3FTE 49
SacramentoSacramentoJ 66SJO 9.5FTE 715
San JoaquinStocktonJ 30SJO 4.5FTE 331
AmadorJacksonJ 2SJO 1FTE 26
CalaverasSan AndreasJ 2SJO 0.3FTE 25
ButteOrovilleJ 11SJO 2FTE 122
ShastaReddingJ 11SJO 2FTE 181
LassenSusanvilleJ 2SJO 0.3FTE 19
PlumasQuincyJ 2SJO 0.3FTE 10SierraDownievilleJ 2SJO 0.3FTE 5NevadaNevada CityJ 6SJO 1.6FTE 51PlacerAuburnJ 10SJO 4.5FTE 133
El DoradoPlacervilleJ 8SJO 1FTE 70
AlpineMarkleevilleJ 2SJO 0.3FTE 4
MonoBridgeportJ 2SJO 0.3FTE 14
ModocAlturasJ 2SJO 0.3FTE 12
3
San Luis ObispoSan Luis ObispoJ 13SJO 2FTE 125
Santa BarbaraSanta BarbaraJ 21SJO 3FTE 220 Ventura
VenturaJ 30SJO 4FTE 386
Los AngelesLos AngelesJ 510SJO 75.3FTE 4,478
2
Del NorteCrescent CityJ 2SJO 0.8FTE 23
HumboldtEurekaJ 7SJO 1FTE 76
MendocinoUkiahJ 8SJO 0.4FTE 58
LakeLakeportJ 4SJO 0.7FTE 32
SonomaSanta RosaJ 20SJO 3FTE 181
MarinSan RafaelJ 12SJO 0.7FTE 100
NapaNapaJ 7SJO 1FTE 60
SolanoFairfieldJ 20SJO 3FTE 208
Contra CostaMartinezJ 38SJO 4FTE 318
AlamedaOaklandJ 73SJO 10FTE 695
San FranciscoSan FranciscoJ 52SJO 3.9FTE 377
San MateoRedwood CityJ 28SJO 5FTE 271
1
Supreme CourtJustices 7FTE 146
First Appellate DistrictJustices 20FTE 113 1
Second Appellate DistrictJustices 32FTE 244 2
Third Appellate DistrictJustices 11FTE 87 3
Fourth Appellate DistrictJustices 26FTE 195 4
Fifth Appellate DistrictJustices 10FTE 77 5
Sixth Appellate DistrictJustices 7FTE 46 6
Superior CourtsAuthorized judges 1,755Authorized SJO 250Total FTE 17,267
California Judicial Officers and Court Employees
8.5 x 14LETTER SIZE MAP ON PAGE 2.

Supreme Court

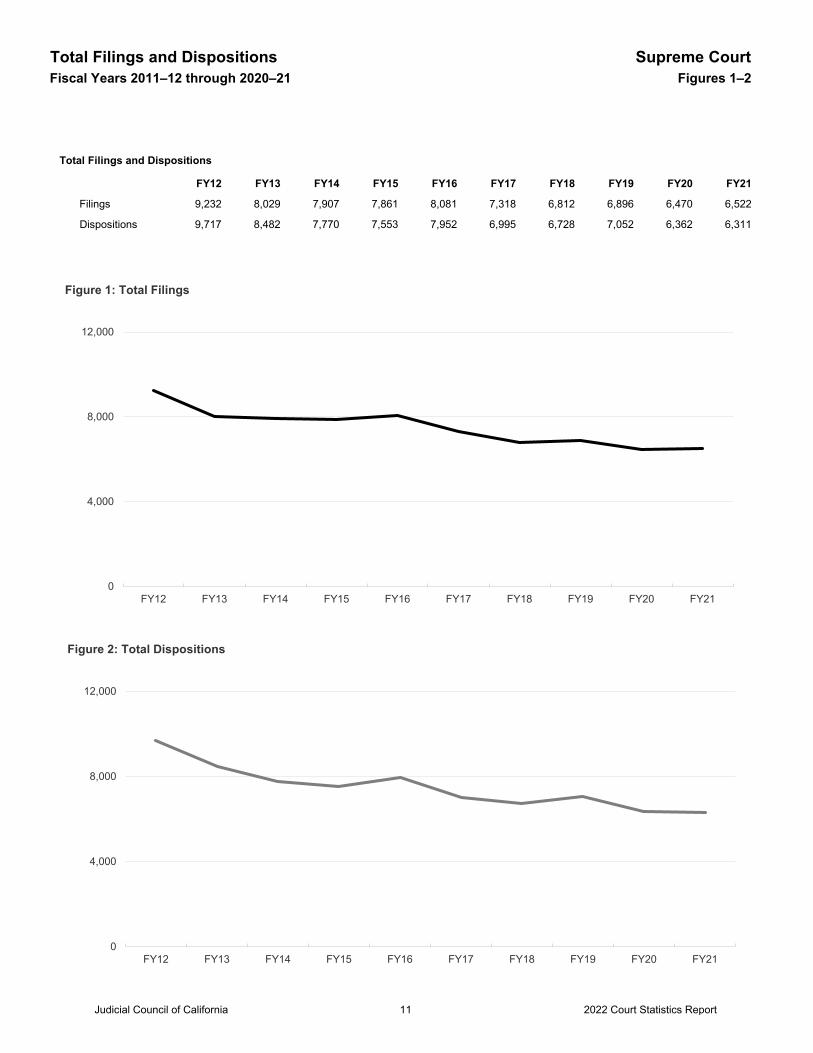
Total Filings and Dispositions Supreme CourtFiscal Years 2011–12 through 2020–21 Figures 1–2
Total Filings and Dispositions
FY12 FY13 FY14 FY15 FY16 FY17 FY18 FY19 FY20 FY21
9,232 8,029 7,907 7,861 8,081 7,318 6,812 6,896 6,470 6,522
9,717 8,482 7,770 7,553 7,952 6,995 6,728 7,052 6,362 6,311
Filings
Dispositions
0
4,000
8,000
12,000
FY12 FY13 FY14 FY15 FY16 FY17 FY18 FY19 FY20 FY21
Figure 2: Total Dispositions
0
4,000
8,000
12,000
FY12 FY13 FY14 FY15 FY16 FY17 FY18 FY19 FY20 FY21
Figure 1: Total Filings
Judicial Council of California 2022 Court Statistics Report11
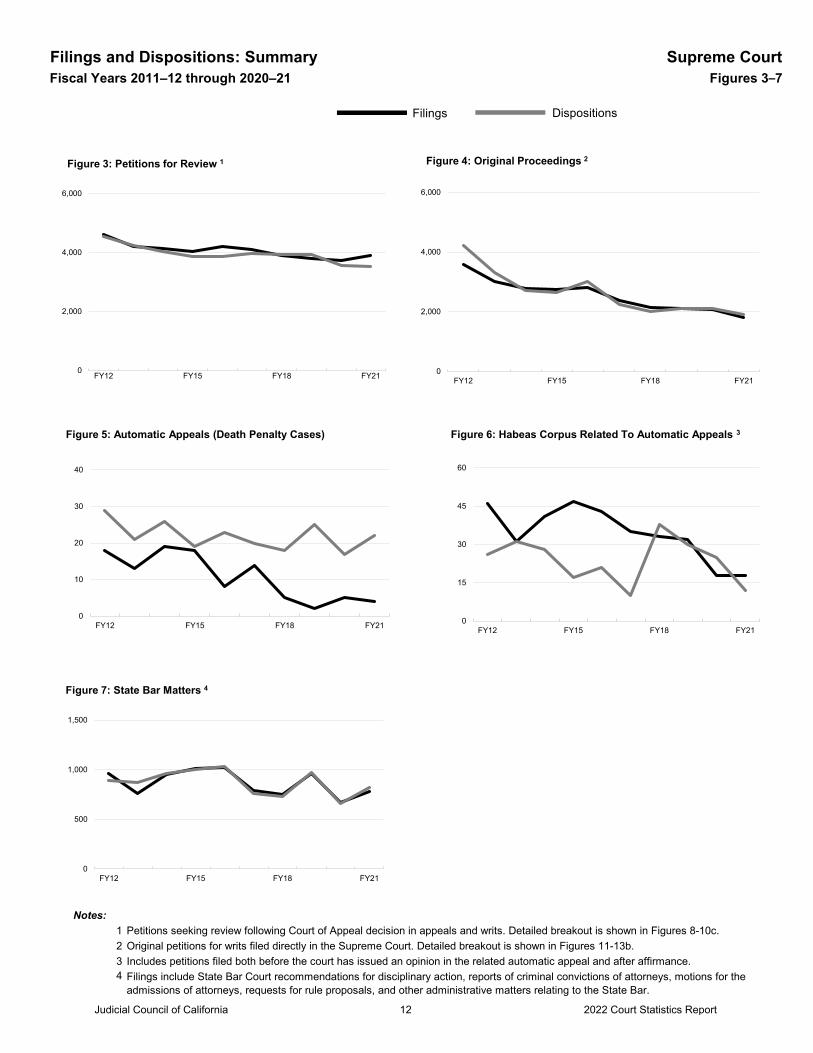
Filings and Dispositions: Summary Supreme CourtFiscal Years 2011–12 through 2020–21 Figures 3–7
Notes:1234
Petitions seeking review following Court of Appeal decision in appeals and writs. Detailed breakout is shown in Figures 8-10c.Original petitions for writs filed directly in the Supreme Court. Detailed breakout is shown in Figures 11-13b.Includes petitions filed both before the court has issued an opinion in the related automatic appeal and after affirmance.Filings include State Bar Court recommendations for disciplinary action, reports of criminal convictions of attorneys, motions for the admissions of attorneys, requests for rule proposals, and other administrative matters relating to the State Bar.
0
2,000
4,000
6,000
FY12 FY15 FY18 FY21
Figure 3: Petitions for Review 1
0
10
20
30
40
FY12 FY15 FY18 FY21
0
2,000
4,000
6,000
FY12 FY15 FY18 FY21
Figure 4: Original Proceedings 2
0
500
1,000
1,500
FY12 FY15 FY18 FY21
Figure 7: State Bar Matters 4
0
15
30
45
60
FY12 FY15 FY18 FY21
Filings Dispositions
Figure 5: Automatic Appeals (Death Penalty Cases) Figure 6: Habeas Corpus Related To Automatic Appeals 3
Judicial Council of California 2022 Court Statistics Report12
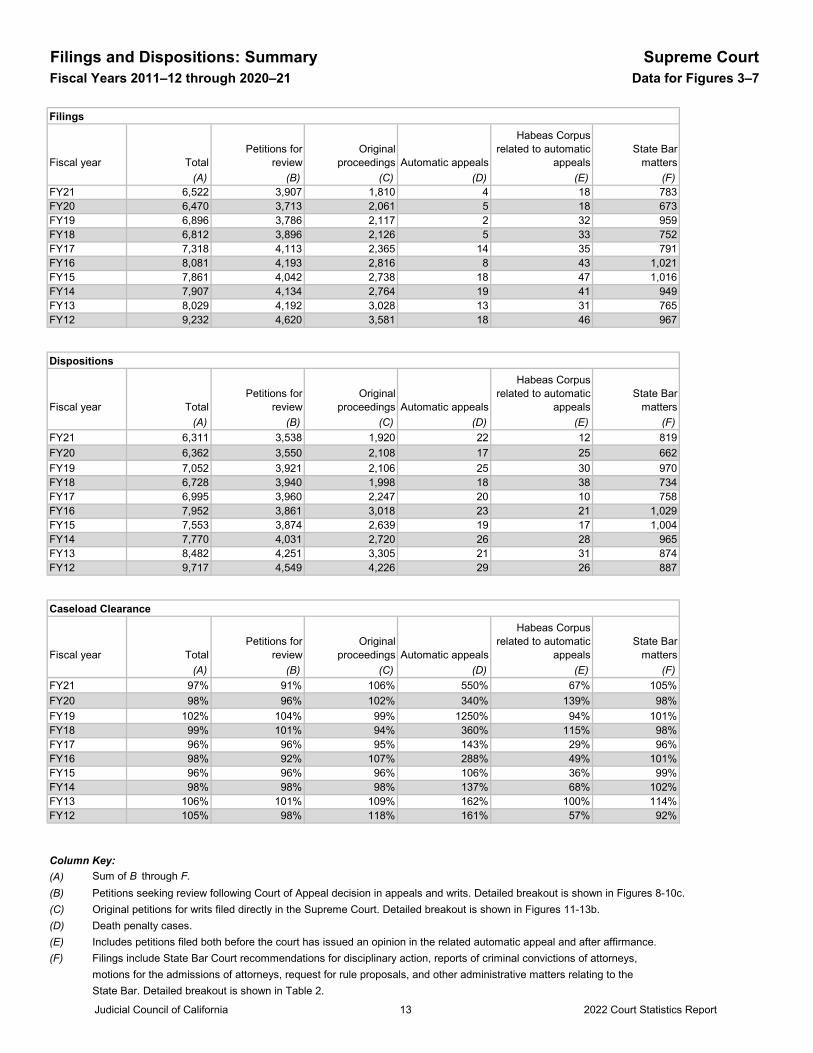
Filings and Dispositions: Summary Supreme CourtFiscal Years 2011–12 through 2020–21 Data for Figures 3–7
Filings
Fiscal year Total (A) (B) (C) (D) (E) (F)
FY21 6,522 3,907 1,810 4 18 783FY20 6,470 3,713 2,061 5 18 673FY19 6,896 3,786 2,117 2 32 959FY18 6,812 3,896 2,126 5 33 752FY17 7,318 4,113 2,365 14 35 791FY16 8,081 4,193 2,816 8 43 1,021FY15 7,861 4,042 2,738 18 47 1,016 FY14 7,907 4,134 2,764 19 41 949FY13 8,029 4,192 3,028 13 31 765FY12 9,232 4,620 3,581 18 46 967
Dispositions
Fiscal year Total
(A) (B) (C) (D) (E) (F)FY21 6,311 3,538 1,920 22 12 819FY20 6,362 3,550 2,108 17 25 662FY19 7,052 3,921 2,106 25 30 970FY18 6,728 3,940 1,998 18 38 734FY17 6,995 3,960 2,247 20 10 758FY16 7,952 3,861 3,018 23 21 1,029 FY15 7,553 3,874 2,639 19 17 1,004FY14 7,770 4,031 2,720 26 28 965FY13 8,482 4,251 3,305 21 31 874FY12 9,717 4,549 4,226 29 26 887
Caseload Clearance
Fiscal year Total(A) (B) (C) (D) (E) (F)
FY21 97% 91% 106% 550% 67% 105%FY20 98% 96% 102% 340% 139% 98%FY19 102% 104% 99% 1250% 94% 101%FY18 99% 101% 94% 360% 115% 98% FY17 96% 96% 95% 143% 29% 96%FY16 98% 92% 107% 288% 49% 101%FY15 96% 96% 96% 106% 36% 99%FY14 98% 98% 98% 137% 68% 102%FY13 106% 101% 109% 162% 100% 114%FY12 105% 98% 118% 161% 57% 92%
Column Key:(A) Sum of B through F.(B) Petitions seeking review following Court of Appeal decision in appeals and writs. Detailed breakout is shown in Figures 8-10c.(C) Original petitions for writs filed directly in the Supreme Court. Detailed breakout is shown in Figures 11-13b.(D) Death penalty cases.(E) Includes petitions filed both before the court has issued an opinion in the related automatic appeal and after affirmance.(F) Filings include State Bar Court recommendations for disciplinary action, reports of criminal convictions of attorneys,
motions for the admissions of attorneys, request for rule proposals, and other administrative matters relating to theState Bar. Detailed breakout is shown in Table 2.
Petitions for review
Original proceedings Automatic appeals
Habeas Corpus related to automatic
appealsState Bar
matters
Petitions for review
Original proceedings Automatic appeals
Habeas Corpus related to automatic
appealsState Bar
matters
Petitions for review
Original proceedings Automatic appeals
Habeas Corpus related to automatic
appealsState Bar
matters
Judicial Council of California 2022 Court Statistics Report13
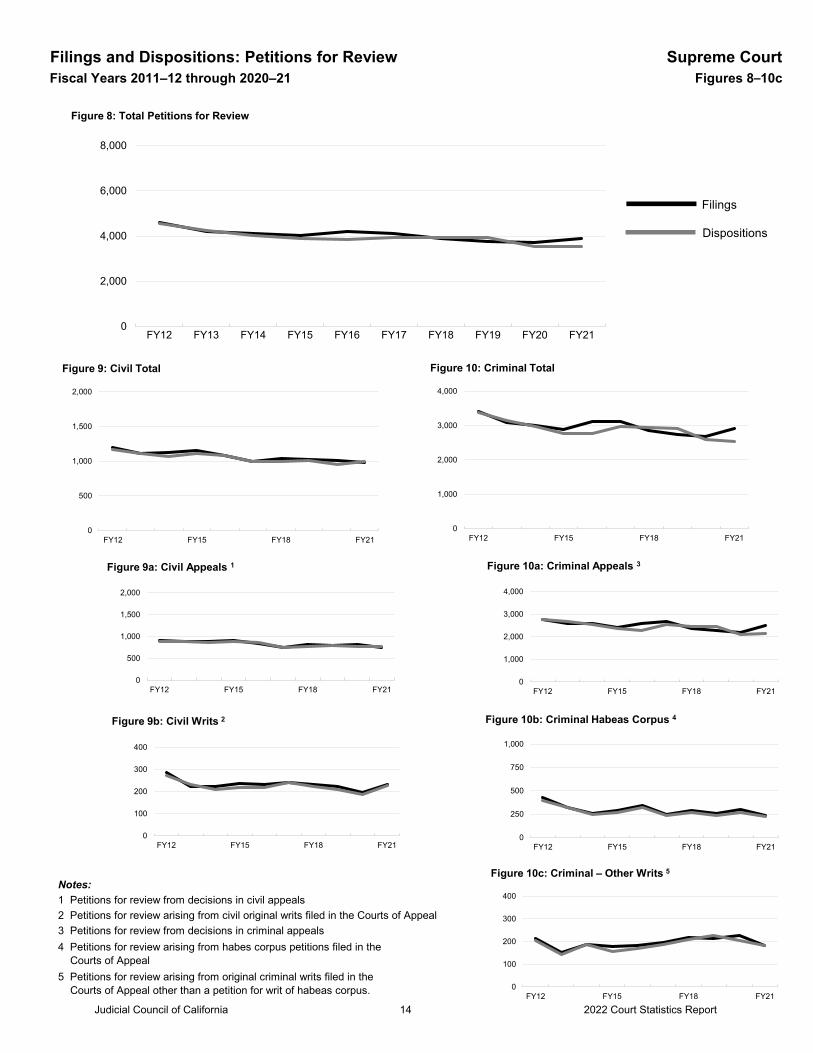
Filings and Dispositions: Petitions for Review Supreme CourtFiscal Years 2011–12 through 2020–21 Figures 8–10c
Notes:1 Petitions for review from decisions in civil appeals2 Petitions for review arising from civil original writs filed in the Courts of Appeal3 Petitions for review from decisions in criminal appeals4 Petitions for review arising from habes corpus petitions filed in the Courts of Appeal5 Petitions for review arising from original criminal writs filed in the Courts of Appeal other than a petition for writ of habeas corpus.
0
2,000
4,000
6,000
8,000
FY12 FY13 FY14 FY15 FY16 FY17 FY18 FY19 FY20 FY21
Figure 8: Total Petitions for Review
0
1,000
2,000
3,000
4,000
FY12 FY15 FY18 FY21
Figure 10: Criminal Total
0
500
1,000
1,500
2,000
FY12 FY15 FY18 FY21
Figure 9: Civil Total
0
1,000
2,000
3,000
4,000
FY12 FY15 FY18 FY21
Figure 10a: Criminal Appeals 3
0
100
200
300
400
FY12 FY15 FY18 FY21
Figure 10c: Criminal – Other Writs 5
0
250
500
750
1,000
FY12 FY15 FY18 FY21
Figure 10b: Criminal Habeas Corpus 4
0
500
1,000
1,500
2,000
FY12 FY15 FY18 FY21
Figure 9a: Civil Appeals 1
0
100
200
300
400
FY12 FY15 FY18 FY21
Figure 9b: Civil Writs 2
Filings
Dispositions
Judicial Council of California 2022 Court Statistics Report14
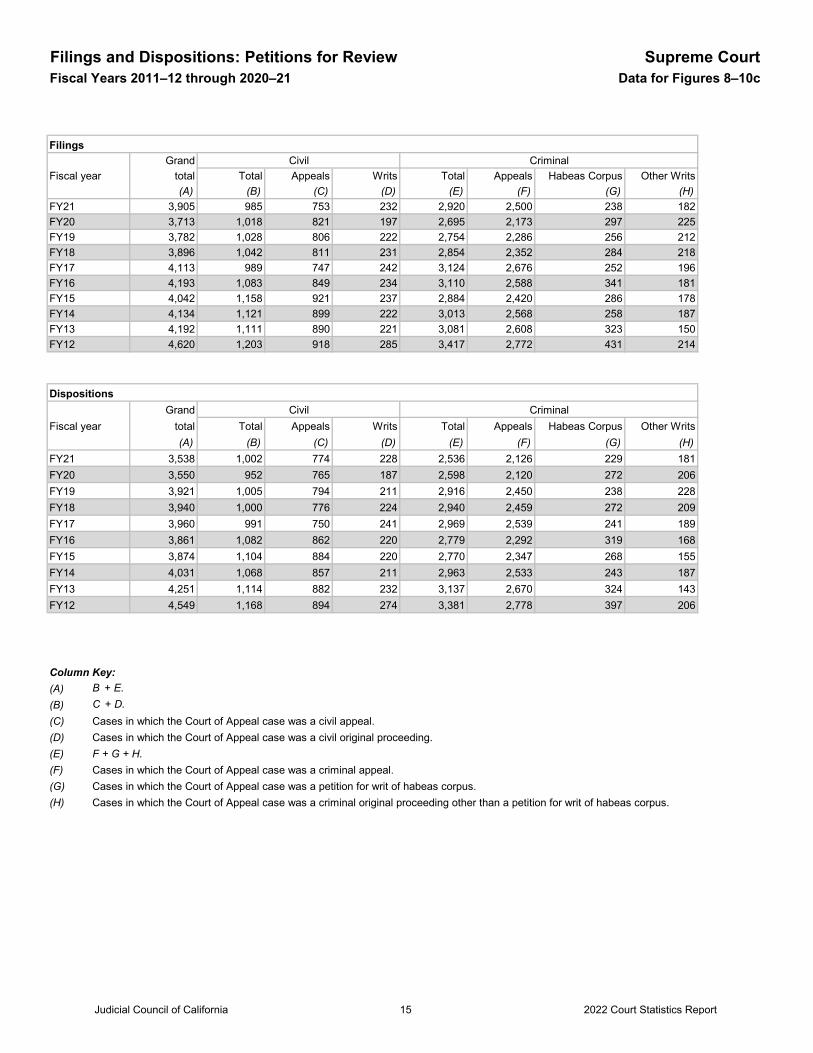
Filings and Dispositions: Petitions for Review Supreme CourtFiscal Years 2011–12 through 2020–21 Data for Figures 8–10c
FilingsGrand Civil Criminal
Fiscal year total Total Appeals Writs Total Appeals Habeas Corpus Other Writs(A) (B) (C) (D) (E) (F) (G) (H)
FY21 3,905 985 753 232 2,920 2,500 238 182FY20 3,713 1,018 821 197 2,695 2,173 297 225FY19 3,782 1,028 806 222 2,754 2,286 256 212FY18 3,896 1,042 811 231 2,854 2,352 284 218FY17 4,113 989 747 242 3,124 2,676 252 196FY16 4,193 1,083 849 234 3,110 2,588 341 181 FY15 4,042 1,158 921 237 2,884 2,420 286 178FY14 4,134 1,121 899 222 3,013 2,568 258 187FY13 4,192 1,111 890 221 3,081 2,608 323 150FY12 4,620 1,203 918 285 3,417 2,772 431 214
DispositionsGrand Civil Criminal
Fiscal year total Total Appeals Writs Total Appeals Habeas Corpus Other Writs(A) (B) (C) (D) (E) (F) (G) (H)
FY21 3,538 1,002 774 228 2,536 2,126 229 181FY20 3,550 952 765 187 2,598 2,120 272 206FY19 3,921 1,005 794 211 2,916 2,450 238 228FY18 3,940 1,000 776 224 2,940 2,459 272 209FY17 3,960 991 750 241 2,969 2,539 241 189FY16 3,861 1,082 862 220 2,779 2,292 319 168 FY15 3,874 1,104 884 220 2,770 2,347 268 155FY14 4,031 1,068 857 211 2,963 2,533 243 187FY13 4,251 1,114 882 232 3,137 2,670 324 143FY12 4,549 1,168 894 274 3,381 2,778 397 206
Column Key:(A) B + E. (B) C + D.(C) Cases in which the Court of Appeal case was a civil appeal.(D) Cases in which the Court of Appeal case was a civil original proceeding.(E) F + G + H.(F) Cases in which the Court of Appeal case was a criminal appeal.(G) Cases in which the Court of Appeal case was a petition for writ of habeas corpus.(H) Cases in which the Court of Appeal case was a criminal original proceeding other than a petition for writ of habeas corpus.
Judicial Council of California 2022 Court Statistics Report15
Summary of Actions on Petitions for Review Supreme CourtFiscal Year 2020–21 Table 1
Disposed Total GrantedGranted and held
Granted and transferred Denied
Percentage granted
(A) (B) (C) (D) (E) (F) (G)Total 3,538 3,901 41 542 56 3,262 16%
Total civil 1,002 971 22 15 14 920 5%
Civil appeals 774 763 22 14 2 725 5%
Civil writs 228 208 0 1 12 195 6%0
Total criminal 2,536 2,930 19 527 42 2,342 20%
Criminal appeals 2,126 2,532 17 506 18 1,991 21%
Criminal writs (excluding habeas corpus) 181 165 1 3 9 152 8%
Habeas Corpus 229 233 1 18 15 199 15%
Column Key: (B) Sum of C through F. (Administrative dispositions are not included in this table.)(G) (C + D + E ) / B
Actions taken on petitions for review
Judicial Council of California 2022 Court Statistics Report16
Filings and Dispositions: Original Proceedings Supreme CourtFiscal Years 2011–12 through 2020–21 Figures 11–13b
Notes:1
23
Includes original writ petitions, questions of state law referred by the federal courts, accusations against attorneys, and petitions pertaining to Commission on Judicial Performance proceedings.Petitions for writs of habeas corpus filed in the Supreme Court’s original jurisdiction, not including filings related to automatic appeals.Primarily petitions for writ of mandate and/or prohibition.
0
1,000
2,000
3,000
4,000
5,000
FY12 FY13 FY14 FY15 FY16 FY17 FY18 FY19 FY20 FY21
Figure 11: Total Original Proceedings
0
100
200
300
400
FY12 FY15 FY18 FY21
Figure 12: Civil Total 1
0
1,000
2,000
3,000
4,000
FY12 FY15 FY18 FY21
Figure 13a: Criminal Habeas Corpus 2
0
1,000
2,000
3,000
4,000
FY12 FY15 FY18 FY21
Figure 13: Criminal Total
0
100
200
300
400
FY12 FY15 FY18 FY21
Figure 13b: Criminal – Other Writs 3
Filings
Dispositions
Judicial Council of California 2022 Court Statistics Report17
Filings and Dispositions: Original Proceedings Supreme CourtFiscal Years 2011–12 through 2020–21 Data for Figures 11–13b
FilingsGrand Civil Criminal
Fiscal year total Total PUC Other Total Habeas Corpus Other Writs(A) (B) (C) (D) (E) (F) (G)
FY21 1,802 264 2 262 1,538 1,359 179FY20 2,055 228 0 228 1,827 1,633 194FY19 2,110 282 3 279 1,828 1,576 252FY18 2,116 250 0 250 1,866 1,676 190FY17 2,355 251 2 249 2,104 1,816 288FY16 2,812 296 2 294 2,516 2,268 248 FY15 2,734 334 0 334 2,400 2,220 180FY14 2,759 233 2 231 2,526 2,326 200FY13 3,021 255 0 255 2,766 2,595 171FY12 3,576 289 0 289 3,287 3,102 185
DispositionsGrand Civil Criminal
Fiscal year total Total PUC Other Total Habeas Corpus Other Writs(A) (B) (C) (D) (E) (F) (G)
FY21 1,911 255 0 255 1,656 1,468 188FY20 2,098 228 1 227 1,870 1,677 193FY19 2,101 267 2 265 1,834 1,593 241FY18 1,992 233 1 232 1,759 1,571 188FY17 2,244 236 0 236 2,008 1,736 272FY16 3,014 309 1 308 2,705 2,452 253FY15 2,635 299 1 298 2,336 2,170 166FY14 2,710 226 1 225 2,484 2,285 199FY13 3,305 247 0 247 3,058 2,896 162 FY12 4,220 274 0 274 3,946 3,759 187
Column Key:(A) B + E.(B) C + D.(C) Petitions for review of Public Utility Commission matters originally filed in the Court of Appeal are reflected in Figure 9b.(D)
(E) F + G.(F)(G) Primarily petitions for writ of mandate and/or prohibition.
Includes original writ petitions, questions of state law referred by the federal courts, accusations against attorneys, and petitions pertaining to Commission on Judicial Performance proceedings.
Petitions for writs of habeas corpus filed in the Supreme Court’s original jurisdiction, not including filings related to automatic appeals.
Judicial Council of California 2022 Court Statistics Report18
State Bar Matters Filed Supreme CourtFiscal Years 2011–12 through 2020–21 Figure 14
Table 2
Table 2: Types of State Bar Matters Filed
Fiscal Year Total Admission Discipline Other Reinstatement ResignationRule
Proposal
FY21 806 5 340 17 5 433 6
FY20 691 3 341 15 1 328 3
FY19 966 4 383 4 4 568 3
FY18 767 3 369 13 1 379 2
FY17 801 6 437 7 0 348 3
FY16 1,032 3 483 10 3 532 1
FY15 1,027 4 512 10 2 498 1
FY14 955 3 456 4 5 485 2
FY13 778 4 462 8 2 297 5
FY12 973 6 610 3 0 351 3
Note:1 Filings include State Bar Court recommendations for disciplinary action, reports of criminal convictions of attorneys, motions for the admission
of attorneys, requests for rule proposals, and other administrative matters relating to the State Bar.
0
500
1,000
1,500
FY12 FY13 FY14 FY15 FY16 FY17 FY18 FY19 FY20 FY21
Figure 14: Total State Bar Matters Filed 1
Judicial Council of California 2022 Court Statistics Report19
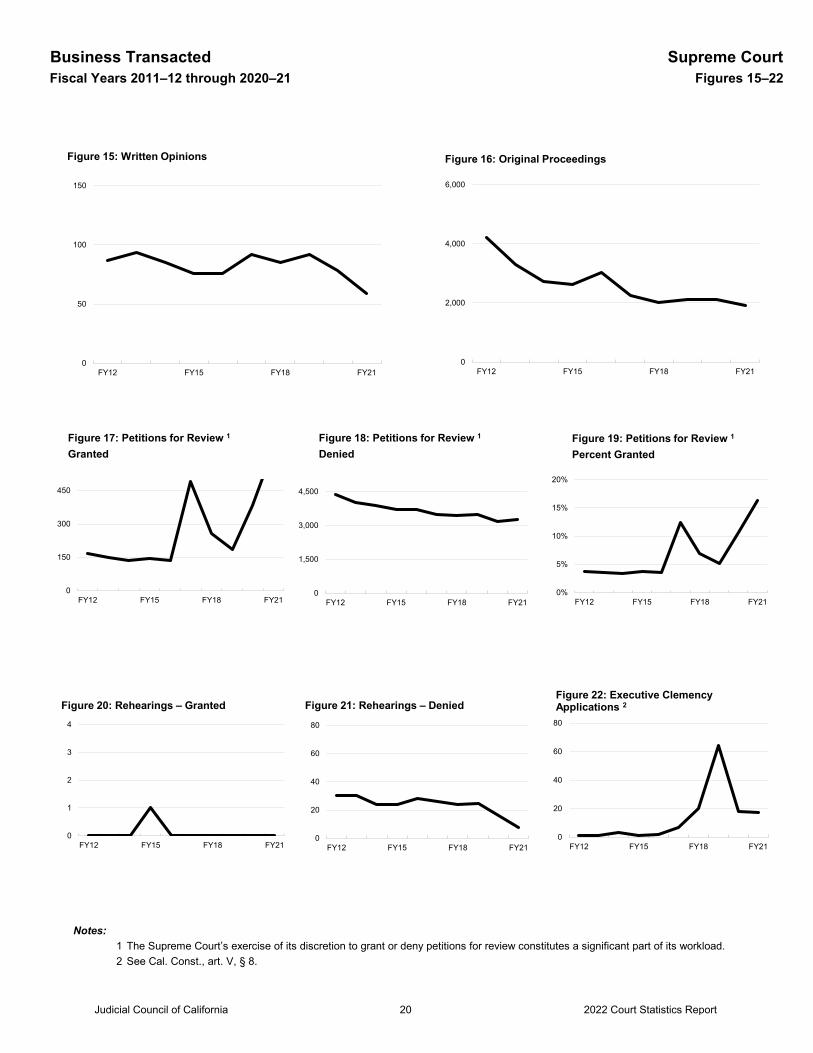
Business Transacted Supreme CourtFiscal Years 2011–12 through 2020–21 Figures 15–22
Notes:1 The Supreme Court’s exercise of its discretion to grant or deny petitions for review constitutes a significant part of its workload.2 See Cal. Const., art. V, § 8.
0
50
100
150
FY12 FY15 FY18 FY21
Figure 15: Written Opinions
0
2,000
4,000
6,000
FY12 FY15 FY18 FY21
Figure 16: Original Proceedings
0%
5%
10%
15%
20%
FY12 FY15 FY18 FY21
Figure 19: Petitions for Review 1
Percent Granted
0
1
2
3
4
FY12 FY15 FY18 FY21
Figure 20: Rehearings – Granted
0
20
40
60
80
FY12 FY15 FY18 FY21
Figure 21: Rehearings – Denied
0
1,500
3,000
4,500
FY12 FY15 FY18 FY21
Figure 18: Petitions for Review 1
Denied
0
150
300
450
FY12 FY15 FY18 FY21
Figure 17: Petitions for Review 1
Granted
0
20
40
60
80
FY12 FY15 FY18 FY21
Figure 22: Executive Clemency Applications 2
Judicial Council of California 2022 Court Statistics Report20
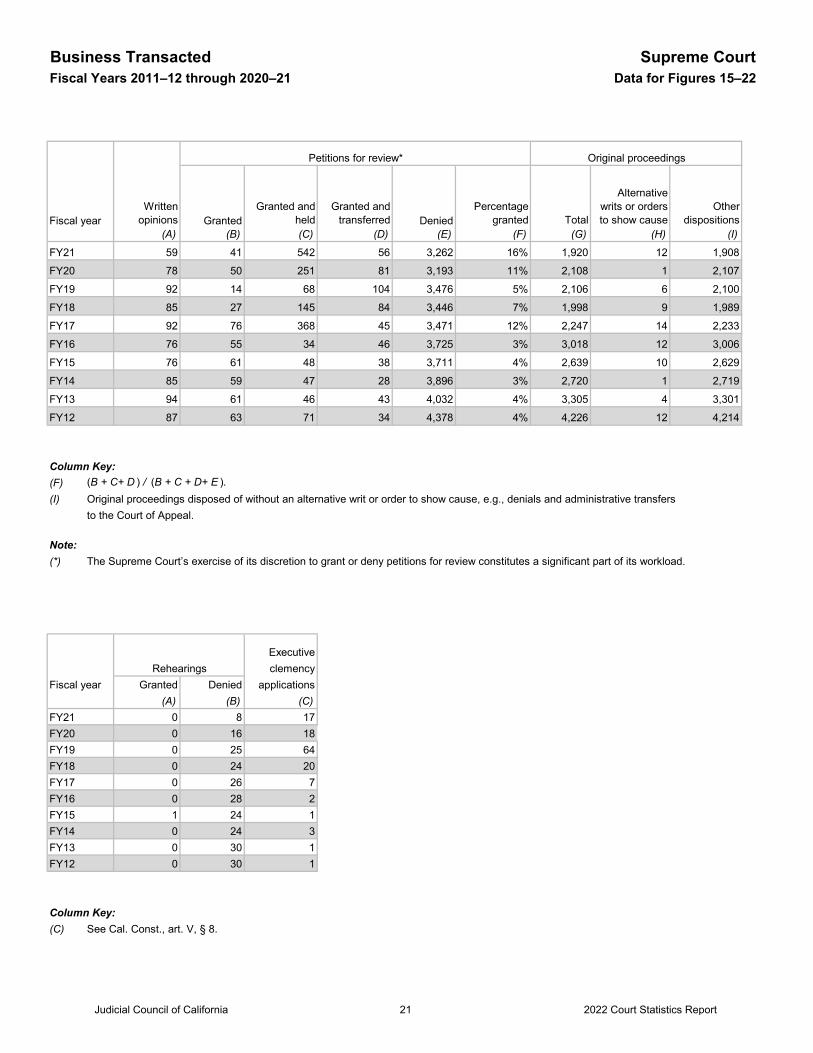
Business Transacted Supreme CourtFiscal Years 2011–12 through 2020–21 Data for Figures 15–22
Petitions for review*
Fiscal yearWritten
opinions GrantedGranted and
heldGranted and
transferred DeniedPercentage
granted Total
Alternative writs or orders to show cause
Other dispositions
(A) (B) (C) (D) (E) (F) (G) (H) (I)
FY21 59 41 542 56 3,262 16% 1,920 12 1,908
FY20 78 50 251 81 3,193 11% 2,108 1 2,107
FY19 92 14 68 104 3,476 5% 2,106 6 2,100
FY18 85 27 145 84 3,446 7% 1,998 9 1,989
FY17 92 76 368 45 3,471 12% 2,247 14 2,233
FY16 76 55 34 46 3,725 3% 3,018 12 3,006
FY15 76 61 48 38 3,711 4% 2,639 10 2,629
FY14 85 59 47 28 3,896 3% 2,720 1 2,719
FY13 94 61 46 43 4,032 4% 3,305 4 3,301
FY12 87 63 71 34 4,378 4% 4,226 12 4,214
Column Key:(F) (B + C+ D ) / (B + C + D+ E ).(I) Original proceedings disposed of without an alternative writ or order to show cause, e.g., denials and administrative transfers to the Court of Appeal.
Note:(*) The Supreme Court’s exercise of its discretion to grant or deny petitions for review constitutes a significant part of its workload.
ExecutiveRehearings clemency
Fiscal year Granted Denied applications(A) (B) (C)
FY21 0 8 17FY20 0 16 18FY19 0 25 64FY18 0 24 20 FY17 0 26 7FY16 0 28 2FY15 1 24 1 FY14 0 24 3FY13 0 30 1FY12 0 30 1
Column Key:(C) See Cal. Const., art. V, § 8.
Original proceedings
Judicial Council of California 2022 Court Statistics Report21
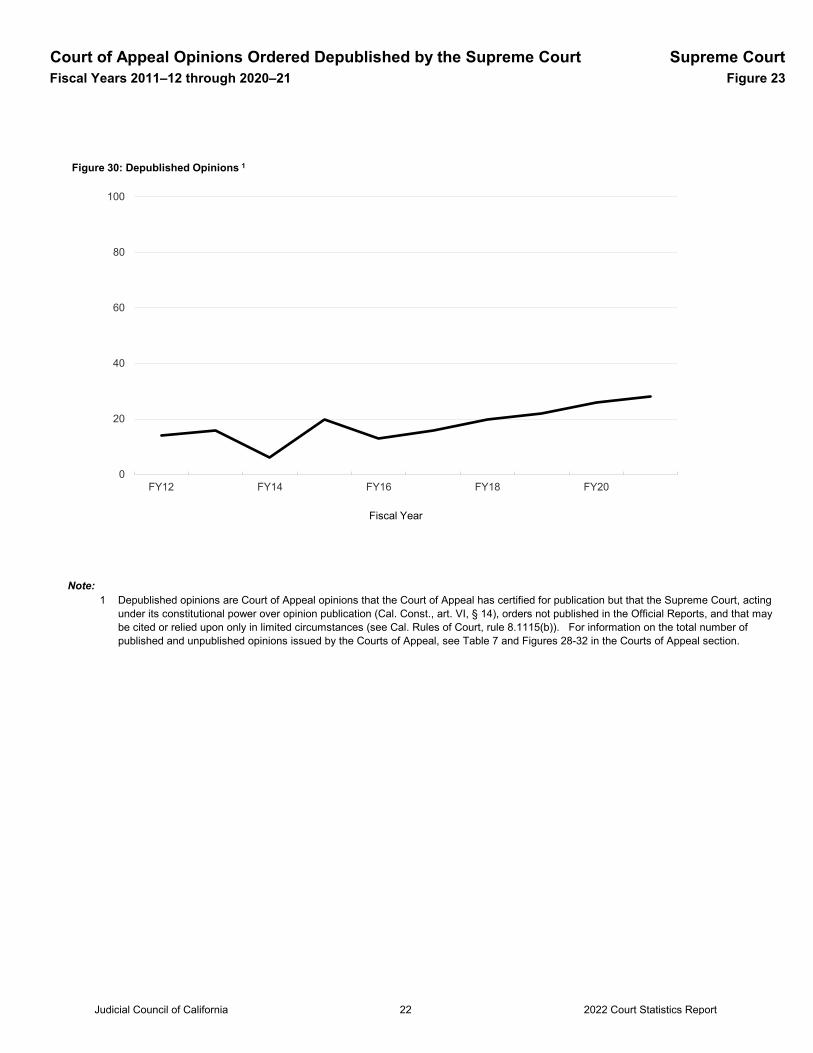
Court of Appeal Opinions Ordered Depublished by the Supreme Court Supreme CourtFiscal Years 2011–12 through 2020–21 Figure 23
Note:1
Depublished opinions are Court of Appeal opinions that the Court of Appeal has certified for publication but that the Supreme Court, acting under its constitutional power over opinion publication (Cal. Const., art. VI, § 14), orders not published in the Official Reports, and that may be cited or relied upon only in limited circumstances (see Cal. Rules of Court, rule 8.1115(b)). For information on the total number of published and unpublished opinions issued by the Courts of Appeal, see Table 7 and Figures 28-32 in the Courts of Appeal section.
0
20
40
60
80
100
FY12 FY14 FY16 FY18 FY20
Fiscal Year
Figure 30: Depublished Opinions 1
Judicial Council of California 2022 Court Statistics Report22
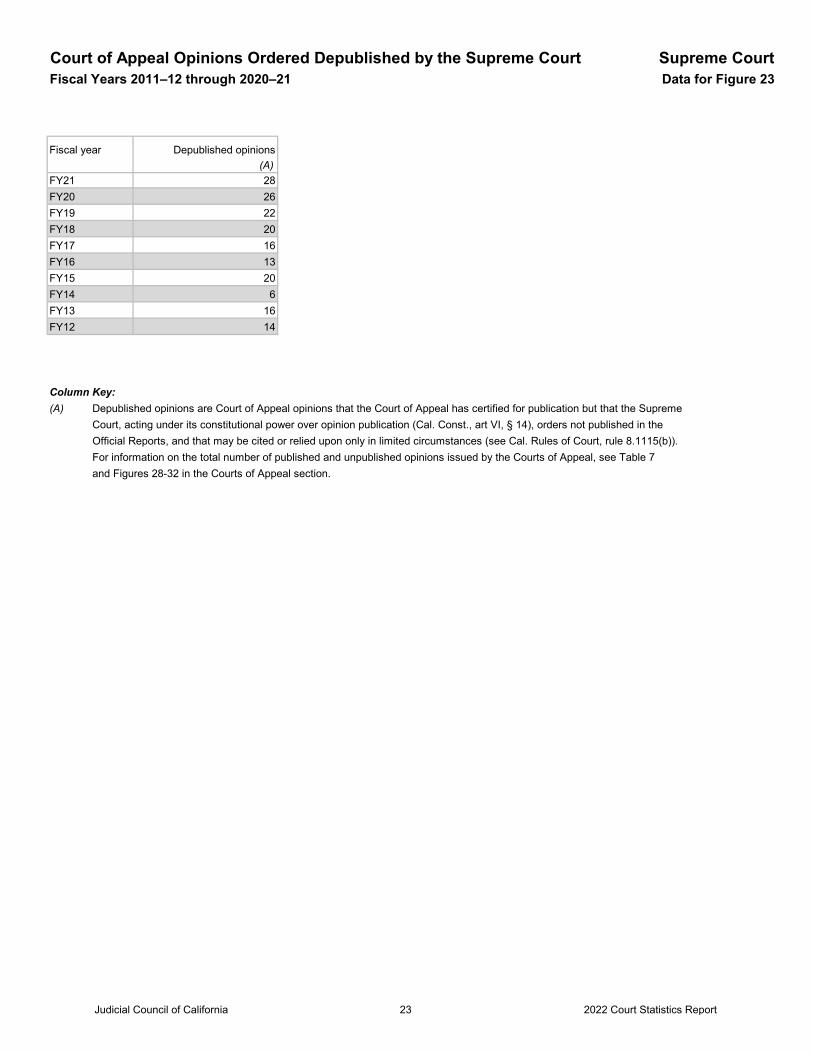
Court of Appeal Opinions Ordered Depublished by the Supreme Court Supreme CourtFiscal Years 2011–12 through 2020–21 Data for Figure 23
Fiscal year Depublished opinions (A)
FY21 28FY20 26FY19 22 FY18 20 FY17 16FY16 13 FY15 20FY14 6 FY13 16 FY12 14
Column Key:(A) Depublished opinions are Court of Appeal opinions that the Court of Appeal has certified for publication but that the Supreme Court, acting under its constitutional power over opinion publication (Cal. Const., art VI, § 14), orders not published in the
Official Reports, and that may be cited or relied upon only in limited circumstances (see Cal. Rules of Court, rule 8.1115(b)).For information on the total number of published and unpublished opinions issued by the Courts of Appeal, see Table 7and Figures 28-32 in the Courts of Appeal section.
Judicial Council of California 2022 Court Statistics Report23
Capital Cases in Which the Record Was Not Certified for Supreme Court Completeness Within 90 Days, and for Accuracy Within 120 Days Table 3
Fiscal Year 2020–2021
In the following cases, the record was not certified for completeness within 90 days. (See Penal Code, § 190.8(d).)
Supreme Court Superior court Sentence County case number Name case number date
There are no cases to report. In the following cases, the record was not certified for accuracy within 120 days. (See Penal Code, § 190.8 (g).)
Supreme Court Superior court Sentence County case number Name case number date
There are no cases to report.
Judicial Council of California 2022 Court Statistics Report24
Courts of Appeal

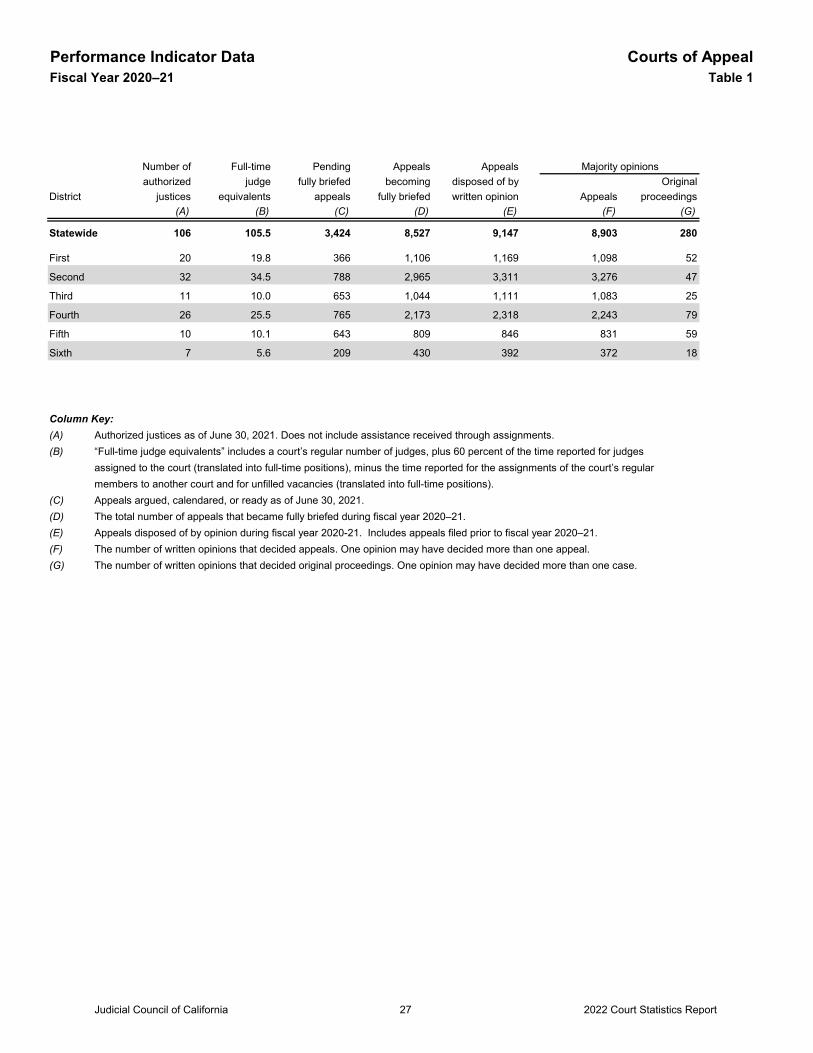
Performance Indicator Data Courts of AppealFiscal Year 2020–21 Table 1
Number of Full-time Pending Appeals Appeals Majority opinionsauthorized judge fully briefed becoming disposed of by Original
District justices equivalents appeals fully briefed written opinion Appeals proceedings(A) (B) (C) (D) (E) (F) (G)
Statewide 106 105.5 3,424 8,527 9,147 8,903 280
First 20 19.8 366 1,106 1,169 1,098 52
Second 32 34.5 788 2,965 3,311 3,276 47
Third 11 10.0 653 1,044 1,111 1,083 25
Fourth 26 25.5 765 2,173 2,318 2,243 79
Fifth 10 10.1 643 809 846 831 59
Sixth 7 5.6 209 430 392 372 18
Column Key:(A) Authorized justices as of June 30, 2021. Does not include assistance received through assignments.(B) “Full-time judge equivalents” includes a court’s regular number of judges, plus 60 percent of the time reported for judges
assigned to the court (translated into full-time positions), minus the time reported for the assignments of the court’s regularmembers to another court and for unfilled vacancies (translated into full-time positions).
(C) Appeals argued, calendared, or ready as of June 30, 2021.(D) The total number of appeals that became fully briefed during fiscal year 2020–21.(E) Appeals disposed of by opinion during fiscal year 2020-21. Includes appeals filed prior to fiscal year 2020–21.(F) The number of written opinions that decided appeals. One opinion may have decided more than one appeal.(G) The number of written opinions that decided original proceedings. One opinion may have decided more than one case.
Judicial Council of California 2022 Court Statistics Report27
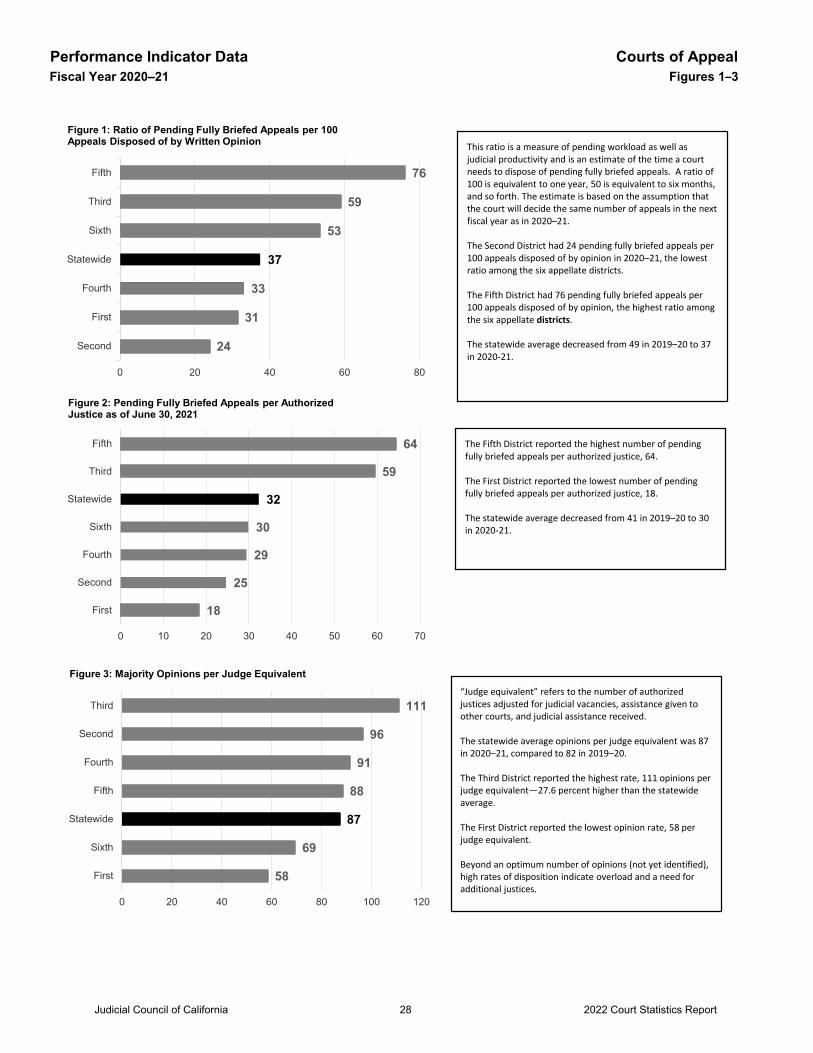
Performance Indicator Data Courts of AppealFiscal Year 2020–21 Figures 1–3
24
31
33
37
53
59
76
0 20 40 60 80
Second
First
Fourth
Statewide
Sixth
Third
Fifth
Figure 1: Ratio of Pending Fully Briefed Appeals per 100 Appeals Disposed of by Written Opinion This ratio is a measure of pending workload as well as
judicial productivity and is an estimate of the time a court needs to dispose of pending fully briefed appeals. A ratio of 100 is equivalent to one year, 50 is equivalent to six months, and so forth. The estimate is based on the assumption that the court will decide the same number of appeals in the next fiscal year as in 2020–21.
The Second District had 24 pending fully briefed appeals per 100 appeals disposed of by opinion in 2020–21, the lowest ratio among the six appellate districts.
The Fifth District had 76 pending fully briefed appeals per 100 appeals disposed of by opinion, the highest ratio among the six appellate districts.
The statewide average decreased from 49 in 2019–20 to 37 in 2020-21.
18
25
29
30
32
59
64
0 10 20 30 40 50 60 70
First
Second
Fourth
Sixth
Statewide
Third
Fifth
Figure 2: Pending Fully Briefed Appeals per Authorized Justice as of June 30, 2021
58
69
87
88
91
96
111
0 20 40 60 80 100 120
First
Sixth
Statewide
Fifth
Fourth
Second
Third
Figure 3: Majority Opinions per Judge Equivalent
The Fifth District reported the highest number of pending fully briefed appeals per authorized justice, 64.
The First District reported the lowest number of pending fully briefed appeals per authorized justice, 18.
The statewide average decreased from 41 in 2019–20 to 30 in 2020-21.
“Judge equivalent” refers to the number of authorized justices adjusted for judicial vacancies, assistance given to other courts, and judicial assistance received.
The statewide average opinions per judge equivalent was 87in 2020–21, compared to 82 in 2019–20.
The Third District reported the highest rate, 111 opinions per judge equivalent—27.6 percent higher than the statewide average.
The First District reported the lowest opinion rate, 58 per judge equivalent.
Beyond an optimum number of opinions (not yet identified), high rates of disposition indicate overload and a need for additional justices.
Judicial Council of California 2022 Court Statistics Report28
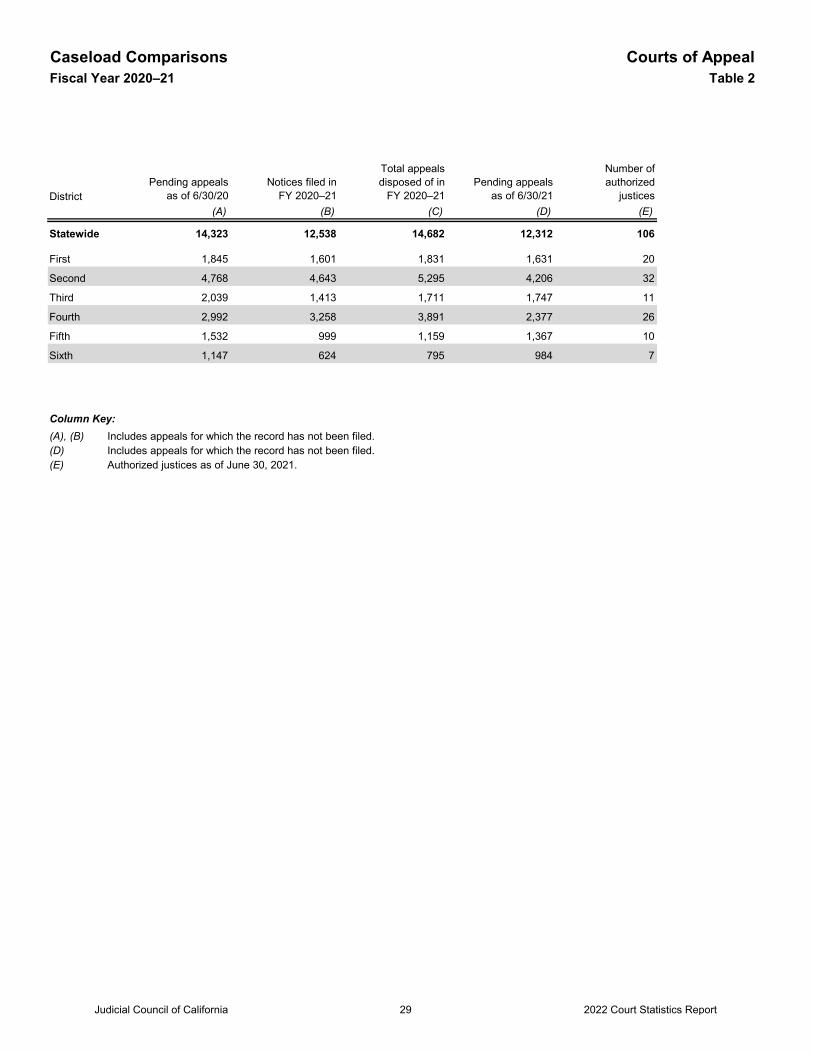
Caseload Comparisons Courts of AppealFiscal Year 2020–21 Table 2
DistrictPending appeals
as of 6/30/20Notices filed in
FY 2020–21
Total appeals disposed of in
FY 2020–21Pending appeals
as of 6/30/21
Number of authorized
justices(A) (B) (C) (D) (E)
Statewide 14,323 12,538 14,682 12,312 106
First 1,845 1,601 1,831 1,631 20
Second 4,768 4,643 5,295 4,206 32
Third 2,039 1,413 1,711 1,747 11
Fourth 2,992 3,258 3,891 2,377 26
Fifth 1,532 999 1,159 1,367 10
Sixth 1,147 624 795 984 7
Column Key:(A), (B) Includes appeals for which the record has not been filed.(D) Includes appeals for which the record has not been filed.(E) Authorized justices as of June 30, 2021.
Judicial Council of California 2022 Court Statistics Report29
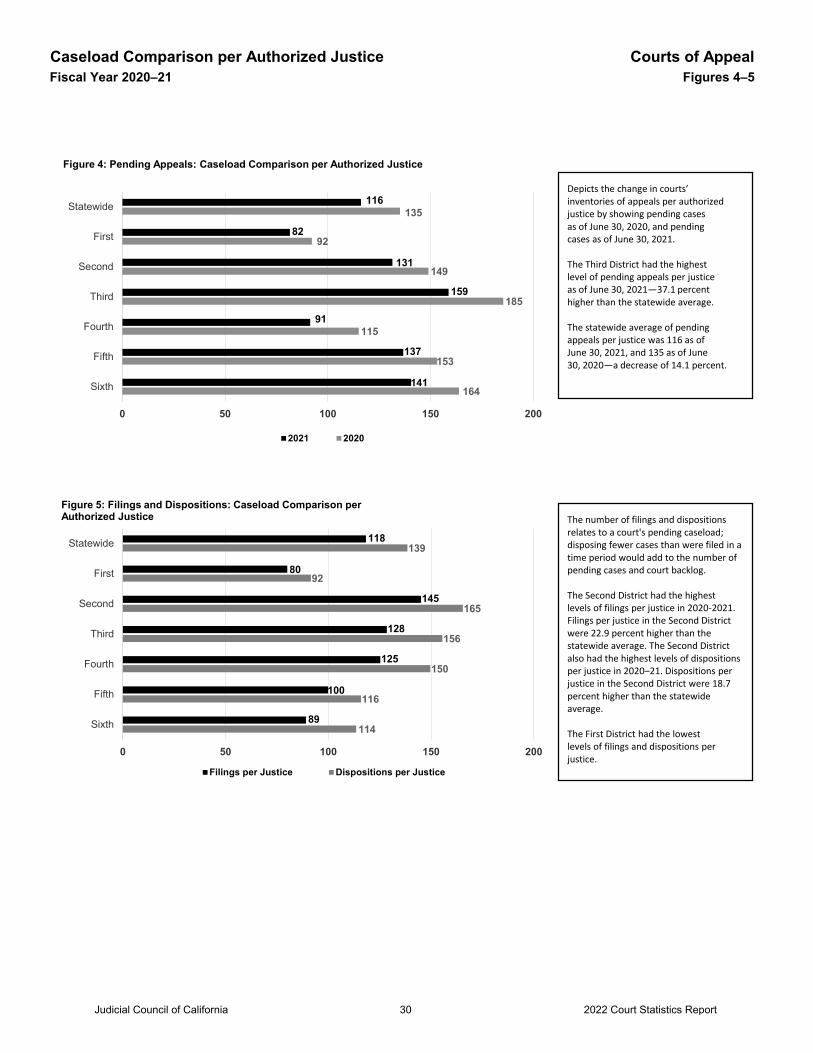
Caseload Comparison per Authorized Justice Courts of AppealFiscal Year 2020–21 Figures 4–5
164
153
115
185
149
92
135
141
137
91
159
131
82
116
0 50 100 150 200
Sixth
Fifth
Fourth
Third
Second
First
Statewide
Figure 4: Pending Appeals: Caseload Comparison per Authorized Justice
2021 2020
114
116
150
156
165
92
139
89
100
125
128
145
80
118
0 50 100 150 200
Sixth
Fifth
Fourth
Third
Second
First
Statewide
Figure 5: Filings and Dispositions: Caseload Comparison per Authorized Justice
Filings per Justice Dispositions per Justice
Depicts the change in courts’inventories of appeals per authorizedjustice by showing pending casesas of June 30, 2020, and pendingcases as of June 30, 2021.
The Third District had the highestlevel of pending appeals per justiceas of June 30, 2021—37.1 percenthigher than the statewide average.
The statewide average of pendingappeals per justice was 116 as ofJune 30, 2021, and 135 as of June30, 2020—a decrease of 14.1 percent.
The number of filings and dispositions relates to a court's pending caseload; disposing fewer cases than were filed in a time period would add to the number of pending cases and court backlog.
The Second District had the highestlevels of filings per justice in 2020-2021. Filings per justice in the Second District were 22.9 percent higher than the statewide average. The Second District also had the highest levels of dispositions per justice in 2020–21. Dispositions per justice in the Second District were 18.7 percent higher than the statewide average.
The First District had the lowestlevels of filings and dispositions per justice.
Judicial Council of California 2022 Court Statistics Report30
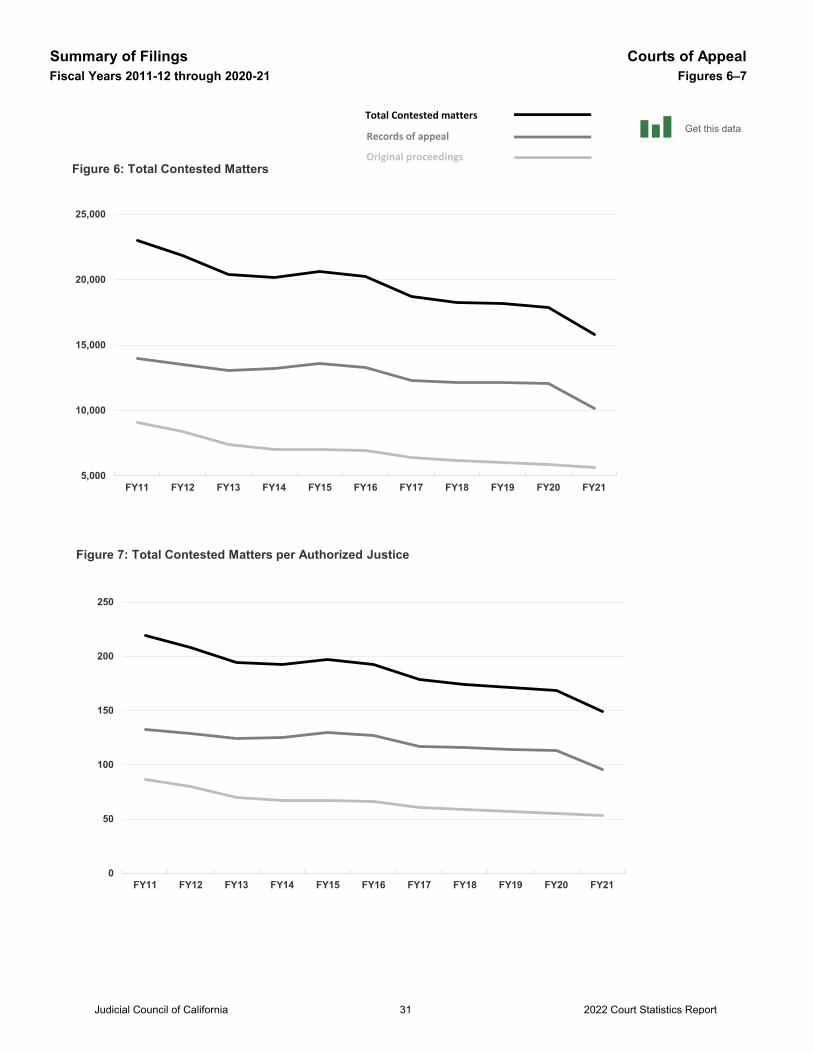
Summary of Filings Courts of AppealFiscal Years 2011-12 through 2020-21 Figures 6–7
5,000
10,000
15,000
20,000
25,000
FY11 FY12 FY13 FY14 FY15 FY16 FY17 FY18 FY19 FY20 FY21
Figure 6: Total Contested Matters
Total Contested matters
Records of appeal
Original proceedings
0
50
100
150
200
250
FY11 FY12 FY13 FY14 FY15 FY16 FY17 FY18 FY19 FY20 FY21
Figure 7: Total Contested Matters per Authorized Justice
Get this data
Judicial Council of California 2022 Court Statistics Report31
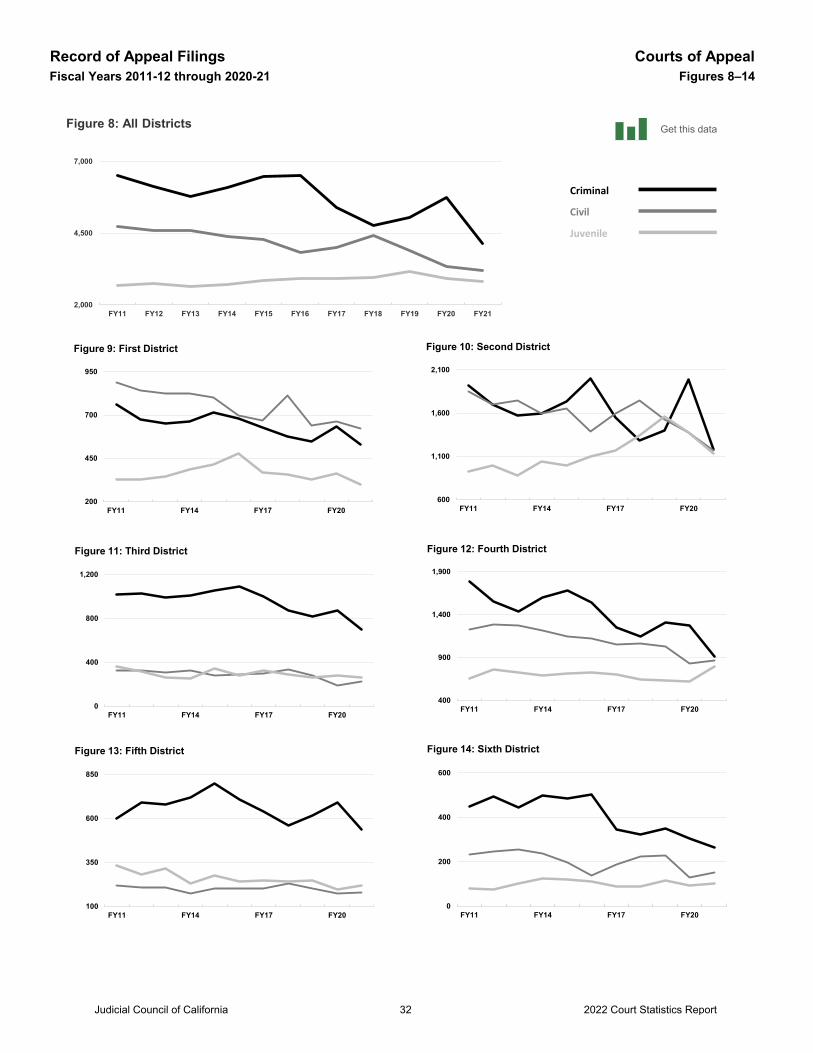
Record of Appeal Filings Courts of AppealFiscal Years 2011-12 through 2020-21 Figures 8–14
2,000
4,500
7,000
FY11 FY12 FY13 FY14 FY15 FY16 FY17 FY18 FY19 FY20 FY21
Figure 8: All Districts
200
450
700
950
FY11 FY14 FY17 FY20
Figure 9: First District
Criminal
Civil
Juvenile
600
1,100
1,600
2,100
FY11 FY14 FY17 FY20
Figure 10: Second District
0
400
800
1,200
FY11 FY14 FY17 FY20
Figure 11: Third District
400
900
1,400
1,900
FY11 FY14 FY17 FY20
Figure 12: Fourth District
100
350
600
850
FY11 FY14 FY17 FY20
Figure 13: Fifth District
0
200
400
600
FY11 FY14 FY17 FY20
Figure 14: Sixth District
Get this data
Judicial Council of California 2022 Court Statistics Report32
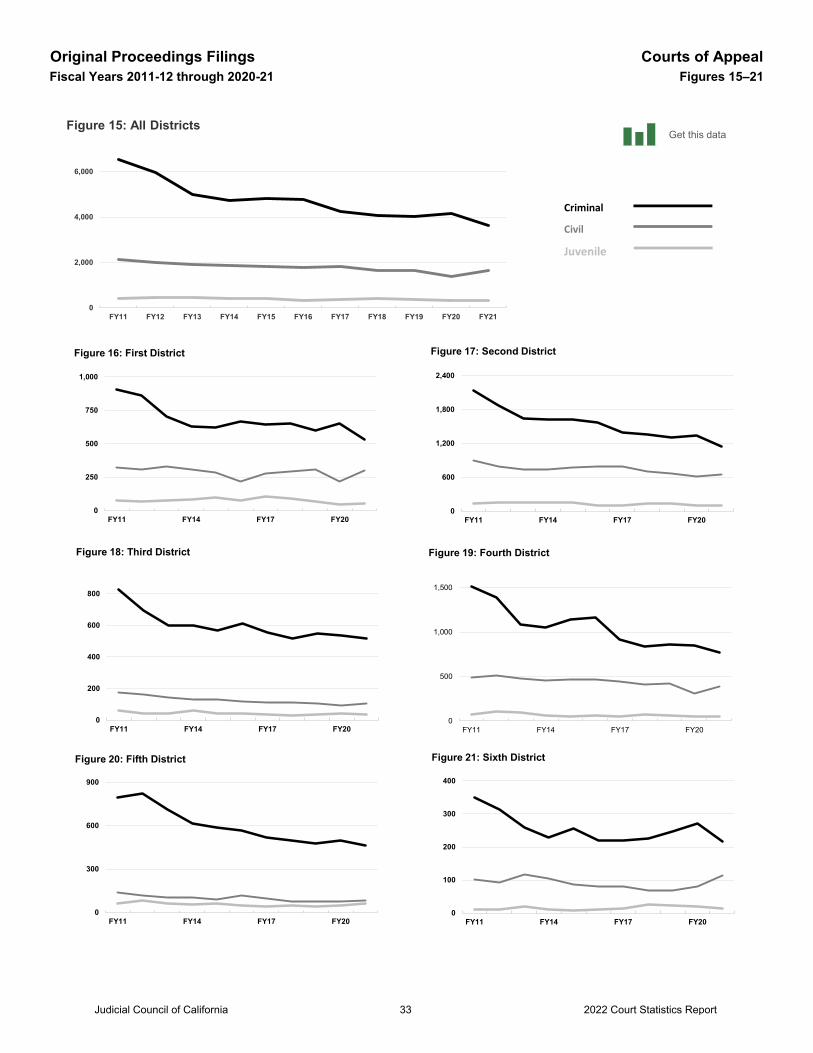
Original Proceedings Filings Courts of AppealFiscal Years 2011-12 through 2020-21 Figures 15–21
0
2,000
4,000
6,000
FY11 FY12 FY13 FY14 FY15 FY16 FY17 FY18 FY19 FY20 FY21
Figure 15: All Districts
0
250
500
750
1,000
FY11 FY14 FY17 FY20
Figure 16: First District
Criminal
Civil
Juvenile
0
600
1,200
1,800
2,400
FY11 FY14 FY17 FY20
Figure 17: Second District
0
200
400
600
800
FY11 FY14 FY17 FY20
Figure 18: Third District
0
500
1,000
1,500
FY11 FY14 FY17 FY20
Figure 19: Fourth District
0
300
600
900
FY11 FY14 FY17 FY20
Figure 20: Fifth District
0
100
200
300
400
FY11 FY14 FY17 FY20
Figure 21: Sixth District
Get this data
Judicial Council of California 2022 Court Statistics Report33
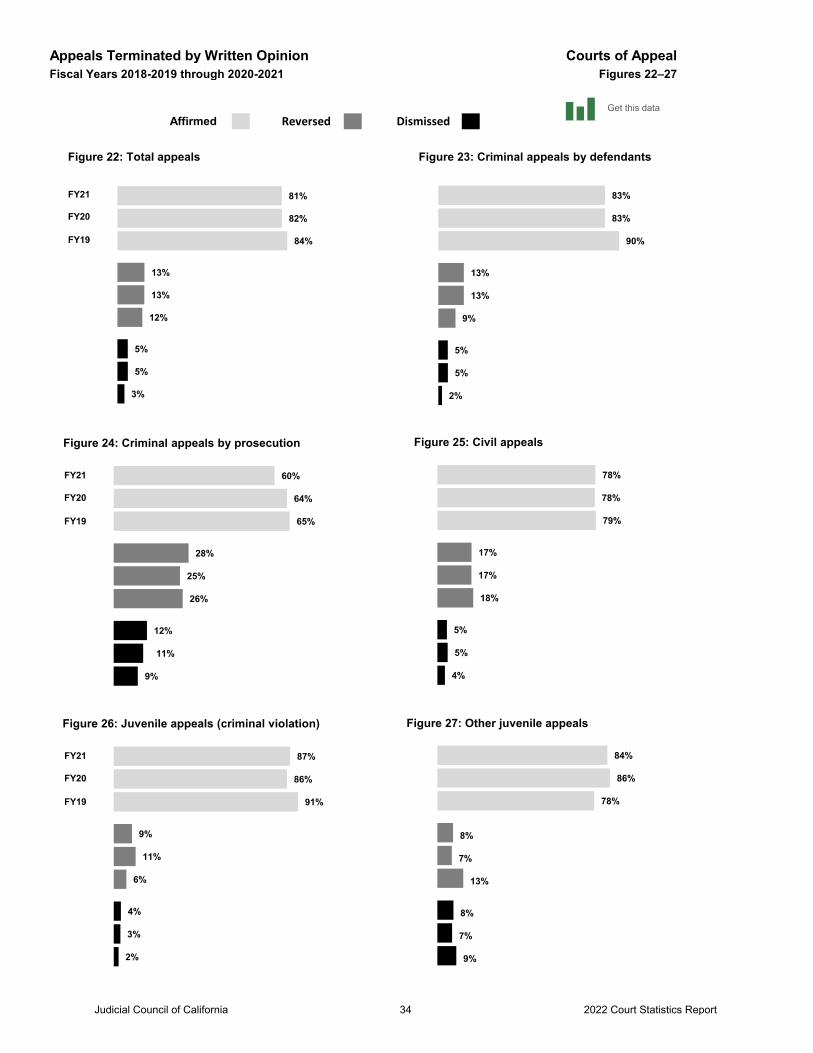
Appeals Terminated by Written Opinion Courts of AppealFiscal Years 2018-2019 through 2020-2021 Figures 22–27
ReversedAffirmed Dismissed
83%
13%
5%
83%
13%
5%
90%
9%
2%
0% 25% 50% 75% 100%Figure 23: Criminal appeals by defendants
81%
13%
5%
82%
13%
5%
84%
12%
3%
Figure 22: Total appeals
FY21
FY20
FY19
60%
28%
12%
64%
25%
11%
65%
26%
9%
0% 25% 50% 75%Figure 24: Criminal appeals by prosecution
FY21
FY20
FY19
78%
17%
5%
78%
17%
5%
79%
18%
4%
0% 25% 50% 75% 100%Figure 25: Civil appeals
87%
9%
4%
86%
11%
3%
91%
6%
2%
0% 25% 50% 75% 100%
FY21
FY20
FY19
Figure 26: Juvenile appeals (criminal violation)
84%
8%
8%
86%
7%
7%
78%
13%
9%
0% 25% 50% 75% 100%Figure 27: Other juvenile appeals
Get this data
Judicial Council of California 2022 Court Statistics Report34
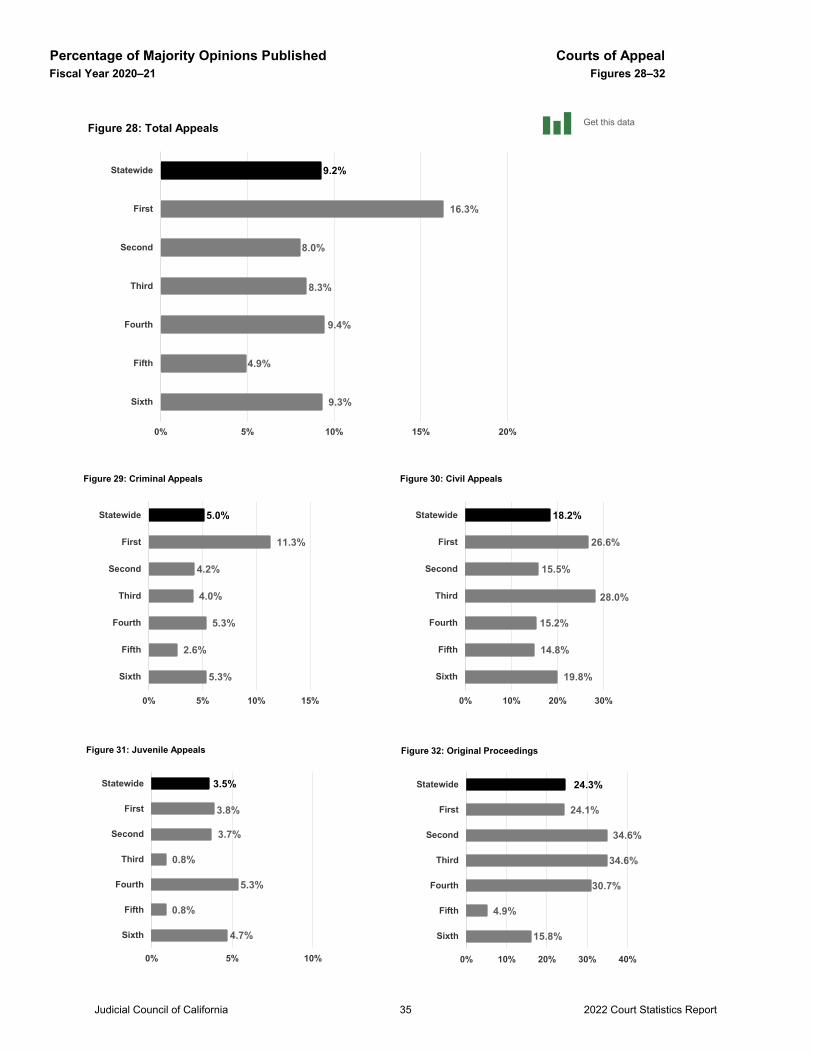
Percentage of Majority Opinions Published Courts of AppealFiscal Year 2020–21 Figures 28–32
9.3%
4.9%
9.4%
8.3%
8.0%
16.3%
9.2%
0% 5% 10% 15% 20%
Sixth
Fifth
Fourth
Third
Second
First
Statewide
Figure 28: Total Appeals
19.8%
14.8%
15.2%
28.0%
15.5%
26.6%
18.2%
0% 10% 20% 30%
Sixth
Fifth
Fourth
Third
Second
First
Statewide
Figure 30: Civil Appeals
5.3%
3%
5%
4%
4%
11%
5%
0% 5% 10% 15%
Sixth
Fifth
Fourth
Third
Second
First
Statewide
Figure 29: Criminal Appeals
5%
1%
5%
1%
4%
4%
4%
0% 5% 10% 15%
Sixth
Fifth
Fourth
Third
Second
First
Statewide
Figure 31: Juvenile Appeals
15.8%
4.9%
30.7%
34.6%
34.6%
24.1%
24.3%
0% 10% 20% 30% 40%
Sixth
Fifth
Fourth
Third
Second
First
Statewide
Figure 32: Original Proceedings
Get this data
5.3%
2.6%
5.3%
4.0%
4.2%
11.3%
5.0%
0% 5% 10% 15%
Sixth
Fifth
Fourth
Third
Second
First
Statewide
Figure 29: Criminal Appeals
4.7%
0.8%
5.3%
0.8%
3.7%
3.8%
3.5%
0% 5% 10%
Sixth
Fifth
Fourth
Third
Second
First
Statewide
Figure 31: Juvenile Appeals
Judicial Council of California 2022 Court Statistics Report35
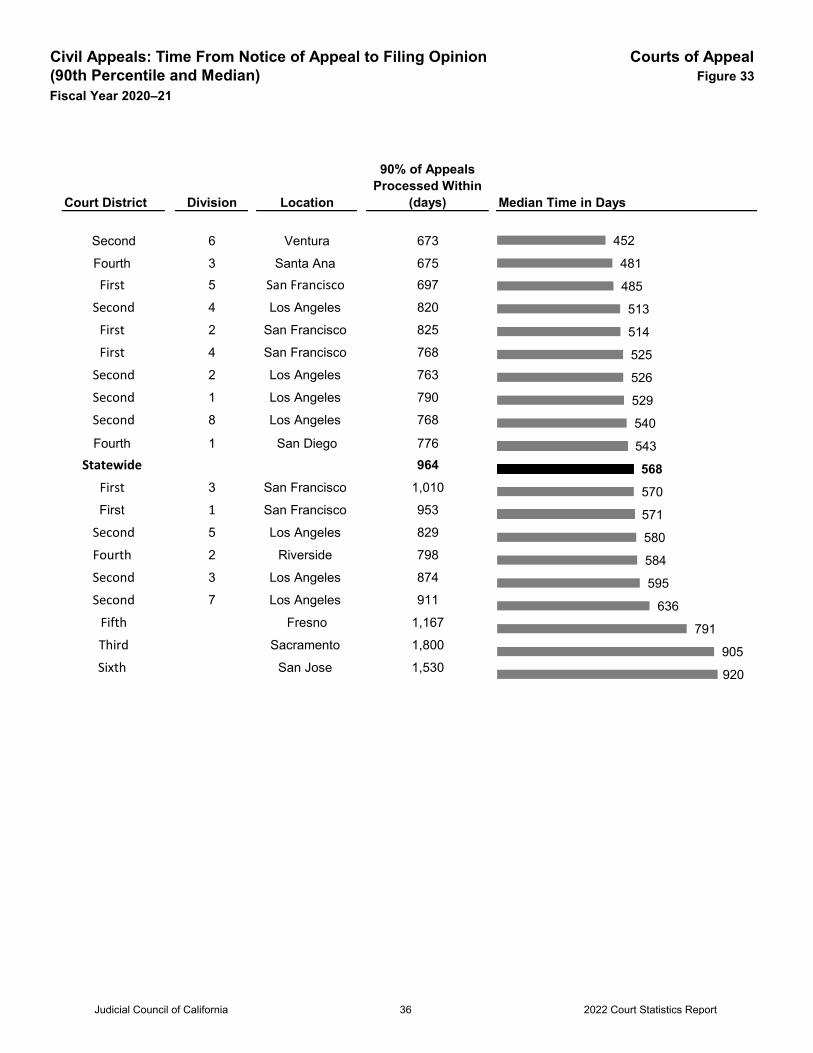
Civil Appeals: Time From Notice of Appeal to Filing Opinion Courts of Appeal(90th Percentile and Median) Figure 33Fiscal Year 2020–21
Court District Division Location
90% of Appeals Processed Within
(days) Median Time in Days
Second 6 Ventura 673
Fourth 3 Santa Ana 675First 5 San Francisco 697
Second 4 Los Angeles 820
First 2 San Francisco 825
First 4 San Francisco 768
Second 2 Los Angeles 763
Second 1 Los Angeles 790
Second 8 Los Angeles 768
Fourth 1 San Diego 776Statewide 964
First 3 San Francisco 1,010
First 1 San Francisco 953
Second 5 Los Angeles 829
Fourth 2 Riverside 798
Second 3 Los Angeles 874
Second 7 Los Angeles 911
Fifth Fresno 1,167
Third Sacramento 1,800
Sixth San Jose 1,530 920
905
791
636
595
584
580
571
570
568543
540
529
526
525
514
513
485
481
452
Judicial Council of California 2022 Court Statistics Report36
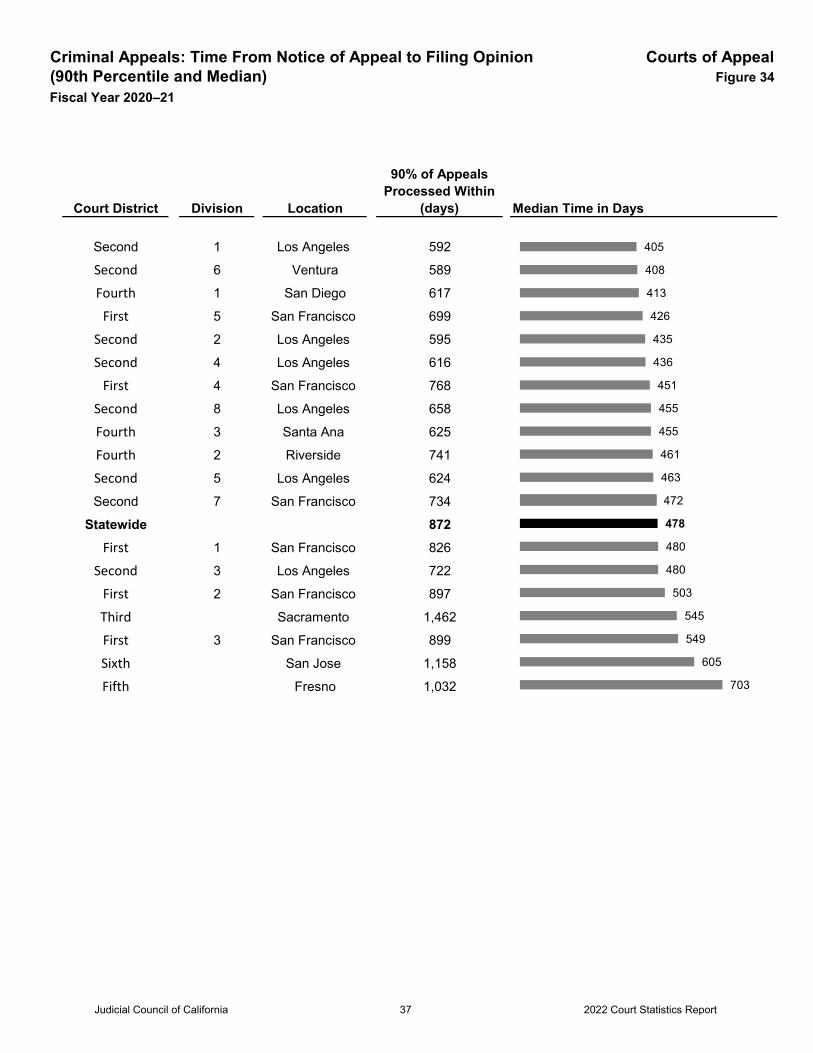
Criminal Appeals: Time From Notice of Appeal to Filing Opinion Courts of Appeal(90th Percentile and Median) Figure 34Fiscal Year 2020–21
Court District Division Location
90% of Appeals Processed Within
(days) Median Time in Days
Second 1 Los Angeles 592
Second 6 Ventura 589
Fourth 1 San Diego 617
First 5 San Francisco 699
Second 2 Los Angeles 595
Second 4 Los Angeles 616
First 4 San Francisco 768
Second 8 Los Angeles 658
Fourth 3 Santa Ana 625
Fourth 2 Riverside 741
Second 5 Los Angeles 624
Second 7 San Francisco 734
Statewide 872First 1 San Francisco 826
Second 3 Los Angeles 722
First 2 San Francisco 897
Third Sacramento 1,462
First 3 San Francisco 899
Sixth San Jose 1,158
Fifth Fresno 1,032 703
605
549
545
503
480
480
478
472
463
461
455
455
451
436
435
426
413
408
405
Judicial Council of California 2022 Court Statistics Report37
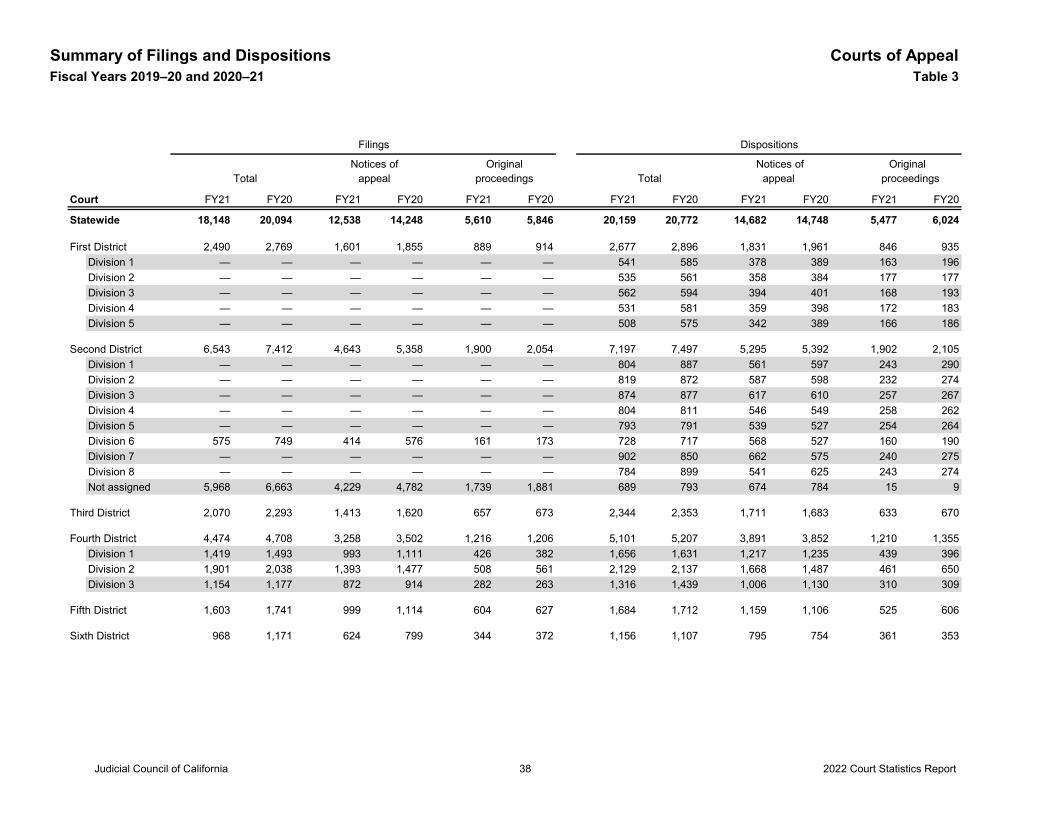
Summary of Filings and Dispositions Courts of AppealFiscal Years 2019–20 and 2020–21 Table 3
Filings Dispositions
Notices of Original Notices of Original Total appeal proceedings Total appeal proceedings
Court FY21 FY20 FY21 FY20 FY21 FY20 FY21 FY20 FY21 FY20 FY21 FY20
Statewide 18,148 20,094 12,538 14,248 5,610 5,846 20,159 20,772 14,682 14,748 5,477 6,024
First District 2,490 2,769 1,601 1,855 889 914 2,677 2,896 1,831 1,961 846 935Division 1 — — — — — — 541 585 378 389 163 196Division 2 — — — — — — 535 561 358 384 177 177Division 3 — — — — — — 562 594 394 401 168 193Division 4 — — — — — — 531 581 359 398 172 183Division 5 — — — — — — 508 575 342 389 166 186
Second District 6,543 7,412 4,643 5,358 1,900 2,054 7,197 7,497 5,295 5,392 1,902 2,105Division 1 — — — — — — 804 887 561 597 243 290Division 2 — — — — — — 819 872 587 598 232 274Division 3 — — — — — — 874 877 617 610 257 267Division 4 — — — — — — 804 811 546 549 258 262Division 5 — — — — — — 793 791 539 527 254 264Division 6 575 749 414 576 161 173 728 717 568 527 160 190Division 7 — — — — — — 902 850 662 575 240 275Division 8 — — — — — — 784 899 541 625 243 274Not assigned 5,968 6,663 4,229 4,782 1,739 1,881 689 793 674 784 15 9
Third District 2,070 2,293 1,413 1,620 657 673 2,344 2,353 1,711 1,683 633 670
Fourth District 4,474 4,708 3,258 3,502 1,216 1,206 5,101 5,207 3,891 3,852 1,210 1,355Division 1 1,419 1,493 993 1,111 426 382 1,656 1,631 1,217 1,235 439 396Division 2 1,901 2,038 1,393 1,477 508 561 2,129 2,137 1,668 1,487 461 650Division 3 1,154 1,177 872 914 282 263 1,316 1,439 1,006 1,130 310 309
Fifth District 1,603 1,741 999 1,114 604 627 1,684 1,712 1,159 1,106 525 606
Sixth District 968 1,171 624 799 344 372 1,156 1,107 795 754 361 353
Judicial Council of California 2022 Court Statistics Report38
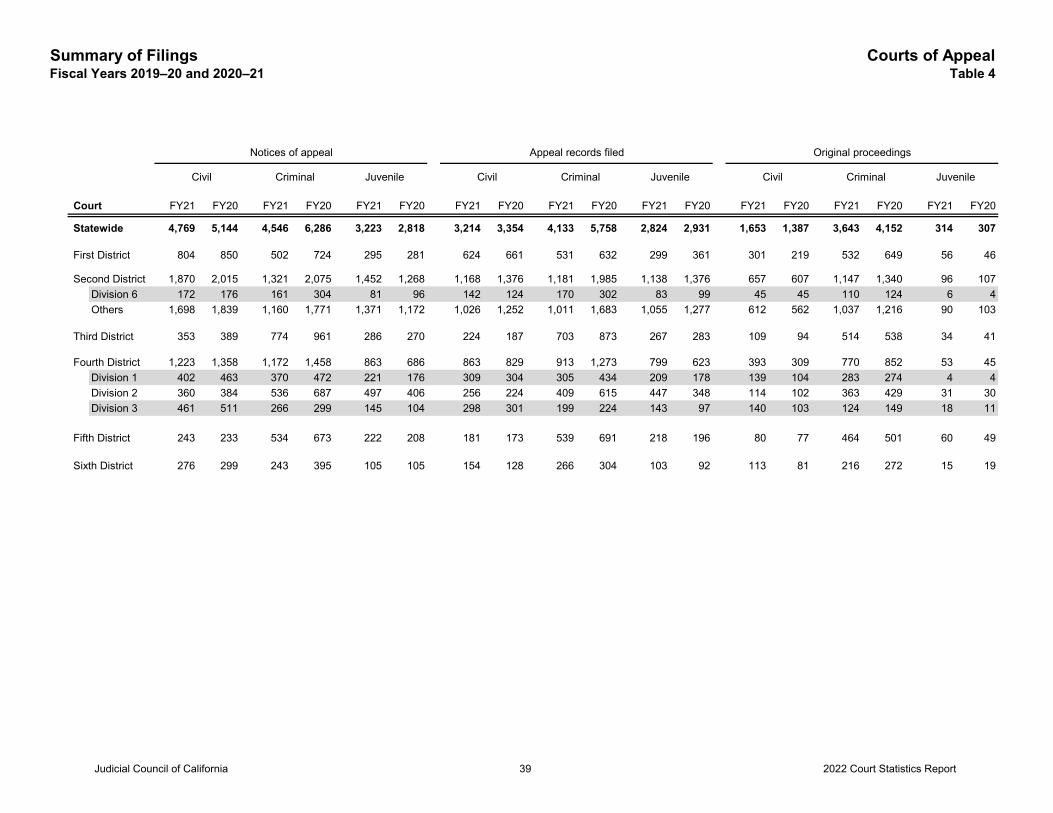
Summary of Filings Courts of AppealFiscal Years 2019–20 and 2020–21 Table 4
Notices of appeal Appeal records filed Original proceedings
Civil Criminal Juvenile Civil Criminal Juvenile Civil Criminal Juvenile
Court FY21 FY20 FY21 FY20 FY21 FY20 FY21 FY20 FY21 FY20 FY21 FY20 FY21 FY20 FY21 FY20 FY21 FY20
Statewide 4,769 5,144 4,546 6,286 3,223 2,818 3,214 3,354 4,133 5,758 2,824 2,931 1,653 1,387 3,643 4,152 314 307
First District 804 850 502 724 295 281 624 661 531 632 299 361 301 219 532 649 56 46
Second District 1,870 2,015 1,321 2,075 1,452 1,268 1,168 1,376 1,181 1,985 1,138 1,376 657 607 1,147 1,340 96 107Division 6 172 176 161 304 81 96 142 124 170 302 83 99 45 45 110 124 6 4Others 1,698 1,839 1,160 1,771 1,371 1,172 1,026 1,252 1,011 1,683 1,055 1,277 612 562 1,037 1,216 90 103
Third District 353 389 774 961 286 270 224 187 703 873 267 283 109 94 514 538 34 41
Fourth District 1,223 1,358 1,172 1,458 863 686 863 829 913 1,273 799 623 393 309 770 852 53 45Division 1 402 463 370 472 221 176 309 304 305 434 209 178 139 104 283 274 4 4Division 2 360 384 536 687 497 406 256 224 409 615 447 348 114 102 363 429 31 30Division 3 461 511 266 299 145 104 298 301 199 224 143 97 140 103 124 149 18 11
Fifth District 243 233 534 673 222 208 181 173 539 691 218 196 80 77 464 501 60 49
Sixth District 276 299 243 395 105 105 154 128 266 304 103 92 113 81 216 272 15 19
Judicial Council of California 2022 Court Statistics Report39
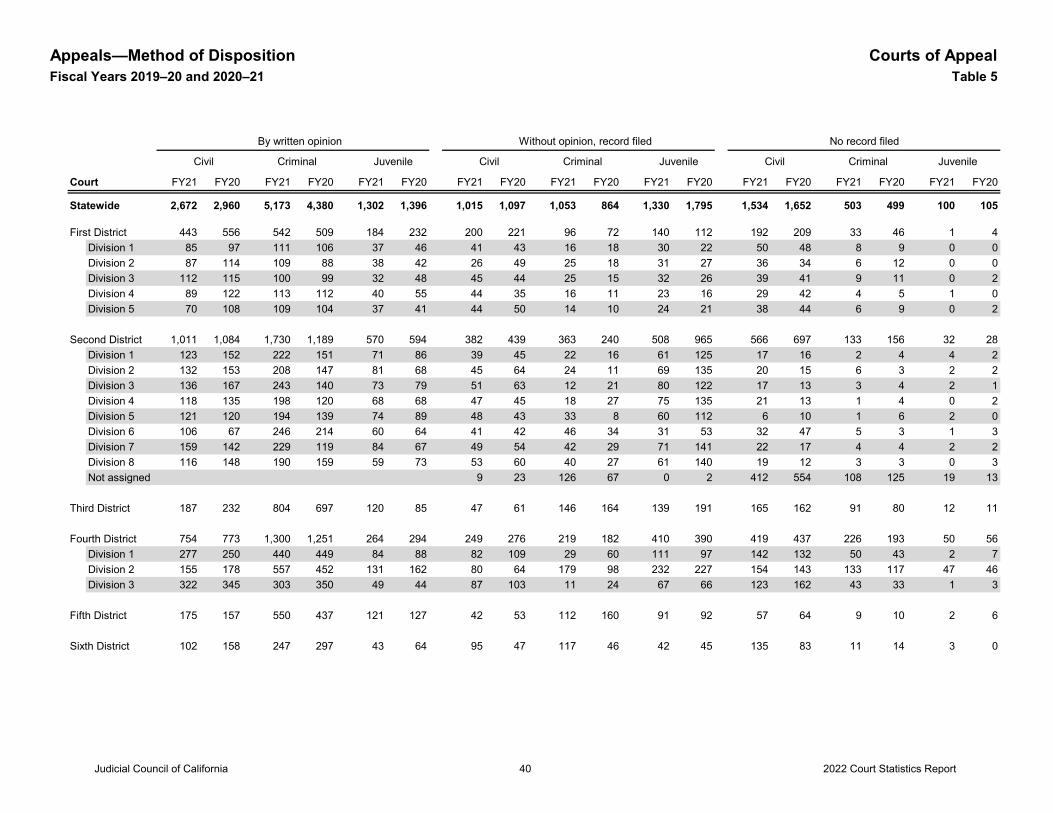
Appeals—Method of Disposition Courts of AppealFiscal Years 2019–20 and 2020–21 Table 5
By written opinion Without opinion, record filed No record filed
Civil Criminal Juvenile Civil Criminal Juvenile Civil Criminal Juvenile
Court FY21 FY20 FY21 FY20 FY21 FY20 FY21 FY20 FY21 FY20 FY21 FY20 FY21 FY20 FY21 FY20 FY21 FY20
Statewide 2,672 2,960 5,173 4,380 1,302 1,396 1,015 1,097 1,053 864 1,330 1,795 1,534 1,652 503 499 100 105
First District 443 556 542 509 184 232 200 221 96 72 140 112 192 209 33 46 1 4Division 1 85 97 111 106 37 46 41 43 16 18 30 22 50 48 8 9 0 0Division 2 87 114 109 88 38 42 26 49 25 18 31 27 36 34 6 12 0 0Division 3 112 115 100 99 32 48 45 44 25 15 32 26 39 41 9 11 0 2Division 4 89 122 113 112 40 55 44 35 16 11 23 16 29 42 4 5 1 0Division 5 70 108 109 104 37 41 44 50 14 10 24 21 38 44 6 9 0 2
Second District 1,011 1,084 1,730 1,189 570 594 382 439 363 240 508 965 566 697 133 156 32 28Division 1 123 152 222 151 71 86 39 45 22 16 61 125 17 16 2 4 4 2Division 2 132 153 208 147 81 68 45 64 24 11 69 135 20 15 6 3 2 2Division 3 136 167 243 140 73 79 51 63 12 21 80 122 17 13 3 4 2 1Division 4 118 135 198 120 68 68 47 45 18 27 75 135 21 13 1 4 0 2Division 5 121 120 194 139 74 89 48 43 33 8 60 112 6 10 1 6 2 0Division 6 106 67 246 214 60 64 41 42 46 34 31 53 32 47 5 3 1 3Division 7 159 142 229 119 84 67 49 54 42 29 71 141 22 17 4 4 2 2Division 8 116 148 190 159 59 73 53 60 40 27 61 140 19 12 3 3 0 3Not assigned 9 23 126 67 0 2 412 554 108 125 19 13
Third District 187 232 804 697 120 85 47 61 146 164 139 191 165 162 91 80 12 11
Fourth District 754 773 1,300 1,251 264 294 249 276 219 182 410 390 419 437 226 193 50 56Division 1 277 250 440 449 84 88 82 109 29 60 111 97 142 132 50 43 2 7Division 2 155 178 557 452 131 162 80 64 179 98 232 227 154 143 133 117 47 46Division 3 322 345 303 350 49 44 87 103 11 24 67 66 123 162 43 33 1 3
Fifth District 175 157 550 437 121 127 42 53 112 160 91 92 57 64 9 10 2 6
Sixth District 102 158 247 297 43 64 95 47 117 46 42 45 135 83 11 14 3 0
Judicial Council of California 2022 Court Statistics Report40
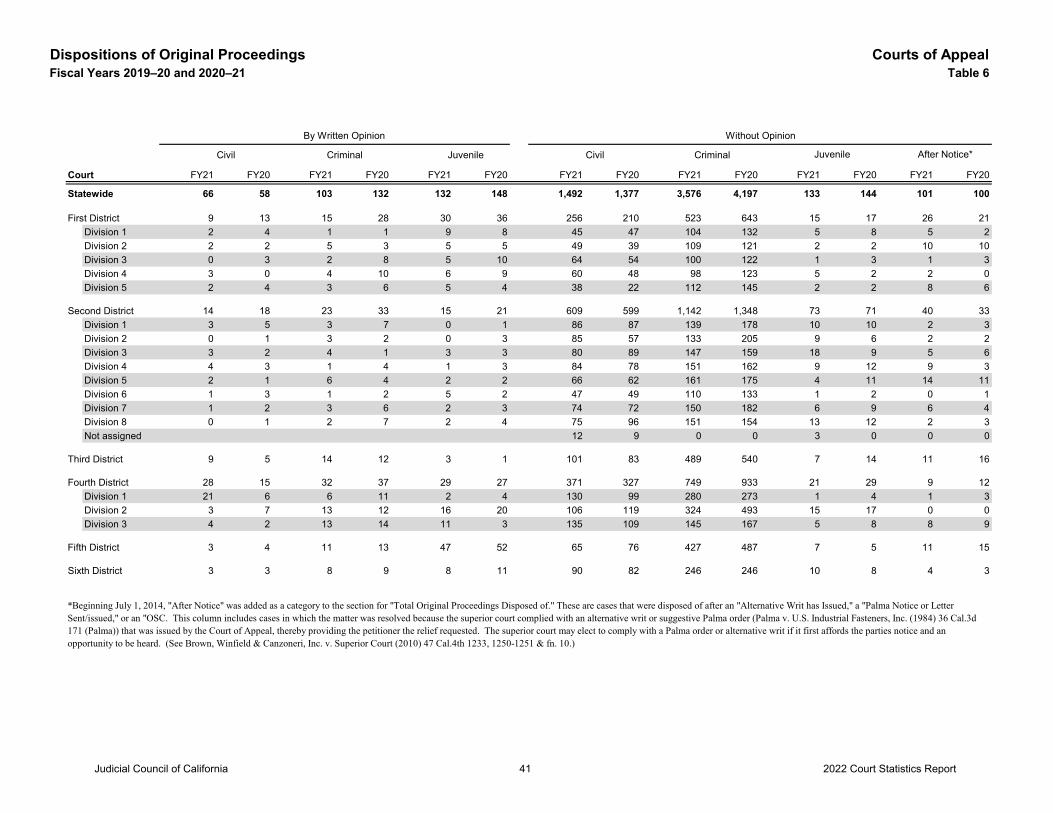
Dispositions of Original Proceedings Courts of AppealFiscal Years 2019–20 and 2020–21 Table 6
By Written Opinion Without Opinion
Civil Criminal Juvenile Civil Criminal
Court FY21 FY20 FY21 FY20 FY21 FY20 FY21 FY20 FY21 FY20 FY21 FY20 FY21 FY20
Statewide 66 58 103 132 132 148 1,492 1,377 3,576 4,197 133 144 101 100
First District 9 13 15 28 30 36 256 210 523 643 15 17 26 21Division 1 2 4 1 1 9 8 45 47 104 132 5 8 5 2Division 2 2 2 5 3 5 5 49 39 109 121 2 2 10 10Division 3 0 3 2 8 5 10 64 54 100 122 1 3 1 3Division 4 3 0 4 10 6 9 60 48 98 123 5 2 2 0Division 5 2 4 3 6 5 4 38 22 112 145 2 2 8 6
Second District 14 18 23 33 15 21 609 599 1,142 1,348 73 71 40 33Division 1 3 5 3 7 0 1 86 87 139 178 10 10 2 3Division 2 0 1 3 2 0 3 85 57 133 205 9 6 2 2Division 3 3 2 4 1 3 3 80 89 147 159 18 9 5 6Division 4 4 3 1 4 1 3 84 78 151 162 9 12 9 3Division 5 2 1 6 4 2 2 66 62 161 175 4 11 14 11Division 6 1 3 1 2 5 2 47 49 110 133 1 2 0 1Division 7 1 2 3 6 2 3 74 72 150 182 6 9 6 4Division 8 0 1 2 7 2 4 75 96 151 154 13 12 2 3Not assigned 12 9 0 0 3 0 0 0
Third District 9 5 14 12 3 1 101 83 489 540 7 14 11 16
Fourth District 28 15 32 37 29 27 371 327 749 933 21 29 9 12Division 1 21 6 6 11 2 4 130 99 280 273 1 4 1 3Division 2 3 7 13 12 16 20 106 119 324 493 15 17 0 0Division 3 4 2 13 14 11 3 135 109 145 167 5 8 8 9
Fifth District 3 4 11 13 47 52 65 76 427 487 7 5 11 15
Sixth District 3 3 8 9 8 11 90 82 246 246 10 8 4 3
Juvenile After Notice*
*Beginning July 1, 2014, "After Notice" was added as a category to the section for "Total Original Proceedings Disposed of." These are cases that were disposed of after an "Alternative Writ has Issued," a "Palma Notice or Letter Sent/issued," or an "OSC. This column includes cases in which the matter was resolved because the superior court complied with an alternative writ or suggestive Palma order (Palma v. U.S. Industrial Fasteners, Inc. (1984) 36 Cal.3d171 (Palma)) that was issued by the Court of Appeal, thereby providing the petitioner the relief requested. The superior court may elect to comply with a Palma order or alternative writ if it first affords the parties notice and an opportunity to be heard. (See Brown, Winfield & Canzoneri, Inc. v. Superior Court (2010) 47 Cal.4th 1233, 1250-1251 & fn. 10.)
Judicial Council of California 2022 Court Statistics Report41
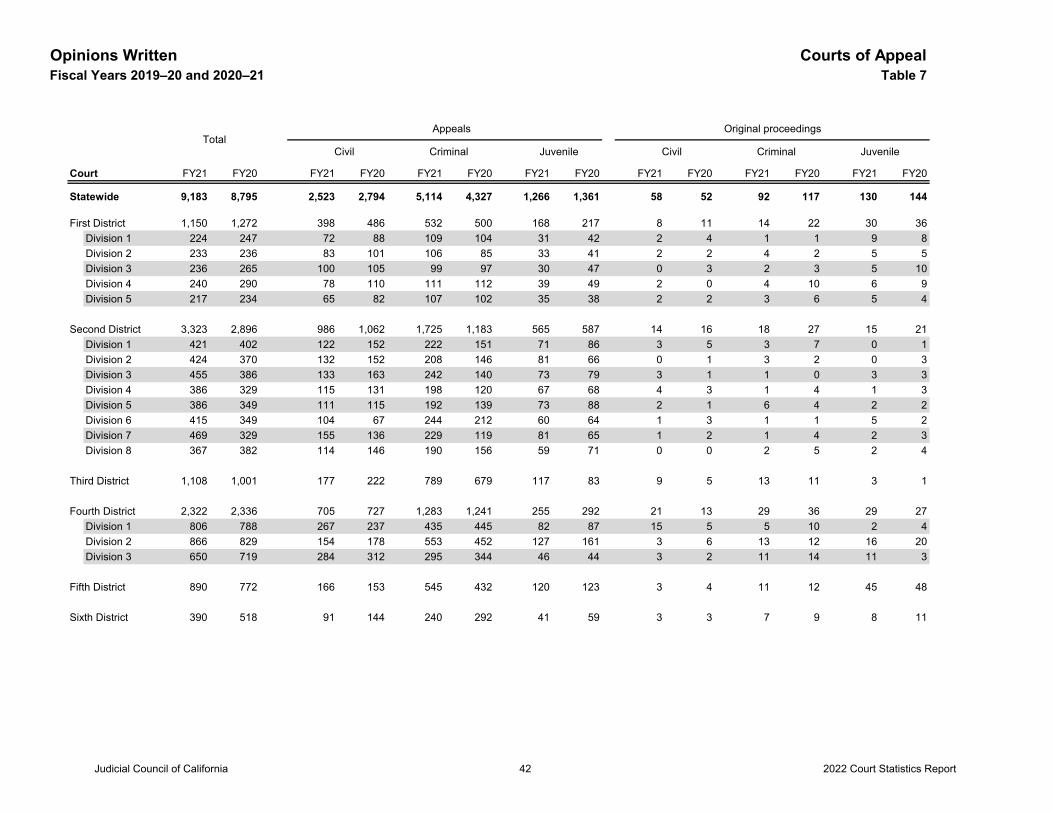
Opinions Written Courts of AppealFiscal Years 2019–20 and 2020–21 Table 7
Appeals Original proceedings
Civil Criminal Juvenile Civil Criminal Juvenile
Court FY21 FY20 FY21 FY20 FY21 FY20 FY21 FY20 FY21 FY20 FY21 FY20 FY21 FY20
Statewide 9,183 8,795 2,523 2,794 5,114 4,327 1,266 1,361 58 52 92 117 130 144
First District 1,150 1,272 398 486 532 500 168 217 8 11 14 22 30 36Division 1 224 247 72 88 109 104 31 42 2 4 1 1 9 8Division 2 233 236 83 101 106 85 33 41 2 2 4 2 5 5Division 3 236 265 100 105 99 97 30 47 0 3 2 3 5 10Division 4 240 290 78 110 111 112 39 49 2 0 4 10 6 9Division 5 217 234 65 82 107 102 35 38 2 2 3 6 5 4
Second District 3,323 2,896 986 1,062 1,725 1,183 565 587 14 16 18 27 15 21Division 1 421 402 122 152 222 151 71 86 3 5 3 7 0 1Division 2 424 370 132 152 208 146 81 66 0 1 3 2 0 3Division 3 455 386 133 163 242 140 73 79 3 1 1 0 3 3Division 4 386 329 115 131 198 120 67 68 4 3 1 4 1 3Division 5 386 349 111 115 192 139 73 88 2 1 6 4 2 2Division 6 415 349 104 67 244 212 60 64 1 3 1 1 5 2Division 7 469 329 155 136 229 119 81 65 1 2 1 4 2 3Division 8 367 382 114 146 190 156 59 71 0 0 2 5 2 4
Third District 1,108 1,001 177 222 789 679 117 83 9 5 13 11 3 1
Fourth District 2,322 2,336 705 727 1,283 1,241 255 292 21 13 29 36 29 27Division 1 806 788 267 237 435 445 82 87 15 5 5 10 2 4Division 2 866 829 154 178 553 452 127 161 3 6 13 12 16 20Division 3 650 719 284 312 295 344 46 44 3 2 11 14 11 3
Fifth District 890 772 166 153 545 432 120 123 3 4 11 12 45 48
Sixth District 390 518 91 144 240 292 41 59 3 3 7 9 8 11
Total
Judicial Council of California 2022 Court Statistics Report42
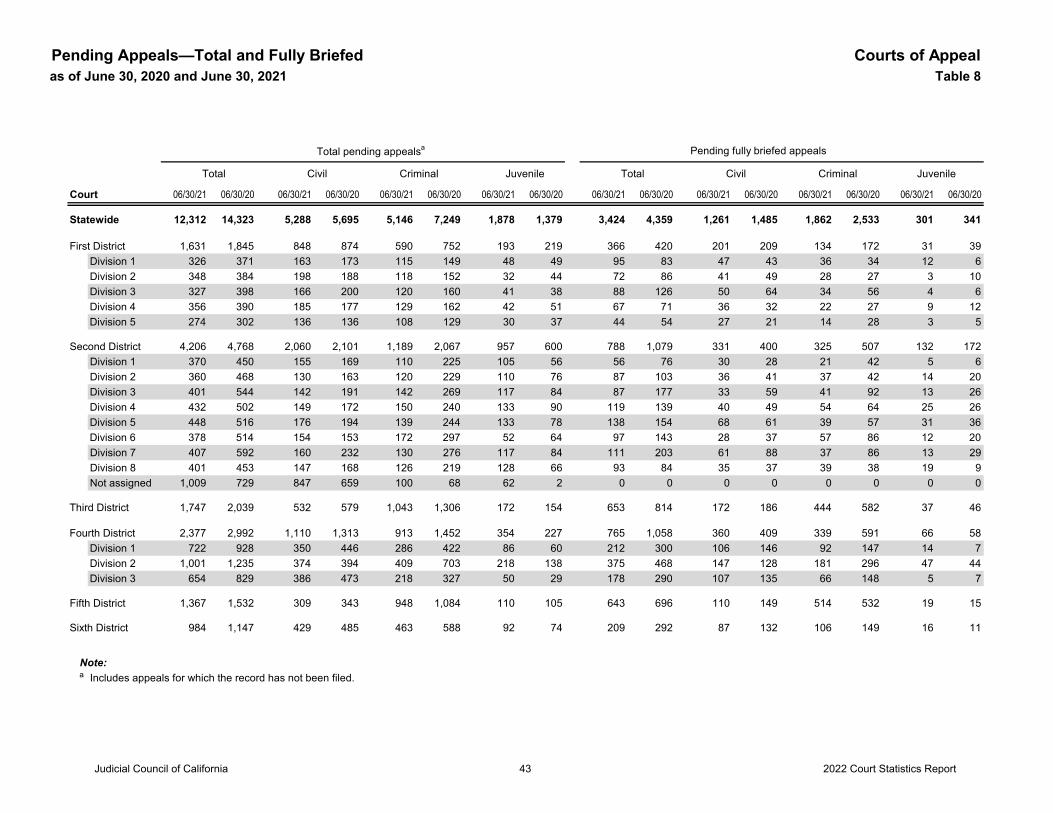
Courts of AppealPending Appeals—Total and Fully Briefedas of June 30, 2020 and June 30, 2021 Table 8
Total pending appealsa Pending fully briefed appeals
Total Civil Criminal Juvenile Total Civil Criminal Juvenile
Court 06/30/21 06/30/20 06/30/21 06/30/20 06/30/21 06/30/20 06/30/21 06/30/20 06/30/21 06/30/20 06/30/21 06/30/20 06/30/21 06/30/20 06/30/21 06/30/20
Statewide 12,312 14,323 5,288 5,695 5,146 7,249 1,878 1,379 3,424 4,359 1,261 1,485 1,862 2,533 301 341
First District 1,631 1,845 848 874 590 752 193 219 366 420 201 209 134 172 31 39Division 1 326 371 163 173 115 149 48 49 95 83 47 43 36 34 12 6Division 2 348 384 198 188 118 152 32 44 72 86 41 49 28 27 3 10Division 3 327 398 166 200 120 160 41 38 88 126 50 64 34 56 4 6Division 4 356 390 185 177 129 162 42 51 67 71 36 32 22 27 9 12Division 5 274 302 136 136 108 129 30 37 44 54 27 21 14 28 3 5
Second District 4,206 4,768 2,060 2,101 1,189 2,067 957 600 788 1,079 331 400 325 507 132 172Division 1 370 450 155 169 110 225 105 56 56 76 30 28 21 42 5 6Division 2 360 468 130 163 120 229 110 76 87 103 36 41 37 42 14 20Division 3 401 544 142 191 142 269 117 84 87 177 33 59 41 92 13 26Division 4 432 502 149 172 150 240 133 90 119 139 40 49 54 64 25 26Division 5 448 516 176 194 139 244 133 78 138 154 68 61 39 57 31 36Division 6 378 514 154 153 172 297 52 64 97 143 28 37 57 86 12 20Division 7 407 592 160 232 130 276 117 84 111 203 61 88 37 86 13 29Division 8 401 453 147 168 126 219 128 66 93 84 35 37 39 38 19 9Not assigned 1,009 729 847 659 100 68 62 2 0 0 0 0 0 0 0 0
Third District 1,747 2,039 532 579 1,043 1,306 172 154 653 814 172 186 444 582 37 46
Fourth District 2,377 2,992 1,110 1,313 913 1,452 354 227 765 1,058 360 409 339 591 66 58Division 1 722 928 350 446 286 422 86 60 212 300 106 146 92 147 14 7Division 2 1,001 1,235 374 394 409 703 218 138 375 468 147 128 181 296 47 44Division 3 654 829 386 473 218 327 50 29 178 290 107 135 66 148 5 7
Fifth District 1,367 1,532 309 343 948 1,084 110 105 643 696 110 149 514 532 19 15
Sixth District 984 1,147 429 485 463 588 92 74 209 292 87 132 106 149 16 11
Note:a Includes appeals for which the record has not been filed.
Judicial Council of California 2022 Court Statistics Report43

Superior Courts

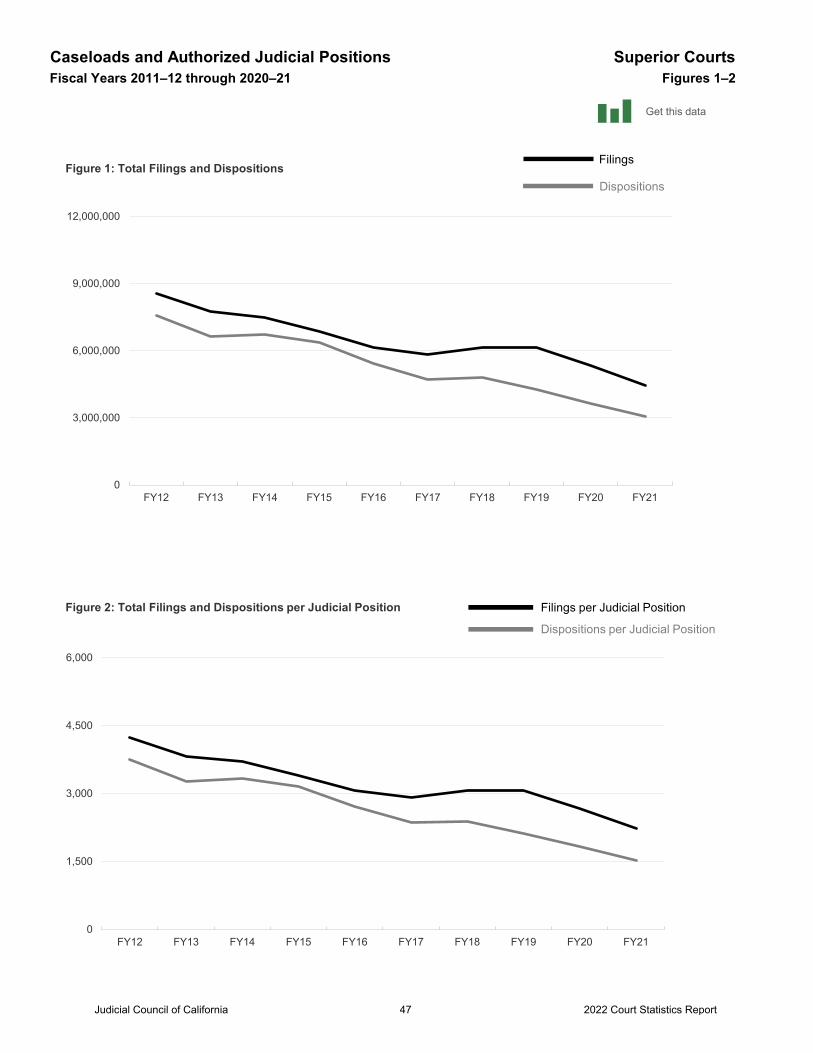
Caseloads and Authorized Judicial Positions Superior CourtsFiscal Years 2011–12 through 2020–21 Figures 1–2
0
3,000,000
6,000,000
9,000,000
12,000,000
FY12 FY13 FY14 FY15 FY16 FY17 FY18 FY19 FY20 FY21
Figure 1: Total Filings and Dispositions
0
1,500
3,000
4,500
6,000
FY12 FY13 FY14 FY15 FY16 FY17 FY18 FY19 FY20 FY21
Figure 2: Total Filings and Dispositions per Judicial Position Filings per Judicial Position
Dispositions per Judicial Position
Filings
Dispositions
Get this data
Judicial Council of California 2022 Court Statistics Report47
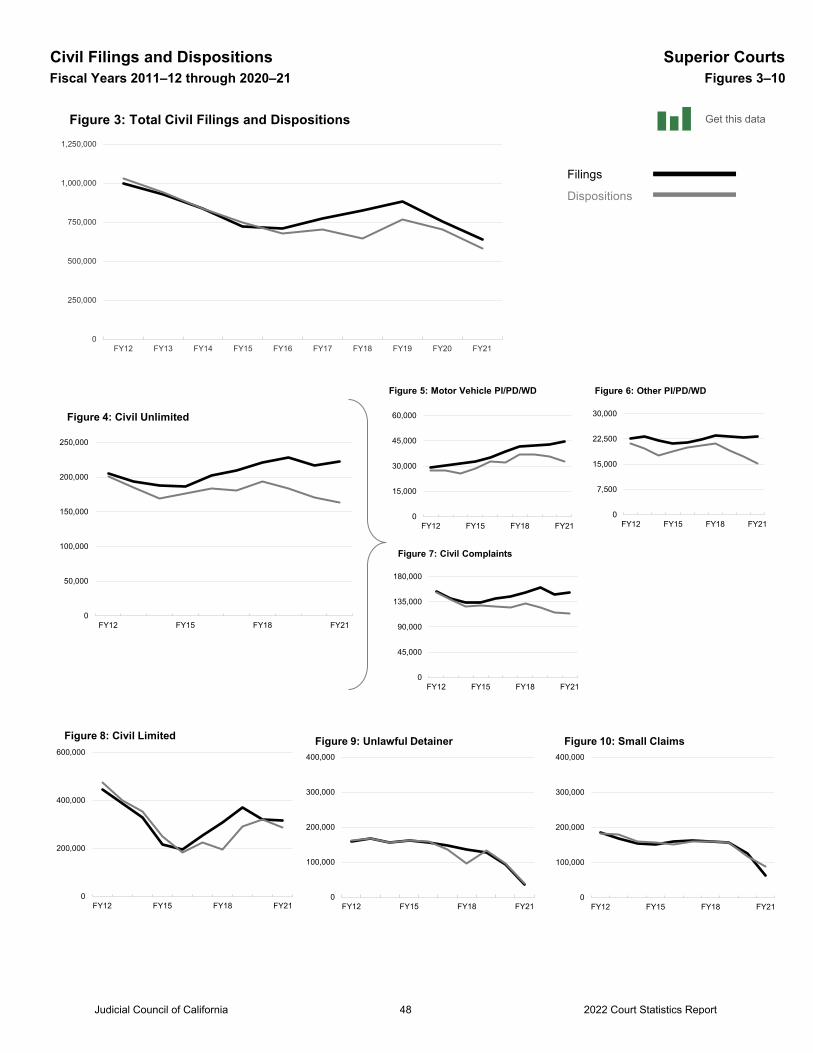
Civil Filings and Dispositions Superior CourtsFiscal Years 2011–12 through 2020–21 Figures 3–10
0
15,000
30,000
45,000
60,000
FY12 FY15 FY18 FY21
Figure 5: Motor Vehicle PI/PD/WD
0
250,000
500,000
750,000
1,000,000
1,250,000
FY12 FY13 FY14 FY15 FY16 FY17 FY18 FY19 FY20 FY21
Figure 3: Total Civil Filings and Dispositions
0
50,000
100,000
150,000
200,000
250,000
FY12 FY15 FY18 FY21
Figure 4: Civil Unlimited
0
200,000
400,000
600,000
FY12 FY15 FY18 FY21
Figure 8: Civil Limited
0
7,500
15,000
22,500
30,000
FY12 FY15 FY18 FY21
Figure 6: Other PI/PD/WD
0
45,000
90,000
135,000
180,000
FY12 FY15 FY18 FY21
Figure 7: Civil Complaints
0
100,000
200,000
300,000
400,000
FY12 FY15 FY18 FY21
Figure 10: Small Claims
Filings
Dispositions
Get this data
0
100,000
200,000
300,000
400,000
FY12 FY15 FY18 FY21
Figure 9: Unlawful Detainer
Judicial Council of California 2022 Court Statistics Report48
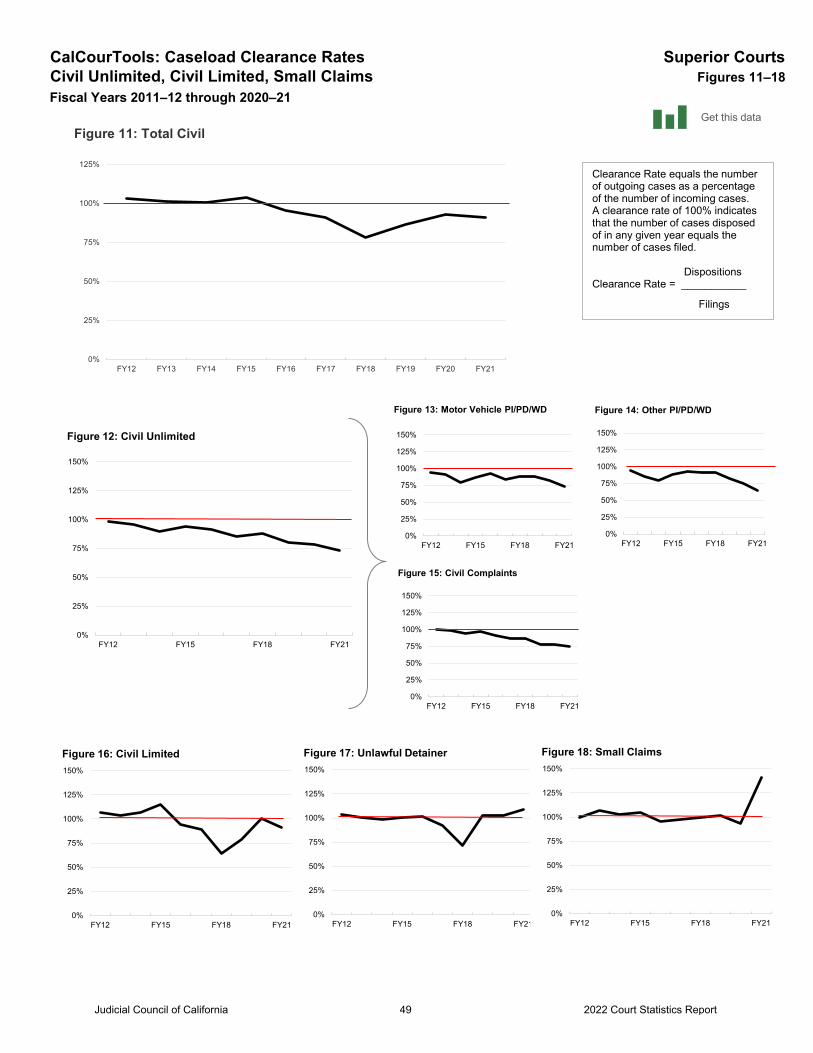
CalCourTools: Caseload Clearance Rates Superior CourtsCivil Unlimited, Civil Limited, Small Claims Figures 11–18Fiscal Years 2011–12 through 2020–21
0%
25%
50%
75%
100%
125%
150%
FY12 FY15 FY18 FY21
Figure 13: Motor Vehicle PI/PD/WD
0%
25%
50%
75%
100%
125%
FY12 FY13 FY14 FY15 FY16 FY17 FY18 FY19 FY20 FY21
Figure 11: Total Civil
Clearance Rate equals the number of outgoing cases as a percentage of the number of incoming cases. A clearance rate of 100% indicates that the number of cases disposed of in any given year equals the number of cases filed.
DispositionsClearance Rate = ___________
Filings
0%
25%
50%
75%
100%
125%
150%
FY12 FY15 FY18 FY21
Figure 12: Civil Unlimited
0%
25%
50%
75%
100%
125%
150%
FY12 FY15 FY18 FY21
Figure 16: Civil Limited
0%
25%
50%
75%
100%
125%
150%
FY12 FY15 FY18 FY21
Figure 14: Other PI/PD/WD
0%
25%
50%
75%
100%
125%
150%
FY12 FY15 FY18 FY21
Figure 15: Civil Complaints
Get this data
0%
25%
50%
75%
100%
125%
150%
FY12 FY15 FY18 FY21
Figure 17: Unlawful Detainer
0%
25%
50%
75%
100%
125%
150%
FY12 FY15 FY18 FY21
Figure 18: Small Claims
Judicial Council of California 2022 Court Statistics Report49
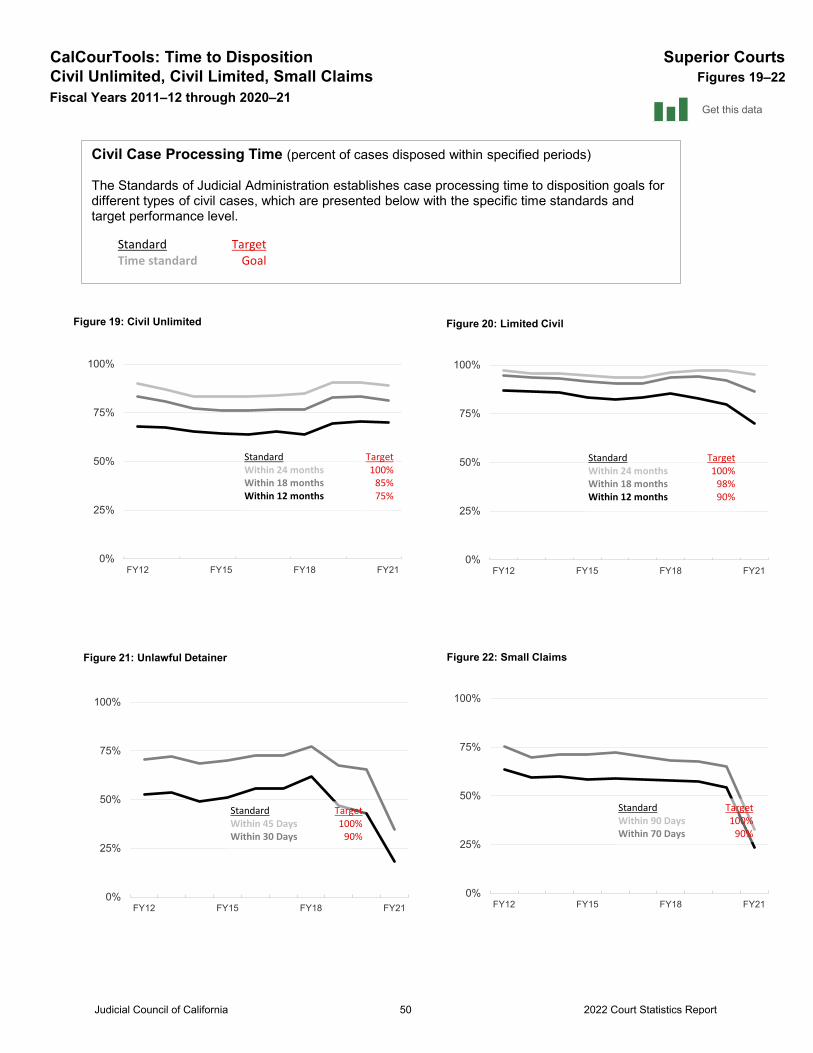
CalCourTools: Time to Disposition Superior CourtsCivil Unlimited, Civil Limited, Small Claims Figures 19–22Fiscal Years 2011–12 through 2020–21
Civil Case Processing Time (percent of cases disposed within specified periods)
The Standards of Judicial Administration establishes case processing time to disposition goals for different types of civil cases, which are presented below with the specific time standards and target performance level.
StandardTime standard
TargetGoal
0%
25%
50%
75%
100%
FY12 FY15 FY18 FY21
Figure 19: Civil Unlimited
0%
25%
50%
75%
100%
FY12 FY15 FY18 FY21
Figure 20: Limited Civil
0%
25%
50%
75%
100%
FY12 FY15 FY18 FY21
Figure 21: Unlawful Detainer
0%
25%
50%
75%
100%
FY12 FY15 FY18 FY21
Figure 22: Small Claims
StandardWithin 24 months Within 18 months Within 12 months
Target100%
85%75%
StandardWithin 45 DaysWithin 30 Days
Target100%
90%
StandardWithin 90 DaysWithin 70 Days
Target100%
90%
StandardWithin 24 monthsWithin 18 monthsWithin 12 months
Target100%
98%90%
Get this data
Judicial Council of California 2022 Court Statistics Report50
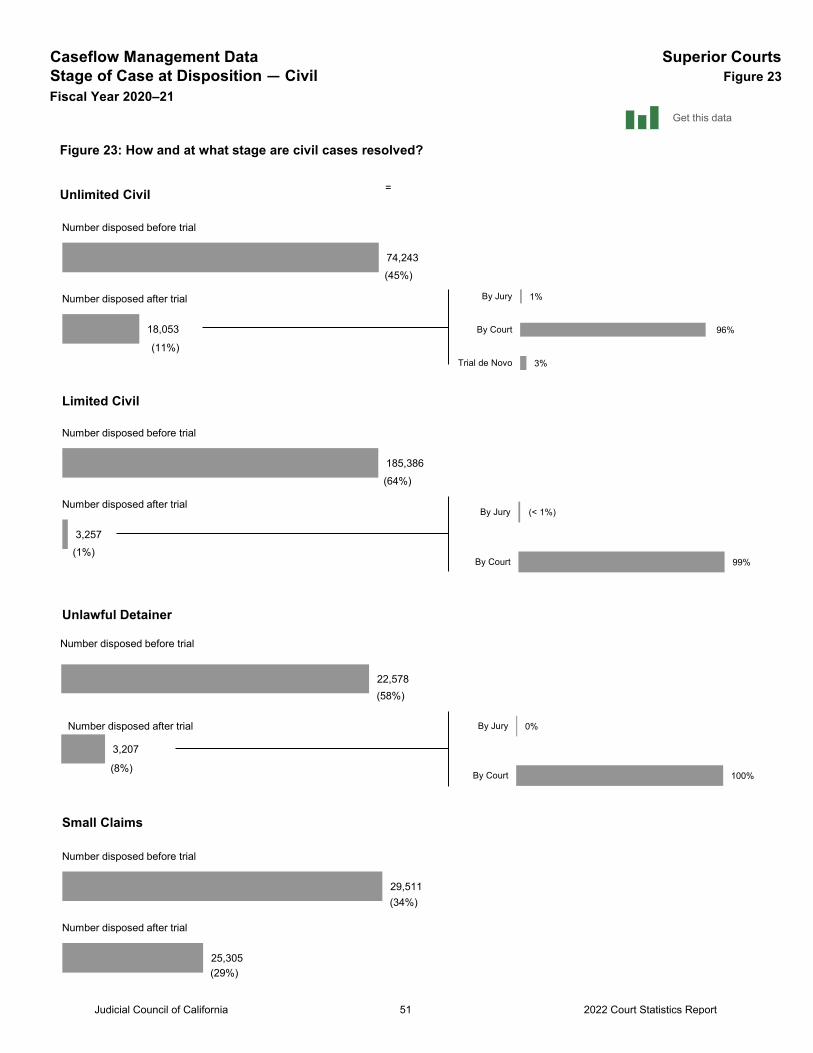
Caseflow Management Data Superior CourtsStage of Case at Disposition — Civil Figure 23Fiscal Year 2020–21
=
74,243
18,053
1%
96%
3%
By Jury
By Court
Trial de Novo
Figure 23: How and at what stage are civil cases resolved?
Unlimited Civil
Number disposed before trial
Number disposed after trial
99%
By Jury
By Court
Limited Civil
Small Claims
185,386
3,257
Number disposed before trial
Number disposed after trial
29,511
25,305
Number disposed before trial
Number disposed after trial
(< 1%)
Get this data
(45%)
(11%)
(64%)
(1%)
(34%)
(29%)
Unlawful Detainer
Number disposed before trial
22,578
3,207
Number disposed after trial 0%
100%
By Jury
By Court(8%)
(58%)
Judicial Council of California 2022 Court Statistics Report51
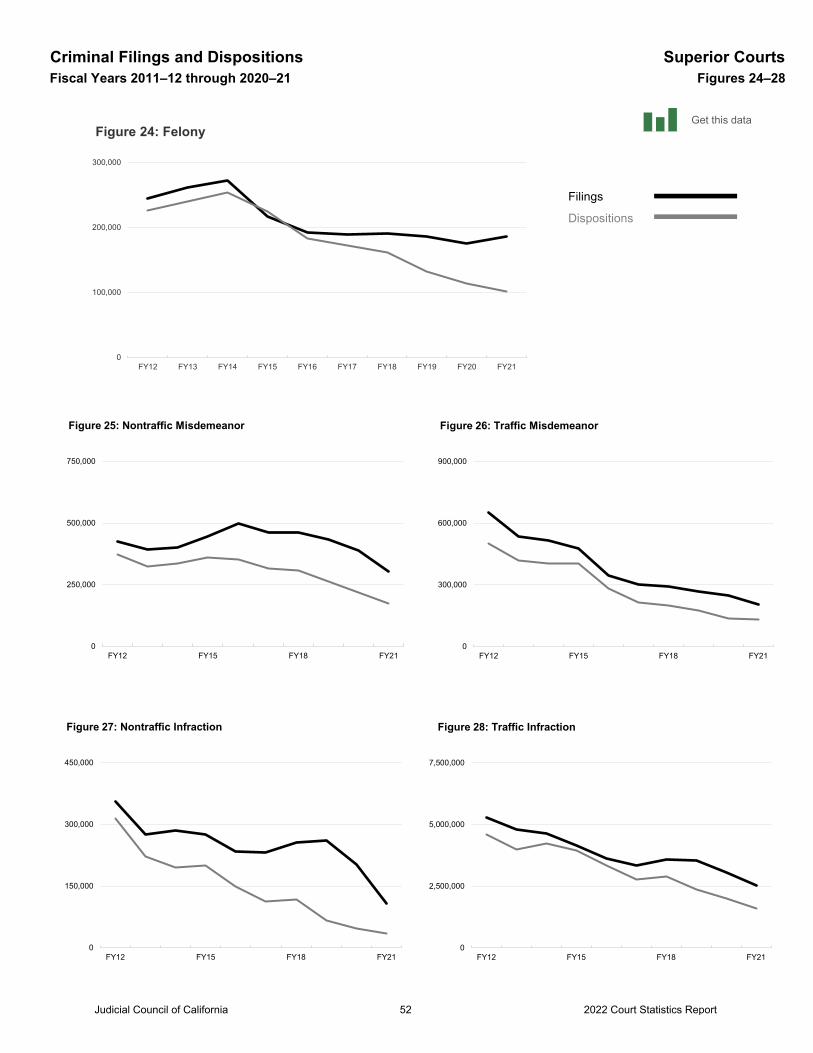
Criminal Filings and Dispositions Superior CourtsFiscal Years 2011–12 through 2020–21 Figures 24–28
0
100,000
200,000
300,000
FY12 FY13 FY14 FY15 FY16 FY17 FY18 FY19 FY20 FY21
Figure 24: Felony
0
150,000
300,000
450,000
FY12 FY15 FY18 FY21
Figure 27: Nontraffic Infraction
0
2,500,000
5,000,000
7,500,000
FY12 FY15 FY18 FY21
Figure 28: Traffic Infraction
0
250,000
500,000
750,000
FY12 FY15 FY18 FY21
Figure 25: Nontraffic Misdemeanor
0
300,000
600,000
900,000
FY12 FY15 FY18 FY21
Figure 26: Traffic Misdemeanor
Filings
Dispositions
Get this data
Judicial Council of California 2022 Court Statistics Report52
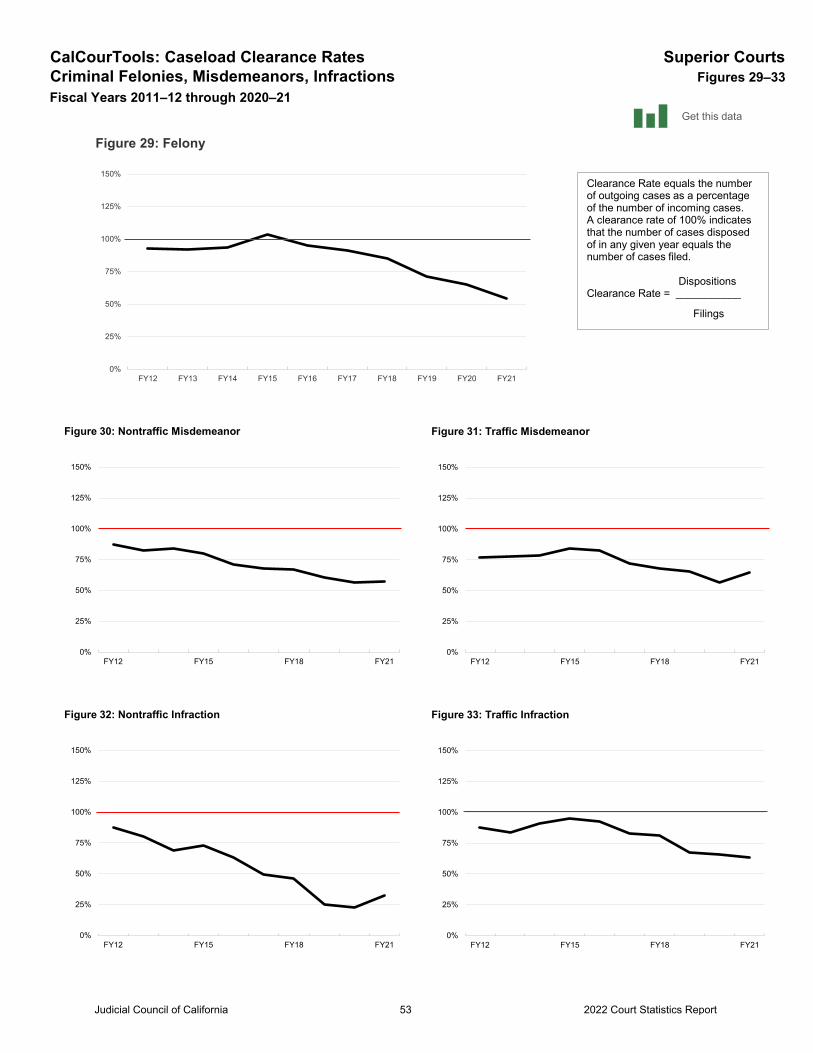
CalCourTools: Caseload Clearance Rates Superior CourtsCriminal Felonies, Misdemeanors, Infractions Figures 29–33Fiscal Years 2011–12 through 2020–21
0%
25%
50%
75%
100%
125%
150%
FY12 FY13 FY14 FY15 FY16 FY17 FY18 FY19 FY20 FY21
Figure 29: Felony
0%
25%
50%
75%
100%
125%
150%
FY12 FY15 FY18 FY21
Figure 32: Nontraffic Infraction
0%
25%
50%
75%
100%
125%
150%
FY12 FY15 FY18 FY21
Figure 33: Traffic Infraction
0%
25%
50%
75%
100%
125%
150%
FY12 FY15 FY18 FY21
Figure 30: Nontraffic Misdemeanor
0%
25%
50%
75%
100%
125%
150%
FY12 FY15 FY18 FY21
Figure 31: Traffic Misdemeanor
Clearance Rate equals the number of outgoing cases as a percentage of the number of incoming cases. A clearance rate of 100% indicates that the number of cases disposed of in any given year equals the number of cases filed.
DispositionsClearance Rate = ___________
Filings
Get this data
Judicial Council of California 2022 Court Statistics Report53
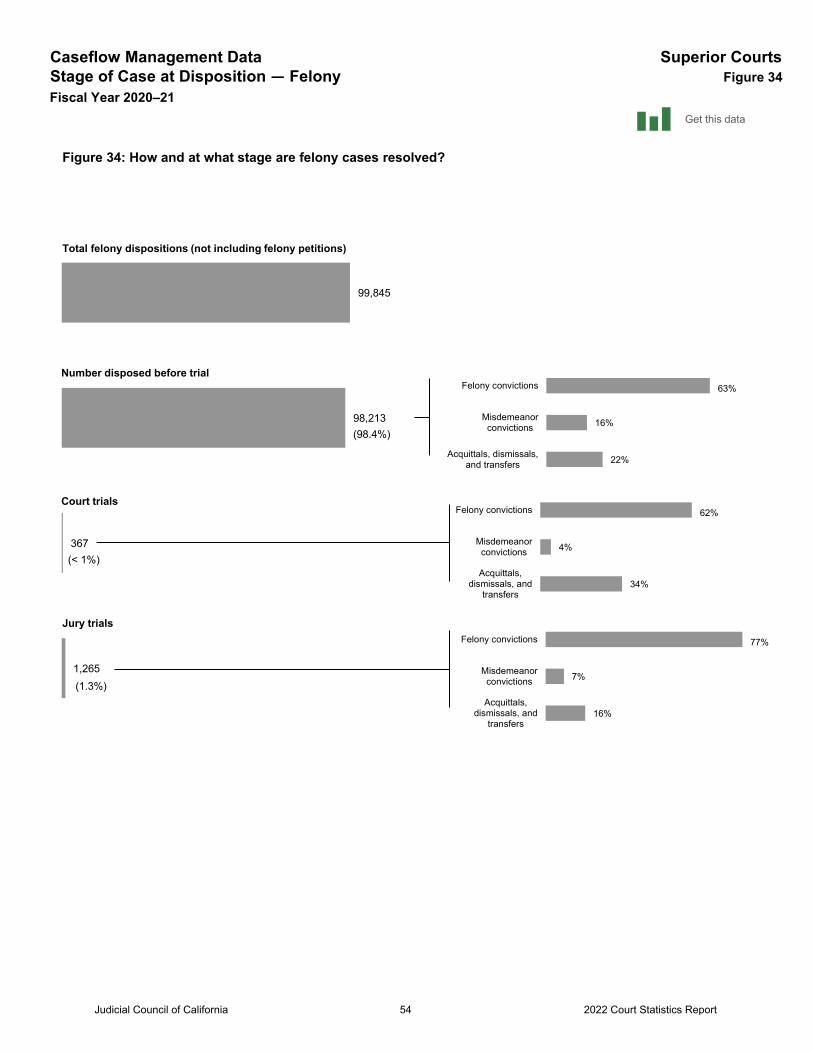
Caseflow Management Data Superior CourtsStage of Case at Disposition — Felony Figure 34Fiscal Year 2020–21
99,845
98,213
367
1,265
Total felony dispositions (not including felony petitions)
Number disposed before trial
Court trials
Jury trials
63%
16%
22%
Felony convictions
Misdemeanorconvictions
Acquittals, dismissals,and transfers
Figure 34: How and at what stage are felony cases resolved?
(98.4%)
(< 1%)
(1.3%)
62%
4%
34%
Felony convictions
Misdemeanorconvictions
Acquittals,dismissals, and
transfers
77%
7%
16%
Felony convictions
Misdemeanorconvictions
Acquittals,dismissals, and
transfers
Get this data
Judicial Council of California 2022 Court Statistics Report54
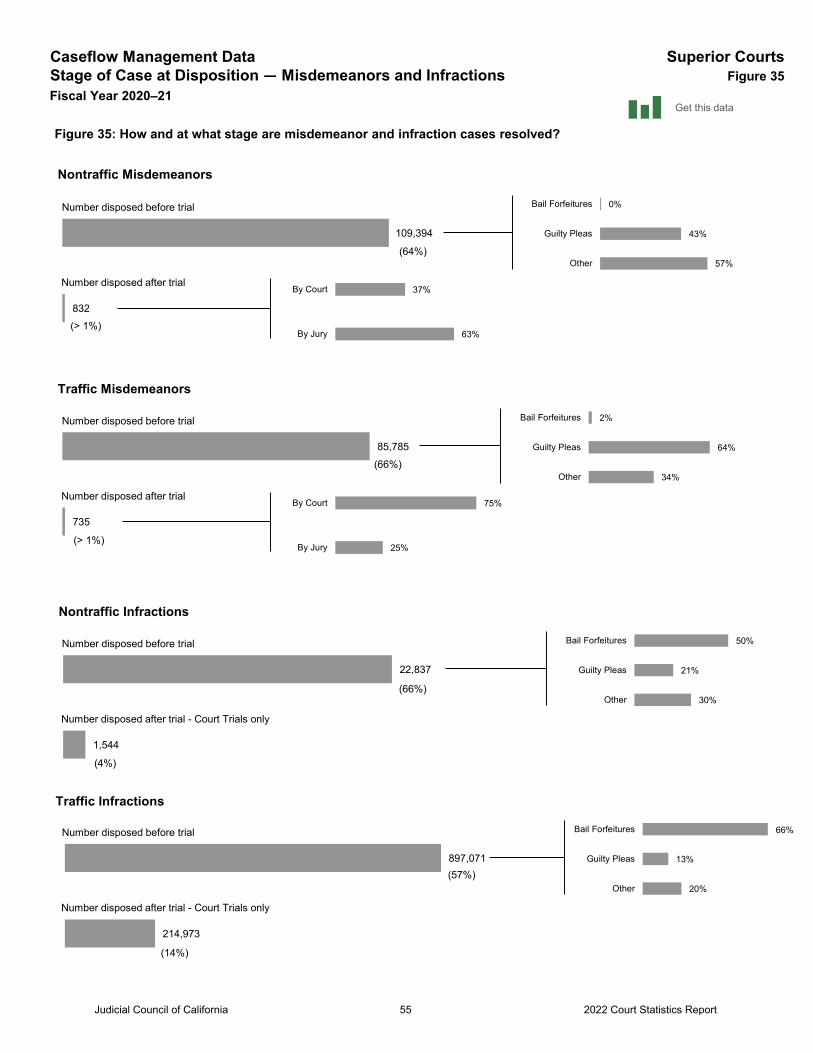
Caseflow Management Data Superior CourtsStage of Case at Disposition — Misdemeanors and Infractions Figure 35Fiscal Year 2020–21
109,394
832
37%
63%
By Court
By Jury
Figure 35: How and at what stage are misdemeanor and infraction cases resolved?
Nontraffic Misdemeanors
Number disposed before trial
Number disposed after trial
Traffic Misdemeanors
Nontraffic Infractions
Traffic Infractions
0%
43%
57%
Bail Forfeitures
Guilty Pleas
Other
85,785
735
75%
25%
By Court
By Jury
Number disposed before trial
Number disposed after trial
2%
64%
34%
Bail Forfeitures
Guilty Pleas
Other
22,837
1,544
Number disposed before trial
Number disposed after trial - Court Trials only
50%
21%
30%
Bail Forfeitures
Guilty Pleas
Other
897,071
214,973
Number disposed before trial
Number disposed after trial - Court Trials only
66%
13%
20%
Bail Forfeitures
Guilty Pleas
Other
Get this data
(64%)
(> 1%)
(66%)
(> 1%)
(66%)
(4%)
(57%)
(14%)
Judicial Council of California 2022 Court Statistics Report55
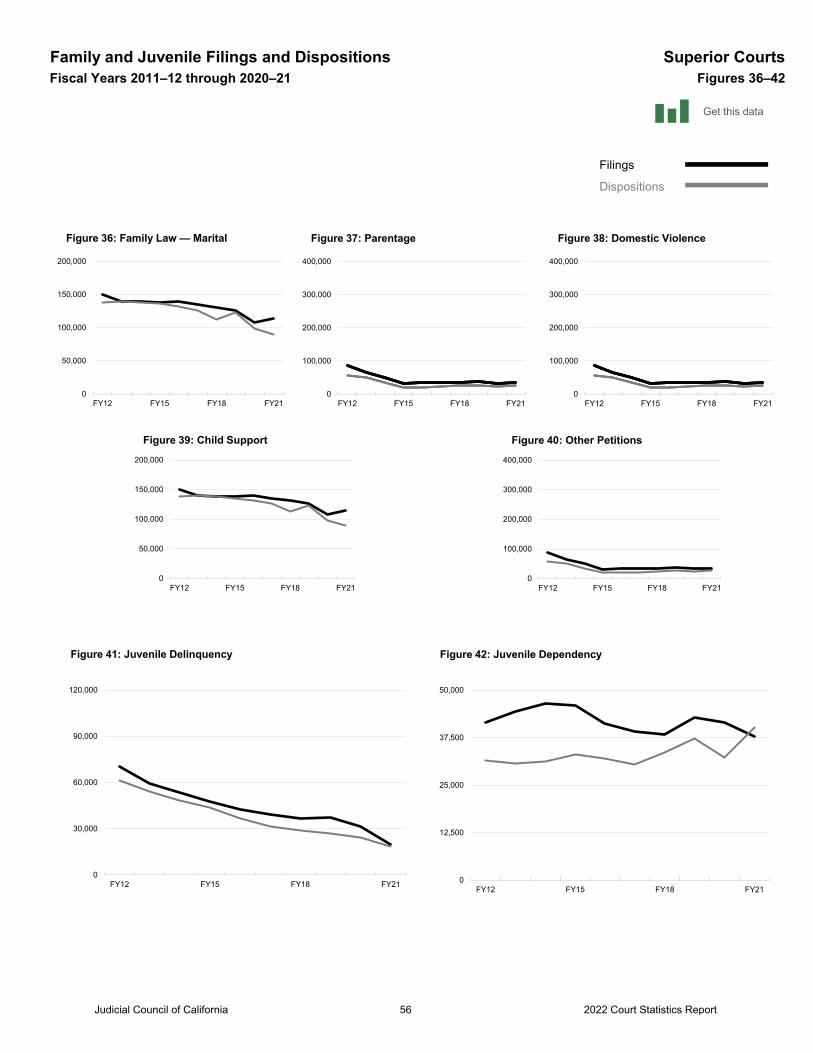
Family and Juvenile Filings and Dispositions Superior CourtsFiscal Years 2011–12 through 2020–21 Figures 36–42
0
30,000
60,000
90,000
120,000
FY12 FY15 FY18 FY21
Figure 41: Juvenile Delinquency
0
12,500
25,000
37,500
50,000
FY12 FY15 FY18 FY21
Figure 42: Juvenile Dependency
0
50,000
100,000
150,000
200,000
FY12 FY15 FY18 FY21
Figure 39: Child Support
0
100,000
200,000
300,000
400,000
FY12 FY15 FY18 FY21
Figure 40: Other Petitions
Filings
Dispositions
Get this data
0
50,000
100,000
150,000
200,000
FY12 FY15 FY18 FY21
Figure 36: Family Law — Marital
0
100,000
200,000
300,000
400,000
FY12 FY15 FY18 FY21
Figure 37: Parentage
0
100,000
200,000
300,000
400,000
FY12 FY15 FY18 FY21
Figure 38: Domestic Violence
Judicial Council of California 2022 Court Statistics Report56
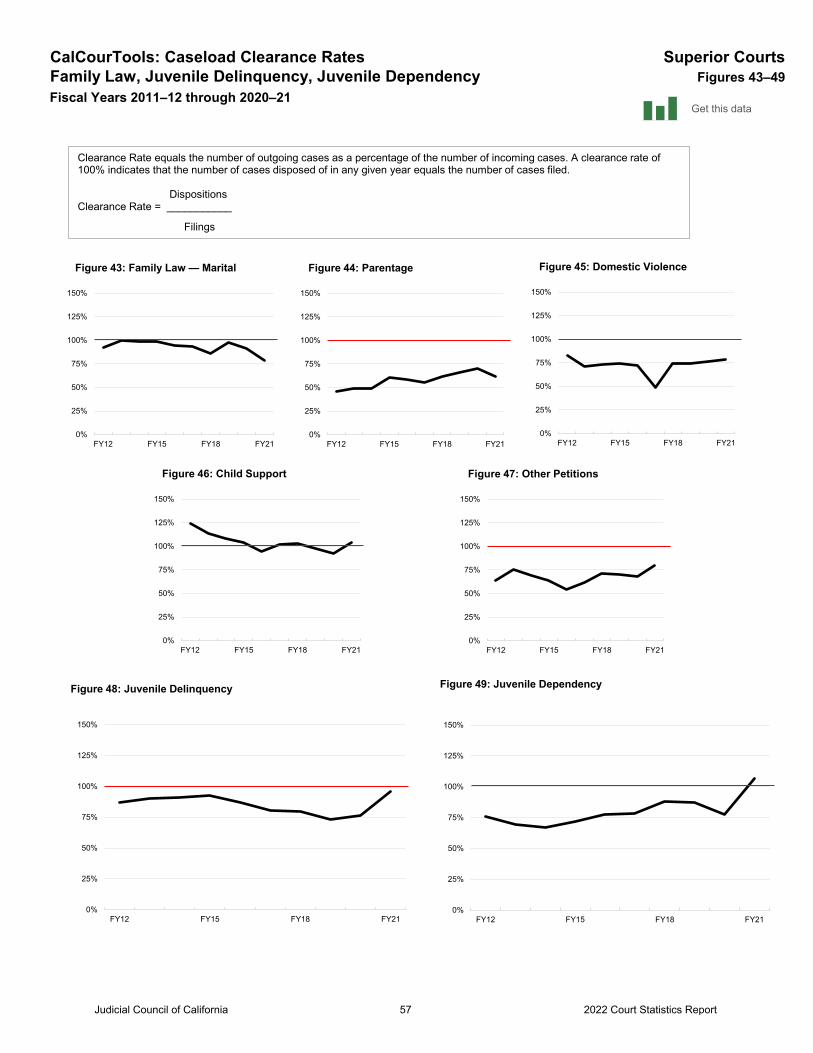
CalCourTools: Caseload Clearance Rates Superior CourtsFamily Law, Juvenile Delinquency, Juvenile Dependency Figures 43–49Fiscal Years 2011–12 through 2020–21
0%
25%
50%
75%
100%
125%
150%
FY12 FY15 FY18 FY21
Figure 48: Juvenile Delinquency
0%
25%
50%
75%
100%
125%
150%
FY12 FY15 FY18 FY21
Figure 49: Juvenile Dependency
0%
25%
50%
75%
100%
125%
150%
FY12 FY15 FY18 FY21
Figure 43: Family Law — Marital
0%
25%
50%
75%
100%
125%
150%
FY12 FY15 FY18 FY21
Figure 44: Parentage
Clearance Rate equals the number of outgoing cases as a percentage of the number of incoming cases. A clearance rate of 100% indicates that the number of cases disposed of in any given year equals the number of cases filed.
DispositionsClearance Rate = ___________
Filings
Get this data
0%
25%
50%
75%
100%
125%
150%
FY12 FY15 FY18 FY21
Figure 46: Child Support
0%
25%
50%
75%
100%
125%
150%
FY12 FY15 FY18 FY21
Figure 47: Other Petitions
0%
25%
50%
75%
100%
125%
150%
FY12 FY15 FY18 FY21
Figure 45: Domestic Violence
Judicial Council of California 2022 Court Statistics Report57
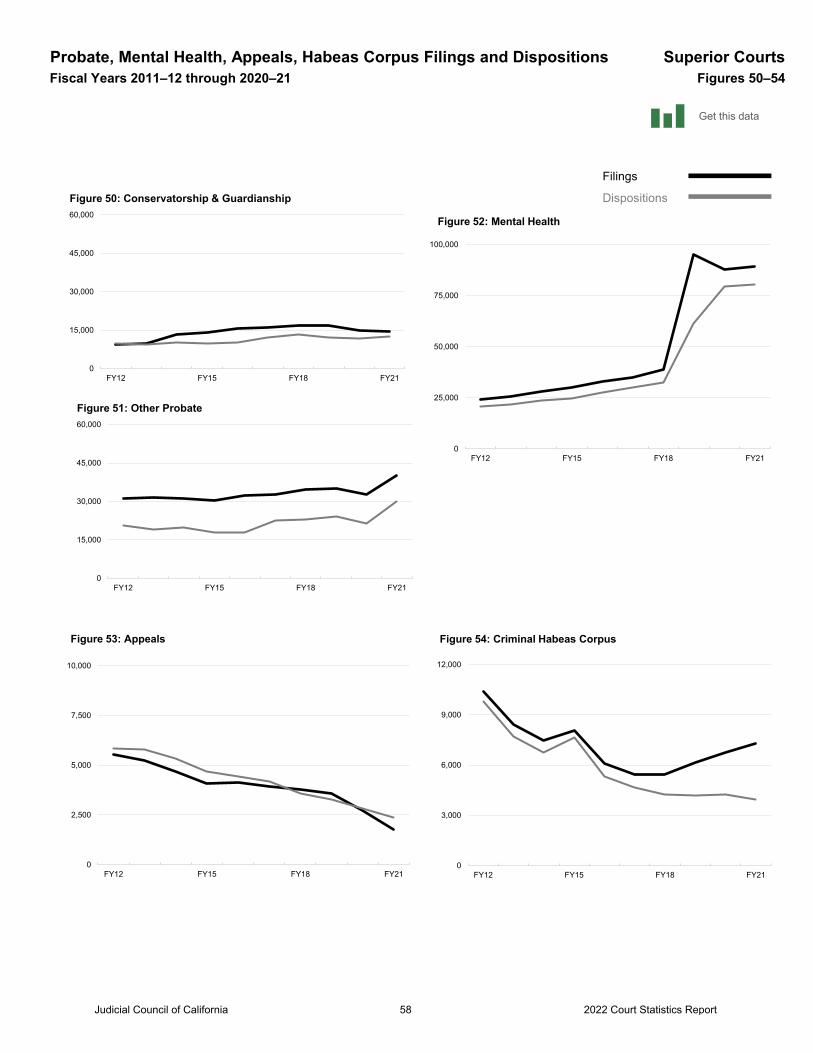
Probate, Mental Health, Appeals, Habeas Corpus Filings and Dispositions Superior CourtsFiscal Years 2011–12 through 2020–21 Figures 50–54
0
2,500
5,000
7,500
10,000
FY12 FY15 FY18 FY21
Figure 53: Appeals
0
3,000
6,000
9,000
FY12 FY15 FY18 FY21
Figure 54: Criminal Habeas Corpus
12,000
0FY12 FY15 FY18 FY21
Figure 50: Conservatorship & Guardianship60,000
45,000
30,000
15,000
0
25,000
50,000
75,000
100,000
FY12 FY15 FY18 FY21
Figure 52: Mental Health
Filings
Dispositions
Get this data
0FY12 FY15 FY18 FY21
Figure 51: Other Probate60,000
45,000
30,000
15,000
Judicial Council of California 2022 Court Statistics Report58
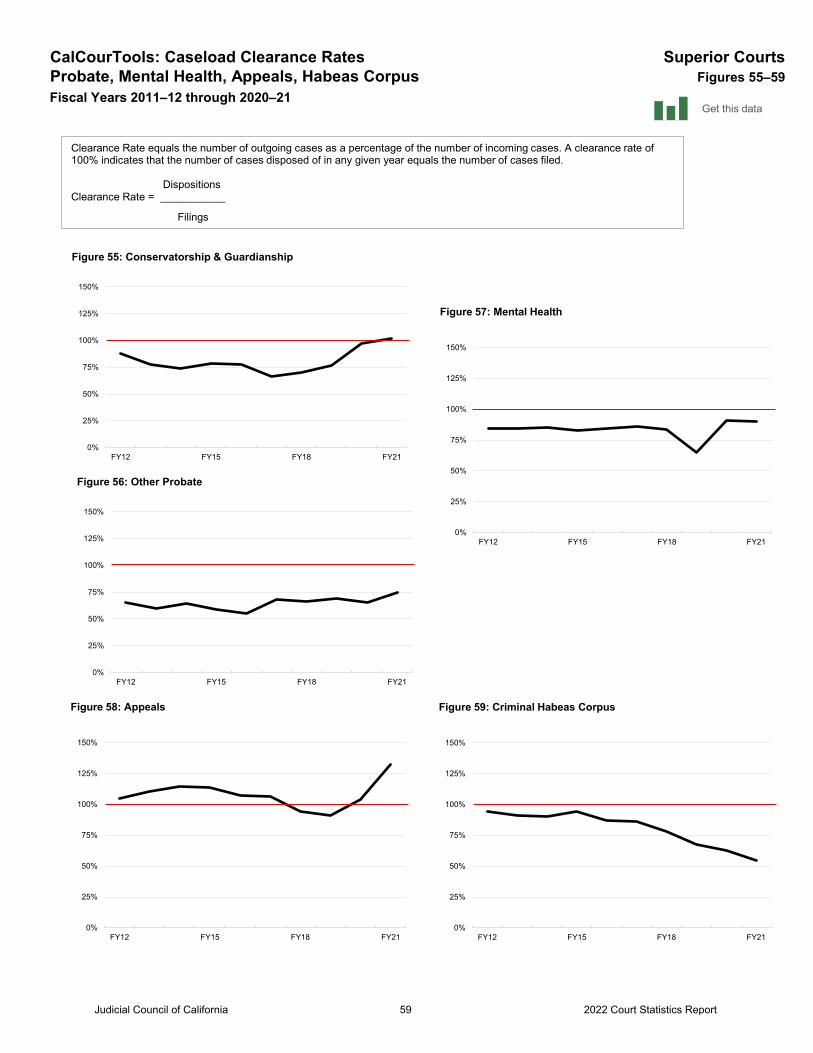
CalCourTools: Caseload Clearance Rates Superior CourtsProbate, Mental Health, Appeals, Habeas Corpus Figures 55–59Fiscal Years 2011–12 through 2020–21
0%
25%
50%
75%
100%
125%
150%
FY12 FY15 FY18 FY21
Figure 58: Appeals
0%
25%
50%
75%
100%
125%
150%
FY12 FY15 FY18 FY21
Figure 59: Criminal Habeas Corpus
0%
25%
50%
75%
100%
125%
150%
FY12 FY15 FY18 FY21
Figure 55: Conservatorship & Guardianship
0%
25%
50%
75%
100%
125%
150%
FY12 FY15 FY18 FY21
Figure 57: Mental Health
Clearance Rate equals the number of outgoing cases as a percentage of the number of incoming cases. A clearance rate of 100% indicates that the number of cases disposed of in any given year equals the number of cases filed.
DispositionsClearance Rate = ___________
Filings
Get this data
0%
25%
50%
75%
100%
125%
150%
FY12 FY15 FY18 FY21
Figure 56: Other Probate
Judicial Council of California 2022 Court Statistics Report59
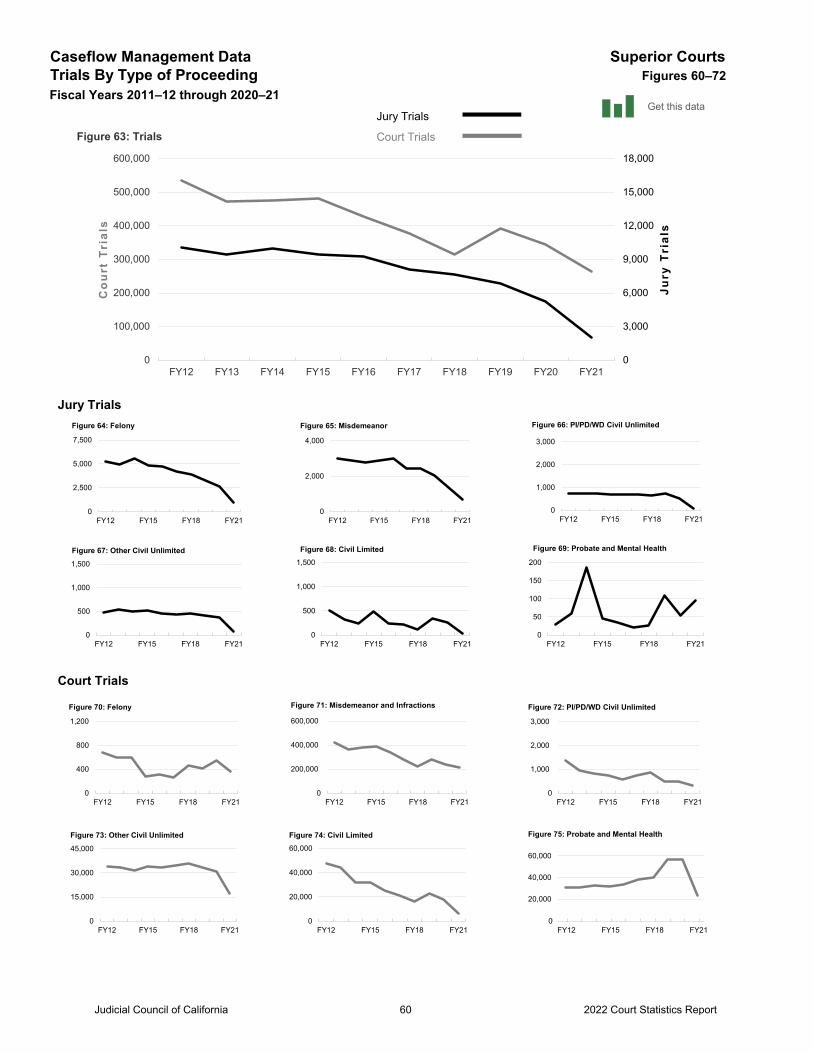
Caseflow Management Data Superior CourtsTrials By Type of Proceeding Figures 60–72Fiscal Years 2011–12 through 2020–21
Jury Trials
Court Trials
0
3,000
6,000
9,000
12,000
15,000
18,000
0
100,000
200,000
300,000
400,000
500,000
600,000
FY12 FY13 FY14 FY15 FY16 FY17 FY18 FY19 FY20 FY21
Jury
Tri
als
Co
urt
Tri
als
Figure 63: Trials
0
2,500
5,000
7,500
FY12 FY15 FY18 FY21
Figure 64: Felony
0
2,000
4,000
FY12 FY15 FY18 FY21
Figure 65: Misdemeanor
0
1,000
2,000
3,000
FY12 FY15 FY18 FY21
Figure 66: PI/PD/WD Civil Unlimited
0
500
1,000
1,500
FY12 FY15 FY18 FY21
Figure 67: Other Civil Unlimited
0
500
1,000
1,500
FY12 FY15 FY18 FY21
Figure 68: Civil Limited
Jury Trials
Court Trials
0
400
800
1,200
FY12 FY15 FY18 FY21
Figure 70: Felony
0
1,000
2,000
3,000
FY12 FY15 FY18 FY21
Figure 72: PI/PD/WD Civil Unlimited
0
15,000
30,000
45,000
FY12 FY15 FY18 FY21
Figure 73: Other Civil Unlimited
0
20,000
40,000
FY12 FY15 FY18 FY21
Figure 74: Civil Limited 60,000
0
50
100
150
200
FY12 FY15 FY18 FY21
Figure 69: Probate and Mental Health
0FY12 FY15 FY18 FY21
Figure 71: Misdemeanor and Infractions
600,000
400,000
200,000
0FY12 FY15 FY18 FY21
Figure 75: Probate and Mental Health
60,000
40,000
20,000
Get this data
Judicial Council of California 60 2022 Court Statistics Report
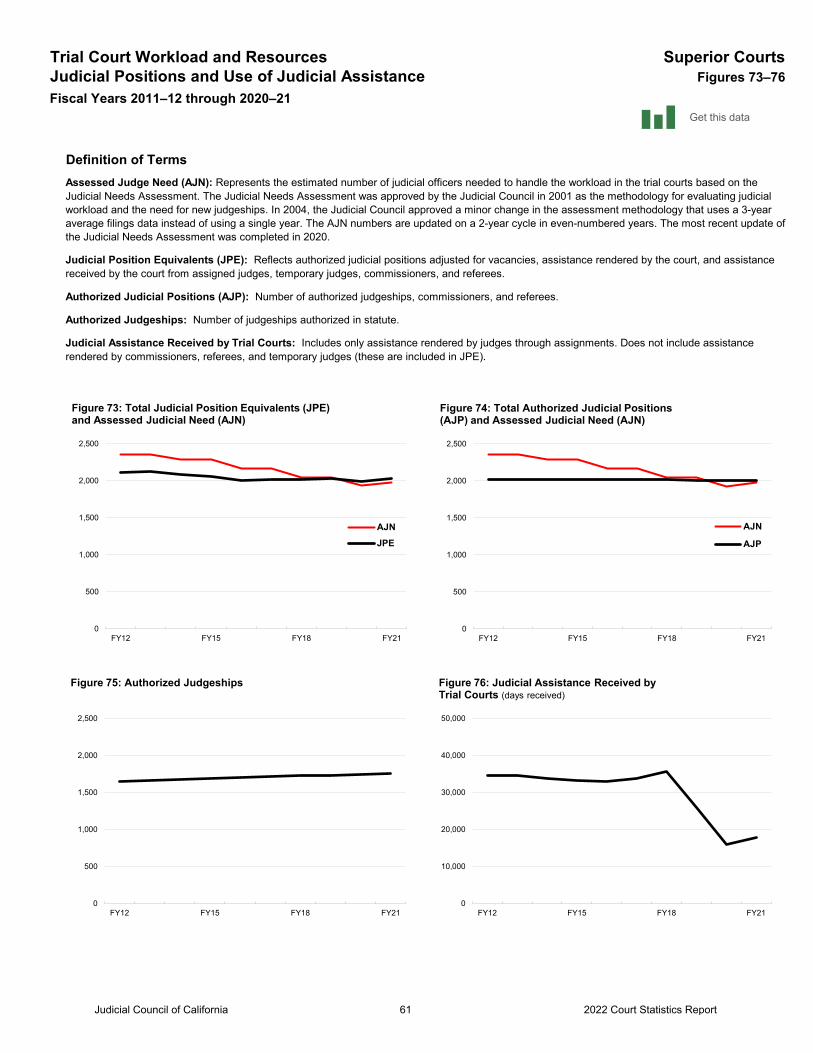
Trial Court Workload and Resources Superior CourtsJudicial Positions and Use of Judicial Assistance Figures 73–76Fiscal Years 2011–12 through 2020–21
Definition of TermsAssessed Judge Need (AJN): Represents the estimated number of judicial officers needed to handle the workload in the trial courts based on the Judicial Needs Assessment. The Judicial Needs Assessment was approved by the Judicial Council in 2001 as the methodology for evaluating judicial workload and the need for new judgeships. In 2004, the Judicial Council approved a minor change in the assessment methodology that uses a 3-year average filings data instead of using a single year. The AJN numbers are updated on a 2-year cycle in even-numbered years. The most recent update of the Judicial Needs Assessment was completed in 2020.
Judicial Position Equivalents (JPE): Reflects authorized judicial positions adjusted for vacancies, assistance rendered by the court, and assistance received by the court from assigned judges, temporary judges, commissioners, and referees.
Authorized Judicial Positions (AJP): Number of authorized judgeships, commissioners, and referees.
Authorized Judgeships: Number of judgeships authorized in statute.
Judicial Assistance Received by Trial Courts: Includes only assistance rendered by judges through assignments. Does not include assistance rendered by commissioners, referees, and temporary judges (these are included in JPE).
0
500
1,000
1,500
2,000
2,500
FY12 FY15 FY18 FY21
Figure 75: Authorized Judgeships
0FY12 FY15 FY18 FY21
Figure 76: Judicial Assistance Received by Trial Courts (days received)
50,000
40,000
30,000
20,000
10,000
0
500
1,000
1,500
2,000
2,500
FY12 FY15 FY18 FY21
Figure 73: Total Judicial Position Equivalents (JPE) and Assessed Judicial Need (AJN)
AJNJPE
0
500
1,000
1,500
2,000
2,500
FY12 FY15 FY18 FY21
Figure 74: Total Authorized Judicial Positions (AJP) and Assessed Judicial Need (AJN)
AJN
AJP
Get this data
Judicial Council of California 2022 Court Statistics Report61
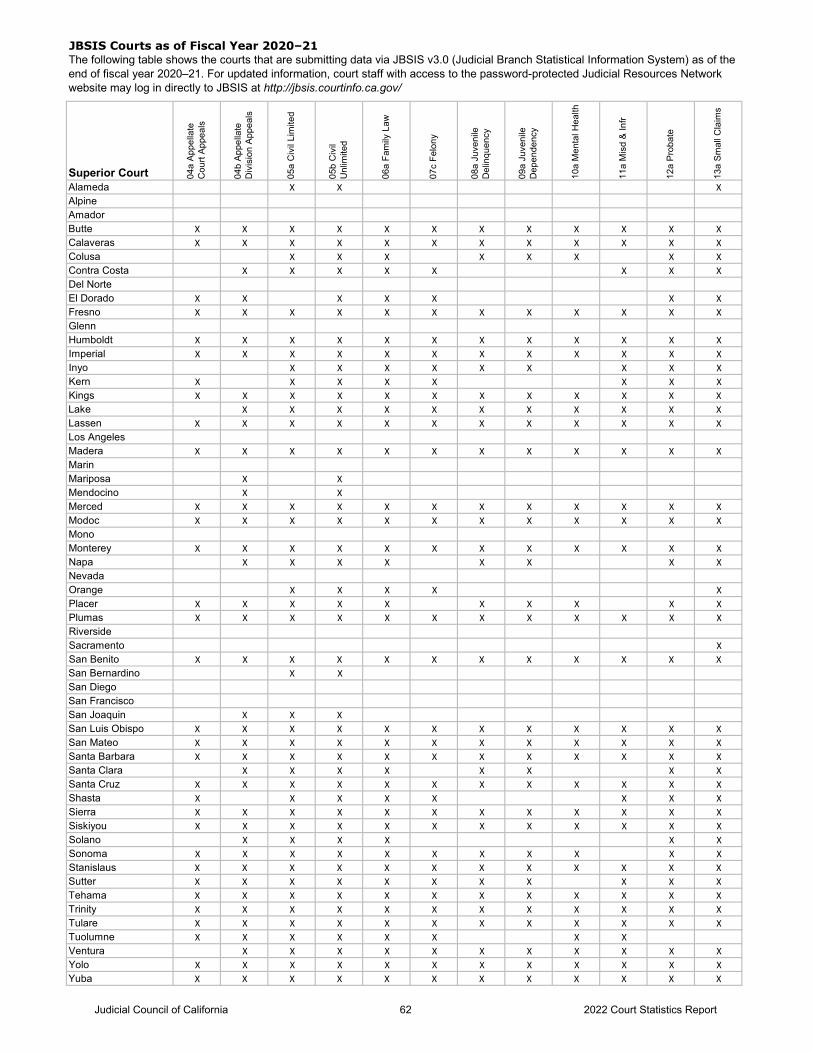
JBSIS Courts as of Fiscal Year 2020–21
Superior Court 04a
Appe
llate
C
ourt
Appe
als
04b
Appe
llate
D
ivis
ion
Appe
als
05a
Civ
il Li
mite
d
05b
Civ
il U
nlim
ited
06a
Fam
ily L
aw
07c
Felo
ny
08a
Juve
nile
D
elin
quen
cy
09a
Juve
nile
D
epen
denc
y
10a
Men
tal H
ealth
11a
Mis
d &
Infr
12a
Prob
ate
13a
Smal
l Cla
ims
Alameda X X XAlpineAmadorButte X X X X X X X X X X X XCalaveras X X X X X X X X X X X XColusa X X X X X X X XContra Costa X X X X X X X XDel NorteEl Dorado X X X X X X XFresno X X X X X X X X X X X XGlennHumboldt X X X X X X X X X X X XImperial X X X X X X X X X X X XInyo X X X X X X X X XKern X X X X X X X XKings X X X X X X X X X X X XLake X X X X X X X X X X XLassen X X X X X X X X X X X XLos AngelesMadera X X X X X X X X X X X XMarinMariposa X XMendocino X XMerced X X X X X X X X X X X XModoc X X X X X X X X X X X XMonoMonterey X X X X X X X X X X X XNapa X X X X X X X XNevadaOrange X X X X XPlacer X X X X X X X X X XPlumas X X X X X X X X X X X XRiversideSacramento XSan Benito X X X X X X X X X X X XSan Bernardino XSan DiegoSan FranciscoSan Joaquin X X XSan Luis Obispo X X X X X X X X X X X XSan Mateo X X X X X X X X X X X XSanta Barbara X X X X X X X X X X X XSanta Clara X X X X X X X XSanta Cruz X X X X X X X X X X X XShasta X X X X X X X XSierra X X X X X X X X X X X XSiskiyou X X X X X X X X X X X XSolano X X X X X XSonoma X X X X X X X X X X XStanislaus X X X X X X X X X X X XSutter X X X X X X X X X X XTehama X X X X X X X X X X X XTrinity X X X X X X X X X X X XTulare X X X X X X X X X X X XTuolumne X X X X X X X XVentura X X X X X X X X X X XYolo X X X X X X X X X X X XYuba X X X X X X X X X X X X
The following table shows the courts that are submitting data via JBSIS v3.0 (Judicial Branch Statistical Information System) as of the end of fiscal year 2020–21. For updated information, court staff with access to the password-protected Judicial Resources Network website may log in directly to JBSIS at http://jbsis.courtinfo.ca.gov/
Judicial Council of California 2022 Court Statistics Report62
X

Appendixes

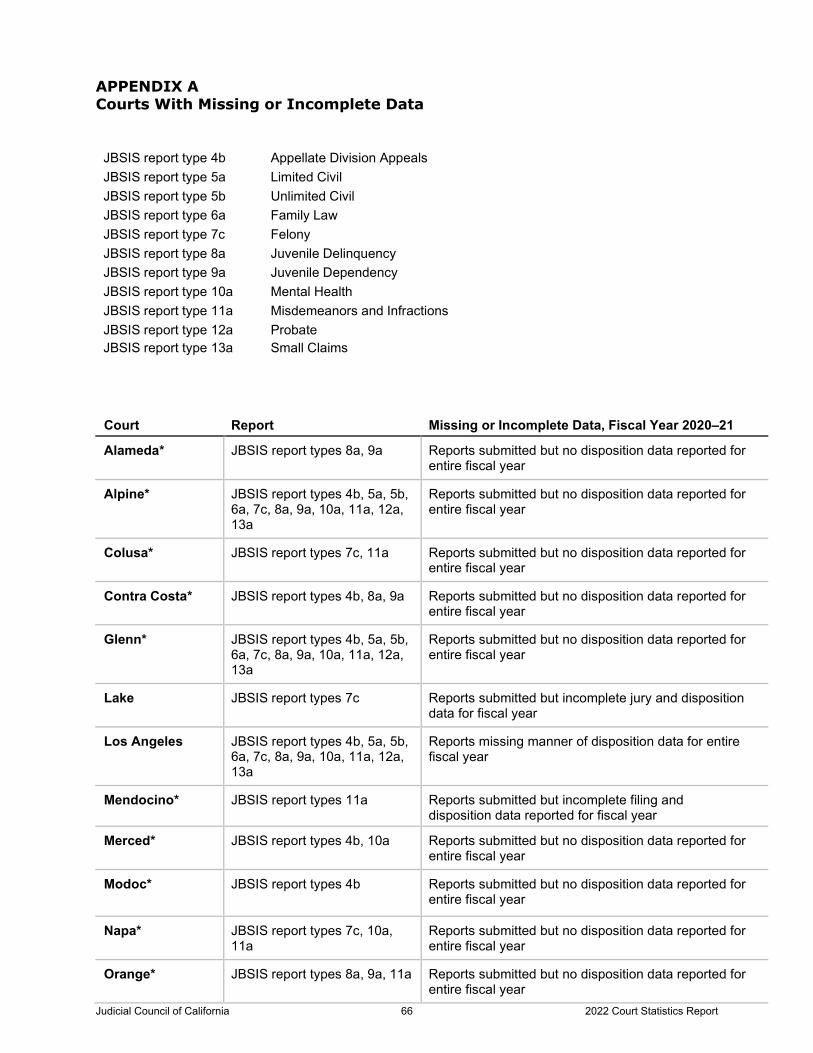
APPENDIX A Courts With Missing or Incomplete Data
JBSIS report type 4b Appellate Division Appeals JBSIS report type 5a Limited Civil JBSIS report type 5b Unlimited Civil JBSIS report type 6a Family Law JBSIS report type 7c Felony JBSIS report type 8a Juvenile Delinquency JBSIS report type 9a Juvenile Dependency JBSIS report type 10a Mental Health JBSIS report type 11a Misdemeanors and Infractions JBSIS report type 12a Probate JBSIS report type 13a Small Claims
Court Report Missing or Incomplete Data, Fiscal Year 2020–21
Alameda* JBSIS report types 8a, 9a Reports submitted but no disposition data reported for entire fiscal year
Alpine* JBSIS report types 4b, 5a, 5b, 6a, 7c, 8a, 9a, 10a, 11a, 12a, 13a
Reports submitted but no disposition data reported for entire fiscal year
Colusa* JBSIS report types 7c, 11a Reports submitted but no disposition data reported for entire fiscal year
Contra Costa* JBSIS report types 4b, 8a, 9a Reports submitted but no disposition data reported for entire fiscal year
Glenn* JBSIS report types 4b, 5a, 5b, 6a, 7c, 8a, 9a, 10a, 11a, 12a, 13a
Reports submitted but no disposition data reported for entire fiscal year
Lake JBSIS report types 7c Reports submitted but incomplete jury and disposition data for fiscal year
Los Angeles JBSIS report types 4b, 5a, 5b, 6a, 7c, 8a, 9a, 10a, 11a, 12a, 13a
Reports missing manner of disposition data for entire fiscal year
Mendocino* JBSIS report types 11a Reports submitted but incomplete filing and disposition data reported for fiscal year
Merced* JBSIS report types 4b, 10a Reports submitted but no disposition data reported for entire fiscal year
Modoc* JBSIS report types 4b Reports submitted but no disposition data reported for entire fiscal year
Napa* JBSIS report types 7c, 10a, 11a
Reports submitted but no disposition data reported for entire fiscal year
Orange* JBSIS report types 8a, 9a, 11a Reports submitted but no disposition data reported for entire fiscal year
Judicial Council of California 2022 Court Statistics Report66
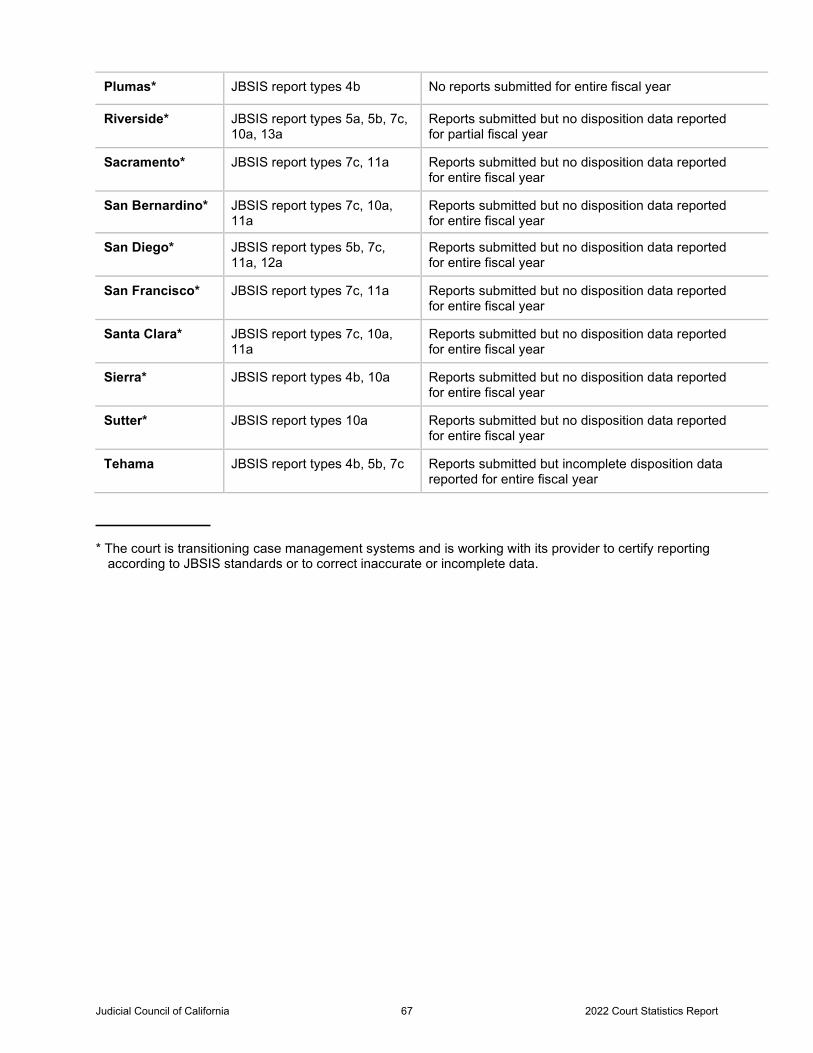
Plumas* JBSIS report types 4b No reports submitted for entire fiscal year
Riverside* JBSIS report types 5a, 5b, 7c, 10a, 13a
Reports submitted but no disposition data reported for partial fiscal year
Sacramento* JBSIS report types 7c, 11a Reports submitted but no disposition data reported for entire fiscal year
San Bernardino* JBSIS report types 7c, 10a, 11a
Reports submitted but no disposition data reported for entire fiscal year
San Diego* JBSIS report types 5b, 7c, 11a, 12a
Reports submitted but no disposition data reported for entire fiscal year
San Francisco* JBSIS report types 7c, 11a Reports submitted but no disposition data reported for entire fiscal year
Santa Clara* JBSIS report types 7c, 10a, 11a
Reports submitted but no disposition data reported for entire fiscal year
Sierra* JBSIS report types 4b, 10a Reports submitted but no disposition data reported for entire fiscal year
Sutter* JBSIS report types 10a Reports submitted but no disposition data reported for entire fiscal year
Tehama JBSIS report types 4b, 5b, 7c Reports submitted but incomplete disposition data reported for entire fiscal year
* The court is transitioning case management systems and is working with its provider to certify reportingaccording to JBSIS standards or to correct inaccurate or incomplete data.
Judicial Council of California 2022 Court Statistics Report67
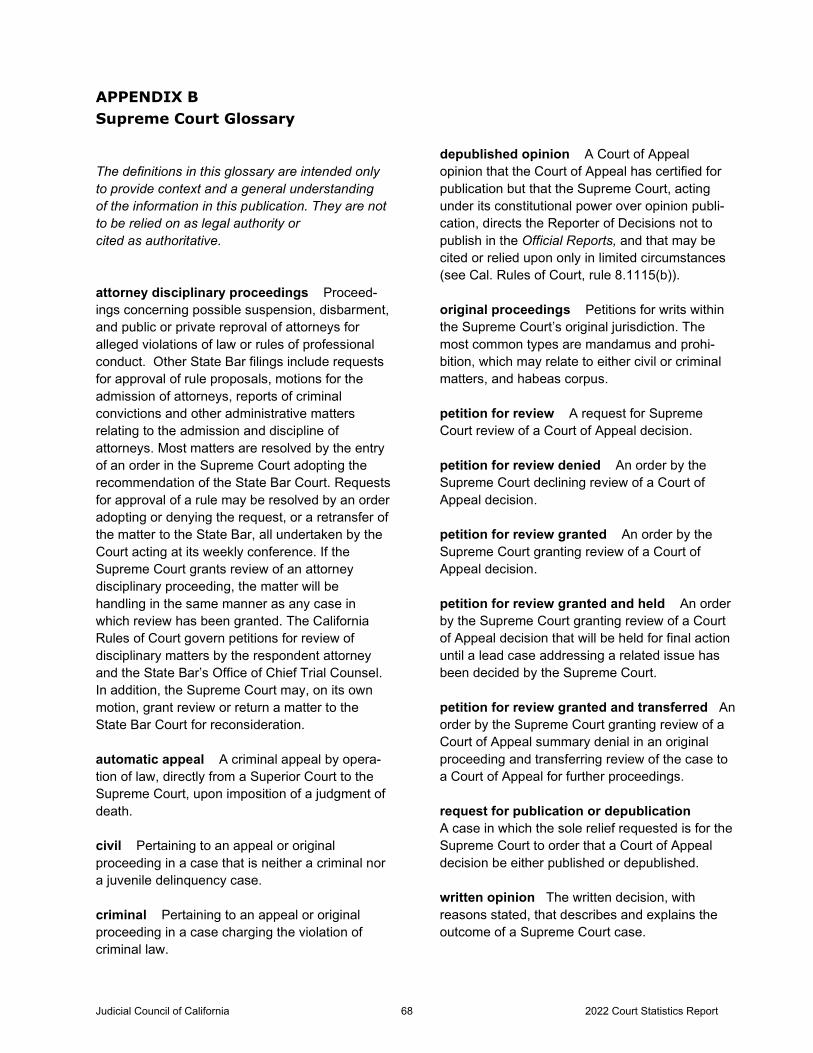
APPENDIX B Supreme Court Glossary
The definitions in this glossary are intended only to provide context and a general understanding of the information in this publication. They are not to be relied on as legal authority or cited as authoritative.
attorney disciplinary proceedings Proceed-ings concerning possible suspension, disbarment, and public or private reproval of attorneys for alleged violations of law or rules of professional conduct. Other State Bar filings include requests for approval of rule proposals, motions for the admission of attorneys, reports of criminal convictions and other administrative matters relating to the admission and discipline of attorneys. Most matters are resolved by the entry of an order in the Supreme Court adopting the recommendation of the State Bar Court. Requests for approval of a rule may be resolved by an order adopting or denying the request, or a retransfer of the matter to the State Bar, all undertaken by the Court acting at its weekly conference. If the Supreme Court grants review of an attorney disciplinary proceeding, the matter will be handling in the same manner as any case in which review has been granted. The California Rules of Court govern petitions for review of disciplinary matters by the respondent attorney and the State Bar’s Office of Chief Trial Counsel. In addition, the Supreme Court may, on its own motion, grant review or return a matter to the State Bar Court for reconsideration.
automatic appeal A criminal appeal by opera-tion of law, directly from a Superior Court to the Supreme Court, upon imposition of a judgment of death.
civil Pertaining to an appeal or original proceeding in a case that is neither a criminal nor a juvenile delinquency case.
criminal Pertaining to an appeal or original proceeding in a case charging the violation of criminal law.
depublished opinion A Court of Appeal opinion that the Court of Appeal has certified for publication but that the Supreme Court, acting under its constitutional power over opinion publi-cation, directs the Reporter of Decisions not to publish in the Official Reports, and that may be cited or relied upon only in limited circumstances (see Cal. Rules of Court, rule 8.1115(b)).
original proceedings Petitions for writs within the Supreme Court’s original jurisdiction. The most common types are mandamus and prohi-bition, which may relate to either civil or criminal matters, and habeas corpus.
petition for review A request for Supreme Court review of a Court of Appeal decision.
petition for review denied An order by the Supreme Court declining review of a Court of Appeal decision.
petition for review granted An order by the Supreme Court granting review of a Court of Appeal decision.
petition for review granted and held An order by the Supreme Court granting review of a Court of Appeal decision that will be held for final action until a lead case addressing a related issue has been decided by the Supreme Court.
petition for review granted and transferred An order by the Supreme Court granting review of a Court of Appeal summary denial in an original proceeding and transferring review of the case to a Court of Appeal for further proceedings.
request for publication or depublication A case in which the sole relief requested is for the Supreme Court to order that a Court of Appeal decision be either published or depublished.
written opinion The written decision, with reasons stated, that describes and explains the outcome of a Supreme Court case.
Judicial Council of California 2022 Court Statistics Report68
APPENDIX C Courts of Appeal Glossary
The definitions in this glossary are intended only to provide context and a general understanding of the information in this publication. They are not to be relied on as legal authority or cited as authoritative.
appeal A proceeding for direct review of a judgment of an appealable order of a trial court. Excludes collateral review by means of an original proceeding. (See “civil appeal” and “criminal appeal.”)
civil appeal An appeal in a case that is neither a criminal nor a juvenile delinquency case.
civil original proceeding Any original pro-ceeding in which the underlying case is not related to a violation of criminal law.
Court of Appeal The California court that hears (1) appeals in all noncapital cases in which a Superior Court has original jurisdiction and (2) appeals under other special circumstances,as prescribed by law.
criminal appeal An appeal from the judgment or order in a case charging a violation of criminal law.
criminal original proceeding Any original proceeding in which the underlying case is related to a violation of criminal law.
disposition Termination of an appeal or origi-nal proceeding. Court of Appeal dispositions are either by written opinion or without opinion (with or without a record filed).
fully briefed appeal A pending appeal in which all briefs have been filed.
median time In a listing where time values are placed in order from shortest to longest, the value with half of the cases above it and half below it.
90th percentile time In a listing where time values are placed in order from shortest to longest, the value with 10 percent of the cases above it and 90 percent below it.
notice filed The filing of a notice of appeal in the Superior Court, initiating the appellate process.
original proceedings Cases begun in an appellate court, commonly called writ proceedings. The most common are writs of mandamus and prohibition, usually seeking an order addressed to a lower court, and writs of habeas corpus, usually addressed to a person holding another in official custody. (See “civil original proceeding” and “criminal original proceeding.”)
palma notice Cases disposed of after an Alternative Writ was Issued, a Palma Notice or Letter Sent/Issued, or an Order to Show Cause. Includes cases in which the matter was resolved because the Superior Court complied with an alternative writ or suggestive Palma order that was issued by the Court of Appeal, thereby providing the petitioner the relief requested. The Superior Court may elect to comply with a Palma order or alternative writ if it first affords the parties notice and an opportunity to be heard.
pending appeal An appeal awaiting decision.
record filed The filing of the trial court clerk’s transcript (copies of documents filed in the case) and the reporter’s transcript (the typed version of oral proceedings).
Judicial Council of California 2022 Court Statistics Report69
APPENDIX D Superior Courts Glossary
The definitions in this glossary are intended only to provide context and a general understanding of the information in this publication. They are not to be relied on as legal authority or cited as authoritative.
appeal A proceeding for direct review of a civil or criminal judgment from a limited-jurisdiction case, including small claims matters.
assessed judge need (AJN) Represents the estimated number of judicial officers needed to handle the workload in the trial courts based on the Judicial Needs Assessment Project.
caseload clearance rate Clearance rates show the number of outgoing cases as a percentage of the number of incoming cases. They measure whether the court is disposing of cases in a timely fashion or whether a backlog of cases is growing.
certification (W&I 5250) A 14-day certification to detain and treat a person who, owing to a mental disorder or chronic alcoholism, is alleged to be a danger to self and/or others and/or is gravely disabled.
commissioner A subordinate judicial officer, employed by the court, who performs judicial or quasi-judicial duties assigned to him or her. A commissioner may be authorized to decide only limited pretrial issues of fact and law or to con-duct complete trials. Commissioners frequently act as temporary judges.
conservatorship and guardianship All probate proceedings, will contests, guardianship and conservatorship proceedings (including con-servatorship proceedings under the Lanterman-Petris-Short Act).
disposition Termination of a proceeding. Civil dispositions before trial include transfers to
another trial court, dismissals, summary judg-ments, and other judgments. Criminal dispositions before trial include transfers to another trial court, sentences after pleas of guilty or no contest, and dismissals. Civil dispositions after trial include entry of judgment after jury trial and court trial. Criminal dispositions after trial include acquittals, grants of probation, and sentences after conviction.
family law (marital) Proceedings in which a petition has been filed for dissolution or voiding of a marriage or for legal separation.
family law (establish parental relationship) A petition (form FL-200) brought under the Uniform Parentage Act to establish parental relationship (Fam. Code, § 7600). A surrogacy petition filed in the court should also be captured in this area.
family law (domestic violence) A family law case type based on a Request for Domestic Violence Restraining Order (form DV 100) seeking protection under the Domestic Violence Prevention Act (Fam. Code, § 6200).
family law (DCSS) A child support matter where the Department of Child Support Services (DCSS) is a party to the case through the filing of one of the following: a complaint (form FL-600) to establish parental obligation, parentage, and/or child support (Fam. Code, §§ 2330.1, 17400, 17404), a Statement for Registration of California Support Order (form FL-650) by DCSS (Fam. Code, § 5601), a Notice Regarding Payment of Support (FL-632), or a petition filed requesting the court to establish a support order for a spouse or child, payable by the obligor under the Uniform Interstate Family Support Act (Fam. Code, § 4900) or the registration of an interstate support order by DCSS (Fam. Code, § 5601).
family law petitions Family law cases other than marital cases, petitions to establish parental relationship, domestic violence petitions and petitions filed by the Department of Child Support Services (DCSS) for reimbursement of child support.
Judicial Council of California 2022 Court Statistics Report70
felony A criminal case alleging an offense punishable by imprisonment in a state prison or by death.
filings in civil matters Civil cases for which complaints or petitions have been filed.
filings in criminal matters The number of defendants against whom criminal charges have been filed.
filings in juvenile matters The number of minors who are the subjects of petitions.
habeas corpus criminal Petition alleging unlawful imprisonment, unlawful restraint of liberty, or unlawful confinement conditions (Pen. Code, § 1473).
judgeship A judicial position conferring power to exercise the full legal authority of the court in which the judge sits (by selection or assign-ment). The term “Judgeships,” as used in this report, represents the number of positions authorized by law, whether filled or vacant.
judicial position equivalents An estimate of the number of judicial officers who were present and available to conduct court business. The number includes authorized judgeships (adjusted to reflect judicial vacancies and assis-tance given to other courts) and assistance received from assigned judges, full-time and part-time commissioners and referees, and temporary judges serving by stipulation of the parties.
judicial positions The number of judgeships authorized by law, plus positions of referees and commissioners.
juvenile delinquency proceedings Petitions filed under Welfare and Institutions Code section 602, alleging violation of a criminal statute, and petitions filed under Welfare and Institutions Code section 601, alleging that a minor is beyond the control of parents or guardians but has not violated any law. An original petition begins a delinquency proceeding. A subsequent petition adds allegations against a minor child who is already subject to the court’s jurisdiction.
juvenile dependency proceedings Petitions filed under Welfare and Institutions Code section 300, seeking to make a minor child a ward of the court because of abuse or neglect. An original petition begins a dependency proceeding. A subsequent petition adds allegations regarding a minor child who is already subject to the court’s jurisdiction.
limited civil All civil matters with a value of $25,000 or less, except small claims matters.
mental health proceedings Includes most types of mental health cases, including LPS conservatorships (W&I 5350), mental competency (PC 1368; W&I 709), and civil commitments with or without an underlying criminal case.
motor vehicle personal injury, death, and property damage Actions for damages in excess of $25,000 for physical injury to persons and property and actions for wrongful death related to motor vehicle accidents.
nontraffic infractions Nontraffic violations of state statutes or local ordinances specified as infractions.
nontraffic misdemeanors Misdemeanors including intoxication complaints and violations of the Penal Code, local city and county ordinances, and the Fish and Game Code.
other civil complaints and petitions Cases not covered in any other civil case category, including complaints for declaratory relief only, mechanics’ liens, and petitions for partnership and corporate governance. If the requested relief is for money, it must be in excess of $25,000 to be filed as a general-jurisdiction case.
other mental health proceedings Includes other mental health cases not included in the mental health category as well as noncriminal habeas corpus.
other probate Includes decedent’s estate, trust and all other probate cases other than conservatorship, or guardianship.
Judicial Council of California 2022 Court Statistics Report71
personal injury, death, and property damage All actions for damages in excess of $25,000 for physical injury to persons and property and all actions for wrongful death.
reduced to misdemeanor Cases in which a charge originally filed as a felony is disposed of as a misdemeanor.
referee A subordinate judicial officer employed by a county to handle matters assigned by the court, such as traffic law violations.
small claims All matters filed in small claims court (value of $10,000 or less).
time to disposition The amount of time it takes a court to dispose of cases within established time frames.
traffic infractions Traffic-related violations of state statutes or city or county ordinances specified as infractions, including parking violations.
traffic misdemeanors Violations of Vehicle Code § 20002 (hit and run, property damage), 23104 (reckless driving, causing injury), and 23152 (driving under the influence of alcohol or drugs) and all other traffic misdemeanors.
unlawful detainer An action involving the possession of real property by a commercial or residential tenant whose original entry was lawful but whose right to the possession has terminated.
unlimited civil All civil matters with a value of more than $25,000.
Judicial Council of California 2022 Court Statistics Report72
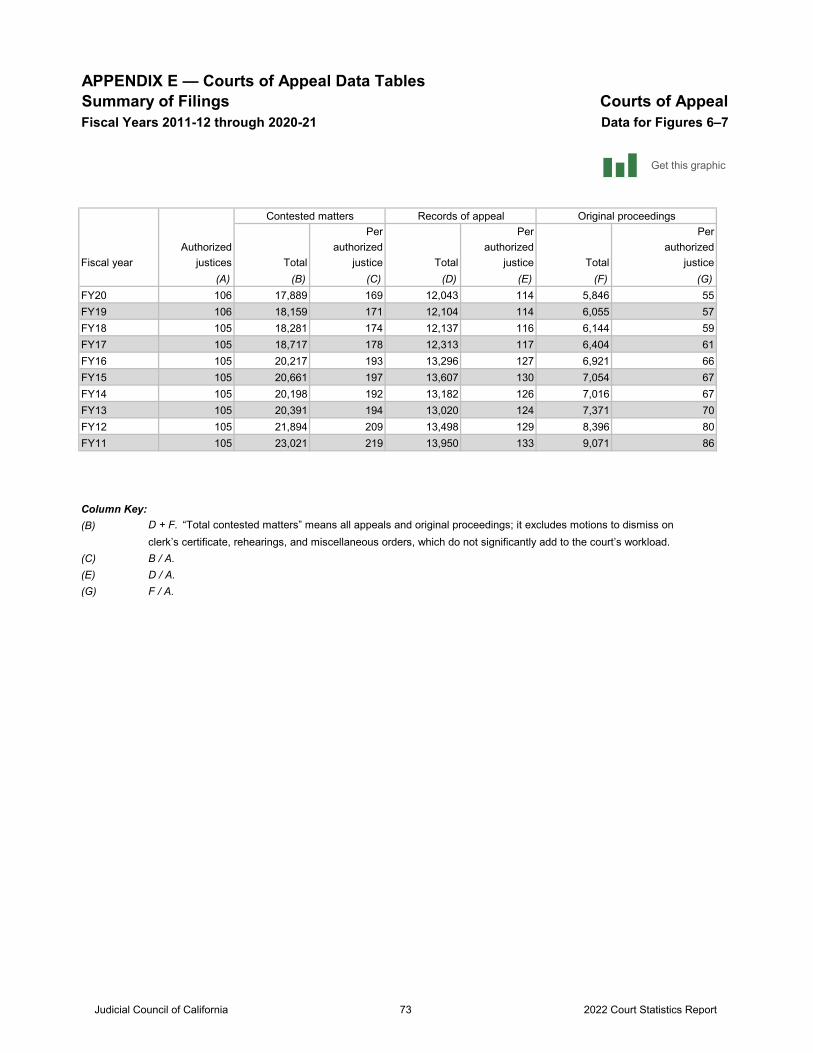
APPENDIX E — Courts of Appeal Data TablesSummary of Filings Courts of AppealFiscal Years 2011-12 through 2020-21 Data for Figures 6–7
Contested matters Records of appeal Original proceedingsPer Per Per
Authorized authorized authorized authorizedFiscal year justices Total justice Total justice Total justice
(A) (B) (C) (D) (E) (F) (G)FY20 106 17,889 169 12,043 114 5,846 55FY19 106 18,159 171 12,104 114 6,055 57FY18 105 18,281 174 12,137 116 6,144 59FY17 105 18,717 178 12,313 117 6,404 61FY16 105 20,217 193 13,296 127 6,921 66FY15 105 20,661 197 13,607 130 7,054 67FY14 105 20,198 192 13,182 126 7,016 67FY13 105 20,391 194 13,020 124 7,371 70FY12 105 21,894 209 13,498 129 8,396 80FY11 105 23,021 219 13,950 133 9,071 86
Column Key:(B) D + F. “Total contested matters” means all appeals and original proceedings; it excludes motions to dismiss on
clerk’s certificate, rehearings, and miscellaneous orders, which do not significantly add to the court’s workload.(C) B / A.(E) D / A.(G) F / A.
Get this graphic
Judicial Council of California 2022 Court Statistics Report73
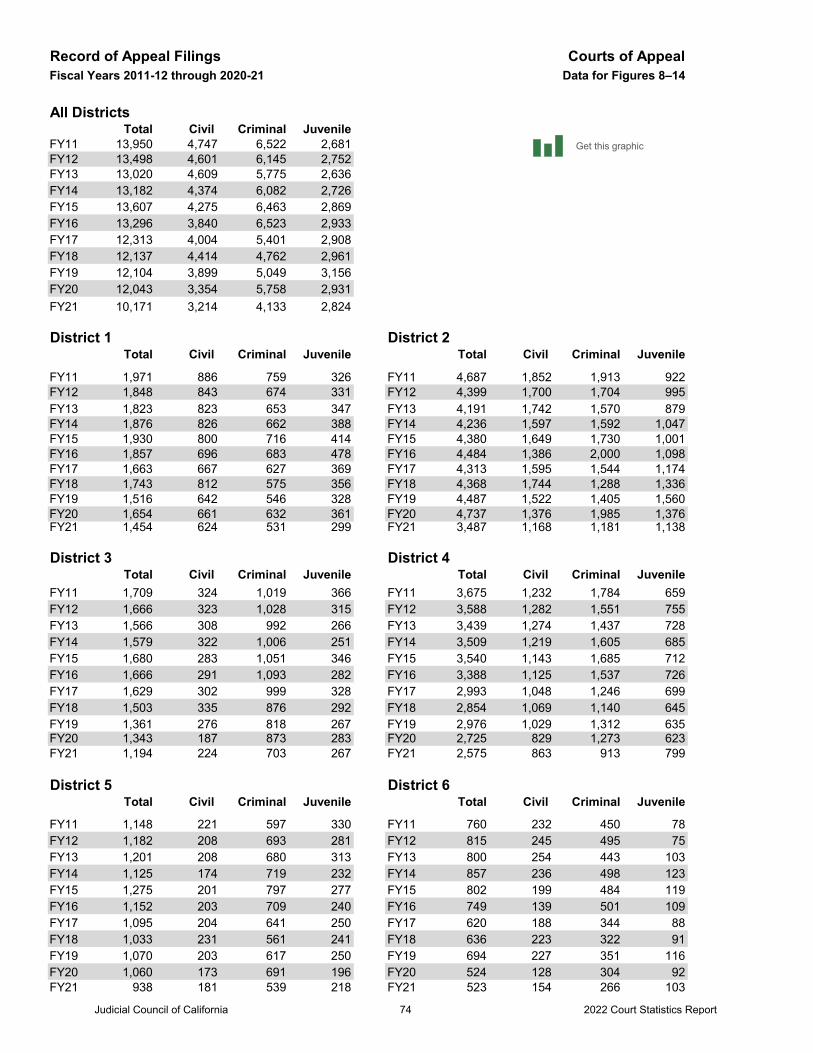
Record of Appeal Filings Courts of AppealFiscal Years 2011-12 through 2020-21 Data for Figures 8–14
All DistrictsTotal Civil Criminal Juvenile
FY11 13,950 4,747 6,522 2,681FY12 13,498 4,601 6,145 2,752FY13 13,020 4,609 5,775 2,636FY14 13,182 4,374 6,082 2,726FY15 13,607 4,275 6,463 2,869FY16 13,296 3,840 6,523 2,933FY17 12,313 4,004 5,401 2,908FY18 12,137 4,414 4,762 2,961FY19 12,104 3,899 5,049 3,156FY20 12,043 3,354 5,758 2,931FY21 10,171 3,214 4,133 2,824
District 1 District 2Total Civil Criminal Juvenile Total Civil Criminal Juvenile
FY11 1,971 886 759 326 FY11 4,687 1,852 1,913 922FY12 1,848 843 674 331 FY12 4,399 1,700 1,704 995FY13 1,823 823 653 347 FY13 4,191 1,742 1,570 879FY14 1,876 826 662 388 FY14 4,236 1,597 1,592 1,047FY15 1,930 800 716 414 FY15 4,380 1,649 1,730 1,001FY16 1,857 696 683 478 FY16 4,484 1,386 2,000 1,098FY17 1,663 667 627 369 FY17 4,313 1,595 1,544 1,174FY18 1,743 812 575 356 FY18 4,368 1,744 1,288 1,336FY19 1,516 642 546 328 FY19 4,487 1,522 1,405 1,560FY20 1,654 661 632 361 FY20 4,737 1,376 1,985 1,376FY21 1,454 624 531 299 FY21 3,487 1,168 1,181 1,138
District 3 District 4Total Civil Criminal Juvenile Total Civil Criminal Juvenile
FY11 1,709 324 1,019 366 FY11 3,675 1,232 1,784 659FY12 1,666 323 1,028 315 FY12 3,588 1,282 1,551 755FY13 1,566 308 992 266 FY13 3,439 1,274 1,437 728FY14 1,579 322 1,006 251 FY14 3,509 1,219 1,605 685FY15 1,680 283 1,051 346 FY15 3,540 1,143 1,685 712FY16 1,666 291 1,093 282 FY16 3,388 1,125 1,537 726FY17 1,629 302 999 328 FY17 2,993 1,048 1,246 699FY18 1,503 335 876 292 FY18 2,854 1,069 1,140 645FY19 1,361 276 818 267 FY19 2,976 1,029 1,312 635FY20 1,343 187 873 283 FY20 2,725 829 1,273 623FY21 1,194 224 703 267 FY21 2,575 863 913 799
District 5 District 6Total Civil Criminal Juvenile Total Civil Criminal Juvenile
FY11 1,148 221 597 330 FY11 760 232 450 78FY12 1,182 208 693 281 FY12 815 245 495 75FY13 1,201 208 680 313 FY13 800 254 443 103FY14 1,125 174 719 232 FY14 857 236 498 123FY15 1,275 201 797 277 FY15 802 199 484 119FY16 1,152 203 709 240 FY16 749 139 501 109FY17 1,095 204 641 250 FY17 620 188 344 88FY18 1,033 231 561 241 FY18 636 223 322 91FY19 1,070 203 617 250 FY19 694 227 351 116FY20 1,060 173 691 196 FY20 524 128 304 92FY21 938 181 539 218 FY21 523 154 266 103
Get this graphic
Judicial Council of California 2022 Court Statistics Report74
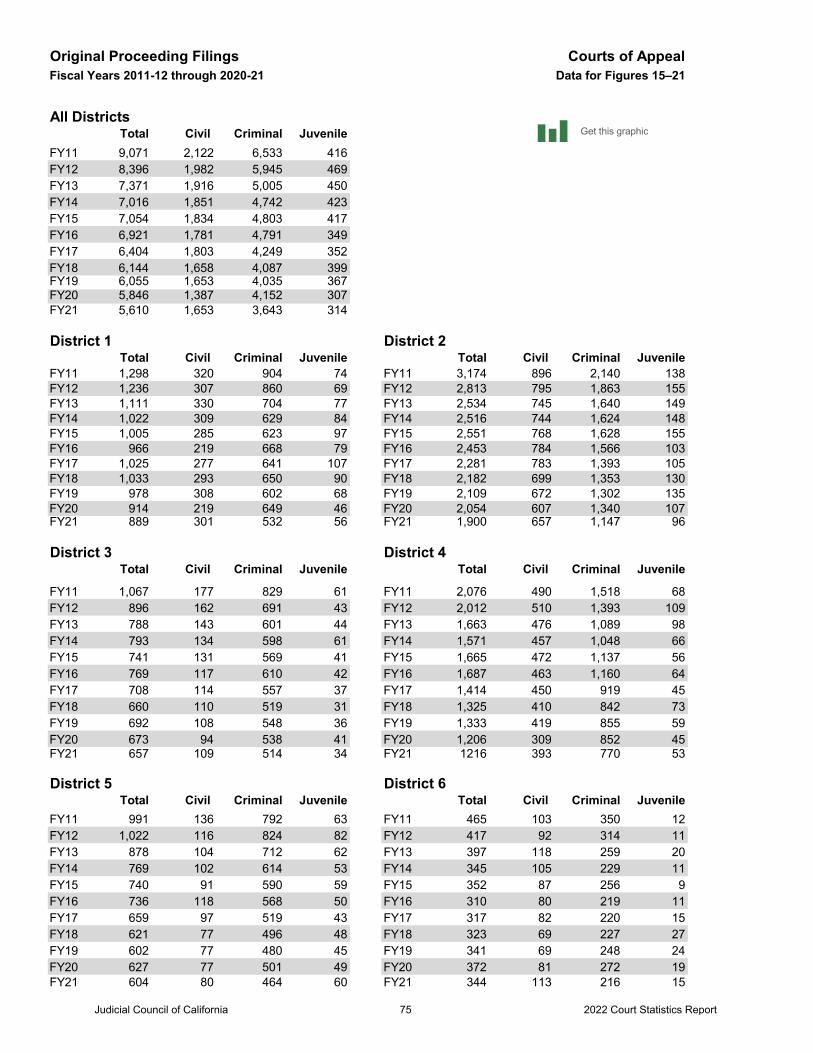
Original Proceeding Filings Courts of AppealFiscal Years 2011-12 through 2020-21 Data for Figures 15–21
All DistrictsTotal Civil Criminal Juvenile
FY11 9,071 2,122 6,533 416FY12 8,396 1,982 5,945 469FY13 7,371 1,916 5,005 450FY14 7,016 1,851 4,742 423FY15 7,054 1,834 4,803 417FY16 6,921 1,781 4,791 349FY17 6,404 1,803 4,249 352FY18 6,144 1,658 4,087 399FY19 6,055 1,653 4,035 367FY20 5,846 1,387 4,152 307FY21 5,610 1,653 3,643 314
District 1 District 2Total Civil Criminal Juvenile Total Civil Criminal Juvenile
FY11 1,298 320 904 74 FY11 3,174 896 2,140 138FY12 1,236 307 860 69 FY12 2,813 795 1,863 155FY13 1,111 330 704 77 FY13 2,534 745 1,640 149FY14 1,022 309 629 84 FY14 2,516 744 1,624 148FY15 1,005 285 623 97 FY15 2,551 768 1,628 155FY16 966 219 668 79 FY16 2,453 784 1,566 103FY17 1,025 277 641 107 FY17 2,281 783 1,393 105FY18 1,033 293 650 90 FY18 2,182 699 1,353 130FY19 978 308 602 68 FY19 2,109 672 1,302 135FY20 914 219 649 46 FY20 2,054 607 1,340 107FY21 889 301 532 56 FY21 1,900 657 1,147 96
District 3 District 4Total Civil Criminal Juvenile Total Civil Criminal Juvenile
FY11 1,067 177 829 61 FY11 2,076 490 1,518 68FY12 896 162 691 43 FY12 2,012 510 1,393 109FY13 788 143 601 44 FY13 1,663 476 1,089 98FY14 793 134 598 61 FY14 1,571 457 1,048 66FY15 741 131 569 41 FY15 1,665 472 1,137 56FY16 769 117 610 42 FY16 1,687 463 1,160 64FY17 708 114 557 37 FY17 1,414 450 919 45FY18 660 110 519 31 FY18 1,325 410 842 73FY19 692 108 548 36 FY19 1,333 419 855 59FY20 673 94 538 41 FY20 1,206 309 852 45FY21 657 109 514 34 FY21 1216 393 770 53
District 5 District 6Total Civil Criminal Juvenile Total Civil Criminal Juvenile
FY11 991 136 792 63 FY11 465 103 350 12FY12 1,022 116 824 82 FY12 417 92 314 11FY13 878 104 712 62 FY13 397 118 259 20FY14 769 102 614 53 FY14 345 105 229 11FY15 740 91 590 59 FY15 352 87 256 9FY16 736 118 568 50 FY16 310 80 219 11FY17 659 97 519 43 FY17 317 82 220 15FY18 621 77 496 48 FY18 323 69 227 27FY19 602 77 480 45 FY19 341 69 248 24FY20 627 77 501 49 FY20 372 81 272 19FY21 604 80 464 60 FY21 344 113 216 15
Get this graphic
Judicial Council of California 2022 Court Statistics Report75
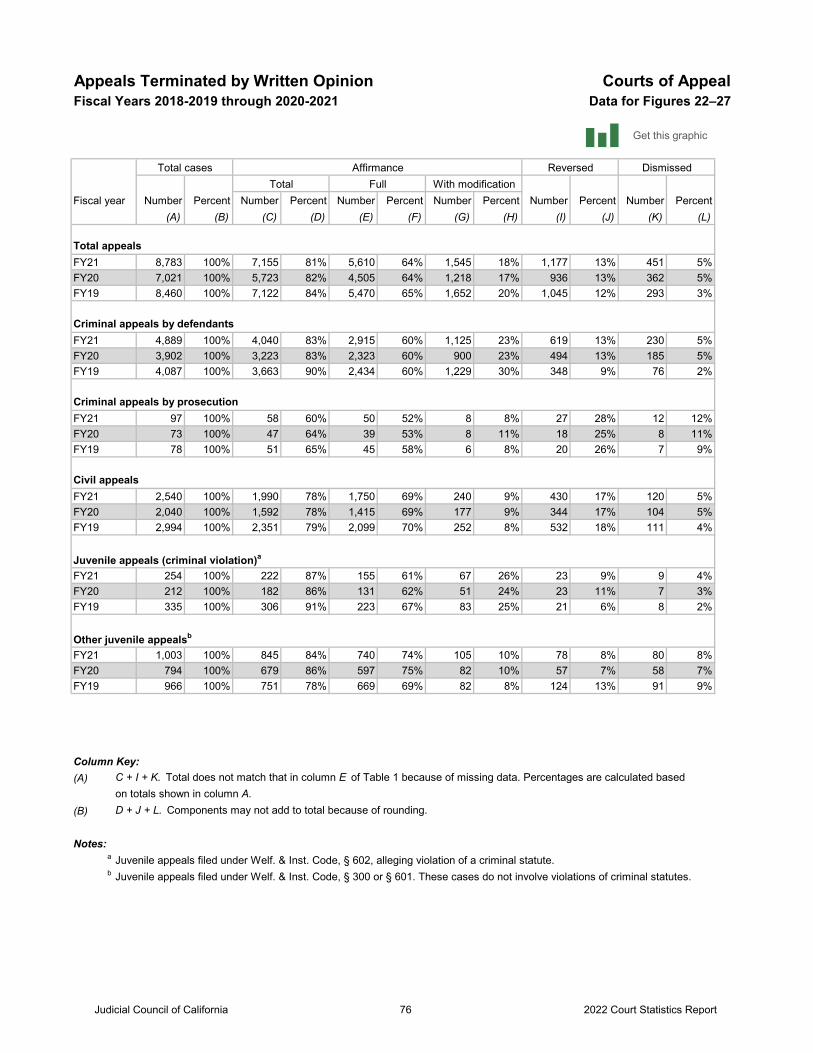
Appeals Terminated by Written Opinion Courts of AppealFiscal Years 2018-2019 through 2020-2021 Data for Figures 22–27
Total cases Affirmance Reversed Dismissed
Total Full With modificationFiscal year Number Percent Number Percent Number Percent Number Percent Number Percent Number Percent
(A) (B) (C) (D) (E) (F) (G) (H) (I) (J) (K) (L)
Total appealsFY21 8,783 100% 7,155 81% 5,610 64% 1,545 18% 1,177 13% 451 5%FY20 7,021 100% 5,723 82% 4,505 64% 1,218 17% 936 13% 362 5%FY19 8,460 100% 7,122 84% 5,470 65% 1,652 20% 1,045 12% 293 3% Criminal appeals by defendantsFY21 4,889 100% 4,040 83% 2,915 60% 1,125 23% 619 13% 230 5%FY20 3,902 100% 3,223 83% 2,323 60% 900 23% 494 13% 185 5%FY19 4,087 100% 3,663 90% 2,434 60% 1,229 30% 348 9% 76 2% Criminal appeals by prosecutionFY21 97 100% 58 60% 50 52% 8 8% 27 28% 12 12%FY20 73 100% 47 64% 39 53% 8 11% 18 25% 8 11%FY19 78 100% 51 65% 45 58% 6 8% 20 26% 7 9%
Civil appealsFY21 2,540 100% 1,990 78% 1,750 69% 240 9% 430 17% 120 5%FY20 2,040 100% 1,592 78% 1,415 69% 177 9% 344 17% 104 5%FY19 2,994 100% 2,351 79% 2,099 70% 252 8% 532 18% 111 4%
Juvenile appeals (criminal violation)a
FY21 254 100% 222 87% 155 61% 67 26% 23 9% 9 4%FY20 212 100% 182 86% 131 62% 51 24% 23 11% 7 3%FY19 335 100% 306 91% 223 67% 83 25% 21 6% 8 2%
Other juvenile appealsb
FY21 1,003 100% 845 84% 740 74% 105 10% 78 8% 80 8%FY20 794 100% 679 86% 597 75% 82 10% 57 7% 58 7%FY19 966 100% 751 78% 669 69% 82 8% 124 13% 91 9%
Column Key:(A) C + I + K. Total does not match that in column E of Table 1 because of missing data. Percentages are calculated based
on totals shown in column A.(B) D + J + L. Components may not add to total because of rounding.
Notes: a Juvenile appeals filed under Welf. & Inst. Code, § 602, alleging violation of a criminal statute. b Juvenile appeals filed under Welf. & Inst. Code, § 300 or § 601. These cases do not involve violations of criminal statutes.
Get this graphic
Judicial Council of California 2022 Court Statistics Report76
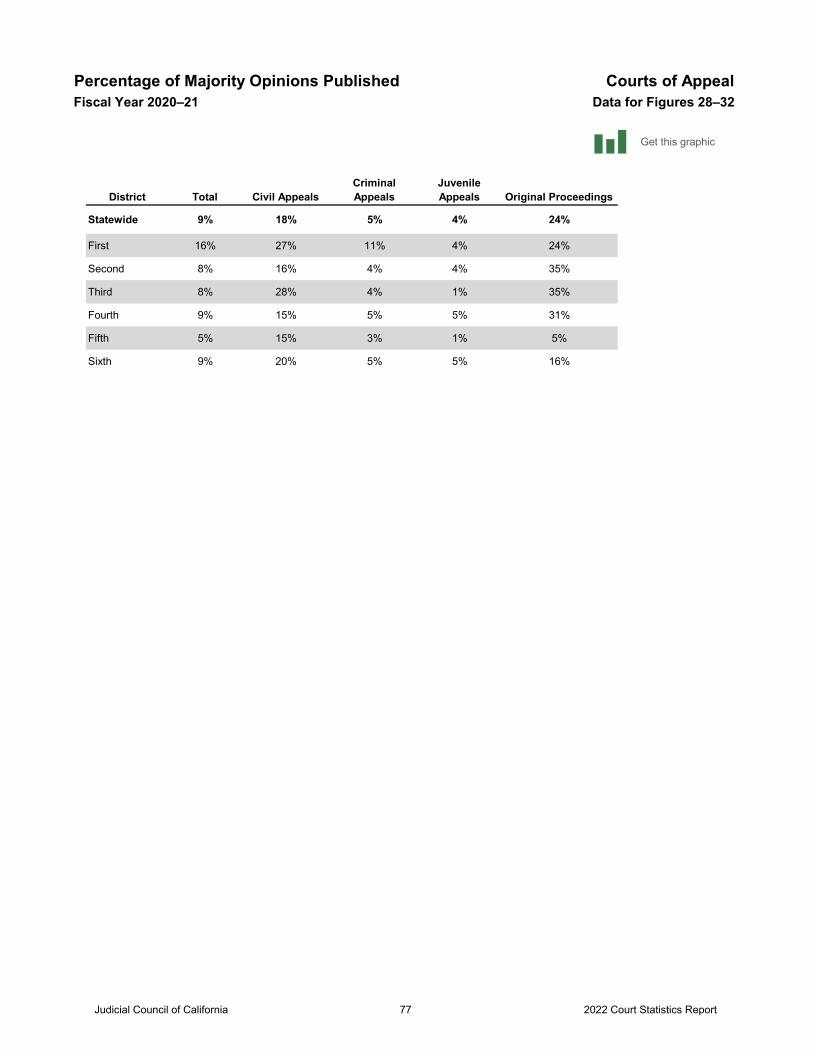
Percentage of Majority Opinions Published Courts of AppealFiscal Year 2020–21 Data for Figures 28–32
District Total Civil AppealsCriminal Appeals
Juvenile Appeals Original Proceedings
Statewide 9% 18% 5% 4% 24%
First 16% 27% 11% 4% 24%
Second 8% 16% 4% 4% 35%
Third 8% 28% 4% 1% 35%
Fourth 9% 15% 5% 5% 31%
Fifth 5% 15% 3% 1% 5%
Sixth 9% 20% 5% 5% 16%
Get this graphic
Judicial Council of California 2022 Court Statistics Report77
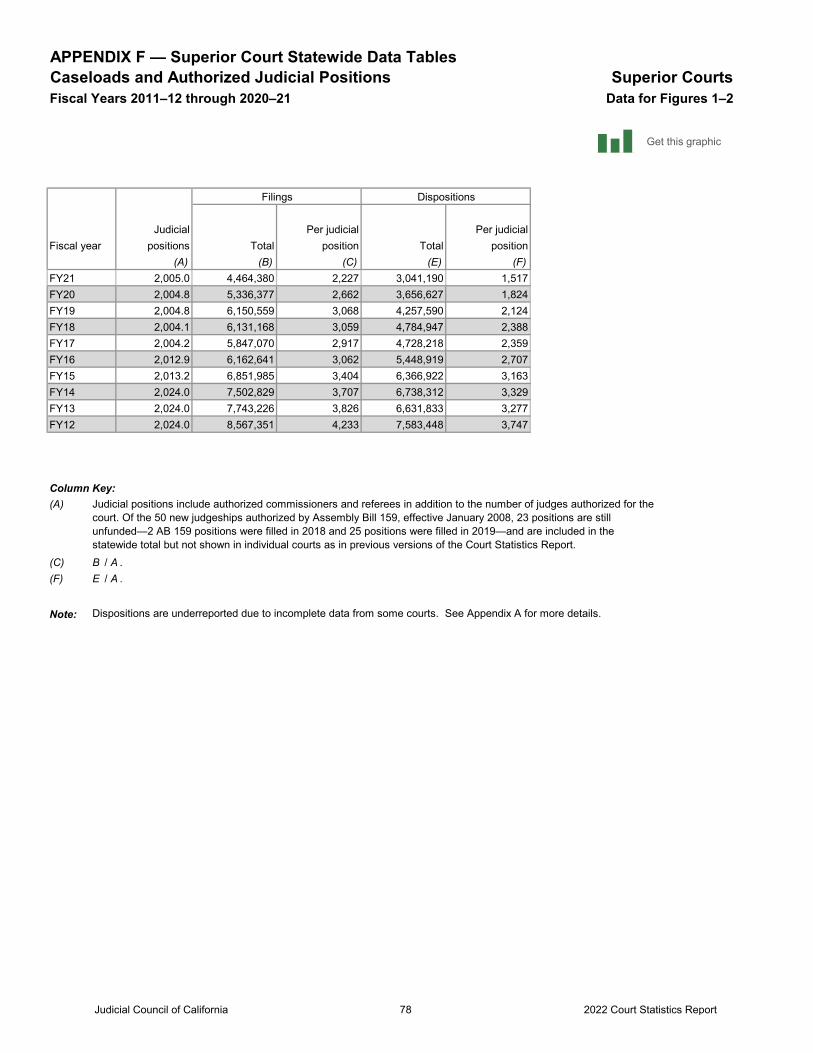
APPENDIX F — Superior Court Statewide Data Tables Caseloads and Authorized Judicial Positions Superior CourtsFiscal Years 2011–12 through 2020–21 Data for Figures 1–2
Filings Dispositions
Judicial Per judicial Per judicialpositions Total position Total position
(A) (B) (C) (E) (F)2,005.0 4,464,380 2,227 3,041,190 1,5172,004.8 5,336,377 2,662 3,656,627 1,8242,004.8 6,150,559 3,068 4,257,590 2,1242,004.1 6,131,168 3,059 4,784,947 2,3882,004.2 5,847,070 2,917 4,728,218 2,3592,012.9 6,162,641 3,062 5,448,919 2,7072,013.2 6,851,985 3,404 6,366,922 3,1632,024.0 7,502,829 3,707 6,738,312 3,3292,024.0 7,743,226 3,826 6,631,833 3,2772,024.0 8,567,351 4,233 7,583,448 3,747
Column Key:(A)
(C) B / A .(F) E / A .
Note: Dispositions are underreported due to incomplete data from some courts. See Appendix A for more details.
FY16
Fiscal year
FY21FY20FY19FY18FY17
Judicial positions include authorized commissioners and referees in addition to the number of judges authorized for the court. Of the 50 new judgeships authorized by Assembly Bill 159, effective January 2008, 23 positions are still unfunded—2 AB 159 positions were filled in 2018 and 25 positions were filled in 2019—and are included in the statewide total but not shown in individual courts as in previous versions of the Court Statistics Report.
FY14FY13FY12
FY15
Get this graphic
Judicial Council of California 2022 Court Statistics Report78
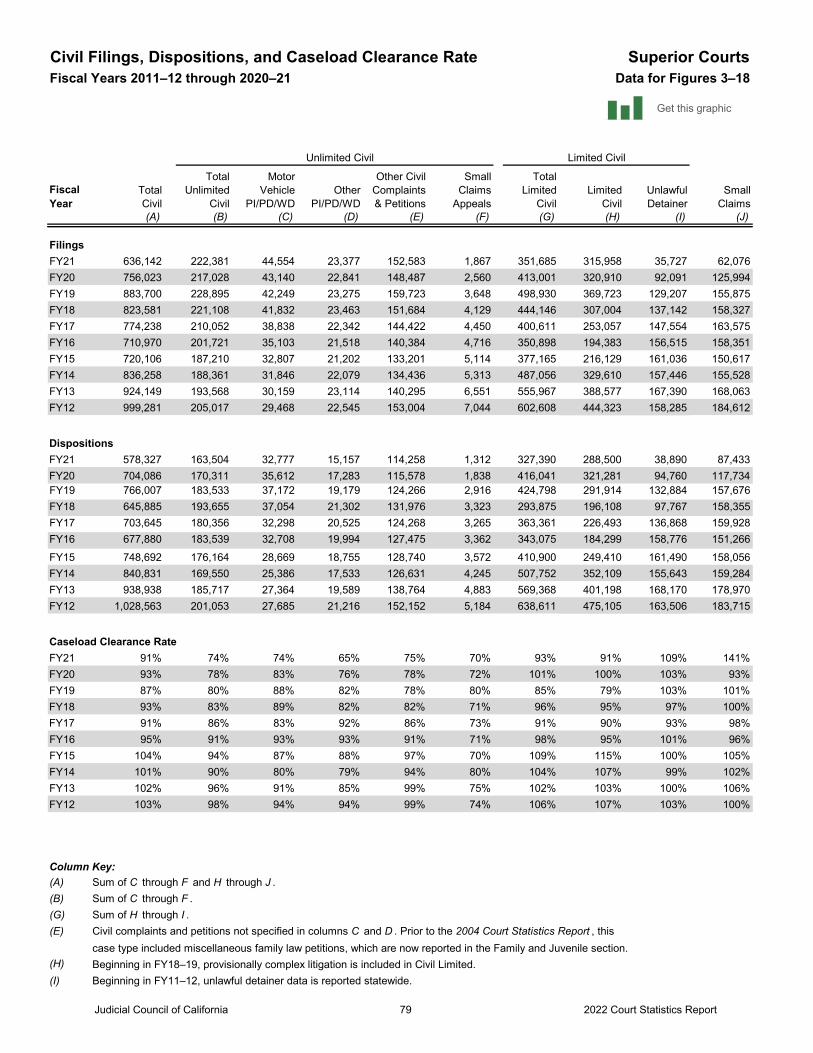
Civil Filings, Dispositions, and Caseload Clearance Rate Superior CourtsFiscal Years 2011–12 through 2020–21 Data for Figures 3–18
Unlimited Civil
(A) (B) (C) (D) (E) (F) (G) (H) (I) (J)
FilingsFY21 636,142 222,381 44,554 23,377 152,583 1,867 351,685 315,958 35,727 62,076FY20 756,023 217,028 43,140 22,841 148,487 2,560 413,001 320,910 92,091 125,994FY19 883,700 228,895 42,249 23,275 159,723 3,648 498,930 369,723 129,207 155,875FY18 823,581 221,108 41,832 23,463 151,684 4,129 444,146 307,004 137,142 158,327FY17 774,238 210,052 38,838 22,342 144,422 4,450 400,611 253,057 147,554 163,575FY16 710,970 201,721 35,103 21,518 140,384 4,716 350,898 194,383 156,515 158,351FY15 720,106 187,210 32,807 21,202 133,201 5,114 377,165 216,129 161,036 150,617FY14 836,258 188,361 31,846 22,079 134,436 5,313 487,056 329,610 157,446 155,528FY13 924,149 193,568 30,159 23,114 140,295 6,551 555,967 388,577 167,390 168,063FY12 999,281 205,017 29,468 22,545 153,004 7,044 602,608 444,323 158,285 184,612
Dispositions FY21 578,327 163,504 32,777 15,157 114,258 1,312 327,390 288,500 38,890 87,433FY20 704,086 170,311 35,612 17,283 115,578 1,838 416,041 321,281 94,760 117,734FY19 766,007 183,533 37,172 19,179 124,266 2,916 424,798 291,914 132,884 157,676FY18 645,885 193,655 37,054 21,302 131,976 3,323 293,875 196,108 97,767 158,355FY17 703,645 180,356 32,298 20,525 124,268 3,265 363,361 226,493 136,868 159,928FY16 677,880 183,539 32,708 19,994 127,475 3,362 343,075 184,299 158,776 151,266FY15 748,692 176,164 28,669 18,755 128,740 3,572 410,900 249,410 161,490 158,056FY14 840,831 169,550 25,386 17,533 126,631 4,245 507,752 352,109 155,643 159,284FY13 938,938 185,717 27,364 19,589 138,764 4,883 569,368 401,198 168,170 178,970FY12 1,028,563 201,053 27,685 21,216 152,152 5,184 638,611 475,105 163,506 183,715
Caseload Clearance RateFY21 91% 74% 74% 65% 75% 70% 93% 91% 109% 141%FY20 93% 78% 83% 76% 78% 72% 101% 100% 103% 93%FY19 87% 80% 88% 82% 78% 80% 85% 79% 103% 101%FY18 93% 83% 89% 82% 82% 71% 96% 95% 97% 100%FY17 91% 86% 83% 92% 86% 73% 91% 90% 93% 98%FY16 95% 91% 93% 93% 91% 71% 98% 95% 101% 96%FY15 104% 94% 87% 88% 97% 70% 109% 115% 100% 105%FY14 101% 90% 80% 79% 94% 80% 104% 107% 99% 102%FY13 102% 96% 91% 85% 99% 75% 102% 103% 100% 106%FY12 103% 98% 94% 94% 99% 74% 106% 107% 103% 100%
Column Key:(A) Sum of C through F and H through J .(B) Sum of C through F .(G) Sum of H through I .(E) Civil complaints and petitions not specified in columns C and D . Prior to the 2004 Court Statistics Report , this
case type included miscellaneous family law petitions, which are now reported in the Family and Juvenile section.(H) Beginning in FY18–19, provisionally complex litigation is included in Civil Limited.(I) Beginning in FY11–12, unlawful detainer data is reported statewide.
Limited Civil
SmallClaims
TotalCivil
Fiscal Year
TotalUnlimited
Civil
MotorVehicle
PI/PD/WDOther
PI/PD/WD
Other CivilComplaints& Petitions
Small Claims
Appeals
Total Limited
CivilLimited
CivilUnlawful Detainer
Get this graphic
Judicial Council of California 2022 Court Statistics Report79
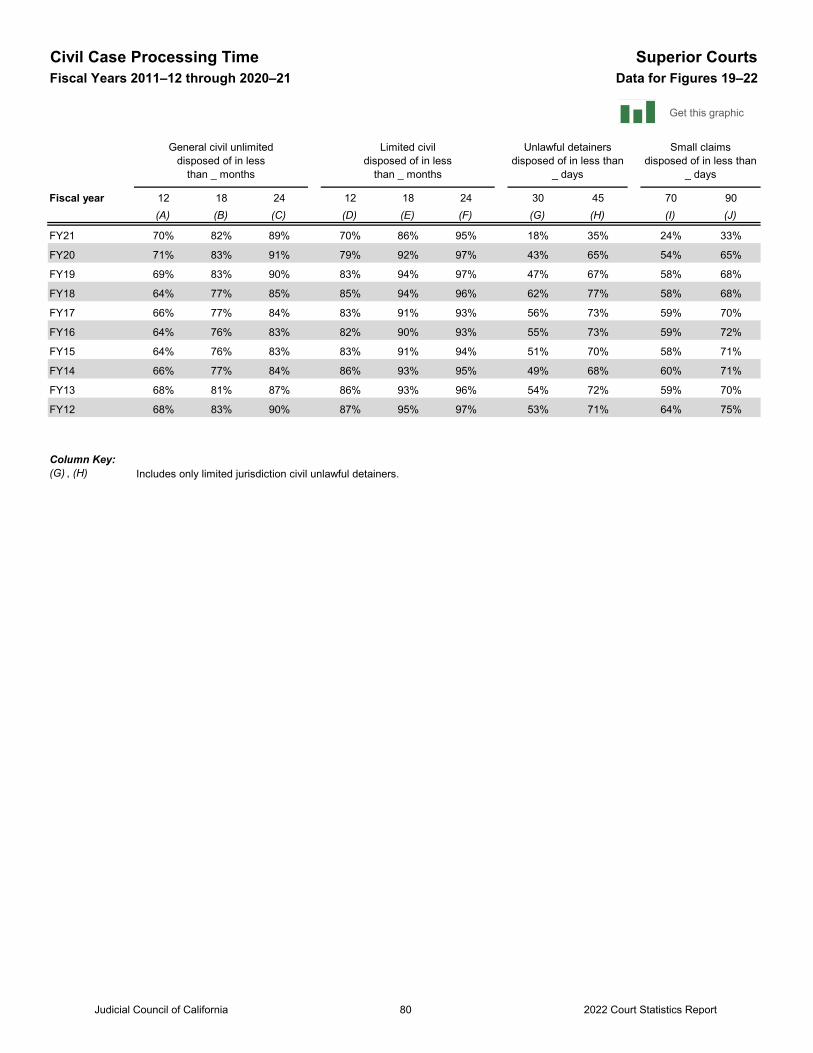
Civil Case Processing Time Superior CourtsFiscal Years 2011–12 through 2020–21 Data for Figures 19–22
Fiscal year 12 18 24 12 18 24 30 45 70 90(A) (B) (C) (D) (E) (F) (G) (H) (I) (J)
FY21 70% 82% 89% 70% 86% 95% 18% 35% 24% 33%
FY20 71% 83% 91% 79% 92% 97% 43% 65% 54% 65%
FY19 69% 83% 90% 83% 94% 97% 47% 67% 58% 68%
FY18 64% 77% 85% 85% 94% 96% 62% 77% 58% 68%
FY17 66% 77% 84% 83% 91% 93% 56% 73% 59% 70%
FY16 64% 76% 83% 82% 90% 93% 55% 73% 59% 72%
FY15 64% 76% 83% 83% 91% 94% 51% 70% 58% 71%
FY14 66% 77% 84% 86% 93% 95% 49% 68% 60% 71%
FY13 68% 81% 87% 86% 93% 96% 54% 72% 59% 70%
FY12 68% 83% 90% 87% 95% 97% 53% 71% 64% 75%
Column Key:(G) , (H) Includes only limited jurisdiction civil unlawful detainers.
General civil unlimited disposed of in less
than _ months
Limited civil disposed of in less
than _ months
Unlawful detainers disposed of in less than
_ days
Small claims disposed of in less than
_ days
Get this graphic
Judicial Council of California 2022 Court Statistics Report80
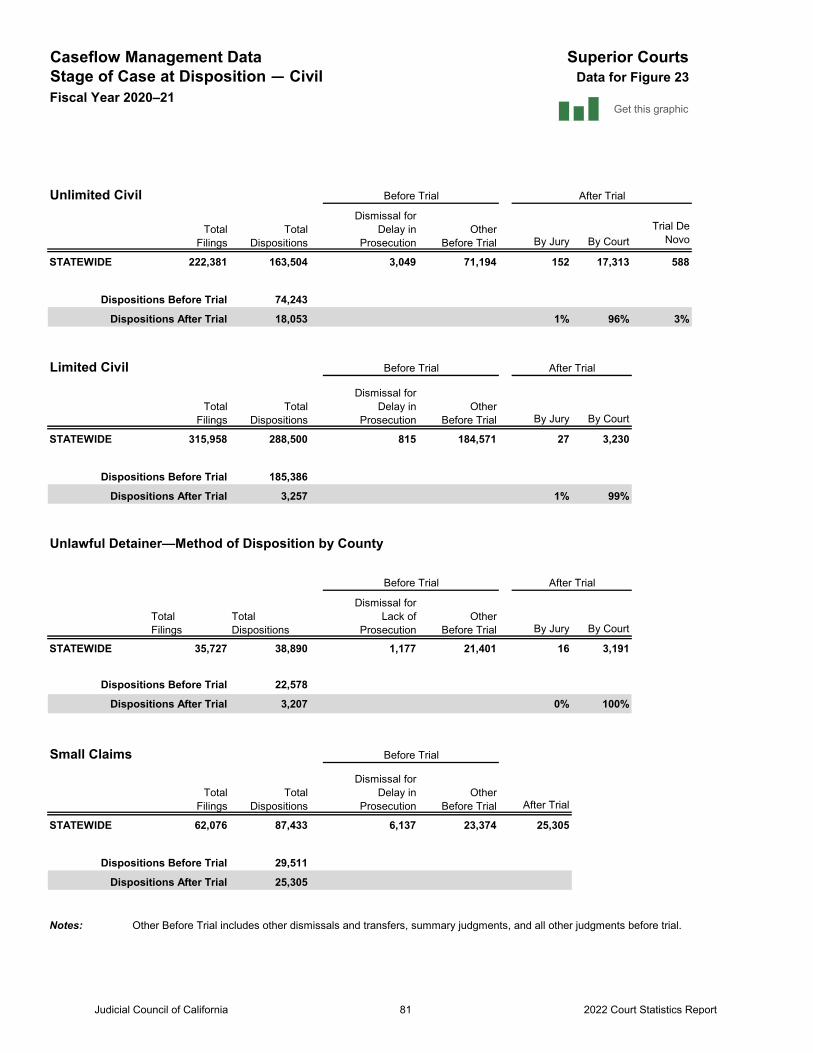
Caseflow Management Data Superior CourtsStage of Case at Disposition — Civil Data for Figure 23Fiscal Year 2020–21
Unlimited Civil
By Jury By CourtTrial De
Novo
STATEWIDE 222,381 163,504 3,049 71,194 152 17,313 588
Dispositions Before Trial 74,243
Dispositions After Trial 18,053 1% 96% 3%
Limited Civil
By Jury By Court
STATEWIDE 315,958 288,500 815 184,571 27 3,230
Dispositions Before Trial 185,386
Dispositions After Trial 3,257 1% 99%
Unlawful Detainer—Method of Disposition by County
By Jury By Court
STATEWIDE 35,727 38,890 1,177 21,401 16 3,191
Dispositions Before Trial 22,578
Dispositions After Trial 3,207 0% 100%
Small Claims
After Trial
STATEWIDE 62,076 87,433 6,137 23,374 25,305
Dispositions Before Trial 29,511
Dispositions After Trial 25,305
Notes: Other Before Trial includes other dismissals and transfers, summary judgments, and all other judgments before trial.
After Trial
After Trial
TotalFilings
TotalDispositions
OtherBefore Trial
After Trial
Dismissal forDelay in
Prosecution
Dismissal forDelay in
Prosecution
Dismissal forDelay in
Prosecution
Before Trial
TotalFilings
Before Trial
TotalFilings
TotalDispositions
OtherBefore Trial
Before Trial
TotalDispositions
OtherBefore Trial
TotalFilings
TotalDispositions
Dismissal forLack of
ProsecutionOther
Before Trial
Before Trial
Get this graphic
Judicial Council of California 81 2022 Court Statistics Report
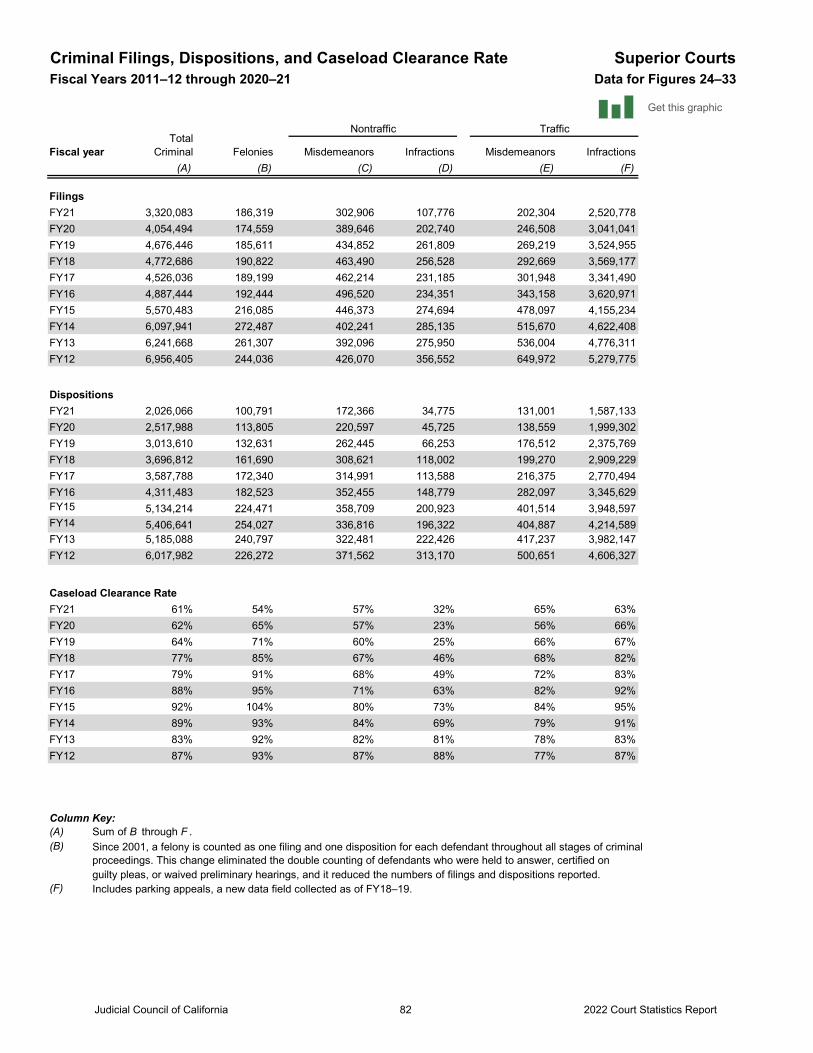
Criminal Filings, Dispositions, and Caseload Clearance Rate Superior CourtsFiscal Years 2011–12 through 2020–21 Data for Figures 24–33
Felonies Misdemeanors Infractions Misdemeanors Infractions(A) (B) (C) (D) (E) (F)
FilingsFY21 3,320,083 186,319 302,906 107,776 202,304 2,520,778FY20 4,054,494 174,559 389,646 202,740 246,508 3,041,041FY19 4,676,446 185,611 434,852 261,809 269,219 3,524,955FY18 4,772,686 190,822 463,490 256,528 292,669 3,569,177FY17 4,526,036 189,199 462,214 231,185 301,948 3,341,490FY16 4,887,444 192,444 496,520 234,351 343,158 3,620,971FY15 5,570,483 216,085 446,373 274,694 478,097 4,155,234FY14 6,097,941 272,487 402,241 285,135 515,670 4,622,408FY13 6,241,668 261,307 392,096 275,950 536,004 4,776,311FY12 6,956,405 244,036 426,070 356,552 649,972 5,279,775
DispositionsFY21 2,026,066 100,791 172,366 34,775 131,001 1,587,133FY20 2,517,988 113,805 220,597 45,725 138,559 1,999,302FY19 3,013,610 132,631 262,445 66,253 176,512 2,375,769FY18 3,696,812 161,690 308,621 118,002 199,270 2,909,229FY17 3,587,788 172,340 314,991 113,588 216,375 2,770,494FY16 4,311,483 182,523 352,455 148,779 282,097 3,345,629FY15 5,134,214 224,471 358,709 200,923 401,514 3,948,597FY14 5,406,641 254,027 336,816 196,322 404,887 4,214,589FY13 5,185,088 240,797 322,481 222,426 417,237 3,982,147FY12 6,017,982 226,272 371,562 313,170 500,651 4,606,327
Caseload Clearance RateFY21 61% 54% 57% 32% 65% 63%FY20 62% 65% 57% 23% 56% 66%FY19 64% 71% 60% 25% 66% 67%FY18 77% 85% 67% 46% 68% 82%FY17 79% 91% 68% 49% 72% 83%FY16 88% 95% 71% 63% 82% 92%FY15 92% 104% 80% 73% 84% 95%FY14 89% 93% 84% 69% 79% 91%FY13 83% 92% 82% 81% 78% 83%FY12 87% 93% 87% 88% 77% 87%
Column Key:(A) Sum of B through F .(B) Since 2001, a felony is counted as one filing and one disposition for each defendant throughout all stages of criminal
proceedings. This change eliminated the double counting of defendants who were held to answer, certified onguilty pleas, or waived preliminary hearings, and it reduced the numbers of filings and dispositions reported.
(F) Includes parking appeals, a new data field collected as of FY18–19.
Total Criminal
Nontraffic Traffic
Fiscal year
Get this graphic
Judicial Council of California 2022 Court Statistics Report82
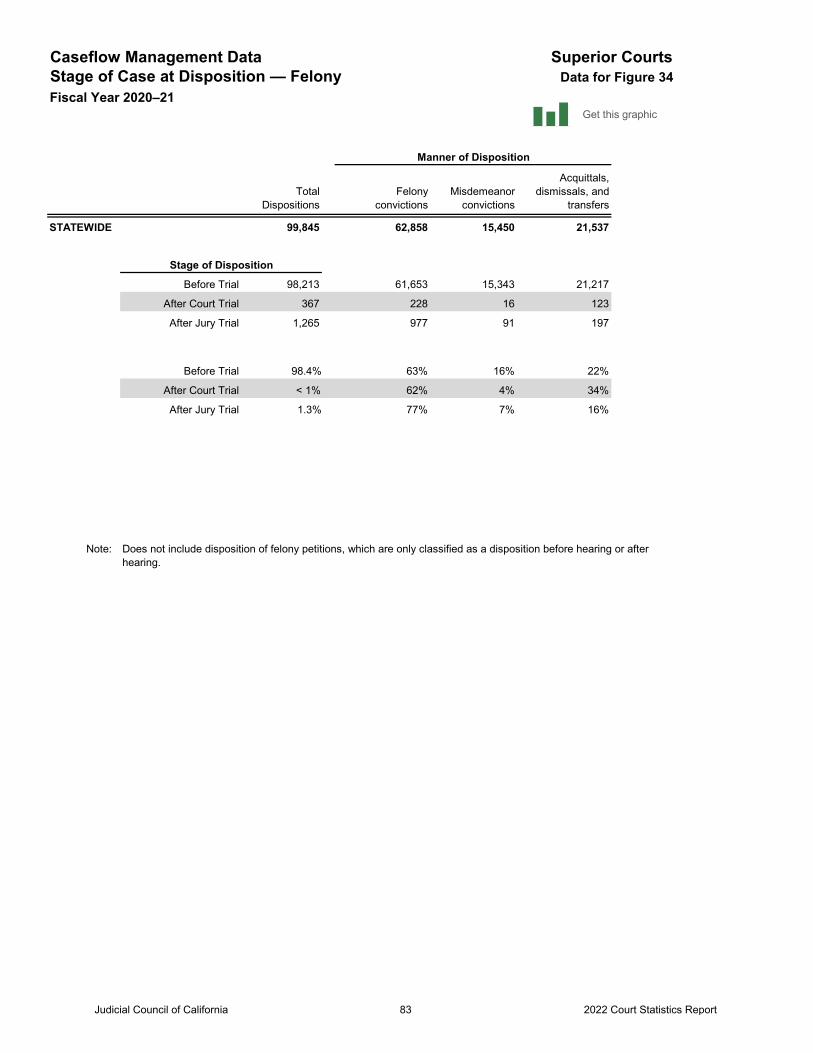
Superior CourtsData for Figure 34
Caseflow Management DataStage of Case at Disposition — FelonyFiscal Year 2020–21
TotalDispositions
Felonyconvictions
Misdemeanor convictions
Acquittals, dismissals, and
transfers
STATEWIDE 99,845 62,858 15,450 21,537
Before Trial 98,213 61,653 15,343 21,217
After Court Trial 367 228 16 123
After Jury Trial 1,265 977 91 197
Before Trial 98.4% 63% 16% 22%
After Court Trial < 1% 62% 4% 34%
After Jury Trial 1.3% 77% 7% 16%
Note: Does not include disposition of felony petitions, which are only classified as a disposition before hearing or after hearing.
Manner of Disposition
Stage of Disposition
Get this graphic
Judicial Council of California 2022 Court Statistics Report83
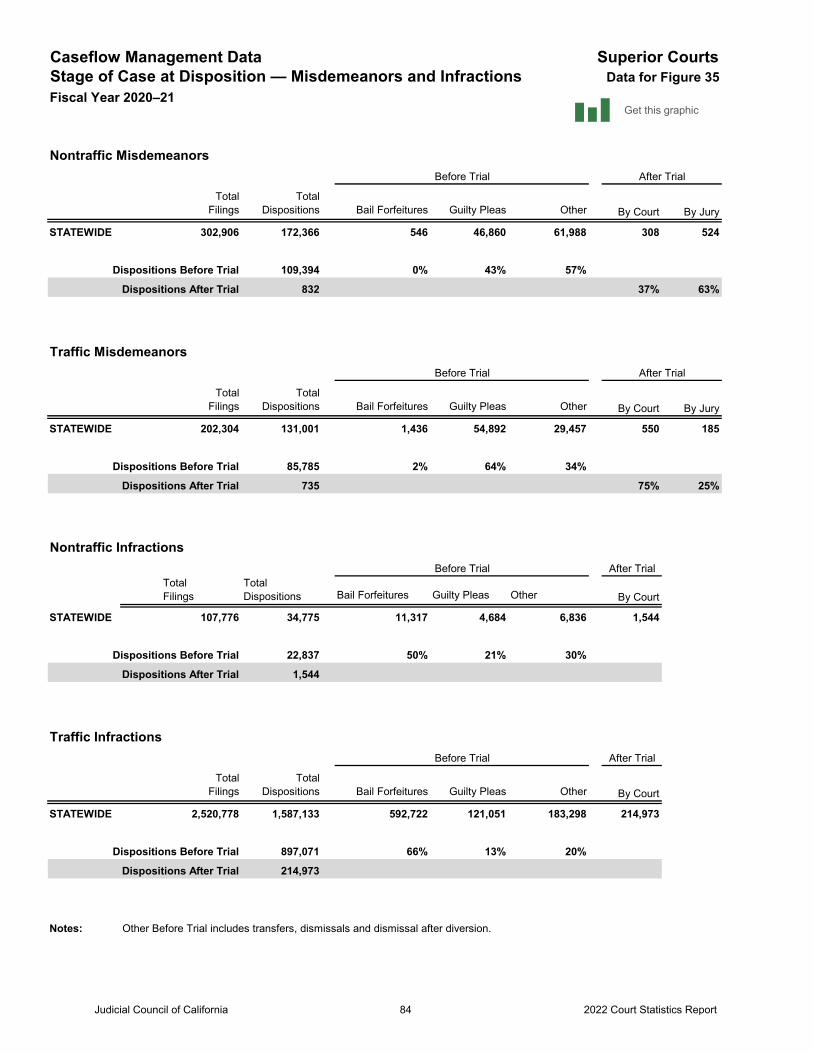
Caseflow Management Data Superior CourtsStage of Case at Disposition — Misdemeanors and InfractionsFiscal Year 2020–21
Nontraffic Misdemeanors
TotalFilings
TotalDispositions Bail Forfeitures Guilty Pleas Other By Court By Jury
STATEWIDE 302,906 172,366 546 46,860 61,988 308 524
Dispositions Before Trial 109,394 0% 43% 57%
Dispositions After Trial 832 37% 63%
Traffic Misdemeanors
TotalFilings
TotalDispositions Bail Forfeitures Guilty Pleas Other By Court By Jury
STATEWIDE 202,304 131,001 1,436 54,892 29,457 550 185
Dispositions Before Trial 85,785 2% 64% 34%
Dispositions After Trial 735 75% 25%
Nontraffic InfractionsAfter Trial
TotalFilings
TotalDispositions Bail Forfeitures Guilty Pleas Other By Court
STATEWIDE 107,776 34,775 11,317 4,684 6,836 1,544
Dispositions Before Trial 22,837 50% 21% 30%
Dispositions After Trial 1,544
Traffic InfractionsAfter Trial
TotalFilings
TotalDispositions Bail Forfeitures Guilty Pleas Other By Court
STATEWIDE 2,520,778 1,587,133 592,722 121,051 183,298 214,973
Dispositions Before Trial 897,071 66% 13% 20%
Dispositions After Trial 214,973
Notes: Other Before Trial includes transfers, dismissals and dismissal after diversion.
Before Trial
After TrialBefore Trial
Before Trial After Trial
Before Trial
Data for Figure 35
Get this graphic
Judicial Council of California 84 2022 Court Statistics Report
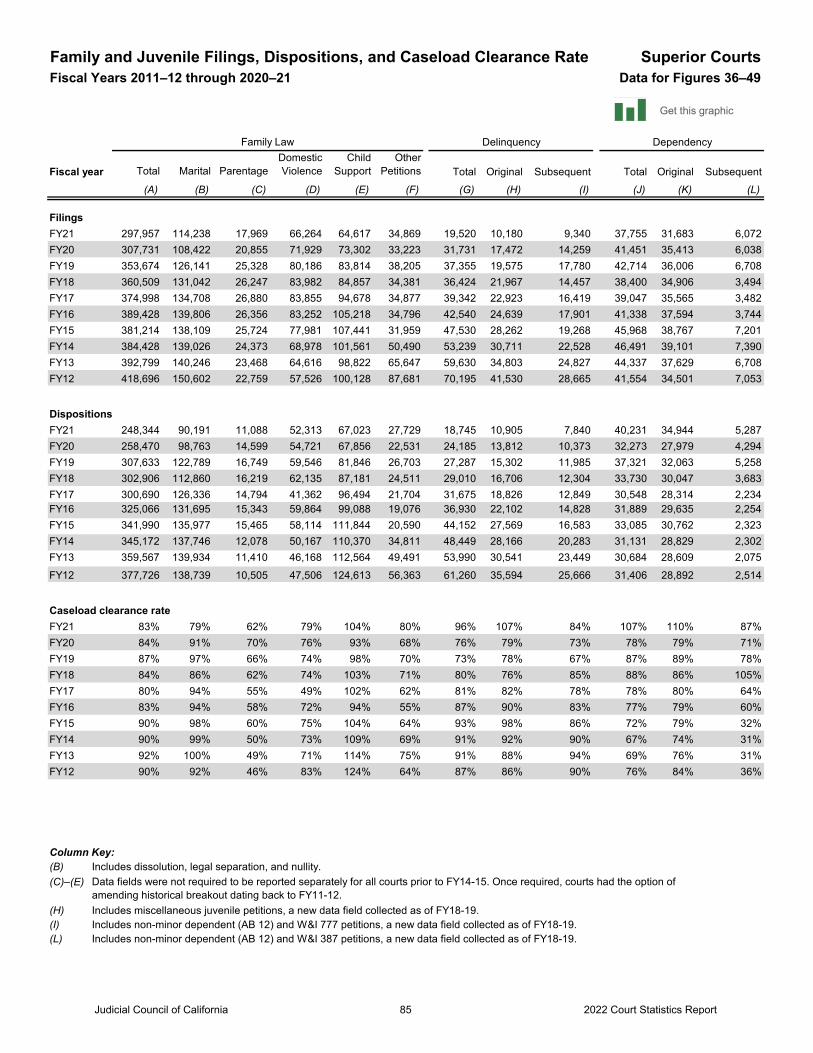
Family and Juvenile Filings, Dispositions, and Caseload Clearance Rate Superior CourtsFiscal Years 2011–12 through 2020–21 Data for Figures 36–49
Total Marital ParentageDomestic Violence
Child Support
Other Petitions Total Original Subsequent Total Original Subsequent
(A) (B) (C) (D) (E) (F) (G) (H) (I) (J) (K) (L)
FilingsFY21 297,957 114,238 17,969 66,264 64,617 34,869 19,520 10,180 9,340 37,755 31,683 6,072FY20 307,731 108,422 20,855 71,929 73,302 33,223 31,731 17,472 14,259 41,451 35,413 6,038FY19 353,674 126,141 25,328 80,186 83,814 38,205 37,355 19,575 17,780 42,714 36,006 6,708FY18 360,509 131,042 26,247 83,982 84,857 34,381 36,424 21,967 14,457 38,400 34,906 3,494FY17 374,998 134,708 26,880 83,855 94,678 34,877 39,342 22,923 16,419 39,047 35,565 3,482FY16 389,428 139,806 26,356 83,252 105,218 34,796 42,540 24,639 17,901 41,338 37,594 3,744FY15 381,214 138,109 25,724 77,981 107,441 31,959 47,530 28,262 19,268 45,968 38,767 7,201FY14 384,428 139,026 24,373 68,978 101,561 50,490 53,239 30,711 22,528 46,491 39,101 7,390FY13 392,799 140,246 23,468 64,616 98,822 65,647 59,630 34,803 24,827 44,337 37,629 6,708FY12 418,696 150,602 22,759 57,526 100,128 87,681 70,195 41,530 28,665 41,554 34,501 7,053
DispositionsFY21 248,344 90,191 11,088 52,313 67,023 27,729 18,745 10,905 7,840 40,231 34,944 5,287FY20 258,470 98,763 14,599 54,721 67,856 22,531 24,185 13,812 10,373 32,273 27,979 4,294FY19 307,633 122,789 16,749 59,546 81,846 26,703 27,287 15,302 11,985 37,321 32,063 5,258FY18 302,906 112,860 16,219 62,135 87,181 24,511 29,010 16,706 12,304 33,730 30,047 3,683FY17 300,690 126,336 14,794 41,362 96,494 21,704 31,675 18,826 12,849 30,548 28,314 2,234FY16 325,066 131,695 15,343 59,864 99,088 19,076 36,930 22,102 14,828 31,889 29,635 2,254FY15 341,990 135,977 15,465 58,114 111,844 20,590 44,152 27,569 16,583 33,085 30,762 2,323FY14 345,172 137,746 12,078 50,167 110,370 34,811 48,449 28,166 20,283 31,131 28,829 2,302FY13 359,567 139,934 11,410 46,168 112,564 49,491 53,990 30,541 23,449 30,684 28,609 2,075FY12 377,726 138,739 10,505 47,506 124,613 56,363 61,260 35,594 25,666 31,406 28,892 2,514
Caseload clearance rateFY21 83% 79% 62% 79% 104% 80% 96% 107% 84% 107% 110% 87%FY20 84% 91% 70% 76% 93% 68% 76% 79% 73% 78% 79% 71%FY19 87% 97% 66% 74% 98% 70% 73% 78% 67% 87% 89% 78%FY18 84% 86% 62% 74% 103% 71% 80% 76% 85% 88% 86% 105%FY17 80% 94% 55% 49% 102% 62% 81% 82% 78% 78% 80% 64%FY16 83% 94% 58% 72% 94% 55% 87% 90% 83% 77% 79% 60%FY15 90% 98% 60% 75% 104% 64% 93% 98% 86% 72% 79% 32%FY14 90% 99% 50% 73% 109% 69% 91% 92% 90% 67% 74% 31%FY13 92% 100% 49% 71% 114% 75% 91% 88% 94% 69% 76% 31%FY12 90% 92% 46% 83% 124% 64% 87% 86% 90% 76% 84% 36%
Column Key:(B) Includes dissolution, legal separation, and nullity.(C)–(E)
(H) Includes miscellaneous juvenile petitions, a new data field collected as of FY18-19.(I) Includes non-minor dependent (AB 12) and W&I 777 petitions, a new data field collected as of FY18-19.(L) Includes non-minor dependent (AB 12) and W&I 387 petitions, a new data field collected as of FY18-19.
Data fields were not required to be reported separately for all courts prior to FY14-15. Once required, courts had the option of amending historical breakout dating back to FY11-12.
Fiscal year
Delinquency DependencyFamily Law
Get this graphic
Judicial Council of California 2022 Court Statistics Report85
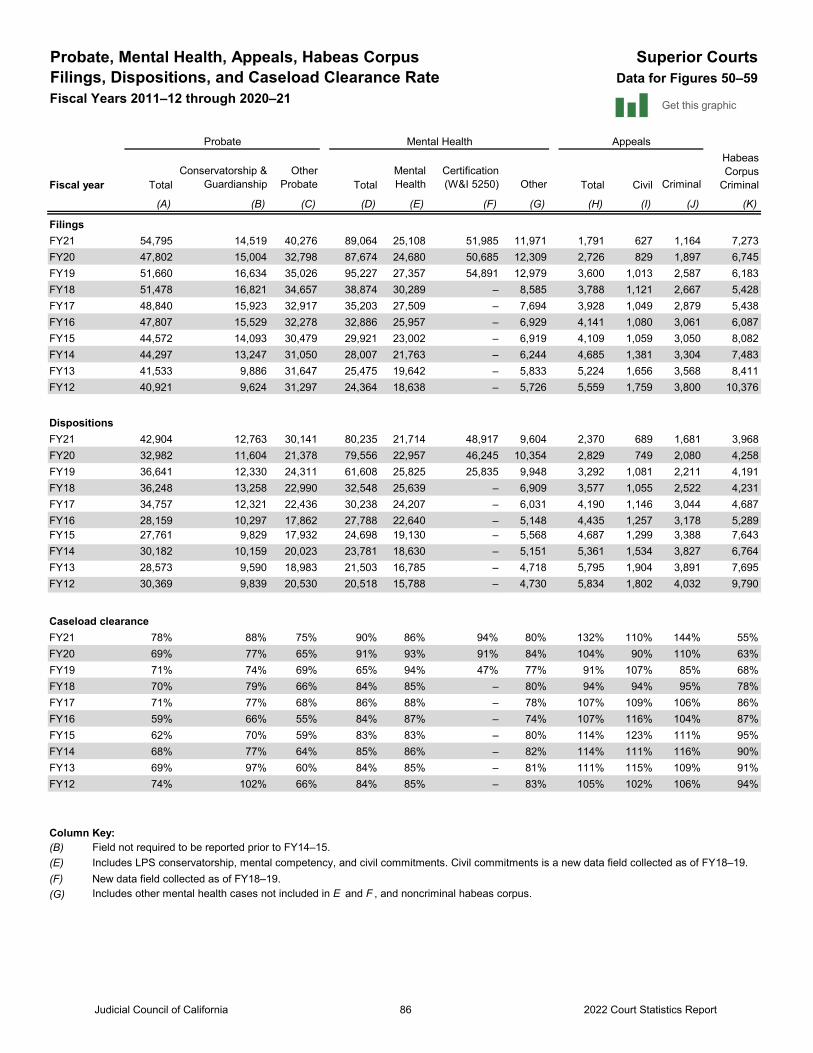
Probate, Mental Health, Appeals, Habeas Corpus Superior CourtsFilings, Dispositions, and Caseload Clearance Rate Data for Figures 50–59Fiscal Years 2011–12 through 2020–21
TotalConservatorship &
GuardianshipOther
Probate TotalMental Health
Certification (W&I 5250) Other Total Civil Criminal
(A) (B) (C) (D) (E) (F) (G) (H) (I) (J) (K)
FilingsFY21 54,795 14,519 40,276 89,064 25,108 51,985 11,971 1,791 627 1,164 7,273FY20 47,802 15,004 32,798 87,674 24,680 50,685 12,309 2,726 829 1,897 6,745FY19 51,660 16,634 35,026 95,227 27,357 54,891 12,979 3,600 1,013 2,587 6,183FY18 51,478 16,821 34,657 38,874 30,289 – 8,585 3,788 1,121 2,667 5,428FY17 48,840 15,923 32,917 35,203 27,509 – 7,694 3,928 1,049 2,879 5,438FY16 47,807 15,529 32,278 32,886 25,957 – 6,929 4,141 1,080 3,061 6,087FY15 44,572 14,093 30,479 29,921 23,002 – 6,919 4,109 1,059 3,050 8,082FY14 44,297 13,247 31,050 28,007 21,763 – 6,244 4,685 1,381 3,304 7,483FY13 41,533 9,886 31,647 25,475 19,642 – 5,833 5,224 1,656 3,568 8,411FY12 40,921 9,624 31,297 24,364 18,638 – 5,726 5,559 1,759 3,800 10,376
DispositionsFY21 42,904 12,763 30,141 80,235 21,714 48,917 9,604 2,370 689 1,681 3,968FY20 32,982 11,604 21,378 79,556 22,957 46,245 10,354 2,829 749 2,080 4,258FY19 36,641 12,330 24,311 61,608 25,825 25,835 9,948 3,292 1,081 2,211 4,191FY18 36,248 13,258 22,990 32,548 25,639 – 6,909 3,577 1,055 2,522 4,231FY17 34,757 12,321 22,436 30,238 24,207 – 6,031 4,190 1,146 3,044 4,687FY16 28,159 10,297 17,862 27,788 22,640 – 5,148 4,435 1,257 3,178 5,289FY15 27,761 9,829 17,932 24,698 19,130 – 5,568 4,687 1,299 3,388 7,643FY14 30,182 10,159 20,023 23,781 18,630 – 5,151 5,361 1,534 3,827 6,764FY13 28,573 9,590 18,983 21,503 16,785 – 4,718 5,795 1,904 3,891 7,695FY12 30,369 9,839 20,530 20,518 15,788 – 4,730 5,834 1,802 4,032 9,790
Caseload clearanceFY21 78% 88% 75% 90% 86% 94% 80% 132% 110% 144% 55%FY20 69% 77% 65% 91% 93% 91% 84% 104% 90% 110% 63%FY19 71% 74% 69% 65% 94% 47% 77% 91% 107% 85% 68%FY18 70% 79% 66% 84% 85% – 80% 94% 94% 95% 78%FY17 71% 77% 68% 86% 88% – 78% 107% 109% 106% 86%FY16 59% 66% 55% 84% 87% – 74% 107% 116% 104% 87%FY15 62% 70% 59% 83% 83% – 80% 114% 123% 111% 95%FY14 68% 77% 64% 85% 86% – 82% 114% 111% 116% 90%FY13 69% 97% 60% 84% 85% – 81% 111% 115% 109% 91%FY12 74% 102% 66% 84% 85% – 83% 105% 102% 106% 94%
Column Key:(B)(E)(F) New data field collected as of FY18–19.(G) Includes other mental health cases not included in E and F , and noncriminal habeas corpus.
Includes LPS conservatorship, mental competency, and civil commitments. Civil commitments is a new data field collected as of FY18–19.
Mental Health AppealsHabeas Corpus
CriminalFiscal year
Probate
Field not required to be reported prior to FY14–15.
Get this graphic
Judicial Council of California 2022 Court Statistics Report86
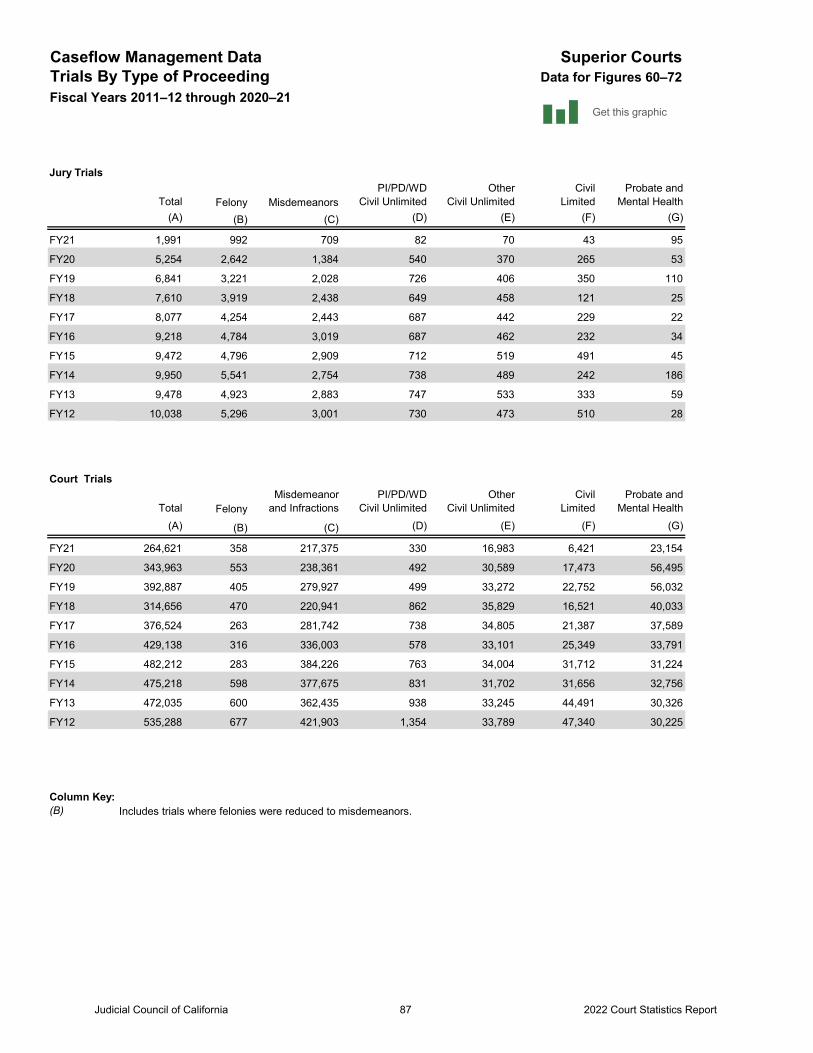
Caseflow Management Data Superior CourtsTrials By Type of Proceeding Data for Figures 60–72Fiscal Years 2011–12 through 2020–21
Jury Trials
Total Felony MisdemeanorsPI/PD/WD
Civil UnlimitedOther
Civil UnlimitedCivil
LimitedProbate and
Mental Health(A) (B) (C) (D) (E) (F) (G)
FY21 1,991 992 709 82 70 43 95
FY20 5,254 2,642 1,384 540 370 265 53
FY19 6,841 3,221 2,028 726 406 350 110
FY18 7,610 3,919 2,438 649 458 121 25
FY17 8,077 4,254 2,443 687 442 229 22
FY16 9,218 4,784 3,019 687 462 232 34
FY15 9,472 4,796 2,909 712 519 491 45
FY14 9,950 5,541 2,754 738 489 242 186
FY13 9,478 4,923 2,883 747 533 333 59
FY12 10,038 5,296 3,001 730 473 510 28
Court Trials
Total FelonyMisdemeanor
and InfractionsPI/PD/WD
Civil UnlimitedOther
Civil UnlimitedCivil
LimitedProbate and
Mental Health(A) (B) (C) (D) (E) (F) (G)
FY21 264,621 358 217,375 330 16,983 6,421 23,154
FY20 343,963 553 238,361 492 30,589 17,473 56,495
FY19 392,887 405 279,927 499 33,272 22,752 56,032
FY18 314,656 470 220,941 862 35,829 16,521 40,033
FY17 376,524 263 281,742 738 34,805 21,387 37,589
FY16 429,138 316 336,003 578 33,101 25,349 33,791
FY15 482,212 283 384,226 763 34,004 31,712 31,224
FY14 475,218 598 377,675 831 31,702 31,656 32,756
FY13 472,035 600 362,435 938 33,245 44,491 30,326
FY12 535,288 677 421,903 1,354 33,789 47,340 30,225
Column Key:(B) Includes trials where felonies were reduced to misdemeanors.
Get this graphic
Judicial Council of California 2022 Court Statistics Report87
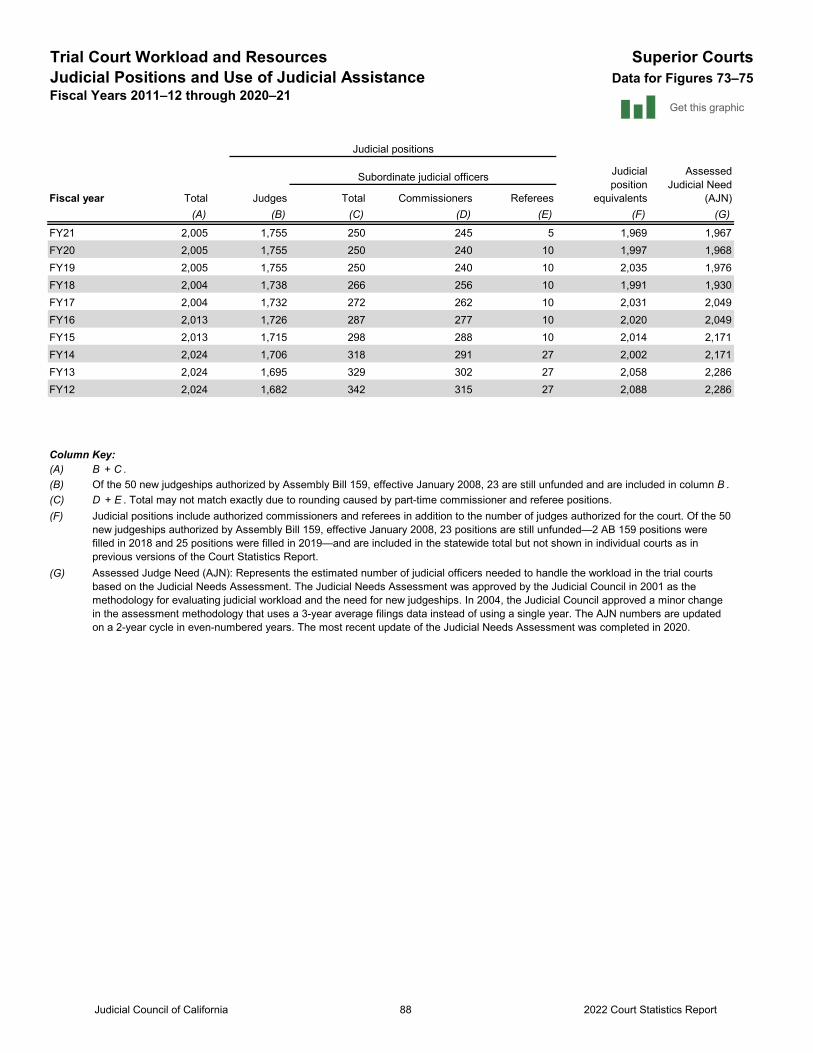
Trial Court Workload and Resources Superior CourtsJudicial Positions and Use of Judicial Assistance Data for Figures 73–75Fiscal Years 2011–12 through 2020–21
Total Judges Total Commissioners Referees(A) (B) (C) (D) (E) (F) (G)
FY21 2,005 1,755 250 245 5 1,969 1,967FY20 2,005 1,755 250 240 10 1,997 1,968FY19 2,005 1,755 250 240 10 2,035 1,976FY18 2,004 1,738 266 256 10 1,991 1,930FY17 2,004 1,732 272 262 10 2,031 2,049FY16 2,013 1,726 287 277 10 2,020 2,049FY15 2,013 1,715 298 288 10 2,014 2,171FY14 2,024 1,706 318 291 27 2,002 2,171FY13 2,024 1,695 329 302 27 2,058 2,286FY12 2,024 1,682 342 315 27 2,088 2,286
Column Key:(A) (B) (C) (F)
(G) Assessed Judge Need (AJN): Represents the estimated number of judicial officers needed to handle the workload in the trial courtsbased on the Judicial Needs Assessment. The Judicial Needs Assessment was approved by the Judicial Council in 2001 as themethodology for evaluating judicial workload and the need for new judgeships. In 2004, the Judicial Council approved a minor changein the assessment methodology that uses a 3-year average filings data instead of using a single year. The AJN numbers are updatedon a 2-year cycle in even-numbered years. The most recent update of the Judicial Needs Assessment was completed in 2020.
D + E . Total may not match exactly due to rounding caused by part-time commissioner and referee positions.Of the 50 new judgeships authorized by Assembly Bill 159, effective January 2008, 23 are still unfunded and are included in column B .
Judicial positions include authorized commissioners and referees in addition to the number of judges authorized for the court. Of the 50 new judgeships authorized by Assembly Bill 159, effective January 2008, 23 positions are still unfunded—2 AB 159 positions were filled in 2018 and 25 positions were filled in 2019—and are included in the statewide total but not shown in individual courts as in previous versions of the Court Statistics Report.
Judicial positions
Subordinate judicial officers
B + C .
Judicial position
equivalents
Assessed Judicial Need
(AJN)Fiscal year
Get this graphic
Judicial Council of California 88 2022 Court Statistics Report
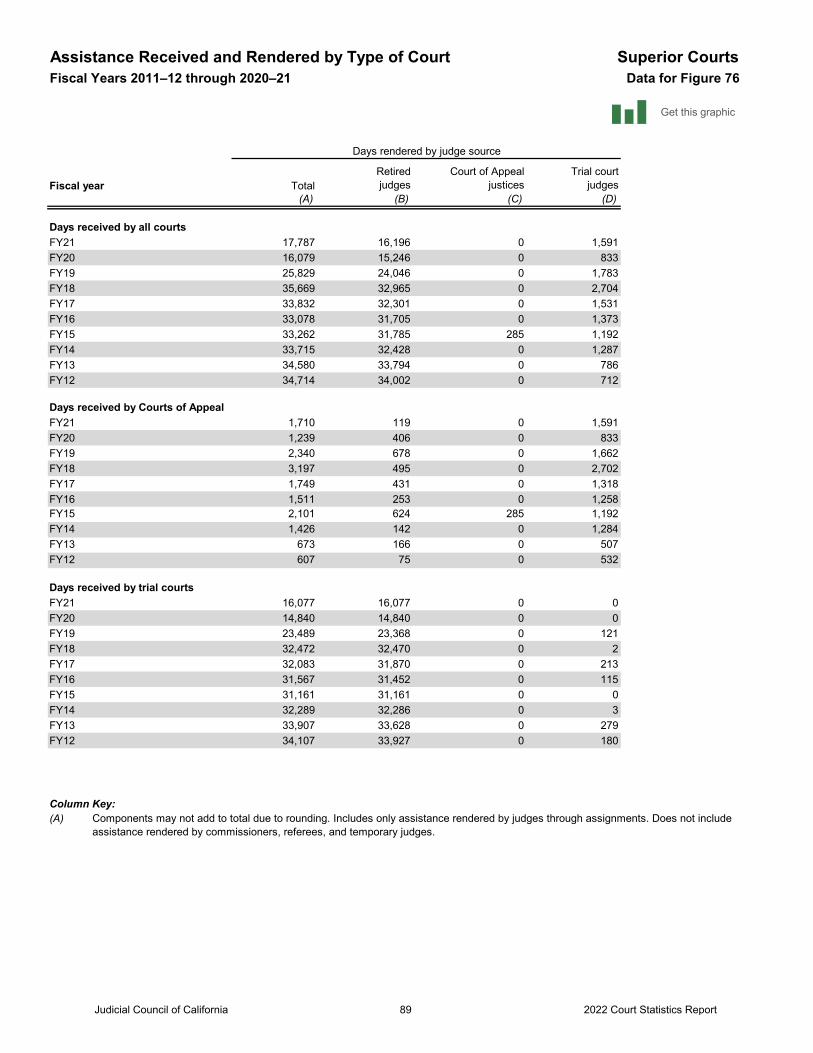
Assistance Received and Rendered by Type of Court Superior CourtsFiscal Years 2011–12 through 2020–21 Data for Figure 76
Fiscal year TotalRetired judges
Court of Appeal justices
Trial court judges
(A) (B) (C) (D)
Days received by all courtsFY21 17,787 16,196 0 1,591FY20 16,079 15,246 0 833FY19 25,829 24,046 0 1,783FY18 35,669 32,965 0 2,704FY17 33,832 32,301 0 1,531FY16 33,078 31,705 0 1,373FY15 33,262 31,785 285 1,192FY14 33,715 32,428 0 1,287FY13 34,580 33,794 0 786FY12 34,714 34,002 0 712
Days received by Courts of AppealFY21 1,710 119 0 1,591FY20 1,239 406 0 833FY19 2,340 678 0 1,662FY18 3,197 495 0 2,702FY17 1,749 431 0 1,318FY16 1,511 253 0 1,258FY15 2,101 624 285 1,192FY14 1,426 142 0 1,284FY13 673 166 0 507FY12 607 75 0 532
Days received by trial courtsFY21 16,077 16,077 0 0FY20 14,840 14,840 0 0FY19 23,489 23,368 0 121FY18 32,472 32,470 0 2FY17 32,083 31,870 0 213FY16 31,567 31,452 0 115FY15 31,161 31,161 0 0FY14 32,289 32,286 0 3FY13 33,907 33,628 0 279FY12 34,107 33,927 0 180
Column Key:(A)
Days rendered by judge source
Components may not add to total due to rounding. Includes only assistance rendered by judges through assignments. Does not include assistance rendered by commissioners, referees, and temporary judges.
Get this graphic
Judicial Council of California 2022 Court Statistics Report89
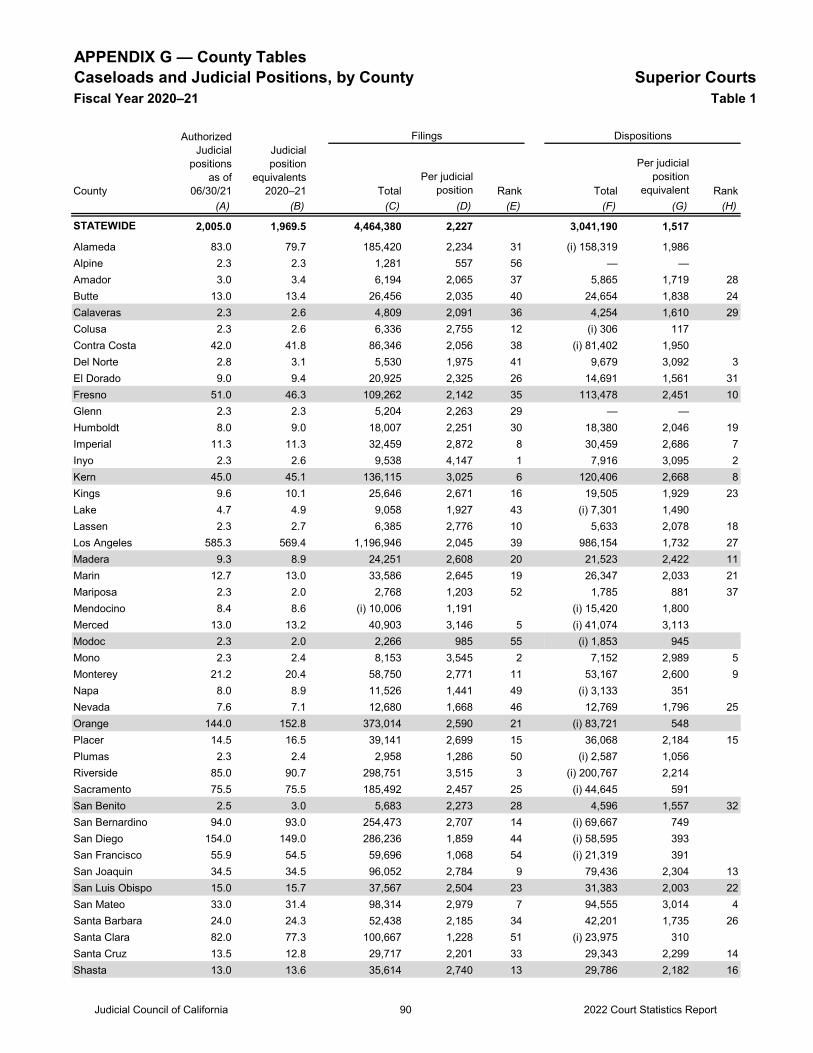
APPENDIX G — County TablesCaseloads and Judicial Positions, by County Superior CourtsFiscal Year 2020–21 Table 1
TotalPer judicial
position Rank Total
Per judicial position
equivalent Rank(A) (B) (C) (D) (E) (F) (G) (H)
2,005.0 1,969.5 4,464,380 2,227 3,041,190 1,517
Alameda 83.0 79.7 185,420 2,234 31 (i) 158,319 1,986Alpine 2.3 2.3 1,281 557 56 — —Amador 3.0 3.4 6,194 2,065 37 5,865 1,719 28Butte 13.0 13.4 26,456 2,035 40 24,654 1,838 24Calaveras 2.3 2.6 4,809 2,091 36 4,254 1,610 29Colusa 2.3 2.6 6,336 2,755 12 (i) 306 117Contra Costa 42.0 41.8 86,346 2,056 38 (i) 81,402 1,950Del Norte 2.8 3.1 5,530 1,975 41 9,679 3,092 3El Dorado 9.0 9.4 20,925 2,325 26 14,691 1,561 31Fresno 51.0 46.3 109,262 2,142 35 113,478 2,451 10Glenn 2.3 2.3 5,204 2,263 29 — —Humboldt 8.0 9.0 18,007 2,251 30 18,380 2,046 19Imperial 11.3 11.3 32,459 2,872 8 30,459 2,686 7Inyo 2.3 2.6 9,538 4,147 1 7,916 3,095 2Kern 45.0 45.1 136,115 3,025 6 120,406 2,668 8Kings 9.6 10.1 25,646 2,671 16 19,505 1,929 23Lake 4.7 4.9 9,058 1,927 43 (i) 7,301 1,490Lassen 2.3 2.7 6,385 2,776 10 5,633 2,078 18Los Angeles 585.3 569.4 1,196,946 2,045 39 986,154 1,732 27Madera 9.3 8.9 24,251 2,608 20 21,523 2,422 11Marin 12.7 13.0 33,586 2,645 19 26,347 2,033 21Mariposa 2.3 2.0 2,768 1,203 52 1,785 881 37Mendocino 8.4 8.6 (i) 10,006 1,191 (i) 15,420 1,800Merced 13.0 13.2 40,903 3,146 5 (i) 41,074 3,113Modoc 2.3 2.0 2,266 985 55 (i) 1,853 945Mono 2.3 2.4 8,153 3,545 2 7,152 2,989 5Monterey 21.2 20.4 58,750 2,771 11 53,167 2,600 9Napa 8.0 8.9 11,526 1,441 49 (i) 3,133 351Nevada 7.6 7.1 12,680 1,668 46 12,769 1,796 25Orange 144.0 152.8 373,014 2,590 21 (i) 83,721 548Placer 14.5 16.5 39,141 2,699 15 36,068 2,184 15Plumas 2.3 2.4 2,958 1,286 50 (i) 2,587 1,056Riverside 85.0 90.7 298,751 3,515 3 (i) 200,767 2,214Sacramento 75.5 75.5 185,492 2,457 25 (i) 44,645 591San Benito 2.5 3.0 5,683 2,273 28 4,596 1,557 32San Bernardino 94.0 93.0 254,473 2,707 14 (i) 69,667 749San Diego 154.0 149.0 286,236 1,859 44 (i) 58,595 393San Francisco 55.9 54.5 59,696 1,068 54 (i) 21,319 391San Joaquin 34.5 34.5 96,052 2,784 9 79,436 2,304 13San Luis Obispo 15.0 15.7 37,567 2,504 23 31,383 2,003 22San Mateo 33.0 31.4 98,314 2,979 7 94,555 3,014 4Santa Barbara 24.0 24.3 52,438 2,185 34 42,201 1,735 26Santa Clara 82.0 77.3 100,667 1,228 51 (i) 23,975 310Santa Cruz 13.5 12.8 29,717 2,201 33 29,343 2,299 14Shasta 13.0 13.6 35,614 2,740 13 29,786 2,182 16
STATEWIDE
Dispositions
County
Authorized Judicial
positions as of
06/30/21
Judicial position
equivalents 2020–21
Filings
Judicial Council of California 2022 Court Statistics Report90
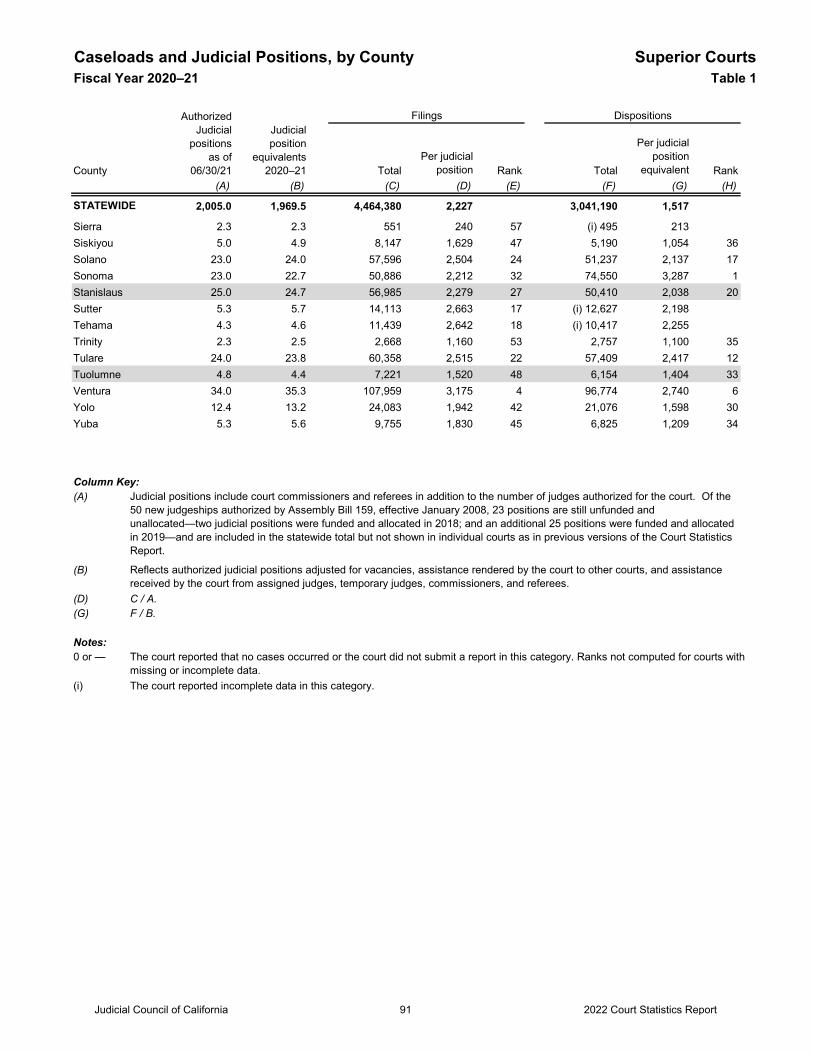
Caseloads and Judicial Positions, by County Superior CourtsFiscal Year 2020–21 Table 1
TotalPer judicial
position Rank Total
Per judicial position
equivalent Rank(A) (B) (C) (D) (E) (F) (G) (H)
2,005.0 1,969.5 4,464,380 2,227 3,041,190 1,517STATEWIDE
Dispositions
County
Authorized Judicial
positions as of
06/30/21
Judicial position
equivalents 2020–21
Filings
Sierra 2.3 2.3 551 240 57 (i) 495 213Siskiyou 5.0 4.9 8,147 1,629 47 5,190 1,054 36Solano 23.0 24.0 57,596 2,504 24 51,237 2,137 17Sonoma 23.0 22.7 50,886 2,212 32 74,550 3,287 1Stanislaus 25.0 24.7 56,985 2,279 27 50,410 2,038 20Sutter 5.3 5.7 14,113 2,663 17 (i) 12,627 2,198Tehama 4.3 4.6 11,439 2,642 18 (i) 10,417 2,255Trinity 2.3 2.5 2,668 1,160 53 2,757 1,100 35Tulare 24.0 23.8 60,358 2,515 22 57,409 2,417 12Tuolumne 4.8 4.4 7,221 1,520 48 6,154 1,404 33Ventura 34.0 35.3 107,959 3,175 4 96,774 2,740 6Yolo 12.4 13.2 24,083 1,942 42 21,076 1,598 30Yuba 5.3 5.6 9,755 1,830 45 6,825 1,209 34
Column Key:(A)
(B)
(D) C / A.(G) F / B.
Notes:0 or —
(i) The court reported incomplete data in this category.
Judicial positions include court commissioners and referees in addition to the number of judges authorized for the court. Of the 50 new judgeships authorized by Assembly Bill 159, effective January 2008, 23 positions are still unfunded and unallocated—two judicial positions were funded and allocated in 2018; and an additional 25 positions were funded and allocated in 2019—and are included in the statewide total but not shown in individual courts as in previous versions of the Court Statistics Report.
The court reported that no cases occurred or the court did not submit a report in this category. Ranks not computed for courts with missing or incomplete data.
Reflects authorized judicial positions adjusted for vacancies, assistance rendered by the court to other courts, and assistance received by the court from assigned judges, temporary judges, commissioners, and referees.
Judicial Council of California 2022 Court Statistics Report91
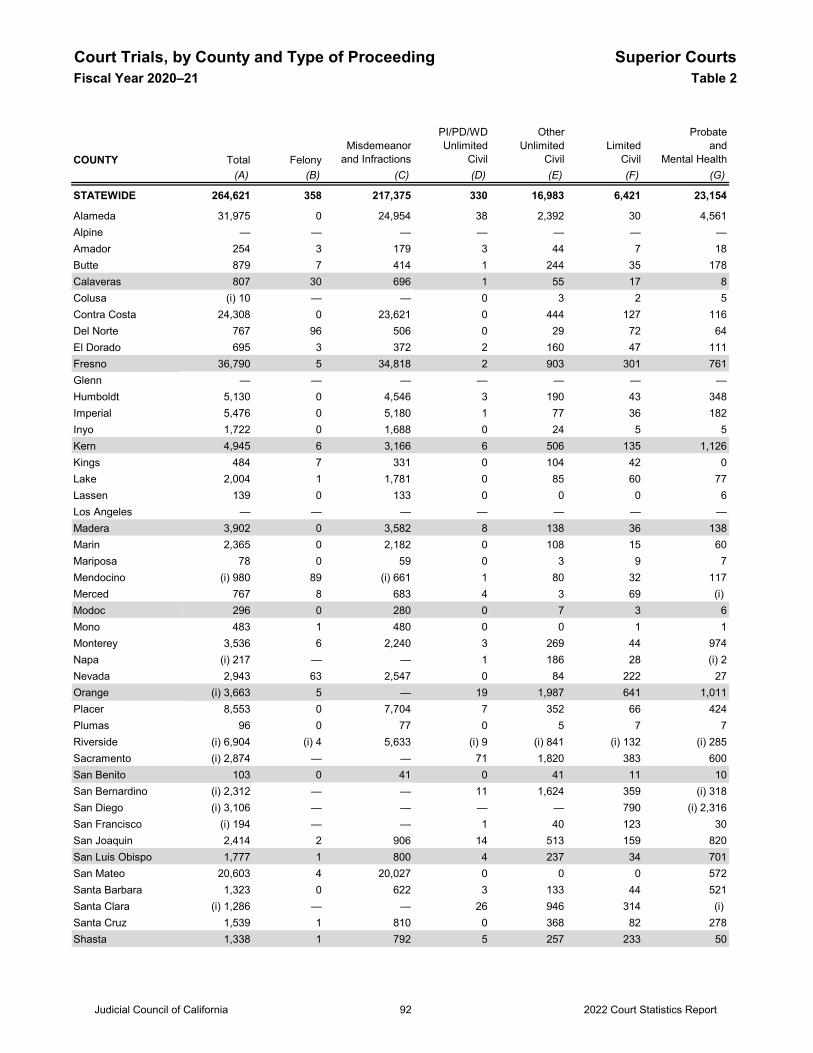
Court Trials, by County and Type of Proceeding Superior CourtsFiscal Year 2020–21 Table 2
COUNTY Total FelonyMisdemeanor
and Infractions
PI/PD/WDUnlimited
Civil
OtherUnlimited
CivilLimited
Civil
Probateand
Mental Health(A) (B) (C) (D) (E) (F) (G)
STATEWIDE 264,621 358 217,375 330 16,983 6,421 23,154
Alameda 31,975 0 24,954 38 2,392 30 4,561Alpine — — — — — — —Amador 254 3 179 3 44 7 18Butte 879 7 414 1 244 35 178Calaveras 807 30 696 1 55 17 8Colusa (i) 10 — — 0 3 2 5Contra Costa 24,308 0 23,621 0 444 127 116Del Norte 767 96 506 0 29 72 64El Dorado 695 3 372 2 160 47 111Fresno 36,790 5 34,818 2 903 301 761Glenn — — — — — — —Humboldt 5,130 0 4,546 3 190 43 348Imperial 5,476 0 5,180 1 77 36 182Inyo 1,722 0 1,688 0 24 5 5Kern 4,945 6 3,166 6 506 135 1,126Kings 484 7 331 0 104 42 0Lake 2,004 1 1,781 0 85 60 77Lassen 139 0 133 0 0 0 6Los Angeles — — — — — — —Madera 3,902 0 3,582 8 138 36 138Marin 2,365 0 2,182 0 108 15 60Mariposa 78 0 59 0 3 9 7Mendocino (i) 980 89 (i) 661 1 80 32 117Merced 767 8 683 4 3 69 (i) Modoc 296 0 280 0 7 3 6Mono 483 1 480 0 0 1 1Monterey 3,536 6 2,240 3 269 44 974Napa (i) 217 — — 1 186 28 (i) 2Nevada 2,943 63 2,547 0 84 222 27Orange (i) 3,663 5 — 19 1,987 641 1,011Placer 8,553 0 7,704 7 352 66 424Plumas 96 0 77 0 5 7 7Riverside (i) 6,904 (i) 4 5,633 (i) 9 (i) 841 (i) 132 (i) 285Sacramento (i) 2,874 — — 71 1,820 383 600San Benito 103 0 41 0 41 11 10San Bernardino (i) 2,312 — — 11 1,624 359 (i) 318San Diego (i) 3,106 — — — — 790 (i) 2,316San Francisco (i) 194 — — 1 40 123 30San Joaquin 2,414 2 906 14 513 159 820San Luis Obispo 1,777 1 800 4 237 34 701San Mateo 20,603 4 20,027 0 0 0 572Santa Barbara 1,323 0 622 3 133 44 521Santa Clara (i) 1,286 — — 26 946 314 (i) Santa Cruz 1,539 1 810 0 368 82 278Shasta 1,338 1 792 5 257 233 50
Judicial Council of California 2022 Court Statistics Report92
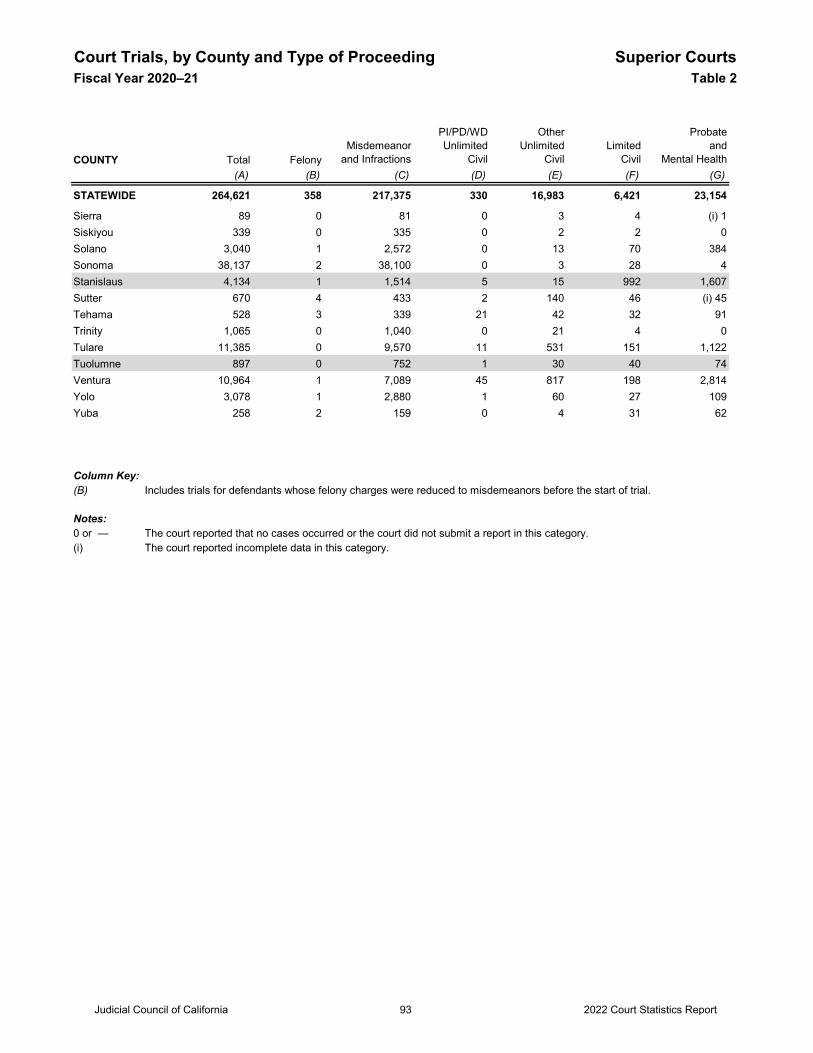
Court Trials, by County and Type of Proceeding Superior CourtsFiscal Year 2020–21 Table 2
COUNTY Total FelonyMisdemeanor
and Infractions
PI/PD/WDUnlimited
Civil
OtherUnlimited
CivilLimited
Civil
Probateand
Mental Health(A) (B) (C) (D) (E) (F) (G)
STATEWIDE 264,621 358 217,375 330 16,983 6,421 23,154
Sierra 89 0 81 0 3 4 (i) 1Siskiyou 339 0 335 0 2 2 0Solano 3,040 1 2,572 0 13 70 384Sonoma 38,137 2 38,100 0 3 28 4Stanislaus 4,134 1 1,514 5 15 992 1,607Sutter 670 4 433 2 140 46 (i) 45Tehama 528 3 339 21 42 32 91Trinity 1,065 0 1,040 0 21 4 0Tulare 11,385 0 9,570 11 531 151 1,122Tuolumne 897 0 752 1 30 40 74Ventura 10,964 1 7,089 45 817 198 2,814Yolo 3,078 1 2,880 1 60 27 109Yuba 258 2 159 0 4 31 62
Column Key:(B) Includes trials for defendants whose felony charges were reduced to misdemeanors before the start of trial.
Notes:0 or — The court reported that no cases occurred or the court did not submit a report in this category.(i) The court reported incomplete data in this category.
Judicial Council of California 2022 Court Statistics Report93
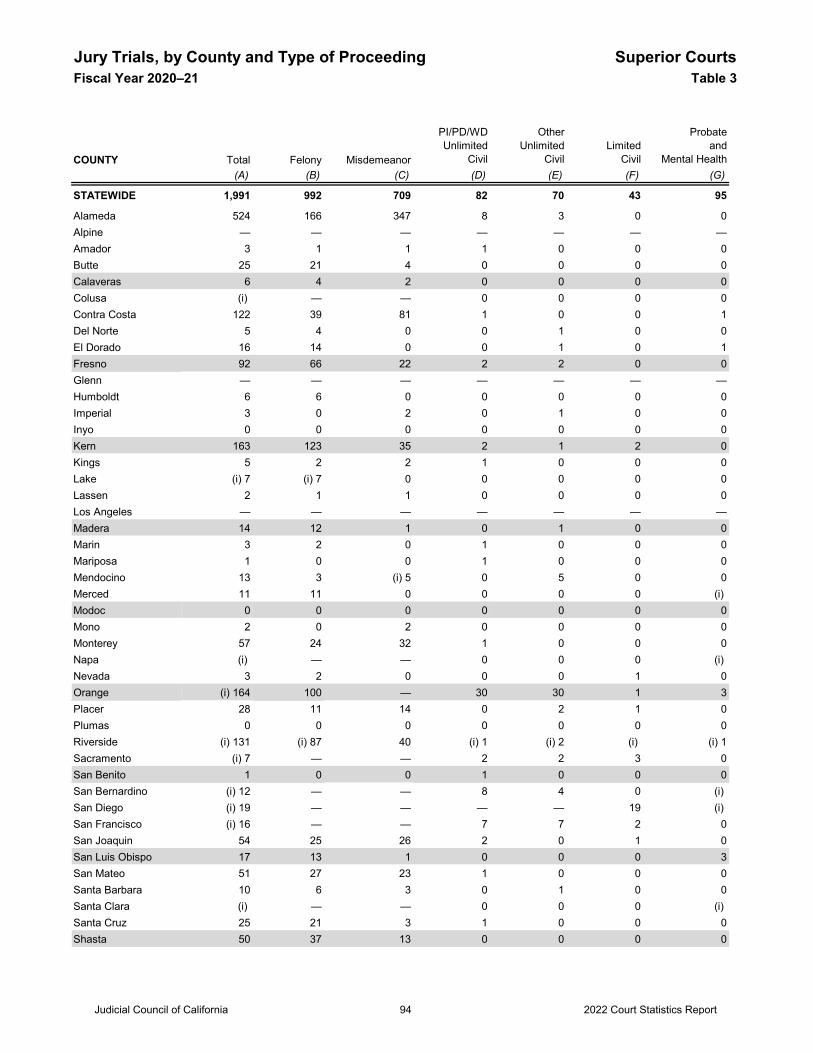
Jury Trials, by County and Type of Proceeding Superior CourtsFiscal Year 2020–21 Table 3
COUNTY Total Felony Misdemeanor
PI/PD/WDUnlimited
Civil
OtherUnlimited
CivilLimited
Civil
Probateand
Mental Health(A) (B) (C) (D) (E) (F) (G)
STATEWIDE 1,991 992 709 82 70 43 95
Alameda 524 166 347 8 3 0 0Alpine — — — — — — —Amador 3 1 1 1 0 0 0Butte 25 21 4 0 0 0 0Calaveras 6 4 2 0 0 0 0Colusa (i) — — 0 0 0 0Contra Costa 122 39 81 1 0 0 1Del Norte 5 4 0 0 1 0 0El Dorado 16 14 0 0 1 0 1Fresno 92 66 22 2 2 0 0Glenn — — — — — — —Humboldt 6 6 0 0 0 0 0Imperial 3 0 2 0 1 0 0Inyo 0 0 0 0 0 0 0Kern 163 123 35 2 1 2 0Kings 5 2 2 1 0 0 0Lake (i) 7 (i) 7 0 0 0 0 0Lassen 2 1 1 0 0 0 0Los Angeles — — — — — — —Madera 14 12 1 0 1 0 0Marin 3 2 0 1 0 0 0Mariposa 1 0 0 1 0 0 0Mendocino 13 3 (i) 5 0 5 0 0Merced 11 11 0 0 0 0 (i) Modoc 0 0 0 0 0 0 0Mono 2 0 2 0 0 0 0Monterey 57 24 32 1 0 0 0Napa (i) — — 0 0 0 (i) Nevada 3 2 0 0 0 1 0Orange (i) 164 100 — 30 30 1 3Placer 28 11 14 0 2 1 0Plumas 0 0 0 0 0 0 0Riverside (i) 131 (i) 87 40 (i) 1 (i) 2 (i) (i) 1Sacramento (i) 7 — — 2 2 3 0San Benito 1 0 0 1 0 0 0San Bernardino (i) 12 — — 8 4 0 (i) San Diego (i) 19 — — — — 19 (i) San Francisco (i) 16 — — 7 7 2 0San Joaquin 54 25 26 2 0 1 0San Luis Obispo 17 13 1 0 0 0 3San Mateo 51 27 23 1 0 0 0Santa Barbara 10 6 3 0 1 0 0Santa Clara (i) — — 0 0 0 (i) Santa Cruz 25 21 3 1 0 0 0Shasta 50 37 13 0 0 0 0
Judicial Council of California 2022 Court Statistics Report94
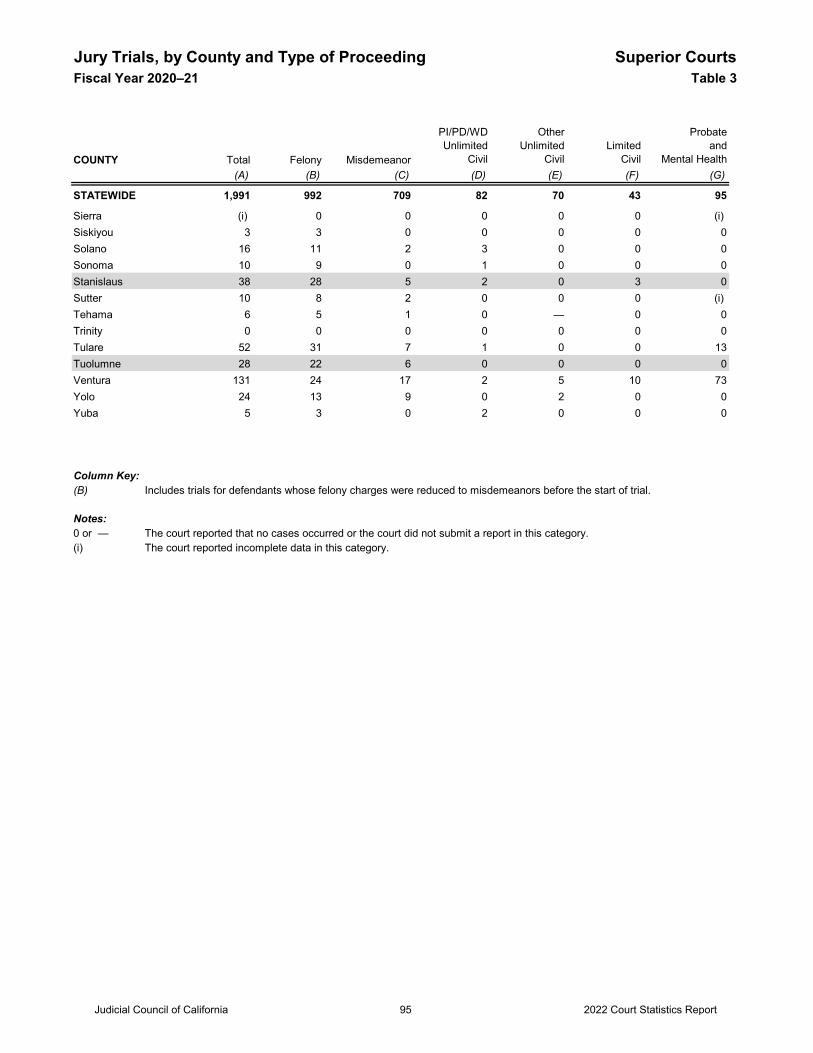
Jury Trials, by County and Type of Proceeding Superior CourtsFiscal Year 2020–21 Table 3
COUNTY Total Felony Misdemeanor
PI/PD/WDUnlimited
Civil
OtherUnlimited
CivilLimited
Civil
Probateand
Mental Health(A) (B) (C) (D) (E) (F) (G)
STATEWIDE 1,991 992 709 82 70 43 95
Sierra (i) 0 0 0 0 0 (i) Siskiyou 3 3 0 0 0 0 0Solano 16 11 2 3 0 0 0Sonoma 10 9 0 1 0 0 0Stanislaus 38 28 5 2 0 3 0Sutter 10 8 2 0 0 0 (i) Tehama 6 5 1 0 — 0 0Trinity 0 0 0 0 0 0 0Tulare 52 31 7 1 0 0 13Tuolumne 28 22 6 0 0 0 0Ventura 131 24 17 2 5 10 73Yolo 24 13 9 0 2 0 0Yuba 5 3 0 2 0 0 0
Column Key:(B) Includes trials for defendants whose felony charges were reduced to misdemeanors before the start of trial. Notes:0 or — The court reported that no cases occurred or the court did not submit a report in this category.(i) The court reported incomplete data in this category.
Judicial Council of California 2022 Court Statistics Report95
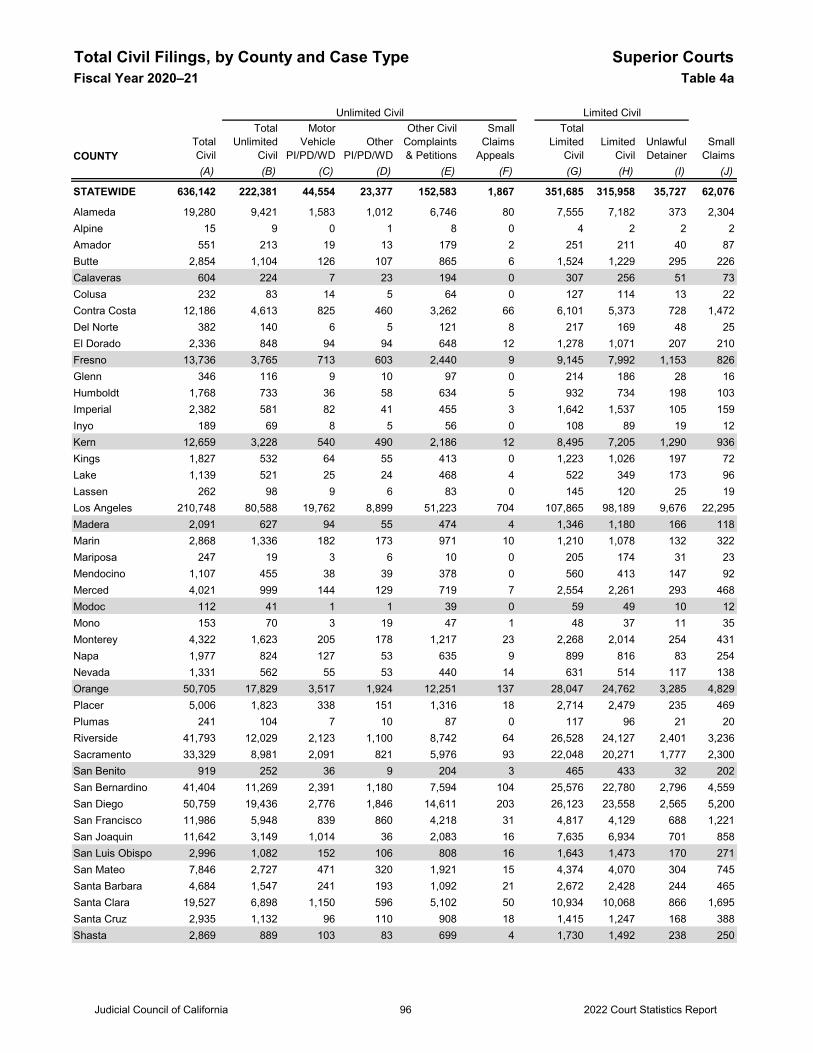
Total Civil Filings, by County and Case Type Superior CourtsFiscal Year 2020–21 Table 4a
COUNTYTotalCivil
TotalUnlimited
Civil
MotorVehicle
PI/PD/WDOther
PI/PD/WD
Other CivilComplaints& Petitions
Small Claims
Appeals
Total Limited
CivilLimited
CivilUnlawful Detainer
SmallClaims
(A) (B) (C) (D) (E) (F) (G) (H) (I) (J)
STATEWIDE 636,142 222,381 44,554 23,377 152,583 1,867 351,685 315,958 35,727 62,076
Alameda 19,280 9,421 1,583 1,012 6,746 80 7,555 7,182 373 2,304Alpine 15 9 0 1 8 0 4 2 2 2Amador 551 213 19 13 179 2 251 211 40 87Butte 2,854 1,104 126 107 865 6 1,524 1,229 295 226Calaveras 604 224 7 23 194 0 307 256 51 73Colusa 232 83 14 5 64 0 127 114 13 22Contra Costa 12,186 4,613 825 460 3,262 66 6,101 5,373 728 1,472Del Norte 382 140 6 5 121 8 217 169 48 25El Dorado 2,336 848 94 94 648 12 1,278 1,071 207 210Fresno 13,736 3,765 713 603 2,440 9 9,145 7,992 1,153 826Glenn 346 116 9 10 97 0 214 186 28 16Humboldt 1,768 733 36 58 634 5 932 734 198 103Imperial 2,382 581 82 41 455 3 1,642 1,537 105 159Inyo 189 69 8 5 56 0 108 89 19 12Kern 12,659 3,228 540 490 2,186 12 8,495 7,205 1,290 936Kings 1,827 532 64 55 413 0 1,223 1,026 197 72Lake 1,139 521 25 24 468 4 522 349 173 96Lassen 262 98 9 6 83 0 145 120 25 19Los Angeles 210,748 80,588 19,762 8,899 51,223 704 107,865 98,189 9,676 22,295Madera 2,091 627 94 55 474 4 1,346 1,180 166 118Marin 2,868 1,336 182 173 971 10 1,210 1,078 132 322Mariposa 247 19 3 6 10 0 205 174 31 23Mendocino 1,107 455 38 39 378 0 560 413 147 92Merced 4,021 999 144 129 719 7 2,554 2,261 293 468Modoc 112 41 1 1 39 0 59 49 10 12Mono 153 70 3 19 47 1 48 37 11 35Monterey 4,322 1,623 205 178 1,217 23 2,268 2,014 254 431Napa 1,977 824 127 53 635 9 899 816 83 254Nevada 1,331 562 55 53 440 14 631 514 117 138Orange 50,705 17,829 3,517 1,924 12,251 137 28,047 24,762 3,285 4,829Placer 5,006 1,823 338 151 1,316 18 2,714 2,479 235 469Plumas 241 104 7 10 87 0 117 96 21 20Riverside 41,793 12,029 2,123 1,100 8,742 64 26,528 24,127 2,401 3,236Sacramento 33,329 8,981 2,091 821 5,976 93 22,048 20,271 1,777 2,300San Benito 919 252 36 9 204 3 465 433 32 202San Bernardino 41,404 11,269 2,391 1,180 7,594 104 25,576 22,780 2,796 4,559San Diego 50,759 19,436 2,776 1,846 14,611 203 26,123 23,558 2,565 5,200San Francisco 11,986 5,948 839 860 4,218 31 4,817 4,129 688 1,221San Joaquin 11,642 3,149 1,014 36 2,083 16 7,635 6,934 701 858San Luis Obispo 2,996 1,082 152 106 808 16 1,643 1,473 170 271San Mateo 7,846 2,727 471 320 1,921 15 4,374 4,070 304 745Santa Barbara 4,684 1,547 241 193 1,092 21 2,672 2,428 244 465Santa Clara 19,527 6,898 1,150 596 5,102 50 10,934 10,068 866 1,695Santa Cruz 2,935 1,132 96 110 908 18 1,415 1,247 168 388Shasta 2,869 889 103 83 699 4 1,730 1,492 238 250
Unlimited Civil Limited Civil
Judicial Council of California 2022 Court Statistics Report96
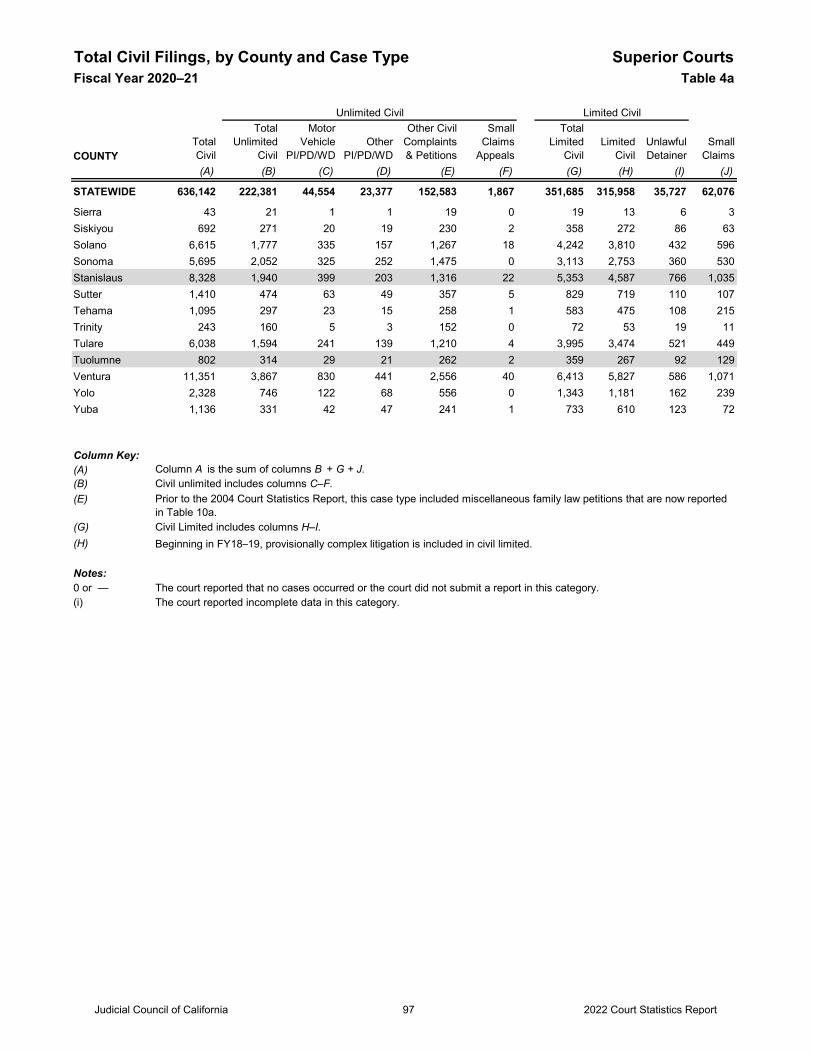
Total Civil Filings, by County and Case Type Superior CourtsFiscal Year 2020–21 Table 4a
COUNTYTotalCivil
TotalUnlimited
Civil
MotorVehicle
PI/PD/WDOther
PI/PD/WD
Other CivilComplaints& Petitions
Small Claims
Appeals
Total Limited
CivilLimited
CivilUnlawful Detainer
SmallClaims
(A) (B) (C) (D) (E) (F) (G) (H) (I) (J)
STATEWIDE 636,142 222,381 44,554 23,377 152,583 1,867 351,685 315,958 35,727 62,076
Unlimited Civil Limited Civil
Sierra 43 21 1 1 19 0 19 13 6 3Siskiyou 692 271 20 19 230 2 358 272 86 63Solano 6,615 1,777 335 157 1,267 18 4,242 3,810 432 596Sonoma 5,695 2,052 325 252 1,475 0 3,113 2,753 360 530Stanislaus 8,328 1,940 399 203 1,316 22 5,353 4,587 766 1,035Sutter 1,410 474 63 49 357 5 829 719 110 107Tehama 1,095 297 23 15 258 1 583 475 108 215Trinity 243 160 5 3 152 0 72 53 19 11Tulare 6,038 1,594 241 139 1,210 4 3,995 3,474 521 449Tuolumne 802 314 29 21 262 2 359 267 92 129Ventura 11,351 3,867 830 441 2,556 40 6,413 5,827 586 1,071Yolo 2,328 746 122 68 556 0 1,343 1,181 162 239Yuba 1,136 331 42 47 241 1 733 610 123 72
Column Key:(A) Column A is the sum of columns B + G + J.(B) Civil unlimited includes columns C–F.(E)
(G) Civil Limited includes columns H–I.(H) Beginning in FY18–19, provisionally complex litigation is included in civil limited.
Notes:0 or — The court reported that no cases occurred or the court did not submit a report in this category.(i) The court reported incomplete data in this category.
Prior to the 2004 Court Statistics Report, this case type included miscellaneous family law petitions that are now reported in Table 10a.
Judicial Council of California 97 2022 Court Statistics Report
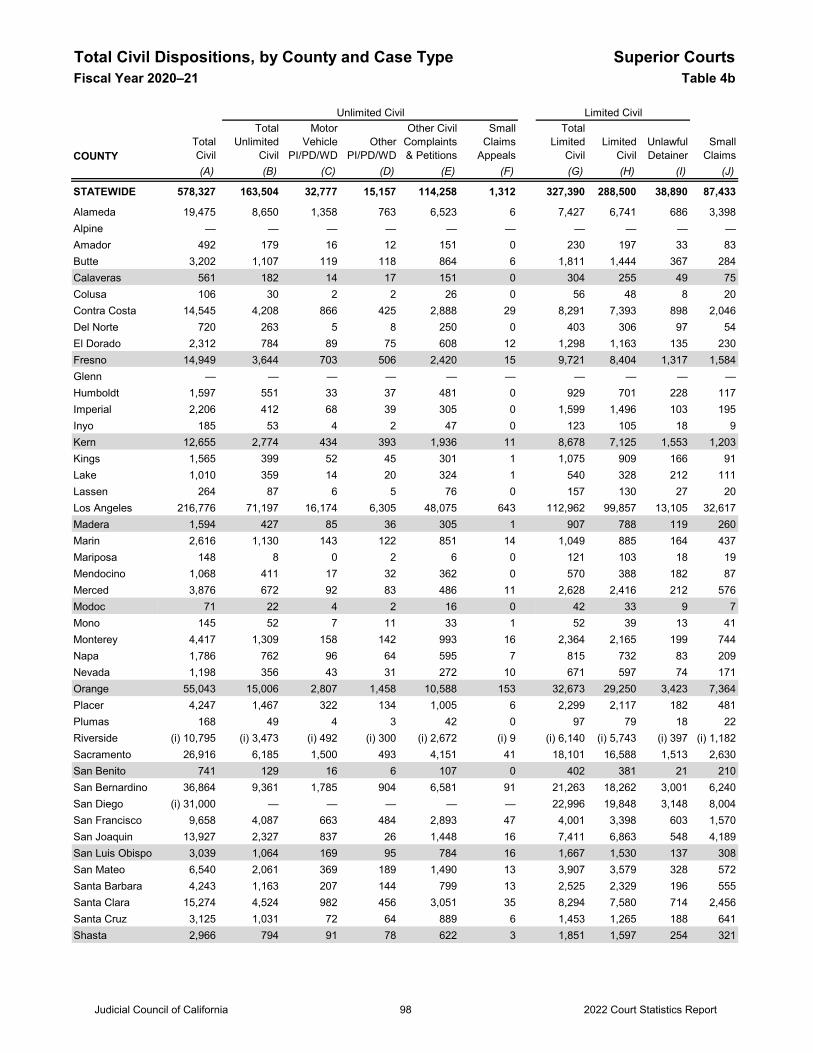
Total Civil Dispositions, by County and Case Type Superior CourtsFiscal Year 2020–21 Table 4b
COUNTYTotalCivil
TotalUnlimited
Civil
MotorVehicle
PI/PD/WDOther
PI/PD/WD
Other CivilComplaints& Petitions
Small Claims
Appeals
Total Limited
CivilLimited
CivilUnlawful Detainer
SmallClaims
(A) (B) (C) (D) (E) (F) (G) (H) (I) (J)
STATEWIDE 578,327 163,504 32,777 15,157 114,258 1,312 327,390 288,500 38,890 87,433
Alameda 19,475 8,650 1,358 763 6,523 6 7,427 6,741 686 3,398Alpine — — — — — — — — — —Amador 492 179 16 12 151 0 230 197 33 83Butte 3,202 1,107 119 118 864 6 1,811 1,444 367 284Calaveras 561 182 14 17 151 0 304 255 49 75Colusa 106 30 2 2 26 0 56 48 8 20Contra Costa 14,545 4,208 866 425 2,888 29 8,291 7,393 898 2,046Del Norte 720 263 5 8 250 0 403 306 97 54El Dorado 2,312 784 89 75 608 12 1,298 1,163 135 230Fresno 14,949 3,644 703 506 2,420 15 9,721 8,404 1,317 1,584Glenn — — — — — — — — — —Humboldt 1,597 551 33 37 481 0 929 701 228 117Imperial 2,206 412 68 39 305 0 1,599 1,496 103 195Inyo 185 53 4 2 47 0 123 105 18 9Kern 12,655 2,774 434 393 1,936 11 8,678 7,125 1,553 1,203Kings 1,565 399 52 45 301 1 1,075 909 166 91Lake 1,010 359 14 20 324 1 540 328 212 111Lassen 264 87 6 5 76 0 157 130 27 20Los Angeles 216,776 71,197 16,174 6,305 48,075 643 112,962 99,857 13,105 32,617Madera 1,594 427 85 36 305 1 907 788 119 260Marin 2,616 1,130 143 122 851 14 1,049 885 164 437Mariposa 148 8 0 2 6 0 121 103 18 19Mendocino 1,068 411 17 32 362 0 570 388 182 87Merced 3,876 672 92 83 486 11 2,628 2,416 212 576Modoc 71 22 4 2 16 0 42 33 9 7Mono 145 52 7 11 33 1 52 39 13 41Monterey 4,417 1,309 158 142 993 16 2,364 2,165 199 744Napa 1,786 762 96 64 595 7 815 732 83 209Nevada 1,198 356 43 31 272 10 671 597 74 171Orange 55,043 15,006 2,807 1,458 10,588 153 32,673 29,250 3,423 7,364Placer 4,247 1,467 322 134 1,005 6 2,299 2,117 182 481Plumas 168 49 4 3 42 0 97 79 18 22Riverside (i) 10,795 (i) 3,473 (i) 492 (i) 300 (i) 2,672 (i) 9 (i) 6,140 (i) 5,743 (i) 397 (i) 1,182Sacramento 26,916 6,185 1,500 493 4,151 41 18,101 16,588 1,513 2,630San Benito 741 129 16 6 107 0 402 381 21 210San Bernardino 36,864 9,361 1,785 904 6,581 91 21,263 18,262 3,001 6,240San Diego (i) 31,000 — — — — — 22,996 19,848 3,148 8,004San Francisco 9,658 4,087 663 484 2,893 47 4,001 3,398 603 1,570San Joaquin 13,927 2,327 837 26 1,448 16 7,411 6,863 548 4,189San Luis Obispo 3,039 1,064 169 95 784 16 1,667 1,530 137 308San Mateo 6,540 2,061 369 189 1,490 13 3,907 3,579 328 572Santa Barbara 4,243 1,163 207 144 799 13 2,525 2,329 196 555Santa Clara 15,274 4,524 982 456 3,051 35 8,294 7,580 714 2,456Santa Cruz 3,125 1,031 72 64 889 6 1,453 1,265 188 641Shasta 2,966 794 91 78 622 3 1,851 1,597 254 321
Unlimited Civil Limited Civil
Judicial Council of California 2022 Court Statistics Report98
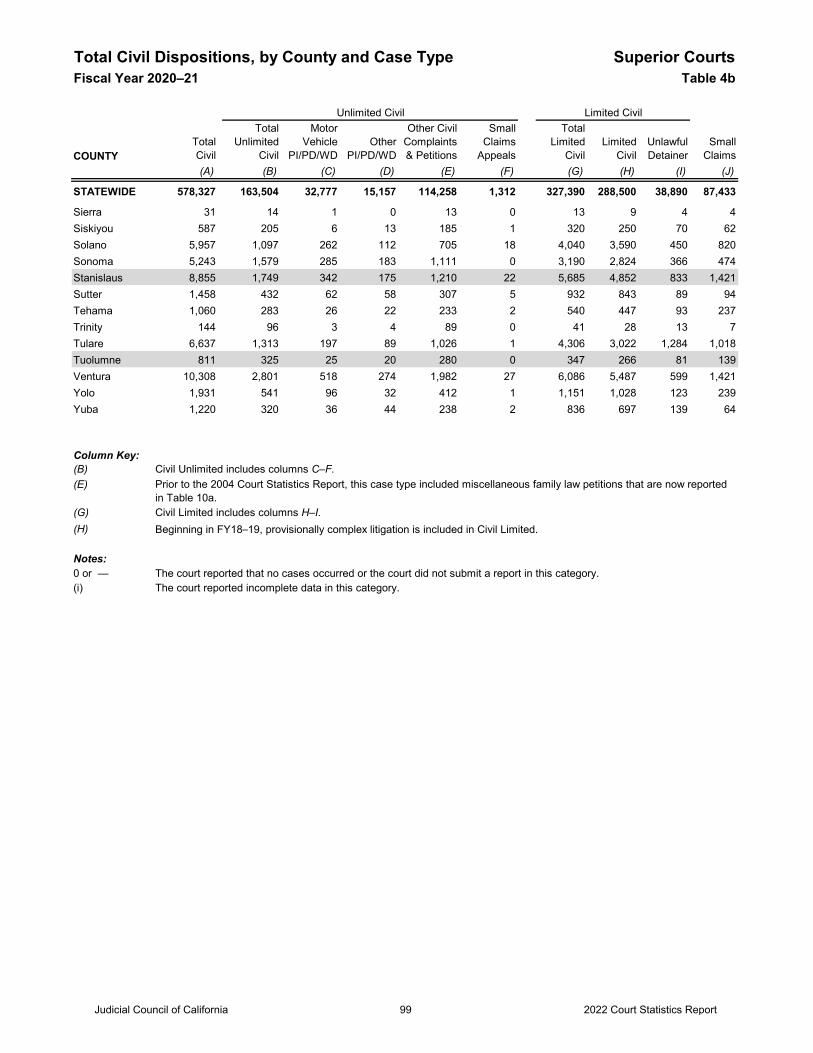
Total Civil Dispositions, by County and Case Type Superior CourtsFiscal Year 2020–21 Table 4b
COUNTYTotalCivil
TotalUnlimited
Civil
MotorVehicle
PI/PD/WDOther
PI/PD/WD
Other CivilComplaints& Petitions
Small Claims
Appeals
Total Limited
CivilLimited
CivilUnlawful Detainer
SmallClaims
(A) (B) (C) (D) (E) (F) (G) (H) (I) (J)
STATEWIDE 578,327 163,504 32,777 15,157 114,258 1,312 327,390 288,500 38,890 87,433
Unlimited Civil Limited Civil
Sierra 31 14 1 0 13 0 13 9 4 4Siskiyou 587 205 6 13 185 1 320 250 70 62Solano 5,957 1,097 262 112 705 18 4,040 3,590 450 820Sonoma 5,243 1,579 285 183 1,111 0 3,190 2,824 366 474Stanislaus 8,855 1,749 342 175 1,210 22 5,685 4,852 833 1,421Sutter 1,458 432 62 58 307 5 932 843 89 94Tehama 1,060 283 26 22 233 2 540 447 93 237Trinity 144 96 3 4 89 0 41 28 13 7Tulare 6,637 1,313 197 89 1,026 1 4,306 3,022 1,284 1,018Tuolumne 811 325 25 20 280 0 347 266 81 139Ventura 10,308 2,801 518 274 1,982 27 6,086 5,487 599 1,421Yolo 1,931 541 96 32 412 1 1,151 1,028 123 239Yuba 1,220 320 36 44 238 2 836 697 139 64
Column Key:(B) Civil Unlimited includes columns C–F.(E)
(G) Civil Limited includes columns H–I.(H) Beginning in FY18–19, provisionally complex litigation is included in Civil Limited.
Notes:0 or — The court reported that no cases occurred or the court did not submit a report in this category.(i) The court reported incomplete data in this category.
Prior to the 2004 Court Statistics Report, this case type included miscellaneous family law petitions that are now reported in Table 10a.
Judicial Council of California 2022 Court Statistics Report99
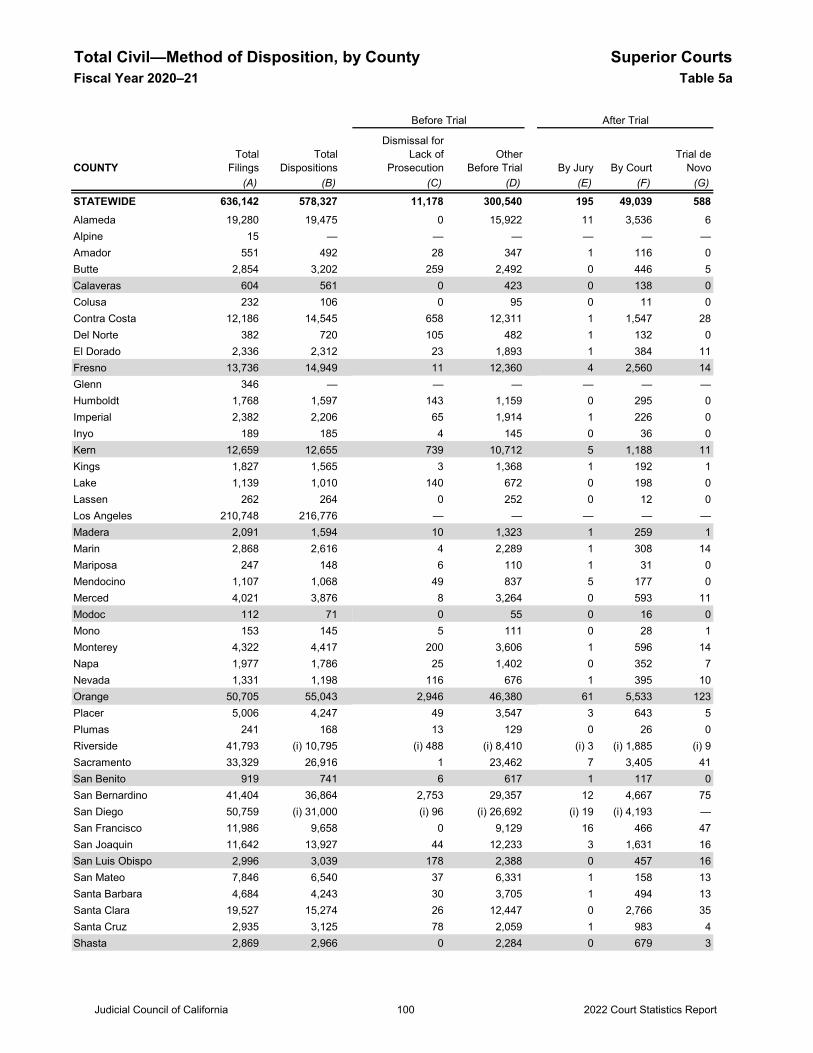
Total Civil—Method of Disposition, by County Superior CourtsFiscal Year 2020–21 Table 5a
COUNTY By Jury By Court(A) (B) (C) (D) (E) (F) (G)
STATEWIDE 636,142 578,327 11,178 300,540 195 49,039 588Alameda 19,280 19,475 0 15,922 11 3,536 6Alpine 15 — — — — — —Amador 551 492 28 347 1 116 0Butte 2,854 3,202 259 2,492 0 446 5Calaveras 604 561 0 423 0 138 0Colusa 232 106 0 95 0 11 0Contra Costa 12,186 14,545 658 12,311 1 1,547 28Del Norte 382 720 105 482 1 132 0El Dorado 2,336 2,312 23 1,893 1 384 11Fresno 13,736 14,949 11 12,360 4 2,560 14Glenn 346 — — — — — —Humboldt 1,768 1,597 143 1,159 0 295 0Imperial 2,382 2,206 65 1,914 1 226 0Inyo 189 185 4 145 0 36 0Kern 12,659 12,655 739 10,712 5 1,188 11Kings 1,827 1,565 3 1,368 1 192 1Lake 1,139 1,010 140 672 0 198 0Lassen 262 264 0 252 0 12 0Los Angeles 210,748 216,776 — — — — —Madera 2,091 1,594 10 1,323 1 259 1Marin 2,868 2,616 4 2,289 1 308 14Mariposa 247 148 6 110 1 31 0Mendocino 1,107 1,068 49 837 5 177 0Merced 4,021 3,876 8 3,264 0 593 11Modoc 112 71 0 55 0 16 0Mono 153 145 5 111 0 28 1Monterey 4,322 4,417 200 3,606 1 596 14Napa 1,977 1,786 25 1,402 0 352 7Nevada 1,331 1,198 116 676 1 395 10Orange 50,705 55,043 2,946 46,380 61 5,533 123Placer 5,006 4,247 49 3,547 3 643 5Plumas 241 168 13 129 0 26 0Riverside 41,793 (i) 10,795 (i) 488 (i) 8,410 (i) 3 (i) 1,885 (i) 9Sacramento 33,329 26,916 1 23,462 7 3,405 41San Benito 919 741 6 617 1 117 0San Bernardino 41,404 36,864 2,753 29,357 12 4,667 75San Diego 50,759 (i) 31,000 (i) 96 (i) 26,692 (i) 19 (i) 4,193 —San Francisco 11,986 9,658 0 9,129 16 466 47San Joaquin 11,642 13,927 44 12,233 3 1,631 16San Luis Obispo 2,996 3,039 178 2,388 0 457 16San Mateo 7,846 6,540 37 6,331 1 158 13Santa Barbara 4,684 4,243 30 3,705 1 494 13Santa Clara 19,527 15,274 26 12,447 0 2,766 35Santa Cruz 2,935 3,125 78 2,059 1 983 4Shasta 2,869 2,966 0 2,284 0 679 3
After TrialBefore Trial
TotalFilings
TotalDispositions
Dismissal forLack of
ProsecutionOther
Before TrialTrial de
Novo
Judicial Council of California 2022 Court Statistics Report100
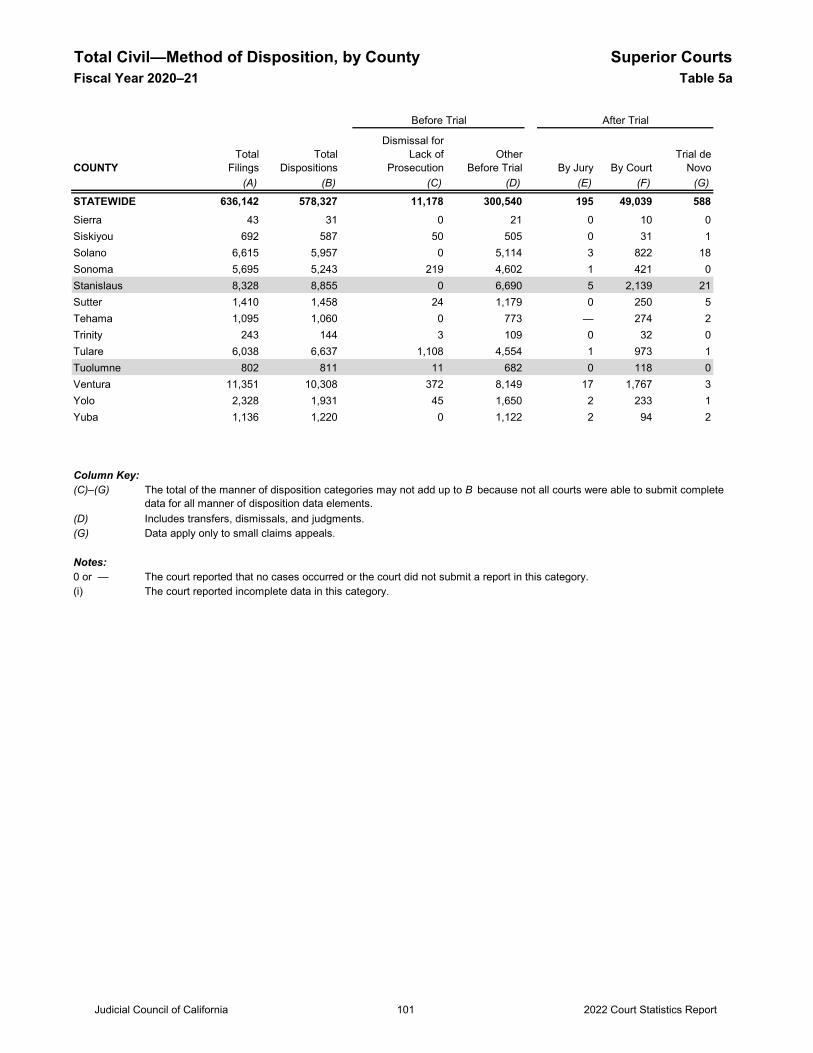
Total Civil—Method of Disposition, by County Superior CourtsFiscal Year 2020–21 Table 5a
COUNTY By Jury By Court(A) (B) (C) (D) (E) (F) (G)
STATEWIDE 636,142 578,327 11,178 300,540 195 49,039 588
After TrialBefore Trial
TotalFilings
TotalDispositions
Dismissal forLack of
ProsecutionOther
Before TrialTrial de
Novo
Sierra 43 31 0 21 0 10 0Siskiyou 692 587 50 505 0 31 1Solano 6,615 5,957 0 5,114 3 822 18Sonoma 5,695 5,243 219 4,602 1 421 0Stanislaus 8,328 8,855 0 6,690 5 2,139 21Sutter 1,410 1,458 24 1,179 0 250 5Tehama 1,095 1,060 0 773 — 274 2Trinity 243 144 3 109 0 32 0Tulare 6,038 6,637 1,108 4,554 1 973 1Tuolumne 802 811 11 682 0 118 0Ventura 11,351 10,308 372 8,149 17 1,767 3Yolo 2,328 1,931 45 1,650 2 233 1Yuba 1,136 1,220 0 1,122 2 94 2
Column Key:(C)–(G)
(D) Includes transfers, dismissals, and judgments. (G) Data apply only to small claims appeals.
Notes:0 or — The court reported that no cases occurred or the court did not submit a report in this category.(i) The court reported incomplete data in this category.
The total of the manner of disposition categories may not add up to B because not all courts were able to submit complete data for all manner of disposition data elements.
Judicial Council of California 2022 Court Statistics Report101
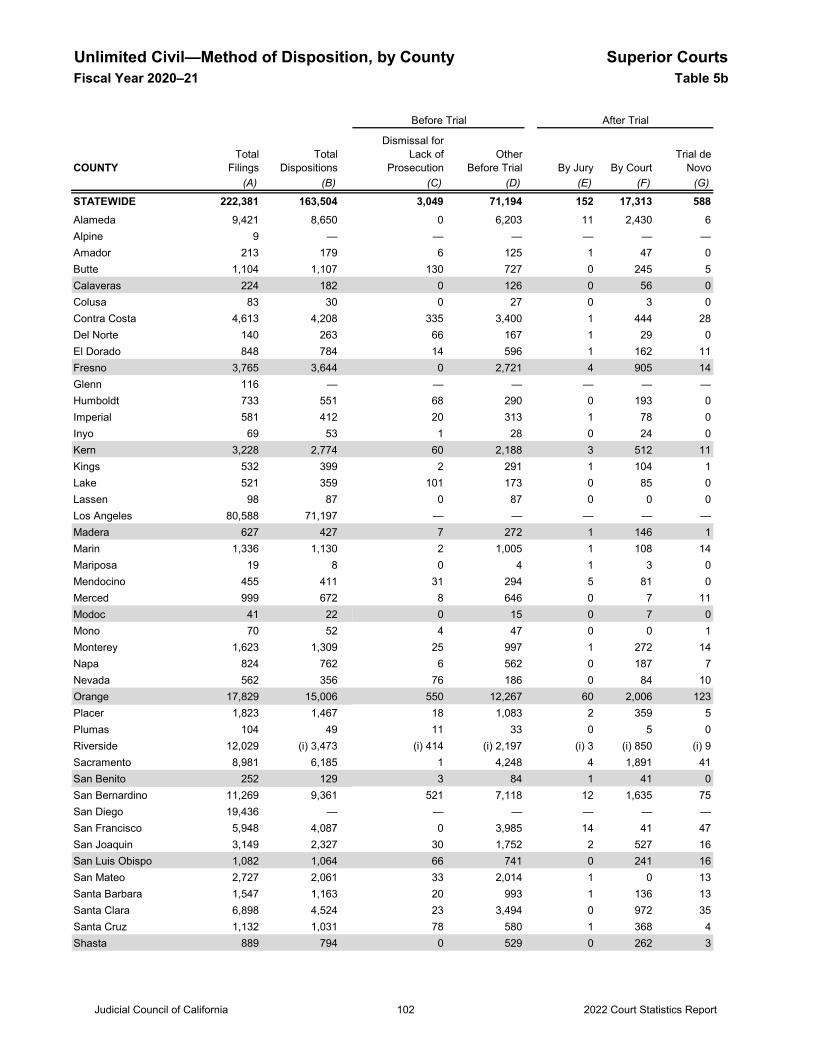
Unlimited Civil—Method of Disposition, by County Superior CourtsFiscal Year 2020–21 Table 5b
COUNTY By Jury By Court(A) (B) (C) (D) (E) (F) (G)
STATEWIDE 222,381 163,504 3,049 71,194 152 17,313 588Alameda 9,421 8,650 0 6,203 11 2,430 6Alpine 9 — — — — — —Amador 213 179 6 125 1 47 0Butte 1,104 1,107 130 727 0 245 5Calaveras 224 182 0 126 0 56 0Colusa 83 30 0 27 0 3 0Contra Costa 4,613 4,208 335 3,400 1 444 28Del Norte 140 263 66 167 1 29 0El Dorado 848 784 14 596 1 162 11Fresno 3,765 3,644 0 2,721 4 905 14Glenn 116 — — — — — —Humboldt 733 551 68 290 0 193 0Imperial 581 412 20 313 1 78 0Inyo 69 53 1 28 0 24 0Kern 3,228 2,774 60 2,188 3 512 11Kings 532 399 2 291 1 104 1Lake 521 359 101 173 0 85 0Lassen 98 87 0 87 0 0 0Los Angeles 80,588 71,197 — — — — —Madera 627 427 7 272 1 146 1Marin 1,336 1,130 2 1,005 1 108 14Mariposa 19 8 0 4 1 3 0Mendocino 455 411 31 294 5 81 0Merced 999 672 8 646 0 7 11Modoc 41 22 0 15 0 7 0Mono 70 52 4 47 0 0 1Monterey 1,623 1,309 25 997 1 272 14Napa 824 762 6 562 0 187 7Nevada 562 356 76 186 0 84 10Orange 17,829 15,006 550 12,267 60 2,006 123Placer 1,823 1,467 18 1,083 2 359 5Plumas 104 49 11 33 0 5 0Riverside 12,029 (i) 3,473 (i) 414 (i) 2,197 (i) 3 (i) 850 (i) 9Sacramento 8,981 6,185 1 4,248 4 1,891 41San Benito 252 129 3 84 1 41 0San Bernardino 11,269 9,361 521 7,118 12 1,635 75San Diego 19,436 — — — — — —San Francisco 5,948 4,087 0 3,985 14 41 47San Joaquin 3,149 2,327 30 1,752 2 527 16San Luis Obispo 1,082 1,064 66 741 0 241 16San Mateo 2,727 2,061 33 2,014 1 0 13Santa Barbara 1,547 1,163 20 993 1 136 13Santa Clara 6,898 4,524 23 3,494 0 972 35Santa Cruz 1,132 1,031 78 580 1 368 4Shasta 889 794 0 529 0 262 3
Before Trial After Trial
Dismissal forLack of
ProsecutionTotal
FilingsTotal
DispositionsOther
Before TrialTrial de
Novo
Judicial Council of California 2022 Court Statistics Report102
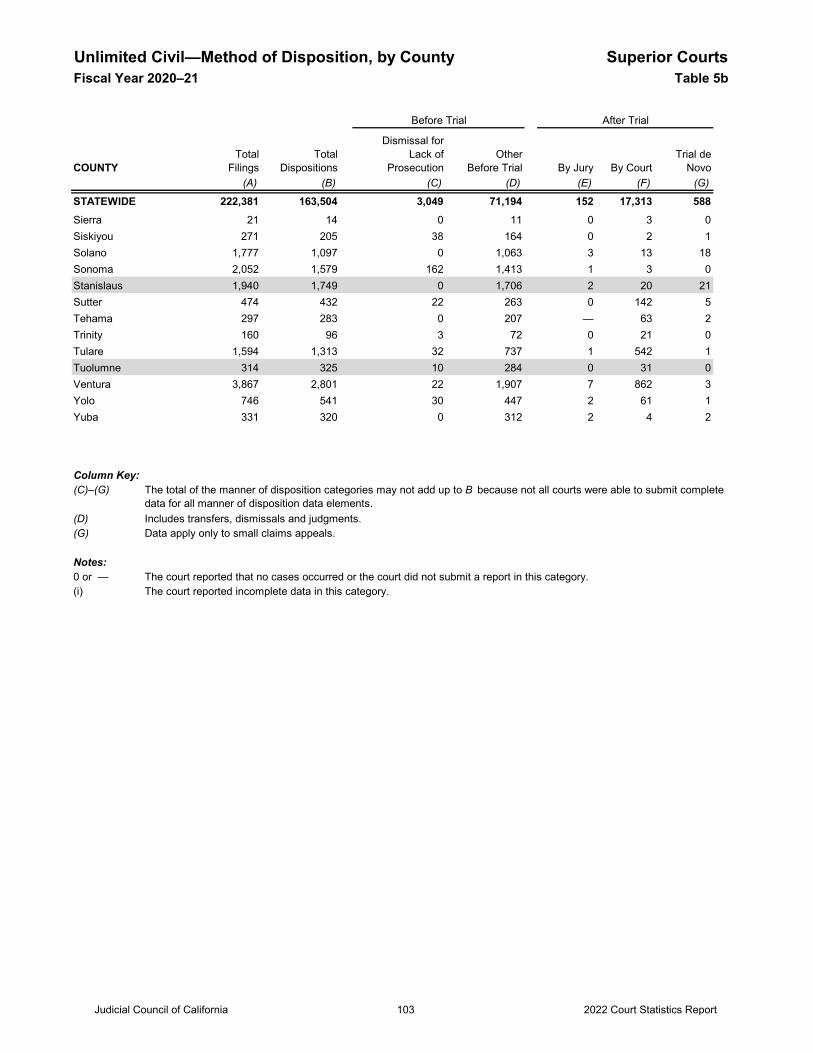
Unlimited Civil—Method of Disposition, by County Superior CourtsFiscal Year 2020–21 Table 5b
COUNTY By Jury By Court(A) (B) (C) (D) (E) (F) (G)
STATEWIDE 222,381 163,504 3,049 71,194 152 17,313 588
Before Trial After Trial
Dismissal forLack of
ProsecutionTotal
FilingsTotal
DispositionsOther
Before TrialTrial de
Novo
Sierra 21 14 0 11 0 3 0Siskiyou 271 205 38 164 0 2 1Solano 1,777 1,097 0 1,063 3 13 18Sonoma 2,052 1,579 162 1,413 1 3 0Stanislaus 1,940 1,749 0 1,706 2 20 21Sutter 474 432 22 263 0 142 5Tehama 297 283 0 207 — 63 2Trinity 160 96 3 72 0 21 0Tulare 1,594 1,313 32 737 1 542 1Tuolumne 314 325 10 284 0 31 0Ventura 3,867 2,801 22 1,907 7 862 3Yolo 746 541 30 447 2 61 1Yuba 331 320 0 312 2 4 2
Column Key:(C)–(G)
(D) Includes transfers, dismissals and judgments.(G) Data apply only to small claims appeals.
Notes:0 or — The court reported that no cases occurred or the court did not submit a report in this category.(i) The court reported incomplete data in this category.
The total of the manner of disposition categories may not add up to B because not all courts were able to submit complete data for all manner of disposition data elements.
Judicial Council of California 2022 Court Statistics Report103
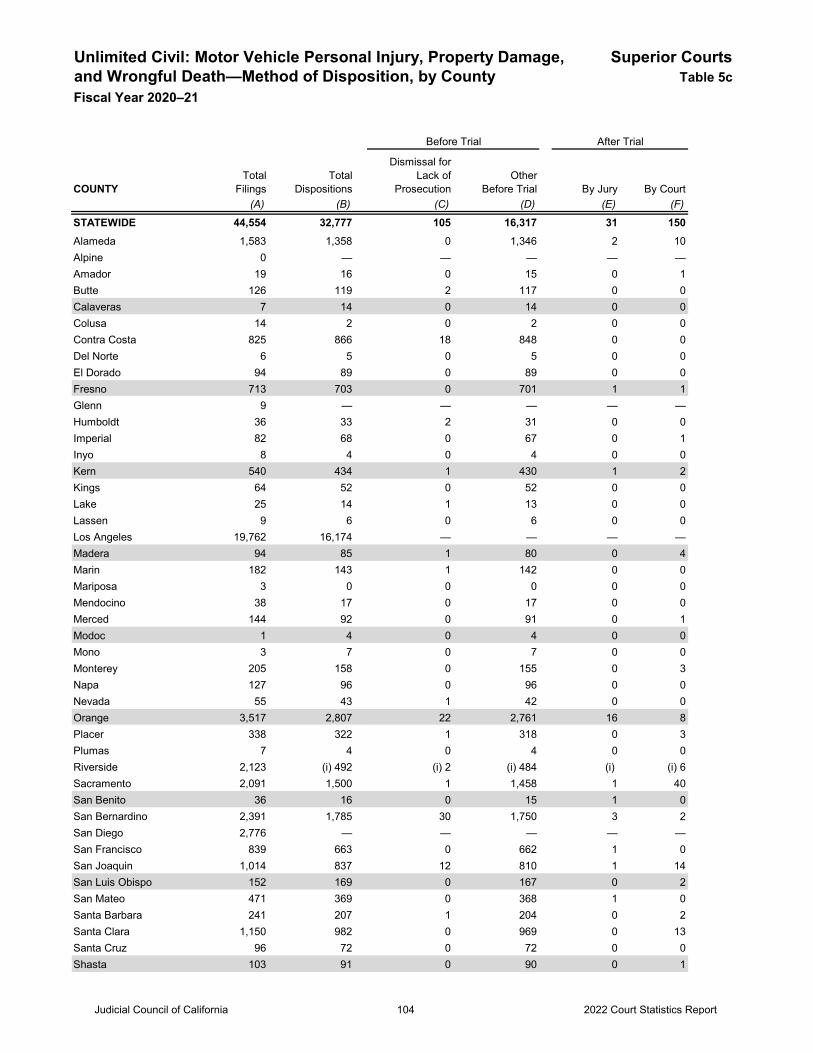
Unlimited Civil: Motor Vehicle Personal Injury, Property Damage, Superior Courtsand Wrongful Death—Method of Disposition, by County Table 5cFiscal Year 2020–21
COUNTY By Jury By Court(A) (B) (C) (D) (E) (F)
STATEWIDE 44,554 32,777 105 16,317 31 150Alameda 1,583 1,358 0 1,346 2 10Alpine 0 — — — — —Amador 19 16 0 15 0 1Butte 126 119 2 117 0 0Calaveras 7 14 0 14 0 0Colusa 14 2 0 2 0 0Contra Costa 825 866 18 848 0 0Del Norte 6 5 0 5 0 0El Dorado 94 89 0 89 0 0Fresno 713 703 0 701 1 1Glenn 9 — — — — —Humboldt 36 33 2 31 0 0Imperial 82 68 0 67 0 1Inyo 8 4 0 4 0 0Kern 540 434 1 430 1 2Kings 64 52 0 52 0 0Lake 25 14 1 13 0 0Lassen 9 6 0 6 0 0Los Angeles 19,762 16,174 — — — —Madera 94 85 1 80 0 4Marin 182 143 1 142 0 0Mariposa 3 0 0 0 0 0Mendocino 38 17 0 17 0 0Merced 144 92 0 91 0 1Modoc 1 4 0 4 0 0Mono 3 7 0 7 0 0Monterey 205 158 0 155 0 3Napa 127 96 0 96 0 0Nevada 55 43 1 42 0 0Orange 3,517 2,807 22 2,761 16 8Placer 338 322 1 318 0 3Plumas 7 4 0 4 0 0Riverside 2,123 (i) 492 (i) 2 (i) 484 (i) (i) 6Sacramento 2,091 1,500 1 1,458 1 40San Benito 36 16 0 15 1 0San Bernardino 2,391 1,785 30 1,750 3 2San Diego 2,776 — — — — —San Francisco 839 663 0 662 1 0San Joaquin 1,014 837 12 810 1 14San Luis Obispo 152 169 0 167 0 2San Mateo 471 369 0 368 1 0Santa Barbara 241 207 1 204 0 2Santa Clara 1,150 982 0 969 0 13Santa Cruz 96 72 0 72 0 0Shasta 103 91 0 90 0 1
After TrialBefore Trial
Dismissal forLack of
ProsecutionTotal
FilingsTotal
DispositionsOther
Before Trial
Judicial Council of California 2022 Court Statistics Report104
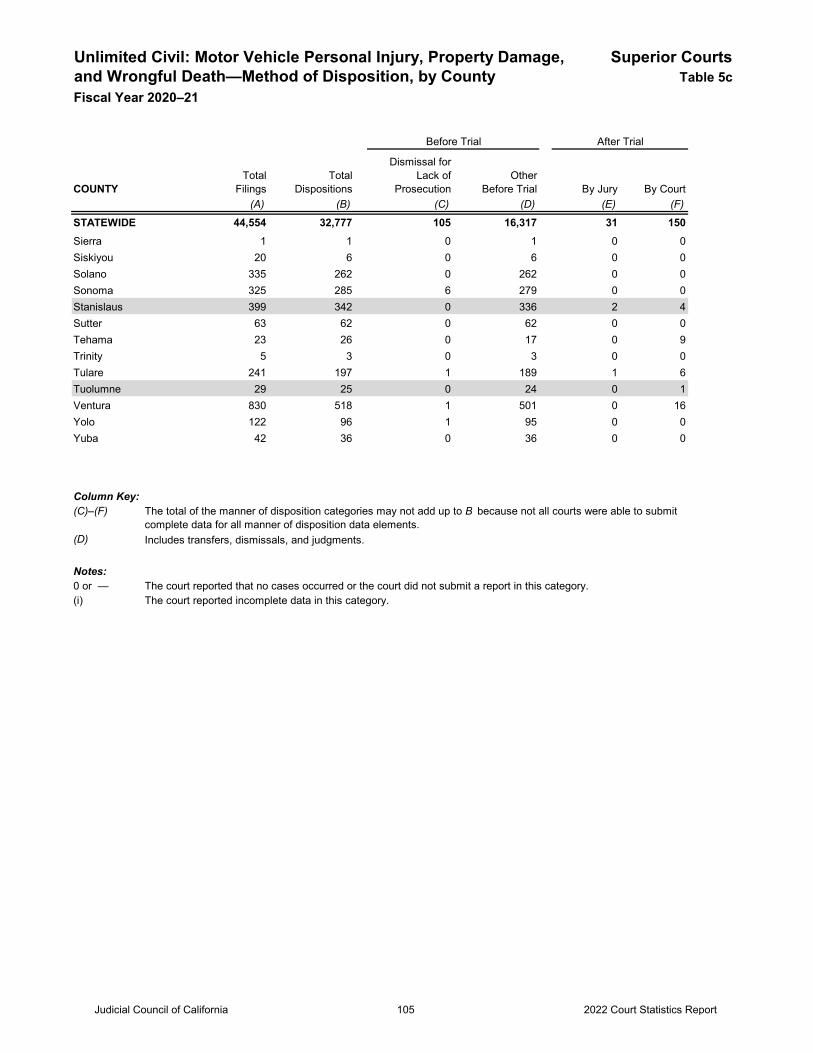
Unlimited Civil: Motor Vehicle Personal Injury, Property Damage, Superior Courtsand Wrongful Death—Method of Disposition, by County Table 5cFiscal Year 2020–21
COUNTY By Jury By Court(A) (B) (C) (D) (E) (F)
STATEWIDE 44,554 32,777 105 16,317 31 150
After TrialBefore Trial
Dismissal forLack of
ProsecutionTotal
FilingsTotal
DispositionsOther
Before Trial
Sierra 1 1 0 1 0 0Siskiyou 20 6 0 6 0 0Solano 335 262 0 262 0 0Sonoma 325 285 6 279 0 0Stanislaus 399 342 0 336 2 4Sutter 63 62 0 62 0 0Tehama 23 26 0 17 0 9Trinity 5 3 0 3 0 0Tulare 241 197 1 189 1 6Tuolumne 29 25 0 24 0 1Ventura 830 518 1 501 0 16Yolo 122 96 1 95 0 0Yuba 42 36 0 36 0 0
Column Key: (C)–(F)
(D) Includes transfers, dismissals, and judgments. Notes:0 or — The court reported that no cases occurred or the court did not submit a report in this category.(i) The court reported incomplete data in this category.
The total of the manner of disposition categories may not add up to B because not all courts were able to submit complete data for all manner of disposition data elements.
Judicial Council of California 2022 Court Statistics Report105
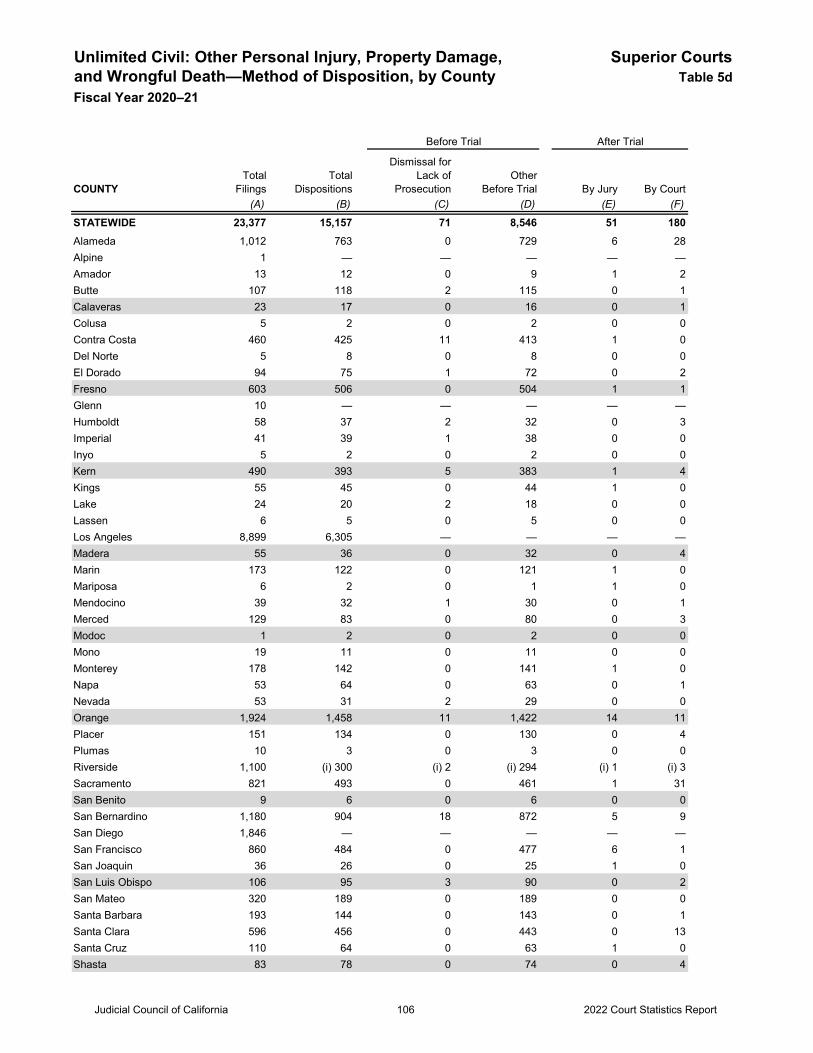
Unlimited Civil: Other Personal Injury, Property Damage, Superior Courtsand Wrongful Death—Method of Disposition, by County Table 5dFiscal Year 2020–21
COUNTY By Jury By Court(A) (B) (C) (D) (E) (F)
STATEWIDE 23,377 15,157 71 8,546 51 180Alameda 1,012 763 0 729 6 28Alpine 1 — — — — —Amador 13 12 0 9 1 2Butte 107 118 2 115 0 1Calaveras 23 17 0 16 0 1Colusa 5 2 0 2 0 0Contra Costa 460 425 11 413 1 0Del Norte 5 8 0 8 0 0El Dorado 94 75 1 72 0 2Fresno 603 506 0 504 1 1Glenn 10 — — — — —Humboldt 58 37 2 32 0 3Imperial 41 39 1 38 0 0Inyo 5 2 0 2 0 0Kern 490 393 5 383 1 4Kings 55 45 0 44 1 0Lake 24 20 2 18 0 0Lassen 6 5 0 5 0 0Los Angeles 8,899 6,305 — — — —Madera 55 36 0 32 0 4Marin 173 122 0 121 1 0Mariposa 6 2 0 1 1 0Mendocino 39 32 1 30 0 1Merced 129 83 0 80 0 3Modoc 1 2 0 2 0 0Mono 19 11 0 11 0 0Monterey 178 142 0 141 1 0Napa 53 64 0 63 0 1Nevada 53 31 2 29 0 0Orange 1,924 1,458 11 1,422 14 11Placer 151 134 0 130 0 4Plumas 10 3 0 3 0 0Riverside 1,100 (i) 300 (i) 2 (i) 294 (i) 1 (i) 3Sacramento 821 493 0 461 1 31San Benito 9 6 0 6 0 0San Bernardino 1,180 904 18 872 5 9San Diego 1,846 — — — — —San Francisco 860 484 0 477 6 1San Joaquin 36 26 0 25 1 0San Luis Obispo 106 95 3 90 0 2San Mateo 320 189 0 189 0 0Santa Barbara 193 144 0 143 0 1Santa Clara 596 456 0 443 0 13Santa Cruz 110 64 0 63 1 0Shasta 83 78 0 74 0 4
After TrialBefore Trial
Dismissal forLack of
ProsecutionTotal
FilingsTotal
DispositionsOther
Before Trial
Judicial Council of California 2022 Court Statistics Report106
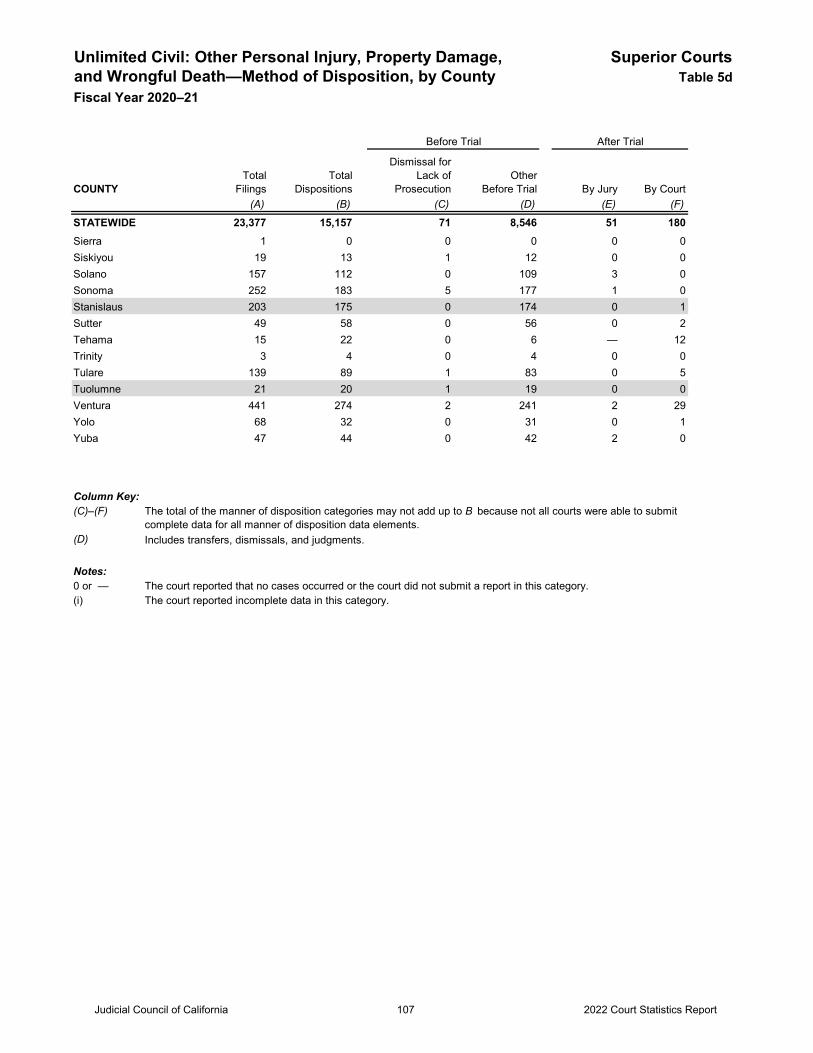
Unlimited Civil: Other Personal Injury, Property Damage, Superior Courtsand Wrongful Death—Method of Disposition, by County Table 5dFiscal Year 2020–21
COUNTY By Jury By Court(A) (B) (C) (D) (E) (F)
STATEWIDE 23,377 15,157 71 8,546 51 180
After TrialBefore Trial
Dismissal forLack of
ProsecutionTotal
FilingsTotal
DispositionsOther
Before Trial
Sierra 1 0 0 0 0 0Siskiyou 19 13 1 12 0 0Solano 157 112 0 109 3 0Sonoma 252 183 5 177 1 0Stanislaus 203 175 0 174 0 1Sutter 49 58 0 56 0 2Tehama 15 22 0 6 — 12Trinity 3 4 0 4 0 0Tulare 139 89 1 83 0 5Tuolumne 21 20 1 19 0 0Ventura 441 274 2 241 2 29Yolo 68 32 0 31 0 1Yuba 47 44 0 42 2 0
Column Key: (C)–(F)
(D) Includes transfers, dismissals, and judgments.
Notes:0 or — The court reported that no cases occurred or the court did not submit a report in this category.(i) The court reported incomplete data in this category.
The total of the manner of disposition categories may not add up to B because not all courts were able to submit complete data for all manner of disposition data elements.
Judicial Council of California 2022 Court Statistics Report107
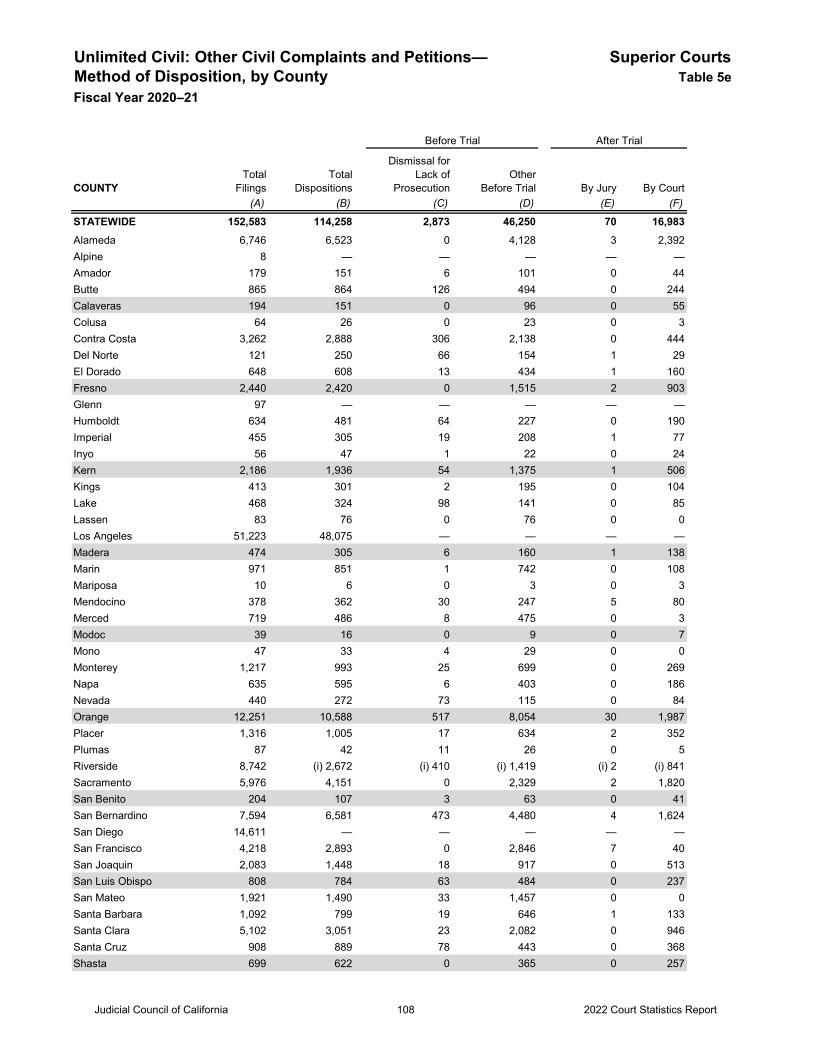
Unlimited Civil: Other Civil Complaints and Petitions— Superior CourtsMethod of Disposition, by County Table 5eFiscal Year 2020–21
COUNTY By Jury By Court(A) (B) (C) (D) (E) (F)
STATEWIDE 152,583 114,258 2,873 46,250 70 16,983Alameda 6,746 6,523 0 4,128 3 2,392Alpine 8 — — — — —Amador 179 151 6 101 0 44Butte 865 864 126 494 0 244Calaveras 194 151 0 96 0 55Colusa 64 26 0 23 0 3Contra Costa 3,262 2,888 306 2,138 0 444Del Norte 121 250 66 154 1 29El Dorado 648 608 13 434 1 160Fresno 2,440 2,420 0 1,515 2 903Glenn 97 — — — — —Humboldt 634 481 64 227 0 190Imperial 455 305 19 208 1 77Inyo 56 47 1 22 0 24Kern 2,186 1,936 54 1,375 1 506Kings 413 301 2 195 0 104Lake 468 324 98 141 0 85Lassen 83 76 0 76 0 0Los Angeles 51,223 48,075 — — — —Madera 474 305 6 160 1 138Marin 971 851 1 742 0 108Mariposa 10 6 0 3 0 3Mendocino 378 362 30 247 5 80Merced 719 486 8 475 0 3Modoc 39 16 0 9 0 7Mono 47 33 4 29 0 0Monterey 1,217 993 25 699 0 269Napa 635 595 6 403 0 186Nevada 440 272 73 115 0 84Orange 12,251 10,588 517 8,054 30 1,987Placer 1,316 1,005 17 634 2 352Plumas 87 42 11 26 0 5Riverside 8,742 (i) 2,672 (i) 410 (i) 1,419 (i) 2 (i) 841Sacramento 5,976 4,151 0 2,329 2 1,820San Benito 204 107 3 63 0 41San Bernardino 7,594 6,581 473 4,480 4 1,624San Diego 14,611 — — — — —San Francisco 4,218 2,893 0 2,846 7 40San Joaquin 2,083 1,448 18 917 0 513San Luis Obispo 808 784 63 484 0 237San Mateo 1,921 1,490 33 1,457 0 0Santa Barbara 1,092 799 19 646 1 133Santa Clara 5,102 3,051 23 2,082 0 946Santa Cruz 908 889 78 443 0 368Shasta 699 622 0 365 0 257
Before Trial After Trial
Dismissal forLack of
ProsecutionTotal
FilingsTotal
DispositionsOther
Before Trial
Judicial Council of California 2022 Court Statistics Report108
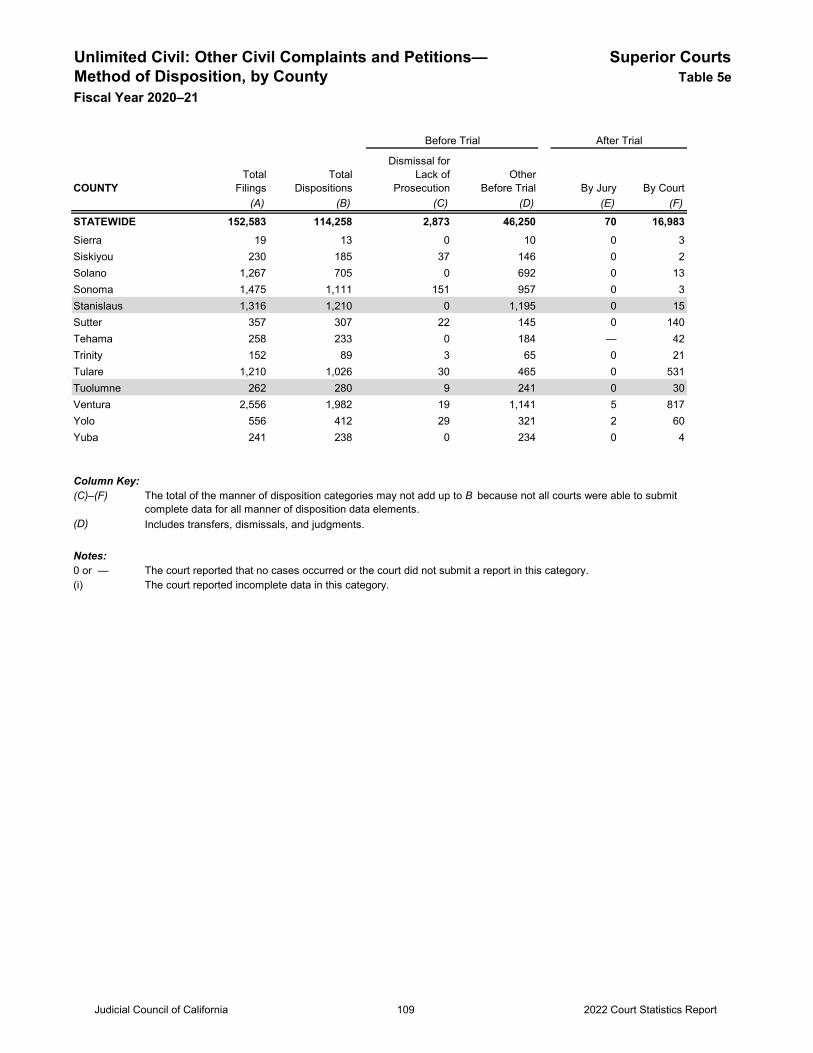
Unlimited Civil: Other Civil Complaints and Petitions— Superior CourtsMethod of Disposition, by County Table 5eFiscal Year 2020–21
COUNTY By Jury By Court(A) (B) (C) (D) (E) (F)
STATEWIDE 152,583 114,258 2,873 46,250 70 16,983
Before Trial After Trial
Dismissal forLack of
ProsecutionTotal
FilingsTotal
DispositionsOther
Before Trial
Sierra 19 13 0 10 0 3Siskiyou 230 185 37 146 0 2Solano 1,267 705 0 692 0 13Sonoma 1,475 1,111 151 957 0 3Stanislaus 1,316 1,210 0 1,195 0 15Sutter 357 307 22 145 0 140Tehama 258 233 0 184 — 42Trinity 152 89 3 65 0 21Tulare 1,210 1,026 30 465 0 531Tuolumne 262 280 9 241 0 30Ventura 2,556 1,982 19 1,141 5 817Yolo 556 412 29 321 2 60Yuba 241 238 0 234 0 4
Column Key: (C)–(F)
(D) Includes transfers, dismissals, and judgments.
Notes:0 or — The court reported that no cases occurred or the court did not submit a report in this category.(i) The court reported incomplete data in this category.
The total of the manner of disposition categories may not add up to B because not all courts were able to submit complete data for all manner of disposition data elements.
Judicial Council of California 2022 Court Statistics Report109
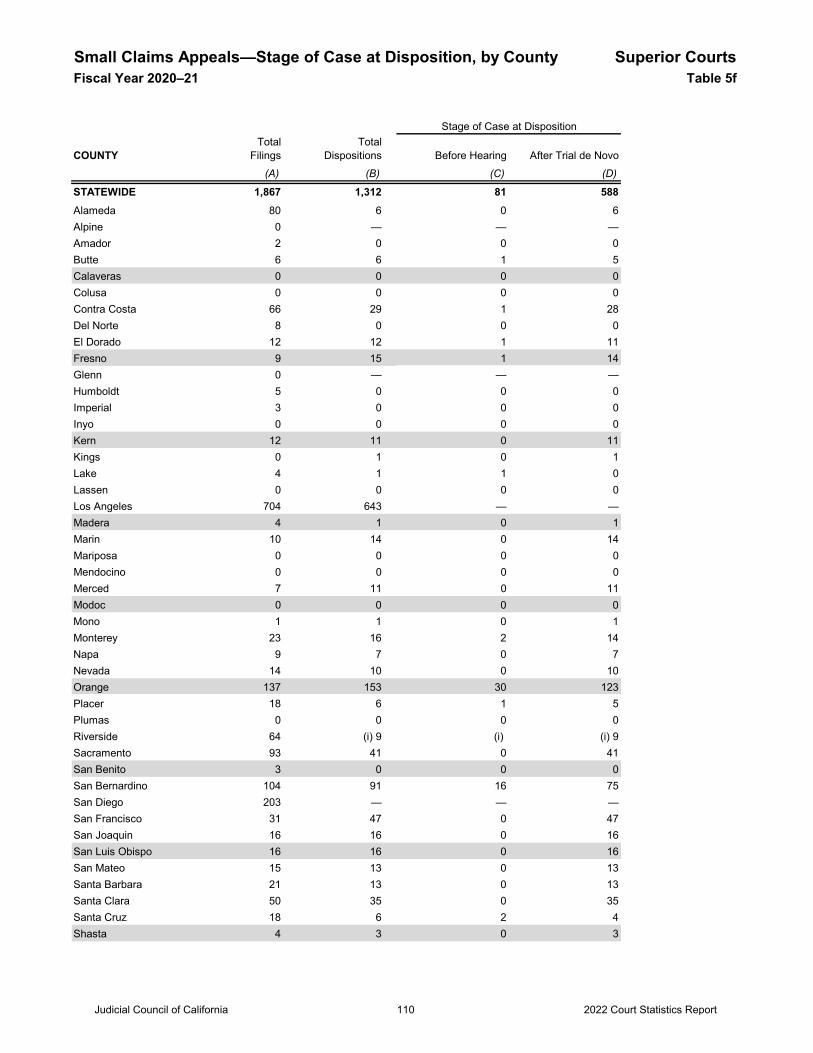
Small Claims Appeals—Stage of Case at Disposition, by County Superior CourtsFiscal Year 2020–21 Table 5f
COUNTY(A) (B) (C) (D)
STATEWIDE 1,867 1,312 81 588Alameda 80 6 0 6Alpine 0 — — —Amador 2 0 0 0Butte 6 6 1 5Calaveras 0 0 0 0Colusa 0 0 0 0Contra Costa 66 29 1 28Del Norte 8 0 0 0El Dorado 12 12 1 11Fresno 9 15 1 14Glenn 0 — — —Humboldt 5 0 0 0Imperial 3 0 0 0Inyo 0 0 0 0Kern 12 11 0 11Kings 0 1 0 1Lake 4 1 1 0Lassen 0 0 0 0Los Angeles 704 643 — —Madera 4 1 0 1Marin 10 14 0 14Mariposa 0 0 0 0Mendocino 0 0 0 0Merced 7 11 0 11Modoc 0 0 0 0Mono 1 1 0 1Monterey 23 16 2 14Napa 9 7 0 7Nevada 14 10 0 10Orange 137 153 30 123Placer 18 6 1 5Plumas 0 0 0 0Riverside 64 (i) 9 (i) (i) 9Sacramento 93 41 0 41San Benito 3 0 0 0San Bernardino 104 91 16 75San Diego 203 — — —San Francisco 31 47 0 47San Joaquin 16 16 0 16San Luis Obispo 16 16 0 16San Mateo 15 13 0 13Santa Barbara 21 13 0 13Santa Clara 50 35 0 35Santa Cruz 18 6 2 4Shasta 4 3 0 3
Stage of Case at Disposition
After Trial de NovoTotal
FilingsTotal
Dispositions Before Hearing
Judicial Council of California 2022 Court Statistics Report110
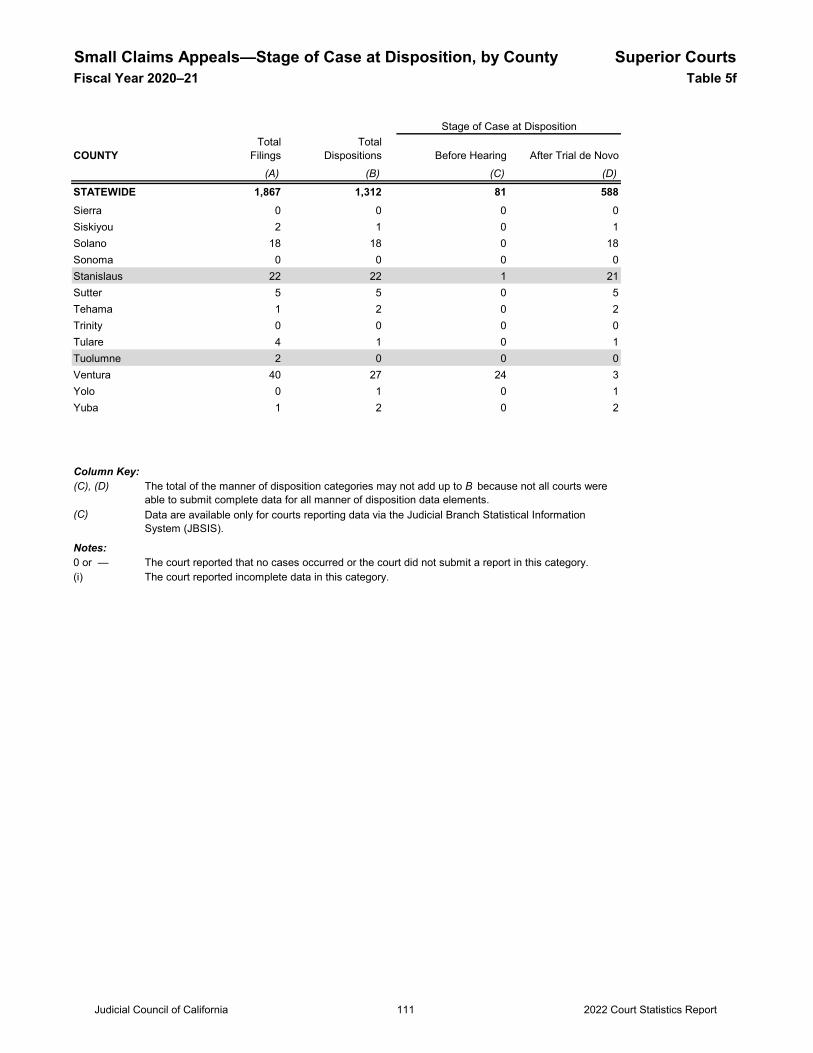
Small Claims Appeals—Stage of Case at Disposition, by County Superior CourtsFiscal Year 2020–21 Table 5f
COUNTY(A) (B) (C) (D)
STATEWIDE 1,867 1,312 81 588
Stage of Case at Disposition
After Trial de NovoTotal
FilingsTotal
Dispositions Before Hearing
Sierra 0 0 0 0Siskiyou 2 1 0 1Solano 18 18 0 18Sonoma 0 0 0 0Stanislaus 22 22 1 21Sutter 5 5 0 5Tehama 1 2 0 2Trinity 0 0 0 0Tulare 4 1 0 1Tuolumne 2 0 0 0Ventura 40 27 24 3Yolo 0 1 0 1Yuba 1 2 0 2
Column Key:(C), (D)
(C) Notes:0 or — The court reported that no cases occurred or the court did not submit a report in this category.(i) The court reported incomplete data in this category.
Data are available only for courts reporting data via the Judicial Branch Statistical Information System (JBSIS).
The total of the manner of disposition categories may not add up to B because not all courts were able to submit complete data for all manner of disposition data elements.
Judicial Council of California 2022 Court Statistics Report111
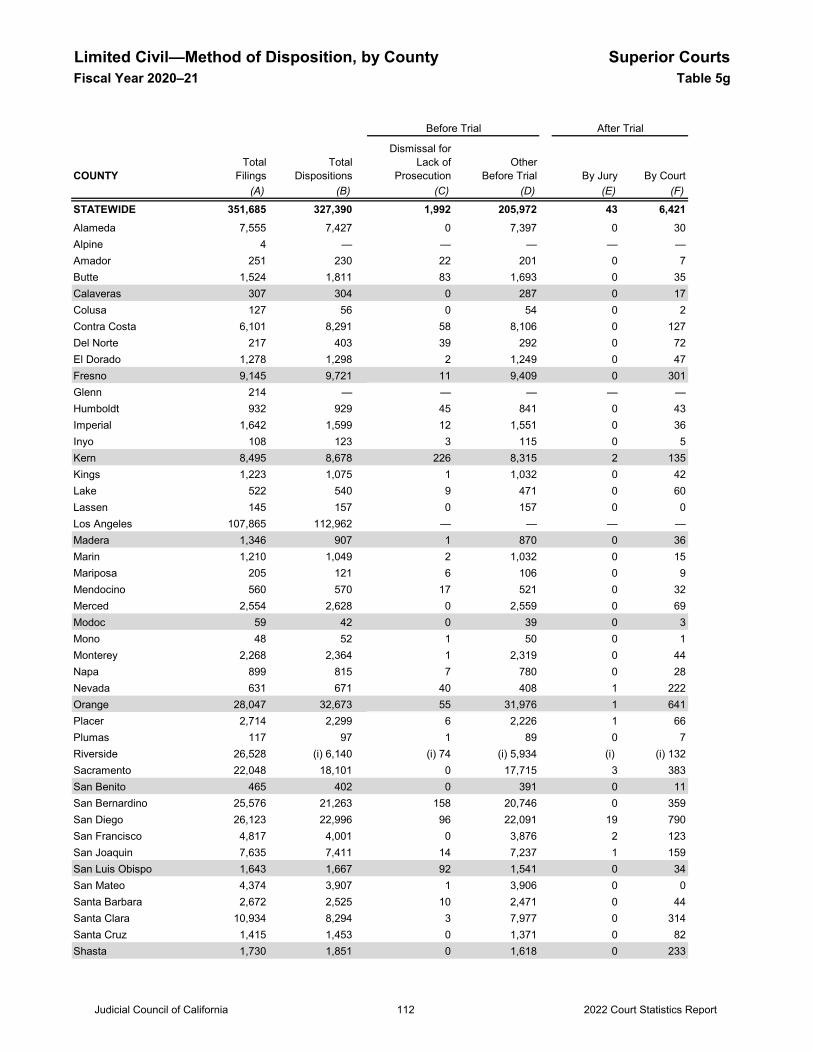
Limited Civil—Method of Disposition, by County Superior CourtsFiscal Year 2020–21 Table 5g
COUNTY By Jury By Court(A) (B) (C) (D) (E) (F)
STATEWIDE 351,685 327,390 1,992 205,972 43 6,421Alameda 7,555 7,427 0 7,397 0 30Alpine 4 — — — — —Amador 251 230 22 201 0 7Butte 1,524 1,811 83 1,693 0 35Calaveras 307 304 0 287 0 17Colusa 127 56 0 54 0 2Contra Costa 6,101 8,291 58 8,106 0 127Del Norte 217 403 39 292 0 72El Dorado 1,278 1,298 2 1,249 0 47Fresno 9,145 9,721 11 9,409 0 301Glenn 214 — — — — —Humboldt 932 929 45 841 0 43Imperial 1,642 1,599 12 1,551 0 36Inyo 108 123 3 115 0 5Kern 8,495 8,678 226 8,315 2 135Kings 1,223 1,075 1 1,032 0 42Lake 522 540 9 471 0 60Lassen 145 157 0 157 0 0Los Angeles 107,865 112,962 — — — —Madera 1,346 907 1 870 0 36Marin 1,210 1,049 2 1,032 0 15Mariposa 205 121 6 106 0 9Mendocino 560 570 17 521 0 32Merced 2,554 2,628 0 2,559 0 69Modoc 59 42 0 39 0 3Mono 48 52 1 50 0 1Monterey 2,268 2,364 1 2,319 0 44Napa 899 815 7 780 0 28Nevada 631 671 40 408 1 222Orange 28,047 32,673 55 31,976 1 641Placer 2,714 2,299 6 2,226 1 66Plumas 117 97 1 89 0 7Riverside 26,528 (i) 6,140 (i) 74 (i) 5,934 (i) (i) 132Sacramento 22,048 18,101 0 17,715 3 383San Benito 465 402 0 391 0 11San Bernardino 25,576 21,263 158 20,746 0 359San Diego 26,123 22,996 96 22,091 19 790San Francisco 4,817 4,001 0 3,876 2 123San Joaquin 7,635 7,411 14 7,237 1 159San Luis Obispo 1,643 1,667 92 1,541 0 34San Mateo 4,374 3,907 1 3,906 0 0Santa Barbara 2,672 2,525 10 2,471 0 44Santa Clara 10,934 8,294 3 7,977 0 314Santa Cruz 1,415 1,453 0 1,371 0 82Shasta 1,730 1,851 0 1,618 0 233
Before Trial After Trial
Dismissal forLack of
ProsecutionTotal
FilingsTotal
DispositionsOther
Before Trial
Judicial Council of California 2022 Court Statistics Report112
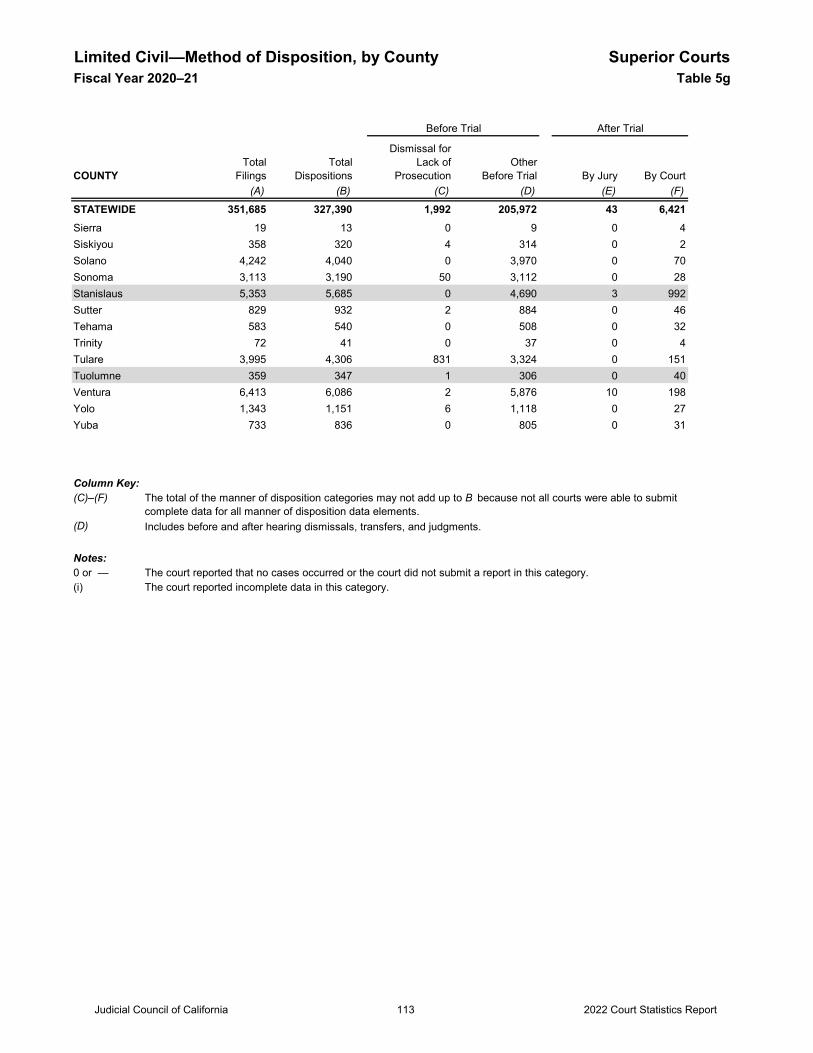
Limited Civil—Method of Disposition, by County Superior CourtsFiscal Year 2020–21 Table 5g
COUNTY By Jury By Court(A) (B) (C) (D) (E) (F)
STATEWIDE 351,685 327,390 1,992 205,972 43 6,421
Before Trial After Trial
Dismissal forLack of
ProsecutionTotal
FilingsTotal
DispositionsOther
Before Trial
Sierra 19 13 0 9 0 4Siskiyou 358 320 4 314 0 2Solano 4,242 4,040 0 3,970 0 70Sonoma 3,113 3,190 50 3,112 0 28Stanislaus 5,353 5,685 0 4,690 3 992Sutter 829 932 2 884 0 46Tehama 583 540 0 508 0 32Trinity 72 41 0 37 0 4Tulare 3,995 4,306 831 3,324 0 151Tuolumne 359 347 1 306 0 40Ventura 6,413 6,086 2 5,876 10 198Yolo 1,343 1,151 6 1,118 0 27Yuba 733 836 0 805 0 31
Column Key: (C)–(F)
(D) Includes before and after hearing dismissals, transfers, and judgments. Notes:0 or — The court reported that no cases occurred or the court did not submit a report in this category.(i) The court reported incomplete data in this category.
The total of the manner of disposition categories may not add up to B because not all courts were able to submit complete data for all manner of disposition data elements.
Judicial Council of California 2022 Court Statistics Report113
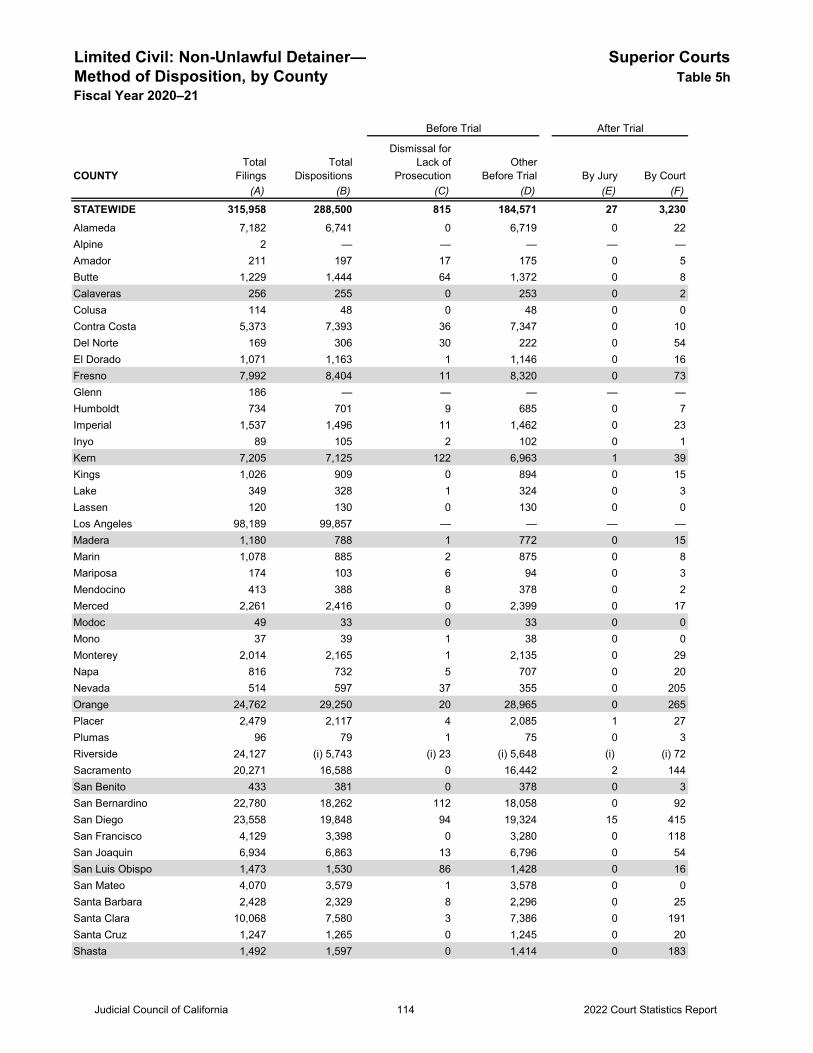
Limited Civil: Non-Unlawful Detainer— Superior CourtsMethod of Disposition, by County Table 5hFiscal Year 2020–21
COUNTY By Jury By Court(A) (B) (C) (D) (E) (F)
STATEWIDE 315,958 288,500 815 184,571 27 3,230Alameda 7,182 6,741 0 6,719 0 22Alpine 2 — — — — —Amador 211 197 17 175 0 5Butte 1,229 1,444 64 1,372 0 8Calaveras 256 255 0 253 0 2Colusa 114 48 0 48 0 0Contra Costa 5,373 7,393 36 7,347 0 10Del Norte 169 306 30 222 0 54El Dorado 1,071 1,163 1 1,146 0 16Fresno 7,992 8,404 11 8,320 0 73Glenn 186 — — — — —Humboldt 734 701 9 685 0 7Imperial 1,537 1,496 11 1,462 0 23Inyo 89 105 2 102 0 1Kern 7,205 7,125 122 6,963 1 39Kings 1,026 909 0 894 0 15Lake 349 328 1 324 0 3Lassen 120 130 0 130 0 0Los Angeles 98,189 99,857 — — — —Madera 1,180 788 1 772 0 15Marin 1,078 885 2 875 0 8Mariposa 174 103 6 94 0 3Mendocino 413 388 8 378 0 2Merced 2,261 2,416 0 2,399 0 17Modoc 49 33 0 33 0 0Mono 37 39 1 38 0 0Monterey 2,014 2,165 1 2,135 0 29Napa 816 732 5 707 0 20Nevada 514 597 37 355 0 205Orange 24,762 29,250 20 28,965 0 265Placer 2,479 2,117 4 2,085 1 27Plumas 96 79 1 75 0 3Riverside 24,127 (i) 5,743 (i) 23 (i) 5,648 (i) (i) 72Sacramento 20,271 16,588 0 16,442 2 144San Benito 433 381 0 378 0 3San Bernardino 22,780 18,262 112 18,058 0 92San Diego 23,558 19,848 94 19,324 15 415San Francisco 4,129 3,398 0 3,280 0 118San Joaquin 6,934 6,863 13 6,796 0 54San Luis Obispo 1,473 1,530 86 1,428 0 16San Mateo 4,070 3,579 1 3,578 0 0Santa Barbara 2,428 2,329 8 2,296 0 25Santa Clara 10,068 7,580 3 7,386 0 191Santa Cruz 1,247 1,265 0 1,245 0 20Shasta 1,492 1,597 0 1,414 0 183
Before Trial After Trial
Dismissal forLack of
ProsecutionTotal
FilingsTotal
DispositionsOther
Before Trial
Judicial Council of California 2022 Court Statistics Report114
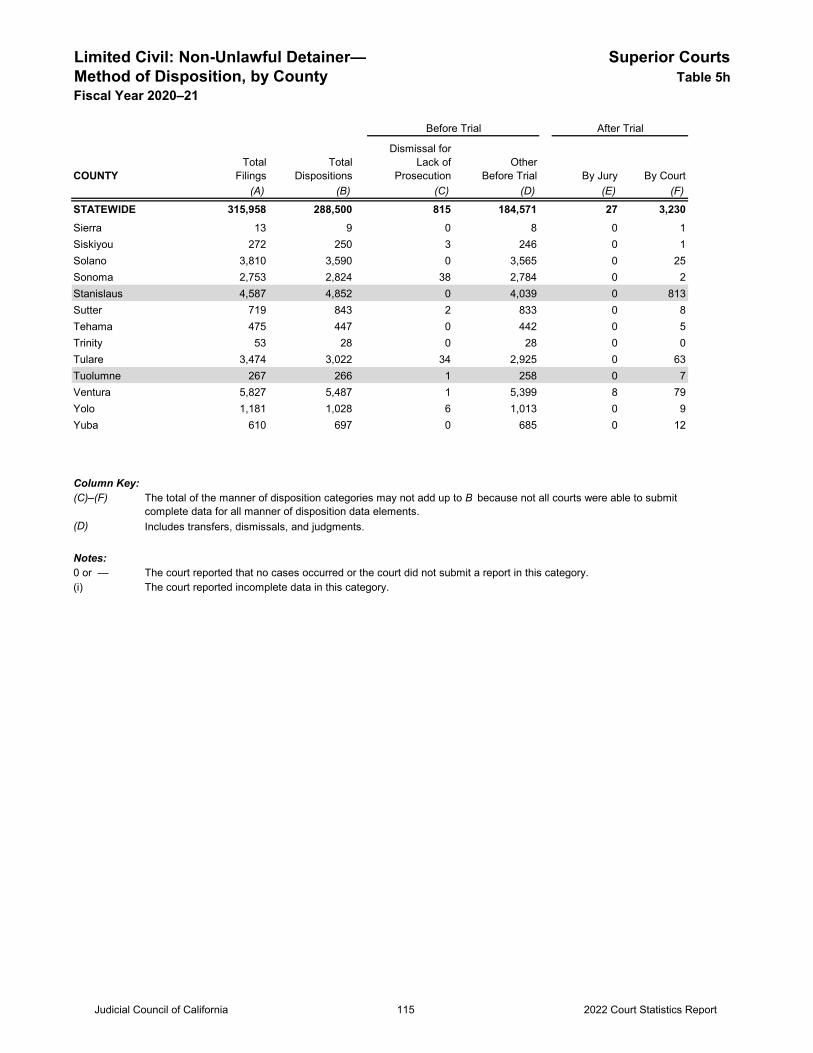
Limited Civil: Non-Unlawful Detainer— Superior CourtsMethod of Disposition, by County Table 5hFiscal Year 2020–21
COUNTY By Jury By Court(A) (B) (C) (D) (E) (F)
STATEWIDE 315,958 288,500 815 184,571 27 3,230
Before Trial After Trial
Dismissal forLack of
ProsecutionTotal
FilingsTotal
DispositionsOther
Before Trial
Sierra 13 9 0 8 0 1Siskiyou 272 250 3 246 0 1Solano 3,810 3,590 0 3,565 0 25Sonoma 2,753 2,824 38 2,784 0 2Stanislaus 4,587 4,852 0 4,039 0 813Sutter 719 843 2 833 0 8Tehama 475 447 0 442 0 5Trinity 53 28 0 28 0 0Tulare 3,474 3,022 34 2,925 0 63Tuolumne 267 266 1 258 0 7Ventura 5,827 5,487 1 5,399 8 79Yolo 1,181 1,028 6 1,013 0 9Yuba 610 697 0 685 0 12
Column Key: (C)–(F)
(D) Includes transfers, dismissals, and judgments.
Notes:0 or — The court reported that no cases occurred or the court did not submit a report in this category.(i) The court reported incomplete data in this category.
The total of the manner of disposition categories may not add up to B because not all courts were able to submit complete data for all manner of disposition data elements.
Judicial Council of California 2022 Court Statistics Report115
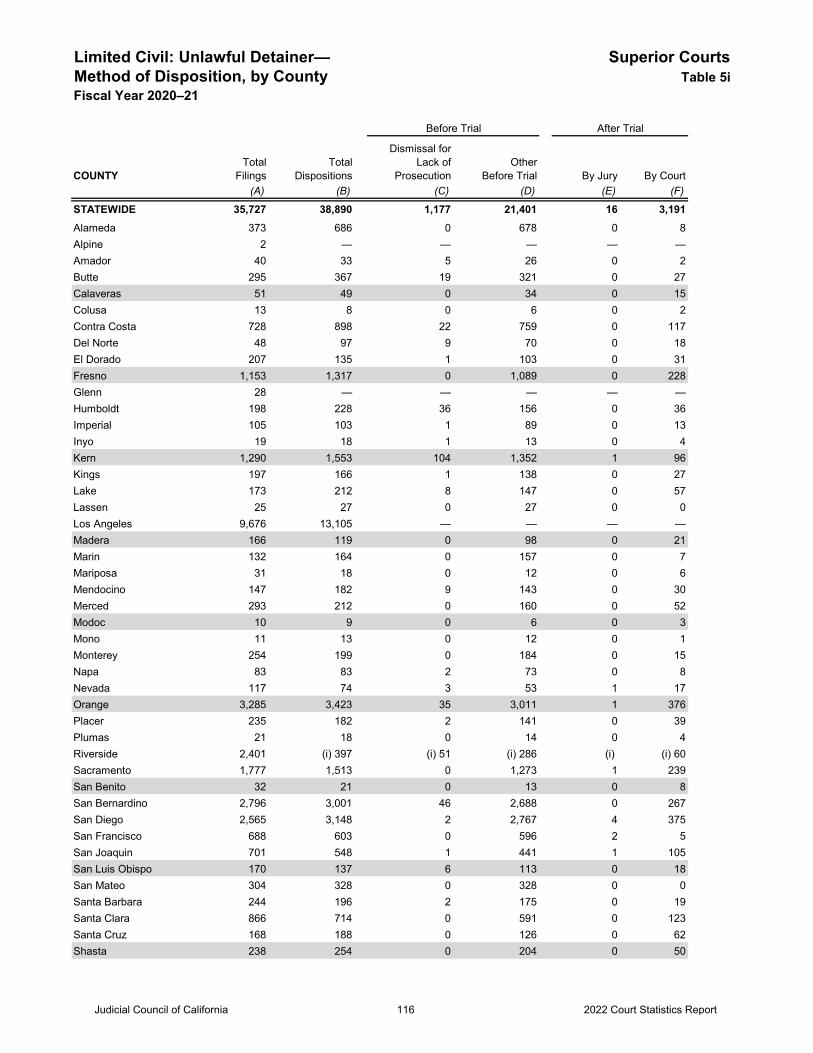
Limited Civil: Unlawful Detainer— Superior CourtsMethod of Disposition, by County Table 5iFiscal Year 2020–21
COUNTY By Jury By Court(A) (B) (C) (D) (E) (F)
STATEWIDE 35,727 38,890 1,177 21,401 16 3,191Alameda 373 686 0 678 0 8Alpine 2 — — — — —Amador 40 33 5 26 0 2Butte 295 367 19 321 0 27Calaveras 51 49 0 34 0 15Colusa 13 8 0 6 0 2Contra Costa 728 898 22 759 0 117Del Norte 48 97 9 70 0 18El Dorado 207 135 1 103 0 31Fresno 1,153 1,317 0 1,089 0 228Glenn 28 — — — — —Humboldt 198 228 36 156 0 36Imperial 105 103 1 89 0 13Inyo 19 18 1 13 0 4Kern 1,290 1,553 104 1,352 1 96Kings 197 166 1 138 0 27Lake 173 212 8 147 0 57Lassen 25 27 0 27 0 0Los Angeles 9,676 13,105 — — — —Madera 166 119 0 98 0 21Marin 132 164 0 157 0 7Mariposa 31 18 0 12 0 6Mendocino 147 182 9 143 0 30Merced 293 212 0 160 0 52Modoc 10 9 0 6 0 3Mono 11 13 0 12 0 1Monterey 254 199 0 184 0 15Napa 83 83 2 73 0 8Nevada 117 74 3 53 1 17Orange 3,285 3,423 35 3,011 1 376Placer 235 182 2 141 0 39Plumas 21 18 0 14 0 4Riverside 2,401 (i) 397 (i) 51 (i) 286 (i) (i) 60Sacramento 1,777 1,513 0 1,273 1 239San Benito 32 21 0 13 0 8San Bernardino 2,796 3,001 46 2,688 0 267San Diego 2,565 3,148 2 2,767 4 375San Francisco 688 603 0 596 2 5San Joaquin 701 548 1 441 1 105San Luis Obispo 170 137 6 113 0 18San Mateo 304 328 0 328 0 0Santa Barbara 244 196 2 175 0 19Santa Clara 866 714 0 591 0 123Santa Cruz 168 188 0 126 0 62Shasta 238 254 0 204 0 50
Before Trial After Trial
Dismissal forLack of
ProsecutionTotal
FilingsTotal
DispositionsOther
Before Trial
Judicial Council of California 2022 Court Statistics Report116
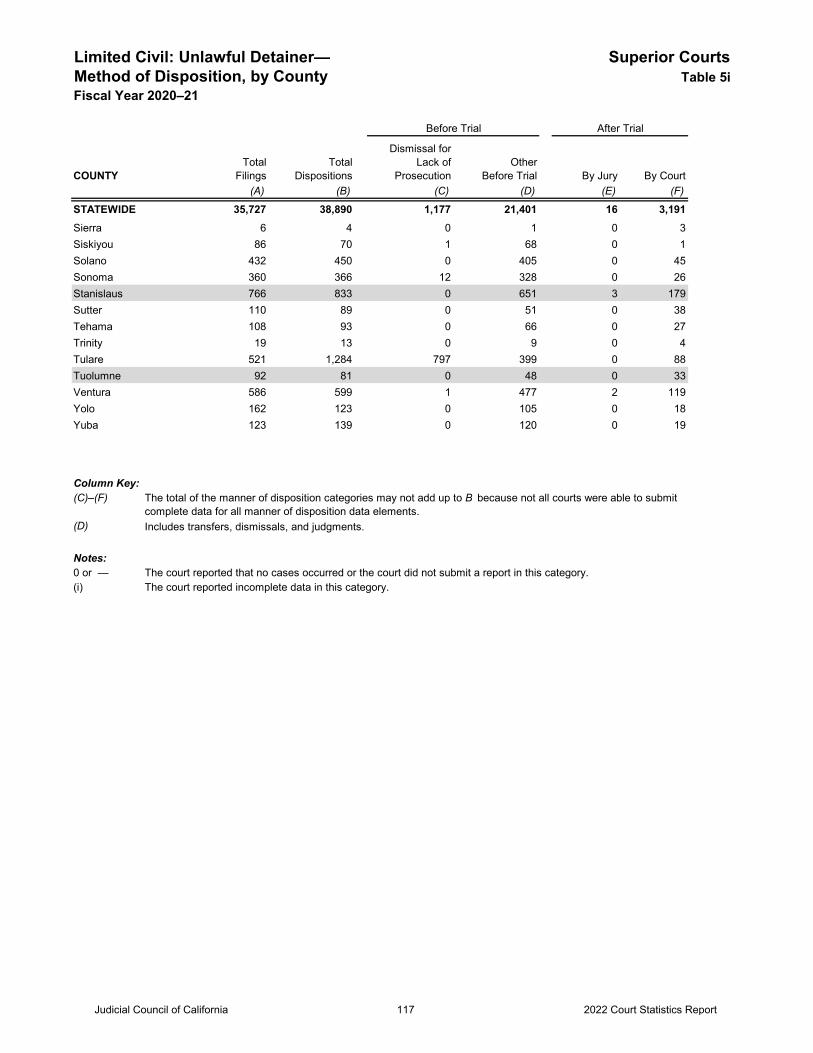
Limited Civil: Unlawful Detainer— Superior CourtsMethod of Disposition, by County Table 5iFiscal Year 2020–21
COUNTY By Jury By Court(A) (B) (C) (D) (E) (F)
STATEWIDE 35,727 38,890 1,177 21,401 16 3,191
Before Trial After Trial
Dismissal forLack of
ProsecutionTotal
FilingsTotal
DispositionsOther
Before Trial
Sierra 6 4 0 1 0 3Siskiyou 86 70 1 68 0 1Solano 432 450 0 405 0 45Sonoma 360 366 12 328 0 26Stanislaus 766 833 0 651 3 179Sutter 110 89 0 51 0 38Tehama 108 93 0 66 0 27Trinity 19 13 0 9 0 4Tulare 521 1,284 797 399 0 88Tuolumne 92 81 0 48 0 33Ventura 586 599 1 477 2 119Yolo 162 123 0 105 0 18Yuba 123 139 0 120 0 19
Column Key: (C)–(F)
(D) Includes transfers, dismissals, and judgments. Notes:0 or — The court reported that no cases occurred or the court did not submit a report in this category.(i) The court reported incomplete data in this category.
The total of the manner of disposition categories may not add up to B because not all courts were able to submit complete data for all manner of disposition data elements.
Judicial Council of California 2022 Court Statistics Report117
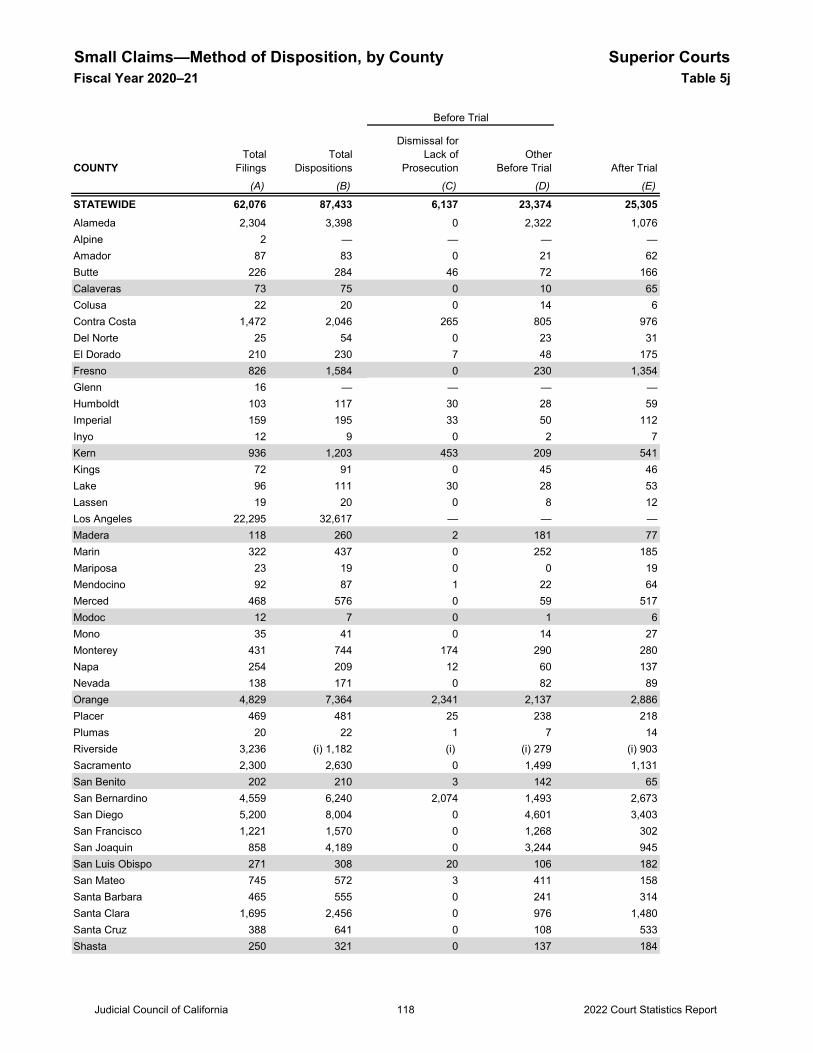
Small Claims—Method of Disposition, by County Superior CourtsFiscal Year 2020–21 Table 5j
COUNTY After Trial(A) (B) (C) (D) (E)
STATEWIDE 62,076 87,433 6,137 23,374 25,305Alameda 2,304 3,398 0 2,322 1,076Alpine 2 — — — —Amador 87 83 0 21 62Butte 226 284 46 72 166Calaveras 73 75 0 10 65Colusa 22 20 0 14 6Contra Costa 1,472 2,046 265 805 976Del Norte 25 54 0 23 31El Dorado 210 230 7 48 175Fresno 826 1,584 0 230 1,354Glenn 16 — — — —Humboldt 103 117 30 28 59Imperial 159 195 33 50 112Inyo 12 9 0 2 7Kern 936 1,203 453 209 541Kings 72 91 0 45 46Lake 96 111 30 28 53Lassen 19 20 0 8 12Los Angeles 22,295 32,617 — — —Madera 118 260 2 181 77Marin 322 437 0 252 185Mariposa 23 19 0 0 19Mendocino 92 87 1 22 64Merced 468 576 0 59 517Modoc 12 7 0 1 6Mono 35 41 0 14 27Monterey 431 744 174 290 280Napa 254 209 12 60 137Nevada 138 171 0 82 89Orange 4,829 7,364 2,341 2,137 2,886Placer 469 481 25 238 218Plumas 20 22 1 7 14Riverside 3,236 (i) 1,182 (i) (i) 279 (i) 903Sacramento 2,300 2,630 0 1,499 1,131San Benito 202 210 3 142 65San Bernardino 4,559 6,240 2,074 1,493 2,673San Diego 5,200 8,004 0 4,601 3,403San Francisco 1,221 1,570 0 1,268 302San Joaquin 858 4,189 0 3,244 945San Luis Obispo 271 308 20 106 182San Mateo 745 572 3 411 158Santa Barbara 465 555 0 241 314Santa Clara 1,695 2,456 0 976 1,480Santa Cruz 388 641 0 108 533Shasta 250 321 0 137 184
Before Trial
Dismissal forLack of
ProsecutionTotal
FilingsTotal
DispositionsOther
Before Trial
Judicial Council of California 2022 Court Statistics Report118
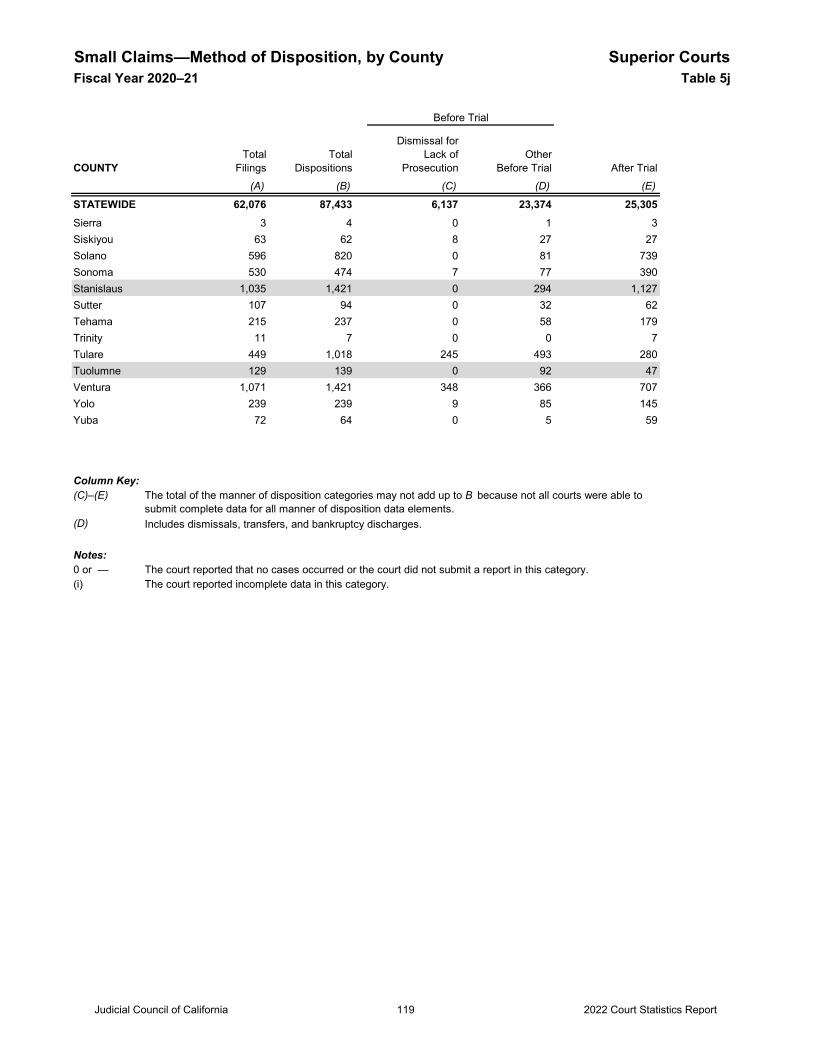
Small Claims—Method of Disposition, by County Superior CourtsFiscal Year 2020–21 Table 5j
COUNTY After Trial(A) (B) (C) (D) (E)
STATEWIDE 62,076 87,433 6,137 23,374 25,305
Before Trial
Dismissal forLack of
ProsecutionTotal
FilingsTotal
DispositionsOther
Before Trial
Sierra 3 4 0 1 3Siskiyou 63 62 8 27 27Solano 596 820 0 81 739Sonoma 530 474 7 77 390Stanislaus 1,035 1,421 0 294 1,127Sutter 107 94 0 32 62Tehama 215 237 0 58 179Trinity 11 7 0 0 7Tulare 449 1,018 245 493 280Tuolumne 129 139 0 92 47Ventura 1,071 1,421 348 366 707Yolo 239 239 9 85 145Yuba 72 64 0 5 59
Column Key: (C)–(E)
(D) Includes dismissals, transfers, and bankruptcy discharges.
Notes:0 or — The court reported that no cases occurred or the court did not submit a report in this category.(i) The court reported incomplete data in this category.
The total of the manner of disposition categories may not add up to B because not all courts were able to submit complete data for all manner of disposition data elements.
Judicial Council of California 2022 Court Statistics Report119
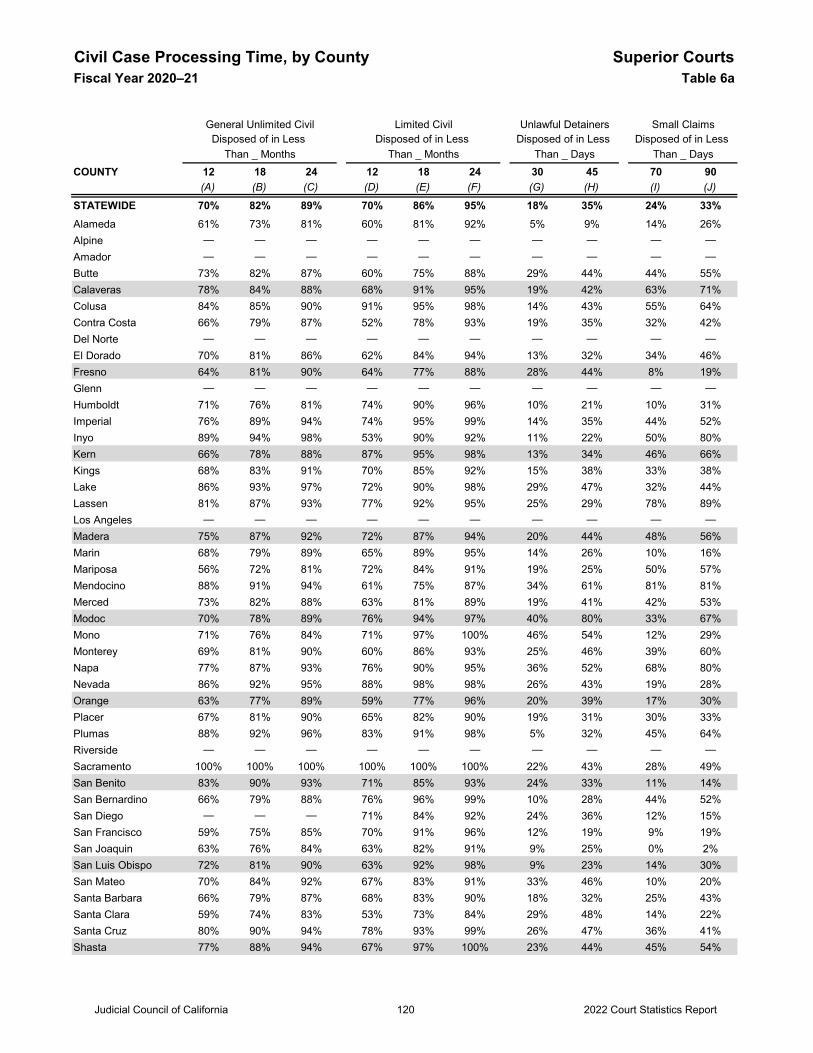
Civil Case Processing Time, by County Superior CourtsFiscal Year 2020–21 Table 6a
COUNTY 12 18 24 12 18 24 30 45 70 90(A) (B) (C) (D) (E) (F) (G) (H) (I) (J)
STATEWIDE 70% 82% 89% 70% 86% 95% 18% 35% 24% 33%Alameda 61% 73% 81% 60% 81% 92% 5% 9% 14% 26%Alpine — — — — — — — — — —Amador — — — — — — — — — —Butte 73% 82% 87% 60% 75% 88% 29% 44% 44% 55%Calaveras 78% 84% 88% 68% 91% 95% 19% 42% 63% 71%Colusa 84% 85% 90% 91% 95% 98% 14% 43% 55% 64%Contra Costa 66% 79% 87% 52% 78% 93% 19% 35% 32% 42%Del Norte — — — — — — — — — —El Dorado 70% 81% 86% 62% 84% 94% 13% 32% 34% 46%Fresno 64% 81% 90% 64% 77% 88% 28% 44% 8% 19%Glenn — — — — — — — — — —Humboldt 71% 76% 81% 74% 90% 96% 10% 21% 10% 31%Imperial 76% 89% 94% 74% 95% 99% 14% 35% 44% 52%Inyo 89% 94% 98% 53% 90% 92% 11% 22% 50% 80%Kern 66% 78% 88% 87% 95% 98% 13% 34% 46% 66%Kings 68% 83% 91% 70% 85% 92% 15% 38% 33% 38%Lake 86% 93% 97% 72% 90% 98% 29% 47% 32% 44%Lassen 81% 87% 93% 77% 92% 95% 25% 29% 78% 89%Los Angeles — — — — — — — — — —Madera 75% 87% 92% 72% 87% 94% 20% 44% 48% 56%Marin 68% 79% 89% 65% 89% 95% 14% 26% 10% 16%Mariposa 56% 72% 81% 72% 84% 91% 19% 25% 50% 57%Mendocino 88% 91% 94% 61% 75% 87% 34% 61% 81% 81%Merced 73% 82% 88% 63% 81% 89% 19% 41% 42% 53%Modoc 70% 78% 89% 76% 94% 97% 40% 80% 33% 67%Mono 71% 76% 84% 71% 97% 100% 46% 54% 12% 29%Monterey 69% 81% 90% 60% 86% 93% 25% 46% 39% 60%Napa 77% 87% 93% 76% 90% 95% 36% 52% 68% 80%Nevada 86% 92% 95% 88% 98% 98% 26% 43% 19% 28%Orange 63% 77% 89% 59% 77% 96% 20% 39% 17% 30%Placer 67% 81% 90% 65% 82% 90% 19% 31% 30% 33%Plumas 88% 92% 96% 83% 91% 98% 5% 32% 45% 64%Riverside — — — — — — — — — —Sacramento 100% 100% 100% 100% 100% 100% 22% 43% 28% 49%San Benito 83% 90% 93% 71% 85% 93% 24% 33% 11% 14%San Bernardino 66% 79% 88% 76% 96% 99% 10% 28% 44% 52%San Diego — — — 71% 84% 92% 24% 36% 12% 15%San Francisco 59% 75% 85% 70% 91% 96% 12% 19% 9% 19%San Joaquin 63% 76% 84% 63% 82% 91% 9% 25% 0% 2%San Luis Obispo 72% 81% 90% 63% 92% 98% 9% 23% 14% 30%San Mateo 70% 84% 92% 67% 83% 91% 33% 46% 10% 20%Santa Barbara 66% 79% 87% 68% 83% 90% 18% 32% 25% 43%Santa Clara 59% 74% 83% 53% 73% 84% 29% 48% 14% 22%Santa Cruz 80% 90% 94% 78% 93% 99% 26% 47% 36% 41%Shasta 77% 88% 94% 67% 97% 100% 23% 44% 45% 54%
General Unlimited CivilDisposed of in Less
Than _ Months
Small ClaimsDisposed of in Less
Than _ Days
Unlawful DetainersDisposed of in Less
Than _ Days
Limited CivilDisposed of in Less
Than _ Months
Judicial Council of California 120 2022 Court Statistics Report
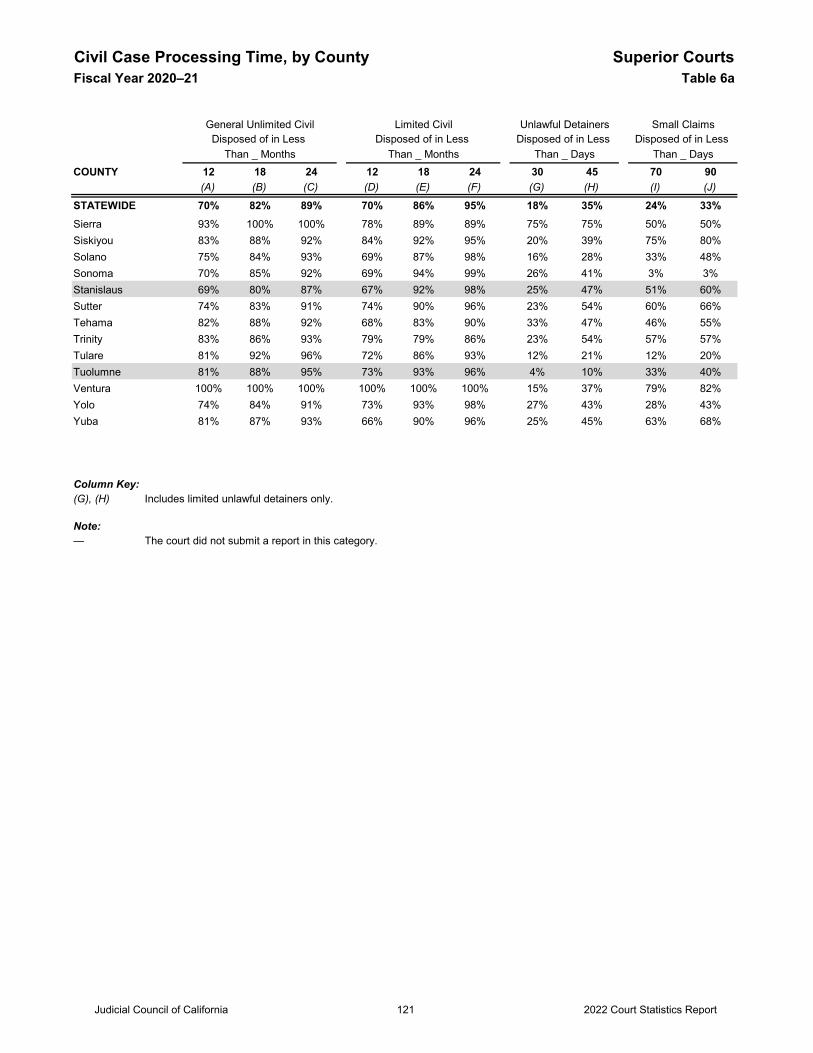
Civil Case Processing Time, by County Superior CourtsFiscal Year 2020–21 Table 6a
COUNTY 12 18 24 12 18 24 30 45 70 90(A) (B) (C) (D) (E) (F) (G) (H) (I) (J)
STATEWIDE 70% 82% 89% 70% 86% 95% 18% 35% 24% 33%
General Unlimited CivilDisposed of in Less
Than _ Months
Small ClaimsDisposed of in Less
Than _ Days
Unlawful DetainersDisposed of in Less
Than _ Days
Limited CivilDisposed of in Less
Than _ Months
Sierra 93% 100% 100% 78% 89% 89% 75% 75% 50% 50%Siskiyou 83% 88% 92% 84% 92% 95% 20% 39% 75% 80%Solano 75% 84% 93% 69% 87% 98% 16% 28% 33% 48%Sonoma 70% 85% 92% 69% 94% 99% 26% 41% 3% 3%Stanislaus 69% 80% 87% 67% 92% 98% 25% 47% 51% 60%Sutter 74% 83% 91% 74% 90% 96% 23% 54% 60% 66%Tehama 82% 88% 92% 68% 83% 90% 33% 47% 46% 55%Trinity 83% 86% 93% 79% 79% 86% 23% 54% 57% 57%Tulare 81% 92% 96% 72% 86% 93% 12% 21% 12% 20%Tuolumne 81% 88% 95% 73% 93% 96% 4% 10% 33% 40%Ventura 100% 100% 100% 100% 100% 100% 15% 37% 79% 82%Yolo 74% 84% 91% 73% 93% 98% 27% 43% 28% 43%Yuba 81% 87% 93% 66% 90% 96% 25% 45% 63% 68%
Column Key:(G), (H) Includes limited unlawful detainers only.
Note:— The court did not submit a report in this category.
Judicial Council of California 121 2022 Court Statistics Report
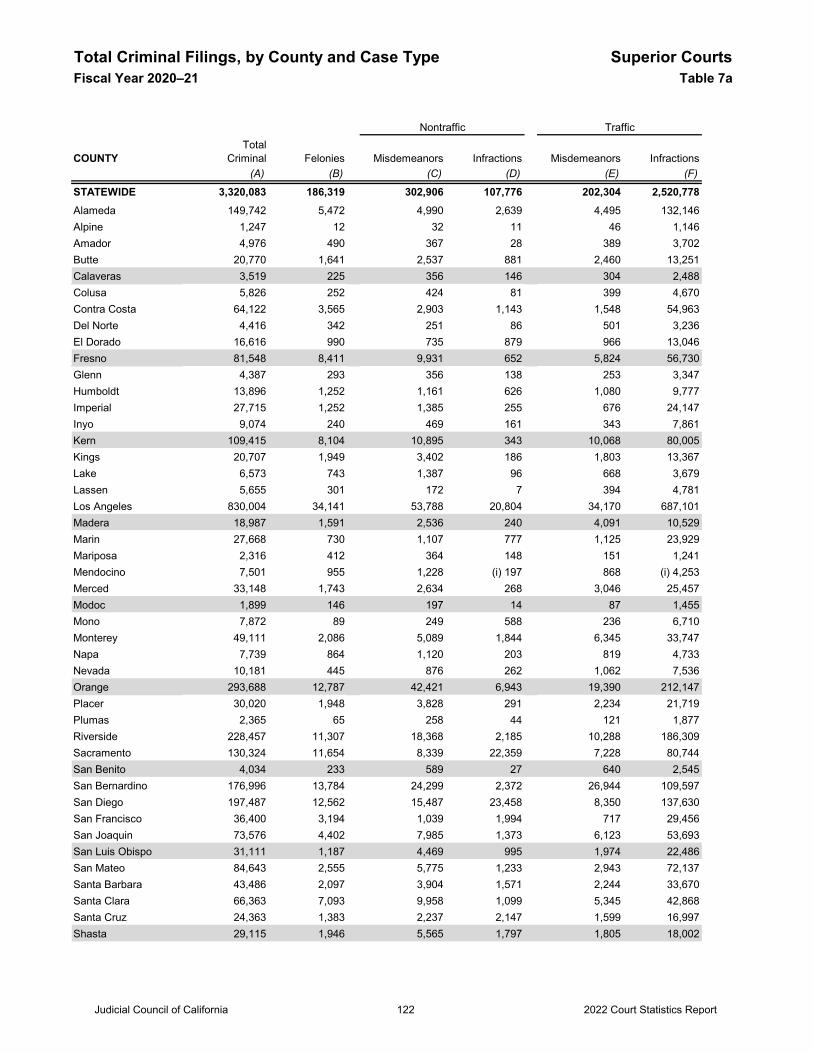
Total Criminal Filings, by County and Case Type Superior CourtsFiscal Year 2020–21 Table 7a
COUNTY Felonies Misdemeanors Infractions Misdemeanors Infractions(A) (B) (C) (D) (E) (F)
STATEWIDE 3,320,083 186,319 302,906 107,776 202,304 2,520,778Alameda 149,742 5,472 4,990 2,639 4,495 132,146Alpine 1,247 12 32 11 46 1,146Amador 4,976 490 367 28 389 3,702Butte 20,770 1,641 2,537 881 2,460 13,251Calaveras 3,519 225 356 146 304 2,488Colusa 5,826 252 424 81 399 4,670Contra Costa 64,122 3,565 2,903 1,143 1,548 54,963Del Norte 4,416 342 251 86 501 3,236El Dorado 16,616 990 735 879 966 13,046Fresno 81,548 8,411 9,931 652 5,824 56,730Glenn 4,387 293 356 138 253 3,347Humboldt 13,896 1,252 1,161 626 1,080 9,777Imperial 27,715 1,252 1,385 255 676 24,147Inyo 9,074 240 469 161 343 7,861Kern 109,415 8,104 10,895 343 10,068 80,005Kings 20,707 1,949 3,402 186 1,803 13,367Lake 6,573 743 1,387 96 668 3,679Lassen 5,655 301 172 7 394 4,781Los Angeles 830,004 34,141 53,788 20,804 34,170 687,101Madera 18,987 1,591 2,536 240 4,091 10,529Marin 27,668 730 1,107 777 1,125 23,929Mariposa 2,316 412 364 148 151 1,241Mendocino 7,501 955 1,228 (i) 197 868 (i) 4,253Merced 33,148 1,743 2,634 268 3,046 25,457Modoc 1,899 146 197 14 87 1,455Mono 7,872 89 249 588 236 6,710Monterey 49,111 2,086 5,089 1,844 6,345 33,747Napa 7,739 864 1,120 203 819 4,733Nevada 10,181 445 876 262 1,062 7,536Orange 293,688 12,787 42,421 6,943 19,390 212,147Placer 30,020 1,948 3,828 291 2,234 21,719Plumas 2,365 65 258 44 121 1,877Riverside 228,457 11,307 18,368 2,185 10,288 186,309Sacramento 130,324 11,654 8,339 22,359 7,228 80,744San Benito 4,034 233 589 27 640 2,545San Bernardino 176,996 13,784 24,299 2,372 26,944 109,597San Diego 197,487 12,562 15,487 23,458 8,350 137,630San Francisco 36,400 3,194 1,039 1,994 717 29,456San Joaquin 73,576 4,402 7,985 1,373 6,123 53,693San Luis Obispo 31,111 1,187 4,469 995 1,974 22,486San Mateo 84,643 2,555 5,775 1,233 2,943 72,137Santa Barbara 43,486 2,097 3,904 1,571 2,244 33,670Santa Clara 66,363 7,093 9,958 1,099 5,345 42,868Santa Cruz 24,363 1,383 2,237 2,147 1,599 16,997Shasta 29,115 1,946 5,565 1,797 1,805 18,002
Nontraffic TrafficTotal
Criminal
Judicial Council of California 2022 Court Statistics Report122
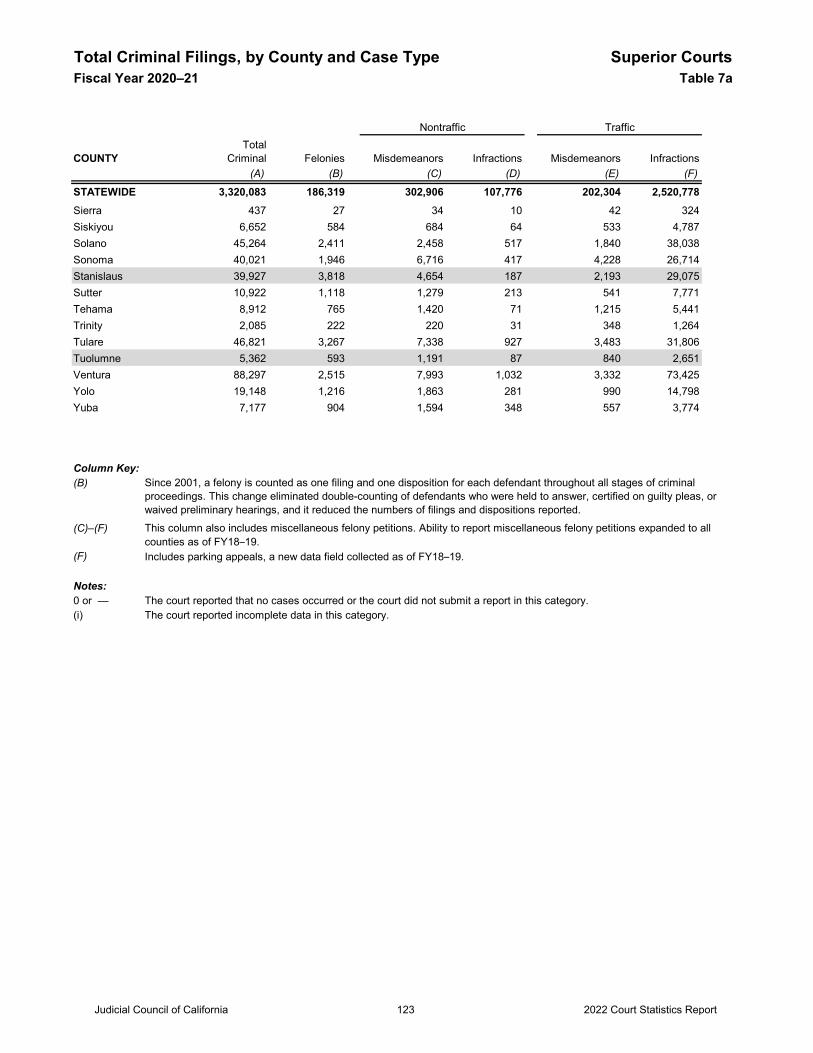
Total Criminal Filings, by County and Case Type Superior CourtsFiscal Year 2020–21 Table 7a
COUNTY Felonies Misdemeanors Infractions Misdemeanors Infractions(A) (B) (C) (D) (E) (F)
STATEWIDE 3,320,083 186,319 302,906 107,776 202,304 2,520,778
Nontraffic TrafficTotal
Criminal
Sierra 437 27 34 10 42 324Siskiyou 6,652 584 684 64 533 4,787Solano 45,264 2,411 2,458 517 1,840 38,038Sonoma 40,021 1,946 6,716 417 4,228 26,714Stanislaus 39,927 3,818 4,654 187 2,193 29,075Sutter 10,922 1,118 1,279 213 541 7,771Tehama 8,912 765 1,420 71 1,215 5,441Trinity 2,085 222 220 31 348 1,264Tulare 46,821 3,267 7,338 927 3,483 31,806Tuolumne 5,362 593 1,191 87 840 2,651Ventura 88,297 2,515 7,993 1,032 3,332 73,425Yolo 19,148 1,216 1,863 281 990 14,798Yuba 7,177 904 1,594 348 557 3,774
Column Key:(B)
(C)–(F)
(F) Includes parking appeals, a new data field collected as of FY18–19.
Notes:0 or — The court reported that no cases occurred or the court did not submit a report in this category.(i) The court reported incomplete data in this category.
This column also includes miscellaneous felony petitions. Ability to report miscellaneous felony petitions expanded to all counties as of FY18–19.
Since 2001, a felony is counted as one filing and one disposition for each defendant throughout all stages of criminal proceedings. This change eliminated double-counting of defendants who were held to answer, certified on guilty pleas, or waived preliminary hearings, and it reduced the numbers of filings and dispositions reported.
Judicial Council of California 2022 Court Statistics Report123
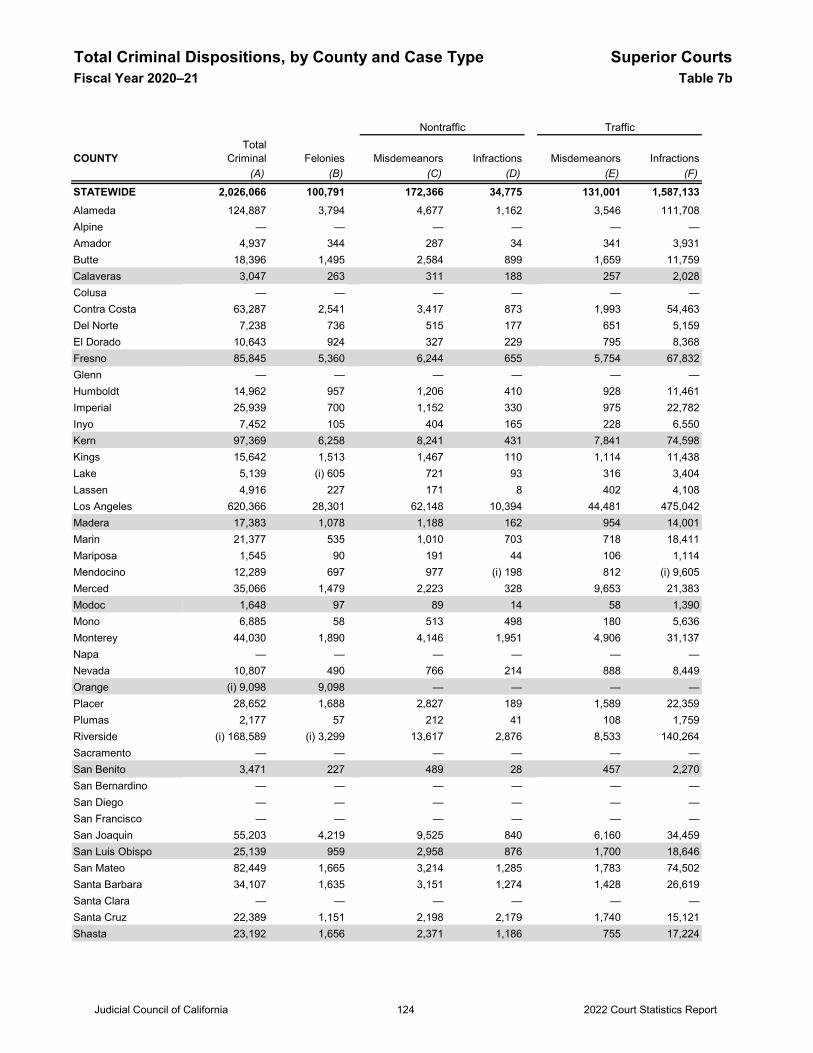
Total Criminal Dispositions, by County and Case Type Superior CourtsFiscal Year 2020–21 Table 7b
COUNTY Felonies Misdemeanors Infractions Misdemeanors Infractions(A) (B) (C) (D) (E) (F)
STATEWIDE 2,026,066 100,791 172,366 34,775 131,001 1,587,133Alameda 124,887 3,794 4,677 1,162 3,546 111,708Alpine — — — — — —Amador 4,937 344 287 34 341 3,931Butte 18,396 1,495 2,584 899 1,659 11,759Calaveras 3,047 263 311 188 257 2,028Colusa — — — — — —Contra Costa 63,287 2,541 3,417 873 1,993 54,463Del Norte 7,238 736 515 177 651 5,159El Dorado 10,643 924 327 229 795 8,368Fresno 85,845 5,360 6,244 655 5,754 67,832Glenn — — — — — —Humboldt 14,962 957 1,206 410 928 11,461Imperial 25,939 700 1,152 330 975 22,782Inyo 7,452 105 404 165 228 6,550Kern 97,369 6,258 8,241 431 7,841 74,598Kings 15,642 1,513 1,467 110 1,114 11,438Lake 5,139 (i) 605 721 93 316 3,404Lassen 4,916 227 171 8 402 4,108Los Angeles 620,366 28,301 62,148 10,394 44,481 475,042Madera 17,383 1,078 1,188 162 954 14,001Marin 21,377 535 1,010 703 718 18,411Mariposa 1,545 90 191 44 106 1,114Mendocino 12,289 697 977 (i) 198 812 (i) 9,605Merced 35,066 1,479 2,223 328 9,653 21,383Modoc 1,648 97 89 14 58 1,390Mono 6,885 58 513 498 180 5,636Monterey 44,030 1,890 4,146 1,951 4,906 31,137Napa — — — — — —Nevada 10,807 490 766 214 888 8,449Orange (i) 9,098 9,098 — — — —Placer 28,652 1,688 2,827 189 1,589 22,359Plumas 2,177 57 212 41 108 1,759Riverside (i) 168,589 (i) 3,299 13,617 2,876 8,533 140,264Sacramento — — — — — —San Benito 3,471 227 489 28 457 2,270San Bernardino — — — — — —San Diego — — — — — —San Francisco — — — — — —San Joaquin 55,203 4,219 9,525 840 6,160 34,459San Luis Obispo 25,139 959 2,958 876 1,700 18,646San Mateo 82,449 1,665 3,214 1,285 1,783 74,502Santa Barbara 34,107 1,635 3,151 1,274 1,428 26,619Santa Clara — — — — — —Santa Cruz 22,389 1,151 2,198 2,179 1,740 15,121Shasta 23,192 1,656 2,371 1,186 755 17,224
Nontraffic TrafficTotal
Criminal
Judicial Council of California 2022 Court Statistics Report124
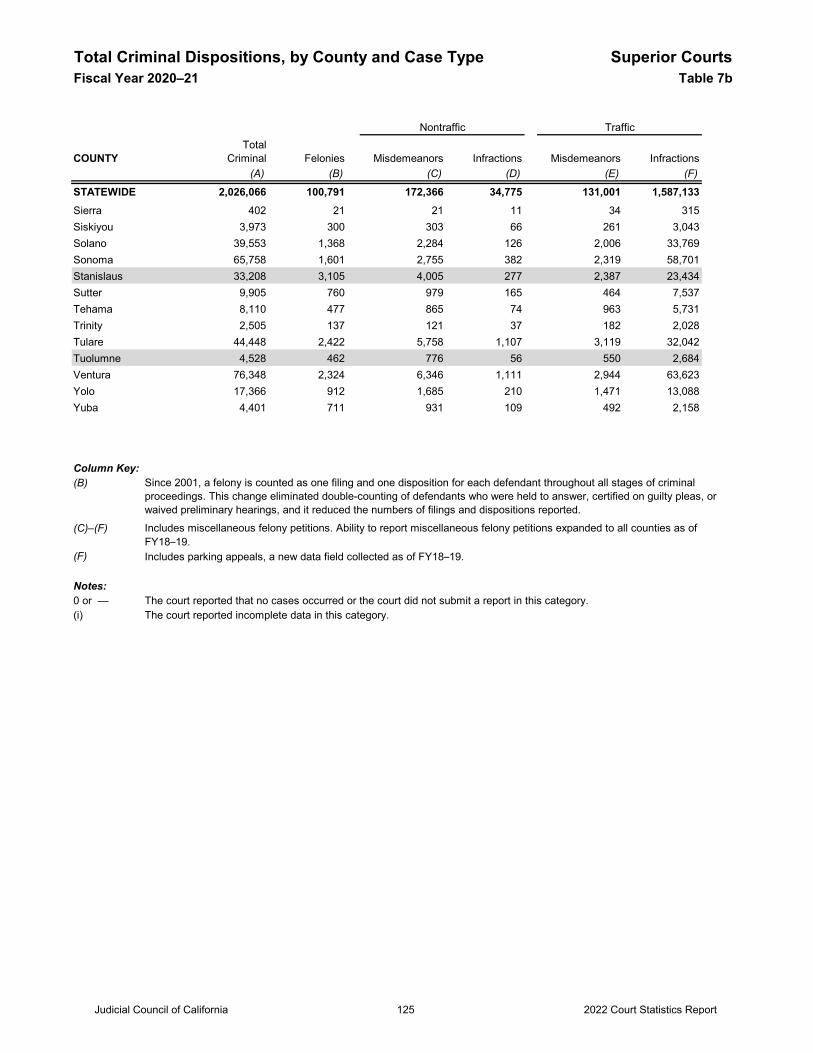
Total Criminal Dispositions, by County and Case Type Superior CourtsFiscal Year 2020–21 Table 7b
COUNTY Felonies Misdemeanors Infractions Misdemeanors Infractions(A) (B) (C) (D) (E) (F)
STATEWIDE 2,026,066 100,791 172,366 34,775 131,001 1,587,133
Nontraffic TrafficTotal
Criminal
Sierra 402 21 21 11 34 315Siskiyou 3,973 300 303 66 261 3,043Solano 39,553 1,368 2,284 126 2,006 33,769Sonoma 65,758 1,601 2,755 382 2,319 58,701Stanislaus 33,208 3,105 4,005 277 2,387 23,434Sutter 9,905 760 979 165 464 7,537Tehama 8,110 477 865 74 963 5,731Trinity 2,505 137 121 37 182 2,028Tulare 44,448 2,422 5,758 1,107 3,119 32,042Tuolumne 4,528 462 776 56 550 2,684Ventura 76,348 2,324 6,346 1,111 2,944 63,623Yolo 17,366 912 1,685 210 1,471 13,088Yuba 4,401 711 931 109 492 2,158
Column Key:(B)
(C)–(F)
(F) Includes parking appeals, a new data field collected as of FY18–19.
Notes:0 or — The court reported that no cases occurred or the court did not submit a report in this category.(i) The court reported incomplete data in this category.
Since 2001, a felony is counted as one filing and one disposition for each defendant throughout all stages of criminal proceedings. This change eliminated double-counting of defendants who were held to answer, certified on guilty pleas, or waived preliminary hearings, and it reduced the numbers of filings and dispositions reported.Includes miscellaneous felony petitions. Ability to report miscellaneous felony petitions expanded to all counties as of FY18–19.
Judicial Council of California 2022 Court Statistics Report125
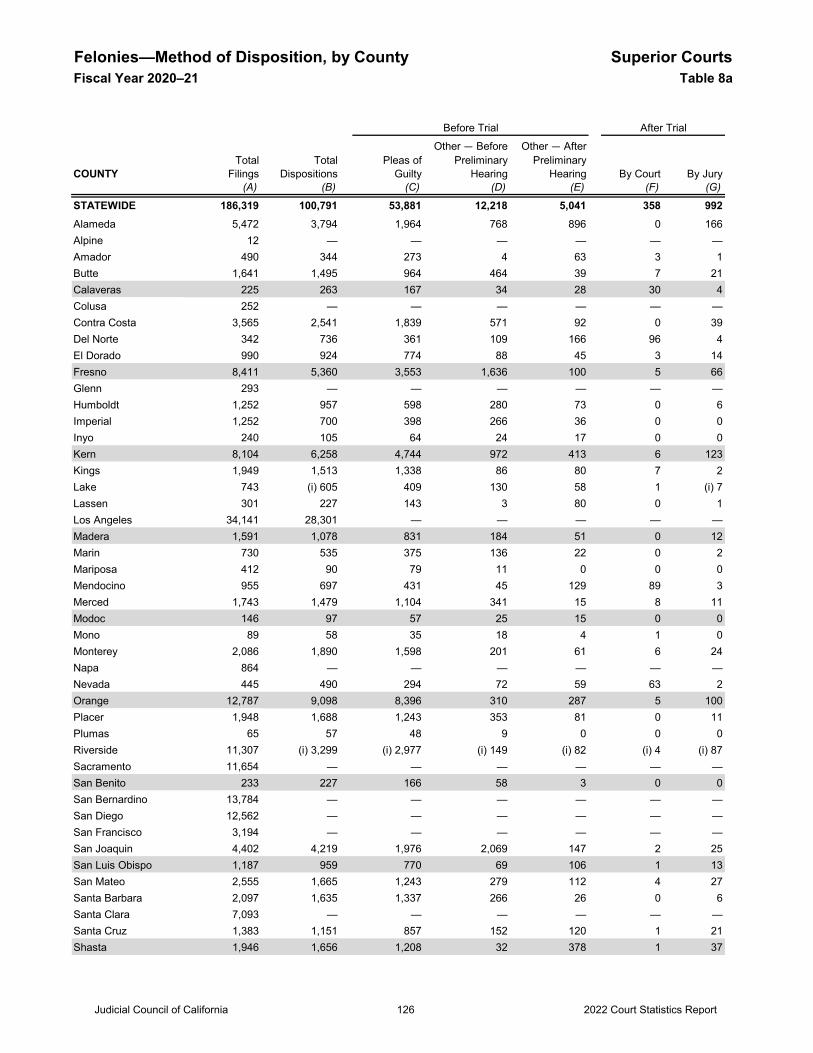
Felonies—Method of Disposition, by County Superior CourtsFiscal Year 2020–21 Table 8a
COUNTY By Court By Jury(A) (B) (C) (D) (E) (F) (G)
STATEWIDE 186,319 100,791 53,881 12,218 5,041 358 992Alameda 5,472 3,794 1,964 768 896 0 166Alpine 12 — — — — — —Amador 490 344 273 4 63 3 1Butte 1,641 1,495 964 464 39 7 21Calaveras 225 263 167 34 28 30 4Colusa 252 — — — — — —Contra Costa 3,565 2,541 1,839 571 92 0 39Del Norte 342 736 361 109 166 96 4El Dorado 990 924 774 88 45 3 14Fresno 8,411 5,360 3,553 1,636 100 5 66Glenn 293 — — — — — —Humboldt 1,252 957 598 280 73 0 6Imperial 1,252 700 398 266 36 0 0Inyo 240 105 64 24 17 0 0Kern 8,104 6,258 4,744 972 413 6 123Kings 1,949 1,513 1,338 86 80 7 2Lake 743 (i) 605 409 130 58 1 (i) 7Lassen 301 227 143 3 80 0 1Los Angeles 34,141 28,301 — — — — —Madera 1,591 1,078 831 184 51 0 12Marin 730 535 375 136 22 0 2Mariposa 412 90 79 11 0 0 0Mendocino 955 697 431 45 129 89 3Merced 1,743 1,479 1,104 341 15 8 11Modoc 146 97 57 25 15 0 0Mono 89 58 35 18 4 1 0Monterey 2,086 1,890 1,598 201 61 6 24Napa 864 — — — — — —Nevada 445 490 294 72 59 63 2Orange 12,787 9,098 8,396 310 287 5 100Placer 1,948 1,688 1,243 353 81 0 11Plumas 65 57 48 9 0 0 0Riverside 11,307 (i) 3,299 (i) 2,977 (i) 149 (i) 82 (i) 4 (i) 87Sacramento 11,654 — — — — — —San Benito 233 227 166 58 3 0 0San Bernardino 13,784 — — — — — —San Diego 12,562 — — — — — —San Francisco 3,194 — — — — — —San Joaquin 4,402 4,219 1,976 2,069 147 2 25San Luis Obispo 1,187 959 770 69 106 1 13San Mateo 2,555 1,665 1,243 279 112 4 27Santa Barbara 2,097 1,635 1,337 266 26 0 6Santa Clara 7,093 — — — — — —Santa Cruz 1,383 1,151 857 152 120 1 21Shasta 1,946 1,656 1,208 32 378 1 37
Before Trial After Trial
TotalFilings
TotalDispositions
Pleas ofGuilty
Other — BeforePreliminary
Hearing
Other — AfterPreliminary
Hearing
Judicial Council of California 2022 Court Statistics Report126
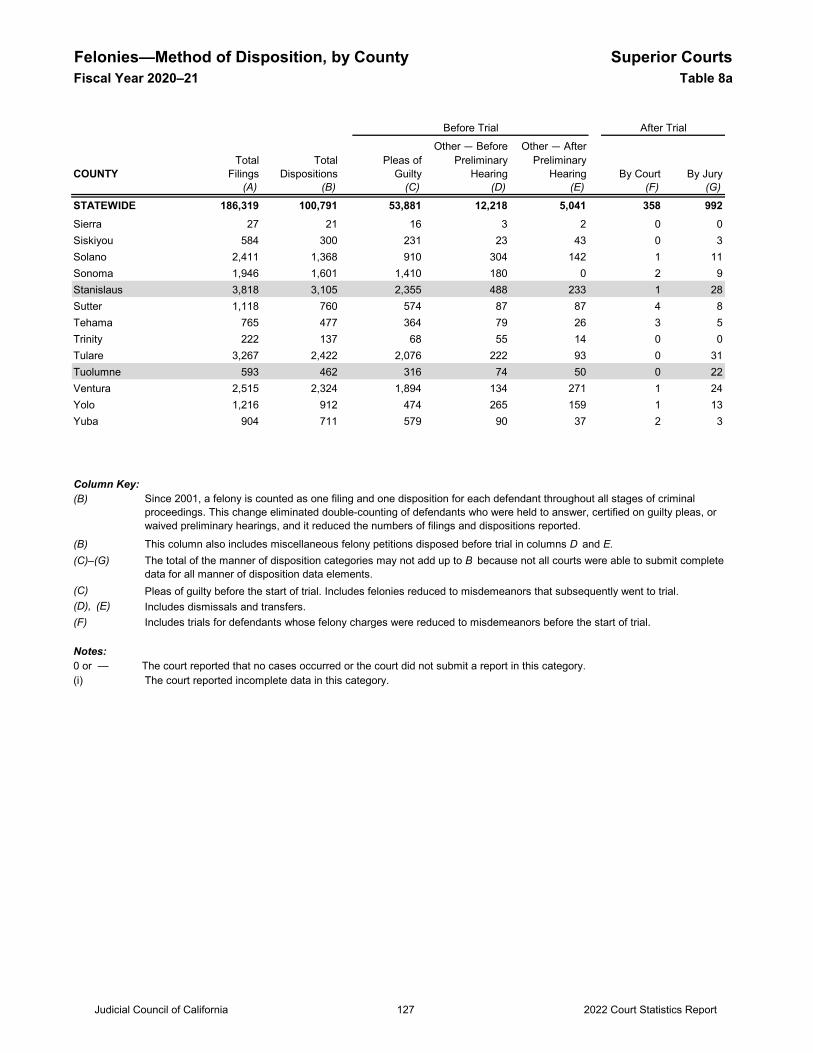
Felonies—Method of Disposition, by County Superior CourtsFiscal Year 2020–21 Table 8a
COUNTY By Court By Jury(A) (B) (C) (D) (E) (F) (G)
STATEWIDE 186,319 100,791 53,881 12,218 5,041 358 992
Before Trial After Trial
TotalFilings
TotalDispositions
Pleas ofGuilty
Other — BeforePreliminary
Hearing
Other — AfterPreliminary
Hearing
Sierra 27 21 16 3 2 0 0Siskiyou 584 300 231 23 43 0 3Solano 2,411 1,368 910 304 142 1 11Sonoma 1,946 1,601 1,410 180 0 2 9Stanislaus 3,818 3,105 2,355 488 233 1 28Sutter 1,118 760 574 87 87 4 8Tehama 765 477 364 79 26 3 5Trinity 222 137 68 55 14 0 0Tulare 3,267 2,422 2,076 222 93 0 31Tuolumne 593 462 316 74 50 0 22Ventura 2,515 2,324 1,894 134 271 1 24Yolo 1,216 912 474 265 159 1 13Yuba 904 711 579 90 37 2 3
Column Key:(B)
(B) (C)–(G)
(C) Pleas of guilty before the start of trial. Includes felonies reduced to misdemeanors that subsequently went to trial.(D), (E) Includes dismissals and transfers.(F) Includes trials for defendants whose felony charges were reduced to misdemeanors before the start of trial. Notes:0 or — The court reported that no cases occurred or the court did not submit a report in this category.(i) The court reported incomplete data in this category.
Since 2001, a felony is counted as one filing and one disposition for each defendant throughout all stages of criminal proceedings. This change eliminated double-counting of defendants who were held to answer, certified on guilty pleas, or waived preliminary hearings, and it reduced the numbers of filings and dispositions reported.
The total of the manner of disposition categories may not add up to B because not all courts were able to submit complete data for all manner of disposition data elements.
This column also includes miscellaneous felony petitions disposed before trial in columns D and E.
Judicial Council of California 2022 Court Statistics Report127
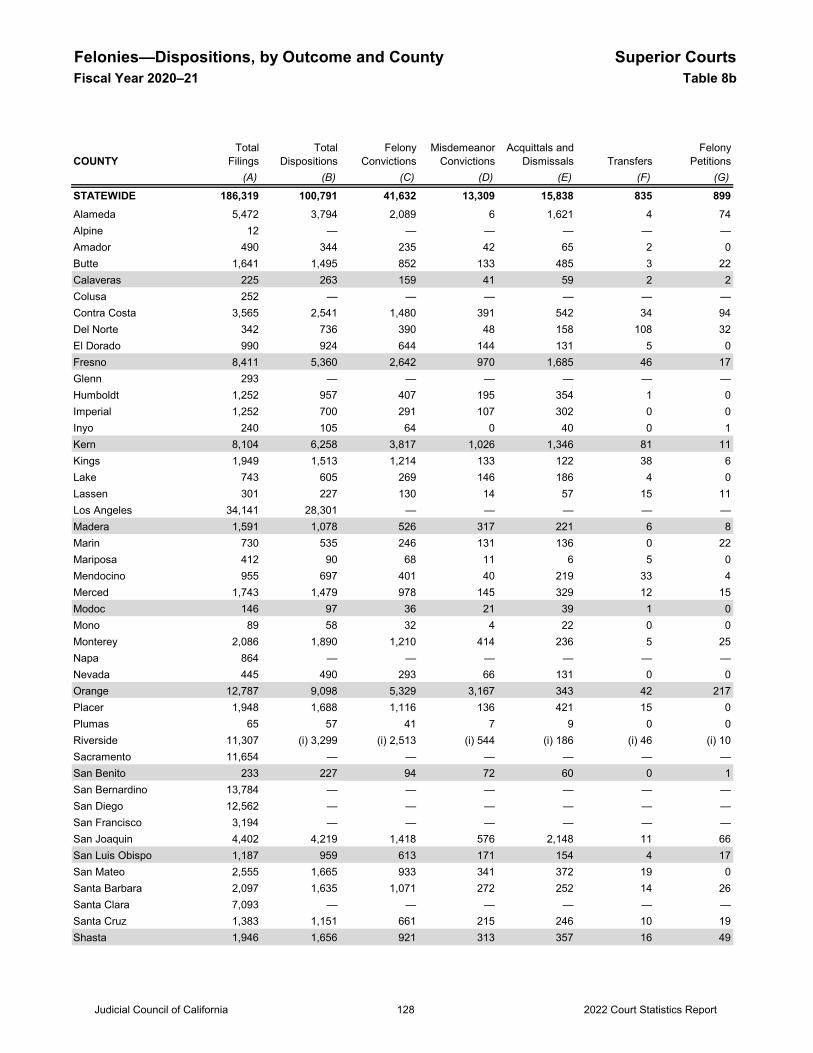
Felonies—Dispositions, by Outcome and County Superior CourtsFiscal Year 2020–21 Table 8b
COUNTY(A) (B) (C) (D) (E) (F) (G)
STATEWIDE 186,319 100,791 41,632 13,309 15,838 835 899Alameda 5,472 3,794 2,089 6 1,621 4 74Alpine 12 — — — — — —Amador 490 344 235 42 65 2 0Butte 1,641 1,495 852 133 485 3 22Calaveras 225 263 159 41 59 2 2Colusa 252 — — — — — —Contra Costa 3,565 2,541 1,480 391 542 34 94Del Norte 342 736 390 48 158 108 32El Dorado 990 924 644 144 131 5 0Fresno 8,411 5,360 2,642 970 1,685 46 17Glenn 293 — — — — — —Humboldt 1,252 957 407 195 354 1 0Imperial 1,252 700 291 107 302 0 0Inyo 240 105 64 0 40 0 1Kern 8,104 6,258 3,817 1,026 1,346 81 11Kings 1,949 1,513 1,214 133 122 38 6Lake 743 605 269 146 186 4 0Lassen 301 227 130 14 57 15 11Los Angeles 34,141 28,301 — — — — —Madera 1,591 1,078 526 317 221 6 8Marin 730 535 246 131 136 0 22Mariposa 412 90 68 11 6 5 0Mendocino 955 697 401 40 219 33 4Merced 1,743 1,479 978 145 329 12 15Modoc 146 97 36 21 39 1 0Mono 89 58 32 4 22 0 0Monterey 2,086 1,890 1,210 414 236 5 25Napa 864 — — — — — —Nevada 445 490 293 66 131 0 0Orange 12,787 9,098 5,329 3,167 343 42 217Placer 1,948 1,688 1,116 136 421 15 0Plumas 65 57 41 7 9 0 0Riverside 11,307 (i) 3,299 (i) 2,513 (i) 544 (i) 186 (i) 46 (i) 10Sacramento 11,654 — — — — — —San Benito 233 227 94 72 60 0 1San Bernardino 13,784 — — — — — —San Diego 12,562 — — — — — —San Francisco 3,194 — — — — — —San Joaquin 4,402 4,219 1,418 576 2,148 11 66San Luis Obispo 1,187 959 613 171 154 4 17San Mateo 2,555 1,665 933 341 372 19 0Santa Barbara 2,097 1,635 1,071 272 252 14 26Santa Clara 7,093 — — — — — —Santa Cruz 1,383 1,151 661 215 246 10 19Shasta 1,946 1,656 921 313 357 16 49
Felony PetitionsTransfers
TotalFilings
TotalDispositions
FelonyConvictions
MisdemeanorConvictions
Acquittals andDismissals
Judicial Council of California 2022 Court Statistics Report128
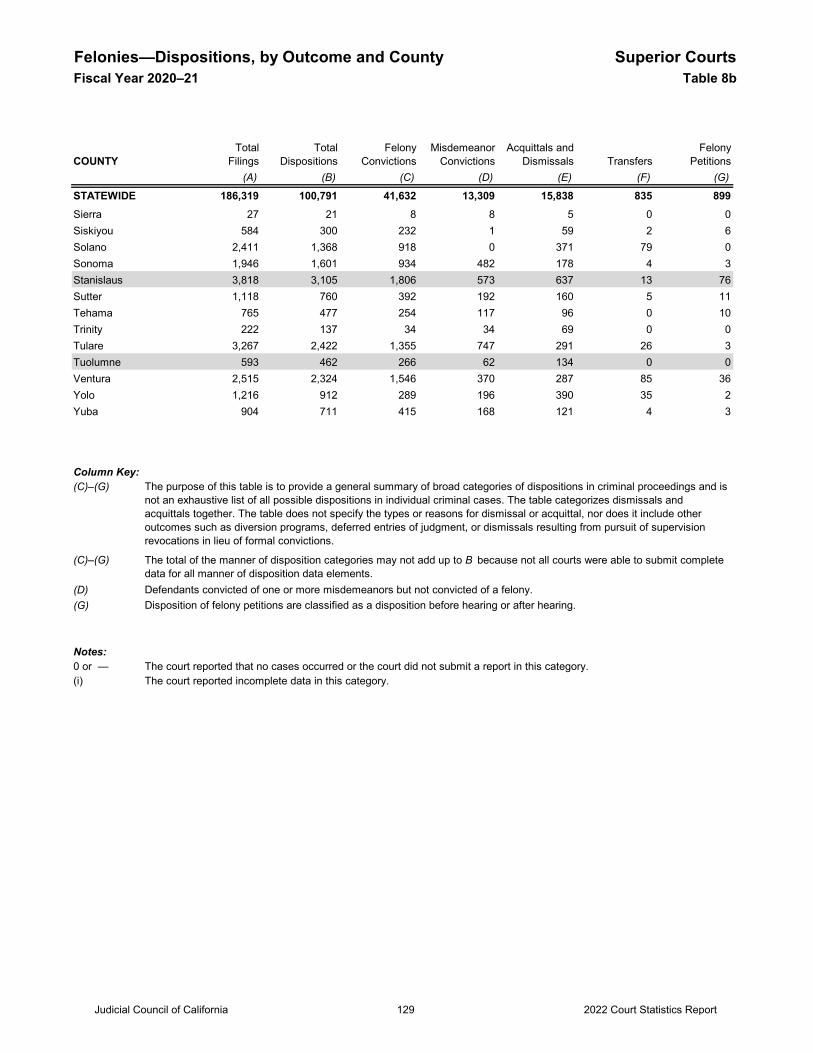
Felonies—Dispositions, by Outcome and County Superior CourtsFiscal Year 2020–21 Table 8b
COUNTY(A) (B) (C) (D) (E) (F) (G)
STATEWIDE 186,319 100,791 41,632 13,309 15,838 835 899
Felony PetitionsTransfers
TotalFilings
TotalDispositions
FelonyConvictions
MisdemeanorConvictions
Acquittals andDismissals
Sierra 27 21 8 8 5 0 0Siskiyou 584 300 232 1 59 2 6Solano 2,411 1,368 918 0 371 79 0Sonoma 1,946 1,601 934 482 178 4 3Stanislaus 3,818 3,105 1,806 573 637 13 76Sutter 1,118 760 392 192 160 5 11Tehama 765 477 254 117 96 0 10Trinity 222 137 34 34 69 0 0Tulare 3,267 2,422 1,355 747 291 26 3Tuolumne 593 462 266 62 134 0 0Ventura 2,515 2,324 1,546 370 287 85 36Yolo 1,216 912 289 196 390 35 2Yuba 904 711 415 168 121 4 3
Column Key:(C)–(G)
(C)–(G)
(D) (G)
Notes:0 or — The court reported that no cases occurred or the court did not submit a report in this category.(i) The court reported incomplete data in this category.
Disposition of felony petitions are classified as a disposition before hearing or after hearing.
The purpose of this table is to provide a general summary of broad categories of dispositions in criminal proceedings and is not an exhaustive list of all possible dispositions in individual criminal cases. The table categorizes dismissals and acquittals together. The table does not specify the types or reasons for dismissal or acquittal, nor does it include other outcomes such as diversion programs, deferred entries of judgment, or dismissals resulting from pursuit of supervision revocations in lieu of formal convictions.
The total of the manner of disposition categories may not add up to B because not all courts were able to submit complete data for all manner of disposition data elements.Defendants convicted of one or more misdemeanors but not convicted of a felony.
Judicial Council of California 2022 Court Statistics Report129
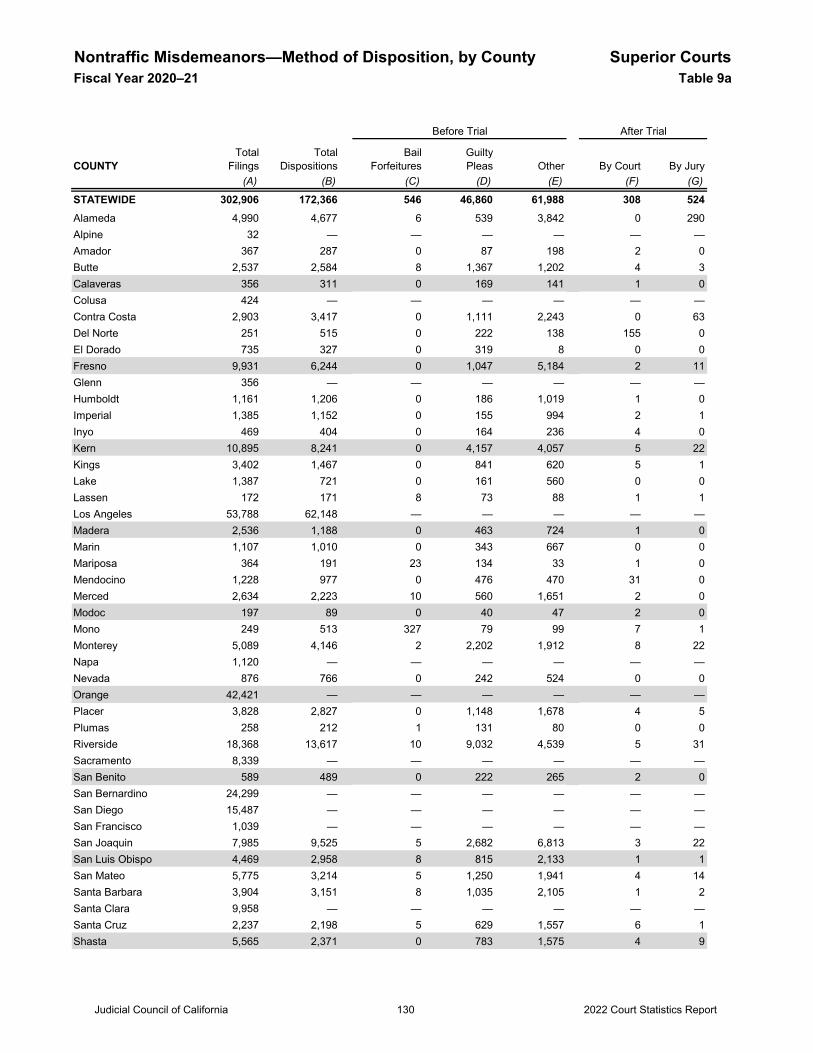
Nontraffic Misdemeanors—Method of Disposition, by County Superior CourtsFiscal Year 2020–21 Table 9a
COUNTY By Court By Jury(A) (B) (C) (D) (E) (F) (G)
STATEWIDE 302,906 172,366 546 46,860 61,988 308 524Alameda 4,990 4,677 6 539 3,842 0 290Alpine 32 — — — — — —Amador 367 287 0 87 198 2 0Butte 2,537 2,584 8 1,367 1,202 4 3Calaveras 356 311 0 169 141 1 0Colusa 424 — — — — — —Contra Costa 2,903 3,417 0 1,111 2,243 0 63Del Norte 251 515 0 222 138 155 0El Dorado 735 327 0 319 8 0 0Fresno 9,931 6,244 0 1,047 5,184 2 11Glenn 356 — — — — — —Humboldt 1,161 1,206 0 186 1,019 1 0Imperial 1,385 1,152 0 155 994 2 1Inyo 469 404 0 164 236 4 0Kern 10,895 8,241 0 4,157 4,057 5 22Kings 3,402 1,467 0 841 620 5 1Lake 1,387 721 0 161 560 0 0Lassen 172 171 8 73 88 1 1Los Angeles 53,788 62,148 — — — — —Madera 2,536 1,188 0 463 724 1 0Marin 1,107 1,010 0 343 667 0 0Mariposa 364 191 23 134 33 1 0Mendocino 1,228 977 0 476 470 31 0Merced 2,634 2,223 10 560 1,651 2 0Modoc 197 89 0 40 47 2 0Mono 249 513 327 79 99 7 1Monterey 5,089 4,146 2 2,202 1,912 8 22Napa 1,120 — — — — — —Nevada 876 766 0 242 524 0 0Orange 42,421 — — — — — —Placer 3,828 2,827 0 1,148 1,678 4 5Plumas 258 212 1 131 80 0 0Riverside 18,368 13,617 10 9,032 4,539 5 31Sacramento 8,339 — — — — — —San Benito 589 489 0 222 265 2 0San Bernardino 24,299 — — — — — —San Diego 15,487 — — — — — —San Francisco 1,039 — — — — — —San Joaquin 7,985 9,525 5 2,682 6,813 3 22San Luis Obispo 4,469 2,958 8 815 2,133 1 1San Mateo 5,775 3,214 5 1,250 1,941 4 14Santa Barbara 3,904 3,151 8 1,035 2,105 1 2Santa Clara 9,958 — — — — — —Santa Cruz 2,237 2,198 5 629 1,557 6 1Shasta 5,565 2,371 0 783 1,575 4 9
Before Trial After Trial
TotalFilings
TotalDispositions
BailForfeitures
GuiltyPleas Other
Judicial Council of California 2022 Court Statistics Report130
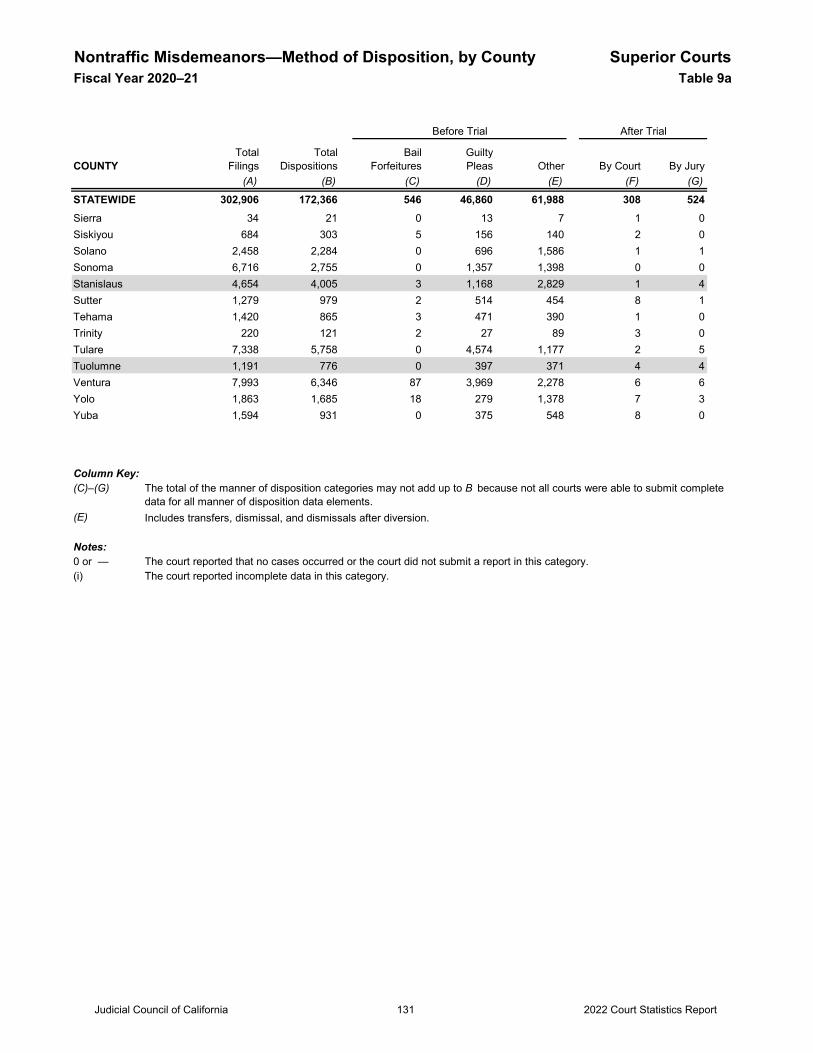
Nontraffic Misdemeanors—Method of Disposition, by County Superior CourtsFiscal Year 2020–21 Table 9a
COUNTY By Court By Jury(A) (B) (C) (D) (E) (F) (G)
STATEWIDE 302,906 172,366 546 46,860 61,988 308 524
Before Trial After Trial
TotalFilings
TotalDispositions
BailForfeitures
GuiltyPleas Other
Sierra 34 21 0 13 7 1 0Siskiyou 684 303 5 156 140 2 0Solano 2,458 2,284 0 696 1,586 1 1Sonoma 6,716 2,755 0 1,357 1,398 0 0Stanislaus 4,654 4,005 3 1,168 2,829 1 4Sutter 1,279 979 2 514 454 8 1Tehama 1,420 865 3 471 390 1 0Trinity 220 121 2 27 89 3 0Tulare 7,338 5,758 0 4,574 1,177 2 5Tuolumne 1,191 776 0 397 371 4 4Ventura 7,993 6,346 87 3,969 2,278 6 6Yolo 1,863 1,685 18 279 1,378 7 3Yuba 1,594 931 0 375 548 8 0
Column Key:(C)–(G)
(E) Includes transfers, dismissal, and dismissals after diversion.
Notes:0 or — The court reported that no cases occurred or the court did not submit a report in this category.(i) The court reported incomplete data in this category.
The total of the manner of disposition categories may not add up to B because not all courts were able to submit complete data for all manner of disposition data elements.
Judicial Council of California 2022 Court Statistics Report131
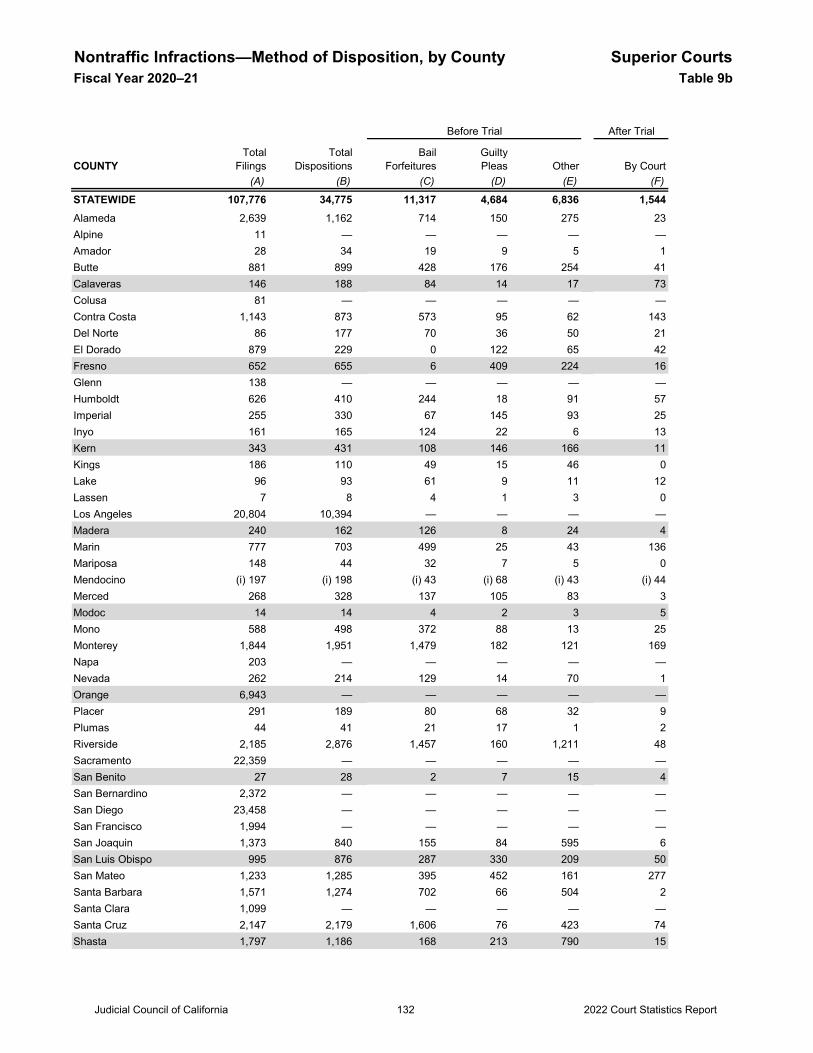
Nontraffic Infractions—Method of Disposition, by County Superior CourtsFiscal Year 2020–21 Table 9b
After Trial
COUNTY By Court(A) (B) (C) (D) (E) (F)
STATEWIDE 107,776 34,775 11,317 4,684 6,836 1,544Alameda 2,639 1,162 714 150 275 23Alpine 11 — — — — —Amador 28 34 19 9 5 1Butte 881 899 428 176 254 41Calaveras 146 188 84 14 17 73Colusa 81 — — — — —Contra Costa 1,143 873 573 95 62 143Del Norte 86 177 70 36 50 21El Dorado 879 229 0 122 65 42Fresno 652 655 6 409 224 16Glenn 138 — — — — —Humboldt 626 410 244 18 91 57Imperial 255 330 67 145 93 25Inyo 161 165 124 22 6 13Kern 343 431 108 146 166 11Kings 186 110 49 15 46 0Lake 96 93 61 9 11 12Lassen 7 8 4 1 3 0Los Angeles 20,804 10,394 — — — —Madera 240 162 126 8 24 4Marin 777 703 499 25 43 136Mariposa 148 44 32 7 5 0Mendocino (i) 197 (i) 198 (i) 43 (i) 68 (i) 43 (i) 44Merced 268 328 137 105 83 3Modoc 14 14 4 2 3 5Mono 588 498 372 88 13 25Monterey 1,844 1,951 1,479 182 121 169Napa 203 — — — — —Nevada 262 214 129 14 70 1Orange 6,943 — — — — —Placer 291 189 80 68 32 9Plumas 44 41 21 17 1 2Riverside 2,185 2,876 1,457 160 1,211 48Sacramento 22,359 — — — — —San Benito 27 28 2 7 15 4San Bernardino 2,372 — — — — —San Diego 23,458 — — — — —San Francisco 1,994 — — — — —San Joaquin 1,373 840 155 84 595 6San Luis Obispo 995 876 287 330 209 50San Mateo 1,233 1,285 395 452 161 277Santa Barbara 1,571 1,274 702 66 504 2Santa Clara 1,099 — — — — —Santa Cruz 2,147 2,179 1,606 76 423 74Shasta 1,797 1,186 168 213 790 15
Before Trial
TotalFilings
TotalDispositions
BailForfeitures
GuiltyPleas Other
Judicial Council of California 2022 Court Statistics Report132
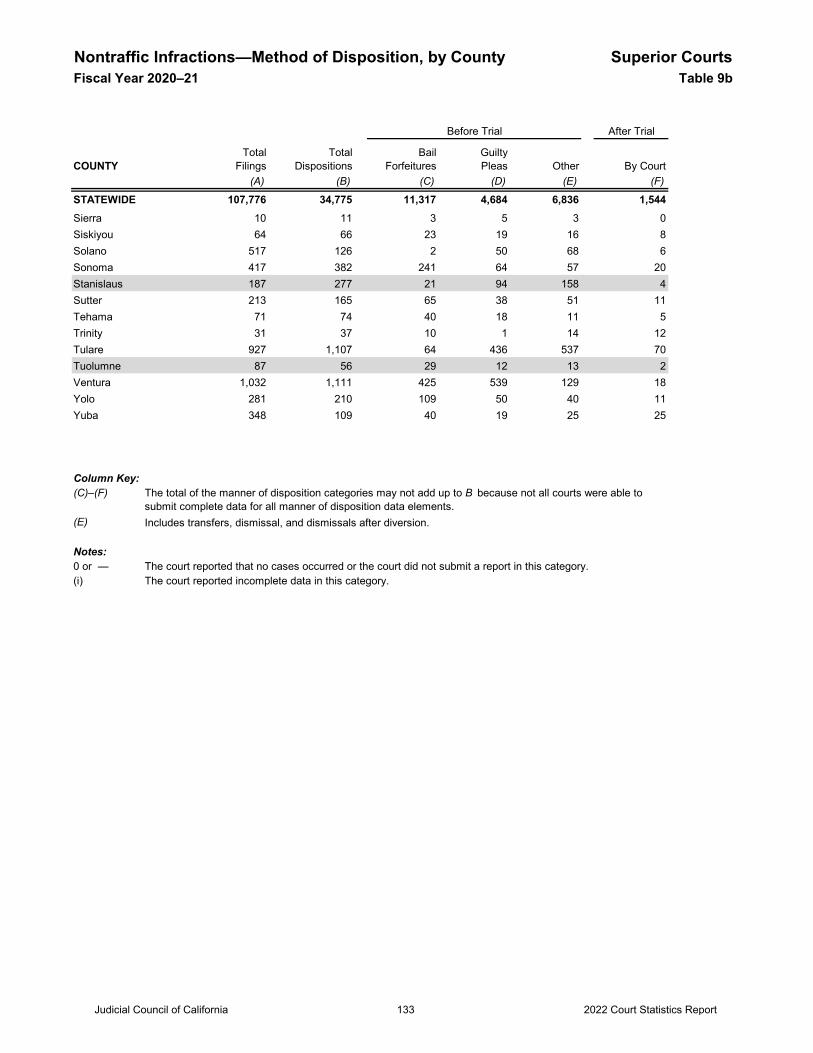
Nontraffic Infractions—Method of Disposition, by County Superior CourtsFiscal Year 2020–21 Table 9b
After Trial
COUNTY By Court(A) (B) (C) (D) (E) (F)
STATEWIDE 107,776 34,775 11,317 4,684 6,836 1,544
Before Trial
TotalFilings
TotalDispositions
BailForfeitures
GuiltyPleas Other
Sierra 10 11 3 5 3 0Siskiyou 64 66 23 19 16 8Solano 517 126 2 50 68 6Sonoma 417 382 241 64 57 20Stanislaus 187 277 21 94 158 4Sutter 213 165 65 38 51 11Tehama 71 74 40 18 11 5Trinity 31 37 10 1 14 12Tulare 927 1,107 64 436 537 70Tuolumne 87 56 29 12 13 2Ventura 1,032 1,111 425 539 129 18Yolo 281 210 109 50 40 11Yuba 348 109 40 19 25 25
Column Key:(C)–(F)
(E) Includes transfers, dismissal, and dismissals after diversion.
Notes:0 or — The court reported that no cases occurred or the court did not submit a report in this category.(i) The court reported incomplete data in this category.
The total of the manner of disposition categories may not add up to B because not all courts were able to submit complete data for all manner of disposition data elements.
Judicial Council of California 2022 Court Statistics Report133
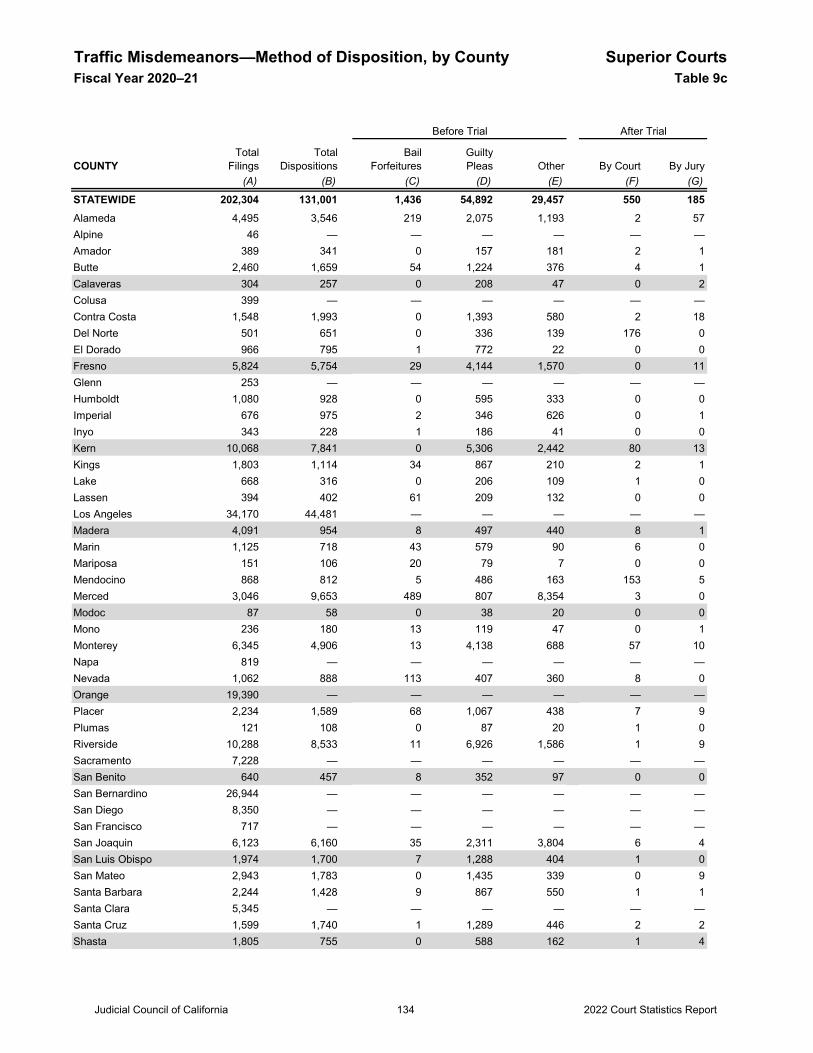
Traffic Misdemeanors—Method of Disposition, by County Superior CourtsFiscal Year 2020–21 Table 9c
COUNTY By Court By Jury(A) (B) (C) (D) (E) (F) (G)
STATEWIDE 202,304 131,001 1,436 54,892 29,457 550 185Alameda 4,495 3,546 219 2,075 1,193 2 57Alpine 46 — — — — — —Amador 389 341 0 157 181 2 1Butte 2,460 1,659 54 1,224 376 4 1Calaveras 304 257 0 208 47 0 2Colusa 399 — — — — — —Contra Costa 1,548 1,993 0 1,393 580 2 18Del Norte 501 651 0 336 139 176 0El Dorado 966 795 1 772 22 0 0Fresno 5,824 5,754 29 4,144 1,570 0 11Glenn 253 — — — — — —Humboldt 1,080 928 0 595 333 0 0Imperial 676 975 2 346 626 0 1Inyo 343 228 1 186 41 0 0Kern 10,068 7,841 0 5,306 2,442 80 13Kings 1,803 1,114 34 867 210 2 1Lake 668 316 0 206 109 1 0Lassen 394 402 61 209 132 0 0Los Angeles 34,170 44,481 — — — — —Madera 4,091 954 8 497 440 8 1Marin 1,125 718 43 579 90 6 0Mariposa 151 106 20 79 7 0 0Mendocino 868 812 5 486 163 153 5Merced 3,046 9,653 489 807 8,354 3 0Modoc 87 58 0 38 20 0 0Mono 236 180 13 119 47 0 1Monterey 6,345 4,906 13 4,138 688 57 10Napa 819 — — — — — —Nevada 1,062 888 113 407 360 8 0Orange 19,390 — — — — — —Placer 2,234 1,589 68 1,067 438 7 9Plumas 121 108 0 87 20 1 0Riverside 10,288 8,533 11 6,926 1,586 1 9Sacramento 7,228 — — — — — —San Benito 640 457 8 352 97 0 0San Bernardino 26,944 — — — — — —San Diego 8,350 — — — — — —San Francisco 717 — — — — — —San Joaquin 6,123 6,160 35 2,311 3,804 6 4San Luis Obispo 1,974 1,700 7 1,288 404 1 0San Mateo 2,943 1,783 0 1,435 339 0 9Santa Barbara 2,244 1,428 9 867 550 1 1Santa Clara 5,345 — — — — — —Santa Cruz 1,599 1,740 1 1,289 446 2 2Shasta 1,805 755 0 588 162 1 4
Before Trial After Trial
TotalFilings
TotalDispositions
BailForfeitures
GuiltyPleas Other
Judicial Council of California 2022 Court Statistics Report134
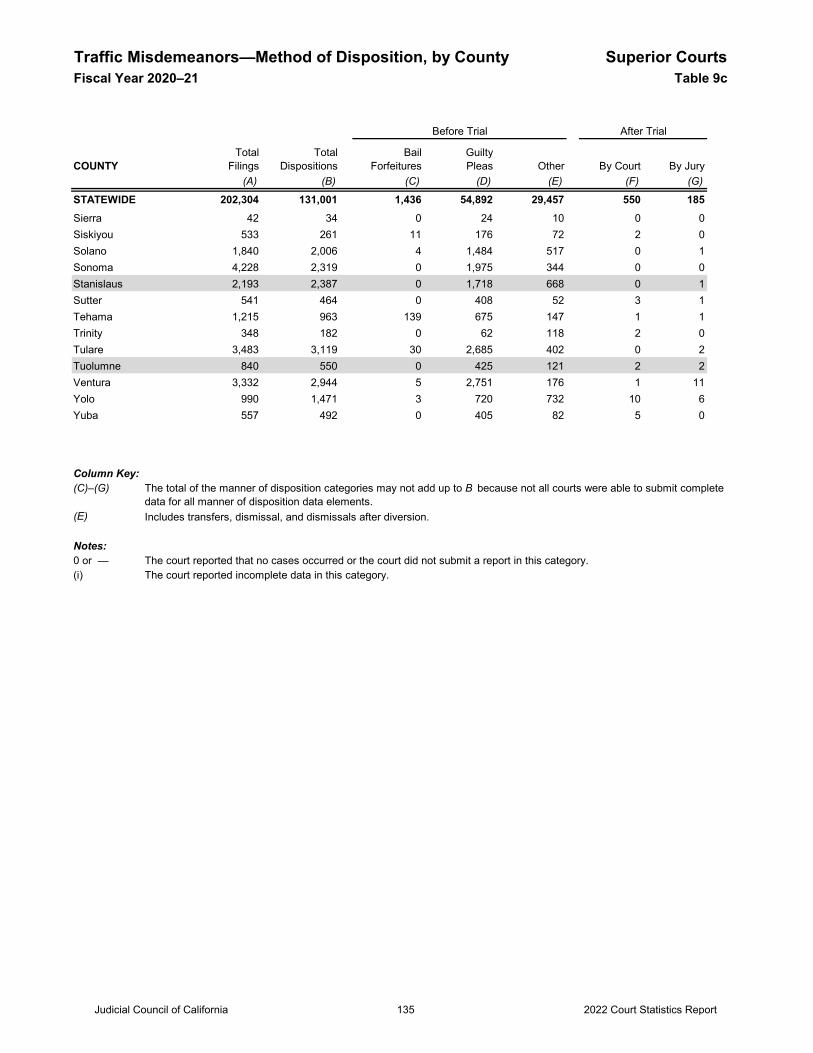
Traffic Misdemeanors—Method of Disposition, by County Superior CourtsFiscal Year 2020–21 Table 9c
COUNTY By Court By Jury(A) (B) (C) (D) (E) (F) (G)
STATEWIDE 202,304 131,001 1,436 54,892 29,457 550 185
Before Trial After Trial
TotalFilings
TotalDispositions
BailForfeitures
GuiltyPleas Other
Sierra 42 34 0 24 10 0 0Siskiyou 533 261 11 176 72 2 0Solano 1,840 2,006 4 1,484 517 0 1Sonoma 4,228 2,319 0 1,975 344 0 0Stanislaus 2,193 2,387 0 1,718 668 0 1Sutter 541 464 0 408 52 3 1Tehama 1,215 963 139 675 147 1 1Trinity 348 182 0 62 118 2 0Tulare 3,483 3,119 30 2,685 402 0 2Tuolumne 840 550 0 425 121 2 2Ventura 3,332 2,944 5 2,751 176 1 11Yolo 990 1,471 3 720 732 10 6Yuba 557 492 0 405 82 5 0
Column Key:(C)–(G)
(E) Includes transfers, dismissal, and dismissals after diversion.
Notes:0 or — The court reported that no cases occurred or the court did not submit a report in this category.(i) The court reported incomplete data in this category.
The total of the manner of disposition categories may not add up to B because not all courts were able to submit complete data for all manner of disposition data elements.
Judicial Council of California 2022 Court Statistics Report135
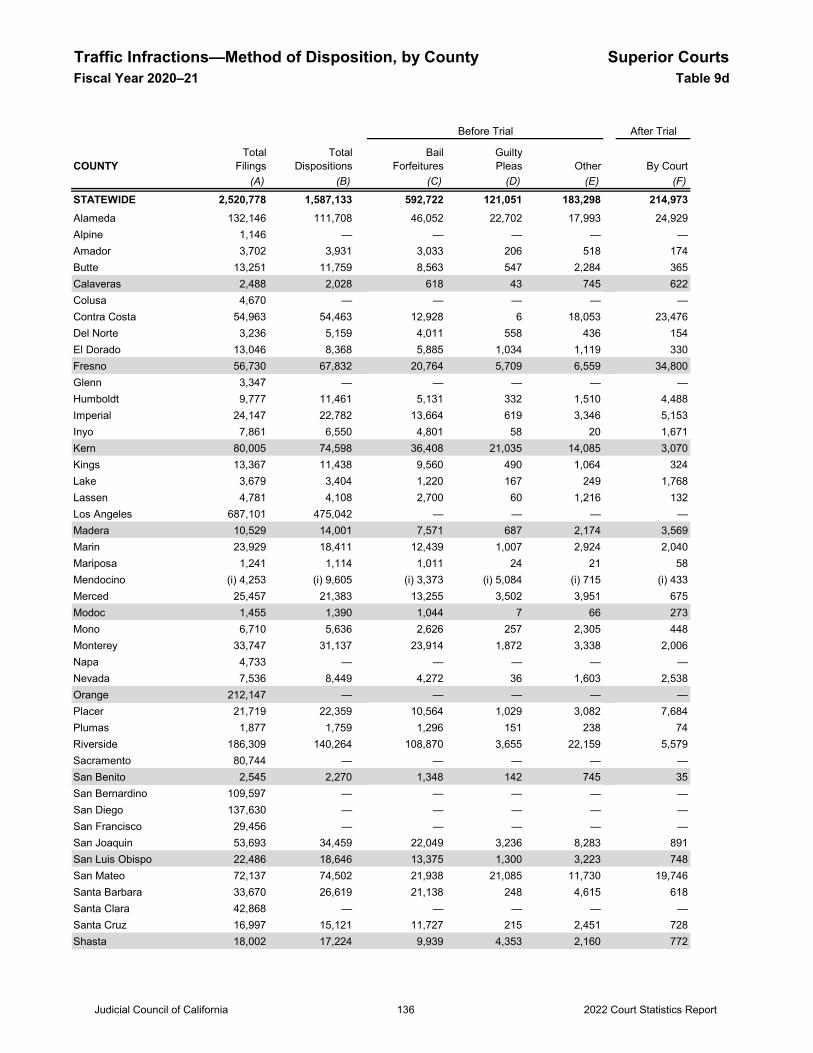
Traffic Infractions—Method of Disposition, by County Superior CourtsFiscal Year 2020–21 Table 9d
After Trial
COUNTY By Court(A) (B) (C) (D) (E) (F)
STATEWIDE 2,520,778 1,587,133 592,722 121,051 183,298 214,973Alameda 132,146 111,708 46,052 22,702 17,993 24,929Alpine 1,146 — — — — —Amador 3,702 3,931 3,033 206 518 174Butte 13,251 11,759 8,563 547 2,284 365Calaveras 2,488 2,028 618 43 745 622Colusa 4,670 — — — — —Contra Costa 54,963 54,463 12,928 6 18,053 23,476Del Norte 3,236 5,159 4,011 558 436 154El Dorado 13,046 8,368 5,885 1,034 1,119 330Fresno 56,730 67,832 20,764 5,709 6,559 34,800Glenn 3,347 — — — — —Humboldt 9,777 11,461 5,131 332 1,510 4,488Imperial 24,147 22,782 13,664 619 3,346 5,153Inyo 7,861 6,550 4,801 58 20 1,671Kern 80,005 74,598 36,408 21,035 14,085 3,070Kings 13,367 11,438 9,560 490 1,064 324Lake 3,679 3,404 1,220 167 249 1,768Lassen 4,781 4,108 2,700 60 1,216 132Los Angeles 687,101 475,042 — — — —Madera 10,529 14,001 7,571 687 2,174 3,569Marin 23,929 18,411 12,439 1,007 2,924 2,040Mariposa 1,241 1,114 1,011 24 21 58Mendocino (i) 4,253 (i) 9,605 (i) 3,373 (i) 5,084 (i) 715 (i) 433Merced 25,457 21,383 13,255 3,502 3,951 675Modoc 1,455 1,390 1,044 7 66 273Mono 6,710 5,636 2,626 257 2,305 448Monterey 33,747 31,137 23,914 1,872 3,338 2,006Napa 4,733 — — — — —Nevada 7,536 8,449 4,272 36 1,603 2,538Orange 212,147 — — — — —Placer 21,719 22,359 10,564 1,029 3,082 7,684Plumas 1,877 1,759 1,296 151 238 74Riverside 186,309 140,264 108,870 3,655 22,159 5,579Sacramento 80,744 — — — — —San Benito 2,545 2,270 1,348 142 745 35San Bernardino 109,597 — — — — —San Diego 137,630 — — — — —San Francisco 29,456 — — — — —San Joaquin 53,693 34,459 22,049 3,236 8,283 891San Luis Obispo 22,486 18,646 13,375 1,300 3,223 748San Mateo 72,137 74,502 21,938 21,085 11,730 19,746Santa Barbara 33,670 26,619 21,138 248 4,615 618Santa Clara 42,868 — — — — —Santa Cruz 16,997 15,121 11,727 215 2,451 728Shasta 18,002 17,224 9,939 4,353 2,160 772
Before Trial
TotalFilings
TotalDispositions
BailForfeitures
GuiltyPleas Other
Judicial Council of California 2022 Court Statistics Report136
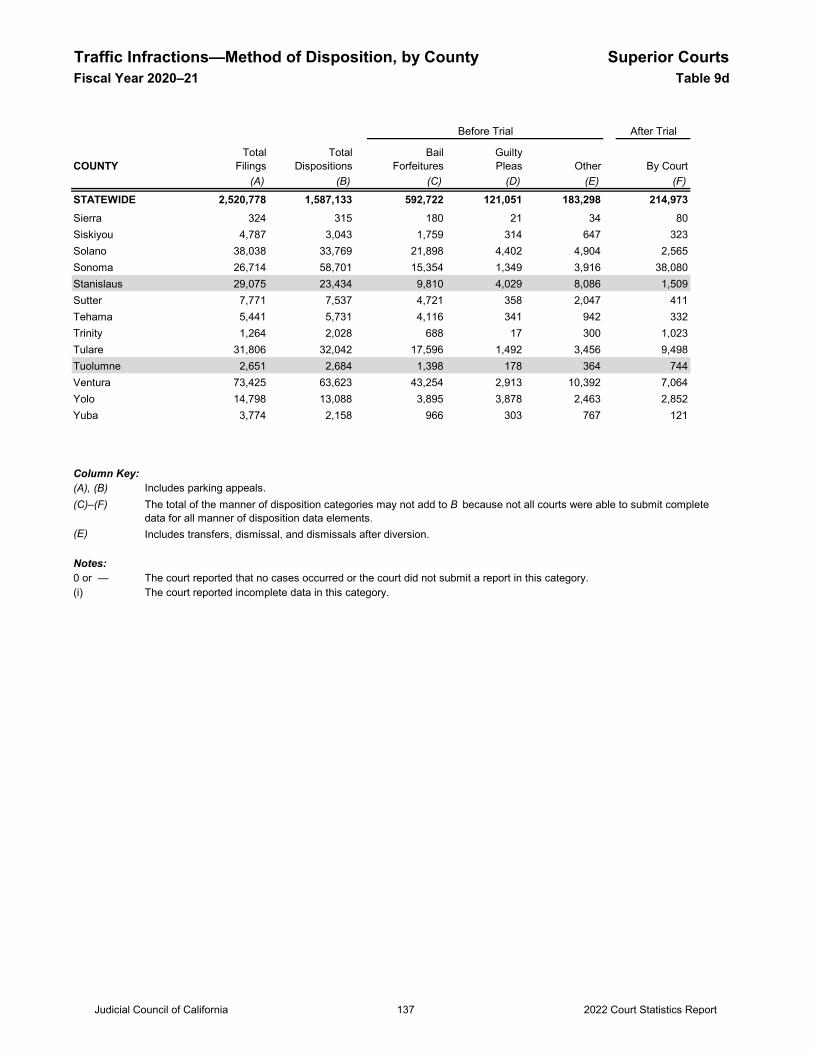
Traffic Infractions—Method of Disposition, by County Superior CourtsFiscal Year 2020–21 Table 9d
After Trial
COUNTY By Court(A) (B) (C) (D) (E) (F)
STATEWIDE 2,520,778 1,587,133 592,722 121,051 183,298 214,973
Before Trial
TotalFilings
TotalDispositions
BailForfeitures
GuiltyPleas Other
Sierra 324 315 180 21 34 80Siskiyou 4,787 3,043 1,759 314 647 323Solano 38,038 33,769 21,898 4,402 4,904 2,565Sonoma 26,714 58,701 15,354 1,349 3,916 38,080Stanislaus 29,075 23,434 9,810 4,029 8,086 1,509Sutter 7,771 7,537 4,721 358 2,047 411Tehama 5,441 5,731 4,116 341 942 332Trinity 1,264 2,028 688 17 300 1,023Tulare 31,806 32,042 17,596 1,492 3,456 9,498Tuolumne 2,651 2,684 1,398 178 364 744Ventura 73,425 63,623 43,254 2,913 10,392 7,064Yolo 14,798 13,088 3,895 3,878 2,463 2,852Yuba 3,774 2,158 966 303 767 121
Column Key:(A), (B)(C)–(F)
(E) Includes transfers, dismissal, and dismissals after diversion.
Notes:0 or — The court reported that no cases occurred or the court did not submit a report in this category.(i) The court reported incomplete data in this category.
The total of the manner of disposition categories may not add to B because not all courts were able to submit complete data for all manner of disposition data elements.
Includes parking appeals.
Judicial Council of California 2022 Court Statistics Report137
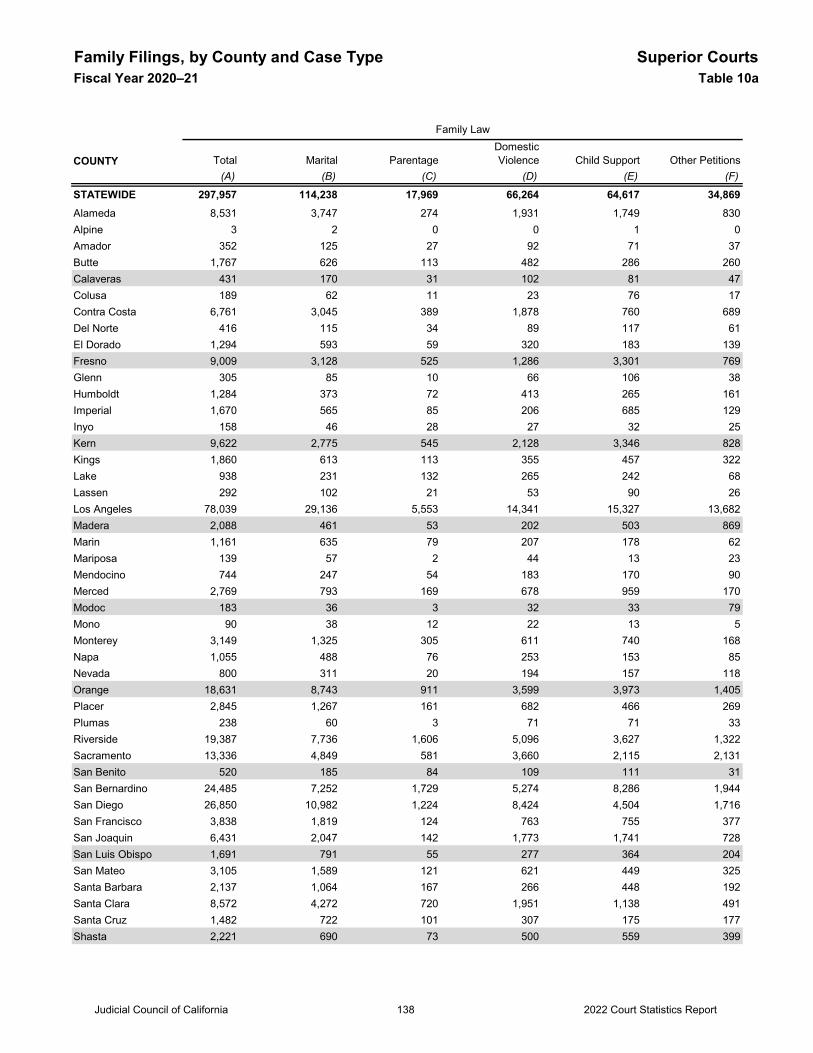
Family Filings, by County and Case Type Superior CourtsFiscal Year 2020–21 Table 10a
COUNTY Total Marital ParentageDomestic Violence Child Support Other Petitions
(A) (B) (C) (D) (E) (F)
STATEWIDE 297,957 114,238 17,969 66,264 64,617 34,869Alameda 8,531 3,747 274 1,931 1,749 830Alpine 3 2 0 0 1 0Amador 352 125 27 92 71 37Butte 1,767 626 113 482 286 260Calaveras 431 170 31 102 81 47Colusa 189 62 11 23 76 17Contra Costa 6,761 3,045 389 1,878 760 689Del Norte 416 115 34 89 117 61El Dorado 1,294 593 59 320 183 139Fresno 9,009 3,128 525 1,286 3,301 769Glenn 305 85 10 66 106 38Humboldt 1,284 373 72 413 265 161Imperial 1,670 565 85 206 685 129Inyo 158 46 28 27 32 25Kern 9,622 2,775 545 2,128 3,346 828Kings 1,860 613 113 355 457 322Lake 938 231 132 265 242 68Lassen 292 102 21 53 90 26Los Angeles 78,039 29,136 5,553 14,341 15,327 13,682Madera 2,088 461 53 202 503 869Marin 1,161 635 79 207 178 62Mariposa 139 57 2 44 13 23Mendocino 744 247 54 183 170 90Merced 2,769 793 169 678 959 170Modoc 183 36 3 32 33 79Mono 90 38 12 22 13 5Monterey 3,149 1,325 305 611 740 168Napa 1,055 488 76 253 153 85Nevada 800 311 20 194 157 118Orange 18,631 8,743 911 3,599 3,973 1,405Placer 2,845 1,267 161 682 466 269Plumas 238 60 3 71 71 33Riverside 19,387 7,736 1,606 5,096 3,627 1,322Sacramento 13,336 4,849 581 3,660 2,115 2,131San Benito 520 185 84 109 111 31San Bernardino 24,485 7,252 1,729 5,274 8,286 1,944San Diego 26,850 10,982 1,224 8,424 4,504 1,716San Francisco 3,838 1,819 124 763 755 377San Joaquin 6,431 2,047 142 1,773 1,741 728San Luis Obispo 1,691 791 55 277 364 204San Mateo 3,105 1,589 121 621 449 325Santa Barbara 2,137 1,064 167 266 448 192Santa Clara 8,572 4,272 720 1,951 1,138 491Santa Cruz 1,482 722 101 307 175 177Shasta 2,221 690 73 500 559 399
Family Law
Judicial Council of California 2022 Court Statistics Report138
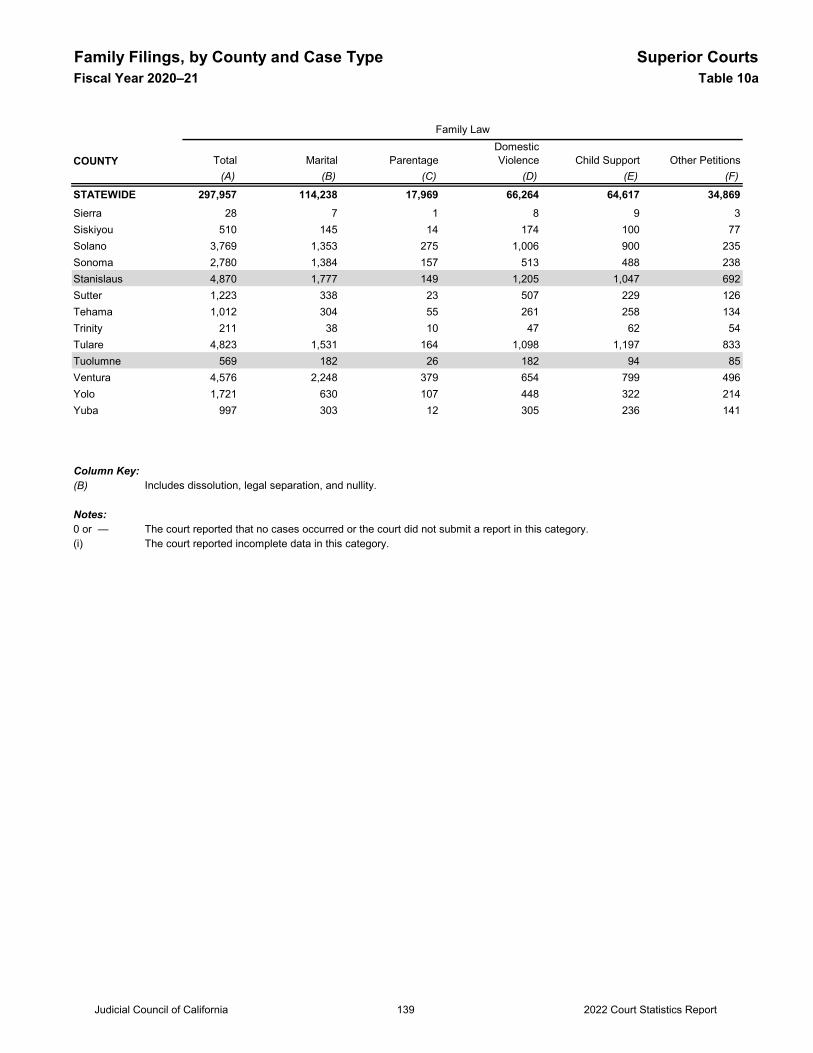
Family Filings, by County and Case Type Superior CourtsFiscal Year 2020–21 Table 10a
COUNTY Total Marital ParentageDomestic Violence Child Support Other Petitions
(A) (B) (C) (D) (E) (F)
STATEWIDE 297,957 114,238 17,969 66,264 64,617 34,869
Family Law
Sierra 28 7 1 8 9 3Siskiyou 510 145 14 174 100 77Solano 3,769 1,353 275 1,006 900 235Sonoma 2,780 1,384 157 513 488 238Stanislaus 4,870 1,777 149 1,205 1,047 692Sutter 1,223 338 23 507 229 126Tehama 1,012 304 55 261 258 134Trinity 211 38 10 47 62 54Tulare 4,823 1,531 164 1,098 1,197 833Tuolumne 569 182 26 182 94 85Ventura 4,576 2,248 379 654 799 496Yolo 1,721 630 107 448 322 214Yuba 997 303 12 305 236 141
Column Key:(B) Includes dissolution, legal separation, and nullity. Notes:0 or — The court reported that no cases occurred or the court did not submit a report in this category.(i) The court reported incomplete data in this category.
Judicial Council of California 2022 Court Statistics Report139
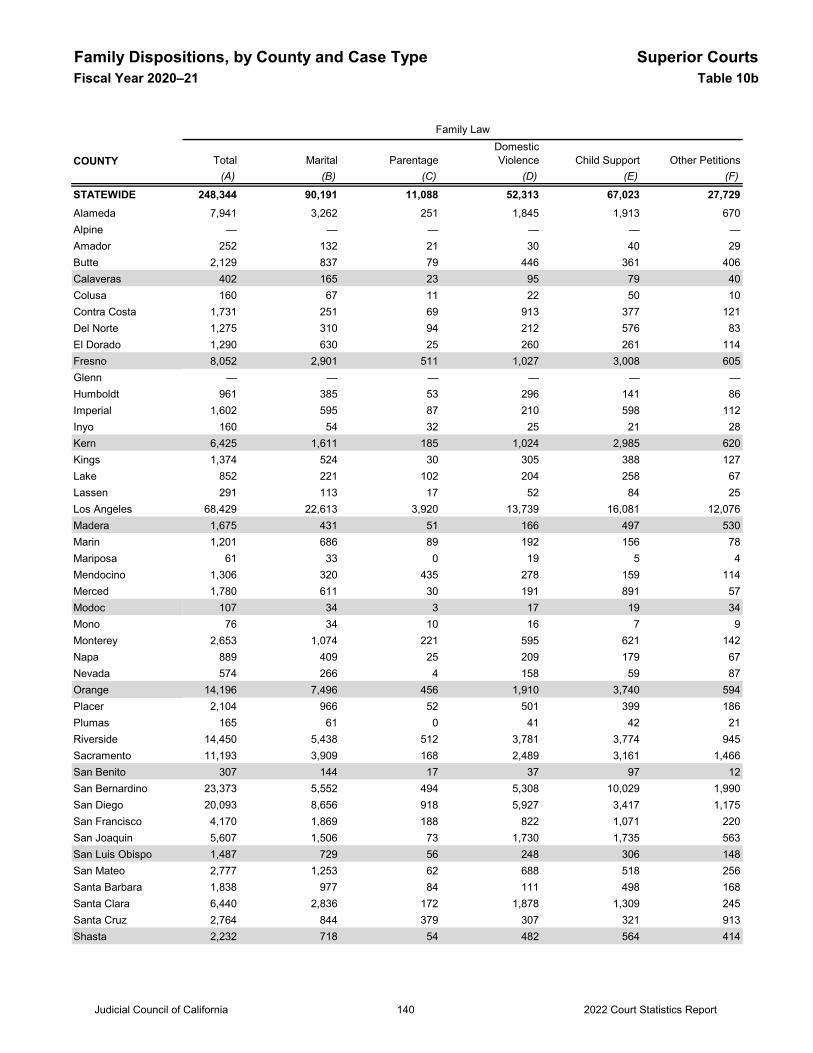
Family Dispositions, by County and Case Type Superior CourtsFiscal Year 2020–21 Table 10b
COUNTY Total Marital ParentageDomestic Violence Child Support Other Petitions
(A) (B) (C) (D) (E) (F)
STATEWIDE 248,344 90,191 11,088 52,313 67,023 27,729Alameda 7,941 3,262 251 1,845 1,913 670Alpine — — — — — —Amador 252 132 21 30 40 29Butte 2,129 837 79 446 361 406Calaveras 402 165 23 95 79 40Colusa 160 67 11 22 50 10Contra Costa 1,731 251 69 913 377 121Del Norte 1,275 310 94 212 576 83El Dorado 1,290 630 25 260 261 114Fresno 8,052 2,901 511 1,027 3,008 605Glenn — — — — — —Humboldt 961 385 53 296 141 86Imperial 1,602 595 87 210 598 112Inyo 160 54 32 25 21 28Kern 6,425 1,611 185 1,024 2,985 620Kings 1,374 524 30 305 388 127Lake 852 221 102 204 258 67Lassen 291 113 17 52 84 25Los Angeles 68,429 22,613 3,920 13,739 16,081 12,076Madera 1,675 431 51 166 497 530Marin 1,201 686 89 192 156 78Mariposa 61 33 0 19 5 4Mendocino 1,306 320 435 278 159 114Merced 1,780 611 30 191 891 57Modoc 107 34 3 17 19 34Mono 76 34 10 16 7 9Monterey 2,653 1,074 221 595 621 142Napa 889 409 25 209 179 67Nevada 574 266 4 158 59 87Orange 14,196 7,496 456 1,910 3,740 594Placer 2,104 966 52 501 399 186Plumas 165 61 0 41 42 21Riverside 14,450 5,438 512 3,781 3,774 945Sacramento 11,193 3,909 168 2,489 3,161 1,466San Benito 307 144 17 37 97 12San Bernardino 23,373 5,552 494 5,308 10,029 1,990San Diego 20,093 8,656 918 5,927 3,417 1,175San Francisco 4,170 1,869 188 822 1,071 220San Joaquin 5,607 1,506 73 1,730 1,735 563San Luis Obispo 1,487 729 56 248 306 148San Mateo 2,777 1,253 62 688 518 256Santa Barbara 1,838 977 84 111 498 168Santa Clara 6,440 2,836 172 1,878 1,309 245Santa Cruz 2,764 844 379 307 321 913Shasta 2,232 718 54 482 564 414
Family Law
Judicial Council of California 2022 Court Statistics Report140
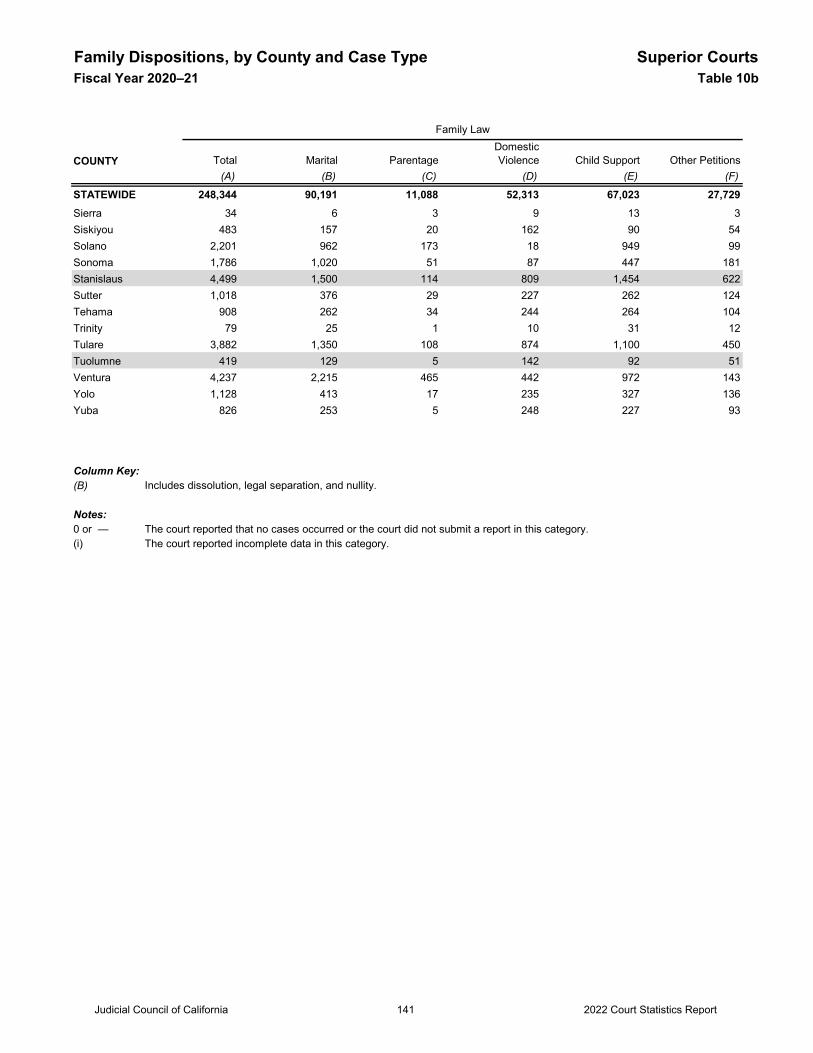
Family Dispositions, by County and Case Type Superior CourtsFiscal Year 2020–21 Table 10b
COUNTY Total Marital ParentageDomestic Violence Child Support Other Petitions
(A) (B) (C) (D) (E) (F)
STATEWIDE 248,344 90,191 11,088 52,313 67,023 27,729
Family Law
Sierra 34 6 3 9 13 3Siskiyou 483 157 20 162 90 54Solano 2,201 962 173 18 949 99Sonoma 1,786 1,020 51 87 447 181Stanislaus 4,499 1,500 114 809 1,454 622Sutter 1,018 376 29 227 262 124Tehama 908 262 34 244 264 104Trinity 79 25 1 10 31 12Tulare 3,882 1,350 108 874 1,100 450Tuolumne 419 129 5 142 92 51Ventura 4,237 2,215 465 442 972 143Yolo 1,128 413 17 235 327 136Yuba 826 253 5 248 227 93
Column Key:(B) Includes dissolution, legal separation, and nullity.
Notes:0 or — The court reported that no cases occurred or the court did not submit a report in this category.(i) The court reported incomplete data in this category.
Judicial Council of California 2022 Court Statistics Report141
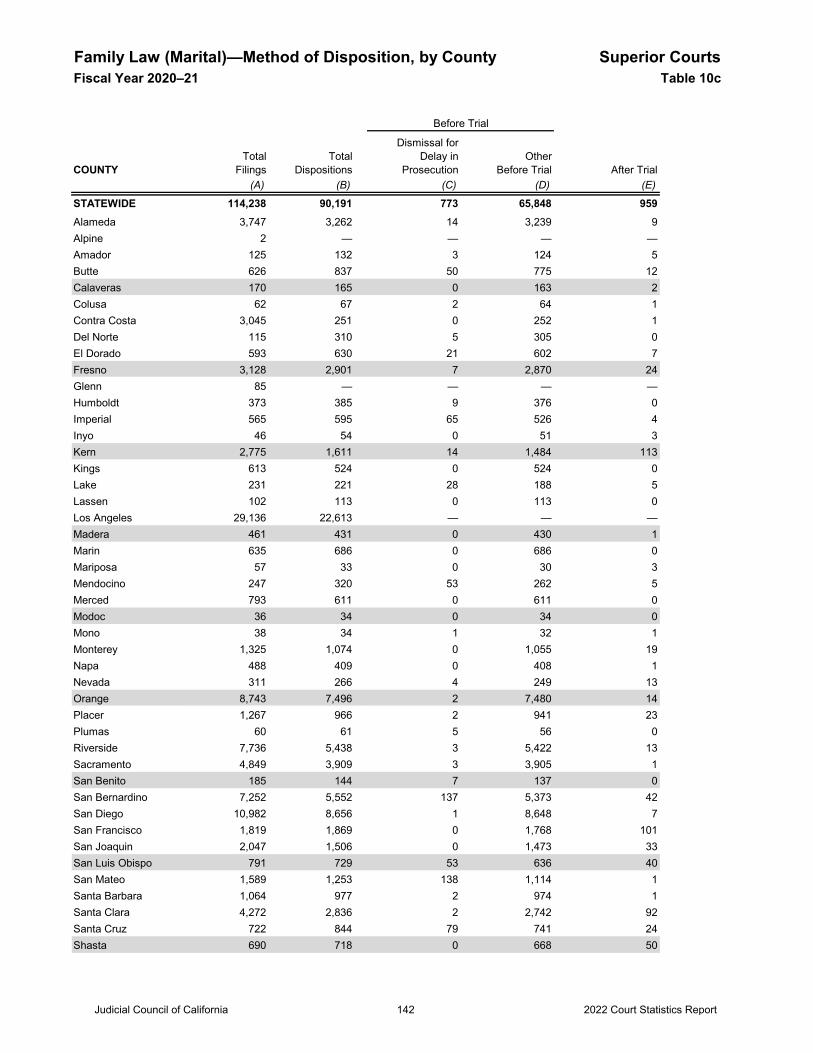
Family Law (Marital)—Method of Disposition, by County Superior CourtsFiscal Year 2020–21 Table 10c
COUNTY After Trial(A) (B) (C) (D) (E)
STATEWIDE 114,238 90,191 773 65,848 959Alameda 3,747 3,262 14 3,239 9Alpine 2 — — — —Amador 125 132 3 124 5Butte 626 837 50 775 12Calaveras 170 165 0 163 2Colusa 62 67 2 64 1Contra Costa 3,045 251 0 252 1Del Norte 115 310 5 305 0El Dorado 593 630 21 602 7Fresno 3,128 2,901 7 2,870 24Glenn 85 — — — —Humboldt 373 385 9 376 0Imperial 565 595 65 526 4Inyo 46 54 0 51 3Kern 2,775 1,611 14 1,484 113Kings 613 524 0 524 0Lake 231 221 28 188 5Lassen 102 113 0 113 0Los Angeles 29,136 22,613 — — —Madera 461 431 0 430 1Marin 635 686 0 686 0Mariposa 57 33 0 30 3Mendocino 247 320 53 262 5Merced 793 611 0 611 0Modoc 36 34 0 34 0Mono 38 34 1 32 1Monterey 1,325 1,074 0 1,055 19Napa 488 409 0 408 1Nevada 311 266 4 249 13Orange 8,743 7,496 2 7,480 14Placer 1,267 966 2 941 23Plumas 60 61 5 56 0Riverside 7,736 5,438 3 5,422 13Sacramento 4,849 3,909 3 3,905 1San Benito 185 144 7 137 0San Bernardino 7,252 5,552 137 5,373 42San Diego 10,982 8,656 1 8,648 7San Francisco 1,819 1,869 0 1,768 101San Joaquin 2,047 1,506 0 1,473 33San Luis Obispo 791 729 53 636 40San Mateo 1,589 1,253 138 1,114 1Santa Barbara 1,064 977 2 974 1Santa Clara 4,272 2,836 2 2,742 92Santa Cruz 722 844 79 741 24Shasta 690 718 0 668 50
OtherBefore Trial
TotalFilings
TotalDispositions
Before Trial
Dismissal forDelay in
Prosecution
Judicial Council of California 2022 Court Statistics Report142
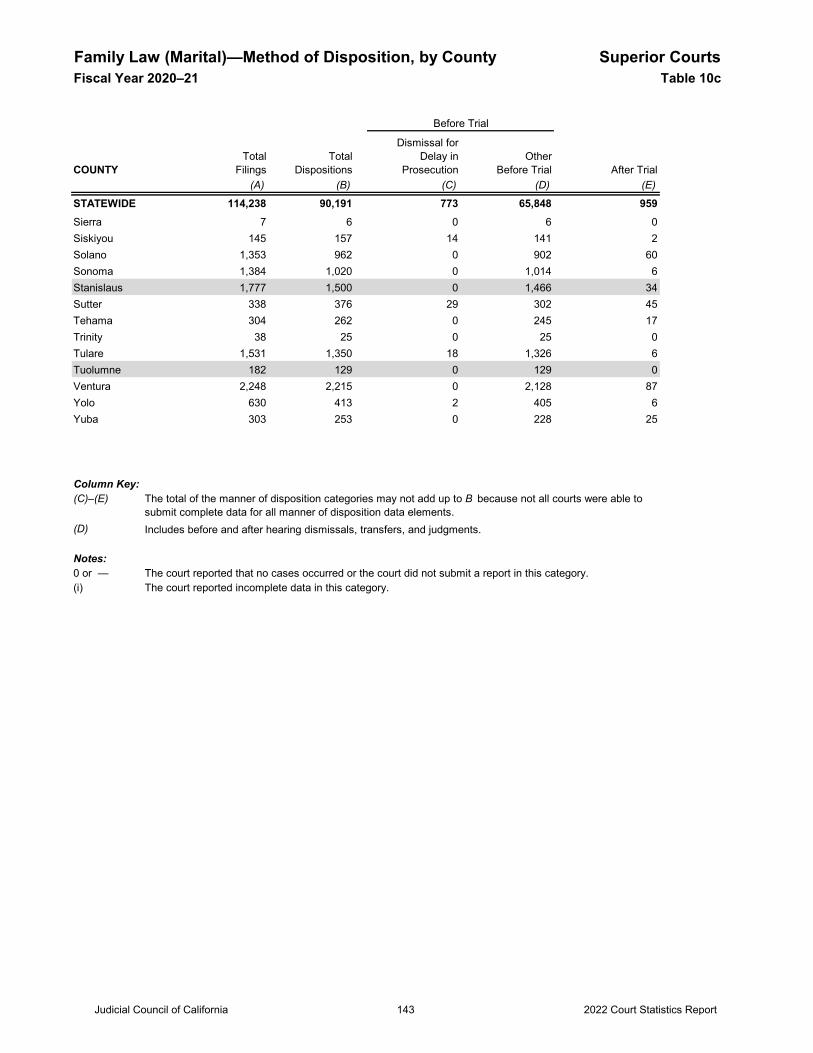
Family Law (Marital)—Method of Disposition, by County Superior CourtsFiscal Year 2020–21 Table 10c
COUNTY After Trial(A) (B) (C) (D) (E)
STATEWIDE 114,238 90,191 773 65,848 959
OtherBefore Trial
TotalFilings
TotalDispositions
Before Trial
Dismissal forDelay in
Prosecution
Sierra 7 6 0 6 0Siskiyou 145 157 14 141 2Solano 1,353 962 0 902 60Sonoma 1,384 1,020 0 1,014 6Stanislaus 1,777 1,500 0 1,466 34Sutter 338 376 29 302 45Tehama 304 262 0 245 17Trinity 38 25 0 25 0Tulare 1,531 1,350 18 1,326 6Tuolumne 182 129 0 129 0Ventura 2,248 2,215 0 2,128 87Yolo 630 413 2 405 6Yuba 303 253 0 228 25
Column Key:(C)–(E)
(D) Includes before and after hearing dismissals, transfers, and judgments.
Notes:0 or — The court reported that no cases occurred or the court did not submit a report in this category.(i) The court reported incomplete data in this category.
The total of the manner of disposition categories may not add up to B because not all courts were able to submit complete data for all manner of disposition data elements.
Judicial Council of California 2022 Court Statistics Report143
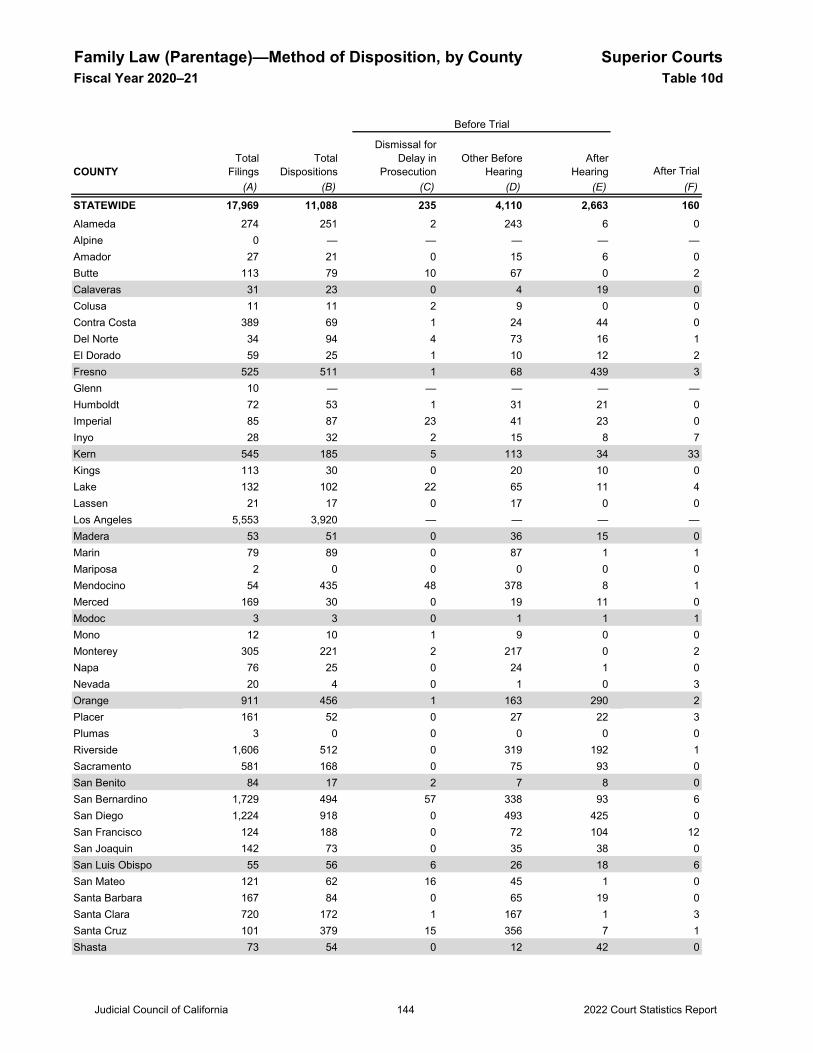
Family Law (Parentage)—Method of Disposition, by County Superior CourtsFiscal Year 2020–21 Table 10d
COUNTY After Trial(A) (B) (C) (D) (E) (F)
STATEWIDE 17,969 11,088 235 4,110 2,663 160Alameda 274 251 2 243 6 0Alpine 0 — — — — —Amador 27 21 0 15 6 0Butte 113 79 10 67 0 2Calaveras 31 23 0 4 19 0Colusa 11 11 2 9 0 0Contra Costa 389 69 1 24 44 0Del Norte 34 94 4 73 16 1El Dorado 59 25 1 10 12 2Fresno 525 511 1 68 439 3Glenn 10 — — — — —Humboldt 72 53 1 31 21 0Imperial 85 87 23 41 23 0Inyo 28 32 2 15 8 7Kern 545 185 5 113 34 33Kings 113 30 0 20 10 0Lake 132 102 22 65 11 4Lassen 21 17 0 17 0 0Los Angeles 5,553 3,920 — — — —Madera 53 51 0 36 15 0Marin 79 89 0 87 1 1Mariposa 2 0 0 0 0 0Mendocino 54 435 48 378 8 1Merced 169 30 0 19 11 0Modoc 3 3 0 1 1 1Mono 12 10 1 9 0 0Monterey 305 221 2 217 0 2Napa 76 25 0 24 1 0Nevada 20 4 0 1 0 3Orange 911 456 1 163 290 2Placer 161 52 0 27 22 3Plumas 3 0 0 0 0 0Riverside 1,606 512 0 319 192 1Sacramento 581 168 0 75 93 0San Benito 84 17 2 7 8 0San Bernardino 1,729 494 57 338 93 6San Diego 1,224 918 0 493 425 0San Francisco 124 188 0 72 104 12San Joaquin 142 73 0 35 38 0San Luis Obispo 55 56 6 26 18 6San Mateo 121 62 16 45 1 0Santa Barbara 167 84 0 65 19 0Santa Clara 720 172 1 167 1 3Santa Cruz 101 379 15 356 7 1Shasta 73 54 0 12 42 0
Before Trial
Dismissal forDelay in
ProsecutionTotal
FilingsTotal
DispositionsOther Before
HearingAfter
Hearing
Judicial Council of California 2022 Court Statistics Report144
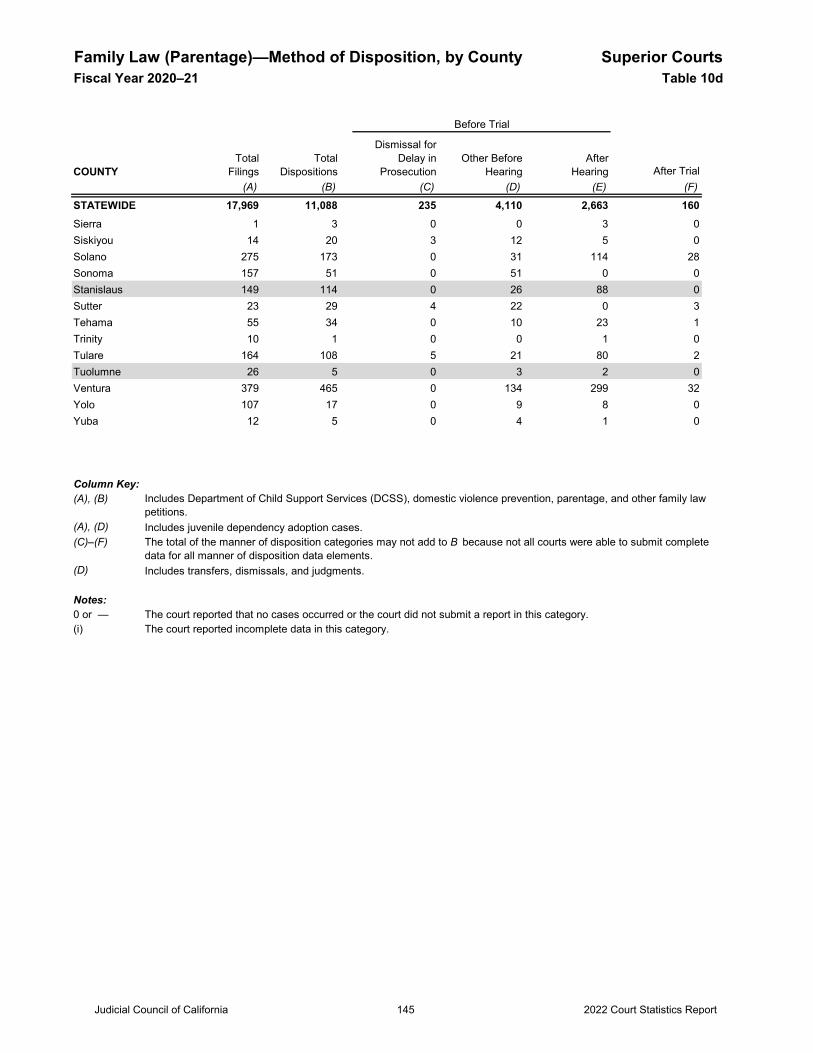
Family Law (Parentage)—Method of Disposition, by County Superior CourtsFiscal Year 2020–21 Table 10d
COUNTY After Trial(A) (B) (C) (D) (E) (F)
STATEWIDE 17,969 11,088 235 4,110 2,663 160
Before Trial
Dismissal forDelay in
ProsecutionTotal
FilingsTotal
DispositionsOther Before
HearingAfter
Hearing
Sierra 1 3 0 0 3 0Siskiyou 14 20 3 12 5 0Solano 275 173 0 31 114 28Sonoma 157 51 0 51 0 0Stanislaus 149 114 0 26 88 0Sutter 23 29 4 22 0 3Tehama 55 34 0 10 23 1Trinity 10 1 0 0 1 0Tulare 164 108 5 21 80 2Tuolumne 26 5 0 3 2 0Ventura 379 465 0 134 299 32Yolo 107 17 0 9 8 0Yuba 12 5 0 4 1 0
Column Key:(A), (B)
(A), (D) Includes juvenile dependency adoption cases. (C)–(F)
(D) Includes transfers, dismissals, and judgments.
Notes:0 or — The court reported that no cases occurred or the court did not submit a report in this category.(i) The court reported incomplete data in this category.
Includes Department of Child Support Services (DCSS), domestic violence prevention, parentage, and other family law petitions.
The total of the manner of disposition categories may not add to B because not all courts were able to submit complete data for all manner of disposition data elements.
Judicial Council of California 2022 Court Statistics Report145
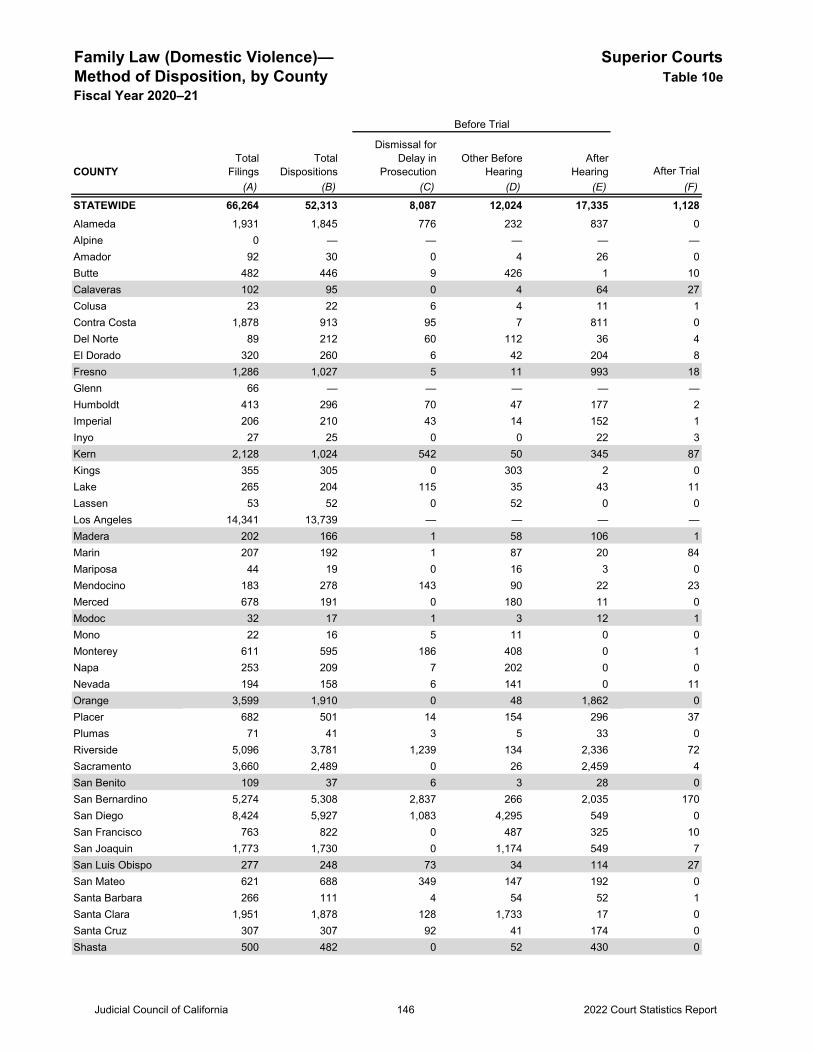
Family Law (Domestic Violence)— Superior CourtsMethod of Disposition, by County Table 10eFiscal Year 2020–21
COUNTY After Trial(A) (B) (C) (D) (E) (F)
STATEWIDE 66,264 52,313 8,087 12,024 17,335 1,128Alameda 1,931 1,845 776 232 837 0Alpine 0 — — — — —Amador 92 30 0 4 26 0Butte 482 446 9 426 1 10Calaveras 102 95 0 4 64 27Colusa 23 22 6 4 11 1Contra Costa 1,878 913 95 7 811 0Del Norte 89 212 60 112 36 4El Dorado 320 260 6 42 204 8Fresno 1,286 1,027 5 11 993 18Glenn 66 — — — — —Humboldt 413 296 70 47 177 2Imperial 206 210 43 14 152 1Inyo 27 25 0 0 22 3Kern 2,128 1,024 542 50 345 87Kings 355 305 0 303 2 0Lake 265 204 115 35 43 11Lassen 53 52 0 52 0 0Los Angeles 14,341 13,739 — — — —Madera 202 166 1 58 106 1Marin 207 192 1 87 20 84Mariposa 44 19 0 16 3 0Mendocino 183 278 143 90 22 23Merced 678 191 0 180 11 0Modoc 32 17 1 3 12 1Mono 22 16 5 11 0 0Monterey 611 595 186 408 0 1Napa 253 209 7 202 0 0Nevada 194 158 6 141 0 11Orange 3,599 1,910 0 48 1,862 0Placer 682 501 14 154 296 37Plumas 71 41 3 5 33 0Riverside 5,096 3,781 1,239 134 2,336 72Sacramento 3,660 2,489 0 26 2,459 4San Benito 109 37 6 3 28 0San Bernardino 5,274 5,308 2,837 266 2,035 170San Diego 8,424 5,927 1,083 4,295 549 0San Francisco 763 822 0 487 325 10San Joaquin 1,773 1,730 0 1,174 549 7San Luis Obispo 277 248 73 34 114 27San Mateo 621 688 349 147 192 0Santa Barbara 266 111 4 54 52 1Santa Clara 1,951 1,878 128 1,733 17 0Santa Cruz 307 307 92 41 174 0Shasta 500 482 0 52 430 0
Before Trial
Dismissal forDelay in
ProsecutionTotal
FilingsTotal
DispositionsOther Before
HearingAfter
Hearing
Judicial Council of California 2022 Court Statistics Report146
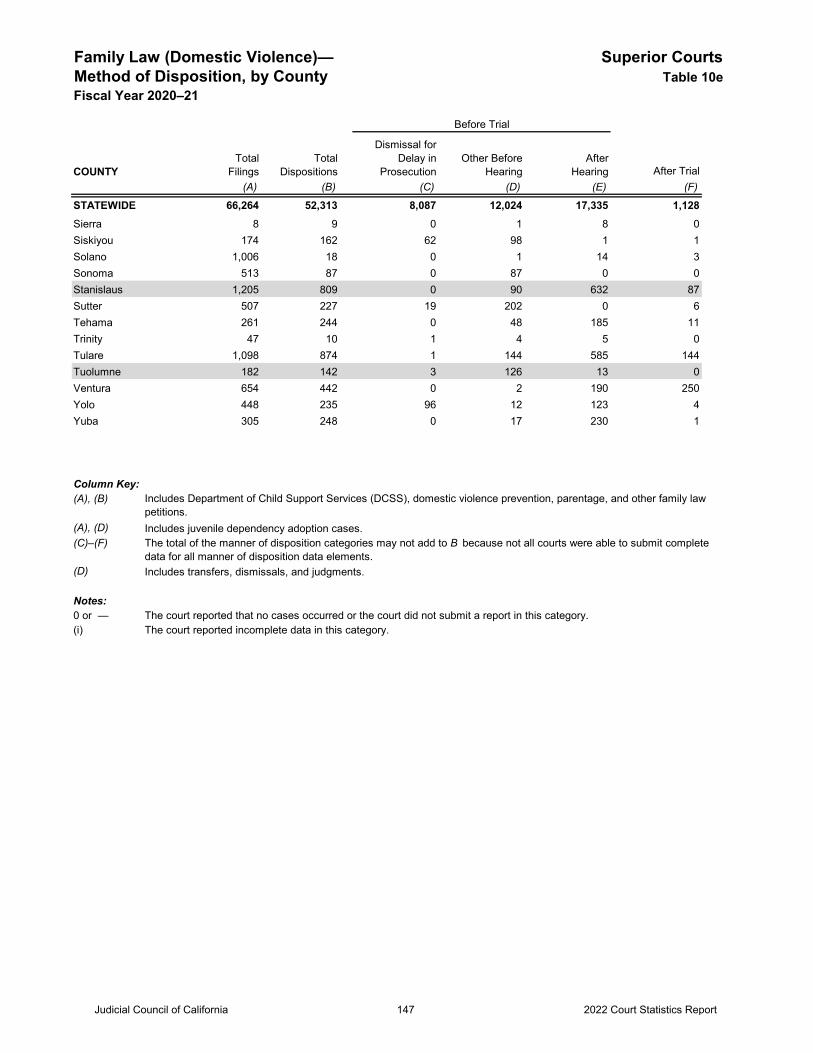
Family Law (Domestic Violence)— Superior CourtsMethod of Disposition, by County Table 10eFiscal Year 2020–21
COUNTY After Trial(A) (B) (C) (D) (E) (F)
STATEWIDE 66,264 52,313 8,087 12,024 17,335 1,128
Before Trial
Dismissal forDelay in
ProsecutionTotal
FilingsTotal
DispositionsOther Before
HearingAfter
Hearing
Sierra 8 9 0 1 8 0Siskiyou 174 162 62 98 1 1Solano 1,006 18 0 1 14 3Sonoma 513 87 0 87 0 0Stanislaus 1,205 809 0 90 632 87Sutter 507 227 19 202 0 6Tehama 261 244 0 48 185 11Trinity 47 10 1 4 5 0Tulare 1,098 874 1 144 585 144Tuolumne 182 142 3 126 13 0Ventura 654 442 0 2 190 250Yolo 448 235 96 12 123 4Yuba 305 248 0 17 230 1
Column Key:(A), (B)
(A), (D) Includes juvenile dependency adoption cases. (C)–(F)
(D) Includes transfers, dismissals, and judgments.
Notes:0 or — The court reported that no cases occurred or the court did not submit a report in this category.(i) The court reported incomplete data in this category.
Includes Department of Child Support Services (DCSS), domestic violence prevention, parentage, and other family law petitions.
The total of the manner of disposition categories may not add to B because not all courts were able to submit complete data for all manner of disposition data elements.
Judicial Council of California 2022 Court Statistics Report147
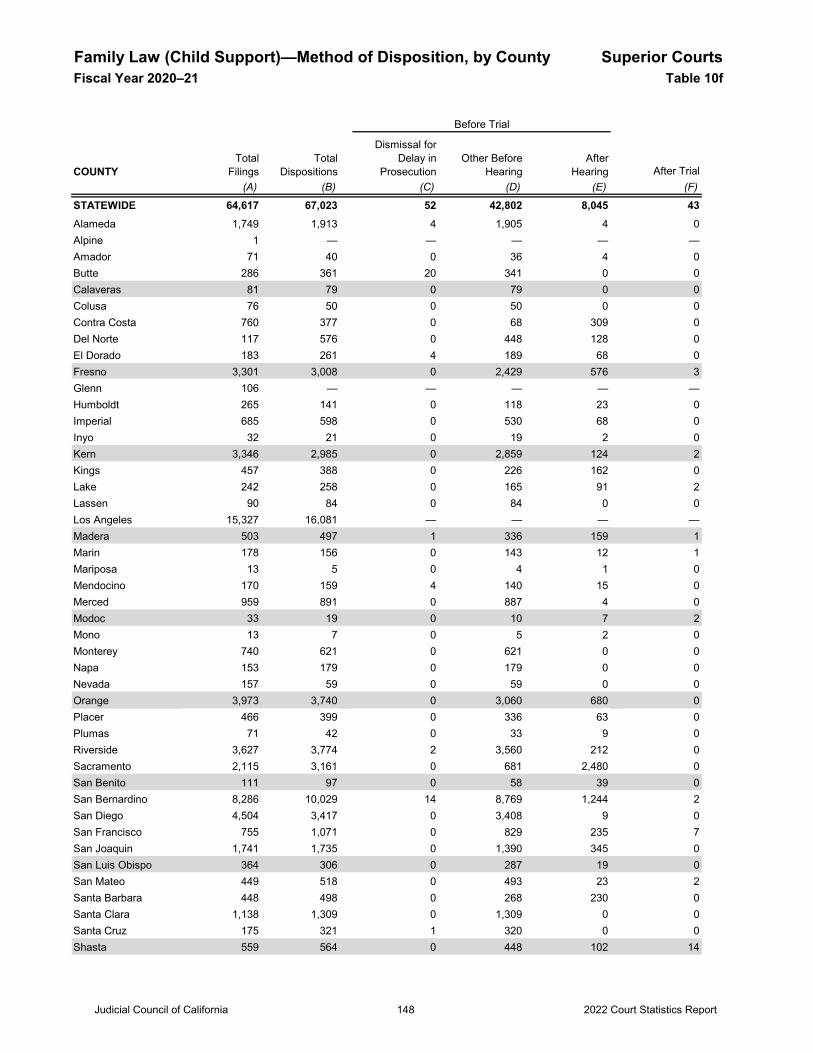
Family Law (Child Support)—Method of Disposition, by County Superior CourtsFiscal Year 2020–21 Table 10f
COUNTY After Trial(A) (B) (C) (D) (E) (F)
STATEWIDE 64,617 67,023 52 42,802 8,045 43Alameda 1,749 1,913 4 1,905 4 0Alpine 1 — — — — —Amador 71 40 0 36 4 0Butte 286 361 20 341 0 0Calaveras 81 79 0 79 0 0Colusa 76 50 0 50 0 0Contra Costa 760 377 0 68 309 0Del Norte 117 576 0 448 128 0El Dorado 183 261 4 189 68 0Fresno 3,301 3,008 0 2,429 576 3Glenn 106 — — — — —Humboldt 265 141 0 118 23 0Imperial 685 598 0 530 68 0Inyo 32 21 0 19 2 0Kern 3,346 2,985 0 2,859 124 2Kings 457 388 0 226 162 0Lake 242 258 0 165 91 2Lassen 90 84 0 84 0 0Los Angeles 15,327 16,081 — — — —Madera 503 497 1 336 159 1Marin 178 156 0 143 12 1Mariposa 13 5 0 4 1 0Mendocino 170 159 4 140 15 0Merced 959 891 0 887 4 0Modoc 33 19 0 10 7 2Mono 13 7 0 5 2 0Monterey 740 621 0 621 0 0Napa 153 179 0 179 0 0Nevada 157 59 0 59 0 0Orange 3,973 3,740 0 3,060 680 0Placer 466 399 0 336 63 0Plumas 71 42 0 33 9 0Riverside 3,627 3,774 2 3,560 212 0Sacramento 2,115 3,161 0 681 2,480 0San Benito 111 97 0 58 39 0San Bernardino 8,286 10,029 14 8,769 1,244 2San Diego 4,504 3,417 0 3,408 9 0San Francisco 755 1,071 0 829 235 7San Joaquin 1,741 1,735 0 1,390 345 0San Luis Obispo 364 306 0 287 19 0San Mateo 449 518 0 493 23 2Santa Barbara 448 498 0 268 230 0Santa Clara 1,138 1,309 0 1,309 0 0Santa Cruz 175 321 1 320 0 0Shasta 559 564 0 448 102 14
Before Trial
Dismissal forDelay in
ProsecutionTotal
FilingsTotal
DispositionsOther Before
HearingAfter
Hearing
Judicial Council of California 2022 Court Statistics Report148
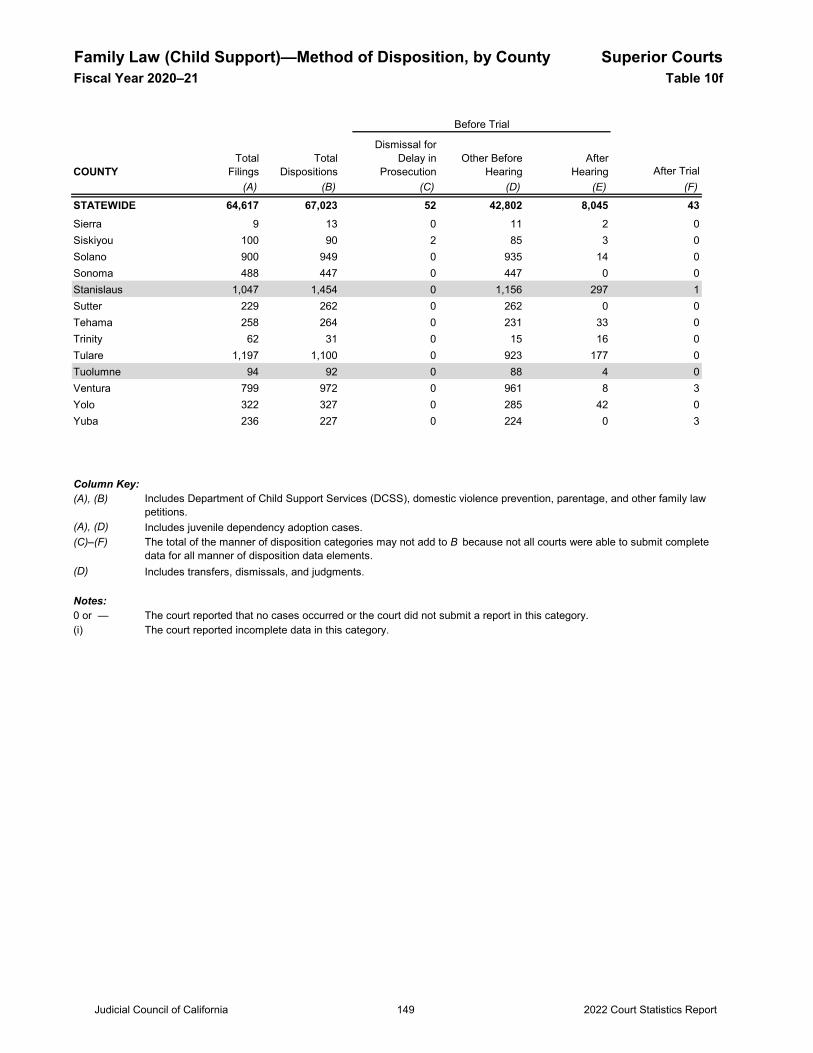
Family Law (Child Support)—Method of Disposition, by County Superior CourtsFiscal Year 2020–21 Table 10f
COUNTY After Trial(A) (B) (C) (D) (E) (F)
STATEWIDE 64,617 67,023 52 42,802 8,045 43
Before Trial
Dismissal forDelay in
ProsecutionTotal
FilingsTotal
DispositionsOther Before
HearingAfter
Hearing
Sierra 9 13 0 11 2 0Siskiyou 100 90 2 85 3 0Solano 900 949 0 935 14 0Sonoma 488 447 0 447 0 0Stanislaus 1,047 1,454 0 1,156 297 1Sutter 229 262 0 262 0 0Tehama 258 264 0 231 33 0Trinity 62 31 0 15 16 0Tulare 1,197 1,100 0 923 177 0Tuolumne 94 92 0 88 4 0Ventura 799 972 0 961 8 3Yolo 322 327 0 285 42 0Yuba 236 227 0 224 0 3
Column Key:(A), (B)
(A), (D) Includes juvenile dependency adoption cases. (C)–(F)
(D) Includes transfers, dismissals, and judgments.
Notes:0 or — The court reported that no cases occurred or the court did not submit a report in this category.(i) The court reported incomplete data in this category.
Includes Department of Child Support Services (DCSS), domestic violence prevention, parentage, and other family law petitions.
The total of the manner of disposition categories may not add to B because not all courts were able to submit complete data for all manner of disposition data elements.
Judicial Council of California 2022 Court Statistics Report149
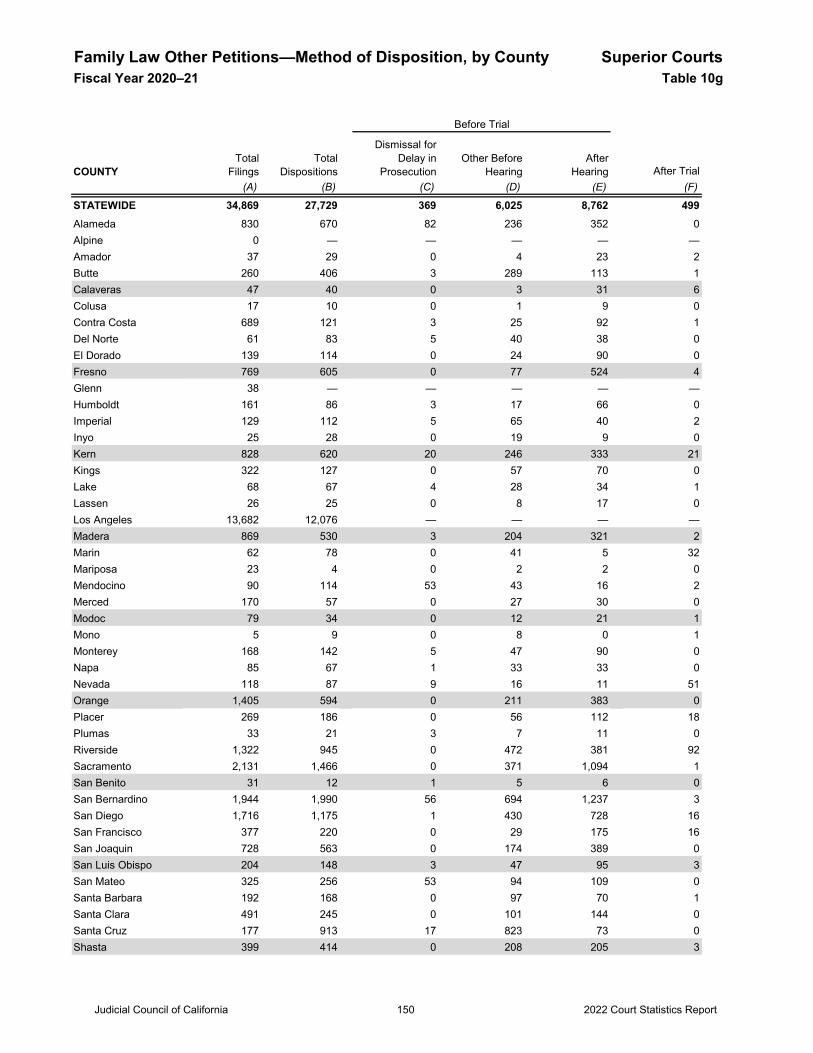
Family Law Other Petitions—Method of Disposition, by County Superior CourtsFiscal Year 2020–21 Table 10g
COUNTY After Trial(A) (B) (C) (D) (E) (F)
STATEWIDE 34,869 27,729 369 6,025 8,762 499Alameda 830 670 82 236 352 0Alpine 0 — — — — —Amador 37 29 0 4 23 2Butte 260 406 3 289 113 1Calaveras 47 40 0 3 31 6Colusa 17 10 0 1 9 0Contra Costa 689 121 3 25 92 1Del Norte 61 83 5 40 38 0El Dorado 139 114 0 24 90 0Fresno 769 605 0 77 524 4Glenn 38 — — — — —Humboldt 161 86 3 17 66 0Imperial 129 112 5 65 40 2Inyo 25 28 0 19 9 0Kern 828 620 20 246 333 21Kings 322 127 0 57 70 0Lake 68 67 4 28 34 1Lassen 26 25 0 8 17 0Los Angeles 13,682 12,076 — — — —Madera 869 530 3 204 321 2Marin 62 78 0 41 5 32Mariposa 23 4 0 2 2 0Mendocino 90 114 53 43 16 2Merced 170 57 0 27 30 0Modoc 79 34 0 12 21 1Mono 5 9 0 8 0 1Monterey 168 142 5 47 90 0Napa 85 67 1 33 33 0Nevada 118 87 9 16 11 51Orange 1,405 594 0 211 383 0Placer 269 186 0 56 112 18Plumas 33 21 3 7 11 0Riverside 1,322 945 0 472 381 92Sacramento 2,131 1,466 0 371 1,094 1San Benito 31 12 1 5 6 0San Bernardino 1,944 1,990 56 694 1,237 3San Diego 1,716 1,175 1 430 728 16San Francisco 377 220 0 29 175 16San Joaquin 728 563 0 174 389 0San Luis Obispo 204 148 3 47 95 3San Mateo 325 256 53 94 109 0Santa Barbara 192 168 0 97 70 1Santa Clara 491 245 0 101 144 0Santa Cruz 177 913 17 823 73 0Shasta 399 414 0 208 205 3
Before Trial
TotalFilings
TotalDispositions
Dismissal forDelay in
ProsecutionOther Before
HearingAfter
Hearing
Judicial Council of California 2022 Court Statistics Report150
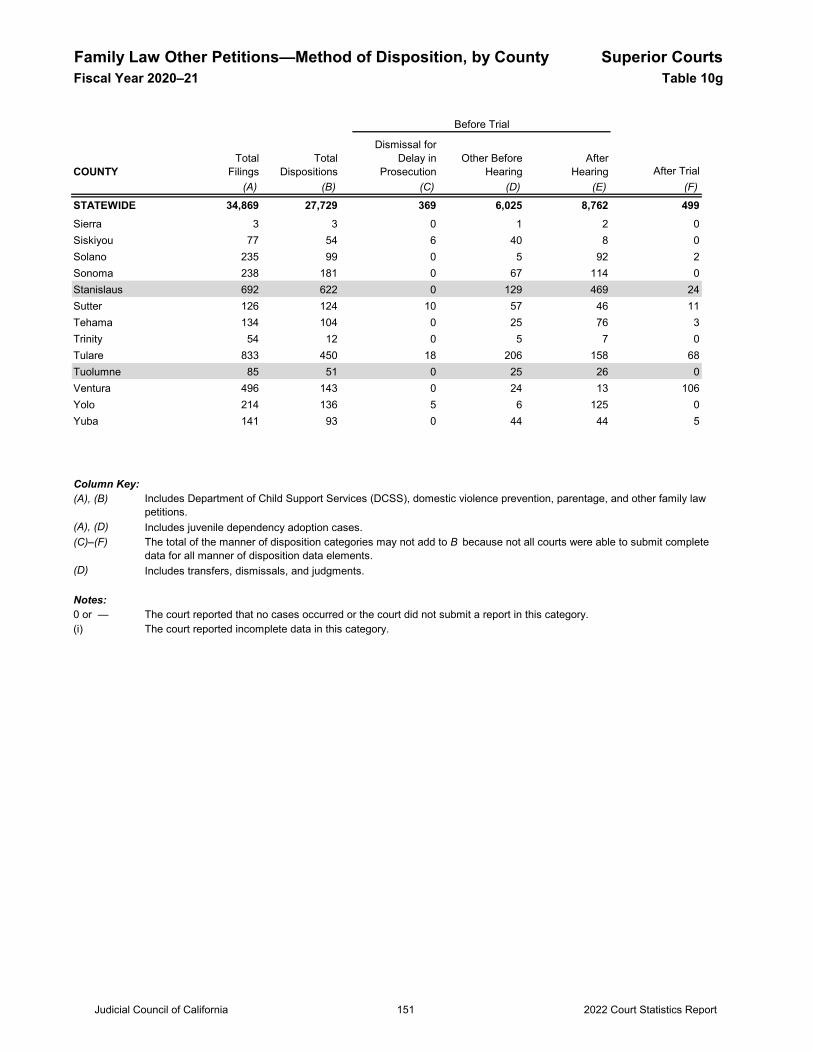
Family Law Other Petitions—Method of Disposition, by County Superior CourtsFiscal Year 2020–21 Table 10g
COUNTY After Trial(A) (B) (C) (D) (E) (F)
STATEWIDE 34,869 27,729 369 6,025 8,762 499
Before Trial
TotalFilings
TotalDispositions
Dismissal forDelay in
ProsecutionOther Before
HearingAfter
Hearing
Sierra 3 3 0 1 2 0Siskiyou 77 54 6 40 8 0Solano 235 99 0 5 92 2Sonoma 238 181 0 67 114 0Stanislaus 692 622 0 129 469 24Sutter 126 124 10 57 46 11Tehama 134 104 0 25 76 3Trinity 54 12 0 5 7 0Tulare 833 450 18 206 158 68Tuolumne 85 51 0 25 26 0Ventura 496 143 0 24 13 106Yolo 214 136 5 6 125 0Yuba 141 93 0 44 44 5
Column Key:(A), (B)
(A), (D) Includes juvenile dependency adoption cases. (C)–(F)
(D) Includes transfers, dismissals, and judgments.
Notes:0 or — The court reported that no cases occurred or the court did not submit a report in this category.(i) The court reported incomplete data in this category.
The total of the manner of disposition categories may not add to B because not all courts were able to submit complete data for all manner of disposition data elements.
Includes Department of Child Support Services (DCSS), domestic violence prevention, parentage, and other family law petitions.
Judicial Council of California 2022 Court Statistics Report151
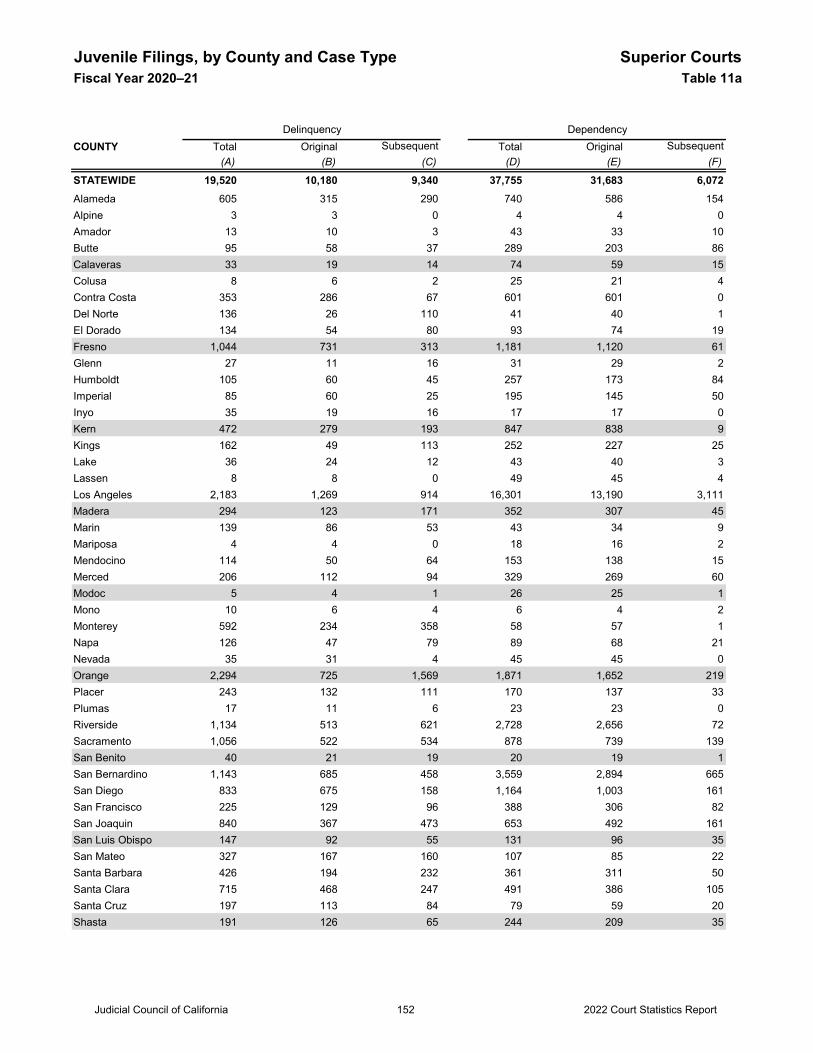
Juvenile Filings, by County and Case Type Superior CourtsFiscal Year 2020–21 Table 11a
COUNTY Total Original Subsequent Total Original Subsequent(A) (B) (C) (D) (E) (F)
STATEWIDE 19,520 10,180 9,340 37,755 31,683 6,072Alameda 605 315 290 740 586 154Alpine 3 3 0 4 4 0Amador 13 10 3 43 33 10Butte 95 58 37 289 203 86Calaveras 33 19 14 74 59 15Colusa 8 6 2 25 21 4Contra Costa 353 286 67 601 601 0Del Norte 136 26 110 41 40 1El Dorado 134 54 80 93 74 19Fresno 1,044 731 313 1,181 1,120 61Glenn 27 11 16 31 29 2Humboldt 105 60 45 257 173 84Imperial 85 60 25 195 145 50Inyo 35 19 16 17 17 0Kern 472 279 193 847 838 9Kings 162 49 113 252 227 25Lake 36 24 12 43 40 3Lassen 8 8 0 49 45 4Los Angeles 2,183 1,269 914 16,301 13,190 3,111Madera 294 123 171 352 307 45Marin 139 86 53 43 34 9Mariposa 4 4 0 18 16 2Mendocino 114 50 64 153 138 15Merced 206 112 94 329 269 60Modoc 5 4 1 26 25 1Mono 10 6 4 6 4 2Monterey 592 234 358 58 57 1Napa 126 47 79 89 68 21Nevada 35 31 4 45 45 0Orange 2,294 725 1,569 1,871 1,652 219Placer 243 132 111 170 137 33Plumas 17 11 6 23 23 0Riverside 1,134 513 621 2,728 2,656 72Sacramento 1,056 522 534 878 739 139San Benito 40 21 19 20 19 1San Bernardino 1,143 685 458 3,559 2,894 665San Diego 833 675 158 1,164 1,003 161San Francisco 225 129 96 388 306 82San Joaquin 840 367 473 653 492 161San Luis Obispo 147 92 55 131 96 35San Mateo 327 167 160 107 85 22Santa Barbara 426 194 232 361 311 50Santa Clara 715 468 247 491 386 105Santa Cruz 197 113 84 79 59 20Shasta 191 126 65 244 209 35
Delinquency Dependency
Judicial Council of California 2022 Court Statistics Report152
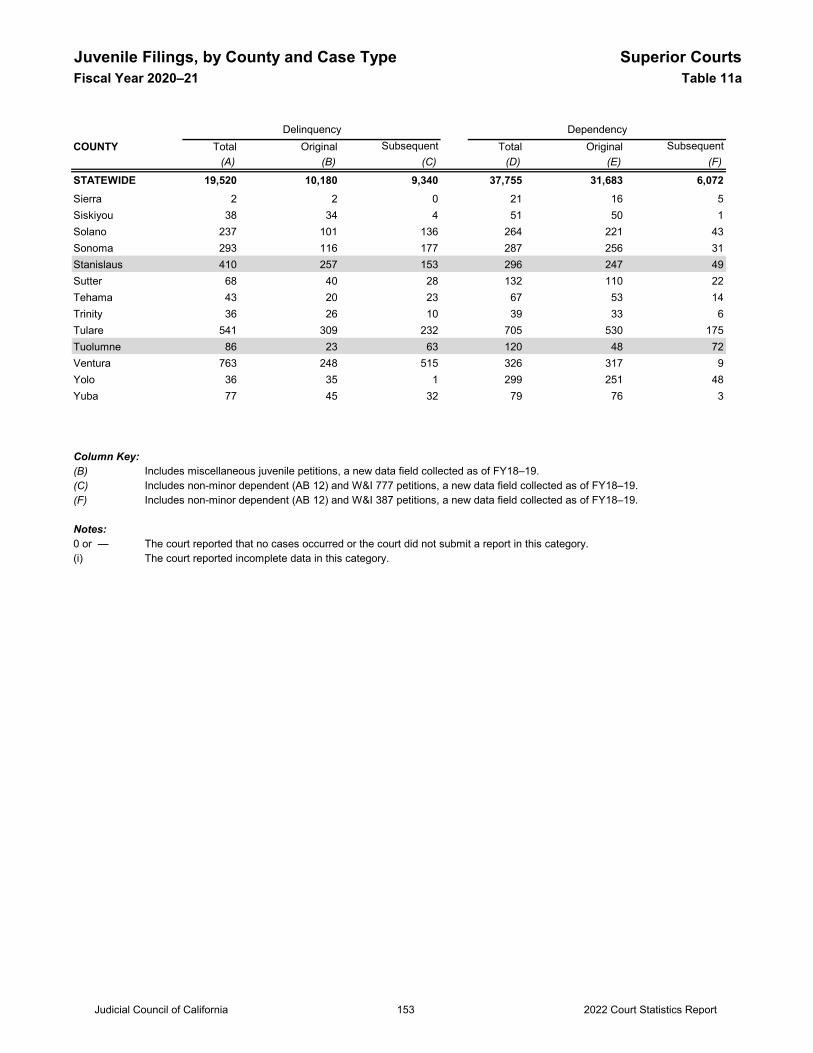
Juvenile Filings, by County and Case Type Superior CourtsFiscal Year 2020–21 Table 11a
COUNTY Total Original Subsequent Total Original Subsequent(A) (B) (C) (D) (E) (F)
STATEWIDE 19,520 10,180 9,340 37,755 31,683 6,072
Delinquency Dependency
Sierra 2 2 0 21 16 5Siskiyou 38 34 4 51 50 1Solano 237 101 136 264 221 43Sonoma 293 116 177 287 256 31Stanislaus 410 257 153 296 247 49Sutter 68 40 28 132 110 22Tehama 43 20 23 67 53 14Trinity 36 26 10 39 33 6Tulare 541 309 232 705 530 175Tuolumne 86 23 63 120 48 72Ventura 763 248 515 326 317 9Yolo 36 35 1 299 251 48Yuba 77 45 32 79 76 3
Column Key:(B) Includes miscellaneous juvenile petitions, a new data field collected as of FY18–19.(C) Includes non-minor dependent (AB 12) and W&I 777 petitions, a new data field collected as of FY18–19.(F) Includes non-minor dependent (AB 12) and W&I 387 petitions, a new data field collected as of FY18–19.
Notes:0 or — The court reported that no cases occurred or the court did not submit a report in this category.(i) The court reported incomplete data in this category.
Judicial Council of California 2022 Court Statistics Report153
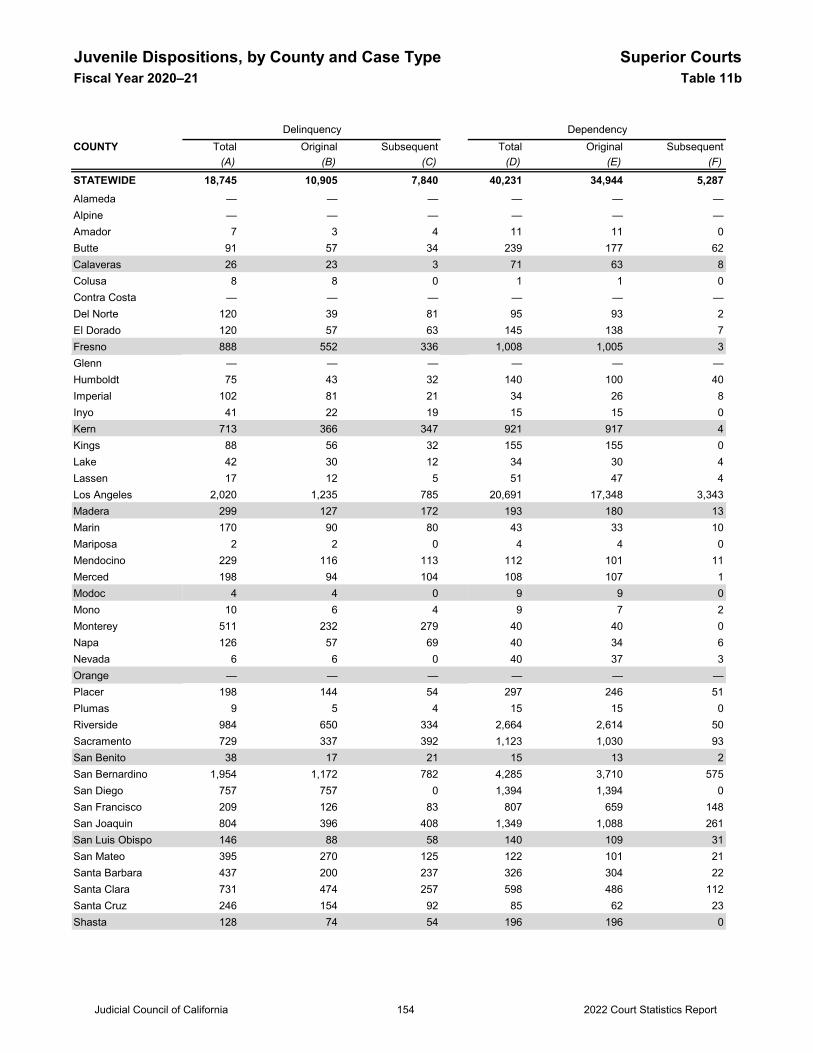
Juvenile Dispositions, by County and Case Type Superior CourtsFiscal Year 2020–21 Table 11b
COUNTY Total Original Subsequent Total Original Subsequent(A) (B) (C) (D) (E) (F)
STATEWIDE 18,745 10,905 7,840 40,231 34,944 5,287Alameda — — — — — —Alpine — — — — — —Amador 7 3 4 11 11 0Butte 91 57 34 239 177 62Calaveras 26 23 3 71 63 8Colusa 8 8 0 1 1 0Contra Costa — — — — — —Del Norte 120 39 81 95 93 2El Dorado 120 57 63 145 138 7Fresno 888 552 336 1,008 1,005 3Glenn — — — — — —Humboldt 75 43 32 140 100 40Imperial 102 81 21 34 26 8Inyo 41 22 19 15 15 0Kern 713 366 347 921 917 4Kings 88 56 32 155 155 0Lake 42 30 12 34 30 4Lassen 17 12 5 51 47 4Los Angeles 2,020 1,235 785 20,691 17,348 3,343Madera 299 127 172 193 180 13Marin 170 90 80 43 33 10Mariposa 2 2 0 4 4 0Mendocino 229 116 113 112 101 11Merced 198 94 104 108 107 1Modoc 4 4 0 9 9 0Mono 10 6 4 9 7 2Monterey 511 232 279 40 40 0Napa 126 57 69 40 34 6Nevada 6 6 0 40 37 3Orange — — — — — —Placer 198 144 54 297 246 51Plumas 9 5 4 15 15 0Riverside 984 650 334 2,664 2,614 50Sacramento 729 337 392 1,123 1,030 93San Benito 38 17 21 15 13 2San Bernardino 1,954 1,172 782 4,285 3,710 575San Diego 757 757 0 1,394 1,394 0San Francisco 209 126 83 807 659 148San Joaquin 804 396 408 1,349 1,088 261San Luis Obispo 146 88 58 140 109 31San Mateo 395 270 125 122 101 21Santa Barbara 437 200 237 326 304 22Santa Clara 731 474 257 598 486 112Santa Cruz 246 154 92 85 62 23Shasta 128 74 54 196 196 0
Delinquency Dependency
Judicial Council of California 2022 Court Statistics Report154

Juvenile Dispositions, by County and Case Type Superior CourtsFiscal Year 2020–21 Table 11b
COUNTY Total Original Subsequent Total Original Subsequent(A) (B) (C) (D) (E) (F)
STATEWIDE 18,745 10,905 7,840 40,231 34,944 5,287
Delinquency Dependency
Sierra 3 3 0 16 11 5Siskiyou 16 16 0 9 9 0Solano 1,921 943 978 182 64 118Sonoma 592 324 268 133 126 7Stanislaus 589 421 168 285 240 45Sutter 66 39 27 75 72 3Tehama 48 27 21 63 51 12Trinity 10 4 6 17 14 3Tulare 610 331 279 555 501 54Tuolumne 74 22 52 116 49 67Ventura 1,005 489 516 861 825 36Yolo 61 59 2 206 198 8Yuba 72 45 27 88 79 9
Column Key:(B) Includes miscellaneous juvenile petitions, a new data field collected as of FY18–19.(C) Includes non-minor dependent (AB 12) and W&I 777 petitions, a new data field collected as of FY18–19.(F) Includes non-minor dependent (AB 12) and W&I 387 petitions, a new data field collected as of FY18–19. Notes:0 or — The court reported that no cases occurred or the court did not submit a report in this category.(i) The court reported incomplete data in this category.
Judicial Council of California 2022 Court Statistics Report155
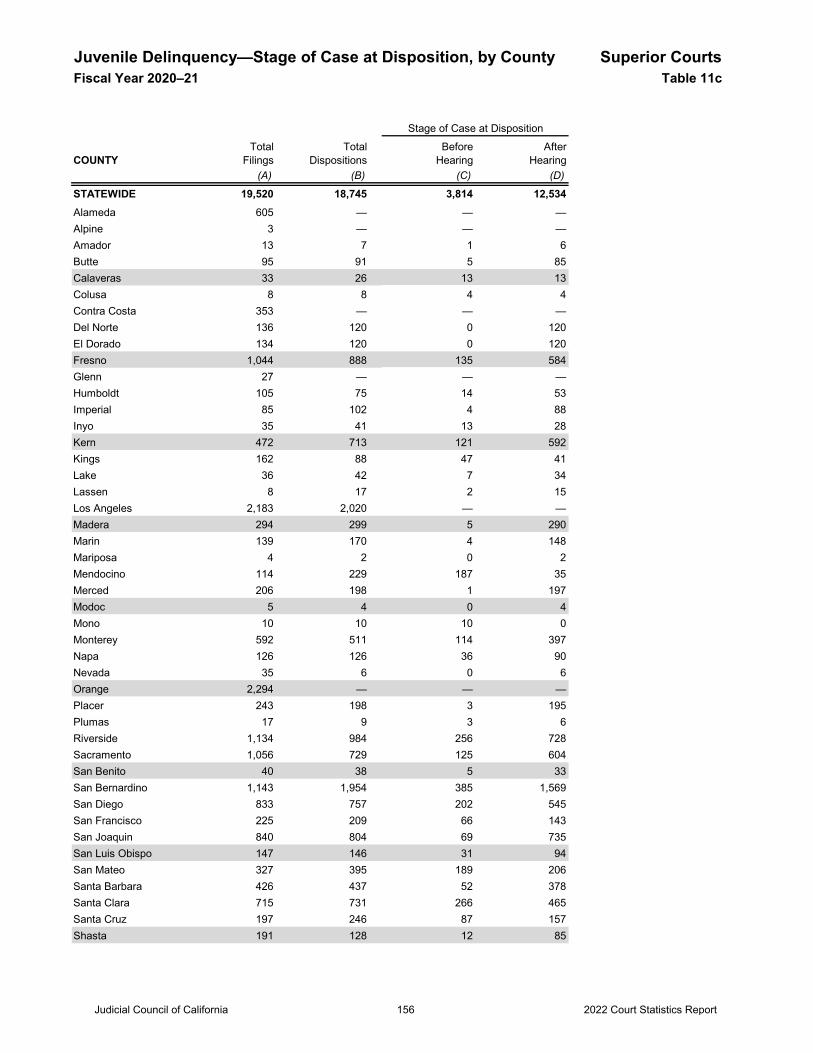
Juvenile Delinquency—Stage of Case at Disposition, by County Superior CourtsFiscal Year 2020–21 Table 11c
COUNTY(A) (B) (C) (D)
STATEWIDE 19,520 18,745 3,814 12,534Alameda 605 — — —Alpine 3 — — —Amador 13 7 1 6Butte 95 91 5 85Calaveras 33 26 13 13Colusa 8 8 4 4Contra Costa 353 — — —Del Norte 136 120 0 120El Dorado 134 120 0 120Fresno 1,044 888 135 584Glenn 27 — — —Humboldt 105 75 14 53Imperial 85 102 4 88Inyo 35 41 13 28Kern 472 713 121 592Kings 162 88 47 41Lake 36 42 7 34Lassen 8 17 2 15Los Angeles 2,183 2,020 — —Madera 294 299 5 290Marin 139 170 4 148Mariposa 4 2 0 2Mendocino 114 229 187 35Merced 206 198 1 197Modoc 5 4 0 4Mono 10 10 10 0Monterey 592 511 114 397Napa 126 126 36 90Nevada 35 6 0 6Orange 2,294 — — —Placer 243 198 3 195Plumas 17 9 3 6Riverside 1,134 984 256 728Sacramento 1,056 729 125 604San Benito 40 38 5 33San Bernardino 1,143 1,954 385 1,569San Diego 833 757 202 545San Francisco 225 209 66 143San Joaquin 840 804 69 735San Luis Obispo 147 146 31 94San Mateo 327 395 189 206Santa Barbara 426 437 52 378Santa Clara 715 731 266 465Santa Cruz 197 246 87 157Shasta 191 128 12 85
Stage of Case at Disposition
TotalFilings
TotalDispositions
BeforeHearing
AfterHearing
Judicial Council of California 2022 Court Statistics Report156
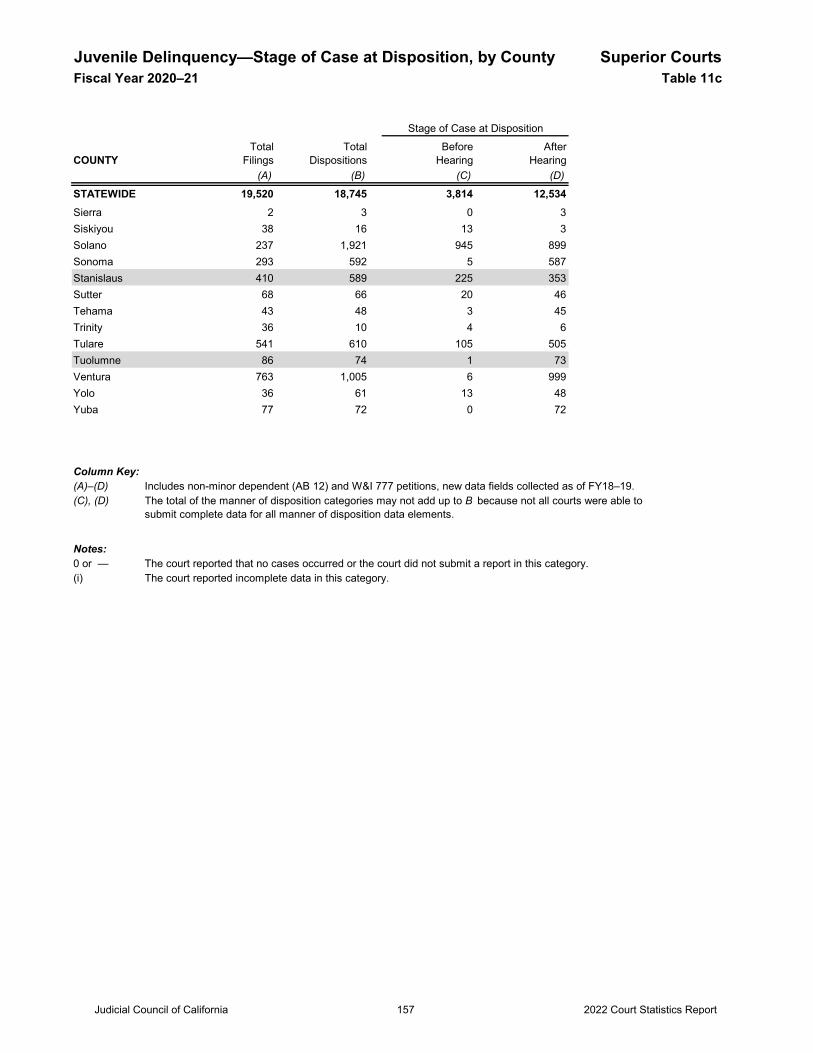
Juvenile Delinquency—Stage of Case at Disposition, by County Superior CourtsFiscal Year 2020–21 Table 11c
COUNTY(A) (B) (C) (D)
STATEWIDE 19,520 18,745 3,814 12,534
Stage of Case at Disposition
TotalFilings
TotalDispositions
BeforeHearing
AfterHearing
Sierra 2 3 0 3Siskiyou 38 16 13 3Solano 237 1,921 945 899Sonoma 293 592 5 587Stanislaus 410 589 225 353Sutter 68 66 20 46Tehama 43 48 3 45Trinity 36 10 4 6Tulare 541 610 105 505Tuolumne 86 74 1 73Ventura 763 1,005 6 999Yolo 36 61 13 48Yuba 77 72 0 72
Column Key:(A)–(D) Includes non-minor dependent (AB 12) and W&I 777 petitions, new data fields collected as of FY18–19.(C), (D)
Notes:0 or — The court reported that no cases occurred or the court did not submit a report in this category.(i) The court reported incomplete data in this category.
The total of the manner of disposition categories may not add up to B because not all courts were able to submit complete data for all manner of disposition data elements.
Judicial Council of California 2022 Court Statistics Report157
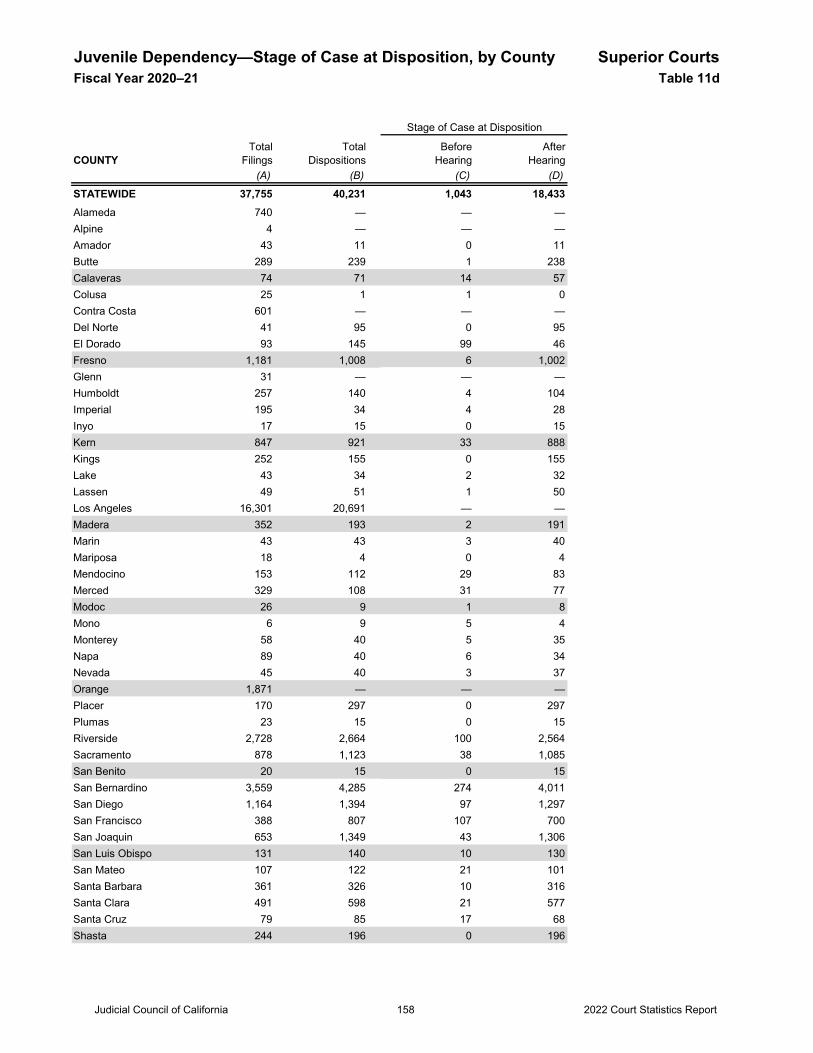
Juvenile Dependency—Stage of Case at Disposition, by County Superior CourtsFiscal Year 2020–21 Table 11d
COUNTY(A) (B) (C) (D)
STATEWIDE 37,755 40,231 1,043 18,433Alameda 740 — — —Alpine 4 — — —Amador 43 11 0 11Butte 289 239 1 238Calaveras 74 71 14 57Colusa 25 1 1 0Contra Costa 601 — — —Del Norte 41 95 0 95El Dorado 93 145 99 46Fresno 1,181 1,008 6 1,002Glenn 31 — — —Humboldt 257 140 4 104Imperial 195 34 4 28Inyo 17 15 0 15Kern 847 921 33 888Kings 252 155 0 155Lake 43 34 2 32Lassen 49 51 1 50Los Angeles 16,301 20,691 — —Madera 352 193 2 191Marin 43 43 3 40Mariposa 18 4 0 4Mendocino 153 112 29 83Merced 329 108 31 77Modoc 26 9 1 8Mono 6 9 5 4Monterey 58 40 5 35Napa 89 40 6 34Nevada 45 40 3 37Orange 1,871 — — —Placer 170 297 0 297Plumas 23 15 0 15Riverside 2,728 2,664 100 2,564Sacramento 878 1,123 38 1,085San Benito 20 15 0 15San Bernardino 3,559 4,285 274 4,011San Diego 1,164 1,394 97 1,297San Francisco 388 807 107 700San Joaquin 653 1,349 43 1,306San Luis Obispo 131 140 10 130San Mateo 107 122 21 101Santa Barbara 361 326 10 316Santa Clara 491 598 21 577Santa Cruz 79 85 17 68Shasta 244 196 0 196
Stage of Case at Disposition
TotalFilings
TotalDispositions
BeforeHearing
AfterHearing
Judicial Council of California 2022 Court Statistics Report158
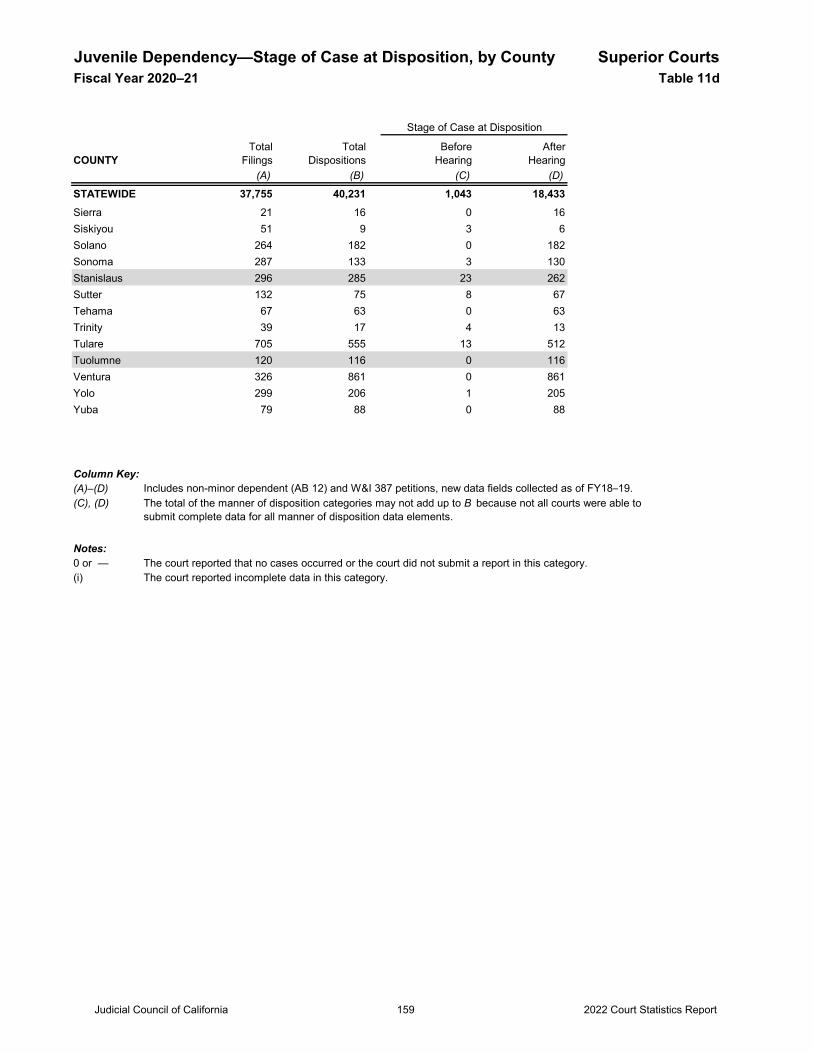
Juvenile Dependency—Stage of Case at Disposition, by County Superior CourtsFiscal Year 2020–21 Table 11d
COUNTY(A) (B) (C) (D)
STATEWIDE 37,755 40,231 1,043 18,433
Stage of Case at Disposition
TotalFilings
TotalDispositions
BeforeHearing
AfterHearing
Sierra 21 16 0 16Siskiyou 51 9 3 6Solano 264 182 0 182Sonoma 287 133 3 130Stanislaus 296 285 23 262Sutter 132 75 8 67Tehama 67 63 0 63Trinity 39 17 4 13Tulare 705 555 13 512Tuolumne 120 116 0 116Ventura 326 861 0 861Yolo 299 206 1 205Yuba 79 88 0 88
Column Key:(A)–(D) Includes non-minor dependent (AB 12) and W&I 387 petitions, new data fields collected as of FY18–19.(C), (D)
Notes:0 or — The court reported that no cases occurred or the court did not submit a report in this category.(i) The court reported incomplete data in this category.
The total of the manner of disposition categories may not add up to B because not all courts were able to submit complete data for all manner of disposition data elements.
Judicial Council of California 2022 Court Statistics Report159
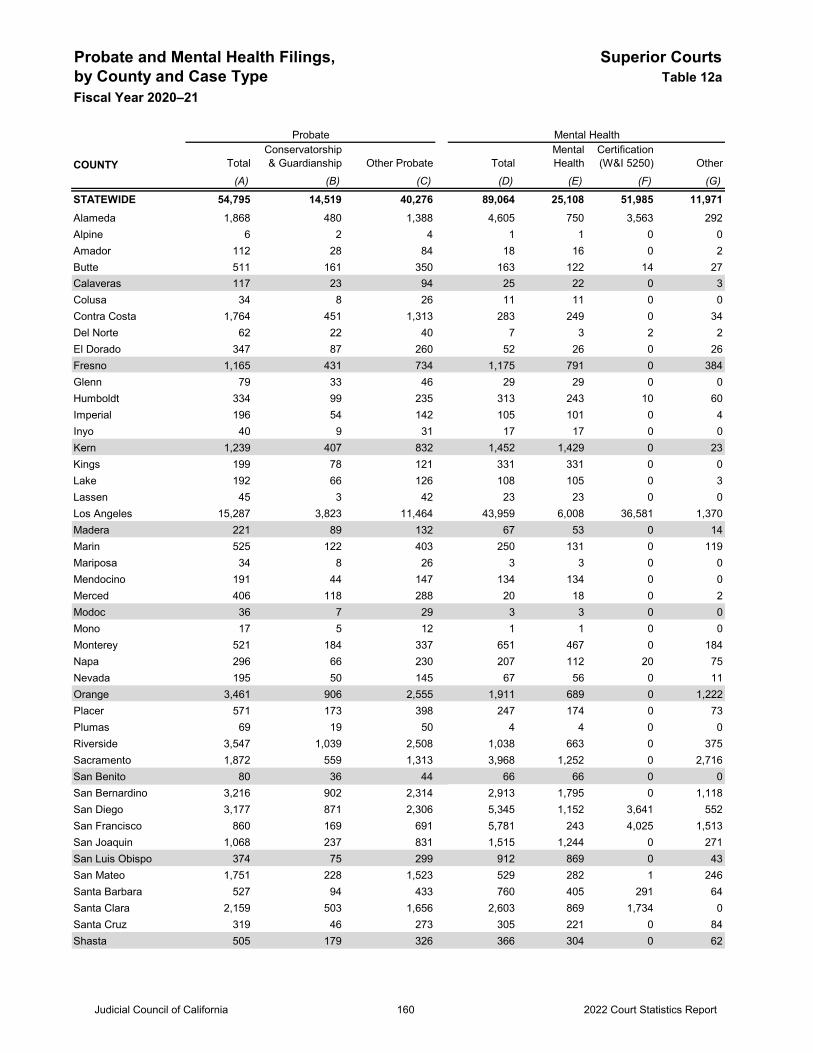
Probate and Mental Health Filings, Superior Courtsby County and Case Type Table 12aFiscal Year 2020–21
COUNTY TotalConservatorship & Guardianship Other Probate Total
Mental Health
Certification(W&I 5250) Other
(A) (B) (C) (D) (E) (F) (G)
STATEWIDE 54,795 14,519 40,276 89,064 25,108 51,985 11,971Alameda 1,868 480 1,388 4,605 750 3,563 292Alpine 6 2 4 1 1 0 0Amador 112 28 84 18 16 0 2Butte 511 161 350 163 122 14 27Calaveras 117 23 94 25 22 0 3Colusa 34 8 26 11 11 0 0Contra Costa 1,764 451 1,313 283 249 0 34Del Norte 62 22 40 7 3 2 2El Dorado 347 87 260 52 26 0 26Fresno 1,165 431 734 1,175 791 0 384Glenn 79 33 46 29 29 0 0Humboldt 334 99 235 313 243 10 60Imperial 196 54 142 105 101 0 4Inyo 40 9 31 17 17 0 0Kern 1,239 407 832 1,452 1,429 0 23Kings 199 78 121 331 331 0 0Lake 192 66 126 108 105 0 3Lassen 45 3 42 23 23 0 0Los Angeles 15,287 3,823 11,464 43,959 6,008 36,581 1,370Madera 221 89 132 67 53 0 14Marin 525 122 403 250 131 0 119Mariposa 34 8 26 3 3 0 0Mendocino 191 44 147 134 134 0 0Merced 406 118 288 20 18 0 2Modoc 36 7 29 3 3 0 0Mono 17 5 12 1 1 0 0Monterey 521 184 337 651 467 0 184Napa 296 66 230 207 112 20 75Nevada 195 50 145 67 56 0 11Orange 3,461 906 2,555 1,911 689 0 1,222Placer 571 173 398 247 174 0 73Plumas 69 19 50 4 4 0 0Riverside 3,547 1,039 2,508 1,038 663 0 375Sacramento 1,872 559 1,313 3,968 1,252 0 2,716San Benito 80 36 44 66 66 0 0San Bernardino 3,216 902 2,314 2,913 1,795 0 1,118San Diego 3,177 871 2,306 5,345 1,152 3,641 552San Francisco 860 169 691 5,781 243 4,025 1,513San Joaquin 1,068 237 831 1,515 1,244 0 271San Luis Obispo 374 75 299 912 869 0 43San Mateo 1,751 228 1,523 529 282 1 246Santa Barbara 527 94 433 760 405 291 64Santa Clara 2,159 503 1,656 2,603 869 1,734 0Santa Cruz 319 46 273 305 221 0 84Shasta 505 179 326 366 304 0 62
Probate Mental Health
Judicial Council of California 2022 Court Statistics Report160
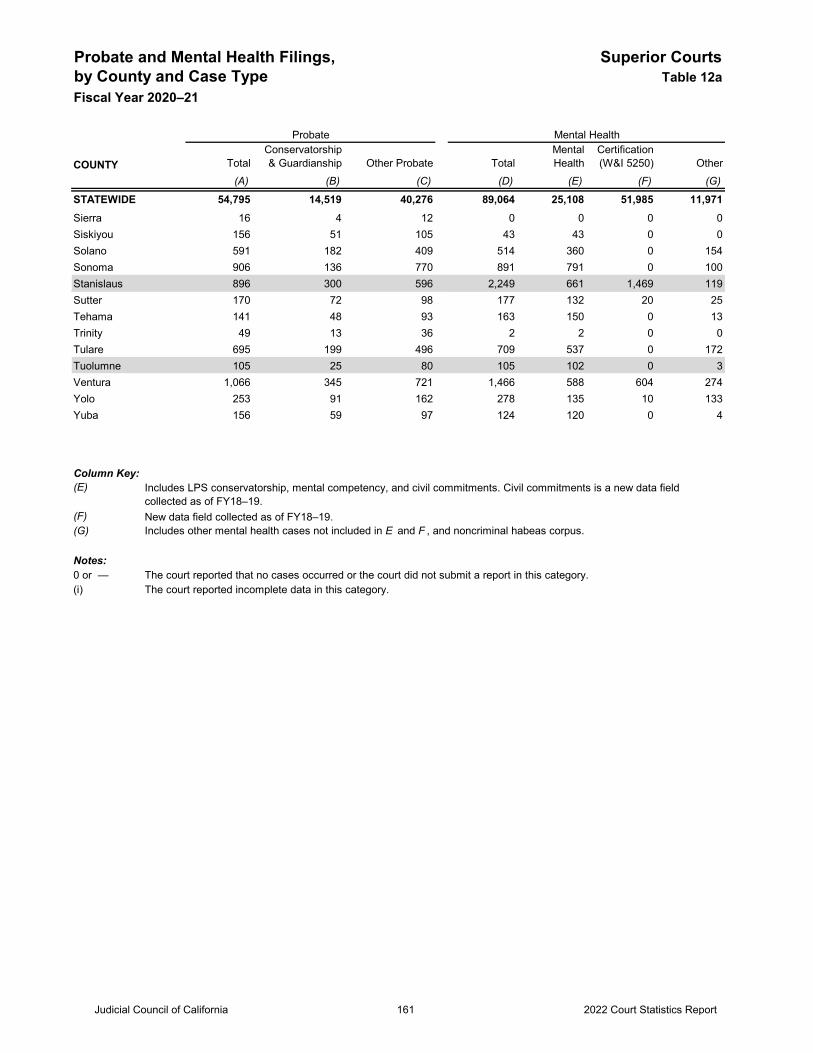
Probate and Mental Health Filings, Superior Courtsby County and Case Type Table 12aFiscal Year 2020–21
COUNTY TotalConservatorship & Guardianship Other Probate Total
Mental Health
Certification(W&I 5250) Other
(A) (B) (C) (D) (E) (F) (G)
STATEWIDE 54,795 14,519 40,276 89,064 25,108 51,985 11,971
Probate Mental Health
Sierra 16 4 12 0 0 0 0Siskiyou 156 51 105 43 43 0 0Solano 591 182 409 514 360 0 154Sonoma 906 136 770 891 791 0 100Stanislaus 896 300 596 2,249 661 1,469 119Sutter 170 72 98 177 132 20 25Tehama 141 48 93 163 150 0 13Trinity 49 13 36 2 2 0 0Tulare 695 199 496 709 537 0 172Tuolumne 105 25 80 105 102 0 3Ventura 1,066 345 721 1,466 588 604 274Yolo 253 91 162 278 135 10 133Yuba 156 59 97 124 120 0 4
Column Key: (E)
(F) New data field collected as of FY18–19.(G) Includes other mental health cases not included in E and F , and noncriminal habeas corpus. Notes:0 or — The court reported that no cases occurred or the court did not submit a report in this category.(i) The court reported incomplete data in this category.
Includes LPS conservatorship, mental competency, and civil commitments. Civil commitments is a new data field collected as of FY18–19.
Judicial Council of California 2022 Court Statistics Report161
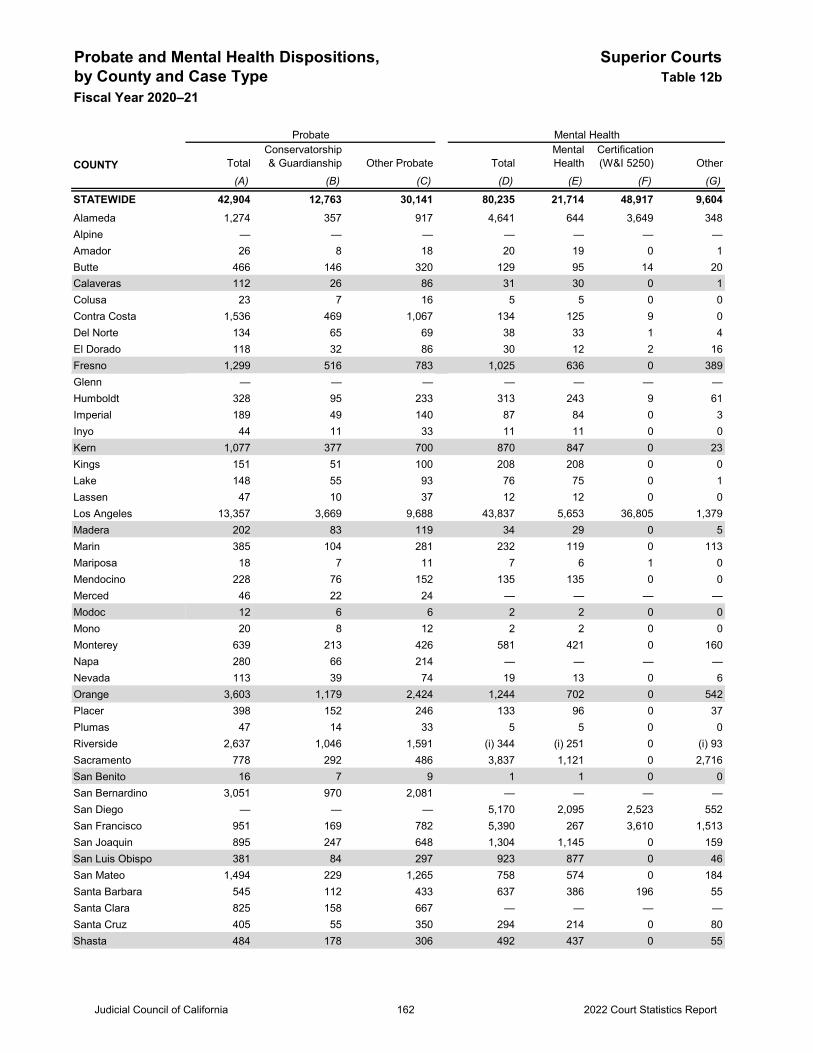
Probate and Mental Health Dispositions, Superior Courtsby County and Case Type Table 12bFiscal Year 2020–21
COUNTY TotalConservatorship & Guardianship Other Probate Total
Mental Health
Certification(W&I 5250) Other
(A) (B) (C) (D) (E) (F) (G)
STATEWIDE 42,904 12,763 30,141 80,235 21,714 48,917 9,604Alameda 1,274 357 917 4,641 644 3,649 348Alpine — — — — — — —Amador 26 8 18 20 19 0 1Butte 466 146 320 129 95 14 20Calaveras 112 26 86 31 30 0 1Colusa 23 7 16 5 5 0 0Contra Costa 1,536 469 1,067 134 125 9 0Del Norte 134 65 69 38 33 1 4El Dorado 118 32 86 30 12 2 16Fresno 1,299 516 783 1,025 636 0 389Glenn — — — — — — —Humboldt 328 95 233 313 243 9 61Imperial 189 49 140 87 84 0 3Inyo 44 11 33 11 11 0 0Kern 1,077 377 700 870 847 0 23Kings 151 51 100 208 208 0 0Lake 148 55 93 76 75 0 1Lassen 47 10 37 12 12 0 0Los Angeles 13,357 3,669 9,688 43,837 5,653 36,805 1,379Madera 202 83 119 34 29 0 5Marin 385 104 281 232 119 0 113Mariposa 18 7 11 7 6 1 0Mendocino 228 76 152 135 135 0 0Merced 46 22 24 — — — —Modoc 12 6 6 2 2 0 0Mono 20 8 12 2 2 0 0Monterey 639 213 426 581 421 0 160Napa 280 66 214 — — — —Nevada 113 39 74 19 13 0 6Orange 3,603 1,179 2,424 1,244 702 0 542Placer 398 152 246 133 96 0 37Plumas 47 14 33 5 5 0 0Riverside 2,637 1,046 1,591 (i) 344 (i) 251 0 (i) 93Sacramento 778 292 486 3,837 1,121 0 2,716San Benito 16 7 9 1 1 0 0San Bernardino 3,051 970 2,081 — — — —San Diego — — — 5,170 2,095 2,523 552San Francisco 951 169 782 5,390 267 3,610 1,513San Joaquin 895 247 648 1,304 1,145 0 159San Luis Obispo 381 84 297 923 877 0 46San Mateo 1,494 229 1,265 758 574 0 184Santa Barbara 545 112 433 637 386 196 55Santa Clara 825 158 667 — — — —Santa Cruz 405 55 350 294 214 0 80Shasta 484 178 306 492 437 0 55
Probate Mental Health
Judicial Council of California 2022 Court Statistics Report162
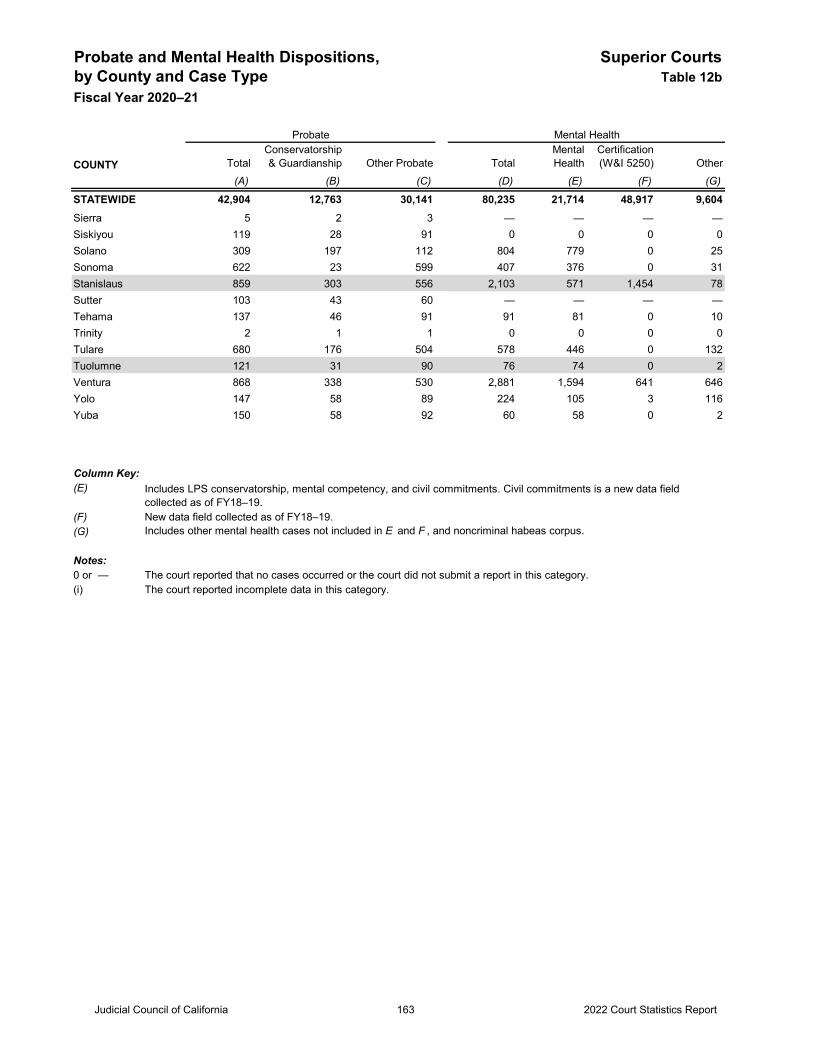
Probate and Mental Health Dispositions, Superior Courtsby County and Case Type Table 12bFiscal Year 2020–21
COUNTY TotalConservatorship & Guardianship Other Probate Total
Mental Health
Certification(W&I 5250) Other
(A) (B) (C) (D) (E) (F) (G)
STATEWIDE 42,904 12,763 30,141 80,235 21,714 48,917 9,604
Probate Mental Health
Sierra 5 2 3 — — — —Siskiyou 119 28 91 0 0 0 0Solano 309 197 112 804 779 0 25Sonoma 622 23 599 407 376 0 31Stanislaus 859 303 556 2,103 571 1,454 78Sutter 103 43 60 — — — —Tehama 137 46 91 91 81 0 10Trinity 2 1 1 0 0 0 0Tulare 680 176 504 578 446 0 132Tuolumne 121 31 90 76 74 0 2Ventura 868 338 530 2,881 1,594 641 646Yolo 147 58 89 224 105 3 116Yuba 150 58 92 60 58 0 2
Column Key: (E)
(F) New data field collected as of FY18–19.(G) Includes other mental health cases not included in E and F , and noncriminal habeas corpus.
Notes:0 or — The court reported that no cases occurred or the court did not submit a report in this category.(i) The court reported incomplete data in this category.
Includes LPS conservatorship, mental competency, and civil commitments. Civil commitments is a new data field collected as of FY18–19.
Judicial Council of California 2022 Court Statistics Report163
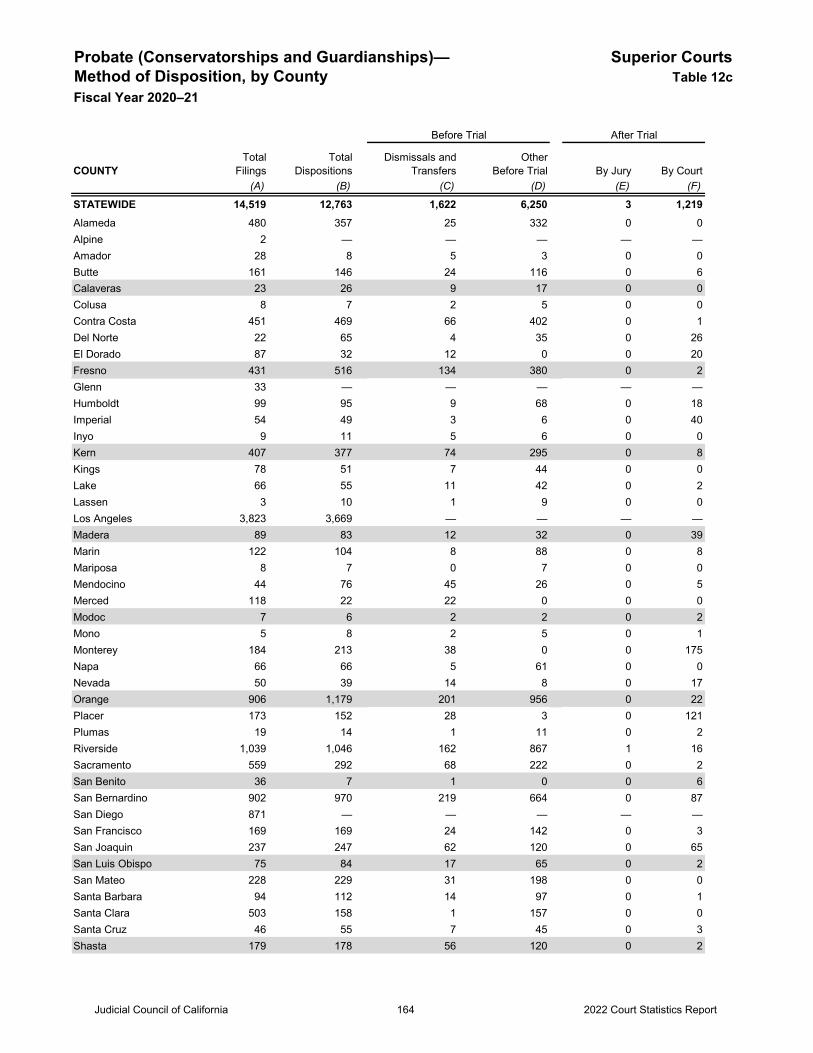
Probate (Conservatorships and Guardianships)— Superior CourtsMethod of Disposition, by County Table 12cFiscal Year 2020–21
COUNTY By Jury By Court(A) (B) (C) (D) (E) (F)
STATEWIDE 14,519 12,763 1,622 6,250 3 1,219Alameda 480 357 25 332 0 0Alpine 2 — — — — —Amador 28 8 5 3 0 0Butte 161 146 24 116 0 6Calaveras 23 26 9 17 0 0Colusa 8 7 2 5 0 0Contra Costa 451 469 66 402 0 1Del Norte 22 65 4 35 0 26El Dorado 87 32 12 0 0 20Fresno 431 516 134 380 0 2Glenn 33 — — — — —Humboldt 99 95 9 68 0 18Imperial 54 49 3 6 0 40Inyo 9 11 5 6 0 0Kern 407 377 74 295 0 8Kings 78 51 7 44 0 0Lake 66 55 11 42 0 2Lassen 3 10 1 9 0 0Los Angeles 3,823 3,669 — — — —Madera 89 83 12 32 0 39Marin 122 104 8 88 0 8Mariposa 8 7 0 7 0 0Mendocino 44 76 45 26 0 5Merced 118 22 22 0 0 0Modoc 7 6 2 2 0 2Mono 5 8 2 5 0 1Monterey 184 213 38 0 0 175Napa 66 66 5 61 0 0Nevada 50 39 14 8 0 17Orange 906 1,179 201 956 0 22Placer 173 152 28 3 0 121Plumas 19 14 1 11 0 2Riverside 1,039 1,046 162 867 1 16Sacramento 559 292 68 222 0 2San Benito 36 7 1 0 0 6San Bernardino 902 970 219 664 0 87San Diego 871 — — — — —San Francisco 169 169 24 142 0 3San Joaquin 237 247 62 120 0 65San Luis Obispo 75 84 17 65 0 2San Mateo 228 229 31 198 0 0Santa Barbara 94 112 14 97 0 1Santa Clara 503 158 1 157 0 0Santa Cruz 46 55 7 45 0 3Shasta 179 178 56 120 0 2
TotalFilings
TotalDispositions
Before Trial After Trial
OtherBefore Trial
Dismissals andTransfers
Judicial Council of California 2022 Court Statistics Report164
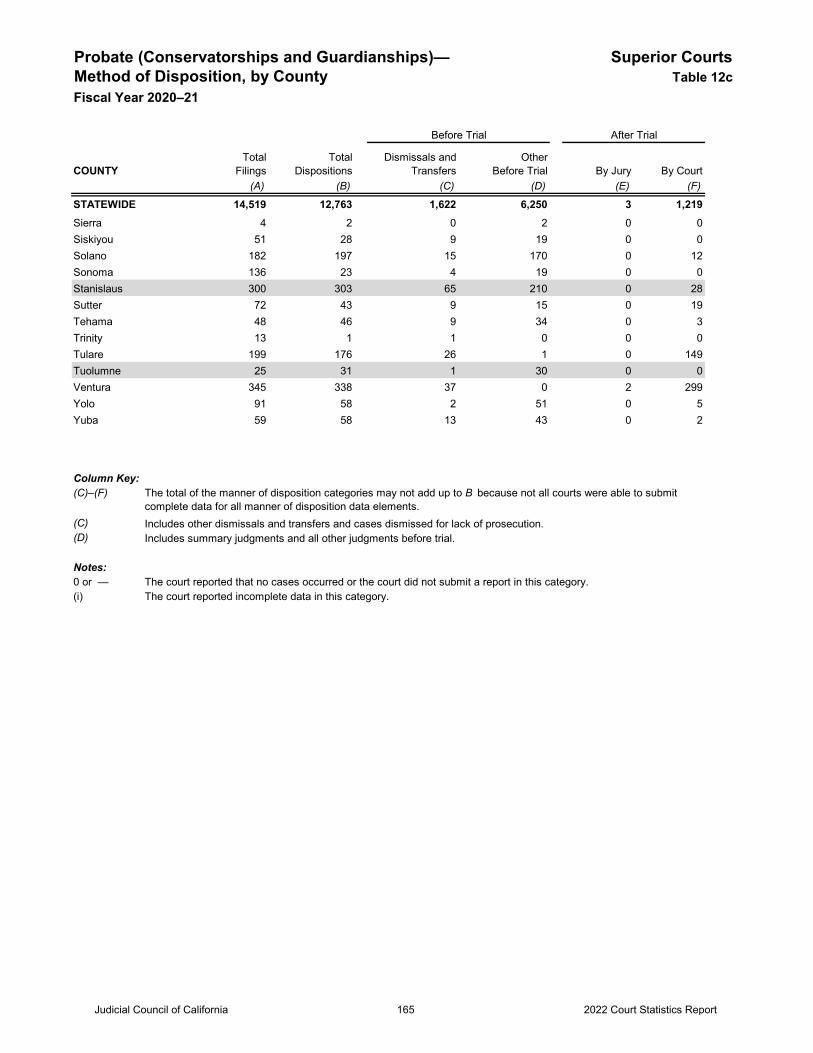
Probate (Conservatorships and Guardianships)— Superior CourtsMethod of Disposition, by County Table 12cFiscal Year 2020–21
COUNTY By Jury By Court(A) (B) (C) (D) (E) (F)
STATEWIDE 14,519 12,763 1,622 6,250 3 1,219
TotalFilings
TotalDispositions
Before Trial After Trial
OtherBefore Trial
Dismissals andTransfers
Sierra 4 2 0 2 0 0Siskiyou 51 28 9 19 0 0Solano 182 197 15 170 0 12Sonoma 136 23 4 19 0 0Stanislaus 300 303 65 210 0 28Sutter 72 43 9 15 0 19Tehama 48 46 9 34 0 3Trinity 13 1 1 0 0 0Tulare 199 176 26 1 0 149Tuolumne 25 31 1 30 0 0Ventura 345 338 37 0 2 299Yolo 91 58 2 51 0 5Yuba 59 58 13 43 0 2
Column Key: (C)–(F)
(C) Includes other dismissals and transfers and cases dismissed for lack of prosecution.(D) Includes summary judgments and all other judgments before trial. Notes:0 or — The court reported that no cases occurred or the court did not submit a report in this category.(i) The court reported incomplete data in this category.
The total of the manner of disposition categories may not add up to B because not all courts were able to submit complete data for all manner of disposition data elements.
Judicial Council of California 2022 Court Statistics Report165
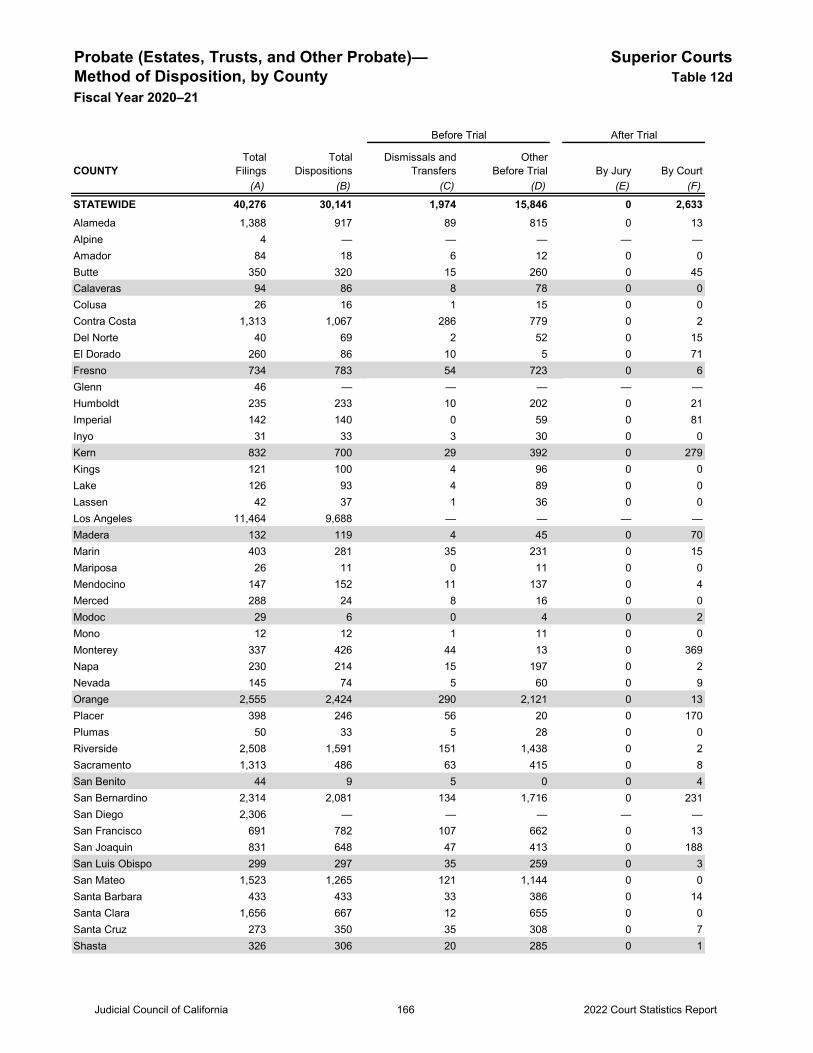
Probate (Estates, Trusts, and Other Probate)— Superior CourtsMethod of Disposition, by County Table 12dFiscal Year 2020–21
COUNTY By Jury By Court(A) (B) (C) (D) (E) (F)
STATEWIDE 40,276 30,141 1,974 15,846 0 2,633Alameda 1,388 917 89 815 0 13Alpine 4 — — — — —Amador 84 18 6 12 0 0Butte 350 320 15 260 0 45Calaveras 94 86 8 78 0 0Colusa 26 16 1 15 0 0Contra Costa 1,313 1,067 286 779 0 2Del Norte 40 69 2 52 0 15El Dorado 260 86 10 5 0 71Fresno 734 783 54 723 0 6Glenn 46 — — — — —Humboldt 235 233 10 202 0 21Imperial 142 140 0 59 0 81Inyo 31 33 3 30 0 0Kern 832 700 29 392 0 279Kings 121 100 4 96 0 0Lake 126 93 4 89 0 0Lassen 42 37 1 36 0 0Los Angeles 11,464 9,688 — — — —Madera 132 119 4 45 0 70Marin 403 281 35 231 0 15Mariposa 26 11 0 11 0 0Mendocino 147 152 11 137 0 4Merced 288 24 8 16 0 0Modoc 29 6 0 4 0 2Mono 12 12 1 11 0 0Monterey 337 426 44 13 0 369Napa 230 214 15 197 0 2Nevada 145 74 5 60 0 9Orange 2,555 2,424 290 2,121 0 13Placer 398 246 56 20 0 170Plumas 50 33 5 28 0 0Riverside 2,508 1,591 151 1,438 0 2Sacramento 1,313 486 63 415 0 8San Benito 44 9 5 0 0 4San Bernardino 2,314 2,081 134 1,716 0 231San Diego 2,306 — — — — —San Francisco 691 782 107 662 0 13San Joaquin 831 648 47 413 0 188San Luis Obispo 299 297 35 259 0 3San Mateo 1,523 1,265 121 1,144 0 0Santa Barbara 433 433 33 386 0 14Santa Clara 1,656 667 12 655 0 0Santa Cruz 273 350 35 308 0 7Shasta 326 306 20 285 0 1
Before Trial After Trial
TotalFilings
TotalDispositions
Dismissals andTransfers
OtherBefore Trial
Judicial Council of California 2022 Court Statistics Report166
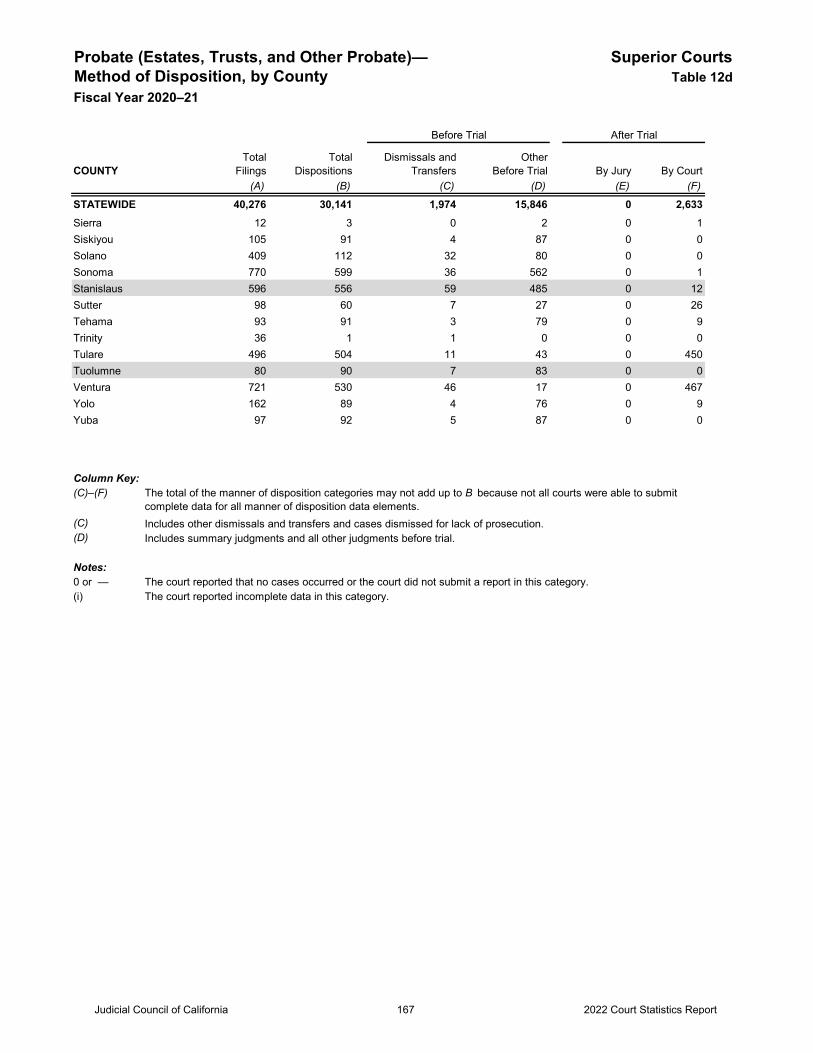
Probate (Estates, Trusts, and Other Probate)— Superior CourtsMethod of Disposition, by County Table 12dFiscal Year 2020–21
COUNTY By Jury By Court(A) (B) (C) (D) (E) (F)
STATEWIDE 40,276 30,141 1,974 15,846 0 2,633
Before Trial After Trial
TotalFilings
TotalDispositions
Dismissals andTransfers
OtherBefore Trial
Sierra 12 3 0 2 0 1Siskiyou 105 91 4 87 0 0Solano 409 112 32 80 0 0Sonoma 770 599 36 562 0 1Stanislaus 596 556 59 485 0 12Sutter 98 60 7 27 0 26Tehama 93 91 3 79 0 9Trinity 36 1 1 0 0 0Tulare 496 504 11 43 0 450Tuolumne 80 90 7 83 0 0Ventura 721 530 46 17 0 467Yolo 162 89 4 76 0 9Yuba 97 92 5 87 0 0
Column Key: (C)–(F)
(C) Includes other dismissals and transfers and cases dismissed for lack of prosecution.(D) Includes summary judgments and all other judgments before trial.
Notes:0 or — The court reported that no cases occurred or the court did not submit a report in this category.(i) The court reported incomplete data in this category.
The total of the manner of disposition categories may not add up to B because not all courts were able to submit complete data for all manner of disposition data elements.
Judicial Council of California 2022 Court Statistics Report167
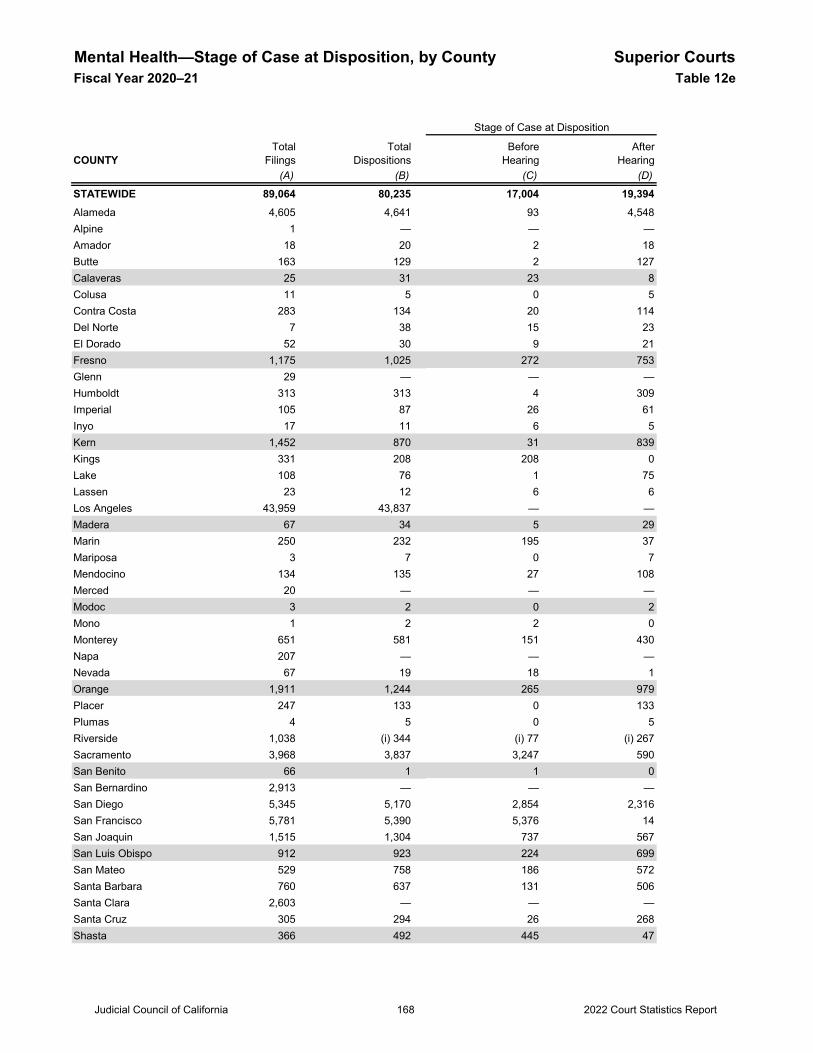
Mental Health—Stage of Case at Disposition, by County Superior CourtsFiscal Year 2020–21 Table 12e
COUNTY(A) (B) (C) (D)
STATEWIDE 89,064 80,235 17,004 19,394Alameda 4,605 4,641 93 4,548Alpine 1 — — —Amador 18 20 2 18Butte 163 129 2 127Calaveras 25 31 23 8Colusa 11 5 0 5Contra Costa 283 134 20 114Del Norte 7 38 15 23El Dorado 52 30 9 21Fresno 1,175 1,025 272 753Glenn 29 — — —Humboldt 313 313 4 309Imperial 105 87 26 61Inyo 17 11 6 5Kern 1,452 870 31 839Kings 331 208 208 0Lake 108 76 1 75Lassen 23 12 6 6Los Angeles 43,959 43,837 — —Madera 67 34 5 29Marin 250 232 195 37Mariposa 3 7 0 7Mendocino 134 135 27 108Merced 20 — — —Modoc 3 2 0 2Mono 1 2 2 0Monterey 651 581 151 430Napa 207 — — —Nevada 67 19 18 1Orange 1,911 1,244 265 979Placer 247 133 0 133Plumas 4 5 0 5Riverside 1,038 (i) 344 (i) 77 (i) 267Sacramento 3,968 3,837 3,247 590San Benito 66 1 1 0San Bernardino 2,913 — — —San Diego 5,345 5,170 2,854 2,316San Francisco 5,781 5,390 5,376 14San Joaquin 1,515 1,304 737 567San Luis Obispo 912 923 224 699San Mateo 529 758 186 572Santa Barbara 760 637 131 506Santa Clara 2,603 — — —Santa Cruz 305 294 26 268Shasta 366 492 445 47
Stage of Case at Disposition
TotalFilings
TotalDispositions
BeforeHearing
AfterHearing
Judicial Council of California 2022 Court Statistics Report168
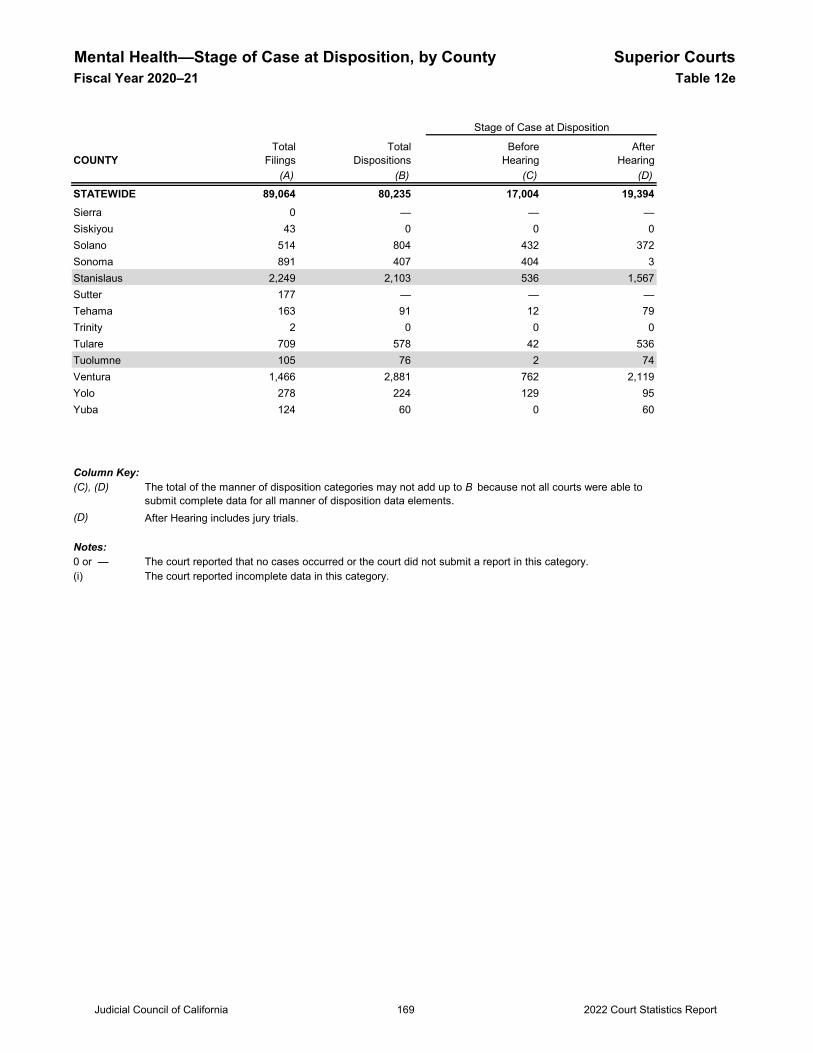
Mental Health—Stage of Case at Disposition, by County Superior CourtsFiscal Year 2020–21 Table 12e
COUNTY(A) (B) (C) (D)
STATEWIDE 89,064 80,235 17,004 19,394
Stage of Case at Disposition
TotalFilings
TotalDispositions
BeforeHearing
AfterHearing
Sierra 0 — — —Siskiyou 43 0 0 0Solano 514 804 432 372Sonoma 891 407 404 3Stanislaus 2,249 2,103 536 1,567Sutter 177 — — —Tehama 163 91 12 79Trinity 2 0 0 0Tulare 709 578 42 536Tuolumne 105 76 2 74Ventura 1,466 2,881 762 2,119Yolo 278 224 129 95Yuba 124 60 0 60
Column Key:(C), (D)
(D) After Hearing includes jury trials.
Notes:0 or — The court reported that no cases occurred or the court did not submit a report in this category.(i) The court reported incomplete data in this category.
The total of the manner of disposition categories may not add up to B because not all courts were able to submit complete data for all manner of disposition data elements.
Judicial Council of California 2022 Court Statistics Report169

Appeals, Habeas Corpus Filings, Superior Courtsby County and Case Type Table 13aFiscal Year 2020–21
COUNTY Total Civil Criminal(A) (B) (C) (D)
STATEWIDE 1,791 627 1,164 7,273Alameda 39 10 29 10Alpine 2 2 0 0Amador 3 2 1 126Butte 7 1 6 0Calaveras 2 0 2 4Colusa 11 8 3 0Contra Costa 131 45 86 145Del Norte 4 2 2 66El Dorado 10 4 6 43Fresno 66 9 57 338Glenn 0 0 0 0Humboldt 5 3 2 45Imperial 10 0 10 101Inyo 5 0 5 3Kern 42 16 26 367Kings 7 0 7 301Lake 1 1 0 28Lassen 1 0 1 50Los Angeles 286 156 130 139Madera 5 3 2 146Marin 19 3 16 913Mariposa 4 4 0 3Mendocino 7 4 3 55Merced 4 0 4 0Modoc 0 0 0 2Mono 2 2 0 2Monterey 26 0 26 320Napa 16 2 14 21Nevada 7 1 6 19Orange 203 93 110 250Placer 17 6 11 22Plumas 0 0 0 1Riverside 219 55 164 448Sacramento 27 9 18 702San Benito 1 0 1 3San Bernardino 102 24 78 655San Diego 124 52 72 497San Francisco 69 33 36 149San Joaquin 24 8 16 303San Luis Obispo 15 3 12 190San Mateo 6 1 5Santa Barbara 9 4 5 48Santa Clara 72 28 44 165Santa Cruz 15 3 12 22Shasta 10 3 7 93
Habeas Corpus Criminal
Appeals
Judicial Council of California 2022 Court Statistics Report170
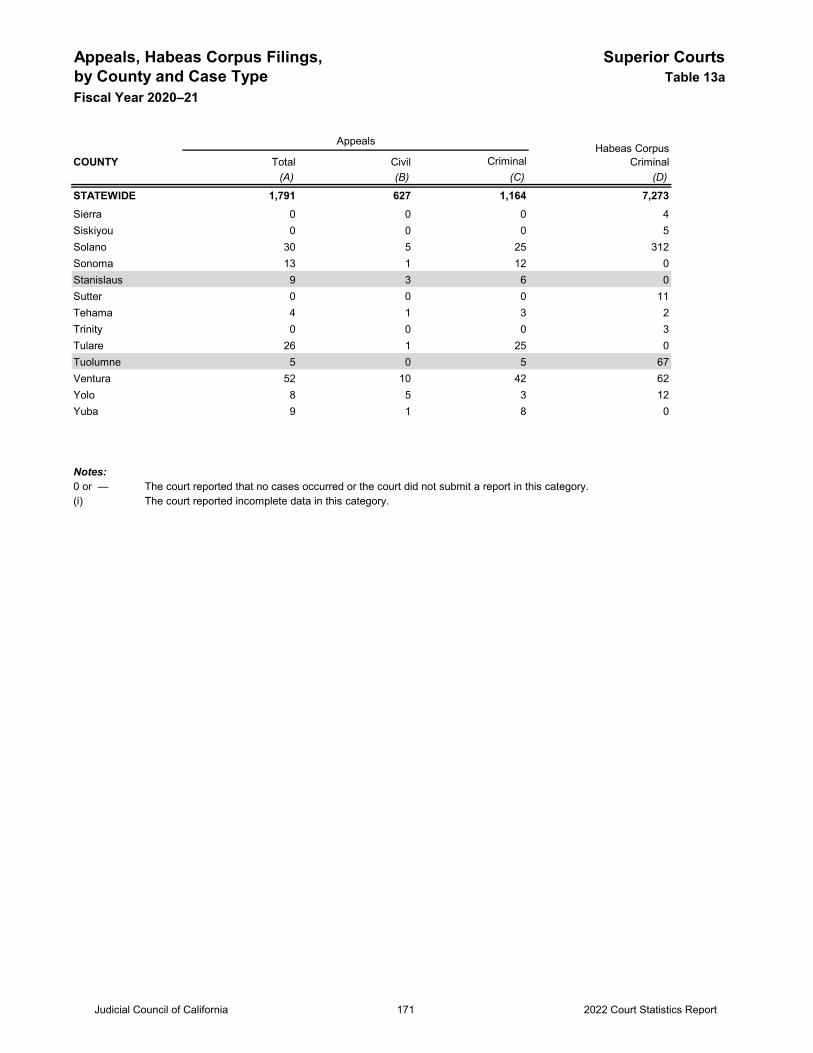
Appeals, Habeas Corpus Filings, Superior Courtsby County and Case Type Table 13aFiscal Year 2020–21
COUNTY Total Civil Criminal(A) (B) (C) (D)
STATEWIDE 1,791 627 1,164 7,273
Habeas Corpus Criminal
Appeals
Sierra 0 0 0 4Siskiyou 0 0 0 5Solano 30 5 25 312Sonoma 13 1 12 0Stanislaus 9 3 6 0Sutter 0 0 0 11Tehama 4 1 3 2Trinity 0 0 0 3Tulare 26 1 25 0Tuolumne 5 0 5 67Ventura 52 10 42 62Yolo 8 5 3 12Yuba 9 1 8 0
Notes:0 or — The court reported that no cases occurred or the court did not submit a report in this category.(i) The court reported incomplete data in this category.
Judicial Council of California 2022 Court Statistics Report171
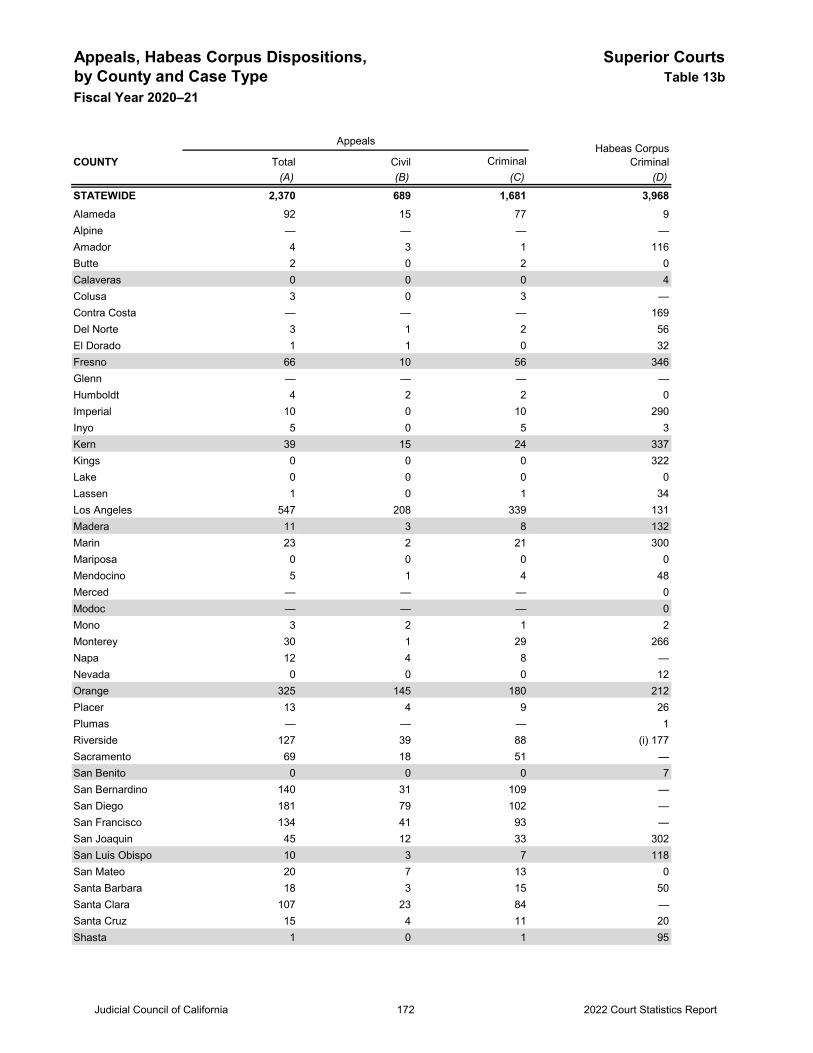
Appeals, Habeas Corpus Dispositions, Superior Courtsby County and Case Type Table 13bFiscal Year 2020–21
COUNTY Total Civil Criminal(A) (B) (C) (D)
STATEWIDE 2,370 689 1,681 3,968Alameda 92 15 77 9Alpine — — — —Amador 4 3 1 116Butte 2 0 2 0Calaveras 0 0 0 4Colusa 3 0 3 —Contra Costa — — — 169Del Norte 3 1 2 56El Dorado 1 1 0 32Fresno 66 10 56 346Glenn — — — —Humboldt 4 2 2 0Imperial 10 0 10 290Inyo 5 0 5 3Kern 39 15 24 337Kings 0 0 0 322Lake 0 0 0 0Lassen 1 0 1 34Los Angeles 547 208 339 131Madera 11 3 8 132Marin 23 2 21 300Mariposa 0 0 0 0Mendocino 5 1 4 48Merced — — — 0Modoc — — — 0Mono 3 2 1 2Monterey 30 1 29 266Napa 12 4 8 —Nevada 0 0 0 12Orange 325 145 180 212Placer 13 4 9 26Plumas — — — 1Riverside 127 39 88 (i) 177Sacramento 69 18 51 —San Benito 0 0 0 7San Bernardino 140 31 109 —San Diego 181 79 102 —San Francisco 134 41 93 —San Joaquin 45 12 33 302San Luis Obispo 10 3 7 118San Mateo 20 7 13 0Santa Barbara 18 3 15 50Santa Clara 107 23 84 —Santa Cruz 15 4 11 20Shasta 1 0 1 95
Habeas Corpus Criminal
Appeals
Judicial Council of California 2022 Court Statistics Report172
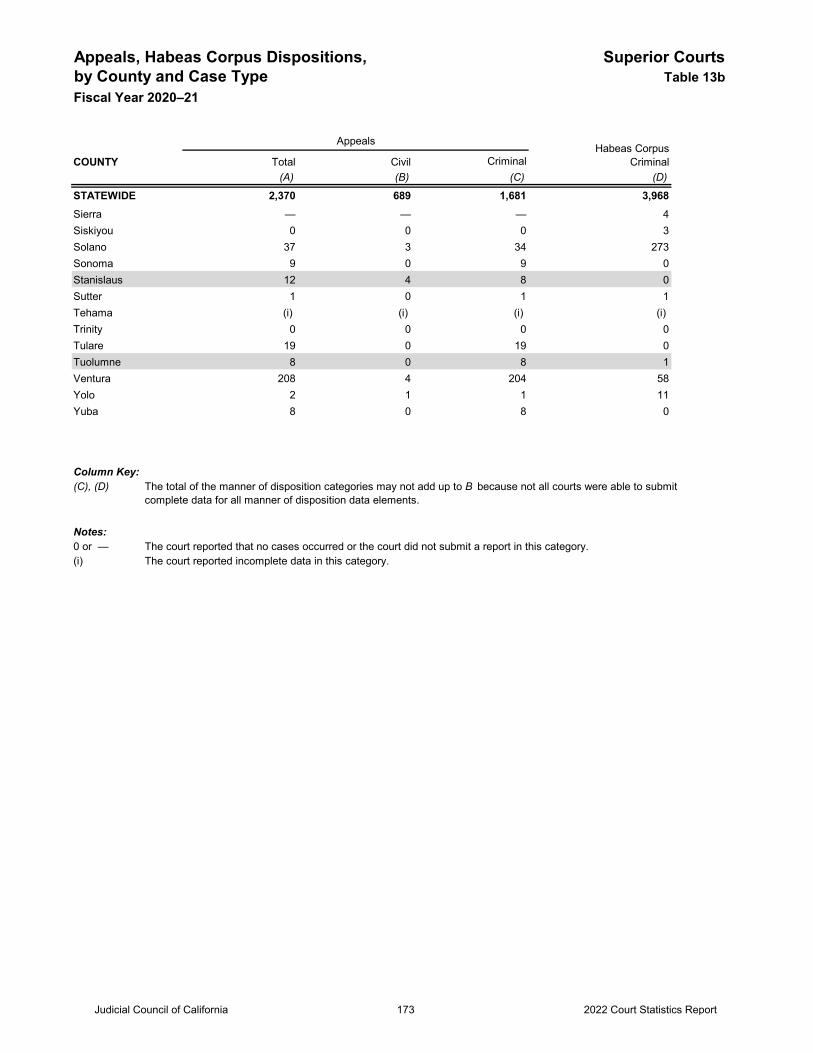
Appeals, Habeas Corpus Dispositions, Superior Courtsby County and Case Type Table 13bFiscal Year 2020–21
COUNTY Total Civil Criminal(A) (B) (C) (D)
STATEWIDE 2,370 689 1,681 3,968
Habeas Corpus Criminal
Appeals
Sierra — — — 4Siskiyou 0 0 0 3Solano 37 3 34 273Sonoma 9 0 9 0Stanislaus 12 4 8 0Sutter 1 0 1 1Tehama (i) (i) (i) (i) Trinity 0 0 0 0Tulare 19 0 19 0Tuolumne 8 0 8 1Ventura 208 4 204 58Yolo 2 1 1 11Yuba 8 0 8 0
Column Key:(C), (D)
Notes:0 or — The court reported that no cases occurred or the court did not submit a report in this category.(i) The court reported incomplete data in this category.
The total of the manner of disposition categories may not add up to B because not all courts were able to submit complete data for all manner of disposition data elements.
Judicial Council of California 2022 Court Statistics Report173
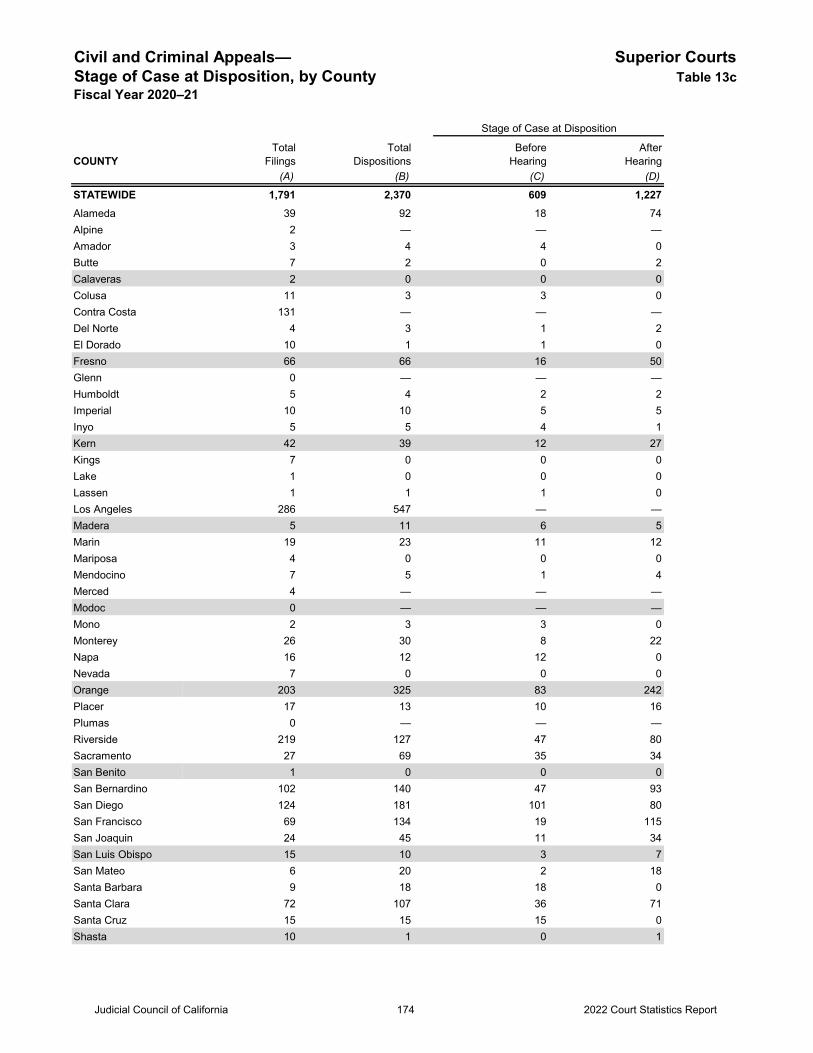
Civil and Criminal Appeals— Superior CourtsStage of Case at Disposition, by County Table 13cFiscal Year 2020–21
COUNTY(A) (B) (C) (D)
STATEWIDE 1,791 2,370 609 1,227Alameda 39 92 18 74Alpine 2 — — —Amador 3 4 4 0Butte 7 2 0 2Calaveras 2 0 0 0Colusa 11 3 3 0Contra Costa 131 — — —Del Norte 4 3 1 2El Dorado 10 1 1 0Fresno 66 66 16 50Glenn 0 — — —Humboldt 5 4 2 2Imperial 10 10 5 5Inyo 5 5 4 1Kern 42 39 12 27Kings 7 0 0 0Lake 1 0 0 0Lassen 1 1 1 0Los Angeles 286 547 — —Madera 5 11 6 5Marin 19 23 11 12Mariposa 4 0 0 0Mendocino 7 5 1 4Merced 4 — — —Modoc 0 — — —Mono 2 3 3 0Monterey 26 30 8 22Napa 16 12 12 0Nevada 7 0 0 0Orange 203 325 83 242Placer 17 13 10 16Plumas 0 — — —Riverside 219 127 47 80Sacramento 27 69 35 34San Benito 1 0 0 0San Bernardino 102 140 47 93San Diego 124 181 101 80San Francisco 69 134 19 115San Joaquin 24 45 11 34San Luis Obispo 15 10 3 7San Mateo 6 20 2 18Santa Barbara 9 18 18 0Santa Clara 72 107 36 71Santa Cruz 15 15 15 0Shasta 10 1 0 1
Stage of Case at Disposition
TotalFilings
TotalDispositions
BeforeHearing
AfterHearing
Judicial Council of California 2022 Court Statistics Report174
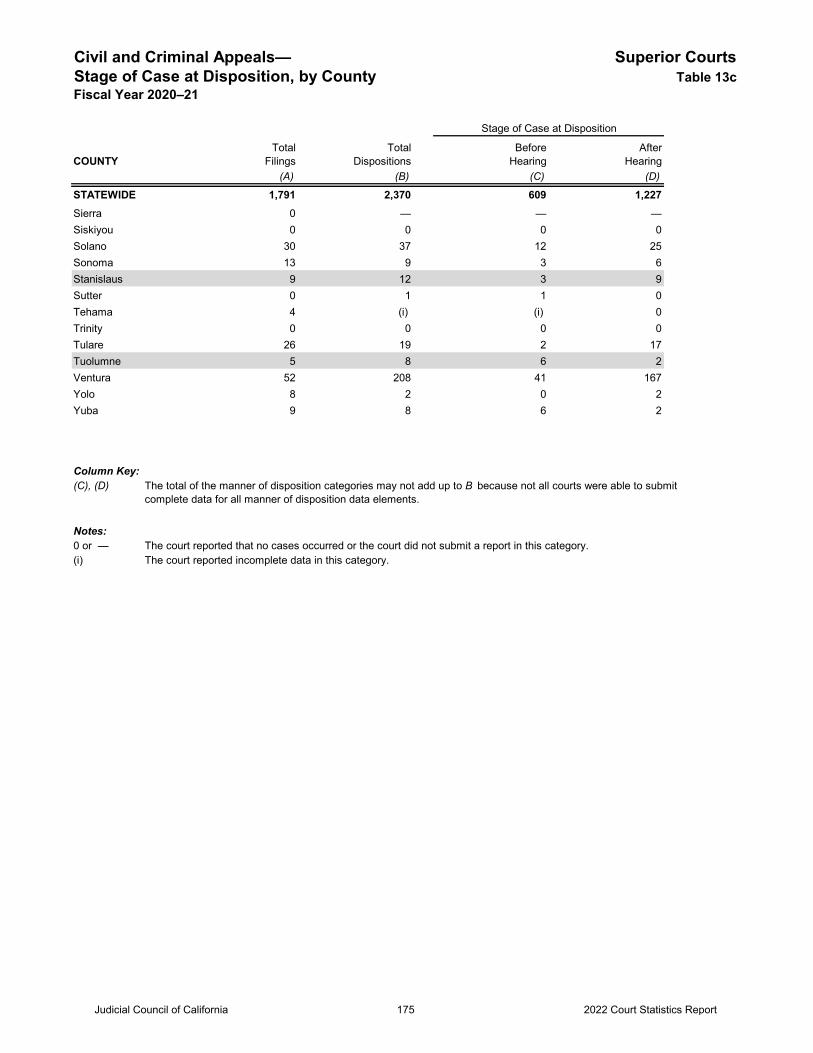
Civil and Criminal Appeals— Superior CourtsStage of Case at Disposition, by County Table 13cFiscal Year 2020–21
COUNTY(A) (B) (C) (D)
STATEWIDE 1,791 2,370 609 1,227
Stage of Case at Disposition
TotalFilings
TotalDispositions
BeforeHearing
AfterHearing
Sierra 0 — — —Siskiyou 0 0 0 0Solano 30 37 12 25Sonoma 13 9 3 6Stanislaus 9 12 3 9Sutter 0 1 1 0Tehama 4 (i) (i) 0Trinity 0 0 0 0Tulare 26 19 2 17Tuolumne 5 8 6 2Ventura 52 208 41 167Yolo 8 2 0 2Yuba 9 8 6 2
Column Key:(C), (D)
Notes:0 or — The court reported that no cases occurred or the court did not submit a report in this category.(i) The court reported incomplete data in this category.
The total of the manner of disposition categories may not add up to B because not all courts were able to submit complete data for all manner of disposition data elements.
Judicial Council of California 2022 Court Statistics Report175
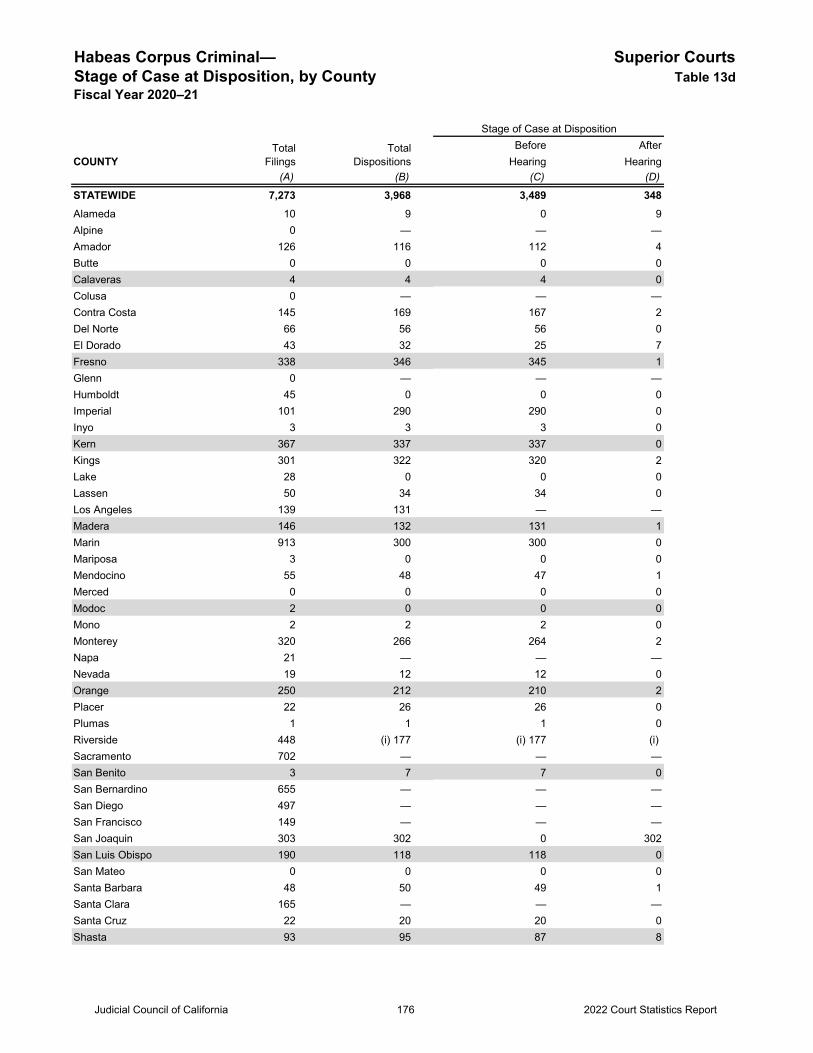
Habeas Corpus Criminal— Superior CourtsStage of Case at Disposition, by County Table 13dFiscal Year 2020–21
Before AfterCOUNTY Hearing Hearing
(A) (B) (C) (D)
STATEWIDE 7,273 3,968 3,489 348Alameda 10 9 0 9Alpine 0 — — —Amador 126 116 112 4Butte 0 0 0 0Calaveras 4 4 4 0Colusa 0 — — —Contra Costa 145 169 167 2Del Norte 66 56 56 0El Dorado 43 32 25 7Fresno 338 346 345 1Glenn 0 — — —Humboldt 45 0 0 0Imperial 101 290 290 0Inyo 3 3 3 0Kern 367 337 337 0Kings 301 322 320 2Lake 28 0 0 0Lassen 50 34 34 0Los Angeles 139 131 — —Madera 146 132 131 1Marin 913 300 300 0Mariposa 3 0 0 0Mendocino 55 48 47 1Merced 0 0 0 0Modoc 2 0 0 0Mono 2 2 2 0Monterey 320 266 264 2Napa 21 — — —Nevada 19 12 12 0Orange 250 212 210 2Placer 22 26 26 0Plumas 1 1 1 0Riverside 448 (i) 177 (i) 177 (i) Sacramento 702 — — —San Benito 3 7 7 0San Bernardino 655 — — —San Diego 497 — — —San Francisco 149 — — —San Joaquin 303 302 0 302San Luis Obispo 190 118 118 0San Mateo 0 0 0 0Santa Barbara 48 50 49 1Santa Clara 165 — — —Santa Cruz 22 20 20 0Shasta 93 95 87 8
Stage of Case at Disposition
TotalFilings
TotalDispositions
Judicial Council of California 2022 Court Statistics Report176
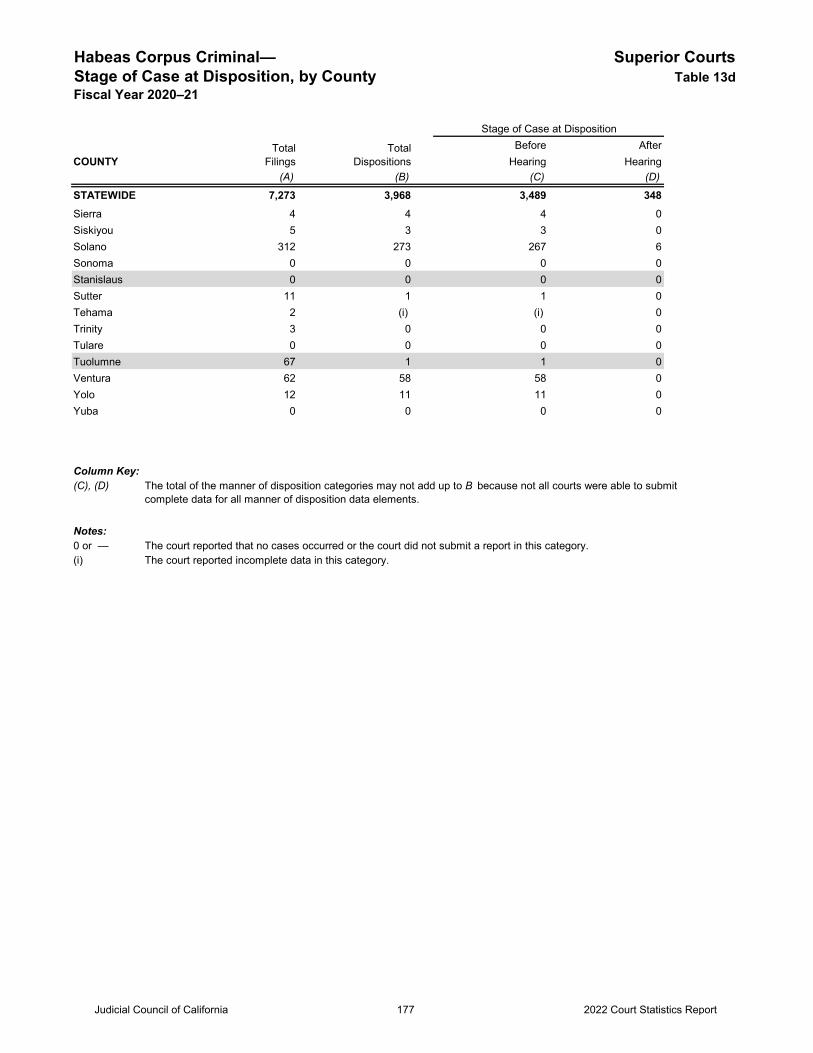
Habeas Corpus Criminal— Superior CourtsStage of Case at Disposition, by County Table 13dFiscal Year 2020–21
Before AfterCOUNTY Hearing Hearing
(A) (B) (C) (D)
STATEWIDE 7,273 3,968 3,489 348
Stage of Case at Disposition
TotalFilings
TotalDispositions
Sierra 4 4 4 0Siskiyou 5 3 3 0Solano 312 273 267 6Sonoma 0 0 0 0Stanislaus 0 0 0 0Sutter 11 1 1 0Tehama 2 (i) (i) 0Trinity 3 0 0 0Tulare 0 0 0 0Tuolumne 67 1 1 0Ventura 62 58 58 0Yolo 12 11 11 0Yuba 0 0 0 0
Column Key:(C), (D)
Notes:0 or — The court reported that no cases occurred or the court did not submit a report in this category.(i) The court reported incomplete data in this category.
The total of the manner of disposition categories may not add up to B because not all courts were able to submit complete data for all manner of disposition data elements.
Judicial Council of California 2022 Court Statistics Report177
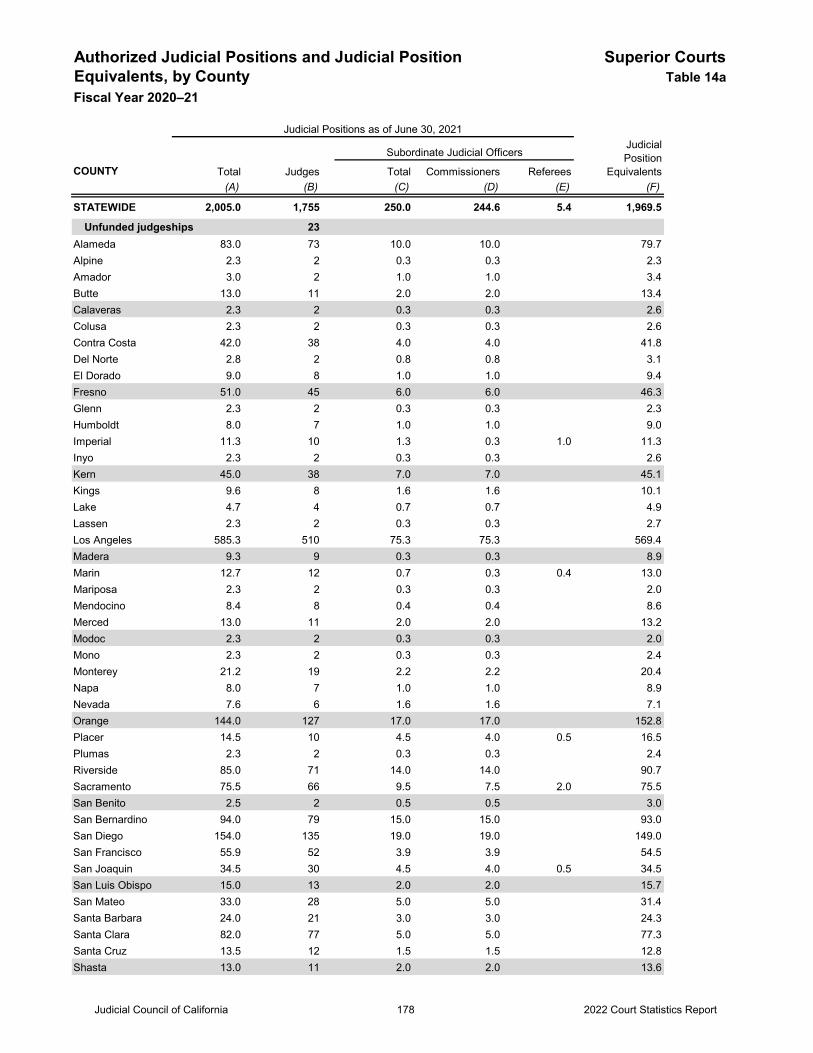
Authorized Judicial Positions and Judicial Position Superior CourtsEquivalents, by County Table 14aFiscal Year 2020–21
COUNTY Total Judges Total Commissioners Referees(A) (B) (C) (D) (E) (F)
STATEWIDE 2,005.0 1,755 250.0 244.6 5.4 1,969.5
Unfunded judgeships 23Alameda 83.0 73 10.0 10.0 79.7Alpine 2.3 2 0.3 0.3 2.3Amador 3.0 2 1.0 1.0 3.4Butte 13.0 11 2.0 2.0 13.4Calaveras 2.3 2 0.3 0.3 2.6Colusa 2.3 2 0.3 0.3 2.6Contra Costa 42.0 38 4.0 4.0 41.8Del Norte 2.8 2 0.8 0.8 3.1El Dorado 9.0 8 1.0 1.0 9.4Fresno 51.0 45 6.0 6.0 46.3Glenn 2.3 2 0.3 0.3 2.3Humboldt 8.0 7 1.0 1.0 9.0Imperial 11.3 10 1.3 0.3 1.0 11.3Inyo 2.3 2 0.3 0.3 2.6Kern 45.0 38 7.0 7.0 45.1Kings 9.6 8 1.6 1.6 10.1Lake 4.7 4 0.7 0.7 4.9Lassen 2.3 2 0.3 0.3 2.7Los Angeles 585.3 510 75.3 75.3 569.4Madera 9.3 9 0.3 0.3 8.9Marin 12.7 12 0.7 0.3 0.4 13.0Mariposa 2.3 2 0.3 0.3 2.0Mendocino 8.4 8 0.4 0.4 8.6Merced 13.0 11 2.0 2.0 13.2Modoc 2.3 2 0.3 0.3 2.0Mono 2.3 2 0.3 0.3 2.4Monterey 21.2 19 2.2 2.2 20.4Napa 8.0 7 1.0 1.0 8.9Nevada 7.6 6 1.6 1.6 7.1Orange 144.0 127 17.0 17.0 152.8Placer 14.5 10 4.5 4.0 0.5 16.5Plumas 2.3 2 0.3 0.3 2.4Riverside 85.0 71 14.0 14.0 90.7Sacramento 75.5 66 9.5 7.5 2.0 75.5San Benito 2.5 2 0.5 0.5 3.0San Bernardino 94.0 79 15.0 15.0 93.0San Diego 154.0 135 19.0 19.0 149.0San Francisco 55.9 52 3.9 3.9 54.5San Joaquin 34.5 30 4.5 4.0 0.5 34.5San Luis Obispo 15.0 13 2.0 2.0 15.7San Mateo 33.0 28 5.0 5.0 31.4Santa Barbara 24.0 21 3.0 3.0 24.3Santa Clara 82.0 77 5.0 5.0 77.3Santa Cruz 13.5 12 1.5 1.5 12.8Shasta 13.0 11 2.0 2.0 13.6
Judicial Positions as of June 30, 2021JudicialPosition
Equivalents
Subordinate Judicial Officers
Judicial Council of California 2022 Court Statistics Report178
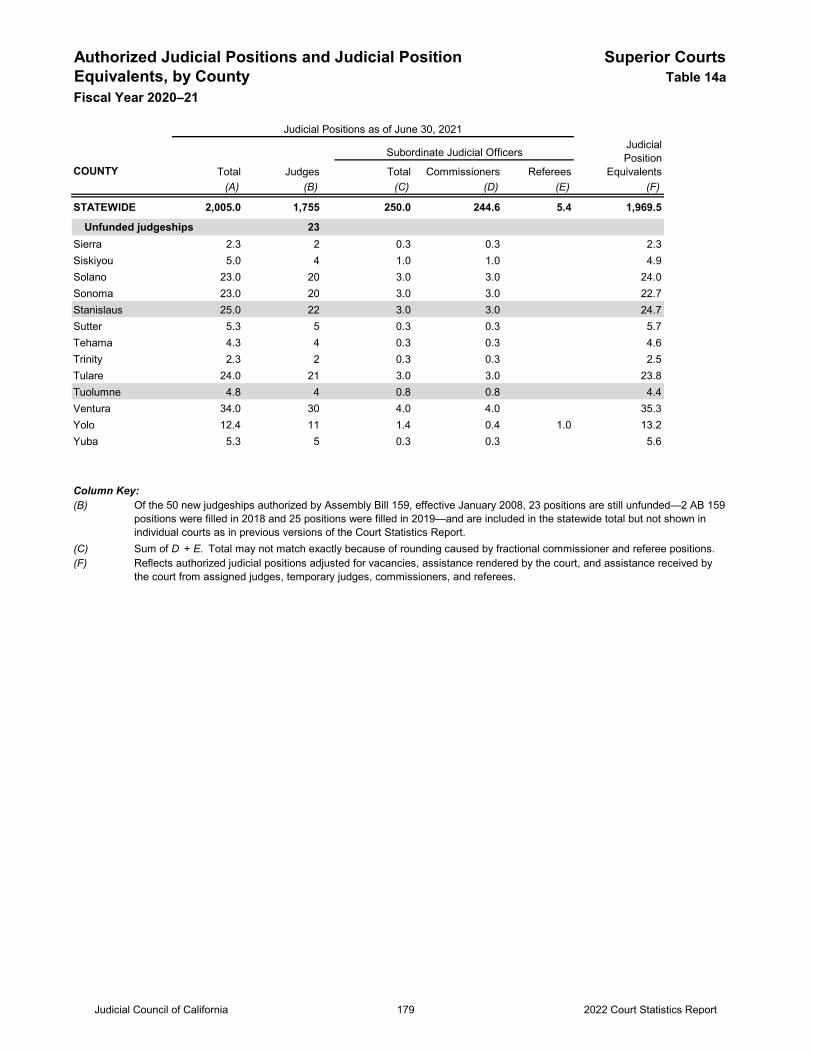
Authorized Judicial Positions and Judicial Position Superior CourtsEquivalents, by County Table 14aFiscal Year 2020–21
COUNTY Total Judges Total Commissioners Referees(A) (B) (C) (D) (E) (F)
STATEWIDE 2,005.0 1,755 250.0 244.6 5.4 1,969.5
Unfunded judgeships 23
Judicial Positions as of June 30, 2021JudicialPosition
Equivalents
Subordinate Judicial Officers
Sierra 2.3 2 0.3 0.3 2.3Siskiyou 5.0 4 1.0 1.0 4.9Solano 23.0 20 3.0 3.0 24.0Sonoma 23.0 20 3.0 3.0 22.7Stanislaus 25.0 22 3.0 3.0 24.7Sutter 5.3 5 0.3 0.3 5.7Tehama 4.3 4 0.3 0.3 4.6Trinity 2.3 2 0.3 0.3 2.5Tulare 24.0 21 3.0 3.0 23.8Tuolumne 4.8 4 0.8 0.8 4.4Ventura 34.0 30 4.0 4.0 35.3Yolo 12.4 11 1.4 0.4 1.0 13.2Yuba 5.3 5 0.3 0.3 5.6
Column Key:(B)
(C) (F)
Sum of D + E. Total may not match exactly because of rounding caused by fractional commissioner and referee positions.Reflects authorized judicial positions adjusted for vacancies, assistance rendered by the court, and assistance received by the court from assigned judges, temporary judges, commissioners, and referees.
Of the 50 new judgeships authorized by Assembly Bill 159, effective January 2008, 23 positions are still unfunded—2 AB 159 positions were filled in 2018 and 25 positions were filled in 2019—and are included in the statewide total but not shown in individual courts as in previous versions of the Court Statistics Report.
Judicial Council of California 2022 Court Statistics Report179
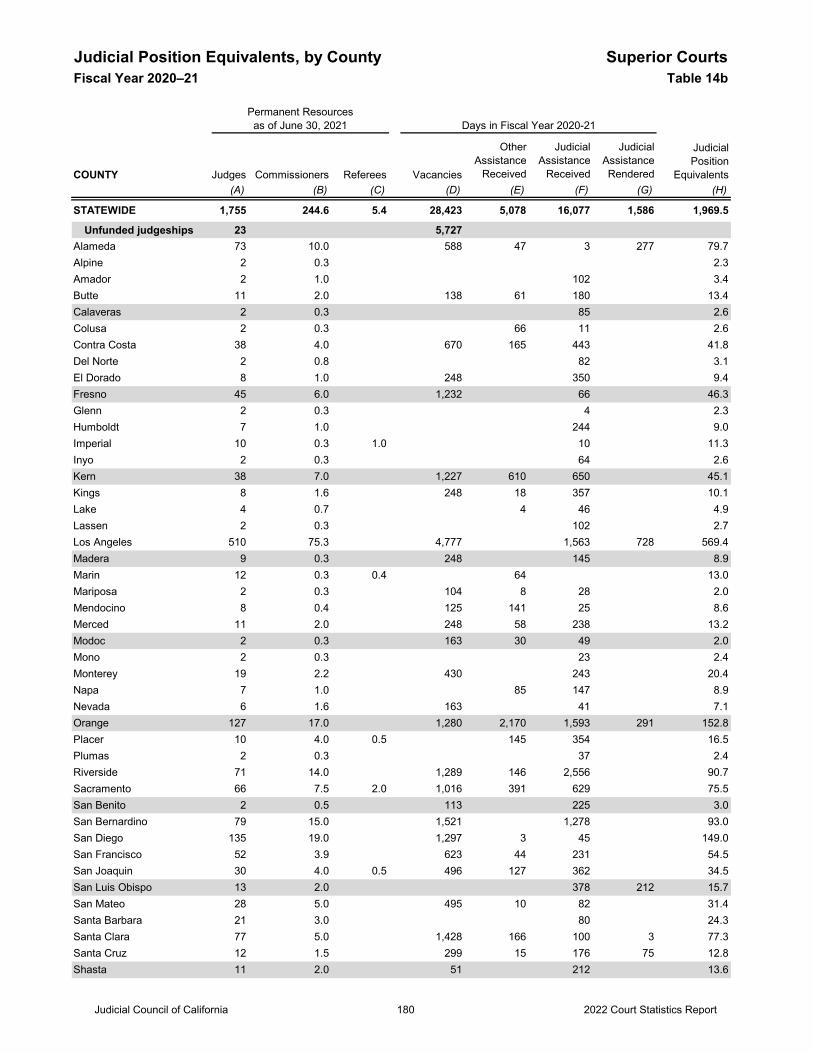
Judicial Position Equivalents, by County Superior CourtsFiscal Year 2020–21 Table 14b
COUNTY Judges Commissioners Referees Vacancies
Other Assistance
Received
Judicial Assistance
Received
Judicial Assistance Rendered
(A) (B) (C) (D) (E) (F) (G) (H)
STATEWIDE 1,755 244.6 5.4 28,423 5,078 16,077 1,586 1,969.5
Unfunded judgeships 23 5,727Alameda 73 10.0 588 47 3 277 79.7Alpine 2 0.3 2.3Amador 2 1.0 102 3.4Butte 11 2.0 138 61 180 13.4Calaveras 2 0.3 85 2.6Colusa 2 0.3 66 11 2.6Contra Costa 38 4.0 670 165 443 41.8Del Norte 2 0.8 82 3.1El Dorado 8 1.0 248 350 9.4Fresno 45 6.0 1,232 66 46.3Glenn 2 0.3 4 2.3Humboldt 7 1.0 244 9.0Imperial 10 0.3 1.0 10 11.3Inyo 2 0.3 64 2.6Kern 38 7.0 1,227 610 650 45.1Kings 8 1.6 248 18 357 10.1Lake 4 0.7 4 46 4.9Lassen 2 0.3 102 2.7Los Angeles 510 75.3 4,777 1,563 728 569.4Madera 9 0.3 248 145 8.9Marin 12 0.3 0.4 64 13.0Mariposa 2 0.3 104 8 28 2.0Mendocino 8 0.4 125 141 25 8.6Merced 11 2.0 248 58 238 13.2Modoc 2 0.3 163 30 49 2.0Mono 2 0.3 23 2.4Monterey 19 2.2 430 243 20.4Napa 7 1.0 85 147 8.9Nevada 6 1.6 163 41 7.1Orange 127 17.0 1,280 2,170 1,593 291 152.8Placer 10 4.0 0.5 145 354 16.5Plumas 2 0.3 37 2.4Riverside 71 14.0 1,289 146 2,556 90.7Sacramento 66 7.5 2.0 1,016 391 629 75.5San Benito 2 0.5 113 225 3.0San Bernardino 79 15.0 1,521 1,278 93.0San Diego 135 19.0 1,297 3 45 149.0San Francisco 52 3.9 623 44 231 54.5San Joaquin 30 4.0 0.5 496 127 362 34.5San Luis Obispo 13 2.0 378 212 15.7San Mateo 28 5.0 495 10 82 31.4Santa Barbara 21 3.0 80 24.3Santa Clara 77 5.0 1,428 166 100 3 77.3Santa Cruz 12 1.5 299 15 176 75 12.8Shasta 11 2.0 51 212 13.6
Days in Fiscal Year 2020-21
JudicialPosition
Equivalents
Permanent Resources as of June 30, 2021
Judicial Council of California 2022 Court Statistics Report180
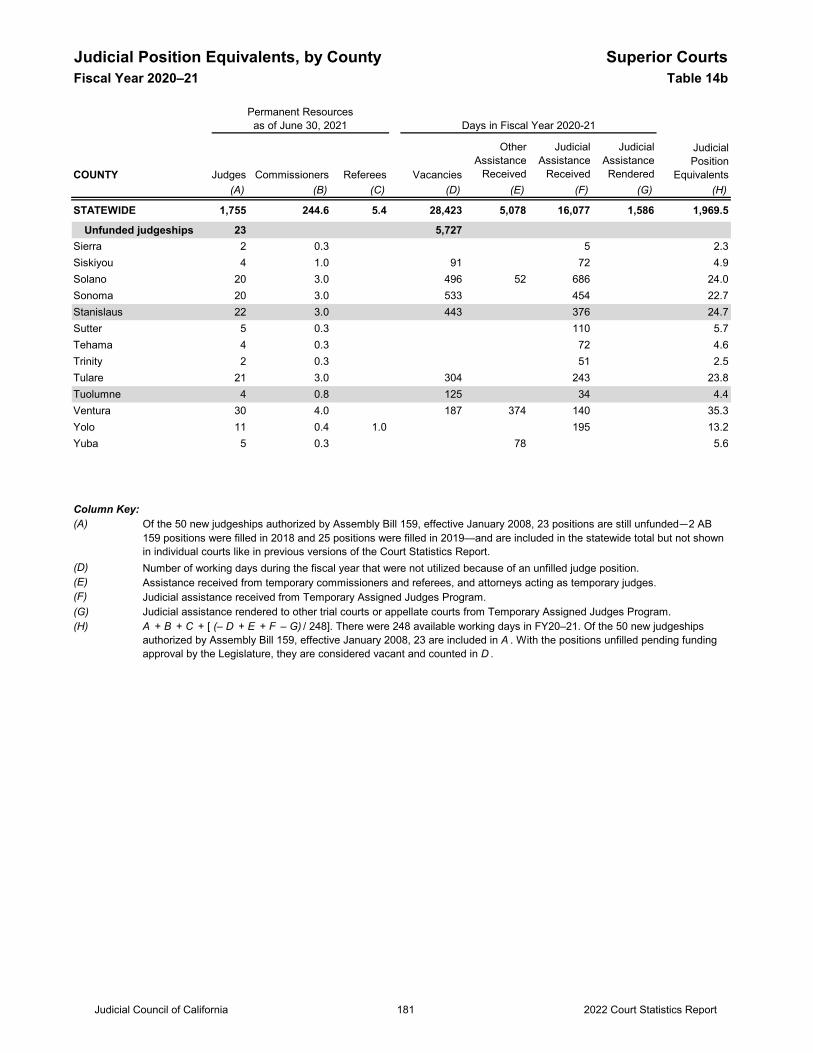
Judicial Position Equivalents, by County Superior CourtsFiscal Year 2020–21 Table 14b
COUNTY Judges Commissioners Referees Vacancies
Other Assistance
Received
Judicial Assistance
Received
Judicial Assistance Rendered
(A) (B) (C) (D) (E) (F) (G) (H)
STATEWIDE 1,755 244.6 5.4 28,423 5,078 16,077 1,586 1,969.5
Unfunded judgeships 23 5,727
Days in Fiscal Year 2020-21
JudicialPosition
Equivalents
Permanent Resources as of June 30, 2021
Sierra 2 0.3 5 2.3Siskiyou 4 1.0 91 72 4.9Solano 20 3.0 496 52 686 24.0Sonoma 20 3.0 533 454 22.7Stanislaus 22 3.0 443 376 24.7Sutter 5 0.3 110 5.7Tehama 4 0.3 72 4.6Trinity 2 0.3 51 2.5Tulare 21 3.0 304 243 23.8Tuolumne 4 0.8 125 34 4.4Ventura 30 4.0 187 374 140 35.3Yolo 11 0.4 1.0 195 13.2Yuba 5 0.3 78 5.6
Column Key:(A)
(D) (E) (F) (G) (H) A + B + C + [ (– D + E + F – G) / 248]. There were 248 available working days in FY20–21. Of the 50 new judgeships
authorized by Assembly Bill 159, effective January 2008, 23 are included in A . With the positions unfilled pending fundingapproval by the Legislature, they are considered vacant and counted in D .
Judicial assistance rendered to other trial courts or appellate courts from Temporary Assigned Judges Program.Judicial assistance received from Temporary Assigned Judges Program.
Number of working days during the fiscal year that were not utilized because of an unfilled judge position.Assistance received from temporary commissioners and referees, and attorneys acting as temporary judges.
Of the 50 new judgeships authorized by Assembly Bill 159, effective January 2008, 23 positions are still unfunded—2 AB 159 positions were filled in 2018 and 25 positions were filled in 2019—and are included in the statewide total but not shown in individual courts like in previous versions of the Court Statistics Report.
Judicial Council of California 2022 Court Statistics Report181