stable silicon isotopic compositions of the lena river and its
TRANSCRIPT
Stable Silicon Isotopic Compositions of the Lena River and its Tributaries: 1
Implications for Silicon Delivery to the Arctic Ocean 2
Xiaole Sun1,2*, Carl-Magnus Mörth3, Don Porcelli4, Liselott Kutscher3,5, Catherine Hirst3,5, Melissa J. 3
Murphy4, Trofim Maximov6,7, Roman E. Petrov6,7, Christoph Humborg1,2, Melanie Schmitt5, Per S. 4
Andersson5 5
1 Baltic Sea Center, Stockholm University, SE-106 91, Stockholm, Sweden 6
2 Department of Environmental Science and Analytical Chemistry, Stockholm University, SE- 106 7
91, Stockholm, Sweden 8
3 Department of Geological Sciences, Stockholm University, SE-106 91, Stockholm, Sweden 9
4 Department of Earth Sciences, Oxford University, OX1 3AN, Oxford, UK 10
5 Department of Geosciences, Swedish Museum of Natural History, SE-104 05, Stockholm, Sweden 11
6 Institute of Biological Problems of the Cryolithozone, Yakutsk, 677891, Russia 12
7 Institute for Natural Sciences of North-Eastern Federal University, Yakusk, Russia 13
*Correspondence to Xiaole Sun, Email: [email protected] 14
15
16
17
18
19
20
21
22
Abstract 23
Silicon isotope values (δ30SiDSi) of dissolved silicon (DSi) have been analyzed in the Lena 24
River and its tributaries, one of the largest Arctic watersheds in the world. The geographical 25
and temporal variations of δ30SiDSi range from +0.39 to +1.86‰ with DSi concentrations 26
from 34 to 121 µM. No obvious patterns of DSi concentrations and δ30SiDSi values were 27
observed along over 200 km of the two major tributaries, the Viliui and Aldan Rivers. In 28
summer, the variations of DSi concentrations and δ30SiDSi values in the water are either 29
caused by biological uptake by higher plants and phytoplankton or by mixing of water 30
masses carrying different DSi concentrations and δ30SiDSi values. DSi in tributaries from the 31
Verkhoyansk Mountain Range seems to be associated with secondary clay formation that 32
increased the δ30SiDSi values, while terrestrial biological production is likely more prevalent 33
in controlling δ30SiDSi values in Central Siberian Plateau and Lena Amganski Inter-River 34
Area. In winter, when soils were frozen, the δ30SiDSi values in the river appeared to be 35
controlled by weathering and clay formation in deep intrapermafrost groundwater. During the 36
spring flood, dissolved silicate materials and phytoliths were flushed from the upper thawed 37
soils into rivers, which reset δ30SiDSi values to the values observed prior to the biological 38
bloom in summer. The results indicate that the Si isotope values reflect the changing 39
processes controlling Si outputs to the Lena River and to the Arctic Ocean between seasons. 40
The annual average δ30SiDSi value of the Lena Si flux is calculated to be +0.86±0.3‰ using 41
measured δ30SiDSi values from each season. Combined with the estimate of +1.6±0.25‰ for 42
the Yenisey River, an updated δ30SiDSi value of the major river Si inputs to the Arctic Ocean 43
is estimated to be +1.3±0.3‰. This value is expected to shift towards higher values in the 44
future because of the impacts from a variety of biological and geochemical processes and 45
sources under global warming. 46
Key words: silicon isotopes, Lena River, tributary, Arctic, seasonality 47
1. Introduction 48
49
Silicate weathering on the continents controls the delivery of dissolved silicon (as H4SiO4, 50
referred to as DSi) and other elements to the ocean, which in turn plays an important role in 51
regulating ocean primary production and CO2 exchange between the atmosphere and the 52
ocean (e.g. Tréguer and De La Rocha, 2013). However, not all DSi released by weathering is 53
transported via rivers and ultimately reaches the ocean. DSi from silicate weathering is also 54
released to soil water and groundwater, incorporated into secondary minerals or taken up by 55
terrestrial plants in the form of amorphous silica, while the remaining part of DSi is delivered 56
to rivers. The fate of DSi during river transport is dependent upon uptake into siliceous 57
phytoplankton and periphyton (e.g. diatoms), which therefore impact the DSi prior to 58
discharge to the ocean (e.g. Cornelis et al., 2011). Understanding these processes still remains 59
challenging, especially in the pan-arctic region, where there are strong seasonal variations of 60
temperature and water discharge, and rapid changes due to global warming. 61
62
The world’s ocean receives 371 000 Gg/yr of DSi from continental runoff (Dürr et al., 2011), 63
of which roughly 11 395 Gg Si/yr are delivered from pan-arctic areas to the Arctic Ocean 64
(Holmes et al., 2011). Normalized to the ocean volume, this is three and seven times the 65
riverine DSi flux delivered to the Atlantic and Pacific Ocean, respectively, and approximately 66
five times the average global flux to the oceans (Dürr et al., 2011). In the Arctic regions, a 67
warmer climate has led to changes in precipitation regimes, increased thickness of the active 68
layer of permafrost soils and permafrost degradation (Frey and McClelland, 2009). These 69
changes have the potential to decrease riverine DSi concentrations and reduce DSi delivery to 70
the Arctic Ocean, which has been predicted by the “ substituting space-for-time” approach 71
(Pokrovsky et al. 2015; Vorobyev et al. 2017). However, the mechanisms controlling the fate 72
of Si remain poorly understood, especially with regard to the seasonal variations of the Si 73
river flux. 74
75
Stable Si isotopes in surface environments have been shown to be useful to characterize 76
different sources and sinks of Si and their controlling geochemical processes. Several studies 77
have shown that waters draining continents are enriched in heavy Si isotopes relative to 78
source rocks, as secondary mineral formation during weathering preferentially incorporates 79
light Si isotopes into newly formed clays e.g. (Georg et al., 2006; Cardinal et al., 2010; 80
Cornelis et al., 2010; Hughes et al., 2011; Opfergelt et al., 2013; Fontorbe et al., 2013; Frings 81
et al., 2014). In addition to this, seasonal variations in Si isotope ratios in river watersheds 82
have been suggested to reflect either mixing of different water masses carrying distinct 83
isotope ratios or biological activities, such as diatom production, that also fractionate Si 84
isotopes (Ding et al., 2004; Alleman et al., 2005; Engström et al., 2010; Cardinal et al., 2010; 85
Hughes et al., 2011; Cockerton et al., 2013; Sun et al., 2013). Decreasing 30Si/28Si ratios in 86
rivers during high water discharge, such as during spring flood, suggest dissolution of Si-87
bearing clay minerals (Georg et al., 2006; Pokrovsky et al., 2013). Terrestrial plants and 88
phytoliths also have relatively low 30Si/28Si ratios to DSi, which suggests that degradation of 89
plant litter and phytoliths could provide an isotopically light Si pool to surface water during 90
high water discharge (Hodson et al., 2008; Opfergelt et al., 2010; Cornelis et al., 2010; 91
Pokrovsky et al., 2013; Frings et al., 2014). Until now, these processes have been studied in 92
tropical, temperate and some boreal areas, but data in permafrost-covered polar areas are still 93
scarce. This hinders the full understanding of Si cycling and land-sea Si fluxes in high-94
latitude systems. 95
96
The major river systems in the pan-arctic region act as integrators of the lithological and 97
climatic changes across large watersheds, thus are ideal places to investigate the processes 98
and the controlling factors of the Si-cycle in polar areas. In this study the Si dynamics in the 99
Lena River watershed are investigated using stable Si isotopes. The Lena River has the ninth 100
largest watershed in the world, of about 2.5x10⁶ km2, and is the second largest freshwater 101
contributor, with a discharge of 581 km3/yr transported to the Arctic Ocean via the Laptev 102
Sea, following the Yenisey River discharge of 636 km3/yr. The overall contribution of the 103
Lena River to the Arctic Ocean is approximately 20% in terms of water discharge and major 104
element fluxes (Holmes et al., 2011). The total DSi flux is 1 347 Gg Si/yr to the sea (Holmes 105
et al., 2011), which is 12% of the total annual DSi flux in the pan-arctic area. The present 106
study provides Si isotope-based data for the main channel of the Lena River as well as for a 107
number of tributaries across the watershed among seasons. Si isotopes will shed light on 108
major biogeochemical processes as weathering, clay formation and primary production 109
patterns in such an extensive permafrost-dominated river system where impacts of increasing 110
temperature on these fundamental processes are most drastic due to the polar amplification of 111
climate change. The findings will also contribute to understanding present primary 112
production and chemical cycles in the Arctic Ocean, and will establish a present-day baseline 113
for quantifying changes in the future. 114
115
2. Materials and methods 116
117
2.1 Field sampling 118
119
River water samples were collected at 77 locations across the Lena River catchment during 120
two field campaigns: July 2012 and June 2013. Seven monthly samples collected from 121
September 2012 to March 2013 were also taken from the Lena River, at Yakutsk. An 122
additional 9 spring flood samples were collected at the Tabaga Hydrological Station, 30 km 123
south of Yakutsk during a field campaign between May 6th and 28th, 2015. Among all the 124
samples, 38 samples were collected in the main stream of the Lena River, and the remaining 125
55 samples were collected from tributaries (Figure 1). For the two major tributaries, the 126
Aldan and Viliui Rivers, multiple samples were taken along their flow path over around 180 127
and 240 km, respectively. Samples were collected from the mouths of most of small 128
tributaries, and in total 40 different tributaries were sampled. All sampling locations were 129
localized using a GPS receiver (Garmin® 62). The pH, temperature and conductivity of the 130
river waters were measured in the field. At each sampling location, a bottle of 50 ml sample 131
was taken and filtered through pre-cleaned 142 mm diameter, 0.22 µm nitrocellulose 132
membrane filters (Millipore®). The samples were acidified with HCl. Sampling details can be 133
found in Hirst et al. (2017). 134
135
2.2 Major element analysis 136
137
The major cations and anions concentrations, including DSi, were measured by ICP-OES and 138
ion chromatography (Thermo ICAP 6500 DUO and a Dionex, DX-120) with an accuracy of 139
better than ± 5% measured from certified standards (NIST 1640a and in house multi element 140
solutions). 141
142
2.3 Si isotope analysis 143
144
All samples were kept in dark for months to years, which allows certain amount of dissolved 145
organic matter to degrade. Large amount of dissolved organic matter was also lost during the 146
following procedure. Prior to Si isotope analysis, DSi was separated by adding a MgCl2 147
solution to each sample for adjustment of the Mg concentration to 50 mM, sufficient for a 148
two-step brucite co-precipitation that avoids incomplete Si recovery. By adding 1M NaOH 149
the DSi was co-precipitated with Mg(OH)2. The samples were then shaken for 30 min and 150
left to settle for 12 hours prior to centrifugation. This was followed by adding an equal 151
amount of 1 M NaOH to the supernatant and the same procedure was repeated. The DSi 152
concentration in the supernatant was rechecked to assure the complete recovery of Si with 153
precipitates (better than 97%). Details of the procedure can be found in Sun et al. (2014). 154
155
The chromatographic purification for Si recovered from dissolution of the precipitates was 156
performed using ion exchange columns filled with a resin bed of 1.5 ml DOWEX 50W-X12 157
(200–400 mesh). This column setting was capable of effectively retaining Mg that was co-158
precipitated with Si. The purified Si was eluted with 18.2 Ωm Milli-Q water and stored for Si 159
isotope analysis (Sun et al. 2014). 160
161
Silicon isotope analyses of water samples was performed using an MC-ICP-MS 162
(Multicollector Inductively Coupled Plasma Mass Spectrometer), the Nu Plasma II (Nu 163
Instruments, UK) at the Vegacenter, Swedish Museum of Natural History. A high mass 164
resolution of 5000 allowed for a separation of the three Si ion beams from all major 165
polyatomic interferences. The Si samples in 0.2 M HCl were introduced through a glass 166
nebulizer (MicroMist, Glass Expansion) with an average uptake rate of 100 µl/minute. The 167
28Si beam intensity was between 1.5 - 2 V/ppm. The 28Si background measured in pure 0.2 168
M HCl was lower than 50 mV and no background-induced effect on Si analysis was 169
observed. The background was stable over days. For each full measurement (i.e. each 170
reported Si isotope value of a sample), a standard-sample bracketing technique was applied. 171
This included four individual measurements of the standard and three individual 172
measurements of a sample in between. Each individual measurement consisted of forty cycles 173
in two blocks. 174
175
Silicon isotope values are all reported in δ notation, which represents the parts per thousand 176
(‰) deviation of the sample isotope ratio relative to that of the NBS28 standard, as follows: 177
𝛿"Si = &' ()* / (),- ./01234
' ()* / (),- .567,-
− 1: ∗ 1000 (Eq.1) 178
where x=29 or 30. To ensure stability of the instrument and reproducibility of Si isotope 179
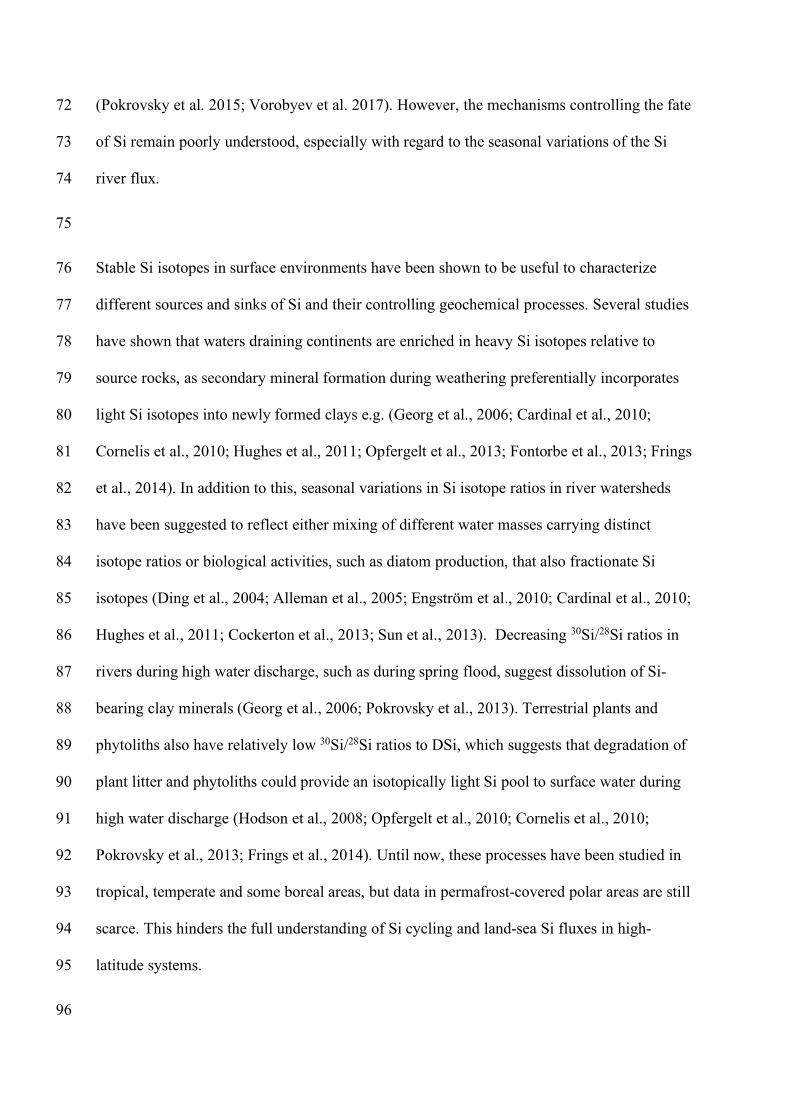
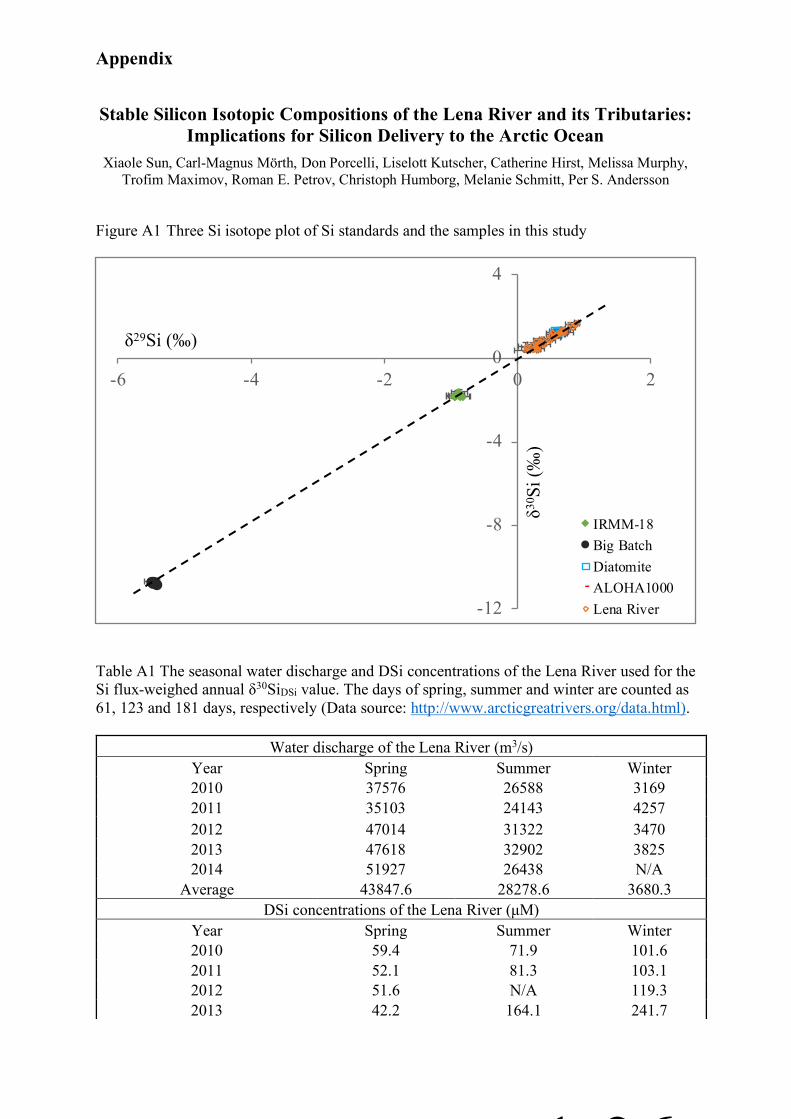
analysis, four standards were regularly measured: (1) IRMM-18, a pure quartz standard, -180
1.79±0.06‰ (2σsd, n=11); (2) Big Batch, a highly fractionated SiO2 material, -10.67±0.11‰ 181
(2σsd, n=11); (3) Diatomite, a natural diatomite sample, +1.24±0.13‰ (2σsd, n=26); and (4) 182
ALOHA1000, a seawater standard that was recently established by the GEOTRACES seawater 183
Si isotope intercalibration exercise, +1.21±0.08‰ (n=19), respectively. These values are in 184
good agreement with earlier reported values (Reynolds et al., 2007; Grasse et al., 2017) and 185
all measurements show mass-dependent fractionation of Si isotopes (Appendix Figure A1). 186
187
3. Results 188
189
3.1 The concentrations of DSi and δ30SiDSi values in the Lena River and its tributaries 190
191
The concentrations of ions in the Lena River and its tributaries sampled in July 2012 and 192
June 2013 are summarized in Table 1. DSi concentrations in the Lena River and its tributaries 193
ranged from 34 to 121 µM, with an average of 68 µM, while the δ30SiDSi values were between 194
+0.39 to +1.71‰ with an average of +0.85‰, exhibiting variations of up to 1.32 ‰ in 195
δ30SiDSi (Table 1 and Figure 3). There is a progressive increase in δ30SiDSi from +0.39±0.08 to 196
+1.27±0.08‰ from south to north in the main stream of the Lena River, along with 197
decreasing DSi concentrations from 87 to 58 µM from south to north. In contrast, DSi 198
concentrations of tributaries in the Verkhoyansk Mountain Range increased from 45 to 85 199
µM from south to north, with δ30SiDSi values ranging from +0.39±0.08 to +1.48±0.12‰. DSi 200
concentrations and δ30SiDSi values from the Aldan and Viliui Rivers were relatively uniform, 201
around 78 and 66 µM, for DSi and +0.51±0.05 and +1.33±0.1 ‰, for δ30SiDSi, respectively. 202
The maximum value of DSi concentration, 121 µM, was from in the Central Siberian Plateau, 203
while the peak δ30SiDSi value, +1.71±0.08‰, was found in the Lena-Amganski Inter-River 204
area. 205
206
3.2 The DSi concentrations and δ30SiDSi values, in the Lena River, during the winter and 207
the spring flood time series 208
209
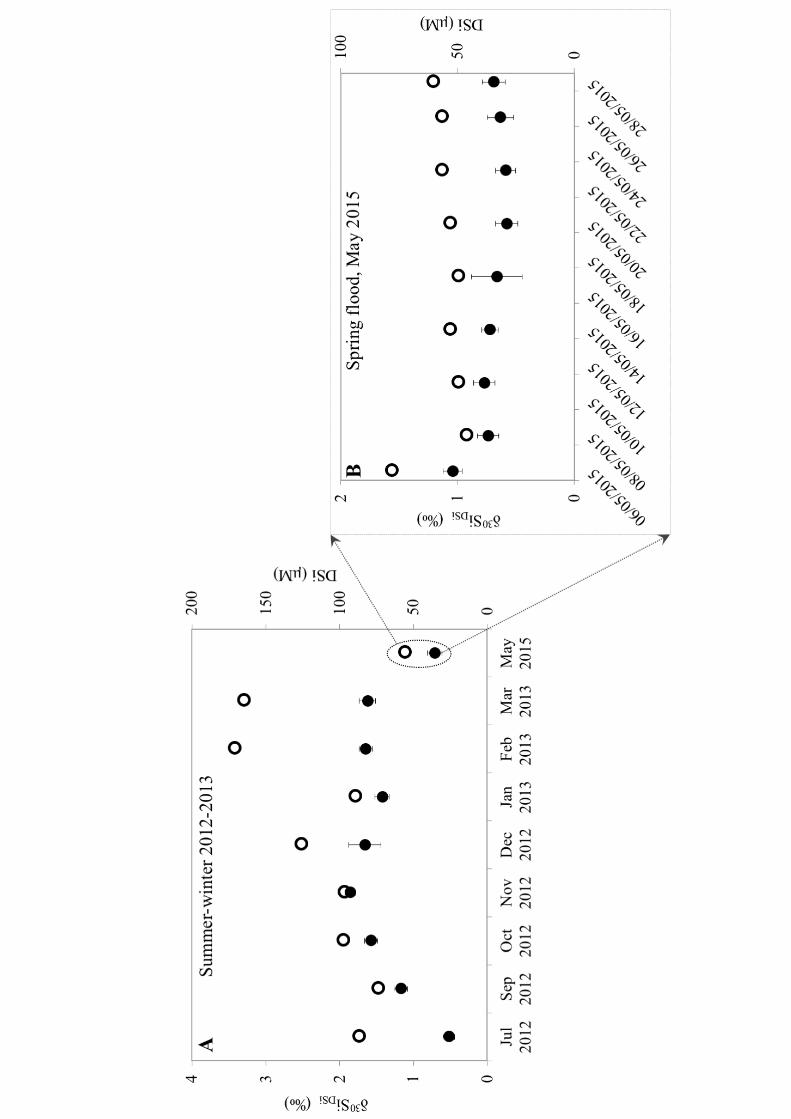
Alkalinity, DSi concentrations and the δ30SiDSi values all exhibited large variations from 210
summer to winter 2012-2013 (Table 2 and Figure 4). Alkalinity ranged from 1.2 to 3.3 mM 211
and DSi concentrations increased from 74 µM in autumn to 172 µM in winter. The 212
corresponding δ30SiDSi values varied from +1.17±0.09 to +1.65±0.09‰. During the spring 213
flood in 2015, alkalinity decreased significantly from 1.7 to 0.58 µM and DSi concentrations 214
declined from 79 to 53 µM. The δ30SiDSi values also decreased from +1.04±0.08‰ at the 215
beginning of the flood to +0.58±0.09‰ at the end of the flood. 216
217
4. Discussion 218
219
4.1 DSi concentrations and δ30SiDSi values of the Lena River watershed 220
221
The average DSi concentration is 68 µM in the Lena River watershed, which is less than half 222
of the typical global river water concentration of 160 µM (Beusen et al., 2009; Dürr et al., 223
2011). This is consistent with an underlying global pattern of climate control on silicate 224
weathering. Lower concentrations are usually observed in cold high-latitude systems, while 225
the tropical areas tend to have higher concentrations. The average δ30SiDSi value of the Lena 226
River including values from its tributaries is +0.87‰, which is similar to published δ30SiDSi 227
values in global rivers. The tropical rivers such as the Amazon River and the Congo River 228
have an average δ30SiDSi values of +0.92‰ and +0.98‰, respectively (Cardinal et al., 2010; 229
Hughes et al., 2013). Temperate alpine rivers have shown δ30SiDSi values in a range of +0.4 to 230
+1.2‰ (De La Rocha et al., 2000; Georg et al., 2006), while somewhat higher values of 231
+0.49 to +2.71‰ have been reported in the Ganges draining the Himalaya and its alluvial 232
plain, with a range of +0.81 to +3.04‰ (Fontorbe et al., 2013; Frings et al., 2015). Similarly, 233
δ30SiDSi values of +0.7 to +3.4‰ have been observed in the temperate Yangtze River (Ding et 234
al., 2004). The boreal but permafrost-free Kalix River located in northern Sweden has 235
δ30SiDSi values of between +0.7 and +1.5‰ (Engström et al., 2010). Central Siberian rivers 236
located in permafrost areas at similar latitudes to that of the Lena River were reported to have 237
a δ30SiDSi range of +1.08 to +1.67‰, with peaks in summer of between +1.5 and +2.5‰ 238
(Pokrovsky et al., 2013). δ30SiDSi values of the Yenisey River and its tributaries have ranged 239
from +0.75 to +2.11‰ during spring flood (Mavromatis et al., 2016). 240
241
Overall, rivers across the Arctic region show similar variations in δ30SiDSi values as in rivers 242
draining other climate regimes. Their δ30SiDSi values are higher than those of primary silicate 243
minerals with a range from -1.1 to +0.7‰ (Basile-Doelsch et al., 2005; Savage et al., 2011; 244
Opfergelt and Delmelle, 2012). The differences between δ30SiDSi values of primary minerals 245
and rivers have been interpreted to reflect Si isotope fractionation during silicate weathering 246
(Georg et al., 2006; Cardinal et al., 2010; Hughes et al., 2011; Fontorbe et al., 2013; Frings et 247
al., 2014). Seasonal variations of water discharge carrying different DSi concentrations, 248
however, are subsequently superimposed on the weathering signal, and reflect fractionation 249
by biological activity (exclusively by vascular plants and diatoms) or mixing of waters with 250
different end-member compositions (such as between groundwater and surface water). 251
252
4.2 Processes controlling δ30SiDSi values in the Lena River watershed 253
Variations of δ30SiDSi values both in the Lena River and the tributaries reflect the cumulative 254
effects of many processes. Therefore, it is often difficult to distinguish various processes 255
from each other given our limited data collected over such a huge watershed. Here, we 256
discuss the most important processes and attempt to distinguish the dominant process that 257
leads to Si isotope fractionation in different areas of the Lena River watershed. 258
259
4.2.1 Main channel of the Lena River 260
261
In general, the δ30SiDSi values increase toward the north corresponding with decreasing DSi 262
concentrations in the Lena River main channel. This could be caused either by a kinetic 263
process that preferably take up lighter Si isotopes during consumption of DSi or simply by 264
mixing with tributaries with lower DSi concentrations and higher δ30SiDSi values. 265
To assess the degree of Si isotope fractionation, the Rayleigh model is chosen (Eq. 2). When 266
DSi from a locally well-mixed water is incrementally removed by a kinetic process, the Si 267
isotope values of DSi in the water is related to the extent of DSi depletion as expressed by: 268
𝛿 𝑆𝑖?() = 𝛿 𝑆𝑖@ + 𝜀𝑙𝑛(𝑓)H@ H@ Eq. 2 269
Or Eq. 2 could be rearranged as 270
𝛿 𝑆𝑖?() = 𝛿 𝑆𝑖@ + 𝜀𝑙𝑛([?()][?()L]
)H@ = 𝛿 𝑆𝑖@ − 𝜀𝑙𝑛([𝐷𝑆𝑖@]) + 𝜀𝑙𝑛([𝐷𝑆𝑖])H@ H@ Eq. 3 271
where δ30SiDSi and δ30Si0 are the Si isotope values of remaining DSi in water and initial DSi, 272
respectively. Si isotope fractionation is represented by 𝜀 = (𝛼 − 1) × 1000, where the Si 273
isotope fractionation factor is 𝛼 = ( 𝑆𝑖/ 𝑆𝑖)(PQ)R /STH@ ( 𝑆𝑖/ 𝑆𝑖)?)UUSTH@ . The variable f is the 274
ratio of remaining to initial DSi concentration (i.e. [?()][?()L]
), where the remaining DSi is the DSi 275
concentration measured in river samples. The upstream of the Lena River and the Aldan 276
River have similar δ30SiDSi values, which could serve as one endmember, i.e. δ30Si0 assuming 277
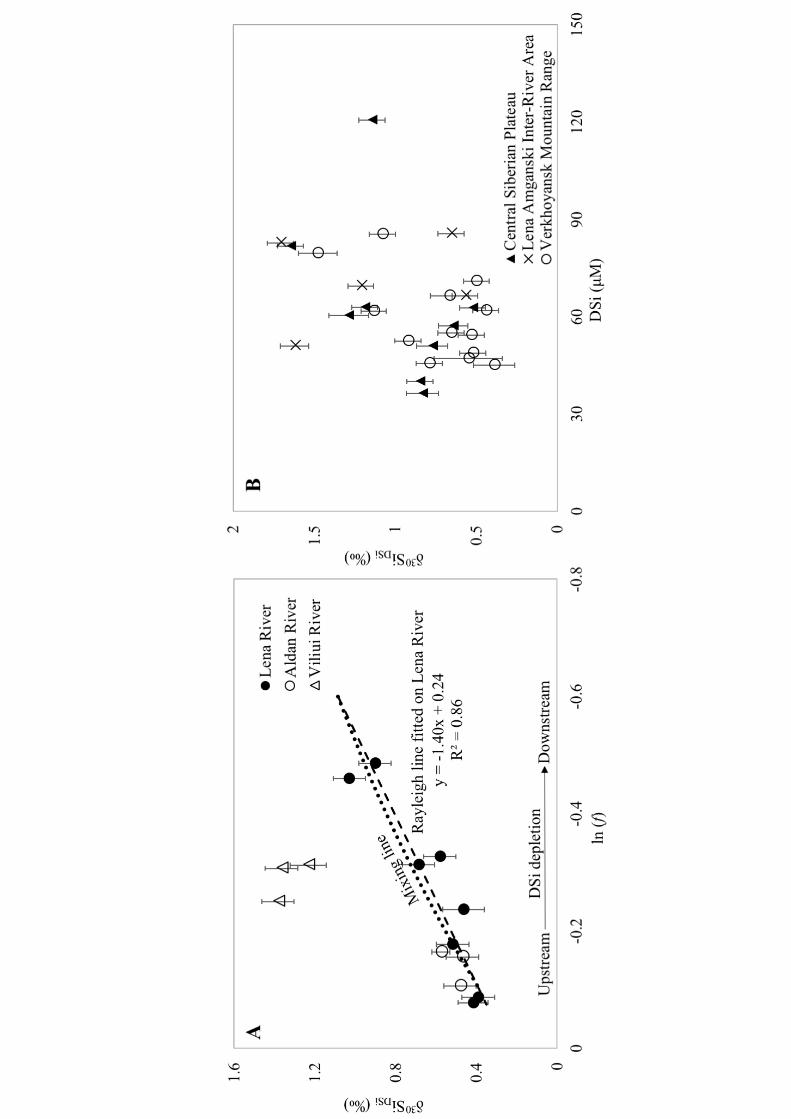
to be +0.38‰. Figure 2A shows that the δ30SiDSi values of the Lena River main channel 278
follow the Rayleigh model well (R2=0.87). The regression lines give 𝜀 of -1.40‰. DSi0 is 279
estimated to be 85 µM by resolving the intercept, 𝛿 𝑆𝑖@ − 𝜀𝑙𝑛([𝐷𝑆𝑖@])H@ , in Eq. 3. 280
281
The Si isotope fractionation observed by the Rayleigh model likely reflects strong biological 282
activity (e.g. diatom production) because: 1) the 𝜀 value is in agreement with the values 283
estimated from laboratory studies (De La Rocha et al., 1997; Sutton et al., 2013; Sun et al., 284
2014) and field studies of freshwater and marine diatom production (De La Rocha et al., 285
2000; Alleman et al., 2005; Fripiat et al., 2011; Opfergelt et al., 2011); 2) a number of 286
diatoms have been widely observed in the filter samples (Hirst et al., 2017); 3) no clear 287
patterns have been revealed between δ30SiDSi and the concentration ratio of DSi to cations, 288
indicating a minor role of weathering and secondary clay formation. 289
290
The biological process can be represented by a steady-state model, in which production is at 291
steady state with a constant supply from external sources. However, in this study, the 292
Rayleigh model is used given the physical scenario in the river it would reflect. The Rayleigh 293
model shows the compositions for waters that are subject to different degrees of DSi removal 294
(f) from water with a single starting composition, i.e. δ30SiDSi would change with different f 295
values starting from a single δ30Si0 value. This reflects the progressive DSi depletion in the 296
Lena River. 297
298
Beside biological activities, simultaneously there is also mixing between a number of 299
tributaries and the Lena River main channel, as well as mixing within the main channel of 300
waters that have suffered varying degrees of depletion by biological production. If there are 301
major tributaries with lower DSi concentrations and higher δ30SiDSi values then these could be 302
responsible for decreases of DSi concentrations in the Lena River main channel. Further, 303
Bouchez et al. (2010) have suggested that the confluence of two water masses in large rivers 304
can take tens to hundreds of kilometers, i.e. incomplete mixing could be observed. The 305
δ30SiDSi values of the two main tributaries, the Aldan and Viliui Rivers are also plotted in 306
Figure 2A, as one would expect the largest mixing to occur between these two tributaries and 307
the main channel. The Aldan River shares similar DSi concentrations and δ30SiDSi values with 308
upstream of the Lena River, and so could not lead to higher δ30SiDSi values in the main 309
channel. This means that the Aldan River is likely to serve together with the upstream of the 310
Lena River as an endmember prior to biological production or strong mixing in the 311
downstream. The Viliui River with higher δ30SiDSi values only contributes <10% of DSi load 312
to the Lena River main channel (Kutscher et al., 2017), implicating the fast confluence of the 313
Viliui River and the Lena main channel. Mixing between the Viliui River and the Lena main 314
channel only leads to the δ30SiDSi value of around +0.5‰ if one takes +0.4‰ of the Lena 315
upstream and +1.2‰ of the Viliui River as two endmembers. The δ30SiDSi values of the Viliui 316
Rivers stand out from the Rayleigh and mixing line of the Lena River confirms the minor role 317
of Viliui mixing into the Lena River. Contributions from other tributaries are even smaller 318
than the Viliui River and are considered to be negligible. 319
320
To evaluate the impact of the mixing, and an example is shown in Figure 2A where water 321
from tributaries with an δ30SiDSi value of +0.40‰ and f=0.90 (i.e. similar to water from 322
upstream of the Lena River) mixes with water with a higher δ30SiDSi value of +1.03‰ and 323
f=0.65 (i.e. water from downstream of the Lena River that has suffered Si depletion due to 324
biological activity). Resulting mixtures with different contributions of the two waters fall on 325
a mixing line that does not significantly deviate from the Rayleigh model line (Figure 2A). 326
This indicates that mixing does not obscure the signal of DSi depletion by biological 327
production (given a wide range of values derived from the biological depletion) and some 328
intermediate values may to some extent reflect mixing. While adding DSi along the Lena 329
River with average δ30SiDSi values that are the same as the δ30Si0 value would move the 330
δ30SiDSi values in the Lena River back towards the initial value, biological activity would still 331
be the cause of lower DSi concentrations and higher δ30SiDSi values. 332
333
Some recent studies have shown small but measurable Si isotope fractionations during 334
biogenic silica dissolution, with the lighter Si isotopes preferentially released to DSi during 335
dissolution with a value for 𝜀 of -0.55‰ for marine diatoms (Demarest et al., 2009) and -336
0.86‰ for estuarine diatoms (Sun et al., 2014), whereas no isotope fractionations were 337
observed using sedimentary diatom opal (Wetzel et al., 2014). Whether or not Si isotopes are 338
fractionated during dissolution remain unclear. Despite this, this process is not likely to be 339
important in the Lena River, as active diatom production in summer greatly surpasses 340
dissolution and Si isotope fractionation from dissolution of biogenic silica will be restricted. 341
342
4.2.2 Verkhoyansk mountain range 343
344
For the tributaries draining the Verkhoyansk mountain range, the observed range of δ30SiDSi 345
values from +0.39 to +1.48‰ is different from the trend in the Lena River (Figure 2B). A 346
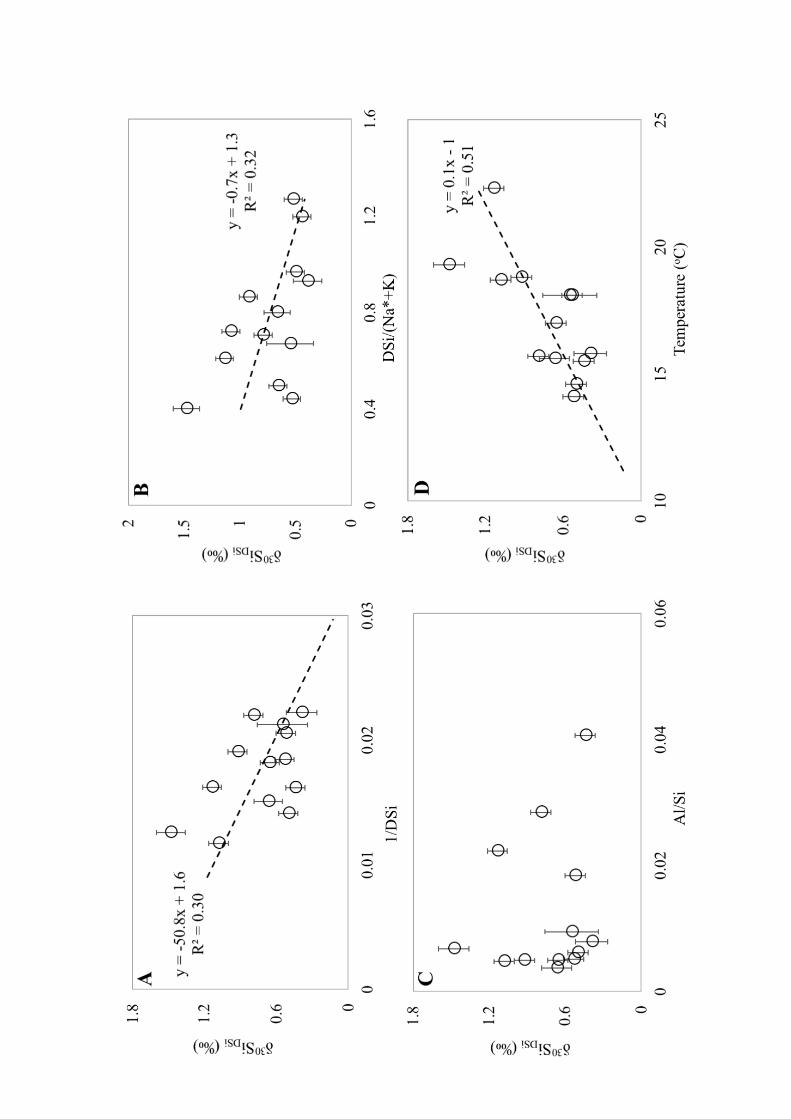
broad correlation between reciprocal DSi concentrations and δ30SiDSi values are observed 347
(R2=0.30, p<<0.05, Figure 3A). This correlation suggests that δ30SiDSi values increase in 348
mountainous areas with elevated DSi concentrations and this is most likely caused by the 349
extent of silicate weathering. A correlation between δ30SiDSi values and Na*+K 350
concentrations (Na*+K = Na – Cl + K for the evaporite correction, R2=0.32) shows relative 351
removal of DSi to Na and K and the loss of lighter Si isotopes (Figure 3B), suggesting 352
secondary clay formation during silicate weathering. 353
354
The Si isotope weathering signal is consistent with incorporation of Si in secondary clays 355
formed during weathering. Lighter Si isotopes are incorporated into newly formed clays, 356
leaving DSi enriched with heavier Si isotopes. This has been demonstrated for a laboratory-357
controlled early stage experiment of clay formation (Oelze et al., 2014). Studies based on Si 358
isotopes in river systems have invoked clay formation to explain similar δ30SiDSi variations, 359
such as in the Nile River (Cockerton et al., 2013), the Congo River (Cardinal et al., 2010), the 360
Scheldt River (Delvaux et al., 2013) and central Siberia rivers (Pokrovsky et al., 2013). The 361
reported lower δ30Si values in clay minerals ranging from -2.95 to -0.16‰ have also 362
supported our observations (Cornelis et al., 2010; Douthitt, 1982; Opfergelt et al., 2010; 363
Ziegler et al., 2005). An earlier study by Georg et al. (2006) suggested the use of Al/Si ratios 364
as tracers for this process, as clay formation removes Al relative to Si and low Al/Si ratios are 365
then associated with high δ30SiDSi values. Figure 3C does not reveal any significant 366
correlation between Al/Si ratios and δ30SiDSi values although δ30SiDSi values display large 367
variations with decreasing Al/Si ratios. pH is another factor that controls Al speciation, but it 368
is not likely the reason for the insignificant correlation, as variations in pH among these 369
tributaries ranging from 6.3 to 7.6 while Al speciation is mainly observed below pH 4.5. The 370
Lena River has high concentrations of dissolved organic carbon, ranging from 590 to 1300 371
µM during our sampling period (Kutscher et al. 2017), thus organic acids could also be an 372
important factor. Al has been shown to highly bound with organic carbon in a Siberian river 373
(Pourpoint et al., 2017), thus preventing the formation of clay minerals which precipitates Al 374
(Pokrovsky et al., 2016). Similarly, due to the low solubility of Al, the formation of colloidal 375
gibbsite can also remove Al from solution. These processes could be particularly important in 376
permafrost-covered watersheds like the Lena River where organic carbon is released during 377
spring-summer thawing of permafrost. 378
379
The detailed Si isotope fractionation mechanisms during clay formation also remain poorly 380
studied, partly because clay formation is not a single process with a fixed isotope 381
fractionation factor and so hard to synthesise in the lab (Opfergelt and Delmelle, 2012) and 382
partly because of the dynamics of repeated cycles of dissolution and re-precipitation (Basile-383
Doelsch et al., 2005; Cornelis et al., 2014). Furthermore, this is also complicated by different 384
clay minerals exhibiting different Si isotope fractionation factors among different clay 385
minerals (Opfergelt and Delmelle, 2012). Opfergelt and Delmelle (2012) report that the Si 386
isotope fractionation factors between primary minerals and clays can vary between -2 and -387
1‰, which is consistent with the observed range of δ30SiDSi values in the Verkhoyansk 388
mountain range. The δ30SiDSi values from +0.39 to +1.48‰ integrate the DSi flows from each 389
tributary and to a large extent reflect the degree of weathering in the Verkhoyansk mountain 390
range. 391
392
Temperature is known to be an important factor controlling weathering rates (Kump et al., 393
2000; Li et al., 2016). Surface water draining warmer areas have higher δ30SiDSi values and 394
major ion concentrations compared to cooler areas given their different weathering rates. In 395
the Verkhoyansk mountain range, Figure 3D (R2=0.51, p<<0.05) suggests a marked 396
temperature impact on the weathering in these high-latitude mountain areas, but this 397
correlation might be obscured as temperatures were measured at the river mouths of 398
tributaries but not in the weathering zones. Another reason for this observed correlation could 399
be glacial influence, as the slope and water discharge of rivers on high mountains increase 400
with decreased temperature. This means that more particulate suspended matters are flushed 401
into rivers under lower temperature, which may shift δ30SiDSi values to lower values by 402
dissolution of isotopically light silicate minerals at high fluid : solid ratios (Georg et al. 403
2006). 404
405
4.2.3 Central Siberian Plateau and Lena-Amganski Inter-River Area 406
Terrestrial biological production also discriminate against the heavier Si isotopes during 407
uptake at the root-interface in soils (Opfergelt et al., 2006; Ding et al., 2008; Delvigne et al., 408
2009), and consequently enrich the soil solutions with heavier Si isotopes. This is likely the 409
reason for higher δ30SiDSi values observed in tributaries in Central Siberian Plateau and Lena-410
Amganski Inter-River Area, which flush through soils (Figure 2B). The range of δ30SiDSi 411
values in these areas is large, with values from +0.52 to +1.71‰ that reflect different Si 412
isotope fractionations from the original Si sources to the rivers. This can be explained at least 413
partially by an effect of different vascular plant species (Opfergelt et al., 2006) and their 414
growth stage (Ding et al., 2008) given the Si isotope fractionation factor of -1‰ during their 415
production (Opfergelt and Pierre, 2012; Frings et al. 2016) and approximately half of 416
terrestrial net primary production by Si accumulating organisms (Carey and Fulweiler, 2012). 417
Another reason could be secondary clay formation in soil solutions during basalt weathering 418
in Central Siberian Plateau (Pokrovsky et al. 2005). This indicates that the δ30SiDSi values in 419
the tributaries possibly carry both strong terrestrial production and weathering signal, which 420
is different from those in the Lena River. However, lack of clear correlations between δ30SiDSi 421
values and DSi concentrations in these two areas suggest other processes complicate the 422
overall pattern of δ30SiDSi distribution and it is not possible to distinguish those processes that 423
control Si. Hence, the δ30SiDSi values in tributaries may serve as an integrated value for the 424
Central Siberian Plateau and Lena-Amganski Inter-River Area. 425
426
4.3 Seasonal variations in the upstream of the Lena River 427
428
Figure 4A displays annual variations of δ30SiDSi values with an average value of +1.6‰ 429
during winter, October 2012 to March 2013 and Figure 4B shows the sharp drop of δ30SiDSi 430
values down to +0.63‰ during the rapid transition from the winter water flow to the spring 431
flood in May 2015. The values decrease by nearly 1‰ from winter to spring, which coincides 432
with the water discharge maximum, i.e. snowmelt in the Lena River watershed. The winter 433
baseflow, dominated by groundwaters with high δ30SiDSi values, is diluted by the large 434
amount of snowmelt water that flush through soils carrying low δ30SiDSi values during the 435
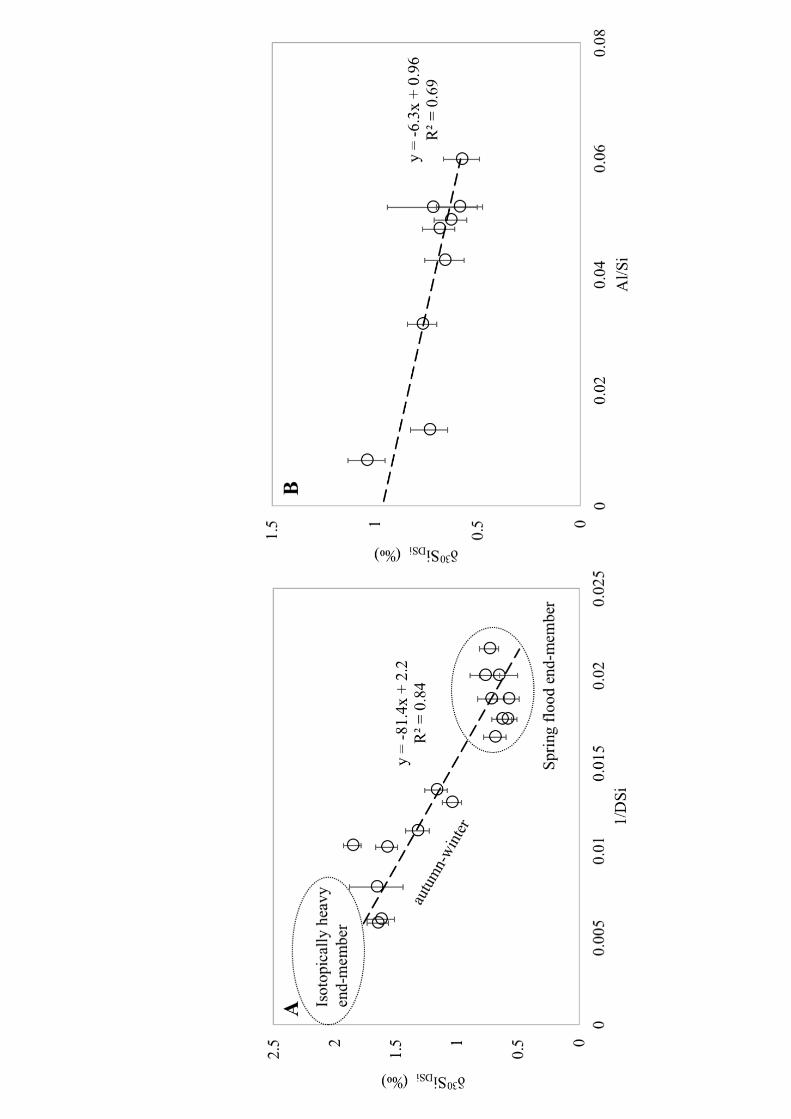
spring flood. Figure 5A shows the δ30SiDSi values vs 1/DSi for the entire temporal period with 436
R2=0.84, possibly reflecting mixing of two distinct water bodies. The δ30SiDSi values during 437
the spring flood in May 2015 remain almost constant and its average value can serve as one 438
endmember of δ30SiDSi values in the Lena River. The other end-member has higher DSi 439
concentration and a higher δ30SiDSi value than the average winter δ30SiDSi value of +1.6‰, but 440
lower than +2.3‰ (given by the intercept of the regression line; Figure 5A). This implies a 441
pronounced DSi supply and Si isotope fractionation in upstream of Yakutsk in the Lena River 442
throughout the year, which implies strong secondary clay mineral formation during 443
weathering in intrapermafrost groundwater in winter, as lighter Si isotopes are preferably 444
incorporated into clay minerals, leaving heavier Si isotopes in water. 445
446
As suggested by Georg et al (2006), a plot of δ30SiDSi values vs dissolved Al/Si could reveal 447
the impact of clay formation and its potential for fractionating Si isotopes. Figure 5B displays 448
a linear correlation between δ30SiDSi values vs Al/Si in the spring flood (R2=0.69, p<<0.05). 449
Without clay formation, the δ30SiDSi values are expected to reflect the isotopic composition of 450
primary silicates (δ30Si = -0.4‰, Frings et al. 2016), and using the data correlation this 451
corresponds to an Al/Si ratio of 0.22. Decreasing Al/Si ratios in river water corresponds to 452
increased δ30SiDSi values, indicating a faster removal of Al compared to Si, and preferential 453
uptake of lighter Si isotopes into newly formed clays. Extrapolation of the data to Al/Si=0 454
gives the intercept of δ30Si = +0.96‰ and corresponds to complete removal of and so the 455
highest δ30SiDSi value created in waters for secondary clay formation during weathering. 456
During winter (October to March), the surface soils in the Lena River watershed are frozen, 457
which restricts the major transport processes in soils but increases the residence and contact 458
time between intrapermafrost groundwaters and the frozen pemafrost soils and bedrock. Thus 459
the winter δ30SiDSi values are likely to represent δ30SiDSi values in groundwater and range 460
between +1.32 and +1.86‰. This agrees with the scenario suggested for central Siberian 461
rivers, which exhibits the winter δ30SiDSi values in between +1.0 to +2.5‰ (Pokrovsky et al., 462
2013). 463
464
During snowmelt the high water discharge causes water flushing through the upper soils, 465
which is observed by a simultaneous increase in dissolved organic carbon concentrations in 466
the river (Kutscher et al. 2017). High water discharge also includes leached water from the 467
upper soil profile and is likely to carry lighter δ30SiDSi values due to mobilization of DSi 468
released from dissolution of silicate materials and dissolution of plant phytoliths in large 469
rivers (Ding et al., 2004; Ziegler et al., 2005; Pokrovsky et al., 2005; Georg et al., 2006; 470
Pokrovsky et al., 2013). Analyses of soil porewaters during the spring flood in northern 471
Sweden (boreal, but not underlain by permafrost) indicates that these waters contribute 472
approximately 90% of the total Si in river water, while groundwater does not supply more 473
than 15% (Land et al., 2000). Thus, contributions of soil floor leachates to river water during 474
the spring flood is expected to dominate in boreal river systems and likely the Lena River as 475
well. This suggests that soil solutions are very likely to have δ30SiDSi value similar to the 476
average δ30SiDSi value of +0.6‰ observed in the Lena River during the spring flood. 477
478
4.4 Implications for Si isotope flux to the Arctic Ocean 479
480
The δ30SiDSi values in the Lena River and its tributaries vary between +0.39 to +1.86‰. The 481
spring flood has a δ30SiDSi value of +0.6‰ and this value increases to +1.3‰ downstream of 482
the Lena River during summer and increases to peak values of +1.86‰ in winter. Tributaries 483
with various Si sources contribute to this range during the mixing with the main channel. 484
This suggests that there is a dynamic shift seasonally between sources and processes and this 485
shift is the primary controlling factor of DSi and δ30SiDSi values in the Lena River and 486
ultimately the Si export to the Arctic Ocean. Long-term water discharge and DSi 487
concentrations are available via Arctic Great Rivers Observatory 488
(http://www.arcticgreatrivers.org/data.html). By using a 5-year average for the water 489
discharge and DSi concentrations from 2010-2014 (Appendix Table A1, but no Si data 490
available for 2015) in the Lena River main channel, which are representative for our 491
sampling periods 2012, 2013 and 2015, a Si flux-weighted annual δ30SiDSi value is calculated 492
to be +0.86±0.3‰. This calculation is based on the average δ30SiDSi values from spring, 493
summer and winter samples in this study, +0.6, +0.8 and +1.6‰, respectively, and the 494
contributions of spring, summer and winter Si discharges to the total annual Si flux, 26, 60 495
and 14%, respectively. 496
497
The Yenisey River has the δ30SiDSi value of +1.6±0.25‰, which was calculated using 498
measured spring flood δ30SiDSi value of +1.3‰, summer δ30SiDSi value of +1.5 ‰ derived 499
from Central Siberian rivers and winter δ30SiDSi value of +2.0‰ adopted from the Nizhnaya 500
Tunguska River (Mavromatis et al., 2016). These values are all higher than the Lena River 501
values measured in this study, which is possibly caused by higher degree of formation of 502
secondary clay minerals and stronger biological activities during summer. However, there are 503
uncertainties associated with our calculations for the Lena River including: 1) the 504
contributions from the Lena tributaries and especially for tributaries with higher δ30SiDSi 505
values in summer are not included in the calculation because of the lack of water discharge 506
data. Therefore, the average δ30SiDSi value in summer is likely underestimated. 2) The isotope 507
values used in the calculation are not from samples of the river mouth, with some from 508
around Yakutsk (e.g. spring flood samples and some samples from upstream of the Lena 509
River main channel); hence certain variations of δ30SiDSi caused by biological activity in the 510
river and mixing with tributaries in the downstream should be expected along the water flow 511
path from the upstream to the river mouth. 512
513
5. Conclusions 514
515
Our results cover almost an annual cycle of variations in DSi and δ30SiDSi values in the Lena 516
River, Siberia, and there is a general trend with lower δ30SiDSi values associated with high 517
DSi flux and higher δ30SiDSi values associated with low DSi flux. This is similar to 518
observations in other large river systems, including Amazon, Congo and Yenisey and 519
confirms that there is a hydrological control of the Si isotope compositions delivered to the 520
ocean irrespectively of climate zones. 521
522
The results reveal a large variation in the δ30SiDSi values both geographically and temporally. 523
The δ30SiDSi values in summer range between +0.39 to +1.71‰, and are caused both by 524
mixing of tributaries with various δ30SiDSi values and biological uptake of DSi through 525
vascular plant and phytoplankton growth on land and in rivers. Secondary clay mineral 526
formation may also play an important role by the enrichment of DSi with heavier Si isotopes 527
in soil- and intrapermafrost groundwater, resulting in higher δ30SiDSi values in the tributaries. 528
Subsequently this will increase the δ30SiDSi values of the water discharge to the main stream 529
and possibly further interact with river sediments. From winter to spring, the δ30SiDSi in the 530
Lena River decreases temporally from high values in winter to low values during the spring 531
flood with high discharge. This is likely caused by a change in the dominant source for Si 532
from permafrost-hosted deep intrapermafrost groundwater during winter to dissolution of 533
silicate materials and phytoliths from the active upper soil layers as well as suspended 534
materials from the bank abrasion during spring discharge. 535
536
The annual δ30SiDSi value of the Si flux to the Arctic Ocean is calculated to be +0.86±0.3‰, 537
which is lower than +1.6±0.25‰ as reported for the Yenisey River. These two rivers are 538
responsible for nearly half of the dissolved Si delivered to the Arctic Ocean and the grand Si 539
inputs to the Arctic Ocean carry an average δ30SiDSi value of +1.3±0.3‰ based weighted Si 540
flux of these two rivers. Global warming not only promotes chemical weathering associated 541
with permafrost thawing and hydrological regime change, but also results in the vegetation 542
rise and colonization of the northernmost territory, all of which would remove isotopically-543
light DSi and shift δ30SiDSi values towards higher values in soils and groundwater and their 544
discharges to river water. 545
546
547
Acknowledgements 548
This project was supported by the Swedish Research Council (VR 621-2010-3917) and the 549
Swedish Polar Research Secretariat (SIMO 2011-165 and 2012-213). Special thanks to our 550
Russian colleagues and the crews on R/V “Akademik” and “Merelotoved”. This is 551
contribution #xx from the Vegacenter. 552
553
References 554
555
Alleman L. Y., Cardinal D., Cocquyt C., Plisnier P.-D., Descy J.-P., Kimirei I., Sinyinza D. 556 and André L. (2005) Silicon Isotopic Fractionation in Lake Tanganyika and Its Main 557 Tributaries. J. Great Lakes Res. 31, 509–519. 558
Basile-Doelsch I., Meunier J. D. and Parron C. (2005) Another continental pool in the 559 terrestrial silicon cycle. Nature 433, 399–402. 560
Beusen A. H. W., Bouwman A. F., Dürr H. H., Dekkers A. L. M. and Hartmann J. (2009) 561 Global patterns of dissolved silica export to the coastal zone: Results from a spatially 562 explicit global model. Global Biogeochem. Cycles 23, GB0A02, 563 doi:10.1029/2008GB003281. 564
Cardinal D., Gaillardet J., Hughes H. J., Opfergelt S. and André L. (2010) Contrasting silicon 565 isotope signatures in rivers from the Congo Basin and the specific behaviour of organic-566 rich waters. Geophys. Res. Lett. 37, L12403, doi:10.1029/2010GL043413. 567
Cockerton H. E., Street-Perrott F. A., Leng M. J., Barker P. A., Horstwood M. S. A. and 568 Pashley V. (2013) Stable-isotope (H, O, and Si) evidence for seasonal variations in 569 hydrology and Si cycling from modern waters in the Nile Basin: implications for 570 interpreting the Quaternary record. Quat. Sci. Rev, 66, 4–21. 571
Cornelis J. T., Delvaux B., Cardinal D., André L., Ranger J. and Opfergelt S. (2010) Tracing 572 mechanisms controlling the release of dissolved silicon in forest soil solutions using Si 573 isotopes and Ge/Si ratios. Geochim. Cosmochim. Acta 74, 3913–3924. 574
Cornelis J. T., Delvaux B., Georg R. B., Lucas Y., Ranger J. and Opfergelt S. (2011) Tracing 575 the origin of dissolved silicon transferred from various soil-plant systems towards rivers: 576 a review. Biogeosciences 8, 89–112. 577
Cornelis J.-T., Weis D., Lavkulich Les, Vermeire M.-L., Delvaux B. and Barling J. (2014) 578 Silicon isotopes record dissolution and re-precipitation of pedogenic clay minerals in a 579 podzolic soil chronosequence. Geoderma 235-236, 19–29. 580
De La Rocha De C. L., Brzezinski M. A. and DeNiro M. J. (2000) A first look at the 581 distribution of the stable isotopes of silicon in natural waters. Geochim. Cosmochim. Acta 582 64, 2467–2477. 583
De La Rocha De C. L., Brzezinski M. A. and DeNiro M. J. (1997) Fractionation of silicon 584 isotopes by marine diatoms during biogenic silica formation. Geochim. Cosmochim. Acta 585 61, 5051–5056. 586
Delvaux C., Cardinal D., Carbonnel V., Chou L., Hughes H. J. and André L. (2013) Controls 587 on riverine δ30Si signatures in a temperate watershed under high anthropogenic pressure 588 (Scheldt — Belgium). J Mar. Syst. 128, 40–51. 589
Delvigne C., Opfergelt S., Cardinal D., Delvaux B. and André L. (2009) Distinct silicon and 590 germanium pathways in the soil-plant system: Evidence from banana and horsetail. J. 591 Geophys. Res. 114, G02013. doi:10.1029/2008JG000899 592
Demarest M. S., Brzezinski M. A. and Beucher C. P. (2009) Fractionation of silicon isotopes 593 during biogenic silica dissolution. Geochim. Cosmochim. Acta 73, 5572–5583. 594
Ding T. P., Tian S. H., Sun L., Wu L. H., Zhou J. X. and Chen Z. Y. (2008) Silicon isotope 595 fractionation between rice plants and nutrient solution and its significance to the study of 596 the silicon cycle. Geochim. Cosmochim. Acta 72, 5600–5615. 597
Ding T., Wan D., Wang C. and Zhang F. (2004) Silicon isotope compositions of dissolved 598 silicon and suspended matter in the Yangtze River, China. Geochim. Cosmochim. Acta 599 68, 205–216. 600
Dürr H. H., Meybeck M., Hartmann J., Laruelle G. G. and Roubeix V. (2011) Global spatial 601 distribution of natural riverine silica inputs to the coastal zone. Biogeosciences 8, 597–602 620. 603
Engström E., Rodushkin I., Ingri J., Baxter D. C., Ecke F., Österlund H. and Öhlander B. 604 (2010) Temporal isotopic variations of dissolved silicon in a pristine boreal river. Chem. 605 Geol. 271, 142–152. 606
Fontorbe G., De La Rocha C. L., Chapman H. J. and Bickle M. J. (2013) The silicon isotopic 607 composition of the Ganges and its tributaries. Earth Planet. Sci. Lett 381, 21–30. 608
Frey K. E. and McClelland J. W. (2009) Impacts of permafrost degradation on arctic river 609 biogeochemistry ed. T. D. Prowse. Hydrol. Process. 23, 169–182. 610
Frings P. J., Clymans W., Fontorbe G., Gray W., Chakrapani G. J., Conley D. J. and De La 611 Rocha C. (2015) Silicate weathering in the Ganges alluvial plain. Earth Planet. Sci. Lett 612 427, 136–148. 613
Frings P. J., Clymans W., Fontorbe G., De La Rocha C. L. and Conley D. J. (2016) The 614 continental Si cycle and its impact on the ocean Si isotope budget. Chem. Geol. 425, 12–615 36. 616
Frings P. J., De La Rocha C., Struyf E., van Pelt D., Schoelynck J., Hudson M. M., Gondwe 617 M. J., Wolski P., Mosimane K., Gray W., Schaller J. and Conley D. J. (2014) Tracing 618 silicon cycling in the Okavango Delta, a sub-tropical flood-pulse wetland using silicon 619 isotopes. Geochim. Cosmochim. Acta 142, 132–148. 620
Fripiat F., Cavagna A.-J., Savoye N., Dehairs F., André L. and Cardinal D. (2011) Isotopic 621 constraints on the Si-biogeochemical cycle of the Antarctic Zone in the Kerguelen area 622 (KEOPS). Mar. Chem. 123, 11–22. 623
Georg R. B., Reynolds B. C., FRANK M. and Halliday A. N. (2006) Mechanisms controlling 624 the silicon isotopic compositions of river waters. Earth Planet. Sci. Lett 249, 290–306. 625
Grasse P., Brzezinski M. A., Cardinal D., de Souza G. F., Andersson P., Closset I., Cao Z., 626 Dai M., Ehlert C., Estrade N., Francois R., Frank M., Jiang G., Jones J. L., Kooijman E., 627 Liu Q., Lu D., Pahnke K., Ponzevera E., Schmitt M., Sun X., Sutton J. N., Thil F., Weis 628
D., Wetzel F., Zhang A., Zhang J. and Zhang Z. (2017) GEOTRACES inter-calibration 629 of the stable silicon isotope composition of dissolved silicic acid in seawater. J. Anal. At. 630 Spectrom., 1–45. 631
Grasse P., Ryabenko E., Ehlert C., Altabet M. A. and Frank M. (2016) Silicon and nitrogen 632 cycling in the upwelling area off Peru: A dual isotope approach. Limnol. Oceanogr. 61, 633 1661–1676. 634
Hirst C., Andersson P. S., Shaw S., Burke I. T., Kutscher L., Murphy M. J., Maximov T., 635 Pokrovsky O. S., Mörth C.-M. and Porcelli D. (2017) Characterisation of Fe-bearing 636 particles and colloids in the Lena River basin, NE Russia. Geochim. Cosmochim. Acta. 637 doi.org/10.1016/j.gca.2017.07.012 638
Hodson M. J., Parker A. G., Leng M. J. and Sloane H. J. (2008) Silicon, oxygen and carbon 639 isotope composition of wheat (Triticum aestivum L.) phytoliths: implications for 640 palaeoecology and archaeology. J. Quaternary Sci. 23, 331–339. 641
Holmes R. M., McClelland J. W., Peterson B. J., Tank S. E., Bulygina E., Eglinton T. I., 642 Gordeev V. V., Gurtovaya T. Y., Raymond P. A., Repeta D. J., Staples R., Striegl R. G., 643 Zhulidov A. V. and Zimov S. A. (2011) Seasonal and Annual Fluxes of Nutrients and 644 Organic Matter from Large Rivers to the Arctic Ocean and Surrounding Seas. Estuaries 645 and Coasts 35, 369–382. 646
Hughes H. J., Sondag F., Cocquyt C., Laraque A., Pandi A., André L. and Cardinal D. (2011) 647 Effect of seasonal biogenic silica variations on dissolved silicon fluxes and isotopic 648 signatures in the Congo River. Limnol. Oceanogr. 56, 551–561. 649
Hughes H. J., Sondag F., Santos R. V., André L. and Cardinal D. (2013) The riverine silicon 650 isotope composition of the Amazon Basin. Geochim. Cosmochim. Acta 121, 637–651. 651
Kump L. R., Brantley S. L. and Arthur M. A. (2000) Chemical weathering, atmospheric CO2 652 and climate. Annu. Rev. Earth Planet. Sci. 28, 611–667. 653
Kutscher L., Mörth C.-M., Porcelli D., Hirst C., Maximov T. C., Petrov R. E., Andersson P. 654 S. Spatial variation in concentration and sources of organic carbon in the Lena River, 655 Siberia. J. Geophys. Res.: Biogeosciences, 122, 8, 1999-2016. 656
Land M., Ingri J., Andersson P. S. and Öhlander B. (2000) Ba/Sr, Ca/Sr and 87Sr/86Sr in soil 657 water and groundwater: implications for relative contributions to stream water discharge. 658 Appl. Geochem. 15, 311–325. 659
Li G., Hartmann J., Derry L. A., West A. J., You C.-F., Long X., Zhan T., Li L., Li G., Qiu 660 W., Li T., Liu L., Chen Y., Ji J., Zhao L. and Chen J. (2016) Temperature dependence of 661 basalt weathering. Earth Planet. Sci. Lett 443, 59–69. 662
Ma X., Yasunari T., Ohata T. and Fukushima Y. (2005) The influence of river ice on spring 663 runoff in the Lena river, Siberia. Annals of Glaciology 40, 123–127. 664
Mavromatis V., Rinder T., Prokushkin A. S., Pokrovsky O. S., Korets M. A., Chmeleff J. and 665 Oelkers E. H. (2016) The effect of permafrost, vegetation, and lithology on Mg and Si 666 isotope composition of the Yenisey River and its tributaries at the end of the spring flood. 667 Geochim. Cosmochim. Acta 191, 32–46. 668
Oelze M., Blanckenburg von F., Hoellen D., Dietzel M. and Bouchez J. (2014) Si stable 669 isotope fractionation during adsorption and the competition between kinetic and 670 equilibrium isotope fractionation: Implications for weathering systems. Chem. Geol. 380, 671 161–171. 672
Opfergelt S. and Delmelle P. (2012) Silicon isotopes and continental weathering processes: 673 Assessing controls on Si transfer to the ocean. Comptes rendus - Geoscience 344, 723–674 738. 675
Opfergelt S., Burton K. W., Strandmann von P. A. E. P., Gislason S. R. and Halliday A. N. 676 (2013) Riverine silicon isotope variations in glaciated basaltic terrains_ Implications for 677 the Si delivery to the ocean over glacial–interglacial intervals. Earth Planet. Sci. Lett 678 369-370, 211–219. 679
Opfergelt S., Cardinal D., André L., Delvigne C., Bremond L. and Delvaux B. (2010) 680 Variations of δ30Si and Ge/Si with weathering and biogenic input in tropical basaltic ash 681 soils under monoculture. Geochim. Cosmochim. Acta 74, 225–240. 682
Opfergelt S., Cardinal D., Henriet C., Draye X., André L. and Delvaux B. (2006) Silicon 683 Isotopic Fractionation by Banana (Musa spp.) Grown in a Continuous Nutrient Flow 684 Device. Plant Soil 285, 333–345. 685
Opfergelt S., Eiriksdottir E. S., Burton K. W., Einarsson A., Siebert C., Gislason S. R. and 686 Halliday A. N. (2011) Quantifying the impact of freshwater diatom productivity on 687 silicon isotopes and silicon fluxes: Lake Myvatn, Iceland. Earth Planet. Sci. Lett 305, 688 73–82. 689
Pokrovsky O. S., Manasypov R. M., Loiko S., Shirokova L. S., Krickov I. A., Pokrovsky B. 690 G., Kolesnichenko L. G., Kopysov S. G., Zemtzov V. A., Kulizhsky S. P., Vorobyev S. 691 N. and Kirpotin S. N. (2015) Permafrost coverage, watershed area and season control of 692 dissolved carbon and major elements in western Siberian rivers. Biogeosciences 12, 693 6301–6320. 694
Pokrovsky O. S., Manasypov R. M., Loiko S. V., Krickov I. A., Kopysov S. G., 695 Kolesnichenko L. G., Vorobyev S. N. and Kirpotin S. N. (2016) Trace element transport 696 in western Siberian rivers across a permafrost gradient. Biogeosciences 13, 1877–1900. 697
Pokrovsky O. S., Reynolds B. C., Prokushkin A. S., Schott J. and Viers J. (2013) Silicon 698 isotope variations in Central Siberian rivers during basalt weathering in permafrost-699 dominated larch forests. Chem. Geol. 355, 103–116. 700
Pokrovsky O. S., Schott J., Kudryavtzev D. I. and Dupré B. (2005) Basalt weathering in 701 Central Siberia under permafrost conditions. Geochim. Cosmochim. Acta 69, 5659–5680. 702
Pourpoint F., Templier J., Anquetil C., Vezin H., Trébosc J., Trivelli X., Chabaux F., 703 Pokrovsky O. S., Prokushkin A. S., Amoureux J.-P., Lafon O. and Derenne S. (2017) 704 Probing the aluminum complexation by Siberian riverine organic matter using solid-state 705 DNP-NMR. Chemical Geology 452, 1–8. 706
Reynolds B. C., Aggarwal J., André L., Baxter D., Beucher C., Brzezinski M. A., Engström 707 E., Georg R. B., Land M., Leng M. J., Opfergelt S., Rodushkin I., Sloane H. J., van den 708 Boorn S. H. J. M., Vroon P. Z. and Cardinal D. (2007) An inter-laboratory comparison of 709
Si isotope reference materials. J. Anal. At. Spectrom. 22, 561–568. 710
Savage P. S., Georg R. B., Williams H. M., Burton K. W. and Halliday A. N. (2011) Silicon 711 isotope fractionation during magmatic differentiation. Geochim. Cosmochim. Acta 75, 712 6124–6139. 713
Sun X., Andersson P. S., Humborg C., Pastuszak M. and Mörth C.-M. (2013) Silicon isotope 714 enrichment in diatoms during nutrient-limited blooms in a eutrophied river system. J 715 Geochem Explor. 132, 173–180. 716
Sun X., Olofsson M., Andersson P. S., Fry B., Legrand C., Humborg C. and Mörth C.-M. 717 (2014) Effects of growth and dissolution on the fractionation of silicon isotopes by 718 estuarine diatoms. Geochim. Cosmochim. Acta 130, 156–166. 719
Sutton J. N., Varela D. E., Brzezinski M. A. and Beucher C. P. (2013) Species-dependent 720 silicon isotope fractionation by marine diatoms. Geochim. Cosmochim. Acta 104, 300–721 309. 722
Tréguer P. J. and De La Rocha C. L. (2013) The World Ocean Silica Cycle. Annu. Rev. 723 Marine. Sci. 5, 477–501. 724
Vorobyev S., Pokrovsky O., Serikova S., Manasypov R., Krickov I., Shirokova L., Lim A., 725 Kolesnichenko L., Kirpotin S. and Karlsson J. (2017) Permafrost Boundary Shift in 726 Western Siberia May Not Modify Dissolved Nutrient Concentrations in Rivers. Water 9, 727 985–17. 728
Wetzel F., de Souza G. F. and Reynolds B. C. (2014) What controls silicon isotope 729 fractionation during dissolution of diatom opal? Geochim. Cosmochim. Acta 131, 128–730 137. 731
Ziegler K., Chadwick O. A., Brzezinski M. A. and Kelly E. F. (2005) Natural variations of 732 δ30Si ratios during progressive basalt weathering, Hawaiian Islands. Geochim. 733 Cosmochim. Acta 69, 4597–4610. 734
735
736
Figure captions 737
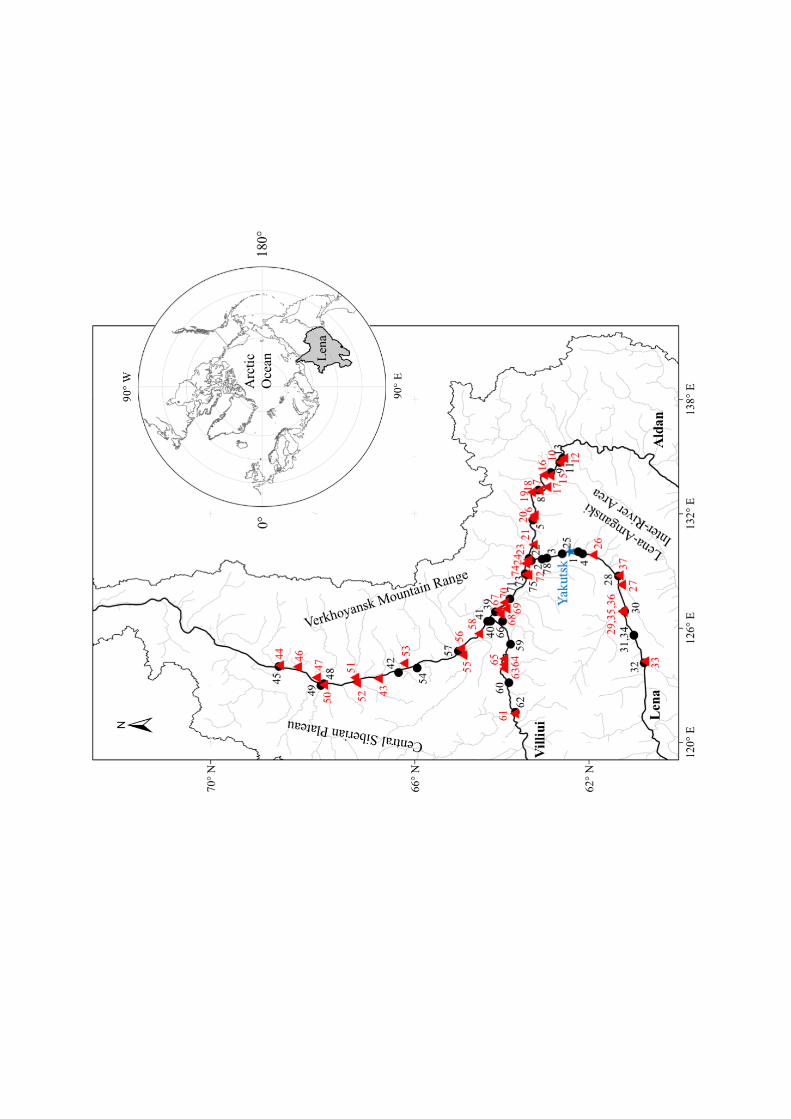
Figure 1 Map of the Lena River watershed and sampling locations. Numbered black dots are 738
sampling locations in the Lena, Viliui and Aldan Rivers, and red triangles are tributary 739
sampling from the three following regions: Central Siberia Plateau (West), Verkhoyansk 740
mountain range (East), Lena-Amganski Inter-River area (LAIRA, South). Blue star is the 741
location of Yakutsk Station. 742
Figure 2 A. Rayleigh model fitted on the measured δ30SiDSi values in the Lena River main 743
channel (long-dashed line) vs mixing line (dotted line) and the measured δ30SiDSi values 744
of the Aldan and Viliui Rivers, f is fraction of remaining DSi; B. δ30SiDSi values vs. DSi 745
in other tributaries in subareas of the Lena River watershed for the three regions 746
mentioned on Figure 1. 747
Figure 3 δ30SiDSi in the tributaries from the Verkhoyansk mountain range. A. δ30SiDSi vs. 748
DSi; B. δ30SiDSi vs. DSi/Na*+K (corrected for evaporite); C. δ30SiDSi vs. Al/Si; D. 749
δ30SiDSi vs. temperature. 750
Figure 4 A. DSi concentrations (open symbols) and δ30SiDSi values (filled symbols with error 751
bars) in the upstream of the Lena River (the Tabaga Hydrological Station) during 752
summer-winter 2012-2013; B. the average DSi concentrations and δ30SiDSi values in the 753
spring flood 2015. 754
Figure 5 A. δ30SiDSi vs 1/DSi of autumn-winter and spring flood samples; B. δ30SiDSi vs Al/Si 755
in river water during spring flood 756
757
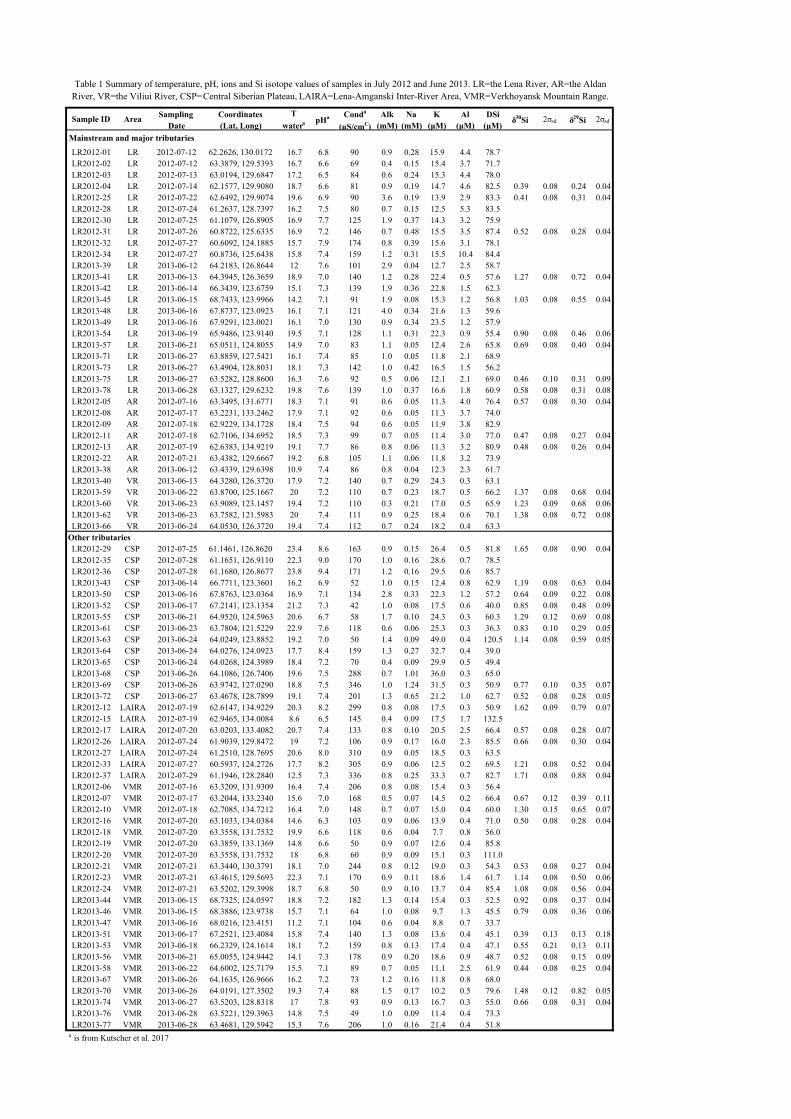
Sample ID Area Sampling Date
Coordinates (Lat, Long)
T watera pHa Conda
(µS/cmC)Alk
(mM)Na
(mM)K
(µM)Al
(µM)DSi
(µM)δ30Si 2σsd δ29Si 2σsd
LR2012-01 LR 2012-07-12 62.2626, 130.0172 16.7 6.8 90 0.9 0.28 15.9 4.4 78.7LR2012-02 LR 2012-07-12 63.3879, 129.5393 16.7 6.6 69 0.4 0.15 15.4 3.7 71.7LR2012-03 LR 2012-07-13 63.0194, 129.6847 17.2 6.5 84 0.6 0.24 15.3 4.4 78.0LR2012-04 LR 2012-07-14 62.1577, 129.9080 18.7 6.6 81 0.9 0.19 14.7 4.6 82.5 0.39 0.08 0.24 0.04LR2012-25 LR 2012-07-22 62.6492, 129.9074 19.6 6.9 90 3.6 0.19 13.9 2.9 83.3 0.41 0.08 0.31 0.04LR2012-28 LR 2012-07-24 61.2637, 128.7397 16.2 7.5 80 0.7 0.15 12.5 5.3 83.5LR2012-30 LR 2012-07-25 61.1079, 126.8905 16.9 7.7 125 1.9 0.37 14.3 3.2 75.9LR2012-31 LR 2012-07-26 60.8722, 125.6335 16.9 7.2 146 0.7 0.48 15.5 3.5 87.4 0.52 0.08 0.28 0.04LR2012-32 LR 2012-07-27 60.6092, 124.1885 15.7 7.9 174 0.8 0.39 15.6 3.1 78.1LR2012-34 LR 2012-07-27 60.8736, 125.6438 15.8 7.4 159 1.2 0.31 15.5 10.4 84.4LR2013-39 LR 2013-06-12 64.2183, 126.8644 12 7.6 101 2.9 0.04 12.7 2.5 58.7LR2013-41 LR 2013-06-13 64.3945, 126.3659 18.9 7.0 140 1.2 0.28 22.4 0.5 57.6 1.27 0.08 0.72 0.04LR2013-42 LR 2013-06-14 66.3439, 123.6759 15.1 7.3 139 1.9 0.36 22.8 1.5 62.3LR2013-45 LR 2013-06-15 68.7433, 123.9966 14.2 7.1 91 1.9 0.08 15.3 1.2 56.8 1.03 0.08 0.55 0.04LR2013-48 LR 2013-06-16 67.8737, 123.0923 16.1 7.1 121 4.0 0.34 21.6 1.3 59.6LR2013-49 LR 2013-06-16 67.9291, 123.0021 16.1 7.0 130 0.9 0.34 23.5 1.2 57.9LR2013-54 LR 2013-06-19 65.9486, 123.9140 19.5 7.1 128 1.1 0.31 22.3 0.9 55.4 0.90 0.08 0.46 0.06LR2013-57 LR 2013-06-21 65.0511, 124.8055 14.9 7.0 83 1.1 0.05 12.4 2.6 65.8 0.69 0.08 0.40 0.04LR2013-71 LR 2013-06-27 63.8859, 127.5421 16.1 7.4 85 1.0 0.05 11.8 2.1 68.9LR2013-73 LR 2013-06-27 63.4904, 128.8031 18.1 7.3 142 1.0 0.42 16.5 1.5 56.2LR2013-75 LR 2013-06-27 63.5282, 128.8600 16.3 7.6 92 0.5 0.06 12.1 2.1 69.0 0.46 0.10 0.31 0.09LR2013-78 LR 2013-06-28 63.1327, 129.6232 19.8 7.6 139 1.0 0.37 16.6 1.8 60.9 0.58 0.08 0.31 0.08LR2012-05 AR 2012-07-16 63.3495, 131.6771 18.3 7.1 91 0.6 0.05 11.3 4.0 76.4 0.57 0.08 0.30 0.04LR2012-08 AR 2012-07-17 63.2231, 133.2462 17.9 7.1 92 0.6 0.05 11.3 3.7 74.0LR2012-09 AR 2012-07-18 62.9229, 134.1728 18.4 7.5 94 0.6 0.05 11.9 3.8 82.9LR2012-11 AR 2012-07-18 62.7106, 134.6952 18.5 7.3 99 0.7 0.05 11.4 3.0 77.0 0.47 0.08 0.27 0.04LR2012-13 AR 2012-07-19 62.6383, 134.9219 19.1 7.7 86 0.8 0.06 11.3 3.2 80.9 0.48 0.08 0.26 0.04LR2012-22 AR 2012-07-21 63.4382, 129.6667 19.2 6.8 105 1.1 0.06 11.8 3.2 73.9LR2013-38 AR 2013-06-12 63.4339, 129.6398 10.9 7.4 86 0.8 0.04 12.3 2.3 61.7LR2013-40 VR 2013-06-13 64.3280, 126.3720 17.9 7.2 140 0.7 0.29 24.3 0.3 63.1LR2013-59 VR 2013-06-22 63.8700, 125.1667 20 7.2 110 0.7 0.23 18.7 0.5 66.2 1.37 0.08 0.68 0.04LR2013-60 VR 2013-06-23 63.9089, 123.1457 19.4 7.2 110 0.3 0.21 17.0 0.5 65.9 1.23 0.09 0.68 0.06LR2013-62 VR 2013-06-23 63.7582, 121.5983 20 7.4 111 0.9 0.25 18.4 0.6 70.1 1.38 0.08 0.72 0.08LR2013-66 VR 2013-06-24 64.0530, 126.3720 19.4 7.4 112 0.7 0.24 18.2 0.4 63.3
LR2012-29 CSP 2012-07-25 61.1461, 126.8620 23.4 8.6 163 0.9 0.15 26.4 0.5 81.8 1.65 0.08 0.90 0.04LR2012-35 CSP 2012-07-28 61.1651, 126.9110 22.3 9.0 170 1.0 0.16 28.6 0.7 78.5LR2012-36 CSP 2012-07-28 61.1680, 126.8677 23.8 9.4 171 1.2 0.16 29.5 0.6 85.7LR2013-43 CSP 2013-06-14 66.7711, 123.3601 16.2 6.9 52 1.0 0.15 12.4 0.8 62.9 1.19 0.08 0.63 0.04LR2013-50 CSP 2013-06-16 67.8763, 123.0364 16.9 7.1 134 2.8 0.33 22.3 1.2 57.2 0.64 0.09 0.22 0.08LR2013-52 CSP 2013-06-17 67.2141, 123.1354 21.2 7.3 42 1.0 0.08 17.5 0.6 40.0 0.85 0.08 0.48 0.09LR2013-55 CSP 2013-06-21 64.9520, 124.5963 20.6 6.7 58 1.7 0.10 24.3 0.3 60.3 1.29 0.12 0.69 0.08LR2013-61 CSP 2013-06-23 63.7804, 121.5229 22.9 7.6 118 0.6 0.06 25.3 0.3 36.3 0.83 0.10 0.29 0.05LR2013-63 CSP 2013-06-24 64.0249, 123.8852 19.2 7.0 50 1.4 0.09 49.0 0.4 120.5 1.14 0.08 0.59 0.05LR2013-64 CSP 2013-06-24 64.0276, 124.0923 17.7 8.4 159 1.3 0.27 32.7 0.4 39.0LR2013-65 CSP 2013-06-24 64.0268, 124.3989 18.4 7.2 70 0.4 0.09 29.9 0.5 49.4LR2013-68 CSP 2013-06-26 64.1086, 126.7406 19.6 7.5 288 0.7 1.01 36.0 0.3 65.0LR2013-69 CSP 2013-06-26 63.9742, 127.0290 18.8 7.5 346 1.0 1.24 31.5 0.3 50.9 0.77 0.10 0.35 0.07LR2013-72 CSP 2013-06-27 63.4678, 128.7899 19.1 7.4 201 1.3 0.65 21.2 1.0 62.7 0.52 0.08 0.28 0.05LR2012-12 LAIRA 2012-07-19 62.6147, 134.9229 20.3 8.2 299 0.8 0.08 17.5 0.3 50.9 1.62 0.09 0.79 0.07LR2012-15 LAIRA 2012-07-19 62.9465, 134.0084 8.6 6.5 145 0.4 0.09 17.5 1.7 132.5LR2012-17 LAIRA 2012-07-20 63.0203, 133.4082 20.7 7.4 133 0.8 0.10 20.5 2.5 66.4 0.57 0.08 0.28 0.07LR2012-26 LAIRA 2012-07-24 61.9039, 129.8472 19 7.2 106 0.9 0.17 16.0 2.3 85.5 0.66 0.08 0.30 0.04LR2012-27 LAIRA 2012-07-24 61.2510, 128.7695 20.6 8.0 310 0.9 0.05 18.5 0.3 63.5LR2012-33 LAIRA 2012-07-27 60.5937, 124.2726 17.7 8.2 305 0.9 0.06 12.5 0.2 69.5 1.21 0.08 0.52 0.04LR2012-37 LAIRA 2012-07-29 61.1946, 128.2840 12.5 7.3 336 0.8 0.25 33.3 0.7 82.7 1.71 0.08 0.88 0.04LR2012-06 VMR 2012-07-16 63.3209, 131.9309 16.4 7.4 206 0.8 0.08 15.4 0.3 56.4LR2012-07 VMR 2012-07-17 63.2044, 133.2340 15.6 7.0 168 0.5 0.07 14.5 0.2 66.4 0.67 0.12 0.39 0.11LR2012-10 VMR 2012-07-18 62.7085, 134.7212 16.4 7.0 148 0.7 0.07 15.0 0.4 60.0 1.30 0.15 0.65 0.07LR2012-16 VMR 2012-07-20 63.1033, 134.0384 14.6 6.3 103 0.9 0.06 13.9 0.4 71.0 0.50 0.08 0.28 0.04LR2012-18 VMR 2012-07-20 63.3558, 131.7532 19.9 6.6 118 0.6 0.04 7.7 0.8 56.0LR2012-19 VMR 2012-07-20 63.3859, 133.1369 14.8 6.6 50 0.9 0.07 12.6 0.4 85.8LR2012-20 VMR 2012-07-20 63.3558, 131.7532 18 6.8 60 0.9 0.09 15.1 0.3 111.0LR2012-21 VMR 2012-07-21 63.3440, 130.3791 18.1 7.0 244 0.8 0.12 19.0 0.3 54.3 0.53 0.08 0.27 0.04LR2012-23 VMR 2012-07-21 63.4615, 129.5693 22.3 7.1 170 0.9 0.11 18.6 1.4 61.7 1.14 0.08 0.50 0.06LR2012-24 VMR 2012-07-21 63.5202, 129.3998 18.7 6.8 50 0.9 0.10 13.7 0.4 85.4 1.08 0.08 0.56 0.04LR2013-44 VMR 2013-06-15 68.7325, 124.0597 18.8 7.2 182 1.3 0.14 15.4 0.3 52.5 0.92 0.08 0.37 0.04LR2013-46 VMR 2013-06-15 68.3886, 123.9738 15.7 7.1 64 1.0 0.08 9.7 1.3 45.5 0.79 0.08 0.36 0.06LR2013-47 VMR 2013-06-16 68.0216, 123.4151 11.2 7.1 104 0.6 0.04 8.8 0.7 33.7LR2013-51 VMR 2013-06-17 67.2521, 123.4084 15.8 7.4 140 1.3 0.08 13.6 0.4 45.1 0.39 0.13 0.13 0.18LR2013-53 VMR 2013-06-18 66.2329, 124.1614 18.1 7.2 159 0.8 0.13 17.4 0.4 47.1 0.55 0.21 0.13 0.11LR2013-56 VMR 2013-06-21 65.0055, 124.9442 14.1 7.3 178 0.9 0.20 18.6 0.9 48.7 0.52 0.08 0.15 0.09LR2013-58 VMR 2013-06-22 64.6002, 125.7179 15.5 7.1 89 0.7 0.05 11.1 2.5 61.9 0.44 0.08 0.25 0.04LR2013-67 VMR 2013-06-26 64.1635, 126.9666 16.2 7.2 73 1.2 0.16 11.8 0.8 68.0LR2013-70 VMR 2013-06-26 64.0191, 127.3502 19.3 7.4 88 1.5 0.17 10.2 0.5 79.6 1.48 0.12 0.82 0.05LR2013-74 VMR 2013-06-27 63.5203, 128.8318 17 7.8 93 0.9 0.13 16.7 0.3 55.0 0.66 0.08 0.31 0.04LR2013-76 VMR 2013-06-28 63.5221, 129.3963 14.8 7.5 49 1.0 0.09 11.4 0.4 73.3LR2013-77 VMR 2013-06-28 63.4681, 129.5942 15.3 7.6 206 1.0 0.16 21.4 0.4 51.8
a is from Kutscher et al. 2017
Mainstream and major tributaries
Other tributaries
Table 1 Summary of temperature, pH, ions and Si isotope values of samples in July 2012 and June 2013. LR=the Lena River, AR=the Aldan River, VR=the Viliui River, CSP= Central Siberian Plateau, LAIRA=Lena-Amganski Inter-River Area, VMR=Verkhoyansk Mountain Range.
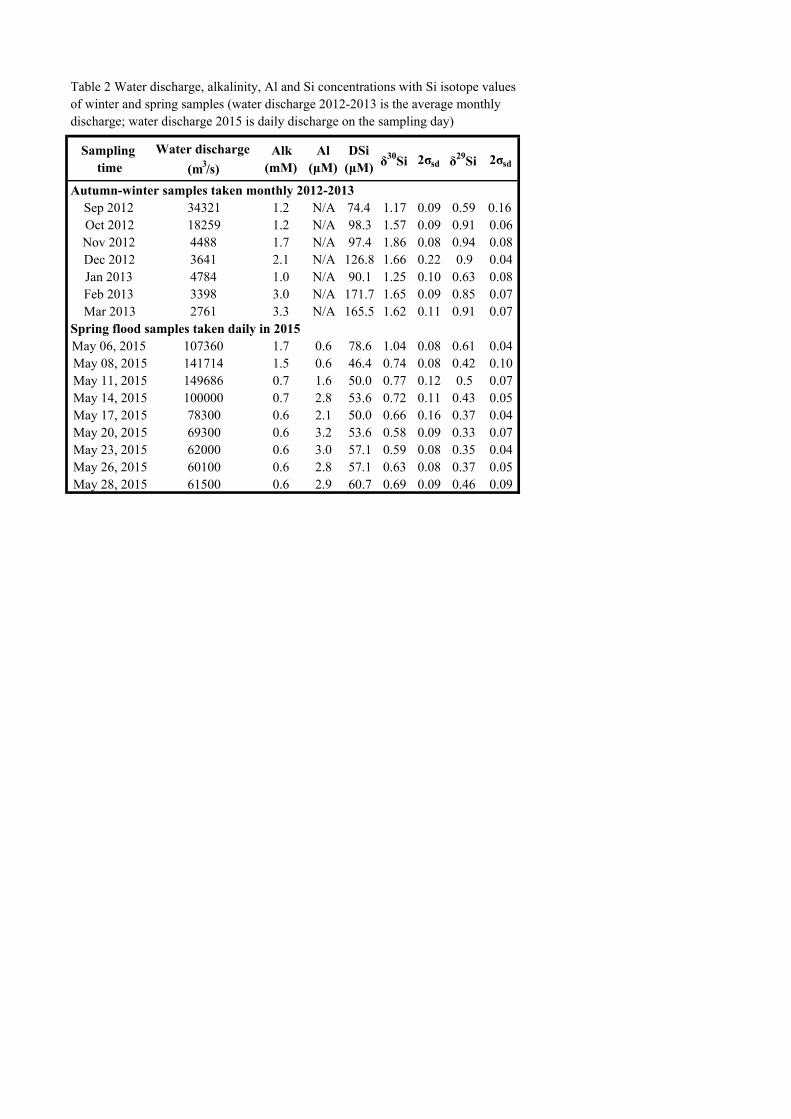
Sampling time
Water discharge (m3/s)
Alk (mM)
Al (µM)
DSi (µM) δ
30Si 2σsd δ29Si 2σsd
Autumn-winter samples taken monthly 2012-2013Sep 2012 34321 1.2 N/A 74.4 1.17 0.09 0.59 0.16Oct 2012 18259 1.2 N/A 98.3 1.57 0.09 0.91 0.06Nov 2012 4488 1.7 N/A 97.4 1.86 0.08 0.94 0.08Dec 2012 3641 2.1 N/A 126.8 1.66 0.22 0.9 0.04Jan 2013 4784 1.0 N/A 90.1 1.25 0.10 0.63 0.08Feb 2013 3398 3.0 N/A 171.7 1.65 0.09 0.85 0.07Mar 2013 2761 3.3 N/A 165.5 1.62 0.11 0.91 0.07
Spring flood samples taken daily in 2015May 06, 2015 107360 1.7 0.6 78.6 1.04 0.08 0.61 0.04May 08, 2015 141714 1.5 0.6 46.4 0.74 0.08 0.42 0.10May 11, 2015 149686 0.7 1.6 50.0 0.77 0.12 0.5 0.07May 14, 2015 100000 0.7 2.8 53.6 0.72 0.11 0.43 0.05May 17, 2015 78300 0.6 2.1 50.0 0.66 0.16 0.37 0.04May 20, 2015 69300 0.6 3.2 53.6 0.58 0.09 0.33 0.07May 23, 2015 62000 0.6 3.0 57.1 0.59 0.08 0.35 0.04May 26, 2015 60100 0.6 2.8 57.1 0.63 0.08 0.37 0.05May 28, 2015 61500 0.6 2.9 60.7 0.69 0.09 0.46 0.09
Table 2 Water discharge, alkalinity, Al and Si concentrations with Si isotope values of winter and spring samples (water discharge 2012-2013 is the average monthly discharge; water discharge 2015 is daily discharge on the sampling day)
Appendix
Stable Silicon Isotopic Compositions of the Lena River and its Tributaries: Implications for Silicon Delivery to the Arctic Ocean
Xiaole Sun, Carl-Magnus Mörth, Don Porcelli, Liselott Kutscher, Catherine Hirst, Melissa Murphy, Trofim Maximov, Roman E. Petrov, Christoph Humborg, Melanie Schmitt, Per S. Andersson
Figure A1 Three Si isotope plot of Si standards and the samples in this study
Table A1 The seasonal water discharge and DSi concentrations of the Lena River used for the Si flux-weighed annual δ30SiDSi value. The days of spring, summer and winter are counted as 61, 123 and 181 days, respectively (Data source: http://www.arcticgreatrivers.org/data.html).
Water discharge of the Lena River (m3/s) Year Spring Summer Winter 2010 37576 26588 3169 2011 35103 24143 4257 2012 47014 31322 3470 2013 47618 32902 3825 2014 51927 26438 N/A
Average 43847.6 28278.6 3680.3 DSi concentrations of the Lena River (µM)
Year Spring Summer Winter 2010 59.4 71.9 101.6 2011 52.1 81.3 103.1 2012 51.6 N/A 119.3 2013 42.2 164.1 241.7
-12
-8
-4
0
4
-6 -4 -2 0 2
δ30 S
i (‰
)
δ29Si (‰)
IRMM-18Big BatchDiatomiteALOHA1000Lena River
y=1.96x R
2=0.998

Appendix
2014 123.4 141.4 N/A Average 65.7 114.6 141.4
Total DSi flow (mol/season) 15189.6 34454.4 8138.4 Contribution percentage (%) 26 60 14