spillover effects of ingredient branded strategies on brand choice: a field study
TRANSCRIPT
Spillover effects of ingredient branded strategieson brand choice: A field study
Vanitha Swaminathan & Srinivas K. Reddy &
Sara Loughran Dommer
Published online: 21 October 2011# Springer Science+Business Media, LLC 2011
Abstract Ingredient branding, or the use of two or more brand names on a singleproduct, is widely seen as providing significant benefits in terms of increasedproduct differentiation and greater market share. The association between two brandnames can both enhance and dilute the brand equity of the host brand name and theingredient brand name. This research examines the behavioral spillover effectsassociated with cobranded strategies across segments of consumers that vary in theirprior brand commitment or loyalty. Different from previous research, this paper usesA.C. Nielsen scanner panel data to investigate the behavioral spillover effects ofingredient branded products on choice of the host and ingredient brands in a fieldsetting. The results suggest that there is a significant behavioral spillover impact oftrial of the cobranded product on the purchase probability of both the host andingredient brands. This effect is greater among prior non-loyal users and prior non-users of the host and ingredient brands and when there is a higher degree ofperceived fit between the host and ingredient brands.
Keywords Ingredient branding . Cobranding . Brand commitment . Brand loyalty
Mark Lett (2012) 23:237–251DOI 10.1007/s11002-011-9150-5
V. Swaminathan (*)Katz Graduate School of Management, University of Pittsburgh, Pittsburgh, PA 15260, USAe-mail: [email protected]
S. K. ReddyCenter for Marketing Excellence, Lee Kong Chian School of Business, Singapore ManagementUniversity, 50 Stamford Road, #05-01, Singapore 178899, Singaporee-mail: [email protected]
S. L. DommerJoseph M. Katz Graduate School of Business, University of Pittsburgh, 245 Mervis Hall, Pittsburgh,PA 15260, USAe-mail: [email protected]
1 Introduction
In 2000, accidents involving Firestone tire-equipped Ford Explorers accounted formost of the 174 deaths and more than 700 injuries that prompted Firestone’s $3billion recall of its 15-in. SUV tires. Interestingly, following the recall, 33% of non-Ford owners said that their opinion of Ford dropped after the announcement of thetire replacement program, while 86% of current owners reported same or betteropinions of Ford after the announcement (Connelly 2001). Thus, anecdotally itappears that the spillover effect of Firestone’s recall on attitudes toward Ford variedbased on consumers’ prior commitment and loyalty.
There is research demonstrating the impact of cobranded strategies on brand attitudesand loyalty toward the original brands which is referred to in the literature as spillovereffects (Desai and Keller 2002; Kumar 2005; Park et al. 1996; Rao et al. 1999;Simonin and Ruth 1998; Voss and Gammoh 2004). A majority of this research focuseson brands in the partnership and only considers consumers in the aggregate. Forinstance, we know that whether the brands are complementary (Park et al. 1996), thetype of ingredient branding strategies (Desai and Keller 2002), the extent to which thebrands signal quality (Rao et al. 1999), brand familiarity (Simonin and Ruth 1998),and the number of cobranded partnerships (Voss and Gammoh 2004) can all affectconsumers’ attitudes toward the cobranded product. Thus, while we know a lot abouthow brand attributes moderate the spillover effects of a cobranded relationship, weknow much less about how consumer attributes moderate such spillover effects.
Different from previous work, we examine how spillover effects vary based onprior usage or loyalty toward each of the partner brands in the cobrand. It is likelythat a cobranded product does not have similar effects on all consumers. Because acobranded product can appeal to new target segments through the addition of asecondary partner brand, the spillover effects among non-users could capture the roleof the cobrand in attracting new users. Further, cobranded products could alsoincrease penetration or usage among existing target segments, by providing uniqueflavors or variants that may appeal to variety-seeking loyal users. Thus,understanding the role of consumer prior usage in moderating the spillover effectscould add rich insights into the mechanisms by which cobranded products contributeto brand equity.
Specifically, we look at a special case of cobranding known as ingredientbranding. Cobranding traditionally involves pairing two or more branded productstogether to form a separate and unique product (Park et al. 1996). Ingredientbranding is a special case of cobranding where a host brand is combined with abranded ingredient, not to form a separate product but to enhance the host brandproduct. The host brand typically refers to the primary product within which theingredient brand resides. For instance, in the cobranded Ben and Jerry’s and Heathice cream, Ben and Jerry’s is the host and Heath candy is the ingredient. There arevarious strategic advantages of this strategy for both the host and the ingredientincluding brand recognition, product differentiation, and greater market share. Theaddition of branded ingredients can result in market share increases for both host andingredient brands. For example, brand names such as Intel, Gore-Tex, Microban, andNutraSweet achieved prominence primarily due to their use of ingredient brandedstrategies (Kotler and Pfoertsch 2010).
238 Mark Lett (2012) 23:237–251
In addition to addressing an important practical and theoretical gap in theliterature by examining how spillover effects vary by usage of and loyaltytoward the partnered brands in ingredient branded strategies, we also contributeto the extant literature by examining the moderating effect of fit between thebrands, as well as testing our hypotheses in a field study of actual behavior, asopposed to an artificial laboratory setting. This latter point is especiallyimportant since the bulk of cobranding research has been conducted in a labsetting using hypothetical examples (Desai and Keller 2002; Kumar 2005; Parket al. 1996; Rao et al. 1999; Simonin and Ruth 1998; Voss and Gammoh 2004).The disadvantage of this approach is that it precludes the ability to examine bothshort-run and long-run consequences of cobranded alliances. The present workcontributes to extant knowledge regarding brand alliances by investigating thespillover effects of ingredient branded strategies in a field setting using A.C.Nielsen scanner panel data. The use of scanner panel data allows us to examine thebehavioral spillover effects of ingredient branded strategies. Behavioral spillovereffects involve the purchase of the host or ingredient brand following the trialpurchase of the cobranded product. In other words, we examine how consumersbehave differently following trial of the cobranded product and how such behaviorvaries across segments of prior users and prior non-users. The importance ofproduct experience (i.e., trial of the cobranded product) is summarized by Smithand Swinyard (1982, p. 84) who suggest, “information gained through directexperience is not subjected to the same level of counterarguing, source derogation,message rejection [as information from advertising]. Accordingly, the resultingbeliefs are stronger, more confidently held, generating a powerful information basefor attitudinal development.” Therefore, examining spillover effects using actualchoice data more accurately represents real-world effects.
2 Theoretical background
The spillover impact of cobranded strategies has been investigated previouslyprimarily with a focus on brand attributes. For example, Park et al. (1996)found that there was a differential spillover effect of the alliance on the partnerbrands with the dominant partner brand receiving a greater impact than the lessdominant partner in a cobranded relationship. Simonin and Ruth (1998) found thatthe brand alliance exerted greater spillover effects on the unfamiliar brand than onthe familiar brand. As noted previously, our research examines how consumerattributes, such as prior usage and loyalty, contribute to future purchases of thehost and ingredient brands. Thus, we define behavioral spillover effects as thepurchase of either the host or ingredient brand following trial of the cobrandedproduct.
Trial of the cobranded product furnishes new information concerning the hostand the ingredient brands. Consumers are known to rely more on informationprovided by product experience than information obtained from other sources(Kempf and Smith 1998). Specifically, the trial of the cobranded product is likelyto have differential behavioral spillover effects on consumers based upon theirdegree of prior experience with the host and ingredient brands. Among prior non-
Mark Lett (2012) 23:237–251 239239
users or among prior non-loyal users of the host and the ingredient brands,consumers’ knowledge structures of the host brands and the ingredient brands arelikely to be less extensive. Under these conditions of limited prior knowledge, thenew information provided by the trial of the cobranded product is likely to havegreater diagnosticity (Fazio et al. 1989). Information that is more diagnostic carriesmore weight and has greater impact (Anderson 1981). Therefore, among prior non-users and among prior non-loyal users, brand alliance information is likely to exertstrong behavioral spillover effects on perceptions of the partner brands.Conversely, since prior loyal users have a higher level of prior experience withthe parent brand and thus well-developed sets of associations (Keller 1993), theadditional information provided by trial of the cobranded product is less diagnosticand has limited potential for behavioral spillover effects. In summary, thefollowing is hypothesized:
H1: Trial of a cobranded product is likely to have a significant behavioralspillover impact on purchase of both the host and ingredient brands, particularlyamong prior non-users or prior non-loyal users of the host and ingredientbrands.
One likely moderator of the behavioral spillover effects among prior users isthe similarity of the host and ingredient to the cobranded product. The role ofperceived fit between the brands, or the similarity between brand images andcategories, in a cobranded alliance has been investigated previously (Park et al.1996; Simonin and Ruth 1998). Park et al. (1996) suggest that attribute-levelcomplementarity is a critical factor influencing the success of cobranded products,where complementarity is judged by the presence of each partner brandcompensating for the attribute weaknesses of the other. Simonin and Ruth (1998)investigate the role of overall product and brand fit in enhancing evaluations ofbrand alliances.
While previous research has focused primarily on the role of perceived fit inenhancing cobranded product attitude (the forward transfer of associations), its rolein moderating spillover effects has not been evaluated previously.1 There isconsiderable theoretical support for the role of perceived fit in moderating thespillover impact. According to the Feldman and Lynch model (1988), the likelihoodthat an input will be used in making a judgment depends partly on the diagnosticityof the input. An input is considered diagnostic if it helps assign a target into aparticular category, such as high or low quality. Using this perspective, consumersare likely to assume their favorable perceptions of a cobrand are more diagnostic formaking a judgment about the individual brands in the cobrand if the two brands aresimilar. From a diagnosticity perspective, therefore, the greater the fit of theingredient with the host brand, the more informative is a piece of informationregarding the cobranded product in influencing the perception of the partner brands.Categorization theory also suggests that the degree to which a new instance fits withthe existing category knowledge will influence the degree to which existing brand
1 Simonin and Ruth (1998) do not explicitly manipulate perceived fit but instead measure the extent ofperceived fit and incorporate this as a covariate.
240 Mark Lett (2012) 23:237–251
beliefs are changed by new information (Weber and Crocker 1983). Consistent withthis, we propose the following:
H2: Trial of the cobranded product is likely to have a greater behavioralspillover impact on purchase of both the host and ingredient brands when theingredient has a greater degree of fit with the host brand.
3 Method
This research examines the behavioral spillover effects of ingredient brandedstrategies in a field setting using household scanner panel data. This dataset wasobtained specifically for this research. The dataset includes a product category wherea brand simultaneously introduced three ingredient branded products as lineextensions to its original brand. All three cobranded products have “stand-alone”ingredients.2 An example of such a brand introduction may be Betty Crocker cakemix introducing a premium line of cake mixes with multiple ingredient brands suchas Hershey’s and Sunkist.
Each of the cobranded products has two brand names. One of the partner brandnames (the host brand) is common across all three cobranded products. The commonhost brand is labeled HB and is the dominant partner as judged by order ofpresentation of names and prominence on packaging. The ingredient parent brandsare labeled IBA, IBB, and IBC, respectively. IBA and IBB belong to the same foodscategory (but distinct from the category where the cobrand is introduced), whereasthe third ingredient IBC has a large presence in another foods category (also distinctfrom the category of the cobranded product). The dataset consists of household-levelscanner panel data for the entire product category for approximately 18 months priorto introduction of the ingredient branded line extensions and for 1 year followingintroduction. While it was desirable to obtain data for a longer time period than1 year following introduction, given the short interpurchase times in this category(approximately 30 days), the 1-year time period post-introduction was deemedsufficient to examine the behavioral spillover effects. The names of the brands andcategories used in the data are masked to provide anonymity.
A brief overview of the three categories (one host and two ingredient categories)follows. The host category had an average interpurchase time (in days) of 29, 36national brands (with greater than .5% market share), and an average price in centsper gram/ounce of 50. The host brand had a market share of 11%. The secondproduct category (of which ingredient brands IBA and IBB were a part) had aninterpurchase time (in days), 30 major brands, and an average price in cents per gramof 173. The ingredient parent brand A had a market share of 10% while theingredient parent brand B had a market share of 8%. The category of the thirdingredient branded product had an interpurchase time of 34 days, 20 major brands,
2 Hershey’s may be viewed as a “stand-alone” ingredient because it has an independent presence in itsown category and sells directly to consumers. In contrast, Intel does not have an independent presence andcannot sell directly to the consumer.
Mark Lett (2012) 23:237–251 241241
and an average price in cents per gram of 226. The market share of ingredient parentbrands was 10%.
3.1 Model development
A logit choice model is a reasonable approach to capture the behavioral spillovereffects associated with the purchase of the cobranded product. To estimate a modelof household choice behavior, however, extensive information regarding marketingmix variables (e.g., price, promotion) for the entire set of competitors is necessary.Our dataset contains price and promotional information regarding the specific brandpurchased on any given choice occasion, but the corresponding information forcompeting brands is unavailable. Some researchers using household-level scannerpanel data impute competitors’ prices from available information to create acompetitive scenario on every choice occasion. In our category, due to the largenumber of competing brands (approximately 30) and the fragmented nature of themarket, imputing competitive prices for each choice occasion is likely to contributeto considerable measurement error.
Our primary objective was to examine households’ propensities for purchasingthe host and ingredient brands (i.e., the behavioral spillover) following their choiceof the cobranded product. This is achieved by modeling with the unit of analysisbeing the household. To examine the spillover effects of prior trial of the cobrandedproduct, we created a dummy variable (SPILLOVER) which takes on the value 1 if ahousehold made a trial purchase during the first 6 months after the introduction ofthe cobranded product and remained 0 otherwise. Behavioral spillover effects of thehost and the ingredient brand are observed subsequent to the initial 6-month period(until the last week recorded in the dataset). Separate models were developed forhost and ingredient brands where the dependent variable is the purchase of theoriginal host (Ppur) or the ingredient brand (Cpur) during this subsequent time period.Further, these models were estimated both for prior users and non-users of the hostand the ingredient.3
In addition to the inclusion of the spillover effects variable, we included threevariables to control for the characteristics of the household that may have an impacton their decision to purchase the host and ingredient brands. These covariates werecarefully chosen to account for the main drivers of purchase following introductionof a new product. First was a variable that captured the household’s prior loyaltytoward the host (LOYHB) or ingredient brands (LOYIB). These variables representthe impact of brand loyalty, which is a significant factor in choice behavior(Guadagni et al. 1983). This is operationalized as a percentage of host/ingredientbrand purchases compared to the total purchases in the category prior to theintroduction of the cobranded product (Guadagni et al. 1983).4 The second variablewas the overall category usage, measured as the total number of category purchases
3 Prior users are defined as those having bought the original host or ingredient brand at least once prior tothe 6-month period in which the dependent variable Phpur was estimated. Prior non-users refer tohouseholds who did not purchase the original brands even once in the time period preceding the same 6-month period.4 Please note that in the model estimated for prior non-users, the prior loyalty variable is zero and istherefore not included.
242 Mark Lett (2012) 23:237–251
made in the host/ingredient category (TOTNUMh and TOTNUMi) by a givenhousehold. The probability of choosing the host or ingredient brands in theirrespective categories is likely to depend upon category usage (i.e., heavy users aremore likely to purchase the cobranded product). Prior research suggests that propensityto purchase a brand extension is influenced by category expertise (Smith and WhanPark 1992). The frequency of purchasing in a category or category usage is anindicator of the knowledge or expertise in a category (Alba and Hutchinson 1987).Given this, we control for category usage in our model. Third, the overall couponproneness of the household was included to account for households’ purchasing of theoriginal brands due to the promotions or coupons associated with these brands. This ismeasured as the ratio of total number of host/ingredient purchases made by thehousehold using a coupon divided by the total number of category purchases prior tothe introduction of the cobranded product (COUPPARh and COUPPARi).
Next we formally provide the behavioral spillover effects models for the host and theingredient brand. First, we describe the model for the host brand. Let Ph (pur host)=1 ifthe parent host was purchased by a household h between the seventh and 12th monthsafter the introduction of the cobranded product and Ph (pur host)=0 otherwise.
Ph pur hostð Þ ¼ expðuÞ=1þ expðuÞ ð1Þ
u ¼ b0 þ b1LOYHBh þ b2 SPILLOVERhð Þ þ b3 TOTNUMhð Þ þ b4 COUPPARhð Þ ð2Þ
LOYHB(h) Loyalty of household h toward the host brand prior to theintroduction of the cobranded product. Following previous work(Guadagni et al. 1983), loyalty was a percentage measure calculatedby dividing the number of host brand purchases by the totalpurchases made in the category
SPILLOVERh An indicator dummy which takes on the value 1 if the cobrandedproduct is purchased by a household h in the first 6 months afterintroduction and remains 0 otherwise
TOTNUMh Total number of category purchases made in the host category byhousehold h prior to the introduction of the cobranded product
COUPPARh Coupon proneness in the host category by household h prior to theintroduction of the cobranded product. Similar to previous research,this was measured by taking the total number of purchases made bya household h using a coupon divided by the total number ofcategory purchases made by the same household.
A similar model was tested for spillover effects in the ingredient category.Loyalty, total category purchases, spillover, and coupon proneness were measured inthe ingredient category in a manner similar to that of the host category. The modelfor spillover effects in the ingredient brand category is described as follows:
Ph pur ingð Þ ¼ expðzÞ=1þ expðzÞ ð3Þwhere z
¼ a0 þ a1LOYIBh þ a2 SPILLOVERhð Þ þ a3 TOTNUMhð Þ þ a4 COUPPARhð Þ
Mark Lett (2012) 23:237–251 243243
where Ph(pur ing)=1 if the ingredient parent brand was purchased by householdh between the seventh and 12th months after the introduction of the cobrandedproduct and Ph(pur ing)=0 otherwise.
Qualification criteria for households and setting product introduction dates Thescanner panel data allow us to investigate spillover effects at the household level. Tostudy the impact of a household’s purchase of the cobranded product on the originalbrands, we imposed some qualifying criteria on the households that were included.First, since the panel is comprised of households that enter and leave the panelcontinuously, we had to ensure that only those households that were present prior tothe introduction of the cobranded product and that were also present at least6 months following product introduction were included in the sample. This resultedin the creation of a static panel. Second, to test the hypothesized effects regardingprior loyalty, it was necessary to construct purchase histories on the households priorto the introduction of the cobranded product. Also, since we investigate spillovereffects on both the host and the ingredient brand, households making at least threepurchases in both the HB and IBi categories both before and after productintroduction were included in the analysis. Additionally, we included only thosehouseholds that had at least one opportunity to purchase in the 6-month time periodwhen spillover effects were measured (i.e., 7 to 12 months after introduction of thecobranded product). Since the new product introduction took place over a 5-weekperiod, the new product introduction date was allowed to vary by market and was setto the week prior to the date on which the first purchase of the product was recordedin a given market.
As the dependent variable in these spillover models is binary, we used a logisticregression to estimate the behavioral spillover effects models. The behavioral spilloverimpact is judged by the significance of the spillover effects variable. A chi-squarestatistic is used to gauge overall model fit. The results of the behavioral spillover effectmodels are presented in Tables 1 and 2.
3.2 Behavioral spillover effects on the host brand
Prior host users As can be seen in Table 1, trial of both cobrands A and B had asignificant impact on inducing trial of the parent host brand among prior users andthe trial of cobrand C was not significant. The odds ratio for the spillover effectsindicator was 1.751 in the case of the cobrand A (p<0.05) and 1.296 (p<0.10) in thecase of cobrand B. The estimated coefficient of spillover variable is the log of oddsratio between the group which tried the cobranded product and the group that did not(for cobrand A, it is 0.560). The odds ratio can be calculated by taking the exponentof the coefficient (e0.560=1.751). This suggests that triers of the cobranded productare 1.751 times more likely to purchase the host brand than non-triers. Or the oddsfor customers who have tried the cobranded product to purchase the host brand are75% higher than the odds for customers who did not try the cobranded product(1.751–1.000).
This indicates a strong behavioral spillover effect of prior cobrand trial onsubsequent purchase of host brand, thereby providing support for hypothesis 1.
244 Mark Lett (2012) 23:237–251
Regarding the control variables, the impact of loyalty toward the host brand and totalcategory experience was positive and significant (p<0.01) across all three cobrands.The coupon proneness in the host category was positive and significant in the case ofcobrands A and B (p<0.01). The overall model was significant for cobrands A andB (p<0.01) and cobrand C (p<0.05).
Prior host non-users The odds ratio for the spillover effects indicator was 2.135 inthe case of cobrand A and 2.932 in the case of cobrand B (p<0.01). This indicatesthat the odds of purchasing cobrand A and cobrand B among triers are 113% and193% higher than non-triers, respectively. The spillover effect variable was notsignificant among prior non-users of cobrand C. Across all three cases, the totalcategory experience variable was not significant. The coupon proneness variable waspositive and significant across all three cases (p<0.01). The overall model wassignificant for cobrands A and B (p<0.01) and cobrand C (p<0.05).
3.3 Behavioral spillover effects on the ingredient brands
Prior ingredient users The behavioral spillover effects of the trial of the cobrandedproduct in the ingredient categories are presented in Table 2. As can be seen inTable 2, among prior users of each of the ingredient brands, the loyalty toward the
Table 1 Spillover effects of trial of the cobranded product among prior users and prior non-users of thehost brand
Prior users Prior non-users
Cobrand A Cobrand B Cobrand C Cobrand A Cobrand B Cobrand C
Intercept −1.231a
(0.104)−1.224a
(0.104)−1.315a
(0.105)−1.651a
(0.112)−1.661a
(0.112)−1.418a
(0.111)
Loyalty (LOYHB) 7.575a (0.426) 7.604a (0.426) 8.004a (0.439)
1,948 2,006 2,992
Spillover effects indicator(SPILLOVER)
0.560a (0.218) 0.259a (0.144) 0.078 (0.239) 0.758a (0.362) 1.076a (0.251) −0.426 (0.756)
1.751 1.296 1.081 2.135 2.932 0.653
Total number of purchasesmade in category(TOTNUM)
0.014a (0.001) 0.01a (0.001) 0.016a (0.001) −0.002 (0.003) −0.003 (0.003) −0.005 (0.003)
1.014 1.010 1.016 0.997 0.997 0.995
Coupon proneness in thehost category(COUPPAR)
2.129a (1.057) 2.068a (1.058) 1.602 (1.108) 4.302a (1.451) 4.117a (1.460) 4.072a (1.489)
8.406 7.909 4.963 73.847 61.374 58.674
Sample size 3,235 3,235 3,170 2,475 2,475 2,305
Trial households 1,250 1,250 1,234 397 397 392
% Age correctly classified 69 69 69 84 84 83
% Concordant 76 76 76 51 50 52
−2 Log L 3,660(p<0.001)
3,664(p<0.001)
3,551(p<0.001)
2,166.232(p=0.004)
2,153.974(p=0.000)
2,091.209(p=0.012)
Figures in parentheses refer to standard errors. Figures in italics represent odds ratiosa Significant at the 1% level
Mark Lett (2012) 23:237–251 245245
ingredient brand in the respective parent categories was positive and significant(p<0.01) across all three cases. The spillover effects variable was not significantacross all three cases. The total number of category purchases was positive andsignificant at the 1% level among prior non-loyal users across all three cases. Thecoupon proneness variable was not significant across all three cases. The overallmodel was significant (p<0.01) across all three cases.
Prior ingredient non-users Among prior non-users of each of the ingredient brands,the spillover effects indicator variable was significant in enhancing the probability ofpurchasing the ingredient brands only for cobrand B (odds ratio=2.184). Thecategory experience variable was not significant across all three cases. The couponproneness variable was not significant across cobrands A and B but was significantfor the cobrand C (p<0.01).
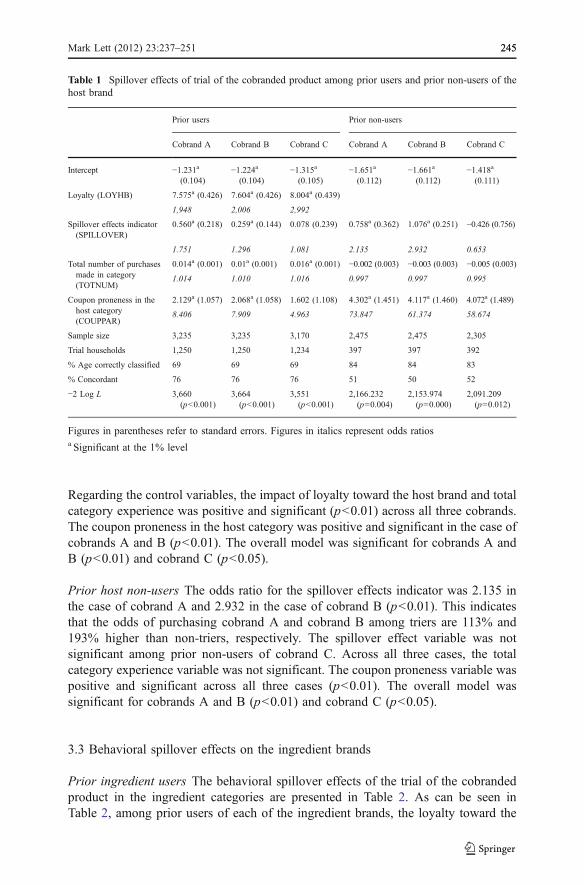
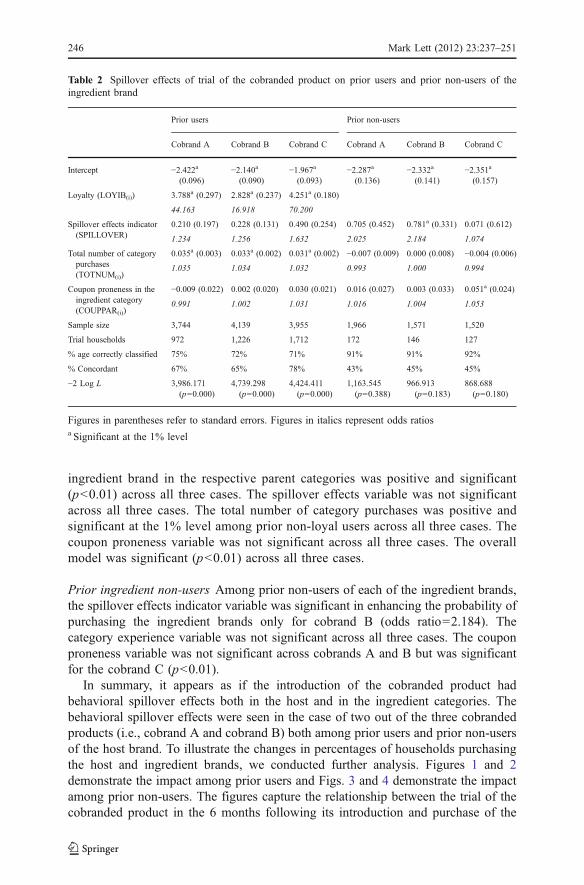
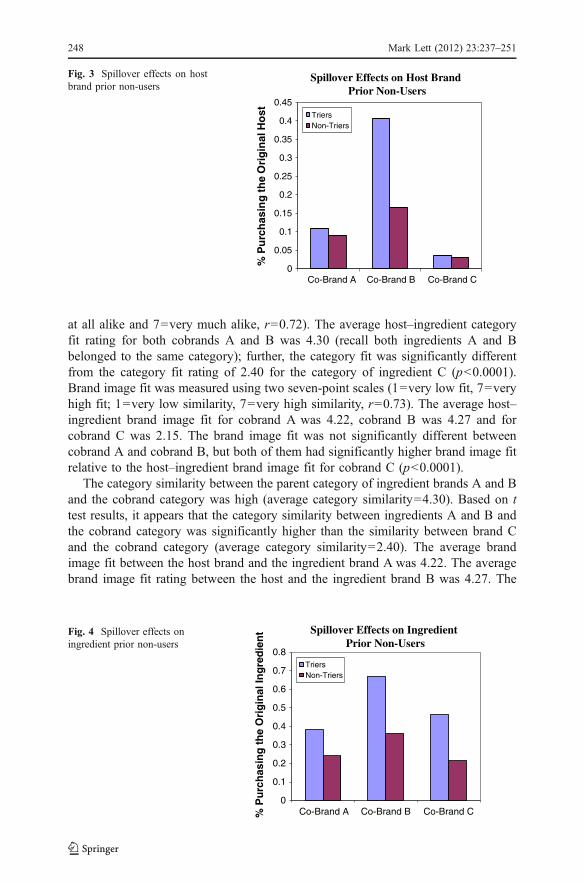
In summary, it appears as if the introduction of the cobranded product hadbehavioral spillover effects both in the host and in the ingredient categories. Thebehavioral spillover effects were seen in the case of two out of the three cobrandedproducts (i.e., cobrand A and cobrand B) both among prior users and prior non-usersof the host brand. To illustrate the changes in percentages of households purchasingthe host and ingredient brands, we conducted further analysis. Figures 1 and 2demonstrate the impact among prior users and Figs. 3 and 4 demonstrate the impactamong prior non-users. The figures capture the relationship between the trial of thecobranded product in the 6 months following its introduction and purchase of the
Table 2 Spillover effects of trial of the cobranded product on prior users and prior non-users of theingredient brand
Prior users Prior non-users
Cobrand A Cobrand B Cobrand C Cobrand A Cobrand B Cobrand C
Intercept −2.422a
(0.096)−2.140a
(0.090)−1.967a
(0.093)−2.287a
(0.136)−2.332a
(0.141)−2.351a
(0.157)
Loyalty (LOYIB(i)) 3.788a (0.297) 2.828a (0.237) 4.251a (0.180)
44.163 16.918 70.200
Spillover effects indicator(SPILLOVER)
0.210 (0.197) 0.228 (0.131) 0.490 (0.254) 0.705 (0.452) 0.781a (0.331) 0.071 (0.612)
1.234 1.256 1.632 2.025 2.184 1.074
Total number of categorypurchases(TOTNUM(i))
0.035a (0.003) 0.033a (0.002) 0.031a (0.002) −0.007 (0.009) 0.000 (0.008) −0.004 (0.006)
1.035 1.034 1.032 0.993 1.000 0.994
Coupon proneness in theingredient category(COUPPAR(i))
−0.009 (0.022) 0.002 (0.020) 0.030 (0.021) 0.016 (0.027) 0.003 (0.033) 0.051a (0.024)
0.991 1.002 1.031 1.016 1.004 1.053
Sample size 3,744 4,139 3,955 1,966 1,571 1,520
Trial households 972 1,226 1,712 172 146 127
% age correctly classified 75% 72% 71% 91% 91% 92%
% Concordant 67% 65% 78% 43% 45% 45%
−2 Log L 3,986.171(p=0.000)
4,739.298(p=0.000)
4,424.411(p=0.000)
1,163.545(p=0.388)
966.913(p=0.183)
868.688(p=0.180)
Figures in parentheses refer to standard errors. Figures in italics represent odds ratiosa Significant at the 1% level
246 Mark Lett (2012) 23:237–251
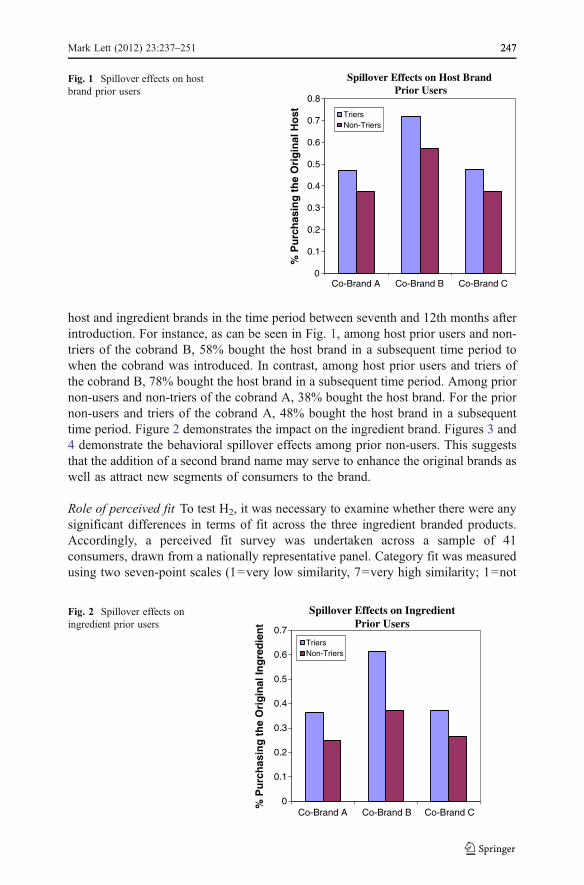
host and ingredient brands in the time period between seventh and 12th months afterintroduction. For instance, as can be seen in Fig. 1, among host prior users and non-triers of the cobrand B, 58% bought the host brand in a subsequent time period towhen the cobrand was introduced. In contrast, among host prior users and triers ofthe cobrand B, 78% bought the host brand in a subsequent time period. Among priornon-users and non-triers of the cobrand A, 38% bought the host brand. For the priornon-users and triers of the cobrand A, 48% bought the host brand in a subsequenttime period. Figure 2 demonstrates the impact on the ingredient brand. Figures 3 and4 demonstrate the behavioral spillover effects among prior non-users. This suggeststhat the addition of a second brand name may serve to enhance the original brands aswell as attract new segments of consumers to the brand.
Role of perceived fit To test H2, it was necessary to examine whether there were anysignificant differences in terms of fit across the three ingredient branded products.Accordingly, a perceived fit survey was undertaken across a sample of 41consumers, drawn from a nationally representative panel. Category fit was measuredusing two seven-point scales (1=very low similarity, 7=very high similarity; 1=not
Spillover Effects on Host Brand Prior Users
0
0.1
0.2
0.3
0.4
0.5
0.6
0.7
0.8
Co-Brand A Co-Brand B Co-Brand C %
Pu
rch
asin
g t
he
Ori
gin
al H
ost Triers
Non-Triers
Fig. 1 Spillover effects on hostbrand prior users
Spillover Effects on IngredientPrior Users
0
0.1
0.2
0.3
0.4
0.5
0.6
0.7
Co-Brand A Co-Brand B Co-Brand C
% P
urc
has
ing
th
e O
rig
inal
Ing
red
ien
t
Triers Non-Triers
Fig. 2 Spillover effects oningredient prior users
Mark Lett (2012) 23:237–251 247247
at all alike and 7=very much alike, r=0.72). The average host–ingredient categoryfit rating for both cobrands A and B was 4.30 (recall both ingredients A and Bbelonged to the same category); further, the category fit was significantly differentfrom the category fit rating of 2.40 for the category of ingredient C (p<0.0001).Brand image fit was measured using two seven-point scales (1=very low fit, 7=veryhigh fit; 1=very low similarity, 7=very high similarity, r=0.73). The average host–ingredient brand image fit for cobrand A was 4.22, cobrand B was 4.27 and forcobrand C was 2.15. The brand image fit was not significantly different betweencobrand A and cobrand B, but both of them had significantly higher brand image fitrelative to the host–ingredient brand image fit for cobrand C (p<0.0001).
The category similarity between the parent category of ingredient brands A and Band the cobrand category was high (average category similarity=4.30). Based on ttest results, it appears that the category similarity between ingredients A and B andthe cobrand category was significantly higher than the similarity between brand Cand the cobrand category (average category similarity=2.40). The average brandimage fit between the host brand and the ingredient brand A was 4.22. The averagebrand image fit rating between the host and the ingredient brand B was 4.27. The
Spillover Effects on Host Brand Prior Non-Users
0
0.05
0.1
0.15
0.2
0.25
0.3
0.35
0.4
0.45
Co-Brand A Co-Brand B Co-Brand C
% P
urc
has
ing
the
Ori
gin
al H
ost Triers
Non-Triers
Fig. 3 Spillover effects on hostbrand prior non-users
Spillover Effects on Ingredient Prior Non-Users
0
0.1
0.2
0.3
0.4
0.5
0.6
0.7
0.8
Co-Brand A Co-Brand B Co-Brand C% P
urc
has
ing
th
e O
rig
inal
Ing
red
ien
t
Triers Non-Triers
Fig. 4 Spillover effects oningredient prior non-users
248 Mark Lett (2012) 23:237–251
average brand image fit rating between the host and the ingredient brand C was 2.15.The differences in brand and category fit between brands A and B were notsignificant. Their ratings both in terms of category similarity and brand image fit,however, were significantly higher than those for brand C.
The behavioral spillover effect in the case of the host brand was only observed in twoout of three cases (cobrands A and B) where the perceived fit between brands wasrelatively high. Therefore, it appears that the reciprocal transfer of associationsfrom the cobrand to the host is moderated by the perceived fit between the hostand the ingredient brands. The less dominant ingredient brand also benefits fromthe introduction of the cobranded product, but the effect is seen only in one outof three cases. The spillover impact is obvious in the case of the cobrand B (i.e., ina situation where the perceived fit between the host and the ingredient categorieswas high and the resultant trial rate was higher than the trial rate of the cobrands Aand C). These findings offer support for H2.
Although not hypothesized, we also examined the role of prior experience withthe host and the ingredient brand on trial of the cobranded product (the forwardtransfer of associations). This is to be expected given the prior empirical work in thearea that shows that a positive attitude or familiarity with the host and the ingredientbrand has a positive effect on attitude toward the cobranded product (Park et al.1996; Simonin and Ruth 1998). To do this analysis, prior experience with the hostand ingredient brands were coded as dummy variables such that any experience withthe host brand in the 1-year time period preceding introduction of the cobrandedproduct was coded as a 1 and the dummy variable was zero otherwise. A similarvariable was created to capture the effect of prior experience with the ingredientbranded product. Across all three cobranded products, the impact of experience withthe host was significant at the 1% level. The impact of experience with the ingredientbrand was evident only in the case of the brand B.
Market share analysis What is the impact of introduction of the cobranded producton overall market share? To examine this, we analyzed the market share of the parentbrand before and after introduction of the cobrand, restricting the analysis to thosewho tried the cobranded product. Among prior users who tried the cobrandedproduct, there was no appreciable increase in market share of the parent brand afterthe introduction of the cobrand. This is understandable because the cobrand mayhave caused a reduction in market share in the parent brand due to cannibalization,which may have offset any increase in preference for the parent brand caused byintroduction of the cobrand. Among prior non-users, the introduction of the cobrandcaused a 6% increase in market share of the parent brand. Taken together, the marketshare of the parent brand increased by 2% in the overall sample (including both priorusers and prior non-users), following introduction of the cobrand. While this ismodest, it should be remembered that the category as a whole is large and consists ofvarious small brands. Therefore, relative to several brands in the category, a marketshare of 2% for the parent brand is considerable, given that we are only examiningthe category for the first year after the introduction of the cobrand. Further, thecobrand itself had a 7% market share among those who tried the cobrand. Similarly,among those who tried the cobranded product, there was a 2% increase in marketshare of the original ingredient brand of cobrand C, and there were no increases
Mark Lett (2012) 23:237–251 249249
evident for the ingredient brands A and B. Thus, consistent with the earlier analysis,the spillover impact of cobrand introduction on market share of the ingredient brandis minimal, with the exception of a small market share increase for cobrand C.
4 Discussion
This research examines the behavioral spillover effects of ingredient brandingstrategies. The existence of behavioral spillover among prior users suggests thatcobranding can enhance overall brand sales without incurring a risk of cannibalizingown brand sales. In other words, cobranded products provide an opportunity toposition each of the line extensions as distinct from one another for different marketsegments. These findings expand on research findings by Desai and Keller (2002)who show that cobranded ingredients can help the host in many ways (e.g., byintroducing new attributes into the product category and by expanding the usage ofthe host brand). They also build on previous work by Swaminathan et al. (2001) in abrand extension context. Further, our findings suggest that category and brand fitmay moderate the behavioral spillover impact of the cobranded product on futurepurchases of both the host and the ingredient brands. Although the use of a smallsample (n=41) for the perceived fit survey is a limitation, future research couldinvestigate the role of fit using a broader range of fit characteristics (e.g., attribute-level fit, image fit) and examine the impact on choice of a cobranded product usinglarger samples of consumers. Brand managers may need to identify ingredients thathave a higher degree of category and brand image fit with the parent to enhance thelikelihood of generating greater spillover effects. The findings from this researchalso provide insights relevant to cross-selling strategies. Recent research hasexamined cross-selling strategies (Li et al. 2005) and has explored various aspectsof multiple-category decision making (Russell et al. 1999). Researchers have alsofound that consumers exhibit similarities in their purchase behavior across productcategories, in terms of responsiveness to price and advertising (Ainslie and Rossi1998) as well as state dependence effects (Seetharaman et al. 1999). The presentresearch sheds some light on potential for cross-selling using cobranded products.
References
Ainslie, A., & Rossi, P. E. (1998). Similarities in choice behavior across product categories. MarketingScience, 17(2), 91–107.
Alba, J., & Hutchinson, J. W. (1987). Dimensions of consumer expertise. Journal of Consumer Research,13, 411–454.
Anderson, N. H. (1981). Foundations of information integration theory. New York: Academic.Connelly, M. (2001). Tire recall turns off non-Ford owners. Automotive News, 76(5947), 3.Desai, K. K., & Keller, K. L. (2002). The effects of ingredient branding strategies on host brand
extendibility. Journal of Marketing, 66(1), 73–93.Fazio, R. H., Powell, M. C., & Williams, C. J. (1989). The role of attitude accessibility in the attitude-to-
behavior process. Journal of Consumer Research, 16(December), 280–288.Feldman, J. M., & Lynch, J. G. (1988). Self-generated validity and other effects of measurement on belief,
attitude, intention, and behavior. Journal of Applied Psychology, 73(August), 421–435.Guadagni, P. M., & Little, J. D. C. (1983). A logit model of brand choice calibrated on scanner data.
Marketing Science, 2(3), 203–239.
250 Mark Lett (2012) 23:237–251
Keller, K. L. (1993). Conceptualizing, measuring, managing customer-based brand equity. Journal ofMarketing, 57(1), 1–22.
Kempf, D. S., & Smith, R. E. (1998). Consumer processing of product trial and the influence of prioradvertising: a structural modeling approach. Journal of Marketing Research, 35(3), 325–339.
Kotler, P., & Pfoertsch, W. (2010). Ingredient branding: making the invisible visible. Heidelberg: Springer.Kumar, P. (2005). The impact of cobranding on customer evaluation of brand counterextensions. Journal
of Marketing, 69(3), 1–18.Li, S., Sun, B., & Wilcox, R. T. (2005). Cross-selling sequentially ordered products: an application to
consumer banking services. Journal of Marketing Research, 42(2), 233–239.Park, C. W., Jun, S. Y., & Shocker, A. D. (1996). Composite branding alliances: an investigation of
extension and feedback effects. Journal of Marketing Research, 33, 453–467.Rao, A., Lu, Qu, & Ruekert, R. W. (1999). Brand alliances as information about unobservable product
quality. Journal of Marketing Research, 36(2), 258–268.Russell, G. J., Ratneshwar, S., Shocker, A. D., Bell, D., Bodapati, A., Degeratu, A., et al. (1999). Multiple-
category decision-making: review and synthesis. Marketing Letters, 10(3), 319–332.Seetharaman, P. B., Ainslie, A., & Chintagunta, P. K. (1999). Investigating household state dependence
effects across categories. Journal of Marketing Research, 36(4), 488–500.Simonin, B. L., & Ruth, J. A. (1998). Is a company known by the company it keeps? Assessing the
spillover effects of brand alliances. Journal of Marketing Research, 35(1), 30–42.Smith, R. E., & Swinyard, W. R. (1982). Information response models: an integrated approach. Journal of
Marketing, 46(Winter), 81–93.Smith, D. C., & Whan Park, C. (1992). The effects of brand extensions on market share and advertising
efficiency. Journal of Marketing Research, 29(August), 296–313.Swaminathan, V., Fox, R. J., & Reddy, S. K. (2001). The impact of brand extension introduction on choice
behavior. Journal of Marketing, 65(4), 1–14.Voss, K. E., & Gammoh, B. S. (2004). Building brands through brand alliances: does a second ally help?
Marketing Letters, 15(2/3), 147–159.Weber, R., & Crocker, J. (1983). Cognitive processes in revision of stereotypic beliefs. Journal of
Personality and Social Psychology, 45, 961–977.
Mark Lett (2012) 23:237–251 251251