spectrophotometric and lc determination of two binary mixtures containing antihistamins
TRANSCRIPT
Spectrophotometric and LC determination of two binary mixturescontaining antihistamins
Alaa El-Gindy *, Samy Emara, Ahmed Mostafa
Pharmaceutical Analytical Chemistry Department, Faculty of Pharmacy, Suez Canal University, Ismailia 41522, Egypt
Received 1 October 2003; accepted 9 April 2004
Available online 29 July 2004
Abstract
Several methods are developed for the determination of two binary mixtures containing cyclizine hydrochloride with pyridoxine HCl(mixture (mix.) 1); and cinnarizine with piracetam (mix. 2). The resolution of the two binary mixtures has been accomplished by usingnumerical spectrophotometric methods as partial least squares (PLS-1) and principal component regression applied to UV spectra of themixture and graphical spectrophotometric method as second derivative of the ratio spectra (2DD). In addition, HPLC methods were developeddepending on using RP18 column with mobile phase consisting of acetonitrile/0.05 M KH2PO4 (50:50, v/v, pH 4.0) with UV detection at239 nm for mix. 1, and mobile phase consisting of acetonitrile/0.05 M KH2PO4/triethylamine (50:50:0.2, v/v/v, pH 3.0) with UV detection at227 nm for mix. 2. The proposed methods were successfully applied for the determination of the two binary combinations in synthetic mixturesand commercial tablets.© 2004 Elsevier SAS. All rights reserved.
Keywords: Cyclizine; Pyridoxine; Cinnarizine; Piracetam; Chemometrics; Second derivative of the ratio spectra; Reversed phase HPLC
1. Introduction
Two binary mixtures are used to treat nausea and circula-tory disturbances, namely, cyclizine (CC) hydrochloridewith pyridoxine (PR) HCl (mixture (mix.) 1), and cinnarizine(CN) with piracetam (PC) (mix. 2), respectively. Mix. 1 is aneffective anti-emetic combination for preventing and control-ling nausea and vomiting due to a variety of conditions. CC isa piperazine derivative which has anti-emetic and antihista-minic properties. PR helps in treating nausea and vomiting.Mix. 2 improves cerebral metabolism. PC is a specific cere-bral metabolic enhancer acts at cerebral cell to improveglucose uptake and utilization. CN improves both peripheraland cerebral blood flow and prevents vasospastic attacks.Spectrophotomertic, densitometric and colorimetric methodsfor determination of CN in binary mixture of CN with PCwere reported [1]. No analytical method has been reportedfor the simultaneous determination of drugs in two studiedbinary mixtures. Simultaneous determination of CC with
ergotamine tartrate using HPLC [2] and dipipanone usingGC [3] were reported.
The greatest difficulties with UV–Visible, multidetermi-nation methods arise when the analytes to be determined givepartly or fully overlapped spectra, as the case with the ingre-dients of most pharmaceutical preparations. The applicationof multivariate calibration, such as partial least squares (PLS)to the absorbance signals produced by drugs during theirsimultaneous determination in pharmaceutical preparationsis an effective means for quality control of their manufacture[4]. Control analyses on pharmaceutical preparations usingmultivariate calibration method has been proved to be a validalternative to HPLC [5]. PLS is a multivariate calibrationmethod based on factor analysis [6]. The basic concept ofPLS regression was originally developed by the Wold [7]. Adetailed description of the mathematical principles of thePLS algorithms have been reported by Martens et al. [8].
The principal component regression (PCR) is simply aprincipal component analysis followed by a regression step[9]. PLS is related to PCR in that the spectral decompositionis also performed, but this decomposition step is performeddifferently. In PCR, the spectra are decomposed on the basisof the maximum variance between spectral data and informa-
* Corresponding author.E-mail address: [email protected] (A. El-Gindy).
IL FARMACO 59 (2004) 713–722
www.elsevier.com/locate/farmac
© 2004 Elsevier SAS. All rights reserved.doi:10.1016/j.farmac.2004.04.010
tion about the concentration is not used, while PLS use bothspectral data and concentration data in modeling [6]. Theutility of chemometrics-assisted spectrophotometry based onPLS and PCR regression for the multidetermination of drugcombinations has been published for determination of PRwith different drugs, such as vitamin B1 [10], metoclopra-mide HCl [11], diazepam [12], meclozine HCl [11], vitaminsB1, B2, B3 [13], vitamin B12, dexamethasone sodium phos-phate [14], vitamin B1, acetylsalicylic acid, caffeine [15],vitamins B1, B2, folic acid [16], vitamin B12, dexametha-sone sodium phosphate, piroxicam [17]. Also, simultaneousdetermination of CN and domperidone was carried out in abinary mixture using PLS and PCR calibration [18].
The performance of graphical methods such as zero-crossing and derivative ratio spectra with standardized divi-sor and numerical methods such as PLS and PCR for theresolution of binary mixtures was compared. Numericalmethods were found to be specially suited to multicompo-nent analysis, particularly for mixtures with highly over-lapped spectra [15]. The utility of graphical methods wasreported for the simultaneous determination of PR with dif-ferent drugs such as meclozine HCl using 2DD [11], melato-nin using first derivative of the ratio spectrophotometry [19]and codeine using first-derivative spectrofluorimetry [20]. Inaddition, simultaneous determination of CN and domperi-done was carried out in a binary mixture using derivativespectrophotometry [18], second derivative UV spectropho-tometry [21] and derivative ratio sepctrophotometry [22].
The UV absorption bands of CC and PC are overlappedwith PR and CN spectra, respectively. Therefore, the conven-tional UV method for the determination of CC or PC issusceptible to interference from PR and CN, respectively.This work concerns PLS, PCR, 2DD and HPLC methods forsimultaneous determination of CC with PR and CN with PC.The proposed methods reduced the duration of the analysis.They are simple, sensitive, and suitable for routine determi-nation of the components in the studied mixtures. The pro-posed HPLC methods were found to be more easier than thepublished chromatographic methods, whereas there is noneed for using internal standard while the other publishedchromatographic methods used internal standard such as,ethyl 4-aminobenzoate [2], methaqualone and prazepam [3].Also, the proposed methods were found to be more sensitivethan the published methods [2,16].
2. Experimental
2.1. Instrumentation
A double-beam Shimadzu (Japan) UV–Visible spectro-photometer, model UV-1601 PC equipped with 1-cm quartzcells and connected to an IBM compatible computer. HP600 inkjet printer was used. The bundled software wasUVPC personal spectroscopy software version 3.7 (Shi-madzu). The spectral bandwidth was 2 nm and the wave-length scanning speed was 1700 nm min–1. PLS and PCR
analysis were carried out by using PLS-Toolbox softwareversion 2.1—PC [23] for use with MATLAB5.
The HPLC (Shimadzu, Kyoto, Japan) instrument wasequipped with a model series LC-10 ADVP pump, SCL-10AVP system controller, DGU-12 A Degasser, Rheodyne7725i injector with a 20 µl loop and a SPD-10AVP UV–vis-ible detector, separation and quantitation were made on a250 × 4.6 mm (i.d.) Shim-pack RP18 column (4.6 µm particlesize). The detector was set at k 239 and 227 nm for mix. 1 andmix. 2, respectively. Data acquisition was performed onclass-VP software.
2.2. Materials and reagents
Pharmaceutical grade of CC, PR, CN and PC were usedand certified to contain 99.9%, 99.8%, 99.9% and 99.7%,respectively. Acetonitrile and methanol used were of HPLCgrade (BDH, Poole, UK). HCl and phosphoric acids usedwere of analytical grade.
The pharmaceutical combination of CC and PR (Emetrixtablets) was manufactured by AMOUN (EL-Obour city,Egypt). Each tablet contains 50 mg of CC and 30 mg of PR.The pharmaceutical combination of CN and PC (Cinaretamtablets) was manufactured by MISR pharmaceutical com-pany (Mataria, Cairo, Egypt). Each tablet contains 25 mg CNand 400 mg PC.
2.3. HPLC conditions
The mobile phase for mix. 1 was prepared by mixingacetonitrile/0.05 M KH2PO4 in a ratio of 50:50 (v/v) and theapparent pH was adjusted to 4 using phosphoric acid. Theflow rate was 1.5 ml min–1. The mobile phase for mix. 2 wasprepared by mixing acetonitrile/0.05 M KH2PO4/triethylamine in a ratio of 50:50:0.2 (v/v/v) and the pH wasadjusted to 3.0 using phosphoric acid. Flow rate was at 1.5 mlmin–1. All determinations were performed at ambient tem-perature. The injection volume was 20 µl.
2.4. Standard solutions and calibration
2.4.1. Mix. 1Stock standard solutions of each CC and PR were pre-
pared separately by dissolving 50 mg and 30 mg of CC andPR, respectively in 100 ml methanol.
The standard solutions were prepared by dilution of thestock standard solutions with 0.1 M HCl (for spectrophoto-metric methods) or mobile phase (for HPLC method) toreach the concentration range of 10–25 and 6–15 µg ml–1 forCC and PR, respectively.
2.4.1.1. PLS and PCR methods. A training set of 21 syn-thetic mixtures with different concentrations of CC and PR inrange 10–25 µg ml–1 for CC and 6–15 µg ml–1 for PR withinconcentration ratio ranged from 1:0.4 to 1:1.5 for CC/PRwere prepared in 0.1 M HCl.
The UV absorption spectra were recorded over the range220–270 nm. The data points of the spectra were collected at
714 A. El-Gindy et al. / IL FARMACO 59 (2004) 713–722
every 0.2 nm. The computations were made in PLS-Toolboxsoftware version 2.1.
PLS-1 and PCR models were applied to the UV absorp-tion spectra of these mixtures using three latent variables (orprincipal component) for determination of CC and PR.
2.4.1.2. HPLC method. Triplicate 20 µl injections were madefor each concentration and chromatographed under the speci-fied chromatographic conditions described previously. Thepeak area values were plotted against corresponding concen-trations. Linear relationship was obtained.
2.4.1.3. 2DD method.2.4.1.3.1. Determination of CC. The UV absorption
spectra of standard solutions of CC were divided by a nor-malized spectrum of PR (a spectrum of unit concentration).The second derivative was calculated for the obtained ratiospectra with nk = 2 nm. The second derivative of the ratiospectra obtained were smoothed with four experimentalpoints and scaling factor of 10. The amplitudes at 217 nmwere measured and found to be proportional to the concen-tration of CC.
2.4.1.3.2. Determination of PR. The UV absorption spec-tra of standard solutions of PR were divided by a normalizedspectrum of CC .The second derivative was calculated for theobtained ratio spectra with nk = 2 nm. The second derivativeof the ratio spectra obtained were smoothed with four experi-mental points and scaling factor of 10. The amplitudes at264.8 nm were measured and found to be proportional to theconcentration of PR.
2.4.2. Mix. 2Stock standard solution of each CN and PC were prepared
separately by dissolving 25 mg of CN and 400 mg of PC in100 ml methanol.
The standard solutions were prepared by dilution of thestock standard solutions with 0.1 M HCl (for spectrophoto-metric methods) or with mobile phase (for HPLC method) toreach the concentration range of 5–17.5 and 80–280 µg ml–1
for CN and PC, respectively.
2.4.2.1. PLS and PCR methods. A training set of 21 syn-thetic mixtures with different concentrations of CN and PC inrange 5–17.5 µg ml–1 for CN and 80–280 µg ml–1 for PCwithin concentration ratio ranged from 1:10 to 1:56 forCN/PC were prepared in 0.1 M HCl.
The UV absorption spectra were recorded over the range220–240 nm. The data points of the spectra were collected atevery 0.2 nm. The computations were made in PLS-Toolboxsoftware version 2.1.
PLS-1 and PCR models were applied to the UV absorp-tion spectra of these mixtures using two latent variables (orprincipal component) for determination of CN and PC.
2.4.2.2. HPLC method. Triplicate 20 µl injections were madefor each concentration and chromatographed under the speci-fied chromatographic conditions described previously. The
peak area values were plotted against corresponding concen-trations. Linear relationship was obtained.
2.4.2.3. 2DD method.2.4.2.3.1. Determination of CN. The UV absorption
spectra of standard solutions of CN were divided by a nor-malized spectrum of PC [a spectrum of unit concentration].The second derivative was calculated for the obtained ratiospectra with nk = 4 nm. The second derivative of the ratiospectra obtained were smoothed with eight experimentalpoints. The amplitudes at 241.4 nm were measured and foundto be proportional to the concentration of CN.
2.4.2.3.2. Determination of PC. The UV absorption spec-tra of standard solutions of PC were divided by a normalizedspectrum of CN. The second derivative was calculated for theobtained ratio spectra with nk = 4 nm. The second derivativeof the ratio spectra obtained was smoothed with eight experi-mental points and scaling factor of 10. The amplitudes at227.4 nm were measured and found to be proportional to theconcentration of PC.
2.5. Sample preparation
2.5.1. Mix. 1 tabletsTwenty tablets were weighed and finely powdered. A
portion of the powder equivalent to about 50 mg of CC and30 mg of PR was weighed accurately, dissolved and dilutedto 100 ml with methanol. The sample solution was filtered.Further dilution was carried out with 0.1 M HCl (for spectro-photometric method) or mobile phase (for HPLC method) toprovide a solution of 20 µg ml–1 of CC and 12 µg ml–1 of PR.The general procedures for PLS-1, PCR, 2DD and HPLCmethods described under calibration were followed and theconcentrations of CC and PR were calculated.
2.5.2. Mix. 2 tabletsTwenty tablets were weighed and finely powdered. A
portion of the powder equivalent to about 25 mg of CN and400 mg of PC was weighed accurately, dissolved and dilutedto 100 ml with methanol. The sample solution was filtered.Further dilution of the filtrate was carried out with 0.1 M HCl(for spectrophotometric methods) or mobile phase (forHPLC method) to provide a solution of 12.5 µg ml–1 of CNand 200 µg ml–1 of PC. The general procedures for PLS-1,PCR, 2DD and HPLC methods described under calibrationwere followed and the concentrations of CN and PR werecalculated.
3. Results and discussion
3.1. PLS and PCR methods
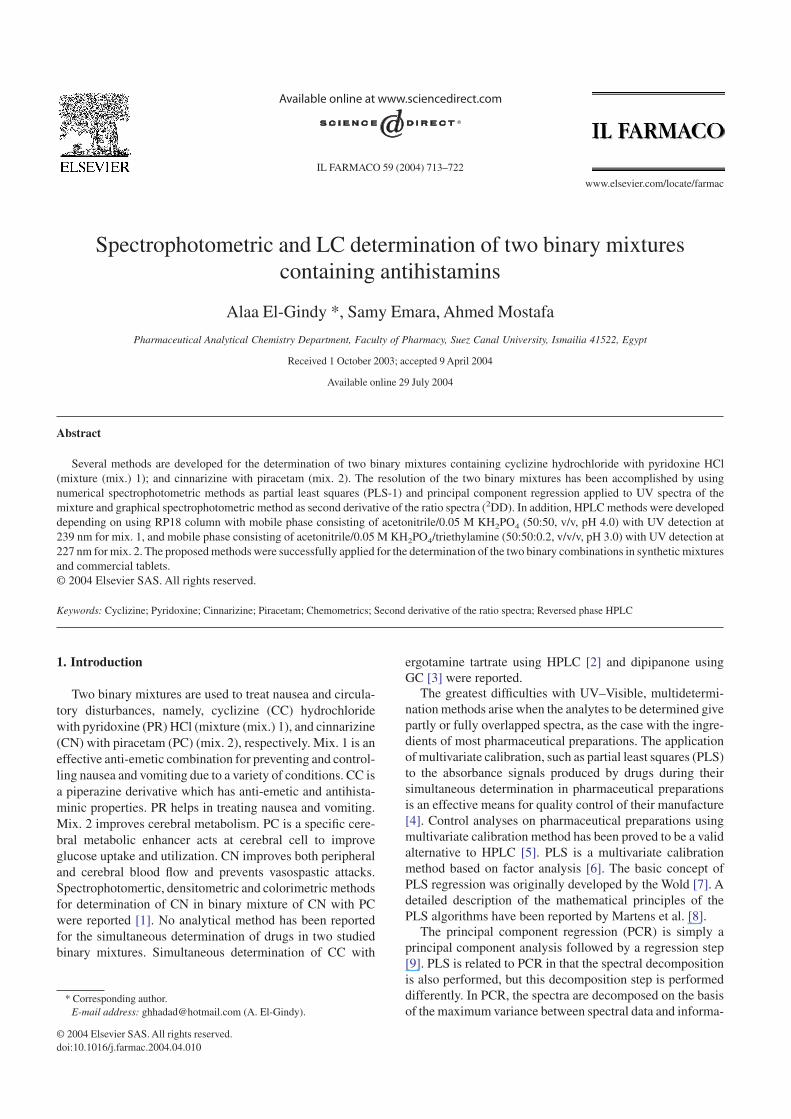
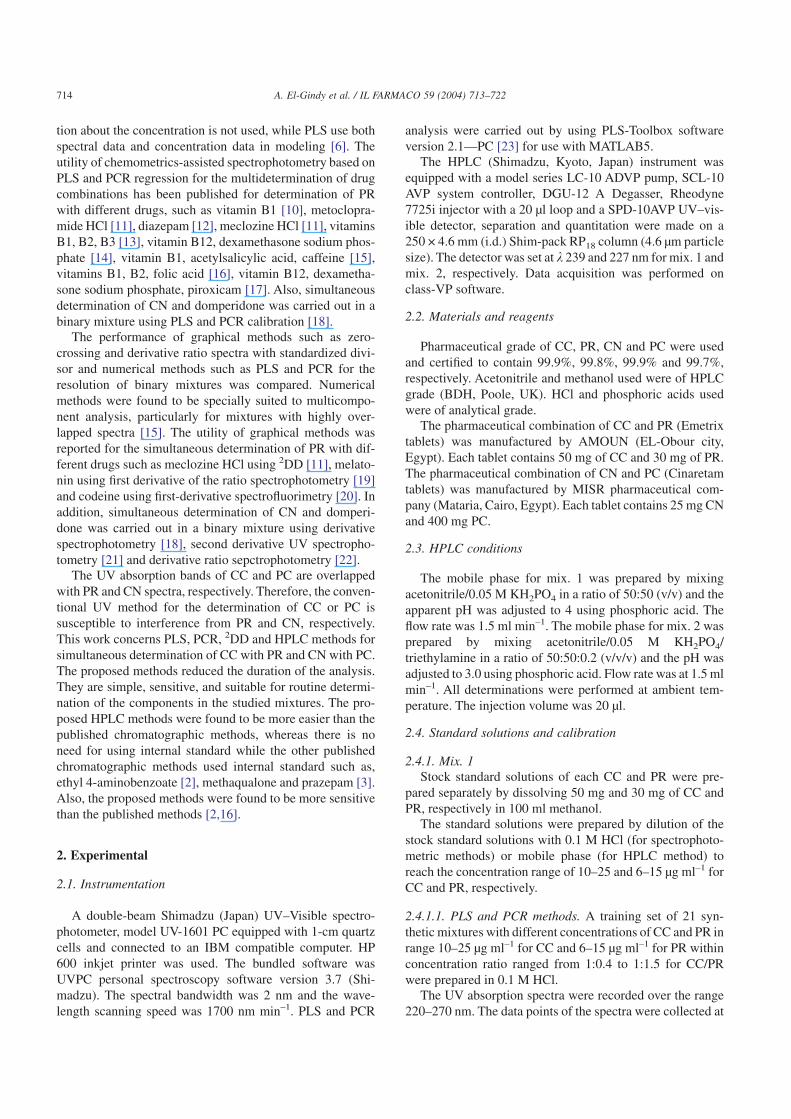
Figs. 1 and 2 show the UV absorption spectra of CC withPR and CN with PC, respectively, at their nominal concen-trations. As can be seen, the UV absorption bands of CC andPC are overlapped with PR and CN spectra, respectively. Theconventional UV method for the assay of CC or PC is sus-
715A. El-Gindy et al. / IL FARMACO 59 (2004) 713–722
ceptible to interference from PR and CN, respectively. PLSor PCR calibration methods can be used to overcome thisproblem. While, the UV spectra of PR and CN are notaffected by the presence of the second component. This is afavourable condition and conventional zero- order or directderivative methods could be applied for determination of PRand CN in the studied binary mixtures.
The quality of multicomponent analysis results is depen-dent on the wavelength range and spectral mode used [24].PLS procedures are designated to be full spectrum computa-
tional procedures; however, using highly noisy, scarcely in-formative wavelengths detracts from precision. Discardingparticularly noisy wavelengths can lessen this. This is quitesensible in UV–Visible spectrophotometry as the pure spec-tra of the analytes are very often available and the positionsof their bands are not usually greatly affected by the presenceof the excipients, so one can predict which spectral region inthe sample spectrum will contain the information relevant tothe analyte [5]. In this work, spectral resolution was assayedwith UV absorption spectra for PLS-1 and PCR methods,measured at 0.2-nm intervals over the range 220–270 nm and220–240 nm, for mix. 1 and 2, respectively.
To select the number of factors in the PLS-1 and PCRalgorithms, a cross-validation method leaving out onesample at a time was employed [25]. For a mentioned train-ing (calibration) set of 21 calibration spectra for each mix-ture, PLS-1 and PCR calibration on 20 calibration spectrawere performed and, using this calibration, the concentrationof the sample left out during the calibration process wasdetermined. This process was repeated 21 times until eachtraining sample had been left out once. The predicted con-centrations of the components in each sample were comparedwith the actual concentrations in this training samples andthe root mean square error of prediction (RMSEP) was cal-culated for each method as follows:
RMSEP = ��i = 1
N
(Ci – Ci)2
N
Where Ci is the true concentration of the component of
interest in the ith sample of the training set, Ci is the estimatedconcentration in µg ml–1 and N is the number of samples inthe training set [26]. The RMSEP was used as a diagnostictest for examining the errors in the predicted concentrations.It indicates both of the precision and accuracy of predictions.
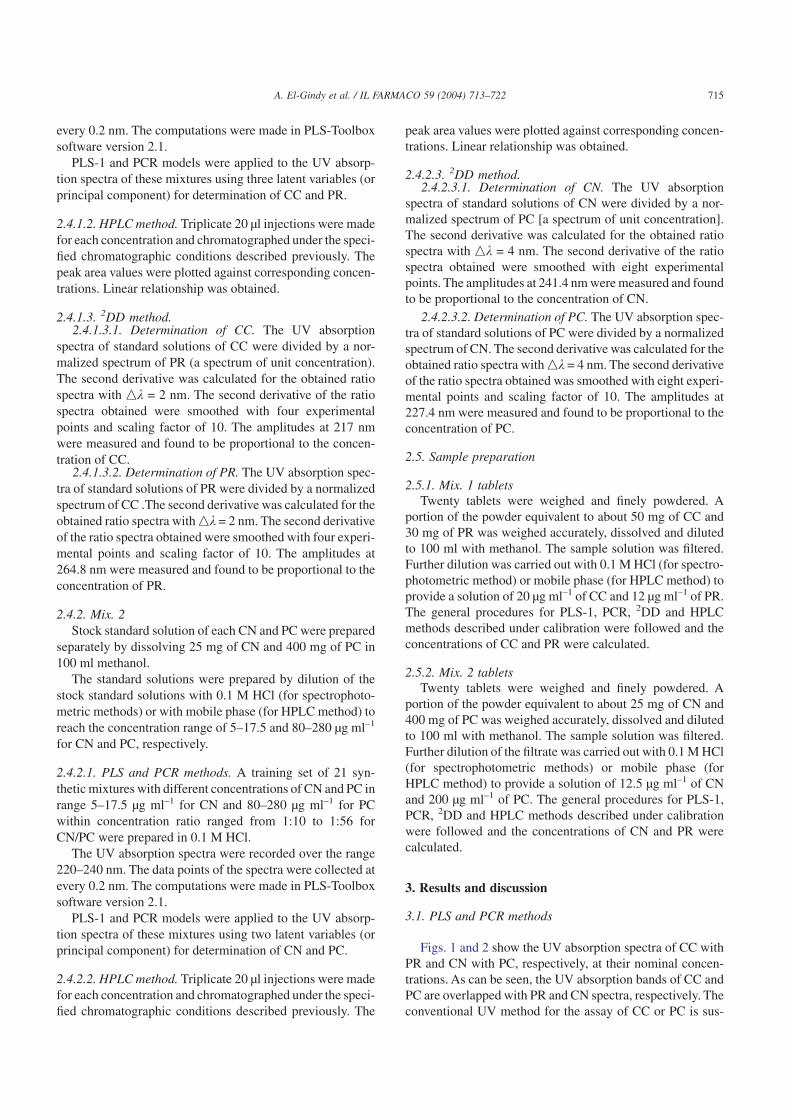
A number of factors of 3 and 2 were obtained as optimumfor mix. 1 and mix. 2, respectively, by the PLS-1 and PCRmethods. The RMSEP obtained by optimizing the calibrationmatrix of the absorption spectra for the PLS-1 and PCRmethods are shown in Table 1 indicating good accuracy andprecision. Satisfactory correlation coefficient (r) values be-tween actual and predicted concentrations are obtained forboth components in the training set by PLS-1 and PCRoptimized models (Table 1).
Fig. 1. UV absorption spectra of 20 µg ml–1 of CC HCl (––––) and 12 µgml–1 of PR HCl (------) in 0.1 M HCl.
Fig. 2. UV absorption spectra of 12.5 µg ml–1 of CN (–––––) and 200 µgml–1 of PC (--------) in 0.1 M HCl.
Table 1Cross-validation results for simultaneous determination of CC and PR; CNand PC by PLS-1 and PCR methods
RMSEP (r)PLS-1 PCR PLS-1 PCR
Mixture 1CC 0.153 0.151 0.9999 0.9999PR 0.101 0.098 0.9999 0.9999
Mixture 2CN 0.042 0.039 0.9999 0.9999PC 0.353 0.356 0.9999 0.9999
716 A. El-Gindy et al. / IL FARMACO 59 (2004) 713–722
3.2. HPLC method
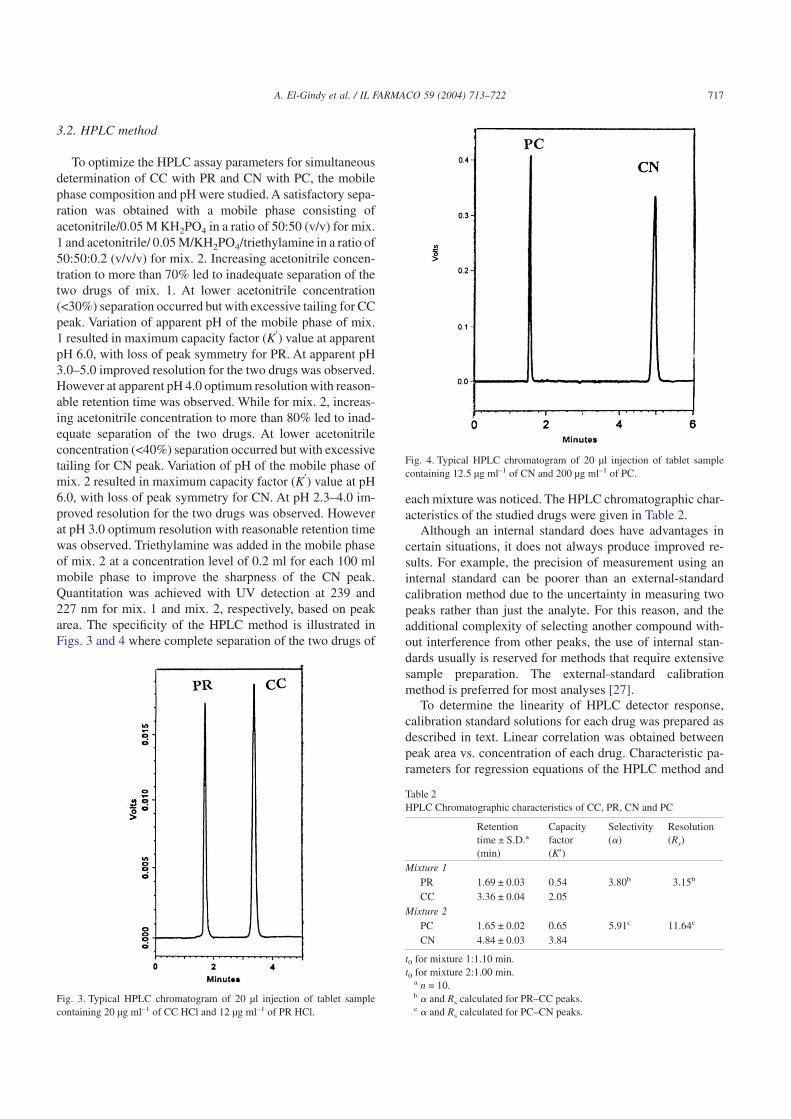
To optimize the HPLC assay parameters for simultaneousdetermination of CC with PR and CN with PC, the mobilephase composition and pH were studied. A satisfactory sepa-ration was obtained with a mobile phase consisting ofacetonitrile/0.05 M KH2PO4 in a ratio of 50:50 (v/v) for mix.1 and acetonitrile/ 0.05 M/KH2PO4/triethylamine in a ratio of50:50:0.2 (v/v/v) for mix. 2. Increasing acetonitrile concen-tration to more than 70% led to inadequate separation of thetwo drugs of mix. 1. At lower acetonitrile concentration(<30%) separation occurred but with excessive tailing for CCpeak. Variation of apparent pH of the mobile phase of mix.1 resulted in maximum capacity factor (K′) value at apparentpH 6.0, with loss of peak symmetry for PR. At apparent pH3.0–5.0 improved resolution for the two drugs was observed.However at apparent pH 4.0 optimum resolution with reason-able retention time was observed. While for mix. 2, increas-ing acetonitrile concentration to more than 80% led to inad-equate separation of the two drugs. At lower acetonitrileconcentration (<40%) separation occurred but with excessivetailing for CN peak. Variation of pH of the mobile phase ofmix. 2 resulted in maximum capacity factor (K′) value at pH6.0, with loss of peak symmetry for CN. At pH 2.3–4.0 im-proved resolution for the two drugs was observed. Howeverat pH 3.0 optimum resolution with reasonable retention timewas observed. Triethylamine was added in the mobile phaseof mix. 2 at a concentration level of 0.2 ml for each 100 mlmobile phase to improve the sharpness of the CN peak.Quantitation was achieved with UV detection at 239 and227 nm for mix. 1 and mix. 2, respectively, based on peakarea. The specificity of the HPLC method is illustrated inFigs. 3 and 4 where complete separation of the two drugs of
each mixture was noticed. The HPLC chromatographic char-acteristics of the studied drugs were given in Table 2.
Although an internal standard does have advantages incertain situations, it does not always produce improved re-sults. For example, the precision of measurement using aninternal standard can be poorer than an external-standardcalibration method due to the uncertainty in measuring twopeaks rather than just the analyte. For this reason, and theadditional complexity of selecting another compound with-out interference from other peaks, the use of internal stan-dards usually is reserved for methods that require extensivesample preparation. The external-standard calibrationmethod is preferred for most analyses [27].
To determine the linearity of HPLC detector response,calibration standard solutions for each drug was prepared asdescribed in text. Linear correlation was obtained betweenpeak area vs. concentration of each drug. Characteristic pa-rameters for regression equations of the HPLC method and
Fig. 3. Typical HPLC chromatogram of 20 µl injection of tablet samplecontaining 20 µg ml–1 of CC HCl and 12 µg ml–1 of PR HCl.
Fig. 4. Typical HPLC chromatogram of 20 µl injection of tablet samplecontaining 12.5 µg ml–1 of CN and 200 µg ml–1 of PC.
Table 2HPLC Chromatographic characteristics of CC, PR, CN and PC
Retentiontime ± S.D.a
(min)
Capacityfactor(K′)
Selectivity(�)
Resolution(Rs)
Mixture 1PR 1.69 ± 0.03 0.54 3.80b 3.15b
CC 3.36 ± 0.04 2.05Mixture 2
PC 1.65 ± 0.02 0.65 5.91c 11.64c
CN 4.84 ± 0.03 3.84
t0 for mixture 1:1.10 min.t0 for mixture 2:1.00 min.
a n = 10.b � and Rs calculated for PR–CC peaks.c � and Rs calculated for PC–CN peaks.
717A. El-Gindy et al. / IL FARMACO 59 (2004) 713–722
correlation coefficient obtained by least squares treatment ofthe results were given in Table 3.
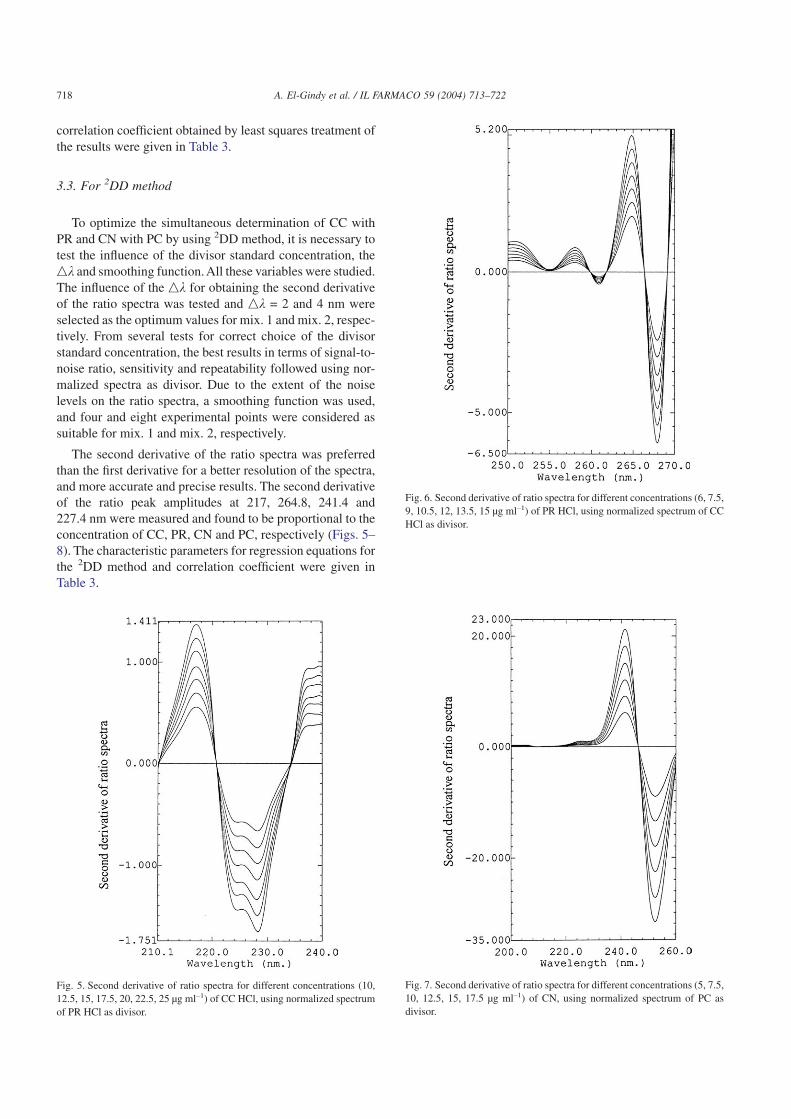
3.3. For 2DD method
To optimize the simultaneous determination of CC withPR and CN with PC by using 2DD method, it is necessary totest the influence of the divisor standard concentration, thenk and smoothing function. All these variables were studied.The influence of the nk for obtaining the second derivativeof the ratio spectra was tested and nk = 2 and 4 nm wereselected as the optimum values for mix. 1 and mix. 2, respec-tively. From several tests for correct choice of the divisorstandard concentration, the best results in terms of signal-to-noise ratio, sensitivity and repeatability followed using nor-malized spectra as divisor. Due to the extent of the noiselevels on the ratio spectra, a smoothing function was used,and four and eight experimental points were considered assuitable for mix. 1 and mix. 2, respectively.
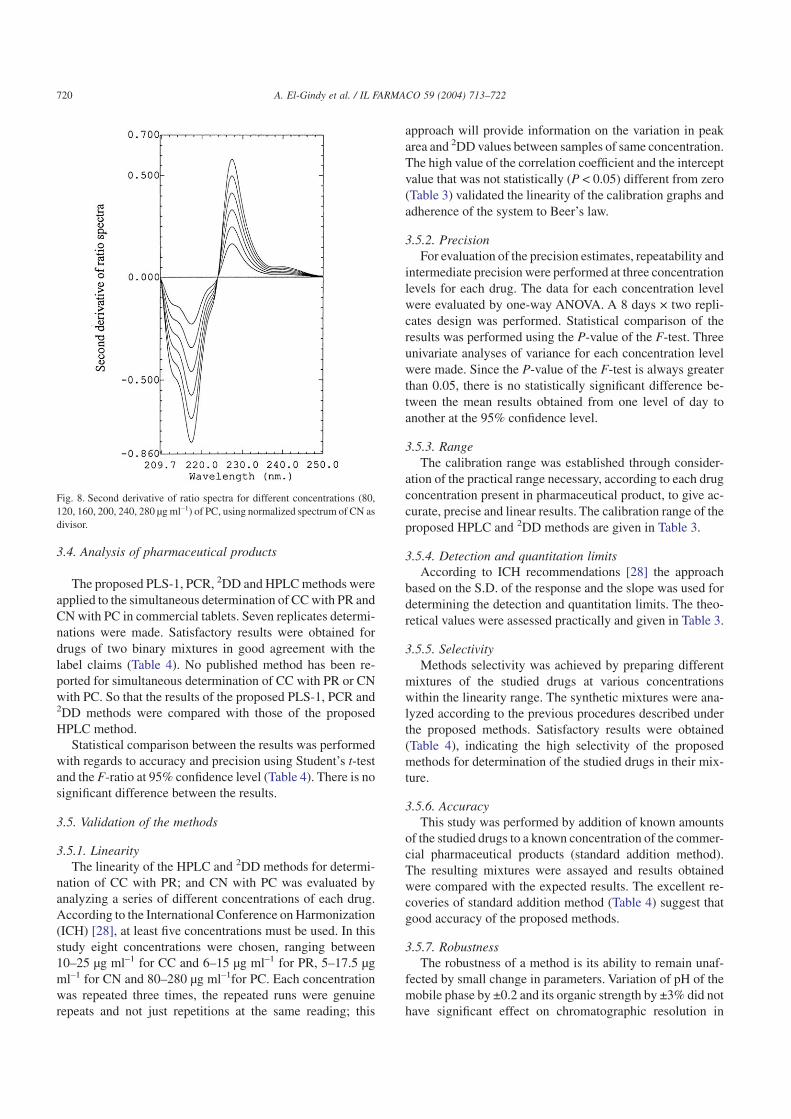
The second derivative of the ratio spectra was preferredthan the first derivative for a better resolution of the spectra,and more accurate and precise results. The second derivativeof the ratio peak amplitudes at 217, 264.8, 241.4 and227.4 nm were measured and found to be proportional to theconcentration of CC, PR, CN and PC, respectively (Figs. 5–8). The characteristic parameters for regression equations forthe 2DD method and correlation coefficient were given inTable 3.
Fig. 5. Second derivative of ratio spectra for different concentrations (10,12.5, 15, 17.5, 20, 22.5, 25 µg ml–1) of CC HCl, using normalized spectrumof PR HCl as divisor.
Fig. 6. Second derivative of ratio spectra for different concentrations (6, 7.5,9, 10.5, 12, 13.5, 15 µg ml–1) of PR HCl, using normalized spectrum of CCHCl as divisor.
Fig. 7. Second derivative of ratio spectra for different concentrations (5, 7.5,10, 12.5, 15, 17.5 µg ml–1) of CN, using normalized spectrum of PC asdivisor.
718 A. El-Gindy et al. / IL FARMACO 59 (2004) 713–722
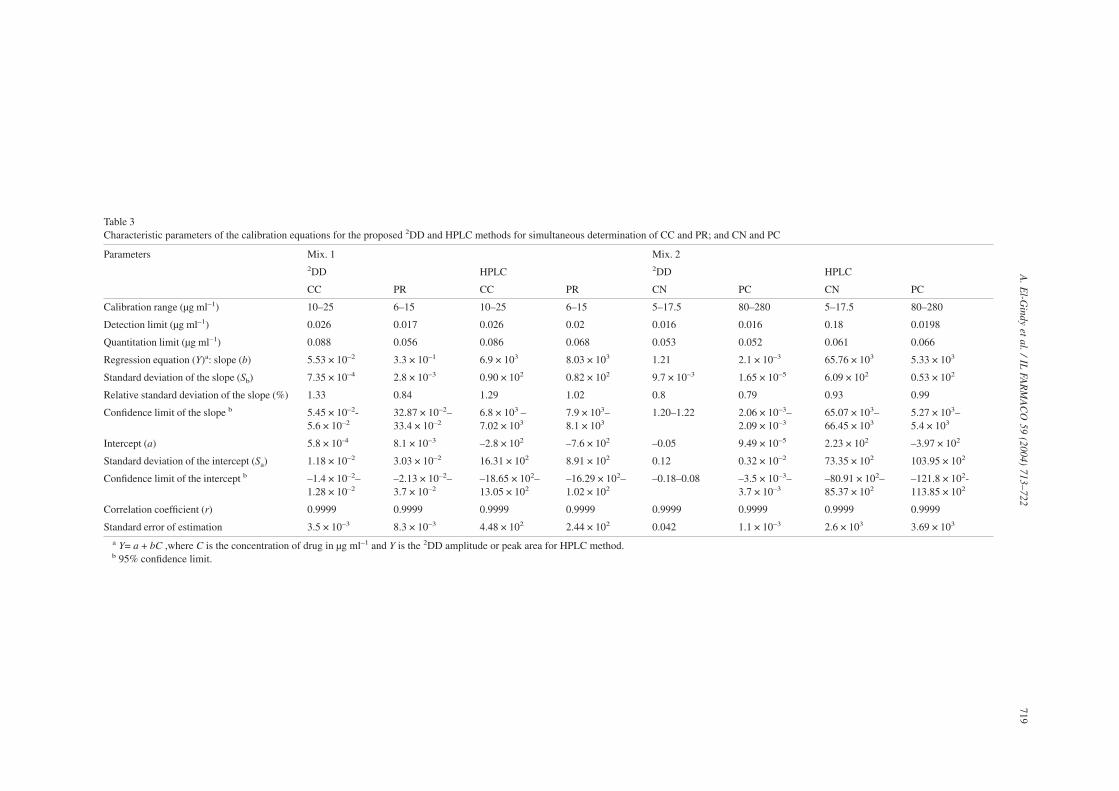
Table 3Characteristic parameters of the calibration equations for the proposed 2DD and HPLC methods for simultaneous determination of CC and PR; and CN and PC
Parameters Mix. 1 Mix. 22DD HPLC 2DD HPLC
CC PR CC PR CN PC CN PC
Calibration range (µg ml–1) 10–25 6–15 10–25 6–15 5–17.5 80–280 5–17.5 80–280
Detection limit (µg ml–1) 0.026 0.017 0.026 0.02 0.016 0.016 0.18 0.0198
Quantitation limit (µg ml–1) 0.088 0.056 0.086 0.068 0.053 0.052 0.061 0.066
Regression equation (Y)a: slope (b) 5.53 × 10⁻² 3.3 × 10⁻¹ 6.9 × 10³ 8.03 × 10³ 1.21 2.1 × 10⁻³ 65.76 × 10³ 5.33 × 10³
Standard deviation of the slope (Sb) 7.35 × 10⁻⁴ 2.8 × 10⁻³ 0.90 × 10² 0.82 × 10² 9.7 × 10⁻³ 1.65 × 10⁻⁵ 6.09 × 10² 0.53 × 10²
Relative standard deviation of the slope (%) 1.33 0.84 1.29 1.02 0.8 0.79 0.93 0.99
Confidence limit of the slope b 5.45 × 10⁻²-5.6 × 10⁻²
32.87 × 10⁻²–33.4 × 10⁻²
6.8 × 10³ –7.02 × 10³
7.9 × 10³–8.1 × 10³
1.20–1.22 2.06 × 10⁻³–2.09 × 10⁻³
65.07 × 10³–66.45 × 10³
5.27 × 10³–5.4 × 10³
Intercept (a) 5.8 × 10⁻⁴ 8.1 × 10⁻³ –2.8 × 10² –7.6 × 10² –0.05 9.49 × 10⁻⁵ 2.23 × 10² –3.97 × 10²
Standard deviation of the intercept (Sa) 1.18 × 10⁻² 3.03 × 10⁻² 16.31 × 10² 8.91 × 10² 0.12 0.32 × 10⁻² 73.35 × 10² 103.95 × 10²
Confidence limit of the intercept b –1.4 × 10⁻²–1.28 × 10⁻²
–2.13 × 10⁻²–3.7 × 10⁻²
–18.65 × 10²–13.05 × 10²
–16.29 × 10²–1.02 × 10²
–0.18–0.08 –3.5 × 10⁻³–3.7 × 10⁻³
–80.91 × 10²–85.37 × 10²
–121.8 × 10²-113.85 × 10²
Correlation coefficient (r) 0.9999 0.9999 0.9999 0.9999 0.9999 0.9999 0.9999 0.9999
Standard error of estimation 3.5 × 10⁻³ 8.3 × 10⁻³ 4.48 × 10² 2.44 × 10² 0.042 1.1 × 10⁻³ 2.6 × 10³ 3.69 × 10³
a Y= a + bC ,where C is the concentration of drug in µg ml–1 and Y is the 2DD amplitude or peak area for HPLC method.b 95% confidence limit.
719A
.El-G
indyet
al./IL
FAR
MA
CO
59(2004)
713–722
3.4. Analysis of pharmaceutical products
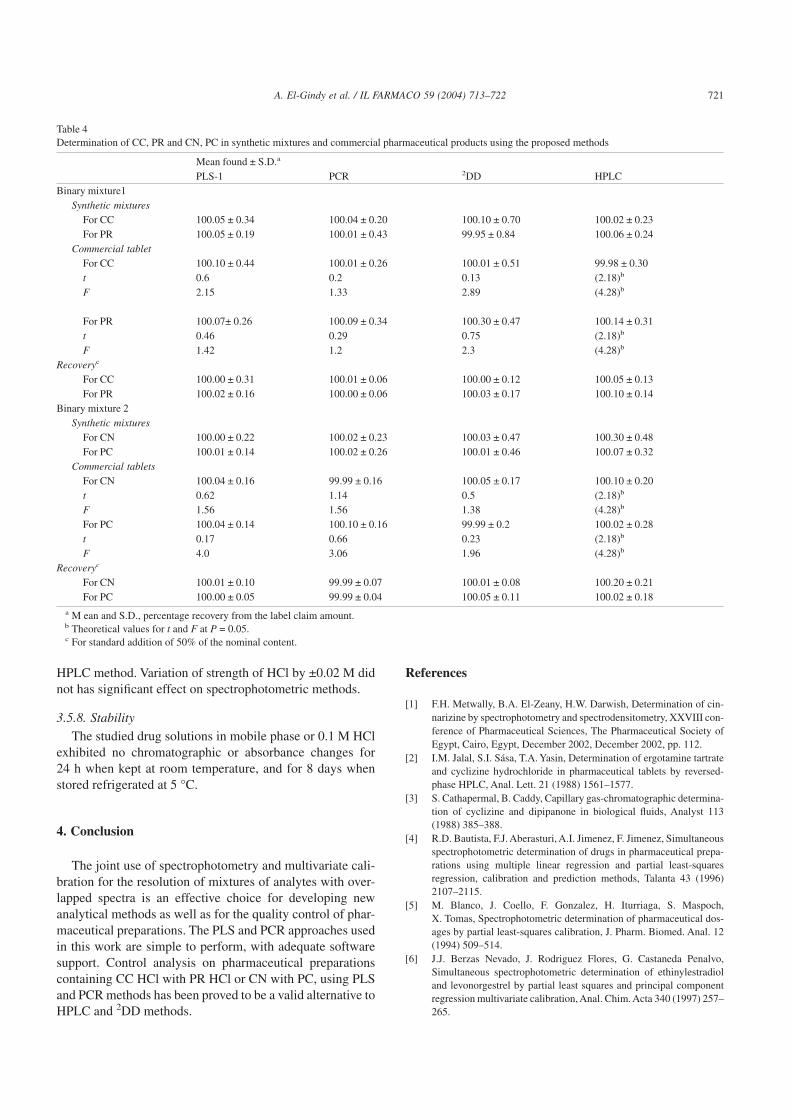
The proposed PLS-1, PCR, 2DD and HPLC methods wereapplied to the simultaneous determination of CC with PR andCN with PC in commercial tablets. Seven replicates determi-nations were made. Satisfactory results were obtained fordrugs of two binary mixtures in good agreement with thelabel claims (Table 4). No published method has been re-ported for simultaneous determination of CC with PR or CNwith PC. So that the results of the proposed PLS-1, PCR and2DD methods were compared with those of the proposedHPLC method.
Statistical comparison between the results was performedwith regards to accuracy and precision using Student’s t-testand the F-ratio at 95% confidence level (Table 4). There is nosignificant difference between the results.
3.5. Validation of the methods
3.5.1. LinearityThe linearity of the HPLC and 2DD methods for determi-
nation of CC with PR; and CN with PC was evaluated byanalyzing a series of different concentrations of each drug.According to the International Conference on Harmonization(ICH) [28], at least five concentrations must be used. In thisstudy eight concentrations were chosen, ranging between10–25 µg ml–1 for CC and 6–15 µg ml–1 for PR, 5–17.5 µgml–1 for CN and 80–280 µg ml–1for PC. Each concentrationwas repeated three times, the repeated runs were genuinerepeats and not just repetitions at the same reading; this
approach will provide information on the variation in peakarea and 2DD values between samples of same concentration.The high value of the correlation coefficient and the interceptvalue that was not statistically (P < 0.05) different from zero(Table 3) validated the linearity of the calibration graphs andadherence of the system to Beer’s law.
3.5.2. PrecisionFor evaluation of the precision estimates, repeatability and
intermediate precision were performed at three concentrationlevels for each drug. The data for each concentration levelwere evaluated by one-way ANOVA. A 8 days × two repli-cates design was performed. Statistical comparison of theresults was performed using the P-value of the F-test. Threeunivariate analyses of variance for each concentration levelwere made. Since the P-value of the F-test is always greaterthan 0.05, there is no statistically significant difference be-tween the mean results obtained from one level of day toanother at the 95% confidence level.
3.5.3. RangeThe calibration range was established through consider-
ation of the practical range necessary, according to each drugconcentration present in pharmaceutical product, to give ac-curate, precise and linear results. The calibration range of theproposed HPLC and 2DD methods are given in Table 3.
3.5.4. Detection and quantitation limitsAccording to ICH recommendations [28] the approach
based on the S.D. of the response and the slope was used fordetermining the detection and quantitation limits. The theo-retical values were assessed practically and given in Table 3.
3.5.5. SelectivityMethods selectivity was achieved by preparing different
mixtures of the studied drugs at various concentrationswithin the linearity range. The synthetic mixtures were ana-lyzed according to the previous procedures described underthe proposed methods. Satisfactory results were obtained(Table 4), indicating the high selectivity of the proposedmethods for determination of the studied drugs in their mix-ture.
3.5.6. AccuracyThis study was performed by addition of known amounts
of the studied drugs to a known concentration of the commer-cial pharmaceutical products (standard addition method).The resulting mixtures were assayed and results obtainedwere compared with the expected results. The excellent re-coveries of standard addition method (Table 4) suggest thatgood accuracy of the proposed methods.
3.5.7. RobustnessThe robustness of a method is its ability to remain unaf-
fected by small change in parameters. Variation of pH of themobile phase by ±0.2 and its organic strength by ±3% did nothave significant effect on chromatographic resolution in
Fig. 8. Second derivative of ratio spectra for different concentrations (80,120, 160, 200, 240, 280 µg ml–1) of PC, using normalized spectrum of CN asdivisor.
720 A. El-Gindy et al. / IL FARMACO 59 (2004) 713–722
HPLC method. Variation of strength of HCl by ±0.02 M didnot has significant effect on spectrophotometric methods.
3.5.8. Stability
The studied drug solutions in mobile phase or 0.1 M HClexhibited no chromatographic or absorbance changes for24 h when kept at room temperature, and for 8 days whenstored refrigerated at 5 °C.
4. Conclusion
The joint use of spectrophotometry and multivariate cali-bration for the resolution of mixtures of analytes with over-lapped spectra is an effective choice for developing newanalytical methods as well as for the quality control of phar-maceutical preparations. The PLS and PCR approaches usedin this work are simple to perform, with adequate softwaresupport. Control analysis on pharmaceutical preparationscontaining CC HCl with PR HCl or CN with PC, using PLSand PCR methods has been proved to be a valid alternative toHPLC and 2DD methods.
References
[1] F.H. Metwally, B.A. El-Zeany, H.W. Darwish, Determination of cin-narizine by spectrophotometry and spectrodensitometry, XXVIII con-ference of Pharmaceutical Sciences, The Pharmaceutical Society ofEgypt, Cairo, Egypt, December 2002, December 2002, pp. 112.
[2] I.M. Jalal, S.I. Sása, T.A. Yasin, Determination of ergotamine tartrateand cyclizine hydrochloride in pharmaceutical tablets by reversed-phase HPLC, Anal. Lett. 21 (1988) 1561–1577.
[3] S. Cathapermal, B. Caddy, Capillary gas-chromatographic determina-tion of cyclizine and dipipanone in biological fluids, Analyst 113(1988) 385–388.
[4] R.D. Bautista, F.J. Aberasturi, A.I. Jimenez, F. Jimenez, Simultaneousspectrophotometric determination of drugs in pharmaceutical prepa-rations using multiple linear regression and partial least-squaresregression, calibration and prediction methods, Talanta 43 (1996)2107–2115.
[5] M. Blanco, J. Coello, F. Gonzalez, H. Iturriaga, S. Maspoch,X. Tomas, Spectrophotometric determination of pharmaceutical dos-ages by partial least-squares calibration, J. Pharm. Biomed. Anal. 12(1994) 509–514.
[6] J.J. Berzas Nevado, J. Rodriguez Flores, G. Castaneda Penalvo,Simultaneous spectrophotometric determination of ethinylestradioland levonorgestrel by partial least squares and principal componentregression multivariate calibration, Anal. Chim. Acta 340 (1997) 257–265.
Table 4Determination of CC, PR and CN, PC in synthetic mixtures and commercial pharmaceutical products using the proposed methods
Mean found ± S.D.a
PLS-1 PCR 2DD HPLCBinary mixture1
Synthetic mixturesFor CC 100.05 ± 0.34 100.04 ± 0.20 100.10 ± 0.70 100.02 ± 0.23For PR 100.05 ± 0.19 100.01 ± 0.43 99.95 ± 0.84 100.06 ± 0.24
Commercial tabletFor CC 100.10 ± 0.44 100.01 ± 0.26 100.01 ± 0.51 99.98 ± 0.30t 0.6 0.2 0.13 (2.18)b
F 2.15 1.33 2.89 (4.28)b
For PR 100.07± 0.26 100.09 ± 0.34 100.30 ± 0.47 100.14 ± 0.31t 0.46 0.29 0.75 (2.18)b
F 1.42 1.2 2.3 (4.28)b
Recoveryc
For CC 100.00 ± 0.31 100.01 ± 0.06 100.00 ± 0.12 100.05 ± 0.13For PR 100.02 ± 0.16 100.00 ± 0.06 100.03 ± 0.17 100.10 ± 0.14
Binary mixture 2Synthetic mixtures
For CN 100.00 ± 0.22 100.02 ± 0.23 100.03 ± 0.47 100.30 ± 0.48For PC 100.01 ± 0.14 100.02 ± 0.26 100.01 ± 0.46 100.07 ± 0.32
Commercial tabletsFor CN 100.04 ± 0.16 99.99 ± 0.16 100.05 ± 0.17 100.10 ± 0.20t 0.62 1.14 0.5 (2.18)b
F 1.56 1.56 1.38 (4.28)b
For PC 100.04 ± 0.14 100.10 ± 0.16 99.99 ± 0.2 100.02 ± 0.28t 0.17 0.66 0.23 (2.18)b
F 4.0 3.06 1.96 (4.28)b
Recoveryc
For CN 100.01 ± 0.10 99.99 ± 0.07 100.01 ± 0.08 100.20 ± 0.21For PC 100.00 ± 0.05 99.99 ± 0.04 100.05 ± 0.11 100.02 ± 0.18
a M ean and S.D., percentage recovery from the label claim amount.b Theoretical values for t and F at P = 0.05.c For standard addition of 50% of the nominal content.
721A. El-Gindy et al. / IL FARMACO 59 (2004) 713–722
[7] H. Wold, in: F. David (Ed.), Research Papers in Statistics, Wiley, NewYork, 1966, pp. 411–444.
[8] H. Martens, T. Naes, Multivariate Calibration, Wiley, Chichester,1992.
[9] I.T. Jollife, Principal Component Analysis, Springer, NewYork, 1986.[10] E. Dinc, D. Baleanu, F. Onur, Chemometric quantitative analysis of
pyridoxine hydrochloride and thiamine hydrochloride in a vitamincombination by principal component analysis, classical least squaresand inverse least squares techniques, Spectroscop. Lett. 34 (2001)279–288.
[11] A. El-Gindy, Spectrophotometric and LC determination of two binarymixtures containing pyridoxine hydrochloride, J. Pharm. Biomed.Anal. 32 (2003) 277–286.
[12] R.D. Bautista, A.I. Jimenez, F. Jimenez, J.J. Arias, Simultaneousdetermination of diazepam and pyridoxine in synthetic mixtures andpharmaceutical formulations using graphical and multivariate calibra-tion–prediction methods, J. Pharm. Biomed. Anal. 15 (1996) 183–192.
[13] H.L. Wu, K. Oguma, R.Q.Yu, Simple multivariate calibration methodwith an appropriate number of principal components using singularvalue decomposition and cross-validation procedure, Anal. Sci. 10(1994) 875–880.
[14] A.J. Nepote, P.C. Damiani, A.C. Olivieri, Chemometric assisted spec-troscopic determination of vitamin B6, vitamin B12 and dexametha-sone in injectables, J. Pharm. Biomed. Anal. 31 (2003) 621–627.
[15] R.D. Bautista, F. Jimenez, A.I. Jimenez, J.J. Arias, Multicomponentanalysis: comparison of various graphical and numerical methods,Talanta 40 (1993) 1687–1694.
[16] F.J. Aberasturi, A.I. Jimenez, J.J. Arias, F. Jimenez, Simultaneousspectrophotometric determination of folic acid, pyridoxine, riboflavinand thiamine by partial least-squares regression, Anal. Lett. 35 (2002)1677–1691.
[17] A.J. Nepote, L. Vera-Candiotti, M.R. Williner, P.C. Damiani,A.C. Olivieri, Development and validation of chemometrics-assistedspectrophotometry and micellar electrokinetic chromatography forthe determination of four-component pharmaceuticals, Anal. Chim.Acta 489 (2003) 77–84.
[18] M.Y. Salem, E.S. El-Zanfaly, M.F. El-Tarras, M.G. El-Bardicy, Simul-taneous determination of domperidone and cinnarizine in a binarymixture using derivative spectrophotometry, partial least squares andprinciple component regression calibration, Anal. Bioanal. Chem. 375(2003) 211–216.
[19] B. Uslu, S.A. Ozkan, H.Y. Aboul-Enein, Spectrophotometric determi-nation of melatonin and pyridoxine hydrochloride in binary mixturesusing first derivative of the ratio spectra method, Anal. Lett. 35 (2002)2305–2317.
[20] A. Molina-Diaz, M. Ramos-Martos, A. Navalon, L.F. Capitan-Vallvey, Simultaneous determination of codeine and pyridoxine inpharmaceutical preparations by first-derivative spectrofluorimetry, J.AOAC Inter. 85 (2002) 861–868.
[21] C. Vinodhini, V. Vaidhyalingam, A. Ajithadas, A. Niramathi, A. Shan-tha, Simultaneous estimation of cinnarizine and domperidone in solidoral dosage form using spectrophotometric method, Indian Drug 39(2002) 491–493.
[22] M.Y. Salem, M.G. El-Bardicy, M.F. El-Tarras, E.S. El-Zanfally,Simultaneous determination of domperidone maleate and cinnarizinein a binary mixture using derivative ratio spectrophotometry andclassical least squares calibration, J. Pharm. Biomed. Anal. 30 (2002)21–33.
[23] B.M. Wise, N.B. Gallagher, PLS-Toolbox Version 2.1, EigenvectorResearch, Inc., 830 Wapato Lake Road, Manson, WA 98831, 2000.
[24] M. Blanco, J. Coello, F. Gonzalez, H. Iturriaga, S. Maspoch, Spectro-photometric analysis of a pharmaceutical preparation by principalcomponent regression, J. Pharm. Sci. 82 (1993) 834–837.
[25] A. Espinosa-Mansilla, F. Salinas, I. De Orbe Paya, Simultaneousdetermination of sulfadiazine, doxycycline, furaltadone and trimetho-prim by partial least squares multivariate calibration, Anal. Chim.Acta 313 (1995) 103–112.
[26] K.R. Beebe, R.J. Pell, M.B. Seasholtz, Chemometrics: A PracticalGuide, A Wiley-Interscience Publication, John Wiley & Sons, Inc.,New York, USA, 1998, pp. 201.
[27] L.R. Snyder, J.J. Kirkland, J.L. Glajck, Practical HPLC MethodDevelopment, second ed, John Wiley & sons, Inc, 1997, pp. 659–660.
[28] The European Agency for the Evaluation of Medical Products, ICHTopic Q2B Note for Guidance on Validation of Analytical Procedures:Methodology GPMP/ICH/281/95, 1996.
722 A. El-Gindy et al. / IL FARMACO 59 (2004) 713–722