species traits and habitats in springtail communities: a regional scale study
TRANSCRIPT

S
SM
a
ARRA
KCSHT
I
ittaitwvcetath
0h
Pedobiologia 55 (2012) 295– 301
Contents lists available at SciVerse ScienceDirect
Pedobiologia - International Journal of Soil Biology
jo u rn al homepage: www.elsev ier .de /pedobi
pecies traits and habitats in springtail communities: A regional scale study
. Salmon, J.F. Ponge ∗
uséum National d’Histoire Naturelle, CNRS UMR 7179, 4 avenue du Petit-Château, 91800 Brunoy, France
r t i c l e i n f o
rticle history:eceived 12 January 2012eceived in revised form 9 May 2012ccepted 12 May 2012
eywords:ollembolapecies trait assemblagesabitatsrait–environment relationships
a b s t r a c t
Although considerable work has been done investigating the factors that underlie species trait assem-blages in emblematic groups such as plants and vertebrates, more remains to be done in belowgroundinvertebrate species. For this group, in particular, relationships between species traits and habitat pref-erences are still a matter of debate. To eludicate upon the relationships, springtails were sampled in aheterogeneous landscape centered on the Sénart forest, near Paris (northern France), which representedthe largest possible array of five environmental gradients (humus forms, vegetation, moisture, verticalstrata, and seasons) over which Collembola are known to be distributed. The distance between samplesvaried from a few cm to several km. Canonical correspondence analysis using species (128) as observa-tions and species trait attributes (30) and habitat indicators (82) as dependent and independent variables,respectively, allowed us to discern whether species habitats and species trait assemblages were relatedand which trends could be found in trait/environment relationships. It was concluded that, within thestudied area, species habitats were significantly associated with species trait assemblages. The main gra-dient explaining the distribution of species traits combined the vertical distribution of habitats (fromthe mineral soil to plant aerial parts), and the openness of the environment, suggesting that a complex
of many ecological factors is at play. For the ecological traits of Collembola, this gradient correspondedto an increasing contribution of sensory and locomotory organs, bright color patterns, size and sexualreproduction, all attributes associated with aboveground life under herbaceous cover. Another impor-tant, although secondary contrast concerned traits associated with habitats far from soil but that wereconcealed (corticolous vs. all other habitats). Soil acidity and water did not contribute significantly totrait distribution, at least within the limits of our database.ntroduction
The indicative power of species trait assemblages has beenntensively studied in plants, birds and beetles, and most speciesraits could be clearly related to habitat preferences of species inhese groups (Graves and Gotelli 1993; Ribera et al. 2001; Cornwellnd Ackerly 2009; Mayfield et al. 2009; Pavoine et al. 2011). Surpris-ngly, although this is common sense and was reported for a longime in soil zoology (Bornebusch 1930), few studies questionedhether the extraordinary diversity of species traits which pre-
ail in soil animal communities could be explained, and potentiallyould have been selected, by differences in habitat use (Vandewallet al. 2010; Decaëns et al. 2011; Bokhorst et al. 2012). Moreover,hese studies focused either on a restricted number of traits, or
restricted number of habitats which does not allow for generalrends in relationships to be established between species traits andabitat use.
∗ Corresponding author. Tel.: +33 6 78930133; fax: +33 1 60465009.E-mail address: [email protected] (J.F. Ponge).
031-4056/$ – see front matter © 2012 Elsevier GmbH. All rights reserved.ttp://dx.doi.org/10.1016/j.pedobi.2012.05.003
© 2012 Elsevier GmbH. All rights reserved.
The aim of our study was to determine trends that emerge fromtrait–environment relationships, particularly how species traitsvary along environmental gradients (e.g. vegetation, soil, depth).
Among soil invertebrates, we selected springtails (Hexapoda,Collembola) as an abundant and diversified monophyletic groupfor which a great deal of work has been devoted to the study ofspecies/environment relationships at the community level (Poole1962; Hågvar 1982; Ponge 1993; Chagnon et al. 2000; Auclercet al. 2009). The Sénart forest (Ile-de-France, northern France)and its surrounding area were selected because they display agreat variety of soil and soil-related habitats (e.g. woodland, heath-land, grassland, ponds, paths, tree trunks) consisting of a littlemore than 3000 ha of heterogeneous landscape, now consideredpart of the Paris area. Data collected from 1973 to 1977, at atime when agriculture was still practiced both inside and out-side the forest, were statistically re-analyzed taking into accountspecies trait/environment relationships. The same pool of data
(370 samples, 127 species) has been already used in severalstudies dealing with species/environment relationships (Ponge1980, 1983, 1993) and was included in the COLTRAIT data base[http://www.bdd-inee.cnrs.fr/spip.php?article51&lang=en], which
2 dobiol
at
M
S
oaYtaAaSemtsswrSofoi
S
itacsttesap(smctispde
mmostdawsea
96 S. Salmon, J.F. Ponge / Pe
lso comprises data about twelve morphological and life-historyraits of more than 300 collembolan species.
aterials and methods
ite description
The Sénart state forest (3000 ha) is located 20 km south-eastf Paris on the western border of the Brie plateau, delineated by
meander of the Seine river and by one of its tributaries, theerres River, at an altitude ranging from 50 to 87 m a.s.l. At theime of sampling the forest was mostly surrounded by urbanizedreas (i.e. the communities of Quincy-sous-Sénart, Boussy-Saint-ntoine, Brunoy, Yerres, Montgeron, and Draveil) on its westernnd northern edges, and by agricultural areas (the communities ofoisy, Étiolles, Tigery, Lieusaint, and Combs-la-Ville) on its east-rn and southern edges. Nowadays, the entire forest is part of theetropolitan area of Paris. Private peripheral woods and agricul-
ural areas (cultivated land and meadows) were included in thetudy. Most of these areas have since been incorporated into thetate forest, with the exception of peripheral agricultural areashich have been built on or transformed into golf courses or other
ecreational areas. A number of soil types can be observed in theénart forest depending on the nature of quaternary deposits (loessr gravels) and the permanent or seasonal waterlogging resultingrom clay migration (perched water tables) or underlying impervi-us clay strata (permanent water tables). More details were givenn previously published papers (Ponge 1980, 1983, 1993).
ampling procedure
Sampling took place from 15 October 1973 to 10 October 1977n every season and all possible types of weather in order to cap-ure a wide range of conditions since our goal was to representll climate conditions, except when the soil was deeply frozen andould not be sampled. At each sampling time, a point was randomlyelected, around which all sites potentially available to spring-ails were investigated, from deep soil (leached mineral horizons)o tree trunks two meters aboveground as well as floating veg-tation in water-filled ponds. No effort was made to standardizeampling and the only requirement was to collect enough litter (atll stages of decomposition), vegetation (aerial and subterraneanarts), bark (naked or covered with lichens or mosses) or soilorgano-mineral to mineral horizons) with enough animals in eachample to determine which species were associated in the sameicro-habitat. The volume sampled varied from 100 mL for moss
ushions, which are particularly rich in springtails (Gerson 1982)o 1 L for bleached mineral soil horizons which are quite impover-shed in fauna (Hågvar 1983). Care was taken not to undersampleome poorly represented habitats. For example, additional sam-les were collected from agricultural areas, calcareous soils andumping places. This procedure allows for a better description ofnvironmental gradients (Gillison and Liswanti 2004).
Soil samples were collected using a shovel, while above-groundaterial was hand-sampled. Care was taken to avoid losing tooany jumping animals in particular when sampling aerial parts
f erect plants. No attempt was made to force a corer into theoil. Samples were immediately sealed in plastic bags and thenransported to the laboratory for same-day extraction. The Berlesery-funnel method was used to extract soil fauna over 10 days with
25 W bulb lamp to avoid excessive desiccation of the samples,
hich can hinder more slowly moving animals from escaping theamples (Nef 1960). Animals were collected and preserved in 95%thyl alcohol in plastic jars. A total of 310 samples were collectednd kept for the analysis.
ogia 55 (2012) 295– 301
Species identification
Animals were sorted in Petri dishes filled with ethyl alcohol;springtails were subsequently mounted and cleared in chloral-lactophenol to be identified later under a light microscope at 400×magnification. At the time of study the only key available forEuropean springtails was that of Gisin (1960), to which numer-ous detailed published studies at the family, genus or species level(complete list available upon request) have been added as wellas miscellaneous (unpublished) additions by Gisin himself. Colorpatterns were noted before animals were discolored in chloral-lactophenol. Young specimens, when not identifiable to specieslevel, were allocated to known species by reference to adults orsubadults found in the same sample, or in samples taken in thevicinity. For instance in the genus Mesaphorura, where severalspecies may cohabit and diagnostic characters are not revealedin the first instar (Rusek 1980), unidentified juveniles were pro-portionally assigned to species based on the identification of adultspecimens in the same sample. Gisin’s nomenclature was updatedusing Fauna Europaea 2011 [http://www.faunaeur.org/]. A total of128 species were found (Table 1).
Trait data
Twelve traits, mostly extracted from the COLTRAIT database andcollected from numerous identification keys or synopses, describemorphology and reproductive mode of the 128 species used inthe analysis. Attributes of each trait (Table 3) were considered asvariables, and were coded as binary (dummy) variables, resultingin a list of 30 attributes: mode of reproduction (parthenogene-sis dominant, sexual reproduction dominant), body size (small,medium, large), body form (cylindrical body, stocky body, spheri-cal body), body color (pale-colored, bright-colored, dark-colored),scales (absent, present), antenna size (short, long), leg size (short,long), furcula size (absent or vestigial, short, long), eye number(0, 1–5, >5), pseudocella (absent, present), post-antennal organ(absent, simple, compound), and trichobothria (absent, present).Antennae, eyes, post-antennal organs and trichobothria are sup-posed to play a sensory role (Hopkin 1997).
Species habitat data
Field notes were used to classify habitat features (sensu lato,including micro-habitat and season) in 82 categories (Table 2).Thus, a set of 82 habitat indicators were assigned to each sample,which describe its main features at varying scales, from the landuselevel (heathland, grassland, woodland) to scale of the samplingplot (e.g. ditch, plain ground, pond, vegetation, soil pH) and fur-ther to the within-plot scale (e.g. plant part, litter, earthworm casts,mineral soil). Species presence was indicated by dummy variables(coded as 0 or 1) for each of the 82 habitat categories.
Statistical treatment of the data
Canonical correspondence analysis was used to analyzetrait–habitat relationships (species as observations, species traitattributes as dependent variables, species habitats as constrainingvariables), permutation tests were employed to test trait–habitatassociations.
Rarefaction curves were calculated to estimate the extent ofour sampling method. Rarefaction curves and jack-knife estimatorswere calculated using EstimateS (version 8.2.0). All other calcula-tions were done using XLSTAT® (Addinsoft®, Paris, France).

S. Salmon, J.F. Ponge / Pedobiologia 55 (2012) 295– 301 297
Table 1Codes and species names of springtails collected in the Senart forest from 1973 to 1977, as well as total abundance, and number of samples in which the species was found.Species names according to Fauna Europaea 2011.
Code Species name Abundance Number of samples Code Species name Abundance Number of samples
ACA Arrhopalites caecus 23 6 MKR Mesaphorura krausbaueri 813 69AEL Anurida ellipsoides 12 4 MMA Mesaphorura macrochaeta 2962 102AFU Allacma fusca 1 1 MMI Megalothorax minimus 963 105AGA Allacma gallica 5 2 MMS Mesaphorura massoudi 31 2APR Arrhopalites principalis 9 7 MMT Micronychiurus minutus 1 1APY Arrhopalites pygmaeus 13 7 MMU Micranurophorus musci 5 1ASE Arrhopalites sericus 24 8 MPY Micranurida pygmaea 829 72BPA Brachystomella parvula 1036 33 MSE Micranurida sensillata 2 2BVI Bourletiella viridescens 50 15 MYO Mesaphorura yosii 158 13CAL Cyphoderus albinus 3 2 NDU Neonaphorura duboscqi 2 1CBE Ceratophysella bengtssoni 436 4 NMU Neanura muscorum 115 53CBI Cryptopygus bipunctatus 2 1 NNO Neonaphorura novemspina 1 1CDE Ceratophysella denticulata 117 16 NRA Neotullbergia ramicuspis 28 2CEX Cryptopygus exilis 4 3 OAM Onychiurus ambulans 2 2CMA Caprainea marginata 9 2 OCI Orchesella cincta 1460 81CSC Cryptopygus scapelliferus 22 3 OCR Oncopodura crassicornis 5 3CTH Cryptopygus thermophilus 13 2 OPS Onychiuroides pseudogranulosus 347 13DFL Deuterosminthurus flavus 7 5 OVI Orchesella villosa 167 44DFI Deuteraphorura fimetaria 1 1 PAL Pseudosinella alba 279 51DFU Dicyrtoma fusca 34 19 PAQ Podura aquatica 410 7DJU Detriturus jubilarius 1 1 PAS Pseudachorutella asigillata 16 5DMI Dicyrtomina minuta 56 30 PAU Protaphorura aurantiaca 740 24DTI Desoria tigrina 1192 5 PCA Paratullbergia callipygos 430 53EAL Entomobrya albocincta 120 17 PDE Pseudosinella decipiens 7 6ELA Entomobrya lanuginosa 39 13 PLO Pogonognathellus longicornis 7 5EMA Entomobrya multifasciata 166 11 PMA Pseudosinella mauli 430 48EMU Entomobrya muscorum 17 15 PMI Proisotoma minima 156 25ENI Entomobrya nivalis 74 8 PMU Proisotoma minuta 212 10EPU Entomobryoides purpurascens 11 2 PNO Parisotoma notabilis 6095 180FCA Folsomia candida 60 9 PPA Pseudachorutes parvulus 229 35FCL Friesea claviseta 67 11 PPE Pseudosinella petterseni 1 1FMA Folsomia manolachei 6274 101 PPO Pseudosinella pongei 12 4FMI Friesea mirabilis 109 13 PSE Pseudisotoma sensibilis 1464 12FPA Folsomides parvulus 145 13 PSU Protaphorura subuliginata 193 20FQU Folsomia quadrioculata 1810 45 SAQ Sminthurides aquaticus 1 1FQS Fasciosminthurus quinquefasciatus 2 2 SAS Sminthurides assimilis 78 12FTR Friesea truncata 361 57 SAU Sminthurinus aureus aureus 1054 75GFL Gisinianus flammeolus 98 6 SDE Stenaphorurella denisi 32 5HCL Heterosminthurus claviger 3 1 SEL Sminthurinus elegans 95 21HIN Heterosminthurus insignis 33 7 SLA Superodontella lamellifera 4 3HMA Heteromurus major 594 71 SMA Sminthurides malmgreni 591 43HNI Heteromurus nitidus 28 18 SNI Sminthurus nigromaculatus 16 9HPU Hypogastrura purpurescens 1 1 SPA Sminthurides parvulus 82 13IAN Isotomurus antennalis 1 1 SPS Subisotoma pusilla 82 5IMI Isotomiella minor 2136 116 SPU Sphaeridia pumilis 1566 107IPA Isotomurus palustris 1483 101 SQU Stenaphorurella quadrispina 7 3IPR Isotomodes productus 4 1 SSC Sminthurides schoetti 401 44ISP Isotomodes sp. 2 2 SSE Schaefferia sexoculata 1 1IVI Isotoma viridis 54 13 SSI Sminthurinus aureus signatus 2407 97KBU Kalaphorura burmeisteri 30 5 STR Sminthurinus reticulatus 1 1LCU Lepidocyrtus curvicollis 72 26 SVI Stenacidia violacea 6 2LCY Lepidocyrtus cyaneus 889 35 TBO Tomocerus botanicus 35 9LLA Lepidocyrtus lanuginosus 3399 160 TMI Tomocerus minor 312 45LLI Lepidocyrtus lignorum 565 63 VAR Vertagopus arboreus 788 31LLU Lipothrix lubbocki 15 6 WAN Willemia anophthalma 577 35LPA Lepidocyrtus paradoxus 2 2 WBU Willemia buddenbrocki 5 3LVI Lepidocyrtus violaceus 4 4 WIN Willemia intermedia 1 1MAB Micraphorura absoloni 3 2 WNI Willowsia nigromaculata 3 1MBE Mesaphorura betschi 12 6 WPO Wankeliella pongei 2 1MGR Monobella grassei 32 14 XBR Xenylla brevisimilis 2 1MHG Mesaphorura hygrophila 1 1 XGR Xenylla grisea 361 19
XXX
R
smnt
MHY Mesaphorura hylophila 633 42
MIN Megalothorax incertus 12 9
MIT Mesaphorura italica 21 9
esults
The rarefaction curve of the 128 observed species showed thatampling had approached an asymptote. Estimating the number of
issing species according to Chao (1987) put the expected totalumber of species for the Sénart forest to 133 and indicated thathe sampling was relatively extensive.
SC Xenylla schillei 18 5TU Xenylla tullbergi 4673 68XA Xenylla xavieri 33 5
Canonical Correspondence Analysis (CCA) with species traitattributes as explained variables and species habitats as explana-tory variables showed that traits were significantly accountedfor by habitats (number or permutations = 500, pseudo-F = 0.94,
P < 0.0001). Constrained variance (variance of species traitsexplained by species habitats) represented 72.9% of the total vari-ance.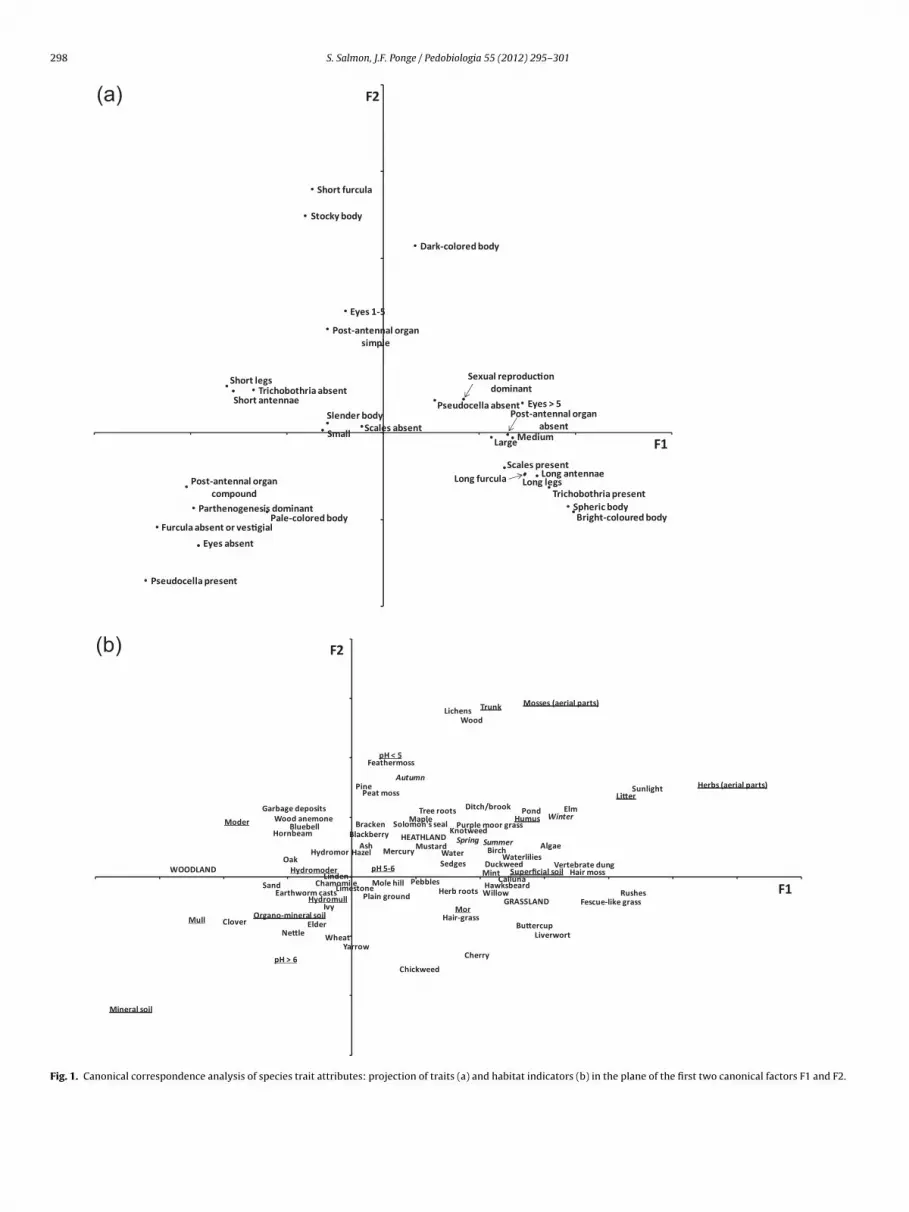
298 S. Salmon, J.F. Ponge / Pedobiologia 55 (2012) 295– 301
Parthenogenesis dominant
Sexual reproduc�ondominant
Small MediumLarge
Slend er body
Stocky body
Spheric bodyPale-colored body Bright-coloured body
Dark-co lored body
Scales absent
Scales present
Short antennae
Long antennae
Short legs
Long legs
Furcula absent or ves� gial
Short furcula
Long fu rcula
Eyes absent
Eyes 1-5
Eyes > 5Pseud ocella absent
Pseud ocell a present
Post-antennal organabsent
Post-antennal organsimple
Post-antenn al organcompound
Trichobothria absent
Trichobothria present
F1
F2(a)
Autumn
Winter
Spring Summer
GRASSLAND
WOODLAND
HEATHLAND
Ditch/broo k Pond
Plain gr ound
Water
Sun light
Limeston eSand Pebb les
Trun k
Mole hillVertebrate du ng
Garbage depo sits
Sup erficial soil
Li�er
Humus
Organo-mineral soil
Mineral soil
Woo d
Earthworm casts
Tree roo ts
Herb roo ts
pH < 5
pH 5-6
pH > 6
Mull
Moder
MorHydromull
Hydromoder
HydromorOak
Birch
Hornb eam
Linden
Maple
Ash
Cherr y
Elm
Wil low
Elder
Hazel
Pine
Callun a
Blackberr y
Ivy
Mosses (aerial parts)
Peat moss
Hair moss
Feathermoss
Liverwort
Lichens
Algae
Herbs (aerial parts)
Bracken Purple moo r grass
Hair -grassFescue-like grass
Rushes
Waterli lies
Hawksbeard
Sedges
Wood anemon eBluebell
Duckweed
Mustard
Chamomile
Chickweed
Yarr owNe�le
Mercury
Solomon 's seal
WheatBu�ercup
Knotweed
Clover
Mint
F1
F2(b)
Fig. 1. Canonical correspondence analysis of species trait attributes: projection of traits (a) and habitat indicators (b) in the plane of the first two canonical factors F1 and F2.

S. Salmon, J.F. Ponge / Pedobiologia 55 (2012) 295– 301 299
Table 2Habitat indicators and the corresponding, number of samples where indicators were quoted as 1 and principal coordinates along the two first components of CCA. F1component (40% of explained variance) is linked to landuse and depth. F2 component (14% of explained variance) is linked more specifically to corticolous micro-habitats.
Number of samples F1 F2 Number of samples F1 F2
Autumn 96 0.045 0.084 Hornbeam 42 −0.046 0.037Winter 108 0.162 0.051 Linden 22 −0.012 0.001Spring 88 0.091 0.035 Maple 8 0.053 0.049Summer 46 0.109 0.030 Ash 8 0.011 0.026Grassland 50 0.136 −0.021 Cherry 9 0.097 −0.066Woodland 279 −0.124 0.006 Elm 3 0.170 0.057Heathland 9 0.064 0.029 Elder 3 0.112 −0.012Ditch/brook 44 0.106 0.059 Hazel 11 −0.027 −0.040Pond 64 0.140 0.056 Pine 12 0.007 0.021Plain ground 230 0.027 −0.011 Calluna 6 0.009 0.076Water 107 0.078 0.023 Blackberry 5 0.124 −0.002Sunlight 141 0.230 0.074 Ivy 4 0.013 0.036pH < 5 32 0.030 0.102 Peat moss 18 0.022 0.071pH 5–6 35 0.024 −0.003 Hair moss 5 0.183 0.008pH > 6 32 −0.052 −0.069 Feathermoss 8 0.030 0.102Limestone 48 0.002 −0.009 Liverwort 1 0.156 −0.041Sand 20 −0.062 −0.009 Lichens 4 0.082 0.140Pebbles 23 0.057 −0.004 Algae 3 0.155 0.023Mull 57 −0.121 −0.036 Bracken 21 0.014 0.044Moder 24 −0.090 0.046 Purple moor grass 21 0.108 0.039Mor 2 0.086 −0.027 Hair-grass 5 0.084 −0.028Hydromull 6 −0.019 −0.019 Fescue-like grass 8 0.201 −0.016Hydromoder 3 −0.030 0.004 Rushes 6 0.219 −0.013Hydromor 3 −0.017 0.021 Waterlilies 10 0.132 0.021Trunk 33 0.108 0.143 Hawksbeard 1 0.121 −0.003Herbs (aerial parts) 58 0.296 0.077 Sedges 4 0.078 0.016Mosses (aerial parts) 74 0.163 0.146 Wood anemone 20 −0.037 0.045Superficial soil 17 0.146 0.003 Bluebell 20 −0.037 0.045Litter 80 0.213 0.068 Duckweed 1 0.121 0.007Humus 41 0.136 0.043 Mustard 1 0.062 0.024Organo-mineral soil 18 −0.049 −0.032 Chamomile 1 −0.013 −0.008Mineral soil 68 −0.172 −0.111 Chickweed 9 0.053 −0.078Mole hill 4 0.028 −0.007 Yarrow 4 0.003 −0.051Vertebrate dung 3 0.181 0.010 Nettle 5 −0.046 −0.047Garbage deposits 11 −0.045 0.058 Mercury 16 0.036 0.022Wood 35 0.093 0.132 Solomon’s seal 8 0.053 0.049Earthworm casts 7 −0.036 −0.013 Wheat 7 −0.011 −0.051Tree roots 5 0.067 0.053 Buttercup 1 0.142 −0.041
trFawtlcFtaHgflsn(appnPht
Herb roots 8 0.083 −0.006
Oak 142 −0.048 0.015
Birch 41 0.113 0.026
The first two canonical components of CCA extracted 54% ofhe constrained (explained) variance (40% and 14% for F1 and F2,espectively). The projection of trait attributes and species in the1–F2 plane is shown in Fig. 1a and b, respectively. Both speciesnd trait attributes were distributed along two dimensions. Speciesith pseudocella and post-antennal organs present (of compound
ype), dominant parthenogenesis, regressed locomotory (furcula,egs) and sensorial organs (eyes, antennae, thichobothria), and paleolor were opposed to species displaying opposite attributes along1. According to principal coordinates of species habitats (Table 2)his corresponded to opposite habitats: woodland vs grasslandnd depth versus surface, from negative to positive sides of F1.eathland was in an intermediate position between woodland andrassland (Table 2). Along F1 depth indicators were ranked in theollowing order: mineral soil, organo-mineral soil, humus (organic),itter, and plant aerial parts. Sunlight was projected on the positiveide of F1 (open environments). The second canonical compo-ent F2 was more specifically linked to corticolous micro-habitatstrunks, wood and associated mosses and lichens): associated traitttributes were short furcula, stocky and dark-colored body, eyesresent but in regressed numbers (1–5), post-antennal organsresent but simple. Acidity and humus type, as well as water, did
ot exhibit any pronounced influence on species trait attributes.artial CCA, which allowed only water and soil acidity (includingumus type) to vary, showed that these variables did not influencehe distribution of trait attributes (pseudo-F = 0.17, P = 0.99).Knotweed 1 0.091 0.037Clover 5 −0.091 −0.038Mint 1 0.123 0.001
Discussion
Previous studies showed that a limited number of ecologi-cal factors could explain the distribution of collembolan specieswhen collected in the same geographical context, at a regionalscale (Ponge 1993; Ponge et al. 2003). Vertical distribution is themain gradient along which most springtail species are distributed(Hågvar 1983; Faber and Joosse 1993; Ponge 2000a), followed bythe contrast between woodland and grassland (Ponge et al. 2003),and other factors such as water availability (Verhoef and Van Selm1983) and soil acidity (Loranger et al. 2001). We showed that grass-land and epigeic habitats were mostly characterized by adaptivetraits to surface life: big size, high mobility, protection against des-iccation by round shape or cuticular clothing (Kærsgaard et al.2004), avoidance of predation by flight and color signaling, andsexual reproduction (Fig. 1 and Table 2, F1 component, positiveside). In contrast, woodland and endogeic habitats were mostlycharacterized by traits associated with subterranean life: smallsize, small locomotory appendages, poor protection from desic-cation, avoidance of predation by toxic excreta (pseudocella), andparthenogenesis.
Life in woodland is often more concealed than in grassland. For
example, smaller forms, more sensitive to environmental stressbecause of a higher surface/volume ratio (Kærsgaard et al. 2004;Bokhorst et al. 2012), and less motile species (Auclerc et al.2009) can find better conditions for survival and reproduction in
300 S. Salmon, J.F. Ponge / Pedobiol
Table 3Trait attributes of the 128 springtail species collected in the Sénart forest, and num-ber of species where attributes were found.
Trait Attribute Number of species
Mode of reproduction Parthenogenesis dominant 36Sexual reproduction dominant 89
Body size Small 86Medium 28Large 14
Body form Slender 92Stocky 6Spheric 30
Body color Pale-coloured 60Bright-coloured 30Dark-coloured 38
Scales Absent 109Present 19
Antenna size Short 65Long 63
Leg size Short 61Long 67
Furcula size Absent or vestigial 35Short 25Long 68
Eye number 0 421–5 24>5 62
Pseudocella Absent 105Present 23
Post-antennal organ Absent 69Simple 21Compound 38
wCtAtSsi(dtefgtCmafabc2
owbtsa
Trichobothria Absent 72Present 56
oodland. Mebes and Filser (1997) showed that surface dispersal ofollembola was much more intense in agricultural fields comparedo adjoining shrubby fallows where litter began to accumulate, andlvarez et al. (1997, 2000) highlighted the role of hedgerows as
emporary refuges for species living at the surface of arable fields.exual reproduction needs easy-to-visit sites for the deposition ofpermatophores by males (Chahartaghi et al. 2006), and for mobil-ty in search of mating partners using olfactory or tactile cluesChernova et al. 2010), which is easier on the soil surface than ineeper layers. This is analogous to the requirements for visual oractile sensory organs to detect the presence of predators (Baatrupt al. 2006) and for escape using jumping movements (ensured byurcula acting as a spring) (Bauer and Christian 1987). The hetero-eneity of the spacee within leaf or needle litter horizons makeshe forest floor difficult for rapid surface movements (Bauer andhristian 1987), while simultaneously protecting soil-dwelling ani-als from surface predation by carabids and vertebrates (Hossie
nd Murray 2010) and offering a variety of food resources such asungal colonies and animal excreta (Bengtsson et al. 1991; Salmonnd Ponge 2001). Other predators are subterranean and cannote avoided through active movements, hence the use of chemi-al repellents excreted by pseudocella (Dettner et al. 1996; Negri004).
Despite clear trends of trait/habitat relationships exhibited byur results, possible biases due to the escape of larger-sized animalsith long furcula during sampling should not be overlooked. If such
iases differ from one habitat to another, this could have impactedrait/habitat relationships. However, the association between largeize and agricultural environments is a novel scientific finding,lthough it should be highlighted that it was more difficult to collect
ogia 55 (2012) 295– 301
highly mobile specimens in the absence of litter (i.e. in agriculturalareas) than in its presence (i.e. in forest areas), which actually sug-gests a bias in the opposite direction to what was observed. Thisprovided assurance that no such bias was present in our dataset.
The second canonical component of trait–environment rela-tionships (Fig. 1 and Table 2, F2 component) distinguishes traitsassociated with life in bark and associated mosses and lichens: thecombination of short furcula, dark color, stocky body, and eyespresent but in limited number is a common adaptation to lifein concealed environments (hence small size and limited move-ments) but far from adaptations to life in soil (hence the need to beprotected from UV radiation through pigmentation and the possi-bilities offered by vision). The structure of the post-antennal organ,showing a compound structure that is more typical of edaphic habi-tats is worthy of note, since no other studies have considered itsecological correlates. The exact role played by this organ is stillunknown, but anatomical observations on the innervation of thesepitted porous plates located not far from the protocerebrum pointto sensory activity (Altner and Thies 1976). Differences betweensimple and compound post-antennal organs are related to the num-ber of dendritic branches, which are more numerous in compoundorgans (Altner and Thies 1976), suggesting that compound post-antennal organs are more sensitive to chemical features of theimmediate environment. The higher sensitivity of the compoundpost-antennal organ could be more adapted to deeper horizons bycompensating the reduction or the complete absence of other senseorgans such as eyes.
The fact that we did not discern any association between traitsand obvious factors such as water and soil acidity (or humus type)does not preclude further scrutiny of such relationships. Two rea-sons could underlie our observations. First, it is possible that ourcurrent database did not cover the traits needed to establish arelationship. Ponge (2000b) showed that acidophilic and acido-phobic species cohabited within the same lineage, pointing tocorresponding traits as mainly based on physiology (mechanismscounteracting oxidative stress) rather than on anatomy and repro-duction mode. For example, traits associated with aquatic life arelargely related to the form and size of claws (Gisin 1960), and ofcourse physiology (resistance to desiccation), which were not con-sidered here. Second, in the particular case of the Senart forest,traits adapting species to habitats that vary in terms of water avail-ability and/or soil acidity could be masked by landuse or verticalstratification effects, and point to the need for studying trait/habitatrelationships on a wider geographic scale, as suggested by Lepetzet al. (2009).
References
Altner, H., Thies, G., 1976. The post-antennal organ: a specialized unicellular sensoryinput to the protocerebrum in apterygotan insects (Collembola). Cell and TissueResearch 167, 97–110.
Alvarez, T., Frampton, G.K., Coulson, D., 1997. Population dynamics of epigeicCollembola in arable fields: the importance of hedgerow proximity and croptype. Pedobiologia 41, 110–114.
Alvarez, T., Frampton, G.K., Coulson, D., 2000. The role of hedgerows in the recoloni-sation of arable fields by epigeal Collembola. Pedobiologia 44, 516–526.
Auclerc, A., Ponge, J.F., Barot, S., Dubs, F., 2009. Experimental assessment of habitatpreference and dispersal ability of soil springtails. Soil Biology and Biochemistry41, 1596–1604.
Baatrup, E., Bayley, M., Axelsen, J.A., 2006. Predation of the mite Hypoaspis aculeiferon the springtail Folsomia fimetaria and the influence of sex, size, starvation, andpoisoning. Entomologia Experimentalis et Applicata 118, 61–70.
Bauer, T., Christian, E., 1987. Habitat dependent differences in the flight behavior ofCollembola. Pedobiologia 30, 233–239.
Bengtsson, G., Hedlund, K., Rundgren, S., 1991. Selective odor perception in the soil
Collembola Onychiurus armatus. Journal of Chemical Ecology 17, 2113–2125.Bokhorst, S., Phoenix, G.K., Bjerke, J.W., Callaghan, T.V., Huyer-Brugman, F., Berg,M.P., 2012. Extreme winter warming events more negatively impact small ratherthan large soil fauna: shift in community composition explained by traits nottaxa. Global Change Biology 18, 1152–1162.

dobiol
B
C
C
C
C
C
D
D
F
G
G
GG
H
H
H
H
K
L
L
B.A., 2010. Functional traits as indicators of biodiversity response to land use
S. Salmon, J.F. Ponge / Pe
ornebusch, C.H., 1930. The fauna of forest soil. Det Forstlige Forsøgsvaesen i Dan-mark 11, 1–158.
hagnon, M., Hébert, C., Paré, D., 2000. Community structures of Collembola in sugarmaple forests: relations to humus type and seasonal trends. Pedobiologia 44,148–174.
hahartaghi, M., Scheu, S., Ruess, L., 2006. Sex ratio and mode of reproduction inCollembola of an oak-beech forest. Pedobiologia 50, 331–340.
hao, A., 1987. Estimating the population size for capture–recapture data withunequal catchability. Biometrics 43, 783–791.
hernova, N.M., Potapov, M.B., Savenkova, Y.Y., Bokova, A.I., 2010. Ecological signif-icance of parthenogenesis in Collembola. Entomological Review 90, 23–38.
ornwell, W.K., Ackerly, D.D., 2009. Community assembly and shifts in plant traitdistributions across an environmental gradient in coastal California. EcologicalMonographs 79, 109–126.
ecaëns, T., Margerie, P., Renault, J., Bureau, F., Aubert, M., Hedde, M., 2011. Nicheoverlap and species assemblage dynamics in an ageing pasture gradient in north-western France. Acta Oecologica 37, 212–219.
ettner, K., Scheuerlein, A., Fabian, P., Schulz, S., Francke, W., 1996. Chemical defenseof giant springtail Tetrodontophora bielanensis (Waga) (Insecta: Collembola).Journal of Chemical Ecology 22, 1051–1074.
aber, J.H., Joosse, E.N.G., 1993. Vertical distribution of Collembola in a Pinus nigraorganic soil. Pedobiologia 37, 336–350.
erson, U., 1982. Bryophytes and invertebrates. In: Smith, A.J.E. (Ed.), BryophyteEcology. Chapman and Hall, London, pp. 291–332.
illison, A.N., Liswanti, N., 2004. Assessing biodiversity at landscape level in northernThailand and Sumatra (Indonesia): the importance of environmental context.Agriculture, Ecosystems and Environment 104, 75–86.
isin, H., 1960. Collembolenfauna Europas. Muséum d’Histoire Naturelle, Geneva.raves, G.R., Gotelli, N.J., 1993. Assembly of avian mixed-species flocks in Amazonia.
Proceedings of the National Academy of Sciences of the United States of America90, 1388–1391.
ågvar, S., 1982. Collembola in Norwegian coniferous forest soils. I. Relations toplant communities and soil fertility. Pedobiologia 24, 255–296.
ågvar, S., 1983. Collembola in Norwegian coniferous forest soils. II. Vertical distri-bution. Pedobiologia 25, 383–401.
opkin, S.P., 1997. Biology of the Springtails (Insecta: Collembola). Oxford UniversityPress, Oxford.
ossie, T.J., Murray, D.L., 2010. You can’t run but you can hide: refuge use in frogtadpoles elicits density-dependent predation by dragonfly larvae. Oecologia 163,395–404.
ærsgaard, C.W., Holmstrup, M., Malte, H., Bayley, M., 2004. The importance ofcuticular permeability, osmolyte production and body size for the desiccationresistance of nine species of Collembola. Journal of Insect Physiology 50, 5–15.
epetz, V., Massot, M., Schmeller, D.S., Clobert, J., 2009. Biodiversity monitoring:
some proposals to adequately study species’ responses to climate change. Bio-diversity and Conservation 18, 3185–3203.oranger, G., Bandyopadhyaya, I., Razaka, B., Ponge, J.F., 2001. Does soil acidityexplain altitudinal sequences in collembolan communities? Soil Biology andBiochemistry 33, 381–393.
ogia 55 (2012) 295– 301 301
Mayfield, M.M., Boni, M.F., Ackerly, D.D., 2009. Traits, habitats, and clades: iden-tifying traits of potential importance to environmental filtering. AmericanNaturalist 174, E1–E22.
Mebes, K.H., Filser, J., 1997. A method for estimating the significance of surface dis-persal for population fluctuations of Collembola in arable land. Pedobiologia 41,115–122.
Nef, L., 1960. Comparaison de l’efficacité de différentes variantes de l’appareil deBerlese–Tullgren. Zeitschrift für Angewandte Entomologie 46, 178–199.
Negri, I., 2004. Spatial distribution of Collembola in presence and absence of a preda-tor. Pedobiologia 48, 585–588.
Pavoine, S., Vela, E., Gachet, S., de Bélair, G., Bonsall, M.B., 2011. Linking patternsin phylogeny, traits, abiotic variables and space: a novel approach to linkingenvironmental filtering and plant community assembly. Journal of Ecology 99,165–175.
Ponge, J.F., 1980. Les biocénoses des collemboles de la forêt de Sénart. In: Pesson, P.(Ed.), Actualités d’Écologie Forestière. Gauthier-Villars, Paris, pp. 151–176.
Ponge, J.F., 1983. Les collemboles, indicateurs du type d’humus en milieu forestier:résultats obtenus au sud de Paris. Acta Oecologica, Oecologia Generalis 4,359–374.
Ponge, J.F., 1993. Biocenoses of Collembola in atlantic temperate grass-woodlandecosystems. Pedobiologia 37, 223–244.
Ponge, J.F., 2000a. Vertical distribution of Collembola (Hexapoda) and their foodresources in organic horizons of beech forests. Biology and Fertility of Soils 32,508–522.
Ponge, J.F., 2000b. Acidophilic Collembola: living fossils? Contributions from theBiological Laboratory, Kyoto University 29, 65–74.
Ponge, J.F., Gillet, S., Dubs, F., Fedoroff, E., Haese, L., Sousa, J.P., Lavelle, P., 2003.Collembolan communities as bioindicators of land use intensification. Soil Biol-ogy and Biochemistry 35, 813–826.
Poole, T.B., 1962. The effect of some environmental factors on the pattern of distri-bution of soil Collembola in a coniferous woodland. Pedobiologia 2, 169–182.
Ribera, I., Doledec, S., Downie, I.S., Foster, G.N., 2001. Effect of land distur-bance and stress on species traits of ground beetle assemblages. Ecology 82,1112–1129.
Rusek, J., 1980. Morphology of juvenile instars in two Mesaphorura species(Collembola: Tullbergiinae). Revue d’Ecologie et de Biologie du Sol 17,583–589.
Salmon, S., Ponge, J.F., 2001. Earthworm excreta attract soil springtails: laboratoryexperiments on Heteromurus nitidus (Collembola: Entomobryidae). Soil Biologyand Biochemistry 33, 1959–1969.
Vandewalle, M., de Bello, F., Berg, M.P., Bolger, T., Dolédec, S., Dubs, F., Feld, C.K.,Harrington, R., Harrison, P.A., Lavorel, S., da Silva, P.M., Moretti, M., Niemelä,J., Santos, P., Sattler, T., Sousa, J.P., Sykes, M.T., Vanbergen, A.J., Woodcock,
changes across ecosystems and organisms. Biodiversity and Conservation 19,2921–2947.
Verhoef, H.A., Van Selm, A.J., 1983. Distribution and population dynamics of Collem-bola in relation to soil moisture. Holarctic Ecology 6, 387–394.