spatially distributed encoding of covert attentional shifts in human thalamus
TRANSCRIPT

Spatially Distributed Encoding of Covert Attentional Shiftsin Human Thalamus
Oliver J. Hulme,1 Louise Whiteley,2 and Stewart Shipp1
1Department of Vision Science, University College London Institute of Ophthalmology, London; and 2Gatsby Computational NeuroscienceUnit, University College London, London, United Kingdom
Submitted 30 March 2010; accepted in final form 11 September 2010
Hulme OJ, Whiteley L, Shipp S. Spatially distributed encoding of covertattentional shifts in human thalamus. J Neurophysiol 104: 3644–3656, 2010.First published September 15, 2010; doi:10.1152/jn.00303.2010. Spatialattention modulates signal processing within visual nuclei of thethalamus—but do other nuclei govern the locus of attention intop-down mode? We examined functional MRI (fMRI) data fromthree subjects performing a task requiring covert attention to 1 of 16positions in a circular array. Target position was cued after stimulusoffset, requiring subjects to perform target detection from iconicvisual memory. We found positionally specific responses at multiplethalamic sites, with individual voxels activating at more than onedirection of attentional shift. Voxel clusters at anatomically equivalentsites across subjects revealed a broad range of directional tuning ateach site, with little sign of contralateral bias. By reference to athalamic atlas, we identified the nuclear correspondence of the fourmost reliably activated sites across subjects: mediodorsal/central-intralaminar (oculomotor thalamus), caudal intralaminar/parafascicu-lar, suprageniculate/limitans, and medial pulvinar/lateral posterior.Hence, the cortical network generating a top-down control signal forrelocating attention acts in concert with a spatially selective thalamicapparatus—the set of active nuclei mirroring the thalamic territory ofcortical “eye-field” areas, thus supporting theories which propose thevisuomotor origins of covert attentional selection.
I N T R O D U C T I O N
From a neural perspective, spatial visual attention is anintegrated ability of the brain to coordinate the allocation ofprocessing resources across multiple cortical areas to the loca-tion of greatest behavioral significance (Beck and Kastner2009; Duncan 2006; Duncan et al. 1997; Shipp 2004). Top-down attention is thought to be mediated by a control signaloriginating from a fronto-parietal cortical network interactingwith visual processing along the occipito-temporal pathway(Corbetta and Shulman 2002; Kastner and Ungerleider 2000;Moore 2006; Yantis and Serences 2003). As these two corticalnetworks connect with largely separate zones within the thal-amus (Selemon and Goldman-Rakic 1988; Shipp 2003), ourthesis is that the engagement of thalamic nuclei with attentionmight divide into similarly discrete, binary categories—i.e., asa source or sink for attentional functionality. Recent progressin imaging thalamic correlates of covert visual attention hasfocused on the latter effect in visual nuclei, showing attentionalenhancement of the response of the inferior pulvinar, andlateral geniculate nucleus (LGN), to contralaterally presentedstimuli (Cotton and Smith 2007; O’Connor et al. 2002; Schnei-der and Kastner 2009; Smith et al. 2009a). By contrast, we set
out to examine spatial tuning in the pan-thalamic pattern ofactivation induced by cued shits of attention to parafovealtargets, addressing mechanisms of top-down control ratherthan the modulation of visual processing.
Neuropsychological studies certainly link thalamic damageto various forms of attentional disturbance, such as contralat-eral neglect (Karnath et al. 2002; Kaufman et al. 2009; Ortigueet al. 2001) or deficits in covert attention (Arend et al. 2008;Rafal and Posner 1987; Ward and Arend 2007) or filteringdistracters (Snow et al. 2009). However, the thalamic lesionsare rarely sufficiently focal to draw precise subthalamic (i.e.,nuclear) functional inferences. Although there is a wealth ofimaging studies documenting cerebral correlates of covertattention, this work has produced surprisingly meager evidenceof any contribution from the thalamus. A common prob-lem—at least in respect of thalamic observations—is the use ofpooled-subject group analysis: the size of individual thalamicnuclei is comparable to the magnitude of the local spatialtransformations achieving stereotaxic normalization, such thatthere is little guarantee that equivalent thalamic activations (ornuclei) will be successfully coregistered. This may explain theabsence of thalamic activation in studies of covert attentionthat do, nonetheless, report subcortical activity in cerebellumand/or putamen (Corbetta et al. 1998; Hopfinger et al. 2000;Nobre et al. 2000; Perry and Zeki 2000). In studies that reportonly cortical activation, it is not always clear whether subcor-tical activation was absent, excluded from regions of interest,or simply went unreported (Corbetta et al. 2000; Ikkai andCurtis 2008; Kelley et al. 2008; Serences and Yantis 2007).Three studies, to our knowledge, have reported thalamic locilinked to the operation of covert attention: these are all unilat-eral, variously attributed to right ventrolateral nucleus (Gitel-man et al. 1999), left anterior thalamus and left pulvinar(Yantis et al. 2002), and left ventroposteromedial nucleus1 (deHaan et al. 2008).
Our source data were obtained in an event-related functionalMRI (fMRI) study of stimulus reportability (Hulme et al.2009), where three subjects viewed a briefly presented, circulararray of disc stimuli surrounding fixation and reported thepresence or absence of a disc at a specified location. The cuefollowed the offset of the disc targets, requiring subjects toperform detection based on their visual iconic memory (Ge-genfurtner and Sperling 1993). The angular spacing of thediscs was commensurate with the limit of attentional resolu-tion, the minimum interobject separation at which two objectscan be individuated (Intriligator and Cavanagh 2001). By
Address for reprint requests and other correspondence: S. Shipp, Depart-ment of Vision Science, UCL Institute of Ophthalmology, 11-43 Bath Street,London EC1V 9EL, UK (E-mail: [email protected]).
1 The thalamic locus specified by the given coordinates is from the interac-tive atlas at www.neurovia.umn.edu/cgi-bin/tal_atlas.
J Neurophysiol 104: 3644–3656, 2010.First published September 15, 2010; doi:10.1152/jn.00303.2010.
3644 0022-3077/10 Copyright © 2010 The American Physiological Society www.jn.org

contrast, previous imaging studies of covert attention havecommonly used just two targets, located in opposite hemifields.The one previous study requiring readout from iconic memoryconcluded that the spatial attention task activated similar cor-tical networks independent of providing the cue before or afterthe stimulus (Ruff et al. 2007). To maximize the sensitivity ofstatistical inference, we collected a high volume of single-subject data and restricted the analysis to a bilateral peri-thalamic region. We sought to identify thalamic nuclei not bystereotaxic coordinates but by cross-referencing individualanatomic criteria from nontransformed brain images to a stan-dard thalamic atlas (Morel et al. 1997). Compilation of activesites across subjects and hemispheres highlighted thalamicnuclei linked to the cortico-thalamocortical circuitry of thefrontoparietal network and also to thalamo-striatal circuitry.Interpretation of this pattern of activation follows the rationaleoutlined by visuomotor theories for the origins of covertattention (Awh et al. 2006; Moore et al. 2003).
M E T H O D S
Subjects, stimuli, and task
Three highly experienced psychophysical observers, naïve to theaims of the experiment (2 males and 1 female; age, 21–25 yr; all righthanded and with normal vision) were scanned. The inclusion criterionfor all subjects was an ability to maintain consistently stable fixationfor the duration of each session (1 subject excluded on this basis). Allsubjects gave informed consent in accordance with the Declaration ofHelsinki, and the Ethics Committee of the National Hospital forNeurology and Neurosurgery, London, UK, granted ethics approvalfor the study. We used a case study design because the degrees offreedom were more powerfully deployed within subjects to maximizesensitivity for detecting small spatial maps. Accordingly, we acquireda large amount of data from each subject (�5,000 volumes/subject).The stimulus consisted of eight small discs (solid circular shapes ofdiameter 0.5°), displayed at 3° eccentricity in a circular array centeredon a permanent fixation cross (Fig. 1). The eight discs were pseudo-randomly distributed among 16 fixed positions, such that each octantcontained one disc. Each disc was defined by a salient sinusoidalluminance transient (200 ms duration, 1 cycle) on a uniform graybackground (98 Cd/m2). Sinusoidal luminance transients were chosenbecause they minimized visual afterimages as tested psychophysicallyand also because they increased the saliency of the discs such thatsubjective indices of perceptual salience (2-alternative forced-choicecomparative salience judgment) and objective measures of detectionaccuracy (d-prime � 3.5) were higher than for a simple ON-OFF
transient of the same contrast and duration.The task was a variant of the Sperling “partial report” paradigm
(Gegenfurtner and Sperling 1993). Each trial started with the onset ofthe disc array transient, which was presented for 200 ms and followed,after a variable delay (200, 1,000, or 2,000 ms), by a cue (100 ms)pointing to 1 of the 16 positions. The cue itself was a thin black line,extending radially from the center of the fixation cross to a point at 1°eccentricity in the direction of one pseudorandomly selected position.Subjects were instructed to indicate in a two-alternative, forced-choicejudgment whether the disc at the cued location had been present orabsent by pressing one of two buttons on a response box. A differenthand was used for each response, and the response modality for eachhand was alternated between sessions. Subjects were instructed tofixate the central cross at all times. There was an additional controlcondition in which exactly the same stimulus and cue were presented,but subjects were instructed not to respond or to attend the cuedlocation. These control trials, which amounted to 7.7% of the total,were performed in blocks separate to those in which subjects actively
performed the task. All stimuli were constructed using COGENT2000 Graphics running in MATLAB (Mathworks). Visual stimuliwere generated by a dedicated PC located in the control room andprojected via a LCD projector onto a transparent screen positionedover the subject’s head and viewed through a tilted mirror fixed to thehead coil (63 cm eye-to-screen distance). Eye movements weremonitored at all times throughout the scan to ensure correct fixation.If saccades were detected during the trial, scanning sessions werestopped and restarted with verbal feedback issued to the subject(instantiated once only, for subject H.E.). The circular arrangementand equal luminance of the discs minimized the likelihood of inducingreflexive saccades.
Subjects were trained extensively before scanning, with two aims:1) to find the contrast parameters of the luminance transients for eachsubject that would result in performance within a controlled range(92.5–97.5% for short delay trials) and 2) to ensure performance hadstabilized and that no further learning was taking place (see Supple-mentary Procedures for additional details).2
Scanning and image processing
Scanning was performed on a 3-T Siemens Allegra fMRI scannerusing standard scanning protocols (TR � 2.47/TE � 65ms) with anative resolution of 2 mm isotropic voxels. There were 10 separatesessions per subject, each consisting of an average of 730 volumes(�30 min/session). The first five images of each run were discardedto allow for magnetic saturation effects. Neither phase mapping norunwarping was necessary in view of the fact that the thalamusoccupies a relatively well-shimmed region, with little susceptibility-related echo-planar imaging artifact.
The remaining images were realigned, resliced, and coregistered tothe individual subjects’ structural scans. The data were analyzed usinga voxel-wise general linear model as implemented in SPM2 software(Wellcome Trust Centre for Neuroimaging, London, UK). The echo
2 The online version of this article contains supplemental data.
FIG. 1. Spatial and temporal configuration of the stimulus display. Eighttarget discs, diameter 0.5°, distributed among 16 invariant positions at 3°eccentricity from fixation (with 1 disc per octant) underwent a sinusoidalluminance transient of 200 ms duration. The cue, a short line pointing fromfixation to 1 position, was presented for 100 ms after a further variable interval.Subjects indicated the presence or absence of a disc at the cued location fromiconic memory.
3645COVERT ATTENTIONAL SHIFTS IN THE THALAMUS
J Neurophysiol • VOL 104 • DECEMBER 2010 • www.jn.org

planar-imaging images were realigned spatially and filtered tempo-rally with a band-pass filter with a low-frequency cut-off period of128 s. Global changes in activity were removed by proportionalscaling. To maximize correspondence of thalamic landmarks in theT1-weighted structural images across subjects, standard stereotaxicnormalization (i.e., with respect to Talairach/MNI coordinates) wasomitted in favor of a manual registration procedure. The latter cor-rected small variations in pitch of the body of the thalamus withrespect to the standard AC-PC plane (requiring rotations �5°). Thefirst functional volume (of the 1st session for each subject) wascoregistered to the manually adjusted structural before automaticrealignment of the remaining functional volumes. Once realigned, allfunctionals and the structurals were cropped down to dual (i.e., leftand right) perithalamic regions, symmetrical about the midline (each3.7 � 3.7 � 3.7 cm, fully enveloping the thalamus of a singlehemisphere). The functional images were supersampled to yield 1 mmcubic voxels; the smoothness introduced by this reslicing (performedby 4th-degree B-spline interpolation) allowed the use of random fieldtheory for statistical testing by ensuring that the lattice approximationwould hold.
Stimulus onsets and attentional shifts were modeled as events time-locked to their occurrence (respectively the onset of the disc array and ofthe cue). Standard multiple linear regression protocols were used toestimate the parameters of the BOLD response to the varying spatialconfigurations of stimuli and cue. To characterize the spatial selectivity ofactivation mediated by attention, we explored the main effect of cuedirection (relative to implicit baseline) in respect of single positions,octants (2 of 16 positions), quadrants (4 of 16), and superior/inferior andright/left hemifields (8 of 16 positions). A separate set of contrastsexamined the main effect of stimulus onset at specific locations (exploit-ing the fact that the presence of a disc at the specified position in 50% oftrials was not correlated with the position of any other disc in the 7remaining octants). All other factors relating to decision and reportelements of the task were modeled as effects of no interest, becausethe balanced design of trial delivery eliminated any correlation withcue direction. The factor of cue delay was treated similarly. Thereason cues were presented with variable delays was to prevent strongtemporal expectations for their arrival; as expected, longer delaysinduced more error in target detection. However, because attentionalorientation and not target detection was the focus of this study, wemaximized statistical power by pooling trials across cue delay and, asnoted, irrespective of target presence/absence and correct/incorrectresponses. A similar analysis in respect of cue direction was per-formed on the control data (in which subjects observed the samevisual stimulus without performing the task). Note that the controlconditions were not part of the factorial design of the experiment; theywere implemented in separate sessions (to serve as a localizer), andtherefore, the control data are not used for direct contrast with the taskperformance data.
The main effects of attentional shifts to separate single positionswere jointly rendered onto structural images to show voxel-wiseattentional field maps. We present data relating to 6/16 positions(shown as paired sets of 3 equally spaced positions, 1 set rotated by1 position with respect to the other). We adopted this approach in viewof the multiple-position sensitivity of single voxels that precluded useof a conventional 8- or 16-point color wheel method of illustration(because the color wheel assigns a single color/direction to each voxeland thus obscures any more complex spatial response profile). Alleffects shown are significant at P � 0.05 familywise error [(FEW)-corrected over the peri-thalamic volume].
Fitting functions to the voxel selectivity profiles
We further aimed to determine what function would best charac-terize the activation of a voxel by the 16 separate directions ofattentional shift [the attentional selectivity profile (ASP)]. This isanalogous to fitting a tuning curve to the directionally tuned responses
of a single neuron but, unlike classical tuning curves, we found thatthalamic voxels show complex, multiply peaked profiles (Fig. 5). Toquantify such a spatial tuning profile, we fit a function with zero, one,two, three, or four modes to each ASP. We used gradient descent onthe posterior probability, with checks for convergence and for repli-cability. The zero mode function was a flat line, and the peakedprofiles consisted of mixtures of between one and four Von Misesfunctions (the circular analog of a Gaussian and thus suitable forradial position). We selected the fitted function under which the datahad the highest likelihood, according to the Bayesian informationcriterion (BIC) approximation. Note that, although there are a smallnumber of data points, use of the BIC for model selection penalizesthe number of parameters, guarding against overfitting; see Supple-mentary Procedures for a full description.
Thalamic profiling: Anatomical identification of active nuclei
Individual nuclear activation was specified by reference to thestereotactic atlas of the human thalamus of Morel et al. (1997). Theatlas shows series of sections in each of the three cardinal axes, withthe sagittal and horizontal series being derived from opposite hemi-spheres of the same brain. To compare images to atlas sections, wemade manual adjustments (�5°) to the horizontal image plane in eachsubject matching the pitch of the body of the thalamus to the standardAC–PC plane at horizontal level zero. We identified homologousanatomical landmarks to serve as reference points for defining corre-sponding slices between the atlas and each subject, allowing indepen-dent linear scaling in each axis of brain space. The atlas shows ahorizontal series of 16 sections from �1.8 to �11.7 mm with respectto the AC-PC plane; having matched the upper and lower boundingsections, our perithalamic image volume was found to extend a littlefurther ventral, providing two additional levels. A similar procedurewas applied to the sagittal series, matching the 18 atlas sections from3.6 to 19.4 mm lateral to the midline, plus three additional levels morelaterally.
The major limitation in the accuracy of the atlas comparison isimposed by interindividual variation in the size and shape of thalamicnuclei, compounded by gross differences in overall thalamic dimen-sions as shown in Fig. 2 (for another example, see Fig. S9, Supple-mentary Data/Discussion Section 3A). To improve the registrationbetween fMR images and atlas templates, we routinely distorted thelatter to match the outline of the thalamus in each of our subjects; anexample is presented in Fig. 3. The ventricular surface of the thalamusis easily discernible, and the reticular nucleus in the atlas templateswas fitted to the gray/white interface between thalamus and internalcapsule. Internal landmarks that assisted fine tuning of the subjectivefit were the habenular nucleus in horizontal sections and the mam-millothalamic tract in sagittal sections. The reliability of the resultingmatch between internal nuclei and template nuclear boundaries willdepend on the degree to which nuclear dimensions are proportional tooverall thalamic dimensions—a property that has been ascertainedpreviously, at least in the rostro-caudal dimension (Brierley and Beck1959).
The patterns of activation elicited by 6/16 test positions weresuperimposed, defining clusters of active voxels responsive (at P �0.05 FWE) to 1 or more of these 6 positions. Most clusters passed aconjunction test (Friston et al. 2005), containing either individual, orcontiguous, supersampled voxels activated at more than one single-position contrast. Clusters responsive to a single position alone, andwith fewer than eight voxels were disregarded, as a precaution againstinferring activation from noise. The surviving single-position clusterswere double this size at minimum, with dimensions exceeding twovoxels in all axes (i.e., both within and orthogonal to the plane ofinspection), ensuring that the same set of clusters would be scoredindependent of the plane used. Clusters were scored to thalamic nucleiidentified by the distorted atlas template at a matching level. Largervoxel clusters frequently overlap one or more nuclear boundaries, and
3646 O. J. HULME, L. WHITELEY, AND S. SHIPP
J Neurophysiol • VOL 104 • DECEMBER 2010 • www.jn.org

in these cases, multiple nuclei were scored to account for the inde-terminacy of anatomical location. We performed the same procedurefor identifying nuclei in both the horizontal and sagittal planes,reasoning that amalgamation of the two sets of results (arising fromtwo independent comparisons of datasets that are essentially iso-morphic across plane of view) would act to attenuate random errors innuclear identification. The horizontal and sagittal atlas series were themost appropriate for this task as, being derived from opposite hemi-spheres of the same brain, they have greater structural similarity witheach other than with the third (coronal) series; the linear distortionbetween nuclear centers of gravity as depicted in the horizontal andsagittal series of the Morel atlas has been estimated at 7% (Niemannet al. 2000).
The results were compiled across anatomical plane, hemisphere,and subject to give a qualitative ranking of the likelihood that eachthalamic nucleus is activated by the covert task—several nucleiachieving the maximum score of 6 (i.e., activation noted for at least 1atlas level in both planes of view, in both hemispheres of all 3subjects). The next highest score, 5.5, indicates that activation wasuniformly scored for that nucleus apart from one plane of view, in onehemisphere, of one subject—and so on. To attempt a more quantita-tive estimation, we also recorded the number of levels at which eachnucleus appears in the atlas and the proportion showing activation byat least one stimulus position. Given roughly spherical voxelclusters, the product of this proportion, obtained separately for allthree planes of view, would provide a rough estimate of thevolumetric fraction of active tissue within each nucleus; however,because we did not analyze data in the coronal plane, the volu-metric fraction was estimated by the product (sh)1.5 (where s andh � proportion of active levels in the sagittal and horizontal planesrespectively).
R E S U L T S
Spatial representation
Given a native anatomical resolution of 2 mm (i.e., voxels of2 � 2 � 2 mm before supersampling), we did not expect ourdata to evince frank retinotopy. Even in the larger nuclei (e.g.,pulvinar or mediodorsal), a spatial map could only span 10–12mm at most, and individual voxels would comprise relativelylarge components of it (in comparison to a larger scale corticalmap, e.g., V1). We therefore looked, initially, for any evidenceof broad spatial tuning, performing contrasts to test for themain effect of attending to different hemifields [upper fieldpositions (13-4) vs. lower field (5–12)] or [left (9–16) vs. right(1–8)] (refer to Fig. 1 for stimulus disc positions). Suchcontrasts were virtually devoid of activation and gave nosignificant effects in any subject, even at low thresholds (P �0.01 uncorrected). Next, we performed contrasts at succes-sively narrower sectors of arc, namely quadrants, octants, andsingle (1/16th) positions (presented in detail below). Theseshowed a clear progression in their outcome, the narrowercontrasts producing wider distributions of activation acrossmultiple thalamic sites, in all three subjects, with progressivelyhigher levels of significance. This suggests that attentionalrepresentation in the pulvinar, mediodorsal, and other nucleihas a fine angular granularity and that the main effects of thecoarser contrasts, indexing attentional shifts to quadrants orhemi-fields, are attenuated by averaging over positions withsuboptimal BOLD responses.
FIG. 2. Individual variation in nuclear anatomy of thalamus. Template HB1R (left) is from the horizontal series used in the thalamic atlas of Morel et al.(1997). Template HB2R is from a different brain but at the same level (D3.6) to show variability in the outline shape of the thalamus and in the internal nuclearconformation. In the superimposition (right), HB1R is shown in grayscale and HB2R in bold outline with nuclear labels. Atlas sections are reproduced bypermission of John Wiley and Sons. CeM, central medial; CL, central lateral nucleus; CM, center median nucleus; Hb, habenular; LD, lateral dorsal nucleus;Li, limitans nucleus; LP, lateral posterior nucleus; MDpc and MDpl, mediodorsal nucleus, parvocellular and paralamellar divisions; MGN, medial geniculatenucleus; MTT, mammillothalamic tract; MV, medioventral; Pf, parafascicular nucleus; Po, posterior nucleus; PuA, anterior pulvinar; PuL, lateral pulvinar; PuM,medial pulvinar; Pv, paraventricular; R, reticular nucleus; Sg, suprageniculate nucleus; sPf, subparafascicular nucleus; VA and VAmc, ventral anterior nucleusand magnocellular division; VLa, ventral lateral anterior nucleus; VLPd and VLPv, ventral lateral posterior nucleus, dorsal and ventral subdivisions; VM, ventralmedial nucleus; VPLp and VPLa, ventral posterior lateral nucleus, posterior and anterior divisions; VPMpc, ventral posterior medial nucleus, parvocellulardivision; VPI , ventral posterior inferior nucleus; ZI, zona incerta; IC, internal capsule.
3647COVERT ATTENTIONAL SHIFTS IN THE THALAMUS
J Neurophysiol • VOL 104 • DECEMBER 2010 • www.jn.org
It should be noted that this is an attentional effect and not avisual (stimulus-driven) response, on the basis of two addi-tional sets of analyses. First we performed equivalent contrastsat the single position level to test for visual responses to thedisc stimuli (note that, although 8 discs were always simulta-neously presented, the stochastic nature of the stimulation canallow position-specific visual responses to be recovered;Hulme et al. 2009). Second, we replicated the contrasts for themain effect of cue direction for single positions, octants,quadrants, and hemifields in the control data (where subjectssaw the same stimuli but did not perform the task). All suchcontrasts failed to show significant disc or cue stimulus drivenactivity in the thalamic region of interest (even at the liberalthreshold of P � 0.01 uncorrected). The absence of a detect-able visual response, even from LGN and pulvinar, is not sounexpected, given that our task design (using minimal, short-duration visual transients) was not specifically optimized forvisual activation, in contrast to previous positive observationsof thalamic visual activity (Cotton and Smith 2007; O’Connoret al. 2002; Schneider and Kastner 2009; Smith et al. 2009a).
The thalamic box region-of-interest included certain extra-thalamic components, including brain stem and minor parts ofbasal ganglia adjoining the internal capsule. These were mainlyinactive, containing sporadic activated voxels or small clusters(P � 0.05 FWE) in the single position contrasts for attentional
shifts. An exception, noted in just one subject (HE), was aswathe of activation extending through bilateral superior col-liculus, pretectum, and midline brain stem structures ventral tothe thalamus.
Examination of single-position responses
Having established that voxels, supersampled at 1 � 1 � 1mm, had reliable main effects of attention to single positions ofour test stimulus, we sought to characterize the nature of theirspatial representation. For clarity of visual inspection andpresentation, the analysis of topography was restricted to asample of six test positions, as shown in Fig. 4. Each imageshows, superimposed, the main effect (P � 0.05 FWE) ofactivations elicited by three separate test positions, as renderedon sagittal slices of the structural MRI from each subject andusing the color mixing scheme shown in the key. Two imagesare shown for each anatomical level, the sample of three evenlyspaced positions shown in one image being rotated by oneposition to give the trio shown in the other image of each pair.The full horizontal and sagittal series are provided in Supple-mentary Figs. S1–S4. The data afford two general properties:1) concordance between the overall pattern of response, acrossthe thalamus, to adjacent positions, and 2) single voxels thatrespond to two or more nonadjacent test positions.
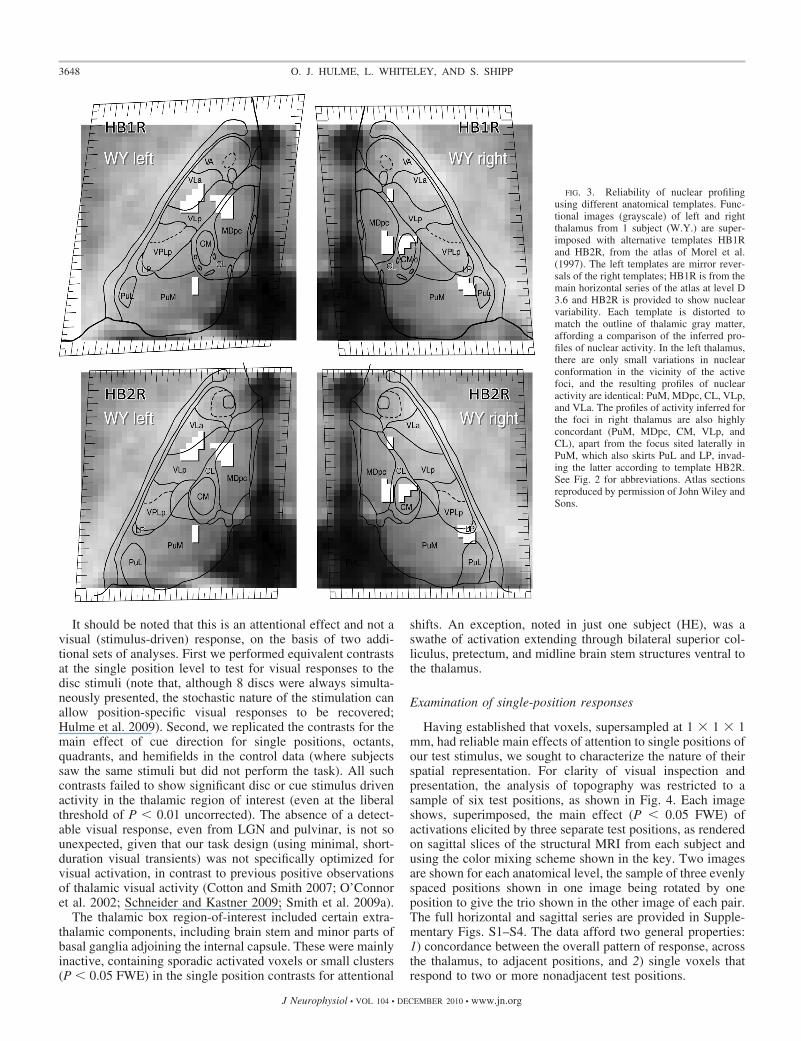
FIG. 3. Reliability of nuclear profilingusing different anatomical templates. Func-tional images (grayscale) of left and rightthalamus from 1 subject (W.Y.) are super-imposed with alternative templates HB1Rand HB2R, from the atlas of Morel et al.(1997). The left templates are mirror rever-sals of the right templates; HB1R is from themain horizontal series of the atlas at level D3.6 and HB2R is provided to show nuclearvariability. Each template is distorted tomatch the outline of thalamic gray matter,affording a comparison of the inferred pro-files of nuclear activity. In the left thalamus,there are only small variations in nuclearconformation in the vicinity of the activefoci, and the resulting profiles of nuclearactivity are identical: PuM, MDpc, CL, VLp,and VLa. The profiles of activity inferred forthe foci in right thalamus are also highlyconcordant (PuM, MDpc, CM, VLp, andCL), apart from the focus sited laterally inPuM, which also skirts PuL and LP, invad-ing the latter according to template HB2R.See Fig. 2 for abbreviations. Atlas sectionsreproduced by permission of John Wiley andSons.
3648 O. J. HULME, L. WHITELEY, AND S. SHIPP
J Neurophysiol • VOL 104 • DECEMBER 2010 • www.jn.org

Across the thalamus as a whole, there was variable expres-sion of topography in spatial representation. One notable ex-ample occurred in a large cluster of activity located in thedorsal sector of the left posterior thalamus in two subjects(shown in the upper elements of Fig. 4)—a location within themedial pulvinar and adjacent lateral posterior nuclei (see Fig.
4B) that we shall refer to as the “dorsal pulvinar cluster”(DPC). The DPC shows separate but overlapping subzonesactivated by the red, green, and blue positions (the inset in Fig.4A shows 1 DPC example with separate color mapping forgreater clarity). However, in rotating the sampling by just oneposition, each zone partially shifts its territory within the
FIG. 4. Positional specificity of thalamic activation. A: serial sagittal slices displaying position specific BOLD activity superimposed on structural images from2 individual subjects: W.Y. and H.E. The dials P1 and P2 show the 2 trios of test positions (red, green, and blue), P2 being rotated 1 position clockwise fromP1. Red, green, and blue voxels indicate significant effects of an attentional shift to 1 of these 3 positions. The color-mixing scheme shows how voxels responsiveto 2 positions are represented by duller yellow, magenta, and cyan hues, whereas responses to all 3 are rendered in black. Each set of 6 images shows P1 andP2 activity in duplicate sections at 3 levels, the corresponding level of the Morel atlas being indicated to the top right of the P2 image. Anatomical axes areindicated by the sagittal plane compass (right middle) and the guidelines linked to each set of slices. The inset at mid-left shows a cluster from case W.Y.triplicated with separate color mapping for greater clarity. B: 1 slice from each of the 4 blocks in A is shown with indicative thalamic nuclei obtained bysuperimposition of templates from the Morel atlas (reproduced by permission of John Wiley and Sons). See Fig. 2 for nuclear abbreviations.
3649COVERT ATTENTIONAL SHIFTS IN THE THALAMUS
J Neurophysiol • VOL 104 • DECEMBER 2010 • www.jn.org
overall cluster in a complex fashion, such that an underlyingmap of polar angle is not readily deciphered. The bottom ofFig. 4A compares the pattern of positional specificities for abilateral focus of activation extending dorsoventrally throughcentral thalamus (involving mediodorsal and caudal intralami-nar nuclei). Both hemispheres show activation correspondingto all six test positions examined. However, again, the impliedpolar topography is either illegible (W.Y., right), and/or poorlyconsistent between the two sets of test positions (W.Y., left).
Modeling voxel-based positional selectivity
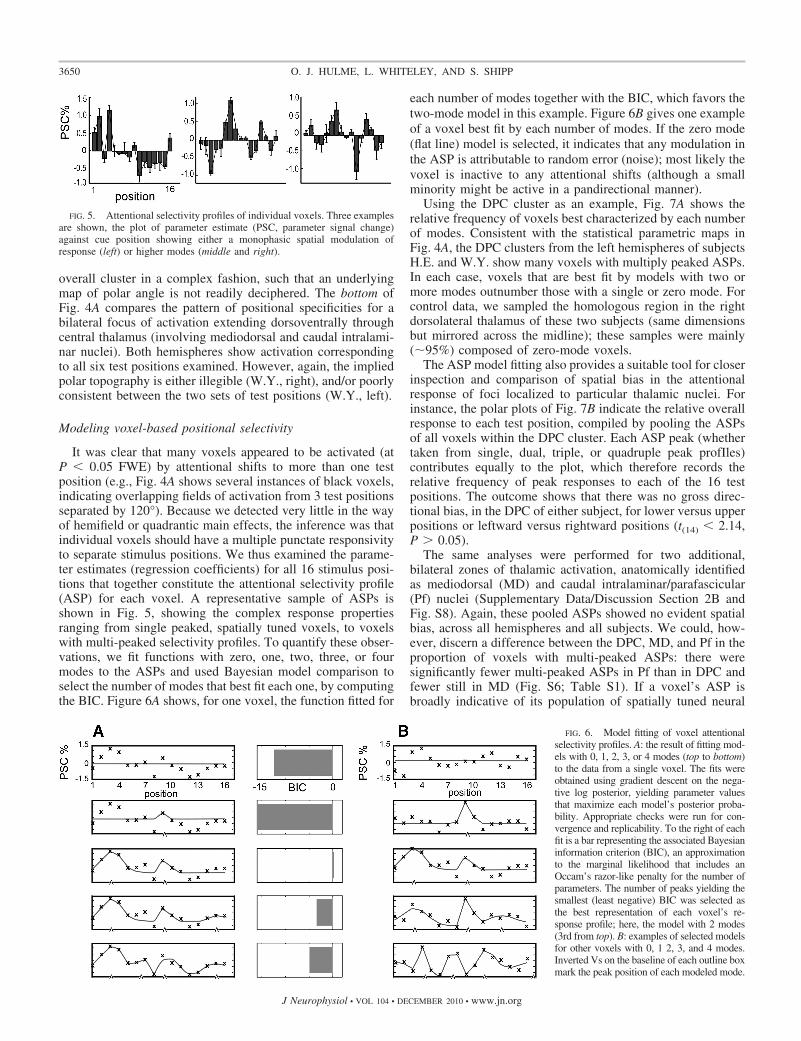
It was clear that many voxels appeared to be activated (atP � 0.05 FWE) by attentional shifts to more than one testposition (e.g., Fig. 4A shows several instances of black voxels,indicating overlapping fields of activation from 3 test positionsseparated by 120°). Because we detected very little in the wayof hemifield or quadrantic main effects, the inference was thatindividual voxels should have a multiple punctate responsivityto separate stimulus positions. We thus examined the parame-ter estimates (regression coefficients) for all 16 stimulus posi-tions that together constitute the attentional selectivity profile(ASP) for each voxel. A representative sample of ASPs isshown in Fig. 5, showing the complex response propertiesranging from single peaked, spatially tuned voxels, to voxelswith multi-peaked selectivity profiles. To quantify these obser-vations, we fit functions with zero, one, two, three, or fourmodes to the ASPs and used Bayesian model comparison toselect the number of modes that best fit each one, by computingthe BIC. Figure 6A shows, for one voxel, the function fitted for
each number of modes together with the BIC, which favors thetwo-mode model in this example. Figure 6B gives one exampleof a voxel best fit by each number of modes. If the zero mode(flat line) model is selected, it indicates that any modulation inthe ASP is attributable to random error (noise); most likely thevoxel is inactive to any attentional shifts (although a smallminority might be active in a pandirectional manner).
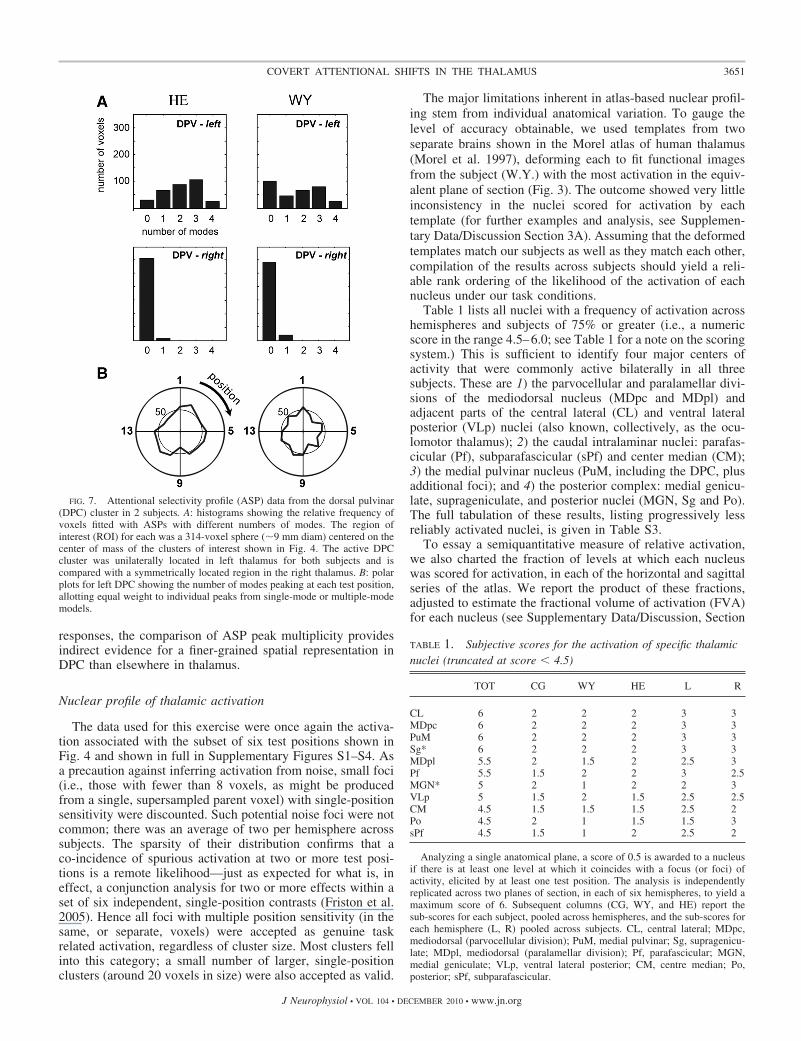
Using the DPC cluster as an example, Fig. 7A shows therelative frequency of voxels best characterized by each numberof modes. Consistent with the statistical parametric maps inFig. 4A, the DPC clusters from the left hemispheres of subjectsH.E. and W.Y. show many voxels with multiply peaked ASPs.In each case, voxels that are best fit by models with two ormore modes outnumber those with a single or zero mode. Forcontrol data, we sampled the homologous region in the rightdorsolateral thalamus of these two subjects (same dimensionsbut mirrored across the midline); these samples were mainly(�95%) composed of zero-mode voxels.
The ASP model fitting also provides a suitable tool for closerinspection and comparison of spatial bias in the attentionalresponse of foci localized to particular thalamic nuclei. Forinstance, the polar plots of Fig. 7B indicate the relative overallresponse to each test position, compiled by pooling the ASPsof all voxels within the DPC cluster. Each ASP peak (whethertaken from single, dual, triple, or quadruple peak profIles)contributes equally to the plot, which therefore records therelative frequency of peak responses to each of the 16 testpositions. The outcome shows that there was no gross direc-tional bias, in the DPC of either subject, for lower versus upperpositions or leftward versus rightward positions (t(14) � 2.14,P � 0.05).
The same analyses were performed for two additional,bilateral zones of thalamic activation, anatomically identifiedas mediodorsal (MD) and caudal intralaminar/parafascicular(Pf) nuclei (Supplementary Data/Discussion Section 2B andFig. S8). Again, these pooled ASPs showed no evident spatialbias, across all hemispheres and all subjects. We could, how-ever, discern a difference between the DPC, MD, and Pf in theproportion of voxels with multi-peaked ASPs: there weresignificantly fewer multi-peaked ASPs in Pf than in DPC andfewer still in MD (Fig. S6; Table S1). If a voxel’s ASP isbroadly indicative of its population of spatially tuned neural
FIG. 5. Attentional selectivity profiles of individual voxels. Three examplesare shown, the plot of parameter estimate (PSC, parameter signal change)against cue position showing either a monophasic spatial modulation ofresponse (left) or higher modes (middle and right).
FIG. 6. Model fitting of voxel attentionalselectivity profiles. A: the result of fitting mod-els with 0, 1, 2, 3, or 4 modes (top to bottom)to the data from a single voxel. The fits wereobtained using gradient descent on the nega-tive log posterior, yielding parameter valuesthat maximize each model’s posterior proba-bility. Appropriate checks were run for con-vergence and replicability. To the right of eachfit is a bar representing the associated Bayesianinformation criterion (BIC), an approximationto the marginal likelihood that includes anOccam’s razor-like penalty for the number ofparameters. The number of peaks yielding thesmallest (least negative) BIC was selected asthe best representation of each voxel’s re-sponse profile; here, the model with 2 modes(3rd from top). B: examples of selected modelsfor other voxels with 0, 1 2, 3, and 4 modes.Inverted Vs on the baseline of each outline boxmark the peak position of each modeled mode.
3650 O. J. HULME, L. WHITELEY, AND S. SHIPP
J Neurophysiol • VOL 104 • DECEMBER 2010 • www.jn.org
responses, the comparison of ASP peak multiplicity providesindirect evidence for a finer-grained spatial representation inDPC than elsewhere in thalamus.
Nuclear profile of thalamic activation
The data used for this exercise were once again the activa-tion associated with the subset of six test positions shown inFig. 4 and shown in full in Supplementary Figures S1–S4. Asa precaution against inferring activation from noise, small foci(i.e., those with fewer than 8 voxels, as might be producedfrom a single, supersampled parent voxel) with single-positionsensitivity were discounted. Such potential noise foci were notcommon; there was an average of two per hemisphere acrosssubjects. The sparsity of their distribution confirms that aco-incidence of spurious activation at two or more test posi-tions is a remote likelihood—just as expected for what is, ineffect, a conjunction analysis for two or more effects within aset of six independent, single-position contrasts (Friston et al.2005). Hence all foci with multiple position sensitivity (in thesame, or separate, voxels) were accepted as genuine taskrelated activation, regardless of cluster size. Most clusters fellinto this category; a small number of larger, single-positionclusters (around 20 voxels in size) were also accepted as valid.
The major limitations inherent in atlas-based nuclear profil-ing stem from individual anatomical variation. To gauge thelevel of accuracy obtainable, we used templates from twoseparate brains shown in the Morel atlas of human thalamus(Morel et al. 1997), deforming each to fit functional imagesfrom the subject (W.Y.) with the most activation in the equiv-alent plane of section (Fig. 3). The outcome showed very littleinconsistency in the nuclei scored for activation by eachtemplate (for further examples and analysis, see Supplemen-tary Data/Discussion Section 3A). Assuming that the deformedtemplates match our subjects as well as they match each other,compilation of the results across subjects should yield a reli-able rank ordering of the likelihood of the activation of eachnucleus under our task conditions.
Table 1 lists all nuclei with a frequency of activation acrosshemispheres and subjects of 75% or greater (i.e., a numericscore in the range 4.5–6.0; see Table 1 for a note on the scoringsystem.) This is sufficient to identify four major centers ofactivity that were commonly active bilaterally in all threesubjects. These are 1) the parvocellular and paralamellar divi-sions of the mediodorsal nucleus (MDpc and MDpl) andadjacent parts of the central lateral (CL) and ventral lateralposterior (VLp) nuclei (also known, collectively, as the ocu-lomotor thalamus); 2) the caudal intralaminar nuclei: parafas-cicular (Pf), subparafascicular (sPf) and center median (CM);3) the medial pulvinar nucleus (PuM, including the DPC, plusadditional foci); and 4) the posterior complex: medial genicu-late, suprageniculate, and posterior nuclei (MGN, Sg and Po).The full tabulation of these results, listing progressively lessreliably activated nuclei, is given in Table S3.
To essay a semiquantitative measure of relative activation,we also charted the fraction of levels at which each nucleuswas scored for activation, in each of the horizontal and sagittalseries of the atlas. We report the product of these fractions,adjusted to estimate the fractional volume of activation (FVA)for each nucleus (see Supplementary Data/Discussion, Section
TABLE 1. Subjective scores for the activation of specific thalamicnuclei (truncated at score � 4.5)
TOT CG WY HE L R
CL 6 2 2 2 3 3MDpc 6 2 2 2 3 3PuM 6 2 2 2 3 3Sg* 6 2 2 2 3 3MDpl 5.5 2 1.5 2 2.5 3Pf 5.5 1.5 2 2 3 2.5MGN* 5 2 1 2 2 3VLp 5 1.5 2 1.5 2.5 2.5CM 4.5 1.5 1.5 1.5 2.5 2Po 4.5 2 1 1.5 1.5 3sPf 4.5 1.5 1 2 2.5 2
Analyzing a single anatomical plane, a score of 0.5 is awarded to a nucleusif there is at least one level at which it coincides with a focus (or foci) ofactivity, elicited by at least one test position. The analysis is independentlyreplicated across two planes of section, in each of six hemispheres, to yield amaximum score of 6. Subsequent columns (CG, WY, and HE) report thesub-scores for each subject, pooled across hemispheres, and the sub-scores foreach hemisphere (L, R) pooled across subjects. CL, central lateral; MDpc,mediodorsal (parvocellular division); PuM, medial pulvinar; Sg, supragenicu-late; MDpl, mediodorsal (paralamellar division); Pf, parafascicular; MGN,medial geniculate; VLp, ventral lateral posterior; CM, centre median; Po,posterior; sPf, subparafascicular.
FIG. 7. Attentional selectivity profile (ASP) data from the dorsal pulvinar(DPC) cluster in 2 subjects. A: histograms showing the relative frequency ofvoxels fitted with ASPs with different numbers of modes. The region ofinterest (ROI) for each was a 314-voxel sphere (�9 mm diam) centered on thecenter of mass of the clusters of interest shown in Fig. 4. The active DPCcluster was unilaterally located in left thalamus for both subjects and iscompared with a symmetrically located region in the right thalamus. B: polarplots for left DPC showing the number of modes peaking at each test position,allotting equal weight to individual peaks from single-mode or multiple-modemodels.
3651COVERT ATTENTIONAL SHIFTS IN THE THALAMUS
J Neurophysiol • VOL 104 • DECEMBER 2010 • www.jn.org
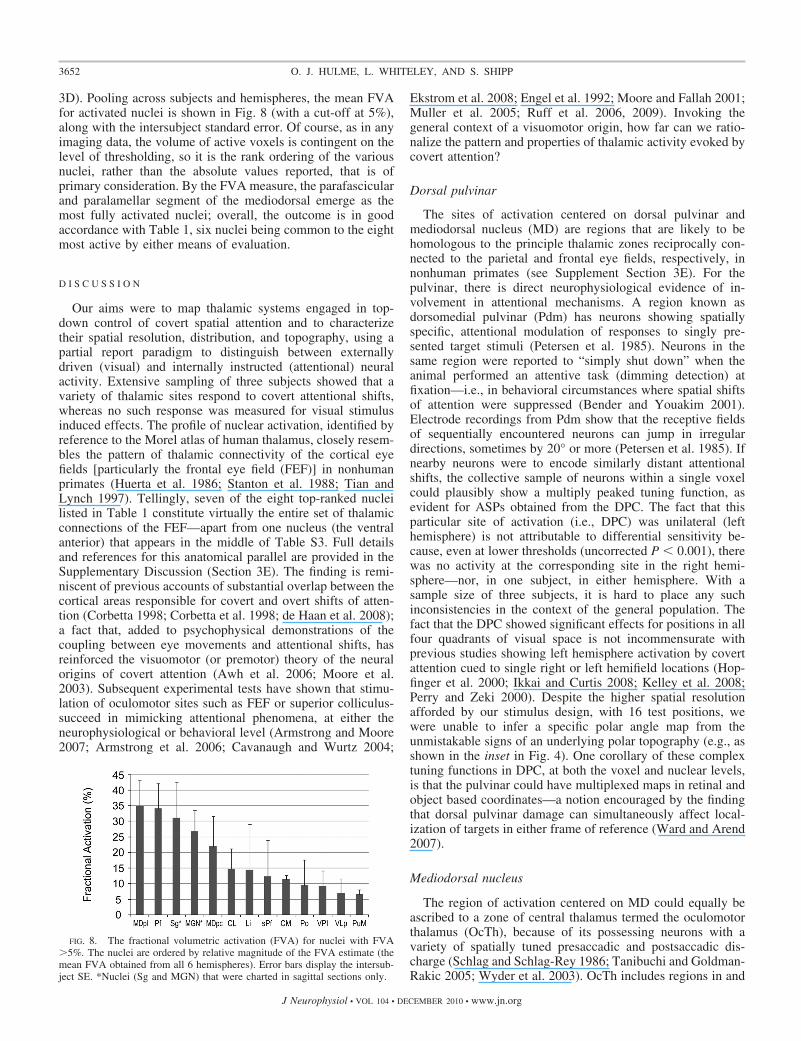
3D). Pooling across subjects and hemispheres, the mean FVAfor activated nuclei is shown in Fig. 8 (with a cut-off at 5%),along with the intersubject standard error. Of course, as in anyimaging data, the volume of active voxels is contingent on thelevel of thresholding, so it is the rank ordering of the variousnuclei, rather than the absolute values reported, that is ofprimary consideration. By the FVA measure, the parafascicularand paralamellar segment of the mediodorsal emerge as themost fully activated nuclei; overall, the outcome is in goodaccordance with Table 1, six nuclei being common to the eightmost active by either means of evaluation.
D I S C U S S I O N
Our aims were to map thalamic systems engaged in top-down control of covert spatial attention and to characterizetheir spatial resolution, distribution, and topography, using apartial report paradigm to distinguish between externallydriven (visual) and internally instructed (attentional) neuralactivity. Extensive sampling of three subjects showed that avariety of thalamic sites respond to covert attentional shifts,whereas no such response was measured for visual stimulusinduced effects. The profile of nuclear activation, identified byreference to the Morel atlas of human thalamus, closely resem-bles the pattern of thalamic connectivity of the cortical eyefields [particularly the frontal eye field (FEF)] in nonhumanprimates (Huerta et al. 1986; Stanton et al. 1988; Tian andLynch 1997). Tellingly, seven of the eight top-ranked nucleilisted in Table 1 constitute virtually the entire set of thalamicconnections of the FEF—apart from one nucleus (the ventralanterior) that appears in the middle of Table S3. Full detailsand references for this anatomical parallel are provided in theSupplementary Discussion (Section 3E). The finding is remi-niscent of previous accounts of substantial overlap between thecortical areas responsible for covert and overt shifts of atten-tion (Corbetta 1998; Corbetta et al. 1998; de Haan et al. 2008);a fact that, added to psychophysical demonstrations of thecoupling between eye movements and attentional shifts, hasreinforced the visuomotor (or premotor) theory of the neuralorigins of covert attention (Awh et al. 2006; Moore et al.2003). Subsequent experimental tests have shown that stimu-lation of oculomotor sites such as FEF or superior colliculus-succeed in mimicking attentional phenomena, at either theneurophysiological or behavioral level (Armstrong and Moore2007; Armstrong et al. 2006; Cavanaugh and Wurtz 2004;
Ekstrom et al. 2008; Engel et al. 1992; Moore and Fallah 2001;Muller et al. 2005; Ruff et al. 2006, 2009). Invoking thegeneral context of a visuomotor origin, how far can we ratio-nalize the pattern and properties of thalamic activity evoked bycovert attention?
Dorsal pulvinar
The sites of activation centered on dorsal pulvinar andmediodorsal nucleus (MD) are regions that are likely to behomologous to the principle thalamic zones reciprocally con-nected to the parietal and frontal eye fields, respectively, innonhuman primates (see Supplement Section 3E). For thepulvinar, there is direct neurophysiological evidence of in-volvement in attentional mechanisms. A region known asdorsomedial pulvinar (Pdm) has neurons showing spatiallyspecific, attentional modulation of responses to singly pre-sented target stimuli (Petersen et al. 1985). Neurons in thesame region were reported to “simply shut down” when theanimal performed an attentive task (dimming detection) atfixation—i.e., in behavioral circumstances where spatial shiftsof attention were suppressed (Bender and Youakim 2001).Electrode recordings from Pdm show that the receptive fieldsof sequentially encountered neurons can jump in irregulardirections, sometimes by 20° or more (Petersen et al. 1985). Ifnearby neurons were to encode similarly distant attentionalshifts, the collective sample of neurons within a single voxelcould plausibly show a multiply peaked tuning function, asevident for ASPs obtained from the DPC. The fact that thisparticular site of activation (i.e., DPC) was unilateral (lefthemisphere) is not attributable to differential sensitivity be-cause, even at lower thresholds (uncorrected P � 0.001), therewas no activity at the corresponding site in the right hemi-sphere—nor, in one subject, in either hemisphere. With asample size of three subjects, it is hard to place any suchinconsistencies in the context of the general population. Thefact that the DPC showed significant effects for positions in allfour quadrants of visual space is not incommensurate withprevious studies showing left hemisphere activation by covertattention cued to single right or left hemifield locations (Hop-finger et al. 2000; Ikkai and Curtis 2008; Kelley et al. 2008;Perry and Zeki 2000). Despite the higher spatial resolutionafforded by our stimulus design, with 16 test positions, wewere unable to infer a specific polar angle map from theunmistakable signs of an underlying polar topography (e.g., asshown in the inset in Fig. 4). One corollary of these complextuning functions in DPC, at both the voxel and nuclear levels,is that the pulvinar could have multiplexed maps in retinal andobject based coordinates—a notion encouraged by the findingthat dorsal pulvinar damage can simultaneously affect local-ization of targets in either frame of reference (Ward and Arend2007).
Mediodorsal nucleus
The region of activation centered on MD could equally beascribed to a zone of central thalamus termed the oculomotorthalamus (OcTh), because of its possessing neurons with avariety of spatially tuned presaccadic and postsaccadic dis-charge (Schlag and Schlag-Rey 1986; Tanibuchi and Goldman-Rakic 2005; Wyder et al. 2003). OcTh includes regions in and
FIG. 8. The fractional volumetric activation (FVA) for nuclei with FVA�5%. The nuclei are ordered by relative magnitude of the FVA estimate (themean FVA obtained from all 6 hemispheres). Error bars display the intersub-ject SE. *Nuclei (Sg and MGN) that were charted in sagittal sections only.
3652 O. J. HULME, L. WHITELEY, AND S. SHIPP
J Neurophysiol • VOL 104 • DECEMBER 2010 • www.jn.org
around the internal medullary lamina, i.e., intralaminar nucleisuch as the central lateral nucleus, and paralaminar parts ofMD, VL (ventral lateral), and VA (ventral anterior) nuclei.There is a particularly notable comparison to be made betweenour results and data obtained from two studies (Watanabe andFunahashi 2004; Wyder et al. 2003) recording activity in MDor OcTh of nonhuman primates while performing a delayedsaccade task (a paradigm in which subjects briefly withhold asaccade from fixation to a flashed target location). In a visuo-motor account of covert attention, the delay period (i.e., theinterval between target flash and the release of the saccade) isone in which covert attention is effectively located on thesaccade target (Awh and Jonides 2001). Also, the geometricdesign of the paradigm is similar, with a ring of target locationssurrounding fixation (16 in our case and 8 in each of the 2animal studies). A substantial proportion of neurons in bothstudies showed sustained, directionally tuned responses duringthe delay period, which might be regarded as functionallyanalogous to the activity recorded in our covert attention task.Fitting neural responses with Gaussian tuning curves, bothstudies concur that the full width half maximum measure ofmean directional tuning was comfortably in excess of a quad-rant; this contrasts with our finding that there is typically anarrow target location (i.e., a 22.5° sector) to which individualvoxels activate most reliably; possibly, this optimal BOLDsignal reflects a peak response in the composite local fieldactivity investing comparably tuned human neurons. Finally, inagreement with the ASPs we plotted for single voxels, thedistribution of neuronal preferred directions in monkey OcThwas fairly uniform. A slightly greater proportion preferred acontralateral direction, but there was no significant differencebetween hemifields (Watanabe and Funahashi 2004). As afootnote, the target eccentricity used in our study was smaller[i.e., 3°, compared with 6–20° (Wyder et al. 2003) or 17°(Watanabe and Funahashi 2004)], which is a potentially sig-nificant factor if neuronal response varies with target eccen-tricity, as well as polar angle, as reported by Wyder et al.(2003).
Parafascicular nucleus
Activation of the third region of thalamus, the caudal in-tralaminar nuclei centered on Pf, implies that our task alsorecruits thalamo-striatal circuitry, because these nuclei areknown to be the principal thalamic source of input to thestriatum (Fenelon et al. 1991; Gimenez-Amaya et al. 1995;Sadikot et al. 1990, 1992). The basal ganglia are known to beinvolved in attentive processes as indexed by various anoma-lies in cued detection tasks shown by subjects with degenera-tive conditions (Couette et al. 2008; Fielding et al. 2006;Filoteo et al. 1997; Yamaguchi and Kobayashi 1998). Parkin-sonian subjects, for example, typically show hyper-reflexivityto exogenous cues (Briand et al. 2001; Fielding et al. 2006;Poliakoff et al. 2003), and this general oversensitivity to salientstimuli can be interpreted as a disorder of top-down control(Cools et al. 2010). Pf in particular has an excitatory influenceover regions in the head and body of the caudate nucleus thatalso receive convergent input from cortical eye fields (FEF andSEF) supplementary eye field (Fenelon et al. 1991; Parthasar-athy et al. 1992; Sadikot et al. 1992; Shook et al. 1991; Stantonet al. 1988). Hence the Pf may modulate the operation of the
oculomotor loop, a closed circuit operating through cortex, basalganglia, and thalamus (specifically FEF/SEF–caudate–ventrolat-eral SNr–VA/MDpl–cortex) (Alexander et al. 1986). Notably Pfis one of the two thalamic sites (the other being dorsal pulvi-nar) where pharmacological manipulation of GABA receptorsis known to influence the speed of spatial shifts of attention, asshown by systematic effects on target detection latency underconditions of invalid spatial cuing in the Posner task (Minami-moto and Kimura 2002; Petersen et al. 1987). Sources of inputto Pf, in addition to the cortical FEF, include brain stemstructures such as the deep layers of the SC (Harting et al.1980), the pedunculopontine nucleus (Lavoie and Parent1994), and monoaminergic modulatory systems (Lavoie andParent 1991; Rico and Cavada 1998; Vogt et al. 2008). Thephysiology of Pf is not well documented, but one study in alertmacaques suggests a kind of alerting function, because rela-tively short latency (�90 ms) neural responses were found tounanticipated visual, tactile, and/or auditory stimuli—re-sponses that rapidly habituated if the stimulus was repeated andbore no association with reward (Matsumoto et al. 2001). ThusPf could be responsible for relaying the occurrence (rather thanthe nature) of an attention-worthy event into basal gangliacircuits (Smith et al. 2009b).
Posterior group nuclei
Activation of the fourth zone, centered on the posteriorgroup of nuclei, includes structures affiliated with multimodalcortical fields and sensory inputs (Burton and Jones 1976) thathave rather poorer credentials for mediating covert shifts ofattention; indeed, their functional roles are not well established.Perhaps activity here could be linked to the integration ofgravitometric cues in a multimodal representation of spatialalignment. The task subjects were required to perform mightseem a hermetically retinal one, yet gravitational influence hasbeen measured in a variety of visual tasks, including orienta-tion pop-out, the Thatcher (inverted face) illusion, mentalimagery, and estimation of vertical alignment (Lobmaier andMast 2007; Lopez et al. 2008; Marendaz et al. 1993; Mast et al.2003)—typically by altering the body position of observers,including the supine position used in the scanner. Thus the keyto posterior group activity may lie in a differential engagementof mechanoreceptive input via the spinothalamic tract (David-son et al. 2008; Ralston and Ralston 1992) and/or vestibularinput, specifically the magnocellular MGN (Hawrylyshyn et al.1978), in reaction to varying cue locations.
Nonactivation of visual thalamus
Paradoxically perhaps for a visual study, we found very littleevidence for activation of the two nuclei (LGN and inferiorpulvinar) that have a demonstrably topographic representationof the visual field (Chen et al. 1999; Cotton and Smith 2007;Schneider et al. 2004), either in respect of visual stimulusdriven activity or visual attentional modulation. Concerningthe former, we know that the disc stimuli used in this studywere capable of activating retinotopically appropriate voxels incortical area V1/V2 (Hulme et al. 2009). However, comparedwith the reversing checkerboard stimuli typically used bystudies that do successfully activate the LGN (Chen et al. 1999;Hess et al. 2009; Schneider et al. 2004), the discs were briefly
3653COVERT ATTENTIONAL SHIFTS IN THE THALAMUS
J Neurophysiol • VOL 104 • DECEMBER 2010 • www.jn.org
presented (200 ms), offered weaker visual transients (becauseof their sinusoidal contrast modulation), and occupied a farsmaller fraction of the visual field. Visual stimulation cangenerate BOLD signal changes that are �50% larger in cortexthan in the LGN (O’Connor et al. 2002). Hence there is littleanomaly in the ability of our disc stimuli to produce detectableactivation in V1 but not LGN. The cue stimulus (a thin blackline 1 deg in length) was still more tenuous. It also failed toproduce a visual response, as indicated by the complete ab-sence of significant activation in contrasts for main effect ofcue direction applied to the control trials (where subjectsviewed the same stimuli without performing the task).
The inferior pulvinar, rather like the LGN, is more robustlyactivated by stimuli with stronger visual drive, e.g., optic flowdot motion versus a luminance-disc transient (Cotton andSmith 2007). As with the LGN, the lack of a detectable visualresponse to our disc stimuli is not much of a surprise. Alsosimilar to the LGN, it shows about 20% signal enhancementwith attention (O’Connor et al. 2002; Smith et al. 2009a).Somewhat unfortunately, the inferior pulvinar falls just outsidethe range of the horizontal and sagittal series depicted in theMorel atlas; however, we infer that it was active, in the maineffect of cue direction, in one case (CG-left; see Figs. S1 andS2, and Supplement for further discussion). The relevant clus-ter of voxels bore no features to distinguish it from any othersite of activation, but it is, by virtue of its presumed visualinput (and the failure of the LGN to activate), the only thalamicsite where an attentionally modulated visual response couldform a plausible component of the observed activation.
Re-entrant visual pathways
The re-entrant visual pathway passing from the superiorcolliculus (SC), via inferior pulvinar, to the ventral corticalareas liable to be forming disc percepts is a possible candidatefor mediating covert attentional effects directed by fronto-parietal cortex (Shipp 2004). The SC fell within our peritha-lamic region of interest, and its activation was also inconsis-tent, being marked in one subject alone (H.E.). The SC isknown to be prone to pulsatile temporal signal artifact, anddetection of its activation is further impeded by a local hemo-dynamic response function of apparent shorter time course(Wall et al. 2009). A more compelling reason why spatiallyspecific activation of the subcortical re-entrant pathway reflect-ing target detection was not consistently observed is that itwould depend on a conjunction of cue position (i.e., directionof attention) and target presence (Cotton and Smith 2007;Smith et al. 2009a). We documented the main effect of cueposition, including 50% target-absent trials, likely diminishingthe net activation of any re-entrant circuits engaged in targetdetection.
Conclusion
The collection of a high volume of fMRI data in a smallnumber of subjects gave us the opportunity to perform asystematic, high-resolution, atlas-based audit of thalamic nu-clei supporting covert visual attention. We found that thedorsal pulvinar, the paralamellar or oculomotor thalamus, andthe parafascicular/caudal intralaminar nuclei each show robustand spatially specific attentional activation that seems particu-
larly significant given their connectivity with the fronto-pari-etal eye fields of the cortex. The findings thus extend theanatomical basis for a visuomotor interpretation of covertattentional shifts (Awh et al. 2006; Moore et al. 2003) whilealso acting to broaden the prevailing corticocentric interpreta-tion of attentional mechanisms.
A C K N O W L E D G M E N T S
We thank Dr. M Sahani (Insitute for Cognitive Neuroscience, UCL) foradvice in quantitative modeling of attentional selectivity profiles.
G R A N T S
This work was supported by the Wellcome Trust (UK). O. J. Hulme wasfunded by the Biotechnology and Biological Sciences Research Council (UK).
D I S C L O S U R E S
No conflicts of interest, financial or otherwise, are declared by the authors.
R E F E R E N C E S
Alexander GE, DeLong MR, Strick PL. Parallel organization of functionallysegregated circuits linking basal ganglia and cortex. Annu Rev Neurosci 9:357–381, 1986.
Arend I, Rafal R, Ward R. Spatial and temporal deficits are regionallydissociable in patients with pulvinar lesions. Brain 131: 2140–2152, 2008.
Armstrong KM, Fitzgerald JK, Moore T. Changes in visual receptive fieldswith microstimulation of frontal cortex. Neuron 50: 791–798, 2006.
Armstrong KM, Moore T. Rapid enhancement of visual cortical responsediscriminability by microstimulation of the frontal eye field. Proc Natl AcadSci USA 104: 9499–9504, 2007.
Awh E, Armstrong KM, Moore T. Visual and oculomotor selection: links,causes and implications for spatial attention. Trends Cogn Sci 10: 124–130,2006.
Awh E, Jonides J. Overlapping mechanisms of attention and spatial workingmemory. Trends Cogn Sci 5: 119–126, 2001.
Beck DM, Kastner S. Top-down and bottom-up mechanisms in biasingcompetition in the human brain. Vision Res 49: 1154–1165, 2009.
Bender DB, Youakim M. Effect of attentive fixation in macaque thalamus andcortex. J Neurophysiol 85: 219–234, 2001.
Briand KA, Hening W, Poizner H, Sereno AB. Automatic orienting ofvisuospatial attention in Parkinson’s disease. Neuropsychologia 39: 1240–1249, 2001.
Brierley JB, Beck E. The significance in human stereotactic brain surgery ofindividual variation in the diencephalon and globus pallidus. J NeurolNeurosurg Psychiatry 22: 287–298, 1959.
Burton H, Jones EG. The posterior thalamic region and its cortical projectionin new world and old world monkeys. J Comp Neurol 168: 249–302, 1976.
Cavanaugh J, Wurtz RH. Subcortical modulation of attention counterschange blindness. J Neurosci 24: 11236–11243, 2004.
Chen W, Zhu XH, Thulborn KR, Ugurbil K. Retinotopic mapping of lateralgeniculate nucleus in humans using functional magnetic resonance imaging.Proc Natl Acad Sci USA 96: 2430–2434, 1999.
Cools R, Rogers R, Barker RA, Robbins TW. Top-down attentional controlin Parkinson’s disease: salient considerations. J Cogn Neurosci 22: 848–859, 2010.
Corbetta M. Frontoparietal cortical networks for directing attention and theeye to visual locations: identical, independent, or overlapping neural sys-tems? Proc Natl Acad Sci USA 95: 831–838, 1998.
Corbetta M, Akbudak E, Conturo TE, Snyder AZ, Ollinger JM, DruryHA, Linenweber MR, Petersen SE, Raichle ME, Van Essen DC, Shul-man GL. A common network of functional areas for attention and eyemovements. Neuron 21: 761–773, 1998.
Corbetta M, Kincade JM, Ollinger JM, McAvoy MP, Shulman GL.Voluntary orienting is dissociated from target detection in human posteriorparietal cortex. Nat Neurosci 3: 292–297, 2000.
Corbetta M, Shulman GL. Control of goal-directed and stimulus-drivenattention in the brain. Nat Rev Neurosci 3: 201–215, 2002.
Cotton PL, Smith AT. Contralateral visual hemifield representations in thehuman pulvinar nucleus. J Neurophysiol 98: 1600–1609, 2007.
3654 O. J. HULME, L. WHITELEY, AND S. SHIPP
J Neurophysiol • VOL 104 • DECEMBER 2010 • www.jn.org

Couette M, Bachoud-Levi AC, Brugieres P, Sieroff E, Bartolomeo P.Orienting of spatial attention in Huntington’s Disease. Neuropsychologia46: 1391–1400, 2008.
Davidson S, Zhang X, Khasabov SG, Simone DA, Giesler GJ Jr. Termi-nation zones of functionally characterized spinothalamic tract neuronswithin the primate posterior thalamus. J Neurophysiol 100: 2026–2037,2008.
de Haan B, Morgan PS, Rorden C. Covert orienting of attention and overteye movements activate identical brain regions. Brain Res 1204: 102–111,2008.
Duncan J. EPS Mid-Career Award 2004: brain mechanisms of attention. Q JExp Psychol (Colchester) 59: 2–27, 2006.
Duncan J, Humphreys G, Ward R. Competitive brain activity in visualattention. Curr Opin Neurobiol 7: 255–261, 1997.
Ekstrom LB, Roelfsema PR, Arsenault JT, Bonmassar G, Vanduffel W.Bottom-up dependent gating of frontal signals in early visual cortex. Science321: 414–417, 2008.
Engel AK, König P, Kreiter AK, Schillen TB, Singer W. Temporal codingin the visual cortex: new vistas on integration in the nervous system. TrendsNeurosci 15: 218–226, 1992.
Fenelon G, Francois C, Percheron G, Yelnik J. Topographic distribution ofthe neurons of the central complex (centre median-parafascicular complex)and of other thalamic neurons projecting to the striatum in macaques.Neuroscience 45: 495–510, 1991.
Fielding J, Georgiou-Karistianis N, White O. The role of the basal gangliain the control of automatic visuospatial attention. J Int Neuropsychol Soc 12:657–667, 2006.
Filoteo JV, Delis DC, Salmon DP, Demadura T, Roman MJ, Shults CW.An examination of the nature of attentional deficits in patients with Parkin-son’s disease: evidence from a spatial orienting task. J Int Neuropsychol Soc3: 337–347, 1997.
Friston KJ, Penny WD, Glaser DE. Conjunction revisited. Neuroimage 25:661–667, 2005.
Gegenfurtner KR, Sperling G. Information transfer in iconic memory ex-periments. J Exp Psychol Hum Percept Perform 19: 845–866, 1993.
Gimenez-Amaya JM, McFarland NR, de las Heras S, Haber SN. Organi-zation of thalamic projections to the ventral striatum in the primate. J CompNeurol 354: 127–149, 1995.
Gitelman DR, Nobre AC, Parrish TB, LaBar KS, Kim YH, Meyer JR,Mesulam M. A large-scale distributed network for covert spatial attention:further anatomical delineation based on stringent behavioural and cognitivecontrols. Brain 122: 1093–1106, 1999.
Harting JK, Huerta MF, Frankfurter AJ, Strominger NL, Royce GJ.Ascending pathways from the monkey superior colliculus: an autoradio-graphic study. J Comp Neurol 192: 853–882, 1980.
Hawrylyshyn PA, Rubin AM, Tasker RR, Organ LW, Fredrickson JM.Vestibulothalamic projections in man–a sixth primary sensory pathway. JNeurophysiol 41: 394–401, 1978.
Hess RF, Thompson B, Gole G, Mullen KT. Deficient responses from thelateral geniculate nucleus in humans with amblyopia. Eur J Neurosci 29:1064–1070, 2009.
Hopfinger JB, Buonocore MH, Mangun GR. The neural mechanisms oftop-down attentional control. Nat Neurosci 3: 284–291, 2000.
Huerta MF, Krubitzer LH, Kaas JH. Frontal eye field as defined byintracortical microstimulation in squirrel monkeys, owl monkeys, and ma-caque monkeys. I. Subcortical connections. J Comp Neurol 253: 415–439,1986.
Hulme OJ, Friston KF, Zeki S. Neural correlates of stimulus reportability. JCogn Neurosci 21: 1602–1610, 2009.
Ikkai A, Curtis CE. Cortical activity time locked to the shift and maintenanceof spatial attention. Cereb Cortex 18: 1384–1394, 2008.
Intriligator J, Cavanagh P. The spatial resolution of visual attention. CognPsychol 43: 171–216, 2001.
Karnath HO, Himmelbach M, Rorden C. The subcortical anatomy of humanspatial neglect: putamen, caudate nucleus and pulvinar. Brain 125: 350–360, 2002.
Kastner S, Ungerleider LG. Mechanisms of visual attention in the humancortex. Annu Rev Neurosci 23: 315–341, 2000.
Kaufman A, Serfaty C, Deouell LY, Ruppin E, Soroker N. Multiperturba-tion analysis of distributed neural networks: the case of spatial neglect. HumBrain Mapp 30: 3687–3695, 2009.
Kelley TA, Serences JT, Giesbrecht B, Yantis S. Cortical mechanisms forshifting and holding visuospatial attention. Cereb Cortex 18: 114–125,2008.
Lavoie B, Parent A. Serotoninergic innervation of the thalamus in theprimate: an immunohistochemical study. J Comp Neurol 312: 1–18, 1991.
Lavoie B, Parent A. Pedunculopontine nucleus in the squirrel monkey:projections to the basal ganglia as revealed by anterograde tract-tracingmethods. J Comp Neurol 344: 210–231, 1994.
Lobmaier JS, Mast FW. The Thatcher illusion: rotating the viewer instead ofthe picture. Perception 36: 537–546, 2007.
Lopez C, Lacour M, Leonard J, Magnan J, Borel L. How body positionchanges visual vertical perception after unilateral vestibular loss. Neuropsy-chologia 46: 2435–2440, 2008.
Marendaz C, Stivalet P, Barraclough L, Walkowiac P. Effect of gravita-tional cues on visual search for orientation. J Exp Psychol Hum PerceptPerform 19: 1266–1277, 1993.
Mast FW, Ganis G, Christie S, Kosslyn SM. Four types of visual mentalimagery processing in upright and tilted observers. Brain Res Cogn BrainRes 17: 238–247, 2003.
Matsumoto N, Minamimoto T, Graybiel AM, Kimura M. Neurons in thethalamic CM-Pf complex supply striatal neurons with information aboutbehaviorally significant sensory events. J Neurophysiol 85: 960–976, 2001.
Minamimoto T, Kimura M. Participation of the thalamic CM-Pf complex inattentional orienting. J Neurophysiol 87: 3090–3101, 2002.
Moore T. The neurobiology of visual attention: finding sources. Curr OpinNeurobiol 16: 159–165, 2006.
Moore T, Armstrong KM, Fallah M. Visuomotor origins of covert spatialattention. Neuron 40: 671–683, 2003.
Moore T, Fallah M. Control of eye movements and spatial attention. ProcNatl Acad Sci USA 98: 1273–1276, 2001.
Morel A, Magnin M, Jeanmonod D. Multiarchitectonic and stereotactic atlasof the human thalamus. J Comp Neurol 387: 588–630, 1997.
Muller JR, Philiastides MG, Newsome WT. Microstimulation of the superiorcolliculus focuses attention without moving the eyes. Proc Natl Acad SciUSA 102: 524–529, 2005.
Niemann K, Mennicken VR, Jeanmonod D, Morel A. The Morel stereo-tactic atlas of the human thalamus: atlas-to-MR registration of internallyconsistent canonical model. Neuroimage 12: 601–616, 2000.
Nobre AC, Gitelman DR, Dias EC, Mesulam MM, Kowler E, Anderson E,Dosher B, Blaser E. Covert visual spatial orienting and saccades: overlap-ping neural systems. Neuroimage 11: 210–216, 2000.
O’Connor DH, Fukui MM, Pinsk MA, Kastner S. Attention modulatesresponses in the human lateral geniculate nucleus. Nat Neurosci 5: 1203–1209, 2002.
Ortigue S, Viaud-Delmon I, Annoni JM, Landis T, Michel C, Blanke O,Vuilleumier P, Mayer E. Pure representational neglect after right thalamiclesion. Ann Neurol 50: 401–404, 2001.
Parthasarathy HB, Schall JD, Graybiel AM. Distributed but convergentordering of corticostriatal projections: analysis of the frontal eye field andthe supplementary eye field in the macaque monkey. J Neurosci 12:4468–4488, 1992.
Perry RJ, Zeki S. The neurology of saccades and covert shifts in spatialattention: an event-related fMRI study. Brain 123: 2273–2288, 2000.
Petersen SE, Robinson DL, Keys W. Pulvinar nuclei of the behavingmonkey: visual responses and their modulation. J Neurophysiol 54: 867–886, 1985.
Petersen SE, Robinson DL, Morris JD. Contributions of the pulvinar tovisual spatial attention. Neuropsychologia 25: 97–105, 1987.
Poliakoff E, O’Boyle DJ, Moore AP, McGlone FP, Cody FW, Spence C.Orienting of attention and Parkinson’s disease: tactile inhibition of returnand response inhibition. Brain 126: 2081–2092, 2003.
Rafal RD, Posner MI. Deficits in human visual spatial attention followingthalamic lesions. Proc Natl Acad Sci USA 84: 7349–7353, 1987.
Ralston HJ III, Ralston DD. The primate dorsal spinothalamic tract: evidencefor a specific termination in the posterior nuclei (Po/SG) of the thalamus.Pain 48: 107–118, 1992.
Rico B, Cavada C. Adrenergic innervation of the monkey thalamus: animmunohistochemical study. Neuroscience 84: 839–847, 1998.
Ruff CC, Blankenburg F, Bjoertomt O, Bestmann S, Freeman E, HaynesJD, Rees G, Josephs O, Deichmann R, Driver J. Concurrent TMS-fMRIand psychophysics reveal frontal influences on human retinotopic visualcortex. Curr Biol 16: 1479–1488, 2006.
Ruff CC, Blankenburg F, Bjoertomt O, Bestmann S, Weiskopf N, DriverJ. Hemispheric differences in frontal and parietal influences on humanoccipital cortex: direct confirmation with concurrent TMS-fMRI. J CognNeurosci 21: 1146–1161, 2009.
3655COVERT ATTENTIONAL SHIFTS IN THE THALAMUS
J Neurophysiol • VOL 104 • DECEMBER 2010 • www.jn.org

Ruff CC, Kristjansson A, Driver J. Readout from iconic memory andselective spatial attention involve similar neural processes. Psychol Sci 18:901–909, 2007.
Sadikot AF, Parent A, Francois C. The centre median and parafascicularthalamic nuclei project respectively to the sensorimotor and associative-limbicstriatal territories in the squirrel monkey. Brain Res 510: 161–165, 1990.
Sadikot AF, Parent A, Francois C. Efferent connections of the centromedianand parafascicular thalamic nuclei in the squirrel monkey: a PHA-L study ofsubcortical projections. J Comp Neurol 315: 137–159, 1992.
Schlag J, Schlag-Rey M. Role of the central thalamus in gaze control. ProgBrain Res 64: 191–201, 1986.
Schneider KA, Kastner S. Effects of sustained spatial attention in the humanlateral geniculate nucleus and superior colliculus. J Neurosci 29: 1784–1795, 2009.
Schneider KA, Richter MC, Kastner S. Retinotopic organization and functionalsubdivisions of the human lateral geniculate nucleus: a high-resolution func-tional magnetic resonance imaging study. J Neurosci 24: 8975–8985, 2004.
Selemon LD, Goldman-Rakic PS. Common cortical and subcortical targetsof the dorsolateral prefrontal and posterior parietal cortices in the rhesusmonkey: evidence for a distributed neural network subserving spatiallyguided behaviour. J Neurosci 8: 4049–4068, 1988.
Serences JT, Yantis S. Spatially selective representations of voluntary andstimulus-driven attentional priority in human occipital, parietal, and frontalcortex. Cereb Cortex 17: 284–293, 2007.
Shipp S. The functional logic of cortico-pulvinar connections. Philos Trans RSoc Lond B Biol Sci 358: 1605–1624, 2003.
Shipp S. The brain circuitry of attention. Trends Cogn Sci 8: 223–230, 2004.Shook BL, Schlag-Rey M, Schlag J. Primate supplementary eye field. II.
Comparative aspects of connections with the thalamus, corpus striatum, andrelated forebrain nuclei. J Comp Neurol 307: 562–583, 1991.
Smith AT, Cotton PL, Bruno A, Moutsiana C. Dissociating vision andvisual attention in the human pulvinar. J Neurophysiol 101: 917–925, 2009a.
Smith Y, Raju D, Nanda B, Pare JF, Galvan A, Wichmann T. Thethalamostriatal systems: anatomical and functional organization in normaland parkinsonian states. Brain Res Bull 78: 60–68, 2009b.
Snow JC, Allen HA, Rafal RD, Humphreys GW. Impaired attentionalselection following lesions to human pulvinar: evidence for homologybetween human and monkey. Proc Natl Acad Sci USA 106: 4054–4059,2009.
Stanton GB, Goldberg ME, Bruce CJ. Frontal eye field efferents in themacaque monkey. I. Subcortical pathways and topography of striatal andthalamic terminal fields. J Comp Neurol 271: 473–492, 1988.
Tanibuchi I, Goldman-Rakic PS. Comparison of oculomotor neuronal ac-tivity in paralaminar and mediodorsal thalamus in the rhesus monkey. JNeurophysiol 93: 614–619, 2005.
Tian JR, Lynch JC. Subcortical input to the smooth and saccadic eyemovement subregions of the frontal eye field in Cebus monkey. J Neurosci17: 9233–9247, 1997.
Vogt BA, Hof PR, Friedman DP, Sikes RW, Vogt LJ. Norepinephrinergicafferents and cytology of the macaque monkey midline, mediodorsal, andintralaminar thalamic nuclei. Brain Struct Funct 212: 465–479, 2008.
Wall MB, Walker R, Smith AT. Functional imaging of the human superiorcolliculus: an optimised approach. Neuroimage 47: 1620–1627, 2009.
Ward R, Arend I. An object-based frame of reference within the humanpulvinar. Brain 130: 2462–2469, 2007.
Watanabe Y, Funahashi S. Neuronal activity throughout the primate me-diodorsal nucleus of the thalamus during oculomotor delayed-responses. I.Cue-, delay-, and response-period activity. J Neurophysiol 92: 1738–1755,2004.
Wyder MT, Massoglia DP, Stanford TR. Quantitative assessment of thetiming and tuning of visual-related, saccade-related, and delay periodactivity in primate central thalamus. J Neurophysiol 90: 2029–2052, 2003.
Yamaguchi S, Kobayashi S. Contributions of the dopaminergic system tovoluntary and automatic orienting of visuospatial attention. J Neurosci 18:1869–1878, 1998.
Yantis S, Schwarzbach J, Serences JT, Carlson RL, Steinmetz MA, PekarJJ, Courtney SM. Transient neural activity in human parietal cortex duringspatial attention shifts. Nat Neurosci 5: 995–1002, 2002.
Yantis S, Serences JT. Cortical mechanisms of space-based and object-basedattentional control. Curr Opin Neurobiol 13: 187–193, 2003.
3656 O. J. HULME, L. WHITELEY, AND S. SHIPP
J Neurophysiol • VOL 104 • DECEMBER 2010 • www.jn.org