spatial relationship between the interhemispheric fissure plane and the head symmetry plane
TRANSCRIPT
International Congress Series 1256 (2003) 220–225
Spatial relationship between the interhemispheric
fissure plane and the head symmetry plane
Qingmao Hu*, Wieslaw L. Nowinski
Biomedical Imaging Laboratory, Institute for Infocomm Research, 21 Heng Mui Keng Terrace,
Singapore 119613, Singapore
Received 13 March 2003; received in revised form 13 March 2003; accepted 17 March 2003
Abstract
The spatial relationship between the plane passing through the interhemispheric fissure (IFP) and
the symmetry plane (SP) that maximizes brain or head symmetry remains weakly explored. A new
method based on local symmetry of the brain/head is proposed to extract the symmetry plane
robustly within 6 s. The SPs for 98 diversified MRI data sets (80 normal, 18 pathological) were
extracted for the brain (BSP) and head (HSP) and compared with the ground-truth IFPs. The results
show that the chance that the IFP and HSP are far is 0.53 (52/98), which increases to 0.78 for
pathological data. This suggests that these two planes are generally not the same and care shall be
taken to choose the IFP or HSP depending on a specific application.
D 2003 Published by Elsevier Science B.V.
Keywords: Midsagittal plane; Symmetry; Brain; Head; Outlier removal; Neuroinformatics
1. Introduction
The plane separating the two human brain hemispheres is called the midsagittal
plane (MSP). Extraction of the MSP is important for spatial normalization; intrasubject,
intersubject, and multimodal registration; and automatic detection of the anterior and
posterior commissures. Prima et al. [1] grouped the existing methods into two
0531-5131/03 D 2003 Published by Elsevier Science B.V.
doi:10.1016/S0531-5131(03)00311-X
Abbreviations: MSP, midsagittal plane; IFP, interhemispheric fissure plane; SP, symmetry plane; HSP, head
symmetry plane; BSP, brain (cerebrum) symmetry plane.
* Corresponding author. Tel.: +65-6874-8281; fax: +65-6774-8056.
E-mail addresses: [email protected] (Q. Hu), [email protected] (W.L. Nowinski).
Q. Hu, W.L. Nowinski / International Congress Series 1256 (2003) 220–225 221
categories based on either detection of the interhemispheric fissure (IFP) or brain/head
symmetry. The relationship between the MSPs of these two categories remains weakly
explored.
This paper proposes a new method to extract the MSP based on local symmetry. By
employing this method, a spatial relationship between these two categories of MSPs is
explored. To differentiate them, the MSP of the first category is denoted as interhemi-
spheric fissure plane (IFP), while the MSP of the second category is denoted as symmetry
plane (SP). In addition, the relationship between the head symmetry plane (HSP) and the
brain (cerebrum) symmetry plane (BSP) is studied.
2. Materials and methods
2.1. Image data
Altogether, 98 MRI data sets from the USA (four hospitals), France (one hospital),
Japan (one hospital), and Singapore (four hospitals) were tested. Two criteria to choose
the data were applied: (1) each data set shall contain a complete head so that both IFP
and HSP can be extracted, and (2) all data sets shall be representative to have various
imaging parameters as well as be with and without pathology. For variations in noise
level and inhomogeneity, the 20 normal MRI data sets from the Internet Brain
Segmentation Repository (http://neuro-www.mgh.harvard.edu/cma/isbr) were chosen.
Among 98 MRI data sets, 57 are T1-weighted, 36 are SPGR, 3 are T2-weighted, 1
is PD-weighted, and 1 is FLAIR. Eighteen data sets are pathological while 80 are
normal.
2.2. Extraction of the symmetry plane
Existing methods for extracting the symmetry plane (SP) are based on global
symmetry in the volume either through 2D slice processing [2] or direct 3D processing
[1]. As the human brain is just roughly symmetric, the assumption of global symmetry
does not generally hold. A different approach is to assume local symmetry instead [3,4].
Here, ‘‘local’’ stands for a neighborhood instead of the entire volume or the whole slice
image.
The coordinate axes are as follows: X along lateral direction, Y along anterior–posterior
direction, and Z along dorsal–ventral direction. A search line is represented by its middle
point and its angle with respect to the Y axis of the axial image. The symmetry line of an
axial slice is the search line along which the local asymmetry reaches its minimum. The
local asymmetry of a search line is calculated as the sum of gray level difference of all
pixels on five pairs of parallel lines 2, 4, 6, 8, and 10 mm away from the search line.
Sixteen axial slices evenly distributed along the whole head for the HSP or the entire
cerebrum for the BSP are picked out to calculate 16 symmetry lines. Suppose (xc,yc,si) is
the mass center of the ith axial slice, the middle point of all the search lines is denoted as
(x,y,si), and the angle between the search line and Y axis of the axial image is h. Coarse andfine searching are carried out to gain both speed and accuracy for localization of the

Q. Hu, W.L. Nowinski / International Congress Series 1256 (2003) 220–225222
symmetry line for each of the 16 axial slices. The coarse search is performed within the
following region
Ax� xcA < 10 mm; y ¼ yc; z ¼ si and Ah � h0A < 10j
with step sizes for x being 2 mm and h being 2j.The rough position of the symmetry line is represented by its middle point (x0,yc,si)
and its angle with respect to the Y axis h0. The fine search is carried in the fine searching
region
Ax� x0A < 3 mm; y ¼ yc; z ¼ si and Ah � h0A < 3j
with step sizes for x being 0.5 mm and h being 0.5j.From these extracted 16 symmetry lines, the histogram of orientation is calculated and
the peak orientation is found. Those lines with an orientation deviation from the peak
orientation bigger than 1j are considered orientation outliers and the rest are considered
orientation inliers [3]. From the orientation inliers, a least-square-fit plane is derived and
the distance of the end points of each orientation inlier to the plane calculated. The next
step is to calculate the histogram of the distance and to find the peak distance. Those
orientation inliers with at least one of its end points having a distance deviation from the
peak distance bigger than 1 mm are considered distance outliers, while the rest are
considered distance inliers [3]. The plane equation of SP is the least square fit of the
distance inliers. The HSP is calculated for the entire head, while the BSP is calculated for
the cerebrum only.
2.3. Derivation of the interhemispheric fissure plane
The interhemispheric fissure planes (IFPs) were identified interactively by a neuro-
anatomy expert. For each MRI volume, the expert drew the interhemispheric fissure lines
on multiple axial slices using a dedicated validation tool. The coronal and the sagittal cases
have been reordered in axial orientation. The tool provides zooming so that the lines can
be drawn with submillimeter accuracy. The plane equation of the IFP is the least square fit
of the drawn lines.
2.4. Quantifying the spatial relationship between IFP and SP
The plane equations of both IFP and SP (HSP or BSP) are denoted in the form of
axþ byþ czþ d ¼ 0
where (a,b,c) is a unit normal vector and d is a negative constant.
The angle between the two plane equations of any MRI volume is called angular
difference, while the absolute difference between the d parameter is called the distance
difference.
For each volume, if the angular difference is smaller than a given value TA and the
distance error is smaller than another given value TD, it is considered that these two planes
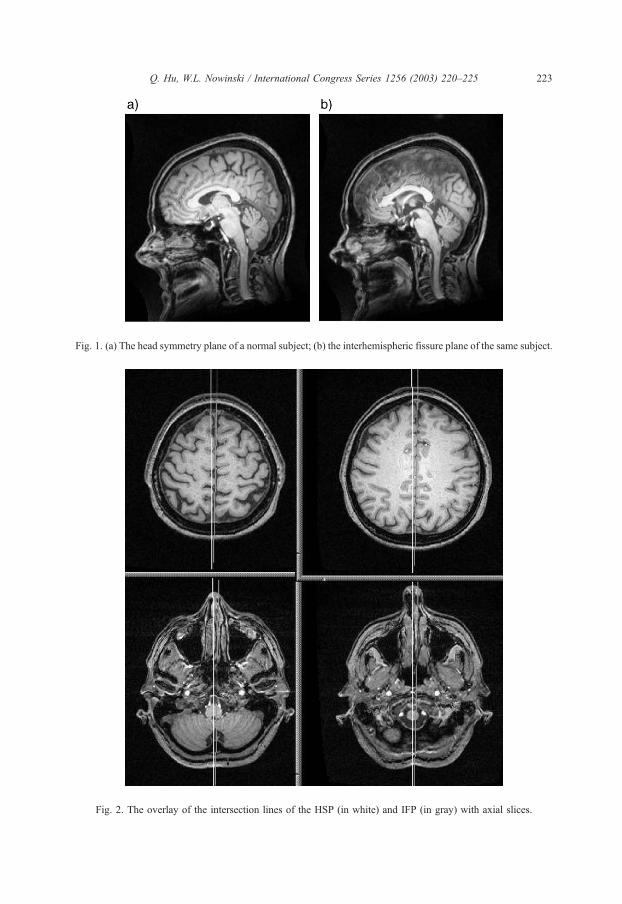
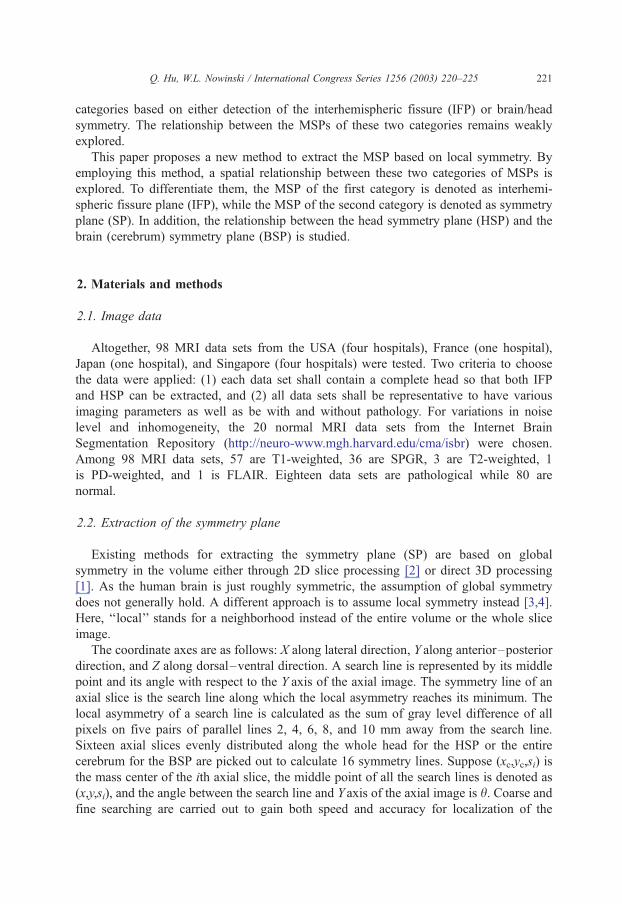
Fig. 1. (a) The head symmetry plane of a normal subject; (b) the interhemispheric fissure plane of the same subject.
Fig. 2. The overlay of the intersection lines of the HSP (in white) and IFP (in gray) with axial slices.
Q. Hu, W.L. Nowinski / International Congress Series 1256 (2003) 220–225 223
Table 1
Relationship between the HSP and IFP for three closeness thresholds
Data type Closeness (1j, 1 mm) (2j, 2 mm) (3j, 3 mm)
Normal Near 42 66 73
Far 38 14 7
Pathological Near 4 9 11
Far 14 9 7
Q. Hu, W.L. Nowinski / International Congress Series 1256 (2003) 220–225224
are close to each other. Otherwise, they are far. For comparison, the closeness thresholds
(TA, TD) take values (1j, 1 mm), (2j, 2 mm) and (3j, 3 mm).
3. Results
3.1. Extraction of the symmetry plane
The proposed algorithm to extract the symmetry plane based on approximation of
symmetry line and outlier removal was implemented in C++ without any specialized
external libraries, and tested on Pentium 4, 2.4 GHz CPU. The SP for each of 98 volumes
was extracted within 6 s.
3.2. An example of the symmetry plane and interhemispheric fissure plane
Fig. 1a,b shows the extracted HSP and IFP for a normal subject, while Fig. 2 shows the
intersections of these two planes with four axial slices.
3.3. Relationship between the symmetry plane and interhemispheric fissure plane
For all 98 data sets, different TA and TD were applied to study the relationship between
the HSP and ground-truth IFP. The results were summarized in Table 1, showing the
number of cases with the two planes being near or far.
The same kind of comparison was carried out for the HSP and BSP (Table 2).
For the distance thresholds (1j, 1 mm), 38 out of 80 normal subjects and 14 out of 18
pathological subjects had their HSP far from the ground-truth IFP, while 55 out of 80
normal subjects and 10 out of 18 pathological subjects had their HSP far from the BSP.
Even for the highest values of the closeness thresholds (3j, 3 mm), many cases are still far
from the IFP.
Table 2
Relationship between the HSP and BSP for three closeness thresholds
Data type Closeness (1j, 1 mm) (2j, 2 mm) (3j, 3 mm)
Normal Near 25 51 68
Far 55 29 12
Pathological Near 8 15 15
Far 10 3 3
Q. Hu, W.L. Nowinski / International Congress Series 1256 (2003) 220–225 225
4. Discussion
Our local symmetry-based algorithm has the following advantages over existing global
symmetry-based methods:
1) fully automatic, with no need for any preprocessing;
2) very fast (more than 10 times faster than any existing methods);
3) can process normal and pathological cases due to a new outlier removal scheme.
There is a substantial difference between the HSP and the IFP for both normal and
pathological data (Table 1). To minimize the impact of algorithm accuracy on this
difference, we have applied the same algorithm to extract the HSP and BSP (Table 2);
in addition, the algorithm has been fully validated and its parameters have been justified in
Ref. [4], showing high accuracy for high-quality data. The results confirm discrepancy
between the brain symmetry plane and the head symmetry plane. In general, the chance
that the IFP and HSP are far is 0.53 [52/98 for the closeness thresholds of (1j, 1 mm)]. For
the normal subjects, the chance that the HSP is far from the IFP is 0.48 (38/80), while for
the pathological subjects, this chance is as high as 0.78 (14/18). This suggests that these
two planes should generally be considered as different. According to Ref. [4], the
symmetry lines in the cerebrum converge to the interhemispheric fissure. As the rest of
the symmetry lines are determined by brain tissues, such as cerebellum and brainstem, as
well as non-brain tissues, such as nose and skull, the symmetry plane is a balance between
the interhemispheric fissure and the other structures.
Therefore, care should be taken in choosing the IFP or the HSP, depending on specific
applications. For instance, it may be more desirable to use the IFP (or its calculated
approximation, BSP) for the location of the anterior and the posterior commissures, while
the HSP will be more appropriate for pathology-induced asymmetry detection.
Acknowledgements
We thank Huang Su for developing the validation environment and Aamer Aziz for
valuable suggestions. We gratefully acknowledge support by the Biomedical Research
Council, Agency for Science, Technology and Research, Singapore.
References
[1] S. Prima, S. Ourselin, N. Ayache, Computation of the midsagittal plane in 3D brain images, IEEE Trans-
actions on Medical Imaging 21 (2) (2002) 122–138.
[2] Y. Liu, R.T. Collins, W.E. Rothfus, Robust midsagittal plane extraction from normal and pathological 3D
neuroradiology images, IEEE Transactions on Medical Imaging 20 (3) (2001) 173–192.
[3] Q.M. Hu, W.L. Nowinski, Statistical data analysis tool, PCT application, PCT/SG02/00231, 2002.
[4] Q.M. Hu, W.L. Nowinski, Robust, rapid, accurate, and automatic extraction of the midsagittal plane of the
human cerebrum for clinical images, IEEE Transactions on Medical Imaging (under re-revision).