southeast asia regional gofc report no. 1 - gofc gold
TRANSCRIPT
Southeast Asia Regional Global Observation of Forest CoverPlanning Meeting
Bogor, Indonesia
31 January - 2 February 2000
Gunawan, I., Skole, D., Sanjaya, H., Rahmadi, A., Muchlis, M., Adi, G.A. andGandharum, L.
GOFC-GOLD Report No. 6
Global Observation of Forest and Land Cover Dynamics (GOFC-GOLD) is a coordinated international effort to ensure a continuousprogram of space-based and in situ forest and other land cover observations to better understand global change, to supportinternational assessments and environmental treaties and to contribute to natural resources management.
GOFC-GOLD encourages countries to increase their ability to measure and track forest and land cover dynamics by promoting andsupporting participation on implementation teams and in regional networks. Through these forums, data users and providers shareinformation to improve understanding of user requirements and product quality.
GOFC-GOLD is a Panel of the Global Terrestrial Observing System (GTOS), sponsored by FAO, UNESCO, WMO, ICSU andUNEP. The GOFC-GOLD Secretariat is hosted by Canada and supported by the Canadian Space Agency and Natural ResourcesCanada. Other contributing agencies include NASA, ESA, START and JRC. Further information can be obtained at
http://www.fao.org/gtos/gofc-gold
Directorate of Technology for Natural Resources Inventory (TISDA) Agency for The Assessment and Application of Technology (BPPT) Jl. MH. Thamrin no.8 Jakarta 10340 INDONESIA http://geocities.com/tisdabppt
SEA GOFC REPORT NO. 1
Southeast Asia Regional Global Observation of Forest Cover (GOFC)
Planning Meeting
Bogor, Indonesia, 31 January - 2 February 2000
Edited by:
Dr. Iwan Gunawan & Dr. Dave SkoleHartanto Sanjaya
Andi Rahmadi M. Muchlis
Guy Adamsyah Adi Laju Gandharum Syamsul B. Agus
GOFC
NASA
UKM NAMRIA NRCT
SOUTH EAST ASIA
REGIONAL CENTER
BPP TEKNOLOGI
SEA GOFC REPORT NO. 1
Southeast Asia Regional Global Observation of Forest Cover (GOFC)
Planning Meeting
Bogor, Indonesia, 31 January - 2 February 2000
Edited by:
Dr. Iwan Gunawan & Dr. Dave SkoleHartanto Sanjaya
Andi Rahmadi M. Muchlis
Guy Adamsyah Adi Laju Gandharum Syamsul B. Agus
Directorate of Technology for Natural Resources Inventory (TISDA) Agency for The Assessment and Application of Technology (BPPT) Jl. MH. Thamrin no.8 Jakarta 10340 INDONESIA http://geocities.com/tisdabppt
GOFC
NASA
UKM NAMRIA NRCT
SOUTH EAST ASIA
REGIONAL CENTER
BPP TEKNOLOGI
Financial support for this workshop, including travel assistance for the participants was provided by the following sponsors. This support is acknowledged with gratitude. BSRSI/TRFIC at Michigan State University GOFC Secretariat Indonesian Agency for the Assessment and Application of Technology (BPPT) Michigan State University NASA NAMRIA - Philippines NRCT - Thailand START International SEA START RC UKM - Malaysia Digital copies of this report are available in PDFTM format through website: http://www.gofc.org/gofc/docs/sea_gofc.pdf
PREFACE During the first Participation Planning Meeting for Tropical Forest Environments of GOFC held in Washington D.C. in March 1999, delegation from Southeast Asian countries were present consisting of members of the Land Use and Land Cover Change (LUCC) research network. This research network was formed from the acquaintance of its members in working together on LUCC research initially supported by the International Geosphere-Biosphere Program (IGBP), and was subsequently supported by NASA’s Land Cover and Land Use Change (LCLUC) Project. In our subjective opinion, the Southeast Asia LUCC team showed a solid teamwork in which common perception, as well as common understanding of the central issues in land/forest cover change research were the main binding factor in their scientific exchange. It is therefore understandable that throughout the course of the preparation of GOFC, particularly for the Tropical Forest Environments component, the SEA LUCC network became the logical choice for being the implementation team for GOFC research in the region. The SEA GOFC Planning meeting held in Bogor, Indonesia in late January 2000 was the follow up of the Washington meeting focusing more on the implementation issues for GOFC in the Southeast Asia region. The meeting, which was organized in conjunction with regular SEA LUCC scientific meeting, was attended by about 58 scientists from 9 different countries including Indonesia, Malaysia, Thailand, the Philippines, Vietnam, Laos, Cambodia, the United States, and Australia. The climate of the discussion was very productive, and can be described simply as taking GOFC as the next step toward carrying out a multi-scale research, as previously experienced by the team in LUCC research, but with more focused targets of products, more well defined methods, and hopefully more secured data supply. It is also important to note that the SEA GOFC team has realized the importance of building a research constituents which include local, regional and global scientists and decision makers. This report contains the narrative version of the notes and presentations taken and delivered during the meeting. An introduction prepared by the Michigan State University team as a terms of reference for the meeting was slightly edited to become the Introduction section of this report. Notes from the breakout groups as well as from panel sessions were edited, extended, and formatted to become the main text of this report detailing specific recommendations, strategy, and the anticipated needed basic infrastructures for the implementation of SEA GOFC. On behalf of the Indonesian LUCC Team which hosted this meeting, I would like to extend our greatest appreciation to the entire participants for their tireless efforts in putting their ideas into concrete plans initiated by this report. I am confident that such an idealism is the key to successfully implement such a massive global initiative as GOFC.
Bogor, April 2000 Iwan Gunawan, Ph.D. Indonesia GOFC Team Leader
TABLE OF CONTENTS
PREFACE TABLE OF CONTENTS Section 1. INTRODUCTION 1
1.1. Background 1 1.2. From Concept to Implementation 2 1.3. Planning Meeting Primary Objectives 3 1.4. Organization of the SEA GOFC Planning Meeting 3
Section 2. THE PLANNING MEETING 4
2.1. Meeting Venue 4 2.2. Primary Outcomes 4 2.3. Major Recommendations 5 2.4. Recommendations and Actions from Forest Characteristics
And Change Working Group 6 2.5. Recommendations and Actions from Fire Monitoring
Working Group 7 2.6. Implementation Strategy 9 2.7. Pilot Project Recommendation 11 2.8. Needs for Infrastructure and Support 11 2.9. Preliminary Identification of Existing National Activities 11
APPENDICES
1. Remarks from The Minister of Forestry and Estate Crops of The Republic of Indonesia
13
2. Proposed Strategy for GOFC Implementation in Indonesia 16 Tropical Forest Mapping and Monitoring in Indonesia 19
3. Forest Fire Monitoring and Mapping for South East Asia 27 4. Mapping and Monitoring of Forest Cover in The Philippines 35 5. Forest and Forest Fires Assessment in Thailand 41 6. GOFC Related Activities in Laos, Vietnam and Cambodia 50 7. Overview, Status and Plans for the CEOS Pilot Project
“Global Observation of Forest Cover”
52 8. Conservation International’s Regional Analyses Toolkits and Their
Use for Conservation Priority Setting Assessment in Papua/Irian Jaya
60 9. IC-SEA and Global Change Research in South East Asia 68 10. Land Use and Land Cover Change (LUCC) Impacts on Carbon
Stocks and Greenhouse Gas Emission
70 11. Detection of SE Asia Active Fires At Night Using DMSP-OLS Data 75 12. GOIN/CEOS/SE Asia GOFC Demonstration 80 13. Some Suggestions and Inputs for GOFC: Frame Work for
GOFC Pilot Project Planning
84 14. Indonesian Needs and Policy on Forest Cover Monitoring Within
The Context of Global Change Study
87 15. Environmental Science for Social Change 89 16. List of GOFC Regional Meeting Participants 91 17. Photos 98
SEA Regional GOFC Planning Meeting, Bogor 2000 1
SECTION 1 INTRODUCTION
1.1. Background In 1997, the Committee on Earth Observation Satellites (CEOS) established an initiative to increase the effectiveness of CEOS members’ investments in earth observation technology by establishing an Integrated Global Observing Strategy (IGOS). An essential component of IGOS is to establish collaborative ties between CEOS agency data providers and those organizations that need high-resolution, remotely-sensed data (such as Forestry, Ocean and Weather agencies and institutes). Particular effort is being expended in research areas where coordinated international effort can be expected to provide vital information for problems of global concern. These efforts will increase the communication between users and providers of data, both data obtained from space and data obtained from more local observations. CEOS expects Global Observation of Forest Cover (GOFC) and the other IGOS pilot projects to provide feedback that will lead to improved coordination and reduced duplication of members’ earth observation programs. The Global Observation of Forest Cover (GOFC) is a project to instigate and facilitate activities which will ultimately result in routine, on-going acquisition and use of data from spaceborne and local sensing to provide the information needed for the formulation of policy and for sustainable management of forested areas at national, continental, and global scales. This will be made possible through the cooperative investments of satellite data providers, end users, and other organizations, much as a global system for meteorological observations is implemented today. In March, 1999, a GOFC Participation Planning Workshop for Tropical Forest Environments was held in Washington, D.C. and sponsored by the International START Secretariat. The purpose of the meeting was to: • Review and obtain feedback on GOFC Implementation Strategy in the context of needs of
nations with tropical forests • Refine the global change research and associated policy requirements of GOFC • Discuss areas of desired collaboration to formulate realistic plans to proceed including: • Identifying GOFC data sets of primary interest and their assimilation • Identifying tropical nations’ needs and wants arising from Framework Convention on Climate
Change • Identifying potential project contributions • Strengthening in-situ data collection and data access • Identify technical constraints on participation and possible solutions • Identify institutional constraints on participation and possible solutions • Identify areas of agreement and how to proceed As the follow up of the 1999 Washington Tropical GOFC workshop, a Southeast Asia regional GOFC planning meeting was organized by the Southeast Asia Land Use Land Cover Change (LUCC) research network. Potential GOFC Activities in Southeast Asia were discussed at this meeting and included the following: Near term activities: 6 months The near term activities was proposed to include the assessment and documentation of baseline datasets and products with an evaluation of their availability. Malaysia LUCC Team of the Universiti Kebangsaan offered to synthesize these materials for the region, provided each country provides a listing of their country's data sets. Coordination to develop requirements for the regional GOFC office were also to be discussed. The role of this office would be to facilitate and coordinate the initial tasks of basemap generation, harmonization of existing data sets to create baseline, and methods for development of new baseline data set using CEOS provided data bundles of satellite
SEA Regional GOFC Planning Meeting, Bogor 2000 2
data. In addition, the development of a strategy for obtaining core-funding support, as well as formulation of plans for expanding within existing countries and engaging other countries in the region into the GOFC activities was also initiated. Mid-term activities: 12-18 months The mid term activities is anticipated to include the development of initial basemap. Workshop to define harmonization approach and plans for the development of new baseline data set from CEOS data bundles needs to be organized within this time frame. This workshop should be held within next 12 months to keep momentum from this initial workshop. This workshop is planned for September-November time frame, and to be conducted in the Philippines. An important aspect of the workshop is the selection of sites for pilot activities. At this stage, the SEA GOFC regional network will need guidance on how GOFC will evolve to provide insight into best approach for expanding the regional network.
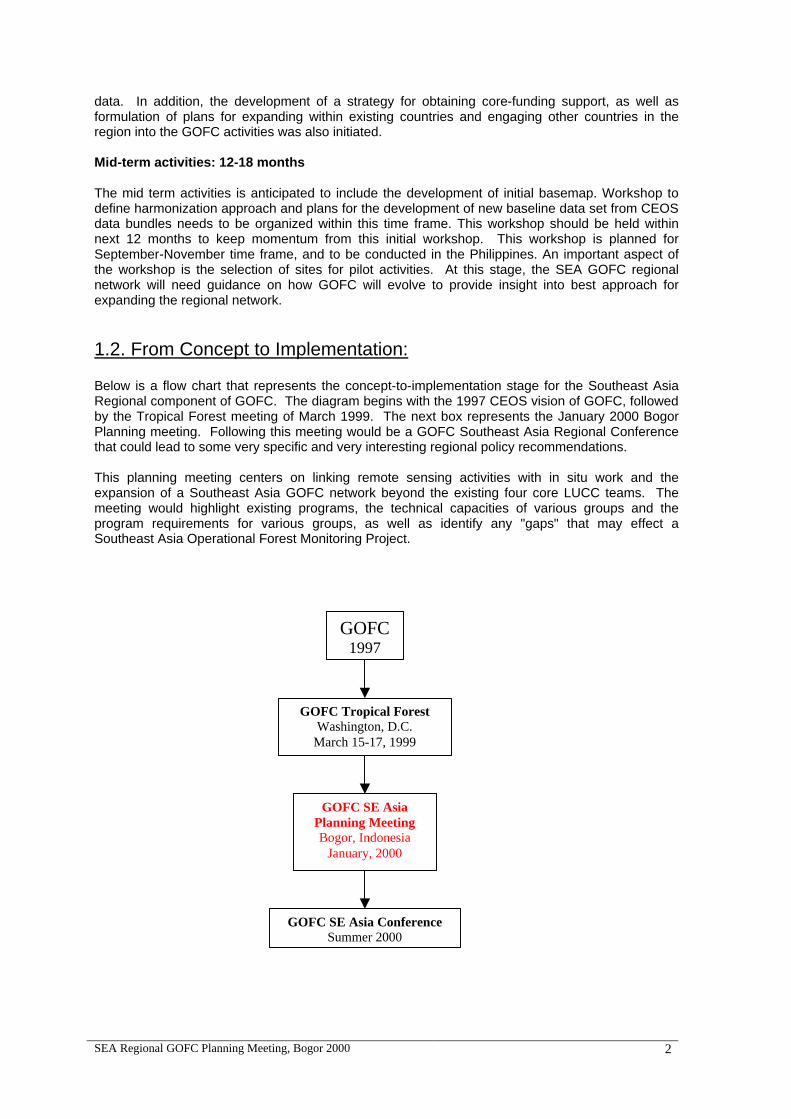
1.2. From Concept to Implementation: Below is a flow chart that represents the concept-to-implementation stage for the Southeast Asia Regional component of GOFC. The diagram begins with the 1997 CEOS vision of GOFC, followed by the Tropical Forest meeting of March 1999. The next box represents the January 2000 Bogor Planning meeting. Following this meeting would be a GOFC Southeast Asia Regional Conference that could lead to some very specific and very interesting regional policy recommendations. This planning meeting centers on linking remote sensing activities with in situ work and the expansion of a Southeast Asia GOFC network beyond the existing four core LUCC teams. The meeting would highlight existing programs, the technical capacities of various groups and the program requirements for various groups, as well as identify any "gaps" that may effect a Southeast Asia Operational Forest Monitoring Project.
GOFC 1997
GOFC Tropical Forest Washington, D.C.
March 15-17, 1999
GOFC SE Asia Planning Meeting Bogor, Indonesia
January, 2000
GOFC SE Asia Conference Summer 2000

SEA Regional GOFC Planning Meeting, Bogor 2000 3
1.3. Planning Meeting Primary Objectives: There are seven primary objectives of this meeting including:
1. Formulation of some initial pilot products and activities • based on prior workshop in Washington, DC • develop more detailed specification and implementation plan • focused on activities of the initial Core group of participating
2. Identification potential partners and participants in the region
• new participants as producers • new participants as users
3. Formulation a mechanism to engage requirements and needs in the region 4. Development a concept of operation and organization of the work
5. Development recommendations to CEOS partners on requirements for data and resources 6. Discussion on areas of desired collaboration to formulate realistic plans to proceed
including: • Identifying GOFC data sets of primary interest and their assimilation • Identifying potential project contributions • Strengthening in-situ data collection [and data access] • Identify technical constraints on participation and possible solutions • Identify institutional constraints on participation and possible solutions • Identify areas of agreement and how to proceed
7. Taking GOFC as an Organizing Framework for developing and demonstrating satellite
based operational forest monitoring – the questions that this meeting started to address include:
• What is currently being done which fits in this Framework? • How can we build on what is being done? • What are the gaps? • What resources can be brought to bear to build on what is being done and fill the
gaps to demonstrate/initiate operational forest monitoring? 1.4. Organization of the SEA GOFC Planning Meeting The SEA Regional GOFC Planning Meeting was hosted by the Indonesian Agency for the Assessment and Application of Technology (BPPT), and was jointly sponsored by :
• NASA LCLUC Project, • IGBP-START, • Indonesia LCLUC Organizations (BPPT, LAPAN, IPB, UI) • Indonesia IHDP (International Human Dimension Program) • Indonesia Department of Forestry and Estate Crops
The meeting invited and attended by various research group working on forest monitoring and research to exchange information concerning their programs.
SEA Regional GOFC Planning Meeting, Bogor 2000 Section-2, Page 1 of 9
SECTION – 2 THE PLANNING MEETING
2.1. Meeting Venue Dates: January 31 – February 2, 2000 Location: Hotel Salak, Bogor, Indonesia Host: The Agency for Assessment and Application of Technology (BPPT)
Indonesia Participants: (See Appendix 16 for the complete list) 58 scientists from 9 countries
• Australia • Cambodia • Indonesia • Laos P.D.R • Malaysia • Philippines • Thailand • United States • Vietnam
2.2. Primary Outcomes: As GOFC is a new research initiative, an introduction and overview of the program structure is always a necessary opening in the planning meetings. In Bogor meeting three Indochina countries (Cambodia, Laos, Vietnam) joined the regional SEA LUCC network for the first time. In addition, a number of international and regional environmental NGOs were also present during the meeting to provide inputs and feedbacks to the SEA GOFC strategy. In general the meeting outcomes include the following:
• Review and explanation of the GOFC program for participants in the workshop. For some participants, this was the first opportunity for them to learn about GOFC.
• Presentations of current “GOFC related” activities in Southeast Asia in the general topics of: Research and Policy
Presentation on these topics were delivered by: o International Human Dimensions Program, Indonesia o Environmental Science for Social Change, Ateneo University, Philippines o Wetlands International, Indonesia o Conservation International, Indonesia o Asian Center for Research on Remote Sensing, Asian Institute of Technology,
Thailand o Impacts Center for Southeast Asia, Indonesia o Southeast Asia LUCC 2000 Network
• Malaysia • Thailand • Philippines • Indonesia • Laos • Cambodia
SEA Regional GOFC Planning Meeting, Bogor 2000 Section-2, Page 2 of 9
• Vietnam Data Providers
Presentation and demonstration were conducted by: o Tropical Rainforest Information Center, Michigan State University, USA
Data Information and Distribution o GOIN-CEOS Network (delivered by Southeast Asia START Regional Center,
Thailand & University Kebangsaan Malaysia) • Summary Recommendations for Potential Regional Activities and Contributions to
Southeast Asia GOFC (issues, activities and action items): for the two GOFC components: o Fire Monitoring o Forest Cover Characteristics and Changes
2.3. Major Recommendations: Through the course of the meeting, following an introduction of the GOFC project and followed by presentations of on-going activities, breakout sessions on fire monitoring and forest cover characteristics and changes were organized. A number of significant and realistic recommendations specific to GOFC opportunities in Southeast Asia were identified. In each breakout group the following subjects were addressed:
• Existing programs and projects that could contribute to GOF-SEA • Opportunities for compiling a common database or web site with regional information,
some analysis results, or primary datasets • Opportunities for developing a harmonized data set and/or map from existing
programs/products in each country • Identification of requirements for a prototype information network to be developed,
particularly in the definition of: o Spatial extent of the prototype areas o User communities to be served and how to define user needs o Topical/thematic extent of the information to be provided
• Existing opportunities to develop a one-stop shopping catalogue for data for o Remote sensing o Ancillary o Metadata
• The needs for remote sensing data for Global, regional, and local usages • Possibility of using a bulk data purchase of Landsat or other data • Identification of current obstacles to data access • Identification on the needs to hold a regional symposium of users and producers, and the
formulation of its goals and objectives, as well as participants • Consensus on the need to continue and endorse thee “GOIN-CEOS” network test, and the
definition of the regional needs for networks • Discussion on the need to increase advocacy to promote:
o Exchange activity information o Development cooperation mechanism
• Identification of areas where GOFC could assist GOF-SEA in capacity building in the field of:
o Data collection and compilation o Scientific interpretation o Reporting, Policy brief development, etc. o Training
Strategies for implementation of SEA GOFC were designed to target both national and regional levels. At the national level, the groups were charged with considering a strategy to:
• Develop a one-stop shopping catalogue • Identify “users” and their needs • Select study areas for prototypes • Develop information exchange protocols • Concert research activities through coordinated planning and implementation
SEA Regional GOFC Planning Meeting, Bogor 2000 Section-2, Page 3 of 9
At the regional level, the groups were charged with considering a strategy to:
• Harmonize and develop a regional base map • Develop a one-stop shopping regional catalogue • Conduct training on analysis methods (characterization, fire monitoring, bio-process
mapping) • Develop policy brief products • Upscale case studies for regional studies
2.4. Recommendations and Actions from Forest Characteristics and Change Working Group 1) The compilation of existing “GOFC” type activities at regional, national and local
scales. First, there needs to be a clear understanding of the existing GOFC type activities at these levels. The development of a summary table with projects and activities listed by country. The development of links (if available) to projects listed in the tables and placed on a web site, initially managed by University Kebangsaan Malaysia (UKM), then hosted by a regional GOFC web page. Countries are to review and edit the tables and provide URLs to UKM to create the web page.
2) Develop a harmonized Baseline Data set. No existing regional forest cover data set
meets national, international and scientific needs. The process of creating a regional harmonized data set is poorly defined. Activities include defining a single projection, spheroid, datum, and harmonizing a baseline boundary map, creating a single data layer for a GOFC template as an ArcInfo vector coverage, and creating a Version 0 forest cover map for the region. Countries are tasked with providing the Thai team with country boundary files and national forest maps at 1:1Million scale as ArcInfo coverages.
3) Develop and test a prototype information network – User Requirements. There is a
need to first identify where the producer’s and the user’s requirements converge. To do so, target groups will be identified to test the prototype information network, in a small area. It was proposed that the user’s requirements may be gathered by two approaches: 1) use feedback from top-down and bottom-up approaches to refine producer’s and user’s requirements, or 2) set up a quick survey to gather feedback on user requirements. Dr. Sharifah Mastura S.A. from Malaysia will develop a draft survey instrument to assist in defining user requirements. This draft will circulate to SEA GOFC participants for review.
4) Develop and test a prototype information network – Data Collection and Distribution.
Clear need for one-stop shopping for data, but its implementation will require significant commitment. Existing activities provide some framework to explore and test options. These include: the DIAL interface with GCMD, Philippine National Mapping and Resource Information Authority (NAMRIA) database system, use of links through various web sites, and the GOIN-CEOS data network testing. The Tropical Rainforest Information Center (TRFIC), SEA START Regional Center and Earth Observation Center and the University Kebangsaan Malaysia are currently committed to the GOIN-CEOS project. The question remains if this network can be extended beyond the TRFIC à SEA START RC & à EOC-UKM connections. TRFIC will assess and coordinate the web approach option. Need to verify that the GOIN-CEOS activity can be expanded.
5) Pursue CEOS data bundle concept for Southeast Asia GOFC Network (GOF-SEA).
Issues include 1) the need for wall-to-wall coverage using high resolution (20 – 30 meter) data to meet national needs, 2) the price of high resolution remote sensing data, 3) the lack of high quality, low cloud cover data for certain areas, and 4) the restrictions on data sharing and distribution. To address some of these issues, it was agreed that a strategy would be developed for wall-to-wall coverage using Landsat 7 data coupled with “gap filling” from SPOT, AVNIR and IRS. A more complete understanding of SAR capabilities for “gap filling” also needs to be developed. And, a sampling strategy for validation and
SEA Regional GOFC Planning Meeting, Bogor 2000 Section-2, Page 4 of 9
accuracy assessments could be developed using very fine (1 – 3 meter) data, such as Ikonos data.
6) Additional capacity building in the region focussed on the use of new sensors and
technologies for operational forest monitoring. Raising the question on the possibility of developing a GOFC technical advisory board (or pool of) scientists to facilitate further capacity building.
7) Need to develop a strategy for “Galvanizing” GOFC communities in SE Asia. Some
questions concerning differences in the institutional requirements under the GOFC framework in relation to the existing SEA LUCC teams current activities. A regional symposium could provide an opportunity to demonstrate the benefits to broad communities and utility to potential funding agencies.
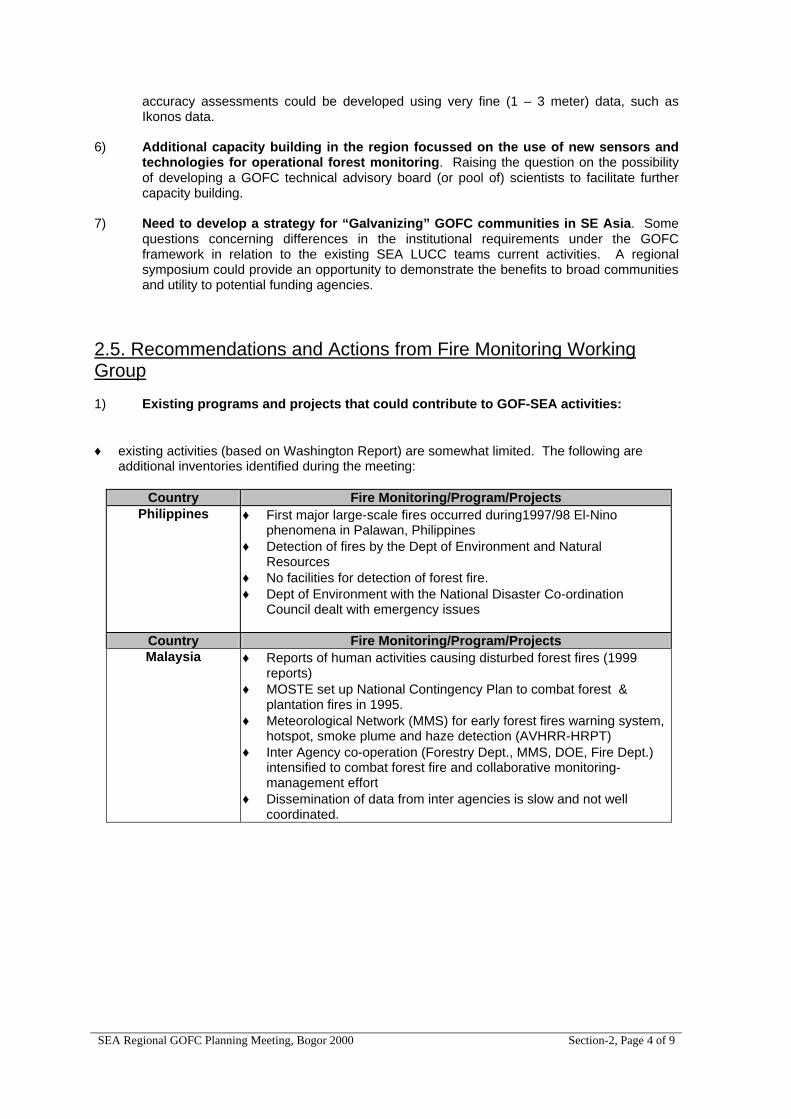
2.5. Recommendations and Actions from Fire Monitoring Working Group 1) Existing programs and projects that could contribute to GOF-SEA activities: ♦ existing activities (based on Washington Report) are somewhat limited. The following are
additional inventories identified during the meeting: Country Fire Monitoring/Program/Projects
Philippines ♦ First major large-scale fires occurred during1997/98 El-Nino phenomena in Palawan, Philippines
♦ Detection of fires by the Dept of Environment and Natural Resources
♦ No facilities for detection of forest fire. ♦ Dept of Environment with the National Disaster Co-ordination
Council dealt with emergency issues
Country Fire Monitoring/Program/Projects Malaysia ♦ Reports of human activities causing disturbed forest fires (1999
reports) ♦ MOSTE set up National Contingency Plan to combat forest &
plantation fires in 1995. ♦ Meteorological Network (MMS) for early forest fires warning system,
hotspot, smoke plume and haze detection (AVHRR-HRPT) ♦ Inter Agency co-operation (Forestry Dept., MMS, DOE, Fire Dept.)
intensified to combat forest fire and collaborative monitoring-management effort
♦ Dissemination of data from inter agencies is slow and not well coordinated.
SEA Regional GOFC Planning Meeting, Bogor 2000 Section-2, Page 5 of 9
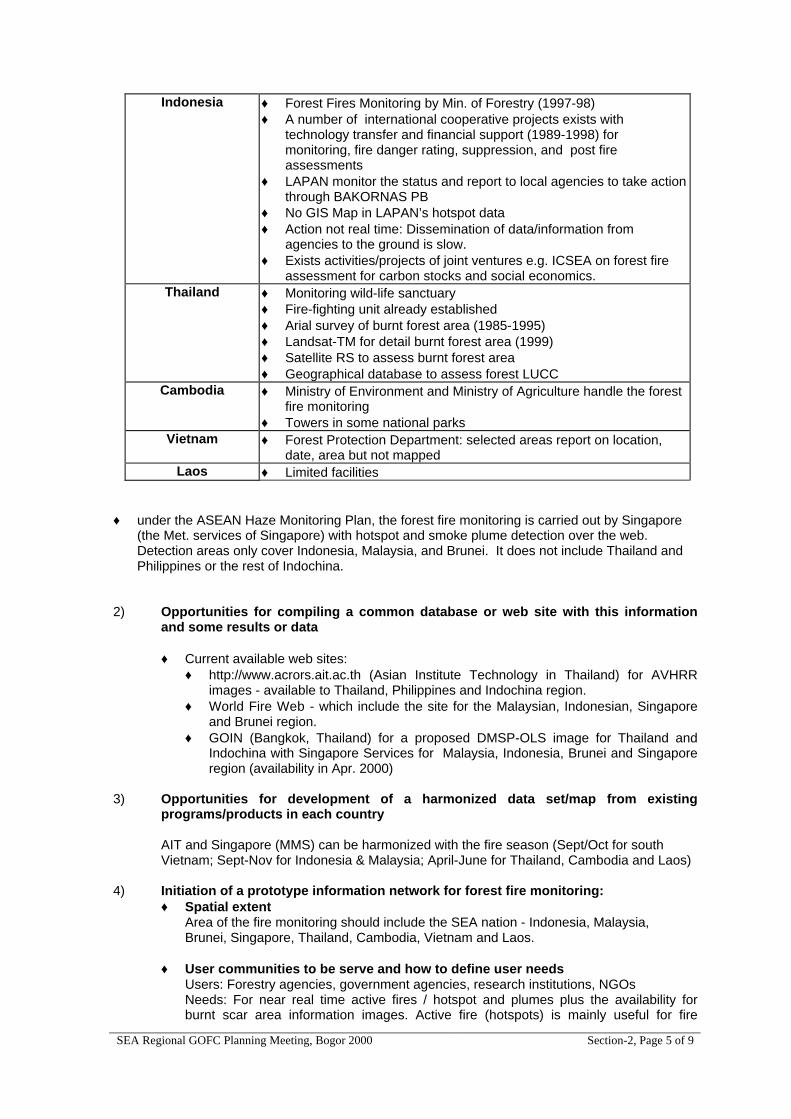
Indonesia ♦ Forest Fires Monitoring by Min. of Forestry (1997-98) ♦ A number of international cooperative projects exists with
technology transfer and financial support (1989-1998) for monitoring, fire danger rating, suppression, and post fire assessments
♦ LAPAN monitor the status and report to local agencies to take action through BAKORNAS PB
♦ No GIS Map in LAPAN’s hotspot data ♦ Action not real time: Dissemination of data/information from
agencies to the ground is slow. ♦ Exists activities/projects of joint ventures e.g. ICSEA on forest fire
assessment for carbon stocks and social economics. Thailand ♦ Monitoring wild-life sanctuary
♦ Fire-fighting unit already established ♦ Arial survey of burnt forest area (1985-1995) ♦ Landsat-TM for detail burnt forest area (1999) ♦ Satellite RS to assess burnt forest area ♦ Geographical database to assess forest LUCC
Cambodia ♦ Ministry of Environment and Ministry of Agriculture handle the forest fire monitoring
♦ Towers in some national parks Vietnam ♦ Forest Protection Department: selected areas report on location,
date, area but not mapped Laos ♦ Limited facilities
♦ under the ASEAN Haze Monitoring Plan, the forest fire monitoring is carried out by Singapore
(the Met. services of Singapore) with hotspot and smoke plume detection over the web. Detection areas only cover Indonesia, Malaysia, and Brunei. It does not include Thailand and Philippines or the rest of Indochina.
2) Opportunities for compiling a common database or web site with this information
and some results or data ♦ Current available web sites:
♦ http://www.acrors.ait.ac.th (Asian Institute Technology in Thailand) for AVHRR images - available to Thailand, Philippines and Indochina region.
♦ World Fire Web - which include the site for the Malaysian, Indonesian, Singapore and Brunei region.
♦ GOIN (Bangkok, Thailand) for a proposed DMSP-OLS image for Thailand and Indochina with Singapore Services for Malaysia, Indonesia, Brunei and Singapore region (availability in Apr. 2000)
3) Opportunities for development of a harmonized data set/map from existing
programs/products in each country AIT and Singapore (MMS) can be harmonized with the fire season (Sept/Oct for south
Vietnam; Sept-Nov for Indonesia & Malaysia; April-June for Thailand, Cambodia and Laos) 4) Initiation of a prototype information network for forest fire monitoring:
♦ Spatial extent Area of the fire monitoring should include the SEA nation - Indonesia, Malaysia, Brunei, Singapore, Thailand, Cambodia, Vietnam and Laos.
♦ User communities to be serve and how to define user needs Users: Forestry agencies, government agencies, research institutions, NGOs Needs: For near real time active fires / hotspot and plumes plus the availability for burnt scar area information images. Active fire (hotspots) is mainly useful for fire
SEA Regional GOFC Planning Meeting, Bogor 2000 Section-2, Page 6 of 9
fighting team and forest managers in different region/areas in SEA. Burnt scar areas is useful for the inventories of the fire area burnt.
♦ Topical/thematic extent Social impacts in term of health and safety, deprivation of livelihood, relocation of villages driven from home, effects to tourism industries, transportation, biological impacts on loss of biodiversity, atmospheric impacts, air quality, greenhouse-gas emissions.
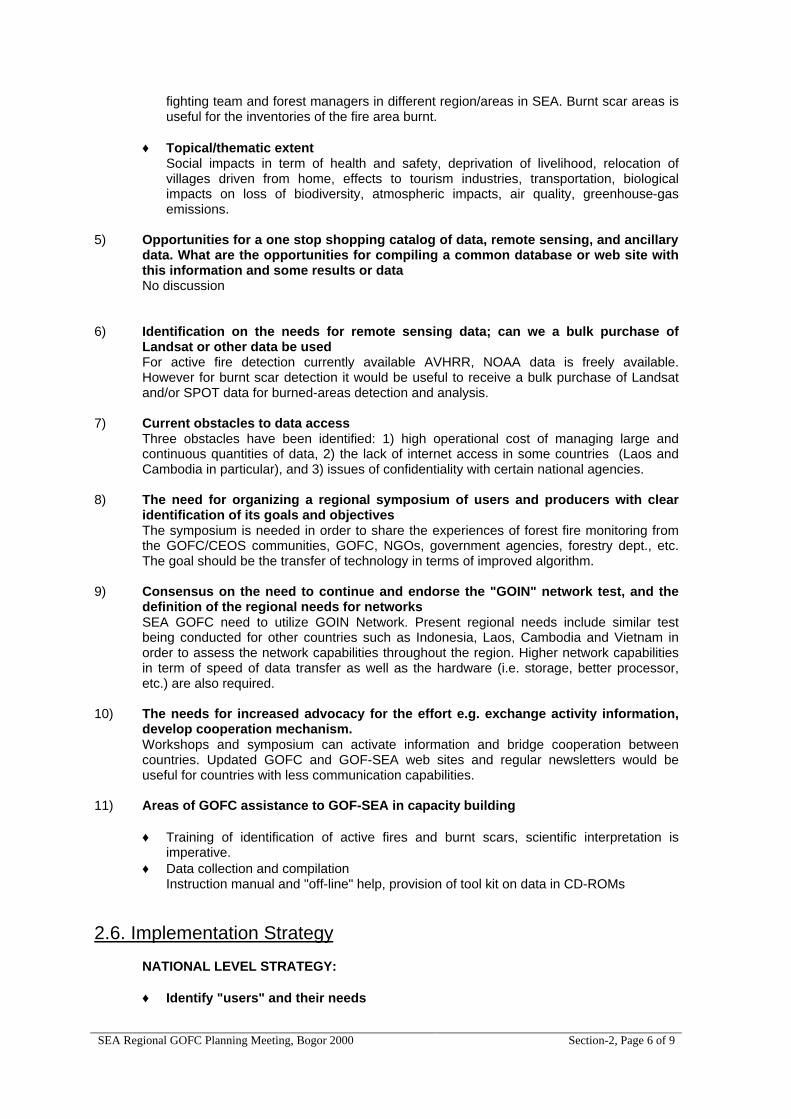
5) Opportunities for a one stop shopping catalog of data, remote sensing, and ancillary
data. What are the opportunities for compiling a common database or web site with this information and some results or data
No discussion 6) Identification on the needs for remote sensing data; can we a bulk purchase of
Landsat or other data be used For active fire detection currently available AVHRR, NOAA data is freely available.
However for burnt scar detection it would be useful to receive a bulk purchase of Landsat and/or SPOT data for burned-areas detection and analysis.
7) Current obstacles to data access
Three obstacles have been identified: 1) high operational cost of managing large and continuous quantities of data, 2) the lack of internet access in some countries (Laos and Cambodia in particular), and 3) issues of confidentiality with certain national agencies.
8) The need for organizing a regional symposium of users and producers with clear
identification of its goals and objectives The symposium is needed in order to share the experiences of forest fire monitoring from
the GOFC/CEOS communities, GOFC, NGOs, government agencies, forestry dept., etc. The goal should be the transfer of technology in terms of improved algorithm.
9) Consensus on the need to continue and endorse the "GOIN" network test, and the
definition of the regional needs for networks SEA GOFC need to utilize GOIN Network. Present regional needs include similar test
being conducted for other countries such as Indonesia, Laos, Cambodia and Vietnam in order to assess the network capabilities throughout the region. Higher network capabilities in term of speed of data transfer as well as the hardware (i.e. storage, better processor, etc.) are also required.
10) The needs for increased advocacy for the effort e.g. exchange activity information,
develop cooperation mechanism. Workshops and symposium can activate information and bridge cooperation between countries. Updated GOFC and GOF-SEA web sites and regular newsletters would be useful for countries with less communication capabilities.
11) Areas of GOFC assistance to GOF-SEA in capacity building
♦ Training of identification of active fires and burnt scars, scientific interpretation is imperative.
♦ Data collection and compilation Instruction manual and "off-line" help, provision of tool kit on data in CD-ROMs
2.6. Implementation Strategy
NATIONAL LEVEL STRATEGY:
♦ Identify "users" and their needs
SEA Regional GOFC Planning Meeting, Bogor 2000 Section-2, Page 7 of 9
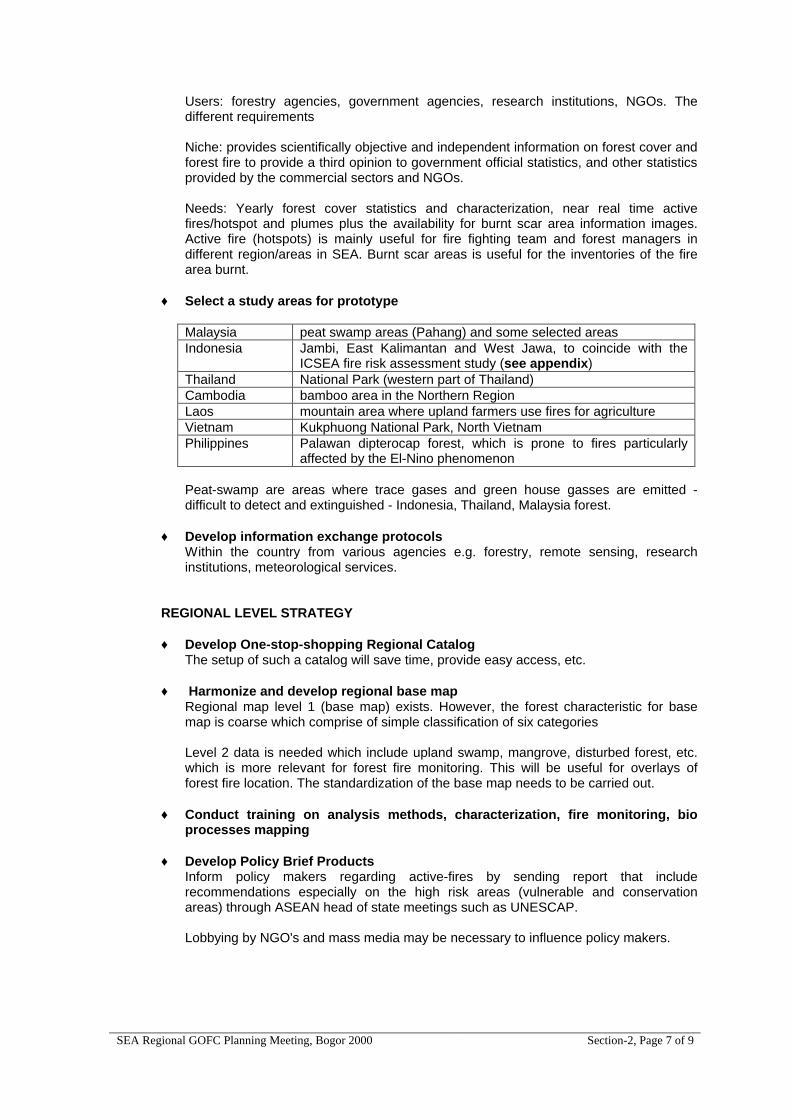
Users: forestry agencies, government agencies, research institutions, NGOs. The different requirements Niche: provides scientifically objective and independent information on forest cover and forest fire to provide a third opinion to government official statistics, and other statistics provided by the commercial sectors and NGOs. Needs: Yearly forest cover statistics and characterization, near real time active fires/hotspot and plumes plus the availability for burnt scar area information images. Active fire (hotspots) is mainly useful for fire fighting team and forest managers in different region/areas in SEA. Burnt scar areas is useful for the inventories of the fire area burnt.
♦ Select a study areas for prototype
Malaysia peat swamp areas (Pahang) and some selected areas Indonesia Jambi, East Kalimantan and West Jawa, to coincide with the
ICSEA fire risk assessment study (see appendix) Thailand National Park (western part of Thailand) Cambodia bamboo area in the Northern Region Laos mountain area where upland farmers use fires for agriculture Vietnam Kukphuong National Park, North Vietnam Philippines Palawan dipterocap forest, which is prone to fires particularly
affected by the El-Nino phenomenon
Peat-swamp are areas where trace gases and green house gasses are emitted - difficult to detect and extinguished - Indonesia, Thailand, Malaysia forest.
♦ Develop information exchange protocols
Within the country from various agencies e.g. forestry, remote sensing, research institutions, meteorological services.
REGIONAL LEVEL STRATEGY ♦ Develop One-stop-shopping Regional Catalog
The setup of such a catalog will save time, provide easy access, etc. ♦ Harmonize and develop regional base map
Regional map level 1 (base map) exists. However, the forest characteristic for base map is coarse which comprise of simple classification of six categories Level 2 data is needed which include upland swamp, mangrove, disturbed forest, etc. which is more relevant for forest fire monitoring. This will be useful for overlays of forest fire location. The standardization of the base map needs to be carried out.
♦ Conduct training on analysis methods, characterization, fire monitoring, bio
processes mapping
♦ Develop Policy Brief Products Inform policy makers regarding active-fires by sending report that include recommendations especially on the high risk areas (vulnerable and conservation areas) through ASEAN head of state meetings such as UNESCAP.
Lobbying by NGO's and mass media may be necessary to influence policy makers.
SEA Regional GOFC Planning Meeting, Bogor 2000 Section-2, Page 8 of 9
2.7. Pilot Project Recommendation During the course of the meeting, a number of ideas on pilot project were presented and discussed. The SEA GOFC regional team identified initial topics of common regional interests that can be used as the initial implementation of GOFC in the southeast Asian region. These topics include:
♦ Risk assessment data base map at national level for vegetation cover in watershed areas, national park, protected areas, peat swamp, etc. of the potential fire areas.
♦ National level studies on social impacts of forest fire; health, air quality could be envisaged.
♦ One stop shopping regional catalog: include suite of satellite sensors of various spatial resolution time frequency such as AVHRR, DMSP, ASTR, Landsat SPOT, MODIS, GLI for processed active fire and burnt scar monitoring.
2.8. Needs for Infrastructure and Support Based on the nearly five years experience of working in regional research collaboration, the availability of basic infrastructure and resource support has always been a necessity. For SEA GOFC, the following are basic infrastructure and common support needed by the research network: • Establishment of Regional GOFC Functional Secretariat in Indonesia • Links to regional LUCC Secretariat in Malaysia • Links to regional network secretariat in Bangkok • Data provision through NASA LCLUC and ESIP providers • Additional support from EOS/ESE science teams and programs -- e.g. MODIS, OGC initiative,
etc • Support needed to network teams in the form of joint-proposal, panel and peer review, and
endorsement of regional proposals in the regional the meetings attended by representatives of funding agencies
• Need to build capacity in new team members such as Cambodia, Laos and Vietnam • Close collaboration with national users and agencies has to be built in from the start
– In all countries: national forest agencies – In respective countries: land management agencies, regional governments, other relevant
technical agencies (e.g. Land Development, NAMRIA)
2.9. Preliminary Identification of Existing National Activities MALAYSIA • National Forest Inventories project in Malaysia is creating forest resource maps for Peninsular
Malaysia. – National inventories are carried out every 10 years starting in 1972. – These maps based initially on aerial photos, but from early 1980s have relied on aerial
photos and Landsat imagery at 1:250K scale. • In 1990, the Continuous Forest Monitoring System (CONFORMS) was established to map and
monitor forest in Pen. Malaysia using both RS (Landsat)and GIS techniques. • Sabah Forestry Dept. established an operational Sabah Forest Management Information
System (SFMIS) . This project utilizes RS (Landsat) and field data for routine monitoring. • A similar system is being developed for Sarawak.
PHILIPPINES • Bureau of Forest Management in Department of Environment has the mandate for forest
mapping in the Philippines. – The goal of this project is to conduct a complete national inventory of forests every 5 years
SEA Regional GOFC Planning Meeting, Bogor 2000 Section-2, Page 9 of 9
– Satellite and aerial photos are used in the 1:250k scale analysis. • WWF has a Global Environmental Facility (GEF) funded project focusing on Protected Areas
Management. • This project has 10 sites in the Philippines, with eco-regional planning using GIS and RS
technologies.
THAILAND • Forest Resources Assessment Division of Royal Forestry Dept. has the mandate to forest
mapping and monitoring in Thailand. – The national forest inventory is updated at least every 3 years. – Forest/Non-Forest maps area produced at 1:250k, with more detailed Level II and Level III
classes at the 1:50k site scale. – The analysis is based on visual interpretation of historic photos and recent Landsat data.
This activity has been operational since early 1960s • RFD and National Research Council of Thailand have a joint Forest Protected Area mapping
project . • This mapping is at a scale of 1:50k for over 100 national parks and wildlife sanctuaries using
Landsat TM data. • The current plan is to update each map every 5 years.
INDONESIA • Dept. of Forestry has the mandate for forest mapping in Indonesia
– The Department has implemented a National Forest Inventory project. – Remote Sensing data are used to map forest extent at 1:250,000 for the entire Indonesia. – These forest maps are used as the basis of countrywide forest use planning and permits.
• A large number of detailed activities exists within the local and international environmental conservation NGO communities. These activities can provide in situ data for GOFC as well as network for local capacity building
• Indonesian Fire Monitoring project is a joint activity with technical and funding supports from GTZ, EU, JICA and CIDA on capacity building in various topics including monitoring, suppression, planning, and post fire assessments.
• Goal is to move forward for monitoring transboundary haze.
SEA Regional GOFC Planning Meeting, Bogor 2000
13
REMARKS OF THE MINISTER OF FORESTRY AND ESTATE CROPS
OF THE REPUBLIC OF INDONESIA On the Opening of
Southeast Asia Regional Planning Meeting of Global Observation of Forest Cover (GOFC)
Bogor, 31 January 2000 Assalamu ‘alaikum warahmatullahi wabarakatuh Distinguished international scientific delegates to the Southeast Asia Regional Planning Meeting on Global Observation of Forest Cover (GOFC), distinguished scientists and participants, ladies and gentlemen, allow me to first welcome you to Indonesia to attend this very important scientific meeting. It is indeed a pleasure for me to deliver a speech in the opening of this important occasion. I have been informed by the Organizing Committee and by Indonesian scientists participating in GOFC about the objective and the proposed plan of this Initiative. I would like to share with you the Government of Indonesia’s perceptions about the importance of forest, forestry, and forest related research such as GOFC. As we are all aware, forest is one of the most important components within the overall earth system. Traditionally, forests have been understood as ecosystems in which human, plants, animals, and other organisms have their livelihood depends on. Recent scientific understanding began to recognize that forests are also rich in biodiversity, and that the natural cycle of the various components in the forest ecosystems, including the human, are interlinked in very closed and complex relationships. More recently, scientists are just becoming aware that forests are also an important component in the global carbon cycle as part of the complex global atmospheric system. These recent understandings, I believe, are only the beginning of a more comprehensive knowledge about the forests that human civilization is yet to discover. As you are also aware, many forest resource management practices, including those in Indonesia, are still using traditional view to the forest. This view sees forest only as a clump of biological resources, or many times even consider it only as a stock of timber. These management practices have to be changed if we want to maintain the natural complex processes within the forest ecosystem, in order to sustain the existence of the forests, thus sustaining the human civilization itself.
Appendix – 1
SEA Regional GOFC Planning Meeting, Bogor 2000
14
Distinguished participants, ladies and gentlemen, I would like to share with you my, still short but very important, experience in managing Indonesian forest resources, to add significance to the research programs that you are about to plan. Forest management decisions, especially as they relates to forest use designation, are always subject to competing interests, be that political, economic, or even sometimes individual. Many of the decisions were not made based on complete information that gives managers options. Although, we should also recognize that the intentions behind the decisions are still the most important factor. But, even the least genuine intention, I believe would still needs objective information as part of its arguments. This is where I think scientific community such as yourselves can play a very important role, that is providing objective information. Distinguished participants, ladies and gentlemen, Allow me to briefly touch on the subject of forest cover dynamics and their global significance. From the materials provided to me about GOFC, I learned that there are at least three primary themes that will be addressed in this Initiatives, including Forest Cover Characteristics and Change, Forest Fire Monitoring and Mapping, and Forest Biophysical Processes. For decision making at local, national, and global levels, these three themes should be equally important. But, what we found today are the different perceptions about the function of the forests as a result of our limited knowledge and the minimum scientific information available. For the global community, forest cover changes due to utilization are sometimes directly attributed to the lack of environmental awareness at the local and national levels. On the other hand, global conservation programs are often seen by local level communities as efforts of passing the blame of forest destruction by the more modern communities, who consume most of the forest products, to the local communities who are always marginalized and left with the impacts of such a consumptive lifestyle. This is where I think your research program should attempt to bridge. In today’s climate of change as a result of the globalization and the cross continental reform movements, there is an urgent need in forestry to define a common value system concerning the role and the function of the forests. Decisions on how forest resources should be utilized, should lead to choices that give multiple benefits for the different levels of communities from global to local. And when there are conflicting requirements, then the resolution should lead to passing the costs to those who received the largest benefit. This is important to understand because forests are essentially global public goods. It, therefore, needs to be managed as public resources for the benefit of the general global public, which naturally includes the local and mostly marginalized communities. I, therefore, strongly urged all of you to focus your research programs to improving the knowledge about the physical as well as social dynamics of the forest as a life-
SEA Regional GOFC Planning Meeting, Bogor 2000
15
system, at the same time producing information concerning the values of forests under various dynamical conditions. These multiple objectives, I believe, will be useful for both scientific and management purposes. To support this, I would like to invite you to interact with the scientists from our Department’s Research and Development Agency, as well as with other Indonesian scientists working in forest research. At the same time, I would strongly encourage the Indonesian scientists to play a more active role, particularly in research on tropical forests. Finally, I wish you a productive meeting, and I hope that you can also enjoy your stay in Bogor. I am looking forward to further support the implementation of the Southeast Asia Regional GOFC research agenda that will be developed during this meeting. Thank you. Wassalamu ‘alaikum warahmatullahi wabarakatuh. Minister of Forestry and Estate Crops Nur Mahmudi Isma’il, Ph.D.
SEA Regional GOFC Planning Meeting, Bogor 2000
16
PROPOSED STRATEGY FOR GOFC IMPLEMENTATION IN INDONESIA
Synthesized by:
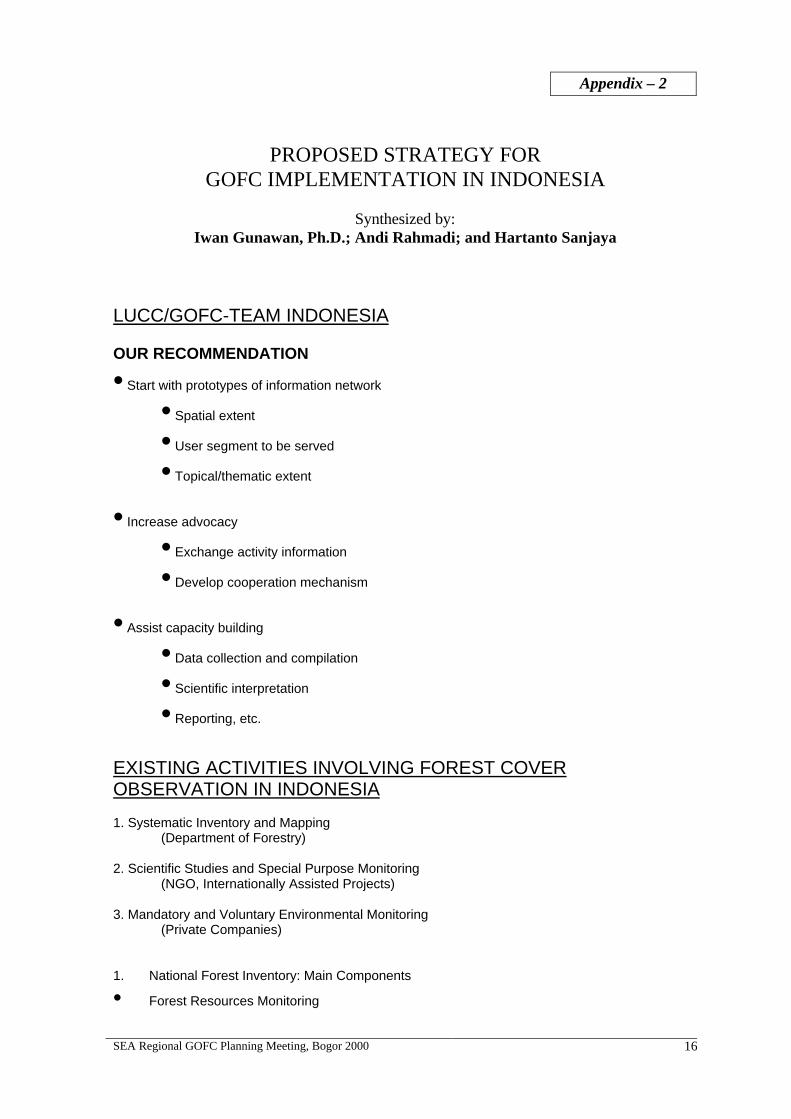
Iwan Gunawan, Ph.D.; Andi Rahmadi; and Hartanto Sanjaya LUCC/GOFC-TEAM INDONESIA OUR RECOMMENDATION
• Start with prototypes of information network
• Spatial extent
• User segment to be served
• Topical/thematic extent
• Increase advocacy
• Exchange activity information
• Develop cooperation mechanism
• Assist capacity building
• Data collection and compilation
• Scientific interpretation
• Reporting, etc.
EXISTING ACTIVITIES INVOLVING FOREST COVER OBSERVATION IN INDONESIA 1. Systematic Inventory and Mapping (Department of Forestry) 2. Scientific Studies and Special Purpose Monitoring (NGO, Internationally Assisted Projects) 3. Mandatory and Voluntary Environmental Monitoring (Private Companies) 1. National Forest Inventory: Main Components
• Forest Resources Monitoring
Appendix – 2
SEA Regional GOFC Planning Meeting, Bogor 2000
17
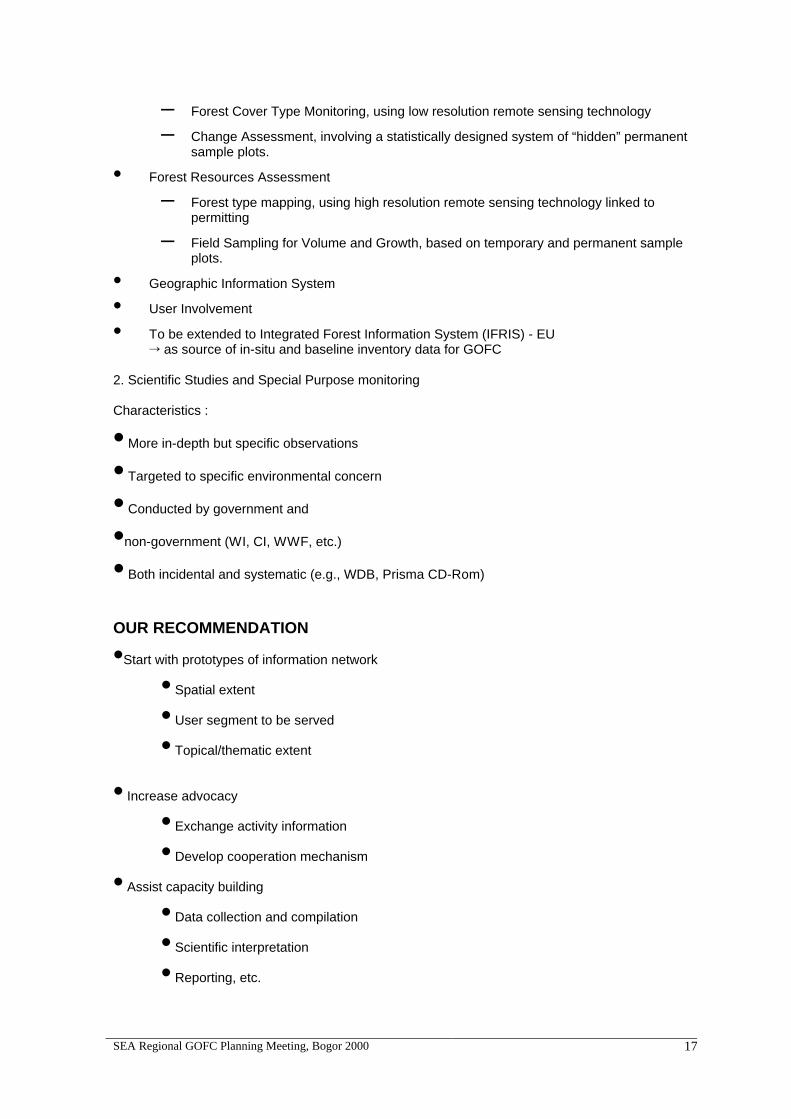
– Forest Cover Type Monitoring, using low resolution remote sensing technology
– Change Assessment, involving a statistically designed system of “hidden” permanent sample plots.
• Forest Resources Assessment
– Forest type mapping, using high resolution remote sensing technology linked to permitting
– Field Sampling for Volume and Growth, based on temporary and permanent sample plots.
• Geographic Information System
• User Involvement
• To be extended to Integrated Forest Information System (IFRIS) - EU Õ as source of in-situ and baseline inventory data for GOFC
2. Scientific Studies and Special Purpose monitoring Characteristics :
• More in-depth but specific observations
• Targeted to specific environmental concern
• Conducted by government and
•non-government (WI, CI, WWF, etc.)
• Both incidental and systematic (e.g., WDB, Prisma CD-Rom) OUR RECOMMENDATION
•Start with prototypes of information network
• Spatial extent
• User segment to be served
• Topical/thematic extent
• Increase advocacy
• Exchange activity information
• Develop cooperation mechanism
• Assist capacity building
• Data collection and compilation
• Scientific interpretation
• Reporting, etc.
SEA Regional GOFC Planning Meeting, Bogor 2000
18
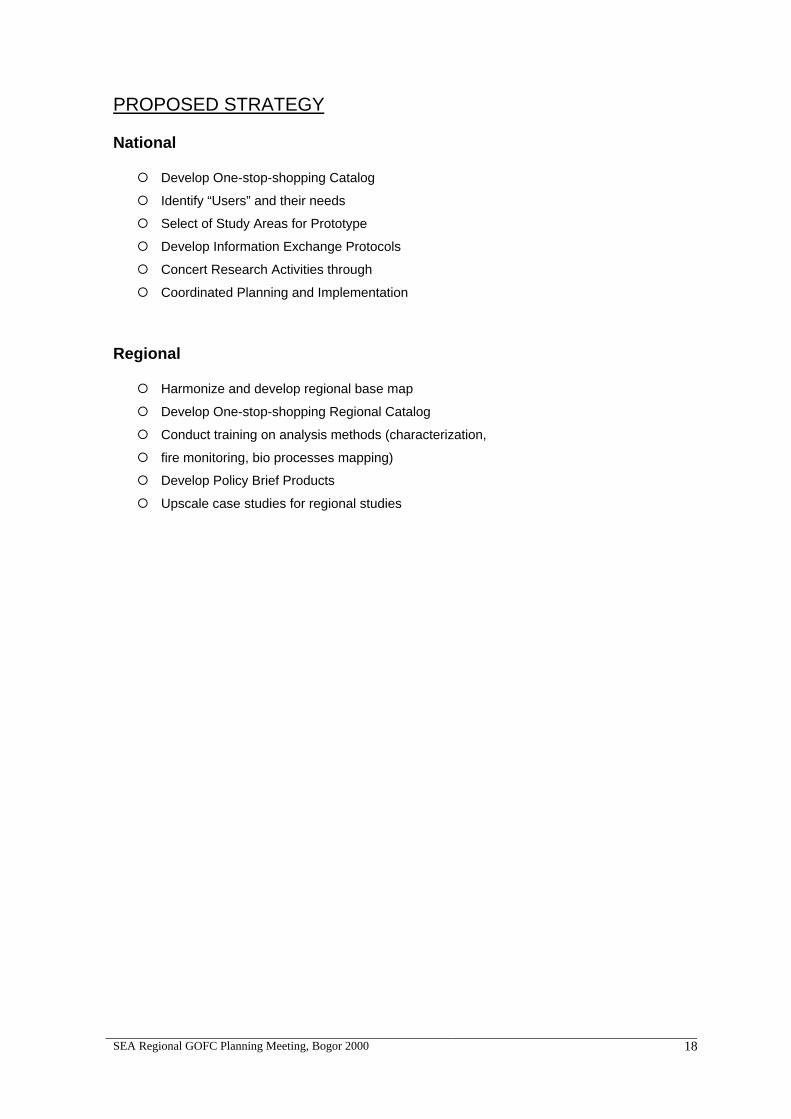
PROPOSED STRATEGY National ¡ Develop One-stop-shopping Catalog
¡ Identify “Users” and their needs
¡ Select of Study Areas for Prototype
¡ Develop Information Exchange Protocols
¡ Concert Research Activities through
¡ Coordinated Planning and Implementation
Regional ¡ Harmonize and develop regional base map
¡ Develop One-stop-shopping Regional Catalog
¡ Conduct training on analysis methods (characterization,
¡ fire monitoring, bio processes mapping)
¡ Develop Policy Brief Products
¡ Upscale case studies for regional studies
SEA Regional GOFC Planning Meeting, Bogor 2000
19
TROPICAL FOREST MAPPING AND MONITORING IN INDONESIA
Dr. Ir. Iwan Gunawan MSc.
Ir. Andi Rahmadi MSc.
Introduction Deforestation in Indonesian due to exploitation and conversion of forest lands tend to rise as a consequence of forest product demand and forest area need in parallel with the people growth, and the national development dynamic. A pressure to natural and plantation forest as a result of increasing Indonesia’s wood demand for growing forest industry. Forest degradation annually about 1 million hectares, due to illegal forest encroachment, forest fires, natural disaster, illegal conversion of forest function, etc tends to reduce the forest multifunction and roles as a wood and non-wood production, environmental values, living resources and its ecosystem, and also for providing lands non forestry purposes and very low achievement on the implementation of forest boundary demarcation and gazettement while forest lands pressure tend to increase legally and illegally. These problems arose in this decade in the forest management monitoring in Indonesia.
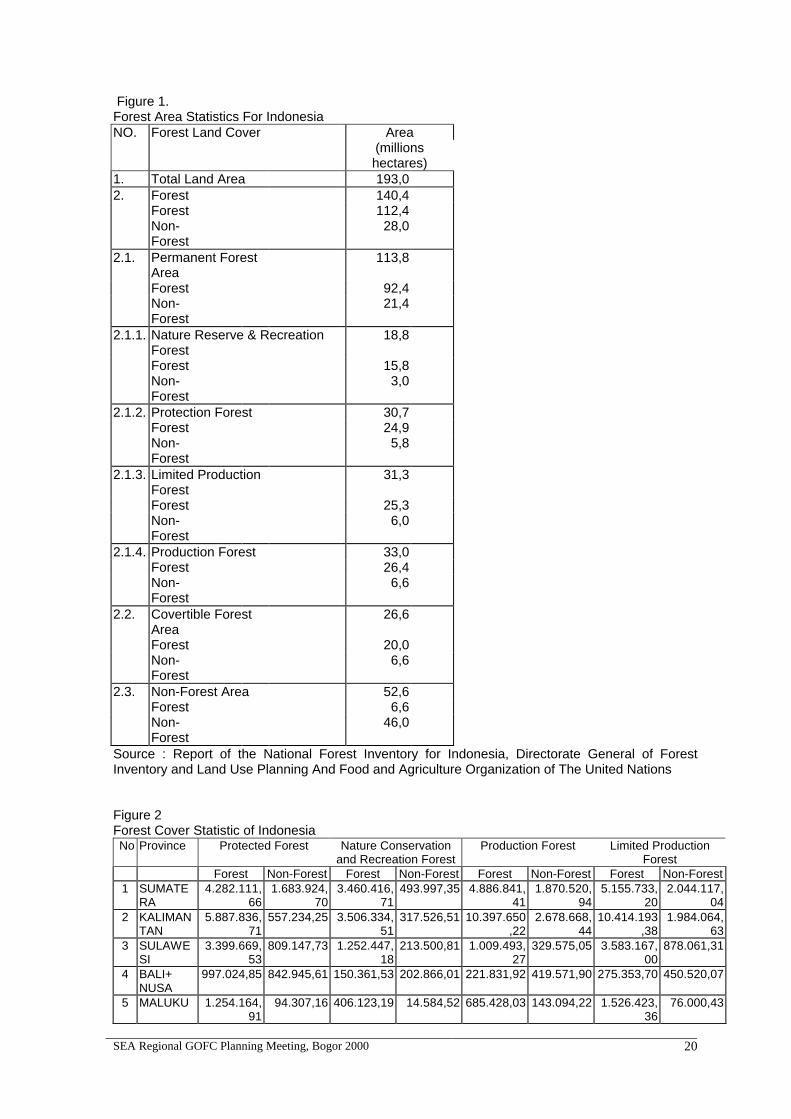
Forest Resources Monitoring Condition In Indonesia Indonesia is a large archipelago of over 1700 islands that straddles the equator for some 5100 km from the Indian Ocean to the Pacific. It has a large land area of approximately 190 million ha of which 85% is accounted for by the six largest islands. The population of approximately 190 million people is concentrated (60%) on Java and Bali, which represent only 7% of the land area. Based on the NFI report total land area of Indonesia 193 million hectares, covered by forest 92,4 million hectares (47,88%), convertible forest area 20 million hectares (10,36%), Non forest area 6,6 million hectares (3,42%), Non covered by forest 74 million hectares (38,34%). In figure 1 can be seen forest statistic for Indonesia which taken from National Forest Inventory Product. The forest resources monitoring in Indonesia activities are mainly done by Ministry of Forestry, Forestry Research Companies, Non Government Organizations, and Companies who responsible to the environment protection. In 1989, Ministry of Forestry which technically assisted by the Food and Agriculture Organization initiated a National Forest Inventory which had activities, such as 1) Forest Resources Monitoring which included Forest cover monitoring, using low resolution remote sensing data and Change assessment, involving a statistically design system of “hidden” permanent sample plot and 2) Forest Resources Assessment which included Forest type mapping, using high resolution remote sensing technology linked to permitting, and Field sampling for volume and growth, based on temporary and permanent sample plots. Forest research companies usually have activities in specific research on the forest monitoring, modeling and management. There are many organizations in the forest research activities in Indonesia such as BIOTROP, CIFOR, ICRAF, and Universities which have forestry faculty. Non Government Organizations usually have specific activities in monitoring of forest resources including human activities in the surrounding forest area, flora, fauna and land monitoring in which should be met or support donor. Companies who used and exploited forest resources have to manage the forest environment to minimize environmental impact. Therefore each companies usually has activities on the forest environment monitoring which should be delivered to management and government authority. These activities such as flora, fauna, and land bio diversity monitoring. By these activities the exploitation can be ensured continually.
SEA Regional GOFC Planning Meeting, Bogor 2000
20
Figure 1. Forest Area Statistics For Indonesia NO. Forest Land Cover Area
(millions hectares)
1. Total Land Area 193,0 2. Forest 140,4
Forest 112,4 Non-Forest
28,0
2.1. Permanent Forest Area
113,8
Forest 92,4 Non-Forest
21,4
2.1.1. Nature Reserve & Recreation Forest
18,8
Forest 15,8 Non-Forest
3,0
2.1.2. Protection Forest 30,7 Forest 24,9 Non-Forest
5,8
2.1.3. Limited Production Forest
31,3
Forest 25,3 Non-Forest
6,0
2.1.4. Production Forest 33,0 Forest 26,4 Non-Forest
6,6
2.2. Covertible Forest Area
26,6
Forest 20,0 Non-Forest
6,6
2.3. Non-Forest Area 52,6 Forest 6,6 Non-Forest
46,0
Source : Report of the National Forest Inventory for Indonesia, Directorate General of Forest Inventory and Land Use Planning And Food and Agriculture Organization of The United Nations Figure 2 Forest Cover Statistic of Indonesia No Province Protected Forest Nature Conservation
and Recreation Forest Production Forest Limited Production
Forest Forest Non-Forest Forest Non-Forest Forest Non-Forest Forest Non-Forest
1 SUMATERA
4.282.111,66
1.683.924,70
3.460.416,71
493.997,35 4.886.841,41
1.870.520,94
5.155.733,20
2.044.117,04
2 KALIMANTAN
5.887.836,71
557.234,25 3.506.334,51
317.526,51 10.397.650,22
2.678.668,44
10.414.193,38
1.984.064,63
3 SULAWESI
3.399.669,53
809.147,73 1.252.447,18
213.500,81 1.009.493,27
329.575,05 3.583.167,00
878.061,31
4 BALI+ NUSA
997.024,85 842.945,61 150.361,53 202.866,01 221.831,92 419.571,90 275.353,70 450.520,07
5 MALUKU 1.254.164,91
94.307,16 406.123,19 14.584,52 685.428,03 143.094,22 1.526.423,36
76.000,43
SEA Regional GOFC Planning Meeting, Bogor 2000
21
6 IRJA 899.809,61 1.386.248,02
6.200.085,84
1.183.857,05
7.577.801,94
558.169,09 4.372.509,00
316.478,33
TOTAL 24.815.617,27
5.373.807,47
14.975.768,96
2.426.332,25
24.779.053,79
5.999.599,64
25.327.379,64
5.749.241,81
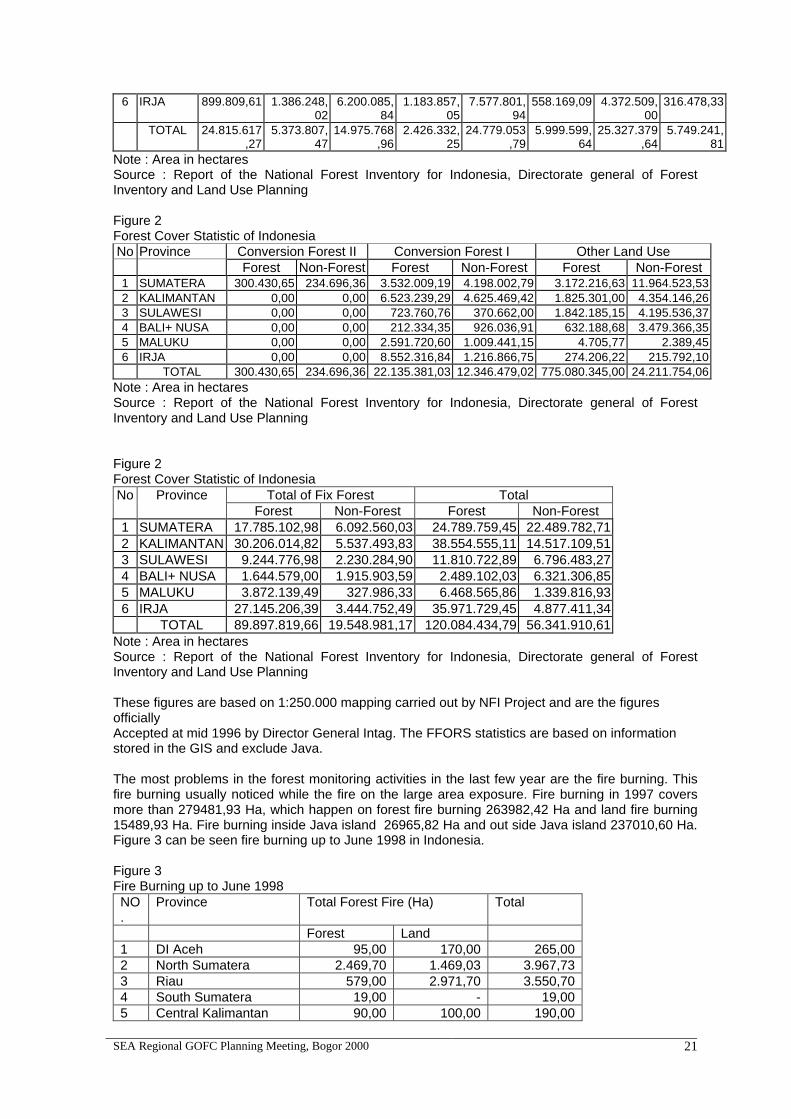
Note : Area in hectares Source : Report of the National Forest Inventory for Indonesia, Directorate general of Forest Inventory and Land Use Planning Figure 2 Forest Cover Statistic of Indonesia No Province Conversion Forest II Conversion Forest I Other Land Use
Forest Non-Forest Forest Non-Forest Forest Non-Forest 1 SUMATERA 300.430,65 234.696,36 3.532.009,19 4.198.002,79 3.172.216,63 11.964.523,53 2 KALIMANTAN 0,00 0,00 6.523.239,29 4.625.469,42 1.825.301,00 4.354.146,26 3 SULAWESI 0,00 0,00 723.760,76 370.662,00 1.842.185,15 4.195.536,37 4 BALI+ NUSA 0,00 0,00 212.334,35 926.036,91 632.188,68 3.479.366,35 5 MALUKU 0,00 0,00 2.591.720,60 1.009.441,15 4.705,77 2.389,45 6 IRJA 0,00 0,00 8.552.316,84 1.216.866,75 274.206,22 215.792,10 TOTAL 300.430,65 234.696,36 22.135.381,03 12.346.479,02 775.080.345,00 24.211.754,06
Note : Area in hectares Source : Report of the National Forest Inventory for Indonesia, Directorate general of Forest Inventory and Land Use Planning Figure 2 Forest Cover Statistic of Indonesia No Province Total of Fix Forest Total
Forest Non-Forest Forest Non-Forest 1 SUMATERA 17.785.102,98 6.092.560,03 24.789.759,45 22.489.782,71 2 KALIMANTAN 30.206.014,82 5.537.493,83 38.554.555,11 14.517.109,51 3 SULAWESI 9.244.776,98 2.230.284,90 11.810.722,89 6.796.483,27 4 BALI+ NUSA 1.644.579,00 1.915.903,59 2.489.102,03 6.321.306,85 5 MALUKU 3.872.139,49 327.986,33 6.468.565,86 1.339.816,93 6 IRJA 27.145.206,39 3.444.752,49 35.971.729,45 4.877.411,34 TOTAL 89.897.819,66 19.548.981,17 120.084.434,79 56.341.910,61
Note : Area in hectares Source : Report of the National Forest Inventory for Indonesia, Directorate general of Forest Inventory and Land Use Planning These figures are based on 1:250.000 mapping carried out by NFI Project and are the figures officially Accepted at mid 1996 by Director General Intag. The FFORS statistics are based on information stored in the GIS and exclude Java. The most problems in the forest monitoring activities in the last few year are the fire burning. This fire burning usually noticed while the fire on the large area exposure. Fire burning in 1997 covers more than 279481,93 Ha, which happen on forest fire burning 263982,42 Ha and land fire burning 15489,93 Ha. Fire burning inside Java island 26965,82 Ha and out side Java island 237010,60 Ha. Figure 3 can be seen fire burning up to June 1998 in Indonesia. Figure 3 Fire Burning up to June 1998 NO.
Province Total Forest Fire (Ha) Total
Forest Land 1 DI Aceh 95,00 170,00 265,00 2 North Sumatera 2.469,70 1.469,03 3.967,73 3 Riau 579,00 2.971,70 3.550,70 4 South Sumatera 19,00 - 19,00 5 Central Kalimantan 90,00 100,00 190,00
SEA Regional GOFC Planning Meeting, Bogor 2000
22
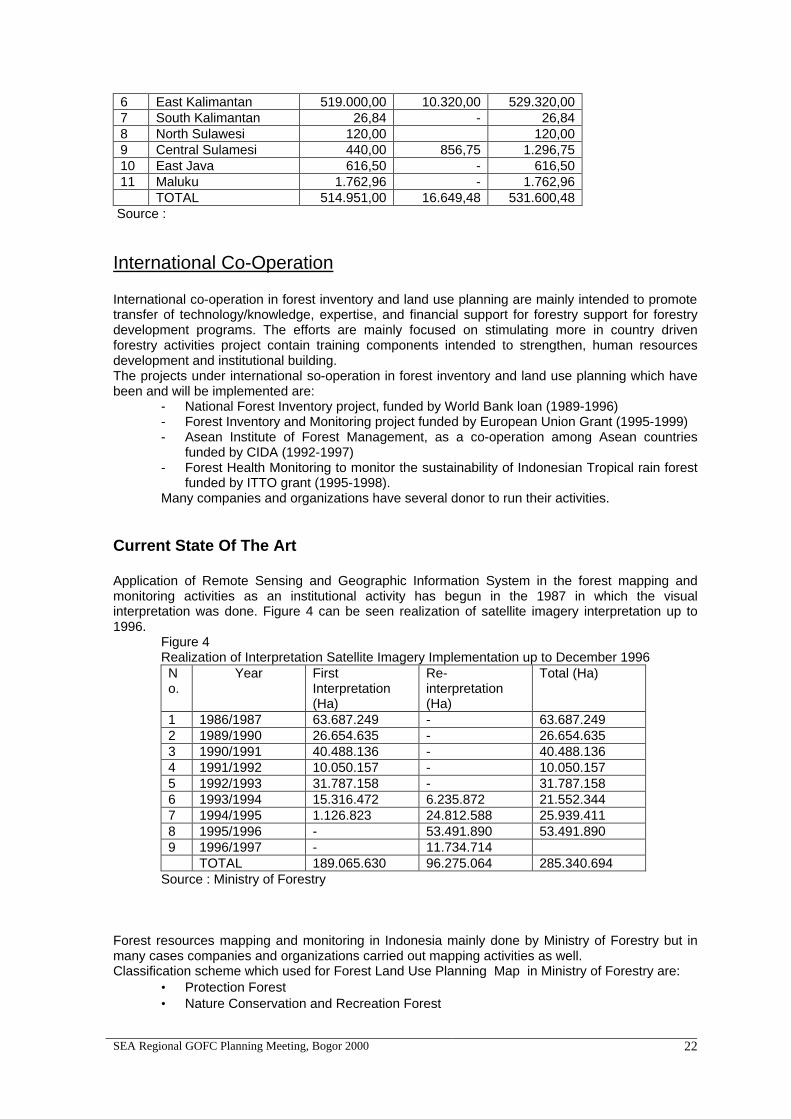
6 East Kalimantan 519.000,00 10.320,00 529.320,00 7 South Kalimantan 26,84 - 26,84 8 North Sulawesi 120,00 120,00 9 Central Sulamesi 440,00 856,75 1.296,75 10 East Java 616,50 - 616,50 11 Maluku 1.762,96 - 1.762,96 TOTAL 514.951,00 16.649,48 531.600,48
Source :
International Co-Operation International co-operation in forest inventory and land use planning are mainly intended to promote transfer of technology/knowledge, expertise, and financial support for forestry support for forestry development programs. The efforts are mainly focused on stimulating more in country driven forestry activities project contain training components intended to strengthen, human resources development and institutional building. The projects under international so-operation in forest inventory and land use planning which have been and will be implemented are:
- National Forest Inventory project, funded by World Bank loan (1989-1996) - Forest Inventory and Monitoring project funded by European Union Grant (1995-1999) - Asean Institute of Forest Management, as a co-operation among Asean countries
funded by CIDA (1992-1997) - Forest Health Monitoring to monitor the sustainability of Indonesian Tropical rain forest
funded by ITTO grant (1995-1998). Many companies and organizations have several donor to run their activities.
Current State Of The Art Application of Remote Sensing and Geographic Information System in the forest mapping and monitoring activities as an institutional activity has begun in the 1987 in which the visual interpretation was done. Figure 4 can be seen realization of satellite imagery interpretation up to 1996.
Figure 4 Realization of Interpretation Satellite Imagery Implementation up to December 1996 No.
Year First Interpretation (Ha)
Re-interpretation (Ha)
Total (Ha)
1 1986/1987 63.687.249 - 63.687.249 2 1989/1990 26.654.635 - 26.654.635 3 1990/1991 40.488.136 - 40.488.136 4 1991/1992 10.050.157 - 10.050.157 5 1992/1993 31.787.158 - 31.787.158 6 1993/1994 15.316.472 6.235.872 21.552.344 7 1994/1995 1.126.823 24.812.588 25.939.411 8 1995/1996 - 53.491.890 53.491.890 9 1996/1997 - 11.734.714 TOTAL 189.065.630 96.275.064 285.340.694
Source : Ministry of Forestry
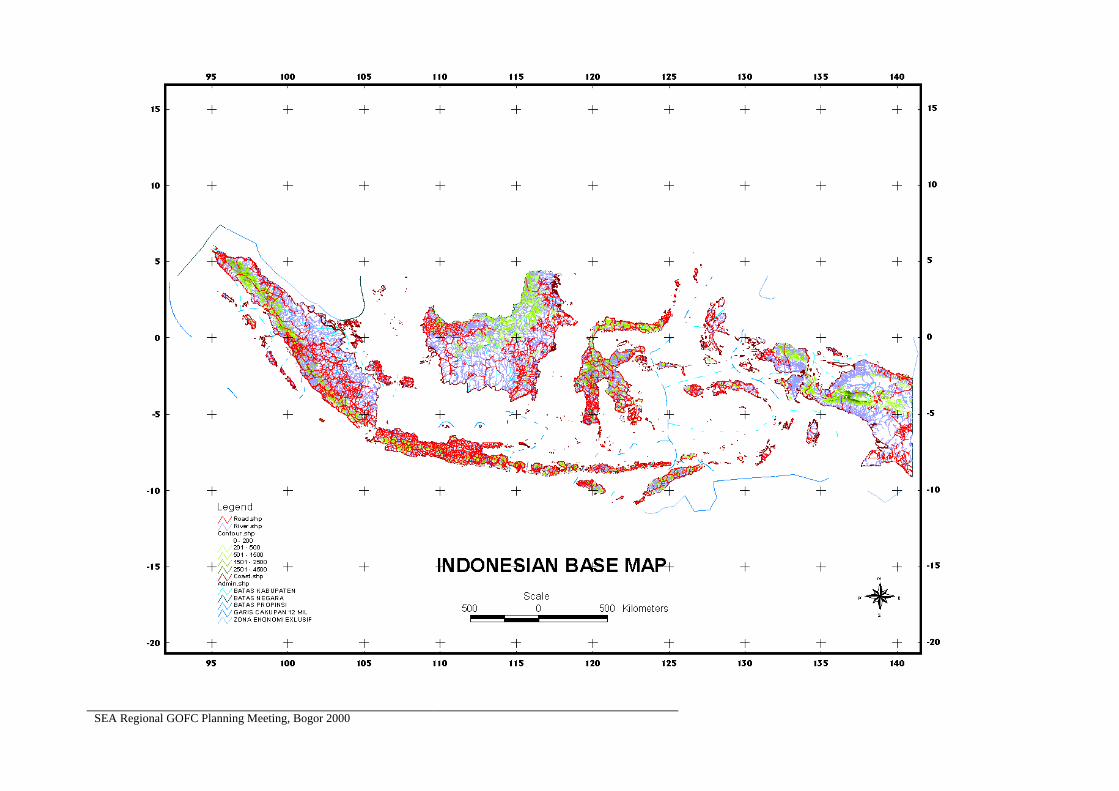
Forest resources mapping and monitoring in Indonesia mainly done by Ministry of Forestry but in many cases companies and organizations carried out mapping activities as well. Classification scheme which used for Forest Land Use Planning Map in Ministry of Forestry are:
• Protection Forest • Nature Conservation and Recreation Forest
SEA Regional GOFC Planning Meeting, Bogor 2000
23
• Production Forest • Limited production • Conversion Forest 1 • Conversion Forest 2 • Other Land Use
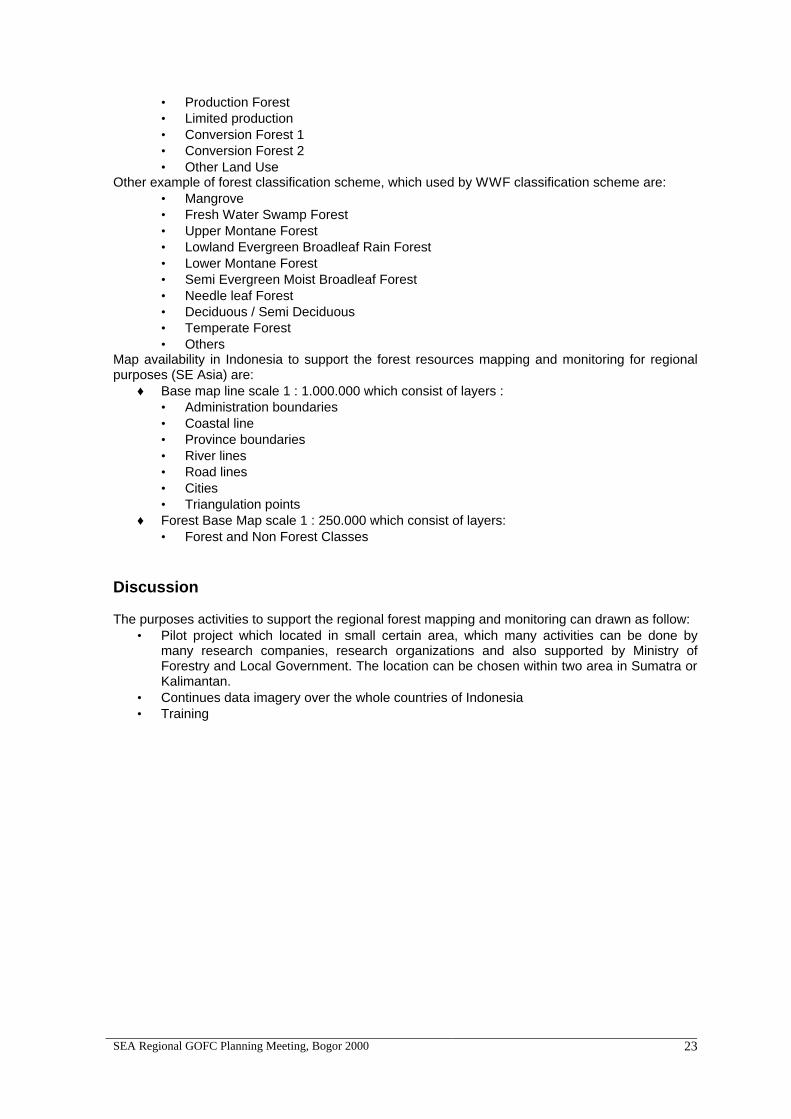
Other example of forest classification scheme, which used by WWF classification scheme are: • Mangrove • Fresh Water Swamp Forest • Upper Montane Forest • Lowland Evergreen Broadleaf Rain Forest • Lower Montane Forest • Semi Evergreen Moist Broadleaf Forest • Needle leaf Forest • Deciduous / Semi Deciduous • Temperate Forest • Others
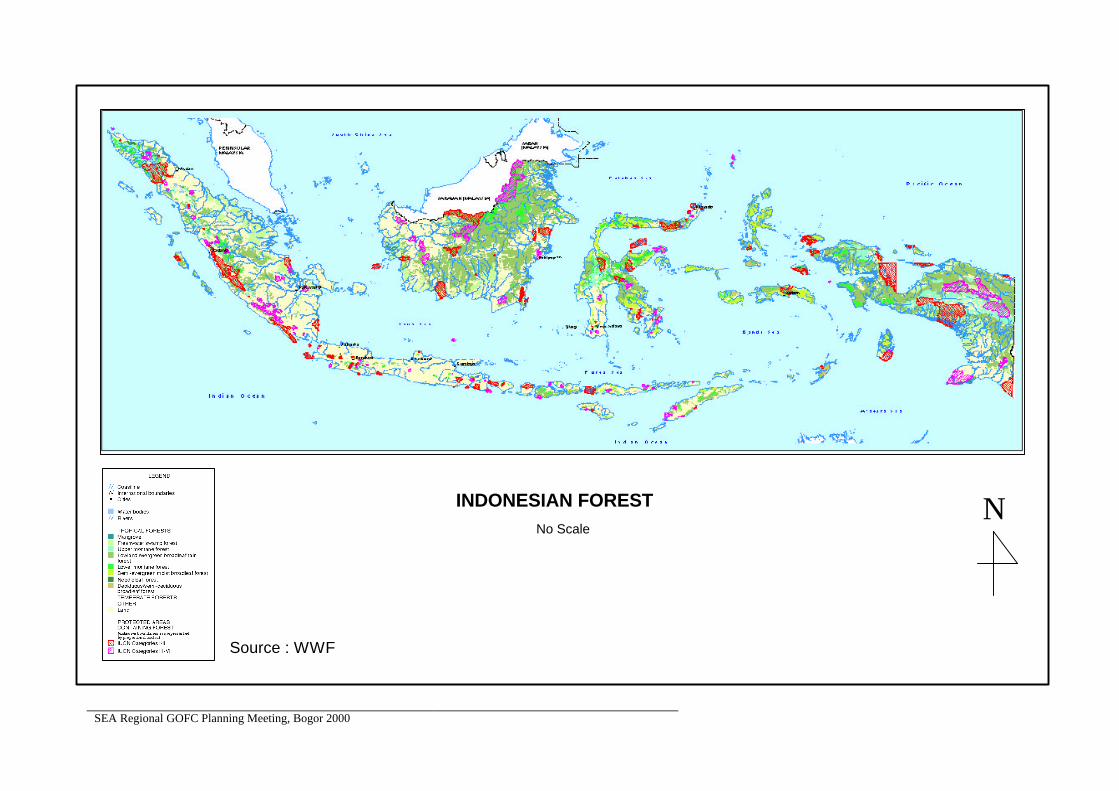
Map availability in Indonesia to support the forest resources mapping and monitoring for regional purposes (SE Asia) are:
♦ Base map line scale 1 : 1.000.000 which consist of layers : • Administration boundaries • Coastal line • Province boundaries • River lines • Road lines • Cities • Triangulation points
♦ Forest Base Map scale 1 : 250.000 which consist of layers: • Forest and Non Forest Classes
Discussion The purposes activities to support the regional forest mapping and monitoring can drawn as follow:
• Pilot project which located in small certain area, which many activities can be done by many research companies, research organizations and also supported by Ministry of Forestry and Local Government. The location can be chosen within two area in Sumatra or Kalimantan.
• Continues data imagery over the whole countries of Indonesia • Training
SEA Regional GOFC Planning Meeting, Bogor 2000
INDONESIAN FOREST MAP No Scale
N
Source : WWF
SEA Regional GOFC Planning Meeting, Bogor 2000
SEA Regional GOFC Planning Meeting, Bogor 2000
SEA Regional GOFC Planning Meeting, Bogor 2000 27
FOREST FIRE MONITORING AND MAPPING FOR SOUTH EAST ASIA
Mastura Mahmud Department of Geography
Universiti Kebangsaan Malaysia
Introduction The use of fires in land use systems and wildfires in the vegetated land in the south East Asian region have long been the traditional method practiced by the locals. Slash and burn cultivation performed by small-scale farmers is deemed necessary, as this is a cheap and very easy method to clear the land. However, until recently, large-scale conversion of forests by big plantation estates for rubber and palm oil has caused extensive and uncontrolled fires, exacerbated by the drought of the 1997/98 major El Nino event. The wildfires, caused by deliberate burning of the trees felled by the employees of the plantations became uncontrolled due to the prolonged drought conditions where the decrease in the soil moisture content and the lack of water from streams and rivers due to the lack of precipitation failed to cleanse the smoke and airborne particulates suspended in the air. The transportation of the suspended particulates and gaseous released from the biomass burning by the prevailing south west monsoon to some parts of the South East Asian region, which included Malaysia, Singapore, Brunei and southern Thailand caught the attention of the world due to its magnitude and length of duration. The occurrence of the wildfires not only influences the development of the plant community, but also contributes to the selection of the species composition of the ecosystem (Levine et. al, 1999). The occurrence of wildfires is not only concentrated in the South East Asian region but is widespread globally. Reports of incidences include Brazil, Mexico, the USA, France, Turkey, China and Russia (Levine et. al, 1999) during the 1997 and 1998 events were related to the severe drought caused by the El Nino event. The occurrence of fire can cause a significant impact on the environment, mainly on the land use and land cover aspects and climate change, whether of local, regional or global scale, where the green house gases released and particulates suspended in the air may alter the short or long term climatic conditions. The atmospheric pollution can cause degradation in the air quality that may affect the health of the locals affected in the region, plus the impacts caused to the socio-economic system (Levine et. al, 1999). One of the strategic activities of GOFC is to develop an operational forest monitoring and mapping exercise at regional and global scales in 3 main areas such as: • Forest cover characteristics and changes : Includes all land cover types (water, snow/ice,
barren / sparsely vegetated, built-up, croplands, grasslands, forests (leaf types, leaf longevity,canopy cover, canopy height) and flooded forests (for hydrological and biogeochemical cycling). Detection of changes in the forest cover plus detection of annual mapping of burned forested areas. The characteristics of the forest types may provide information about the types of fuel burned during the forest fire events, which may provide information on the types and amount of aerosols and green house gases emitted during the burn.
• Forest fire monitoring and mapping • Forest Biophysical processes : Estimates of annual forest ecosystem dynamics, productivity
and measures of the forest structure is needed. Information on above-ground biomass can indicate the forest carbon stocks and sequestration potential. End product : the carbon budget
Appendix – 3
SEA Regional GOFC Planning Meeting, Bogor 2000 28
of the earth. Products required : LAI, PAR (total photosynthetic active radiation), FPAR (fraction of incident photosynthetic radiation), above ground biomass and NPP (mass of new carbon stored in vegetation).
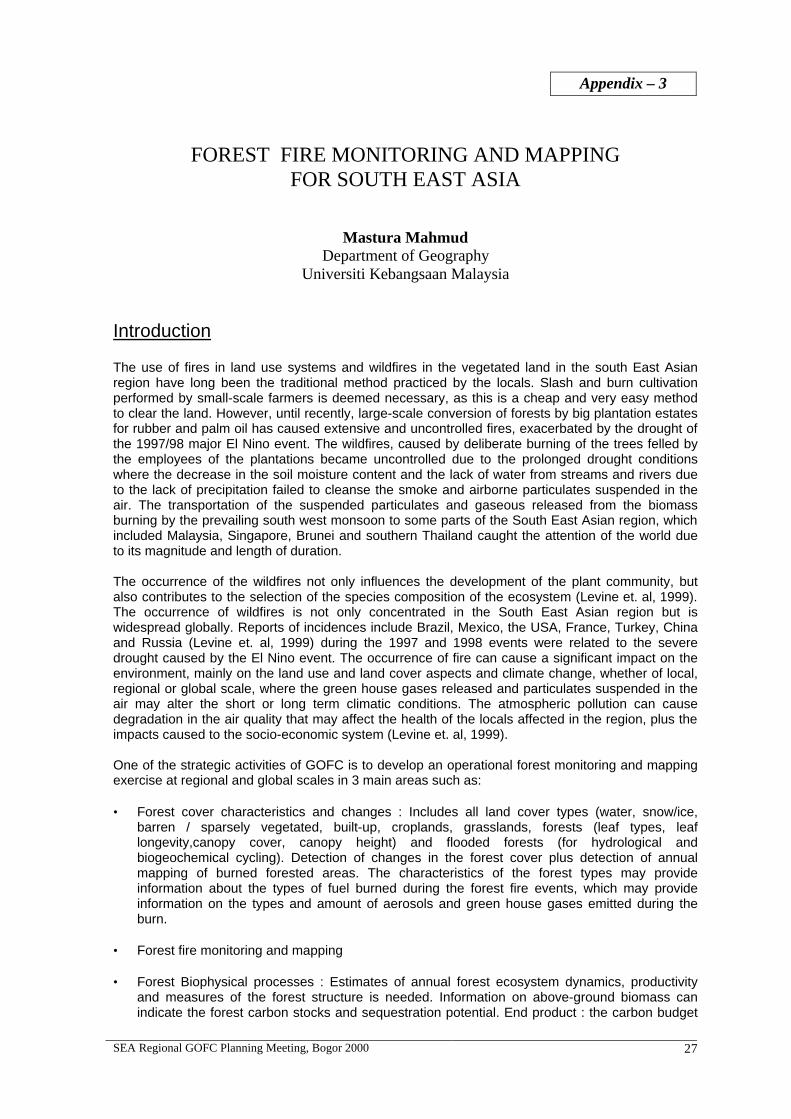
These three areas are interrelated and provide the information on the potential risk of fire danger and also the pollution caused by the release of aerosols and green houses gas emissions to the atmosphere (Figure 1).
Source: Ahern et. al, 1999 Figure 1 : The relationship and associations of the GOFC themes.
The theme of CEOS/GOFC includes: 1) the monitoring of active fires during the fire season 2) The end product of mapped burnt areas during and after the end of the fire season, which
would be useful for national forest inventories, fire statistics and indicators for monitoring the sustainable forest management.
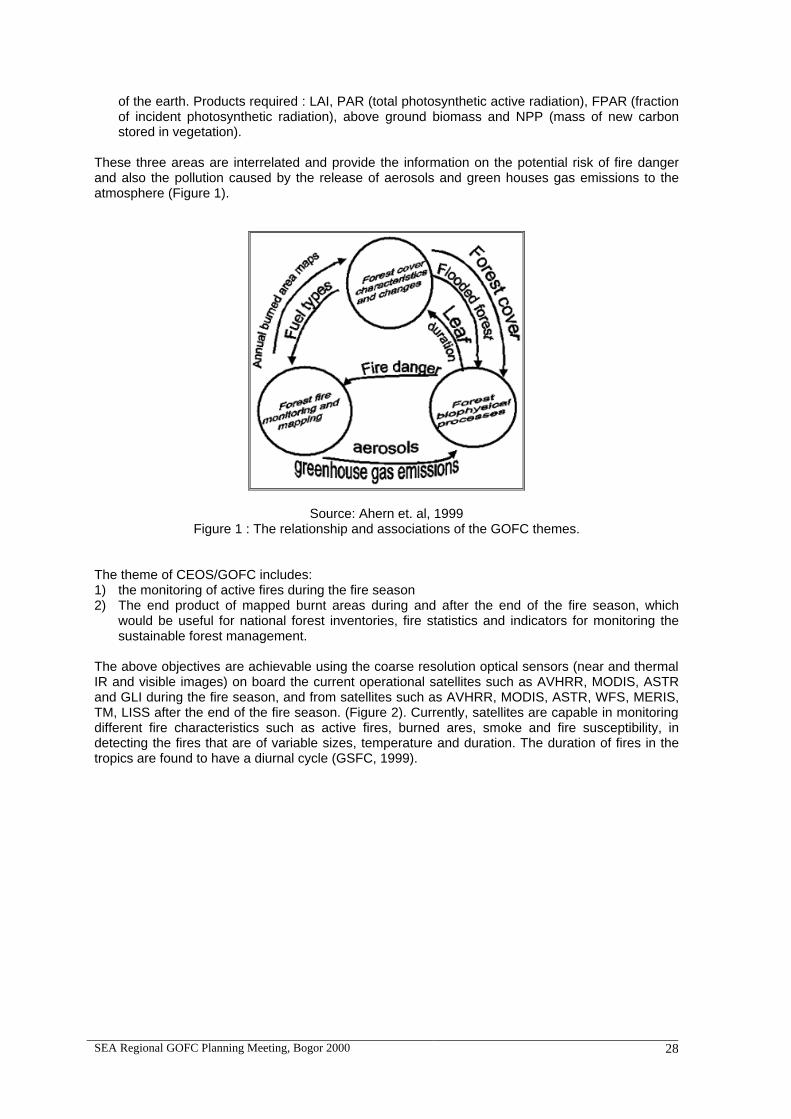
The above objectives are achievable using the coarse resolution optical sensors (near and thermal IR and visible images) on board the current operational satellites such as AVHRR, MODIS, ASTR and GLI during the fire season, and from satellites such as AVHRR, MODIS, ASTR, WFS, MERIS, TM, LISS after the end of the fire season. (Figure 2). Currently, satellites are capable in monitoring different fire characteristics such as active fires, burned ares, smoke and fire susceptibility, in detecting the fires that are of variable sizes, temperature and duration. The duration of fires in the tropics are found to have a diurnal cycle (GSFC, 1999).
SEA Regional GOFC Planning Meeting, Bogor 2000 29
Figure 2: Forest Fire Monitoring and Mapping Strategy that is centrally coordinated/regionally or
nationally executed by GOFC. (Ahern et. al, 1999) The calculation of the intensity of burn, the fuel load, the fire consumption, locations of hotspots, conversion of forest biomass to CO2, the emissions of aerosols and gases will be modeled. The model will utilize information from the forest cover and biophysical processes (Levine et. al, 1999). More sophisticated models will be used to simulate the fire intensity, the rate of spread and fuel consumption, possibly on a near real time basis. This is more useful in the fire fighting and fire suppression tactics operations (Ahern et. al, 1999). The annual maps of burned areas produced will also help the United Nations Framework Convention on climate change and the convention on biological diversity in their research efforts and objectives. The GOFC forest fire monitoring and mapping strategy with the different space and time resolutions is shown in Table 1. Table 1 Products of Fire Monitoring and Mapping by GOFC
Objectives: Spatial resolution
Revisit cycle
Data delivery Sources of data
• Fire monitoring
250m – 1 km 12 hr 12 hr Coarse resolution for hotspot locations
• Mapping burnt area
25 m – 1 km Annual 3 mths Coarse and fine resolution for location and areal perimeter of fires
• Modeling 250m-1 km annual 6 mths Coarse resolution Source : Ahern et. al, 1999 Limitations of monitoring of hotspots locations from satellite: • The presence of clouds that hide the hotspots underneath the thick, widespread cloud cover or
even haze or smoke. • The present NOAA satellites are designed for weather and oceanic observations, mainly to
detect clouds at temperatures of below 40C. A small, hot and intense fire can influence the average temperature of a pixel (Stolle et. al, 1998).
SEA Regional GOFC Planning Meeting, Bogor 2000 30
• The size of pixels. A pixel resolution of 1 km2 may include burning areas less than 1 km2. This means that several small fires within the kilometre square or a fire over several hectares can be detected as one hot spot.
• Barren soil and low vegetation (grass) can have high temperatures during the day and may be
mistakenly assigned as a hot spot (Legg, 1997). • Most hotspots are detected in a short time period during the burning season. In Sumatra 30%
hotspots for 1997-1998 was detected in 1 week. Most burning occurred in the ‘wetland’ zone and not the natural forests. (50% of the burning occurred in Sumatra).
Reports of the estimation of the burnt areas the 1997 Indonesian fires were found to be different, illustrated in the following table: Table 2 Estimation of the burnt areas in Indonesia 1997 Sources of references Satellite Images Resolution
(space and time) Estimation of burnt
area Liew et. al (1998) 776 SPOT ‘quicklook’ images
– complete coverage 100 m
(August to December 1997)
• Kalimantan : 30,600 km2
• Sumatra : 15,000 km2
• Total = 45,600km2 Levine et. al (1998) 77 US Forest Service maps
- only highlights the highest density fire regions
1997
• Sumatra: 12,934 km2
• Kalimantan:12,335 km2
• Total : ~ 25,000 km2
• Java : 363 km2 Estimates from the Ministry of Forestry, Indonesia
a) 1650 km2
designated forests only
b) 6000 km2 in early October, 1997
Makarim et. al, 1998 2.4 to 3.6 million hectares ( ~ 54,638 to 81,958 km2).
Source: Levine et. al, 1999 Forest fire potential, detection, monitoring and assessment. The forest fire monitoring operation will be beneficial to the developing countries especially in detecting the fast changing burning areas, particularly when fires occur over the remote and sparsely populated areas. Neighbouring countries affected by the transboundary pollution could also monitor the smoke plumes. Klaver et. al (1998) suggests effective response for the analysis and assessment of the fires: 1) The fire potential determination. This involves the baseline vegetation information, the
monitoring of the vegetation condition, with the knowledge of the present weather conditions and the risk management information. The fire potential and actual fires can be modeled with information from the economic factors (population and landuse), for assessing the impact of loss to the population caused by the burned area, which include the impacts of the haze on health, tourism and forest productivity.
SEA Regional GOFC Planning Meeting, Bogor 2000 31
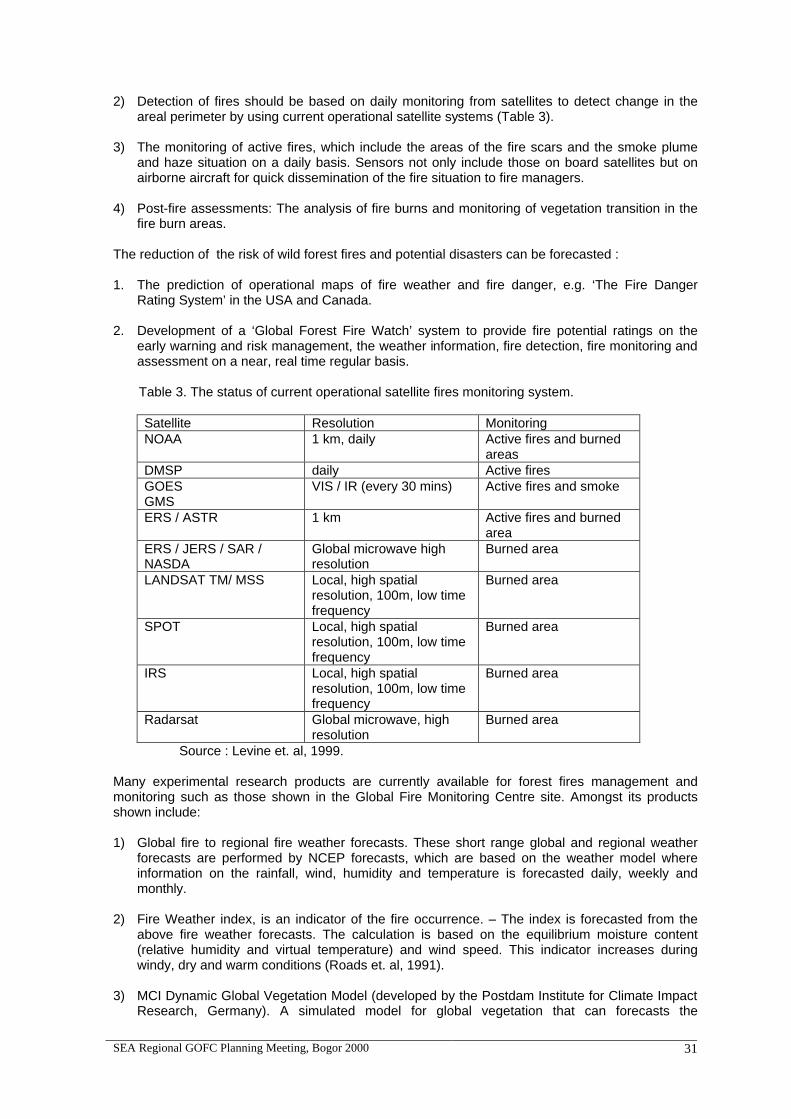
2) Detection of fires should be based on daily monitoring from satellites to detect change in the areal perimeter by using current operational satellite systems (Table 3).
3) The monitoring of active fires, which include the areas of the fire scars and the smoke plume
and haze situation on a daily basis. Sensors not only include those on board satellites but on airborne aircraft for quick dissemination of the fire situation to fire managers.
4) Post-fire assessments: The analysis of fire burns and monitoring of vegetation transition in the
fire burn areas. The reduction of the risk of wild forest fires and potential disasters can be forecasted : 1. The prediction of operational maps of fire weather and fire danger, e.g. ‘The Fire Danger
Rating System’ in the USA and Canada. 2. Development of a ‘Global Forest Fire Watch’ system to provide fire potential ratings on the
early warning and risk management, the weather information, fire detection, fire monitoring and assessment on a near, real time regular basis.
Table 3. The status of current operational satellite fires monitoring system.
Satellite Resolution Monitoring NOAA 1 km, daily Active fires and burned
areas DMSP daily Active fires GOES GMS
VIS / IR (every 30 mins) Active fires and smoke
ERS / ASTR 1 km Active fires and burned area
ERS / JERS / SAR / NASDA
Global microwave high resolution
Burned area
LANDSAT TM/ MSS Local, high spatial resolution, 100m, low time frequency
Burned area
SPOT Local, high spatial resolution, 100m, low time frequency
Burned area
IRS Local, high spatial resolution, 100m, low time frequency
Burned area
Radarsat Global microwave, high resolution
Burned area
Source : Levine et. al, 1999. Many experimental research products are currently available for forest fires management and monitoring such as those shown in the Global Fire Monitoring Centre site. Amongst its products shown include: 1) Global fire to regional fire weather forecasts. These short range global and regional weather
forecasts are performed by NCEP forecasts, which are based on the weather model where information on the rainfall, wind, humidity and temperature is forecasted daily, weekly and monthly.
2) Fire Weather index, is an indicator of the fire occurrence. – The index is forecasted from the
above fire weather forecasts. The calculation is based on the equilibrium moisture content (relative humidity and virtual temperature) and wind speed. This indicator increases during windy, dry and warm conditions (Roads et. al, 1991).
3) MCI Dynamic Global Vegetation Model (developed by the Postdam Institute for Climate Impact
Research, Germany). A simulated model for global vegetation that can forecasts the
SEA Regional GOFC Planning Meeting, Bogor 2000 32
occurrence of fire, where it can estimate the conditions for ignition and spread of individual fires. Factors such as fire size, return intervals are also considered.
4) Global Vegetation Fire Inventory (GVFI), is instigated by the Fire Ecology Research Group,
Freiburg University, Germany. The inventory is done to counter the lack of data statistics available for the international community. Their objective is to obtain a ‘quick look’ of the global fire scene, through a collection of raw data information on the forest area burned, fraction burned per month and the causes of fire. The classification types of vegetation burned and the categories of fires, whether wildfires or prescribed burns are also considered.
Atmospheric Impact Analysis It was estimated that about 300 million inhabitants of South east Asia was affected by the transboundary haze (Mohd. Noor Hassan et. al, 1998). About 1.8 million cases reported was associated with symptoms of respiratory diseases and astha in Indonesia (Dawud, 1998). From 12.4 million people in Riau, Sumatra and Kalimantan, 527 people died from September to November,1997 (Dawud, 1998). There were 1.5 million cases of asthma recorded in four states in Malaysia: in Sarawak, Selangor, Penang and Melaka (Mohd. Noor Hassan et. al, 1998). The damage cost associated with the massive forest fire was estimated at more than US 3 billion, which include the impact on health, productivivity of industry, the tourism industry and the fishing industry (Mohd. Noor Hassan et. al, 1998). 85% of the loss was incurred by Indonesia, whilst 15 % by the neighbouring nations (WWF, 1998). The air quality and visibility across the South East Asian region was badly affected by the massive biomass burning. Total suspended particulates and soot, which made up the bulk of the aerosols that caused health problems and degraded the visibility, plus polluted trace gases such as CO2, CO, CH4, NOx, NH3 (ammonia) were released during the Indonesian fires. The total suspended particulates (smoke / soot particles) that become airborne can absorb and scatter the solar radiation, and this can cause an impact on the local and regional climate. The absorption of solar radiation, mainly from soot of incomplete combustion processes may cause the atmosphere to be heated, thus decreasing the solar radiation received at the ground level. This alters the local vertical lapse rate of the atmosphere. This was experienced at some stations in Malaysia during the haze period of 1997, where the haze that was detected to a height of approximately 3 km also affected the health of the public and visibility. On the other hand, carbonaceous aerosols of condensed organic compunds may scatter solar radiation and cause a net radiational cooling of the atmosphere-ocean system (Penner, 1995). Additional aerosols may act as seeds of the cloud condensation nuclei. Clouds of polluted atmosphere tend to have smaller droplets in water clouds and are more numerous than an unpolluted atmosphere (King et. al, 1995). Green house gases such as CO2, CH4, NOx may also have an impact on the climate, where the changes of radiative forcing is achieved by changing either the absorption or reflection of solar radiation, or reemission and absorption of the terrestrial radiation (IPCC, 1995). Projection of future anthropogenic climate change is dependent on future emissions of green house gases and the proportions of emissions remaining in the atmosphere (IPCC, 1995). There is evidence that the CO2 levels is on an increase during this decade. It is uncertain at the moment, how much the 1997 Indonesian fires, and for that matter, biomass burning from other areas of the globe have affected the local or global climate change or whether it has exerted a short or long-term impact that is reversible or irreversible. Emission of radiatively active and chemically reactive trace gases such as NOx, HC, CO and aerosols from biomass burning play a role in the formation of photochemical ozone (Lelieveld et. al, 1997). Ozone is an absorber of infrared radiation in the tropical upper troposphere, and thus exerts a radiative forcing, making the global tropical tropospheric atmosphere as a major sink of natural anthropogenic trace gases. Ozone is a green house gas in the troposphere and is a health hazard to human and plants.
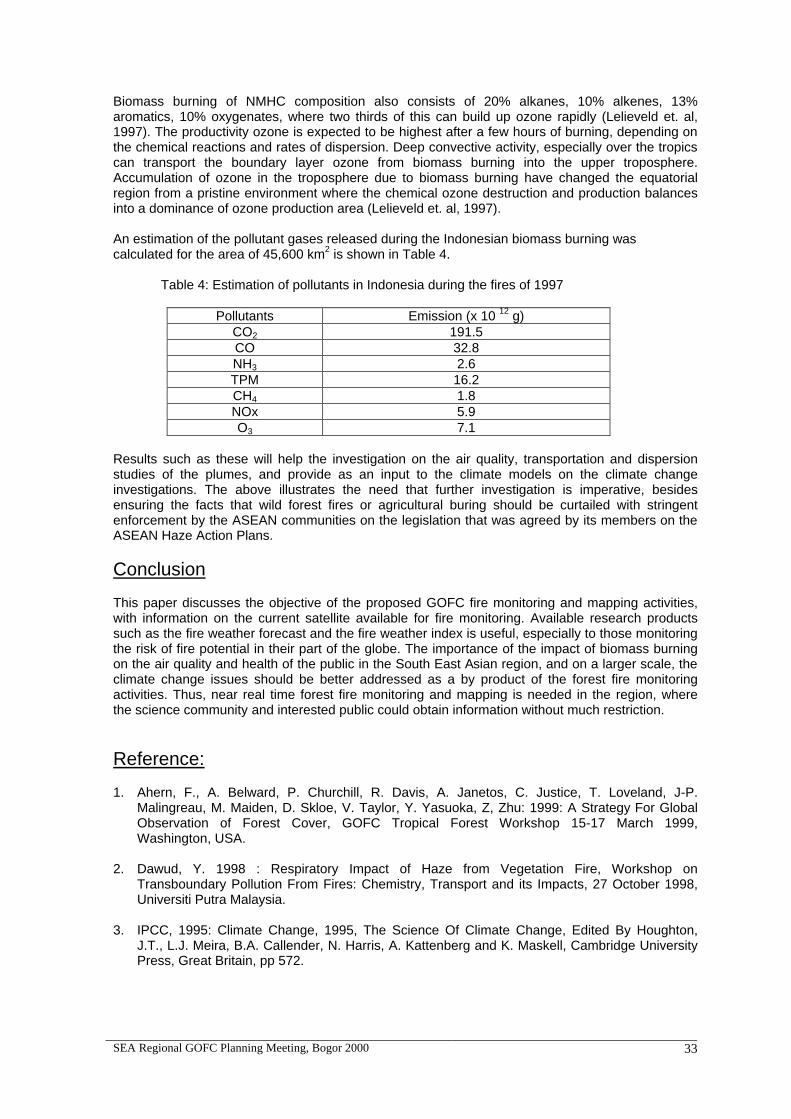
SEA Regional GOFC Planning Meeting, Bogor 2000 33
Biomass burning of NMHC composition also consists of 20% alkanes, 10% alkenes, 13% aromatics, 10% oxygenates, where two thirds of this can build up ozone rapidly (Lelieveld et. al, 1997). The productivity ozone is expected to be highest after a few hours of burning, depending on the chemical reactions and rates of dispersion. Deep convective activity, especially over the tropics can transport the boundary layer ozone from biomass burning into the upper troposphere. Accumulation of ozone in the troposphere due to biomass burning have changed the equatorial region from a pristine environment where the chemical ozone destruction and production balances into a dominance of ozone production area (Lelieveld et. al, 1997). An estimation of the pollutant gases released during the Indonesian biomass burning was calculated for the area of 45,600 km2 is shown in Table 4. Table 4: Estimation of pollutants in Indonesia during the fires of 1997
Pollutants Emission (x 10 12 g) CO2 191.5 CO 32.8 NH3 2.6 TPM 16.2 CH4 1.8 NOx 5.9 O3 7.1
Results such as these will help the investigation on the air quality, transportation and dispersion studies of the plumes, and provide as an input to the climate models on the climate change investigations. The above illustrates the need that further investigation is imperative, besides ensuring the facts that wild forest fires or agricultural buring should be curtailed with stringent enforcement by the ASEAN communities on the legislation that was agreed by its members on the ASEAN Haze Action Plans.
Conclusion This paper discusses the objective of the proposed GOFC fire monitoring and mapping activities, with information on the current satellite available for fire monitoring. Available research products such as the fire weather forecast and the fire weather index is useful, especially to those monitoring the risk of fire potential in their part of the globe. The importance of the impact of biomass burning on the air quality and health of the public in the South East Asian region, and on a larger scale, the climate change issues should be better addressed as a by product of the forest fire monitoring activities. Thus, near real time forest fire monitoring and mapping is needed in the region, where the science community and interested public could obtain information without much restriction.
Reference: 1. Ahern, F., A. Belward, P. Churchill, R. Davis, A. Janetos, C. Justice, T. Loveland, J-P.
Malingreau, M. Maiden, D. Skloe, V. Taylor, Y. Yasuoka, Z, Zhu: 1999: A Strategy For Global Observation of Forest Cover, GOFC Tropical Forest Workshop 15-17 March 1999, Washington, USA.
2. Dawud, Y. 1998 : Respiratory Impact of Haze from Vegetation Fire, Workshop on
Transboundary Pollution From Fires: Chemistry, Transport and its Impacts, 27 October 1998, Universiti Putra Malaysia.
3. IPCC, 1995: Climate Change, 1995, The Science Of Climate Change, Edited By Houghton,
J.T., L.J. Meira, B.A. Callender, N. Harris, A. Kattenberg and K. Maskell, Cambridge University Press, Great Britain, pp 572.
SEA Regional GOFC Planning Meeting, Bogor 2000 34
4. King, M.D. Si-Chee Tsay And S. Platnick, 1995 : In Situ Observations Of Indirect Effects Of Aerosols On Clouds, in Aerosol Forcing Of Climate, Edited By Charson, R.J. And J. Heintzenberg, Wiley And Sons Ltd., England, 91-108.
5. Klaver, J.M., R.W. Klaver and R.E. Burgan, 1998: Using GIS to Assess Forest Fire Hazard in
the Mediterranean Region of the United States. 1997 ESRI Users Conference, San Diego, CA, July 8-11, 1997.
6. Levine, J.S, T. Bobbe, N. Ray, R.G. Witt and A. Singh, 1999: Wildland Fires and the
Environment: A Global Synthesis. Environment Information and Assessment Technical Report, pp 46.
7. Liew, S.C., O.K. Lim, L.K. Kwoh and H. Lim, 1998: A Study of the 1997 Fires In South East
Asia Using SPOT Quicklook Mosaics. Paper presented at the 1998 International Geoscience and Remote Sensing Symposium, July 6-10, Seattle, Washington.
8. Lileiveld, J., P.J. Curtzen, D.J. Jacob And A.M Thompson, 1997: Modelling Of Biomass
Burning Influences on Tropospheric Ozone, In Fire In Southern African Savannas, Ecological and Atmospheric Perspectives, published by University Press, Johannesburg, pp 256.
9. Makarim, N., Y.A. Arbai, A.Deddy and M. Brady, 1998 : Assessment of the 1997 Land and
Forest Fires in Indonesia: National Coordination. International Forest Fires News, United Nations Economic Commission For Europe and the Food and Agriculture Organization of the United Nations, Geneva, Switzerland, No. 18, 4-12.
10. Mohd. Noor Hassan, , M. Awang, R. Abdullah, M.S. Othman, J. Othman, M.A. Alias, D. Kuang,
A.M. Abdullah, A. Muda dan T.L. Chong, 1998: The Damage Costs of Haze Episodes in Malaysia : Concepts, Emphirical Studies and Improvement Policies, Workshop on Transboundary Pollution From Fires: Chemistry, Transport and Its Impacts, 27 October 1998, Universiti Putra Malaysia.
11. Penner, J., 1995: Carbonaceous Aerosols Influencing Atmospheric Radiation: Black And
Organic Carbon, in Aerosol Forcing Of Climate, Edited By Charson, R.J. and J. Heintzenberg, Wiley And Sons Ltd., England, 91-108.
12. Roads, J.O., K.Ueyoshi, S-C. Chen, J. Alpert and F.Fujioka, 1991: Medium-Range Fire
Weather Forecasts, Journal of Wildfire 1, 159-176. 13. Scholes, R.J., D. E. Ward, C.O. Justice, 1996: Emission of Trace Gases and Aerosol Particles
due to Vegetation Burning in Southern Hemisphere Africa, Journal of Geophysical Research, Vol. 101, 23677-23682.
14. Stolle, F. , R. Dennis, N. Byron dan T.P. Tomich 1998: Fires, A Review of the 1997-1998 Fire
Event in Sumatra , Science Policy Working Group Meeting, Impacts Centre for Southeast Asia, Bogor, Indonesia.
15. World Wildlife Fund (WWF), 1998 : The Fire this Time. An Overview of Indonesian’s Forest
Fires in 1997/98 . http://smd.mega.net.id/iffim/first.html
SEA Regional GOFC Planning Meeting, Bogor 2000 35
MAPPING AND MONITORING OF FOREST COVER IN THE PHILIPPINES
LCLUC Philippine Project Team Introduction Philippine forest can be classified into four types, namely: dipterocarp, pine, mangrove and mossy forests. The dipterocarp forest is the predominant type and in the past, led the country’s log exports and wood for domestic building construction and infrastructure development. Majority of the remaining dipterocarp species is found in the mountain ranges of Luzon and in the northern and western parts of Mindanao Island. Pine forest dominates the Cordillera mountain range in Northern Luzon. Large coverage of mangrove forests is still found in the provinces of Palawan and Samar. One of the major concerns in forest management in the Philippines is the degradation of forest cover. Estimates reveal that deforestation rate reached as high as 300,000 hectares per year in the late 1960s and continued at rates exceeding 180,000 hectares per year during the 1980s. Recent estimates, however, that out of the country’s total land area of 30 million hectares, about 18% are still with forest cover as of 1997. With the decrease of forest cover, the volume of timber in the remaining forests also decreased from a total of 1.68 billion cubic meters in 1972 to only 404 million cubic meters in 1997 or a decrease of 76%. The issue of deforestation has overshadowed the important contributions of the forestry sector. In order to address the above concern, several policies were promulgated to preserve the remaining forests and to achieve the country’s goal for sustainable development. One policy was issued by the Department of Environment and Natural Resources (DENR) in 1991 under Administrative Order No. 15 to ban logging in areas above 1000 meter elevation and above 50% slope in order to preserve the remaining tropical forest gene pool and bio-diversity in the country. The same policy re-directed the focus on logged-over forests. With the government’s programs aimed at eradicating illegal and destructive logging activities and in rehabilitating forests, forest denudation has considerably diminished and is now estimated to be only less than 100,000 hectares per year. The total log ban policy however, has become a contentious issue. The present DENR officials are appealing for a reconsideration of the log ban and are promoting the implementation of sustainable forestry management instead. Presently, the Philippines is importing at least 65 per cent of its wood requirements. DENR officials contend that the total logging ban, implemented in lieu of the internationally accepted sustainable forest management, would effectively remove the Philippines from the international trade of timber. As a member country to the International Tropical Timber Organization (ITTO), the Philippines is committed to export tropical timber and timber products from sustainably managed forests by 2000.
Institutional Arrangement The Department of Environment and Natural Resources (DENR) is the primary government agency responsible for the sustainable development of the country’s natural resources and ecosystems. Two of the agencies under DENR are mandated to assess, monitor and evaluate changes on the country’s forest namely, the Forest Management Bureau (FMB) and the National Mapping and Resources Information Authority (NAMRIA). Both agencies continuously generate critical
Appendix – 4
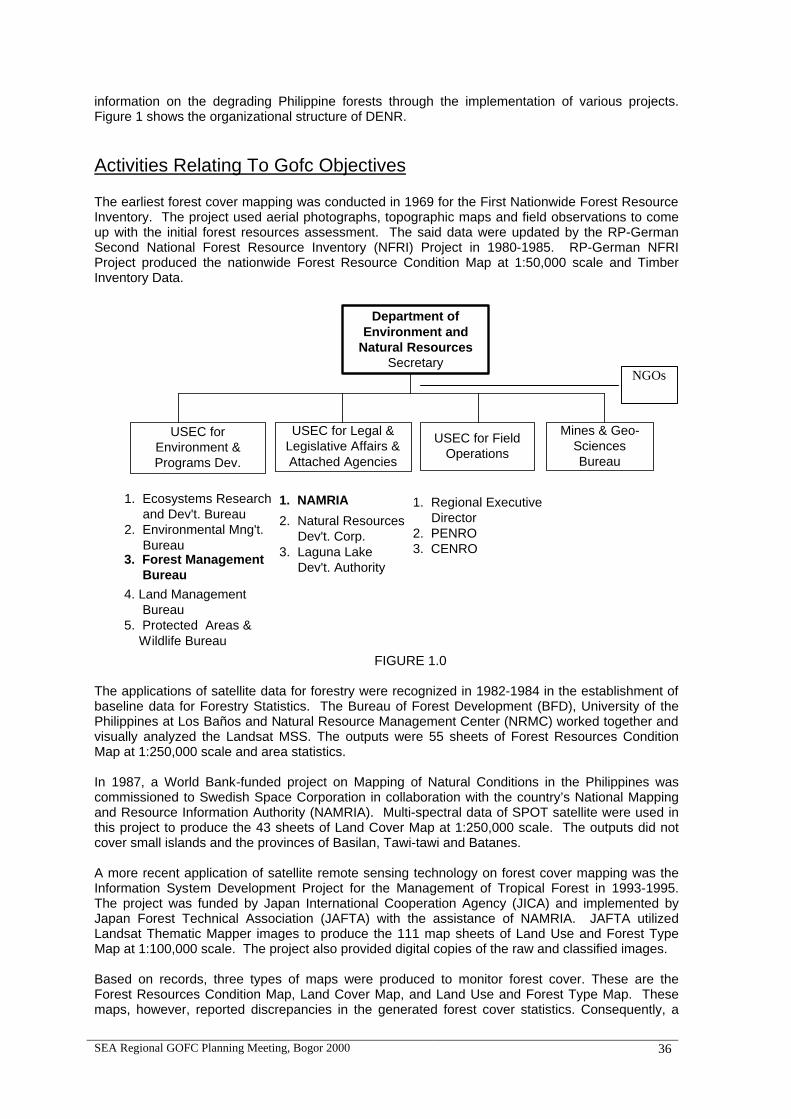
SEA Regional GOFC Planning Meeting, Bogor 2000 36
information on the degrading Philippine forests through the implementation of various projects. Figure 1 shows the organizational structure of DENR.
Activities Relating To Gofc Objectives The earliest forest cover mapping was conducted in 1969 for the First Nationwide Forest Resource Inventory. The project used aerial photographs, topographic maps and field observations to come up with the initial forest resources assessment. The said data were updated by the RP-German Second National Forest Resource Inventory (NFRI) Project in 1980-1985. RP-German NFRI Project produced the nationwide Forest Resource Condition Map at 1:50,000 scale and Timber Inventory Data.
Department ofEnvironment and
Natural ResourcesSecretary
USEC forEnvironment &Programs Dev.
USEC for Legal &Legislative Affairs &Attached Agencies
USEC for FieldOperations
Mines & Geo-SciencesBureau
1. NAMRIA
2. Natural Resources Dev't. Corp.3. Laguna Lake Dev't. Authority
1. Regional Executive Director2. PENRO3. CENRO
1. Ecosystems Research and Dev't. Bureau2. Environmental Mng't. Bureau3. Forest Management Bureau
4. Land Management Bureau5. Protected Areas & Wildlife Bureau
FIGURE 1.0 The applications of satellite data for forestry were recognized in 1982-1984 in the establishment of baseline data for Forestry Statistics. The Bureau of Forest Development (BFD), University of the Philippines at Los Baños and Natural Resource Management Center (NRMC) worked together and visually analyzed the Landsat MSS. The outputs were 55 sheets of Forest Resources Condition Map at 1:250,000 scale and area statistics. In 1987, a World Bank-funded project on Mapping of Natural Conditions in the Philippines was commissioned to Swedish Space Corporation in collaboration with the country’s National Mapping and Resource Information Authority (NAMRIA). Multi-spectral data of SPOT satellite were used in this project to produce the 43 sheets of Land Cover Map at 1:250,000 scale. The outputs did not cover small islands and the provinces of Basilan, Tawi-tawi and Batanes. A more recent application of satellite remote sensing technology on forest cover mapping was the Information System Development Project for the Management of Tropical Forest in 1993-1995. The project was funded by Japan International Cooperation Agency (JICA) and implemented by Japan Forest Technical Association (JAFTA) with the assistance of NAMRIA. JAFTA utilized Landsat Thematic Mapper images to produce the 111 map sheets of Land Use and Forest Type Map at 1:100,000 scale. The project also provided digital copies of the raw and classified images. Based on records, three types of maps were produced to monitor forest cover. These are the Forest Resources Condition Map, Land Cover Map, and Land Use and Forest Type Map. These maps, however, reported discrepancies in the generated forest cover statistics. Consequently, a
NGOs
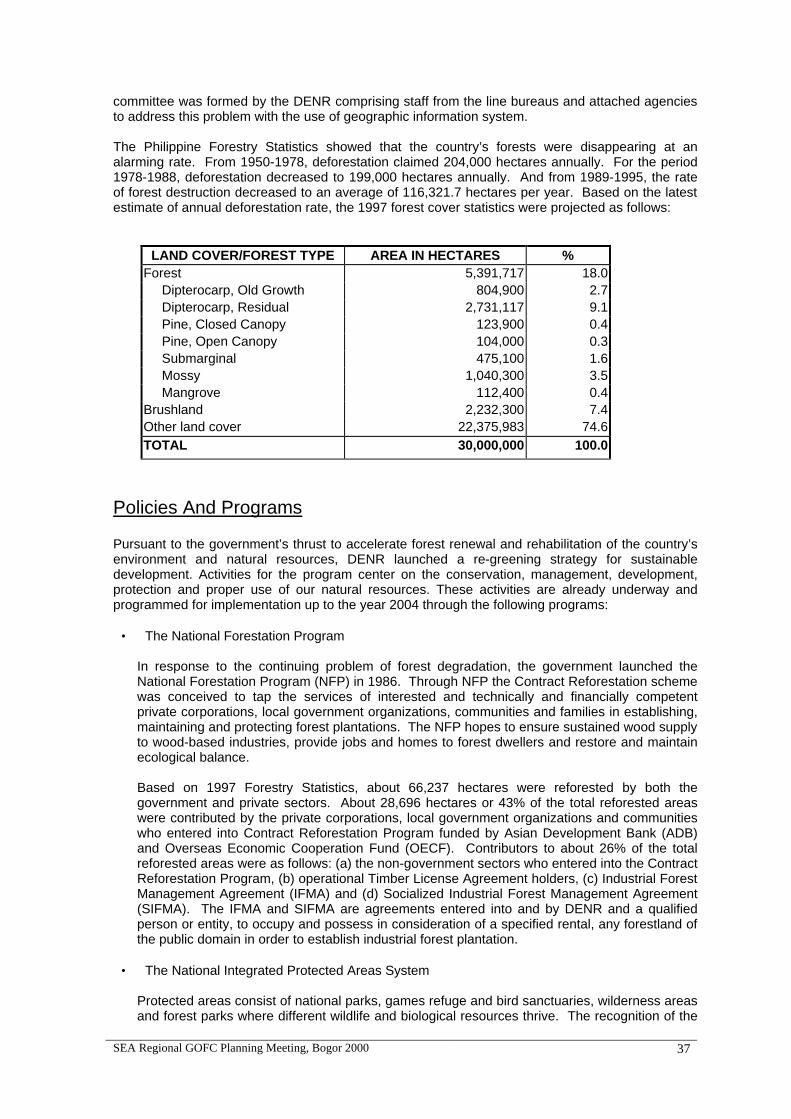
SEA Regional GOFC Planning Meeting, Bogor 2000 37
committee was formed by the DENR comprising staff from the line bureaus and attached agencies to address this problem with the use of geographic information system.
The Philippine Forestry Statistics showed that the country’s forests were disappearing at an alarming rate. From 1950-1978, deforestation claimed 204,000 hectares annually. For the period 1978-1988, deforestation decreased to 199,000 hectares annually. And from 1989-1995, the rate of forest destruction decreased to an average of 116,321.7 hectares per year. Based on the latest estimate of annual deforestation rate, the 1997 forest cover statistics were projected as follows:
LAND COVER/FOREST TYPE AREA IN HECTARES % Forest 5,391,717 18.0 Dipterocarp, Old Growth 804,900 2.7 Dipterocarp, Residual 2,731,117 9.1 Pine, Closed Canopy 123,900 0.4 Pine, Open Canopy 104,000 0.3 Submarginal 475,100 1.6 Mossy 1,040,300 3.5 Mangrove 112,400 0.4 Brushland 2,232,300 7.4 Other land cover 22,375,983 74.6
TOTAL 30,000,000 100.0
Policies And Programs Pursuant to the government’s thrust to accelerate forest renewal and rehabilitation of the country’s environment and natural resources, DENR launched a re-greening strategy for sustainable development. Activities for the program center on the conservation, management, development, protection and proper use of our natural resources. These activities are already underway and programmed for implementation up to the year 2004 through the following programs:
• The National Forestation Program
In response to the continuing problem of forest degradation, the government launched the National Forestation Program (NFP) in 1986. Through NFP the Contract Reforestation scheme was conceived to tap the services of interested and technically and financially competent private corporations, local government organizations, communities and families in establishing, maintaining and protecting forest plantations. The NFP hopes to ensure sustained wood supply to wood-based industries, provide jobs and homes to forest dwellers and restore and maintain ecological balance.
Based on 1997 Forestry Statistics, about 66,237 hectares were reforested by both the government and private sectors. About 28,696 hectares or 43% of the total reforested areas were contributed by the private corporations, local government organizations and communities who entered into Contract Reforestation Program funded by Asian Development Bank (ADB) and Overseas Economic Cooperation Fund (OECF). Contributors to about 26% of the total reforested areas were as follows: (a) the non-government sectors who entered into the Contract Reforestation Program, (b) operational Timber License Agreement holders, (c) Industrial Forest Management Agreement (IFMA) and (d) Socialized Industrial Forest Management Agreement (SIFMA). The IFMA and SIFMA are agreements entered into and by DENR and a qualified person or entity, to occupy and possess in consideration of a specified rental, any forestland of the public domain in order to establish industrial forest plantation.
• The National Integrated Protected Areas System
Protected areas consist of national parks, games refuge and bird sanctuaries, wilderness areas and forest parks where different wildlife and biological resources thrive. The recognition of the
SEA Regional GOFC Planning Meeting, Bogor 2000 38
need to preserve wild species and genetic diversity in view of their scientific, educational, cultural and historical values had provoked the formulation of National Integrated Protected Areas System or the NIPAS Act of 1992.
• Soil and Watershed Rehabilitation and Management
Rehabilitation of the country’s critical watersheds involves application of engineering and vegetative measures to prevent soil erosion and stabilize land configuration. In 1997, a total of 32,664 cubic meters of engineering measures such as gabions, check dams, and ripraps were constructed. The vegetative measures were applied to about 14 million square meters of degraded watershed areas. A task force on watershed management has been created under Executive Order 374 whose mandate includes the prioritization of programs and projects for sustainable, adequate, safe and affordable water supply.
• Range and Timber Management
The range management is concerned with the improvement, protection and maintenance of rangelands to bolster production of meat and dairy products. About 179,027 hectares of rangelands in 1997 were developed and managed. The timber management relates to managing the forest under the selective logging system. Under this system, only mature trees are cut while healthy residuals of smaller trees are left to be the growing stock. This system involved three phases, namely: tree marking, residual inventory and timber stand improvement.
• Urban Forestry/Clean and Green Program
This program was implemented to rehabilitate the environment in urban centers through the establishment of tree strips and forest parks. Two hundred thirty five (235) mini-forests were already established.
• People-Oriented Forestry Programs
By virtue of Executive Order No. 263 Series of 1995, Community-based Forest Management (CBFM) was adopted as the national strategy to ensure the sustainable development of the country’s forestlands resources and to promote social justice. CBFM programs were introduced to transform upland dwellers from forest destroyers to active partners in the development and conservation of forest resources as well as food production. The community-based/people-oriented forestry programs include the following: Integrated Social Forestry Program (ISFP), Upland Development Program (UDP), Forest Land Management Program (FLMP), Low Income Upland Communities Projects (LIUCP), Community Forestry Program (CFP), Regional Resources Management Project (RRMP), Forestry Sector Project (FSP), Coastal Environmental Program (CEP) and Recognition of Ancestral Domain/Claims.
Future Plans By The Government In order to achieve more accurate and recent information of the Philippine forests, DENR hopes to conduct the following:
1. Use of images taken from very high resolution satellites; 2. Conduct of forest resources inventory; and 3. Carry out the nationwide land use planning guided by the Land Use Act of the
Philippines, in order to strictly implement the regulation on the utilization and conservation of the areas within the forestland.
SEA Regional GOFC Planning Meeting, Bogor 2000 39
References Annual Accomplishment Report, 1995, Department of Environment and Natural Resources,
Philippines. Annual Accomplishment Report, 1997, Department of Environment and Natural Resources,
Philippines. Forest Resources Inventory of the Philippines, 1985, GTZ-Bureau of Forest Development,
Philippines. Mapping of Natural Conditions in the Philippines, 1988, Swedish Space Corporation – Department
of Environment and Natural Resources, Philippines. Philippine Forestry Statistics, 1997, Forest Management Bureau, Department of Environment And
Natural Resources. Report of Development Study of Tropical Forest Resources Information Analysis Technology,
Philippines, 1995, Information System Development Project for the Management of Tropical Forest, Japan Forest Technical Association.
SEA Regional GOFC Planning Meeting, Bogor 2000 41
FOREST AND FOREST FIRES ASSESSMENT IN THAILAND
Suwit Ongsomwang
Forest Research Office, Royal Forest Departmet, Thailand I. Background Thailand is located centrally in the Indochinese Peninsular between 5° 40 ′ and 20° 30 ′ North latitude and 90° 70 ′ and 105° 45′ East latitude. The total area of the country is 513,115 sq. km. The longest North -South span is about 1,920 km, and the widest part is about 750 km. from East to West. According to the location, Thailand is dominated by monsoon. Being under the influence of monsoonal climatic condition, the vegetation of Thailand is really a humid tropic one, and vast areas are well covered with luxuriant forests. Owing on the composite nature of the topography, the long range of both latitudes and longitudes, the variation in temperature and precipitation, the forests of Thailand are considered varied. Pengklai and Santisuk (1976) used climatic factors, edaphic factors, topographic factors and specific characteristics such as fresh water or salt water for forest type classification. The forests of Thailand are classified into two primary categories: evergreen and deciduous. 1. Evergreen forest. The evergreen forest is composed of a high proportion of species lacking a leafless period. It can be divided into four subtypes as follows: 1. 1 Tropical Evergreen forest. This type of forest occurs along the wet belt of the country, usually
where high rainfall prevails, and is strongly affected by the monsoon. Its soil is always wet. It is scattered all over the country either on the peneplain or the mountains. The tropical evergreen can be divided into three categories, based on climatic and physiographic conditions, as follows:
o Tropical Rain forest. This occurs in the South-eastern and Peninsular regions, where
the impact of the monsoon is direct, the rainfall is very high (2500 mm up). It occupies the elevation from the mean sea level up to 100 meters. Trees consist of Dipterocarpus spp., Hopea spp., Shorea spp., Balanocarpus heimii, Parashorea stellata, Anisoptera scaphula, Anisoptera curtisii, Dyera costulata, Melanorrhoea spp., Palaqium maingayi, Palaqium obovatum. The dense undergrowth is composed of palms, rattans, bamboos and climbers.
o Dry Evergreen Forest. This type of forest is scattered all over the country along the
depressions on the peneplain, along the valleys of low hill ranges of about 500 m. Annual rainfall where it occurs is between 1,000-2,000 mm. Trees consists of Anisoptera costata, Dipterocarpus alatus, Dipterocarpus turbinatus, Hopea ferrea, Shorea thorelii, Alstonia scholaris, Tetrameles nudiflora, Afzelia xylocarpa, Antiaria toxicaria, Irvingia malayana, Memecylon spp. etc. The sparse ground flora is composed of palms, rattans and members of the ginger family.
Appendix – 5
SEA Regional GOFC Planning Meeting, Bogor 2000 42
o Hill Evergreen Forest. The hill evergreen forest is confined to an altitude of above 1,000 m.; it is scattered all over the country. Annual rainfall is between 1,500-2,000 mm. The floristic composition is quite low. Trees include Quercus spp., Lithocarpus spp., Castanopsis spp., and others including Dacrydium elatum, Podocarpus imbricatus, Podocarpus neriifolius, Podocarpus polystachyus wallichianus, Cephalotaxus griffithii, Calocedrus macrolepis, Schima wallichii, Cedrela toona, Betula alnoides, Ulmus lancifolia. Epiphytes area abundant on trees. Besides mosses and lichens, there are a number of Dryopteris amboinensis and bamboos.
1. 2 Coniferous forest. The coniferous forest is scattered in small pockets in the North, Northeast,
East and Southwest regions at between 200-1,600 m. It may occur on footslopes, slopes or steep slopes where water drainage is good. The soil is either sandy or gravelly. It is also sometimes lateritic.
1. 3 Swamp forest. The swamp forest is more or less subjected to periodic inundation and is
scattered in the wet region of the country. Annual rainfall is higher than 2,000 mm. This type can be physiographically classified into subtypes as follows:
o Fresh Water Swamp forest. This type of forest is usually along depressions inland.
The soil is either sandy or alluvial. If the soil is alluvial, the surface is muddy and fen-like. Trees that are found include Dyera costulata, Palaqium gutta, Scaphium lychnophorum, Hydnocarpus sematrana, Hopea latifolia, Heritiera littoralis, Xanthophyllum glaucum, Alstonia spathulata, Fagraea fragrans, Melaleuca leucadendra, Syzygium grandis, Baeckia frutescens.
o Mangrove swamp forest. The mangrove swamp forest occurs along river estuaries
and muddy coastlines, where the soil is deep alluvium with a high saline content. This type is very extensive on the west coast from Ranong province southwards to Stool province, and within the Gulf of Thailand it occurs from Samut Songkram province in the south to Trat province in the southeast. The main floristic compositions are Rhizophora apiculata and Rhizophora macronata and others including Sonneratia alba, Sonneratia ovata, Sonneratia griffithii, Bruguiera spp., Ceriops decandra, Ceriops tagal, Lumnitzera littorea, Lumnitzera racemosa. Ground flora are Acanthus ilicifolius, Derris trifoliata, Acrostichum aureum, Acrostichum, Nipa fruticans.
1. 4 Beach forest. The beach forest occurs on coastal sand dunes, rocky seashores and elevated
coasts. This types of forest is common along the east coast. If the soil on the coast is sand, most of the trees are Casuarina equisetifolia. Ground flora are Vitex trifolia and climbers. If soil on the coast is rocky, most of the trees are Calophyllum inophyllum, Syzygium grandis, Terminalia catappa and Manilkara hexandra.
2. Deciduous forest. In contrast, the deciduous forest is composed of species with leafless periods. Tree growing in this type of forest tend to develop growth or annual rings, a feature not often found in the species of the evergreen forest. This forest is more or less subjected to ground fire during the dry season. 2. 1 Mixed Deciduous forest. The mixed deciduous forest is scattered all over the country either on
the peneplains or the mountains. This type of forest occurs between the elevations of 50-600 m. Trees varies from clay to loamy or lateritic. Annual rainfall is not more than 1,000 mm. Trees growing in this type of forest tend to develop growth or annual ring. Floristic composition is highly diversified. Trees consist of Tectona grandis, Xylia kerrii, Dalbergia cultrata, Dalbergia oliveri, Dalbergia dongnaiensis, Albizia lebbeck, Albizia lebbeckoides, Acacia luecophloea, Anogeissus acuminata, Lagerstroemia tomentosa, Terminalia alata, Millettia brandisiana, etc. This forest is more or less to ground fire during the dry season.
2. 2 Dry Deciduous forest. The dry deciduous forest is scattered all over the country either on the
peneplains or the mountains. This type of forest occurs between the elevations of 100-600 m. The soil is sandy and lateritic. Trees consist of Shorea obtusa, Pentacme siamensis, Dipterocarpus obtusifolius, Dipterocarpus tuberculatus, Dipterocarpus intricatus, Pterocarpus
SEA Regional GOFC Planning Meeting, Bogor 2000 43
macrocarpus, Strychnos nux-vomica and Strychnos nux-blanda, Aporusa villosa, Phyllanthus emblica, Parinaria anamense, Canarium subulatum etc. Ground floras are grasses and bamboos, including Arundinaria pusiila.
2. 3 Savannah forest. The savannah forest originated subsequently from other natural forest types.
The soil is very deterioratd. Some trees can be found in this area, but most of vegetation is grass. This type of forest is found in the north, northeast, and in eastern regions of Thailand. Most of trees consist of Careya arborea, Acacia siamensis, Acacia catechu, Pterocarpus macrocarpus and Ochna integerrima. These trees are highly fire resistant. Most of grasses are Imperata cylindrica, Vetiveria zizanioides, Panicum repens, and Sorghum halepense.
II Forest Assessment and Monitoing In the past, Thailand was covered with dense forests distributed all over the country, except in some areas of the great central plain where the forest had been removed to make way for agriculture. The first project of forest assessment in Thailand was conducted by the Ordnance Survey Department in 1961. The panchromatic aerial photographs of medium scale 1: 25,000 were interpreted for the main land use classification. It reported that the existing forest of Thailand in 1961 amounted to 273,628.50 sq. km or 53.33 percent of the total area of the country. In 1975 aerial photographs of large scale 1:15,000 were applied for cadastral survey for land titling and other multi-purpose in Thailand. The Royal Forest Department traditionally utilized these photographs to classify the forest types for inventory purposes. However, the aerial photographs for the whole country which are produced by the Royal Thai Survey are rapidly going out of date and are time consuming for interpretation and mapping. In 1970, the National Aeronautics and Space Administration (NASA) introduced the usefulness and possible applications of data from Earth Resources Technology Satellite (Landsat presently) to the Government of Thailand (Klankamsorn, 1992). After that, the Thailand National Remote Sensing Program was set up in 1971 by cabinet decision as a new technology. According to this decision, the National Research Council of Thailand formulated the outline of the remote sensing development policy indicating the long range framework and guideline. The Thailand Remote Sensing program was later accepted by NASA in 1972 to participate in Landsat missions. This created the availability of up-to-date and accurate information required by the various government agencies concerned with the planning for development and management of natural resources. Landsat data have been applied in various disciplines. Moreover, remote sensing technology has been accepted by the National Economic and Social Development Board as a tool to investigate natural resources (Sabhasri, et. al, 1980). Early in 1973, several government agencies used Landsat-1 imageries in their activities including in the field of forestry. Landsat imageries proved to be an important tool for natural resource surveys and management by the government agencies. The Royal Forest Department established the Remote Sensing and Forest Mapping Sub-division (Forest Resources Assessment Division presently) and started to use the Landsat imageries for natural forest monitoring. The first report of assessment of existing forest area which was finished in 1973 reported that the existing forest area of Thailand in 1973 amounted to 43.21 percent of the total area of the country. After the first successful existing forest assessment in 1973 the natural forest resources were conducted in 1976, 1978, 1982, 1985, 1988, 1989, 1991, 1993, 1995 and 1998. The results of using remote sensing techniques for assessing the natural resources in since 1961 show the monitoring of the existing forest area in each period as shown in Table 1. Therefore, in the last 37 years (1961-1998), the deforestation in Thailand was 143,907 sq. km with the annual deforestation rate about 3,889 sq. km, and the forest was reduced by about half. Presently, the Forest Resources Assessment Division of the RFD routinely conducted the natural forest resources monitoring of the country and provided the information about the existing forest area by using various of remote sensing data. The current methods used are based on visual interpretation. The following procedure is applied:
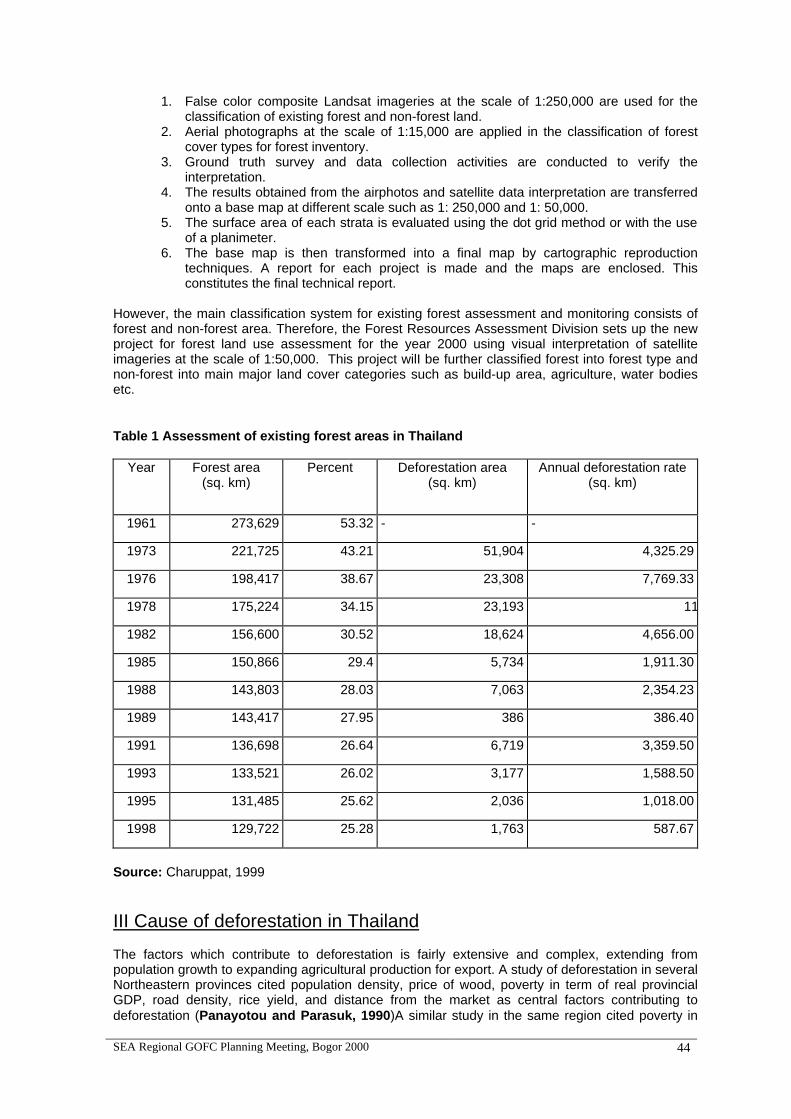
SEA Regional GOFC Planning Meeting, Bogor 2000 44
1. False color composite Landsat imageries at the scale of 1:250,000 are used for the classification of existing forest and non-forest land.
2. Aerial photographs at the scale of 1:15,000 are applied in the classification of forest cover types for forest inventory.
3. Ground truth survey and data collection activities are conducted to verify the interpretation.
4. The results obtained from the airphotos and satellite data interpretation are transferred onto a base map at different scale such as 1: 250,000 and 1: 50,000.
5. The surface area of each strata is evaluated using the dot grid method or with the use of a planimeter.
6. The base map is then transformed into a final map by cartographic reproduction techniques. A report for each project is made and the maps are enclosed. This constitutes the final technical report.
However, the main classification system for existing forest assessment and monitoring consists of forest and non-forest area. Therefore, the Forest Resources Assessment Division sets up the new project for forest land use assessment for the year 2000 using visual interpretation of satellite imageries at the scale of 1:50,000. This project wilI be further classified forest into forest type and non-forest into main major land cover categories such as build-up area, agriculture, water bodies etc. Table 1 Assessment of existing forest areas in Thailand
Year Forest area (sq. km)
Percent Deforestation area (sq. km)
Annual deforestation rate (sq. km)
1961 273,629 53.32 - -
1973 221,725 43.21 51,904 4,325.29
1976 198,417 38.67 23,308 7,769.33
1978 175,224 34.15 23,193 11,596.50
1982 156,600 30.52 18,624 4,656.00
1985 150,866 29.4 5,734 1,911.30
1988 143,803 28.03 7,063 2,354.23
1989 143,417 27.95 386 386.40
1991 136,698 26.64 6,719 3,359.50
1993 133,521 26.02 3,177 1,588.50
1995 131,485 25.62 2,036 1,018.00
1998 129,722 25.28 1,763 587.67
Source: Charuppat, 1999
III Cause of deforestation in Thailand The factors which contribute to deforestation is fairly extensive and complex, extending from population growth to expanding agricultural production for export. A study of deforestation in several Northeastern provinces cited population density, price of wood, poverty in term of real provincial GDP, road density, rice yield, and distance from the market as central factors contributing to deforestation (Panayotou and Parasuk, 1990)A similar study in the same region cited poverty in
SEA Regional GOFC Planning Meeting, Bogor 2000 45
term of real GDP per capita, population growth, and the real price of cassava as the main causes (Tongpan, et al., 1990). Yet another study showed that the demand for agricultural land, which helps to explain the conversion of forest to agriculture, is positively related to the price of main crops and the numbers of the farm population, and negatively related to agricultural productivity and degree of industrialization (Panayotou and Parasuk, 1990). It appears probable that the two main underlying causes of deforestation in Thailand have been the increasing demand for land for agriculture to meet the needs of the growing population, and commercial logging. Demand for land depends on land prices, agricultural productivity, prices of agricultural product, alternative sources of off-farm employment and income, and population growth (TFSMP, 1993). The intensity of logging, whether legal or illegal, is influenced by wood demand and prices, forest accessibility, and population growth. The effects of these factors are probably as follows:
• Land prices. There are no proper market or market prices for forest land since it belongs to the state, but nevertheless land speculation is common close to growth centers. The implicit price of forest land is determined by the cost of clearing and transport, which the farmer would incur as long as the marginal cost is lower than the marginal benefits obtained from both the forest and the farm produce.
• Land productivity. As land productivity increases, the demand for land increases as
forgers try to maximize profits. However, subsistence farmers need less land to meet basic food requirements. conversely, if land productivity decreases, subsistence farmers need more land to support themselves, while profit-oriented farmers have less incentive to invest in new land. The aggregate of land productivity therefore depends on the proportion of subsistence farmers to commercial or profit-oriented farmers.
• Crop prices. Higher crop prices make it profitable to clear new land, some of which may
have been economically inaccessible in the past. For commercial farmers, the effect of crop prices is similar to the effect of land productivity. Most of the agriculture expansion made possible by clearing forests has been aimed at increasing the production of upland cash crops.
• Off-farm employment and income. Industrialization of the economy provides alternative
income-earning opportunities and reduces the demand for land, In an open, diversified cash economy, food can always be purchased and exchanged for other good that are being produced.
• Forest accessibility. The accessibility of the forest affects both logging and land
cleaning through the profit maximizing behavior of the logger and the farmer. The most easily accessible forest is logged or cleared first, and as time goes on, the remaining forest may simply become more and more economically inaccessible. This slows down deforestation, whereas the opening of new roads in connection with logging or infrastructure building increases the demand for new land.
• Wood demand and prices. High demand for tropical hardwood for industrial or
indigenous consumption and high wood prices are likely causes of deforestation. However, the areas harvested officially were not large enough to explain the high rate of deforestation, even if the logged-over areas had not been property regenerated. Logging probably had a greater effect on deforestation indirectly, by the construction of roads which made the forest easily accessible.
• Population growth. Population acts as a demand shifter for new land or for more wood.
In regions of high population density, one would expect the relative forest cover to be smaller, assuming the other factors to be equal.
SEA Regional GOFC Planning Meeting, Bogor 2000 46
IV. National forest policy In 1896, the RFD was established. In 1900, the government promulgated a law governing the conservation of wild elephants, which became the first wildlife species to be protected. In the early 1940s, the deteriorating condition of the forests and examples set by the USA and Canada in the conservation of the natural heritage brought about a heightened awareness in Thailand for nature conservation. In 1941, the Forestry Act was passed. The sequence of five-year national economic and social development plans (NESDP) were launched starting in 1961. A few years before this, the conservation movement took a large stride. In 1958, the Ministers of Agriculture and Interior were directed to establish national parks and other protected areas and to draft their enabling legislation. In 1959, the Cabinet established the National Park and Wild Animals Reservation and Protection Committees, and with the assistance of IUCN and the us National Park Service, 14 sites were selected to become national parks. In 1960, the Wild Animals Reservation and Protection Act was passed, and in 1961, the national Parks Act. The progress of ecosystems and biodiversity conservation during the period of the six and the beginning of seven NESDPs are summarized as follows: First NESDP (1961-66). Starting with the Khao Yai National Park in 1962 and the Salak Phra Wildlife Sanctuary in 1965, 4 national parks, 1 wildlife sanctuary, and 7 forest parks were established, covering about 1% of the country. The National Park Section became a subdivision. The forest declined from 54.6% of the total land area to 51% Second NESDP (1967-71). Still 4 forest parks were the same as the First NESDP. There was not any national park or wildlife sanctuary added to the protected areas. Meanwhile, the forest cover ratio declined to 42%. Third NESDP (1972-76). To arrest the declined of the forest cover, the establishment of protected areas was accelerated. The Government declared 9 national parks, 11 wildlife sanctuary, 9 non-hunting areas, and 6 forest parks, covering 4.9% of the country. One biosphere reserve was declared. The National Park and Wildlife Sanctuary Subdivision became two separate divisions. The forest cover further declined to 38.7%. Fourth NESDP (1977-81). The protected area system further increased to 20 national parks, 12 wildlife sanctuaries, 13 non-hunting areas, and 22 forest parks, and included 2 biosphere reserves. The extent of the protected areas increased to 6.9% of the country, and the 40% forest cover target was set, but the forest declined to only 30% of the country. Fifth NESDP (1982-86). During this period, 19 national parks, 4 wildlife sanctuaries, 10 non-hunting areas, and 11 forest parks were added to the protected area system, bringing the total area to 10.2% of the country. Only 29% of the country was covered with forest by the end of the plan period. Sixth NESDP (1987-91). During this period, 14 national parks, 5 wildlife sanctuaries, 7 non-hunting areas, and 1 forest park were established. The Management Plan of the Khao Yai National Park was prepared for implementation in 1987-1990 as a model for park management. The preparation of the management plan for the Tarutao Marine Park followed. The two planning projects generated funding support for the plan formulation for 23 other protected areas, and an Office for Protected Area Planning was established within RFD. The other significant developments that occurred during this period included:
• The nationwide ban on logging in 1989. • The first conference on biodiversity in 1989. • The initiation of forest zoning in 1989. • The approval by Cabinet of 263 national conservation areas also in 1989. • The approval by cabinet of measures for managing mangrove forests and coral reefs in
1991. • The Huai Kha Khaeng-Thung Yai Naresuan was declared as a Natural World Heritage
Site by UNESCO.
SEA Regional GOFC Planning Meeting, Bogor 2000 47
• Forest cover declined to only 26.64% of the country. Seventh NESDP (1992-96). Forest areas should be covered 40% of the total country which is divided into conservation forest 25% and economic forest 15%. During 1992-1993 period, 11 national parks and 3 wildlife sanctuaries were already established. Hence, in 1993, total national parks and wildlife sanctuaries are 77 and 36 sites and areas are 39,283 and 28,988 sq. km, respectively. 33 national parks and 10 wildlife sanctuaries are planned to declare throughout the seventh NESDP. Eigth NESDP (1997-2001). Protective forest areas that should be conserved and rehabilatated covered 25% of the total country. In addition, mangrove forests should cover at least 1,000,000 Rai or 160,000 ha for the whole country.
V. Forest protection and their functions The protected area in Thailand can be classified by their functions as follows National Park. National parks include land with beautiful landscape, important history, and rare plant or animal species; preserved on its natural state for the benefit of public education and enjoyment; and declared as such under the National Park Act. Wildlife sanctuary. Wildlife sanctuaries are lands declared for the conservation of wildlife, so the wildlife can freely breed and increase their population in the natural environment. It was declared as such under the.Wild Animals Reservation and Protection Act. Forest park. Forest park includes land with attractive scenery developed for public recreation, but is too small to be declared as a national park. Non-hunting area. Non-hunting areas are those that have been designated as such for protection of specific wildlife species. No hunting areas are generally smaller than wildlife sanctuaries. Biosphere reserve. biosphere reserves are intended to conserve the diversity and integrity of biotic communities of plants and animals within natural ecosystems, and to safeguard the genetics diversity of species on which their continuing evolution depends. Biosphere reserves are declared as such by the Man and the Biosphere International coordination Committee. World Heritage Site. World Heritage Sites are lands with unique natural and cultural values which are considered to have outstanding universal significance. World Heritage Sites are nominated by countries that are party the World Heritage Convention. Watershed Class 1 (WCS 1) area. WCS 1 areas are those designated to have permanent forest cover because of their steep slopes, high susceptibility to soil erosion, and important as head-watershed. Botanical garden. Botanical gardens are areas established to contain collections of indigenous and exotic species, which are considered rare or have economic value, planted in taxonomic order for purposes of research, dissemination of knowledge, and ex situ conservation. Arboretum. Arborea are smaller than botanical gardens and are established to collect various plant species, especially the economically useful plants and flowering plants, which are indigenous to the area. Conservation mangrove forest. Conservation mangrove forests are mangrove forests excluded from utilization to protects fragile ecosystems and serves as shelter nursery ground for marine flora and fauna. Natural conservation area. Natural conservation areas comprise islands, mountains, swamps, lakes, fossils, and interesting morphologies which should be protected from economic and social exploitation.
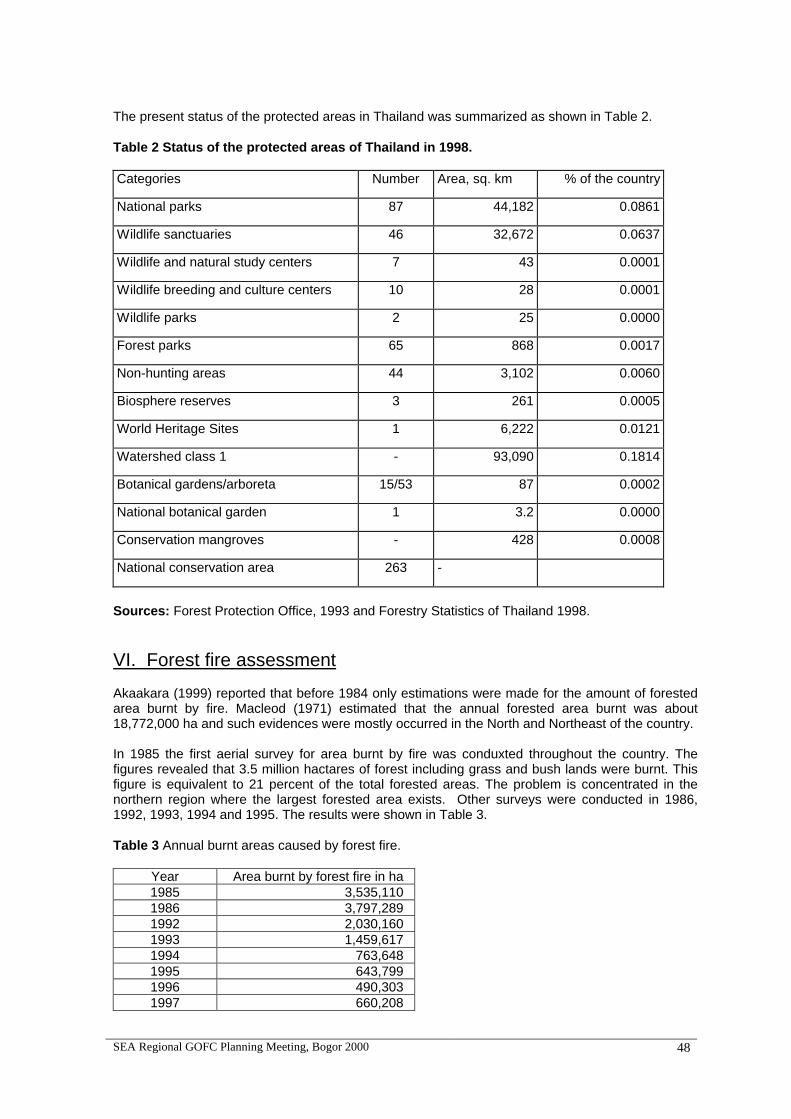
SEA Regional GOFC Planning Meeting, Bogor 2000 48
The present status of the protected areas in Thailand was summarized as shown in Table 2. Table 2 Status of the protected areas of Thailand in 1998. Categories Number Area, sq. km % of the country
National parks 87 44,182 0.0861
Wildlife sanctuaries 46 32,672 0.0637
Wildlife and natural study centers 7 43 0.0001
Wildlife breeding and culture centers 10 28 0.0001
Wildlife parks 2 25 0.0000
Forest parks 65 868 0.0017
Non-hunting areas 44 3,102 0.0060
Biosphere reserves 3 261 0.0005
World Heritage Sites 1 6,222 0.0121
Watershed class 1 - 93,090 0.1814
Botanical gardens/arboreta 15/53 87 0.0002
National botanical garden 1 3.2 0.0000
Conservation mangroves - 428 0.0008
National conservation area 263 -
Sources: Forest Protection Office, 1993 and Forestry Statistics of Thailand 1998.
VI. Forest fire assessment Akaakara (1999) reported that before 1984 only estimations were made for the amount of forested area burnt by fire. Macleod (1971) estimated that the annual forested area burnt was about 18,772,000 ha and such evidences were mostly occurred in the North and Northeast of the country. In 1985 the first aerial survey for area burnt by fire was conduxted throughout the country. The figures revealed that 3.5 million hactares of forest including grass and bush lands were burnt. This figure is equivalent to 21 percent of the total forested areas. The problem is concentrated in the northern region where the largest forested area exists. Other surveys were conducted in 1986, 1992, 1993, 1994 and 1995. The results were shown in Table 3. Table 3 Annual burnt areas caused by forest fire.
Year Area burnt by forest fire in ha 1985 3,535,110 1986 3,797,289 1992 2,030,160 1993 1,459,617 1994 763,648 1995 643,799 1996 490,303 1997 660,208
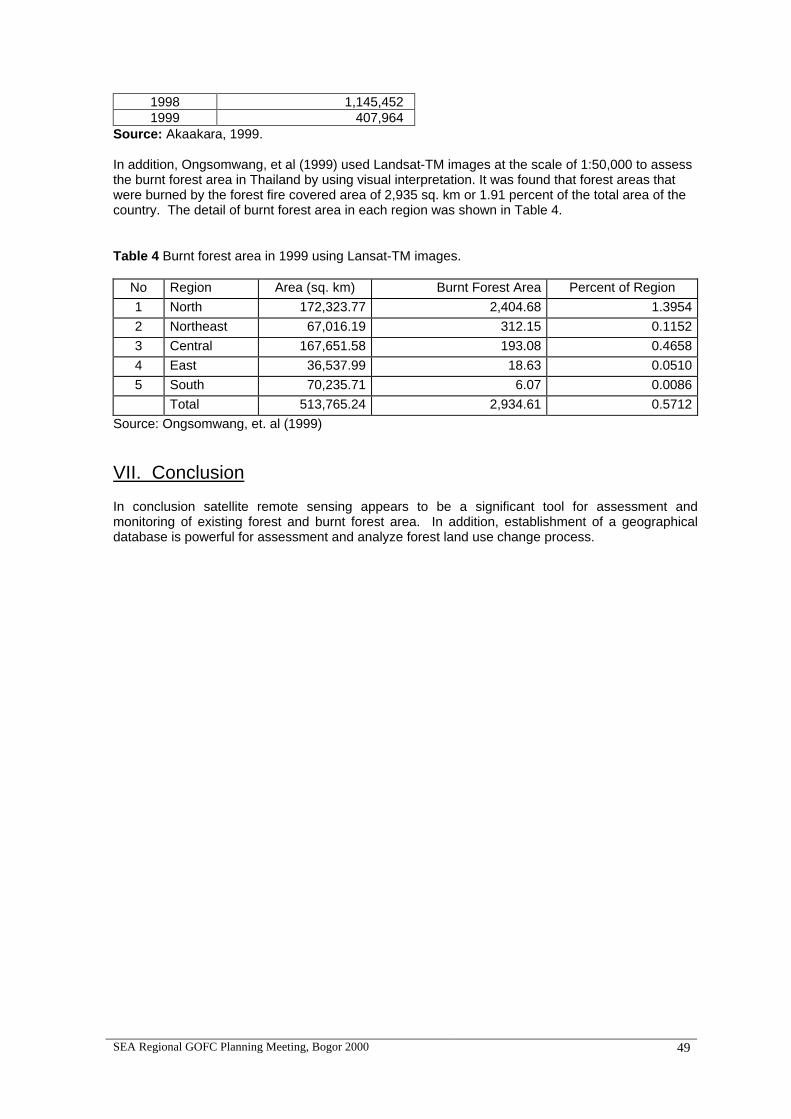
SEA Regional GOFC Planning Meeting, Bogor 2000 49
1998 1,145,452 1999 407,964
Source: Akaakara, 1999. In addition, Ongsomwang, et al (1999) used Landsat-TM images at the scale of 1:50,000 to assess the burnt forest area in Thailand by using visual interpretation. It was found that forest areas that were burned by the forest fire covered area of 2,935 sq. km or 1.91 percent of the total area of the country. The detail of burnt forest area in each region was shown in Table 4. Table 4 Burnt forest area in 1999 using Lansat-TM images.
No Region Area (sq. km) Burnt Forest Area Percent of Region
1 North 172,323.77 2,404.68 1.3954
2 Northeast 67,016.19 312.15 0.1152
3 Central 167,651.58 193.08 0.4658
4 East 36,537.99 18.63 0.0510
5 South 70,235.71 6.07 0.0086
Total 513,765.24 2,934.61 0.5712
Source: Ongsomwang, et. al (1999)
VII. Conclusion In conclusion satellite remote sensing appears to be a significant tool for assessment and monitoring of existing forest and burnt forest area. In addition, establishment of a geographical database is powerful for assessment and analyze forest land use change process.
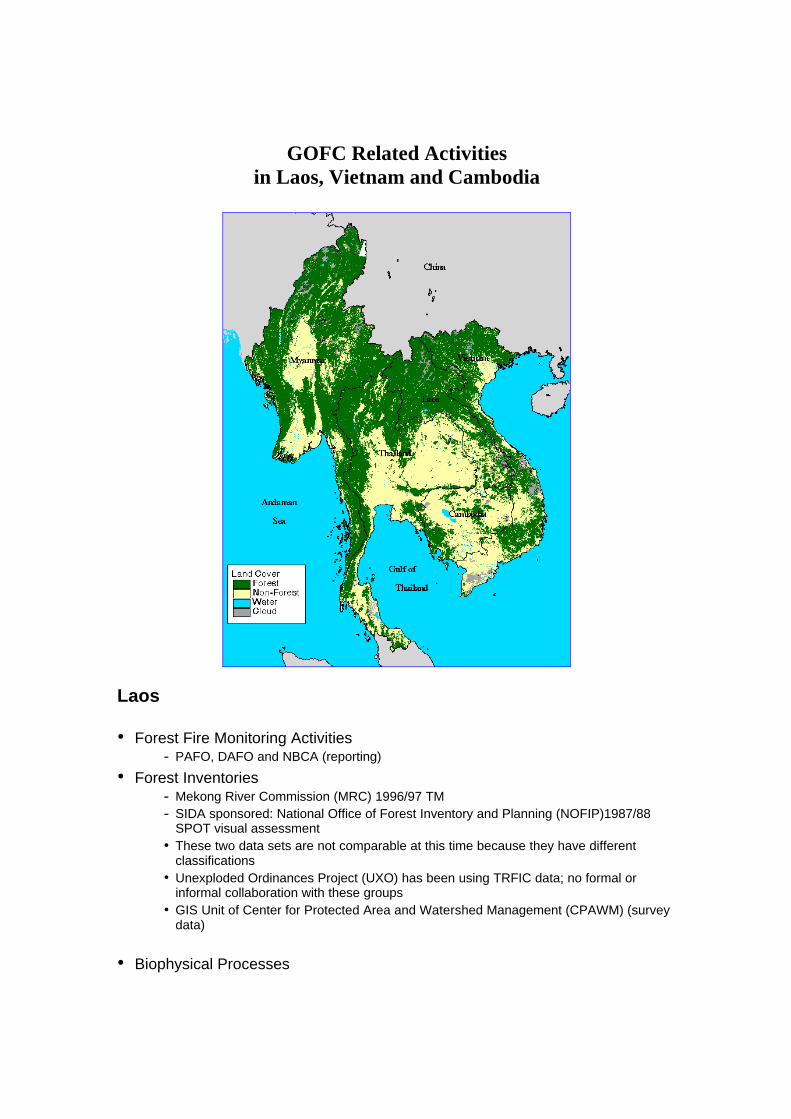
GOFC Related Activities in Laos, Vietnam and Cambodia
Laos
• Forest Fire Monitoring Activities - PAFO, DAFO and NBCA (reporting)
• Forest Inventories - Mekong River Commission (MRC) 1996/97 TM - SIDA sponsored: National Office of Forest Inventory and Planning (NOFIP)1987/88
SPOT visual assessment • These two data sets are not comparable at this time because they have different
classifications • Unexploded Ordinances Project (UXO) has been using TRFIC data; no formal or
informal collaboration with these groups • GIS Unit of Center for Protected Area and Watershed Management (CPAWM) (survey
data)
• Biophysical Processes
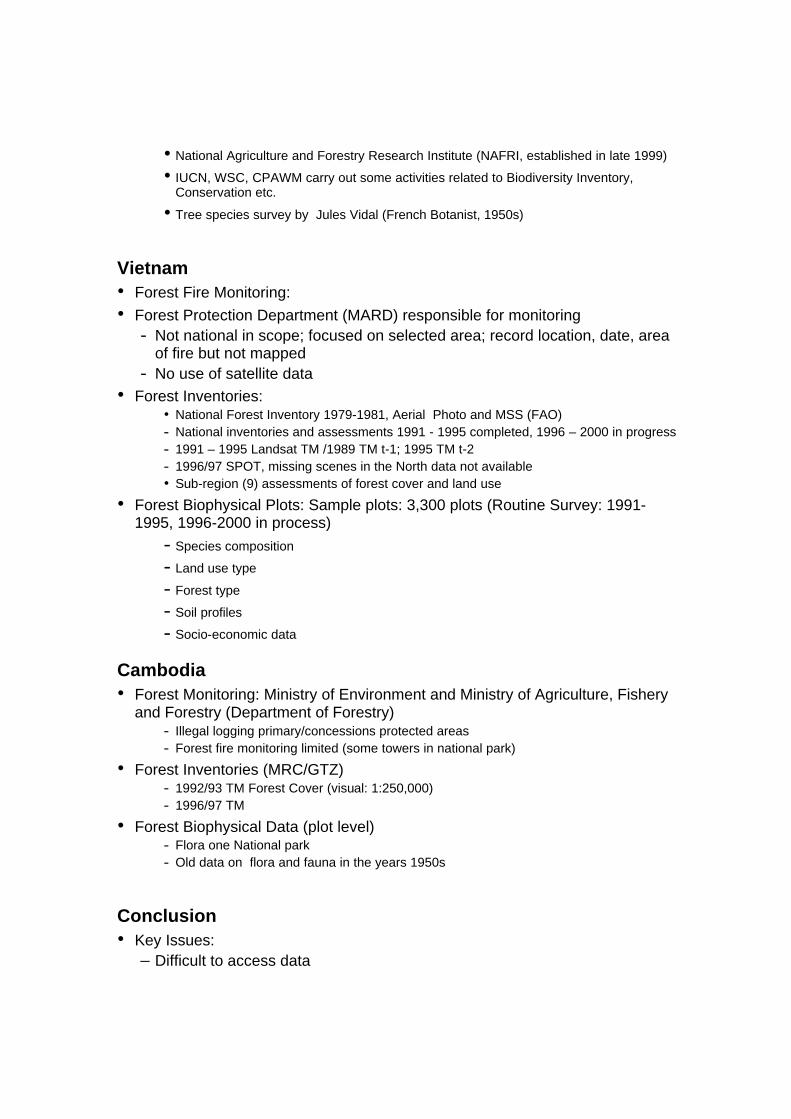
• National Agriculture and Forestry Research Institute (NAFRI, established in late 1999)
• IUCN, WSC, CPAWM carry out some activities related to Biodiversity Inventory, Conservation etc.
• Tree species survey by Jules Vidal (French Botanist, 1950s) Vietnam • Forest Fire Monitoring:
• Forest Protection Department (MARD) responsible for monitoring - Not national in scope; focused on selected area; record location, date, area
of fire but not mapped - No use of satellite data
• Forest Inventories: • National Forest Inventory 1979-1981, Aerial Photo and MSS (FAO) - National inventories and assessments 1991 - 1995 completed, 1996 – 2000 in progress - 1991 – 1995 Landsat TM /1989 TM t-1; 1995 TM t-2 - 1996/97 SPOT, missing scenes in the North data not available • Sub-region (9) assessments of forest cover and land use
• Forest Biophysical Plots: Sample plots: 3,300 plots (Routine Survey: 1991-1995, 1996-2000 in process)
- Species composition
- Land use type
- Forest type
- Soil profiles
- Socio-economic data Cambodia • Forest Monitoring: Ministry of Environment and Ministry of Agriculture, Fishery
and Forestry (Department of Forestry) - Illegal logging primary/concessions protected areas - Forest fire monitoring limited (some towers in national park)
• Forest Inventories (MRC/GTZ) - 1992/93 TM Forest Cover (visual: 1:250,000) - 1996/97 TM
• Forest Biophysical Data (plot level) - Flora one National park - Old data on flora and fauna in the years 1950s
Conclusion • Key Issues:
– Difficult to access data

– Lack of research support – Low Capacity and Insecurity in some areas, (Cambodia) – Insufficient Coordination among related institutions.
SEA Regional GOFC Planning Meeting, Bogor 2000 52
OVERVIEW, STATUS, AND PLANS FOR THE CEOS PILOT PROJECT
“GLOBAL OBSERVATION OF FOREST COVER”
David Skole
Michigan State University
Frank Ahern Canada Centre for Remote Sensing
What is GOFC? GOFC is the first coordinated international effort to develop institutional arrangements and operational systems to produce current, reliable, validated information about the Earth’s forests using space-borne and local data. GOFC was created by CEOS as a pilot project to help bring about an Integrated Global Observing Strategy (IGOS).
• GOFC is an operational pilot project, aimed at testing end-to-end development of products for forest inventory, mapping and monitoring
– using remote sensing and in situ data
• It is intended to test concepts and approaches monitoring with multiple uses and users in mind
Why the IGOS-Partnership?
• To improve use of E-O data to address major problems of global concern;
• To improve coordination of national earth observation programs;
• To improve co-operation between providers and users of E-O data for global applications.
• GOFC is a project created by CEOS to advance the IGOS concept;
• Forest problems have become global in magnitude and concern;
• Earth observation is the only technology capable of providing consistent information about forests on continental and global scales.
GOFC Vision Shared data ==> shared knowledge ==> informed action
Appendix – 7

SEA Regional GOFC Planning Meeting, Bogor 2000 53
Importance of Regional Networks
• Information creation and delivery through regional participation will be needed – in-country creation of value-added products – calibration of satellite data – validation of products – integration of in situ data
• Twinning between regional programs, e.g. START, FAO, and GOFC data partners/providers/science centers, e.g. NASA centers
GOFC as a catalyst: Bringing the parts together
IGOS-P: themes and projects
• Themes are broad areas of coordinated activity to ensure significant global needs are being met
• Projects are specific implementation activities IGOS-P theme: terrestrial carbon
• frequent and sustained satellite observations
• on-going ground-based measurements
• reliable translation of observations into environmental variables
• organizations and systems to ensure implementation and operation
• GOFC becomes an organization to bring about the observational portion of the terrestrial carbon theme.
Other important themes
• Forest monitoring for inventory and management
• Forest monitoring for land use and cover change analyses in the context of planning
• Success will be achieved if we obtain multiple objectives -- suiting the needs of users
Emphasis on Change
• Most information challenges will be for looking at changes in forest cover
• This will require:
– registration of data
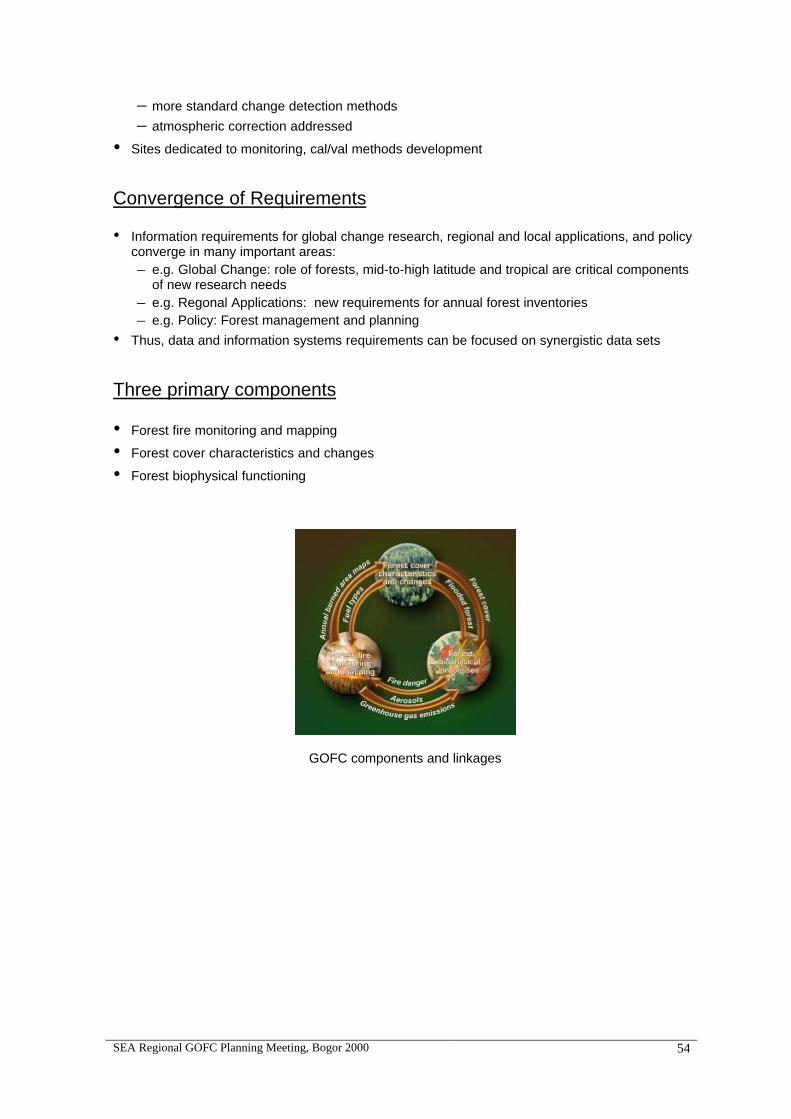
SEA Regional GOFC Planning Meeting, Bogor 2000 54
– more standard change detection methods
– atmospheric correction addressed
• Sites dedicated to monitoring, cal/val methods development
Convergence of Requirements
• Information requirements for global change research, regional and local applications, and policy converge in many important areas: – e.g. Global Change: role of forests, mid-to-high latitude and tropical are critical components
of new research needs – e.g. Regonal Applications: new requirements for annual forest inventories – e.g. Policy: Forest management and planning
• Thus, data and information systems requirements can be focused on synergistic data sets
Three primary components
• Forest fire monitoring and mapping
• Forest cover characteristics and changes
• Forest biophysical functioning
GOFC components and linkages
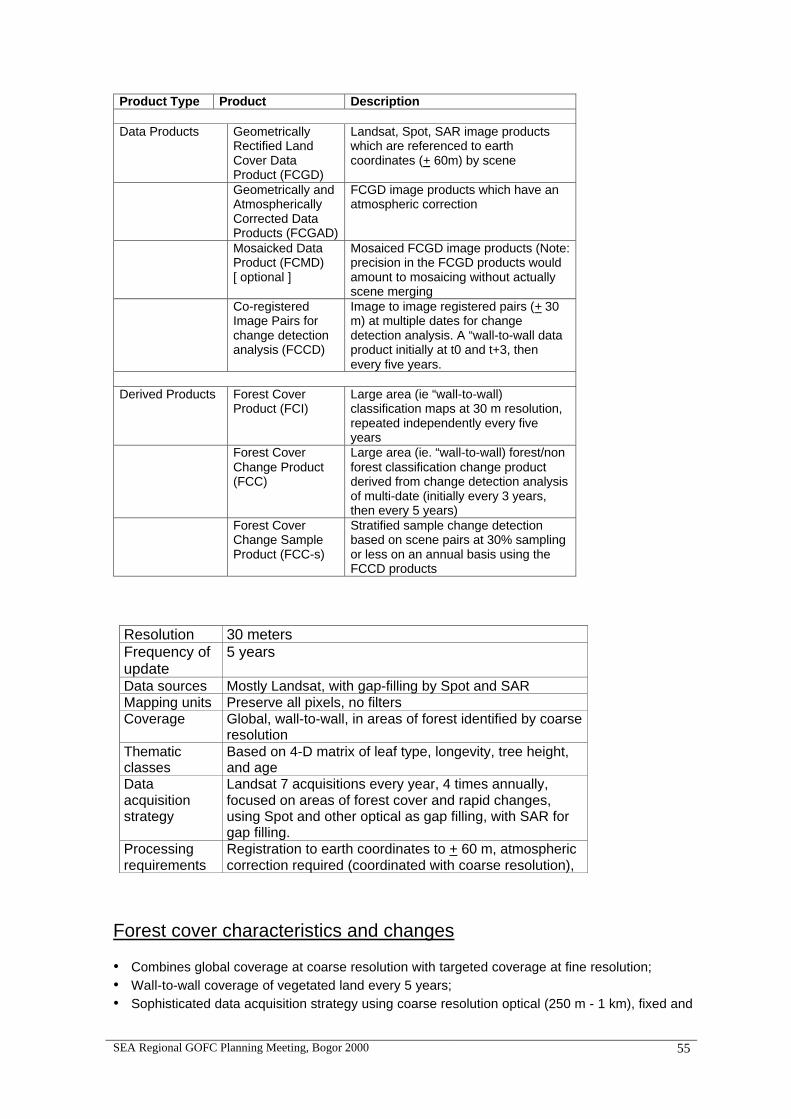
SEA Regional GOFC Planning Meeting, Bogor 2000 55
Product Type Product Description
Data Products GeometricallyRectified LandCover DataProduct (FCGD)
Landsat, Spot, SAR image productswhich are referenced to earthcoordinates (+ 60m) by scene
Geometrically andAtmosphericallyCorrected DataProducts (FCGAD)
FCGD image products which have anatmospheric correction
Mosaicked DataProduct (FCMD)[ optional ]
Mosaiced FCGD image products (Note:precision in the FCGD products wouldamount to mosaicing without actuallyscene merging
Co-registeredImage Pairs forchange detectionanalysis (FCCD)
Image to image registered pairs (+ 30m) at multiple dates for changedetection analysis. A “wall-to-wall dataproduct initially at t0 and t+3, thenevery five years.
Derived Products Forest CoverProduct (FCI)
Large area (ie “wall-to-wall)classification maps at 30 m resolution,repeated independently every fiveyears
Forest CoverChange Product(FCC)
Large area (ie. “wall-to-wall) forest/nonforest classification change productderived from change detection analysisof multi-date (initially every 3 years,then every 5 years)
Forest CoverChange SampleProduct (FCC-s)
Stratified sample change detectionbased on scene pairs at 30% samplingor less on an annual basis using theFCCD products
Resolution 30 metersFrequency ofupdate
5 years
Data sources Mostly Landsat, with gap-filling by Spot and SARMapping units Preserve all pixels, no filtersCoverage Global, wall-to-wall, in areas of forest identified by coarse
resolutionThematicclasses
Based on 4-D matrix of leaf type, longevity, tree height,and age
Dataacquisitionstrategy
Landsat 7 acquisitions every year, 4 times annually,focused on areas of forest cover and rapid changes,using Spot and other optical as gap filling, with SAR forgap filling.
Processingrequirements
Registration to earth coordinates to + 60 m, atmosphericcorrection required (coordinated with coarse resolution),
Forest cover characteristics and changes • Combines global coverage at coarse resolution with targeted coverage at fine resolution;
• Wall-to-wall coverage of vegetated land every 5 years;
• Sophisticated data acquisition strategy using coarse resolution optical (250 m - 1 km), fixed and
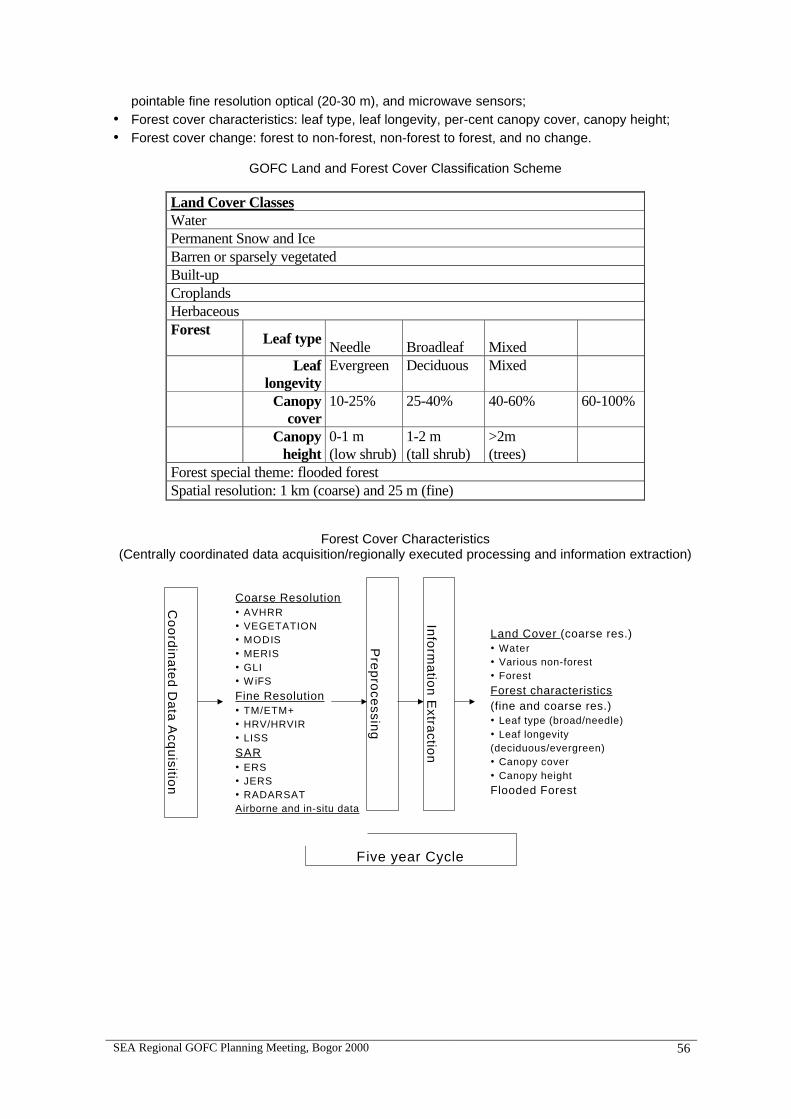
SEA Regional GOFC Planning Meeting, Bogor 2000 56
pointable fine resolution optical (20-30 m), and microwave sensors;
• Forest cover characteristics: leaf type, leaf longevity, per-cent canopy cover, canopy height;
• Forest cover change: forest to non-forest, non-forest to forest, and no change.
GOFC Land and Forest Cover Classification Scheme
Land Cover ClassesWaterPermanent Snow and IceBarren or sparsely vegetatedBuilt-upCroplandsHerbaceousForest
Leaf type Needle Broadleaf MixedLeaf
longevityEvergreen Deciduous Mixed
Canopycover
10-25% 25-40% 40-60% 60-100%
Canopyheight
0-1 m(low shrub)
1-2 m(tall shrub)
>2m(trees)
Forest special theme: flooded forestSpatial resolution: 1 km (coarse) and 25 m (fine)
Forest Cover Characteristics (Centrally coordinated data acquisition/regionally executed processing and information extraction)
Five year Cycle
Co
ord
ina
ted
Da
ta A
cqu
isition
Coarse Resolution• AVHRR• VEGETATION• MODIS• MERIS• GLI• W iFS
Fine Resolution• TM/ETM+• HRV/HRVIR• LISS
SAR• ERS• JERS• RADARSATAirborne and in-situ data
Pre
pro
cessin
g
Info
rma
tion
Extra
ction
Land Cover (coarse res.)• Water• Various non-forest• Forest
Forest characteristics(fine and coarse res.)• Leaf type (broad/needle)• Leaf longevity(deciduous/evergreen)• Canopy cover• Canopy height
Flooded Forest
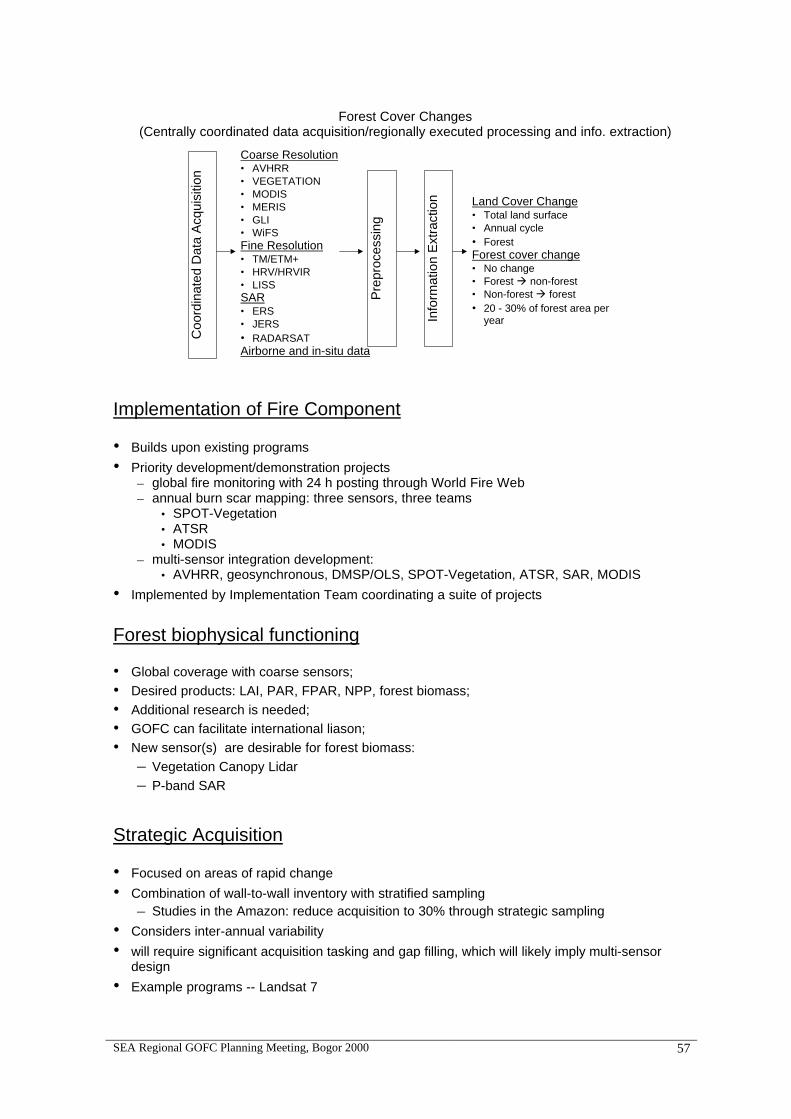
SEA Regional GOFC Planning Meeting, Bogor 2000 57
Forest Cover Changes
(Centrally coordinated data acquisition/regionally executed processing and info. extraction)
Coord
inate
d D
ata
Acq
uis
ition
Coarse Resolution• AVHRR• VEGETATION• MODIS• MERIS• GLI• WiFSFine Resolution• TM/ETM+• HRV/HRVIR• LISSSAR• ERS• JERS• RADARSATAirborne and in-situ data
Pre
pro
cess
ing
Info
rmatio
n E
xtra
ctio
n Land Cover Change• Total land surface• Annual cycle• ForestForest cover change• No change• Forest à non-forest• Non-forest à forest• 20 - 30% of forest area per
year
Implementation of Fire Component
• Builds upon existing programs
• Priority development/demonstration projects – global fire monitoring with 24 h posting through World Fire Web – annual burn scar mapping: three sensors, three teams
• SPOT-Vegetation • ATSR • MODIS
– multi-sensor integration development: • AVHRR, geosynchronous, DMSP/OLS, SPOT-Vegetation, ATSR, SAR, MODIS
• Implemented by Implementation Team coordinating a suite of projects
Forest biophysical functioning
• Global coverage with coarse sensors;
• Desired products: LAI, PAR, FPAR, NPP, forest biomass;
• Additional research is needed;
• GOFC can facilitate international liason;
• New sensor(s) are desirable for forest biomass:
– Vegetation Canopy Lidar
– P-band SAR
Strategic Acquisition
• Focused on areas of rapid change
• Combination of wall-to-wall inventory with stratified sampling – Studies in the Amazon: reduce acquisition to 30% through strategic sampling
• Considers inter-annual variability
• will require significant acquisition tasking and gap filling, which will likely imply multi-sensor design
• Example programs -- Landsat 7
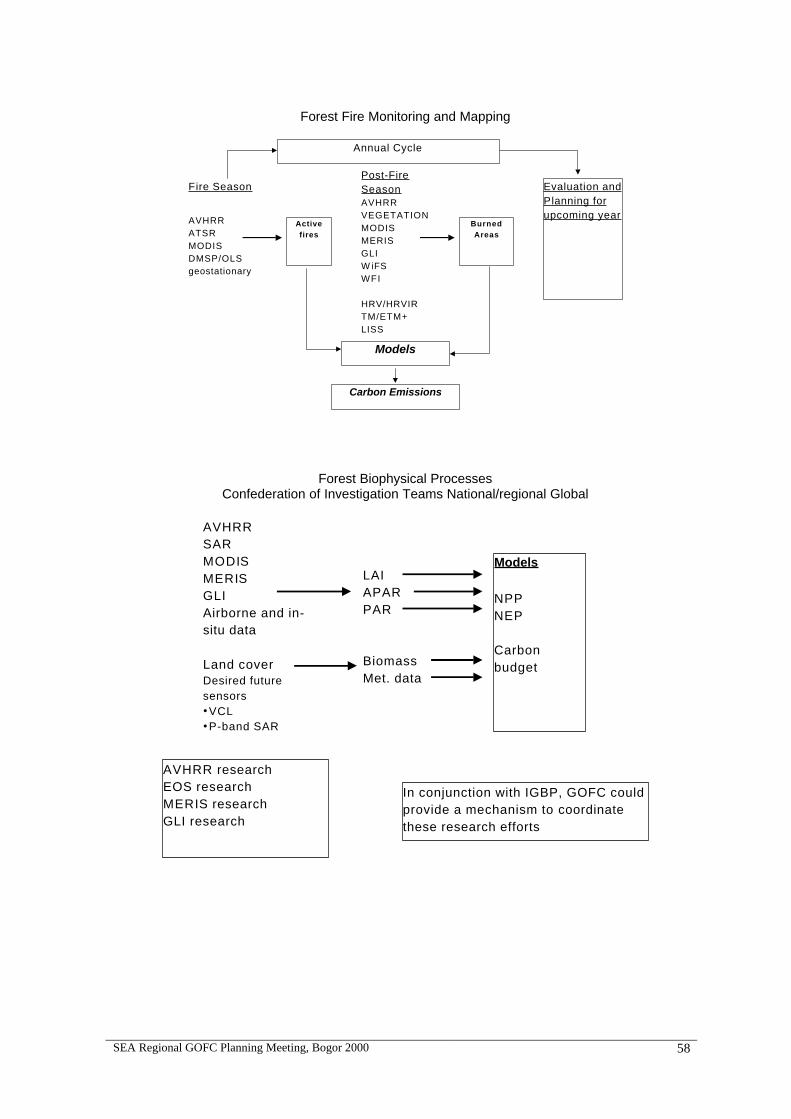
SEA Regional GOFC Planning Meeting, Bogor 2000 58
Forest Fire Monitoring and Mapping
Annual Cycle
Fire Season
AVHRRATSRMODISDMSP/OLSgeostationary
Activefires
Evaluation andPlanning forupcoming year
Post-FireSeasonAVHRRVEGETATIONMODISMERISGLIW iFSWFI
HRV/HRVIRTM/ETM+LISS
BurnedAreas
Models
Carbon Emissions
Forest Biophysical Processes Confederation of Investigation Teams National/regional Global
AVHRR researchEOS researchMERIS researchGLI research
In conjunction with IGBP, GOFC couldprovide a mechanism to coordinatethese research efforts
LAIAPARPAR
BiomassMet. data
AVHRRSARMODISMERISGLIAirborne and in-situ data
Land coverDesired futuresensors•VCL•P-band SAR
Models
NPPNEP
Carbonbudget
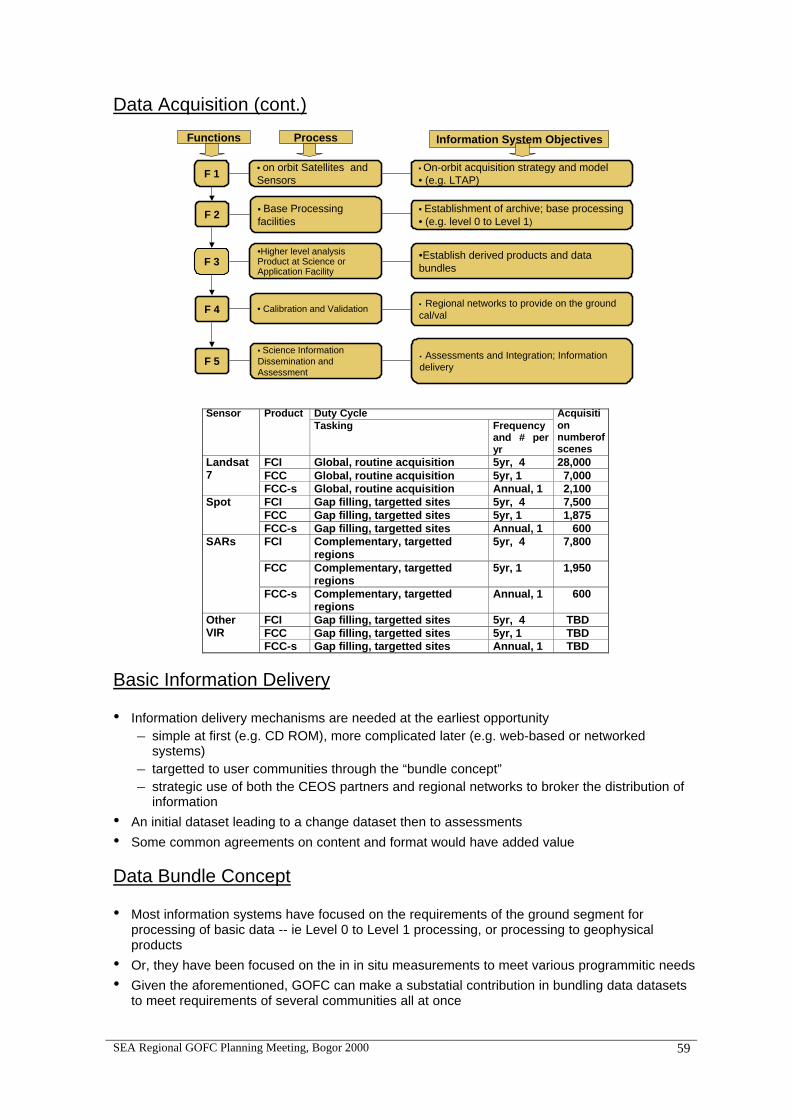
SEA Regional GOFC Planning Meeting, Bogor 2000 59
Data Acquisition (cont.)
F 1• on orbit Satellites andSensors
• On-orbit acquisition strategy and model• (e.g. LTAP)
F 2 • Base Processingfacilities
• Establishment of archive; base processing• (e.g. level 0 to Level 1)
F 4 • Calibration and Validation• Regional networks to provide on the groundcal/val
F 5• Science InformationDissemination andAssessment
• Assessments and Integration; Informationdelivery
F 3•Establish derived products and databundles
•Higher level analysisProduct at Science orApplication Facility
Functions Process Information System Objectives
Duty CycleSensor ProductTasking Frequency
and # peryr
Acquisitionnumberofscenes
FCI Global, routine acquisition 5yr, 4 28,000FCC Global, routine acquisition 5yr, 1 7,000
Landsat7
FCC-s Global, routine acquisition Annual, 1 2,100FCI Gap filling, targetted sites 5yr, 4 7,500FCC Gap filling, targetted sites 5yr, 1 1,875
Spot
FCC-s Gap filling, targetted sites Annual, 1 600FCI Complementary, targetted
regions5yr, 4 7,800
FCC Complementary, targettedregions
5yr, 1 1,950
SARs
FCC-s Complementary, targettedregions
Annual, 1 600
FCI Gap filling, targetted sites 5yr, 4 TBDFCC Gap filling, targetted sites 5yr, 1 TBD
OtherVIR
FCC-s Gap filling, targetted sites Annual, 1 TBD
Basic Information Delivery
• Information delivery mechanisms are needed at the earliest opportunity – simple at first (e.g. CD ROM), more complicated later (e.g. web-based or networked
systems) – targetted to user communities through the “bundle concept” – strategic use of both the CEOS partners and regional networks to broker the distribution of
information
• An initial dataset leading to a change dataset then to assessments
• Some common agreements on content and format would have added value
Data Bundle Concept
• Most information systems have focused on the requirements of the ground segment for processing of basic data -- ie Level 0 to Level 1 processing, or processing to geophysical products
• Or, they have been focused on the in in situ measurements to meet various programmitic needs
• Given the aforementioned, GOFC can make a substatial contribution in bundling data datasets to meet requirements of several communities all at once
SEA Regional GOFC Planning Meeting, Bogor 2000 60
CONSERVATION INTERNATIONAL’S REGIONAL ANALYSES TOOLKITS AND THEIR USE FOR
CONSERVATION PRIORITY SETTING ASSESSMENT IN PAPUA /IRIAN JAYA
Jatna Supriatna, Iwan Wijayanto Conservation International Indonesia Program
Introduction One of the biggest barriers to effective conservation everywhere is lack of basic information about ecosystems, a prerequisite to all rational planning and conservation decision-making. Conservation International (CI) developed a program called Regional Conservation Analysis to address this problem by bringing together the best expertise and technology to produce a comprehensive analysis of a region's conservation priorities and status. CI also pioneered the use of Conservation Priority Setting Workshops (CPWs) to build consensus and focus limited resources on biodiversity conservation. These workshops have looked at different geographical units, including large ecosystems encompassing several nations (biomes, e.g. Amazonia), regional subsets of ecosystems (e.g. the northeastern Atlantic Forest region in Brazil), and discrete countries or administrative boundary (e.g. Papua New Guinea, and the Papua province (prev. Irian Jaya). CI is a non profit organization based in Washington DC, that works in 24 countries to conserve global biodiversity and shows that human societies can live harmoniously with nature. CI uses a scale analyses determine conservation priorities, first at global level using, then at regional level by using “hotspots” and “major tropical wilderness concept”, there is also another new concept being introduced, the “megadiversity countries” which are the top 17 countries with the most biodiversity wealth. The next is at lanscape level by using the “corridors” concept, and at ecosystem level with protected area concept. Indonesia has two “hotspots”, the western and eastern Sondaic region also one major wilderness area which is the Papua province, and Indonesia also one of the top three megadiversity countries.
Regional Conservation Analyses & Conservation Priority Setting Workshops The method begins with a thorough process of pulling together the available biological and socio-economical data, cartographic information and satellite imagery. This information is then reviewed and refined in a workshop format, involving the leading experts on that particular region. This technique attempts to address several elements required for biodiversity conservation: to generate an easily understandable assessment and mapping of biodiversity resources; to organize and disseminate such data; to assess potential and current human impacts o biodiversity; to set conservation priorities through a bottom-up participatory process based on broad consensus-making, and to help develop local capacity in conservation planning and management based on the development and establishedment of an integrated conservation information system and related training. The goals of the priority setting workshop are to: organize and convene conservation priority consensus-building projects in all of the world's rain forest "hotspot" & “major wilderness area” regions; integrate global-scale conservation priority data for the major tropical regions: Latin
Appendix – 8
SEA Regional GOFC Planning Meeting, Bogor 2000 61
America, Asia/Pacific, and Africa; and, recommend and promote policy changes within the next five years to ensure the sustainable use of biodiversity. Since 1990 CI had conducted fourteen workshops including the one in Papua/Irian Jaya. These Conservation Priority Setting Workshops and Regional Conservation Analyses bring together leaders in science, government, and non-governmental sectors to create a consensus-based framework for conservation action. They focus on two of Conservation International's strategic objectives: the use of science to direct our conservation actions and the development of local institutional capacity in the developing world. To fulfill the mission by finding solutions to critical limiting factors, problems common to many of our local partners, but problems that small local organizations may not have the means to solve on their own.
CI’s Tools for Regional Scale Monitoring GIS & Remote Sensing One of the most important sources of data available to natural resource managers and policy makers is remote sensing imagery. The power of remote sensing data—which includes satellite imagery, aerial photography, and side-scan sonar—lies in its ability to provide real-time, unbiased information about the distribution, extraction, and loss of natural resources at a variety of spatial scales. In the tropics, there are myriad threats to ecosystem viability, ranging from logging and mining, to colonization, deforestation, and infrastructure development. Remote sensing can capture the impacts of these threats while they are occurring, and help conservationists to define where action is needed first. Conservation International uses remote sensing for many different purposes, including terrestrial and marine mapping, designing and demarcating protected areas, identifying conservation priorities, and monitoring ecosystem health. Different types of remote sensing data are used for different applications: satellite imagery for mapping and monitoring large geographic areas where less detail is required; aerial photography for smaller geographic areas where a high degree of detail is important; videography for the georectification of aerial photography and for systematically ground-truthing large areas; and side-scan sonar for mapping bathymetry in turbid marine environments. Satellite imagery Satellite imagery, such as multispectral data from Landsat TM, SPOT, or IRS-1C, and radar data from JERS-1, SIR-C, or Radarsat, is ideal for projects that cover many square kilometers. Satellite imagery is particularly useful when base maps are unavailable, since it can be processed to differentiate among vegetation types and land uses, soils, hydrography, topography, or bathymetry. During the past two years, Conservation International's remote sensing program has been providing technical assistance to host-country institutions. Some of the projects which use this technology include:
• Monitoring deforestation in the Maya Biosphere Reserve, Guatemala • Establishment of the Central Suriname Nature Reserve, Suriname • Re-zonification of Madidi National Park, Bolivia • Global Land Cover Data for Biodiversity Analysis (NASA) • Carbon Sequestration from Aceh Remaining Forest (Indonesia) • Protected Area Design and Management for Mamberamo (Indonesia) • Mapping the Natural Resources of Asmat Region (Indonesia)
Aerial Photography and Videography When highly detailed imagery is required for mapping and monitoring micro-scale environmental impacts, Conservation International has employed aerial photography and videography. Aerial photography is often more appropriate than satellite imagery due to its superior resolution and stereo overlap, allowing the user to view the landscape in three dimensions, while permitting the creation of digital elevation models. For local conservation projects, aerial photography may be
SEA Regional GOFC Planning Meeting, Bogor 2000 62
preferable to currently available satellite imagery for documenting and monitoring specific land use activities (e.g., agricultural crop types, property and land tenure boundaries, logging roads, hunting and mining camps) and gather ecological data (e.g., vegetation type, habitats and wildlife communities) that are too small to accurately distinguish with satellite imagery, and too extensive to be collected on the ground. However, the higher costs associated with collecting and processing the data mean that aerial photography is only cost effective for smaller regions. To minimize these costs, Conservation International is using small-format aerial photography and videography, with commercially available technologies that can be flown on conventional aircraft. Conservation projects in Africa, Asia, and Latin America are benefitting from this technology since it gives them access to accurate and timely data that can be used for field work, mapping, and resource policy making. During 1997-98, CI has conducted aerial surveys for a variety of purposes, including:
• Monitoring deforestation and land uses patterns in Laguna del Tigre National Park, Petén, Guatemala
• Classifying vegetation types and assessing the impacts of infrastructure development in the Una Nature Reserve and Itacare National Park, Southern Bahia, Brazil
• Wildlife Surveys in the Okavango Delta, Botswana • Aceh & Mamberamo (proposed)
Tropical rain forests are often too dense for conservationists to monitor in the field; too rugged, roadless, or remote to accomplish the necessary ground surveys for tracking new clearcuts and logging roads. Without aerial mapping and satellite imaging, it would be virtually impossible for park managers to collect reliable information on threats to the integrity of protected areas. With the help of enterprising partners in aerial surveying, CI is now using efficient, affordable technology to monitor environmental change across vast forest lands. In 1997, CI began using small-format color aerial photography and videography, a system developed at the University of Massachusetts' Department of Forestry and Wildlife Management. This aerial survey system is composed of inexpensive off-the-shelf 35mm camera equipment and GPS-logged Hi8 video camcorders that can be mounted in virtually any local Cessna aircraft, producing comprehensive, detailed aerial maps. The system is affordable, enabling repeated overflights for systematically monitoring changes over time. While satellite imagery is ideal for large geographic regions, it lacks the resolution for displaying features the size of small buildings, minor roads, shade or subsistence agriculture, and other land uses that are key to understanding the qualitative aspects of environmental change. In contrast, aerial photographs can capture many of these features since it can be acquired at varying altitudes according to the detail needed, generally 0.75-1.5 meters.
Conservation Priority Setting Workshop in Irian Jaya The Papua/Irian Jaya Workshop, held in Biak, Papua/Irian Jaya from 7-12 January 1997, had three primary objectives: To help prioritize the most critical areas for biodiversity conservation based on expert scientific information; to assess the local capacity for implementing conservation- and sustainable development-oriented activities; and to seek a consensus among government and academic institutions and NGOs about how best to integrate conservation and development planning in Irian Jaya. One goal was to assist the Indonesian government by creating a comprehensive and coherent database on biodiversity in Irian Jaya, and in providing assistance in using this information to more effectively integrate biodiversity conservation with economic development and land-use planning in the province. The database generated by the workshop will provide all stakeholders with the most accurate, up-to-date, and comprehensive scientific information on the biological resources of the province. Socio-economic factors, including the implications of current and future development plans and demographic trends for local people and biota in Irian Jaya, were also examined. Most important, the meeting has established a process for productive dialogue and consensus-building among
SEA Regional GOFC Planning Meeting, Bogor 2000 63
local, provincial, national, and international stakeholders. This final element is crucial for the successful implementation of an integrated development and conservation strategy for Irian Jaya. There are three major concrete products from the workshop: a scientifically accurate assessment of the biological importance of subregions and sites in Irian Jaya, which includes socio-economic qualifiers of biodiversity valuation; an assessment of the local capacity for implementation of conservation and development plans, and a set of recommendations intended to advance the goals of sustainable development; a bilingual map of priority areas for biodiversity conservation, bilingual publication of workshop reports and recommendations (in book and CD-ROM formats).
Workshop Methodology
The workshop methodology consisted of assembling published and unpublished biological, socio-economic, and cartographic information, and then refining this information in the workshop, involving the leading scientific experts specializing in Irian Jaya. Phases One [database development and planning] and Two [the Workshop itself] of the Papua/Papua/Papua/Irian Jaya Priority-Setting Program are complete. Phase Three [follow-up activities, publications, and training] began following completion of the workshop in early 1997, and will continue through 1998. Adding new data on species distribution and biodiversity through initiating new field projects in Papua/Papua/Papua/Irian Jaya has long been viewed as perhaps the only way to increase our knowledge about the biodiversity of an area. However, perhaps equally important is research into ways to best utilize, analyze, and combine existing data records into a coherent picture of our present knowledge of a given biogeographic zone. Over the past year, work was conducted at Conservation International Indonesia to aggregate existing data records from collections and databases. Special emphasis was made on records catalogued by LIPI and its various branches, also international museums and herbariums. The focus of the research was on data referring to the province of Irian Jaya, the western half of the island of New Guinea. Using GIS analysis to plot existing biological data, it was shown that research to date has not yet covered large and possibly biologically significant portions of the province. In addition, GIS analysis of these records provides insight into ways data gathering can be strengthened making field research results more relevant to regional planning and conservation efforts. A combination of socioeconomic and biological GIS data were used to help determine areas of biological importance, information targeted for use by regional planners within the government to help foster sustainable development within Irian Jaya. The results were combined in a comprehensive map by using Arcinfo. The resulting biodiversity conservation priorities shown on the map fall into five categories, and various shaded areas indicate that the area is currently listed as having some degree of protected status (such as Strict Nature Reserve, National Park, Game Reserve) whether implemented or proposed. One problem that is resulting from the increasing scientific interest in Irian’s great biological richness is the best way to utilize the flood of research results and species records. For decades, the best way was to study all existing literature and try to form a rough composite picture on one’s own about the status of known biodiversity and the locations of past research efforts. Not only is such a process prone to error, it is in most cases prohibitively time-consuming. However, over the past number of years, a number of powerful tools have been developed that make data manipulation and analysis fast and comprehensive. Perhaps the most revolutionary of these is Geographic Information System GIS softwares. GIS allows one to take existing data and plot it in map format. The way GIS works is conceptually quite simple: any type of data that has a geographic component (e.g. lat/long of a specimen record; political boundaries; maps of soil types or elevation) can be digitally plotted. Much as graphs allow one to make powerful and intuitive analyses from numeric data, GIS mapping allows an individual to rapidly plot and look at the geographic importance of collected data. Examples include overlaying species distribution data over a map of protected areas to see which species remain unprotected; plotting historical collection records to identify geographic areas
SEA Regional GOFC Planning Meeting, Bogor 2000 64
still relatively unknown to science; and to study present and future trends regarding economic development and human population growth and how these may affect current biodiversity levels. This research project focusing on the use of computer analysis to better analyze regional biodiversity and future research needs for an area. The goal was to map out all existing species collection records for the province of Irian Jaya. This involves creating databases for all currently existing records, digitizing maps of Irian Jaya, and running various GIS procedures on the data to help researchers and planners visualize the state of existing knowledge about Irian Jaya’s biodiversity. It is hoped that these maps will: allow researchers to quickly see where there are “data holes” concerning our knowledge of Irian Jaya. This will allow researchers or research teams to best focus efforts in little-known areas; provide information to government planning groups such as BAPPEDA and Departemen Kehutanan about current conflicts or possible synergies among existing development strategies (e.g. how existing park boundaries coincide with road building plans); to provide baseline knowledge for researchers, NGOs, and government officials for group analysis in the January 1997 “Papua/Irian Jaya Conservation Priority Setting Workshop” that was held in Biak , Irian Jaya. This workshop, cosponsored by Conservation International, LIPI, BAPPEDA, PHPA, and the Universitas Cenderawasih was a groundbreaking multilateral effort to help achieve a consensus regarding biodiversity and the future development of the region. The Papua/Irian Jaya Biodiversity Priority-Setting Workshop divided participants into nine thematic working groups: the biological taxa groups (Mammals, Birds, Plants, Reptiles and Amphibians, Arthropods/Insects, Freshwater Systems, and Coastal/Marine Systems), a Socio-Economic Group, and a Conservation Implementation Group. Each thematic group was led by two recognized experts (one Indonesian and one international scientist) in the respective field. These groups identified biodiversity priorities based on their own thematic perspective. They also examined and assessed conservation and development strategies for the province. From Day 1 to Day 3 of the workshop, taxa groups used specific sets of biological criteria and methods in order to delineate conservation priority areas on base maps. The Socio-Economic Group examined demographic trends and the conservation and socio-economic implications of various land-use and development strategies. The Conservation Implementation Group assessed the local institutional capacity for carrying out conservation goals, and sought to determine harmonious strategies for implementing the scientific recommendations of the biological taxa groups. Plenary sessions were held daily to allow each group to discuss its methods and progress with other working groups. Scientific and other recommendations and priority area designations made by each thematic group were transferred to digital forms and maps by a team of computer and GIS experts at the workshop. On Day 4 of the Workshop, members of the various thematic groups completed their tasks. Members were assigned to four regional working groups: Northern Irian, Southern/Highlands Irian, Vogelkop, and Offshore Islands. These interdisciplinary groups convened to determine a consensus on the prioritization of specific areas within these regions. Biological, cultural, and socio-economic criteria were examined. The discussion and emergent consensus was based on each participants’ particular disciplinary, professional, or community-based perspective. The resulting biodiversity conservation priorities shown on the map fall into six categories, and various shaded areas indicate that the area is currently listed as having some degree of protected status, such as Strict Nature Reserve, National Park, Game Reserve, etc.
(1) Green: Areas of Documented Biological Significance. Indicates consensus that the area contains documented high biological diversity, endemic species, and/or unique natural features. These areas require effective conservation plans for their biotic resources, which should be designed and carried out in close cooperation between government planners, NGOs, local communities, and scientists.
(2) Yellow: Areas Inadequately Surveyed, But With Indications of Biological Significance. These areas are thought to probably contain high biodiversity or endemic species, but this status cannot yet be confirmed due to inadequate scientific documentation. These areas require immediate scientific and socio-economic surveys to determine their recommended conservation status.
(3) Red: Areas Requiring Integrated Biological Resource Management. These are areas with important biological and/or social importance, and which require special management in the use of biotic and other natural resources.
SEA Regional GOFC Planning Meeting, Bogor 2000 65
(4) Blue: Marine Areas of Documented Biological Significance. Indicates scientific consensus that the marine area contains documented high species diversity and/or unique natural features. These areas require effective conservation status.
(5) Blue-gray: Mangrove Areas that requiring special protection (6) White (Blank): Sufficient information needed to determine conservation status
The scientific consensus at the workshop was that the existing Protected Areas System (PAS) in Papua/Papua/Papua/Irian Jaya is very well designed. Since there were a few biologically critical areas not included in the current PAS, workshop scientists identified a number of new recommended priority areas and extensions of existing areas. Some of the new biodiversity priority areas are located in the karst areas of the Bird’s Neck, the forest lowlands at the southern base of the central mountains, the Tami River valley on the north coast adjacent to PNG, and several other important areas. Also, the boundaries of some existing protected areas should be slightly extended to include biologically important habitat that is not currently protected. All new and expanded areas contain endemic species, high species richness, and/or unique natural features. Finally, there is strong agreement that the management of existing protected areas is inadequate and needs to be strengthened.
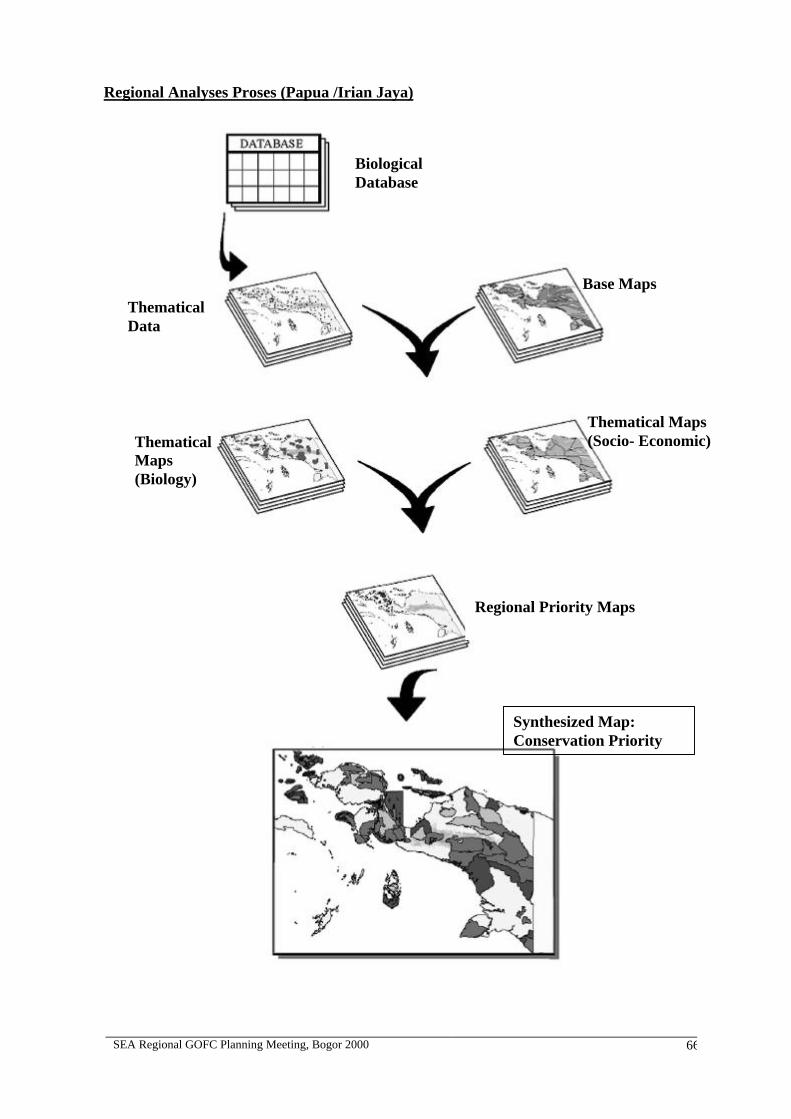
SEA Regional GOFC Planning Meeting, Bogor 2000 66
mn
Biological Database
Base Maps
Thematical Data
Thematical Maps (Biology)
Thematical Maps (Socio- Economic)
Regional Priority Maps
Synthesized Map: Conservation Priority
Regional Analyses Proses (Papua /Irian Jaya)
SEA Regional GOFC Planning Meeting, Bogor 2000 67
Further Readings. Conservation International Web Page : http://www.conservation.org BAPPEDA. 1986. RePPProt series 1:250,000 maps. BAPPEDA, Jakarta. BPS. 1994. Irian Jaya Dalam Angka. BPS, Jayapura. Conservation International Department of Conservation Planning and Technical Cooperation. 1992. CISIG Geographic Information System User’s Manual. Washington, DC. Conservation International Indonesia Program. 1997. Executive Summary: Lokakarya Prioritas Konservasi Keanekaragamanhayati Irian Jaya. Jakarta. Eastman, J. Ronald. 1995. Idrisi for Windows, User’s Guide Version 1.0. Clark University, Worchester MA. Flannery, Tim. 1995. Mammals of New Guinea. Reed Books, Sydney Australia. Garren, William R. et al. 1982. Gazetteer of Indonesia. 2 Vol. Defense Mapping Agency, Washington DC. Gressitt, J. L. 1982. Biogeography and Ecology of New Guinea. 2 Vol. Dr W. Junk Publishers, London. R.A. Mitttermeier, I.A. Bowles, R.B. Cavalcanti, S. Olivieri and G.A.B da Fonsesca. 1994. A Participatory Approach to Biodiversity Conservation: The Regional Priority Setting Workshop. Conservation International ,Washington, D.C.
SEA Regional GOFC Planning Meeting, Bogor 2000 68
IC-SEA AND GLOBAL CHANGE RESEARCH IN SOUTHEAST ASIA
D. Murdiyarso
BIOTROP/GCTE Impacts Centre for Southeast Asia (IC-SEA) Jl. Raya Tajur Km.6, P.O. Box 116, Bogor, Indonesia
Abstracts The Global Change Impacts Centre for Southeast Asia (IC-SEA) was established in October 1995 by the Global Change and Terrestrial Ecosystems (GCTE) a Core Project of the International Geosphere-Biosphere Programme (IGBP). It is hosted by the Regional Centre for Tropical Biology (BIOTROP) one of the Southeast Asian Ministry of Education Organisation (SEAMEO) Centre in Bogor, Indonesia. The objective of IC-SEA is twofold, to build the capacity of the Southeast Asian scientists in assessing the impacts of global change on terrestrial ecosystems and to promote planning for sustainable development and conservation of biodiversity in the rapidly changing global environment. This paper attempts to describe various activities organised by IC-SEA related to global change research carried out both in-house as well as in collaboration with partners in the region. Land-use/cover change, as part of the global change phenomena, has resulted various environmental consequences, such as, net carbon dioxide release to the atmosphere due to removal of standing carbon stocks and changes in biogeochemical cycles. Planned deforestation, land and forest fires are among large-scale terrestrial change in the region merit further quantification and evaluation before larger scale decisions are going to be made. Training workshop on the methodology of assessing terrestrial carbon stocks and the field work have been carried out in the region with the support and participation of various international and national agencies. The use of remote sensing and GIS techniques have enhanced the activities besides laboratory support to analyse the data. This combination is likely to be the necessary technique to be developed in the future for biogechemical cycle related studies. Results on the impacts of land-cover change on C-stocks and emission of greenhouse gas emissions are promising. It is demonstrated that direct impacts on the depletion of the above-ground biomass was observable even from relatively low spatial resolution of satellite imageries. Calculation of CO2 exchange hat was carried out in 1988-1996 and crossed checked by ground-truthing was phenomenal. The on-going activities are directed towards the integration of a number of approaches attempting to assess above- and below-ground carbon stocks to have a complete picture of carbon cycles. Measurements campaign is expanded and experimental works are intensified. To this end, we will have a better position to scale up the overall processes and demonstrate them in spatial terms. Modelling tools are devised in order to give predictive capability required in decision-making processes. This is particularly important for the planning of sustainable development at national or local levels. Moreover, such understanding will be extremely important when non-Annex 1 countries including Southeast Asian countries to participate in the legally binding UNFCCC or in implementing the Kyoto Protocol on voluntary basis. Systematic monitoring of forest cover will boost the assessment of global terrestrial carbon budget. Moreover, in the light of the operationalisation of the Kyoto Protocol the use of multi-date spatial data will enhance the observation of 'Kyoto forest'. Organisation of data is an urgent need so that
Appendix – 9
SEA Regional GOFC Planning Meeting, Bogor 2000 69
research overlaps and gaps may be reduced and the scarce resources may be optimised. A database on terrestrial carbon stocks are being developed at IC-SEA for wider use by the global change research community in the region and elsewhere. ______________ Keywords: remote sensing/GIS, land-use/cover change, greenhouse gas emissions, C-stocks
SEA Regional GOFC Planning Meeting, Bogor 2000 70
LAND-USE AND LAND COVER CHANGE (LUCC) IMPACTS ON CARBON STOCK AND GREENHOUSE
GAS EMISSION
Lilik Budi Prasetyoa, Daniel Murdiyarsob, Upik Rosalinac
Saito Genyad, Haruo Tsurutad, Katsuo Okamotod, Ishizuka Shigehiroe, Ueda Shingof
a) Bogor Agriculture University, Indonesia
b) South East Asia Impact Center, Indonesia c) SEAMEO-BIOTROP, Indonesia
d) National Institute of Agro-Environmental Sciences, Japan e) Forestry and Forest Product Institute, Japan
f) Nihon University, Japan
Abstract
LUCC of Pasir Mayang, Jambi Province, Indonesia during 1993 - 1995 periods was analyzed based on Landsat/TM data. The LUCC data were combined with field survey data of aboveground carbon stock and soil surface emission of greenhouse gases (N2O, CH4 and CO2). It showed that there was a reduction of aboveground carbon stock and methane absorption. Meanwhile, there was an increase emission of carbon dioxide (CO2) and Nitrous oxide (N2O).
I. Introduction
Forest plays an important role in the global carbon cycle, since they hold most terrestrial carbon. Deforestation, conversion of forested land into non-forested land, will cause significant impact on the increase of atmospheric carbon. Today the global release carbon is estimated at from 0.6 to 2,6 billion ton per year (Holdgate, 1995). In addition, deforestation also results in emission of greenhouse gases, such as carbon dioxide, nitrous oxide and methane. However, there is considerably uncertainty in the figures, since limited information on its mechanism and measurement, especially in tropical areas. Emission of greenhouse gases from deforestation might be come from biomass burning (slash and burn agricultural practices) or from the results of soil microorganism activities. Estimation of greenhouse gases release from biomass burning have been intensively investigated. However, information on the impact of LUCC process on greenhouse gases emission is limited. Thus, recognition of land-use/land cover impacts on greenhouse gases emission is urgently required, especially in tropical areas. The research aimed at regional estimation of aboveground carbon stock and soil surface green house gas emission changes caused by land-use/land cover changes using GIS and Remote Sensing. As a case study land-use/land cover change between 1993 to 1995 of Pasir Mayang, Jambi Province, Indonesia will be evaluated.
Appendix – 10
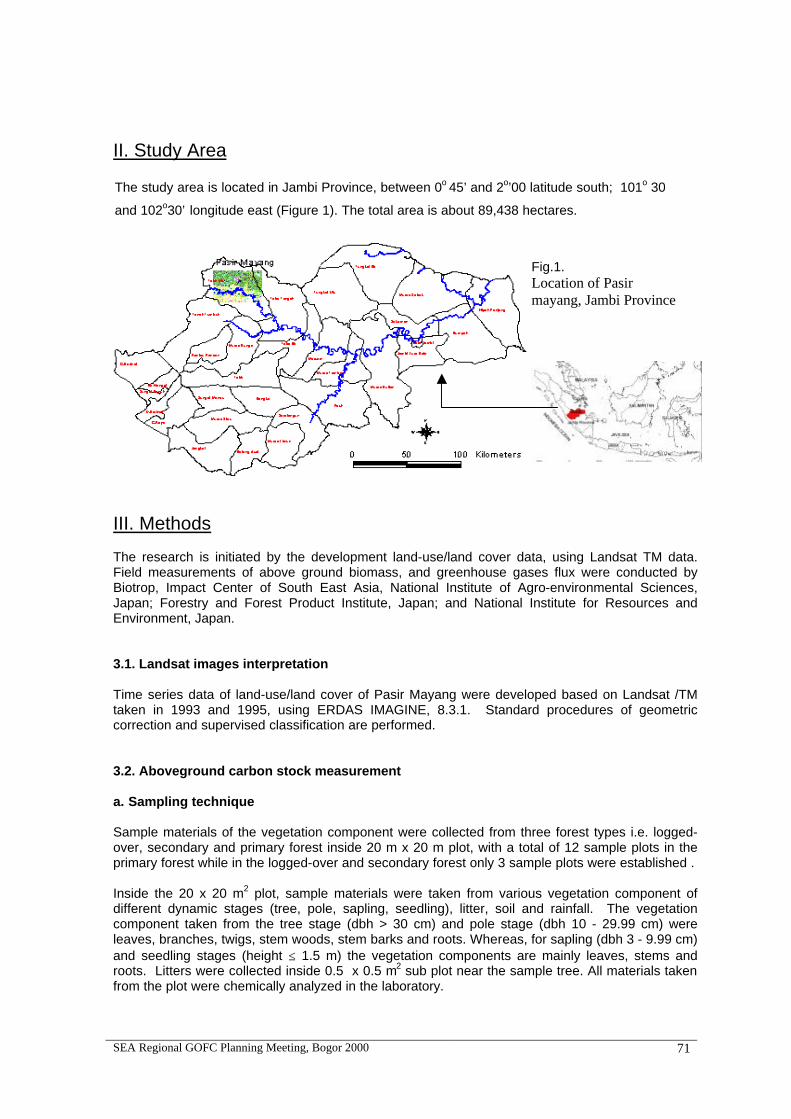
SEA Regional GOFC Planning Meeting, Bogor 2000 71
II. Study Area
METHODOLOGY
III. Methods The research is initiated by the development land-use/land cover data, using Landsat TM data. Field measurements of above ground biomass, and greenhouse gases flux were conducted by Biotrop, Impact Center of South East Asia, National Institute of Agro-environmental Sciences, Japan; Forestry and Forest Product Institute, Japan; and National Institute for Resources and Environment, Japan. 3.1. Landsat images interpretation Time series data of land-use/land cover of Pasir Mayang were developed based on Landsat /TM taken in 1993 and 1995, using ERDAS IMAGINE, 8.3.1. Standard procedures of geometric correction and supervised classification are performed. 3.2. Aboveground carbon stock measurement a. Sampling technique Sample materials of the vegetation component were collected from three forest types i.e. logged-over, secondary and primary forest inside 20 m x 20 m plot, with a total of 12 sample plots in the primary forest while in the logged-over and secondary forest only 3 sample plots were established . Inside the 20 x 20 m2 plot, sample materials were taken from various vegetation component of different dynamic stages (tree, pole, sapling, seedling), litter, soil and rainfall. The vegetation component taken from the tree stage (dbh > 30 cm) and pole stage (dbh 10 - 29.99 cm) were leaves, branches, twigs, stem woods, stem barks and roots. Whereas, for sapling (dbh 3 - 9.99 cm) and seedling stages (height ≤ 1.5 m) the vegetation components are mainly leaves, stems and roots. Litters were collected inside 0.5 x 0.5 m2 sub plot near the sample tree. All materials taken from the plot were chemically analyzed in the laboratory.
Fig.1. Location of Pasir mayang, Jambi Province
The study area is located in Jambi Province, between 0o 45’ and 2o’00 latitude south; 101o 30
and 102o30’ longitude east (Figure 1). The total area is about 89,438 hectares.
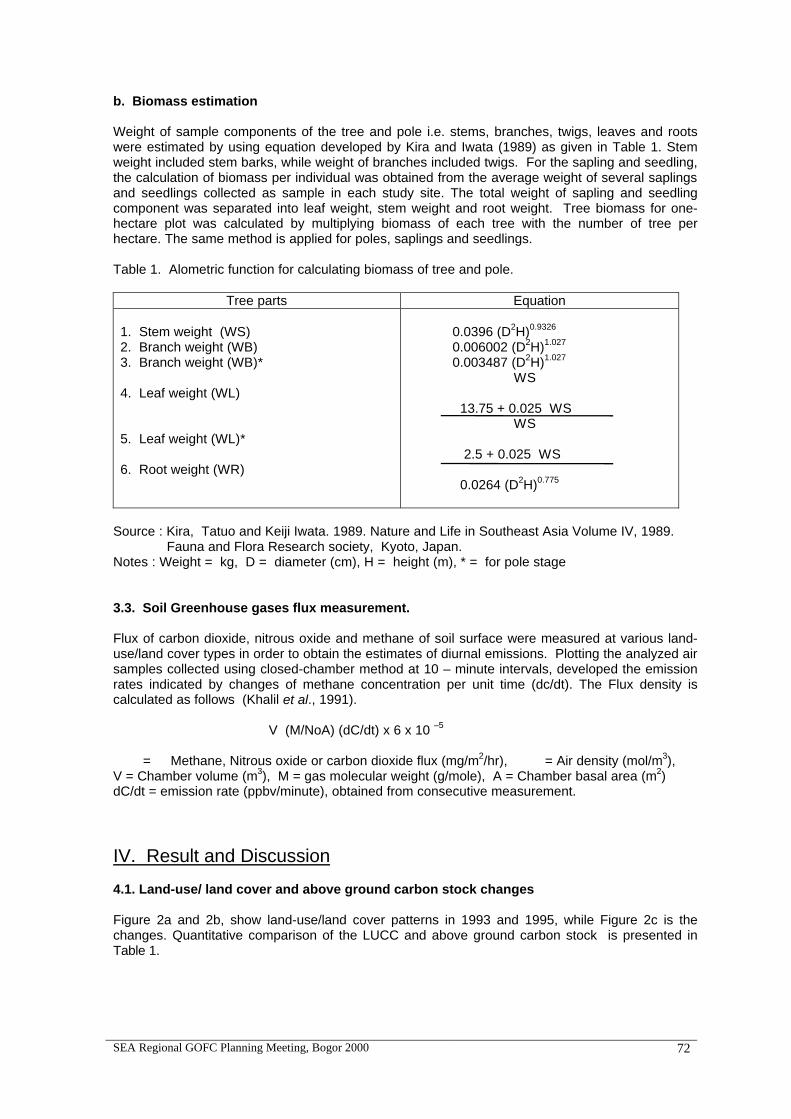
SEA Regional GOFC Planning Meeting, Bogor 2000 72
b. Biomass estimation Weight of sample components of the tree and pole i.e. stems, branches, twigs, leaves and roots were estimated by using equation developed by Kira and Iwata (1989) as given in Table 1. Stem weight included stem barks, while weight of branches included twigs. For the sapling and seedling, the calculation of biomass per individual was obtained from the average weight of several saplings and seedlings collected as sample in each study site. The total weight of sapling and seedling component was separated into leaf weight, stem weight and root weight. Tree biomass for one-hectare plot was calculated by multiplying biomass of each tree with the number of tree per hectare. The same method is applied for poles, saplings and seedlings. Table 1. Alometric function for calculating biomass of tree and pole.
Tree parts Equation 1. Stem weight (WS) 2. Branch weight (WB) 3. Branch weight (WB)* 4. Leaf weight (WL) 5. Leaf weight (WL)* 6. Root weight (WR)
0.0396 (D2H)0.9326 0.006002 (D2H)1.027 0.003487 (D2H)1.027 WS 13.75 + 0.025 WS WS 2.5 + 0.025 WS 0.0264 (D2H)0.775
Source : Kira, Tatuo and Keiji Iwata. 1989. Nature and Life in Southeast Asia Volume IV, 1989. Fauna and Flora Research society, Kyoto, Japan. Notes : Weight = kg, D = diameter (cm), H = height (m), * = for pole stage 3.3. Soil Greenhouse gases flux measurement. Flux of carbon dioxide, nitrous oxide and methane of soil surface were measured at various land-use/land cover types in order to obtain the estimates of diurnal emissions. Plotting the analyzed air samples collected using closed-chamber method at 10 – minute intervals, developed the emission rates indicated by changes of methane concentration per unit time (dc/dt). The Flux density is calculated as follows (Khalil et al., 1991).
����������V (M/NoA) (dC/dt) x 6 x 10 –5
���=��Methane, Nitrous oxide or carbon dioxide flux (mg/m2/hr), ���= Air density (mol/m3), V = Chamber volume (m3), M = gas molecular weight (g/mole), A = Chamber basal area (m2) dC/dt = emission rate (ppbv/minute), obtained from consecutive measurement.
IV. Result and Discussion
4.1. Land-use/ land cover and above ground carbon stock changes Figure 2a and 2b, show land-use/land cover patterns in 1993 and 1995, while Figure 2c is the changes. Quantitative comparison of the LUCC and above ground carbon stock is presented in Table 1.
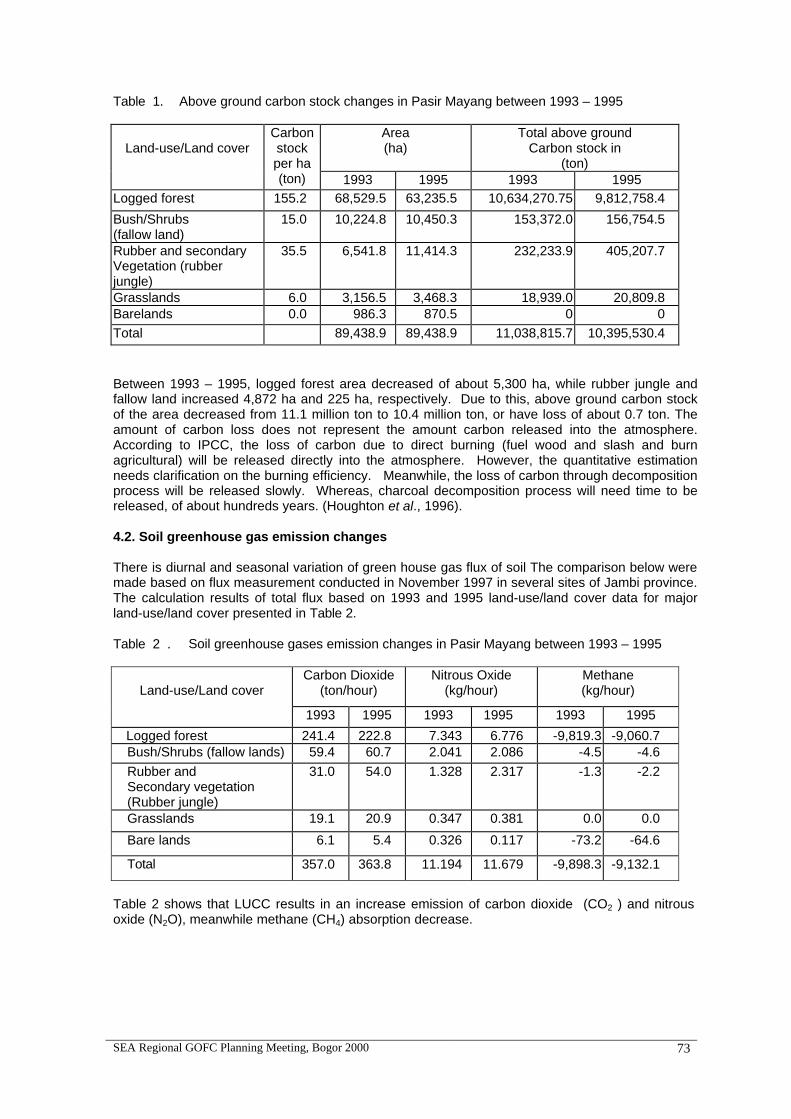
SEA Regional GOFC Planning Meeting, Bogor 2000 73
Table 1. Above ground carbon stock changes in Pasir Mayang between 1993 – 1995
Area (ha)
Total above ground Carbon stock in
(ton)
Land-use/Land cover
Carbon stock per ha (ton) 1993 1995 1993 1995
Logged forest 155.2 68,529.5 63,235.5 10,634,270.75 9,812,758.4
Bush/Shrubs (fallow land)
15.0 10,224.8 10,450.3 153,372.0 156,754.5
Rubber and secondary Vegetation (rubber jungle)
35.5 6,541.8 11,414.3 232,233.9 405,207.7
Grasslands 6.0 3,156.5 3,468.3 18,939.0 20,809.8 Barelands 0.0 986.3 870.5 0 0
Total 89,438.9 89,438.9 11,038,815.7 10,395,530.4
Between 1993 – 1995, logged forest area decreased of about 5,300 ha, while rubber jungle and fallow land increased 4,872 ha and 225 ha, respectively. Due to this, above ground carbon stock of the area decreased from 11.1 million ton to 10.4 million ton, or have loss of about 0.7 ton. The amount of carbon loss does not represent the amount carbon released into the atmosphere. According to IPCC, the loss of carbon due to direct burning (fuel wood and slash and burn agricultural) will be released directly into the atmosphere. However, the quantitative estimation needs clarification on the burning efficiency. Meanwhile, the loss of carbon through decomposition process will be released slowly. Whereas, charcoal decomposition process will need time to be released, of about hundreds years. (Houghton et al., 1996).
4.2. Soil greenhouse gas emission changes There is diurnal and seasonal variation of green house gas flux of soil The comparison below were made based on flux measurement conducted in November 1997 in several sites of Jambi province. The calculation results of total flux based on 1993 and 1995 land-use/land cover data for major land-use/land cover presented in Table 2.
Table 2 . Soil greenhouse gases emission changes in Pasir Mayang between 1993 – 1995
Carbon Dioxide
(ton/hour) Nitrous Oxide
(kg/hour) Methane (kg/hour)
Land-use/Land cover
1993 1995 1993 1995 1993 1995
Logged forest 241.4 222.8 7.343 6.776 -9,819.3 -9,060.7 Bush/Shrubs (fallow lands) 59.4 60.7 2.041 2.086 -4.5 -4.6
Rubber and Secondary vegetation (Rubber jungle)
31.0 54.0 1.328 2.317 -1.3 -2.2
Grasslands 19.1 20.9 0.347 0.381 0.0 0.0
Bare lands 6.1 5.4 0.326 0.117 -73.2 -64.6
Total 357.0 363.8 11.194 11.679 -9,898.3 -9,132.1
Table 2 shows that LUCC results in an increase emission of carbon dioxide (CO2 ) and nitrous oxide (N2O), meanwhile methane (CH4) absorption decrease.
SEA Regional GOFC Planning Meeting, Bogor 2000 74
V. Conclussion Land-use/land cover changes in Jambi between 1993 to 1995 results in the loss of carbon about 0.7 millions ton, especially came from logged forest area reduction. In addition, the process also gave impacts on greenhouse gases flux of soil surface. There was an increase emission of carbon dioxide (CO2) and Nitrous oxide (N2O), meanwhile reduction in methane absoprtion. This finding reinforce the urgent need to conserve tropical rain forest, in order to reduce/ slow down the increase rate of atmospheric greenhouse gases concentration.
Acknowledgement Authors would like to thanks to Environmental Agency of Japan for the research funding.
References Holdgate, M. 1995. Greenhouse gas balance in forestry : Opening address to FRCC Conference.
Forestry 68 (4) : 297 – 302 Houghton, J.T., et al. 1996. Greenhouse gas inventory reference Manual : page 5.1 – 5.74 Khalil, M.A.K., R.A. Rasmussen, M.X. Wang and L.Ren. 1991. Methane emissions from rice fields
in china. Environ. Sci. Tech. 25: 979-981 Kira, Tatuo and Keiji Iwata. 1989. Nature and Life in Southeast Asia Volume IV, 1989. Fauna and
Flora Research society, Kyoto, Japan.
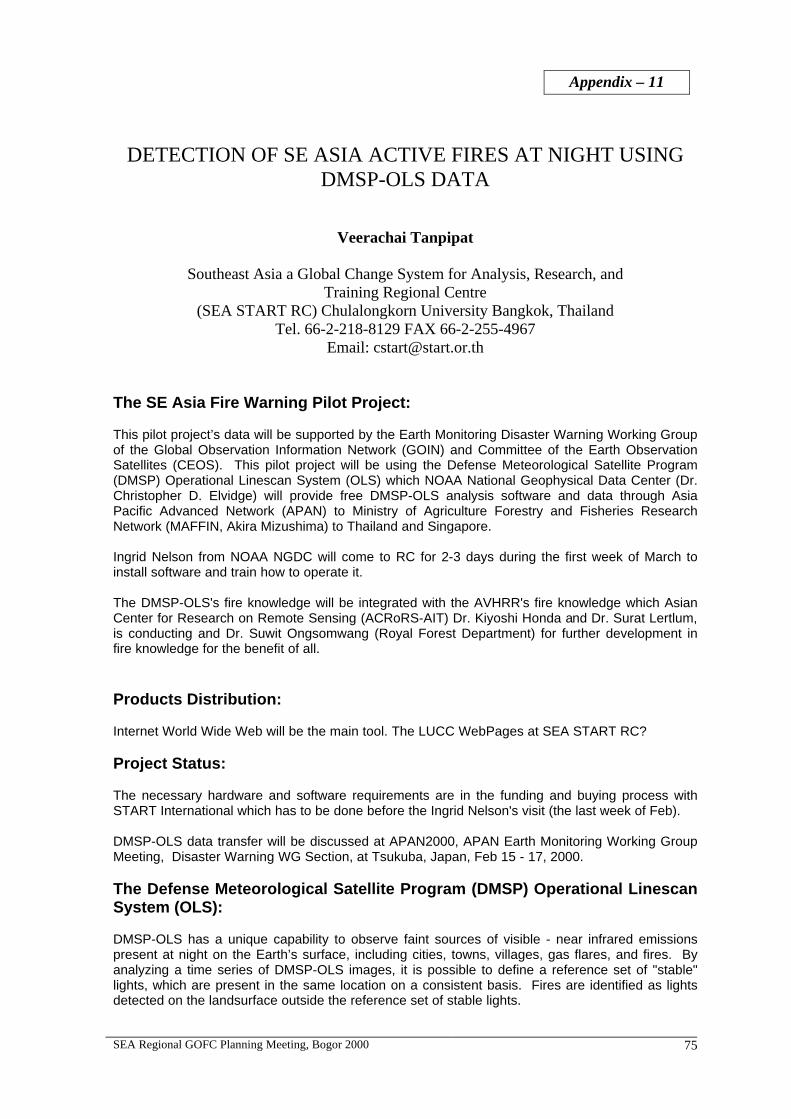
SEA Regional GOFC Planning Meeting, Bogor 2000 75
DETECTION OF SE ASIA ACTIVE FIRES AT NIGHT USING DMSP-OLS DATA
Veerachai Tanpipat
Southeast Asia a Global Change System for Analysis, Research, and Training Regional Centre
(SEA START RC) Chulalongkorn University Bangkok, Thailand Tel. 66-2-218-8129 FAX 66-2-255-4967
Email: [email protected] The SE Asia Fire Warning Pilot Project: This pilot project’s data will be supported by the Earth Monitoring Disaster Warning Working Group of the Global Observation Information Network (GOIN) and Committee of the Earth Observation Satellites (CEOS). This pilot project will be using the Defense Meteorological Satellite Program (DMSP) Operational Linescan System (OLS) which NOAA National Geophysical Data Center (Dr. Christopher D. Elvidge) will provide free DMSP-OLS analysis software and data through Asia Pacific Advanced Network (APAN) to Ministry of Agriculture Forestry and Fisheries Research Network (MAFFIN, Akira Mizushima) to Thailand and Singapore. Ingrid Nelson from NOAA NGDC will come to RC for 2-3 days during the first week of March to install software and train how to operate it. The DMSP-OLS's fire knowledge will be integrated with the AVHRR's fire knowledge which Asian Center for Research on Remote Sensing (ACRoRS-AIT) Dr. Kiyoshi Honda and Dr. Surat Lertlum, is conducting and Dr. Suwit Ongsomwang (Royal Forest Department) for further development in fire knowledge for the benefit of all. Products Distribution: Internet World Wide Web will be the main tool. The LUCC WebPages at SEA START RC? Project Status: The necessary hardware and software requirements are in the funding and buying process with START International which has to be done before the Ingrid Nelson's visit (the last week of Feb). DMSP-OLS data transfer will be discussed at APAN2000, APAN Earth Monitoring Working Group Meeting, Disaster Warning WG Section, at Tsukuba, Japan, Feb 15 - 17, 2000. The Defense Meteorological Satellite Program (DMSP) Operational Linescan System (OLS): DMSP-OLS has a unique capability to observe faint sources of visible - near infrared emissions present at night on the Earth’s surface, including cities, towns, villages, gas flares, and fires. By analyzing a time series of DMSP-OLS images, it is possible to define a reference set of "stable" lights, which are present in the same location on a consistent basis. Fires are identified as lights detected on the landsurface outside the reference set of stable lights.
Appendix – 11
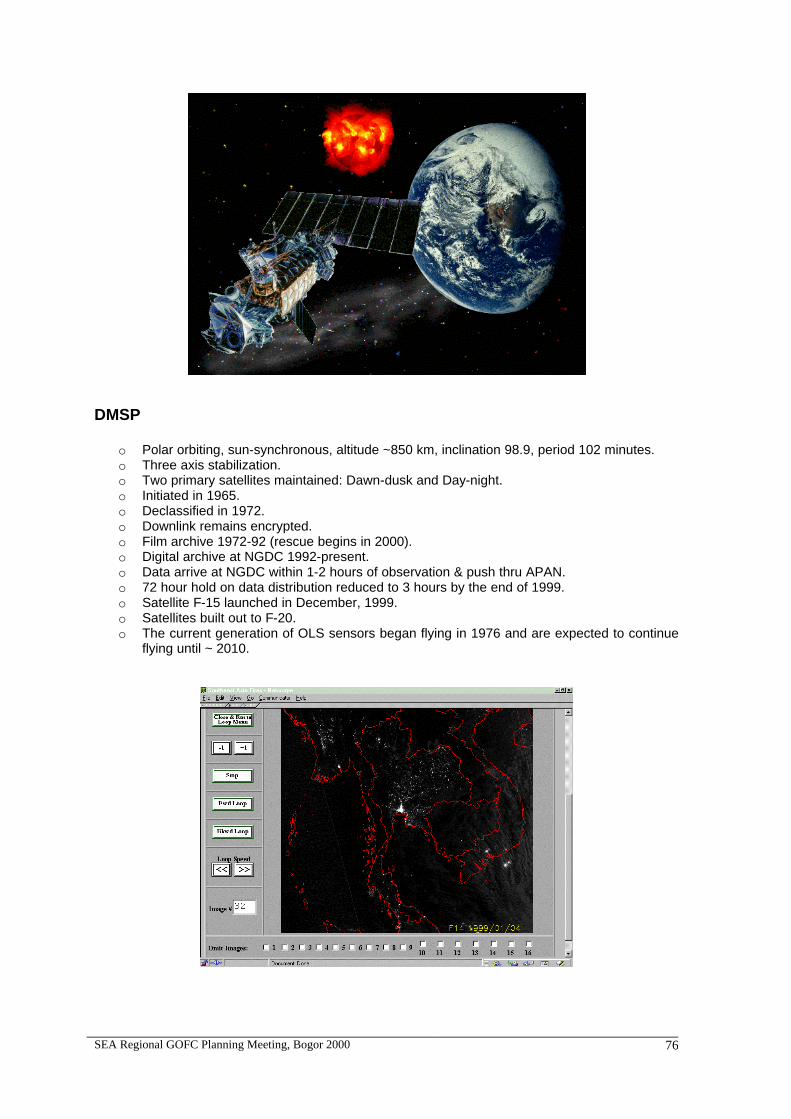
SEA Regional GOFC Planning Meeting, Bogor 2000 76
DMSP
o Polar orbiting, sun-synchronous, altitude ~850 km, inclination 98.9, period 102 minutes. o Three axis stabilization. o Two primary satellites maintained: Dawn-dusk and Day-night. o Initiated in 1965. o Declassified in 1972. o Downlink remains encrypted. o Film archive 1972-92 (rescue begins in 2000). o Digital archive at NGDC 1992-present. o Data arrive at NGDC within 1-2 hours of observation & push thru APAN. o 72 hour hold on data distribution reduced to 3 hours by the end of 1999. o Satellite F-15 launched in December, 1999. o Satellites built out to F-20. o The current generation of OLS sensors began flying in 1976 and are expected to continue
flying until ~ 2010.
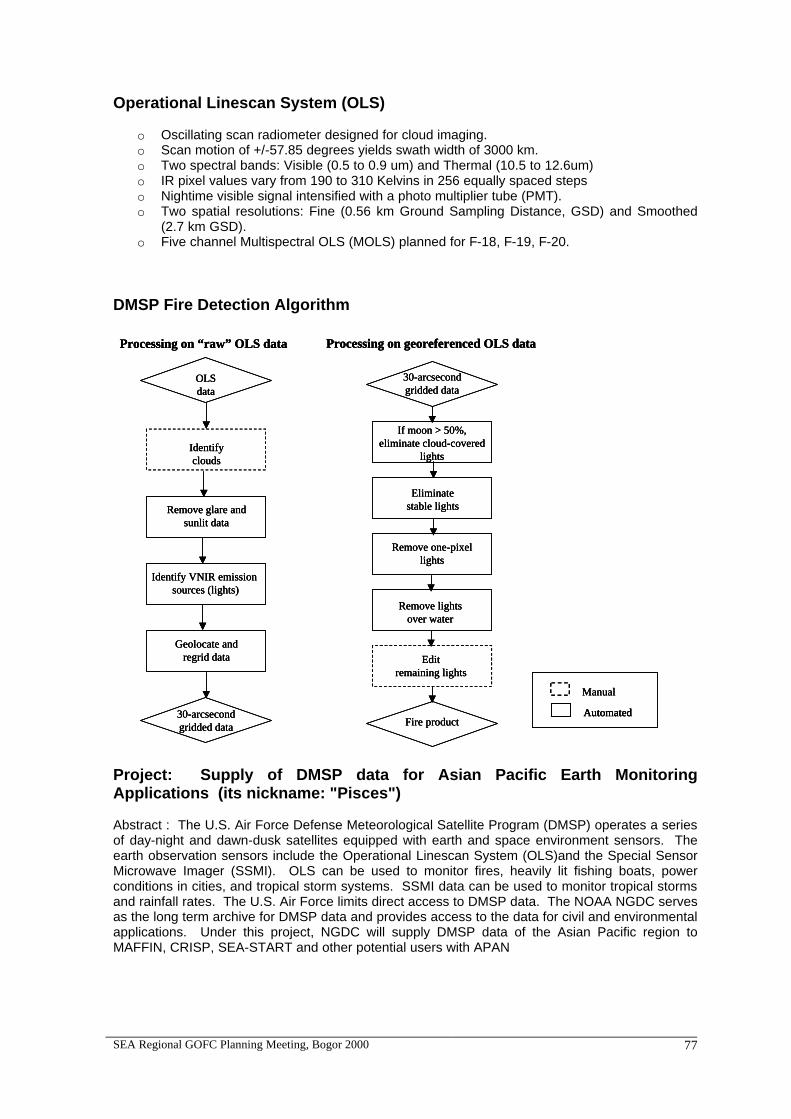
SEA Regional GOFC Planning Meeting, Bogor 2000 77
Operational Linescan System (OLS)
o Oscillating scan radiometer designed for cloud imaging. o Scan motion of +/-57.85 degrees yields swath width of 3000 km. o Two spectral bands: Visible (0.5 to 0.9 um) and Thermal (10.5 to 12.6um) o IR pixel values vary from 190 to 310 Kelvins in 256 equally spaced steps o Nightime visible signal intensified with a photo multiplier tube (PMT). o Two spatial resolutions: Fine (0.56 km Ground Sampling Distance, GSD) and Smoothed
(2.7 km GSD). o Five channel Multispectral OLS (MOLS) planned for F-18, F-19, F-20.
DMSP Fire Detection Algorithm
Manual
Automated
Identify VNIR emission sources (lights)
OLSdata
30-arcsecondgridded data
Geolocate andregrid data
Remove glare and sunlit data
Identifyclouds
Processing on “raw” OLS data
30-arcsecondgridded data
Fire product
If moon > 50%,eliminate cloud-covered
lights
Eliminate stable lights
Remove one-pixellights
Remove lights over water
Edit remaining lights
Processing on georeferenced OLS data
Manual
Automated
Manual
AutomatedAutomated
Identify VNIR emission sources (lights)
OLSdata
30-arcsecondgridded data
Geolocate andregrid data
Remove glare and sunlit data
Identifyclouds
Processing on “raw” OLS data
Identify VNIR emission sources (lights)
OLSdata
30-arcsecondgridded data
Geolocate andregrid data
Remove glare and sunlit data
Identifyclouds
Processing on “raw” OLS data
30-arcsecondgridded data
Fire product
If moon > 50%,eliminate cloud-covered
lights
Eliminate stable lights
Remove one-pixellights
Remove lights over water
Edit remaining lights
Processing on georeferenced OLS data
30-arcsecondgridded data
Fire product
If moon > 50%,eliminate cloud-covered
lights
Eliminate stable lights
Remove one-pixellights
Remove lights over water
Edit remaining lights
Processing on georeferenced OLS data
Project: Supply of DMSP data for Asian Pacific Earth Monitoring Applications (its nickname: "Pisces") Abstract : The U.S. Air Force Defense Meteorological Satellite Program (DMSP) operates a series of day-night and dawn-dusk satellites equipped with earth and space environment sensors. The earth observation sensors include the Operational Linescan System (OLS)and the Special Sensor Microwave Imager (SSMI). OLS can be used to monitor fires, heavily lit fishing boats, power conditions in cities, and tropical storm systems. SSMI data can be used to monitor tropical storms and rainfall rates. The U.S. Air Force limits direct access to DMSP data. The NOAA NGDC serves as the long term archive for DMSP data and provides access to the data for civil and environmental applications. Under this project, NGDC will supply DMSP data of the Asian Pacific region to MAFFIN, CRISP, SEA-START and other potential users with APAN
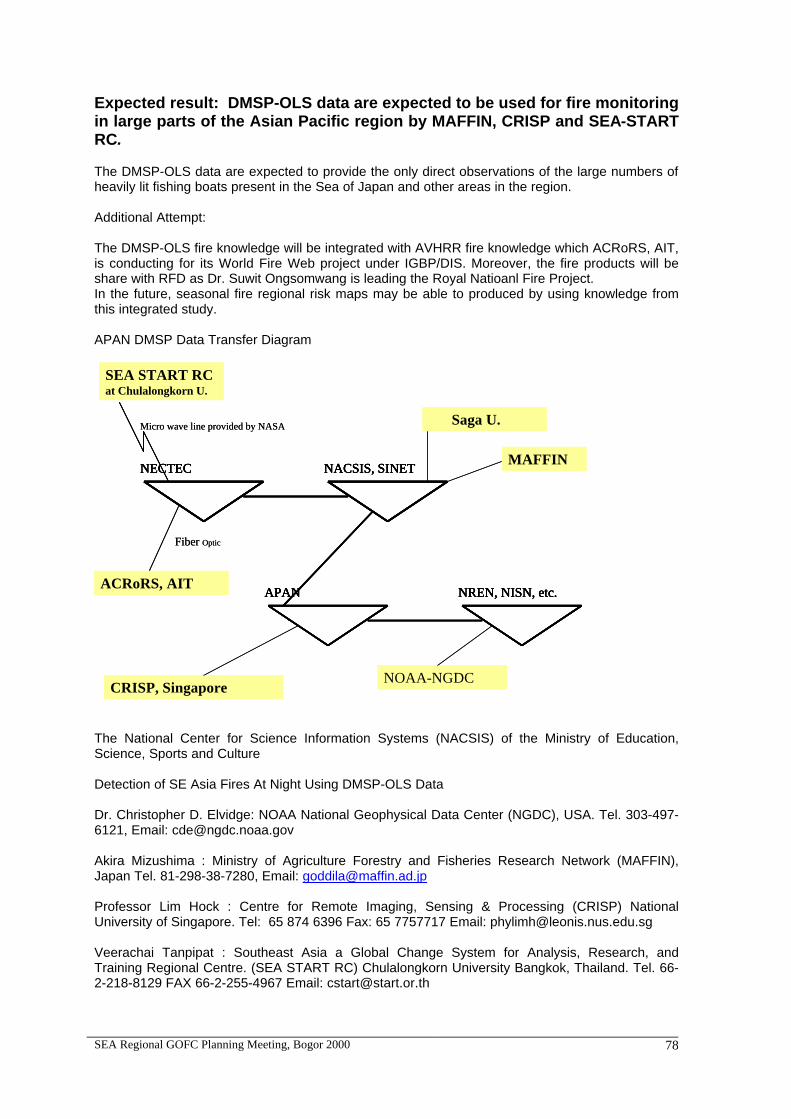
SEA Regional GOFC Planning Meeting, Bogor 2000 78
Expected result: DMSP-OLS data are expected to be used for fire monitoring in large parts of the Asian Pacific region by MAFFIN, CRISP and SEA-START RC. The DMSP-OLS data are expected to provide the only direct observations of the large numbers of heavily lit fishing boats present in the Sea of Japan and other areas in the region. Additional Attempt: The DMSP-OLS fire knowledge will be integrated with AVHRR fire knowledge which ACRoRS, AIT, is conducting for its World Fire Web project under IGBP/DIS. Moreover, the fire products will be share with RFD as Dr. Suwit Ongsomwang is leading the Royal Natioanl Fire Project. In the future, seasonal fire regional risk maps may be able to produced by using knowledge from this integrated study. APAN DMSP Data Transfer Diagram
NECTEC NACSIS, SINET
APAN NREN, NISN, etc.
SEA START RCat Chulalongkorn U.
Micro wave line provided by NASA Saga U.
ACRoRS, AIT
Fiber Optic
NOAA-NGDC
MAFFIN
CRISP, Singapore
NECTEC NACSIS, SINET
APAN NREN, NISN, etc.
NECTECNECTEC NACSIS, SINETNACSIS, SINET
APANAPAN NREN, NISN, etc.NREN, NISN, etc.
SEA START RCat Chulalongkorn U.
Micro wave line provided by NASA Saga U.
ACRoRS, AIT
Fiber Optic
NOAA-NGDC
MAFFIN
CRISP, Singapore The National Center for Science Information Systems (NACSIS) of the Ministry of Education, Science, Sports and Culture Detection of SE Asia Fires At Night Using DMSP-OLS Data Dr. Christopher D. Elvidge: NOAA National Geophysical Data Center (NGDC), USA. Tel. 303-497-6121, Email: [email protected] Akira Mizushima : Ministry of Agriculture Forestry and Fisheries Research Network (MAFFIN), Japan Tel. 81-298-38-7280, Email: [email protected] Professor Lim Hock : Centre for Remote Imaging, Sensing & Processing (CRISP) National University of Singapore. Tel: 65 874 6396 Fax: 65 7757717 Email: [email protected] Veerachai Tanpipat : Southeast Asia a Global Change System for Analysis, Research, and Training Regional Centre. (SEA START RC) Chulalongkorn University Bangkok, Thailand. Tel. 66-2-218-8129 FAX 66-2-255-4967 Email: [email protected]
SEA Regional GOFC Planning Meeting, Bogor 2000 79
Participant Institutions 1. NOAA National Geophysical Data Center (NOAA-NGDC) 2. Ministry of Agriculture Forestry and Fisheries Research Network (MAFFIN) 3. National University of Singapore-Center for Remote Imaging Sensing and Processing
(NUS-CRISP) 4. Southeast Asia The Global Change SysTem for Analysis, Research and Training Regional
Centre, Environmental Research Institute of Chulalongkorn University, Thailand. (SEA START RC)
5. IPMIST Lab, China Agricultural University (IPMIST) 6. Nanjing Institute of Geography and Limnology, Chinese Academy (NAIGLAS) 7. Laboratory Image Processing & GIS - Geodetic Engineering Department - The Institute of
Technology, Bandung (GE-ITB) 8. Universiti Putra Malaysia (UPM) 9. Asian Center for Research on Remote Sensing (ACRoRS-AIT) 10. Volcanological Survey of Indonesia (VSI) 11. Meteorological Research Institute of Korea Meteorological Administration(MRI) 12. Philippine Atmospheric, Geophysical & Astronomical Services Administration (PAGASA) 13. Tokai University Research & Information Center (TU-RIC) 14. Network Research Group, School Of Computer Science, Universiti Sains Malaysia (NRG-
USM) 15. Computer Center Tohoku University, Japan (CC-TU) 16. Mariano Marcos State University, Philippines (MMSU) 17. Soil and Fertilizer Institute, Chinese (SFI) 18. Australian National University (ACSys CRC) 19. Research Institute, Padjadjaran University (RIPU) 20. Remote Sensing Technology Application Center, Ministry of Water Resources, China
(RSTAC) 21. Malaysian Meteorological Service (MMS) 22. National Astronomical Observatory, Japan (NAO) 23. National Application and Training Center for Agricultural Remote Sensing China
Agricultural University (NATC-ARC). Contact to [email protected]
SEA Regional GOFC Planning Meeting, Bogor 2000 80
GOIN/CEOS/SE ASIA GOFC DEMONSTRATION
Veerachai Tanpipat
Southeast Asia a Global Change System for Analysis, Research, and Training Regional Centre
(SEA START RC) Chulalongkorn University Bangkok, Thailand Tel. 66-2-218-8129 FAX 66-2-255-4967
Email: [email protected]
Bogor, Indonesia, February 1, 2000 Earth Obsevation Science Prototyping Activities
Phase 3: APAN2000 Demonstration Febuary 15 - 17, 2000, Tsukuba, Japan
This demonstration project addresses high performance data exchange, data visualization as well as videoconference over high peoformance networks. Four demonstrations will be provided at APAN2000 utilizing multiple High Performance Research and Education Networks (HPRENs). Two demonstration areas will be set up: the conference room area to perform demonstrations during the Earth Monitoring Working Group meeting and a demonstration area to futher discuss the demonstration during the lunch and break times. Expected results of these demonstrations include:
1. The establishment of high performance data search, retrieval, exchange and visualization over international research networks.
2. A remote team “teleseminar” utilizing data exchange and video-conferencing over IP networks.
The demonstrations at APAN2000 will mark the third phase of an ongoing effort to demonstrate the fact that science researchers have access to High Performance Research and Education Networks (HPRENs) to collect, distribute and collaborate on Earth Observation data. Demostration Information: 1. Data Search and Access Using Data and Information Access Link (DIAL)
o Search geographically distributed interactive catalogues for specific EOS data; retrieve and display sekected browse images from the data archieves in near real time.
o Samurai: Jeff Smith, NASA/GSFC @Email: [email protected]
o Application POC: Liping Di, NASA @Email: [email protected]
Expected Results: Rapid retrieval of data “hits” from the majority of sites searched and retrieval of browse images from one selected archive in near real time 2. Distribution Solar Activity Prediction Modeling (ST)
o Display comparison of multiple solar activity predictions models based upon shared data inputs and compare outputs based on 5 to to processing intervals.
o Samurai: Thom Stone, NASA Ames Research Center
Appendix – 12
SEA Regional GOFC Planning Meeting, Bogor 2000 81
@Email: [email protected] o POC: Herb Kroehi, NOAA
Expected Results: Near real time comparison of results of different solr activity models, and ability to compare results and adjust models accordingly. 3. Data Access and 3D Visualization via the WWW (VMRL)
o Users make interactive Java data plot pulling data from the distributed servers to overplot them with an interactive Java graphics on the desktop. This is the Next Generation NOAA server prototype software.
o Samulai: TBD o Application POC: Nancy Soreide, NOAA
@Email: [email protected] Expected Results: Interactive 3D animations of El Nino and La Nina Virtual Reality Modeling Language (VRML) 4. Real-time TeleSeminar - Discussion of Tropical Rainfall Measurement Mission (TRMM) Data Results
o Team collaboration / teleseminar is an efficient to support discussion / seminar about global change issues, such as El Nino, forest fire, land use and land cover change, natural hazards, among scientists, policy makers and data providers around the world.
o Samurai: Horiguchi, NASDA o Application POC: Shin-ichi Sobue, NASDA
@Email [email protected]
Expected Results: Demonstration of the effectiveness of team collaboration tools over networks of geographically distributed science team members in support of CEOS science projects. Earth Observation Demonstration Activities Milestone: Phase I GOIN99 took place in Honolulu, Hawaii during March 22 - 25, 1999. Phase II CEOS99 took place in Strockholm, Sweden during November 10 - 12, 1999. Phase III APAN2000 will take place in Tsukuba, Japan during Febuary 15 - 17, 2000. Phase IV CEOS/GOFC2000 will take place in BKK, Thailand September 2000. 5. Tropical Rainforest Infomation Center (TRFIC) ?? - Samurai: TBD - POC: TBD Expected Results: SE Asia GOFC Network for data and information of forests in both RS and GIS for researchers, policy makers, and general public wanting information of current trends and condition. The pilot project’s details needs to be discussed among SE Asia GOFC Members to present the needs to GOIN/CEOS.
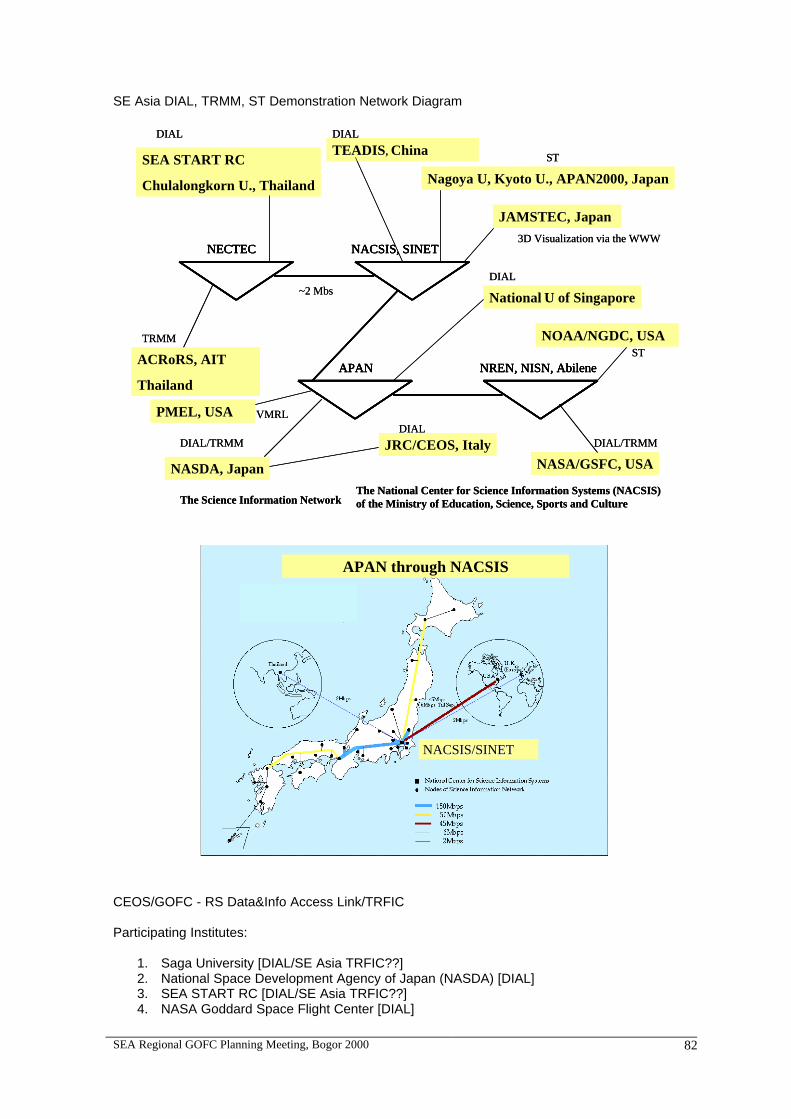
SEA Regional GOFC Planning Meeting, Bogor 2000 82
SE Asia DIAL, TRMM, ST Demonstration Network Diagram
NECTEC NACSIS, SINET
APAN NREN, NISN, Abilene
SEA START RC
Chulalongkorn U., Thailand
NASDA, Japan NASA/GSFC, USA
ACRoRS, AIT
Thailand
The National Center for Science Information Systems (NACSIS) of the Ministry of Education, Science, Sports and Culture
~2 Mbs
DIAL/TRMMDIAL/TRMM
DIAL
TRMM
The Science Information Network
TEADIS, ChinaDIAL
National U of Singapore
DIAL
JRC/CEOS, ItalyDIAL
NOAA/NGDC, USAST
Nagoya U, Kyoto U., APAN2000, Japan
ST
JAMSTEC, Japan
3D Visualization via the WWW
PMEL, USA VMRL
NECTEC NACSIS, SINET
APAN NREN, NISN, Abilene
NECTECNECTEC NACSIS, SINETNACSIS, SINET
APANAPAN NREN, NISN, AbileneNREN, NISN, Abilene
SEA START RC
Chulalongkorn U., Thailand
NASDA, Japan NASA/GSFC, USA
ACRoRS, AIT
Thailand
The National Center for Science Information Systems (NACSIS) of the Ministry of Education, Science, Sports and Culture
~2 Mbs
DIAL/TRMMDIAL/TRMM
DIAL
TRMM
The Science Information Network
TEADIS, ChinaDIAL
National U of Singapore
DIAL
JRC/CEOS, ItalyDIAL
NOAA/NGDC, USAST
Nagoya U, Kyoto U., APAN2000, Japan
ST
JAMSTEC, Japan
3D Visualization via the WWW
PMEL, USA VMRL
NACSIS/SINETNACSIS/SINET
APAN through NACSIS
NACSIS/SINETNACSIS/SINET
APAN through NACSIS
CEOS/GOFC - RS Data&Info Access Link/TRFIC Participating Institutes:
1. Saga University [DIAL/SE Asia TRFIC??] 2. National Space Development Agency of Japan (NASDA) [DIAL] 3. SEA START RC [DIAL/SE Asia TRFIC??] 4. NASA Goddard Space Flight Center [DIAL]
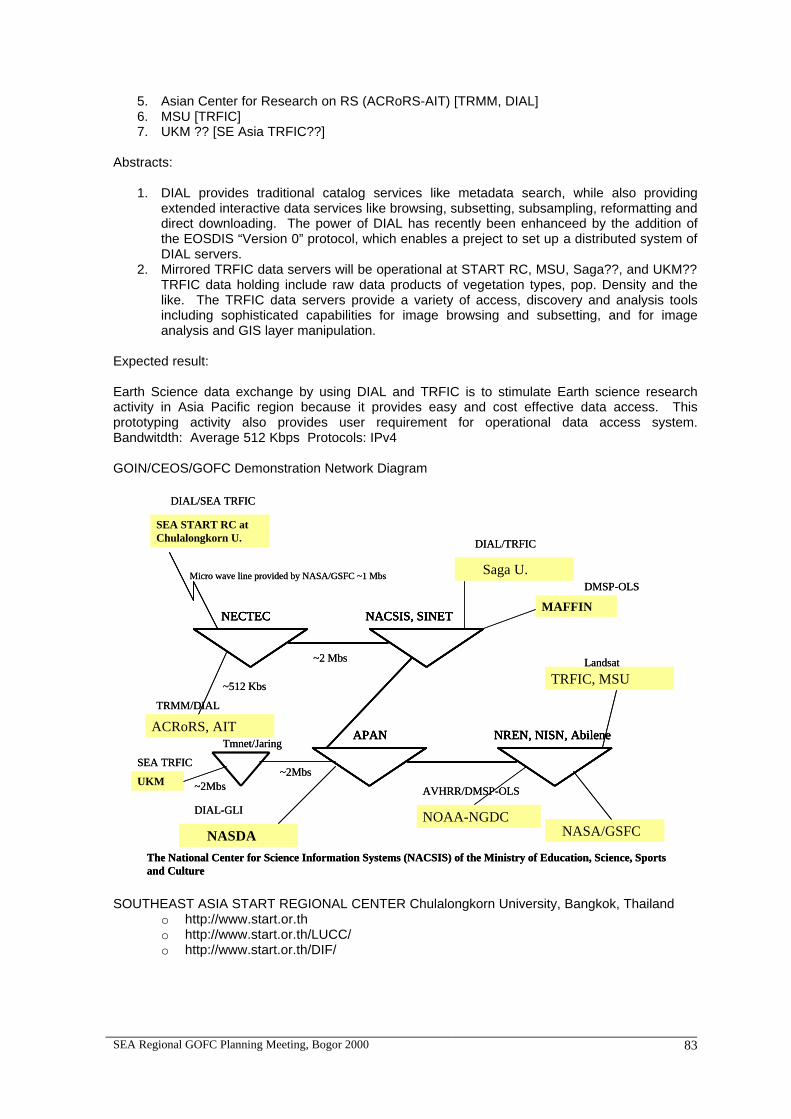
SEA Regional GOFC Planning Meeting, Bogor 2000 83
5. Asian Center for Research on RS (ACRoRS-AIT) [TRMM, DIAL] 6. MSU [TRFIC] 7. UKM ?? [SE Asia TRFIC??]
Abstracts:
1. DIAL provides traditional catalog services like metadata search, while also providing extended interactive data services like browsing, subsetting, subsampling, reformatting and direct downloading. The power of DIAL has recently been enhanceed by the addition of the EOSDIS “Version 0” protocol, which enables a preject to set up a distributed system of DIAL servers.
2. Mirrored TRFIC data servers will be operational at START RC, MSU, Saga??, and UKM?? TRFIC data holding include raw data products of vegetation types, pop. Density and the like. The TRFIC data servers provide a variety of access, discovery and analysis tools including sophisticated capabilities for image browsing and subsetting, and for image analysis and GIS layer manipulation.
Expected result: Earth Science data exchange by using DIAL and TRFIC is to stimulate Earth science research activity in Asia Pacific region because it provides easy and cost effective data access. This prototyping activity also provides user requirement for operational data access system. Bandwitdth: Average 512 Kbps Protocols: IPv4 GOIN/CEOS/GOFC Demonstration Network Diagram
NECTEC NACSIS, SINET
APAN NREN, NISN, Abilene
SEA START RC at Chulalongkorn U.
Micro wave line provided by NASA/GSFC ~1 Mbs Saga U.
NASDA NASA/GSFC
ACRoRS, AIT
~512 KbsTRFIC, MSU
NOAA-NGDC
The National Center for Science Information Systems (NACSIS) of the Ministry of Education, Science, Sports and Culture
MAFFIN
~2 Mbs
UKM
Tmnet/Jaring
~2Mbs~2Mbs
Landsat
AVHRR/DMSP-OLS
DIAL-GLI
DIAL/TRFIC
SEA TRFIC
DIAL/SEA TRFIC
TRMM/DIAL
DMSP-OLS
NECTEC NACSIS, SINET
APAN NREN, NISN, Abilene
NECTECNECTEC NACSIS, SINETNACSIS, SINET
APANAPAN NREN, NISN, AbileneNREN, NISN, Abilene
SEA START RC at Chulalongkorn U.
Micro wave line provided by NASA/GSFC ~1 Mbs Saga U.
NASDA NASA/GSFC
ACRoRS, AIT
~512 KbsTRFIC, MSU
NOAA-NGDC
The National Center for Science Information Systems (NACSIS) of the Ministry of Education, Science, Sports and Culture
MAFFIN
~2 Mbs
UKM
Tmnet/Jaring
~2Mbs~2Mbs
Landsat
AVHRR/DMSP-OLS
DIAL-GLI
DIAL/TRFIC
SEA TRFIC
DIAL/SEA TRFIC
TRMM/DIAL
DMSP-OLS
SOUTHEAST ASIA START REGIONAL CENTER Chulalongkorn University, Bangkok, Thailand
o http://www.start.or.th o http://www.start.or.th/LUCC/ o http://www.start.or.th/DIF/
SEA Regional GOFC Planning Meeting, Bogor 2000 84
SOME SUGGESTIONS AS INPUTS FOR GOFC : FRAMEWORK FOR GOFC PILOT PROJECT PLANNING
Riga Adiwoso Suprapto
Ingress: I have to apologize for not being able to attend the meeting today. However, I felt there is a need to provide further details and clarification on the ‘Framework for GOFC Pilot Project Planning’ presented by Dr. Syarifah based on draft written/drawn (in haste)by me during the meeting. I hope it will be a useful starting point or at least serve as an alternative way in framing the pilot project. Background Rationale for the Framework: • Reading the objectives as presented by David Skole, it seems aside from technical questions
to be solved, the core issue in planning the Pilot-Project is the very question of how to narrow the gap between producers and users of remote sensing data on forest cover. I have borrowed a framework often used in business to approach the core issue at hand. (My apology to use business management terms to explain the framework).
• In bridging the ‘gap’ between the data ‘producers’ and the ‘users’ there are two approaches: (1) “classical marketing approach through selling”; i.e., providing training and “convincing” (or “selling” to) various parties on the virtues and benefits of “remote sensing maps” as produced by GOFC; or (2) “consumer/user oriented approach”; i.e. seeking to understand based on “need assessment study” what are the specification and types of products the users need and/or want.
• The first one is more a ‘top-down’ approach. The scientists are free to define the sites, the scales, as well as the various parameters in their works. After producing maps and data the scientists will then try to convince others the applicability and ‘usefulness’ of the results.
• The second one is more a “bottom-up” approach. This means (using business management term) “becoming more user-oriented”. This, in effect warrants a preliminary or a “pre-pilot project” activity,-conducting a ‘’User need-assessment study’-, prior to defining the sites as well as the parameters and scales for GOFC data/maps.
• Since various parties (such as Wetland International, Conservation International as well as IC-SEA/GCTE) gave presentations, explaining what satellite data were used, and how they were employed in their respective projects, my understanding is that there is a greater want to use the ‘bottom-up’/ second approach for the GOFC pilot project.
Pilot Project Planning Phases: • The GOFC Pilot Project could consist of two consecutive phases, one following the other. • The first phase is the ‘PRE-PILOT PROJECT’ . The second phase is the ‘PILOT-PROJECT
Exercise in several sites’. • Between the first and the second phase a workshop should be held to decide on the sites,
scales, parameters to be included in the GOFC pilot project based on the first phase results ( thus not ‘a priori’ defined). In short, the second phase can only be defined and proposal submitted after the first (Pre-Pilot Project) phase has been completed.
PRE-PILOT PROJECT PHASE: Objectives :
• Obtain baseline information and assessing Users’ Data Needs, • Obtain information of Approaches Used or Practices by various levels of Producers, • Assess the Feasibility of Providing users’ needs.
Appendix – 13
SEA Regional GOFC Planning Meeting, Bogor 2000 85
Expected Outputs : 1. Initial Data-Base of Users in the Region both institutions and Individuals. 2. Identification of User Needs for Forest Cover Satelite Data 3. Identification of Resources and Participants for Ground-Truth Activity.
Duration : This Phase can be carried out in 3 months and can be conducted by the respective
national project team. Framework Design and Methods: The Pre-pilot Project Phase will consist of two main activities that are further divided into sub-activities:
1. User Need-Assessment: • Identifying and creating Data-Base (Inventory) of Users:
This activity can be carried out by each country team. One possible way suggested for classification and assigning categories of data will be between institutions and individiuals be it local as well as international and national bodies or individuals (figure 2). The Data Base serves also the purpose as a base for further networkings within the country. (Will gladly help in designing the Data Base Categorization) Method: A possible way to go about this is to do initial secondary data gathering, as well as using ‘snowball technique’ to get in touch with institutions and/or individuals. Another way is to hold a meeting of identified users to share information.
• Identifying Users’ Needs: This activity will concentrate on obtaining detailed information of current and potential (if possible) user needs. Three main areas of information to be collected will be directed towards the following questions:
• What data are currently in use, • What data are perceived as ‘ideal’ and not obtainable, • How are satelite data used, and for what purposes ( how are satelite
data understood), • How varied are the interpretations of data (e.g. are the same term
used differently etc.) Method/s: Depending on the degree of involvement in decision making one wants users to participate in deciding the parameters, sites, scales of the pilot project the method/s for collecting and assessing user needs is/are selected. Possible methods are questionnaire distribution, brainstorming sessions using nominal group or focus group discussions, iterative delphi method, etc. (Will be happy to help out in designing the method/s, including the questionnaire if deemed appropriate)
2. Approaches or Practices of Data Producers: • Identification what and how data are produced:
Since there are various levels of producers just as there are many levels of users; i.e. since a producer may well be a data user from a different level and sources-, there is a need to review and obtain overview of what data are produced (e.g. various GIS) and how they are produced. The main purposes of this sub-activity are (1) to obtain a better picture of the clustering of data availablibility with their variations, and (2) define what are feasible to produce based on familiarity and capability of producers, as well as state-of-the-art of the methods and techniques currently in use. Method/s: The methods available ranges from questionnaire to various brainstorming session methods.
• Internal Discussion Among Various Levels of Producers to ‘Harmonize’ or ‘Standardize’ Data for Wider Use: Initial discussion is necessary to obtain insights into how to overcome variabilities in both data collections and data analysis and interpretation. There is a need to decide the extent to which variabilities in methods and approaches are desirable for GOFC. There is always the problem of how could ‘generic data’ be produced
SEA Regional GOFC Planning Meeting, Bogor 2000 86
that allow a degree of flexibility for varieties of uses. The result of this discussion will then become the basis for the workshop between the Pre-Pilot Project Phase and the Pilot Project Phase.
WORKSHOP PREPARATION AND PROPOSAL WRITING FOR SECOND PHASE: Objectives:
• Review and exchange information on the results of Pre-Project Phase • Define the framework including the parameters, sampling, protocols etc. for the Pilot
Project, • Define networking among users and producers.
Expected Outputs: • Pilot Project proposal, • Descripton (both conceptual and operational definitions) of the method/s to be used in
the Pilot Project • Initial agreement in networking and collaboration.
Duration : Two to Three Days. PILOT PROJECT PHASE: ( details will be further defined based on data collected) Focus: Forest Cover Time Dimension: Approximate Locations: in SEAS in how many places can be discussed. Committed Participants:
SEA Regional GOFC Planning Meeting, Bogor 2000 87
INDONESIAN NEEDS AND POLICY ON FOREST COVER MONITORING WITHIN THE CONTEXT OF GLOBAL
CHANGE STUDY
Untung Iskandar
Director General,
Forest and Estate Crops R & D PERMANENT FOREST LAND
Forested: 90.1 million ha o Production Forest o Protection Forest o Conservation Forest
(50.2 million ha) (24.9 million ha) (15.0 million ha)
Unforested 19.4 million ha Total 109.5 million ha
GDP CONTRIBUTION IN 1998 (constant price 1993)
Forestry Agriculture Mining Oil & Gas Processing Property
4.05 % 15.3 % 9.82 % 2.89 % 5.64 %
RATE OF DEFORESTATION IN INDONESIA
o 1,600,000 hectares per year o Based on RePProt 1985 and MoFEC June 1998 o Including Kalimantan, Sumatera, Sulawesi and Irian Jaya
PRINCIPLE DATABASE DESIGN
o product of NFI digital map databases is map sheets, and provincial digital database of map layers.
o database is derived from cartographic products. o digital map, and derived maps must be made available to PC-based users
PROBLEMS ENCOUNTERED o Data acquisition: due to limited coverage of the satellite image receiving station
and lack of financial resources o Inadequate infrastructure, due to insufficient financial resources o Lack of human resources, especially in the provinces
Appendix – 14
SEA Regional GOFC Planning Meeting, Bogor 2000 88
FORESTRY DATABASE
o Map standard: BAKOSURTANAL Rupabumi Basemaps; o thematic maps from other institutions sent to NFI for clearance; o other institutiosn within the Ministry send catalog of standardized data and
information to NFI Centre; o catalogue of national forest resources information would be disseminated to other
institutions; o information would be centrally managed, reviewed for clearance, and transferred
by NFI, which is a node within the national spatial database network; o NFI node sends the catalogue to other nodes, and becomes the national forestry
data and information clearance house.
SEA Regional GOFC Planning Meeting, Bogor 2000 89
ENVIRONMENTAL SCIENCE FOR SOCIAL CHANGE
Peter W.Walpole, Director
Quezon City, Philippines
Briefly, about ESSC, it is working for change, change in society’s management of the environment and so is driven by the needs of society for sustainable environment and this is the basis for establishing the scientific focus. As a research institute methodological development are critical, while its relevance and impact is sought at all levels of society. We are part of a long tradition in mapping and weather in the Philippines, and for the last ten years have been working with water and forest, management and mapping with policy dialogue. Most recent has been the developing dialogue in response to 30% of the Philippines being licensed for mining exploration, Mining Revisited, a documentation of perspectives and some area mapping of the concerns. Most of the work we are familiar with is micro level research and pilot studies of government and academic organizations. For the macro level we draw heavily on baseline data of NAMRIA and PAGASA as well as work in the University of the Philippines. For sustainable forest management a continuous monitoring and inventory is needed, along with criteria and indicators (from ITTO, UNCED and UNCRD). The need is to know at the detail of local impact what the biophysical and ecological status and human trends and impact. The value of this is in the development of a national Information Framework for Forestland Management and Conservation, integration of all land/water use policies and management programs and strategies. ESSC EFFORTS The efforts of ESSC may be viewed on the national and local level, and in most cases using NAMRIA sourced data, while in particular activities we do our own classification:
1. Review and analyze existing historical data for general consumption, for example, Decline of the Philippine Forest, map series from 1900 to 2000 with scenarios for 2010 based on government data and programs.
2. Compilation of national data sets with Philippine biodiversity experts and Conservation
International and develop an understanding of biodiversity hot spots and where research and protection is most needed. Expected collaborative map and CDROM by the end of the year (as has been done for Madagascar etc.).
3. Basic mapping of cultural community area presence and forest areas, for planning and
program consideration, Philippine Culture and Ecosystems, 1998, as well as particular Ancestral Domain Claims and Management Agreements in several areas.
4. Related to this are studies reflecting forest fragmentation, example, Mindanao Forest
Cover, map series 1994. 5. Integration of community mapping with technical mapping as basis to improve validation
and potential management, example, Resource Conflict and Cultural Management, map series 1997.
6. Specific area classification and validation done with ISPRA in Southeast Asia for their
regional map,1992.
Appendix – 15
SEA Regional GOFC Planning Meeting, Bogor 2000 90
7. Analysis of planning and management for improved multiple land use activities, example, Mindoro in the Balance, map series of history and programs on the island of Mindoro, 1998.
8. Cloud forest classification and assessment in the Philippines, in line with forest conversion
studies.
9. Analysis of landuse practices on the Pantaron Range, Mindanao, for better planning and management strategies, Ecological Services of the Pantaron, map series expected 2001. This will also include modification of software used in temperate climates for better tropical forest classification.
10. Much of the work has contributed to a larger dialogue with forest management practitioners
(around 500) in Southeast Asia, through the Asia Forest Network, and with the IUCN – Community Involvement in forest Management and the Intergovernmental Forum on Forests.
The need is to improve classification of forestlands in terms of community management and multiple resource extraction, rather than the traditional logging extraction and general overviews. Calibration and validation aspects are most important in getting more local organizations involved. Areas where local level work is critical is in monitoring buffer zones, patterns of small scale seasonal burning, biodiversity corridors, municipal water supply catchments, cloud forest blocks, social and resource pressure areas.
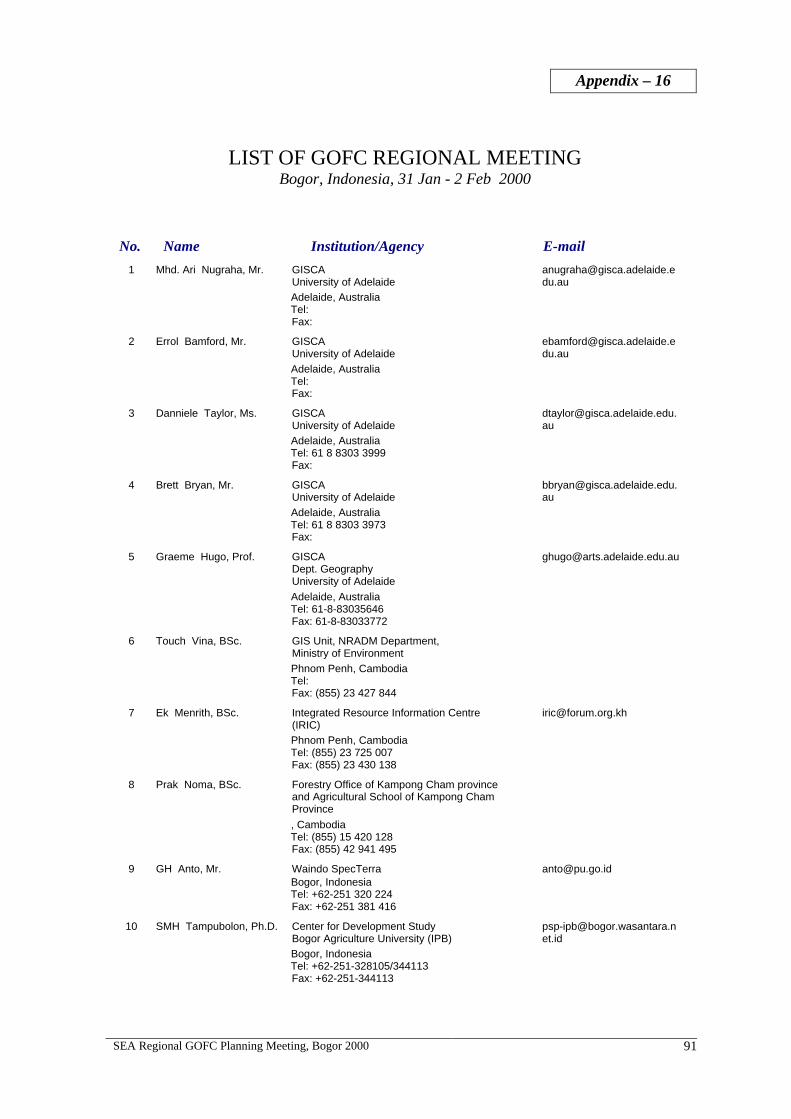
SEA Regional GOFC Planning Meeting, Bogor 2000
91
LIST OF GOFC REGIONAL MEETING Bogor, Indonesia, 31 Jan - 2 Feb 2000
No. Name Institution/Agency E-mail 1 Mhd. Ari Nugraha, Mr. GISCA [email protected] University of Adelaide du.au Adelaide, Australia Tel: Fax:
2 Errol Bamford, Mr. GISCA [email protected] University of Adelaide du.au Adelaide, Australia Tel: Fax:
3 Danniele Taylor, Ms. GISCA [email protected]. University of Adelaide au Adelaide, Australia Tel: 61 8 8303 3999 Fax:
4 Brett Bryan, Mr. GISCA [email protected]. University of Adelaide au Adelaide, Australia Tel: 61 8 8303 3973 Fax:
5 Graeme Hugo, Prof. GISCA [email protected] Dept. Geography University of Adelaide Adelaide, Australia Tel: 61-8-83035646 Fax: 61-8-83033772
6 Touch Vina, BSc. GIS Unit, NRADM Department, Ministry of Environment Phnom Penh, Cambodia Tel: Fax: (855) 23 427 844
7 Ek Menrith, BSc. Integrated Resource Information Centre [email protected] (IRIC) Phnom Penh, Cambodia Tel: (855) 23 725 007 Fax: (855) 23 430 138
8 Prak Noma, BSc. Forestry Office of Kampong Cham province and Agricultural School of Kampong Cham Province , Cambodia Tel: (855) 15 420 128 Fax: (855) 42 941 495
9 GH Anto, Mr. Waindo SpecTerra [email protected] Bogor, Indonesia Tel: +62-251 320 224 Fax: +62-251 381 416
10 SMH Tampubolon, Ph.D. Center for Development Study [email protected] Bogor Agriculture University (IPB) et.id Bogor, Indonesia Tel: +62-251-328105/344113 Fax: +62-251-344113
Appendix – 16
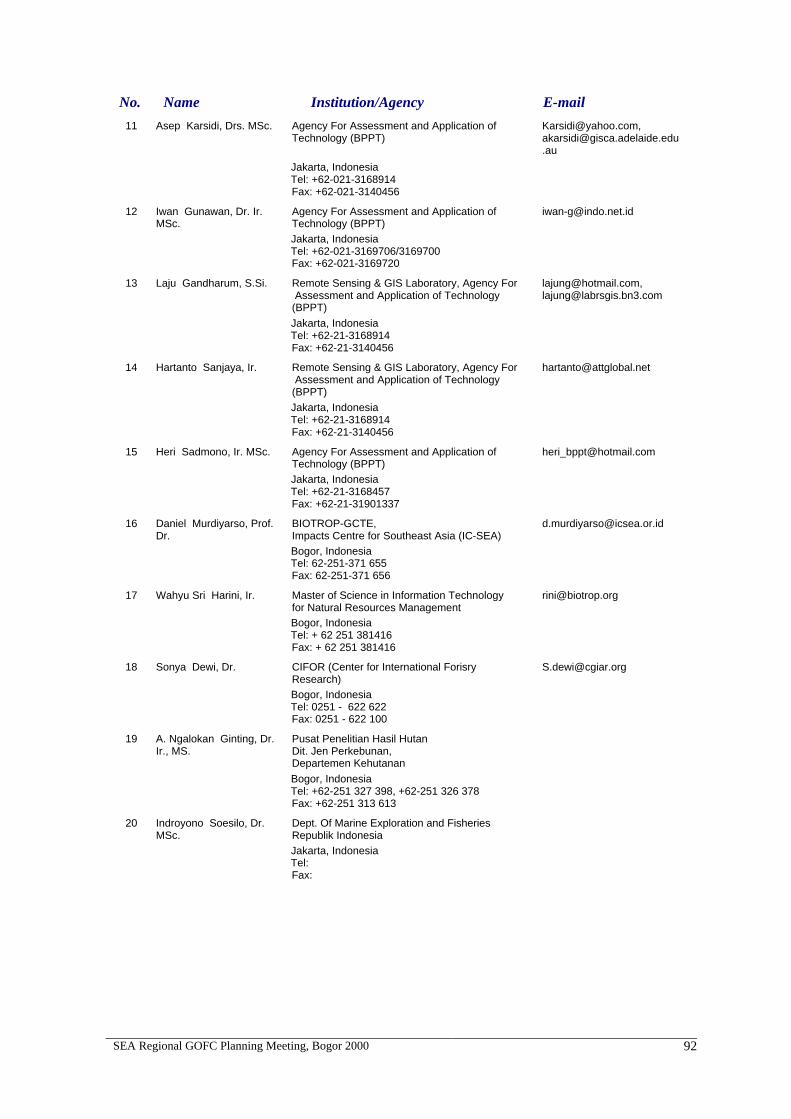
SEA Regional GOFC Planning Meeting, Bogor 2000
92
No. Name Institution/Agency E-mail 11 Asep Karsidi, Drs. MSc. Agency For Assessment and Application of [email protected], Technology (BPPT) [email protected] .au
Jakarta, Indonesia Tel: +62-021-3168914 Fax: +62-021-3140456
12 Iwan Gunawan, Dr. Ir. Agency For Assessment and Application of [email protected] MSc. Technology (BPPT) Jakarta, Indonesia Tel: +62-021-3169706/3169700 Fax: +62-021-3169720
13 Laju Gandharum, S.Si. Remote Sensing & GIS Laboratory, Agency For [email protected], Assessment and Application of Technology [email protected] (BPPT) Jakarta, Indonesia Tel: +62-21-3168914 Fax: +62-21-3140456
14 Hartanto Sanjaya, Ir. Remote Sensing & GIS Laboratory, Agency For [email protected] Assessment and Application of Technology (BPPT) Jakarta, Indonesia Tel: +62-21-3168914 Fax: +62-21-3140456
15 Heri Sadmono, Ir. MSc. Agency For Assessment and Application of [email protected] Technology (BPPT) Jakarta, Indonesia Tel: +62-21-3168457 Fax: +62-21-31901337
16 Daniel Murdiyarso, Prof. BIOTROP-GCTE, [email protected] Dr. Impacts Centre for Southeast Asia (IC-SEA) Bogor, Indonesia Tel: 62-251-371 655 Fax: 62-251-371 656
17 Wahyu Sri Harini, Ir. Master of Science in Information Technology [email protected] for Natural Resources Management Bogor, Indonesia Tel: + 62 251 381416 Fax: + 62 251 381416
18 Sonya Dewi, Dr. CIFOR (Center for International Forisry [email protected] Research) Bogor, Indonesia Tel: 0251 - 622 622 Fax: 0251 - 622 100
19 A. Ngalokan Ginting, Dr. Pusat Penelitian Hasil Hutan Ir., MS. Dit. Jen Perkebunan, Departemen Kehutanan Bogor, Indonesia Tel: +62-251 327 398, +62-251 326 378 Fax: +62-251 313 613
20 Indroyono Soesilo, Dr. Dept. Of Marine Exploration and Fisheries MSc. Republik Indonesia Jakarta, Indonesia Tel: Fax:
SEA Regional GOFC Planning Meeting, Bogor 2000
93
No. Name Institution/Agency E-mail 21 Diah Saraswati, Ms. PT. Waindo SpecTerra [email protected] BOGOR, Indonesia Tel: 62-251-320224 Fax: 62-251-381416
22 Riga Adiwoso, Dr. Faculty of Economic University Of Indonesia Depok, Indonesia Tel: 3103976 Fax: 3103931
23 Lilik Budi Prasetyo, Dr. Forest Resources Conservation [email protected] Faculty of Forestry Bogor Agriculture Universeity (IPB) Bogor, Indonesia Tel: +62 251 621 947 Fax: +62 251 621 256
24 Aryo Hanggono, Dr. Dit. TISDA BPP Teknologi Jakarta, Indonesia Tel: +62 21 316 8140 Fax: +62 21 392 6513
25 Untung Iskandar, Dr. Kepala Badan Pengembangan dan Penelitian Departemen Kehutanan dan Perkebunan Jakarta, Indonesia Tel: +62 21 570 1114 Fax:
26 Muhammad Muchlis, Ir. Indonesian National Aeronautics and Space [email protected] Institute (LAPAN) Jakarta, Indonesia Tel: +62-021-8717717 Fax: +62-021-8717715
27 Iwan Setiawan, Mr. MSc. In IT for Natural Resources Mngt. (MIT) [email protected] BOGOR, Indonesia Tel: 62-251-381416 Fax: 62-251-381416
28 Aca Sugandhy, Ir., MSc. Ministry of Environment [email protected] Republik Indonesia Jakarta, Indonesia Tel: +62-21-851-8138 Fax: +62-21-858-0111
29 Muhammad Helmi, Mr. PT. Waindo SpecTerra [email protected] BOGOR, Indonesia Tel: 62-251-320224 Fax: 62-25-381416
30 Makmur Widodo, Mr. BIOTROP-GCTE, [email protected] Impacts Centre for Southeast Asia (IC-SEA) Bogor, Indonesia Tel: 62-251-371 655 Fax: 62-251-371 656
31 Chairil Anwar Siregar, Dr. Pusat Penelitian Pengembangan Hutan [email protected] , Ir., MSc. Dit. Jen Perkebunan, Departemen Kehutanan Bogor, Indonesia Tel: +62-251 327 398, +62-251 326 378 Fax:
SEA Regional GOFC Planning Meeting, Bogor 2000
94
No. Name Institution/Agency E-mail 32 Hermawan Wijayanto, Mr. Conservation International - [email protected] Indonesia Programme Jakarta, Indonesia Tel: 788 38 624 Fax: 780 0265
33 I Nyoman Suryadiputra, Ir. Wetland International - [email protected] Indonesia Programme Bogor, Indonesia Tel: +62 251 312 189 Fax: +62 251 325 755
34 Nur Mahmudi Ismail, Dr. Department of Forestry and Republic of Indonesia Jakarta, Indonesia Tel: Fax:
35 Jatna Supriyatna, Dr. Conservation International - Indonesia Program [email protected] (CI - IP) Jakarta, Indonesia Tel: 021- 788 38 624, 021 - 788 38 626 Fax: 021 - 780 0256
36 Tom Tomich, Dr. ICRAF Southeast Asia Regional Programme [email protected] Bogor, Indonesia Tel: 62-251-625-415 ext: 3730 Fax: 62-251-625-416
37 Andi Rahmadi, Ir. MSc. Agency For Assessment and Application of [email protected] Technology (BPPT) Jakarta, Indonesia Tel: +62-21-3169740 Fax: +62-21-3169720
38 Bruno Verbist, Dr ICRAF Southeast Asia Regional Programme Bogor, Indonesia Tel: 62-251-625-415 ext: 3730 Fax: 62-251-625-416
39 Sengkham Inthiravongsy, National University of Laos [email protected] Mr. Vientiane, LAOS PDR Tel: +856-20-513863 Fax: 856-21-612286
40 Sithong Thongmanivong, National University of Laos [email protected] Mr.
Vientiane, LAOS PDR Tel: (+856-21) 413631, 412385, Fax: (+856-21) 412381, 612286
41 Houngphet Chanthavong, National University of Laos Mr. Vientiane, LAOS PDR Tel: (+856-21) 414813, 732290 Fax: (+856-21) 732096, 732294
42 Sharifah Mastura Syed Department of Geography [email protected] Abdullah, Prof. Dr. Universiti Kebangsaan Malaysia (LCLUC Malaysia) Selangor, Malaysia Tel: 603 829 3679 Fax: 603 829 3334
SEA Regional GOFC Planning Meeting, Bogor 2000
95
No. Name Institution/Agency E-mail 43 Asmah Ahmad, Assoc. Department of Geography [email protected] Prof. Dr. Universiti Kebangsaan Malaysia (LCLUC Malaysia) Selangor, Malaysia Tel: 603 829 3679 Fax: 603 829 3334
44 Maimon Abdullah, Assoc. Center for Environmental and Natural [email protected] Prof. Dr. Resources Sciences Faculty of Science and Technology Universiti Kebangsaan Malaysia (LCLUC Malaysia) Selangor, Malaysia Tel: 603 829 3679 Fax: 603 829 3334
45 Zuriati Zakaria, Assoc. School of Chemical Sciences and [email protected] Prof. Dr. Food Technology, Faculty of Science and Technology Universiti Kebangsaan Malaysia (LCLUC Malaysia) Selangor, Malaysia Tel: 603 829 2430 / 2424 Fax: 603 829
46 Othman A. Karim, Assoc. Departement of Civil and Structural Engineering [email protected] Prof. Dr. Faculty of Engineering Universiti Kebangsaan Malaysia Selangor, Malaysia Tel: 603 829 6220 Fax: 603 829 6147
47 Mahamod Ismail, Assoc. Departement of Electrical, [email protected] Prof. Dr. Electronic and System Engineering Faculty of Engineering Universiti Kebangsaan Malaysia (LCLUC Malaysia) Selangor, Malaysia Tel: 603 829 6326 Fax: 603 829 6146
48 Mokhtar Jaafar, Mr. Department of Geography [email protected] Universiti Kebangsaan Malaysia (LCLUC Malaysia) Selangor, Malaysia Tel: 603 829 3608 Fax: 603 829 3334
49 Mastura Mahmud, Dr. Departement of Geography [email protected] Universiti Kebangsaan Malaysia (LCLUC Malaysia) Selangor, Malaysia Tel: 603 829 2672 Fax: 603 829 3334
50 Alias Md. Sood, Mr. Departement of Geography [email protected] Universiti Kebangsaan Malaysia (LCLUC Malaysia) Selangor, Malaysia Tel: 603 829 3679 Fax: 603 829 3334
51 Peter Walpole S.J., Mr. Environmental Science for Social Change, INC. [email protected], (ESSC) [email protected] Manila, Philippines Tel: +63 2 426 5921 Fax: +63 2 426 5958
SEA Regional GOFC Planning Meeting, Bogor 2000
96
No. Name Institution/Agency E-mail 52 Bobby Crisostomo, Mr. LCLUC Philippines [email protected] NAMRIA Lawton Avenue Manila, Philippines Tel: +632 810 5463 / 810 5460 Fax: +632 810 5466
53 Joselito C. Bernando, Mr. LCLUC Philippines [email protected]. NEDA ph,[email protected] Manila, Philippines Tel: +632 631 21 87/633 60 15 Fax: +632 631 21 87
54 Virgilio Santos, Dr. LCLUC Philippines [email protected] Manila, Philippines Tel: (+632) 810 5463 Fax: (+632) 810 5466, 5468
55 Surat Lertlum, Dr. Asian Center for Research on Remote Sensing [email protected] (ACRoRS), Asian Institute of Technology Pathumthani, Thailand Tel: +66-2-524-6197 Fax: +66-2-524-6147
56 Charlie Navanugraha, Dr. Faculty of Environment & Resources Studies, [email protected] Mahidol University Nakronpathom, Thailand Tel: +66-2-4419507 ext 235 Fax: +66-2-4419509-10
57 Suwit Ongsomwang, Dr. Royal Ferest Department [email protected] Bangkok, Thailand Tel: +66-2-9405737 Fax: +66-2-9405737
58 Chaowalit Silapathong, National Research Council of Thailand [email protected] Dr.
Bangkok, Thailand Tel: +66-2-9405652 Fax: +66-2-9405652
59 Chethpong Butthep, Mr. National Research Council of Thailand Bangkok, Thailand Tel: +66-2-9406369 Fax: +66-2-9406369
60 Veerachai Tanpipat, Mr. SouthEast Asia The Global Change System for [email protected] Analysis Research and Training Regional Centre (SEA START RC) Chulalongkorn University Bangkok, Thailand Tel: 66-2-218-8129 Fax: 66-2-255-4967
61 Connie Chiang, Ms. START/SARCS [email protected] Environment Research Institute Chulalongkorn University Bangkok, Thailand Tel: (662) 218-8126/27 Fax: (662) 255-4967
62 Jariya Boonjawat, Dr. SouthEast Asia The Global Change System for [email protected] Analysis Research and Training Regional Centre (SEA START RC) Bangkok, Thailand Tel: (662) 218-8126 - 9 Fax: (662) 255-4967
SEA Regional GOFC Planning Meeting, Bogor 2000
97
No. Name Institution/Agency E-mail 63 Bill Salas, Dr. Compex System Research Center Morse Hall, University of New Hampshire New Hampshire, USA Tel: 603 862 4113 Fax: 603 862 4247
64 Jay Samek, Dr. Basic Science and Remote Sensing Initiative [email protected] Departement of Geography Michigan State University East Lansing, USA Tel: 517 432 3924 Fax: 517 353 2932
65 David L. Skole, Prof. Dr. Basic Science and Remote Sensing Initiative [email protected] Departement of Geography Michigan State University East Lansing, USA Tel: 517 432 7774 Fax: 517 353 2932
66 Nguyen Vinh Thu, Mr. National Center for Hydro-Meteorogical [email protected] Forecasting Hanoi, Vietnam Tel: 844 - 826 1187 Fax: 844 - 825 4278
67 Do Xuan Lan, Dr. Forest Inventory and Planning Institute (FIPI) [email protected] Hanoi, Vietnam Tel: 844 861 5513 Fax: 844 861 6081