sound - an interactive ebook - libretexts
TRANSCRIPT
SOUND - AN INTERACTIVE EBOOK
Kyle Forinash and Wolfgang Christian
Sound - An Interactive eBook
Kyle Forinash and Wolfgang Christian
This text is disseminated via the Open Education Resource (OER) LibreTexts Project (https://LibreTexts.org) and like the hundredsof other texts available within this powerful platform, it is freely available for reading, printing and "consuming." Most, but not all,pages in the library have licenses that may allow individuals to make changes, save, and print this book. Carefullyconsult the applicable license(s) before pursuing such effects.
Instructors can adopt existing LibreTexts texts or Remix them to quickly build course-specific resources to meet the needs of theirstudents. Unlike traditional textbooks, LibreTexts’ web based origins allow powerful integration of advanced features and newtechnologies to support learning.
The LibreTexts mission is to unite students, faculty and scholars in a cooperative effort to develop an easy-to-use online platformfor the construction, customization, and dissemination of OER content to reduce the burdens of unreasonable textbook costs to ourstudents and society. The LibreTexts project is a multi-institutional collaborative venture to develop the next generation of open-access texts to improve postsecondary education at all levels of higher learning by developing an Open Access Resourceenvironment. The project currently consists of 14 independently operating and interconnected libraries that are constantly beingoptimized by students, faculty, and outside experts to supplant conventional paper-based books. These free textbook alternatives areorganized within a central environment that is both vertically (from advance to basic level) and horizontally (across different fields)integrated.
The LibreTexts libraries are Powered by MindTouch and are supported by the Department of Education Open Textbook PilotProject, the UC Davis Office of the Provost, the UC Davis Library, the California State University Affordable Learning SolutionsProgram, and Merlot. This material is based upon work supported by the National Science Foundation under Grant No. 1246120,1525057, and 1413739. Unless otherwise noted, LibreTexts content is licensed by CC BY-NC-SA 3.0.
Any opinions, findings, and conclusions or recommendations expressed in this material are those of the author(s) and do notnecessarily reflect the views of the National Science Foundation nor the US Department of Education.
Have questions or comments? For information about adoptions or adaptions contact [email protected]. More information on ouractivities can be found via Facebook (https://facebook.com/Libretexts), Twitter (https://twitter.com/libretexts), or our blog(http://Blog.Libretexts.org).
This text was compiled on 03/24/2022
®
Kyle Forinash and Wolfgang Christian 1 3/24/2022 https://phys.libretexts.org/@go/page/25912
Introduction to Sound
Sound: An Interactive eBook
Sound: An Interactive eBook consists of 33 interactive simulations which require the reader to click buttons, move sliders, etc. inorder to answer questions about the behavior of waves and sound in particular. There are also dozens of links to YouTube videosand other online resources that pertain to the topics being covered as well as suggestions for laboratory exercises and sound clipsfor understanding the fascinating subject of sound and music. The goal was to create an engaging text that integrates the strengthsof printed, static textbooks and the interactive dynamics possible with simulations to engage the student in actively learning thephysics of sound.
This book began in the way most textbooks do, as notes put together for a new course. The physics of sound, however, lends itselfparticularly well to examples, demonstrations and student participation in experiments. There are thousands of YouTube videos ofinteresting sound phenomena and dozens of simulations related to the physics of sound and music. This book was created fromtrying to provide access to these resources in a single source, first from a web page, then as interactive simulations on web pagesand finally as this interactive textbook.
Interactivity
Gutenberg’s invention of movable type around 1450 did not revolutionize the content or the format of the information beingprovided. It did have the important consequence of speeding up and broadening access to information. In a similar way, much ofour modern technology has accelerated and expanded access to the world’s knowledge base. Instructors today routinely provide acourse syllabus, course information, instructor notes, assignments, sample tests, supplementary reading, and web links to othermaterial, all online using a course management system or simple web pages. Many university students now receive access to a PDFversion of the course textbook when they register for a course.
These uses, however, are not interactive. Much like an enhanced printing press, this technology serves to accelerate the one waytransfer of material from the instructor to the student. In this regard it is not much different from what was already being done 560years ago by Gutenberg; the information flow is unidirectional, albeit much faster. While, in hindsight, Gutenberg’s creation wasseminal to mass education, the communications revolution of the past century has yet to produce comparable improvements inhuman learning. However, today’s technology has the capacity to function much more interactively of which this book is anexample.
Not all platforms allow JavaScript access to the sound hardware. Reset the simulation and try the Sound button again if thesound fails to play.
The above simulation (found in Chapter 10) is an example of the interactive nature of the simulations in this book. Play thesimulation (you may have to click the reset button for the sound to turn on). What do you hear? What is the mathematicalrelationship between the beats you hear and the two frequencies? Use the slider to gradually change the difference in frequencies.At what point do you no longer hear beats? This unpleasant sound is called dissonance. At what difference in frequencies does thisoccur? If you continue to separate the two frequencies you will eventually hear two separate tones. When does this occur?
Acknowledgements
There are a great many people and institutions that have contributed to our efforts, and we take great pleasure in acknowledgingtheir support and their interest. The Open Source Physics project has benefited tremendously from collaborations with U.S. andnon-U.S. universities. In particular, we give special thanks and recognition to the Easy JavaScript Simulations developers FranciscoEsquembre and Felix Garcia at the University Murcia, Spain. We would also like to thank the AAPT- ComPADRE team headed byBruce Mason, Lyle Barbato, and Matt Riggsbee.
W.C. would like to thank his Davidson College colleague and collaborator Mario Belloni for his support and many contributions tothe Open Source Physics project. He would also like to thank the numerous students who have worked with him over the yearsdeveloping programs for use in undergraduate physics education. In particular, he would like to single out Drew Glassman for hiswork on the JavaScript adaptations of the original Java-based Physlet material.
Note

Kyle Forinash and Wolfgang Christian 2 3/24/2022 https://phys.libretexts.org/@go/page/25912
K.F. would like to thank Indiana University Southeast for research reassigned time which was used for the preparation of the initialversion of this tutorial and to the many students over multiple semesters who proof read the material and offered suggestions forimprovement.
1 3/24/2022
TABLE OF CONTENTSThe goal was to create an engaging text that integrates the strengths of printed, static textbooks and the interactive dynamics possible withsimulations to engage the student in actively learning the physics of sound. This book consists of 33 interactive simulations which requirethe reader to click buttons, move sliders, etc. in order to answer questions about the behavior of waves and sound in particular.
INTRODUCTION TO SOUND
1: BASICS1.1: BASICS- WORK AND ENERGY
1.1.1: MOTION AND FORCE1.1.2: NEWTON'S THREE LAWS1.1.3: DENSITY AND PRESSURE1.1.4: ENERGY AND POWER1.1.5: TWO ENERGY LAWS1.1.6: CONSERVATION OF ENERGY SIMULATION1.2: BASICS- THE MOLECULAR BASIS OF MATTER
1.2.1: MOLECULAR DYNAMICS SIMULATION
2: VIBRATIONS2.1: VIBRATIONS
2.1.1: SIMPLE HARMONIC MOTION2.1.2: PERIOD, FREQUENCY, AMPLITUDE, RESTORING FORCE, PHASE2.1.3: SIMPLE HARMONIC MOTION SIMULATION
3: RESONANCE3.1: RESONANCE
3.1.1: RESONANCE EXAMPLES3.1.2: A FEW OTHER EXAMPLES OF RESONANCE3.1.3: HARMONIC MOTION AND RESONANCE SIMULATION3.2: RESONANCE SPRINGS
3.2.1: DRIVEN SPRINGS SIMULATION3.3: QUALITY FACTOR
3.3.1: QUALITY3.3.2: Q-FACTOR SIMULATION
4: WAVE TYPES4.1: TRANSVERSE WAVES
4.1.1: TRANSVERSE WAVES4.1.2: TRANSVERSE WAVE SIMULATION4.2: LONGITUDINAL WAVES
4.2.1: LONGITUDINAL WAVES4.2.2: LONGITUDINAL WAVE SIMULATION4.3: OTHER WAVES
4.3.1: TORSIONAL WAVES4.3.2: EXAMPLES OF WAVES4.3.3: WATER WAVE SIMULATION4.4: ELECTROMAGNETIC WAVES
4.4.1: ELECTROMAGNETIC WAVES4.4.2: ANTENNA SIMULATION
2 3/24/2022
5: WAVE SPEED5.1: WAVE SPEED
5.1.1: SPEEDS OF DIFFERENT TYPES OF WAVES5.1.2: SPEED OF A WAVE SIMULATION
6: WAVE BEHAVIOR6.1: DOPPLER SHIFT
6.1.1: DOPPLER SHIFT6.1.2: THE DOPPLER EFFECT SIMULATION6.2: MIRRORS AND REFLECTION
6.2.1: REFLECTION6.2.2: REFLECTION SIMULATION6.3: REFRACTION
6.3.1: REFRACTION6.3.2: REFRACTION SIMULATION6.4: LENSES
6.4.1: LENS SIMULATION6.5: DISPERSION
6.5.1: DISPERSION SIMULATION6.6: ADDING WAVE PULSES
6.6.1: ADDING WAVES6.6.2: ADDING TWO WAVE PULSES (SUPERPOSITION)6.7: ADDING SINUSOIDAL WAVES
6.7.1: ADDING TWO LINEAR WAVES SIMULATION6.8: PATH DIFFERENCE
6.8.1: INTERFERENCE6.8.2: INTERFERENCE DUE TO PATH DIFFERENCE SIMULATION6.9: INTERFERENCE
6.9.1: INTERFERENCE- RIPPLE TANK SIMULATION6.10: DIFFRACTION
6.10.1: DIFFRACTION6.10.2: DIFFRACTION SIMULATION
7: PITCH, LOUDNESS AND TIMBRE7.1: PITCH, LOUDNESS AND TIMBRE
7.1.1: PITCH7.1.2: LOUDNESS7.1.3: THE DECIBEL SCALE7.1.4: JUST NOTICEABLE DIFFERENCE7.1.5: TIMBRE (THE FIRST TIME)
8: FOURIER SERIES8.1: SOUND TEXTURE
8.1.1: WAVE SHAPE8.1.2: SOUND WAVEFORMS SIMULATION8.2: FOURIER SERIES
8.2.1: FOURIER SERIES8.2.2: FOURIER ANALYSIS8.2.3: FOURIER SERIES SIMULATION8.2.4: TIMBRE (AGAIN!)
3 3/24/2022
8.3: MICROPHONE SOUND ANALYZER
8.3.1: FOURIER ANALYSIS OF MICROPHONE DATA
9: THE EAR AND PERCEPTION9.1: THE EAR AND PERCEPTION
9.1.1: STRUCTURE OF THE EAR9.1.2: THE PLACE THEORY OF HEARING9.1.3: THE TEMPORAL THEORY OF HEARING9.1.4: HEARING LOSS9.1.5: THE MISSING FUNDAMENTAL9.1.6: MISSING FUNDAMENTAL SIMULATION9.2: BEATS
9.2.1: OTHER COMBINATION TONES9.2.2: BEATS AND CRITICAL BANDS SIMULATION9.2.3: OTHER INTERESTING AUDITORY PHENOMENA9.2.4: ANIMAL HEARING
10: STRINGS10.1: DRIVEN STRING AND RESONANCE
10.1.1: STRING RESONANCE10.1.2: DRIVEN STRING SIMULATION10.2: PLUCKED STRING
10.2.1: PLUCKED STRING10.2.2: PLUCKED STRING SIMULATION10.3: VIBRATING PLATES SIMULATION
10.3.1: SURFACE RESONANCES10.3.2: VIBRATING PLATE SIMULATION10.3.3: OTHER SURFACES10.3.4: VOLUME OR HELMHOLTZ RESONANCE10.3.5: STRINGED INSTRUMENTS
11: TUBES11.1: STANDING WAVES IN A TUBE
11.1.1: TUBE RESONANCE11.1.2: STANDING WAVE SIMULATION11.2: REFLECTION OF WAVES AT A BOUNDARY
11.2.1: REFLECTION OF WAVES11.2.2: REFLECTION SIMULATION11.3: IMPEDANCE
11.3.1: IMPEDANCE11.3.2: IMPEDANCE SIMULATION11.3.3: WOODWIND INSTRUMENTS11.3.4: BRASS INSTRUMENTS11.3.5: PIPE ORGANS AND OTHER REED INSTRUMENTS
12: PERCUSSION12.1: PERCUSSION AND DRUMHEADS
12.1.1: VIBRATING MEMBRANES12.1.2: CIRCULAR DRUM HEAD SIMULATION12.1.3: DRUMS12.1.4: HARMONIC PERCUSSION INSTRUMENTS12.1.5: OTHER MUSICAL INSTRUMENTS
4 3/24/2022
13: VOICE13.1: THE HUMAN VOICE
13.1.1: THE VOCAL TRACT13.1.2: VOCAL FORMANTS13.1.3: PHONEMES13.1.4: SINGING13.1.5: ANIMAL SOUNDS
14: MUSICAL SCALES14.1: MUSICAL SCALES
14.1.1: THE PYTHAGOREAN SCALE14.1.2: EQUAL TEMPERAMENT14.1.3: TEMPERAMENT SIMULATION
15: ACOUSTICS15.1: ACOUSTICS
15.1.1: 16.1.1-ACOUSTIC QUALITIES15.1.2: REVERBERATION15.1.3: OTHER ACOUSTICAL EFFECTS15.1.4: SOUND REINFORCEMENT15.1.5: SPATIAL PERCEPTION15.1.6: ANIMAL ACOUSTICS15.1.7: OTHER ACOUSTICAL APPLICATIONS
16: ELECTRICITY AND MAGNETISM16.1: EANDM- OHM'S LAW
16.1.1: OHM'S LAW16.2: EANDM- CURRENTS AND MAGNETIC FIELDS
16.2.1: CURRENTS CAUSE MAGNETIC FIELDS16.2.2: MAGNETIC FIELD SIMULATION16.3: EANDM- ELECTRIC AND MAGNETIC FORCES
16.3.1: CURRENTS IN A MAGNETIC FIELD MAY EXPERIENCE A FORCE16.3.2: ELECTRIC AND MAGNETIC FORCES SIMULATION16.4: EANDM- FARADAY'S LAW
16.4.1: A CHANGING MAGNETIC FIELD CAN CAUSE CURRENT TO FLOW16.4.2: FARADAY'S LAW SIMULATION
17: ELECTRONICS17.1: ELECTRONICS
17.1.1: MICROPHONES17.1.2: RECORDING17.1.3: AMPLIFICATION17.1.4: SPEAKERS17.1.5: TRANSMISSION
BACK MATTERINDEXINDEXGLOSSARYGLOSSARY
1 3/24/2022
CHAPTER OVERVIEW1: BASICS
In this chapter various physics concepts and definitions needed for the study of sound, acoustics and musical instruments are presented. Ifthese terms are already familiar to you, you may wish to skim this chapter and skip to the next one on simple harmonic motion.
In science words have specific narrow definitions that sometimes don't correspond to their use in everyday language. These definitions arerelatively easy to memorize but surprisingly hard to apply correctly. The only way to really understand these concepts and how to apply themis to work the examples (group work, homework, simulation exercises, etc.) that are part of this book.
It is also important to realize that science is in the business of measuring things. This means that, unlike a math class, any number you see isa measurement of something and has a unit attached to it. So we never have but we can have centimeters or a frequency of hertz (
). This book uses the metric system but other sets of units are mentioned. Here is a useful site that converts metric units to other systems:Conversion Calculator.
KEY TERMS:
Position, displacement, time, velocity, speed, acceleration, mass, weight, density, linear density, force, tension, Newton's three laws, pressure,the ideal gas law, Bernoulli's principle, energy, conservation of energy, power, the first and second laws of thermodynamics.
1.1: BASICS- WORK AND ENERGY
1.1.1: MOTION AND FORCE1.1.2: NEWTON'S THREE LAWS1.1.3: DENSITY AND PRESSURE1.1.4: ENERGY AND POWER1.1.5: TWO ENERGY LAWS1.1.6: CONSERVATION OF ENERGY SIMULATION1.2: BASICS- THE MOLECULAR BASIS OF MATTER
1.2.1: MOLECULAR DYNAMICS SIMULATION
9.5 9.5 9.5
Hz

Kyle Forinash and Wolfgang Christian 1.1.1 3/24/2022 https://phys.libretexts.org/@go/page/25983
1.1: Basics- Work and EnergyVarious physics concepts and definitions needed for the study of sound, acoustics and musical instruments are presented.
Contributions and AttributionsThis page is licensed under a CC BY-NC-SA 3.0 license and was authored, remixed, and/or curated by Kyle Forinash andWolfgang Christian. Source content is found at https://www.compadre.org/books/SoundBook. Page content has been edited andupdated to conform to the style and standards of the LibreTexts platform. A detailed versioning history of the edits to source contentis available upon request.
Kyle Forinash and Wolfgang Christian 1.1.1.1 3/24/2022 https://phys.libretexts.org/@go/page/26128
1.1.1: Motion and ForceThe location of an object is called the position and is generally measured in meters (or centimeters or inches or feet, etc.) startingfrom an agreed upon starting point (called the origin). Sometimes it is convenient to set up a coordinate system with and -axis, -axis and -axis in order to locate something precisely in three dimensional space. We may want to also know how far something isfrom where it started or from its normal, at rest position. This is the displacement or displacement from equilibrium and is alsomeasured in meters. For example, when a violin string is plucked or bowed, different points on the string are displaced from theirequilibrium positions by different amounts initially.
Speed, , is the rate of change of position and is measured in meters per second, m/s (or ft/sec or miles per hour, mph, etc.). If thereis no acceleration, speed is related to distance traveled as rate times time equal distance; . Velocity is speed with additionalinformation about which direction something is moving. So if you are traveling at (no direction given) you have a speedbut if you are traveling and headed north-east we call that a velocity.
Acceleration is a word that has a specific definition in science but gets confused with speed and velocity in everyday use.Acceleration is a change in velocity over a given time and is measured in meters per second squared, (or , etc.). A cargoing down the road in the same direction might have a constant speed of . If neither the speed or direction changes thenthe acceleration is zero. If the car speeds up, slows down or changes direction then the velocity has changed and there isacceleration. The gas pedal in your car is both an acceleration pedal (if you push it to the floor or ease off the pedal you changeyour speed and get faster or slower) and also a speed pedal (if you hold it constant you keep a constant speed with no acceleration).Your brake pedal is also an acceleration pedal; it slows you down. Your steering wheel is also an accelerator control because itchanges your direction.
For objects near the surface of the earth there is a special acceleration, called the acceleration of gravity. For something falling inthe case where air resistance doesn't slow it down too much, the speed changes by every second so we say it has anacceleration of per or (or in the English system). So if a pot gets pushed off an upper story windowledge it starts from rest (zero speed) and will be falling at a speed of after one second, after two seconds, after three seconds, etc. This acceleration of gravity works the samefor any object, regardless of size or weight, as long as air resistance is small and you are near the earth's surface. This is whatGalileo figured out by dropping different sized objects off the leaning tower of Pisa; objects accelerate (get faster) at the same rateno matter what their size (again, if you can ignore air resistance).
The amount of 'stuff' an object has regardless of where it is (in space, on earth, on the moon), its 'heft' you might say, is called massand is measured in kilograms, kg (or sometimes grams where ). The English units of mass are the slug and the stonebut we seldom use them.
A force is a push or shove and is measured in newtons , , which is a kilogram-meter per second squared, . The tension ina guitar string is the force pulling at either end of the string (the force pulling each end is the same and balances out so the stringdoesn't go anywhere). The English unit of force is the pound which is also the unit used to measure weight. This can lead to someconfusion because the pound is also sometimes incorrectly used for mass.
Weight is the force that gravity causes an object to exert on the earth. Weight is measured in newtons in the metric system orpounds in the English system. This is how mass and weight get confused; in everyday use we use weight and mass interchangeablywhich, strictly speaking is incorrect. For example in the grocery store you may see a bag of sugar that says or which isreally comparing different things; measures weight but measures mass which is different. What the label should say is "thisitem weights or " (because times is which is a unit of weight). Or it could say"this item has a mass of or " ( divided by is and and measure mass). So if yousee something that claims to have a weight of (or ) remember what that really means is its mass is .
Questions on Motion:1. Why are units (such as meters or seconds or miles) important in science?2. What is different about numbers in a science course as compared to numbers in a math course?3. What is the difference between speed and velocity?4. What is the difference between velocity and acceleration?5. Does a car speedometer measure speed or velocity? Explain.
x y
z
v
vt = d
50 mph
50 mph
m/s2
ft/s2
50 mph
9.8 m/s
9.8 m/s 1s 9.8 m/s2 32 ft/s2
9.8 m/s 9.8 m/s +9.8 m/s = 19.6 m/s
9.8 m/s +9.8 m/s +9.8 m/s = 29.4 m/s
1000 g = 1 kg
N kg m/s2
5 lbs 2.3 kg
lbs kg
5 lbs 22.3 newtons 2.3 kg 9.8 m/s2 22.3 newtons
2.3 kg 0.16 slug 5 lbs 32 ft/s2
0.16 slugs slugs kg
2.3 kg 5 lbs 2.3 kg
Kyle Forinash and Wolfgang Christian 1.1.1.2 3/24/2022 https://phys.libretexts.org/@go/page/26128
6. If you go around a curve at constant speed, do you have an acceleration? Explain.7. Can a rapidly moving object have the same acceleration as a slowly moving one? Explain.8. Can an object have an instantaneous velocity of zero and have a non-zero acceleration? Give an example.9. At the end of its arc, the velocity of a pendulum is zero. Is its acceleration also zero at this point? Why or why not?
10. Assuming air resistance can be ignored, which gets to the ground first, a bowling ball or a tennis ball if they are dropped fromthe same height at the same time? Explain.
11. What is the difference in saying something is moving at a constant velocity and saying it is moving with zero acceleration?12. Explain the difference between mass and weight.13. Consult a table for the speed of sound in various substances (found in chapter six). If you have one ear in the water and one ear
out while swimming in a pool and a bell is rung that is half way in the water, which ear hears the sound first?14. At the speed of sound is . How far does sound travel in ? How far does sound travel in ?15. Compare the last two answers with the distance traveled by light which has a speed of . Why do you see
something happen before you hear it?16. The speed of sound in water is . How far does sound travel under water in ? How far does sound travel under water
in ?17. What would an orchestra sound like to someone in the audience if different instruments produced sounds that traveled at
different speeds?18. For the previous question, would it make a difference if you sat further away from the orchestra?
Contributions and Attributions
This page is licensed under a CC BY-NC-SA 3.0 license and was authored, remixed, and/or curated by Kyle Forinash andWolfgang Christian. Source content is found at https://www.compadre.org/books/SoundBook. Page content has been edited andupdated to conform to the style and standards of the LibreTexts platform. A detailed versioning history of the edits to source contentis available upon request.
C20∘ 344 m/s 1 s 60 s
3.0 × m/s108
1482 m/s 1 s
60 s
Kyle Forinash and Wolfgang Christian 1.1.2.1 3/24/2022 https://phys.libretexts.org/@go/page/26129
1.1.2: Newton's Three LawsNewton came up with several important laws of physics, three of which we may find useful for the physics of sound.
First Law: Objects continue at rest or in straight-line motion with constant velocity unless an unbalanced force acts on them. Youmight think that if no forces act the object is stationary. But this is only one case; the first law also says that if all the forces add tozero the object could still be moving at constant velocity. So why do you need to run the motor in your car if you are going downthe road in the same direction at the same speed? The motor supplies enough force to overcome friction. Not more force thanfriction but a force exactly equal to friction so that the total force is exactly zero and you continue moving at a constant velocity.Similarly, a performer playing a wind instrument must continue to supply force on the air in the instrument to overcome friction asthe air passes through the instrument. Inertia is the term used for the property of an object that causes it continue in straight linemotion unless acted on by an unbalanced force.
Second Law: Forces cause accelerations (forces do not cause velocity but changes in velocity). The second law is also known as where is the total force acting on mass , and is the acceleration of the mass. Note that as was stated in the first law,
a net total force is not needed to maintain a constant velocity; the first law says once something is moving it will keep movingunless a force (for example friction) acts to stop it. When you accelerate your car there is a net force on it. But when you reachcruising speed the net force goes to zero (the motor force exactly cancels resistance forces). In this case (when the net force adds tozero) the object (your car) obeys Newton's 1st law and you continue moving in a straight line at constant velocity.
Third Law: Anytime one object exerts a force on a second object, the second object exerts an equal force (but in the oppositedirection) back on the first object. Forces always act in pairs on two different objects; an action force acting on one object and areaction force acting on the second object. Another way to say this is you cannot touch something without it touching you back,and just as hard as you touched it. This seems simple if you are pushing on the wall; the wall obviously pushes back with the sameforce. But what about the force on a baseball as you throw it (before release)? Is the force pushing back by the baseball the same asthe force you apply? YES! The laws of physics are always true with no exceptions. So how can you throw the baseball if the twoforces are equal in magnitude but opposite in direction? The key is to realize the action and reaction forces act on different objects.Your force on the ball makes it go forward until it leaves your hand. The equal reaction force back from the ball acts on your hand(not the ball) so you can feel the ball as you throw it.
Video/audio examples:Newton's first law: egg drop.Newton's first law (car crash testing) one, two, three. Watch the movement of the dummy's body and head when the carsuddenly stops. Because there is no force acting on the head, it keeps moving, according to Newton's 1st law.Newton's first and second law: sky diving. If you understand this example you have a good idea of how Newton's laws work.Newton's first, second and third law applied to a bicycle.Newton's third law: examples on the space station.
Questions on Newton's First Law:1. If you are sitting at a stop sign and get hit from the rear, your head seems to fly back and hit the headrest. Explain, using
Newton’s law of inertia, what really happens.2. If you are standing in a bus and it suddenly stops, you feel like you are being thrown forward. Using Newton’s law of inertia,
explain what is really happening.3. Using Newton’s law of inertia, explain why a headrest prevents whiplash.4. Using Newton’s law of inertia, explain why using a seatbelt in a car, plane, rollercoaster, etc. is a good idea.5. Once a satellite is in orbit it doesn’t need to fire any rockets to stay there. Why not? What keeps it going?6. What keeps the earth going around the sun?7. A magic trick you can preform at home is to pull the tablecloth out from under some dishes on a table by giving the tablecloth a
very quick horizontal jerk. Explain why the dishes don’t move.8. Bowling balls slow down slightly as they roll down the lane. Explain why this does not violate Newton’s law of inertia?9. If you quit pushing a shopping cart it stops. Explain how this does not violate Newton’s law of inertia.
10. The earth is rotating such that objects on the surface are traveling at close to per hour (this is slightly differentdepending on latitude). Using Newton’s law, explain why you don’t get slammed by the wall if you jump straight up into the air.
11. When you are traveling in an airplane at cruising altitude, why does an object that is dropped not fly to the back of the plane?
F = ma F m a
1000 km
Kyle Forinash and Wolfgang Christian 1.1.2.2 3/24/2022 https://phys.libretexts.org/@go/page/26129
12. A person drops a wrench from the top of the mast of a sailboat that is moving forward at constant velocity. Where does thewrench land relative to the mast if the boat has a speed of and the mast is high?
13. A driver heading towards a left curve encounters some ice on the road. Describe the motion of the car (drawing a picture willhelp) assuming the ice prevents any friction force from acting on the car. Which of Newton's laws tells you what will happen?
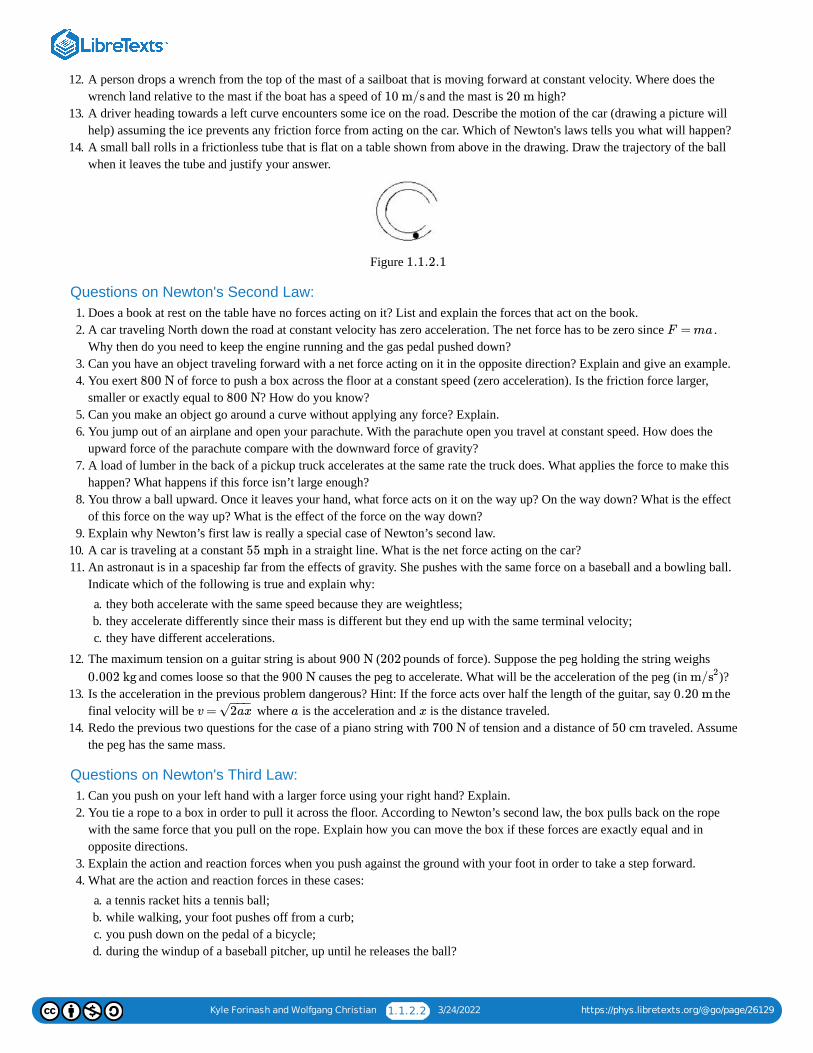
14. A small ball rolls in a frictionless tube that is flat on a table shown from above in the drawing. Draw the trajectory of the ballwhen it leaves the tube and justify your answer.
Figure
Questions on Newton's Second Law:1. Does a book at rest on the table have no forces acting on it? List and explain the forces that act on the book.2. A car traveling North down the road at constant velocity has zero acceleration. The net force has to be zero since .
Why then do you need to keep the engine running and the gas pedal pushed down?3. Can you have an object traveling forward with a net force acting on it in the opposite direction? Explain and give an example.4. You exert of force to push a box across the floor at a constant speed (zero acceleration). Is the friction force larger,
smaller or exactly equal to ? How do you know?5. Can you make an object go around a curve without applying any force? Explain.6. You jump out of an airplane and open your parachute. With the parachute open you travel at constant speed. How does the
upward force of the parachute compare with the downward force of gravity?7. A load of lumber in the back of a pickup truck accelerates at the same rate the truck does. What applies the force to make this
happen? What happens if this force isn’t large enough?8. You throw a ball upward. Once it leaves your hand, what force acts on it on the way up? On the way down? What is the effect
of this force on the way up? What is the effect of the force on the way down?9. Explain why Newton’s first law is really a special case of Newton’s second law.
10. A car is traveling at a constant in a straight line. What is the net force acting on the car?11. An astronaut is in a spaceship far from the effects of gravity. She pushes with the same force on a baseball and a bowling ball.
Indicate which of the following is true and explain why:a. they both accelerate with the same speed because they are weightless;b. they accelerate differently since their mass is different but they end up with the same terminal velocity;c. they have different accelerations.
12. The maximum tension on a guitar string is about ( pounds of force). Suppose the peg holding the string weighs and comes loose so that the causes the peg to accelerate. What will be the acceleration of the peg (in )?
13. Is the acceleration in the previous problem dangerous? Hint: If the force acts over half the length of the guitar, say thefinal velocity will be where is the acceleration and is the distance traveled.
14. Redo the previous two questions for the case of a piano string with of tension and a distance of traveled. Assumethe peg has the same mass.
Questions on Newton's Third Law:1. Can you push on your left hand with a larger force using your right hand? Explain.2. You tie a rope to a box in order to pull it across the floor. According to Newton’s second law, the box pulls back on the rope
with the same force that you pull on the rope. Explain how you can move the box if these forces are exactly equal and inopposite directions.
3. Explain the action and reaction forces when you push against the ground with your foot in order to take a step forward.4. What are the action and reaction forces in these cases:
a. a tennis racket hits a tennis ball;b. while walking, your foot pushes off from a curb;c. you push down on the pedal of a bicycle;d. during the windup of a baseball pitcher, up until he releases the ball?
10 m/s 20 m
1.1.2.1
F = ma
800 N800 N
55 mph
900 N 202
0.002 kg 900 N m/s2
0.20 mv = 2ax
− −−√ a x
700 N 50 cm
Kyle Forinash and Wolfgang Christian 1.1.2.3 3/24/2022 https://phys.libretexts.org/@go/page/26129
5. For each case in the previous question, state which force is the larger force.6. A force pushes towards the left on a box. A friction force, , between the floor and the box resists the movement of the box.
These are the only forces acting in the horizontal direction. For the following three cases state which is bigger (or the samesize), or and why.a. The box does not move.b. The box moves to the left with constant velocity.c. The box moves to the left and accelerates.d. The box moves to the left and decelerates.
7. A bowling ball collides with a tennis ball. Which object has the larger impact force on the other? Which has the greateracceleration? Explain.
8. Before space travel some people thought rockets would not work in space because there was no atmosphere for the rocketexhaust to push against. Explain the error in this thinking using Newton’s third law.
9. You are in a railroad car but the tracks are very smooth and the windows closed so you cannot tell if you are moving or not. Youdrop a tennis ball and it falls straight down and lands directly below your hand. What can you conclude about the motion of thecar from this observation?
10. When you hit a xylophone bar with a mallet the mallet will bounce back. Which of Newton's three laws explains where theforce comes from which causes the mallet to bounce back into the air?
11. A guitar string pulls on the peg mechanism with a tension of ( of force). What minimum force must themechanism be able to pull back with to avoid having the string change tension (which also changes the pitch)?
12. What force must a piano frame be able to withstand if the tension in the tightest string is ?
Contributions and Attributions
This page is licensed under a CC BY-NC-SA 3.0 license and was authored, remixed, and/or curated by Kyle Forinash andWolfgang Christian. Source content is found at https://www.compadre.org/books/SoundBook. Page content has been edited andupdated to conform to the style and standards of the LibreTexts platform. A detailed versioning history of the edits to source contentis available upon request.
F f
F f
600 N 134 lbs
900 N
Kyle Forinash and Wolfgang Christian 1.1.3.1 3/24/2022 https://phys.libretexts.org/@go/page/26130
1.1.3: Density and PressureThe density of something is its mass divided by its volume ( ) and is measured in kilograms per cubic meter, (orsometimes grams per cubic centimeter; ). So a kilogram of feathers and a kilogram of iron have the same mass and weighthe same but since the kilogram of feathers takes up more space (larger volume) it is less dense. One other version of density wewill use is called the linear density which is the mass per length in . Bass strings on guitars and in pianos have a larger lineardensity than the strings used for the higher notes. We will see why later on.
Pressure is defined to be a force acting over an area; . There are several units of pressure; we will use the pascal, ,which is a newton per meter squared, . Other units are the bar; atmospheres; millimeters of mercury, ; inches ofwater; , etc. A larger force over the same area increases pressure but the same force over a larger area decreases pressure. Adull knife does not apply the same pressure as a sharp knife because the area of contact of the dull blade is larger than the area ofcontact of the sharp blade. Being stepped on by the heel of a high heeled shoe hurts a lot more than if the same person steps on youwith a low heel because the same force (the persons weight) applied with a high heel acts over a smaller area so the pressure ismuch higher. As we will see, the loudness of a sound wave is related to pressure; high volume sound exerts more pressure onaverage, and therefore more force on the surface of your eardrum.
For gasses in a closed container, pressure and volume are inversely proportional (pressure increases as volume decreases). Pressureand volume are also each directly proportional to temperature (either pressure or volume or both will increase if the temperatureincreases). These properties are sometimes summarized as the ideal gas law which can be written as . Here ispressure, is volume, is temperature in kelvin, . The variable indicates how much gas there is (in moles where a mole is
atoms or molecules) and is a constant equal to .
Pressure in a liquid or gas is the weight of the liquid pushing downward on an area at a given depth (and is measured in the sameunits as pressure) or where is the depth, (Greek letter rho) is the density in kilograms per meter cubed, and isgravitational acceleration. We sit at the bottom of a sea of air that pushes down on us. This pressure is called atmospheric pressureand it varies a little bit from day today because the air above us is moving and also because of changes in temperature and humidity(and so its density changes). When you use a straw you are decreasing the pressure inside the straw and atmospheric pressureoutside the straw pushes the liquid up into the straw. This is why a straw would not work in a vacuum. If you are under water, thewater above you pushes down on you in addition to the air above the water which pushes down on the water. Since water is muchmore dense than air, pressure changes a lot faster as you go deeper under water than it does if you change altitude in the air.
Bernoulli's principle says that if the speed of a fluid (liquid or gas) increases, the internal pressure in the fluid decreases. Take astrip of paper one inch wide and inches long. Hold the short end up to your lips and blow. You'll notice that the strip pullsupward to meet the flowing air. This is because the moving air above has a slightly lower pressure than the stationary air below. Asimilar effect causes baseballs to change direction (curve balls) and airplane wings to have lift. Some wind instruments and thehuman voice operate in part because of forces due to the Bernoulli effect, as we shall see.
Video/audio examples:Pressure and a bed of nails: with a balloon, with a person. What would happen to the pressure if the number of nails is reduced?What would this do to the person lying on them?Bernoulli's principle: Hair dryer. Why does the ping pong ball stay suspended? Soccer ball. Why does the ball not followNewton's first law and travel in a straight line? Several Examples. Why do the balloon's come together?
Questions on Density and Pressure:
Density1. Does the mass of a car change if it is crushed into a cube? Explain.2. Does the density of a car change if it is crushed into a cube? Explain.3. Does a dieting person lose mass? Weight? Density? Explain your answers.4. How does the density of water change when it freezes into ice?5. Which is more dense, a kilogram of feathers or a kilogram of iron?6. Which weighs more on the earth, a kilogram of feathers or a kilogram of iron?7. What is the difference between density and linear density?
m/V kg/m3
g/cm3
kg/m
P = F /A Pa
N/m2 mmHg
torr
P V = nRT P
V T K n
6.0 ×10²³ R 3.14 J/mol K
P = ρgh h ρ g
12
Kyle Forinash and Wolfgang Christian 1.1.3.2 3/24/2022 https://phys.libretexts.org/@go/page/26130
8. Given what you know about Newton’s second law ( ), why would you expect a denser guitar string to vibrate moreslowly when plucked with the same force?
Pressure1. Why does a sharp knife cut better than a dull knife (even when you apply the same force)?2. An old time magic trick (that originally came from India) was to lie down on a bed of nails (hundreds of nails sticking up
through a board) without getting hurt. Using the definition of pressure, explain how this is possible.3. Does a bathroom scale measure pressure or force? Explain. (Try this at home: Stand with both feet on the scale, look at the
reading and then stand on one foot on the scale and check. Are the readings different?)4. Which exerts more pressure on the ground, the foot of an elephant or a person in high-heeled shoes? State your reasoning.5. You may notice that an unopened bag of chips is soft while on the ground but is puffs out to be firm when at cruising altitude in
an airplane. Explain why.6. Why would you want the bottom of a dam to be stronger than the top?7. Why would it be slightly more difficult to suck soda through a straw on top of a high mountain as compared to sea level?8. You decide you want to use a piece of garden hose with one end above water to go to the bottom of a pool deep and be able
to breath. What is wrong with this plan?9. A siphon is a tube that transfers liquid from a higher level to a lower level. How does it work?
10. What causes the 'lift' on an airplane wing?11. Why is it easier on your heart when you are lying down compared to when you are standing?12. Why does a lightweight shower curtain move in towards you when the shower is running?13. How does an airplane wing provide lift?14. The pressure variation in a sound wave from a jet engine is around (Pascal). What is this in ?15. Suppose a marimba mallet makes contact with a wooden marimba bar and applies a strike force of . You measure the
contact area of the mallet to be square millimeters ( ). What pressure (in ) was exerted on the marimbabar? Convert this to atmospheres ( atmosphere ). Do you think this could do damage to a marimba bar?
16. For sound waves from a normal conversation the pressure at the listener’s ear fluctuates by around . How much doesthe force change on the eardrum if the area is ( )?
17. Suppose the pressure of a sound wave reaching a microphone fluctuates by atmospheres. What is the force on themicrophone if it has an area of ( )?
Contributions and Attributions
This page is licensed under a CC BY-NC-SA 3.0 license and was authored, remixed, and/or curated by Kyle Forinash andWolfgang Christian. Source content is found at https://www.compadre.org/books/SoundBook. Page content has been edited andupdated to conform to the style and standards of the LibreTexts platform. A detailed versioning history of the edits to source contentis available upon request.
F = ma
3 m
200 Pa N/m2
600 N
5 5.0 ×10⁻⁶ m2 N/m2
1 = 101325 N/m2
0.2 N/m2
1 cm2 1.0 ×10⁻⁴ m2
0.002
2 cm2 2.0 ×10⁻⁴ m2
Kyle Forinash and Wolfgang Christian 1.1.4.1 3/24/2022 https://phys.libretexts.org/@go/page/26131
1.1.4: Energy and PowerEnergy is the capacity to do work and it is measured in joules; . Other common units of energy are the (Britishthermal unit); the calorie ( ); the food calorie ( ); the kilowatt-hour (
). Notice that the calories listed for food are actually a thousand scientific calories each.
There are many forms of energy (all measured in joules) and you can convert from one form to another. The capacity of a musicalinstrument for converting mechanical energy of vibration (a vibrating guitar string for example) into vibrations in the airdetermines how loud the instrument will sound.
Work is one form of energy. Work is defined scientifically as force times the displacement caused by the force; . Weonly count the part of the force that acts in the same direction as the displacement; so a force acting perpendicular to adisplacement does not do work. Likewise, if something doesn't move, no work is done.Kinetic energy is energy of motion. If we do work on a ball (apply a force over a distance) and then release it the ball will havekinetic energy. Kinetic energy is directly proportional to mass (double the mass of an object at the same speed and you havetwice as much energy) and directly proportional to velocity squared (double the speed of an object and you have four times asmuch kinetic energy); .Gravitational potential energy is the energy (work) you can get out of an object due to letting it fall. Or if you do work inlifting a mass against the pull of gravity you store up energy that you can get back by letting it fall. Gravitational potentialenergy is directly proportional to mass and how high it is: , where is the acceleration of gravity.You can do work on a spring by either stretching it or compressing it a distance in which case there is stored spring potentialenergy. The stiffness of a spring is given by a constant, , and the energy stored is .Electromagnetic radiation is energy carried in the form of electromagnetic waves. Examples of electromagnetic waves arelight, radio signals, Wi-Fi signals, blue tooth, cell phone signals, x-rays, gamma rays, microwaves, infrared, ultraviolet, etc. Thedifference between each kind of electromagnetic wave is the size of the wavelength and the energy it carries. Except for visiblelight, we cannot detect electromagnetic waves. In general we need some electronic device to detect electromagnetic signals. Forexample a car radio turns electromagnetic waves from the radio station into audible sound waves.A chemical reaction occurs when two or more atoms interact by re-arranging where their electrons are located (they may shareelectrons, donate or borrow electrons, or have other complicated interactions). When this happens energy may be emitted orabsorbed in the form of heat and/or electromagnetic waves. A burning candle is an example; the molecules making up thecandle are interacting with oxygen and giving off heat (increased random molecular energy) and light (electromagnetic energy).The chemical energy stored in a battery is another example; molecules in the battery can combine in a way to give energy to aflow of electrons in a wire.As Einstein famously showed, there are certain types of changes in the nucleus of some atoms that give off heat. This nuclearenergy comes from the atom changing a very small amount of mass directly into energy via , where is the speed oflight. In other words, in certain special atoms (called radionuclides) something happens to make the atom either randomly splitor give off part of its nucleus. If you could weigh the pieces after the reaction you would find a tiny bit of mass was missing. Itis this mass that has been turned into energy via Einstein's famous equation. This is the energy used in nuclear reactors and alsothe energy source of the sun.
In the above examples there is only one mass or object involved. But we know all matter is made of atoms and chemically boundcombination of atoms called molecules that are too small to see, even in a microscope. In a solid these atoms are not stationary butvibrate around an equilibrium position. For liquids and gasses they move relative to each other as you saw in the pressuresimulation. In both cases the average kinetic energy is proportional to something we call temperature. Temperature is not a type ofenergy but is proportional to the internal kinetic energy of the molecules that make up a substance and is measured in fahrenheit,
, celsius, , or kelvin, .
In addition to random kinetic energy molecules can bend, vibrate and rotate in both solids, liquids and gasses. If we place an objectthat has a high temperature (high internal random motion) in contact with an object that has a low temperature (low randominternal motion) energy will flow from the high temperature object to the low temperature object (the molecules of each will bumpinto each other so they eventually have the same average random energy). When this happens we call the energy that moves fromthe hot object to the cold object heat which is measured in joules. Notice that heat and temperature are not the same thing. Heat is aflow of energy (measured in Joules) and temperature is a number in celsius that is proportional to the internal kinetic energy of themolecules making up a substance.
J = kg m2/s2 Btu
1 cal = 4.18 J 1 kcal = 1000 cal = 4186.8 J
1 kWh = 3, 600, 000 J
W = Fd
KE = 1/2mv2
GPE = mgh g = 0.8 m/s2
x
κ SPE = 1/2κx2
E = mc2 c
F∘ C∘ K
Kyle Forinash and Wolfgang Christian 1.1.4.2 3/24/2022 https://phys.libretexts.org/@go/page/26131
There is one other term, related to energy, which is how fast energy is being used or delivered. The rate at which energy is used orwork done is called power and it is measured in watts, , and horsepower ( ). In the US we use watts for electricalpower but hp for mechanical power. It would make more sense to either measure light bulbs in hp or cars in watts so thateverything had the same units. Power is directly proportional to the amount of energy delivered and inversely proportional to thetime it takes to deliver the energy; . So accelerating your car up to a certain speed will require the same amount of energyregardless of whether you do it slowly or rapidly. But in order to accelerate faster (reach the same kinetic energy in a shorter time)you need a motor that is more powerful.
Questions on Energy and Power:
Mechanical Energy (work, kinetic, gravitational potential, spring potential, heat)1. Does a baseball pitcher do any work on a baseball as they throw a ball (before release)?2. Does a baseball pitcher do any work on a baseball after they release the ball?3. Suppose you are hired to stand and push on a sheet of plywood to keep it stationary while other workers paint it. Are you doing
any work in the physics sense?4. Does the force of gravity do any work on a ball rolling across the floor? What about a satellite in orbit around the earth?5. We know that for every force on an object there is an equal force in the opposite direction (Newton’s third law). So if you push
a filing cabinet across the floor and there is an equal force pushing back on you, does this mean you do no work on the cabinet?Explain.
6. Bullets leaving a rifle typically are traveling at a much higher velocity (more kinetic energy) than bullets leaving the barrel of apistol. This has something to do with the length of the barrels. Explain.
7. What is the difference between “conserving energy” (i.e. turning off lights, turning the thermostat down) and conservation ofenergy (a law of physics)?
8. Suppose a mass is held at a height of one meter so that it has a potential energy of . Answer the following:a. If it is released, how much kinetic energy does it have right before it hits the floor?b. How much kinetic energy does it have when it is half way down?c. What happens to this energy after the mass comes to rest on the floor?
9. A simple pendulum consists of a mass swinging back and forth at the end of a long string or rope. When is the gravitationalpotential energy a maximum? When it the kinetic energy a maximum? What is the relationship between the kinetic energy andthe gravitational potential energy?
10. Describe the changes in types of energy when you throw a ball up into the air during each of the following steps:a. You apply a force over a distance to get the ball started;b. You release the ball and it starts upward;c. The ball slows at it goes upwards until it reaches its highest point;d. The ball turns around and begins increasing speed on the way down;e. Just before the ball reaches the ground it has its maximum speed;f. The ball hits the ground and comes to rest.
11. A kid reaches the bottom of a slide in the playground with of kinetic energy. Based on the height of the slide he had of potential energy at the top. What happened to the missing ?
12. Years ago the Wham-O company sold a “superball” with the claim that it would bounce higher than the height at which it wasdropped. Is this possible? Explain.
13. Is it possible to build a rollercoaster that has peaks that are higher than the starting point without using any motors? Explain.14. A Ping-Pong ball and a golf ball have the same kinetic energy. Which has the higher speed?15. Helium molecules are lighter than oxygen molecules. In a mixture of these gasses at the same temperature they have the same
kinetic energy. Which type of molecule is moving faster?16. Suppose you do of work on a guitar string by stretching the middle it to some maximum position. Then you let it go.
Figure a. How much kinetic energy does the string have when it passes through its equilibrium (straight) position?
W 1 hp = 746 W
P = W/t
10 kg 100 J
1200 J
1400 J 200 J
25 J
1.1.4.1
Kyle Forinash and Wolfgang Christian 1.1.4.3 3/24/2022 https://phys.libretexts.org/@go/page/26131
Figure b. How much potential energy does the string have when it reaches the maximum in the other direction?
Figure
c. What happens to the energy when, after a while, the string comes to rest?17. Why do the brakes on your car get hot when you stop?18. Does a car burn more gasoline if the lights are on? What about if the engine is off? Does the gas mileage change in either case?
Explain.19. A gasoline engine only converts about of the energy in the gasoline into useful mechanical energy (making the car go,
running the lights, etc.). What happens to the rest of the energy?20. If a car engine could be efficient (it cannot), would it give off heat? What about sound? What about vibrations?21. Calories are another unit for energy (a food calorie, like is listed on a soft drink can is actually calories). We need energy
to generate body heat and to move around. What happens over time to someone if input calories (what you eat) is less than theoutput calories (body heat and movement)? What happens if someone takes in more calories than they burn?
22. Why would you expect the temperature of a jar of water to increase when shaken vigorously?23. The temperature of the water at the bottom of a waterfall is slightly higher than at the top. Explain why.24. Suppose there is a sudden loud sound in a closed room. Eventually the sound dies away. What happened to the energy in the
sound waves that were produced? What can you say about the temperature of the walls of the room after the sound has diedaway?
Power1. If the power company can’t provide enough electricity fast enough, is this a power crisis or an energy crisis? Explain.2. When you reach the top of a hill, have you used more power if you go straight up versus if you take a zigzag path (Hint; it takes
more time to walk the zigzag path)?3. Betty and Bob have the same mass and race up the stairs. Betty gets there first. Who does more work? Who uses more power?4. Use a calculator to find out how many horsepower a light bulb is capable of putting out. ( )5. Use a calculator to find out how many Watts a car motor is capable of putting out.
Thermodynamics1. An inventor claims to have the following new system. An engine runs by burning hydrogen. The engine turns a generator that
makes electricity. The electricity runs through water to make hydrogen. The hydrogen is used in the engine. The inventor claimsthe system produces more energy than it uses. Should you invest in this new system? Why not (name the law which is broken)?
2. An inventor claims to have invented a motor that is efficient. Would you invest in this device? Why not?3. Why can’t a gasoline car engine be efficient?4. The actual upper limit of efficiency for a gasoline engine is probably something less than . Where does this limit come
from?5. Why do amplifier circuits for electric guitars generate heat?6. Many instruments (violins and guitars for example) have to be returned after they have been played for a few minutes. This is
because they get warmer. One source of the heat that causes them to warm up is heat from the hands of the performer. Whatother source of heat is involved?
Contributions and Attributions
This page is licensed under a CC BY-NC-SA 3.0 license and was authored, remixed, and/or curated by Kyle Forinash andWolfgang Christian. Source content is found at https://www.compadre.org/books/SoundBook. Page content has been edited andupdated to conform to the style and standards of the LibreTexts platform. A detailed versioning history of the edits to source contentis available upon request.
1.1.4.2
1.1.4.3
20%
100%
1000
100 Watt 1 hp = 746 Watts
250 hp
100%
100%
45%
Kyle Forinash and Wolfgang Christian 1.1.5.1 3/24/2022 https://phys.libretexts.org/@go/page/26132
1.1.5: Two Energy LawsOne very important concept in the physics of sound (and for all of physics) is the law of conservation of energy: Energy cannot becreated or destroyed but it can be transformed from one type of energy to another.
Consider the following energy conversions. You do of work on the spring of a toy gun so that of potential energy arestored. When you pull the trigger the spring energy is converted to of kinetic energy and a ball leaves the gun going upward.The kinetic energy gradually turns into gravitational potential energy as the ball goes upward. Halfway up it has of kineticenergy and of potential. At the top there is no kinetic left but you have of gravitational potential energy. On the way downthe potential energy is gradually converted to kinetic energy. Just before the ball hits the ground it has of kinetic energy. Onceit hits the ground the is converted to sound and heat; the ball is just a tiny bit warmer than it was.
You can also trace the original back in time before you pushed the spring on the toy gun. The energy for moving your armcame from chemical energy stored in your body. This chemical energy came from the plants and/or animals you ate. That energycan eventually be traced back to the nuclear energy released in the form of electromagnetic waves from the sun. Plants absorbedthis light energy to form stored chemical energy for you to eat. Energy was never created or destroyed in any of these conversionsteps. The law of conservation of energy is also called the first law of thermodynamics.
There is a second energy law that is also very important but we will not need to know the details of how it works. The second lawof thermodynamics says that anytime you change energy from one form to another, some of the energy must (that is the law!) endup in a much less useful form, usually as random thermal energy (heat). When the mechanical energy of bowing a violin is turnedinto vibrational energy in the strings and then that energy is turned into sound energy in the air, a small amount of the total energyalways ends up as heat. The violin and surrounding air will be just a tiny bit warmer. Likewise, amplifiers for radios, stereos andelectric guitars give off heat because they are converting electrical energy into sound energy; according to the second law theconversion process has to give off some heat.
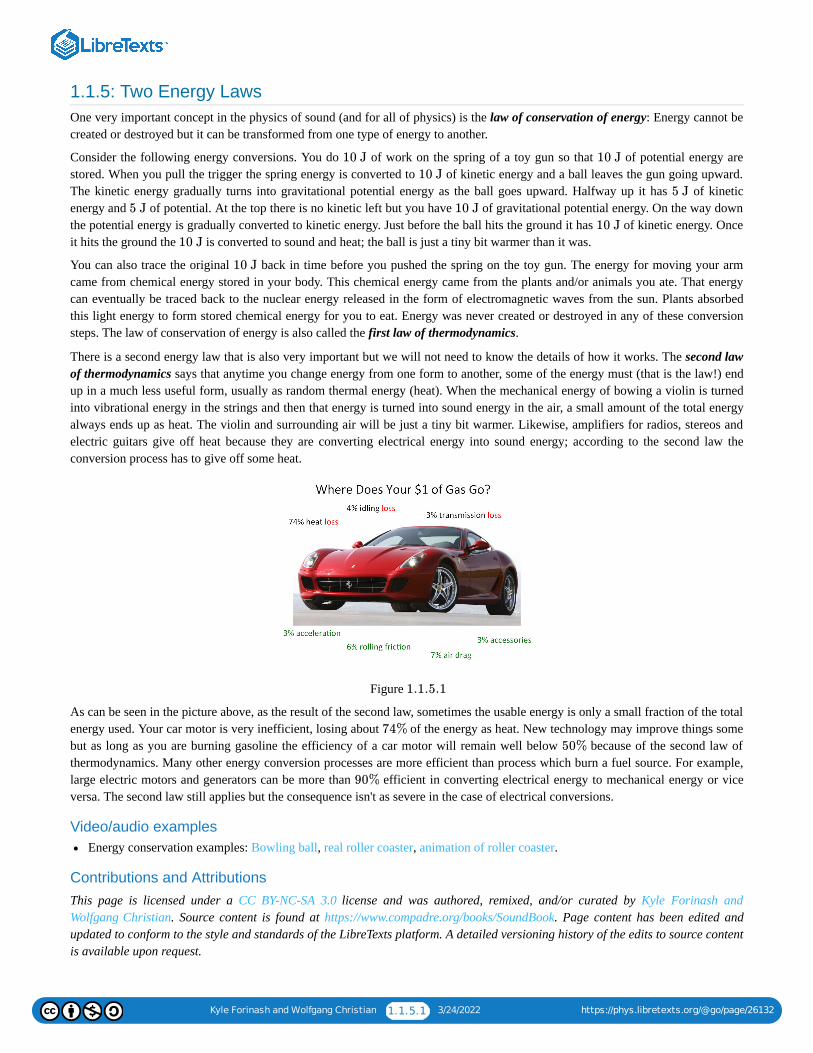
Figure
As can be seen in the picture above, as the result of the second law, sometimes the usable energy is only a small fraction of the totalenergy used. Your car motor is very inefficient, losing about of the energy as heat. New technology may improve things somebut as long as you are burning gasoline the efficiency of a car motor will remain well below because of the second law ofthermodynamics. Many other energy conversion processes are more efficient than process which burn a fuel source. For example,large electric motors and generators can be more than efficient in converting electrical energy to mechanical energy or viceversa. The second law still applies but the consequence isn't as severe in the case of electrical conversions.
Video/audio examplesEnergy conservation examples: Bowling ball, real roller coaster, animation of roller coaster.
Contributions and AttributionsThis page is licensed under a CC BY-NC-SA 3.0 license and was authored, remixed, and/or curated by Kyle Forinash andWolfgang Christian. Source content is found at https://www.compadre.org/books/SoundBook. Page content has been edited andupdated to conform to the style and standards of the LibreTexts platform. A detailed versioning history of the edits to source contentis available upon request.
10 J 10 J
10 J
5 J
5 J 10 J
10 J
10 J
10 J
1.1.5.1
74%
50%
90%
Kyle Forinash and Wolfgang Christian 1.1.6.1 3/24/2022 https://phys.libretexts.org/@go/page/26133
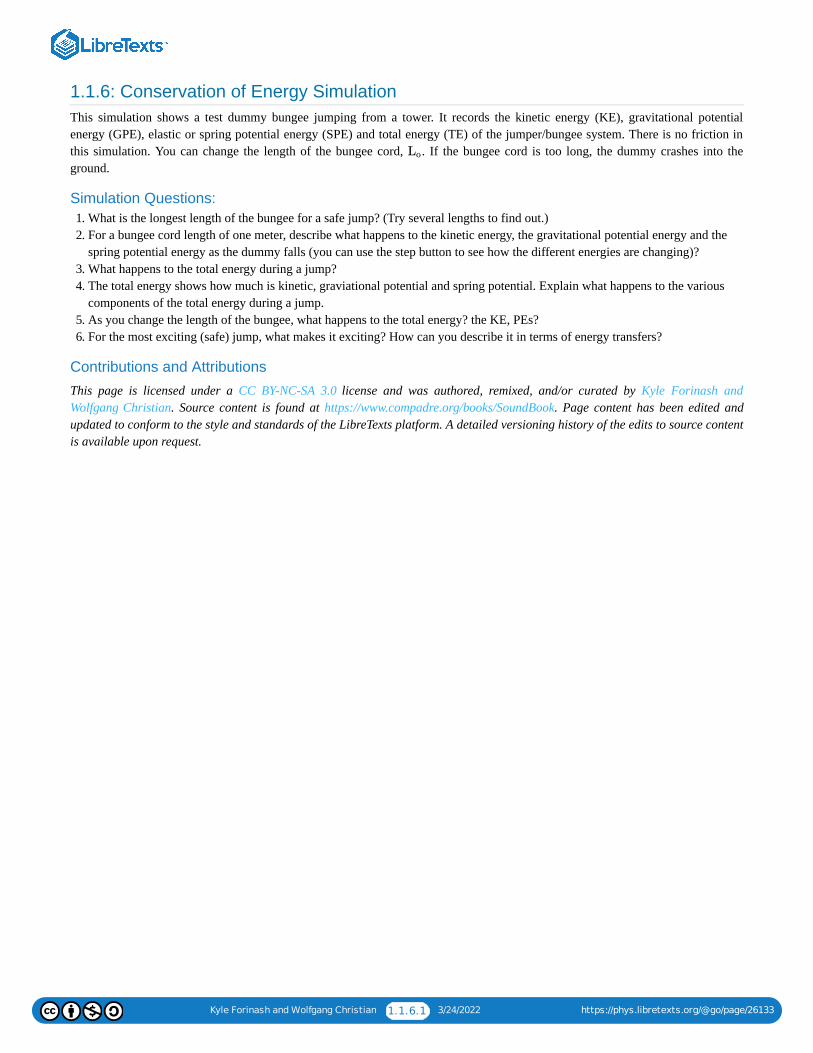
1.1.6: Conservation of Energy SimulationThis simulation shows a test dummy bungee jumping from a tower. It records the kinetic energy (KE), gravitational potentialenergy (GPE), elastic or spring potential energy (SPE) and total energy (TE) of the jumper/bungee system. There is no friction inthis simulation. You can change the length of the bungee cord, . If the bungee cord is too long, the dummy crashes into theground.
Simulation Questions:1. What is the longest length of the bungee for a safe jump? (Try several lengths to find out.)2. For a bungee cord length of one meter, describe what happens to the kinetic energy, the gravitational potential energy and the
spring potential energy as the dummy falls (you can use the step button to see how the different energies are changing)?3. What happens to the total energy during a jump?4. The total energy shows how much is kinetic, graviational potential and spring potential. Explain what happens to the various
components of the total energy during a jump.5. As you change the length of the bungee, what happens to the total energy? the KE, PEs?6. For the most exciting (safe) jump, what makes it exciting? How can you describe it in terms of energy transfers?
Contributions and Attributions
This page is licensed under a CC BY-NC-SA 3.0 license and was authored, remixed, and/or curated by Kyle Forinash andWolfgang Christian. Source content is found at https://www.compadre.org/books/SoundBook. Page content has been edited andupdated to conform to the style and standards of the LibreTexts platform. A detailed versioning history of the edits to source contentis available upon request.
Lo
Kyle Forinash and Wolfgang Christian 1.2.1 3/24/2022 https://phys.libretexts.org/@go/page/25984
1.2: Basics- The Molecular Basis of MatterThis simulation shows particles interacting with a slight attraction which will cause them to stay connected with each other to forma a solid at low temperature. But if they have enough thermal energy they will begin to move around each other to act like liquid.Additional thermal energy causes them to act like a gas.
Contributions and AttributionsThis page is licensed under a CC BY-NC-SA 3.0 license and was authored, remixed, and/or curated by Kyle Forinash andWolfgang Christian. Source content is found at https://www.compadre.org/books/SoundBook. Page content has been edited andupdated to conform to the style and standards of the LibreTexts platform. A detailed versioning history of the edits to source contentis available upon request.
Kyle Forinash and Wolfgang Christian 1.2.1.1 3/24/2022 https://phys.libretexts.org/@go/page/26134
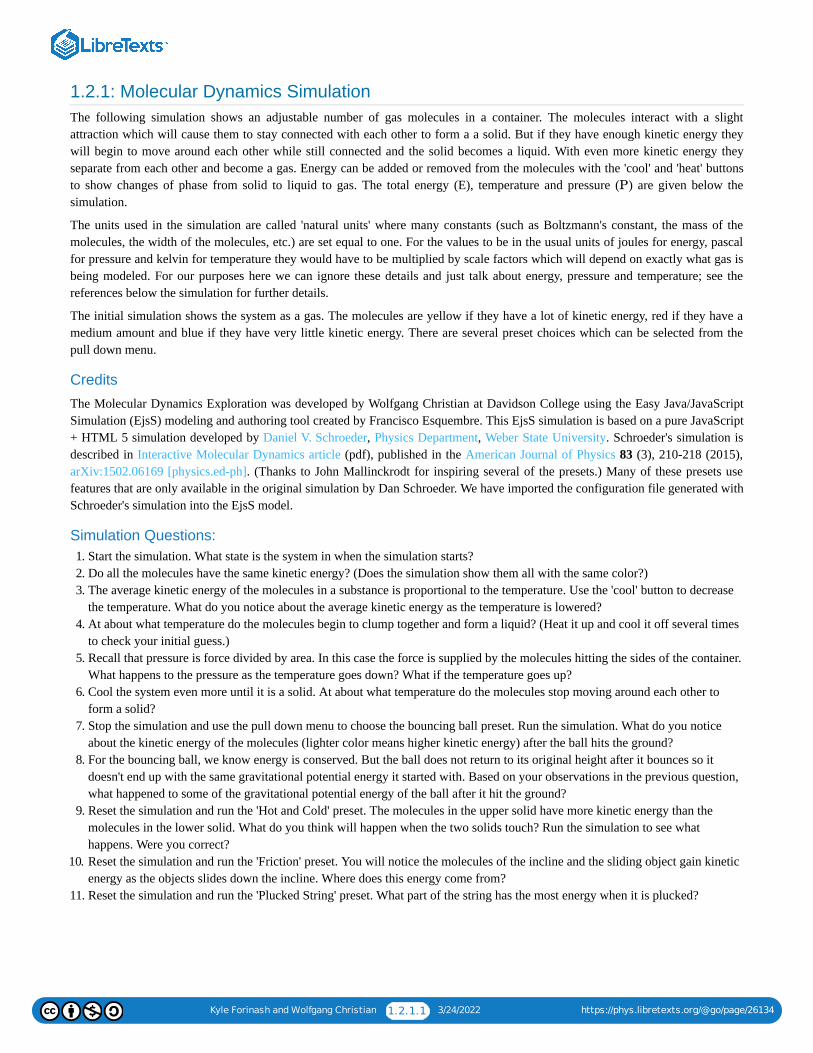
1.2.1: Molecular Dynamics SimulationThe following simulation shows an adjustable number of gas molecules in a container. The molecules interact with a slightattraction which will cause them to stay connected with each other to form a a solid. But if they have enough kinetic energy theywill begin to move around each other while still connected and the solid becomes a liquid. With even more kinetic energy theyseparate from each other and become a gas. Energy can be added or removed from the molecules with the 'cool' and 'heat' buttonsto show changes of phase from solid to liquid to gas. The total energy (E), temperature and pressure ( ) are given below thesimulation.
The units used in the simulation are called 'natural units' where many constants (such as Boltzmann's constant, the mass of themolecules, the width of the molecules, etc.) are set equal to one. For the values to be in the usual units of joules for energy, pascalfor pressure and kelvin for temperature they would have to be multiplied by scale factors which will depend on exactly what gas isbeing modeled. For our purposes here we can ignore these details and just talk about energy, pressure and temperature; see thereferences below the simulation for further details.
The initial simulation shows the system as a gas. The molecules are yellow if they have a lot of kinetic energy, red if they have amedium amount and blue if they have very little kinetic energy. There are several preset choices which can be selected from thepull down menu.
Credits
The Molecular Dynamics Exploration was developed by Wolfgang Christian at Davidson College using the Easy Java/JavaScriptSimulation (EjsS) modeling and authoring tool created by Francisco Esquembre. This EjsS simulation is based on a pure JavaScript+ HTML 5 simulation developed by Daniel V. Schroeder, Physics Department, Weber State University. Schroeder's simulation isdescribed in Interactive Molecular Dynamics article (pdf), published in the American Journal of Physics 83 (3), 210-218 (2015),arXiv:1502.06169 [physics.ed-ph]. (Thanks to John Mallinckrodt for inspiring several of the presets.) Many of these presets usefeatures that are only available in the original simulation by Dan Schroeder. We have imported the configuration file generated withSchroeder's simulation into the EjsS model.
Simulation Questions:1. Start the simulation. What state is the system in when the simulation starts?2. Do all the molecules have the same kinetic energy? (Does the simulation show them all with the same color?)3. The average kinetic energy of the molecules in a substance is proportional to the temperature. Use the 'cool' button to decrease
the temperature. What do you notice about the average kinetic energy as the temperature is lowered?4. At about what temperature do the molecules begin to clump together and form a liquid? (Heat it up and cool it off several times
to check your initial guess.)5. Recall that pressure is force divided by area. In this case the force is supplied by the molecules hitting the sides of the container.
What happens to the pressure as the temperature goes down? What if the temperature goes up?6. Cool the system even more until it is a solid. At about what temperature do the molecules stop moving around each other to
form a solid?7. Stop the simulation and use the pull down menu to choose the bouncing ball preset. Run the simulation. What do you notice
about the kinetic energy of the molecules (lighter color means higher kinetic energy) after the ball hits the ground?8. For the bouncing ball, we know energy is conserved. But the ball does not return to its original height after it bounces so it
doesn't end up with the same gravitational potential energy it started with. Based on your observations in the previous question,what happened to some of the gravitational potential energy of the ball after it hit the ground?
9. Reset the simulation and run the 'Hot and Cold' preset. The molecules in the upper solid have more kinetic energy than themolecules in the lower solid. What do you think will happen when the two solids touch? Run the simulation to see whathappens. Were you correct?
10. Reset the simulation and run the 'Friction' preset. You will notice the molecules of the incline and the sliding object gain kineticenergy as the objects slides down the incline. Where does this energy come from?
11. Reset the simulation and run the 'Plucked String' preset. What part of the string has the most energy when it is plucked?
P
Kyle Forinash and Wolfgang Christian 1.2.1.2 3/24/2022 https://phys.libretexts.org/@go/page/26134
Chapter Two SummaryForces cause accelerations, not velocities (objects will keep moving with constant velocity if the net force is zero). For every forcethere is always a second reaction force of the same amount but acting on a different object and in the opposite direction. Pressure isforce distributed over an area. Bernoulli's principle is the result of air flow at different speeds and different pressures and causesbaseballs to curve and the lips of a trumpet player to buzz. Energy comes in many forms and the total amount of energy isconserved (we can't create it or destroy it, only convert it from one type to another). When energy is converted from one form toanother some of it has to end up in a less useful form (heat that generally isn't useful). Also, as you go through this book rememberthat: Science words have specific narrow definitions; Any number you see in science is a measurement of something, unlike inmath class; and The laws of physics are always true with no exceptions.
Contributions and Attributions
This page is licensed under a CC BY-NC-SA 3.0 license and was authored, remixed, and/or curated by Kyle Forinash andWolfgang Christian. Source content is found at https://www.compadre.org/books/SoundBook. Page content has been edited andupdated to conform to the style and standards of the LibreTexts platform. A detailed versioning history of the edits to source contentis available upon request.
Kyle Forinash and Wolfgang Christian 2.1 3/24/2022 https://phys.libretexts.org/@go/page/26003
2: VibrationsAll sound starts with something that vibrates. The reed in a clarinet vibrates, the vocal cords in a singer's throat vibrate, the airflowing over the mouthpiece of a flute oscillates, and the speaker cone on your stereo or in an ear-bud vibrates. In this chapter weinvestigate a particular kind of vibration called simple harmonic motion. Most of the vibrations in musical instruments and thehuman voice can be described approximately by simple harmonic motion.
Key Terms:Periodic, period (cycle), linear restoring force (Hooke's law), non-linear restoring force, amplitude, displacement, phase, frequency,natural frequency, spring constant, simple harmonic motion, damped harmonic motion, damped driven harmonic motion.
2.1: Vibrations
Contributions and Attributions
This page is licensed under a CC BY-NC-SA 3.0 license and was authored, remixed, and/or curated by Kyle Forinash andWolfgang Christian. Source content is found at https://www.compadre.org/books/SoundBook. Page content has been edited andupdated to conform to the style and standards of the LibreTexts platform. A detailed versioning history of the edits to source contentis available upon request.
2.1.1: Simple Harmonic Motion
2.1.2: Period, Frequency, Amplitude, Restoring Force, Phase
2.1.3: Simple Harmonic Motion Simulation
Kyle Forinash and Wolfgang Christian 2.1.1 3/24/2022 https://phys.libretexts.org/@go/page/25997
2.1: VibrationsAll sound starts with something that vibrates. The reed in a clarinet vibrates, the vocal cords in a singer's throat vibrate, the airflowing over the mouthpiece of a flute oscillates, and the speaker cone on your stereo or in an ear-bud vibrates. In this chapter weinvestigate a particular kind of vibration called simple harmonic motion.
Contributions and AttributionsThis page is licensed under a CC BY-NC-SA 3.0 license and was authored, remixed, and/or curated by Kyle Forinash andWolfgang Christian. Source content is found at https://www.compadre.org/books/SoundBook. Page content has been edited andupdated to conform to the style and standards of the LibreTexts platform. A detailed versioning history of the edits to source contentis available upon request.
Kyle Forinash and Wolfgang Christian 2.1.1.1 3/24/2022 https://phys.libretexts.org/@go/page/26137
2.1.1: Simple Harmonic MotionAn object will not vibrate if there is no restoring force causing it to want to return to its equilibrium position. If this force isproportional to the distance from equilibrium it is a linear restoring force and obeys Hooke's law. Hooke's law says that if wedouble the displacement from equilibrium, the force acting to return the object to the equilibrium position also doubles. If thedisplacement is one third as big the force is one third as big and so on. Most springs obey Hooke's law; the more you stretch thespring, the larger the force.
What if the force is not proportional to the displacement? Such a force is called a non-linear force which does not obey Hooke'slaw. An example is the modern compound bow used in archery. A system of pulleys causes the force to be the smallest when thedisplacement is greatest. This makes it easier for the archer to hold the bow at maximum displacement while he or she aims at thetarget. Non-linear forces can be quite complicated but fortunately most forces involved in sound and musical instruments are closeenough to linear that we can ignore non-linear effects. The few times a non-linear force acts will be explicitly mentioned; in allother cases you can assume the forces are linear.
The simplest of all vibrations occurs when there is a Hooke's law force and no friction acts. This type of motion is called simpleharmonic motion and will be the model we will use for vibrations in musical instruments. A free hanging mass on a spring and apendulum swinging with low amplitude approximately obey simple harmonic motion.
If friction acts the motion will gradually stop. This is called damped harmonic motion. To maintain a constant vibration when thereis friction, a periodic force must be applied. Harmonic motion that has damping and an applied periodic force is called damped,driven harmonic motion and will be discussed further in the next chapter.
Questions on Simple Harmonic Motion:1. How is sound created?2. How would you determine the period of a pendulum?3. How are frequency and period related?4. Define the units of frequency.5. What is the difference between ‘amplitude’ and ‘displacement’? In the strict sense, why aren’t these terms interchangeable?6. If the period of an oscillation doubles, what happens to the frequency?7. The frequency of middle C sound wave is . What period of oscillation which produces this sound?8. What is the period of oscillation of a string if the frequency is ?9. What is the frequency of oscillation if the period is ?
10. A cork fishing float bobs up and down times per minute. What is period of oscillation in seconds? What is the frequency inHertz?
11. What is the period of the second hand of a watch for going all the way around once?12. The frequency of a local radio station is ( = mega = ). What is the period of oscillation of the electromagnetic
waves of this signal?13. If the CPU of a computer from the year 2000 is , what would the period of oscillation be?14. If you hang a larger mass on the same spring, what happens to its period?15. The average guitar has six strings each in ascending thickness. How might the thickness affect the frequency of the sound from
each string when plucked?16. Suppose a vibrating guitar string moves a total distance of from it’s maximum in one direction to the maximum in the
other direction. What is the maximum amplitude for this motion?17. Suppose a clarinet reed vibrates with a maximum amplitude of . How far does it travel in a complete cycle (all the way
back to its starting point)?18. What does the phase of an oscillation tell you about its motion?19. A phase of is how many radians?20. A phase of is how many radians?21. Define simple harmonic motion.22. What conditions are required for simple harmonic motion to occur?23. What is Hooke’s law and why is it important?24. What is the difference between a linear force and a non-linear force?25. Which has the larger period, a stiff spring or a soft spring?
262 Hz
200 Hz
1.2 s
15
89.3 MHz M 106
200 MHz
1.0 cm
0.04 cm
270 degrees
200 degrees
Kyle Forinash and Wolfgang Christian 2.1.1.2 3/24/2022 https://phys.libretexts.org/@go/page/26137
26. Which has the larger frequency, a stiff spring or a soft spring?27. Which has the larger period, a small mass hanging from a spring or a large mass hanging from the same spring?28. What kind of clarinet reed would more easily play low frequency notes, a stiff reed or a soft reed (assuming the mass is the
same)? Explain your thinking.29. What kind of saxophone reed would more easily play low frequency notes, a thick, heavy reed or a thin, light reed (assuming
the stiffness is the same)? Explain your thinking.30. The mathematical description of SHM is given by . Explain what each of the terms ( )
represent in the motion of a mass on a spring.
Contributions and AttributionsThis page is licensed under a CC BY-NC-SA 3.0 license and was authored, remixed, and/or curated by Kyle Forinash andWolfgang Christian. Source content is found at https://www.compadre.org/books/SoundBook. Page content has been edited andupdated to conform to the style and standards of the LibreTexts platform. A detailed versioning history of the edits to source contentis available upon request.
y(t) = A cos(2πft +ϕ) A, cos, π, f , t, ϕ
Kyle Forinash and Wolfgang Christian 2.1.2.1 3/24/2022 https://phys.libretexts.org/@go/page/26138
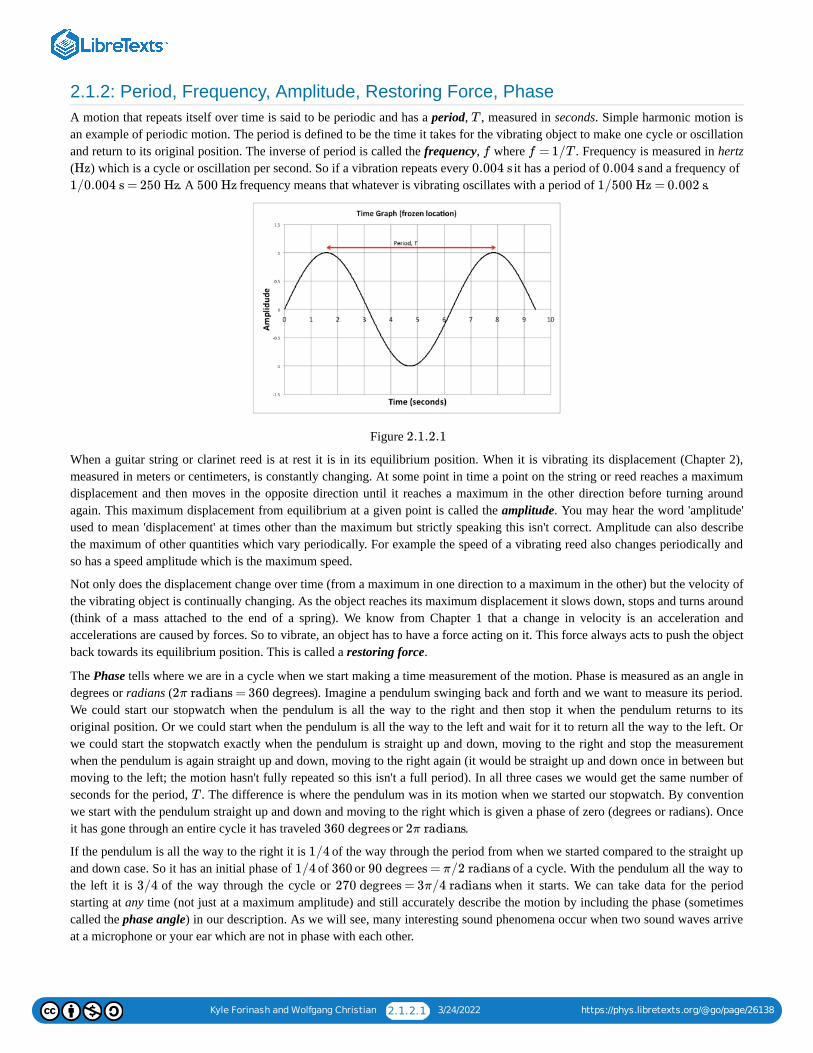
2.1.2: Period, Frequency, Amplitude, Restoring Force, PhaseA motion that repeats itself over time is said to be periodic and has a period, , measured in seconds. Simple harmonic motion isan example of periodic motion. The period is defined to be the time it takes for the vibrating object to make one cycle or oscillationand return to its original position. The inverse of period is called the frequency, where . Frequency is measured in hertz( ) which is a cycle or oscillation per second. So if a vibration repeats every it has a period of and a frequency of
. A frequency means that whatever is vibrating oscillates with a period of .
Figure
When a guitar string or clarinet reed is at rest it is in its equilibrium position. When it is vibrating its displacement (Chapter 2),measured in meters or centimeters, is constantly changing. At some point in time a point on the string or reed reaches a maximumdisplacement and then moves in the opposite direction until it reaches a maximum in the other direction before turning aroundagain. This maximum displacement from equilibrium at a given point is called the amplitude. You may hear the word 'amplitude'used to mean 'displacement' at times other than the maximum but strictly speaking this isn't correct. Amplitude can also describethe maximum of other quantities which vary periodically. For example the speed of a vibrating reed also changes periodically andso has a speed amplitude which is the maximum speed.
Not only does the displacement change over time (from a maximum in one direction to a maximum in the other) but the velocity ofthe vibrating object is continually changing. As the object reaches its maximum displacement it slows down, stops and turns around(think of a mass attached to the end of a spring). We know from Chapter 1 that a change in velocity is an acceleration andaccelerations are caused by forces. So to vibrate, an object has to have a force acting on it. This force always acts to push the objectback towards its equilibrium position. This is called a restoring force.
The Phase tells where we are in a cycle when we start making a time measurement of the motion. Phase is measured as an angle indegrees or radians ( ). Imagine a pendulum swinging back and forth and we want to measure its period.We could start our stopwatch when the pendulum is all the way to the right and then stop it when the pendulum returns to itsoriginal position. Or we could start when the pendulum is all the way to the left and wait for it to return all the way to the left. Orwe could start the stopwatch exactly when the pendulum is straight up and down, moving to the right and stop the measurementwhen the pendulum is again straight up and down, moving to the right again (it would be straight up and down once in between butmoving to the left; the motion hasn't fully repeated so this isn't a full period). In all three cases we would get the same number ofseconds for the period, . The difference is where the pendulum was in its motion when we started our stopwatch. By conventionwe start with the pendulum straight up and down and moving to the right which is given a phase of zero (degrees or radians). Onceit has gone through an entire cycle it has traveled or .
If the pendulum is all the way to the right it is of the way through the period from when we started compared to the straight upand down case. So it has an initial phase of of or of a cycle. With the pendulum all the way tothe left it is of the way through the cycle or when it starts. We can take data for the periodstarting at any time (not just at a maximum amplitude) and still accurately describe the motion by including the phase (sometimescalled the phase angle) in our description. As we will see, many interesting sound phenomena occur when two sound waves arriveat a microphone or your ear which are not in phase with each other.
T
f f = 1/T
Hz 0.004 s 0.004 s
1/0.004 s = 250 Hz 500 Hz 1/500 Hz = 0.002 s
2.1.2.1
2π radians = 360 degrees
T
360 degrees 2π radians
1/4
1/4 360 90 degrees = π/2 radians
3/4 270 degrees = 3π/4 radians
Kyle Forinash and Wolfgang Christian 2.1.2.2 3/24/2022 https://phys.libretexts.org/@go/page/26138
Both simple harmonic motion and many waves can be described by the trigonometric functions sine and cosine. What is thedifference between these two functions? A sine function starts with an amplitude of zero ( ) whereas a cosinefunction starts with an amplitude of one ( ). If we slide the sine function to the left by itexactly matches a cosine curve. In other words the sine and cosine are out of phase by ; forany . So we can use either function by adjusting the phase appropriately.
Video/audio examples:Examples of oscillation (some are simple harmonic, others not).Simple harmonic motion: explanation and examples.Tuning fork in water in slow motion.Brass player's lips vibrating.Example of a nonlinear spring. Note that the frequency shifts upward over time, unlike a linear system where the frequencyremains constant when the amplitude changes.
Contributions and AttributionsThis page is licensed under a CC BY-NC-SA 3.0 license and was authored, remixed, and/or curated by Kyle Forinash andWolfgang Christian. Source content is found at https://www.compadre.org/books/SoundBook. Page content has been edited andupdated to conform to the style and standards of the LibreTexts platform. A detailed versioning history of the edits to source contentis available upon request.
Note
sin(0) = 0
cos(0) = 1 90 degrees = π/2 radians
90 degrees sin(x +π/2) = cos(x)
x
Kyle Forinash and Wolfgang Christian 2.1.3.1 3/24/2022 https://phys.libretexts.org/@go/page/26139
2.1.3: Simple Harmonic Motion SimulationThe following is a simulation of a mass on a spring. The graph shows the (vertical) location of the mass at different times. Theforce acting on the mass in this case is called a Hooke's Law force: where is called the spring constant, in indicating the stiffness of the spring and is the location of the mass from some equilibrium position.
The points on the graph of the motion of the mass on a spring can be described by the mathematical function where is the cosine function, is the frequency, is the amplitude (maximum displacement) and
is the phase in radians. For any time, , the displacement of the mass can be found by calculating ifthe frequency and starting point (phase) are known.
Simulation Questions:1. Drag the mass to some initial location using the mouse. Click 'play' button (lower left) to see the motion and the graph of the
mass location. Determine the period of oscillation from the graph by finding the difference in time between two peaks.2. Now find the period from the times of two consecutive times when the mass is at the bottom of its oscillation. Is this the same
period you got in the first question? Explain.3. Try a different starting displacement and measure the period. Does changing the amplitude of the oscillation change the period?4. Clicking on the graph shows the coordinates of the mouse in a yellow box at the lower left. Determine the period and frequency
of this motion from the values on the graph (Hint: Frequency in is the inverse of period .5. Check the 'V' box to see graphs of both position and velocity. Where is the mass when the velocity is a maximum? Where is the
mass when the velocity becomes zero?6. Try different spring constant values, , between to , resetting and releasing the mass at the same point each
time. What is the relationship between spring constant and frequency?7. For a given spring the frequency is determined by the mass hanging on it and the stiffness of the spring; .
Measure the frequency for the case of a spring constant, equal to . What must be the mass on the end of this spring? Verifythat you get the same mass by measuring the frequency for several different spring constants (this is equivalent to hanging thesame mass on several different springs).
8. According to the equation for frequency, what would happen to the period of oscillation of a spring-mass system if the mass isdoubled?
9. Why is it more convenient to use a cosine function with a phase of zero for the description of the motion of the mass in thiscase? (Hint: Does the mass start with an amplitude of zero or a maximum amplitude?)
Advanced Questions:1. As we will see in Chapter 6, angular frequency is given by . What is the angular frequency of the motion of the mass?2. The points on the graph of the motion of the mass on a spring can be described by the mathematical function
where is the cosine function, is the angular frequency and is the phase in radians. Using thisequation and a calculator (in radian mode!), what is the location of the mass when and ? What is the location of themass when and (don't forget we are in radian mode)? Explain what the phase angle, tells you about the initialposition ( ) of the mass on the spring.
3. If is the location of the mass on the spring and the time derivative (using calculus) of location isvelocity, then the velocity of the mass is given by . Check the 'V' box and run a simulation with aninitial amplitude of and a spring constant of . From the graph find the angular frequency and calculate the speedamplitude . How does this number compare with the maximum value on the velocity graph, are they the same?
4. Find an expression for the acceleration of a mass on a spring, based on the position given by and thefact that acceleration is the second derivative of position with respect to time (this requires calculus).
Chapter Three Summary
Vibrating objects can be described by their period (in seconds) or the inverse, their frequency (in Hertz). The phase angle tellswhere in the cycle a measurement of time or space is starting. Anything that experiences a Hooke's law force (a force proportionalto displacement) without being driven and without friction will undergo simple harmonic motion. Simple harmonic motion can bedescribed mathematically by a sine or cosine function.
y
F = −κy κ N/m
y
y(t) = A cos(−2πft +ϕ) cos f A
ϕ t y(t) = A cos(−2πft +ϕ)
Hz f = 1/T
κ 0.5 N/m 5.0 N/m
f = (κ/m /(2π))1/2
κ 2.0
ω = 2πf
y(t) = A cos(−ωt +ϕ) cos ω ϕ
t = 0 ϕ = 0
t = 0 ϕ = π ϕ
t = 0
y(t) = A cos(−ωt +ϕ)
v(t) = −Aω sin(−ωt +ϕ)
6.0 m 2
= Aωvmax
y(t) = A cos(−ωt +ϕ)

Kyle Forinash and Wolfgang Christian 2.1.3.2 3/24/2022 https://phys.libretexts.org/@go/page/26139
Contributions and AttributionsThis page is licensed under a CC BY-NC-SA 3.0 license and was authored, remixed, and/or curated by Kyle Forinash andWolfgang Christian. Source content is found at https://www.compadre.org/books/SoundBook. Page content has been edited andupdated to conform to the style and standards of the LibreTexts platform. A detailed versioning history of the edits to source contentis available upon request.
1 3/24/2022
CHAPTER OVERVIEW3: RESONANCE
Resonance is a key concept in the production of sound in instruments and in acoustics. We will come across it many more times in this book.The natural frequency ( measured in hertz) is the frequency at which an oscillating system naturally wants to vibrate. For a mass on aspring, this is determined by the size of the mass and the stiffness of the spring; a stiffer spring has a higher natural frequency as we saw inthe previous chapter. To keep a system vibrating in the presence of friction we have to keep pushing it with a periodic force. The frequencyof this periodic driving force is called the driving frequency, which is totally independent of the natural frequency (we can push our masson a spring at a frequency different from the frequency at which it wants to vibrate).
KEY TERMS:
Natural frequency, driving frequency, angular frequency, damped harmonic motion, driven harmonic motion, resonance, resonator,Helmholtz resonance, Quality or Q-factor.
3.1: RESONANCE
3.1.1: RESONANCE EXAMPLES3.1.2: A FEW OTHER EXAMPLES OF RESONANCE3.1.3: HARMONIC MOTION AND RESONANCE SIMULATION3.2: RESONANCE SPRINGS
3.2.1: DRIVEN SPRINGS SIMULATION3.3: QUALITY FACTOR
3.3.1: QUALITY3.3.2: Q-FACTOR SIMULATION
fo
f
Kyle Forinash and Wolfgang Christian 3.1.1 3/24/2022 https://phys.libretexts.org/@go/page/26004
3.1: ResonanceResonance occurs in an oscillating system when the driving frequency happens to equal the natural frequency. For this special casethe amplitude of the motion becomes a maximum. An example is trying to push someone on a swing so that the swing gets higherand higher. If the frequency of the push equals the natural frequency of the swing, the motion gets bigger and bigger. Resonance isa key concept in the production of sound in instruments and in acoustics and we will come across it many times.
Contributions and AttributionsThis page is licensed under a CC BY-NC-SA 3.0 license and was authored, remixed, and/or curated by Kyle Forinash andWolfgang Christian. Source content is found at https://www.compadre.org/books/SoundBook. Page content has been edited andupdated to conform to the style and standards of the LibreTexts platform. A detailed versioning history of the edits to source contentis available upon request.
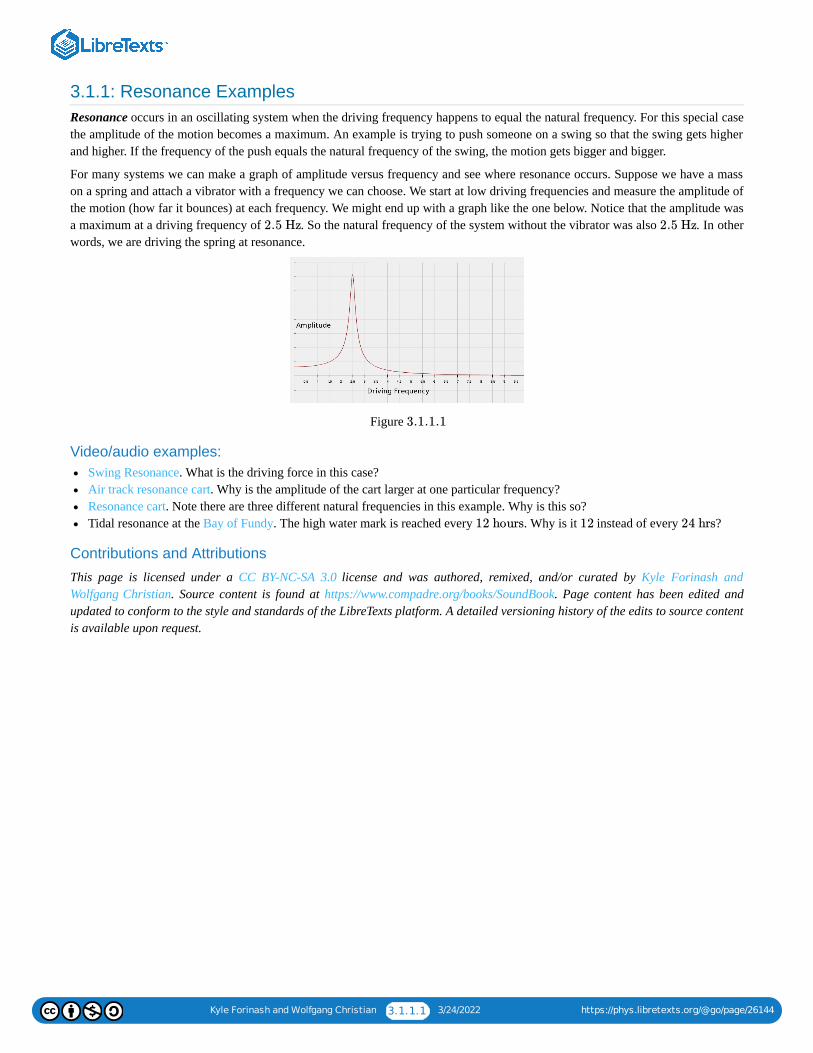
Kyle Forinash and Wolfgang Christian 3.1.1.1 3/24/2022 https://phys.libretexts.org/@go/page/26144
3.1.1: Resonance ExamplesResonance occurs in an oscillating system when the driving frequency happens to equal the natural frequency. For this special casethe amplitude of the motion becomes a maximum. An example is trying to push someone on a swing so that the swing gets higherand higher. If the frequency of the push equals the natural frequency of the swing, the motion gets bigger and bigger.
For many systems we can make a graph of amplitude versus frequency and see where resonance occurs. Suppose we have a masson a spring and attach a vibrator with a frequency we can choose. We start at low driving frequencies and measure the amplitude ofthe motion (how far it bounces) at each frequency. We might end up with a graph like the one below. Notice that the amplitude wasa maximum at a driving frequency of . So the natural frequency of the system without the vibrator was also . In otherwords, we are driving the spring at resonance.
Figure
Video/audio examples:Swing Resonance. What is the driving force in this case?Air track resonance cart. Why is the amplitude of the cart larger at one particular frequency?Resonance cart. Note there are three different natural frequencies in this example. Why is this so?Tidal resonance at the Bay of Fundy. The high water mark is reached every . Why is it instead of every ?
Contributions and Attributions
This page is licensed under a CC BY-NC-SA 3.0 license and was authored, remixed, and/or curated by Kyle Forinash andWolfgang Christian. Source content is found at https://www.compadre.org/books/SoundBook. Page content has been edited andupdated to conform to the style and standards of the LibreTexts platform. A detailed versioning history of the edits to source contentis available upon request.
2.5 Hz 2.5 Hz
3.1.1.1
12 hours 12 24 hrs
Kyle Forinash and Wolfgang Christian 3.1.2.1 3/24/2022 https://phys.libretexts.org/@go/page/26145
3.1.2: A Few Other Examples of ResonanceResonance can occur in any system that has a natural frequency. You probably have experienced a rattle or buzz in your car thatonly occurs at a certain speed. This is an example of resonance; the tires provide a periodic driving force which changes frequencyas you change speed. Various parts of the car have different natural frequencies, particularly parts that have come loose. If thedriving frequency of the rotating tires matches the natural frequency these parts will vibrate at a larger amplitude, making a buzz orrattle. Here are some other examples.
Video/audio examples:Helicopter ground resonance. What is the driving force in this case?Bridge resonances: bouncing, twisting, Tacoma Narrows, Russian bridge.Breaking glass: 1, 2. What are the driving forces in these two cases? [NOTE: Don't do this at home! The breaking glass can gointo your eyes or mouth.]More Singing rod. What is the driving force that makes the rod resonate?A web page with more examples of resonance.A description of building resonance as a result of a dance class.
You probably have blown across the top of a bottle to get a note. Different sized bottles make different notes and partially fillingthe bottles with water also changes the pitch. These are examples of Helmholtz resonators; a container of gas with a single openingthat will resonate at a specific pitch. Blowing across the top causes a driving force on the air inside which has a natural frequencydue to the 'springiness' of the air and the size of the container. As we will see, acoustic stringed instruments such as the guitarconsist of a hollow body which acts like a Helmholtz resonator. Here are more details on Helmholtz resonance.
If you have ever been annoyed by a low frequency sound while driving down the highway with one window partially open, youwere experiencing a Helmholtz resonance where the air blowing past the open window caused the air inside the car to vibrate.
Resonance also occurs in electrical circuits. In fact this is one way a radio receiver can tune to a certain broadcast frequency. Theparameters of the circuit are adjusted so that the circuit has a resonance equal to the frequency of the station you are trying to listento. With those parameters the circuit has much more current flowing for that particular frequency, thus making current flow for thatfrequency much larger than any other frequency. Here is a circuit simulation that shows three circuits. The top circuit is beingdriven below resonance so the current flow is small. The bottom circuit has a driving frequency that is too large. The middle circuitis driven at the resonance frequency of and has the largest current oscillations.
You may have heard the word resonance applied in the medical world. Magnetic Resonance Imaging (MRI) is used in medicine toget images inside the body without doing harm to the living tissue. Every different molecule in the body has a different naturalfrequency of oscillation. Each molecule also has electrical charges on them so that they can be driven by an oscillating magneticand electric field (an electromagnetic wave). When the driving frequency of the oscillating magnetic field equals the naturalfrequency of the molecule, the molecule absorbs the energy and undergoes larger oscillations. This absorbed energy doesn't passthrough the body and so is not detected outside after the magnetic field passes through. By changing the driving frequency (thefrequency of the electromagnetic wave) it is possible to map the location of different types of molecules in the body, giving a mapof the internal structures. This tutorial on MRI gives more details and shows some pictures generated using magnetic resonanceimaging.
Questions on Resonance:1. What is meant by damped harmonic motion? Give an example.2. What is meant by driven, damped harmonic motion? Give an example.3. What is the difference between natural frequency and driving frequency?4. Define resonance.5. List as many examples of resonance in every day life as you can think of.6. In the YouTube of the singer who broke a wine glass using his voice, explain why the wine glass broke.7. What is a Helmholtz resonator? Give an example.8. In the simulation with several different masses, explain why different masses resonate at different driving frequencies.9. The natural frequency of an oscillating object is . At what frequency would you want push it in order to make the
oscillations bigger?10. For the previous question, how often in seconds should you push the object to make the oscillations bigger?
41.1 Hz
10 Hz
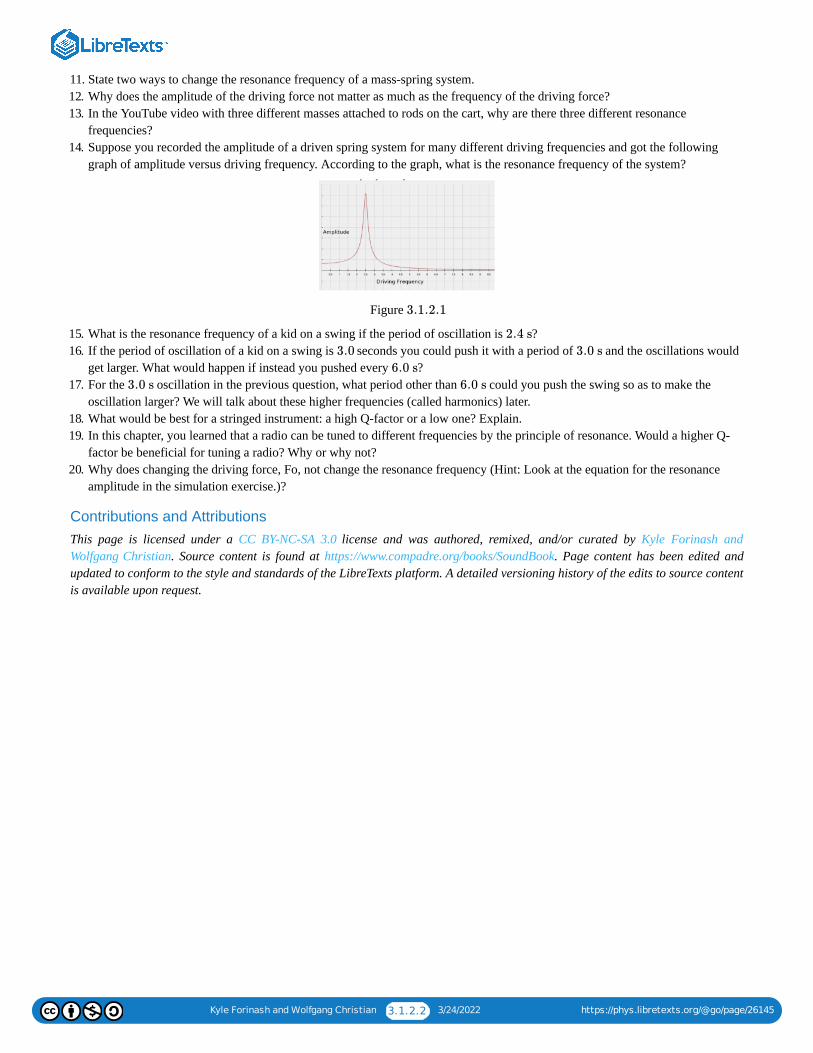
Kyle Forinash and Wolfgang Christian 3.1.2.2 3/24/2022 https://phys.libretexts.org/@go/page/26145
11. State two ways to change the resonance frequency of a mass-spring system.12. Why does the amplitude of the driving force not matter as much as the frequency of the driving force?13. In the YouTube video with three different masses attached to rods on the cart, why are there three different resonance
frequencies?14. Suppose you recorded the amplitude of a driven spring system for many different driving frequencies and got the following
graph of amplitude versus driving frequency. According to the graph, what is the resonance frequency of the system?
Figure
15. What is the resonance frequency of a kid on a swing if the period of oscillation is ?16. If the period of oscillation of a kid on a swing is seconds you could push it with a period of and the oscillations would
get larger. What would happen if instead you pushed every ?17. For the oscillation in the previous question, what period other than could you push the swing so as to make the
oscillation larger? We will talk about these higher frequencies (called harmonics) later.18. What would be best for a stringed instrument: a high Q-factor or a low one? Explain.19. In this chapter, you learned that a radio can be tuned to different frequencies by the principle of resonance. Would a higher Q-
factor be beneficial for tuning a radio? Why or why not?20. Why does changing the driving force, Fo, not change the resonance frequency (Hint: Look at the equation for the resonance
amplitude in the simulation exercise.)?
Contributions and AttributionsThis page is licensed under a CC BY-NC-SA 3.0 license and was authored, remixed, and/or curated by Kyle Forinash andWolfgang Christian. Source content is found at https://www.compadre.org/books/SoundBook. Page content has been edited andupdated to conform to the style and standards of the LibreTexts platform. A detailed versioning history of the edits to source contentis available upon request.
3.1.2.1
2.4 s
3.0 3.0 s
6.0 s
3.0 s 6.0 s
Kyle Forinash and Wolfgang Christian 3.1.3.1 3/24/2022 https://phys.libretexts.org/@go/page/26146
3.1.3: Harmonic Motion and Resonance SimulationThe following simulation shows a driven, damped harmonic oscillator; a mass on a spring with spring constant . Thedisplacement of the motion is graphed versus time. The driving frequency, , can be adjusted so we expect that for one particularfrequency we will see the amplitude (maximum displacement) of the motion to be very large; in other words, resonance will occur.
Several other parameters can also be adjusted. is the amount of friction in (this could be air resistance or sliding friction orfriction in the spring itself); in is the initial velocity of the mass, and is the magnitude of the driving force in Newtons.
In this (and many other simulations we will use) it is easier to write where is the angular frequency in radians persecond instead of having to write everywhere.
Simulation Questions:1. Start with the default parameters, drag the ball to the maximum starting position (or enter in the box for ) and hit
play. How does this motion compare with simple harmonic motion (in the last chapter)?2. Reset the simulation, change the friction parameter, to , drag the ball to the maximum starting position ( ) and
hit play. (You can also click the button at the top for under damped motion.) What happens? This motion is called dampedharmonic motion.
3. Try different values for . How is the behavior of the mass for small values of (less than one) different than for values largerthan (be sure to use the same starting position each time)?
4. If the mass oscillates at least once before stopping the damping is called underdamped motion. If the mass never quite getsback to the equilibrium position the motion is called overdamped. The case where there is just enough damping so that anoscillation does not occur (the mass just barely makes it back to equilibrium) is called critically damped motion. Click thebuttons on the top for under, over and critically damped motion. Describe the differences between these three cases.
5. Reset the simulation, set the friction parameter, to and the magnitude of the driving force, to . The angularfrequency should be also. Drag the ball to the maximum starting position and hit play. In this and the next fewquestions you will need to wait or so for the motion to stabilize. Describe the stable motion after the initial oscillations forthis case. This motion is called driven, damped harmonic motion.
6. Experiment with different amounts of force, keeping friction and angular frequency equal to one. Also start from the sameposition each time. What is the effect of larger values of force amplitude, on the final, stable motion of the mass?
7. With damping, set to and set to try several values of the angular driving frequency, . Start with a valueof and increase by each time until you get to . In each case, wait until the animation ends and measurethe amplitude by clicking on the top of the curve near the end. The second number in the yellow box is the amplitude in .Write down the amplitude for each driving frequency. Which driving frequency ended up giving the largest amplitude? (This isthe resonance frequency of the system.)
8. The natural frequency, written as is given by the stiffness of the spring, , and the mass; and ismeasured in . In this simulation the mass is and the spring constant is so and the natural angularfrequency, equals . In the previous question you should have seen the maximum amplitude for a drivingfrequency of . In other words a driving frequency, of leads to resonance (maximum amplitude) becauseit equals the natural frequency, . In the previous question, did you get a maximum amplitude for a driving frequency of
?9. Use a calculator to find the natural frequency for a spring and mass system with and . What do you
expect the resonance frequency to be for this case?
Advanced Questions:1. The mathematical formula that describes damped harmonic motion is where . Notice that this is
the same cosine function for simple harmonic motion but the amplitude, , is multiplied by an exponentially decreasingfunction of time, . So we expect the oscillation of a damped harmonic oscillator to be an up and down cosine function withan amplitude that decreases over time. Check to see if the formula really does describe the behavior ofdamped harmonic motion in the simulation. To do this, use a graphing calculator (or go to meta calculator and chose graphingcalculator or use desmos calculator) and plot . This is the case
; and . (You can cut and paste the equation into the online calculator).
1 kg 2 N/m
f
b Ns/m
vo m/s Fo
ω = 2πf ω
2πf
10.0 m xo
b 0.5 Ns/m 10 m
b b
2 Ns/m
b 1.0 Ns/m Fo 1.0 N
1.0 rad/s
10 s
Fo
b 0.2 Ns/m Fo 1.0 N ω
1.1 rad/s 0.1 1.8 rad/s
m
fo κ = (κ/m /2πfo )1/2
Hz 1 kg 2 N/m = 0.225 Hzfo
= 2πfωo 1.41 rad/s
1.41 rad/s ω 1.41 rad/s
ωo
1.41 rad/s
m = 2.0 kg κ = 5.0 N/m
A cos(ωt +ϕ)e−γt γ = b/2m
A
e−γt
A cos(ωt +ϕ)e−γt
y = 10 ∗ exp(−.2 ∗ x) ∗ cos(1. ∗ x)
A = 10 m; b = 0.4 Ns/m; m = 1.0 kg ω = 1.0 rad/s

Kyle Forinash and Wolfgang Christian 3.1.3.2 3/24/2022 https://phys.libretexts.org/@go/page/26146
How does this graph compare with the simulation for these same parameters (note: you are only interested in the positive xvalues)?
2. The mathematical formula that describes driven, damped harmonic motion is where . In this case the amplitude, does not change over time but it is dependent on the
driving frequency, . What happens to the amplitude, , when (assume all the other factors are constant numbers)? Isthere any other combination of and that gives a larger amplitude?
3. Verify your previous answer by making a plot of for a range of driving frequency. Todo this, use a graphing calculator to graph . Where does this graph have a maximumfor positive values of ?
4. Based on the previous two questions, what is the resonance frequency of this system and how does this compare with thenatural frequency?
Contributions and AttributionsThis page is licensed under a CC BY-NC-SA 3.0 license and was authored, remixed, and/or curated by Kyle Forinash andWolfgang Christian. Source content is found at https://www.compadre.org/books/SoundBook. Page content has been edited andupdated to conform to the style and standards of the LibreTexts platform. A detailed versioning history of the edits to source contentis available upon request.
cos(ωt +ϕ)Ao
= ( /m)/(( − +4Ao Fo ω2 ω2o)2 γ2ω2)1/2 Ao
ω Ao ω = ωo
ω ωo
= ( /m)/(( − +4Ao Fo ω2 ω2o)2 γ2ω2)1/2
y = 1.0/(( − +4 ∗ .04 ∗1.42 x2)2 1.42).5
x
Kyle Forinash and Wolfgang Christian 3.2.1 3/24/2022 https://phys.libretexts.org/@go/page/26005
3.2: Resonance SpringsThis simulation shows five different masses, each attached to a spring of the same stiffness. The springs are mounted on amechanical device that shakes the springs and attached masses.
Contributions and AttributionsThis page is licensed under a CC BY-NC-SA 3.0 license and was authored, remixed, and/or curated by Kyle Forinash andWolfgang Christian. Source content is found at https://www.compadre.org/books/SoundBook. Page content has been edited andupdated to conform to the style and standards of the LibreTexts platform. A detailed versioning history of the edits to source contentis available upon request.
Kyle Forinash and Wolfgang Christian 3.2.1.1 3/24/2022 https://phys.libretexts.org/@go/page/26147
3.2.1: Driven Springs SimulationThe following simulation shows five different masses, each attached to a spring of the same stiffness. The springs are mounted on amechanical device that shakes the springs and attached masses. You can adjust the driving frequency, in , of the shakingmechanism, the amplitude of the driving force, , in Newtons, the amount of friction, in , and the stiffness of the springs,
, measured in .
Simulation Questions:1. Start the simulation. Do any of the masses have a very large amplitude?2. Increase the amplitude of the driving force, . Now do any of the masses have a very large amplitude?3. Reset the simulation and change the driving frequency, , to . Wait a few seconds. What do you see now?4. Why is the oscillation of mass number five much larger than the other ones now?5. Reset the simulation and change the driving frequency to . What do you notice now?6. See if you can determine the resonance frequency of the center mass by trial and error. What is its resonance frequency?7. In the previous simulation we saw that the natural frequency, written as is given by the stiffness of the spring, , and the
mass; . In this simulation the large mass is and the spring constant is initially so . This is why it has a large oscillation when driven at ; it will resonate with a driving frequency equal to its
natural frequency. The center mass (number three) is so the natural frequency is . Did you find a resonancefrequency of for this mass?
8. Mass number two is . Calculate its natural frequency. Verify your result by trying it out in the simulation.9. Reset the simulation so that none of the masses are in resonance. Why doesn't the driving amplitude have much of an effect on
the oscillation of the masses?10. Change the spring stiffness, to . (This changes the stiffness of all the springs.) Do the masses have the same
resonance frequencies? Explain.11. Use the formula for the natural frequency to calculate the natural frequency of the mass (mass number five) with a spring
constant of . Verify your result using the simulation.
Contributions and AttributionsThis page is licensed under a CC BY-NC-SA 3.0 license and was authored, remixed, and/or curated by Kyle Forinash andWolfgang Christian. Source content is found at https://www.compadre.org/books/SoundBook. Page content has been edited andupdated to conform to the style and standards of the LibreTexts platform. A detailed versioning history of the edits to source contentis available upon request.
f Hz
Fo b Ns/m
κ N/m
Fo
f 0.5 Hz
2.0 Hz
fo κ
= (κ/m /(2π)fo )1/2 10 kg 100 N/m
= 0.5 Hzfo 0.5 Hz
2.5 kg 1.0 Hz
1.0 Hz
1.25 kg
κ 150 N/m
10 kg
150 N/m
Kyle Forinash and Wolfgang Christian 3.3.1 3/24/2022 https://phys.libretexts.org/@go/page/26006
3.3: Quality FactorMany systems, including musical instruments, have a wide range of frequencies at which the system will resonate. We study howthis range depends on the damping coefficient.
Contributions and AttributionsThis page is licensed under a CC BY-NC-SA 3.0 license and was authored, remixed, and/or curated by Kyle Forinash andWolfgang Christian. Source content is found at https://www.compadre.org/books/SoundBook. Page content has been edited andupdated to conform to the style and standards of the LibreTexts platform. A detailed versioning history of the edits to source contentis available upon request.
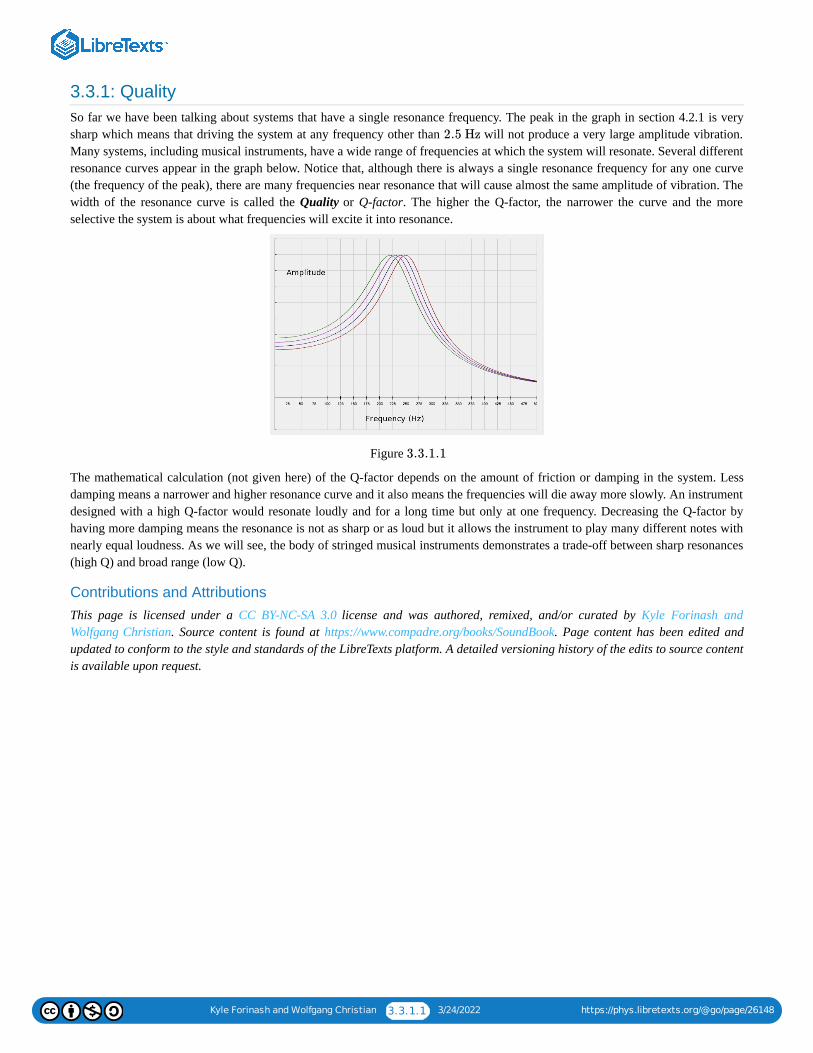
Kyle Forinash and Wolfgang Christian 3.3.1.1 3/24/2022 https://phys.libretexts.org/@go/page/26148
3.3.1: QualitySo far we have been talking about systems that have a single resonance frequency. The peak in the graph in section 4.2.1 is verysharp which means that driving the system at any frequency other than will not produce a very large amplitude vibration.Many systems, including musical instruments, have a wide range of frequencies at which the system will resonate. Several differentresonance curves appear in the graph below. Notice that, although there is always a single resonance frequency for any one curve(the frequency of the peak), there are many frequencies near resonance that will cause almost the same amplitude of vibration. Thewidth of the resonance curve is called the Quality or Q-factor. The higher the Q-factor, the narrower the curve and the moreselective the system is about what frequencies will excite it into resonance.
Figure
The mathematical calculation (not given here) of the Q-factor depends on the amount of friction or damping in the system. Lessdamping means a narrower and higher resonance curve and it also means the frequencies will die away more slowly. An instrumentdesigned with a high Q-factor would resonate loudly and for a long time but only at one frequency. Decreasing the Q-factor byhaving more damping means the resonance is not as sharp or as loud but it allows the instrument to play many different notes withnearly equal loudness. As we will see, the body of stringed musical instruments demonstrates a trade-off between sharp resonances(high Q) and broad range (low Q).
Contributions and AttributionsThis page is licensed under a CC BY-NC-SA 3.0 license and was authored, remixed, and/or curated by Kyle Forinash andWolfgang Christian. Source content is found at https://www.compadre.org/books/SoundBook. Page content has been edited andupdated to conform to the style and standards of the LibreTexts platform. A detailed versioning history of the edits to source contentis available upon request.
2.5 Hz
3.3.1.1
Kyle Forinash and Wolfgang Christian 3.3.2.1 3/24/2022 https://phys.libretexts.org/@go/page/26149
3.3.2: Q-Factor SimulationThis simulation expands on what was shown in the previous simulation. Now there are fifty-one independent, damped, drivenharmonic oscillators instead of five. Each oscillator is independent of the others and has a different mass which means their naturalfrequencies are all slightly different. The ratio of the driving frequency, , to the natural frequency, for each oscillator is givenon the horizontal axis. The masses are heaviest on the left (blue) and lightest on the right (red). Each mass is driven by the samesinusoidal driver with the same amplitude and the same driving frequency. A red arrow shows the driving force being applied toeach of the masses. The amplitude of the driving force (red arrow) is the same for all damping but will appear different because thescale on the left changes to match the amplitude of the center mass.
In the previous simulations we examined the effects of damping, driving amplitude and driving frequency on a damped, drivenharmonic oscillator. In this simulation, the only adjustable parameter is the amount of damping, which is the same for eachoscillator. The grey dots show the maximum displacement of each of the masses for a given amount of damping but note that thescale on the left changes depending on amplitude. Keep in mind the masses are independent and do not interact with each other.
Simulation Questions1. On which side of the center is the driving frequency higher than the natural frequency? On which side is the driving frequency
lower than the natural frequency?2. Damped driven harmonic oscillators settle into a steady state after a certain time as you saw in the previous two simulations.
How long does it take for the steady state behavior (when the center mass reaches its maximum shown by the grey circles) toemerge if ? If ?
3. The time to reach steady state is also an indication of how long the oscillations take to relax to zero if the driver is turned off.Based on your previous answer, which amount of damping will let the system 'ring' the longest?
4. How does the damping coefficient affect the maximum displacement of the center mass (look at the scale on the left fordifferent values of damping)?
5. Describe the shape of the maximum amplitudes of all the masses when damping is small compared to when damping is large. Inwhich case are more oscillators moving, low damping or high damping?
6. Based on what you have seen, what is the relationship between damping and Q-factor?
Chapter Four SummaryOscillators will vibrate at their natural frequency which is determined by the physical properties of the system (mass, stiffness,etc.). Most real oscillators have some damping (friction) so that they will gradually stop unless external forces are acting. If anoscillator is pushed (driven) with a periodic force it may have several different amplitudes of vibration, depending on the frequencyof the driving force. The largest amplitude occurs when the driving frequency equals the natural frequency. This condition is calledresonance.
Resonances may occur at a broad range of frequencies (low Q) or a very sharp, single frequency (high Q) in which case thevibrations will die away more slowly once the driving force is turned off.
Contributions and AttributionsThis page is licensed under a CC BY-NC-SA 3.0 license and was authored, remixed, and/or curated by Kyle Forinash andWolfgang Christian. Source content is found at https://www.compadre.org/books/SoundBook. Page content has been edited andupdated to conform to the style and standards of the LibreTexts platform. A detailed versioning history of the edits to source contentis available upon request.
f fo
b
b = 0.1 Ns/m b = 0.2 Ns/m
1 3/24/2022
CHAPTER OVERVIEW4: WAVE TYPES
Transverse waves are the type of wave you usually think of when you imagine a wave. The motion of the material constituting the wave is upand down so that as the wave moves forward the material moves perpendicular (or transverse) to the direction the wave moves. Examples oftransverse waves include waves on a string and electromagnetic waves. Water waves can be approximately transverse in some cases.
KEY TERMS:
Transverse wave, longitudinal wave, compressional wave, torsional wave, wavelength, wave vector, wave period, amplitude, wavefrequency, angular frequency, electromagnetic waves, sound waves, water waves, S-waves, P-waves, Rayleigh waves, Love waves, .
4.1: TRANSVERSE WAVES
4.1.1: TRANSVERSE WAVES4.1.2: TRANSVERSE WAVE SIMULATION4.2: LONGITUDINAL WAVES
4.2.1: LONGITUDINAL WAVES4.2.2: LONGITUDINAL WAVE SIMULATION4.3: OTHER WAVES
4.3.1: TORSIONAL WAVES4.3.2: EXAMPLES OF WAVES4.3.3: WATER WAVE SIMULATION4.4: ELECTROMAGNETIC WAVES
4.4.1: ELECTROMAGNETIC WAVES4.4.2: ANTENNA SIMULATION
v = λf
Kyle Forinash and Wolfgang Christian 4.1.1 3/24/2022 https://phys.libretexts.org/@go/page/26011
4.1: Transverse WavesTransverse waves are the type of wave you usually think of when you imagine a wave. The motion of the material constituting thewave is up and down so that as the wave moves forward the material moves perpendicular (or transverse) to the direction the wavemoves.
Contributions and AttributionsThis page is licensed under a CC BY-NC-SA 3.0 license and was authored, remixed, and/or curated by Kyle Forinash andWolfgang Christian. Source content is found at https://www.compadre.org/books/SoundBook. Page content has been edited andupdated to conform to the style and standards of the LibreTexts platform. A detailed versioning history of the edits to source contentis available upon request.
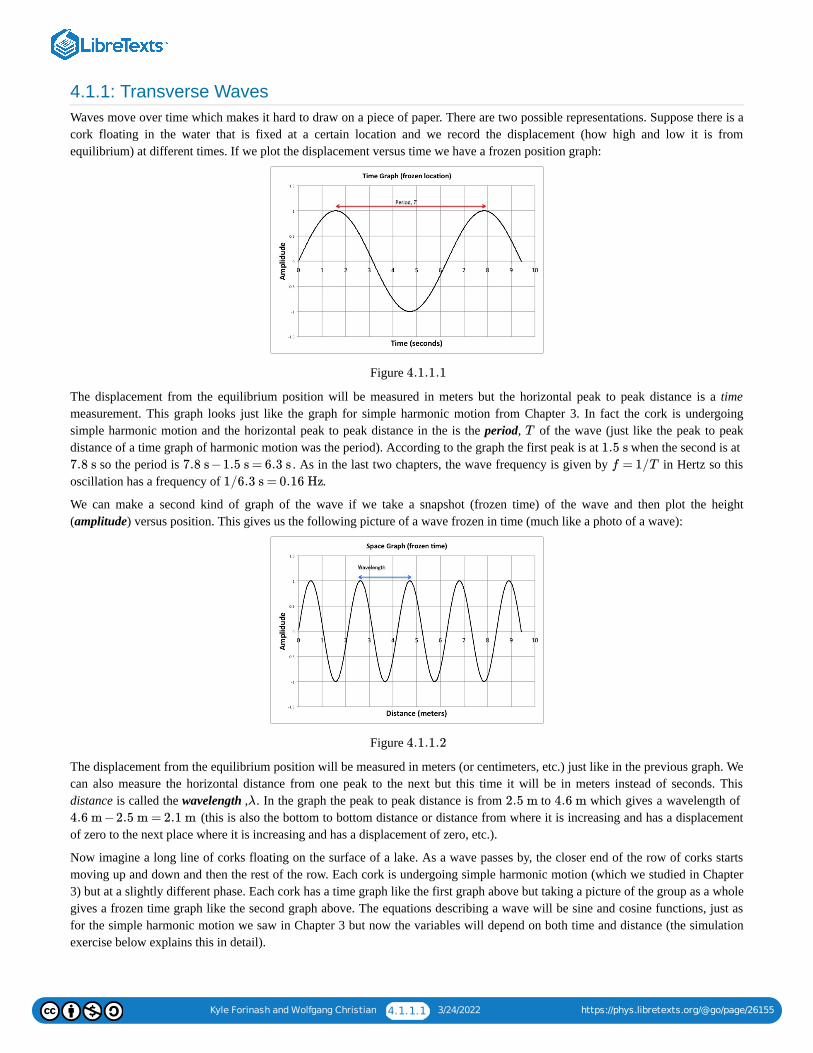
Kyle Forinash and Wolfgang Christian 4.1.1.1 3/24/2022 https://phys.libretexts.org/@go/page/26155
4.1.1: Transverse WavesWaves move over time which makes it hard to draw on a piece of paper. There are two possible representations. Suppose there is acork floating in the water that is fixed at a certain location and we record the displacement (how high and low it is fromequilibrium) at different times. If we plot the displacement versus time we have a frozen position graph:
Figure
The displacement from the equilibrium position will be measured in meters but the horizontal peak to peak distance is a timemeasurement. This graph looks just like the graph for simple harmonic motion from Chapter 3. In fact the cork is undergoingsimple harmonic motion and the horizontal peak to peak distance in the is the period, of the wave (just like the peak to peakdistance of a time graph of harmonic motion was the period). According to the graph the first peak is at when the second is at
so the period is . As in the last two chapters, the wave frequency is given by in Hertz so thisoscillation has a frequency of .
We can make a second kind of graph of the wave if we take a snapshot (frozen time) of the wave and then plot the height(amplitude) versus position. This gives us the following picture of a wave frozen in time (much like a photo of a wave):
Figure
The displacement from the equilibrium position will be measured in meters (or centimeters, etc.) just like in the previous graph. Wecan also measure the horizontal distance from one peak to the next but this time it will be in meters instead of seconds. Thisdistance is called the wavelength , . In the graph the peak to peak distance is from to which gives a wavelength of
(this is also the bottom to bottom distance or distance from where it is increasing and has a displacementof zero to the next place where it is increasing and has a displacement of zero, etc.).
Now imagine a long line of corks floating on the surface of a lake. As a wave passes by, the closer end of the row of corks startsmoving up and down and then the rest of the row. Each cork is undergoing simple harmonic motion (which we studied in Chapter3) but at a slightly different phase. Each cork has a time graph like the first graph above but taking a picture of the group as a wholegives a frozen time graph like the second graph above. The equations describing a wave will be sine and cosine functions, just asfor the simple harmonic motion we saw in Chapter 3 but now the variables will depend on both time and distance (the simulationexercise below explains this in detail).
4.1.1.1
T
1.5 s
7.8 s 7.8 s −1.5 s = 6.3 s f = 1/T
1/6.3 s = 0.16 Hz
4.1.1.2
λ 2.5 m 4.6 m
4.6 m −2.5 m = 2.1 m
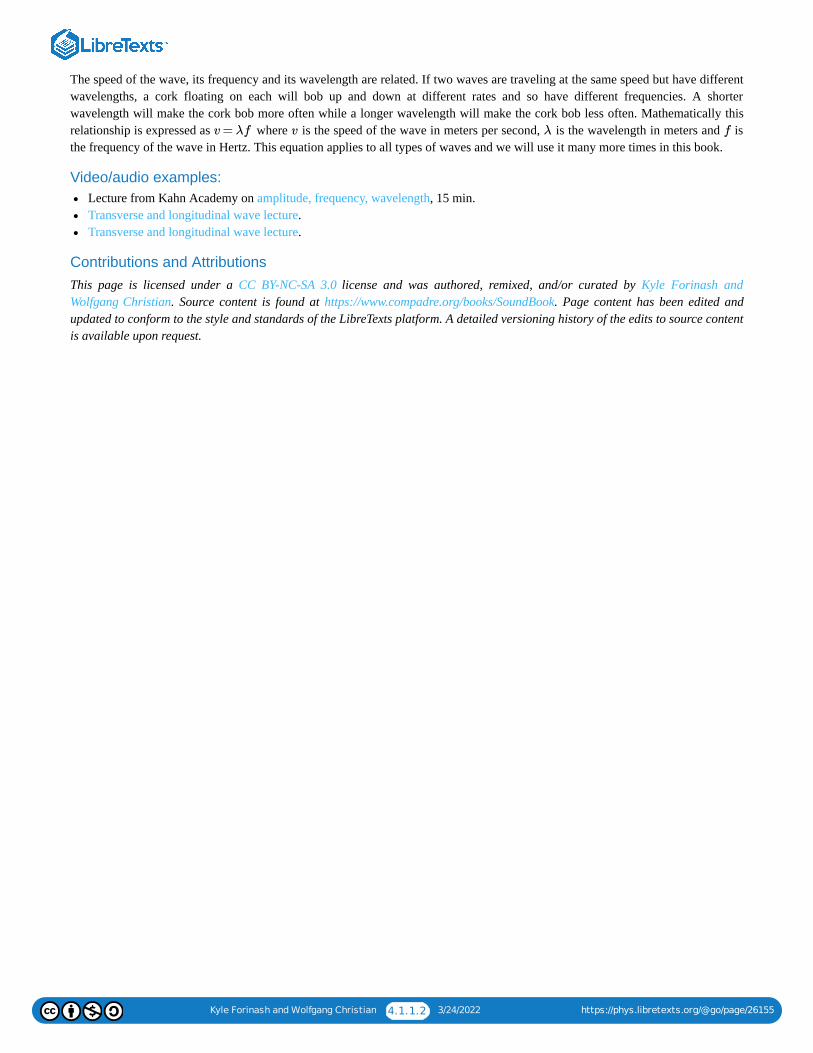
Kyle Forinash and Wolfgang Christian 4.1.1.2 3/24/2022 https://phys.libretexts.org/@go/page/26155
The speed of the wave, its frequency and its wavelength are related. If two waves are traveling at the same speed but have differentwavelengths, a cork floating on each will bob up and down at different rates and so have different frequencies. A shorterwavelength will make the cork bob more often while a longer wavelength will make the cork bob less often. Mathematically thisrelationship is expressed as where is the speed of the wave in meters per second, is the wavelength in meters and isthe frequency of the wave in Hertz. This equation applies to all types of waves and we will use it many more times in this book.
Video/audio examples:Lecture from Kahn Academy on amplitude, frequency, wavelength, 15 min.Transverse and longitudinal wave lecture.Transverse and longitudinal wave lecture.
Contributions and AttributionsThis page is licensed under a CC BY-NC-SA 3.0 license and was authored, remixed, and/or curated by Kyle Forinash andWolfgang Christian. Source content is found at https://www.compadre.org/books/SoundBook. Page content has been edited andupdated to conform to the style and standards of the LibreTexts platform. A detailed versioning history of the edits to source contentis available upon request.
v = λf v λ f
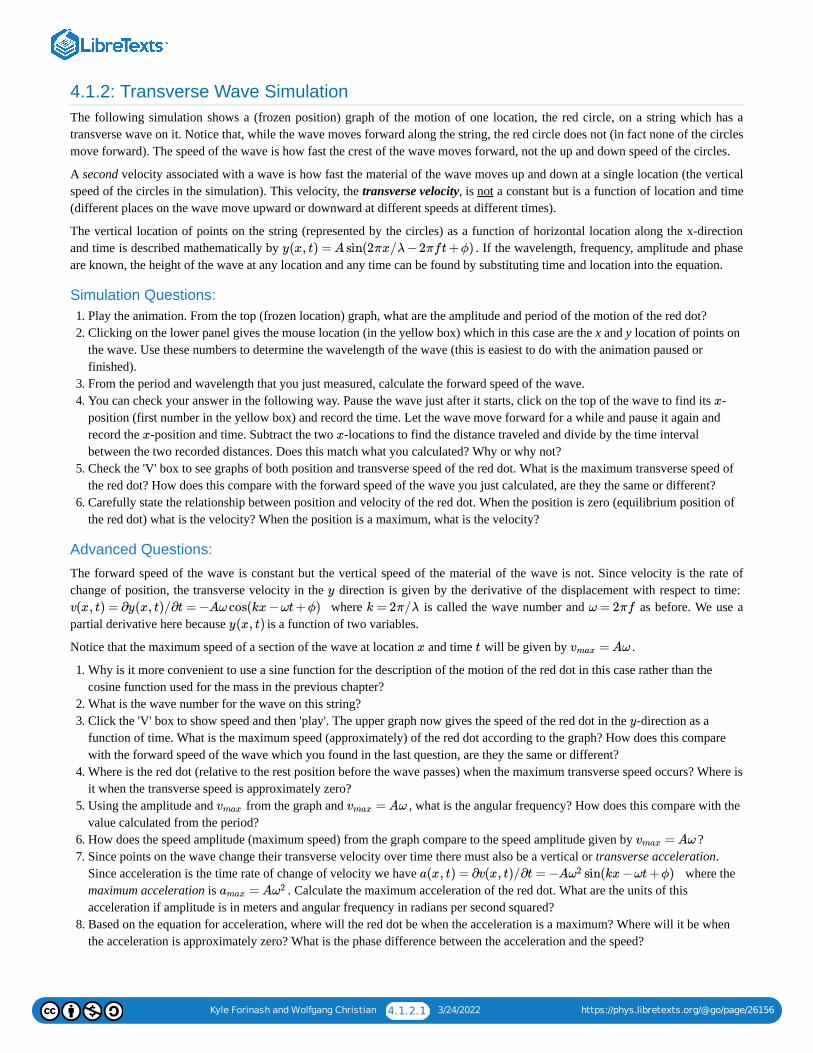
Kyle Forinash and Wolfgang Christian 4.1.2.1 3/24/2022 https://phys.libretexts.org/@go/page/26156
4.1.2: Transverse Wave SimulationThe following simulation shows a (frozen position) graph of the motion of one location, the red circle, on a string which has atransverse wave on it. Notice that, while the wave moves forward along the string, the red circle does not (in fact none of the circlesmove forward). The speed of the wave is how fast the crest of the wave moves forward, not the up and down speed of the circles.
A second velocity associated with a wave is how fast the material of the wave moves up and down at a single location (the verticalspeed of the circles in the simulation). This velocity, the transverse velocity, is not a constant but is a function of location and time(different places on the wave move upward or downward at different speeds at different times).
The vertical location of points on the string (represented by the circles) as a function of horizontal location along the x-directionand time is described mathematically by . If the wavelength, frequency, amplitude and phaseare known, the height of the wave at any location and any time can be found by substituting time and location into the equation.
Simulation Questions:1. Play the animation. From the top (frozen location) graph, what are the amplitude and period of the motion of the red dot?2. Clicking on the lower panel gives the mouse location (in the yellow box) which in this case are the x and y location of points on
the wave. Use these numbers to determine the wavelength of the wave (this is easiest to do with the animation paused orfinished).
3. From the period and wavelength that you just measured, calculate the forward speed of the wave.4. You can check your answer in the following way. Pause the wave just after it starts, click on the top of the wave to find its -
position (first number in the yellow box) and record the time. Let the wave move forward for a while and pause it again andrecord the -position and time. Subtract the two -locations to find the distance traveled and divide by the time intervalbetween the two recorded distances. Does this match what you calculated? Why or why not?
5. Check the 'V' box to see graphs of both position and transverse speed of the red dot. What is the maximum transverse speed ofthe red dot? How does this compare with the forward speed of the wave you just calculated, are they the same or different?
6. Carefully state the relationship between position and velocity of the red dot. When the position is zero (equilibrium position ofthe red dot) what is the velocity? When the position is a maximum, what is the velocity?
Advanced Questions:
The forward speed of the wave is constant but the vertical speed of the material of the wave is not. Since velocity is the rate ofchange of position, the transverse velocity in the direction is given by the derivative of the displacement with respect to time:
where is called the wave number and as before. We use apartial derivative here because is a function of two variables.
Notice that the maximum speed of a section of the wave at location and time will be given by .
1. Why is it more convenient to use a sine function for the description of the motion of the red dot in this case rather than thecosine function used for the mass in the previous chapter?
2. What is the wave number for the wave on this string?3. Click the 'V' box to show speed and then 'play'. The upper graph now gives the speed of the red dot in the -direction as a
function of time. What is the maximum speed (approximately) of the red dot according to the graph? How does this comparewith the forward speed of the wave which you found in the last question, are they the same or different?
4. Where is the red dot (relative to the rest position before the wave passes) when the maximum transverse speed occurs? Where isit when the transverse speed is approximately zero?
5. Using the amplitude and from the graph and , what is the angular frequency? How does this compare with thevalue calculated from the period?
6. How does the speed amplitude (maximum speed) from the graph compare to the speed amplitude given by ?7. Since points on the wave change their transverse velocity over time there must also be a vertical or transverse acceleration.
Since acceleration is the time rate of change of velocity we have where themaximum acceleration is . Calculate the maximum acceleration of the red dot. What are the units of thisacceleration if amplitude is in meters and angular frequency in radians per second squared?
8. Based on the equation for acceleration, where will the red dot be when the acceleration is a maximum? Where will it be whenthe acceleration is approximately zero? What is the phase difference between the acceleration and the speed?
y(x, t) = A sin(2πx/λ −2πft +ϕ)
x
x x
y
v(x, t) = ∂y(x, t)/∂t = −Aω cos(kx −ωt +ϕ) k = 2π/λ ω = 2πf
y(x, t)
x t = Aωvmax
y
vmax = Aωvmax
= Aωvmax
a(x, t) = ∂v(x, t)/∂t = −A sin(kx −ωt +ϕ)ω2
= Aamax ω2

Kyle Forinash and Wolfgang Christian 4.1.2.2 3/24/2022 https://phys.libretexts.org/@go/page/26156
9. Carefully state the relationship between position, speed and acceleration. When the position is zero (equilibrium position of thered dot) what are the speed and acceleration? When the position is a maximum, what are the speed and acceleration?
Contributions and AttributionsThis page is licensed under a CC BY-NC-SA 3.0 license and was authored, remixed, and/or curated by Kyle Forinash andWolfgang Christian. Source content is found at https://www.compadre.org/books/SoundBook. Page content has been edited andupdated to conform to the style and standards of the LibreTexts platform. A detailed versioning history of the edits to source contentis available upon request.
Kyle Forinash and Wolfgang Christian 4.2.1 3/24/2022 https://phys.libretexts.org/@go/page/26012
4.2: Longitudinal WavesLongitudinal waves are waves where the motion of the material in the wave is back and forth in the same direction that the wavemoves. Longitudinal waves are sometimes called compressional waves. Sound waves (in air and in solids) are examples oflongitudinal waves.
Contributions and AttributionsThis page is licensed under a CC BY-NC-SA 3.0 license and was authored, remixed, and/or curated by Kyle Forinash andWolfgang Christian. Source content is found at https://www.compadre.org/books/SoundBook. Page content has been edited andupdated to conform to the style and standards of the LibreTexts platform. A detailed versioning history of the edits to source contentis available upon request.

Kyle Forinash and Wolfgang Christian 4.2.1.1 3/24/2022 https://phys.libretexts.org/@go/page/26157
4.2.1: Longitudinal WavesIn Chapters 3 and 4 we saw that vertical springs and horizontal springs behave the same way and can be described by the sameequation. In this chapter so far we have seen that transverse waves can be described by a line of masses undergoing transverse (up-and-down) harmonic motion. Can we also have a wave where the particles move with harmonic motion in the horizontal direction?
YES! Longitudinal waves are waves where the motion of the material in the wave is back and forth in the same direction that thewave moves. Longitudinal waves are sometimes called compressional waves. Sound waves (in air and in solids) are examples oflongitudinal waves. When a tuning fork or stereo speaker vibrates it moves back and forth creating regions of compression (wherethe pressure is slightly higher) and regions in between where the air has a lower pressure (called a rarefaction). Thesecompressions and rarefactions move out away from the tuning fork or speaker at the speed of sound. When they reach your ear theycause your eardrum to vibrate, sending signals through the rest of the ear to the brain.
Contributions and AttributionsThis page is licensed under a CC BY-NC-SA 3.0 license and was authored, remixed, and/or curated by Kyle Forinash andWolfgang Christian. Source content is found at https://www.compadre.org/books/SoundBook. Page content has been edited andupdated to conform to the style and standards of the LibreTexts platform. A detailed versioning history of the edits to source contentis available upon request.
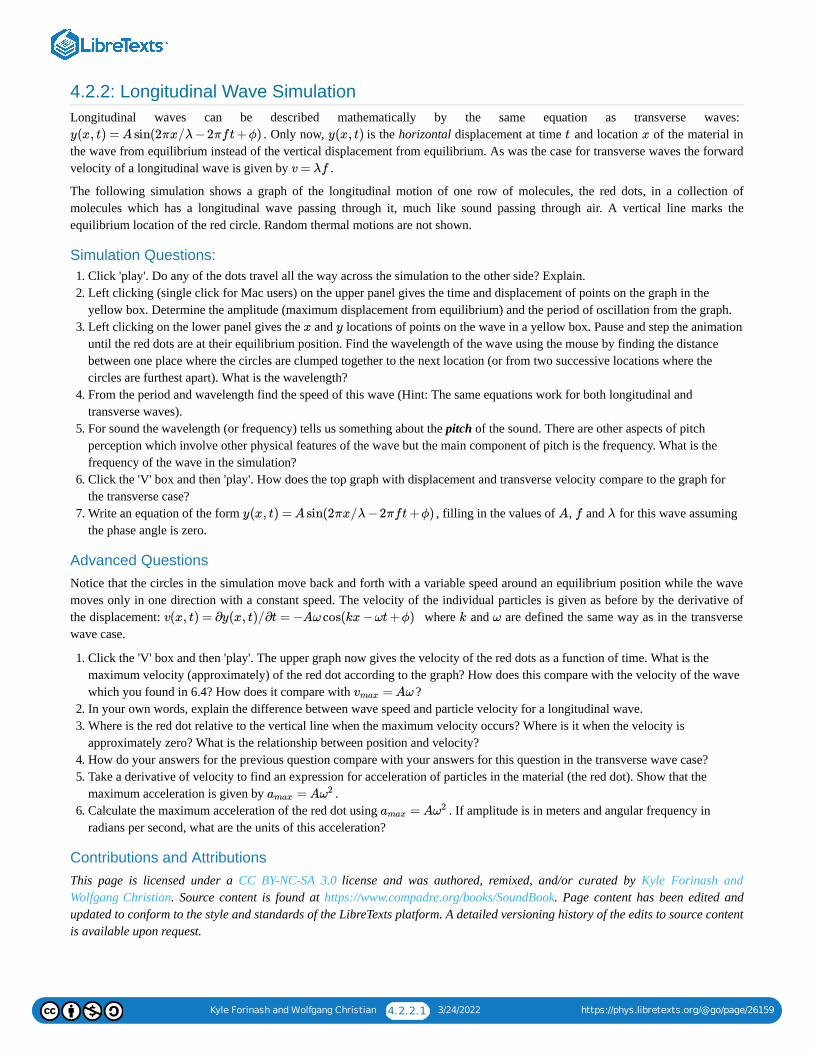
Kyle Forinash and Wolfgang Christian 4.2.2.1 3/24/2022 https://phys.libretexts.org/@go/page/26159
4.2.2: Longitudinal Wave SimulationLongitudinal waves can be described mathematically by the same equation as transverse waves:
. Only now, is the horizontal displacement at time and location of the material inthe wave from equilibrium instead of the vertical displacement from equilibrium. As was the case for transverse waves the forwardvelocity of a longitudinal wave is given by .
The following simulation shows a graph of the longitudinal motion of one row of molecules, the red dots, in a collection ofmolecules which has a longitudinal wave passing through it, much like sound passing through air. A vertical line marks theequilibrium location of the red circle. Random thermal motions are not shown.
Simulation Questions:1. Click 'play'. Do any of the dots travel all the way across the simulation to the other side? Explain.2. Left clicking (single click for Mac users) on the upper panel gives the time and displacement of points on the graph in the
yellow box. Determine the amplitude (maximum displacement from equilibrium) and the period of oscillation from the graph.3. Left clicking on the lower panel gives the and locations of points on the wave in a yellow box. Pause and step the animation
until the red dots are at their equilibrium position. Find the wavelength of the wave using the mouse by finding the distancebetween one place where the circles are clumped together to the next location (or from two successive locations where thecircles are furthest apart). What is the wavelength?
4. From the period and wavelength find the speed of this wave (Hint: The same equations work for both longitudinal andtransverse waves).
5. For sound the wavelength (or frequency) tells us something about the pitch of the sound. There are other aspects of pitchperception which involve other physical features of the wave but the main component of pitch is the frequency. What is thefrequency of the wave in the simulation?
6. Click the 'V' box and then 'play'. How does the top graph with displacement and transverse velocity compare to the graph forthe transverse case?
7. Write an equation of the form , filling in the values of , and for this wave assumingthe phase angle is zero.
Advanced QuestionsNotice that the circles in the simulation move back and forth with a variable speed around an equilibrium position while the wavemoves only in one direction with a constant speed. The velocity of the individual particles is given as before by the derivative ofthe displacement: where and are defined the same way as in the transversewave case.
1. Click the 'V' box and then 'play'. The upper graph now gives the velocity of the red dots as a function of time. What is themaximum velocity (approximately) of the red dot according to the graph? How does this compare with the velocity of the wavewhich you found in 6.4? How does it compare with ?
2. In your own words, explain the difference between wave speed and particle velocity for a longitudinal wave.3. Where is the red dot relative to the vertical line when the maximum velocity occurs? Where is it when the velocity is
approximately zero? What is the relationship between position and velocity?4. How do your answers for the previous question compare with your answers for this question in the transverse wave case?5. Take a derivative of velocity to find an expression for acceleration of particles in the material (the red dot). Show that the
maximum acceleration is given by .6. Calculate the maximum acceleration of the red dot using . If amplitude is in meters and angular frequency in
radians per second, what are the units of this acceleration?
Contributions and AttributionsThis page is licensed under a CC BY-NC-SA 3.0 license and was authored, remixed, and/or curated by Kyle Forinash andWolfgang Christian. Source content is found at https://www.compadre.org/books/SoundBook. Page content has been edited andupdated to conform to the style and standards of the LibreTexts platform. A detailed versioning history of the edits to source contentis available upon request.
y(x, t) = A sin(2πx/λ −2πft +ϕ) y(x, t) t x
v = λf
x y
y(x, t) = A sin(2πx/λ −2πft +ϕ) A f λ
v(x, t) = ∂y(x, t)/∂t = −Aω cos(kx −ωt +ϕ) k ω
= Aωvmax
= Aamax ω2
= Aamax ω2

Kyle Forinash and Wolfgang Christian 4.3.1 3/24/2022 https://phys.libretexts.org/@go/page/26013
4.3: Other WavesIf you stretch a slinky out between two points and gently twist it at one end, the twist will travel down the slinky as a wave pulse.This is an example of a torsional wave.
Contributions and AttributionsThis page is licensed under a CC BY-NC-SA 3.0 license and was authored, remixed, and/or curated by Kyle Forinash andWolfgang Christian. Source content is found at https://www.compadre.org/books/SoundBook. Page content has been edited andupdated to conform to the style and standards of the LibreTexts platform. A detailed versioning history of the edits to source contentis available upon request.
Kyle Forinash and Wolfgang Christian 4.3.1.1 3/24/2022 https://phys.libretexts.org/@go/page/26160
4.3.1: Torsional WavesA third type of wave is a torsional or twisting wave. If you stretch a slinky out between two points and gently twist it at one end,the twist will travel down the slinky as a wave pulse. This is an example of a torsional wave. We saw two YouTube examples ofbridges undergoing torsional motion in the last chapter: twisting bridge, Tacoma Narrows. These were examples of standingtorsional waves.
Video/audio examples:Transverse, longitudinal and torsional waves lecture.Longitudinal and transverse waves on a slinky.Animations of different wave types.Torsion pendulum lecture demo.Wilberforce Pendulum which converts up and down motion to twisting motion and back.
Contributions and Attributions
This page is licensed under a CC BY-NC-SA 3.0 license and was authored, remixed, and/or curated by Kyle Forinash andWolfgang Christian. Source content is found at https://www.compadre.org/books/SoundBook. Page content has been edited andupdated to conform to the style and standards of the LibreTexts platform. A detailed versioning history of the edits to source contentis available upon request.
Kyle Forinash and Wolfgang Christian 4.3.2.1 3/24/2022 https://phys.libretexts.org/@go/page/26161
4.3.2: Examples of WavesSound waves are an example of a longitudinal wave, the air molecules vibrate back and forth as the sound wave passes throughthem. We will look at the details of sound waves in the next few chapters. We are mainly interested in sound waves in this book butmany other types of waves exist and have the same properties and behavior as sound waves. It is also the case that the sameequations apply to many types of waves, although we won't go into great detail about this. If you are interested in the deepermathematical properties of waves, have a look at Forinash's Wave Tutorial.
Although waves on the surface of a pond or ocean look like examples of transverse waves, they are actually a bit morecomplicated. A cork on the surface also has a little bit of back and forth motion as it bobs up and down. For a particle suspended inthe water at a certain depth the back and forth motion increases with depth and the up and down motion decreases.
An earthquake occurs when there is a sudden movement of two parts of the earth's crust relative to each other. If the movement isinside the earth, two different types of waves, S-waves and P-waves are formed. S- or Shear waves are transverse waves; the earthmoves up and down (or back and forth) as the wave moves through. P- or Primary waves are longitudinal (compressional) waves;the earth moves back and forth relative to the direction the wave is traveling as the wave passes. P-waves travel faster than S-waves. If these disturbances cause a wave to travel along the surface of the earth they are called surface or L-waves whichgenerally move more slowly than S- or P- waves. The main types of surface waves are Rayleigh waves, Love waves and Stonelywaves. Rayleigh waves are rolling waves, similar to transverse waves but with more bending motion. Love waves are a type oftransverse wave where the motion is side to side instead of up and down. Love waves generally cause more damage than Rayleighwaves since buildings can often withstand an up and down jolt but are not typically built to withstand side to side motion. Stonelywaves are transverse waves at an intersection or boundary inside the earth. All of these types of waves (and several others) travel atdifferent speeds and the difference in speed can be used to locate the origin of the earthquake.
Video/audio examples:Wave pulse in slow motion.Sound waves can be visualized using a technique called Schlieren Flow Visualization (Wikipedia). Several examples are givenin this video.Wikipedia has simulations of both S-waves and P-waves as well as other seismic waves.Video examples of earthquakes: mostly P-wave, mostly S-wave.
Contributions and Attributions
This page is licensed under a CC BY-NC-SA 3.0 license and was authored, remixed, and/or curated by Kyle Forinash andWolfgang Christian. Source content is found at https://www.compadre.org/books/SoundBook. Page content has been edited andupdated to conform to the style and standards of the LibreTexts platform. A detailed versioning history of the edits to source contentis available upon request.
Kyle Forinash and Wolfgang Christian 4.3.3.1 3/24/2022 https://phys.libretexts.org/@go/page/26162
4.3.3: Water Wave SimulationMany real, physical waves are combinations of three kinds of wave motion; transverse, longitudinal and torsional (which we havenot yet discussed). The following is a more accurate simulation of water waves (but it still does not show breaking wave behaviorwhich will come later). The dots are locations of water molecules or small objects floating in the water.
Simulation Questions:1. What two types of wave motion are represented in the simulation?2. Are the wavelengths and periods the same for both types of motion (Hint: Use 'pause' and hold the left mouse button down to
make measurements; numbers in the yellow box give the cursor location in meters)?3. Determine the wavelength, period and speed of the wave (use the 'pause' and 'step' buttons to measure the length of time it take
a peak to pass a given location in the simulation).4. How does the motion at the top of the water compare with the motion at the bottom?5. Describe the overall motion of one of the red dots; what path does the dot follow?6. Earthquakes can produce several different kinds of waves, each traveling at a different speed. Search for a reliable source and
find a definition for P-waves, S-waves, Rayleigh waves and Love waves. Be sure to include comments on their speeds andwhich ones are more destructive.
Contributions and Attributions
This page is licensed under a CC BY-NC-SA 3.0 license and was authored, remixed, and/or curated by Kyle Forinash andWolfgang Christian. Source content is found at https://www.compadre.org/books/SoundBook. Page content has been edited andupdated to conform to the style and standards of the LibreTexts platform. A detailed versioning history of the edits to source contentis available upon request.

Kyle Forinash and Wolfgang Christian 4.4.1 3/24/2022 https://phys.libretexts.org/@go/page/26014
4.4: Electromagnetic WavesThis simulation shows an oscillating electron in a sending antenna on the left. Because electrons have an electric field, anaccelerating electron will create a wave in the electric field around it. Magnetic fields are created by moving charges so a magneticwave is also formed by an accelerating charge. Only the y-component of the change in the electric field is shown (so an oscillationfrequency of zero will show nothing, because there is only a constant electric field).
Contributions and AttributionsThis page is licensed under a CC BY-NC-SA 3.0 license and was authored, remixed, and/or curated by Kyle Forinash andWolfgang Christian. Source content is found at https://www.compadre.org/books/SoundBook. Page content has been edited andupdated to conform to the style and standards of the LibreTexts platform. A detailed versioning history of the edits to source contentis available upon request.
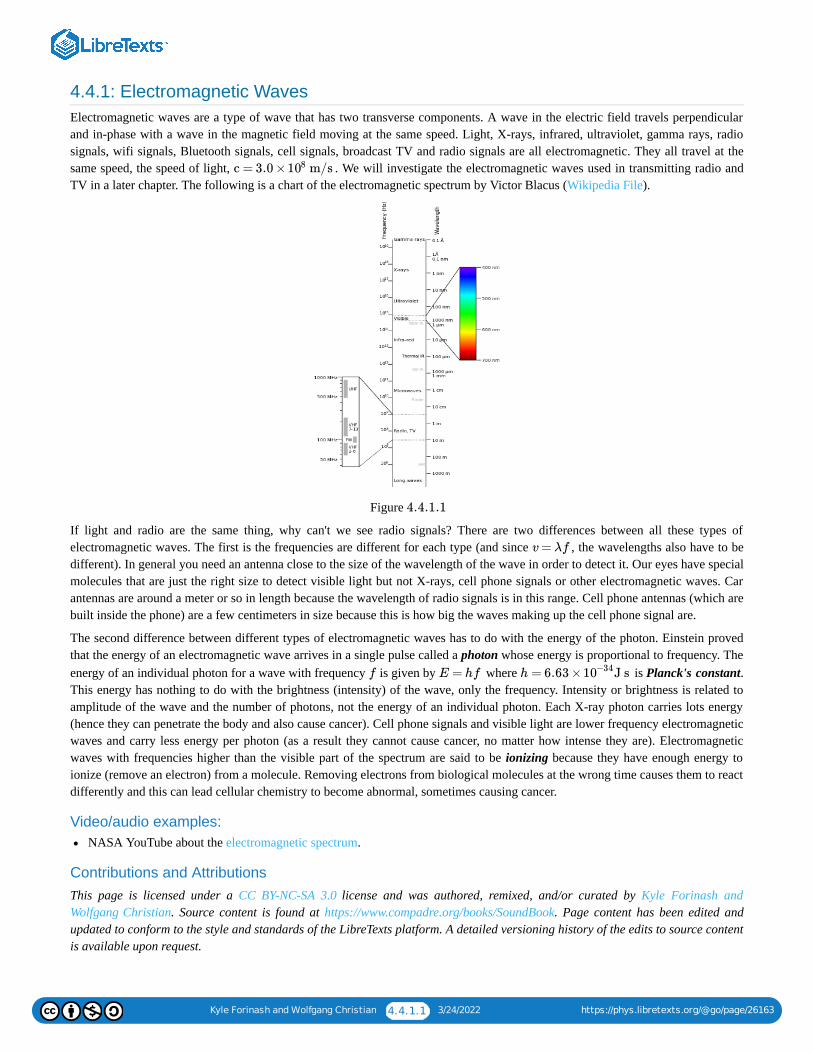
Kyle Forinash and Wolfgang Christian 4.4.1.1 3/24/2022 https://phys.libretexts.org/@go/page/26163
4.4.1: Electromagnetic WavesElectromagnetic waves are a type of wave that has two transverse components. A wave in the electric field travels perpendicularand in-phase with a wave in the magnetic field moving at the same speed. Light, X-rays, infrared, ultraviolet, gamma rays, radiosignals, wifi signals, Bluetooth signals, cell signals, broadcast TV and radio signals are all electromagnetic. They all travel at thesame speed, the speed of light, . We will investigate the electromagnetic waves used in transmitting radio andTV in a later chapter. The following is a chart of the electromagnetic spectrum by Victor Blacus (Wikipedia File).
Figure
If light and radio are the same thing, why can't we see radio signals? There are two differences between all these types ofelectromagnetic waves. The first is the frequencies are different for each type (and since , the wavelengths also have to bedifferent). In general you need an antenna close to the size of the wavelength of the wave in order to detect it. Our eyes have specialmolecules that are just the right size to detect visible light but not X-rays, cell phone signals or other electromagnetic waves. Carantennas are around a meter or so in length because the wavelength of radio signals is in this range. Cell phone antennas (which arebuilt inside the phone) are a few centimeters in size because this is how big the waves making up the cell phone signal are.
The second difference between different types of electromagnetic waves has to do with the energy of the photon. Einstein provedthat the energy of an electromagnetic wave arrives in a single pulse called a photon whose energy is proportional to frequency. Theenergy of an individual photon for a wave with frequency is given by where is Planck's constant.This energy has nothing to do with the brightness (intensity) of the wave, only the frequency. Intensity or brightness is related toamplitude of the wave and the number of photons, not the energy of an individual photon. Each X-ray photon carries lots energy(hence they can penetrate the body and also cause cancer). Cell phone signals and visible light are lower frequency electromagneticwaves and carry less energy per photon (as a result they cannot cause cancer, no matter how intense they are). Electromagneticwaves with frequencies higher than the visible part of the spectrum are said to be ionizing because they have enough energy toionize (remove an electron) from a molecule. Removing electrons from biological molecules at the wrong time causes them to reactdifferently and this can lead cellular chemistry to become abnormal, sometimes causing cancer.
Video/audio examples:NASA YouTube about the electromagnetic spectrum.
Contributions and AttributionsThis page is licensed under a CC BY-NC-SA 3.0 license and was authored, remixed, and/or curated by Kyle Forinash andWolfgang Christian. Source content is found at https://www.compadre.org/books/SoundBook. Page content has been edited andupdated to conform to the style and standards of the LibreTexts platform. A detailed versioning history of the edits to source contentis available upon request.
c = 3.0 × m/s108
4.4.1.1
v = λf
f E = hf h = 6.63 × J s10−34
Kyle Forinash and Wolfgang Christian 4.4.2.1 3/24/2022 https://phys.libretexts.org/@go/page/26164
4.4.2: Antenna SimulationIn this simulation you see an oscillating electron in a sending antenna on the left. Because electrons have an electric field, anaccelerating electron will create a wave in the electric field around it. Magnetic fields are created by moving charges so a magneticwave is also formed by an accelerating charge. Only the y-component of the change in the electric field is shown (so an oscillationfrequency of zero will show nothing, because there is only a constant electric field). The magnetic fields are not shown.
The simplest type of receiving antenna can be approximated by free charges (electrons) constrained by a metal wire. For areceiving antenna oriented in the y-direction, an oscillating field traveling in the -direction will cause the charges in the receiver tooscillate in the y-direction with the same frequency as the wave (the charges cannot move in the -direction because they areconfined to the wire). This oscillating current can then be analyzed by electronic circuitry to extract the transmitted signal. Ageneral rule of thumb is that for strongest reception, the receiving antenna should be roughly the same length as the wavelength ofthe wave it is trying to receive.
For simplicity this simulation has oscillating positive charges in the sending and receiving antennas. (Electrons feel a force in theopposite direction of the applied field.) Time is measured in microseconds ( ).
Simulation Questions:1. Run the simulation and describe what you see. Does the receiving antenna charge start oscillating immediately? Why or why
not?2. Try different oscillation frequencies. How does the frequency of the sending charge compare with the frequency of oscillation
of the charge in the receiving antenna?3. Use the step button to find the time lapse between when the source charge starts to oscillate and when the receiver starts
oscillating. If the receiving antenna is away, what is the speed of the wave?4. Repeat the previous exercise with different oscillation frequencies. Does changing the oscillation frequency change the speed
the wave travels in the -direction? What does change if the oscillation speed changes? (Hint: Recall that where is thespeed of the wave.)
5. What do you notice about the amplitude of the wave as it travels away from the sending antenna? Explain.
Chapter Five SummaryFor transverse waves the motion is up and down while the wave moves forward. Examples include water waves, electromagneticwaves, and earthquake S-waves. In longitudinal (compressional) waves the motion is back and forth in the same direction the wavetravels. Sound waves and earthquake P-waves are examples. The same equations and behavior applies to all types of waves.
Questions on Wave Types:
1. Give a definition of wavelength. In what units is wavelength measured?2. What is the difference between wavelength and period? How do you measure each?3. Give a definition and example of a transverse wave, a longitudinal wave and a torsional wave.4. Suppose you have a slinky stretched between you and another person. Describe what you would do to your end to make
a. a transverse waveb. a longitudinal wavec. a torsional wave.
5. In the following graph, determine the period and wavelength of the wave on the string. Each block on the lower graph is onemeter, time is in seconds as shown on the upper graph.
x
x
s10−6
1.6 × m103
x v = λf v
f = 1/T v = fλ v = ω/k k = 2π/λ ω = 2πf y(x, t) = A cos(kx −ωt +ϕ)
Kyle Forinash and Wolfgang Christian 4.4.2.2 3/24/2022 https://phys.libretexts.org/@go/page/26164
Figure
6. In the following graph, determine the period and wavelength of the wave on the string. Each block on the lower graph is onemeter, time is in seconds as shown on the upper graph.
Figure
7. Why are longitudinal waves sometimes called compressional waves?8. What are compressions and rarefactions in sound waves?9. How is simple harmonic motion (a mass on a spring) connected to wave motion for transverse waves (Hint: Look at the
transverse wave simulation.)?10. How is simple harmonic motion (a mass on a spring) connected to wave motion for longitudinal waves?11. What are S-waves and P-waves?12. Describe the major types of surface earthquake waves.13. Is a water wave longitudinal, transverse or both? Explain.14. Find the wavelength of a sound wave (about the lowest note humans can hear) and the wavelength of a
sound wave (about the highest note humans can hear). Assume the speed of sound is .15. What is the connection between simple harmonic motion and the points on a string when the string has a wave traveling on it?16. In the following graph, determine the wavelength of the wave. X is measured in centimeters.
Figure
17. In the graph above, what is the amplitude of the wave?18. In the following graph, determine the period of the wave.
Figure
19. For the graph above, what is the frequency of the wave?20. For the preceding graph, what is the amplitude of the wave?21. What is the angular frequency, , for a sound wave? (Hint: See top of page).22. What is the wave vector, , for a meter sound wave?23. What are electromagnetic waves? Give some examples.24. What is the difference between sound waves and radio signals?25. Why can we see visible light but not other types of electromagnetic waves?26. What is the difference between a gamma-ray and visible light?27. What is the difference between ionizing radiation and non-ionizing radiation?28. Why can’t cell phone signals cause cancer but x-rays can (they both electromagnetic waves)?
4.4.2.1
4.4.2.2
20 Hz 20, 000 Hz
343 m/s
4.4.2.3
4.4.2.4
ω 20 Hz
k 4.0

Kyle Forinash and Wolfgang Christian 4.4.2.3 3/24/2022 https://phys.libretexts.org/@go/page/26164
29. What is the wavelength of a radio signal of , given than Mega and the speed of radio signals are thesame as light ( )?
30. Calculate the frequency of your favorite color. Hint: Nanometers .
Contributions and Attributions
This page is licensed under a CC BY-NC-SA 3.0 license and was authored, remixed, and/or curated by Kyle Forinash andWolfgang Christian. Source content is found at https://www.compadre.org/books/SoundBook. Page content has been edited andupdated to conform to the style and standards of the LibreTexts platform. A detailed versioning history of the edits to source contentis available upon request.
89.3 MHz M = = 106
3.0 × m/s108
= nm = m10−9

Kyle Forinash and Wolfgang Christian 5.1 3/24/2022 https://phys.libretexts.org/@go/page/26024
5: Wave SpeedThere are two different speeds involved with describing a wave. In previous chapters we saw that the individual points on a waveoscillate (up and down for transverse waves, back and forth for longitudinal waves) with simple harmonic motion, just like masseson springs. A point on a transverse wave moves fastest as it passes through the equilibrium point, slows down as it reaches themaximum amplitude, stops, turns around and increases speed in the opposite direction. So this speed is changing over time; pointson the wave accelerate up and down.
But the up and down speed of a point on a transverse wave doesn't tell us how fast the wave moves from one place to the next. Thewave speed, , is how fast the wave travels and is determined by the properties of the medium in which the wave is moving. If themedium is uniform (does not change) then the wave speed will be constant. The speed of sound in dry air at is butthis speed can change if the temperature changes.
It is also possible to include the direction and define a vector called the wave velocity which is speed and direction but for now wewill just talk about wave speed.
Key Terms:
Speed of a point on the wave, speed of the wave, velocity of the wave, bulk modulus (compressibility), Young's modulus(stiffness), speed of electromagnetic waves, speed of sound in different media, linear waves, , wave number, angularfrequency, index of refraction.
5.1: Wave Speed
Contributions and AttributionsThis page is licensed under a CC BY-NC-SA 3.0 license and was authored, remixed, and/or curated by Kyle Forinash andWolfgang Christian. Source content is found at https://www.compadre.org/books/SoundBook. Page content has been edited andupdated to conform to the style and standards of the LibreTexts platform. A detailed versioning history of the edits to source contentis available upon request.
5.1.1: Speeds of Different Types of Waves
5.1.2: Speed of a Wave Simulation
v
C20∘ 344 m/s
v = λf
Kyle Forinash and Wolfgang Christian 5.1.1 3/24/2022 https://phys.libretexts.org/@go/page/26018
5.1: Wave SpeedThere are two different speeds involved with describing a wave. In previous chapters we saw that the individual points on a waveoscillate (up and down for transverse waves, back and forth for longitudinal waves) with simple harmonic motion, just like masseson springs. But the up and down speed of a point on a transverse wave doesn't tell us how fast the wave moves from one place tothe next. The wave speed, v, is how fast the wave travels and is determined by the properties of the medium.
Contributions and AttributionsThis page is licensed under a CC BY-NC-SA 3.0 license and was authored, remixed, and/or curated by Kyle Forinash andWolfgang Christian. Source content is found at https://www.compadre.org/books/SoundBook. Page content has been edited andupdated to conform to the style and standards of the LibreTexts platform. A detailed versioning history of the edits to source contentis available upon request.
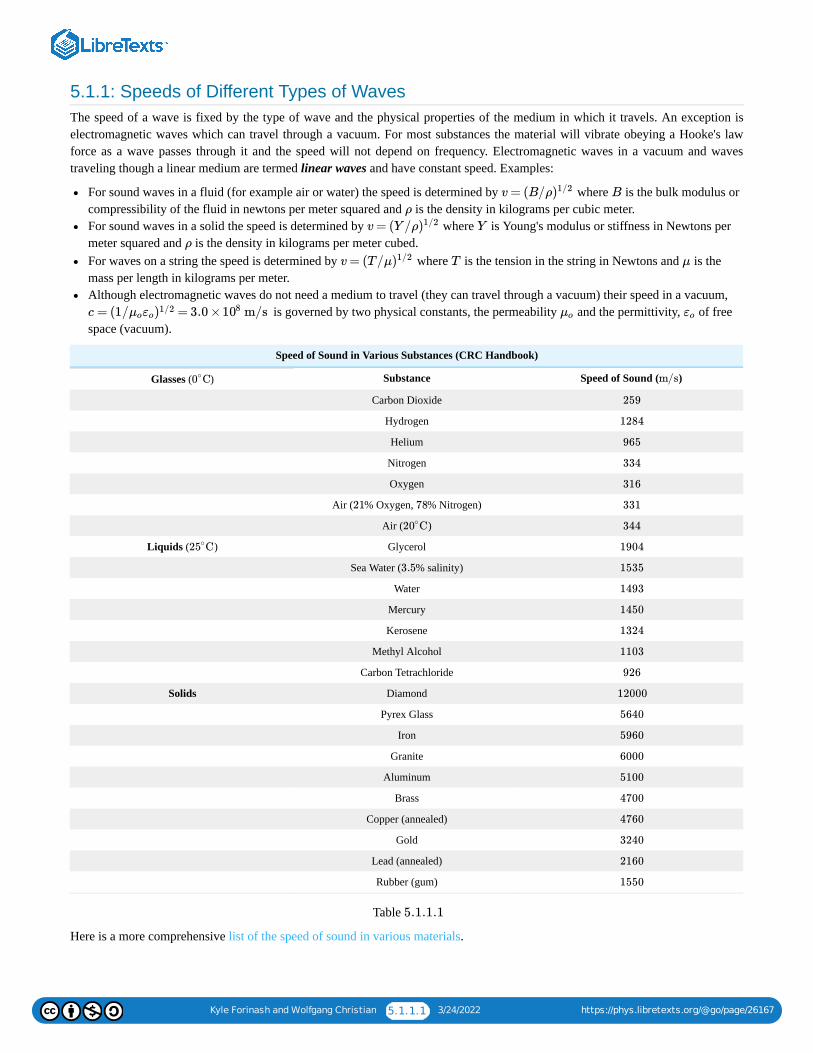
Kyle Forinash and Wolfgang Christian 5.1.1.1 3/24/2022 https://phys.libretexts.org/@go/page/26167
5.1.1: Speeds of Different Types of WavesThe speed of a wave is fixed by the type of wave and the physical properties of the medium in which it travels. An exception iselectromagnetic waves which can travel through a vacuum. For most substances the material will vibrate obeying a Hooke's lawforce as a wave passes through it and the speed will not depend on frequency. Electromagnetic waves in a vacuum and wavestraveling though a linear medium are termed linear waves and have constant speed. Examples:
For sound waves in a fluid (for example air or water) the speed is determined by where is the bulk modulus orcompressibility of the fluid in newtons per meter squared and is the density in kilograms per cubic meter.For sound waves in a solid the speed is determined by where is Young's modulus or stiffness in Newtons permeter squared and is the density in kilograms per meter cubed.For waves on a string the speed is determined by where is the tension in the string in Newtons and is themass per length in kilograms per meter.Although electromagnetic waves do not need a medium to travel (they can travel through a vacuum) their speed in a vacuum,
is governed by two physical constants, the permeability and the permittivity, of freespace (vacuum).
Speed of Sound in Various Substances (CRC Handbook)
Glasses ( ) Substance Speed of Sound ( )
Carbon Dioxide
Hydrogen
Helium
Nitrogen
Oxygen
Air ( % Oxygen, % Nitrogen)
Air ( )
Liquids ( ) Glycerol
Sea Water ( % salinity)
Water
Mercury
Kerosene
Methyl Alcohol
Carbon Tetrachloride
Solids Diamond
Pyrex Glass
Iron
Granite
Aluminum
Brass
Copper (annealed)
Gold
Lead (annealed)
Rubber (gum)
Table
Here is a more comprehensive list of the speed of sound in various materials.
v = (B/ρ)1/2 B
ρ
v = (Y /ρ)1/2 Y
ρ
v = (T /μ)1/2 T μ
c = (1/ = 3.0 × m/sμoεo)1/2 108 μo εo
C0∘ m/s
259
1284
965
334
316
21 78 331
C20∘ 344
C25∘ 1904
3.5 1535
1493
1450
1324
1103
926
12000
5640
5960
6000
5100
4700
4760
3240
2160
1550
5.1.1.1
Kyle Forinash and Wolfgang Christian 5.1.1.2 3/24/2022 https://phys.libretexts.org/@go/page/26167
As we saw in the previous chapter, there is a relationship between the period, wavelength and speed of the wave. The period of acork floating in the water is affected by how fast the wave passes (wave speed) and the distance between peaks (wavelength). Therelationship between speed, period and wavelength of a sine wave is given by where wavelength and period for a sinewave were defined previously. This can also be written as since frequency is the inverse of period and is true for all linearwaves. Notice that, since wave speed is normally a fixed quantity the frequency and wavelength will be inversely proportion;higher frequencies mean shorter wavelengths.
Often it is easier to write where is the angular frequency in radians per second instead of having to write everywhere. Likewise it is easier to write where is the wave number in radians per meter rather than having to write
a lot. (Note that is not a spring constant here.) Using these new definitions the speed of a wave can also be written as .
If the medium is uniform the speed of a wave is fixed and does not change. There are circumstances where the speed of a particularwave does change, however. Notice that the speed of sound in air depends on the density of the air (mass per volume). But thedensity of air changes with temperature and humidity. So the speed of sound can be different on different days and in differentlocations. The temperature dependence of the speed of sound in air is given by in meters per second where
is the temperature in Celsius ( here is temperature, not period). Notice that at room temperature ( ) sound travels at .
The speed of sound can also be affected by the movement of the medium in which it travels. For example, wind can carry soundwaves further (i.e. faster) if the sound is traveling in the same direction or it can slow the sound down if the sound is traveling in adirection opposite to the wind direction.
Electromagnetic waves travel at in a vacuum but slow down when they pass through a medium (for examplelight passing from air to glass). This occurs because the material has a different value for the permittivity and/or permeability dueto the interaction of the wave with the atoms of the material. The amount the speed changes is given by the index of refraction
where is the speed of light in a vacuum and is the speed in the medium. The frequency of the wave does not changewhen it slows down so, since , the wavelength of electromagnetic waves in a medium must be slightly smaller.
Video/audio examples:What is the speed of sound in a vacuum? Buzzer in a bell jar. Why is there no sound when the air is removed from the jar?Demonstration of speed of sound in different gasses. Why is there no sound when the air is removed from the jar?These two videos demonstrate the Allasonic effect. The speed of sound is different in a liquid with air bubbles because thedensity is different. As the bubbles burst, the speed of sound changes, causing the frequency of sound waves in the liquidcolumn to change, thus changing the pitch. Example: one, two. What do you hear in each case?The Zube Tube is a toy that has a spring inside attached to two plastic cups on either end. Vibrations in the spring travel atdifferent speeds so a sound starting at one end (for example a click when you shake the tube and the spring hits the cup) ends upchanging pitch at the other end as the various frequencies arrive. In other words this is a nonlinear system. See if you can figureout from the video which frequencies travel faster, high frequencies or low.
Mini-lab on measuring the speed of sound.
Questions on Wave Speed:
1. Light travels at but sound waves travel at about . What is the time delay for light and sound to arrivefrom a source that is away (this can be used to get an approximate distance to a thunderstorm)?
2. What two mistakes are made in science fiction movies where you see and hear an explosion in space at the same time?3. Consult the table for the speed of sound in various substances. If you have one ear in the water and one ear out while swimming
in a lake and a bell is rung that is half way in the water some distance away, which ear hears the sound first?4. At the speed of sound is . How far does sound travel in ? How far does sound travel in ?5. Compare the last two answers with the distance traveled by light which has a speed of . Why do you see
something happen before you hear it?6. The speed of sound in water is . How far does sound travel under water in ? How far does sound travel under water
in ?7. What happens to the speed of sound in air as temperature increases?
v = λ/T
v = λf
ω = 2πf ω 2πf
k = 2π/λ k
2π/λ k
v = fλ = ω/k
v = 344 +0.6(T −20)
T T C20∘
344 m/s
c = 3.0 × m/s108
n = c/v c v
v = λf
f = 1/T , v = fλ, v = ω/k, k = 2π/λ, ω = 2πf , y(x, t) = A cos(kx −ωt +ϕ), v = B/Q− −−−
√
3.0 × m/s108 344 m/s
10, 000 m
20C 344 m/s 1 s 60 s
3.0 × m/s108
1482 m/s 1 s
60 s
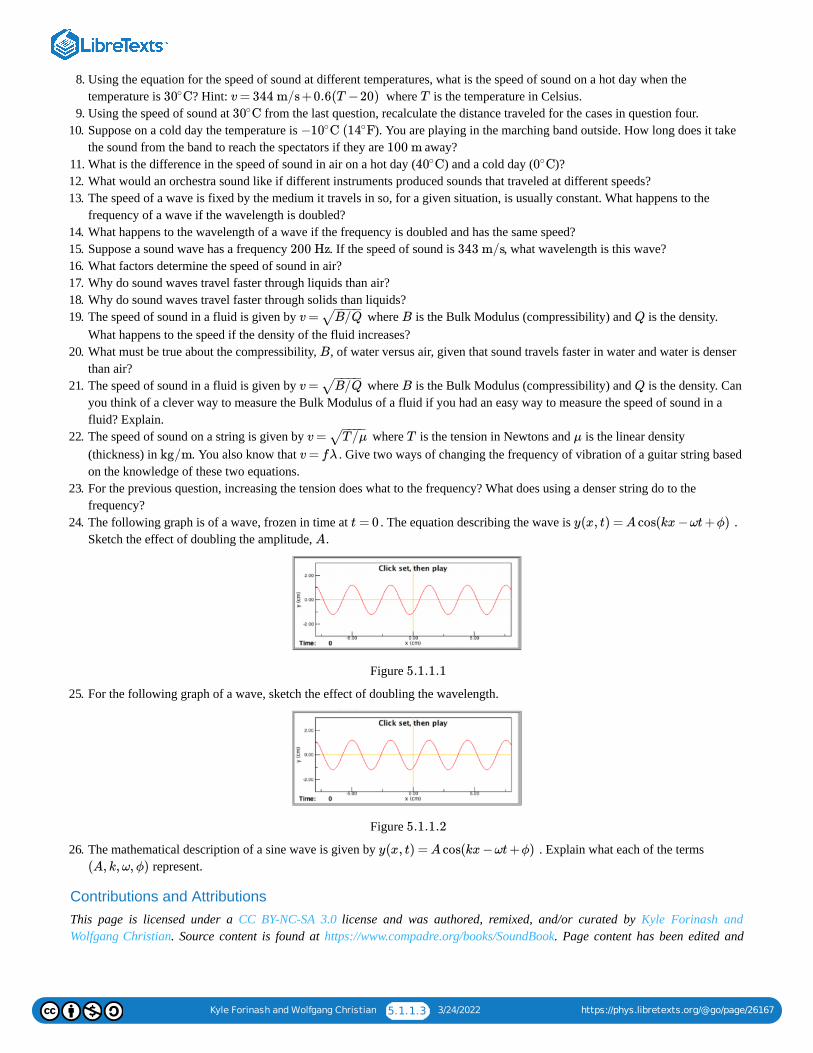
Kyle Forinash and Wolfgang Christian 5.1.1.3 3/24/2022 https://phys.libretexts.org/@go/page/26167
8. Using the equation for the speed of sound at different temperatures, what is the speed of sound on a hot day when thetemperature is ? Hint: where is the temperature in Celsius.
9. Using the speed of sound at from the last question, recalculate the distance traveled for the cases in question four.10. Suppose on a cold day the temperature is ). You are playing in the marching band outside. How long does it take
the sound from the band to reach the spectators if they are away?11. What is the difference in the speed of sound in air on a hot day ( ) and a cold day ( )?12. What would an orchestra sound like if different instruments produced sounds that traveled at different speeds?13. The speed of a wave is fixed by the medium it travels in so, for a given situation, is usually constant. What happens to the
frequency of a wave if the wavelength is doubled?14. What happens to the wavelength of a wave if the frequency is doubled and has the same speed?15. Suppose a sound wave has a frequency . If the speed of sound is , what wavelength is this wave?16. What factors determine the speed of sound in air?17. Why do sound waves travel faster through liquids than air?18. Why do sound waves travel faster through solids than liquids?19. The speed of sound in a fluid is given by where is the Bulk Modulus (compressibility) and is the density.
What happens to the speed if the density of the fluid increases?20. What must be true about the compressibility, , of water versus air, given that sound travels faster in water and water is denser
than air?21. The speed of sound in a fluid is given by where is the Bulk Modulus (compressibility) and is the density. Can
you think of a clever way to measure the Bulk Modulus of a fluid if you had an easy way to measure the speed of sound in afluid? Explain.
22. The speed of sound on a string is given by where is the tension in Newtons and is the linear density(thickness) in . You also know that . Give two ways of changing the frequency of vibration of a guitar string basedon the knowledge of these two equations.
23. For the previous question, increasing the tension does what to the frequency? What does using a denser string do to thefrequency?
24. The following graph is of a wave, frozen in time at . The equation describing the wave is .Sketch the effect of doubling the amplitude, .
Figure
25. For the following graph of a wave, sketch the effect of doubling the wavelength.
Figure
26. The mathematical description of a sine wave is given by . Explain what each of the terms represent.
Contributions and AttributionsThis page is licensed under a CC BY-NC-SA 3.0 license and was authored, remixed, and/or curated by Kyle Forinash andWolfgang Christian. Source content is found at https://www.compadre.org/books/SoundBook. Page content has been edited and
C30∘ v = 344 m/s +0.6(T −20) T
C30∘
− C ( F10∘ 14∘
100 m
C40∘ C0∘
200 Hz 343 m/s
v = B/Q− −−−
√ B Q
B
v = B/Q− −−−
√ B Q
v = T /μ− −−−
√ T μ
kg/m v = fλ
t = 0 y(x, t) = A cos(kx −ωt +ϕ)
A
5.1.1.1
5.1.1.2
y(x, t) = A cos(kx −ωt +ϕ)
(A, k, ω, ϕ)

Kyle Forinash and Wolfgang Christian 5.1.1.4 3/24/2022 https://phys.libretexts.org/@go/page/26167
updated to conform to the style and standards of the LibreTexts platform. A detailed versioning history of the edits to source contentis available upon request.
Kyle Forinash and Wolfgang Christian 5.1.2.1 3/24/2022 https://phys.libretexts.org/@go/page/26169
5.1.2: Speed of a Wave SimulationThe velocity of the wave, , is a constant determined by the properties of the medium in which the wave is moving as we sawabove. The velocity is a vector which gives the forward speed of the wave and the direction the wave is traveling. For now we willnot worry about direction since the waves being discussed will all be assumed to travel along the x-axis. The speed of a sine waveis given by where wavelength and period for a sine wave were defined in the previous exercise. Note that this is NOT theup and down speed of a point on the wave. Here we are talking about the forward speed of the wave crests.
In this simulation the original wave will remain in the window so that as you make changes to you can see how the movingwave (in red) compares to the original stationary wave ( , in blue).
This simulation is misleading in one important way. In the simulation you can set any combination of angular frequency andwavenumber you choose and so have any speed you want for the wave. But as we saw above, for mechanical and acoustic wavesthe speed is determined by the medium in which the wave travels. Since it is the case that the angular frequency andwavenumber are inversely proportional with a constant .
Simulation Questions:1. Determine the speed of the wave in the simulation using where wavelength and period are determined from the
simulation (wavelength is the peak to peak distance and period is the time for one peak to travel to the location of the nextpeak). What is the forward speed of this wave?
2. The speed of this wave is also given mathematically by since and . What is the speed ofthis wave based on the values of and in the equation? Does this match the speed you got from the simulation?
3. Reset the initial conditions and experiment with values of the wavenumber both smaller and larger than keeping theangular frequency fixed. How does the wavenumber change the speed of the wave?
4. Reset the initial conditions and experiment with values of the angular frequency both smaller and larger than keepingthe wavenumber fixed. How does the angular frequency change the speed of the wave?
5. Reset the initial conditions. For a wavenumber of experiment to find the correct angular frequency which gives theoriginal speed of the wave you found in questions one and two (you should be able to see from the simulation when the newwave is traveling at the same speed as the original).
6. Calculate the wavenumber which gives the speed of the original wave for angular frequencies of and using the relationship in question two. Check your answers with the simulation if you are in doubt.
Chapter Six Summary
The speed of a wave is generally fixed by the properties of the physical material through which the wave is traveling, the exceptionbeing electromagnetic waves which require no medium (they can travel through a vacuum). In all cases of linear waves thewavelength and frequency are inversely proportional and given by .
Contributions and AttributionsThis page is licensed under a CC BY-NC-SA 3.0 license and was authored, remixed, and/or curated by Kyle Forinash andWolfgang Christian. Source content is found at https://www.compadre.org/books/SoundBook. Page content has been edited andupdated to conform to the style and standards of the LibreTexts platform. A detailed versioning history of the edits to source contentis available upon request.
v
v = λ/T
f(x, t)
g(x, t)
v = ω/k
v
v = λ/T
v = ω/k ω = 2πf = 2π/T k = 2π/λ
ω k
2.0 rad/m
0.8 rad/s
4.0 rad/m
0.4, 0.6, 1.0, 1.2 rad/s
v = fλ = ω/k
1 3/24/2022
CHAPTER OVERVIEW6: WAVE BEHAVIOR
In this chapter (the longest in the book!) we investigate the behavior of waves in various circumstances. Some of our examples will be forlight but remember that all waves have similar behavior; sound waves will also obey the laws of reflection and refraction, scattering,diffraction, interference, etc.
KEY TERMS:
Reflection, specular and diffuse reflection, refraction, constructive and destructive interference, path difference, diffraction, dispersion,Doppler shift, standing waves, scattering, beats, ultrasound.
6.1: DOPPLER SHIFT
6.1.1: DOPPLER SHIFT6.1.2: THE DOPPLER EFFECT SIMULATION6.2: MIRRORS AND REFLECTION
6.2.1: REFLECTION6.2.2: REFLECTION SIMULATION6.3: REFRACTION
6.3.1: REFRACTION6.3.2: REFRACTION SIMULATION6.4: LENSES
6.4.1: LENS SIMULATION6.5: DISPERSION
6.5.1: DISPERSION SIMULATION6.6: ADDING WAVE PULSES
6.6.1: ADDING WAVES6.6.2: ADDING TWO WAVE PULSES (SUPERPOSITION)6.7: ADDING SINUSOIDAL WAVES
6.7.1: ADDING TWO LINEAR WAVES SIMULATION6.8: PATH DIFFERENCE
6.8.1: INTERFERENCE6.8.2: INTERFERENCE DUE TO PATH DIFFERENCE SIMULATION6.9: INTERFERENCE
6.9.1: INTERFERENCE- RIPPLE TANK SIMULATION6.10: DIFFRACTION
6.10.1: DIFFRACTION6.10.2: DIFFRACTION SIMULATION
Kyle Forinash and Wolfgang Christian 6.1.1 3/24/2022 https://phys.libretexts.org/@go/page/26180
6.1: Doppler ShiftIf the wave source or receiver is moving, the waves will appear to have a different frequency. For example if you are movingtowards a sound source you catch up with the next peak in the wave sooner than you would expect because you are movingtowards it. This effect is called the Doppler Shift and occurs for both light and sound.
Contributions and AttributionsThis page is licensed under a CC BY-NC-SA 3.0 license and was authored, remixed, and/or curated by Kyle Forinash andWolfgang Christian. Source content is found at https://www.compadre.org/books/SoundBook. Page content has been edited andupdated to conform to the style and standards of the LibreTexts platform. A detailed versioning history of the edits to source contentis available upon request.
Kyle Forinash and Wolfgang Christian 6.1.1.1 3/24/2022 https://phys.libretexts.org/@go/page/26200
6.1.1: Doppler ShiftThe movement of a source of waves does not change the speed of the waves. Neither does the movement of a receiver of waves.However, if the source or receiver is moving, the waves will appear to have a different frequency. For example if you are movingtowards a sound source you catch up with the next peak in the wave sooner than you would expect because you are movingtowards it. This effect is called the Doppler Shift and occurs for both light and sound. For sound, if the object moves towards youthe frequency seems higher. If the object is moving away the frequency seems lower.
It isn't the loudness we are talking about here, which also increases as the source gets closer and decreases as the source movesaway; the Doppler shift is about frequency, not volume.
The Doppler shift for light changes the frequency or color of the light. Objects moving at high speed towards you will have theircolor shifted a little towards the blue end of the spectrum while objects moving away have colors shifted towards the red end of thespectrum. This cannot be seen with the eye but can be measured and is used in astronomy to determine the speed and direction ofstars and galaxies. The Doppler shift tells us that most galaxies are moving away from ours which tells us the universe isexpanding.
Police radar and weather radar both use the Doppler Effect to measure the speed of something. For a stationary object (a car, araincloud) the reflected radar beam returns with the same frequency it originally had. Measuring how long it takes for the beam toget back gives us the distance to the object but not its speed. If the object (car, raincloud) is moving the Doppler Effect will cause ashift in the returning frequency. A computer compares the outgoing and reflected beam to determine not only how far away theobject is (from the time it takes to return), but also how fast it is moving (from the Doppler shift in frequency). For weather radarthe amount of reflected radar also tells us something about the water content in the cloud. Hail and snow have different reflectionpatterns than rain so radar can also tell us what is in the cloud in addition to distance and speed.
Video/audio examples:Doppler shift of a fire engine. Notice that the loudness is NOT what is important; the change in pitch is the Doppler effect.For a source traveling faster than the speed of sound the waves pile up into a shock wave which produces a sonic boom.Once piece of evidence (there are others) that the universe is expanding is the Doppler shift of light from stars.Sound waves with frequencies above 20,000 Hz are called ultrasound sound waves. You may be familiar with pictures ofunborn children made using ultrasound. The Doppler shift can also be used with ultrasound to see the movement of blood in theheart. This is known as echo cardiology.Directions for building your own radar detector and a lecture on how it works.
Contributions and AttributionsThis page is licensed under a CC BY-NC-SA 3.0 license and was authored, remixed, and/or curated by Kyle Forinash andWolfgang Christian. Source content is found at https://www.compadre.org/books/SoundBook. Page content has been edited andupdated to conform to the style and standards of the LibreTexts platform. A detailed versioning history of the edits to source contentis available upon request.
Note
Kyle Forinash and Wolfgang Christian 6.1.2.1 3/24/2022 https://phys.libretexts.org/@go/page/26201
6.1.2: The Doppler Effect SimulationThis simulation looks at the Doppler effect for sound; the black circle is the source and the red circle is the receiver. The time ismeasured in centiseconds ( ), distances are in meters. A similar effect occurs for light but in that case the source and receivercannot travel faster than the wave speed (the speed of light).
Simulation Questions:1. Click the play button to see a stationary source and receiver (Animation 1). Reset and use the pause and step buttons to verify
that the period at the receiver (time elapsed from when one wave reaches the receiver until the next one reaches it) is . What is the frequency of this wave?
2. After there are several waves in the simulation pause it and use the mouse to find the wavelength (distance between twosuccessive crests). What are the wavelength and speed of the wave (wavelength/period)?
3. Now look at Animation 2, where the receiver is moving. Use the step button above to find the period (time between crests) asmeasured by the moving receiver when it is on the right of the source (moving towards the source). What is the frequency at thereceiver if it is moving towards the source?
4. When the receiver gets to the left of the source (moving away from the source) pause the simulation and measure the period.What is the frequency at the receiver if it is moving away from the source?
5. Now look at Animation 3 which shows the source moving but the receiver stationary. Again find the frequency while the sourceis on the left, moving towards the receiver and the frequency when it is on the right moving away.
Advanced Questions:Animation 4 shows the effects of a moving source and a moving observer at the same time. The equation for the Doppler shift withboth a moving source and observer is given by where is the received frequency, is the originalfrequency, is the speed of the wave, is the speed of the observer and is the speed of the source. The upper signs in theequation are used if either the observer or source is moving towards each other and the lower signs are used if the either object ismoving away from the other (so if the observer is moving towards the source but the source is moving away from the observer theequation to use is ).
1. For the case of the moving receiver and stationary source ( ) use the original frequency you found in question one, theshifted frequency ( ) you found in question three and the speed of sound you found in two to find the speed of the observer.
2. Animation 5 shows a source moving faster than the speed of the sound wave. In this case all of the wave crests arrive togetherforming a shock wave or "sonic boom". Why can this not happen in the case of light from a moving light source?
3. Electromagnetic waves will also undergo a Doppler shift except that the relative velocity between the source and observer cannever be larger than the speed of light and the formula for calculating the shift is slightly different. For electromagnetic waveswe have where is the relative speed between the observer and source (positive if they areapproaching and negative if they are moving away from each other) and is the speed of light.
4. If the speed of the wave is known and the original and received frequencies are know the speed of the source or observer can befound. Explain how you could determine the speed of a car or thunderstorm by bouncing radio or microwaves off of them.(Police radar and thunderstorm tracking both use the Doppler Effect.)
5. If a car goes past with its radio blaring we easily hear the Doppler shift for sound as the car passes (the sound appears to shiftfrom a pitch which is too high to one which is too low). (Note: We are talking about the change in pitch, not the change involume.) But if a car goes past with its lights on we do not notice the Doppler shift for light (the color does not seem to shifttowards the red frequencies). Explain why this is so. (Hint: Try plugging in some numbers for a car speed in the equation for theDoppler shift for light).
6. If an astronomer notices that the spectrum of colors coming from a star are all shifted towards the red end of the spectrum (thefrequencies are lower than they should be) what can she conclude about the motion of the star relative to the earth? (This is oneof the pieces of evidence that the universe is expanding; nearly all the stars and galaxies around us are moving away from us.)
Chapter Seven Summary
Waves (of all types) will: reflect (diffuse or specular) at the same angle when they hit a solid surface; bend if their speed changes(refraction); bend if they run into an object or opening that is near the same size as the wavelength (diffraction); change frequency(NOT loudness!) if the source or receiver are moving (Doppler shift). Two waves can add constructively or destructively to give a
s10−2
5.0 × s10−3
= f(v± )/(v∓ )f ′ vo vs f ′ f
v vo vs
= f(v+ )/(v+ )f ′ vo vs
= 0vs
f ′
= f((c +v)/(c −v)f ′ )1/2 v
c
Kyle Forinash and Wolfgang Christian 6.1.2.2 3/24/2022 https://phys.libretexts.org/@go/page/26201
wave with larger amplitude (louder sound or brighter light) or sound cancellation, standing waves, beats, interference (colors onsoap bubbles, moth wings, bird feathers).
Questions on Wave Behavior:1. Give a definition of the law of reflection.2. Do sound waves obey the law of reflection? Explain.3. A police officer has a new sound gun that stuns the criminal. They can see their suspect who is around the corner, reflected in a
mirror. Should she simply aim at the image of the target in the mirror? Explain.4. Trucks sometimes have a sign on the back that says “If you can’t see me in my mirror, I can’t see you.” Explain the physics
here.5. Why is the image in a mirror reversed left to right but not top to bottom? (A drawing might help your explanation.)6. Some storefront windows are angled so the bottom is further in and the top comes out towards the street. Explain how this
would help reduce glare on a bright day. (A drawing might help your explanation.)7. What is the difference between diffuse reflection and specular reflection?8. Why are matte finishes for photos and books generally better than glossy finishes?9. Why do sound studios often have the walls covered with egg carton shaped foam?
10. Why is it harder to see the road at night in the rain?11. Give a definition of the law of refraction, explaining the difference between reflection and refraction.12. How does refraction depend on the speed of a wave?13. Give some examples of common, everyday objects that use refraction to operate.14. Why are images blurry underwater if you don’t have goggles?15. Why are images not blurry underwater if you are wearing goggles?16. If a fish wore goggles to come above the surface, why would it want to have goggles filled with water?17. If you place a glass test tube in water you can still see it but if you place it in soybean oil it disappears. What does this tell you
about the speed of light in glass, water and soybean oil?18. If you want to spear a fish under water from the shore should you aim below it, at it or above it? Explain.19. If you want to zap a fish with a laser, should you aim below it, at it or above it? Explain.20. Why does a pond or lake with very clear water look shallower than it really is? Explain using a diagram.21. Suppose color X bends more when passing through glass than color Y. Which moves slower in the glass?22. What is total internal reflection? When does it occur?23. What modern devices depends on total internal reflection?24. On a windy day, why can you hear someone clearly if they are downwind but can’t hear them as well if they are upwind?25. Why is it difficult to hear someone on the other side of a lake during the day when the air above the lake is cool but very easy to
hear voices at night when the air above the lake is warmer than air higher up? (Hint: Sound travels faster in warmer air.)26. The term ‘heat lightning’ is sometimes used to describe lightning that we can see off at a distance but not hear. Why don’t we
hear it like ordinary lightning? (Hint: Think about the previous question.)27. What is dispersion and what causes it? Give an example.28. What is constructive and destructive interference? When does each occur?29. Explain how does path difference cause constructive and destructive interference?30. Explain how the phenomena of beats occurs.31. Why do some bird feathers appear to be iridescent, changing color when viewed from different angles?32. What causes the different colors on a CD disk?33. What causes the different colors on a soap bubble?34. Suppose you are standing directly in front of a pair of stereo speakers. Why would you expect the sound not to be quite as loud
if you move slightly to the left or right?35. What is diffraction? Give some examples.36. Under what circumstances do you expect to see the effects of diffraction?37. Why can you hear sound from the other room, even when you cannot see into the room?38. Why does light not bend when it passes through a doorway but sound does?39. What is scattering?40. Why is the sky blue?41. What is the Doppler effect?
Kyle Forinash and Wolfgang Christian 6.1.2.3 3/24/2022 https://phys.libretexts.org/@go/page/26201
42. A friend hears an ambulance go by and says this is an example of the Doppler effect because the sound got louder and thensofter. Correct your friend’s mistaken definition of the Doppler effect.
43. Give an example of the Doppler effect for light and one for sound.44. Does the Doppler shift depend on whether the source or the receiver is moving?45. Does the speed of the wave change when there is a Doppler shift? Explain.46. We can easily hear the Doppler shift of a car passing by but we do not notice the Doppler shift of light from its headlamps. Why
is that?47. Originally radar was just used to find the distance to a plane or thundercloud by measuring how long it took for the signal to
return. What additional information does measuring the Doppler effect provide?48. What is one piece of information that tells us the universe is expanding?
Contributions and AttributionsThis page is licensed under a CC BY-NC-SA 3.0 license and was authored, remixed, and/or curated by Kyle Forinash andWolfgang Christian. Source content is found at https://www.compadre.org/books/SoundBook. Page content has been edited andupdated to conform to the style and standards of the LibreTexts platform. A detailed versioning history of the edits to source contentis available upon request.
Kyle Forinash and Wolfgang Christian 6.2.1 3/24/2022 https://phys.libretexts.org/@go/page/26025
6.2: Mirrors and ReflectionIn many cases waves of all types will travel in a straight line, reflecting off of objects and surfaces at the same angle that they strikethe surface. This is called the law of reflection and is true for sound waves as well as light as long as the surface is smooth relativeto the wavelength.
Contributions and AttributionsThis page is licensed under a CC BY-NC-SA 3.0 license and was authored, remixed, and/or curated by Kyle Forinash andWolfgang Christian. Source content is found at https://www.compadre.org/books/SoundBook. Page content has been edited andupdated to conform to the style and standards of the LibreTexts platform. A detailed versioning history of the edits to source contentis available upon request.
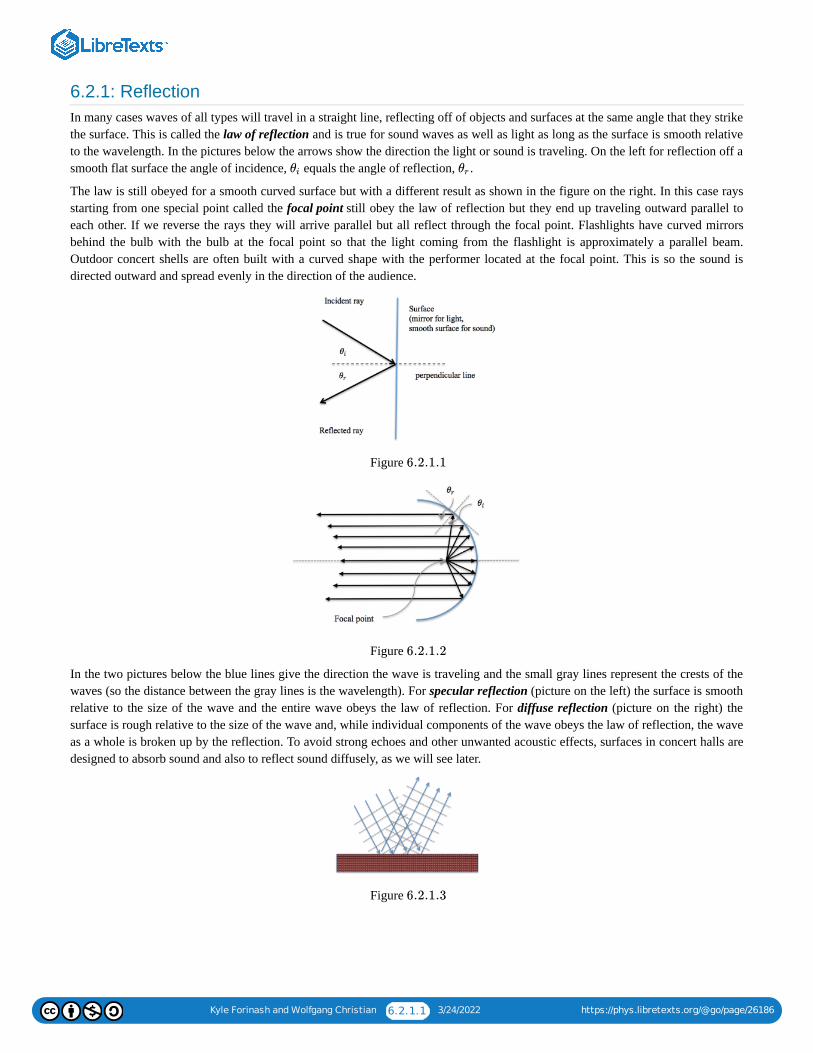
Kyle Forinash and Wolfgang Christian 6.2.1.1 3/24/2022 https://phys.libretexts.org/@go/page/26186
6.2.1: ReflectionIn many cases waves of all types will travel in a straight line, reflecting off of objects and surfaces at the same angle that they strikethe surface. This is called the law of reflection and is true for sound waves as well as light as long as the surface is smooth relativeto the wavelength. In the pictures below the arrows show the direction the light or sound is traveling. On the left for reflection off asmooth flat surface the angle of incidence, equals the angle of reflection, .
The law is still obeyed for a smooth curved surface but with a different result as shown in the figure on the right. In this case raysstarting from one special point called the focal point still obey the law of reflection but they end up traveling outward parallel toeach other. If we reverse the rays they will arrive parallel but all reflect through the focal point. Flashlights have curved mirrorsbehind the bulb with the bulb at the focal point so that the light coming from the flashlight is approximately a parallel beam.Outdoor concert shells are often built with a curved shape with the performer located at the focal point. This is so the sound isdirected outward and spread evenly in the direction of the audience.
Figure
Figure
In the two pictures below the blue lines give the direction the wave is traveling and the small gray lines represent the crests of thewaves (so the distance between the gray lines is the wavelength). For specular reflection (picture on the left) the surface is smoothrelative to the size of the wave and the entire wave obeys the law of reflection. For diffuse reflection (picture on the right) thesurface is rough relative to the size of the wave and, while individual components of the wave obeys the law of reflection, the waveas a whole is broken up by the reflection. To avoid strong echoes and other unwanted acoustic effects, surfaces in concert halls aredesigned to absorb sound and also to reflect sound diffusely, as we will see later.
Figure
θi θr
6.2.1.1
6.2.1.2
6.2.1.3
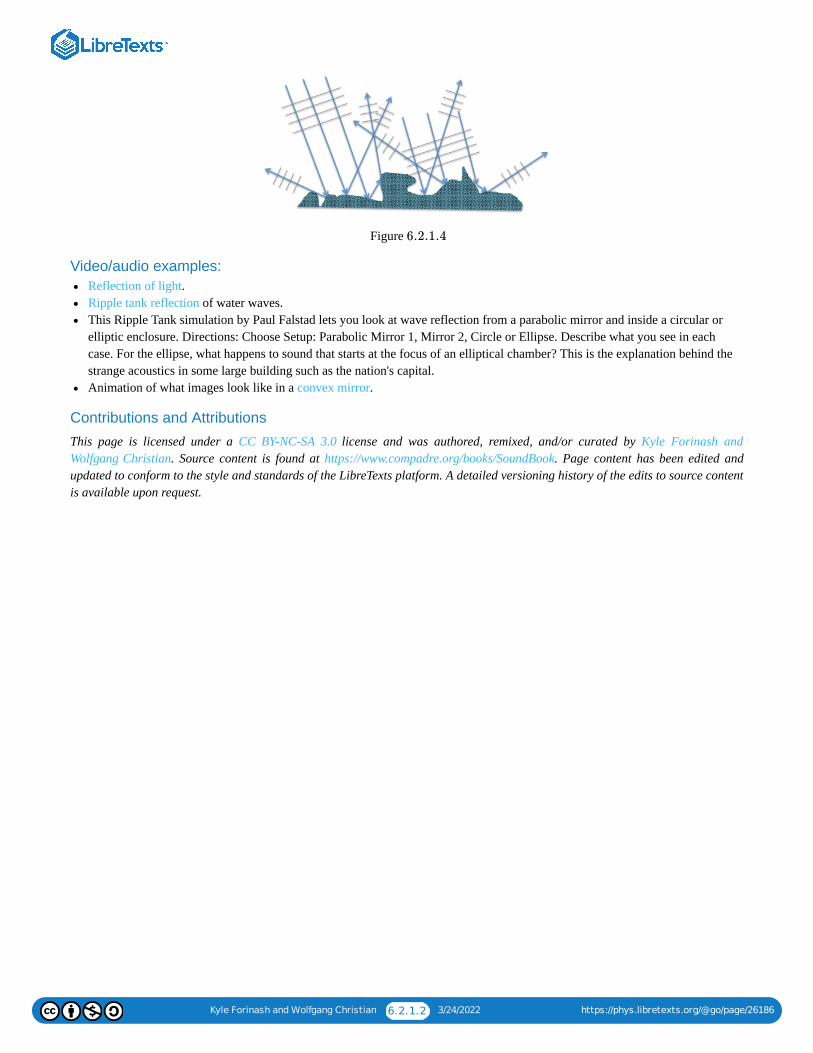
Kyle Forinash and Wolfgang Christian 6.2.1.2 3/24/2022 https://phys.libretexts.org/@go/page/26186
Figure
Video/audio examples:Reflection of light.Ripple tank reflection of water waves.This Ripple Tank simulation by Paul Falstad lets you look at wave reflection from a parabolic mirror and inside a circular orelliptic enclosure. Directions: Choose Setup: Parabolic Mirror 1, Mirror 2, Circle or Ellipse. Describe what you see in eachcase. For the ellipse, what happens to sound that starts at the focus of an elliptical chamber? This is the explanation behind thestrange acoustics in some large building such as the nation's capital.Animation of what images look like in a convex mirror.
Contributions and Attributions
This page is licensed under a CC BY-NC-SA 3.0 license and was authored, remixed, and/or curated by Kyle Forinash andWolfgang Christian. Source content is found at https://www.compadre.org/books/SoundBook. Page content has been edited andupdated to conform to the style and standards of the LibreTexts platform. A detailed versioning history of the edits to source contentis available upon request.
6.2.1.4
Kyle Forinash and Wolfgang Christian 6.2.2.1 3/24/2022 https://phys.libretexts.org/@go/page/26187
6.2.2: Reflection SimulationThe simulation below allows for a brief exploration of specular reflection. In this case we are simulating mirrors but keep in mindthat, if the surface is smooth relative to the wavelength, any wave will obey the same rules. The mirror in each case in the centerand everything to the right is behind the mirror (virtual). The units of height, , and distance, , are arbitrary (cm, inches, etc.).
Simulation Questions:1. The simulation starts with a flat mirror, an object on the left (a candle) and the candle's image (shown on the right). Two real
rays (white arrows) are shown leaving the object and reflecting off the mirror. Carefully describe each ray. What does theparallel ray do when it reflects off the mirror? What does the ray that goes to the center of the mirror do when it reflects?
2. The small protractor can be dragged to different locations and the arrow tip can be moved to change the angle. Use it to measurethe incident and reflected angles (angles are measured from the horizontal line which is perpendicular to the surface of themirror, not from the surface of the mirror). What are the incident and reflected angles for the ray going from the object to thecenter of the mirror? Is the law of reflection obeyed?
3. Our eyes and brain do not perceive the rays as reflecting. Instead, our brains perceive the reflected rays as coming from behindthe mirror (the magenta arrows) from an imaginary or virtual image behind the mirror. The object can be moved using themouse. Does the size of the image change if the object is moved back and forth?
4. Now choose the convex mirror button. Move the object back and forth. Describe what happens to the image as the object movesback and forth. What happens to a parallel ray when it reflects? What happens to a ray going to the center of the mirror?
5. The red dot on the right is the focal point of the mirror and is the radius of curvature of the mirror. The turquoise dot locatesthe center of curvature and the radius of curvature is from the center of curvature to the mirror. What happens to a ray that startson the left and heads towards the focal point on the other side; how does it reflect?
6. Use the protractor to measure the incident and reflected angles for the ray striking the center of the mirror for the convex case.(Note: The curvature of the mirrors is exaggerated; place the protractor on the turquoise line rather than the mirror itself.) Arethe incident and reflected angles equal?
7. The other rays also obey the law of reflection but the mirror surface at those locations is not perpendicular to the -axis. For avery short object, place the protractor at the location (on the turquoise line) where the top ray strikes the mirror and rotate thearrow to point directly away from the center of curvature (turquoise dot). This is the direction of a perpendicular to the mirrorand should fall precisely between the incoming and outgoing rays. What is the angle? (Note: These measurements only workfor the very center of the mirror; in other words for a very short object relative to the height of the mirror.)
8. For the flat and convex mirror, does the size of the object change the laws of reflection? Describe what you see.9. Now click on the concave mirror button. Slide the object back and forth, moving it from very far away from the mirror to very
close. Describe where the image is, its size relative to the object and orientation (Hint: There are three different cases; Closerthan the focus; further away than the focus but closer than twice the focal length; further away than twice the focal length.)
10. Images appearing behind the mirror (to the right in the simulation) are virtual images; we can only see them by looking into themirror. Images appearing on the left side, in front of the mirror are real images. These can be seen in the mirror and can also beprojected onto a screen. For the flat mirror were the images real or virtual? Are the images for the convex mirror real or virtual?How do you know? In which cases were the images real and virtual in the concave mirror?
11. Describe the three reflected rays for the case of a virtual image in the concave mirror case. Do they obey the law of reflection?Explain.
12. Describe the three reflected rays for the case of a real image in the concave mirror case. Do they obey the law of reflection? Dothe laws of reflection change depending on the size of the object in the concave case? Explain.
13. Go back to the flat mirror and use the mouse to find the distance from the mirror to the object and from the mirror to the image.(Use the absolute values of the numbers in the yellow box. You may also have to click the mouse down and slide over to theobject to get a value without moving the object.) How is the distance to the mirror from the object related to the distance to theimage for the flat mirror?
14. For a flat mirror the image height and image distance are the same as the object's. For a curved mirror the relation between thedistance to the object, and to the image are related to the focal length, which is equal to one half the radius of curvatureof the mirror. The relationship is where the focal length is positive for a concave mirror and negative for aconvex mirror. The distance to the image will be positive if the image is real and negative if virtual. Use the mouse to find thedistance to the object and to the image for several different distances in the convex mirror case. Use these values to find the
h d
1/2
x
s s′ f
1/f = 1/s+1/s′

Kyle Forinash and Wolfgang Christian 6.2.2.2 3/24/2022 https://phys.libretexts.org/@go/page/26187
focal length, (use the absolute values of the distances given in the yellow box and the rule that distances to the image will bepositive if the image is real and negative if virtual).
Contributions and AttributionsThis page is licensed under a CC BY-NC-SA 3.0 license and was authored, remixed, and/or curated by Kyle Forinash andWolfgang Christian. Source content is found at https://www.compadre.org/books/SoundBook. Page content has been edited andupdated to conform to the style and standards of the LibreTexts platform. A detailed versioning history of the edits to source contentis available upon request.
f

Kyle Forinash and Wolfgang Christian 6.3.1 3/24/2022 https://phys.libretexts.org/@go/page/26026
6.3: RefractionA wave that changes speed as it crosses the boundary of between two materials will also change direction if it crosses the boundaryat an angle other than perpendicular. This is because the part of the wavefront that gets to the boundary first, slows down first. Thebending of a wave due to changes in speed as it crosses a boundary is called refraction.
Contributions and AttributionsThis page is licensed under a CC BY-NC-SA 3.0 license and was authored, remixed, and/or curated by Kyle Forinash andWolfgang Christian. Source content is found at https://www.compadre.org/books/SoundBook. Page content has been edited andupdated to conform to the style and standards of the LibreTexts platform. A detailed versioning history of the edits to source contentis available upon request.
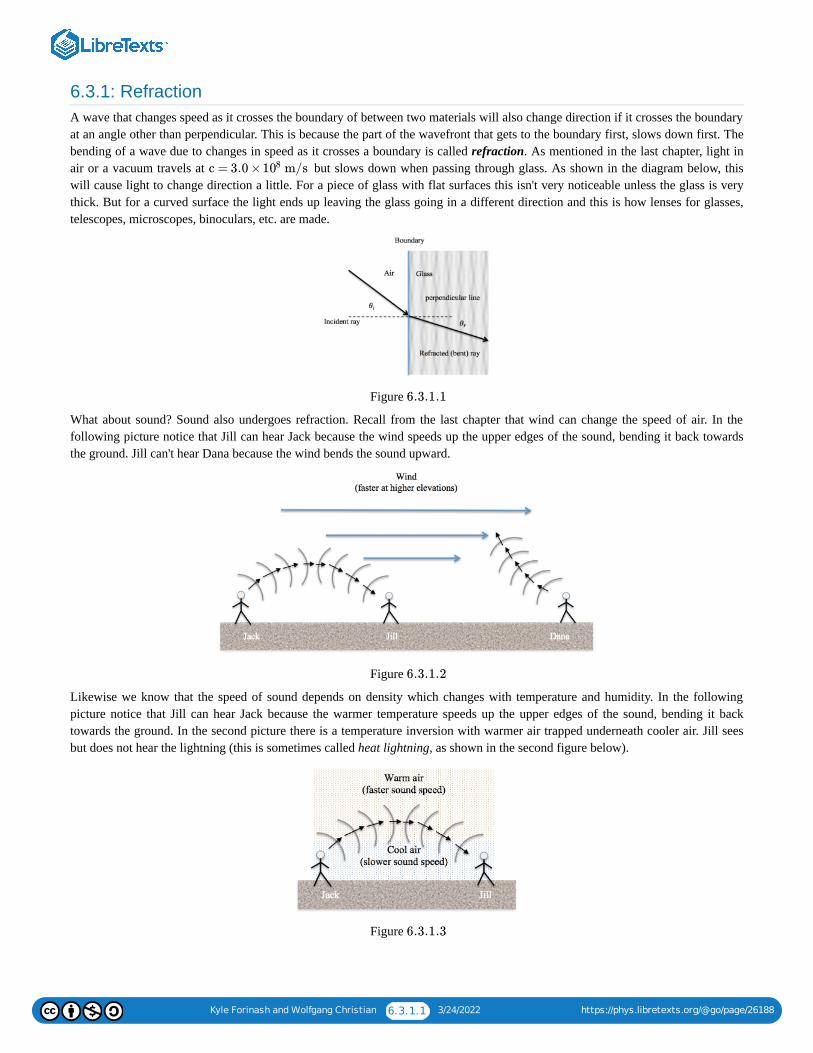
Kyle Forinash and Wolfgang Christian 6.3.1.1 3/24/2022 https://phys.libretexts.org/@go/page/26188
6.3.1: RefractionA wave that changes speed as it crosses the boundary of between two materials will also change direction if it crosses the boundaryat an angle other than perpendicular. This is because the part of the wavefront that gets to the boundary first, slows down first. Thebending of a wave due to changes in speed as it crosses a boundary is called refraction. As mentioned in the last chapter, light inair or a vacuum travels at but slows down when passing through glass. As shown in the diagram below, thiswill cause light to change direction a little. For a piece of glass with flat surfaces this isn't very noticeable unless the glass is verythick. But for a curved surface the light ends up leaving the glass going in a different direction and this is how lenses for glasses,telescopes, microscopes, binoculars, etc. are made.
Figure
What about sound? Sound also undergoes refraction. Recall from the last chapter that wind can change the speed of air. In thefollowing picture notice that Jill can hear Jack because the wind speeds up the upper edges of the sound, bending it back towardsthe ground. Jill can't hear Dana because the wind bends the sound upward.
Figure
Likewise we know that the speed of sound depends on density which changes with temperature and humidity. In the followingpicture notice that Jill can hear Jack because the warmer temperature speeds up the upper edges of the sound, bending it backtowards the ground. In the second picture there is a temperature inversion with warmer air trapped underneath cooler air. Jill seesbut does not hear the lightning (this is sometimes called heat lightning, as shown in the second figure below).
Figure
c = 3.0 × m/s108
6.3.1.1
6.3.1.2
6.3.1.3
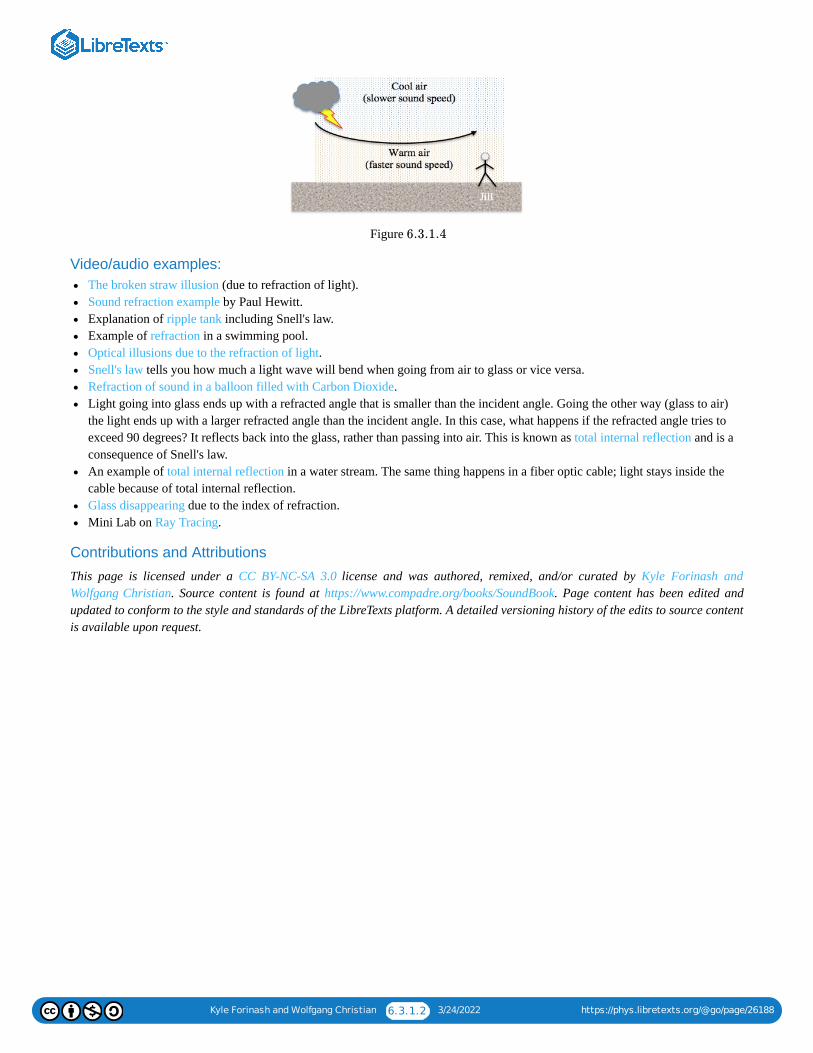
Kyle Forinash and Wolfgang Christian 6.3.1.2 3/24/2022 https://phys.libretexts.org/@go/page/26188
Figure
Video/audio examples:The broken straw illusion (due to refraction of light).Sound refraction example by Paul Hewitt.Explanation of ripple tank including Snell's law.Example of refraction in a swimming pool.Optical illusions due to the refraction of light.Snell's law tells you how much a light wave will bend when going from air to glass or vice versa.Refraction of sound in a balloon filled with Carbon Dioxide.Light going into glass ends up with a refracted angle that is smaller than the incident angle. Going the other way (glass to air)the light ends up with a larger refracted angle than the incident angle. In this case, what happens if the refracted angle tries toexceed 90 degrees? It reflects back into the glass, rather than passing into air. This is known as total internal reflection and is aconsequence of Snell's law.An example of total internal reflection in a water stream. The same thing happens in a fiber optic cable; light stays inside thecable because of total internal reflection.Glass disappearing due to the index of refraction.Mini Lab on Ray Tracing.
Contributions and Attributions
This page is licensed under a CC BY-NC-SA 3.0 license and was authored, remixed, and/or curated by Kyle Forinash andWolfgang Christian. Source content is found at https://www.compadre.org/books/SoundBook. Page content has been edited andupdated to conform to the style and standards of the LibreTexts platform. A detailed versioning history of the edits to source contentis available upon request.
6.3.1.4
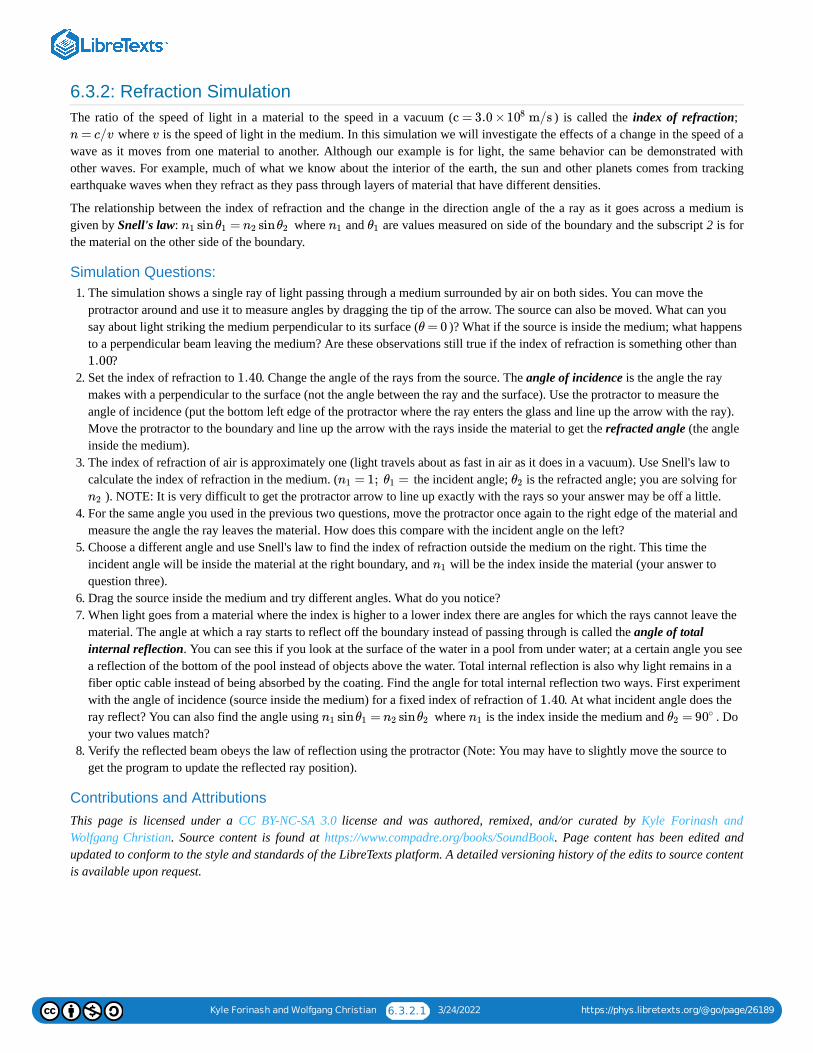
Kyle Forinash and Wolfgang Christian 6.3.2.1 3/24/2022 https://phys.libretexts.org/@go/page/26189
6.3.2: Refraction SimulationThe ratio of the speed of light in a material to the speed in a vacuum ( ) is called the index of refraction;
where is the speed of light in the medium. In this simulation we will investigate the effects of a change in the speed of awave as it moves from one material to another. Although our example is for light, the same behavior can be demonstrated withother waves. For example, much of what we know about the interior of the earth, the sun and other planets comes from trackingearthquake waves when they refract as they pass through layers of material that have different densities.
The relationship between the index of refraction and the change in the direction angle of the a ray as it goes across a medium isgiven by Snell's law: where and are values measured on side of the boundary and the subscript 2 is forthe material on the other side of the boundary.
Simulation Questions:1. The simulation shows a single ray of light passing through a medium surrounded by air on both sides. You can move the
protractor around and use it to measure angles by dragging the tip of the arrow. The source can also be moved. What can yousay about light striking the medium perpendicular to its surface ( )? What if the source is inside the medium; what happensto a perpendicular beam leaving the medium? Are these observations still true if the index of refraction is something other than
?2. Set the index of refraction to . Change the angle of the rays from the source. The angle of incidence is the angle the ray
makes with a perpendicular to the surface (not the angle between the ray and the surface). Use the protractor to measure theangle of incidence (put the bottom left edge of the protractor where the ray enters the glass and line up the arrow with the ray).Move the protractor to the boundary and line up the arrow with the rays inside the material to get the refracted angle (the angleinside the medium).
3. The index of refraction of air is approximately one (light travels about as fast in air as it does in a vacuum). Use Snell's law tocalculate the index of refraction in the medium. ( the incident angle; is the refracted angle; you are solving for
). NOTE: It is very difficult to get the protractor arrow to line up exactly with the rays so your answer may be off a little.4. For the same angle you used in the previous two questions, move the protractor once again to the right edge of the material and
measure the angle the ray leaves the material. How does this compare with the incident angle on the left?5. Choose a different angle and use Snell's law to find the index of refraction outside the medium on the right. This time the
incident angle will be inside the material at the right boundary, and will be the index inside the material (your answer toquestion three).
6. Drag the source inside the medium and try different angles. What do you notice?7. When light goes from a material where the index is higher to a lower index there are angles for which the rays cannot leave the
material. The angle at which a ray starts to reflect off the boundary instead of passing through is called the angle of totalinternal reflection. You can see this if you look at the surface of the water in a pool from under water; at a certain angle you seea reflection of the bottom of the pool instead of objects above the water. Total internal reflection is also why light remains in afiber optic cable instead of being absorbed by the coating. Find the angle for total internal reflection two ways. First experimentwith the angle of incidence (source inside the medium) for a fixed index of refraction of . At what incident angle does theray reflect? You can also find the angle using where is the index inside the medium and . Doyour two values match?
8. Verify the reflected beam obeys the law of reflection using the protractor (Note: You may have to slightly move the source toget the program to update the reflected ray position).
Contributions and AttributionsThis page is licensed under a CC BY-NC-SA 3.0 license and was authored, remixed, and/or curated by Kyle Forinash andWolfgang Christian. Source content is found at https://www.compadre.org/books/SoundBook. Page content has been edited andupdated to conform to the style and standards of the LibreTexts platform. A detailed versioning history of the edits to source contentis available upon request.
c = 3.0 × m/s108
n = c/v v
sin = sinn1 θ1 n2 θ2 n1 θ1
θ = 0
1.00
1.40
= 1; =n1 θ1 θ2
n2
n1
1.40
sin = sinn1 θ1 n2 θ2 n1 =θ2 90∘
Kyle Forinash and Wolfgang Christian 6.4.1 3/24/2022 https://phys.libretexts.org/@go/page/26027
6.4: LensesA wave that passes all the way through a piece of material with parallel sides leaves the material at the same angle that it entered.The wave un-bends when it exits the material by the same amount that it bent when entering but this is only true if the sides of thematerial are parallel. Convex and concave lenses have sides that are not parallel (except near the center). In this case parallel raysof light end up exiting in different directions.
Contributions and AttributionsThis page is licensed under a CC BY-NC-SA 3.0 license and was authored, remixed, and/or curated by Kyle Forinash andWolfgang Christian. Source content is found at https://www.compadre.org/books/SoundBook. Page content has been edited andupdated to conform to the style and standards of the LibreTexts platform. A detailed versioning history of the edits to source contentis available upon request.
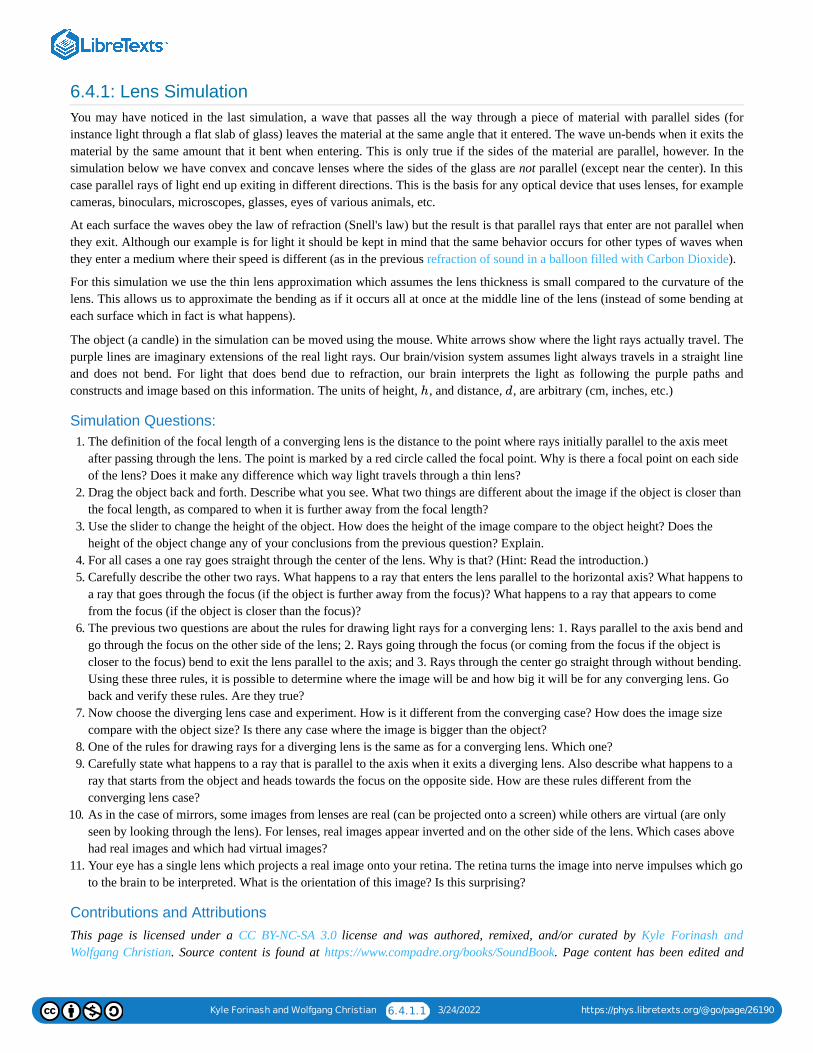
Kyle Forinash and Wolfgang Christian 6.4.1.1 3/24/2022 https://phys.libretexts.org/@go/page/26190
6.4.1: Lens SimulationYou may have noticed in the last simulation, a wave that passes all the way through a piece of material with parallel sides (forinstance light through a flat slab of glass) leaves the material at the same angle that it entered. The wave un-bends when it exits thematerial by the same amount that it bent when entering. This is only true if the sides of the material are parallel, however. In thesimulation below we have convex and concave lenses where the sides of the glass are not parallel (except near the center). In thiscase parallel rays of light end up exiting in different directions. This is the basis for any optical device that uses lenses, for examplecameras, binoculars, microscopes, glasses, eyes of various animals, etc.
At each surface the waves obey the law of refraction (Snell's law) but the result is that parallel rays that enter are not parallel whenthey exit. Although our example is for light it should be kept in mind that the same behavior occurs for other types of waves whenthey enter a medium where their speed is different (as in the previous refraction of sound in a balloon filled with Carbon Dioxide).
For this simulation we use the thin lens approximation which assumes the lens thickness is small compared to the curvature of thelens. This allows us to approximate the bending as if it occurs all at once at the middle line of the lens (instead of some bending ateach surface which in fact is what happens).
The object (a candle) in the simulation can be moved using the mouse. White arrows show where the light rays actually travel. Thepurple lines are imaginary extensions of the real light rays. Our brain/vision system assumes light always travels in a straight lineand does not bend. For light that does bend due to refraction, our brain interprets the light as following the purple paths andconstructs and image based on this information. The units of height, , and distance, , are arbitrary (cm, inches, etc.)
Simulation Questions:1. The definition of the focal length of a converging lens is the distance to the point where rays initially parallel to the axis meet
after passing through the lens. The point is marked by a red circle called the focal point. Why is there a focal point on each sideof the lens? Does it make any difference which way light travels through a thin lens?
2. Drag the object back and forth. Describe what you see. What two things are different about the image if the object is closer thanthe focal length, as compared to when it is further away from the focal length?
3. Use the slider to change the height of the object. How does the height of the image compare to the object height? Does theheight of the object change any of your conclusions from the previous question? Explain.
4. For all cases a one ray goes straight through the center of the lens. Why is that? (Hint: Read the introduction.)5. Carefully describe the other two rays. What happens to a ray that enters the lens parallel to the horizontal axis? What happens to
a ray that goes through the focus (if the object is further away from the focus)? What happens to a ray that appears to comefrom the focus (if the object is closer than the focus)?
6. The previous two questions are about the rules for drawing light rays for a converging lens: 1. Rays parallel to the axis bend andgo through the focus on the other side of the lens; 2. Rays going through the focus (or coming from the focus if the object iscloser to the focus) bend to exit the lens parallel to the axis; and 3. Rays through the center go straight through without bending.Using these three rules, it is possible to determine where the image will be and how big it will be for any converging lens. Goback and verify these rules. Are they true?
7. Now choose the diverging lens case and experiment. How is it different from the converging case? How does the image sizecompare with the object size? Is there any case where the image is bigger than the object?
8. One of the rules for drawing rays for a diverging lens is the same as for a converging lens. Which one?9. Carefully state what happens to a ray that is parallel to the axis when it exits a diverging lens. Also describe what happens to a
ray that starts from the object and heads towards the focus on the opposite side. How are these rules different from theconverging lens case?
10. As in the case of mirrors, some images from lenses are real (can be projected onto a screen) while others are virtual (are onlyseen by looking through the lens). For lenses, real images appear inverted and on the other side of the lens. Which cases abovehad real images and which had virtual images?
11. Your eye has a single lens which projects a real image onto your retina. The retina turns the image into nerve impulses which goto the brain to be interpreted. What is the orientation of this image? Is this surprising?
Contributions and AttributionsThis page is licensed under a CC BY-NC-SA 3.0 license and was authored, remixed, and/or curated by Kyle Forinash andWolfgang Christian. Source content is found at https://www.compadre.org/books/SoundBook. Page content has been edited and
h d

Kyle Forinash and Wolfgang Christian 6.4.1.2 3/24/2022 https://phys.libretexts.org/@go/page/26190
updated to conform to the style and standards of the LibreTexts platform. A detailed versioning history of the edits to source contentis available upon request.
Kyle Forinash and Wolfgang Christian 6.5.1 3/24/2022 https://phys.libretexts.org/@go/page/26028
6.5: DispersionThe speed of a wave can depend on the frequency of the wave, a phenomenon known as dispersion. Although this effect is oftensmall. it is easy to observe with a prism.
Contributions and AttributionsThis page is licensed under a CC BY-NC-SA 3.0 license and was authored, remixed, and/or curated by Kyle Forinash andWolfgang Christian. Source content is found at https://www.compadre.org/books/SoundBook. Page content has been edited andupdated to conform to the style and standards of the LibreTexts platform. A detailed versioning history of the edits to source contentis available upon request.
Kyle Forinash and Wolfgang Christian 6.5.1.1 3/24/2022 https://phys.libretexts.org/@go/page/26191
6.5.1: Dispersion SimulationSo far in this chapter and the previous one we have assumed that the speed of a wave does not depend on its frequency orwavelength. This is generally true; for example all the sounds of the instruments in an orchestra reach your ear at the same time, nomatter what frequencies they are playing. However, it is the case that under some circumstances speed can depend on the frequencyof the wave, a phenomenon known as dispersion. For electrical signals in a cable this means the signal gradually deteriorates inquality because high frequency components travel at a different speed compared to lower frequency components. Different colorsof light travel at slightly different speeds through glass (in other words the index of refraction depends on frequency) which is howa prism separates out the different frequencies of white light.
In the previous simulations on refraction we assumed that all wavelengths bend by the same amount. But with dispersion if we startwith several different wavelengths (different colors) we expect there may be some situations in which the colors will separate. Ifthe sides of the medium are parallel, each color unbends by the same amount that it bent going into the medium so all the colors areagain going in the same direction. However if the sides are not parallel, such as a prism or lens, there will be a separation of color.This is in fact how a prism and water droplets separate colors and why good camera lenses (which compensate for this effect byusing compound lenses) are expensive.
Dispersion occurs for all types of waves. For example, longer wavelength surface waves on the ocean travel faster than shorterwavelength waves. There is not much dispersion for sound waves in air but acoustic waves in solids do experience significantdispersion. The simulation below is for visible light passing through a prism. You can choose the color and see what the index is forthat wavelength.
Simulation Questions:1. Use the slider at the bottom of the simulation to try different wavelengths. Which visible wavelength is bent the most? Which
the least? Note that the wavelength is given in nanometers ( ).2. What would you see on the right if the source were a white light composed of all wavelengths?3. The speed of light is and the index of refraction is where is the speed in the medium. Using the
index given in the simulation for the chosen wavelength, what are the maximum and minimum speeds for colors in the visiblespectrum?
4. For one of the wavelengths use the protractor to measure the incident and refracted angles (as you did in the mirror simulation)for the exiting ray on the right. Calculate the index of the prism for that color using Snell's law. Don't forget that the angles aremeasured from a perpendicular to the surface (you will have to correct for the fact that the prism sides are slanted at
). What is your answer? Do you get the index of refraction shown in the simulation for that color?
Contributions and Attributions
This page is licensed under a CC BY-NC-SA 3.0 license and was authored, remixed, and/or curated by Kyle Forinash andWolfgang Christian. Source content is found at https://www.compadre.org/books/SoundBook. Page content has been edited andupdated to conform to the style and standards of the LibreTexts platform. A detailed versioning history of the edits to source contentis available upon request.
nm
c = 3 × m/s108n = c/v v
60 degrees
Kyle Forinash and Wolfgang Christian 6.6.1 3/24/2022 https://phys.libretexts.org/@go/page/26029
6.6: Adding Wave PulsesWhen two waves of the same type come together it is usually the case that their amplitudes add. So two overlapping water waveshave an amplitude that is twice as high as the amplitude of the individual waves. This is called constructive interference and it canoccur for sinusoidal waves as well as pulses.
Contributions and AttributionsThis page is licensed under a CC BY-NC-SA 3.0 license and was authored, remixed, and/or curated by Kyle Forinash andWolfgang Christian. Source content is found at https://www.compadre.org/books/SoundBook. Page content has been edited andupdated to conform to the style and standards of the LibreTexts platform. A detailed versioning history of the edits to source contentis available upon request.
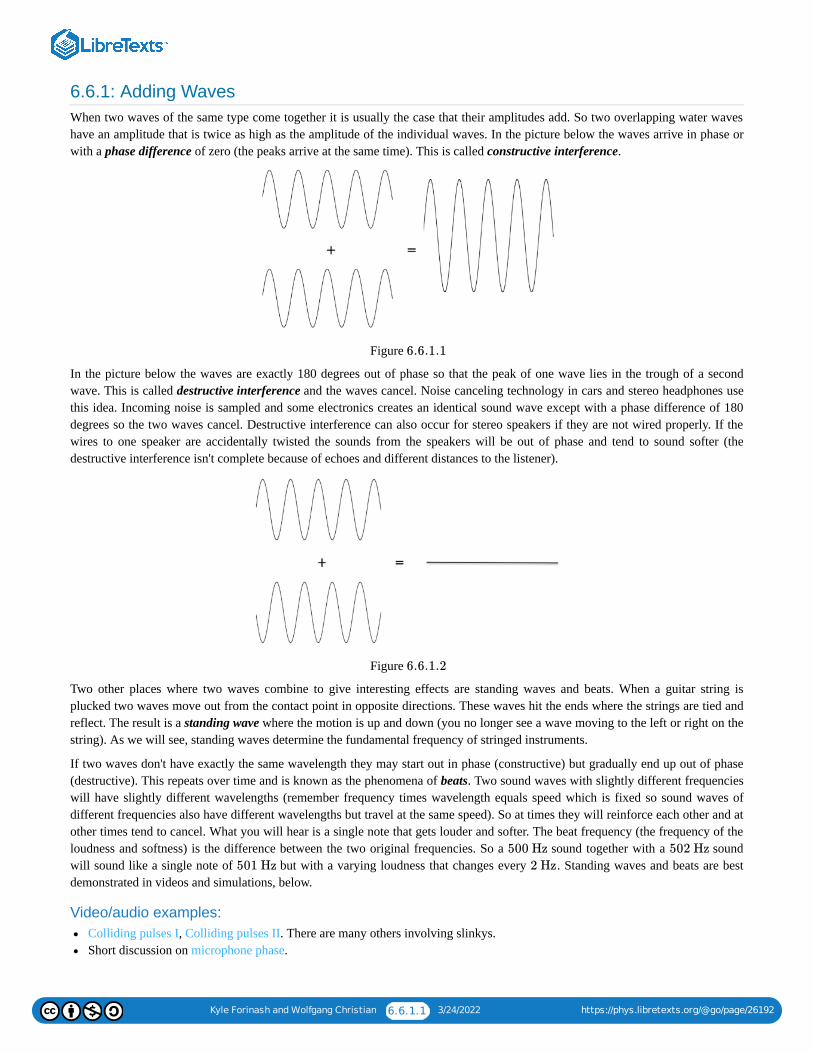
Kyle Forinash and Wolfgang Christian 6.6.1.1 3/24/2022 https://phys.libretexts.org/@go/page/26192
6.6.1: Adding WavesWhen two waves of the same type come together it is usually the case that their amplitudes add. So two overlapping water waveshave an amplitude that is twice as high as the amplitude of the individual waves. In the picture below the waves arrive in phase orwith a phase difference of zero (the peaks arrive at the same time). This is called constructive interference.
Figure
In the picture below the waves are exactly 180 degrees out of phase so that the peak of one wave lies in the trough of a secondwave. This is called destructive interference and the waves cancel. Noise canceling technology in cars and stereo headphones usethis idea. Incoming noise is sampled and some electronics creates an identical sound wave except with a phase difference of 180degrees so the two waves cancel. Destructive interference can also occur for stereo speakers if they are not wired properly. If thewires to one speaker are accidentally twisted the sounds from the speakers will be out of phase and tend to sound softer (thedestructive interference isn't complete because of echoes and different distances to the listener).
Figure
Two other places where two waves combine to give interesting effects are standing waves and beats. When a guitar string isplucked two waves move out from the contact point in opposite directions. These waves hit the ends where the strings are tied andreflect. The result is a standing wave where the motion is up and down (you no longer see a wave moving to the left or right on thestring). As we will see, standing waves determine the fundamental frequency of stringed instruments.
If two waves don't have exactly the same wavelength they may start out in phase (constructive) but gradually end up out of phase(destructive). This repeats over time and is known as the phenomena of beats. Two sound waves with slightly different frequencieswill have slightly different wavelengths (remember frequency times wavelength equals speed which is fixed so sound waves ofdifferent frequencies also have different wavelengths but travel at the same speed). So at times they will reinforce each other and atother times tend to cancel. What you will hear is a single note that gets louder and softer. The beat frequency (the frequency of theloudness and softness) is the difference between the two original frequencies. So a sound together with a soundwill sound like a single note of but with a varying loudness that changes every . Standing waves and beats are bestdemonstrated in videos and simulations, below.
Video/audio examples:Colliding pulses I, Colliding pulses II. There are many others involving slinkys.Short discussion on microphone phase.
6.6.1.1
6.6.1.2
500 Hz 502 Hz
501 Hz 2 Hz
Kyle Forinash and Wolfgang Christian 6.6.1.2 3/24/2022 https://phys.libretexts.org/@go/page/26192
Standing waves in water. Notice that the waves start from the far end of the tank, reflect off the near end and eventually make aset of standing waves.Audio demonstration of beats.Sound cancellation in a car muffler.Interesting water waves in a Japanese laboratory.A few other interesting applications of sound waves.
Contributions and AttributionsThis page is licensed under a CC BY-NC-SA 3.0 license and was authored, remixed, and/or curated by Kyle Forinash andWolfgang Christian. Source content is found at https://www.compadre.org/books/SoundBook. Page content has been edited andupdated to conform to the style and standards of the LibreTexts platform. A detailed versioning history of the edits to source contentis available upon request.
Kyle Forinash and Wolfgang Christian 6.6.2.1 3/24/2022 https://phys.libretexts.org/@go/page/26193
6.6.2: Adding Two Wave Pulses (Superposition)In this simulation you see two wave pulses (red and green) and then the sum of the two pulses (blue). You can choose to have thetwo pulses both have an initial positive amplitude (Animation 1) or have the second pulse start with a negative pulse (Animation 2).When two waves are linear (the forces involved are Hooke's law forces) they can be added point by point at each instance of time.This is called superposition and occurs for any shape of linear wave.
Simulation Questions:1. Step through Animation 1 until both pulses are on top of each other (a single blue pulse). What is the amplitude of the
combination compared to the amplitude of the two individual pulses?2. Now step through Animation 2 until both pulses are on top of each other (a single blue pulse). What is the amplitude of the
combination compared to the amplitude of the two individual pulses? Why is the combination amplitude zero when the pulsescollide?
Contributions and Attributions
This page is licensed under a CC BY-NC-SA 3.0 license and was authored, remixed, and/or curated by Kyle Forinash andWolfgang Christian. Source content is found at https://www.compadre.org/books/SoundBook. Page content has been edited andupdated to conform to the style and standards of the LibreTexts platform. A detailed versioning history of the edits to source contentis available upon request.
Kyle Forinash and Wolfgang Christian 6.7.1 3/24/2022 https://phys.libretexts.org/@go/page/26181
6.7: Adding Sinusoidal WavesSinusoidal waves have the property, called superposition, that their amplitudes add linearly if they arrive at the same point at thesame time. This gives rise to several interesting phenomena in nature which we will investigate in this and the next fewsimulations.
Contributions and AttributionsThis page is licensed under a CC BY-NC-SA 3.0 license and was authored, remixed, and/or curated by Kyle Forinash andWolfgang Christian. Source content is found at https://www.compadre.org/books/SoundBook. Page content has been edited andupdated to conform to the style and standards of the LibreTexts platform. A detailed versioning history of the edits to source contentis available upon request.
Kyle Forinash and Wolfgang Christian 6.7.1.1 3/24/2022 https://phys.libretexts.org/@go/page/26194
6.7.1: Adding Two Linear Waves SimulationThe waves we have been discussing so far and the ones that are most often seen in everyday life, such as light and sound, are forthe most part linear waves. Linear waves have the property, called superposition, that their amplitudes add linearly if they arrive atthe same point at the same time. This gives rise to several interesting phenomena in nature which we will investigate in this and thenext few simulations.
The simulation shows the function in red, in the blue and in grey. The check boxes onthe lower right determine which functions are visible. You can enter your own functions for and using the samenotations used for spreadsheets and calculators.
Simulation Questions:1. Uncheck the function so that just is showing. What is the amplitude (half the height from highest point to lowest
point) of ? Now measure the amplitude of (they should be the same). Now find the amplitude of the sum, .How does the amplitude of the sum compare with the amplitude of or ? This is an example of constructiveinterference; the two waves add to give a wave with an amplitude which is the sum of the two amplitudes.
2. Start the simulation (button on lower left). How does the wavelength, frequency and speed of or compare withthe wavelength, frequency and speed of ?
3. Change to have a phase of (the simulation reads pi as ; type or cut and paste for andpress Return or Enter). Run the simulation. What happens to the amplitude of the sum of the two waves, ? This is anexample of destructive interference. Write a definition for destructive interference in your own words.
4. Experiment with cases in between total destructive and total constructive interference by changing the phase of to be and . Stop the simulation each time and record the amplitude of the sum compared to the amplitude of or
.5. Click the reset button (fourth button on lower left) and then change the amplitude of from to and the amplitude
of from to (Hit Return or Enter to update the values). What is the amplitude of in this case?How does this amplitude compare to the original case?
6. Go back to the original functions but change one of the minus signs to a plus sign (so now and ). The sum is called a standing wave in this case (an example would be the waves on a guitar
string as we will see later). Describe the behavior of . How does the period and wavelength of the combined wavecompare to the period and wavelength of two components? How is the maximum amplitude of the sum related to theamplitudes of the two components? What can you say about the speed of the sum?
7. For standing waves on a string a node is a location where there is no motion and an anti-node is a location where there ismaximum motion. For the standing wave in the previous exercise, how many nodes are there? How many anti-nodes?
Advanced Questions:1. Use trigonometric identities to show that the sum of and equals
. We can interpret this as a time dependent amplitude, , multiplying a sine wave which is fixedin space. What happens to the amplitude as time increases? What fixes the location of the maximums and minimums of thestanding wave (Hint: )?
2. Notice that the standing wave has zero amplitude on both ends in the simulation. This means that only certain wavelengths will"fit" on a given length. See if you can adjust min and max so that you have a wave with more nodes and anti nodes that fitson a longer string with the amplitude still zero on the ends. (Hint: .)
3. Now enter the following functions: and (you can cut and pasteinstead of typing). Watch the just the sum for a while and describe what happens (it changesslowly). Two waves with slightly different frequencies added together give rise to the phenomena of beats. Now turn and on. Are these waves still traveling at the same speed as ? Find the beat frequency the following way: Stop thesimulation when the two source waves exactly cancel ( is a straight line) and record the time (use the stepbuttons if you overshoot). Start the simulation and stop it again the next time the waves cancel. Record the new time andsubtract to get the elapsed time. The beat frequency is 1/(time elapsed). How does this compare to the frequency of subtracted from the frequency of ?
f(x, t) g(x, t) u(x, t) = f(x, t) +g(x, t)
f(x, t) g(x, t)
g(x, t) f(x, t)
f(x, t) g(x, t) u(x, t)
f(x, t) g(x, t)
f(x, t) g(x, t)
u(x, t)
f(x, t) π π 2.0*sin(x - t + pi) f(x, t)
u(x, t)
f(x, t)
π/2, π/3, π/4 f(x, t)
g(x, t)
f(x, t) 2.0 3.0
g(x, t) 2.0 1.0 f(x, t) +g(x, t)
f(x, t) = 2.0* sin(x + t)
g(x, t) = 2.0* sin(x − t) u(x, t)
u(x, t)
f(x, t) = A sin(kx +ωt) g(x, t) = A sin(kx −ωt)
2A cos(ωt) sin(kx) 2A cos(ωt)
k = 2π/λ
x x
6.28 = 2π
f(x, t) = 2.0* sin(x − t) g(x, t) = 2.0* sin(1.1*x −1.1*t)
u(x, t) = f(x, t) +g(x, t)
f(x, t)
g(x, t) u(x, t)
f(x, t) +g(x, t)
f(x, t)
g(x, t)

Kyle Forinash and Wolfgang Christian 6.7.1.2 3/24/2022 https://phys.libretexts.org/@go/page/26194
Contributions and AttributionsThis page is licensed under a CC BY-NC-SA 3.0 license and was authored, remixed, and/or curated by Kyle Forinash andWolfgang Christian. Source content is found at https://www.compadre.org/books/SoundBook. Page content has been edited andupdated to conform to the style and standards of the LibreTexts platform. A detailed versioning history of the edits to source contentis available upon request.
Kyle Forinash and Wolfgang Christian 6.8.1 3/24/2022 https://phys.libretexts.org/@go/page/26030
6.8: Path DifferenceIf two sources of waves are in phase to start with, when they reach a distant location they may be in-phase (leading to constructiveinterference) or out-of-phase (leading to destructive interference) depending on slight differences in the distance traveled. This pathdifference gives rise to many interesting phenomena such as interference patterns (in the case of light) and dead spots inauditoriums (in the case of sound).
Contributions and AttributionsThis page is licensed under a CC BY-NC-SA 3.0 license and was authored, remixed, and/or curated by Kyle Forinash andWolfgang Christian. Source content is found at https://www.compadre.org/books/SoundBook. Page content has been edited andupdated to conform to the style and standards of the LibreTexts platform. A detailed versioning history of the edits to source contentis available upon request.
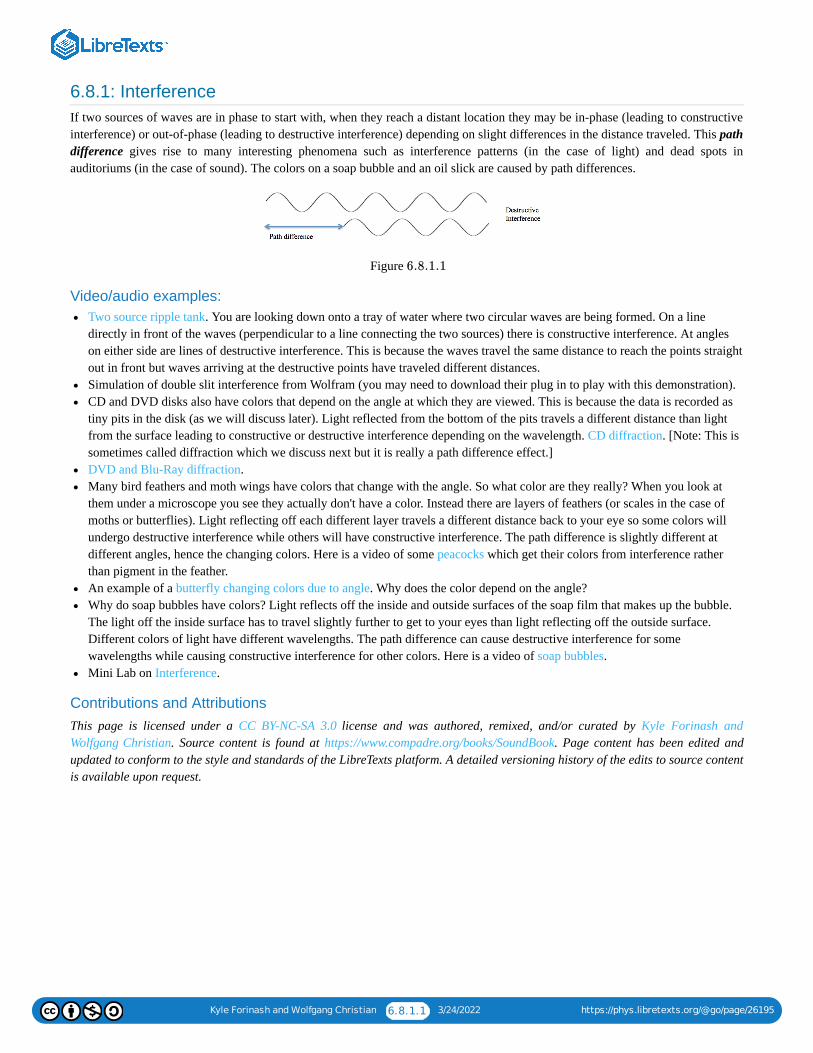
Kyle Forinash and Wolfgang Christian 6.8.1.1 3/24/2022 https://phys.libretexts.org/@go/page/26195
6.8.1: InterferenceIf two sources of waves are in phase to start with, when they reach a distant location they may be in-phase (leading to constructiveinterference) or out-of-phase (leading to destructive interference) depending on slight differences in the distance traveled. This pathdifference gives rise to many interesting phenomena such as interference patterns (in the case of light) and dead spots inauditoriums (in the case of sound). The colors on a soap bubble and an oil slick are caused by path differences.
Figure
Video/audio examples:Two source ripple tank. You are looking down onto a tray of water where two circular waves are being formed. On a linedirectly in front of the waves (perpendicular to a line connecting the two sources) there is constructive interference. At angleson either side are lines of destructive interference. This is because the waves travel the same distance to reach the points straightout in front but waves arriving at the destructive points have traveled different distances.Simulation of double slit interference from Wolfram (you may need to download their plug in to play with this demonstration).CD and DVD disks also have colors that depend on the angle at which they are viewed. This is because the data is recorded astiny pits in the disk (as we will discuss later). Light reflected from the bottom of the pits travels a different distance than lightfrom the surface leading to constructive or destructive interference depending on the wavelength. CD diffraction. [Note: This issometimes called diffraction which we discuss next but it is really a path difference effect.]DVD and Blu-Ray diffraction.Many bird feathers and moth wings have colors that change with the angle. So what color are they really? When you look atthem under a microscope you see they actually don't have a color. Instead there are layers of feathers (or scales in the case ofmoths or butterflies). Light reflecting off each different layer travels a different distance back to your eye so some colors willundergo destructive interference while others will have constructive interference. The path difference is slightly different atdifferent angles, hence the changing colors. Here is a video of some peacocks which get their colors from interference ratherthan pigment in the feather.An example of a butterfly changing colors due to angle. Why does the color depend on the angle?Why do soap bubbles have colors? Light reflects off the inside and outside surfaces of the soap film that makes up the bubble.The light off the inside surface has to travel slightly further to get to your eyes than light reflecting off the outside surface.Different colors of light have different wavelengths. The path difference can cause destructive interference for somewavelengths while causing constructive interference for other colors. Here is a video of soap bubbles.Mini Lab on Interference.
Contributions and AttributionsThis page is licensed under a CC BY-NC-SA 3.0 license and was authored, remixed, and/or curated by Kyle Forinash andWolfgang Christian. Source content is found at https://www.compadre.org/books/SoundBook. Page content has been edited andupdated to conform to the style and standards of the LibreTexts platform. A detailed versioning history of the edits to source contentis available upon request.
6.8.1.1
Kyle Forinash and Wolfgang Christian 6.8.2.1 3/24/2022 https://phys.libretexts.org/@go/page/26196
6.8.2: Interference Due to Path Difference SimulationIn this simulation the top two waves are identical but may be set to start at different locations. The bottom graph shows the sum ofthe two waves. Depending on the path difference the two waves may end up exactly in phase (leading to constructive interference),exactly out of phase (destructive interference) or something in between. The step thickness, , controlled by the slider on the lowerleft, determines the distance between the starting locations of the two waves.
Simulation Questions:1. Start the simulation with the step thickness, , equal to zero. Are the waves in phase? Slowly increase until the waves are
exactly out of phase. What step thickness causes this?2. Reset the simulation and slowly increase to find the first three thicknesses that cause destructive interference. Verify that
destructive interference occurs at step thicknesses given by and (find the wavelength by subtracting the -location of two successive peaks of the wave).
3. Reset the simulation and enter for (this is the case of half a wavelength path difference so the waves cancel). Increasethe wave number, , until you find the next wavelength that experiences destructive interference (don't change ).What is the wave vector and wavelength of this wave?
4. For light, changing the wavelength changes the color. Can the same step thickness cause destructive interference for all colors?Explain.
5. The general formula for destructive interference due to a path difference is given by where is the indexof refraction of the medium in which the wave is traveling, is the wavelength, is the path difference and What can you say about the various choices of in this equation; what physical cases do they represent (assume fornow)?
6. This simulation starts the two waves at different locations but path differences can also occur due to reflection from a surfacethat has multiple layers. Imagine what would happen if this simulation represented monochromatic (single wavelength) lightreflecting off a surface with two levels (waves come in from the right and reflect back to the right). In this case the pathdifference would be twice the depth of the step so . How would this change the results? In which case would there beno reflection from the surface? In which case would there be constructive interference?
7. For a reflected wave is the actual path difference; a wave reflected off the surface in the top panel must travel anextra distance equal to twice the step thickness to catch up with a wave reflected off the surface in the second panel. Reset thesimulation, change the step thickness, , to find a case of destructive interference. Now click the check box to simulate the caseof reflected waves (instead of two waves starting from the left). What do you notice about the combined waves in the case ofreflection?
8. A music CD has information stored on it in the form of tiny divots blasted into the surface with a laser. Suppose you seeconstructive interference for red light (wavelength of ). What is the minimum ( ) depth of the divots? (Hint: Thepath difference is twice the divot depth.)
9. Explain why you only see one particular color when looking at a small region of a CD at a fixed angle. What happens to theother colors?
10. If you look at the colors being reflected from a CD you will notice that the color changes depending on the angle. How does thepath difference change as you look at the divots at different angles? (Hint: Imagine the waves in the simulation coming in atdifferent angles instead of horizontally. Now the path difference is the hypotenuse of a triangle, one side of which is the Stepheight.)
11. Suppose you wanted to make a "stealth" jet plane which was non-reflective to a particular wavelength of radar. Describe oneway you might try to do this by modifying the surface of the plane.
12. Some insect wings and the feathers of some birds (for example peacocks) exhibit a feature known as iridescence. From a fixedangle only one color of reflected light can be seen. Explain this phenomena given the fact that insect wings and feathers consistof overlapping layers causing the surface to be multi-layered.
13. Soap bubbles show different colors at different places on the bubble. So do oil slicks on water. In both cases light reflects off theupper and lower surfaces of the layer of soap or oil. Explain the different colors in terms of path difference (Hint: draw a picturewhere the wall of the soap bubble is nearly the same thickness as one wavelength and explain why the path difference is twicethe thickness of the soap).
14. There are two other details needed to explain the soap bubble and oil slick color phenomena completely. While the light isinside the soap or oil it travels at a different speed so the wavelength is different. This is why the index of refraction, , is
D
D D
D
1/2λ, 3/2λ, 5/2λ x
1.57 D
k = 2π/λ D
δ = (m +1/2)λ/n n
λ δ m = 0, 1, 2, 3, …
m n = 1
δ = 2 ×D
δ = 2 ×D
D
650 nm m = 0
n
Kyle Forinash and Wolfgang Christian 6.8.2.2 3/24/2022 https://phys.libretexts.org/@go/page/26196
included in the formula . For the case of in the formula, what would happen to a wavelength whichreflected from a thickness with constructive interference for an index equal to one if instead the index was equal to ?
15. The second detail for light reflecting off a soap bubble or oil slick is light reflecting from the top surface is going from a "soft"medium (air) to a "stiff" medium (soap) but the light reflecting from the bottom layer of the soap is going from a "stiff" medium(soap) to a "soft" medium (air inside the bubble). This causes a phase change of at the top surface but not at the bottom. Ifthe path difference for a particular thickness of soap film was just right for destructive interference but there was a phasechange for the top reflected wave but not the bottom reflected wave, what would happen to that color?
Contributions and AttributionsThis page is licensed under a CC BY-NC-SA 3.0 license and was authored, remixed, and/or curated by Kyle Forinash andWolfgang Christian. Source content is found at https://www.compadre.org/books/SoundBook. Page content has been edited andupdated to conform to the style and standards of the LibreTexts platform. A detailed versioning history of the edits to source contentis available upon request.
δ = (m +1/2)λ/n m = 1
1.5
180∘
180∘
Kyle Forinash and Wolfgang Christian 6.9.1 3/24/2022 https://phys.libretexts.org/@go/page/26171
6.9: InterferenceThis simulation shows a top view of waves interfering on the surface of a tank of water (imagine tapping the surface of a pond withthe end of a stick at regular intervals). The white circles coming from the spot represents the wave crests with troughs in between.Two sources can be seen at the same time and the separation between them and the wavelength of both can be adjusted.
Contributions and AttributionsThis page is licensed under a CC BY-NC-SA 3.0 license and was authored, remixed, and/or curated by Kyle Forinash andWolfgang Christian. Source content is found at https://www.compadre.org/books/SoundBook. Page content has been edited andupdated to conform to the style and standards of the LibreTexts platform. A detailed versioning history of the edits to source contentis available upon request.
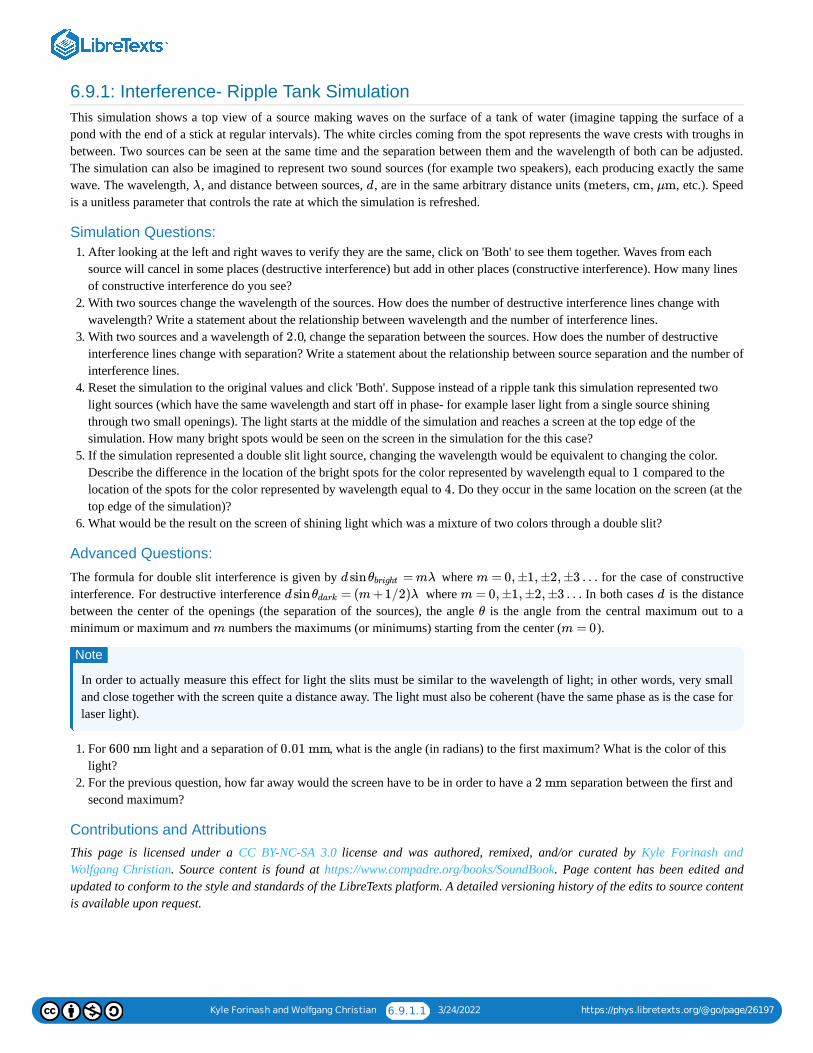
Kyle Forinash and Wolfgang Christian 6.9.1.1 3/24/2022 https://phys.libretexts.org/@go/page/26197
6.9.1: Interference- Ripple Tank SimulationThis simulation shows a top view of a source making waves on the surface of a tank of water (imagine tapping the surface of apond with the end of a stick at regular intervals). The white circles coming from the spot represents the wave crests with troughs inbetween. Two sources can be seen at the same time and the separation between them and the wavelength of both can be adjusted.The simulation can also be imagined to represent two sound sources (for example two speakers), each producing exactly the samewave. The wavelength, , and distance between sources, , are in the same arbitrary distance units ( , etc.). Speedis a unitless parameter that controls the rate at which the simulation is refreshed.
Simulation Questions:1. After looking at the left and right waves to verify they are the same, click on 'Both' to see them together. Waves from each
source will cancel in some places (destructive interference) but add in other places (constructive interference). How many linesof constructive interference do you see?
2. With two sources change the wavelength of the sources. How does the number of destructive interference lines change withwavelength? Write a statement about the relationship between wavelength and the number of interference lines.
3. With two sources and a wavelength of , change the separation between the sources. How does the number of destructiveinterference lines change with separation? Write a statement about the relationship between source separation and the number ofinterference lines.
4. Reset the simulation to the original values and click 'Both'. Suppose instead of a ripple tank this simulation represented twolight sources (which have the same wavelength and start off in phase- for example laser light from a single source shiningthrough two small openings). The light starts at the middle of the simulation and reaches a screen at the top edge of thesimulation. How many bright spots would be seen on the screen in the simulation for the this case?
5. If the simulation represented a double slit light source, changing the wavelength would be equivalent to changing the color.Describe the difference in the location of the bright spots for the color represented by wavelength equal to compared to thelocation of the spots for the color represented by wavelength equal to . Do they occur in the same location on the screen (at thetop edge of the simulation)?
6. What would be the result on the screen of shining light which was a mixture of two colors through a double slit?
Advanced Questions:
The formula for double slit interference is given by where for the case of constructiveinterference. For destructive interference where In both cases is the distancebetween the center of the openings (the separation of the sources), the angle is the angle from the central maximum out to aminimum or maximum and numbers the maximums (or minimums) starting from the center ( ).
In order to actually measure this effect for light the slits must be similar to the wavelength of light; in other words, very smalland close together with the screen quite a distance away. The light must also be coherent (have the same phase as is the case forlaser light).
1. For light and a separation of , what is the angle (in radians) to the first maximum? What is the color of thislight?
2. For the previous question, how far away would the screen have to be in order to have a separation between the first andsecond maximum?
Contributions and AttributionsThis page is licensed under a CC BY-NC-SA 3.0 license and was authored, remixed, and/or curated by Kyle Forinash andWolfgang Christian. Source content is found at https://www.compadre.org/books/SoundBook. Page content has been edited andupdated to conform to the style and standards of the LibreTexts platform. A detailed versioning history of the edits to source contentis available upon request.
λ d meters, cm, μm
2.0
1
4
d sin = mλθbright m = 0, ±1, ±2, ±3 …
d sin = (m+1/2)λθdark m = 0, ±1, ±2, ±3 … d
θ
m m = 0
Note
600 nm 0.01 mm
2 mm
Kyle Forinash and Wolfgang Christian 6.10.1 3/24/2022 https://phys.libretexts.org/@go/page/26179
6.10: DiffractionSometimes waves don't travel in a straight line, even if their speed does not change (as in the case of refraction). For example, youcan hear the conversation in the next room even though you cannot see the source. This is because sound waves undergodiffraction, bending as they go through the doorway between the two rooms.
Contributions and AttributionsThis page is licensed under a CC BY-NC-SA 3.0 license and was authored, remixed, and/or curated by Kyle Forinash andWolfgang Christian. Source content is found at https://www.compadre.org/books/SoundBook. Page content has been edited andupdated to conform to the style and standards of the LibreTexts platform. A detailed versioning history of the edits to source contentis available upon request.
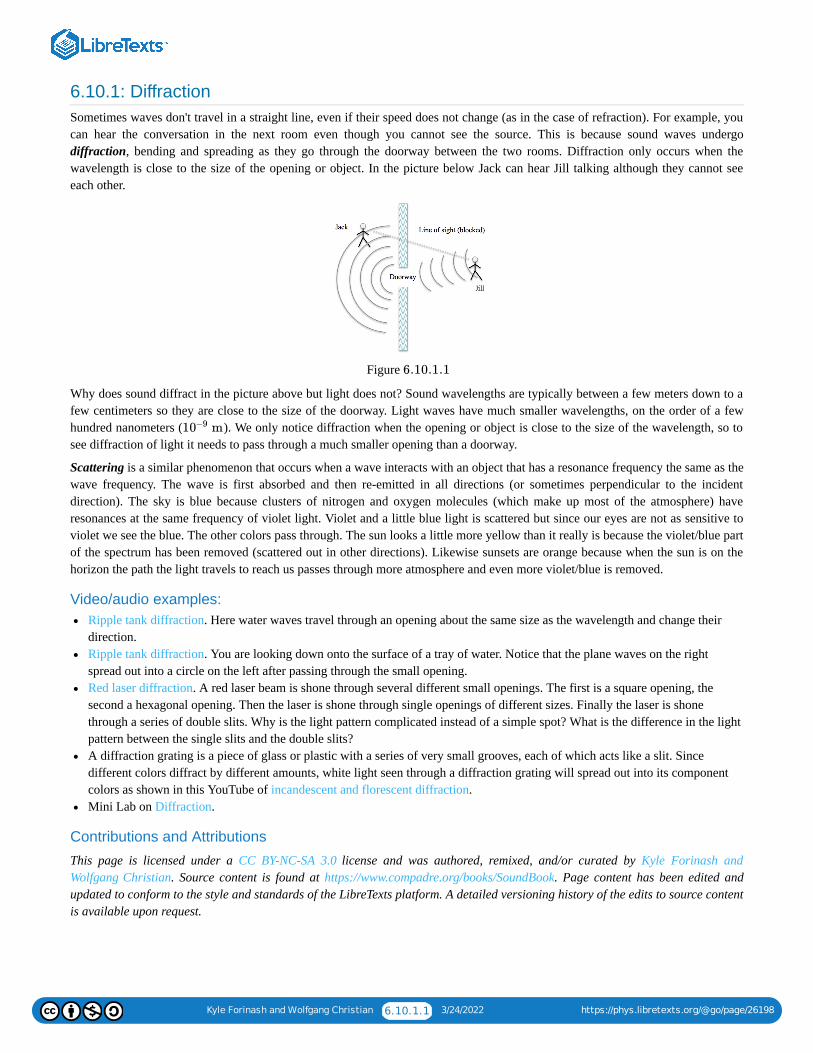
Kyle Forinash and Wolfgang Christian 6.10.1.1 3/24/2022 https://phys.libretexts.org/@go/page/26198
6.10.1: DiffractionSometimes waves don't travel in a straight line, even if their speed does not change (as in the case of refraction). For example, youcan hear the conversation in the next room even though you cannot see the source. This is because sound waves undergodiffraction, bending and spreading as they go through the doorway between the two rooms. Diffraction only occurs when thewavelength is close to the size of the opening or object. In the picture below Jack can hear Jill talking although they cannot seeeach other.
Figure
Why does sound diffract in the picture above but light does not? Sound wavelengths are typically between a few meters down to afew centimeters so they are close to the size of the doorway. Light waves have much smaller wavelengths, on the order of a fewhundred nanometers ( ). We only notice diffraction when the opening or object is close to the size of the wavelength, so tosee diffraction of light it needs to pass through a much smaller opening than a doorway.
Scattering is a similar phenomenon that occurs when a wave interacts with an object that has a resonance frequency the same as thewave frequency. The wave is first absorbed and then re-emitted in all directions (or sometimes perpendicular to the incidentdirection). The sky is blue because clusters of nitrogen and oxygen molecules (which make up most of the atmosphere) haveresonances at the same frequency of violet light. Violet and a little blue light is scattered but since our eyes are not as sensitive toviolet we see the blue. The other colors pass through. The sun looks a little more yellow than it really is because the violet/blue partof the spectrum has been removed (scattered out in other directions). Likewise sunsets are orange because when the sun is on thehorizon the path the light travels to reach us passes through more atmosphere and even more violet/blue is removed.
Video/audio examples:Ripple tank diffraction. Here water waves travel through an opening about the same size as the wavelength and change theirdirection.Ripple tank diffraction. You are looking down onto the surface of a tray of water. Notice that the plane waves on the rightspread out into a circle on the left after passing through the small opening.Red laser diffraction. A red laser beam is shone through several different small openings. The first is a square opening, thesecond a hexagonal opening. Then the laser is shone through single openings of different sizes. Finally the laser is shonethrough a series of double slits. Why is the light pattern complicated instead of a simple spot? What is the difference in the lightpattern between the single slits and the double slits?A diffraction grating is a piece of glass or plastic with a series of very small grooves, each of which acts like a slit. Sincedifferent colors diffract by different amounts, white light seen through a diffraction grating will spread out into its componentcolors as shown in this YouTube of incandescent and florescent diffraction.Mini Lab on Diffraction.
Contributions and Attributions
This page is licensed under a CC BY-NC-SA 3.0 license and was authored, remixed, and/or curated by Kyle Forinash andWolfgang Christian. Source content is found at https://www.compadre.org/books/SoundBook. Page content has been edited andupdated to conform to the style and standards of the LibreTexts platform. A detailed versioning history of the edits to source contentis available upon request.
6.10.1.1
m10−9
Kyle Forinash and Wolfgang Christian 6.10.2.1 3/24/2022 https://phys.libretexts.org/@go/page/26199
6.10.2: Diffraction SimulationThe simulation shows what happens to a planewave light source (below the simulation, not shown) as it passes through an opening.The wavelength (color for light, pitch for sound) of the waves and the size of the opening, , are in the same arbitrary units (
, etc.) and can be adjusted. The waves in the simulation represent light, sound or any other type of linear wave.
Simulation Questions:1. Leave the opening width fixed and experiment with the wavelength of the waves. Describe what you see.2. You should have noticed that for a long wavelength the opening basically becomes a point source of waves. The waves on the
other side of the opening move outward in all directions. But once the wavelength is much smaller than the opening the wavesdo not spread as much and appear to be more like plane wave all headed in the same direction. Light, with it's very smallwavelength, passes through a doorway without bending because the door is much larger than the wavelength. Sound, however,is a wave with wavelengths close to the size of the opening of a door. Explain why we can hear noise through a doorway toanother room even though the source (a person, radio, TV. etc.) is not in our direct line of sight.
3. All optical instruments (telescopes, microscopes, even radio telescopes which look at radio waves instead of light waves) haveopenings to allow light in. This means diffraction will be a problem for that instrument for some sizes of waves. If you want toreduce the effects of diffraction for a particular instrument, would you want to try to use longer or shorter wavelengths? (Hint:Electron microscopes can provide much higher magnification because electron waves can be much smaller than light.)
4. Reset the simulation and leave the wavelength fixed while changing the size of the opening. Describe what you see. How doesthe opening size affect the diffraction pattern?
Advanced Questions:
Diffraction can also be explained as a type of interference resulting from a path difference from multiple sources. Recall in theripple tank simulation of two sources waves from the source on the left must travel a longer path to get to a point at the top right ofthe simulation than waves from the source on the right. This path difference changes depending on how far to the right we lookresulting in spots of destructive and constructive interference along the top. For a single opening instead of two separate sources wecan imagine a row of many sources filling up the single opening. Again there will be a path difference from the different sourcesbut the pattern will look different because there are now many sources lined up next to each other.
1. The formula for the location of destructive interference in the case of single slit diffraction is given by where is the opening size and where is the width of the opening and is the angle to each successive dark
spot, labeled with the number .2. For light and an opening of , what is the angle (in radians) to the first minimum?3. For the previous question, how far away would the screen have to be in order to have a separation between the central
maximum ( ) and the first minimum?4. Red light has a longer wavelength than green light. Which color bends the least when going through a small opening, red or
green?5. What would be the result of shining white light through a small opening?
Contributions and Attributions
This page is licensed under a CC BY-NC-SA 3.0 license and was authored, remixed, and/or curated by Kyle Forinash andWolfgang Christian. Source content is found at https://www.compadre.org/books/SoundBook. Page content has been edited andupdated to conform to the style and standards of the LibreTexts platform. A detailed versioning history of the edits to source contentis available upon request.
a
meters, cm, μm
sin = mλ/aθdarka m = 0, ±1, ±2, ±3 … a θ
m
600 nm 0.01 mm
2 mm
θ = 0
Kyle Forinash and Wolfgang Christian 7.1 3/24/2022 https://phys.libretexts.org/@go/page/26038
7: Pitch, Loudness and TimbreThe mechanism of human hearing does not operate as a perfect scientific instrument. In this chapter we relate a few subjectivemeasurements of sound (things people report after hearing a sound) to objective, scientific measurements (measurements made in alaboratory using scientific instruments). The three subjective quantities of pitch, loudness and timbre are related to laboratorymeasurements of a sound wave's fundamental frequency, amplitude and waveform, respectively.
Key Terms:
Pitch, fundamental frequency, , loudness, sound intensity (in ), sound intensity level (SIL in ), decibels ( ),inverse square law, just noticeable difference (loudness and frequency), timbre.
7.1: Pitch, Loudness and Timbre
Contributions and AttributionsThis page is licensed under a CC BY-NC-SA 3.0 license and was authored, remixed, and/or curated by Kyle Forinash andWolfgang Christian. Source content is found at https://www.compadre.org/books/SoundBook. Page content has been edited andupdated to conform to the style and standards of the LibreTexts platform. A detailed versioning history of the edits to source contentis available upon request.
7.1.1: Pitch
7.1.2: Loudness
7.1.3: The Decibel Scale
7.1.4: Just Noticeable Difference
7.1.5: Timbre (the first time)
v = fλ W/m2 dB dB

Kyle Forinash and Wolfgang Christian 7.1.1 3/24/2022 https://phys.libretexts.org/@go/page/26032
7.1: Pitch, Loudness and TimbreThe mechanism of human hearing does not operate as a perfect scientific instrument. In this chapter we relate a few subjectivemeasurements of sound (things people report after hearing a sound) to objective, scientific measurements (measurements made in alaboratory using scientific instruments). The three subjective quantities of pitch, loudness and timbre are related to laboratorymeasurements of a sound wave's fundamental frequency, amplitude and waveform, respectively.
Contributions and AttributionsThis page is licensed under a CC BY-NC-SA 3.0 license and was authored, remixed, and/or curated by Kyle Forinash andWolfgang Christian. Source content is found at https://www.compadre.org/books/SoundBook. Page content has been edited andupdated to conform to the style and standards of the LibreTexts platform. A detailed versioning history of the edits to source contentis available upon request.
Kyle Forinash and Wolfgang Christian 7.1.1.1 3/24/2022 https://phys.libretexts.org/@go/page/26204
7.1.1: PitchThe main component that gives us the perception of the pitch of a musical note is the fundamental frequency, measured in hertz.In the modern musical scales used today the piano note middle C has a frequency of (we will look at how scales areconstructed a bit later). This chart has the frequencies of all musical notes, based on a frequency of for the note labeled A(A above middle C on the piano). As we will see in the next chapter, musical sounds are usually composed of many frequencies butthe fundamental frequency gives us the basic quality we perceive as pitch.
Recall that for both sound and light, frequency times wavelength equals speed ( ) but the speeds of light and sound are verydifferent ( for light for sound). We can use the equation to find that a sound wave has awavelength of . In the case of light, frequency tells us the color of light. Green light for example lies in the frequency range
to ( is tera or ). A electromagnetic signal has a wavelength of ( is nano ).The previous chart also has the wavelengths of notes on the musical scale in centimeters.
A person whose hearing is not damaged can hear frequencies as low as and as high as . But very few peopletoday can hear this range of frequencies. Exposure to normal sounds in everyday modern life tends to do at least some damage tomost peoples hearing at an early age. Hearing is also affected by normal aging.
Video/audio examples:Article by Peter L. Tyack in Physics Today about Human-generated sound and marine mammals.Christian Huygens in 1693 noticed that the fountain at Chantilly, France produced an audible pitch. He determined this was theresult of the echo of sound from the fountain being reflected off of a set of nearby steps. The steps were about half a meter indepth, causing sound to return from each subsequent step with a time delay (period) of 1m divided by ( ). A setof pulses with this period will have a frequency of . This is sometimes called a repetition pitch. He was one of the firstscientists to connect sound with the frequency of a wave.Sounds reflected from the steps of the Mayan ruins at Chichenitza also produce a pitch, similar to Huygens' fountain but thepitch changes over time, due to the height of the steps. Sound from the bottom of the stairs has a repetition pitch depending onjust the depth of the first step. Sound reflecting off the upper steps has a different repetition pitch because of the angle (thesound travels along a hypotenuse connecting the edge of one step to the next, rather than the shorter distance from the edgedirectly to the back of the step). This lower repetition pitch also takes longer to return because of the further distance to thehigher steps. The result turns a hand-clap into a chirp: Sounds.
Contributions and AttributionsThis page is licensed under a CC BY-NC-SA 3.0 license and was authored, remixed, and/or curated by Kyle Forinash andWolfgang Christian. Source content is found at https://www.compadre.org/books/SoundBook. Page content has been edited andupdated to conform to the style and standards of the LibreTexts platform. A detailed versioning history of the edits to source contentis available upon request.
261.63 Hz
440 Hz 4
v= fλ
v= 3 × m/s108 v= 344 m/s 440 Hz
0.78 m
525 THz 575 THz T 1012 525 THz 571 nm n = 10−9
20 Hz 20, 000 Hz
340 m/s vt = d
340 Hz
Kyle Forinash and Wolfgang Christian 7.1.2.1 3/24/2022 https://phys.libretexts.org/@go/page/26205
7.1.2: LoudnessGenerally the loudness of a sound is related to the amplitude of the sound wave; a wave with bigger variations in pressure generallysounds louder. For any type of wave the energy carried by the wave is proportional to amplitude squared. This means doubling theamplitude increases the power by a factor of four (two squared). But the amount of energy reaching your ear also depends on thefrequency since a wave with more oscillations per second (higher frequency) will mean the same amplitude hits your eardrum moreoften. Sound intensity is defined to be the energy per second (power in watts) reaching a given area (measured in square meters).Normal conversation has an intensity of about .
Unobstructed sound from a small sound source spreads out in all directions in an expanding spherical shape. Because the energy isspread over a larger and larger area as time goes on, the intensity decreases as you move further from the source. The area of asphere is given by so the decrease in intensity is proportional to where is the distance from the source. This is known asan inverse square law and many other laws in physics follow this same law (diagram of the inverse square law). For example thegravitational field of the earth (or any other object) decreases as you move away from it proportional to an inverse square law. Sodoes the electric field around an electron or proton. For practical purposes, what this means is doubling the distance decreases thestrength by . If you move three times as far away the strength is or as much. Shortening the distance byhalf means the intensity will be four times as much.
Contributions and AttributionsThis page is licensed under a CC BY-NC-SA 3.0 license and was authored, remixed, and/or curated by Kyle Forinash andWolfgang Christian. Source content is found at https://www.compadre.org/books/SoundBook. Page content has been edited andupdated to conform to the style and standards of the LibreTexts platform. A detailed versioning history of the edits to source contentis available upon request.
10−6 W/m2
4πr2
r2
r
1/ = 1/422 1/32 1/9th
Kyle Forinash and Wolfgang Christian 7.1.3.1 3/24/2022 https://phys.libretexts.org/@go/page/26206
7.1.3: The Decibel ScaleThe human ear is an amazing instrument that can detect intensities as low as and can hear intensities as high as
(although this is loud enough to cause damage to the ear). To make this huge range easier to write down, a second scaleof loudness was created called the sound intensity level, measured in decibels. The relationship between sound intensity, measured in watts per meter squared and sound intensity level ( ) measured in decibels ( ), is given by .Here is the logarithm and is a reference sound intensity at about the threshold of human hearing.
We know sound waves are longitudinal fluctuations in the pressure of the air (or other medium) in which the sound is traveling.This is a fluctuation above and below normal atmospheric pressure and is measured in pascals ( ), the standard unit of pressure.If you tried to report an average value of the fluctuation you would get zero since the pressure varies from above to below normalatmospheric pressure. We could just give the (maximum) amplitude of the fluctuation but what is usually done is to report the rmsvalue which is the square root of the average of the squares of the amplitude. By first squaring the amplitude and then taking anaverage and then a square root you have a kind of average value that is not zero. In the chart below the root mean square ( )variation in pressure from normal atmospheric pressure (in pascals ), the sound intensity level ( in ) and the intensity (in ) are given for several sounds.
Source Pressure Sound Intensity Level Intensity
Jet engine at
Jet engine
Jack hammer
Car horn (pain threshold)
Rock band
Machine shop
Train
Vacuum cleaner
TV
Conversation
Office
Library
Hospital
Broadcast studio
Rustle of leaves
Threshold of hearing
Table
Here are a few examples and rules of thumb for converting intensity ( ) into intensity levels (in ):
A fold increase in intensity equals an addition of . So going from a car horn to a jackhammer multiplies the intensityby ( to ) but adds to the intensity level ( to ).A two fold increase in intensity (twice as loud in ) equals and addition of to the . Suppose one tromboneproduces a sound level of . How loud are four trombones? Doubling the number of trombones to two adds ,doubling again to four adds more so the new sound level is .Suppose the sound intensity is . What is the sound level?
.Suppose the sound level is . What is the sound intensity? . Divide both sides by to get
. Now take inverse (same as ) to get . Multiply both sides by to get .
A Sound Conversion web site that converts between sound level, sound pressure and sound intensity.
10−12 W/m2
103 W/m2
I
SIL dB SIL = 10 log(I/ )Io
log =Io 10−12 W/m2
Pa
rms
Pa SIL dB I
W/m2
rms (Pa) SIL (dB) ( )W/m2
10 m 150 103
200 140 100
60 130 10
20 120 1
6 110 0.1
2 100 0.01
0.6 90 10−3
0.2 80 10−4
0.06 70 10−5
0.02 60 10−6
0.006 50 10−7
0.002 40 10−8
0.0006 30 10−9
0.0002 20 10−10
0.00006 10 10−11
0.00002 0 10−12
7.1.3.1
W/m2 dB
10 10 dB
10 1 W/m2
10 W/m2
10 dB 120 dB 130 dB
W/m2 3 dB SIL
40 dB 3 dB
3 dB 46 dB
100 W/m2
SIL = 10 log(100/ ) = 10 log( ) = 10 ∗ 14 = 140 dB10−12 1014
110 dB 110 dB = 10 log(I/ )10−12 10
11 = log(I/ )10−12 log 11 1011 = I/1011 10−12 10−12
0.1 = I W/m2
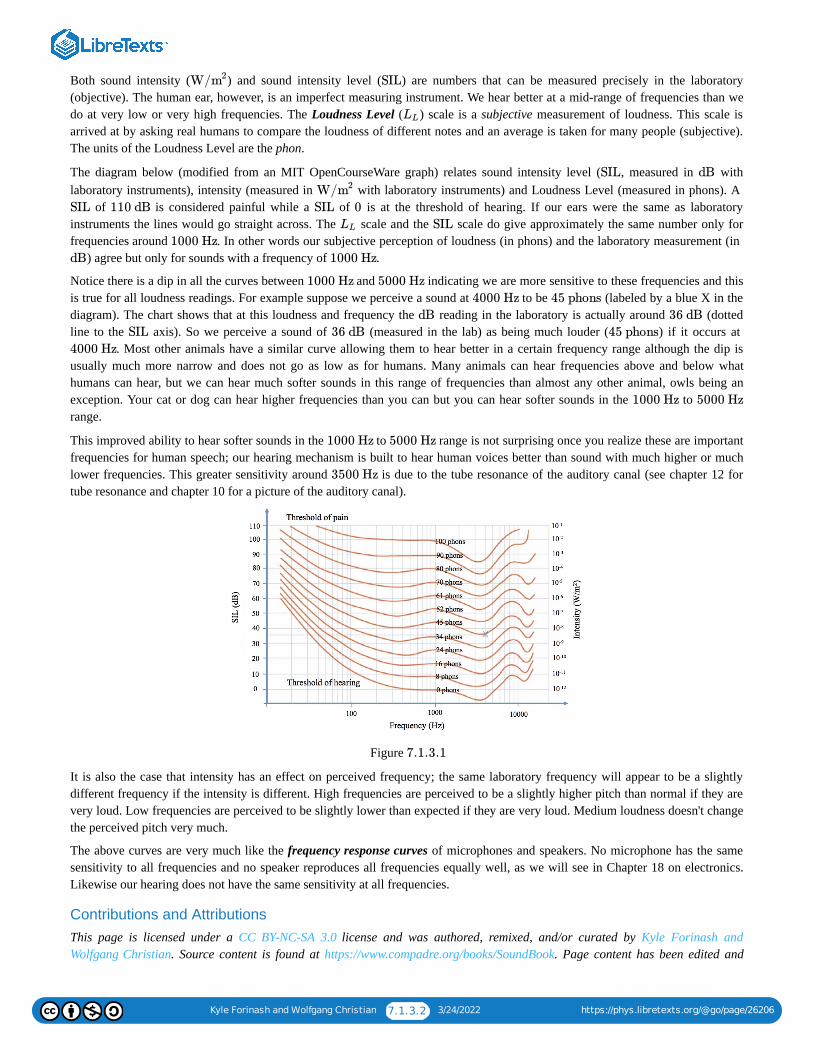
Kyle Forinash and Wolfgang Christian 7.1.3.2 3/24/2022 https://phys.libretexts.org/@go/page/26206
Both sound intensity ( ) and sound intensity level ( ) are numbers that can be measured precisely in the laboratory(objective). The human ear, however, is an imperfect measuring instrument. We hear better at a mid-range of frequencies than wedo at very low or very high frequencies. The Loudness Level ( ) scale is a subjective measurement of loudness. This scale isarrived at by asking real humans to compare the loudness of different notes and an average is taken for many people (subjective).The units of the Loudness Level are the phon.
The diagram below (modified from an MIT OpenCourseWare graph) relates sound intensity level ( , measured in withlaboratory instruments), intensity (measured in with laboratory instruments) and Loudness Level (measured in phons). A
of is considered painful while a of is at the threshold of hearing. If our ears were the same as laboratoryinstruments the lines would go straight across. The scale and the scale do give approximately the same number only forfrequencies around . In other words our subjective perception of loudness (in phons) and the laboratory measurement (in
) agree but only for sounds with a frequency of .
Notice there is a dip in all the curves between and indicating we are more sensitive to these frequencies and thisis true for all loudness readings. For example suppose we perceive a sound at to be (labeled by a blue X in thediagram). The chart shows that at this loudness and frequency the reading in the laboratory is actually around (dottedline to the axis). So we perceive a sound of (measured in the lab) as being much louder ( ) if it occurs at
. Most other animals have a similar curve allowing them to hear better in a certain frequency range although the dip isusually much more narrow and does not go as low as for humans. Many animals can hear frequencies above and below whathumans can hear, but we can hear much softer sounds in this range of frequencies than almost any other animal, owls being anexception. Your cat or dog can hear higher frequencies than you can but you can hear softer sounds in the to range.
This improved ability to hear softer sounds in the to range is not surprising once you realize these are importantfrequencies for human speech; our hearing mechanism is built to hear human voices better than sound with much higher or muchlower frequencies. This greater sensitivity around is due to the tube resonance of the auditory canal (see chapter 12 fortube resonance and chapter 10 for a picture of the auditory canal).
Figure
It is also the case that intensity has an effect on perceived frequency; the same laboratory frequency will appear to be a slightlydifferent frequency if the intensity is different. High frequencies are perceived to be a slightly higher pitch than normal if they arevery loud. Low frequencies are perceived to be slightly lower than expected if they are very loud. Medium loudness doesn't changethe perceived pitch very much.
The above curves are very much like the frequency response curves of microphones and speakers. No microphone has the samesensitivity to all frequencies and no speaker reproduces all frequencies equally well, as we will see in Chapter 18 on electronics.Likewise our hearing does not have the same sensitivity at all frequencies.
Contributions and AttributionsThis page is licensed under a CC BY-NC-SA 3.0 license and was authored, remixed, and/or curated by Kyle Forinash andWolfgang Christian. Source content is found at https://www.compadre.org/books/SoundBook. Page content has been edited and
W/m2 SIL
LL
SIL dB
W/m2
SIL 110 dB SIL 0
LL SIL
1000 Hz
dB 1000 Hz
1000 Hz 5000 Hz
4000 Hz 45 phons
dB 36 dB
SIL 36 dB 45 phons
4000 Hz
1000 Hz 5000 Hz
1000 Hz 5000 Hz
3500 Hz
7.1.3.1

Kyle Forinash and Wolfgang Christian 7.1.3.3 3/24/2022 https://phys.libretexts.org/@go/page/26206
updated to conform to the style and standards of the LibreTexts platform. A detailed versioning history of the edits to source contentis available upon request.
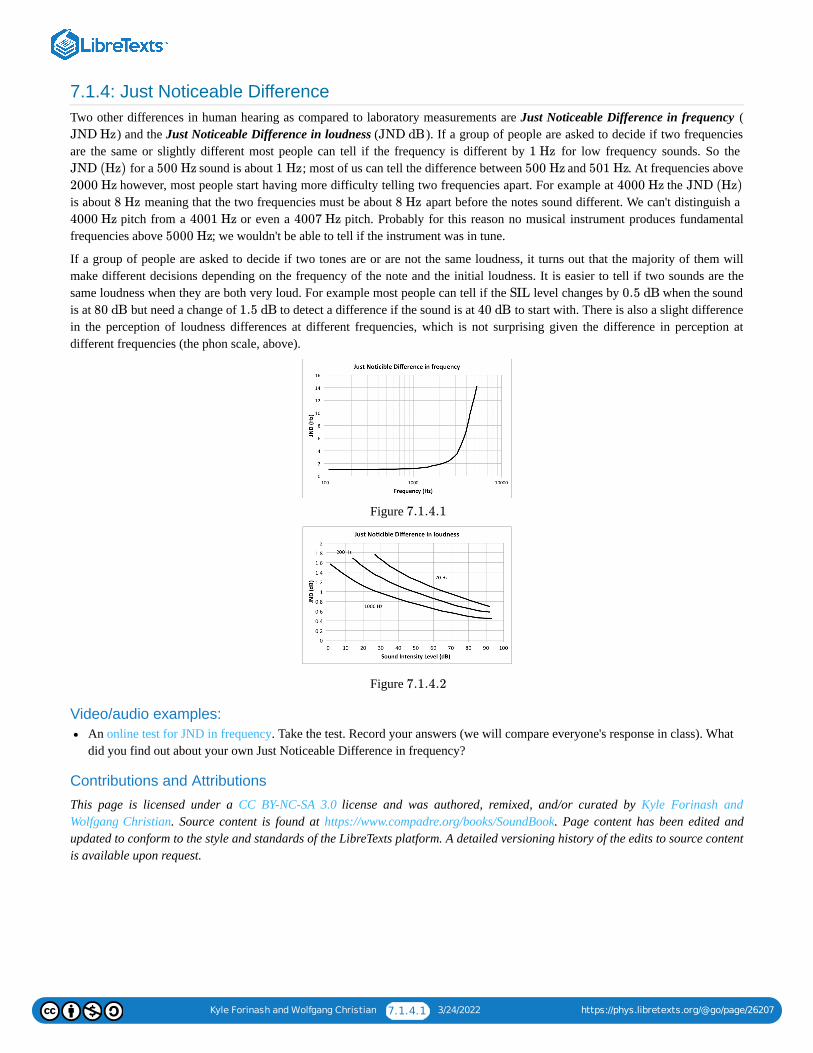
Kyle Forinash and Wolfgang Christian 7.1.4.1 3/24/2022 https://phys.libretexts.org/@go/page/26207
7.1.4: Just Noticeable DifferenceTwo other differences in human hearing as compared to laboratory measurements are Just Noticeable Difference in frequency (
) and the Just Noticeable Difference in loudness ( ). If a group of people are asked to decide if two frequenciesare the same or slightly different most people can tell if the frequency is different by for low frequency sounds. So the
for a sound is about ; most of us can tell the difference between and . At frequencies above however, most people start having more difficulty telling two frequencies apart. For example at the
is about meaning that the two frequencies must be about apart before the notes sound different. We can't distinguish a pitch from a or even a pitch. Probably for this reason no musical instrument produces fundamental
frequencies above ; we wouldn't be able to tell if the instrument was in tune.
If a group of people are asked to decide if two tones are or are not the same loudness, it turns out that the majority of them willmake different decisions depending on the frequency of the note and the initial loudness. It is easier to tell if two sounds are thesame loudness when they are both very loud. For example most people can tell if the level changes by when the soundis at but need a change of to detect a difference if the sound is at to start with. There is also a slight differencein the perception of loudness differences at different frequencies, which is not surprising given the difference in perception atdifferent frequencies (the phon scale, above).
Figure
Figure
Video/audio examples:An online test for JND in frequency. Take the test. Record your answers (we will compare everyone's response in class). Whatdid you find out about your own Just Noticeable Difference in frequency?
Contributions and Attributions
This page is licensed under a CC BY-NC-SA 3.0 license and was authored, remixed, and/or curated by Kyle Forinash andWolfgang Christian. Source content is found at https://www.compadre.org/books/SoundBook. Page content has been edited andupdated to conform to the style and standards of the LibreTexts platform. A detailed versioning history of the edits to source contentis available upon request.
JND Hz JND dB
1 Hz
JND (Hz) 500 Hz 1 Hz 500 Hz 501 Hz
2000 Hz 4000 Hz JND (Hz)
8 Hz 8 Hz
4000 Hz 4001 Hz 4007 Hz
5000 Hz
SIL 0.5 dB
80 dB 1.5 dB 40 dB
7.1.4.1
7.1.4.2
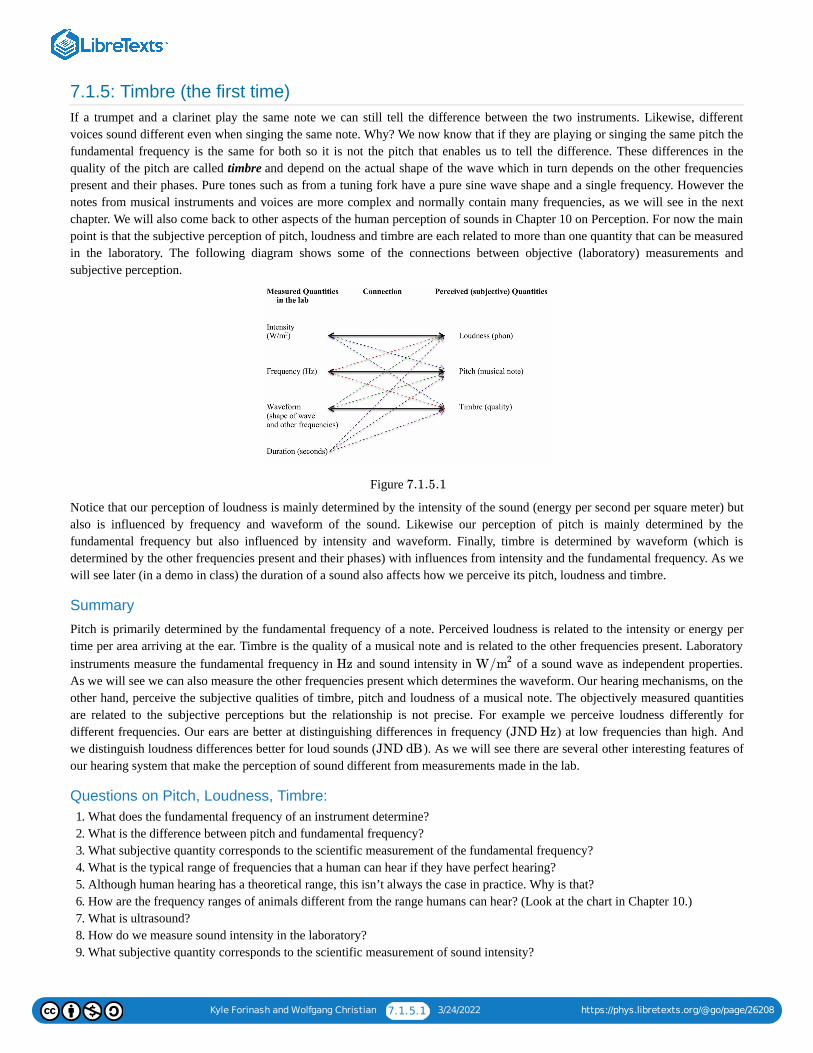
Kyle Forinash and Wolfgang Christian 7.1.5.1 3/24/2022 https://phys.libretexts.org/@go/page/26208
7.1.5: Timbre (the first time)If a trumpet and a clarinet play the same note we can still tell the difference between the two instruments. Likewise, differentvoices sound different even when singing the same note. Why? We now know that if they are playing or singing the same pitch thefundamental frequency is the same for both so it is not the pitch that enables us to tell the difference. These differences in thequality of the pitch are called timbre and depend on the actual shape of the wave which in turn depends on the other frequenciespresent and their phases. Pure tones such as from a tuning fork have a pure sine wave shape and a single frequency. However thenotes from musical instruments and voices are more complex and normally contain many frequencies, as we will see in the nextchapter. We will also come back to other aspects of the human perception of sounds in Chapter 10 on Perception. For now the mainpoint is that the subjective perception of pitch, loudness and timbre are each related to more than one quantity that can be measuredin the laboratory. The following diagram shows some of the connections between objective (laboratory) measurements andsubjective perception.
Figure
Notice that our perception of loudness is mainly determined by the intensity of the sound (energy per second per square meter) butalso is influenced by frequency and waveform of the sound. Likewise our perception of pitch is mainly determined by thefundamental frequency but also influenced by intensity and waveform. Finally, timbre is determined by waveform (which isdetermined by the other frequencies present and their phases) with influences from intensity and the fundamental frequency. As wewill see later (in a demo in class) the duration of a sound also affects how we perceive its pitch, loudness and timbre.
Summary
Pitch is primarily determined by the fundamental frequency of a note. Perceived loudness is related to the intensity or energy pertime per area arriving at the ear. Timbre is the quality of a musical note and is related to the other frequencies present. Laboratoryinstruments measure the fundamental frequency in and sound intensity in of a sound wave as independent properties.As we will see we can also measure the other frequencies present which determines the waveform. Our hearing mechanisms, on theother hand, perceive the subjective qualities of timbre, pitch and loudness of a musical note. The objectively measured quantitiesare related to the subjective perceptions but the relationship is not precise. For example we perceive loudness differently fordifferent frequencies. Our ears are better at distinguishing differences in frequency ( ) at low frequencies than high. Andwe distinguish loudness differences better for loud sounds ( ). As we will see there are several other interesting features ofour hearing system that make the perception of sound different from measurements made in the lab.
Questions on Pitch, Loudness, Timbre:1. What does the fundamental frequency of an instrument determine?2. What is the difference between pitch and fundamental frequency?3. What subjective quantity corresponds to the scientific measurement of the fundamental frequency?4. What is the typical range of frequencies that a human can hear if they have perfect hearing?5. Although human hearing has a theoretical range, this isn’t always the case in practice. Why is that?6. How are the frequency ranges of animals different from the range humans can hear? (Look at the chart in Chapter 10.)7. What is ultrasound?8. How do we measure sound intensity in the laboratory?9. What subjective quantity corresponds to the scientific measurement of sound intensity?
7.1.5.1
Hz W/m2
JND Hz
JND dB
Kyle Forinash and Wolfgang Christian 7.1.5.2 3/24/2022 https://phys.libretexts.org/@go/page/26208
10. What is the difference between sound intensity and sound intensity level? What units are used for each?11. The energy per second per area in is one way to measure sound intensity. What other scale is used?12. What is the threshold for pain in terms of sound intensity?13. What is the difference between the phon measurement and the decibel measurement?14. Suppose one clarinet has a measured loudness of . How loud will five identical clarinets together be?15. What is the sound intensity level in dB for a sound with intensity of ?16. A vacuum cleaner is about times as loud as ordinary conversation as measured in . How much of a difference is this
in ?17. How loud are rustling leaves in ? In ?18. In the graph of phons compared to and sound intensity at different frequencies, why does the phon curve take a dip between
and ?19. What is just noticeable difference in frequency?20. According to the chart in this chapter, what is the normal (in ) at ? At ?21. What is just noticeable difference in loudness?22. For a sound, what is the normal (in ) at ? At ?23. What is timbre and what causes it?24. Pitch is mainly related to the fundamental frequency. But what other factors affect perceived pitch (what else affects the pitch
that we think we hear)?25. Loudness is mainly related to the sound intensity. But what other factors affect perceived loudness (what else affects the
loudness that we think we hear)?26. Explain the difference between subjective measures of pitch, loudness and timbre as compared to the objective measurements of
fundamental frequency, sound intensity and waveform.
Contributions and Attributions
This page is licensed under a CC BY-NC-SA 3.0 license and was authored, remixed, and/or curated by Kyle Forinash andWolfgang Christian. Source content is found at https://www.compadre.org/books/SoundBook. Page content has been edited andupdated to conform to the style and standards of the LibreTexts platform. A detailed versioning history of the edits to source contentis available upon request.
W/m2
30 dB
1 W/m2
100 W/m2
dB
dB W/m2
SIL
3000 Hz 5000 Hz
JND Hz 1000 Hz 4000 Hz
1000 Hz JND dB 20 dB 50 dB
1 3/24/2022
CHAPTER OVERVIEW8: FOURIER SERIES
In the previous chapter we hinted that timbre is determined by the waveform or shape of the wave. So far we have only looked at waves thatcan be described by the mathematical functions of sine and cosine. How are differently shaped waves related to simple sine or cosine waves?What gives different waveforms different shapes?
KEY TERMS:
Fourier's theorem, Fourier analysis, Fourier synthesis, synthesizer, Fourier series, Fourier spectrum, fundamental frequency, uncertaintyprinciple, harmonic, overtone.
8.1: SOUND TEXTURE
8.1.1: WAVE SHAPE8.1.2: SOUND WAVEFORMS SIMULATION8.2: FOURIER SERIES
8.2.1: FOURIER SERIES8.2.2: FOURIER ANALYSIS8.2.3: FOURIER SERIES SIMULATION8.2.4: TIMBRE (AGAIN!)8.3: MICROPHONE SOUND ANALYZER
8.3.1: FOURIER ANALYSIS OF MICROPHONE DATA
Kyle Forinash and Wolfgang Christian 8.1.1 3/24/2022 https://phys.libretexts.org/@go/page/26039
8.1: Sound TextureThis simulation explores the aural texture of four basic periodic waveforms: sine, triangle, square, and sawtooth. The sinewaveform has a single frequency and is the building block of other periodic waves by summing harmonics in a Fourier Series as wewill see in the next section. The richness of the sound is called the timbre (defined in the previous chapter) and is determined by theamplitude of the harmonics in the Fourier sum.
Contributions and AttributionsThis page is licensed under a CC BY-NC-SA 3.0 license and was authored, remixed, and/or curated by Kyle Forinash andWolfgang Christian. Source content is found at https://www.compadre.org/books/SoundBook. Page content has been edited andupdated to conform to the style and standards of the LibreTexts platform. A detailed versioning history of the edits to source contentis available upon request.
Kyle Forinash and Wolfgang Christian 8.1.1.1 3/24/2022 https://phys.libretexts.org/@go/page/26213
8.1.1: Wave ShapeAn oscilloscope is an electronic device that allows us to capture the shape of a sound wave coming from a microphone. Themicrophone turns the sound waves into an analog electric current which varies in voltage the same way the sound wave does inpressure. The oscilloscope shows the voltage on a screen. Although the sound wave is longitudinal (back and forth) the voltage isplotted vertically (transverse). The variations in voltage are actually too fast to see if they were plotted in real time. However, if thevariations are periodic (repeat over time) the oscilloscope can make these variations visible by repeatedly plotting the samevariation over and over on the screen. Some oscilloscopes can also capture a short, rapidly changing sound by taking a timesnapshot of the sound. Note that oscilloscope pictures are time graphs of the sound wave; the oscilloscope does not show the spacepicture of the wave.
Video/audio examples:Oscilloscope used to capture sound waves from a whistle.Oscilloscope showing sound waves changing in amplitude and then frequency.Oscilloscope showing different frequencies of a quitar.There are also smart phone apps that will show the shape of a sound wave in real time (for example SignalScope or oScope forthe iPhone or SpecScope for Android).There are other, more artistic ways to visualize sound as shown in this sound waves art exhibit. In this exhibit sound wavesdrive the motion of tiny styrofoam balls. Why do they form into the shapes that you see?
Contributions and Attributions
This page is licensed under a CC BY-NC-SA 3.0 license and was authored, remixed, and/or curated by Kyle Forinash andWolfgang Christian. Source content is found at https://www.compadre.org/books/SoundBook. Page content has been edited andupdated to conform to the style and standards of the LibreTexts platform. A detailed versioning history of the edits to source contentis available upon request.
Kyle Forinash and Wolfgang Christian 8.1.2.1 3/24/2022 https://phys.libretexts.org/@go/page/26214
8.1.2: Sound Waveforms SimulationThis simulation explores the aural texture of four basic periodic waveforms: sine, triangle, square, and sawtooth. The sinewaveform has a single frequency and is the building block of other periodic waves by summing harmonics in a Fourier Series as wewill see in the next section. The richness of the sound is called the timbre (defined in the previous chapter) and is determined by theamplitude of the harmonics in the Fourier sum.
Click on the waveform image to hear the difference types of sounds these waveforms produce and drag up and down within theimage to change the waveform frequency. Drag left and right to adjust the volume. The sine waveform produces the smoothestsound because it consists of a single fundamental frequency . The triangle waveform has a richer and higher timbre because thedominant frequency is joined by the odd harmonics etc. The square waveform also has only odd harmonics butit sounds higher than the triangle waveform because the amplitude of these harmonics is greater than for a triangle waveform. Inother words, the triangle waveform more closely matches a sine waveform than the square waveform. The sawtooth waveform hasthe most complex timbre because every harmonic is present.
The Sound Waveforms JavaScript Model uses the HTML 5 Web Audio API. This API is still under development and may not besupported on all platforms. Press the Reset button to reinitialize the simulation if the sound does not play when the simulations isfirst loaded.
Press Reset if sound does not play when the simulation first loads.
Simulation Questions:
When two waves have the same fundamental frequency they have the same pitch, according to our ears. If there are otherfrequencies present (overtones) the pitch stays the same but the timbre is different. Note: Computer speakers do not play very lowor very high frequencies accurately; this simulation works better if you use better speakers or headphones.
1. Listen to each wave by clicking on the appropriate picture without changing the fundamental frequency. Describe how each onesounds (what is the timbre of the sound for each one?).
2. Can you distinguish each waveform from the others even when the fundamental frequency is the same?3. Now drag the mouse cursor up and down on one picture to change the fundamental frequency (or change the number in the
box). What do the other waves sound like at this frequency? Is the pitch the same? Can you still tell them apart?
Contributions and Attributions
This page is licensed under a CC BY-NC-SA 3.0 license and was authored, remixed, and/or curated by Kyle Forinash andWolfgang Christian. Source content is found at https://www.compadre.org/books/SoundBook. Page content has been edited andupdated to conform to the style and standards of the LibreTexts platform. A detailed versioning history of the edits to source contentis available upon request.
Fo
Fo 3 , 5 , 7 ,Fo Fo Fo
Note
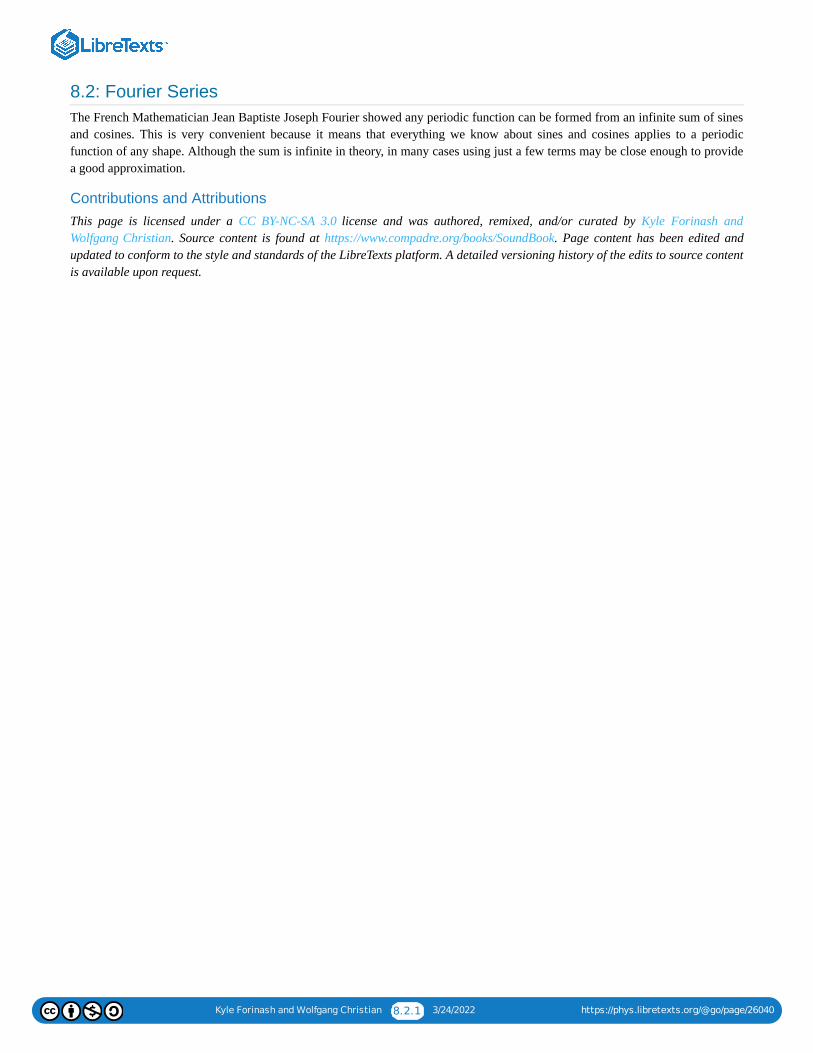
Kyle Forinash and Wolfgang Christian 8.2.1 3/24/2022 https://phys.libretexts.org/@go/page/26040
8.2: Fourier SeriesThe French Mathematician Jean Baptiste Joseph Fourier showed any periodic function can be formed from an infinite sum of sinesand cosines. This is very convenient because it means that everything we know about sines and cosines applies to a periodicfunction of any shape. Although the sum is infinite in theory, in many cases using just a few terms may be close enough to providea good approximation.
Contributions and AttributionsThis page is licensed under a CC BY-NC-SA 3.0 license and was authored, remixed, and/or curated by Kyle Forinash andWolfgang Christian. Source content is found at https://www.compadre.org/books/SoundBook. Page content has been edited andupdated to conform to the style and standards of the LibreTexts platform. A detailed versioning history of the edits to source contentis available upon request.
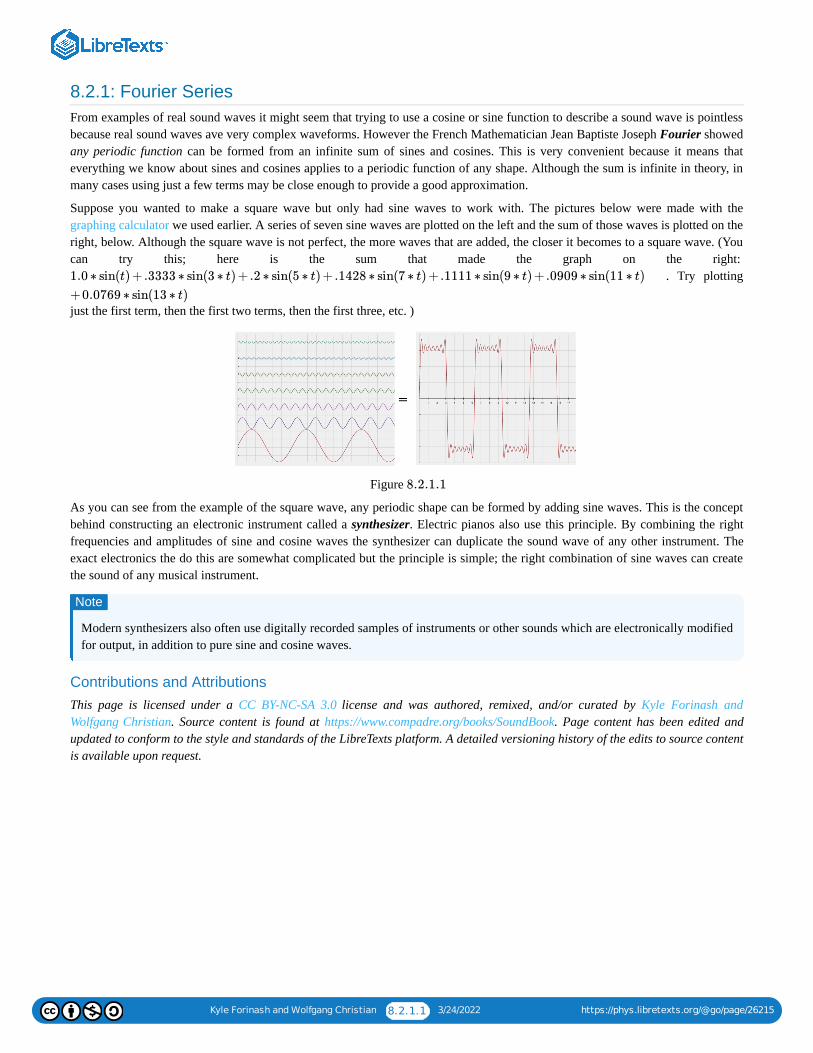
Kyle Forinash and Wolfgang Christian 8.2.1.1 3/24/2022 https://phys.libretexts.org/@go/page/26215
8.2.1: Fourier SeriesFrom examples of real sound waves it might seem that trying to use a cosine or sine function to describe a sound wave is pointlessbecause real sound waves ave very complex waveforms. However the French Mathematician Jean Baptiste Joseph Fourier showedany periodic function can be formed from an infinite sum of sines and cosines. This is very convenient because it means thateverything we know about sines and cosines applies to a periodic function of any shape. Although the sum is infinite in theory, inmany cases using just a few terms may be close enough to provide a good approximation.
Suppose you wanted to make a square wave but only had sine waves to work with. The pictures below were made with thegraphing calculator we used earlier. A series of seven sine waves are plotted on the left and the sum of those waves is plotted on theright, below. Although the square wave is not perfect, the more waves that are added, the closer it becomes to a square wave. (Youcan try this; here is the sum that made the graph on the right:
. Try plotting
just the first term, then the first two terms, then the first three, etc. )
Figure
As you can see from the example of the square wave, any periodic shape can be formed by adding sine waves. This is the conceptbehind constructing an electronic instrument called a synthesizer. Electric pianos also use this principle. By combining the rightfrequencies and amplitudes of sine and cosine waves the synthesizer can duplicate the sound wave of any other instrument. Theexact electronics the do this are somewhat complicated but the principle is simple; the right combination of sine waves can createthe sound of any musical instrument.
Modern synthesizers also often use digitally recorded samples of instruments or other sounds which are electronically modifiedfor output, in addition to pure sine and cosine waves.
Contributions and AttributionsThis page is licensed under a CC BY-NC-SA 3.0 license and was authored, remixed, and/or curated by Kyle Forinash andWolfgang Christian. Source content is found at https://www.compadre.org/books/SoundBook. Page content has been edited andupdated to conform to the style and standards of the LibreTexts platform. A detailed versioning history of the edits to source contentis available upon request.
1.0 ∗ sin(t) +.3333 ∗ sin(3 ∗ t) +.2 ∗ sin(5 ∗ t) +.1428 ∗ sin(7 ∗ t) +.1111 ∗ sin(9 ∗ t) +.0909 ∗ sin(11 ∗ t)
+0.0769 ∗ sin(13 ∗ t)
8.2.1.1
Note
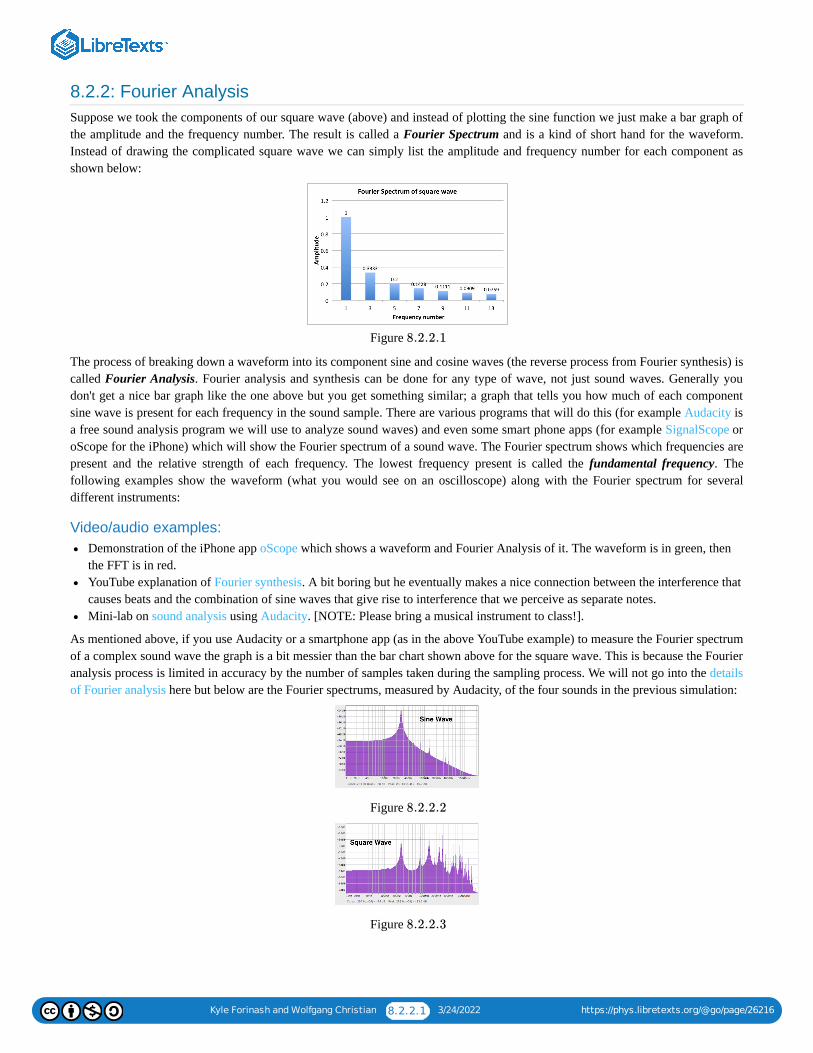
Kyle Forinash and Wolfgang Christian 8.2.2.1 3/24/2022 https://phys.libretexts.org/@go/page/26216
8.2.2: Fourier AnalysisSuppose we took the components of our square wave (above) and instead of plotting the sine function we just make a bar graph ofthe amplitude and the frequency number. The result is called a Fourier Spectrum and is a kind of short hand for the waveform.Instead of drawing the complicated square wave we can simply list the amplitude and frequency number for each component asshown below:
Figure
The process of breaking down a waveform into its component sine and cosine waves (the reverse process from Fourier synthesis) iscalled Fourier Analysis. Fourier analysis and synthesis can be done for any type of wave, not just sound waves. Generally youdon't get a nice bar graph like the one above but you get something similar; a graph that tells you how much of each componentsine wave is present for each frequency in the sound sample. There are various programs that will do this (for example Audacity isa free sound analysis program we will use to analyze sound waves) and even some smart phone apps (for example SignalScope oroScope for the iPhone) which will show the Fourier spectrum of a sound wave. The Fourier spectrum shows which frequencies arepresent and the relative strength of each frequency. The lowest frequency present is called the fundamental frequency. Thefollowing examples show the waveform (what you would see on an oscilloscope) along with the Fourier spectrum for severaldifferent instruments:
Video/audio examples:Demonstration of the iPhone app oScope which shows a waveform and Fourier Analysis of it. The waveform is in green, thenthe FFT is in red.YouTube explanation of Fourier synthesis. A bit boring but he eventually makes a nice connection between the interference thatcauses beats and the combination of sine waves that give rise to interference that we perceive as separate notes.Mini-lab on sound analysis using Audacity. [NOTE: Please bring a musical instrument to class!].
As mentioned above, if you use Audacity or a smartphone app (as in the above YouTube example) to measure the Fourier spectrumof a complex sound wave the graph is a bit messier than the bar chart shown above for the square wave. This is because the Fourieranalysis process is limited in accuracy by the number of samples taken during the sampling process. We will not go into the detailsof Fourier analysis here but below are the Fourier spectrums, measured by Audacity, of the four sounds in the previous simulation:
Figure
Figure
8.2.2.1
8.2.2.2
8.2.2.3
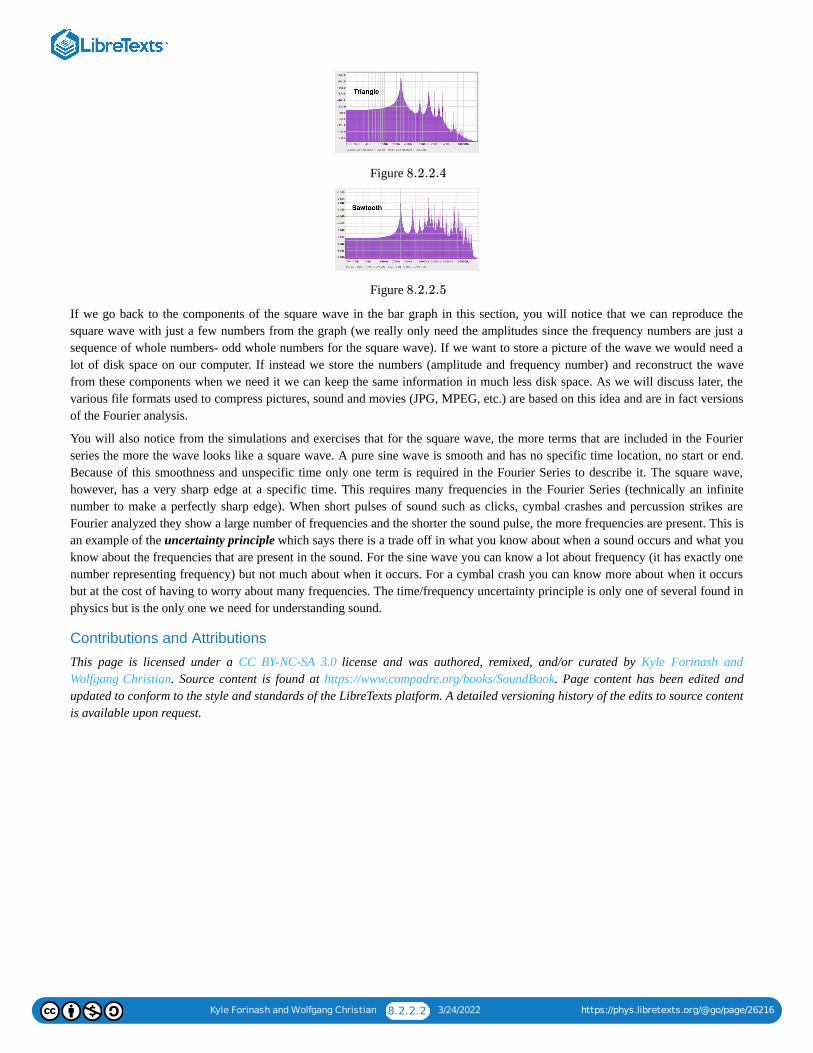
Kyle Forinash and Wolfgang Christian 8.2.2.2 3/24/2022 https://phys.libretexts.org/@go/page/26216
Figure
Figure
If we go back to the components of the square wave in the bar graph in this section, you will notice that we can reproduce thesquare wave with just a few numbers from the graph (we really only need the amplitudes since the frequency numbers are just asequence of whole numbers- odd whole numbers for the square wave). If we want to store a picture of the wave we would need alot of disk space on our computer. If instead we store the numbers (amplitude and frequency number) and reconstruct the wavefrom these components when we need it we can keep the same information in much less disk space. As we will discuss later, thevarious file formats used to compress pictures, sound and movies (JPG, MPEG, etc.) are based on this idea and are in fact versionsof the Fourier analysis.
You will also notice from the simulations and exercises that for the square wave, the more terms that are included in the Fourierseries the more the wave looks like a square wave. A pure sine wave is smooth and has no specific time location, no start or end.Because of this smoothness and unspecific time only one term is required in the Fourier Series to describe it. The square wave,however, has a very sharp edge at a specific time. This requires many frequencies in the Fourier Series (technically an infinitenumber to make a perfectly sharp edge). When short pulses of sound such as clicks, cymbal crashes and percussion strikes areFourier analyzed they show a large number of frequencies and the shorter the sound pulse, the more frequencies are present. This isan example of the uncertainty principle which says there is a trade off in what you know about when a sound occurs and what youknow about the frequencies that are present in the sound. For the sine wave you can know a lot about frequency (it has exactly onenumber representing frequency) but not much about when it occurs. For a cymbal crash you can know more about when it occursbut at the cost of having to worry about many frequencies. The time/frequency uncertainty principle is only one of several found inphysics but is the only one we need for understanding sound.
Contributions and Attributions
This page is licensed under a CC BY-NC-SA 3.0 license and was authored, remixed, and/or curated by Kyle Forinash andWolfgang Christian. Source content is found at https://www.compadre.org/books/SoundBook. Page content has been edited andupdated to conform to the style and standards of the LibreTexts platform. A detailed versioning history of the edits to source contentis available upon request.
8.2.2.4
8.2.2.5
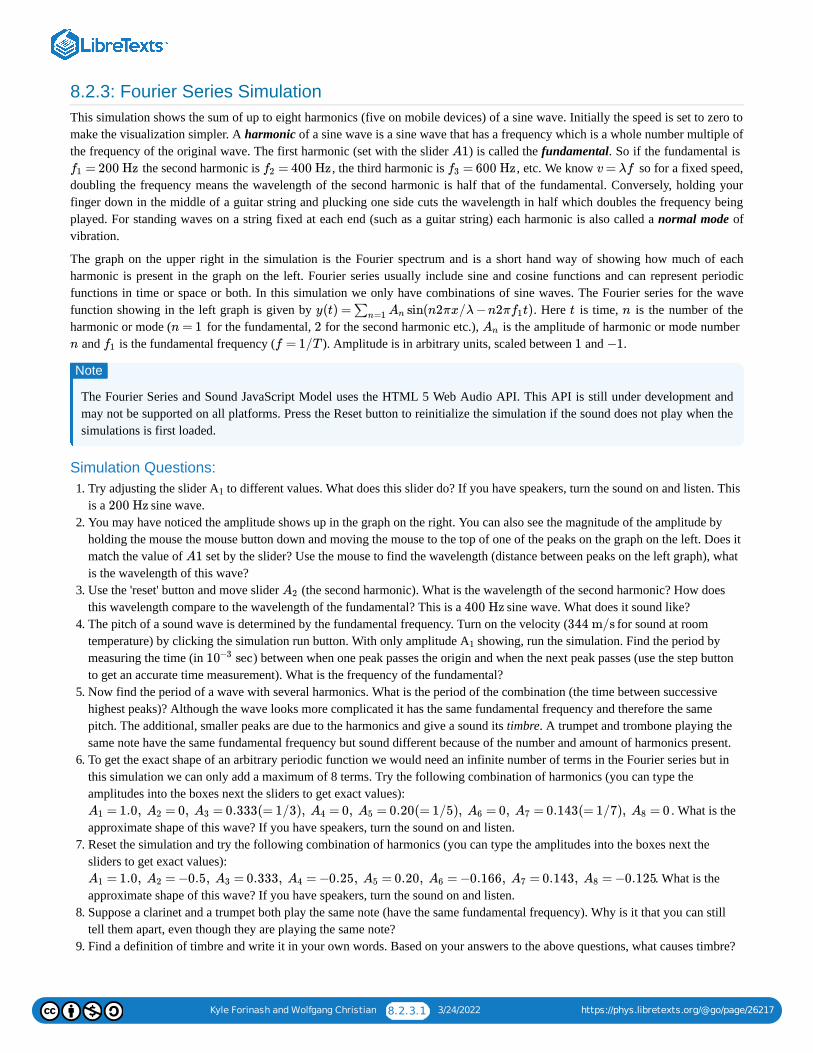
Kyle Forinash and Wolfgang Christian 8.2.3.1 3/24/2022 https://phys.libretexts.org/@go/page/26217
8.2.3: Fourier Series SimulationThis simulation shows the sum of up to eight harmonics (five on mobile devices) of a sine wave. Initially the speed is set to zero tomake the visualization simpler. A harmonic of a sine wave is a sine wave that has a frequency which is a whole number multiple ofthe frequency of the original wave. The first harmonic (set with the slider ) is called the fundamental. So if the fundamental is
the second harmonic is , the third harmonic is , etc. We know so for a fixed speed,doubling the frequency means the wavelength of the second harmonic is half that of the fundamental. Conversely, holding yourfinger down in the middle of a guitar string and plucking one side cuts the wavelength in half which doubles the frequency beingplayed. For standing waves on a string fixed at each end (such as a guitar string) each harmonic is also called a normal mode ofvibration.
The graph on the upper right in the simulation is the Fourier spectrum and is a short hand way of showing how much of eachharmonic is present in the graph on the left. Fourier series usually include sine and cosine functions and can represent periodicfunctions in time or space or both. In this simulation we only have combinations of sine waves. The Fourier series for the wavefunction showing in the left graph is given by . Here is time, is the number of theharmonic or mode ( for the fundamental, for the second harmonic etc.), is the amplitude of harmonic or mode number
and is the fundamental frequency ( ). Amplitude is in arbitrary units, scaled between and .
The Fourier Series and Sound JavaScript Model uses the HTML 5 Web Audio API. This API is still under development andmay not be supported on all platforms. Press the Reset button to reinitialize the simulation if the sound does not play when thesimulations is first loaded.
Simulation Questions:1. Try adjusting the slider A to different values. What does this slider do? If you have speakers, turn the sound on and listen. This
is a sine wave.2. You may have noticed the amplitude shows up in the graph on the right. You can also see the magnitude of the amplitude by
holding the mouse the mouse button down and moving the mouse to the top of one of the peaks on the graph on the left. Does itmatch the value of set by the slider? Use the mouse to find the wavelength (distance between peaks on the left graph), whatis the wavelength of this wave?
3. Use the 'reset' button and move slider (the second harmonic). What is the wavelength of the second harmonic? How doesthis wavelength compare to the wavelength of the fundamental? This is a sine wave. What does it sound like?
4. The pitch of a sound wave is determined by the fundamental frequency. Turn on the velocity ( for sound at roomtemperature) by clicking the simulation run button. With only amplitude A showing, run the simulation. Find the period bymeasuring the time (in ) between when one peak passes the origin and when the next peak passes (use the step buttonto get an accurate time measurement). What is the frequency of the fundamental?
5. Now find the period of a wave with several harmonics. What is the period of the combination (the time between successivehighest peaks)? Although the wave looks more complicated it has the same fundamental frequency and therefore the samepitch. The additional, smaller peaks are due to the harmonics and give a sound its timbre. A trumpet and trombone playing thesame note have the same fundamental frequency but sound different because of the number and amount of harmonics present.
6. To get the exact shape of an arbitrary periodic function we would need an infinite number of terms in the Fourier series but inthis simulation we can only add a maximum of 8 terms. Try the following combination of harmonics (you can type theamplitudes into the boxes next the sliders to get exact values):
. What is theapproximate shape of this wave? If you have speakers, turn the sound on and listen.
7. Reset the simulation and try the following combination of harmonics (you can type the amplitudes into the boxes next thesliders to get exact values):
. What is theapproximate shape of this wave? If you have speakers, turn the sound on and listen.
8. Suppose a clarinet and a trumpet both play the same note (have the same fundamental frequency). Why is it that you can stilltell them apart, even though they are playing the same note?
9. Find a definition of timbre and write it in your own words. Based on your answers to the above questions, what causes timbre?
A1
= 200 Hzf1 = 400 Hzf2 = 600 Hzf3 v = λf
y(t) = sin(n2πx/λ −n2π t)∑n=1 An f1 t n
n = 1 2 An
n f1 f = 1/T 1 −1
Note
1200 Hz
A1
A2
400 Hz
344 m/s
1 sec10−3
= 1.0, = 0, = 0.333(= 1/3), = 0, = 0.20(= 1/5), = 0, = 0.143(= 1/7), = 0A1 A2 A3 A4 A5 A6 A7 A8
= 1.0, = −0.5, = 0.333, = −0.25, = 0.20, = −0.166, = 0.143, = −0.125A1 A2 A3 A4 A5 A6 A7 A8

Kyle Forinash and Wolfgang Christian 8.2.3.2 3/24/2022 https://phys.libretexts.org/@go/page/26217
10. Suppose you wanted to build an electronic instrument which added waves together to imitate other instruments (this is howsome musical synthesizers work). What would you need to know about the sound a trumpet makes in order to reconstruct thatsound? (Hint: think about the information contained in the graph at the top right.)
Contributions and AttributionsThis page is licensed under a CC BY-NC-SA 3.0 license and was authored, remixed, and/or curated by Kyle Forinash andWolfgang Christian. Source content is found at https://www.compadre.org/books/SoundBook. Page content has been edited andupdated to conform to the style and standards of the LibreTexts platform. A detailed versioning history of the edits to source contentis available upon request.
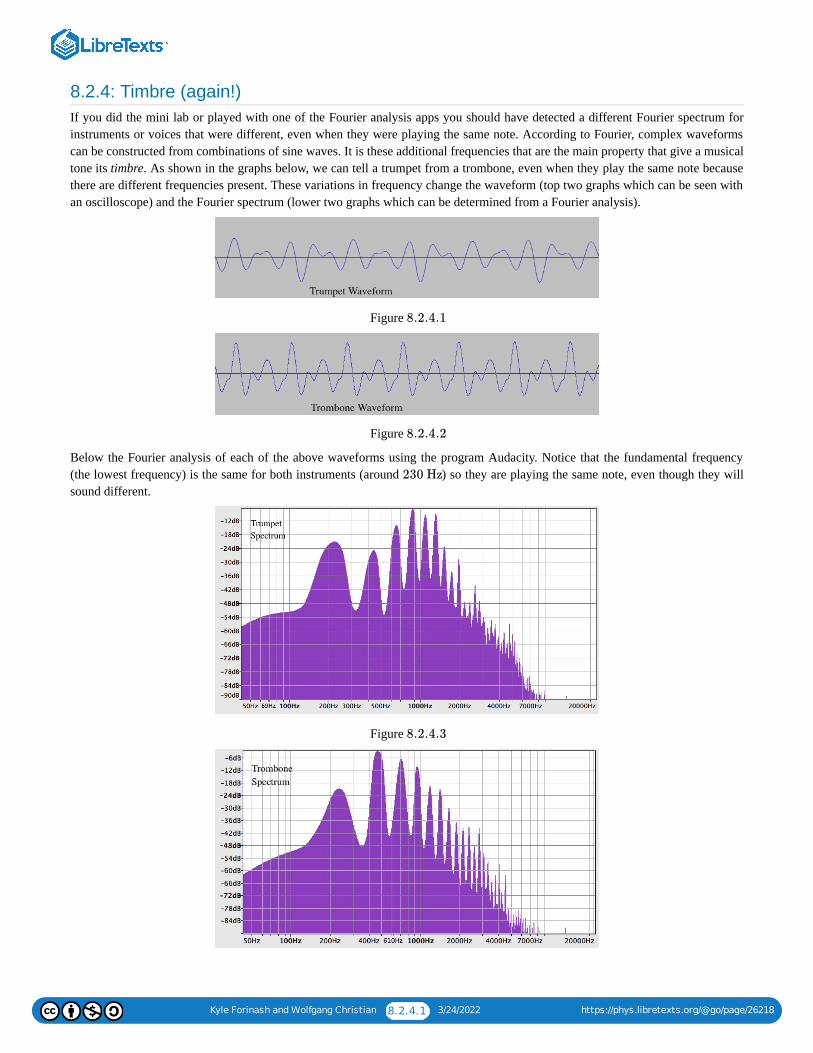
Kyle Forinash and Wolfgang Christian 8.2.4.1 3/24/2022 https://phys.libretexts.org/@go/page/26218
8.2.4: Timbre (again!)If you did the mini lab or played with one of the Fourier analysis apps you should have detected a different Fourier spectrum forinstruments or voices that were different, even when they were playing the same note. According to Fourier, complex waveformscan be constructed from combinations of sine waves. It is these additional frequencies that are the main property that give a musicaltone its timbre. As shown in the graphs below, we can tell a trumpet from a trombone, even when they play the same note becausethere are different frequencies present. These variations in frequency change the waveform (top two graphs which can be seen withan oscilloscope) and the Fourier spectrum (lower two graphs which can be determined from a Fourier analysis).
Figure
Figure
Below the Fourier analysis of each of the above waveforms using the program Audacity. Notice that the fundamental frequency(the lowest frequency) is the same for both instruments (around ) so they are playing the same note, even though they willsound different.
Figure
8.2.4.1
8.2.4.2
230 Hz
8.2.4.3
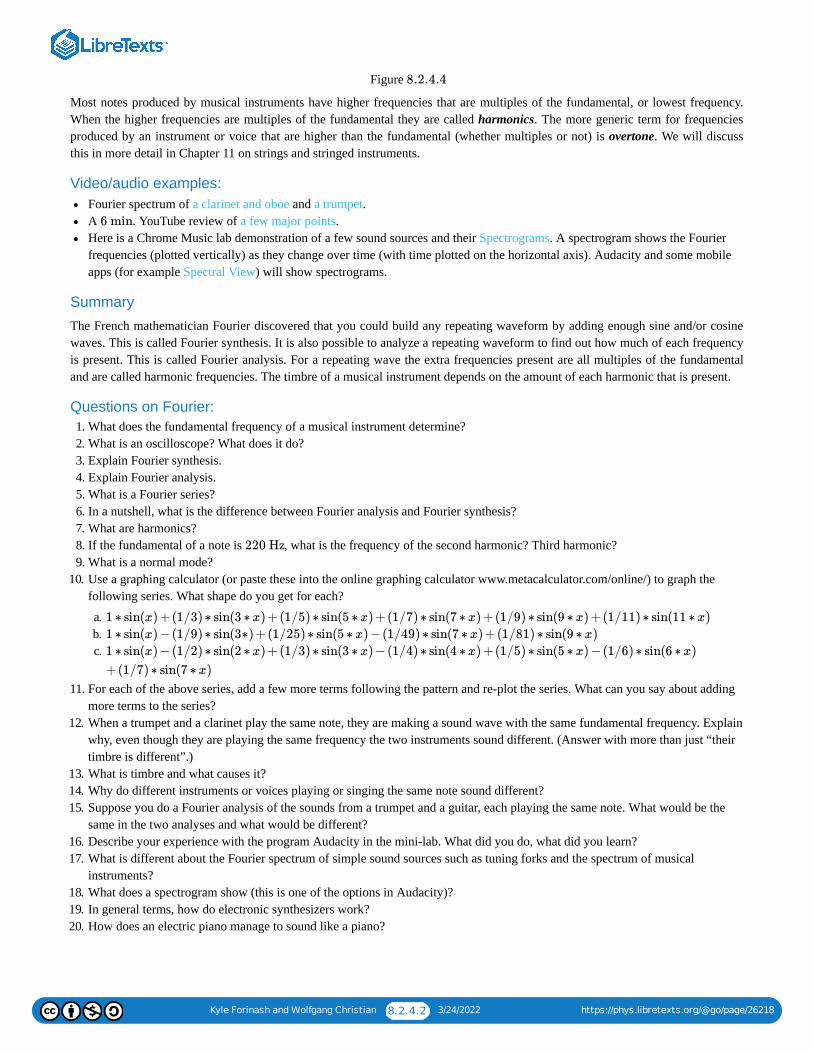
Kyle Forinash and Wolfgang Christian 8.2.4.2 3/24/2022 https://phys.libretexts.org/@go/page/26218
Figure
Most notes produced by musical instruments have higher frequencies that are multiples of the fundamental, or lowest frequency.When the higher frequencies are multiples of the fundamental they are called harmonics. The more generic term for frequenciesproduced by an instrument or voice that are higher than the fundamental (whether multiples or not) is overtone. We will discussthis in more detail in Chapter 11 on strings and stringed instruments.
Video/audio examples:Fourier spectrum of a clarinet and oboe and a trumpet.A . YouTube review of a few major points.Here is a Chrome Music lab demonstration of a few sound sources and their Spectrograms. A spectrogram shows the Fourierfrequencies (plotted vertically) as they change over time (with time plotted on the horizontal axis). Audacity and some mobileapps (for example Spectral View) will show spectrograms.
Summary
The French mathematician Fourier discovered that you could build any repeating waveform by adding enough sine and/or cosinewaves. This is called Fourier synthesis. It is also possible to analyze a repeating waveform to find out how much of each frequencyis present. This is called Fourier analysis. For a repeating wave the extra frequencies present are all multiples of the fundamentaland are called harmonic frequencies. The timbre of a musical instrument depends on the amount of each harmonic that is present.
Questions on Fourier:1. What does the fundamental frequency of a musical instrument determine?2. What is an oscilloscope? What does it do?3. Explain Fourier synthesis.4. Explain Fourier analysis.5. What is a Fourier series?6. In a nutshell, what is the difference between Fourier analysis and Fourier synthesis?7. What are harmonics?8. If the fundamental of a note is , what is the frequency of the second harmonic? Third harmonic?9. What is a normal mode?
10. Use a graphing calculator (or paste these into the online graphing calculator www.metacalculator.com/online/) to graph thefollowing series. What shape do you get for each?
a. b. c.
11. For each of the above series, add a few more terms following the pattern and re-plot the series. What can you say about addingmore terms to the series?
12. When a trumpet and a clarinet play the same note, they are making a sound wave with the same fundamental frequency. Explainwhy, even though they are playing the same frequency the two instruments sound different. (Answer with more than just “theirtimbre is different”.)
13. What is timbre and what causes it?14. Why do different instruments or voices playing or singing the same note sound different?15. Suppose you do a Fourier analysis of the sounds from a trumpet and a guitar, each playing the same note. What would be the
same in the two analyses and what would be different?16. Describe your experience with the program Audacity in the mini-lab. What did you do, what did you learn?17. What is different about the Fourier spectrum of simple sound sources such as tuning forks and the spectrum of musical
instruments?18. What does a spectrogram show (this is one of the options in Audacity)?19. In general terms, how do electronic synthesizers work?20. How does an electric piano manage to sound like a piano?
8.2.4.4
6 min
220 Hz
1 ∗ sin(x) +(1/3) ∗ sin(3 ∗ x) +(1/5) ∗ sin(5 ∗ x) +(1/7) ∗ sin(7 ∗ x) +(1/9) ∗ sin(9 ∗ x) +(1/11) ∗ sin(11 ∗ x)
1 ∗ sin(x) −(1/9) ∗ sin(3∗) +(1/25) ∗ sin(5 ∗ x) −(1/49) ∗ sin(7 ∗ x) +(1/81) ∗ sin(9 ∗ x)
1 ∗ sin(x) −(1/2) ∗ sin(2 ∗ x) +(1/3) ∗ sin(3 ∗ x) −(1/4) ∗ sin(4 ∗ x) +(1/5) ∗ sin(5 ∗ x) −(1/6) ∗ sin(6 ∗ x)
+(1/7) ∗ sin(7 ∗ x)

Kyle Forinash and Wolfgang Christian 8.2.4.3 3/24/2022 https://phys.libretexts.org/@go/page/26218
Contributions and AttributionsThis page is licensed under a CC BY-NC-SA 3.0 license and was authored, remixed, and/or curated by Kyle Forinash andWolfgang Christian. Source content is found at https://www.compadre.org/books/SoundBook. Page content has been edited andupdated to conform to the style and standards of the LibreTexts platform. A detailed versioning history of the edits to source contentis available upon request.

Kyle Forinash and Wolfgang Christian 8.3.1 3/24/2022 https://phys.libretexts.org/@go/page/26041
8.3: Microphone Sound AnalyzerUsing this software you can analyze a sound sample captured by your computer or mobile device microphone.
Contributions and AttributionsThis page is licensed under a CC BY-NC-SA 3.0 license and was authored, remixed, and/or curated by Kyle Forinash andWolfgang Christian. Source content is found at https://www.compadre.org/books/SoundBook. Page content has been edited andupdated to conform to the style and standards of the LibreTexts platform. A detailed versioning history of the edits to source contentis available upon request.
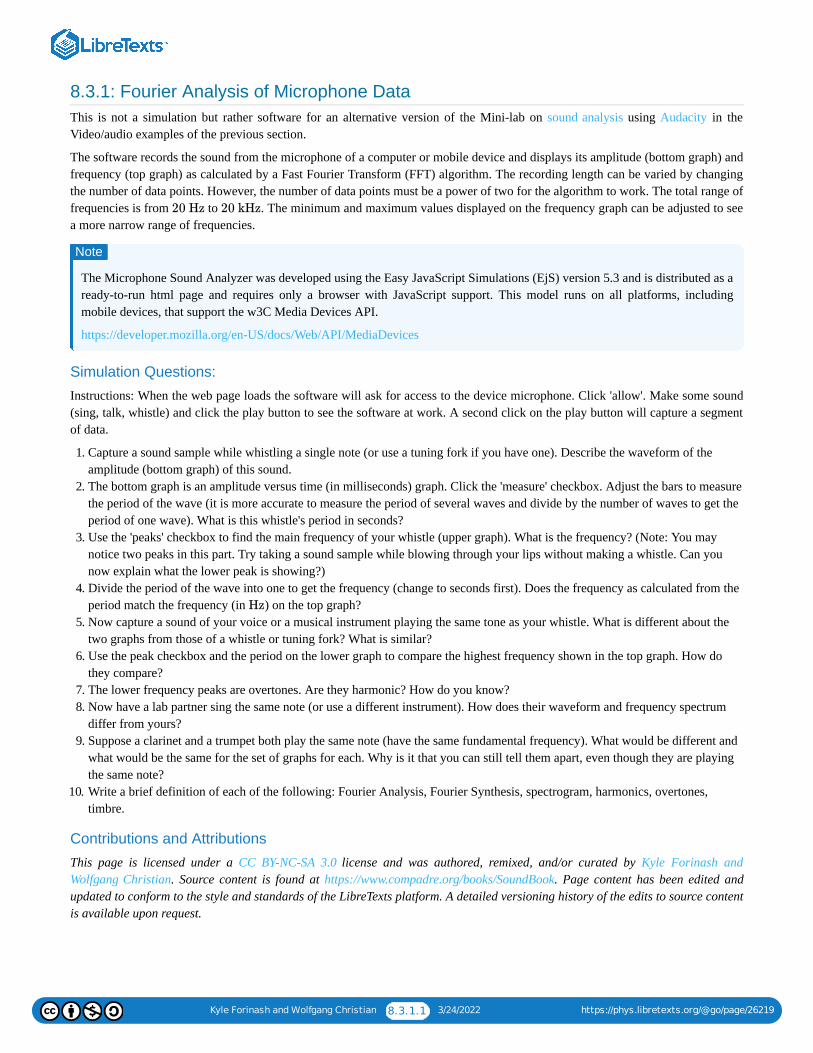
Kyle Forinash and Wolfgang Christian 8.3.1.1 3/24/2022 https://phys.libretexts.org/@go/page/26219
8.3.1: Fourier Analysis of Microphone DataThis is not a simulation but rather software for an alternative version of the Mini-lab on sound analysis using Audacity in theVideo/audio examples of the previous section.
The software records the sound from the microphone of a computer or mobile device and displays its amplitude (bottom graph) andfrequency (top graph) as calculated by a Fast Fourier Transform (FFT) algorithm. The recording length can be varied by changingthe number of data points. However, the number of data points must be a power of two for the algorithm to work. The total range offrequencies is from to . The minimum and maximum values displayed on the frequency graph can be adjusted to seea more narrow range of frequencies.
The Microphone Sound Analyzer was developed using the Easy JavaScript Simulations (EjS) version 5.3 and is distributed as aready-to-run html page and requires only a browser with JavaScript support. This model runs on all platforms, includingmobile devices, that support the w3C Media Devices API.
https://developer.mozilla.org/en-US/docs/Web/API/MediaDevices
Simulation Questions:
Instructions: When the web page loads the software will ask for access to the device microphone. Click 'allow'. Make some sound(sing, talk, whistle) and click the play button to see the software at work. A second click on the play button will capture a segmentof data.
1. Capture a sound sample while whistling a single note (or use a tuning fork if you have one). Describe the waveform of theamplitude (bottom graph) of this sound.
2. The bottom graph is an amplitude versus time (in milliseconds) graph. Click the 'measure' checkbox. Adjust the bars to measurethe period of the wave (it is more accurate to measure the period of several waves and divide by the number of waves to get theperiod of one wave). What is this whistle's period in seconds?
3. Use the 'peaks' checkbox to find the main frequency of your whistle (upper graph). What is the frequency? (Note: You maynotice two peaks in this part. Try taking a sound sample while blowing through your lips without making a whistle. Can younow explain what the lower peak is showing?)
4. Divide the period of the wave into one to get the frequency (change to seconds first). Does the frequency as calculated from theperiod match the frequency (in ) on the top graph?
5. Now capture a sound of your voice or a musical instrument playing the same tone as your whistle. What is different about thetwo graphs from those of a whistle or tuning fork? What is similar?
6. Use the peak checkbox and the period on the lower graph to compare the highest frequency shown in the top graph. How dothey compare?
7. The lower frequency peaks are overtones. Are they harmonic? How do you know?8. Now have a lab partner sing the same note (or use a different instrument). How does their waveform and frequency spectrum
differ from yours?9. Suppose a clarinet and a trumpet both play the same note (have the same fundamental frequency). What would be different and
what would be the same for the set of graphs for each. Why is it that you can still tell them apart, even though they are playingthe same note?
10. Write a brief definition of each of the following: Fourier Analysis, Fourier Synthesis, spectrogram, harmonics, overtones,timbre.
Contributions and Attributions
This page is licensed under a CC BY-NC-SA 3.0 license and was authored, remixed, and/or curated by Kyle Forinash andWolfgang Christian. Source content is found at https://www.compadre.org/books/SoundBook. Page content has been edited andupdated to conform to the style and standards of the LibreTexts platform. A detailed versioning history of the edits to source contentis available upon request.
20 Hz 20 kHz
Note
Hz
1 3/24/2022
CHAPTER OVERVIEW9: THE EAR AND PERCEPTION
According to what we have learned so far, the fundamental frequency of vibrations in the air is the biggest factor in determining theperceived pitch of a note and the energy per second per square meter (intensity) determines how loud the sound is. We also know that ourperceptions do not perfectly match frequencies and intensities measured by laboratory instruments. In this chapter we look at how the earturns vibrations into the perception of sound. Some of the exact details of this process are still not completely understood but the generalpicture of how we hear is fairly well established. Once again we will see that the human hearing mechanism gives us experiences that do notcorrespond exactly to laboratory measurements.
KEY TERMS:
Pinna, middle ear, inner ear, cochlea, timpanic membrane, ossicles, cochlea, semicircular canals, vestibular nerve, auditory nerve, inner haircells, outer hair cells, place theory of hearing, timing theory of hearing, missing fundamental, auditory illusions, attack frequencies, criticalbands, conductive hearing loss, otoacoustic emission, sensorineural hearing loss, presbycusis.
9.1: THE EAR AND PERCEPTION
9.1.1: STRUCTURE OF THE EAR9.1.2: THE PLACE THEORY OF HEARING9.1.3: THE TEMPORAL THEORY OF HEARING9.1.4: HEARING LOSS9.1.5: THE MISSING FUNDAMENTAL9.1.6: MISSING FUNDAMENTAL SIMULATION9.2: BEATS
9.2.1: OTHER COMBINATION TONES9.2.2: BEATS AND CRITICAL BANDS SIMULATION9.2.3: OTHER INTERESTING AUDITORY PHENOMENA9.2.4: ANIMAL HEARING
Kyle Forinash and Wolfgang Christian 9.1.1 3/24/2022 https://phys.libretexts.org/@go/page/25913
9.1: The Ear and PerceptionWe look at how the ear turns vibrations into the perception of sound. Some of the exact details of this process are still notcompletely understood but the general picture of how we hear is fairly well established. Once again we will see that the humanhearing mechanism gives us experiences that do not correspond exactly to laboratory measurements.
Contributions and AttributionsThis page is licensed under a CC BY-NC-SA 3.0 license and was authored, remixed, and/or curated by Kyle Forinash andWolfgang Christian. Source content is found at https://www.compadre.org/books/SoundBook. Page content has been edited andupdated to conform to the style and standards of the LibreTexts platform. A detailed versioning history of the edits to source contentis available upon request.
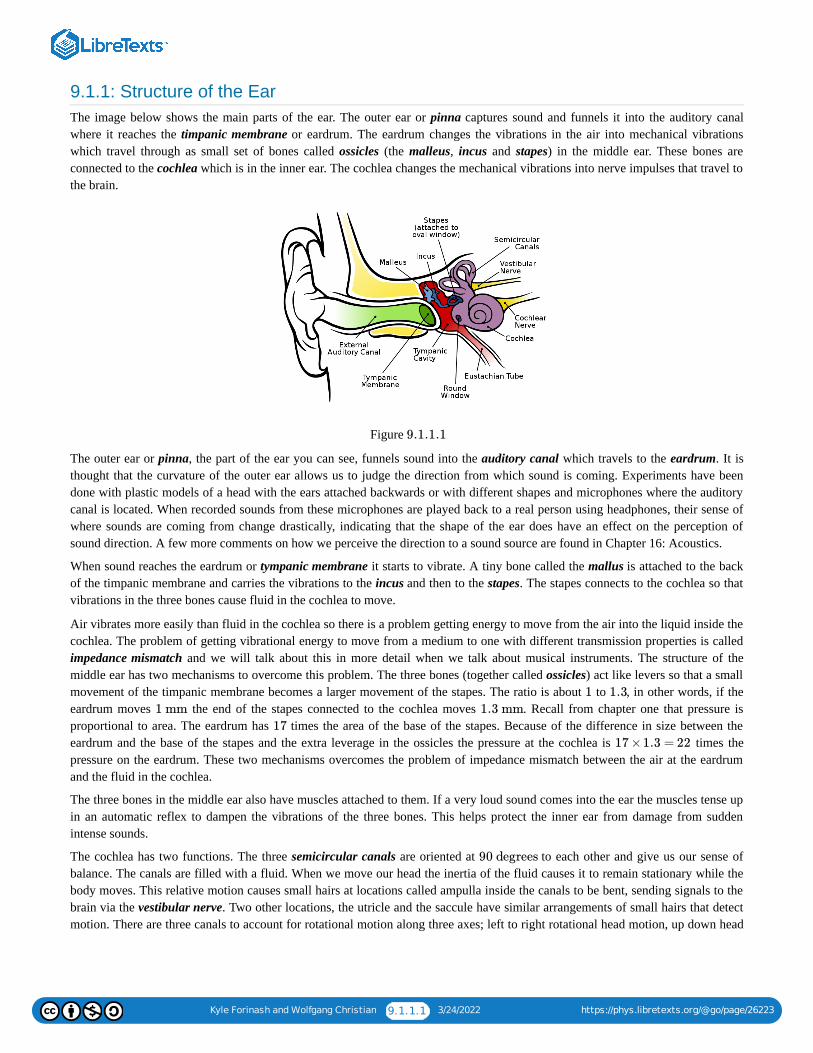
Kyle Forinash and Wolfgang Christian 9.1.1.1 3/24/2022 https://phys.libretexts.org/@go/page/26223
9.1.1: Structure of the EarThe image below shows the main parts of the ear. The outer ear or pinna captures sound and funnels it into the auditory canalwhere it reaches the timpanic membrane or eardrum. The eardrum changes the vibrations in the air into mechanical vibrationswhich travel through as small set of bones called ossicles (the malleus, incus and stapes) in the middle ear. These bones areconnected to the cochlea which is in the inner ear. The cochlea changes the mechanical vibrations into nerve impulses that travel tothe brain.
Figure
The outer ear or pinna, the part of the ear you can see, funnels sound into the auditory canal which travels to the eardrum. It isthought that the curvature of the outer ear allows us to judge the direction from which sound is coming. Experiments have beendone with plastic models of a head with the ears attached backwards or with different shapes and microphones where the auditorycanal is located. When recorded sounds from these microphones are played back to a real person using headphones, their sense ofwhere sounds are coming from change drastically, indicating that the shape of the ear does have an effect on the perception ofsound direction. A few more comments on how we perceive the direction to a sound source are found in Chapter 16: Acoustics.
When sound reaches the eardrum or tympanic membrane it starts to vibrate. A tiny bone called the mallus is attached to the backof the timpanic membrane and carries the vibrations to the incus and then to the stapes. The stapes connects to the cochlea so thatvibrations in the three bones cause fluid in the cochlea to move.
Air vibrates more easily than fluid in the cochlea so there is a problem getting energy to move from the air into the liquid inside thecochlea. The problem of getting vibrational energy to move from a medium to one with different transmission properties is calledimpedance mismatch and we will talk about this in more detail when we talk about musical instruments. The structure of themiddle ear has two mechanisms to overcome this problem. The three bones (together called ossicles) act like levers so that a smallmovement of the timpanic membrane becomes a larger movement of the stapes. The ratio is about to , in other words, if theeardrum moves the end of the stapes connected to the cochlea moves . Recall from chapter one that pressure isproportional to area. The eardrum has times the area of the base of the stapes. Because of the difference in size between theeardrum and the base of the stapes and the extra leverage in the ossicles the pressure at the cochlea is times thepressure on the eardrum. These two mechanisms overcomes the problem of impedance mismatch between the air at the eardrumand the fluid in the cochlea.
The three bones in the middle ear also have muscles attached to them. If a very loud sound comes into the ear the muscles tense upin an automatic reflex to dampen the vibrations of the three bones. This helps protect the inner ear from damage from suddenintense sounds.
The cochlea has two functions. The three semicircular canals are oriented at to each other and give us our sense ofbalance. The canals are filled with a fluid. When we move our head the inertia of the fluid causes it to remain stationary while thebody moves. This relative motion causes small hairs at locations called ampulla inside the canals to be bent, sending signals to thebrain via the vestibular nerve. Two other locations, the utricle and the saccule have similar arrangements of small hairs that detectmotion. There are three canals to account for rotational motion along three axes; left to right rotational head motion, up down head
9.1.1.1
1 1.3
1 mm 1.3 mm
17
17 ×1.3 = 22
90 degrees
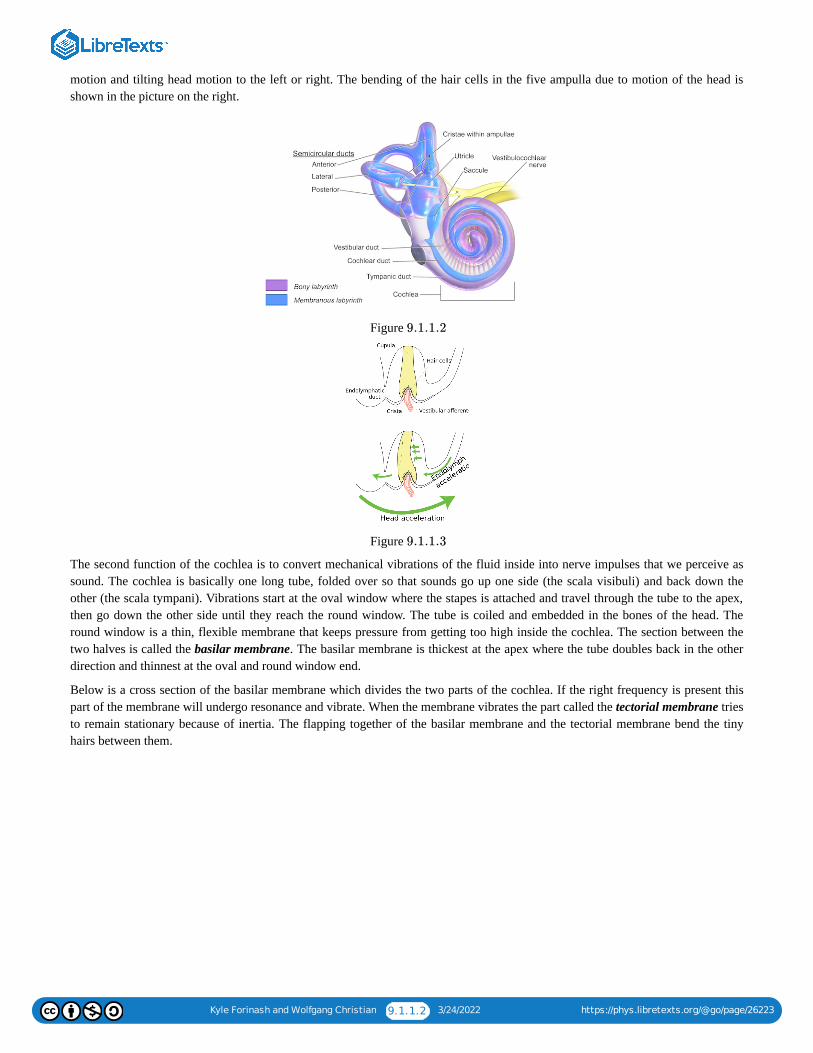
Kyle Forinash and Wolfgang Christian 9.1.1.2 3/24/2022 https://phys.libretexts.org/@go/page/26223
motion and tilting head motion to the left or right. The bending of the hair cells in the five ampulla due to motion of the head isshown in the picture on the right.
Figure
Figure
The second function of the cochlea is to convert mechanical vibrations of the fluid inside into nerve impulses that we perceive assound. The cochlea is basically one long tube, folded over so that sounds go up one side (the scala visibuli) and back down theother (the scala tympani). Vibrations start at the oval window where the stapes is attached and travel through the tube to the apex,then go down the other side until they reach the round window. The tube is coiled and embedded in the bones of the head. Theround window is a thin, flexible membrane that keeps pressure from getting too high inside the cochlea. The section between thetwo halves is called the basilar membrane. The basilar membrane is thickest at the apex where the tube doubles back in the otherdirection and thinnest at the oval and round window end.
Below is a cross section of the basilar membrane which divides the two parts of the cochlea. If the right frequency is present thispart of the membrane will undergo resonance and vibrate. When the membrane vibrates the part called the tectorial membrane triesto remain stationary because of inertia. The flapping together of the basilar membrane and the tectorial membrane bend the tinyhairs between them.
9.1.1.2
9.1.1.3
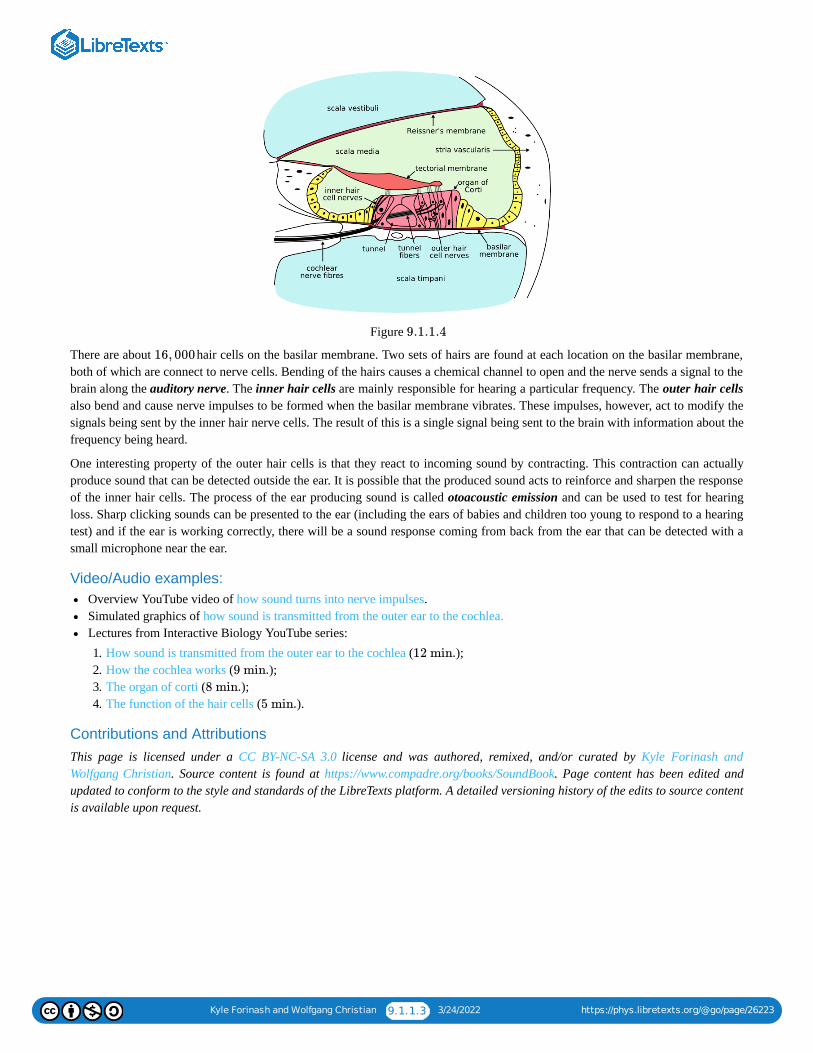
Kyle Forinash and Wolfgang Christian 9.1.1.3 3/24/2022 https://phys.libretexts.org/@go/page/26223
Figure
There are about hair cells on the basilar membrane. Two sets of hairs are found at each location on the basilar membrane,both of which are connect to nerve cells. Bending of the hairs causes a chemical channel to open and the nerve sends a signal to thebrain along the auditory nerve. The inner hair cells are mainly responsible for hearing a particular frequency. The outer hair cellsalso bend and cause nerve impulses to be formed when the basilar membrane vibrates. These impulses, however, act to modify thesignals being sent by the inner hair nerve cells. The result of this is a single signal being sent to the brain with information about thefrequency being heard.
One interesting property of the outer hair cells is that they react to incoming sound by contracting. This contraction can actuallyproduce sound that can be detected outside the ear. It is possible that the produced sound acts to reinforce and sharpen the responseof the inner hair cells. The process of the ear producing sound is called otoacoustic emission and can be used to test for hearingloss. Sharp clicking sounds can be presented to the ear (including the ears of babies and children too young to respond to a hearingtest) and if the ear is working correctly, there will be a sound response coming from back from the ear that can be detected with asmall microphone near the ear.
Video/Audio examples:Overview YouTube video of how sound turns into nerve impulses.Simulated graphics of how sound is transmitted from the outer ear to the cochlea.Lectures from Interactive Biology YouTube series:1. How sound is transmitted from the outer ear to the cochlea ( );2. How the cochlea works ( );3. The organ of corti ( );4. The function of the hair cells ( ).
Contributions and AttributionsThis page is licensed under a CC BY-NC-SA 3.0 license and was authored, remixed, and/or curated by Kyle Forinash andWolfgang Christian. Source content is found at https://www.compadre.org/books/SoundBook. Page content has been edited andupdated to conform to the style and standards of the LibreTexts platform. A detailed versioning history of the edits to source contentis available upon request.
9.1.1.4
16, 000
12 min.
9 min.
8 min.
5 min.
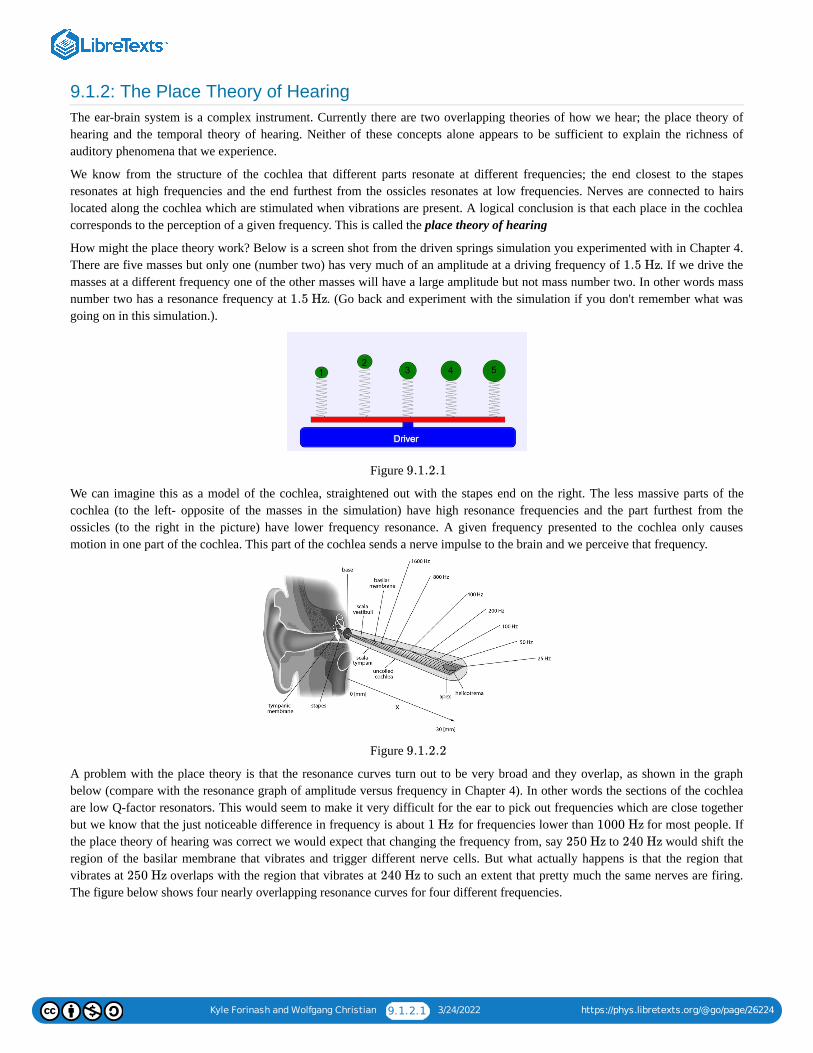
Kyle Forinash and Wolfgang Christian 9.1.2.1 3/24/2022 https://phys.libretexts.org/@go/page/26224
9.1.2: The Place Theory of HearingThe ear-brain system is a complex instrument. Currently there are two overlapping theories of how we hear; the place theory ofhearing and the temporal theory of hearing. Neither of these concepts alone appears to be sufficient to explain the richness ofauditory phenomena that we experience.
We know from the structure of the cochlea that different parts resonate at different frequencies; the end closest to the stapesresonates at high frequencies and the end furthest from the ossicles resonates at low frequencies. Nerves are connected to hairslocated along the cochlea which are stimulated when vibrations are present. A logical conclusion is that each place in the cochleacorresponds to the perception of a given frequency. This is called the place theory of hearing
How might the place theory work? Below is a screen shot from the driven springs simulation you experimented with in Chapter 4.There are five masses but only one (number two) has very much of an amplitude at a driving frequency of . If we drive themasses at a different frequency one of the other masses will have a large amplitude but not mass number two. In other words massnumber two has a resonance frequency at . (Go back and experiment with the simulation if you don't remember what wasgoing on in this simulation.).
Figure
We can imagine this as a model of the cochlea, straightened out with the stapes end on the right. The less massive parts of thecochlea (to the left- opposite of the masses in the simulation) have high resonance frequencies and the part furthest from theossicles (to the right in the picture) have lower frequency resonance. A given frequency presented to the cochlea only causesmotion in one part of the cochlea. This part of the cochlea sends a nerve impulse to the brain and we perceive that frequency.
Figure
A problem with the place theory is that the resonance curves turn out to be very broad and they overlap, as shown in the graphbelow (compare with the resonance graph of amplitude versus frequency in Chapter 4). In other words the sections of the cochleaare low Q-factor resonators. This would seem to make it very difficult for the ear to pick out frequencies which are close togetherbut we know that the just noticeable difference in frequency is about for frequencies lower than for most people. Ifthe place theory of hearing was correct we would expect that changing the frequency from, say to would shift theregion of the basilar membrane that vibrates and trigger different nerve cells. But what actually happens is that the region thatvibrates at overlaps with the region that vibrates at to such an extent that pretty much the same nerves are firing.The figure below shows four nearly overlapping resonance curves for four different frequencies.
1.5 Hz
1.5 Hz
9.1.2.1
9.1.2.2
1 Hz 1000 Hz
250 Hz 240 Hz
250 Hz 240 Hz
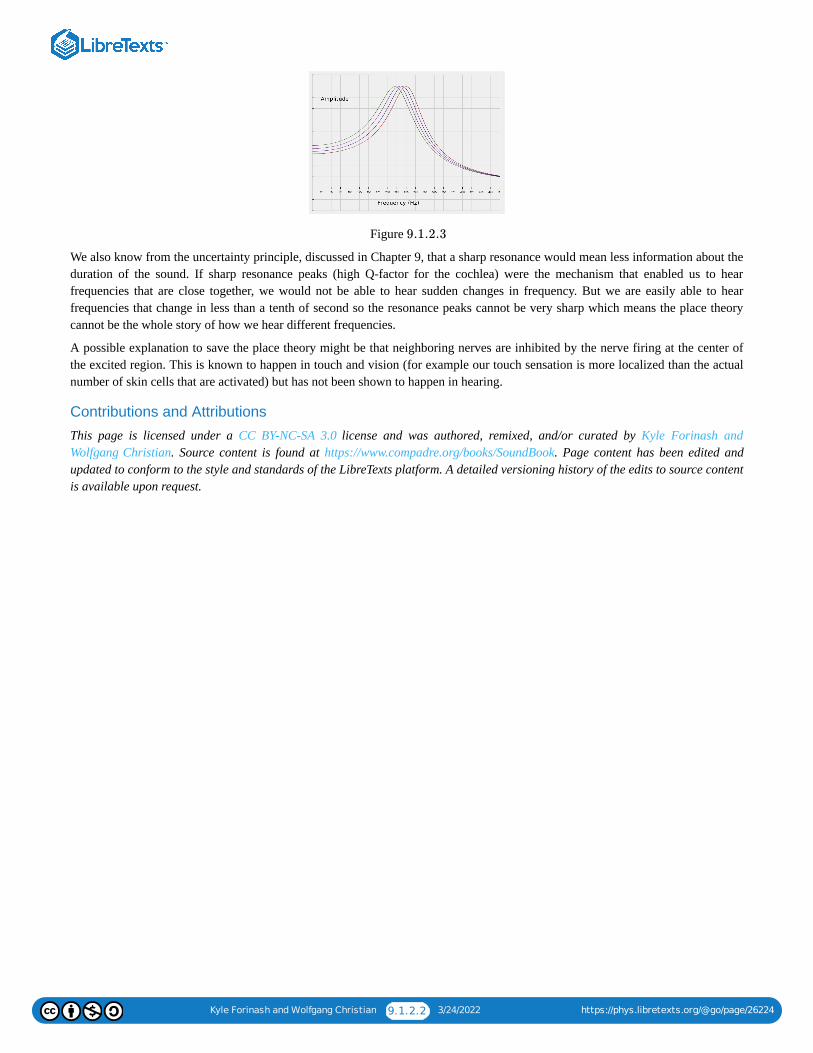
Kyle Forinash and Wolfgang Christian 9.1.2.2 3/24/2022 https://phys.libretexts.org/@go/page/26224
Figure
We also know from the uncertainty principle, discussed in Chapter 9, that a sharp resonance would mean less information about theduration of the sound. If sharp resonance peaks (high Q-factor for the cochlea) were the mechanism that enabled us to hearfrequencies that are close together, we would not be able to hear sudden changes in frequency. But we are easily able to hearfrequencies that change in less than a tenth of second so the resonance peaks cannot be very sharp which means the place theorycannot be the whole story of how we hear different frequencies.
A possible explanation to save the place theory might be that neighboring nerves are inhibited by the nerve firing at the center ofthe excited region. This is known to happen in touch and vision (for example our touch sensation is more localized than the actualnumber of skin cells that are activated) but has not been shown to happen in hearing.
Contributions and Attributions
This page is licensed under a CC BY-NC-SA 3.0 license and was authored, remixed, and/or curated by Kyle Forinash andWolfgang Christian. Source content is found at https://www.compadre.org/books/SoundBook. Page content has been edited andupdated to conform to the style and standards of the LibreTexts platform. A detailed versioning history of the edits to source contentis available upon request.
9.1.2.3
Kyle Forinash and Wolfgang Christian 9.1.3.1 3/24/2022 https://phys.libretexts.org/@go/page/26225
9.1.3: The Temporal Theory of HearingA second theory of hearing is called the periodicity or temporal theory of hearing. In this theory it is the timing of the firing ofnerve impulses that carries information about the perceived pitch. A simple sine wave at repeats with a period of
. The simplest form of the theory says that the vibration causes a nerve to fire every , sending a signalto the brain that is interpreted as a sound. Different sections of a complex sound waveform also repeat periodically. Wewould expect that hair cells might also fire with the same periodicity of sections of the waveform. For complex waveforms theremight be more nerves firing for larger amplitude parts of the wave so that information about the wave shape is also transmitted tothe brain.
One difficulty with this theory is that the nerves attached to the hair cells in the cochlea don't seem to fire as often as the theorywould predict (and can't fire at a rate of , at the high end of human hearing). For example instead of firing every for a signal the nerve might initially fire at a period of but then skip to intervals, intervals or somecombination of these periods. This could still transmit the correct information, however. The brain could possibly interpret asequence of firings etc. as multiples of and conclude the real signal is . Another idea is thatthe nerves in the cochlea itself somehow filter and combine signals to send a message that is read by the brain as the signal for a
signal. There are two locations of hair cells inside the cochlea. It is possible that impulses from the outer hair cells couldaffect signals from the inner hair cells in a feedback process to produce some combined signal that has information about frequencyand waveform. Alternative schemes explaining how the temporal theory could still work with a nerve firing rate not equal to theperiod of the signal have been proposed but as yet there is not enough experimental evidence to settle the issue.
Contributions and AttributionsThis page is licensed under a CC BY-NC-SA 3.0 license and was authored, remixed, and/or curated by Kyle Forinash andWolfgang Christian. Source content is found at https://www.compadre.org/books/SoundBook. Page content has been edited andupdated to conform to the style and standards of the LibreTexts platform. A detailed versioning history of the edits to source contentis available upon request.
500 Hz
1/500 Hz = 0.002 s 0.002 s
500 Hz
20, 000 Hz 0.002 s
500 Hz 0.002 s 0.004 s 0.006 s
0.002 s, 0.004 s, 0.006 s 0.002 0.002 s
500 Hz
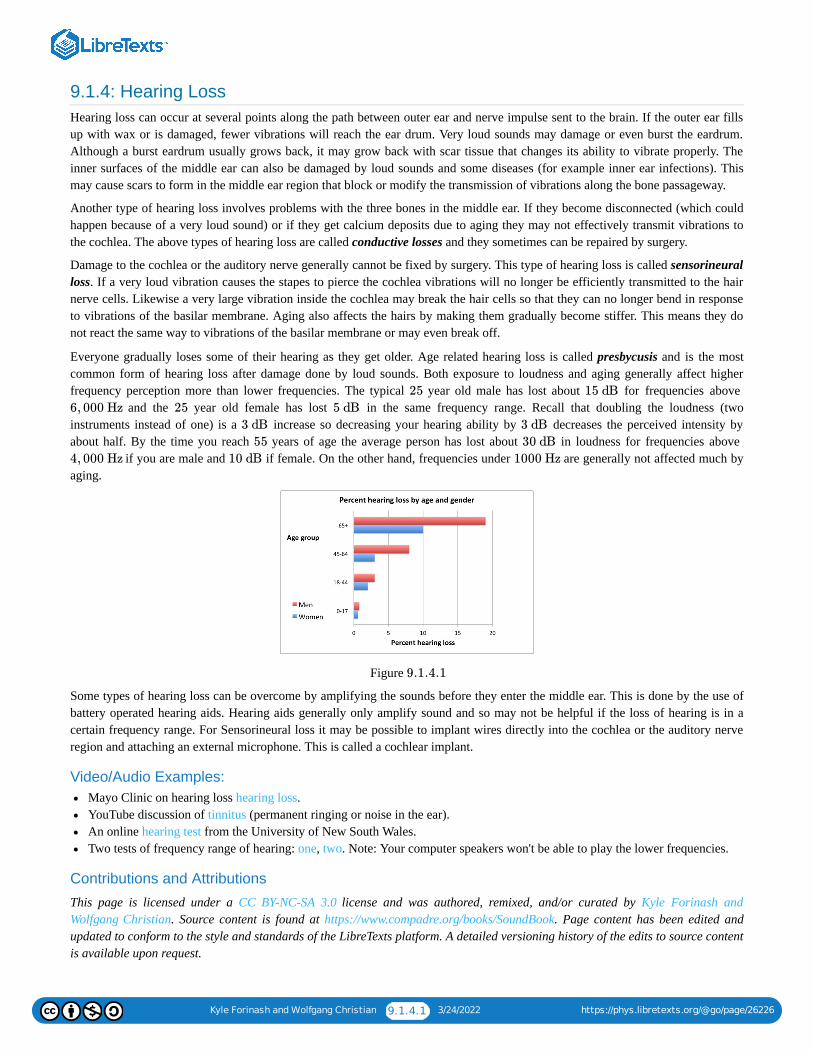
Kyle Forinash and Wolfgang Christian 9.1.4.1 3/24/2022 https://phys.libretexts.org/@go/page/26226
9.1.4: Hearing LossHearing loss can occur at several points along the path between outer ear and nerve impulse sent to the brain. If the outer ear fillsup with wax or is damaged, fewer vibrations will reach the ear drum. Very loud sounds may damage or even burst the eardrum.Although a burst eardrum usually grows back, it may grow back with scar tissue that changes its ability to vibrate properly. Theinner surfaces of the middle ear can also be damaged by loud sounds and some diseases (for example inner ear infections). Thismay cause scars to form in the middle ear region that block or modify the transmission of vibrations along the bone passageway.
Another type of hearing loss involves problems with the three bones in the middle ear. If they become disconnected (which couldhappen because of a very loud sound) or if they get calcium deposits due to aging they may not effectively transmit vibrations tothe cochlea. The above types of hearing loss are called conductive losses and they sometimes can be repaired by surgery.
Damage to the cochlea or the auditory nerve generally cannot be fixed by surgery. This type of hearing loss is called sensorineuralloss. If a very loud vibration causes the stapes to pierce the cochlea vibrations will no longer be efficiently transmitted to the hairnerve cells. Likewise a very large vibration inside the cochlea may break the hair cells so that they can no longer bend in responseto vibrations of the basilar membrane. Aging also affects the hairs by making them gradually become stiffer. This means they donot react the same way to vibrations of the basilar membrane or may even break off.
Everyone gradually loses some of their hearing as they get older. Age related hearing loss is called presbycusis and is the mostcommon form of hearing loss after damage done by loud sounds. Both exposure to loudness and aging generally affect higherfrequency perception more than lower frequencies. The typical year old male has lost about for frequencies above
and the year old female has lost in the same frequency range. Recall that doubling the loudness (twoinstruments instead of one) is a increase so decreasing your hearing ability by decreases the perceived intensity byabout half. By the time you reach years of age the average person has lost about in loudness for frequencies above
if you are male and if female. On the other hand, frequencies under are generally not affected much byaging.
Figure
Some types of hearing loss can be overcome by amplifying the sounds before they enter the middle ear. This is done by the use ofbattery operated hearing aids. Hearing aids generally only amplify sound and so may not be helpful if the loss of hearing is in acertain frequency range. For Sensorineural loss it may be possible to implant wires directly into the cochlea or the auditory nerveregion and attaching an external microphone. This is called a cochlear implant.
Video/Audio Examples:Mayo Clinic on hearing loss hearing loss.YouTube discussion of tinnitus (permanent ringing or noise in the ear).An online hearing test from the University of New South Wales.Two tests of frequency range of hearing: one, two. Note: Your computer speakers won't be able to play the lower frequencies.
Contributions and Attributions
This page is licensed under a CC BY-NC-SA 3.0 license and was authored, remixed, and/or curated by Kyle Forinash andWolfgang Christian. Source content is found at https://www.compadre.org/books/SoundBook. Page content has been edited andupdated to conform to the style and standards of the LibreTexts platform. A detailed versioning history of the edits to source contentis available upon request.
25 15 dB
6, 000 Hz 25 5 dB
3 dB 3 dB
55 30 dB
4, 000 Hz 10 dB 1000 Hz
9.1.4.1
Kyle Forinash and Wolfgang Christian 9.1.5.1 3/24/2022 https://phys.libretexts.org/@go/page/26227
9.1.5: The Missing FundamentalOne important auditory phenomena that cannot easily be explained by either theory of hearing is the missing fundamental orvirtual pitch. Some sources refer to the effect as residue pitch. As we saw in the chapter on Fourier analysis, musical instrumentshave overtones which are harmonic, meaning they are multiples of the fundamental frequency. When you hear a guitar play a notewith a fundamental frequency of there are harmonic frequencies of , etc. present in the sound.Your ear-brain system perceives this as a single pitch of instead of a collection of individual frequencies. An interestingauditory phenomena is that if you are listening to a series of frequencies of , etc. your ear-brain systemwill ALSO perceive a single note of even if the fundamental is missing.
Contributions and AttributionsThis page is licensed under a CC BY-NC-SA 3.0 license and was authored, remixed, and/or curated by Kyle Forinash andWolfgang Christian. Source content is found at https://www.compadre.org/books/SoundBook. Page content has been edited andupdated to conform to the style and standards of the LibreTexts platform. A detailed versioning history of the edits to source contentis available upon request.
100 Hz 200 Hz, 300 Hz, 400 Hz
100 Hz
200 Hz, 300 Hz, 400 Hz
100 Hz 100 Hz
Kyle Forinash and Wolfgang Christian 9.1.6.1 3/24/2022 https://phys.libretexts.org/@go/page/26228
9.1.6: Missing Fundamental SimulationThe simulation is actually the same as the Fourier simulation in the previous chapter but you will do something different with it. Upto eight harmonics (five on mobile devices) of a sine wave are shown and the fundamental is set at . The secondharmonic is , the third harmonic is , etc.
The Fourier Series and Sound JavaScript Model uses the HTML 5 Web Audio API. This API is still under development andmay not be supported on all platforms. Press the Reset button to reinitialize the simulation if the sound does not play when thesimulations is first loaded.
Simulation Questions:1. With a fundamental frequency of , push all of the sliders to the right. Listen to the sound (you may need to use external
speakers or good headphones since the built-in speakers in your computer are usually not very good). Describe the sound, thetimbre.
2. Now slide the first slider, , to zero. You will notice a change in the timbre of the sound but does the perceived pitch (the notebeing played) change?
3. Try sliding both the and amplitudes to zero, leaving the other amplitudes at 1.00. The timbre will again be different butdoes the perceived pitch change?
4. Try leaving only the highest two frequencies at maximum amplitude and the others at zero. Has the perceived pitch changed?
The missing fundamental is what makes it possible to hear music over small speakers that cannot reproduce the full range offrequencies. Small speakers often do not produce the lower base note frequencies but you still hear them because the higherharmonics are present and your ear-brain system fills in the missing fundamental. As we will see, for many musical instruments,percussion instruments in particular, the missing fundamental is the note we hear when the instrument is playing.
Experiments done with pure tones through headphones show that in fact you only need two frequencies, for example and , to perceive a missing fundamental of if the notes are in phase. Even stranger is the fact that you will perceive the
missing fundamental when the individual harmonics are played to different ears. Somehow the brain combines signals from bothears to hear one note at a frequency that isn't present. Any theory of how the ear works must be able explain this and other curiousauditory phenomena.
The idea that certain regions of the basilar membrane respond to certain frequencies as an explanation for sound perception seemsto be basically correct. The place theory, however, cannot explain the missing fundamental phenomena. If a fundamental frequencyis missing it cannot cause that region of the basilar membrane to vibrate yet we perceive the frequency as being present. Somehowthe harmonics add up to give us that experience. In fact, we would expect that if the harmonics were exciting different regions wemight perceive separate harmonic tones instead of one single note but we don't; nearly all listeners hear a single missingfundamental.
In support of the temporal theory, the missing fundamental shifts in a peculiar way if the harmonics shift. For example a missingfundamental of is heard when harmonics of and are played. It would be tempting to say thatthe difference of between the harmonics causes the perception of a signal. But if these frequencies are shifted to
and , also a difference of , the ear-brain system perceives a missing fundamental of about . The temporal theory can explain this because the peak to peak period of the second combination of frequencies is around which would be the same as a pure tone of . On the other hand, the temporal theory predicts a greater sensitivity to
the phase of a wave than we experience (under most circumstances we are unaware of the phase of a given frequency). The placetheory does not have this problem.
It is possible (and there is some evidence to support the idea) that both place and temporal mechanisms work but operate indifferent frequency regimes. The place theory seems to be the more likely mechanism for frequencies above while thetemporal theory seems to be a better explanation for frequencies under . Someone with perfect hearing can hearfrequencies up to but our sense of pitch and ability to distinguish differences in frequency gets much weaker forfrequencies above as noted in Section 8.1.3 on just noticeable differences in frequency. These features of our ear-brainsystem fit with a dual system of frequency detection. Most likely the mechanisms for both theories combine somehow to give usour perception of musical sound.
= 200 Hzf1
= 400 Hzf2 = 600 Hzf3
Note
200 Hz
A1
A1 A2
200 Hz
300 Hz 100 Hz
200 Hz 1800 Hz, 2000 Hz 2200 Hz
200 Hz 200 Hz
1860 Hz, 2060 Hz 2260 Hz 200 Hz
207 Hz
4.83 ms 207 Hz
5000 Hz
5000 Hz
20, 000 Hz
5000 Hz

Kyle Forinash and Wolfgang Christian 9.1.6.2 3/24/2022 https://phys.libretexts.org/@go/page/26228
Contributions and AttributionsThis page is licensed under a CC BY-NC-SA 3.0 license and was authored, remixed, and/or curated by Kyle Forinash andWolfgang Christian. Source content is found at https://www.compadre.org/books/SoundBook. Page content has been edited andupdated to conform to the style and standards of the LibreTexts platform. A detailed versioning history of the edits to source contentis available upon request.

Kyle Forinash and Wolfgang Christian 9.2.1 3/24/2022 https://phys.libretexts.org/@go/page/25914
9.2: BeatsThe phenomena of beats occurs when two notes are close together in frequencies and we perceive one note which varies inloudness. A guitar string can be tuned by comparing a note with a known pitch and tuning the string until the beats disappear. Whathappens if the two frequencies get further and further apart?
Contributions and AttributionsThis page is licensed under a CC BY-NC-SA 3.0 license and was authored, remixed, and/or curated by Kyle Forinash andWolfgang Christian. Source content is found at https://www.compadre.org/books/SoundBook. Page content has been edited andupdated to conform to the style and standards of the LibreTexts platform. A detailed versioning history of the edits to source contentis available upon request.
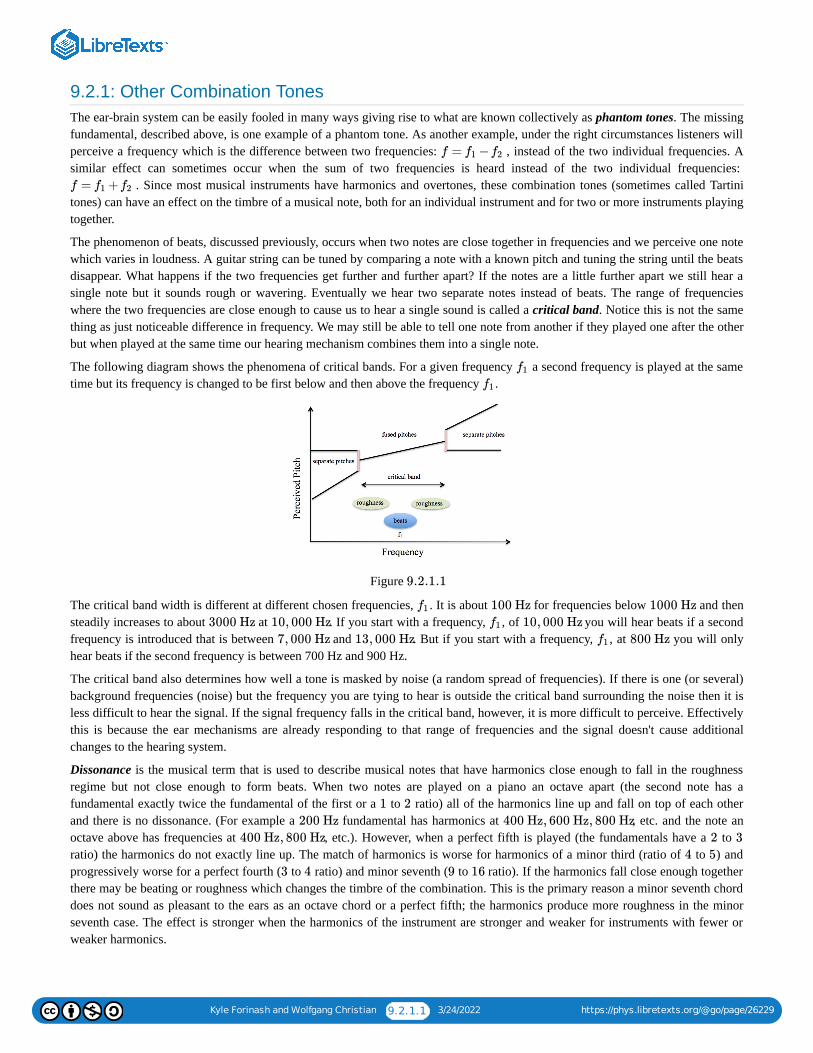
Kyle Forinash and Wolfgang Christian 9.2.1.1 3/24/2022 https://phys.libretexts.org/@go/page/26229
9.2.1: Other Combination TonesThe ear-brain system can be easily fooled in many ways giving rise to what are known collectively as phantom tones. The missingfundamental, described above, is one example of a phantom tone. As another example, under the right circumstances listeners willperceive a frequency which is the difference between two frequencies: , instead of the two individual frequencies. Asimilar effect can sometimes occur when the sum of two frequencies is heard instead of the two individual frequencies:
. Since most musical instruments have harmonics and overtones, these combination tones (sometimes called Tartinitones) can have an effect on the timbre of a musical note, both for an individual instrument and for two or more instruments playingtogether.
The phenomenon of beats, discussed previously, occurs when two notes are close together in frequencies and we perceive one notewhich varies in loudness. A guitar string can be tuned by comparing a note with a known pitch and tuning the string until the beatsdisappear. What happens if the two frequencies get further and further apart? If the notes are a little further apart we still hear asingle note but it sounds rough or wavering. Eventually we hear two separate notes instead of beats. The range of frequencieswhere the two frequencies are close enough to cause us to hear a single sound is called a critical band. Notice this is not the samething as just noticeable difference in frequency. We may still be able to tell one note from another if they played one after the otherbut when played at the same time our hearing mechanism combines them into a single note.
The following diagram shows the phenomena of critical bands. For a given frequency a second frequency is played at the sametime but its frequency is changed to be first below and then above the frequency .
Figure
The critical band width is different at different chosen frequencies, . It is about for frequencies below and thensteadily increases to about at . If you start with a frequency, , of you will hear beats if a secondfrequency is introduced that is between and . But if you start with a frequency, , at you will onlyhear beats if the second frequency is between 700 Hz and 900 Hz.
The critical band also determines how well a tone is masked by noise (a random spread of frequencies). If there is one (or several)background frequencies (noise) but the frequency you are tying to hear is outside the critical band surrounding the noise then it isless difficult to hear the signal. If the signal frequency falls in the critical band, however, it is more difficult to perceive. Effectivelythis is because the ear mechanisms are already responding to that range of frequencies and the signal doesn't cause additionalchanges to the hearing system.
Dissonance is the musical term that is used to describe musical notes that have harmonics close enough to fall in the roughnessregime but not close enough to form beats. When two notes are played on a piano an octave apart (the second note has afundamental exactly twice the fundamental of the first or a to ratio) all of the harmonics line up and fall on top of each otherand there is no dissonance. (For example a fundamental has harmonics at , etc. and the note anoctave above has frequencies at , etc.). However, when a perfect fifth is played (the fundamentals have a to ratio) the harmonics do not exactly line up. The match of harmonics is worse for harmonics of a minor third (ratio of to ) andprogressively worse for a perfect fourth ( to ratio) and minor seventh ( to ratio). If the harmonics fall close enough togetherthere may be beating or roughness which changes the timbre of the combination. This is the primary reason a minor seventh chorddoes not sound as pleasant to the ears as an octave chord or a perfect fifth; the harmonics produce more roughness in the minorseventh case. The effect is stronger when the harmonics of the instrument are stronger and weaker for instruments with fewer orweaker harmonics.
f = −f1 f2
f = +f1 f2
f1
f1
9.2.1.1
f1 100 Hz 1000 Hz
3000 Hz 10, 000 Hz f1 10, 000 Hz
7, 000 Hz 13, 000 Hz f1 800 Hz
1 2
200 Hz 400 Hz, 600 Hz, 800 Hz
400 Hz, 800 Hz 2 3
4 5
3 4 9 16
Kyle Forinash and Wolfgang Christian 9.2.1.2 3/24/2022 https://phys.libretexts.org/@go/page/26229
A more subtle from of beats, called waveform beats, can occur for a slight difference between two frequencies about an octaveapart (one frequency is twice the other). So for example, a sound and a sound together will have a oscillationin volume. This is because the octave above would have a frequency which is from the signal.Interestingly, a plus a signal is heard with a beat frequency of because the octave above is which is only difference from . The difference between the two cases has to do with the actual shape of the waveformand indicates that our ear-brain system does detect some information about the shape of the wave being heard, in addition to thefrequencies (and is best explained by the place theory of hearing). This phenomena can have a slight effect on the timbre of amusical note.
Contributions and AttributionsThis page is licensed under a CC BY-NC-SA 3.0 license and was authored, remixed, and/or curated by Kyle Forinash andWolfgang Christian. Source content is found at https://www.compadre.org/books/SoundBook. Page content has been edited andupdated to conform to the style and standards of the LibreTexts platform. A detailed versioning history of the edits to source contentis available upon request.
201 Hz 400 Hz 2 Hz
201 Hz 402 Hz 2 Hz 400 Hz
200 Hz 401 Hz 1 Hz 200 Hz 400 Hz
1 Hz 401 Hz
Kyle Forinash and Wolfgang Christian 9.2.2.1 3/24/2022 https://phys.libretexts.org/@go/page/26230
9.2.2: Beats and Critical Bands SimulationIn this simulation you can hear and see two frequencies and their combination. You can view either the red signal or the greensignal and/or their combination (in blue) using the check boxes at the top. The slider labeled adds or subtracts an amount from
to modify . The plot is what you would see on an oscilloscope connected to a microphone near the two sound sources withthese frequencies. The delay slider sets the phase difference between the two signals so that you can see how they combine atdifferent times which is equivalent to moving the microphone closer or further from the sources. The Scope menu adjust thehorizontal axis scale on the oscilloscope, allowing you to zoom in or out on the view. Time is measured in seconds.
Simulation Questions:1. Listen to the combination and and describe what you hear.2. The beat frequency is calculated by subtracting the two frequencies and taking the absolute value (to get a positive number).
What is the beat frequency for the combination and ?3. Change the Scope measurement to zoom in and out on the signal. Why does the combination wave (blue) get larger and
smaller?4. Change to be . Does the beat frequency get larger or smaller?5. Now try a frequency of for . What do you notice about the beat frequency?6. It is also possible to hear beats between notes that are nearly an octave apart (double the frequency). This is called waveform
beats. First listen to a signal and a signal. Now listen carefully to a signal and a signal (this is alittle hard to detect without earphones). Is it the same beat frequency?
7. In the previous example you should have heard a beat frequency of for the plus combination but a beat frequency for the signal added to the signal. This is because our ear/brain system hears the beatingbetween and . Now compare this to a signal added to a signal. What is the beatfrequency in this case? In this case our ear/brain system compares with and hears a beat frequencyof .
8. Reset the simulation and very slowly adjust the slider to hear different combinations. For small differences in frequency youwill hear beats. For slightly larger differences you will hear roughness (as described in the text). As the frequencies get evenfurther apart you will hear two notes (or a combination that does not sound rough). Adjust until the perception of beatsbegins to sound rough. What is at this point?
9. Now try to find the value of where the perception of roughness starts to sound like separate notes or harmonious. What valueof did you get for this transition?
10. If you repeat the previous two questions for a different starting frequency for you may get a different critical band. Try thisand describe your results.
Contributions and Attributions
This page is licensed under a CC BY-NC-SA 3.0 license and was authored, remixed, and/or curated by Kyle Forinash andWolfgang Christian. Source content is found at https://www.compadre.org/books/SoundBook. Page content has been edited andupdated to conform to the style and standards of the LibreTexts platform. A detailed versioning history of the edits to source contentis available upon request.
Δ
fA fB
Δt
= 300 HzfA = 305 HzfB
= 300 HzfA = 305 HzfB
Δt
fB 302 Hz
310 Hz fB
201 Hz 200 Hz 201 Hz 400 Hz
1 Hz 201 Hz 200 Hz 2 Hz
201 Hz 400 Hz
2 ×201 = 402 Hz 400 Hz 200 Hz 401 Hz
2 ×200 = 400 Hz 401 Hz
1 Hz
Δ
Δ
Δ
Δ
Δ
fA
Kyle Forinash and Wolfgang Christian 9.2.3.1 3/24/2022 https://phys.libretexts.org/@go/page/26231
9.2.3: Other Interesting Auditory PhenomenaMost musical instruments produce a combination of frequencies that change in amplitude as the note is played. These transitorypitches are called attack frequencies and they sometimes enable us to tell the difference between different instruments. Whenmusic is played backwards, particularly on stringed instruments it often sounds very strange because the attack frequencies occur inthe wrong place. Our perception of timbre is determined not only by harmonics, intensity and duration as we have discussedpreviously, but also by the attack frequencies. Here are YouTubes of a piano played backwards; one, two.
The following is a list of other examples where our ears are fooled into perceiving something that isn't actually present. Definitionsand examples of several of them can be found at Wikipedia or Richard Waren's site.
Many of these effects can only be heard using high quality headphones.
Shepard's Illusion. The illusion of a continuously rising (or falling) scale of notes. YouTube example. The continuous versionof Shepard's Illusion is called the Risset rhythm.The Octave Illusion. Two notes an octave apart are played alternating back and forth between each ear (eg. to left ear,
to right ear, then switch). Most listeners perceive a the low tone in one ear and a high frequency tone in the other(instead of back and forth). Which ear depends on handedness (right handed people hear the high note in the right ear).Wikipedia (with sound sample).Deutsch's Scale Illusion. If a two different patterns of notes which alternate up and down in pitch are played simultaneously toeach ear the perception of a rising scale is heard.Glissando illusion. An instrument or voice can be made to appear to change from one side of a stereo output to the other bysimultaneously playing a sine wave that is shifting in pitch.Continuity of Tones. If you interrupt a continuous rising tone with a brief burst of noise your perception will be that the tonedid not stop during the break.McGurk effect. Your vision affects what you think you hear. For example if you see a set of lips forming the sound "ga" whileyou are hearing the sound "ba" you will perceive the sound "da". There are many other examples where visual clues affect whatyou think you hear; YouTube example.Context effects. The sound immediately preceding a sound may affect the how the second sound is perceived. For example "al"plus "da" sounds like "al ga" but "ar" plus "da" sounds like "ar da". Similar to this is prior information affects what you hear:YouTube exampleChromatic Auditory Illusion. Alternating pitches may be perceived as two scales going in opposite directions.Melody illusion. Keeping the same notes but changing their octave can make a melody unrecognizable; YouTube example.
Video/Audio examples:Many auditory illusions are demonstrated in YouTube videos.The Auditory Neuroscience Website is a wonderful source of sound samples and videos of various auditory illusions,demonstrations of acoustic phenomena and indepth discussions of hearing loss.List of auditory examples demonstrated in class.A list of auditory CDs along with a description of each. You may be able to find others in a search on Amazon.Sonification is the process of making data audible in order to detect patterns in a large data set. Technical link: SonificaitonHandbook.
Contributions and AttributionsThis page is licensed under a CC BY-NC-SA 3.0 license and was authored, remixed, and/or curated by Kyle Forinash andWolfgang Christian. Source content is found at https://www.compadre.org/books/SoundBook. Page content has been edited andupdated to conform to the style and standards of the LibreTexts platform. A detailed versioning history of the edits to source contentis available upon request.
Note
400 Hz
800 Hz
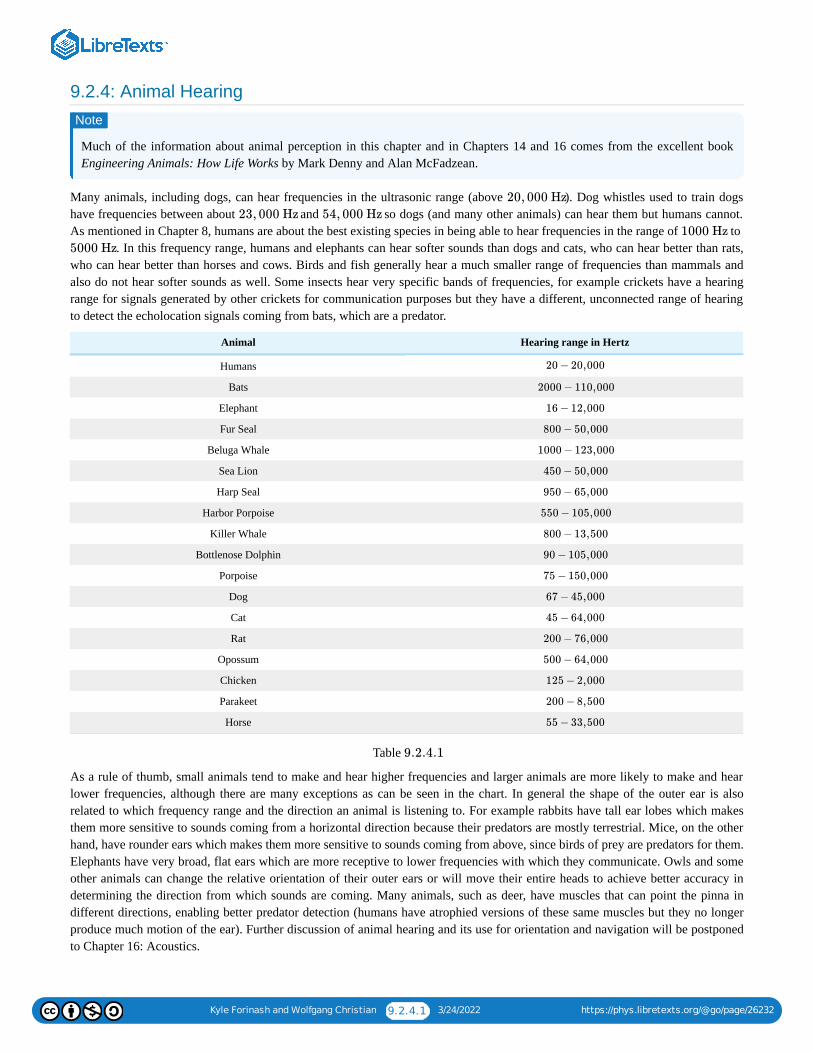
Kyle Forinash and Wolfgang Christian 9.2.4.1 3/24/2022 https://phys.libretexts.org/@go/page/26232
9.2.4: Animal Hearing
Much of the information about animal perception in this chapter and in Chapters 14 and 16 comes from the excellent bookEngineering Animals: How Life Works by Mark Denny and Alan McFadzean.
Many animals, including dogs, can hear frequencies in the ultrasonic range (above ). Dog whistles used to train dogshave frequencies between about and so dogs (and many other animals) can hear them but humans cannot.As mentioned in Chapter 8, humans are about the best existing species in being able to hear frequencies in the range of to
. In this frequency range, humans and elephants can hear softer sounds than dogs and cats, who can hear better than rats,who can hear better than horses and cows. Birds and fish generally hear a much smaller range of frequencies than mammals andalso do not hear softer sounds as well. Some insects hear very specific bands of frequencies, for example crickets have a hearingrange for signals generated by other crickets for communication purposes but they have a different, unconnected range of hearingto detect the echolocation signals coming from bats, which are a predator.
Animal Hearing range in Hertz
Humans
Bats
Elephant
Fur Seal
Beluga Whale
Sea Lion
Harp Seal
Harbor Porpoise
Killer Whale
Bottlenose Dolphin
Porpoise
Dog
Cat
Rat
Opossum
Chicken
Parakeet
Horse
Table
As a rule of thumb, small animals tend to make and hear higher frequencies and larger animals are more likely to make and hearlower frequencies, although there are many exceptions as can be seen in the chart. In general the shape of the outer ear is alsorelated to which frequency range and the direction an animal is listening to. For example rabbits have tall ear lobes which makesthem more sensitive to sounds coming from a horizontal direction because their predators are mostly terrestrial. Mice, on the otherhand, have rounder ears which makes them more sensitive to sounds coming from above, since birds of prey are predators for them.Elephants have very broad, flat ears which are more receptive to lower frequencies with which they communicate. Owls and someother animals can change the relative orientation of their outer ears or will move their entire heads to achieve better accuracy indetermining the direction from which sounds are coming. Many animals, such as deer, have muscles that can point the pinna indifferent directions, enabling better predator detection (humans have atrophied versions of these same muscles but they no longerproduce much motion of the ear). Further discussion of animal hearing and its use for orientation and navigation will be postponedto Chapter 16: Acoustics.
Note
20, 000 Hz
23, 000 Hz 54, 000 Hz
1000 Hz
5000 Hz
20 − 20,000
2000 − 110,000
16 − 12,000
800 − 50,000
1000 − 123,000
450 − 50,000
950 − 65,000
550 − 105,000
800 − 13,500
90 − 105,000
75 − 150,000
67 − 45,000
45 − 64,000
200 − 76,000
500 − 64,000
125 − 2,000
200 − 8,500
55 − 33,500
9.2.4.1
Kyle Forinash and Wolfgang Christian 9.2.4.2 3/24/2022 https://phys.libretexts.org/@go/page/26232
Video/audio examples:Article by Peter L. Tyack in Physics Today about Human-generated sound and marine mammals.
SummaryThe ear is composed of three main parts. The shape of the outer ear gives us information about the direction sound is coming fromand funnels sound into the middle ear. The middle ear overcomes the impedance mismatch between air and liquid and transmitssound to the cochlea via the ossicles. The cochlea gives us our sense of balance and turns mechanical vibrations into nerveimpulses. There are two theories of hearing, the place theory and the temporal theory. Neither can account for the richness of ourperception of sound such as the missing fundamental, critical bands or other interesting aural illusions. Both theories may operatebut in different frequency ranges. Age related hearing loss, presbycusis, generally lowers the loudness of high frequencies as wegrow older. Loud sounds can also cause either conductive or sensorineural hearing loss.
Questions on Perception:1. What does the fundamental frequency of an instrument determine?2. Explain the difference between subjective measures of pitch, loudness and timbre as compared to the objective measurements of
fundamental frequency, sound intensity and waveform.3. Describe the structure of the outer ear, middle ear and inner ear. What is the function of each of these sections of the ear?4. What is the function of the pinnae?5. What do the ossicles in the middle ear do?6. What does the cochlea do besides turn sound into nerve impulses?7. What are the two types of hair cells (in the cochlea) and what does each do?8. What is the basilar membrane and what does it do?9. What is impedance mismatch? Why is this significant in the context of the ear?
10. How does the structure of the ear overcome the impedance mismatch between the air at the eardrum and the fluid in thecochlea?
11. Explain the place theory of hearing.12. Explain the temporal theory of hearing.13. Why do we have two theories of hearing?14. What is virtual pitch (missing fundamental)?15. An ear bud for a cell phone cannot produce a low frequency, long wavelength sound wave of . Yet we perceive this
frequency when we listen to music through an ear bud. How does this work?16. There are two uses of the word ‘beats’ in sound. One has to do with the rhythm of the music. The other has to do with
something that happens when two notes near the same frequency are played together. Explain the second use of the word‘beats’.
17. Explain the concept of critical bands for two notes that are close together in frequency played at the same time.18. What is dissonance? How would you demonstrate this if you had a way to make several different frequencies (like the critical
band simulation)?19. What are attack frequencies? What effect do they have on our perception of an instruments timbre?20. What are the two main causes of hearing loss?21. What are the two main types of hearing loss?22. What is presbycusis, why does it happen and what are the results?23. Which type of hearing loss can be corrected by surgery?24. What can go wrong in the middle ear to cause hearing loss?25. What can go wrong in the cochlea to cause hearing loss?26. Pick two the following auditory illusions and explain them:
a. Shepard’s illusionb. octave illusionc. Deutsch's Scale Illusiond. glissando illusione. McGurk effectf. melody illusion.
50 Hz

Kyle Forinash and Wolfgang Christian 9.2.4.3 3/24/2022 https://phys.libretexts.org/@go/page/26232
Contributions and AttributionsThis page is licensed under a CC BY-NC-SA 3.0 license and was authored, remixed, and/or curated by Kyle Forinash andWolfgang Christian. Source content is found at https://www.compadre.org/books/SoundBook. Page content has been edited andupdated to conform to the style and standards of the LibreTexts platform. A detailed versioning history of the edits to source contentis available upon request.
1 3/24/2022
CHAPTER OVERVIEW10: STRINGS
In this chapter we start with resonance on a string and then look at resonances on two dimensional surfaces. A brief introduction of threedimensional resonance in an enclosed volume is given and will be expanded on in Chapter 16 on Acoustics. Once the basic behavior ofwaves on a string, surfaces and in an enclosed volume are examined we look at how these principles end up explaining how stringedinstruments such as guitars and violins work.
KEY TERMS:
String resonance, nodes, anti-nodes, fundamental, harmonics, partials, overtones, conservation of energy (again!), nodal lines, holographicinterferometry, Helmholtz resonance, f hole, bridge, wolf tone, sound post, bass bar, plectrum, tangent, piano sound board.
10.1: DRIVEN STRING AND RESONANCE
10.1.1: STRING RESONANCE10.1.2: DRIVEN STRING SIMULATION10.2: PLUCKED STRING
10.2.1: PLUCKED STRING10.2.2: PLUCKED STRING SIMULATION10.3: VIBRATING PLATES SIMULATION
10.3.1: SURFACE RESONANCES10.3.2: VIBRATING PLATE SIMULATION10.3.3: OTHER SURFACES10.3.4: VOLUME OR HELMHOLTZ RESONANCE10.3.5: STRINGED INSTRUMENTS

Kyle Forinash and Wolfgang Christian 10.1.1 3/24/2022 https://phys.libretexts.org/@go/page/25920
10.1: Driven String and ResonanceIn this simulation a string is driven at one end by an oscillating driver. The result is that a wave will eventually form on the string.At certain frequencies the wave will become large and we refer to this resonance phenomena as a standing wave.
Contributions and AttributionsThis page is licensed under a CC BY-NC-SA 3.0 license and was authored, remixed, and/or curated by Kyle Forinash andWolfgang Christian. Source content is found at https://www.compadre.org/books/SoundBook. Page content has been edited andupdated to conform to the style and standards of the LibreTexts platform. A detailed versioning history of the edits to source contentis available upon request.
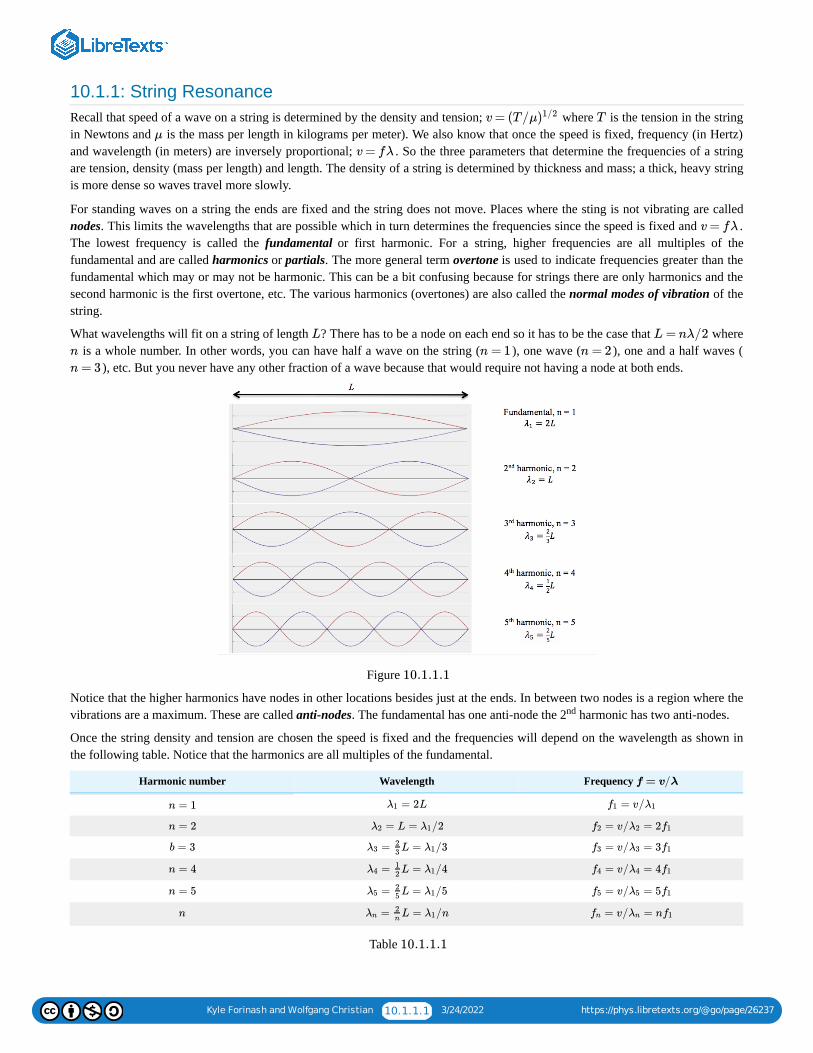
Kyle Forinash and Wolfgang Christian 10.1.1.1 3/24/2022 https://phys.libretexts.org/@go/page/26237
10.1.1: String ResonanceRecall that speed of a wave on a string is determined by the density and tension; where is the tension in the stringin Newtons and is the mass per length in kilograms per meter). We also know that once the speed is fixed, frequency (in Hertz)and wavelength (in meters) are inversely proportional; . So the three parameters that determine the frequencies of a stringare tension, density (mass per length) and length. The density of a string is determined by thickness and mass; a thick, heavy stringis more dense so waves travel more slowly.
For standing waves on a string the ends are fixed and the string does not move. Places where the sting is not vibrating are callednodes. This limits the wavelengths that are possible which in turn determines the frequencies since the speed is fixed and .The lowest frequency is called the fundamental or first harmonic. For a string, higher frequencies are all multiples of thefundamental and are called harmonics or partials. The more general term overtone is used to indicate frequencies greater than thefundamental which may or may not be harmonic. This can be a bit confusing because for strings there are only harmonics and thesecond harmonic is the first overtone, etc. The various harmonics (overtones) are also called the normal modes of vibration of thestring.
What wavelengths will fit on a string of length ? There has to be a node on each end so it has to be the case that where is a whole number. In other words, you can have half a wave on the string ( ), one wave ( ), one and a half waves (
), etc. But you never have any other fraction of a wave because that would require not having a node at both ends.
Figure
Notice that the higher harmonics have nodes in other locations besides just at the ends. In between two nodes is a region where thevibrations are a maximum. These are called anti-nodes. The fundamental has one anti-node the 2 harmonic has two anti-nodes.
Once the string density and tension are chosen the speed is fixed and the frequencies will depend on the wavelength as shown inthe following table. Notice that the harmonics are all multiples of the fundamental.
Harmonic number Wavelength Frequency
Table
v = (T/μ)1/2 T
μ
v = fλ
v = fλ
L L = nλ/2
n n = 1 n = 2
n = 3
10.1.1.1
nd
f = v/λ
n = 1 = 2Lλ1 = v/f1 λ1
n = 2 = L = /2λ2 λ1 = v/ = 2f2 λ2 f1
b = 3 = L = /3λ323 λ1 = v/ = 3f3 λ3 f1
n = 4 = L = /4λ412 λ1 = v/ = 4f4 λ4 f1
n = 5 = L = /5λ525 λ1 = v/ = 5f5 λ5 f1
n = L = /nλn2n
λ1 = v/ = nfn λn f1
10.1.1.1
Kyle Forinash and Wolfgang Christian 10.1.1.2 3/24/2022 https://phys.libretexts.org/@go/page/26237
In Chapter 4 we defined resonance to be the case when the amplitude of vibration got larger because the driving frequency matchedthe natural frequency. Here we see there are many natural frequencies. This means there are many resonance frequencies. For astring these are all harmonics (whole number multiples) of the fundamental. In a real string that is plucked or bowed, it is often thecase that several of these resonance frequencies are present at the same time. This means that musical instruments usually producenot only a fundamental, but also harmonics that give the instrument its timbre.
Contributions and AttributionsThis page is licensed under a CC BY-NC-SA 3.0 license and was authored, remixed, and/or curated by Kyle Forinash andWolfgang Christian. Source content is found at https://www.compadre.org/books/SoundBook. Page content has been edited andupdated to conform to the style and standards of the LibreTexts platform. A detailed versioning history of the edits to source contentis available upon request.
Kyle Forinash and Wolfgang Christian 10.1.2.1 3/24/2022 https://phys.libretexts.org/@go/page/26239
10.1.2: Driven String SimulationIn this simulation a string is driven on one end by an oscillating driver. We can imagine the string as if it were made up of a row ofidentical oscillating masses, each undergoing simple harmonic motion (just like the row of masses in the transverse wavesimulation). Because the string is driven from one end, each successive mass in the row will start later than the one before it (inother words each mass is slightly out of phase with its neighbor). The result is a wave will eventually form on the string.
As we know from the chapter on resonance, if a mass is driven at its natural frequency, its amplitude will increase to a maximum.So the masses that make up the wave on the string will have the largest amplitude only when driven at resonance. When resonanceoccurs the string has the largest amplitude standing wave on it.
There is one slight complication in this picture, however. There is more than one way for the phases between the masses to occurand still have the masses in resonance. These other resonances occur at multiples of the fundamental resonance frequency and arecalled harmonics.
Simulation Questions:1. Start the simulation and wait a few seconds. This is the fundamental (resonance) frequency. What is the period of the wave?
(Use the step button and the time to find the period.) What is the frequency of the wave? Is this the same number as the drivingfrequency?
2. The length of the string is . What is the wavelength of the fundamental frequency?3. Reset the simulation and change the driving frequency to . How does the amplitude compare to when the driving
frequency is ?4. Reset the simulation, set the driving frequency to and increase the driving amplitude to . Is the amplitude of the
wave larger than when the driving frequency is ? Explain.5. Reset the simulation and change the driving frequency to . How does the amplitude compare to when the driving
frequency is ?6. Now try a driving frequency of . How does the amplitude compare to when the driving frequency is or ?7. This frequency, , is the second harmonic; the masses are again in resonance but with different phases. What is the
wavelength of the second harmonic?8. Find the frequencies for the third and fourth harmonics. What are they?9. What are the wavelengths for the third and fourth harmonics?
Contributions and Attributions
This page is licensed under a CC BY-NC-SA 3.0 license and was authored, remixed, and/or curated by Kyle Forinash andWolfgang Christian. Source content is found at https://www.compadre.org/books/SoundBook. Page content has been edited andupdated to conform to the style and standards of the LibreTexts platform. A detailed versioning history of the edits to source contentis available upon request.
100 cm
0.3 Hz
0.4 Hz
0.3 Hz 0.09 cm
0.4 Hz
0.6 Hz
0.4 Hz
0.8 Hz 0.3 Hz 0.6 Hz
0.8 Hz
Kyle Forinash and Wolfgang Christian 10.2.1 3/24/2022 https://phys.libretexts.org/@go/page/25921
10.2: Plucked StringIn this section a set of initial conditions for a vibrating string is shown. The first is the fundamental frequency of the string, thesecond is the second harmonic. The third and fourth initial conditions simulate plucking in the center and at a location one fourth ofthe way along the string.
Contributions and AttributionsThis page is licensed under a CC BY-NC-SA 3.0 license and was authored, remixed, and/or curated by Kyle Forinash andWolfgang Christian. Source content is found at https://www.compadre.org/books/SoundBook. Page content has been edited andupdated to conform to the style and standards of the LibreTexts platform. A detailed versioning history of the edits to source contentis available upon request.
Kyle Forinash and Wolfgang Christian 10.2.1.1 3/24/2022 https://phys.libretexts.org/@go/page/26240
10.2.1: Plucked StringGenerally strings are either plucked or bowed. In both cases the string does not undergo the simple scenario of harmonics describedabove. Plucking a string at the center does not cause a nicely shaped sinusoidal wave; instead you start with a triangle shape on thestring.
But we know from Fourier's work that any repeating shape can be formed from a series of sine waves. Plucking a string at thecenter emphasizes the fundamental but many other harmonics will be included. Plucking the string at a location one fourth of theway along the string makes the second harmonic a bit louder but other harmonics will still be present. The result of plucking(starting with a triangle shape) and plucking at different locations means the spectrum is not uniform; where you pluck the stringdetermines which harmonics are emphasized.
In the plucked case the triangle shape immediately converts into a combination of sines and cosines, some of which die awayquickly. If the string is bowed, however, the triangle wave is maintained since the bow continues to pull the string to one side at thepoint of contact. The triangle shaped wave travels to the bridge, reflects, and returns to the bow contact location. When the point ofthe triangle shape returns to the bow it causes the string to break loose from the bow. The wave continues and reflects off the fretend, returning to the bow again, now causing the string to stick to the bow. This slip-stick mechanism maintains a triangle shapedwave moving on the string, reflecting from each end. Once again, changing the location of the bow contact determines whichharmonics are emphasized.
Video/audio examples:A YouTube of a standing waves on a driven string.Wikipedia on string resonance (lists many types of stringed instruments.A few stringed instruments, such as the Indian sitar have sympathetic strings. These are extra strings that are not normallyplayed by the musician but vibrate due to resonance because they are tuned to the strings that are plucked or bowed.Slow motion YouTube of a bowed string.Slow motion YouTube of a plucked string.
Contributions and Attributions
This page is licensed under a CC BY-NC-SA 3.0 license and was authored, remixed, and/or curated by Kyle Forinash andWolfgang Christian. Source content is found at https://www.compadre.org/books/SoundBook. Page content has been edited andupdated to conform to the style and standards of the LibreTexts platform. A detailed versioning history of the edits to source contentis available upon request.
Kyle Forinash and Wolfgang Christian 10.2.2.1 3/24/2022 https://phys.libretexts.org/@go/page/26241
10.2.2: Plucked String SimulationIn this simulation a set of initial conditions for a vibrating string can be chosen. The first is the fundamental frequency of the string,the second is the second harmonic. The third and fourth initial conditions simulate plucking in the center and at a location onefourth of the way along the string.
Simulation Questions:1. Run the fundamental and second harmonic initial conditions. How are standing waves formed on a string?2. How many sine wave Fourier components are present in the case of the fundamental?3. Which Fourier components are present if the string vibrates in the second harmonic mode?4. Now look at the case of the string plucked in the center. What is the initial shape? Based on your experience with the triangle
wave forms in the Waveform simulation in Chapter 9, do you expect the string plucked at the center to sound different from thefundamental or second harmonic? Explain.
5. Now look at the case of the string plucked off-center. Which wave is this similar to in the Waveform simulation in Chapter 9?6. Based on what you know from the Fourier simulation in Chapter 9, what would you expect the Fourier components to look
like? (Hint; Do Fourier simulation question seven.)7. Based on your experience with listening to the wave forms in the Waveform simulation in Chapter 9, do you expect the string
plucked off-center to sound different from the fundamental or second harmonic? Will it sound different from the string pluckedin the center? Explain.
Contributions and Attributions
This page is licensed under a CC BY-NC-SA 3.0 license and was authored, remixed, and/or curated by Kyle Forinash andWolfgang Christian. Source content is found at https://www.compadre.org/books/SoundBook. Page content has been edited andupdated to conform to the style and standards of the LibreTexts platform. A detailed versioning history of the edits to source contentis available upon request.
Kyle Forinash and Wolfgang Christian 10.3.1 3/24/2022 https://phys.libretexts.org/@go/page/25922
10.3: Vibrating Plates SimulationThe Vibrating Plates simulation examines vibrational modes on a rectangular surface. The surface is fixed at the edges so the nodallines occur in different places compared to a rectangle with free edges. The model assumes that the surface is very thin and veryflexible; real surfaces which are stiffer will have slightly different nodal lines and anti-nodes.
Contributions and AttributionsThis page is licensed under a CC BY-NC-SA 3.0 license and was authored, remixed, and/or curated by Kyle Forinash andWolfgang Christian. Source content is found at https://www.compadre.org/books/SoundBook. Page content has been edited andupdated to conform to the style and standards of the LibreTexts platform. A detailed versioning history of the edits to source contentis available upon request.
Kyle Forinash and Wolfgang Christian 10.3.1.1 3/24/2022 https://phys.libretexts.org/@go/page/26242
10.3.1: Surface ResonancesIf you fix a string at both ends in free space with no resonating body attached to it the string does not make very much sound.Connecting the string to a surface that vibrates allows the energy of the string to move to the surface and cause it to vibrate. A largesurface can move much more air, resulting in a much louder sound.
You might think this violates conservation of energy; a vibrating string in air doesn't produce much sound but a string attached to asurface does. But conservation of energy is a fundamental law of physics that can't be broken. So what is happening? If you timehow long a free string vibrates and compare it to how long it will vibrate if attached to a surface you find something interesting.When attached to a surface the string's vibrations die away much more rapidly. In other words, because the energy is being used tocreate lots of sound, it dissipates much faster. A free string can vibrate longer because it doesn't dissipate it's energy making sound.
Vibrating strings have resonances with different numbers of nodal points, places on the string which do not vibrate. These dependon the driving frequency. A similar thing happens with surfaces; there are resonance frequencies which result in places where notmuch vibration occurs. These locations are linked together in nodal lines which depend on the shape and thickness of the surface.One way to see these lines is to drive the surface with an oscillator and put powder or salt on the surface. The powder will notmove from the nodal line but will be thrown off of the anti-nodal regions, as shown in the following example.
Video/audio examples:Chladni plate. Notice that as the frequency is increased different nodal lines occur, just like different nodes occurred on thestring at different frequencies. If you listen carefully to this video you can hear that there is more sound when the plate reaches aresonance. This is because the amplitude is larger at the resonance frequency (as expected).Flat plates of various shapes called Bell plates, tuned to specific frequencies, have long been used as inexpensive substitutes forbells.
We know that stringed instruments have harmonic frequencies which are multiples of the fundamental. This is the case because thestring is a fixed length; the longest wave that can exist on the string (with fixed ends) has a wavelength that is twice the length ofthe string. The next wavelength that can fit is the exact length of the string; the next wavelength that will fit is times the lengthof the string and so on as we saw previously in the chapter on stringed instruments. Wavelengths in between these would not have anode at both ends and so can't exist on the string. Each of these different ways of vibrating is labeled by the number ; thefundamental is labeled , the second harmonic is labeled , etc. This number, called the mode number indicates howmany anti-nodes are on the string.
Surfaces of various shapes (round, rectangular, square) however, are two dimensional and so will require two mode numbers, and, to label each mode of vibration. For a rectangular surface fixed at the edges we can label the two dimensions as and and
there are sine wave shapes in the -direction and in the -direction with nodes at the edges, just like a string, as shown in thefollowing simulation.
Contributions and AttributionsThis page is licensed under a CC BY-NC-SA 3.0 license and was authored, remixed, and/or curated by Kyle Forinash andWolfgang Christian. Source content is found at https://www.compadre.org/books/SoundBook. Page content has been edited andupdated to conform to the style and standards of the LibreTexts platform. A detailed versioning history of the edits to source contentis available upon request.
1.5
n
n = 1 n = 2
n
m x y
x y
Kyle Forinash and Wolfgang Christian 10.3.2.1 3/24/2022 https://phys.libretexts.org/@go/page/26243
10.3.2: Vibrating Plate SimulationThis simulation allows you to examine vibrational modes on a rectangular surface. In this case, unlike the Chladni plate in thevideo, the surface is fixed at the edges so the nodal lines occur in different places compared to a rectangle with free edges. Thissimulation also models a surface that is very thin and very flexible (a membrane); real surfaces which are stiffer will have slightlydifferent nodal lines and anti-nodes. The effect is very similar, however. Free edged surfaces, thin flexible surfaces and thick stiffsurfaces all have nodal lines and anti-node areas.
The buttons at the top allow you to see the first few pure modes. The custom button allows you to look at higher pure modes and toadd several modes together. To see a higher order pure mode in the simulation, click the reset button, click the custom button,choose and , enter (so the yellow disappears) and click 'add'. If you do not click the reset first button the selected mode getsadded to the modes that are already present. The simulation can be viewed as a two dimensional surface or as a surface in threedimensions. In the 3D view you can grab the surface with the mouse and rotate it. The amplitudes of the vibrations are exaggeratedcompared to a real surface to make them more visible. Increasing makes the simulation run faster but also less accurately,particularly for higher mode numbers.
The relative mode amplitudes in the case of more than one mode are not properly normalized in this simulation.
Simulation Questions:1. Describe the mode in the surface view and in the 3D view. If you sliced through the middle of the surface in the
-direction, which string mode would it look like? How about in the -direction?2. What is the frequency of the mode? What is the period?3. Describe the mode in the surface and 3D view. (Don't forget you can rotate the view using the mouse to get a
better angle.) Now if you slice along the -direction in the middle of the surface which string mode does it look like?4. For the and mode, how many anti-nodes are along the -direction? How many anti-nodes are along the -
direction? Describe the location of the nodal line located.5. What is the frequency of the mode? How does this compare to the fundamental frequency? Is this a harmonic?
How do you know?6. Now look at the and mode and describe the motion in the surface and 3D view. What is the frequency of this
mode? How does this compare to the and mode frequency? This is an example of degeneracy; two differentmodes end up with the same frequency because of the symmetrical nature of the system.
7. Look at the and mode. For a slice in the -direction a quarter of the way up the -axis, what string mode does thislook like?
8. Where are the nodal lines for the mode?9. What is the frequency of the mode? How does this compare to the and mode frequency? Is the
mode a harmonic?10. Now look at other pure modes by choosing the custom button, selecting and , 'enter' and 'add'. To change to a different pure
mode, click reset before each 'add'. Try to find other cases of degeneracy. Which combinations of and are degenerate?11. Find the number of anti-nodes in the -direction and in the -direction for the and pure mode (don't forget to
click reset before adding the values of and ).12. Describe the nodal lines for the and pure mode.13. If you do NOT click reset before adding a mode, the mode gets added to whatever modes are already present on the surface.
Add the and mode to the and mode. Describe what you see in the surface view and the 3D view.14. Add several higher modes (don't hit reset in between). What is the effect of having lots of different modes on the surface at the
same time?
Contributions and AttributionsThis page is licensed under a CC BY-NC-SA 3.0 license and was authored, remixed, and/or curated by Kyle Forinash andWolfgang Christian. Source content is found at https://www.compadre.org/books/SoundBook. Page content has been edited andupdated to conform to the style and standards of the LibreTexts platform. A detailed versioning history of the edits to source contentis available upon request.
n m
Δt
Note
n = 1, m = 1
x y
n = 1, m = 1
n = 2, m = 1
x
n = 2 m = 1 x y
n = 2, m = 1
n = 1 m = 2
n = 2 m = 1
n = 2 m = 2 x y
n = 2, m = 2
n = 2, m = 2 n = 2 m = 1
n = 2, m = 2
n m
n m
x y n = 3 m = 2
n m
n = 3 m = 2
n = 1 m = 1 n = 2 m = 2
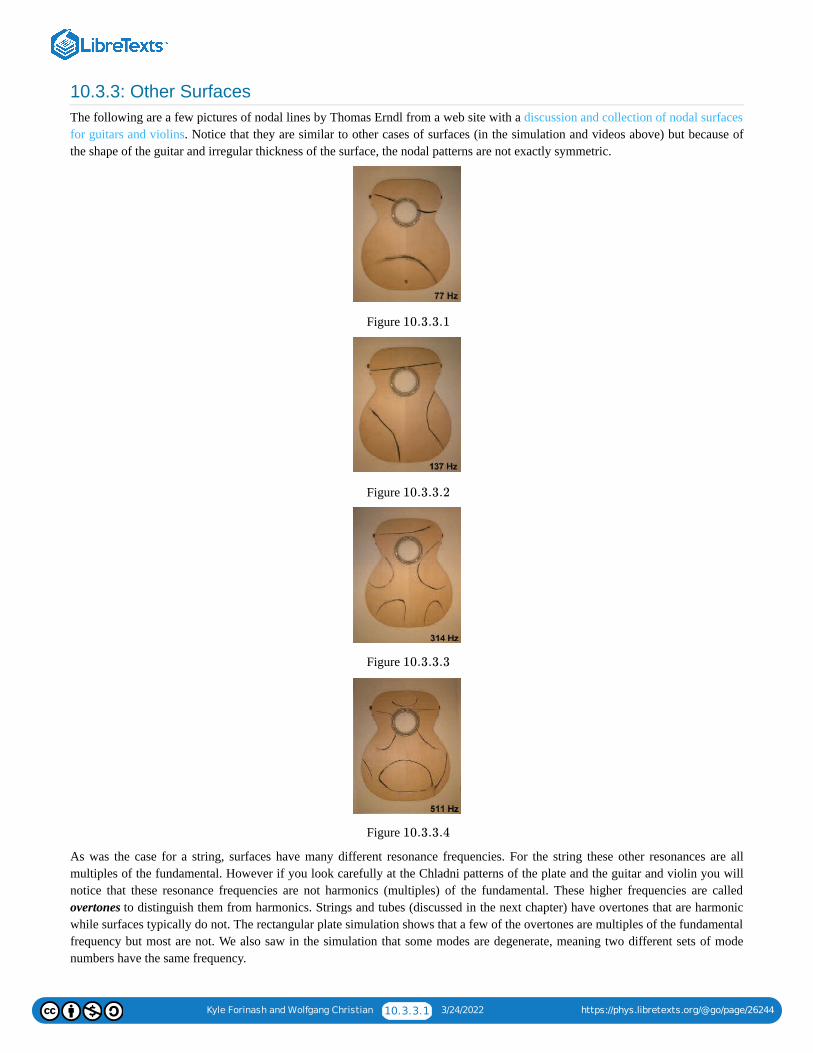
Kyle Forinash and Wolfgang Christian 10.3.3.1 3/24/2022 https://phys.libretexts.org/@go/page/26244
10.3.3: Other SurfacesThe following are a few pictures of nodal lines by Thomas Erndl from a web site with a discussion and collection of nodal surfacesfor guitars and violins. Notice that they are similar to other cases of surfaces (in the simulation and videos above) but because ofthe shape of the guitar and irregular thickness of the surface, the nodal patterns are not exactly symmetric.
Figure
Figure
Figure
Figure
As was the case for a string, surfaces have many different resonance frequencies. For the string these other resonances are allmultiples of the fundamental. However if you look carefully at the Chladni patterns of the plate and the guitar and violin you willnotice that these resonance frequencies are not harmonics (multiples) of the fundamental. These higher frequencies are calledovertones to distinguish them from harmonics. Strings and tubes (discussed in the next chapter) have overtones that are harmonicwhile surfaces typically do not. The rectangular plate simulation shows that a few of the overtones are multiples of the fundamentalfrequency but most are not. We also saw in the simulation that some modes are degenerate, meaning two different sets of modenumbers have the same frequency.
10.3.3.1
10.3.3.2
10.3.3.3
10.3.3.4
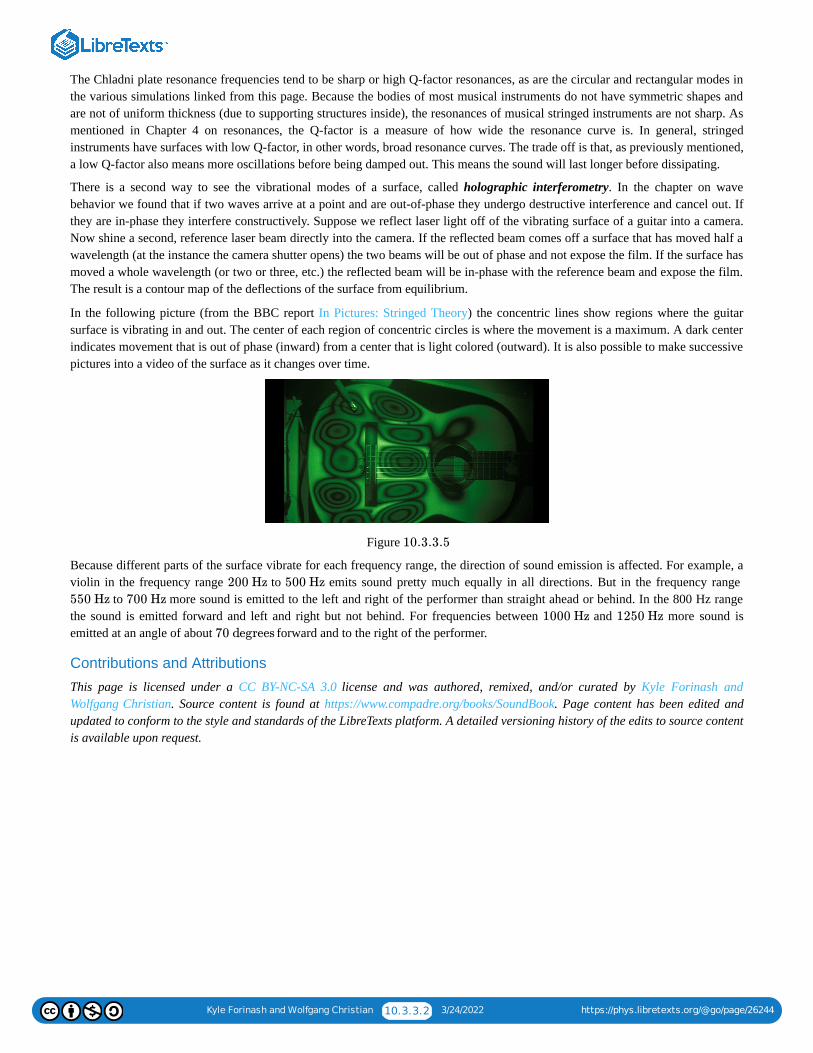
Kyle Forinash and Wolfgang Christian 10.3.3.2 3/24/2022 https://phys.libretexts.org/@go/page/26244
The Chladni plate resonance frequencies tend to be sharp or high Q-factor resonances, as are the circular and rectangular modes inthe various simulations linked from this page. Because the bodies of most musical instruments do not have symmetric shapes andare not of uniform thickness (due to supporting structures inside), the resonances of musical stringed instruments are not sharp. Asmentioned in Chapter 4 on resonances, the Q-factor is a measure of how wide the resonance curve is. In general, stringedinstruments have surfaces with low Q-factor, in other words, broad resonance curves. The trade off is that, as previously mentioned,a low Q-factor also means more oscillations before being damped out. This means the sound will last longer before dissipating.
There is a second way to see the vibrational modes of a surface, called holographic interferometry. In the chapter on wavebehavior we found that if two waves arrive at a point and are out-of-phase they undergo destructive interference and cancel out. Ifthey are in-phase they interfere constructively. Suppose we reflect laser light off of the vibrating surface of a guitar into a camera.Now shine a second, reference laser beam directly into the camera. If the reflected beam comes off a surface that has moved half awavelength (at the instance the camera shutter opens) the two beams will be out of phase and not expose the film. If the surface hasmoved a whole wavelength (or two or three, etc.) the reflected beam will be in-phase with the reference beam and expose the film.The result is a contour map of the deflections of the surface from equilibrium.
In the following picture (from the BBC report In Pictures: Stringed Theory) the concentric lines show regions where the guitarsurface is vibrating in and out. The center of each region of concentric circles is where the movement is a maximum. A dark centerindicates movement that is out of phase (inward) from a center that is light colored (outward). It is also possible to make successivepictures into a video of the surface as it changes over time.
Figure
Because different parts of the surface vibrate for each frequency range, the direction of sound emission is affected. For example, aviolin in the frequency range to emits sound pretty much equally in all directions. But in the frequency range
to more sound is emitted to the left and right of the performer than straight ahead or behind. In the 800 Hz rangethe sound is emitted forward and left and right but not behind. For frequencies between and more sound isemitted at an angle of about forward and to the right of the performer.
Contributions and Attributions
This page is licensed under a CC BY-NC-SA 3.0 license and was authored, remixed, and/or curated by Kyle Forinash andWolfgang Christian. Source content is found at https://www.compadre.org/books/SoundBook. Page content has been edited andupdated to conform to the style and standards of the LibreTexts platform. A detailed versioning history of the edits to source contentis available upon request.
10.3.3.5
200 Hz 500 Hz
550 Hz 700 Hz
1000 Hz 1250 Hz
70 degrees
Kyle Forinash and Wolfgang Christian 10.3.4.1 3/24/2022 https://phys.libretexts.org/@go/page/26245
10.3.4: Volume or Helmholtz ResonanceRooms, containers and many instruments have a confined volume of air of a certain size. If a small opening is made in a containeror a window opened in a room the air can oscillate with a frequency that depends on the size of the container or room. Thefundamental frequency produced is referred to as Helmholtz resonance, as mentioned in Chapter 4. If you have ever blown acrossthe top of a soft drink bottle to get a note you have excited a Helmholtz resonance. Another example is when you drive your car atjust the right speed with one window partly opened and you hear a low frequency sound.
For a rectangular container the walls are parallel to each other and we can describe the higher frequency modes of the container asstanding waves in three dimensions, much like the standing waves on a guitar string. As shown above, for a string the overtones aregiven by where is the length of the string, is the speed of a wave on the string and is the modenumber. Extending this to three dimensions, the equation for frequency modes inside a rectangular container with height , length
and width is . Now there are three different mode numbers since sound cantravel in three directions. You can explore these modes in this box modes simulation Applet by Paul Falstad (notice you can graband rotate the box to see different modes from different angles).
Acoustic stringed instruments have a body that contains a volume of air and air holes in the body so that this air can resonate. Theshapes are much more complicated than a rectangular box but there are still resonance modes. Along with the surface resonancesthese volume resonances modify the string harmonics to give an instrument its unique timbre.
Contributions and AttributionsThis page is licensed under a CC BY-NC-SA 3.0 license and was authored, remixed, and/or curated by Kyle Forinash andWolfgang Christian. Source content is found at https://www.compadre.org/books/SoundBook. Page content has been edited andupdated to conform to the style and standards of the LibreTexts platform. A detailed versioning history of the edits to source contentis available upon request.
= v/2((n/Lfn )2)1/2 L v n
H
L W = v/2((n/L +(l/H +(m/Wfn,l,m )2 )2 )2)1/2
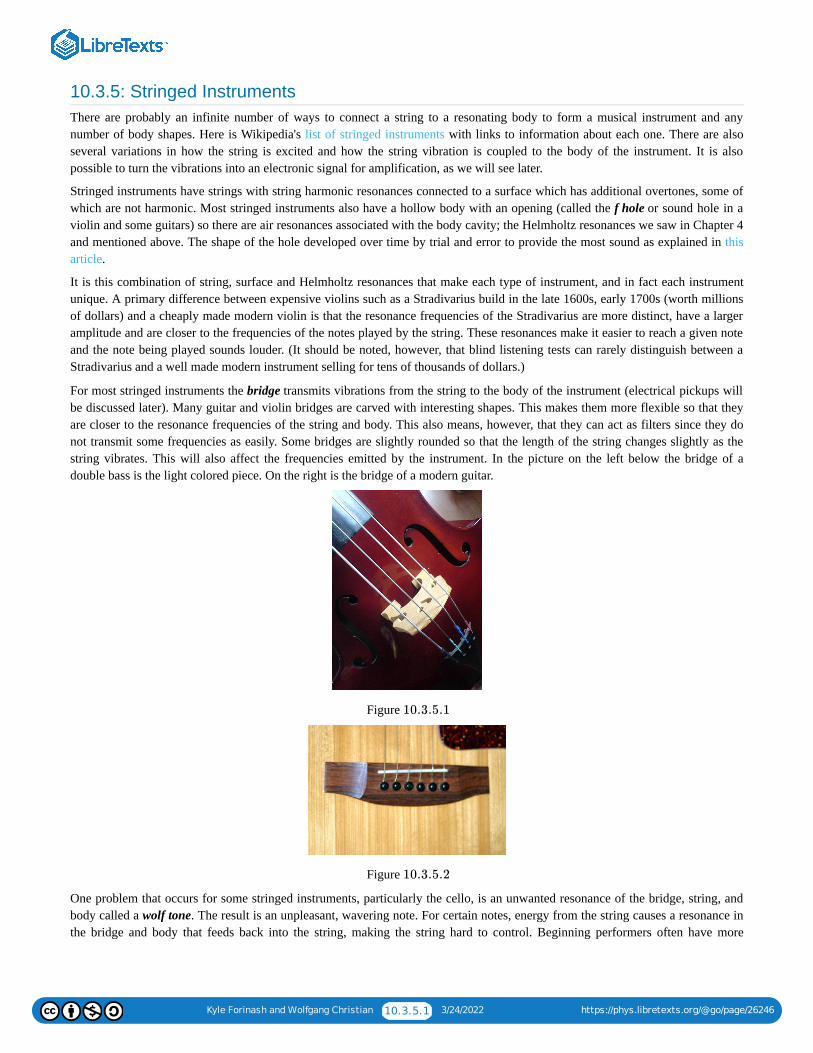
Kyle Forinash and Wolfgang Christian 10.3.5.1 3/24/2022 https://phys.libretexts.org/@go/page/26246
10.3.5: Stringed InstrumentsThere are probably an infinite number of ways to connect a string to a resonating body to form a musical instrument and anynumber of body shapes. Here is Wikipedia's list of stringed instruments with links to information about each one. There are alsoseveral variations in how the string is excited and how the string vibration is coupled to the body of the instrument. It is alsopossible to turn the vibrations into an electronic signal for amplification, as we will see later.
Stringed instruments have strings with string harmonic resonances connected to a surface which has additional overtones, some ofwhich are not harmonic. Most stringed instruments also have a hollow body with an opening (called the f hole or sound hole in aviolin and some guitars) so there are air resonances associated with the body cavity; the Helmholtz resonances we saw in Chapter 4and mentioned above. The shape of the hole developed over time by trial and error to provide the most sound as explained in thisarticle.
It is this combination of string, surface and Helmholtz resonances that make each type of instrument, and in fact each instrumentunique. A primary difference between expensive violins such as a Stradivarius build in the late 1600s, early 1700s (worth millionsof dollars) and a cheaply made modern violin is that the resonance frequencies of the Stradivarius are more distinct, have a largeramplitude and are closer to the frequencies of the notes played by the string. These resonances make it easier to reach a given noteand the note being played sounds louder. (It should be noted, however, that blind listening tests can rarely distinguish between aStradivarius and a well made modern instrument selling for tens of thousands of dollars.)
For most stringed instruments the bridge transmits vibrations from the string to the body of the instrument (electrical pickups willbe discussed later). Many guitar and violin bridges are carved with interesting shapes. This makes them more flexible so that theyare closer to the resonance frequencies of the string and body. This also means, however, that they can act as filters since they donot transmit some frequencies as easily. Some bridges are slightly rounded so that the length of the string changes slightly as thestring vibrates. This will also affect the frequencies emitted by the instrument. In the picture on the left below the bridge of adouble bass is the light colored piece. On the right is the bridge of a modern guitar.
Figure
Figure
One problem that occurs for some stringed instruments, particularly the cello, is an unwanted resonance of the bridge, string, andbody called a wolf tone. The result is an unpleasant, wavering note. For certain notes, energy from the string causes a resonance inthe bridge and body that feeds back into the string, making the string hard to control. Beginning performers often have more
10.3.5.1
10.3.5.2
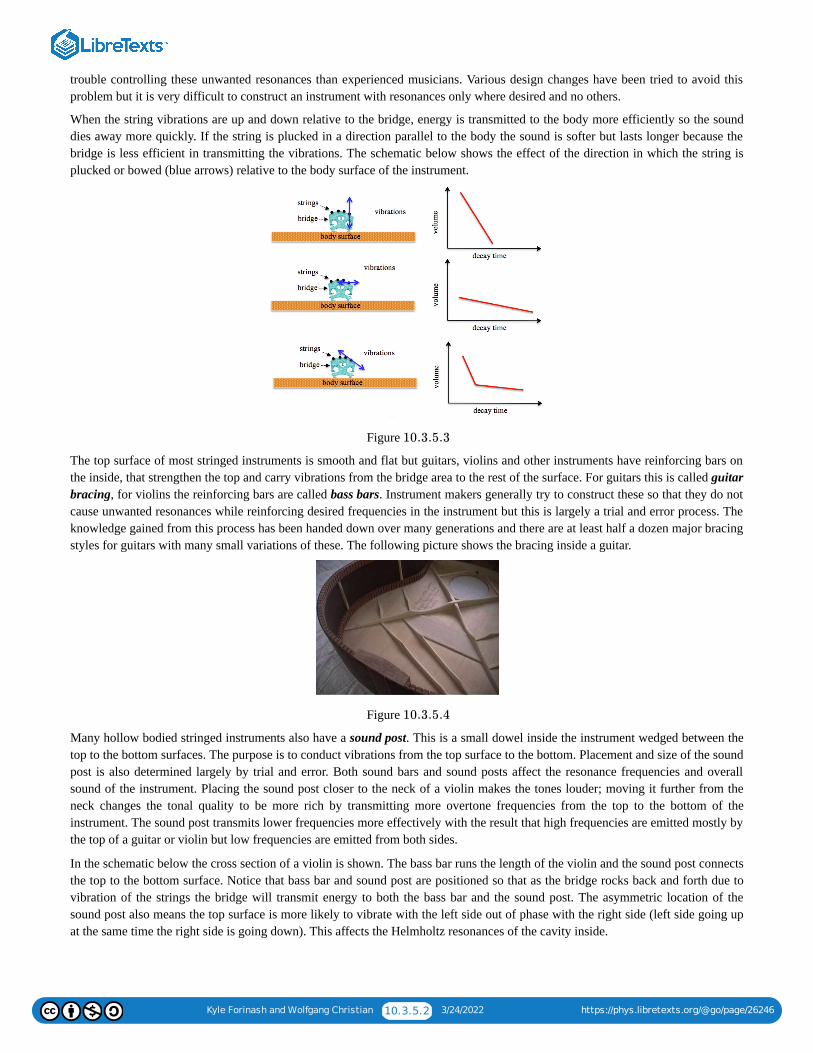
Kyle Forinash and Wolfgang Christian 10.3.5.2 3/24/2022 https://phys.libretexts.org/@go/page/26246
trouble controlling these unwanted resonances than experienced musicians. Various design changes have been tried to avoid thisproblem but it is very difficult to construct an instrument with resonances only where desired and no others.
When the string vibrations are up and down relative to the bridge, energy is transmitted to the body more efficiently so the sounddies away more quickly. If the string is plucked in a direction parallel to the body the sound is softer but lasts longer because thebridge is less efficient in transmitting the vibrations. The schematic below shows the effect of the direction in which the string isplucked or bowed (blue arrows) relative to the body surface of the instrument.
Figure
The top surface of most stringed instruments is smooth and flat but guitars, violins and other instruments have reinforcing bars onthe inside, that strengthen the top and carry vibrations from the bridge area to the rest of the surface. For guitars this is called guitarbracing, for violins the reinforcing bars are called bass bars. Instrument makers generally try to construct these so that they do notcause unwanted resonances while reinforcing desired frequencies in the instrument but this is largely a trial and error process. Theknowledge gained from this process has been handed down over many generations and there are at least half a dozen major bracingstyles for guitars with many small variations of these. The following picture shows the bracing inside a guitar.
Figure
Many hollow bodied stringed instruments also have a sound post. This is a small dowel inside the instrument wedged between thetop to the bottom surfaces. The purpose is to conduct vibrations from the top surface to the bottom. Placement and size of the soundpost is also determined largely by trial and error. Both sound bars and sound posts affect the resonance frequencies and overallsound of the instrument. Placing the sound post closer to the neck of a violin makes the tones louder; moving it further from theneck changes the tonal quality to be more rich by transmitting more overtone frequencies from the top to the bottom of theinstrument. The sound post transmits lower frequencies more effectively with the result that high frequencies are emitted mostly bythe top of a guitar or violin but low frequencies are emitted from both sides.
In the schematic below the cross section of a violin is shown. The bass bar runs the length of the violin and the sound post connectsthe top to the bottom surface. Notice that bass bar and sound post are positioned so that as the bridge rocks back and forth due tovibration of the strings the bridge will transmit energy to both the bass bar and the sound post. The asymmetric location of thesound post also means the top surface is more likely to vibrate with the left side out of phase with the right side (left side going upat the same time the right side is going down). This affects the Helmholtz resonances of the cavity inside.
10.3.5.3
10.3.5.4
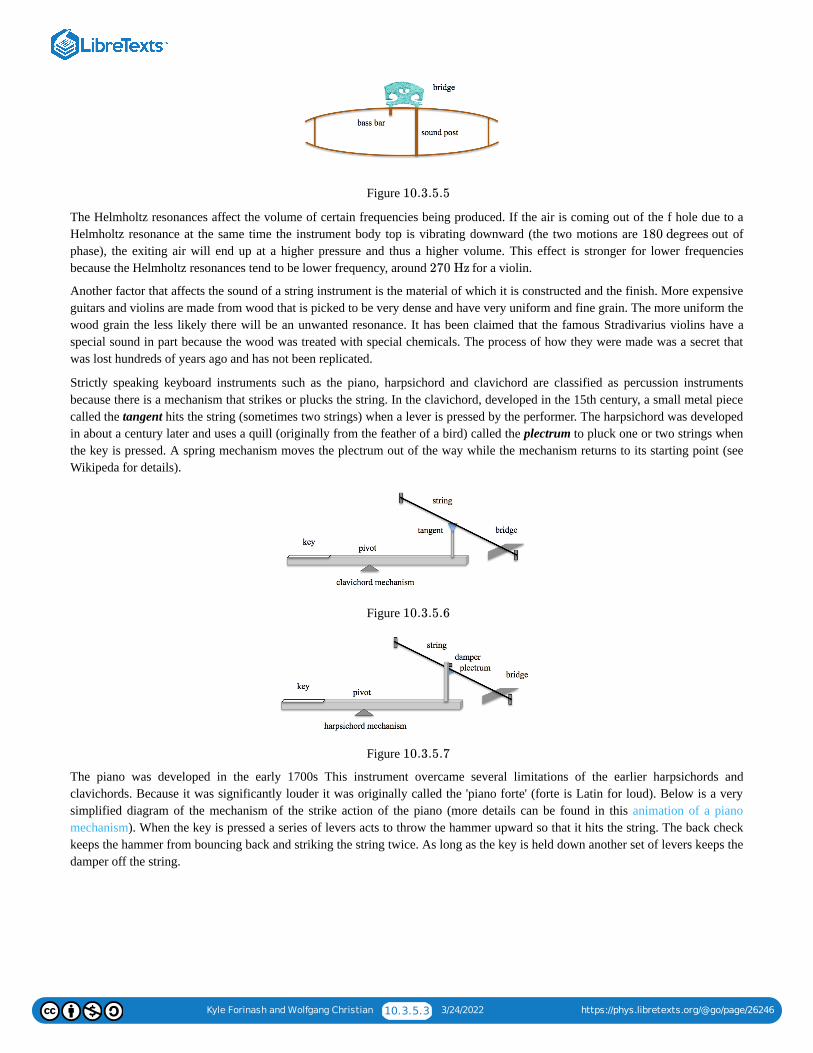
Kyle Forinash and Wolfgang Christian 10.3.5.3 3/24/2022 https://phys.libretexts.org/@go/page/26246
Figure
The Helmholtz resonances affect the volume of certain frequencies being produced. If the air is coming out of the f hole due to aHelmholtz resonance at the same time the instrument body top is vibrating downward (the two motions are out ofphase), the exiting air will end up at a higher pressure and thus a higher volume. This effect is stronger for lower frequenciesbecause the Helmholtz resonances tend to be lower frequency, around for a violin.
Another factor that affects the sound of a string instrument is the material of which it is constructed and the finish. More expensiveguitars and violins are made from wood that is picked to be very dense and have very uniform and fine grain. The more uniform thewood grain the less likely there will be an unwanted resonance. It has been claimed that the famous Stradivarius violins have aspecial sound in part because the wood was treated with special chemicals. The process of how they were made was a secret thatwas lost hundreds of years ago and has not been replicated.
Strictly speaking keyboard instruments such as the piano, harpsichord and clavichord are classified as percussion instrumentsbecause there is a mechanism that strikes or plucks the string. In the clavichord, developed in the 15th century, a small metal piececalled the tangent hits the string (sometimes two strings) when a lever is pressed by the performer. The harpsichord was developedin about a century later and uses a quill (originally from the feather of a bird) called the plectrum to pluck one or two strings whenthe key is pressed. A spring mechanism moves the plectrum out of the way while the mechanism returns to its starting point (seeWikipeda for details).
Figure
Figure
The piano was developed in the early 1700s This instrument overcame several limitations of the earlier harpsichords andclavichords. Because it was significantly louder it was originally called the 'piano forte' (forte is Latin for loud). Below is a verysimplified diagram of the mechanism of the strike action of the piano (more details can be found in this animation of a pianomechanism). When the key is pressed a series of levers acts to throw the hammer upward so that it hits the string. The back checkkeeps the hammer from bouncing back and striking the string twice. As long as the key is held down another set of levers keeps thedamper off the string.
10.3.5.5
180 degrees
270 Hz
10.3.5.6
10.3.5.7
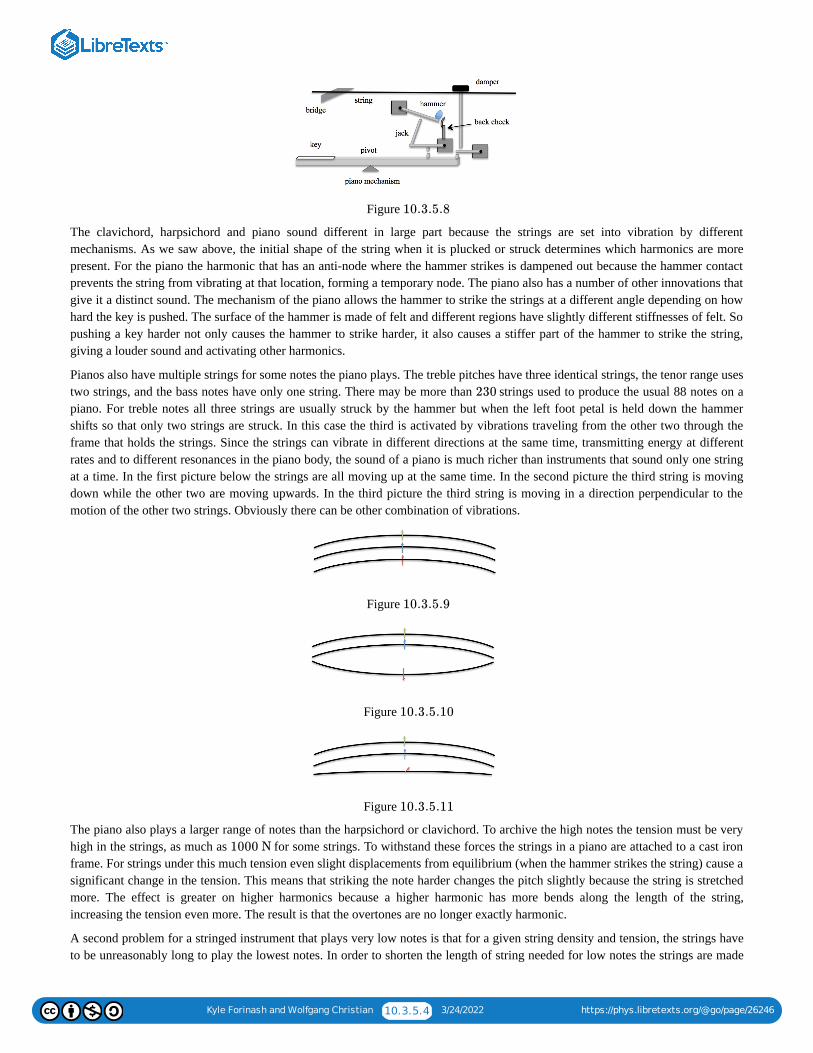
Kyle Forinash and Wolfgang Christian 10.3.5.4 3/24/2022 https://phys.libretexts.org/@go/page/26246
Figure
The clavichord, harpsichord and piano sound different in large part because the strings are set into vibration by differentmechanisms. As we saw above, the initial shape of the string when it is plucked or struck determines which harmonics are morepresent. For the piano the harmonic that has an anti-node where the hammer strikes is dampened out because the hammer contactprevents the string from vibrating at that location, forming a temporary node. The piano also has a number of other innovations thatgive it a distinct sound. The mechanism of the piano allows the hammer to strike the strings at a different angle depending on howhard the key is pushed. The surface of the hammer is made of felt and different regions have slightly different stiffnesses of felt. Sopushing a key harder not only causes the hammer to strike harder, it also causes a stiffer part of the hammer to strike the string,giving a louder sound and activating other harmonics.
Pianos also have multiple strings for some notes the piano plays. The treble pitches have three identical strings, the tenor range usestwo strings, and the bass notes have only one string. There may be more than strings used to produce the usual 88 notes on apiano. For treble notes all three strings are usually struck by the hammer but when the left foot petal is held down the hammershifts so that only two strings are struck. In this case the third is activated by vibrations traveling from the other two through theframe that holds the strings. Since the strings can vibrate in different directions at the same time, transmitting energy at differentrates and to different resonances in the piano body, the sound of a piano is much richer than instruments that sound only one stringat a time. In the first picture below the strings are all moving up at the same time. In the second picture the third string is movingdown while the other two are moving upwards. In the third picture the third string is moving in a direction perpendicular to themotion of the other two strings. Obviously there can be other combination of vibrations.
Figure
Figure
Figure
The piano also plays a larger range of notes than the harpsichord or clavichord. To archive the high notes the tension must be veryhigh in the strings, as much as for some strings. To withstand these forces the strings in a piano are attached to a cast ironframe. For strings under this much tension even slight displacements from equilibrium (when the hammer strikes the string) cause asignificant change in the tension. This means that striking the note harder changes the pitch slightly because the string is stretchedmore. The effect is greater on higher harmonics because a higher harmonic has more bends along the length of the string,increasing the tension even more. The result is that the overtones are no longer exactly harmonic.
A second problem for a stringed instrument that plays very low notes is that for a given string density and tension, the strings haveto be unreasonably long to play the lowest notes. In order to shorten the length of string needed for low notes the strings are made
10.3.5.8
230
10.3.5.9
10.3.5.10
10.3.5.11
1000 N
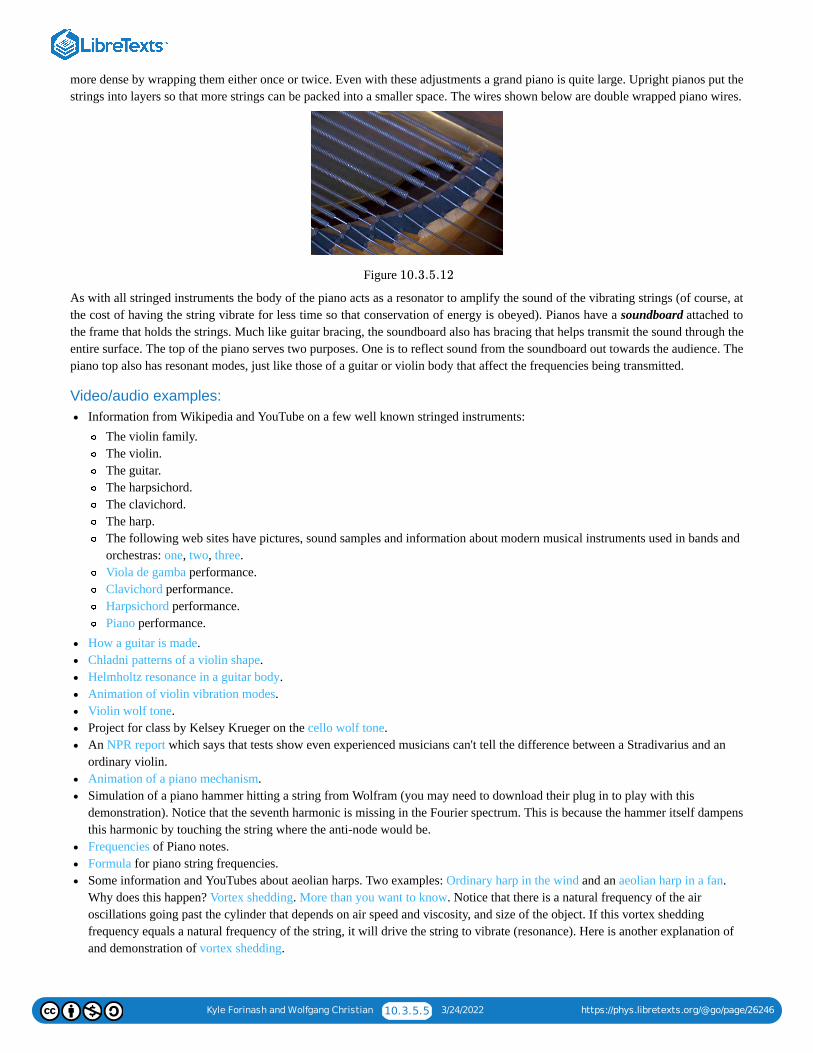
Kyle Forinash and Wolfgang Christian 10.3.5.5 3/24/2022 https://phys.libretexts.org/@go/page/26246
more dense by wrapping them either once or twice. Even with these adjustments a grand piano is quite large. Upright pianos put thestrings into layers so that more strings can be packed into a smaller space. The wires shown below are double wrapped piano wires.
Figure
As with all stringed instruments the body of the piano acts as a resonator to amplify the sound of the vibrating strings (of course, atthe cost of having the string vibrate for less time so that conservation of energy is obeyed). Pianos have a soundboard attached tothe frame that holds the strings. Much like guitar bracing, the soundboard also has bracing that helps transmit the sound through theentire surface. The top of the piano serves two purposes. One is to reflect sound from the soundboard out towards the audience. Thepiano top also has resonant modes, just like those of a guitar or violin body that affect the frequencies being transmitted.
Video/audio examples:Information from Wikipedia and YouTube on a few well known stringed instruments:
The violin family.The violin.The guitar.The harpsichord.The clavichord.The harp.The following web sites have pictures, sound samples and information about modern musical instruments used in bands andorchestras: one, two, three.Viola de gamba performance.Clavichord performance.Harpsichord performance.Piano performance.
How a guitar is made.Chladni patterns of a violin shape.Helmholtz resonance in a guitar body.Animation of violin vibration modes.Violin wolf tone.Project for class by Kelsey Krueger on the cello wolf tone.An NPR report which says that tests show even experienced musicians can't tell the difference between a Stradivarius and anordinary violin.Animation of a piano mechanism.Simulation of a piano hammer hitting a string from Wolfram (you may need to download their plug in to play with thisdemonstration). Notice that the seventh harmonic is missing in the Fourier spectrum. This is because the hammer itself dampensthis harmonic by touching the string where the anti-node would be.Frequencies of Piano notes.Formula for piano string frequencies.Some information and YouTubes about aeolian harps. Two examples: Ordinary harp in the wind and an aeolian harp in a fan.Why does this happen? Vortex shedding. More than you want to know. Notice that there is a natural frequency of the airoscillations going past the cylinder that depends on air speed and viscosity, and size of the object. If this vortex sheddingfrequency equals a natural frequency of the string, it will drive the string to vibrate (resonance). Here is another explanation ofand demonstration of vortex shedding.
10.3.5.12
Kyle Forinash and Wolfgang Christian 10.3.5.6 3/24/2022 https://phys.libretexts.org/@go/page/26246
SummaryStrings have harmonic resonances at multiples of the fundamental frequency. The bridge of a stringed instrument transmits theseharmonics to a surface that has its own resonance frequencies which are usually not harmonic. The surface can move more air thana string and so acts to amplify the sound of the string (at the expense of a shorter vibration time for the string). If the instrument hasa hollow body the Helmholtz resonances of the cavity contribute to the frequencies that are present. The particular combination ofstring, surface and body cavity resonances give each individual instrument its timbre.
Questions on Stringed Instruments:1. What are the three parameters that determine the fundamental frequency of a vibrating string?2. What is the relationship between the speed of a wave on a string and the fundamental frequency?3. What are harmonic frequencies?4. If you have a fundamental frequency of , what are the next three harmonic frequencies above this?5. What is the distinction between a node and an anti-node?6. How many nodes and antinodes are there in the 3rd harmonic? The 6th?7. Explain the difference between harmonics and overtones.8. What is the relationship between the fundamental frequency of a vibrating string on a stringed instrument and pitch?9. What effect does plucking a string at different locations have on the harmonics that are formed?
10. What is the difference in vibrational modes between a string that is plucked and one that is bowed?11. Why is it that a vibrating string in air doesn’t produce as much sound as a vibrating string attached to a surface?12. A string attached to a surface is louder than if it is not. How does this fit with conservation of energy?13. Strings have harmonic overtones but surfaces typically do not. How does this effect the sound produced by a stringed
instrument?14. What is holographic interferometry and how does it show the vibrational modes of a surface?15. Are Chladni plate resonance frequencies harmonic? Explain.16. Explain Q-factor in terms of surface resonances for a stringed instrument.17. Why do you want the body of a stringed instrument to have low Q resonance frequencies?18. Why is uniformity in wood grain for a stringed instrument such as a guitar important with respect to resonance?19. What does the bridge of a stringed instrument do?20. What is the purpose of the sound post in a stringed instrument?21. What is the purpose of bracing in a guitar?22. What is the purpose of the bass bar in a violin?23. What is the Wolf tone, and what causes it?24. Which can play a note longer, a harpsichord or a piano and why?25. Why is the piano louder than the harpsichord?26. Using a reliable source, find out how much tension do the strings of a piano have. Using this, explain why pianos had to wait
until the development of cast iron before the first piano was created.27. What is a Helmholtz resonance? Explain what this has to do with acoustic string instruments.28. Why do acoustic stringed instrument have hollow bodies with holes?29. Find a reliable source and discuss the history of the f-hole.30. Violins and guitars are both stringed instruments with hollow bodies and can play some of the same notes. Why is the timbre
different between these two instruments?31. On the Indian instrument, the sitar, why are there strings that are not plucked? Explain how this works.
Contributions and Attributions
This page is licensed under a CC BY-NC-SA 3.0 license and was authored, remixed, and/or curated by Kyle Forinash andWolfgang Christian. Source content is found at https://www.compadre.org/books/SoundBook. Page content has been edited andupdated to conform to the style and standards of the LibreTexts platform. A detailed versioning history of the edits to source contentis available upon request.
102 Hz
1 3/24/2022
CHAPTER OVERVIEW11: TUBES
In this chapter we start with resonance in a tube. Once the basic behavior of pressure waves in a tube are explained we look at variousinstruments that are basically tubes, such as flutes, brass, woodwinds, and pipe organs.
KEY TERMS:
Displacement node versus pressure node, tube resonance, tube harmonics, impedance, reed, fipple, edge tone, embouchure, free reedaerophones.
11.1: STANDING WAVES IN A TUBE
11.1.1: TUBE RESONANCE11.1.2: STANDING WAVE SIMULATION11.2: REFLECTION OF WAVES AT A BOUNDARY
11.2.1: REFLECTION OF WAVES11.2.2: REFLECTION SIMULATION11.3: IMPEDANCE
11.3.1: IMPEDANCE11.3.2: IMPEDANCE SIMULATION11.3.3: WOODWIND INSTRUMENTS11.3.4: BRASS INSTRUMENTS11.3.5: PIPE ORGANS AND OTHER REED INSTRUMENTS
Kyle Forinash and Wolfgang Christian 11.1.1 3/24/2022 https://phys.libretexts.org/@go/page/25927
11.1: Standing Waves in a TubeThis section shows a simulation that compares the fundamental, second, third and forth harmonics of standing waves on a stringwith standing waves in a tube. Notice that for a tube open on both ends the displacement nodes occur where the string has nodesand the displacement anti-nodes in the tube occur where the string has displacement nodes. The pressure nodes in a tube open atboth ends occur in the same place as the string nodes.
Contributions and AttributionsThis page is licensed under a CC BY-NC-SA 3.0 license and was authored, remixed, and/or curated by Kyle Forinash andWolfgang Christian. Source content is found at https://www.compadre.org/books/SoundBook. Page content has been edited andupdated to conform to the style and standards of the LibreTexts platform. A detailed versioning history of the edits to source contentis available upon request.
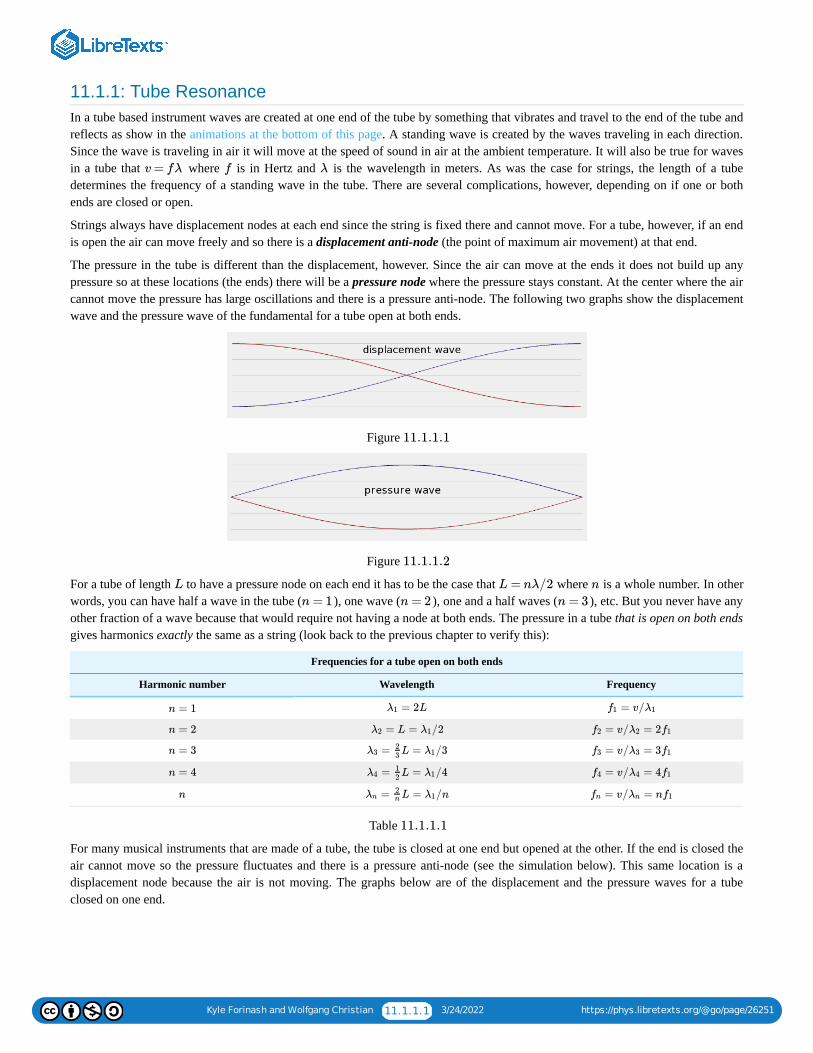
Kyle Forinash and Wolfgang Christian 11.1.1.1 3/24/2022 https://phys.libretexts.org/@go/page/26251
11.1.1: Tube ResonanceIn a tube based instrument waves are created at one end of the tube by something that vibrates and travel to the end of the tube andreflects as show in the animations at the bottom of this page. A standing wave is created by the waves traveling in each direction.Since the wave is traveling in air it will move at the speed of sound in air at the ambient temperature. It will also be true for wavesin a tube that where is in Hertz and is the wavelength in meters. As was the case for strings, the length of a tubedetermines the frequency of a standing wave in the tube. There are several complications, however, depending on if one or bothends are closed or open.
Strings always have displacement nodes at each end since the string is fixed there and cannot move. For a tube, however, if an endis open the air can move freely and so there is a displacement anti-node (the point of maximum air movement) at that end.
The pressure in the tube is different than the displacement, however. Since the air can move at the ends it does not build up anypressure so at these locations (the ends) there will be a pressure node where the pressure stays constant. At the center where the aircannot move the pressure has large oscillations and there is a pressure anti-node. The following two graphs show the displacementwave and the pressure wave of the fundamental for a tube open at both ends.
Figure
Figure
For a tube of length to have a pressure node on each end it has to be the case that where is a whole number. In otherwords, you can have half a wave in the tube ( ), one wave ( ), one and a half waves ( ), etc. But you never have anyother fraction of a wave because that would require not having a node at both ends. The pressure in a tube that is open on both endsgives harmonics exactly the same as a string (look back to the previous chapter to verify this):
Frequencies for a tube open on both ends
Harmonic number Wavelength Frequency
Table
For many musical instruments that are made of a tube, the tube is closed at one end but opened at the other. If the end is closed theair cannot move so the pressure fluctuates and there is a pressure anti-node (see the simulation below). This same location is adisplacement node because the air is not moving. The graphs below are of the displacement and the pressure waves for a tubeclosed on one end.
v = fλ f λ
11.1.1.1
11.1.1.2
L L = nλ/2 n
n = 1 n = 2 n = 3
n = 1 = 2Lλ1 = v/f1 λ1
n = 2 = L = /2λ2 λ1 = v/ = 2f2 λ2 f1
n = 3 = L = /3λ323 λ1 = v/ = 3f3 λ3 f1
n = 4 = L = /4λ412 λ1 = v/ = 4f4 λ4 f1
n = L = /nλn2n λ1 = v/ = nfn λn f1
11.1.1.1
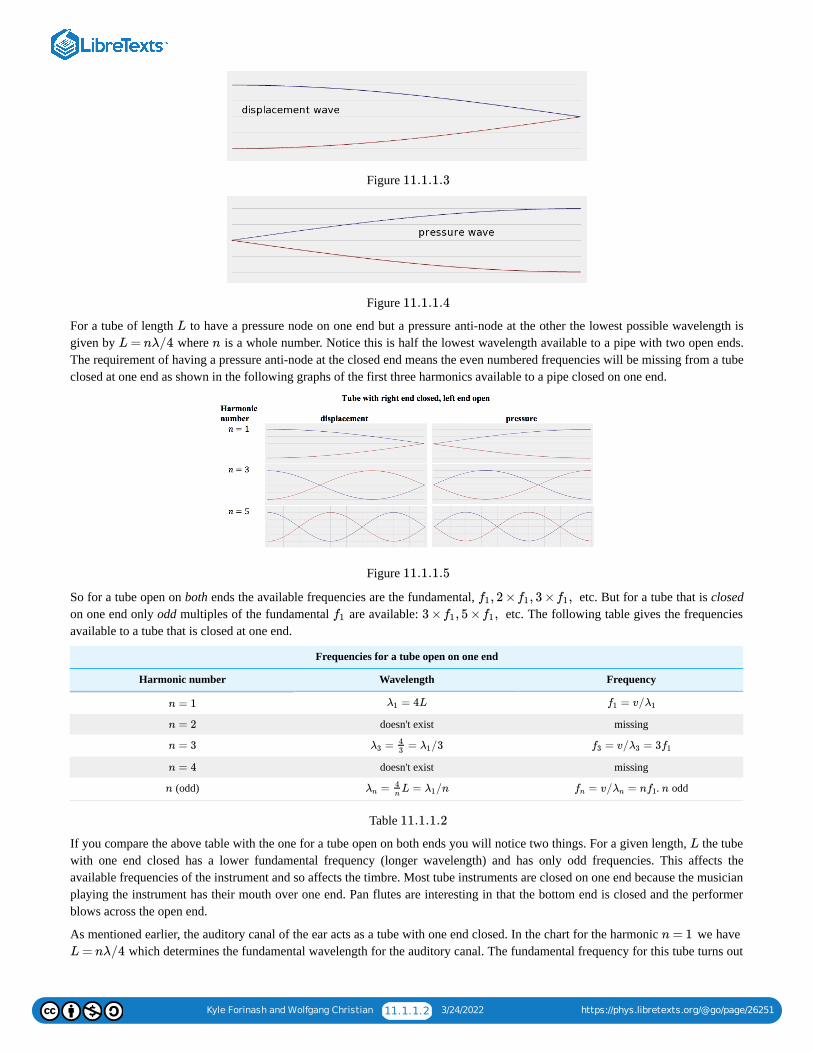
Kyle Forinash and Wolfgang Christian 11.1.1.2 3/24/2022 https://phys.libretexts.org/@go/page/26251
Figure
Figure
For a tube of length to have a pressure node on one end but a pressure anti-node at the other the lowest possible wavelength isgiven by where is a whole number. Notice this is half the lowest wavelength available to a pipe with two open ends.The requirement of having a pressure anti-node at the closed end means the even numbered frequencies will be missing from a tubeclosed at one end as shown in the following graphs of the first three harmonics available to a pipe closed on one end.
Figure
So for a tube open on both ends the available frequencies are the fundamental, etc. But for a tube that is closedon one end only odd multiples of the fundamental are available: etc. The following table gives the frequenciesavailable to a tube that is closed at one end.
Frequencies for a tube open on one end
Harmonic number Wavelength Frequency
doesn't exist missing
doesn't exist missing
(odd) . odd
Table
If you compare the above table with the one for a tube open on both ends you will notice two things. For a given length, the tubewith one end closed has a lower fundamental frequency (longer wavelength) and has only odd frequencies. This affects theavailable frequencies of the instrument and so affects the timbre. Most tube instruments are closed on one end because the musicianplaying the instrument has their mouth over one end. Pan flutes are interesting in that the bottom end is closed and the performerblows across the open end.
As mentioned earlier, the auditory canal of the ear acts as a tube with one end closed. In the chart for the harmonic we have which determines the fundamental wavelength for the auditory canal. The fundamental frequency for this tube turns out
11.1.1.3
11.1.1.4
L
L = nλ/4 n
11.1.1.5
, 2 × , 3 × ,f1 f1 f1
f1 3 × , 5 × ,f1 f1
n = 1 = 4Lλ1 = v/f1 λ1
n = 2
n = 3 = = /3λ343 λ1 = v/ = 3f3 λ3 f1
n = 4
n = L = /nλn4n
λ1 = v/ = nfn λn f1 n
11.1.1.2
L
n = 1
L = nλ/4
Kyle Forinash and Wolfgang Christian 11.1.1.3 3/24/2022 https://phys.libretexts.org/@go/page/26251
to be around and this is where human hearing is the most sensitive as we saw in the Sound Intensity Level chart inChapter 8.
Unless the pipe is very narrow compared to its length, a slight correction to the above formulas needs to be made. We know astanding wave inside a tube is formed from waves being reflected from the ends (just like standing waves on a string). It turns outthat for an open end, the wave doesn't reflect exactly at the end of the tube. In order to "feel" the pressure difference at the end andbe reflected it goes a little past the end before being reflected. The effect is as if the pipe is just a little bit longer and this extralength depends on the radius of the tube. For a pipe of radius , the extra amount turns out to be (after some sophisticatedcalculations) . The formulas for the tube open on one end can be corrected by replacing in the table above with .For a single open end the fundamental will be given by . In the case of two open ends the extra length is addedtwice so the fundamental is .
Unlike a stringed instrument where the speed of the wave on the string can be changed by changing the density and/or tension, thespeed of sound in air at a given temperature is fixed. The fundamental frequency of a string can be changed by changing density,tension or length but the only way to change the fundamental frequency of a tube instrument is to change the length of the tube.There are several ways to do that, as we will see below.
Video/audio examples:Actually, the previous paragraph is not quite right; there is a way to change the frequency of a tube without changing its length.If the density of the gas inside changes, the speed of sound will change and this changes the frequencies in the tube. Tubeinstruments will be slightly out of tune on a cold day compared to a hot day due to the change in the density of air withtemperature. The frequency will also change if the tube is filled with a gas other than air as shown in this YouTube of tromboneand trumpet filled with different gasses.Animations of open ended and closed ended tubes.Visualization of sound in a tube using a Kundts Tube (filled with Styrofoam balls).Visualization of sound in a tube using a Rubens' Tube.
Contributions and AttributionsThis page is licensed under a CC BY-NC-SA 3.0 license and was authored, remixed, and/or curated by Kyle Forinash andWolfgang Christian. Source content is found at https://www.compadre.org/books/SoundBook. Page content has been edited andupdated to conform to the style and standards of the LibreTexts platform. A detailed versioning history of the edits to source contentis available upon request.
3500 Hz
r
0.61r L L +0.61r
= 4(L +0.61r)λ1
= 2(L +1.22r)λ1
Kyle Forinash and Wolfgang Christian 11.1.2.1 3/24/2022 https://phys.libretexts.org/@go/page/26252
11.1.2: Standing Wave SimulationThe following simulation compares the fundamental, second, third and forth harmonics of standing waves on a string with standingwaves in a tube. Notice that for a tube open on both ends the displacement nodes occur where the string has nodes and thedisplacement anti-nodes in the tube occur where the string has displacement nodes. The pressure nodes in a tube open at both endsoccur in the same place as the string nodes.
For a tube closed at one end (as is the case for most musical instruments based on vibrating columns of air) the even harmonicscannot exist. A tube closed on one end has a different timbre because the even harmonics are missing.
Simulation Questions:1. Play the standing wave simulation for the case of the fundamental. The length of the string is . What is the wavelength
of the fundamental?2. Describe the fundamental of the tube simulation (bottom). Where do the dots (representing air molecules) move the most?
Where do they form a displacement node? Assuming the tube is the same length as the string, what is the fundamentalwavelength of the tube open at both ends?
3. Use the time in the simulations to find the period and calculate the frequency of the fundamental for both simulations. For amusical instrument this would be the frequency of the tone being sounded by the instrument when it plays its lowest note.
4. What is the wave speed of each of the component waves making up the fundamental (the speed determined by )?5. Now click the box for a tube closed at one end. What is the wavelength of the fundamental for a tube closed at one end? How is
this different for the case of the tube open at both ends?6. Reset the simulation and look at the second harmonic for the string and tube open at both ends. What is the wavelength and
frequency of the second harmonic/first overtone for the string and tube open on both ends? What is the speed of the componentwaves?
7. Try the third and fourth harmonics for the string and tube open at both ends. What are the wavelengths and frequencies of thesewaves? What are the speeds of the component waves?
8. The formula for the wavelength as a function of the length of the string or open tube is given by where is a wholenumber and is the length of the string. Verify this relationship with the numbers you got in the previous questions.
9. Now check the box for a pipe with closed end simulation and examine the harmonics. Describe the difference in the node andanti-node pattern. What are the wavelengths for these cases? The formula for the frequencies of a tube closed at one end aregiven by where is an odd whole number. Verify this relationship with the numbers you got in the previousquestions.
10. Flutes are basically pipes with openings at both ends but clarinets, trumpets and trombones are basically tubes that are closed atone end. Why does this make a difference in the frequencies each instrument plays?
11. Pressure anti-nodes occur at places where the air is not moving (displacement nodes). What would be the effect of cutting a holein the tube at the location of a pressure anti-node? Would the standing wavelength be affected? (This is the basis behind usingfinger holes in wind instruments to play different frequencies.)
Contributions and AttributionsThis page is licensed under a CC BY-NC-SA 3.0 license and was authored, remixed, and/or curated by Kyle Forinash andWolfgang Christian. Source content is found at https://www.compadre.org/books/SoundBook. Page content has been edited andupdated to conform to the style and standards of the LibreTexts platform. A detailed versioning history of the edits to source contentis available upon request.
3.14 m
v = fλ
λ = 2L/n n
L
λ = 4L/n n
Kyle Forinash and Wolfgang Christian 11.2.1 3/24/2022 https://phys.libretexts.org/@go/page/25928
11.2: Reflection of Waves at a BoundaryWaves on a string form standing waves because the wave reflects from each end of the string where there is a fixed node. How dostanding waves form in a tube full of air? This section shows that waves reflect from the end of a tube and that this reflection canbe of two types, depending on whether the boundary is 'soft' or 'rigid'.
Contributions and AttributionsThis page is licensed under a CC BY-NC-SA 3.0 license and was authored, remixed, and/or curated by Kyle Forinash andWolfgang Christian. Source content is found at https://www.compadre.org/books/SoundBook. Page content has been edited andupdated to conform to the style and standards of the LibreTexts platform. A detailed versioning history of the edits to source contentis available upon request.
Kyle Forinash and Wolfgang Christian 11.2.1.1 3/24/2022 https://phys.libretexts.org/@go/page/26253
11.2.1: Reflection of WavesWaves on a string form standing waves because the wave reflects from each end of the string where there is a fixed node. How dostanding waves form in a tube full of air?
Contributions and AttributionsThis page is licensed under a CC BY-NC-SA 3.0 license and was authored, remixed, and/or curated by Kyle Forinash andWolfgang Christian. Source content is found at https://www.compadre.org/books/SoundBook. Page content has been edited andupdated to conform to the style and standards of the LibreTexts platform. A detailed versioning history of the edits to source contentis available upon request.
Kyle Forinash and Wolfgang Christian 11.2.2.1 3/24/2022 https://phys.libretexts.org/@go/page/26254
11.2.2: Reflection SimulationWe already know that a wave which moves from one medium to another can change speed. In many cases this causes a bending ofthe wave called refraction. A second effect also occurs when a wave goes from one medium to another. There is usually a partialreflection of the wave, depending on how different the two mediums are. Reflection can be of two types, depending on whether theboundary is 'soft' or 'rigid'. If the wave is going from a more rigid medium into a softer medium the reflected wave will have thesame phase as the incoming wave. Waves in a soft medium reflecting from a boundary with a stiff medium will change phase by
. The simulation below shows this effect.
Simulation Questions:1. Run the simulation to see how a Gaussian pulse reflects off the two different boundaries. How is a pulse reflected from a fixed
boundary different from one reflected from a free boundary?2. Now check the sine wave check box to see what happens when a sine wave hits the two types of boundaries. What is the end
result in these cases? (Hint: Go back to chapter seven and the Adding Sinusoidal Waves simulation where you added twoidentical sine waves traveling in opposite directions.)
3. Although the reflecting sine waves in both cases interacts with the incoming wave to form a standing waves there is a slightdifference between the two. Which case has a node at the boundary and which has an anti-node at the boundary?
Contributions and Attributions
This page is licensed under a CC BY-NC-SA 3.0 license and was authored, remixed, and/or curated by Kyle Forinash andWolfgang Christian. Source content is found at https://www.compadre.org/books/SoundBook. Page content has been edited andupdated to conform to the style and standards of the LibreTexts platform. A detailed versioning history of the edits to source contentis available upon request.
180 degrees
Kyle Forinash and Wolfgang Christian 11.3.1 3/24/2022 https://phys.libretexts.org/@go/page/25929
11.3: ImpedanceBut why do sound waves reflect from the open end of a tube or when the size of tube changes abruptly? The resistance to themovement of a wave crossing a boundary from one medium into another is called impedance and occurs for waves on a string,sound waves in air and electronic signals in a circuit. When a wave tries to travel from a medium with one impedance to a regionwhere the impedance is different, there will be a partial reflection.
Contributions and AttributionsThis page is licensed under a CC BY-NC-SA 3.0 license and was authored, remixed, and/or curated by Kyle Forinash andWolfgang Christian. Source content is found at https://www.compadre.org/books/SoundBook. Page content has been edited andupdated to conform to the style and standards of the LibreTexts platform. A detailed versioning history of the edits to source contentis available upon request.
Kyle Forinash and Wolfgang Christian 11.3.1.1 3/24/2022 https://phys.libretexts.org/@go/page/26255
11.3.1: ImpedanceBut why do sound waves reflect from the open end of a tube?
The resistance to the movement of a wave crossing a boundary from one medium into another is called impedance and occurs forwaves on a string, sound waves in air and electronic signals in a circuit. When a wave tries to travel from a medium with oneimpedance to a region where the impedance is different, there will be a partial reflection. The reflection means that not all theenergy of the wave is transmitted to the new medium.
There are several ways to try to avoid or minimize the effects of impedance. In general the idea is to match impedance between thetwo regions. For example, the speakers of a stereo system are chosen to match the impedance of the amplifier/tuner component. Inelectrical components impedance is measured in ohms ( ) so if a speaker has an impedance of an amplifier with ischosen (or vice versa). If the impedance was not matched some of the energy from the amplifier would reflect back and not get tothe speaker, making the system less efficient at turning electrical signals into sound. The three bones in your middle ear areresponsible for matching impedance between the air outside your ear and the fluid in your cochlea as explained in this video onimpedance matching in the ear.
Tube instruments have an impedance problem in that sound inside the tube will reflect off the ends, even an open end. Air insidethe tube is confined by the walls of the tube but air outside is not. This difference in impedance causes some sound to reflect backinto the tube at an open end and it is this reflected wave that sets up a standing wave inside the tube. Reflection is strongest if thetube diameter is less than a quarter of the wavelength of the sound wave in the tube. Open end reflection is weaker as the diametergets bigger compared to the wavelength.
On the one hand this reflection is what causes the tube to have a fundamental frequency (resonance) but this also means less soundgets out of the instrument. Flutes are not corrected for impedance miss-match and are the softest woodwind instrument. Most otherwoodwinds are louder because they have bells that act as impedance matching devices between inside the instrument and outside.Brass instruments have even larger bells and so have better impedance matching and are even louder than woodwinds on average.As we will see, the bell of a wind instrument also affects the overtones present (and therefor the timbre) but the main function of abell is to help sound waves exit the instrument by matching the impedance.
The mathematical symbol for impedance is , measured in ohms. In some references you will see the inverse of this number, theadmittance which is defined as , measured in siemens. Here is a more complete definition of acoustical impedance. Hereis a Java Applet that calculates impedance (reflected and transmitted sound energy) when sound is moving from one substance toanother.
Contributions and AttributionsThis page is licensed under a CC BY-NC-SA 3.0 license and was authored, remixed, and/or curated by Kyle Forinash andWolfgang Christian. Source content is found at https://www.compadre.org/books/SoundBook. Page content has been edited andupdated to conform to the style and standards of the LibreTexts platform. A detailed versioning history of the edits to source contentis available upon request.
Ω 10Ω 10Ω
Z
Y = 1/Z
Kyle Forinash and Wolfgang Christian 11.3.2.1 3/24/2022 https://phys.libretexts.org/@go/page/26256
11.3.2: Impedance SimulationIn many cases a wave colliding with a boundary will partially reflect and be partially transmitted. The kind of wave reflected andthe amount of energy transmitted depend on the properties of the material on either side of the boundary. This animation againsimulates a string as a row of individual masses connected by invisible springs. In this case the mass of the string is different on theleft as compared with the right. A similar reflection occurs when a sound wave confined to the inside of a tube encounters the openend of a tube where the air can move freely.
Simulation Questions:1. Run the simulation and describe what happens when a pulse goes from a light string to a heavy string.2. Click the 'Heavy to Light' button, run the simulation and describe what happens when a pulse goes from a heavy string to a light
string.3. In which case is the reflected pulse inverted? Based on what you learned about reflections from soft and hard boundaries in the
previous simulation, explain this result.4. In which case is the reflected pulse larger than the transmitted pulse?5. In which case is the reflected pulse faster? Based on what you learned about how physical properties determine the speed of a
wave, explain this result.
Contributions and Attributions
This page is licensed under a CC BY-NC-SA 3.0 license and was authored, remixed, and/or curated by Kyle Forinash andWolfgang Christian. Source content is found at https://www.compadre.org/books/SoundBook. Page content has been edited andupdated to conform to the style and standards of the LibreTexts platform. A detailed versioning history of the edits to source contentis available upon request.
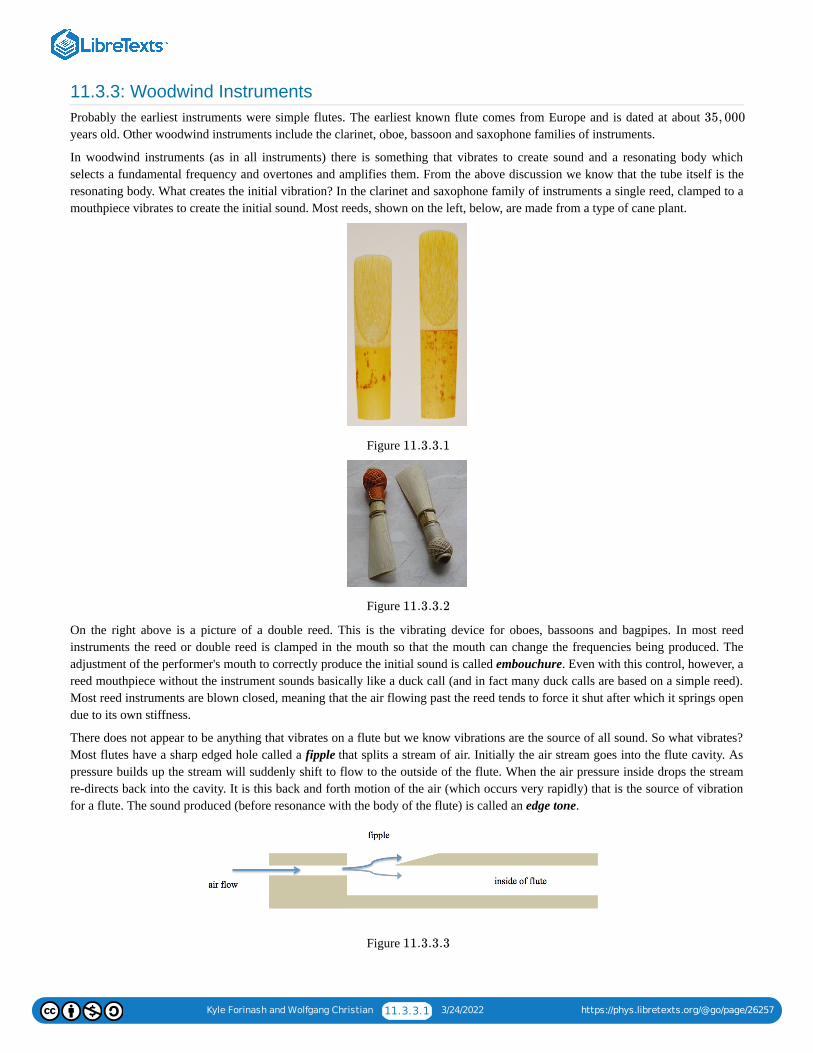
Kyle Forinash and Wolfgang Christian 11.3.3.1 3/24/2022 https://phys.libretexts.org/@go/page/26257
11.3.3: Woodwind InstrumentsProbably the earliest instruments were simple flutes. The earliest known flute comes from Europe and is dated at about years old. Other woodwind instruments include the clarinet, oboe, bassoon and saxophone families of instruments.
In woodwind instruments (as in all instruments) there is something that vibrates to create sound and a resonating body whichselects a fundamental frequency and overtones and amplifies them. From the above discussion we know that the tube itself is theresonating body. What creates the initial vibration? In the clarinet and saxophone family of instruments a single reed, clamped to amouthpiece vibrates to create the initial sound. Most reeds, shown on the left, below, are made from a type of cane plant.
Figure
Figure
On the right above is a picture of a double reed. This is the vibrating device for oboes, bassoons and bagpipes. In most reedinstruments the reed or double reed is clamped in the mouth so that the mouth can change the frequencies being produced. Theadjustment of the performer's mouth to correctly produce the initial sound is called embouchure. Even with this control, however, areed mouthpiece without the instrument sounds basically like a duck call (and in fact many duck calls are based on a simple reed).Most reed instruments are blown closed, meaning that the air flowing past the reed tends to force it shut after which it springs opendue to its own stiffness.
There does not appear to be anything that vibrates on a flute but we know vibrations are the source of all sound. So what vibrates?Most flutes have a sharp edged hole called a fipple that splits a stream of air. Initially the air stream goes into the flute cavity. Aspressure builds up the stream will suddenly shift to flow to the outside of the flute. When the air pressure inside drops the streamre-directs back into the cavity. It is this back and forth motion of the air (which occurs very rapidly) that is the source of vibrationfor a flute. The sound produced (before resonance with the body of the flute) is called an edge tone.
Figure
35, 000
11.3.3.1
11.3.3.2
11.3.3.3
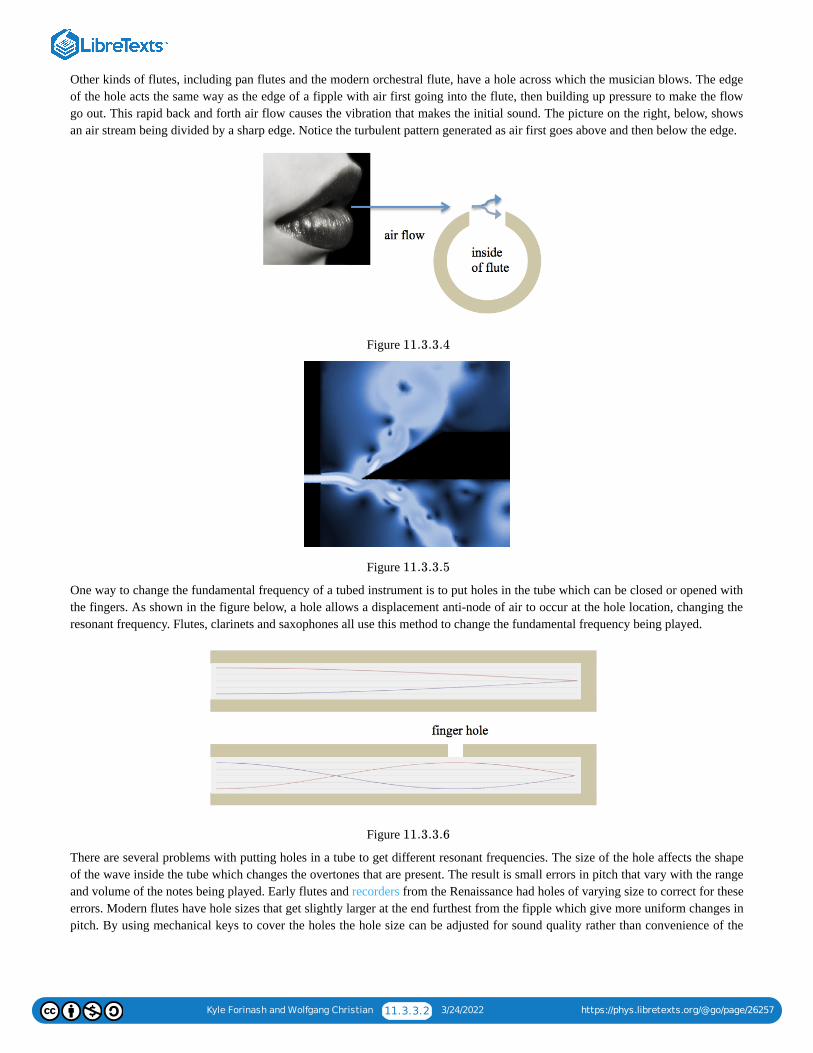
Kyle Forinash and Wolfgang Christian 11.3.3.2 3/24/2022 https://phys.libretexts.org/@go/page/26257
Other kinds of flutes, including pan flutes and the modern orchestral flute, have a hole across which the musician blows. The edgeof the hole acts the same way as the edge of a fipple with air first going into the flute, then building up pressure to make the flowgo out. This rapid back and forth air flow causes the vibration that makes the initial sound. The picture on the right, below, showsan air stream being divided by a sharp edge. Notice the turbulent pattern generated as air first goes above and then below the edge.
Figure
Figure
One way to change the fundamental frequency of a tubed instrument is to put holes in the tube which can be closed or opened withthe fingers. As shown in the figure below, a hole allows a displacement anti-node of air to occur at the hole location, changing theresonant frequency. Flutes, clarinets and saxophones all use this method to change the fundamental frequency being played.
Figure
There are several problems with putting holes in a tube to get different resonant frequencies. The size of the hole affects the shapeof the wave inside the tube which changes the overtones that are present. The result is small errors in pitch that vary with the rangeand volume of the notes being played. Early flutes and recorders from the Renaissance had holes of varying size to correct for theseerrors. Modern flutes have hole sizes that get slightly larger at the end furthest from the fipple which give more uniform changes inpitch. By using mechanical keys to cover the holes the hole size can be adjusted for sound quality rather than convenience of the
11.3.3.4
11.3.3.5
11.3.3.6
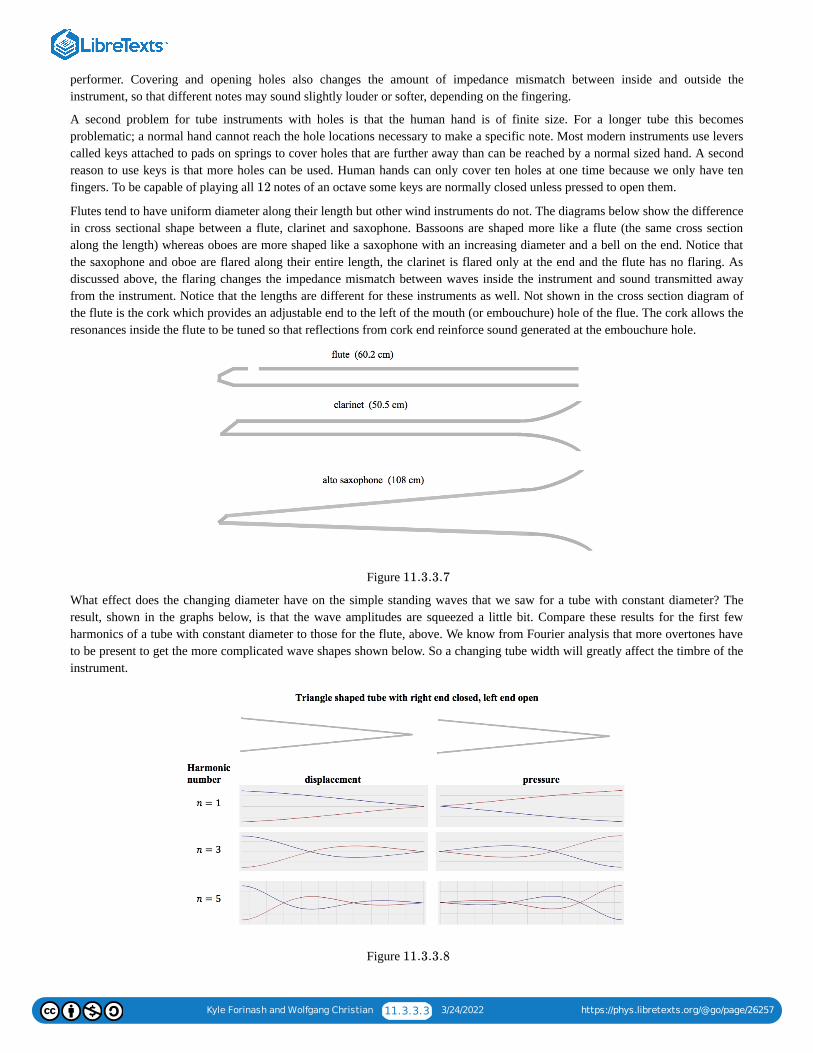
Kyle Forinash and Wolfgang Christian 11.3.3.3 3/24/2022 https://phys.libretexts.org/@go/page/26257
performer. Covering and opening holes also changes the amount of impedance mismatch between inside and outside theinstrument, so that different notes may sound slightly louder or softer, depending on the fingering.
A second problem for tube instruments with holes is that the human hand is of finite size. For a longer tube this becomesproblematic; a normal hand cannot reach the hole locations necessary to make a specific note. Most modern instruments use leverscalled keys attached to pads on springs to cover holes that are further away than can be reached by a normal sized hand. A secondreason to use keys is that more holes can be used. Human hands can only cover ten holes at one time because we only have tenfingers. To be capable of playing all notes of an octave some keys are normally closed unless pressed to open them.
Flutes tend to have uniform diameter along their length but other wind instruments do not. The diagrams below show the differencein cross sectional shape between a flute, clarinet and saxophone. Bassoons are shaped more like a flute (the same cross sectionalong the length) whereas oboes are more shaped like a saxophone with an increasing diameter and a bell on the end. Notice thatthe saxophone and oboe are flared along their entire length, the clarinet is flared only at the end and the flute has no flaring. Asdiscussed above, the flaring changes the impedance mismatch between waves inside the instrument and sound transmitted awayfrom the instrument. Notice that the lengths are different for these instruments as well. Not shown in the cross section diagram ofthe flute is the cork which provides an adjustable end to the left of the mouth (or embouchure) hole of the flue. The cork allows theresonances inside the flute to be tuned so that reflections from cork end reinforce sound generated at the embouchure hole.
Figure
What effect does the changing diameter have on the simple standing waves that we saw for a tube with constant diameter? Theresult, shown in the graphs below, is that the wave amplitudes are squeezed a little bit. Compare these results for the first fewharmonics of a tube with constant diameter to those for the flute, above. We know from Fourier analysis that more overtones haveto be present to get the more complicated wave shapes shown below. So a changing tube width will greatly affect the timbre of theinstrument.
Figure
12
11.3.3.7
11.3.3.8
Kyle Forinash and Wolfgang Christian 11.3.3.4 3/24/2022 https://phys.libretexts.org/@go/page/26257
Video/audio examples:Fipple turbulence video.Animation of a clarinet making sound.Bass flute performance.Tin whistle performance.Nose flute: history, modern.Wikipedia on flutes, clarinet, recorders, oboe, bassoon and saxophone family.
Contributions and AttributionsThis page is licensed under a CC BY-NC-SA 3.0 license and was authored, remixed, and/or curated by Kyle Forinash andWolfgang Christian. Source content is found at https://www.compadre.org/books/SoundBook. Page content has been edited andupdated to conform to the style and standards of the LibreTexts platform. A detailed versioning history of the edits to source contentis available upon request.
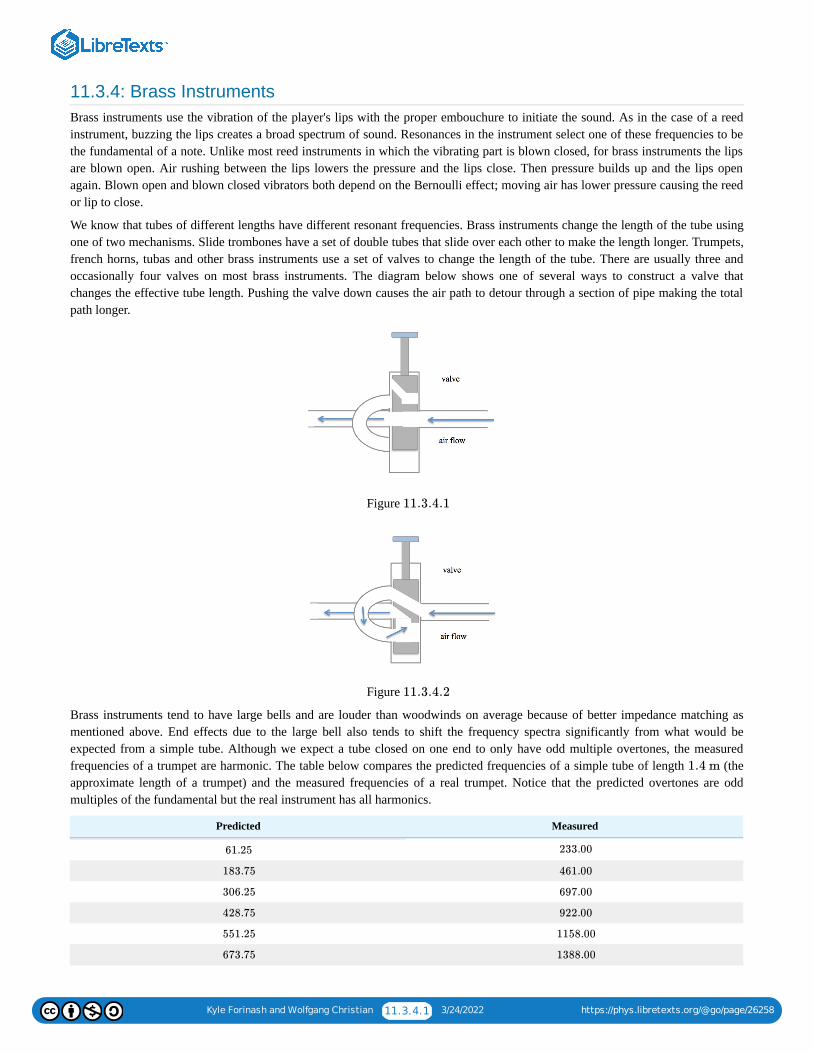
Kyle Forinash and Wolfgang Christian 11.3.4.1 3/24/2022 https://phys.libretexts.org/@go/page/26258
11.3.4: Brass InstrumentsBrass instruments use the vibration of the player's lips with the proper embouchure to initiate the sound. As in the case of a reedinstrument, buzzing the lips creates a broad spectrum of sound. Resonances in the instrument select one of these frequencies to bethe fundamental of a note. Unlike most reed instruments in which the vibrating part is blown closed, for brass instruments the lipsare blown open. Air rushing between the lips lowers the pressure and the lips close. Then pressure builds up and the lips openagain. Blown open and blown closed vibrators both depend on the Bernoulli effect; moving air has lower pressure causing the reedor lip to close.
We know that tubes of different lengths have different resonant frequencies. Brass instruments change the length of the tube usingone of two mechanisms. Slide trombones have a set of double tubes that slide over each other to make the length longer. Trumpets,french horns, tubas and other brass instruments use a set of valves to change the length of the tube. There are usually three andoccasionally four valves on most brass instruments. The diagram below shows one of several ways to construct a valve thatchanges the effective tube length. Pushing the valve down causes the air path to detour through a section of pipe making the totalpath longer.
Figure
Figure
Brass instruments tend to have large bells and are louder than woodwinds on average because of better impedance matching asmentioned above. End effects due to the large bell also tends to shift the frequency spectra significantly from what would beexpected from a simple tube. Although we expect a tube closed on one end to only have odd multiple overtones, the measuredfrequencies of a trumpet are harmonic. The table below compares the predicted frequencies of a simple tube of length (theapproximate length of a trumpet) and the measured frequencies of a real trumpet. Notice that the predicted overtones are oddmultiples of the fundamental but the real instrument has all harmonics.
Predicted Measured
11.3.4.1
11.3.4.2
1.4 m
61.25 233.00
183.75 461.00
306.25 697.00
428.75 922.00
551.25 1158.00
673.75 1388.00
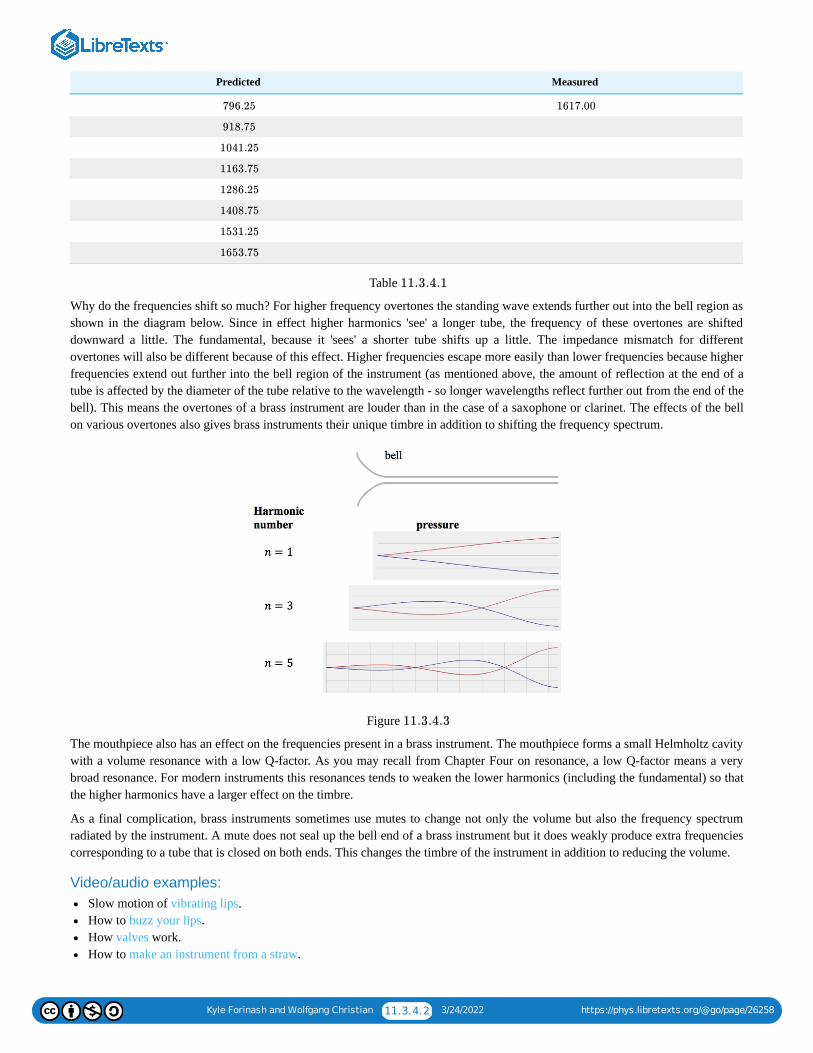
Kyle Forinash and Wolfgang Christian 11.3.4.2 3/24/2022 https://phys.libretexts.org/@go/page/26258
Predicted Measured
Table
Why do the frequencies shift so much? For higher frequency overtones the standing wave extends further out into the bell region asshown in the diagram below. Since in effect higher harmonics 'see' a longer tube, the frequency of these overtones are shifteddownward a little. The fundamental, because it 'sees' a shorter tube shifts up a little. The impedance mismatch for differentovertones will also be different because of this effect. Higher frequencies escape more easily than lower frequencies because higherfrequencies extend out further into the bell region of the instrument (as mentioned above, the amount of reflection at the end of atube is affected by the diameter of the tube relative to the wavelength - so longer wavelengths reflect further out from the end of thebell). This means the overtones of a brass instrument are louder than in the case of a saxophone or clarinet. The effects of the bellon various overtones also gives brass instruments their unique timbre in addition to shifting the frequency spectrum.
Figure
The mouthpiece also has an effect on the frequencies present in a brass instrument. The mouthpiece forms a small Helmholtz cavitywith a volume resonance with a low Q-factor. As you may recall from Chapter Four on resonance, a low Q-factor means a verybroad resonance. For modern instruments this resonances tends to weaken the lower harmonics (including the fundamental) so thatthe higher harmonics have a larger effect on the timbre.
As a final complication, brass instruments sometimes use mutes to change not only the volume but also the frequency spectrumradiated by the instrument. A mute does not seal up the bell end of a brass instrument but it does weakly produce extra frequenciescorresponding to a tube that is closed on both ends. This changes the timbre of the instrument in addition to reducing the volume.
Video/audio examples:Slow motion of vibrating lips.How to buzz your lips.How valves work.How to make an instrument from a straw.
796.25 1617.00
918.75
1041.25
1163.75
1286.25
1408.75
1531.25
1653.75
11.3.4.1
11.3.4.3

Kyle Forinash and Wolfgang Christian 11.3.4.3 3/24/2022 https://phys.libretexts.org/@go/page/26258
Wikipedia on trombones, trumpets, french horns, tubas, and sousaphones.The following web sites have pictures, sound samples and information about modern musical instruments used in bands andorchestras: one, two, three, four.
Contributions and AttributionsThis page is licensed under a CC BY-NC-SA 3.0 license and was authored, remixed, and/or curated by Kyle Forinash andWolfgang Christian. Source content is found at https://www.compadre.org/books/SoundBook. Page content has been edited andupdated to conform to the style and standards of the LibreTexts platform. A detailed versioning history of the edits to source contentis available upon request.
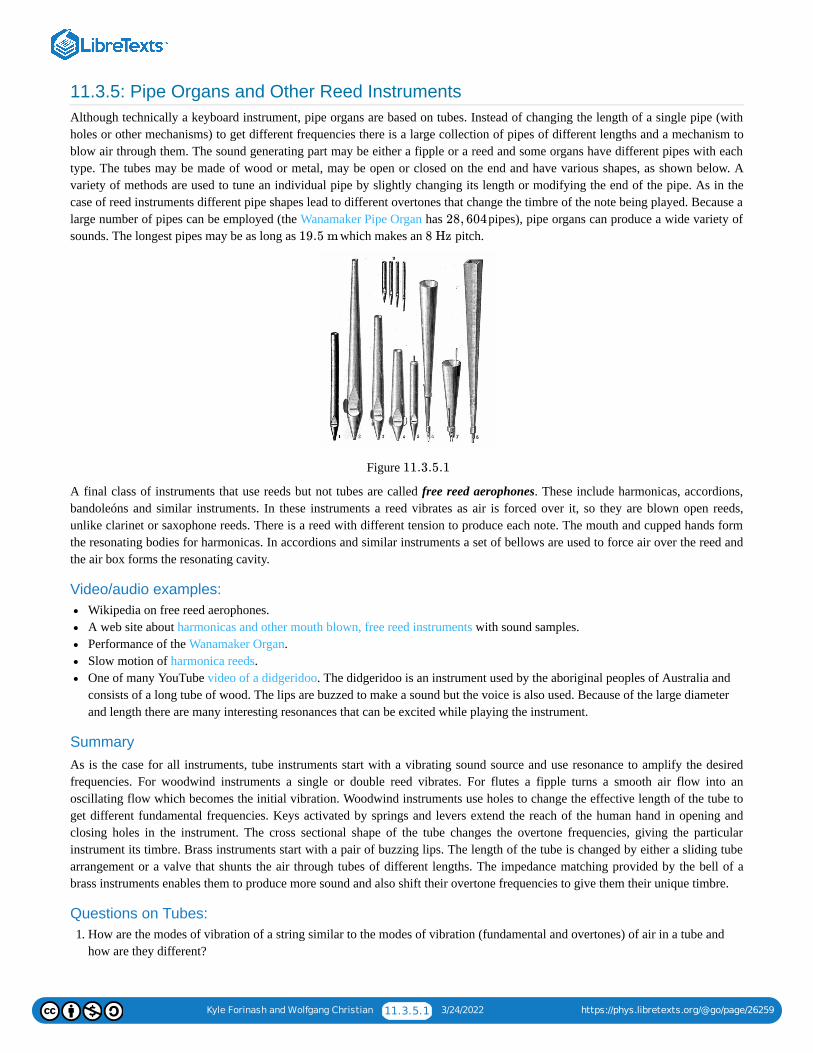
Kyle Forinash and Wolfgang Christian 11.3.5.1 3/24/2022 https://phys.libretexts.org/@go/page/26259
11.3.5: Pipe Organs and Other Reed InstrumentsAlthough technically a keyboard instrument, pipe organs are based on tubes. Instead of changing the length of a single pipe (withholes or other mechanisms) to get different frequencies there is a large collection of pipes of different lengths and a mechanism toblow air through them. The sound generating part may be either a fipple or a reed and some organs have different pipes with eachtype. The tubes may be made of wood or metal, may be open or closed on the end and have various shapes, as shown below. Avariety of methods are used to tune an individual pipe by slightly changing its length or modifying the end of the pipe. As in thecase of reed instruments different pipe shapes lead to different overtones that change the timbre of the note being played. Because alarge number of pipes can be employed (the Wanamaker Pipe Organ has pipes), pipe organs can produce a wide variety ofsounds. The longest pipes may be as long as which makes an pitch.
Figure
A final class of instruments that use reeds but not tubes are called free reed aerophones. These include harmonicas, accordions,bandoleóns and similar instruments. In these instruments a reed vibrates as air is forced over it, so they are blown open reeds,unlike clarinet or saxophone reeds. There is a reed with different tension to produce each note. The mouth and cupped hands formthe resonating bodies for harmonicas. In accordions and similar instruments a set of bellows are used to force air over the reed andthe air box forms the resonating cavity.
Video/audio examples:Wikipedia on free reed aerophones.A web site about harmonicas and other mouth blown, free reed instruments with sound samples.Performance of the Wanamaker Organ.Slow motion of harmonica reeds.One of many YouTube video of a didgeridoo. The didgeridoo is an instrument used by the aboriginal peoples of Australia andconsists of a long tube of wood. The lips are buzzed to make a sound but the voice is also used. Because of the large diameterand length there are many interesting resonances that can be excited while playing the instrument.
SummaryAs is the case for all instruments, tube instruments start with a vibrating sound source and use resonance to amplify the desiredfrequencies. For woodwind instruments a single or double reed vibrates. For flutes a fipple turns a smooth air flow into anoscillating flow which becomes the initial vibration. Woodwind instruments use holes to change the effective length of the tube toget different fundamental frequencies. Keys activated by springs and levers extend the reach of the human hand in opening andclosing holes in the instrument. The cross sectional shape of the tube changes the overtone frequencies, giving the particularinstrument its timbre. Brass instruments start with a pair of buzzing lips. The length of the tube is changed by either a sliding tubearrangement or a valve that shunts the air through tubes of different lengths. The impedance matching provided by the bell of abrass instruments enables them to produce more sound and also shift their overtone frequencies to give them their unique timbre.
Questions on Tubes:1. How are the modes of vibration of a string similar to the modes of vibration (fundamental and overtones) of air in a tube and
how are they different?
28, 604
19.5 m 8 Hz
11.3.5.1
Kyle Forinash and Wolfgang Christian 11.3.5.2 3/24/2022 https://phys.libretexts.org/@go/page/26259
2. How are the modes of vibration of air in a tube that is closed at one end different than those of one open at both ends?3. How is the length of a tube related to the fundamental frequency of vibration of air inside a tube open at both ends?4. How is the length of a tube related to the fundamental frequency of vibration of air inside a tube open at only one end?5. What is the difference between pressure nodes and displacement nodes in a tube instrument?6. What are pressure anti-nodes and where are they located in a tube open on both ends for the fundamental and the first three
harmonics?7. How can the fundamental frequency of a tube instrument be changed?8. Why does introducing finger holes in a flute affect the frequency played?9. Holes on a tube instrument change the frequencies being played. List some problems with using holes for this purpose.
10. What is the general definition of impedance?11. Why is some impedance necessary for tube instruments?12. In a tube instrument, how are standing waves established in the tube?13. What vibrates to produce the initial sound in each of the following instruments: Oboe, clarinet, flute, pipe organ, trumpet,
trombone.14. What is embouchure and why is it important?15. Explain how a flute works without a reed to vibrate.16. What is an edge tone?17. Brass instruments are generally louder than woodwind instruments because they have bigger bells. Why does a bigger bell
make the instrument sound louder (Hint: Think about impedance.)?18. What other effect does a large bell have on a brass instrument besides making it sound louder?19. Clarinets and trumpets are both tube instruments which can play the same note (same fundamental frequency) but they have
very different timbre. What are some factors that cause the timbre to be different?20. How do the following instruments change the pitch they are playing: Slide trombone, trumpet, flute, French horn, clarinet,
saxophone, flute, pipe organ.21. A didgeridoo is a long lube of wood, an instrument used by Aboriginals in Australia. How is the sound produce? Is there any
impedance? Explain your answers.22. Harmonicas, accordions, and bandoleóns all belong to what type of non-tube instrument? How do they work?
Contributions and AttributionsThis page is licensed under a CC BY-NC-SA 3.0 license and was authored, remixed, and/or curated by Kyle Forinash andWolfgang Christian. Source content is found at https://www.compadre.org/books/SoundBook. Page content has been edited andupdated to conform to the style and standards of the LibreTexts platform. A detailed versioning history of the edits to source contentis available upon request.
Kyle Forinash and Wolfgang Christian 12.1 3/24/2022 https://phys.libretexts.org/@go/page/25940
12: PercussionPercussion instruments can be divided into two groups; those that make a distinct tone and those that do not. Pianos, xylophones,marimbas, steel drums and some tuned drums (for example tympani) are percussion instruments that have distinct tones. In otherwords, their overtones are harmonic. Cymbals, wood block, llaves and most drums, on the other hand do not produce a tone. ThisWikipedia link has a long list of percussion instruments with links and explanations for each.
Key Terms:Modes of vibration, mode numbers, nodal lines, strike tone, decay rate, anharmonic.
12.1: Percussion and Drumheads
Contributions and Attributions
This page is licensed under a CC BY-NC-SA 3.0 license and was authored, remixed, and/or curated by Kyle Forinash andWolfgang Christian. Source content is found at https://www.compadre.org/books/SoundBook. Page content has been edited andupdated to conform to the style and standards of the LibreTexts platform. A detailed versioning history of the edits to source contentis available upon request.
12.1.1: Vibrating Membranes
12.1.2: Circular Drum Head Simulation
12.1.3: Drums
12.1.4: Harmonic Percussion Instruments
12.1.5: Other Musical Instruments
Kyle Forinash and Wolfgang Christian 12.1.1 3/24/2022 https://phys.libretexts.org/@go/page/25934
12.1: Percussion and DrumheadsThis section allows you to see and manipulate the modes for a square drum head. You can change the modes using the sliders tochange the mode numbers and . For a membrane there are nodal lines which do not vibrate similar to the nodes we saw on thestring but now in two dimensions. You can rotate and enlarge the surface by dragging the mouse over the image. Just like the casefor a vibrating string, more than one mode can be present on the two dimensional surface at the same time.
Contributions and AttributionsThis page is licensed under a CC BY-NC-SA 3.0 license and was authored, remixed, and/or curated by Kyle Forinash andWolfgang Christian. Source content is found at https://www.compadre.org/books/SoundBook. Page content has been edited andupdated to conform to the style and standards of the LibreTexts platform. A detailed versioning history of the edits to source contentis available upon request.
n m
Kyle Forinash and Wolfgang Christian 12.1.1.1 3/24/2022 https://phys.libretexts.org/@go/page/26262
12.1.1: Vibrating MembranesAs we have seen string modes of vibration can be labeled by a single mode number, , and the modes are harmonic. Eachsubsequent mode (or overtone) produces a frequency that is a multiple of the fundamental.
There are slight variations to this rule when the string amplitude gets very large or if the string is very stiff but we won't worryabout that here.
In the simulation of the square surface in Chapter 11 we saw that two mode numbers, and , are needed to specify a mode on atwo dimensional surface. We also discovered that some of the modes were degenerate meaning two different combinations of and
lead to the same frequency but in general the frequencies were not harmonic. This is generally true of most vibrating surfacesand membranes; they do not have harmonic overtones. As a result our ear-brain system does not detect a distinct pitch from mostdrums.
Video/audio examples:Pennsylvania State simulations of circular membranes.Wikipedia explanation of circular membranes (first admire the mathematics and then scroll to the bottom to see thesimulations).YouTube of a membrane driven by a speaker.
Contributions and AttributionsThis page is licensed under a CC BY-NC-SA 3.0 license and was authored, remixed, and/or curated by Kyle Forinash andWolfgang Christian. Source content is found at https://www.compadre.org/books/SoundBook. Page content has been edited andupdated to conform to the style and standards of the LibreTexts platform. A detailed versioning history of the edits to source contentis available upon request.
n
Note
n m
n
m
Kyle Forinash and Wolfgang Christian 12.1.2.1 3/24/2022 https://phys.libretexts.org/@go/page/26263
12.1.2: Circular Drum Head SimulationThe following simulation allows you to see and manipulate the pure modes for a circular drum head (fixed around the edge). Thesimulation can be viewed as a two dimensional surface or as a surface in three dimensions. In the 3D view you can grab the surfacewith the mouse and rotate it. The amplitudes of the vibrations are exaggerated compared to a real surface to make them morevisible. Increasing makes the simulation run faster but also less accurately, particularly for higher mode numbers.
The shapes for a circular membrane are given by Bessel Functions multiplied by sine waves instead of sine waves as was the casein the rectangular surface (which is as much math as we need to know for now). For a rectangular surface the values of and start at one and one and are always positive. For a circular membrane starts at one and must be positive but can be zero andalso negative.
The relative mode amplitudes in the case of more than one mode are not properly normalized, mathematically, in thissimulation.
Simulation Questions1. Set and , run the simulation and describe the motion in the surface view. Also describe the motion in the 3D view
(if the surface is too large to fit in the window, use the mouse to shrink it to fit).2. What is the frequency of the mode? What is the period?3. Look at the and mode and describe the motion in the surface and 3D view. (Don't forget you can rotate the view
using the mouse to get a better angle.) Describe the location of the nodal line.4. For the and mode, what is the frequency? Is this a harmonic?5. For the and mode, what is the frequency? Is this a harmonic?6. Try several different pure modes. Can you find any harmonics of the lowest frequency mode?7. Look at the pure modes for and (a pure mode has one of the two mode numbers equal to zero). What do
the modes all have in common?8. For any of the modes you have looked at, is there a cross section through the 3D view that would be a sine or cosine shape? The
shape of the curve from the center out to the edge is given by Bessel Functions instead of sines or cosines.9. Compare the mode with the mode. What is the difference? Are these degenerate modes (the
same frequency for two different choices of mode numbers)?10. This simulation only shows pure modes. What would be the effect of having lots of different modes on the surface at the same
time? (Go back to the rectangular plate simulation for a hint.)
Contributions and AttributionsThis page is licensed under a CC BY-NC-SA 3.0 license and was authored, remixed, and/or curated by Kyle Forinash andWolfgang Christian. Source content is found at https://www.compadre.org/books/SoundBook. Page content has been edited andupdated to conform to the style and standards of the LibreTexts platform. A detailed versioning history of the edits to source contentis available upon request.
Δt
n m
n m
Note
n = 1 m = 0
n = 1, m = 0
n = 1 m = 1
n = 1 m = 1
n = 2 m = 0
n = 1, 2, 3, 4 m = 0
m = 0
n = 1, m = 1 n = 1, m = −1
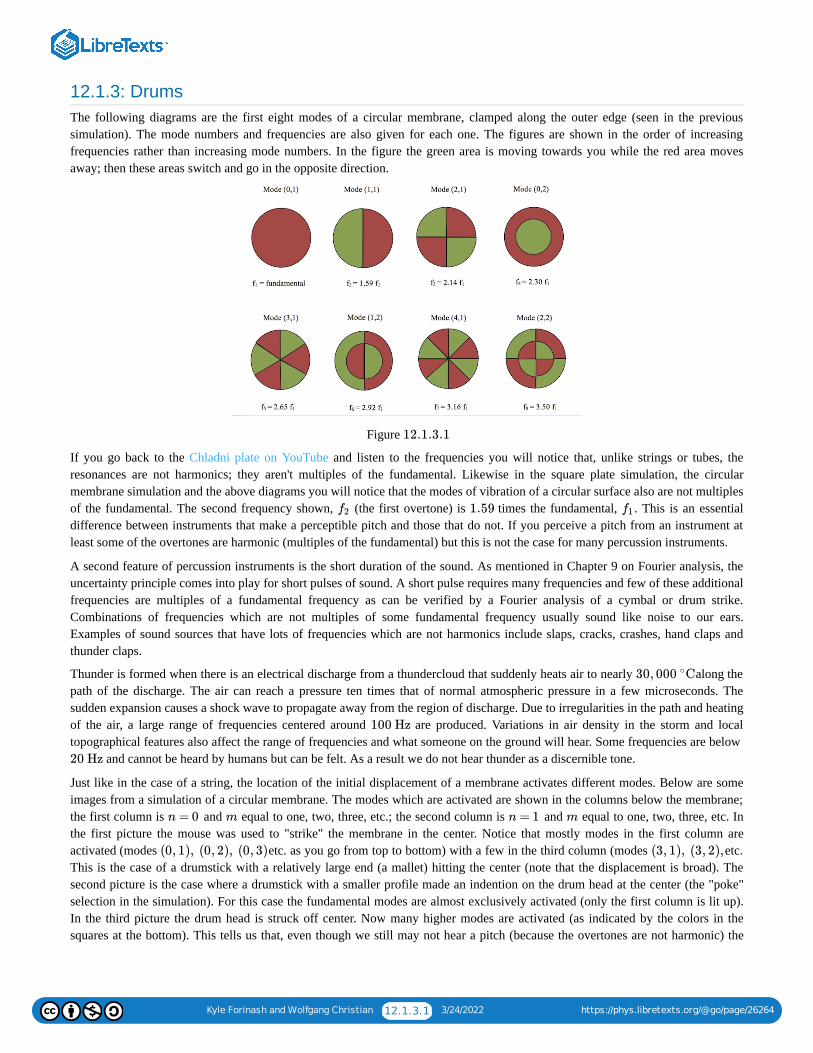
Kyle Forinash and Wolfgang Christian 12.1.3.1 3/24/2022 https://phys.libretexts.org/@go/page/26264
12.1.3: DrumsThe following diagrams are the first eight modes of a circular membrane, clamped along the outer edge (seen in the previoussimulation). The mode numbers and frequencies are also given for each one. The figures are shown in the order of increasingfrequencies rather than increasing mode numbers. In the figure the green area is moving towards you while the red area movesaway; then these areas switch and go in the opposite direction.
Figure
If you go back to the Chladni plate on YouTube and listen to the frequencies you will notice that, unlike strings or tubes, theresonances are not harmonics; they aren't multiples of the fundamental. Likewise in the square plate simulation, the circularmembrane simulation and the above diagrams you will notice that the modes of vibration of a circular surface also are not multiplesof the fundamental. The second frequency shown, (the first overtone) is times the fundamental, . This is an essentialdifference between instruments that make a perceptible pitch and those that do not. If you perceive a pitch from an instrument atleast some of the overtones are harmonic (multiples of the fundamental) but this is not the case for many percussion instruments.
A second feature of percussion instruments is the short duration of the sound. As mentioned in Chapter 9 on Fourier analysis, theuncertainty principle comes into play for short pulses of sound. A short pulse requires many frequencies and few of these additionalfrequencies are multiples of a fundamental frequency as can be verified by a Fourier analysis of a cymbal or drum strike.Combinations of frequencies which are not multiples of some fundamental frequency usually sound like noise to our ears.Examples of sound sources that have lots of frequencies which are not harmonics include slaps, cracks, crashes, hand claps andthunder claps.
Thunder is formed when there is an electrical discharge from a thundercloud that suddenly heats air to nearly along thepath of the discharge. The air can reach a pressure ten times that of normal atmospheric pressure in a few microseconds. Thesudden expansion causes a shock wave to propagate away from the region of discharge. Due to irregularities in the path and heatingof the air, a large range of frequencies centered around are produced. Variations in air density in the storm and localtopographical features also affect the range of frequencies and what someone on the ground will hear. Some frequencies are below
and cannot be heard by humans but can be felt. As a result we do not hear thunder as a discernible tone.
Just like in the case of a string, the location of the initial displacement of a membrane activates different modes. Below are someimages from a simulation of a circular membrane. The modes which are activated are shown in the columns below the membrane;the first column is and equal to one, two, three, etc.; the second column is and equal to one, two, three, etc. Inthe first picture the mouse was used to "strike" the membrane in the center. Notice that mostly modes in the first column areactivated (modes etc. as you go from top to bottom) with a few in the third column (modes etc.This is the case of a drumstick with a relatively large end (a mallet) hitting the center (note that the displacement is broad). Thesecond picture is the case where a drumstick with a smaller profile made an indention on the drum head at the center (the "poke"selection in the simulation). For this case the fundamental modes are almost exclusively activated (only the first column is lit up).In the third picture the drum head is struck off center. Now many higher modes are activated (as indicated by the colors in thesquares at the bottom). This tells us that, even though we still may not hear a pitch (because the overtones are not harmonic) the
12.1.3.1
f2 1.59 f1
30, 000 C∘
100 Hz
20 Hz
n = 0 m n = 1 m
(0, 1), (0, 2), (0, 3) (3, 1), (3, 2),
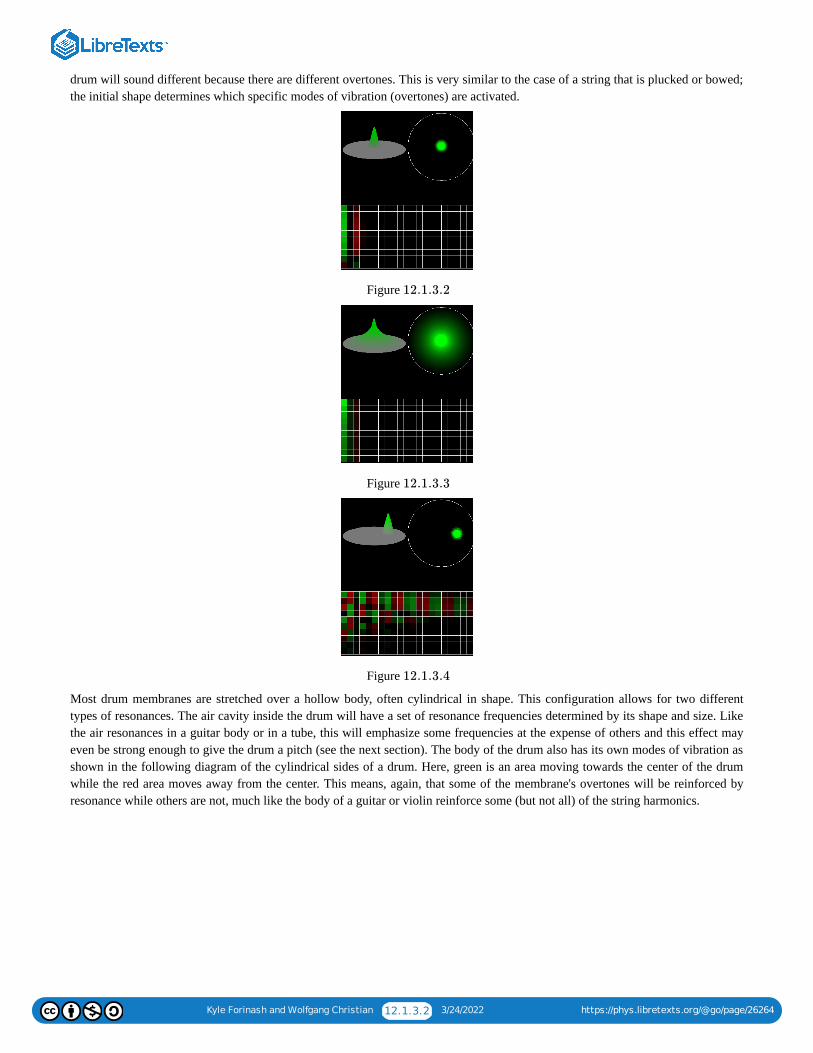
Kyle Forinash and Wolfgang Christian 12.1.3.2 3/24/2022 https://phys.libretexts.org/@go/page/26264
drum will sound different because there are different overtones. This is very similar to the case of a string that is plucked or bowed;the initial shape determines which specific modes of vibration (overtones) are activated.
Figure
Figure
Figure
Most drum membranes are stretched over a hollow body, often cylindrical in shape. This configuration allows for two differenttypes of resonances. The air cavity inside the drum will have a set of resonance frequencies determined by its shape and size. Likethe air resonances in a guitar body or in a tube, this will emphasize some frequencies at the expense of others and this effect mayeven be strong enough to give the drum a pitch (see the next section). The body of the drum also has its own modes of vibration asshown in the following diagram of the cylindrical sides of a drum. Here, green is an area moving towards the center of the drumwhile the red area moves away from the center. This means, again, that some of the membrane's overtones will be reinforced byresonance while others are not, much like the body of a guitar or violin reinforce some (but not all) of the string harmonics.
12.1.3.2
12.1.3.3
12.1.3.4
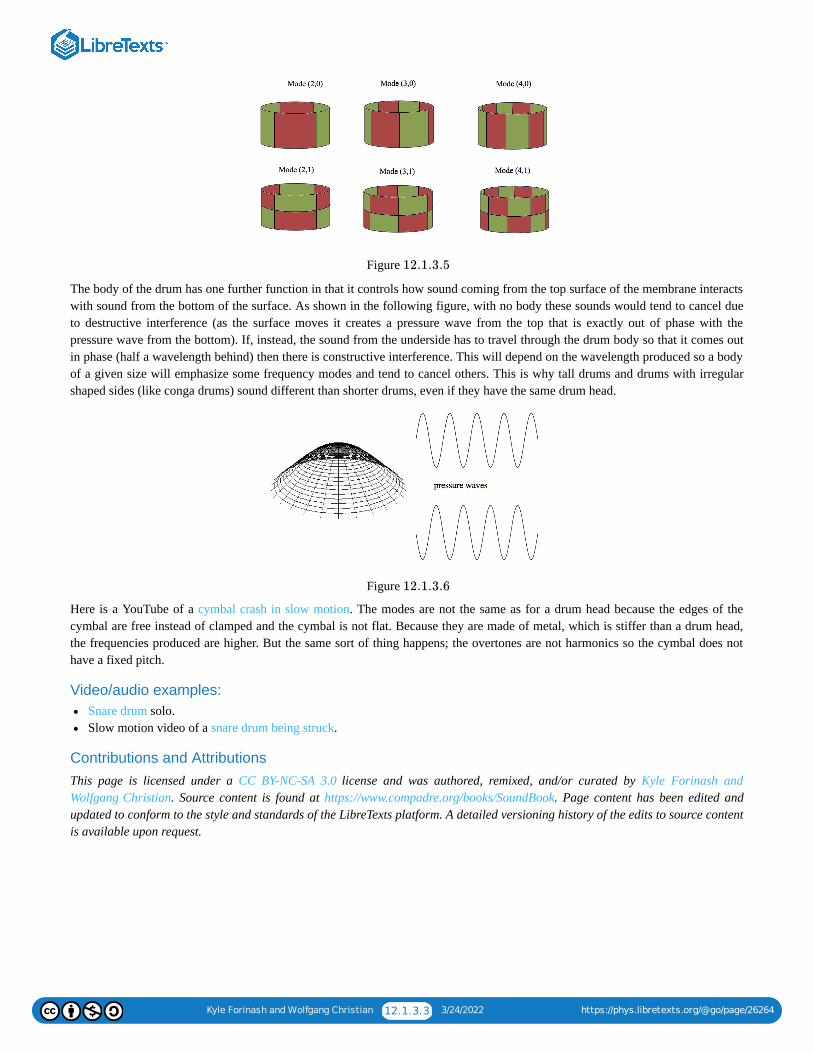
Kyle Forinash and Wolfgang Christian 12.1.3.3 3/24/2022 https://phys.libretexts.org/@go/page/26264
Figure
The body of the drum has one further function in that it controls how sound coming from the top surface of the membrane interactswith sound from the bottom of the surface. As shown in the following figure, with no body these sounds would tend to cancel dueto destructive interference (as the surface moves it creates a pressure wave from the top that is exactly out of phase with thepressure wave from the bottom). If, instead, the sound from the underside has to travel through the drum body so that it comes outin phase (half a wavelength behind) then there is constructive interference. This will depend on the wavelength produced so a bodyof a given size will emphasize some frequency modes and tend to cancel others. This is why tall drums and drums with irregularshaped sides (like conga drums) sound different than shorter drums, even if they have the same drum head.
Figure
Here is a YouTube of a cymbal crash in slow motion. The modes are not the same as for a drum head because the edges of thecymbal are free instead of clamped and the cymbal is not flat. Because they are made of metal, which is stiffer than a drum head,the frequencies produced are higher. But the same sort of thing happens; the overtones are not harmonics so the cymbal does nothave a fixed pitch.
Video/audio examples:Snare drum solo.Slow motion video of a snare drum being struck.
Contributions and AttributionsThis page is licensed under a CC BY-NC-SA 3.0 license and was authored, remixed, and/or curated by Kyle Forinash andWolfgang Christian. Source content is found at https://www.compadre.org/books/SoundBook. Page content has been edited andupdated to conform to the style and standards of the LibreTexts platform. A detailed versioning history of the edits to source contentis available upon request.
12.1.3.5
12.1.3.6
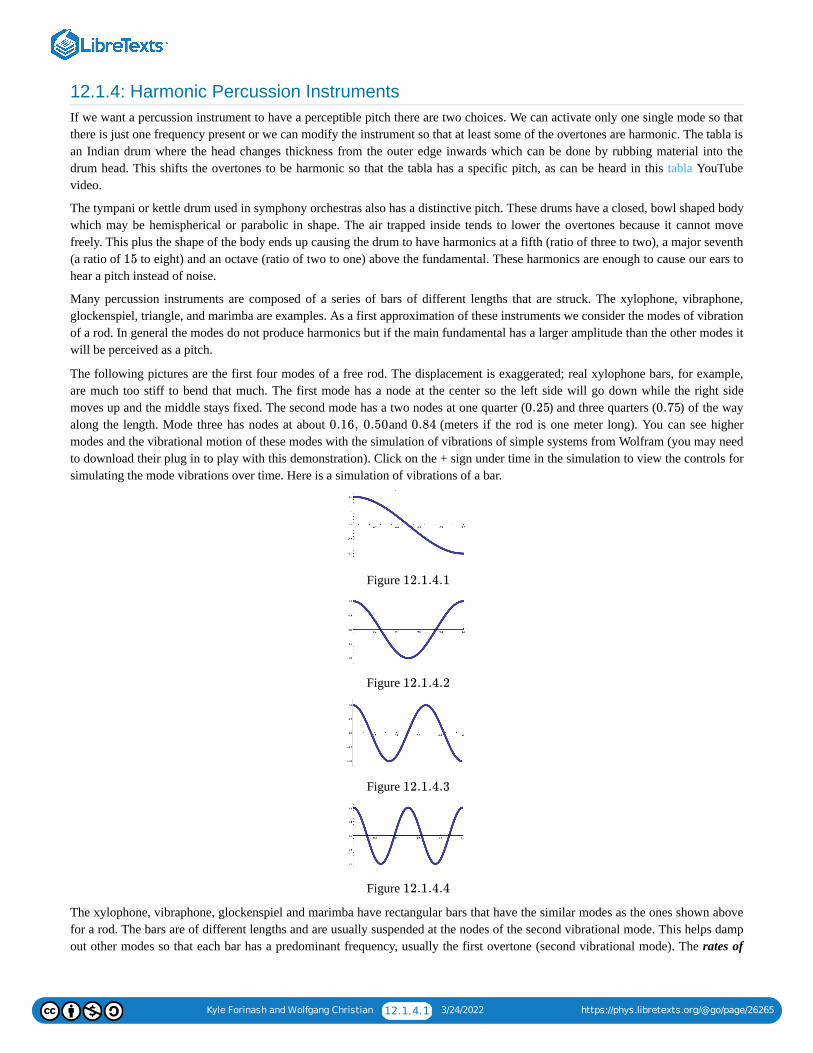
Kyle Forinash and Wolfgang Christian 12.1.4.1 3/24/2022 https://phys.libretexts.org/@go/page/26265
12.1.4: Harmonic Percussion InstrumentsIf we want a percussion instrument to have a perceptible pitch there are two choices. We can activate only one single mode so thatthere is just one frequency present or we can modify the instrument so that at least some of the overtones are harmonic. The tabla isan Indian drum where the head changes thickness from the outer edge inwards which can be done by rubbing material into thedrum head. This shifts the overtones to be harmonic so that the tabla has a specific pitch, as can be heard in this tabla YouTubevideo.
The tympani or kettle drum used in symphony orchestras also has a distinctive pitch. These drums have a closed, bowl shaped bodywhich may be hemispherical or parabolic in shape. The air trapped inside tends to lower the overtones because it cannot movefreely. This plus the shape of the body ends up causing the drum to have harmonics at a fifth (ratio of three to two), a major seventh(a ratio of to eight) and an octave (ratio of two to one) above the fundamental. These harmonics are enough to cause our ears tohear a pitch instead of noise.
Many percussion instruments are composed of a series of bars of different lengths that are struck. The xylophone, vibraphone,glockenspiel, triangle, and marimba are examples. As a first approximation of these instruments we consider the modes of vibrationof a rod. In general the modes do not produce harmonics but if the main fundamental has a larger amplitude than the other modes itwill be perceived as a pitch.
The following pictures are the first four modes of a free rod. The displacement is exaggerated; real xylophone bars, for example,are much too stiff to bend that much. The first mode has a node at the center so the left side will go down while the right sidemoves up and the middle stays fixed. The second mode has a two nodes at one quarter ( ) and three quarters ( ) of the wayalong the length. Mode three has nodes at about and (meters if the rod is one meter long). You can see highermodes and the vibrational motion of these modes with the simulation of vibrations of simple systems from Wolfram (you may needto download their plug in to play with this demonstration). Click on the + sign under time in the simulation to view the controls forsimulating the mode vibrations over time. Here is a simulation of vibrations of a bar.
Figure
Figure
Figure
Figure
The xylophone, vibraphone, glockenspiel and marimba have rectangular bars that have the similar modes as the ones shown abovefor a rod. The bars are of different lengths and are usually suspended at the nodes of the second vibrational mode. This helps dampout other modes so that each bar has a predominant frequency, usually the first overtone (second vibrational mode). The rates of
15
0.25 0.75
0.16, 0.50 0.84
12.1.4.1
12.1.4.2
12.1.4.3
12.1.4.4
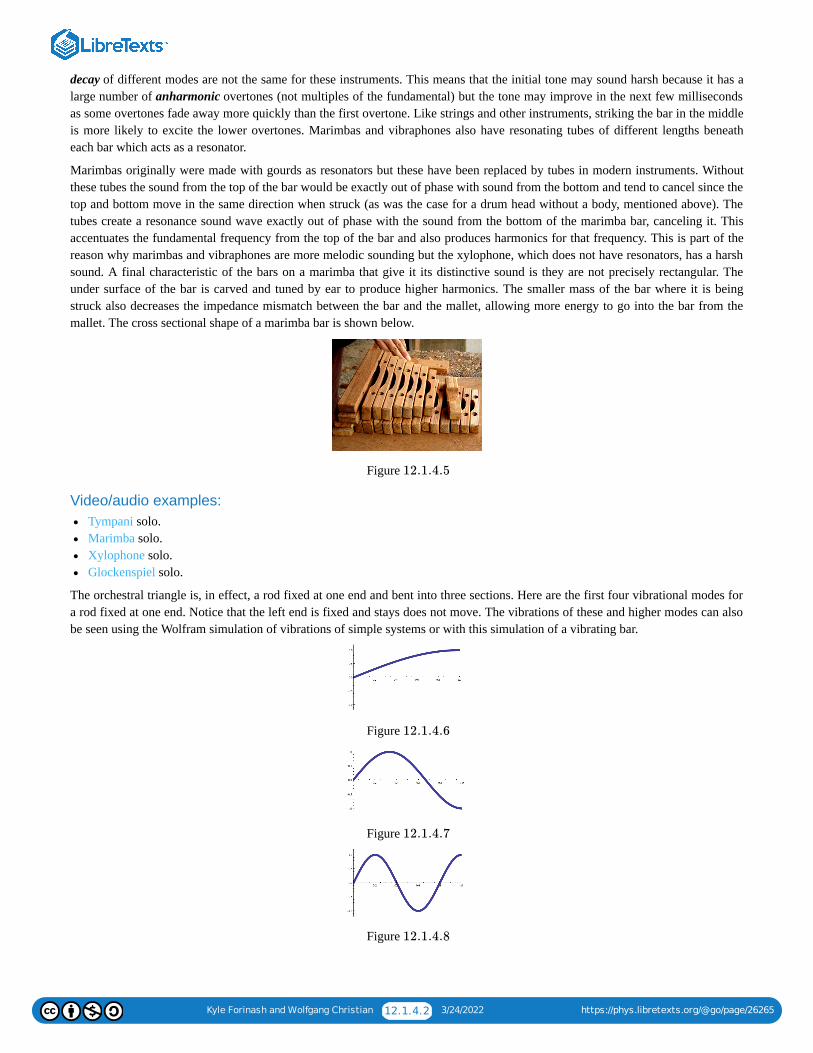
Kyle Forinash and Wolfgang Christian 12.1.4.2 3/24/2022 https://phys.libretexts.org/@go/page/26265
decay of different modes are not the same for these instruments. This means that the initial tone may sound harsh because it has alarge number of anharmonic overtones (not multiples of the fundamental) but the tone may improve in the next few millisecondsas some overtones fade away more quickly than the first overtone. Like strings and other instruments, striking the bar in the middleis more likely to excite the lower overtones. Marimbas and vibraphones also have resonating tubes of different lengths beneatheach bar which acts as a resonator.
Marimbas originally were made with gourds as resonators but these have been replaced by tubes in modern instruments. Withoutthese tubes the sound from the top of the bar would be exactly out of phase with sound from the bottom and tend to cancel since thetop and bottom move in the same direction when struck (as was the case for a drum head without a body, mentioned above). Thetubes create a resonance sound wave exactly out of phase with the sound from the bottom of the marimba bar, canceling it. Thisaccentuates the fundamental frequency from the top of the bar and also produces harmonics for that frequency. This is part of thereason why marimbas and vibraphones are more melodic sounding but the xylophone, which does not have resonators, has a harshsound. A final characteristic of the bars on a marimba that give it its distinctive sound is they are not precisely rectangular. Theunder surface of the bar is carved and tuned by ear to produce higher harmonics. The smaller mass of the bar where it is beingstruck also decreases the impedance mismatch between the bar and the mallet, allowing more energy to go into the bar from themallet. The cross sectional shape of a marimba bar is shown below.
Figure
Video/audio examples:Tympani solo.Marimba solo.Xylophone solo.Glockenspiel solo.
The orchestral triangle is, in effect, a rod fixed at one end and bent into three sections. Here are the first four vibrational modes fora rod fixed at one end. Notice that the left end is fixed and stays does not move. The vibrations of these and higher modes can alsobe seen using the Wolfram simulation of vibrations of simple systems or with this simulation of a vibrating bar.
Figure
Figure
Figure
12.1.4.5
12.1.4.6
12.1.4.7
12.1.4.8
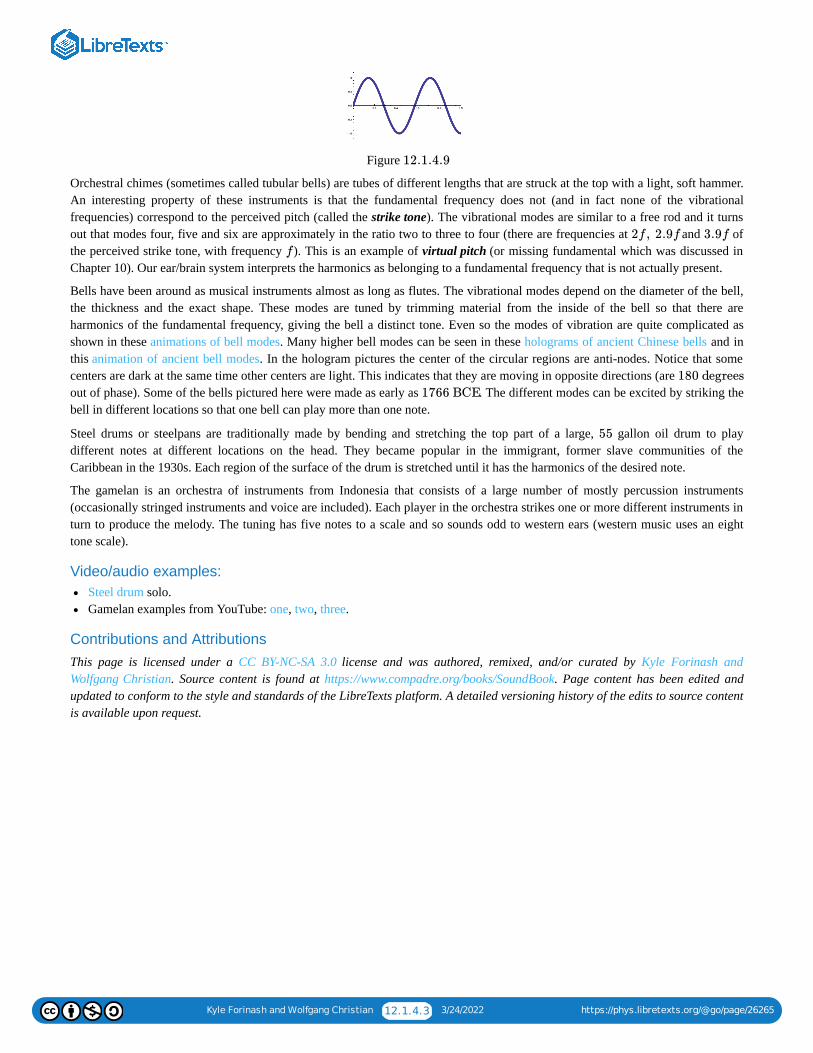
Kyle Forinash and Wolfgang Christian 12.1.4.3 3/24/2022 https://phys.libretexts.org/@go/page/26265
Figure
Orchestral chimes (sometimes called tubular bells) are tubes of different lengths that are struck at the top with a light, soft hammer.An interesting property of these instruments is that the fundamental frequency does not (and in fact none of the vibrationalfrequencies) correspond to the perceived pitch (called the strike tone). The vibrational modes are similar to a free rod and it turnsout that modes four, five and six are approximately in the ratio two to three to four (there are frequencies at and ofthe perceived strike tone, with frequency ). This is an example of virtual pitch (or missing fundamental which was discussed inChapter 10). Our ear/brain system interprets the harmonics as belonging to a fundamental frequency that is not actually present.
Bells have been around as musical instruments almost as long as flutes. The vibrational modes depend on the diameter of the bell,the thickness and the exact shape. These modes are tuned by trimming material from the inside of the bell so that there areharmonics of the fundamental frequency, giving the bell a distinct tone. Even so the modes of vibration are quite complicated asshown in these animations of bell modes. Many higher bell modes can be seen in these holograms of ancient Chinese bells and inthis animation of ancient bell modes. In the hologram pictures the center of the circular regions are anti-nodes. Notice that somecenters are dark at the same time other centers are light. This indicates that they are moving in opposite directions (are out of phase). Some of the bells pictured here were made as early as . The different modes can be excited by striking thebell in different locations so that one bell can play more than one note.
Steel drums or steelpans are traditionally made by bending and stretching the top part of a large, gallon oil drum to playdifferent notes at different locations on the head. They became popular in the immigrant, former slave communities of theCaribbean in the 1930s. Each region of the surface of the drum is stretched until it has the harmonics of the desired note.
The gamelan is an orchestra of instruments from Indonesia that consists of a large number of mostly percussion instruments(occasionally stringed instruments and voice are included). Each player in the orchestra strikes one or more different instruments inturn to produce the melody. The tuning has five notes to a scale and so sounds odd to western ears (western music uses an eighttone scale).
Video/audio examples:Steel drum solo.Gamelan examples from YouTube: one, two, three.
Contributions and AttributionsThis page is licensed under a CC BY-NC-SA 3.0 license and was authored, remixed, and/or curated by Kyle Forinash andWolfgang Christian. Source content is found at https://www.compadre.org/books/SoundBook. Page content has been edited andupdated to conform to the style and standards of the LibreTexts platform. A detailed versioning history of the edits to source contentis available upon request.
12.1.4.9
2f , 2.9f 3.9f
f
180 degrees
1766 BCE
55
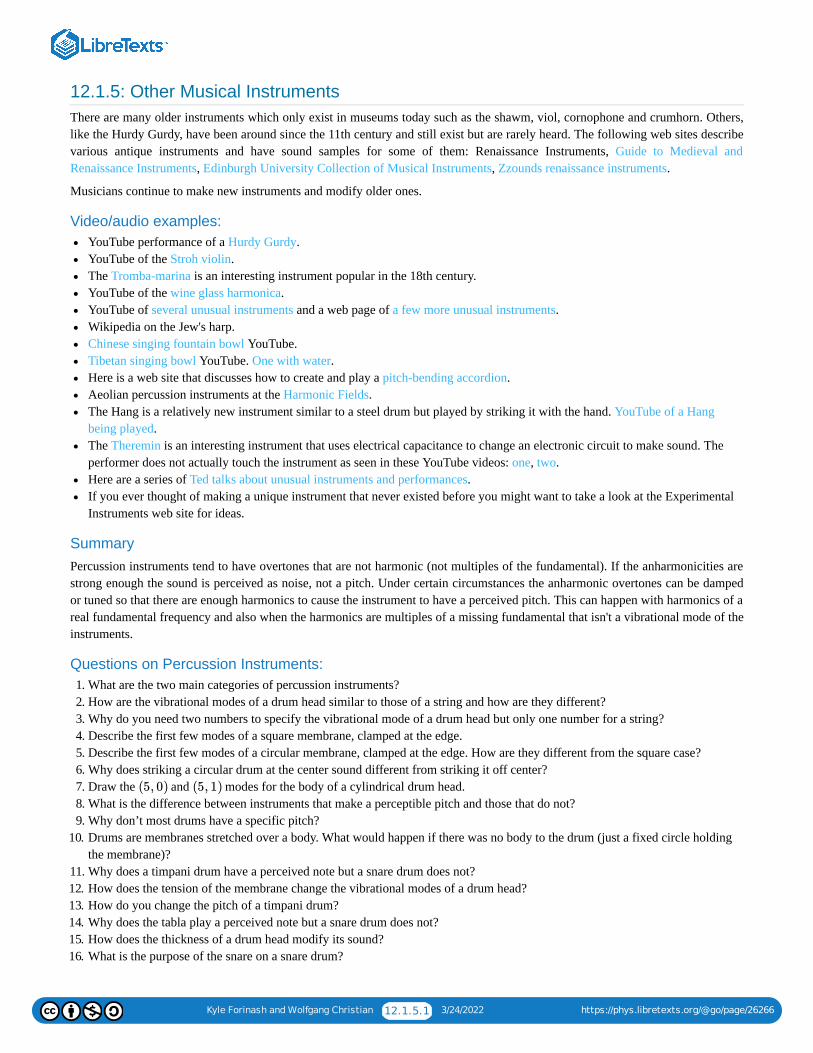
Kyle Forinash and Wolfgang Christian 12.1.5.1 3/24/2022 https://phys.libretexts.org/@go/page/26266
12.1.5: Other Musical InstrumentsThere are many older instruments which only exist in museums today such as the shawm, viol, cornophone and crumhorn. Others,like the Hurdy Gurdy, have been around since the 11th century and still exist but are rarely heard. The following web sites describevarious antique instruments and have sound samples for some of them: Renaissance Instruments, Guide to Medieval andRenaissance Instruments, Edinburgh University Collection of Musical Instruments, Zzounds renaissance instruments.
Musicians continue to make new instruments and modify older ones.
Video/audio examples:YouTube performance of a Hurdy Gurdy.YouTube of the Stroh violin.The Tromba-marina is an interesting instrument popular in the 18th century.YouTube of the wine glass harmonica.YouTube of several unusual instruments and a web page of a few more unusual instruments.Wikipedia on the Jew's harp.Chinese singing fountain bowl YouTube.Tibetan singing bowl YouTube. One with water.Here is a web site that discusses how to create and play a pitch-bending accordion.Aeolian percussion instruments at the Harmonic Fields.The Hang is a relatively new instrument similar to a steel drum but played by striking it with the hand. YouTube of a Hangbeing played.The Theremin is an interesting instrument that uses electrical capacitance to change an electronic circuit to make sound. Theperformer does not actually touch the instrument as seen in these YouTube videos: one, two.Here are a series of Ted talks about unusual instruments and performances.If you ever thought of making a unique instrument that never existed before you might want to take a look at the ExperimentalInstruments web site for ideas.
SummaryPercussion instruments tend to have overtones that are not harmonic (not multiples of the fundamental). If the anharmonicities arestrong enough the sound is perceived as noise, not a pitch. Under certain circumstances the anharmonic overtones can be dampedor tuned so that there are enough harmonics to cause the instrument to have a perceived pitch. This can happen with harmonics of areal fundamental frequency and also when the harmonics are multiples of a missing fundamental that isn't a vibrational mode of theinstruments.
Questions on Percussion Instruments:1. What are the two main categories of percussion instruments?2. How are the vibrational modes of a drum head similar to those of a string and how are they different?3. Why do you need two numbers to specify the vibrational mode of a drum head but only one number for a string?4. Describe the first few modes of a square membrane, clamped at the edge.5. Describe the first few modes of a circular membrane, clamped at the edge. How are they different from the square case?6. Why does striking a circular drum at the center sound different from striking it off center?7. Draw the and modes for the body of a cylindrical drum head.8. What is the difference between instruments that make a perceptible pitch and those that do not?9. Why don’t most drums have a specific pitch?
10. Drums are membranes stretched over a body. What would happen if there was no body to the drum (just a fixed circle holdingthe membrane)?
11. Why does a timpani drum have a perceived note but a snare drum does not?12. How does the tension of the membrane change the vibrational modes of a drum head?13. How do you change the pitch of a timpani drum?14. Why does the tabla play a perceived note but a snare drum does not?15. How does the thickness of a drum head modify its sound?16. What is the purpose of the snare on a snare drum?
(5, 0) (5, 1)
Kyle Forinash and Wolfgang Christian 12.1.5.2 3/24/2022 https://phys.libretexts.org/@go/page/26266
17. What are some differences between the vibrational modes of a string and of a rod that is free at both ends?18. Draw the mode of a rod with one end fixed.19. Which mode is emphasized by suspending a bar from the points one quarter and three quarters along its length? Explain.20. What is different about a xylophone and a vibraphone that make them sound different?21. What effect does different decay rates for various overtones of a percussion instrument have on the perceived pitch?22. When playing a xylophone, why might it initially sound harsh before it smoothens out?23. What is the purpose of resonance tubes below the bars of a vibraphone and marimba?24. What is the purpose of trimming the bottom side of a marimba bar?25. Why is the strike tone of a chime not the same as the perceived tone (Hint: Review the section in the perception chapter on
virtual pitch.)?26. What is a gamelan?27. In class and in the book you saw some pictures of holograms of ancient Chinese bells. Explain what the holograms showed.28. What is a Theremin and how does it work?29. What is different about the vibrational modes of a cylindrical cymbal and a cylindrical drum head?30. Define anharmonic.
Contributions and AttributionsThis page is licensed under a CC BY-NC-SA 3.0 license and was authored, remixed, and/or curated by Kyle Forinash andWolfgang Christian. Source content is found at https://www.compadre.org/books/SoundBook. Page content has been edited andupdated to conform to the style and standards of the LibreTexts platform. A detailed versioning history of the edits to source contentis available upon request.
5th
Kyle Forinash and Wolfgang Christian 13.1 3/24/2022 https://phys.libretexts.org/@go/page/25947
13: VoiceAs we know, musical instruments consist of a vibration which is amplified by resonance. The human singing voice is no different.The vocal chords are the vibrating part and the throat, mouth, nasal cavities and bronchial tubes constitute the resonance cavitiesthat amplify these vibrations into sound. Because every person's combination of throat, mouth, nasal cavities and bronchial tubes isslightly different, we all sound slightly different. The fact that we can change the shape of some of these cavities at will enables usto produce a wide range of pitches, depending on the initial structure and training. Here is Wikipedia on the human voice.
Key Terms:Vocal cords, vocal tract, Bernoulli's principle, resonance cavities, vocal formants, trachea, larynx, phonemes (plosive, fricative,vowels, diphthongs, consonants, semivowels, gliding consonants, liquids, nasal), throat singing, articulation (opera singers).
13.1: The Human Voice
Contributions and Attributions
This page is licensed under a CC BY-NC-SA 3.0 license and was authored, remixed, and/or curated by Kyle Forinash andWolfgang Christian. Source content is found at https://www.compadre.org/books/SoundBook. Page content has been edited andupdated to conform to the style and standards of the LibreTexts platform. A detailed versioning history of the edits to source contentis available upon request.
13.1.1: The Vocal Tract
13.1.2: Vocal Formants
13.1.3: Phonemes
13.1.4: Singing
13.1.5: Animal Sounds
Kyle Forinash and Wolfgang Christian 13.1.1 3/24/2022 https://phys.libretexts.org/@go/page/25941
13.1: The Human VoiceThe human singing voice is also a vibration which is amplified by resonance. The vocal chords are the vibrating part and the throat,mouth, nasal cavities and bronchial tubes constitute the resonance cavities that amplify these vibrations into sound. Because everyperson's combination of throat, mouth, nasal cavities and bronchial tubes is slightly different, we all sound slightly different.
Contributions and AttributionsThis page is licensed under a CC BY-NC-SA 3.0 license and was authored, remixed, and/or curated by Kyle Forinash andWolfgang Christian. Source content is found at https://www.compadre.org/books/SoundBook. Page content has been edited andupdated to conform to the style and standards of the LibreTexts platform. A detailed versioning history of the edits to source contentis available upon request.
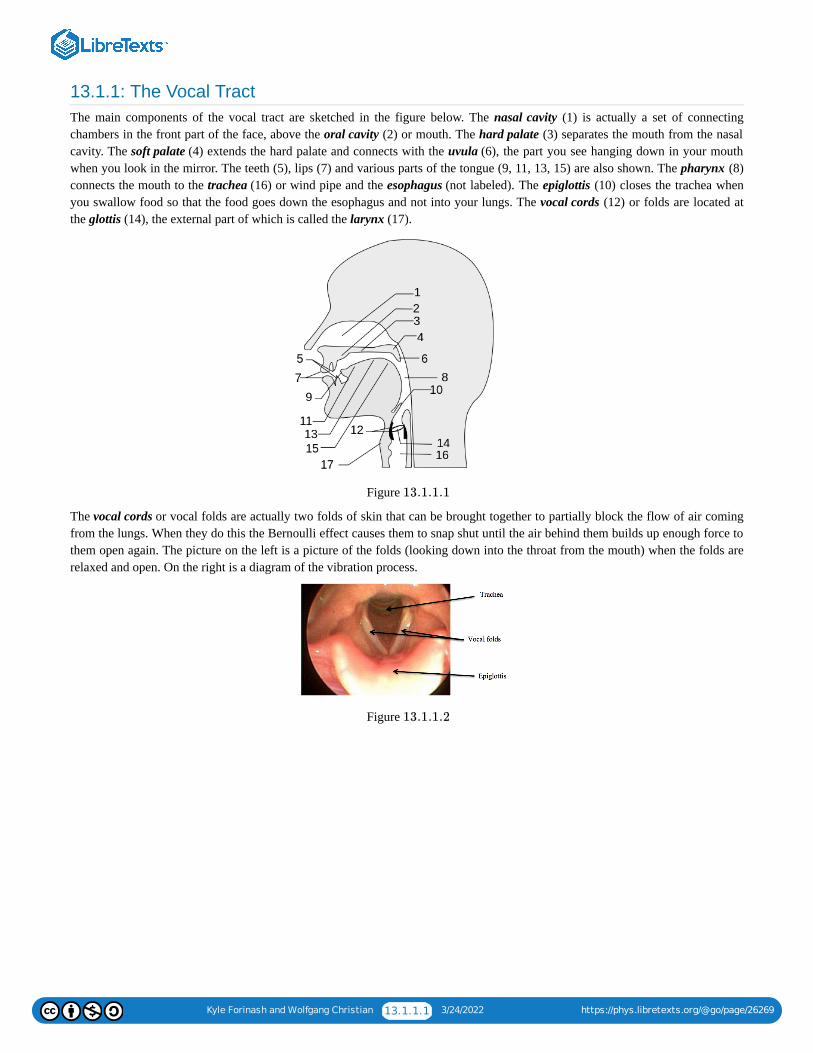
Kyle Forinash and Wolfgang Christian 13.1.1.1 3/24/2022 https://phys.libretexts.org/@go/page/26269
13.1.1: The Vocal TractThe main components of the vocal tract are sketched in the figure below. The nasal cavity (1) is actually a set of connectingchambers in the front part of the face, above the oral cavity (2) or mouth. The hard palate (3) separates the mouth from the nasalcavity. The soft palate (4) extends the hard palate and connects with the uvula (6), the part you see hanging down in your mouthwhen you look in the mirror. The teeth (5), lips (7) and various parts of the tongue (9, 11, 13, 15) are also shown. The pharynx (8)connects the mouth to the trachea (16) or wind pipe and the esophagus (not labeled). The epiglottis (10) closes the trachea whenyou swallow food so that the food goes down the esophagus and not into your lungs. The vocal cords (12) or folds are located atthe glottis (14), the external part of which is called the larynx (17).
Figure
The vocal cords or vocal folds are actually two folds of skin that can be brought together to partially block the flow of air comingfrom the lungs. When they do this the Bernoulli effect causes them to snap shut until the air behind them builds up enough force tothem open again. The picture on the left is a picture of the folds (looking down into the throat from the mouth) when the folds arerelaxed and open. On the right is a diagram of the vibration process.
Figure
13.1.1.1
13.1.1.2
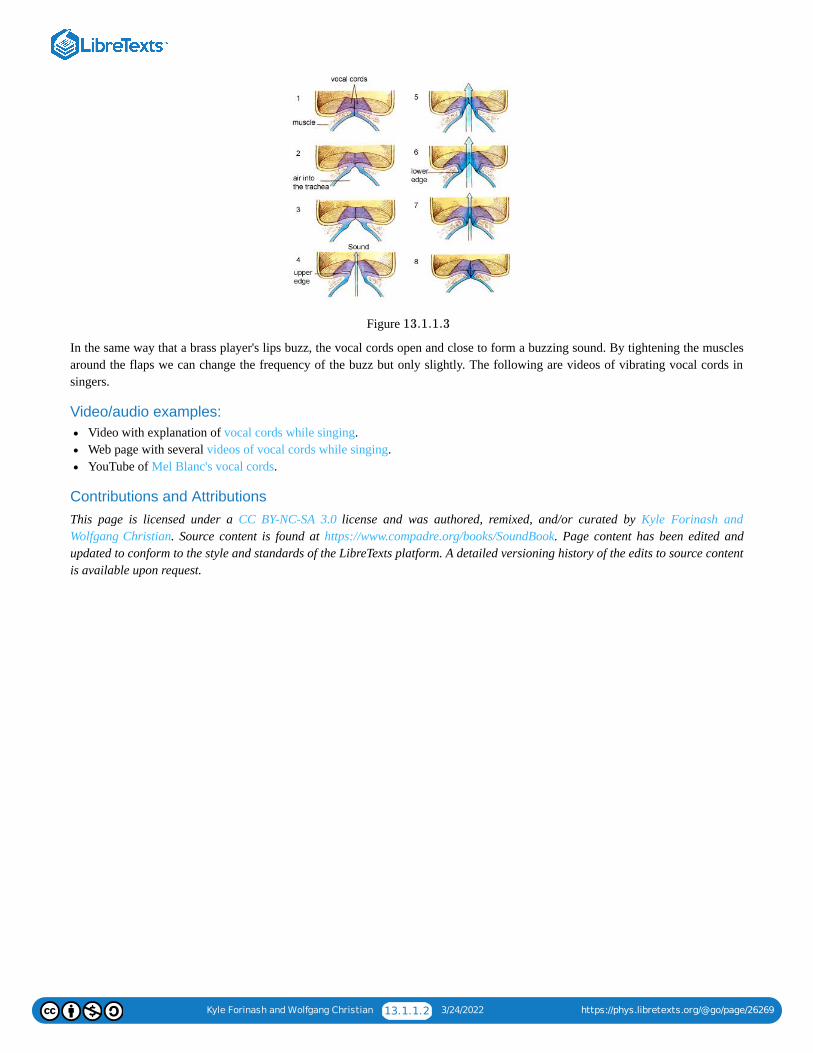
Kyle Forinash and Wolfgang Christian 13.1.1.2 3/24/2022 https://phys.libretexts.org/@go/page/26269
Figure
In the same way that a brass player's lips buzz, the vocal cords open and close to form a buzzing sound. By tightening the musclesaround the flaps we can change the frequency of the buzz but only slightly. The following are videos of vibrating vocal cords insingers.
Video/audio examples:Video with explanation of vocal cords while singing.Web page with several videos of vocal cords while singing.YouTube of Mel Blanc's vocal cords.
Contributions and AttributionsThis page is licensed under a CC BY-NC-SA 3.0 license and was authored, remixed, and/or curated by Kyle Forinash andWolfgang Christian. Source content is found at https://www.compadre.org/books/SoundBook. Page content has been edited andupdated to conform to the style and standards of the LibreTexts platform. A detailed versioning history of the edits to source contentis available upon request.
13.1.1.3
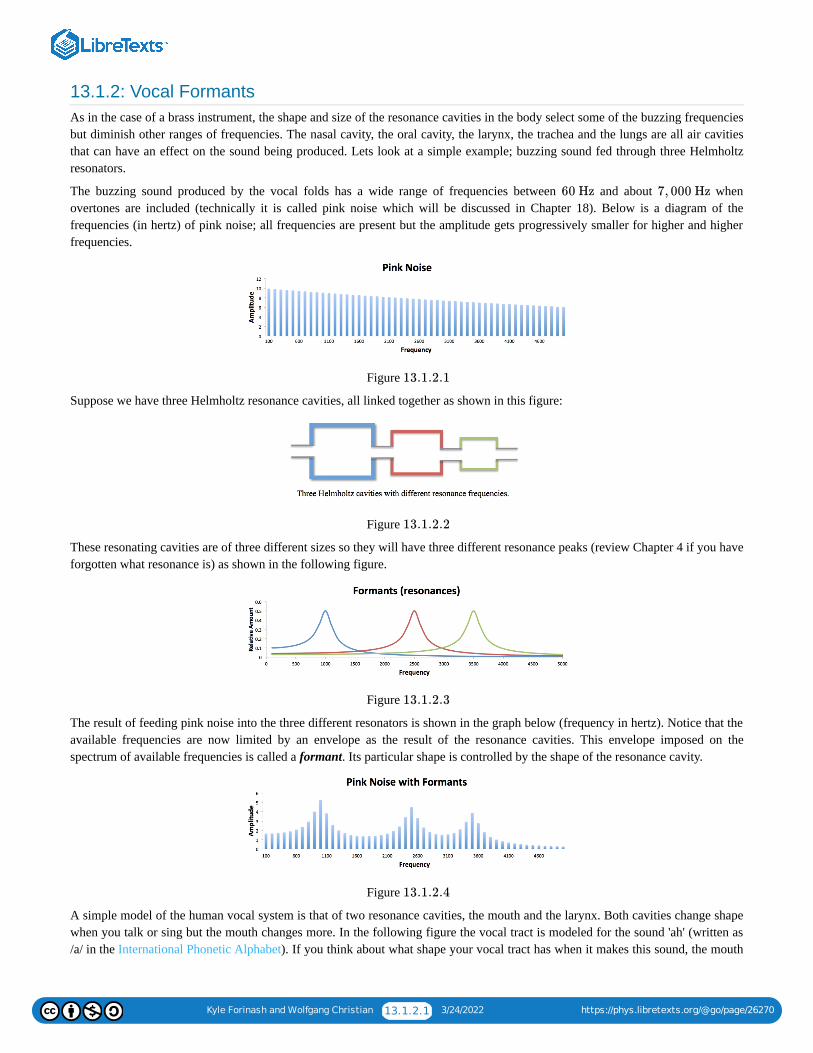
Kyle Forinash and Wolfgang Christian 13.1.2.1 3/24/2022 https://phys.libretexts.org/@go/page/26270
13.1.2: Vocal FormantsAs in the case of a brass instrument, the shape and size of the resonance cavities in the body select some of the buzzing frequenciesbut diminish other ranges of frequencies. The nasal cavity, the oral cavity, the larynx, the trachea and the lungs are all air cavitiesthat can have an effect on the sound being produced. Lets look at a simple example; buzzing sound fed through three Helmholtzresonators.
The buzzing sound produced by the vocal folds has a wide range of frequencies between and about whenovertones are included (technically it is called pink noise which will be discussed in Chapter 18). Below is a diagram of thefrequencies (in hertz) of pink noise; all frequencies are present but the amplitude gets progressively smaller for higher and higherfrequencies.
Figure
Suppose we have three Helmholtz resonance cavities, all linked together as shown in this figure:
Figure
These resonating cavities are of three different sizes so they will have three different resonance peaks (review Chapter 4 if you haveforgotten what resonance is) as shown in the following figure.
Figure
The result of feeding pink noise into the three different resonators is shown in the graph below (frequency in hertz). Notice that theavailable frequencies are now limited by an envelope as the result of the resonance cavities. This envelope imposed on thespectrum of available frequencies is called a formant. Its particular shape is controlled by the shape of the resonance cavity.
Figure
A simple model of the human vocal system is that of two resonance cavities, the mouth and the larynx. Both cavities change shapewhen you talk or sing but the mouth changes more. In the following figure the vocal tract is modeled for the sound 'ah' (written as/a/ in the International Phonetic Alphabet). If you think about what shape your vocal tract has when it makes this sound, the mouth
60 Hz 7, 000 Hz
13.1.2.1
13.1.2.2
13.1.2.3
13.1.2.4
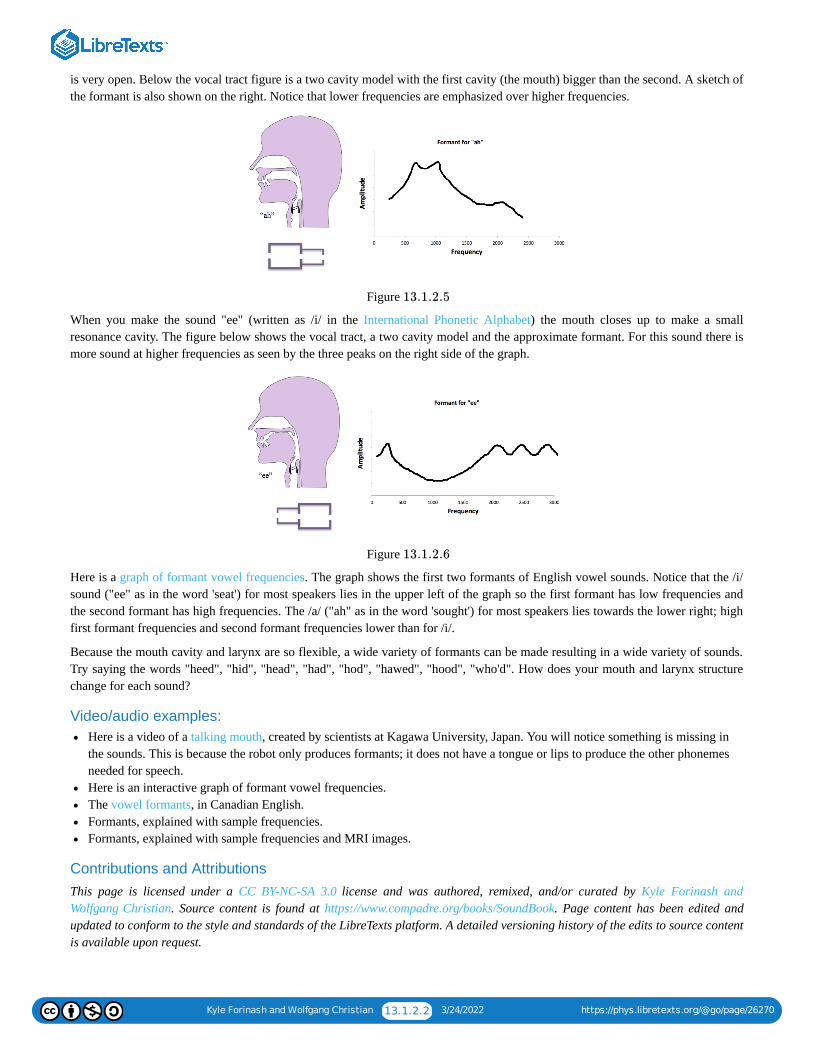
Kyle Forinash and Wolfgang Christian 13.1.2.2 3/24/2022 https://phys.libretexts.org/@go/page/26270
is very open. Below the vocal tract figure is a two cavity model with the first cavity (the mouth) bigger than the second. A sketch ofthe formant is also shown on the right. Notice that lower frequencies are emphasized over higher frequencies.
Figure
When you make the sound "ee" (written as /i/ in the International Phonetic Alphabet) the mouth closes up to make a smallresonance cavity. The figure below shows the vocal tract, a two cavity model and the approximate formant. For this sound there ismore sound at higher frequencies as seen by the three peaks on the right side of the graph.
Figure
Here is a graph of formant vowel frequencies. The graph shows the first two formants of English vowel sounds. Notice that the /i/sound ("ee" as in the word 'seat') for most speakers lies in the upper left of the graph so the first formant has low frequencies andthe second formant has high frequencies. The /a/ ("ah" as in the word 'sought') for most speakers lies towards the lower right; highfirst formant frequencies and second formant frequencies lower than for /i/.
Because the mouth cavity and larynx are so flexible, a wide variety of formants can be made resulting in a wide variety of sounds.Try saying the words "heed", "hid", "head", "had", "hod", "hawed", "hood", "who'd". How does your mouth and larynx structurechange for each sound?
Video/audio examples:Here is a video of a talking mouth, created by scientists at Kagawa University, Japan. You will notice something is missing inthe sounds. This is because the robot only produces formants; it does not have a tongue or lips to produce the other phonemesneeded for speech.Here is an interactive graph of formant vowel frequencies.The vowel formants, in Canadian English.Formants, explained with sample frequencies.Formants, explained with sample frequencies and MRI images.
Contributions and AttributionsThis page is licensed under a CC BY-NC-SA 3.0 license and was authored, remixed, and/or curated by Kyle Forinash andWolfgang Christian. Source content is found at https://www.compadre.org/books/SoundBook. Page content has been edited andupdated to conform to the style and standards of the LibreTexts platform. A detailed versioning history of the edits to source contentis available upon request.
13.1.2.5
13.1.2.6
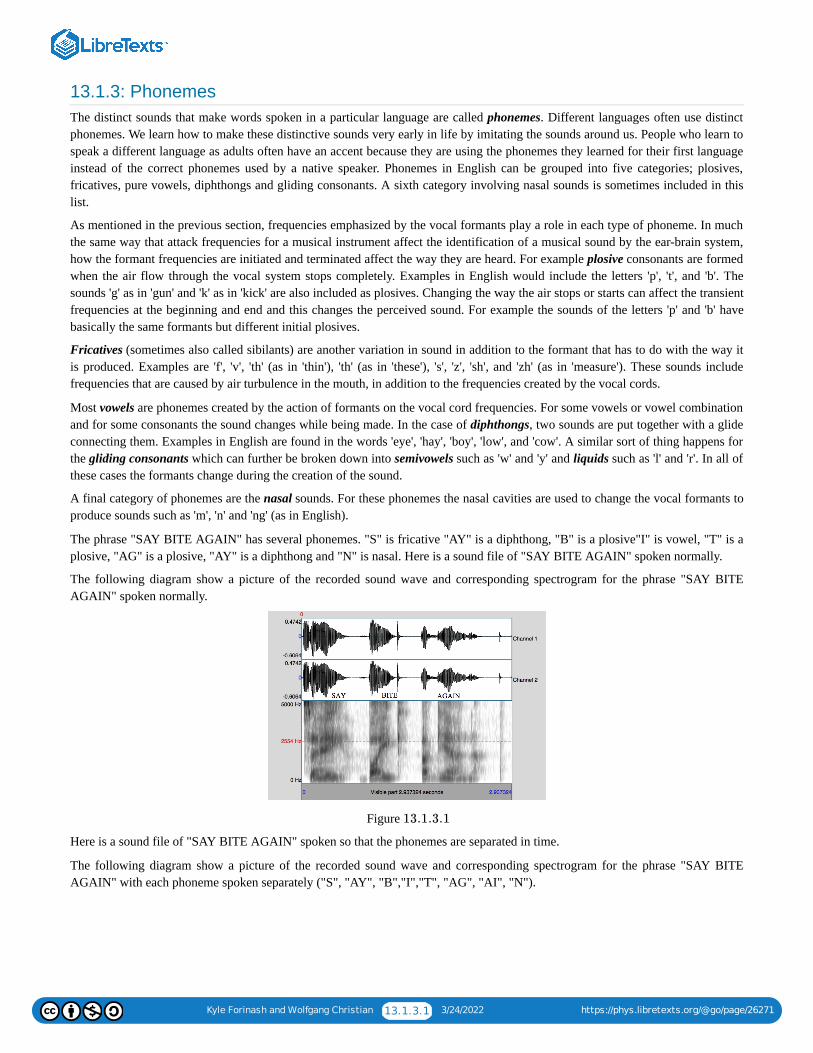
Kyle Forinash and Wolfgang Christian 13.1.3.1 3/24/2022 https://phys.libretexts.org/@go/page/26271
13.1.3: PhonemesThe distinct sounds that make words spoken in a particular language are called phonemes. Different languages often use distinctphonemes. We learn how to make these distinctive sounds very early in life by imitating the sounds around us. People who learn tospeak a different language as adults often have an accent because they are using the phonemes they learned for their first languageinstead of the correct phonemes used by a native speaker. Phonemes in English can be grouped into five categories; plosives,fricatives, pure vowels, diphthongs and gliding consonants. A sixth category involving nasal sounds is sometimes included in thislist.
As mentioned in the previous section, frequencies emphasized by the vocal formants play a role in each type of phoneme. In muchthe same way that attack frequencies for a musical instrument affect the identification of a musical sound by the ear-brain system,how the formant frequencies are initiated and terminated affect the way they are heard. For example plosive consonants are formedwhen the air flow through the vocal system stops completely. Examples in English would include the letters 'p', 't', and 'b'. Thesounds 'g' as in 'gun' and 'k' as in 'kick' are also included as plosives. Changing the way the air stops or starts can affect the transientfrequencies at the beginning and end and this changes the perceived sound. For example the sounds of the letters 'p' and 'b' havebasically the same formants but different initial plosives.
Fricatives (sometimes also called sibilants) are another variation in sound in addition to the formant that has to do with the way itis produced. Examples are 'f', 'v', 'th' (as in 'thin'), 'th' (as in 'these'), 's', 'z', 'sh', and 'zh' (as in 'measure'). These sounds includefrequencies that are caused by air turbulence in the mouth, in addition to the frequencies created by the vocal cords.
Most vowels are phonemes created by the action of formants on the vocal cord frequencies. For some vowels or vowel combinationand for some consonants the sound changes while being made. In the case of diphthongs, two sounds are put together with a glideconnecting them. Examples in English are found in the words 'eye', 'hay', 'boy', 'low', and 'cow'. A similar sort of thing happens forthe gliding consonants which can further be broken down into semivowels such as 'w' and 'y' and liquids such as 'l' and 'r'. In all ofthese cases the formants change during the creation of the sound.
A final category of phonemes are the nasal sounds. For these phonemes the nasal cavities are used to change the vocal formants toproduce sounds such as 'm', 'n' and 'ng' (as in English).
The phrase "SAY BITE AGAIN" has several phonemes. "S" is fricative "AY" is a diphthong, "B" is a plosive"I" is vowel, "T" is aplosive, "AG" is a plosive, "AY" is a diphthong and "N" is nasal. Here is a sound file of "SAY BITE AGAIN" spoken normally.
The following diagram show a picture of the recorded sound wave and corresponding spectrogram for the phrase "SAY BITEAGAIN" spoken normally.
Figure
Here is a sound file of "SAY BITE AGAIN" spoken so that the phonemes are separated in time.
The following diagram show a picture of the recorded sound wave and corresponding spectrogram for the phrase "SAY BITEAGAIN" with each phoneme spoken separately ("S", "AY", "B","I","T", "AG", "AI", "N").
13.1.3.1
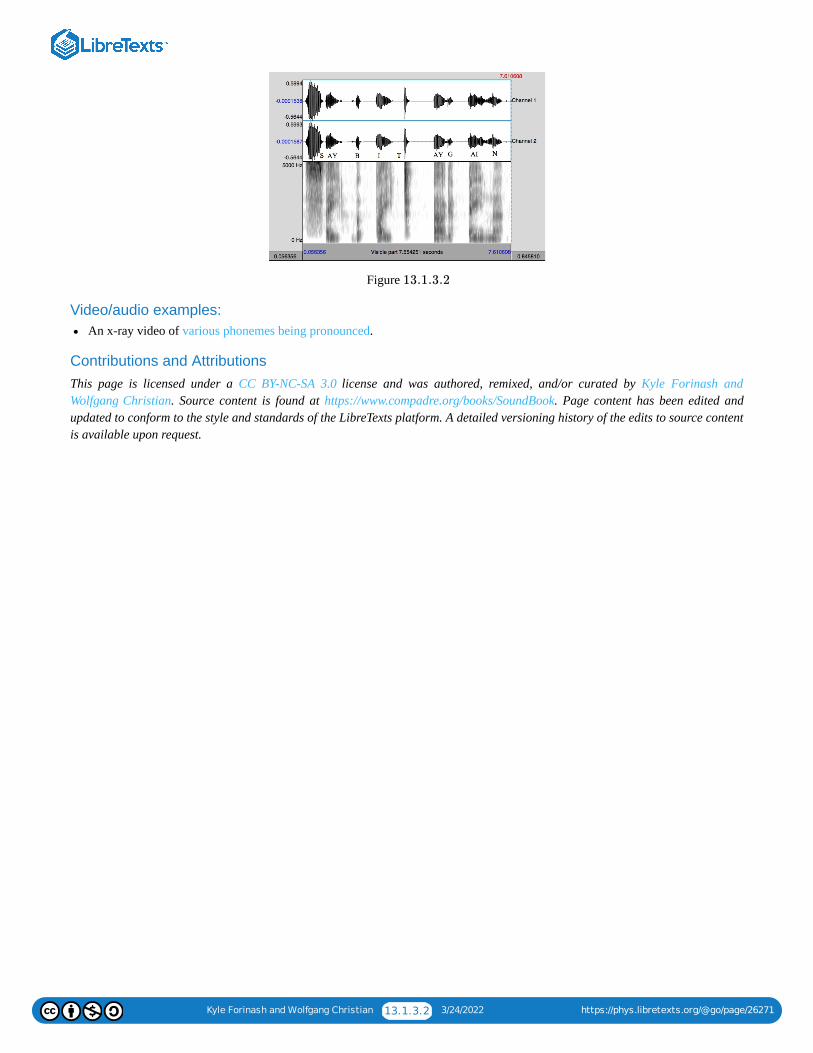
Kyle Forinash and Wolfgang Christian 13.1.3.2 3/24/2022 https://phys.libretexts.org/@go/page/26271
Figure
Video/audio examples:An x-ray video of various phonemes being pronounced.
Contributions and AttributionsThis page is licensed under a CC BY-NC-SA 3.0 license and was authored, remixed, and/or curated by Kyle Forinash andWolfgang Christian. Source content is found at https://www.compadre.org/books/SoundBook. Page content has been edited andupdated to conform to the style and standards of the LibreTexts platform. A detailed versioning history of the edits to source contentis available upon request.
13.1.3.2
Kyle Forinash and Wolfgang Christian 13.1.4.1 3/24/2022 https://phys.libretexts.org/@go/page/26272
13.1.4: SingingThe nasal, trachea and lung cavities also add resonances that change the timbre of a person's voice. Some people are gifted withinternal air cavities that lead to formants which emphasize frequencies that we find pleasant to listen to; for example a fundamentaland several overtones which are exact harmonics. If they are further gifted with (or can train) an ear-brain system that candistinguish frequencies well, they can become a good singer. Training of the voice can improve the range and ability of a singer.Opera sopranos, for example, undergo a long period of training to be able to sing higher notes and to sing loud enough to be heardover the orchestra.
Being heard over the sound of an orchestra seems like an impossible task but opera singers are helped by the fact that the formantsinvolved emphasize many frequencies between and . Trained singers create this formant by lowering the larynxand expanding the throat region above the larynx. Orchestral instruments are louder but in a lower frequency range. That plus thefact that humans hear better in the range of frequencies that the voice uses makes it possible for an opera singer to sound as loud asthe orchestra without using a microphone (although many performances today do use artificial amplification).
Although the formants used by an opera singer makes the sound more easily heard, they also have an effect on the way certainphonemes sound. The result is that in opera singing, particularly in the higher register of singing, it is harder to distinguish thewords being sung. Here are examples of an opera soprano singing scales using a given phoneme. Notice that in the higher pitches itbecomes difficult to distinguish different phonemes.
Because there are two or three predominant vocal formants, some singers can emphasize a note and a higher partial at the sametime so that they can be heard as distinct tones. This is often called overtone or throat singing. Singers in Mongolia and some otherregions use this technique as demonstrated in this video of Mongolian throat singing. About into the video you willhear a whistling sound singing a melody along with a lower drone sound at the same time. Both sounds are coming from thesinger's vocal system. This is something that can be learned by almost anyone, as demonstrated by the dozens of YouTube videoson "Tuva Throat Singing".
We know that the speed of sound changes if the density of the medium in which it is traveling changes. We also know that since thespeed of sound is related to wavelength and frequency by , changing the speed of a wave will change its frequency (thewavelength remains fixed). You may have heard the voice of someone change when they inhale helium. This occurs because thespeed of sound changes and therefore so does the frequency. The effect is as if the formants have shifted upward. Here is a video ofa voice with helium and with sulfur hexafluoride. Sound in sulfur hexafluoride is slower so the frequencies of the formant will belower.
Do NOT try this at home. Helium and sulfur hexafluoride do not have oxygen in them and it is possible to suffocate. Inparticular sulfur hexafluoride is heavier than air and is difficult to get out of the lungs.
Video/audio examples:An MRI video of a singing soprano, and the scientific paper that describes why they did it.A young girl throat singing "Amazing Grace" (you may have to listen twice to hear the melody).An very good explanation of polyphonic singing.Recordings and description of Katadjak’, a form of Inuit throat singing and voice competition.A little science behind "beatboxing". An example without the help of a microphone, Bobby McFerrin.What happens to a musical instrument filled with helium or sulfur hexafluoride?
Contributions and AttributionsThis page is licensed under a CC BY-NC-SA 3.0 license and was authored, remixed, and/or curated by Kyle Forinash andWolfgang Christian. Source content is found at https://www.compadre.org/books/SoundBook. Page content has been edited andupdated to conform to the style and standards of the LibreTexts platform. A detailed versioning history of the edits to source contentis available upon request.
2000 Hz 3000 Hz
20 seconds
v = λf
Note
Kyle Forinash and Wolfgang Christian 13.1.5.1 3/24/2022 https://phys.libretexts.org/@go/page/26273
13.1.5: Animal SoundsMany animals use sounds either to attract mates or warn away competitors. A few animals use sounds to navigate (discussed inChapter 16: Acoustics). In general, smaller animals make higher frequencies and larger animals make lower frequencies but thereare plenty of exceptions. Elephants and whales use infrasound (below ) to communicate over long distances but bothmammals can also make higher frequency sounds.
Most mammals have vocal cords much like humans. Some marine mammals such as dolphins have phonic lips in their nasalcavities instead of vocal cords in their throats. These phonic lips act the same way vocal cords do, vibrating when the dolphinexhales and are controlled by muscles in the nasal passage. Whales do not have vocal cords but can pass air between two largeinternal cavities in their bodies and the passage way vibrates, allowing the whale to make sounds while submerged withoutexhaling.
Most insects and some crustaceans make sounds by rubbing body parts together. This form of making sound is called stridulation.Insects also use resonating body parts such as wings and hollow body cavities to amplify the sound. Cicadas have an air filledabdominal cavity ribbed with cartilage and muscles and it is the contraction of these muscles which makes the sound we hear.Cicadas are much louder than other insects which generate sound by stridulation because of their unique method of making sound.A few insects such as crickets use leaf structures or tunnels in the ground to amplify their calls. The treehopper, an insect,communicates to others of its species by sending vibrations through the branches of the plant it is on.
Fish generally make sounds by contracting the muscles around their swim bladder if they have one. This typically produces a broadspectrum of low frequency sounds (under ) and is called drumming. At least one type of herring emits gas through its anusto produce sounds.
Most birds have two sets of syrinx, one on each of their two trachea. These small areas of the trachea can vibrate and because thereare usually two regions, some birds can make two sounds at the same time. This is part of the reason birdsong can be very complex.This arrangement also allows birds to produce short sounds with durations of of a second, times faster than humans.This is probably why birds also have absolute pitch (their ear/brain system hears exact frequencies) whereas humans have relativepitch. Some birds and some frogs have resonating sacs that amplify the sounds being produced by vocal cords or syrinx.
Video/audio examples:Snapping shrimp, and more snapping shrimp.Ant communication.Recordings of soundscapes (natural ambient sound- there is more there than you think!).
SummaryLike all instruments, the human voice relies on resonance to emphasize a particular fundamental frequency and overtones. Fortalking, humans use the mouth and larynx to form two resonance cavities which produce vocal formants that shape the buzzing ofthe vocal folds into distinct sounds. Other phonemes require attack and ending frequencies produced by starting or stopping the airflow with the lips or tongue. Singers train their vocal folds, larynx and mouth to have very clear resonances. They are helped bybeing gifted with nasal and lung cavities that accentuate pleasant overtones.
Questions on Voice:1. Describe the vocal cords and explain how they work.2. Explain how the Bernoulli effect relates to the movement of your vocal chords.3. How are the muscles of the vocal chords similar to a brass player’s lips buzzing?4. What range of frequencies (in ) do your vocal cords make?5. List the main parts of the vocal tract and their function.6. What actually happens when you swallow and something “goes down the wrong pipe?” Do we actually have two different
“pipes” in our throats?7. Musical instruments all have a vibrating part that acts as a source of sound and resonators that enhance certain frequencies. For
the human voice, what acts as the vibrating sound source and what acts as resonators?8. What other parts of the body function as resonating cavities for the human voice?9. What is pink noise?
20 Hz
1000 Hz
1/200th 10
Hz
Kyle Forinash and Wolfgang Christian 13.1.5.2 3/24/2022 https://phys.libretexts.org/@go/page/26273
10. What are vocal formants?11. Explain, in terms of formants, what is occurring when a Mongolian throat singer sings.12. What happens to the human voice if you inhale helium? Why?13. What happens to the human voice if you inhale sulfur hexafluoride? Why?14. Why is inhaling sulfur hexafluoride more dangerous than inhaling Helium?15. Would helium and/or sulfur hexafluoride change the sound of a stringed instrument? What about a tube based instrument?
Explain.16. The distinct sounds that make up the words spoken in a particular language are called _____________.17. What is a diphthong?18. Name the six categories of phonemes in the English language and how they are formed.19. Describe the difference in what we do with our mouths when we say a long o, an ah, and an ee sound.20. Without a tongue or lips, are we able to create all phonemes needed for speech? Explain.21. What are plosives and fricatives? Give three examples of each.22. How are the phonemes used by opera singers different from ordinary speech?23. Why are the phonemes used by opera singers different from ordinary speech?24. What factors allow an opera singer to be heard over an orchestra, even without electronic amplification?25. How does impedance matching apply to operatic singing?
Contributions and AttributionsThis page is licensed under a CC BY-NC-SA 3.0 license and was authored, remixed, and/or curated by Kyle Forinash andWolfgang Christian. Source content is found at https://www.compadre.org/books/SoundBook. Page content has been edited andupdated to conform to the style and standards of the LibreTexts platform. A detailed versioning history of the edits to source contentis available upon request.
Kyle Forinash and Wolfgang Christian 14.1 3/24/2022 https://phys.libretexts.org/@go/page/25954
14: Musical ScalesUnlike the human voice (which can make any pitch in a large range of pitches) for many instruments once the decision about howto construct the instrument is made, there are a limited number of pitches it can produce. For example, once the holes in a flute aredrilled the flute can only make a certain set of notes (although for some instruments the musician can often 'bend' a note bychanging the position of the lips and or fingers). This set of notes is called a scale and we would like to have a scale (or set ofnotes) where we get the greatest number of combinations that sound good together. We also would like to standardize the scale insuch a way that if we build other instruments, two instruments playing together can play the same pitch. This turns out to be moredifficult than it would seem. The choice of scale is arbitrary; we can choose any combination of notes that we like and in fact somecultures have chosen scales very different from the ones used in western music. However there are advantages and disadvantagesfor any of these various choices, as explained in this chapter.
Key Terms:Scale (Pythagorean, Ptolemaic, Equal-tempered), mode (or key), septatonic, pentatonic, the problems of changing key andchanging octave, the problem of fixed tuning for pianos and tube based instruments, tone, semitone, cents, temperaments,Railsback curve.
14.1: Musical Scales
Contributions and Attributions
This page is licensed under a CC BY-NC-SA 3.0 license and was authored, remixed, and/or curated by Kyle Forinash andWolfgang Christian. Source content is found at https://www.compadre.org/books/SoundBook. Page content has been edited andupdated to conform to the style and standards of the LibreTexts platform. A detailed versioning history of the edits to source contentis available upon request.
14.1.1: The Pythagorean Scale
14.1.2: Equal Temperament
14.1.3: Temperament Simulation
Kyle Forinash and Wolfgang Christian 14.1.1 3/24/2022 https://phys.libretexts.org/@go/page/25948
14.1: Musical ScalesThe notes on musical instruments are organized into scales and we would like to have a scale where we get the greatest number ofcombinations that sound good together. We also would like to standardize the scale in such a way that if we build other instruments,two instruments playing together can play the same pitch. This turns out to be more difficult than it would seem. The choice ofscale is arbitrary and different cultures have chosen differently.
Contributions and AttributionsThis page is licensed under a CC BY-NC-SA 3.0 license and was authored, remixed, and/or curated by Kyle Forinash andWolfgang Christian. Source content is found at https://www.compadre.org/books/SoundBook. Page content has been edited andupdated to conform to the style and standards of the LibreTexts platform. A detailed versioning history of the edits to source contentis available upon request.
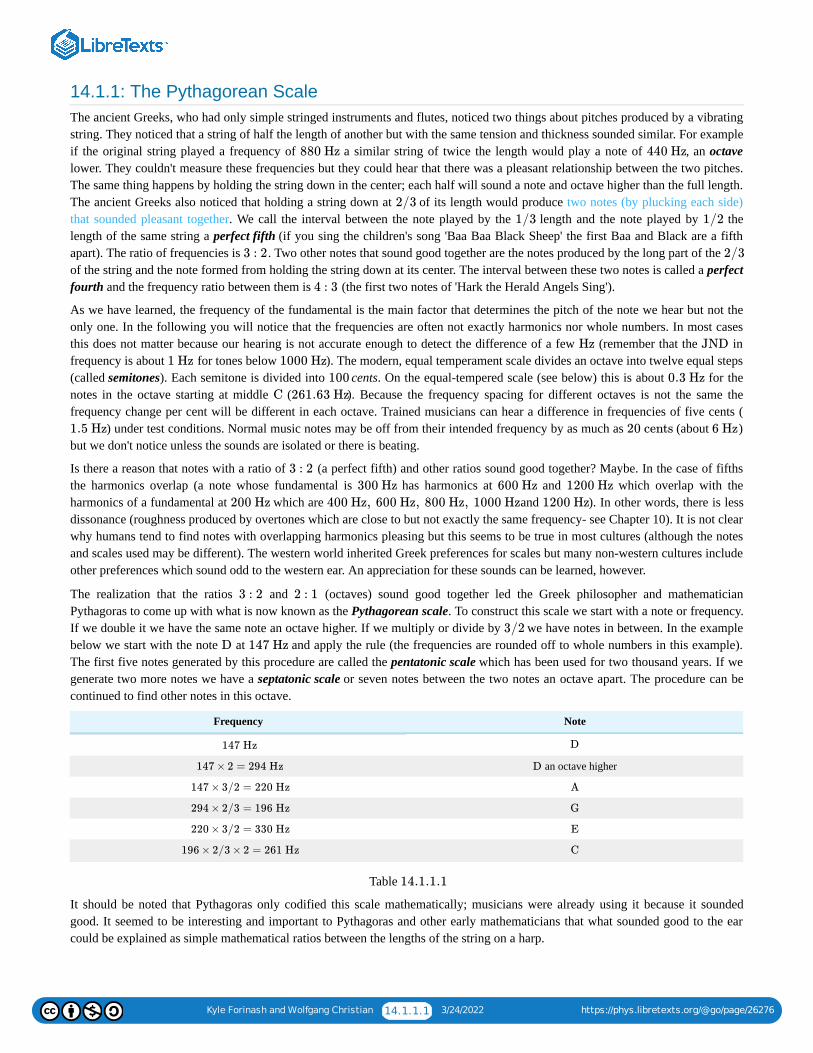
Kyle Forinash and Wolfgang Christian 14.1.1.1 3/24/2022 https://phys.libretexts.org/@go/page/26276
14.1.1: The Pythagorean ScaleThe ancient Greeks, who had only simple stringed instruments and flutes, noticed two things about pitches produced by a vibratingstring. They noticed that a string of half the length of another but with the same tension and thickness sounded similar. For exampleif the original string played a frequency of a similar string of twice the length would play a note of , an octavelower. They couldn't measure these frequencies but they could hear that there was a pleasant relationship between the two pitches.The same thing happens by holding the string down in the center; each half will sound a note and octave higher than the full length.The ancient Greeks also noticed that holding a string down at of its length would produce two notes (by plucking each side)that sounded pleasant together. We call the interval between the note played by the length and the note played by thelength of the same string a perfect fifth (if you sing the children's song 'Baa Baa Black Sheep' the first Baa and Black are a fifthapart). The ratio of frequencies is . Two other notes that sound good together are the notes produced by the long part of the of the string and the note formed from holding the string down at its center. The interval between these two notes is called a perfectfourth and the frequency ratio between them is (the first two notes of 'Hark the Herald Angels Sing').
As we have learned, the frequency of the fundamental is the main factor that determines the pitch of the note we hear but not theonly one. In the following you will notice that the frequencies are often not exactly harmonics nor whole numbers. In most casesthis does not matter because our hearing is not accurate enough to detect the difference of a few (remember that the infrequency is about for tones below ). The modern, equal temperament scale divides an octave into twelve equal steps(called semitones). Each semitone is divided into cents. On the equal-tempered scale (see below) this is about for thenotes in the octave starting at middle ( ). Because the frequency spacing for different octaves is not the same thefrequency change per cent will be different in each octave. Trained musicians can hear a difference in frequencies of five cents (
) under test conditions. Normal music notes may be off from their intended frequency by as much as (about )but we don't notice unless the sounds are isolated or there is beating.
Is there a reason that notes with a ratio of (a perfect fifth) and other ratios sound good together? Maybe. In the case of fifthsthe harmonics overlap (a note whose fundamental is has harmonics at and which overlap with theharmonics of a fundamental at which are and ). In other words, there is lessdissonance (roughness produced by overtones which are close to but not exactly the same frequency- see Chapter 10). It is not clearwhy humans tend to find notes with overlapping harmonics pleasing but this seems to be true in most cultures (although the notesand scales used may be different). The western world inherited Greek preferences for scales but many non-western cultures includeother preferences which sound odd to the western ear. An appreciation for these sounds can be learned, however.
The realization that the ratios and (octaves) sound good together led the Greek philosopher and mathematicianPythagoras to come up with what is now known as the Pythagorean scale. To construct this scale we start with a note or frequency.If we double it we have the same note an octave higher. If we multiply or divide by we have notes in between. In the examplebelow we start with the note at and apply the rule (the frequencies are rounded off to whole numbers in this example).The first five notes generated by this procedure are called the pentatonic scale which has been used for two thousand years. If wegenerate two more notes we have a septatonic scale or seven notes between the two notes an octave apart. The procedure can becontinued to find other notes in this octave.
Frequency Note
an octave higher
Table
It should be noted that Pythagoras only codified this scale mathematically; musicians were already using it because it soundedgood. It seemed to be interesting and important to Pythagoras and other early mathematicians that what sounded good to the earcould be explained as simple mathematical ratios between the lengths of the string on a harp.
880 Hz 440 Hz
2/3
1/3 1/2
3 : 2 2/3
4 : 3
Hz JND
1 Hz 1000 Hz
100 0.3 Hz
C 261.63 Hz
1.5 Hz 20 cents 6 Hz
3 : 2
300 Hz 600 Hz 1200 Hz
200 Hz 400 Hz, 600 Hz, 800 Hz, 1000 Hz 1200 Hz
3 : 2 2 : 1
3/2
D 147 Hz
147 Hz D
147 × 2 = 294 Hz D
147 × 3/2 = 220 Hz A
294 × 2/3 = 196 Hz G
220 × 3/2 = 330 Hz E
196 × 2/3 × 2 = 261 Hz C
14.1.1.1
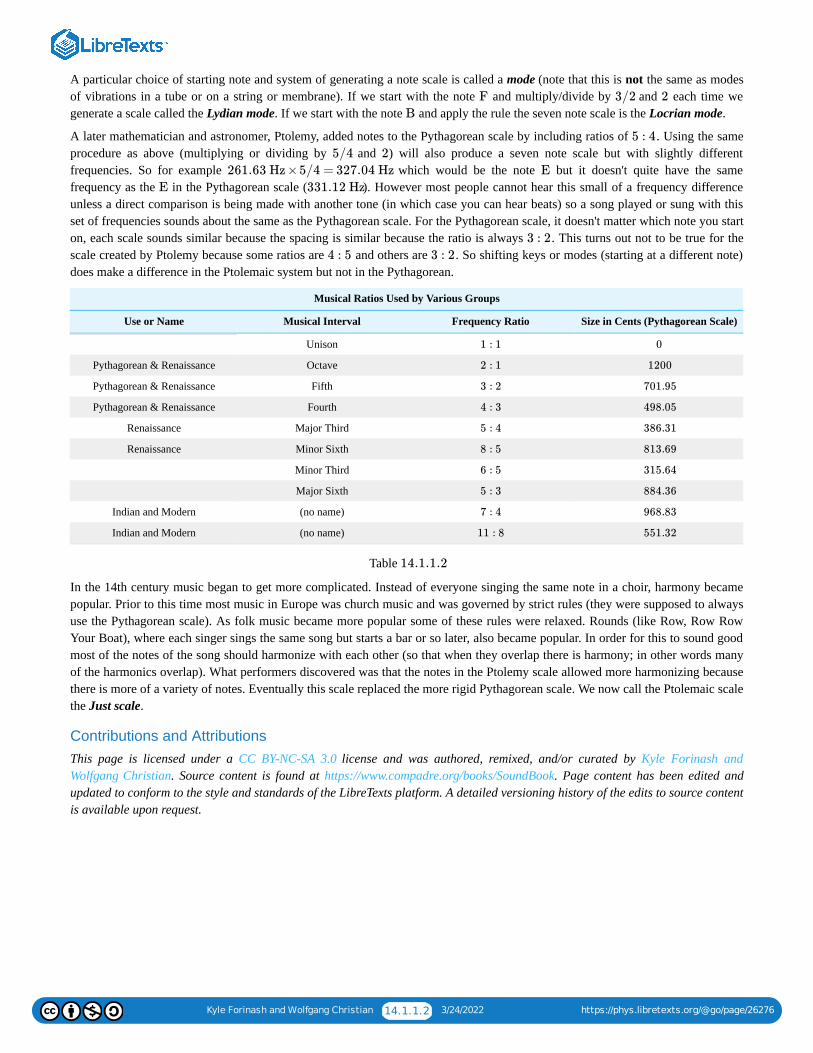
Kyle Forinash and Wolfgang Christian 14.1.1.2 3/24/2022 https://phys.libretexts.org/@go/page/26276
A particular choice of starting note and system of generating a note scale is called a mode (note that this is not the same as modesof vibrations in a tube or on a string or membrane). If we start with the note and multiply/divide by and each time wegenerate a scale called the Lydian mode. If we start with the note and apply the rule the seven note scale is the Locrian mode.
A later mathematician and astronomer, Ptolemy, added notes to the Pythagorean scale by including ratios of . Using the sameprocedure as above (multiplying or dividing by and ) will also produce a seven note scale but with slightly differentfrequencies. So for example which would be the note but it doesn't quite have the samefrequency as the in the Pythagorean scale ( ). However most people cannot hear this small of a frequency differenceunless a direct comparison is being made with another tone (in which case you can hear beats) so a song played or sung with thisset of frequencies sounds about the same as the Pythagorean scale. For the Pythagorean scale, it doesn't matter which note you starton, each scale sounds similar because the spacing is similar because the ratio is always . This turns out not to be true for thescale created by Ptolemy because some ratios are and others are . So shifting keys or modes (starting at a different note)does make a difference in the Ptolemaic system but not in the Pythagorean.
Musical Ratios Used by Various Groups
Use or Name Musical Interval Frequency Ratio Size in Cents (Pythagorean Scale)
Unison
Pythagorean & Renaissance Octave
Pythagorean & Renaissance Fifth
Pythagorean & Renaissance Fourth
Renaissance Major Third
Renaissance Minor Sixth
Minor Third
Major Sixth
Indian and Modern (no name)
Indian and Modern (no name)
Table
In the 14th century music began to get more complicated. Instead of everyone singing the same note in a choir, harmony becamepopular. Prior to this time most music in Europe was church music and was governed by strict rules (they were supposed to alwaysuse the Pythagorean scale). As folk music became more popular some of these rules were relaxed. Rounds (like Row, Row RowYour Boat), where each singer sings the same song but starts a bar or so later, also became popular. In order for this to sound goodmost of the notes of the song should harmonize with each other (so that when they overlap there is harmony; in other words manyof the harmonics overlap). What performers discovered was that the notes in the Ptolemy scale allowed more harmonizing becausethere is more of a variety of notes. Eventually this scale replaced the more rigid Pythagorean scale. We now call the Ptolemaic scalethe Just scale.
Contributions and AttributionsThis page is licensed under a CC BY-NC-SA 3.0 license and was authored, remixed, and/or curated by Kyle Forinash andWolfgang Christian. Source content is found at https://www.compadre.org/books/SoundBook. Page content has been edited andupdated to conform to the style and standards of the LibreTexts platform. A detailed versioning history of the edits to source contentis available upon request.
F 3/2 2
B
5 : 4
5/4 2
261.63 Hz ×5/4 = 327.04 Hz E
E 331.12 Hz
3 : 2
4 : 5 3 : 2
1 : 1 0
2 : 1 1200
3 : 2 701.95
4 : 3 498.05
5 : 4 386.31
8 : 5 813.69
6 : 5 315.64
5 : 3 884.36
7 : 4 968.83
11 : 8 551.32
14.1.1.2
Kyle Forinash and Wolfgang Christian 14.1.2.1 3/24/2022 https://phys.libretexts.org/@go/page/26277
14.1.2: Equal TemperamentSeems simple enough; start with a note at a given frequency, apply the multiplication rules to get the other notes in the scale. Somultiplying by gives a note an octave higher, multiplying by a note in between, and so forth. What could go wrong?
We already know the rules for the Pythagorean scale do not give exactly the same frequencies as the rules for the Ptolemaic (orJust) Scale. Let's stick with Pythagoras and decide we want to fill in the notes between (at the modern day frequency of
) and an octave above ( ). We start with and multiply by to get which is . We take ( ) and multiply by again to get which is an octave above so we divide
by to get which is . We can get at by multiplying by . Multiplying by and dividingby gives which is . Multiplying by gives which is . Repeating this procedure (multiplying by and dividing by if it is outside the octave) two more times gives ( sharp) and ( sharp). So far so good.
Now we run into a problem. Because if we use this at and multiply by we get which is not a noteon the scale! In fact it is so close to ( flat) at that we probably would mistake it for . Likewise if we do theprocedure again we get which is very close to at but is not on this scale. In other words, the Pythagoreansystem of generating notes finds an infinite set of notes between at and the an octave above. The Pythagoreansolution was to stop after five notes (a pentatonic scale) and not use any more. But the idea of using the simple mathematical ruleof for generating more notes where all the notes harmonize doesn't work. The dilemma is that ratios of sound good to theear but using a ratio of does not result in a closed, limited number of notes.
As music became more complicated, musicians started to want to switch keys during the piece of music. When a musician changeskey they are essentially starting with a different note (say at in the Pythagorean scale) and using an octave based onthat new starting point. But starting on a different note and applying the rule to generate the scale results in new notes which are notclose to previous notes (it almost works in the Pythagorean scale but not in the Just temperament). If you have a musicalinstrument, say a piano, set up so that the notes correspond to a Just scale based on (the key of ) for example, changing to a keyof isn't possible unless you add extra strings to the piano because there are new frequencies in the key of . The new notes alsodo not harmonize with the old notes. To maintain the Just scale requires a different instrument, one tuned differently for each keyyou want to play in (or many extra strings).
This problem gets worse when you try to generate notes an octave above or below the initial octave using the rules; the higheroctave doesn't harmonize with the lower octave if they are generated using the rules. Notes an octave above should be twice thefrequency of the note in the lower octave but using the formula to generate the note doesn't give a frequency twice that of the loweroctave. For singing and even violins, which can make any desired frequency (within a given range), this isn't a problem because theperformer can just shift the note a little so that it sounds right. But for the piano, organ, flute and stringed instruments with frets thisis a big problem because the notes are determined by the construction of the instrument and cannot be changed without re-tuning it.So it appears there is a choice between making instruments so they harmonize well in one octave and scale but not another; or havedifferent instruments for each octave and each scale; or re-tune the instrument every time you want to change scales or octaves.
A scale system that tries to correct for the problem of being able to play in any key is called a temperament. The chosen startingnote of a scale is called the tonic and a musical fifth consists of the tonic and the fifth note of the scale.
Historically several scale adjustments generically known as well-tempered scales were proposed and eventually the even-temperedscale won out (see Well versus Even Temperament). In this scale the frequencies between octaves are chosen to be equally spacedin which case the ratio between notes is (the notes can be generated by multiplying or dividing by either and/or
). This divides an octave into twelve notes. Another way to write this mathematically is where isgenerally chosen to be in modern times. and each value of generates a new note.
Johann Sebastian Bach was the musician who managed to get the world to pay attention to alternative scales by writing music (thiswas in the 1700's) specifically to sound good for instruments tuned a certain way. Eventually most western cultures adopted theeven-tempered scale (some other cultures did not which is why, for example, music from India often sounds very different thanwestern music). Because the ratios between frequencies are not exactly or you can often hear chords where there isbeating and dissonance. The chords also do not sound as pure as Pythagorean tuning because they are not exactly harmonichowever the greater flexibility to change keys and to (almost) harmonize over several octaves makes equal temperament a usefulcompromise. Below is a diagram of the frequencies of various scale systems (temperaments).
2 3/2
C
261.63 Hz C 261.63 Hz ×2 = 523.15 Hz 261.63 Hz 3/2
392.44 Hz G G 392.44 Hz 3/2 588.67 Hz
2 294.33 Hz D A 441.49 Hz 294.33 Hz 3/2 3/2
2 331.12 Hz E 3/2 496.69 Hz B 3/2
2 F# F C# C
C# 279.39 Hz 3/2 419.08 Hz
Ab A 412.42 Hz Ab
314.31 Hz Eb 310.08 Hz
C 261.63 Hz C
2/3 3 : 2
3 : 2
B 496.67 Hz
F F
B B
1.059463 2
1.059463 f = ×(fo 21/2)n fo
440 Hz = 1.059463094 …21/2 n
3 : 2 5 : 4
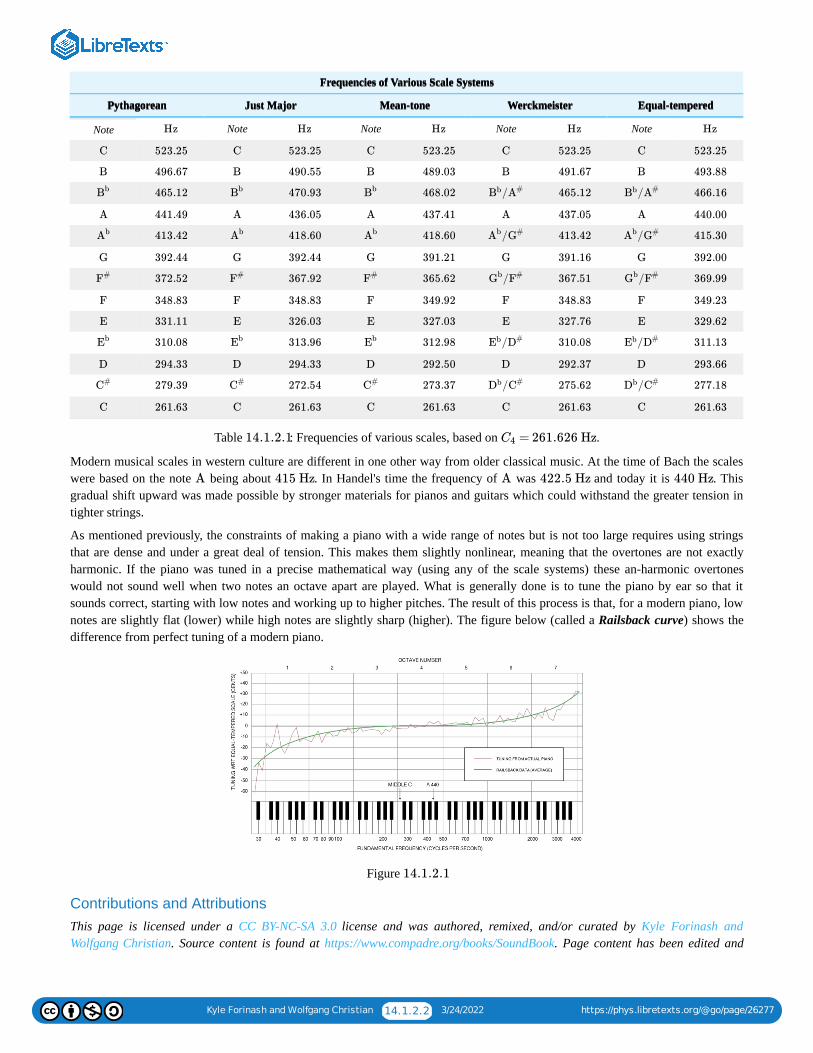
Kyle Forinash and Wolfgang Christian 14.1.2.2 3/24/2022 https://phys.libretexts.org/@go/page/26277
Frequencies of Various Scale Systems
Pythagorean Just Major Mean-tone Werckmeister Equal-tempered
Frequencies of Various Scale Systems
Pythagorean Just Major Mean-tone Werckmeister Equal-tempered
Note Note Note Note Note
Table : Frequencies of various scales, based on .
Modern musical scales in western culture are different in one other way from older classical music. At the time of Bach the scaleswere based on the note being about . In Handel's time the frequency of was and today it is . Thisgradual shift upward was made possible by stronger materials for pianos and guitars which could withstand the greater tension intighter strings.
As mentioned previously, the constraints of making a piano with a wide range of notes but is not too large requires using stringsthat are dense and under a great deal of tension. This makes them slightly nonlinear, meaning that the overtones are not exactlyharmonic. If the piano was tuned in a precise mathematical way (using any of the scale systems) these an-harmonic overtoneswould not sound well when two notes an octave apart are played. What is generally done is to tune the piano by ear so that itsounds correct, starting with low notes and working up to higher pitches. The result of this process is that, for a modern piano, lownotes are slightly flat (lower) while high notes are slightly sharp (higher). The figure below (called a Railsback curve) shows thedifference from perfect tuning of a modern piano.
Figure
Contributions and AttributionsThis page is licensed under a CC BY-NC-SA 3.0 license and was authored, remixed, and/or curated by Kyle Forinash andWolfgang Christian. Source content is found at https://www.compadre.org/books/SoundBook. Page content has been edited and
Hz Hz Hz Hz Hz
C 523.25 C 523.25 C 523.25 C 523.25 C 523.25
B 496.67 B 490.55 B 489.03 B 491.67 B 493.88
Bb 465.12 Bb 470.93 Bb 468.02 Bb/A# 465.12 Bb/A# 466.16
A 441.49 A 436.05 A 437.41 A 437.05 A 440.00
Ab 413.42 Ab 418.60 Ab 418.60 Ab/G# 413.42 Ab/G# 415.30
G 392.44 G 392.44 G 391.21 G 391.16 G 392.00
F# 372.52 F# 367.92 F# 365.62 Gb/F# 367.51 Gb/F# 369.99
F 348.83 F 348.83 F 349.92 F 348.83 F 349.23
E 331.11 E 326.03 E 327.03 E 327.76 E 329.62
Eb 310.08 Eb 313.96 Eb 312.98 Eb/D# 310.08 Eb/D# 311.13
D 294.33 D 294.33 D 292.50 D 292.37 D 293.66
C# 279.39 C# 272.54 C# 273.37 Db/C# 275.62 Db/C# 277.18
C 261.63 C 261.63 C 261.63 C 261.63 C 261.63
14.1.2.1 = 261.626 HzC4
A 415 Hz A 422.5 Hz 440 Hz
14.1.2.1

Kyle Forinash and Wolfgang Christian 14.1.2.3 3/24/2022 https://phys.libretexts.org/@go/page/26277
updated to conform to the style and standards of the LibreTexts platform. A detailed versioning history of the edits to source contentis available upon request.
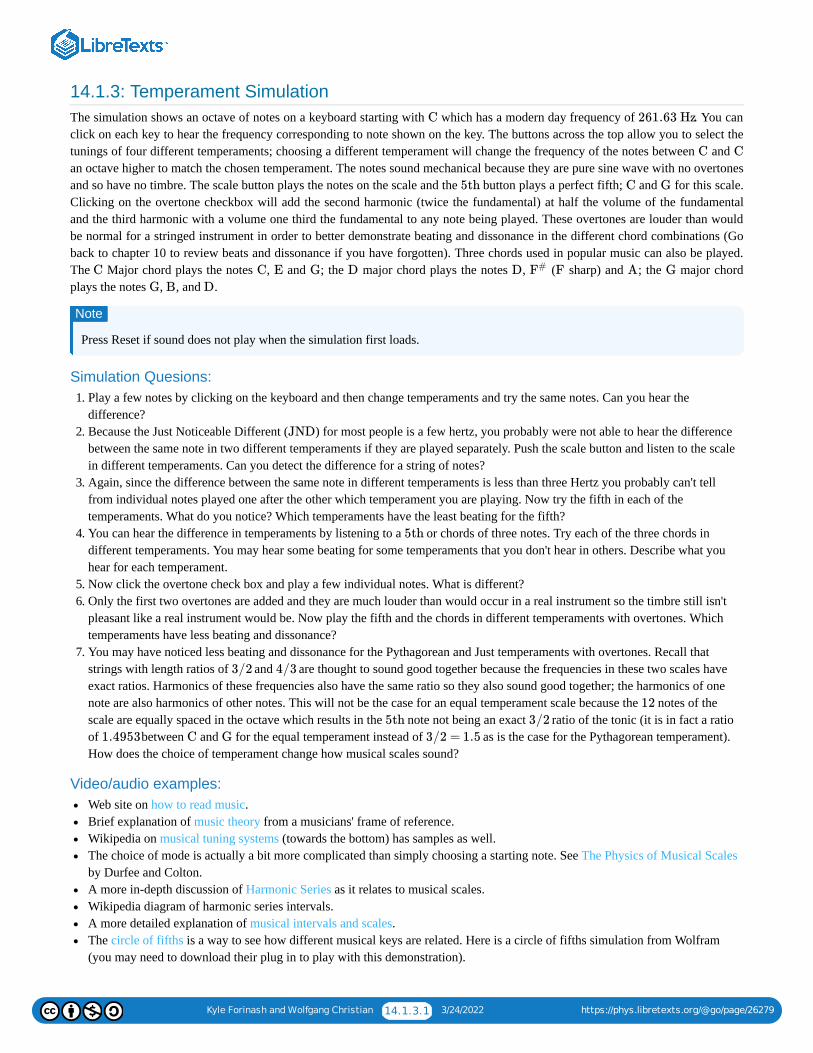
Kyle Forinash and Wolfgang Christian 14.1.3.1 3/24/2022 https://phys.libretexts.org/@go/page/26279
14.1.3: Temperament SimulationThe simulation shows an octave of notes on a keyboard starting with which has a modern day frequency of . You canclick on each key to hear the frequency corresponding to note shown on the key. The buttons across the top allow you to select thetunings of four different temperaments; choosing a different temperament will change the frequency of the notes between and an octave higher to match the chosen temperament. The notes sound mechanical because they are pure sine wave with no overtonesand so have no timbre. The scale button plays the notes on the scale and the button plays a perfect fifth; and for this scale.Clicking on the overtone checkbox will add the second harmonic (twice the fundamental) at half the volume of the fundamentaland the third harmonic with a volume one third the fundamental to any note being played. These overtones are louder than wouldbe normal for a stringed instrument in order to better demonstrate beating and dissonance in the different chord combinations (Goback to chapter 10 to review beats and dissonance if you have forgotten). Three chords used in popular music can also be played.The Major chord plays the notes , and ; the major chord plays the notes , ( sharp) and ; the major chordplays the notes , , and .
Press Reset if sound does not play when the simulation first loads.
Simulation Quesions:1. Play a few notes by clicking on the keyboard and then change temperaments and try the same notes. Can you hear the
difference?2. Because the Just Noticeable Different ( ) for most people is a few hertz, you probably were not able to hear the difference
between the same note in two different temperaments if they are played separately. Push the scale button and listen to the scalein different temperaments. Can you detect the difference for a string of notes?
3. Again, since the difference between the same note in different temperaments is less than three Hertz you probably can't tellfrom individual notes played one after the other which temperament you are playing. Now try the fifth in each of thetemperaments. What do you notice? Which temperaments have the least beating for the fifth?
4. You can hear the difference in temperaments by listening to a or chords of three notes. Try each of the three chords indifferent temperaments. You may hear some beating for some temperaments that you don't hear in others. Describe what youhear for each temperament.
5. Now click the overtone check box and play a few individual notes. What is different?6. Only the first two overtones are added and they are much louder than would occur in a real instrument so the timbre still isn't
pleasant like a real instrument would be. Now play the fifth and the chords in different temperaments with overtones. Whichtemperaments have less beating and dissonance?
7. You may have noticed less beating and dissonance for the Pythagorean and Just temperaments with overtones. Recall thatstrings with length ratios of and are thought to sound good together because the frequencies in these two scales haveexact ratios. Harmonics of these frequencies also have the same ratio so they also sound good together; the harmonics of onenote are also harmonics of other notes. This will not be the case for an equal temperament scale because the notes of thescale are equally spaced in the octave which results in the note not being an exact ratio of the tonic (it is in fact a ratioof between and for the equal temperament instead of as is the case for the Pythagorean temperament).How does the choice of temperament change how musical scales sound?
Video/audio examples:Web site on how to read music.Brief explanation of music theory from a musicians' frame of reference.Wikipedia on musical tuning systems (towards the bottom) has samples as well.The choice of mode is actually a bit more complicated than simply choosing a starting note. See The Physics of Musical Scalesby Durfee and Colton.A more in-depth discussion of Harmonic Series as it relates to musical scales.Wikipedia diagram of harmonic series intervals.A more detailed explanation of musical intervals and scales.The circle of fifths is a way to see how different musical keys are related. Here is a circle of fifths simulation from Wolfram(you may need to download their plug in to play with this demonstration).
C 261.63 Hz
C C
5th C G
C C E G D D F# F A G
G B D
Note
JND
5th
3/2 4/3
12
5th 3/2
1.4953 C G 3/2 = 1.5
Kyle Forinash and Wolfgang Christian 14.1.3.2 3/24/2022 https://phys.libretexts.org/@go/page/26279
Pierre Lewis gives a detailed explanation of temperaments.Dallin Durfee's Temperament Studio , a Java applet that plays scales and chords in different temperaments.Pierre Lewis's Java Tuner, an applet that plays scales in different temperaments. If security blocks the Java you can stilldownload it and use it locally (scroll to the bottom of the page).Wolfram's demonstration of musical scales and temperaments (you may need to download their plug in to play with thisdemonstration).Music by Bill Sethares using alternate tunings (click on mp3s for listening).Article in American Scientist by Cook and Hayashi about The Psychoacoustics of Harmony Perception.Human voices are not restricted to sounding a specific note like most musical instruments; the voice is very flexible in thechoice of tones it can make. The so called barbershop seventh is an example. The notes in a typical chord have the ratios
which are notes in the Just scale. These frequencies also cause a missing fundamental frequency so that four singerswill create five perceived notes. The chord makes use of a tuning scale that cannot be reproduced on a piano tuned to an equaltempered scale. Here is an example from The Music Man (skip to seconds to hear the first chord).
SummaryMusicians even before recorded history have made music and musical instruments that sounded good to them. The oldest flutefound is about years old and is made of the bone of a giant vulture. Ancient Greek mathematicians realized that the noteson a string that sounded pleasant together have specific length ratios. For a long time after that mathematicians thought they couldcodify the scales used by musicians into set ratios of frequencies. With the advent of modern music which uses more than oneoctave, much more harmony and instruments that have fixed scales that are not easily changed, compromises in the 'perfect' ratioshad to be made. The slight differences between Pythagorean and equal tempered scales can be heard by a trained ear but are notenough to change the overall feel of a musical piece.
Questions on Scales:1. What is the Pythagorean scale and how was it developed?2. What is an octave?3. If you hold a guitar string down in the middle each side of the string will be a ________ lower (or half) than the original sound
of the full length.4. In what way is the Pythagorean scale limited? What problems arise from its limitation?5. Define a perfect fifth and a perfect fourth.6. What is the ratio of a string’s length that produces a perfect ? A perfect ?7. Why do notes with a ratio of (a perfect fifth) and other ratios sound good together?8. Explain the contribution Ptolemy made to the Pythagorean scale.9. Explain how the Pythagorean formula eventually calculates notes which are not on the desired scale.
10. Why is it that most people cannot hear the small frequency differences between notes on the Polemic scale and the Pythagoreanscale (Hint: Review the chapter on perception.)?
11. What is a mode?12. A particular choice of starting note and system of generating a note scale is called a __________?13. What is a temperament?14. What is a semitone?15. How many semitones are in an octave? How many cents are in a semitone?16. Why did the question of music scales become more complicated beginning with the 14th century?17. How are modern musical scales in Western culture different from older classical music?18. Why and when was the equal tempered scale developed? What problems did it solve?19. Who popularized the equal tempered scale?20. On the equal temperament scale _______ cents is about .21. What is the current scale that most modern composers use? What is the compromise of using this scale?22. When tuning a piano, how are the higher notes tuned as compared to the lower notes?23. What is a Railsback curve?24. Why are the overtones in a piano not exactly harmonic? What is the result of this mismatch?25. Barbershop quartets, generally, have a very rich sound and use a specific type of scale. What scale do they use? Why is it easier
for the quartet to use this scale compared to a piano and what happens when their frequencies combine?
4 : 5 : 6 : 7
40
35, 000
5th 4th
2/3
0.3 Hz

Kyle Forinash and Wolfgang Christian 14.1.3.3 3/24/2022 https://phys.libretexts.org/@go/page/26279
26. The note gradually changed in frequency over time from to . What made this possible?
Contributions and AttributionsThis page is licensed under a CC BY-NC-SA 3.0 license and was authored, remixed, and/or curated by Kyle Forinash andWolfgang Christian. Source content is found at https://www.compadre.org/books/SoundBook. Page content has been edited andupdated to conform to the style and standards of the LibreTexts platform. A detailed versioning history of the edits to source contentis available upon request.
A 415 Hz 440 Hz
Kyle Forinash and Wolfgang Christian 15.1 3/24/2022 https://phys.libretexts.org/@go/page/25961
15: AcousticsThe study of what happens to sound in an enclosed space or as the result of interactions with large objects such as buildings iscalled acoustics. Humans have been trying to improve the acoustics of auditoriums and other public spaces since the time of theancient Romans. Marcus Vitruvius Pollio worked as an architect and engineer in the first century BCE and is credited withinstalling resonating cavities called Echea in Roman amphitheaters. These were made of brass or clay and placed under the seats ofthe auditorium to enhance the voices of actors on stage. None of these devices still exist and it is not clear if they actually workedor not.
The rules presented previously (Chapter 7) of how waves interact with objects, such as reflection, refraction, path difference,diffraction and interference, govern how sound will behave inside rooms and auditoriums as well as outdoor concert pavilions.Although much is known about the topic, it is still difficult to know exactly what a given band or orchestra will sound like in anewly designed auditorium.
Key Terms:Acoustics, reverberation, comb effect, echo, direct sound, reverberation time, absorptivity, standing waves, dead spot, feedback,binaural hearing, reflection (specular and diffuse), exponential decay, attenuation, infrasound, matching room acoustics to type ofmusic.
15.1: Acoustics
Contributions and AttributionsThis page is licensed under a CC BY-NC-SA 3.0 license and was authored, remixed, and/or curated by Kyle Forinash andWolfgang Christian. Source content is found at https://www.compadre.org/books/SoundBook. Page content has been edited andupdated to conform to the style and standards of the LibreTexts platform. A detailed versioning history of the edits to source contentis available upon request.
15.1.1: 16.1.1-Acoustic Qualities
15.1.2: Reverberation
15.1.3: Other Acoustical Effects
15.1.4: Sound Reinforcement
15.1.5: Spatial Perception
15.1.6: Animal Acoustics
15.1.7: Other Acoustical Applications
Kyle Forinash and Wolfgang Christian 15.1.1 3/24/2022 https://phys.libretexts.org/@go/page/25955
15.1: AcousticsThe study of what happens to sound in an enclosed space or as the result of interactions with large objects such as buildings iscalled acoustics. Humans have been trying to improve the acoustics of auditoriums and other public spaces since the time of theancient Romans. Reflection, refraction, path difference, diffraction and interference will govern how sound behaves inside rooms,auditoriums and concert pavilions.
Contributions and AttributionsThis page is licensed under a CC BY-NC-SA 3.0 license and was authored, remixed, and/or curated by Kyle Forinash andWolfgang Christian. Source content is found at https://www.compadre.org/books/SoundBook. Page content has been edited andupdated to conform to the style and standards of the LibreTexts platform. A detailed versioning history of the edits to source contentis available upon request.
Kyle Forinash and Wolfgang Christian 15.1.1.1 3/24/2022 https://phys.libretexts.org/@go/page/26282
15.1.1: 16.1.1-Acoustic QualitiesThere are several general properties that are desirable in an auditorium or concert space. We would like every listener to haveexactly the same sound experience. Any noise external to the room should be excluded or minimized. The sounds coming from theperformers should be heard clearly and distinctly. If there are any echoes they should be below some threshold relative to the totalsound so as not to interfere with the sound being listened to and should not change the sensation of where the music is comingfrom. The performers should not hear distracting echoes. One of the largest factors impacting how the shape, size and constructionof an auditorium affect the sound of a musical performance is reverberation.
Contributions and AttributionsThis page is licensed under a CC BY-NC-SA 3.0 license and was authored, remixed, and/or curated by Kyle Forinash andWolfgang Christian. Source content is found at https://www.compadre.org/books/SoundBook. Page content has been edited andupdated to conform to the style and standards of the LibreTexts platform. A detailed versioning history of the edits to source contentis available upon request.
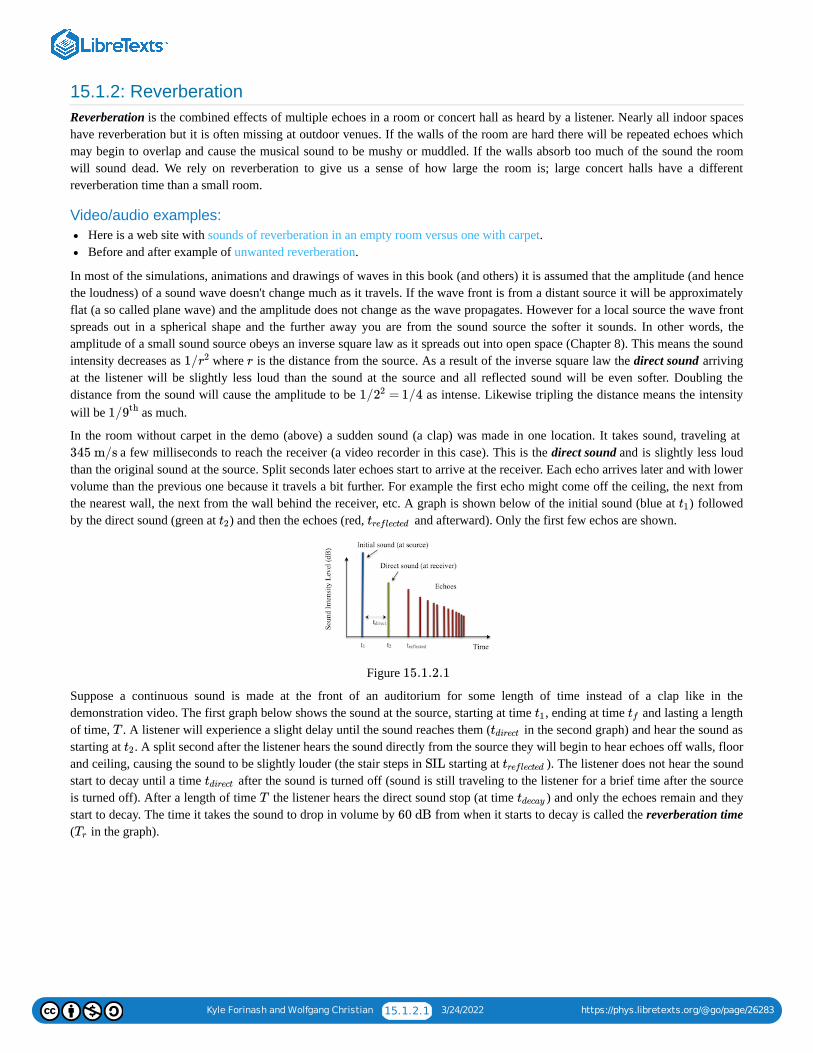
Kyle Forinash and Wolfgang Christian 15.1.2.1 3/24/2022 https://phys.libretexts.org/@go/page/26283
15.1.2: ReverberationReverberation is the combined effects of multiple echoes in a room or concert hall as heard by a listener. Nearly all indoor spaceshave reverberation but it is often missing at outdoor venues. If the walls of the room are hard there will be repeated echoes whichmay begin to overlap and cause the musical sound to be mushy or muddled. If the walls absorb too much of the sound the roomwill sound dead. We rely on reverberation to give us a sense of how large the room is; large concert halls have a differentreverberation time than a small room.
Video/audio examples:Here is a web site with sounds of reverberation in an empty room versus one with carpet.Before and after example of unwanted reverberation.
In most of the simulations, animations and drawings of waves in this book (and others) it is assumed that the amplitude (and hencethe loudness) of a sound wave doesn't change much as it travels. If the wave front is from a distant source it will be approximatelyflat (a so called plane wave) and the amplitude does not change as the wave propagates. However for a local source the wave frontspreads out in a spherical shape and the further away you are from the sound source the softer it sounds. In other words, theamplitude of a small sound source obeys an inverse square law as it spreads out into open space (Chapter 8). This means the soundintensity decreases as where is the distance from the source. As a result of the inverse square law the direct sound arrivingat the listener will be slightly less loud than the sound at the source and all reflected sound will be even softer. Doubling thedistance from the sound will cause the amplitude to be as intense. Likewise tripling the distance means the intensitywill be as much.
In the room without carpet in the demo (above) a sudden sound (a clap) was made in one location. It takes sound, traveling at a few milliseconds to reach the receiver (a video recorder in this case). This is the direct sound and is slightly less loud
than the original sound at the source. Split seconds later echoes start to arrive at the receiver. Each echo arrives later and with lowervolume than the previous one because it travels a bit further. For example the first echo might come off the ceiling, the next fromthe nearest wall, the next from the wall behind the receiver, etc. A graph is shown below of the initial sound (blue at ) followedby the direct sound (green at ) and then the echoes (red, and afterward). Only the first few echos are shown.
Figure
Suppose a continuous sound is made at the front of an auditorium for some length of time instead of a clap like in thedemonstration video. The first graph below shows the sound at the source, starting at time , ending at time and lasting a lengthof time, . A listener will experience a slight delay until the sound reaches them ( in the second graph) and hear the sound asstarting at . A split second after the listener hears the sound directly from the source they will begin to hear echoes off walls, floorand ceiling, causing the sound to be slightly louder (the stair steps in starting at ). The listener does not hear the soundstart to decay until a time after the sound is turned off (sound is still traveling to the listener for a brief time after the sourceis turned off). After a length of time the listener hears the direct sound stop (at time ) and only the echoes remain and theystart to decay. The time it takes the sound to drop in volume by from when it starts to decay is called the reverberation time( in the graph).
1/r2 r
1/ = 1/422
1/9th
345 m/s
t1
t2 treflected
15.1.2.1
t1 tfT tdirectt2
SIL treflectedtdirect
T tdecay60 dB
Tr
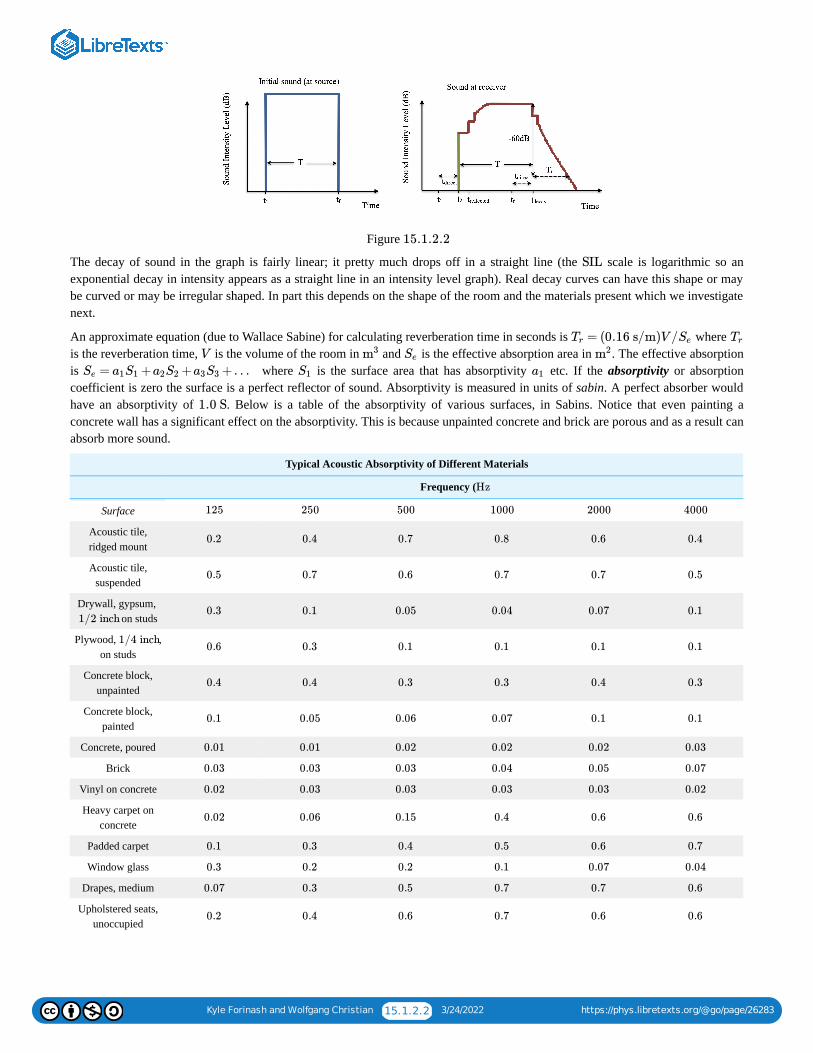
Kyle Forinash and Wolfgang Christian 15.1.2.2 3/24/2022 https://phys.libretexts.org/@go/page/26283
Figure
The decay of sound in the graph is fairly linear; it pretty much drops off in a straight line (the scale is logarithmic so anexponential decay in intensity appears as a straight line in an intensity level graph). Real decay curves can have this shape or maybe curved or may be irregular shaped. In part this depends on the shape of the room and the materials present which we investigatenext.
An approximate equation (due to Wallace Sabine) for calculating reverberation time in seconds is where is the reverberation time, is the volume of the room in and is the effective absorption area in . The effective absorptionis where is the surface area that has absorptivity etc. If the absorptivity or absorptioncoefficient is zero the surface is a perfect reflector of sound. Absorptivity is measured in units of sabin. A perfect absorber wouldhave an absorptivity of . Below is a table of the absorptivity of various surfaces, in Sabins. Notice that even painting aconcrete wall has a significant effect on the absorptivity. This is because unpainted concrete and brick are porous and as a result canabsorb more sound.
Typical Acoustic Absorptivity of Different Materials
Frequency (
Surface
Acoustic tile,ridged mount
Acoustic tile,suspended
Drywall, gypsum, on studs
Plywood, ,on studs
Concrete block,unpainted
Concrete block,painted
Concrete, poured
Brick
Vinyl on concrete
Heavy carpet onconcrete
Padded carpet
Window glass
Drapes, medium
Upholstered seats,unoccupied
15.1.2.2
SIL
= (0.16 s/m)V /Tr Se TrV m3 Se m2
= + + +…Se a1S1 a2S2 a3S3 S1 a1
1.0 S
Hz
125 250 500 1000 2000 4000
0.2 0.4 0.7 0.8 0.6 0.4
0.5 0.7 0.6 0.7 0.7 0.5
1/2 inch0.3 0.1 0.05 0.04 0.07 0.1
1/4 inch0.6 0.3 0.1 0.1 0.1 0.1
0.4 0.4 0.3 0.3 0.4 0.3
0.1 0.05 0.06 0.07 0.1 0.1
0.01 0.01 0.02 0.02 0.02 0.03
0.03 0.03 0.03 0.04 0.05 0.07
0.02 0.03 0.03 0.03 0.03 0.02
0.02 0.06 0.15 0.4 0.6 0.6
0.1 0.3 0.4 0.5 0.6 0.7
0.3 0.2 0.2 0.1 0.07 0.04
0.07 0.3 0.5 0.7 0.7 0.6
0.2 0.4 0.6 0.7 0.6 0.6
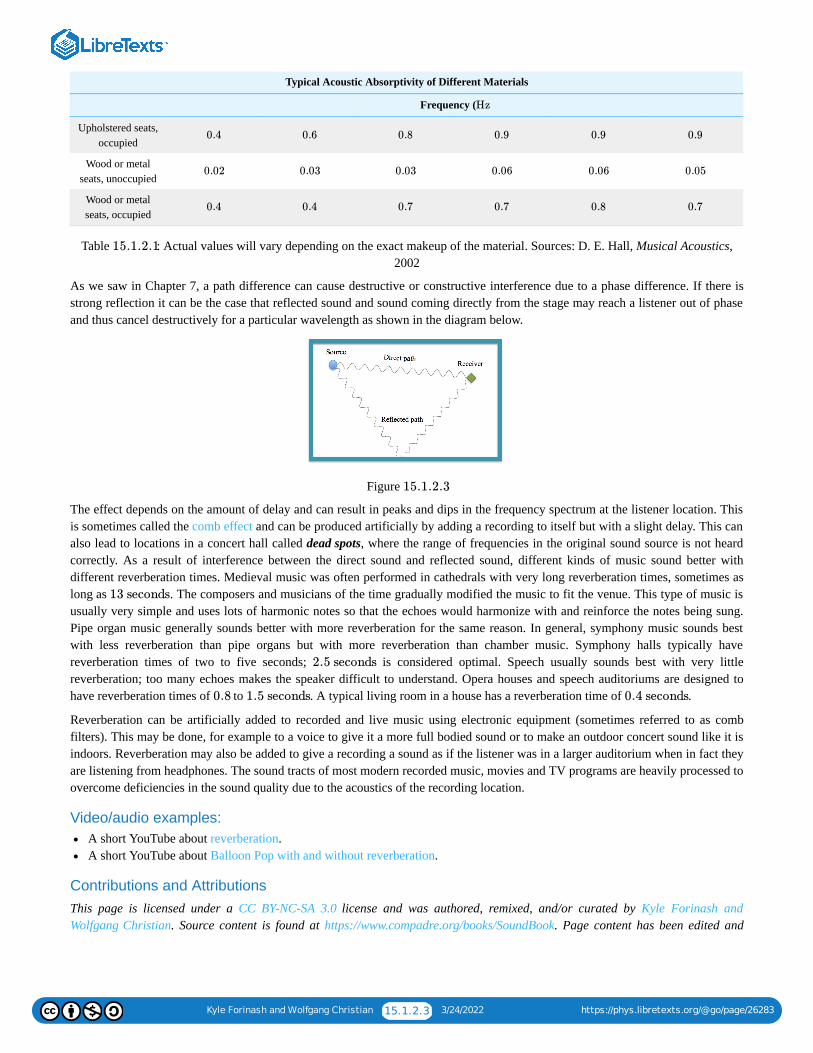
Kyle Forinash and Wolfgang Christian 15.1.2.3 3/24/2022 https://phys.libretexts.org/@go/page/26283
Typical Acoustic Absorptivity of Different Materials
Frequency (
Upholstered seats,occupied
Wood or metalseats, unoccupied
Wood or metalseats, occupied
Table : Actual values will vary depending on the exact makeup of the material. Sources: D. E. Hall, Musical Acoustics,2002
As we saw in Chapter 7, a path difference can cause destructive or constructive interference due to a phase difference. If there isstrong reflection it can be the case that reflected sound and sound coming directly from the stage may reach a listener out of phaseand thus cancel destructively for a particular wavelength as shown in the diagram below.
Figure
The effect depends on the amount of delay and can result in peaks and dips in the frequency spectrum at the listener location. Thisis sometimes called the comb effect and can be produced artificially by adding a recording to itself but with a slight delay. This canalso lead to locations in a concert hall called dead spots, where the range of frequencies in the original sound source is not heardcorrectly. As a result of interference between the direct sound and reflected sound, different kinds of music sound better withdifferent reverberation times. Medieval music was often performed in cathedrals with very long reverberation times, sometimes aslong as . The composers and musicians of the time gradually modified the music to fit the venue. This type of music isusually very simple and uses lots of harmonic notes so that the echoes would harmonize with and reinforce the notes being sung.Pipe organ music generally sounds better with more reverberation for the same reason. In general, symphony music sounds bestwith less reverberation than pipe organs but with more reverberation than chamber music. Symphony halls typically havereverberation times of two to five seconds; is considered optimal. Speech usually sounds best with very littlereverberation; too many echoes makes the speaker difficult to understand. Opera houses and speech auditoriums are designed tohave reverberation times of to . A typical living room in a house has a reverberation time of .
Reverberation can be artificially added to recorded and live music using electronic equipment (sometimes referred to as combfilters). This may be done, for example to a voice to give it a more full bodied sound or to make an outdoor concert sound like it isindoors. Reverberation may also be added to give a recording a sound as if the listener was in a larger auditorium when in fact theyare listening from headphones. The sound tracts of most modern recorded music, movies and TV programs are heavily processed toovercome deficiencies in the sound quality due to the acoustics of the recording location.
Video/audio examples:A short YouTube about reverberation.A short YouTube about Balloon Pop with and without reverberation.
Contributions and AttributionsThis page is licensed under a CC BY-NC-SA 3.0 license and was authored, remixed, and/or curated by Kyle Forinash andWolfgang Christian. Source content is found at https://www.compadre.org/books/SoundBook. Page content has been edited and
Hz
0.4 0.6 0.8 0.9 0.9 0.9
0.02 0.03 0.03 0.06 0.06 0.05
0.4 0.4 0.7 0.7 0.8 0.7
15.1.2.1
15.1.2.3
13 seconds
2.5 seconds
0.8 1.5 seconds 0.4 seconds

Kyle Forinash and Wolfgang Christian 15.1.2.4 3/24/2022 https://phys.libretexts.org/@go/page/26283
updated to conform to the style and standards of the LibreTexts platform. A detailed versioning history of the edits to source contentis available upon request.
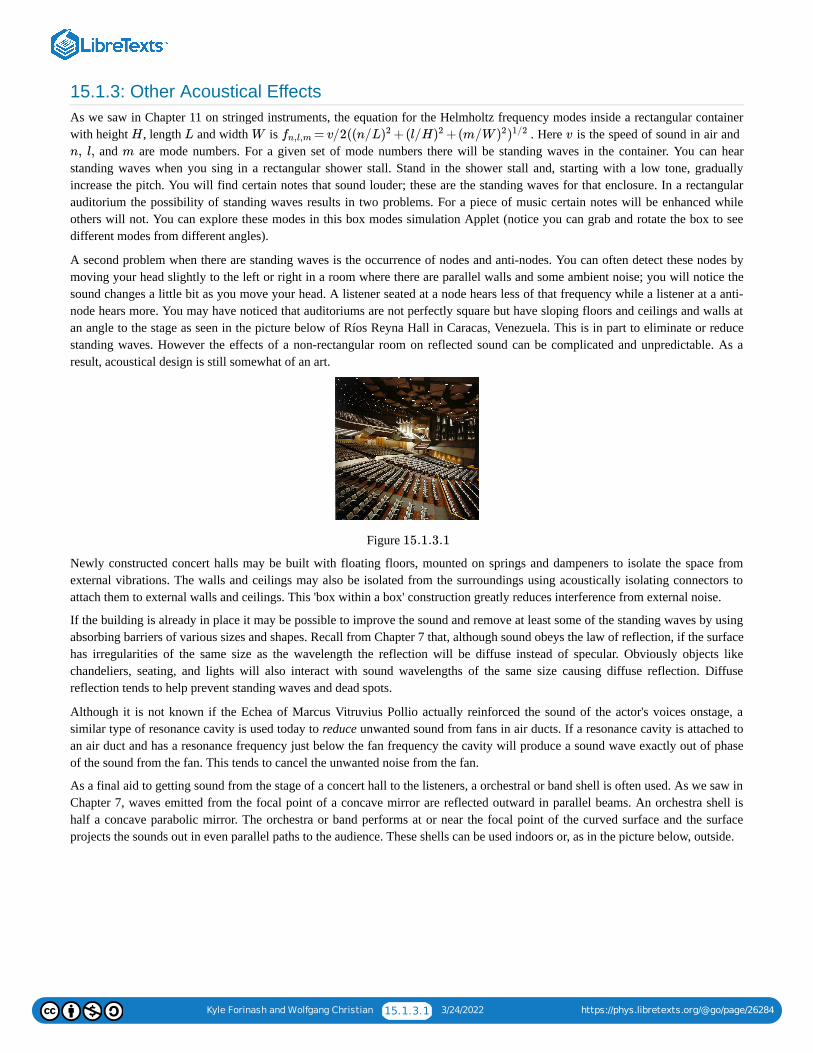
Kyle Forinash and Wolfgang Christian 15.1.3.1 3/24/2022 https://phys.libretexts.org/@go/page/26284
15.1.3: Other Acoustical EffectsAs we saw in Chapter 11 on stringed instruments, the equation for the Helmholtz frequency modes inside a rectangular containerwith height , length and width is . Here is the speed of sound in air and
and are mode numbers. For a given set of mode numbers there will be standing waves in the container. You can hearstanding waves when you sing in a rectangular shower stall. Stand in the shower stall and, starting with a low tone, graduallyincrease the pitch. You will find certain notes that sound louder; these are the standing waves for that enclosure. In a rectangularauditorium the possibility of standing waves results in two problems. For a piece of music certain notes will be enhanced whileothers will not. You can explore these modes in this box modes simulation Applet (notice you can grab and rotate the box to seedifferent modes from different angles).
A second problem when there are standing waves is the occurrence of nodes and anti-nodes. You can often detect these nodes bymoving your head slightly to the left or right in a room where there are parallel walls and some ambient noise; you will notice thesound changes a little bit as you move your head. A listener seated at a node hears less of that frequency while a listener at a anti-node hears more. You may have noticed that auditoriums are not perfectly square but have sloping floors and ceilings and walls atan angle to the stage as seen in the picture below of Ríos Reyna Hall in Caracas, Venezuela. This is in part to eliminate or reducestanding waves. However the effects of a non-rectangular room on reflected sound can be complicated and unpredictable. As aresult, acoustical design is still somewhat of an art.
Figure
Newly constructed concert halls may be built with floating floors, mounted on springs and dampeners to isolate the space fromexternal vibrations. The walls and ceilings may also be isolated from the surroundings using acoustically isolating connectors toattach them to external walls and ceilings. This 'box within a box' construction greatly reduces interference from external noise.
If the building is already in place it may be possible to improve the sound and remove at least some of the standing waves by usingabsorbing barriers of various sizes and shapes. Recall from Chapter 7 that, although sound obeys the law of reflection, if the surfacehas irregularities of the same size as the wavelength the reflection will be diffuse instead of specular. Obviously objects likechandeliers, seating, and lights will also interact with sound wavelengths of the same size causing diffuse reflection. Diffusereflection tends to help prevent standing waves and dead spots.
Although it is not known if the Echea of Marcus Vitruvius Pollio actually reinforced the sound of the actor's voices onstage, asimilar type of resonance cavity is used today to reduce unwanted sound from fans in air ducts. If a resonance cavity is attached toan air duct and has a resonance frequency just below the fan frequency the cavity will produce a sound wave exactly out of phaseof the sound from the fan. This tends to cancel the unwanted noise from the fan.
As a final aid to getting sound from the stage of a concert hall to the listeners, a orchestral or band shell is often used. As we saw inChapter 7, waves emitted from the focal point of a concave mirror are reflected outward in parallel beams. An orchestra shell ishalf a concave parabolic mirror. The orchestra or band performs at or near the focal point of the curved surface and the surfaceprojects the sounds out in even parallel paths to the audience. These shells can be used indoors or, as in the picture below, outside.
H L W = v/2((n/L +(l/H +(m/Wfn,l,m )2 )2 )2)1/2 v
n, l, m
15.1.3.1
Kyle Forinash and Wolfgang Christian 15.1.3.2 3/24/2022 https://phys.libretexts.org/@go/page/26284
Figure
Contributions and AttributionsThis page is licensed under a CC BY-NC-SA 3.0 license and was authored, remixed, and/or curated by Kyle Forinash andWolfgang Christian. Source content is found at https://www.compadre.org/books/SoundBook. Page content has been edited andupdated to conform to the style and standards of the LibreTexts platform. A detailed versioning history of the edits to source contentis available upon request.
15.1.3.2
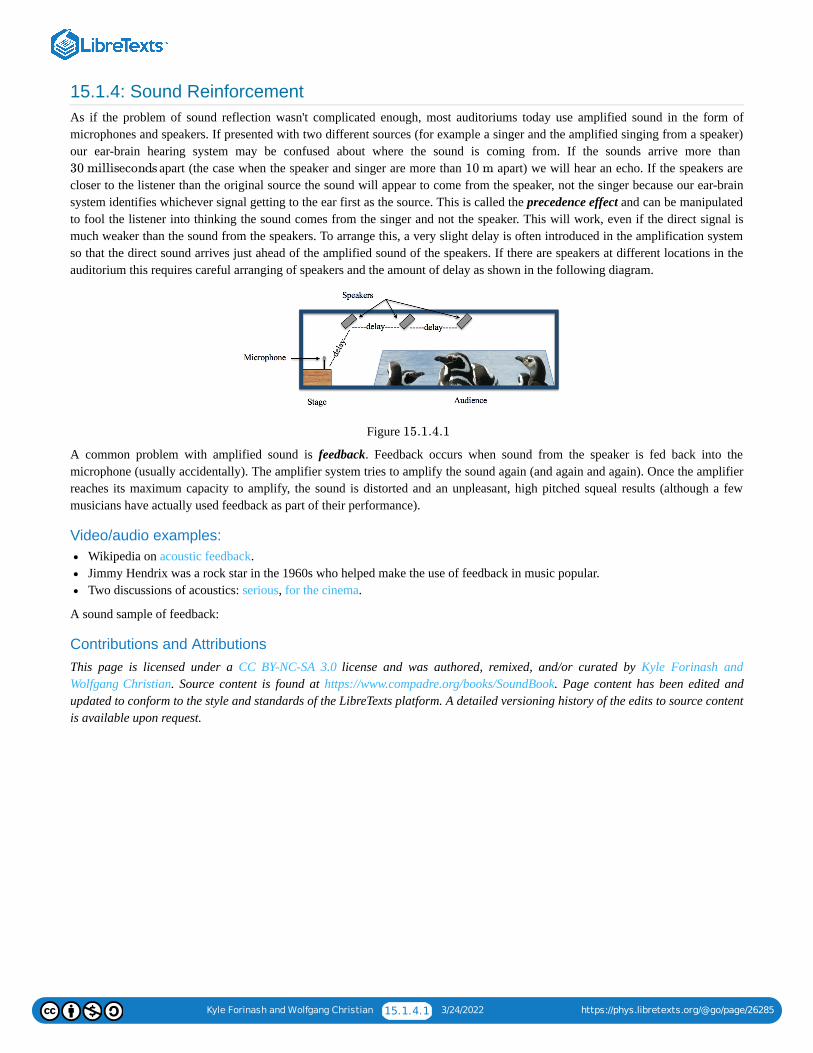
Kyle Forinash and Wolfgang Christian 15.1.4.1 3/24/2022 https://phys.libretexts.org/@go/page/26285
15.1.4: Sound ReinforcementAs if the problem of sound reflection wasn't complicated enough, most auditoriums today use amplified sound in the form ofmicrophones and speakers. If presented with two different sources (for example a singer and the amplified singing from a speaker)our ear-brain hearing system may be confused about where the sound is coming from. If the sounds arrive more than
apart (the case when the speaker and singer are more than apart) we will hear an echo. If the speakers arecloser to the listener than the original source the sound will appear to come from the speaker, not the singer because our ear-brainsystem identifies whichever signal getting to the ear first as the source. This is called the precedence effect and can be manipulatedto fool the listener into thinking the sound comes from the singer and not the speaker. This will work, even if the direct signal ismuch weaker than the sound from the speakers. To arrange this, a very slight delay is often introduced in the amplification systemso that the direct sound arrives just ahead of the amplified sound of the speakers. If there are speakers at different locations in theauditorium this requires careful arranging of speakers and the amount of delay as shown in the following diagram.
Figure
A common problem with amplified sound is feedback. Feedback occurs when sound from the speaker is fed back into themicrophone (usually accidentally). The amplifier system tries to amplify the sound again (and again and again). Once the amplifierreaches its maximum capacity to amplify, the sound is distorted and an unpleasant, high pitched squeal results (although a fewmusicians have actually used feedback as part of their performance).
Video/audio examples:Wikipedia on acoustic feedback.Jimmy Hendrix was a rock star in the 1960s who helped make the use of feedback in music popular.Two discussions of acoustics: serious, for the cinema.
A sound sample of feedback:
Contributions and AttributionsThis page is licensed under a CC BY-NC-SA 3.0 license and was authored, remixed, and/or curated by Kyle Forinash andWolfgang Christian. Source content is found at https://www.compadre.org/books/SoundBook. Page content has been edited andupdated to conform to the style and standards of the LibreTexts platform. A detailed versioning history of the edits to source contentis available upon request.
30 milliseconds 10 m
15.1.4.1
Kyle Forinash and Wolfgang Christian 15.1.5.1 3/24/2022 https://phys.libretexts.org/@go/page/26286
15.1.5: Spatial PerceptionOur perception of distance and direction also strongly affects our experience in a concert hall. We determine the distance to a soundsource in part by how loud it is. Part of our clues about distance also come from reverberation. If there is little or no reflected soundit is difficult to determine how far way a sound source is.
In addition to reverberation our ear-brain hearing system uses four other methods to determine the direction and distance to asound source. The distance between your ears is about , causing as much as a delay for sounds coming fromone side. If a sound arrives at the left ear a little before the right ear we perceive the sound as coming from the left. This time delaygives us clues about left and right but does not help us distinguish front from back or up from down. It works best for shortwavelengths of sound that have to travel around our head to reach the other ear.
Our ear/brain system is also capable of detecting phase difference in some special cases. Recall from Chapter 3 that the phase of awave tells us when it starts relative to some arbitrary starting time. If the phase of the peaks in the sound wave arriving at the leftear is slightly ahead of the phase of the peaks arriving at the right ear our ear-brain system interprets the sound as coming from theleft. Notice this is different from a time lag between ears; phase differences can be detected even for a continuous tone that does notstart or stop. This ability occurs most prominently for sounds below . The picture below shows a difference of phasebetween a wave going to the right ear and a wave going to the left ear.
Figure
For higher frequencies we may be able to detect slight intensity differences of sounds coming from different directions.Frequencies between and have wavelengths that are larger than your head so they diffract (see Chapter 7) aroundyour head, making the time delay negligible. But the intensity difference still provides a clue about direction. If the left earperceives a louder sound we experience the sound as coming from the left.
The above three methods of determining direction to a sound source work well for left-right determination and require two ears.This makes them binaural methods for determining direction. A forth method of determining direction relies on the shape of theouter ear. For frequencies above the shape of the outer ear reflects sounds coming from different directions with slightlydifferent time delays. Slight movements of the head change the amount and time delay of these frequencies relative to otherfrequencies which gives us a sense of whether the sound is coming from in front or behind us.
For humans our left-right determination of sound direction is stronger than our ability to determine whether sound is coming fromabove or below. This has the practical result that sound from speakers in a concert hall which are too far apart in the horizontaldirection do not sound right; we are not easily fooled into thinking the sound is coming from the center of the stage where theperformers are. Because our up-down discrimination is not so refined we are less bothered by speakers hanging overhead. For themost part we tend to perceive the sound as coming to us from the front even when the speakers are above us.
Contributions and AttributionsThis page is licensed under a CC BY-NC-SA 3.0 license and was authored, remixed, and/or curated by Kyle Forinash andWolfgang Christian. Source content is found at https://www.compadre.org/books/SoundBook. Page content has been edited andupdated to conform to the style and standards of the LibreTexts platform. A detailed versioning history of the edits to source contentis available upon request.
15 cm 0.4 millisecond
1500 Hz
15.1.5.1
2 kHz 3 kHz
5 kHz
Kyle Forinash and Wolfgang Christian 15.1.6.1 3/24/2022 https://phys.libretexts.org/@go/page/26287
15.1.6: Animal Acoustics
Much of the information about animal perception in this chapter and in Chapters 10 and 14 comes from the excellent bookEngineering Animals: How Life Works by Mark Denny and Alan McFadzean.
Animals use sounds to communicate to others in their species, to navigate and to find prey. As mentioned previously, small animalstend to make and use high frequency sound to communicate whereas larger animals tend to use lower frequencies but there areexceptions. The size of an animal also affects which of the methods in the previous section it might use to detect the source of asound. Animals with small heads tend to use phase difference to locate a sound source because the timing difference is too small ifyour ears are closer together.
Under normal circumstances low frequencies travel larger distances with less attenuation or loss. Elephants use this fact tocommunicate over distances of a few kilometers using infrasound (frequencies below ). Woodpeckers use hollow trees tocreate lower sounds than they sing in order to attract mates and establish territory over longer distances. There is some evidencethat pigeons can use the infrasound acoustic signatures of particular land features for long distance migration. Because higherfrequencies attenuate sooner than low frequencies, particularly in forests, the timbre of a birdsong will change depending on thedistance from the source to the listener. Some birds appear to be able to make use of this fact to locate mates and competitors inplaces where visibility is limited.
Water carries low frequencies much better than air and whales and dolphins use low frequency sounds to communicate. In theocean the speed of sound is affected by temperature, salinity and pressure. Temperature decreases with depth but pressure increaseswith the result that there is a layer of the ocean at a depth of about where the speed of sound is the slowest. At thisparticular depth, called the Sound Fixing and Ranging channel (SOFAR), the speed of sound is about (compared to asmuch as at other temperatures and pressures). The layer acts as a wave guide; sound that tries to leave the layer refractsback into the layer because of total internal reflection, just like light trying to exit a fiber optic cable at a small angle. Becausesound is trapped in this layer it can travel long distances with very little attenuation. The navy has investigated the SOFAR channelas a potential way to detect sounds of enemy submarines at large distances. Some whales appear to be able to communicate overhundreds of kilometers by emitting low frequency sounds in the SOFAR layer.
Most birds do not emit sound signals to navigate or find prey but instead use intensity, phase difference or timing differences ofambient sounds as described in the previous section. The ears of owls are located asymmetrically at different heights on the head.Owls can also change the orientation of the feathers around the ears to get slightly different phase information from a sound source.Based on laboratory experiments we know some owls use timing to establish the azimuthal (up and down) angle to a prey but theyuse phase shifts to determine the horizontal location of a sound source. This probably gives them something like a two dimensionalpicture of what is around them using sound instead of light.
A few birds navigate by echolocation, emitting signals and listening for their return. Oilbirds and swiftlets can navigate by timinghow long a signal takes to return, the least sophisticated form of echolocation. This allows them to find their nests in dark caveswhere they nest and avoid collision with other birds but they do not use echolocation to find prey.
Bats and toothed whales are best at echolocation. Higher frequencies have shorter wavelengths which increase accuracy so mostecholocating animals use high frequency chirps or clicks to echolocate. Because sound attenuation in water is less than in air,whales can echolocate over much larger distances than bats. Bats use sound to communicate with others of their own species overdistances of to but must be within about to use echolocation to hunt prey.
About species of bats echolocate and some have abilities beyond what humans can do with radar or other electronic forms ofecholocation. Bats often have unusual face and nose shapes in order to funnel the emitted sound into a narrow beam which helpsavoid spurious echoes from background sources. They also have sophisticated brain circuitry which can measure the Doppler shift(Chapter 7) to not only locate their prey but also determine how fast and in which direction the prey is traveling. There is someevidence that some bats can even use the very small Doppler shift from the flapping of the wings of a moth to identify which kindof moth is present. Things are not all bad for the moths, however. Tiger moths can detect the signals emitted by its bat predator andtake evasive action and they can even emit a 'jamming' signal to confuse the bat.
Whales and dolphins emit higher frequency clicks, chirps and other sounds which they use for echolocation in addition to lowerfrequency sounds for communication. It has been shown that dolphins can emit clicks of around seconds in duration
Note
20 Hz
0.7 km
1480 m/s
1540 m/s
50 m 100 m 5 m
800
50 micro
Kyle Forinash and Wolfgang Christian 15.1.6.2 3/24/2022 https://phys.libretexts.org/@go/page/26287
which gives them up to a resolution at a distance of . Many of these marine mammals have structures in theirforeheads which focus the sounds into a beam pointing forward. When dolphins are closer to their prey they change the frequencyof the chirps which gives them a resolution at a distance of . Because some of these sounds penetrate into the fish theyare hunting it is very likely dolphins can identify the type of fish present by forming basically a three dimensional picture of thefish, including its skeleton and inner organs using only sound.
One might wonder how it is that echolocators don't deafen their delicate ears with the sounds they emit. We know sound intensitydies off as an inverse square law (Chapter 8) so by the time a signal returns after reflecting off a prey it must be very weak, in factas much as times weaker. The bat or whale wants to maximize the output signal but have ears as sensitive as possible for thereturn signal. How is this possible? Most echolocators have mechanisms that mechanically disconnect their hearing apparatus whenthey are emitting signals.
Contributions and AttributionsThis page is licensed under a CC BY-NC-SA 3.0 license and was authored, remixed, and/or curated by Kyle Forinash andWolfgang Christian. Source content is found at https://www.compadre.org/books/SoundBook. Page content has been edited andupdated to conform to the style and standards of the LibreTexts platform. A detailed versioning history of the edits to source contentis available upon request.
1 cm 100 m
0.5 mm 1 m
1020
Kyle Forinash and Wolfgang Christian 15.1.7.1 3/24/2022 https://phys.libretexts.org/@go/page/26288
15.1.7: Other Acoustical ApplicationsThe science of acoustics has been and is being applied to a large number of different problems. The following is a list of interestingapplications of acoustic techniques.
Video/audio examples:A YouTube example where they manipulate your hearing to mimic the effect of spacial changes in the location of the source(requires headphones).Sound tourism; a list and samples of interesting sounds in the world by Trevor Cox.Interview with a blind person who uses sound to navigate.Putting a fire out with sound.Mechanical sound cancellation using acoustic metamaterial (Ghaffarivardavagh, Nikolajczyk, Anderson, and Zhang).In the phenomena of thermoacoustics sound is can be turned into heat or heat into sound. Using this conversion it is possible tomake a thermoacoustic heat engine that acts as a heat pump or refrigerator.Levitation of small objects with standing sound waves. Another YouTube. Here is an article in Science about uses of soniclevitation.Moving Helmholtz resonators.Making standing wave patterns in liquids with sound. A second example with a cornstarch solution. A third example, morecontrolled.Explanation of earthquake booms, Seneca guns and other sounds.Discussion in Physics Today, vol. 71, issue 8, 2018, of infrasound as a tool for the remote sensing of thunderstorms, volcanoes,nuclear bombs and more.Turning scientific data into sound: Samples from a group in Germany; Wikipedia article on Sonification; Sonification ofTohoku earthquake, Japan; Sonification of particles from the sun hitting satellites; Sonification of Voyager data.Singing sand dunes. Here is a YouTube of booming sand.Here is a list of software that allows you to modify sound files to create your own acoustical effects (I have only used Audacity;I cannot vouch for the others):
Audacity.Gold Wave.Adobe Audition.Praat.Max and several other sound products.Melodyne.Fleximusic.
Various resources on musical acoustics from the University of New South Wales.Dan Russell's page of simulations and animations on acoustics.
SummaryAuditorium design generally includes gently curving surfaces, diffuse reflection and controlled absorptivity of sound. Large flatsurfaces with strong, specular reflection are avoided. Still, auditorium design is only partially scientific; a great deal is left to trialand error. Our perception is sensitive to reverberation, echoes, timing, intensity, phase and other clues about the direction anddistance to a sound source. These effects have to be taken into account in order for a performance to sound natural, especially whenelectronic amplification is used.
Questions on Acoustics:1. Define acoustics.2. What are some of the acoustic qualities to be considered when planning a music or concert hall?3. Who was Marcus Vitruvius Pollio and what did he do?4. What is the principle behind Echeas?5. Explain reverberation and how it is measured.6. Why would you not want to get rid of reverberation entirely?7. What does it mean if the absorptivity of absorption coefficient is zero?
Kyle Forinash and Wolfgang Christian 15.1.7.2 3/24/2022 https://phys.libretexts.org/@go/page/26288
8. Absorption is measured in what units?9. If the distance to a sound source is doubled, that happens to the sound intensity?
10. What is the Comb effect and why is it useful?11. Explain feedback (what is it, when does it occur, why does it occur).12. What is a way to minimize echoes in a concert hall?13. What is one of the largest factors that impact the sound of a musical performance?14. Why do auditoriums have walls and floors that are slanted and angled?15. In addition to reverberation our ear-brain hearing system uses four other methods to determine the direction to a sound source.
Write a brief description of each.16. What is the precedence effect?17. How does our perception of the direction of sound from a vertical angle differ from a horizontal angle?18. How are we fooled at a concert to think the sound we hear is coming from the singer and not from the speakers on each side?19. A person is singing on stage, but their voice is amplified by speakers that are closer to the audience. How can you make it so the
audience perceives the sound originating from the stage and not the speaker?20. Why do speakers overhead not cause us to think the musicians are on the ceiling?21. Is it possible to design a perfect concert hall using only scientific principles? Explain your answer.22. Why are multiple speakers aligned in a plane going away from the stage each given a slight delay?23. Name a famous rocker that used feedback from his guitar as part of his musical performance.24. What two problems do standing waves pose for sound in a room?25. How can dead spots be reduced in a room?
Contributions and AttributionsThis page is licensed under a CC BY-NC-SA 3.0 license and was authored, remixed, and/or curated by Kyle Forinash andWolfgang Christian. Source content is found at https://www.compadre.org/books/SoundBook. Page content has been edited andupdated to conform to the style and standards of the LibreTexts platform. A detailed versioning history of the edits to source contentis available upon request.
1 3/24/2022
CHAPTER OVERVIEW16: ELECTRICITY AND MAGNETISM
This chapter is a very brief overview of some key concepts in electricity and magnetism. Most of our modern technology is based on theseconcepts. In the next chapter we will use these concepts to explain how microphones, speakers and digital recording work.
KEY TERMS:
Ohm's law, charge, coulombs, current, amperes, electrical potential, volts, resistance, ohms, magnetic field, compass, tesla, gauss,electromagnet, force on an electric charge in a magnetic field, electric motor, Faraday's law, electric generator.
16.1: EANDM- OHM'S LAW
16.1.1: OHM'S LAW16.2: EANDM- CURRENTS AND MAGNETIC FIELDS
16.2.1: CURRENTS CAUSE MAGNETIC FIELDS16.2.2: MAGNETIC FIELD SIMULATION16.3: EANDM- ELECTRIC AND MAGNETIC FORCES
16.3.1: CURRENTS IN A MAGNETIC FIELD MAY EXPERIENCE A FORCE16.3.2: ELECTRIC AND MAGNETIC FORCES SIMULATION16.4: EANDM- FARADAY'S LAW
16.4.1: A CHANGING MAGNETIC FIELD CAN CAUSE CURRENT TO FLOW16.4.2: FARADAY'S LAW SIMULATION
Kyle Forinash and Wolfgang Christian 16.1.1 3/24/2022 https://phys.libretexts.org/@go/page/25962
16.1: EandM- Ohm's LawThe electrical resistance of an electrical conductor is a measure of the difficulty to pass an electric current through that conductor. Itis measured in Ohms and the relation between resistance ( ), current ( ) and electrical potential ( ) is Ohm's law: .Ohm's law says that a larger voltage makes more current flow if resistance is fixed. Or if resistance is lower at the same voltage,more current will flow.
Contributions and AttributionsThis page is licensed under a CC BY-NC-SA 3.0 license and was authored, remixed, and/or curated by Kyle Forinash andWolfgang Christian. Source content is found at https://www.compadre.org/books/SoundBook. Page content has been edited andupdated to conform to the style and standards of the LibreTexts platform. A detailed versioning history of the edits to source contentis available upon request.
R I V V = IR
Kyle Forinash and Wolfgang Christian 16.1.1.1 3/24/2022 https://phys.libretexts.org/@go/page/26298
16.1.1: Ohm's LawAtoms are made of protons, neutrons and electrons. The protons and neutrons (each of which is 1800 times heavier than theelectron) are found at the center of the atom in the nucleus. The electrons surround the nucleus and occupy most of the space in theatom. Charge is measured in coulombs; a proton has a positive charge of while the electron has a negative chargeof and the neutron has no charge. The nuclear force holds the protons and neutrons together; the electrical forcebetween the protons and electrons keeps the electrons from wandering off. The electrons associated with metal atoms such as iron,aluminum or copper can move freely from one atom to another in a solid made of these atoms. A flow of electrons is called anelectrical current which is measured in amperes. An ampere is a flow of one coulomb of charge per second.
What is required for a current to flow? We already know there must be a metal conductor so that there are free electrons. There alsomust be energy to make them start moving. Recall earlier in the semester we said that if you raise a mass up to a certain height itwould store gravitational potential energy, measured in joules. In electricity, instead of measuring potential energy we measure thepotential energy per charge which is called voltage. A volt is a joule of potential energy per each coulomb of charge. Whenelectrons flow through an electrical component such as a light bulb, toaster or radio they give up some of their energy but the samenumber of electrons per second flow out as are flowing in (charge is conserved; we don't lose any of it). Although the same current(electrons per second) flows out of the component as flows in, the total current in the circuit is controlled by the resistance of thecircuit. Resistance is measured in ohms. The relation between resistance ( ), current ( ) and electrical potential ( ) is Ohm's law:
. Ohm's law says that a larger voltage makes more current flow if resistance is fixed. Or if resistance is lower at the samevoltage, more current will flow.
A good analogy for Ohm's law is water flowing in a system of pipes. Current is like the water, voltage is like the pressure andresistance is analogous to the size and number of pipes. There is pressure in the pipes (potential energy in the battery or powersupply) even if the water isn't flowing right at the moment. Flipping a switch in an electrical circuit is equivalent to turning a valveon in a water flow system. If the pipes are bigger or there are more of them (less resistance) there is more flow (more current) at thesame pressure (same voltage).
Video/audio examples:Ohm's law simulation (turn in answers on a separate sheet of paper): Electrical circuits. Requires JAVA.
There is a simplified HTML5 version of this simulation also available from PhET.
1. Download or run the simulation from the web page. Drag a battery, light bulb, switch and several wires from the panel ontothe screen. Connect them so that you get current to flow and the light bulb to light. Draw a sketch of your circuit. Hint: Thedifferent items connect together automatically; you can separate them by using a control click on the junction.
2. Click the box for adding a non-contact ammeter. Drag it over different parts of the circuit. What is the current in the circuit?Is it the same everywhere? If the current isn't used up in the circuit, what is?
3. Click on the box to add a voltmeter. You will notice there are two leads to the voltmeter; this is because it measures thepotential energy difference between two locations. What is the voltage difference across the battery? What about the voltageacross the light bulb? What about the voltage from one end of a wire to the other end?
4. Separate one of the junctions and add a resistor. What happens to the current compared to the circuit with no resistor? Whathappens to your voltage readings?
5. Replace the battery with the AC source. What is the difference between a battery (which provides DC or direct current) andthe AC (alternating current) source?
6. Add a current chart to the circuit. Move the probe over various parts of the circuit. Describe or sketch what the current isdoing, according to the current chart.
The basics of Ohm's law.It's not the voltage that kills you .... or is it?
Questions on Ohm's Law ( ):1. Suppose you have a wire in a circuit that has flowing in it and it branches into two other wires. If there is in one of
the wires, how much must be flowing in the other?
+1.6 × C10−19
−1.6 × C10−19
R I V
V = IR
Note
V = IR
10 A 7 A
Kyle Forinash and Wolfgang Christian 16.1.1.2 3/24/2022 https://phys.libretexts.org/@go/page/26298
2. Which is more like an electrical circuit, the cooling system of your car or the plumbing in your house? Explain.3. Why is it incorrect to say that voltage flows around a circuit? (Hint: start with definitions of current and voltage.)4. A person standing on an insulated stool touches a charged insulated conductor. What happens?5. Birds sit on high-tension wires and do not get electrocuted, even when the wire is bare, yet a squirrel which steps from a bare
wire to a pole or to another wire dies instantly. Why?6. What happens to the brightness of a light bulb if more current flows through it?7. What is the difference between current (in Amperes) and voltage (in Volts)?8. If you want make a brighter light bulb, do you want to increase the resistance or decrease the resistance of the filament? (Hint:
The brightness increases if more current flows.)9. What is the difference between AC and DC?
10. What do batteries supply to an electric circuit?11. When a battery dies, is it out of electrons or out of energy? Explain.12. If the same amount of current (electrons per second) flows into a light bulb flow out of it, what is being ‘used up’ in the circuit?13. If the same current flows into your house as flows out of it, why do you have to pay for electricity?14. Is it current or voltage that cause electric shock?15. Wet feet reduce the resistance between you and the ground. From this fact explain why the same outlet is much more
dangerous if you have wet feet than if you have dry feet.16. Why do warnings on power relay stations say ‘Warning, High Voltage’ when it is the current that is dangerous?
Contributions and AttributionsThis page is licensed under a CC BY-NC-SA 3.0 license and was authored, remixed, and/or curated by Kyle Forinash andWolfgang Christian. Source content is found at https://www.compadre.org/books/SoundBook. Page content has been edited andupdated to conform to the style and standards of the LibreTexts platform. A detailed versioning history of the edits to source contentis available upon request.
120 V
Kyle Forinash and Wolfgang Christian 16.2.1 3/24/2022 https://phys.libretexts.org/@go/page/25963
16.2: EandM- Currents and Magnetic FieldsIn this section we study the magnetic field of either a permanent magnet or the field produced by a flow of current in a coil. Field ismeasured in Gauss. The compass, magnet and coil are all draggable. The earth's magnetic field can also be demonstrated.
Contributions and AttributionsThis page is licensed under a CC BY-NC-SA 3.0 license and was authored, remixed, and/or curated by Kyle Forinash andWolfgang Christian. Source content is found at https://www.compadre.org/books/SoundBook. Page content has been edited andupdated to conform to the style and standards of the LibreTexts platform. A detailed versioning history of the edits to source contentis available upon request.
Kyle Forinash and Wolfgang Christian 16.2.1.1 3/24/2022 https://phys.libretexts.org/@go/page/26299
16.2.1: Currents Cause Magnetic FieldsOut of the some elements known in the world, three are special. Cobalt, nickel and iron have a special arrangement of electronsthat causes them to have a magnetic field. All permanent magnets are composed of one or a combination of these metals. Magneticfields are measured in either tesla, , or gauss, where .
The magnetic field of individual cobalt, nickel or iron will tend to line up with each other over limited regions called domains. As aresult of this alignment the magnetic field due to all the atoms in a particular domain points in one direction. If the domains line upwith each other in a piece of metal you have a magnet; if the domains do not line up the magnetic field cancels and the piece ofmetal is not a magnet, although the individual atoms still cause each domain to have a magnetic field. One way to destroy themagnetic field of a magnet is to drop it or heat it so that the domains reorient in such a way that the total field is zero.
Technology would be very limited if the only way to get a magnetic field was from one of the three special metals. Fortunately wecan arrange a current flow of electrons in a special way so that we can mimic the magnetic field found naturally in these threeelements. All currents create magnetic fields but when the arrangement of the current is specifically for the purpose of making amagnetic field we call it an electromagnet. Electromagnets can create exactly the same magnetic fields found in permanentmagnets but have the added advantage that they can be turned off or reversed by turning off or reversing the current flow throughthem.
Contributions and AttributionsThis page is licensed under a CC BY-NC-SA 3.0 license and was authored, remixed, and/or curated by Kyle Forinash andWolfgang Christian. Source content is found at https://www.compadre.org/books/SoundBook. Page content has been edited andupdated to conform to the style and standards of the LibreTexts platform. A detailed versioning history of the edits to source contentis available upon request.
117
T = Vs/m2 1 G = T10−4
Kyle Forinash and Wolfgang Christian 16.2.2.1 3/24/2022 https://phys.libretexts.org/@go/page/26300
16.2.2: Magnetic Field SimulationIn this simulation you examine the magnetic field of either a permanent magnet or the field produced by a flow of current in a coil.Field is measured in gauss. The compass, magnet and coil are all draggable. The earth's magnetic field can also be demonstrated.
Simulation Questions:1. First leave the magnet stationary and move the compass around by dragging it at its center. Which end of the compass points
towards the north pole of the magnet? What happens at the south pole of the magnet?2. Describe the magnetic field around the magnet. What happens to the field strength as you get further away? What happens near
the middle of the magnet?3. Reset the simulation. Now leave the compass stationary and move the magnet around. Describe the behavior of the compass
needle. Is your description of the magnetic field different from the case of moving the compass? Explain.4. Click the 'Earth' radio button. What do you notice about the magnetic field of the earth? Is the geographic north different from
the magnetic north? Explain.5. Reset the simulation and click the 'coil' radio button. Leave the coil stationary and move the compass around. How does the
magnetic field of the coil compare to the magnetic field of the bar?6. Now try different currents in the coil using the slider. What happens when the current is zero? Explain what happens when the
current is negative (which means it flows in the opposite direction).
Contributions and Attributions
This page is licensed under a CC BY-NC-SA 3.0 license and was authored, remixed, and/or curated by Kyle Forinash andWolfgang Christian. Source content is found at https://www.compadre.org/books/SoundBook. Page content has been edited andupdated to conform to the style and standards of the LibreTexts platform. A detailed versioning history of the edits to source contentis available upon request.
Kyle Forinash and Wolfgang Christian 16.3.1 3/24/2022 https://phys.libretexts.org/@go/page/25964
16.3: EandM- Electric and Magnetic ForcesIn this section we study electric and magnetic fields with different orientations to see their effects on neutral, positive and negativecharges. For the electric field case the particles have zero initial velocity. In second case with a magnetic field in the -direction theinitial velocity is zero but there is a check-box so that you can give the particles an initial velocity in the direction. In the thirdcase the magnetic field is rotated so that it points into the screen.
Contributions and AttributionsThis page is licensed under a CC BY-NC-SA 3.0 license and was authored, remixed, and/or curated by Kyle Forinash andWolfgang Christian. Source content is found at https://www.compadre.org/books/SoundBook. Page content has been edited andupdated to conform to the style and standards of the LibreTexts platform. A detailed versioning history of the edits to source contentis available upon request.
x
+x
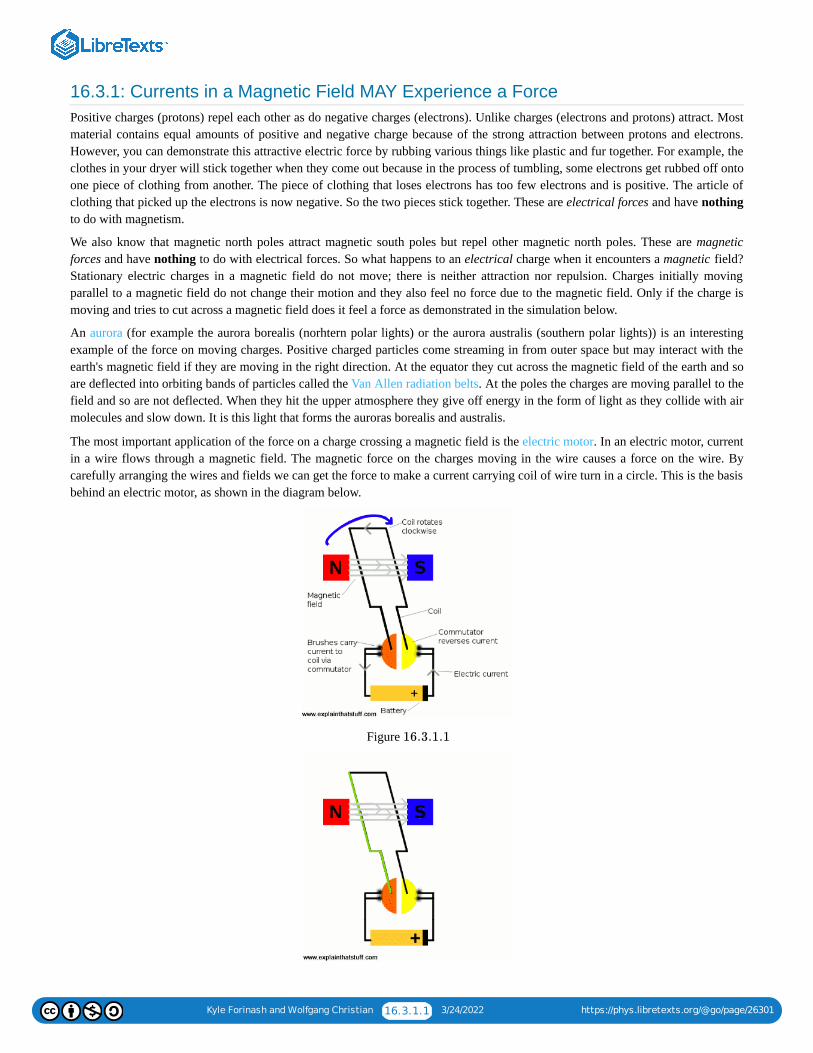
Kyle Forinash and Wolfgang Christian 16.3.1.1 3/24/2022 https://phys.libretexts.org/@go/page/26301
16.3.1: Currents in a Magnetic Field MAY Experience a ForcePositive charges (protons) repel each other as do negative charges (electrons). Unlike charges (electrons and protons) attract. Mostmaterial contains equal amounts of positive and negative charge because of the strong attraction between protons and electrons.However, you can demonstrate this attractive electric force by rubbing various things like plastic and fur together. For example, theclothes in your dryer will stick together when they come out because in the process of tumbling, some electrons get rubbed off ontoone piece of clothing from another. The piece of clothing that loses electrons has too few electrons and is positive. The article ofclothing that picked up the electrons is now negative. So the two pieces stick together. These are electrical forces and have nothingto do with magnetism.
We also know that magnetic north poles attract magnetic south poles but repel other magnetic north poles. These are magneticforces and have nothing to do with electrical forces. So what happens to an electrical charge when it encounters a magnetic field?Stationary electric charges in a magnetic field do not move; there is neither attraction nor repulsion. Charges initially movingparallel to a magnetic field do not change their motion and they also feel no force due to the magnetic field. Only if the charge ismoving and tries to cut across a magnetic field does it feel a force as demonstrated in the simulation below.
An aurora (for example the aurora borealis (norhtern polar lights) or the aurora australis (southern polar lights)) is an interestingexample of the force on moving charges. Positive charged particles come streaming in from outer space but may interact with theearth's magnetic field if they are moving in the right direction. At the equator they cut across the magnetic field of the earth and soare deflected into orbiting bands of particles called the Van Allen radiation belts. At the poles the charges are moving parallel to thefield and so are not deflected. When they hit the upper atmosphere they give off energy in the form of light as they collide with airmolecules and slow down. It is this light that forms the auroras borealis and australis.
The most important application of the force on a charge crossing a magnetic field is the electric motor. In an electric motor, currentin a wire flows through a magnetic field. The magnetic force on the charges moving in the wire causes a force on the wire. Bycarefully arranging the wires and fields we can get the force to make a current carrying coil of wire turn in a circle. This is the basisbehind an electric motor, as shown in the diagram below.
Figure 16.3.1.1

Kyle Forinash and Wolfgang Christian 16.3.1.2 3/24/2022 https://phys.libretexts.org/@go/page/26301
Figure
In the picture on the left, above, current flows from the battery at the bottom up the right side of the coil (black wire; real motorshave hundreds of turns but the drawing only shows one for clarity). As the current passes the south end of the magnet (blue) it feelsa downward force. The current continues across the top of the coil and comes downward past the north end of the magnet (red)where it feels an upward force. The current then returns to the battery. The upward force on the left half of the coil and thedownward force on the right half of the coil cause the coil to rotate . What keeps it going on around? Once the left sidehas flipped around to the right (and the right side to the left) notice that the current will still be going up on the right and down onthe left. The commutator has reversed the current flow. So the coil continues to rotate in the same direction (blue arrow). See if youcan follow the sequence in the animation on the right.
Contributions and Attributions
This page is licensed under a CC BY-NC-SA 3.0 license and was authored, remixed, and/or curated by Kyle Forinash andWolfgang Christian. Source content is found at https://www.compadre.org/books/SoundBook. Page content has been edited andupdated to conform to the style and standards of the LibreTexts platform. A detailed versioning history of the edits to source contentis available upon request.
16.3.1.2
180 degrees
Kyle Forinash and Wolfgang Christian 16.3.2.1 3/24/2022 https://phys.libretexts.org/@go/page/26302
16.3.2: Electric and Magnetic Forces SimulationIn this simulation you can select an electric field and two different orientations of a magnetic field to see their effects on neutral,positive and negative charges. For the electric field case the particles have zero initial velocity. In second case with a magnetic fieldin the -direction the initial velocity is zero but there is a check-box so that you can give the particles an initial velocity in the direction. In the third case the magnetic field is rotated so that it points into the screen (which is now the direction) and theparticles have an initial velocity in the direction. For this case a black arrow shows the direction of the force on the particle.Light grey arrows show the velocity of the particle.
Simulation Questions:1. With the electric field case selected, run the simulation for each of the three particles (neutral, positive and negative) and
describe what happens (reset the simulation between each choice). Do the charges have a constant velocity or are theyaccelerating? Hint: The length of the gray arrow is proportional to the speed of the particle.
2. Reset the simulation and choose the second case with a magnetic field in the -direction and the particles with a zero initialvelocity. What happens to the particles? Can the magnetic field cause them to accelerate if they are initially stationary?
3. For the magnetic field in the -direction, use the check-box to give the particle an initial -velocity. Try the other charges,resetting the simulation each time. Describe the motion of the particles. Do they accelerate in this case? (Again; the length ofthe gray arrow is proportional to the speed.)
4. Reset the simulation and choose the magnetic field pointing into the screen (the third case at the top). Each of the particles startwith the same initial -velocity, indicated by the grey arrow. Describe what happens in each case.
Questions on Magnetic Fields:1. Electric fields come from charges. Where do magnetic fields come from (your answer should include more than just saying
“magnets”)?2. In what sense can we say that the ultimate source of all magnetic fields (even permanent magnets) is moving charge?3. What is an electromagnet?4. Suppose you float a magnet in a bowl by attaching it to a piece of Styrofoam. Will it drift towards the north side of the bowl due
to the attraction of the north pole of the magnet? Why or why not?5. Opposite magnetic poles attract each other. So why does the north end of a compass point north?6. If a compass needle could point in any direction (north, south, up, down, etc.) which way would it point if it were located at the
earth’s geographical north pole?7. Does a compass still point north if it is in the southern hemisphere, or does it reverse?8. Do electrical charges always feel a force due to a magnetic field? Explain.9. If a charged particle moves in a straight line through a region of space at constant speed, can you say that the magnetic field in
that region is zero? Explain.10. What is the origin of the Aurora Borealis (the Northern Lights)? Why are the not usually seen near the equator?11. Residents of Alaska get hit by more cosmic rays (charged particles from space) than residents of Panama. Why is that?12. Explain how an electric motor works.
Contributions and Attributions
This page is licensed under a CC BY-NC-SA 3.0 license and was authored, remixed, and/or curated by Kyle Forinash andWolfgang Christian. Source content is found at https://www.compadre.org/books/SoundBook. Page content has been edited andupdated to conform to the style and standards of the LibreTexts platform. A detailed versioning history of the edits to source contentis available upon request.
x +x
x
+z
x
x x
x
Kyle Forinash and Wolfgang Christian 16.4.1 3/24/2022 https://phys.libretexts.org/@go/page/25965
16.4: EandM- Faraday's LawIf a changing magnetic field is present near a wire that is part of a circuit it will cause current to flow in the circuit. This is knownas Faraday's law and is the basis for a lot of modern technology. Electric generators, metal detectors, the read head on a computerhard drive, credit card readers, cassette tape readers. We will see several applications for sound reproduction.
Contributions and AttributionsThis page is licensed under a CC BY-NC-SA 3.0 license and was authored, remixed, and/or curated by Kyle Forinash andWolfgang Christian. Source content is found at https://www.compadre.org/books/SoundBook. Page content has been edited andupdated to conform to the style and standards of the LibreTexts platform. A detailed versioning history of the edits to source contentis available upon request.
Kyle Forinash and Wolfgang Christian 16.4.1.1 3/24/2022 https://phys.libretexts.org/@go/page/26303
16.4.1: A CHANGING Magnetic Field Can Cause Current to FlowIf a changing magnetic field is present near a wire that is part of a circuit it will cause current to flow in the circuit. This is knownas Faraday's law and is the basis for a lot of modern technology. Electric generators, traffic detectors embedded in the road, metaldetectors, the read head on a computer hard drive, credit card readers, cassette tape readers, and transformers (both the ones on theutility pole outside your house and the little boxes that plug into the wall to run electronic gear) all use Faraday's law to operate. Wewill see several applications for sound reproduction in the next chapter.
One important application of Faraday's law is an electrical transformer. A transformer consists of a piece of iron with two separatecoils wrapped around it. One coil is called the primary, the other coil is called the secondary. If there is an alternating current (AC)in the primary there will also be a changing magnetic field. This changing field will induce a current in the secondary due toFaraday's law. Although the wires of the primary are not physically connected to the wires of the secondary, a current flows in thesecondary if an alternating current flows in the primary.
Why have a transformer? Why not just connect the secondary to the primary directly? The voltage and current can be adjustedbetween the primary and secondary by changing the number of loops in each. If the primary has loops and the secondary loops the voltage in the secondary will be of the voltage in the primary but the current in the secondary will be times thatof the primary. The voltage ratio between primary and secondary is proportional to the ratio in the number of turns of wire in each.This makes it easy to step up voltage (while stepping down current) or step down voltage (while stepping up current).
Why change voltage with a transformer? Electricity is delivered to your neighborhood at high voltage low current. Low currentmeans less loss to resistance between the power plant and your neighborhood. Another transformer near your house steps thevoltage down and the current up so that more of current is delivered to your home. You want more current but less voltage so thatmore energy is available for your electrical appliances.
Contributions and AttributionsThis page is licensed under a CC BY-NC-SA 3.0 license and was authored, remixed, and/or curated by Kyle Forinash andWolfgang Christian. Source content is found at https://www.compadre.org/books/SoundBook. Page content has been edited andupdated to conform to the style and standards of the LibreTexts platform. A detailed versioning history of the edits to source contentis available upon request.
100 10
1/10 10
Kyle Forinash and Wolfgang Christian 16.4.2.1 3/24/2022 https://phys.libretexts.org/@go/page/26304
16.4.2: Faraday's Law SimulationIn this simulation you can experiment with Faraday's law. One important application is also shown; a moving coil microphone.Magnetic flux is defined to be the amount of magnetic field passing through a given area and has units of webers where
. The technical definition of Faraday's law says that a changing magnetic flux ( ) causes an electromotive force(emf in volts). If there is a circuit, that emf will cause current to flow, just like a battery. A second law, Lenz's law, says that thecurrent flow will be in a direction opposite to the change that induced the current flow. The current direction is shown two differentways; one is by the arrow in the meter which is attached to the coil. The other is an arrow which appears below the coil when thecurrent flows.
Simulation Questions:1. Run the simulation and slowly drag the magnet back and forth through the coil. What happens to the emf (shown in the graph
and in the box below) when the north pole of the magnet moves into the coil? Which way does the needle on the meter point?2. What happens to the emf when the north end of the magnet moves away (to the right) from the coil? Which way does the needle
point in this case?3. What happens to the emf if the magnet is not moving?4. When the magnet is close to the coil but not moving, the emf is zero. What about the flux ( )? This is the essence of Faraday's
law, the flux has to change for an emf to occur.5. Choosing the reverse button allows you to drag the coil instead of the magnet. Run the simulation after clicking the reverse
button. Does it make a difference in the graphs if you move the magnet or the coil? Explain.6. Now choose the coil button and run the simulation. As we saw earlier in this chapter, a coil with current flowing in it will have a
magnetic field. Is there a difference in the emf graph if you drag a current-carrying coil through the stationary coil instead of amagnet? Explain.
7. Now choose the microphone button and run the simulation. This is a simulation of a moving coil microphone. In this type ofmicrophone a small coil is attached to a flexible diaphragm. When sound waves hit the diaphragm it causes the coil to vibratenear a stationary magnet. The changing flux in the coil causes a current to flow due to Faraday's law. It is this current that isamplified and sent to loudspeakers or recorded on tape or digital recording (see the next chapter). You can change the soundwave frequency. How does this affect the frequency of the emf shown in the graph?
SummaryOhm's law says voltage acts as a kind of potential energy that will cause charge to flow if there is a path (a circuit). The number ofcharges in a circuit remain fixed but they carry electrical energy which is turned into other useful forms of energy (light, heat,sound, etc.) by components in the circuit (light bulb, toaster, stereo). Currents cause magnetic fields. If a current finds itself in amagnetic field caused by some other source (magnet or other current) it will feel a force unless it moves parallel to the magneticfield. This is the basis of an electric motor. Faraday's law says a changing magnetic field through an area (or equivalently, achanging area with constant field) will cause a voltage. This is the mechanism behind electric generators, credit cards, metaldetectors, computer hard drives, etc.
Questions on Faraday's Law:1. Why is a generator coil harder to turn when it is generating electricity than when it does not?2. A magnet falling through a narrow copper tube will slow down, even though copper is not magnetic (your instructor may have
demonstrated this in class). Explain why this happens.3. Does your car burn more gas when you run the head lights than if the lights are off?4. When you swipe a credit card the reader gets information from a strip on the back of the card. Explain how that works.5. Most traffic lights are connected by a small computer chip to a wire embedded in the road which detects the presence of a car.
How does this work?6. The metal detectors at airport security can detect non-magnetic metals such as aluminum. Explain how that works.7. Information is contained on your computer hard drive as a series of small magnetic fields (hard drives have iron particles
embedded in them so that different regions can be magnetized). The read head consists of a small coil of wire that is locatedvery close to the disk and can be moved around to reach different parts of the disk. Explain how the read head detects theinformation. Would this work if the disk were not spinning?
8. Explain how a generator works.
1 Wb = 1 Tm2 ϕ
ϕ
Kyle Forinash and Wolfgang Christian 16.4.2.2 3/24/2022 https://phys.libretexts.org/@go/page/26304
9. What is the difference between an electric motor and an electric generator?10. Why don't transformers work with direct current (DC)?11. Why is power transmitted at high voltages (and low current) over long distances?12. What is Faraday's law?13. A transformer with turns in the primary and turns in the secondary will convert an AC voltage of to . Explain
why this doesn't contradict conservation of energy.14. A pickup for an electric guitar consists of a small metal coil of wire wrapped around a magnet. Due to Faraday’s law current is
induced in the coil if the magnetic field near the pickup changes. Will this type of pickup work with nylon or other, non-metalstrings? Explain.
15. Suppose a metal string is vibrating at in front of the pickup described in the previous question. What frequency will theinduced current in the coil have as a result of Faraday’s law?
Contributions and AttributionsThis page is licensed under a CC BY-NC-SA 3.0 license and was authored, remixed, and/or curated by Kyle Forinash andWolfgang Christian. Source content is found at https://www.compadre.org/books/SoundBook. Page content has been edited andupdated to conform to the style and standards of the LibreTexts platform. A detailed versioning history of the edits to source contentis available upon request.
10 100 5 V 50 V
100 Hz
Kyle Forinash and Wolfgang Christian 17.1 3/24/2022 https://phys.libretexts.org/@go/page/25975
17: ElectronicsThis chapter explains several electronic devices used in sound recording and reproduction. Concepts needed to explain the functionof these devices were introduced in the previous chapter.
There is no way to record, transmit and replay sounds perfectly so that they sound exactly as they were heard originally. Allrecording processes fail to capture the full range of audio frequencies present when the original sound was made. Microphoneshave limited ranges of sensitivity as do speakers and amplifying systems. These problems are referred to generally as distortion andare discussed below. The problems of sound reproduction are further complicated by the fact that all the devices involved inrecording, transmitting and reproducing sound add unwanted frequencies called noise. Pure noise can generally be defined as asound sample which contains some of all frequencies. The amount of each range of frequencies present determines the color of thenoise. Here are Wikipedia pages on different colors of noise: white noise, pink noise, Brownian noise, grey noise.
Key TermsNoise, speakers (magnetic, electrostatic, tweeter, bass), microphones (dynamic; 3 types: electrostatic, piezoelectric, carbon), vinyl,magnetic tape, analog, analog to digital, digital to analog, binary number system, sample rate, bit rate, digital recording (divots,CD, DVD, Blu-ray), audio compression, lossless, lossy, MPEG3, AM, FM, digital, distortion (amplitude, harmonic, frequency,phase), MIDI.
17.1: Electronics
Contributions and AttributionsThis page is licensed under a CC BY-NC-SA 3.0 license and was authored, remixed, and/or curated by Kyle Forinash andWolfgang Christian. Source content is found at https://www.compadre.org/books/SoundBook. Page content has been edited andupdated to conform to the style and standards of the LibreTexts platform. A detailed versioning history of the edits to source contentis available upon request.
17.1.1: Microphones
17.1.2: Recording
17.1.3: Amplification
17.1.4: Speakers
17.1.5: Transmission

Kyle Forinash and Wolfgang Christian 17.1.1 3/24/2022 https://phys.libretexts.org/@go/page/25969
17.1: ElectronicsIt is not possible to record, transmit and replay sounds perfectly so that they sound exactly as they were heard originally. Thischapter explains several electronic devices used in sound recording and reproduction using concepts that were introduced inprevious chapters.
Contributions and AttributionsThis page is licensed under a CC BY-NC-SA 3.0 license and was authored, remixed, and/or curated by Kyle Forinash andWolfgang Christian. Source content is found at https://www.compadre.org/books/SoundBook. Page content has been edited andupdated to conform to the style and standards of the LibreTexts platform. A detailed versioning history of the edits to source contentis available upon request.
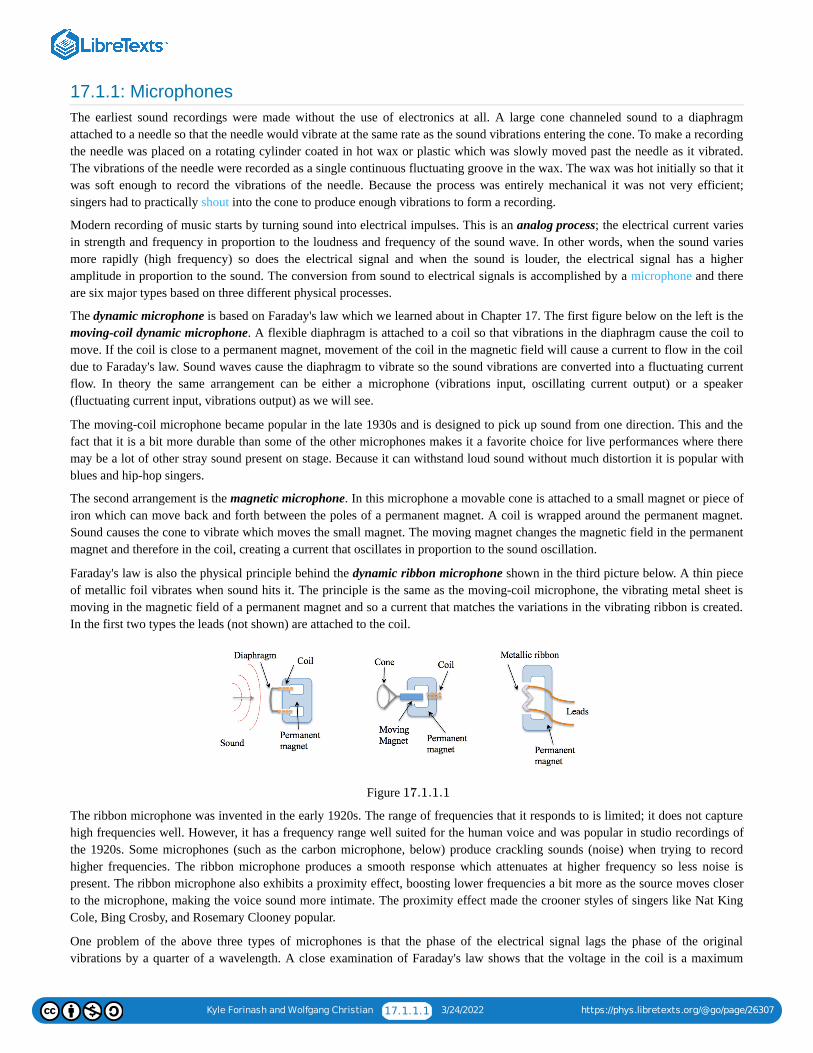
Kyle Forinash and Wolfgang Christian 17.1.1.1 3/24/2022 https://phys.libretexts.org/@go/page/26307
17.1.1: MicrophonesThe earliest sound recordings were made without the use of electronics at all. A large cone channeled sound to a diaphragmattached to a needle so that the needle would vibrate at the same rate as the sound vibrations entering the cone. To make a recordingthe needle was placed on a rotating cylinder coated in hot wax or plastic which was slowly moved past the needle as it vibrated.The vibrations of the needle were recorded as a single continuous fluctuating groove in the wax. The wax was hot initially so that itwas soft enough to record the vibrations of the needle. Because the process was entirely mechanical it was not very efficient;singers had to practically shout into the cone to produce enough vibrations to form a recording.
Modern recording of music starts by turning sound into electrical impulses. This is an analog process; the electrical current variesin strength and frequency in proportion to the loudness and frequency of the sound wave. In other words, when the sound variesmore rapidly (high frequency) so does the electrical signal and when the sound is louder, the electrical signal has a higheramplitude in proportion to the sound. The conversion from sound to electrical signals is accomplished by a microphone and thereare six major types based on three different physical processes.
The dynamic microphone is based on Faraday's law which we learned about in Chapter 17. The first figure below on the left is themoving-coil dynamic microphone. A flexible diaphragm is attached to a coil so that vibrations in the diaphragm cause the coil tomove. If the coil is close to a permanent magnet, movement of the coil in the magnetic field will cause a current to flow in the coildue to Faraday's law. Sound waves cause the diaphragm to vibrate so the sound vibrations are converted into a fluctuating currentflow. In theory the same arrangement can be either a microphone (vibrations input, oscillating current output) or a speaker(fluctuating current input, vibrations output) as we will see.
The moving-coil microphone became popular in the late 1930s and is designed to pick up sound from one direction. This and thefact that it is a bit more durable than some of the other microphones makes it a favorite choice for live performances where theremay be a lot of other stray sound present on stage. Because it can withstand loud sound without much distortion it is popular withblues and hip-hop singers.
The second arrangement is the magnetic microphone. In this microphone a movable cone is attached to a small magnet or piece ofiron which can move back and forth between the poles of a permanent magnet. A coil is wrapped around the permanent magnet.Sound causes the cone to vibrate which moves the small magnet. The moving magnet changes the magnetic field in the permanentmagnet and therefore in the coil, creating a current that oscillates in proportion to the sound oscillation.
Faraday's law is also the physical principle behind the dynamic ribbon microphone shown in the third picture below. A thin pieceof metallic foil vibrates when sound hits it. The principle is the same as the moving-coil microphone, the vibrating metal sheet ismoving in the magnetic field of a permanent magnet and so a current that matches the variations in the vibrating ribbon is created.In the first two types the leads (not shown) are attached to the coil.
Figure
The ribbon microphone was invented in the early 1920s. The range of frequencies that it responds to is limited; it does not capturehigh frequencies well. However, it has a frequency range well suited for the human voice and was popular in studio recordings ofthe 1920s. Some microphones (such as the carbon microphone, below) produce crackling sounds (noise) when trying to recordhigher frequencies. The ribbon microphone produces a smooth response which attenuates at higher frequency so less noise ispresent. The ribbon microphone also exhibits a proximity effect, boosting lower frequencies a bit more as the source moves closerto the microphone, making the voice sound more intimate. The proximity effect made the crooner styles of singers like Nat KingCole, Bing Crosby, and Rosemary Clooney popular.
One problem of the above three types of microphones is that the phase of the electrical signal lags the phase of the originalvibrations by a quarter of a wavelength. A close examination of Faraday's law shows that the voltage in the coil is a maximum
17.1.1.1
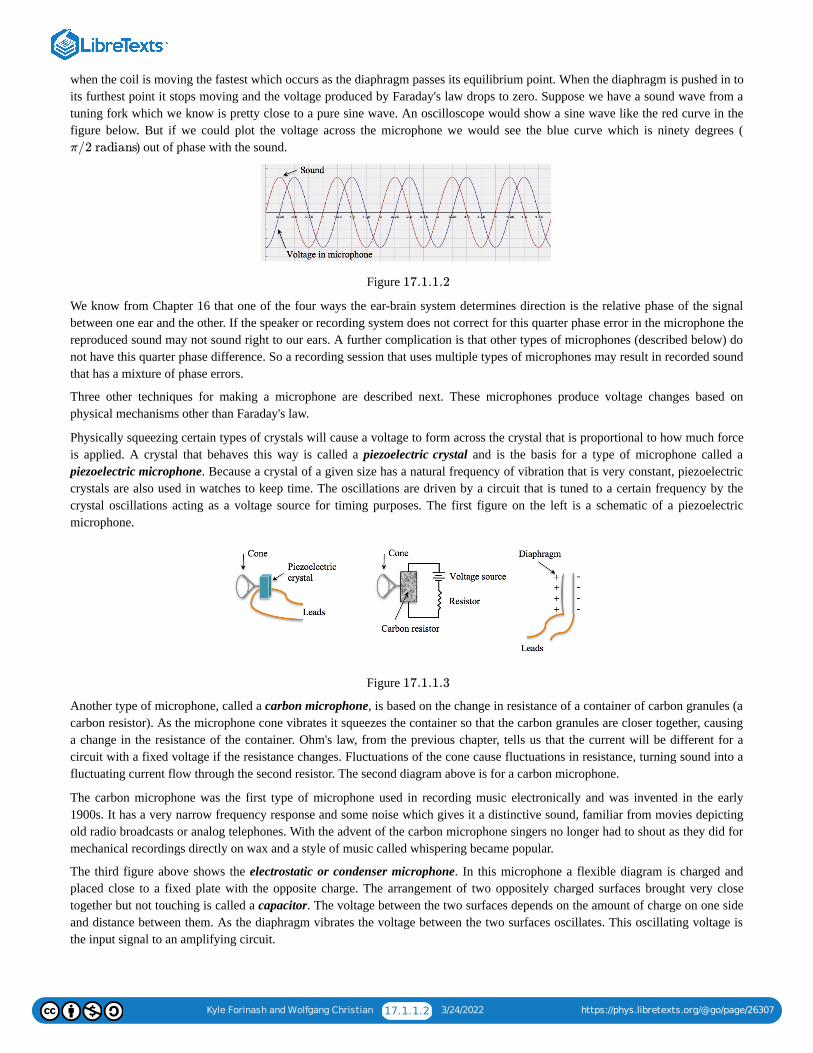
Kyle Forinash and Wolfgang Christian 17.1.1.2 3/24/2022 https://phys.libretexts.org/@go/page/26307
when the coil is moving the fastest which occurs as the diaphragm passes its equilibrium point. When the diaphragm is pushed in toits furthest point it stops moving and the voltage produced by Faraday's law drops to zero. Suppose we have a sound wave from atuning fork which we know is pretty close to a pure sine wave. An oscilloscope would show a sine wave like the red curve in thefigure below. But if we could plot the voltage across the microphone we would see the blue curve which is ninety degrees (
) out of phase with the sound.
Figure
We know from Chapter 16 that one of the four ways the ear-brain system determines direction is the relative phase of the signalbetween one ear and the other. If the speaker or recording system does not correct for this quarter phase error in the microphone thereproduced sound may not sound right to our ears. A further complication is that other types of microphones (described below) donot have this quarter phase difference. So a recording session that uses multiple types of microphones may result in recorded soundthat has a mixture of phase errors.
Three other techniques for making a microphone are described next. These microphones produce voltage changes based onphysical mechanisms other than Faraday's law.
Physically squeezing certain types of crystals will cause a voltage to form across the crystal that is proportional to how much forceis applied. A crystal that behaves this way is called a piezoelectric crystal and is the basis for a type of microphone called apiezoelectric microphone. Because a crystal of a given size has a natural frequency of vibration that is very constant, piezoelectriccrystals are also used in watches to keep time. The oscillations are driven by a circuit that is tuned to a certain frequency by thecrystal oscillations acting as a voltage source for timing purposes. The first figure on the left is a schematic of a piezoelectricmicrophone.
Figure
Another type of microphone, called a carbon microphone, is based on the change in resistance of a container of carbon granules (acarbon resistor). As the microphone cone vibrates it squeezes the container so that the carbon granules are closer together, causinga change in the resistance of the container. Ohm's law, from the previous chapter, tells us that the current will be different for acircuit with a fixed voltage if the resistance changes. Fluctuations of the cone cause fluctuations in resistance, turning sound into afluctuating current flow through the second resistor. The second diagram above is for a carbon microphone.
The carbon microphone was the first type of microphone used in recording music electronically and was invented in the early1900s. It has a very narrow frequency response and some noise which gives it a distinctive sound, familiar from movies depictingold radio broadcasts or analog telephones. With the advent of the carbon microphone singers no longer had to shout as they did formechanical recordings directly on wax and a style of music called whispering became popular.
The third figure above shows the electrostatic or condenser microphone. In this microphone a flexible diagram is charged andplaced close to a fixed plate with the opposite charge. The arrangement of two oppositely charged surfaces brought very closetogether but not touching is called a capacitor. The voltage between the two surfaces depends on the amount of charge on one sideand distance between them. As the diaphragm vibrates the voltage between the two surfaces oscillates. This oscillating voltage isthe input signal to an amplifying circuit.
π/2 radians
17.1.1.2
17.1.1.3
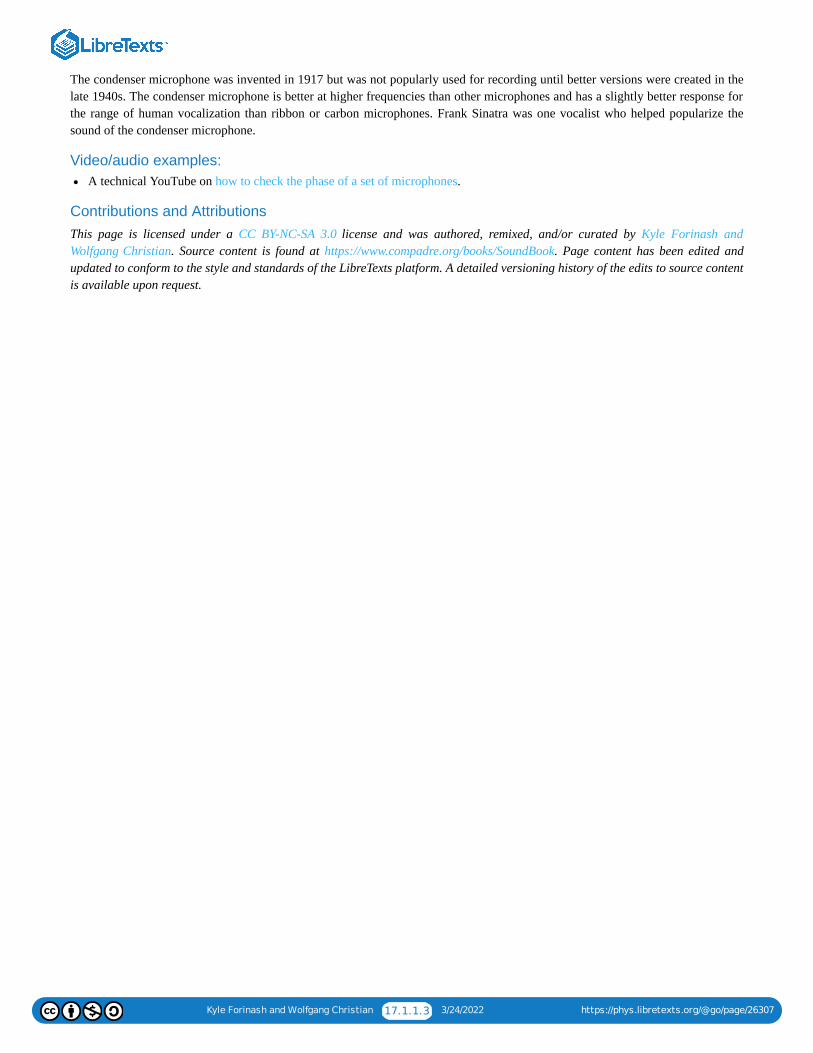
Kyle Forinash and Wolfgang Christian 17.1.1.3 3/24/2022 https://phys.libretexts.org/@go/page/26307
The condenser microphone was invented in 1917 but was not popularly used for recording until better versions were created in thelate 1940s. The condenser microphone is better at higher frequencies than other microphones and has a slightly better response forthe range of human vocalization than ribbon or carbon microphones. Frank Sinatra was one vocalist who helped popularize thesound of the condenser microphone.
Video/audio examples:A technical YouTube on how to check the phase of a set of microphones.
Contributions and AttributionsThis page is licensed under a CC BY-NC-SA 3.0 license and was authored, remixed, and/or curated by Kyle Forinash andWolfgang Christian. Source content is found at https://www.compadre.org/books/SoundBook. Page content has been edited andupdated to conform to the style and standards of the LibreTexts platform. A detailed versioning history of the edits to source contentis available upon request.
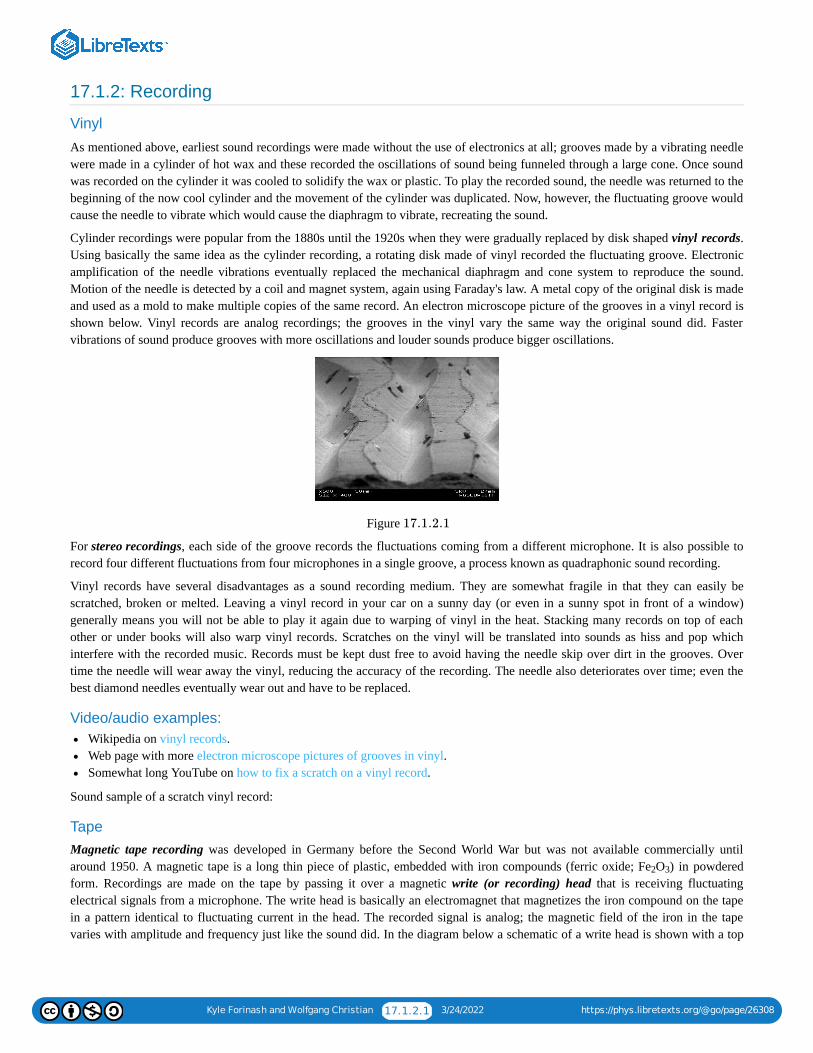
Kyle Forinash and Wolfgang Christian 17.1.2.1 3/24/2022 https://phys.libretexts.org/@go/page/26308
17.1.2: Recording
Vinyl
As mentioned above, earliest sound recordings were made without the use of electronics at all; grooves made by a vibrating needlewere made in a cylinder of hot wax and these recorded the oscillations of sound being funneled through a large cone. Once soundwas recorded on the cylinder it was cooled to solidify the wax or plastic. To play the recorded sound, the needle was returned to thebeginning of the now cool cylinder and the movement of the cylinder was duplicated. Now, however, the fluctuating groove wouldcause the needle to vibrate which would cause the diaphragm to vibrate, recreating the sound.
Cylinder recordings were popular from the 1880s until the 1920s when they were gradually replaced by disk shaped vinyl records.Using basically the same idea as the cylinder recording, a rotating disk made of vinyl recorded the fluctuating groove. Electronicamplification of the needle vibrations eventually replaced the mechanical diaphragm and cone system to reproduce the sound.Motion of the needle is detected by a coil and magnet system, again using Faraday's law. A metal copy of the original disk is madeand used as a mold to make multiple copies of the same record. An electron microscope picture of the grooves in a vinyl record isshown below. Vinyl records are analog recordings; the grooves in the vinyl vary the same way the original sound did. Fastervibrations of sound produce grooves with more oscillations and louder sounds produce bigger oscillations.
Figure
For stereo recordings, each side of the groove records the fluctuations coming from a different microphone. It is also possible torecord four different fluctuations from four microphones in a single groove, a process known as quadraphonic sound recording.
Vinyl records have several disadvantages as a sound recording medium. They are somewhat fragile in that they can easily bescratched, broken or melted. Leaving a vinyl record in your car on a sunny day (or even in a sunny spot in front of a window)generally means you will not be able to play it again due to warping of vinyl in the heat. Stacking many records on top of eachother or under books will also warp vinyl records. Scratches on the vinyl will be translated into sounds as hiss and pop whichinterfere with the recorded music. Records must be kept dust free to avoid having the needle skip over dirt in the grooves. Overtime the needle will wear away the vinyl, reducing the accuracy of the recording. The needle also deteriorates over time; even thebest diamond needles eventually wear out and have to be replaced.
Video/audio examples:Wikipedia on vinyl records.Web page with more electron microscope pictures of grooves in vinyl.Somewhat long YouTube on how to fix a scratch on a vinyl record.
Sound sample of a scratch vinyl record:
TapeMagnetic tape recording was developed in Germany before the Second World War but was not available commercially untilaround 1950. A magnetic tape is a long thin piece of plastic, embedded with iron compounds (ferric oxide; Fe O ) in powderedform. Recordings are made on the tape by passing it over a magnetic write (or recording) head that is receiving fluctuatingelectrical signals from a microphone. The write head is basically an electromagnet that magnetizes the iron compound on the tapein a pattern identical to fluctuating current in the head. The recorded signal is analog; the magnetic field of the iron in the tapevaries with amplitude and frequency just like the sound did. In the diagram below a schematic of a write head is shown with a top
17.1.2.1
2 3
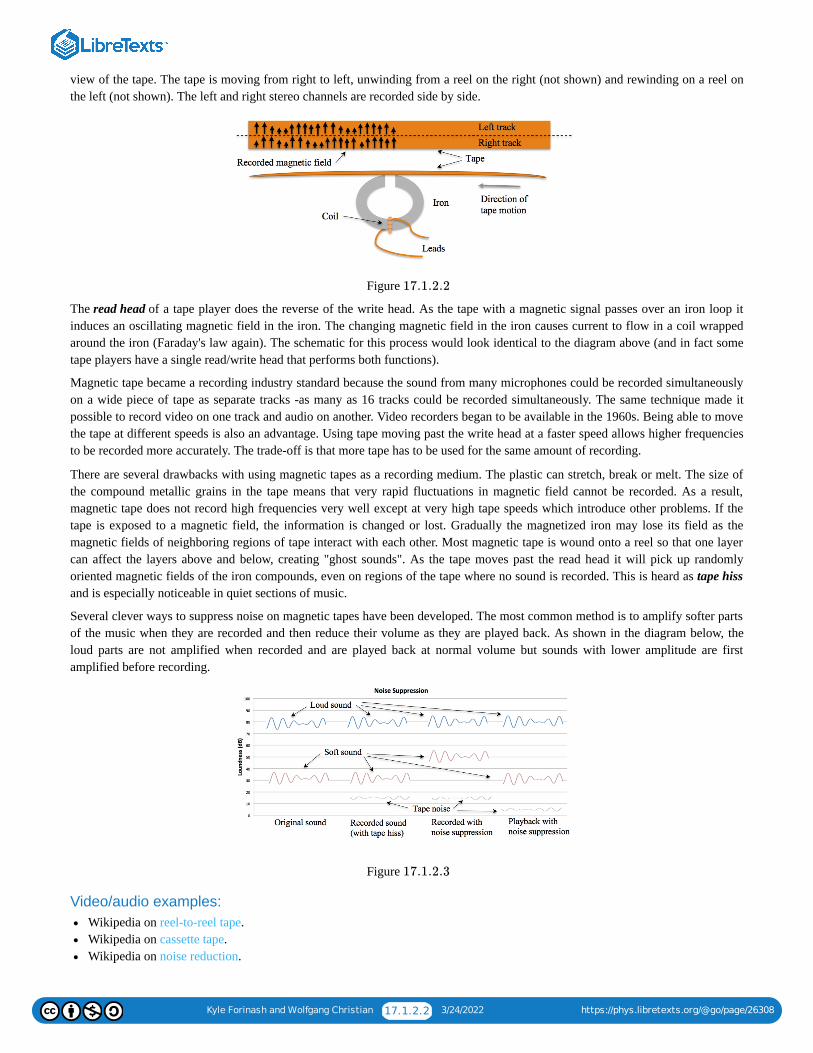
Kyle Forinash and Wolfgang Christian 17.1.2.2 3/24/2022 https://phys.libretexts.org/@go/page/26308
view of the tape. The tape is moving from right to left, unwinding from a reel on the right (not shown) and rewinding on a reel onthe left (not shown). The left and right stereo channels are recorded side by side.
Figure
The read head of a tape player does the reverse of the write head. As the tape with a magnetic signal passes over an iron loop itinduces an oscillating magnetic field in the iron. The changing magnetic field in the iron causes current to flow in a coil wrappedaround the iron (Faraday's law again). The schematic for this process would look identical to the diagram above (and in fact sometape players have a single read/write head that performs both functions).
Magnetic tape became a recording industry standard because the sound from many microphones could be recorded simultaneouslyon a wide piece of tape as separate tracks -as many as 16 tracks could be recorded simultaneously. The same technique made itpossible to record video on one track and audio on another. Video recorders began to be available in the 1960s. Being able to movethe tape at different speeds is also an advantage. Using tape moving past the write head at a faster speed allows higher frequenciesto be recorded more accurately. The trade-off is that more tape has to be used for the same amount of recording.
There are several drawbacks with using magnetic tapes as a recording medium. The plastic can stretch, break or melt. The size ofthe compound metallic grains in the tape means that very rapid fluctuations in magnetic field cannot be recorded. As a result,magnetic tape does not record high frequencies very well except at very high tape speeds which introduce other problems. If thetape is exposed to a magnetic field, the information is changed or lost. Gradually the magnetized iron may lose its field as themagnetic fields of neighboring regions of tape interact with each other. Most magnetic tape is wound onto a reel so that one layercan affect the layers above and below, creating "ghost sounds". As the tape moves past the read head it will pick up randomlyoriented magnetic fields of the iron compounds, even on regions of the tape where no sound is recorded. This is heard as tape hissand is especially noticeable in quiet sections of music.
Several clever ways to suppress noise on magnetic tapes have been developed. The most common method is to amplify softer partsof the music when they are recorded and then reduce their volume as they are played back. As shown in the diagram below, theloud parts are not amplified when recorded and are played back at normal volume but sounds with lower amplitude are firstamplified before recording.
Figure
Video/audio examples:Wikipedia on reel-to-reel tape.Wikipedia on cassette tape.Wikipedia on noise reduction.
17.1.2.2
17.1.2.3
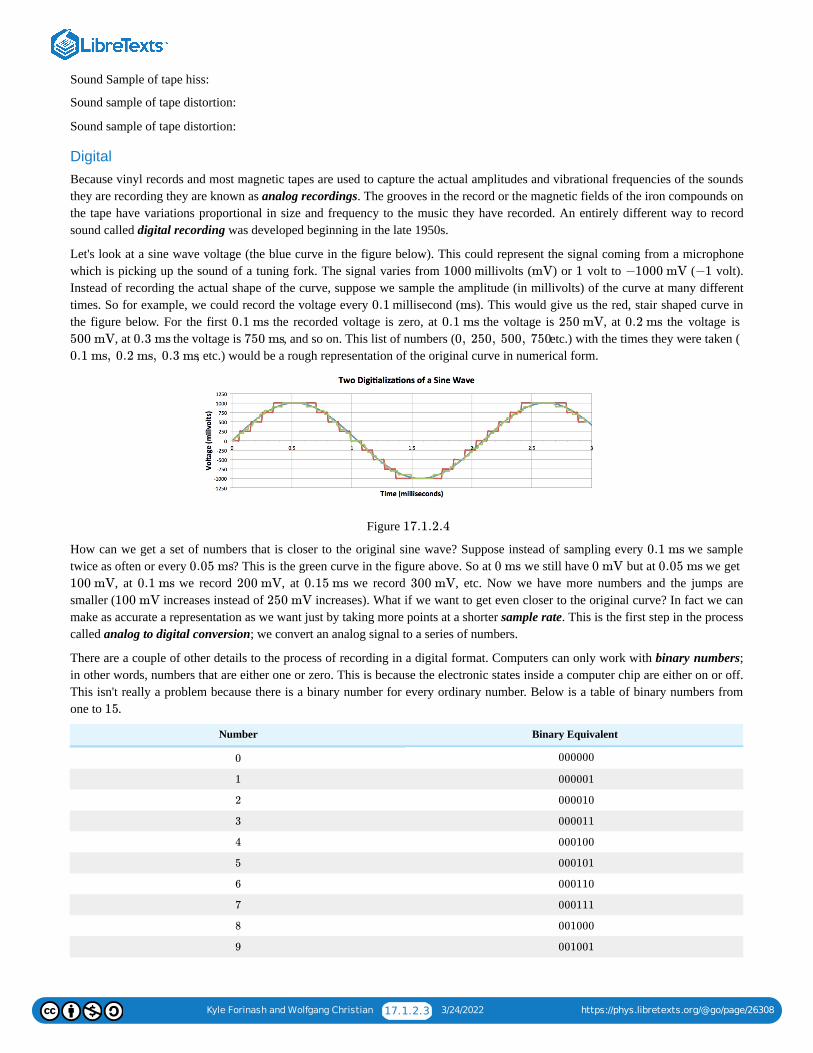
Kyle Forinash and Wolfgang Christian 17.1.2.3 3/24/2022 https://phys.libretexts.org/@go/page/26308
Sound Sample of tape hiss:
Sound sample of tape distortion:
Sound sample of tape distortion:
DigitalBecause vinyl records and most magnetic tapes are used to capture the actual amplitudes and vibrational frequencies of the soundsthey are recording they are known as analog recordings. The grooves in the record or the magnetic fields of the iron compounds onthe tape have variations proportional in size and frequency to the music they have recorded. An entirely different way to recordsound called digital recording was developed beginning in the late 1950s.
Let's look at a sine wave voltage (the blue curve in the figure below). This could represent the signal coming from a microphonewhich is picking up the sound of a tuning fork. The signal varies from millivolts ( ) or volt to ( volt).Instead of recording the actual shape of the curve, suppose we sample the amplitude (in millivolts) of the curve at many differenttimes. So for example, we could record the voltage every millisecond ( ). This would give us the red, stair shaped curve inthe figure below. For the first the recorded voltage is zero, at the voltage is , at the voltage is
, at the voltage is , and so on. This list of numbers ( etc.) with the times they were taken ( , etc.) would be a rough representation of the original curve in numerical form.
Figure
How can we get a set of numbers that is closer to the original sine wave? Suppose instead of sampling every we sampletwice as often or every ? This is the green curve in the figure above. So at we still have but at we get
, at we record , at we record , etc. Now we have more numbers and the jumps aresmaller ( increases instead of increases). What if we want to get even closer to the original curve? In fact we canmake as accurate a representation as we want just by taking more points at a shorter sample rate. This is the first step in the processcalled analog to digital conversion; we convert an analog signal to a series of numbers.
There are a couple of other details to the process of recording in a digital format. Computers can only work with binary numbers;in other words, numbers that are either one or zero. This is because the electronic states inside a computer chip are either on or off.This isn't really a problem because there is a binary number for every ordinary number. Below is a table of binary numbers fromone to .
Number Binary Equivalent
1000 mV 1 −1000 mV −1
0.1 ms
0.1 ms 0.1 ms 250 mV 0.2 ms
500 mV 0.3 ms 750 ms 0, 250, 500, 750
0.1 ms, 0.2 ms, 0.3 ms
17.1.2.4
0.1 ms
0.05 ms 0 ms 0 mV 0.05 ms
100 mV 0.1 ms 200 mV 0.15 ms 300 mV
100 mV 250 mV
15
0 000000
1 000001
2 000010
3 000011
4 000100
5 000101
6 000110
7 000111
8 001000
9 001001
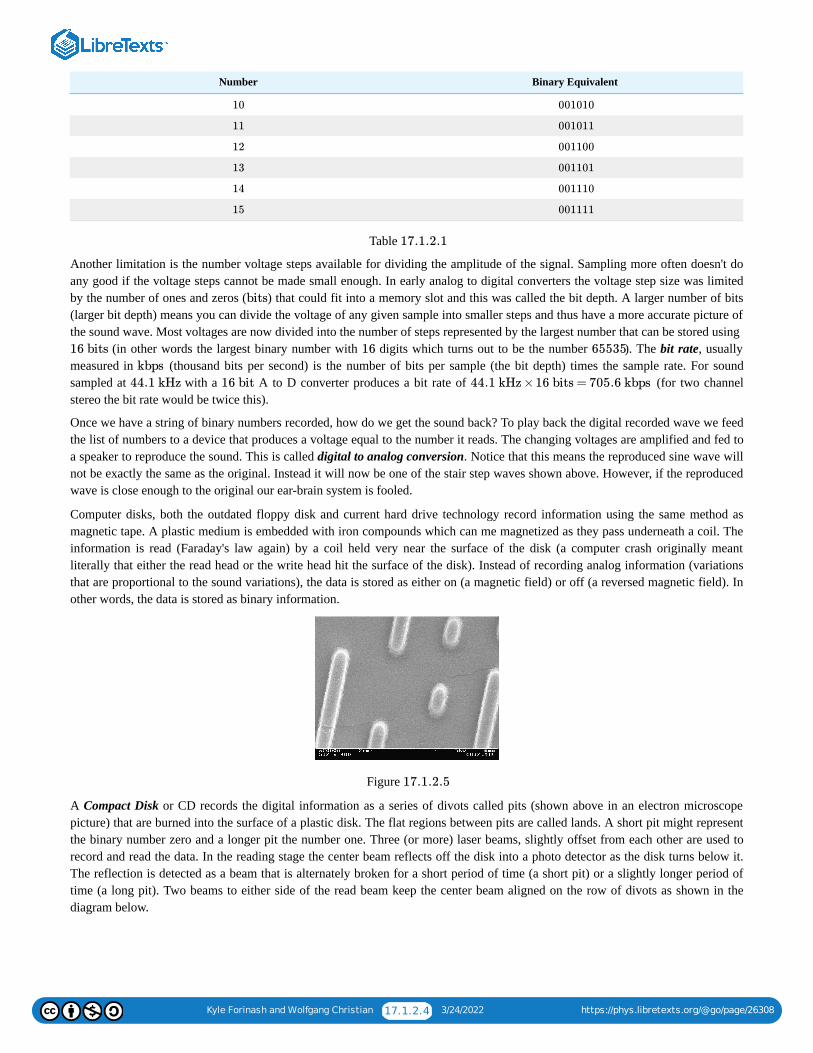
Kyle Forinash and Wolfgang Christian 17.1.2.4 3/24/2022 https://phys.libretexts.org/@go/page/26308
Number Binary Equivalent
Table
Another limitation is the number voltage steps available for dividing the amplitude of the signal. Sampling more often doesn't doany good if the voltage steps cannot be made small enough. In early analog to digital converters the voltage step size was limitedby the number of ones and zeros ( ) that could fit into a memory slot and this was called the bit depth. A larger number of bits(larger bit depth) means you can divide the voltage of any given sample into smaller steps and thus have a more accurate picture ofthe sound wave. Most voltages are now divided into the number of steps represented by the largest number that can be stored using
(in other words the largest binary number with digits which turns out to be the number ). The bit rate, usuallymeasured in (thousand bits per second) is the number of bits per sample (the bit depth) times the sample rate. For soundsampled at with a A to D converter produces a bit rate of (for two channelstereo the bit rate would be twice this).
Once we have a string of binary numbers recorded, how do we get the sound back? To play back the digital recorded wave we feedthe list of numbers to a device that produces a voltage equal to the number it reads. The changing voltages are amplified and fed toa speaker to reproduce the sound. This is called digital to analog conversion. Notice that this means the reproduced sine wave willnot be exactly the same as the original. Instead it will now be one of the stair step waves shown above. However, if the reproducedwave is close enough to the original our ear-brain system is fooled.
Computer disks, both the outdated floppy disk and current hard drive technology record information using the same method asmagnetic tape. A plastic medium is embedded with iron compounds which can me magnetized as they pass underneath a coil. Theinformation is read (Faraday's law again) by a coil held very near the surface of the disk (a computer crash originally meantliterally that either the read head or the write head hit the surface of the disk). Instead of recording analog information (variationsthat are proportional to the sound variations), the data is stored as either on (a magnetic field) or off (a reversed magnetic field). Inother words, the data is stored as binary information.
Figure
A Compact Disk or CD records the digital information as a series of divots called pits (shown above in an electron microscopepicture) that are burned into the surface of a plastic disk. The flat regions between pits are called lands. A short pit might representthe binary number zero and a longer pit the number one. Three (or more) laser beams, slightly offset from each other are used torecord and read the data. In the reading stage the center beam reflects off the disk into a photo detector as the disk turns below it.The reflection is detected as a beam that is alternately broken for a short period of time (a short pit) or a slightly longer period oftime (a long pit). Two beams to either side of the read beam keep the center beam aligned on the row of divots as shown in thediagram below.
10 001010
11 001011
12 001100
13 001101
14 001110
15 001111
17.1.2.1
bits
16 bits 16 65535
kbps
44.1 kHz 16 bit 44.1 kHz ×16 bits = 705.6 kbps
17.1.2.5
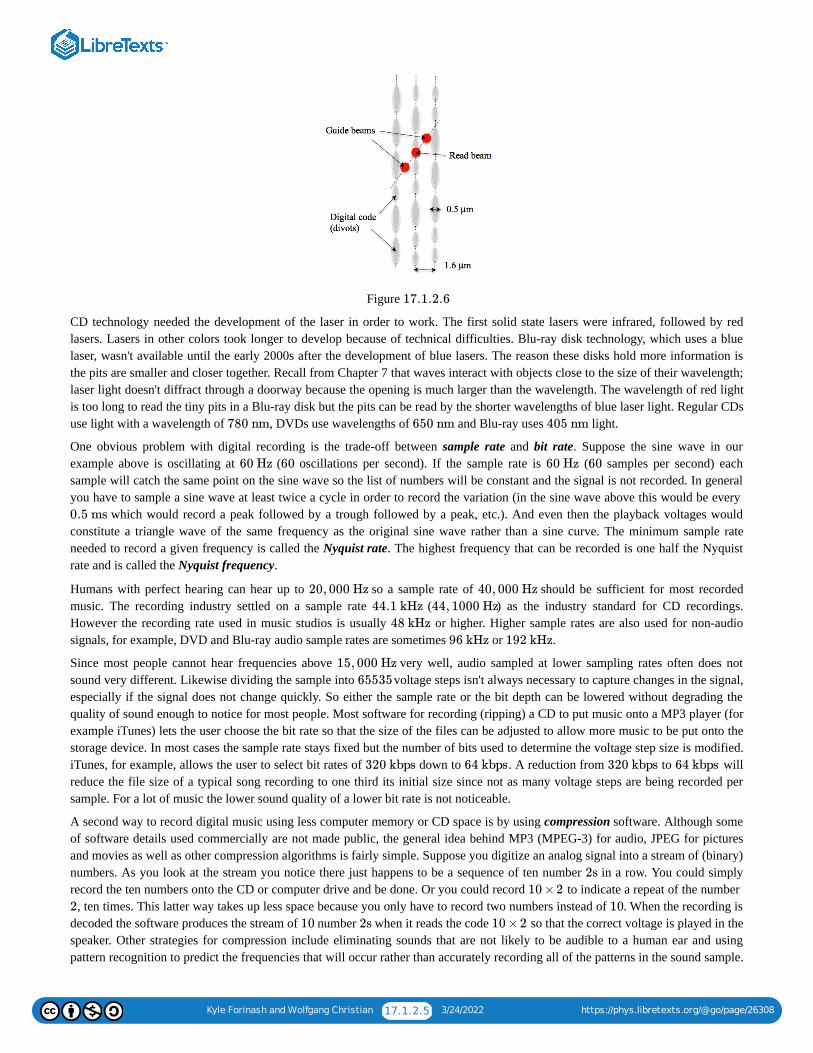
Kyle Forinash and Wolfgang Christian 17.1.2.5 3/24/2022 https://phys.libretexts.org/@go/page/26308
Figure
CD technology needed the development of the laser in order to work. The first solid state lasers were infrared, followed by redlasers. Lasers in other colors took longer to develop because of technical difficulties. Blu-ray disk technology, which uses a bluelaser, wasn't available until the early 2000s after the development of blue lasers. The reason these disks hold more information isthe pits are smaller and closer together. Recall from Chapter 7 that waves interact with objects close to the size of their wavelength;laser light doesn't diffract through a doorway because the opening is much larger than the wavelength. The wavelength of red lightis too long to read the tiny pits in a Blu-ray disk but the pits can be read by the shorter wavelengths of blue laser light. Regular CDsuse light with a wavelength of , DVDs use wavelengths of and Blu-ray uses light.
One obvious problem with digital recording is the trade-off between sample rate and bit rate. Suppose the sine wave in ourexample above is oscillating at ( oscillations per second). If the sample rate is ( samples per second) eachsample will catch the same point on the sine wave so the list of numbers will be constant and the signal is not recorded. In generalyou have to sample a sine wave at least twice a cycle in order to record the variation (in the sine wave above this would be every
which would record a peak followed by a trough followed by a peak, etc.). And even then the playback voltages wouldconstitute a triangle wave of the same frequency as the original sine wave rather than a sine curve. The minimum sample rateneeded to record a given frequency is called the Nyquist rate. The highest frequency that can be recorded is one half the Nyquistrate and is called the Nyquist frequency.
Humans with perfect hearing can hear up to so a sample rate of should be sufficient for most recordedmusic. The recording industry settled on a sample rate ( ) as the industry standard for CD recordings.However the recording rate used in music studios is usually or higher. Higher sample rates are also used for non-audiosignals, for example, DVD and Blu-ray audio sample rates are sometimes or .
Since most people cannot hear frequencies above very well, audio sampled at lower sampling rates often does notsound very different. Likewise dividing the sample into voltage steps isn't always necessary to capture changes in the signal,especially if the signal does not change quickly. So either the sample rate or the bit depth can be lowered without degrading thequality of sound enough to notice for most people. Most software for recording (ripping) a CD to put music onto a MP3 player (forexample iTunes) lets the user choose the bit rate so that the size of the files can be adjusted to allow more music to be put onto thestorage device. In most cases the sample rate stays fixed but the number of bits used to determine the voltage step size is modified.iTunes, for example, allows the user to select bit rates of down to . A reduction from to willreduce the file size of a typical song recording to one third its initial size since not as many voltage steps are being recorded persample. For a lot of music the lower sound quality of a lower bit rate is not noticeable.
A second way to record digital music using less computer memory or CD space is by using compression software. Although someof software details used commercially are not made public, the general idea behind MP3 (MPEG-3) for audio, JPEG for picturesand movies as well as other compression algorithms is fairly simple. Suppose you digitize an analog signal into a stream of (binary)numbers. As you look at the stream you notice there just happens to be a sequence of ten number in a row. You could simplyrecord the ten numbers onto the CD or computer drive and be done. Or you could record to indicate a repeat of the number
, ten times. This latter way takes up less space because you only have to record two numbers instead of . When the recording isdecoded the software produces the stream of number when it reads the code so that the correct voltage is played in thespeaker. Other strategies for compression include eliminating sounds that are not likely to be audible to a human ear and usingpattern recognition to predict the frequencies that will occur rather than accurately recording all of the patterns in the sound sample.
17.1.2.6
780 nm 650 nm 405 nm
60 Hz 60 60 Hz 60
0.5 ms
20, 000 Hz 40, 000 Hz
44.1 kHz 44, 1000 Hz
48 kHz
96 kHz 192 kHz
15, 000 Hz
65535
320 kbps 64 kbps 320 kbps 64 kbps
2s
10 ×2
2 10
10 2s 10 ×2
Kyle Forinash and Wolfgang Christian 17.1.2.6 3/24/2022 https://phys.libretexts.org/@go/page/26308
Compression is lossless if all the original data is recorded. In a lossy compression some data that is assumed not to affect soundquality is discarded.
There is one special type of digital signal that is used internally in electronic instruments such as keyboards, drum machines, musicsequencers and computers connected to these devices. MIDI stands for Musical Instrument Digital Interface and is an industrystandard for communicating between electronic music devices. A MIDI recording is a bit like recording the sheet music to a pieceof music instead of the actual sound. When a key is pressed on an electronic keyboard, information is collected about how long thekey is pressed, how hard and possibly other physical information about the movement of the key. This information is digital inform (binary) and can be recorded by a computer, manipulated by a computer program, or sent to an output device that converts thedigital signal into an analog signal that can be amplified and sent to a speaker or headphone. Because the output is computercontrolled, the key sequence can be used to control any sound, for example flute sounds or trumpet sounds, etc. MIDI files areusually much smaller than audio files which can be an advantage. A disadvantage is the full range of analog musical frequenciescannot be recorded this way.
Video/audio examples:A comparison of CD, DVD, HD DVD and Blu-ray.Sound samples of a song from a CD, recorded at different sample rates. Original file was AIFF format, . Allrecordings were made at fixed speed. The first number is the bit rate in kilobites per second, the second number is the samplerate, the third number is the file size.The Wikipedia history of the choice of 44.1 kHz.A more detailed explanation of MIDI.A MIDI file. You can download this, open it with Audacity and compare the file with a regular mp3. It will also open withGarageBand and other software.
Contributions and Attributions
This page is licensed under a CC BY-NC-SA 3.0 license and was authored, remixed, and/or curated by Kyle Forinash andWolfgang Christian. Source content is found at https://www.compadre.org/books/SoundBook. Page content has been edited andupdated to conform to the style and standards of the LibreTexts platform. A detailed versioning history of the edits to source contentis available upon request.
52.5 MB
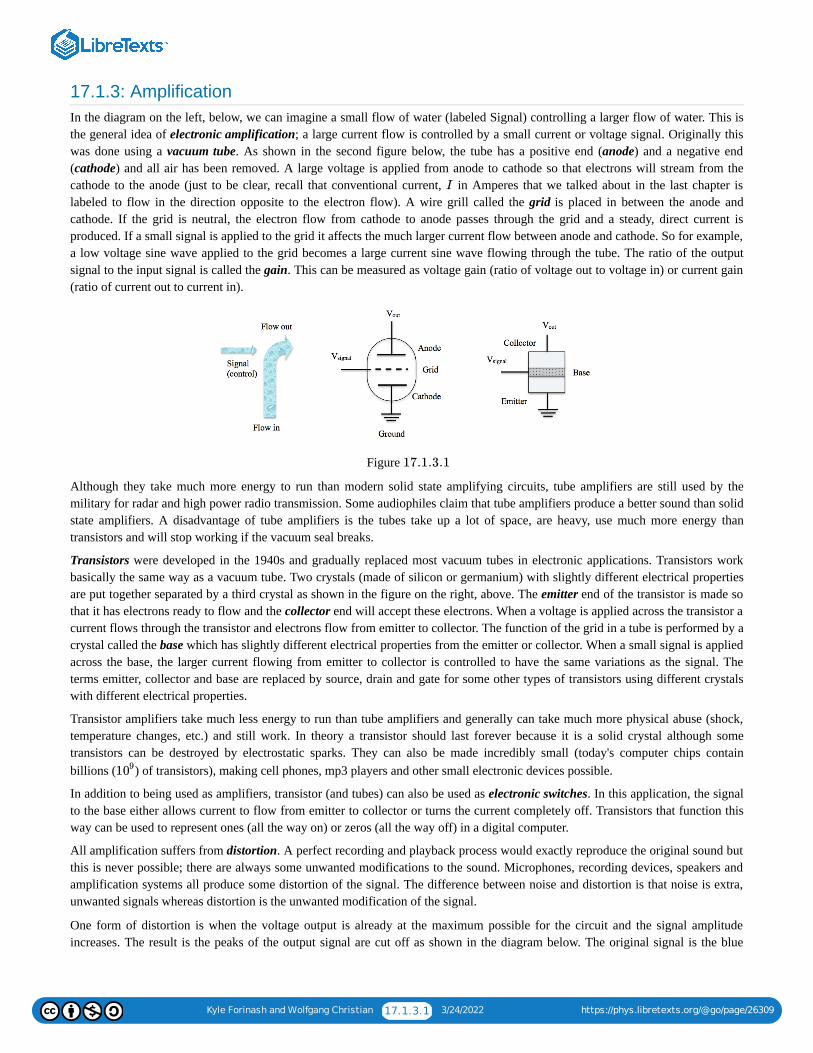
Kyle Forinash and Wolfgang Christian 17.1.3.1 3/24/2022 https://phys.libretexts.org/@go/page/26309
17.1.3: AmplificationIn the diagram on the left, below, we can imagine a small flow of water (labeled Signal) controlling a larger flow of water. This isthe general idea of electronic amplification; a large current flow is controlled by a small current or voltage signal. Originally thiswas done using a vacuum tube. As shown in the second figure below, the tube has a positive end (anode) and a negative end(cathode) and all air has been removed. A large voltage is applied from anode to cathode so that electrons will stream from thecathode to the anode (just to be clear, recall that conventional current, in Amperes that we talked about in the last chapter islabeled to flow in the direction opposite to the electron flow). A wire grill called the grid is placed in between the anode andcathode. If the grid is neutral, the electron flow from cathode to anode passes through the grid and a steady, direct current isproduced. If a small signal is applied to the grid it affects the much larger current flow between anode and cathode. So for example,a low voltage sine wave applied to the grid becomes a large current sine wave flowing through the tube. The ratio of the outputsignal to the input signal is called the gain. This can be measured as voltage gain (ratio of voltage out to voltage in) or current gain(ratio of current out to current in).
Figure
Although they take much more energy to run than modern solid state amplifying circuits, tube amplifiers are still used by themilitary for radar and high power radio transmission. Some audiophiles claim that tube amplifiers produce a better sound than solidstate amplifiers. A disadvantage of tube amplifiers is the tubes take up a lot of space, are heavy, use much more energy thantransistors and will stop working if the vacuum seal breaks.
Transistors were developed in the 1940s and gradually replaced most vacuum tubes in electronic applications. Transistors workbasically the same way as a vacuum tube. Two crystals (made of silicon or germanium) with slightly different electrical propertiesare put together separated by a third crystal as shown in the figure on the right, above. The emitter end of the transistor is made sothat it has electrons ready to flow and the collector end will accept these electrons. When a voltage is applied across the transistor acurrent flows through the transistor and electrons flow from emitter to collector. The function of the grid in a tube is performed by acrystal called the base which has slightly different electrical properties from the emitter or collector. When a small signal is appliedacross the base, the larger current flowing from emitter to collector is controlled to have the same variations as the signal. Theterms emitter, collector and base are replaced by source, drain and gate for some other types of transistors using different crystalswith different electrical properties.
Transistor amplifiers take much less energy to run than tube amplifiers and generally can take much more physical abuse (shock,temperature changes, etc.) and still work. In theory a transistor should last forever because it is a solid crystal although sometransistors can be destroyed by electrostatic sparks. They can also be made incredibly small (today's computer chips containbillions ( ) of transistors), making cell phones, mp3 players and other small electronic devices possible.
In addition to being used as amplifiers, transistor (and tubes) can also be used as electronic switches. In this application, the signalto the base either allows current to flow from emitter to collector or turns the current completely off. Transistors that function thisway can be used to represent ones (all the way on) or zeros (all the way off) in a digital computer.
All amplification suffers from distortion. A perfect recording and playback process would exactly reproduce the original sound butthis is never possible; there are always some unwanted modifications to the sound. Microphones, recording devices, speakers andamplification systems all produce some distortion of the signal. The difference between noise and distortion is that noise is extra,unwanted signals whereas distortion is the unwanted modification of the signal.
One form of distortion is when the voltage output is already at the maximum possible for the circuit and the signal amplitudeincreases. The result is the peaks of the output signal are cut off as shown in the diagram below. The original signal is the blue
I
17.1.3.1
109
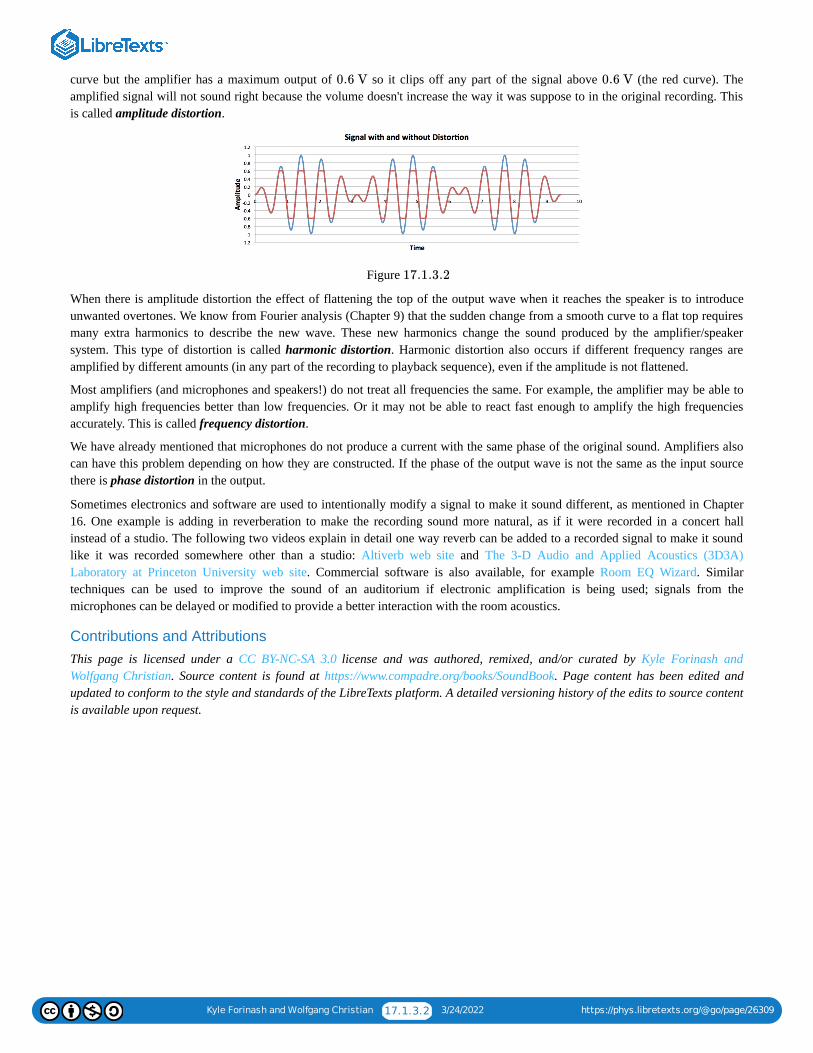
Kyle Forinash and Wolfgang Christian 17.1.3.2 3/24/2022 https://phys.libretexts.org/@go/page/26309
curve but the amplifier has a maximum output of so it clips off any part of the signal above (the red curve). Theamplified signal will not sound right because the volume doesn't increase the way it was suppose to in the original recording. Thisis called amplitude distortion.
Figure
When there is amplitude distortion the effect of flattening the top of the output wave when it reaches the speaker is to introduceunwanted overtones. We know from Fourier analysis (Chapter 9) that the sudden change from a smooth curve to a flat top requiresmany extra harmonics to describe the new wave. These new harmonics change the sound produced by the amplifier/speakersystem. This type of distortion is called harmonic distortion. Harmonic distortion also occurs if different frequency ranges areamplified by different amounts (in any part of the recording to playback sequence), even if the amplitude is not flattened.
Most amplifiers (and microphones and speakers!) do not treat all frequencies the same. For example, the amplifier may be able toamplify high frequencies better than low frequencies. Or it may not be able to react fast enough to amplify the high frequenciesaccurately. This is called frequency distortion.
We have already mentioned that microphones do not produce a current with the same phase of the original sound. Amplifiers alsocan have this problem depending on how they are constructed. If the phase of the output wave is not the same as the input sourcethere is phase distortion in the output.
Sometimes electronics and software are used to intentionally modify a signal to make it sound different, as mentioned in Chapter16. One example is adding in reverberation to make the recording sound more natural, as if it were recorded in a concert hallinstead of a studio. The following two videos explain in detail one way reverb can be added to a recorded signal to make it soundlike it was recorded somewhere other than a studio: Altiverb web site and The 3-D Audio and Applied Acoustics (3D3A)Laboratory at Princeton University web site. Commercial software is also available, for example Room EQ Wizard. Similartechniques can be used to improve the sound of an auditorium if electronic amplification is being used; signals from themicrophones can be delayed or modified to provide a better interaction with the room acoustics.
Contributions and AttributionsThis page is licensed under a CC BY-NC-SA 3.0 license and was authored, remixed, and/or curated by Kyle Forinash andWolfgang Christian. Source content is found at https://www.compadre.org/books/SoundBook. Page content has been edited andupdated to conform to the style and standards of the LibreTexts platform. A detailed versioning history of the edits to source contentis available upon request.
0.6 V 0.6 V
17.1.3.2
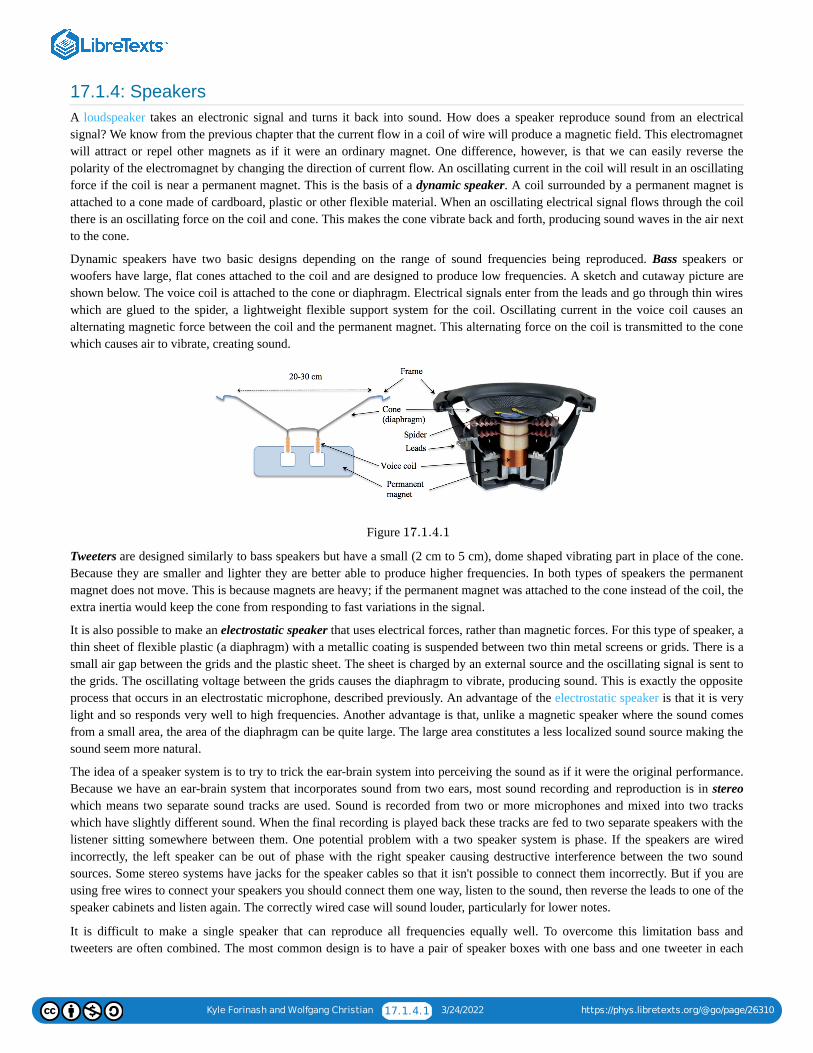
Kyle Forinash and Wolfgang Christian 17.1.4.1 3/24/2022 https://phys.libretexts.org/@go/page/26310
17.1.4: SpeakersA loudspeaker takes an electronic signal and turns it back into sound. How does a speaker reproduce sound from an electricalsignal? We know from the previous chapter that the current flow in a coil of wire will produce a magnetic field. This electromagnetwill attract or repel other magnets as if it were an ordinary magnet. One difference, however, is that we can easily reverse thepolarity of the electromagnet by changing the direction of current flow. An oscillating current in the coil will result in an oscillatingforce if the coil is near a permanent magnet. This is the basis of a dynamic speaker. A coil surrounded by a permanent magnet isattached to a cone made of cardboard, plastic or other flexible material. When an oscillating electrical signal flows through the coilthere is an oscillating force on the coil and cone. This makes the cone vibrate back and forth, producing sound waves in the air nextto the cone.
Dynamic speakers have two basic designs depending on the range of sound frequencies being reproduced. Bass speakers orwoofers have large, flat cones attached to the coil and are designed to produce low frequencies. A sketch and cutaway picture areshown below. The voice coil is attached to the cone or diaphragm. Electrical signals enter from the leads and go through thin wireswhich are glued to the spider, a lightweight flexible support system for the coil. Oscillating current in the voice coil causes analternating magnetic force between the coil and the permanent magnet. This alternating force on the coil is transmitted to the conewhich causes air to vibrate, creating sound.
Figure
Tweeters are designed similarly to bass speakers but have a small (2 cm to 5 cm), dome shaped vibrating part in place of the cone.Because they are smaller and lighter they are better able to produce higher frequencies. In both types of speakers the permanentmagnet does not move. This is because magnets are heavy; if the permanent magnet was attached to the cone instead of the coil, theextra inertia would keep the cone from responding to fast variations in the signal.
It is also possible to make an electrostatic speaker that uses electrical forces, rather than magnetic forces. For this type of speaker, athin sheet of flexible plastic (a diaphragm) with a metallic coating is suspended between two thin metal screens or grids. There is asmall air gap between the grids and the plastic sheet. The sheet is charged by an external source and the oscillating signal is sent tothe grids. The oscillating voltage between the grids causes the diaphragm to vibrate, producing sound. This is exactly the oppositeprocess that occurs in an electrostatic microphone, described previously. An advantage of the electrostatic speaker is that it is verylight and so responds very well to high frequencies. Another advantage is that, unlike a magnetic speaker where the sound comesfrom a small area, the area of the diaphragm can be quite large. The large area constitutes a less localized sound source making thesound seem more natural.
The idea of a speaker system is to try to trick the ear-brain system into perceiving the sound as if it were the original performance.Because we have an ear-brain system that incorporates sound from two ears, most sound recording and reproduction is in stereowhich means two separate sound tracks are used. Sound is recorded from two or more microphones and mixed into two trackswhich have slightly different sound. When the final recording is played back these tracks are fed to two separate speakers with thelistener sitting somewhere between them. One potential problem with a two speaker system is phase. If the speakers are wiredincorrectly, the left speaker can be out of phase with the right speaker causing destructive interference between the two soundsources. Some stereo systems have jacks for the speaker cables so that it isn't possible to connect them incorrectly. But if you areusing free wires to connect your speakers you should connect them one way, listen to the sound, then reverse the leads to one of thespeaker cabinets and listen again. The correctly wired case will sound louder, particularly for lower notes.
It is difficult to make a single speaker that can reproduce all frequencies equally well. To overcome this limitation bass andtweeters are often combined. The most common design is to have a pair of speaker boxes with one bass and one tweeter in each
17.1.4.1
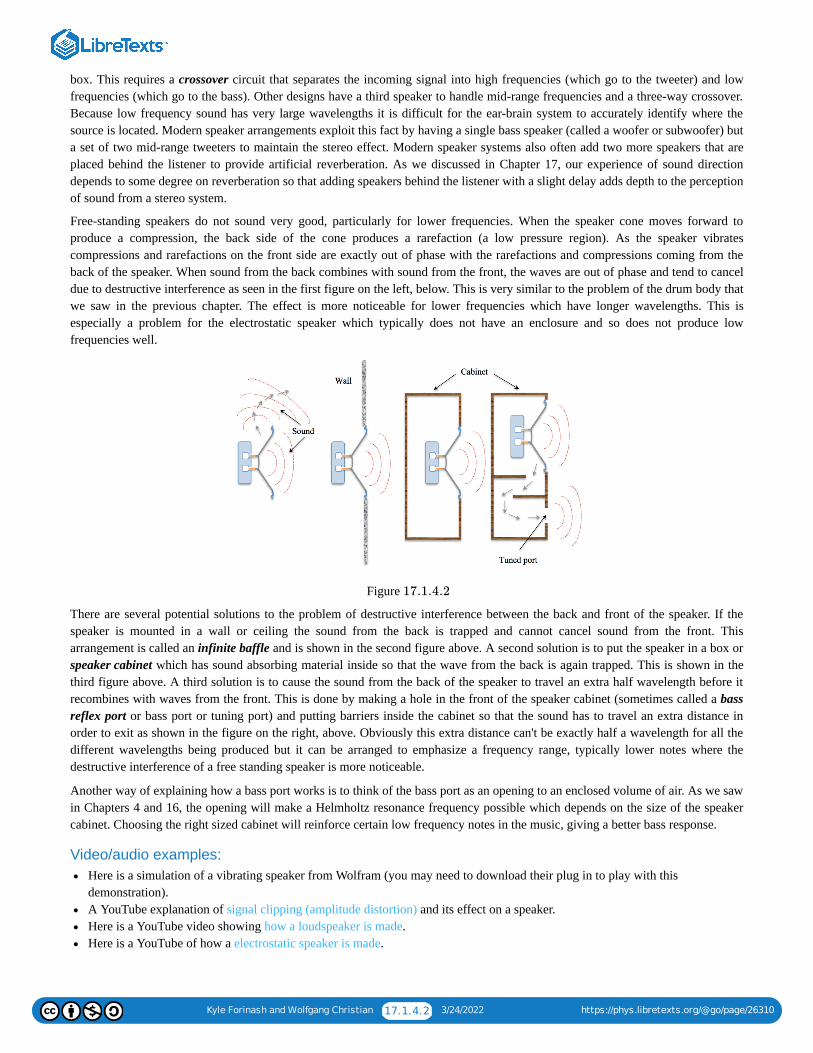
Kyle Forinash and Wolfgang Christian 17.1.4.2 3/24/2022 https://phys.libretexts.org/@go/page/26310
box. This requires a crossover circuit that separates the incoming signal into high frequencies (which go to the tweeter) and lowfrequencies (which go to the bass). Other designs have a third speaker to handle mid-range frequencies and a three-way crossover.Because low frequency sound has very large wavelengths it is difficult for the ear-brain system to accurately identify where thesource is located. Modern speaker arrangements exploit this fact by having a single bass speaker (called a woofer or subwoofer) buta set of two mid-range tweeters to maintain the stereo effect. Modern speaker systems also often add two more speakers that areplaced behind the listener to provide artificial reverberation. As we discussed in Chapter 17, our experience of sound directiondepends to some degree on reverberation so that adding speakers behind the listener with a slight delay adds depth to the perceptionof sound from a stereo system.
Free-standing speakers do not sound very good, particularly for lower frequencies. When the speaker cone moves forward toproduce a compression, the back side of the cone produces a rarefaction (a low pressure region). As the speaker vibratescompressions and rarefactions on the front side are exactly out of phase with the rarefactions and compressions coming from theback of the speaker. When sound from the back combines with sound from the front, the waves are out of phase and tend to canceldue to destructive interference as seen in the first figure on the left, below. This is very similar to the problem of the drum body thatwe saw in the previous chapter. The effect is more noticeable for lower frequencies which have longer wavelengths. This isespecially a problem for the electrostatic speaker which typically does not have an enclosure and so does not produce lowfrequencies well.
Figure
There are several potential solutions to the problem of destructive interference between the back and front of the speaker. If thespeaker is mounted in a wall or ceiling the sound from the back is trapped and cannot cancel sound from the front. Thisarrangement is called an infinite baffle and is shown in the second figure above. A second solution is to put the speaker in a box orspeaker cabinet which has sound absorbing material inside so that the wave from the back is again trapped. This is shown in thethird figure above. A third solution is to cause the sound from the back of the speaker to travel an extra half wavelength before itrecombines with waves from the front. This is done by making a hole in the front of the speaker cabinet (sometimes called a bassreflex port or bass port or tuning port) and putting barriers inside the cabinet so that the sound has to travel an extra distance inorder to exit as shown in the figure on the right, above. Obviously this extra distance can't be exactly half a wavelength for all thedifferent wavelengths being produced but it can be arranged to emphasize a frequency range, typically lower notes where thedestructive interference of a free standing speaker is more noticeable.
Another way of explaining how a bass port works is to think of the bass port as an opening to an enclosed volume of air. As we sawin Chapters 4 and 16, the opening will make a Helmholtz resonance frequency possible which depends on the size of the speakercabinet. Choosing the right sized cabinet will reinforce certain low frequency notes in the music, giving a better bass response.
Video/audio examples:Here is a simulation of a vibrating speaker from Wolfram (you may need to download their plug in to play with thisdemonstration).A YouTube explanation of signal clipping (amplitude distortion) and its effect on a speaker.Here is a YouTube video showing how a loudspeaker is made.Here is a YouTube of how a electrostatic speaker is made.
17.1.4.2

Kyle Forinash and Wolfgang Christian 17.1.4.3 3/24/2022 https://phys.libretexts.org/@go/page/26310
Contributions and AttributionsThis page is licensed under a CC BY-NC-SA 3.0 license and was authored, remixed, and/or curated by Kyle Forinash andWolfgang Christian. Source content is found at https://www.compadre.org/books/SoundBook. Page content has been edited andupdated to conform to the style and standards of the LibreTexts platform. A detailed versioning history of the edits to source contentis available upon request.
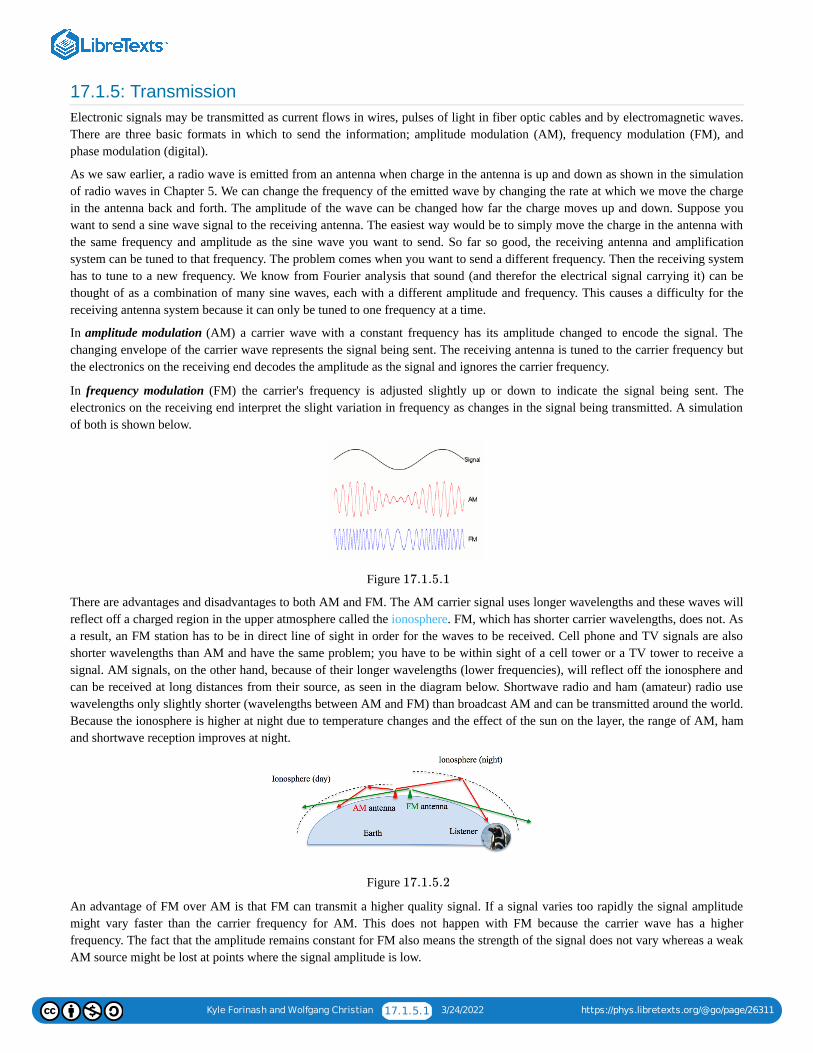
Kyle Forinash and Wolfgang Christian 17.1.5.1 3/24/2022 https://phys.libretexts.org/@go/page/26311
17.1.5: TransmissionElectronic signals may be transmitted as current flows in wires, pulses of light in fiber optic cables and by electromagnetic waves.There are three basic formats in which to send the information; amplitude modulation (AM), frequency modulation (FM), andphase modulation (digital).
As we saw earlier, a radio wave is emitted from an antenna when charge in the antenna is up and down as shown in the simulationof radio waves in Chapter 5. We can change the frequency of the emitted wave by changing the rate at which we move the chargein the antenna back and forth. The amplitude of the wave can be changed how far the charge moves up and down. Suppose youwant to send a sine wave signal to the receiving antenna. The easiest way would be to simply move the charge in the antenna withthe same frequency and amplitude as the sine wave you want to send. So far so good, the receiving antenna and amplificationsystem can be tuned to that frequency. The problem comes when you want to send a different frequency. Then the receiving systemhas to tune to a new frequency. We know from Fourier analysis that sound (and therefor the electrical signal carrying it) can bethought of as a combination of many sine waves, each with a different amplitude and frequency. This causes a difficulty for thereceiving antenna system because it can only be tuned to one frequency at a time.
In amplitude modulation (AM) a carrier wave with a constant frequency has its amplitude changed to encode the signal. Thechanging envelope of the carrier wave represents the signal being sent. The receiving antenna is tuned to the carrier frequency butthe electronics on the receiving end decodes the amplitude as the signal and ignores the carrier frequency.
In frequency modulation (FM) the carrier's frequency is adjusted slightly up or down to indicate the signal being sent. Theelectronics on the receiving end interpret the slight variation in frequency as changes in the signal being transmitted. A simulationof both is shown below.
Figure
There are advantages and disadvantages to both AM and FM. The AM carrier signal uses longer wavelengths and these waves willreflect off a charged region in the upper atmosphere called the ionosphere. FM, which has shorter carrier wavelengths, does not. Asa result, an FM station has to be in direct line of sight in order for the waves to be received. Cell phone and TV signals are alsoshorter wavelengths than AM and have the same problem; you have to be within sight of a cell tower or a TV tower to receive asignal. AM signals, on the other hand, because of their longer wavelengths (lower frequencies), will reflect off the ionosphere andcan be received at long distances from their source, as seen in the diagram below. Shortwave radio and ham (amateur) radio usewavelengths only slightly shorter (wavelengths between AM and FM) than broadcast AM and can be transmitted around the world.Because the ionosphere is higher at night due to temperature changes and the effect of the sun on the layer, the range of AM, hamand shortwave reception improves at night.
Figure
An advantage of FM over AM is that FM can transmit a higher quality signal. If a signal varies too rapidly the signal amplitudemight vary faster than the carrier frequency for AM. This does not happen with FM because the carrier wave has a higherfrequency. The fact that the amplitude remains constant for FM also means the strength of the signal does not vary whereas a weakAM source might be lost at points where the signal amplitude is low.
17.1.5.1
17.1.5.2
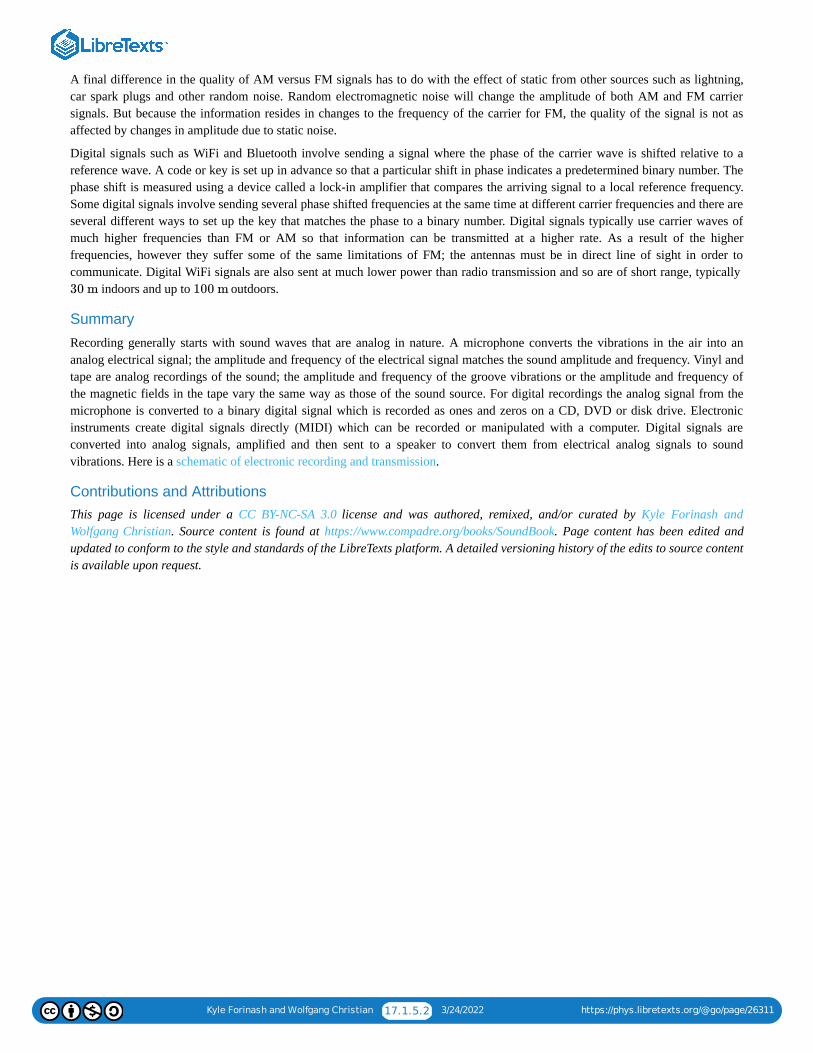
Kyle Forinash and Wolfgang Christian 17.1.5.2 3/24/2022 https://phys.libretexts.org/@go/page/26311
A final difference in the quality of AM versus FM signals has to do with the effect of static from other sources such as lightning,car spark plugs and other random noise. Random electromagnetic noise will change the amplitude of both AM and FM carriersignals. But because the information resides in changes to the frequency of the carrier for FM, the quality of the signal is not asaffected by changes in amplitude due to static noise.
Digital signals such as WiFi and Bluetooth involve sending a signal where the phase of the carrier wave is shifted relative to areference wave. A code or key is set up in advance so that a particular shift in phase indicates a predetermined binary number. Thephase shift is measured using a device called a lock-in amplifier that compares the arriving signal to a local reference frequency.Some digital signals involve sending several phase shifted frequencies at the same time at different carrier frequencies and there areseveral different ways to set up the key that matches the phase to a binary number. Digital signals typically use carrier waves ofmuch higher frequencies than FM or AM so that information can be transmitted at a higher rate. As a result of the higherfrequencies, however they suffer some of the same limitations of FM; the antennas must be in direct line of sight in order tocommunicate. Digital WiFi signals are also sent at much lower power than radio transmission and so are of short range, typically
indoors and up to outdoors.
Summary
Recording generally starts with sound waves that are analog in nature. A microphone converts the vibrations in the air into ananalog electrical signal; the amplitude and frequency of the electrical signal matches the sound amplitude and frequency. Vinyl andtape are analog recordings of the sound; the amplitude and frequency of the groove vibrations or the amplitude and frequency ofthe magnetic fields in the tape vary the same way as those of the sound source. For digital recordings the analog signal from themicrophone is converted to a binary digital signal which is recorded as ones and zeros on a CD, DVD or disk drive. Electronicinstruments create digital signals directly (MIDI) which can be recorded or manipulated with a computer. Digital signals areconverted into analog signals, amplified and then sent to a speaker to convert them from electrical analog signals to soundvibrations. Here is a schematic of electronic recording and transmission.
Contributions and AttributionsThis page is licensed under a CC BY-NC-SA 3.0 license and was authored, remixed, and/or curated by Kyle Forinash andWolfgang Christian. Source content is found at https://www.compadre.org/books/SoundBook. Page content has been edited andupdated to conform to the style and standards of the LibreTexts platform. A detailed versioning history of the edits to source contentis available upon request.
30 m 100 m


GlossarySample Word 1 | Sample Definition 1

GlossarySample Word 1 | Sample Definition 1